bibliometrics of bibliometrics: a research topic in the mirror of bibliometric indicators
TRANSCRIPT
Bibliometrics of Bibliometrics: A Research Topic in
the Mirror of Bibliometric Indicators
VICTOR RODRIGUEZ
Department of Applied Economics
Katholieke Universiteit Leuven, Belgium
Abstract
This exploratory study tries to get insights on one way of exteriorising thepublication activity of bibliometricians and how such activity is taken intoconsideration within the scientific community. As we thought in advance,the evidence shows that the USA is the most productive, most cited and mostcollaborative publisher. The neighbourhood is a ground to collaborate, likeCanada or Mexico with the USA, and Belgium with the Netherlands. Themost visible topics are small-world networks and webometrics.
Keywords: bibliometrics; publication activity; citation impact; research
collaboration
Resumen
Este estudio exploratorio intenta echar un vistazo sobre una forma deexteriorización de publicaciones de bibliometristas y cómo tal actividad esconsiderada dentro de la comunidad científica. Como lo pensamos deantemano, la evidencia muestra que los EEUU son los más productivos, elmás citado y el más colaborador en bibliometría. Los vecinos son buenoscolaboradores, como Canadá o México con los EEUU y Bélgica con losPaíses Bajos. Los temas más visibles son las redes de pequeño mundo ywebometrics.
Palabras claves: bibliometría; publicación científica; impacto de citas;
colaboración científica
Revista de Economía y Estadística - Vol. XLIV - (1) - Año 2006Instituto de Economía y Finanzas - Facultad de Ciencias Económicas,Universidad Nacional de Córdoba - Argentina

I. INTRODUCTION
The main objective of this paper is to determine bibliometric
indicators for the publications contained in the sample. By using
quantitative techniques, we try to get insights on one way of exteriorising
the (single or collaborative) activity of scientists and how such activity is
taken into consideration within the scientific community.
First, the working database was constructed retrieving
information concerning the 2001 publications in all languages in
journals recorded in the three databases of the ISI Web of KnowledgeSM
(viz., science, social sciences, and arts and humanities). Second, the
analysis was restricted to four types of documents, namely article, letter,
note, and review, because they have references. Third, the terms
searched in the title, keywords, or abstract of the documents were
“bibliometr* OR scientometr* OR citation* analy* OR co-citation OR
cocitation OR (impact factor* same journal) OR coauthorship* OR co-
authorship* OR scientific collaboration OR collaboration in science OR
publication activ* OR research performance.” Finally, citations were
counted until 2004.
The database fields that were included in our own tables were
author(s), title, source, language, document type, keywords, addresses,
cited references count, times cited, publisher information, ISSN, source
abbreviation, page count, and IDS number. The retrieved information was
exported into an MS-Excel File, where noise was removed.
The remainder of this paper is organized as follows. Section II deals
with publication activity. Section III describes citation impact. Section IV
analyses collaboration. Finally, Section V points out some concluding
remarks.
II. PUBLICATION ACTIVITY
From a dynamic point of view, publication activity is the amount of
documents published by a selected unit (author, university, and country) in
a period. This indicator is thus a flow variable.
The full or integer counting scheme was used in the three levels of
analysis: micro (author), meso (university), and macro (country). If a unit
of analysis appears twice or more in the same publication, that unit was
138 Victor Rodriguez

considered only once. Thus, a copublication was fully assigned to each
contributing non-repeated unit.
If we take into account the total number of publications by authors
(Table 1), Van Raan published the most. But, if we consider single (Table
2) and collaborative (Table 3) documents separately, Van Raan and
Newman published the most individually, while Ingwersen and Kostoff
published the most in collaboration. None of the authors had a heavy
relative weight in the sample; even the top publishers had a low share.
Table 1
Top Publication Activity by Authors
Table 2
Top Single Publication Activity by Authors
139Bibliometrics of Bibliometrics: A Research Topic in the Mirror...

Table 3
Top Collaborative Publication Activity by Authors
With regard to the total number of publications by institutions
(Table 4), Leiden University published the most. If we consider single
(Table 5) and collaborative (Table 6) documents separately, again, Leiden
University published the most. However, the Hungarian Academy of
Science, Indiana University, Office of Naval Research, and Research
Association of Scientific Communication and Information were on an
equal footing with Leiden University as publishers of the greatest number
of papers written in collaboration. None of the institutions had a heavy
relative weight in the sample; even the top publishers had a low share.
Table 4
Top Publication Activity by Institutions
140 Victor Rodriguez
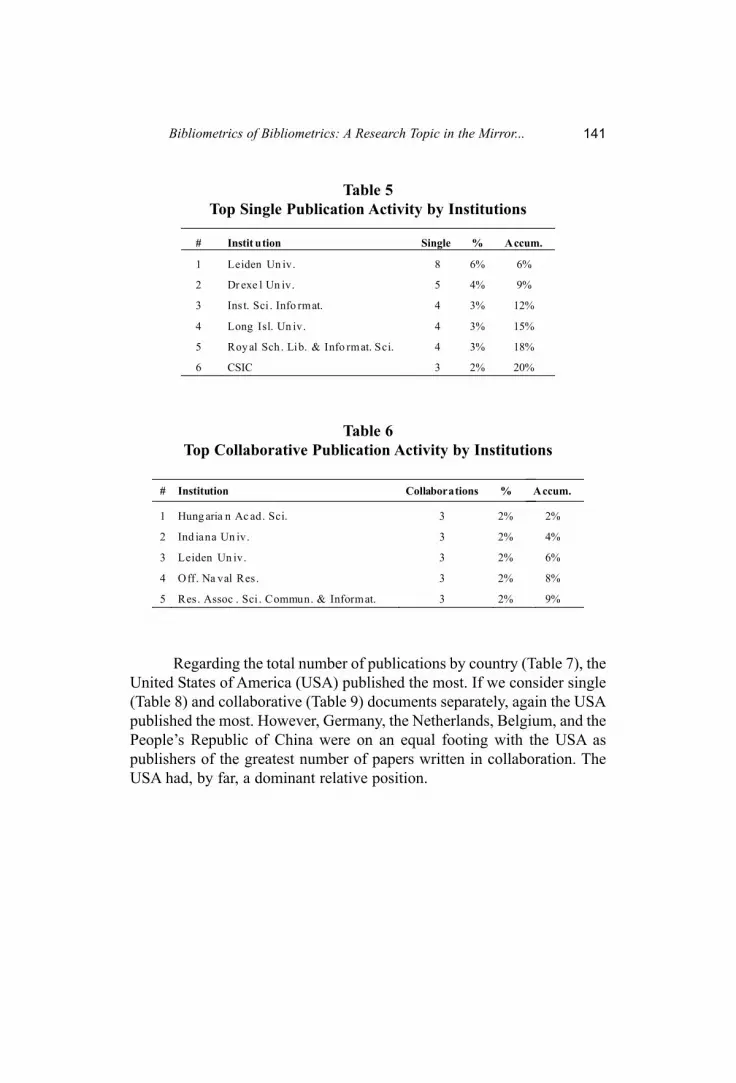
Table 5
Top Single Publication Activity by Institutions
Table 6
Top Collaborative Publication Activity by Institutions
Regarding the total number of publications by country (Table 7), the
United States of America (USA) published the most. If we consider single
(Table 8) and collaborative (Table 9) documents separately, again the USA
published the most. However, Germany, the Netherlands, Belgium, and the
People’s Republic of China were on an equal footing with the USA as
publishers of the greatest number of papers written in collaboration. The
USA had, by far, a dominant relative position.
141Bibliometrics of Bibliometrics: A Research Topic in the Mirror...

Table 7
Top Publication Activity by Countries
Table 8
Top Single Publication Activity by Countries
Table 9
Top Collaborative Publication Activity by Countries
The core journals that publish documents most frequently turn out
to be Scientometrics and the Journal of the American Society forInformation Science and Technology (Figure 1). The former is represented
geographically mainly by the Netherlands and Germany. The latter
basically publishes American documents.
142 Victor Rodriguez
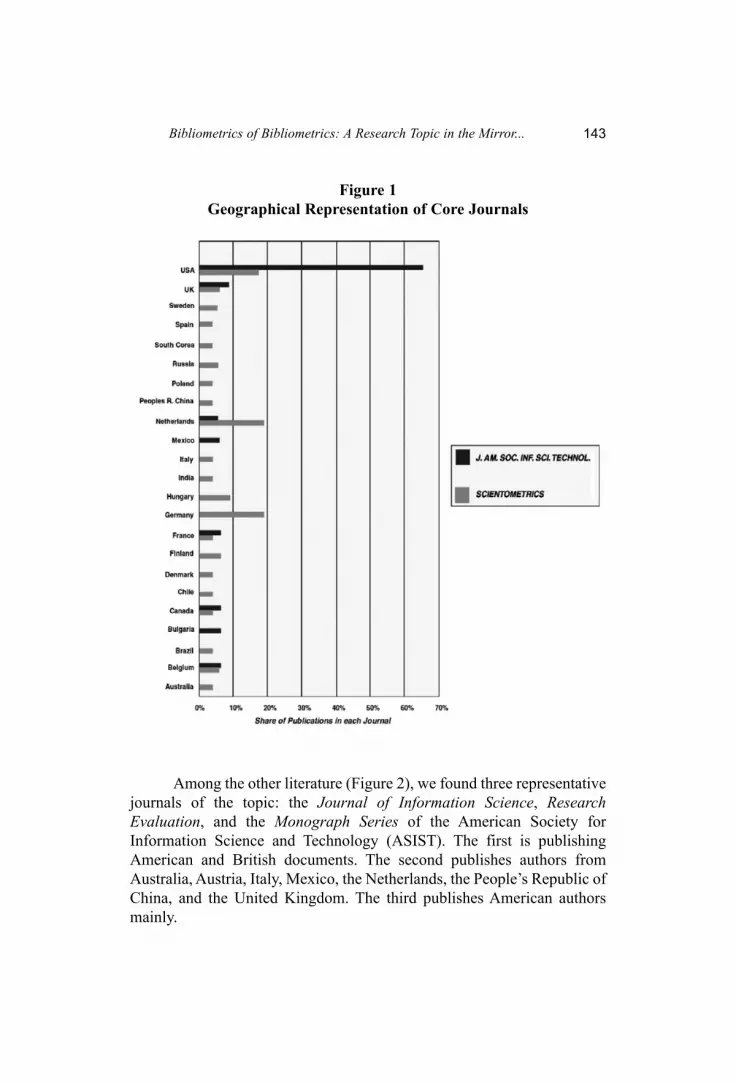
Figure 1
Geographical Representation of Core Journals
Among the other literature (Figure 2), we found three representative
journals of the topic: the Journal of Information Science, ResearchEvaluation, and the Monograph Series of the American Society for
Information Science and Technology (ASIST). The first is publishing
American and British documents. The second publishes authors from
Australia, Austria, Italy, Mexico, the Netherlands, the People’s Republic of
China, and the United Kingdom. The third publishes American authors
mainly.
143Bibliometrics of Bibliometrics: A Research Topic in the Mirror...
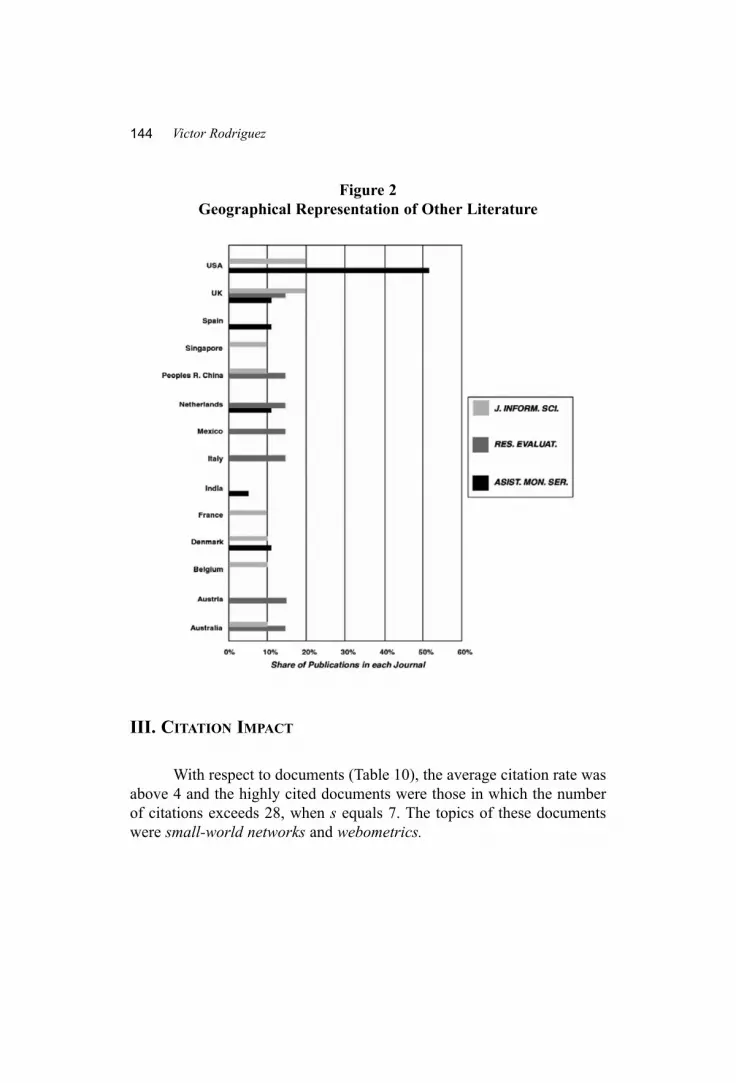
Figure 2
Geographical Representation of Other Literature
III. CITATION IMPACT
With respect to documents (Table 10), the average citation rate was
above 4 and the highly cited documents were those in which the number
of citations exceeds 28, when s equals 7. The topics of these documents
were small-world networks and webometrics.
144 Victor Rodriguez
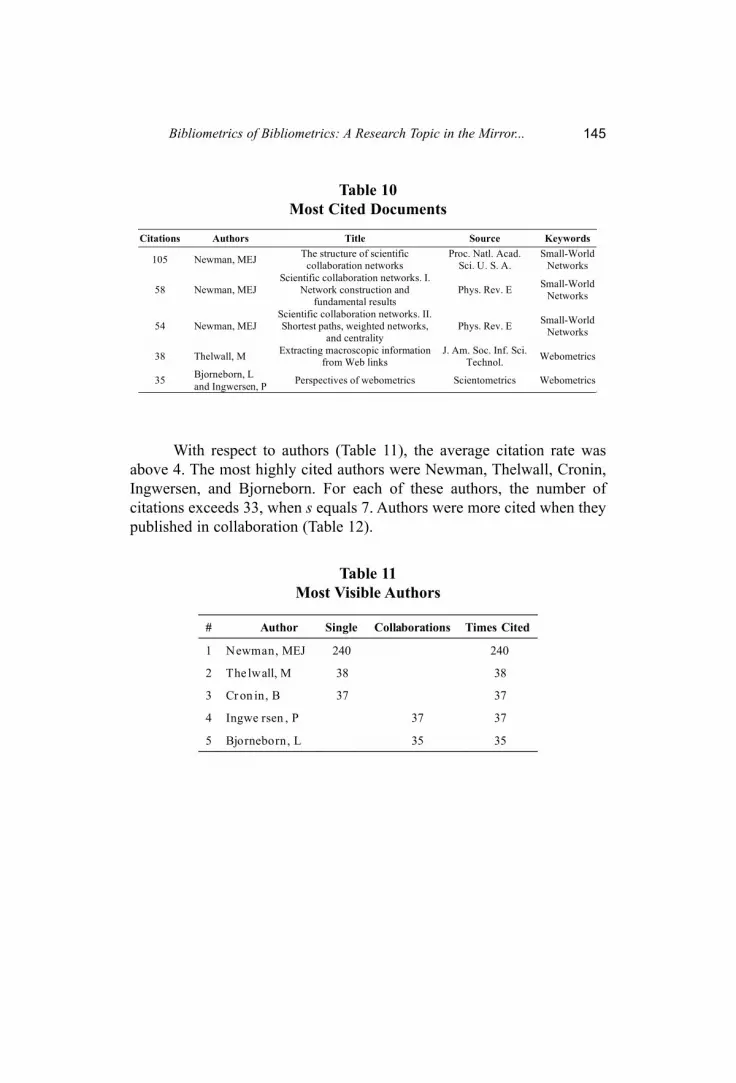
Table 10
Most Cited Documents
With respect to authors (Table 11), the average citation rate was
above 4. The most highly cited authors were Newman, Thelwall, Cronin,
Ingwersen, and Bjorneborn. For each of these authors, the number of
citations exceeds 33, when s equals 7. Authors were more cited when they
published in collaboration (Table 12).
Table 11
Most Visible Authors
145Bibliometrics of Bibliometrics: A Research Topic in the Mirror...

146 Victor Rodriguez
Table 12
Frequency of Cited Authors
With respect to institutions (Table 13), the average citation rate was
above 6. The most highly cited institutions were Santa Fe Institute, Cornell
University, and Indiana University. For each of these institutions, the
number of citations exceeds 47, when s equals 7. Institutions were more
cited when they published in collaboration (Table 14).
Table 13
Most Visible Institutions
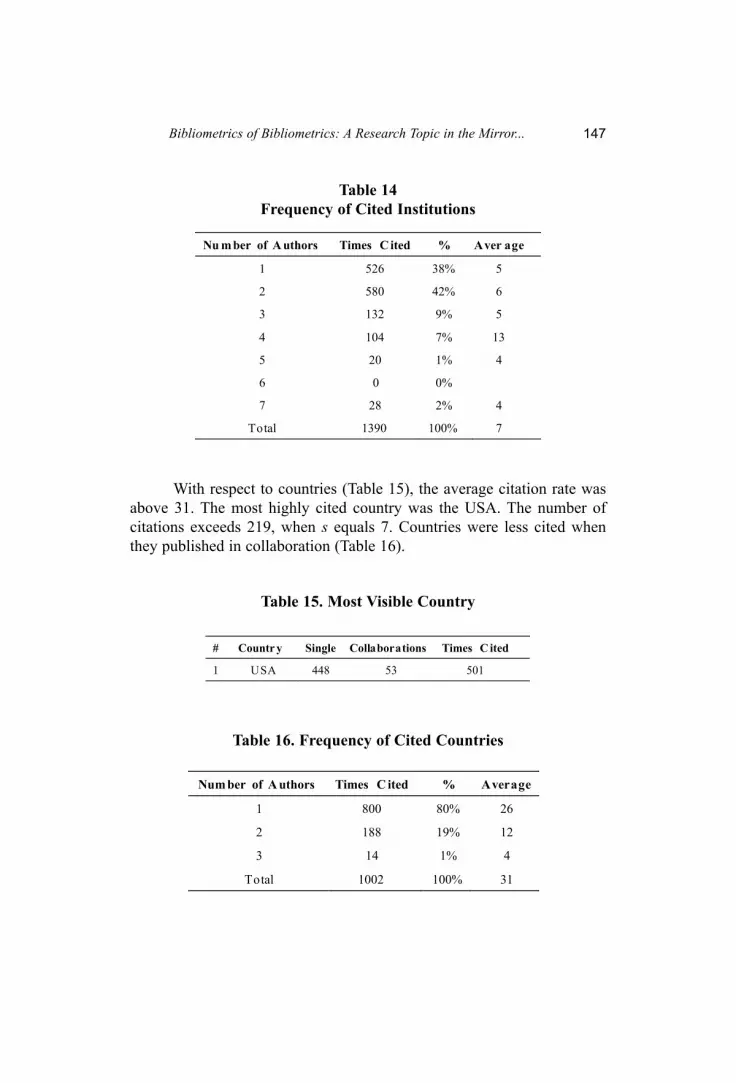
Table 14
Frequency of Cited Institutions
With respect to countries (Table 15), the average citation rate was
above 31. The most highly cited country was the USA. The number of
citations exceeds 219, when s equals 7. Countries were less cited when
they published in collaboration (Table 16).
Table 15. Most Visible Country
Table 16. Frequency of Cited Countries
147Bibliometrics of Bibliometrics: A Research Topic in the Mirror...

IV. COLLABORATION
As collaboration patterns can be examined at different levels of
aggregation, we proceed as follows. First, we analyze cooperation among
individual authors; i.e. at the microlevel. Second, we focus on cooperation
among institutions; i.e. at the mesolevel. Finally, we assess the importance
of international scientific collaboration; i.e. at the macrolevel.
We created frequency tables with the number of documents for each
number of units. Considering occurrence, 54% of documents were
published in collaboration by authors (Table 17). Furthermore, 30% of the
total documents were published in collaboration by institutions (Table 18)
and 12% by countries (Table 19).
Table 17
Frequency of Collaboration by Authors
148 Victor Rodriguez
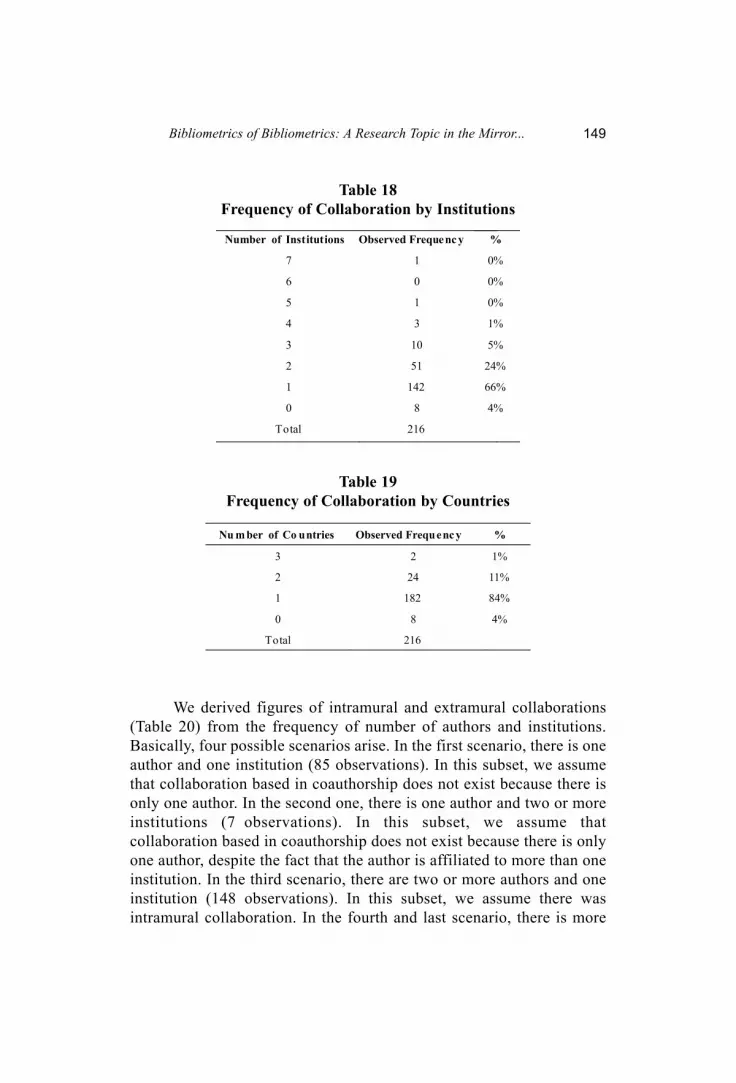
Table 18
Frequency of Collaboration by Institutions
Table 19
Frequency of Collaboration by Countries
We derived figures of intramural and extramural collaborations
(Table 20) from the frequency of number of authors and institutions.
Basically, four possible scenarios arise. In the first scenario, there is one
author and one institution (85 observations). In this subset, we assume
that collaboration based in coauthorship does not exist because there is
only one author. In the second one, there is one author and two or more
institutions (7 observations). In this subset, we assume that
collaboration based in coauthorship does not exist because there is only
one author, despite the fact that the author is affiliated to more than one
institution. In the third scenario, there are two or more authors and one
institution (148 observations). In this subset, we assume there was
intramural collaboration. In the fourth and last scenario, there is more
149Bibliometrics of Bibliometrics: A Research Topic in the Mirror...
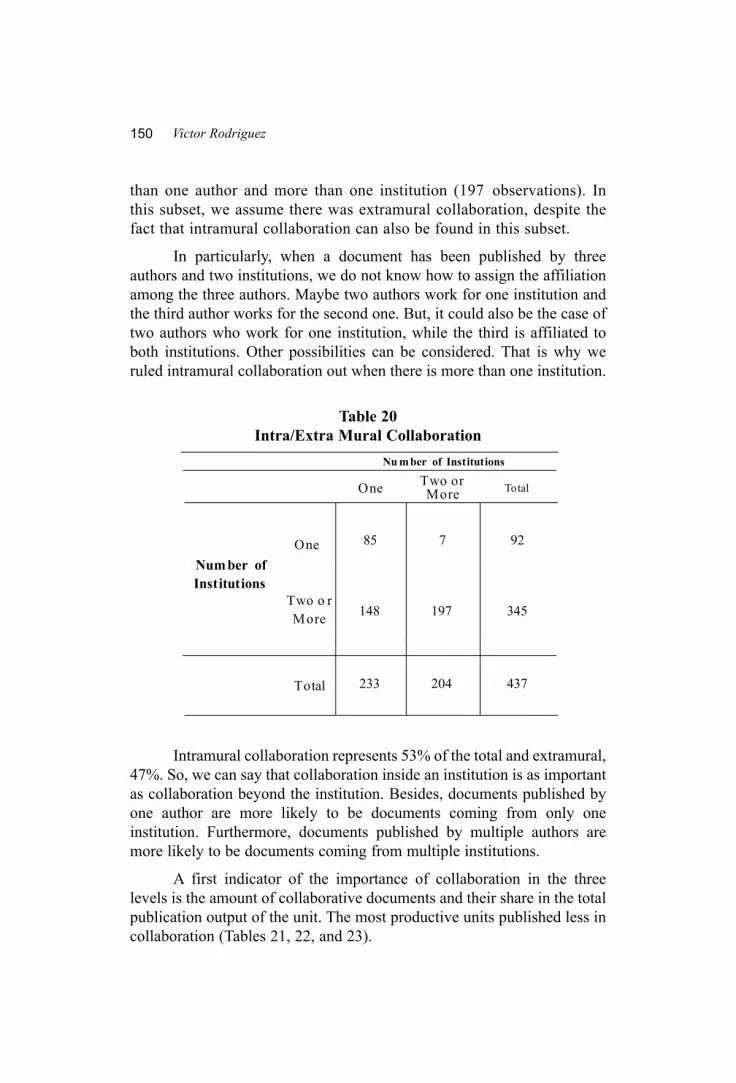
than one author and more than one institution (197 observations). In
this subset, we assume there was extramural collaboration, despite the
fact that intramural collaboration can also be found in this subset.
In particularly, when a document has been published by three
authors and two institutions, we do not know how to assign the affiliation
among the three authors. Maybe two authors work for one institution and
the third author works for the second one. But, it could also be the case of
two authors who work for one institution, while the third is affiliated to
both institutions. Other possibilities can be considered. That is why we
ruled intramural collaboration out when there is more than one institution.
Table 20
Intra/Extra Mural Collaboration
Intramural collaboration represents 53% of the total and extramural,
47%. So, we can say that collaboration inside an institution is as important
as collaboration beyond the institution. Besides, documents published by
one author are more likely to be documents coming from only one
institution. Furthermore, documents published by multiple authors are
more likely to be documents coming from multiple institutions.
A first indicator of the importance of collaboration in the three
levels is the amount of collaborative documents and their share in the total
publication output of the unit. The most productive units published less in
collaboration (Tables 21, 22, and 23).
150 Victor Rodriguez

Moreover, the more aggregated the level of analysis was, the less
collaborative the most productive units were, on average. If the whole
sample is considered; i.e. not only the top publishers, authors published
averagely 79% of their publications in collaboration; institutions, 56%;
and countries, 34%.
Table 21
Collaborations in Top Publication Activity by Authors
Table 22
Collaborations in Top Publication Activity by Institutions
151Bibliometrics of Bibliometrics: A Research Topic in the Mirror...

Table 23
Collaborations in Top Publication Activity by Countries
Table 24
Transaction Matrix: Number of International Copublications
In order to calculate the strengths of coauthorship links, we
constructed a bidimensional transaction matrix (Table 24) where rows and
columns represent the countries that collaborate. Particularly, if a
document has been published by three countries (A, B, and C), this is
152 Victor Rodriguez
considered as published in our bidimensional matrix by A-B, A-C, B-C, B-
A, C-A, and C-B (Luukkonen et al. 1993, 17). Thus, the analysis is based
on the number of coauthorship links and not on the number of
copublications.
The matrix shows that the USA has, by far, the highest amount of
links, followed by Germany, The Netherlands, and China. Moreover, there
is a research cluster located in the Northern Hemisphere, mainly in the
USA and Western Europe.
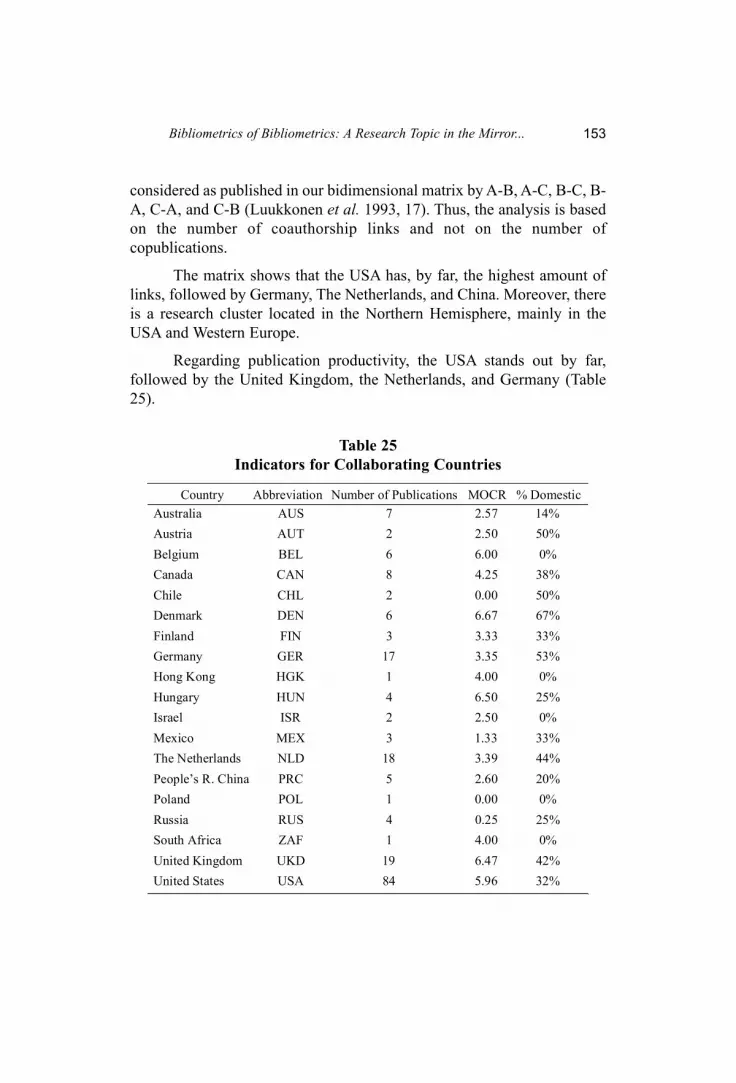
Regarding publication productivity, the USA stands out by far,
followed by the United Kingdom, the Netherlands, and Germany (Table
25).
Table 25
Indicators for Collaborating Countries
153Bibliometrics of Bibliometrics: A Research Topic in the Mirror...
The highest mean observed citation rates (MOCR), whose values are
six or more, can be found in Denmark, Hungary, the United Kingdom, and
Belgium (Table 25). The share of publications without any foreign
coauthors in the country’s total is half or more in Denmark, Germany, and
Chile (Table 25).
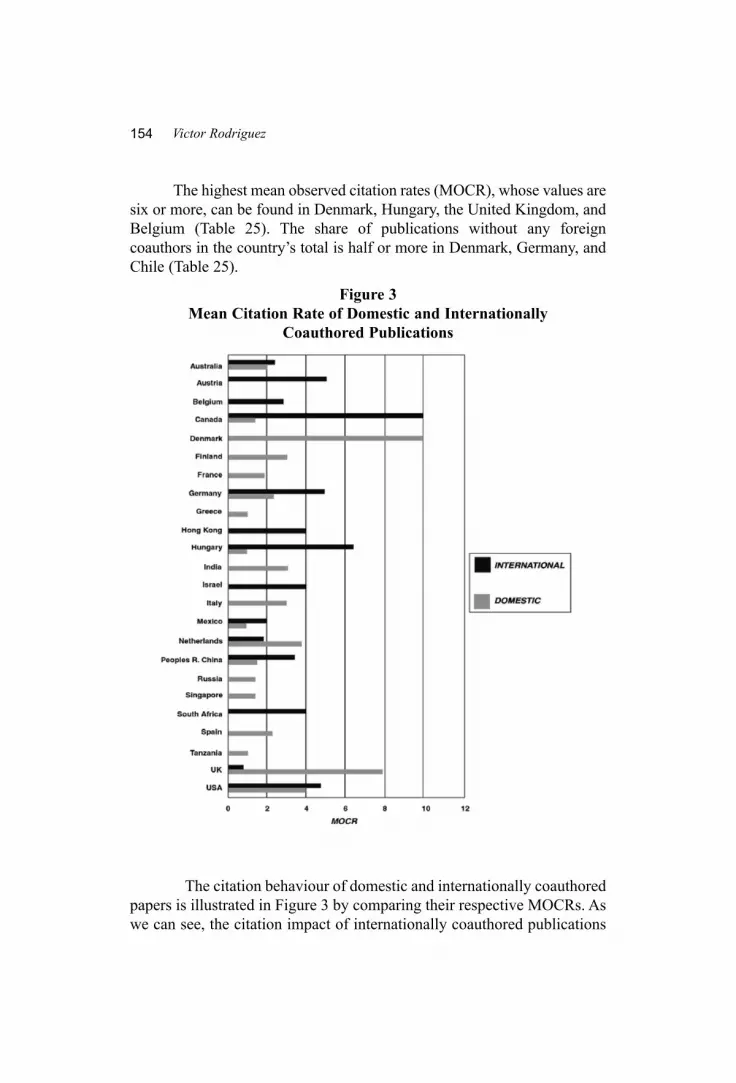
Figure 3
Mean Citation Rate of Domestic and Internationally
Coauthored Publications
The citation behaviour of domestic and internationally coauthored
papers is illustrated in Figure 3 by comparing their respective MOCRs. As
we can see, the citation impact of internationally coauthored publications
154 Victor Rodriguez
is higher than that of the domestic coauthored publications in Australia,
Austria, Belgium, Canada, Germany, Hong Kong, Hungary, Israel,
Mexico, the People’s Republic of China, South Africa, and the USA. On
the contrary, the citation impact of domestic coauthored publications is
higher than that of the internationally coauthored publications in Denmark,
Finland, France, Greece, India, Italy, the Netherlands, Russia, Singapore,
Spain, Tanzania, and the United Kingdom.
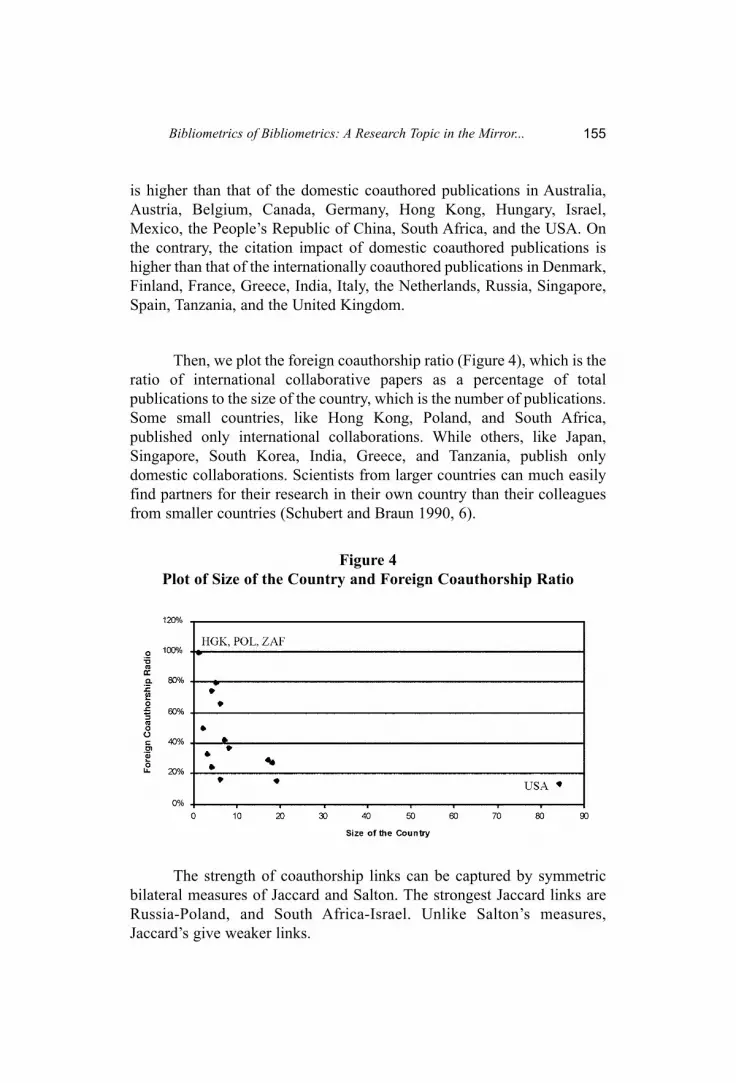
Then, we plot the foreign coauthorship ratio (Figure 4), which is the
ratio of international collaborative papers as a percentage of total
publications to the size of the country, which is the number of publications.
Some small countries, like Hong Kong, Poland, and South Africa,
published only international collaborations. While others, like Japan,
Singapore, South Korea, India, Greece, and Tanzania, publish only
domestic collaborations. Scientists from larger countries can much easily
find partners for their research in their own country than their colleagues
from smaller countries (Schubert and Braun 1990, 6).
Figure 4
Plot of Size of the Country and Foreign Coauthorship Ratio
The strength of coauthorship links can be captured by symmetric
bilateral measures of Jaccard and Salton. The strongest Jaccard links are
Russia-Poland, and South Africa-Israel. Unlike Salton’s measures,
Jaccard’s give weaker links.
155Bibliometrics of Bibliometrics: A Research Topic in the Mirror...
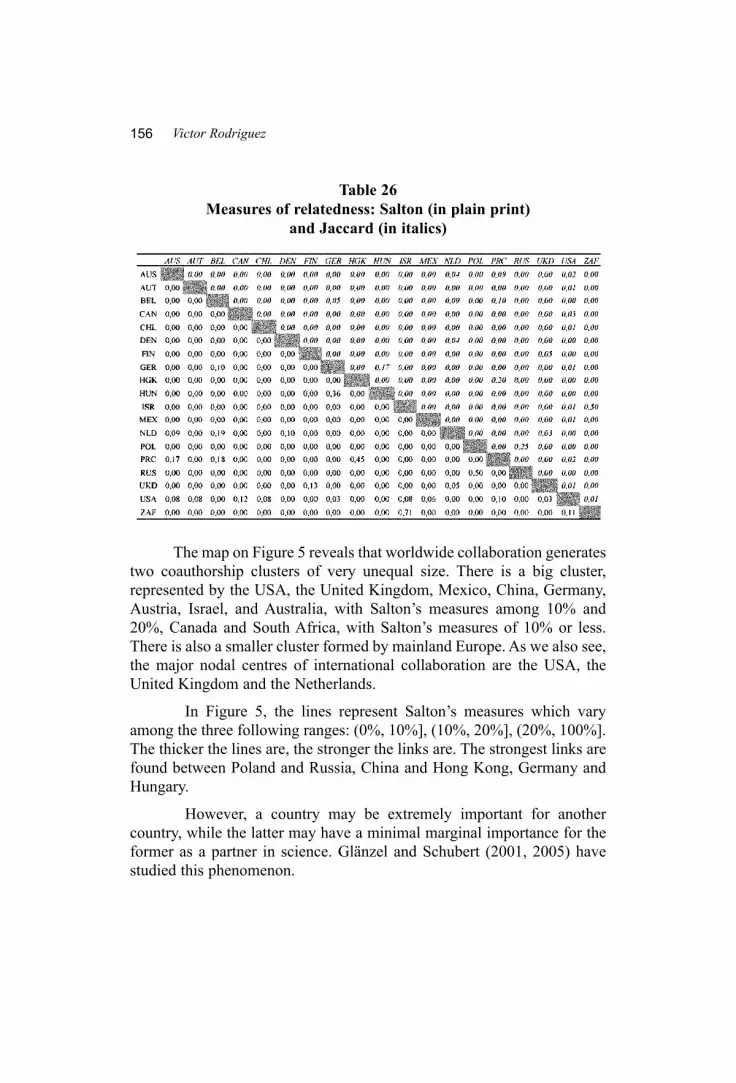
Table 26
Measures of relatedness: Salton (in plain print)
and Jaccard (in italics)
The map on Figure 5 reveals that worldwide collaboration generates
two coauthorship clusters of very unequal size. There is a big cluster,
represented by the USA, the United Kingdom, Mexico, China, Germany,
Austria, Israel, and Australia, with Salton’s measures among 10% and
20%, Canada and South Africa, with Salton’s measures of 10% or less.
There is also a smaller cluster formed by mainland Europe. As we also see,
the major nodal centres of international collaboration are the USA, the
United Kingdom and the Netherlands.
In Figure 5, the lines represent Salton’s measures which vary
among the three following ranges: (0%, 10%], (10%, 20%], (20%, 100%].
The thicker the lines are, the stronger the links are. The strongest links are
found between Poland and Russia, China and Hong Kong, Germany and
Hungary.
However, a country may be extremely important for another
country, while the latter may have a minimal marginal importance for the
former as a partner in science. Glänzel and Schubert (2001, 2005) have
studied this phenomenon.
156 Victor Rodriguez
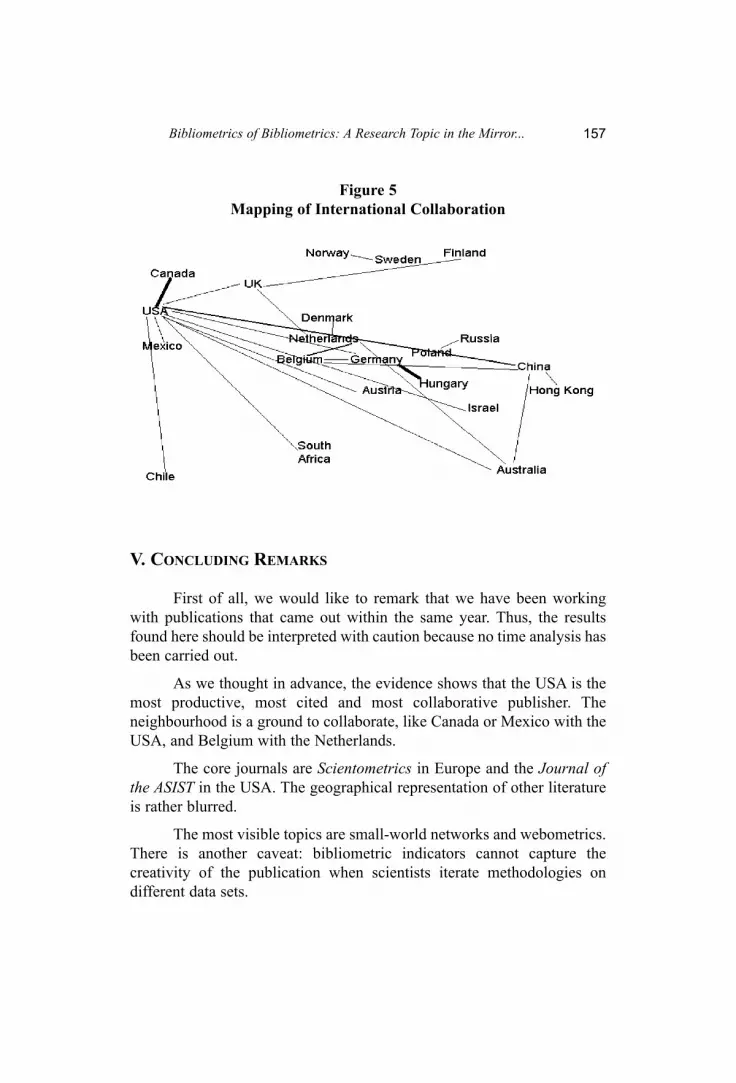
Figure 5
Mapping of International Collaboration
V. CONCLUDING REMARKS
First of all, we would like to remark that we have been working
with publications that came out within the same year. Thus, the results
found here should be interpreted with caution because no time analysis has
been carried out.
As we thought in advance, the evidence shows that the USA is the
most productive, most cited and most collaborative publisher. The
neighbourhood is a ground to collaborate, like Canada or Mexico with the
USA, and Belgium with the Netherlands.
The core journals are Scientometrics in Europe and the Journal ofthe ASIST in the USA. The geographical representation of other literature
is rather blurred.
The most visible topics are small-world networks and webometrics.
There is another caveat: bibliometric indicators cannot capture the
creativity of the publication when scientists iterate methodologies on
different data sets.
157Bibliometrics of Bibliometrics: A Research Topic in the Mirror...

ACKNOWLEDGMENTS
The author would like to thank Jean Gilbert for helpful comments
on drafts of this paper
REFERENCES
Glanzel, W., and A. Schubert, 2001. “Double effort = Double impact? A
critical view at international co-authorship in chemistry.”
Scientometrics 50: 199-214.
Luukkonen, T., R.J.W. Tijsen, O. Persson, and G. Siversten, 1992. “The
measurement of international scientific collaboration.”
Scientometrics 28: 15-36.
Schubert, A., and T. Braun, 1990. “International collaboration in the
sciences 1981-1985.” Scientometrics 19: 3-10.
158 Victor Rodriguez