beyond fractionalization: mapping ethnicity onto nationalist insurgencies
TRANSCRIPT
Beyond Fractionalization:
Mapping Ethnicity onto Nationalist Insurgencies
Lars-Erik Cederman and Luc Girardin Center for Comparative and International Studies (CIS) Swiss Federal Institute of Technology, Zurich (ETH)
Seilergraben 49 8032 Zurich Switzerland
http://www.icr.ethz.ch
March 8, 2006
Abstract:
This paper theorizes the link between ethnicity and conflict. Conventional research
relies on the ethno-linguistic fractionalization index (ELF) to explore a possible causal
connection between these two phenomena. However, such approaches implicitly
postulate unrealistic, individualist interaction topologies. Moreover, ELF-based
studies fail to articulate explicit causal mechanisms of collective action. In order to
overcome these difficulties, we introduce the new index N* of ethno-nationalist
exclusiveness that maps ethnic configurations onto political violence. This
formalization is confirmed statistically in regression analysis based on data from
Eurasia and North Africa.
*) Earlier versions of this article were presented at the University of California San
Diego, the University of Bielefeld, the Graduate Institute of International Studies,
Geneva, the Swiss Institute of Technology Zurich, and the Norwegian University of
Science and Technology, Trondheim. We are grateful to the participants of those
meetings and the anonymous reviewers of this journal for their helpful comments. We
have drawn on the expertise of many colleagues, including Andreas Wimmer, Bear
Braumoeller, Keith Darden, Scott Gates, Kristian Gleditsch, Simon Hug, Arman
Grigorian, Håvard Hegre, Ian Lustick, Brendan O’Leary, Ellen Lust-Okar, Daniel
Posner, and Idean Saleyan. However, the responsibility of any errors is ours alone.
Finally, we would like to thank Lutz Krebs and Kimberley Sims for research
assistance.
Toward the end of the Cold War, a wave of scholarship emerged that associated
internal conflict with ethnic factors. Ethnic conflict in the former Yugoslavia and in
Rwanda lent such theories considerable credibility. More recently, however, the
political-economy literature has generated major studies that challenge this causal link
(Fearon and Latin 2003; Collier and Hoeffler 2004). Their application of econometric
methods suggests that ethnic grievance washes away once materialist factors, such as
per-capita income, access to raw materials, are controlled for.
Some of the most prominent assessments of the role of ethnicity in internal conflicts
rely on various versions of the ethno-linguistic fractionalization index (ELF). Despite
its widespread use, however, this index has yet to be supported by a convincing set of
causal mechanisms that links it to political violence. Before rejecting ethnic
characteristics as determinants of civil war onset, it is therefore reasonable to question
whether the ELF index serves as a meaningful operationalization of ethnic politics.
In this paper, we argue that specific ethno-nationalist configurations are more prone to
generate violence in civil wars. In order to back up this claim, we offer an alternative
index of ethno-nationalist exclusion called N*, which does a better job of capturing
mainstream theories of ethno-nationalist violence. It deviates from standard
fractionalization measures by introducing state-centric, rather than symmetric, ethnic
configurations and by postulating group-level, rather than individual-level micro
mechanisms of mobilization.
Using Fearon and Laitin’s (2003) well-known insurgency model as an empirical
reference point, we compare our new measure N* to conventional indicators. Because
of coding limitations, we focus on a subset of their global dataset, namely Eurasia and
North Africa. The results are very encouraging: for the sub-sample in question, N* has
a strong effect which is highly significant, thus casting doubt on the tendency to
ignore ethnic politics as an explanation of civil wars.
1
In the following, we introduce the logic of fractionalization measures and attempt to
derive causal mechanisms compatible with them. Building on theories of nationalism
and ethnic politics, we then lay the conceptual foundations of our alternative measure.
The N* index is defined and empirically deployed for the Eurasian cases, before being
put to use in Fearon and Laitin’s model. The essay ends with a discussion of the
theoretical significance of our findings.
Conventional indices of ethnicity
In contrast to qualitative studies, econometrics allows us to draw systematic and
precise inferences about a large number of cases, provided the underlying causal
“story” remains stable throughout the population. However, this does not mean that
there is no room for debate, even when highly significant findings are present. Apart
from thorny issues of model specification and estimation, perhaps the most tricky
issue is how to map micro-level mechanisms onto macro-level behavior (Schelling
1978). According to Sambanis (2004a, p. 259) this problem applies acutely to civil-
war studies:
The already significant gap between micro-level behavior and their macro-
level explanation is magnified when…micro-macro relationships are studied
solely through cross-national statistical analyses. Such studies often overlook
information about causal pathways that link individual or group behavior with
the outbreak of civil war.
In this section, we show that similar uncertainty reigns with respect to hypotheses that
relate civil war to ethnicity. Many prominent studies of the ethnic determinants of
civil war rely on some type of fractionalization index.1 We refer to this family of
indices under the acronym of ELF, which stands for the index of Ethno-Linguistic
2
Fractionalization. Originally this index was calculated based on data collected by
Soviet scholars in the 1960s (Taylor and Hudson 1972). However, there are many
versions based on various coding criteria of how to define the relevant ethnic,
linguistic or religious groups in the first place (e.g. Alesina et al. 2003; Fearon 2003;
Roeder 2001). Most of the studies that rely on fractionalization as a measure of
ethnicity, including Fearon and Laitin (2003) and Collier and Hoeffler (2004), come
to the conclusion that it has no impact on civil war onset.2
In all its guises, the ELF is based on the Herfindahl concentration formula:
∑=
−=n
iisELF
1
21
where is the share of group i out of a total of n groups. is
The logic behind this expression is well-known and extremely simple, because it
measures the probability that two randomly selected individuals from the entire
population will be from different groups.
Despite its widespread use, the ELF has attracted considerable criticism. Drawing on
constructivist assumptions, Laitin and Posner (2001) point out that attributing a fixed
score to each state obscures the degree to which ethnic identities vary over time. They
also note that a single index is under-equipped to capture the multidimensional quality
of ethnic identities and the endogenous effects that allow the dependent variable to
influence the index over time.
In a sophisticated applied analysis of the ELF that focuses on Sub-Saharan Africa
Posner (2004) further elaborates on their fourth and final critique. Posner introduces a
version of ELF that he calls PREG or “politically relevant ethnic groups.” His idea is
3
to relate the identification of ethnic groups to the political logic under scrutiny. Based
on extensive area expertise and thorough coding, Posner and his collaborators are able
to provide PREG measures at ten-year intervals. Although the introduction of PREG
represents considerable empirical and conceptual progress, Posner admits that it still
afflicted by the same theoretical weaknesses as the other ELF indices, since it also
relies on the Herfindahl logic.
In order to see what these difficulties entail for civil war studies, it is helpful to
reconstruct an explicit causal theory of conflict that is compatible with the ELF logic.
This calls for the identification of a micro-level mechanism of conflict M and of an
ethnic configuration C that maps M onto the systemic probability of conflict:
Pr(CivilViolence) = C(M)
Given this formalism, we can now derive a very simple individualist theory of conflict
that is compatible with the ELF:
C: If two members i and j interact, the probability of conflict is if they
belong to different groups and < if they belong to the same group.
1p
0p 1p
M: All pairs of individuals (i,j) in the population have an equal chance of
interacting with each other.
Hence the probability of conflict is:
00101 )()1()Pr( pELFppELFpELFpnceCivilViole +−=−+=
4
where > 0 by assumption C. Thus, the conflict propensity is an increasing
linear function in ELF, which means that regression analysis should be well suited to
capture the effect of ethnic fractionalization on conflict.
)( 01 pp −
Some reflection suggests why the ELF model of civil wars is inappropriate. It appears
to work much better for ethnic riots or brawls that occur between randomly interacting
individuals (Tilly 2003). The problem is that full-fledged ethno-nationalist warfare,
whether within or among states, presupposes that violence is organized rather than
random and that it is not generated in a completely bottom-up fashion. Our causal
reconstruction says nothing about how a dyadic conflict at the individual level can
escalate to a full-fledged civil war. Moreover, this account is silent on the role of the
state, which is paramount in all civil wars by definition (Sambanis 2004b). In
principle, it is possible that a non-individualist theory of ethnic warfare based on the
ELF could be developed, but to our knowledge, nobody has so far managed to
construct plausible micro-level mechanisms to support such an account.3
Theorizing ethno-nationalist civil wars
In this section, we reconsider how contemporary approaches relate ethnic nationalism
to political violence. Theories of nationalism tell us that ethno-nationalist wars, rather
than being merely “horizontal” fights among ethnic groups after the collapse of state
authority, are actually fought with the help of, and indeed over, state power
(Cederman 1997: Chap. 7, 8; 2002). Thus, it is high time to bring the state back into
our theories about ethnic conflict!4
We follow Gellner (1983) in defining nationalism as “primarily a political doctrine,
which holds that the political and the national unit should be congruent” (p. 1).
Wherever this principle is violated, i.e. where “home rule” for each population has not
been established, tensions often arise in response to the perceived incongruence. Such
tensions tend to inspire ethno-nationalist mobilization, which may in turn provoke a
5
realignment of previous political coalitions with conflict as a possible consequence.
More specifically, Gellner’s theory of societal conflict expects friction to be present
wherever group interests are violated and access to power is blocked by
discrimination and “counter-entropic” obstacles to assimilation. This account
corresponds largely to Fearon and Laitin’s (2003, p. 78) characterization of modernist
theories, including that of Gellner (1983). However, their operational hypotheses H1
and H2, which focus on ethnic and religious diversity at the macro level, fail to
articulate the relevant micro foundations that drive conflict.
In fact, Gellner’s relatively apolitical account also falls short of pinpointing the
identity of the key actors in question and their relationship to the state (O’Leary
1998). Therefore we turn to more recent contributions to the literature on nationalism.
Building explicitly on Gellner’s conceptual legacy, Wimmer (2002) interprets such
conflict patterns as integral parts of political mobilization under modernity. Starting
around the time of the French Revolution, this macro-historical process swept through
the modernizing world, spilling over into the non-Western world in the 20th century.
In the Western world, this process usually led to the creation of relatively
homogenous nation-states. In contrast, as nationalism continued to spread throughout
the globe, nation-building tended to be much less successful. In cases where no
nationalizing group managed to dominate the state,
a fight erupts over which ‘people’ the state should belong to, and social
closure proceeds along many ethnic lines instead of one national line.
Sometimes this contest for the control of the state escalates into ethno-
nationalist civil wars, destroying much of whatever social and political
cohesion there was (Wimmer 2002, p. 91).
This explanation of conflict rests on two crucial assumptions that are violated by ELF-
based approaches to ethnic civil wars, namely that (A1) the state plays a central role
6
for the evolution of conflict, and that (A2) conflict proceeds among groups rather than
among individuals, once ethnicity has been politicized and social closure has occurred
along ethnic lines.
A1. Conflict over ownership of the state
The state is at the very center of nationalist conflict. In a competition for state goods,
ownership of the state is the ultimate prize (Wimmer 2002). In addition to securing
material resources, the winner acquires crucial symbolic powers and international
recognition. Domestically, the state’s importance grew as its role became increasingly
intrusive in citizens’ lives. As state control has increased, opportunities have arisen to
favor a specific ethnic group or groups through an ethnicized bureaucracy in terms of
public schooling, language laws, and religious regulations. In this way, ethnicity
started to serve as a formidable instrument of social and political exclusion.
A2. Conflict at the level of entire groups
In a pioneering contribution to the theory of nationalism, Gellner (1964) explained
how individuals in the modern world identify themselves, and classify others,
according to cultural categories. This stands in stark contrast to the pre-nationalist
world, in which direct interpersonal connections were paramount. Categorization
makes it possible to conceive of large groups as “imagined communities,” a
prerequisite for nationalism (Anderson 1991). In general, nationalist groups derive
their cohesion from collective-level identities that resonate deeply with the emotional
needs of modern citizens. Conversely, nationalism can quickly implode multi-ethnic
states, such as the former Yugoslavia, once ethnic mobilization starts to pull the
component groups apart. All this supports the hypothesis that “competition for state
resources is seen as a matter concerning not just individuals or associations of shared
interests but rather whole ethnic groups” (Wimmer 2002, p. 103).
7
Still, establishing that internal conflict is over state ownership, and that the main
competitors in such conflict are ethno-national groups, does not mean that we have
explained why violence actually ensues in particular cases. Ultimately, this task calls
for a complete theory of collective action that explains how the groups in question
mobilize politically and how their mobilization triggers violence.
Mobilization depends on availability of collective identities, shared motivations and
opportunities for collective action (Gurr 2000). Collective identities constitute the
boundaries of the group in terms of ethnically defined membership and thus form the
basis for the articulation of common interests. Shared motivations refer to the group
members’ incentives to participate in collective action endeavors. In general,
perceived grievances, whether socio-economic (Gellner 1983) or political (Wimmer
2002), could contribute to motivational articulation. Finally, action opportunities
hinge on the power balance between ethnic groups, which in itself is a complex
function of demographic, technological, geographic conditions, including the
influence of international factors (Tilly 1978; Gurr 2000).
These key factors should be seen as necessary, rather than sufficient, conditions of
collective action. In the following, however, we will focus primarily on ethno-
political opportunity structures, while assuming that politically relevant group
identities already exist and that all groups possess the motivation to engage in
collective action. This does not mean that we believe that identities are primordially
given or that the process of identity formation has nothing to do with the outbreak of
conflict. Nor should it be concluded that the specific level of ethno-political grievance
is unrelated to the frequency or intensity of violence. Rather than advancing a
complete theory of nationalist mobilization and violence, our modest goal is to
develop a simplified model that associates ethno-political configurations with civil-
war outcomes.
8
It goes without saying that our mechanisms can only be partial and should be seen as
the starting point for future theory-building. In brief, we assert that escalation to
violence is more likely where the dominant group is a demographic minority. The
more demographically significant ethnic groups are excluded from state power, the
more likely it is that there will be violent attempts at overcoming such imbalances. If
the principle of ethno-national representativity is violated, we postulate a higher
likelihood of grievance along ethnic lines, as well as a higher potential for escalation
to political violence. In order to test this hypothesis, we need to measure the relative
degree to which ethnic groups are included or excluded from state power.
The N* index: A model of ethno-nationalist civil wars
The general reasoning of the preceding section leaves many gaps open that will need
to be filled before proceeding to empirical analysis. Our two main tasks are to identify
the ethno-political configuration C* and the mechanism M* that make up the core of
the model. We will consider each task in turn.
A star-like ethnic configuration C*
Based on our assumption of the state’s central role in ethno-nationalist conflict, we
decided to reject the symmetric interaction topologies implied by the ELF index.
Instead, drawing on assumptions A1 and A2, we postulate a star-like configuration
with the ethnic group(s) in power (EGIP) at the center, surrounded by peripheral
groups. This implies that the governmental group (or coalition) interacts with each
non-governmental group, and that the latter groups do not interact with each other.
This configuration adds up to a star-like interaction topology.
It is now straightforward to compute the conflict propensity of the entire system:
9
( )∏−
=
−−=1
1
)(11)Pr(n
i
ipictCivilConfl
where p(i) is the probability of dyadic conflict erupting between the EGIP and the
excluded group i. Here we are assuming that the relational probability of conflict p(i)
does not depend on the conflict propensity of the other dyads. A more realistic model
could capture interactions among the provinces due to demonstration effects or other
types of conflict contagion.
Note that this center-periphery logic resembles Fearon and Laitin’s (2003) insurgency
model, although their focus is of course entirely non-ethnic. In contrast, Rokkan
(1999) proposes a richer representation of how peripheries interact with central states,
by accounting not only for economic and geographic factors but also for a cultural
dimension (see also Cederman forthcoming).
An opportunity-based mechanism M*
To complete our simple model, we need to specify what happens in each dyad, which
in technical terms boils down to specifying the function p(i). Let us assume that the n
ethnic groups can be ordered as a vector { , , ... } where denotes the
size of the EGIP and the remaining entries the non-governmental groups is whatever
order. Following the logic developed in the last section, we assume that conflict is
likely to occur wherever demographically important groups are excluded from power.
The larger these peripheral groups are, the more likely it is that they will successfully
challenge the center.
0s 1s 2s 1−ns 0s
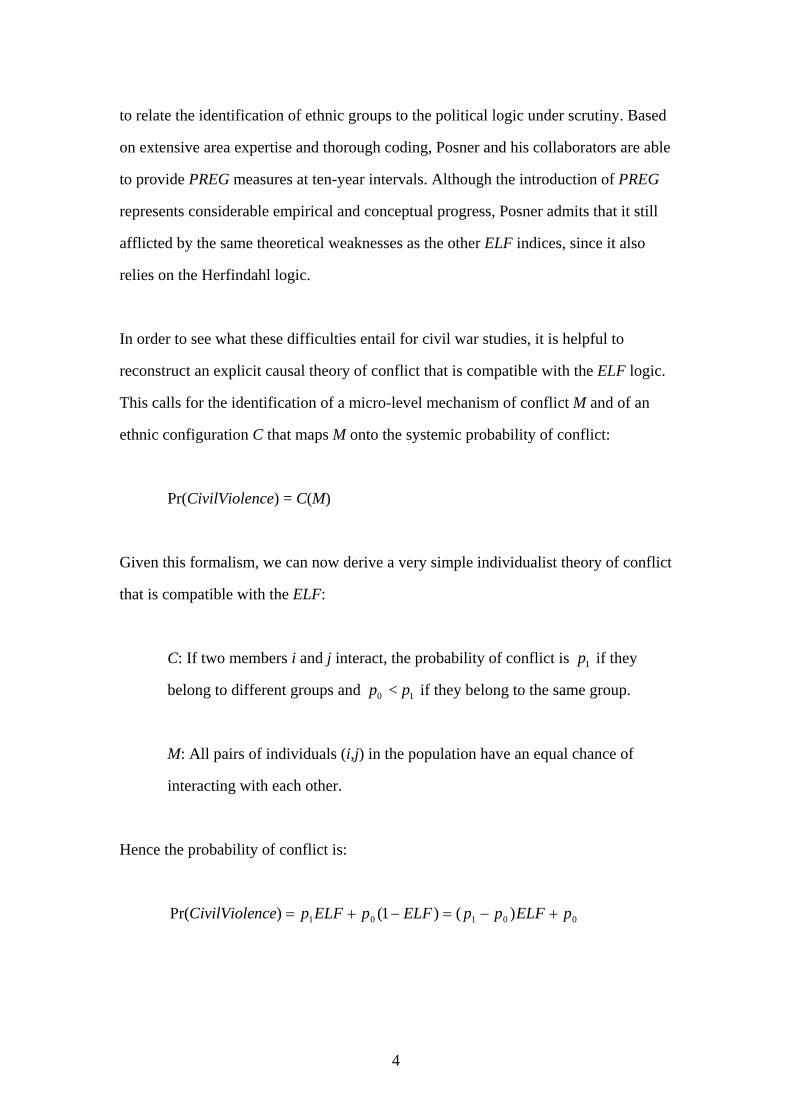
It seems reasonable to select a logistical contest success function to formalize this
logic. In a seminal article, Tullock (1967) proposed a success contest function on
ratio-form. According to Hirshleifer (2001, p.94), however, logistical contest success
functions are better suited to military contests under uncertain and unconventional
10
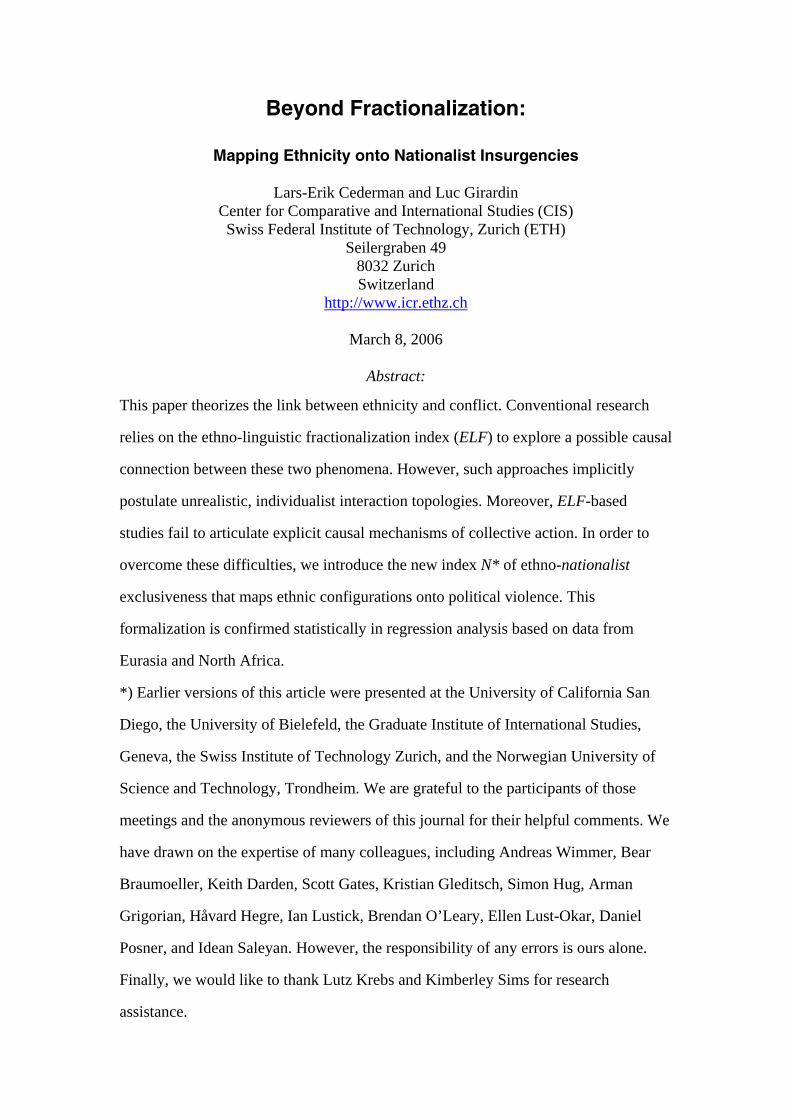
conditions, as is usually the case in civil wars. Thus we define the probability of
dyadic conflict with non-governmental group i as
kririp −+=
})({11)(
where )/()( 0sssir ii += is group i’s share of the total dyadic population, r is a
threshold value and k a slope parameter. It should be noted that our functional form
differs slightly from the standard version of the logistical conflict success function
because it features the total dyadic resources in the denominator rather than merely
those of the opponent. We choose this format since it seems more intuitive without
changing our main findings.
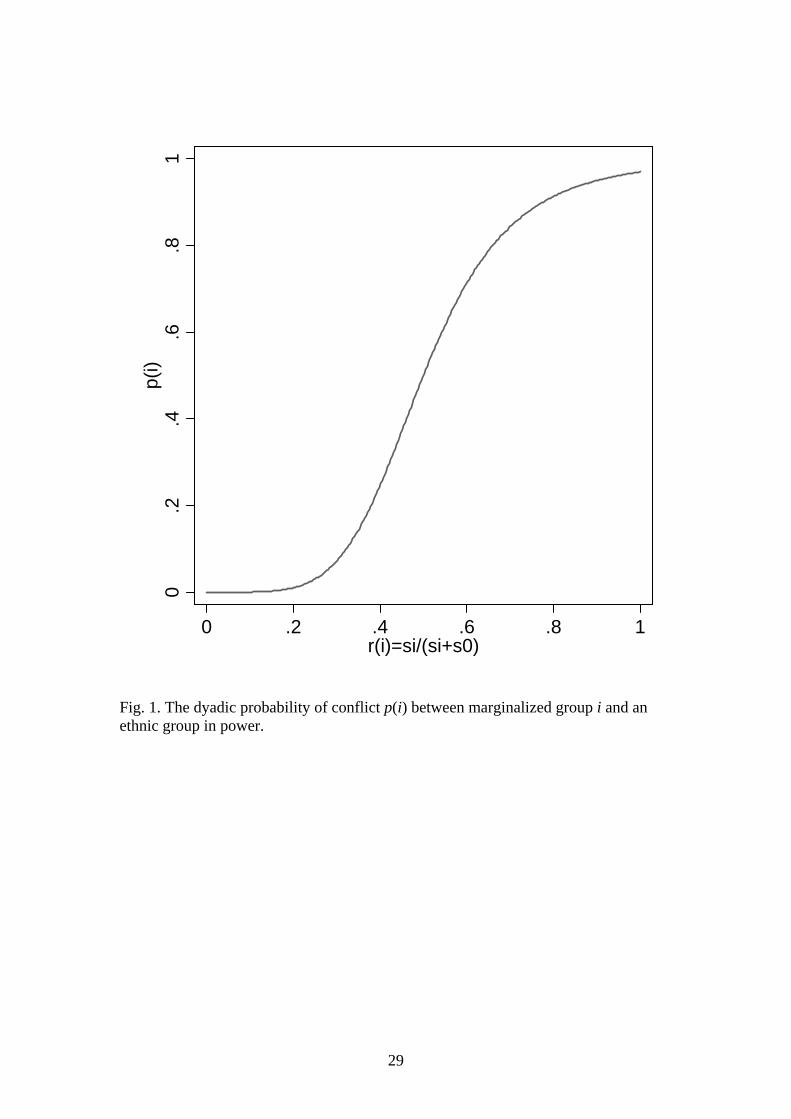
The threshold parameter r stipulates at what demographic balance the odds are even
for a challenge, i.e. where p(i) = 0.5. Parameter k controls how steeply the curve
slopes, and can be interpreted as a measure of how decisive combat is (Hirshleifer
2001). For k = 0 it is entirely flat and as k goes to infinity, it becomes a perfect step
function. The curve in Figure 1 illustrates the functional form for parameters r = 0.5
and k = 5.
[Figure 1 about here]
Note that although the mechanism seems to be entirely one-directional, this
impression is misleading. In fact, no assumption has been made as to which side starts
the fight. It may well be that the government preempts what it perceives as a threat by
a demographically sizeable, but politically marginalized, group. Moreover, even if the
peripheral actor takes action first, the most extreme instances of ethnic violence have
almost all been perpetrated by states in response to insurgencies (Mann 2005, p. 7).
11
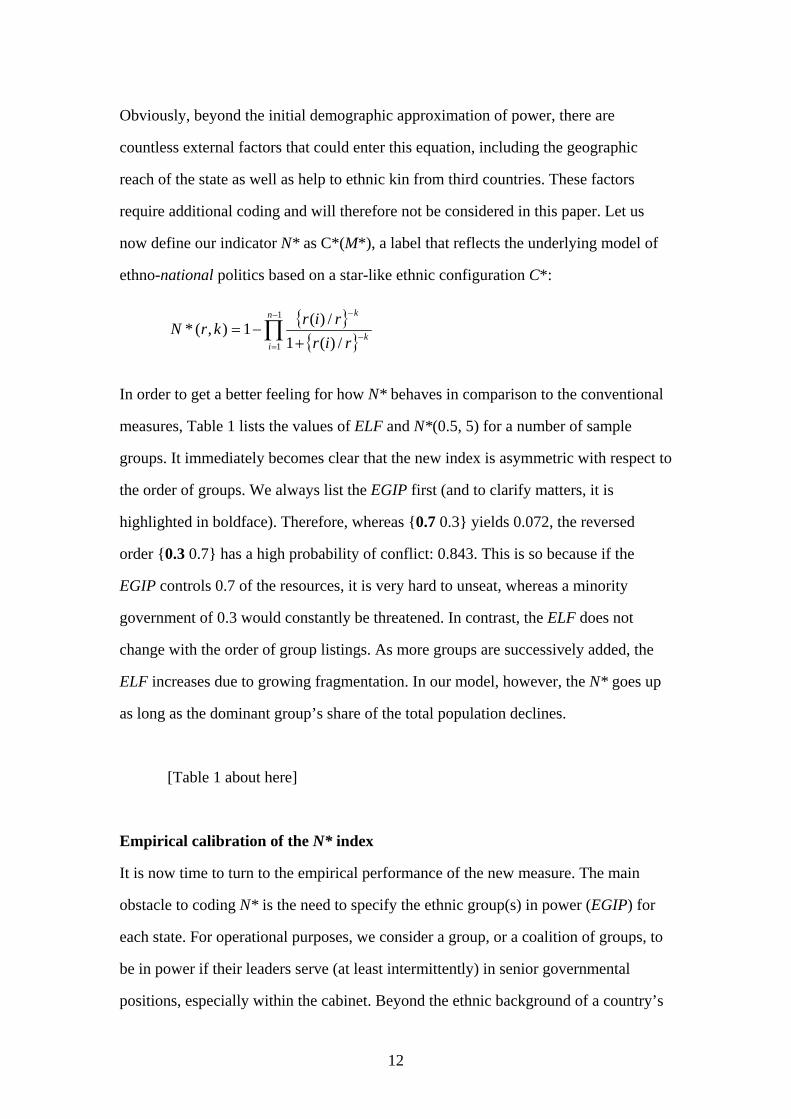
Obviously, beyond the initial demographic approximation of power, there are
countless external factors that could enter this equation, including the geographic
reach of the state as well as help to ethnic kin from third countries. These factors
require additional coding and will therefore not be considered in this paper. Let us
now define our indicator N* as C*(M*), a label that reflects the underlying model of
ethno-national politics based on a star-like ethnic configuration C*:
{ }{ }∏
−
=−
−
+−=
1
1 /)(1/)(1),(*
n
ik
k
rirrirkrN
In order to get a better feeling for how N* behaves in comparison to the conventional
measures, Table 1 lists the values of ELF and N*(0.5, 5) for a number of sample
groups. It immediately becomes clear that the new index is asymmetric with respect to
the order of groups. We always list the EGIP first (and to clarify matters, it is
highlighted in boldface). Therefore, whereas {0.7 0.3} yields 0.072, the reversed
order {0.3 0.7} has a high probability of conflict: 0.843. This is so because if the
EGIP controls 0.7 of the resources, it is very hard to unseat, whereas a minority
government of 0.3 would constantly be threatened. In contrast, the ELF does not
change with the order of group listings. As more groups are successively added, the
ELF increases due to growing fragmentation. In our model, however, the N* goes up
as long as the dominant group’s share of the total population declines.
[Table 1 about here]
Empirical calibration of the N* index
It is now time to turn to the empirical performance of the new measure. The main
obstacle to coding N* is the need to specify the ethnic group(s) in power (EGIP) for
each state. For operational purposes, we consider a group, or a coalition of groups, to
be in power if their leaders serve (at least intermittently) in senior governmental
positions, especially within the cabinet. Beyond the ethnic background of a country’s
12
leading politicians, specific institutional arrangements, such as different types of
power sharing and consociationalism, may also be indicators of power inclusion.
Mere regional autonomy without significant input into cabinet-level governmental
decision-making, on the other hand, is clearly not sufficient to warrant status as EGIP.
Thus, in cases where the group in question is systematically excluded from power it is
judged to be a marginalized ethnic group (MEG).
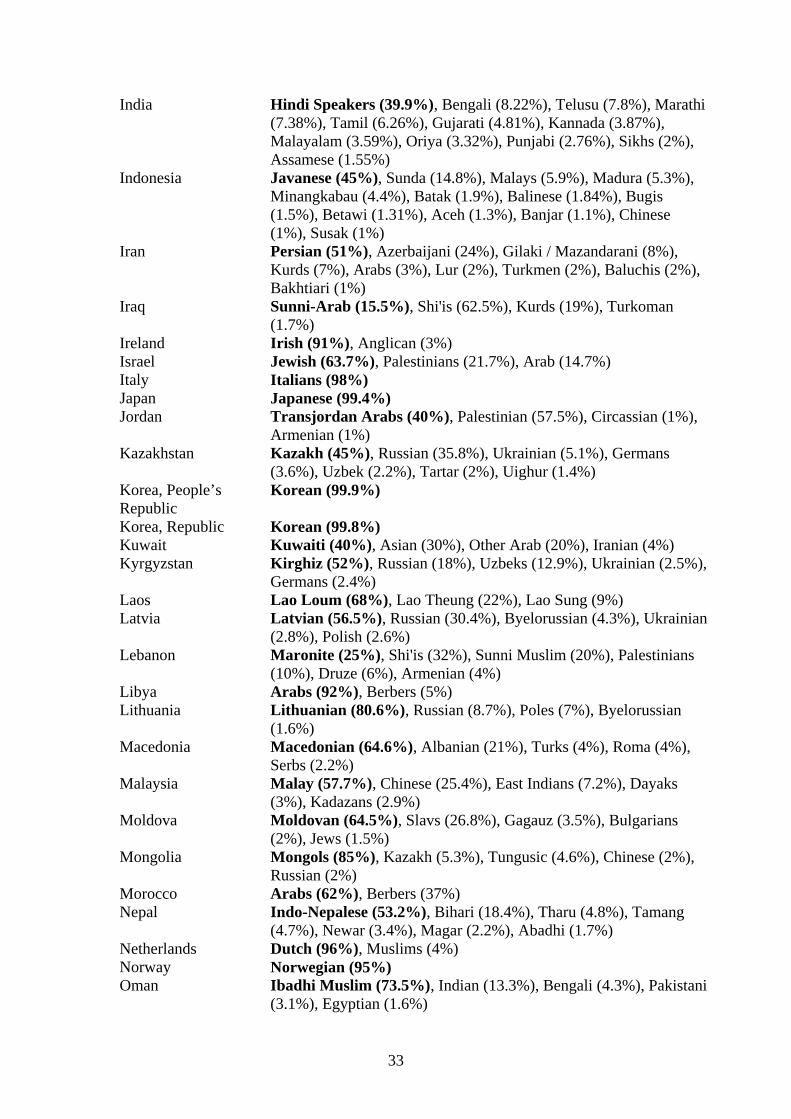
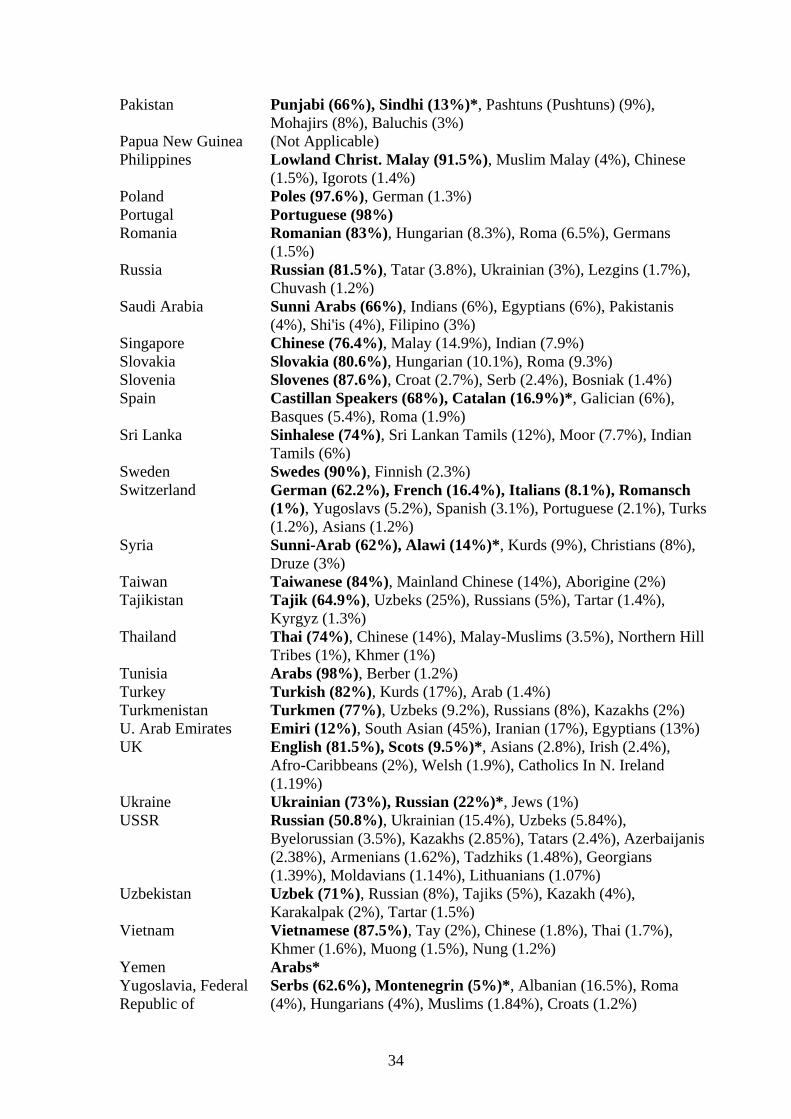
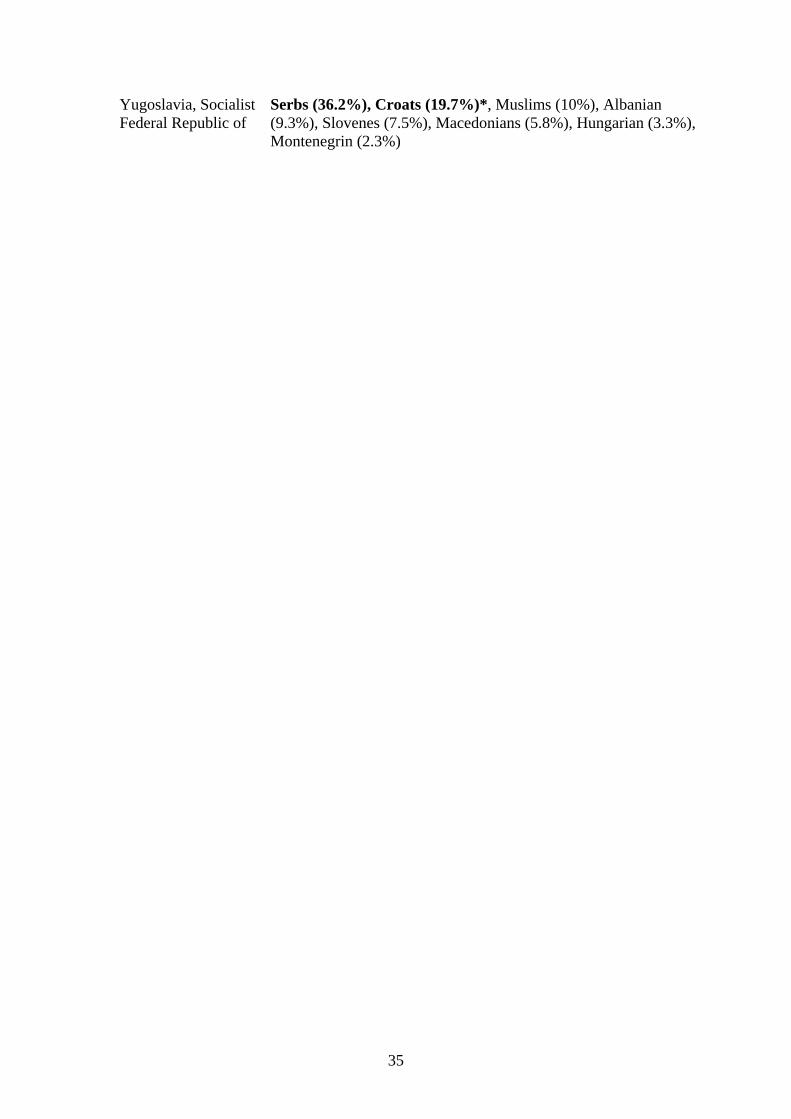
It goes without saying that this definition is hard to operationalize (see the Appendix).
One source of potential confusion relates to the exact nature of governmental
involvement. For example, because of elite assimilation, our coding of Ukrainians as
being marginalized within the USSR can be disputed. Another difficulty relates to the
possibility that different parts of the ethnic group might be included while other,
possibly more radical branches, are excluded. The contemporary US
counterinsurgency strategy in Iraq aims to split the Sunni resistance in this way. There
is also a potentially treacherous temporal dimension: one group may be EGIP during
one period of a country’s history but an MEG during another. To be sure, the Sunni
dominance in Iraq did not necessarily extend to the entire sample period, especially
not before 1958. Moreover, from 1963 to 1970 the Syrian EGIP was Druze-Alwite
dominated, etc. These are important shifts that would have to await a dynamic coding
of N*.
Ultimately, it can be debated to what extent it is possible to identify clearly distinct
ethnic groups at all. In the long run, at least, ethnic and national identifications are
endogenous to other political processes, including state formation and conflict
behavior (Laitin and Posner 2001). By applying the measure to the post-1945 period,
however, we are assuming that group identities are, at least in the majority of the
cases studied, clearly marked and relatively stable.
13
In a first cut, we focus on Eurasia and North Africa. Within this subset of the
population, we believe that most of the cases can be coded in a relatively
straightforward manner. Because of its notoriously hard-to-grasp, fluid identities,
Sub-Saharan Africa was judged to be too difficult to code with respect to EGIP
without extensive additional research. In future work, we plan to extend the coding to
this and to other parts of the world, but extensive area expertise will be needed to get
this data-gathering exercise right (cf. Posner 2004).
Our coding effort yielded observations for 88 countries, as indicated in the Appendix.
We built on Fearon’s (2003) list of ethnic groups and selected the EGIPs. Wherever
more than one group was found to belong to the EGIP, the strength of the entire
coalition was summed and kept as the first entry in the group vector. We compared
our EGIP partitioning with an independent coder. To determine if a group was an
EGIP, we relied on Heger and Saleyan’s (2005) dataset of leaders’ ethnic affiliations
that is based on information from a leader data collected by Chiozza, Geomans,
Gleditsch and Choung (2005). Because this data is limited to conflict periods,
additional information was extracted from the Minorities At Risk (MAR) database and
the CIA World Factbook.
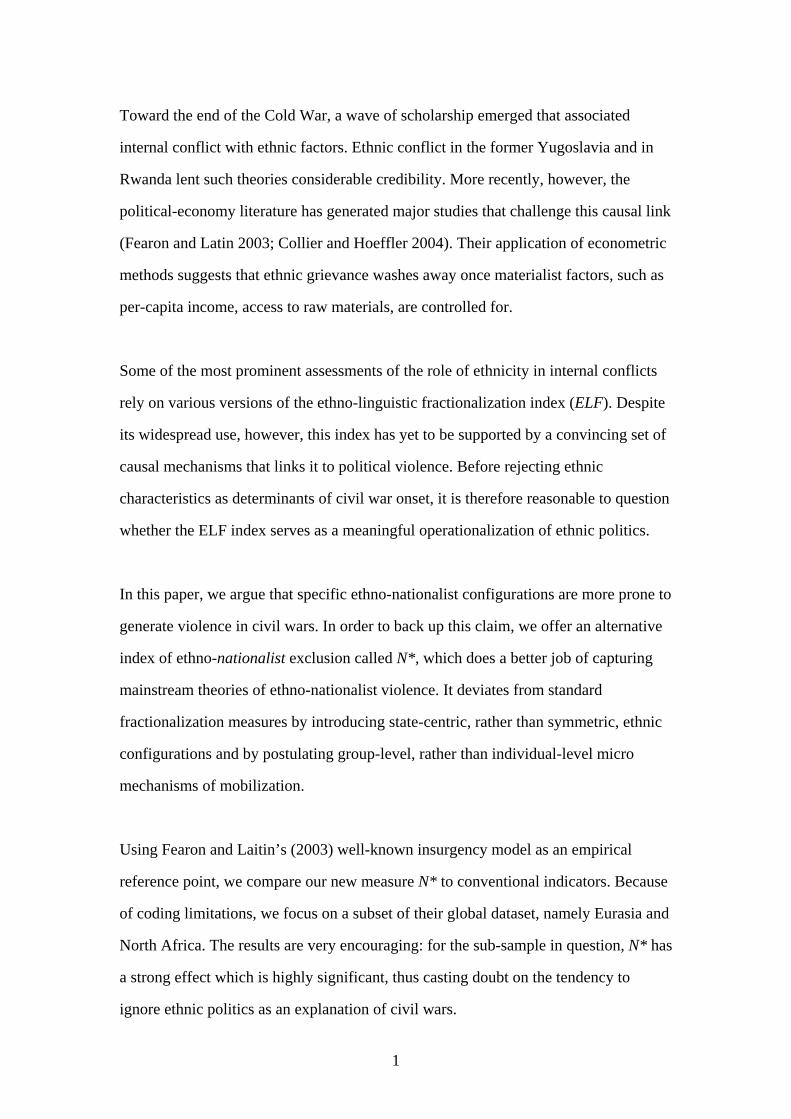
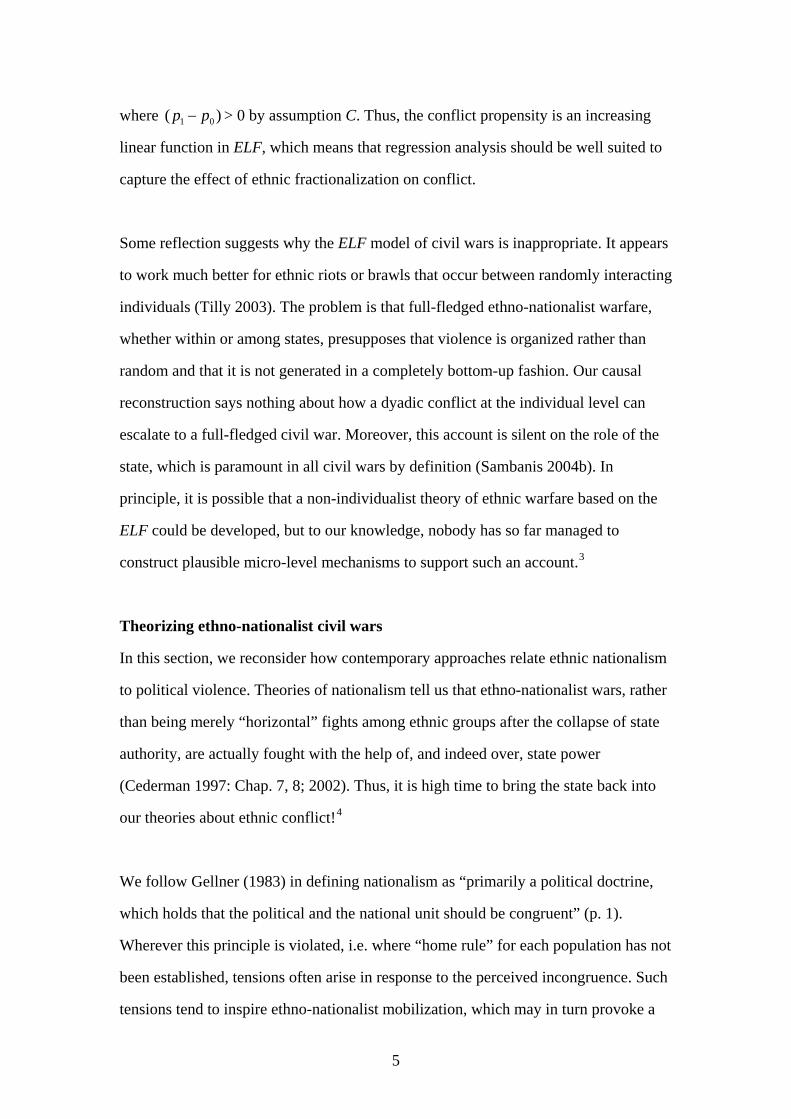
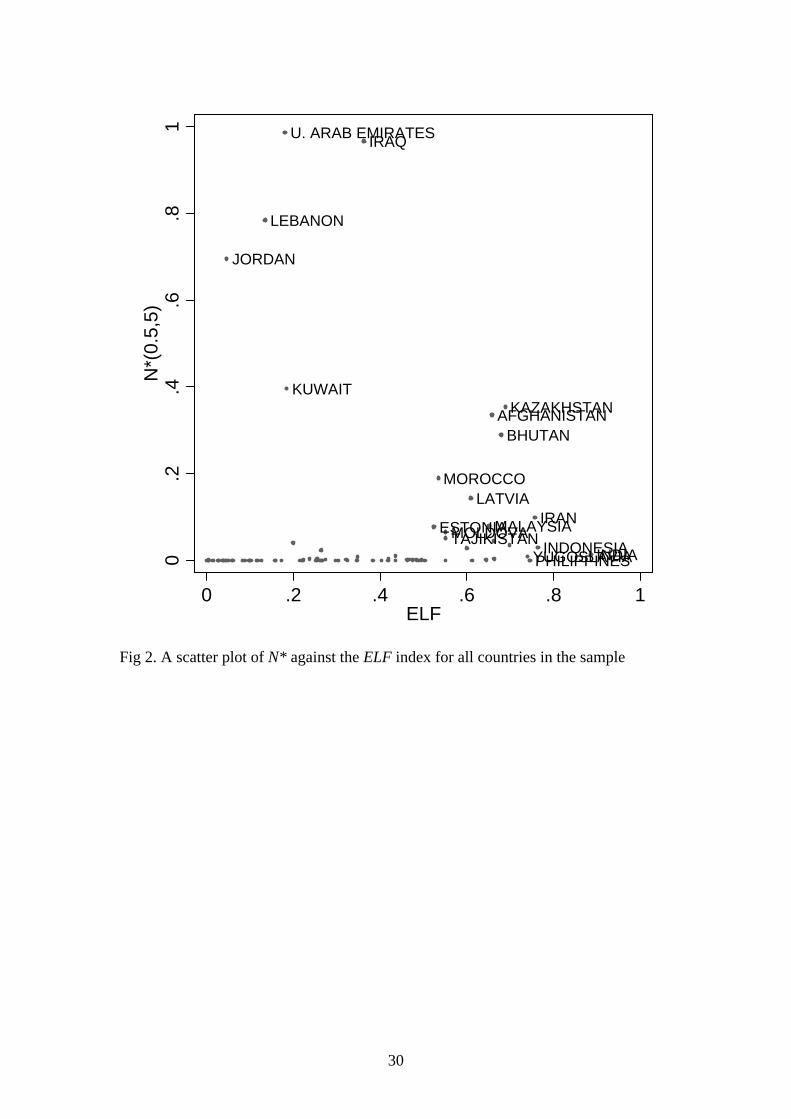
This empirical procedure generated an N* index that is radically different from the
ELF (correlation-coefficient 0.42). This is confirmed by Figures 2, which plots
N*(0.5, 5) based on real-world observations as a function of the ELF. If N* were
identical to these other indices, the scatter plots would have formed a diagonal line
from the lower left to the upper right. Instead, in both cases, the N* remains very low
for most observations with low to medium ELF. For high ones, however, the variance
is very high. Thus, there is no simple one-to-one correspondence between the N* and
fractionalization.
[Figure 2 about here]
14
Regression analysis
This section evaluates the N* index’s impact on conflict behavior. We do so within
the context of Fearon and Laitin’s (2003) econometric model that focuses on the onset
of civil wars during the post-WWII period. This model is based on a pooled time
series that contains country-year observations coded as a one if a civil war started
within that observation and as a zero for all other cases. We use exactly the same list
of independent variables as Fearon and Laitin include in their Model 1 except for the
religious fractionalization index, which is dropped due to its marginal theoretical
relevance to this paper. We did not find any model specification in which it differed
noticeably from the ELF. Without exception, it remained as insignificant as that
index. Thus the list includes lagged ongoing wars, per capita income, population,
terrain, territorial contiguity, oil exports, recent independence, political instability,
democracy, and the ELF (see Table 2). For details about the operationalization of
these variables, the reader is referred to Fearon and Laitin (2003).
[Table 2 about here]
Relying on logit analysis, Table 3 contains the results of our first set of estimations.5
Due to the limited data availability for the N* index, we focus on the Eurasian and
North African cases only, which yields 3,327 out of the original 6,327 observations.
Model 1 replicates Fearon and Laitin’s (2003) base model for this sub-sample. There
are no major surprises: the independent variables that were strongly significant in the
full sample perform well here too. The variables per capita income, population, oil
exports, and recent independence remain significant. In contrast, the mountain
variable and political instability lose their significance. The main “winner” is the
democracy variable, which is now significant, although with a positive sign,
indicating that democracy contributes to the risk of civil-war onset. All other variables
remain insignificant, including (most importantly for our purposes) the ELF index.6
15
[Table 3 about here]
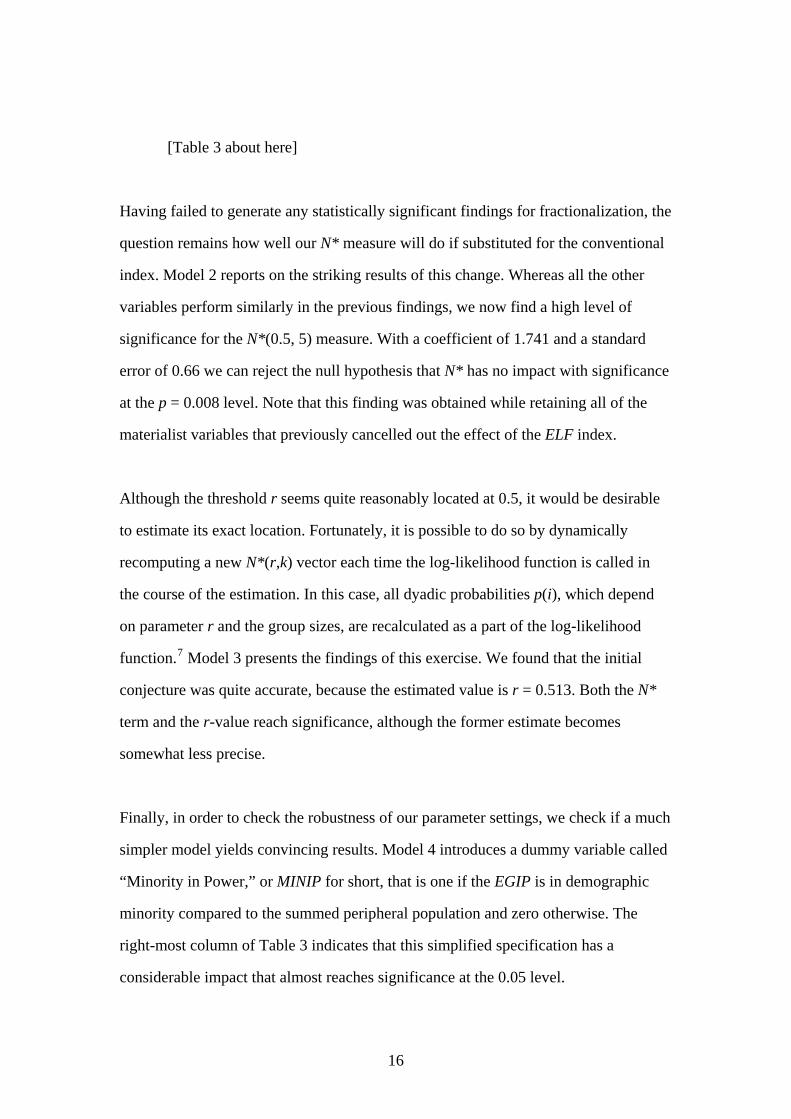
Having failed to generate any statistically significant findings for fractionalization, the
question remains how well our N* measure will do if substituted for the conventional
index. Model 2 reports on the striking results of this change. Whereas all the other
variables perform similarly in the previous findings, we now find a high level of
significance for the N*(0.5, 5) measure. With a coefficient of 1.741 and a standard
error of 0.66 we can reject the null hypothesis that N* has no impact with significance
at the p = 0.008 level. Note that this finding was obtained while retaining all of the
materialist variables that previously cancelled out the effect of the ELF index.
Although the threshold r seems quite reasonably located at 0.5, it would be desirable
to estimate its exact location. Fortunately, it is possible to do so by dynamically
recomputing a new N*(r,k) vector each time the log-likelihood function is called in
the course of the estimation. In this case, all dyadic probabilities p(i), which depend
on parameter r and the group sizes, are recalculated as a part of the log-likelihood
function.7 Model 3 presents the findings of this exercise. We found that the initial
conjecture was quite accurate, because the estimated value is r = 0.513. Both the N*
term and the r-value reach significance, although the former estimate becomes
somewhat less precise.
Finally, in order to check the robustness of our parameter settings, we check if a much
simpler model yields convincing results. Model 4 introduces a dummy variable called
“Minority in Power,” or MINIP for short, that is one if the EGIP is in demographic
minority compared to the summed peripheral population and zero otherwise. The
right-most column of Table 3 indicates that this simplified specification has a
considerable impact that almost reaches significance at the 0.05 level.
16
It is quite remarkable that such crude models of ethno-nationalist politics generate
strong results. All estimations reported in Table 3 are based on a dependent variable
that treats all civil wars as one large category. Still, there are good reasons to believe
that such an inclusive assumption ignores considerable unit heterogeneity, especially
since it lumps together ethno-nationalist civil wars with coups and other non-ethnic
conflicts (Sambanis 2002a). Fortunately, Fearon and Laitin’s (2003) data set includes
a variable that separates ethnic wars from other types of internal conflict. If our model
of ethno-nationalist conflict is correct, it should perform especially well for this
dependent variable. After all, such a coding corresponds directly to the causal logic
advanced in this paper.
To find out if this intuition can be empirically confirmed we reran all models of Table
3 for the alternative dependent variable (see Table 4). As expected, Model 5 shows
that the ELF index remains totally insignificant for the new specification. In contrast,
our new N* measure performs extremely well. As suggested by Model 6, a fixed
index N*(0.5, 5) yields a very high level of significance at p = 0.001 that equals or
even surpasses the materialist variables per capita income and oil exports in this
respect. As before, the democracy indicator is significant and the variables associated
with prior war, population size and recent independence continue to have a strong
impact.
[Table 4 about here]
Model 7 presents a dynamic estimation of r, similar to that shown by Model 3. In this
case, the parameter comes out somewhat lower (r = 0.421) than in the previous model.
As expected, the estimation is even more significant for ethnic wars than for all civil
wars. The model seems to fit the data remarkably well for these cases. Indeed, the
statistical results of N* confirm that the postulated causal mechanisms do a good job
of summarizing the center-periphery relationship between EGIPs and MEGs. In
17
addition, Model 8 reveals that the simple MINIP indicator now becomes significant,
thus suggesting that our fundamental causal insight does not hinge on the exact
functional form of the N* index.8
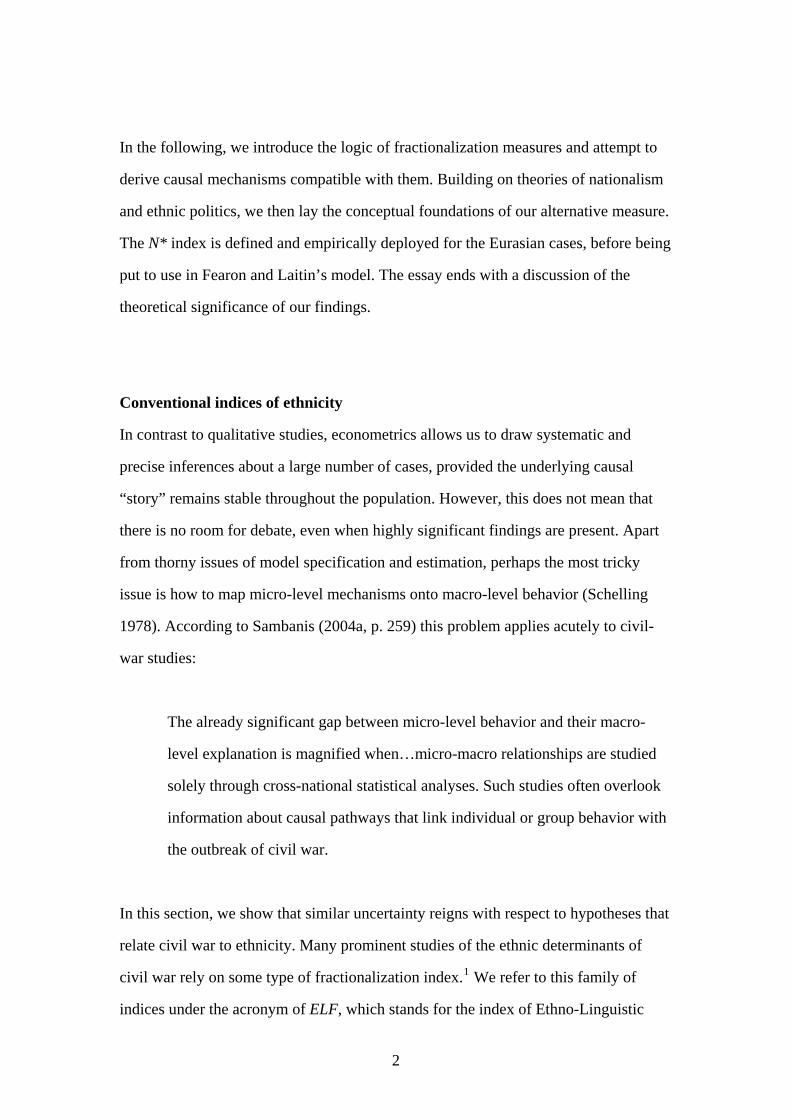
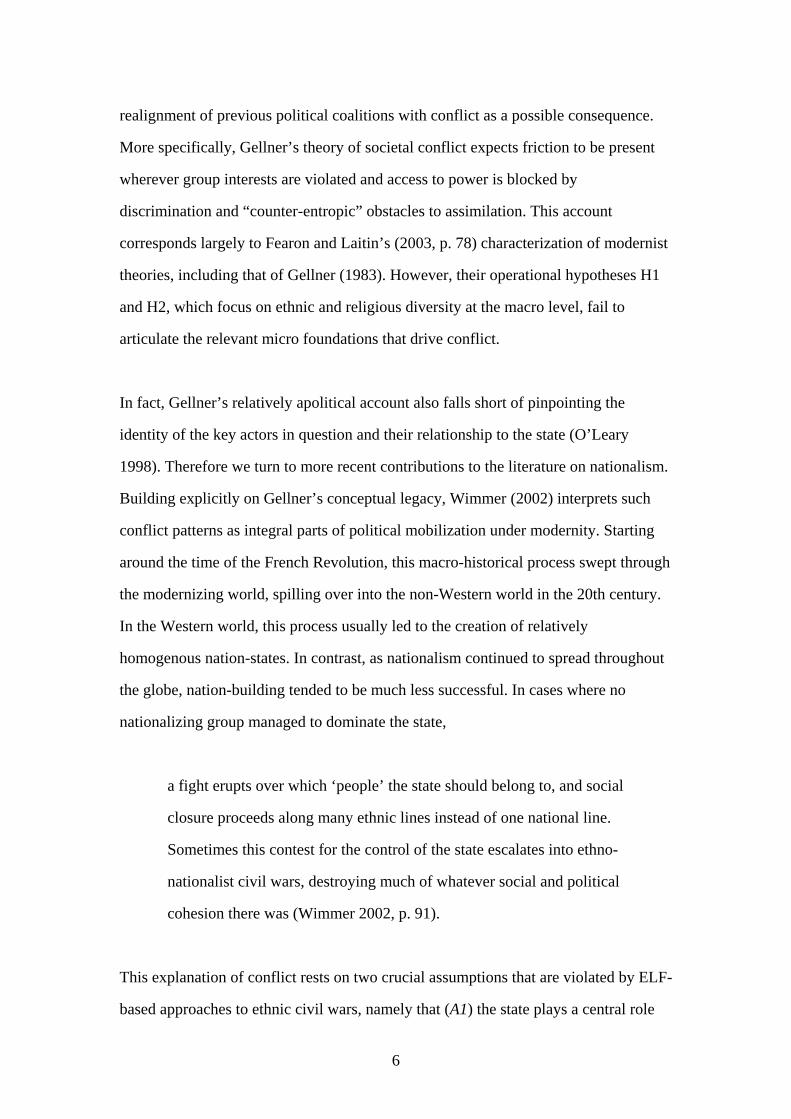
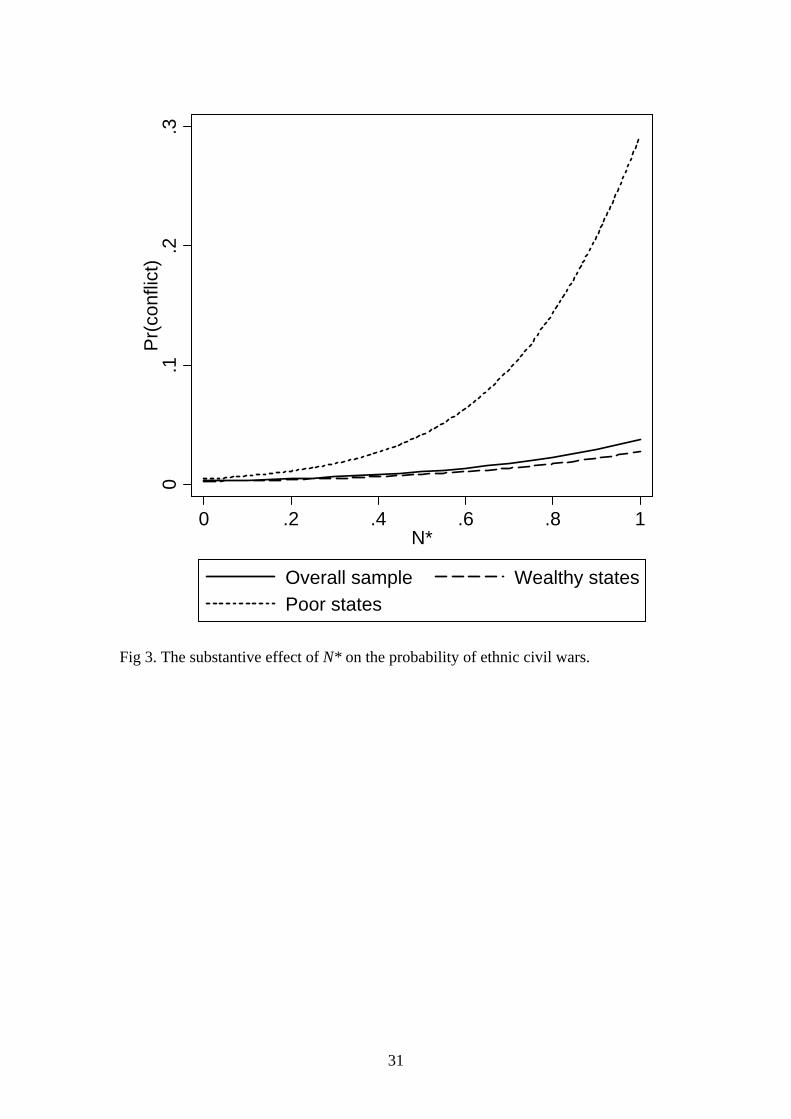
What is the substantive effect of our new indicator? Figure 3 plots the predicted
annual probability of ethnic war as a function of the N* values. The graph displays
three curves, all based on the estimates of Model 5. The middle one represents the
conflict propensity of a typical state where all other independent variables are held at
their means. If N* = 0 conflict is virtually excluded. As the indicator increases,
however, the risk of ethnic war grows steadily up to about 0.02 for N* = 1. The two
remaining curves correspond to two sub-samples holding states with GDP values
below and above the mean. Whereas the effect of N* is just below that of the overall
sample for the wealthy cases, the poor ones demonstrate a much stronger effect. In
these cases, the conflict propensity increases to almost 0.3 for N* = 1.
[Figure 3 about here]
Of course, it would be premature to draw any definitive conclusions for the entire
world. In this paper, we have limited ourselves to slightly more than half of the global
sample studied by Fearon and Laitin. An extension of the N* index to the non-
Eurasian cases will require careful empirical coding of EGIP. Moreover, it will be
necessary to study the robustness of the operationalization proposed in the Appendix
even for the cases at hand. Such a coding project should also pay more attention to
diachronic differences in the status of EGIPs than we have been able to do in this
paper.
A particularly exciting extension of the current paper would attempt to derive group-
specific measures beyond demographic size. Based on the agent-based model
introduced in Cederman (forthcoming), we expect the location of the ethnic group to
18
be very important. Future research could rely on Geographic Information Systems
(GIS) to measure the logistical obstacles encountered by the capital in its dealings
with each group. In reality, even small groups can be very powerful in asymmetric
conflicts, thanks to their ability to take advantage of difficult terrain far away from the
capital. It would also be interesting to go beyond the primarily opportunity-driven
logic of the present model by separating those cases that feature actual ethno-
nationalist escalation from structural situations that are conducive to conflict.
Conclusion
We started this paper by observing that the causal mechanisms implied by the ethnic
fractionalization index have very little to do with any reasonable account of ethno-
nationalist civil wars. Such “tests” of ethnicity misstate the theory in at least two
crucial ways. First, they tend to assume that violence is primarily a reflection of
individual, as opposed to group-level, dynamics. Second, conventional econometric
models also implicitly assume that conflict patterns are entirely symmetric.
The contemporary civil-war literature has systematically overlooked what a long
tradition of qualitative scholarship has established, namely that ethnic and national
identities derive their political significance from their relationship to the state (e.g.
Geertz 1963; Tilly 1996; Wimmer 2002). From this vantage point, it makes little
sense to test hypotheses relating ethnicity to war without any explicit reference to the
state. What matters are politically mobilized ethnic cleavages. However, the ELF
index makes no attempt to locate ethnic groups in relation to state power. According
to these models, ethnic conflict can be expected to unfold as if it occurred among
ethnic gangs in an American city.
This misspecification would have been much less problematic had it not been dressed
up as a main finding about civil wars. Far from shying away from making far-
19
reaching policy conclusions, Fearon and Laitin (2003) warn policy makers and
scholars against inferring
that ethnic diversity is the root cause of civil conflict when they observe
insurgents in a poor country who mobilize fighters along ethnic lines. Instead,
the civil wars of the period have structural roots, in the combination of a
simple, robust military technology and decolonization, which created an
international system numerically dominated by fragile states with limited
administrative control of their peripheries (p. 88).
We hope that the current study will provide a counterweight to such sweeping
judgments. While we do not purport to have crafted a complete explanation of ethno-
nationalist conflict, we do think that our results are promising enough to inspire future
research on how cultural and logistical mechanisms interact to produce political
violence.
20
References:
Alesina, Alberto, Arnaud Devleeschauwer, William Easterly, Sergio Kurlat, and
Romain Wacziarg. 2003. Fractionalization. Journal of Economic Growth 8
(June): 155-94.
Anderson, Benedict. 1991. Imagined Communities: Reflections on the Origin and
Spread of Nationalism. London: Verso.
Cederman, Lars-Erik. 1997. Emergent Actors in World Politics: How States Develop
and Dissolve. Princeton University Press.
Cederman, Lars-Erik. 2002. Nationalism and Ethnicity. In The Handbook of
International Relations, edited by Walter Carlsnaes, Thomas Risse and Beth
Simmons. London: Sage.
Cederman, Lars-Erik. forthcoming. Articulating the Geo-Cultural Logic of Nationalist
Insurgency. in Order, Conflict, and Violence, ed. Stahis Kalyvas and Ian
Shapiro. Cambridge: Cambridge University Press.
Goemans, Hein, Kristian Skrede Gleditsch, Giacomo Chiozza, and Jinhee L. Choung.
2004. Archigos: A Database on Political Leaders. Typescript, University of
Rochester and University of California San Diego.
Collier, Paul, and Anke Hoeffler. 2004. Greed and Grievance in Civil Wars. Oxford
Economic Papers 56 (October): 563-595.
Central Information Agency. 2005. The World Factbook.
http://www.cia.gov/cia/publications/factbook/
21
Davenport, Christian. 2003. Minorities At Risk Dataset Users Manual.
http://www.cidcm.umd.edu/inscr/mar/margene/mar-codebook_040903.pdf
Elbadawi, Ibrahim, and Nicholas Sambanis. 2002. How Much War Will We see?
Explaining the Prevalence of Civil War. Journal of Conflict Resolution 46
(June): 307-334.
Ellingsen, Tanja. 2000. Colorful Community or Ethnic Witches' Brew? Multiethnicity
and Domestic Conflict During and After the Cold War. Journal of Conflict
Resolution 44 (April): 228-249.
Fearon, James D. 2003. Ethnic and Cultural Diversity by Country. Journal of
Economic Growth 8 (June): 195-222.
Fearon, James D., and David D. Laitin. 2003. Ethnicity, Insurgency, and Civil War.
American Political Science Review 97 (March):75-90.
Garcia-Montalvo, José, and Marta Reynal-Querol. 2005. Ethnic Polarization, Potential
Conflict, and Civil Wars. American Economic Review 95 (3): 796-816.
Geertz, Clifford. 1963. The Integrative Revolution. in Old Societies and New States:
The Quest for Modernity in Asia and Africa, ed. Clifford Geertz. New York:
Free Press of Glencoe.
Gellner, Ernest. 1964. Thought and Change. London: Widenfeld & Nicolson.
Gellner, Ernest. 1983. Nations and Nationalism. Ithaca, NY: Cornell University Press.
22
Gurr, Ted Robert. 2000. Peoples Versus States: Minorities at Risk in the New
Century. Washington, DC: United States Institute of Peace Press.
Heger, Lindsay and Idean Salehyan. 2005. Ruthless Rulers: Coalition Size and the
Severity of Civil Conflict. Unpublished ms. University of California, San Diego.
Hegre, Håvard, Tanja Ellingsen, Scott Gates, and Nils Petter Gleditsch. 2001. Toward
a Democratic Civil Peace? Democracy, Political Change, and Civil War, 1816-
1992. American Political Science Review 95 (March): 33-48.
Hirschleifer, Jack. 2001. The Dark Side of the Force: Economic Foundations of
Conflict Theory. Cambridge: Cambridge University Press.
Laitin, David D., and Daniel N. Posner. 2001. The Implications of Constructivism for
Constructing Ethnic Fractionalization Indices. APSA-CP: Newsletter of the
Organized Section in Comparative Politics of the American Political Science
Association. 12 (Winter): 13-17.
Mann, Michael. 2005. The Dark Side of Democracy: Explaining Ethnic Cleansing.
Cambridge: Cambridge University Press.
O’Leary, Brendan. 1998. Ernest Gellner’s Diagnoses of Nationalism. In The State of
the Nation: Ernest Gellner and the Theory of Nationalism, edited by J. A. Hall.
Cambridge: Cambridge University Press.
Posner, Daniel N. 2004. Measuring Ethnic Fractionalization in Africa. American
Journal of Political Science 48 (October): 849-863.
23
Reynal-Querol, Marta. 2002. Ethnicity, Political Systems, and Civil Wars. Journal of
Conflict Resolution 46 (February): 29-54.
Roeder, Philip G. 2001. Ethnolinguistic Fractionalization (ELF) Indices, 1961 and
1985. February 16. http://weber.ucsd.edu/~proeder/elf.htm.
Rokkan, Stein 1999. State Formation, Nation-Building, and Mass Politics in Europe:
The Theory of Stein Rokkan. Flora, Peter, ed. Oxford: Oxford University Press.
Sambanis, Nicholas. 2001. Do Ethnic and Nonethnic Civil Wars Have the Same
Causes? A Theoretical and Empirical Inquiry. Journal of Conflict Resolution 45
(June): 259-282.
Sambanis, Nicholas. 2004a. Using Case Studies to Expand Economic Models of Civil
War. Perspectives on Politics 2 (June): 259-279.
Sambanis, Nicholas. 2004b. What is Civil War? Conceptual and Empirical
Complexities of an Operational Definition. Journal of Conflict Resolution 48
(December): 814-858.
Schelling, Thomas C. 1978. Micromotives and Macrobehavior. New York: W. W.
Norton.
Taylor, Charles L., and Michael C. Hudson. 1972. World Handbook of Political and
Social Indicators. New Haven, Conn.: Yale University Press.
Tierney, Luke. 1990. LISP-STAT: An Object-Oriented Environment for Statistical
Computing and Dynamic Graphics. New York: John Wiley.
24
Tilly, Charles. 1978. From Mobilization to Revolution. New York: McGraw-Hill.
Tilly, Charles. 1996. The State of Nationalism. Critical Review 10 (Spring): 299-306
Tilly, Charles. 2003. The Politics of Collective Violence. Cambridge: Cambridge
University Press.
Tullock, Gordon. 1967. The Welfare Costs of Tariffs, Monopolies, and Theft. Western
Economic Journal 5 (June): 224-232.
Weber, Max. 1946. From Max Weber: Essays in Sociology. Edited by H. H. Gerth
and C. W. Mills. New York: Oxford University Press.
Wimmer, Andreas. 2002. Nationalist Exclusion and Ethnic Conflict: Shadows of
Modernity. Cambridge: Cambridge University Press.
25
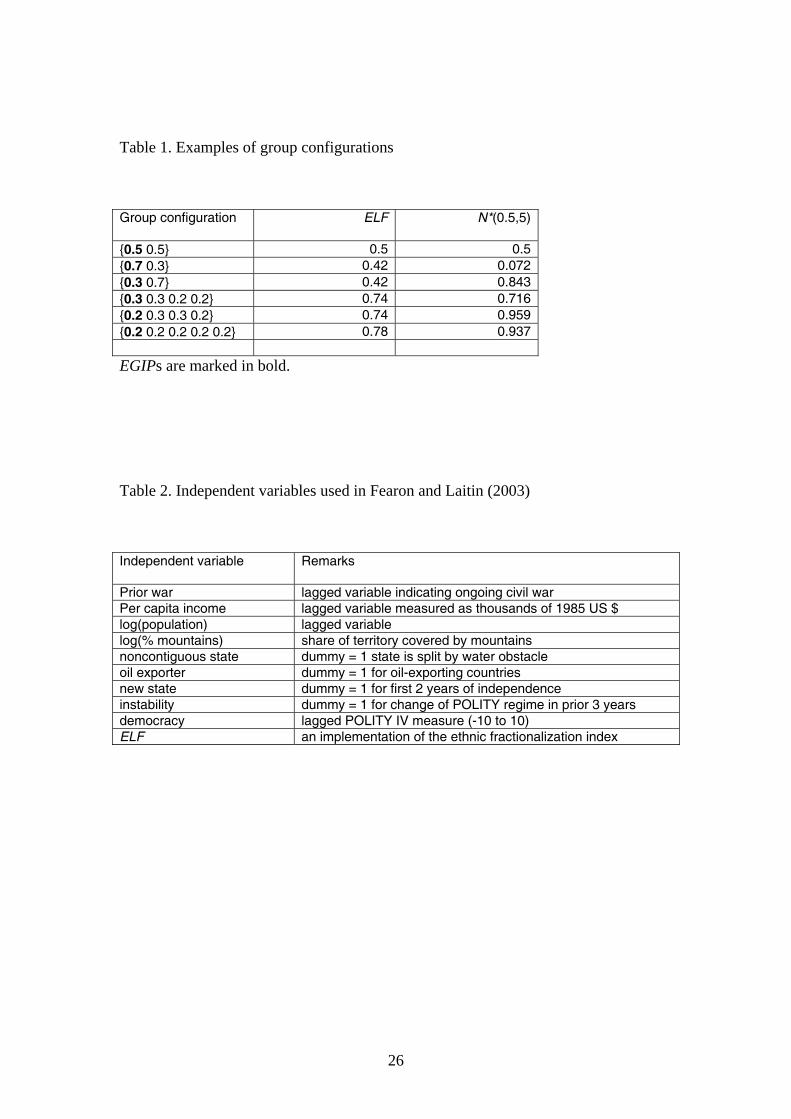
Table 1. Examples of group configurations
Group configuration ELF N*(0.5,5)
{0.5 0.5} 0.5 0.5 {0.7 0.3} 0.42 0.072 {0.3 0.7} 0.42 0.843 {0.3 0.3 0.2 0.2} 0.74 0.716 {0.2 0.3 0.3 0.2} 0.74 0.959 {0.2 0.2 0.2 0.2 0.2} 0.78 0.937 EGIPs are marked in bold.
Table 2. Independent variables used in Fearon and Laitin (2003)
Independent variable
Remarks
Prior war lagged variable indicating ongoing civil war Per capita income lagged variable measured as thousands of 1985 US $ log(population) lagged variable log(% mountains) share of territory covered by mountains noncontiguous state dummy = 1 state is split by water obstacle oil exporter dummy = 1 for oil-exporting countries new state dummy = 1 for first 2 years of independence instability dummy = 1 for change of POLITY regime in prior 3 years democracy lagged POLITY IV measure (-10 to 10) ELF an implementation of the ethnic fractionalization index
26
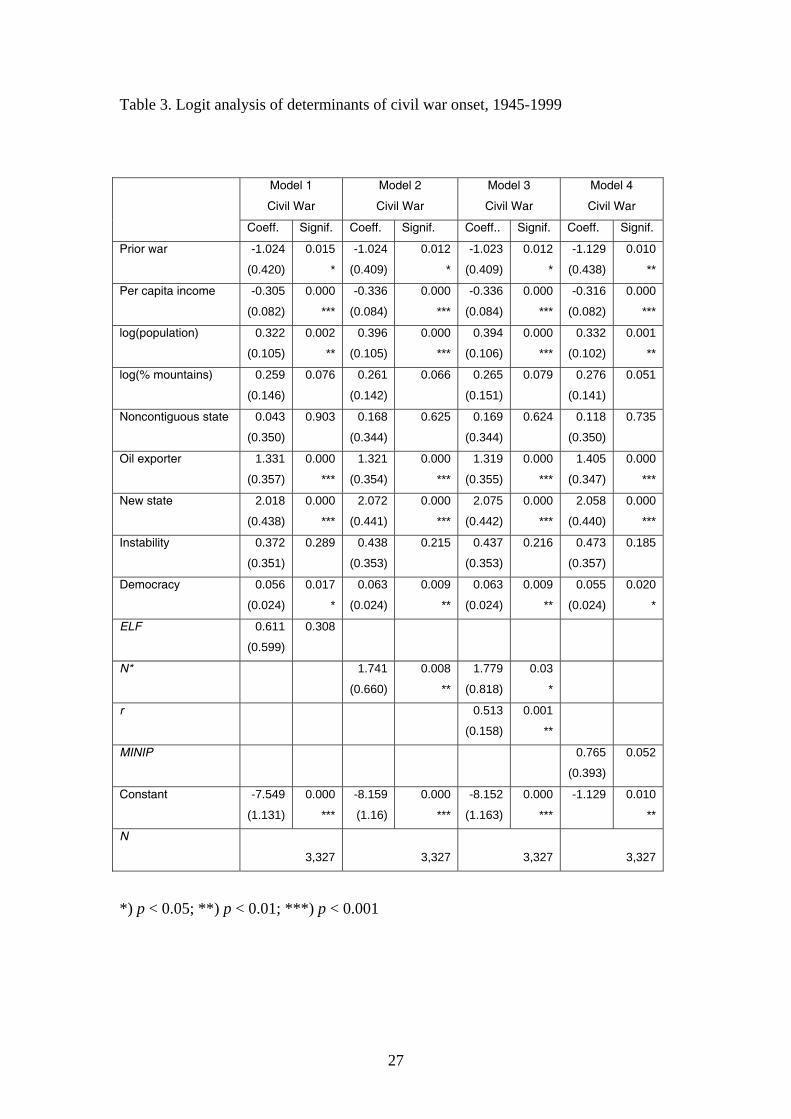
Table 3. Logit analysis of determinants of civil war onset, 1945-1999
Model 1
Civil War
Model 2
Civil War
Model 3
Civil War
Model 4
Civil War
Coeff. Signif. Coeff. Signif. Coeff.. Signif. Coeff. Signif.
Prior war -1.024
(0.420)
0.015
*
-1.024
(0.409)
0.012
*
-1.023
(0.409)
0.012
*
-1.129
(0.438)
0.010
**
Per capita income -0.305
(0.082)
0.000
***
-0.336
(0.084)
0.000
***
-0.336
(0.084)
0.000
***
-0.316
(0.082)
0.000
***
log(population) 0.322
(0.105)
0.002
**
0.396
(0.105)
0.000
***
0.394
(0.106)
0.000
***
0.332
(0.102)
0.001
**
log(% mountains) 0.259
(0.146)
0.076
0.261
(0.142)
0.066
0.265
(0.151)
0.079
0.276
(0.141)
0.051
Noncontiguous state 0.043
(0.350)
0.903
0.168
(0.344)
0.625
0.169
(0.344)
0.624
0.118
(0.350)
0.735
Oil exporter 1.331
(0.357)
0.000
***
1.321
(0.354)
0.000
***
1.319
(0.355)
0.000
***
1.405
(0.347)
0.000
***
New state 2.018
(0.438)
0.000
***
2.072
(0.441)
0.000
***
2.075
(0.442)
0.000
***
2.058
(0.440)
0.000
***
Instability 0.372
(0.351)
0.289
0.438
(0.353)
0.215
0.437
(0.353)
0.216
0.473
(0.357)
0.185
Democracy 0.056
(0.024)
0.017
*
0.063
(0.024)
0.009
**
0.063
(0.024)
0.009
**
0.055
(0.024)
0.020
*
ELF 0.611
(0.599)
0.308
N*
1.741
(0.660)
0.008
**
1.779
(0.818)
0.03
*
r
0.513
(0.158)
0.001
**
MINIP
0.765
(0.393)
0.052
Constant -7.549
(1.131)
0.000
***
-8.159
(1.16)
0.000
***
-8.152
(1.163)
0.000
***
-1.129 0.010
**
N
3,327 3,327 3,327 3,327
*) p < 0.05; **) p < 0.01; ***) p < 0.001
27
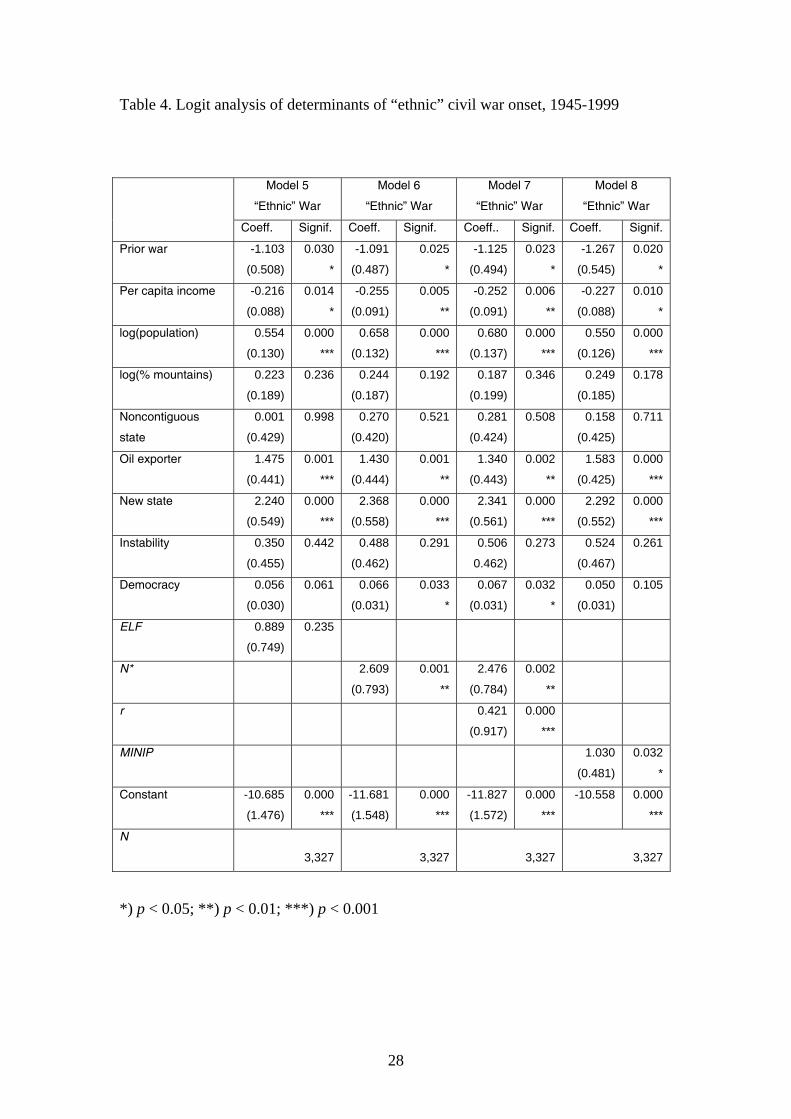
Table 4. Logit analysis of determinants of “ethnic” civil war onset, 1945-1999
Model 5
“Ethnic” War
Model 6
“Ethnic” War
Model 7
“Ethnic” War
Model 8
“Ethnic” War
Coeff. Signif. Coeff. Signif. Coeff.. Signif. Coeff. Signif.
Prior war -1.103
(0.508)
0.030
*
-1.091
(0.487)
0.025
*
-1.125
(0.494)
0.023
*
-1.267
(0.545)
0.020
*
Per capita income -0.216
(0.088)
0.014
*
-0.255
(0.091)
0.005
**
-0.252
(0.091)
0.006
**
-0.227
(0.088)
0.010
*
log(population) 0.554
(0.130)
0.000
***
0.658
(0.132)
0.000
***
0.680
(0.137)
0.000
***
0.550
(0.126)
0.000
***
log(% mountains) 0.223
(0.189)
0.236 0.244
(0.187)
0.192 0.187
(0.199)
0.346 0.249
(0.185)
0.178
Noncontiguous
state
0.001
(0.429)
0.998 0.270
(0.420)
0.521 0.281
(0.424)
0.508 0.158
(0.425)
0.711
Oil exporter 1.475
(0.441)
0.001
***
1.430
(0.444)
0.001
**
1.340
(0.443)
0.002
**
1.583
(0.425)
0.000
***
New state 2.240
(0.549)
0.000
***
2.368
(0.558)
0.000
***
2.341
(0.561)
0.000
***
2.292
(0.552)
0.000
***
Instability 0.350
(0.455)
0.442 0.488
(0.462)
0.291 0.506
0.462)
0.273 0.524
(0.467)
0.261
Democracy 0.056
(0.030)
0.061 0.066
(0.031)
0.033
*
0.067
(0.031)
0.032
*
0.050
(0.031)
0.105
ELF 0.889
(0.749)
0.235
N* 2.609
(0.793)
0.001
**
2.476
(0.784)
0.002
**
r 0.421
(0.917)
0.000
***
MINIP 1.030
(0.481)
0.032
*
Constant -10.685
(1.476)
0.000
***
-11.681
(1.548)
0.000
***
-11.827
(1.572)
0.000
***
-10.558 0.000
***
N
3,327 3,327 3,327 3,327
*) p < 0.05; **) p < 0.01; ***) p < 0.001
28
0.2
.4.6
.81
p(i)
0 .2 .4 .6 .8 1r(i)=si/(si+s0)
Fig. 1. The dyadic probability of conflict p(i) between marginalized group i and an ethnic group in power.
29
INDONESIA
KUWAIT
IRAN
MOROCCO
JORDAN
KAZAKHSTAN
INDIATAJIKISTANMOLDOVA
AFGHANISTAN
U. ARAB EMIRATES
LEBANON
BHUTAN
PHILIPPINES
LATVIA
YUGOSLAVIA
MALAYSIAESTONIA
IRAQ
0.2
.4.6
.81
N*(
0.5,
5)
0 .2 .4 .6 .8 1ELF
Fig 2. A scatter plot of N* against the ELF index for all countries in the sample
30
0.1
.2.3
Pr(
conf
lict)
0 .2 .4 .6 .8 1N*
Overall sample Wealthy statesPoor states
Fig 3. The substantive effect of N* on the probability of ethnic civil wars.
31
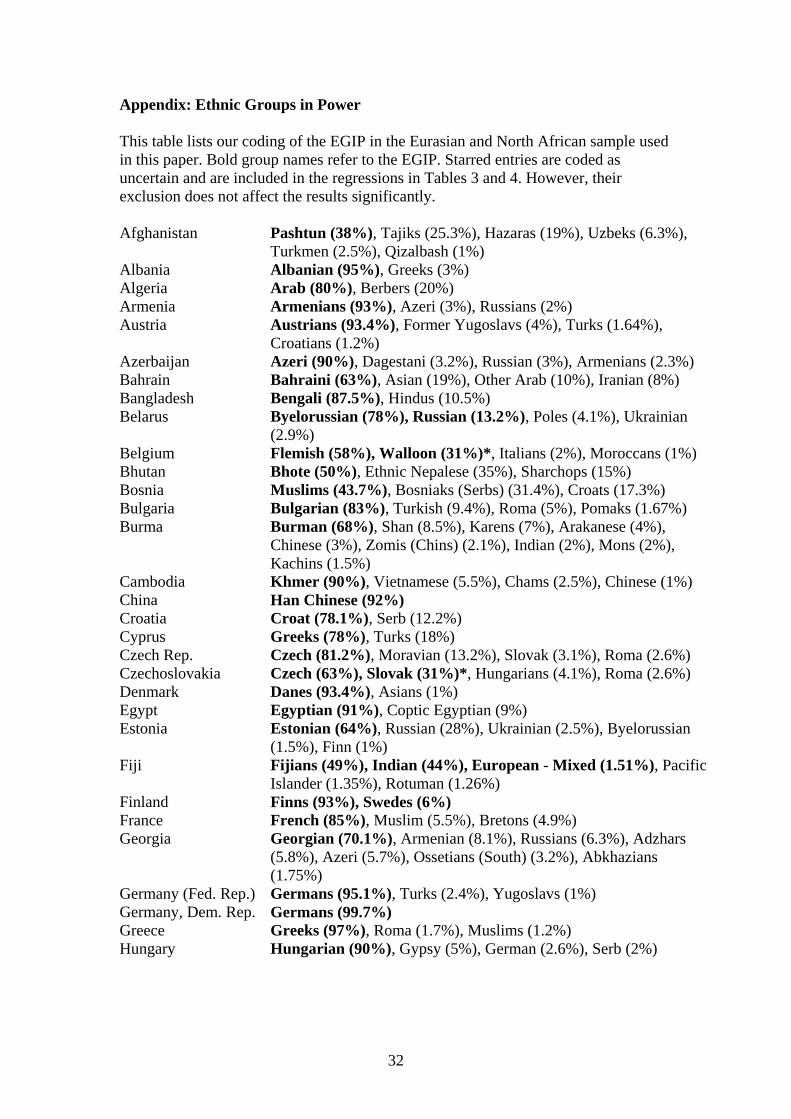
Appendix: Ethnic Groups in Power This table lists our coding of the EGIP in the Eurasian and North African sample used in this paper. Bold group names refer to the EGIP. Starred entries are coded as uncertain and are included in the regressions in Tables 3 and 4. However, their exclusion does not affect the results significantly. Afghanistan Pashtun (38%), Tajiks (25.3%), Hazaras (19%), Uzbeks (6.3%),
Turkmen (2.5%), Qizalbash (1%) Albania Albanian (95%), Greeks (3%) Algeria Arab (80%), Berbers (20%) Armenia Armenians (93%), Azeri (3%), Russians (2%) Austria Austrians (93.4%), Former Yugoslavs (4%), Turks (1.64%),
Croatians (1.2%) Azerbaijan Azeri (90%), Dagestani (3.2%), Russian (3%), Armenians (2.3%) Bahrain Bahraini (63%), Asian (19%), Other Arab (10%), Iranian (8%) Bangladesh Bengali (87.5%), Hindus (10.5%) Belarus Byelorussian (78%), Russian (13.2%), Poles (4.1%), Ukrainian
(2.9%) Belgium Flemish (58%), Walloon (31%)*, Italians (2%), Moroccans (1%) Bhutan Bhote (50%), Ethnic Nepalese (35%), Sharchops (15%) Bosnia Muslims (43.7%), Bosniaks (Serbs) (31.4%), Croats (17.3%) Bulgaria Bulgarian (83%), Turkish (9.4%), Roma (5%), Pomaks (1.67%) Burma Burman (68%), Shan (8.5%), Karens (7%), Arakanese (4%),
Chinese (3%), Zomis (Chins) (2.1%), Indian (2%), Mons (2%), Kachins (1.5%)
Cambodia Khmer (90%), Vietnamese (5.5%), Chams (2.5%), Chinese (1%) China Han Chinese (92%) Croatia Croat (78.1%), Serb (12.2%) Cyprus Greeks (78%), Turks (18%) Czech Rep. Czech (81.2%), Moravian (13.2%), Slovak (3.1%), Roma (2.6%) Czechoslovakia Czech (63%), Slovak (31%)*, Hungarians (4.1%), Roma (2.6%) Denmark Danes (93.4%), Asians (1%) Egypt Egyptian (91%), Coptic Egyptian (9%) Estonia Estonian (64%), Russian (28%), Ukrainian (2.5%), Byelorussian
(1.5%), Finn (1%) Fiji Fijians (49%), Indian (44%), European - Mixed (1.51%), Pacific
Islander (1.35%), Rotuman (1.26%) Finland Finns (93%), Swedes (6%) France French (85%), Muslim (5.5%), Bretons (4.9%) Georgia Georgian (70.1%), Armenian (8.1%), Russians (6.3%), Adzhars
(5.8%), Azeri (5.7%), Ossetians (South) (3.2%), Abkhazians (1.75%)
Germany (Fed. Rep.) Germans (95.1%), Turks (2.4%), Yugoslavs (1%) Germany, Dem. Rep. Germans (99.7%) Greece Greeks (97%), Roma (1.7%), Muslims (1.2%) Hungary Hungarian (90%), Gypsy (5%), German (2.6%), Serb (2%)
32
India Hindi Speakers (39.9%), Bengali (8.22%), Telusu (7.8%), Marathi (7.38%), Tamil (6.26%), Gujarati (4.81%), Kannada (3.87%), Malayalam (3.59%), Oriya (3.32%), Punjabi (2.76%), Sikhs (2%), Assamese (1.55%)
Indonesia Javanese (45%), Sunda (14.8%), Malays (5.9%), Madura (5.3%), Minangkabau (4.4%), Batak (1.9%), Balinese (1.84%), Bugis (1.5%), Betawi (1.31%), Aceh (1.3%), Banjar (1.1%), Chinese (1%), Susak (1%)
Iran Persian (51%), Azerbaijani (24%), Gilaki / Mazandarani (8%), Kurds (7%), Arabs (3%), Lur (2%), Turkmen (2%), Baluchis (2%), Bakhtiari (1%)
Iraq Sunni-Arab (15.5%), Shi'is (62.5%), Kurds (19%), Turkoman (1.7%)
Ireland Irish (91%), Anglican (3%) Israel Jewish (63.7%), Palestinians (21.7%), Arab (14.7%) Italy Italians (98%) Japan Japanese (99.4%) Jordan Transjordan Arabs (40%), Palestinian (57.5%), Circassian (1%),
Armenian (1%) Kazakhstan Kazakh (45%), Russian (35.8%), Ukrainian (5.1%), Germans
(3.6%), Uzbek (2.2%), Tartar (2%), Uighur (1.4%) Korea, People’s Republic
Korean (99.9%)
Korea, Republic Korean (99.8%) Kuwait Kuwaiti (40%), Asian (30%), Other Arab (20%), Iranian (4%) Kyrgyzstan Kirghiz (52%), Russian (18%), Uzbeks (12.9%), Ukrainian (2.5%),
Germans (2.4%) Laos Lao Loum (68%), Lao Theung (22%), Lao Sung (9%) Latvia Latvian (56.5%), Russian (30.4%), Byelorussian (4.3%), Ukrainian
(2.8%), Polish (2.6%) Lebanon Maronite (25%), Shi'is (32%), Sunni Muslim (20%), Palestinians
(10%), Druze (6%), Armenian (4%) Libya Arabs (92%), Berbers (5%) Lithuania Lithuanian (80.6%), Russian (8.7%), Poles (7%), Byelorussian
(1.6%) Macedonia Macedonian (64.6%), Albanian (21%), Turks (4%), Roma (4%),
Serbs (2.2%) Malaysia Malay (57.7%), Chinese (25.4%), East Indians (7.2%), Dayaks
(3%), Kadazans (2.9%) Moldova Moldovan (64.5%), Slavs (26.8%), Gagauz (3.5%), Bulgarians
(2%), Jews (1.5%) Mongolia Mongols (85%), Kazakh (5.3%), Tungusic (4.6%), Chinese (2%),
Russian (2%) Morocco Arabs (62%), Berbers (37%) Nepal Indo-Nepalese (53.2%), Bihari (18.4%), Tharu (4.8%), Tamang
(4.7%), Newar (3.4%), Magar (2.2%), Abadhi (1.7%) Netherlands Dutch (96%), Muslims (4%) Norway Norwegian (95%) Oman Ibadhi Muslim (73.5%), Indian (13.3%), Bengali (4.3%), Pakistani
(3.1%), Egyptian (1.6%)
33
Pakistan Punjabi (66%), Sindhi (13%)*, Pashtuns (Pushtuns) (9%), Mohajirs (8%), Baluchis (3%)
Papua New Guinea (Not Applicable) Philippines Lowland Christ. Malay (91.5%), Muslim Malay (4%), Chinese
(1.5%), Igorots (1.4%) Poland Poles (97.6%), German (1.3%) Portugal Portuguese (98%) Romania Romanian (83%), Hungarian (8.3%), Roma (6.5%), Germans
(1.5%) Russia Russian (81.5%), Tatar (3.8%), Ukrainian (3%), Lezgins (1.7%),
Chuvash (1.2%) Saudi Arabia Sunni Arabs (66%), Indians (6%), Egyptians (6%), Pakistanis
(4%), Shi'is (4%), Filipino (3%) Singapore Chinese (76.4%), Malay (14.9%), Indian (7.9%) Slovakia Slovakia (80.6%), Hungarian (10.1%), Roma (9.3%) Slovenia Slovenes (87.6%), Croat (2.7%), Serb (2.4%), Bosniak (1.4%) Spain Castillan Speakers (68%), Catalan (16.9%)*, Galician (6%),
Basques (5.4%), Roma (1.9%) Sri Lanka Sinhalese (74%), Sri Lankan Tamils (12%), Moor (7.7%), Indian
Tamils (6%) Sweden Swedes (90%), Finnish (2.3%) Switzerland German (62.2%), French (16.4%), Italians (8.1%), Romansch
(1%), Yugoslavs (5.2%), Spanish (3.1%), Portuguese (2.1%), Turks (1.2%), Asians (1.2%)
Syria Sunni-Arab (62%), Alawi (14%)*, Kurds (9%), Christians (8%), Druze (3%)
Taiwan Taiwanese (84%), Mainland Chinese (14%), Aborigine (2%) Tajikistan Tajik (64.9%), Uzbeks (25%), Russians (5%), Tartar (1.4%),
Kyrgyz (1.3%) Thailand Thai (74%), Chinese (14%), Malay-Muslims (3.5%), Northern Hill
Tribes (1%), Khmer (1%) Tunisia Arabs (98%), Berber (1.2%) Turkey Turkish (82%), Kurds (17%), Arab (1.4%) Turkmenistan Turkmen (77%), Uzbeks (9.2%), Russians (8%), Kazakhs (2%) U. Arab Emirates Emiri (12%), South Asian (45%), Iranian (17%), Egyptians (13%) UK English (81.5%), Scots (9.5%)*, Asians (2.8%), Irish (2.4%),
Afro-Caribbeans (2%), Welsh (1.9%), Catholics In N. Ireland (1.19%)
Ukraine Ukrainian (73%), Russian (22%)*, Jews (1%) USSR Russian (50.8%), Ukrainian (15.4%), Uzbeks (5.84%),
Byelorussian (3.5%), Kazakhs (2.85%), Tatars (2.4%), Azerbaijanis (2.38%), Armenians (1.62%), Tadzhiks (1.48%), Georgians (1.39%), Moldavians (1.14%), Lithuanians (1.07%)
Uzbekistan Uzbek (71%), Russian (8%), Tajiks (5%), Kazakh (4%), Karakalpak (2%), Tartar (1.5%)
Vietnam Vietnamese (87.5%), Tay (2%), Chinese (1.8%), Thai (1.7%), Khmer (1.6%), Muong (1.5%), Nung (1.2%)
Yemen Arabs* Yugoslavia, Federal Republic of
Serbs (62.6%), Montenegrin (5%)*, Albanian (16.5%), Roma (4%), Hungarians (4%), Muslims (1.84%), Croats (1.2%)
34
Yugoslavia, Socialist Federal Republic of
Serbs (36.2%), Croats (19.7%)*, Muslims (10%), Albanian (9.3%), Slovenes (7.5%), Macedonians (5.8%), Hungarian (3.3%), Montenegrin (2.3%)
35
Endnotes:
1 Other indicators of ethnic configurations include different operationalizations of
ethnic dominance (Hegre et al. 2001; Collier and Hoeffler 2004), the size of the
largest or second-largest groups (Ellingsen 2000), culture distance (Fearon 2003), and
polarization (Reynal-Querol 2002; Montalvo and Reynal-Querol 2005). As opposed
to the studies that rely on fractionalization, many of these alternative measures of
ethnicity receive statistical support. However, the status of their micro-level
mechanisms remains as unclear as in the case of the models relying on
fractionalization indices. 2 However, see Sambanis (2001) and Elbadawi and Sambanis (2002) for econometric
models in which quadratic terms of the ELF attain significance. These authors justify
the non-monotonic relationship based on the observation that highly fragmented and
ethnically cohesive countries offer less chances to stage rebellions. 3 In order to justify their polarization measure, Montalvo and Reynal-Querol (2005)
come close to developing a non-individualist theory, but their account differs from the
ELF primarily by factoring in relative group sizes and thus leaves the crucial question
of group-level agency unspecified. 4 Obviously, the state already figures in other explanations of civil wars, such as
Fearon and Laitin’s (2003) logistical theory of insurgency. However, their operational
account of ethnicity makes no reference to state-specific mechanisms. 5 The models were implemented in Stata and Lisp-Stat (Tierney 1990). Java routines
were also used for data management and for computation of the N* index. 6 These results are derived from Fearon and Laitin’s (2003) ELF coding. It is also
possible to compute the ELF based on Fearon’s group data, which we used to
calculate the N* index. Such a coding generates roughly the same results. The same
thing applies for squared ELF terms, which are also insignificant. 7 This step was carried out in Lisp-Stat. Unfortunately, we don’t have enough
information to estimate k as well, which is therefore kept at k = 5. Additional
36
regression runs, not shown in the tables, confirm that the main findings are not
sensitive to the exact value of k. We experimented with k = 2 and 10. The former
setting weakened the significance of N* somewhat in Model 2, but the result remains
significant (p = 0.013). 8 We tested a series of alternative ethnicity measures based on the RQ polarization
index (Garcia-Montalvo and Reynal-Querol 2002), ethnic dominance (Collier and
Hoeffler 2004), the largest ethnic group s (Ellingsen 2000), and 1-s2 (Hegre et al.
2001). All these measures were significant on their own replacing ELF in Model 5,
except ethnic dominance, but when N* was added to the equation, none of them
reached significance at the 0.05 level.
37