benefits and harms vella, sandro - discovery - the university
TRANSCRIPT
University of Dundee
DOCTOR OF MEDICINE
Pharmacological modulation of insulin resistance - benefits and harms
Vella, Sandro
Award date:2013
Link to publication
General rightsCopyright and moral rights for the publications made accessible in the public portal are retained by the authors and/or other copyright ownersand it is a condition of accessing publications that users recognise and abide by the legal requirements associated with these rights.
• Users may download and print one copy of any publication from the public portal for the purpose of private study or research. • You may not further distribute the material or use it for any profit-making activity or commercial gain • You may freely distribute the URL identifying the publication in the public portal
Take down policyIf you believe that this document breaches copyright please contact us providing details, and we will remove access to the work immediatelyand investigate your claim.
Download date: 27. Jan. 2022
DOCTOR OF MEDICINE
Pharmacological modulation of insulinresistance - benefits and harms
Sandro Vella
2013
University of Dundee
Conditions for Use and DuplicationCopyright of this work belongs to the author unless otherwise identified in the body of the thesis. It is permittedto use and duplicate this work only for personal and non-commercial research, study or criticism/review. Youmust obtain prior written consent from the author for any other use. Any quotation from this thesis must beacknowledged using the normal academic conventions. It is not permitted to supply the whole or part of thisthesis to any other person or to post the same on any website or other online location without the prior writtenconsent of the author. Contact the Discovery team ([email protected]) with any queries about the useor acknowledgement of this work.
Pharmacological modulation of insulin resistance
Benefits and harms
Dr. Sandro Vella
University of Dundee
Doctor of Medicine (MD)
November, 2013
© Sandro Vella, 2013
i
Contents
List of tables vi List of figures xiv Acknowledgements xx Declaration xxiii Abstract xxiv Publications arising from this thesis xxvi List of abbreviations xxvii Chapter 1 Introduction and literature review 1 Section I Physiological mechanisms underpinning insulin action in relation to
metformin and thiazolidinedione therapy
2 1.1 The insulin signalling pathway 4 1.2 Diabetes is associated with defective insulin signalling 6 1.3 Metformin - a multifaceted therapeutic approach to insulin resistance 9
1.3.1 Metformin and AMPK 10 1.3.2 The insulin-independent effects of metformin: effects on glucose absorption 14 1.3.3 Metformin and the organic cation transporter 15
1.4 Thiazolidinediones - a 'novel' class of insulin sensitizers 16 1.4.1 Peroxisome Proliferator Activator Receptors - a heterogenous family of
nuclear receptors 17
1.4.2 Physiological consequences of PPAR-γ activation 23 1.4.3 Thiazolidinediones and AMPK activation 24
Section II Heart failure in diabetes, with particular reference to thiazolidinedione
therapy
26 1.5 Concurrence of diabetes and heart failure 26
1.5.1 Prevalence 27 1.5.2 Incidence 27
1.6 Mortality risks associated with heart failure 29 1.7 Thiazolidinediones and oedema 31 1.8 Thiazolidinediones and heart failure 32
1.8.1 Clinical efficacy/safety trials 32 1.8.2 Prospective randomized trials 34 1.8.3 Meta-analyses and retrospective case control studies 48
1.9 Association of comparator 'first and second line' oral glucose lowering agents (metformin, sulphonylureas) with incident heart failure
62
1.10 Use of comparator 'first and second line' oral glucose lowering agents (metformin, sulphonylureas) in patients with established heart failure
64
ii
Section III Mechanisms underpinning fluid retention following thiazolidinedione therapy
66
1.11 Renal haemodynamics 66
1.11.1 The collecting duct and distal tubule 67 1.11.2 The proximal tubule 71 1.11.3 Evidence for an ‘escape mechanism’ and the ‘salt handling paradox’ 74 1.11.4 Endothelial dysfunction and peripheral vascular resistance 77 1.11.5 Effects on vascular permeability 80
1.12 Thiazolidinediones and cardiac pump function 84 1.13 Other suggested ‘fluid-retaining’ mechanisms 90 1.14 Thiazolidinediones and heart failure: unanswered questions 90 Section IV Insulin resistance in type 1 diabetes - is there a role for metformin? 92 1.15 Insulin resistance - a common co-morbidity in type 1 diabetes 92
1.15.1 The 'accelerator' hypothesis 93 1.15.2 The concept of 'double diabetes' 95
1.16 Consequences of insulin resistance in type 1 diabetes 96 1.17 Is there a conceptual role for metformin in type 1 diabetes? 99 1.18 Metformin in type 2 diabetes - benefits beyond glycaemic control 101 1.19 Use of adjunct metformin in type 1 diabetes: what is the evidence? 104
Chapter 2 Clinical study - Characterising thiazolidinedione 'tolerant' and 'intolerant ' patients - a physiological approach 105
Section I Methods 106 2.1 Study design 106 2.2 Good clinical practice 106 2.3 Ethics 107 2.4 Caldicott-Guardian approval 107 2.5 Study objectives 108
2.5.1 Objective 1 - to compare the baseline characteristics of two cohorts of patients with type 2 diabetes who are either sensitive or insensitive to thiazolidinedione-associated fluid retention
108 2.5.2 Objective 2 - to compare the characteristics of the above two cohorts during
an acute and chronic 'high normal' sodium loading in order to detect differences in metabolic, cardiovascular and renal characteristics
109 2.6 Study population 110 2.7 Inclusion criteria 111 2.8 Exclusion criteria 112 2.9 Withdrawal from the study 113 2.10 Recruitment process 114 2.11 Study procedure - visit 1 116 2.12 Study procedure - visit 2 121
2.12.1 Baseline measurements 122 2.12.2 Biochemistry 123 2.12.3 Biomarkers 125 2.12.4 Echocardiography (including tissue doppler) 127 2.12.5 Ankle-foot volume measurements 128 2.12.6 Pulse wave velocity and analysis 130
iii
2.12.7 Assessment of glomerular filtration rate (inulin clearance method) 132 2.12.8 Fractional excretion of sodium 135 2.12.9 Fractional excretion of lithium 136 2.12.10 Fractional reabsorption of distally delivered sodium 137 2.12.11 Salt sensitivity of blood pressure 137
2.13 Study procedure - visit 3 138 2.13.1 Total body water estimation 139 2.13.2 Glomerular filtration rate 141 2.13.3 Salt and water handling techniques 141
2.14 Biostatistical considerations 142 2.14.1 Sample size 142 2.14.2 Statistical analyses 143
2.15 Follow-up of these patients 144 2.16 Validation of ankle-foot volume measurements by the water displacement
technique
145 2.16.1 Aim 145 2.16.2 Methods 145 2.16.3 Results 147 2.16.4 Discussion 152 2.16.5 Conclusion 153
Section II Results 154 2.17 Phenotype 154
2.17.1 Baseline demographic characteristics 154 2.17.2 Past medical history 155 2.17.3 Drug history 156 2.17.4 Clinical measurements 157 2.17.5 Biochemistry 158 2.17.6 Sodium exposure - low and high salt diets 161
2.18 Arterial stiffness 161 2.18.1 Pulse wave analysis 162 2.18.2 Pulse wave velocity 166
2.19 Echocardiography 167 2.20 Biomarkers 167
2.20.1 Vascular endothelial growth factor 168 2.20.2 Atrial natriuretic peptide 169 2.20.3 B-type natriuretic peptide 171 2.20.4 N-terminal prohormone of B-type natriuretic peptide 173 2.20.5 Aldosterone 174 2.20.6 Renin 176 2.20.7 Copeptin 179
2.21 Haematocrit shifts in response to salt loading 179 2.22 Weight change in response to salt loading 182 2.23 Ankle-foot volume changes in response to dietary sodium exposure 183 2.24 Salt sensitivity of blood pressure 186
2.24.1 Systolic blood pressure 186 2.24.2 Diastolic blood pressure 187 2.24.3 Mean arterial pressure 189
2.25 Deuterium analysis 190 2.25.1 Total body water estimation 190 2.25.2 Fat-free mass and fat mass 191
iv
2.26 Inulin clearance 192 2.27 Fractional excretion of sodium 194 2.28 Fractional excretion of lithium 195 2.29 Fractional reabsorption of distally delivered sodium 196 2.30 Discussion 198
Chapter 3 Factors predicting diuretic prescription and heart failure after initiation of thiazolidinedione therapy - a population based approach 210
Section I Methods 211 3.1 Rationale of this study 211 3.2 Research aims 212 3.3 Hypotheses 213 3.4 Study outcomes 213 3.5 Study population 214
3.5.1 Type 2 diabetes definition 216 3.5.2 Type 2 diabetes cohorts 216
3.6 Defining drug dose 221 3.7 Definition of heart failure 221 3.8 Clinical data extraction 223
3.8.1 Basic demographics 223 3.8.2 Past medical history 223 3.8.3 Drug history 224 3.8.4 Clinical measurements 225 3.8.5 Laboratory investigations 226 3.8.6 Echocardiography measurements 227 3.8.7 Genotyping 228
3.9 Statistical measurements 229 3.9.1 Descriptive statistics 229 3.9.2 Logistic regression analysis 229 3.9.3 Time to event analysis 230
Section II Results 233
3.10 Data capture - number of patients in each treatment cohort 233
3.10.1 Patients treated with metformin-sulphonylurea combination therapy, insulin and thiazolidediones in excess of 90 days
233
3.10.2 Background loop diuretic therapy at inclusion into each respective treatment cohort
237
3.10.3 Background heart failure at inclusion into each respective cohort 243 3.10.4 Prescription of index loop diuretic therapy within one year of inclusion into
each respective treatment cohort
249 3.10.5 Kaplan-Meier survival curves for index loop diuretic therapy 255 3.10.6 Timing of index loop diuretic prescription within a year after index
metformin-sulphonylurea, insulin or thiazolidinedione therapy
257 3.10.7 Occurrence of incident heart failure within one year of inclusion into each
respective treatment cohort
259 3.10.8 Kaplan-Meier survival curves for incident heart failure 266 3.10.9 Timing of incident heart failure events within a year after index metformin-
sulphonylurea, insulin or thiazolidinedione therapy
268 3.11 Baseline characteristics 270
v
3.11.1 Age, diabetes duration and duration of follow-up 270 3.11.2 Past medical history 275 3.11.3 Drug history 283 3.11.4 Clinical measurements 299 3.11.5 Haematology and biochemistry 306 3.11.6 Echocardiography 318
3.12 Logistic regression model: predicting risk factors for index loop diuretic prescription required within one year after index metformin-sulphonylurea combination or thiazolidinedione therapy
321 3.12.1 Univariate logistic regression 321 3.12.2 Multivariate logistic regression 328
3.13 Cox regression model: predicting risk factors for index loop diuretic prescription required within one year after index metformin-sulphonylurea combination or thiazolidinedione therapy
334 3.13.1 Univariate Cox regression 334 3.13.2 Multivariate Cox regression 340
3.14 Logistic regression model: predicting risk factors for incident congestive heart failure events occurring within one year after index metformin-sulphonylurea combination or thiazolidinedione therapy
350 3.14.1 Univariate logistic regression 350 3.14.2 Multivariate logistic regression 351
3.15 Cox regression model: predicting risk factors for incident congestive heart failure events occurring within one year after index metformin-sulphonylurea combination or thiazolidinedione therapy
359 3.15.1 Univariate Cox regression 359 3.15.2 Multivariate Cox regression 361 3.16 Do CYP2C8*3 and *4 genotypes infer a reduced oedematogenic risk
following thiazolidinedione exposure?
371 3.17 Discussion 374 Chapter 4 Systematic review and meta-analysis. Is there a role for adjunct
metformin in type 1 diabetes? 389 Section I Methods 390 4.1 Eligible studies 390 4.2 Search strategy 390
4.2.1 Subjects 392 4.2.2 Analysis 393
Section II Results 395 4.3 Systematic review 395 4.4 Meta-analyses 403 4.5 Discussion 405 Chapter 5 Conclusions and future work 415 References 420 Appendix 452
vi
List of tables
Table 1.1 Peroxisome proliferator-activated receptor-γ (PPAR-γ) receptor isotype distribution
19
Table 1.2 The four major prospective thiazolidinedione trials: study design and
baseline characteristics of participants
45 Table 1.3 The four major prospective thiazolidinedione trials: study outcomes 46 Table 1.4 Meta-analyses and major retrospective analyses of thiazolidinedione-related
outcomes and side-effect profile
58 Table 1.5 Distribution of sodium transporters and sodium channel proteins in the
nephron. Transporters marked with an asterisk (*) have been implicated to play a role in PPARγ mediated salt retention
74 Table 2.1 Biochemistry assay methodology 124 Table 2.2 Biomarker assay methodology 126 Table 2.3 Demographic and clinical characteristics of the ankle-foot volume validation
study participants
148 Table 2.4 Leg volume measurements and derived coefficient of variation for each
subject at visit 1
149 Table 2.5 Leg volume measurements and derived coefficient of variation for each
subject at visit 2
149 Table 2.6 Leg volume measurements and derived coefficient of variation for each
subject at visit 3
150 Table 2.7 Demographic characteristics of thiazolidinedione - 'tolerant' and 'intolerant'
patients
155 Table 2.8 Oral glucose lowering agent and statin therapy of thiazolidinedione 'tolerant'
and 'intolerant' patients
157 Table 2.9 Clinical measurements of thiazolidinedione 'tolerant' and 'intolerant' patients 159 Table 2.10 Baseline biochemistry results of thiazolidinedione 'tolerant' and 'intolerant'
patients
160 Table 2.11 Central augmentation index (cAI) measurements (%) and derived %
differences between sodium load exposures
162 Table 2.12 Peripheral augmentation index (pAI) measurements (%) and derived %
differences between sodium load exposures
164
vii
Table 2.13 Pulse wave velocity (PWV) measurements (m/s) and derived % differences between sodium load exposures
166
Table 2.14 Atrial natriuretic peptide (ANP) measurements (fmol/mL) and derived %
differences between sodium load exposures for visits 2 and 3
169 Table 2.15 B-type natriuretic peptide (BNP) measurements (pg/mL) and derived %
differences between sodium load exposures for visits 2 and 3
172 Table 2.16 N-terminal prohormone of B-type natriuretic peptide (NT-pro-BNP)
measurements (fmol/mL) and derived % differences between sodium load exposures for visits 2 and 3
174 Table 2.17 Plasma aldosterone measurements (pg/mL) and derived % differences
between sodium load exposures for visits 2 and 3.
175 Table 2.18 Plasma renin measurements (ng/mL/hour) and derived % differences
between sodium load exposures for visits 2 and 3
177 Table 2.19 Haematocrit measurements (%) and derived % differences between sodium
load exposures for visits 2 and 3.
180 Table 2.20 Body weight (kg) and derived % differences between sodium load exposures
for visits 2 and 3.
183 Table 2.21 Ankle-foot volume (AFV) measurements and derived % differences
between sodium load exposures for visits 2 and 3
184 Table 2.22 Diastolic blood pressure (DBP) readings (mmHg) and derived % differences
between sodium load exposures for visits 2 and 3
188 Table 2.23 Total body water (TBW) measurements (kg) and derived % TBW values for
thiazolidinedione 'tolerant' and 'intolerant' patients exposed to a moderately high sodium diet
190 Table 2.24 Derived fat-free mass (FFM) and fat mass (FM) measurements (kg), and
derived % FFM and % FM for thiazolidinedione 'tolerant' and 'intolerant' patients exposed to a moderately high sodium diet)
192 Table 2.25 Inulin clearance (InCl) and derived % differences between sodium load
exposures for visits 2 and 3
193 Table 2.26 Fractional excretion of sodium (FeNa) and derived % differences between
sodium load exposures for visits 2 and 3
195 Table 2.27 Fractional excretion of lithium (FeLi) and derived % differences between
sodium load exposures for visits 2 and 3
196 Table 2.28 Fractional reabsorption of distally delivered sodium (FRDDNa) and derived
% differences between sodium load exposures for visits 2 and 3
197 Table 3.1 Baseline demographics 223
viii
Table 3.2 Past medical history 224 Table 3.3 Drug history 225 Table 3.4 Clinical measurements 226 Table 3.5 Laboratory investigations 227 Table 3.6 Echocardiography measurements 228 Table 3.7 Total number N (%) of thiazolidinedione-treated patients fitting the
inclusion criteria for this study
233 Table 3.8 Total number N of patients treated with thiazolidinediones in excess of 90
days and fitting the inclusion criteria for this study
235 Table 3.9 Total number N (%) of patients treated with thiazolidinediones in excess of
90 days and fitting the inclusion criteria for this study, classified according to tendency to switch between rosiglitazone and pioglitazone therapy
236 Table 3.10 Differences in frequency of background loop diuretics therapy at inclusion
into the metformin-sulphonylurea, insulin and thiazolidinedione cohorts for at least three months
239 Table 3.11 Post-hoc analysis - Chi square tests for the association between frequency of
background loop diuretic therapy and inclusion into the metformin-sulphonylurea, insulin and thiazolidinedione cohorts for at least three months
240 Table 3.12 Derivation of baseline heart failure (HF) data at inclusion into the respective
treatment cohort, based on data extraction definitions.
243 Table 3.13 Differences in frequency of occurrence of background heart failure at
inclusion into the metformin-sulphonylurea, insulin and thiazolidinedione cohorts for at least three months
245 Table 3.14 Post-hoc analysis - Chi square tests for the association between frequency of
occurrence of background heart failure and inclusion into the metformin-sulphonylurea, insulin and thiazolidinedione cohorts for at least three months
246 Table 3.15 Differences in frequency of prescription of index loop diuretics within one
year after inclusion into the metformin-sulphonylurea, insulin and thiazolidinedione cohorts for at least three months
250 Table 3.16 Post-hoc analysis - Chi square tests for the association between frequency of
prescription of index loop diuretics within one year and inclusion into the metformin-sulphonylurea, insulin and thiazolidinedione cohorts for at least three months
251 Table 3.17 Unadjusted relative risk of index loop diuretic prescription after exposure to
index insulin therapy vs thiazolidinedione therapy
254
ix
Table 3.18 Unadjusted relative risk of index loop diuretic prescription after exposure to index insulin therapy vs metformin-sulphonylurea therapy
254
Table 3.19 Unadjusted relative risk of index loop diuretic prescription after exposure to
index thiazolidinedione therapy (vs metformin-sulphonylurea therapy)
255 Table 3.20 Survival (Kaplan Meier) analysis comparing time to index loop diuretic
prescription (censored at one year) after index metformin-sulphonylurea combination, insulin or thiazolidinedione therapy
256 Table 3.21 Index loop diuretic prescriptions stratified in three monthly intervals
following index metformin-sulphonylurea combination, thiazolidinedione and thiazolidinedione therapy
257 Table 3.22 Derivation of index heart failure (HF) data within one year of inclusion into
the respective treatment cohort, based on data extraction definitions
259 Table 3.23 Differences in frequency of occurrence of incident heart failure within one
year after inclusion into the metformin-sulphonylurea, insulin and thiazolidinedione cohorts for at least three months
261 Table 3.24 Post-hoc analysis - Chi square tests for the association between frequency of
occurrence of incident heart failure within one year and inclusion into the metformin-sulphonylurea, insulin and thiazolidinedione cohorts for at least three months
262 Table 3.25 Unadjusted relative risk of occurrence of incident heart failure after
exposure to index insulin therapy vs thiazolidinedione therapy
265 Table 3.26 Unadjusted relative risk of occurrence of incident heart failure after
exposure to index insulin therapy vs metformin-sulphonylurea therapy
265 Table 3.27 Unadjusted relative risk of occurrence of incident heart failure after
exposure to index thiazolidinedione therapy (vs metformin-sulphonylurea therapy)
266 Table 3.28 Survival (Kaplan Meier) analysis comparing time to incident heart failure
(censored at one year) after index metformin-sulphonylurea combination, insulin or thiazolidinedione therapy
267 Table 3.29 Incident heart failure events stratified in three monthly intervals following
index metformin-sulphonylurea combination, thiazolidinedione and thiazolidinedione therapy
268 Table 3.30 Comparison of mean (SD) values for baseline age, diabetes duration and
study duration for patients treated with metformin-sulphonylurea combination, insulin and thiazolidinedione therapy for at least three months, and having no background loop diuretic therapy at inclusion into their respective cohort
273 Table 3.31 Comparison of mean (SD) values for age, duration of diabetes and years of
follow-up between individuals requiring treatment with loop diuretics and
x
those remaining loop diuretic-free within one year after exposure to metformin-sulphonylurea combination, insulin or thiazolidinedione therapy for a minimum of three months, and having no background loop diuretic therapy at inclusion into their respective cohort
274 Table 3.32 Comparison of the relative frequency [n (%)] of background and post-
treatment macrovascular disease and heart failure among patients treated with metformin-sulphonylurea combination, insulin or thiazolidinedione therapy for a minimum of three months, and having no background loop diuretic therapy at inclusion into their respective cohort
279 Table 3.33 Comparison of the relative frequency of background and post-treatment
macrovascular disease and heart failure between individuals requiring treatment with loop diuretics and those remaining loop diuretic-free within one year after exposure to metformin-sulphonylurea combination, insulin or thiazolidinedione therapy for a minimum of three months, and having no background loop diuretic therapy at inclusion into their respective cohort
281 Table 3.34 Comparison of the relative frequency [n (%)] of background and post-
treatment drug history among patients treated with metformin-sulphonylurea combination, insulin or thiazolidinedione therapy for a minimum of three months
287 Table 3.35 Comparison of the relative frequency [n (%)] of prescription of background
drug therapy between individuals requiring treatment with loop diuretics and those remaining loop diuretic-free within one year after exposure to metformin-sulphonylurea combination, insulin or thiazolidinedione therapy for a minimum of three months, and having no background loop diuretic therapy at inclusion into their respective cohort
293 Table 3.36 Comparison of mean (SD) values for background and post-treatment clinical
measurements among patients treated with metformin-sulphonylurea combination, insulin or thiazolidinedione therapy for a minimum of three months, and no background loop diuretic therapy
302 Table 3.37 Comparison of mean (SD) values for clinical measurements between
individuals requiring treatment with loop diuretics and those remaining loop diuretic free within one year after exposure to metformin-sulphonylurea combination, insulin or thiazolidinedione therapy for a minimum of three months
304 Table 3.38 Comparison of mean (SD) values for heamatology and biochemistry results
of patients treated with metformin-sulphonylurea combination, insulin and thiazolidinedione therapy for at least three months, and having no background loop diuretic therapy at inclusion into their respective cohort
310 Table 3.39 Comparison of mean (SD) values for blood investigations between
individuals requiring treatment with loop diuretics and those remaining loop diuretic free within one year after exposure to metformin-sulphonylurea combination, insulin or thiazolidinedione therapy for a minimum of three months
314
xi
Table 3.40 Comparison of mean (SD) values for echocardiographic parameters for a subset of patients a treated with metformin-sulphonylurea combination, insulin and thiazolidinedione therapy for at least three months, and having no background loop diuretic therapy at inclusion into their respective cohort
319 Table 3.41 Comparison of mean (SD) values for baseline and post-treatment
bechocardiographic parameters between individuals requiring treatment with loop diuretics and those remaining loop diuretic-free within one year after exposure to metformin-sulphonylurea combination, insulin or thiazolidinedione therapy for a minimum of three months, and no background loop diuretic therapy
320 Table 3.42 Univariate logistic regression analysis: baseline continuous independent
variables predicting index loop diuretic prescription within one year of inclusion into the metformin-sulphonylurea or thiazolidinedione cohort
324 Table 3.43 Univariate logistic regression analysis: baseline categorical independent
variables predicting index loop diuretic prescription within one year of inclusion into the metformin-sulphonylurea or thiazolidinedione cohort
326 Table 3.44 Index loop diuretic logistic regression model step 1: final model covariates
predicting index loop diuretic prescription within one year of inclusion into the metformin-sulphonylurea combination or thiazolidinedione cohort
332 Table 3.45 Index loop diuretic logistic regression model 2: final model covariates
predicting index loop diuretic prescription within one year of inclusion into the metformin-sulphonylurea combination or thiazolidinedione cohort
333 Table 3.46 Univariate Cox regression - baseline continuous independent variable
predicting index loop diuretic prescription within one year of inclusion into the metformin-sulphonylurea or thiazolidinedione cohort
335 Table 3.47 Univariate Cox regression analysis (Kaplan-Meier survival) - baseline
categorical independent variables predicting index loop diuretic prescription within one year of inclusion into the metformin-sulphonylurea or thiazolidinedione cohort
337 Table 3.48 Loop diuretic Cox regression model 1 predicting index loop diuretic
prescription within one year of inclusion into the metformin-sulphonylurea combination or thiazolidinedione cohort
343 Table 3.49 Three monthly variation in estimated hazard ratios (HR) for index loop
diuretic prescription after index metformin-sulphonylurea or thiazolidinedione prescription. HR were estimated at six months, nine months and one year for all significant covariates in loop Cox regression model 1
344 Table 3.50 Loop diuretic Cox regression model 2 predicting index loop diuretic
prescription within one year of inclusion into the metformin-sulphonylurea combination or thiazolidinedione cohort
347 Table 3.51 Three monthly variation in estimated hazard ratios (HR) for index loop
xii
diuretic prescription after index metformin-sulphonylurea or thiazolidinedione prescription. HR were estimated at six months, nine months and one year for all significant covariates in loop Cox regression model 2
348 Table 3.52 Univariate logistic regression analysis: baseline continuous independent
variables predicting incident heart failure events within one year of inclusion into the metformin-sulphonylurea or thiazolidinedione cohort
352 Table 3.53 Univariate logistic regression analysis: baseline categorical independent
variables predicting index heart failure events within one year of inclusion into the metformin-sulphonylurea or thiazolidinedione cohort
354 Table 3.54 Incident heart failure binary logistic regression model 1: final model
covariates predicting incident congestive heart failure within one year of exposure to index metformin-sulphonylurea combination or thiazolidinedione therapy
358 Table 3.55 Incident heart failure binary logistic regression model 2: final model
covariates predicting incident congestive heart failure within one year of exposure to index metformin-sulphonylurea combination or thiazolidinedione therapy
359 Table 3.56 Univariate Cox regression: baseline continuous independent variable
predicting incident heart failure events occurring within one year of inclusion into the metformin-sulphonylurea or thiazolidinedione cohort
362 Table 3.57 Univariate Cox regression analysis (Kaplan-Meier survival): baseline
categorical independent variables predicting incident heart failure events occurring within one year of inclusion into the metformin-sulphonylurea or thiazolidinedione cohort
364 Table 3.58 Incident heart failure Cox regression model 1 predicting incident heart falure
events within one year of inclusion into the metformin-sulphonylurea combination or thiazolidinedione cohort
368 Table 3.59 Incident heart failure Cox regression model 1 predicting incident heart
failure within one year of inclusion into the metformin-sulphonylurea or thiazolidinedione cohort. Variation of estimated hazard ratios (HR) is given at three monthly intervals (six months, nine months and one year) for all covariates
369 Table 3.60 Number (%) of patients treated with an index loop diuretic within one year
after inclusion into the thiazolidinedone cohort
372 Table 3.61 Number (%) of patients developing heart failure within one year after
inclusion into the thiazolidinedone cohort
372 Table 3.62 Univariate binary logistic regression predicting index loop diuretic
prescription within one year of index thiazolidinedione therapy
373 Table 3.63 Univariate binary logistic regression predicting incident heart failure within
xiii
one year of index thiazolidinedione therapy 373 Table 4.1 Study design and baseline characteristics of participants 398 Table 4.2 Study outcomes 399 Table II.1 Left ventricular ejection fraction (LVEF) measurements (%) and derived %
differences between sodium load exposures for visits 2 and 3.
453 Table II.2 E-wave/A-wave (E/A) ratio readings and derived % differences between
sodium load exposures for visits 2 and 3
453 Table II.3 E prime (E') readings and derived % differences between sodium load
exposures for visits 2 and 3
454 Table II.4 E wave/E prime (E/e') ratio readings and derived % differences between
sodium load exposures for visits 2 and 3
454 Table II.5 Left ventricular mass (LVM) readings (g) and derived % differences
between sodium load exposures for visits 2 and 3.
455 Table II.6 Vascular endothelial growth factor (VEGF) measurements (pg/mL) and
derived % differences between sodium load exposures for visits 2 and 3.
455 Table II.7 Plasma copeptin measurements (pmol/L) and derived % differences between
sodium load exposures for visits 2 and 3
456 Table II.8 Systolic blood pressure (SBP) readings (mmHg) and derived % differences
between sodium load exposures for visits 2 and 3.
456 Table II.9 Mean arterial pressure (MAP) readings (mmHg) and derived % differences
between sodium load exposures for visits 2 and 3
457 Table III.1 Unadjusted odds ratio of index loop diuretic prescription after exposure to
index insulin therapy (vs thiazolidinedione therapy)
457 Table III.2 Unadjusted odds ratio of index loop diuretic prescription after exposure to
index insulin therapy (vs metformin-sulphonylurea combination therapy)
457 Table III.3 Unadjusted odds ratio of index loop diuretic prescription after exposure to
index thiazolidinedione therapy (vs metformin-sulphonylurea therapy)
458 Table III.4 Unadjusted odds ratio of incident heart failure after exposure to index
insulin therapy (vs thiazolidinedione therapy)
458 Table III.5 Unadjusted odds ratio of incident heart failure after exposure to index
insulin therapy (vs metformin-sulphonylurea combination therapy
458 Table III.6 Unadjusted odds ratio of incident heart failure after exposure to index
thiazolidinedione therapy vs metformin-sulphonylurea therapy
459
xiv
List of figures Figure 1.1 Schematic diagram illustrating the main insulin signalling pathways
regulating glycaemic control and metformin’s pharmacological effects
8 Figure 1.2 Structure of the peroxisome proliferator-activated receptor-γ (PPAR-γ) 21 Figure 1.3 Schematic diagram of the mechanism of PPAR-γ action 22 Figure 2.1 Schematic diagram of a water bath used to measure ankle-foot volume by
water displacement
129 Figure 2.2 Mean (SD) ankle fluid volume values in ten healthy subjects measured at
each of three successive visits (1-3) one week apart
150 Figure 2.3 Variation in ankle fluid volume measurements between visits 1 and 2 [CV =
0.91% for visits 1 and 2a; ICC = 0.993 (95% CI 0.974, 0.998)]
151 Figure 2.4 Variation in ankle fluid volume measurements between visits 2 and 3 [CV =
0.81% for visits 2 and 3a; ICC = 0.994 (95% CI 0.977, 0.999)]
151 Figure 2.5 Variation in ankle fluid volume measurements between visits 1 and 3 [CV =
0.89 % for visits 1 and 3a; ICC = 0.989 (95% CI 0.958, 0.997)]
152 Figure 2.6 Mean (95% CI) central augmentation index (cAI) values (%) for
thiazolidinedione (TZD) tolerant (n = 9, plotted in blue) and individual cAI readings for thiazolidinedione intolerant (n = 2, plotted in red) subjects exposed to a low sodium diet and a chronic high sodium load
163 Figure 2.7 Percentage difference in central augmentation index (cAI) readings (%)
between exposure to a moderately low sodium diet and a chronic high sodium load for thiazolidinedione (TZD) tolerant (n = 9, plotted in blue) and intolerant (n = 2, plotted in red) subjects. Mean and 95% confidence intervals were derived for TZD tolerant subjects
163 Figure 2.8 Mean (95% CI) peripheral augmentation index (pAI) values (%) for
thiazolidinedione (TZD) tolerant (n = 9, plotted in blue) and individual pAI readings for thiazolidinedione intolerant (n = 2, plotted in red) subjects exposed to a low sodium diet and a chronic high sodium load
165 Figure 2.9 Percentage difference in peripheral augmentation index (pAI) readings (%)
between exposure to a moderately low sodium diet and a chronic high sodium load for thiazolidinedione (TZD) tolerant (n = 9, plotted in blue) and TZD intolerant (n = 2, plotted in red) subjects. Mean and 95% confidence intervals were derived for TZD tolerant subjects.
165 Figure 2.10 Mean (95% CI) atrial natriuretic peptide (ANP) values (fmol/mL) for
thiazolidinedione (TZD) tolerant [n = 8 (low sodium diet), n = 7 (chronic high sodium load), plotted in blue] and individual ANP readings for thiazolidinedione intolerant (n = 2, plotted in red) subjects exposed to a low
xv
sodium diet and a chronic high sodium load 170 Figure 2.11 Percentage difference in atrial natriuretic peptide (ANP) readings (fmol/mL)
between exposure to a moderately low sodium diet and a chronic high sodium load for thiazolidinedione (TZD) tolerant [n = 7 (low sodium diet), n = 8 (chronic high sodium load), plotted in blue] and intolerant (n = 2, plotted in red) subjects. Mean and 95% confidence intervals were derived for thiazolidinedione tolerant subjects
171 Figure 2.12 Mean (95% CI) B-type natriuretic peptide (BNP) values (pg/mL) for
thiazolidinedione (TZD) tolerant (n = 8, plotted in blue) and individual BNP readings for thiazolidinedione intolerant (n = 2, plotted in red) subjects exposed to a low sodium diet and a chronic high sodium load
172 Figure 2.13 Percentage difference in B-type natriuretic peptide (BNP) readings (pg/mL)
between exposure to a moderately low sodium diet and a chronic high sodium load for thiazolidinedione (TZD) tolerant (n = 8, plotted in blue) and intolerant (n = 2, plotted in red) subjects. Mean and 95% confidence intervals were derived for thiazolidinedione tolerant subjects
173 Figure 2.14 Mean (95% CI) plasma aldosterone values (pg/mL) for thiazolidinedione
(TZD) tolerant [n = 8 (low sodium diet), n = 9 (chronic high sodium load), plotted in blue] and individual aldosterone readings for thiazolidinedione intolerant (n = 2, plotted in red) subjects exposed to a low sodium diet and a chronic high sodium load
175 Figure 2.15 Percentage difference in plasma aldosterone readings (pg/mL) between
exposure to a moderately low sodium diet and a chronic high sodium load for thiazolidinedione (TZD) tolerant [n = 8 (low sodium diet), n = 9 (chronic high sodium load), plotted in blue] and intolerant (n = 2, plotted in red) subjects. Mean and 95% confidence intervals were derived for thiazolidinedione tolerant subjects
176 Figure 2.16 Mean (95% CI) plasma renin values (ng/mL/hour) for thiazolidinedione
(TZD) tolerant [n = 8 (low sodium diet), n = 9 (chronic high sodium load), plotted in blue] and individual renin readings for thiazolidinedione intolerant (n = 2, plotted in red) subjects exposed to a low sodium diet and a chronic high sodium load
178 Figure 2.17 Percentage difference in plasma renin readings (ng/mL/hour) between
exposure to a moderately low sodium diet and a chronic high sodium load for thiazolidinedione (TZD) tolerant [n = 8 (low sodium diet), n = 9 (chronic high sodium load), plotted in blue] and intolerant (n = 2, plotted in red) subjects. Mean and 95% confidence intervals were derived for thiazolidinedione tolerant subjects
178 Figure 2.18 Mean (95% CI) haematocrit readings (%) for thiazolidinedione (TZD)
tolerant [n = 8 (low sodium diet); n = 7 (acute high sodium load), n = 9 (chronic high sodium diet), plotted in blue] and individual haematocrit readings for thiazolidinedione intolerant (n = 2, plotted in red) subjects exposed to a low sodium diet, an acute high sodium load and a chronic high sodium load
181
xvi
Figure 2.19 Percentage difference in haematocrit between exposure to a moderately low sodium diet and an acute high sodium load for thiazolidinedione (TZD) tolerant [n = 8 (low sodium), n = 7 (acute high sodium), plotted in blue] and intolerant (n = 2, plotted in red) subjects. Mean and 95% confidence intervals were derived for TZD tolerant subjects
181 Figure 2.20 Percentage difference in haematocrit between exposure to a moderately low
sodium diet and a chronic high sodium load for thiazolidinedione (TZD) tolerant [n = 8 (low sodium), n = 9 (chronic high sodium), plotted in blue] and intolerant (n = 2, plotted in red) subjects. Mean and 95% confidence intervals were derived for TZD tolerant subjects
182 Figure 2.21 Mean (95% CI) ankle-foot volume (AFV) readings (mLs) for
thiazolidinedione (TZD) tolerant (n = 9, plotted in blue) and individual PWV readings for thiazolidinedione intolerant (n = 2, plotted in red) subjects exposed to a low sodium diet, an acute high sodium load and a chronic high sodium load
185 Figure 2.22 Percentage difference in ankle-foot volume (AFV) between exposure to a
moderately low sodium diet and an acute high sodium load for thiazolidinedione (TZD) tolerant (n = 8, plotted in blue) and intolerant (n = 2, plotted in red) subjects. Mean and 95% confidence intervals were derived for TZD tolerant subjects
185 Figure 2.23 Percentage difference in ankle-foot volume (AFV) between exposure to a
moderately low sodium diet and an chronic high sodium load for thiazolidinedione (TZD) tolerant (n = 9, plotted in blue) and intolerant (n = 2, plotted in red) subjects. Mean and 95% confidence intervals were derived for TZD tolerant subjects
186 Figure 2.24 Mean (95% CI) diastolic blood pressure (DBP) values (mmHg) for
thiazolidinedione (TZD) tolerant (n = 9, plotted in blue) and individual systolic blood pressure readings for thiazolidinedione intolerant (n = 2, plotted in red) subjects exposed to a low sodium diet and a chronic high sodium load
188 Figure 2.25 Percentage difference in diastolic blood pressure (DBP) readings (mmHg)
between exposure to a moderately low sodium diet and a chronic high sodium load for thiazolidinedione (TZD) tolerant (n = 9, plotted in blue) and intolerant (n = 2, plotted in red) subjects. Mean and 95% confidence intervals were derived for thiazolidinedione tolerant subjects
189 Figure 3.1 Relative proportions (%) of background loop diuretic therapy at inclusion
into each respective cohort for at least three months
241 Figure 3.2 Relative proportions (%) of background loop diuretic therapy at inclusion
into each respective cohort for at least three months, stratified by gender
242 Figure 3.3 Relative proportions (%) of background occurrence of heart failure (HF) at
inclusion into each respective cohort for at least three months
247 Figure 3.4 Relative proportions (%) of background occurrence of heart failure (HF) at
xvii
inclusion into each respective cohort for at least three months, stratified by gender
248
Figure 3.5 Relative proportions (%) of index loop diuretic prescription within one year
of inclusion into each cohort
252 Figure 3.6 Relative proportions (%) of index loop diuretic prescription within one year
of inclusion into each cohort, stratified by gender
253 Figure 3.7 Hazard curve comparing time to index loop diuretic prescription following
index metformin-sulphonylurea combination, insulin and thiazolidinedione therapy
256 Figure 3.8 Number of patients prescibed an index loop diuretic stratified in three
monthly intervals after index metformin-sulphonylurea, insulin and thiazolidinedione therapy
258 Figure 3.9 Relative proportions (%) of occurrence of incident heart failure (HF) within
one year of inclusion into each cohort
263 Figure 3.10 Relative proportions (%) of development of incident heart failure (HF)
within one year of inclusion into each cohort, stratified by gender
264 Figure 3.11 Hazard curves comparing time to incident heart failure following index
metformin-sulphonylurea, insulin or thiazolidinedione therapy
267 Figure 3.12 Number of incident heart failure events occurring at three monthly intervals
after index metformin-sulphonylurea, insulin and thiazolidinedione therapy
269 Figure 3.13 Variation in hazard ratio values for index loop diuretic prescription within
one year of index metformin-sulphonylurea combination or thiazolidinedione prescription - loop Cox regression model 1. Data are plotted at 180, 270 and 365 days. Patients treated with metformin-sulphonylurea combination or thiazolidinedione therapy for less than 90 days were excluded
345 Figure 3.14 Variation in hazard ratio values for index loop diuretic prescription within
one year of index metformin-sulphonylurea combination or thiazolidinedione prescription - loop Cox regression model 2. Data are plotted at 180, 270 and 365 days. Patients treated with metformin-sulphonylurea combination or thiazolidinedione therapy for less than 90 days were excluded
349 Figure 3.15 Variation in hazard ratio values for incident heart failure developing within
one year of index metformin-sulphonylurea combination or thiazolidinedione prescription. Data are plotted at 180, 270 and 365 days. Patients treated with metformin-sulphonylurea combination or thiazolidinedione therapy for less than 90 days were excluded
370 Figure 4.1 Flow chart of the literature search 397 Figure 4.2 Standardised mean difference of HbA1c level between metformin-treated
xviii
and metformin free type 1 diabetes patients for five randomised controlled studies, including the largest study to date [699] (see text for equivalent %HbA1c units
406 Figure 4.3 Standardised mean difference of HbA1c level between metformin-treated
and metformin free type 1 diabetes patients for four randomised controlled studies, excluding the largest study to date [699] (see text for equivalent %HbA1c units)
407 Figure 4.4 Standardised mean difference of insulin dose between metformin-treated
and metformin free type 1 diabetes patients for five randomised controlled studies, including the largest study to date [699] (see text for equivalent insulin dose units)
408 Figure 4.5 Standardised mean difference of insulin dose between metformin-treated
and metformin free type 1 diabetes patients for four randomised controlled studies, excluding the largest study to date [699] (see text for equivalent insulin dose units)
409
xix
Dedicated to my treasured wife Katia,
a beacon of love, support and inspiration, and
to our beloved first-born son, Samuel born on November 2nd, 2013,
a few days before submission of this MD thesis.
xx
Acknowledgements
I am indebted to Professor John R. Petrie who supervised this thesis, and provided me with invaluable support and feedback throughout this programme of research. I thank Professor Chim C. Lang for his co-supervisory role, particularly his invaluable advice pertaining to the clinical and epidemiology study of thiazolidinedione-treated patients. Special thanks are also due to Professor Ewan R. Pearson for offering to join my supervisory team as a co-supervisor and extend his expert support throughout this research process, particularly in the design and data analyses of the population based study of thiazolidinedione-treated patients. Professor Helen M. Colhoun, together with Professor Petrie, co-supervised work on the systematic review and meta-analysis investigating a possible role for adjunct metformin in type 1 diabetes, and expertly guided me throughout the relevant research process. I also extend my heartfelt gratitude to the following people whose contribution has been invaluable: Medical Research Institute, University of Dundee - Dr. Adnan Nadir, Clinical Research Fellow, Division of Cardiovascular and Diabetes Medicine, for help with echocardiography (clinical study of thiazolidinedione-treated patients) - Dr. L Buetow, for help with extraction of data pertaining to the systematic review (adjunct metformin in type 1 diabetes) - Dr. Louise A. Donnelly, Post-doctoral Research Assistant, Division of Cardiovascular and Diabetes Medicine, for help with extraction and cleaning of data (population based study of thiazolidinedione-treated patients) - Dr. Alexis Duncan - former Research Nurse at the Division of Cardiovascular and Diabetes Medicine, for her help during the thiazolidinedione clinical study visits. - Ms. Shona Livingstone, Statistician and Epidemiologist, Division of Population Health Sciences, for statistical help pertaining to the meta-analysis of data arising from the systematic review (adjunct metformin in type 1 diabetes) - Ms. Lesley McFarlane, Division of Cardiovascular and Diabetes Medicine, University of Dundee for ANP, BNP, NT-pro-BNP, aldosterone and renin assays - Professor Peter T. Donnan from the Division of Population Health Sciences, for statistical advice (population based study of thiazolidinedione-treated patients)
xxi
- Mr. Kaixin Zhou, Statistical Geneticist, Division of Cardiovascular and Diabetes Medicine Scottish Diabetes Research Network - Ms. Gillian Reekie - Diabetes Specialist Research Nurse, Scottish Diabetes Research Network (SDRN) for help during the thiaazolidinedione clinical study visits Health Informatics Centre, University of Dundee - Ms. Alison Bell and Mr. Duncan Heather for anonymisation, record-linkage and other procedural assistance in preparing the dataset required for the population based study of thiazolidindione-treated patients NHS Tayside - Dr. James Burns, Quality Manager (Biochemical Medicine), Department of Blood Sciences, for help with NHS Tayside related assay work - Mr. Ritchie McAlpine from the Clinical Technology Centre, Ninewells Hospital, for help with data extraction from SCI-DC records University of Edinburgh - Mr. Neil R Johnston (Laboratory Manager), and Professor David Webb, from the Clinical Pharmacology Unit, Queens' Medical Research Institute, for help with plasma inulin and urinary lithium assays University of Glasgow - Dr. Paul Welsh and Professor Naveed Sattar, Institute of Cardiovascular and Medical Sciences, for their help with VEGF and high sensitivity copeptin assays University of Aberdeen - Dr. Pamela Royle for her help with data extraction, and Professor Norman Waugh for advice pertaining to the manuscript arising from the systematic review and meta-analysis (adjunct metformin in type 1 diabetes)
xxii
Scottish Universities Environmental Research Centre (SUERC) - Professor Tom Preston and Ms. Alexandra Small (research technician, Stable Isotope Biochemistry Laboratory) for supplying deuterium oxide samples and carrying out analyses pertaining to total body water estimation Funding bodies - The Translational Medicines Research Collaboration, Wyeth Pharmaceuticals and Pfizer for funding the thiazolidinedione clinical study.
My immediate family Finally, I am particularly indebted to my wife Katia, and the rest of my immediate family, especially my mother Mary Doris and my sister Charmaine. Their love, patience, and enthusiastic support were an inspiration.
xxiii
Declaration
With reference to this thesis being submitted to the University of Dundee for
fulfillment of the degree Doctor of Medicine (MD), the undersigned, Dr. Sandro
Vella declares that:
(i) he is the author of this thesis;
(ii) all cited references have been consulted by the candidate;
(iii) this thesis records work which has been carried out by the undersigned;
(iv) this thesis has not been previously accepted for a higher degree.
Dr. Sandro Vella
25th November 2013
xxiv
Abstract Aims Thiazolidinediones have been advocated as second or third line insulin-
sensitizing agents in the management of type 2 diabetes (T2DM). Their widespread
use has been hampered by concerns about their cardiovascular safety, including fluid
retention. Metformin is established as first-line glucose-lowering pharmacotherapy
in T2DM. It has also been suggested that it may have benefits in alleviating insulin
resistance in type 1 diabetes (T1DM). This thesis examined: (i) cardiovascular, renal
and metabolic differences between individuals with T2DM ‘tolerant’ or ‘intolerant’
of TZDs; (ii) risk factors for TZD-associated oedema in T2DM; and (iii) the
potential for metformin as adjunct therapy in T1DM.
Methods (i) A small clinical study characterising TZD tolerant and intolerant
individuals with T2DM; (ii) A population-based epidemiological study of TZD-
induced oedema in individuals with T2DM in Tayside, Scotland (using incident loop
diuretic prescription as a surrogate); (iii) A systematic review and meta-analysis of
published studies of adjunct metformin in T1DM.
Results (i) During a five-day high sodium diet, two known TZD-intolerant
individuals with T2DM had reductions in haematocrit, aldosterone, and diastolic BP
and increases in ANP and central and peripheral augmentation indices which were
outwith reference ranges derived from nine TZD-tolerant individuals; (ii) Predictors
of time to loop diuretic prescription included age, body mass index, systolic BP,
haematocrit, ALT and macrovascular disease but rates of this outcome did not differ
by therapy: 4.3% (TZDs) vs 4.7% (other agents ) [unadjusted OR 0.909 (95% CI
xxv
0.690, 1.196); p = 0.493]; (iii) In meta-analysis of nine small studies in T1DM
(192.8 patient-years of follow-up), metformin was associated with a reduction in
total daily insulin dose (6.6 units/day; p < 0.001) but no studies examined
cardiovascular surrogates or outcomes.
Conclusions Hypotheses were generated for several potential biomarkers predictive
of TZD-induced oedema but the clinical importance of TZDs as a risk factor for
oedema in individuals with T2DM was questioned. As there is some evidence for the
safety of metformin as an adjunct therapy in T1DM but little evidence of efficacy,
larger studies are warranted.
xxvi
Publications arising from this thesis
2013
Vella S, Donnelly L, Lang CC, Pearson ER, Petrie JR (2013) Is thiazolidinedione treatment an important cause of oedema? Diabet Med 30 (Suppl 1): 197 (Abstract)
2011
Vella S, Buetow L, Royle P, Livingstone S, Petrie JR (2011) Metformin in type 1 diabetes reduces insulin requirements without significantly improving glycaemic control. Reply to Schatz H (letter). Diabetologia 54: 203-204
2010
Vella S, Petrie JR (2010) Macrovascular disease: pathogenesis and risk assessment. Medicine 38: 626-631
Vella S, Buetow L, Royle P, Livingstone S, Colhoun HM, Petrie JR (2010) The use of metformin in type 1 diabetes: a systematic review of efficacy. Diabetologia 53: 809–820
Vella S, Buetow L, Royle P, Livingstone S, Colhoun HM, Petrie JR (2010) What are the effects of metformin in type 1 diabetes? A systematic review. Diabet Med 27 (Suppl 1): 33, 160 (Abstract)
xxvii
List of abbreviations ADA American Diabetes Association
ADOPT A Diabetes Outcome Progression Trial
AF-1 activation-function 1
A-F2 activation-function 2 domain
AFV ankle-foot volume
AMP adenosine monophosphate
AMPK AMP-activated protein kinase
ANP atrial natriuretic peptide
ATP adenosine triphosphate
AUC area under the curve
BEST Beta-blocker Evaluation in Survival Trial
BMI body mass index
BNP B-type natriuretic peptide
cAI central augmentation index
CaMKK calcium/calcmodulin-dependent protein kinase kinase
cAMP cyclic AMP
CAP c-Cbl associating protein
CARDS Collaborative AtoRvastatin Diabetes Study
CBP CREB binding protein
CHARM Candesartan in Heart failure Assessment of Reduction in Mortality and
morbidity
CI confidence intervals
CREB c-AMP response element binding protein
CRTC2 CREB-regulated transcroption co-activator 2
CV coefficient of variation
DBD DNA-binding domain
DBP diastolic blood pressure
DCCT Diabetes Control and Complications Trial
DIABHYCAR Non-Insulin Dependent Diabetes, Hypertension, Microalbuminuria or
Proteinuria, Cardiovascular Events, and Ramipril
DIAMOND-HF Danish Investigations of Arrhythmia and Mortality ON Dofetilide Heart Failure
DIG Digitalis Investigation Group
DREAM Diabetes REduction Assessment with ramipril and rosiglitazone Medication
EASD European Association for the Study of Diabetes
ECG
eGDR
Electrocardiogram
estimated glucose disposal rate
EMA European Medicines Agency
xxviii
FATP1 fatty acid transporter 1
FDA US Food and Drugs Administration
FeLi fractional excretion of lithium
FeNa fractional excretion of sodium
FFM fat-free mass
FFMI fat-free mass index
FIELD Fenofibrate Intervention and Event Lowering in Diabetes
FM fat mass
FOXO forkhead box-containing protein O
FRDDNa fractional reabsorption of distally delivered sodium
GFR glomerular filtration rate
G6p glucose-6 phosphatase
GLP-1 glucagon-like peptide-1
GLUT-4 glucose transporter-4
GSK3 glycogen synthase kinase-3
HbA1c glycosylated haemoglobin
HDL-C high-density lipoprotein cholesterol
HF heart failure
HR hazard ratio
ICC intraclass correlation coefficient
IDF International Diabetes Federation
IHD ischaemic heart disease
InCl inulin clearance
IRS insulin receptor substrate proteins
LDL low-density lipoprotein
LVEF left ventricular ejection fraction
LVM left ventricular mass
MAP mean arterial pressure
MESA Multi-Ethnic Study of Atherosclerosis
MFSU metformin-sulphonylurea combination therapy
MO25 mouse protein 25
mRNA messanger RNA
NHANES National Health and Nutrition Examination Survey
NICE National Institute for Health and Clinical Excellence
NT-pro-BNP N-terminal prohormone of brain natriuretic peptide
NYHA New York Heart Association
OCT organic cation transporter
OR odds ratio
pAI peripheral augmentation index
PDK1 phosphoinositide dependent protein kinase
xxix
PEPCK phosphoenylpyruvate carboxykinase
PI phosphatidylinositol
PIP2 phosphoinositol 4,5 biphosphate
PIP3 phosphoinositol 3,4,5 triphosphate
PKB protein kinase B
PKC protein kinase C
PKCζ atypical protein kinase C
PMAT plasma membrane monoamine transporter
PPAR peroxisome proliferator-activated receptor
Ppargc PPAR-γ co-activator
PPRE PPAR response element
PROactive PROspective pioglitAzone Clinical Trial in macroVascular Events
PWV pulse wave velocity
RECORD Rosiglitazone Evaluate for Cardiovascular outcomes in ORal agent combination
therapy for type 2 Diabetes
RR relative risk
RXR retinoid-X-receptor
SBP systolic blood pressure
SD
SERR
standard deviation
standardised estimate of relative risk
SIGN Scottish Intercollegiate Guideline Network
SIK salt-inducible kinase 2
SOLVD
SRE
Studies of Left Ventricular Dysfunction
standardised regression estimate
STRAD ste20-related adaptor
T1DM type 1 diabetes
T2DM type 2 diabetes
TBW total body water
TK tyrosine kinase
TZD thiazolidinedione
UKPDS United Kingdom Prospective Diabetes Study
UNa urinary sodium
VEGF vascular endothelial growth factor

1
Chapter 1
Introduction and literature review
2
Chapter 1 - Introduction and literature review
Section I - Physiological mechanisms underpinning insulin action in
relation to metformin and thiazolidinedione therapy
The incidence and prevalence of diabetes is rising worldwide in epidemic
proportions [1, 2]. Its associated morbidity and mortality are imposing a major
burden on health care systems [1, 3, 4]. Type 2 diabetes (T2DM), accounting for
over 90% of diabetes cases worldwide [5], is characterised by two major
pathophysiological processes: insulin resistance (impaired responsiveness to insulin)
and beta-cell failure. The hyperbolic relationship between insulin sensitivity and
insulin secretion is well established; insulin secretion increases in response to a
reduction in insulin sensitivity only up to the point at which the beta-cell cannot cope
with the added demands such that any further increase in insulin resistance will
cause a fall in insulin secretion [6, 7]. Data extrapolated from the United Kingdom
Prospective Diabetes Study (UKPDS) suggest that loss of beta-cell function
commences some 10-12 years before T2DM is diagnosed [8].
Insulin sensitivity varies between different ethnic groups [9] and populations, up to
seven fold at any given age [10]. It is influenced by genetic susceptibilities [11],
constitutional factors (such as obesity [12] and physical inactivity [13]) or both. The
principal sites for insulin resistance are the skeletal muscle and the liver; adipose
tissue and peripheral tissues are also implicated [14-16]. Skeletal muscle glucose
transport alone accounts for 75% of the insulin-mediated glucose uptake in healthy
individuals [17]. Insulin resistance has been associated with reduced expression of
3
insulin receptors at the surface of insulin-responsive cells [17], alterations in signal
transduction pathways that are activated following insulin binding to the receptor
[18], and abnormalities in glucose transport and glycogen synthesis [19, 20]. The
role of leptin, adiponectin, and adipocytokines in adipose tissue inflammation, and
their contribution to insulin resistance is also generating considerable interest [21].
Although type 1 diabetes (T1DM) is characterised by autoimmune beta-cell failure,
insulin resistance is being increasingly recognized as an important
pathophysiological feature, resulting in an association of this disease with the
components of the metabolic syndrome [22-24]. The relevance of this association is
further enhanced by the observation that insulin resistance is an independent risk
factor for vascular complications, both in type 1 [24-32] and in type 2 diabetes [33-
35]. Randomized controlled trials in T2DM have shown that a pharmacologically-
mediated reduction in insulin resistance decreases the incidence of diabetes and the
risk of macrovascular complications keep [36-39]. Tight glycaemic control has been
shown in the Diabetes Control and Complications Trial (DCCT) to reduce rates of
microvascular complications in T1DM [40].
Targeting insulin resistance and hyperglycaemia through different and
complementary mechanisms, metformin and thiazolidinediones are widely used,
alone or in combination, in the management of T2DM. However, the benefits of
thiazolidinediones have been hampered by their association with fluid retention,
bone fractures [41], and a possible association with myocardial infarction
(rosiglitazone) and bladder cancer (pioglitazone) [42]. While metformin’s use in
T2DM is firmly established, there is currently considerable interest in its potential in
4
T1DM. This review will address the issues surrounding thiazolidinedione-associated
fluid retention in T2DM patients. Moreover, it will examine the evidence supporting
insulin resistance in type 1 and type 2 diabetes and benefits associated with the use
of metformin in T2DM.
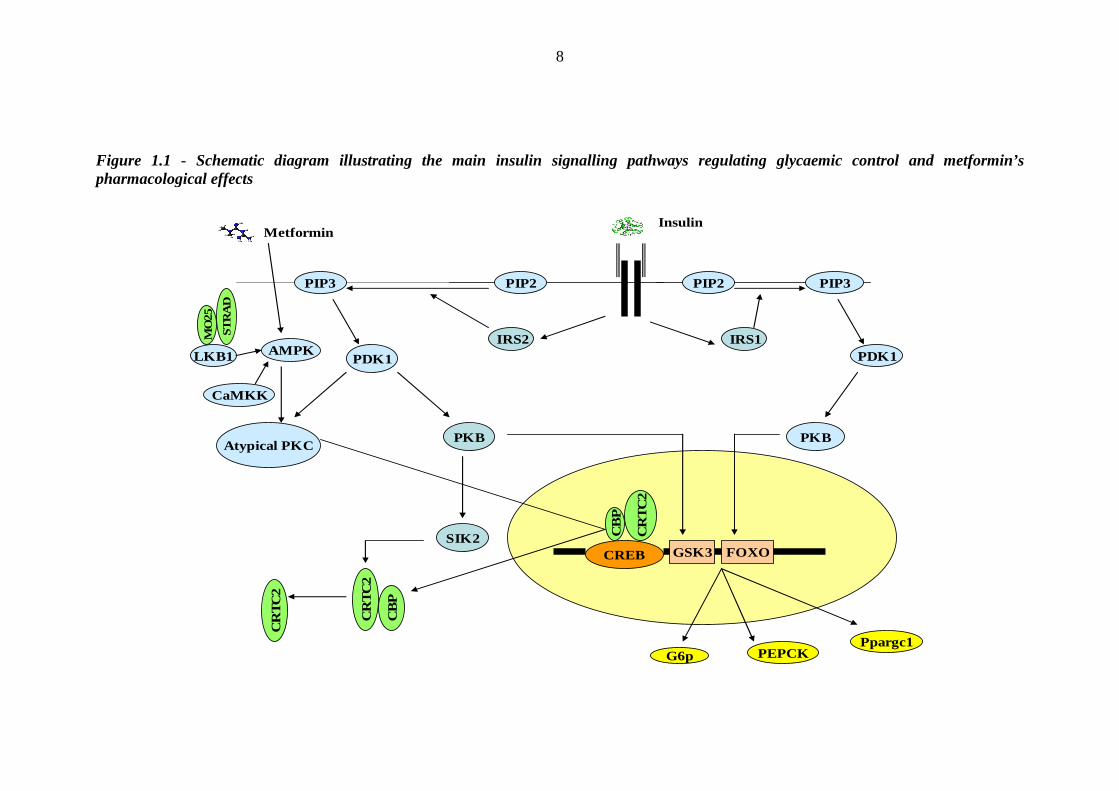
1.1 The insulin signalling pathway
The pleiotropic effects of insulin are mediated through its interaction with a
signalling network of molecules that are set in motion following the hormone’s
binding to its receptor (figure 1.1). The insulin receptor is an integral membrane
glycoprotein existing as a dimer. Each monomer contains an α- and a β chain. The α-
subunits link to each other and to the β-subunits by disulfide bonds, and are located
on the extracellular side of the plasma membrane [43, 44]. The β-subunits traverse
the membrane, and are characterised by a tyrosine kinase (TK) enzyme domain on
the cytoplasmic side [44-46]. Insulin binding to an α-subunit activates the TK
domain on the β-chain, leading to autophosphorylation of the TK domains in each β-
subunit. Insulin receptor substrate proteins (IRS) are then recruited to the plasma
membrane through an interaction with the phosphorylated insulin receptor, resulting
in phosphorylation of IRS tyrosine residues [47, 48]. Phosphorylated IRS in turn
recruit additional signalling proteins.
The lipid kinase phosphatidylinositol (PI) 3-kinase binds to IRS proteins and
converts phosphoinositol 4,5 biphosphate (PIP2) to phosphoinositol 3,4,5
triphosphate (PIP3) [49]. This in turn recruits peckstrin homology domain containing
proteins to the membrane, altering their conformation and activating protein kinase
5
cascades. The best characterised of these is the phosphoinositide dependent protein
kinase (PDK1) pathway. PDK is a master regulator of a number of protein kinases,
including protein kinase B (PKB, also known as Akt), PKC, p90, RSK, p70, S6K
and SGK [50], which in turn phosphorylate and regulate a wide variety of proteins
involved in growth and metabolism. Of relevance to glucose homeostasis, PKB
phosphorylates and inactivates glycogen synthase kinase-3 (GSK3) [51, 52] and
forkhead box-containing protein O (FOXO) [53, 54] transcription factors. By
regulating the transcription of PEPCK and glucose-6-phosphatase genes, these two
transcription factors modify two important rate controlling steps in gluconeogenesis.
Hepatic expression of both PEPCK and glucose-6-phosphatase is high in animal
models of diabetes, and overexpression of PEPCK is sufficient to induce diabetes in
animals [55].
How does insulin regulate the expression of PEPCK and glucose 6-phosphatase?
During starvation, glucagon promotes the assembly of a nuclear transcription
complex comprising CREB (c-AMP response element binding protein), CBP (CREB
binding protein) and CRTC2 (CREB-regulated transcription co-activator 2, also
known as TORC2). This complex increases the expression of PPAR-γ co-activator 1
(Ppargc1), PEPCK, glucose-6-phosphatase, and other key gluconeogenic enzymes.
Postprandial activation of the PI3-PKB pathway stimulates salt-inducible kinase 2
(SIK2), which inactivates the CREB-CBP-CRTC2 complex by phosphorylating
CRTC2 at Ser171 and targeting it for degradation in the cytosol [56] (figure 1.1).
Although the IRS/PI 3-kinase/PDK1/PKB pathway is considered a major pathway of
insulin action, it is not the only pathway downstream of IRS. The Ras-ERK pathway
6
has also been elucidated. In summary, the protein complex Grb2/mSOS interacts
with phospho-IRS (tyrosine residues being phosphorylated at sites distinct to those
that recruit PI 3-kinase). Bound mSOS exchanges GDP for GTP on the small G-
protein Ras, activating Ras [57]. This in turn activates the oncogene c-Raf, which
additionally has protein kinase activity. c-Raf phosphorylates and activates
MAP/ERK kinase (MEK) [58], which in turn phosphorylates and activates ERK1/2
[59]. The latter acts on multiple substrates, most of which are related to cell growth.
Insulin has also been reported to regulate several other proteins relevant to glucose
homeostasis, such as Rab, atypical PKC (PKCζ,), CAP and GLUT4 (all involved in
glucose transport) and PDE3, hormone sensitive lipase and ATP citrate lyase
(involved in fat metabolism) [60]. In particular, the translocation of the glucose
transporter GLUT-4 from the intracellular pool to the plasma membrane plays a
crucial role in insulin-mediated glucose entry into skeletal muscle [61], and is
thought to be mediated by PI3-kinase and its downsteam phosphorylation of PKB
[62] or atypical PKC [63, 64]. In summary, insulin signalling is a complex, as yet
incompletely unravelled pathway potentially prone to dysregulation or mutation at
several molecular points, resulting in insulin resistance.
1.2 Diabetes is associated with defective insulin signalling
The molecular pathology of insulin resistance is not yet established. It is likely to
result from a post-receptor defect, reducing the ability of insulin to mediate its
pleiotropic actions at hepatic, skeletal muscle and adipose tissue level. Although it is
7
assumed that obesity predates and promotes the molecular defects, this has not been
formally proven in man [60].
Insulin resistance can be generated in mice by deleting key insulin signalling
molecules. Thus, a partial loss of the insulin receptor (IR +/-), combined with a
partial loss of IRS1 (+/-), results in severe insulin resistance, and a greatly increased
prevalence of diabetes [65]. Reduced IRS expression has been reported in
association with obesity and T2DM [66]. Reduced IRS1 signalling has also been
reported in human T2DM [67-69]. Phosphorylation of IRS on serine and threonine
residues, as opposed to tyrosine residues (as discussed previously), reduces the
interaction of IRS with the insulin receptor and downstream signalling components
[70, 71] and increases the rate of IRS degradation. Serine phosphorylation has been
ascribed to feedback from downstream components (eg p70S6K) and protein kinases
induced by obesity, such as PKC or JNK [72-76], providing a link between obesity
and insulin resistance. Several isoforms of PKC, IKK, Mtor/p70S6K and GSK-3,
implicated in serine/threonine phosphorylation, are activated by free fatty acids,
ceramide, TNF-α and chronic hyperinsulinaemia [71, 77, 78].
8
Figure 1.1 - Schematic diagram illustrating the main insulin signalling pathways regulating glycaemic control and metformin’s pharmacological effects
IRS2 IRS1
PIP3 PIP2
SIK2
PKB
PDK1
Atypical PKC
PIP2 PIP3
PKB
PDK1
CREB
CB
P
CR
TC2
CR
TC2
CB
P
CR
TC2
AMPKLKB1
STR
AD
MO
25
CaMKK
Insulin
GSK3 FOXO
Ppargc1G6p PEPCK
Metformin
9
There is evidence suggesting that the Ras-ERK pathway may be defective in at least
one insulin resistant state, called polycystic ovary syndrome [79, 80], and in many
young males with a BMI exceeding 29kg/m2 [60]. Similarly, in a study of 22
normoglycaemic young men with a body mass index (BMI) ranging from 20 to 37
kg/m2, Ruiz-Alcaraz et al. concluded that the MAP-ERK pathway (amongst other
insulin signalling pathways) is defective in obese insulin resistant individuals [81],
implicating that such defects predate a clinical presentation with overt diabetes.
The analysis of the intracellular insulin signalling process in man is technically
problematic. Individually, insulin signalling mutations have little effect owing to
considerable apparent redundancy of pathways. In summary, in humans, insulin
resistance is thought to arise from the synergistic effect of multiple minor molecular
signalling defects [60].
1.3 Metformin – a multifaceted therapeutic approach to insulin resistance
Metformin is most widely prescribed oral anithyperglycaemic agent worldwide, and
is recommended as a first line agent in the treatment of T2DM by several national
and international diabetes guidelines, such as those issued by the National Institute
for Health and Clinical Excellence (NICE) [82], the Scottish Intercollegiate
Guideline Network (SIGN) [83], the European Association for the Study of Diabetes
and the American Diabetes Association (EASD/ADA) [84], and the International
Diabetes Federation (IDF) [85]. Used for approximately 55 years in the UK
(although for only 18 years in the US), metformin decreases intestinal glucose
absorption, reduces hepatic glucose production by over 30% [86] and increases
10
peripheral glucose disposal through complex insulin-sensitizing and insulin-
independent mechanisms [87].
1.3.1 Metformin and AMPK
The highly conserved energy sensor adenosine monophosphate (AMP)-activated
protein kinase (AMPK) has been identified as a key modulator of the
pharmacological effects of metformin [88] and thiazolidinediones [89]. AMPK is
activated by a range of physiological and pathological stresses that increase the
intracellular AMP: adenosine triphosphate (ATP) ratio, either by decreasing ATP
generation (eg ischaemia or hypoxia) or increasing ATP consumption (eg muscle
contraction). This kinase acts to restore cellular energy balance by favouring ATP
generating pathways (eg fatty acid oxidation) while inhibiting ATP utilizing
pathways (eg fatty acid synthesis and gluconeogenesis). This is achieved initially by
direct phosphorylation of key metabolic enzymes, and in the long term by effects on
gene transcription [90-92]. Additionally, AMPK is also involved in the central
regulation of food intake and energy expenditure in response to hormones such as
leptin, ghrelin and adiponectin [93].
AMPK exists as a heterotrimeric complex containing a catalytic subunit (α), and two
regulatory subunits (β and γ) [94]. The α-subunit contains the catalytic domain,
including the all important Thr172 subunit, which is phosphorylated by upstream
kinases. The major upstream kinase in mammalian cells is a complex of the protein
kinase LKB1 and two accessory subunits STRAD (Ste20-related adaptor) and MO25
(mouse protein 25) [95-97]. LKB1 is dependent on the STRAD subunit in order to
11
phosphorylate the Thr172 subunit [96]. Besides LKB1, STRAD and MO25, AMPK
can also be activated by an LKB1-independent mechanism involving
calcium/calmodulin-dependent protein kinase kinase (CaMKK) [98-100]. The β
subunit has a glycogen binding C-terminal domain; high glycogen content exerts an
inhibitory effect on AMPK through an interaction with the β-subunit in skeletal
muscle, although the exact mechanism is unknown [101]. The γ subunit contains
four repeats forming two tandem domains, each of which bind one molecule of ATP
or AMP in a mutually exclusive manner [102]. The tandem domains bind AMP with
a high degree of cooperativity [102], suggesting that the second site is inaccessible to
AMP until the latter has bound to the first tandem domain. Interestingly, insulin and
AMPK signalling pathways work in the same direction at the level of skeletal
muscle, liver and adipose tissue, particularly for processes that regulate glucose
homeostasis [103]. As with insulin, AMPK-mediated skeletal muscle glucose
disposal is achieved through an increased translocation of the glucose transporter
GLUT4 to the plasma membrane, although the fate of the glucose is different:
glycogen synthesis in the case of insulin and glycolysis/oxidation in the case of
AMPK [104, 105]. Both insulin and AMPK inhibit hepatic gluconeogenesis by
repressing the expression of gluconeogenic enzymes, such as phosphoenolpyruvate
carboxykinase (PEPCK) and glucose-6 phosphatase (G6p) [106]. Both insulin and
AMPK inhibit hormone-sensitive lipase, and hence lipolysis [107-109], albeit
through different mechanisms. Thus, AMPK phosphorylates hormone sensitive
lipase at Ser565, an effect that antagonises activation by cAMP-dependent protein
kinase [110], whereas insulin causes phosphorylation and activation of
phosphodiesterase 3B by PKB, thus lowering cAMP [111].
12
Metformin is thought to activate AMPK indirectly through an inhibition of complex
1 of the respiratory chain [112], causing an increase in the AMP/ATP ratio.
Inhibition of the respiratory chain in the intestinal mucosa may account for the
gastrointestinal adverse effects of this drug [113]. The same mechanism may also
underlie the propensity of its biguanide predecessor phenformin (now withdrawn) to
precipate lactic acidosis [113]. It is pertinent to point out, however, that metformin
pharmacotherapy has not been associated with a significantly increased risk of lactic
acidosis in a recent Cochrane review [114].
Metformin has been reported to activate AMPK in cardiac myocytes [115-117],
hepatocytes [88] and skeletal muscle cells [88]. LKB1 plays a crucial role in
metformin’s interaction with AMPK, such that liver specific knock-out of LKB1
ablates metformin’s ability to lower blood glucose in obese rodents [118]. Like
insulin, metformin also stimulates the phosphorylation of CREB-regulated
transcriptional coactivator 2 (CRCT2) at Ser171. This sequesters CRCT2 into the
cytosol, and away from the nucleus, barring any effects on gluconeogenic gene
transcription. In obese and insulin resistant individuals, CRCT2 is O-glycosylated at
Ser171, blocking any benefical phosphorylation by metformin at this site [119]. Both
insulin and metformin circumvent this block by activating atypical Protein Kinase C,
which phosphorylates CBP at Ser436, initiating the dissociation of the CBP:CRTC2
from CREB, and targeting CREB for dissociation in the cytosol [120]. Despite these
findings, the relevance of a metformin-AMPK interaction has recently been
questioned, following observations that metfomin-treated mice lacking AMPK in the
liver achieved comparable glycaemic control as wild-type mice [121]. Moreover,
Forretz et al. observed that metformin-induced inhibition of glucose production was
13
higher in AMPK- and LKB1-deficient hepatocytes compared with wild-type
hepatocytes, and that this inhibition correlated in a dose-dependent manner with a
reduction in intracellular ATP content. This led the authors to suggest that metformin
reduces hepatic gluconeogenesis through a reduction in hepatic energy state
(possibly through an interaction with complex 1 of the respiratory chain),
independently of any AMPK- or LKB1- related repression of gluconeogenic genes
[121].
In contrast, metformin is reported to inhibit AMPK in the hypothalamus, by
inhibiting low glucose-induced AMPK phosphorylation and neuropeptide-Y mRNA
expression [122]. This mechanism is thought to underlie metformin’s anorectic
effects. Indeed, a recent study carried out on a new delayed-release formulation of
metformin (newmet) concluded that higher plasma concentrations of metformin do
not confer increased therapeutic efficacy. Bypassing the upper gastrointestinal tract,
lowering systemic exposure and improving tolerability through its special pH-
sensitive coating, newmet is reportedly able to maintain its glucose-lowering effect
through an activation of nutrient receptors located on enteroendocrine cells. The
latter produce key glucose-regulating hormones such as peptide YY (which signals
satiety to the brain) and glucagon-like peptide-1 (GLP-1) [123]. Other studies
suggest that metformin may have a deletirious effect on pancreatic beta-cell function
by reducing mitochondrial ATP synthesis, a scenario that impairs responsiveness,
inhibits insulin release, and possibly induces beta-cell apoptosis [124] [125].
14
1.3.2 The insulin-independent effects of metformin: effects on glucose
absorption
The contribution of the intestine in metformin’s antihyperglycaemic effects is often
overlooked because of paucity of clinical data. In a study on normal 18 hour fasted
mice, Wilcock and Bailey reported that metformin (administered as an intragastric
bolus) decreased intestinal glucose absorption in a dose dependent manner through
effects on mucosal and serosal glucose transfer, mostly in the middle portion of the
small intestine [126]. Animal studies suggest that metformin delays glucose
absorption, such that this occurs more distally in the gastrointestinal tract [126, 127].
Metformin administration results in the accumulation of very high drug
concentrations in the intestinal wall [128]. This is accompanied by an increased
utilization of glucose by the intestine, particularly through anaerobic metabolism
[129-131], explaining, at least in part, the apparent shortfall in the passage of glucose
from the luminal to the serosal surface of the intestine. To this effect, Bailey et al.
reported that incubation of human jejunal biopsy tissue with metformin significantly
increased lactate production within the tissue sample by 35%. Additionally, in a
study on eight recently-diagnosed, obese, drug naïve T2DM patients, the authors
showed that incident metformin administration is associated with metformin jejunal
concentrations ranging from 30 to 300 times higher than plasma metformin
concentrations [132].
15
1.3.3 Metformin and the organic cation transporter
Primarily excreted unchanged in the urine, metformin is a substrate of a number of
organic cation transporters; those identified so far are organic cation transporters 1
and 2 (OCT1 and OCT2) and plasma membrane monoamine transporter (PMAT).
Organic cation transporters are polyspecific transporters most commonly expressed
in the liver and the kidney, where they play a role in the elimination of organic
cations from the systemic circulation.[133-135]. In particular, OCT1 is thought to be
a major determinant of metformin’s pharmacological effects in the liver [136, 137];
passive diffusion and other transporters may account for a small portion [137]. In a
transgenic mouse model, knockout of liver OCT1 virtually abolished biguanide-
induced hepatic lactate production [136]. Deletion of the OCT1 gene in mouse liver
reduces metformin’s effects on gluconeogenesis and the drug’s interaction with
AMPK [137]. OCT1 polymorphisms have been reported to reduce metformin effects
on the response to oral glucose, and affect serum metformin concentrations [137,
138], and may, at least partly, explain why about 40% of metformin-treated T2DM
patients fail to achieve target fasting plasma glucose levels [139, 140]. Expressed in
the basolateral membrane of renal tubular cells, OCT2 is implicated in the renal
excretion of the drug [141, 142]. While both OCT1 and OCT2 are expressed at low
levels in the basolateral membranes of entrocytes [133, 135, 143], PMAT has
recently been identified as a more important metformin transporter in the small
intestine, and is expressed at higher levels in the apical membrane of these cells
[143-145]
16
1.4 Thiazolidinediones – a ‘novel’ class of insulin sensitizers
The thiazolidinediones (TZDs) rosiglitazone and pioglitazone were approved by the
US Food and Drugs Administration (FDA) as pharmacological agents in the
management of individuals with T2DM in 1999. Thiazolidinediones are currently
recommended as second or third line T2DM pharmacotherapy by NICE and SIGN
[82, 83]. The 2009 consensus statement of the EASD and the ADA did not
recommend the use of rosiglitazone in view of concerns about its cardiovascular
safety profile, while suggesting that pioglitazone may be used as a second line agent
in specific clinical circumstances, such as ‘when hypoglycaemia is particularly
undesirable’ [84]. The updated 2012 EASD/ADA recommendations, guided by the
principle of 'primum non nocere' ('first do no harm') retain a potential role for
pioglitazone as a second-line add-on agent. However the authors seemingly prefer to
focus on its safety and adverse effect profile [146]. Concerns about the
cardiovascular safety profile of rosiglitazone, initially raised by (the much disputed)
Nissen and Wolski’s meta-analysis [147], and confirmed by some [148-150], but not
other [151-154] studies and meta-analyses led the US Food and Drug Administration
(FDA) to issue guidance detailing the approach for acquiring, analysing and
reporting the necessary safety information from all Phase II and III trials [155].
Acting upon updated meta-analyses data [156, 157], FDA restricted rosiglitazone’s
use in the management of T2DM [158]. The European Medicines Agency (EMA)
went further, withdrawing its marketing authorization with immediate effect in
September 2010 [159]. A recent editorial has questioned the wisdom of curtailing
rosiglitazone's marketing authorization, given the limitations imposed by the
available medical evidence [160].
17
Thiazolidinediones lower fasting and postprandial blood glucose levels by increasing
insulin sensitivity in muscle, fat and liver cells. This is achieved through modulation
of peroxisome-proliferator-activated receptor-γ (PPARγ) activity. Troglitazone, the
first widely used thiazolidinedione introduced in 1997, was withdrawn from clinical
practice on account of liver toxicity [161]. The association between
thiazolidinedione therapy and heart failure (HF) was reported in the same year, when
Hirsch et al. described two cases of pulmonary oedema complicating the use of
troglitazone in two diabetes patients with preserved left ventricular function. This
clinical condition improved after the drug was discontinued [162]. Fluid retention
and weight gain have since been confirmed as the principal adverse effects of
rosiglitazone and pioglitazone, such that drug manufacturers do not recommend their
use in patients with New York Heart Association (NYHA) functional class III or IV
HF [163, 164]. Both NICE and SIGN guidelines have adopted a more stringent
approach, such that they do not recommend the use of these drugs in any patient with
HF [82, 83]. This chapter aims to review the current understanding of the
pathophysiology of PPAR-γ agonists. Additionally, it shall discuss the clinical
evidence and mechanisms underlying thiazolidinedione-induced oedema.
1.4.1 Peroxisome Proliferator Activated Receptors - a heterogenous family of
nuclear receptors
The identification of the insulin-sensitizing properties of thiazolidinediones in
animals and humans has generated significant interest into the mechanism of action
of these drugs. Thiazolidinediones act as peroxisome proliferator-activated receptor
18
(PPAR)-γ agonists. Together with PPAR-α and PPAR-δ, PPAR-γ belongs to a
nuclear receptor superfamily of transcription factors [165] which are activated by
polyunsaturated fatty acids, prostanoids and oxidised fatty-acids found in low
density lipoproteins (LDLs) [166-168]. PPAR-α, -δ and –γ are encoded on three
different genes (PPARA, PPARD, and PPARG) located at chromosomes 22, 6, and
3, respectively [165]. While PPAR-δ is ubiquitously expressed [169], PPAR-α
distribution is largely restricted to tissues where active fatty acid catabolism occurs.
Thus, although predominantly expressed in the liver, it has additionally also been
identified at moderate levels in the kidney and brown adipose tissue, and at relatively
lower levels in heart and intestine [170]. It has also been localised in skeletal muscle
[171]. PPAR-γ is mostly, though not exclusively, expressed in white and brown
adipose tissue; additionally, it has been localised in the intestine, vascular
endothelium, macrophages, pancreatic beta cells [172, 173] and skeletal muscle
[174]. It is characterised by several splice variants, named PPAR-γ1 to PPAR-γ7
[175-177] , the relative distribution of which is further outlined in table 1.1.
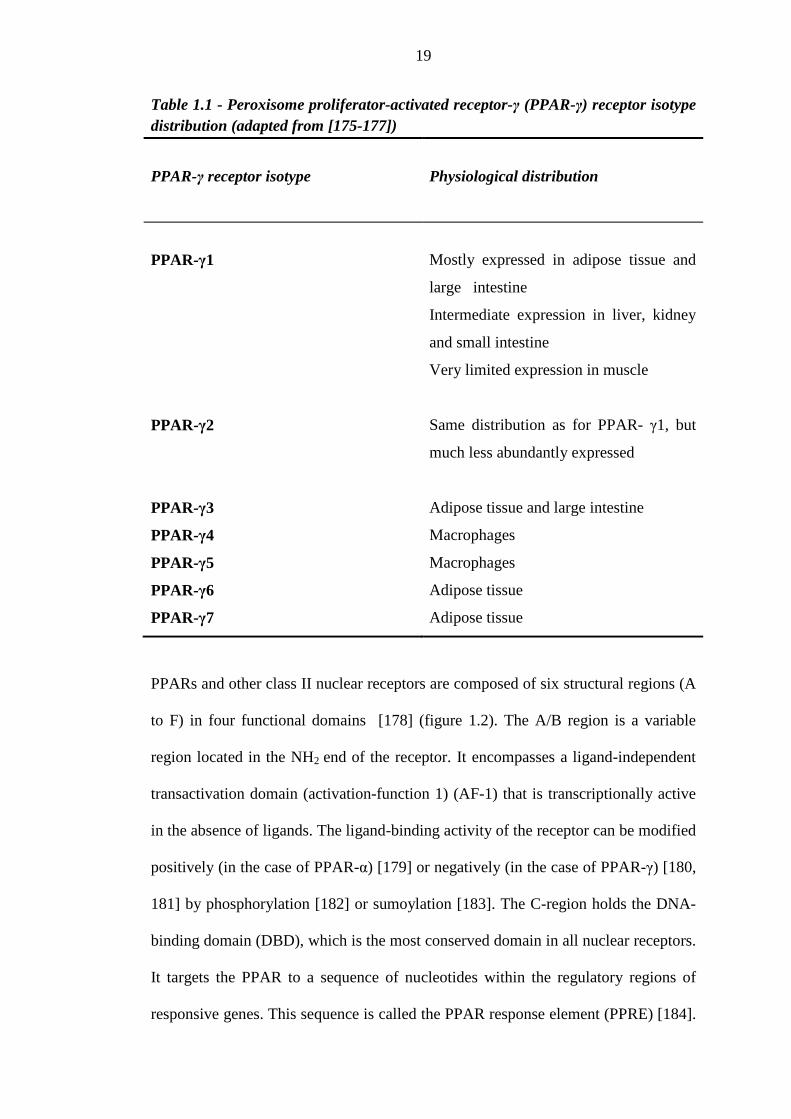
19
Table 1.1 - Peroxisome proliferator-activated receptor-γ (PPAR-γ) receptor isotype distribution (adapted from [175-177])
PPAR-γ receptor isotype
Physiological distribution
PPAR-γ1
PPAR-γ2
PPAR-γ3
PPAR-γ4
PPAR-γ5
PPAR-γ6
PPAR-γ7
Mostly expressed in adipose tissue and
large intestine
Intermediate expression in liver, kidney
and small intestine
Very limited expression in muscle
Same distribution as for PPAR- γ1, but
much less abundantly expressed
Adipose tissue and large intestine
Macrophages
Macrophages
Adipose tissue
Adipose tissue
PPARs and other class II nuclear receptors are composed of six structural regions (A
to F) in four functional domains [178] (figure 1.2). The A/B region is a variable
region located in the NH2 end of the receptor. It encompasses a ligand-independent
transactivation domain (activation-function 1) (AF-1) that is transcriptionally active
in the absence of ligands. The ligand-binding activity of the receptor can be modified
positively (in the case of PPAR-α) [179] or negatively (in the case of PPAR-γ) [180,
181] by phosphorylation [182] or sumoylation [183]. The C-region holds the DNA-
binding domain (DBD), which is the most conserved domain in all nuclear receptors.
It targets the PPAR to a sequence of nucleotides within the regulatory regions of
responsive genes. This sequence is called the PPAR response element (PPRE) [184].
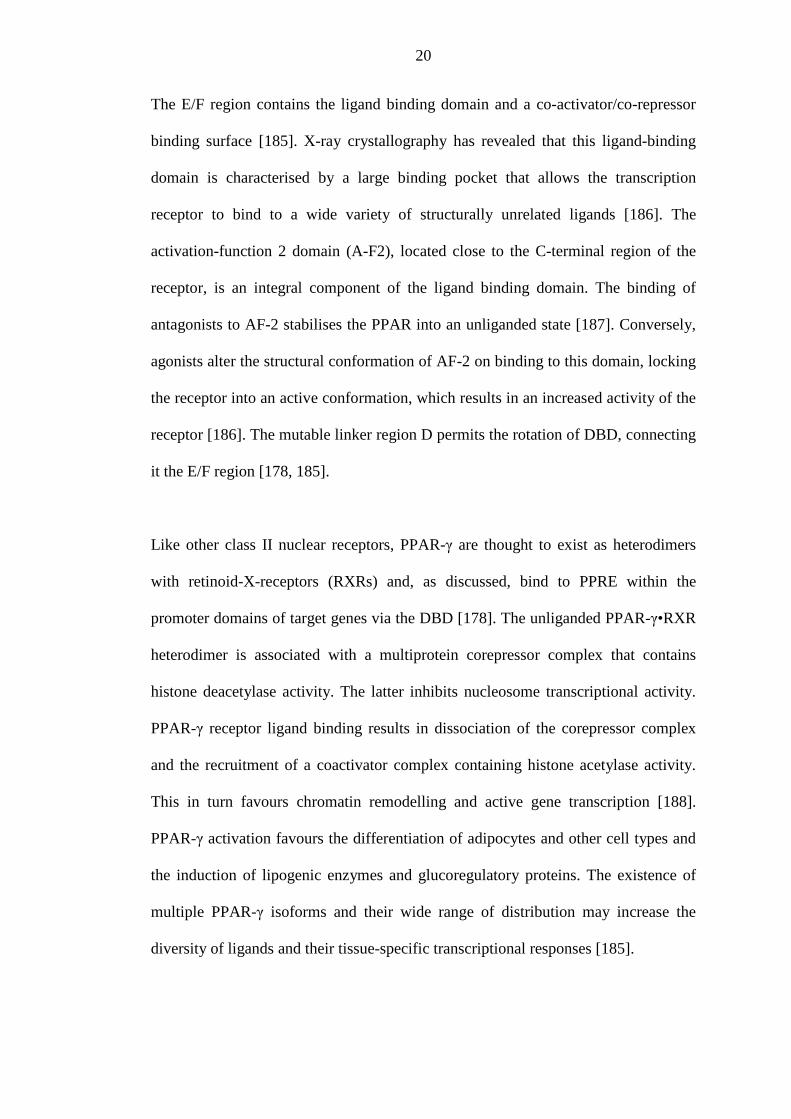
20
The E/F region contains the ligand binding domain and a co-activator/co-repressor
binding surface [185]. X-ray crystallography has revealed that this ligand-binding
domain is characterised by a large binding pocket that allows the transcription
receptor to bind to a wide variety of structurally unrelated ligands [186]. The
activation-function 2 domain (A-F2), located close to the C-terminal region of the
receptor, is an integral component of the ligand binding domain. The binding of
antagonists to AF-2 stabilises the PPAR into an unliganded state [187]. Conversely,
agonists alter the structural conformation of AF-2 on binding to this domain, locking
the receptor into an active conformation, which results in an increased activity of the
receptor [186]. The mutable linker region D permits the rotation of DBD, connecting
it the E/F region [178, 185].
Like other class II nuclear receptors, PPAR-γ are thought to exist as heterodimers
with retinoid-X-receptors (RXRs) and, as discussed, bind to PPRE within the
promoter domains of target genes via the DBD [178]. The unliganded PPAR-γ•RXR
heterodimer is associated with a multiprotein corepressor complex that contains
histone deacetylase activity. The latter inhibits nucleosome transcriptional activity.
PPAR-γ receptor ligand binding results in dissociation of the corepressor complex
and the recruitment of a coactivator complex containing histone acetylase activity.
This in turn favours chromatin remodelling and active gene transcription [188].
PPAR-γ activation favours the differentiation of adipocytes and other cell types and
the induction of lipogenic enzymes and glucoregulatory proteins. The existence of
multiple PPAR-γ isoforms and their wide range of distribution may increase the
diversity of ligands and their tissue-specific transcriptional responses [185].
21
Figure 1.2 - Structure of the peroxisome proliferator-activated receptor-γ (PPAR-γ) (adapted from [189])
A B C FEH2N COOHD
AF-1 DBD
linker
AF-2
AF-1 is subjectedto phosphorylationand sumoylation
bind to PPRE
rotation
agonist locks the receptor into an active conformation while antagonist stabilizes the receptor into an
inactive conformation
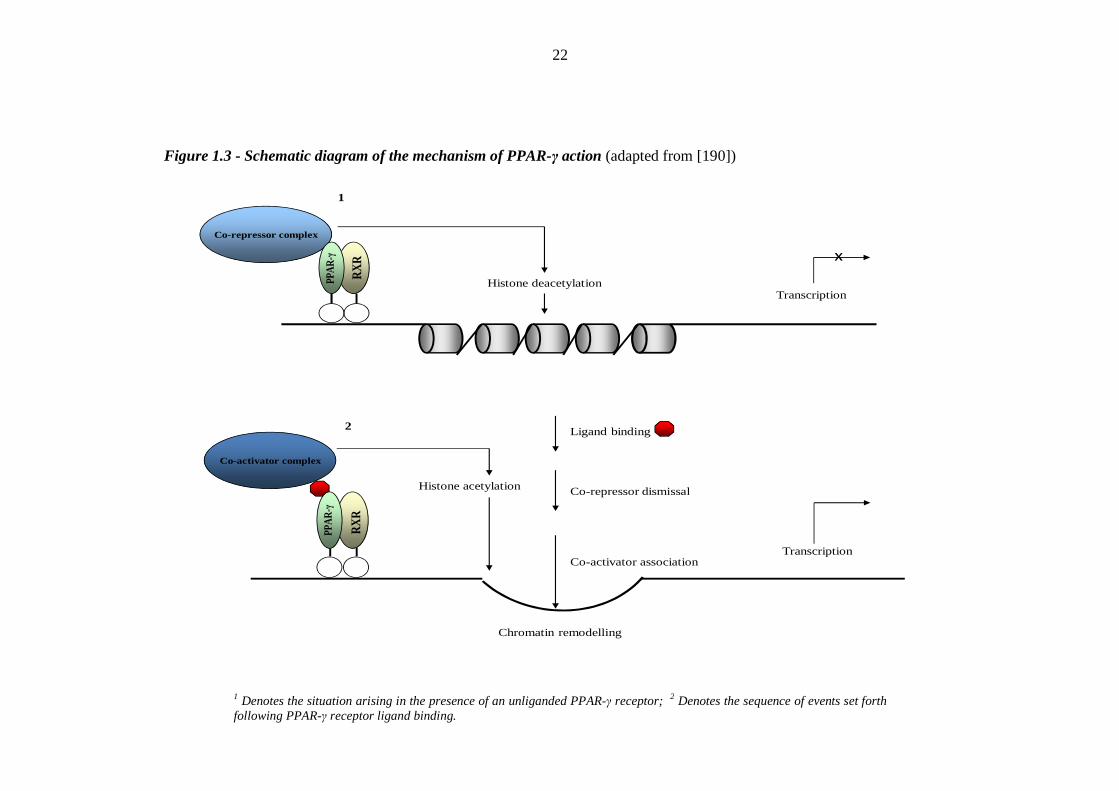
22
Figure 1.3 - Schematic diagram of the mechanism of PPAR-γ action (adapted from [190])
RXR
Co-repressor complex
PPAR
-γ
Histone deacetylationTranscription
x
Ligand binding
Co-repressor dismissal
Co-activator associationTranscription
Chromatin remodelling
Co-activator complex
1
2
RXR
PPAR
-γ
Histone acetylation
1 Denotes the situation arising in the presence of an unliganded PPAR-γ receptor; 2 Denotes the sequence of events set forth following PPAR-γ receptor ligand binding.
23
1.4.2 Physiological consequences of PPAR-γ activation
PPAR-γ activation, as evidenced by PPAR-γ mRNA expression, has been shown to
play a critical role in adipogenesis and adipocyte differentiation [191, 192]. PPARγ
interacts with CCAAT/enhancer-binding protein (-alpha, -beta, -delta), setting a
transcriptional network that plays a central role in adipogenesis [191]. This is
achieved in a series of steps. Adipogenic hormones, such as insulin and
dexamethasone, relay signals to CCAAT/enhancer binding protein-beta and -delta.
In turn, CCAAT/enhancer binding protein-beta and -delta synergistically induce the
expression of both CCAAT/enhancer binding protein-alpha and PPAR-γ by
heterodimerizing with each other [193-196]. CCAAT/enhancer binding protein-alpha
and PPAR-γ subsequently enhance each other [197, 198], turning on a battery of
genes which are required for the synthesis, uptake and storage of fatty acids and
increasing the number of adipocytes [199-201].
Transcription factor PPAR-γ increases insulin sensitivity through a number of
mechanisms acting in tandem. PPAR-γ favours the selective expression of genes
encoding for proteins involved in fatty acid uptake in adipose tissue, namely
adipocyte fatty acid binding protein, acyl-Co A synthase and lipoprotein lipase,
without affecting their expression in muscle tissue. This adipocyte free fatty acid
‘steal phonomenon’ causes a relative depletion of fatty acids in muscle [202, 203].
Moreover, PPAR-γ activation favours the retention of fatty acids in tissues through
activation of fatty acid transporters [fatty acid transporter 1 (FATP1) and CD36],
phosphoenylpyruvate carboxykinase (PEPCK) and glycerol kinase. PPAR-γ also
regulates adipocyte hormone gene expression, enhancing the expression of genes
24
encoding for insulin sensitizing adipocytokines such as adiponectin, while repressing
the expression of genes encoding for adipocytokines implicated in insulin resistance,
such as leptin, resistin, tumour necrosis factor-α, 11-β hydroxysteroid dehydrogenase
type-1, interleukin-6 and plasminogen activator inhibitor-1. Additionally, PPAR-γ
directly enhances adipocyte glucose disposal by inducing glucose transporter-4
(GLUT-4) and c-Cbl associating protein (CAP), the latter being crucial for GLUT4
translocation to the cell surface [204].
1.4.3 Thiazolidinediones and AMPK activation
AMP-activated protein kinase (AMPK), a highly conserved major regulator of
cellular and whole-body energy homeostasis, is also a target of thiazolidinedione
action [89]. Thiazolidinediones are reported to activate AMPK via two independent
mechanisms. Like the biguanides, thiazolidinediones appear to exert their acute
effects on AMPK by inhibiting complex 1 of the respiratory chain [205], therebye
explaining the associated drug-induced increase in the cellular AMP:ATP ratio [206,
207]. Morerover, as outlined above, thiazolidinedione-induced PPAR-γ activation
induces the expression and release of adiponectin from human and rodent adipocytes
[208]. Adiponectin in turn activates AMPK in the liver and skeletal muscle, reducing
hepatic gluconeogenesis, and favouring glucose uptake and fatty acid oxidation
[209]. Mice lacking adiponectin fail to exhibit thiazolidinedone-induced AMPK
activation and improvements in glucose tolerance [210].
In conclusion, metformin and thiazolidinediones improve insulin sensitivity through
multifaceted but complementary approaches: both act as AMPK activators, but
25
metformin predominantly targets hepatic glucose output while thiazolidinediones
regulate peripheral glucose and fatty acid uptake predominantly in adipose tissue via
PPAR-γ receptor modulation. In both cases, glucose control is improved with a
minimal risk of hypoglycaemia.
26
Section II - Heart failure in diabetes, with particular reference to
thiazolidinedione therapy
1.5 Concurrence of diabetes and heart failure
In recent years, the relationship between HF and diabetes has been increasingly
recognised and investigated. The American Heart Association classifies diabetes as a
high risk factor for the development of HF [211]. There is evidence for diabetes
related effects on HF prevalence, incidence and mortality. It is to be noted that large
diabetes trials either excluded patients with HF [e.g. UKPDS [212], Non-Insulin
Dependent Diabetes, Hypertension, Microalbuminuria or Proteinuria, Cardiovascular
Events, and Ramipril (DIABHYCAR) [213], DCCT [214]] or did not report HF as a
co-morbidity [e.g. Collaborative Atorvastatin Diabetes Study (CARDS) [215],
Fenofibrate Intervention and Event Lowering in Diabetes (FIELD) [216],
PROspective pioglitAzone Clinical Trial in macroVascular Events (PROactive)
[217]]. As for the occurrence of diabetes in HF, figures need to be interpreted with
caution, given that the strict recruitment criteria for the individual trials exclude
individuals at higher risk of diabetes (such as older age groups, and renal
dysfunction). Similarly, it is difficult to extract population-based estimates of the
incidence of HF in diabetes from large trials such as the UKPDS, which solely
recruited patients with newly diagnosed diabetes (mean age = 53 years). Given these
constraints, prevalence and incidence data have been retrieved largely from
population based studies.
27
1.5.1 Prevalence
Prevalence of heart failure in diabetes: The prevalence of HF in diabetes stands at
12% [218], increasing to 22% among individuals aged above 64 years [219],
compared to 1-4% in the general population [218].
Prevalence of diabetes in heart failure: Diabetes was reported as being four times
more prevalent among patients with newly diagnosed HF [220]. Diabetes occurs in
12-30% of individuals with symptomatic HF [218, 220-222], and in 33-40% of
hospital admissions resulting from HF [223-225]. A retrospective analysis of around
45,000 patients with idiopathic cardiomyopathy confimed similar results, namely
significantly higher prevalence rates among the diabetic sub-population [26.6% vs
17.2%, corresponding to a relative odds of 1.58 (95% CI 1.55, 1.62) after adjusting
for age, sex, hypertension and median income [226]]. Data from other smaller
epidemiological studies of patients with left ventricular systolic dysfunction (ranging
from 188 to 3960 patients) reported diabetes prevalence rates of 6-25.5%, although
there were considerable differences in patient age and in the definition of left
ventricular systolic dysfunction between studies [227-233]. It is as yet unclear
whether the prevalence of diabetes in HF varies according to ethnic group [224,
225].
1.5.2 Incidence
Incidence of heart failure in diabetes: Diabetes has also been identified as a major
contributor to the incidence of this cardiac condition. A diagnosis of HF was 2.4
28
times as likely among diabetic men and 5.1 times as likely among diabetic women
who participated in the Framingham Heart Study (age range 45-74 years). This
association was independent of age, obesity, hypertension, dyslipidaemia and
coronary artery disease. The effect was even more pronounced in individuals
younger than 65 years, where the risk of developing HF was estimated at 4 fold and
8 fold higher for diabetic men and women respectively [234]. The National Health
and Nutrition Examination Survey (NHANES) [235] and Cardiovascular Health
Study [236] reported hazard ratios of 1.85 (95% CI 1.51, 2.28) and 1.74 (95% CI
1.38, 2.19) respectively for HF development in diabetic patients. In Iceland, the age-
adjusted odds ratio for the development of HF was 2.8 (95% CI 2.2, 3.6) in diabetic
patients, compared to their non-diabetic counterparts [218].
A cross-sectional study comparing the incidence of HF between diabetic and non-
diabetic subgroups of 2737 American elderly patients (mean age 81 ± 9 years)
revealed that HF developed in 39% of diabetic patients compared with 23% of non-
diabetic individuals (p < 0.0001). Relative risk was estimated at 1.3 for the diabetic
population [237]. A large US cohort study of 115,803 diabetes patients over 64 years
of age reported 126 cases of incident HF per 1000 patient years [219].
The United Kingdom Diabetes Prospective Diabetes Study (UKPDS) reported that
the risk of HF increased with worsening glycaemic control in T2DM patients, such
that there was a 16% reduction in the risk of HF for every 1% reduction in
glycosylated haemoglobin (HbA1c) [212]. Conversely, each 1% increase in HbA1c
was linked to an 8% increase in HF risk (95% CI 5, 12%) in a US study [238]. A 2.5
unit increase in BMI has been associated with a 12% increase in the risk of HF in
29
diabetic patients [239]. A similar relationship was reported in another study [240].
Increasing age [213, 219, 239], use of insulin [239], and duration of diabetes [239]
have also been identified as risk factors.
Coronary heart disease is a risk factor for HF in diabetes [219, 239, 240]. Morerover,
diabetic patients are more likely to develop HF following a myocardial infarction
despite comparable infarct sizes [241]. Diabetic patients with retinopathy have also
been recognised as being at an increased risk of HF [242]. Subgroup analysis of the
Multi-Ethnic Study of Atherosclerosis (MESA) cohort showed broadly similar
findings, namely an association between retinal arteriolar narrowing and left
ventricular remodelling [243]. Other studies reported proteinuria and albuminuria
[213, 240, 244], nephropathy [219] and end-stage renal disease [219, 239] as
additional risk factors for HF in diabetes. Overall, these results support the concept
of microvascular aetiology for HF in diabetes, or an interaction between large and
small vessel disease.
Incidence of diabetes in heart failure: Only one non-clinical trial population study
investigated the development of diabetes among patients diagnosed with HF. The 3
year incidence of diabetes was 28.8% in elderly Italian patients with HF compared
with 18.3% in individuals without HF [220].
1.6 Mortality risks associated with heart failure
Diabetes and mortality in patients with heart failure: Diabetes is a recognised
independent risk factor of death among patients with established HF. This is borne
30
out of the results of a number of studies. However, it is unclear whether this risk
holds only for individuals in whom HF is caused by a specific aetiology. Analysis of
clinical trial population data from the Studies of Left Ventricular Dysfunction
(SOLVD) [245, 246], Beta-blocker Evaluation in Survival Trial (BEST) [247] and
Digitalis Investigation Group (DIG) [248] studies suggested that mortality risk was
confined to individuals with HF of ischaemic aetiology, in contrast to a US
community cohort based study, which reported an association with non-ischaemic
HF [222]. In contrast, diabetes posed a mortality risk to HF patients of either
category in the Danish Investigations of Arrhythmia and Mortality ON Dofetilide
Heart Failure (DIAMOND-HF) [249] and Candesartan in Heart failure Assessment
of Reduction in Mortality and morbidity (CHARM) [250] clinical trials. Differences
in study outcomes may be borne out of underdiagnosis of coronary artery disease in
diabetes and differences in study population characteristics and study design. The
hazard ratios for death from pump failure in diabetic individuals were reported as
1.44 (95% CI 1.18, 1.76) and 1.50 (95% CI 1.15, 1.74) in the SOLVD [245, 246] and
BEST [247] trials respectively. Subgroup analysis of data from the Framingham
study suggested that the risk of diabetes related mortality was confined to female HF
patients [251]. The results may have been influenced by the small sample size, and
may explain why such gender differences were not confirmed in other studies.
Interestingly, a low HbA1c has been identified as a mortality risk factor for HF in
diabetic patients in one observational study [252]. Analysing for 123 individuals
with advanced HF, 2 year all-cause mortality rates were significantly higher for
patients with an HbA1c of 7 or less compared to those with higher values (35% vs
31
20%). These figures need to be interpreted with caution, and probably reflect the
effects of cachexia, which is inherent to individuals with advanced HF.
Heart failure and mortality in patients with diabetes: Current evidence suggests
that diabetes patients who develop HF are at an increased risk of mortality. The
DIABHYCAR study showed that T2DM patients who develop HF had a twelve-fold
higher annual mortality rate compared to diabetic individuals who were not
diagnosed with HF (36.4% vs 3.2%). This study was carried out in individuals above
50 years of age and urinary albumin concentrations equalling or exceeding 20mg/L
[213]. A large US population study recruiting data from diabetic patients aged 65
years or older reported a five year survival of 12.5% for individuals who developed
HF, as compared to 80% for those who did not develop this cardiovascular condition
[219].
1.7 Thiazolidinediones and oedema
A meta-analysis of 26 prospective, randomised, placebo-controlled or comparative
studies investigating the incidence of oedema in thiazolidinedione-treated patients
concluded that the latter are associated with a doubling of risk [pooled OR 2.26
(95% CI 2.02, 2.53); p < 0.00001]. Oedema rates were approximately three fold
higher for rosiglitazone-treated patients [pooled OR 2.74 (95% CI 2.33, 3.14)]. Open
labelled studies reported a higher thiazolidinedione-associated risk [pooled OR 6.74
(95% CI 3.32, 13.71); p < 0.00001] [253]. However, recruited studies adopted
different definitions of oedema. Moreover, only two studies used objective methods
to evaluate this adverse effect, while severity was only reported in three studies.
32
Available data did not permit investigating whether concomitant drugs mitigate or
exacerbate the risk of fluid overload [253].
1.8 Thiazolidinediones and heart failure
The clinical benefits and widespread use of thiazolidinediones have been hampered
by concerns on their cardiovascular safety profile, namely ischaemic heart disease
(rosiglitazone) and an association with fluid retention/HF. Early clinical
efficacy/safety (phase II) trials had failed to clearly demonstrate any relationship
between pioglotazone or rosiglitazone monotherapy and the development of HF,
although the risk may be increased when the drug is used in combination with
insulin. On the other hand, four major prospective randomized trials and recent meta-
analyses of data from these and other studies have attested this relationship.
1.8.1 Clinical efficacy/safety trials
The package inserts for rosiglitazone maleate (Avandia®) [254] and pioglotazone
hydrochloride (Actos®) [255] yield useful prescribing advice in this regard. Both
drugs are deemed contraindicated in individuals with New York Heart Association
(NYHA) HF classes III and IV. Additionally, the manufacturers do not recommend
their use in individuals with symptomatic HF. Individuals with NYHA HF classes I
and II are deemed as being at an increased risk of ‘other cardiovascular effects’ when
treated with Avandia®. The manufacturers of Actos® recommend that this drug
should be commenced at the lowest approved dose if contemplated for use in T2DM
patients with NYHA HF class II. Any further dose escalation, if necessary, should be
33
carried out after ‘several months of treatment’ and ‘careful monitoring for weight
gain, oedema, or signs and symptoms of CHF exacerbation’. When evaluating
available data, one must keep in mind that individuals with NYHA HF class III and
IV were not included in the pre-approval clinical trials.
(i) Unpublished clinical safety trials for pioglitazone hydrochloride (Actos®)
In their package insert [255], the manufacturers of pioglitazone hydrochloride refer
to a double-blind placebo controlled pre-approval clinical trial involving 566 insulin-
treated T2DM patients followed up for 16 weeks. Participants were randomised to
pioglitazone at 15mg or 30 mg daily, or placebo, and included individuals with
arterial hypertension (57.2%), coronary heart disease (19.6%), history of MI (8.8%),
history of angina pectoris (4.4%), congestive heart failure (2.3%) and stroke and/or
transient ischemic attack (4.1%). 2 patients on pioglitazone 15mg and 2 of those on
pioglitazone 30mg developed CHF. Although this adverse event was not reported in
placebo-treated individuals, it was restricted to individuals with a past history of
cardiovascular disease.
A 24 week post-marketing study compared the safety profile of pioglitazone (n =
262) and glyburide (n = 256) in uncontrolled T2DM patients (mean baseline HbA1c
8.8%) characterised by NYHA class III and IV HF and a baseline ejection fraction
less than 40% (mean 30%). Overnight hospitalization for HF was increased, reported
in 9.9% of pioglitazone-treated patients compared to 4.7% of those managed with
glyburide. Treatment differences were first noted after 6 weeks of therapy.
34
Pioglitazone-associated hospitalization for HF was more common in individuals
aged over 64 years and those treated with insulin at baseline.
Statistical analyses of the differences between treatment groups are not reported for
either of the two studies, which are not referenced in the package insert.
(ii) Unpublished clinical safety trials for rosiglitazone maleate (Avandia®)
The package insert for rosiglitazone maleate [254] refers to a 52 week double-blind
placebo-controlled study carried out in 224 T2DM patients with NYHA class I or II
HF and a baseline ejection fraction equalling or less than 45%, treated with
background antidiabetic and CHF therapy. While the investigators reported no
differences in change in ejection fraction between treatment groups, rosiglitazone-
treated patients were more prone to adverse cardiovascular events (new or worsening
oedema, new or worsening dyspnoea, increases in CHF medication, cardiovascular
hospitalization, cardiovascular deaths) compared to their placebo-treated
counterparts. It is not clear whether this study was carried out in the pre-approval
phase, and statistical analysis of the differences between treatment groups is not
reported. This study is not referenced in the package insert.
1.8.2 Prospective randomized trials
Four large-scale randomized prospective trials (tables 1.2 and 1.3) cumulatively
recruiting over nineteen thousand patients have yielded valuable information on the
safety profile of thiazolidinediones. They recruited individuals from four very
35
different populations: patients with pre-diabetes (impaired glucose tolerance or
impaired fasting glucose) and no evidence of cardiovascular disease [Diabetes
REduction Assessment with ramipril and rosiglitazone Medication (DREAM)]
[152], pharmacologically naïve T2DM patients [A Diabetes Outcome Progression
Trial (ADOPT)] [154], T2DM patients (some with previous cardiovascular disease)
inadequately controlled on a sulphonylurea or metformin [Rosiglitazone Evaluate for
Cardiovascular outcomes in ORal agent combination therapy for type 2 Diabetes
(RECORD)] [153], and high risk T2DM patients with established cardiovascular
disease [PROspective pioglitAzone Clinical Trial in macroVascular Events
(PROactive)] [256]. Two of these trials compared thiazolidinedione treatment with
placebo therapy (DREAM, PROactive) [152, 256], while the other two trials
(ADOPT, RECORD) [153, 154] compared thiazolidinedione therapy with metformin
and sulphonylureas. Three studies (DREAM, ADOPT, RECORD) randomised
patients to thiazolidinedone treatment with rosiglitazone [152-154], while the
PROactive study randomised individuals to pioglitazone [256]. The mean age of the
patients at recruitment ranged from 54.7 to 61.8 years. Baseline HbA1c was sub-
optimal, ranging from 7.4-7.9 in three [153, 154, 256] out of four [152-154, 256]
trials (it was not reported in the DREAM trial which recruited patients with pre-
diabetes [152]). The PROactive trial excluded patients with NYHA HF class II or
above [256]. The DREAM [152], ADOPT [154] and RECORD [153] studies
excluded any individual with HF at recruitment.
All four trials reported a significant excess of thiazolidinedione-treated patients with
HF. The DREAM trial [152] defined HF as acute treatment with at least two of the
following criteria: typical signs and symptoms, typical radiological evidence and the
36
use of diuretics, vasodilators or inotropes. 14 rosiglitazone-treated patients and 2
placebo-treated patients developed HF during the study [HR 7.03 (95% CI 1.60,
30.9); p = 0.01). There were no reports of deaths from HF during the study, although
the investigators reported a death from myocardial infarction in one rosiglitazone-
treated patient who had developed HF. Additionally, 174 (6.8%) of the 2547
rosiglitazone-treated patients had developed peripheral oedema by the final visit,
compared to 124 (4.9%) of the 2554 patients randomised to a placebo (p = 0.003).
The authors also reported a significant mean body weight increase of 2.2 kg in the
rosiglitazone-treated group compared to placebo (p < 0.0001). While rosiglitazone
therapy significantly reduced the composite endpoint of incident diabetes or death (p
< 0.0001), there were no significant differences between treatment groups in
composite cardiovascular endpoints (comprising myocardial infarction, stroke,
cardiovascular death, revascularization procedure, HF, new angina with objective
evidence of ischaemia, ventricular arrhythmias requiring resuscitation), overall
mortality, myocardial infarction, new angina or stroke between the treatment groups.
The study did not report information on differences in changes in lipid profile
between rosiglitazone and placebo-treated groups.
The ADOPT trial [154] sought to investigate differences in outcomes between
T2DM patients randomised to monotherapy with rosiglitazone (n = 1456),
metformin (n = 1454) or glyburide (n = 1441). Although the study protocol excluded
patients with known CHF, retrospective analysis of source data identified this
diagnosis in 17 study patients at recruitment (5 in the rosiglitazone group, 6 in the
metformin group and 6 in the glyburide group). Only 1 of these patients, randomised
to metformin, subsequently developed a HF event during the study. There were no
37
significant differences in the number of patients with HF between the rosiglitazone
and metformin-treated groups at the end of the study [22 vs 19; HR 1.22 (95% CI
0.66, 2.26); p = 0.52). Although a greater number of rosiglitazone-treated patients
developed HF compared to those randomised to glyburide (22 vs 9), the difference
achieved only borderline statistical significance [HR 2.20 (95% CI 1.01, 4.79); p =
0.05]. Serious HF events (defined as life threatening, fatal, disabling, requiring
hospitalization or prolongation of hospital stay, associated with a congenital
anomaly, cancer or a drug overdose, regarded as such by the investigator or
suggesting substantial hazard, contraindication, side-effect or precaution) affected 12
patients in the rosiglitazone-treated group, 12 patients in the metformin-treated group
and 3 glyburide-treated individuals (p < 0.05 for the comparison between
rosiglitazone and glyburide-treated patients). A significantly greater number of
rosiglitazone-treated patients developed peripheral oedema compared to those on
metformin (205 vs 104; p < 0.001) or glyburide (205 vs 123, p < 0.001).
Rosiglitazone-treated patients gained 4.8kg (95% CI 4.3, 5.3) in weight compared to
a reduction of 2.9 kg (95% CI -3.4, -2.3) for metformin-treated patients and an
increase of 1.6kg (95% CI 1.0, 2.2) for glyburide-treated individuals. At the end of
the study, rosiglitazone-treated patients were 6.9 kg heavier (95% CI 6.3, 7.4) than
their metformin-treated counterparts (p < 0.001) and 2.5 kg (95% CI 2.0, 3.1)
heavier than patients randomised to glyburide (p < 0.001). The study confirmed that
thiazolidinedione treatment is associated with a lower rate of monotherapy failure at
5 years (defined as fasting plasma glucose exceeding 10 mmol/L) compared to
metformin or glyburide (p < 0.001 for both comparisons). Rosiglitazone-treated
patients achieved significantly greater reductions in their glycated haemoglobin level
compared to those randomized to metformin [reduction difference of 0.13% (95% CI
38
-0.22, -0.05); p = 0.002] or glyburide [reduction difference of 0.42% (95% CI -0.50,
-0.33); p < 0.001]. Despite rosiglitazone being associated with higher LDL
cholesterol levels at the end of the study, compared to metformin [2.69 (95% CI
2.63, 2.75) vs 2.50 (95% CI 2.44, 2.55) mmol/L; p < 0.001] and glyburide [2.69
(95% CI 2.63, 2.75) vs 2.57 (95% CI 2.51, 2.64); p = 0.008], this did not translate
into any significant differences in the number of patients with fatal or nonfatal MI,
stroke or overall mortality between the treatment groups.
The conclusions borne out of the ADOPT study have been the subject of
considerable debate. Although the study yielded useful data concerning drug
associated changes in body weight, oedema and HF, it was primarily designed to
compare durability of glycaemic control between three treatment groups. Given that
the investigators only reported outcomes at the end of the study period (48 months
for metformin and rosiglitazone-treated patients, 39.6 months for glyburide-treated
patients), it is not possible to compare outcomes after 1, 2 or 3 years. Morerover,
high dropout rates were reported for the three treatment groups (63% for
rosiglitazone, 62.1% for metformin, 56% for glyburide), potentially introducing
hidden biases in reported adverse event rates [257]. Complications such as weight
gain would be expected to adversely affect drug compliance.
The RECORD trial [153] comprised an unblinded prospective study recruiting
T2DM patients inadequately controlled on metformin or sulphonylurea
monotherapy. The investigators compared primary and secondary cardiovascular
prevention between patients randomised to treatment with rosiglitazone or
metformin-sulphonylurea combination. By the end of the trial, a significantly greater
39
number of rosiglitazone-treated patients had developed new-onset HF leading to
hospitalization (undefined in the study) or death compared to their comparator-
treated counterparts [61 vs 29; HR 2.1 (95% CI 1.35, 3.27); p < 0.001]. There were
10 deaths attributed to HF in the rosiglitazone-treated group and 2 in the
sulphonylurea/metformin group; these figures were not compared statistically.
However there was no significant difference in all cause mortality between the
treatment groups [136 (rosiglitazone) vs 157 (comparator)], as the higher mortality
from HF was offset by a lower occurrence of death from stroke [0 (rosiglitazone) vs
5 (comparator)], myocardial infarction [7 (rosiglitazone) vs 10 (comparator)] and
other cardiovascular causes [43 (rosiglitazone) vs 54 (comparator)]. The authors did
not report any significant differences in the occurrence of myocardial infarction [64
(rosiglitazone) vs 56 (comparator)] and stroke [46 (rosiglitazone) vs 63
(comparator)] between the treatment groups. The authors maintained that the
excessive mortality from HF for rosiglitazone-treated patients was compatible with
the increased occurrence of HF seen in this treatment group, and that the excess
relative risk of HF for these patients was similar for individuals with and without
ischaemic heart disease. Metformin-treated patients randomised to additional
treatment with rosiglitazone gained more weight compared those treated with adjunct
sulphonylurea (+3.8 vs 0.0 kg; p < 0.0001). Sulphonylurea-treated patients
randomized to adjunct rosiglitazone gained more weight than those randomised to
additional treatment with metformin (+4.1 vs -1.5 kg; p < 0.0001).
A follow-up paper focussing on occurrence of HF events in RECORD [258] reported
that the mean duration (± SD) of admission for HF in the rosiglitazone group [69
events, 10.5 (± 6.6) days] was similar to that for the active control group [36 events,
40
9.6 (± 5.3) days]. Despite more incident HF events in the rosiglitazone group than in
the active control group [61 (rosiglitazone) vs 29 (active control); HR 2.10 (95% CI
1.35, 3.27); p < 0.001], recurrent HF events were similar in both treatment groups
[12 (rosiglitazone) vs 6 (active control)]. The estimated excess event rate for HF was
2.6 (95% CI 1.1, 4.1) per 1000 person-years. Of the ten deaths complicating HF in
the rosiglitazone group, four were incident HF events while six deaths occurred
following a recurrent HF episode. There were no fatal incident HF events in the
control group, while two deaths complicated a recurrent HF episode. 17 (30%) of the
57 rosiglitazone-treated patients who survived a first HF event subsequently died,
compared with 8 (28%) of patients in the active control group. Thiazolidinedone
treatment was associated with a similar relative risk increase but a doubled absolute
risk for HF events in patients with a history of ischaemic heart disease (IHD)
compared with their IHD free counterparts [4.4% of rosiglitazone-treated patients
with prior IHD vs 2.4% of rosiglitazone-treated patients without prior IHD; RR 2.16
(95% CI 0.94, 4.94) for patients with prior IHD vs RR 2.10 (95% CI 1.25, 3.51) for
patients without prior IHD]. Rosiglitazone assignment [HR 2.34 (95% CI 1.47,
3.72) vs control], age [1.10 (95% CI 1.07, 1.13) per one-year increase], BMI [HR
1.11 (95% CI 1.06, 1.15) per 1kg/m2 increase], systolic blood pressure at baseline
[HR 2.74 (95% CI 1.40, 5.36) for baseline antihypertensive therapy vs no therapy;
HR 1.66 (95% CI 1.06, 2.62) for uncontrolled hypertension vs no uncontrolled
hypertension] and urinary albumin:creatinine ratio [HR 2.95 (95% CI 1.90, 2.47) for
microalbuminuria/proteinuria vs normoalbuminuria] were independent predictors of
HF events. A history of previous cardiovascular disease, gender and duration of
diabetes were not predictive of HF in this cohort [258].
41
Although RECORD remains the only large, randomised, long-term trial assessing the
cardiovascular safety of rosiglitazone compared to other glucose lowering agents in
T2DM, its results have been questioned on account of certain built-in limitations,
namely its open-labelled design, its relatively small size (for a cardiovascular trial)
and the choice of primary endpoint. Importantly, the provision for investigator
option in referring potential events for adjudication and the publication of an
unplanned interim analysis of its results [259] triggered by the publication of meta-
analyses questioning the cardiovascular safety of thiazolidinediones may have
inherently biased the cardiovascular outcome results of RECORD. These
observations led the FDA to request a re-analysis of RECORD data in a bid to clarify
these conflicting conclusions [158]. Including an additional 328 patient-years of
follow-up, RECORD investigators confirmed initial findings [revised HR for
rosiglitazone vs metformin/sulphonylurea for the composite endpoint of death
(cardiovascular/unknown cause), myocardial infarction or stroke being 0.95 (95% CI
0.78, 1.17) vs 0.93 (95% CI 0.74, 1.15) in the original analysis; revised HR for
myocardial infarction 1.13 (95% CI 0.80, 1.59) vs 1.14 (0.80, 1.63); revised HR for
stroke 0.79 (95% CI 0.54, 1.14) vs 0.72 (95% CI 0.49, 1.06); unchanged for all-cause
death]. This re-analysis made no reference to HF events or oedema [260].
The PROactive study [256] randomized high risk T2DM patients with a background
of macrovascular disease to additional treatment with pioglitazone or placebo for a
mean duration of 34.5 months. Despite an unfavourable effect on LDL cholesterol
[+7.2% over baseline (pioglitazone) vs +4.9% over baseline (placebo); p = 0.003],
pioglitazone was shown to reduce the composite endpoint of all-cause mortality,
non-fatal myocardial infarction and stroke in high risk T2DM patients [301
42
(pioglitazone) vs 358 (placebo) HR 0.84 (95% CI 0.72, 0.98); p = 0.02] [256]. The
investigators reported that a HF event (defined as evidence of ventricular
dysfunction e.g. electrocardiogram (ECG), echocardiogram or auscultation,
accompanied by signs or symptoms of HF) occurred in 10.8% of pioglitazone-treated
patients compared with 7.5% of those randomized to a placebo (p<0.0001).
Although pioglitazone therapy was associated with a significantly increased risk of a
serious HF event, (defined as HF leading to or prolonging a hospitalisation stay)
[149 (5.7%) (pioglitazone) vs 108 (4.1%) (placebo); HR 1.41 (95% CI 1.10, 1.80); p
= 0.007], mortality rates from HF were comparable to placebo-treated patients [25
(0.96%) (pioglitazone) vs 22 (0.84%) (placebo); HR 1.15 (95% CI 0.65, 2.03); p =
0.639] [256]. Further analyzing data from patients with a serious HF event, a follow-
up paper reported that subsequent all-cause mortality was proportionately lower with
pioglitazone, although the difference did not reach statistical significance [40
(26.8%) (pioglitazone) vs 37 (34.3%) (placebo); HR 0.71 (95% CI 0.454, 1.111); p =
0.1338] [261]. Significantly fewer such patients subsequently developed an event in
the secondary endpoint, comprising a composite of all-cause mortality, non-fatal
myocardial infarction and stroke [52 of 149 (34.9%) (pioglitazone) vs 51 of 108
(47.2%) (placebo); HR 0.64 (95% CI 0.436, 0.946); p = 0.025] [261]. Although
fewer pioglitazone-treated patients who had developed a serious HF event went on to
develop an event in the primary endpoint (composite of all-cause mortality, non-fatal
myocardial infarction [including silent myocardial infarction], stroke, acute coronary
syndrome, endovascular or surgical intervention in the coronary or leg arteries, and
amputation above the ankle), the difference did not reach statistical significance [71
of 149 (47.7%) (pioglitazone) vs 62 of 108 (57.4%) (placebo); HR 0.72 (95% CI
0.512, 1.013); p = 0.0593] [261]. Analyzing data from individuals who developed
43
serious HF, there were no significant differences between the treatment groups in the
median number of days spent in hospital (11 days in each treatment group) and in the
median number of days spent in intensive care/high dependency unit [4 days
(pioglitazone) vs 3 (placebo); p = 0.584] [261]. Most serious HF events resolved in
either group [77.9% (pioglitazone) vs 74.1% (placebo); p = 0.4822]. 22.8% of
pioglitazone-treated patients and 15.7% of placebo-treated patients had a serious HF
event that resulted in discontinuation from the study; this difference did not reach
statistical significance (p = 0.1602) [261]. Significant predictors of a serious HF
event on multivariate analysis were randomisation to pioglitazone [HR 1.53 (95% CI
1.183, 1.979)], age in years [HR 1.07 (95% CI 1.044, 1.087)], BMI [HR 1.03 (95%
CI 1.007, 1.061)], HbA1c of/exceeding 7.5% [HR 1.43 (95% CI 1.078, 1.895)],
diabetes duration of/exceeding 10 years vs less than 5 years [HR 1.53 (95% CI
1.107, 2.115)], creatinine > 130 μmol/L [HR 2.7 (95% CI 1.796, 4.061)], diuretic use
[HR 2.10 (95% CI 1.62, 2.732)], LDL cholesterol > 4 mmol/L vs < 3mmol/L [HR
1.74 (95% CI 1.245, 2.442)], and previous myocardial infarction [HR 1.70 (95% CI
1.317, 2.205)] [261]. Despite its usefulness, HF data from the PROactive trial need
to be interpreted with caution given the occurrence of potentially confounding
baseline differences between pioglitazone and placebo patients who developed
serious HF, namely higher baseline prevalence rates for percutaneous coronary
intervention/coronary artery bypass graft and transient ischaemic attacks. Such
patients were also characterized by a higher baseline systolic blood pressure (data
not shown) [261] – the latter having been reported as a predictor of HF events
complicating rosiglitazone therapy in the RECORD trial [262] Moreover, a higher
proportion of pioglitazone-treated patients who went on to develop serious HF had
been receiving nonsteroidal anti-inflammatory drugs [12% (pioglitazone) vs 1%
44
(placebo)] and loop diuretics [40% (pioglitazone) vs 30% (placebo)] at baseline,
albeit the reverse was true for baseline insulin therapy [36% (pioglitazone) vs 44%
(placebo)] [261]. Pioglitazone therapy was associated with significantly higher risk
for a non-serious HF event [6.4% (pioglitazone) vs 4.3% (placebo); p = 0.0007],
although a similar proportion of such patients progressed to a serious HF event [21
(pioglitazone) vs 20 (placebo)]. In keeping with the results of other studies, Erdmann
et al. reported significant differences in change in weight between the treatment
groups at the end of the study [+3.6 kg (pioglitazone) vs -0.4 kg (placebo);
p<0.0001]. Peripheral oedema occurring in the absence of HF occurred more
commonly in pioglitazone-treated patients [563 (21.6%) (pioglitazone) vs 341
(13.0%) (placebo); p < 0.0001] [261]. Oedema was more likely to precede a serious
HF event in pioglitazone-treated patients [51 out of 149 (34.2%) (pioglitazone) vs 26
out of 108 (24.1%) (placebo)]; this difference was not statistically compared between
allocation groups [261].
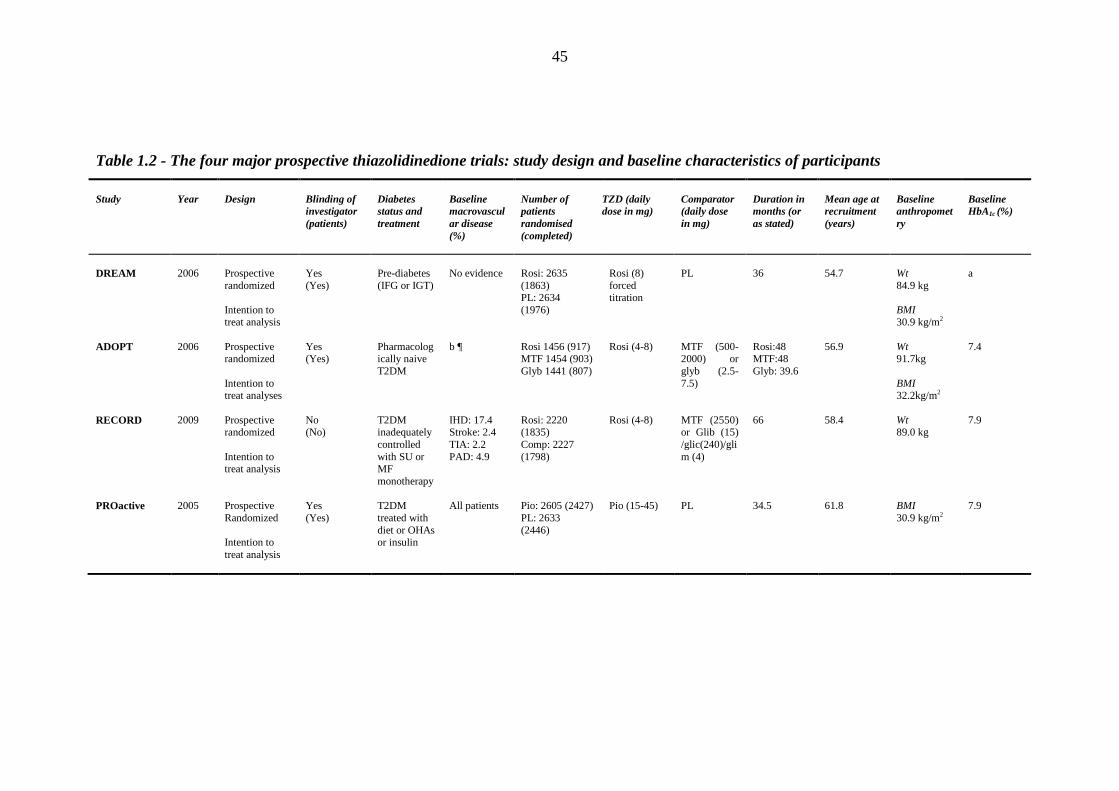
45
Table 1.2 - The four major prospective thiazolidinedione trials: study design and baseline characteristics of participants
Study
Year
Design
Blinding of investigator (patients)
Diabetes status and treatment
Baseline macrovascular disease (%)
Number of patients randomised (completed)
TZD (daily dose in mg)
Comparator (daily dose in mg)
Duration in months (or as stated)
Mean age at recruitment (years)
Baseline anthropometry
Baseline HbA1c (%)
DREAM ADOPT RECORD PROactive
2006 2006 2009 2005
Prospective randomized Intention to treat analysis Prospective randomized Intention to treat analyses Prospective randomized Intention to treat analysis Prospective Randomized Intention to treat analysis
Yes (Yes) Yes (Yes) No (No) Yes (Yes)
Pre-diabetes (IFG or IGT) Pharmacologically naive T2DM T2DM inadequately controlled with SU or MF monotherapy T2DM treated with diet or OHAs or insulin
No evidence b ¶ IHD: 17.4 Stroke: 2.4 TIA: 2.2 PAD: 4.9 All patients
Rosi: 2635 (1863) PL: 2634 (1976) Rosi 1456 (917) MTF 1454 (903) Glyb 1441 (807) Rosi: 2220 (1835) Comp: 2227 (1798) Pio: 2605 (2427) PL: 2633 (2446)
Rosi (8) forced titration Rosi (4-8) Rosi (4-8) Pio (15-45)
PL MTF (500-2000) or glyb (2.5-7.5) MTF (2550) or Glib (15) /glic(240)/glim (4) PL
36 Rosi:48 MTF:48 Glyb: 39.6 66 34.5
54.7 56.9 58.4 61.8
Wt 84.9 kg BMI 30.9 kg/m2 Wt 91.7kg BMI 32.2kg/m2 Wt 89.0 kg BMI 30.9 kg/m2
a 7.4 7.9 7.9
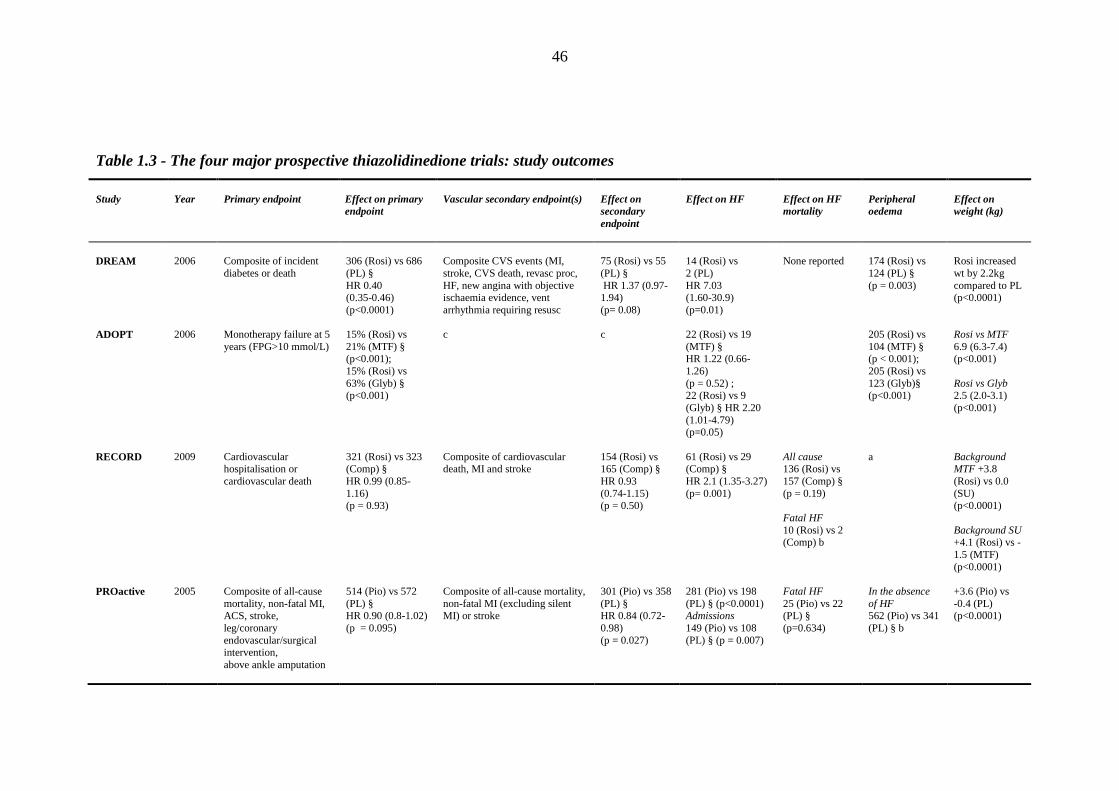
46
Table 1.3 - The four major prospective thiazolidinedione trials: study outcomes
Study
Year
Primary endpoint
Effect on primary endpoint
Vascular secondary endpoint(s)
Effect on secondary endpoint
Effect on HF
Effect on HF mortality
Peripheral oedema
Effect on weight (kg)
DREAM ADOPT RECORD PROactive
2006 2006 2009 2005
Composite of incident diabetes or death Monotherapy failure at 5 years (FPG>10 mmol/L) Cardiovascular hospitalisation or cardiovascular death Composite of all-cause mortality, non-fatal MI, ACS, stroke, leg/coronary endovascular/surgical intervention, above ankle amputation
306 (Rosi) vs 686 (PL) § HR 0.40 (0.35-0.46) (p<0.0001) 15% (Rosi) vs 21% (MTF) § (p<0.001); 15% (Rosi) vs 63% (Glyb) § (p<0.001) 321 (Rosi) vs 323 (Comp) § HR 0.99 (0.85-1.16) (p = 0.93) 514 (Pio) vs 572 (PL) § HR 0.90 (0.8-1.02) (p = 0.095)
Composite CVS events (MI, stroke, CVS death, revasc proc, HF, new angina with objective ischaemia evidence, vent arrhythmia requiring resusc c Composite of cardiovascular death, MI and stroke Composite of all-cause mortality, non-fatal MI (excluding silent MI) or stroke
75 (Rosi) vs 55 (PL) § HR 1.37 (0.97-1.94) (p= 0.08) c 154 (Rosi) vs 165 (Comp) § HR 0.93 (0.74-1.15) (p = 0.50) 301 (Pio) vs 358 (PL) § HR 0.84 (0.72-0.98) (p = 0.027)
14 (Rosi) vs 2 (PL) HR 7.03 (1.60-30.9) (p=0.01) 22 (Rosi) vs 19 (MTF) § HR 1.22 (0.66-1.26) (p = 0.52) ; 22 (Rosi) vs 9 (Glyb) § HR 2.20 (1.01-4.79) (p=0.05) 61 (Rosi) vs 29 (Comp) § HR 2.1 (1.35-3.27) (p= 0.001) 281 (Pio) vs 198 (PL) § (p<0.0001) Admissions 149 (Pio) vs 108 (PL) § (p = 0.007)
None reported All cause 136 (Rosi) vs 157 (Comp) § (p = 0.19) Fatal HF 10 (Rosi) vs 2 (Comp) b Fatal HF 25 (Pio) vs 22 (PL) § (p=0.634)
174 (Rosi) vs 124 (PL) § (p = 0.003) 205 (Rosi) vs 104 (MTF) § (p < 0.001); 205 (Rosi) vs 123 (Glyb)§ (p<0.001) a In the absence of HF 562 (Pio) vs 341 (PL) § b
Rosi increased wt by 2.2kg compared to PL (p<0.0001) Rosi vs MTF 6.9 (6.3-7.4) (p<0.001) Rosi vs Glyb 2.5 (2.0-3.1) (p<0.001) Background MTF +3.8 (Rosi) vs 0.0 (SU) (p<0.0001) Background SU +4.1 (Rosi) vs -1.5 (MTF) (p<0.0001) +3.6 (Pio) vs -0.4 (PL) (p<0.0001)
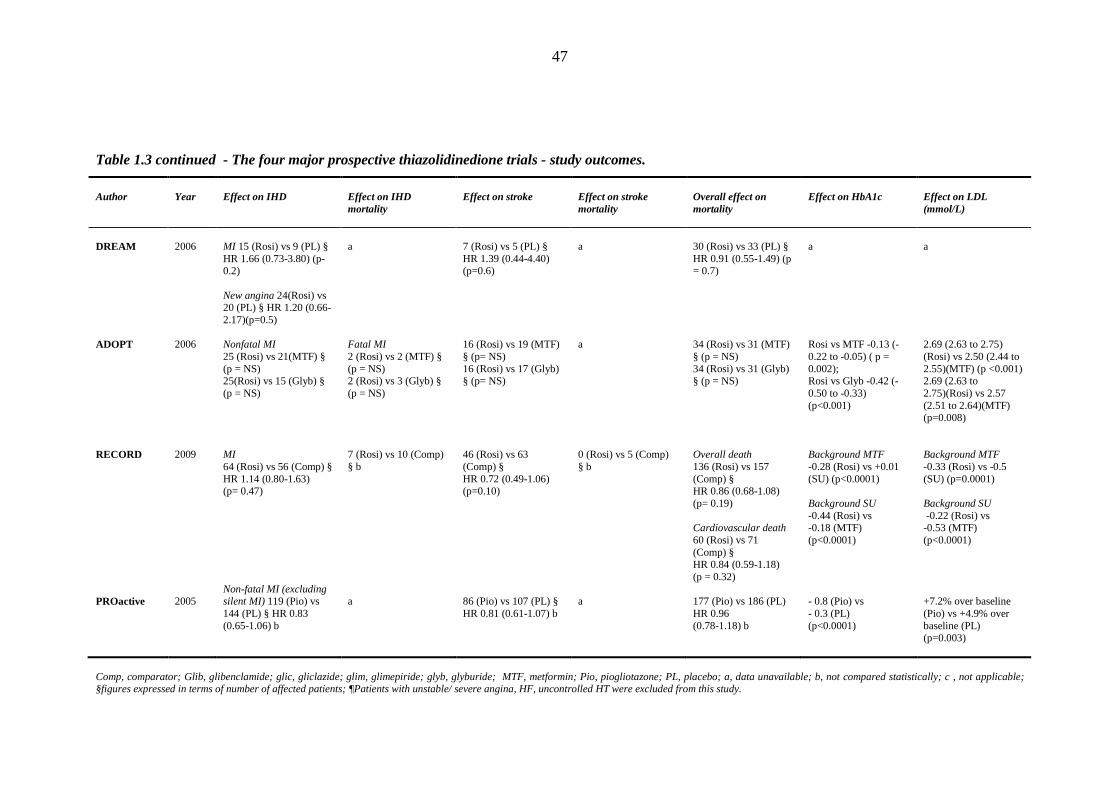
47
Table 1.3 continued - The four major prospective thiazolidinedione trials - study outcomes.
Author
Year
Effect on IHD
Effect on IHD mortality
Effect on stroke
Effect on stroke mortality
Overall effect on mortality
Effect on HbA1c
Effect on LDL (mmol/L)
DREAM ADOPT RECORD PROactive
2006 2006 2009 2005
MI 15 (Rosi) vs 9 (PL) § HR 1.66 (0.73-3.80) (p-0.2) New angina 24(Rosi) vs 20 (PL) § HR 1.20 (0.66-2.17)(p=0.5) Nonfatal MI 25 (Rosi) vs 21(MTF) § (p = NS) 25(Rosi) vs 15 (Glyb) § (p = NS) MI 64 (Rosi) vs 56 (Comp) § HR 1.14 (0.80-1.63) (p= 0.47) Non-fatal MI (excluding silent MI) 119 (Pio) vs 144 (PL) § HR 0.83 (0.65-1.06) b
a Fatal MI 2 (Rosi) vs 2 (MTF) § (p = NS) 2 (Rosi) vs 3 (Glyb) § (p = NS) 7 (Rosi) vs 10 (Comp) § b a
7 (Rosi) vs 5 (PL) § HR 1.39 (0.44-4.40) (p=0.6) 16 (Rosi) vs 19 (MTF) § (p= NS) 16 (Rosi) vs 17 (Glyb) § (p= NS) 46 (Rosi) vs 63 (Comp) § HR 0.72 (0.49-1.06) (p=0.10) 86 (Pio) vs 107 (PL) § HR 0.81 (0.61-1.07) b
a a 0 (Rosi) vs 5 (Comp) § b a
30 (Rosi) vs 33 (PL) § HR 0.91 (0.55-1.49) (p = 0.7) 34 (Rosi) vs 31 (MTF) § (p = NS) 34 (Rosi) vs 31 (Glyb) § (p = NS) Overall death 136 (Rosi) vs 157 (Comp) § HR 0.86 (0.68-1.08) (p= 0.19) Cardiovascular death 60 (Rosi) vs 71 (Comp) § HR 0.84 (0.59-1.18) (p = 0.32) 177 (Pio) vs 186 (PL) HR 0.96 (0.78-1.18) b
a Rosi vs MTF -0.13 (-0.22 to -0.05) ( p = 0.002); Rosi vs Glyb -0.42 (-0.50 to -0.33) (p<0.001) Background MTF -0.28 (Rosi) vs +0.01 (SU) (p<0.0001) Background SU -0.44 (Rosi) vs -0.18 (MTF) (p<0.0001) - 0.8 (Pio) vs - 0.3 (PL) (p<0.0001)
a 2.69 (2.63 to 2.75) (Rosi) vs 2.50 (2.44 to 2.55)(MTF) (p <0.001) 2.69 (2.63 to 2.75)(Rosi) vs 2.57 (2.51 to 2.64)(MTF) (p=0.008) Background MTF -0.33 (Rosi) vs -0.5 (SU) (p=0.0001) Background SU -0.22 (Rosi) vs -0.53 (MTF) (p<0.0001) +7.2% over baseline (Pio) vs +4.9% over baseline (PL) (p=0.003)
Comp, comparator; Glib, glibenclamide; glic, gliclazide; glim, glimepiride; glyb, glyburide; MTF, metformin; Pio, piogliotazone; PL, placebo; a, data unavailable; b, not compared statistically; c , not applicable; §figures expressed in terms of number of affected patients; ¶Patients with unstable/ severe angina, HF, uncontrolled HT were excluded from this study.
48
1.8.3 Meta-analyses and retrospective case control studies
A number of meta-analyses and retrospective studies have sought to explore the
relationship between thiazolidinediones and cardiovascular disease (table 1.4).
Generally speaking, these studies have confirmed the association of
thiazolidinediones with HF.
A meta-analysis of data from 20191 patients recruited into 19 randomised controlled
double blind studies analyzed congestive heart failure and cardiovascular mortality
outcomes for rosiglitazone-treated (5 trials) and pioglitazone-treated (2 trials)
patients [263]. Comparing with controls, thiazolidinedione-treated patients were at
an increased risk of HF [2.3% vs 1.4%; RR 1.72 (95% CI 1.21, 2.42); p < 0.002].
There were no significant differences in cardiovascular mortality between treatment
groups. Lago et al. did not report data for oedema and weight [263].
In a meta-analysis of 19 studies involving 16390 patients randomised to treatment
with pioglitazone or placebo/active comparator, Lincoff et al. reported significantly
higher rates of serious HF for pioglitazone-treated patients [2.34% vs 1.77%; HR
1.41 (95% CI 1.14, 1.76); p = 0.002] [264]. However, pioglitazone therapy conferred
a significant reduction in the composite endpoint of death, myocardial infarction and
stroke compared to a placebo/active comparator [4.4 % (pioglitazone) vs 5.7%
(placebo/active comparator); HR 0.82 (95% CI 0.72, 0.94); p = 0.005], despite the
absence of a similar relationship for each individual outcome [264]. An earlier
Cochrane review of the safety profile of pioglitazone did not yield any meta-analysis
of HF related data [265]. Analyzing randomized controlled trials lasting at least 24
49
weeks, the authors could only retrieve suitable data from the PROactive study, the
results of which have been discussed earlier. However, the authors pointed out that
data from the recruited studies showed that pioglitazone therapy was associated with
a weight increase of up to 3.9 kg and a BMI rise of up to 1.5 kg/m2. Moreover,
pioglitazone was reported to increase the risk of significant oedema almost threefold
[RR 2.86 (95% CI 2.14, 3.18); p < 0.00001] [265].
A meta-analysis by Clar et al. compared glycaemic control, hypoglycaemia, weight
change, lipids and adverse events for studies recruiting patients randomized to
treatment with insulin with/out adjunct pioglitazone [266]. Although adjunct
pioglitazone therapy was again associated with a greater increase in body weight (1.4
to 4.4 kg for adjunct pioglitazone vs -0.04 to +4.9 kg for insulin-only groups), there
was insufficient data for a formal meta-analysis of this relationship. Similarly, the
investigators reported that mild to moderate oedema seemed to be more commonly
reported for pioglitazone-treated patients, although p values were rarely reported
[266]. Formal reports of HF were sparse, largely reflecting the fact that most studies
were not sufficiently powered to investigate cardiovascular adverse outcomes. The
authors were however able to conclude that adjunct pioglitazone therapy afforded
beneficial effects on glycaemic control [a mean HbA1c reduction of 0.58% (95% CI
-0.70, -0.46); p < 0.001] albeit at the expense of a greater risk of hypoglycaemia [RR
1.40 (95% CI 1.14, 1.73); p < 0.002] [266].
Both Singh et al. [149] and Richter et al. [267] analyzed data for rosiglitazone-
treated patients. Focussing on randomized controlled studies of at least 24 weeks
duration, the latter reported a rosiglitazone-associated increased risk of oedema [OR
50
2.27 (95% CI 1.83, 2.81); p < 0.001] [267]. Given that this meta-analysis showed
moderate heterogeneity, the authors carried out a sensitivity analysis excluding the
largest study at the time (ADOPT [154]); this reported that rosiglitazone therapy is
associated with an OR for oedema of 6.04 (95% CI 3.31, 11.2) (p < 0.00001) [267].
Richter et al. also reported that rosiglitazone therapy was associated with a body
weight increase of up to 5 kg in 11 studies and a BMI increase of up to 1.5 kg/m2 in
four studies [267]. The authors concluded that only the ADOPT study [154] yielded
sufficient data for HF, diabetes-related outcomes, and overall mortality [267]. This
contrasts with the approach taken by Singh et al. [149]. Analyzing data from
randomized controlled studies which included at least 12 months of rosiglitazone
therapy follow-up, the authors concluded that rosiglitazone therapy is associated
with an increased risk of HF [1.59% of rosiglitazone-treated patients vs 0.79% of
control-treated patients; RR 2.09 (95% CI 1.52, 2.88); p < 0.001] and myocardial
infarction [1.46% of rosiglitazone-treated patients vs 1.05% of control-treated
patients; RR 1.42 (95% CI 1.06, 1.91); p = 0.02]. The meta-analysis additionally
reported no difference in cardiovascular mortality between rosiglitazone and control-
treated patients [149]; the latter result generally agrees with that reported by the two
largest prospective rosiglitazone studies to date (ADOPT [154] and RECORD[153]).
Despite their undisputed relevance in secondary medical research, meta-analyses
need to be interpreted with caution, particularly as the resulting data are bound to
guide patient management. An interesting study by Friedrich et al. showed that
different methodological approaches to the rosiglitazone cardiovascular safety
related meta-analyses can yield increased or decreased risks that are statistically
significant or not significant at the p = 0.05 level [268]. An editorial by Farkouh and
51
Fouster maintained that p values hovering around 0.05 should be regarded with
extreme caution. Indeed, some experts believe that values of 0.01 or lower should be
adopted [269]. It is widely accepted that the reliability of a meta-analysis is linked to
the overall number of events accrued. This is particularly of relevance when the
meta-analysis includes data from predominantly small studies, as is the case with a
considerable number of thiazolidinedione-related studies. In conclusion, while meta-
analysis generates valuable information related to the direction of treatment effects,
the mainstay of evidence based medicine relies on the outcomes of large, sufficiently
powered, well-designed, randomized controlled studies [269].
In a retrospective nested case control analysis of patients on a health care database in
Ontario (Canada), Lipscombe et al. studied the association between
thiazolidinedione therapy and congestive HF, myocardial infarction and mortality
among T2DM patients aged 66 years or older, by comparing outcomes with similarly
aged individuals on other oral hypoglycaemic agents [270]. Analyzing emergency
department visit and hospital admission data, the authors concluded that treatment
with thiazolidinediones was associated with increased risk of HF, and that the risk
was higher for those on monotherapy [adjusted RR 1.60 (95% CI 1.21, 2.10); p <
0.001] than those on combination therapy (ie thiazolodinediones combined with
other oral hypoglycaemic agents) [adjusted RR 1.31 (95% CI 1.17, 1.47); p <
0.001]. Although the authors suggested that the increased risk was limited to patients
treated with rosiglitazone, both as monotherapy [adjusted RR 1.98 (95% CI 1.44,
2.72); p < 0.001] or as part of combination therapy [adjusted RR 1.43 (95% CI 1.25,
1.63); p < 0.001], they indicated that their study may have been not sufficiently
powered to identify a similar association for pioglitazone-treated individuals. Past
52
thiazolidinedione use was also associated with an increased risk of HF [adjusted RR
for rosiglitazone 1.87 (95% CI 1.53, 2.28); p < 0.001]; the authors ascribed this to
residual effects of the drug or to discontinuation in individuals with a past history of
HF. While thiazolidinedione monotherapy was also associated with an increased risk
of acute myocardial infarction [adjusted RR 1.40 (95% CI 1.05, 1.86), p = 0.02] and
death [adjusted RR 1.29 (95% CI 1.02, 1.62); p = 0.03], combination therapy was
only associated with an increased risk of the latter [adjusted RR 1.24 (95% CI 1.11,
1.39); p < 0.001]. As for the risk of HF, these associations were restricted to
rosiglitazone-treated individuals.
In a retrospective cohort study of 91251 diabetes patients, Tzoulaki et al. analyzed
the association of oral anthyperglycaemic pharmacotherapy with incident myocardial
infarction (n = 3588), incident congestive HF (n = 6900) and death (n = 18548)
[271]. Individually, rosiglitazone monotherapy, rosiglitazone combination therapy
and pioglitazone therapy (monotherapy + combination therapy) did not show any
significant association with incident myocardial infarction when compared with
metformin.monotherapy, irrespective of the Cox regression model used. Neither
thiazolidinedione was associated with a significantly increased risk of incident HF in
the fully adjusted model, irrespective of its use as monotherapy or combination
therapy. Pioglitazone therapy (alone + combined) was associated with a reduced risk
of all cause mortality compared with metformin [HR 0.69 (95% CI 0.49, 0.98); p =
0.024] in the fully adjusted model. The authors compared the cardiovascular risks of
the two thiazolidinedione drugs, reporting no significant risk differences for
myocardial infarction (albeit a trend towards a higher risk with rosiglitazone).
Although Tzoulaki et al. suggest that rosiglitazone is associated with a higher risk of
53
all-cause mortality, the reported 95% confidence intervals (CI) span unity in the fully
adjusted model [HR 1.34 (95% CI 0.90, 1.97)] [271], rendering the conclusion
dubious. While the overall results are reassuring, the thiazolidinedione-related data
borne out of this retrospective study must be interpreted with caution – indeed the
authors acknowledge the possibility of false negative results owing to a marked
reduction in sample size in the fully adjusted model, such that each
thiazolidinedione-associated statistical outcome was based on the analysis of less
than 90 incident cases.
A retrospective analysis of electronic health data from a cohort of 20450 T2DM
patients reported no differences in risk of CHF (defined via ICD-9 code and/or a
post-baseline left ventricular ejection fraction <40%) between initial rosiglitazone
monotherapy and initial metformin monotherapy, while suggesting an increased risk
with initial pioglitazone monotherapy [HR 1.38 (95% CI 1.0, 1.90); p = 0.05] [272].
The former finding is consistent with the results of ADOPT [154]. There was no
difference in CHF risk between initial rosiglitazone therapy and initial sulphonylurea
therapy. Similarly, Pantalone et al. did not report differences between initial
pioglitazone monotherapy and initial sulphonylurea therapy [272]. The equivalence
of CHF risk for initial rosiglitazone and sulphonylurea monotherapy contrast with
those reported in ADOPT [154]. Moreover, Pantalone et al. reported that initial
metformin monotherapy was associated with a 24% reduction in the risk of CHF
compared with initial sulphonylurea monotherapy [HR 0.76 (95% CI 0.64, 0.91); p =
0.003] [272].
54
Another retrospective cohort study sought to investigate the incidence of CHF
among male T2DM patients seen in the South Central U.S. Veterans Administration
health care network between 1st October 1996 and 31st December 2004 (n = 3956)
[273]. Bivariate analysis showed that the risk of CHF was increased by a history of
peripheral vascular disease (p < 0.0001) and higher levels of BMI (p < 0.0001),
HbA1c (p < 0.0001), low-density lipoprotein (p = 0.0002), triglycerides (p < 0.0001)
and systolic blood pressure (p < 0.0001). Prescription of a higher total number of
glucose lowering agents (p < 0.0001), prescription of metformin (p<0.0001),
exposure to HMG-CoA reductase inhibitors (p < 0.0001) and (surprisingly)
treatment with thiazolidinediones (p < 0.0001) was associated with a lower risk of
incident CHF. After adjustment for multiple cardiac risk factors, prescription of
thiazolidinediones remained a lower risk factor for incident CHF [HR 0.69 (95% CI
0.60, 0.79)] [273]. In addition to the limitations imposed by a retrospective design in
which treatment assignment was neither random nor blinded, the investigators
acknowledged that the results of this study may have been influenced by prescribing
practice, such that thiazolidinedione exposure was limited among patients perceived
to be at an increased risk of HF. Additionally, Toprani et al. had no access to data
showing duration of diabetes, length of treatment with thiazolidinediones and the
reason for drug withdrawal. The latter may have biased study outcomes if patients
developing signs of early fluid retention were withdrawn from thiazolidinedione
therapy before they developed CHF as defined in the study. Moreover, a diagnosis of
HF based on ICD-9 criteria may have been based on the presence of oedema or
dyspnoea rather than a formal assessment of cardiac function. Finally, the study was
carried out in male veterans (mean age 61.5 years), limiting extrapolation of results
to female patients, and individuals in other age groups.
55
Habib et al. published a large retrospective cohort study of 39736 T2DM patients
aged 66 years or older who were prescribed thiazolidinedione therapy between 1st
April 2002 and 31st March 2008 yielded comparative data on incident HF among
rosiglitazone and pioglitazone-treated patients [274]. Adjusting for demographic and
clinical factors and drug doses, pioglitazone-treated patients were reported to be at a
lower risk of developing the composite outcome of death or hospital admission for
either acute myocardial infarction or HF than their rosiglitazone-treated counterparts
[adjusted HR 0.83 (95% CI 0.76, 0.90)]. Pioglitazone therapy was also associated
with lower rates of incident congestive HF and all-cause death [adjusted HR 0.77
(95% CI 0.69, 0.87) for HF; adjusted HR 0.86 (95% CI 0.75, 0.98) for mortality],
despite no significant differences in the risk for myocardial infarction [adjusted HR
0.95 (95% CI 0.81, 1.11)]. Compared with high dose rosiglitazone, low dose
rosiglitazone was not associated with a significant lower risk of the composite
outcome [adjusted HR 0.94 (95% CI 0.83, 1.07)], whereas both low dose [adjusted
HR 0.83 (95% CI 0.70, 0.97)] and high dose pioglitazone [adjusted HR 0.76 (95%
CI 0.66, 0.88)] were [274].
Using time-updated propensity score adjusted analysis (modelling the probability of
being treated with a thiazolidinedione), Habib et al. examined data from 19171
T2DM patients treated with oral glucose lowering agents and followed longitudinally
within a US health system between 1st January 2000 and 1st December 2006 [275].
The authors compared rates of hospitalization for congestive HF between
thiazolidinedione-treated patients and those not exposed to these drugs, concluding
that the former were at a greater risk of CHF hospitalization [adjusted HR with
56
propensity adjustment (PA) 1.24 (95% CI 1.07, 1.44)] but a significantly lower risk
of all-cause mortality [adjusted HR with PA 0.69 (95% CI 0.52, 0.90)].
Thiazolidinedione use was not associated with an increased risk of the composite
endpoint of fatal and nonfatal acute myocardial infarction [adjusted HR with PA
0.92 (95% CI 0.73, 1.17)]. Similarly, thiazolidinedione exposure did not increase the
risk of any of the other secondary outcomes, namely cerebrovascular accidents
/transient ischaemic attacks [adjusted HR with PA 0.97 (95% CI 0.79, 1.20)] or
combined coronary heart disease events [adjusted HR with PA 0.92 (95% CI 0.77,
1.10)]. Rosiglitazone exposure was associated with an increased risk of CHF
hospitalization [adjusted HR with PA 1.65 (95% CI 1.25, 2.19)] but no significant
effects on acute myocardial infarction [adjusted HR with PA 1.06 (95% CI 0.66,
1.70)], cerebrovascular events/transient ischaemic attacks [adjusted HR with PA 1.20
(95% CI 0.79, 1.82)], combined coronary heart disease events [(adjusted HR with
PA 1.22 (95% CI 0.91, 1.63)] or all-cause mortality [adjusted HR with PA 0.91
(95% CI 0.57, 1.48)]. Pioglitazone treatment carried an increased risk of CHF
hospitalization when analysed without propensity adjustment [adjusted HR 1.25
(95% CI 1.05, 1.50)]; this risk disappeared once the probability of being treated with
pioglitazone was factored into the model [adjusted HR with PA 1.14 (95% CI 0.96,
1.37]. Pioglitazone was associated with a reduction in all-cause mortality [adjusted
HR with PA 0.60 (95% CI 0.42, 0.96)], but no significant effects on acute
myocardial infarction [adjusted HR with PA 0.91 (95% CI 0.69, 1.21)],
cerebrovascular events/transient ischaemic attacks [adjusted HR with PA 0.93 (95%
CI 0.72, 1.20)] or combined coronary heart disease events [adjusted HR with PA
0.86 (95% CI 0.69, 1.06)]. Comparing outcomes between pioglitazone- and
rosiglitazone-treated patients, Habib et al. concluded that exposure to pioglitazone is
57
generally associated with a lower risk than rosiglitazone for all the above outcomes,
although the difference only reached statistical significance for CHF hospitalizations
(p = 0.013) and combined coronary heart disease events (p = 0.048) [275].
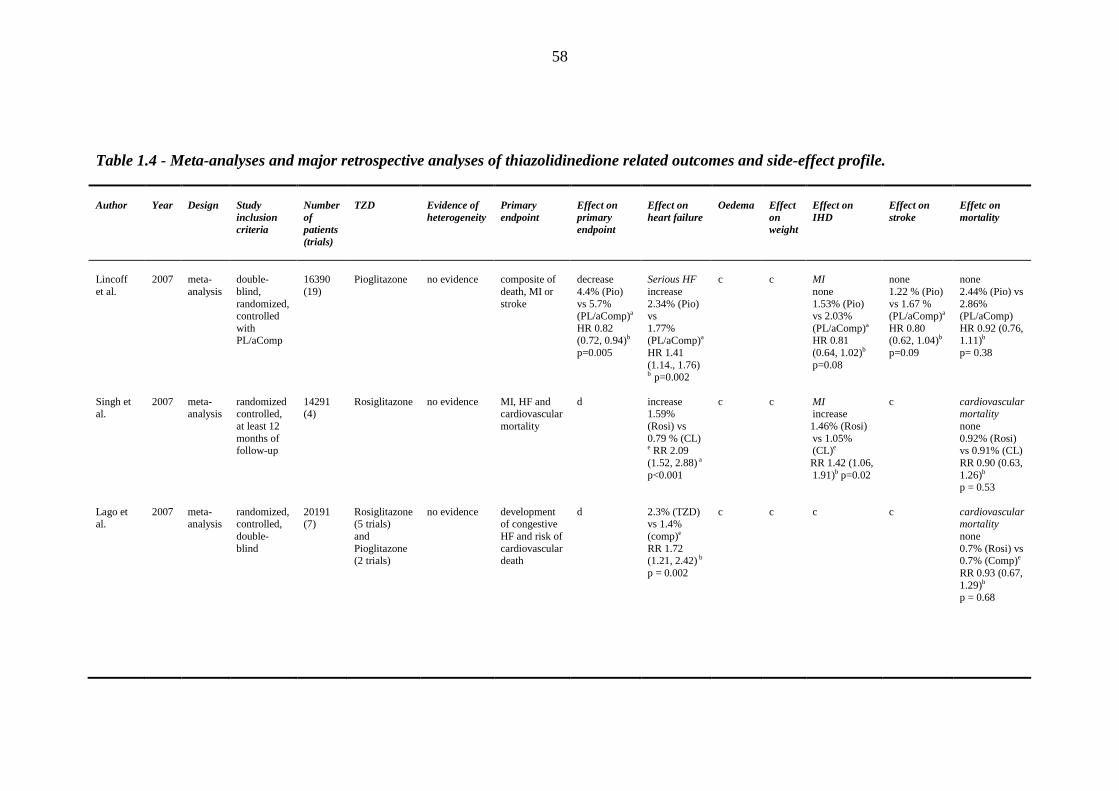
58
Table 1.4 - Meta-analyses and major retrospective analyses of thiazolidinedione related outcomes and side-effect profile.
Author
Year
Design
Study inclusion criteria
Number of patients (trials)
TZD
Evidence of heterogeneity
Primary endpoint
Effect on primary endpoint
Effect on heart failure
Oedema
Effect on weight
Effect on IHD
Effect on stroke
Effetc on mortality
Lincoff et al. Singh et al. Lago et al.
2007 2007 2007
meta-analysis meta-analysis meta-analysis
double-blind, randomized, controlled with PL/aComp randomized controlled, at least 12 months of follow-up randomized, controlled, double-blind
16390 (19) 14291 (4) 20191 (7)
Pioglitazone Rosiglitazone Rosiglitazone (5 trials) and Pioglitazone (2 trials)
no evidence no evidence no evidence
composite of death, MI or stroke MI, HF and cardiovascular mortality development of congestive HF and risk of cardiovascular death
decrease 4.4% (Pio) vs 5.7% (PL/aComp)a HR 0.82 (0.72, 0.94)b p=0.005
d d
Serious HF increase 2.34% (Pio) vs 1.77% (PL/aComp)a HR 1.41 (1.14., 1.76) b p=0.002
increase 1.59% (Rosi) vs 0.79 % (CL) e RR 2.09 (1.52, 2.88) a p<0.001 2.3% (TZD) vs 1.4% (comp)e RR 1.72 (1.21, 2.42) b p = 0.002
c c c
c c c
MI none 1.53% (Pio) vs 2.03% (PL/aComp)a HR 0.81 (0.64, 1.02)b p=0.08 MI increase 1.46% (Rosi) vs 1.05% (CL)e RR 1.42 (1.06, 1.91)b p=0.02
c
none 1.22 % (Pio) vs 1.67 % (PL/aComp)a HR 0.80 (0.62, 1.04)b p=0.09
c c
none 2.44% (Pio) vs 2.86% (PL/aComp) HR 0.92 (0.76, 1.11)b p= 0.38 cardiovascular mortality none 0.92% (Rosi) vs 0.91% (CL) RR 0.90 (0.63, 1.26)b
p = 0.53 cardiovascular mortality none 0.7% (Rosi) vs 0.7% (Comp)e RR 0.93 (0.67, 1.29)b
p = 0.68
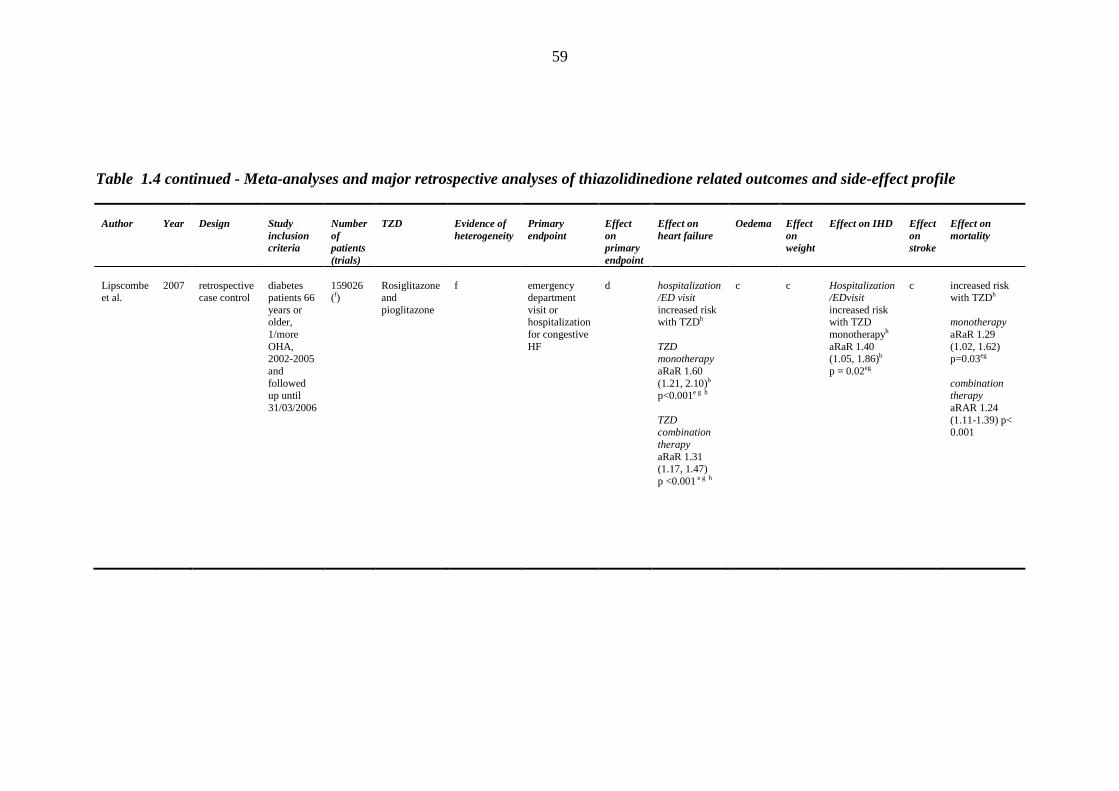
59
Table 1.4 continued - Meta-analyses and major retrospective analyses of thiazolidinedione related outcomes and side-effect profile
Author
Year
Design
Study inclusion criteria
Number of patients (trials)
TZD
Evidence of heterogeneity
Primary endpoint
Effect on primary endpoint
Effect on heart failure
Oedema
Effect on weight
Effect on IHD
Effect on stroke
Effect on mortality
Lipscombe et al.
2007
retrospective case control
diabetes patients 66 years or older, 1/more OHA, 2002-2005 and followed up until 31/03/2006
159026 (f)
Rosiglitazone and pioglitazone
f
emergency department visit or hospitalization for congestive HF
d
hospitalization /ED visit increased risk with TZDh
TZD monotherapy aRaR 1.60 (1.21, 2.10)b
p<0.001e g h
TZD combination therapy
aRaR 1.31 (1.17, 1.47) p <0.001 e g h
c
c
Hospitalization /EDvisit increased risk with TZD monotherapyh aRaR 1.40 (1.05, 1.86)b p = 0.02eg
c
increased risk with TZDh monotherapy aRaR 1.29 (1.02, 1.62) p=0.03eg
combination therapy aRAR 1.24 (1.11-1.39) p< 0.001
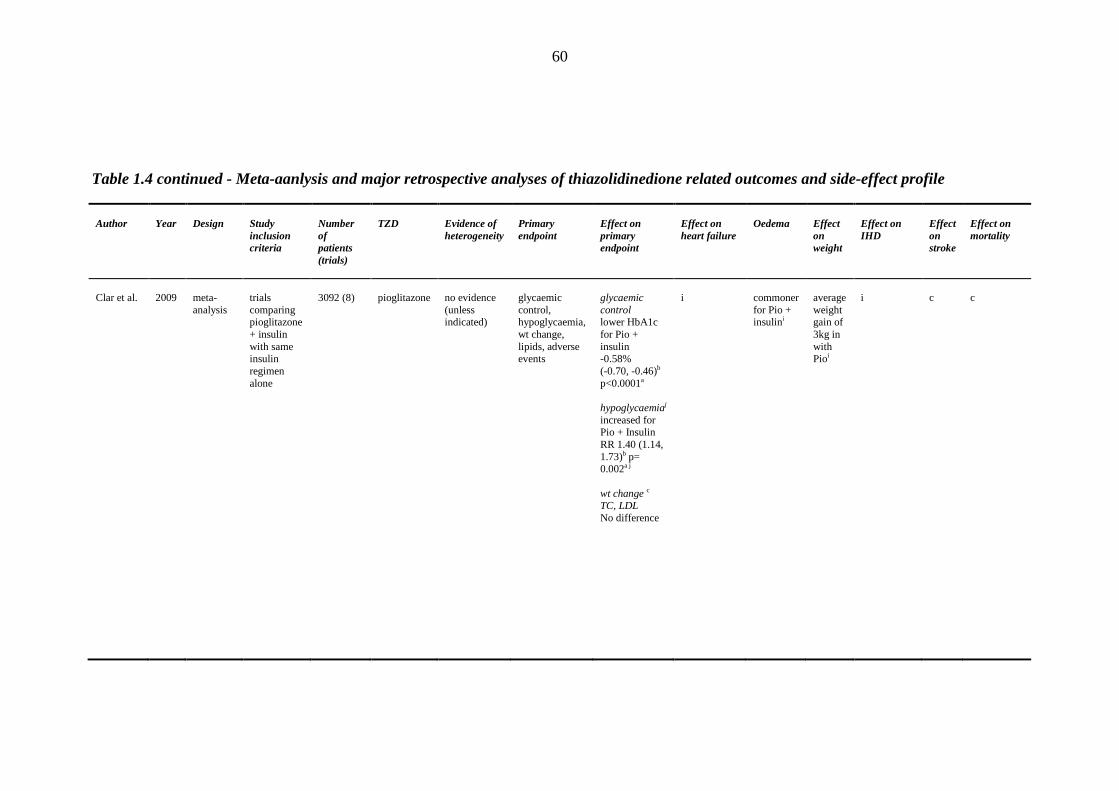
60
Table 1.4 continued - Meta-aanlysis and major retrospective analyses of thiazolidinedione related outcomes and side-effect profile
Author
Year
Design
Study inclusion criteria
Number of patients (trials)
TZD
Evidence of heterogeneity
Primary endpoint
Effect on primary endpoint
Effect on heart failure
Oedema
Effect on weight
Effect on IHD
Effect on stroke
Effect on mortality
Clar et al.
2009
meta-analysis
trials comparing pioglitazone + insulin with same insulin regimen alone
3092 (8)
pioglitazone
no evidence (unless indicated)
glycaemic control, hypoglycaemia, wt change, lipids, adverse events
glycaemic control lower HbA1c for Pio + insulin -0.58% (-0.70, -0.46)b p<0.0001a hypoglycaemiaj
increased for Pio + Insulin RR 1.40 (1.14, 1.73)b p= 0.002a j wt change c TC, LDL No difference
i
commoner for Pio + insulini
average weight gain of 3kg in with Pioi
i
c
c
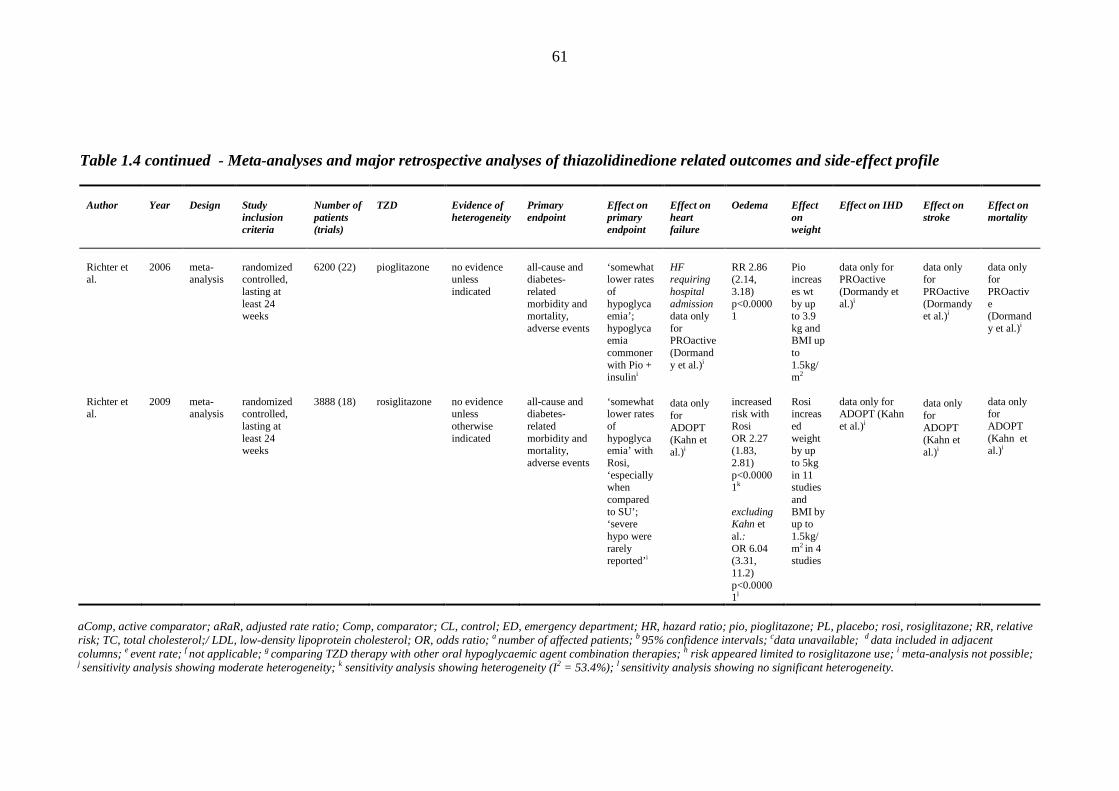
61
Table 1.4 continued - Meta-analyses and major retrospective analyses of thiazolidinedione related outcomes and side-effect profile
Author
Year
Design
Study inclusion criteria
Number of patients (trials)
TZD
Evidence of heterogeneity
Primary endpoint
Effect on primary endpoint
Effect on heart failure
Oedema
Effect on weight
Effect on IHD
Effect on stroke
Effect on mortality
Richter et al. Richter et al.
2006 2009
meta-analysis meta-analysis
randomized controlled, lasting at least 24 weeks randomized controlled, lasting at least 24 weeks
6200 (22) 3888 (18)
pioglitazone rosiglitazone
no evidence unless indicated no evidence unless otherwise indicated
all-cause and diabetes-related morbidity and mortality, adverse events all-cause and diabetes-related morbidity and mortality, adverse events
‘somewhat lower rates of hypoglycaemia’; hypoglycaemia commoner with Pio + insulini
‘somewhat lower rates of hypoglycaemia’ with Rosi, ‘especially when compared to SU’; ‘severe hypo were rarely reported’i
HF requiring hospital admission data only for PROactive (Dormandy et al.)i
data only for ADOPT (Kahn et al.)i
RR 2.86 (2.14, 3.18) p<0.00001
increased risk with Rosi OR 2.27 (1.83, 2.81) p<0.00001k excluding Kahn et al.: OR 6.04 (3.31, 11.2) p<0.00001l
Pio increases wt by up to 3.9 kg and BMI up to 1.5kg/m2 Rosi increased weight by up to 5kg in 11 studies and BMI by up to 1.5kg/m2 in 4 studies
data only for PROactive (Dormandy et al.)i
data only for ADOPT (Kahn et al.)i
data only for PROactive (Dormandy et al.)i
data only for ADOPT (Kahn et al.)i
data only for PROactive (Dormandy et al.)i
data only for ADOPT (Kahn et al.)i
aComp, active comparator; aRaR, adjusted rate ratio; Comp, comparator; CL, control; ED, emergency department; HR, hazard ratio; pio, pioglitazone; PL, placebo; rosi, rosiglitazone; RR, relative risk; TC, total cholesterol;/ LDL, low-density lipoprotein cholesterol; OR, odds ratio; a number of affected patients; b 95% confidence intervals; cdata unavailable; d data included in adjacent columns; e event rate; f not applicable; g comparing TZD therapy with other oral hypoglycaemic agent combination therapies; h risk appeared limited to rosiglitazone use; i meta-analysis not possible; j sensitivity analysis showing moderate heterogeneity; k sensitivity analysis showing heterogeneity (I2 = 53.4%); l sensitivity analysis showing no significant heterogeneity.
62
1.9 Association of comparator 'first and second line' oral glucose lowering
agents (metformin, sulphonylureas) with incident heart failure
Evidence supporting or refuting a possible association between other glucose
lowering agents and incident HF is surpisingly sparse. Although the US Food and
Drug Administration relatively recently removed its contraindication to prescribing
metformin in patients with HF, it strongly cautions its use in this setting. This
clinical concern is likely to account for an absence of randomised control trials
exploring outcomes in metformin-treated T2DM individuals with, or prone to HF.
The only prospective data exploring incident HF events in metformin-treated patients
were provided by the RECORD study [153]. Three retrospective studies recruiting
patients from a US register of T2DM patients shed valuable information in this
regard. Nichols et al. reported that incident congestive HF rates were lowest in
regimens that included metformin and highest in those that included insulin.
Compared with patients on metformin monotherapy (typical ‘early stage’ diabetes),
adjusted incident congestive HF rates (per 1000 patient years) were 32% higher
among patients treated with sulphonylurea monotherapy, 28% higher among patients
on metformin-sulphonylurea combination therapy, and 2.6 times higher in patients
on insulin monotherapy [276]. These findings are consistent with those from an
earlier retrospective study [277]. In contrast, use of metformin or sulphonylureas did
not influence incident congestive HF rates over a follow-up period of 72 months,
unlike insulin [HR 1.25 (95% CI 1.06, 1.48); p < 0.001] [239]. Analyzing data from
6900 incident cases of congestive HF occurring in 91521 patients with T2DM who
were followed up for a mean period of 7.1 years, Tzoulaki et al. reported that,
compared with metformin monotherapy, second generaton sulphonylurea
63
monotherapy was associated with an 18% to 30% excess risk of new onset
congestive HF in adjusted Cox regression models. Rosiglitazone combination
therapy (with meformin and/or sulphonylurea) was associated with an increased risk
of incident HF compared with individuals prescribed metformin monotherapy in two
Cox regression models. Neither sulphonylureas (first or second generation) nor
thiazolidinediones rosiglitazone or pioglitazone) emerged as significant risk factors
for new onset congestive HF in a fully adjusted model [271].
The effect of duration of therapy on incident HF rates was investigated by Maru and
colleagues. Analyzing data from 25, 690 newly diagnosed T2DM patients registered
in the UK General Practice Research Database, glucose lowering agent use
(metformin or sulphonylurea or insulin) within the first year of diagnosis carried a
4.75 fold (hazard ratio) increased risk of incident HF compared with their drug free
counterparts. This risk did not persist beyond the first year (mean follow-up 2.5
years) and seemed unrelated to type-specific drug exposures [278].
A retrospective study recruiting 5631 T2DM patients newly treated with a single oral
glucose lowering agent and followed up for almost five years further supported
evidence for an association between high sulphonylureas and incident HF [adjusted
HR 1.24 (95% CI 1.01, 1.54)]. Additionally, McAlister and colleagues reported that
high dose sulphonylurea therapy was more likely to result in incident HF [HR 1.38
(95% CI 1.20, 1.60)] than low dose sulphonylureas. No such association existed for
metformin users [279].
64
1.10 Use of comparator 'first and second' line oral glucose lowering agents
(metformin, sulphonylureas) in patients with established heart failure
Compared with data for incident HF, a larger number of studies (mostly
observational) looked at additional HF events and outcomes in patients with T2DM
and established HF. Using propensity score matched samples, Aguilar et al. reported
that metformin therapy was associated with lower mortality rates [HR 0.76 (95% CI
0.63, 0.92)], albeit no effect on hospitalization rates [280]. A retrospective analysis
of data from 12 272 HF patients who were newly prescribed with oral glucose
lowering agents for T2DM reported that both metforin monotherapy and metformin-
sulphonylurea combination therapy were associated with fewer deaths than
sulphonylurea monotherapy [adjusted HR 0.70 (95% CI 0.54, 0.91) and 0.61 (95%
CI 0.52, 0.72) respectively] [281]. A reduction in the composite of all-cause deaths
or all-cause hospitalizations was also observed [HR 0.83 (95% CI 0.70, 0.99) for
metformin monotherapy vs sulphonylurea monotherapy; HR 0.86 (95% CI 0.77,
0.96) for metformin monotherapy vs metformin-sulphonylurea combination
therapy]. Risks of all-cause death, all-cause hospitalization and the composite (all-
cause hospitalization or all-cause death) seemingly increased at study end (mean ±
SD duration of follow-up 2.5 ± 2 years) compared with results at one year [281].
These results generally agree with those reported by Andersson et al. in a cohort of
Danish patients treated with metformin, sulphonylureas or insulin in the setting of
established HF. Using sulphonylurea monotherapy as a reference, these authors
reported that metformin monotherapy carries the lowest mortality risk in this setting
[adjusted HR 0.85 (95% CI 0.75, 0.98)] followed by metformin-sulphonylurea
combination therapy [adjusted HR 0.89 (95% CI 0.82, 0.96)] and insulin [adjusted
65
HR 1.14 (95% CI 1.06, 1.20)] [282]. A retrospective review of 16 417 T2DM with
established HF showed that treatment with both metformin [adjusted HR 0.86 (95%
CI 0.78, 0.97)] and thiazolidinediones [adjusted HR 0.87 (95% CI 0.80, 0.94)] was
associated with a lower risk of death compared with patients not treated with an
insulin sensitizer (sulphonylurea or insulin). Readmission with HF was more likely
in patients treated with a thiazolidinedione [adjusted HR 1.06 (95% CI 1.00, 1.09)]
and less likely in patients on metformin [adjusted HR 0.92 (95% CI 0.86, 0.99)]
[283].
A systematic review and meta-analyses of randomised studies or controlled trials
revealed that metformin significantly reduced all cause mortality in two studies [HR
0.86 (95% CI 0.78, 0.97)] compared with other anitdiabetic drugs and insulin; a
similar trend was seen in a third study. Metformin was also associated with reduced
all cause hospital admissions at one year compared to other treatments [pooled OR
0.85 (95% CI 0.76, 0.95); p = 0.004] [284]. In 1633 patients newly diagnosed with
T2DM and HF, both metformin monotherapy [adjusted OR 0.65 (95% CI 0.48,
0.87)] and metformin combined with/out other agents [adjusted OR 0.72 (95% CI
0.59, 0.90)] were associated with reduced mortality rates compared with antidiabetic
treatment naïve patients [285].
In conclusion, both prospective and retrospective studies support an association
between thiazolidinediones and oedema/heart failure. Absolute rates may be higher
in the setting of cardiovsacular disease, and are possibly influenced by the
concurrent use of other glucose lowering pharmacotherapies.
66
Section III - Mechanisms underpinning fluid retention following
thiazolidinedione therapy
While the association between thiazolidinedione therapy, cardiac failure and fluid
retention has been demonstrated by several prospective and retrospective
studies/meta-analyses, the pathophysiological mechanisms underlying these
complications remain unclear. It is clear that the current paucity of research data in
this field impairs the identification of any predisposing factors of thiazolidinedione
induced fluid overload, an issue which hampers the development of clearer clinical
guidelines governing their use. Moreover, concerns regarding the cardiovascular
safety profile of rosiglitazone, initially reported in Nissen and Wolski’s meta-
analysis [147] and culminating in an FDA’s ruling (since revised) that this drug
increases cardiovascular events [150, 160], influenced prescribing practices
worldwide. Indeed, this has been outlined in a recent study of prescribing data in
Tayside, Scotland for the period October 2006-March 2008, which confirmed a 34%
decrease in the number of prescriptions for rosiglitazone (alone or as combination
therapy with metformin), and an accompanying increase in those for pioglitazone
(alone or as combination with metformin) [286]. These developments, call for a
concerted effort in this regard towards a better understanding of the relevant
mechanisms.
1.11 Renal haemodynamics
As outlined earlier, the PPAR-γ1 receptor isotype has been shown to be moderately
expressed in the kidneys. Guan et al. examined the distribution of the different PPAR
67
receptors within the human kidney and urinary tract using in situ hybridization
techniques, concluding that renal PPAR-γ receptors are exclusively expressed in the
medullary collecting duct, ureter and bladder [287]. PPAR-γ is also expressed to a
lesser extent in the glomeruli and renal microvasculature [288]. Low but significant
expression has been reported in the proximal tubules and in many other nephron
segments [289]. Other studies have reported constitutive expression of PPAR-γ
receptors in cultured glomerular mesangial cells, podocytes, proximal epithelial cells
and epithelial cells of collecting ducts [290]. This distribution suggests diverse roles
for PPAR-γ in the kidney, both therapeutically and in its modulation of
thiazolidinedione-induced fluid overload.
1.11.1 The collecting duct and distal tubule
The localisation of PPAR-γ receptors in the medullary collecting duct lead to the
hypothesis that PPAR-γ activation increases sodium retention through its action at
this critical site in fluid metabolism that responds to the integrated effects of multiple
hormones such as aldosterone, arginine vasopressin (AVP), insulin and atrial
natriuretic peptide (ANP) [291]. Acting via the mineralocorticoid receptor,
aldosterone enhances the absorption of sodium by the principal cells of the collecting
duct. This is achieved by inducing the expression of key genes that encode for key
regulators of sodium transport, namely the epithelial sodium channel-α (ENaCα,),
serum and glucocorticoid regulated kinase-1 (Sgk) and the sodium-potassium-
ATPase-α (Na-K-ATPase-α) [292, 293] (table 1.5). Reabsorption of sodium in the
distal nephron is a two-step process. Sodium first enters renal cells from the luminal
compartment via the rate-limiting apical ENaC, and is then actively transported out
68
of the cell by the basolateral Na-K-ATPase [294]. ENaC consists of three subunits
designated ENaC- α, -β and -γ [295]. Expression of the ENaCγ subunit (encoded by
the Scnn1g gene) plays a crucial role in the trafficking of the ENaCα, and ENaCβ to
the cell membrane [296]. Sgk is a novel member of the serine/threonine kinase gene
family, comprising three highly organ-specific isoforms (Sgk-1, -2, -3) sharing 80%
amino acid identity [297, 298]. Skg-1 is thought to be a key mediator of aldosterone-
induced sodium reabsorption through the ENaC at the collecting duct [299], and has
been reported as a target gene of PPAR-γ in a murine study [291]. Similarly, Hong et
al. have shown that PPAR-γ can bind to specific elements in the Sgk-1 promoter in
human collecting duct cells [300]. Hypotonic conditions increase Sgk-1 expression
and sodium transport in A6 cells, a cultured cell line derived from the Xenopus
laevis distal nephron [301]. This contrasted with findings by Guan et al., who did not
find any evidence for increased expression of Sgk-1 in cultured mouse inner
medullary collecting duct cells. [302]
Two elegant murine studies sought to investigate the hypothesis that
thiazolidinediones induce fluid retention through PPAR-γ mediated activity at the
collecting duct. Deletion of PPARg (which encodes for PPAR-γ) in the murine
collecting duct prevented thiazolidinedione-induced weight gain, decreased renal
sodium retention and increased plasma aldosterone (a reliable index of plasma
volume) in a study by Guan et al. [302]. Mice pre-treated with amiloride (an
aldosterone antagonist) at a dose of 2mg/kg/day were also immune to the weight
increasing effect of pioglitazone. Additionally, the authors reported that the
treatment of cultured collecting ducts with thiazolidinediones increased amiloride-
sensitive sodium absorption through the epithelial sodium channel (ENaC); this
69
effect was abolished in PPAR-γ deficient collecting duct cells. Guan et al. [302]
demonstrated that Scnn1g expression is increased by thiazolidinedione therapy,
identifying Scnn1g as a direct and specific target gene of PPAR-γ in the medullary
collecting duct. A contemporary study by Zhang et al. comparing outcomes in
PPAR-γ collecting duct knock-out and control mice reported similar
thiazolidinedione-induced PPAR-γ mediated differences in body weight, sodium
balance, ENaC sodium transport and plasma aldosterone levels [303].
The data from the above two studies somewhat contrast with those from another
study investigating the renal effects of the highly potent and selective PPAR-γ
agonist farglitazar [291]. Murine administration of this pharmacological agent led to
plasma volume expansion, a small but significant decrease in plasma potassium,
lower aldosterone concentrations and a small but significant increase in plasma
sodium and chloride concentrations. These changes are consistent with aldosterone’s
role at the level of the medullary collecting duct, favouring sodium reabsorption and
potassium excretion. Paradoxically however, low dose amiloride (1mg/kg/day)
exacerbated farglitazar-induced plasma volume expansion and significantly
increased the renal expression of ENaCα. One notes however that the investigators
used a lower dose of amiloride in this study (1mg/kg/day) compared with Guan et al.
[302], which may, at least in part, explain the difference in treatment outcomes.
Artunc et al. compared body weight, haematocrit, plasma aldosterone, leptin, blood
pressure and renal Sgk-1 expression in Sgk knockout mice and their wild type
littermates treated with pioglitazone [304]. Pioglitazone treatment significantly
increased Sgk-1 mRNA and protein expression and plasma volume only in wild type
70
mice. The latter group also exhibited a significantly greater increase in in body
weight and a significantly more pronounced reduction in haematocrit in response to
treatment. Pioglitazone therapy decreased plasma aldosterone and blood pressure,
and increased leptin levels in both litter genetic subtypes. The authors concluded that
Sgk-1 contributes, but does not fully explain thiazolidinecdione-induced fluid
retention.
Nofziger et al. reported no change in Sgk-1 transcript or protein expression after
incubating mouse principal kidney cortical collecting duct cells with the PPAR-γ
agonists GW7845 (a potent non-thiazolidinedione) and pioglitazone [305]. Although
the authors were able to identify PPAR-γ in 3 different in vitro models of renal
principal cells, the same agents did not increase basal or insulin-stimulated sodium
flux via the ENaC, supporting the possibility that these agonists may be favouring
water and sodium retention at a more proximal site within the nephron. Consistent
with these observations, Vallon et al. reported that mice selectively lacking the
ENaC α subunit in the collecting duct were still prone to thiazolidinedione-induced
water retention, and that thiazolidinediones increased the activity of an unspecified
nonselective cation channel [306]. Indeed, in a recent publication, the latter research
group found that thiazolidinediones may actually repress the ENaC γ subunit
transcription by suppressing histone H4K5 acetylation in murine M1 collecting duct
cells [307].
71
1.11.2 The proximal tubule
As discussed earlier, PPAR-γ is also reportedly expressed in human proximal tubular
cells. Moreover, this expression is up-regulated in the presence of high glucose and
PPAR-γ agonists [308]. The proximal tubule constitutes more than 90% of renal
tissue, and together with the descending limbs of Henle’s loop, account for the
reabsorption of approximately 80% of the water and solutes, and 60% of the sodium
filtered at glomerular level. This is mediated through the activity of membrane-
inserted water channel proteins called aquaporins (AQPs). AQP1 and AQP7 are the
principal isoforms expressed in the proximal tubule [309, 310].
Strongly expressed in the apical and basolateral plasma membranes of proximal
tubular cells, AQP1 plays a major role in proximal tubular transcellular transport
[310-312]. Experiments on AQP1 knockout mice reduced proximal tubular transport
by 90%, suggesting that 90% of water transport at the proximal convoluted tubule is
transcellular and 10% is paracellular [313, 314]. Schnermann et al. concluded that
other AQPs and non-AQP transporters play little, if any role in determining proximal
tubule water reabsorption [314]. AQP7 is an aquaglyceroporin, which allows the
rapid transport of glycerol and water; it is expressed on the apical membrane of the
proximal straight tubules [315]. Murine experiments using AQP7 knockout and
AQP1/AQP7 knockout mice concluded that the estimated relative contribution of
AQP7 to water permeability on the proximal straight tubules was one-eight that of
AQP1 [316].
72
Although rosiglitazone has been reported to induce AQP2 and AQP3 in whole
kidney homogenates in rats and AQP1, AQP2 and AQP3 in the inner medulla [310],
the effect of PPAR-γ on AQP expression in the proximal tubule is largely unknown.
AQP7 has been identified as a PPAR-γ target gene [317]. Saad et al. reported that
PPAR-γ agonists enhance the expression of AQP1 and AQP7 in humans through an
Sgk-1 mediated pathway [318]. The clinical relevance of these findings remains
unclear.
The type 3 sodium hydrogen exchanger (NHE3) is another key modulator of sodium
reabsorption at the proximal tubule. Rosiglitazone was reported to increase NHE3
(and the α1 subunit of the sodium-potassium-ATPase, the bumetanide sensitive
sodium-potassium-2 chloride cotransporter, aquaporins 2 and 3, and endothelial
nitric oxide synthase) expression in a murine model [319]. The effect of
thiazolidinediones on NHE3 expression was later confirmed in human proximal
tubular cells, occurring through an Sgk-1 dependent pathway [318]. The basolateral
type 1 sodium-bicarbonate cotansporter has also been implicated in
thiazolidinedione-induced fluid retention, as evidenced by data from a study by Muto
et al. [320]. Using in vitro electrophysiological studies on rabbit proximal straight
tubule cells, the authors established that troglitazone stimulated this cotransporter in
a dose dependent fashion. Endo et al. described similar findings in rat, rabbit, human
but not in mouse proximal tubular cells. Additionally, these authors reported that
stimulation of the sodium-bicarbonate cotransporter is mediated in a non-genomic
fashion through PPAR-γ induced stimulation of the Src-EGFR-ERK signalling
pathway [321].
73
Zanchi et al. investigated the effects of pioglitazone on renal salt water handling in
response to a low salt (20 mmol/day) and a high salt (>200 mmol/day) diet [322].
This double-blind, randomized, placebo controlled, cross-over study recruiting 10
healthy normotensive male subjects demonstrated that a 6 week course of
pioglitazone therapy (45 mg daily) significantly lowered urinary sodium excretion
and reduces lithium clearance when patients were subjected to a low salt diet,
suggesting that the drug increases proximal tubular sodium reabsorption. A high salt
diet produced similar trends (albeit not statistically significant); the authors ascribed
this to individual variability.
In summary, the physiological mechanisms underlying thiazolidinedione- induced
salt and water retention in the kidney remain largely unravelled and the subject of
considerable debate, despite their clear clinical importance.
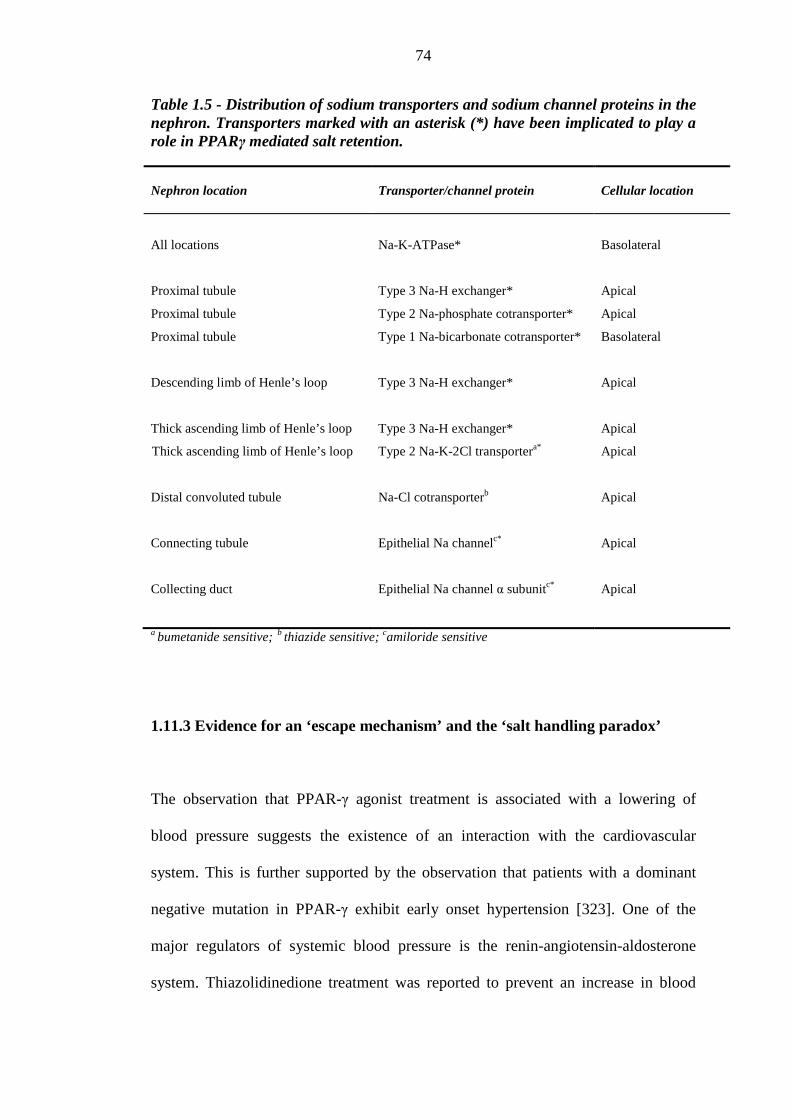
74
Table 1.5 - Distribution of sodium transporters and sodium channel proteins in the nephron. Transporters marked with an asterisk (*) have been implicated to play a role in PPARγ mediated salt retention. Nephron location
Transporter/channel protein
Cellular location
All locations
Proximal tubule
Proximal tubule
Proximal tubule
Descending limb of Henle’s loop
Thick ascending limb of Henle’s loop
Thick ascending limb of Henle’s loop
Distal convoluted tubule
Connecting tubule
Collecting duct
Na-K-ATPase*
Type 3 Na-H exchanger*
Type 2 Na-phosphate cotransporter*
Type 1 Na-bicarbonate cotransporter*
Type 3 Na-H exchanger*
Type 3 Na-H exchanger*
Type 2 Na-K-2Cl transportera*
Na-Cl cotransporterb
Epithelial Na channelc*
Epithelial Na channel α subunitc*
Basolateral
Apical
Apical
Basolateral
Apical
Apical
Apical
Apical
Apical
Apical
a bumetanide sensitive; b thiazide sensitive; camiloride sensitive
1.11.3 Evidence for an ‘escape mechanism’ and the ‘salt handling paradox’
The observation that PPAR-γ agonist treatment is associated with a lowering of
blood pressure suggests the existence of an interaction with the cardiovascular
system. This is further supported by the observation that patients with a dominant
negative mutation in PPAR-γ exhibit early onset hypertension [323]. One of the
major regulators of systemic blood pressure is the renin-angiotensin-aldosterone
system. Thiazolidinedione treatment was reported to prevent an increase in blood
75
pressure caused by the infusion of angiotensin II in rats [324]. Additionally, it
decreases blood pressure and improves endothelial function in a mouse model of
lifelong hypertension caused by the overexpression of both human renin and human
angiotensinogen transgenes [325]. Morerover, thiazolidinedione therapy was also
reported to downregulate angiotensin II type I receptor gene expression via a PPAR-
γ dependent mechanism in vascular smooth muscle cells [326].
Renin is the rate limiting step in angiotensin II synthesis. In their study on healthy
normotensive male volunteers subjected to a low and high salt diet, Zanchi et al.
[322] reported that pioglitazone therapy increased plasma renin activity in both salt-
loading states, despite recording no significant blood pressure changes in response to
thiazolidinedione treatment or alteration in dietary sodium load. However, the
authors did note that piogliazone therapy was associated with a significant increase
in daytime heart rate, which reached statistical significance only on a low salt diet. In
the absence of any effect on supine (nocturnal) blood pressure, the authors postulated
that the raised renin is a physiological response to thiazolidinedione induced
peripheral vasodilatation. This hypothesis was consistent with earlier reports that
thiazolidinediones exert several vasodilatory effects on the vascular system, namely
reducing endothelin-1 secretion by endothelial cells [327], modulating its
endogenous production in endothelin-dependent hypertension [328] and inhibiting
vascular smooth muscle calcium currents [329, 330]. In a later study on human renin
secreting Calu-6 cells (derived from a pulmonary carcinoma), Todorov et al.
reported that rosiglitazone increases renin gene expression via a PPAR-γ dependent
mechanism. This association is however disputed, since other studies have reported
that PPAR-γ has no influence on renin mRNA levels [331, 332]. Despite the lack of
76
consistent data, a delicate balance may exist between the effects of
thiazolidinediones on the renin-angiotensin-aldosterone system and other mediators
of vascular tone. Further studies are warranted to clarify this relationship.
Nonetheless, these observations cannot adequately explain the dietary sodium related
differences in renal salt handling during thiazolidinedione therapy [322]. Animal
studies suggest that sodium reabsorption from the collecting duct during
rosiglitazone treatment reaches a peak at day 6, and that balance returns to normal by
day 9 [303]. This led to the hypothesis that an ‘escape mechanism’ plays a role in
thiazolidinedione-associated sodium handling under salt-loading conditions, similar
to that seen with mineralocorticoid excess [333, 334]. ANP is thought to play a
critical role in this mechanism [333, 334], particularly in low renin states. To this
effect, Goenka et al. [335] investigated the effects of water immersion to the level of
the neck (which causes a 16% increase in plasma volume and a redistribution of 700
mls of blood centrally to the thoracic cavity) on renal and hormonal dynamics in
normal and T2DM individuals. The investigators confirmed earlier reports that
T2DM patients are characterized by an impaired natriuretic response, diminished
ANP and a blunted cGMP response to volume expansion [335]. Rosiglitazone
treatment for 7 days restored these responses in T2DM individuals, and significantly
increased the ANP response in control individuals [335]. These findings may, at least
in part, explain the salt handling differences reported by Zanchi et al. [322], such that
individuals on a chronic high salt diet would have already suppressed the renin-
angiotensin-aldosterone system and increased their ANP secretion, limiting further
physiological responses to thiazolidinedione therapy [335].
77
Available data suggest that thiazolidinedione therapy paradoxically increases, rather
than decreases natriuresis in response to volume expansion. Rosiglitazone treated
Zucker rats (an animal model of T2DM) exposed to an acute sodium load (a volume
expansion stimulus) showed a more rapid natriuresis compared to control animals
[336]. Goenka et al. reported similar results in humans, suggesting that in
thiazolidinedione treated individuals, the initial increased sodium retention leads to
increased ANP levels or sensitivity, which in turn contributes to an enhanced
natriuretic response to an acute sodium load. This may prove to be a protective
mechanism against fluid retention [335].
Given that the common praline-to-alanine substitution at codon 12 (Pro12Ala) of
exon B in the PPAR-γ gene may be a pharmacogenetic risk factor for
thiazolidinedione-induced oedema [337], and that ACE inhibitors may be less
effective in individuals with this polymorphism [338], studies are warranted to
investigate whether the propensity for thiazolidinedione-induced fluid retention
arises as a result of a lower state of activation of the renin-angiotensin-aldosterone
system. Moreover, although Black and Asian ethnic group individuals with low renin
volume mechanisms have been shown to have higher proximal tubular sodium
reabsorption [339], it is unclear whether such individuals are more prone to
thiazolidinedione-induced oedema.
1.11.4 Endothelial dysfunction and peripheral vascular resistance
Increased arterial stiffness and endothelial dysfunction associated with diabetes and
the metabolic syndrome may in part explain the increased cardiovascular risk
78
associated with these conditions [340]. Biopsy specimens from subcutaneous fat
have demonstrated that endothelial dysfunction [341] and structural alteration [342]
of small resistance arteries contribute to peripheral vascular resistance in diabetic
patients. In healthy individuals, vascular endothelial secretion of nitric oxide
(vasodilator) and endothelin (vasoconstrictor) is kept in balance by circulating
insulin levels [343, 344]. Hyperinsulinaemia disrupts this fine balance, favouring an
enhancement of endothelin secretion and a reduction in nitric oxide secretion [344].
In turn, this increases vascular tone, arterial stiffness and peripheral vascular
resistance. Not surprisingly, arterial stiffness has been identified as a risk factor for
HF [345]. Moreover, arterial stiffness has recently been associated with early and
asymptomatic impairment of systolic and diastolic myocardial function [346].
The mechanism by which thiazolidinediones reduce peripheral vascular resistance is
likely to be multifactorial. PPAR-γ is expressed in various components of the
vascular system, including endothelial cells, the vascular smooth muscle cells of the
intimal and medial layers, and monocytes/macrophages [347]. As discussed earlier,
thiazolidinediones downregulate endothelin-1 secretion, inhibit vascular smooth
muscle currents, and are likely to restore the fine balance between circulating levels
of endothelin and NO, by virtue of their insulin sensitizing effects. These drugs have
also been shown to have a favourable on low grade inflammation, as evidenced, for
example, by a reduction in circulating levels of plasminogen activator inhibitor-1,
interleukin-6, tumour necrosis factor-α (TNF-α) and non-esterified fatty acids, all of
which have been associated with insulin resistance[348], and its associated vascular
endothelial dysfunction [349].
79
These effects cumulatively translate into a thiazolidinedione-associated improvement
in arterial stiffness, as shown in clinical trials [350, 351]. This beneficial effect
should theoretically reduce (rather than increase) the risk of development of HF and
its associated fluid retention. Nonetheless, there are no studies evaluating whether
T2DM individuals with a history of thiazolidinedione-induced HF are characterised
by a greater degree of arterial stiffness compared to their ‘thiazolidinedione tolerant’
counterparts. Such a ‘susceptiblity factor’, if existent, could in turn be influenced by
sodium balance, and possibly by relative thiazolidinedione-induced improvements in
insulin sensitivity. The oedematogenic properties of insulin are well documented
[352]. Indeed, insulin has been shown to favour sodium reabsorption along various
nephron segments [353]. Blazer-Yost et al. described insulin-induced, PI3K-
mediated, activation of the ENaC at the distal convoluted tubule/medullary
collecting duct [354]. The PI3K pathway has also been shown to mediate insulin-
induced sodium reabsorption at the proximal convoluted tubule [355, 356]. It has
long been been suggested that the association of thiazolidinediones with oedema
may occur on account of its favourable effects on insulin sensitivity, and may well
explain why the prevalence of oedema is higher in patients treated with a
combination of insulin and thiazolidinediones [357]. Other authors have ascribed this
phenomenon to a synergistic effect of thiazolidinediones and insulin on renal sodium
handling [358], particularly given the observation that the oedematogenic effects of
insulin require IRS2 rather than IRS1 [356]. Insulin resistance is often associated
with defects in the IRS1-dependent signalling, while IRS2-dependent signalling
seems to be sometimes preserved in adipocytes and skeletal muscle [66, 359-361].
80
1.11.5 Effects on vascular permeability
Increased capillary permeability has also been postulated to contribute to
thiazolidinedione-induced oedema. This hypothesis was first investigated by Idris et
al. [362], who examined the effects of rosiglitazone on endothelial barrier function
using an in vitro system of pulmonary artery endothelial cell monolayers, and Evans
blue-labelled albumin to measure transendothelial albumin flux. Exposure of the
cells to high concentrations of rosiglitazone (10 μM to 100 μM) for 4 hours resulted
in a dose-dependent increase in transendothelial albumin flux. This effect was fully
reversible on washing rosiglitazone off the monolayer, and subsided if exposure was
prolonged to 24-48 hours.
The mechanism(s) underlying thiazolidinedione-induced capillary permeability
remain obscure. Several factors, notably vascular endothelial growth factor (VEGF),
nitric oxide and protein kinase C have been implicated.
(i) Vascular Endothelial Growth Factor (VEGF)
VEGF is estimated to be 50 times more potent than histamine in enhancing vascular
permeability [363]. Lower extremity oedema was induced following gene transfer of
naked plasmid DNA encoding the 165 amino-acid isoform of VEGF in patients with
peripheral artery disease [364]. Emoto et al. reported that plasma levels of VEGF
were significantly higher in troglitazone treated T2DM patients compared to those
treated with dietary measures alone, sulphonylurea or insulin [365]. Additionally, a
longitudinal study of 5 glibenclamide treated T2DM patients showed that adjunct
81
troglitazone therapy was associated with a reversible increase in plasma VEGF
levels [365]. The same investigators reported that therapeutic concentrations of
troglitazone and rosiglitazone are associated with an increase in VEGF mRNA
expression in 3T3-L1 adipocytes. In a study on Zucker rats, Sotirpoulos et al.
established that rosiglitazone treatment increased VEGF mRNA expression in
epididymal fat, and that this correlated with increased vascular permeability [366].
Similar findings were reported in retinal tissue, although the increase in VEGF
mRNA did not reach statistical significance [366]. Troglitazone, pioglitazone and
two other experimental PPAR-γ agonists (LY171883 and 15d-PGI2) increased
VEGF secretion from cultured human umbilical artery vascular smooth muscle cells
[367]. While these studies support a role for VEGF in thiazolidinedione-induced
oedema, they are not consistent with the results of other investigations, which
suggest that PPAR-γ negatively regulates VEGF signalling.
Both rosiglitazone and 15-deoxy-delta 12, 14-prostaglandin decreased VEGF protein
expression in transformed and primary endometrial cells in a study by Peeters et al.
[368]. Using PPRE3 luciferase reporter transfected Ishikawa adenocarcinoma cells,
rosiglitazone was shown to repress VEGF promoter activity in a dose-dependent
fashion (IC50 around 50 nM). Cotransfecting full-length and truncated VEGF
promoter-luciferase constructs and PPAR-γ expression vectors into Ishikawa cells,
Peeters et al. also revealed that the PPAR-γ regulated domain is a direct repeat-1
motif - 443 bp upstream of the transcriptional start site [368]. Sander et al. [369]
reported that rosiglitazone inhibits VEGF-induced proliferation and migration of
human pulmonary valve endothelial cells, by antagonizing VEGF-mediated nuclear
factor of activated T cells, Cytoplasmic 1 (NFATc1) (essential for heart valve
82
formation). This inhibitory mechanism was confirmed in a parallel study on human
umbilical vein endothelial cells [369]. In another study on identical cells,
rosiglitazone was reported to markedly reduce VEGF-induced tube formation and
endothelial cell migration, which are critical steps in angiogenesis [370]. Tooke et al.
reported no significant difference in change in VEGF levels among insulin treated
T2DM patients who were randomized to treatment with pioglitazone (n = 14) or
placebo (n = 15) [371].
The conflicting data summarized above might result from a PPAR-γ induced,
possibly cell specific, dual effect on VEGF signalling. The relative contribution of
these factors, if any, in thiazolidinedione-induced oedema remains obscure.
(ii) Nitric oxide (NO)
Synthesised by endothelial cells from the amino acid L-arginine through the activity
of endothelial nitric oxide synthase (eNOS), the ubiquitous naturally occurring
molecule nitric oxide (NO) is an important regulator of vascular function, including
vascular permeabilty. eNOS is regulated at the level of expression [372-374], post-
translationally through its interaction with multiple proteins [375-378], and by eNOS
phosphorylation [379-382]. A possible relationship between thiazolidinediones and
NO was first reported by Vinik et al.. In a 16 week, randomized, double-blind,
placebo-controlled, crossover to open-label single blind trial, NO production was
significantly increased in rosiglitazone treated T2DM patients [383]. Treating human
umbilical vein endothelial cells with the PPAR-γ ligands 15d-PGI2, ciglitazone and
rosiglitazone increased nitric oxide synthase (NOS) activity and NO release through
83
a PPAR-γ dependent mechanism in a study by Polikandriotis et al. [384].
Furthermore, the investigators reported that rosiglitazone and 15d-PGI2 treatment
lead to eNOS ser1177 phosphorylation, an effect that is attenuated by the PPAR-γ
antagonist GW9962 [384]. In an in vivo study on the fructose-fed rat model, St-
Pierre et al. investigated vascular permeability by assessing the extravasation of
Evans blue dye in distinct muscle groups [385]. Rosiglitazone increased
extravasation by 30-50% in the rectus femoris, soleus, gastrocnemius lateralis, vastus
lateralis and tibialis cranialis skeletal muscles. In homogenates of skeletal muscles
(vastus lateralis) from fructose-fed rats, rosiglitazone treatment resulted in a
significant increase in NOS activity and eNOS immunoreactive mass, compared to
control animals. Interestingly, the authors reported no significant change in the level
of neuronal NOS (the most common muscle NOS isoform) [385].
(iii) Protein kinase C (PKC)
Protein kinase C (PKC) constitutes an important determinant of vascular
permeability through its phosphorylation of cytoskeletal proteins that make up the
tight intercellular junction [386-389]. In a study on Zucker rats, Sotiropoulos et al.
reported that the rosiglitazone-associated increases in vascular permeability and
weight were associated with selective activation of PKC and its potent activator
diacylglycerol (DAG) in fat and retinal tissues [366]. The same investigators
established that these rosiglitazone-induced effects in adipose tissue were abolished
by the specific PKCβ inhibitor ruboxistaurin and in PKCβ knockout mice [366].
84
(iv) Other potential permeability factors
Analyzing 384 single nucleotide polymorphisms (SNPs) from 222 cardiovascular
and metabolic genes in 87 thiazolidinedione treated T2DM patients, Ruano et al.
sought to discover associations between thiazolidinedione therapy and oedema [390].
The investigators reported significant associations with the genes for neuropeptide
Y, glycogen synthase-1 muscle (Gsk-1 muscle), chemokine C-C motif ligand 2,
oxidized LDL receptor 1 and Growth Hormone Releasing Hormone [390]. Despite
being a long-lasting vasoconstrictor, neuropeptide Y increases endothelial
permeability [391], and has been implicated in neurogenic pulmonary oedema [392],
laryngeal oedema [393] and inflammatory paw oedema in rats [394]. Chemokine C-
C motif ligand 2 increases the permeability of the blood-brain barrier, and
contributes to vasogenic brain oedema [395]. Encoded by the ORL1 gene, the
oxidized LDL receptor 1 is expressed on vascular endothelial cells [396] and is
involved in capillary formation [397]. In summary, Ruano et al. conclude that the
physiogenomic associations suggest a link between vascular permeability and
thiazolidinedione-induced oedema [390].
1.12 Thiazolidinediones and cardiac pump function
Partients with diabetes have a high prevalence of subclinical systolic and diastolic
cardiac dysfunction and impaired cardiac reserve, likely due to a number of
abnormalites such as impaired coronary flow reserve, even in the absence of
obstructive epicardial disease [398, 399], autonomic dysfunction [400-402],
myocardial fibrosis [403] and maladaptive myocardial energy metabolism [404].
85
Although cardiac expression of PPAR-γ is relatively lower than PPAR-α, the former
is thought to be an important modulator of cardiac structure and function,
particularly in the left ventricle. In a murine study by Duan et al., cardiac-specific
deletion of the PPAR-γ receptor resulted in mild cardiac hypertrophy [405]. These
findings were consistent with earlier reports that the pressure-overload induced
increases in heart weight-to-body weight ratio and wall thickness were more
prominent in heterozygous PPAR-γ deficient mice compared to their wild type
counterparts [406].
The effects of exogenous PPAR-γ treatment on cardiac function is controversial.
Studies have shown that PPAR-γ agonist therapy inhibits mechanical strain- [407],
angiotensin-II- [406, 407] and phenylephrine-induced [407] cardiac hypertrophy of
neonatal cardiac rat myocytes in vitro. Asakawa et al. reported similar results in vivo,
showing that pioglitazone inhibits pressure overload-induced cardiac hypertrophy
strongly in wild type mice, and moderately so in heterozygous PPAR-γ deficient
mice [406]. These pioglitazone-related effects on pressure-overload induced cardiac
hypertrophy were associated with a significant reduction in the expression of
endothelin-1 mRNA [408]. Endothelin-1 has positive inotropic and chronotropic
actions, and induces cardiac hypertrophy [409]. In a murine study investigating
effects at a pathophysiological level, Tsuji et al. showed that a pioglitazone induced
reduction in left ventricular weight to body weight ratio was accompanied by a
reduction in left ventricular collagen content, left ventricular diastolic dysfunction
and plasma malondialdehyde-thiobarbituric acid (a marker of oxidative stress) [410].
Studies on intact animal models showed that PPAR-γ agonists improve cardiac
contractility, systolic performance [411-414] and diastolic performance [412-415].
86
Myocardial intracellular calcium concentrations increase in response to myocyte
stretch, in a bid to enhance cardiac output. The calcium, calmodulin-dependent
phosphatase calcineurin plays a critical role in this process, through
dephosphorylation of a family of transcription factors known as nuclear factors of
activated T cells (NFATs) [416]. Four calcineurin sensitive NFAT isoforms have
been identified (NFATc1, NFATc2, NFATc3, NFATc4) [417, 418].
Dephosphorylated by calcineurin, NFAT transcription factors translocate to the
nucleus and regulate the expression of target myocardial genes [416, 419].
Activation of calcineurin or NFATc4 was shown to induce cardiac hypertrophy and
HF in murine models [416]. Treatment of cardiomyocytes with rosiglitazone
inhibited endothelin-1 induced calcineurin activity, enhanced the association of
PPAR-γ with calcineurin/NFATc4 and suppressed the nuclear translocation of
NFATc4 [420]. This observation is consistent with genotypic observations from the
DREAM study, in which one single nucleotide polymorphism (SNP) in NFATC2
(rs6123045) was significantly associated with oedema [OR 1.89 (95% CI 1.47, 2.42)
[421]. The effect is seemingly additive, with oedema rates being highest among
patients homozygous for the risk allele, intermediate in heterozygous individuals,
and lowest among subjects homozygous for the protective allele [421].
Multiple human studies have demonstrated no untoward effects on various
parameters of cardiac performance and some trends toward improved systolic
function associated with longer-term thiazolidinedione therapy. Ghazzi et al.
compared echocardiographic data before and 48 weeks after randomizing 154 T2DM
patients to treatment with troglitazone or glyburide, showing that thiazolidinedione
therapy was associated with significant improvements from baseline in stroke
87
volume index and cardiac index, with no change in left ventricular mass index. There
were no significant changes in any echocardiographic parameter in the glyburide-
treated group [411]. A similar randomized, blinded clinical trial that included 203
patients did not report any significant differences in left ventricular mass index,
ejection fraction or left ventricular end-diastolic volume between patients
randomized to rosiglitazone versus glyburide [422]. A smaller study by Hirayama
and co-workers investigated echocardiographic parameters in 10 male hypertensive
T2DM men and 12 normotensive T2DM men treated with pioglitazone for 6 months.
There was no change in fractional shortening (a simple way of measuring ejection
fraction) in either group. Pioglitazone was however associated with a significant
reduction in left ventricular mass in the normotensive group [423]. In a 52 week
placebo controlled study of 224 T2DM patients with NYHA class I/II HF,
rosiglitazone was not associated with any changes in left ventricular volumes, left
ventricular ejection fraction or cardiac index [424]. Similarly, albeit a different study
population, Horio et al. did not report changes in the absolute values of left atrial or
left ventricular end-diastolic diameter in 30 non-diabetic patients with essential
hypertension treated with pioglitazone for 6 months [425].
The cardiac antihypertrophic properties of exogenous PPAR-γ agonist therapy
discussed above contrast with the results of other studies. Duan et al. reported that
rosiglitazone treatment caused cardiac hypertrophy in wild type and cardiac-specific
PPAR-γ knockout mice, suggesting that although PPAR-γ is essential for normal
cardiac development, treatment with exogenous PPAR-γ agonists might be
detrimental [405]. This raised the hypothesis that exogenous PPAR-γ-associated
cardiac hypertrophy could reflect the anabolic consequences of improved insulin
88
sensitivity. However, comparing outcomes in wild type mice and mice with
cardiomyocyte restricted knockout of insulin receptors, the non-thiazolidinedione
PPAR-γ agonist 2-(2-(4-phenoxy-2-propylphenoxy) ethyl) indole-5-acetic acid
increased heart weights by 16% in the former group and 22% in the latter, and
induced similar fold increases in the expression of hypertrophic markers such as α-
skeletal actin, brain natriuretic peptide, and ANP in both type of mice [426]. These
outcomes suggested that thiazolidinedione-induced myocardial hypertrophy occurs
independently of insulin signalling [426]. Indeed, it is plausible to hypothesize that
cardiac hypertrophy is a consequence of thiazolidinedione-induced water retention
[427], in keeping with the observation that 2-(2-(4-phenoxy-2-propylphenoxy) ethyl)
indole-5-acetic acid-treated mice had typical echocardiographic features of volume
overload (increased left ventricular diastolic diameters and increased cardiac output)
[426]. In a pilot study randomizing 30 T2DM patients inadequately controlled in
metformin and sulphonylurea to treatment with pioglitazone or insulin glargine for
26 weeks, Dorkhan et al. reported that left ventricular end-diastolic volume increased
by 11% and left atrial systolic volume increased by 17% in the pioglitazone group (p
< 0.05 for the difference between pioglitazone- and insulin-treated groups). There
were no differences in the change of ejection fraction or left ventricular mass
between the randomization arms [428]. The reported increases in left atrial volume
may be of particular clinical significance in thiazolidinedione-treated T2DM
patients, given the observation that this echocardiographic parameter carries
prognostic significance in a variety of cardiac disorders and in the general population
[429]. Moreover, one case series suggested that T2DM patients with diastolic
dysfunction are more prone to developing thiazolidinedione-induced HF [430].
Although most patients can tolerate a 6-8% plasma volume expansion occurring
89
subacutely after initiation of thiazolidinedione therapy [163, 164, 431], diabetic
patients with impaired cardiac reserve may manifest signs and symptoms of CHF in
this setting.
There is currently considerable interest in the concept of ‘cardiac lipotoxicity’,
wherein triglycerides are deposited in cardiac myocytes [432, 433], particularly in
the setting of obesity or absolute or relative leptin deficiency/resistance (a phenotype
associated with T2DM). Intracardiac triglyceride content was reported to be higher
in obese human subjects, and was associated with increased left ventricular mass and
decreased septal wall thickening [434]. Intramyocardial accumulation of ectopic
fatty acid results in cellular dysfunction and non-oxidative fatty acid metabolism,
which increases traffic through the ceramide pathway [432], resulting in
lipoapoptosis, impairing cardiac compliance and contractility [435]. Troglitazone
was shown to reduce intra-cardiomyocyte lipid concentrations and prevent loss of
myocardial contractile function in a Zucker rat model [433].
In summary, the effects of PPAR-γ agonists on cardiac performance remain unclear,
particularly given the conflicting results from animal studies. Human studies have
been reassuring in this regard, albeit limited by the number of recruited patients and
duration of follow-up. Further mechanistic research based on careful phenotyping is
clearly warranted to clarify these issues further, particularly given the ongoing lack
of large scale, prospective trials.

90
1.13 Other suggested ‘fluid-retaining’ mechanisms
Thiazolidinedione-induced oedema has also been ascribed to altered water-ion
transport in the gastrointestinal tract. The latter hypothesis is borne out of the results
of a study investigating the effects of troglitazone on rat and human duodenal
mucosa cells. In this study, Hosokawa et al. demonstrated inhibition of electrogenic
bicarbonate secretion by these cells, possibly interfering with passive sodium and
water movement into the gastrointestinal tract lumen via a paracellular pathway
[436].
1.14 Thiazolidinediones and heart failure: unanswered questions
Guided by the data summrised above, the manufacturers of rosiglitazone and
pioglitazone excluded diabetic patients with New York Heart Association (NYHA)
functional class III or IV HF from their applications for marketing licenses [163,
164]. The NICE guidelines have adopted a more stringent approach, and do not
recommend the use of these drugs in any patient with HF, irrespective of severity
[82]. While this approach is likely to minimize the risk of fluid retention, it does not
eliminate it completely. Although thiazolidinedione-associated oedema is a clinically
important adverse effect, absolute rates are low and the time course is uncertain.
Traditional observational study designs have encountered difficulties in finding
informative cases. Given the hypothesis that some individuals are more sensitive to
the phenotype than others, it seems appropriate (and cost-effective) to study
previously-intolerant individuals in some depth. The most appropriate comparator
group is patients who are tolerant of thiazolidinediones.
91
Based on a case-control design, one of the aims of this thesis was therefore to
identify and compare the baseline characteristics of matched cohorts of patients
tolerant and previously intolerant of thiazolidinediones with the aim of assessing
whether patients known to be intolerant to thiazolidinediones are characterised
during acute or chronic ‘high salt’ loading by differences in their metabolic,
cardiovascular and renal responses.
Given the anticipated difficulties in identifying thiazolidinedione intolerant patients,
a parallel project was conceived in collaboration with the Health Informatics Centre
(HIC) at the University of Dundee to identify and characterize NHS patients exposed
to thiazolidinediones in routine clinical care. Prescription and hospital admission
data were used to identify thiazolidinedione-treated patients whose treatment was
apparently complicated by HF. Moreover, the Diabetes Audit and Research in
Tayside Scotland (GoDARTS) cohort [437], a well-validated electronic data linkage
– based register of diabetes patients in Tayside, Scotland enabled genetic
characterization of the phenotypic characteristics identified at population level. At
the time these studies were conceived, it was intended that they would provide
sufficient background data to embark on a large prospective trial validating the
usefulness of one or more biomarkers in the prediction of thiazolidinedione-
associated fluid retention. Better characterization of thiazolidinedione intolerant
patients, together with an adequate understanding of the mechanisms underlying
thiazolidinedione-associated fluid retention was intended to guide the development
and future assessment of PPAR-γ receptor modulators (and related agents such as
dual PPARγ/δ agonists) with apparently more favourable adverse event profiles.
92
.Section IV - Insulin resistance in type 1 diabetes - is there a role for
metformin?
1.15 Insulin resistance – a common co-morbidity in type 1 diabetes
While insulin resistance is undoubtedly a central pathognomonic feature of T2DM,
its association with T1DM is also increasingly recognized. Insulin resistant patients
with T1DM have been shown to express lower tissue levels of the insulin receptor
[438]. Moreover, the expression of the GLUT-4 transporter in skeletal muscle is
lower in obese patients with T1DM [439]. Insulin-insensitive patients with T1DM
and T2DM have been reported to have raised intramyocellular lipid [440], which as
discussed, interferes with insulin signalling. Comparing adipocytokine levels in 91
T1DM and 91 healthy children, Celi et al. reported that circulating adiponectin levels
were higher in prepubertal diabetic children and positively correlated with HbA1c,
while BMI-adjusted leptin concentrations were higher in pubertal diabetic children
and positively correlated with daily insulin dose. There were no differences in TNF-
α concentrations between the two groups [441]. Luna et al. similarly reported that
children with T1DM were characterized by higher leptin concentrations compared
with their healthy counterparts, but did not associate this finding with HbA1c, daily
insulin dose or duration of the disease [442]. Two small studies investigating the
kinetic mechanisms of insulin resistance in T1DM reported that impaired insulin-
stimulated vasodilation impairs glucose delivery, and hence extraction at the level of
skeletal muscle [443, 444].
93
Additional factors are thought to contribute to insulin resistance in pubertal T1DM
patients. Insulin resistance increases in puberty, and reaches a peak at Tanner stage 3
[445]. The situation is further compounded by the fact that obesity is a growing
problem in young patients with T1DM. Indeed, Libman et al. [446] showed that 50%
of young Americans with T1DM were overweight or obese. Produced in the liver,
insulin growth factor (IGF-1) plays a insulin-like role in glucose homeostasis,
influencing hepatic glucose output and peripheral glucose uptake. Circulating IGF-1
levels are reduced in T1DM [447], possibly secondary to portal hypoinsulinaemia
[448]. This results in a compensatory increase in Growth Hormone (GH) secretion
(which antagonizes the effects of insulin) and IGF-1 binding protein synthesis [448,
449], diminishing free (and hence biologically active) IGF-1 levels further.
1.15.1 The 'accelerator' hypothesis
Although the functional effects of these multi-level differences are yet to be clearly
elucidated, they have the potential to contribute to the mechanism of insulin
resistance in T1DM individuals. It has been noted that T1DM is increasing in
incidence and generally presenting at a younger age. Moreover, a smaller proportion
of newly diagnosed patients are characterised by high risk and protective HLA
haplotypes [450, 451], while a larger number have intermediate genetic susceptibility
[452]. This suggests an increasing role of the environment in the aetiology of T1DM.
Some [446, 453, 454], though not all studies [455, 456], have reported that obese
patients with T1DM present at a younger age, possibly reflecting genetic and ethnic
differences between study populations [457]. Additionally, BMI may have been too
crude a measure of insulin resistance in pubertal patients [445]. Four studies carried
94
out in different continents analyzed data from prospective follow-up studies of
autoantibody positive first degree relatives of patients with T1DM. Using the
homeostasis model of insulin resistance (HOMA-IR) to first phase insulin response
(FPIR) as an index that standardizes insulin resistance to residual β-cell function and
corrects for falling FPIR as the T1DM process progresses, all four studies reported
that insulin resistance is an independent risk factor for the development of T1DM
[458-461]. Insulin resistance in pre-T1DM may not genetically determined, as
suggested in a twin study by Hawa et al., in which patients developing T1DM had
higher fasting insulin levels compared to their monozygotic twin counterpart who
did not progress to the disease after 18 months of follow-up [462]. The hyperbolic
insulin secretory response of the β-cells is dependent on normal insulin sensitivity
[7]. Given that several studies have reported that islet-cell antibody individuals who
progress to T1DM have greater insulin resistance for their level of insulin secretion
[458-461], the insulin resistant state may unmask β-cell deficiency at an earlier stage
[456, 463]. Adipocytokine receptors are expressed on the surface of immune cells
[464], an observation that is likely to be relevant in the aetiopathogenesis of T1DM
given that the intraperitoneal injection of leptin accelerated the autoimmune
destruction of insulin-producing β cells and significantly increased interferon-γ
production in peripheral T-cells in the non-obese diabetic mouse (a model of T1DM)
[465]. Reports that insulin resistance is associated with a lower frequency of entering
the ‘honeymoon phase’ in T1DM [466, 467] follow the same line of thought,
potentially further justifying pharmacological attempts at reducing insulin resistance
in T1DM. Thus, in summary, the accelerator hypothesis suggests that, while T1DM
is essentially triggered by an immune mediated process, its progression is expedited
by potentially modifiable factors such as insulin resistance and BMI [468]. This
95
essentially implies that, in the absence of a triggering immunological event, such
patients would have developed T2DM at some point in their lives.
1.15.2 The concept of 'double diabetes'
The term 'double diabetes' was coined from the observation that patients with T1DM
and a family history of T2DM were more likely to be overweight, required higher
insulin doses and yet were less likely to achieve adequate glycaemic control [469].
This hypothesis considers T1DM and insulin resistance/obesity as independent
processes. A study of 427 patients with T1DM reported that 15% fulfilled the WHO
criteria for the metabolic syndrome, and of these 26.9% were insulin resistant,
compared with 3.4% of those without metabolic syndrome (OR 8.9; p = 0.001).
Those with the metabolic syndrome required higher median insulin dosage [0.9
(interquartile range = 0.7, 1.2) vs 0.6 (interquartile range = 0.5, 0.9) U/kg; p = 0.03],
were older [median 35.0 (interquatile range = 26.2, 47.3) vs. 29.7 (interquartile range
= 23.4, 36.4) years, p = 0.002], and had longer duration of diabetes [median 19.7
(interquartile range = 10.7, 25.6) vs. 12.1 (interquartile range = 6.3, 17.9) years, p =
0.0001] [23]. 21% and 44% of patients with T1DM met WHO diagnostic criteria of
the metabolic syndrome in the Pittsburgh EDC [470] and FiannDiane [471] cohorts
respectively. A parental history of hypertension has been associated with
albuminuria in both men and women with T1DM. Additionally, albuminuria in
women with T1DM was associated with parental diabetes in a cross-sectional study
of 3250 patients recruited into the EURODIAB study [472]. Analyzing data from the
Pittsburgh Epidemiology of Diabetes Complications Study, Erbey et al. concluded
that T1DM patients with a first degree family member with T2DM were at higher
96
risk of coronary artery disease [OR 1.89 (95% CI 1.27, 2.84)]. However, this effect
did not remain significant after adjusting for T1DM duration, triglycerides,
hypertension, Beck depression and nephropathy status [OR 1.45 (95% CI 0.87,
2.28)] [473]. Nonetheless, a T1DM patient's risk of developing coronary artery
disease increased with an increasing number of first degree family members
suffering from T2DM (p = 0.001 for trend), such that the presence of two, rather
than one family member virtually increased a T1DM individual's OR from 1.62 to
5.13 [473].
1.16 Consequences of insulin resistance in type 1 diabetes
McGill et al. reported that patients with T1DM and features of the metabolic
syndrome were characterised by a higher macrovascular composite endpoint (OR =
3.3, p = 0.02), and a higher combined macrovascular and microvascular endpoint
(OR = 3.1, p = 0.0001). Subdividing individuals with T1DM into duration of
diabetes quartiles, the same investigators additionally reported that individuals
diagnosed 20 or more years earlier and fulfilling the criteria for the metabolic
syndrome were at a higher risk of stroke (OR = 22.8, p = 0.008) and severe
retinopathy (OR = 3.7, p = 0.01); the risk of peripheral vascular disease was
borderline (OR = 7.3, p = 0.05) [23]. Investigating 1337 Caucasian patients with
T1DM fulfilling IDF diagnostic criteria for the metabolic syndrome and participating
in the DCCT trial, Kilpatrick et al. [24] reported that insulin sensitivity (measured as
estimated glucose disposal rate [eGDR] in mg/kg/min) strongly protected against the
development of retinopathy (HR 0.75 per mg/kg/min; p < 0.001), nephropathy (HR
0.88 per mg/kg/min; p = 0.005) and cardiovascular disease (HR 0.70 per mg/kg/min;
97
p = 0.002). The authors also reported that the prevalence of the metabolic syndrome
in these patients increased from 15.5% at baseline to 27.2% at year nine in
conventionally-treated patients. The corresponding rise was higher in intensively-
treated individuals (13.7% to 45.4%). These changes were attributed to weight gain
[24].
Similar associations between markers of the metabolic syndrome, insulin resistance
and individual macro-/micro-vascular complications in T1DM were reported in other
studies [25-32]. A historical prospective cohort study of 603 patients with T1DM
recruited from the Pittsburgh epidemiology of diabetes complications study and
followed up for 10 years (excluding individuals with prevalent coronary artery
disease) showed that insulin resistance, (measured using eGDR, and comparing
lowest quintile versus the rest), predicted hard coronary artery disease endpoints
(myocardial infarction, coronary artery disease death or angiographically proven
stenosis) [HR 2.7 (95% CI 1.3, 5.6); p = 0.007 (from Cox proportional hazards
model)] [27]. In general, this result is in agreement with that published by
Soedamah-Muthu et al., who reported a relationship between waist-hip ratio (a
surrogate measure of insulin resistance) and coronary heart disease in men
participating in the EURODIAB Prospective Complications Study (n = 2329
patients) [HR 1.32 (95% CI 1.08, 1.62); p < 0.01 (from Cox proportional hazards
model)] [28].
Olson et al. investigated the relationship between insulin resistance and peripheral
artery disease in a cohort of patients from the Pittsburugh epidemiology of diabetes
complications study (n = 586 patients), concluding that eGDR predicts the
98
development of lower extremity arterial disease (defined as claudication, foot
ulceration or lower extremity claudication) in women [HR 0.45 (95% CI 0.32, 0.64);
p < 0.001 (from Cox proportional hazards model)] [32].
A review of the relationship between insulin resistance and microvascular
complications also yields significant data. In a separate publication based on follow-
up data of patients from the Pittsburgh epidemiology of diabetes complications study
(n = 485 patients), insulin resistance was reported to be a predictive factor for overt
nephropathy in T1DM, both in the short term (1-5 years of follow-up) and in the
long term (6-10 years of follow-up) [p < 0.001 for both associations (from Cox
proportional hazards model)] [31]. Giorgino et al. analyzed data from 352
microalbuminuric patients with T1DM from 31 European centres recruited in the
EURODIAB Prospective Diabetes Study. The investigators compared risk factors at
baseline between patients who remained microalbuminuric, progressed to
macroalbuminuria or reverted to normoalbuminuria. Baseline body weight was
associated with progression to macroalbuminuria [Standardised estimate of relative
risk (SERR) 1.5 (95% CI 1.1, 2.3); p = 0.03], together with HbA1c [SERR 2.1 (95%
CI 1.4, 3.0); p = 0.0003] and albumin excretion rate [SERR 1.9 (95% CI 1.3, 2.8); p
= 0.0006]. [30]. de Boer et al. investigated whether waist circumference is associated
with incident microalbuminuria and a change in creatinine clearance among 1279
patients with T1DM who were enrolled in the Diabetes Control and Complications
Trial (DCCT). Each 10 cm increase in waist circumference was associated with a
significantly increased risk of incident microalbuminuria [HR 1.34 (95% CI 1.07,
1.58)], after adjusting for age, gender, race, duration of diabetes, treatment group,
99
smoking status, waist circumference, HbA1c and albumin excretion rate (each of
which were measured at DCCT close-out) [25].
Analyzing data from 764 patients with T1DM recruited into the EURODIAB study
and followed up for 7.3 years, Chaturvedi et al. reported that waist-hip ratio is a risk
factor for developing retinopathy [standardized regression estimate (SRE) 1.32 (95%
CI 1.07, 1.63); p = 0.01], together with duration of diabetes [SRE 1.32 (95% CI 1.07,
1.61); p = 0.008], HbA1c [SRE 1.93 (95% CI 1.52, 2.44); p = 0.0001] and fasting
triglyceride levels [SRE 1.24 (95% CI 1.01, 1.54); p = 0.04] [26].
Data from the EURODIAB study was also used to investigate the association
between insulin resistance, its surrogate measures and incident distal symmetric
neuropathy in 1172 patients with T1DM. Adjusting for HbA1c values and duration
of diabetes, weight [OR 1.34 (95% CI 1.17, 1.54); p < 0.001], BMI [OR 1.40 (95%
CI 1.22, 1.61); p < 0.001] and a lower eGDR [OR 1.37 (95% CI 1.08, 1.73); p =
0.01] were associated with an increased risk of incident neuropathy [29].
1.17 Is there a conceptual role for metformin in type 1 diabetes?
Intensive glycaemic control in patients with T1DM was reported to decrease the long
term risk of cardiovascular disease by 42% and the risk of nonfatal myocardial
infarction, stroke or cardiovascular death by 57% [474], with changes in HbA1c
(rather than changes in cardiovascular risk factors) seemingly accounting for most of
the benefit. However, the DCCT showed that intensive insulin therapy is hampered
by excessive weight gain, resulting in visceral adiposity [475], and deletirious effects
100
on lipids, blood pressure [476] and inflammatory markers [477]. Similar findings
were reported in the EURODIAB study, with T1DM patients gaining more than 5 kg
over a mean observation period of 7.3 years being characterised by better glycaemic
control at the expense of higher blood pressure, LDL-cholesterol and triacylglycerol,
and lower HDL-cholesterol [478]. Subcutaneous insulin administration is associated
with relative peripheral hyperinsulinaemia and relative hepatic hypoinsulinaemia
[479]. Surprisingly, although portal administration of insulin increased IGF-1 and
reduced prevalent GH levels, this occurred at the expense of a more atherogenic lipid
profile (reduced HDL-cholesterol, increased LDL-cholesterol:HDL-cholesterol ratio)
[480-484]. Whether this effect translates into a adverse cardiovascular outcomes
remains to be determined. Despite relative hepatic hypoinsulinaemia, glucagon
secretion is preserved in T1DM, favouring lipid oxidation. Exogeneous
subcutaneous insulin administration further enhances this process, increasing
circulating levels of non-esterified fatty acids and fuelling lipid accumulation in
skeletal muscle [440, 479, 485, 486].
These findings may justify the addition of the weight neutral insulin-sensitizing drug
metformin, the use of which (in T2DM) has been associated with modest reductions
in serum triacylglycerol, VLDL and LDL levels, decreased C reactive protein,
decreased platelet activation and a reduction in procoagulant factors (such as factor
VII and fibrinogen) [487].
101
1.18 Metformin in type 2 diabetes - benefits beyond glycaemic control
The United Kingdom Prospective Diabetes Study (UKPDS) was the first major study
underpinning the cardiovascular benefits of metformin in T2DM. The study
randomized 1704 overweight patients with T2DM to initial treatment with
metformin (342 patients), sulphonylurea/insulin (951 patients) or dietary measures
alone (411 patients). Compared with dietary measures, metformin (but not
sulphonylurea/insulin therapy) was associated with a 32% lower incidence of any
diabetes-related endpoint (micro and macrovascular) (95% CI 13, 47; p = 0.002),
42% fewer diabetes related deaths (95% CI 9, 63; p = 0.017), 36% lower all-cause
mortality (95% CI 9, 55; p = 0.011), and 39% fewer myocardial infarctions (MIs) (p
= 0.010) [488]. These effects persisted after 10 years of follow-up [risk reductions of
21% for any diabetes related end-point (p = 0.01), 33% for myocardial infarction (p
= 0.005), and 27% for death from any cause (p = 0.002)], despite the fact that
differences in glycaemic control (as assessed by HbA1c levels) were lost after one
year of follow-up [489].
The cardiovascular benefits of metformin in high risk patients with T2DM was
elucidated by the the Prevention of Restenosis with Tranilast and its Outcomes
(PRESTO) trial. This double-blind randomised controlled trial compared
cardiovascular outcomes in patients treated with tranilast following a percutanouse
coronary intervention. After 9 months of follow-up, patients treated with metformin
(with or without additional therapy, n = 887) were at a significantly lower risk of
death [OR 0.39 (95% CI 0.19, 0.77); p = 0.007) and myocardial infarction [OR 0.31
102
(95% CI 0.15, 0.66); p = 0.002] compared to those treated with insulin and/or
sulphonylurea (n = 1110) [490].
Similar beneficial outcomes were noted following retrospective analysis of data from
several large databases of patients with T2DM. The Diabetes and Audit in Research
Tayside Scotland (DARTS) study (n = 5730 patients) reported that mortality was
significantly lower after 5 years among drug-naïve T2DM patients initially treated
with metformin compared to a sulphonylurea [491]. McAfee et al. compared
cardiovascular outcomes in T2DM patients commenced on metformin, a
sulphonylurea or rosiglitazone over a period of 4.5 years and whose data were
extracted from a large US insurance database (n = 33363). Metformin monotherapy
was associated with a lower risk of the composite endpoint of myocardial infarction
and coronary revascularization after 5 years of follow-up compared to sulphonylurea
monotherapy [HR 0.77 (95% CI 0.62, 0.96)] [492]. These findings are consistent
with the results of other studies. Eurich et al. analyzed data of 12,272 new users of
oral hypoglycaemic agents suffering from T2DM and HF, recruited from the
Saskatchewan Health Database (n = 1833, average age 72 years) and followed up for
a mean of 2.5 years. Metformin monotherapy was associated with a lower risk of
mortality [HR 0.70 (95% CI 0.54, 0.91)] and a lower risk of the composite outcome
of deaths or hospitalizations [HR 0.83 (95% CI 0.70, 0.99)] compared to
sulphonylurea monotherapy [281]. A retrospective study of 16417 Medicare
beneficiaries with HF discharged after hospitalization with a principal diagnosis of
HF showed that metformin pharmacotherapy was associated with a reduction in
crude 1-year mortality rates (24.7% vs 36.0% of patients not treated with an insulin
sensitizing drug; p < 0.0001), a result confirmed in multivariate analysis [HR 0.87
103
(95% CI 0.78, 0.97)] [283]. Metformin was also associated with a modestly reduced
risk of readmission with HF [HR 0.92 (95% CI 0.86, 0.99)] but no effect on all-cause
readmissions [283]. A systematic review and meta-analysis of eight controlled
studies compared outcomes between different antihyperglycaemic agents in T2DM
patients with HF [284]. Metformin was associated with significantly reduced all
cause mortality in two studies [HR 0.86 (95% CI 0.78, 0.97)] (n = 1861 patients),
and with similar trends in a third study, compared with non-sensitisers
(sulphonylureas, non-sulphonylurea insulin secretagogues, alpha glucosidase
inhibitors or insulin) (n = 12069 patients). Formal meta-analysis showed that
metformin was not associated with any significant effects on all-cause
hospitalization, albeit a lower risk for heart-failure related readmissions [HR 0.92
(95% CI 0.86, 0.99)] [284], in keeping with the findings of Masoudi et al. [283].
Of potential direct relevance to T1DM, Kooy et al. compared outcomes in 390
insulin-treated patients with T2DM randomized to treatment with metformin or
placebo therapy and followed up for 4.3 years [493]. Adjunct metformin
pharmacotherapy was associated with a reductions in body weight [-3.07 kg (range -
3.85 to -2.28); p < 0.001], HbA1c level [mean -0.4% (95% CI -0.25, -0.55); p <
0.001] and insulin requirements [mean -19.63 IU/day (95% CI -14.36, -24.91); p <
0.001]. Additionally, metformin was reported to decrease macrovascular morbidity
and mortality (HR 0.61 [95% CI 0.40, 0.94]; p = 0.02), an effect that was partly
explained by the difference in weight [493].
In a retrospective study on 8063 patients with no prior history of congestive HF,
Nichols et al. compared the incidence of HF between individuals who were
104
commenced on additional treatment for T2DM over a period of 4 years [494]. The
prescription of metformin to insulin-treated patients with T2DM reduced the
congestive HF rate ratio to 0.63 (95% CI 0.3, 1.07), a development which is
particularly desirable given that initial insulin therapy was associated with a higher
incidence of congestive HF [44.5/1000 patients/year (95% CI 37.9, 52.3)] than
metformin [15.3/1000 patients/year (95% CI 8.9, 26.3)] or sulphonylureas
[19.9/1000 patients/year (95% CI 17.2, 23.1)] [494]. In a similar vein, the
systematic review by Eurich et al. had also reported that insulin treatment was
associated with increased cardiovascular morbidity (hospital admission for HF,
prescription for open label angiotensin converting enzyme inhibitor, or myocardial
infarction) and mortality [HR 1.38 (95% CI 1.06, 1.80)] [284].
1.19 Use of adjunct metformin in type 1 diabetes: what is the evidence?
As suggested above, the available data underpinning the use of metformin in T2DM
justify examining the safety and efficacy of this drug in T1DM. Its low cost, proven
safety profile and promising short and long-term macro- and microvascular benefits
in T2DM justify studies to define its use in a disease increasingly associated with
insulin resistance and other components of the metabolic syndrome. This thesis will
therefore examine the available evidence supporting the use of this drug in T1DM,
and investigate the hypothesis that adjunct metformin is associated with (i) a
decrease in insulin dose and weight, and (ii) an improvement in glycaemic control
and lipid profile.
105
Chapter 2
Clinical study
Characterising thiazolidinedione
'tolerant' and 'intolerant' patients
A physiological approach
106
Chapter 2 - Clinical study
Characterising thiazolidinedione 'tolerant' and 'intolerant' patients
A physiological approach
Section I - Methods
2.1 Study design
This clinical study was a case-control biomarker study in T2DM patients aged 40 to
70 years. It compared physiological parameters between thiazolidinedione 'tolerant'
and 'intolerant' patients in response to a low, acute high and chronic high salt diet.
This was achieved during three study visits.
2.2 Good clinical practice
The study was conducted in accordance with the protocol, protocol amendments,
Good Clinical Practice (GCP) as described in the International Conference on
Harmonization (ICH) tripartite harmonized guidelines of technical requirements for
registration of pharmaceuticals for human use [495], the Declaration of Helsinki
(2000 Edinburgh) [496], the ‘Research Governance Framework for Health and
Community Care’, second edition, 2006 [497], and applicable legal and regulatory
requirements
107
2.3 Ethics
In accordance with the above guidelines governing medical research, the study
protocol and its subsequent amendments were subjected to ethical approval by the
Tayside Research Ethics committee. The protocol for this study was approved in
February 2008. A number of amendments pertaining to study documentation were
subsequently submitted for ethical approval in view of difficulties with patient
recruitment, funding withdrawal by Wyeth Pharmaceuticals, and a re-location of the
principal investigator. Patient recruitment and study procedures were allowed to
commence and/or proceed only when the ethics committee approval letter had been
received by the Principal Investigator at each stage. Protocol amendments were
prepared by the undersigned, working as a Clinical Research Fellow in this project,
and approved by the Principal Investigator. Administrative amendments that did not
affect the conduct of the study or patient safety, and did not significantly reduce the
scientific value of the protocol did not require a formal review and approval from the
Ethics Committee. A copy of all correspondence between the investigator and the
Ethics Committee was kept in the appropriate section of the study file. The Clinical
Research Fellow or Principal Investigator was bound to follow local institutional
guidelines on reporting serious adverse events.
2.4 Caldicott-Guardian approval
ICH GCP section 2.13 states that ‘systems with procedures that assure the quality of
every aspect of the trial should be implemented’ [495]. The identification of
potentially suitable patients was aided by access to SCI-DC datasets. With this in
108
mind, the data collection process was subjected to Caldicott-Guardian approval in
accordance with established protocols [498], and only commenced once the
necessary approval letter was received by the Principal Investigator. A copy of all
study-related correspondence pertaining to Caldicott-Guardian approval was kept at
the appropriate section of the study file.
2.5 Study objectives
2.5.1 Objective 1 – to compare the baseline characteristics of two cohorts of
patients with type 2 diabetes who are either sensitive or insensitive to
thiazolidinedione-associated fluid retention
Although thiazolidinedione-induced oedema is a clinically important adverse effect,
absolute rates are low and the time course is uncertain. Traditional observational
studies have encountered difficulties in finding informative cases. Given the
hypothesis that some individuals may be more prone to thiazolidinedione-associated
oedema than others, it seemed appropriate and cost-effective to study these
'intolerant' individuals in some depth. The most appropriate comparator group was a
cohort of thiazolidinedione 'tolerant' patients. The potentially confounding effect of
thiazolidinedione therapy was avoided by substituting these antihyperglycaemic
agents with sulphonylurea therapy for 4 weeks prior to the study interventions, while
maintaining stable glycaemic control.
109
2.5.2 Objective 2 – to compare the characteristics of the above two cohorts
during an acute and chronic ‘high normal’ sodium loading in order to detect
differences in metabolic, cardiovascular and renal characteristics.
This case-control study, comparing cohorts of matched thiazolidinedione 'tolerant'
and previously 'intolerant' patients, was designed to address the following
hypotheses:
Primary hypotheses:
Are patients known previously to have been intolerant of thiazolidinediones
characterised during either acute or chronic “high normal” sodium loading by:
1) Increased ankle-foot volume (AFV) (a measure of oedema)
2) Impaired left ventricular diastolic function (including tissue Doppler)
3) High pulse wave velocity
4) Salt sensitivity of blood pressure
5) High plasma VEGF levels
Secondary hypotheses:
Do renin-angiotensin system activation, fractional sodium excretion, free water
handling and/or total body water (deuterium dilution) differ between cohorts 1 and 2
during acute or chronic sodium loading?
110
2.6 Study population
The study recruited male and female T2DM patients aged between 40 and 70 years
of age with a history of thiazolidinedione exposure. These patients were subdivided
into two cohorts:
• A thiazolidinedione 'tolerant' cohort (cohort 1) defined by T2DM individuals
previously initiated on thiazolidinediones (usually, but not exclusively in
combination with metformin), with HbA1c ≤9.0% and without diuretic
therapy, whose current thiazolidinedione therapy was not complicated by
fluid retention and/or HF.
• A thiazolidinedione 'intolerant' cohort (cohort 2) defined by T2DM patients
whose thiazolidinedione therapy was withdrawn within three months of onset
of thiazolidinedione exposure as a consequence of drug-associated fluid
retention and/or HF, and now with an HbA1c of ≤9.0% on one or two non-
thiazolidinedione agents (sulphonylreas/metformin) and without diuretic
therapy.
The cohorts were matched as far as possible for age and gender. Only patients who
met all inclusion criteria and no exclusion criteria were considered for participation
in this study.
111
2.7 Inclusion criteria
All patients recruited into the study were required to fulfil all of the following
criteria:
• Adult patients tolerant (cohort 1) or previously-intolerant (cohort 2) of
thiazolidinediones
• T2DM
• Aged ≥40 years and ≤70 years
• Recorded HbA1c ≤9.0% within last six weeks
• Non-microalbuminuric (either negative single morning sample or tested at
screening)
• Recorded blood pressure ≤145/85 mmHg on no therapy, monotherapy or dual
therapy
• Ability to understand and willingness to sign the informed consent form
Patients in Cohort 1 (tolerant of thiazolidinediones) were additionally required to
fulfil all of the following criteria:
• Previously initiated and currently continuing on thiazolidinedione therapy
without diuretic therapy
• Prepared to discontinue thiazolidinedione therapy with informed consent
• Prepared to take an alternative treatment instead of thiazolidinedione therapy
Patients in cohort 2 (previously intolerant of thiazolidinediones) were likewise
additionally required to fulfil all of the following inclusion criteria:
112
• Previously withdrawn from thiazolidinedione therapy at any stage because of
reported fluid retention (including oedema and/or HF)
• Currently being treated with one or two non-thiazolidinedione oral anti-
hyperglycaemic agents
• No current diuretic therapy
2.8 Exclusion criteria
Patients were excluded from the study if they met any of the following criteria:
• BMI > 40 kg/m2
• HbA1c > 9.0%
• Patients (Cohort 2) withdrawn from thiazolidinedione therapy for reasons
other than oedema (e.g. weight gain without oedema, liver dysfunction, lack
of efficacy, other adverse events).
• Hypertension requiring treatment with three or more anti-hypertensive agents
• HF (NYHA Classes II, III, IV or left ventricular systolic ejection fraction <
40%)
• Significant renal or hepatic dysfunction (defined as a serum creatinine level
exceeding 130 µmol/L or a > 2.5 fold increase in prevalent alanine
aminotransferase (ALT) levels respectively)
• Known to be HIV-positive
• Known active hepatitis B and/or hepatitis C infection
• Pregnant or lactating women
• Known drug/alcohol abuse
• Known psychiatric condition
113
Both men and women and members of all ethnic groups were eligible for this study.
Pregnant women were excluded for safety reasons. Children were not eligible – the
study population encompassed individuals aged 18 – 70 years.
2.9 Withdrawal from the study
Patients had the right to withdraw from the study at any stage, for any or no specific
reason, without affecting any of their statutory rights as patients or continuing care.
The investigator had the right to withdraw patients in accordance with the following
guidelines:
• At his discretion, if it was perceived to be in the best interests of the patient
to withdraw
• Intercurrent illness: a condition, injury or disease unrelated to diabetes, that
rendered continuing the study unsafe or regular follow-up impossible
• General or specific changes in the patient's condition that rendered the patient
ineligible
• Noncompliance with study procedures or protocol-required evaluations
• Termination of the clinical study by the sponsor or funding body
The reasons for any withdrawal(s) were clearly explained in the case report form
(CRF).
114
2.10 Recruitment process
The study recruited T2DM patients whose routine management is monitored within
the Scottish Care Information – Diabetes Collaborative (SCI-DC) clinical
information system in Tayside, Scotland. This confidential password-protected
national computerised clinical system provides up-to-date single patient records,
yielding a Scottish-wide register of all patients with diabetes based on a unique nine-
digit patient identifying number [Community Health Identifying (CHI) number].
Primarily designed to deliver integrated diabetes care to all members of the diabetes
care team, it is also an invaluable research tool for recruitment purposes [437]. The
original Diabetes Audit and Research Tayside (DARTS) database for Tayside has a
sensitivity of 96% and a positive predictive value of 95% for ascertainment of
known diabetes [437]. At the time of the study, SCI-DC consisted of two separate
elements, called SCI-DC clinical and SCI-DC network. The former was a secondary
care clinical management system whilst the latter was a web-based clinical system
containing data from primary and secondary care (both were superceded in 2012 by
a single web-based system, SCI-Diabetes). SCI-DC data is linked to the Medicines
Monitoring Unit (MEMO) database. The latter was developed for
pharmacoepidemiological research in the population of Tayside, and contains
detailed records of all prescription items dispensed to patients at community
pharmacies [499]. Thus, at the time of the study, detailed records of all prescriptions
dispensed for thiazolidinediones, insulin, diuretics, and all other drugs referred to
hereafter were available for all Tayside patients (now across Scotland). This highly
integrated clinical information system proved indispensable in identifying the two
115
groups of thiazolidinedione-treated patients fitting the very specific inclusion criteria
for this study.
The method of approaching T2DM patients followed the Standard Operating
Procedures developed by the Scottish School of Primary Care, formerly Scottish
Practices and Professionals Involved in Research (SPPIRe) [500]. Thus, the
University of Dundee Health Informatics Centre produced a computer diskette
permitting the interrogation of the computer systems of participating practices by
study research nurses. An algorithm was used to identify patients on
thiazolidinedione therapy (cohort 1) or in receipt of up to three (but not more)
previous prescriptions for rosiglitazone or pioglitazone in the last two years (cohort
2). Individual general practitioners were contacted regarding patients who were
likely to fit the inclusion criteria. General practitioners who agreed were invited to
forward a signed letter to the patient inviting them to participate in the study. This
approach ensured that only patients who were likely to fit the inclusion criteria were
actually contacted, minimizing patient inconvenience.
Additionally, the University of Dundee Health Informatics Centre identified
potential patients who had been recruited into the Wellcome Trust Case Control
Genetics study (LREC ref 053/04). These patients had consented to be re-contacted
regarding participation in future research. Patients fulfilling the preliminary
recruitment criteria (as assessed on the SCI-DC clinical information system) were
written to using a standard letter specific to the cohort, accompanied by an
information sheet outlining the nature of the study. Where telephone contact details
were available in this Wellcome Trust dataset, this correspondence was followed up
116
by means of a phone call made by the author, a clinical research fellow in this study.
An alternative recruitment approach was used in those instances where the patient’s
telephone number was not available from the study database. A letter of invitation
was sent to these patients. This included a tear- off slip allowing invited patients to
indicate whether they were interested in participation and to provide current contact
details in the prepaid envelope provided. For patients who are willing to participate,
screening of suitable patients was aided by clinical data available on the SCI-DC
clinical information system. This recruitment approach commenced after obtaining
Caldicott-Guardian approval.
The author personally invited participation by T2DM patients who were likely to
fulfil the study inclusion criteria (as suggested by available SCI-DC records) when
they attended the Diabetes Clinic at Ninewells Hospital between December 2008 and
April 2010. This process commenced after obtaining the necessary Caldicott-
Guardian approvals.
2.11 Study procedure - visit 1
Patients identified as potentially suitable either for inclusion into cohort 1
(thiazolidinedione tolerant) or cohort 2 (thiazolidinedione intolerant) were provided
with one of two specific patient information sheet, outlining the aims and method of
this study. They were also informed about the potential benefits and adverse effects
associated with participation. The information sheet explained that participation,
while greatly appreciated, was entirely voluntary. Patients were free to decline the
invitation, or withdraw from participating at any stage. They were not obliged to
117
explain their reasons for doing so; additionally, it was clarified that such a decision
did not adversely affect their statutory rights as patients. Subjects were offered the
opportunity to clarify any concerns with the study research nurses, myself, the
principal investigator or an external advisor (Professor Ewan Pearson). All patients
considered for participation were recorded on a screening log that was maintained at
the study site.
Patients expressing an interest were thus scheduled for a first study visit, which also
encompassed a screening procedure. Transport was provided for all study and
monitoring visits. In accordance with procedures approved by ethics committee,
patients were compensated for time and inconvenience incurred as a result of
participation in this study (£50 for each study visit), and for any travelling costs
incurred if they opted to travel to the study site, as per ethical approval.
Patient participants were once again familiarised with the study schedule and given
the opportunity to ask questions. I was delegated with responsibility for obtaining
informed consenting using the approved form. The consent encompassed the
extraction of routine clinical data from the SCI-DC system.
The following data were subsequently collected:
• Date of birth and age
• Gender
• A brief structured questionnaire detailing patient’s experience of
thiazolidinedione therapy, with particular emphasis of duration of
thiazolidinedione therapy, ankle swelling, fluid retention, symptoms or signs
118
of HF, other adverse effects while on thiazolidinedione therapy (including
hypoglycaemia)
• Diabetes related history with collection of data on diagnosis, macrovascular
and microvascular complications. Status was assessed through available SCI-
DC records. Retinal screening was repeated if not assessed within the last 12
months
• Past medical history
• Concomitant medications
• Weight was measured to the nearest 0.1 kilogram (kg) using an electronic,
recently calibrated weighing scale. Patients were asked to stand unattended
and barefoot on both feet at the centre of the weighing platform scale.
• Standing height was measured to the nearest 0.5 centimetre (cm) using a
Leicester height measure. The subject was asked to remove any head dress or
head ornaments and to stand barefoot with his/her back against the height
rule, such that the back of the head, back, buttocks, calves and heels were
touching the vertical scale, feet together. The attending clinical research
fellow ensured that the patient was looking straight ahead, with the top of the
external auditory meatus level with the inferior margin of the bony orbit. The
apparatus’ horizontal measure was lowered to touch the top of the head once
the latter was correctly positioned.
• Waist circumference was measured using a flexible but non-stretchable
measuring tape to the nearest 0.1 cm midway between the lower rib margin
and the iliac crest at the mid-axillary line. The measuring points on each side
were determined by marking these bony margins using a water-soluble
marker pen, and determining and marking the midway point for each side.
119
Patients were asked to remove clothing from around the waist and hips.
Measurement was taken with the subjects standing on both feet, with their
feet pointing forwards and approximately 25-30 cm apart. They were asked
to breathe normally. The reading of the measurement was taken at the end of
a gentle exhalation. BMI was calculated by dividing each subject’s weight in
kilograms by the square of the height in metres
• Pregnancy test (if applicable) – patients with a positive pregnancy test were
excluded
• Pulse and blood pressure were recorded in triplicate after 5 minutes of rest, in
the non-dominant arm and sitting posture, using an automated
sphygmomanometer placed at the level of the patient’s heart and approved by
the British Hypertension Society. Patients were asked not to cross their legs
while sitting. They were also advised to refrain from smoking, drinking tea,
coffee or cola, and participating in any arduous activity for one hour prior to
blood pressure measurement. Adherence to these recommendations was
verified at the study visit. Measurements were taken using an appropriately
sized cuff that covered 80% of the circumference of the midpoint of the
upper arm, after removing or loosing any clothing covering this site. Care
was taken to ensure that the cuff was rotated such that the indicated mark on
the cuff was placed over the brachial artery. The arm was rested on a pillow
or bed while the measurement was being taken. Patients were asked to refrain
from moving and speaking for a minute while the blood pressure was being
recorded. Subjects were rested for five minutes before repeating the readings.
All three pulse and blood pressure readings were recoded on the CRF,
enabling the calculation of a mean reading for each clinical parameter.
120
Patients were excluded from participation if their mean blood pressure (on
current antihypertensive therapy if applicable) exceeded 145/85mmHg.
• Physical examination of the cardiovascular, respiratory, abdominal,
neurological, locomotor and endocrine systems was carried out.
• Venous blood samples were taken for estimation of full blood count, HbA1c,
sodium, urea, creatinine, glucose, liver function tests and lipid profile.
• Dipstick urinalysis and urine for microalbuminuria – A second morning mid-
stream urine sample was collected in a sterile universal container for this
purpose. Patients were appropriately counselled by the research nurse or
clinical research fellow prior to this procedure
• ECG
Cohort 1 patients were asked to replace their current thiazolidinedione therapy with
gliclazide therapy at the same visit. They were provided with a glucose meter, and
advised to check and record their blood glucose readings on the diary provided. The
clinical research fellow maintained telephone contact with these patients, titrating
sulphonylurea dose if necessary to maintain prevailing HbA1c at <9%. Cohort 2
(thiazolidinedione 'intolerant' patients were advised to continue therapy with their
current antihyerglycaemic agents.
Individuals treated with (one or two) antihypertensive agents were advised to
discontinue these agents, one at a time, with careful follow-up of blood pressure
readings at each stage. Patients were withdrawn from the study if their blood
pressure exceeded 160/110 mmHg following the withdrawal of one or both
antihypertensive agents. Aspirin-treated individuals were advised to discontinue this
121
agent 10 days prior to visit 2. Patients were advised to recommence treatment with
aspirin and antihypertensives once visit 3 was completed.
Participating individuals were asked to follow a moderate low (100 mmol/day)
sodium diet for five days prior to visit 2; written information was provided in this
regard. They were additionally supplied with self-weighing scales and urine
specimen collecting containers enabling self-weighing and the collection of early
spot urine samples for urinary sodium and urinary creatinine estimation for 5
consecutive days prior to the next visit.
2.12 - Study procedure - visit 2
Visit 2 was scheduled 4-7 weeks after visit 1, allowing adequate ‘wash-out’ of
thiazolidinedione effects in thiazolidinedione 'tolerant' individuals (cohort 1).
Patients were instructed to follow a moderately low (100 mmol/day) salt diet for five
consecutive days prior to the study visit. On these days, participating subjects were
asked to collect an early morning urine sample for urinary sodium and creatinine
estimation, and to weigh themselves on awakening, dressed in their underwear, using
the electronic self-weighing scale provided, recording the measurements on a diary.
Patients arrived at the vascular research laboratory at around 08.30 hours. They were
instructed to consume 300 mg lithium carbonate at 22.00 hrs the previous night and
subsequently remain starved. Patients were asked to refrain from smoking and
consuming alcohol and caffeine-containing beverages for the duration of the fast;
compliance to this advice was verbally ascertained at the start of the study visit. On
arrival, patients were made comfortable on a bed, and remained supine, except for
122
voiding and ankle-fluid measurements. Patients remained fasted until the end of the
study visit, which lasted till about 16.00 hours. Patients were permitted to drink a
volume of water equivalent to urinary losses throughout this visit. They were
additionally provided with a sandwich meal before leaving the unit
2.12.1 Baseline measurements
During this study visit, the following baseline assessments and measurements were
made:
• Echocardiography including tissue Doppler
• Concomitant therapy
• Compliance with diet
• Compliance with medication
• Assessment of occurrences of hypoglycaemia
• Dipstick urinalysis and urine for microalbuminuria
• Weight and waist measurement
• Blood pressure (in triplicate)
• AFV by water displacement
• Pulse wave analysis and velocity.
• HbA1c
• Plasma for biochemistry (urea and electrolytes, liver function tests)
• ANP
• Aldosterone
• Renin
• BNP and NT-proBNP
123
• VEGF
• AVP
2.12.2 Biochemistry
Blood samples for HbA1c estimation were collected in a vacuum collection tube
containing EDTA. while plasma glucose samples were collected in a vacuum
collection tube containing FX sodium fluoride/potassium oxalate. Sera for renal,
liver and lipid profiles, serum albumin and lithium measurement were collected in a
Z serum clot activator vacuum collection tube with gel separator. Details pertaining
to assay methodology are outlined in table 2.1 below. Urinary lithium levels were
measured by Mr Neil R Johnston in Professor David Webb’s laboratory at the
Clinical Pharmacology Unit, Queens' Medical Research Institute, University of
Edinburgh, Edinburgh, using the flame photometry technique. The latter is
characterized by an intra-assay CV of 1.54% and an inter-assay CV of 2.98%, based
on repeated analysis of the control sample. The measuring instrument, a BWB-1
Flame Photometer (BWB Technologies) has a working range of between 1 and 100
ppm lithium. All other analyses were carried out at NHS Tayside laboratories,
Ninewells Hospital and Medical School, Dundee.
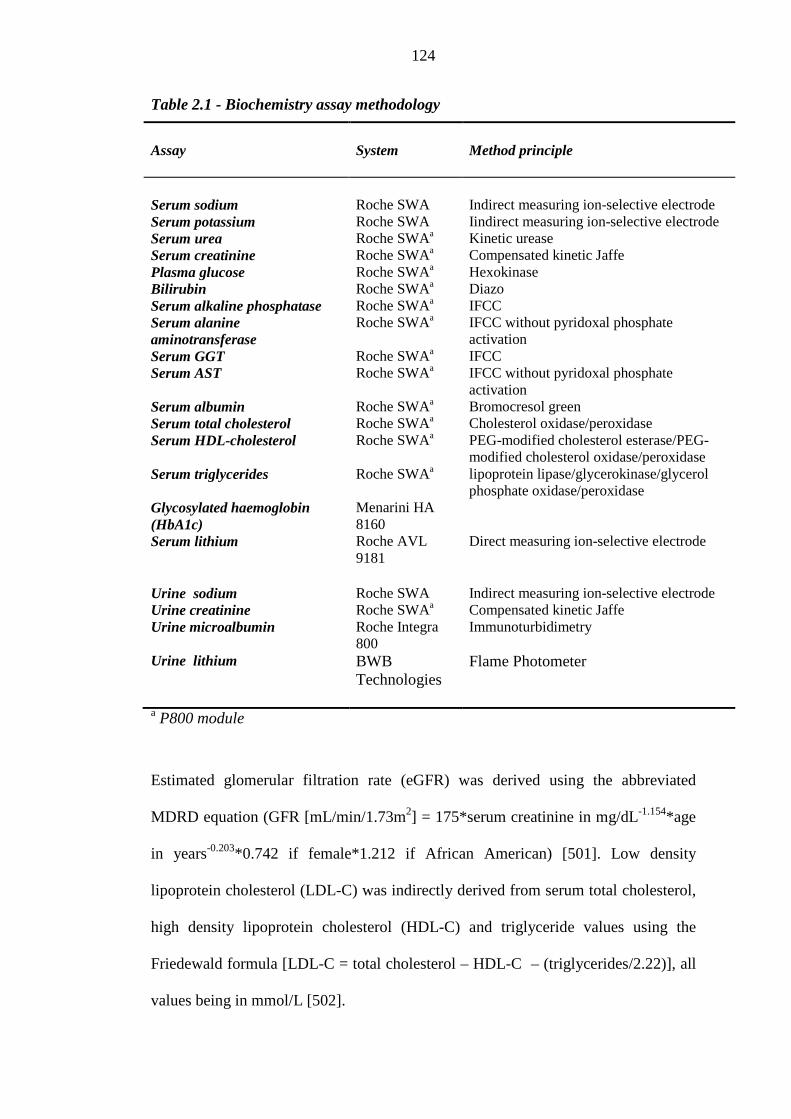
124
Table 2.1 - Biochemistry assay methodology
Assay
System
Method principle
Serum sodium Roche SWA Indirect measuring ion-selective electrode Serum potassium Roche SWA Iindirect measuring ion-selective electrode Serum urea Roche SWAa Kinetic urease Serum creatinine Roche SWAa Compensated kinetic Jaffe Plasma glucose Roche SWAa Hexokinase Bilirubin Roche SWAa Diazo Serum alkaline phosphatase Roche SWAa IFCC Serum alanine aminotransferase
Roche SWAa IFCC without pyridoxal phosphate activation
Serum GGT Roche SWAa IFCC Serum AST Roche SWAa IFCC without pyridoxal phosphate
activation Serum albumin Roche SWAa Bromocresol green Serum total cholesterol Roche SWAa Cholesterol oxidase/peroxidase Serum HDL-cholesterol Roche SWAa PEG-modified cholesterol esterase/PEG-
modified cholesterol oxidase/peroxidase Serum triglycerides Roche SWAa lipoprotein lipase/glycerokinase/glycerol
phosphate oxidase/peroxidase Glycosylated haemoglobin (HbA1c)
Menarini HA 8160
Serum lithium Roche AVL 9181
Direct measuring ion-selective electrode
Urine sodium Roche SWA Indirect measuring ion-selective electrode Urine creatinine Roche SWAa Compensated kinetic Jaffe Urine microalbumin Roche Integra
800 Immunoturbidimetry
Urine lithium BWB Technologies
Flame Photometer
a P800 module
Estimated glomerular filtration rate (eGFR) was derived using the abbreviated
MDRD equation (GFR [mL/min/1.73m2] = 175*serum creatinine in mg/dL-1.154*age
in years-0.203*0.742 if female*1.212 if African American) [501]. Low density
lipoprotein cholesterol (LDL-C) was indirectly derived from serum total cholesterol,
high density lipoprotein cholesterol (HDL-C) and triglyceride values using the
Friedewald formula [LDL-C = total cholesterol – HDL-C – (triglycerides/2.22)], all
values being in mmol/L [502].
125
2.12.3 Biomarkers
Plasma samples for measurement of Vascular Endothelial Growth Factor (VEGF)
and high sensitivity copeptin were assayed by Dr. Paul Welsh in the laboratory of
Professor Naveed Sattar at the Institute of Cardiovascular and Medical Sciences,
University of Glasgow. The high sensitivity copeptin assay used is characterised by a
functional assay sensitivity of less than 2 pmol/L, an intra-assay CV of < 3% (for hs
copeptin concentrations exceeding 50 pmol/L) to < 15 % (for hs copeptin
concentrations of 3-4 pmol/L) and an inter-assay CV of < 5% (for hs copeptin
concentrations exceeding 50 pmol/L) to < 17% (for hs copeptin levels of 3 to 4
pmol/L). The VEGF assay used gives a functional assay sensitivity of < 5 pg/mL, an
intra-assay CV of 4.5% to 6.7% and an inter-assay CV of 6.2% to 8.8%. Blood
samples for estimation of hs copeptin and VEGF concentrations were both collected
in vacuum collection tubes containing EDTA, stored at -80 ºC until assay, thawed
overnight in a refrigerator at 4 ºC, and mixed by inversion prior to assay. The rest of
the biomarkers [ANP, B-type natriuretic peptide (BNP), N-terminal prohormone of
brain natriuretic peptide (NT-pro-BNP), aldosterone and renin] were analysed by
Ms. Leslie McFarlane at the laboratories of the Division of Cardiovascular and
Research Medicine, Medical Research Institute, University of Dundee. Blood
samples for ANP, BNP, and renin were collected in vacuum collection tubes
containing EDTA, and immediately spun (3000 rpm) for 10 minutes at 4ºC. Two 2
mL plasma aliquots were collected in 5mL plastic tubes and frozen at - 70ºC until
formal analysis of ANP and BNP levels. Two 1mL plasma aliquots were likewise
collected in 1.5mL plastic tubes and frozen at -20ºC pending formal renin level
estimation. Both ANP (reference range: 8.6 ± 0.8 pg/mL) and BNP (reference range:
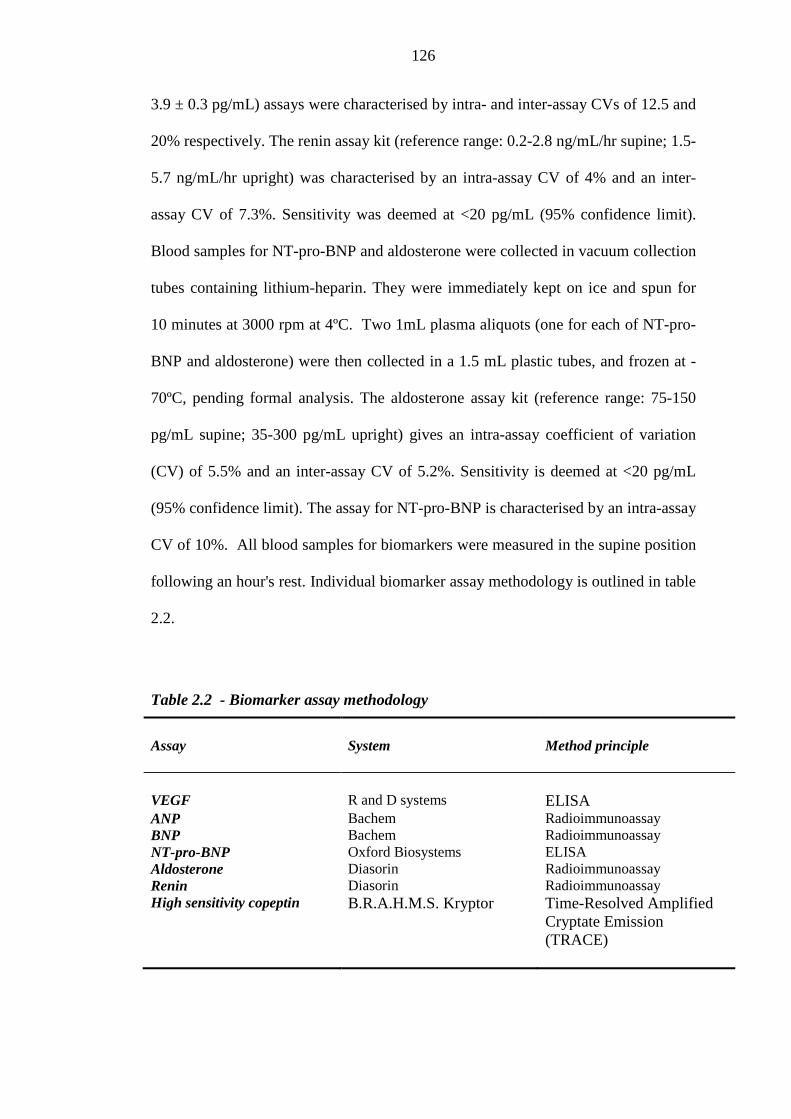
126
3.9 ± 0.3 pg/mL) assays were characterised by intra- and inter-assay CVs of 12.5 and
20% respectively. The renin assay kit (reference range: 0.2-2.8 ng/mL/hr supine; 1.5-
5.7 ng/mL/hr upright) was characterised by an intra-assay CV of 4% and an inter-
assay CV of 7.3%. Sensitivity was deemed at <20 pg/mL (95% confidence limit).
Blood samples for NT-pro-BNP and aldosterone were collected in vacuum collection
tubes containing lithium-heparin. They were immediately kept on ice and spun for
10 minutes at 3000 rpm at 4ºC. Two 1mL plasma aliquots (one for each of NT-pro-
BNP and aldosterone) were then collected in a 1.5 mL plastic tubes, and frozen at -
70ºC, pending formal analysis. The aldosterone assay kit (reference range: 75-150
pg/mL supine; 35-300 pg/mL upright) gives an intra-assay coefficient of variation
(CV) of 5.5% and an inter-assay CV of 5.2%. Sensitivity is deemed at <20 pg/mL
(95% confidence limit). The assay for NT-pro-BNP is characterised by an intra-assay
CV of 10%. All blood samples for biomarkers were measured in the supine position
following an hour's rest. Individual biomarker assay methodology is outlined in table
2.2.
Table 2.2 - Biomarker assay methodology
Assay
System
Method principle
VEGF R and D systems ELISA ANP Bachem Radioimmunoassay BNP Bachem Radioimmunoassay NT-pro-BNP Oxford Biosystems ELISA Aldosterone Diasorin Radioimmunoassay Renin Diasorin Radioimmunoassay High sensitivity copeptin B.R.A.H.M.S. Kryptor Time-Resolved Amplified
Cryptate Emission (TRACE)
127
2.12.4 Echocardiography (including tissue doppler)
At the start of this study visit, the patient underwent echocardiography enabling a
baseline assessment of left ventricular function in moderate low sodium states. This
procedure was repeated after infusion of one litre of 0.9% saline for each
participating subject, allowing additional assessment of cardiac function in response
to acute salt loading. All echocardiographic measurements were carried out by Dr.
Adnan Nadir (Clinical Research Fellow, Division of Cardiovascular and Diabetes
Medicine, Ninewells Medical School).
The Philips iE33 echocardiography system enables semi-automated analysis of true
left ventricular volumes, using all the voxels to generate a full three dimensional
endocardial border. This approach is characterised by higher accuracy and less
dependency on left ventricular shape assumptions than conventional methods. Its
three dimensional quantification advanced (3D QA) waveform display provides
accurate data for the assessment of global function based on left ventricular volume,
ejection fraction and stroke volume, while allowing simultaneous display of 17
regional waveforms, enabling temporal comparisons between the segments. Any
patients found to have previously-undetected baseline left ventricular systolic
ejection fraction below 40% were excluded by protocol at this stage of this study.
The E-wave/A-wave (E/A) ratio was used to assess left ventricular systolic and
diastolic function. E prime (E’) was measured at the level of the mitral valve annulus
as a sensitive index of longitudinal axis left ventricular relaxation [503]. The latter
method is well established in the University of Dundee Division of Medicine and
Therapeutics. Three dimensional echocardiography also allowed accurate,
128
assumption free and reproducible quantification of left ventricular mass. The 3D QA
waveform display was thus poised to characterise the baseline
echocardiocardiographic features of thiazolidinedione 'tolerant’ and 'intolerant’
patients, and to investigate the effects of dietary and therapeutic interventions on
cardiac function among patients in either cohort.
2.12.5 Ankle-foot volume measurements
AFV was measured close to the start of visit 2, and repeated after infusion of one
litre of 0.9% saline, allowing analysis of data in both low and acute high sodium
states. Measurements were made using a plastic water bath (measuring 390 mm long
by 330 mm wide by 280 mm high) with an outlet tap for water overflow at the top of
the bath, located 200 mm from the bottom of the water bath (figure 2.1). This tap had
a tube attached, from which the overflow water was collected into a plastic
container. Patients were verbally familiarised with the procedure prior to
commencing the measurements. The water bath (including all its grooves) was filled
with water at 26-27 °C, and water was allowed to flow out through the overflow tap
into the plastic collecting container until the water within the water bath levelled
with the overflow tap. The latter was fully closed at this point. Water temperature
was assessed using an electronic thermometer. The plastic collecting container was
then emptied and weighed on an electronic scale, ensuring it was placed at the centre
of the weighing scale platform, without touching the bath or its attached water tap.
The subject was then asked to dip their bare feet slowly into the bath of water until
their feet were flat at the bottom of the bath, as they sat at the edge of a bed with
their knees flexed at right angles. His/her feet were positioned into a reproducible

129
position, facing forwards, in the water bath. The subject was then asked to sit still,
while being kept comfortable to rest their arms on a pillow placed over their knees.
Once the water level within the bath had settled, the water tap was turned open and
left in this position for five minutes (timed using an electronic stopwatch). The
volume/weight of the water displaced was weighed at the end of this time-interval.
The procedure was repeated thrice, enabling the calculation of mean values for the
ankle fluid volume at each stage of the study. Displaced water was replaced within
the water bath at each repeat ankle fluid volume measurement procedure.
Figure 2.1 – Schematic diagram of a water bath used to measure ankle-foot
volume by water displacement
390 mm
280 mm
200 mm
330 mm
130
2.12.6 Pulse wave velocity and analysis
Arterial stiffness was measured in this study using applanation tonometry
(SphygmoCor). The latter is a computerised diagnostic tool permitting accurate
description of pulse wave characteristics and pulse wave velocity, and the
extrapolation of findings to central cardiac and aortic physiological events.
SphygmoCor derives central aortic pressure waveform non-invasively from the
pressure pulse recorded at a peripheral site by applanation tonometry. The apparatus
reconstructs the aortic waveform from the non-invasively derived radial waveform
by a validated mathematical model termed transfer function [504]. While the
characteristics of transfer function are determined by the physical properties of the
arterial system (namely arterial diameter, wall elasticity, wall thickness, amount of
branching and the condition of the peripheral arterial beds), its main components do
not change markedly between normal individuals with age. This is consistent with
the observation that most of the ageing changes occur in the aortic trunk rather than
in the arteries of the arm [505].
Although arterial stiffness is a major risk factor for cardiovascular disease, and
predicts the development of left ventricular failure [506-508], traditional methods
detecting left ventricular failure do not provide information on the arterial dynamics
that determine left ventricular hypertrophy. To this effect, this study utilized the
technique of applanation tonometery to investigate the hypothesis that individuals
prone to develop HF after incident thiazolidinedione prescription are characterised
by greater arterial stiffness compared with their ‘thiazolidinedione tolerant’
counterparts.
131
The patient was advised to lie supine, calm and relaxed on a bed, with their head
supported on a pillow and their arms relaxed by their sides, in a temperature
controlled room. The patient’s right wrist was supported, such that the palm faced
upwards. I ascertained that the radial pulse was identical in both arms and that the
arterial pressure by cuff sphygmomanometry was within 10mmHg systolic. A
baseline ECG ruled out significant arrhythmias while baseline echocardiography
carried out immediately prior to this procedure rule out significant aortic stenosis
(gradient > 60 mmHg). Both aortic stenosis and cardiac arrhythmias adversely affect
the reproducibility of pulse wave analysis and velocity measurements [509, 510]. For
pulse wave analysis, the SphygmoCor tonometer was placed on the patient’s radial
artery by the clinical research fellow. The patient was advised to dorsiflex the wrist
while supporting it on a small cushion, so as to push the artery towards the surface,
easing access. The tonometer was pressed gently and steadily on the patient’s radial
artery, adjusting the tonometer slightly backwards and forwards until a consistent
large arterial waveform was displaced completely within the laptop computer
monitor screen. The pulse wave signal was captured only after ascertaining that the
pulse waveform was characterised by a steady vertical waveform position, constant
pulse height and consistent waveform profiles for two complete screens (at least 10
seconds). The study report was generated by the computer software. Data were
recorded on the CRF.
For pulse wave velocity measurement, which was carried out immediately following
pulse wave analysis, the patient was positioned as previously. Three ECG electrodes
were attached to the patient’s skin. Skin was prepared beforehand, by shaving excess
132
hair over the electrode site (if indicated) and briskly rubbing the site with a cotton
pad soaked in isopropyl alcohol, to ensure a stable, artefact free ECG trace. The
SphygmoCor system uses a LEAD II ECG lead configuration system. Leads were
placed on the chest wall to increase QRS height. The pulse wave velocity was
calculated using a three-stage process. The distance from the suprasternal notch to
the arterial pulse site was measured and recorded in millimetres in the
SphygomoCor computer software. The distance between the suprasternal notch and
the carotid pulse was likewise measured and recorded. The subtraction of these two
measurements was automatically performed by the software once the proximal and
distal values were entered. The tonometer was used to capture steady pulse
waveforms, intially on the distal (radial artery) site, and subsequently on the
proximal (carotid artery) site, once good quality waveforms were ascertained for
each site. The study report was then generated by the computer software. Data were
recorded on the CRF.
2.12.7 Assessment of glomerular filtration rate (inulin clearance method)
Glomerular filtration rate (GFR) cannot be measured directly in humans, and is
determined by measuring the clearance of an ideal filtration marker. Inulin, an
uncharged polymer of fructose derived from plant tubers, fulfils this requirement on
account of the following characteristics, which render it the gold standard method in
this field [511, 512]:
(i) its low molecular weight
(ii) physiologically inert
(iii) being unbound to plasma proteins
133
(iv) ability to reach a stable plasma concentration
(v) free filtration at the glomerulus
(vi) not reabsorbed, secreted or metabolised in the kidney
(vii) does not alter renal function
The CV in serum and urine inulin levels ranging from 100 to 250 mg/L is less than
5%. The intra-test CV in inulin clearance is around 10% [512].
As outlined earlier, following informed consent, patient participants were requested
to fast from 22.00 hours prior to visit 2, refraining from smoking and consuming
alcohol and caffeine containing beverages for the duration of the fast (free fluids
permitted). On arrival for visit 2, two intravenous cannulae were inserted into the
antecubital veins, one for infusion of inulin, and the second one into the contralateral
vein for drawing blood. The patient was made comfortable on a bed, and was
advised to remain supine throughout the test procedure, except for voiding. Baseline
levels of inulin were measured at t = -130 minutes. Blood samples were collected in
a Z serum clot activator vacuum collection tube with gel separator and allowed to
settle at room temperature for about ten minutes. They were then spun for ten
minutes at 3000 rpm and stored at -20ºC, prior to transfer on dry ice for analysis by
Mr Neil R Johnston in Professor David Webb's laboratory at the Clinical
Pharmacology Unit, Queens' Medical Research Institute, University of Edinburgh,
Edinburgh. Plasma inulin was measured using an in-house colorimetric microplate
assay based upon the chemical reaction between fructose and resocinol, following an
initial acid hydrolysis of inulin to its fructose subunits [513]. This method gives
sensitivity of 50 ug/mL, an intra-assay CV of 3.7% and an inter-assay CV of 5.35%.
A priming dose of inulin (Inutest® 25%) was commenced at t = -120 minutes,
134
administered as an intravenous bolus of 50 mg/kg inulin, followed by a continuous
intravenous infusion at a rate of 25mg/min, infused in 0.9% saline until t = 130
minutes (ie over 250 minutes) [514]. Venous blood samples for plasma inulin were
again measured at t = - 10 minutes and t = - 5 minutes. Plasma levels of inulin reach
a steady state after approximately 60 to 90 minutes of administration [512, 514]. One
litre of 0.9% saline was then infused over two hours (as per salt loading protocol,
section 2.12.11), commencing at t = 0 minutes, with measurements of plasma inulin
levels at t = 120 minutes and t = 130 minutes. The patient’s glomerular filration rate
was estimated from the steady state infusion of inulin according to the calculation
method described by Schnurr et al. [515].
Normally, clearance (C) is calculated from serum and urine samples using the
formula:
U*V/ S ml/min
where U = urine concentration, V = urine volume and S = serum concentration
In the method outlined here, clearance is calculated by replacing U*V by the
infusion rate IC*IV
where IC = concentration of the test substance in the infusion fluid and IV = rate of
the infusion.
i.e. C = IC*IV/ S ml/min
135
The result was corrected for body surface area using the standard nomogram.
Inulin is not considered a hazardous compound according to EU Directive
67/548/EC. Therefore, any risks associated with inulin infusion were related only to
the procedures of intravenous cannulation and infusion. Inulin had been infused in
the same vascular research laboratory on several occasions, without adverse effects
[516].
2.12.8 Fractional excretion of sodium
Fractional excretion of sodium (FENa) was calculated from spot measurements of
urine sodium, serum sodium, urine creatinine and plasma creatinine, using the
formula:
FENa = (UNa*Pcr/PNa*U cr)*100
where UNa = urine sodium, Pcr = serum creatinine, PNa = serum creatinine and Ucr =
urine creatinine [517].
All four measurements were made at t = -120 minutes and t = 0 minutes (before
infusion of 0.9% saline), enabling a calculation of mean FENa at low sodium states).
Similar measurements were made at t = 120 minutes and t = 240 minutes (after 0.9%
saline infusion, enabling a calculation of mean FENa following acute high salt
loading.
136
2.12.9 Fractional excretion of lithium
Renal reabsorption of lithium is virtually confined to the proximal tubules, and
occurs in the same proportion as that of sodium and water. Post-proximal tubule
reabsorption of lithium has been deemed limited [518, 519]), and probably
unimportant in humans [520]. This method has been deemed the best available
estimate of proximal tubule function [521]. Hence calculation of fractional excretion
of lithium (FELi) gives an accurate and non-invasive assessment of sodium and
water delivery to the distal tubules.
FELi was likewise calculated from spot measurements of urine lithium, serum
lithium, urine creatinine and plasma creatinine , using the formula
FELi = (ULi*Pcr/PLi*U cr)*100
where ULi = urine lithium, Pcr = serum creatinine, PLi = serum lithium and Ucr = urine
creatinine
Once again, all four measurements were made at t = -120 minutes, t = 0 minutes, t =
120 minutes and t = 240 minutes, enabling calculation of FELi at low sodium and
acute high sodium states.
137
2.12.10 Fractional reabsorption of distally delivered sodium
Fractional reabsorption of distally delivered sodium (FRDDNa) was calculated at t =
-120 minutes, t = 0 minutes, t = 120 minutes and t = 240 minutes, using the formula:
(FELi - FENa/FELi)*100
Each result was expressed as a percentage [522, 523].
2.12.11 Salt sensitivity of blood pressure
Pulse, blood pressure and respiratory rate readings were taken at ten minute intervals
from the non-dominant arm using an automated sphygmomanometer while a litre of
0.9% saline was infused over two hours in the recombinant position, as discussed
earlier. The attending clinical research fellow also assessed the patient for signs of
fluid overload at each time-point. Participants complaining of dyspnoea or whose
respiratory rate exceeded 20 breaths per minute at rest (or increased by more than
five breaths per minute from baseline) were assessed earlier. Patients with a priori
HF were excluded from the study. Moreover, baseline echocardiography performed
at the start of visit 2 excluded patients whose left ventricular ejection fraction was
estimated at less than 40%. The saline infusion was discontinued immediately if
patients were deemed to be developing signs of fluid overload, showing other signs
of decompensation, or developing a blood pressure rise exceeding 170/95 mmHg at
rest (mean of two duplicates).
138
2.13 Study procedure - visit 3
Visit 3 was scheduled one to two weeks after visit 2, following five days on a ‘high
normal’ 200 mmol/day sodium diet, essentially comprising the previous ‘low salt’
diet supplemented by ten slow sodium tablets (HK Pharma, each 10 mmol/sodium)
daily. On these five preceding days, participating subjects were asked to collect an
early morning urine sample for urinary sodium and creatinine estimation. They were
also instructed to weigh themselves on awakening, dressed in their underwear, using
the electronic self-weighing scale provided, recording the measurements on a diary.
Patients arrived at the vascular research laboratory at around 08.30 hours, having
consumed 300 mg lithium carbonate at 22.00 hrs and subsequently fasted the
previous night. Patients were asked to refrain from smoking and consuming alcohol
and caffeine-containing beverages for the duration of the fast; compliance to this
advice was verbally ascertained at the start of the study visit. On arrival, patients
were made comfortable on a bed, and remained supine, except for voiding and ankle-
fluid measurements. Patients remained fasted until the end of the study visit, which
lasted until about 13.30 hours. They were provided with a sandwich meal before
leaving the research unit.
During this study visit, the following baseline assessments and measurements were
repeated:
• Echocardiography including tissue Doppler
• Concomitant pharmacological therapy
• Compliance with a ‘high normal’ 200 mmol/day sodium diet
• Compliance with medication
139
• Assessment of occurrences of hypoglycaemia
• Dipstick urinalysis and urine for microalbuminuria
• Weight/waist measurement
• Blood pressure (in triplicate)
• AFV by water displacement
• Pulse wave analysis and velocity.
• HbA1c
• Plasma for biochemistry (urea and electrolytes, liver function tests)
• ANP
• Aldosterone
• Renin
• BNP and NT-proBNP
• VEGF
• AVP
2.13.1 Total body water estimation
Total body water (TBW), comprising both intracellular and extracellular fluid, was
measured in this study visit using deuterium, a natural stable isotope of hydrogen.
The isotope dilution technique has been dubbed as the most robust method of TBW
estimation [524-526], with a reproducibility of approximately 0.5% [525]. A basal
spot urine sample was collected at the onset of study visit 3. A 25 ml aliquot of this
sample was stored in a labelled universal bottle in a freezer for eventual analysis by
Ms. Alexandra Small in Professor Tom Preston’s Stable Isotope Biochemistry
Laboratory, Scottish Universities Environmental Research Centre (SUERC),
140
Glasgow. 4g deuterium oxide were administered as an oral stable isotope dilution at t
= -120 minutes, ie 2 hours prior to the administration of the inulin infusion.
Deuterium oxide had been previously produced gravimetrically at SUERC, diluted
with around 50 ml tap water and stored in a leak proof container in a specific freezer
until thawed for use. The dose bottle was rinsed with tap water, and the latter was
also drunk by the patient, ensuring complete ingestion of the deuterium oxide dose.
The participating patient was asked to provide three post dose urine samples at
approximately two hourly intervals (approximately t = 0 minutes, t = 120 minutes
and t = 240 mins). from the start of the inulin infusion. Patients were encouraged to
void at an earlier stage or at additional time points if they so required. The time and
volume of each sample was accurately recorded and a ~25mL aliquot stored in a
labelled universal bottle in a freezer for IRMS analysis at SUERC. The residue of
each sample was discarded. Patients were permitted to drink a volume of water
equivalent to urinary losses throughout this visit.
Fat-free mass (FFM, also known as lean body mass) was derived from TBW by
dividing the latter by the water content of fat free tissue (73.2%) [524]. Fat mass
(FM) was derived by subtracting FFM from each individual patient's total body
mass. Percentage FM and percentage FFM were calculated relative to total body
weight [527]. Derived FFM values were validated against non-linear regression
models published by Wang et al. (FFM = 10.8*height (m) 2.95 for males and
10.1*height (m) 2.90 for females) [528].
Use of deuterium for TBW measurement has been deemed free from the hazards
associated with radioisotopes. An adult male of 80kg may have a TBW of 40 kg or
141
greater. This will naturally contain 155 ppm deuterium or 6.2g deuterium oxide in 40
kg water [527]. Isotope ratio mass spectrometry employed for TBW estimation
allowed minimalization of deuterium dosage, such that all doses used were less than
that naturally present in the human body. This approach, coupled with the sourcing
of deuterium oxide of guaranteed purity and the use of a non-invasive protocol
combining oral doses of heavy water and urine sampling, ensured that the TBW
protocol was completely risk free.
2.13.2 Glomerular filtration rate
Glomerular filtration rate was once again assessed in visit 3 using the inulin
clearance method outlined earlier. Following a bolus dose (50 mg/kg), inulin was
administered at a rate of 25 mg/min over 130 minutes (starting at t = 0 minutes).
Venous plasma samples were withdrawn pre-infusion (t = -10 minutes), t = 120
minutes and t = 130 minutes, and sent for measurement of inulin levels.
2.13.3 Salt and water handling techniques
FENa, FELi and FRDDNa were calculated on a chronic moderately high sodium diet
using the formulas discussed earlier. The relevant urine and serum samples were
collected at t = -120 minutes, t = 0 minutes, t = 120 minutes and t = 130 minutes.
142
2.14 Biostatistical considerations
2.14.1 Sample size
About five months into recruitment for this study, Wyeth Pharmaceuticals, who had
provided funding via the Scottish Translational Medicines Research Collaboration
(TMRC) underwent a merger with Pfizer. An initial threat that funding would be
completely withdrawn was successfully challenged on ethical grounds (given that
patients had already been enrolled and undergone invasive procedures). However,
the project had to be scaled down to a to a maximum of 30-40 patients, enabling a
comparison between 10 thiazolidinedione intolerant patients and 20
thiazolidinedione tolerant completed patients, which was a significant reduction from
the original recruitment plan for this study (40-60 patients comprising at least 20
thiazolidinedione tolerant and 20 thiazolidinedione intolerant patients). It should also
be acknowledged that recruitment had proved more difficult than anticipated,
especially for thiazolidinedione intolerant patients (as confirmed section II), despite
adopting an integrated and multifaceted approach.
This was an exploratory study aimed at assessing the potential of ankle−foot volume
(and/or other specified measurements) under acute and/or chronic sodium challenge
as biomarkers of TZD intolerance. This was of interest to Wyeth Pharmaceuticals,
who provided funding via the TMRC. We did not find data in the literature to
permit a formal power calculation for ankle-foot volume measurements. The
background literature from which the sample size was derived was a study in which
AFV had a between-day intra-subject coefficient of variation of 1.76% [529];
143
amlodipine therapy increased this parameter by 23% in 80 unselected hypertensive
patients in a study by Fogari et al [530]. I found no previous data measuring AFV on
high salt diets either in TZD-tolerant or intolerant patients with or without diabetes.
Other endpoints were purely exploratory. It was pre-specified that there would be no
adjustment for multiple comparisons.
Once the study had been initiated, as already mentioned (page 142), following the
merger of Wyeth and Pfizer, subsequent limitations on funding imposed by the
TMRC dictated a reduced sample size from that originally intended. Thus, a revised
submission was made to the TMRC adopting a more constrained exploratory
analysis defining a reference range (with 95% CIs) from thiazolidinedione tolerant
patients, and plotting individual data from the thiazolidinedione intolerant patients
individually against these reference ranges to examine and explore the data formally
for trends [531]. The ultimate power of these analyses was lower than originally
intended and can be visualised for those results that were positive from the graphs
showing 95% CIs for the reference range in the TZD-tolerant patients.
2.14.2 Statistical analyses
Objective 1: All patients who completed visit 1 were considered in the analysis of
baseline characteristics. Any patient(s) withdrawing consent after visit 1 had their
data included in the analysis.
Objective 2: All patients who completed all the study visits, or had completed visits
1 and 2 (including patients who have withdrawn due to hypertension) were
144
considered in the analysis. If the patient withdrew consent after visit 2, their data
were included in the analysis. Patients who withdrew prior to visit 2 were not
considered in the analysis.
Patients judged not to have complied with diet on the basis of urinary sodium
excretion were excluded from the analysis. Given the limited sample size, only
descriptive statistics were used.
2.15 Follow-up of these patients
All cohort 1 patients were offered the option of switching back from gliclazide to
their usual thiazolidinedione at completion of visit 3. They were also advised to
recommence their usual antihypertensive therapy, and switch back to their ‘usual’
sodium diet. All patients were offered a follow-up visit within a few days of
completing visit 3, so as to address issues pertaining to drug therapy modification,
glucose monitoring or any other potential queries arising out of their participation in
this study. General practitioners were advised regarding any long-term therapeutic
modifications once patients completed their participation in this study.
145
2.16 Validation of ankle-foot volume measurement by the water displacement
technique
2.16.1 Aim
The water displacement technique is establishing itself as a useful volumetric
method for monitoring peripheral oedema. However, it is also considered to be time
consuming and difficult to perform [532, 533]. Its day-to-day reproducibility has
only been validated over a mean duration of 4.8 days [529], which limits its use to
monitor longer-term volumetric changes. This is particularly relevant in research
practice, where rigorous objective assessment is crucial. This study aimed to
investigate intra-subject variability of the water displacement technique over a longer
period of 2 weeks.
2.16.2 Methods
Ten healthy individuals without signs of peripheral oedema were recruited for this
single centre prospective cohort study carried out at the Vascular Research
Laboratory of the Department of Clinical Pharmacology and Therapeutics, Division
of Cardiovascular and Diabetes Medicine, Medical Research Institute, University of
Dundee. Recruitment was carried out by emailing potentially interested participants
working at Ninewells Medical School. No particular instructions on physical
activity, working hours or break time was given to participants. Subjects were
excluded if any of the following criteria were met: current hospitalization, known
history of selected medical conditions (hypertension, cardiac failure, renal

146
impairment/failure, liver disease, lymphoedema, chronic venous insufficiency, deep
vein thrombosis), treatment with diuretics, calcium channel antagonists, statins,
insulin or thiazolidinediones, known pregnancy, presence of superficial skin ulcers,
open sores, wounds, or other skin conditions on the lower extremity, history of an
ankle injury or lower extremity surgery within the past 30 days.
I carried out a simplified clinical examination of the lower limbs, essentially
comprising an assessment for signs of chronic venous insufficiency, ulcers, ankle/leg
injuries or skin conditions that precluded subjects from participation.
Subjects fitting inclusion criteria had their cumulative (bilateral) ankle volume
measured in triplicate at weekly intervals for three successive weeks. Measurements
were taken at approximately the same time each week (± 1 hour), minimising diurnal
variation. An outline of the method used has been described elsewhere. All
measurements were carried out by myself. Shoes and socks were removed before
each examination. Height, weight and blood pressure were measured for each
participant. Standing height was measured using a stadiometer and standing weight
using the same validated electronic scale, as outlined earlier. Blood pressure was
measured using a British Hypertensive Society validated automated
sphygmomanometer with the patient sitting comfortably at rest for five minutes.
Waist circumference was measured using a non-elastic measuring tape in accordance
with Scottish Diabetes Research Network (SDRN) standard operation procedures.
Distribution of baseline demographic data and clinical characteristics were presented
as mean (± SD) or as percentages. An estimate of the analytical variance (also
147
known as measurement error), defined as the average variance of repeated
measurements at the same time point, was defined for the cohort of participating
subjects at each study visit using one way ANOVA (subject as term). Within-
individual variance, the average variance of repeated measurement in the same
subject at different time points was likewise calculated for each individual using
two-way ANOVA (subject and day as terms). Residuals were deemed to be normally
distributed using the Kolmogorov-Smirnov test and by constructing Q-Q plots. The
CV in each case was calculated by dividing the square root of the total error term of
the adjusted mean squares from ANOVA by the mean of the observations and
expressed as a percentage. Intra-class correlation coefficient (ICC) (with
corresponding 95% CI value) was calculated as an overall estimation of the
reproducibility of leg volume measurements. All statistical analyses were performed
using SPSS® version 21.0.
2.16.3 Results
Descriptive statistics for the ten participating subjects (five males, five females) are
summarised in table 2.3. Although mean (SD) BMI was in overweight range, mean
systolic blood pressure (SBP) and diastolic blood pressure (DBP) readings were in
the normotensive range.
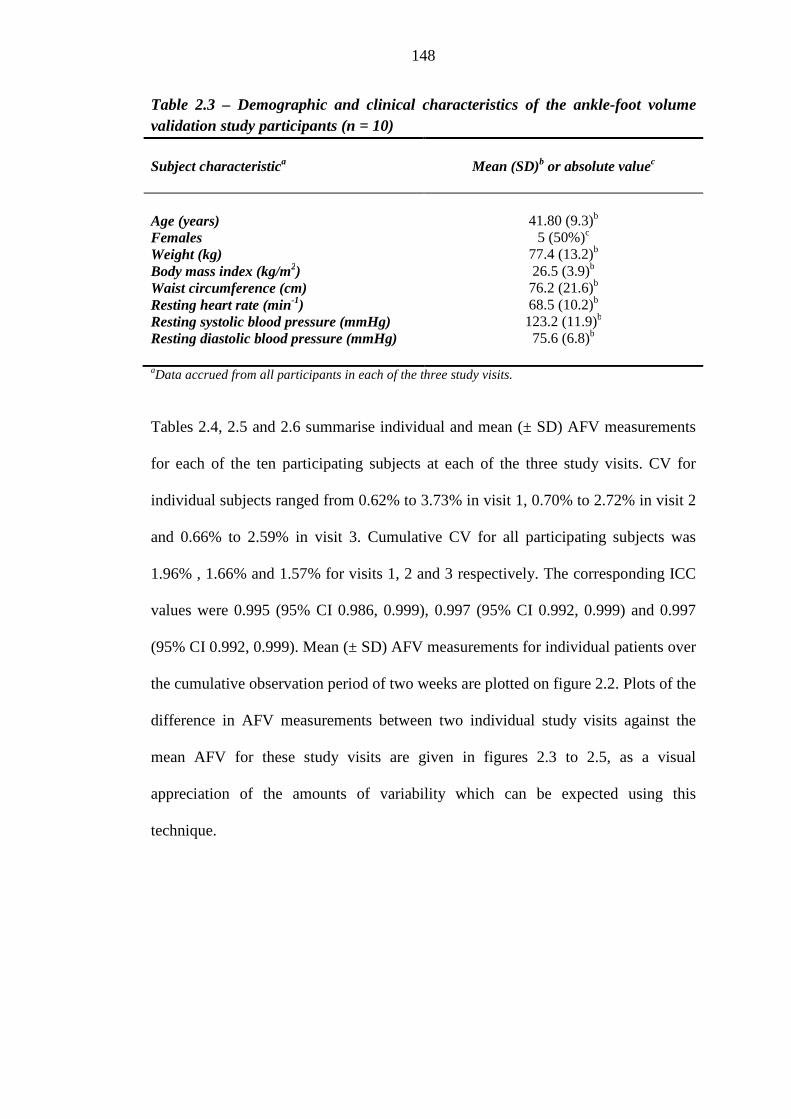
148
Table 2.3 – Demographic and clinical characteristics of the ankle-foot volume validation study participants (n = 10)
Subject characteristica
Mean (SD)b or absolute valuec
Age (years) 41.80 (9.3)b Females 5 (50%)c Weight (kg) 77.4 (13.2)b Body mass index (kg/m2) 26.5 (3.9)b Waist circumference (cm) 76.2 (21.6)b Resting heart rate (min-1) 68.5 (10.2)b Resting systolic blood pressure (mmHg) 123.2 (11.9)b Resting diastolic blood pressure (mmHg) 75.6 (6.8)b aData accrued from all participants in each of the three study visits.
Tables 2.4, 2.5 and 2.6 summarise individual and mean (± SD) AFV measurements
for each of the ten participating subjects at each of the three study visits. CV for
individual subjects ranged from 0.62% to 3.73% in visit 1, 0.70% to 2.72% in visit 2
and 0.66% to 2.59% in visit 3. Cumulative CV for all participating subjects was
1.96% , 1.66% and 1.57% for visits 1, 2 and 3 respectively. The corresponding ICC
values were 0.995 (95% CI 0.986, 0.999), 0.997 (95% CI 0.992, 0.999) and 0.997
(95% CI 0.992, 0.999). Mean (± SD) AFV measurements for individual patients over
the cumulative observation period of two weeks are plotted on figure 2.2. Plots of the
difference in AFV measurements between two individual study visits against the
mean AFV for these study visits are given in figures 2.3 to 2.5, as a visual
appreciation of the amounts of variability which can be expected using this
technique.
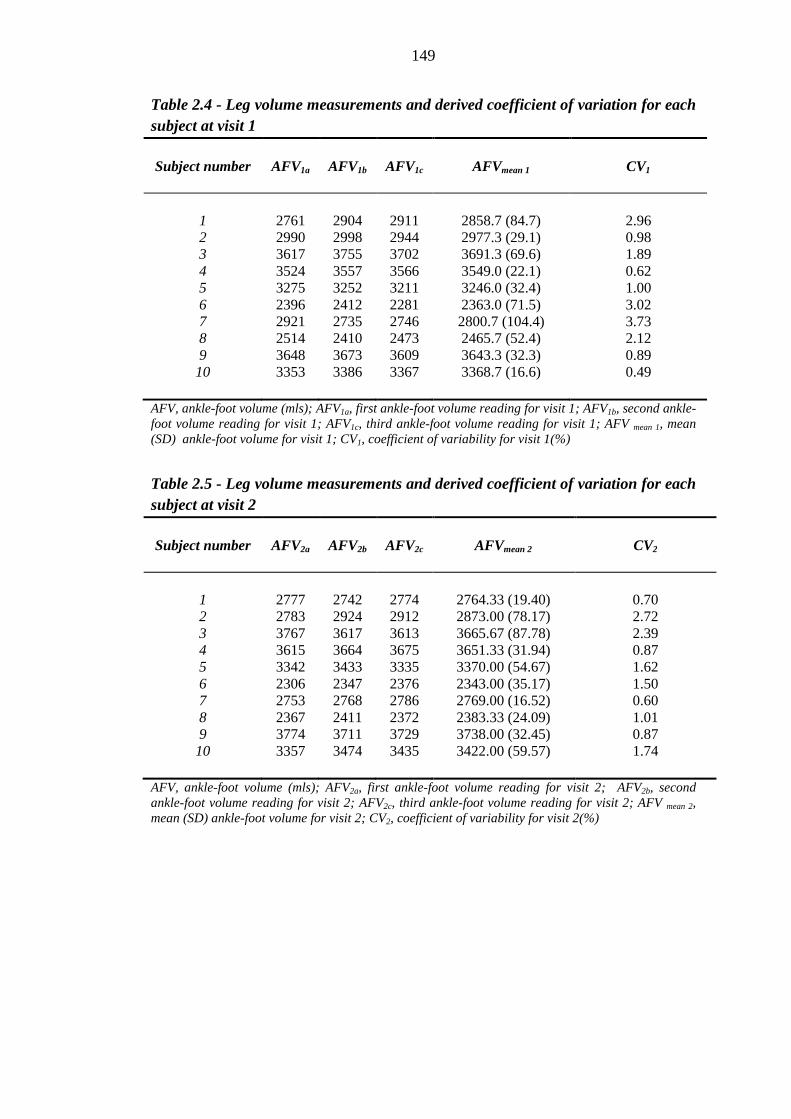
149
Table 2.4 - Leg volume measurements and derived coefficient of variation for each subject at visit 1
Subject number
AFV1a AFV1b AFV1c AFVmean 1 CV1
1 2761 2904 2911 2858.7 (84.7) 2.96 2 2990 2998 2944 2977.3 (29.1) 0.98 3 3617 3755 3702 3691.3 (69.6) 1.89 4 3524 3557 3566 3549.0 (22.1) 0.62 5 3275 3252 3211 3246.0 (32.4) 1.00 6 2396 2412 2281 2363.0 (71.5) 3.02 7 2921 2735 2746 2800.7 (104.4) 3.73 8 2514 2410 2473 2465.7 (52.4) 2.12 9 3648 3673 3609 3643.3 (32.3) 0.89 10 3353 3386 3367 3368.7 (16.6) 0.49
AFV, ankle-foot volume (mls); AFV1a, first ankle-foot volume reading for visit 1; AFV1b, second ankle-foot volume reading for visit 1; AFV1c, third ankle-foot volume reading for visit 1; AFV mean 1, mean (SD) ankle-foot volume for visit 1; CV1, coefficient of variability for visit 1(%)
Table 2.5 - Leg volume measurements and derived coefficient of variation for each subject at visit 2
Subject number
AFV2a AFV2b AFV2c AFVmean 2 CV2
1 2777 2742 2774 2764.33 (19.40) 0.70 2 2783 2924 2912 2873.00 (78.17) 2.72 3 3767 3617 3613 3665.67 (87.78) 2.39 4 3615 3664 3675 3651.33 (31.94) 0.87 5 3342 3433 3335 3370.00 (54.67) 1.62 6 2306 2347 2376 2343.00 (35.17) 1.50 7 2753 2768 2786 2769.00 (16.52) 0.60 8 2367 2411 2372 2383.33 (24.09) 1.01 9 3774 3711 3729 3738.00 (32.45) 0.87 10 3357 3474 3435 3422.00 (59.57) 1.74
AFV, ankle-foot volume (mls); AFV2a, first ankle-foot volume reading for visit 2; AFV2b, second ankle-foot volume reading for visit 2; AFV2c, third ankle-foot volume reading for visit 2; AFV mean 2, mean (SD) ankle-foot volume for visit 2; CV2, coefficient of variability for visit 2(%)
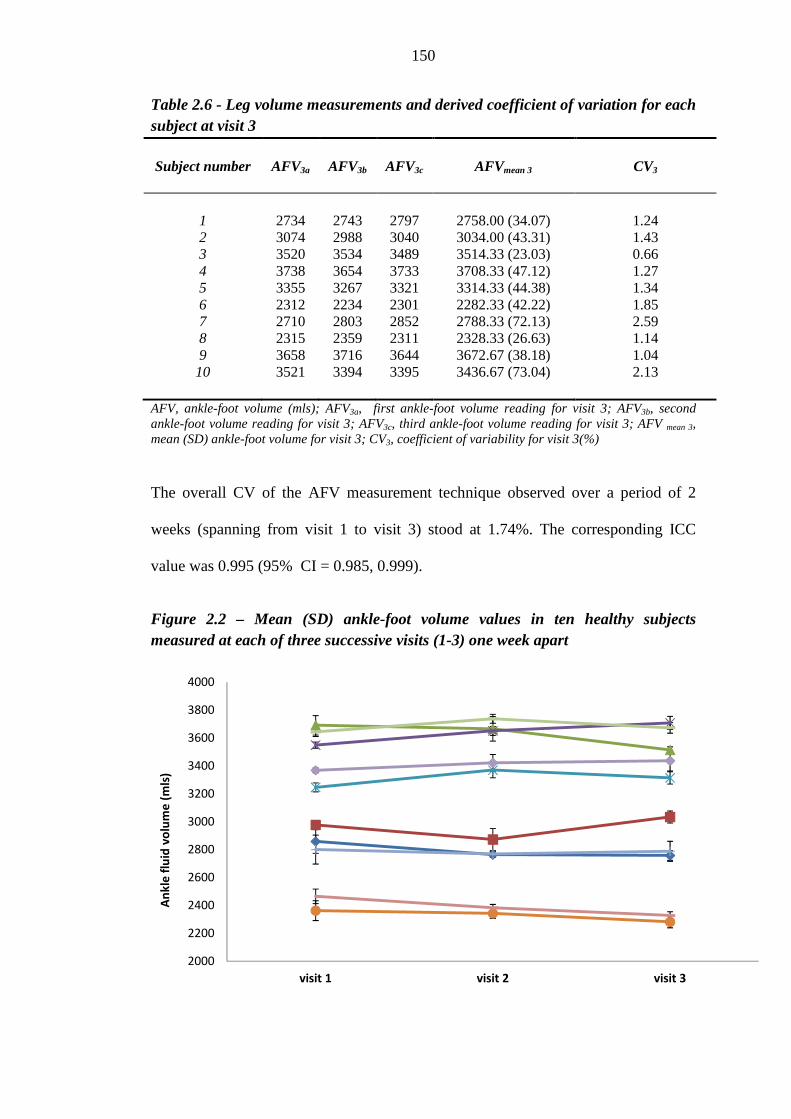
150
Table 2.6 - Leg volume measurements and derived coefficient of variation for each subject at visit 3
Subject number
AFV3a AFV3b AFV3c AFVmean 3 CV3
1 2734 2743 2797 2758.00 (34.07) 1.24 2 3074 2988 3040 3034.00 (43.31) 1.43 3 3520 3534 3489 3514.33 (23.03) 0.66 4 3738 3654 3733 3708.33 (47.12) 1.27 5 3355 3267 3321 3314.33 (44.38) 1.34 6 2312 2234 2301 2282.33 (42.22) 1.85 7 2710 2803 2852 2788.33 (72.13) 2.59 8 2315 2359 2311 2328.33 (26.63) 1.14 9 3658 3716 3644 3672.67 (38.18) 1.04 10 3521 3394 3395 3436.67 (73.04) 2.13
AFV, ankle-foot volume (mls); AFV3a, first ankle-foot volume reading for visit 3; AFV3b, second ankle-foot volume reading for visit 3; AFV3c, third ankle-foot volume reading for visit 3; AFV mean 3, mean (SD) ankle-foot volume for visit 3; CV3, coefficient of variability for visit 3(%)
The overall CV of the AFV measurement technique observed over a period of 2
weeks (spanning from visit 1 to visit 3) stood at 1.74%. The corresponding ICC
value was 0.995 (95% CI = 0.985, 0.999).
Figure 2.2 – Mean (SD) ankle-foot volume values in ten healthy subjects measured at each of three successive visits (1-3) one week apart
2000
2200
2400
2600
2800
3000
3200
3400
3600
3800
4000
visit 1 visit 2 visit 3
An
kle
flu
id v
olu
me
(m
ls)
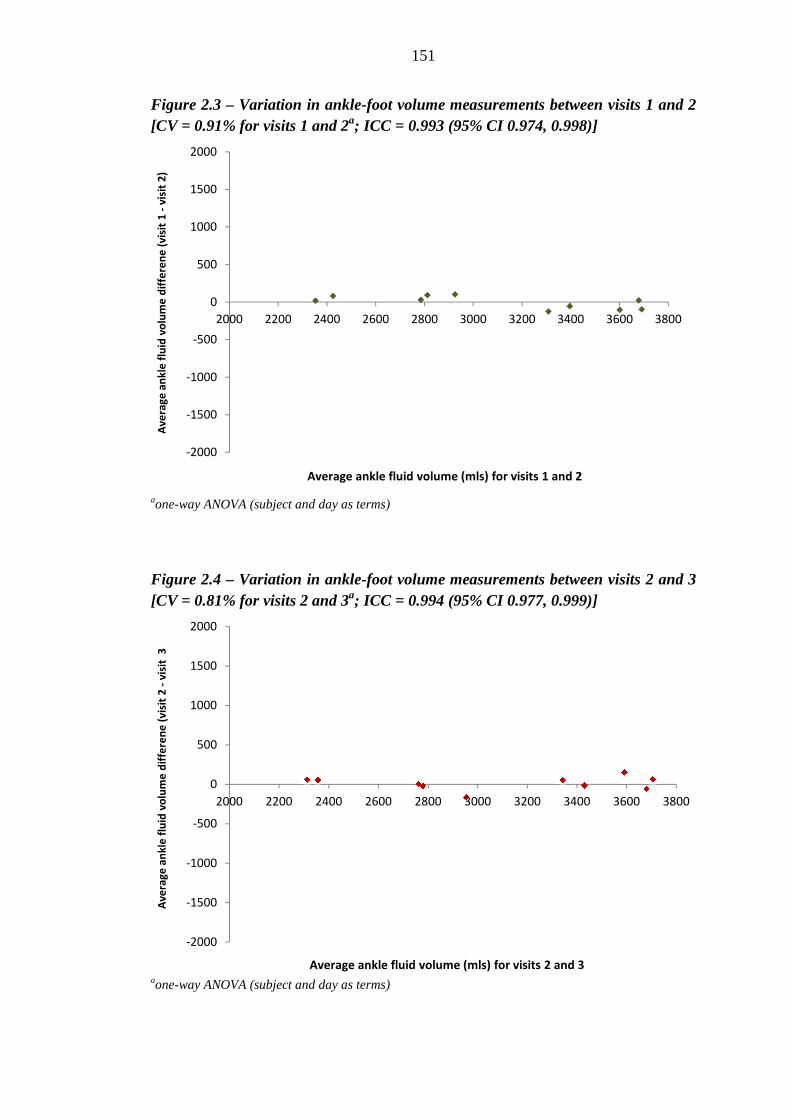
Figure 2.3 – Variation in ankle[CV = 0.91% for visits 1 and 2
aone-way ANOVA (subject and da
Figure 2.4 – Variation in ankle[CV = 0.81% for visits 2 and 3
aone-way ANOVA (subject and day as terms)
-2000
-1500
-1000
-500
0
500
1000
1500
2000
2000 2200
Av
era
ge
an
kle
flu
id v
olu
me
dif
fere
ne
(v
isit
1 -
vis
it 2
)
-2000
-1500
-1000
-500
0
500
1000
1500
2000
2000 2200
Av
era
ge
an
kle
flu
id v
olu
me
dif
fere
ne
(v
isit
2 -
vis
it
3
151
Variation in ankle-foot volume measurements between visits 1 and 2 [CV = 0.91% for visits 1 and 2a; ICC = 0.993 (95% CI 0.974, 0.998
way ANOVA (subject and day as terms)
Variation in ankle-foot volume measurements between visits 2 and 3 [CV = 0.81% for visits 2 and 3a; ICC = 0.994 (95% CI 0.977, 0.999
way ANOVA (subject and day as terms)
2200 2400 2600 2800 3000 3200 3400
Average ankle fluid volume (mls) for visits 1 and 2
2200 2400 2600 2800 3000 3200 3400
Average ankle fluid volume (mls) for visits 2 and 3
foot volume measurements between visits 1 and 2 0.974, 0.998)]
foot volume measurements between visits 2 and 3 0.977, 0.999)]
3400 3600 3800
Average ankle fluid volume (mls) for visits 1 and 2
3400 3600 3800
Average ankle fluid volume (mls) for visits 2 and 3
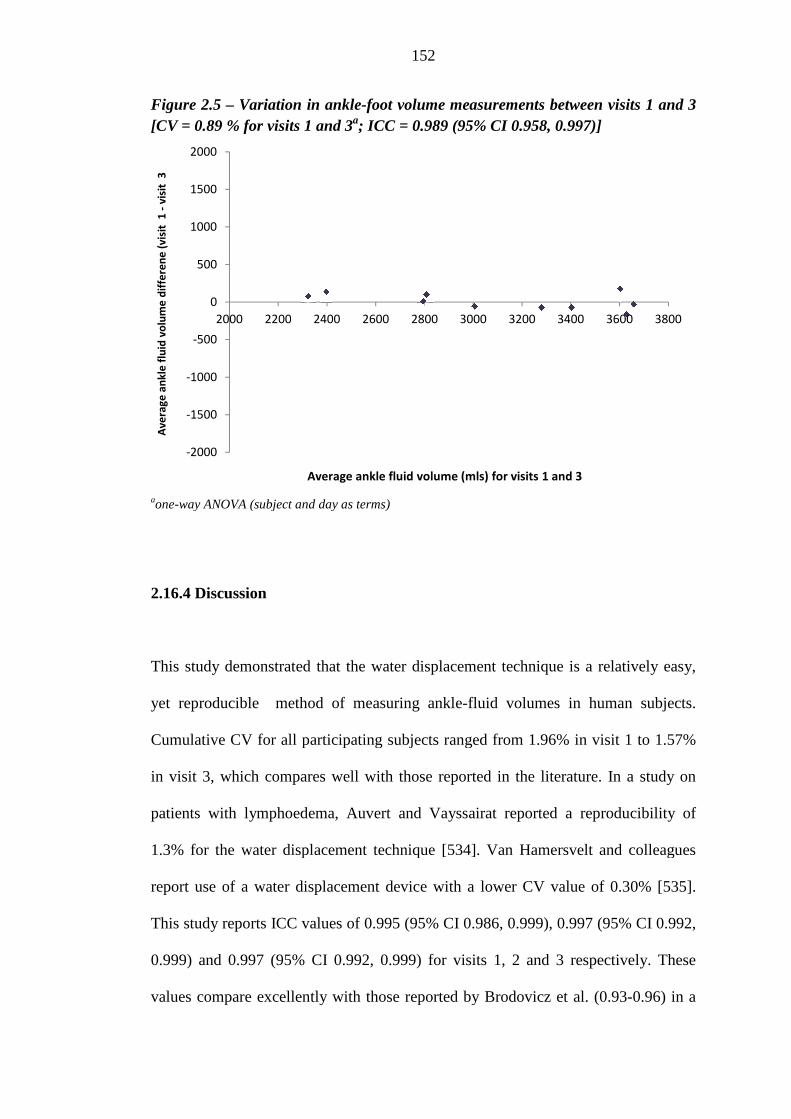
Figure 2.5 – Variation in ankle[CV = 0.89 % for visits 1 and 3
aone-way ANOVA (subject and day as terms)
2.16.4 Discussion
This study demonstrated that the water displacement technique is a relatively easy,
yet reproducible method of measuring ankle
Cumulative CV for all participating subjects ranged from 1.96% in visit 1 to 1.57%
in visit 3, which compares well with those reported in the literature. In a study on
patients with lymphoedema, Auvert and Vayssairat reported a reproducibility of
1.3% for the water displacement technique
report use of a water displacement device with a lower CV value of 0.30%
This study reports ICC values of 0.995 (95% CI 0.986, 0.999), 0.997 (95% CI 0.992,
0.999) and 0.997 (95% CI 0.992, 0.999) for visits 1, 2 and 3 respectively. These
values compare excellently with those reported by Brodovicz
-2000
-1500
-1000
-500
0
500
1000
1500
2000
2000 2200
Av
era
ge
an
kle
flu
id v
olu
me
dif
fere
ne
(v
isit
1
-v
isit
3
152
Variation in ankle-foot volume measurements between visits 1 and 3 [CV = 0.89 % for visits 1 and 3a; ICC = 0.989 (95% CI 0.958, 0.997
way ANOVA (subject and day as terms)
This study demonstrated that the water displacement technique is a relatively easy,
t reproducible method of measuring ankle-fluid volumes in human subjects.
Cumulative CV for all participating subjects ranged from 1.96% in visit 1 to 1.57%
in visit 3, which compares well with those reported in the literature. In a study on
lymphoedema, Auvert and Vayssairat reported a reproducibility of
1.3% for the water displacement technique [534]. Van Hamersvelt and colleagues
report use of a water displacement device with a lower CV value of 0.30%
This study reports ICC values of 0.995 (95% CI 0.986, 0.999), 0.997 (95% CI 0.992,
0.997 (95% CI 0.992, 0.999) for visits 1, 2 and 3 respectively. These
values compare excellently with those reported by Brodovicz et al. (0.93
2200 2400 2600 2800 3000 3200 3400
Average ankle fluid volume (mls) for visits 1 and 3
measurements between visits 1 and 3 58, 0.997)]
This study demonstrated that the water displacement technique is a relatively easy,
fluid volumes in human subjects.
Cumulative CV for all participating subjects ranged from 1.96% in visit 1 to 1.57%
in visit 3, which compares well with those reported in the literature. In a study on
lymphoedema, Auvert and Vayssairat reported a reproducibility of
. Van Hamersvelt and colleagues
report use of a water displacement device with a lower CV value of 0.30% [535].
This study reports ICC values of 0.995 (95% CI 0.986, 0.999), 0.997 (95% CI 0.992,
0.997 (95% CI 0.992, 0.999) for visits 1, 2 and 3 respectively. These
et al. (0.93-0.96) in a
3400 3600 3800
Average ankle fluid volume (mls) for visits 1 and 3
153
study which evaluated foot and ankle volumes in each leg separately [536].
Additionally, this study's CV and ICC values confirm that measurements are highly
reproducible over a period of two weeks in the absence of any significant
intervention. This renders interpretation of temporal effects on AFV using this
measurement technique highly plausible in an experimental setting. To this effect,
Brijker et al. reported a CV of 1.76% over a mean observation period of 4.8 days
[529], which is considerably shorter than this study's observation period of two
weeks. Diurnal variation in leg volume, and hence fluid displacement have been
reported in several studies [529, 537, 538]. This possibility was minimised by
ensuring that participating subjects had their fluid volumes measured at
approximately identical times each week [539]. None of the subjects reported
significant alteration in their daily lifestyle over the intervening observation period.
2.16.5 Conclusion
Measuring leg volume by water displacement is relatively easy, cheap, and highly
reproducible. It can be used to monitor temporal changes in peripheral oedema over
an extended period of time.
154
Section II - Results
2.17 Phenotype
2.17.1 Baseline demographic characteristics
Thirteen Caucasian patients attended and completed the initial screening visit for this
study (visit 1). Of these, 11 (subjects 1 to 9, subject A and subject B, comprising
seven males and four females) reported themselves to be tolerant of
thiazolidinediones, and two (subjects 11 and 12, both females) had been withdraawn
from TZDs on account of fluid retention. In one of the latter cases, thiazolidinedione
had been withdrawn less than three months after index thiazolidinedione prescription
on account of 'severe bilateral hand oedema'. The second had discontinued her
thiazolidinedione within one to two weeks after developing 'weight gain and severe
abdominal, bilateral upper limb and ankle swelling'. Adverse effects resolved
spontaneously on drug withdrawal in both instances. Thiazolidinedione tolerant
subject A had to be withdrawn soon after recruitment into this study on account of
development of proteinuria soon after withdrawal of his losartan therapy (as per
study Protocol). Subject B was likewise withdrawn after developing an excessively
high blood pressure ( > 160/110 mmHg) on withdrawal of his antihypertensive
(atenolol 50 mg). Thiazolidinedione tolerant subjects were on average older [mean
(95% CI) age = 61.6 (58.9, 64.2) years] than their thiazolidinedione intolerant
counterparts (both aged 55) at recruitment into the study (table 2.7).
Thiazolidinedione 'intolerant' subject 10 had been diagnosed slightly earlier (166
months) than her 'tolerant' counterparts [114.2 (95% CI 76.8, 151.5) months]. The
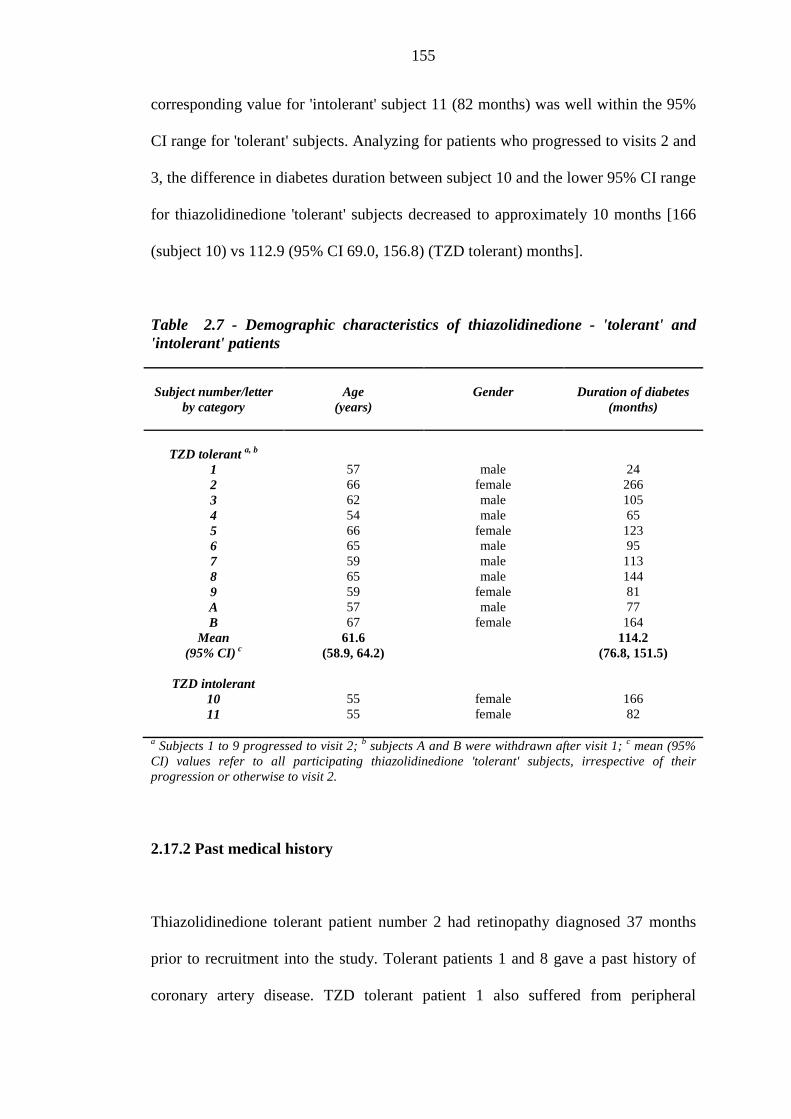
155
corresponding value for 'intolerant' subject 11 (82 months) was well within the 95%
CI range for 'tolerant' subjects. Analyzing for patients who progressed to visits 2 and
3, the difference in diabetes duration between subject 10 and the lower 95% CI range
for thiazolidinedione 'tolerant' subjects decreased to approximately 10 months [166
(subject 10) vs 112.9 (95% CI 69.0, 156.8) (TZD tolerant) months].
Table 2.7 - Demographic characteristics of thiazolidinedione - 'tolerant' and 'intolerant' patients Subject number/letter
by category
Age
(years)
Gender
Duration of diabetes
(months)
TZD tolerant a, b
1 57 male 24 2 66 female 266 3 62 male 105 4 54 male 65 5 66 female 123 6 65 male 95 7 59 male 113 8 65 male 144 9 59 female 81 A 57 male 77 B 67 female 164
Mean (95% CI) c
61.6 (58.9, 64.2)
114.2
(76.8, 151.5)
TZD intolerant 10 55 female 166 11 55 female 82
a Subjects 1 to 9 progressed to visit 2; b subjects A and B were withdrawn after visit 1; c mean (95% CI) values refer to all participating thiazolidinedione 'tolerant' subjects, irrespective of their progression or otherwise to visit 2.
2.17.2 Past medical history
Thiazolidinedione tolerant patient number 2 had retinopathy diagnosed 37 months
prior to recruitment into the study. Tolerant patients 1 and 8 gave a past history of
coronary artery disease. TZD tolerant patient 1 also suffered from peripheral
156
vascular disease; however none of the patients had undergone any peripheral
vascularization procedure or amputation. Tolerant patient A had sustained a
cerebrovascular accident in the past. TZD tolerant patient 1 had been diagnosed with
C5/C6 radiculopathy. None of the patients gave a history of peripheral neuropathy,
autonomic neuropathy or erectile dysfunction. As expected, more than 50% of
thiazolidiedione tolerant patients suffered from hypertension (patients 1, 2, 6, 8, A
and B), whereas an even higher proportion suffered from dyslipidaemia (patients 1,
2, 3, 5, 7, 8, 9, A, B, and thiazolidinedione intolerant patient number 14). None of
the participants were known to suffer from HF at recruitment.
2.17.3 Drug history
Eight out of 11 thiazolidinedione tolerant patients (61.5%) were being treated with
pioglitazone at visit 1, with dose ranging from 15 to 45 mg. Daily rosiglitazone dose
ranged from 4 to 8 mg. Both intolerant patients were being treated with the lowest
possible dose on withdrawal of the offending thiazolidinedione. Duration of
thiazolidinedone therapy for 'tolerant' subjects ranged from 7 to 51 months. All
participating patients, except one, were being treated with a statin (table 2.8).
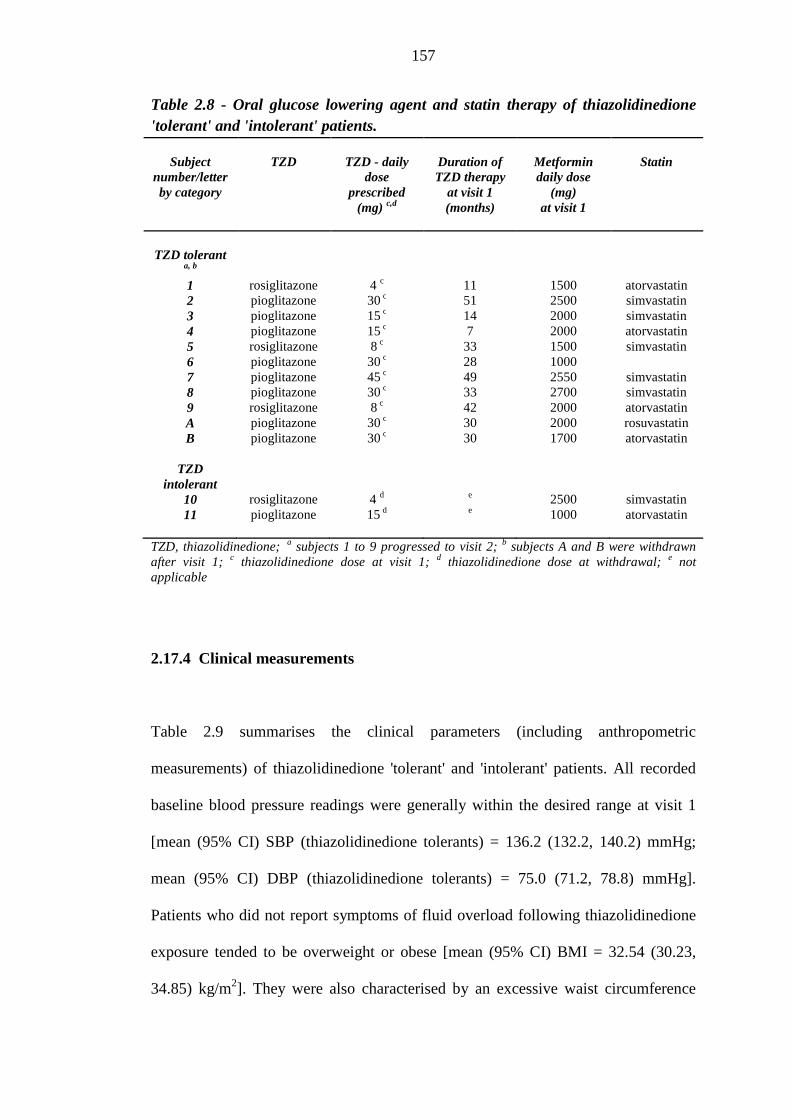
157
Table 2.8 - Oral glucose lowering agent and statin therapy of thiazolidinedione 'tolerant' and 'intolerant' patients.
Subject
number/letter by category
TZD
TZD - daily
dose prescribed
(mg) c,d
Duration of TZD therapy
at visit 1 (months)
Metformin daily dose
(mg) at visit 1
Statin
TZD tolerant
a, b
1 rosiglitazone 4 c 11 1500 atorvastatin 2 pioglitazone 30 c 51 2500 simvastatin 3 pioglitazone 15 c 14 2000 simvastatin 4 pioglitazone 15 c 7 2000 atorvastatin 5 rosiglitazone 8 c 33 1500 simvastatin 6 pioglitazone 30 c 28 1000 7 pioglitazone 45 c 49 2550 simvastatin 8 pioglitazone 30 c 33 2700 simvastatin 9 rosiglitazone 8 c 42 2000 atorvastatin A pioglitazone 30 c 30 2000 rosuvastatin B pioglitazone 30 c 30 1700 atorvastatin
TZD intolerant
10 rosiglitazone 4 d e 2500 simvastatin 11 pioglitazone 15 d e 1000 atorvastatin
TZD, thiazolidinedione; a subjects 1 to 9 progressed to visit 2; b subjects A and B were withdrawn after visit 1; c thiazolidinedione dose at visit 1; d thiazolidinedione dose at withdrawal; e not applicable
2.17.4 Clinical measurements
Table 2.9 summarises the clinical parameters (including anthropometric
measurements) of thiazolidinedione 'tolerant' and 'intolerant' patients. All recorded
baseline blood pressure readings were generally within the desired range at visit 1
[mean (95% CI) SBP (thiazolidinedione tolerants) = 136.2 (132.2, 140.2) mmHg;
mean (95% CI) DBP (thiazolidinedione tolerants) = 75.0 (71.2, 78.8) mmHg].
Patients who did not report symptoms of fluid overload following thiazolidinedione
exposure tended to be overweight or obese [mean (95% CI) BMI = 32.54 (30.23,
34.85) kg/m2]. They were also characterised by an excessive waist circumference
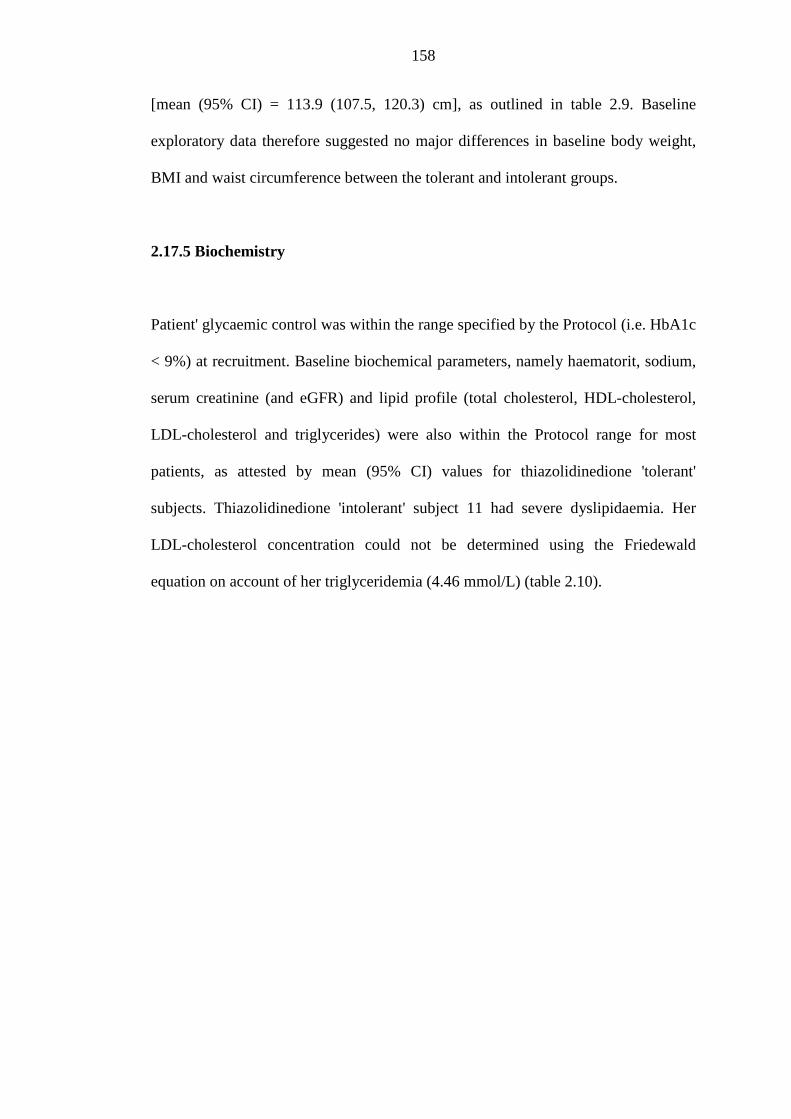
158
[mean (95% CI) = 113.9 (107.5, 120.3) cm], as outlined in table 2.9. Baseline
exploratory data therefore suggested no major differences in baseline body weight,
BMI and waist circumference between the tolerant and intolerant groups.
2.17.5 Biochemistry
Patient' glycaemic control was within the range specified by the Protocol (i.e. HbA1c
< 9%) at recruitment. Baseline biochemical parameters, namely haematorit, sodium,
serum creatinine (and eGFR) and lipid profile (total cholesterol, HDL-cholesterol,
LDL-cholesterol and triglycerides) were also within the Protocol range for most
patients, as attested by mean (95% CI) values for thiazolidinedione 'tolerant'
subjects. Thiazolidinedione 'intolerant' subject 11 had severe dyslipidaemia. Her
LDL-cholesterol concentration could not be determined using the Friedewald
equation on account of her triglyceridemia (4.46 mmol/L) (table 2.10).
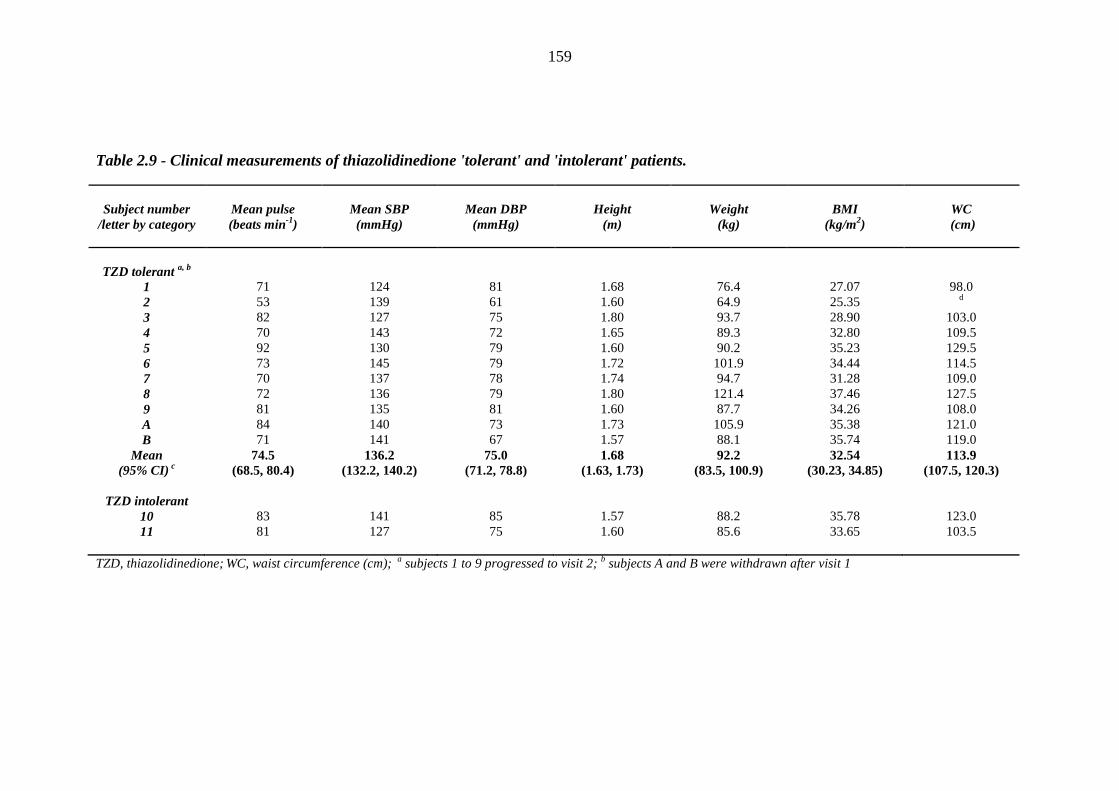
159
Table 2.9 - Clinical measurements of thiazolidinedione 'tolerant' and 'intolerant' patients.
Subject number
/letter by category
Mean pulse (beats min-1)
Mean SBP (mmHg)
Mean DBP
(mmHg)
Height
(m)
Weight
(kg)
BMI
(kg/m2)
WC
(cm)
TZD tolerant a, b
1 71 124 81 1.68 76.4 27.07 98.0 2 53 139 61 1.60 64.9 25.35 d
3 82 127 75 1.80 93.7 28.90 103.0 4 70 143 72 1.65 89.3 32.80 109.5 5 92 130 79 1.60 90.2 35.23 129.5 6 73 145 79 1.72 101.9 34.44 114.5 7 70 137 78 1.74 94.7 31.28 109.0 8 72 136 79 1.80 121.4 37.46 127.5 9 81 135 81 1.60 87.7 34.26 108.0 A 84 140 73 1.73 105.9 35.38 121.0 B 71 141 67 1.57 88.1 35.74 119.0
Mean (95% CI) c
74.5 (68.5, 80.4)
136.2 (132.2, 140.2)
75.0 (71.2, 78.8)
1.68 (1.63, 1.73)
92.2 (83.5, 100.9)
32.54 (30.23, 34.85)
113.9 (107.5, 120.3)
TZD intolerant
10 83 141 85 1.57 88.2 35.78 123.0 11 81 127 75 1.60 85.6 33.65 103.5
TZD, thiazolidinedione; WC, waist circumference (cm); a subjects 1 to 9 progressed to visit 2; b subjects A and B were withdrawn after visit 1
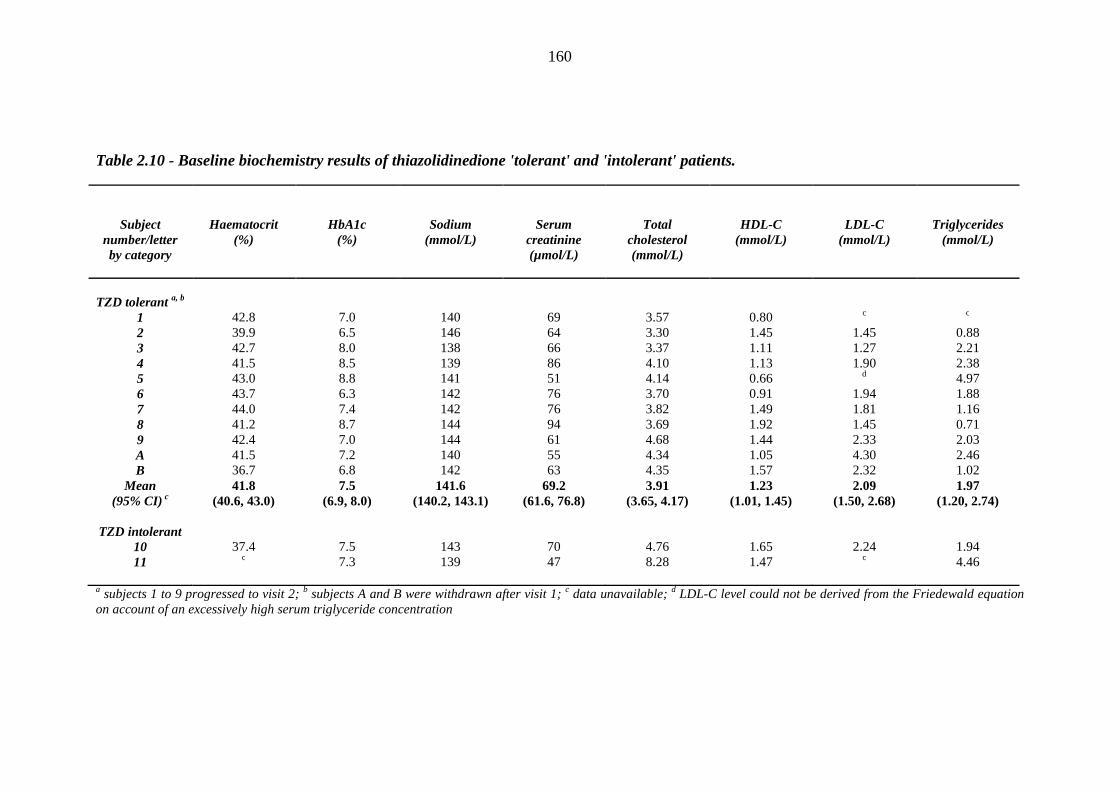
160
Table 2.10 - Baseline biochemistry results of thiazolidinedione 'tolerant' and 'intolerant' patients.
Subject
number/letter by category
Haematocrit (%)
HbA1c (%)
Sodium (mmol/L)
Serum
creatinine (µmol/L)
Total cholesterol (mmol/L)
HDL-C (mmol/L)
LDL-C
(mmol/L)
Triglycerides
(mmol/L)
TZD tolerant a, b
1 42.8 7.0 140 69 3.57 0.80 c c
2 39.9 6.5 146 64 3.30 1.45 1.45 0.88 3 42.7 8.0 138 66 3.37 1.11 1.27 2.21 4 41.5 8.5 139 86 4.10 1.13 1.90 2.38 5 43.0 8.8 141 51 4.14 0.66 d 4.97 6 43.7 6.3 142 76 3.70 0.91 1.94 1.88 7 44.0 7.4 142 76 3.82 1.49 1.81 1.16 8 41.2 8.7 144 94 3.69 1.92 1.45 0.71 9 42.4 7.0 144 61 4.68 1.44 2.33 2.03 A 41.5 7.2 140 55 4.34 1.05 4.30 2.46 B 36.7 6.8 142 63 4.35 1.57 2.32 1.02
Mean (95% CI) c
41.8 (40.6, 43.0)
7.5 (6.9, 8.0)
141.6 (140.2, 143.1)
69.2 (61.6, 76.8)
3.91 (3.65, 4.17)
1.23 (1.01, 1.45)
2.09 (1.50, 2.68)
1.97 (1.20, 2.74)
TZD intolerant
10 37.4 7.5 143 70 4.76 1.65 2.24 1.94 11 c 7.3 139 47 8.28 1.47 c 4.46
a subjects 1 to 9 progressed to visit 2; b subjects A and B were withdrawn after visit 1; c data unavailable; d LDL-C level could not be derived from the Friedewald equation on account of an excessively high serum triglyceride concentration
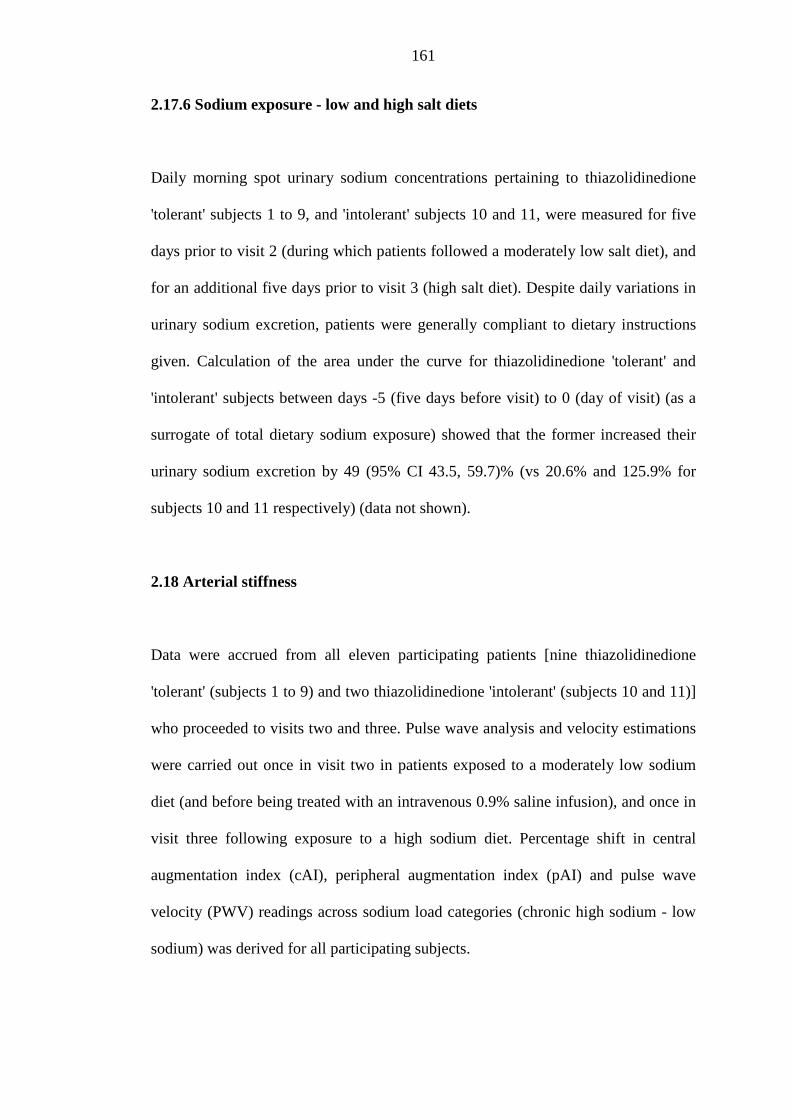
161
2.17.6 Sodium exposure - low and high salt diets
Daily morning spot urinary sodium concentrations pertaining to thiazolidinedione
'tolerant' subjects 1 to 9, and 'intolerant' subjects 10 and 11, were measured for five
days prior to visit 2 (during which patients followed a moderately low salt diet), and
for an additional five days prior to visit 3 (high salt diet). Despite daily variations in
urinary sodium excretion, patients were generally compliant to dietary instructions
given. Calculation of the area under the curve for thiazolidinedione 'tolerant' and
'intolerant' subjects between days -5 (five days before visit) to 0 (day of visit) (as a
surrogate of total dietary sodium exposure) showed that the former increased their
urinary sodium excretion by 49 (95% CI 43.5, 59.7)% (vs 20.6% and 125.9% for
subjects 10 and 11 respectively) (data not shown).
2.18 Arterial stiffness
Data were accrued from all eleven participating patients [nine thiazolidinedione
'tolerant' (subjects 1 to 9) and two thiazolidinedione 'intolerant' (subjects 10 and 11)]
who proceeded to visits two and three. Pulse wave analysis and velocity estimations
were carried out once in visit two in patients exposed to a moderately low sodium
diet (and before being treated with an intravenous 0.9% saline infusion), and once in
visit three following exposure to a high sodium diet. Percentage shift in central
augmentation index (cAI), peripheral augmentation index (pAI) and pulse wave
velocity (PWV) readings across sodium load categories (chronic high sodium - low
sodium) was derived for all participating subjects.
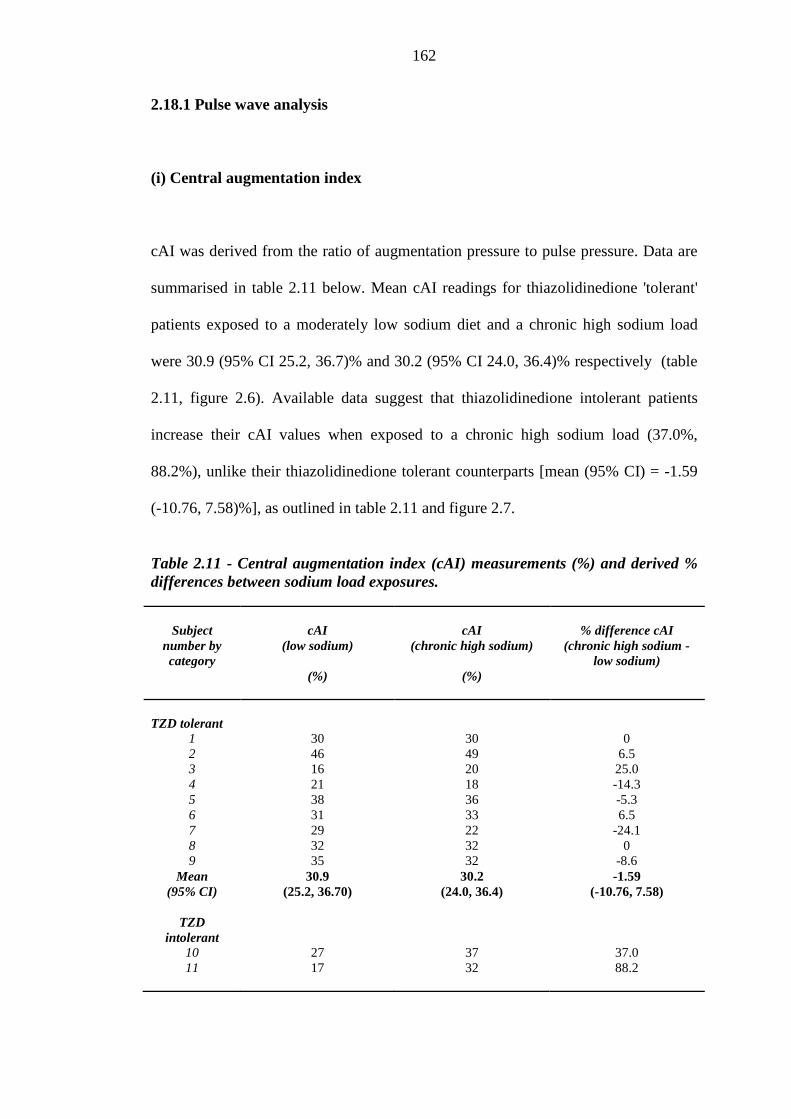
162
2.18.1 Pulse wave analysis
(i) Central augmentation index
cAI was derived from the ratio of augmentation pressure to pulse pressure. Data are
summarised in table 2.11 below. Mean cAI readings for thiazolidinedione 'tolerant'
patients exposed to a moderately low sodium diet and a chronic high sodium load
were 30.9 (95% CI 25.2, 36.7)% and 30.2 (95% CI 24.0, 36.4)% respectively (table
2.11, figure 2.6). Available data suggest that thiazolidinedione intolerant patients
increase their cAI values when exposed to a chronic high sodium load (37.0%,
88.2%), unlike their thiazolidinedione tolerant counterparts [mean (95% CI) = -1.59
(-10.76, 7.58)%], as outlined in table 2.11 and figure 2.7.
Table 2.11 - Central augmentation index (cAI) measurements (%) and derived % differences between sodium load exposures.
Subject number by category
cAI
(low sodium)
(%)
cAI
(chronic high sodium)
(%)
% difference cAI
(chronic high sodium - low sodium)
TZD tolerant
1 30 30 0 2 46 49 6.5 3 16 20 25.0 4 21 18 -14.3 5 38 36 -5.3 6 31 33 6.5 7 29 22 -24.1 8 32 32 0 9 35 32 -8.6
Mean 30.9 30.2 -1.59 (95% CI) (25.2, 36.70) (24.0, 36.4) (-10.76, 7.58)
TZD
intolerant
10 27 37 37.0 11 17 32 88.2
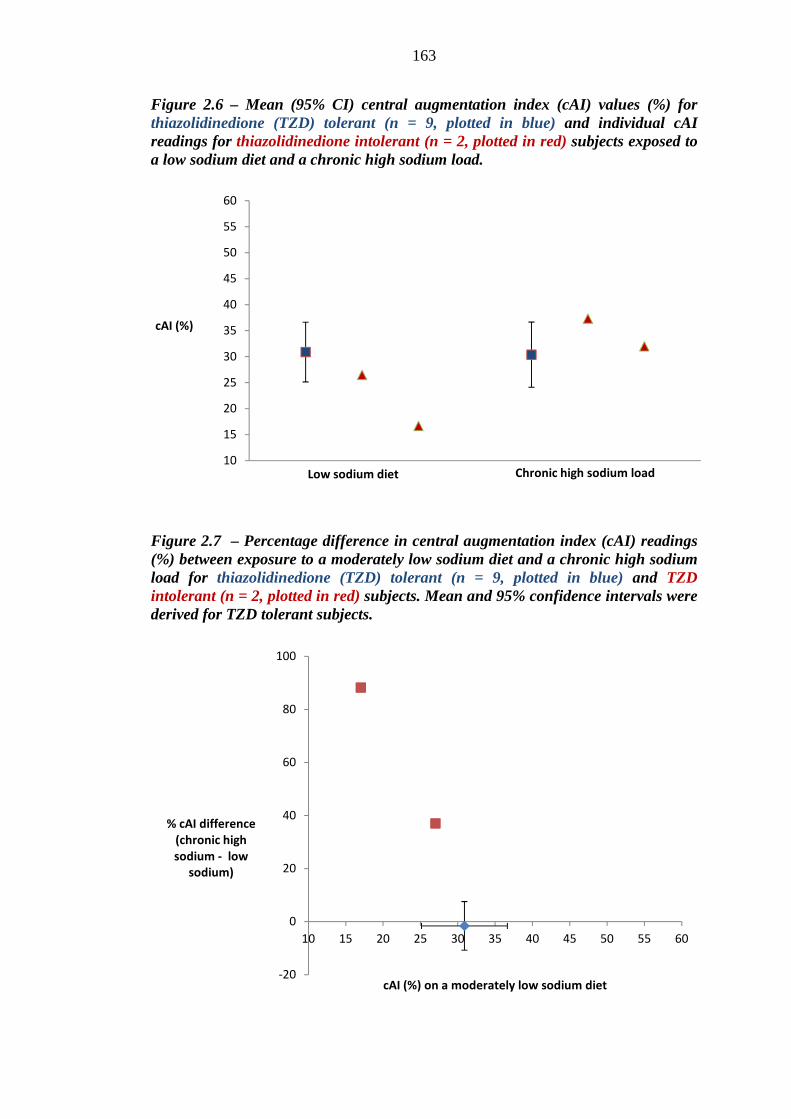
163
Figure 2.6 – Mean (95% CI) central augmentation index (cAI) values (%) for thiazolidinedione (TZD) tolerant (n = 9, plotted in blue) and individual cAI readings for thiazolidinedione intolerant (n = 2, plotted in red) subjects exposed to a low sodium diet and a chronic high sodium load.
Figure 2.7 – Percentage difference in central augmentation index (cAI) readings (%) between exposure to a moderately low sodium diet and a chronic high sodium load for thiazolidinedione (TZD) tolerant (n = 9, plotted in blue) and TZD intolerant (n = 2, plotted in red) subjects. Mean and 95% confidence intervals were derived for TZD tolerant subjects.
10
15
20
25
30
35
40
45
50
55
60
cAI (%)
Low sodium diet Chronic high sodium load
-20
0
20
40
60
80
100
10 15 20 25 30 35 40 45 50 55 60
% cAI difference
(chronic high
sodium - low
sodium)
cAI (%) on a moderately low sodium diet
164
(ii) Peripheral augmentation index
Peripheral augmentation index (pAI) was likewise derived using applanation
tonometry from the ratio of late systolic pressure (P2) to early systolic pressure (P1).
Percentage shifts in pAI readings were also estimated for visits 2 and 3, as outlined
in table 2.12.
Table 2.12 - Peripheral augmentation index (pAI) measurements (%) and derived % differences between sodium load exposures. Subject number
by category
pAI
(low sodium)
(%)
pAI
(chronic high sodium)
(%)
% difference pAI
(chronic high sodium - low sodium)
TZD tolerant
1 143 142 -0.7 2 185 196 5.9 3 119 126 5.0 4 127 122 -3.9 5 162 156 -3.7 6 145 150 3.4 7 141 129 -8.5 8 146 148 0.7 9 153 148 -3.9
Mean 147.1 146.3 -0.6 (95% CI) (134.7, 159.5) (131.9, 160.7) (-3.74, 2.54)
TZD intolerant
10 136 159 16.9 11 120 147 22.5
Mean pAI readings for thiazolidinedione tolerant patients were 147.1 (95% CI 134.7,
159.5) % and 146.3 (95% CI 131.9, 160.7)% under moderately low and high sodium
dietary conditions respectively (table 2.12, figure 2.8). Oedema prone TZD patients
seemingly increase their pAI when subjected to a chronic sodium load, unlike their
thiazolidinedione tolerant counterparts [-0.6 (95% CI -3.74, 2.54)% (TZD tolerant)
vs 16.9%, 22.5% (TZD intolerant)] (table 2.12, figure 2.9).
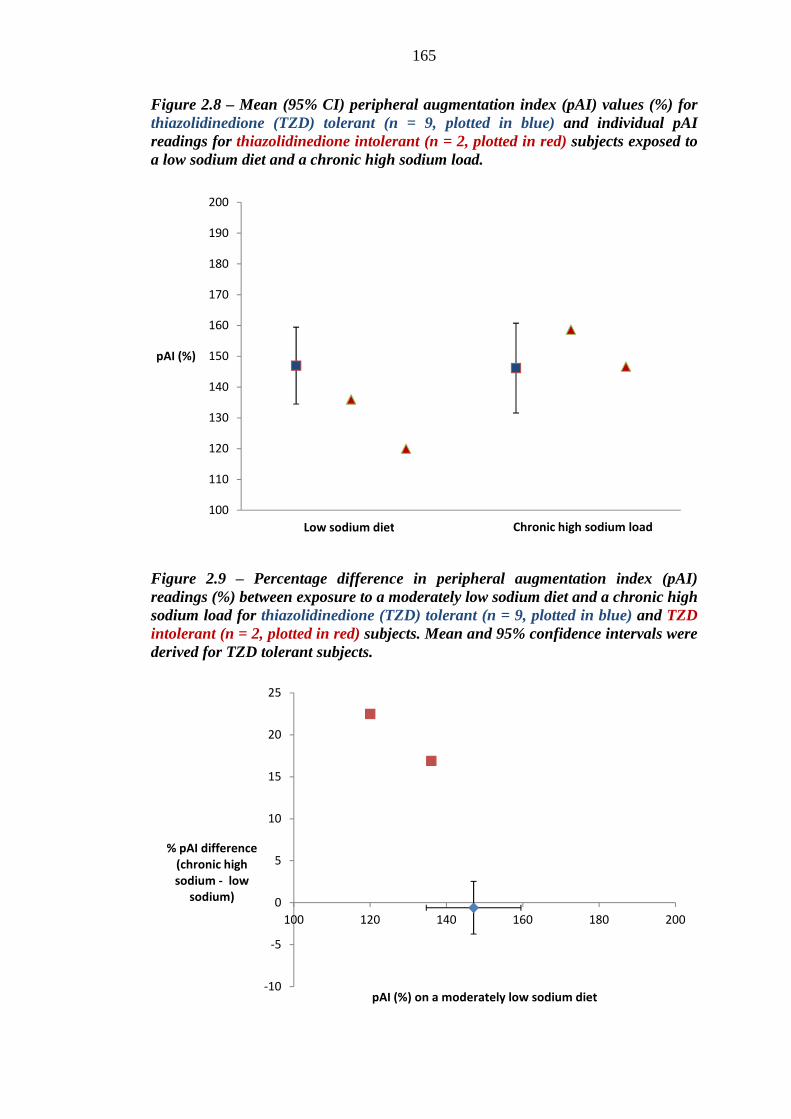
165
Figure 2.8 – Mean (95% CI) peripheral augmentation index (pAI) values (%) for thiazolidinedione (TZD) tolerant (n = 9, plotted in blue) and individual pAI readings for thiazolidinedione intolerant (n = 2, plotted in red) subjects exposed to a low sodium diet and a chronic high sodium load.
Figure 2.9 – Percentage difference in peripheral augmentation index (pAI) readings (%) between exposure to a moderately low sodium diet and a chronic high sodium load for thiazolidinedione (TZD) tolerant (n = 9, plotted in blue) and TZD intolerant (n = 2, plotted in red) subjects. Mean and 95% confidence intervals were derived for TZD tolerant subjects.
100
110
120
130
140
150
160
170
180
190
200
pAI (%)
Low sodium diet Chronic high sodium load
-10
-5
0
5
10
15
20
25
100 120 140 160 180 200
% pAI difference
(chronic high
sodium - low
sodium)
pAI (%) on a moderately low sodium diet
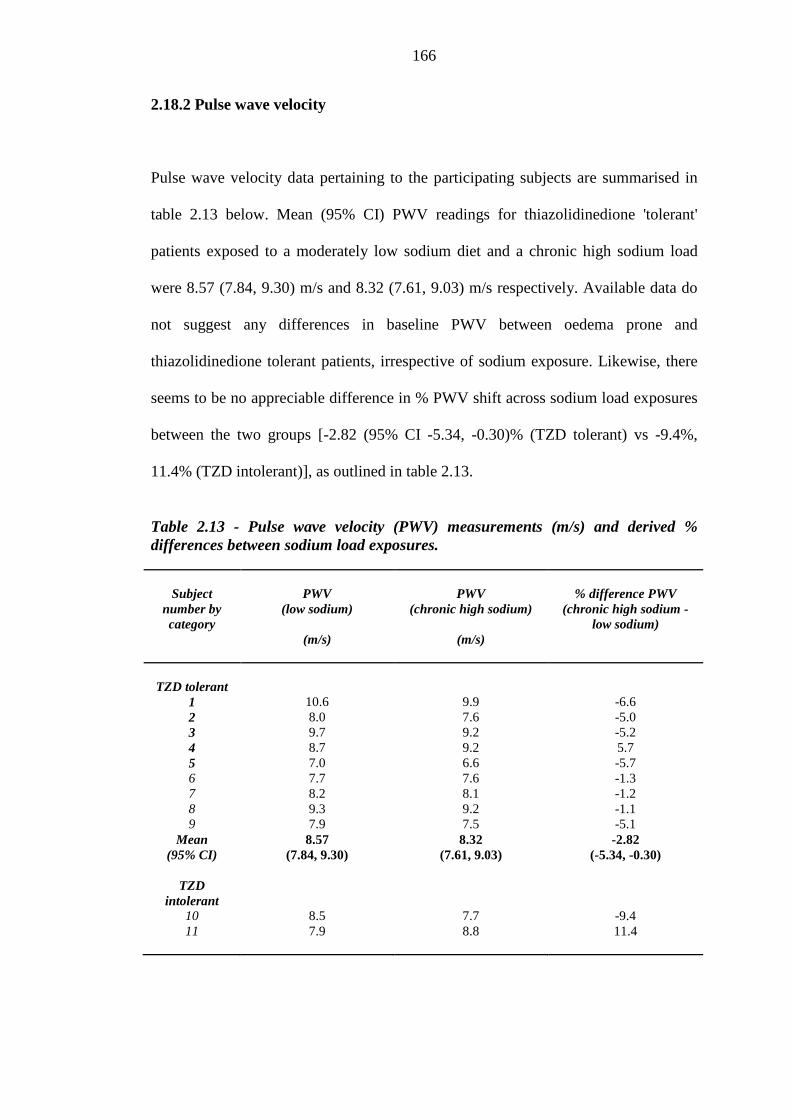
166
2.18.2 Pulse wave velocity
Pulse wave velocity data pertaining to the participating subjects are summarised in
table 2.13 below. Mean (95% CI) PWV readings for thiazolidinedione 'tolerant'
patients exposed to a moderately low sodium diet and a chronic high sodium load
were 8.57 (7.84, 9.30) m/s and 8.32 (7.61, 9.03) m/s respectively. Available data do
not suggest any differences in baseline PWV between oedema prone and
thiazolidinedione tolerant patients, irrespective of sodium exposure. Likewise, there
seems to be no appreciable difference in % PWV shift across sodium load exposures
between the two groups [-2.82 (95% CI -5.34, -0.30)% (TZD tolerant) vs -9.4%,
11.4% (TZD intolerant)], as outlined in table 2.13.
Table 2.13 - Pulse wave velocity (PWV) measurements (m/s) and derived % differences between sodium load exposures.
Subject number by category
PWV
(low sodium)
(m/s)
PWV
(chronic high sodium)
(m/s)
% difference PWV
(chronic high sodium - low sodium)
TZD tolerant
1 10.6 9.9 -6.6 2 8.0 7.6 -5.0 3 9.7 9.2 -5.2 4 8.7 9.2 5.7 5 7.0 6.6 -5.7 6 7.7 7.6 -1.3 7 8.2 8.1 -1.2 8 9.3 9.2 -1.1 9 7.9 7.5 -5.1
Mean 8.57 8.32 -2.82 (95% CI) (7.84, 9.30) (7.61, 9.03) (-5.34, -0.30)
TZD
intolerant
10 8.5 7.7 -9.4 11 7.9 8.8 11.4
167
2.19 Echocardiography
Echocardiographic parameters (left ventricular ejection fraction, E/A ratio, E prime,
E/e prime ratio, left ventricular mass) were captured for participating subjects in
visits two and three. Data were collected for nine, eight and nine thiazolidinedione
tolerant subjects following exposure to a moderately low, acute high and chronic
high sodium loads respectively (one patient declined an echo following intravenous
saline administration). Data were captured from both TZD 'intolerant' patients in all
three instances. Preliminary exploratory data suggests no differences in any of the
measured echocardiographic parameters between thiazolidinedione patient
categories. Plotting percentage change in any of these measurements across sodium
load categories for both TZD tolerant and intolerant patients did not yield any
consistent trends (appendix tables II.1 to II.5).
2.20 Biomarkers
In a bid to identify predisposing factors for thiazolidinedinoe-associated fluid
retention, this study measured a number of biomarkers of interest, as outlined in
section I. Plasma samples were collected to measure vascular endothelial growth
factor (VEGF), ANP, BNP, N-terminal prohormone of B-type natriuretic peptide
(NT-pro-BNP), aldosterone, renin and copeptin for each patient at visit 2 (moderately
low sodium diet, before infusion of intravenous saline) and visit 3 (chronic sodium
load). This enabled a relative comparison between thiazolidinedione 'tolerant' and
'intolerant' subjects.
168
2.20.1 Vascular endothelial growth factor
Plasma was sampled for VEGF level estimation from eight and nine
thiazolidinedione tolerant patients at visits 2 and 3 respectively, and from both
thiazolidinedione intolerant patients at either visit. Mean (95% CI) VEGF readings
for 'tolerant' subjects were 57.3 (12.0, 102.6) pg/mL and 38.6 (24.1, 53.1) pg/mL
after exposure to a moderately low and a chronic high sodium load respectively
(appendix table II.6). Generally decreasing for 'tolerant' patients on sodium loading,
available data suggest no significant difference in VEGF levels between
thiazolidinedione categories on exposure to a low sodium diet. However, exposure to
a moderately high sodium diet for five days resulted in seemingly lower VEGF levels
for thiazolidinedione intolerant subjects compared to their intolerant counterparts
(appendix table II.6). Plotting percentage change in VEGF readings between
exposure to a moderately low sodium diet and a chronic high sodium load showed a
mean (95% CI) VEGF reduction of 11.6 (-32.5, 9.3)% for thiazolidinedione tolerant
individuals. The two intolerant subjects exhibited VEGF changes on either side of
the 95% CI range for their tolerant counterparts (appendix table II.6).
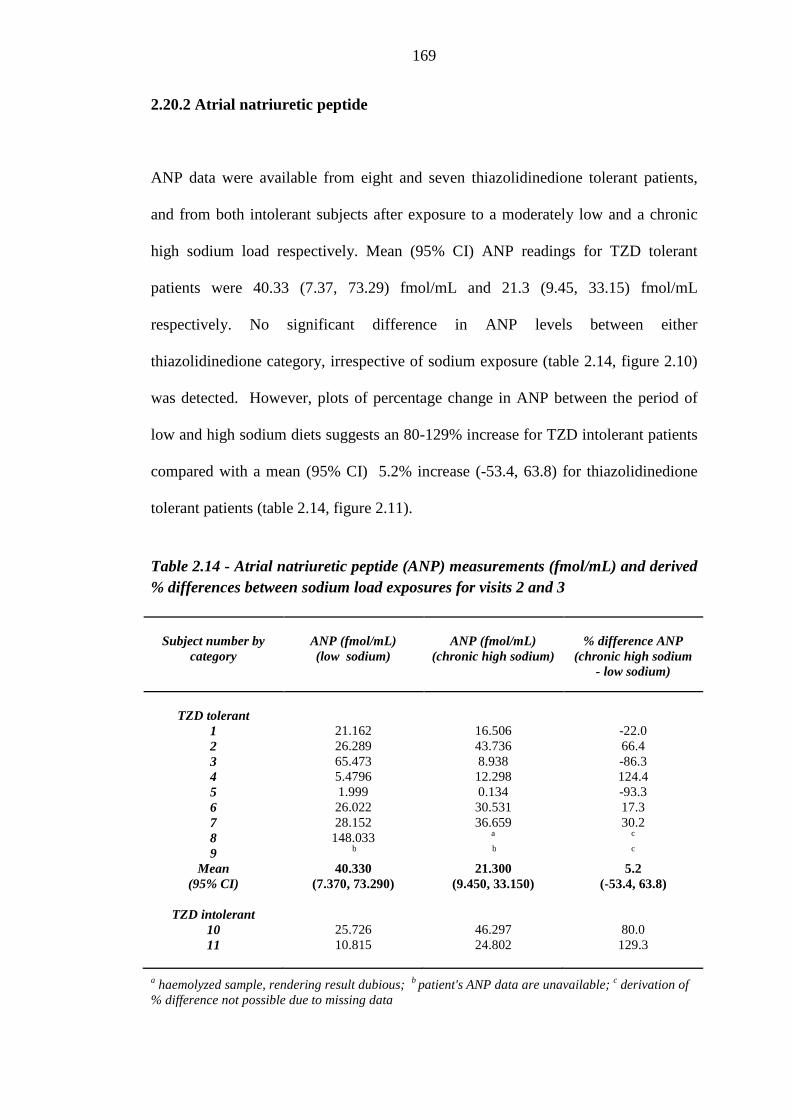
169
2.20.2 Atrial natriuretic peptide
ANP data were available from eight and seven thiazolidinedione tolerant patients,
and from both intolerant subjects after exposure to a moderately low and a chronic
high sodium load respectively. Mean (95% CI) ANP readings for TZD tolerant
patients were 40.33 (7.37, 73.29) fmol/mL and 21.3 (9.45, 33.15) fmol/mL
respectively. No significant difference in ANP levels between either
thiazolidinedione category, irrespective of sodium exposure (table 2.14, figure 2.10)
was detected. However, plots of percentage change in ANP between the period of
low and high sodium diets suggests an 80-129% increase for TZD intolerant patients
compared with a mean (95% CI) 5.2% increase (-53.4, 63.8) for thiazolidinedione
tolerant patients (table 2.14, figure 2.11).
Table 2.14 - Atrial natriuretic peptide (ANP) measurements (fmol/mL) and derived % differences between sodium load exposures for visits 2 and 3
Subject number by
category
ANP (fmol/mL) (low sodium)
ANP (fmol/mL)
(chronic high sodium)
% difference ANP
(chronic high sodium - low sodium)
TZD tolerant
1 21.162 16.506 -22.0 2 26.289 43.736 66.4 3 65.473 8.938 -86.3 4 5.4796 12.298 124.4 5 1.999 0.134 -93.3 6 26.022 30.531 17.3 7 28.152 36.659 30.2 8 148.033 a c
9 b b c
Mean (95% CI)
40.330 (7.370, 73.290)
21.300 (9.450, 33.150)
5.2 (-53.4, 63.8)
TZD intolerant
10 25.726 46.297 80.0 11 10.815 24.802 129.3
a haemolyzed sample, rendering result dubious; b patient's ANP data are unavailable; c derivation of % difference not possible due to missing data
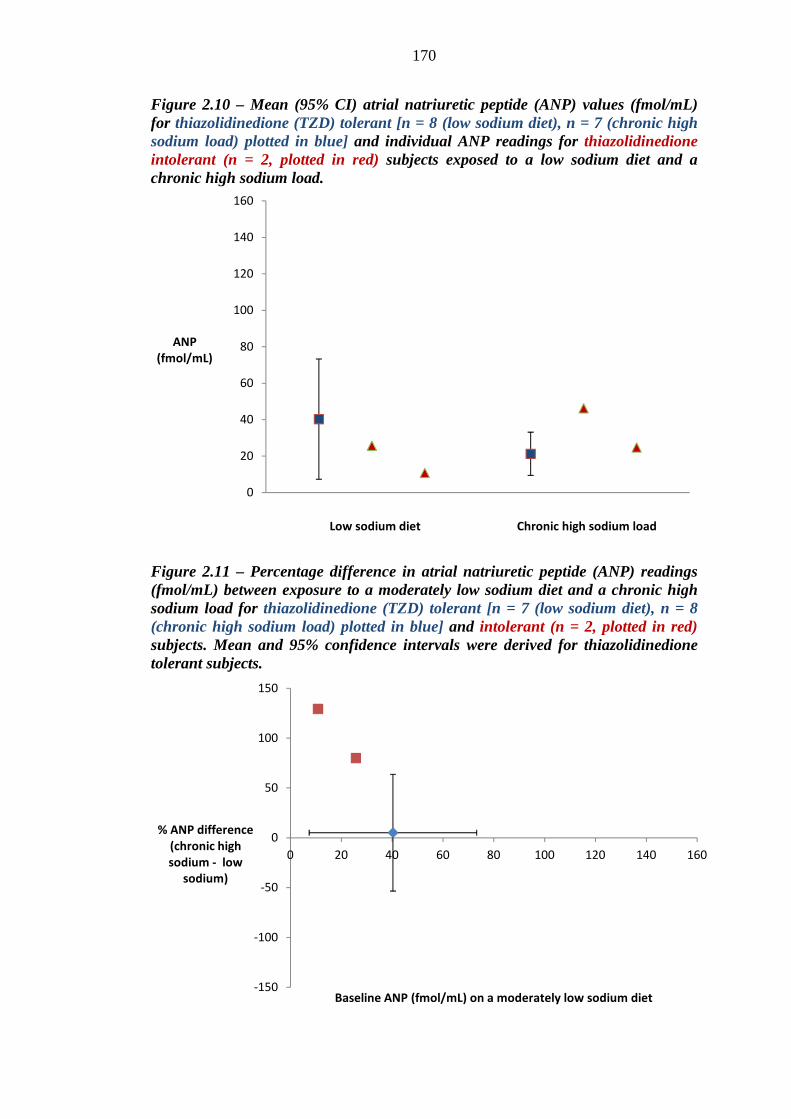
170
Figure 2.10 – Mean (95% CI) atrial natriuretic peptide (ANP) values (fmol/mL) for thiazolidinedione (TZD) tolerant [n = 8 (low sodium diet), n = 7 (chronic high sodium load) plotted in blue] and individual ANP readings for thiazolidinedione intolerant (n = 2, plotted in red) subjects exposed to a low sodium diet and a chronic high sodium load.
Figure 2.11 – Percentage difference in atrial natriuretic peptide (ANP) readings (fmol/mL) between exposure to a moderately low sodium diet and a chronic high sodium load for thiazolidinedione (TZD) tolerant [n = 7 (low sodium diet), n = 8 (chronic high sodium load) plotted in blue] and intolerant (n = 2, plotted in red) subjects. Mean and 95% confidence intervals were derived for thiazolidinedione tolerant subjects.
0
20
40
60
80
100
120
140
160
ANP
(fmol/mL)
-150
-100
-50
0
50
100
150
0 20 40 60 80 100 120 140 160
% ANP difference
(chronic high
sodium - low
sodium)
Baseline ANP (fmol/mL) on a moderately low sodium diet
Low sodium diet Chronic high sodium load
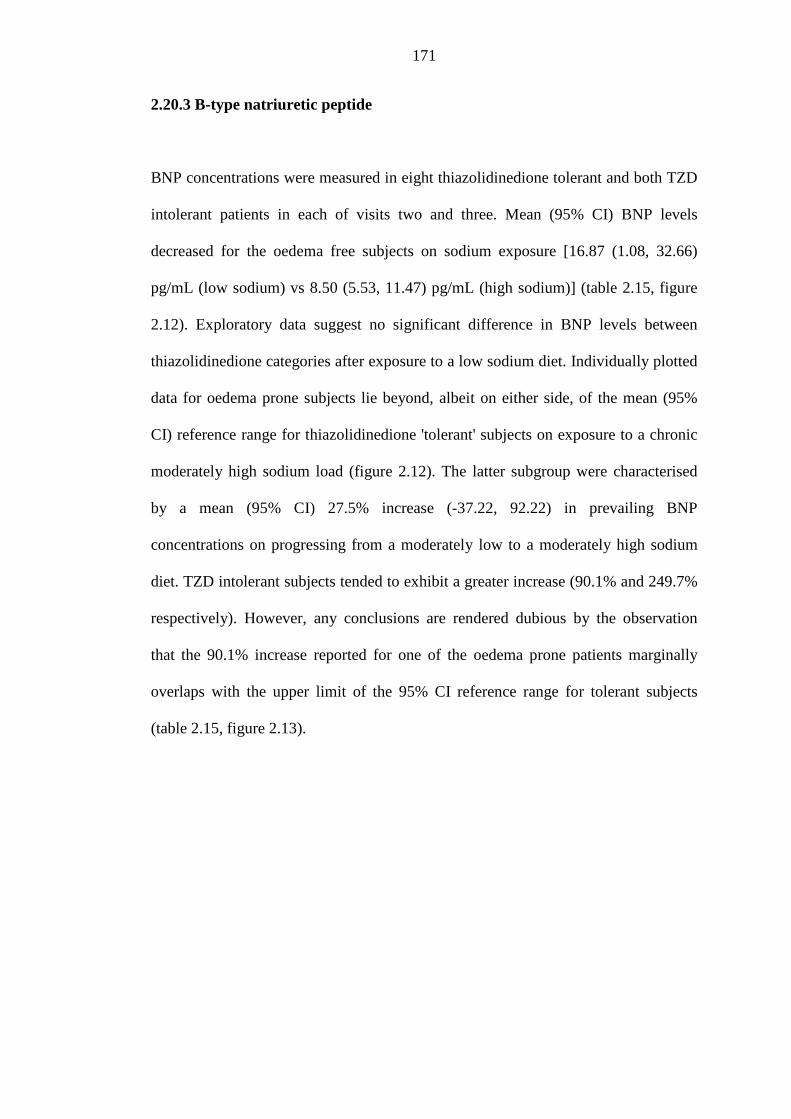
171
2.20.3 B-type natriuretic peptide
BNP concentrations were measured in eight thiazolidinedione tolerant and both TZD
intolerant patients in each of visits two and three. Mean (95% CI) BNP levels
decreased for the oedema free subjects on sodium exposure [16.87 (1.08, 32.66)
pg/mL (low sodium) vs 8.50 (5.53, 11.47) pg/mL (high sodium)] (table 2.15, figure
2.12). Exploratory data suggest no significant difference in BNP levels between
thiazolidinedione categories after exposure to a low sodium diet. Individually plotted
data for oedema prone subjects lie beyond, albeit on either side, of the mean (95%
CI) reference range for thiazolidinedione 'tolerant' subjects on exposure to a chronic
moderately high sodium load (figure 2.12). The latter subgroup were characterised
by a mean (95% CI) 27.5% increase (-37.22, 92.22) in prevailing BNP
concentrations on progressing from a moderately low to a moderately high sodium
diet. TZD intolerant subjects tended to exhibit a greater increase (90.1% and 249.7%
respectively). However, any conclusions are rendered dubious by the observation
that the 90.1% increase reported for one of the oedema prone patients marginally
overlaps with the upper limit of the 95% CI reference range for tolerant subjects
(table 2.15, figure 2.13).
172
Table 2.15 - B-type natriuretic peptide (BNP) measurements (pg/mL) and derived % differences between sodium load exposures for visits 2 and 3
Subject number by category
BNP (pg/mL) (low sodium)
BNP (pg/mL)
(chronic high sodium)
% difference BNP
(chronic high sodium - low sodium)
TZD tolerant 1 5.284 9.399 77.9 2 4.645 11.082 138.6 3 3.511 4.610 31.3 4 29.089 4.687 -83.9 5 68.905 12.482 -81.9 6 1.975 5.138 160.2 7 7.656 4.917 -35.8 8 13.868 15.697 13.2 9 a a b
Mean (95% CI)
16.870 (1.080, 32.660)
8.500 (5.530, 11.470)
27.5 (-37.22, 92.22)
TZD intolerant
10 2.303 4.379 90.1 11 6.440 22.523 249.7
a patient's BNP data were unavailable; b calculation not possible due to missing data Figure 2.12 – Mean (95% CI) B-type natriuretic peptide (BNP) values (pg/mL) for thiazolidinedione (TZD) tolerant (n = 8, plotted in blue) and individual BNP readings for thiazolidinedione intolerant (n = 2, plotted in red) subjects exposed to a low sodium diet and a chronic high sodium load.
0
10
20
30
40
50
60
70
80
BNP
(pg/mL)
Low sodium diet Chronic high sodium load
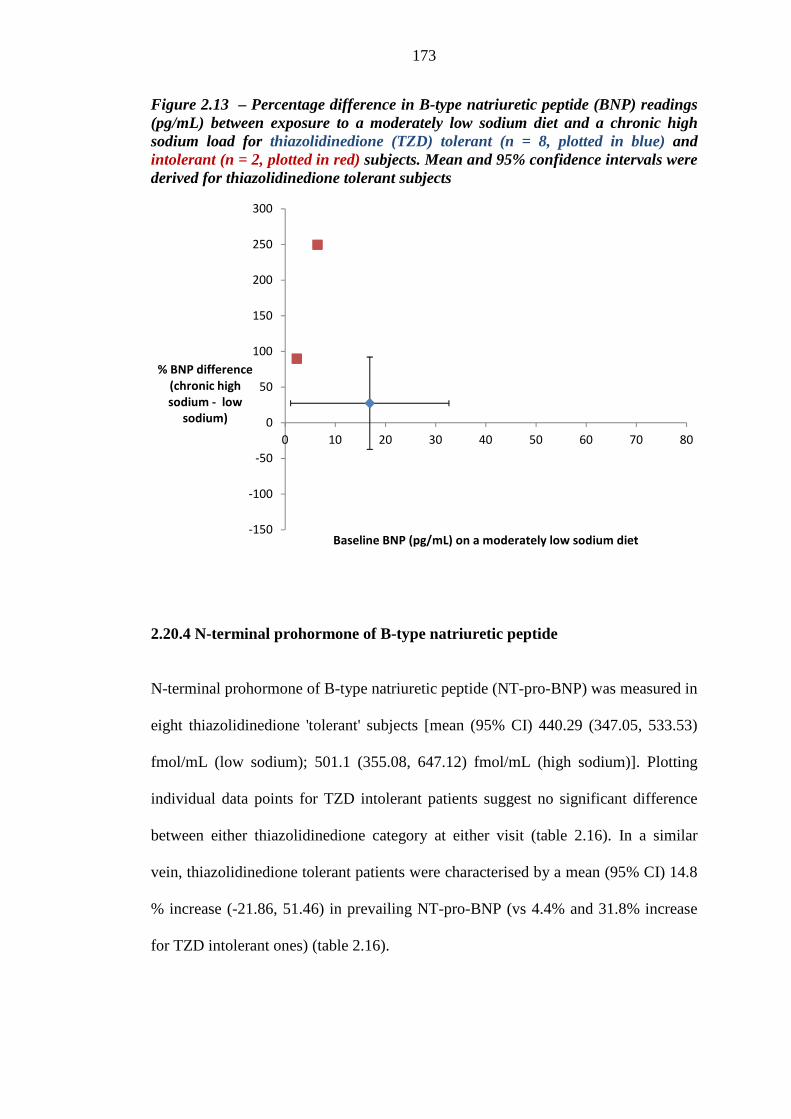
173
Figure 2.13 – Percentage difference in B-type natriuretic peptide (BNP) readings (pg/mL) between exposure to a moderately low sodium diet and a chronic high sodium load for thiazolidinedione (TZD) tolerant (n = 8, plotted in blue) and intolerant (n = 2, plotted in red) subjects. Mean and 95% confidence intervals were derived for thiazolidinedione tolerant subjects
2.20.4 N-terminal prohormone of B-type natriuretic peptide
N-terminal prohormone of B-type natriuretic peptide (NT-pro-BNP) was measured in
eight thiazolidinedione 'tolerant' subjects [mean (95% CI) 440.29 (347.05, 533.53)
fmol/mL (low sodium); 501.1 (355.08, 647.12) fmol/mL (high sodium)]. Plotting
individual data points for TZD intolerant patients suggest no significant difference
between either thiazolidinedione category at either visit (table 2.16). In a similar
vein, thiazolidinedione tolerant patients were characterised by a mean (95% CI) 14.8
% increase (-21.86, 51.46) in prevailing NT-pro-BNP (vs 4.4% and 31.8% increase
for TZD intolerant ones) (table 2.16).
-150
-100
-50
0
50
100
150
200
250
300
0 10 20 30 40 50 60 70 80
% BNP difference
(chronic high
sodium - low
sodium)
Baseline BNP (pg/mL) on a moderately low sodium diet
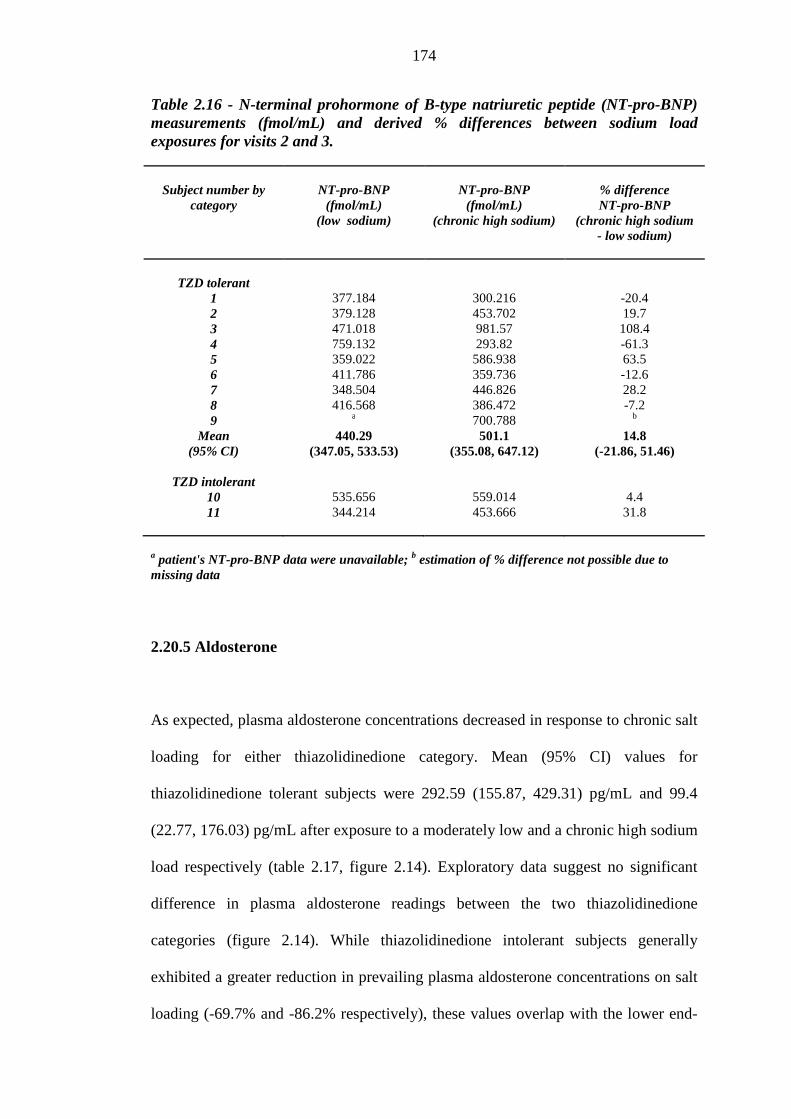
174
Table 2.16 - N-terminal prohormone of B-type natriuretic peptide (NT-pro-BNP) measurements (fmol/mL) and derived % differences between sodium load exposures for visits 2 and 3.
Subject number by category
NT-pro-BNP
(fmol/mL) (low sodium)
NT-pro-BNP
(fmol/mL) (chronic high sodium)
% difference NT-pro-BNP
(chronic high sodium - low sodium)
TZD tolerant 1 377.184 300.216 -20.4 2 379.128 453.702 19.7 3 471.018 981.57 108.4 4 759.132 293.82 -61.3 5 359.022 586.938 63.5 6 411.786 359.736 -12.6 7 348.504 446.826 28.2 8 416.568 386.472 -7.2 9 a 700.788 b
Mean (95% CI)
440.29 (347.05, 533.53)
501.1 (355.08, 647.12)
14.8 (-21.86, 51.46)
TZD intolerant
10 535.656 559.014 4.4 11 344.214 453.666 31.8
a patient's NT-pro-BNP data were unavailable; b estimation of % difference not possible due to missing data
2.20.5 Aldosterone
As expected, plasma aldosterone concentrations decreased in response to chronic salt
loading for either thiazolidinedione category. Mean (95% CI) values for
thiazolidinedione tolerant subjects were 292.59 (155.87, 429.31) pg/mL and 99.4
(22.77, 176.03) pg/mL after exposure to a moderately low and a chronic high sodium
load respectively (table 2.17, figure 2.14). Exploratory data suggest no significant
difference in plasma aldosterone readings between the two thiazolidinedione
categories (figure 2.14). While thiazolidinedione intolerant subjects generally
exhibited a greater reduction in prevailing plasma aldosterone concentrations on salt
loading (-69.7% and -86.2% respectively), these values overlap with the lower end-
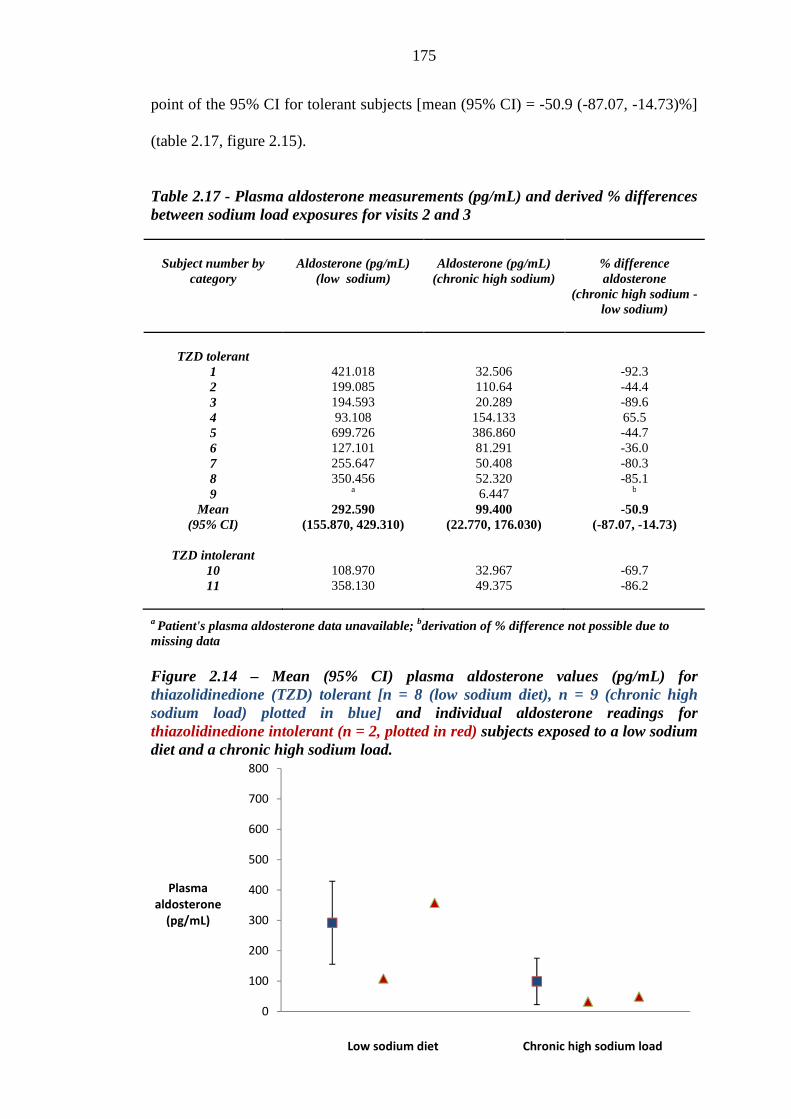
175
point of the 95% CI for tolerant subjects [mean (95% CI) = -50.9 (-87.07, -14.73)%]
(table 2.17, figure 2.15).
Table 2.17 - Plasma aldosterone measurements (pg/mL) and derived % differences between sodium load exposures for visits 2 and 3
Subject number by category
Aldosterone (pg/mL)
(low sodium)
Aldosterone (pg/mL)
(chronic high sodium)
% difference aldosterone
(chronic high sodium - low sodium)
TZD tolerant 1 421.018 32.506 -92.3 2 199.085 110.64 -44.4 3 194.593 20.289 -89.6 4 93.108 154.133 65.5 5 699.726 386.860 -44.7 6 127.101 81.291 -36.0 7 255.647 50.408 -80.3 8 350.456 52.320 -85.1 9 a 6.447 b
Mean (95% CI)
292.590 (155.870, 429.310)
99.400 (22.770, 176.030)
-50.9 (-87.07, -14.73)
TZD intolerant
10 108.970 32.967 -69.7 11 358.130 49.375 -86.2
a Patient's plasma aldosterone data unavailable; bderivation of % difference not possible due to missing data Figure 2.14 – Mean (95% CI) plasma aldosterone values (pg/mL) for thiazolidinedione (TZD) tolerant [n = 8 (low sodium diet), n = 9 (chronic high sodium load) plotted in blue] and individual aldosterone readings for thiazolidinedione intolerant (n = 2, plotted in red) subjects exposed to a low sodium diet and a chronic high sodium load.
0
100
200
300
400
500
600
700
800
Plasma
aldosterone
(pg/mL)
Low sodium diet Chronic high sodium load
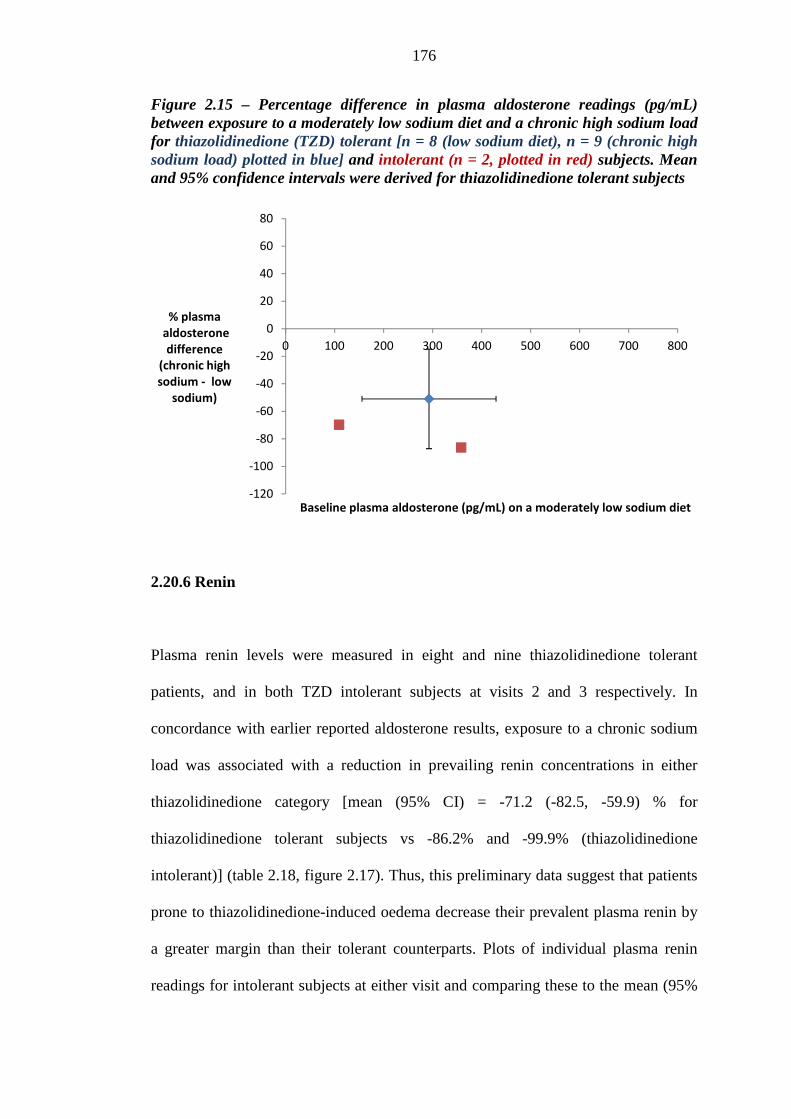
176
Figure 2.15 – Percentage difference in plasma aldosterone readings (pg/mL) between exposure to a moderately low sodium diet and a chronic high sodium load for thiazolidinedione (TZD) tolerant [n = 8 (low sodium diet), n = 9 (chronic high sodium load) plotted in blue] and intolerant (n = 2, plotted in red) subjects. Mean and 95% confidence intervals were derived for thiazolidinedione tolerant subjects
2.20.6 Renin
Plasma renin levels were measured in eight and nine thiazolidinedione tolerant
patients, and in both TZD intolerant subjects at visits 2 and 3 respectively. In
concordance with earlier reported aldosterone results, exposure to a chronic sodium
load was associated with a reduction in prevailing renin concentrations in either
thiazolidinedione category [mean (95% CI) = -71.2 (-82.5, -59.9) % for
thiazolidinedione tolerant subjects vs -86.2% and -99.9% (thiazolidinedione
intolerant)] (table 2.18, figure 2.17). Thus, this preliminary data suggest that patients
prone to thiazolidinedione-induced oedema decrease their prevalent plasma renin by
a greater margin than their tolerant counterparts. Plots of individual plasma renin
readings for intolerant subjects at either visit and comparing these to the mean (95%
-120
-100
-80
-60
-40
-20
0
20
40
60
80
0 100 200 300 400 500 600 700 800
% plasma
aldosterone
difference
(chronic high
sodium - low
sodium)
Baseline plasma aldosterone (pg/mL) on a moderately low sodium diet
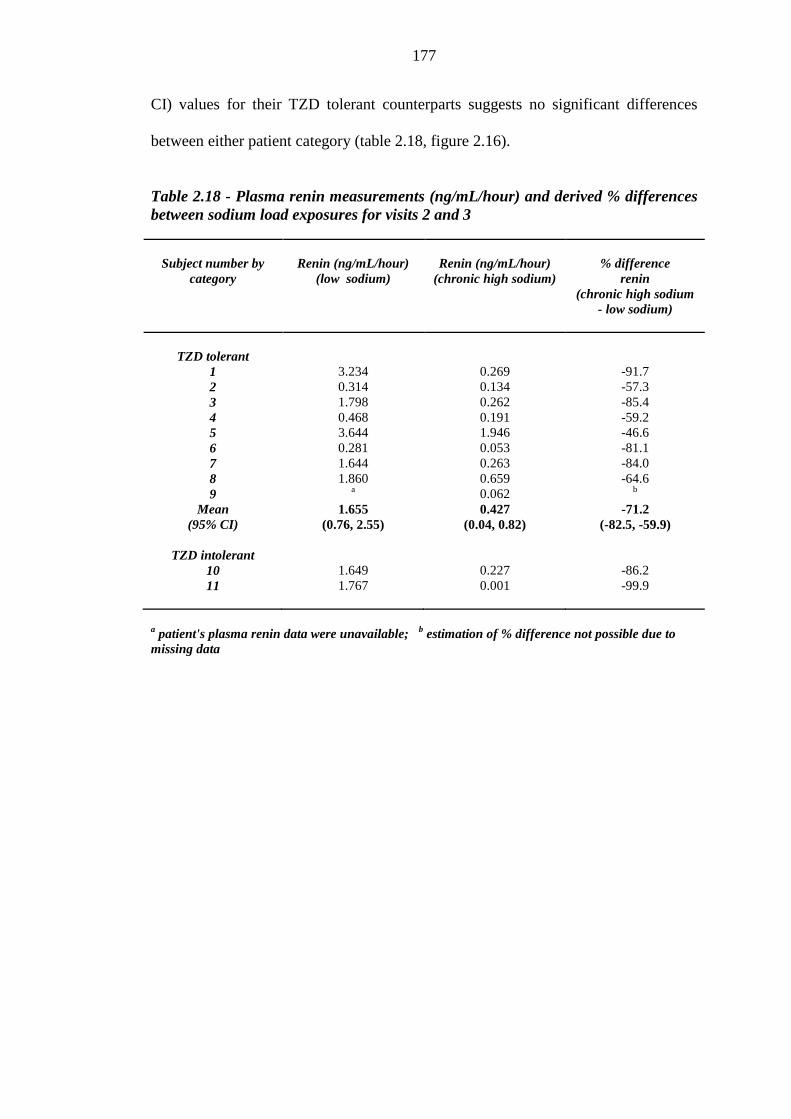
177
CI) values for their TZD tolerant counterparts suggests no significant differences
between either patient category (table 2.18, figure 2.16).
Table 2.18 - Plasma renin measurements (ng/mL/hour) and derived % differences between sodium load exposures for visits 2 and 3
Subject number by category
Renin (ng/mL/hour)
(low sodium)
Renin (ng/mL/hour)
(chronic high sodium)
% difference
renin (chronic high sodium
- low sodium)
TZD tolerant
1 3.234 0.269 -91.7 2 0.314 0.134 -57.3 3 1.798 0.262 -85.4 4 0.468 0.191 -59.2 5 3.644 1.946 -46.6 6 0.281 0.053 -81.1 7 1.644 0.263 -84.0 8 1.860 0.659 -64.6 9 a 0.062 b
Mean (95% CI)
1.655 (0.76, 2.55)
0.427 (0.04, 0.82)
-71.2 (-82.5, -59.9)
TZD intolerant
10 1.649 0.227 -86.2 11 1.767 0.001 -99.9
a patient's plasma renin data were unavailable; b estimation of % difference not possible due to missing data
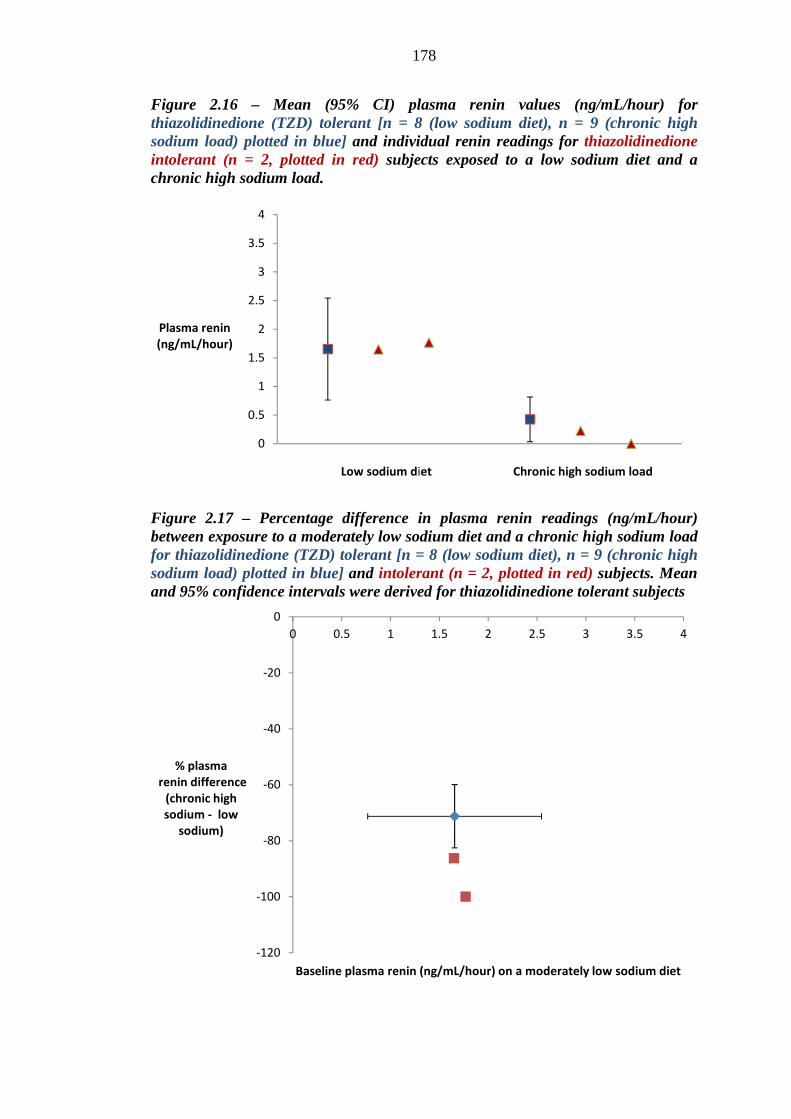
178
Figure 2.16 – Mean (95% CI) plasma renin values (ng/mL/hour) for thiazolidinedione (TZD) tolerant [n = 8 (low sodium diet), n = 9 (chronic high sodium load) plotted in blue] and individual renin readings for thiazolidinedione intolerant (n = 2, plotted in red) subjects exposed to a low sodium diet and a chronic high sodium load.
Figure 2.17 – Percentage difference in plasma renin readings (ng/mL/hour) between exposure to a moderately low sodium diet and a chronic high sodium load for thiazolidinedione (TZD) tolerant [n = 8 (low sodium diet), n = 9 (chronic high sodium load) plotted in blue] and intolerant (n = 2, plotted in red) subjects. Mean and 95% confidence intervals were derived for thiazolidinedione tolerant subjects
0
0.5
1
1.5
2
2.5
3
3.5
4
Plasma renin
(ng/mL/hour)
-120
-100
-80
-60
-40
-20
0
0 0.5 1 1.5 2 2.5 3 3.5 4
% plasma
renin difference
(chronic high
sodium - low
sodium)
Baseline plasma renin (ng/mL/hour) on a moderately low sodium diet
Low sodium diet Chronic high sodium load
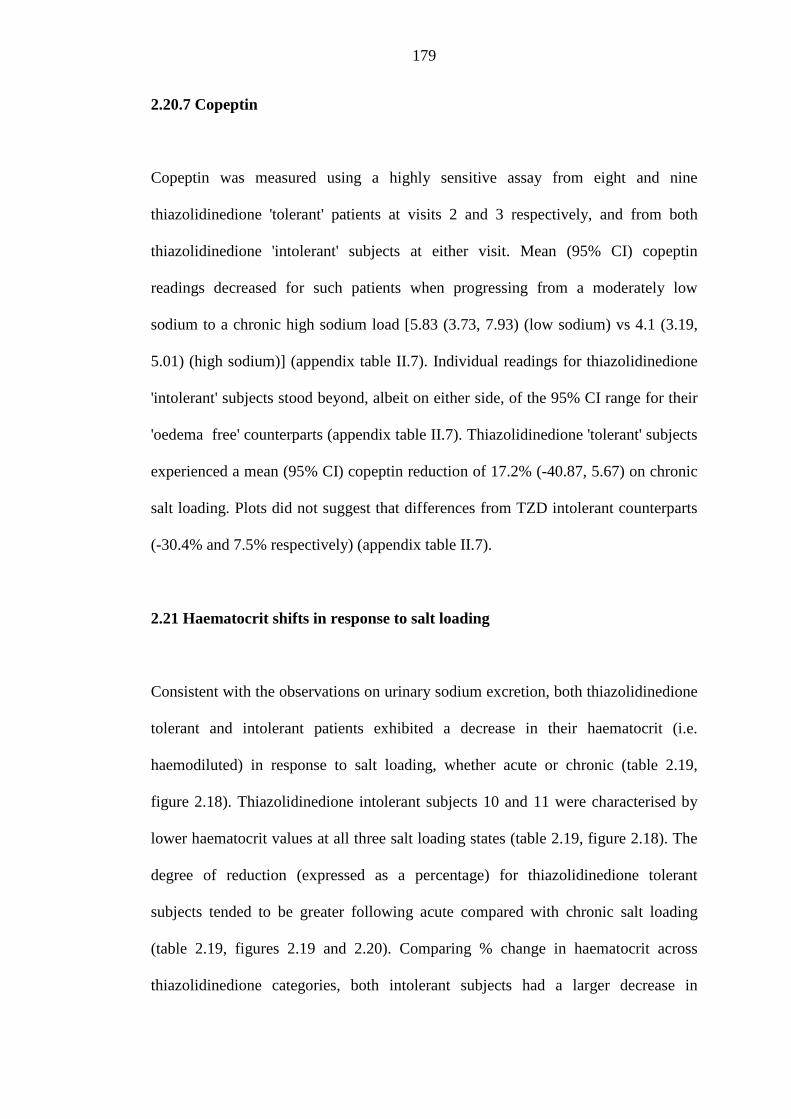
179
2.20.7 Copeptin
Copeptin was measured using a highly sensitive assay from eight and nine
thiazolidinedione 'tolerant' patients at visits 2 and 3 respectively, and from both
thiazolidinedione 'intolerant' subjects at either visit. Mean (95% CI) copeptin
readings decreased for such patients when progressing from a moderately low
sodium to a chronic high sodium load [5.83 (3.73, 7.93) (low sodium) vs 4.1 (3.19,
5.01) (high sodium)] (appendix table II.7). Individual readings for thiazolidinedione
'intolerant' subjects stood beyond, albeit on either side, of the 95% CI range for their
'oedema free' counterparts (appendix table II.7). Thiazolidinedione 'tolerant' subjects
experienced a mean (95% CI) copeptin reduction of 17.2% (-40.87, 5.67) on chronic
salt loading. Plots did not suggest that differences from TZD intolerant counterparts
(-30.4% and 7.5% respectively) (appendix table II.7).
2.21 Haematocrit shifts in response to salt loading
Consistent with the observations on urinary sodium excretion, both thiazolidinedione
tolerant and intolerant patients exhibited a decrease in their haematocrit (i.e.
haemodiluted) in response to salt loading, whether acute or chronic (table 2.19,
figure 2.18). Thiazolidinedione intolerant subjects 10 and 11 were characterised by
lower haematocrit values at all three salt loading states (table 2.19, figure 2.18). The
degree of reduction (expressed as a percentage) for thiazolidinedione tolerant
subjects tended to be greater following acute compared with chronic salt loading
(table 2.19, figures 2.19 and 2.20). Comparing % change in haematocrit across
thiazolidinedione categories, both intolerant subjects had a larger decrease in
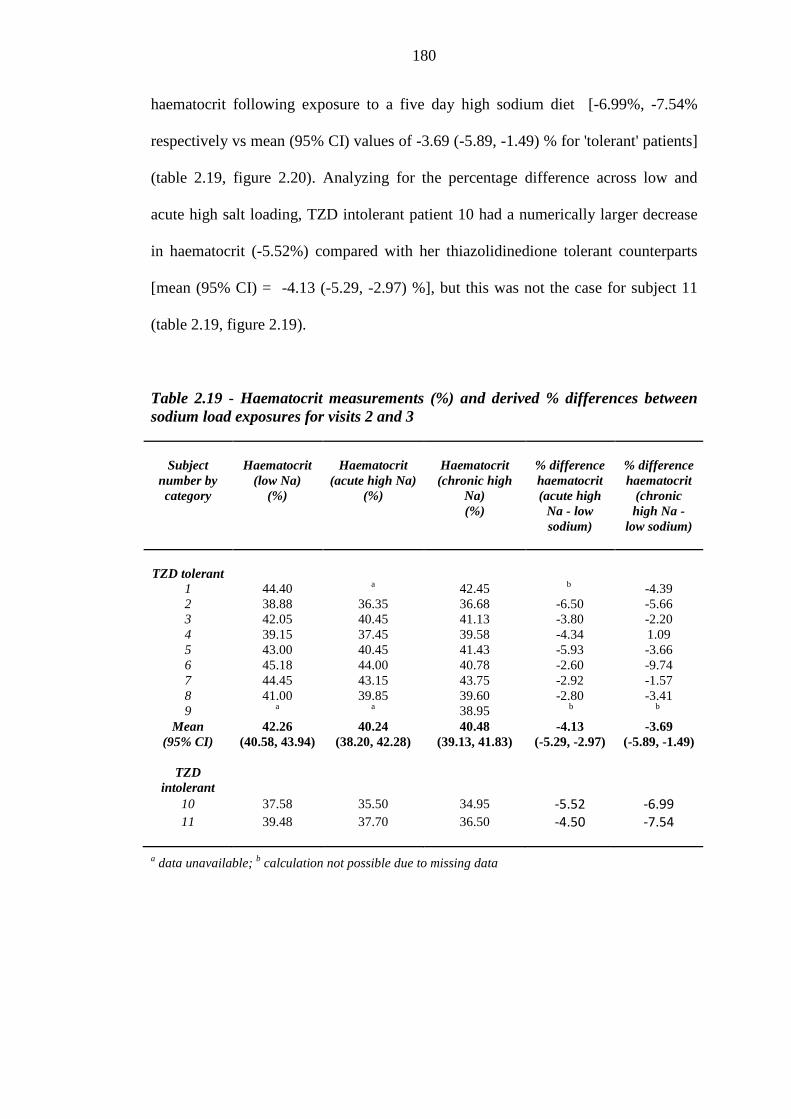
180
haematocrit following exposure to a five day high sodium diet [-6.99%, -7.54%
respectively vs mean (95% CI) values of -3.69 (-5.89, -1.49) % for 'tolerant' patients]
(table 2.19, figure 2.20). Analyzing for the percentage difference across low and
acute high salt loading, TZD intolerant patient 10 had a numerically larger decrease
in haematocrit (-5.52%) compared with her thiazolidinedione tolerant counterparts
[mean (95% CI) = -4.13 (-5.29, -2.97) %], but this was not the case for subject 11
(table 2.19, figure 2.19).
Table 2.19 - Haematocrit measurements (%) and derived % differences between sodium load exposures for visits 2 and 3
Subject number by category
Haematocrit
(low Na) (%)
Haematocrit
(acute high Na) (%)
Haematocrit (chronic high
Na) (%)
% difference haematocrit (acute high
Na - low sodium)
% difference haematocrit
(chronic high Na -
low sodium)
TZD tolerant
1 44.40 a 42.45 b -4.39 2 38.88 36.35 36.68 -6.50 -5.66 3 42.05 40.45 41.13 -3.80 -2.20 4 39.15 37.45 39.58 -4.34 1.09 5 43.00 40.45 41.43 -5.93 -3.66 6 45.18 44.00 40.78 -2.60 -9.74 7 44.45 43.15 43.75 -2.92 -1.57 8 41.00 39.85 39.60 -2.80 -3.41 9 a a 38.95 b b
Mean 42.26 40.24 40.48 -4.13 -3.69 (95% CI) (40.58, 43.94) (38.20, 42.28) (39.13, 41.83) (-5.29, -2.97) (-5.89, -1.49)
TZD
intolerant
10 37.58 35.50 34.95 -5.52 -6.99
11 39.48 37.70 36.50 -4.50 -7.54
a data unavailable; b calculation not possible due to missing data
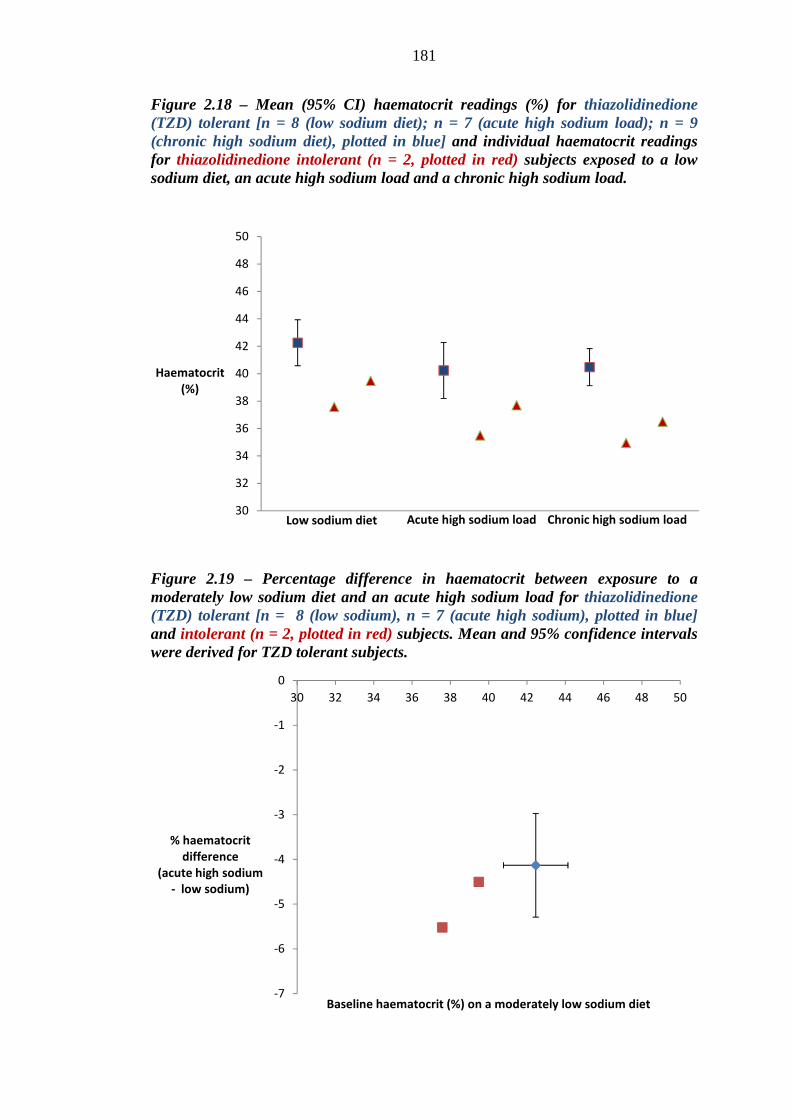
181
Figure 2.18 – Mean (95% CI) haematocrit readings (%) for thiazolidinedione (TZD) tolerant [n = 8 (low sodium diet); n = 7 (acute high sodium load); n = 9 (chronic high sodium diet), plotted in blue] and individual haematocrit readings for thiazolidinedione intolerant (n = 2, plotted in red) subjects exposed to a low sodium diet, an acute high sodium load and a chronic high sodium load.
Figure 2.19 – Percentage difference in haematocrit between exposure to a moderately low sodium diet and an acute high sodium load for thiazolidinedione (TZD) tolerant [n = 8 (low sodium), n = 7 (acute high sodium), plotted in blue] and intolerant (n = 2, plotted in red) subjects. Mean and 95% confidence intervals were derived for TZD tolerant subjects.
30
32
34
36
38
40
42
44
46
48
50
Haematocrit
(%)
Low sodium diet Chronic high sodium loadAcute high sodium load
-7
-6
-5
-4
-3
-2
-1
0
30 32 34 36 38 40 42 44 46 48 50
% haematocrit
difference
(acute high sodium
- low sodium)
Baseline haematocrit (%) on a moderately low sodium diet
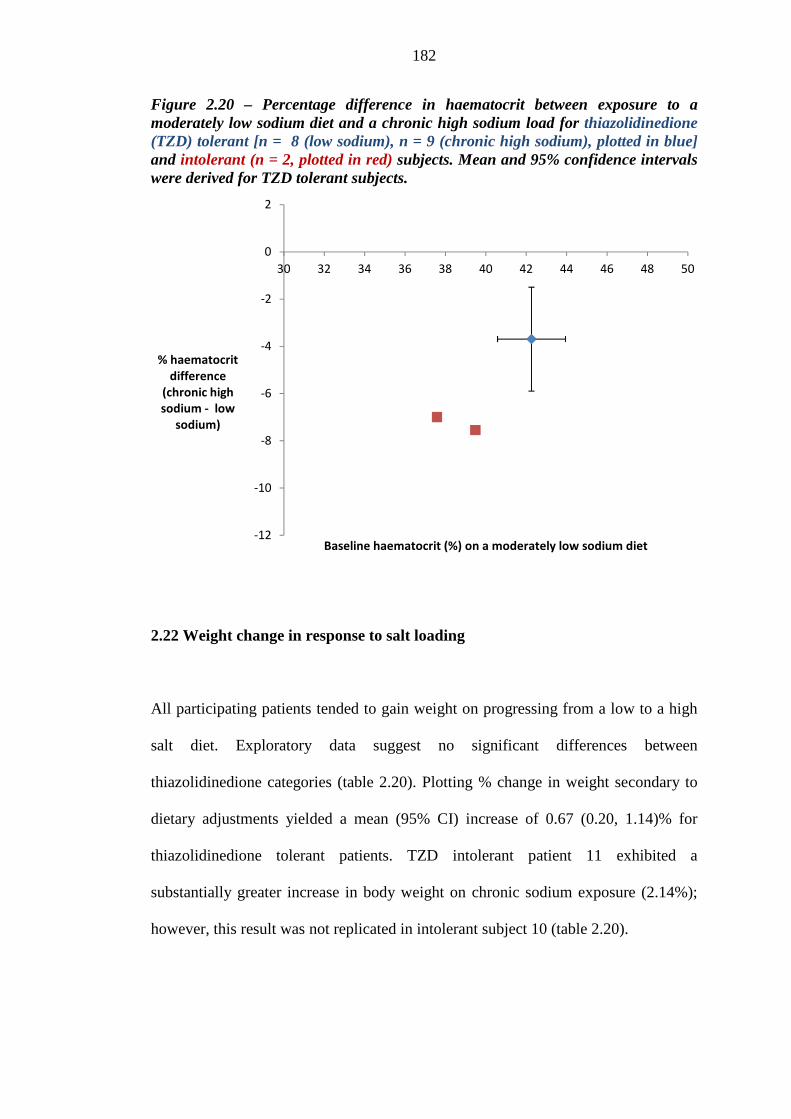
182
Figure 2.20 – Percentage difference in haematocrit between exposure to a moderately low sodium diet and a chronic high sodium load for thiazolidinedione (TZD) tolerant [n = 8 (low sodium), n = 9 (chronic high sodium), plotted in blue] and intolerant (n = 2, plotted in red) subjects. Mean and 95% confidence intervals were derived for TZD tolerant subjects.
2.22 Weight change in response to salt loading
All participating patients tended to gain weight on progressing from a low to a high
salt diet. Exploratory data suggest no significant differences between
thiazolidinedione categories (table 2.20). Plotting % change in weight secondary to
dietary adjustments yielded a mean (95% CI) increase of 0.67 (0.20, 1.14)% for
thiazolidinedione tolerant patients. TZD intolerant patient 11 exhibited a
substantially greater increase in body weight on chronic sodium exposure (2.14%);
however, this result was not replicated in intolerant subject 10 (table 2.20).
-12
-10
-8
-6
-4
-2
0
2
30 32 34 36 38 40 42 44 46 48 50
% haematocrit
difference
(chronic high
sodium - low
sodium)
Baseline haematocrit (%) on a moderately low sodium diet
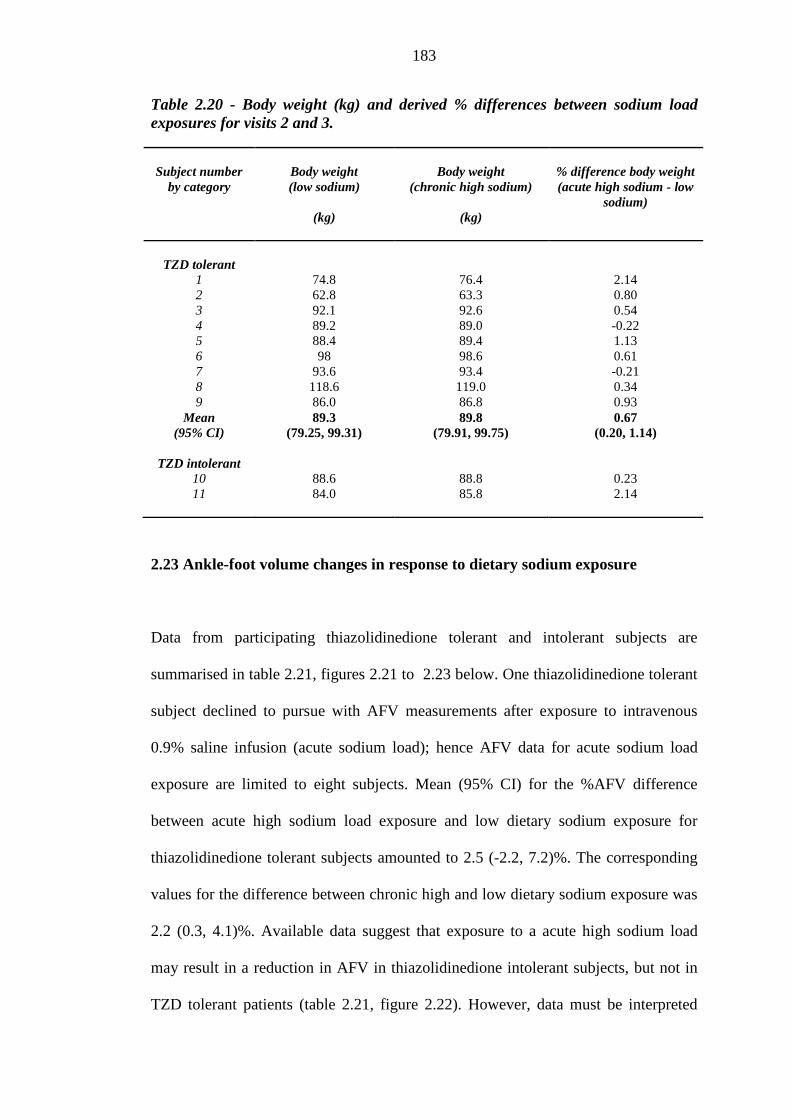
183
Table 2.20 - Body weight (kg) and derived % differences between sodium load exposures for visits 2 and 3. Subject number
by category
Body weight (low sodium)
(kg)
Body weight
(chronic high sodium)
(kg)
% difference body weight (acute high sodium - low
sodium)
TZD tolerant
1 74.8 76.4 2.14 2 62.8 63.3 0.80 3 92.1 92.6 0.54 4 89.2 89.0 -0.22 5 88.4 89.4 1.13 6 98 98.6 0.61 7 93.6 93.4 -0.21 8 118.6 119.0 0.34 9 86.0 86.8 0.93
Mean 89.3 89.8 0.67 (95% CI) (79.25, 99.31) (79.91, 99.75) (0.20, 1.14)
TZD intolerant
10 88.6 88.8 0.23 11 84.0 85.8 2.14
2.23 Ankle-foot volume changes in response to dietary sodium exposure
Data from participating thiazolidinedione tolerant and intolerant subjects are
summarised in table 2.21, figures 2.21 to 2.23 below. One thiazolidinedione tolerant
subject declined to pursue with AFV measurements after exposure to intravenous
0.9% saline infusion (acute sodium load); hence AFV data for acute sodium load
exposure are limited to eight subjects. Mean (95% CI) for the %AFV difference
between acute high sodium load exposure and low dietary sodium exposure for
thiazolidinedione tolerant subjects amounted to 2.5 (-2.2, 7.2)%. The corresponding
values for the difference between chronic high and low dietary sodium exposure was
2.2 (0.3, 4.1)%. Available data suggest that exposure to a acute high sodium load
may result in a reduction in AFV in thiazolidinedione intolerant subjects, but not in
TZD tolerant patients (table 2.21, figure 2.22). However, data must be interpreted
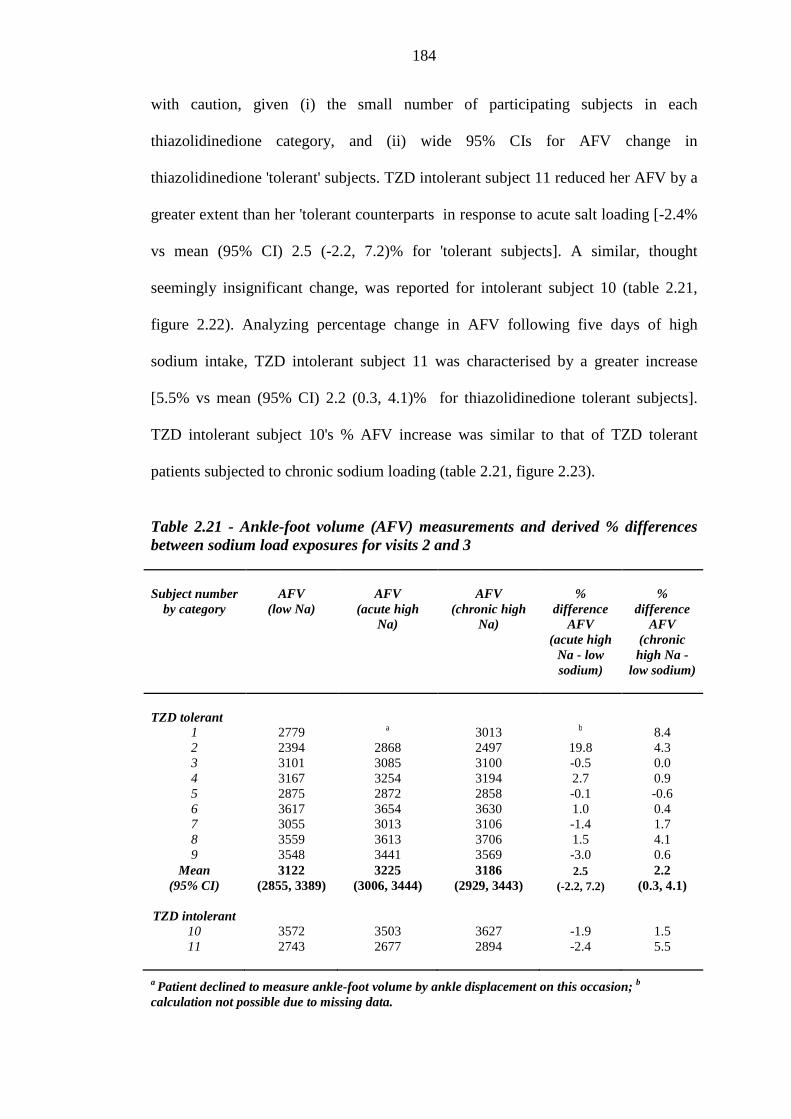
184
with caution, given (i) the small number of participating subjects in each
thiazolidinedione category, and (ii) wide 95% CIs for AFV change in
thiazolidinedione 'tolerant' subjects. TZD intolerant subject 11 reduced her AFV by a
greater extent than her 'tolerant counterparts in response to acute salt loading [-2.4%
vs mean (95% CI) 2.5 (-2.2, 7.2)% for 'tolerant subjects]. A similar, thought
seemingly insignificant change, was reported for intolerant subject 10 (table 2.21,
figure 2.22). Analyzing percentage change in AFV following five days of high
sodium intake, TZD intolerant subject 11 was characterised by a greater increase
[5.5% vs mean (95% CI) 2.2 (0.3, 4.1)% for thiazolidinedione tolerant subjects].
TZD intolerant subject 10's % AFV increase was similar to that of TZD tolerant
patients subjected to chronic sodium loading (table 2.21, figure 2.23).
Table 2.21 - Ankle-foot volume (AFV) measurements and derived % differences between sodium load exposures for visits 2 and 3 Subject number
by category
AFV
(low Na)
AFV
(acute high Na)
AFV
(chronic high Na)
%
difference AFV
(acute high Na - low sodium)
%
difference AFV
(chronic high Na -
low sodium)
TZD tolerant
1 2779 a 3013 b 8.4 2 2394 2868 2497 19.8 4.3 3 3101 3085 3100 -0.5 0.0 4 3167 3254 3194 2.7 0.9 5 2875 2872 2858 -0.1 -0.6 6 3617 3654 3630 1.0 0.4 7 3055 3013 3106 -1.4 1.7 8 3559 3613 3706 1.5 4.1 9 3548 3441 3569 -3.0 0.6
Mean 3122 3225 3186 2.5 2.2 (95% CI) (2855, 3389) (3006, 3444) (2929, 3443) (-2.2, 7.2) (0.3, 4.1)
TZD intolerant
10 3572 3503 3627 -1.9 1.5 11 2743 2677 2894 -2.4 5.5
a Patient declined to measure ankle-foot volume by ankle displacement on this occasion; b
calculation not possible due to missing data.
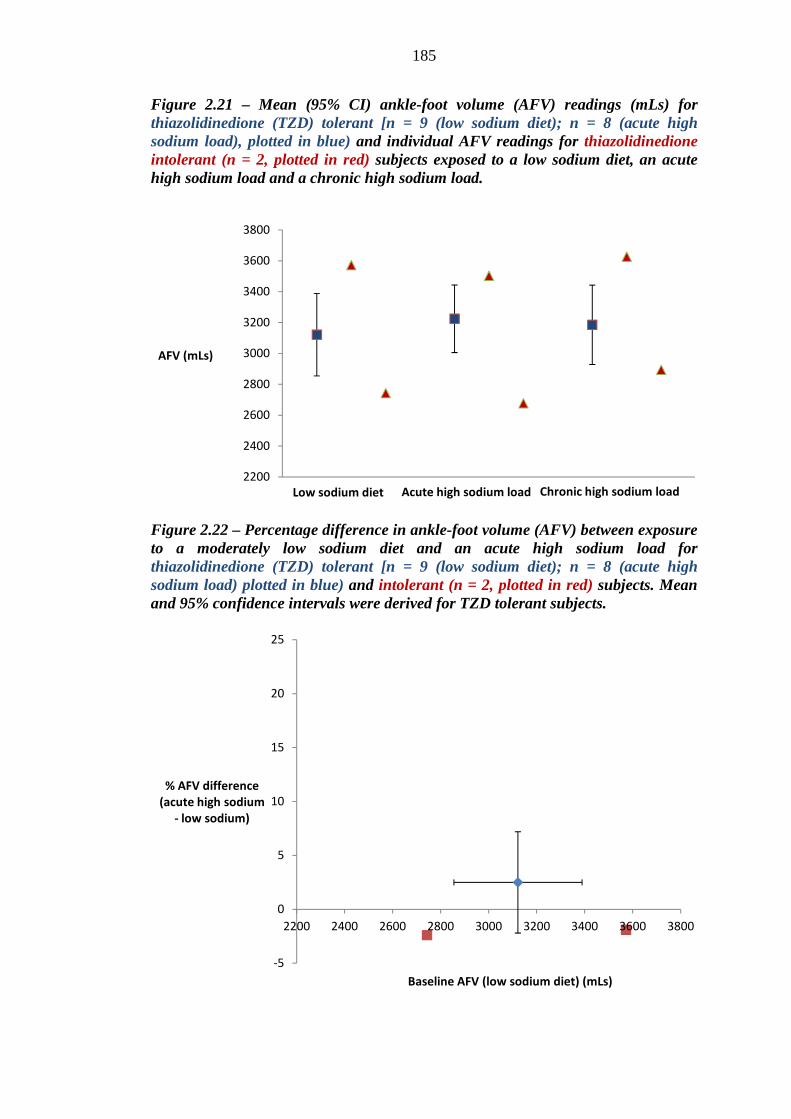
185
Figure 2.21 – Mean (95% CI) ankle-foot volume (AFV) readings (mLs) for thiazolidinedione (TZD) tolerant [n = 9 (low sodium diet); n = 8 (acute high sodium load), plotted in blue) and individual AFV readings for thiazolidinedione intolerant (n = 2, plotted in red) subjects exposed to a low sodium diet, an acute high sodium load and a chronic high sodium load.
Figure 2.22 – Percentage difference in ankle-foot volume (AFV) between exposure to a moderately low sodium diet and an acute high sodium load for thiazolidinedione (TZD) tolerant [n = 9 (low sodium diet); n = 8 (acute high sodium load) plotted in blue) and intolerant (n = 2, plotted in red) subjects. Mean and 95% confidence intervals were derived for TZD tolerant subjects.
2200
2400
2600
2800
3000
3200
3400
3600
3800
AFV (mLs)
Low sodium diet Chronic high sodium loadAcute high sodium load
-5
0
5
10
15
20
25
2200 2400 2600 2800 3000 3200 3400 3600 3800
% AFV difference
(acute high sodium
- low sodium)
Baseline AFV (low sodium diet) (mLs)
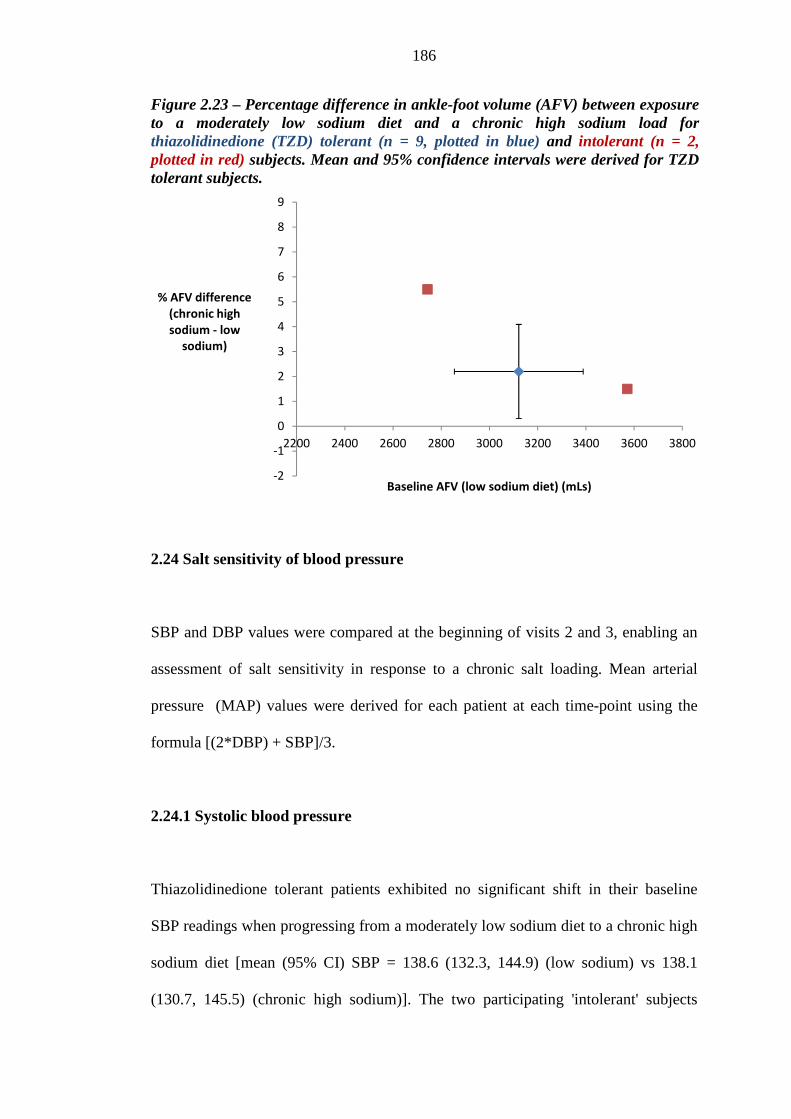
186
Figure 2.23 – Percentage difference in ankle-foot volume (AFV) between exposure to a moderately low sodium diet and a chronic high sodium load for thiazolidinedione (TZD) tolerant (n = 9, plotted in blue) and intolerant (n = 2, plotted in red) subjects. Mean and 95% confidence intervals were derived for TZD tolerant subjects.
2.24 Salt sensitivity of blood pressure
SBP and DBP values were compared at the beginning of visits 2 and 3, enabling an
assessment of salt sensitivity in response to a chronic salt loading. Mean arterial
pressure (MAP) values were derived for each patient at each time-point using the
formula [(2*DBP) + SBP]/3.
2.24.1 Systolic blood pressure
Thiazolidinedione tolerant patients exhibited no significant shift in their baseline
SBP readings when progressing from a moderately low sodium diet to a chronic high
sodium diet [mean (95% CI) SBP = 138.6 (132.3, 144.9) (low sodium) vs 138.1
(130.7, 145.5) (chronic high sodium)]. The two participating 'intolerant' subjects
-2
-1
0
1
2
3
4
5
6
7
8
9
2200 2400 2600 2800 3000 3200 3400 3600 3800
% AFV difference
(chronic high
sodium - low
sodium)
Baseline AFV (low sodium diet) (mLs)
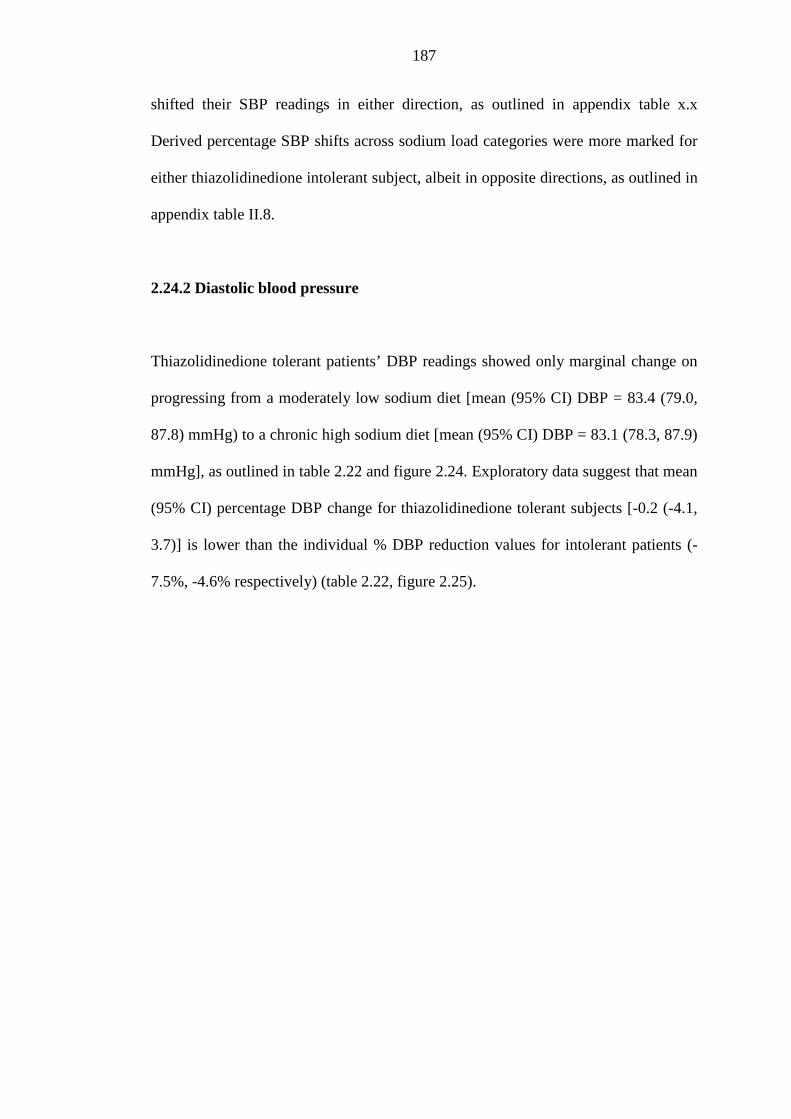
187
shifted their SBP readings in either direction, as outlined in appendix table x.x
Derived percentage SBP shifts across sodium load categories were more marked for
either thiazolidinedione intolerant subject, albeit in opposite directions, as outlined in
appendix table II.8.
2.24.2 Diastolic blood pressure
Thiazolidinedione tolerant patients’ DBP readings showed only marginal change on
progressing from a moderately low sodium diet [mean (95% CI) DBP = 83.4 (79.0,
87.8) mmHg) to a chronic high sodium diet [mean (95% CI) DBP = 83.1 (78.3, 87.9)
mmHg], as outlined in table 2.22 and figure 2.24. Exploratory data suggest that mean
(95% CI) percentage DBP change for thiazolidinedione tolerant subjects [-0.2 (-4.1,
3.7)] is lower than the individual % DBP reduction values for intolerant patients (-
7.5%, -4.6% respectively) (table 2.22, figure 2.25).
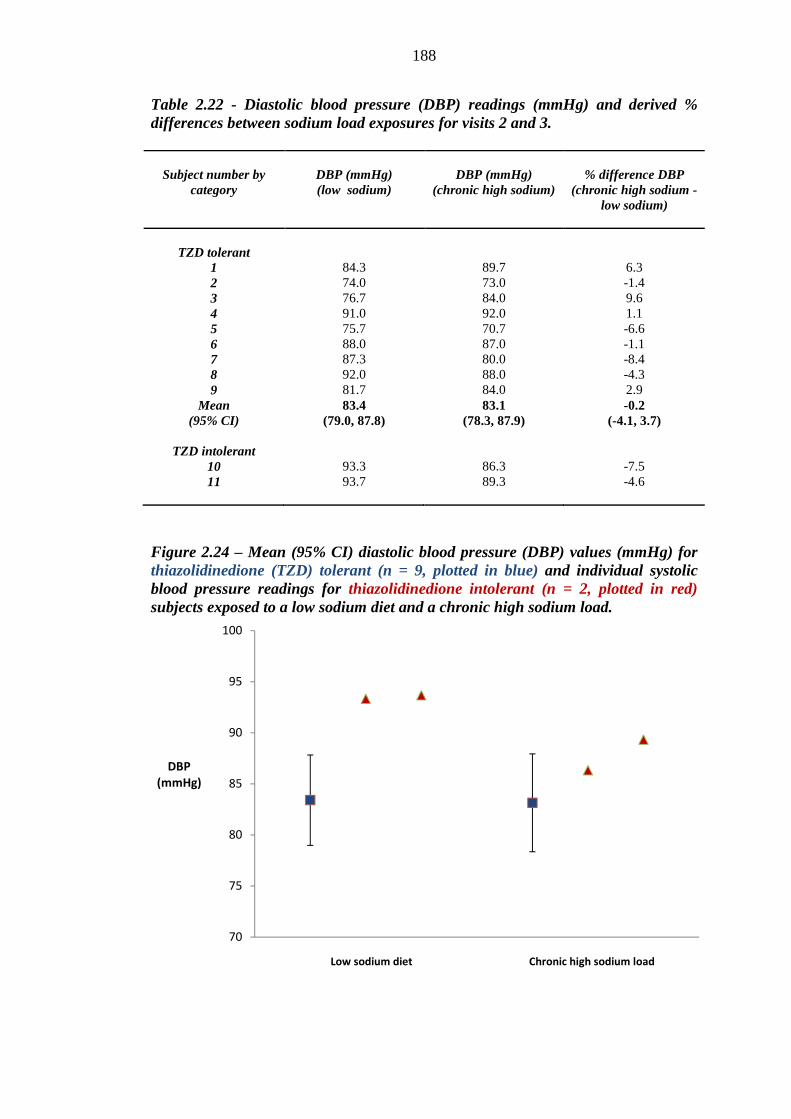
188
Table 2.22 - Diastolic blood pressure (DBP) readings (mmHg) and derived % differences between sodium load exposures for visits 2 and 3.
Subject number by category
DBP (mmHg) (low sodium)
DBP (mmHg)
(chronic high sodium)
% difference DBP
(chronic high sodium - low sodium)
TZD tolerant 1 84.3 89.7 6.3 2 74.0 73.0 -1.4 3 76.7 84.0 9.6 4 91.0 92.0 1.1 5 75.7 70.7 -6.6 6 88.0 87.0 -1.1 7 87.3 80.0 -8.4 8 92.0 88.0 -4.3 9 81.7 84.0 2.9
Mean (95% CI)
83.4 (79.0, 87.8)
83.1 (78.3, 87.9)
-0.2 (-4.1, 3.7)
TZD intolerant
10 93.3 86.3 -7.5 11 93.7 89.3 -4.6
Figure 2.24 – Mean (95% CI) diastolic blood pressure (DBP) values (mmHg) for thiazolidinedione (TZD) tolerant (n = 9, plotted in blue) and individual systolic blood pressure readings for thiazolidinedione intolerant (n = 2, plotted in red) subjects exposed to a low sodium diet and a chronic high sodium load.
70
75
80
85
90
95
100
DBP
(mmHg)
Low sodium diet Chronic high sodium load
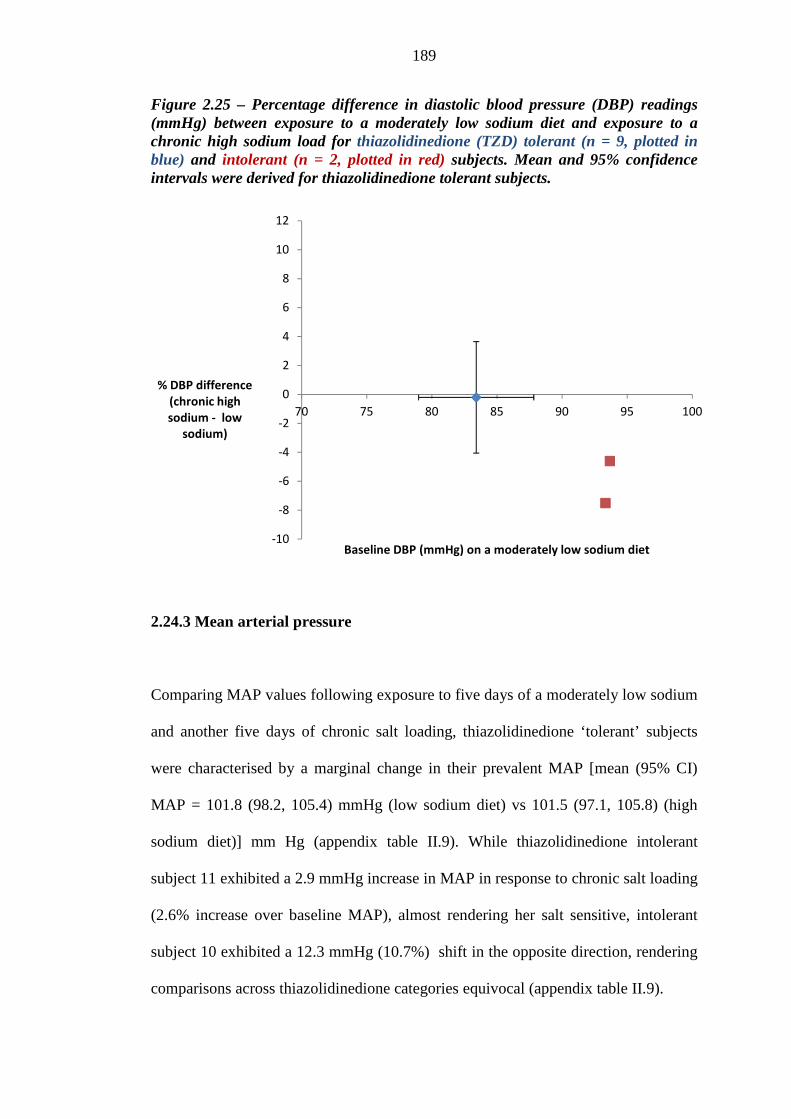
189
Figure 2.25 – Percentage difference in diastolic blood pressure (DBP) readings (mmHg) between exposure to a moderately low sodium diet and exposure to a chronic high sodium load for thiazolidinedione (TZD) tolerant (n = 9, plotted in blue) and intolerant (n = 2, plotted in red) subjects. Mean and 95% confidence intervals were derived for thiazolidinedione tolerant subjects.
2.24.3 Mean arterial pressure
Comparing MAP values following exposure to five days of a moderately low sodium
and another five days of chronic salt loading, thiazolidinedione ‘tolerant’ subjects
were characterised by a marginal change in their prevalent MAP [mean (95% CI)
MAP = 101.8 (98.2, 105.4) mmHg (low sodium diet) vs 101.5 (97.1, 105.8) (high
sodium diet)] mm Hg (appendix table II.9). While thiazolidinedione intolerant
subject 11 exhibited a 2.9 mmHg increase in MAP in response to chronic salt loading
(2.6% increase over baseline MAP), almost rendering her salt sensitive, intolerant
subject 10 exhibited a 12.3 mmHg (10.7%) shift in the opposite direction, rendering
comparisons across thiazolidinedione categories equivocal (appendix table II.9).
-10
-8
-6
-4
-2
0
2
4
6
8
10
12
70 75 80 85 90 95 100
% DBP difference
(chronic high
sodium - low
sodium)
Baseline DBP (mmHg) on a moderately low sodium diet
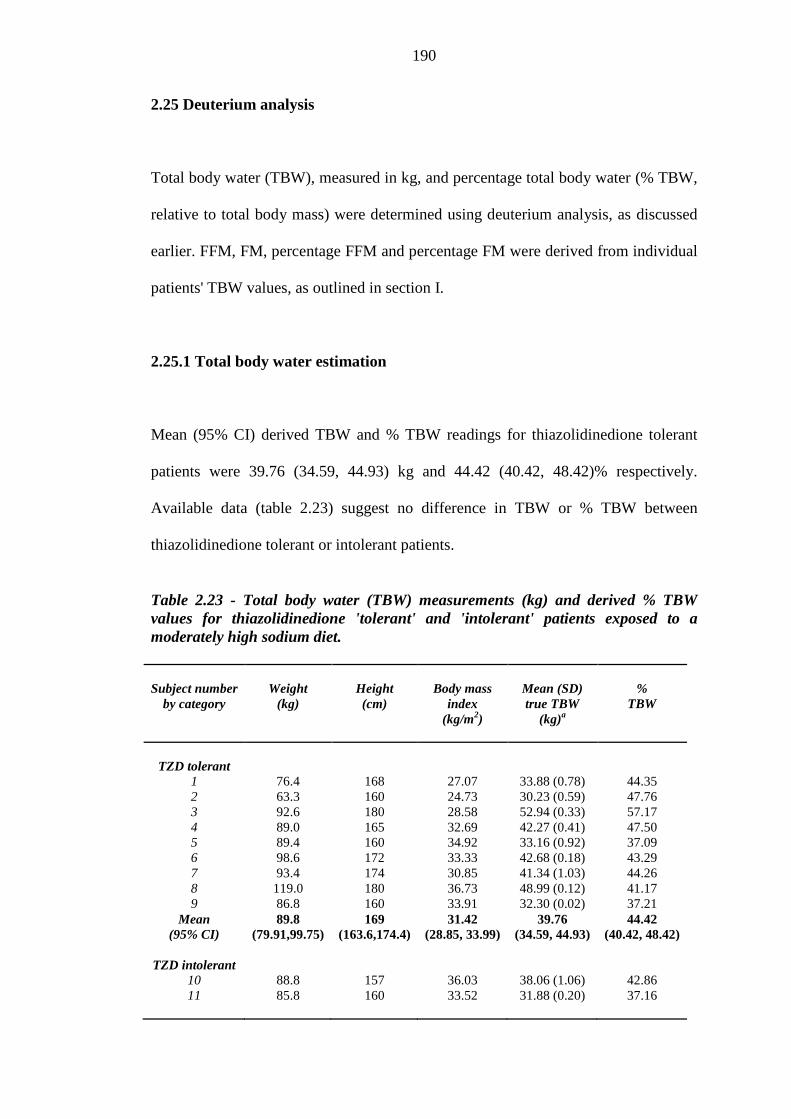
190
2.25 Deuterium analysis
Total body water (TBW), measured in kg, and percentage total body water (% TBW,
relative to total body mass) were determined using deuterium analysis, as discussed
earlier. FFM, FM, percentage FFM and percentage FM were derived from individual
patients' TBW values, as outlined in section I.
2.25.1 Total body water estimation
Mean (95% CI) derived TBW and % TBW readings for thiazolidinedione tolerant
patients were 39.76 (34.59, 44.93) kg and 44.42 (40.42, 48.42)% respectively.
Available data (table 2.23) suggest no difference in TBW or % TBW between
thiazolidinedione tolerant or intolerant patients.
Table 2.23 - Total body water (TBW) measurements (kg) and derived % TBW values for thiazolidinedione 'tolerant' and 'intolerant' patients exposed to a moderately high sodium diet.
Subject number
by category
Weight
(kg)
Height (cm)
Body mass
index (kg/m2)
Mean (SD) true TBW
(kg)a
%
TBW
TZD tolerant
1 76.4 168 27.07 33.88 (0.78) 44.35 2 63.3 160 24.73 30.23 (0.59) 47.76 3 92.6 180 28.58 52.94 (0.33) 57.17 4 89.0 165 32.69 42.27 (0.41) 47.50 5 89.4 160 34.92 33.16 (0.92) 37.09 6 98.6 172 33.33 42.68 (0.18) 43.29 7 93.4 174 30.85 41.34 (1.03) 44.26 8 119.0 180 36.73 48.99 (0.12) 41.17 9 86.8 160 33.91 32.30 (0.02) 37.21
Mean 89.8 169 31.42 39.76 44.42 (95% CI) (79.91,99.75) (163.6,174.4) (28.85, 33.99) (34.59, 44.93) (40.42, 48.42)
TZD intolerant
10 88.8 157 36.03 38.06 (1.06) 42.86 11 85.8 160 33.52 31.88 (0.20) 37.16
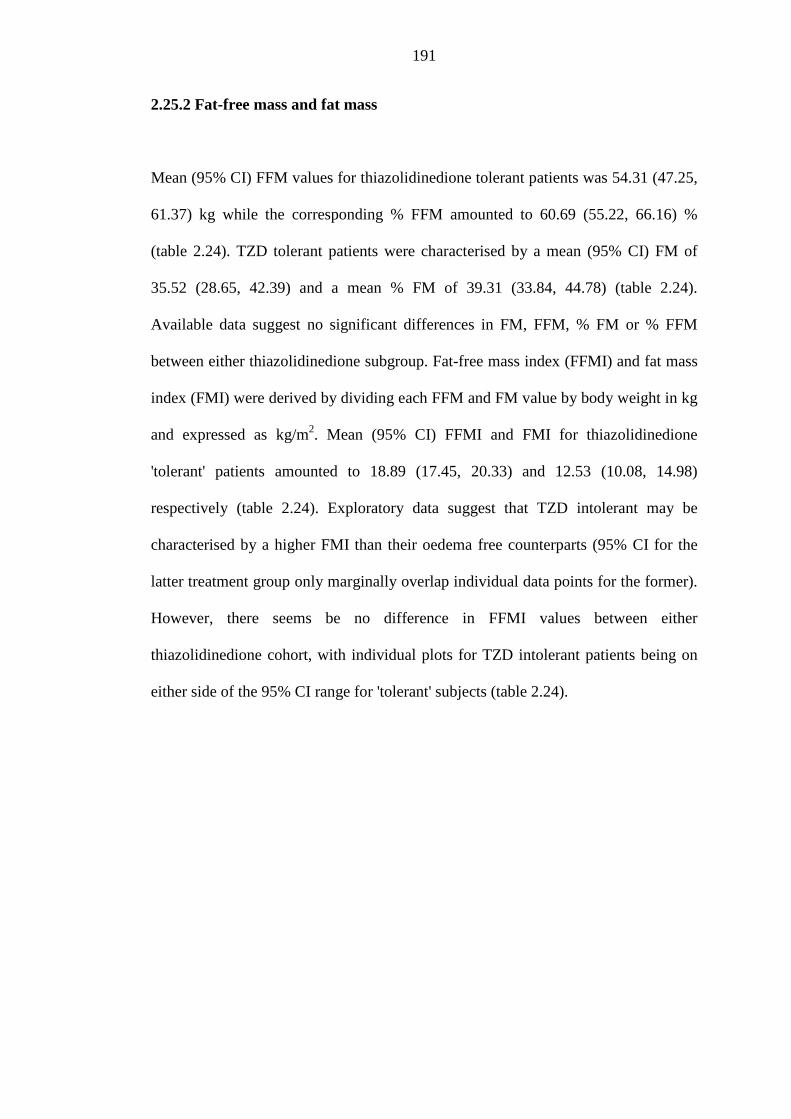
191
2.25.2 Fat-free mass and fat mass
Mean (95% CI) FFM values for thiazolidinedione tolerant patients was 54.31 (47.25,
61.37) kg while the corresponding % FFM amounted to 60.69 (55.22, 66.16) %
(table 2.24). TZD tolerant patients were characterised by a mean (95% CI) FM of
35.52 (28.65, 42.39) and a mean % FM of 39.31 (33.84, 44.78) (table 2.24).
Available data suggest no significant differences in FM, FFM, % FM or % FFM
between either thiazolidinedione subgroup. Fat-free mass index (FFMI) and fat mass
index (FMI) were derived by dividing each FFM and FM value by body weight in kg
and expressed as kg/m2. Mean (95% CI) FFMI and FMI for thiazolidinedione
'tolerant' patients amounted to 18.89 (17.45, 20.33) and 12.53 (10.08, 14.98)
respectively (table 2.24). Exploratory data suggest that TZD intolerant may be
characterised by a higher FMI than their oedema free counterparts (95% CI for the
latter treatment group only marginally overlap individual data points for the former).
However, there seems be no difference in FFMI values between either
thiazolidinedione cohort, with individual plots for TZD intolerant patients being on
either side of the 95% CI range for 'tolerant' subjects (table 2.24).
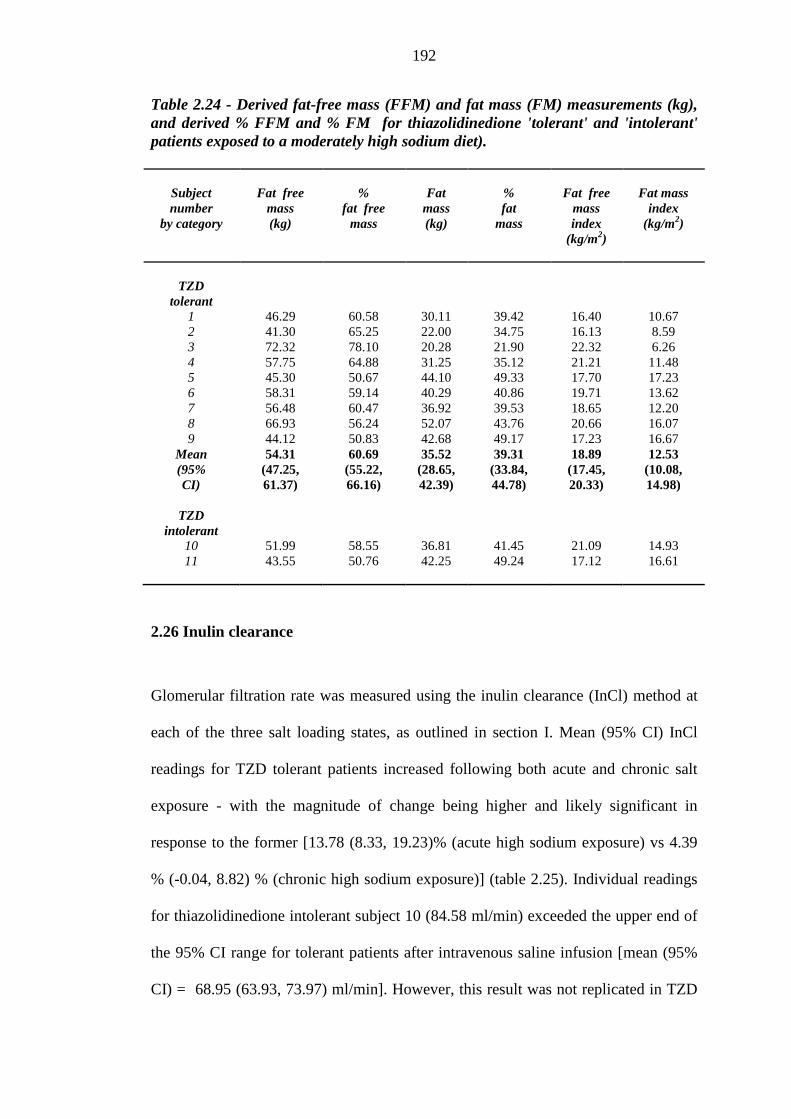
192
Table 2.24 - Derived fat-free mass (FFM) and fat mass (FM) measurements (kg), and derived % FFM and % FM for thiazolidinedione 'tolerant' and 'intolerant' patients exposed to a moderately high sodium diet).
Subject number
by category
Fat free
mass (kg)
%
fat free mass
Fat
mass (kg)
% fat
mass
Fat free
mass index
(kg/m2)
Fat mass
index (kg/m2)
TZD
tolerant
1 46.29 60.58 30.11 39.42 16.40 10.67 2 41.30 65.25 22.00 34.75 16.13 8.59 3 72.32 78.10 20.28 21.90 22.32 6.26 4 57.75 64.88 31.25 35.12 21.21 11.48 5 45.30 50.67 44.10 49.33 17.70 17.23 6 58.31 59.14 40.29 40.86 19.71 13.62 7 56.48 60.47 36.92 39.53 18.65 12.20 8 66.93 56.24 52.07 43.76 20.66 16.07 9 44.12 50.83 42.68 49.17 17.23 16.67
Mean 54.31 60.69 35.52 39.31 18.89 12.53 (95% CI)
(47.25, 61.37)
(55.22, 66.16)
(28.65, 42.39)
(33.84, 44.78)
(17.45, 20.33)
(10.08, 14.98)
TZD
intolerant
10 51.99 58.55 36.81 41.45 21.09 14.93 11 43.55 50.76 42.25 49.24 17.12 16.61
2.26 Inulin clearance
Glomerular filtration rate was measured using the inulin clearance (InCl) method at
each of the three salt loading states, as outlined in section I. Mean (95% CI) InCl
readings for TZD tolerant patients increased following both acute and chronic salt
exposure - with the magnitude of change being higher and likely significant in
response to the former [13.78 (8.33, 19.23)% (acute high sodium exposure) vs 4.39
% (-0.04, 8.82) % (chronic high sodium exposure)] (table 2.25). Individual readings
for thiazolidinedione intolerant subject 10 (84.58 ml/min) exceeded the upper end of
the 95% CI range for tolerant patients after intravenous saline infusion [mean (95%
CI) = 68.95 (63.93, 73.97) ml/min]. However, this result was not replicated in TZD
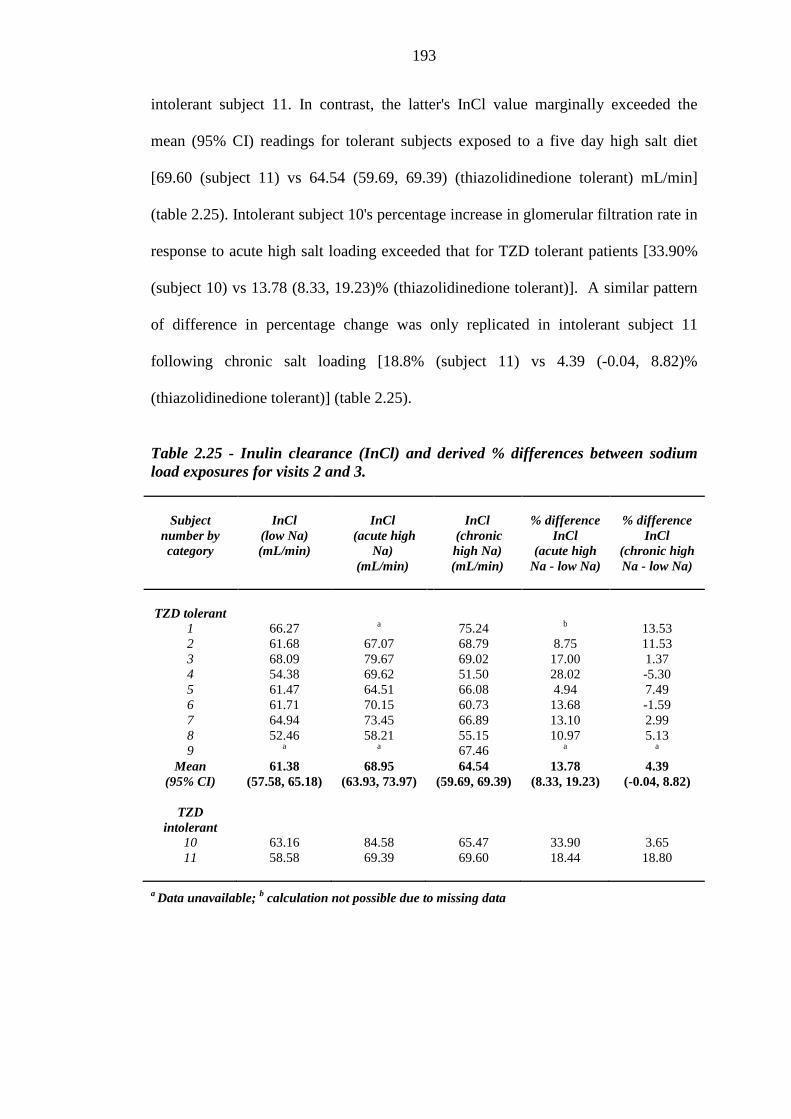
193
intolerant subject 11. In contrast, the latter's InCl value marginally exceeded the
mean (95% CI) readings for tolerant subjects exposed to a five day high salt diet
[69.60 (subject 11) vs 64.54 (59.69, 69.39) (thiazolidinedione tolerant) mL/min]
(table 2.25). Intolerant subject 10's percentage increase in glomerular filtration rate in
response to acute high salt loading exceeded that for TZD tolerant patients [33.90%
(subject 10) vs 13.78 (8.33, 19.23)% (thiazolidinedione tolerant)]. A similar pattern
of difference in percentage change was only replicated in intolerant subject 11
following chronic salt loading [18.8% (subject 11) vs 4.39 (-0.04, 8.82)%
(thiazolidinedione tolerant)] (table 2.25).
Table 2.25 - Inulin clearance (InCl) and derived % differences between sodium load exposures for visits 2 and 3.
Subject
number by category
InCl
(low Na) (mL/min)
InCl
(acute high Na)
(mL/min)
InCl
(chronic high Na) (mL/min)
% difference
InCl (acute high
Na - low Na)
% difference
InCl (chronic high Na - low Na)
TZD tolerant 1 66.27 a 75.24 b 13.53 2 61.68 67.07 68.79 8.75 11.53 3 68.09 79.67 69.02 17.00 1.37 4 54.38 69.62 51.50 28.02 -5.30 5 61.47 64.51 66.08 4.94 7.49 6 61.71 70.15 60.73 13.68 -1.59 7 64.94 73.45 66.89 13.10 2.99 8 52.46 58.21 55.15 10.97 5.13 9 a a 67.46 a a
Mean (95% CI)
61.38 (57.58, 65.18)
68.95 (63.93, 73.97)
64.54 (59.69, 69.39)
13.78 (8.33, 19.23)
4.39 (-0.04, 8.82)
TZD
intolerant
10 63.16 84.58 65.47 33.90 3.65 11 58.58 69.39 69.60 18.44 18.80
a Data unavailable; b calculation not possible due to missing data
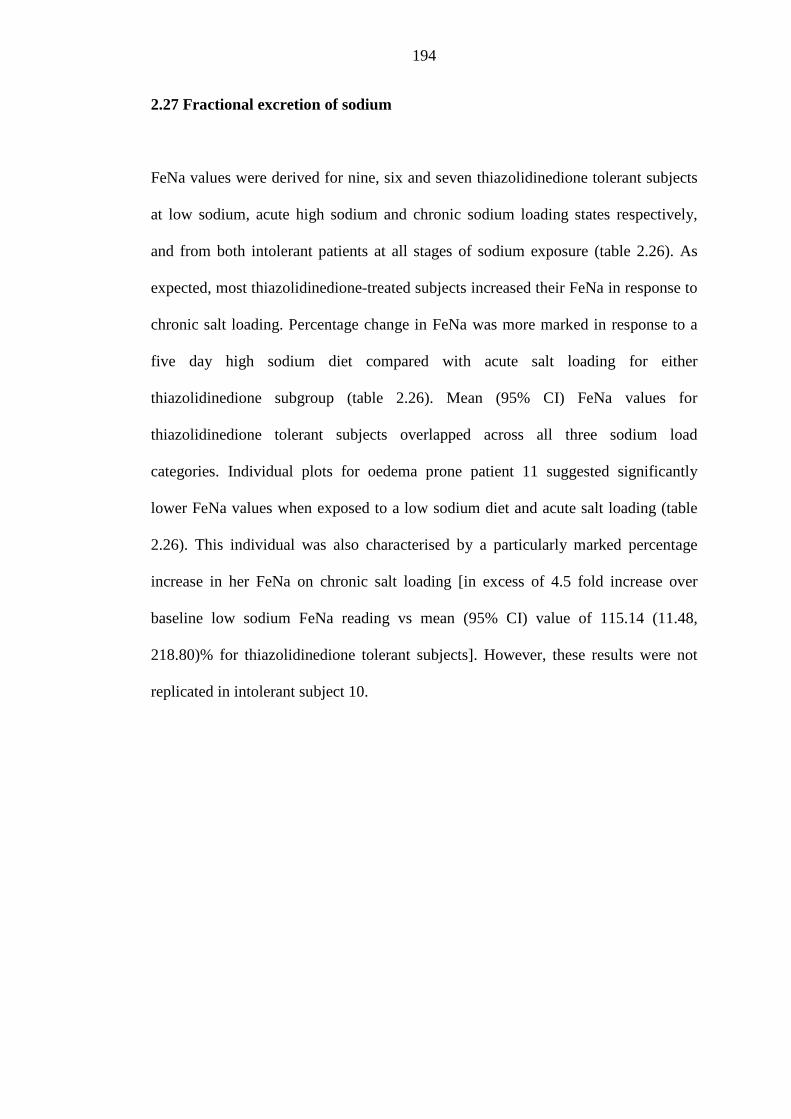
194
2.27 Fractional excretion of sodium
FeNa values were derived for nine, six and seven thiazolidinedione tolerant subjects
at low sodium, acute high sodium and chronic sodium loading states respectively,
and from both intolerant patients at all stages of sodium exposure (table 2.26). As
expected, most thiazolidinedione-treated subjects increased their FeNa in response to
chronic salt loading. Percentage change in FeNa was more marked in response to a
five day high sodium diet compared with acute salt loading for either
thiazolidinedione subgroup (table 2.26). Mean (95% CI) FeNa values for
thiazolidinedione tolerant subjects overlapped across all three sodium load
categories. Individual plots for oedema prone patient 11 suggested significantly
lower FeNa values when exposed to a low sodium diet and acute salt loading (table
2.26). This individual was also characterised by a particularly marked percentage
increase in her FeNa on chronic salt loading [in excess of 4.5 fold increase over
baseline low sodium FeNa reading vs mean (95% CI) value of 115.14 (11.48,
218.80)% for thiazolidinedione tolerant subjects]. However, these results were not
replicated in intolerant subject 10.
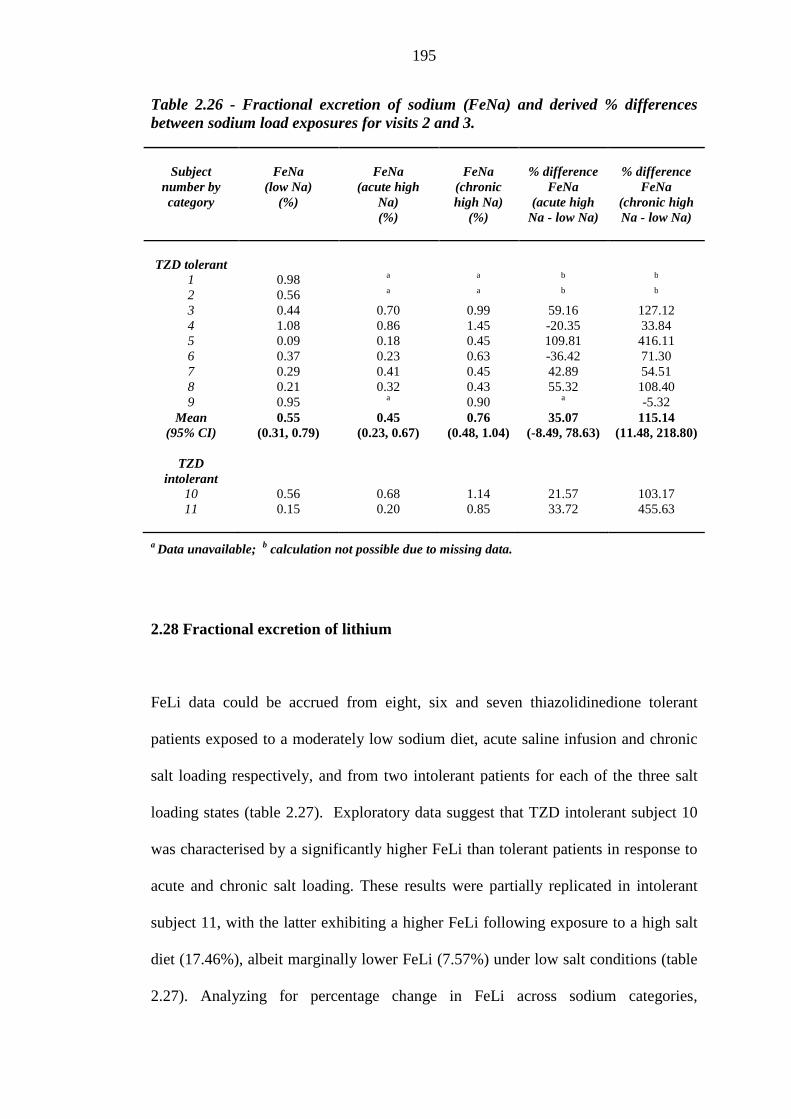
195
Table 2.26 - Fractional excretion of sodium (FeNa) and derived % differences between sodium load exposures for visits 2 and 3.
Subject number by category
FeNa
(low Na) (%)
FeNa
(acute high Na) (%)
FeNa
(chronic high Na)
(%)
% difference
FeNa (acute high
Na - low Na)
% difference
FeNa (chronic high Na - low Na)
TZD tolerant
1 0.98 a a b b
2 0.56 a a b b
3 0.44 0.70 0.99 59.16 127.12 4 1.08 0.86 1.45 -20.35 33.84 5 0.09 0.18 0.45 109.81 416.11 6 0.37 0.23 0.63 -36.42 71.30 7 0.29 0.41 0.45 42.89 54.51 8 0.21 0.32 0.43 55.32 108.40 9 0.95 a 0.90 a -5.32
Mean (95% CI)
0.55 (0.31, 0.79)
0.45 (0.23, 0.67)
0.76 (0.48, 1.04)
35.07 (-8.49, 78.63)
115.14 (11.48, 218.80)
TZD
intolerant
10 0.56 0.68 1.14 21.57 103.17 11 0.15 0.20 0.85 33.72 455.63
a Data unavailable; b calculation not possible due to missing data.
2.28 Fractional excretion of lithium
FeLi data could be accrued from eight, six and seven thiazolidinedione tolerant
patients exposed to a moderately low sodium diet, acute saline infusion and chronic
salt loading respectively, and from two intolerant patients for each of the three salt
loading states (table 2.27). Exploratory data suggest that TZD intolerant subject 10
was characterised by a significantly higher FeLi than tolerant patients in response to
acute and chronic salt loading. These results were partially replicated in intolerant
subject 11, with the latter exhibiting a higher FeLi following exposure to a high salt
diet (17.46%), albeit marginally lower FeLi (7.57%) under low salt conditions (table
2.27). Analyzing for percentage change in FeLi across sodium categories,
196
thiazolidinedinone intolerant subject 11 was characterised by a greater increase over
baseline (low sodium diet) on both acute and chronic salt loading. TZD intolerant
subject 10's % FeLi change was within the 95% CI range for 'tolerant' subjects after
exposure to one litre of intravenous saline, and exhibited a reduction in FeLi in
response to chronic salt loading (table 2.27).
Table 2.27 - Fractional excretion of lithium (FeLi) and derived % differences between sodium load exposures for visits 2 and 3.
Subject
number by category
FeLi
(low Na) (%)
FeLi
(acute high Na) (%)
FeLi
(chronic high Na)
(%)
% difference
FeLi (acute high
Na - low Na)
% difference
FeLi (chronic high Na - low Na)
TZD tolerant 1 18.09 a a b b
2 40.00 a a b b
3 19.28 15.43 15.17 -19.99 -21.34 4 14.93 13.77 17.53 -7.77 17.42 5 7.51 8.15 11.26 8.51 50.04 6 10.83 9.76 11.63 -9.96 7.36 7 7.40 12.19 11.16 64.82 50.90 8 10.51 11.07 10.80 5.29 2.74 9 a a 18.35 b b
Mean (95% CI)
16.07 (8.68, 23.46)
11.73 (9.6, 13.86)
13.7 (11.29, 16.11)
6.82 (-17.40,31.04)
17.85 (-4.79, 40.49)
TZD
intolerant
10 17.67 19.63 16.33 11.10 -7.56 11 7.57 11.96 17.46 58.04 130.71
a Data unavailable; b calculation not possible due to missing data. 2.29 Fractional reabsorption of distally delivered sodium
Fractional reabsorption of distally delivered sodium (FRDDNa) was calculated for
each participant from FeNa and FeLi values, as outlined in section I. Data were
accrued from eight, six and seven thiazolidinedione tolerant subjects after low, acute
197
high and chronic high sodium exposure respectively, and from each of the two
intolerant subjects at each instance.
Table 2.28 - Fractional reabsorption of distally delivered sodium (FRDDNa) and derived % differences between sodium load exposures for visits 2 and 3.
Subject
number by category
FRDDNa (low Na)
(%)
FRDDNa
(acute high Na) (%)
FRDDNa
(chronic high Na) (%)
% difference
FRDDNa (acute high
Na - low Na)
% difference
FRDDNa (chronic high Na - low Na)
TZD tolerant 1 94.58 a a b b
2 98.60 a a b b
3 97.72 95.46 93.47 -2.31 -4.34 4 92.77 93.75 91.73 1.07 -1.12 5 98.80 97.79 96.00 -1.02 -2.83 6 96.58 97.64 94.58 1.10 -2.07 7 96.08 96.64 95.97 0.58 -0.12 8 98.00 97.11 96.02 -0.91 -2.02 9 a a 95.10 b b
Mean (95% CI)
96.64 (95.18, 98.10)
96.40 (95.17, 97.63)
94.70 (93.51, 95.89)
-0.25 (-1.35, 0.85)
-2.08 (-3.24, -0.92)
TZD
intolerant
10 96.83 96.54 93.02 -0.30 -3.94 11 98.02 98.33 95.13 0.32 -2.95
a Data unavailable; b calculation not possible due to missing data
Comparing with mean (95% CI) values for thiazolidinedione tolerant patients, TZD
intolerant subject 11 (albeit not subject 10) was characterised by a higher absolute
FRDDNa value in response to acute salt loading. TZD intolerant subject 10 exhibited
a lower FRDDNa than her tolerant counterparts in response to a five day moderately
high sodium diet (table 2.28). No differences in % shifts in FRDDNa between
thiazolidinedione categories were reported in response to acute salt loading.
Thiazolidinedione intolerant subject 11 decreased her FRDDNa to a greater extent
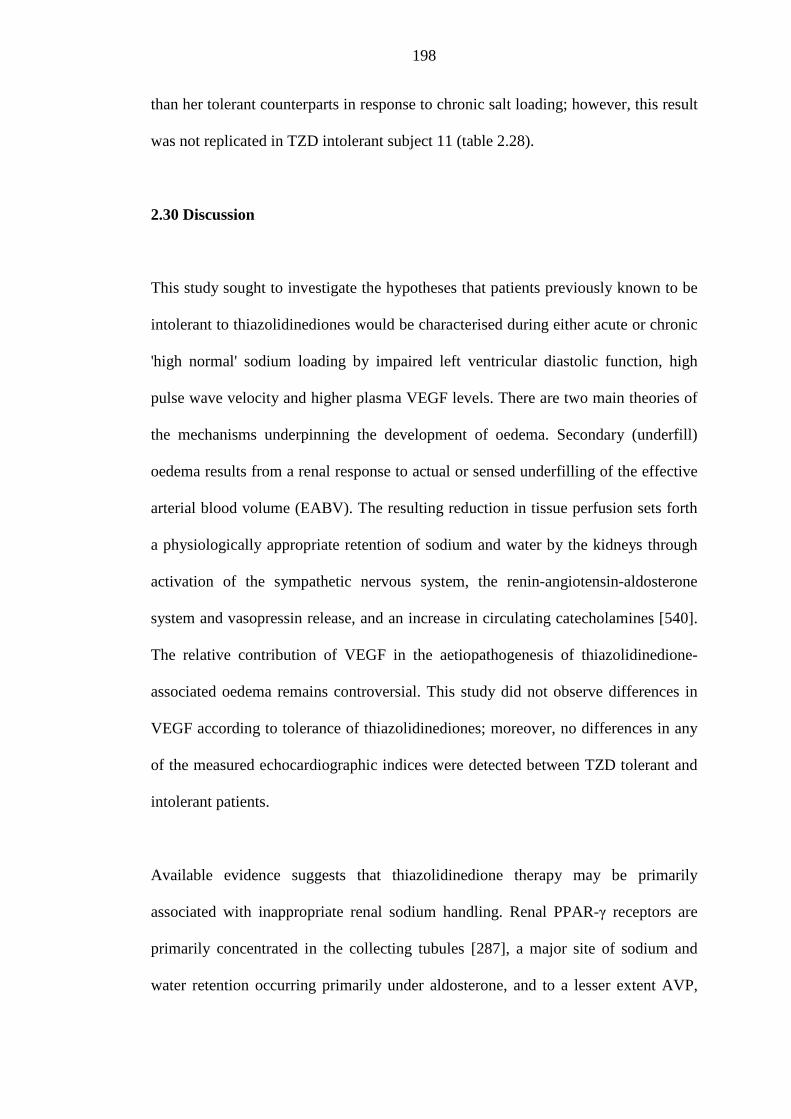
198
than her tolerant counterparts in response to chronic salt loading; however, this result
was not replicated in TZD intolerant subject 11 (table 2.28).
2.30 Discussion
This study sought to investigate the hypotheses that patients previously known to be
intolerant to thiazolidinediones would be characterised during either acute or chronic
'high normal' sodium loading by impaired left ventricular diastolic function, high
pulse wave velocity and higher plasma VEGF levels. There are two main theories of
the mechanisms underpinning the development of oedema. Secondary (underfill)
oedema results from a renal response to actual or sensed underfilling of the effective
arterial blood volume (EABV). The resulting reduction in tissue perfusion sets forth
a physiologically appropriate retention of sodium and water by the kidneys through
activation of the sympathetic nervous system, the renin-angiotensin-aldosterone
system and vasopressin release, and an increase in circulating catecholamines [540].
The relative contribution of VEGF in the aetiopathogenesis of thiazolidinedione-
associated oedema remains controversial. This study did not observe differences in
VEGF according to tolerance of thiazolidinediones; moreover, no differences in any
of the measured echocardiographic indices were detected between TZD tolerant and
intolerant patients.
Available evidence suggests that thiazolidinedione therapy may be primarily
associated with inappropriate renal sodium handling. Renal PPAR-γ receptors are
primarily concentrated in the collecting tubules [287], a major site of sodium and
water retention occurring primarily under aldosterone, and to a lesser extent AVP,
199
ANP and insulin control [541]. PPAR-γ-mediated ENaC activity may favour sodium
reabsorption and an increase in extracellular fluid volume [302, 303], causing an
expansion of its subcompartments, manifesting clinically as oedema. In accordance
with the overfill theory, this would be expected to enhance the normal central
inhibition of the sympathetic nervous system, while suppressing both the renin-
angiotensin-aldosterone pathway and baroreceptor mediated AVP release [540].
Thiazolidinedione intolerant patients exhibited a greater decrease in haematocrit, and
increase in cAI and pAI (surrogate markers of arterial stiffness) in response to salt
loading. This would suggest a preservation of the EABV. Thiazolidinedione therapy
has been associated with a reduction in aldosterone [303, 304, 541] and an increase
in ANP [335, 336] in published studies of animal models and human subjects. ANP
is synthesised and stored (within granules) as pre-pro-ANP, cleaved to pro-ANP1-126,
and secreted as the biologically active 28 amino acid peptide (together with
biologically inactive N-terminal pro-ANP) [542]. These physiological processes
proceed in the atria in response to increased atrial pressure and distension [543],
occurring as a result of acute volume expansion, salt feeding, water immersion and
postural changes. BNP is likewise synthesised as a 134 amino acid peptide called
pre-pro-BNP, cleaved into pro-BNP 1-108 [544, 545], and secreted in bursts as
biologically active BNP 1-32 (together with its inactive amino-terminal fragment NT-
pro-BNP) [545-547]. This synthetic activity progresses primarily in the ventricular
myocardium, particularly in response to volume expansion [548, 549]. Both pro-
ANP and pro-BNP are cleaved into biologically active ANP and BNP by the cardiac
myocyte transmembrane enzyme corin, a member of the serine protease family
[550]. ANP and BNP play a pivotal role in salt and water homeostasis by increasing
200
glomerular filtration and filtration fraction despite a fall in mean arterial pressure
[551]. Moreover they decrease sodium reabsorption in the cortical collecting tubule
and inner medullary collecting duct (independently of effects on glomerular
filtration) [552], decrease passive sodium chloride reabsorption in the thin ascending
limb [553], reduce renin secretion, block aldosterone secretion and oppose the
vasoconstrictive effect of angiotensin II [549, 554, 555]. This study did not report
differences in aldosterone, renin, ANP and BNP concentrations between
thiazolidinedione tolerant patients and those whose thiazolidinedione therapy was
complicated by oedema and /or HF. However, TZD intolerant patients were
characterised by a significantly greater reduction in their circulating renin (and
possibly aldosterone), and a greater increase in ANP levels (and possibly BNP)
following chronic salt loading. These observations are consistent with the overfill
theory. Copeptin is a 39 amino-acid peptide released together with AVP during
processing of the precursor peptide pro-AVP, and has proven to be a useful surrogate
marker of circulating AVP [556]. AVP secretion is favoured by hypovolaemia,
increased serum osmolality [556, 557], angiotensin II and norephinephrine [558]. As
expected, high sensitivity copeptin decreased in response to chronic salt loading in
thiazolidinedione tolerant subjects. Physiologically, this would be an expected
response in the face of an increased EABV (as attested by an accompanying fall in
haematocrit). 'Oedema-prone' subject 10's copeptin level was lower than the mean
(95% CI) range for 'tolerant' subjects, in keeping with the overfill theory. Perhaps
surprisingly, 'intolerant' subject 11 increased her copeptin on chronic salt loading.
This study's small dataset precludes from judging whether this is a stress response
[556] or a result worthy of further investigation.
201
In their study on healthy, normotensive male volunteers subjected to both low and
high salt diets, Zanchi et al. reported that thiazolidinedione therapy is associated with
a significant increase in plasma renin activity in both instances, as well a rise in
daytime heart rate, which however, only reached statistical significance in low salt
loading states. In the absence of a significant effect on nocturnal (supine) blood
pressure, the authors ascribed this to thiazolidinedione-associated peripheral
vasodilation [322]. Results arising from this study seem to imply that 'oedema-prone'
patients are less likely to peripherally vasodilate in response to chronic salt loading,
further enhancing intravascular volume, increasing atrial stretch (and hence ANP and
BNP release), while propogating a further inhibition of the renin-angiotensin-
aldosterone pathway. While thiazolidinedione-mediated increases in ANP should
theoretically mitigate any drug-associated oedema, this effect is blunted in T2DM
patients [335].
Although the synthetic activity of atrial and cardiac myocytes may be overwhelmed
in severe HF (creating a relative deficiency) [559, 560], resistance to the effects of
natriuretic peptides has been suggested as a possible contributory mechanism in the
aetiopathogenesis of fluid overload. ANP and BNP bind to the natriuretic peptide A
receptor (NPR-A) and exert their hormonal effects via 3', 5' - cyclic guanosine
monophosphate (cGMP). Both natriuretic peptides are cleared via the natriuretic
peptide C receptor (NPR-C), and degraded by the ectoenzyme neutral endopeptidase
24.11 (NEP). ANP and/or BNP resistance reportedly arise as a consequence of
decreased corin activity, down-regulation of NPR-A, increased metabolism of cGMP
by cGMP phosphodiesterase V or increased clearance of the natriuretic peptides by
NPR-C or NEP [561-564]. A higher relative increase in ANP and BNP levels in
202
response to chronic salt loading among thiazolidinedione 'intolerant' patients in this
exploratory study could thus be ascribed to natriuretic peptide resistance.
There is currently considerable interest in the association of common genetic variants
at the Natriuretic Peptide Precursor A (NPPA) - Natriuretic Peptide Precursor B
(NPPB) locus on chromosome 1 with circulating ANP and BNP concentrations.
Cheh et al. reported that genetic variants rs5068 and rs198358 are associated with
higher ANP concentrations, lower SBP and DBP values, and a lower risk of
hypertension in a 14,743 individuals of European ancestry with no prior HF
participating in the Framingham study [565]. These effects are not entirely surprising
given ANP's modulation of natriuresis and vascular tone. Cannone et al. additionally
associated genetic variant rs5068 with a better cardiometabolic profile (lower BMI,
lower prevalence of obesity, lower waist circumference, lower C-reactive protein,
higher high-density lipoprotein cholesterol), albeit no association with an altered risk
for hypertension, congestive HF, coronary artery disease, atrial fibrillation or
cerebrovascular accident in a study of 1608 randomly selected US subjects [566].
Similar results were reported in a Mediterranean population [567]. Moreover, the
corin I555 (P568) allele, particularly common in blacks, has been associated with
higher blood pressure and a higher prevalence of hypertension in a genotype-
phenotype genetic association study of US patients [568]. This study described
considerable differences in prevalent ANP levels between individual subjects
participating in this small exploratory study, particularly among those pertaining to
the thiazolidinedione tolerant subgroup. While it would be unwise to draw specific
conclusions, such differences could well be ascribed to genetic variants, and may be
worthy of further study.
203
This study also sought to investigate the hypotheses that patients prone to
thiazolidinedione-associated oedema and HF are characterised by increased AFV,
salt sensitivity of blood pressure and differences in fractional sodium excretion, free
water handling and total body water when compared with thiazolidinedione tolerant
subjects. A decline in haematocrit and an accompanying increase in total body
weight was reported in response to chronic salt loading for all subjects. This
observation would be consistent with a tendency to fluid overload. The degree of
haemodilution following acute compared with chronic salt loading tended to be
greater within thiazolidinedione tolerant subjects suggesting a role for compensatory
physiological mechanisms which become more effective in the 'longer' rather than
'shorter' term. In contrast, patients whose thiazolidinedione therapy was previously
complicated by oedema were characterised by a greater degree of haemodilution
following chronic salt loading. This could imply a relative failure of counter-
regulatory mechanisms.
Thiazolidinedione intolerant subject 11 virtually fulfils the criterion for salt-
sensitivity of blood pressure (SSBP) (being characterised by a 2.9 mmHg increase in
MAP following chronic salt loading). This patient was also characterised by a 17.3
mmHg increase in SBP following exposure to a chronic high salt diet. Oedema prone
subject 10 shifted her MAP and SBP in the opposite direction. This study's reported
mean (95% CI) reductions in SBP and MAP for thiazolidinedione 'tolerant' patients
are perhaps surprising, and generally contrast with those reported in the literature.
The INTERSALT study analyzed data from 10,079 patients aged 20 to 59 recruited
from 52 centres across 32 countries. Multivariate analysis with and without BMI in
the analysis showed that a 100 mmol daily dietary salt reduction results in a 3.1-6.0
204
mmHg and a 0.1 -6.0 mmHg reduction in SBP and DBP respectively [569]. The
Dietary Approach to Stop Hypertension (DASH) study published data on the effect
of the DASH diet and dietary salt restriction (<100 mmol/day) on SBP, claiming it is
associated with a 7.1 mmHg reduction in normotensive individuals and a 11.5 mmHg
reduction in hypertensive individuals compared to controls exposed to a high salt diet
[570]. A recent Cochrane systematic review and meta-analysis of 34 trials recruiting
3230 participants concluded that a 75 mmol reduction in daily urinary sodium
excretion (equivalent to a reduction of 4.4 g/day) for at least four weeks is associated
with a 4.18 mmHg reduction in prevalent SBP (95% CI - 5.18, -3.18) and a 2.06
mmHg reduction in DBP (95% CI -2.67, -1.45), and that this was associated with a
small physiological increase in plasma renin activity, aldosterone and noradrenaline
(albeit no significant change in lipid concentrations) [571]. In a study of 70 Hong
Kong Chinese patients with untreated hypertension and 47 normotensive controls,
DBP correlated with 24 hour urinary sodium excretion in hypertensive patients, but
not in controls [572]. Despite their undisputed validity, these studies findings' may
not be directly relevant to this exploratory study, particularly as they either (i)
recruited patients whose dietary sodium intake was modified for substantially longer
periods (>30 days) [570, 571] or (ii) observed the effects of long-term (usual)
dietary sodium habits [569, 572]. Closer to this study's design, Foo et al. analysed
the impact of a 6-day high (220 mmol/day) and low (40 mmol/day) sodium diet on
blood pressure, leg flow and insulin sensitivity in 18 healthy normotensive subjects.
Salt loading was associated with a borderline significant increase in 24-hour SBP
[mean (SD) = +5.8 (± 14.2) mmHg], but no significant impact on DBP or MAP
[573]. Twenty healthy normotensive volunteers were recruited into another study
investigating the impact of dietary salt on insulin sensitivity. Although Townsend et
205
al. reported a 6/4 mmHg BP increase on progressing from a six-day 20 mmol/day
sodium diet to a six-day 200 mmol/day diet, this change did not reach statistical
significance [574]. Vedovato et al. examined the impact of a seven-day low (20
mmol) and seven-day high (250 mmol) sodium diet on MAP and other parameters in
a cohort of 20 T2DM patients with microalbuminuria and 21 T2DM patients without
microalbuminuria. 24-hour MAP increased significantly from 95 (SEM ±2) mmHg
to 103 (SEM ±2) mmHg on salt loading (p<0.0001). No significant MAP change was
reported in normoalbuminuric patients [575]. Similar results were published in
microalbuminuric T1DM patients [576]. Indeed, available evidence suggests that salt
sensitivity of blood pressure (defined as a MAP increment > or = 3 mmHg on a salt
loading) is least common in non-diabetic subjects (17%), increasing to 37% in
normoalbuminuric T1DM patients and 50% in T1DM patients with
microalbuminuria [577].
Several mechanisms have been put forward to explain salt sensitivity in T2DM
patients. These include low prevalent renin concentrations [578-580], hypertension,
activated sympathetic nervous system and hyperinsulinism [575, 581-585].
Additionally, evidence points to two types of hereditary SSBP, namely the low renin
(LR) phenotype and non-modulation. Whereas patients with the former are
characterised by a blunted rise in plama renin activity in response to salt restriction
[586], the latter typically display a muted aldosterone response to exogenous
angiotensin II despite a normal renin response to a low sodium balance [587, 588].
Underwood et al. reported that elevated BP is the strongest predictor of SSBP in
T2DM patients, and that the latter is largely driven by non-modulation [589]. T2DM
patients recruited into this exploratory clinical study were normoalbuminuric and
206
exhibited relatively well controlled blood pressure readings despite withdrawal of
their antihypertensive therapy. This, coupled with the small number of participating
subjects, lessened the possibility of identifying salt-sensitive patients in either
thiazolidinedione subgroup.
Both thiazolidinedione subgroups decreased their DBP in response to chronic salt
loading, with the degree of reduction being greater among subjects prone to
thiazolidinedione-associated oedema. Ventricular-arterial stiffening is
characteristically accompanied by a reduction in DBP. As peripheral arterial
resistance increases in older individuals (aged 20 to 70), expanded artery walls are
less likely to recoil in diastole, leading to earlier wave reflection, higher SBP, lower
DBP, increased pulse pressure and an increase in cardiac afterload, with resultant
ventricular-vascular uncoupling [590, 591]. The left ventricle becomes progressively
stiffer (possibly an adaptive mechanism) and later hypertrophic, a phenomenon
associated with increased cardiovascular risk [592-595]. Extrapolating from this
study's exploratory data, a greater reduction in DBP in response to chronic salt
loading among thiazolidinedione intolerant patients is consistent with this study's
reported greater increase in cAI and pAI, suggesting that such patients are more
prone to increase their arterial stiffness on chronic salt exposure.
Exploratory data suggest no consistent differences in TBW between
thiazolidinedione categories following a five-day high salt diet, albeit a higher FMI
among patients prone to fluid overload. AFV tended to increase in response to both
acute and chronic salt loading among tolerant subjects, but decreased following acute
intravenous saline infusion in 'intolerant' patients. The degree of increase in AFV
207
seems to become mitigated in tolerant patients as they progress from acute to chronic
salt loading. However, the small number of participating subjects and wide 95% CIs
hamper definitive conclusions in this regard. Moreover, TZD intolerant patients
seemingly exhibited inconsistent degrees of %AFV shifts in response to chronic salt
loading.
Both thiazolidinedione intolerant patients tended to be characterised by higher GFR
on salt loading. Subject 10's GFR was higher than that for her 'tolerant' counterparts
in response to acute salt loading, whereas subject 11 exhibited a similar trend
following a five day high sodium diet. Percentage increase in GFR was generally
higher for acute than for chronic salt loading, except for thiazolidinedione intolerant
subject 11, where the reverse was true. Lithium ions are freely filtered at the
glomerulus and reabsorbed at the proximal tubule in the same proportion as sodium
and water. There could be some reabsorption of lithium in the loop of Henle in some
extreme conditions [596]. This renders calculation of FeLi a valuable marker of
proximal tubule salt and water handling. Thus, a higher FeLi would be consistent
with less proximal tubule sodium and water reabsorption, and hence greater delivery
to the distal tubules [596]. TZD intolerant subject 10 was characterised by a higher
FeLi (implicating greater sodium and water delivery to the distal tubules) albeit no
difference in FRDDNa on acute salt loading. Not surprisingly, this translated into a
higher FeNa, implicating that this patient improved her natriuresis in response to
acute salt loading. Following exposure to a five-day high sodium diet, subject 10's
FeLi and FENa were higher, while FRDDNa was lower, again implicated better renal
sodium handling than her 'oedema free' counterparts. Thiazolidinedione intolerant
subject 11's FRDDNa was no different from that of thiazolidinedione tolerant
208
patients on acute salt loading. However, this patient was characterised by a lower
FENa (less natriuresis) and a lower FeLi, implicating a greater degree of proximal
tubular sodium and water reabsorption. In response to chronic salt loading, subject
11 exhibited a higher FeLi (implicating more sodium and water delivery to the distal
tubules), albeit no differences in FeNa and FRDDNa, suggesting impaired renal
sodium and water handling between the proximal and distal tubules.
In summary, the limited exploratory data for thiazolidinedione intolerant subjects
suggest heterogeneity in sodium handling. Subject 11's results are generally
consistent with those reported by Zanchi et al. [322], with a role for aquaporins
(AQP) 1 and 7, the type 3 sodium hydrogen exchanger (NHE3) or the type 1 sodium-
bicarbonate cotansporter in the aetiopathogenesis of thiazolidinedione-associated
oedema. On the other hand, subject 10 exhibited a better natriuresis in response to
chronic salt loading with an increase in ANP (and possibly BNP) in the context of
apparent suppression of renin (and possibly aldosterone); other as yet unidentified
mechanisms play a role in fluid overload in her case.
This is the first case-control study comprehensively investigating physiological
differences between patients tolerant to thiazolidinediones and those developing HF
and/or oedema within three months of their index thiazolidinedione exposure. The
study design seemed ideally suited to investigate what was recognised as being a
relatively infrequent adverse event (as confirmed in this thesis' population based
study in Chapter 3). A case-control design thus permitted a detailed characterisation
of both thiazolidinedione subgroups (over three study visits cumulatively lasting
several hours), as exposed to different degrees of salt loading. Moreover, a case-
209
control approach allowed detailed investigation of an adverse event arising from a
class of drugs whose prescription has diminished over the years for reasons discussed
elsewhere. This study's approach did not permit a calculation of incidence (absolute
risk). However, this issue was specifically tackled at a population level elsewhere in
this thesis (chapter 3). Ultimately, the main problem encountered was difficulty in
identifying adequate numbers of confirmed cases of TZD-intolerant patients for
formal statistical analysis, despite comprehensive searching using multiple methods.
It is recognised that study design may also have been hampered by selection bias and
reliance on recall of exposure to the drug of interest (rosiglitazone/pioglitazone),
particularly with respect to the temporality of adverse drug reactions. However, this
possibility was inherently minimised by cross-checking with prescription data readily
linked to the SCI-DC database. Access to detailed clinical records at NHS Tayside
permitted the inclusion of patients who fitted very strict inclusion and exclusion
criteria, minimising confounding factors and major biases, particularly when
selecting the control group of thiazolidinedione tolerant subjects.
210
Chapter 3
Factors predicting diuretic prescription
and heart failure after initiation of
thiazolidinedione therapy
A population based approach
211
Chapter 3 - Factors predicting diuretic prescription and heart failure
after initiation of thiazolidinedione therapy
A population based approach
Section I - Methods
3.1 Rationale of this study
Given the difficulties in identifying thiazolidinedione intolerant patients for the
aforementioned clinical study, I embarked on related secondary research based on
anonymised person-specific data sets captured by the NHS and the University of
Dundee, and managed by the Health Informatics Centre (HIC) at the latter
institution. This enabled the identification and characterisation of patients exposed to
thiazolidinediones and compared data with two control populations, namely (i) a
metformin-sulphonylurea combination therapy cohort, comprising patients treated
with established, cheap and effective first and second line oral glucose lowering
agents, and (ii) insulin-treated cohort, comprising patients at a more advanced stage
of their disease process. There is currently paucity of data comparing incident HF
and ‘oedema’ rates between patients treated with index metformin-sulphonylurea
combination therapy and index thiazolidinedione therapy. Moreover, it is unclear
whether risk factors for incident HF /oedema are shared by patients in either cohort.
212
3.2 Research aims
This population based research project was designed with the following objectives in
mind:
• Defining T2DM at a population level
• Defining incident thiazolidinedione use
• Defining comparator T2DM populations
• Defining index loop diuretic prescription as a surrogate marker of fluid
overload /oedema
• Defining incident HF
• Phenotypic characterisation of thiazolidinedione-treated patients.
• Identification and phenotypic characterisation of patients whose index
thiazolidinedione therapy was complicated by index loop diuretic prescription
and / or congestive HF, and comparing them with their loop diuretic /
congestive HF free counterparts
• Defining the genetic characteristics of T2DM patients whose
thiazolidinedione treatment was followed by incident loop diuretic use and
/or hospitalization for HF
• Comparing the genotypic characteristics of T2DM patients of patients whose
treatment with thiazolidinediones was/was not followed by index loop
prescription and/or diagnosis of congestive HF
213
3.3 Hypotheses
This study aimed to investigate the hypotheses that thiazolidinedione-treated patients
are at a higher risk of progressing to index loop diuretic prescription (a surrogate
marker of oedema) and/or HF compared with patients on 'established' first and
second line oral glucose lowering agents (metformin-sulphonylurea combination
therapy). Additionally, this study hypothesised that such patients are more likely to
progress to such adverse events if they fulfill one or more of the following baseline
criteria:
• macrovascular disease
• co-administration of insulin and thiazolidinediones
• non-steroidal anti-inflammatory agents (NSAIDS) and/or dihydropyridine
calcium channel blockers
• higher mean systolic blood pressure, higher mean DBP and higher mean
arterial pressure (as surrogate markers of arterial stiffness)
• impaired renal function
• impaired left ventricular function
• CYP2C8*1/*1 (wild type) carriers compared with CYP2C8*3 and / or
CYP2C8*4 allelic variants
3.4 Study outcomes
Based on the results of epidemiology data, this study sought to explore simple
clinical differences between individuals who are ‘tolerant’ and ‘intolerant’ to
thiazolidinedione therapy, using a comparative approach. Two cohorts, comprising
214
metformin-sulphonylurea combination therapy treated patient’ and insulin-treated
patients (defined in section 3.5) acted as control populations in this regard.
Initially, the primary and secondary outcomes of this study were defined as time
from index thiazolidinedione pharmacotherapy to index loop diuretic prescription
and incident HF respectively. Acting upon available data, a decision was
subsequently made to pursue a post-hoc analysis which amalgamated the metformin-
sulphonylurea and thiazolidinedione cohorts. This enabled inclusion of index TZD
therapy (vs index metformin-sulphonylurea combination therapy) as a covariate in
multivariate logistic and Cox regression analyses.
3.5 Study population
This observational cohort study was carried out among the resident population of the
Tayside Health Board, Scotland (approximately 400, 000 people). Data were
provided by the Health Informatics Centre (HIC), University of Dundee after
approval by the Tayside Committee Medical Research Ethics. HIC has developed a
record-linkage of multiple routinely-collected datasets to carry out anonymized
health-related research in Tayside. Accurate electronic linkage was facilitated by the
widespread use of a nine-digit Community Health Identifier that is assigned to all
patients in Scotland who are registered with a general practitioner. Data-sets used for
this study included:
- Scottish Care Information-Diabetes Collaboration (SCI-DC): a validated
population based diabetes clinical information system. The original Diabetes
215
Audit and Research Tayside (DARTS) database for Tayside has 95%
sensitivity for identifying people with diabetes [437].
- Additionally, patients were identified from an ongoing study of the Genetics
of Diabetes Audit and Research Tayside (GoDARTS). Since October 1997,
all patients with diabetes have been invited to give written informed consent
to have their DNA and serum collected as part of the Wellcome Trust United
Kingdom Type 2 Diabetes Case Control Collection [597]. As of June 2009,
more than 8,000 individuals have participated in the Go-DARTS study [598].
- Scottish Morbidity Record (SMR) data: Forming part of a national database
managed by ISD Scotland on behalf of NHS Scotland, the SMR project
compiles a comprehensive core data-set based on a standard set of data
definitions and codes for the key areas of (i) patient identification and
demographic data, (ii) episode management data, and (iii) general clinical
data [599]. SMR data were used to identify patients who have been registered
with a clinical diagnosis of HF.
- The Tayside echocardiography database: Maintained by the Department of
Cardiology at Ninewells Hospital, Dundee, this database hosts all elective
outpatient echocardiograms carried out by British Society of
Echocardiography (BSE) accredited echocardiographers [600]. A random
blinded re-reading of left ventricular functional assessment recorded a 90%
concordance rate between results reported in the database and those recorded
at independent review [600].
216
- The above data were linked to the Medicines Monitoring Unit (MEMO)
database [499]. The MEMO database was developed for
pharmacoepidemiological research in the population of Tayside and contains
detailed records of all prescription items dispensed to patients at community
pharmacies. Thus for all Tayside patients, there are detailed records of all
prescriptions dispensed for thiazolidinediones, insulin, diuretics, and all other
drugs referred to hereafter.
This data-linkage permitted a detailed retrospective phenotypic, genetic and
pharmacoepidemiological comparison of ‘thiazolidinedione intolerant’ with
‘thiazolidinedione tolerant’ cohorts, and with a control population of T2DM patients.
3.5.1 Type 2 diabetes definition
Patients were defined as suffering from T2DM if they were diagnosed after the age
of 40, with no progression to insulin within six months of diagnosis, and currently
treated with metformin and /or a sulphonylurea. Patients diagnosed above the age of
90 were excluded. Patients commencing insulin more than six months after the
diagnosis were eligible for inclusion. This T2DM definition has been adopted and
validated elsewhere [601].
3.5.2 Type 2 diabetes cohorts
(i) Thiazolidinedione cohort: a cohort of T2DM patients commenced on a
thiazolidinedione (pioglitazone or rosiglitazone) in routine clinical care. This cohort
217
was further subdivided into patients whose pioglitazone or rosiglitazone therapy was
being used (i) in the absence of insulin i.e. as add on to metformin and /or
sulphonylurea or as monotherapy and (ii) in combination with insulin (+/- metformin
and/or sulphonylurea). Patients treated with adjunct acarbose, nateglinide /
repaglinide, sitagliptin / vildagliptin or exenatide / liraglutide (BNF section 6.1.2.3)
while on pioglitazone or rosiglitazone were excluded from this cohort.
Patients were eligible for inclusion from the date of index prescription of
pioglitazone or rosiglitazone until the date of the last thiazolidinedione
prescription/censor unless excluding factors came into effect. Patients were excluded
from the thiazolidinedione cohort if they had received any treatment with
thiazolidinediones (pioglitazone or rosiglitazone) at any point within the previous
twelve months. The index date of thiazolidinedione prescription was defined as the
date of first thiazolidinedione prescription which was followed by a subsequent
thiazolidinedione prescription within the first three months. If the latter gap exceeded
three months, the next eligible thiazolidinedione prescription for inclusion as an
index thiazolidinedione prescription was one which had not been preceded by an
earlier thiazolidinedione prescription over the previous 12 months.
Thiazolidinedione-treated patients were censored if they commenced treatment with
another oral glucose lowering agent, namely acarbose, nateglinide / repaglinide,
sitagliptin / vildagliptin or exenatide / liraglutide (BNF sections 6.1.2.3) after index
thiazolidinedione prescription. The censor date in this case was defined by the date
of first prescription of the first additional oral glucose lowering agent.
Thiazolidinedione-treated patients who had been treated with insulin prior to index
218
thiazolidinedione prescription, but whose insulin was stopped prior to index
thiazolidinedione prescription were excluded from the thiazolidinedione cohort.
Thiazolidinedione-treated patients who were treated with insulin both before and
after index thiazolidinedione prescription were defined as belonging to the TZD +
insulin group for the purposes of this study. The minimum number of insulin
prescriptions required for inclusion into the TZD + insulin group was set at two - one
prescription before index thiazolideindione therapy and one after.
Thiazolidinedione-treated patients who had insulin added on to prevalent
thiazolidinedione therapy, and whose thiazolidinedione therapy was continued
uninterruptedly were defined by two study dates:
- study period 1 comprising the time between index thiazolidinedione
prescription (index date 1) and index insulin prescription. Such patients were
included in the TZD – insulin group for the purpose of this study.
- study period 2 comprising the time between the first thiazolidinedione
prescription occurring after index insulin prescription (index date 2) and the
last thiazolidinedione prescription. Such patients were included in the TZD +
insulin group for the purposes of this study.
Thiazolidinedione-treated patients who were commenced on insulin at some point
after index thiazolidinedione prescription, and whose thiazolidinedione therapy was
stopped at that point were included in the TZD-insulin group.
219
(ii) Metformin and sulphonylurea combination therapy cohort (MFSU cohort or
control cohort 1): a cohort of T2DM patients treated with a combination of
metformin and sulphonylurea therapy. This included patients who had a
sulphonylurea added on to metformin monotherapy and patients who had metformin
added on to sulphonylurea monotherapy.
This cohort excludes treatment with thiazolidinediones at any time point. Patients
were also excluded if they were treated with insulin (BNF sections 6.1.1.1 and
6.1.1.2), acarbose, nateglinide / repaglinide, sitagliptin / vildagliptin or exenatide /
liraglutide (BNF section 6.1.2.3). Censor date was defined by the date of first
prescription of any of these drug or drugs (while on metformin-sulphonylurea
combination), whichever was introduced first
The index date of metformin prescription was defined as the date of first metformin
prescription which was followed by a subsequent metformin prescription within the
first three months. If the latter gap exceeded three months, the next eligible
metformin prescription for inclusion as an index metformin prescription was one
which had not been preceded by an earlier metformin prescription over the previous
12 months.
The index date of sulphonylurea prescription was defined as the date of first
sulphonylurea prescription which was followed by a subsequent sulphonylurea
prescription within the first three months. If the latter gap exceeded three months, the
next eligible sulphonylurea prescription for inclusion as an index sulphonylurea
220
prescription was one which had not been preceded by an earlier sulphonylurea
prescription over the previous 12 months.
Patients who separately fulfilled index date criteria for metformin and sulphonylurea
prescription, as defined above, and whose index dates for metformin and
sulphonylurea prescription overlapped, were eligible for inclusion into control cohort
1. Index date for inclusion into this combination control cohort 1 was defined as the
first day of adjunct index metformin/sulphonylurea prescription. End date for
inclusion into control cohort 1 was defined as the date of the last metformin or
sulphonylurea prescription, whichever was withdrawn first. Patients with an index
date prior to 1st January 1994 were excluded from inclusion into the cohort.
Patients were likewise censored if commenced on insulin (BNF sections 6.1.1.1 and
6.1.1.2), acarbose, nateglinide / repaglinide, sitagliptin / vildagliptin or exenatide /
liraglutide (BNF section 6.1.2.3) after index date. Censor date was defined by the
date of first prescription of any of these drug or drugs, whichever was introduced
first.
(iii) Insulin-treated cohort (control cohort 2): a cohort of insulin treated T2DM
patients treated with insulin
- in combination with metformin and /or sulphonylurea OR
- Monotherapy
but excluding thiazolidinedione therapy (pioglitazone or rosiglitazone)
221
Patients were eligible for inclusion from the date of index insulin prescription until
the date of the last insulin prescription/censor unless excluding factors come into
effect. To be eligible for inclusion into the control cohort 2, patients must not have
had any treatment with insulin within 12 months prior to index insulin prescription
The index date of insulin prescription was defined as the date of first insulin
prescription which was followed by a subsequent insulin prescription within the first
three months. If the latter gap exceeded three months, the next eligible insulin
prescription for inclusion as an index insulin prescription was one which had not
been preceded by an earlier insulin prescription over the previous 12 months.
Patients were excluded from this cohort if their index insulin prescription date
occurred prior to 1st January 1994.
3.6 Defining drug dose
Thiazolidinedione therapy Population based drug dispensing records were used to
express each prescribed dose of thiazolidinedione as a percentage of the maximal
prescribed dose in the British National Formulary, deriving a mean percentage dose
for each thiazolidinedione-treated patient.
3.7 Definition of heart failure
Individuals were defined as suffering from congestive HF if they fulfil one of the
following criteria:
222
- have had a standardized morbidity record (SMR) for congestive HF. This was
defined as a hospital admission International Classification of Diseases, Ninth
Revision and 10th Revision (ICD 9/10) diagnostic code for congestive HF
during the study period (ICD-9 code 428, ICD-10 code 150). The date of
admission was defined as the date of CHF diagnosis. An SMR for HF in
Tayside gives the date of admission, type of admission (emergency or not),
and the primary reason for admission according to the ICD code.
OR
- have had echocardiographic evidence of left ventricular systolic dysfunction
and prescription of a loop diuretic (BNF code 2.2.2) within one year. The
date of prescription of a loop diuretic and/or diagnosis of left ventricular
systolic dysfunction, whichever came first, was defined as the date of CHF
diagnosis. The latter echocardiographic based definition of HF has been
validated elsewhere (reporting a 91% concordance with a clinical diagnosis
of HF from case note review).
Any subsequent CHF events after diagnosis date were defined using SMR data.
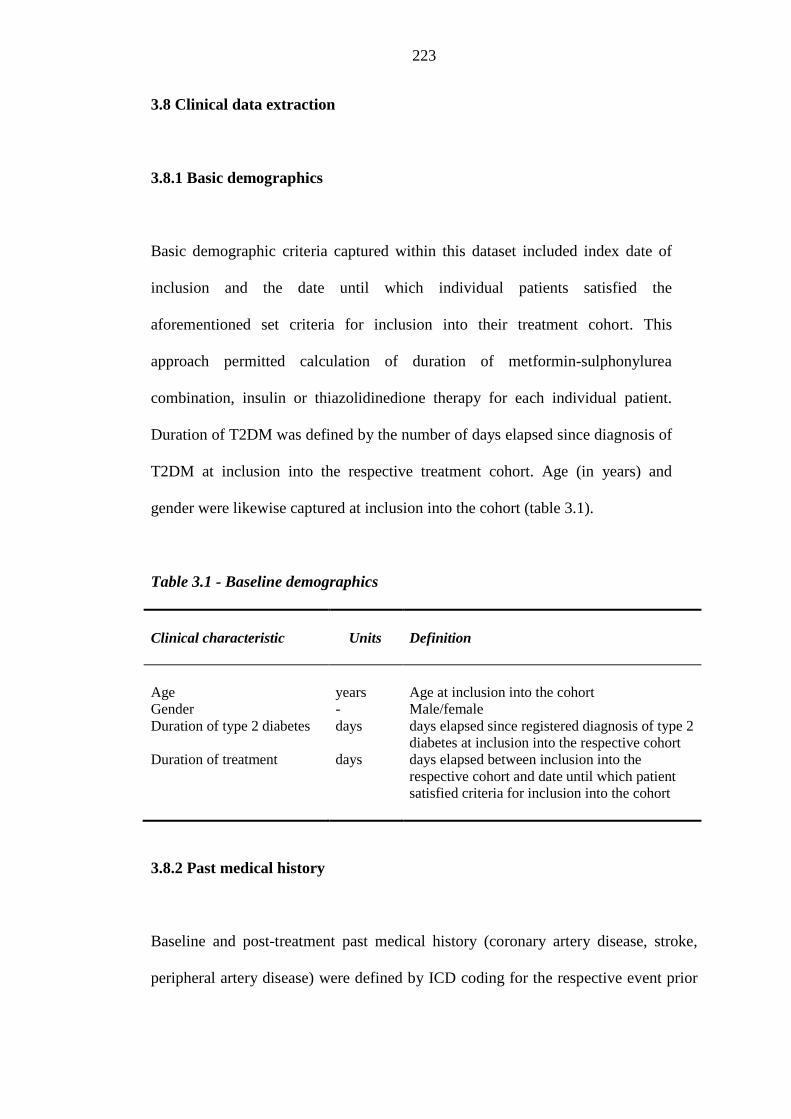
223
3.8 Clinical data extraction
3.8.1 Basic demographics
Basic demographic criteria captured within this dataset included index date of
inclusion and the date until which individual patients satisfied the
aforementioned set criteria for inclusion into their treatment cohort. This
approach permitted calculation of duration of metformin-sulphonylurea
combination, insulin or thiazolidinedione therapy for each individual patient.
Duration of T2DM was defined by the number of days elapsed since diagnosis of
T2DM at inclusion into the respective treatment cohort. Age (in years) and
gender were likewise captured at inclusion into the cohort (table 3.1).
Table 3.1 - Baseline demographics
Clinical characteristic
Units Definition
Age years Age at inclusion into the cohort Gender - Male/female Duration of type 2 diabetes days days elapsed since registered diagnosis of type 2
diabetes at inclusion into the respective cohort Duration of treatment days days elapsed between inclusion into the
respective cohort and date until which patient satisfied criteria for inclusion into the cohort
3.8.2 Past medical history
Baseline and post-treatment past medical history (coronary artery disease, stroke,
peripheral artery disease) were defined by ICD coding for the respective event prior
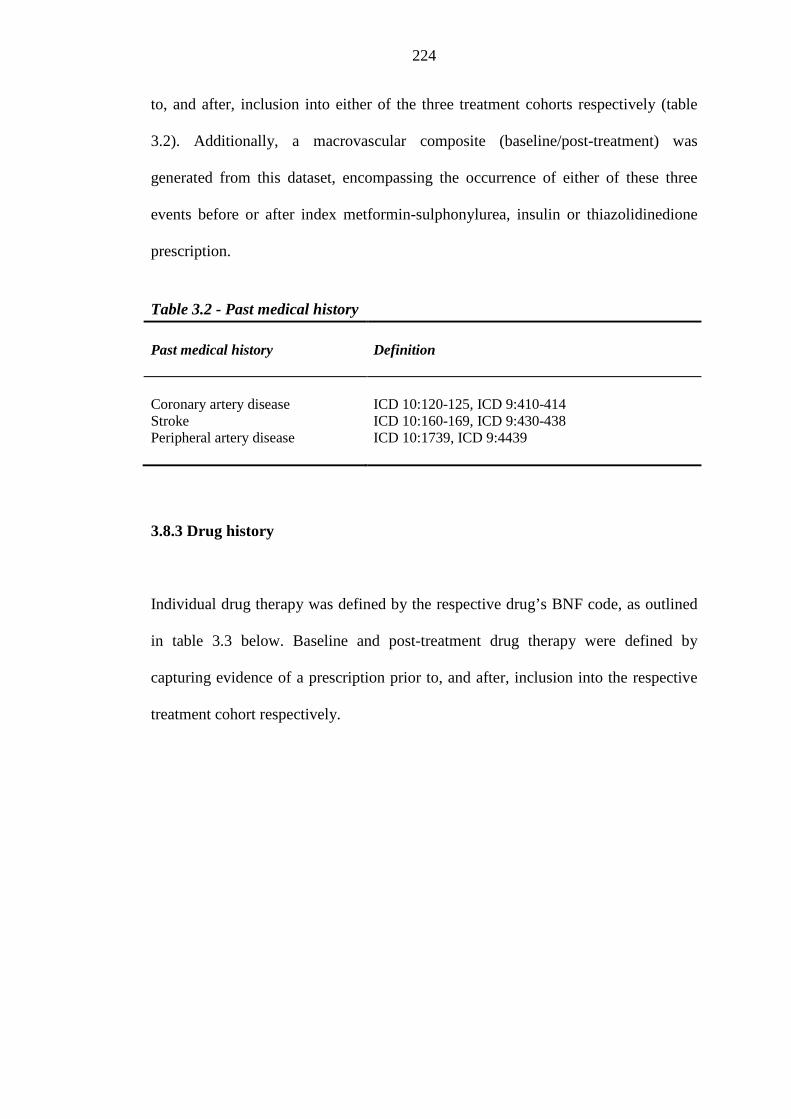
224
to, and after, inclusion into either of the three treatment cohorts respectively (table
3.2). Additionally, a macrovascular composite (baseline/post-treatment) was
generated from this dataset, encompassing the occurrence of either of these three
events before or after index metformin-sulphonylurea, insulin or thiazolidinedione
prescription.
Table 3.2 - Past medical history
Past medical history
Definition
Coronary artery disease ICD 10:120-125, ICD 9:410-414 Stroke ICD 10:160-169, ICD 9:430-438 Peripheral artery disease ICD 10:1739, ICD 9:4439 3.8.3 Drug history
Individual drug therapy was defined by the respective drug’s BNF code, as outlined
in table 3.3 below. Baseline and post-treatment drug therapy were defined by
capturing evidence of a prescription prior to, and after, inclusion into the respective
treatment cohort respectively.
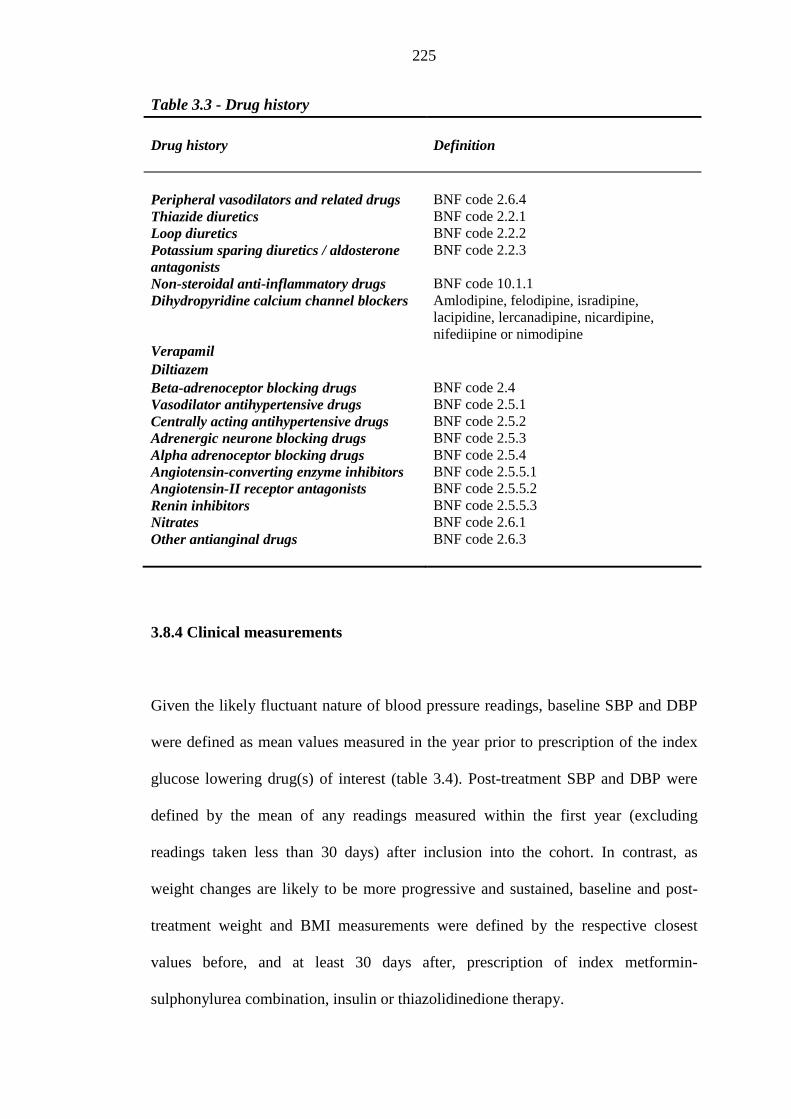
225
Table 3.3 - Drug history
Drug history
Definition
Peripheral vasodilators and related drugs BNF code 2.6.4 Thiazide diuretics BNF code 2.2.1 Loop diuretics BNF code 2.2.2 Potassium sparing diuretics / aldosterone antagonists
BNF code 2.2.3
Non-steroidal anti-inflammatory drugs BNF code 10.1.1 Dihydropyridine calcium channel blockers Amlodipine, felodipine, isradipine,
lacipidine, lercanadipine, nicardipine, nifediipine or nimodipine
Verapamil Diltiazem Beta-adrenoceptor blocking drugs BNF code 2.4 Vasodilator antihypertensive drugs BNF code 2.5.1 Centrally acting antihypertensive drugs BNF code 2.5.2 Adrenergic neurone blocking drugs BNF code 2.5.3 Alpha adrenoceptor blocking drugs BNF code 2.5.4 Angiotensin-converting enzyme inhibitors BNF code 2.5.5.1 Angiotensin-II receptor antagonists BNF code 2.5.5.2 Renin inhibitors BNF code 2.5.5.3 Nitrates BNF code 2.6.1 Other antianginal drugs BNF code 2.6.3 3.8.4 Clinical measurements
Given the likely fluctuant nature of blood pressure readings, baseline SBP and DBP
were defined as mean values measured in the year prior to prescription of the index
glucose lowering drug(s) of interest (table 3.4). Post-treatment SBP and DBP were
defined by the mean of any readings measured within the first year (excluding
readings taken less than 30 days) after inclusion into the cohort. In contrast, as
weight changes are likely to be more progressive and sustained, baseline and post-
treatment weight and BMI measurements were defined by the respective closest
values before, and at least 30 days after, prescription of index metformin-
sulphonylurea combination, insulin or thiazolidinedione therapy.
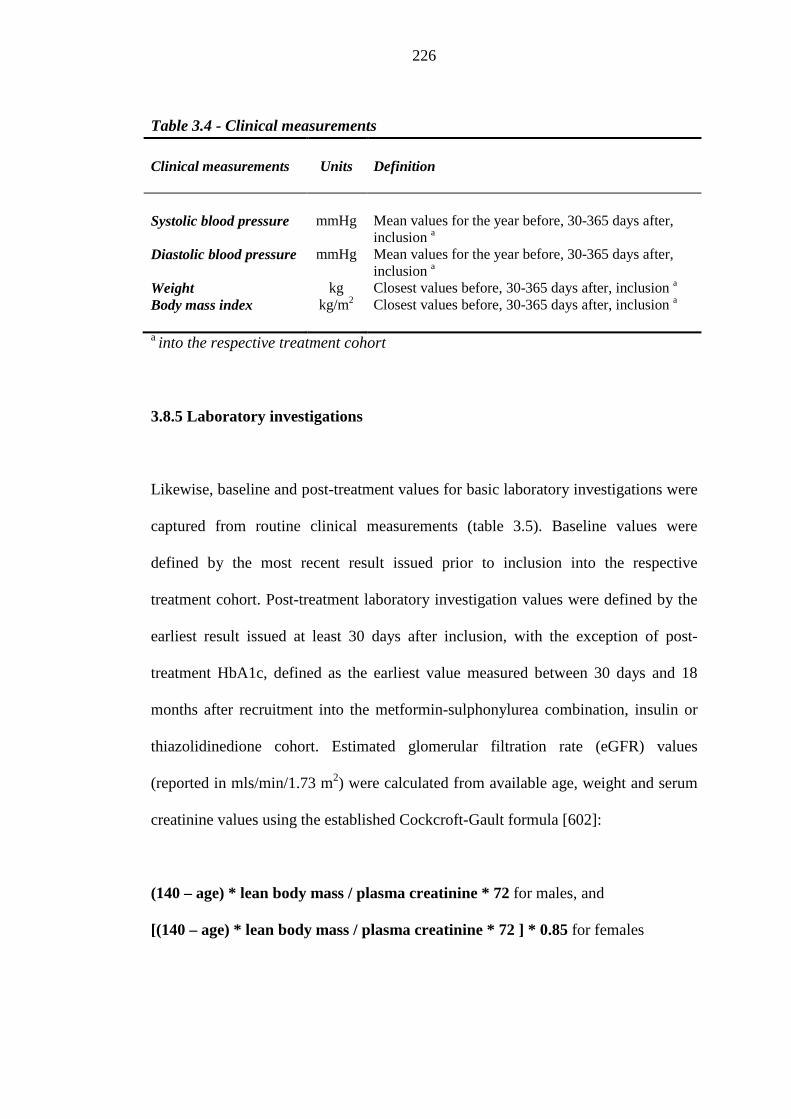
226
Table 3.4 - Clinical measurements
Clinical measurements
Units Definition
Systolic blood pressure mmHg Mean values for the year before, 30-365 days after,
inclusion a Diastolic blood pressure mmHg Mean values for the year before, 30-365 days after,
inclusion a Weight kg Closest values before, 30-365 days after, inclusion a Body mass index kg/m2 Closest values before, 30-365 days after, inclusion a a into the respective treatment cohort 3.8.5 Laboratory investigations
Likewise, baseline and post-treatment values for basic laboratory investigations were
captured from routine clinical measurements (table 3.5). Baseline values were
defined by the most recent result issued prior to inclusion into the respective
treatment cohort. Post-treatment laboratory investigation values were defined by the
earliest result issued at least 30 days after inclusion, with the exception of post-
treatment HbA1c, defined as the earliest value measured between 30 days and 18
months after recruitment into the metformin-sulphonylurea combination, insulin or
thiazolidinedione cohort. Estimated glomerular filtration rate (eGFR) values
(reported in mls/min/1.73 m2) were calculated from available age, weight and serum
creatinine values using the established Cockcroft-Gault formula [602]:
(140 – age) * lean body mass / plasma creatinine * 72 for males, and
[(140 – age) * lean body mass / plasma creatinine * 72 ] * 0.85 for females
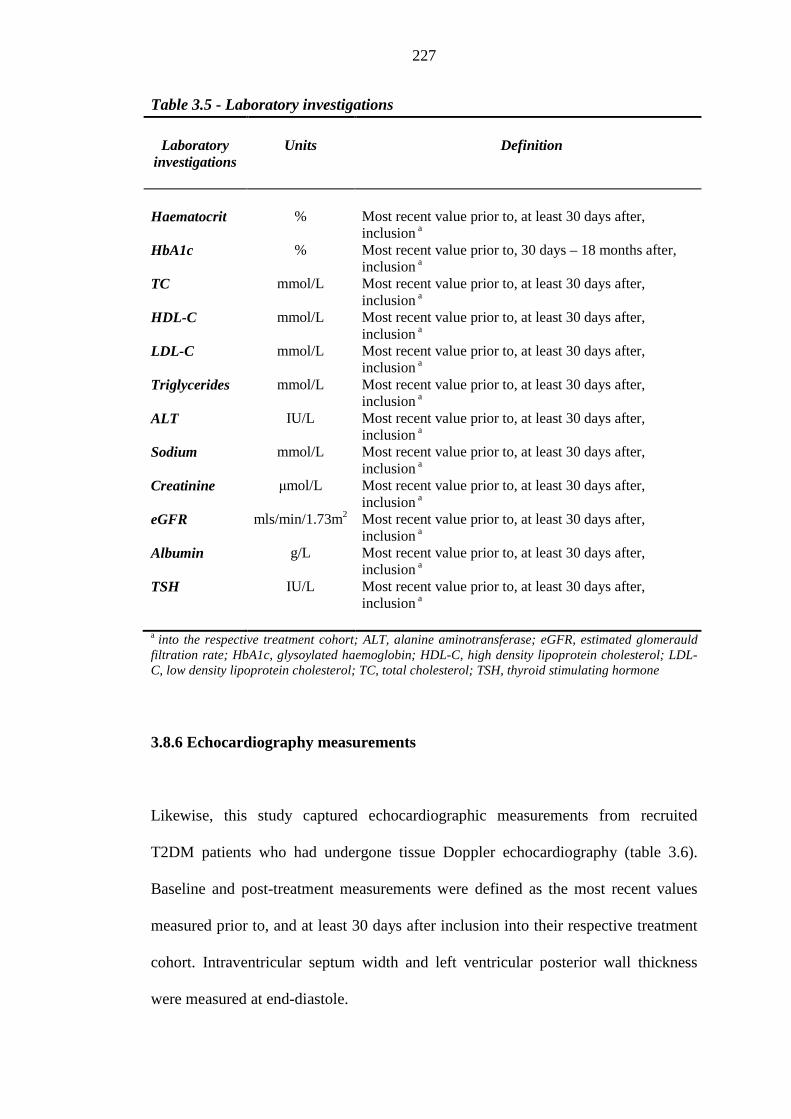
227
Table 3.5 - Laboratory investigations
Laboratory investigations
Units
Definition
Haematocrit % Most recent value prior to, at least 30 days after,
inclusion a HbA1c % Most recent value prior to, 30 days – 18 months after,
inclusion a TC mmol/L Most recent value prior to, at least 30 days after,
inclusion a HDL-C mmol/L Most recent value prior to, at least 30 days after,
inclusion a LDL-C mmol/L Most recent value prior to, at least 30 days after,
inclusion a Triglycerides mmol/L Most recent value prior to, at least 30 days after,
inclusion a ALT IU/L Most recent value prior to, at least 30 days after,
inclusion a Sodium mmol/L Most recent value prior to, at least 30 days after,
inclusion a Creatinine μmol/L Most recent value prior to, at least 30 days after,
inclusion a eGFR mls/min/1.73m2 Most recent value prior to, at least 30 days after,
inclusion a Albumin g/L Most recent value prior to, at least 30 days after,
inclusion a TSH IU/L Most recent value prior to, at least 30 days after,
inclusion a a into the respective treatment cohort; ALT, alanine aminotransferase; eGFR, estimated glomerauld filtration rate; HbA1c, glysoylated haemoglobin; HDL-C, high density lipoprotein cholesterol; LDL-C, low density lipoprotein cholesterol; TC, total cholesterol; TSH, thyroid stimulating hormone 3.8.6 Echocardiography measurements
Likewise, this study captured echocardiographic measurements from recruited
T2DM patients who had undergone tissue Doppler echocardiography (table 3.6).
Baseline and post-treatment measurements were defined as the most recent values
measured prior to, and at least 30 days after inclusion into their respective treatment
cohort. Intraventricular septum width and left ventricular posterior wall thickness
were measured at end-diastole.
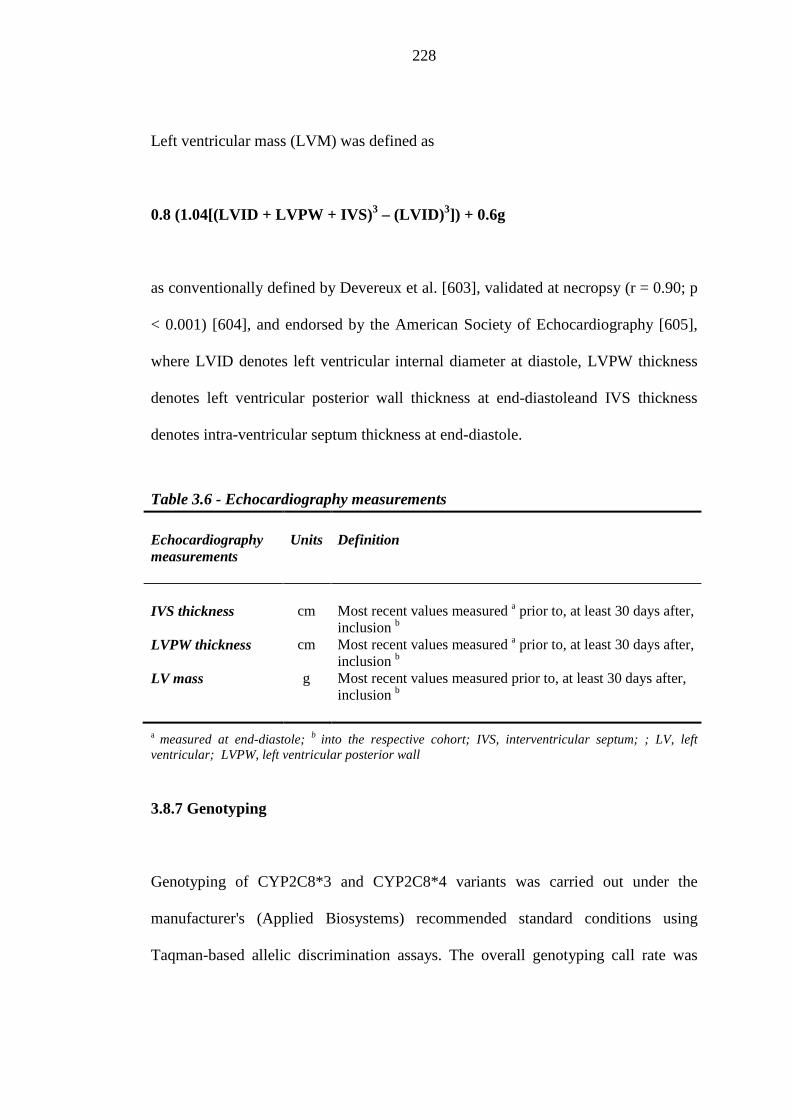
228
Left ventricular mass (LVM) was defined as
0.8 (1.04[(LVID + LVPW + IVS)3 – (LVID) 3]) + 0.6g
as conventionally defined by Devereux et al. [603], validated at necropsy (r = 0.90; p
< 0.001) [604], and endorsed by the American Society of Echocardiography [605],
where LVID denotes left ventricular internal diameter at diastole, LVPW thickness
denotes left ventricular posterior wall thickness at end-diastoleand IVS thickness
denotes intra-ventricular septum thickness at end-diastole.
Table 3.6 - Echocardiography measurements
Echocardiography measurements
Units
Definition
IVS thickness cm Most recent values measured a prior to, at least 30 days after,
inclusion b LVPW thickness cm Most recent values measured a prior to, at least 30 days after,
inclusion b LV mass g Most recent values measured prior to, at least 30 days after,
inclusion b a measured at end-diastole; b into the respective cohort; IVS, interventricular septum; ; LV, left ventricular; LVPW, left ventricular posterior wall
3.8.7 Genotyping
Genotyping of CYP2C8*3 and CYP2C8*4 variants was carried out under the
manufacturer's (Applied Biosystems) recommended standard conditions using
Taqman-based allelic discrimination assays. The overall genotyping call rate was
229
94% and both SNPs were in Hardy-Weinberg Equilibrium in the sample (p > 0.05).
Genotyping data were extracted and merged with the available datasets for analysis.
3.9 Statistical methods
3.9.1 Descriptive statistics
Continuous variables were expressed as means and standard deviations.
Dichotomous variables were expressed as percentages. Continuous variables did not
satisfy criteria for normality (as assessed by visual plot inspection and estimation of
skewness) were transformed (loge, square root or reciprocal) to achieve normality.
Between-group differences across normally distributed variables were compared
using one-way Analysis of Variance (ANOVA). Skewed variables which defied
attempts at normalisation through transformation were compared using the Mann-
Whitney U test. Chi Square and Fisher’s exact tests were used to compare
dichotomous variables. All tests were two-sided, with a p value < 0.05 considered as
statistically significant. All post-hoc analyses were Bonferroni, Tukey-HSD or
Games-Howell test corrected, as appropriate. Statistical analyses were performed
using IBM Social Package for the Statistical Sciences (SPSS®) version 18.0.
3.9.2 Logistic regression analysis
Binary logistic regression analyses were conducted to predict (i) index loop diuretic
prescription, and (ii) incident HF within one year after exposure to metformin-
sulphonylurea combination / thiazolidinedione therapy. The backward:LR regression
230
method was used in each case. The regression of the binary outcome (index loop
diuretic prescription / incident HF) on the covariates included only those covariates
passing the univariable screening. Binary univariate logistic regression was thus run
between index loop diuretic prescription / incident HF (dependent variable) and
individual continuous and categorical variables (individually acting as independent
variables), separating the covariates into those significant and those not significant at
p < 0.1. Categorical covariates were dummy coded, using non-exposure to the
categorical variable of interest as the reference group (and conversely, exposure as
the indicator group). Index thiazolidinedione prescription (vs metformin-
sulphonylurea combination) was included as a covariate in the logistic regression
models, irrespective of the outcome of its univariate regression with the dependent
categorical variables of interest, in a bid to emphazise its contribution or otherwise in
predicting fluid overload/HF events. Logistic regression models were tested for
residuals and overdispersion, and satisfied the assumptions of linearity of logit and
multicollinearity. ROC curves were generated for each model to assess model
discrimination.
3.9.3 Time to event analysis
Cox proportional hazards regression models (Backward:LR method) were used to
predict (i) time to index loop diuretic prescription and (ii) time to incident HF within
one year of inclusion into the metformin-sulphonylurea combination therapy or
thiazolidinedione cohort, investigating (i) predictors of either event of interest and
(ii) specifically whether thiazolidinedione prescription (as a categorical covariate)
has a significant impact on either outcome.
231
Binary univariate logistic regression was run between prescription of index loop
diuretic within one year of exposure to index metformin-sulphonylurea combination /
thiazolidinedione therapy (dependent variable) and individual continuous and
categorical variables (individually acting as independent variables), separating the
covariates into those significant and those not significant at p < 0.1. Univariate
regression of continuous variables was carried out using univariate Cox regression
while univariate regression of categorical variables was carried out using Kaplan
Meier survival analysis (separating significant and non-significant categorical
covariates using the Log Rank test). Likewise, binary univariate logistic regression
was run between development of incident HF within one year of inclusion into the
metformin-sulphonylurea combination / thiazolidinedione cohort and the same
individual continuous and categorical covariates (independent variables). Only
covariates passing univariate screening (p < 0.1) were considered for inclusion into
the Cox regression model. Time-independent covariates were included The
Proportional Hazards assumption was formally assessed using log-minus-log against
survival/log survival time plots. Covariates not satisfying the Proportional Hazards
Assumption on account of a time-varying effect were transformed into time-
dependent covariates by forming an interaction (product) term between the
individual predictor (continuous or categorical) and a function of time (loge time to
index loop diuretic prescription / incident HF, whichever was applicable), as
described by Bellera et al. [606]. Covariates which seemingly satisfied the
Proportional Hazards Assumption were nonetheless transformed into time-dependent
covariates using the same procedures, in order to confirm their time-independent
contribution to the final model. The correlation between any categorical variables
232
that proved to be significant (p < 0.1) at univariate regression (log rank test) was
determined using a chi square test. When two variables were significantly correlated,
the variable more significantly linked to index loop diuretic prescription / incident
HF (and hence to ‘fluid overload’) was included in multivariate analysis.
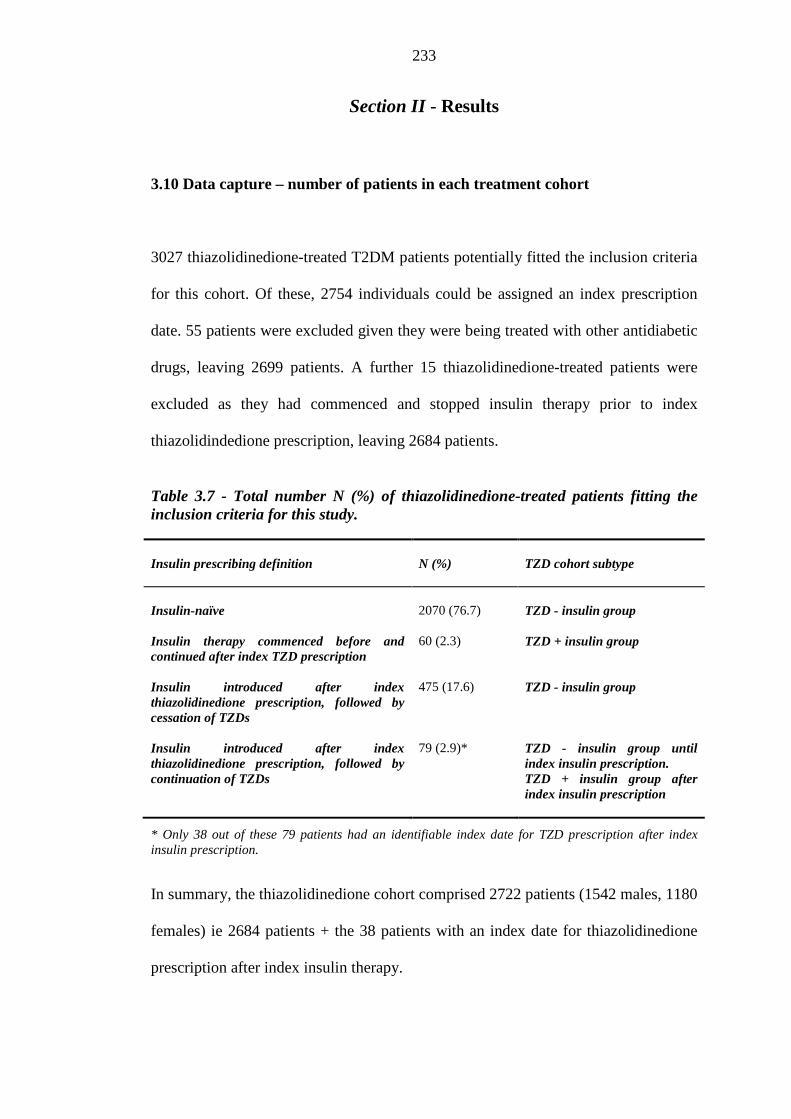
233
Section II - Results
3.10 Data capture – number of patients in each treatment cohort
3027 thiazolidinedione-treated T2DM patients potentially fitted the inclusion criteria
for this cohort. Of these, 2754 individuals could be assigned an index prescription
date. 55 patients were excluded given they were being treated with other antidiabetic
drugs, leaving 2699 patients. A further 15 thiazolidinedione-treated patients were
excluded as they had commenced and stopped insulin therapy prior to index
thiazolidindedione prescription, leaving 2684 patients.
Table 3.7 - Total number N (%) of thiazolidinedione-treated patients fitting the inclusion criteria for this study. Insulin prescribing definition
N (%)
TZD cohort subtype
Insulin-naïve
2070 (76.7)
TZD - insulin group
Insulin therapy commenced before and continued after index TZD prescription
60 (2.3)
TZD + insulin group
Insulin introduced after index thiazolidinedione prescription, followed by cessation of TZDs
475 (17.6)
TZD - insulin group
Insulin introduced after index thiazolidinedione prescription, followed by continuation of TZDs
79 (2.9)*
TZD - insulin group until index insulin prescription. TZD + insulin group after index insulin prescription
* Only 38 out of these 79 patients had an identifiable index date for TZD prescription after index insulin prescription.
In summary, the thiazolidinedione cohort comprised 2722 patients (1542 males, 1180
females) ie 2684 patients + the 38 patients with an index date for thiazolidinedione
prescription after index insulin therapy.
234
The TZD-insulin group comprised a total of 2624 patients (1489 males, 1135
females) subdivided into:
• 2070 thiazolidinedione-treated insulin-naïve patients (never treated with
insulin)
• 475 patients who had insulin therapy introduced after index thiazolidinedione
prescription followed by cessation of thiazolidinedione therapy
• 79 thiazolidinedione-treated patients whose adjunct insulin therapy
(introduced after index thiazolidinedione prescription) was accompanied by
continuation of thiazolidinedione therapy (censored at first insulin
prescription).
TZD + insulin group comprised a total of 98 patients (53 males, 45 females)
subdivided into:
• 60 thiazolidinedione-treated patients whose insulin therapy had been
commenced before and continued after index thiazolidinedione prescription
• 38 thiazolidinedione-treated patients whose insulin therapy was introduced
after index thiazolidinedione prescription, followed by continuation of
thiazolidinediones.
The metformin-sulphonylurea cohort comprised a total of 3725 patients (2079 males,
1646 females). 2205 patients (1124 males, 1081 females) were treated with insulin
(without thiazolidinediones).
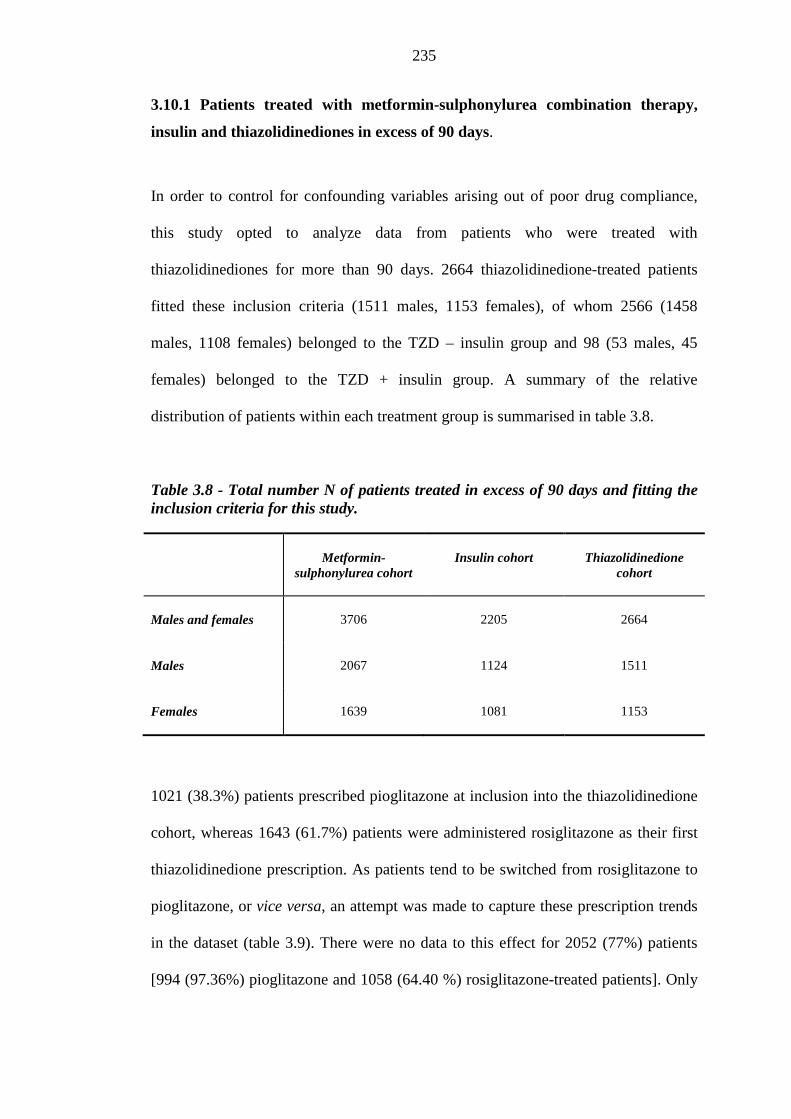
235
3.10.1 Patients treated with metformin-sulphonylurea combination therapy,
insulin and thiazolidinediones in excess of 90 days.
In order to control for confounding variables arising out of poor drug compliance,
this study opted to analyze data from patients who were treated with
thiazolidinediones for more than 90 days. 2664 thiazolidinedione-treated patients
fitted these inclusion criteria (1511 males, 1153 females), of whom 2566 (1458
males, 1108 females) belonged to the TZD – insulin group and 98 (53 males, 45
females) belonged to the TZD + insulin group. A summary of the relative
distribution of patients within each treatment group is summarised in table 3.8.
Table 3.8 - Total number N of patients treated in excess of 90 days and fitting the inclusion criteria for this study.
Metformin-sulphonylurea cohort
Insulin cohort
Thiazolidinedione
cohort
Males and females
3706 2205 2664
Males
2067 1124 1511
Females
1639 1081 1153
1021 (38.3%) patients prescribed pioglitazone at inclusion into the thiazolidinedione
cohort, whereas 1643 (61.7%) patients were administered rosiglitazone as their first
thiazolidinedione prescription. As patients tend to be switched from rosiglitazone to
pioglitazone, or vice versa, an attempt was made to capture these prescription trends
in the dataset (table 3.9). There were no data to this effect for 2052 (77%) patients
[994 (97.36%) pioglitazone and 1058 (64.40 %) rosiglitazone-treated patients]. Only
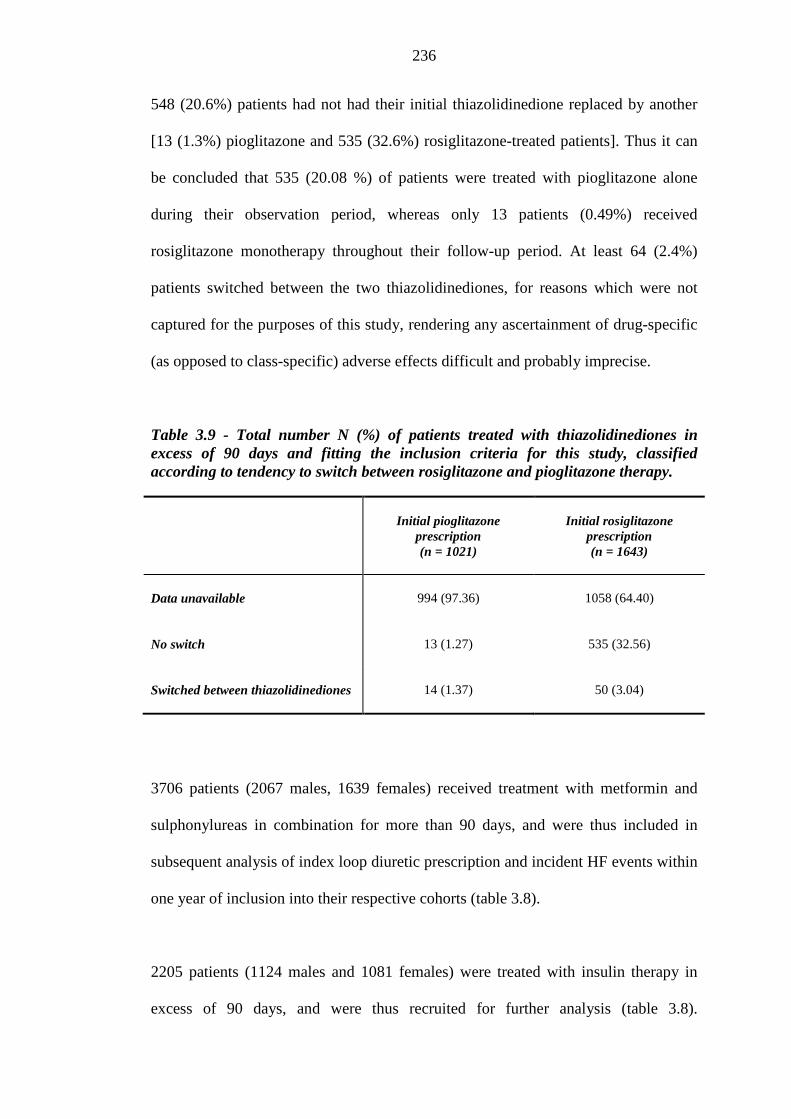
236
548 (20.6%) patients had not had their initial thiazolidinedione replaced by another
[13 (1.3%) pioglitazone and 535 (32.6%) rosiglitazone-treated patients]. Thus it can
be concluded that 535 (20.08 %) of patients were treated with pioglitazone alone
during their observation period, whereas only 13 patients (0.49%) received
rosiglitazone monotherapy throughout their follow-up period. At least 64 (2.4%)
patients switched between the two thiazolidinediones, for reasons which were not
captured for the purposes of this study, rendering any ascertainment of drug-specific
(as opposed to class-specific) adverse effects difficult and probably imprecise.
Table 3.9 - Total number N (%) of patients treated with thiazolidinediones in excess of 90 days and fitting the inclusion criteria for this study, classified according to tendency to switch between rosiglitazone and pioglitazone therapy.
Initial pioglitazone prescription (n = 1021)
Initial rosiglitazone
prescription (n = 1643)
Data unavailable
994 (97.36) 1058 (64.40)
No switch
13 (1.27) 535 (32.56)
Switched between thiazolidinediones
14 (1.37) 50 (3.04)
3706 patients (2067 males, 1639 females) received treatment with metformin and
sulphonylureas in combination for more than 90 days, and were thus included in
subsequent analysis of index loop diuretic prescription and incident HF events within
one year of inclusion into their respective cohorts (table 3.8).
2205 patients (1124 males and 1081 females) were treated with insulin therapy in
excess of 90 days, and were thus recruited for further analysis (table 3.8).
237
Interestingly, this approach did not diminish the original number of insulin-treated
patients fitting the inclusion criteria, presumably because insulin is a ‘final’
therapeutic option in patients with T2DM.
Further analysis will refer to patients treated with metformin-sulphonylurea (MFSU)
combination, insulin and thiazolidinedione therapy in excess of 90 days.
3.10.2 Background loop diuretic therapy at inclusion into each respective
treatment cohort
As the intention was to compare patients in whom index metformin-sulphonylurea
combination therapy, insulin monotherapy or thiazolidinedione therapy was followed
by index loop diuretic prescription, it was necessary to exclude patients with a
background of loop diuretic therapy at inclusion into their respective cohort. This left
a total of 2785 (1634 males, 1151 females), 1361 (744 males, 617 females) and 2097
(1264 males, 833 females) in the metformin-sulphonylurea, insulin and
thiazolidinedione cohorts respectively (tables 3.10 and 3.11, figures 3.1 and 3.2).
The corollary to this observation is that 21.3 % of patients (567 out of 2664) were
already being treated with a loop diuretic at index thiazolidinedione prescription. The
respective proportions for MFSU and insulin-treated patients were 24.9 % and 38.3%
respectively (tables 3.10 and 3.11, figures 3.1 and 3.2). Pairwise post-hoc
comparisons between the cohorts (Bonferroni corrected) confirmed that these
differences reached statistical significance (except for male patients prescribed a
thiazolidinedione vs metformin-sulphonylurea combination therapy). Although rates
238
of background loop diuretic therapy for thiazolidinedione therapy were the lowest
among the three cohorts, one would have expected a smaller proportion of such
‘fluid overloaded’ patients being prescribed a drug repeatedly associated with weight
gain, fluid retention and HF events. Background loop diuretic rates for T2DM
patients prescribed insulin pharmacotherapy are not entirely surprising, given that the
latter tends to be prescribed at a relatively ‘late’ stage of the disease, in patients
prone to other cardiovascular risk factors and/or established coronary artery disease.
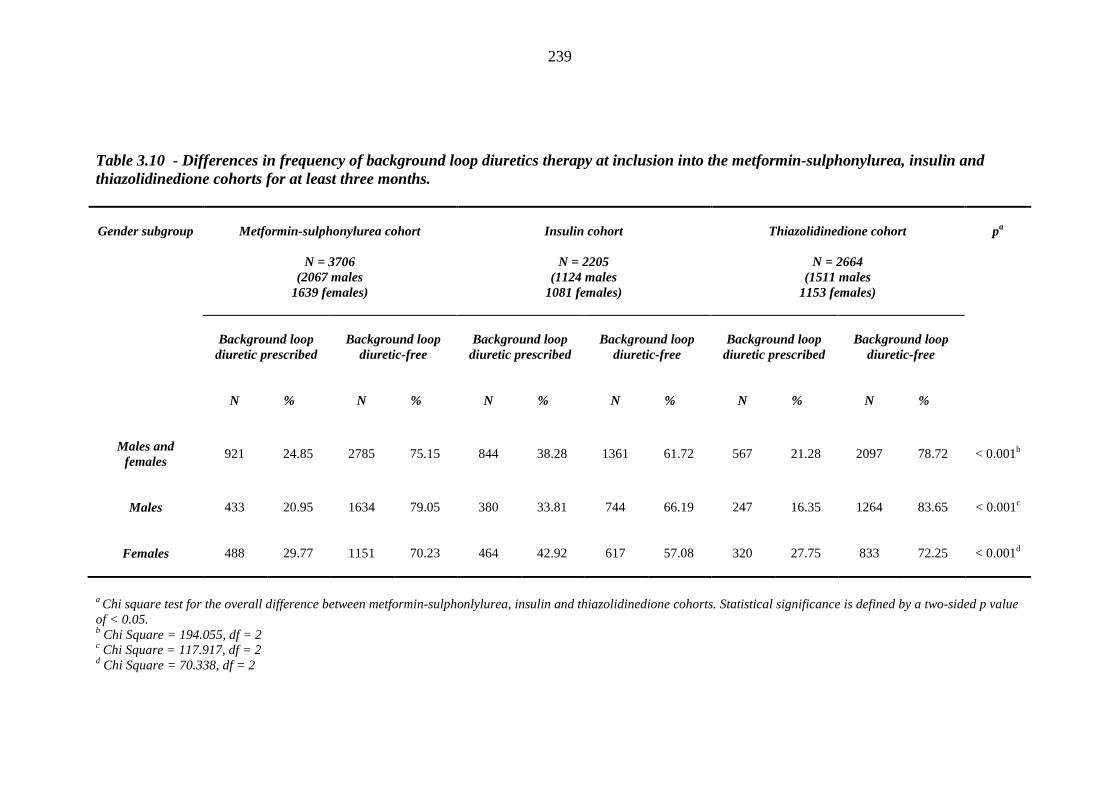
239
Table 3.10 - Differences in frequency of background loop diuretics therapy at inclusion into the metformin-sulphonylurea, insulin and thiazolidinedione cohorts for at least three months.
Gender subgroup
Metformin-sulphonylurea cohort
N = 3706 (2067 males
1639 females)
Insulin cohort
N = 2205
(1124 males 1081 females)
Thiazolidinedione cohort
N = 2664
(1511 males 1153 females)
pa
Background loop diuretic prescribed
Background loop
diuretic-free
Background loop diuretic prescribed
Background loop
diuretic-free
Background loop diuretic prescribed
Background loop
diuretic-free
N
%
N
%
N
%
N
%
N
%
N
%
Males and
females
921 24.85 2785 75.15 844 38.28 1361 61.72 567 21.28 2097 78.72 < 0.001b
Males
433 20.95 1634 79.05 380 33.81 744 66.19 247 16.35 1264 83.65 < 0.001c
Females
488 29.77 1151 70.23 464 42.92 617 57.08 320 27.75 833 72.25 < 0.001d
a Chi square test for the overall difference between metformin-sulphonlylurea, insulin and thiazolidinedione cohorts. Statistical significance is defined by a two-sided p value of < 0.05. b Chi Square = 194.055, df = 2 c Chi Square = 117.917, df = 2 d Chi Square = 70.338, df = 2
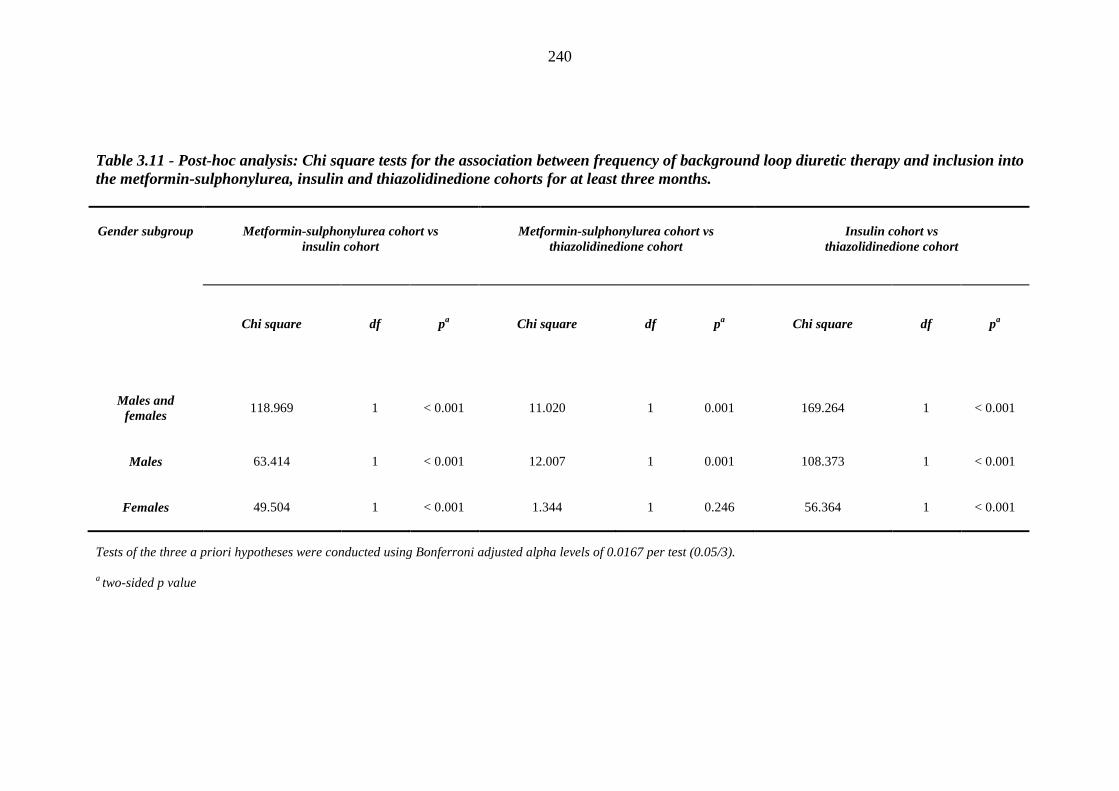
240
Table 3.11 - Post-hoc analysis: Chi square tests for the association between frequency of background loop diuretic therapy and inclusion into the metformin-sulphonylurea, insulin and thiazolidinedione cohorts for at least three months.
Gender subgroup
Metformin-sulphonylurea cohort vs insulin cohort
Metformin-sulphonylurea cohort vs
thiazolidinedione cohort
Insulin cohort vs
thiazolidinedione cohort
Chi square
df
pa
Chi square
df
pa
Chi square
df
pa
Males and
females
118.969 1 < 0.001 11.020 1 0.001 169.264 1 < 0.001
Males
63.414 1 < 0.001 12.007 1 0.001 108.373 1 < 0.001
Females
49.504 1 < 0.001 1.344 1 0.246 56.364 1 < 0.001
Tests of the three a priori hypotheses were conducted using Bonferroni adjusted alpha levels of 0.0167 per test (0.05/3). a two-sided p value
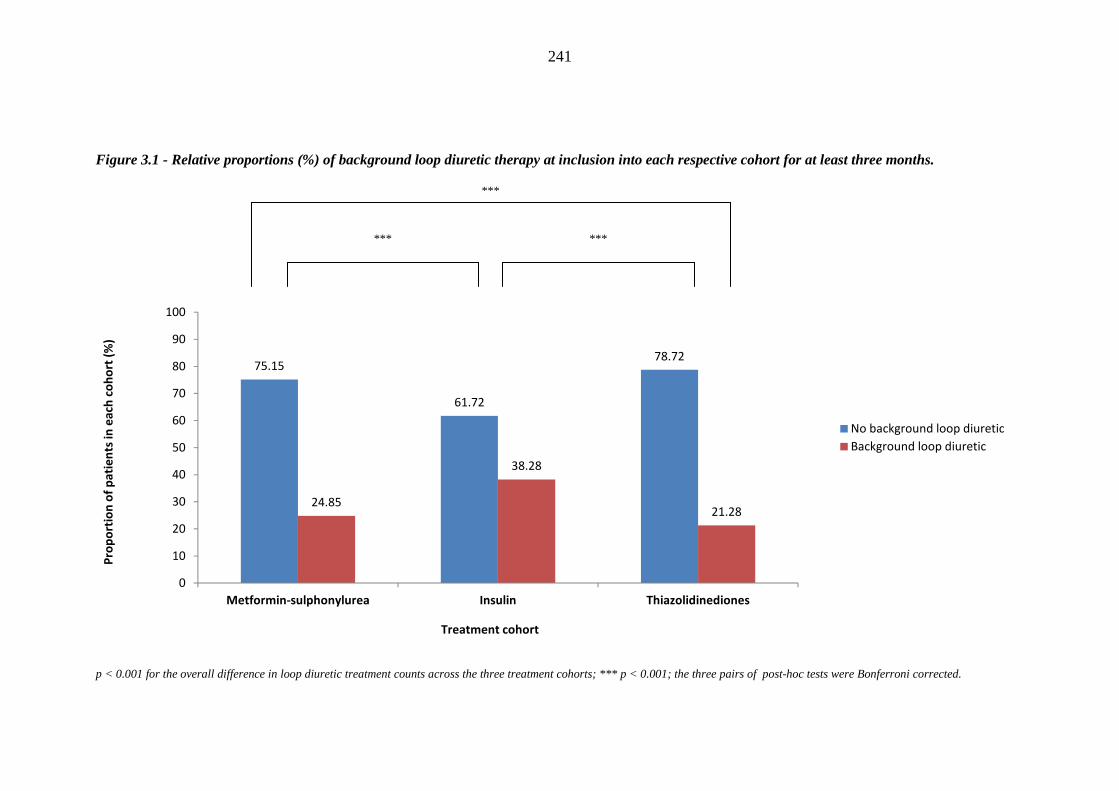
241
Figure 3.1 - Relative proportions (%) of background loop diuretic therapy at inclusion into each respective cohort for at least three months.
p < 0.001 for the overall difference in loop diuretic treatment counts across the three treatment cohorts; *** p < 0.001; the three pairs of post-hoc tests were Bonferroni corrected.
75.15
61.72
78.72
24.85
38.28
21.28
0
10
20
30
40
50
60
70
80
90
100
Metformin-sulphonylurea Insulin Thiazolidinediones
Pro
po
rtio
n o
f p
ati
en
ts i
n e
ach
co
ho
rt (
%)
Treatment cohort
No background loop diuretic
Background loop diuretic
***
*** ***
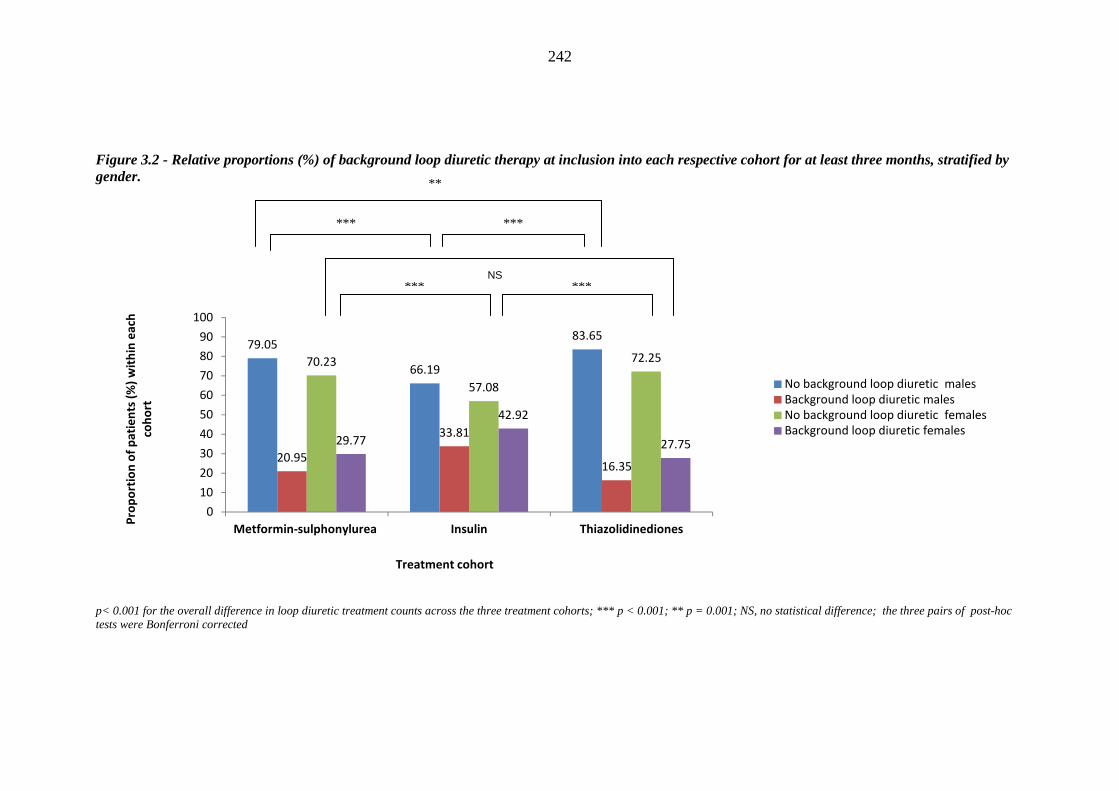
242
Figure 3.2 - Relative proportions (%) of background loop diuretic therapy at inclusion into each respective cohort for at least three months, stratified by gender.
p< 0.001 for the overall difference in loop diuretic treatment counts across the three treatment cohorts; *** p < 0.001; ** p = 0.001; NS, no statistical difference; the three pairs of post-hoc tests were Bonferroni corrected
79.05
66.19
83.65
20.95
33.81
16.35
70.23
57.08
72.25
29.77
42.92
27.75
0
10
20
30
40
50
60
70
80
90
100
Metformin-sulphonylurea Insulin Thiazolidinediones
Pro
po
rtio
n o
f p
ati
en
ts (
%)
wit
hin
ea
ch
coh
ort
Treatment cohort
No background loop diuretic males
Background loop diuretic males
No background loop diuretic females
Background loop diuretic females
*** *** NS
**
*** ***
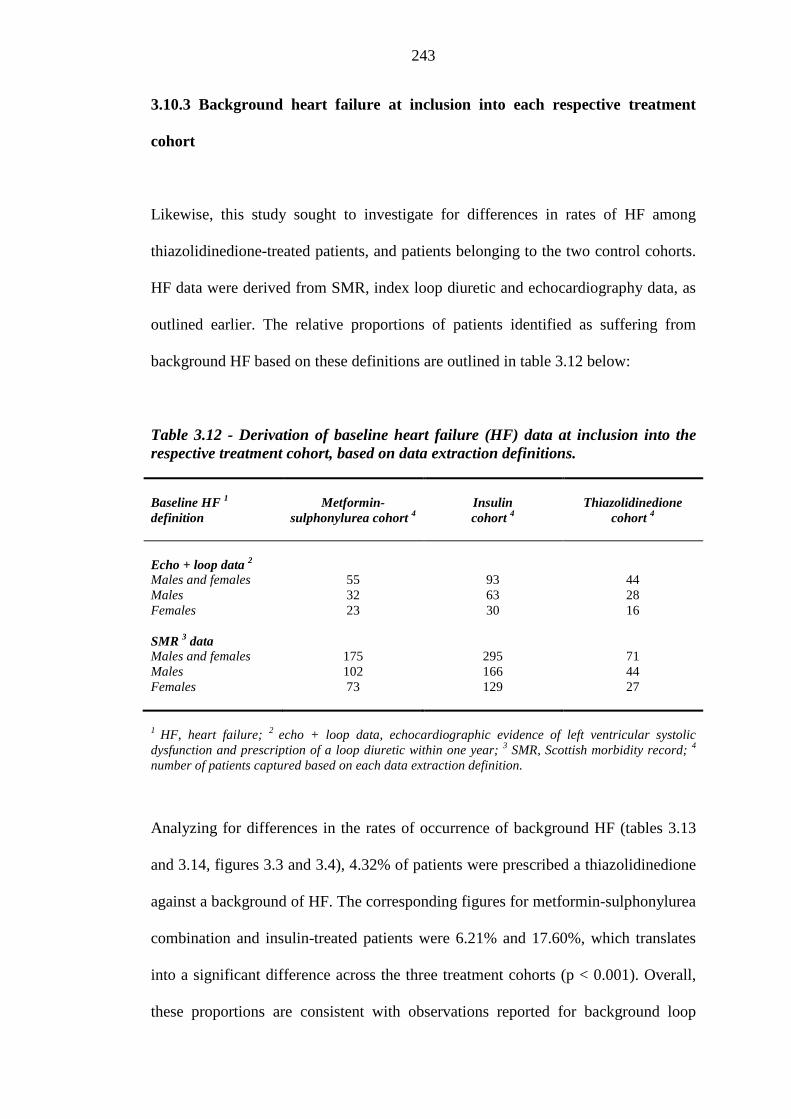
243
3.10.3 Background heart failure at inclusion into each respective treatment
cohort
Likewise, this study sought to investigate for differences in rates of HF among
thiazolidinedione-treated patients, and patients belonging to the two control cohorts.
HF data were derived from SMR, index loop diuretic and echocardiography data, as
outlined earlier. The relative proportions of patients identified as suffering from
background HF based on these definitions are outlined in table 3.12 below:
Table 3.12 - Derivation of baseline heart failure (HF) data at inclusion into the respective treatment cohort, based on data extraction definitions. Baseline HF 1
definition
Metformin-
sulphonylurea cohort 4
Insulin cohort 4
Thiazolidinedione
cohort 4
Echo + loop data 2 Males and females 55 93 44 Males 32 63 28 Females 23 30 16 SMR 3 data Males and females 175 295 71 Males 102 166 44 Females 73 129 27
1 HF, heart failure; 2 echo + loop data, echocardiographic evidence of left ventricular systolic dysfunction and prescription of a loop diuretic within one year; 3 SMR, Scottish morbidity record; 4
number of patients captured based on each data extraction definition.
Analyzing for differences in the rates of occurrence of background HF (tables 3.13
and 3.14, figures 3.3 and 3.4), 4.32% of patients were prescribed a thiazolidinedione
against a background of HF. The corresponding figures for metformin-sulphonylurea
combination and insulin-treated patients were 6.21% and 17.60%, which translates
into a significant difference across the three treatment cohorts (p < 0.001). Overall,
these proportions are consistent with observations reported for background loop
244
diuretic therapy. Pairwise comparisons (Bonferroni corrected) showed that
thiazolidinedione-treated patients had lower rates of background HF compared with
their metformin-sulphonylurea combination (p = 0.001) or insulin-treated (p < 0.001)
counterparts. As discussed earlier, the latter observation is likely to represent the
end-result of a progressive illness characterised by a tendency to progress to
coronary artery disease. One would have expected a lower proportion of patients
having thiazolidinediones prescribed against a background of HF, given the much
publicized association with fluid overload.
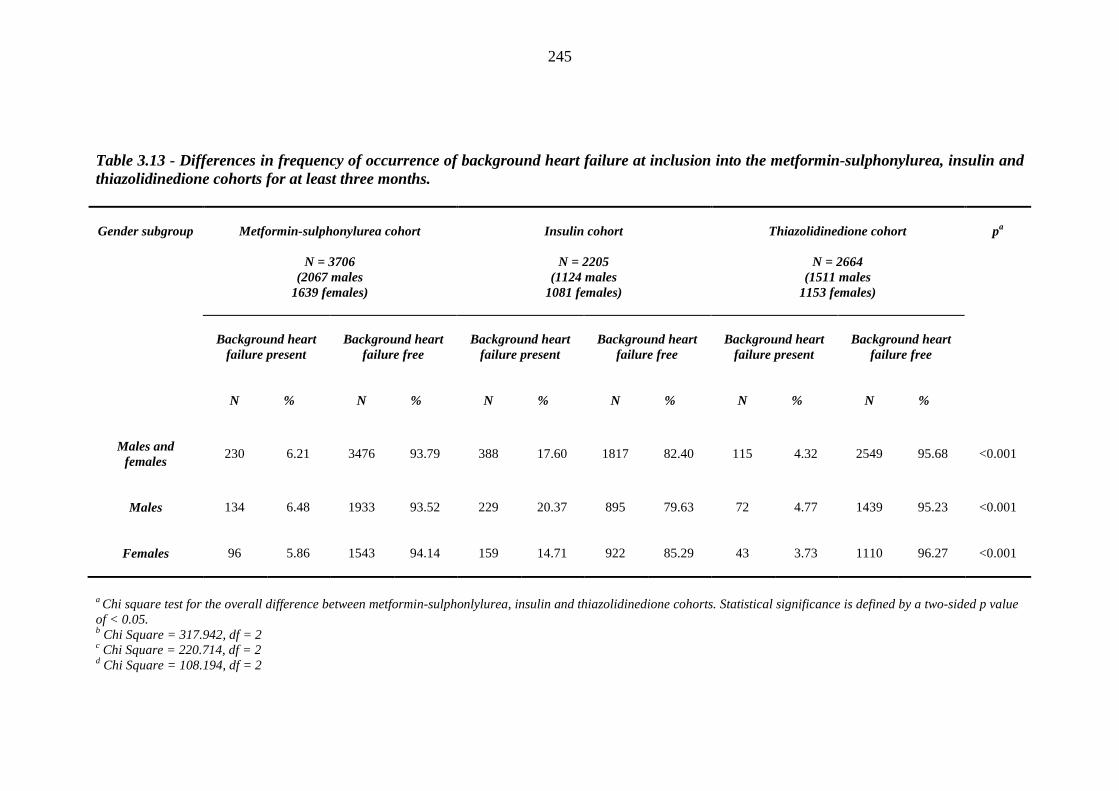
245
Table 3.13 - Differences in frequency of occurrence of background heart failure at inclusion into the metformin-sulphonylurea, insulin and thiazolidinedione cohorts for at least three months.
Gender subgroup
Metformin-sulphonylurea cohort
N = 3706 (2067 males
1639 females)
Insulin cohort
N = 2205
(1124 males 1081 females)
Thiazolidinedione cohort
N = 2664
(1511 males 1153 females)
pa
Background heart
failure present
Background heart
failure free
Background heart
failure present
Background heart
failure free
Background heart
failure present
Background heart
failure free
N
%
N
%
N
%
N
%
N
%
N
%
Males and
females
230 6.21 3476 93.79 388 17.60 1817 82.40 115 4.32 2549 95.68 <0.001
Males
134 6.48 1933 93.52 229 20.37 895 79.63 72 4.77 1439 95.23 <0.001
Females
96 5.86 1543 94.14 159 14.71 922 85.29 43 3.73 1110 96.27 <0.001
a Chi square test for the overall difference between metformin-sulphonlylurea, insulin and thiazolidinedione cohorts. Statistical significance is defined by a two-sided p value of < 0.05. b Chi Square = 317.942, df = 2 c Chi Square = 220.714, df = 2 d Chi Square = 108.194, df = 2
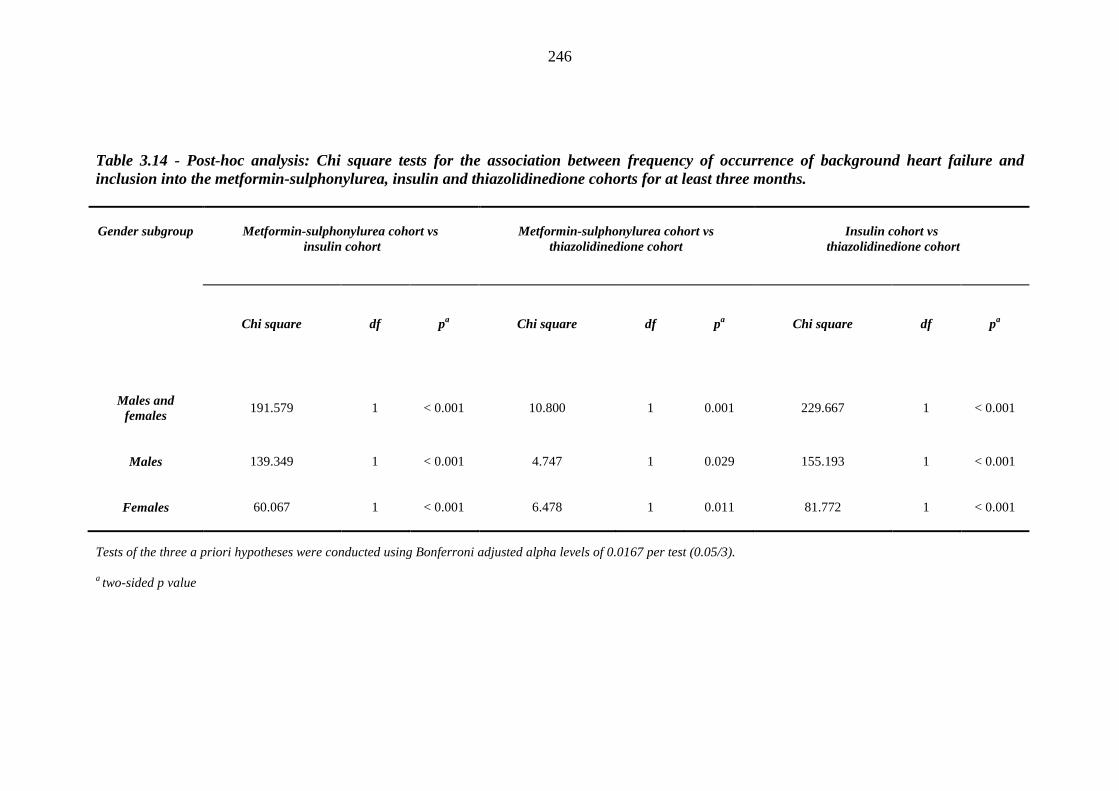
246
Table 3.14 - Post-hoc analysis: Chi square tests for the association between frequency of occurrence of background heart failure and inclusion into the metformin-sulphonylurea, insulin and thiazolidinedione cohorts for at least three months.
Gender subgroup
Metformin-sulphonylurea cohort vs insulin cohort
Metformin-sulphonylurea cohort vs
thiazolidinedione cohort
Insulin cohort vs
thiazolidinedione cohort
Chi square
df
pa
Chi square
df
pa
Chi square
df
pa
Males and
females
191.579 1 < 0.001 10.800 1 0.001 229.667 1 < 0.001
Males
139.349 1 < 0.001 4.747 1 0.029 155.193 1 < 0.001
Females
60.067 1 < 0.001 6.478 1 0.011 81.772 1 < 0.001
Tests of the three a priori hypotheses were conducted using Bonferroni adjusted alpha levels of 0.0167 per test (0.05/3). a two-sided p value
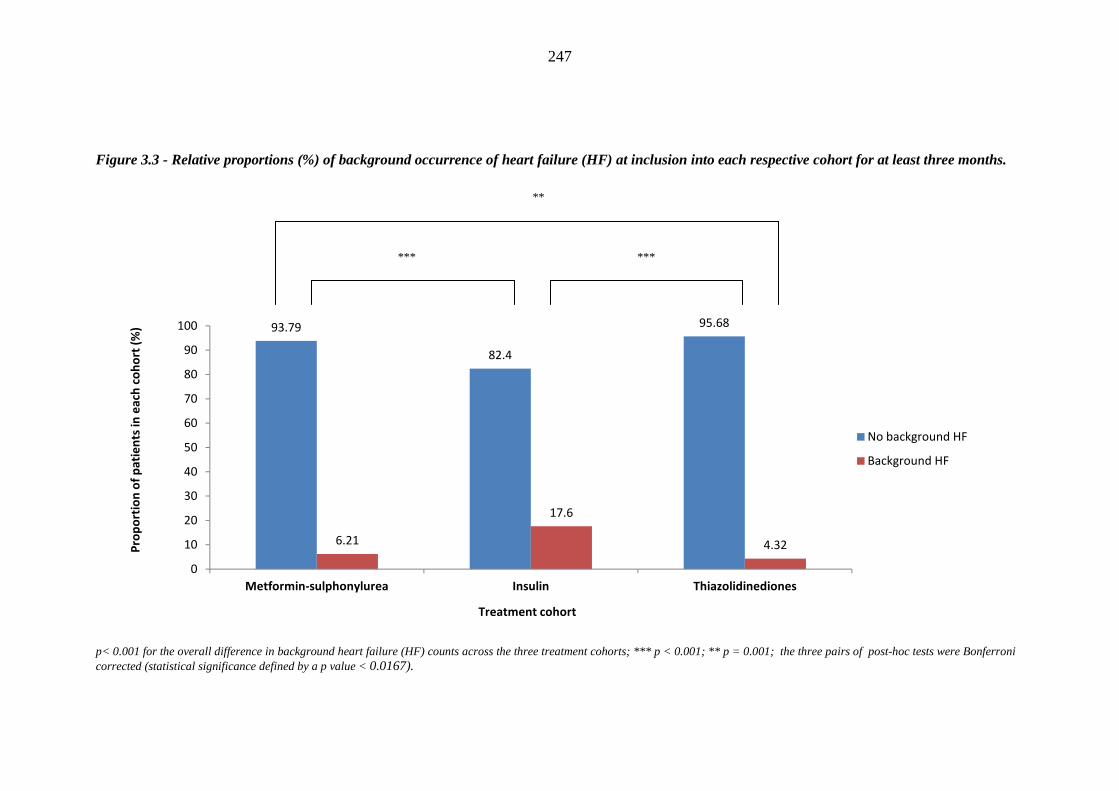
247
Figure 3.3 - Relative proportions (%) of background occurrence of heart failure (HF) at inclusion into each respective cohort for at least three months.
p< 0.001 for the overall difference in background heart failure (HF) counts across the three treatment cohorts; *** p < 0.001; ** p = 0.001; the three pairs of post-hoc tests were Bonferroni corrected (statistical significance defined by a p value < 0.0167).
93.79
82.4
95.68
6.21
17.6
4.32
0
10
20
30
40
50
60
70
80
90
100
Metformin-sulphonylurea Insulin Thiazolidinediones
Pro
po
rtio
n o
f p
ati
en
ts i
n e
ach
co
ho
rt (
%)
Treatment cohort
No background HF
Background HF
**
*** ***
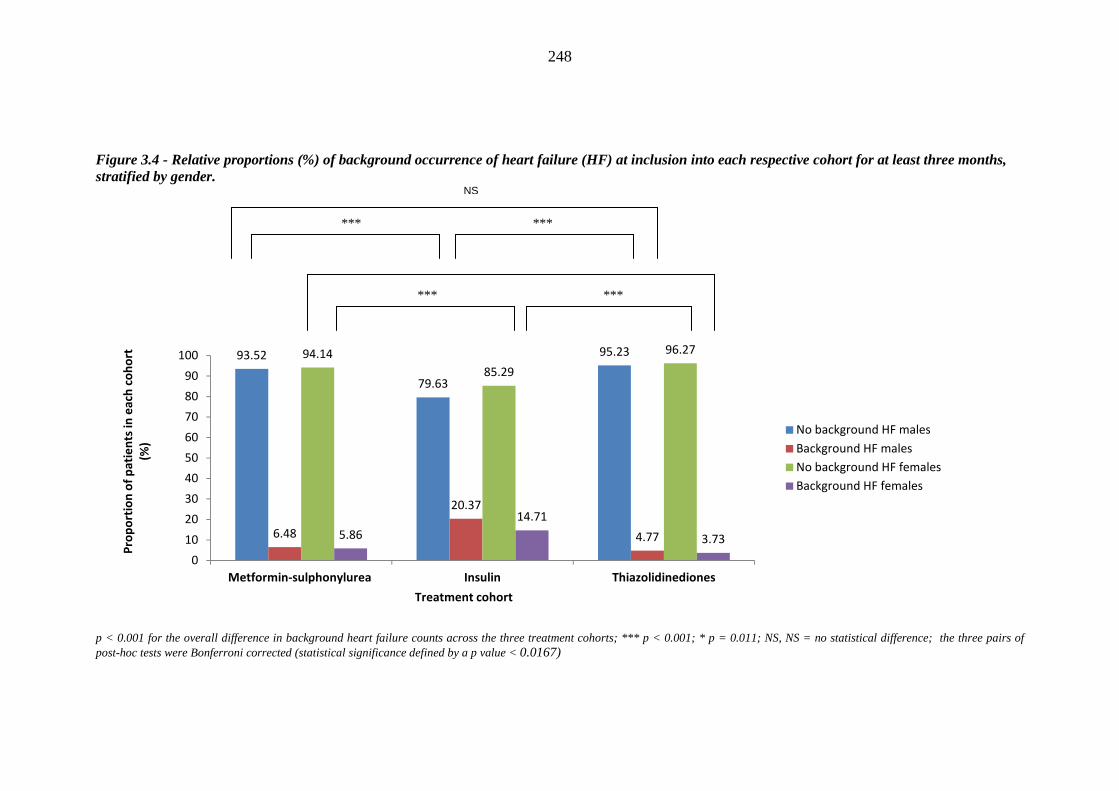
248
Figure 3.4 - Relative proportions (%) of background occurrence of heart failure (HF) at inclusion into each respective cohort for at least three months, stratified by gender.
p < 0.001 for the overall difference in background heart failure counts across the three treatment cohorts; *** p < 0.001; * p = 0.011; NS, NS = no statistical difference; the three pairs of post-hoc tests were Bonferroni corrected (statistical significance defined by a p value < 0.0167)
93.52
79.63
95.23
6.48
20.37
4.77
94.14
85.29
96.27
5.86
14.71
3.73
0
10
20
30
40
50
60
70
80
90
100
Metformin-sulphonylurea Insulin Thiazolidinediones
Pro
po
rtio
n o
f p
ati
en
ts i
n e
ach
co
ho
rt
(%)
Treatment cohort
No background HF males
Background HF males
No background HF females
Background HF females
*** ***
NS
*** ***
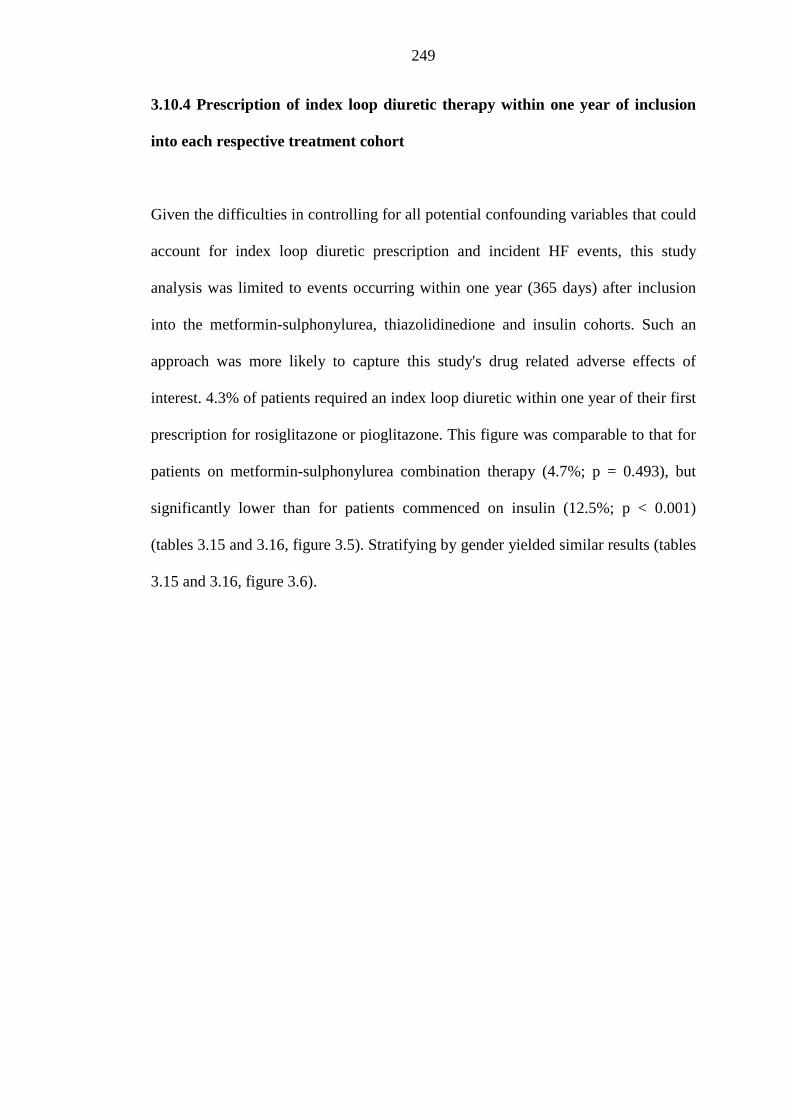
249
3.10.4 Prescription of index loop diuretic therapy within one year of inclusion
into each respective treatment cohort
Given the difficulties in controlling for all potential confounding variables that could
account for index loop diuretic prescription and incident HF events, this study
analysis was limited to events occurring within one year (365 days) after inclusion
into the metformin-sulphonylurea, thiazolidinedione and insulin cohorts. Such an
approach was more likely to capture this study's drug related adverse effects of
interest. 4.3% of patients required an index loop diuretic within one year of their first
prescription for rosiglitazone or pioglitazone. This figure was comparable to that for
patients on metformin-sulphonylurea combination therapy (4.7%; p = 0.493), but
significantly lower than for patients commenced on insulin (12.5%; p < 0.001)
(tables 3.15 and 3.16, figure 3.5). Stratifying by gender yielded similar results (tables
3.15 and 3.16, figure 3.6).
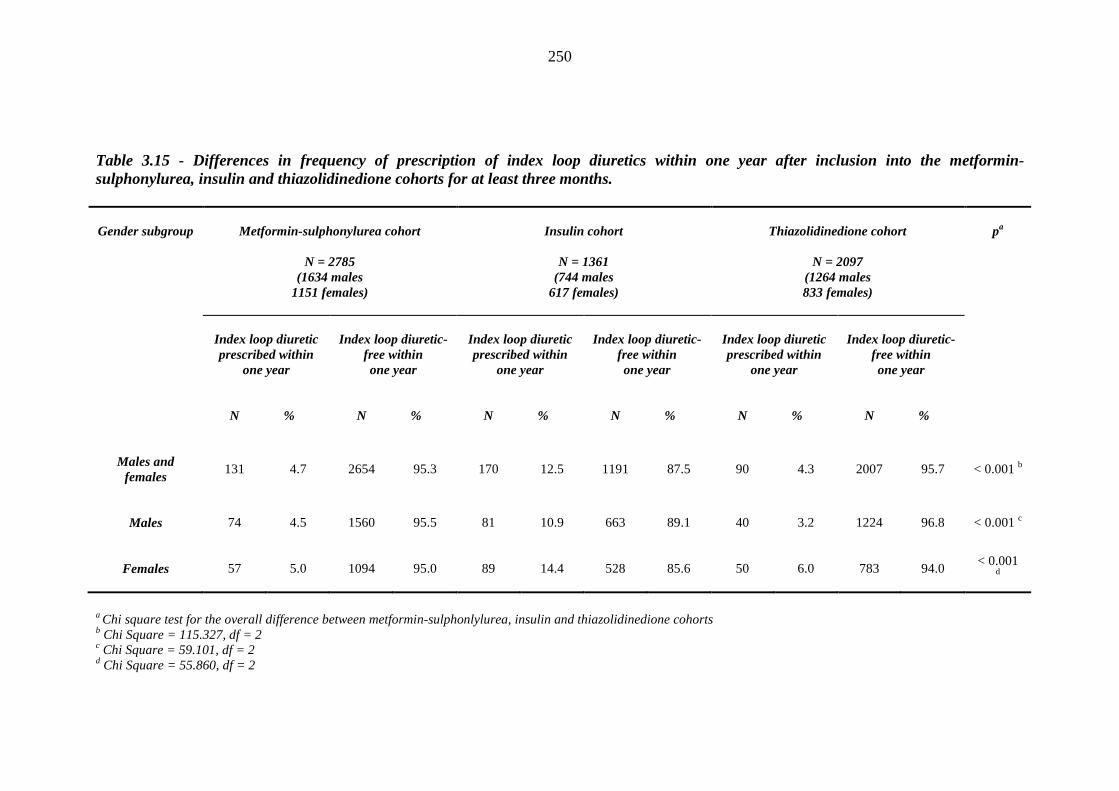
250
Table 3.15 - Differences in frequency of prescription of index loop diuretics within one year after inclusion into the metformin-sulphonylurea, insulin and thiazolidinedione cohorts for at least three months.
Gender subgroup
Metformin-sulphonylurea cohort
N = 2785 (1634 males
1151 females)
Insulin cohort
N = 1361
(744 males 617 females)
Thiazolidinedione cohort
N = 2097
(1264 males 833 females)
pa
Index loop diuretic prescribed within
one year
Index loop diuretic-
free within one year
Index loop diuretic prescribed within
one year
Index loop diuretic-
free within one year
Index loop diuretic prescribed within
one year
Index loop diuretic-
free within one year
N
%
N
%
N
%
N
%
N
%
N
%
Males and
females
131 4.7 2654 95.3 170 12.5 1191 87.5 90 4.3 2007 95.7 < 0.001 b
Males
74 4.5 1560 95.5 81 10.9 663 89.1 40 3.2 1224 96.8 < 0.001 c
Females
57 5.0 1094 95.0 89 14.4 528 85.6 50 6.0 783 94.0
< 0.001 d
a Chi square test for the overall difference between metformin-sulphonlylurea, insulin and thiazolidinedione cohorts b Chi Square = 115.327, df = 2 c Chi Square = 59.101, df = 2 d Chi Square = 55.860, df = 2

251
Table 3.16 - Post-hoc analysis: Chi square tests for the association between frequency of prescription of index loop diuretics within one year and inclusion into the metformin-sulphonylurea, insulin and thiazolidinedione cohorts for at least three months.
Gender subgroup
Metformin-sulphonylurea cohort vs insulin cohort
Metformin-sulphonylurea cohort vs
thiazolidinedione cohort
Insulin cohort vs
thiazolidinedione cohort
Chi square
df
p
Chi square
df
p
Chi square
df
p
Males and
females
82.337 1 < 0.001 0.470 1 0.493 79.790 1 < 0.001
Males
33.920 1 < 0.001 3.510 1 0.061 49.323 1 < 0.001
Females
47.573 1 < 0.001 1.045 1 0.307 29.009 1 < 0.001
Tests of the three a priori hypotheses were conducted using Bonferroni adjusted alpha levels of 0.0167 per test (0.05/3).
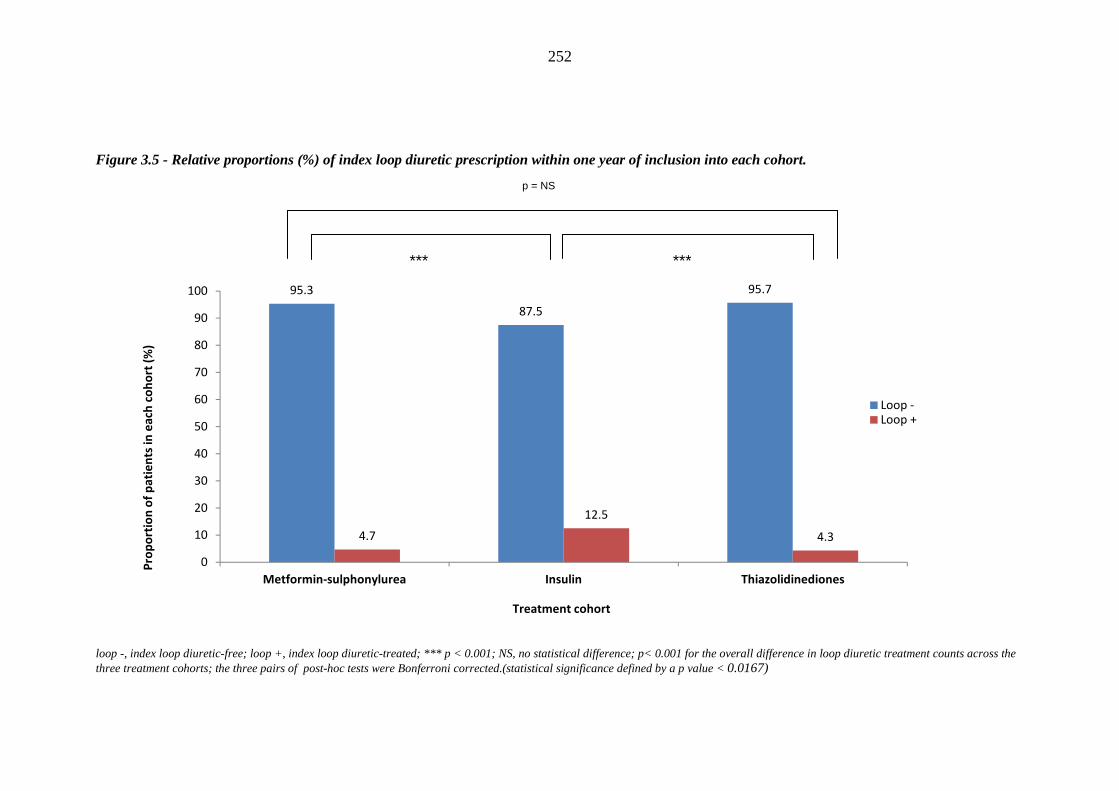
252
Figure 3.5 - Relative proportions (%) of index loop diuretic prescription within one year of inclusion into each cohort.
loop -, index loop diuretic-free; loop +, index loop diuretic-treated; *** p < 0.001; NS, no statistical difference; p< 0.001 for the overall difference in loop diuretic treatment counts across the three treatment cohorts; the three pairs of post-hoc tests were Bonferroni corrected.(statistical significance defined by a p value < 0.0167)
95.3
87.5
95.7
4.7
12.5
4.3
0
10
20
30
40
50
60
70
80
90
100
Metformin-sulphonylurea Insulin Thiazolidinediones
Pro
po
rtio
n o
f p
ati
en
ts i
n e
ach
co
ho
rt (
%)
Treatment cohort
Loop -Loop +
p = NS
*** ***
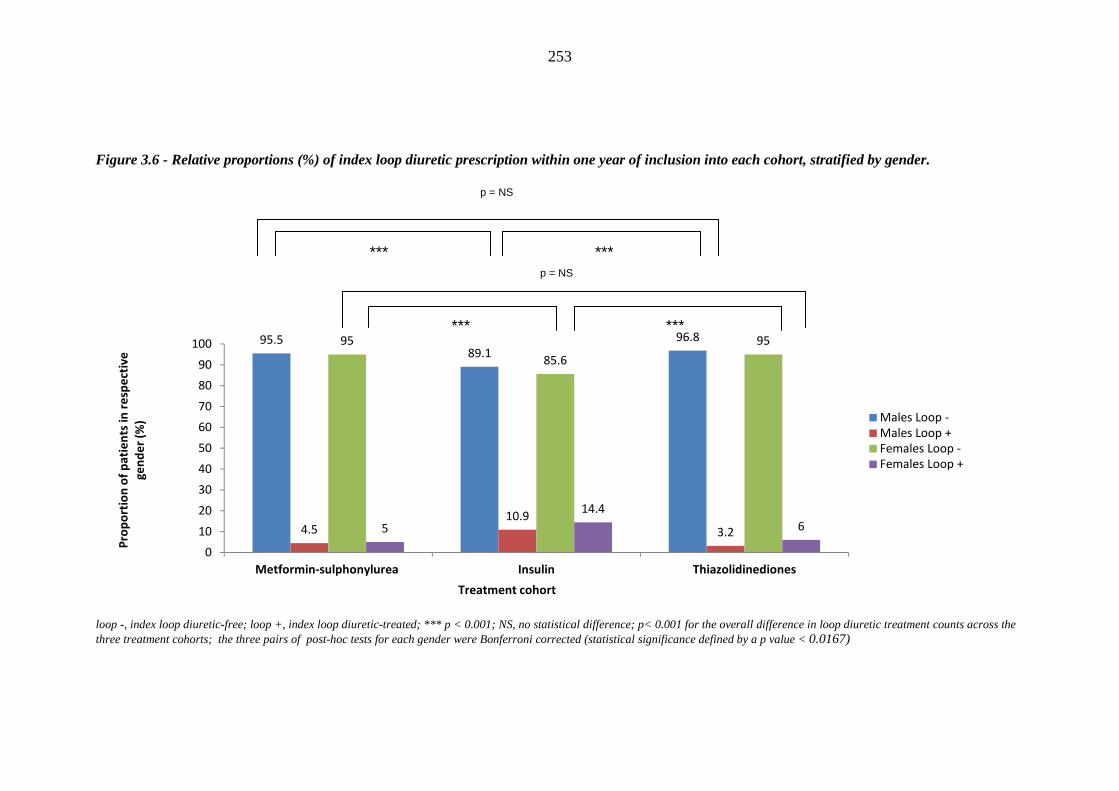
253
Figure 3.6 - Relative proportions (%) of index loop diuretic prescription within one year of inclusion into each cohort, stratified by gender.
loop -, index loop diuretic-free; loop +, index loop diuretic-treated; *** p < 0.001; NS, no statistical difference; p< 0.001 for the overall difference in loop diuretic treatment counts across the three treatment cohorts; the three pairs of post-hoc tests for each gender were Bonferroni corrected (statistical significance defined by a p value < 0.0167)
95.589.1
96.8
4.510.9
3.2
95
85.6
95
5
14.4
6
0
10
20
30
40
50
60
70
80
90
100
Metformin-sulphonylurea Insulin Thiazolidinediones
Pro
po
rtio
n o
f p
ati
en
ts i
n r
esp
ect
ive
ge
nd
er
(%)
Treatment cohort
Males Loop -
Males Loop +
Females Loop -
Females Loop +
p = NS
*** p = NS
*** ***
***
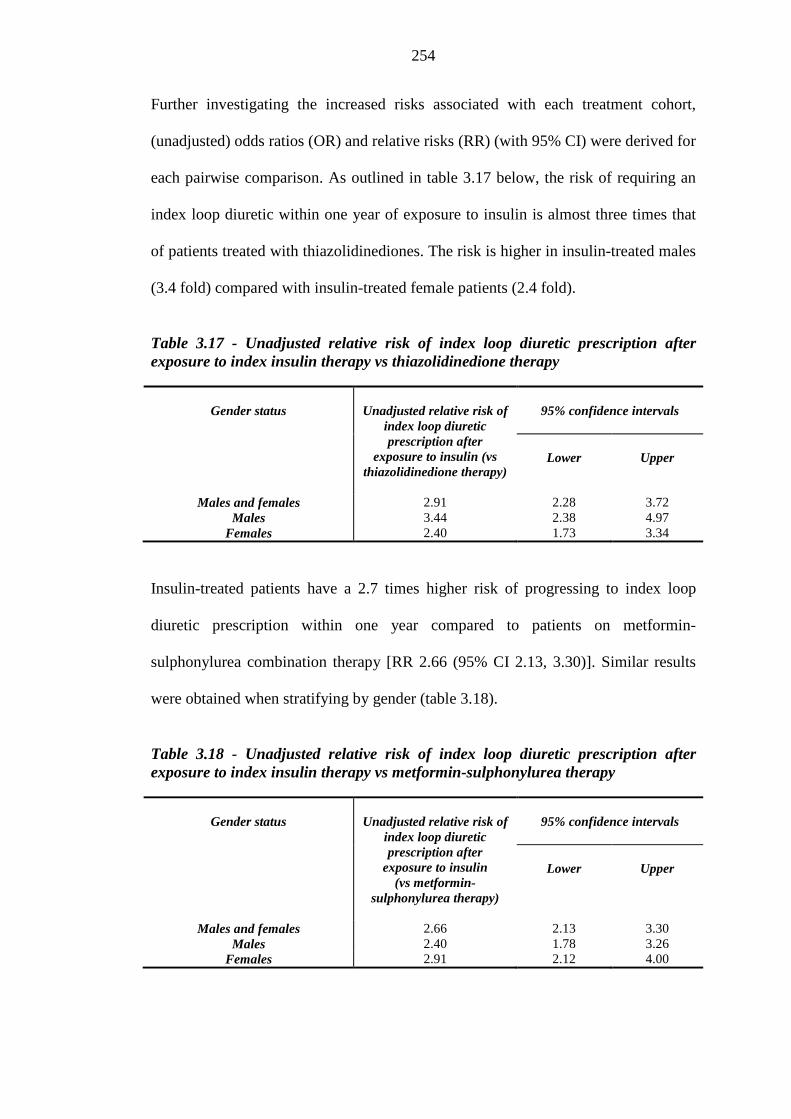
254
Further investigating the increased risks associated with each treatment cohort,
(unadjusted) odds ratios (OR) and relative risks (RR) (with 95% CI) were derived for
each pairwise comparison. As outlined in table 3.17 below, the risk of requiring an
index loop diuretic within one year of exposure to insulin is almost three times that
of patients treated with thiazolidinediones. The risk is higher in insulin-treated males
(3.4 fold) compared with insulin-treated female patients (2.4 fold).
Table 3.17 - Unadjusted relative risk of index loop diuretic prescription after exposure to index insulin therapy vs thiazolidinedione therapy
Gender status
Unadjusted relative risk of
index loop diuretic prescription after
exposure to insulin (vs thiazolidinedione therapy)
95% confidence intervals
Lower
Upper
Males and females 2.91 2.28 3.72 Males 3.44 2.38 4.97
Females 2.40 1.73 3.34
Insulin-treated patients have a 2.7 times higher risk of progressing to index loop
diuretic prescription within one year compared to patients on metformin-
sulphonylurea combination therapy [RR 2.66 (95% CI 2.13, 3.30)]. Similar results
were obtained when stratifying by gender (table 3.18).
Table 3.18 - Unadjusted relative risk of index loop diuretic prescription after exposure to index insulin therapy vs metformin-sulphonylurea therapy
Gender status
Unadjusted relative risk of
index loop diuretic prescription after
exposure to insulin (vs metformin-
sulphonylurea therapy)
95% confidence intervals
Lower
Upper
Males and females 2.66 2.13 3.30 Males 2.40 1.78 3.26
Females 2.91 2.12 4.00
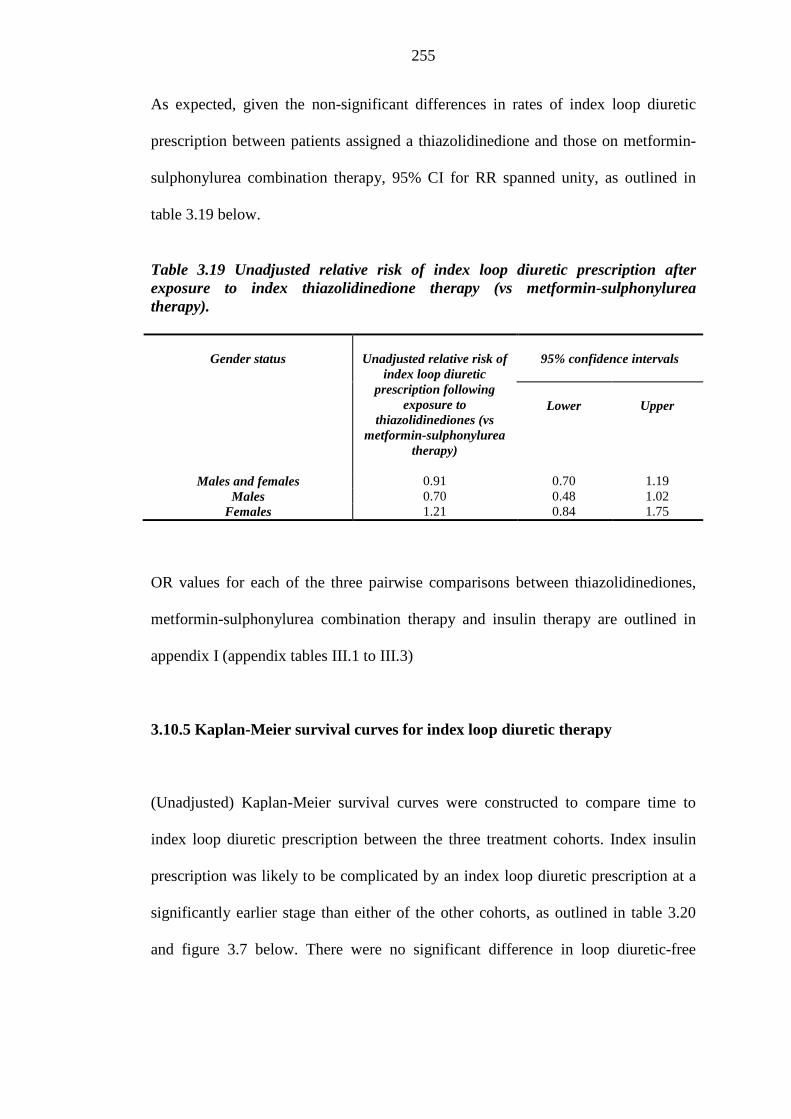
255
As expected, given the non-significant differences in rates of index loop diuretic
prescription between patients assigned a thiazolidinedione and those on metformin-
sulphonylurea combination therapy, 95% CI for RR spanned unity, as outlined in
table 3.19 below.
Table 3.19 Unadjusted relative risk of index loop diuretic prescription after exposure to index thiazolidinedione therapy (vs metformin-sulphonylurea therapy).
Gender status
Unadjusted relative risk of
index loop diuretic prescription following
exposure to thiazolidinediones (vs
metformin-sulphonylurea therapy)
95% confidence intervals
Lower
Upper
Males and females 0.91 0.70 1.19 Males 0.70 0.48 1.02
Females 1.21 0.84 1.75
OR values for each of the three pairwise comparisons between thiazolidinediones,
metformin-sulphonylurea combination therapy and insulin therapy are outlined in
appendix I (appendix tables III.1 to III.3)
3.10.5 Kaplan-Meier survival curves for index loop diuretic therapy
(Unadjusted) Kaplan-Meier survival curves were constructed to compare time to
index loop diuretic prescription between the three treatment cohorts. Index insulin
prescription was likely to be complicated by an index loop diuretic prescription at a
significantly earlier stage than either of the other cohorts, as outlined in table 3.20
and figure 3.7 below. There were no significant difference in loop diuretic-free
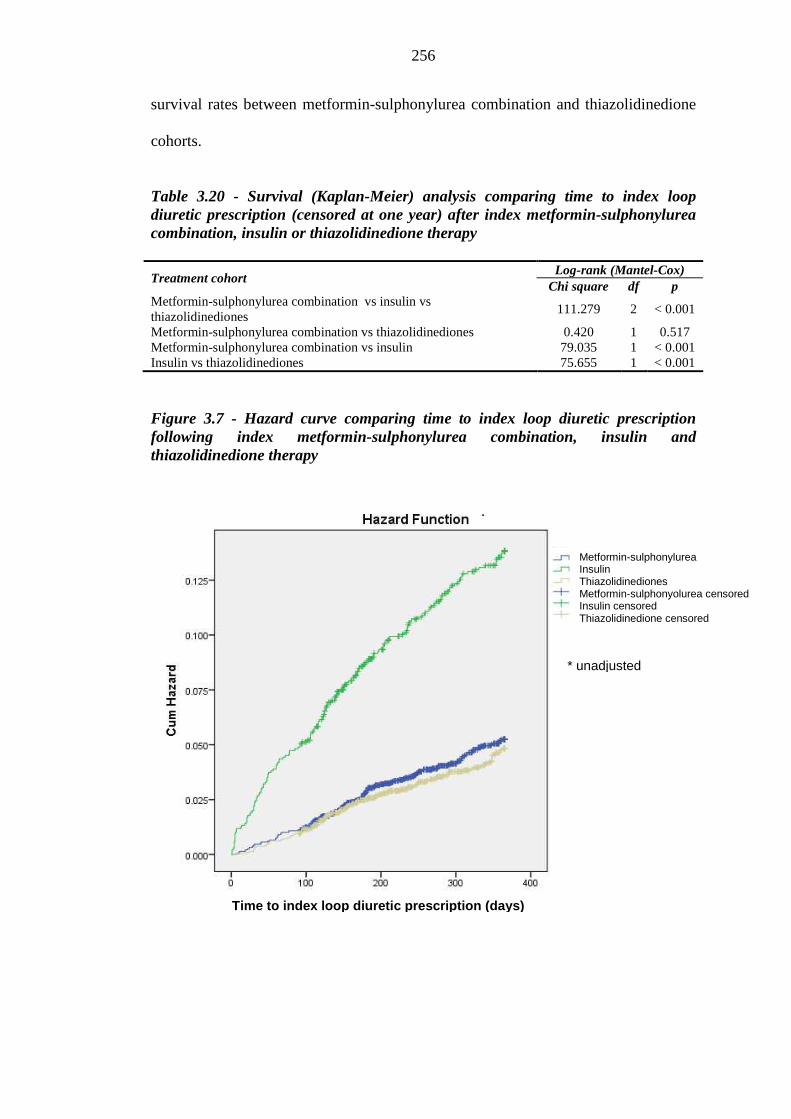
256
survival rates between metformin-sulphonylurea combination and thiazolidinedione
cohorts.
Table 3.20 - Survival (Kaplan-Meier) analysis comparing time to index loop diuretic prescription (censored at one year) after index metformin-sulphonylurea combination, insulin or thiazolidinedione therapy
Treatment cohort Log-rank (Mantel-Cox)
Chi square df p Metformin-sulphonylurea combination vs insulin vs thiazolidinediones
111.279 2 < 0.001
Metformin-sulphonylurea combination vs thiazolidinediones 0.420 1 0.517 Metformin-sulphonylurea combination vs insulin 79.035 1 < 0.001 Insulin vs thiazolidinediones 75.655 1 < 0.001
Figure 3.7 - Hazard curve comparing time to index loop diuretic prescription following index metformin-sulphonylurea combination, insulin and thiazolidinedione therapy
Metformin-sulphonylurea Insulin Thiazolidinediones Metformin-sulphonyolurea censored Insulin censored Thiazolidinedione censored
Time to index loop diuretic prescription (days)
*
* unadjusted
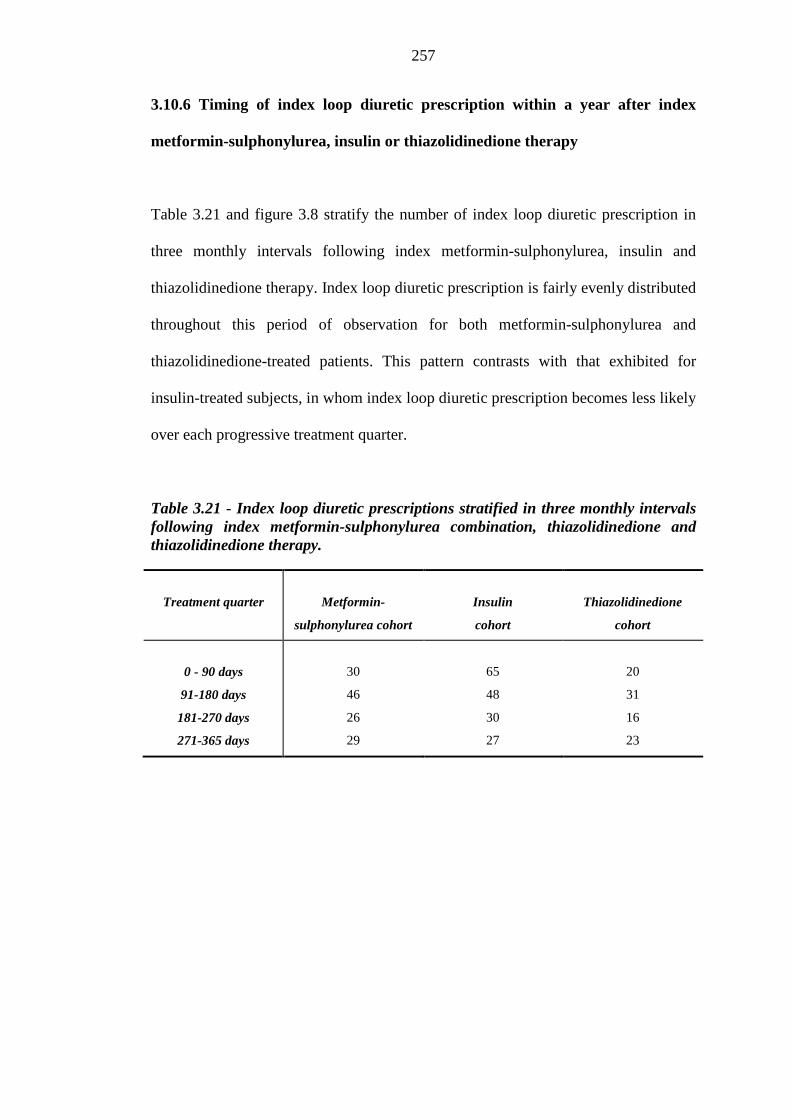
257
3.10.6 Timing of index loop diuretic prescription within a year after index
metformin-sulphonylurea, insulin or thiazolidinedione therapy
Table 3.21 and figure 3.8 stratify the number of index loop diuretic prescription in
three monthly intervals following index metformin-sulphonylurea, insulin and
thiazolidinedione therapy. Index loop diuretic prescription is fairly evenly distributed
throughout this period of observation for both metformin-sulphonylurea and
thiazolidinedione-treated patients. This pattern contrasts with that exhibited for
insulin-treated subjects, in whom index loop diuretic prescription becomes less likely
over each progressive treatment quarter.
Table 3.21 - Index loop diuretic prescriptions stratified in three monthly intervals following index metformin-sulphonylurea combination, thiazolidinedione and thiazolidinedione therapy.
Treatment quarter
Metformin-
sulphonylurea cohort
Insulin
cohort
Thiazolidinedione
cohort
0 - 90 days
91-180 days
181-270 days
271-365 days
30
46
26
29
65
48
30
27
20
31
16
23
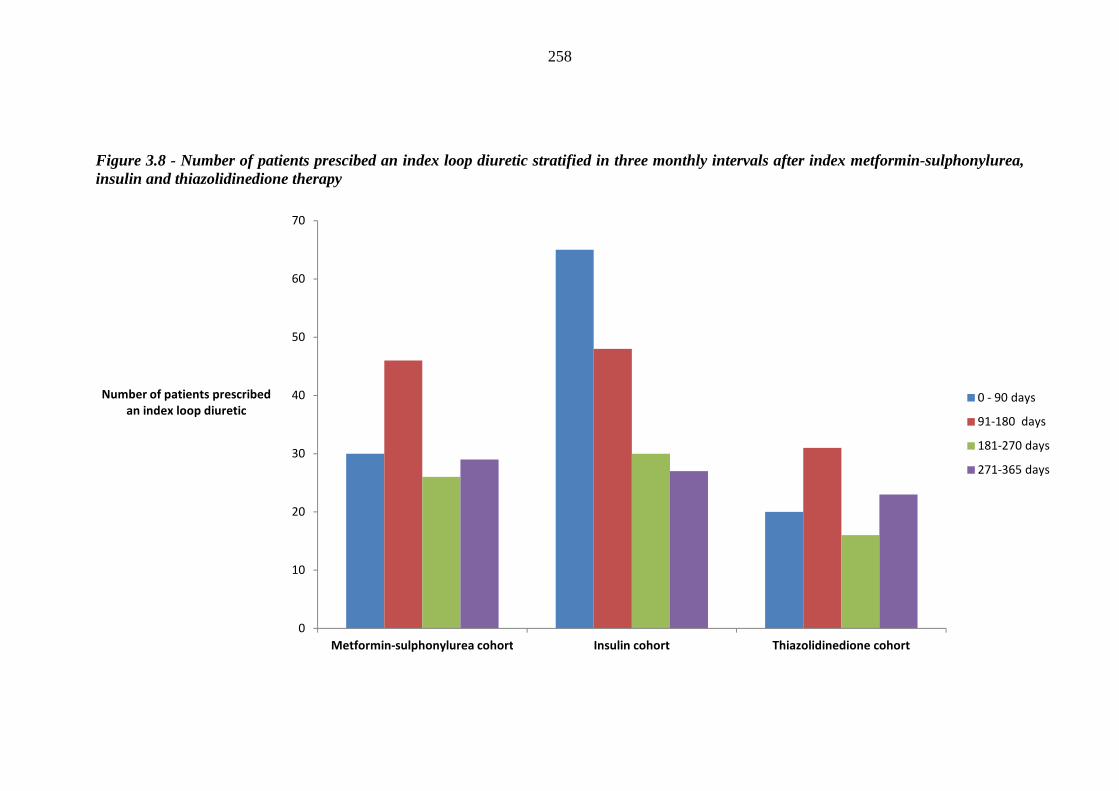
258
Figure 3.8 - Number of patients prescibed an index loop diuretic stratified in three monthly intervals after index metformin-sulphonylurea, insulin and thiazolidinedione therapy
0
10
20
30
40
50
60
70
Metformin-sulphonylurea cohort Insulin cohort Thiazolidinedione cohort
Number of patients prescribed
an index loop diuretic0 - 90 days
91-180 days
181-270 days
271-365 days
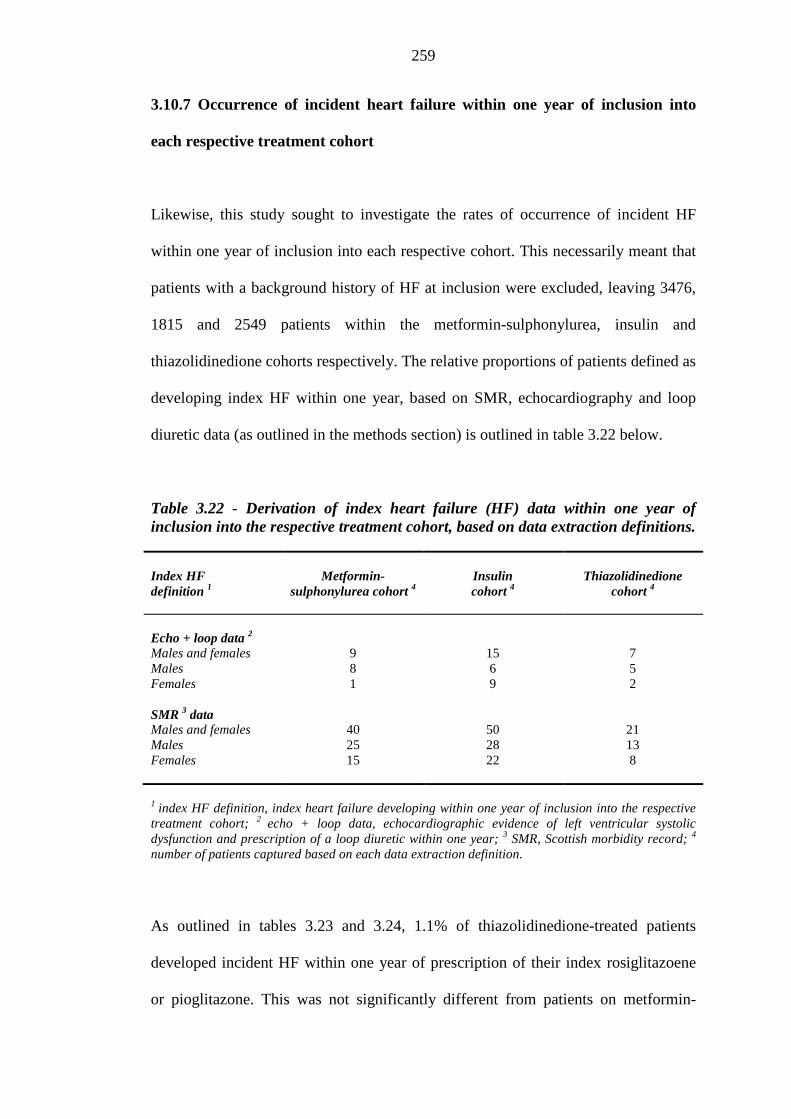
259
3.10.7 Occurrence of incident heart failure within one year of inclusion into
each respective treatment cohort
Likewise, this study sought to investigate the rates of occurrence of incident HF
within one year of inclusion into each respective cohort. This necessarily meant that
patients with a background history of HF at inclusion were excluded, leaving 3476,
1815 and 2549 patients within the metformin-sulphonylurea, insulin and
thiazolidinedione cohorts respectively. The relative proportions of patients defined as
developing index HF within one year, based on SMR, echocardiography and loop
diuretic data (as outlined in the methods section) is outlined in table 3.22 below.
Table 3.22 - Derivation of index heart failure (HF) data within one year of inclusion into the respective treatment cohort, based on data extraction definitions. Index HF definition 1
Metformin-
sulphonylurea cohort 4
Insulin cohort 4
Thiazolidinedione
cohort 4
Echo + loop data 2 Males and females 9 15 7 Males 8 6 5 Females 1 9 2 SMR 3 data Males and females 40 50 21 Males 25 28 13 Females 15 22 8
1 index HF definition, index heart failure developing within one year of inclusion into the respective treatment cohort; 2 echo + loop data, echocardiographic evidence of left ventricular systolic dysfunction and prescription of a loop diuretic within one year; 3 SMR, Scottish morbidity record; 4 number of patients captured based on each data extraction definition.
As outlined in tables 3.23 and 3.24, 1.1% of thiazolidinedione-treated patients
developed incident HF within one year of prescription of their index rosiglitazoene
or pioglitazone. This was not significantly different from patients on metformin-
260
sulphonylurea combination therapy (1.4%; p = 0.288), but significantly lower than
for patients prescribed insulin (3.5%; p < 0.001). Stratifying by gender yielded
similar results. These relative proportions are also summarised in figures 3.9 and
3.10.
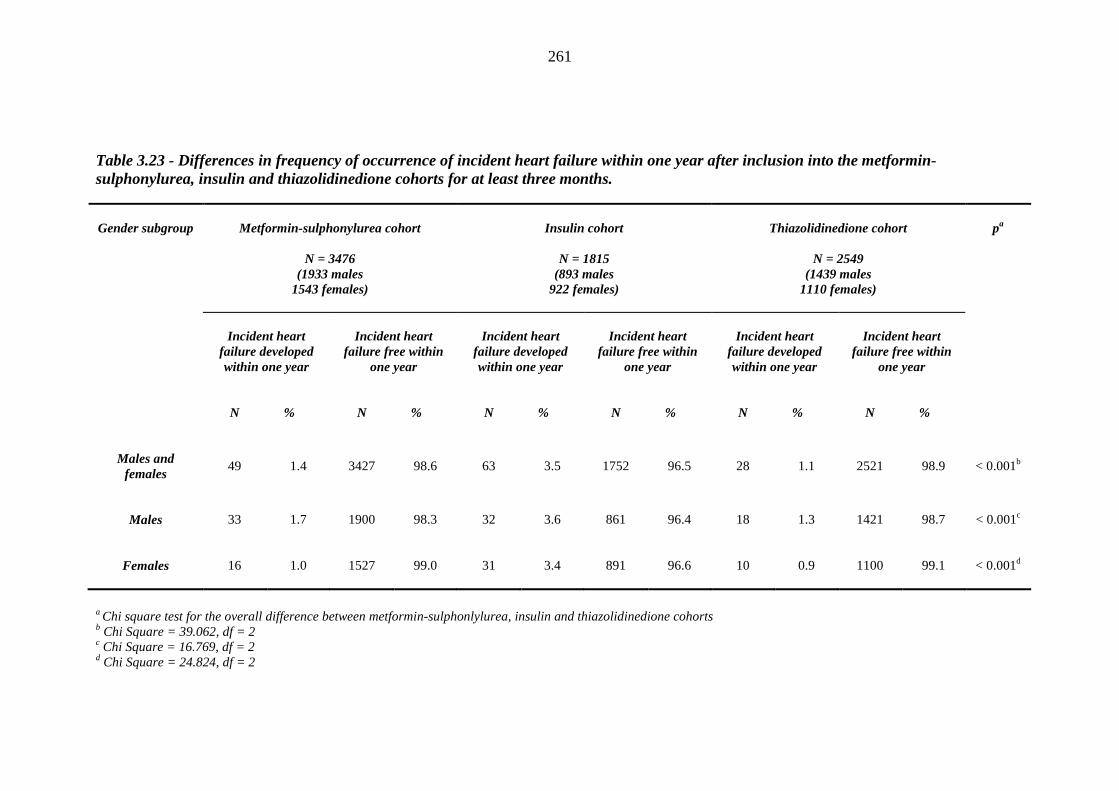
261
Table 3.23 - Differences in frequency of occurrence of incident heart failure within one year after inclusion into the metformin-sulphonylurea, insulin and thiazolidinedione cohorts for at least three months.
Gender subgroup
Metformin-sulphonylurea cohort
N = 3476 (1933 males
1543 females)
Insulin cohort
N = 1815
(893 males 922 females)
Thiazolidinedione cohort
N = 2549
(1439 males 1110 females)
pa
Incident heart
failure developed within one year
Incident heart
failure free within one year
Incident heart
failure developed within one year
Incident heart
failure free within one year
Incident heart
failure developed within one year
Incident heart
failure free within one year
N
%
N
%
N
%
N
%
N
%
N
%
Males and
females
49 1.4 3427 98.6 63 3.5 1752 96.5 28 1.1 2521 98.9 < 0.001b
Males
33 1.7 1900 98.3 32 3.6 861 96.4 18 1.3 1421 98.7 < 0.001c
Females
16 1.0 1527 99.0 31 3.4 891 96.6 10 0.9 1100 99.1 < 0.001d
a Chi square test for the overall difference between metformin-sulphonlylurea, insulin and thiazolidinedione cohorts b Chi Square = 39.062, df = 2 c Chi Square = 16.769, df = 2 d Chi Square = 24.824, df = 2
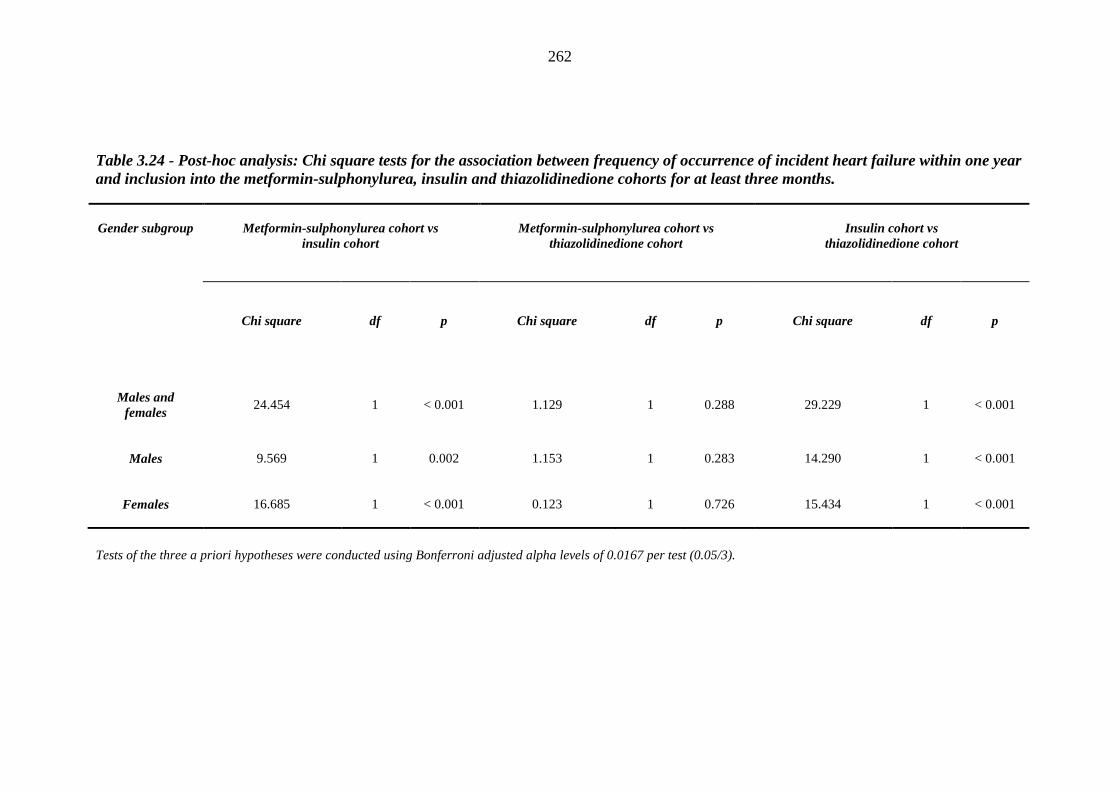
262
Table 3.24 - Post-hoc analysis: Chi square tests for the association between frequency of occurrence of incident heart failure within one year and inclusion into the metformin-sulphonylurea, insulin and thiazolidinedione cohorts for at least three months.
Gender subgroup
Metformin-sulphonylurea cohort vs insulin cohort
Metformin-sulphonylurea cohort vs
thiazolidinedione cohort
Insulin cohort vs
thiazolidinedione cohort
Chi square
df
p
Chi square
df
p
Chi square
df
p
Males and
females
24.454 1 < 0.001 1.129 1 0.288 29.229 1 < 0.001
Males
9.569 1 0.002 1.153 1 0.283 14.290 1 < 0.001
Females
16.685 1 < 0.001 0.123 1 0.726 15.434 1 < 0.001
Tests of the three a priori hypotheses were conducted using Bonferroni adjusted alpha levels of 0.0167 per test (0.05/3).
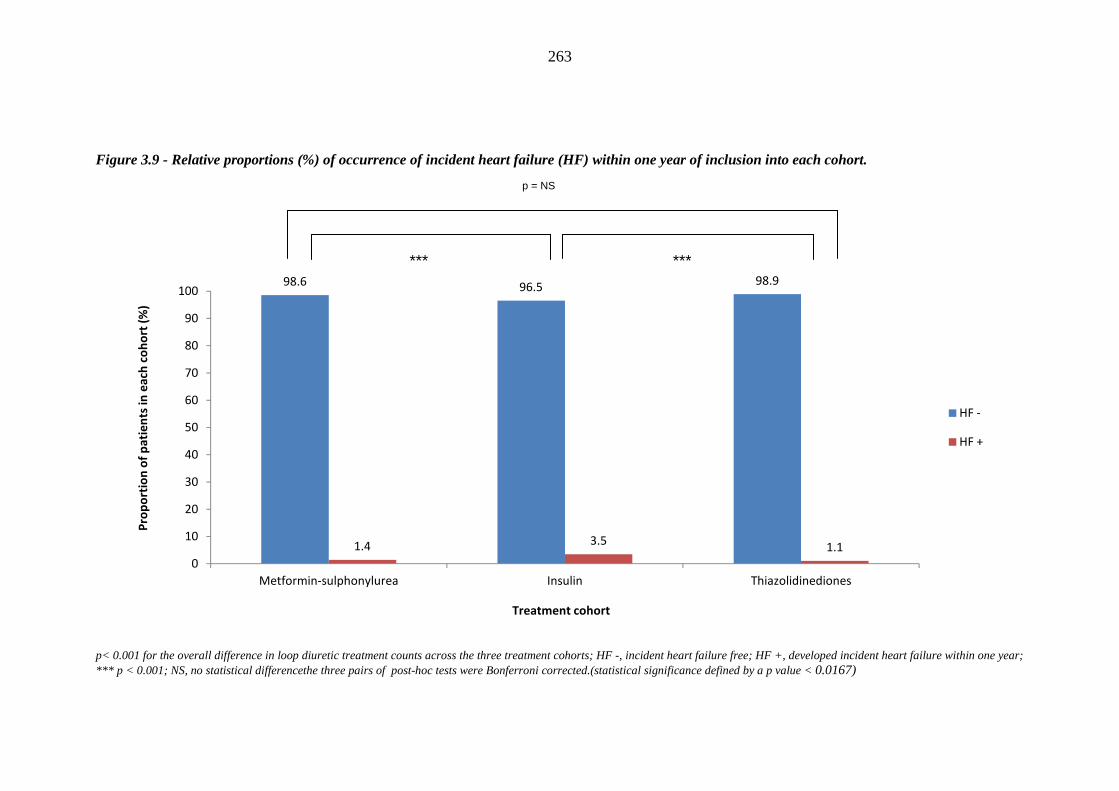
263
Figure 3.9 - Relative proportions (%) of occurrence of incident heart failure (HF) within one year of inclusion into each cohort.
p< 0.001 for the overall difference in loop diuretic treatment counts across the three treatment cohorts; HF -, incident heart failure free; HF +, developed incident heart failure within one year; *** p < 0.001; NS, no statistical differencethe three pairs of post-hoc tests were Bonferroni corrected.(statistical significance defined by a p value < 0.0167)
98.6 96.598.9
1.4 3.51.1
0
10
20
30
40
50
60
70
80
90
100
Metformin-sulphonylurea Insulin Thiazolidinediones
Pro
po
rtio
n o
f p
ati
en
ts i
n e
ach
co
ho
rt (
%)
Treatment cohort
HF -
HF +
p = NS
*** ***
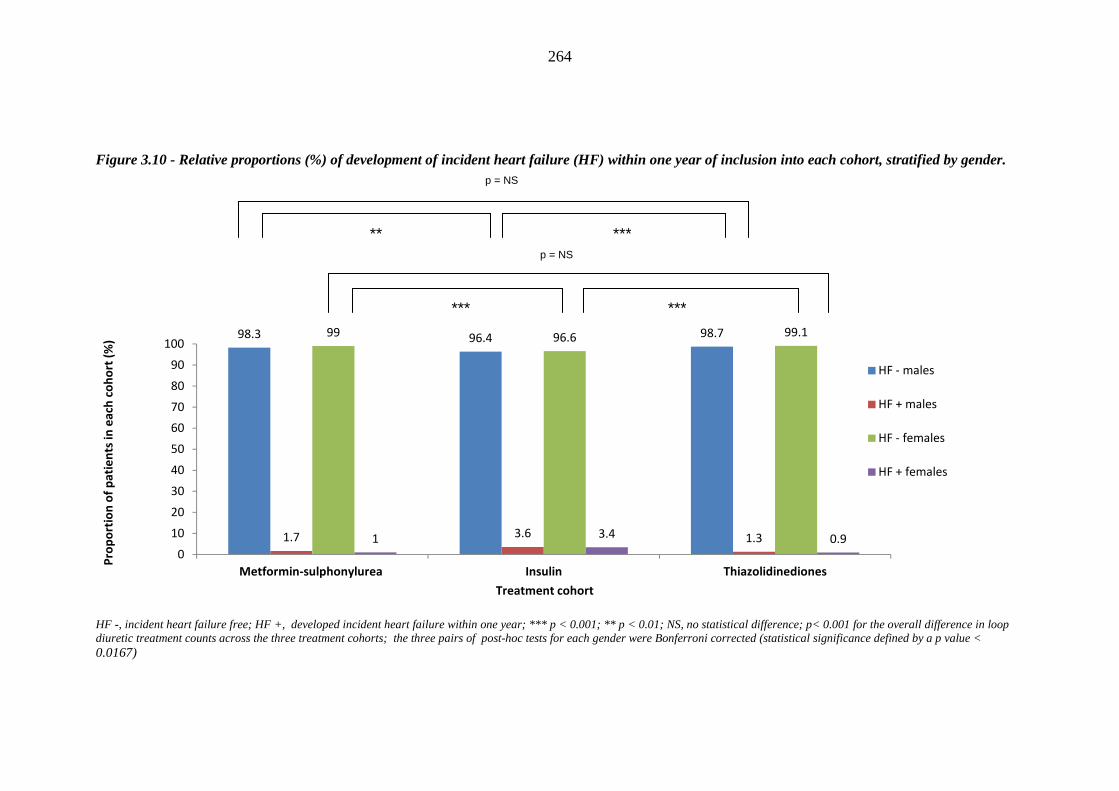
264
Figure 3.10 - Relative proportions (%) of development of incident heart failure (HF) within one year of inclusion into each cohort, stratified by gender.
HF -, incident heart failure free; HF +, developed incident heart failure within one year; *** p < 0.001; ** p < 0.01; NS, no statistical difference; p< 0.001 for the overall difference in loop diuretic treatment counts across the three treatment cohorts; the three pairs of post-hoc tests for each gender were Bonferroni corrected (statistical significance defined by a p value < 0.0167)
98.3 96.4 98.7
1.7 3.6 1.3
99 96.6 99.1
1 3.4 0.9
0
10
20
30
40
50
60
70
80
90
100
Metformin-sulphonylurea Insulin Thiazolidinediones
Pro
po
rtio
n o
f p
ati
en
ts i
n e
ach
co
ho
rt (
%)
Treatment cohort
HF - males
HF + males
HF - females
HF + females
p = NS
*** p = NS
*** ***
**
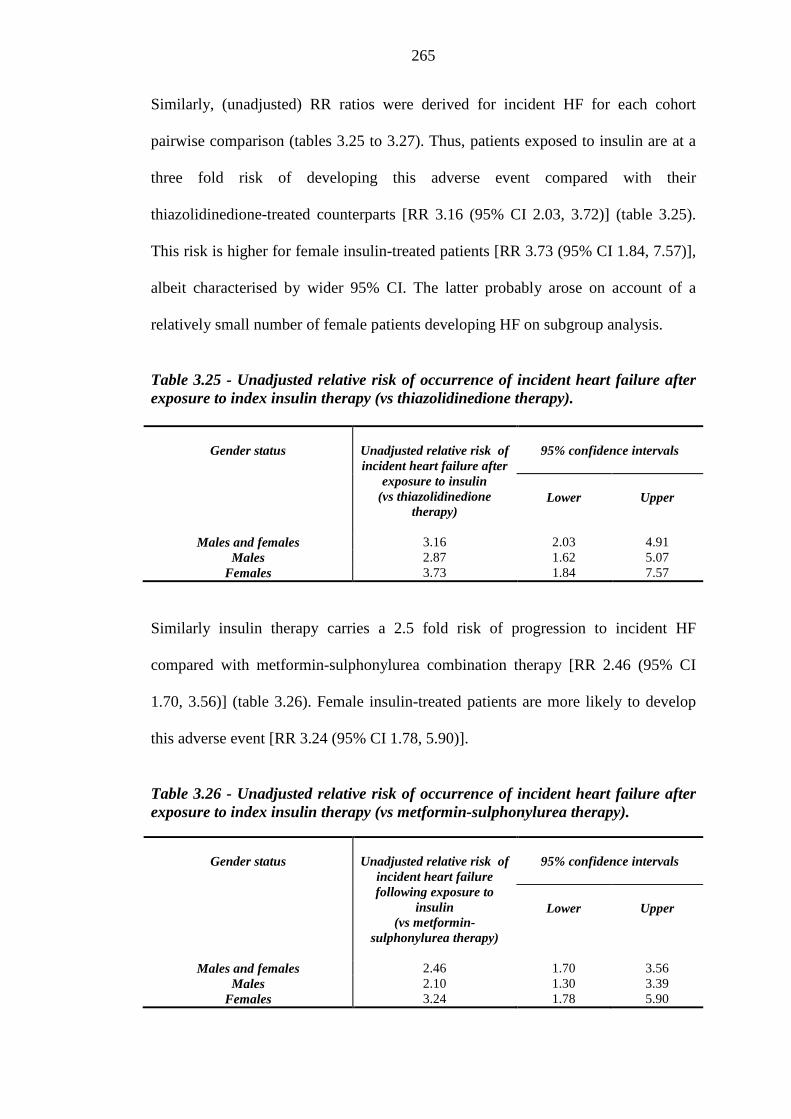
265
Similarly, (unadjusted) RR ratios were derived for incident HF for each cohort
pairwise comparison (tables 3.25 to 3.27). Thus, patients exposed to insulin are at a
three fold risk of developing this adverse event compared with their
thiazolidinedione-treated counterparts [RR 3.16 (95% CI 2.03, 3.72)] (table 3.25).
This risk is higher for female insulin-treated patients [RR 3.73 (95% CI 1.84, 7.57)],
albeit characterised by wider 95% CI. The latter probably arose on account of a
relatively small number of female patients developing HF on subgroup analysis.
Table 3.25 - Unadjusted relative risk of occurrence of incident heart failure after exposure to index insulin therapy (vs thiazolidinedione therapy).
Gender status
Unadjusted relative risk of incident heart failure after
exposure to insulin (vs thiazolidinedione
therapy)
95% confidence intervals
Lower
Upper
Males and females 3.16 2.03 4.91 Males 2.87 1.62 5.07
Females 3.73 1.84 7.57
Similarly insulin therapy carries a 2.5 fold risk of progression to incident HF
compared with metformin-sulphonylurea combination therapy [RR 2.46 (95% CI
1.70, 3.56)] (table 3.26). Female insulin-treated patients are more likely to develop
this adverse event [RR 3.24 (95% CI 1.78, 5.90)].
Table 3.26 - Unadjusted relative risk of occurrence of incident heart failure after exposure to index insulin therapy (vs metformin-sulphonylurea therapy).
Gender status
Unadjusted relative risk of
incident heart failure following exposure to
insulin (vs metformin-
sulphonylurea therapy)
95% confidence intervals
Lower
Upper
Males and females 2.46 1.70 3.56 Males 2.10 1.30 3.39
Females 3.24 1.78 5.90
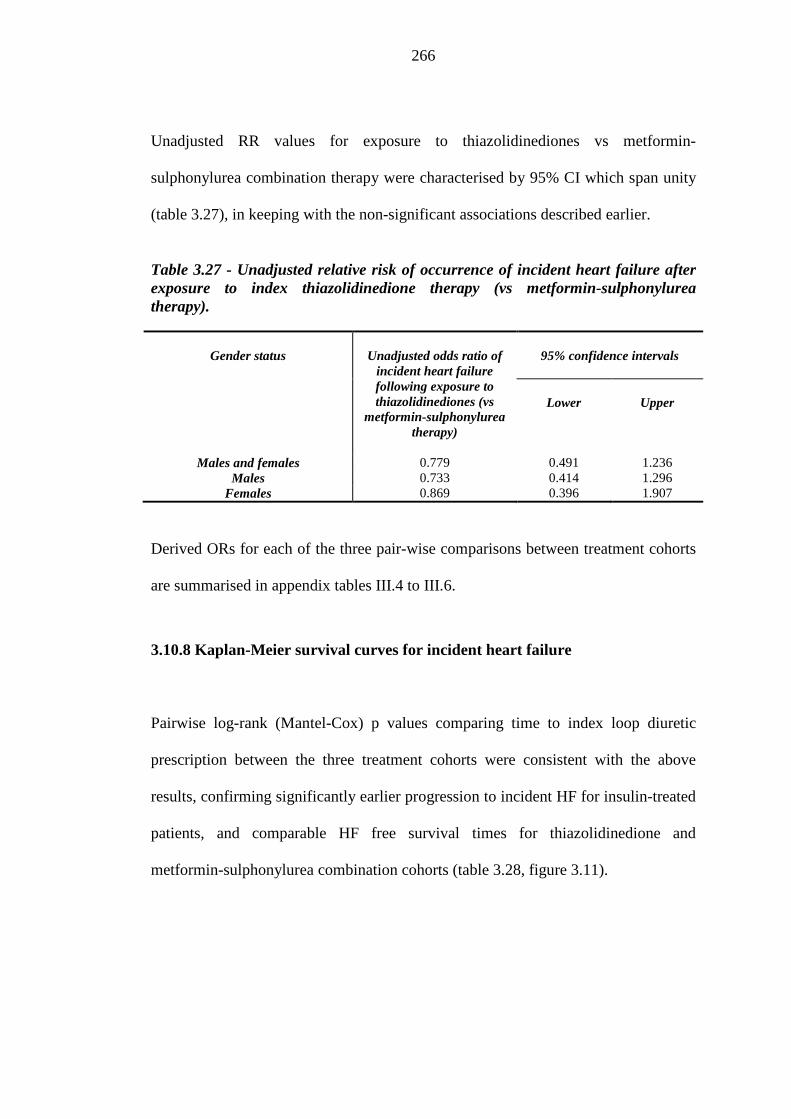
266
Unadjusted RR values for exposure to thiazolidinediones vs metformin-
sulphonylurea combination therapy were characterised by 95% CI which span unity
(table 3.27), in keeping with the non-significant associations described earlier.
Table 3.27 - Unadjusted relative risk of occurrence of incident heart failure after exposure to index thiazolidinedione therapy (vs metformin-sulphonylurea therapy).
Gender status
Unadjusted odds ratio of
incident heart failure following exposure to thiazolidinediones (vs
metformin-sulphonylurea therapy)
95% confidence intervals
Lower
Upper
Males and females 0.779 0.491 1.236 Males 0.733 0.414 1.296
Females 0.869 0.396 1.907
Derived ORs for each of the three pair-wise comparisons between treatment cohorts
are summarised in appendix tables III.4 to III.6.
3.10.8 Kaplan-Meier survival curves for incident heart failure
Pairwise log-rank (Mantel-Cox) p values comparing time to index loop diuretic
prescription between the three treatment cohorts were consistent with the above
results, confirming significantly earlier progression to incident HF for insulin-treated
patients, and comparable HF free survival times for thiazolidinedione and
metformin-sulphonylurea combination cohorts (table 3.28, figure 3.11).
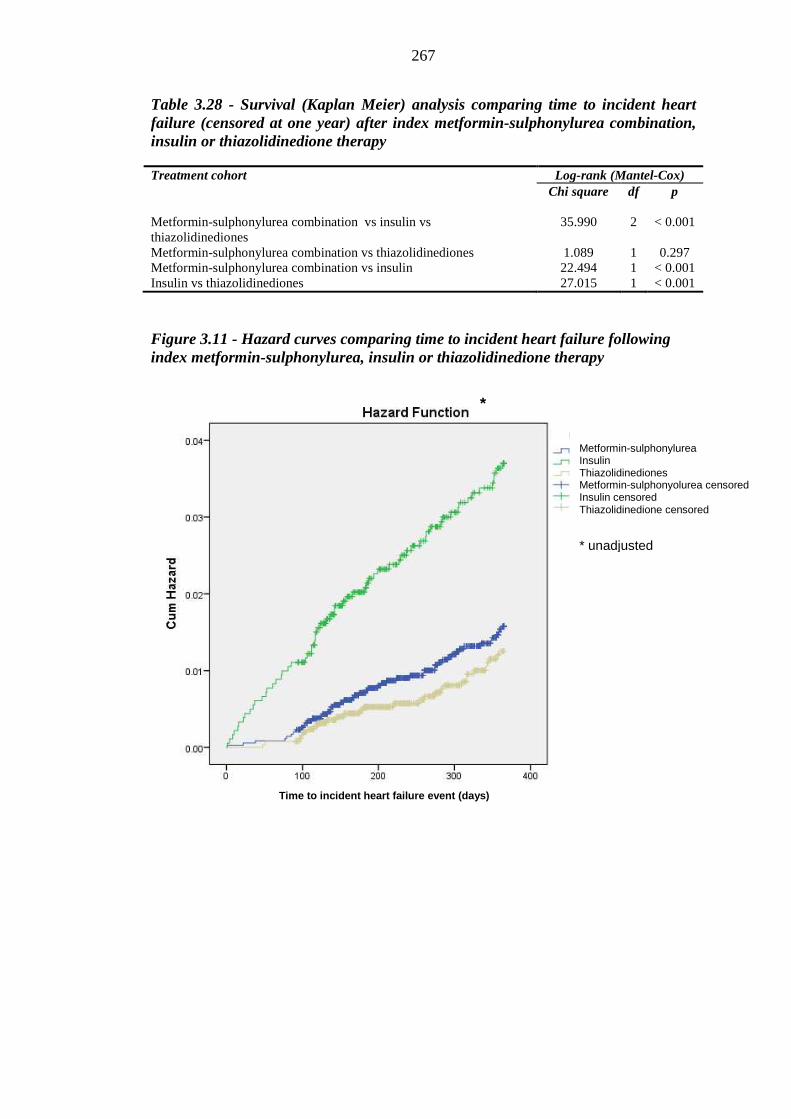
267
Table 3.28 - Survival (Kaplan Meier) analysis comparing time to incident heart failure (censored at one year) after index metformin-sulphonylurea combination, insulin or thiazolidinedione therapy Treatment cohort Log-rank (Mantel-Cox)
Chi square df p Metformin-sulphonylurea combination vs insulin vs thiazolidinediones
35.990 2 < 0.001
Metformin-sulphonylurea combination vs thiazolidinediones 1.089 1 0.297 Metformin-sulphonylurea combination vs insulin 22.494 1 < 0.001 Insulin vs thiazolidinediones 27.015 1 < 0.001
Figure 3.11 - Hazard curves comparing time to incident heart failure following index metformin-sulphonylurea, insulin or thiazolidinedione therapy
Metformin-sulphonylurea Insulin Thiazolidinediones Metformin-sulphonyolurea censored Insulin censored Thiazolidinedione censored
Time to incident heart failure event (days)
*
* unadjusted
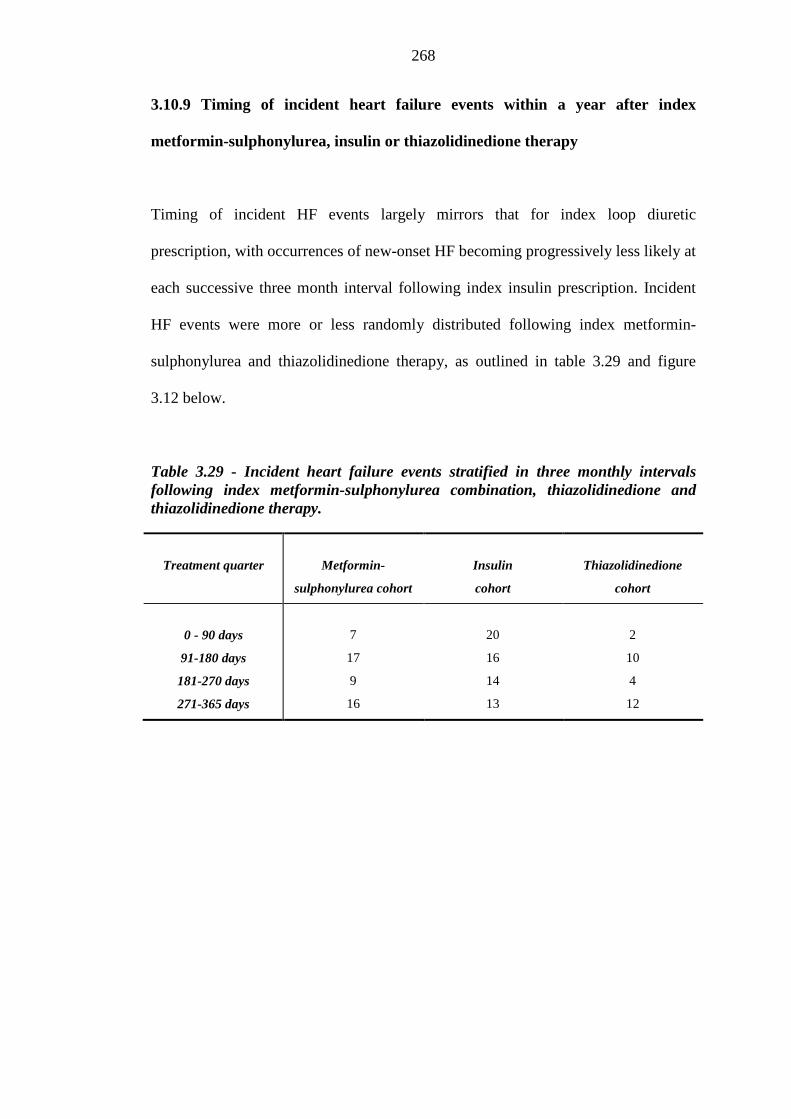
268
3.10.9 Timing of incident heart failure events within a year after index
metformin-sulphonylurea, insulin or thiazolidinedione therapy
Timing of incident HF events largely mirrors that for index loop diuretic
prescription, with occurrences of new-onset HF becoming progressively less likely at
each successive three month interval following index insulin prescription. Incident
HF events were more or less randomly distributed following index metformin-
sulphonylurea and thiazolidinedione therapy, as outlined in table 3.29 and figure
3.12 below.
Table 3.29 - Incident heart failure events stratified in three monthly intervals following index metformin-sulphonylurea combination, thiazolidinedione and thiazolidinedione therapy.
Treatment quarter
Metformin-
sulphonylurea cohort
Insulin
cohort
Thiazolidinedione
cohort
0 - 90 days
91-180 days
181-270 days
271-365 days
7
17
9
16
20
16
14
13
2
10
4
12
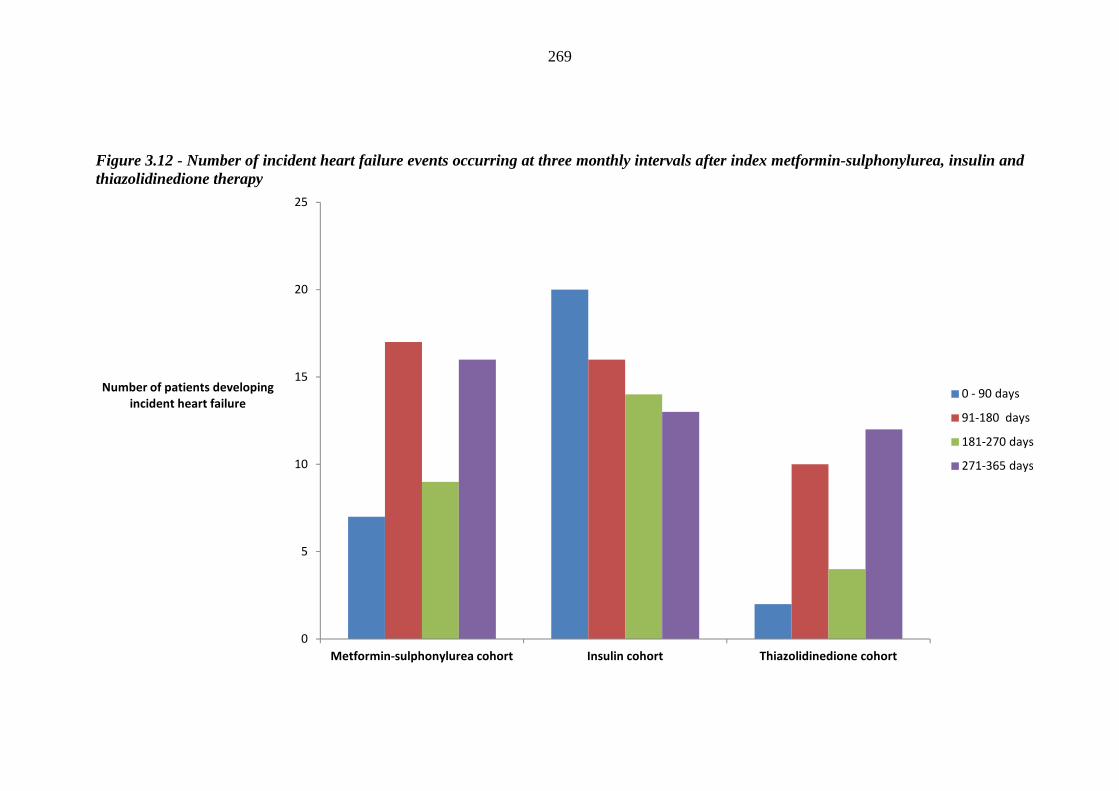
269
Figure 3.12 - Number of incident heart failure events occurring at three monthly intervals after index metformin-sulphonylurea, insulin and thiazolidinedione therapy
0
5
10
15
20
25
Metformin-sulphonylurea cohort Insulin cohort Thiazolidinedione cohort
Number of patients developing
incident heart failure0 - 90 days
91-180 days
181-270 days
271-365 days
270
3.11 Baseline characteristics
3.11.1 Age, diabetes duration and duration of follow-up
Table 3.30 outlines mean (SD) values for age, diabetes duration and study duration
for patients without background loop diuretic therapy. Thiazolidinedione-treated
patients tended to be younger than their metformin-sulphonylurea [63.23 (9.77) vs
64.96 (10.53) years; p < 0.001] and insulin-treated [63.23 (9.77) vs 64.92 (10.13)
years; p < 0.001] counterparts. As perhaps expected for a second/third line glucose
lowering agent such as a thiazolidinedione, patients prescribed the latter drugs
tended to have been diagnosed with diabetes at an earlier stage than patients on
metformin-sulphonylurea combination therapy [6.86 (4.90) vs 5.31 (4.74) years; p <
0.001], although not as long as for insulin-treated subjects [6.86 (4.90) vs 8.70 (6.02)
years; p < 0.001]. Thiazolidinedione-treated patients had the shortest follow-up
observation period [3.02 (2.16) years], possibly reflecting tendency to drug
withdrawal on developing/suspicion of developing adverse effects to these drugs.
This duration of follow-up was significantly shorter than for insulin [6.22 (4.10)
years] and metformin-sulphonylurea [3.53 (3.02) years] treated patients (p < 0.001
for either treatment cohort vs thiazolidinediones).
Table 3.31 outlines the mean (SD) values for age, diabetes duration and years of
follow-up for each treatment cohort, stratified by index loop diuretic status and
gender. Thiazolidinedione-treated patients requiring an index loop diuretic within
one year of inclusion into the cohort were older [67.98 (10.02) vs 63.02 (9.70) years;
p < 0.001], and had been diagnosed with diabetes at a significant earlier stage [8.44
271
(5.61) vs 6.79 (4.85) years; p = 0.003] than their index loop diuretic-free
counterparts. Index loop diuretic-treated TZD patients were also characterised by a
tendency for a shorter observation period of follow-up (albeit not statistically
significant) [2.60 (1.92) vs 3.04 (2.17) years; p = 0.056], once again, possibly
reflecting a tendency to discontinue thiazolidinedione therapy, or shorter survival
once there is clinical evidence of fluid overload. A similar analysis of incident HF
events occurring within one year of inclusion into each of the three treatment cohorts
(HF +) yielded largely similar results, albeit with differences in duration of follow-
up [1.50 (1.65) (HF +) vs 2.98 (2.12) (HF – ) years) reaching statistical significance
(p < 0.001), in contrast to those for diabetes duration [8.15 (4.88) (HF +) vs 6.93
(5.01) (HF –) years; p = 0.136) (data not shown in table format).
Likewise, MFSU patients treated with an index loop diuretic after inclusion into the
cohort were older [69.21 (9.81) vs 64.75 (10.52) years; p < 0.001], and had a longer
duration of diabetes [6.56 (5.50) vs 5.24 (4.69) years; p = 0.005] compared with their
index loop diuretic-free counterparts. The duration of follow-up of these patients was
largely similar [3.46 (3.16) vs 3.53 (3.01) years; p = 0.669] (table 3.31), an
observation that is perhaps not entirely surprising given the lack of a known
association between metformin-sulphonylurea combination therapy and fluid
overload. Similar trends were reported for incident HF events, with differences being
more pronounced, and reaching statistical significance with respect to duration of
follow-up [1.99 (2.24) (HF +) vs 3.49 (2.96) (HF -) years; p < 0.001) (data not
shown in table format). This suggests that once HF sets in, patients are either (i)
characterised by a shorter survival, or (ii) more likely to be switched to more
intensive glucose lowering therapy (such as insulin).
272
Insulin-treated patients requiring an index loop diuretic were older [68.30 (9.24) vs
64.44 (10.16) years; p < 0.001] and likely to be observed for a significantly shorter
period after inclusion into their respective cohort [5.18 (3.81) vs 6.37 (4.11) years; p
< 0.001] (table 3.31). Whilst discontinuation of insulin therapy is unlikely at such a
late stage of the disease, a shorter observation period could reflect higher mortality
rates for index loop diuretic-treated patients in this cohort. Diabetes duration was
similar in either insulin subgroup [9.12 (6.61) vs 8.65 (5.93) years; p = 0.420] (table
3.31). Similar results were reported for incident HF events (data not shown in table
format), with particularly pronounced, statistically significant, differences in
duration (years) of follow-up [3.30 (3.13) (HF +) vs 5.99 (4.06) (HF -) years; p <
0.001].
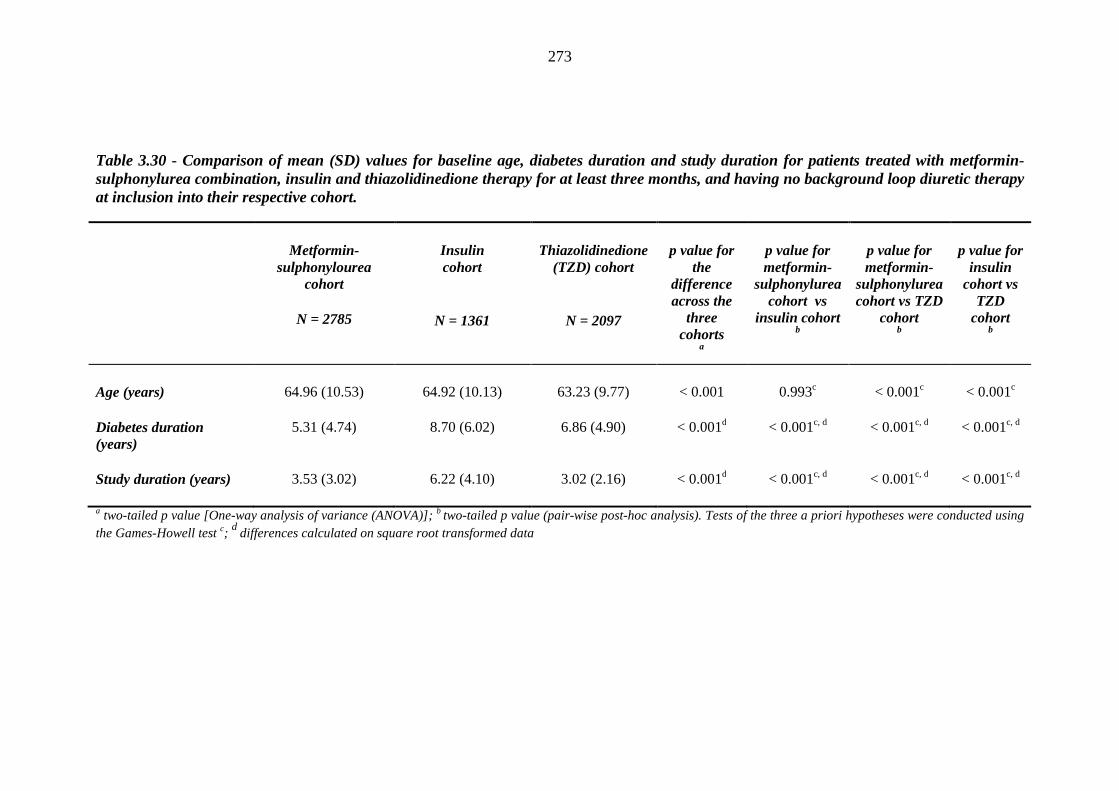
273
Table 3.30 - Comparison of mean (SD) values for baseline age, diabetes duration and study duration for patients treated with metformin-sulphonylurea combination, insulin and thiazolidinedione therapy for at least three months, and having no background loop diuretic therapy at inclusion into their respective cohort.
Metformin-
sulphonylourea cohort
N = 2785
Insulin cohort
N = 1361
Thiazolidinedione
(TZD) cohort
N = 2097
p value for
the difference across the
three cohorts
a
p value for metformin-
sulphonylurea cohort vs
insulin cohort b
p value for metformin-
sulphonylurea cohort vs TZD
cohort b
p value for
insulin cohort vs
TZD cohort
b
Age (years) 64.96 (10.53) 64.92 (10.13) 63.23 (9.77) < 0.001 0.993c < 0.001c < 0.001c Diabetes duration (years)
5.31 (4.74) 8.70 (6.02) 6.86 (4.90) < 0.001d < 0.001c, d < 0.001c, d < 0.001c, d
Study duration (years) 3.53 (3.02) 6.22 (4.10) 3.02 (2.16) < 0.001d < 0.001c, d < 0.001c, d < 0.001c, d
a two-tailed p value [One-way analysis of variance (ANOVA)]; b two-tailed p value (pair-wise post-hoc analysis). Tests of the three a priori hypotheses were conducted using the Games-Howell test c;
d differences calculated on square root transformed data
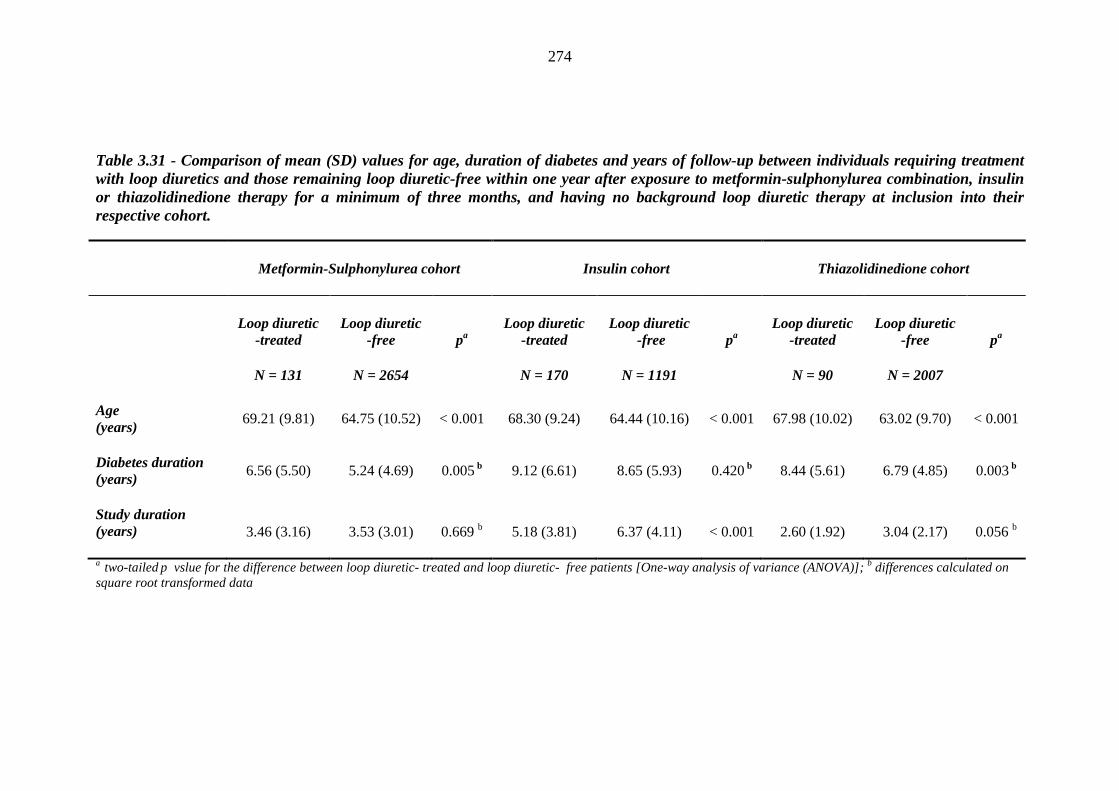
274
Table 3.31 - Comparison of mean (SD) values for age, duration of diabetes and years of follow-up between individuals requiring treatment with loop diuretics and those remaining loop diuretic-free within one year after exposure to metformin-sulphonylurea combination, insulin or thiazolidinedione therapy for a minimum of three months, and having no background loop diuretic therapy at inclusion into their respective cohort.
Metformin-Sulphonylurea cohort
Insulin cohort
Thiazolidinedione cohort
Loop diuretic
-treated
N = 131
Loop diuretic -free
N = 2654
pa
Loop diuretic
-treated
N = 170
Loop diuretic
-free
N = 1191
pa
Loop diuretic
-treated
N = 90
Loop diuretic
-free
N = 2007
pa
Age (years) 69.21 (9.81) 64.75 (10.52) < 0.001 68.30 (9.24) 64.44 (10.16) < 0.001 67.98 (10.02) 63.02 (9.70) < 0.001
Diabetes duration (years)
6.56 (5.50)
5.24 (4.69)
0.005 b
9.12 (6.61)
8.65 (5.93)
0.420 b
8.44 (5.61)
6.79 (4.85)
0.003 b
Study duration (years)
3.46 (3.16)
3.53 (3.01)
0.669 b
5.18 (3.81)
6.37 (4.11)
< 0.001
2.60 (1.92)
3.04 (2.17)
0.056 b
a two-tailed p vslue for the difference between loop diuretic- treated and loop diuretic- free patients [One-way analysis of variance (ANOVA)]; b differences calculated on square root transformed data
275
3.11.2 Past medical history
Analyzing data pertaining to these patients’ past medical history, 317 (15.1%) of
patients with no background loop diuretic therapy were prescribed an index
thiazolidinedione on a background of known coronary artery disease or peripheral
arterial disease or stroke. This is considerably lower than for metformin-
sulphonylurea- [549 (19.7%); p < 0.001] and insulin- [363 (26.7%); p < 0.001]
treated patients (table 3.32). Analyzing these macrovascular complications
separately, these post-hoc pairwise comparisons reached statistical significance only
for coronary artery disease and stroke. There was no significant difference in the
frequency of background peripheral artery disease between metformin-sulphonylurea
and thiazolidinedione-treated patients, although the latter were significantly less
likely to suffer from background PAD at index TZD prescription compared with
their insulin-treated counterparts [43 (2.1%) vs 67 (4.9%); p < 0.001] (table 3.32).
Analyzing for individuals who had never been prescribed a loop diuretic before
inclusion into their respective cohort, there were no significant differences in the
frequencies of background HF between thiazolidinedione and metformin-
sulphonylurea-treated patients [18 (0.9%) (TZD) vs 31 (1.1%) (MFSU); p = 0.377]
(table 3.32). Lower background rates for HF at an early stage of T2DM (when
metformin-sulphonylurea combination therapy is likely to be prescribed) are likely to
be offset by lower background rates of HF among patients prescribed
thiazolidinediones in accordance with established treatment guidelines. Insulin is
statistically more likely to be prescribed in patients known to suffer from HF
compared with thiazolidinediones [69 (5.1%) vs 18 (0.9%); p < 0.001], again
276
probably reflecting (i) consensus guided prescribing practices (thiazolidinediones are
contraindicated in patients with HF) and (ii) the fact that insulin requiring patients
are more prone to coronary artery disease with complicating HF given the more
advanced stage of their disease.
Interestingly, excluding patients with background loop diuretic therapy, HF rates
following inclusion into the respective treatment cohorts were lowest for
thiazolidinediones [64 (3.1%)], significantly less than for metformin-sulphonylurea
[162 (5.8%); p < 0.001] or insulin [209 (15.4%); p < 0.001] (table 3.32), although
this comparison must be interpreted with caution, as (i) these patients were followed
up for a significantly shorter period than their metformin-sulphonylurea and insulin-
treated counterparts, and (ii) background HF rates were significantly lower for
thiazolidinedione-treated patients compared with insulin-treated ones. Similar
observations apply to post-treatment coronary artery disease, stroke and peripheral
artery disease, or their composite.
Patients requiring an index loop diuretic within one year after index
thiazolidinedione prescription were more likely to suffer from background coronary
artery disease [18 (20.0%) vs 225 (11.2%); p = 0.011], peripheral artery disease [6
(6.7%) vs 37 (1.8%); p = 0.009] or the composite of macrovasular disease [27
(30.2%) vs 290 (14.4%); p < 0.001] (table 3.33). Although background stroke rates
were higher among patients requiring an index loop diuretic after TZD prescription
[4 (4.6%) vs 53 (2.6%)], these differences did not reach statistical significance,
possibly as a result of the relatively smaller number of patients with this disease
category at TZD prescription. Similar differences, namely higher background rates
277
of coronary artery disease, peripheral artery disease and the composite of
macrovascular disease were observed for index loop diuretic requiring metformin-
sulphonylurea-treated patients (table 3.33). Analyzing for incident HF events, both
thiazolidinedione and metformin-sulphonylurea combination therapy patients
diagnosed with new-onset HF within one year of inclusion into either cohort were
likewise characterised by significantly higher rates of background coronary artery
disease [11 (39.3%) vs 337 (13.4%), p = 0.001 for thiazolidinedione-treated patients;
22 (44.9%) vs 540 (15.8%), p < 0.001 for MFSU-treated patients]. Higher
background stroke rates among HF prone TZD- and MFSU-treated patients did not
reach statistical significance – however, the number of incident HF events was
particularly low for either cohort [3 (MFSU) and 2 (TZD)], rendering statistical
interpretation somewhat dubious (data not shown in table format).
Insulin-treated patients requiring requiring an index loop diuretic within one year
after inclusion into this glucose lowering treatment category were more likely to
have suffered from coronary artery disease [63 (37.1%) vs 214 (18.0%); p < 0.001]
or the composite of macrovascular disease [74 (43.5%) vs 289 (24.3%); p < 0.001] at
baseline. (table 3.33). Higher rates of index loop diuretic prescription among insulin-
treated patients with a history of stroke or peripheral artery disease did not reach
statistical significance. Similar results were replicated for incident HF events in this
treatment cohort (data not shown).
Perhaps not surprisingly, index loop diuretic prescription was commoner among
metformin-sulphonylurea or insulin-treated patients prescribed these drugs on a
background of HF [6 (4.6%) vs 25 (0.9%); p = 0.003 (metformin-sulphonylurea); 32
278
(18.8%) vs 37 (3.1%); p < 0.001 (insulin)]. Such a difference, although reported for
thiazolidinediones [2 (2.2%) vs 16 (0.8%)] did not reach statistical difference,
probably because of lower rates of background HF for this cohort (table 3.33).
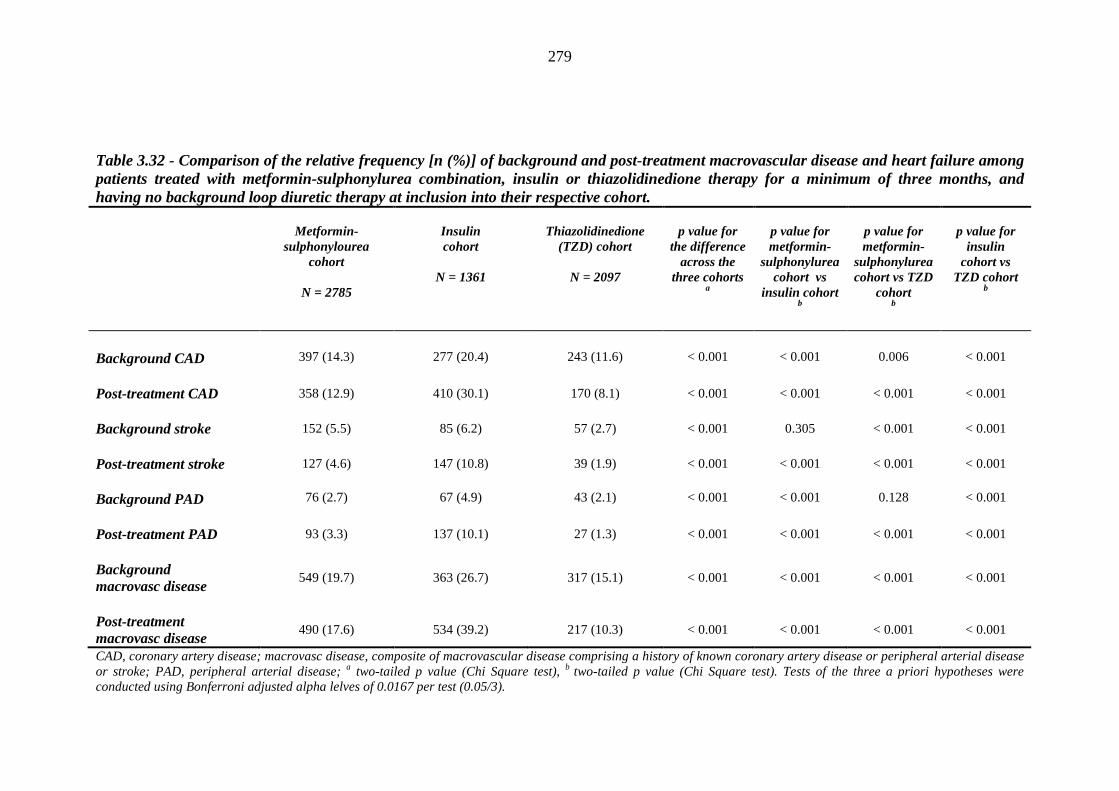
279
Table 3.32 - Comparison of the relative frequency [n (%)] of background and post-treatment macrovascular disease and heart failure among patients treated with metformin-sulphonylurea combination, insulin or thiazolidinedione therapy for a minimum of three months, and having no background loop diuretic therapy at inclusion into their respective cohort.
Metformin-
sulphonylourea cohort
N = 2785
Insulin cohort
N = 1361
Thiazolidinedione
(TZD) cohort
N = 2097
p value for
the difference across the
three cohorts a
p value for metformin-
sulphonylurea cohort vs
insulin cohort b
p value for metformin-
sulphonylurea cohort vs TZD
cohort b
p value for
insulin cohort vs
TZD cohort b
Background CAD
397 (14.3)
277 (20.4)
243 (11.6)
< 0.001
< 0.001
0.006
< 0.001
Post-treatment CAD 358 (12.9) 410 (30.1) 170 (8.1) < 0.001 < 0.001 < 0.001 < 0.001 Background stroke 152 (5.5) 85 (6.2) 57 (2.7) < 0.001 0.305 < 0.001 < 0.001
Post-treatment stroke 127 (4.6) 147 (10.8) 39 (1.9) < 0.001 < 0.001 < 0.001 < 0.001
Background PAD
76 (2.7)
67 (4.9)
43 (2.1)
< 0.001
< 0.001
0.128
< 0.001
Post-treatment PAD 93 (3.3) 137 (10.1) 27 (1.3) < 0.001 < 0.001 < 0.001 < 0.001
Background macrovasc disease
549 (19.7) 363 (26.7) 317 (15.1) < 0.001 < 0.001 < 0.001 < 0.001
Post-treatment macrovasc disease
490 (17.6) 534 (39.2) 217 (10.3) < 0.001 < 0.001 < 0.001 < 0.001
CAD, coronary artery disease; macrovasc disease, composite of macrovascular disease comprising a history of known coronary artery disease or peripheral arterial disease or stroke; PAD, peripheral arterial disease; a two-tailed p value (Chi Square test), b two-tailed p value (Chi Square test). Tests of the three a priori hypotheses were conducted using Bonferroni adjusted alpha lelves of 0.0167 per test (0.05/3).
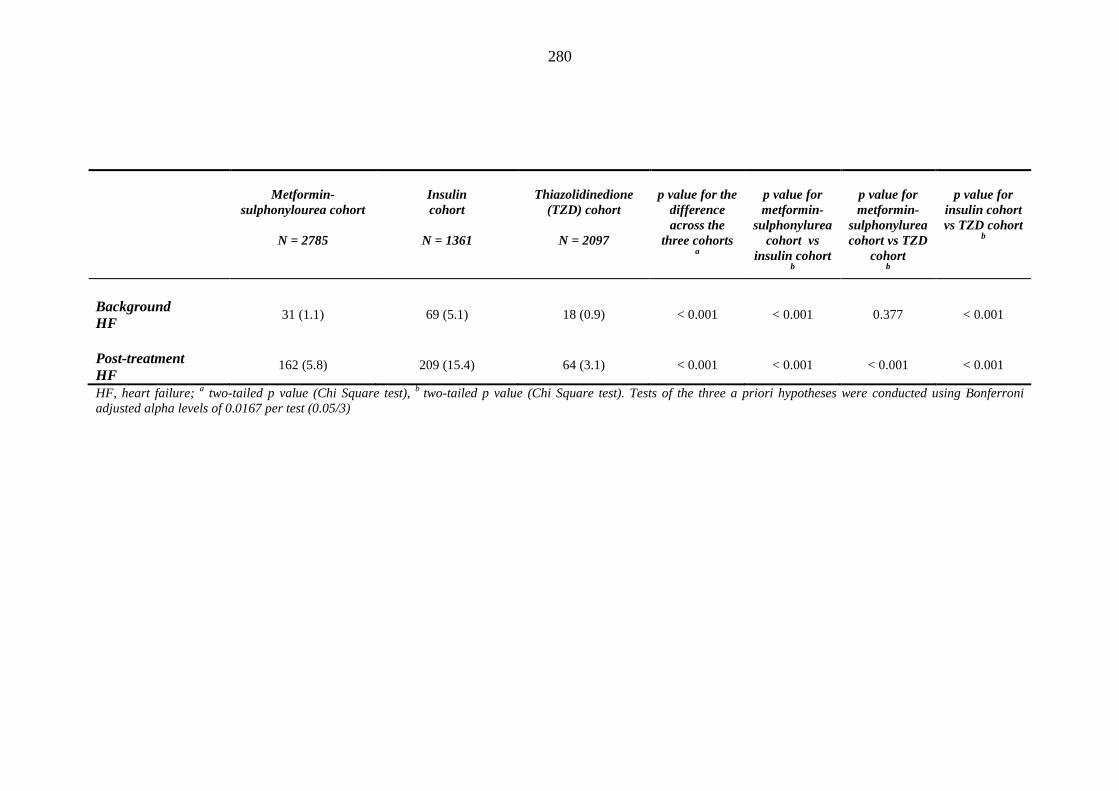
280
Metformin-sulphonylourea cohort
N = 2785
Insulin cohort
N = 1361
Thiazolidinedione
(TZD) cohort
N = 2097
p value for the
difference across the
three cohorts a
p value for metformin-
sulphonylurea cohort vs
insulin cohort b
p value for metformin-
sulphonylurea cohort vs TZD
cohort b
p value for
insulin cohort vs TZD cohort
b
Background HF
31 (1.1) 69 (5.1) 18 (0.9) < 0.001 < 0.001 0.377 < 0.001
Post-treatment HF
162 (5.8)
209 (15.4)
64 (3.1)
< 0.001
< 0.001
< 0.001
< 0.001
HF, heart failure; a two-tailed p value (Chi Square test), b two-tailed p value (Chi Square test). Tests of the three a priori hypotheses were conducted using Bonferroni adjusted alpha levels of 0.0167 per test (0.05/3)
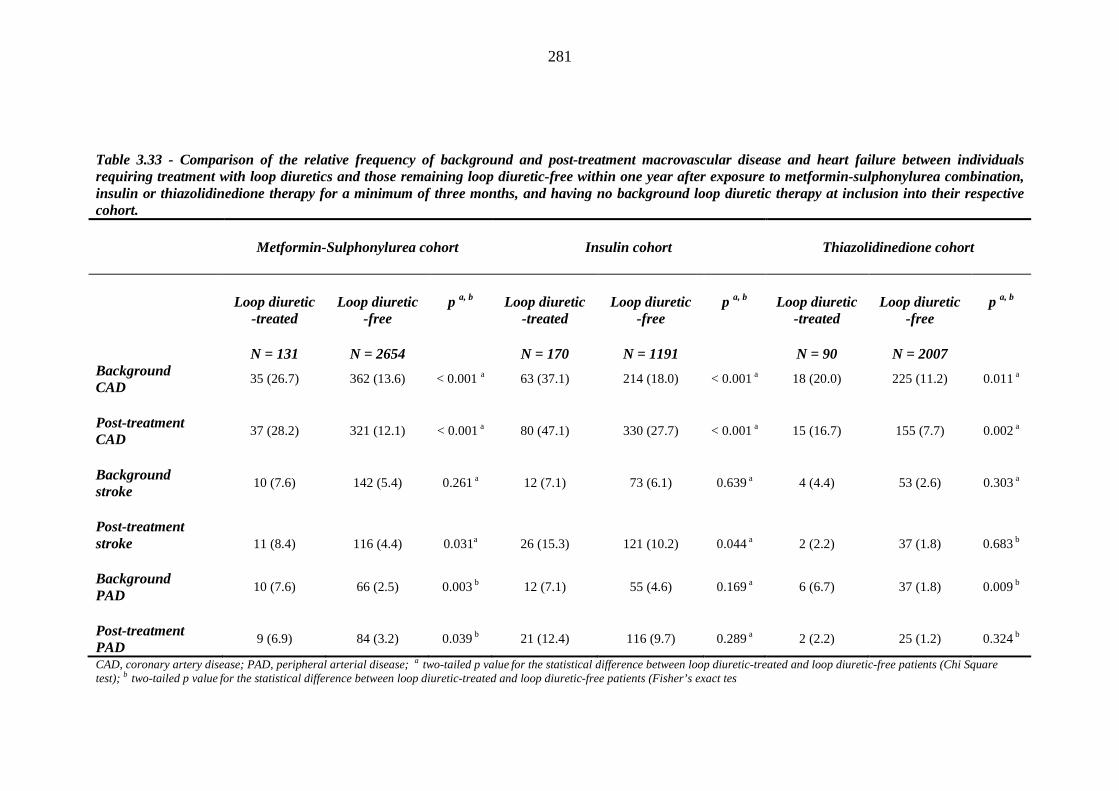
281
Table 3.33 - Comparison of the relative frequency of background and post-treatment macrovascular disease and heart failure between individuals requiring treatment with loop diuretics and those remaining loop diuretic-free within one year after exposure to metformin-sulphonylurea combination, insulin or thiazolidinedione therapy for a minimum of three months, and having no background loop diuretic therapy at inclusion into their respective cohort.
Metformin-Sulphonylurea cohort
Insulin cohort
Thiazolidinedione cohort
Loop diuretic -treated
N = 131
Loop diuretic
-free
N = 2654
p a, b
Loop diuretic
-treated
N = 170
Loop diuretic
-free
N = 1191
p a, b
Loop diuretic
-treated
N = 90
Loop diuretic
-free
N = 2007
p a, b
Background CAD
35 (26.7) 362 (13.6) < 0.001 a 63 (37.1) 214 (18.0) < 0.001 a 18 (20.0) 225 (11.2) 0.011 a
Post-treatment CAD
37 (28.2) 321 (12.1) < 0.001 a 80 (47.1) 330 (27.7) < 0.001 a 15 (16.7) 155 (7.7) 0.002 a
Background stroke
10 (7.6) 142 (5.4) 0.261 a 12 (7.1) 73 (6.1) 0.639 a 4 (4.4) 53 (2.6) 0.303 a
Post-treatment stroke
11 (8.4) 116 (4.4) 0.031a 26 (15.3) 121 (10.2) 0.044 a 2 (2.2) 37 (1.8) 0.683 b
Background PAD
10 (7.6) 66 (2.5) 0.003 b 12 (7.1) 55 (4.6) 0.169 a 6 (6.7) 37 (1.8) 0.009 b
Post-treatment PAD
9 (6.9) 84 (3.2) 0.039 b 21 (12.4) 116 (9.7) 0.289 a 2 (2.2) 25 (1.2) 0.324 b
CAD, coronary artery disease; PAD, peripheral arterial disease; a two-tailed p value for the statistical difference between loop diuretic-treated and loop diuretic-free patients (Chi Square test); b two-tailed p value for the statistical difference between loop diuretic-treated and loop diuretic-free patients (Fisher’s exact tes
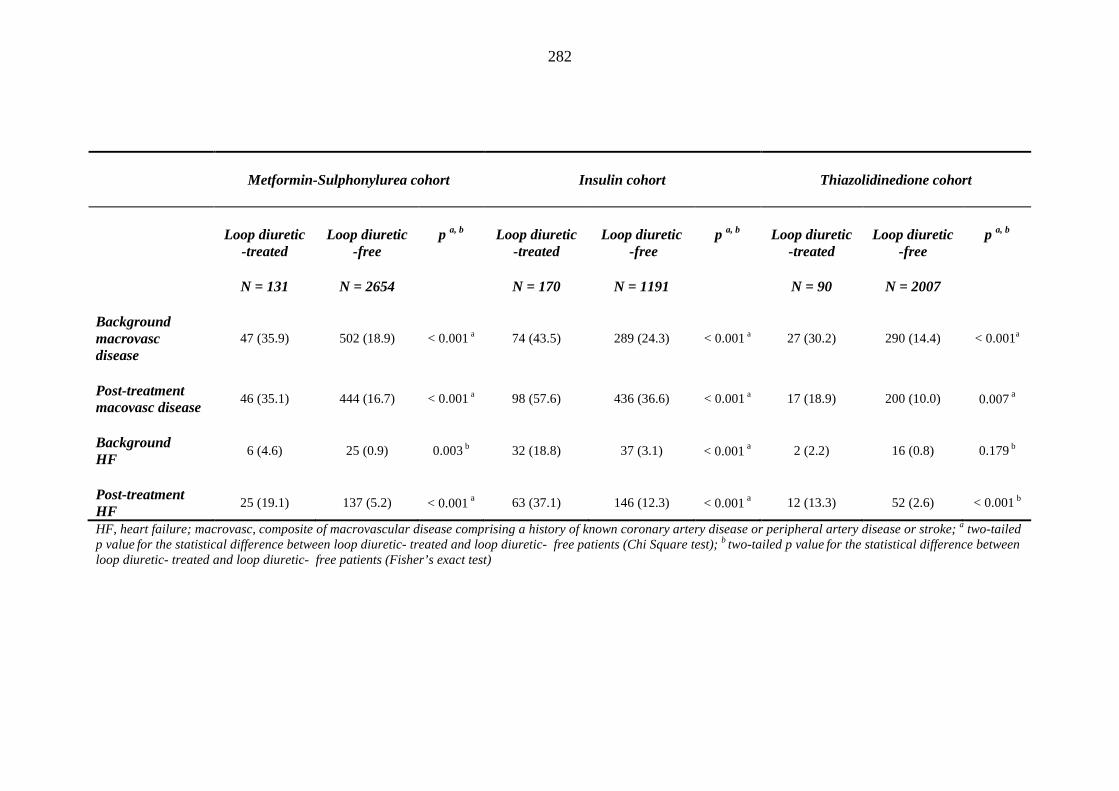
282
Metformin-Sulphonylurea cohort
Insulin cohort
Thiazolidinedione cohort
Loop diuretic
-treated
N = 131
Loop diuretic
-free
N = 2654
p a, b
Loop diuretic
-treated
N = 170
Loop diuretic
-free
N = 1191
p a, b
Loop diuretic
-treated
N = 90
Loop diuretic
-free
N = 2007
p a, b
Background macrovasc disease
47 (35.9) 502 (18.9) < 0.001 a 74 (43.5) 289 (24.3) < 0.001 a 27 (30.2) 290 (14.4) < 0.001a
Post-treatment macovasc disease
46 (35.1) 444 (16.7) < 0.001 a 98 (57.6) 436 (36.6) < 0.001 a 17 (18.9) 200 (10.0) 0.007 a
Background HF
6 (4.6) 25 (0.9) 0.003 b 32 (18.8) 37 (3.1) < 0.001 a 2 (2.2) 16 (0.8) 0.179 b
Post-treatment HF
25 (19.1) 137 (5.2) < 0.001 a 63 (37.1) 146 (12.3) < 0.001 a 12 (13.3) 52 (2.6) < 0.001 b
HF, heart failure; macrovasc, composite of macrovascular disease comprising a history of known coronary artery disease or peripheral artery disease or stroke; a two-tailed p value for the statistical difference between loop diuretic- treated and loop diuretic- free patients (Chi Square test); b two-tailed p value for the statistical difference between loop diuretic- treated and loop diuretic- free patients (Fisher’s exact test)
283
3.11.3 Drug history
This study captured data pertaining to a wide range of drugs which could possibly, at
least partly, explain an increased risk for fluid overload following index
thiazolidinedione prescription. Thiazolidinedione-treated patients were more likely
to be prescribed these oral glucose lowering agents on a background of peripheral
vasodilators (3.2%), thiazide diuretics (35.8%), non-steroidal anti-inflammatory
drugs (69.8%), angiotensin converting enzyme inhibitors (54.9%) and aldosterone
receptor antagonists (14.9%), compared with their metformin-sulphonylurea or
insulin-treated counterparts (table 3.34).
Thiazolidinedione-treated patients were additionally characterised by higher
background rates of dihydropyridine calcium channel blockers (35.4%), diltiazem
(6.5%), beta blockers (40.1%), nitrates (18.7%) and other anti-anginal drugs (2.2%)
and lower background prescription of peripheral vasocilators (3.2%) compared with
patients on insulin. Antecedent prescription of alpha adrenoceptor blocking drugs
was commoner among thiazolidinedione prescribed patients (8.9%) compared with
metformin-sulphonylurea-treated ones (table 3.34).
Searching for possible causes of fluid overload, this study compared frequencies of
background drug therapy between patients requiring loop diuretic (LD+), and those
remaining loop diuretic-free (LD-) after index thiazolidinedione therapy (table 3.35).
The former patients were more likely to be treated with a nitrate [25 (27.8%) (LD+)
vs 367 (18.3%) (LD-); p = 0.024], in keeping with higher rates of coronary artery
disease among this category of thiazolidinedione-treated patients. Higher
284
background use of thiazides [41 (45.6%) (LD+) vs 710 (35.4%) (LD-)] was
borderline statistically significant (p = 0.049).
Patients were more likely to require an index prescription of a loop diuretic after
index metformin-sulphonylurea combination therapy if the latter was introduced
against a background of peripheral vasodilators [12 (9.2%) (LD+) vs 118 (4.4%)
(LD-); p = 0.013), dihydropyridine calcium channel blockers [55 (42.0%) (LD+) vs
853 (32.1%) (LD-); p = 0.019], diltiazem [19 (14.5%) (LD+) vs 170 (6.4%) (LD-); p
< 0.001); beta blockers [64 (48.9%) (LD+) vs 982 (37.0%) (LD-); p = 0.006] or
nitrates [52 (39.7%) (LD) vs 532 (20.0%) (LD-); p < 0.001] (table 3.35).
T2DM patients treated with insulin were more likely to require treatment with an
index loop diuretic after their index insulin prescription if the latter was introduced
on a background of thiazide diuretics [46 (27.1%) (LD+) vs 237 (19.9%) (LD-); p =
0.031], diltiazem [25 (14.7%) (LD+) vs 115 (9.7%) (LD-); p = 0.043], alpha
adrenoceptor blocking drugs [22 (12.9%) (LD+) vs 75 (6.3) (LD-); p = 0.002],
angiotensin II receptor antagonists [16 (9.4%) (LD+) vs 58 (4.9%) (LD-); p = 0.015]
or nitrates [60 (35.3%) (LD+) vs 280 (23.5%) (LD-); p = 0.001] (table 3.35).
Likewise, a comparison of background drug prescription among individuals
developing incident heart failure (HF+), and those remaining heart failure free (HF-)
within one year of inclusion into each of the three treatment cohorts yielded
provocative but preliminary results (data not shown), as interpretation was limited in
by small numbers of patients being prescribed less commonly used drugs, especially
in the context of a relatively infrequent adverse event of interest (HF). Thus, patients
285
developing incident HF within one year of their index thiazolidinedione prescription
were more likely to have had their oral glucose lowering agent introduced against a
background of verapamil [4 (14.3%) (HF+) vs 34 (1.3%) (HF-); p = 0.001],
diltiazem [7 (25.0%) (HF+) vs 206 (8.2%) (HF-); p = 0.007], beta blockers [18
(64.3%) (HF+) vs 1084 (43.0%) (HF-); p = 0.024], and nitrates [16 (57.1%) (HF+)
vs 548 (21.7%) (HF-); p < 0.001]. Analyzing for metformin-sulphonylurea
combination therapy, patients were more likely to be diagnosed with new-onset HF
if their glucose lowering therapy was prescribed while on potassium sparing
diuretics/aldosterone antagonists [8 (16.3%) (HF+) vs 148 (4.3%) (HF-); p = 0.001],
beta blockers [28 (57.1%) (HF+] vs 1402 (40.9%) (HF-); p = 0.022] or nitrates [25
(51.0%) (HF+) vs 831 (24.2%) (HF-); p <0 .001]. Patients whose insulin therapy was
commenced while on potassium sparing diuretics/aldosterone antagonists [10
(15.9%) (HF+) vs 99 (5.7%) (HF-); p = 0.003], non-steroidal anti-inflammatory
drugs [50 (79.4%) (HF+) vs 1148 (65.5%) (HF-); p = 0.023], dihydropyridine
calcium channel blockers [34 (54.0%) (HF+) vs 673 (38.4%); p = 0.013], diltiazem
[18 (28.6%) (HF+) vs 213 (12.2%) (HF-); p < 0.001], angiotensin converting
enzyme inhibitors [33 (55.6%) (HF+) vs 725 (41.4%) (HF-); p = 0.025] or nitrates
[36 (57.1%) (HF+) vs 495 (28.3%) (HF-); p < 0.001] were more likely to progress to
incident HF within one year. Baseline angiotensin II receptor antagonists were only
marginally significant [9 (14.3%) (HF+) vs 128 (7.3%) (HF-); p = 0.050).
Associations with potassium sparing diuretics/aldosterone antagonists, angiotensin
converting enzyme inhibitors, angiotensin II receptor antagonists and nitrates suggest
a priori coronary artery disease, its risk factors (including hypertension) and its
consequence of interest (namely HF), and are consistent with results reported earlier.
286
As expected, patients developing incident HF within one year of inclusion into either
of the three cohorts were more likely to have had their glucose modulating drug
introduced against a background of loop diuretic therapy [28 (57.1%) (HF+) vs 694
(20.3%) (HF-), p < 0.001 for metformin-sulphonylurea-treated patients; 40 (63.5%)
(HF+) vs 485 (27.7%) (HF-), p < 0.001 for insulin-treated patients; 15 (53.6%)
(HF+) vs 455 (18.0%) (HF-), p < 0.001 for thiazolidinedione-treated patients] (data
not shown).
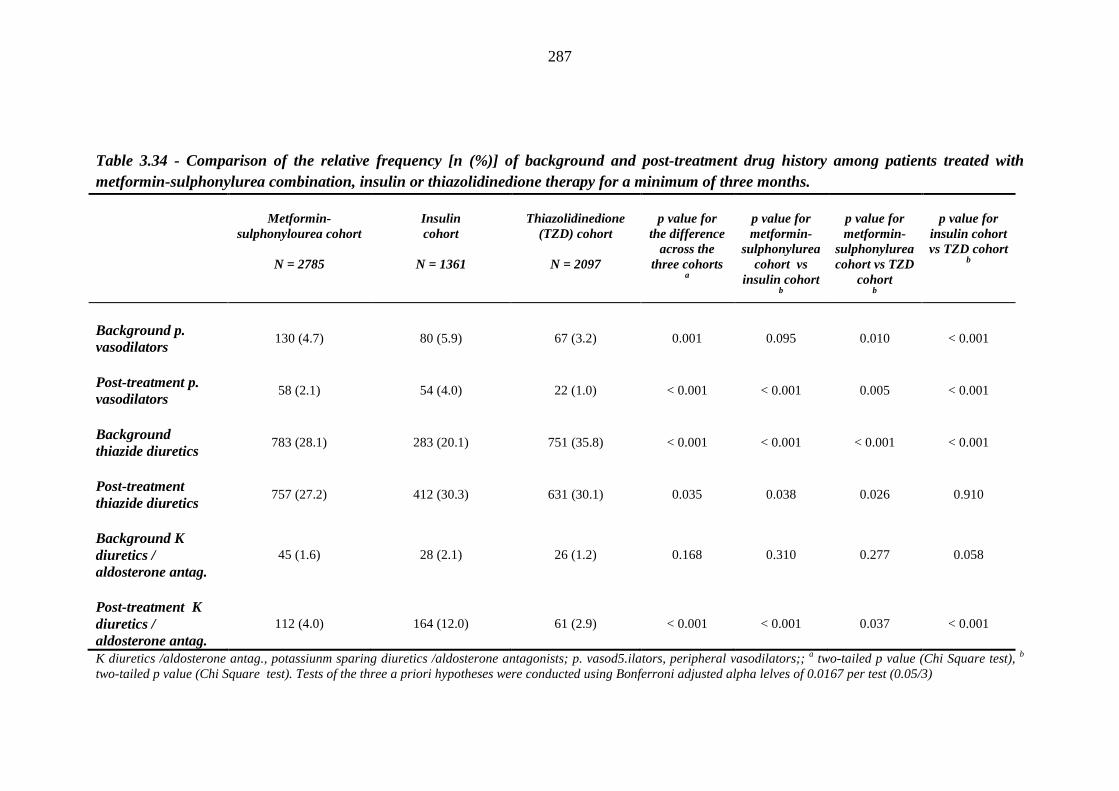
287
Table 3.34 - Comparison of the relative frequency [n (%)] of background and post-treatment drug history among patients treated with metformin-sulphonylurea combination, insulin or thiazolidinedione therapy for a minimum of three months.
Metformin-
sulphonylourea cohort
N = 2785
Insulin cohort
N = 1361
Thiazolidinedione
(TZD) cohort
N = 2097
p value for
the difference across the
three cohorts a
p value for metformin-
sulphonylurea cohort vs
insulin cohort b
p value for metformin-
sulphonylurea cohort vs TZD
cohort b
p value for
insulin cohort vs TZD cohort
b
Background p. vasodilators
130 (4.7) 80 (5.9) 67 (3.2) 0.001 0.095 0.010 < 0.001
Post-treatment p. vasodilators
58 (2.1) 54 (4.0) 22 (1.0) < 0.001 < 0.001 0.005 < 0.001
Background thiazide diuretics
783 (28.1) 283 (20.1) 751 (35.8) < 0.001 < 0.001 < 0.001 < 0.001
Post-treatment thiazide diuretics
757 (27.2) 412 (30.3) 631 (30.1) 0.035 0.038 0.026 0.910
Background K diuretics / aldosterone antag.
45 (1.6) 28 (2.1) 26 (1.2) 0.168 0.310 0.277 0.058
Post-treatment K diuretics / aldosterone antag.
112 (4.0) 164 (12.0) 61 (2.9) < 0.001 < 0.001 0.037 < 0.001
K diuretics /aldosterone antag., potassiunm sparing diuretics /aldosterone antagonists; p. vasod5.ilators, peripheral vasodilators;; a two-tailed p value (Chi Square test), b
two-tailed p value (Chi Square test). Tests of the three a priori hypotheses were conducted using Bonferroni adjusted alpha lelves of 0.0167 per test (0.05/3)
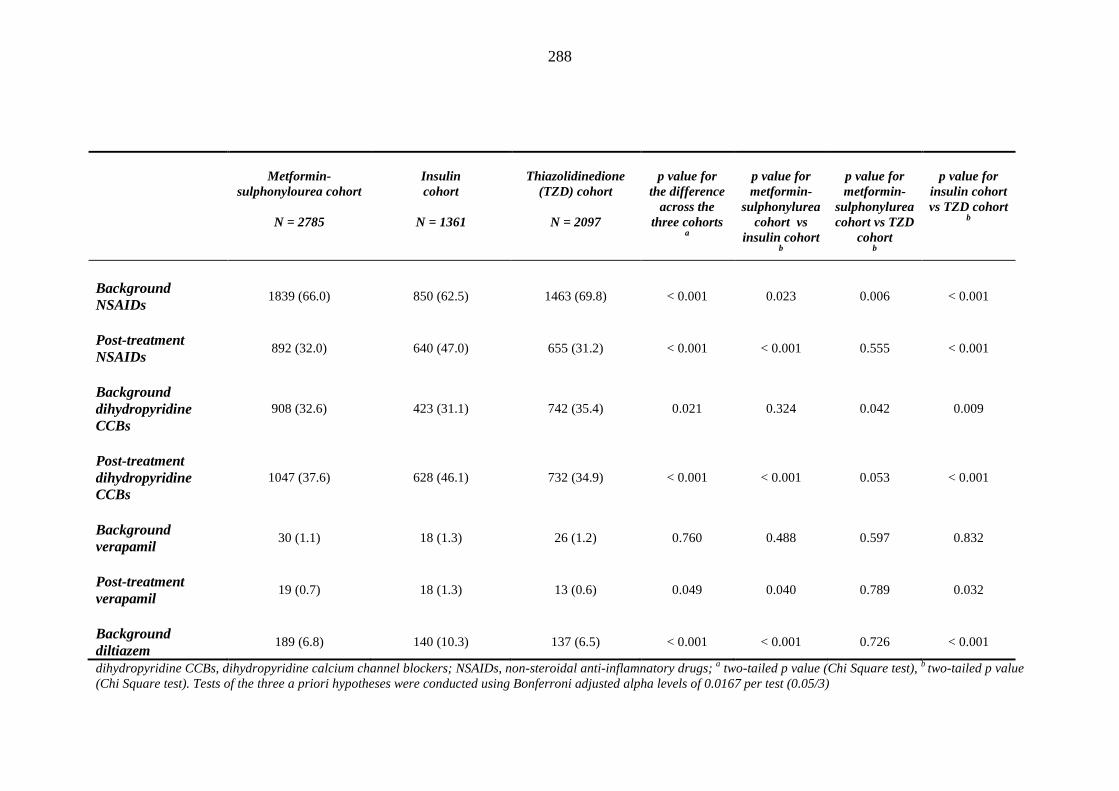
288
Metformin-
sulphonylourea cohort
N = 2785
Insulin cohort
N = 1361
Thiazolidinedione
(TZD) cohort
N = 2097
p value for
the difference across the
three cohorts a
p value for metformin-
sulphonylurea cohort vs
insulin cohort b
p value for metformin-
sulphonylurea cohort vs TZD
cohort b
p value for
insulin cohort vs TZD cohort
b
Background NSAIDs
1839 (66.0) 850 (62.5) 1463 (69.8) < 0.001 0.023 0.006 < 0.001
Post-treatment NSAIDs
892 (32.0) 640 (47.0) 655 (31.2) < 0.001 < 0.001 0.555 < 0.001
Background dihydropyridine CCBs
908 (32.6) 423 (31.1) 742 (35.4) 0.021 0.324 0.042 0.009
Post-treatment dihydropyridine CCBs
1047 (37.6) 628 (46.1) 732 (34.9) < 0.001 < 0.001 0.053 < 0.001
Background verapamil
30 (1.1) 18 (1.3) 26 (1.2) 0.760 0.488 0.597 0.832
Post-treatment verapamil
19 (0.7) 18 (1.3) 13 (0.6) 0.049 0.040 0.789 0.032
Background diltiazem
189 (6.8) 140 (10.3) 137 (6.5) < 0.001 < 0.001 0.726 < 0.001
dihydropyridine CCBs, dihydropyridine calcium channel blockers; NSAIDs, non-steroidal anti-inflamnatory drugs; a two-tailed p value (Chi Square test), b two-tailed p value (Chi Square test). Tests of the three a priori hypotheses were conducted using Bonferroni adjusted alpha levels of 0.0167 per test (0.05/3)
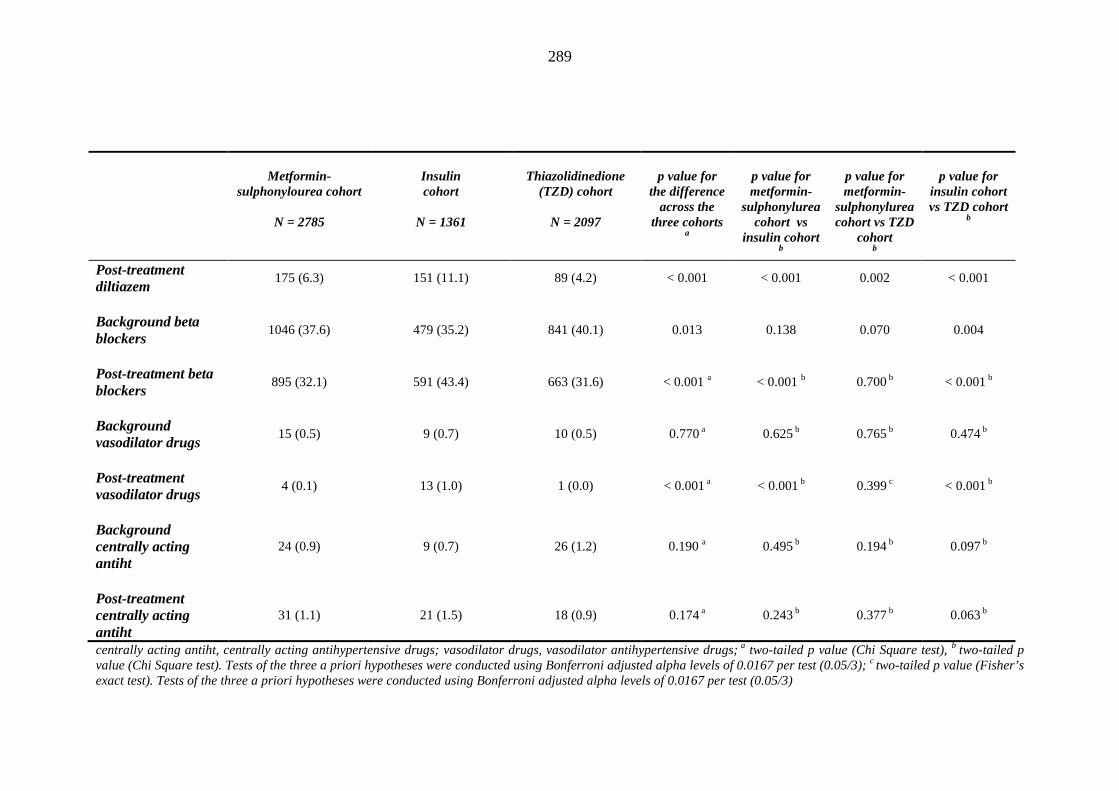
289
Metformin-
sulphonylourea cohort
N = 2785
Insulin cohort
N = 1361
Thiazolidinedione
(TZD) cohort
N = 2097
p value for
the difference across the
three cohorts a
p value for metformin-
sulphonylurea cohort vs
insulin cohort b
p value for metformin-
sulphonylurea cohort vs TZD
cohort b
p value for
insulin cohort vs TZD cohort
b
Post-treatment diltiazem
175 (6.3) 151 (11.1) 89 (4.2) < 0.001 < 0.001 0.002 < 0.001
Background beta blockers
1046 (37.6) 479 (35.2) 841 (40.1) 0.013 0.138 0.070 0.004
Post-treatment beta blockers
895 (32.1) 591 (43.4) 663 (31.6) < 0.001 a < 0.001 b 0.700 b < 0.001 b
Background vasodilator drugs
15 (0.5) 9 (0.7) 10 (0.5) 0.770 a 0.625 b 0.765 b 0.474 b
Post-treatment vasodilator drugs
4 (0.1) 13 (1.0) 1 (0.0) < 0.001 a < 0.001 b 0.399 c < 0.001 b
Background centrally acting antiht
24 (0.9) 9 (0.7) 26 (1.2) 0.190 a 0.495 b 0.194 b 0.097 b
Post-treatment centrally acting antiht
31 (1.1) 21 (1.5) 18 (0.9) 0.174 a 0.243 b 0.377 b 0.063 b
centrally acting antiht, centrally acting antihypertensive drugs; vasodilator drugs, vasodilator antihypertensive drugs; a two-tailed p value (Chi Square test), b two-tailed p value (Chi Square test). Tests of the three a priori hypotheses were conducted using Bonferroni adjusted alpha levels of 0.0167 per test (0.05/3); c two-tailed p value (Fisher’s exact test). Tests of the three a priori hypotheses were conducted using Bonferroni adjusted alpha levels of 0.0167 per test (0.05/3)
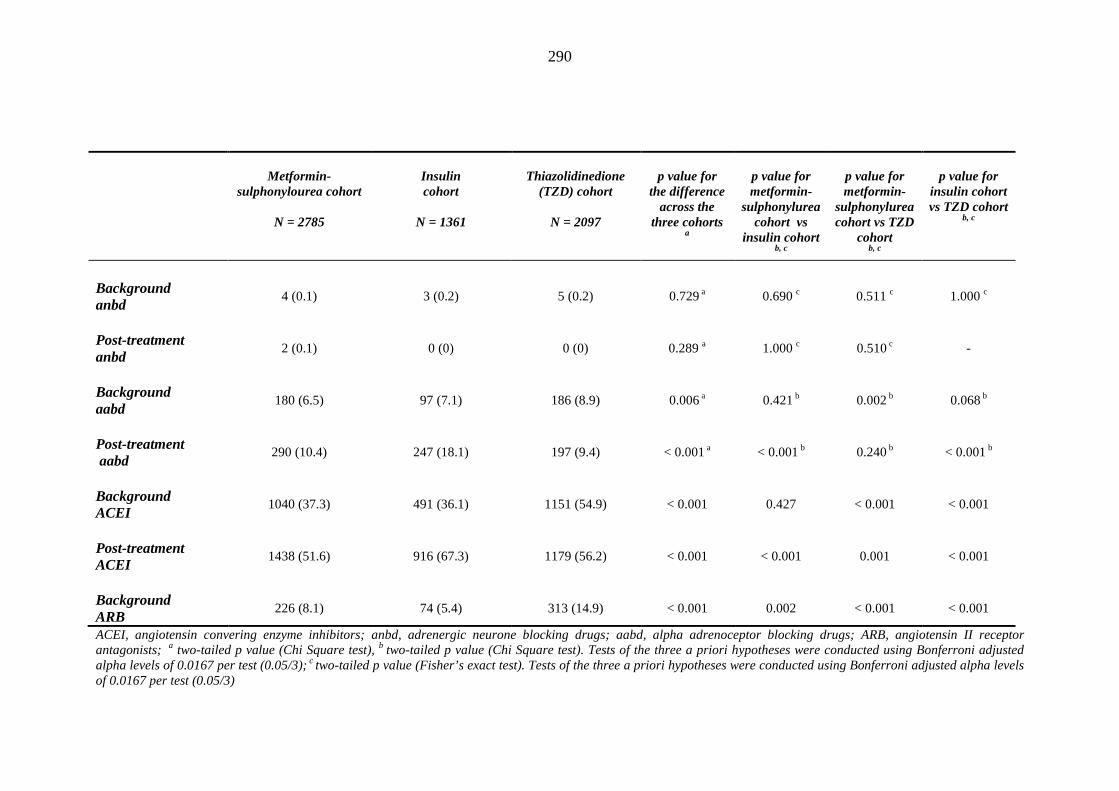
290
Metformin-
sulphonylourea cohort
N = 2785
Insulin cohort
N = 1361
Thiazolidinedione
(TZD) cohort
N = 2097
p value for
the difference across the
three cohorts a
p value for metformin-
sulphonylurea cohort vs
insulin cohort b, c
p value for metformin-
sulphonylurea cohort vs TZD
cohort b, c
p value for
insulin cohort vs TZD cohort
b, c
Background anbd
4 (0.1) 3 (0.2) 5 (0.2) 0.729 a 0.690 c 0.511 c 1.000 c
Post-treatment anbd
2 (0.1) 0 (0) 0 (0) 0.289 a 1.000 c 0.510 c -
Background aabd
180 (6.5) 97 (7.1) 186 (8.9) 0.006 a 0.421 b 0.002 b 0.068 b
Post-treatment aabd
290 (10.4) 247 (18.1) 197 (9.4) < 0.001 a < 0.001 b 0.240 b < 0.001 b
Background ACEI
1040 (37.3) 491 (36.1) 1151 (54.9) < 0.001 0.427 < 0.001 < 0.001
Post-treatment ACEI
1438 (51.6) 916 (67.3) 1179 (56.2) < 0.001 < 0.001 0.001 < 0.001
Background ARB
226 (8.1) 74 (5.4) 313 (14.9) < 0.001 0.002 < 0.001 < 0.001
ACEI, angiotensin convering enzyme inhibitors; anbd, adrenergic neurone blocking drugs; aabd, alpha adrenoceptor blocking drugs; ARB, angiotensin II receptor antagonists; a two-tailed p value (Chi Square test), b two-tailed p value (Chi Square test). Tests of the three a priori hypotheses were conducted using Bonferroni adjusted alpha levels of 0.0167 per test (0.05/3); c two-tailed p value (Fisher’s exact test). Tests of the three a priori hypotheses were conducted using Bonferroni adjusted alpha levels of 0.0167 per test (0.05/3)
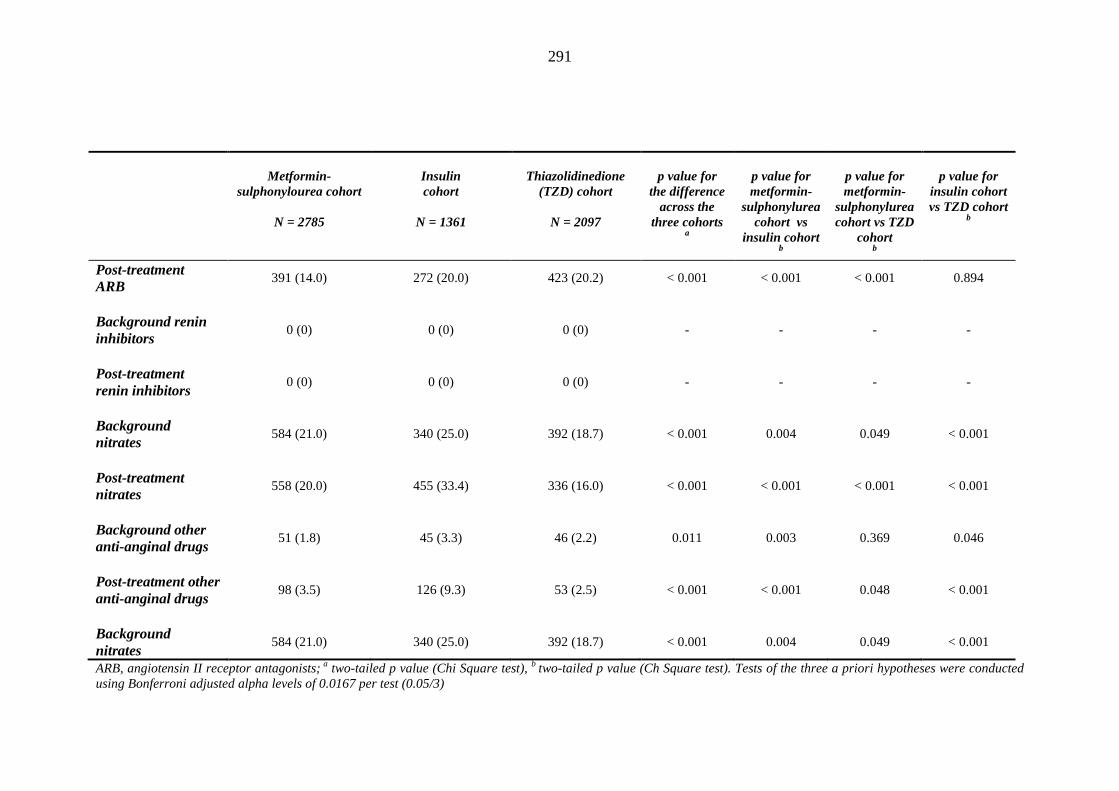
291
Metformin-
sulphonylourea cohort
N = 2785
Insulin cohort
N = 1361
Thiazolidinedione
(TZD) cohort
N = 2097
p value for
the difference across the
three cohorts a
p value for metformin-
sulphonylurea cohort vs
insulin cohort b
p value for metformin-
sulphonylurea cohort vs TZD
cohort b
p value for
insulin cohort vs TZD cohort
b
Post-treatment ARB
391 (14.0) 272 (20.0) 423 (20.2) < 0.001 < 0.001 < 0.001 0.894
Background renin inhibitors
0 (0) 0 (0) 0 (0) - - - -
Post-treatment renin inhibitors
0 (0) 0 (0) 0 (0) - - - -
Background nitrates
584 (21.0) 340 (25.0) 392 (18.7) < 0.001 0.004 0.049 < 0.001
Post-treatment nitrates
558 (20.0) 455 (33.4) 336 (16.0) < 0.001 < 0.001 < 0.001 < 0.001
Background other anti-anginal drugs
51 (1.8) 45 (3.3) 46 (2.2) 0.011 0.003 0.369 0.046
Post-treatment other anti-anginal drugs
98 (3.5) 126 (9.3) 53 (2.5) < 0.001 < 0.001 0.048 < 0.001
Background nitrates
584 (21.0) 340 (25.0) 392 (18.7) < 0.001 0.004 0.049 < 0.001
ARB, angiotensin II receptor antagonists; a two-tailed p value (Chi Square test), b two-tailed p value (Ch Square test). Tests of the three a priori hypotheses were conducted using Bonferroni adjusted alpha levels of 0.0167 per test (0.05/3)
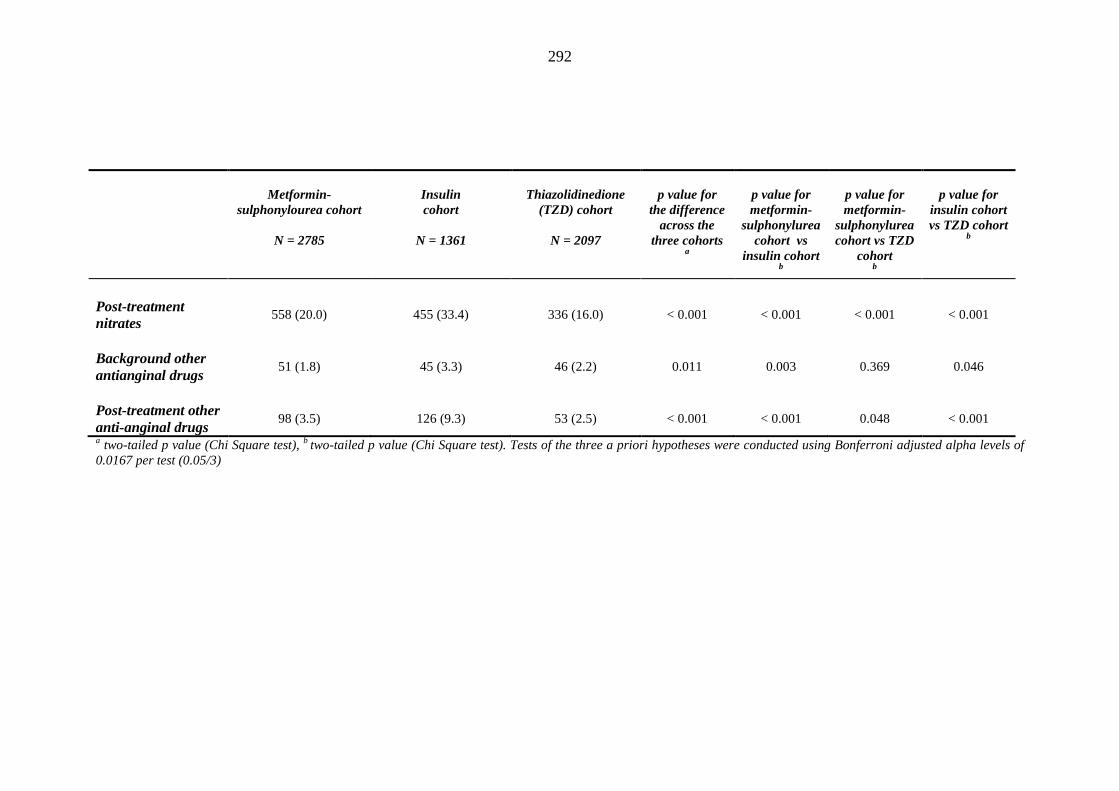
292
Metformin-sulphonylourea cohort
N = 2785
Insulin cohort
N = 1361
Thiazolidinedione
(TZD) cohort
N = 2097
p value for
the difference across the
three cohorts a
p value for metformin-
sulphonylurea cohort vs
insulin cohort b
p value for metformin-
sulphonylurea cohort vs TZD
cohort b
p value for
insulin cohort vs TZD cohort
b
Post-treatment nitrates
558 (20.0) 455 (33.4) 336 (16.0) < 0.001 < 0.001 < 0.001 < 0.001
Background other antianginal drugs
51 (1.8) 45 (3.3) 46 (2.2) 0.011 0.003 0.369 0.046
Post-treatment other anti-anginal drugs
98 (3.5) 126 (9.3) 53 (2.5) < 0.001 < 0.001 0.048 < 0.001
a two-tailed p value (Chi Square test), b two-tailed p value (Chi Square test). Tests of the three a priori hypotheses were conducted using Bonferroni adjusted alpha levels of 0.0167 per test (0.05/3)
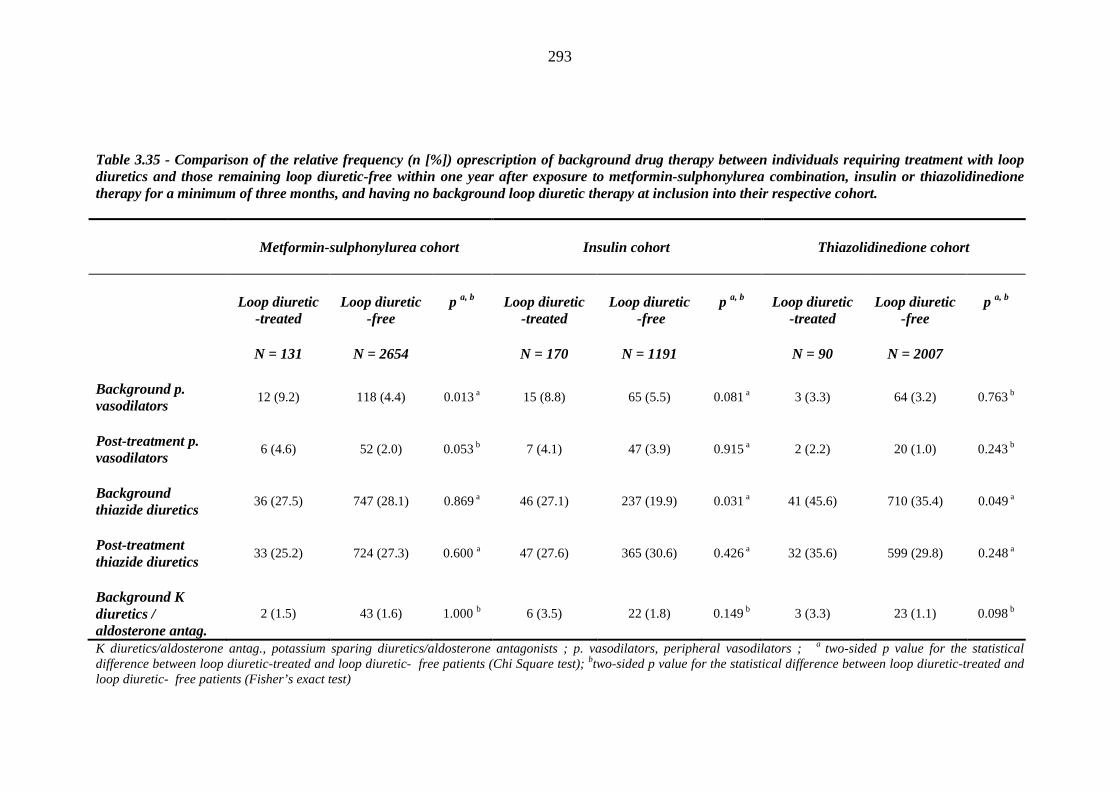
293
Table 3.35 - Comparison of the relative frequency (n [%]) oprescription of background drug therapy between individuals requiring treatment with loop diuretics and those remaining loop diuretic-free within one year after exposure to metformin-sulphonylurea combination, insulin or thiazolidinedione therapy for a minimum of three months, and having no background loop diuretic therapy at inclusion into their respective cohort.
Metformin-sulphonylurea cohort
Insulin cohort
Thiazolidinedione cohort
Loop diuretic
-treated
N = 131
Loop diuretic
-free
N = 2654
p a, b
Loop diuretic
-treated
N = 170
Loop diuretic
-free
N = 1191
p a, b
Loop diuretic
-treated
N = 90
Loop diuretic
-free
N = 2007
p a, b
Background p. vasodilators
12 (9.2) 118 (4.4) 0.013 a 15 (8.8) 65 (5.5) 0.081 a 3 (3.3) 64 (3.2) 0.763 b
Post-treatment p. vasodilators
6 (4.6) 52 (2.0) 0.053 b 7 (4.1) 47 (3.9) 0.915 a 2 (2.2) 20 (1.0) 0.243 b
Background thiazide diuretics
36 (27.5) 747 (28.1) 0.869 a 46 (27.1) 237 (19.9) 0.031 a 41 (45.6) 710 (35.4) 0.049 a
Post-treatment thiazide diuretics
33 (25.2) 724 (27.3) 0.600 a 47 (27.6) 365 (30.6) 0.426 a 32 (35.6) 599 (29.8) 0.248 a
Background K diuretics / aldosterone antag.
2 (1.5) 43 (1.6) 1.000 b 6 (3.5) 22 (1.8) 0.149 b 3 (3.3) 23 (1.1) 0.098 b
K diuretics/aldosterone antag., potassium sparing diuretics/aldosterone antagonists ; p. vasodilators, peripheral vasodilators ; a two-sided p value for the statistical difference between loop diuretic-treated and loop diuretic- free patients (Chi Square test); btwo-sided p value for the statistical difference between loop diuretic-treated and loop diuretic- free patients (Fisher’s exact test)
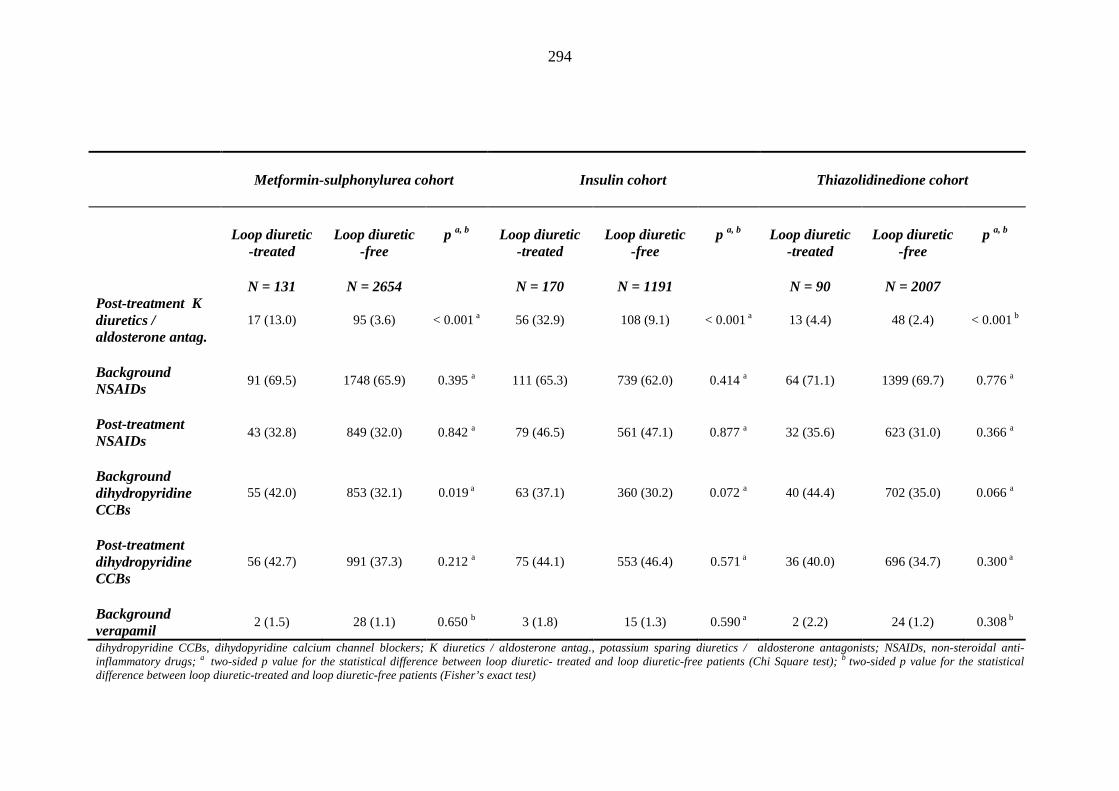
294
Metformin-sulphonylurea cohort
Insulin cohort
Thiazolidinedione cohort
Loop diuretic
-treated
N = 131
Loop diuretic
-free
N = 2654
p a, b
Loop diuretic
-treated
N = 170
Loop diuretic
-free
N = 1191
p a, b
Loop diuretic
-treated
N = 90
Loop diuretic
-free
N = 2007
p a, b
Post-treatment K diuretics / aldosterone antag.
17 (13.0) 95 (3.6) < 0.001 a 56 (32.9) 108 (9.1) < 0.001 a 13 (4.4) 48 (2.4) < 0.001 b
Background NSAIDs
91 (69.5) 1748 (65.9) 0.395 a 111 (65.3) 739 (62.0) 0.414 a 64 (71.1) 1399 (69.7) 0.776 a
Post-treatment NSAIDs
43 (32.8) 849 (32.0) 0.842 a 79 (46.5) 561 (47.1) 0.877 a 32 (35.6) 623 (31.0) 0.366 a
Background dihydropyridine CCBs
55 (42.0) 853 (32.1) 0.019 a 63 (37.1) 360 (30.2) 0.072 a 40 (44.4) 702 (35.0) 0.066 a
Post-treatment dihydropyridine CCBs
56 (42.7) 991 (37.3) 0.212 a 75 (44.1) 553 (46.4) 0.571 a 36 (40.0) 696 (34.7) 0.300 a
Background verapamil
2 (1.5) 28 (1.1) 0.650 b 3 (1.8) 15 (1.3) 0.590 a 2 (2.2) 24 (1.2) 0.308 b
dihydropyridine CCBs, dihydopyridine calcium channel blockers; K diuretics / aldosterone antag., potassium sparing diuretics / aldosterone antagonists; NSAIDs, non-steroidal anti-inflammatory drugs; a two-sided p value for the statistical difference between loop diuretic- treated and loop diuretic-free patients (Chi Square test); b two-sided p value for the statistical difference between loop diuretic-treated and loop diuretic-free patients (Fisher’s exact test)
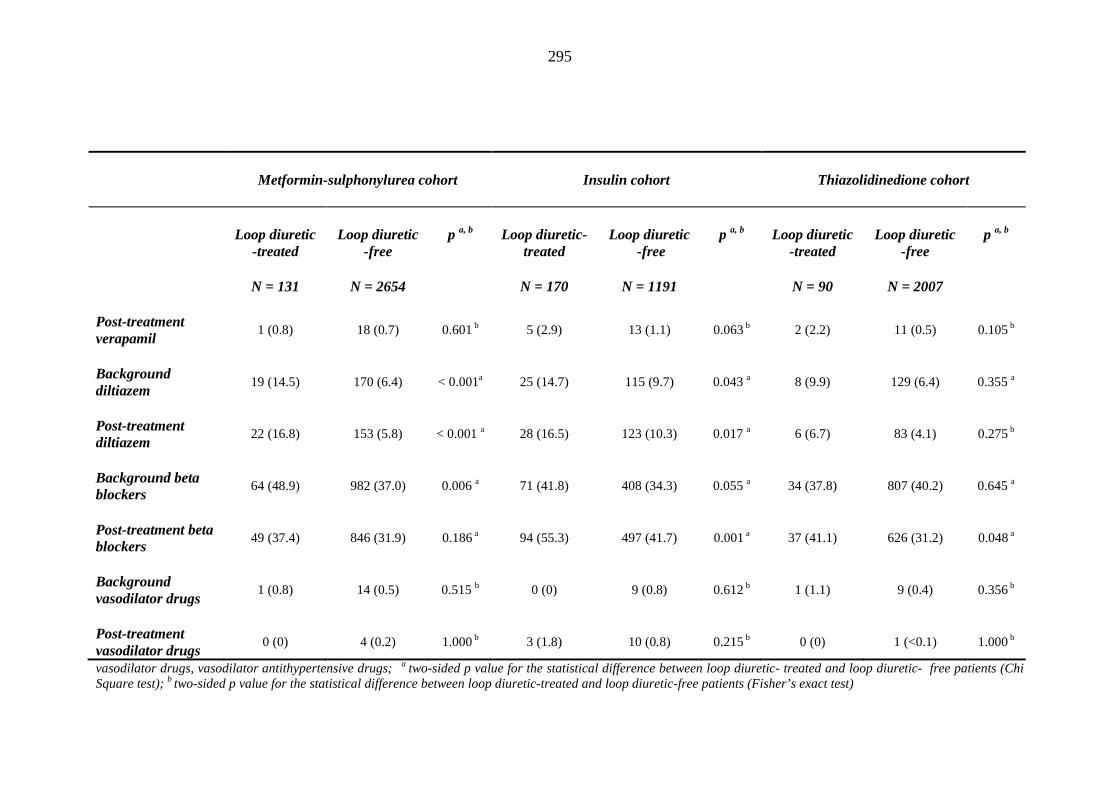
295
Metformin-sulphonylurea cohort
Insulin cohort
Thiazolidinedione cohort
Loop diuretic
-treated
N = 131
Loop diuretic
-free
N = 2654
p a, b
Loop diuretic-
treated
N = 170
Loop diuretic
-free
N = 1191
p a, b
Loop diuretic
-treated
N = 90
Loop diuretic
-free
N = 2007
p a, b
Post-treatment verapamil
1 (0.8) 18 (0.7) 0.601 b 5 (2.9) 13 (1.1) 0.063 b 2 (2.2) 11 (0.5) 0.105 b
Background diltiazem
19 (14.5) 170 (6.4) < 0.001a 25 (14.7) 115 (9.7) 0.043 a 8 (9.9) 129 (6.4) 0.355 a
Post-treatment diltiazem
22 (16.8) 153 (5.8) < 0.001 a 28 (16.5) 123 (10.3) 0.017 a 6 (6.7) 83 (4.1) 0.275 b
Background beta blockers
64 (48.9) 982 (37.0) 0.006 a 71 (41.8) 408 (34.3) 0.055 a 34 (37.8) 807 (40.2) 0.645 a
Post-treatment beta blockers
49 (37.4) 846 (31.9) 0.186 a 94 (55.3) 497 (41.7) 0.001 a 37 (41.1) 626 (31.2) 0.048 a
Background vasodilator drugs
1 (0.8) 14 (0.5) 0.515 b 0 (0) 9 (0.8) 0.612 b 1 (1.1) 9 (0.4) 0.356 b
Post-treatment vasodilator drugs
0 (0) 4 (0.2) 1.000 b 3 (1.8) 10 (0.8) 0.215 b 0 (0) 1 (<0.1) 1.000 b
vasodilator drugs, vasodilator antithypertensive drugs; a two-sided p value for the statistical difference between loop diuretic- treated and loop diuretic- free patients (Chi Square test); b two-sided p value for the statistical difference between loop diuretic-treated and loop diuretic-free patients (Fisher’s exact test)
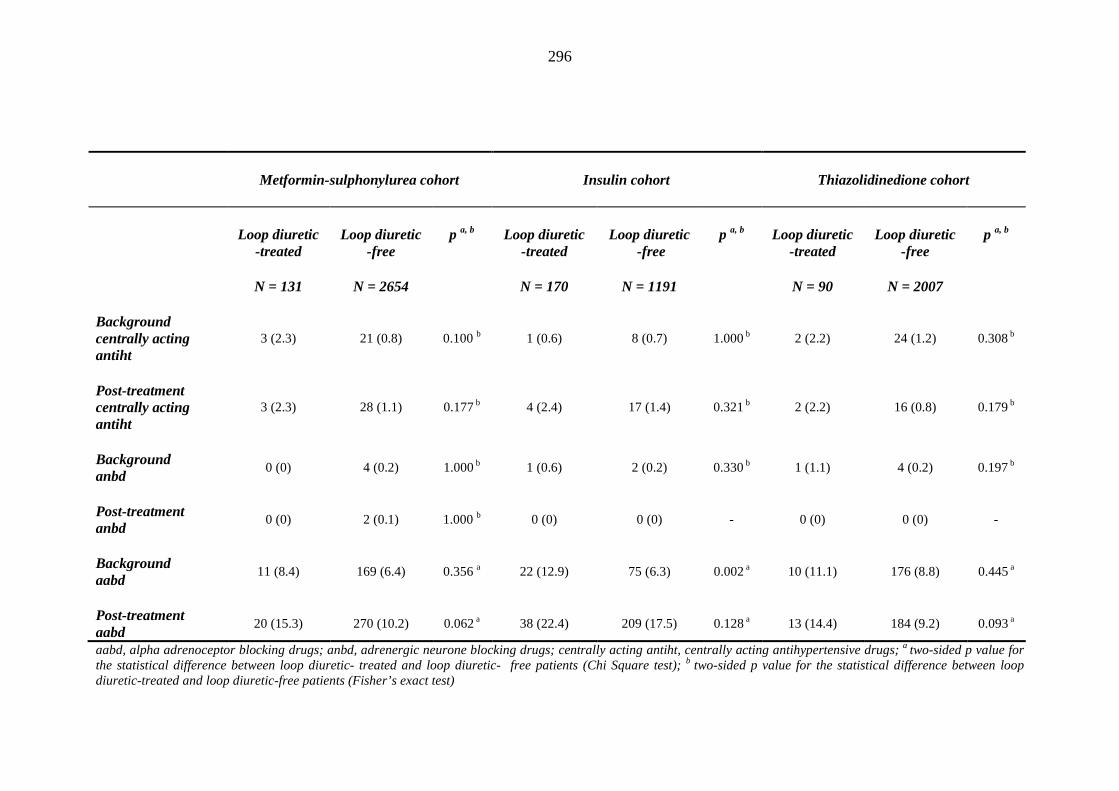
296
Metformin-sulphonylurea cohort
Insulin cohort
Thiazolidinedione cohort
Loop diuretic
-treated
N = 131
Loop diuretic
-free
N = 2654
p a, b
Loop diuretic
-treated
N = 170
Loop diuretic
-free
N = 1191
p a, b
Loop diuretic
-treated
N = 90
Loop diuretic
-free
N = 2007
p a, b
Background centrally acting antiht
3 (2.3) 21 (0.8) 0.100 b 1 (0.6) 8 (0.7) 1.000 b 2 (2.2) 24 (1.2) 0.308 b
Post-treatment centrally acting antiht
3 (2.3) 28 (1.1) 0.177 b 4 (2.4) 17 (1.4) 0.321 b 2 (2.2) 16 (0.8) 0.179 b
Background anbd
0 (0) 4 (0.2) 1.000 b 1 (0.6) 2 (0.2) 0.330 b 1 (1.1) 4 (0.2) 0.197 b
Post-treatment anbd
0 (0) 2 (0.1) 1.000 b 0 (0) 0 (0) - 0 (0) 0 (0) -
Background aabd
11 (8.4) 169 (6.4) 0.356 a 22 (12.9) 75 (6.3) 0.002 a 10 (11.1) 176 (8.8) 0.445 a
Post-treatment aabd
20 (15.3) 270 (10.2) 0.062 a 38 (22.4) 209 (17.5) 0.128 a 13 (14.4) 184 (9.2) 0.093 a
aabd, alpha adrenoceptor blocking drugs; anbd, adrenergic neurone blocking drugs; centrally acting antiht, centrally acting antihypertensive drugs; a two-sided p value for the statistical difference between loop diuretic- treated and loop diuretic- free patients (Chi Square test); b two-sided p value for the statistical difference between loop diuretic-treated and loop diuretic-free patients (Fisher’s exact test)
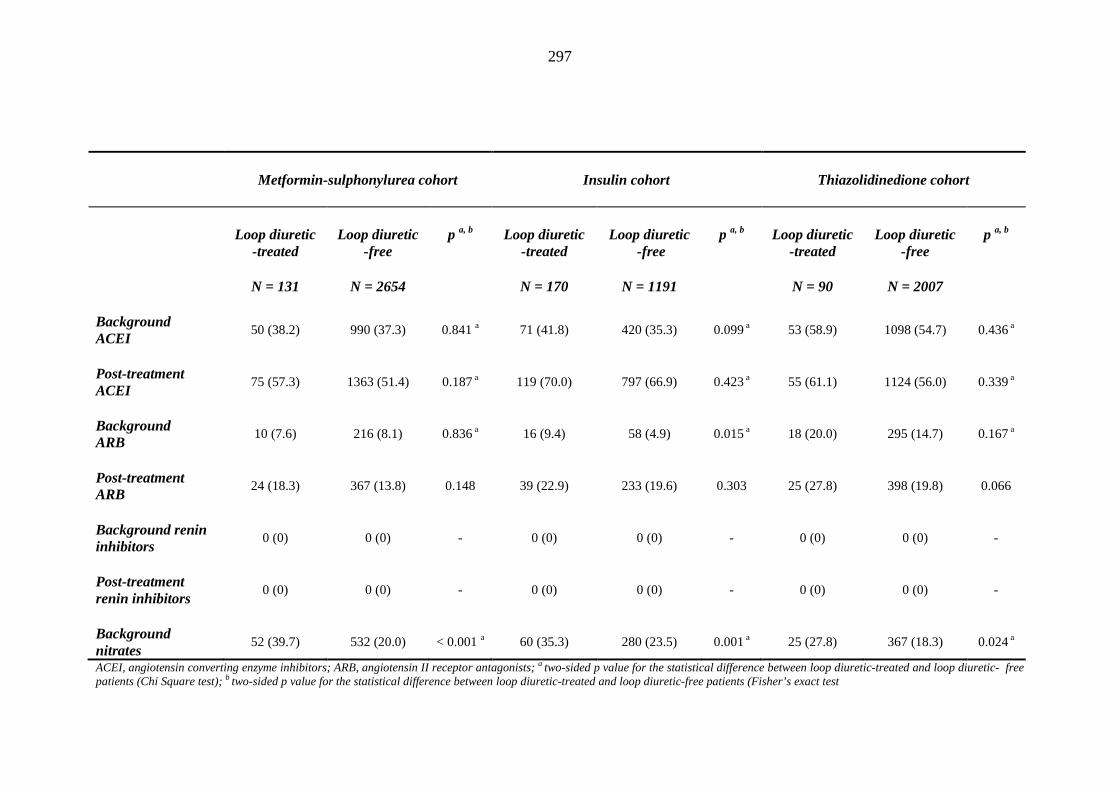
297
Metformin-sulphonylurea cohort
Insulin cohort
Thiazolidinedione cohort
Loop diuretic
-treated
N = 131
Loop diuretic
-free
N = 2654
p a, b
Loop diuretic
-treated
N = 170
Loop diuretic
-free
N = 1191
p a, b
Loop diuretic
-treated
N = 90
Loop diuretic
-free
N = 2007
p a, b
Background ACEI
50 (38.2) 990 (37.3) 0.841 a 71 (41.8) 420 (35.3) 0.099 a 53 (58.9) 1098 (54.7) 0.436 a
Post-treatment ACEI
75 (57.3) 1363 (51.4) 0.187 a 119 (70.0) 797 (66.9) 0.423 a 55 (61.1) 1124 (56.0) 0.339 a
Background ARB
10 (7.6) 216 (8.1) 0.836 a 16 (9.4) 58 (4.9) 0.015 a 18 (20.0) 295 (14.7) 0.167 a
Post-treatment ARB
24 (18.3) 367 (13.8) 0.148 39 (22.9) 233 (19.6) 0.303 25 (27.8) 398 (19.8) 0.066
Background renin inhibitors
0 (0) 0 (0) - 0 (0) 0 (0) - 0 (0) 0 (0) -
Post-treatment renin inhibitors
0 (0) 0 (0) - 0 (0) 0 (0) - 0 (0) 0 (0) -
Background nitrates
52 (39.7) 532 (20.0) < 0.001 a 60 (35.3) 280 (23.5) 0.001 a 25 (27.8) 367 (18.3) 0.024 a
ACEI, angiotensin converting enzyme inhibitors; ARB, angiotensin II receptor antagonists; a two-sided p value for the statistical difference between loop diuretic-treated and loop diuretic- free patients (Chi Square test); b two-sided p value for the statistical difference between loop diuretic-treated and loop diuretic-free patients (Fisher’s exact test
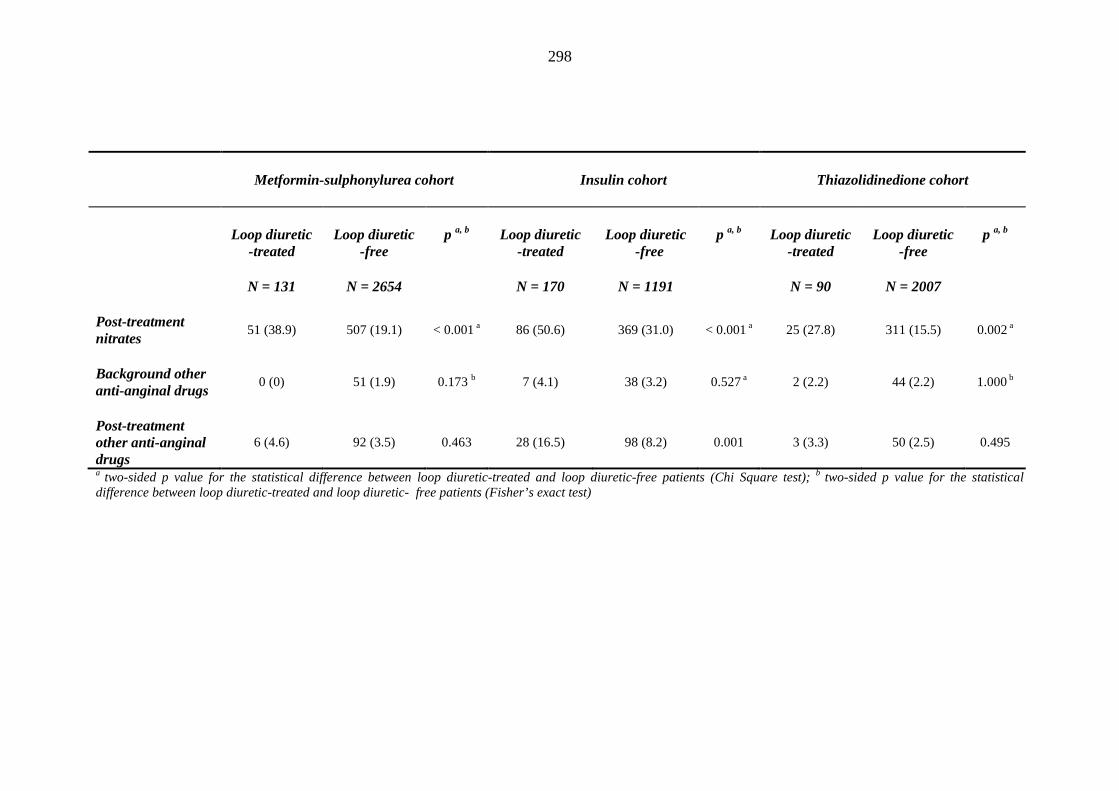
298
Metformin-sulphonylurea cohort
Insulin cohort
Thiazolidinedione cohort
Loop diuretic
-treated
N = 131
Loop diuretic
-free
N = 2654
p a, b
Loop diuretic
-treated
N = 170
Loop diuretic
-free
N = 1191
p a, b
Loop diuretic
-treated
N = 90
Loop diuretic
-free
N = 2007
p a, b
Post-treatment nitrates
51 (38.9) 507 (19.1) < 0.001 a 86 (50.6) 369 (31.0) < 0.001 a 25 (27.8) 311 (15.5) 0.002 a
Background other anti-anginal drugs
0 (0) 51 (1.9) 0.173 b 7 (4.1) 38 (3.2) 0.527 a 2 (2.2) 44 (2.2) 1.000 b
Post-treatment other anti-anginal drugs
6 (4.6) 92 (3.5) 0.463 28 (16.5) 98 (8.2) 0.001 3 (3.3) 50 (2.5) 0.495
a two-sided p value for the statistical difference between loop diuretic-treated and loop diuretic-free patients (Chi Square test); b two-sided p value for the statistical difference between loop diuretic-treated and loop diuretic- free patients (Fisher’s exact test)
299
3.11.4 Clinical measurements
Table 3.36 summarises clinical measurements for patients belonging to each of the
three treatment cohorts, together with two-sided p values for trend across the cohorts,
and post-hoc pairwise comparisons between the treatment groups. Table 3.37
outlines mean (SD) values, and two-sided p values for the comparison between loop
diuretic-treated and -free patients belonging to each of the three treatment cohorts.
Comparing with metformin-sulphonylurea-treated patients, patients prescribed an
index thiazolidinedione were characterised by lower baseline mean arterial pressure
[99.32 (9.77) vs 100.29 (9.48) mmHg; p = 0.001], lower baseline systolic blood
pressure [139.65 (12.92) vs 141.23 (15.70) mmHg; p = 0.001], lower baseline DBP
[79.17 (7.92) vs 79.81 (8.64) mmHg; p = 0.032], higher baseline weight [88.97
(17.54) vs 84.67 (16.84) kg; p < 0.001], and higher baseline BMI [31.29 (5.37) vs
30.19 (5.32) kg/m2 ; p < 0.001] (table 3.36). Higher baseline values for weight and
BMI among patients treated with a second or third line thiazolidinedione may reflect
the ‘end-effect’ of several months/years of antecedent (first or second line)
sulphonylurea therapy, with their characteristic insulinotropic, weight promoting,
effect.
Likewise, comparing thiazolidinedione with insulin-treated patients, the former were
characterised by significantly lower baseline systolic blood pressure [139.65 (12.92)
vs 141.26 (16.10) mmHg; p = 0.011], higher baseline weight [88.97 (17.54) vs 79.06
(16.51) kg; p < 0.001] and higher baseline BMI [31.29 (5.37) vs 28.43 (5.45) kg/m2;
p < 0.001] (table 3.36).
300
Index loop diuretic prescribed thiazolidinedione-treated patients were characterised
by a significantly higher mean baseline BMI [33.11 (6.54) (LD+) vs 31.21 (5.31)
(LD-) kg/m2; p = 0.002] compared with their index loop diuretic-free counterparts,
despite no differences in baseline body weight (table 3.37). BMI is now established
as a more precise marker of obesity than body weight. There were no differences in
baseline mean arterial pressure and DBP between the two index loop diuretic
categories. Mean baseline systolic blood pressure tended to be higher in index loop
diuretic-treated patients – with the difference reaching borderline statistical
significance [142.35 (13.91) (LD+) vs 139.53 (12.8) (LD); p = 0.048].
Similar observations were reported for baseline mean arterial pressure, DBP and
weight among patients on metformin-suphonylurea combination therapy and insulin
(without TZD) respectively (table 3.37). Differences in baseline BMI reached
statistical significance in either cohort. Baseline systolic blood pressure was
significantly higher in loop diuretic prescibed insulin-treated patients; differences in
systolic blood pressure did not reach statistical significance in patients on
metformin-sulphonylurea combination therapy. Thus index loop diuretic requiring
metformin-sulphonylurea-treated patients were characterised by a higher baseline
BMI [31.50 (6.07) vs 30.13 (5.28) kg/m2; p = 0.012]. Likewise, insulin-treated
patients characterised by a higher baseline systolic blood pressure [145.07 (16.17) vs
140.73 (16.03) mmHg; p = 0.003] and higher baseline BMI [29.46 (5.60) vs 28.29
(5.42) kg/m2; p = 0.014] were more prone to ‘oedema’ after index insulin
prescription.
301
Analyzing separately for incident HF events occurring within one year of inclusion
into each of the three treatment cohorts yielded no statistical difference in mean
baseline systolic blood pressure or baseline body mass index between incident HF
subgroups, albeit significantly lower baseline DBP readings for HF prone insulin-
treated patients [75.22 (8.70) HF + vs 79.01 (8.78) HF – mmHg; p = 0.001] (data not
reproduced in table format).
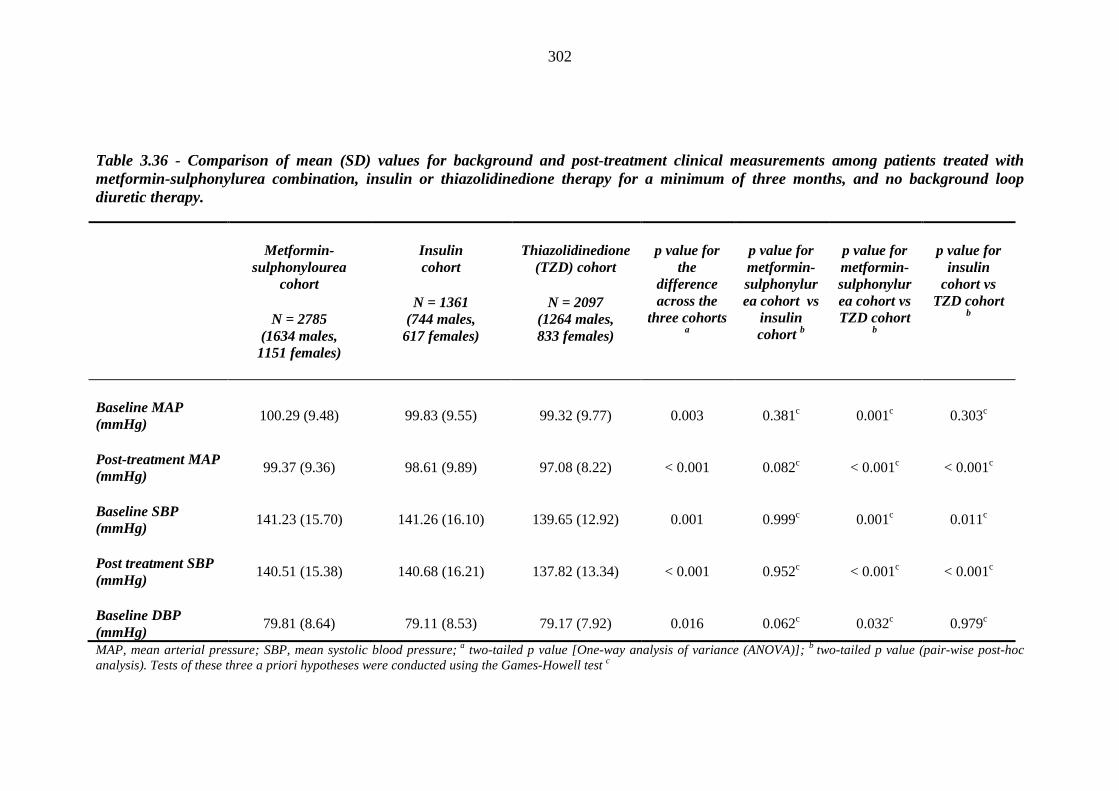
302
Table 3.36 - Comparison of mean (SD) values for background and post-treatment clinical measurements among patients treated with metformin-sulphonylurea combination, insulin or thiazolidinedione therapy for a minimum of three months, and no background loop diuretic therapy.
Metformin-
sulphonylourea cohort
N = 2785
(1634 males, 1151 females)
Insulin cohort
N = 1361
(744 males, 617 females)
Thiazolidinedione
(TZD) cohort
N = 2097 (1264 males, 833 females)
p value for
the difference across the
three cohorts a
p value for metformin-sulphonylurea cohort vs
insulin cohort b
p value for metformin-sulphonylurea cohort vs TZD cohort
b
p value for
insulin cohort vs
TZD cohort b
Baseline MAP (mmHg) 100.29 (9.48) 99.83 (9.55) 99.32 (9.77) 0.003 0.381c 0.001c 0.303c
Post-treatment MAP (mmHg) 99.37 (9.36) 98.61 (9.89) 97.08 (8.22) < 0.001 0.082c < 0.001c < 0.001c
Baseline SBP (mmHg) 141.23 (15.70) 141.26 (16.10) 139.65 (12.92) 0.001 0.999c 0.001c 0.011c
Post treatment SBP (mmHg) 140.51 (15.38) 140.68 (16.21) 137.82 (13.34) < 0.001 0.952c < 0.001c < 0.001c
Baseline DBP (mmHg) 79.81 (8.64) 79.11 (8.53) 79.17 (7.92) 0.016 0.062c 0.032c 0.979c
MAP, mean arterial pressure; SBP, mean systolic blood pressure; a two-tailed p value [One-way analysis of variance (ANOVA)]; b two-tailed p value (pair-wise post-hoc analysis). Tests of these three a priori hypotheses were conducted using the Games-Howell test c
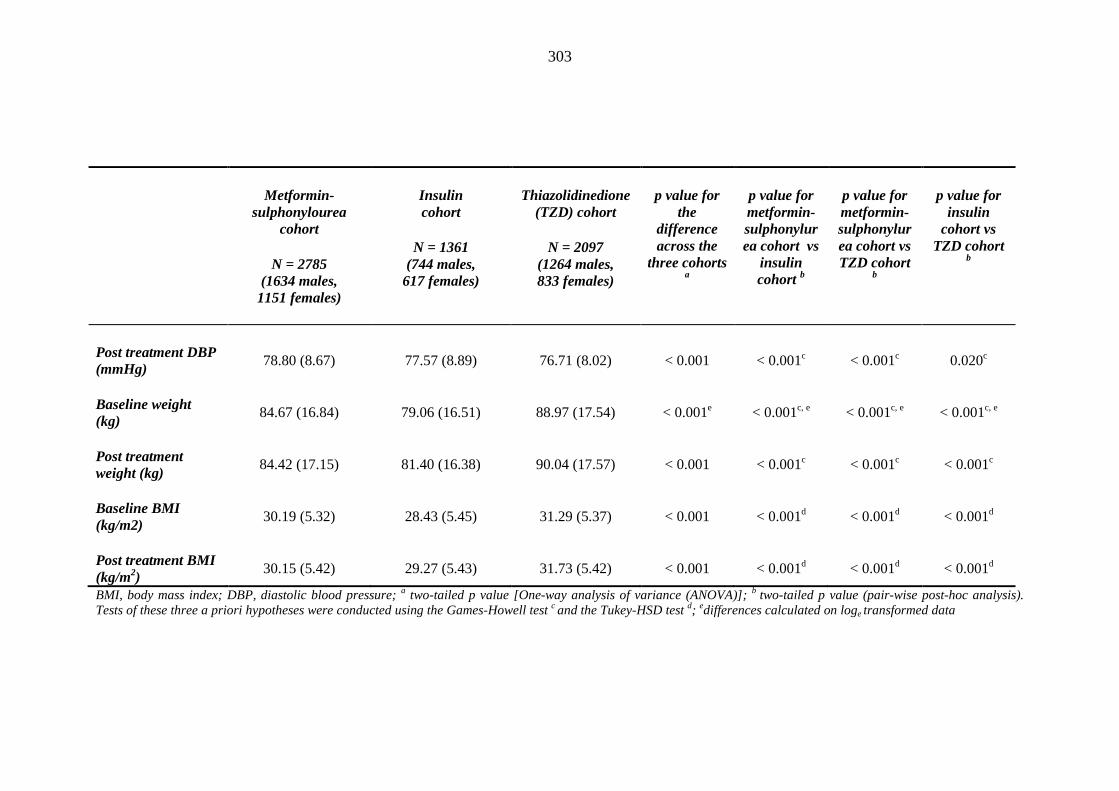
303
Metformin-
sulphonylourea cohort
N = 2785
(1634 males, 1151 females)
Insulin cohort
N = 1361
(744 males, 617 females)
Thiazolidinedione
(TZD) cohort
N = 2097 (1264 males, 833 females)
p value for
the difference across the
three cohorts a
p value for metformin-sulphonylurea cohort vs
insulin cohort b
p value for metformin-sulphonylurea cohort vs TZD cohort
b
p value for
insulin cohort vs
TZD cohort b
Post treatment DBP (mmHg) 78.80 (8.67) 77.57 (8.89) 76.71 (8.02) < 0.001 < 0.001c < 0.001c 0.020c
Baseline weight (kg) 84.67 (16.84) 79.06 (16.51) 88.97 (17.54) < 0.001e < 0.001c, e < 0.001c, e < 0.001c, e
Post treatment weight (kg) 84.42 (17.15) 81.40 (16.38) 90.04 (17.57) < 0.001 < 0.001c < 0.001c < 0.001c
Baseline BMI (kg/m2) 30.19 (5.32) 28.43 (5.45) 31.29 (5.37) < 0.001 < 0.001d < 0.001d < 0.001d
Post treatment BMI (kg/m2) 30.15 (5.42) 29.27 (5.43) 31.73 (5.42) < 0.001 < 0.001d < 0.001d < 0.001d
BMI, body mass index; DBP, diastolic blood pressure; a two-tailed p value [One-way analysis of variance (ANOVA)]; b two-tailed p value (pair-wise post-hoc analysis). Tests of these three a priori hypotheses were conducted using the Games-Howell test c and the Tukey-HSD test d; edifferences calculated on loge transformed data
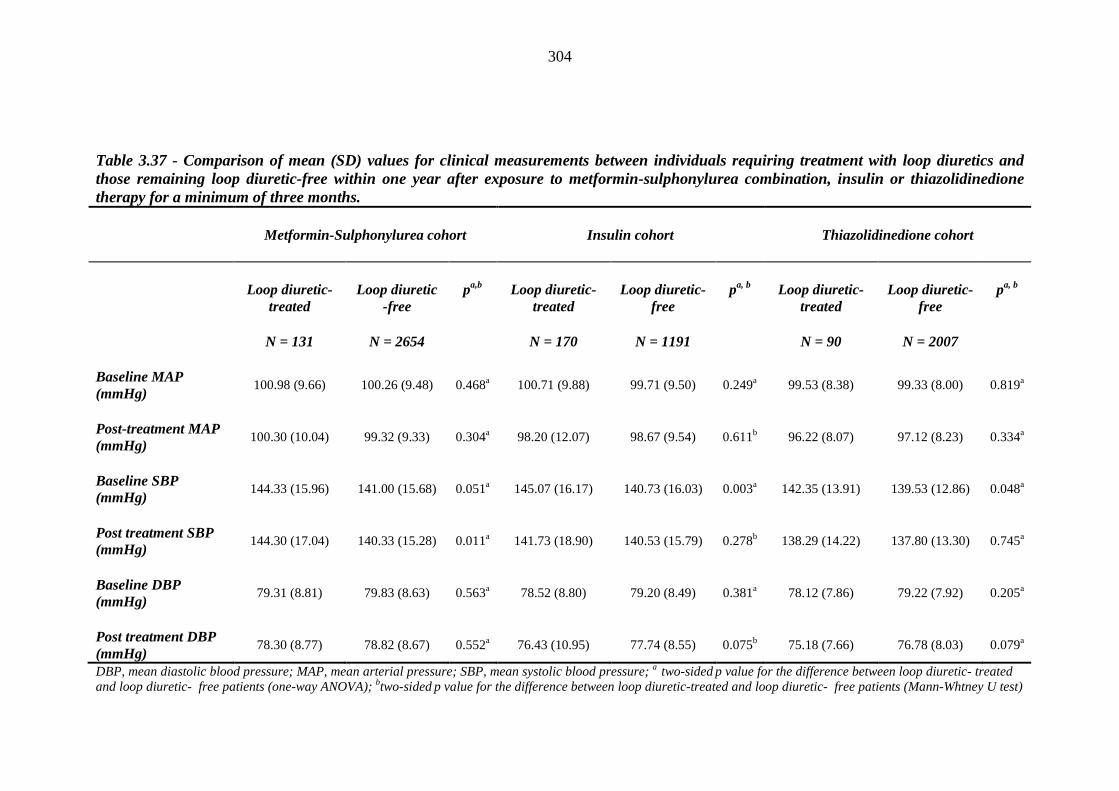
304
Table 3.37 - Comparison of mean (SD) values for clinical measurements between individuals requiring treatment with loop diuretics and those remaining loop diuretic-free within one year after exposure to metformin-sulphonylurea combination, insulin or thiazolidinedione therapy for a minimum of three months.
Metformin-Sulphonylurea cohort
Insulin cohort
Thiazolidinedione cohort
Loop diuretic-
treated
N = 131
Loop diuretic
-free
N = 2654
pa,b
Loop diuretic-
treated
N = 170
Loop diuretic-
free
N = 1191
pa, b
Loop diuretic-
treated
N = 90
Loop diuretic-
free
N = 2007
pa, b
Baseline MAP (mmHg)
100.98 (9.66) 100.26 (9.48) 0.468a 100.71 (9.88) 99.71 (9.50) 0.249a 99.53 (8.38) 99.33 (8.00) 0.819a
Post-treatment MAP (mmHg)
100.30 (10.04) 99.32 (9.33) 0.304a 98.20 (12.07) 98.67 (9.54) 0.611b 96.22 (8.07) 97.12 (8.23) 0.334a
Baseline SBP (mmHg)
144.33 (15.96) 141.00 (15.68) 0.051a 145.07 (16.17) 140.73 (16.03) 0.003a 142.35 (13.91) 139.53 (12.86) 0.048a
Post treatment SBP (mmHg)
144.30 (17.04) 140.33 (15.28) 0.011a 141.73 (18.90) 140.53 (15.79) 0.278b 138.29 (14.22) 137.80 (13.30) 0.745a
Baseline DBP (mmHg)
79.31 (8.81) 79.83 (8.63) 0.563a 78.52 (8.80) 79.20 (8.49) 0.381a 78.12 (7.86) 79.22 (7.92) 0.205a
Post treatment DBP (mmHg)
78.30 (8.77) 78.82 (8.67) 0.552a 76.43 (10.95) 77.74 (8.55) 0.075b 75.18 (7.66) 76.78 (8.03) 0.079a
DBP, mean diastolic blood pressure; MAP, mean arterial pressure; SBP, mean systolic blood pressure; a two-sided p value for the difference between loop diuretic- treated and loop diuretic- free patients (one-way ANOVA); btwo-sided p value for the difference between loop diuretic-treated and loop diuretic- free patients (Mann-Whtney U test)
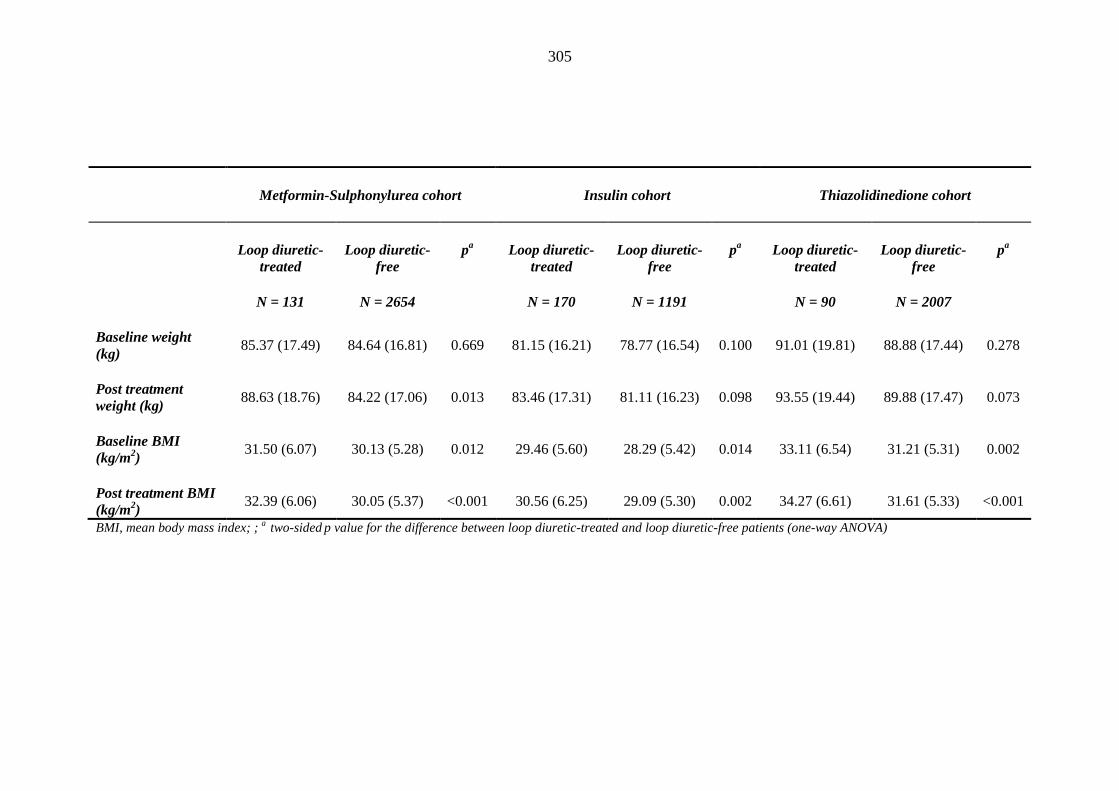
305
Metformin-Sulphonylurea cohort
Insulin cohort
Thiazolidinedione cohort
Loop diuretic-
treated
N = 131
Loop diuretic-
free
N = 2654
pa
Loop diuretic-
treated
N = 170
Loop diuretic-
free
N = 1191
pa
Loop diuretic-
treated
N = 90
Loop diuretic-
free
N = 2007
pa
Baseline weight (kg) 85.37 (17.49) 84.64 (16.81) 0.669 81.15 (16.21) 78.77 (16.54) 0.100 91.01 (19.81) 88.88 (17.44) 0.278
Post treatment weight (kg) 88.63 (18.76) 84.22 (17.06) 0.013 83.46 (17.31) 81.11 (16.23) 0.098 93.55 (19.44) 89.88 (17.47) 0.073
Baseline BMI (kg/m2) 31.50 (6.07) 30.13 (5.28) 0.012 29.46 (5.60) 28.29 (5.42) 0.014 33.11 (6.54) 31.21 (5.31) 0.002
Post treatment BMI (kg/m2) 32.39 (6.06) 30.05 (5.37) <0.001 30.56 (6.25) 29.09 (5.30) 0.002 34.27 (6.61) 31.61 (5.33) <0.001
BMI, mean body mass index; ; a two-sided p value for the difference between loop diuretic-treated and loop diuretic-free patients (one-way ANOVA)
306
3.11.5 Haematology and biochemistry
Inspection of baseline haematocrit, biochemistry profile and thyrotropin
concentrations across the metformin-sulphonylurea, insulin and thiazolidinedione
cohorts yielded unexpected findings. Patients requiring an index thiazolidinedione
prescription were characterised by lower baseline total cholesterol [4.46 (0.93) vs
4.84 (1.18) mmol/L; p < 0.001], lower baseline low density lipoprotein cholesterol
(LDL-C) [2.29 (0.90) vs 2.50 (1.04) mmol/L; p < 0.001], higher baseline serum
sodium [136.68 (2.73) vs 138.39 (2.86) mmol/L; p = 0.001], higher baseline
estimated glomerular filtration rate [96.40 (35.91) vs 91.54 (36.13) mls/min/1.73 m2;
p < 0.001], and a higher baseline serum albumin [44.00 (2.88) vs 43.51 (3.55) g/L; p
< 0.001] (table 3.38) compared with their metformin-sulphonylurea-treated
counterparts. Higher baseline values for estimated glomerular filtration rate and
serum albumin for thiazolidinedione-treated patients are perhaps rather surprising,
but could stem from an a priori tendency to avoid metformin and/or sulphonylureas
in patients with impaired renal and/or liver function, shifting mean (SD) values for
these variables. Lower baseline serum total cholesterol concentrations at index
thiazolidinedione prescription could perhaps reflect a metformin-associated benefical
effect on lipid status, as reported in a meta-analysis by Wulffele et al [607].
Comparing thiazolidinedione and insulin-treated patients, the former were
characterised by a higher baseline haematocrit [42.26 (3.68) vs 40.22 (4.59) %; p <
0.001], a lower baseline HbA1c [8.89 (1.37) vs 9.67 (1.82) %; p < 0.001], lower
baseline total cholesterol [4.46 (0.93) vs 4.94 (1.21) mmol/L; p < 0.001], lower
baseline LDL-C [2.29 (0.90) vs 2.60 (1.01) mmol/L; p < 0.001], higher baseline
307
alanine aminotransferase (ALT) [33.51 (19.56) vs 31.84 (24.66); p < 0.001], higher
baseline serum sodium [138.68 (2.73) vs 137.32 (3.18); p < 0.001], higher baseline
estimated glomerular filtration rate (eGFR) [96.40 (35.91) vs 79.39 (31.11)
mls/min/1.73 m2; p < 0.001], higher baseline TSH [2.03 (1.33) vs 1.99 (1.45) mIU/L;
p = 0.017], higher baseline serum albumin [44.00 (2.88) vs 41.53 (4.81) g/dL; p <
0.001] and a lower baseline serum creatinine [88.16 (20.70) vs 94.83 (33.57); p <
0.001] (table 3.38). Lower baseline values for serum haematocrit for insulin-treated
patients could stem from a tendency to switch patients from thiazolidinediones to
insulin therapy in the face of fluid overload. It is perhaps not entirely surprising that
patients prescribed insulin therapy are prone to poorer renal function at baseline –
probably reflecting the gradual deterioration characteristic of patients with poorly
controlled T2DM (higher HbA1c, total cholesterol and LDL-C concentrations).
Given the reported association between ALT and visceral fat accumulation, higher
baseline ALT for thiazolidinedione-treated patients could stem from a tendency to
prescribe these ‘third line’ insulin sensitizers in patients with surrogate markers of
insulin resistance. As a corollary, a lower mean baseline ALT in insulin-treated
T2DM patients could reflect the ‘end result’ of thiazolidinedione prescription in
patients moving on to ‘fourth line’ insulin therapy.
As outlined in table 3.39, patients requiring an index loop diuretic within one year of
index thiazolidinedione therapy were characterised by significantly lower baseline
values for serum albumin [42.54 (3.69) (LD+) vs 44.06 (2.82) (LD-) g/dL; p <
0.001] and estimated glomerular filtration rates [67.65 (21.21) (LD+) vs 76.61
(19.03) (LD-) mls/min/1.73m2; p < 0.001] despite no differences in baseline serum
creatinine [93.80 (28.18) (LD+) vs 87.93 (20.30) (LD-) μmol/L; p = 0.152]. This is
308
consistent with the observation of lower haematocrit values (a surrogate measure of
haemodilution, and hence fluid balance) for such patients [40.93 (4.26) (LD+) vs
42.32 (3.64) (LD-) %; p = 0.001]. Index loop diuretic-treated TZD patients had
lower baseline ALT values than their loop diuretic-free counterparts [28.60 (16.07)
(LD+) vs 33.72 (19.67) IU/L (LD-); p = 0.003]. Given the reported association
between prevalent ALT and visceral fat accumulation, this observation surprisingly
seems to suggest that insulin sensitivity is a predisposing factor to thiazolidinedione-
associated fliud retention. There were no differences in baseline HbA1c, sodium,
total cholesterol (and its lipoprotein fractions), triglycerides and TSH (albeit a trend
towards higher TSH values for loop diuretic-treated patients [2.37 (1.52) (LD+] vs
2.01 (1.32) (LD-) mIU/L; p = 0.054] (table 3.39). Indeed, subclinical hypothyroidism
has been associated with increased capillary permeability to protein in a small
clinical study of nine female patients [608]. Whether this association holds true for
TSH values within the reference range remains to be determined.
Analyzing for patients both control cohorts, loop diuretic-treated patients were
likewise characterised by a lower baseline haematocrit, estimated glomerular
filtration rate and serum albumin and a significantly higher serum creatinine than
their loop diuretic-free counterparts (table 3.39). There were no differences in
baseline lipid profile and thyrotropin concentrations for either cohort. Insulin-treated
patients requiring an index loop diuretic were characterised by better glycaemic
control (lower HbA1c). Individuals treated with an index loop diuretic after index
metformin-sulphonylourea combination therapy were uniquely characterised by a
lower baseline serum sodium concentration, suggesting a role for altered sodium
haemodynamics in such patients at a relatively early stage of T2DM. An alteration in

309
the prevalent sodium milieu in ‘oedema prone’ patients could be masked by other
(stronger) contributory factors in thiazolidinedione and insulin-treated patients
whose T2DM is more likely to be complicated by macrovascular and microvascular
disease
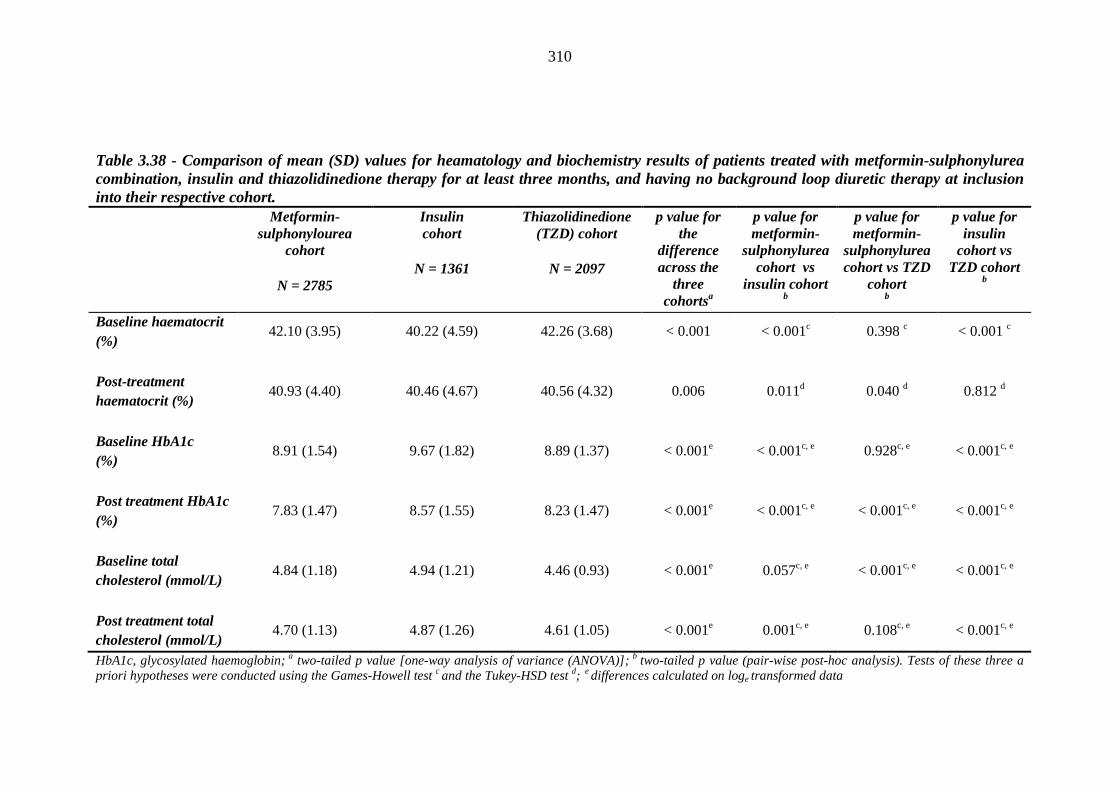
310
Table 3.38 - Comparison of mean (SD) values for heamatology and biochemistry results of patients treated with metformin-sulphonylurea combination, insulin and thiazolidinedione therapy for at least three months, and having no background loop diuretic therapy at inclusion into their respective cohort.
Metformin-sulphonylourea
cohort
N = 2785
Insulin cohort
N = 1361
Thiazolidinedione (TZD) cohort
N = 2097
p value for the
difference across the
three cohortsa
p value for metformin-
sulphonylurea cohort vs
insulin cohort b
p value for metformin-
sulphonylurea cohort vs TZD
cohort b
p value for insulin
cohort vs TZD cohort
b
Baseline haematocrit (%)
42.10 (3.95) 40.22 (4.59) 42.26 (3.68) < 0.001 < 0.001c 0.398 c < 0.001 c
Post-treatment haematocrit (%)
40.93 (4.40) 40.46 (4.67) 40.56 (4.32) 0.006 0.011d 0.040 d 0.812 d
Baseline HbA1c (%)
8.91 (1.54) 9.67 (1.82) 8.89 (1.37) < 0.001e < 0.001c, e 0.928c, e < 0.001c, e
Post treatment HbA1c (%)
7.83 (1.47) 8.57 (1.55) 8.23 (1.47) < 0.001e < 0.001c, e < 0.001c, e < 0.001c, e
Baseline total cholesterol (mmol/L)
4.84 (1.18) 4.94 (1.21) 4.46 (0.93) < 0.001e 0.057c, e < 0.001c, e < 0.001c, e
Post treatment total cholesterol (mmol/L)
4.70 (1.13) 4.87 (1.26) 4.61 (1.05) < 0.001e 0.001c, e 0.108c, e < 0.001c, e
HbA1c, glycosylated haemoglobin; a two-tailed p value [one-way analysis of variance (ANOVA)]; b two-tailed p value (pair-wise post-hoc analysis). Tests of these three a priori hypotheses were conducted using the Games-Howell test c and the Tukey-HSD test d; e differences calculated on loge transformed data
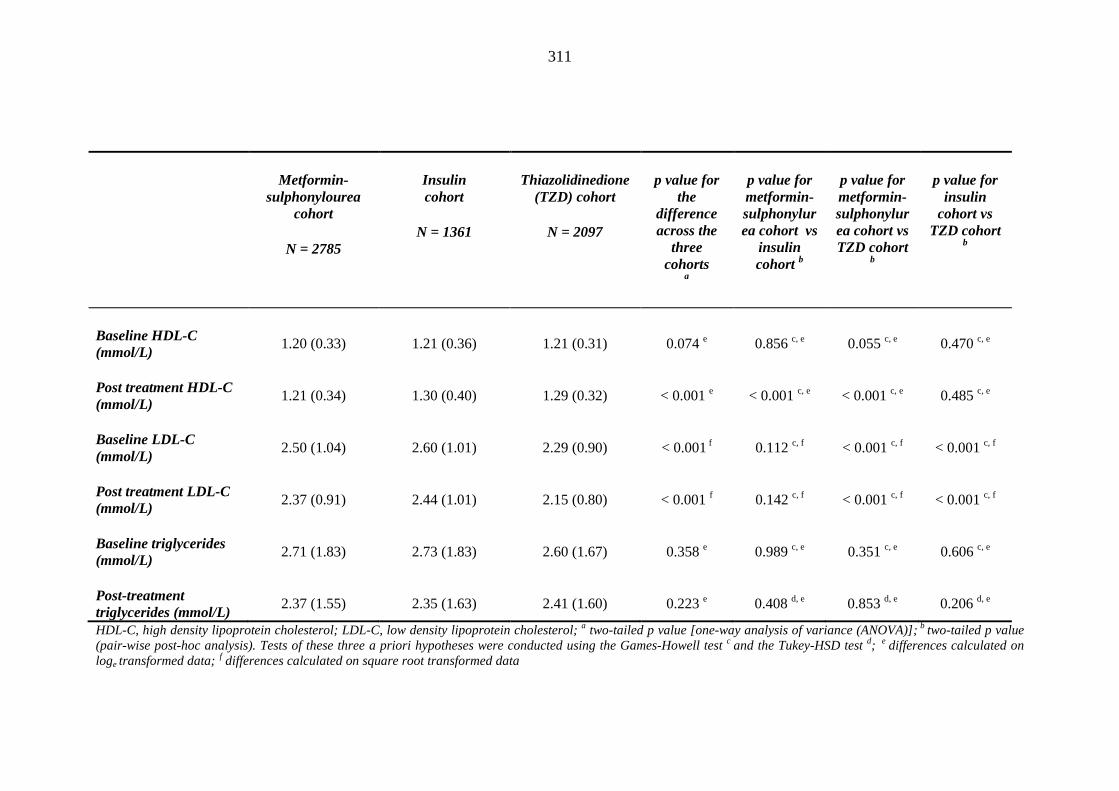
311
Metformin-
sulphonylourea cohort
N = 2785
Insulin cohort
N = 1361
Thiazolidinedione
(TZD) cohort
N = 2097
p value for
the difference across the
three cohorts
a
p value for metformin-sulphonylurea cohort vs
insulin cohort b
p value for metformin-sulphonylurea cohort vs TZD cohort
b
p value for
insulin cohort vs
TZD cohort b
Baseline HDL-C (mmol/L) 1.20 (0.33) 1.21 (0.36) 1.21 (0.31) 0.074 e 0.856 c, e 0.055 c, e 0.470 c, e
Post treatment HDL-C (mmol/L) 1.21 (0.34) 1.30 (0.40) 1.29 (0.32) < 0.001 e < 0.001 c, e < 0.001 c, e 0.485 c, e
Baseline LDL-C (mmol/L) 2.50 (1.04) 2.60 (1.01) 2.29 (0.90) < 0.001 f 0.112 c, f < 0.001 c, f < 0.001 c, f
Post treatment LDL-C (mmol/L) 2.37 (0.91) 2.44 (1.01) 2.15 (0.80) < 0.001 f 0.142 c, f < 0.001 c, f < 0.001 c, f
Baseline triglycerides (mmol/L) 2.71 (1.83) 2.73 (1.83) 2.60 (1.67) 0.358 e 0.989 c, e 0.351 c, e 0.606 c, e
Post-treatment triglycerides (mmol/L) 2.37 (1.55) 2.35 (1.63) 2.41 (1.60) 0.223 e 0.408 d, e 0.853 d, e 0.206 d, e
HDL-C, high density lipoprotein cholesterol; LDL-C, low density lipoprotein cholesterol; a two-tailed p value [one-way analysis of variance (ANOVA)]; b two-tailed p value (pair-wise post-hoc analysis). Tests of these three a priori hypotheses were conducted using the Games-Howell test c and the Tukey-HSD test d; e differences calculated on loge transformed data; f differences calculated on square root transformed data
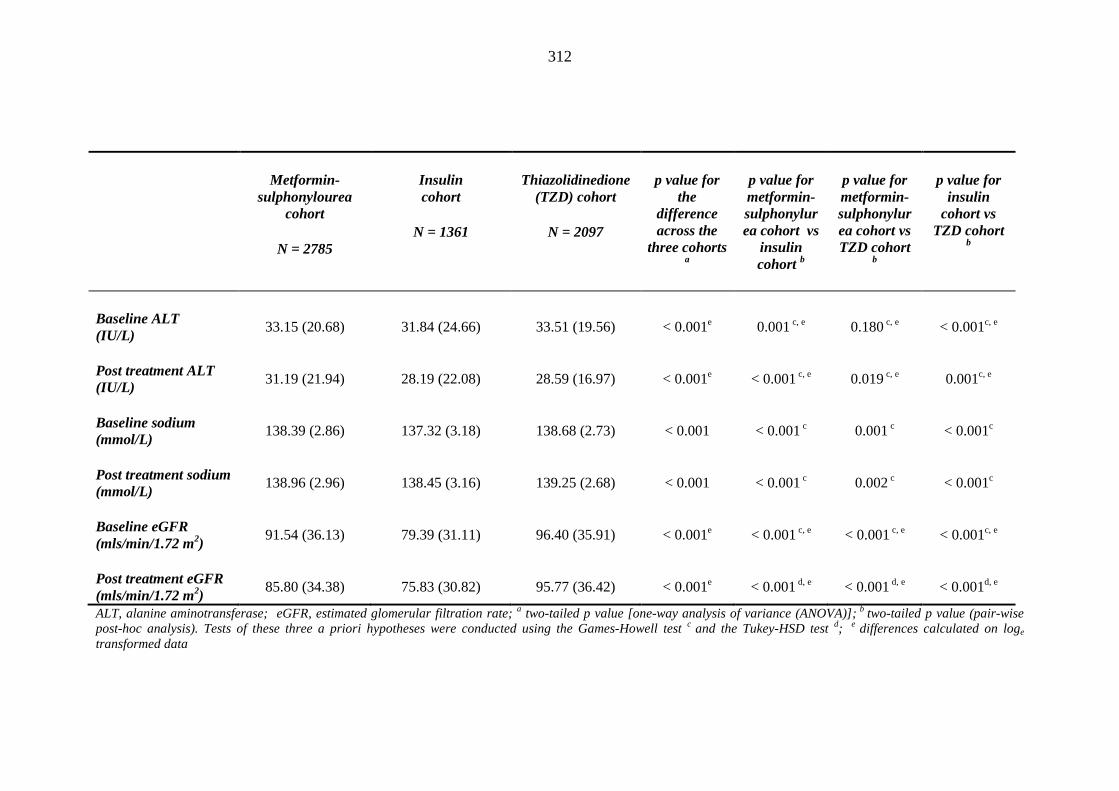
312
Metformin-
sulphonylourea cohort
N = 2785
Insulin cohort
N = 1361
Thiazolidinedione
(TZD) cohort
N = 2097
p value for
the difference across the
three cohorts a
p value for metformin-sulphonylurea cohort vs
insulin cohort b
p value for metformin-sulphonylurea cohort vs TZD cohort
b
p value for
insulin cohort vs
TZD cohort b
Baseline ALT (IU/L) 33.15 (20.68) 31.84 (24.66) 33.51 (19.56) < 0.001e 0.001 c, e 0.180 c, e < 0.001c, e
Post treatment ALT (IU/L) 31.19 (21.94) 28.19 (22.08) 28.59 (16.97) < 0.001e < 0.001 c, e 0.019 c, e 0.001c, e
Baseline sodium (mmol/L) 138.39 (2.86) 137.32 (3.18) 138.68 (2.73) < 0.001 < 0.001 c 0.001 c < 0.001c
Post treatment sodium (mmol/L) 138.96 (2.96) 138.45 (3.16) 139.25 (2.68) < 0.001 < 0.001 c 0.002 c < 0.001c
Baseline eGFR (mls/min/1.72 m2) 91.54 (36.13) 79.39 (31.11) 96.40 (35.91) < 0.001e < 0.001 c, e < 0.001 c, e < 0.001c, e
Post treatment eGFR (mls/min/1.72 m2) 85.80 (34.38) 75.83 (30.82) 95.77 (36.42) < 0.001e < 0.001 d, e < 0.001 d, e < 0.001d, e
ALT, alanine aminotransferase; eGFR, estimated glomerular filtration rate; a two-tailed p value [one-way analysis of variance (ANOVA)]; b two-tailed p value (pair-wise post-hoc analysis). Tests of these three a priori hypotheses were conducted using the Games-Howell test c and the Tukey-HSD test d; e differences calculated on loge
transformed data
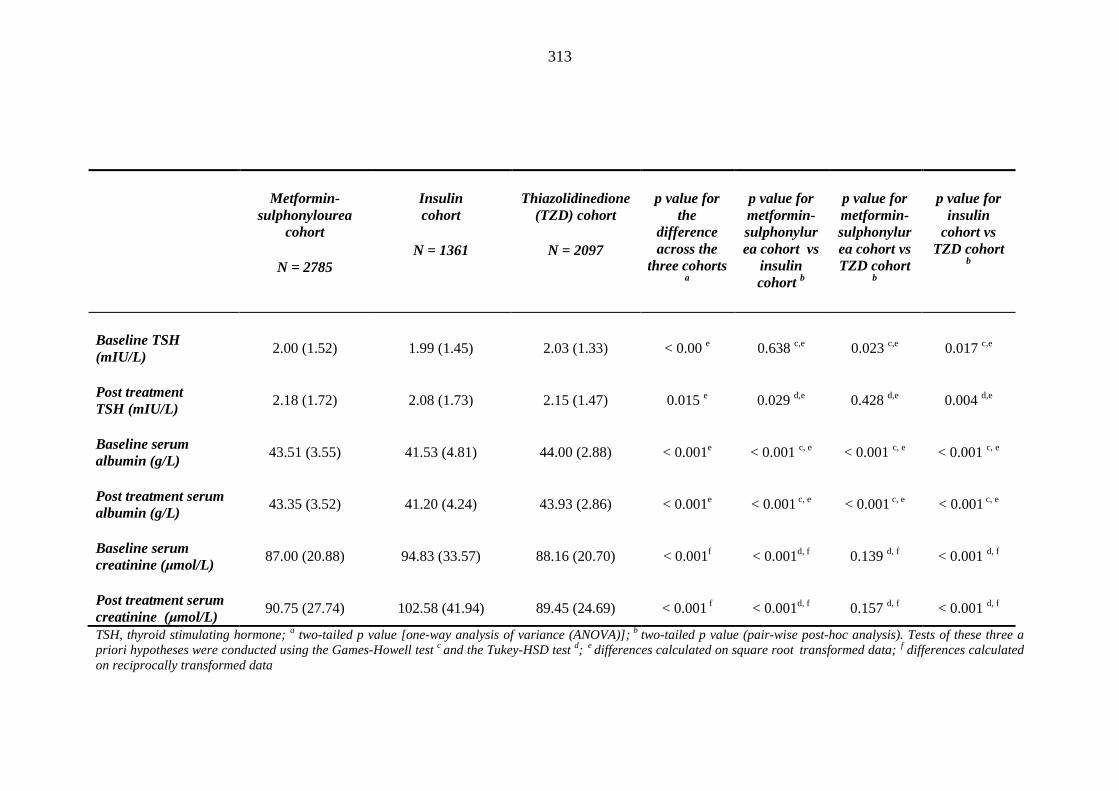
313
Metformin-sulphonylourea
cohort
N = 2785
Insulin cohort
N = 1361
Thiazolidinedione
(TZD) cohort
N = 2097
p value for
the difference across the
three cohorts a
p value for metformin-sulphonylurea cohort vs
insulin cohort b
p value for metformin-sulphonylurea cohort vs TZD cohort
b
p value for
insulin cohort vs
TZD cohort b
Baseline TSH (mIU/L) 2.00 (1.52) 1.99 (1.45) 2.03 (1.33) < 0.00 e 0.638 c,e 0.023 c,e 0.017 c,e
Post treatment TSH (mIU/L) 2.18 (1.72) 2.08 (1.73) 2.15 (1.47) 0.015 e 0.029 d,e 0.428 d,e 0.004 d,e
Baseline serum albumin (g/L) 43.51 (3.55) 41.53 (4.81) 44.00 (2.88) < 0.001e < 0.001 c, e < 0.001 c, e < 0.001 c, e
Post treatment serum albumin (g/L) 43.35 (3.52) 41.20 (4.24) 43.93 (2.86) < 0.001e < 0.001 c, e < 0.001 c, e < 0.001 c, e
Baseline serum creatinine (μmol/L) 87.00 (20.88) 94.83 (33.57) 88.16 (20.70) < 0.001f < 0.001d, f 0.139 d, f < 0.001 d, f
Post treatment serum creatinine (μmol/L) 90.75 (27.74) 102.58 (41.94) 89.45 (24.69) < 0.001 f < 0.001d, f 0.157 d, f < 0.001 d, f
TSH, thyroid stimulating hormone; a two-tailed p value [one-way analysis of variance (ANOVA)]; b two-tailed p value (pair-wise post-hoc analysis). Tests of these three a priori hypotheses were conducted using the Games-Howell test c and the Tukey-HSD test d; e differences calculated on square root transformed data; f differences calculated on reciprocally transformed data
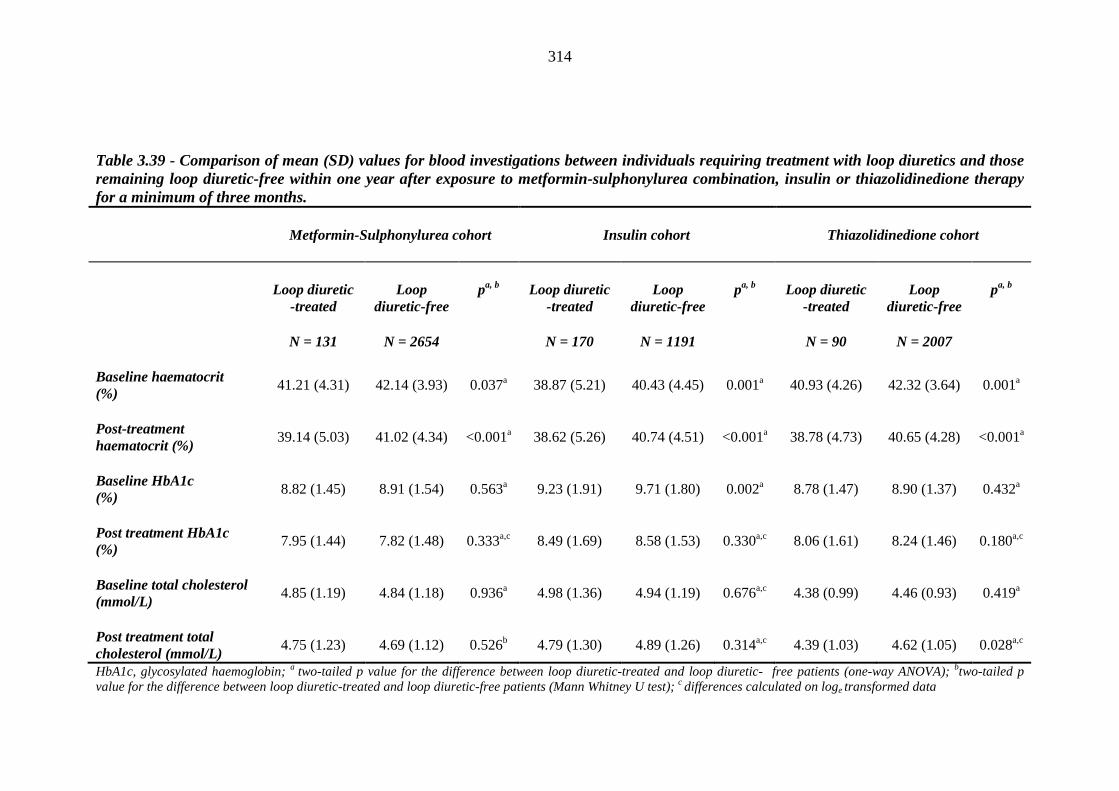
314
Table 3.39 - Comparison of mean (SD) values for blood investigations between individuals requiring treatment with loop diuretics and those remaining loop diuretic-free within one year after exposure to metformin-sulphonylurea combination, insulin or thiazolidinedione therapy for a minimum of three months.
Metformin-Sulphonylurea cohort
Insulin cohort
Thiazolidinedione cohort
Loop diuretic
-treated
N = 131
Loop
diuretic-free
N = 2654
pa, b
Loop diuretic
-treated
N = 170
Loop
diuretic-free
N = 1191
pa, b
Loop diuretic
-treated
N = 90
Loop
diuretic-free
N = 2007
pa, b
Baseline haematocrit (%) 41.21 (4.31) 42.14 (3.93) 0.037a 38.87 (5.21) 40.43 (4.45) 0.001a 40.93 (4.26) 42.32 (3.64) 0.001a
Post-treatment haematocrit (%) 39.14 (5.03) 41.02 (4.34) <0.001a 38.62 (5.26) 40.74 (4.51) <0.001a 38.78 (4.73) 40.65 (4.28) <0.001a
Baseline HbA1c (%) 8.82 (1.45) 8.91 (1.54) 0.563a 9.23 (1.91) 9.71 (1.80) 0.002a 8.78 (1.47) 8.90 (1.37) 0.432a
Post treatment HbA1c (%) 7.95 (1.44) 7.82 (1.48) 0.333a,c 8.49 (1.69) 8.58 (1.53) 0.330a,c 8.06 (1.61) 8.24 (1.46) 0.180a,c
Baseline total cholesterol (mmol/L) 4.85 (1.19) 4.84 (1.18) 0.936a 4.98 (1.36) 4.94 (1.19) 0.676a,c 4.38 (0.99) 4.46 (0.93) 0.419a
Post treatment total cholesterol (mmol/L) 4.75 (1.23) 4.69 (1.12) 0.526b 4.79 (1.30) 4.89 (1.26) 0.314a,c 4.39 (1.03) 4.62 (1.05) 0.028a,c
HbA1c, glycosylated haemoglobin; a two-tailed p value for the difference between loop diuretic-treated and loop diuretic- free patients (one-way ANOVA); btwo-tailed p value for the difference between loop diuretic-treated and loop diuretic-free patients (Mann Whitney U test); c differences calculated on loge transformed data
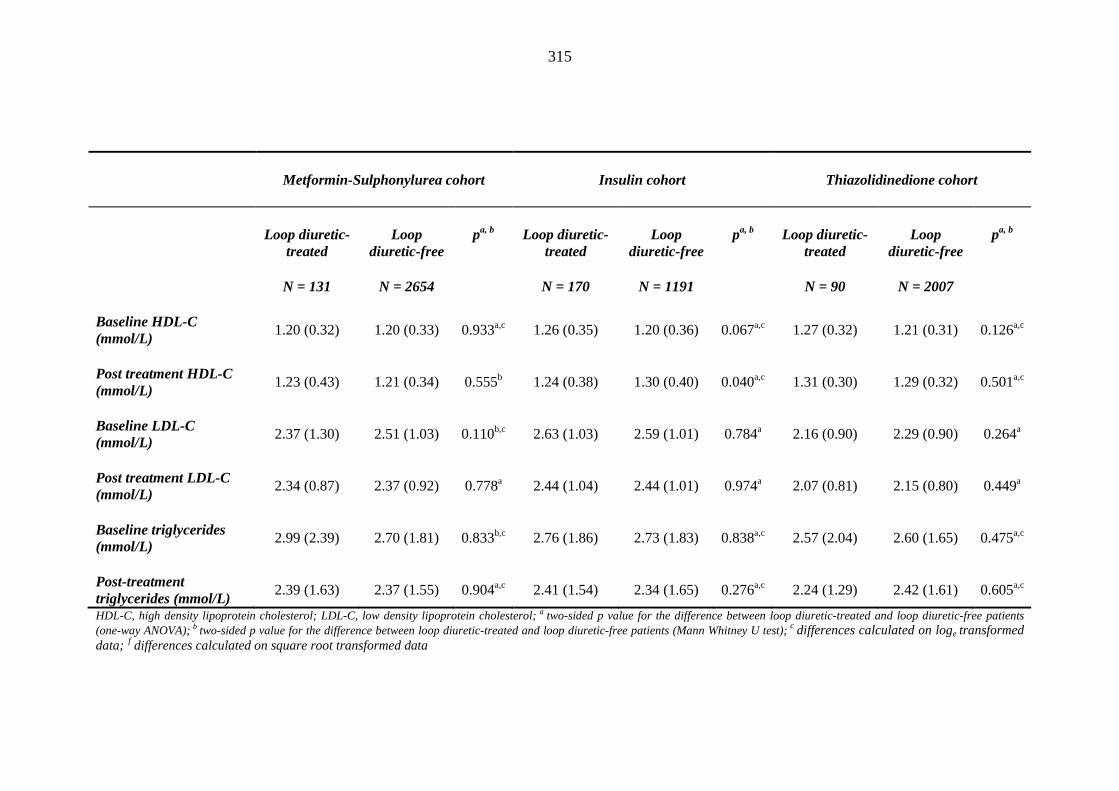
315
Metformin-Sulphonylurea cohort
Insulin cohort
Thiazolidinedione cohort
Loop diuretic-
treated
N = 131
Loop
diuretic-free
N = 2654
pa, b
Loop diuretic-
treated
N = 170
Loop
diuretic-free
N = 1191
pa, b
Loop diuretic-
treated
N = 90
Loop
diuretic-free
N = 2007
pa, b
Baseline HDL-C (mmol/L) 1.20 (0.32) 1.20 (0.33) 0.933a,c 1.26 (0.35) 1.20 (0.36) 0.067a,c 1.27 (0.32) 1.21 (0.31) 0.126a,c
Post treatment HDL-C (mmol/L) 1.23 (0.43) 1.21 (0.34) 0.555b 1.24 (0.38) 1.30 (0.40) 0.040a,c 1.31 (0.30) 1.29 (0.32) 0.501a,c
Baseline LDL-C (mmol/L) 2.37 (1.30) 2.51 (1.03) 0.110b,c 2.63 (1.03) 2.59 (1.01) 0.784a 2.16 (0.90) 2.29 (0.90) 0.264a
Post treatment LDL-C (mmol/L) 2.34 (0.87) 2.37 (0.92) 0.778a 2.44 (1.04) 2.44 (1.01) 0.974a 2.07 (0.81) 2.15 (0.80) 0.449a
Baseline triglycerides (mmol/L) 2.99 (2.39) 2.70 (1.81) 0.833b,c 2.76 (1.86) 2.73 (1.83) 0.838a,c 2.57 (2.04) 2.60 (1.65) 0.475a,c
Post-treatment triglycerides (mmol/L) 2.39 (1.63) 2.37 (1.55) 0.904a,c 2.41 (1.54) 2.34 (1.65) 0.276a,c 2.24 (1.29) 2.42 (1.61) 0.605a,c
HDL-C, high density lipoprotein cholesterol; LDL-C, low density lipoprotein cholesterol; a two-sided p value for the difference between loop diuretic-treated and loop diuretic-free patients (one-way ANOVA); b two-sided p value for the difference between loop diuretic-treated and loop diuretic-free patients (Mann Whitney U test); c differences calculated on loge transformed data; f differences calculated on square root transformed data
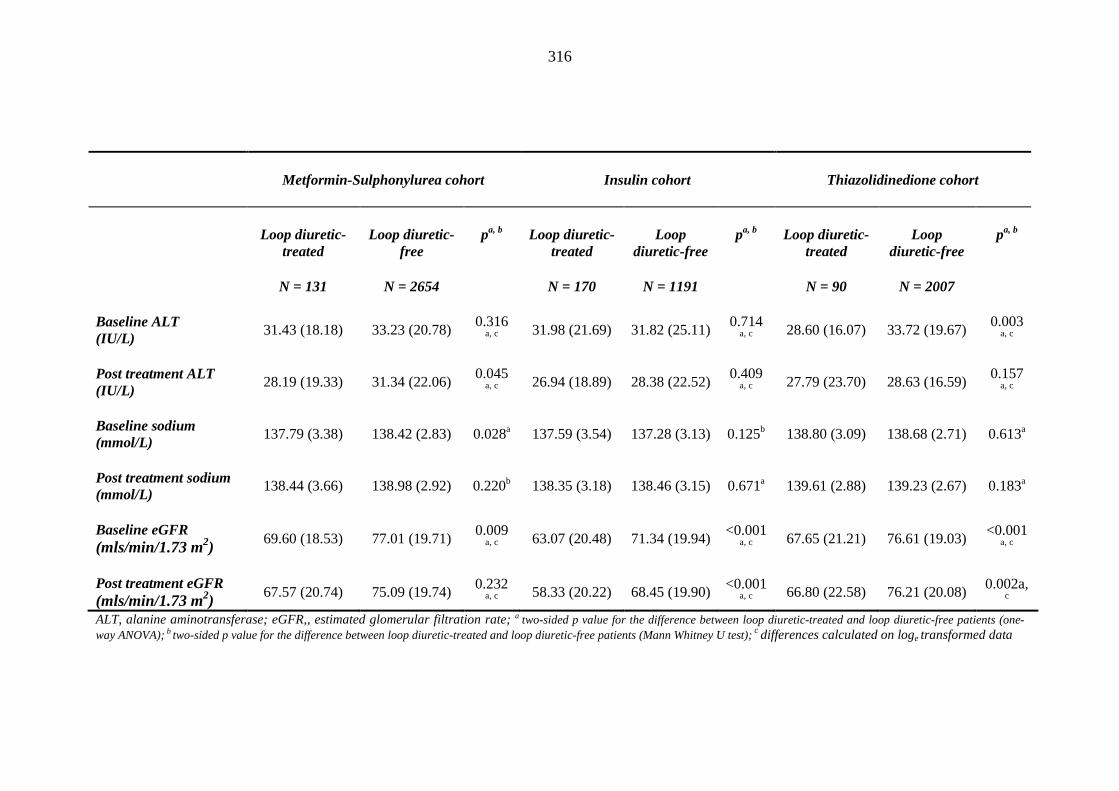
316
Metformin-Sulphonylurea cohort
Insulin cohort
Thiazolidinedione cohort
Loop diuretic-
treated
N = 131
Loop diuretic-
free
N = 2654
pa, b
Loop diuretic-
treated
N = 170
Loop
diuretic-free
N = 1191
pa, b
Loop diuretic-
treated
N = 90
Loop
diuretic-free
N = 2007
pa, b
Baseline ALT (IU/L) 31.43 (18.18) 33.23 (20.78) 0.316
a, c 31.98 (21.69) 31.82 (25.11) 0.714 a, c 28.60 (16.07) 33.72 (19.67) 0.003
a, c
Post treatment ALT (IU/L) 28.19 (19.33) 31.34 (22.06) 0.045
a, c 26.94 (18.89) 28.38 (22.52) 0.409 a, c 27.79 (23.70) 28.63 (16.59) 0.157
a, c
Baseline sodium (mmol/L) 137.79 (3.38) 138.42 (2.83) 0.028a 137.59 (3.54) 137.28 (3.13) 0.125b 138.80 (3.09) 138.68 (2.71) 0.613a
Post treatment sodium (mmol/L) 138.44 (3.66) 138.98 (2.92) 0.220b 138.35 (3.18) 138.46 (3.15) 0.671a 139.61 (2.88) 139.23 (2.67) 0.183a
Baseline eGFR (mls/min/1.73 m2)
69.60 (18.53) 77.01 (19.71) 0.009 a, c 63.07 (20.48) 71.34 (19.94) <0.001
a, c 67.65 (21.21) 76.61 (19.03) <0.001 a, c
Post treatment eGFR (mls/min/1.73 m2)
67.57 (20.74) 75.09 (19.74) 0.232 a, c 58.33 (20.22) 68.45 (19.90) <0.001
a, c 66.80 (22.58) 76.21 (20.08) 0.002a, c
ALT, alanine aminotransferase; eGFR,, estimated glomerular filtration rate; a two-sided p value for the difference between loop diuretic-treated and loop diuretic-free patients (one-way ANOVA); b two-sided p value for the difference between loop diuretic-treated and loop diuretic-free patients (Mann Whitney U test); c differences calculated on loge transformed data
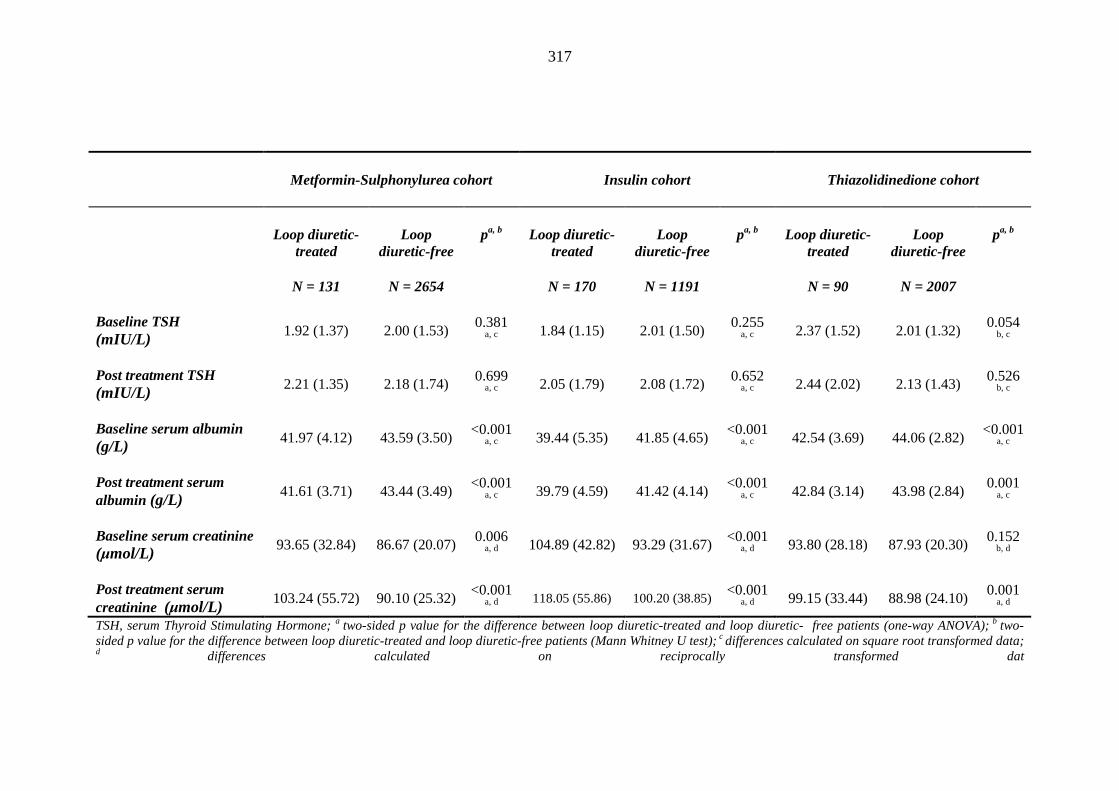
317
Metformin-Sulphonylurea cohort
Insulin cohort
Thiazolidinedione cohort
Loop diuretic-
treated
N = 131
Loop
diuretic-free
N = 2654
pa, b
Loop diuretic-
treated
N = 170
Loop
diuretic-free
N = 1191
pa, b
Loop diuretic-
treated
N = 90
Loop
diuretic-free
N = 2007
pa, b
Baseline TSH (mIU/L)
1.92 (1.37) 2.00 (1.53) 0.381 a, c 1.84 (1.15) 2.01 (1.50) 0.255
a, c 2.37 (1.52) 2.01 (1.32) 0.054 b, c
Post treatment TSH (mIU/L)
2.21 (1.35) 2.18 (1.74) 0.699 a, c 2.05 (1.79) 2.08 (1.72) 0.652
a, c 2.44 (2.02) 2.13 (1.43) 0.526 b, c
Baseline serum albumin (g/L)
41.97 (4.12) 43.59 (3.50) <0.001 a, c 39.44 (5.35) 41.85 (4.65) <0.001
a, c 42.54 (3.69) 44.06 (2.82) <0.001 a, c
Post treatment serum albumin (g/L)
41.61 (3.71) 43.44 (3.49) <0.001 a, c 39.79 (4.59) 41.42 (4.14) <0.001
a, c 42.84 (3.14) 43.98 (2.84) 0.001 a, c
Baseline serum creatinine (μmol/L)
93.65 (32.84) 86.67 (20.07) 0.006 a, d 104.89 (42.82) 93.29 (31.67) <0.001
a, d 93.80 (28.18) 87.93 (20.30) 0.152 b, d
Post treatment serum creatinine (μmol/L)
103.24 (55.72) 90.10 (25.32) <0.001 a, d 118.05 (55.86) 100.20 (38.85)
<0.001 a, d 99.15 (33.44) 88.98 (24.10) 0.001
a, d
TSH, serum Thyroid Stimulating Hormone; a two-sided p value for the difference between loop diuretic-treated and loop diuretic- free patients (one-way ANOVA); b two-sided p value for the difference between loop diuretic-treated and loop diuretic-free patients (Mann Whitney U test); c differences calculated on square root transformed data; d differences calculated on reciprocally transformed dat
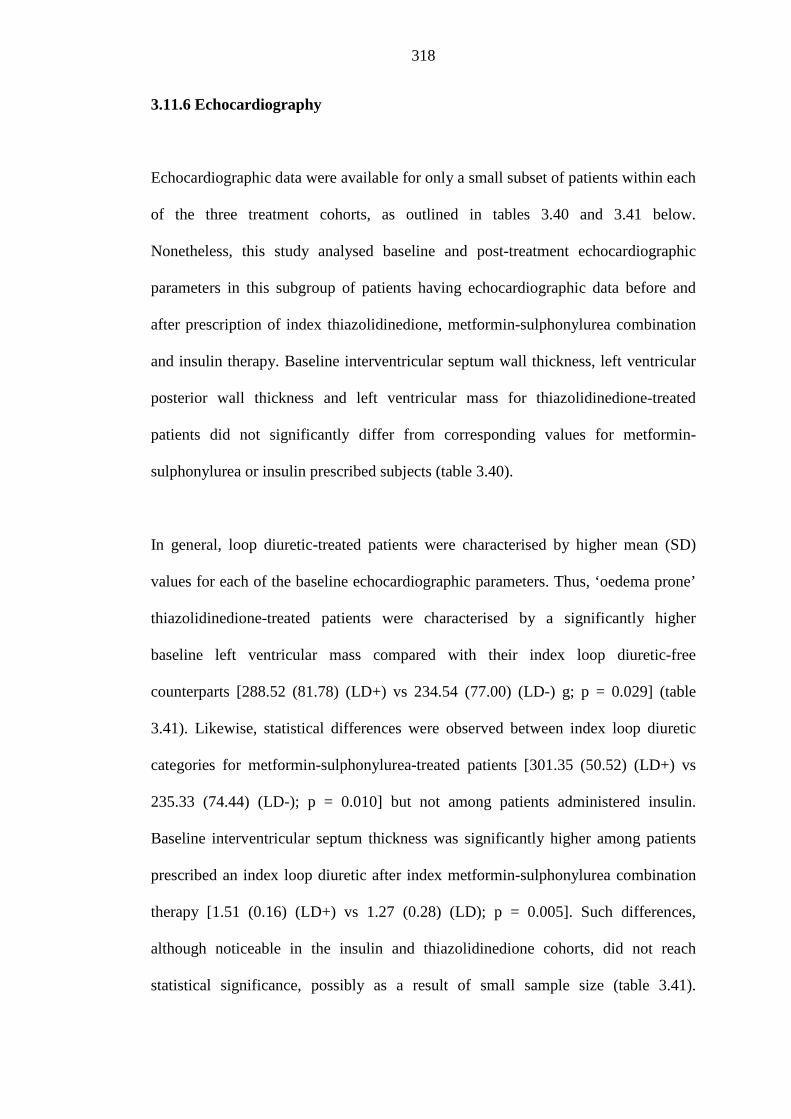
318
3.11.6 Echocardiography
Echocardiographic data were available for only a small subset of patients within each
of the three treatment cohorts, as outlined in tables 3.40 and 3.41 below.
Nonetheless, this study analysed baseline and post-treatment echocardiographic
parameters in this subgroup of patients having echocardiographic data before and
after prescription of index thiazolidinedione, metformin-sulphonylurea combination
and insulin therapy. Baseline interventricular septum wall thickness, left ventricular
posterior wall thickness and left ventricular mass for thiazolidinedione-treated
patients did not significantly differ from corresponding values for metformin-
sulphonylurea or insulin prescribed subjects (table 3.40).
In general, loop diuretic-treated patients were characterised by higher mean (SD)
values for each of the baseline echocardiographic parameters. Thus, ‘oedema prone’
thiazolidinedione-treated patients were characterised by a significantly higher
baseline left ventricular mass compared with their index loop diuretic-free
counterparts [288.52 (81.78) (LD+) vs 234.54 (77.00) (LD-) g; p = 0.029] (table
3.41). Likewise, statistical differences were observed between index loop diuretic
categories for metformin-sulphonylurea-treated patients [301.35 (50.52) (LD+) vs
235.33 (74.44) (LD-); p = 0.010] but not among patients administered insulin.
Baseline interventricular septum thickness was significantly higher among patients
prescribed an index loop diuretic after index metformin-sulphonylurea combination
therapy [1.51 (0.16) (LD+) vs 1.27 (0.28) (LD); p = 0.005]. Such differences,
although noticeable in the insulin and thiazolidinedione cohorts, did not reach
statistical significance, possibly as a result of small sample size (table 3.41).
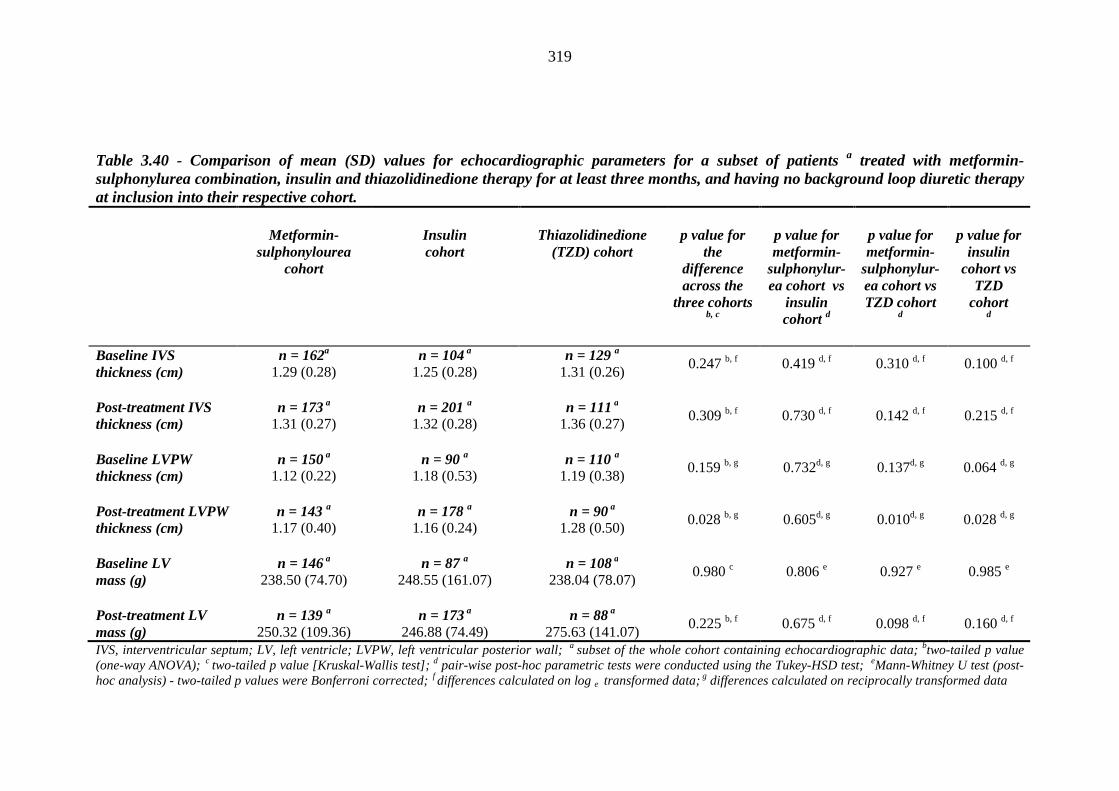
319
Table 3.40 - Comparison of mean (SD) values for echocardiographic parameters for a subset of patients a treated with metformin-sulphonylurea combination, insulin and thiazolidinedione therapy for at least three months, and having no background loop diuretic therapy at inclusion into their respective cohort.
Metformin-
sulphonylourea cohort
Insulin cohort
Thiazolidinedione
(TZD) cohort
p value for
the difference across the
three cohorts b, c
p value for metformin-
sulphonylur-ea cohort vs
insulin cohort d
p value for metformin-
sulphonylur-ea cohort vs TZD cohort
d
p value for
insulin cohort vs
TZD cohort
d
Baseline IVS thickness (cm)
n = 162a 1.29 (0.28)
n = 104 a 1.25 (0.28)
n = 129 a 1.31 (0.26) 0.247 b, f 0.419 d, f 0.310 d, f 0.100 d, f
Post-treatment IVS thickness (cm)
n = 173 a 1.31 (0.27)
n = 201 a 1.32 (0.28)
n = 111 a 1.36 (0.27) 0.309 b, f 0.730 d, f 0.142 d, f 0.215 d, f
Baseline LVPW thickness (cm)
n = 150 a 1.12 (0.22)
n = 90 a 1.18 (0.53)
n = 110 a 1.19 (0.38) 0.159 b, g 0.732d, g 0.137d, g 0.064 d, g
Post-treatment LVPW thickness (cm)
n = 143 a 1.17 (0.40)
n = 178 a 1.16 (0.24)
n = 90 a 1.28 (0.50) 0.028 b, g 0.605d, g 0.010d, g 0.028 d, g
Baseline LV mass (g)
n = 146 a 238.50 (74.70)
n = 87 a 248.55 (161.07)
n = 108 a 238.04 (78.07) 0.980 c 0.806 e 0.927 e 0.985 e
Post-treatment LV mass (g)
n = 139 a 250.32 (109.36)
n = 173 a 246.88 (74.49)
n = 88 a 275.63 (141.07) 0.225 b, f 0.675 d, f 0.098 d, f 0.160 d, f
IVS, interventricular septum; LV, left ventricle; LVPW, left ventricular posterior wall; a subset of the whole cohort containing echocardiographic data; btwo-tailed p value (one-way ANOVA); c two-tailed p value [Kruskal-Wallis test]; d pair-wise post-hoc parametric tests were conducted using the Tukey-HSD test; eMann-Whitney U test (post-hoc analysis) - two-tailed p values were Bonferroni corrected; f differences calculated on log e transformed data; g differences calculated on reciprocally transformed data
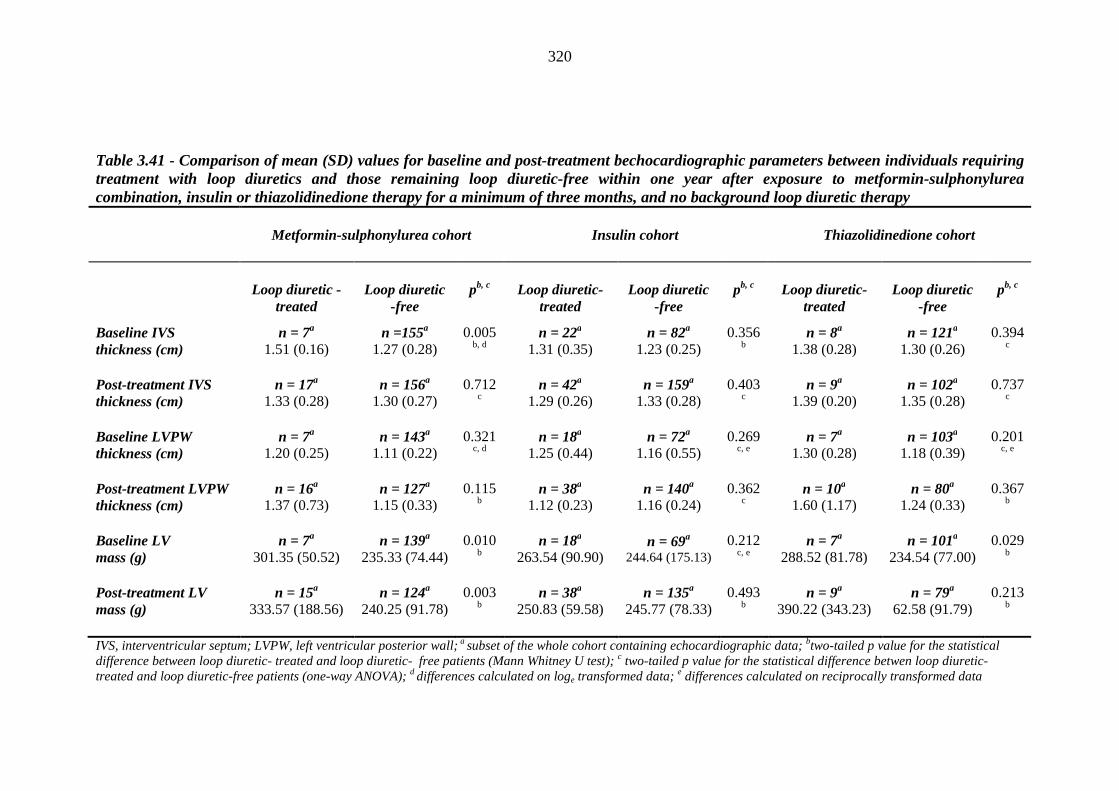
320
Table 3.41 - Comparison of mean (SD) values for baseline and post-treatment bechocardiographic parameters between individuals requiring treatment with loop diuretics and those remaining loop diuretic-free within one year after exposure to metformin-sulphonylurea combination, insulin or thiazolidinedione therapy for a minimum of three months, and no background loop diuretic therapy
Metformin-sulphonylurea cohort
Insulin cohort
Thiazolidinedione cohort
Loop diuretic -
treated
Loop diuretic
-free
pb, c
Loop diuretic-
treated
Loop diuretic
-free
pb, c
Loop diuretic-
treated
Loop diuretic
-free
pb, c
Baseline IVS thickness (cm)
n = 7a 1.51 (0.16)
n =155a 1.27 (0.28)
0.005 b, d
n = 22a 1.31 (0.35)
n = 82a 1.23 (0.25)
0.356b
n = 8a 1.38 (0.28)
n = 121a 1.30 (0.26)
0.394c
Post-treatment IVS thickness (cm)
n = 17a 1.33 (0.28)
n = 156a 1.30 (0.27)
0.712c
n = 42a 1.29 (0.26)
n = 159a 1.33 (0.28)
0.403c
n = 9a 1.39 (0.20)
n = 102a 1.35 (0.28)
0.737c
Baseline LVPW thickness (cm)
n = 7a 1.20 (0.25)
n = 143a 1.11 (0.22)
0.321c, d
n = 18a 1.25 (0.44)
n = 72a 1.16 (0.55)
0.269c, e
n = 7a 1.30 (0.28)
n = 103a 1.18 (0.39)
0.201c, e
Post-treatment LVPW thickness (cm)
n = 16a 1.37 (0.73)
n = 127a 1.15 (0.33)
0.115b
n = 38a 1.12 (0.23)
n = 140a 1.16 (0.24)
0.362c
n = 10a 1.60 (1.17)
n = 80a 1.24 (0.33)
0.367b
Baseline LV mass (g)
n = 7a 301.35 (50.52)
n = 139a 235.33 (74.44)
0.010b
n = 18a 263.54 (90.90)
n = 69a 244.64 (175.13)
0.212 c, e
n = 7a 288.52 (81.78)
n = 101a 234.54 (77.00)
0.029b
Post-treatment LV mass (g)
n = 15a 333.57 (188.56)
n = 124a 240.25 (91.78)
0.003b
n = 38a 250.83 (59.58)
n = 135a 245.77 (78.33)
0.493b
n = 9a 390.22 (343.23)
n = 79a 62.58 (91.79)
0.213b
IVS, interventricular septum; LVPW, left ventricular posterior wall; a subset of the whole cohort containing echocardiographic data; btwo-tailed p value for the statistical difference between loop diuretic- treated and loop diuretic- free patients (Mann Whitney U test); c two-tailed p value for the statistical difference betwen loop diuretic- treated and loop diuretic-free patients (one-way ANOVA); d differences calculated on loge transformed data; e differences calculated on reciprocally transformed data
321
3.12 Logistic regression model: predicting risk factors for index loop diuretic
prescription required within one year after index metformin-sulphonylurea
combination or thiazolidinedione therapy
3.12.1 Univariate logistic regression
Given the similar proportions of patients requiring an index loop diuretic
prescription after incident metformin-sulphonylurea combination or
thiazolidinedione therapy, I opted to investigate whether index thiazolidinedione
therapy is associated with an increased risk of fluid retention compared with
metformin-sulphonylureas combination therapy on multivariate analysis. Patients on
insulin therapy were not included as a comparator cohort in this logistic regression
analysis, given that they are likely to represent a more diseased cohort, with
potentially different confounding factors influencing index loop diuretic prescription,
as suggested by the results of this study's descriptive analysis. None of the patients
were being treated with a baseline renin inhibitor at inclusion into the treatment
cohort, and thus could not be included in univariate or multivariate analysis.
Categorical covariates were dummy coded, using non-exposure to the categorical
variable of interest as the reference group (and conversely, exposure as the indicator
group). Univariate analysis found that index loop diuretic prescription within one
year of inclusion into either the metformin-sulphonylurea/metformin cohort was
significantly associated with the following characteristics (tables 3.42 and 3.43):
322
Demographics
• age in years [OR 1.047 (95% CI 1.033, 1.061); p < 0.001]
• diabetes duration in years (square root transformed data)
[OR 1.290 (95% CI 1.131,
1.472); p < 0.001]
• female gender [OR 1.392 (95% CI 1.062, 1.824); p = 0.016]
Past medical history
• baseline macrovascular disease [OR 2.459 (95% CI 1.841, 3.285); p < 0.001]
Drug history
• % maximal thiazolidinedione dose [OR 1.009 (95% CI 0.999, 1.020); p =
0.074]
• baseline peripheral vasodilator therapy [OR 1.792 (95% CI 1.039, 3.090); p
= 0.036]
• baseline calcium channel blocker therapy [OR 1.506 (95% CI 1.146, 1.979);
p = 0.003]
• baseline diltiazem therapy [OR 2.030 (95% CI 1.335, 3.088); p = 0.001]
• baseline beta blocker therapy [OR 1.279 (95% CI 0.975, 1.679); p = 0.076]
• baseline central antihypertensive therapy [OR 2.374 (95% CI 0.933, 6.042); p
= 0.070]
• baseline nitrates [OR 2.238, (95% CI 1.681, 2.979); p < 0.001]
Clinical measurements
• baseline systolic blood pressure in mmHg [OR 1.014 (95% CI 1.004, 1.024);
p = 0.007]
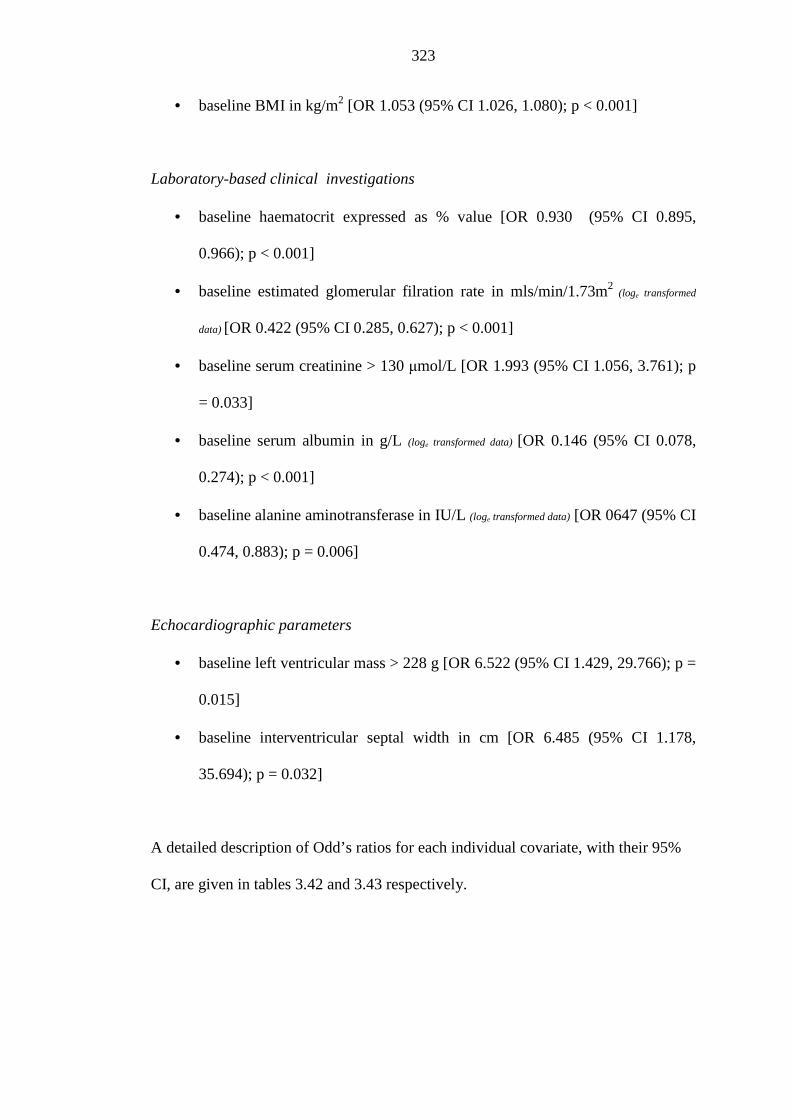
323
• baseline BMI in kg/m2 [OR 1.053 (95% CI 1.026, 1.080); p < 0.001]
Laboratory-based clinical investigations
• baseline haematocrit expressed as % value [OR 0.930 (95% CI 0.895,
0.966); p < 0.001]
• baseline estimated glomerular filration rate in mls/min/1.73m2 (loge transformed
data) [OR 0.422 (95% CI 0.285, 0.627); p < 0.001]
• baseline serum creatinine > 130 μmol/L [OR 1.993 (95% CI 1.056, 3.761); p
= 0.033]
• baseline serum albumin in g/L (loge transformed data) [OR 0.146 (95% CI 0.078,
0.274); p < 0.001]
• baseline alanine aminotransferase in IU/L (loge transformed data) [OR 0647 (95% CI
0.474, 0.883); p = 0.006]
Echocardiographic parameters
• baseline left ventricular mass > 228 g [OR 6.522 (95% CI 1.429, 29.766); p =
0.015]
• baseline interventricular septal width in cm [OR 6.485 (95% CI 1.178,
35.694); p = 0.032]
A detailed description of Odd’s ratios for each individual covariate, with their 95%
CI, are given in tables 3.42 and 3.43 respectively.
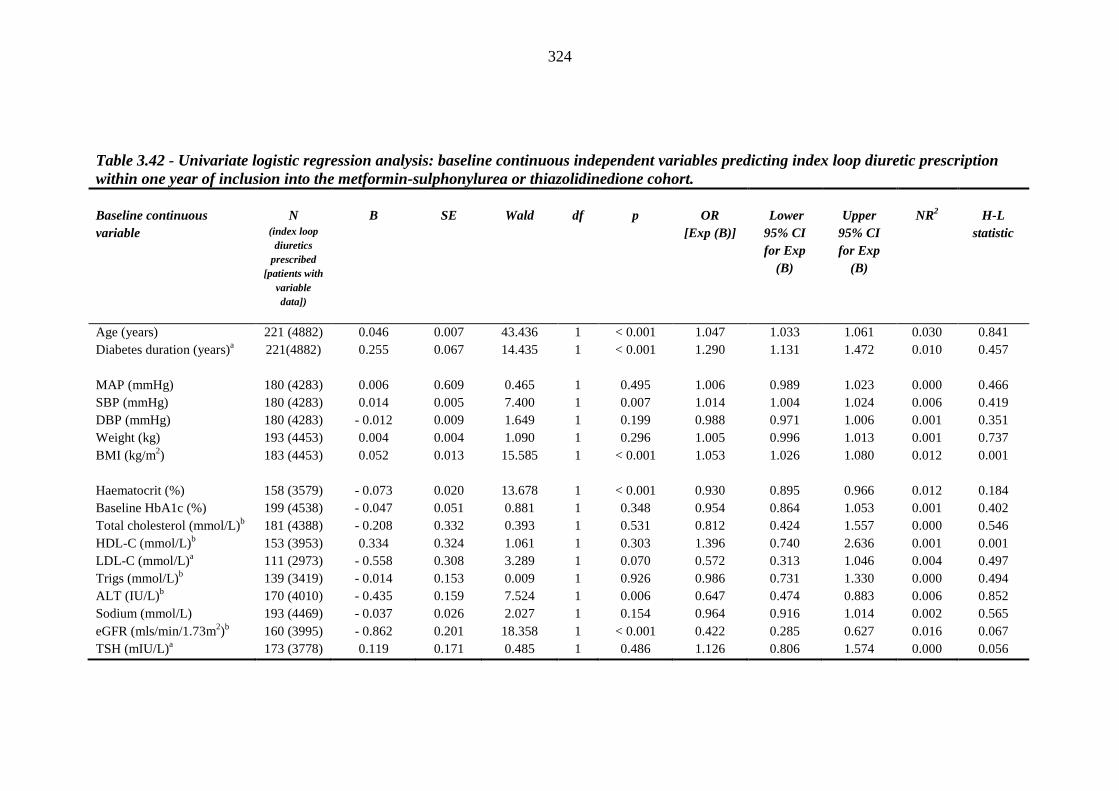
324
Table 3.42 - Univariate logistic regression analysis: baseline continuous independent variables predicting index loop diuretic prescription within one year of inclusion into the metformin-sulphonylurea or thiazolidinedione cohort.
Baseline continuous variable
N
(index loop diuretics
prescribed [patients with
variable data])
B
SE
Wald
df
p
OR
[Exp (B)]
Lower 95% CI for Exp
(B)
Upper
95% CI for Exp
(B)
NR2
H-L
statistic
Age (years) 221 (4882) 0.046 0.007 43.436 1 < 0.001 1.047 1.033 1.061 0.030 0.841 Diabetes duration (years)a 221(4882) 0.255 0.067 14.435 1 < 0.001 1.290 1.131 1.472 0.010 0.457 MAP (mmHg) 180 (4283) 0.006 0.609 0.465 1 0.495 1.006 0.989 1.023 0.000 0.466 SBP (mmHg) 180 (4283) 0.014 0.005 7.400 1 0.007 1.014 1.004 1.024 0.006 0.419 DBP (mmHg) 180 (4283) - 0.012 0.009 1.649 1 0.199 0.988 0.971 1.006 0.001 0.351 Weight (kg) 193 (4453) 0.004 0.004 1.090 1 0.296 1.005 0.996 1.013 0.001 0.737 BMI (kg/m2) 183 (4453) 0.052 0.013 15.585 1 < 0.001 1.053 1.026 1.080 0.012 0.001 Haematocrit (%) 158 (3579) - 0.073 0.020 13.678 1 < 0.001 0.930 0.895 0.966 0.012 0.184 Baseline HbA1c (%) 199 (4538) - 0.047 0.051 0.881 1 0.348 0.954 0.864 1.053 0.001 0.402 Total cholesterol (mmol/L)b 181 (4388) - 0.208 0.332 0.393 1 0.531 0.812 0.424 1.557 0.000 0.546 HDL-C (mmol/L)b 153 (3953) 0.334 0.324 1.061 1 0.303 1.396 0.740 2.636 0.001 0.001 LDL-C (mmol/L)a 111 (2973) - 0.558 0.308 3.289 1 0.070 0.572 0.313 1.046 0.004 0.497 Trigs (mmol/L)b 139 (3419) - 0.014 0.153 0.009 1 0.926 0.986 0.731 1.330 0.000 0.494 ALT (IU/L) b 170 (4010) - 0.435 0.159 7.524 1 0.006 0.647 0.474 0.883 0.006 0.852 Sodium (mmol/L) 193 (4469) - 0.037 0.026 2.027 1 0.154 0.964 0.916 1.014 0.002 0.565 eGFR (mls/min/1.73m2)b 160 (3995) - 0.862 0.201 18.358 1 < 0.001 0.422 0.285 0.627 0.016 0.067 TSH (mIU/L)a 173 (3778) 0.119 0.171 0.485 1 0.486 1.126 0.806 1.574 0.000 0.056
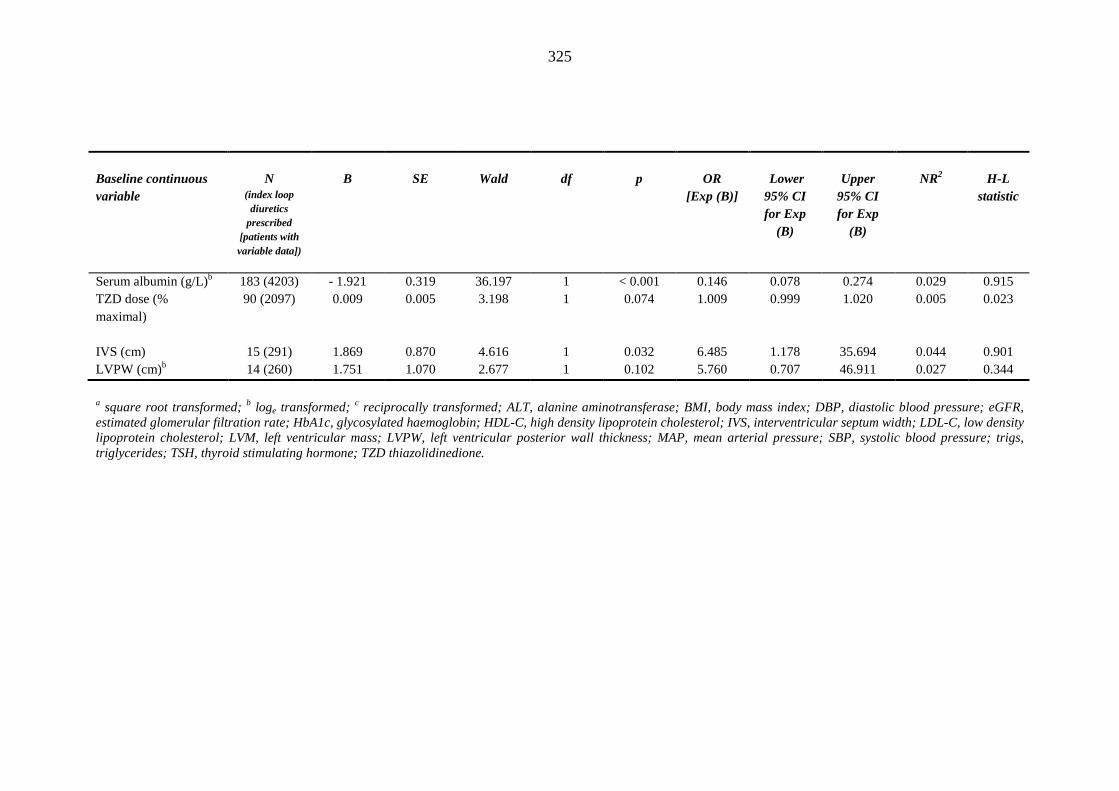
325
Baseline continuous variable
N
(index loop diuretics
prescribed [patients with variable data])
B
SE
Wald
df
p
OR
[Exp (B)]
Lower 95% CI for Exp
(B)
Upper
95% CI for Exp
(B)
NR2
H-L
statistic
Serum albumin (g/L)b 183 (4203) - 1.921 0.319 36.197 1 < 0.001 0.146 0.078 0.274 0.029 0.915 TZD dose (% maximal)
90 (2097) 0.009 0.005 3.198 1 0.074 1.009 0.999 1.020 0.005 0.023
IVS (cm) 15 (291) 1.869 0.870 4.616 1 0.032 6.485 1.178 35.694 0.044 0.901 LVPW (cm)b 14 (260) 1.751 1.070 2.677 1 0.102 5.760 0.707 46.911 0.027 0.344
a square root transformed; b loge transformed; c reciprocally transformed; ALT, alanine aminotransferase; BMI, body mass index; DBP, diastolic blood pressure; eGFR, estimated glomerular filtration rate; HbA1c, glycosylated haemoglobin; HDL-C, high density lipoprotein cholesterol; IVS, interventricular septum width; LDL-C, low density lipoprotein cholesterol; LVM, left ventricular mass; LVPW, left ventricular posterior wall thickness; MAP, mean arterial pressure; SBP, systolic blood pressure; trigs, triglycerides; TSH, thyroid stimulating hormone; TZD thiazolidinedione.
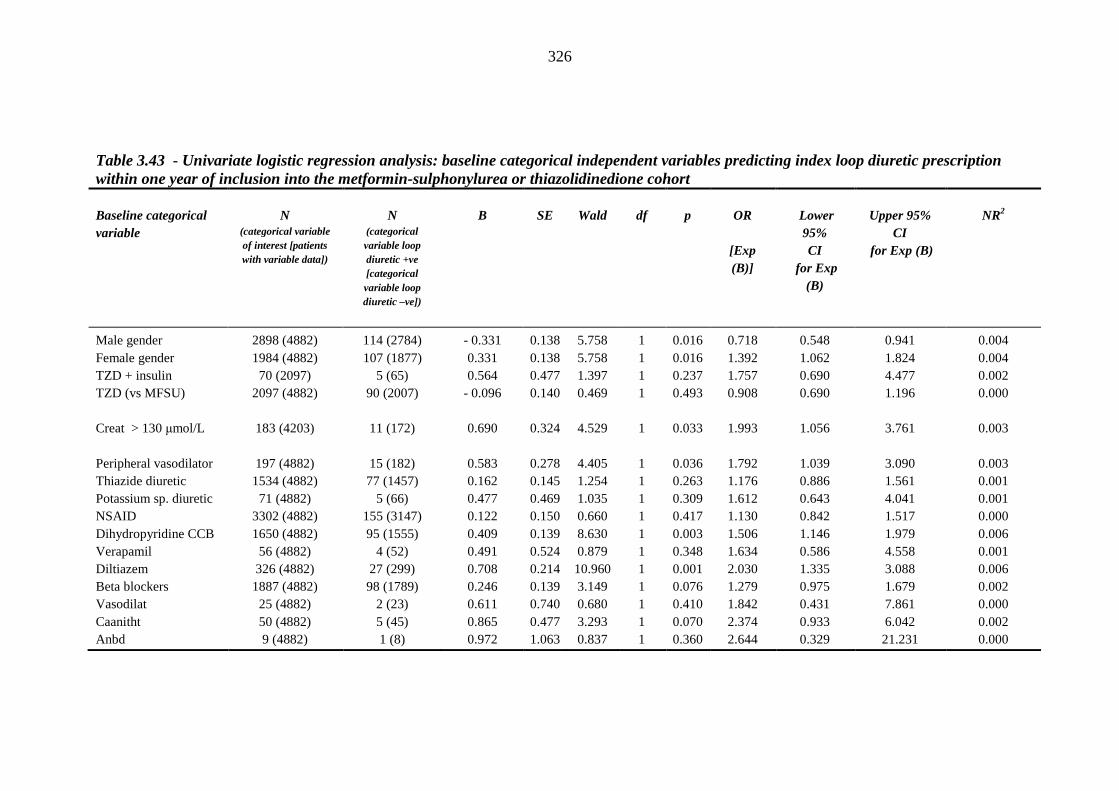
326
Table 3.43 - Univariate logistic regression analysis: baseline categorical independent variables predicting index loop diuretic prescription within one year of inclusion into the metformin-sulphonylurea or thiazolidinedione cohort Baseline categorical variable
N
(categorical variable of interest [patients with variable data])
N
(categorical variable loop diuretic +ve [categorical variable loop diuretic –ve])
B
SE
Wald
df
p
OR
[Exp (B)]
Lower 95% CI
for Exp (B)
Upper 95%
CI for Exp (B)
NR2
Male gender 2898 (4882) 114 (2784) - 0.331 0.138 5.758 1 0.016 0.718 0.548 0.941 0.004 Female gender 1984 (4882) 107 (1877) 0.331 0.138 5.758 1 0.016 1.392 1.062 1.824 0.004 TZD + insulin 70 (2097) 5 (65) 0.564 0.477 1.397 1 0.237 1.757 0.690 4.477 0.002 TZD (vs MFSU) 2097 (4882) 90 (2007) - 0.096 0.140 0.469 1 0.493 0.908 0.690 1.196 0.000 Creat > 130 μmol/L 183 (4203) 11 (172) 0.690 0.324 4.529 1 0.033 1.993 1.056 3.761 0.003 Peripheral vasodilator 197 (4882) 15 (182) 0.583 0.278 4.405 1 0.036 1.792 1.039 3.090 0.003 Thiazide diuretic 1534 (4882) 77 (1457) 0.162 0.145 1.254 1 0.263 1.176 0.886 1.561 0.001 Potassium sp. diuretic 71 (4882) 5 (66) 0.477 0.469 1.035 1 0.309 1.612 0.643 4.041 0.001 NSAID 3302 (4882) 155 (3147) 0.122 0.150 0.660 1 0.417 1.130 0.842 1.517 0.000 Dihydropyridine CCB 1650 (4882) 95 (1555) 0.409 0.139 8.630 1 0.003 1.506 1.146 1.979 0.006 Verapamil 56 (4882) 4 (52) 0.491 0.524 0.879 1 0.348 1.634 0.586 4.558 0.001 Diltiazem 326 (4882) 27 (299) 0.708 0.214 10.960 1 0.001 2.030 1.335 3.088 0.006 Beta blockers 1887 (4882) 98 (1789) 0.246 0.139 3.149 1 0.076 1.279 0.975 1.679 0.002 Vasodilat 25 (4882) 2 (23) 0.611 0.740 0.680 1 0.410 1.842 0.431 7.861 0.000 Caanitht 50 (4882) 5 (45) 0.865 0.477 3.293 1 0.070 2.374 0.933 6.042 0.002 Anbd 9 (4882) 1 (8) 0.972 1.063 0.837 1 0.360 2.644 0.329 21.231 0.000
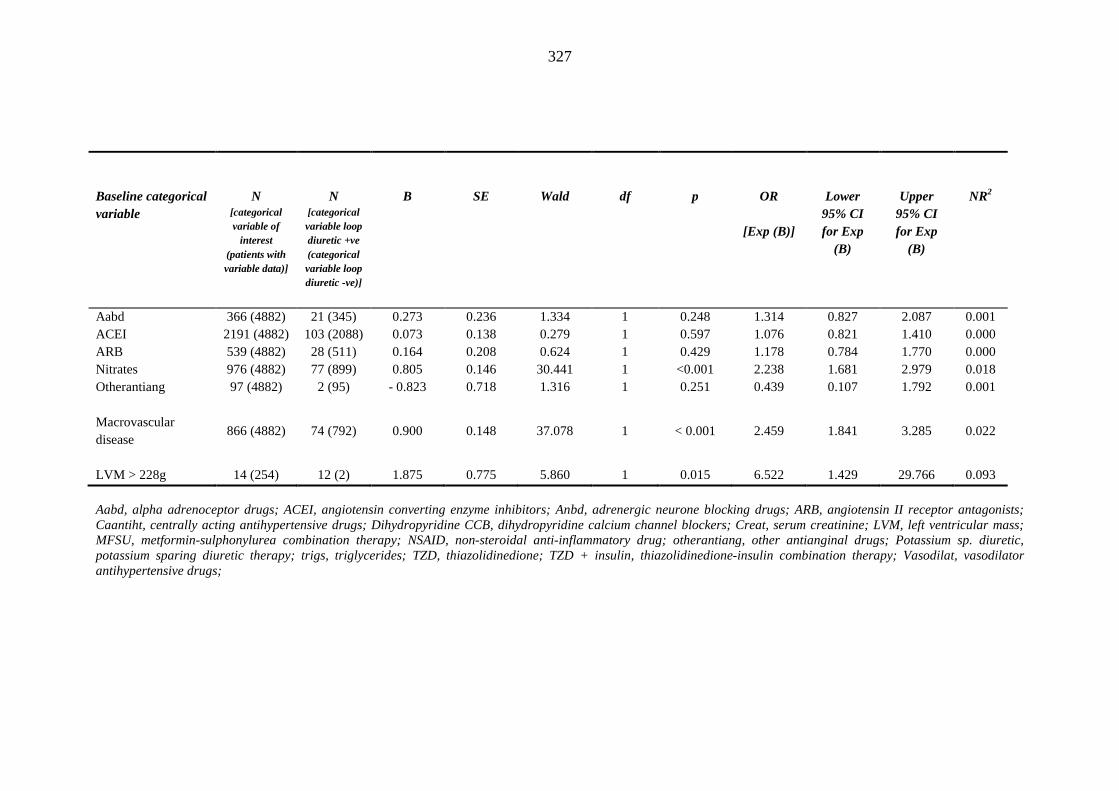
327
Baseline categorical variable
N [categorical variable of
interest (patients with variable data)]
N [categorical variable loop diuretic +ve (categorical variable loop diuretic -ve)]
B
SE
Wald
df
p
OR
[Exp (B)]
Lower 95% CI for Exp
(B)
Upper 95% CI for Exp
(B)
NR2
Aabd 366 (4882) 21 (345) 0.273 0.236 1.334 1 0.248 1.314 0.827 2.087 0.001 ACEI 2191 (4882) 103 (2088) 0.073 0.138 0.279 1 0.597 1.076 0.821 1.410 0.000 ARB 539 (4882) 28 (511) 0.164 0.208 0.624 1 0.429 1.178 0.784 1.770 0.000 Nitrates 976 (4882) 77 (899) 0.805 0.146 30.441 1 <0.001 2.238 1.681 2.979 0.018 Otherantiang 97 (4882) 2 (95) - 0.823 0.718 1.316 1 0.251 0.439 0.107 1.792 0.001 Macrovascular disease
866 (4882) 74 (792) 0.900 0.148 37.078 1 < 0.001 2.459 1.841 3.285 0.022
LVM > 228g 14 (254) 12 (2) 1.875 0.775 5.860 1 0.015 6.522 1.429 29.766 0.093
Aabd, alpha adrenoceptor drugs; ACEI, angiotensin converting enzyme inhibitors; Anbd, adrenergic neurone blocking drugs; ARB, angiotensin II receptor antagonists; Caantiht, centrally acting antihypertensive drugs; Dihydropyridine CCB, dihydropyridine calcium channel blockers; Creat, serum creatinine; LVM, left ventricular mass; MFSU, metformin-sulphonylurea combination therapy; NSAID, non-steroidal anti-inflammatory drug; otherantiang, other antianginal drugs; Potassium sp. diuretic, potassium sparing diuretic therapy; trigs, triglycerides; TZD, thiazolidinedione; TZD + insulin, thiazolidinedione-insulin combination therapy; Vasodilat, vasodilator antihypertensive drugs;
328
3.12.2 Multivariate logistic regression
90 and 131 patients required prescription of an index loop diuretic within one year
after exposure to thiazolidinedione therapy and metformin-sulphonylurea
combination therapy respectively. 2007 thiazolidinedione-treated patients and 2654
patients on metformin-sulphonylurea combination therapy did not develop require an
index loop diuretic after inclusion into their respective cohort. Hence, the overall
proportion of patients requiring an index loop diuretic prescription amounts to
0.04526 (or 4.53%).
Based on statistical work reported by Peduzzi et al. [609], given the proportion of
patients requiring an index loop diuretic after index thiazolidinedione prescription,
the maximum number of covariates that can be included in any model amounts to 22.
Based on univariate analysis, and taking into account the number of patients for
whom data for each covariate were available, covariates of interest were modelled
into two stepwise index loop diuretic logistic regression models (1 and 2).
(i) Index loop diuretic logistic regession model 1
The following predictors (covariates) were included in index loop diuretic logistic
regression model 1
• Age (years)
• diabetes duration (years) (square root transformed data)
329
• baseline BMI (kg/m2)
• baseline haematocrit (%)
• baseline serum creatinine > 130 μmol/L
• baseline albumin (g/L) (loge transformed data)
• baseline ALT (IU/L) (loge transformed data)
• baseline systolic blood pressure (mmHg)
• female gender
• baseline macrovascular disease (composite of coronary artery disease,
peripheral artery disease and cerebrovascular disease)
• index thiazolidinedione prescription (vs baseline metformin-sulphonylurea
combination therapy)
% maximal thiazolidinedione dose was not included into the logistic regression
model, so as not to restrict the model to thiazolidinedione-treated patients. Index
thiazolidinedione prescription (vs metformin-sulphonylurea combination therapy)
was included as a covariate despite not reaching statistical significance on univariate
regression, given this study’s aim of investigating whether PPAR-γ agonist therapy
predicts index loop diuretic prescription in a multivariate model.
3116 patients were included into the logistic regression model. Employing a 0.05
criterion of statistical significance, the Wald criterion demonstrated that baseline
BMI, baseline age, baseline macrovascular disease, baseline serum albumin and
diabetes duration made a significant contribution to prediction, as shown in table
3.44.
330
A test of the full model versus a model with intercept only was statistically
significant (chi square 82.198, p < 0.001 with df = 5). The p value for the Hosmer
and Leneshow test statistic (H-L statistic) was greater than 0.05 (chi square 6.761, df
= 8, p = 0.563), implying that the model’s estimates fit the data at an acceptable
level. Nagelkerke’s R2 = 0.091, effectively indicating a relationship of 9.1% between
predictors (covariates) and the prediction (ie index loop diuretic prescription).
Prediction success overall was 96.0%.
Wald’s statistic for the final model indicate that baseline BMI, age and baseline
macrovascular disease are the strongest predictors of fluid overload (in decreasing
order of importance). From table 3.44, the fitted model is:
Logit (p) = - 7.413 + (0.085*BMI) + (0.053*age) + (0.723*macrovascular disease) +
(-1.339*serum albumin [loge transformed data]) + (0.214*diabetes duration [square root
transformed data])
where p is the probability of progessing to index loop diuretic prescription within
one year.
Thus, when holding all other variables constant, a patient known to suffer from
macrovascular disease at metformin-sulphonylurea combination or thiazolidinedione
prescription is 2.06 times more likely to require prescription of an index loop diuretic
within one year after inclusion into either cohort. With each unit square root (√)
passing year since diagnosis of T2DM, a patient’s risk of requiring index loop
diuretic prescription after inclusion into either cohort increases by 23.9%, assuming
all other covariates are unchanged during the observation period. Holding all other
variables constant, each one year increase in age at prescription of metformin-
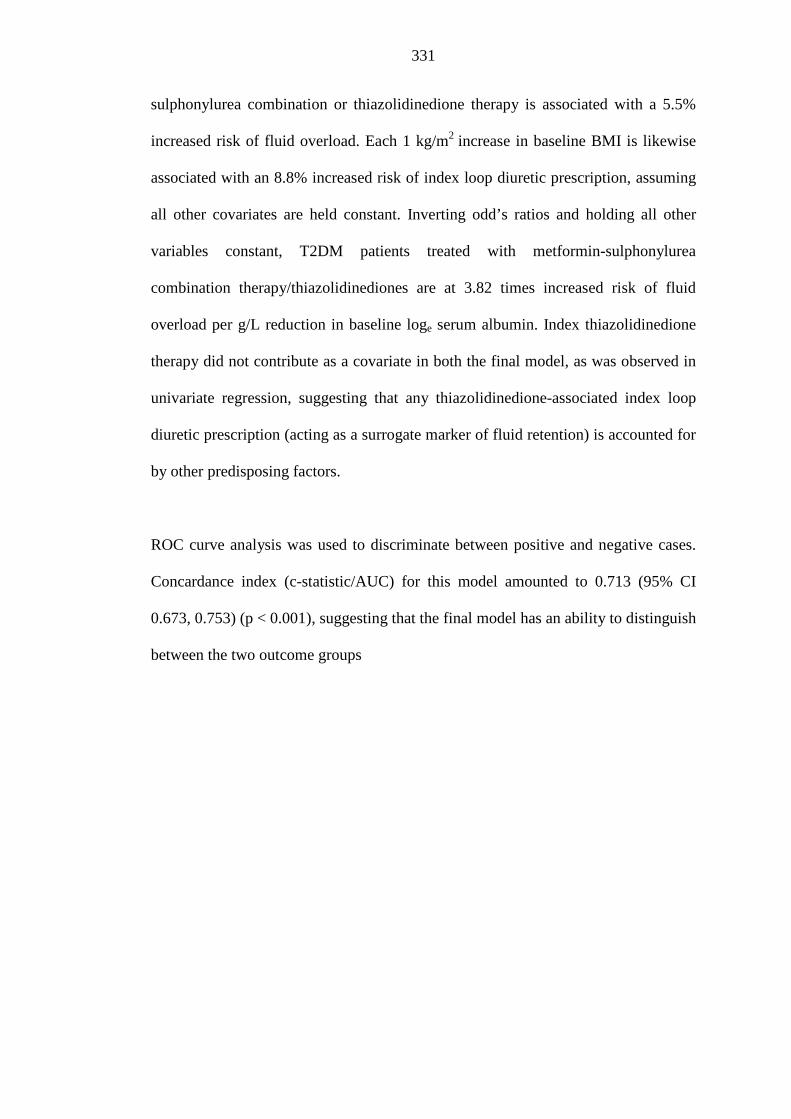
331
sulphonylurea combination or thiazolidinedione therapy is associated with a 5.5%
increased risk of fluid overload. Each 1 kg/m2 increase in baseline BMI is likewise
associated with an 8.8% increased risk of index loop diuretic prescription, assuming
all other covariates are held constant. Inverting odd’s ratios and holding all other
variables constant, T2DM patients treated with metformin-sulphonylurea
combination therapy/thiazolidinediones are at 3.82 times increased risk of fluid
overload per g/L reduction in baseline loge serum albumin. Index thiazolidinedione
therapy did not contribute as a covariate in both the final model, as was observed in
univariate regression, suggesting that any thiazolidinedione-associated index loop
diuretic prescription (acting as a surrogate marker of fluid retention) is accounted for
by other predisposing factors.
ROC curve analysis was used to discriminate between positive and negative cases.
Concardance index (c-statistic/AUC) for this model amounted to 0.713 (95% CI
0.673, 0.753) (p < 0.001), suggesting that the final model has an ability to distinguish
between the two outcome groups
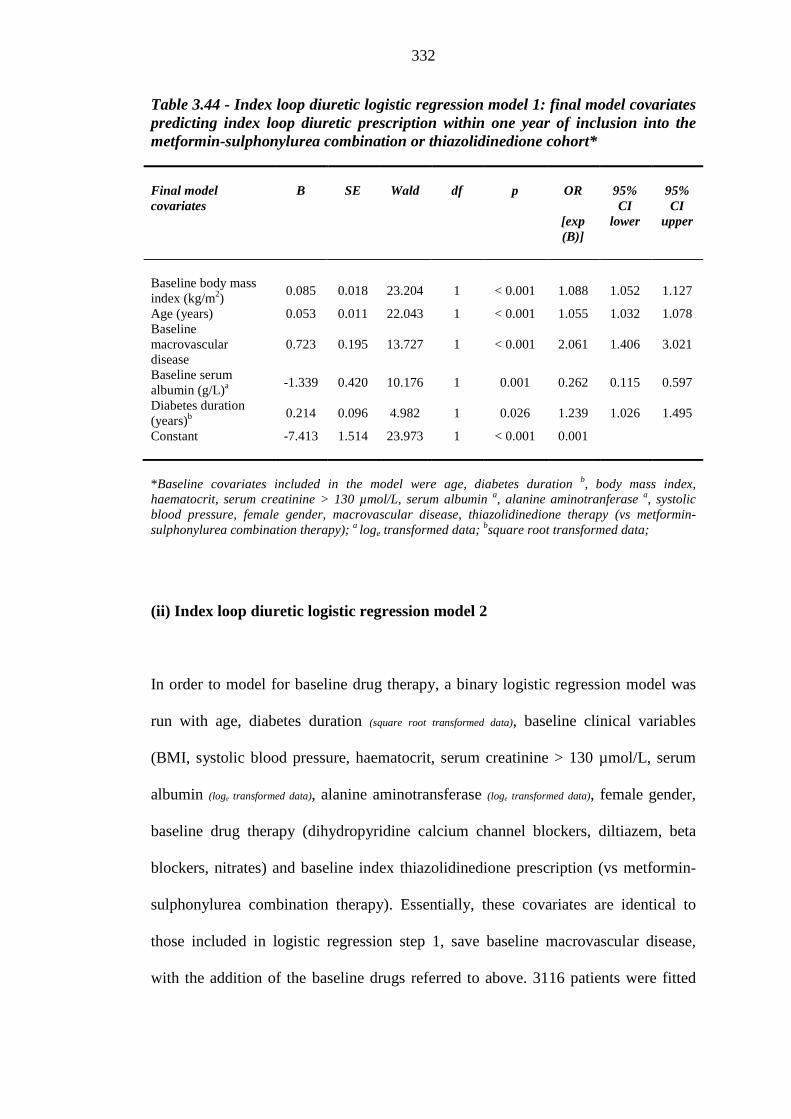
332
Table 3.44 - Index loop diuretic logistic regression model 1: final model covariates predicting index loop diuretic prescription within one year of inclusion into the metformin-sulphonylurea combination or thiazolidinedione cohort* Final model covariates
B
SE
Wald
df
p
OR
[exp (B)]
95% CI
lower
95% CI
upper
Baseline body mass index (kg/m2)
0.085 0.018 23.204 1 < 0.001 1.088 1.052 1.127
Age (years) 0.053 0.011 22.043 1 < 0.001 1.055 1.032 1.078 Baseline macrovascular disease
0.723 0.195 13.727 1 < 0.001 2.061 1.406 3.021
Baseline serum albumin (g/L)a
-1.339 0.420 10.176 1 0.001 0.262 0.115 0.597
Diabetes duration (years)b
0.214 0.096 4.982 1 0.026 1.239 1.026 1.495
Constant -7.413 1.514 23.973 1 < 0.001 0.001 *Baseline covariates included in the model were age, diabetes duration b, body mass index, haematocrit, serum creatinine > 130 µmol/L, serum albumin a, alanine aminotranferase a, systolic blood pressure, female gender, macrovascular disease, thiazolidinedione therapy (vs metformin-sulphonylurea combination therapy); a loge transformed data; bsquare root transformed data;
(ii) Index loop diuretic logistic regression model 2
In order to model for baseline drug therapy, a binary logistic regression model was
run with age, diabetes duration (square root transformed data), baseline clinical variables
(BMI, systolic blood pressure, haematocrit, serum creatinine > 130 µmol/L, serum
albumin (loge transformed data), alanine aminotransferase (loge transformed data), female gender,
baseline drug therapy (dihydropyridine calcium channel blockers, diltiazem, beta
blockers, nitrates) and baseline index thiazolidinedione prescription (vs metformin-
sulphonylurea combination therapy). Essentially, these covariates are identical to
those included in logistic regression step 1, save baseline macrovascular disease,
with the addition of the baseline drugs referred to above. 3116 patients were fitted
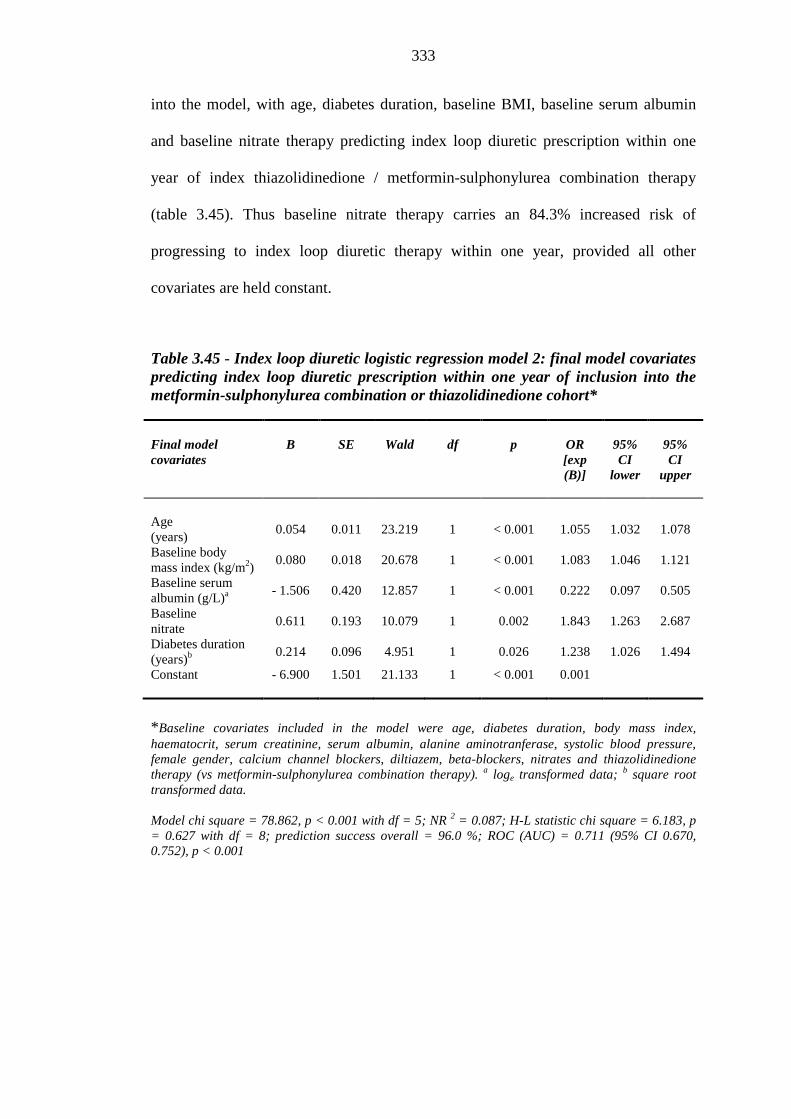
333
into the model, with age, diabetes duration, baseline BMI, baseline serum albumin
and baseline nitrate therapy predicting index loop diuretic prescription within one
year of index thiazolidinedione / metformin-sulphonylurea combination therapy
(table 3.45). Thus baseline nitrate therapy carries an 84.3% increased risk of
progressing to index loop diuretic therapy within one year, provided all other
covariates are held constant.
Table 3.45 - Index loop diuretic logistic regression model 2: final model covariates predicting index loop diuretic prescription within one year of inclusion into the metformin-sulphonylurea combination or thiazolidinedione cohort* Final model covariates
B
SE
Wald
df
p
OR [exp (B)]
95% CI
lower
95% CI
upper
Age (years)
0.054 0.011 23.219 1 < 0.001 1.055 1.032 1.078
Baseline body mass index (kg/m2)
0.080 0.018 20.678 1 < 0.001 1.083 1.046 1.121
Baseline serum albumin (g/L)a
- 1.506 0.420 12.857 1 < 0.001 0.222 0.097 0.505
Baseline nitrate
0.611 0.193 10.079 1 0.002 1.843 1.263 2.687
Diabetes duration (years)b
0.214 0.096 4.951 1 0.026 1.238 1.026 1.494
Constant - 6.900 1.501 21.133 1 < 0.001 0.001
*Baseline covariates included in the model were age, diabetes duration, body mass index, haematocrit, serum creatinine, serum albumin, alanine aminotranferase, systolic blood pressure, female gender, calcium channel blockers, diltiazem, beta-blockers, nitrates and thiazolidinedione therapy (vs metformin-sulphonylurea combination therapy). a loge transformed data; b square root transformed data. Model chi square = 78.862, p < 0.001 with df = 5; NR 2 = 0.087; H-L statistic chi square = 6.183, p = 0.627 with df = 8; prediction success overall = 96.0 %; ROC (AUC) = 0.711 (95% CI 0.670, 0.752), p < 0.001
334
3.13 Cox regression model: predicting risk factors for index loop diuretic
prescription required within one year after index metformin-sulphonylurea
combination or thiazolidinedione therapy
3.13.1 Univariate Cox regression
Following on from the results of logistic regression analysis, this study sought to
model onset time to index loop diuretic prescription (the ‘failure event’) following
index prescription to metformin-sulphonylurea combination therapy or
thiazolidinediones, using Cox proportional hazards regression analysis.
On univariate analysis (tables 3.46 and 3.47) the following clinical and pathological
factors were associated with time to index loop diuretic prescription:
Demographics
• age in years [HR 1.046 (95% CI 1.032, 1.059); p < 0.001]
• diabetes duration in years (square root transformed data) [HR 1.294 (95% CI 1.138,
1.472); p < 0.001]
• female gender (p = 0.011)
Past medical history
• baseline macrovascular disease (p < 0.001)
Drug history
• baseline peripheral vasodilator therapy (p = 0.031)
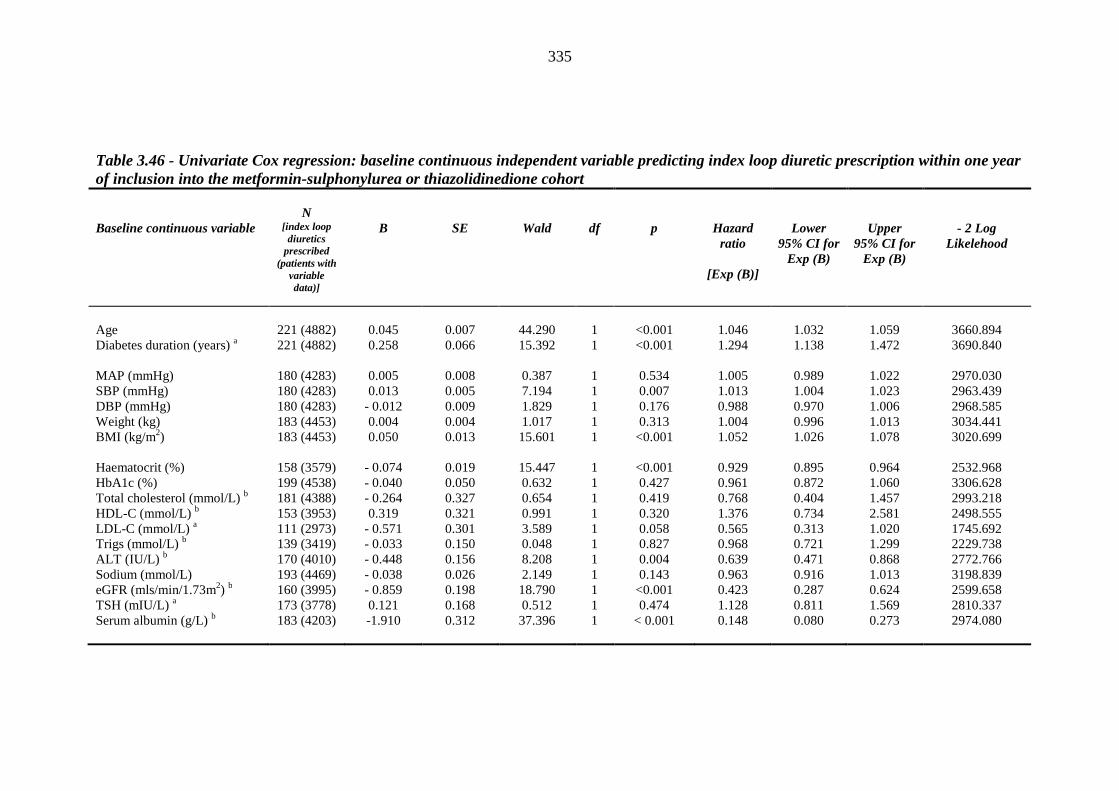
335
Table 3.46 - Univariate Cox regression: baseline continuous independent variable predicting index loop diuretic prescription within one year of inclusion into the metformin-sulphonylurea or thiazolidinedione cohort
Baseline continuous variable
N
[index loop diuretics
prescribed (patients with
variable data)]
B
SE
Wald
df
p
Hazard ratio
[Exp (B)]
Lower 95% CI for
Exp (B)
Upper 95% CI for
Exp (B)
- 2 Log Likelehood
Age 221 (4882) 0.045 0.007 44.290 1 <0.001 1.046 1.032 1.059 3660.894 Diabetes duration (years) a 221 (4882) 0.258 0.066 15.392 1 <0.001 1.294 1.138 1.472 3690.840 MAP (mmHg) 180 (4283) 0.005 0.008 0.387 1 0.534 1.005 0.989 1.022 2970.030 SBP (mmHg) 180 (4283) 0.013 0.005 7.194 1 0.007 1.013 1.004 1.023 2963.439 DBP (mmHg) 180 (4283) - 0.012 0.009 1.829 1 0.176 0.988 0.970 1.006 2968.585 Weight (kg) 183 (4453) 0.004 0.004 1.017 1 0.313 1.004 0.996 1.013 3034.441 BMI (kg/m2) 183 (4453) 0.050 0.013 15.601 1 <0.001 1.052 1.026 1.078 3020.699 Haematocrit (%) 158 (3579) - 0.074 0.019 15.447 1 <0.001 0.929 0.895 0.964 2532.968 HbA1c (%) 199 (4538) - 0.040 0.050 0.632 1 0.427 0.961 0.872 1.060 3306.628 Total cholesterol (mmol/L) b 181 (4388) - 0.264 0.327 0.654 1 0.419 0.768 0.404 1.457 2993.218 HDL-C (mmol/L) b 153 (3953) 0.319 0.321 0.991 1 0.320 1.376 0.734 2.581 2498.555 LDL-C (mmol/L) a 111 (2973) - 0.571 0.301 3.589 1 0.058 0.565 0.313 1.020 1745.692 Trigs (mmol/L) b 139 (3419) - 0.033 0.150 0.048 1 0.827 0.968 0.721 1.299 2229.738 ALT (IU/L) b 170 (4010) - 0.448 0.156 8.208 1 0.004 0.639 0.471 0.868 2772.766 Sodium (mmol/L) 193 (4469) - 0.038 0.026 2.149 1 0.143 0.963 0.916 1.013 3198.839 eGFR (mls/min/1.73m2) b 160 (3995) - 0.859 0.198 18.790 1 <0.001 0.423 0.287 0.624 2599.658 TSH (mIU/L) a 173 (3778) 0.121 0.168 0.512 1 0.474 1.128 0.811 1.569 2810.337 Serum albumin (g/L) b 183 (4203) -1.910 0.312 37.396 1 < 0.001 0.148 0.080 0.273 2974.080
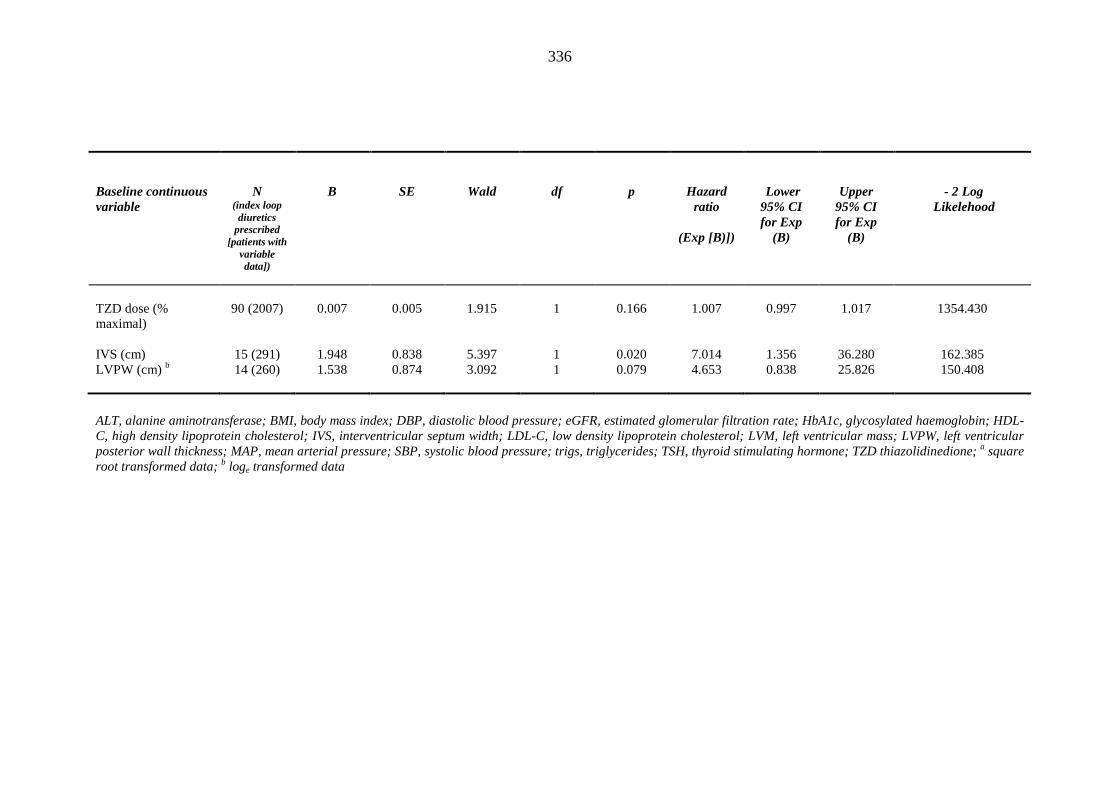
336
Baseline continuous variable
N (index loop diuretics
prescribed [patients with
variable data])
B
SE
Wald
df
p
Hazard ratio
(Exp [B)])
Lower 95% CI for Exp
(B)
Upper 95% CI for Exp
(B)
- 2 Log
Likelehood
TZD dose (% maximal)
90 (2007) 0.007 0.005 1.915 1 0.166 1.007 0.997 1.017 1354.430
IVS (cm) 15 (291) 1.948 0.838 5.397 1 0.020 7.014 1.356 36.280 162.385 LVPW (cm) b 14 (260) 1.538 0.874 3.092 1 0.079 4.653 0.838 25.826 150.408
ALT, alanine aminotransferase; BMI, body mass index; DBP, diastolic blood pressure; eGFR, estimated glomerular filtration rate; HbA1c, glycosylated haemoglobin; HDL-C, high density lipoprotein cholesterol; IVS, interventricular septum width; LDL-C, low density lipoprotein cholesterol; LVM, left ventricular mass; LVPW, left ventricular posterior wall thickness; MAP, mean arterial pressure; SBP, systolic blood pressure; trigs, triglycerides; TSH, thyroid stimulating hormone; TZD thiazolidinedione; a square root transformed data; b loge transformed data
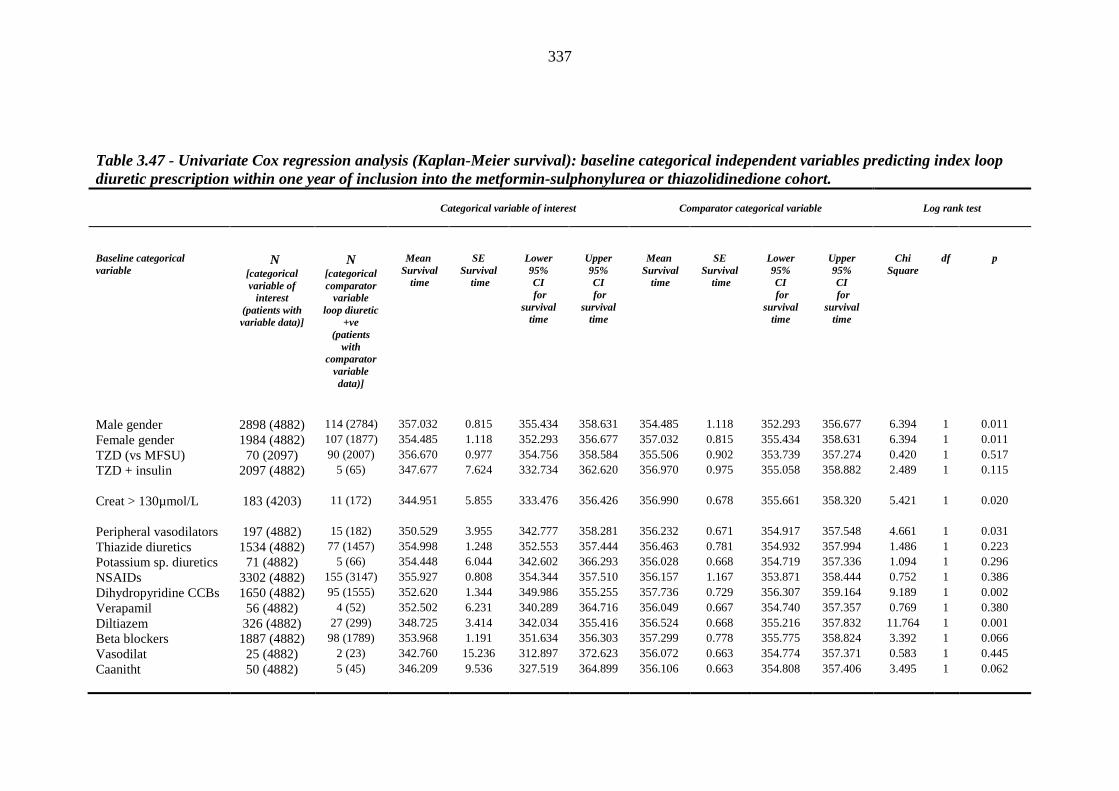
337
Table 3.47 - Univariate Cox regression analysis (Kaplan-Meier survival): baseline categorical independent variables predicting index loop diuretic prescription within one year of inclusion into the metformin-sulphonylurea or thiazolidinedione cohort.
Categorical variable of interest
Comparator categorical variable
Log rank test
Baseline categorical variable
N
[categorical variable of
interest (patients with variable data)]
N [categorical comparator
variable loop diuretic
+ve (patients
with comparator
variable data)]
Mean Survival
time
SE Survival
time
Lower 95% CI for
survival time
Upper 95% CI for
survival time
Mean Survival
time
SE Survival
time
Lower 95% CI for
survival time
Upper 95% CI for
survival time
Chi Square
df
p
Male gender 2898 (4882) 114 (2784) 357.032 0.815 355.434 358.631 354.485 1.118 352.293 356.677 6.394 1 0.011 Female gender 1984 (4882) 107 (1877) 354.485 1.118 352.293 356.677 357.032 0.815 355.434 358.631 6.394 1 0.011 TZD (vs MFSU) 70 (2097) 90 (2007) 356.670 0.977 354.756 358.584 355.506 0.902 353.739 357.274 0.420 1 0.517 TZD + insulin 2097 (4882) 5 (65) 347.677 7.624 332.734 362.620 356.970 0.975 355.058 358.882 2.489 1 0.115 Creat > 130µmol/L 183 (4203) 11 (172) 344.951 5.855 333.476 356.426 356.990 0.678 355.661 358.320 5.421 1 0.020 Peripheral vasodilators 197 (4882) 15 (182) 350.529 3.955 342.777 358.281 356.232 0.671 354.917 357.548 4.661 1 0.031 Thiazide diuretics 1534 (4882) 77 (1457) 354.998 1.248 352.553 357.444 356.463 0.781 354.932 357.994 1.486 1 0.223 Potassium sp. diuretics 71 (4882) 5 (66) 354.448 6.044 342.602 366.293 356.028 0.668 354.719 357.336 1.094 1 0.296 NSAIDs 3302 (4882) 155 (3147) 355.927 0.808 354.344 357.510 356.157 1.167 353.871 358.444 0.752 1 0.386 Dihydropyridine CCBs 1650 (4882) 95 (1555) 352.620 1.344 349.986 355.255 357.736 0.729 356.307 359.164 9.189 1 0.002 Verapamil 56 (4882) 4 (52) 352.502 6.231 340.289 364.716 356.049 0.667 354.740 357.357 0.769 1 0.380 Diltiazem 326 (4882) 27 (299) 348.725 3.414 342.034 355.416 356.524 0.668 355.216 357.832 11.764 1 0.001 Beta blockers 1887 (4882) 98 (1789) 353.968 1.191 351.634 356.303 357.299 0.778 355.775 358.824 3.392 1 0.066 Vasodilat 25 (4882) 2 (23) 342.760 15.236 312.897 372.623 356.072 0.663 354.774 357.371 0.583 1 0.445 Caanitht 50 (4882) 5 (45) 346.209 9.536 327.519 364.899 356.106 0.663 354.808 357.406 3.495 1 0.062
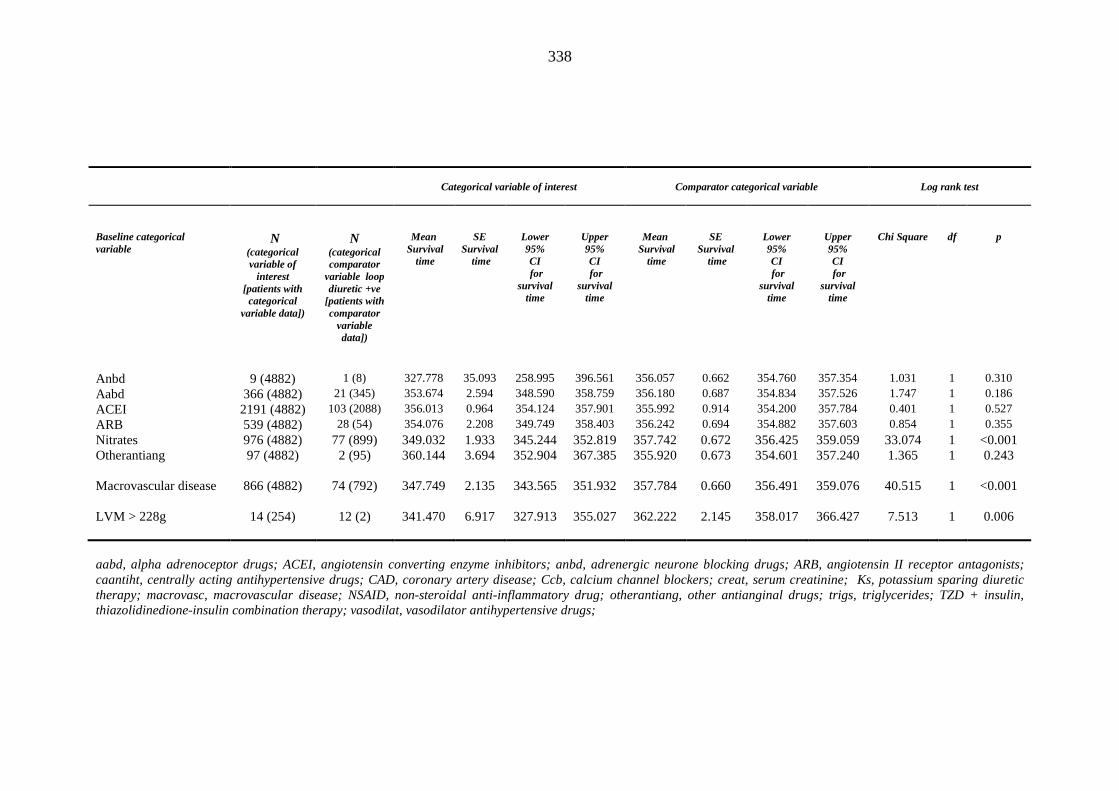
338
Categorical variable of interest
Comparator categorical variable
Log rank test
Baseline categorical variable
N
(categorical variable of
interest [patients with categorical
variable data])
N (categorical comparator
variable loop diuretic +ve
[patients with comparator
variable data])
Mean Survival
time
SE Survival
time
Lower 95% CI for
survival time
Upper 95% CI for
survival time
Mean Survival
time
SE Survival
time
Lower 95% CI for
survival time
Upper 95% CI for
survival time
Chi Square
df
p
Anbd 9 (4882) 1 (8) 327.778 35.093 258.995 396.561 356.057 0.662 354.760 357.354 1.031 1 0.310 Aabd 366 (4882) 21 (345) 353.674 2.594 348.590 358.759 356.180 0.687 354.834 357.526 1.747 1 0.186 ACEI 2191 (4882) 103 (2088) 356.013 0.964 354.124 357.901 355.992 0.914 354.200 357.784 0.401 1 0.527 ARB 539 (4882) 28 (54) 354.076 2.208 349.749 358.403 356.242 0.694 354.882 357.603 0.854 1 0.355 Nitrates 976 (4882) 77 (899) 349.032 1.933 345.244 352.819 357.742 0.672 356.425 359.059 33.074 1 <0.001 Otherantiang 97 (4882) 2 (95) 360.144 3.694 352.904 367.385 355.920 0.673 354.601 357.240 1.365 1 0.243 Macrovascular disease 866 (4882) 74 (792) 347.749 2.135 343.565 351.932 357.784 0.660 356.491 359.076 40.515 1 <0.001 LVM > 228g 14 (254) 12 (2) 341.470 6.917 327.913 355.027 362.222 2.145 358.017 366.427 7.513 1 0.006 aabd, alpha adrenoceptor drugs; ACEI, angiotensin converting enzyme inhibitors; anbd, adrenergic neurone blocking drugs; ARB, angiotensin II receptor antagonists; caantiht, centrally acting antihypertensive drugs; CAD, coronary artery disease; Ccb, calcium channel blockers; creat, serum creatinine; Ks, potassium sparing diuretic therapy; macrovasc, macrovascular disease; NSAID, non-steroidal anti-inflammatory drug; otherantiang, other antianginal drugs; trigs, triglycerides; TZD + insulin, thiazolidinedione-insulin combination therapy; vasodilat, vasodilator antihypertensive drugs;
339
• baseline dihydropyridine calcium channel blocker therapy (p = 0.002)
• baseline diltiazem therapy (p = 0.001)
• baseline beta blocker therapy (p = 0.066)
• baseline central antihypertensive therapy (p = 0.062)
• baseline nitrates (p < 0.001)
Clinical measurements
• baseline systolic blood pressure in mmHg [HR 1.013 (95% CI 1.004, 1.023);
p = 0.007]
• baseline BMI in kg/m2 [HR 1.052 (95% CI 1.026, 1.078); p < 0.001]
Laboratory-based clinical investigations
• baseline haematocrit expressed as % value [HR 0.929 (95% CI 0.895,
0.964)]; p < 0.001]
• baseline estimated glomerular filration rate in mls/min/1.73m2 (loge transformed
data) [HR 0.423 (95% CI 0.287, 0.624); p < 0.001]
• baseline serum creatinine >130 µmol/L (p = 0.020)
• baseline serum albumin in g/L (loge transformed data) [HR 0.148 (95% CI 0.080,
0.273); p < 0.001]
• baseline LDL-cholesterol in mmol/L (square root transformed data) [HR 0.565 (95%
CI 0.313, 1.020); p = 0.058]
• baseline alanine aminotransferase in IU/L (loge transformed data) [HR 0.639 (95%
CI 0.471, 0.868); p = 0.004]
340
Echocardiographic parameters
• baseline left ventricular mass > 228g (p = 0.006)
• baseline interventricular septal width in cm [HR 7.014 (95% CI 1.356,
36.280); p = 0.020]
• baseline left ventricular posterior wall thickness in cm (loge transformed data) [HR
4.653 (95% CI 0.838, 25.826); p = 0.079]
Thus, neither baseline thiazolidinedione therapy nor % maximal thiazolidinedione
dose were associated with time to progression to fluid overload.
3.13.2 Multivariate Cox regression
(i) Loop diuretic Cox regression model 1
Based on the outcomes of univariate analysis, Cox regression was used to assess the
strength of association between time to index loop diuretic prescription and clinical
and pathological risk factors. As outlined in multivariate logistic regression analysis,
the maximum number of covariates that could be included in Cox regression
analysis, based on the available data, amounted to 22.
Variables (covariates) included in multivariate Cox regression analysis were those
deemed significant (p < 0.1) on univariate screening (tables 3.46 and 3.47), namely:
• Age (years)
• Female gender
• Diabetes duration (years) (square root transformed data)
341
• Baseline BMI (kg/m2)
• Baseline systolic blood pressure (mmHg)
• Baseline haematocrit (%)
• Baseline serum creatinine > 130 μmol/L
• Baseline serum albumin (g/L) (loge transformed data)
• Baseline alanine aminotransferase (IU/L) (loge transformed data)
• Baseline macrovascular disease
• Index thiazolidinedione prescription (vs metformin-sulphonylurea)
Given that female gender, baseline serum creatinine > 130 µmol/L, macrovascular
disease and index thiazolidinedione prescription defied the Proportional Hazards
Assumption, time-dependent variables were constructed for each variable by adding
an interaction term that involved loge time (days) to index loop diuretic prescription
into the Cox model, and testing for its significance. Time-dependent variables were
also constructed in the same fashion for age, diabetes duration, BMI, systolic blood
pressure, haematocrit, serum albumin (loge transformed data) and alanine aminotransferase
(loge transformed data) as evidence that hazard ratios for these covariates do not change
over time.
There were no significant interactions between any of the included covariates in this
model. Out of a total of 3116 patients, for whom data were available for this model,
126 patients required an index loop diuretic within one year of prescription of
metformin-sulphonylurea combination or thiazolidinedione therapy. 2990 patients
were censored within the aforementioned period of observation. The covariates as a
set reliably improved the predictability of the Cox regression model (chi square
342
2517.726, p < 0.001 with df = 15). The standard error (SE) of each variable included
in the model was small, suggesting no significant multicollinearity. The Wald
criterion demonstrated that (in decreasing order of importance) age, baseline
haematocrit, baseline BMI, baseline alanine aminotransferase, baseline systolic
blood pressure and baseline macrovascular disease, and their respective interactions
with time made a significant contribution to predicting time to index loop diuretic
prescription in this setting, as outlined in table 3.48. Covariate*time interactions
suggested a decreasing hazard ratio over time for baseline macrovascular disease,
alanine aminotransferase and serum albumin. Hazard ratios for age, BMI, systolic
blood pressure, and haematocrit remained relatively (albeit not completely) stable
over the period of observation, in keeping with log-minus-log plots which had
suggested that each of the latter covariates satisfied the Proportiona Hazards
Assumption (table 3.49, figure 3.13).
Thus, the hazard ratio for requiring an index loop diuretic at time t (HRt) associated
with baseline macrovascular disease can be summarised by the equation:
(HRt) = exp (8.810 - 1.527*t)
which at t = 180 days (ie six months, loge of which = 5.19, amounts to exp (8.810 -
1.527*5.19) = 2.423
whereas at t = 270 days (ie 9 months, loge of which = 5.60), equals exp (8.810-
1.527*5.60) = 1.295
while at t = 365 days (ie one year, loge of which = 5.90) amounts to exp (8.810 -
1.527*5.90) = 0.819.
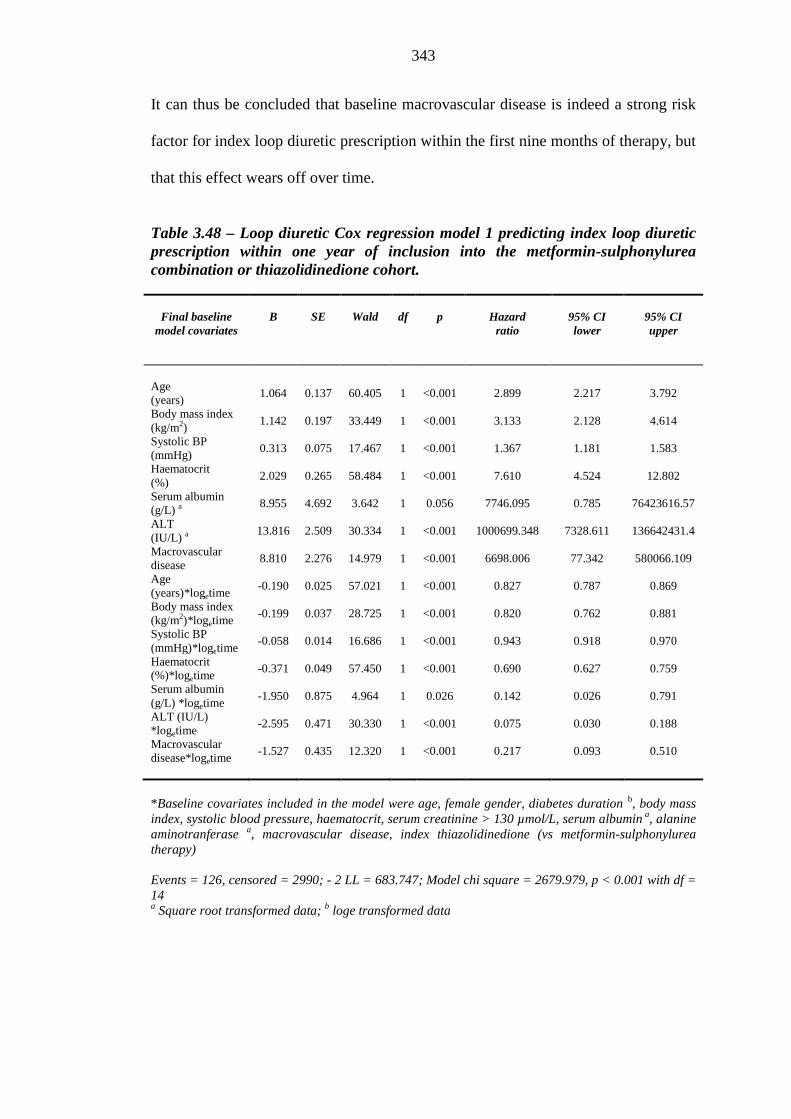
343
It can thus be concluded that baseline macrovascular disease is indeed a strong risk
factor for index loop diuretic prescription within the first nine months of therapy, but
that this effect wears off over time.
Table 3.48 – Loop diuretic Cox regression model 1 predicting index loop diuretic prescription within one year of inclusion into the metformin-sulphonylurea combination or thiazolidinedione cohort.
Final baseline
model covariates
B
SE
Wald
df
p
Hazard
ratio
95% CI lower
95% CI upper
Age (years)
1.064 0.137 60.405 1 <0.001 2.899 2.217 3.792
Body mass index (kg/m2)
1.142 0.197 33.449 1 <0.001 3.133 2.128 4.614
Systolic BP (mmHg)
0.313 0.075 17.467 1 <0.001 1.367 1.181 1.583
Haematocrit (%)
2.029 0.265 58.484 1 <0.001 7.610 4.524 12.802
Serum albumin (g/L) a
8.955 4.692 3.642 1 0.056 7746.095 0.785 76423616.57
ALT (IU/L) a
13.816 2.509 30.334 1 <0.001 1000699.348 7328.611 136642431.4
Macrovascular disease
8.810 2.276 14.979 1 <0.001 6698.006 77.342 580066.109
Age (years)*logetime
-0.190 0.025 57.021 1 <0.001 0.827 0.787 0.869
Body mass index (kg/m2)*logetime
-0.199 0.037 28.725 1 <0.001 0.820 0.762 0.881
Systolic BP (mmHg)*logetime
-0.058 0.014 16.686 1 <0.001 0.943 0.918 0.970
Haematocrit (%)*logetime
-0.371 0.049 57.450 1 <0.001 0.690 0.627 0.759
Serum albumin (g/L) *logetime
-1.950 0.875 4.964 1 0.026 0.142 0.026 0.791
ALT (IU/L) *logetime
-2.595 0.471 30.330 1 <0.001 0.075 0.030 0.188
Macrovascular disease*logetime
-1.527 0.435 12.320 1 <0.001 0.217 0.093 0.510
*Baseline covariates included in the model were age, female gender, diabetes duration b, body mass index, systolic blood pressure, haematocrit, serum creatinine > 130 µmol/L, serum albumin a, alanine aminotranferase a, macrovascular disease, index thiazolidinedione (vs metformin-sulphonylurea therapy) Events = 126, censored = 2990; - 2 LL = 683.747; Model chi square = 2679.979, p < 0.001 with df = 14 a Square root transformed data; b loge transformed data
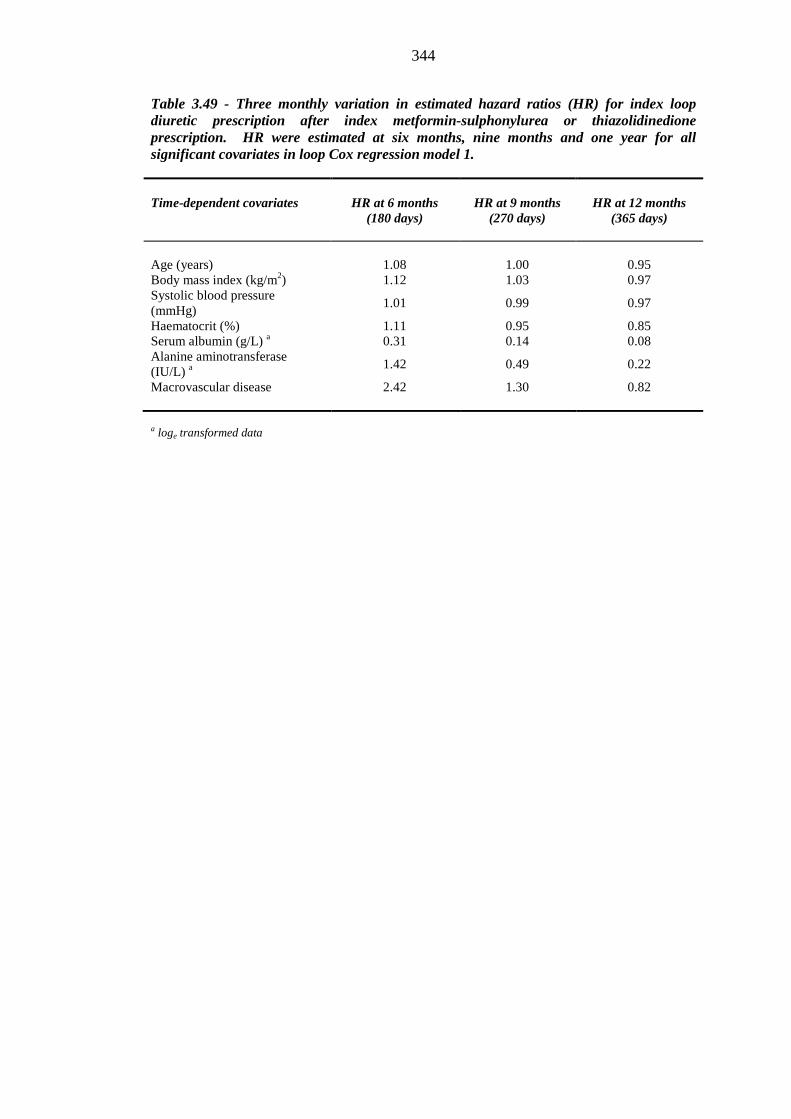
344
Table 3.49 - Three monthly variation in estimated hazard ratios (HR) for index loop diuretic prescription after index metformin-sulphonylurea or thiazolidinedione prescription. HR were estimated at six months, nine months and one year for all significant covariates in loop Cox regression model 1.
Time-dependent covariates
HR at 6 months
(180 days)
HR at 9 months
(270 days)
HR at 12 months
(365 days)
Age (years) 1.08 1.00 0.95 Body mass index (kg/m2) 1.12 1.03 0.97 Systolic blood pressure (mmHg)
1.01 0.99 0.97
Haematocrit (%) 1.11 0.95 0.85 Serum albumin (g/L) a 0.31 0.14 0.08 Alanine aminotransferase (IU/L) a
1.42 0.49 0.22
Macrovascular disease 2.42 1.30 0.82 a loge transformed data
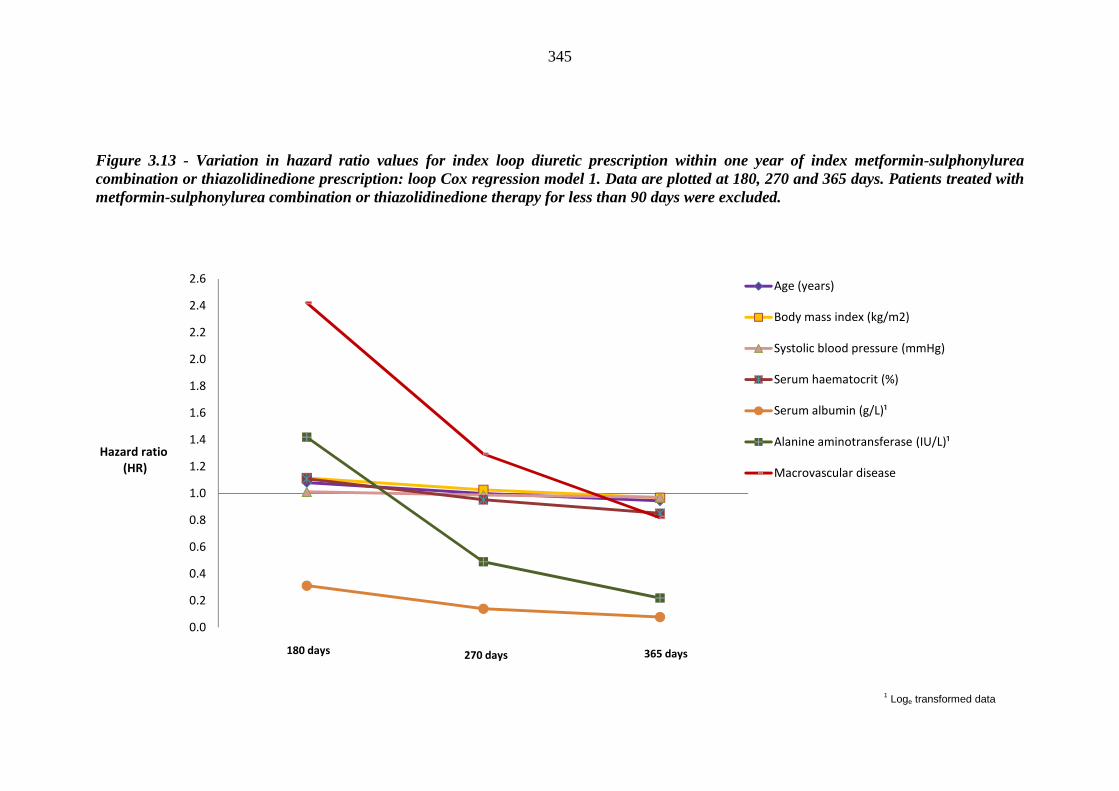
345
Figure 3.13 - Variation in hazard ratio values for index loop diuretic prescription within one year of index metformin-sulphonylurea combination or thiazolidinedione prescription: loop Cox regression model 1. Data are plotted at 180, 270 and 365 days. Patients treated with metformin-sulphonylurea combination or thiazolidinedione therapy for less than 90 days were excluded.
0.0
0.2
0.4
0.6
0.8
1.0
1.2
1.4
1.6
1.8
2.0
2.2
2.4
2.6
Hazard ratio
(HR)
Age (years)
Body mass index (kg/m2)
Systolic blood pressure (mmHg)
Serum haematocrit (%)
Serum albumin (g/L)¹
Alanine aminotransferase (IU/L)¹
Macrovascular disease
180 days 270 days 365 days
1 Loge transformed data
346
(ii) Loop diuretic Cox regression model 2
In this model, baseline dihydropyridine calcium channel blockers, diltiazem, beta
blockers and nitrates were included as covariates in lieu of baseline macrovascular
disease. All other covariates included in step 1 were maintained. Baseline age, BMI,
systolic blood pressure, haematocrit, serum albumin, alanine aminotransferase and
nitrates emerged as significant predictors of time to index loop diuretic prescription
on multivariate analysis, as shown in table 3.50 below.
Hazard ratios for serum albumin and alanine aminotransferase exhbited a time-dependent
reduction over the period of observation, as outlined in loop Cox regression model 1.
Varation in risk associated with age, BMI, systolic blood pressure and haematocrit was
relatively mild. Hazard ratios for background nitrate therapy remained constant throughout
the first year after index metfformin-sulphonylure combination or thiazolidinedione
prescription (table 3.51, figure 3.14).
The relatively small number of patients with data for baseline left ventricular mass
and interventricular septum width did not permit a generation of a Cox regression
model incorporating these echocardiographic variables as covariates.
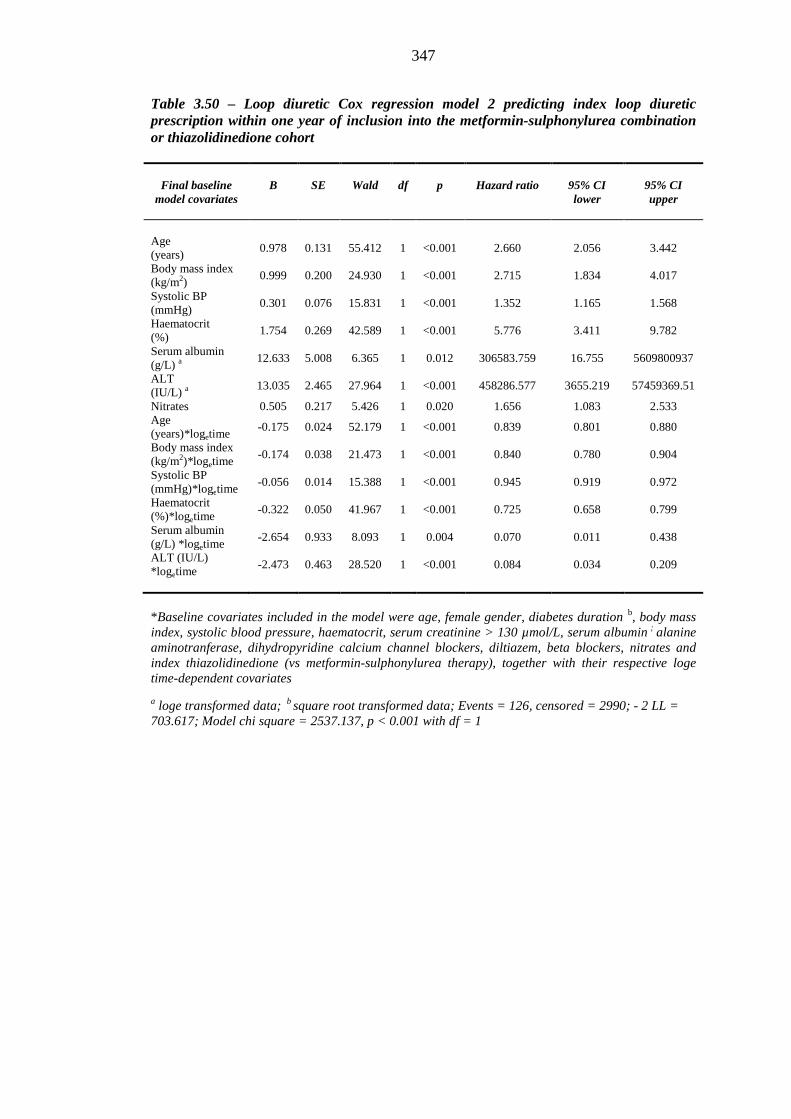
347
Table 3.50 – Loop diuretic Cox regression model 2 predicting index loop diuretic prescription within one year of inclusion into the metformin-sulphonylurea combination or thiazolidinedione cohort
Final baseline
model covariates
B
SE
Wald
df
p
Hazard ratio
95% CI lower
95% CI upper
Age (years)
0.978 0.131 55.412 1 <0.001 2.660 2.056 3.442
Body mass index (kg/m2)
0.999 0.200 24.930 1 <0.001 2.715 1.834 4.017
Systolic BP (mmHg)
0.301 0.076 15.831 1 <0.001 1.352 1.165 1.568
Haematocrit (%)
1.754 0.269 42.589 1 <0.001 5.776 3.411 9.782
Serum albumin (g/L) a
12.633 5.008 6.365 1 0.012 306583.759 16.755 5609800937
ALT (IU/L) a
13.035 2.465 27.964 1 <0.001 458286.577 3655.219 57459369.51
Nitrates 0.505 0.217 5.426 1 0.020 1.656 1.083 2.533 Age (years)*logetime
-0.175 0.024 52.179 1 <0.001 0.839 0.801 0.880
Body mass index (kg/m2)*logetime
-0.174 0.038 21.473 1 <0.001 0.840 0.780 0.904
Systolic BP (mmHg)*logetime
-0.056 0.014 15.388 1 <0.001 0.945 0.919 0.972
Haematocrit (%)*logetime
-0.322 0.050 41.967 1 <0.001 0.725 0.658 0.799
Serum albumin (g/L) *logetime
-2.654 0.933 8.093 1 0.004 0.070 0.011 0.438
ALT (IU/L) *logetime
-2.473 0.463 28.520 1 <0.001 0.084 0.034 0.209
*Baseline covariates included in the model were age, female gender, diabetes duration b, body mass index, systolic blood pressure, haematocrit, serum creatinine > 130 µmol/L, serum albumin ; alanine aminotranferase, dihydropyridine calcium channel blockers, diltiazem, beta blockers, nitrates and index thiazolidinedione (vs metformin-sulphonylurea therapy), together with their respective loge time-dependent covariates a loge transformed data; b square root transformed data; Events = 126, censored = 2990; - 2 LL = 703.617; Model chi square = 2537.137, p < 0.001 with df = 1
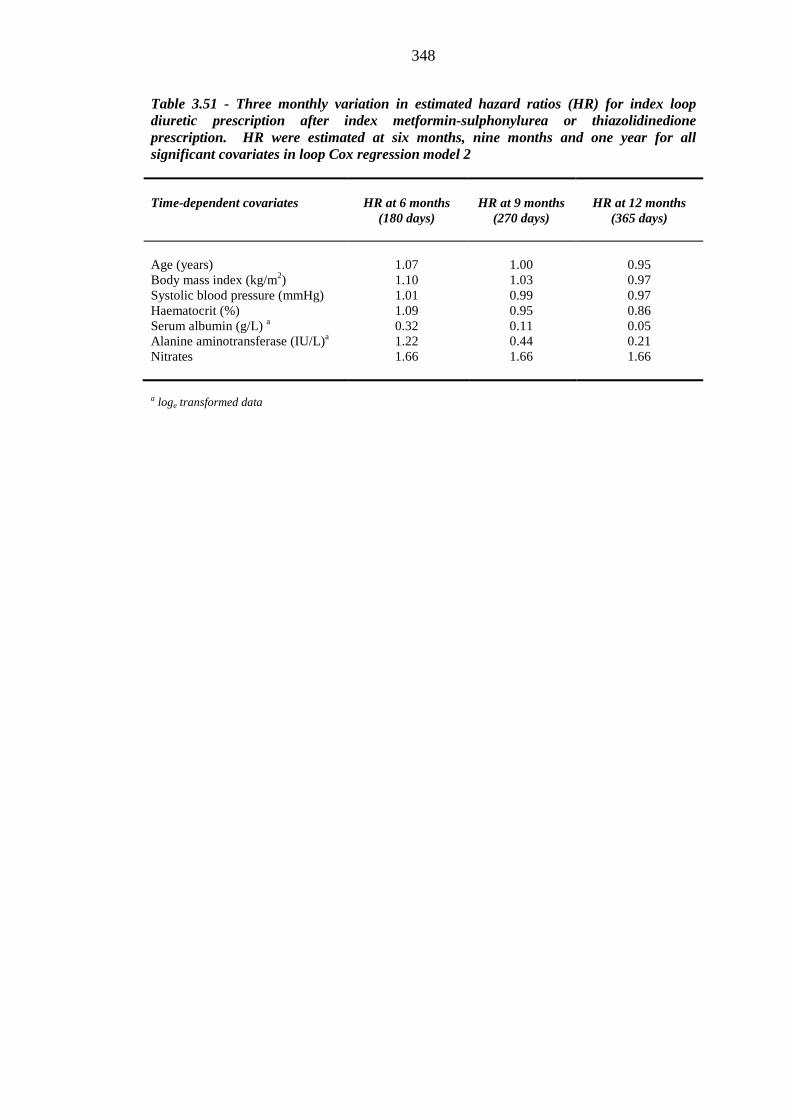
348
Table 3.51 - Three monthly variation in estimated hazard ratios (HR) for index loop diuretic prescription after index metformin-sulphonylurea or thiazolidinedione prescription. HR were estimated at six months, nine months and one year for all significant covariates in loop Cox regression model 2
Time-dependent covariates
HR at 6 months
(180 days)
HR at 9 months
(270 days)
HR at 12 months
(365 days)
Age (years) 1.07 1.00 0.95 Body mass index (kg/m2) 1.10 1.03 0.97 Systolic blood pressure (mmHg) 1.01 0.99 0.97 Haematocrit (%) 1.09 0.95 0.86 Serum albumin (g/L) a 0.32 0.11 0.05 Alanine aminotransferase (IU/L)a 1.22 0.44 0.21 Nitrates 1.66 1.66 1.66 a loge transformed data
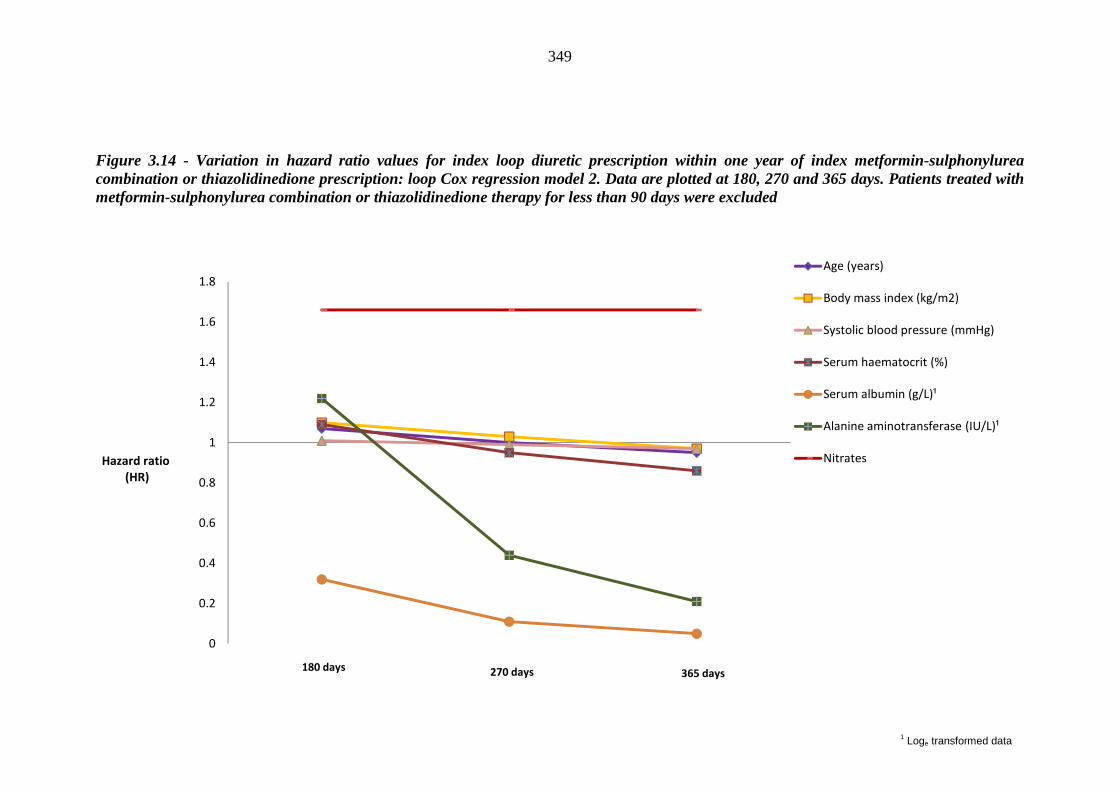
349
Figure 3.14 - Variation in hazard ratio values for index loop diuretic prescription within one year of index metformin-sulphonylurea combination or thiazolidinedione prescription: loop Cox regression model 2. Data are plotted at 180, 270 and 365 days. Patients treated with metformin-sulphonylurea combination or thiazolidinedione therapy for less than 90 days were excluded
0
0.2
0.4
0.6
0.8
1
1.2
1.4
1.6
1.8
Hazard ratio
(HR)
Age (years)
Body mass index (kg/m2)
Systolic blood pressure (mmHg)
Serum haematocrit (%)
Serum albumin (g/L)¹
Alanine aminotransferase (IU/L)¹
Nitrates
180 days 270 days 365 days
1 Loge transformed data
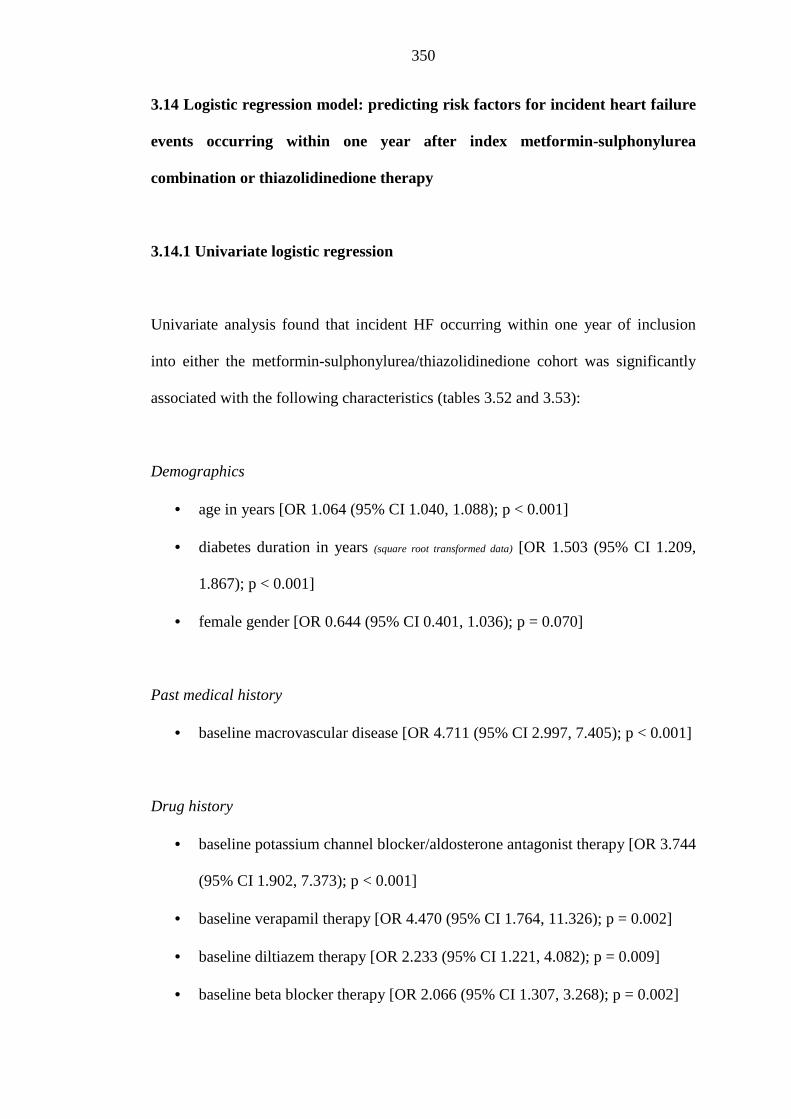
350
3.14 Logistic regression model: predicting risk factors for incident heart failure
events occurring within one year after index metformin-sulphonylurea
combination or thiazolidinedione therapy
3.14.1 Univariate logistic regression
Univariate analysis found that incident HF occurring within one year of inclusion
into either the metformin-sulphonylurea/thiazolidinedione cohort was significantly
associated with the following characteristics (tables 3.52 and 3.53):
Demographics
• age in years [OR 1.064 (95% CI 1.040, 1.088); p < 0.001]
• diabetes duration in years (square root transformed data) [OR 1.503 (95% CI 1.209,
1.867); p < 0.001]
• female gender [OR 0.644 (95% CI 0.401, 1.036); p = 0.070]
Past medical history
• baseline macrovascular disease [OR 4.711 (95% CI 2.997, 7.405); p < 0.001]
Drug history
• baseline potassium channel blocker/aldosterone antagonist therapy [OR 3.744
(95% CI 1.902, 7.373); p < 0.001]
• baseline verapamil therapy [OR 4.470 (95% CI 1.764, 11.326); p = 0.002]
• baseline diltiazem therapy [OR 2.233 (95% CI 1.221, 4.082); p = 0.009]
• baseline beta blocker therapy [OR 2.066 (95% CI 1.307, 3.268); p = 0.002]
351
• baseline alpha adrenoceptor drugs [OR 1.794 (95% CI 0.963, 3.341); p =
0.066]
• baseline nitrates [OR 3.773 (95% CI 2.402, 5.928); p = 0.041]
• baseline other antianginals [OR 2.419 (95% CI 0.964, 6.066); p = 0.060]
Laboratory-based clinical investigations
• baseline haematocrit expressed as % value [OR 0.902 (95% CI 0.845, 0.962);
p = 0.002]
• baseline HDL-C concentration in mmol/L (loge transformed data) [OR 3.495 (95%
CI 1.204, 10.146); p = 0.021]
• baseline estimated glomerular filration rate in mls/min/1.73m2 (loge transformed
data) [OR 0.305 (95% CI 0.171, 0.543); p < 0.001]
• baseline serum creatinine > 130 µmol/L [OR 3.586 (95% CI 1.810, 7.104); p
< 0.001]
• baseline serum albumin in g/L (loge transformed data) [OR 0.135 (95% CI 0.051,
0.359); p < 0.001]
• baseline alanine aminotransferase in IU/L (loge transformed data) [OR 0.428 (95%
CI 0.254, 0.721); p = 0.001]
3.14.2 Multivariate logistic regression
28 and 49 patients developed incident HF within one year after exposure to
thiazolidinedione therapy and metformin-sulphonylurea combination therapy
respectively. 2521 thiazolidinedione-treated patients and 3427 patients on
metformin-sulphonylurea combination therapy remained incident HF free within one
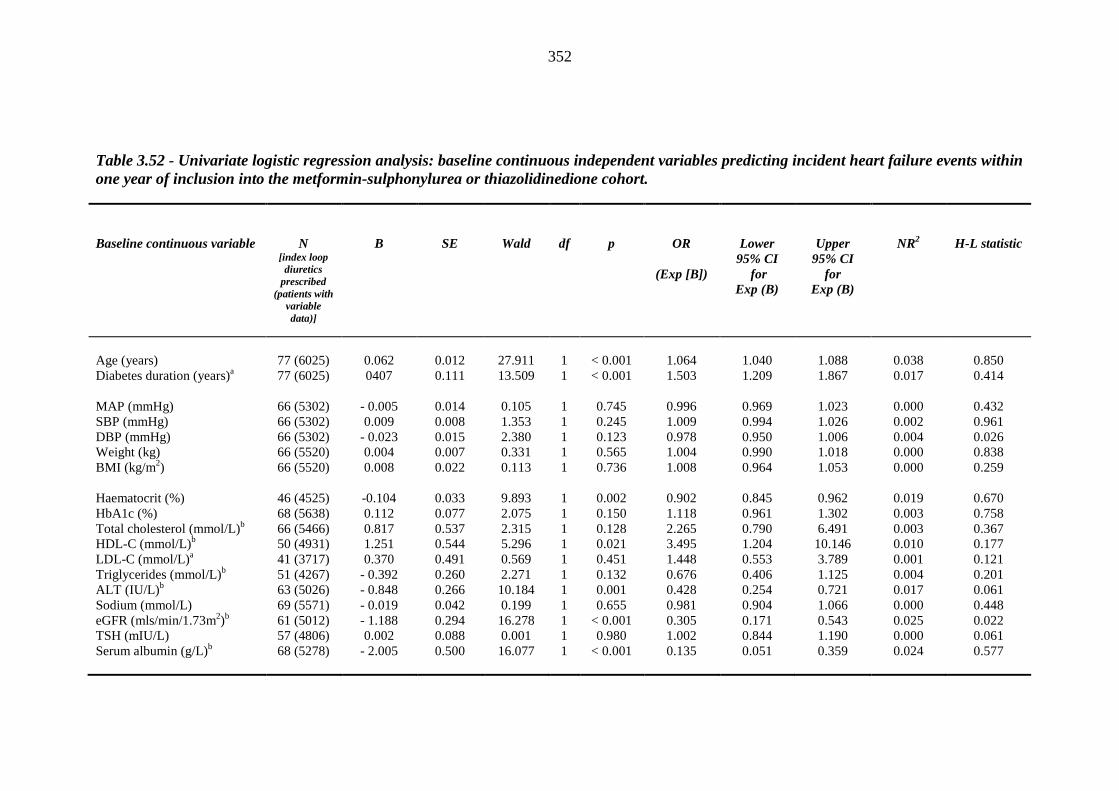
352
Table 3.52 - Univariate logistic regression analysis: baseline continuous independent variables predicting incident heart failure events within one year of inclusion into the metformin-sulphonylurea or thiazolidinedione cohort.
Baseline continuous variable
N [index loop diuretics
prescribed (patients with
variable data)]
B
SE
Wald
df
p
OR
(Exp [B])
Lower 95% CI
for Exp (B)
Upper 95% CI
for Exp (B)
NR2
H-L statistic
Age (years) 77 (6025) 0.062 0.012 27.911 1 < 0.001 1.064 1.040 1.088 0.038 0.850 Diabetes duration (years)a 77 (6025) 0407 0.111 13.509 1 < 0.001 1.503 1.209 1.867 0.017 0.414 MAP (mmHg) 66 (5302) - 0.005 0.014 0.105 1 0.745 0.996 0.969 1.023 0.000 0.432 SBP (mmHg) 66 (5302) 0.009 0.008 1.353 1 0.245 1.009 0.994 1.026 0.002 0.961 DBP (mmHg) 66 (5302) - 0.023 0.015 2.380 1 0.123 0.978 0.950 1.006 0.004 0.026 Weight (kg) 66 (5520) 0.004 0.007 0.331 1 0.565 1.004 0.990 1.018 0.000 0.838 BMI (kg/m2) 66 (5520) 0.008 0.022 0.113 1 0.736 1.008 0.964 1.053 0.000 0.259 Haematocrit (%) 46 (4525) -0.104 0.033 9.893 1 0.002 0.902 0.845 0.962 0.019 0.670 HbA1c (%) 68 (5638) 0.112 0.077 2.075 1 0.150 1.118 0.961 1.302 0.003 0.758 Total cholesterol (mmol/L)b 66 (5466) 0.817 0.537 2.315 1 0.128 2.265 0.790 6.491 0.003 0.367 HDL-C (mmol/L)b 50 (4931) 1.251 0.544 5.296 1 0.021 3.495 1.204 10.146 0.010 0.177 LDL-C (mmol/L)a 41 (3717) 0.370 0.491 0.569 1 0.451 1.448 0.553 3.789 0.001 0.121 Triglycerides (mmol/L)b 51 (4267) - 0.392 0.260 2.271 1 0.132 0.676 0.406 1.125 0.004 0.201 ALT (IU/L) b 63 (5026) - 0.848 0.266 10.184 1 0.001 0.428 0.254 0.721 0.017 0.061 Sodium (mmol/L) 69 (5571) - 0.019 0.042 0.199 1 0.655 0.981 0.904 1.066 0.000 0.448 eGFR (mls/min/1.73m2)b 61 (5012) - 1.188 0.294 16.278 1 < 0.001 0.305 0.171 0.543 0.025 0.022 TSH (mIU/L) 57 (4806) 0.002 0.088 0.001 1 0.980 1.002 0.844 1.190 0.000 0.061 Serum albumin (g/L)b 68 (5278) - 2.005 0.500 16.077 1 < 0.001 0.135 0.051 0.359 0.024 0.577
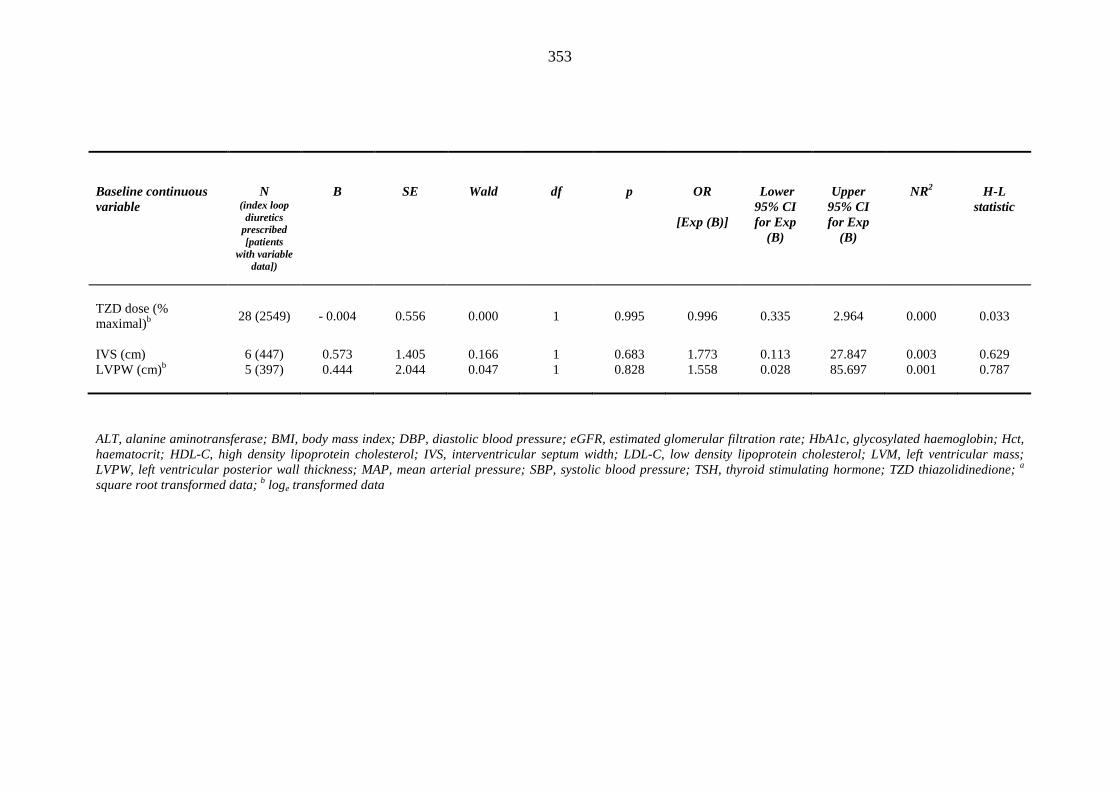
353
Baseline continuous variable
N (index loop diuretics
prescribed [patients
with variable data])
B
SE
Wald
df
p
OR
[Exp (B)]
Lower 95% CI for Exp
(B)
Upper 95% CI for Exp
(B)
NR2
H-L statistic
TZD dose (% maximal)b
28 (2549) - 0.004 0.556 0.000 1 0.995 0.996 0.335 2.964 0.000 0.033
IVS (cm) 6 (447) 0.573 1.405 0.166 1 0.683 1.773 0.113 27.847 0.003 0.629 LVPW (cm)b 5 (397) 0.444 2.044 0.047 1 0.828 1.558 0.028 85.697 0.001 0.787
ALT, alanine aminotransferase; BMI, body mass index; DBP, diastolic blood pressure; eGFR, estimated glomerular filtration rate; HbA1c, glycosylated haemoglobin; Hct, haematocrit; HDL-C, high density lipoprotein cholesterol; IVS, interventricular septum width; LDL-C, low density lipoprotein cholesterol; LVM, left ventricular mass; LVPW, left ventricular posterior wall thickness; MAP, mean arterial pressure; SBP, systolic blood pressure; TSH, thyroid stimulating hormone; TZD thiazolidinedione; a
square root transformed data; b loge transformed data
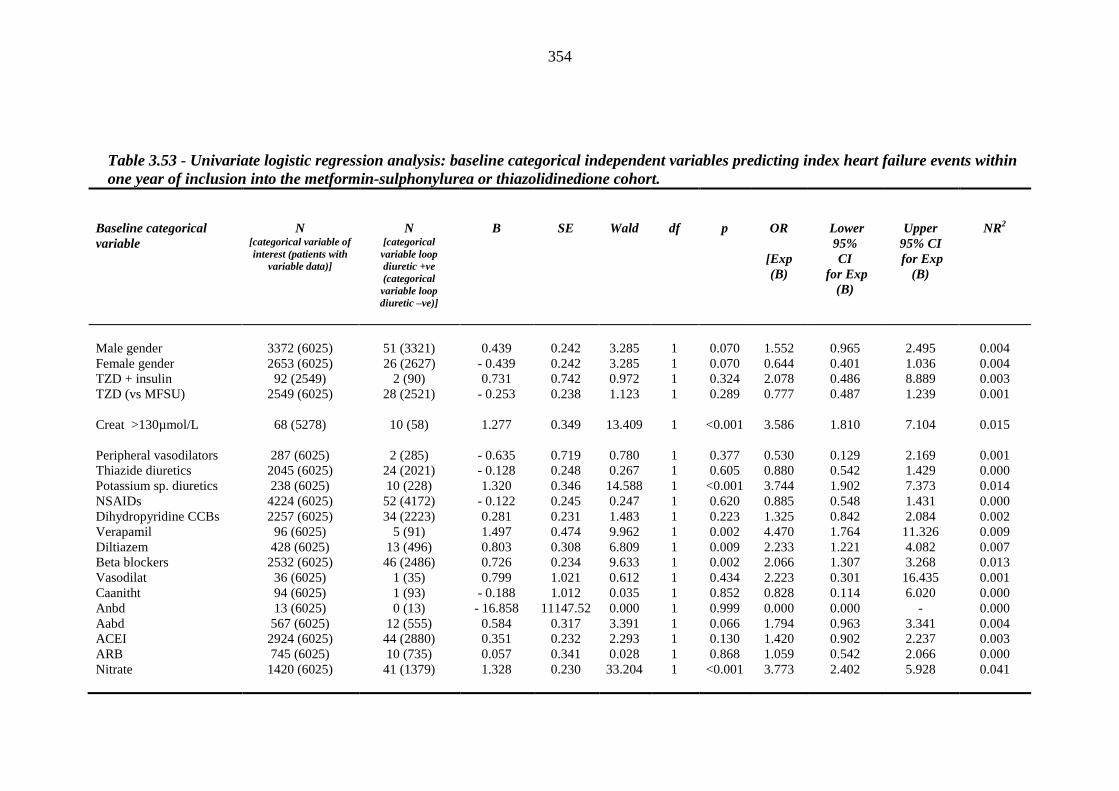
354
Table 3.53 - Univariate logistic regression analysis: baseline categorical independent variables predicting index heart failure events within one year of inclusion into the metformin-sulphonylurea or thiazolidinedione cohort.
Baseline categorical variable
N [categorical variable of interest (patients with
variable data)]
N [categorical variable loop diuretic +ve (categorical variable loop diuretic –ve)]
B
SE
Wald
df
p
OR
[Exp (B)
Lower 95% CI
for Exp (B)
Upper 95% CI for Exp
(B)
NR2
Male gender 3372 (6025) 51 (3321) 0.439 0.242 3.285 1 0.070 1.552 0.965 2.495 0.004 Female gender 2653 (6025) 26 (2627) - 0.439 0.242 3.285 1 0.070 0.644 0.401 1.036 0.004 TZD + insulin 92 (2549) 2 (90) 0.731 0.742 0.972 1 0.324 2.078 0.486 8.889 0.003 TZD (vs MFSU) 2549 (6025) 28 (2521) - 0.253 0.238 1.123 1 0.289 0.777 0.487 1.239 0.001 Creat >130µmol/L 68 (5278) 10 (58) 1.277 0.349 13.409 1 <0.001 3.586 1.810 7.104 0.015 Peripheral vasodilators 287 (6025) 2 (285) - 0.635 0.719 0.780 1 0.377 0.530 0.129 2.169 0.001 Thiazide diuretics 2045 (6025) 24 (2021) - 0.128 0.248 0.267 1 0.605 0.880 0.542 1.429 0.000 Potassium sp. diuretics 238 (6025) 10 (228) 1.320 0.346 14.588 1 <0.001 3.744 1.902 7.373 0.014 NSAIDs 4224 (6025) 52 (4172) - 0.122 0.245 0.247 1 0.620 0.885 0.548 1.431 0.000 Dihydropyridine CCBs 2257 (6025) 34 (2223) 0.281 0.231 1.483 1 0.223 1.325 0.842 2.084 0.002 Verapamil 96 (6025) 5 (91) 1.497 0.474 9.962 1 0.002 4.470 1.764 11.326 0.009 Diltiazem 428 (6025) 13 (496) 0.803 0.308 6.809 1 0.009 2.233 1.221 4.082 0.007 Beta blockers 2532 (6025) 46 (2486) 0.726 0.234 9.633 1 0.002 2.066 1.307 3.268 0.013 Vasodilat 36 (6025) 1 (35) 0.799 1.021 0.612 1 0.434 2.223 0.301 16.435 0.001 Caanitht 94 (6025) 1 (93) - 0.188 1.012 0.035 1 0.852 0.828 0.114 6.020 0.000 Anbd 13 (6025) 0 (13) - 16.858 11147.52 0.000 1 0.999 0.000 0.000 - 0.000 Aabd 567 (6025) 12 (555) 0.584 0.317 3.391 1 0.066 1.794 0.963 3.341 0.004 ACEI 2924 (6025) 44 (2880) 0.351 0.232 2.293 1 0.130 1.420 0.902 2.237 0.003 ARB 745 (6025) 10 (735) 0.057 0.341 0.028 1 0.868 1.059 0.542 2.066 0.000 Nitrate 1420 (6025) 41 (1379) 1.328 0.230 33.204 1 <0.001 3.773 2.402 5.928 0.041
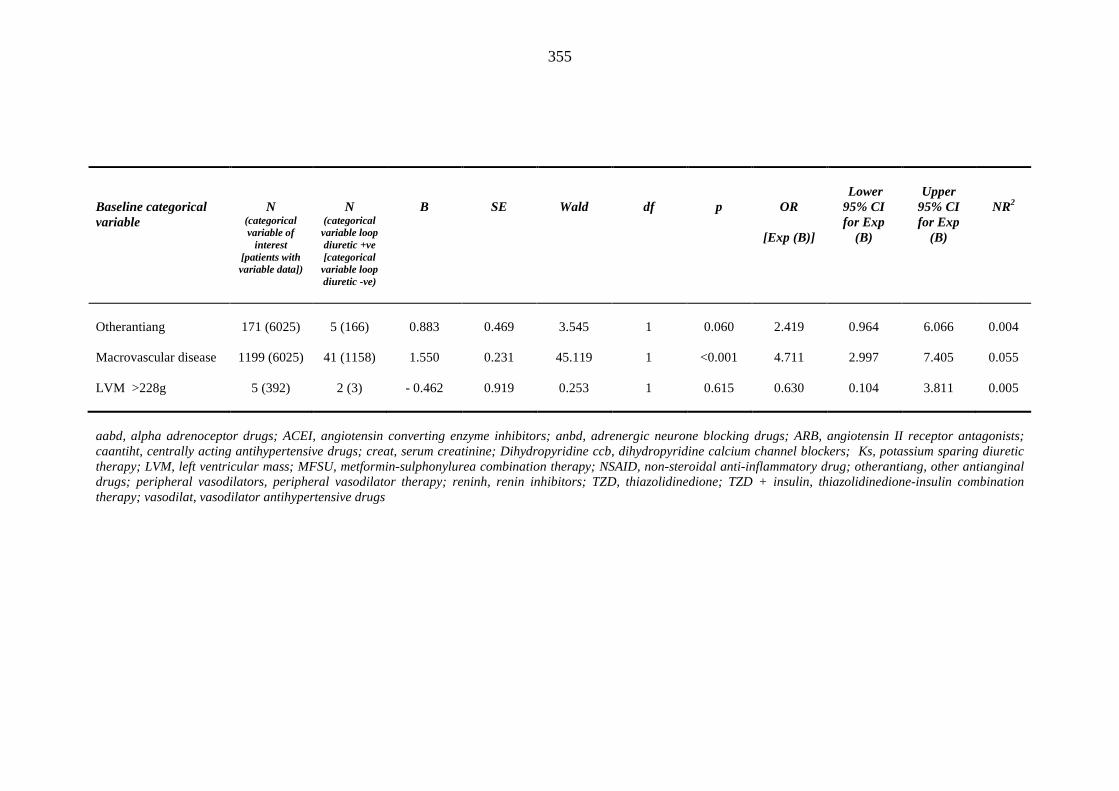
355
Baseline categorical variable
N (categorical variable of
interest [patients with variable data])
N (categorical variable loop diuretic +ve [categorical variable loop diuretic -ve)
B
SE
Wald
df
p
OR
[Exp (B)]
Lower 95% CI for Exp
(B)
Upper
95% CI for Exp
(B)
NR2
Otherantiang 171 (6025) 5 (166) 0.883 0.469 3.545 1 0.060 2.419 0.964 6.066 0.004 Macrovascular disease 1199 (6025) 41 (1158) 1.550 0.231 45.119 1 <0.001 4.711 2.997 7.405 0.055 LVM >228g 5 (392) 2 (3) - 0.462 0.919 0.253 1 0.615 0.630 0.104 3.811 0.005 aabd, alpha adrenoceptor drugs; ACEI, angiotensin converting enzyme inhibitors; anbd, adrenergic neurone blocking drugs; ARB, angiotensin II receptor antagonists; caantiht, centrally acting antihypertensive drugs; creat, serum creatinine; Dihydropyridine ccb, dihydropyridine calcium channel blockers; Ks, potassium sparing diuretic therapy; LVM, left ventricular mass; MFSU, metformin-sulphonylurea combination therapy; NSAID, non-steroidal anti-inflammatory drug; otherantiang, other antianginal drugs; peripheral vasodilators, peripheral vasodilator therapy; reninh, renin inhibitors; TZD, thiazolidinedione; TZD + insulin, thiazolidinedione-insulin combination therapy; vasodilat, vasodilator antihypertensive drugs
356
year after inclusion into their respective cohort. Hence, the overall proportion of
patients developing incident HF amounts to 0.0129455 (or 1.29%).
As advised by Peduzzi et al. [609], given the proportion of patients developing
incident HF within one year after index thiazolidinedione prescription, the maximum
number of covariates that can be included in any model amounted to eight.
(i) Incident heart failure logistic regression model 1
Based on univariate analysis (tables 3.52 and 3.53), and taking into account the
number of patients for whom data for each covariate were available, the following
predictors (covariates) were included:
• Age (years)
• diabetes duration (years) (square root transformed data)
• baseline ALT (IU/L) (loge transformed data)
• baseline albumin (g/L) (loge transformed data)
• baseline serum creatinine > 130 μmol/L
• female gender
• baseline macrovascular disease (composite of coronary artery disease,
peripheral artery disease and cerebrovascular disease)
• index thiazolidinedione prescription (vs MFSU)
4690 patients were included into the logistic regression model. Employing a
significance level of 0.05, the Wald criterion demonstrated that age, baseline serum
albumin, baseline serum creatinine and baseline macrovascular disease made a
357
significant contribution to prediction (see table 3.54). A test of the full model versus
a model with intercept only was statistically significant (chi square 70.293, p < 0.001
with df = 4). Hosmer and Leneshow test statistic indicated that the model’s estimates
fit the data at an acceptable level (chi square 5.661, df = 8, p = 0.685). Nagelkerke’s
R2 = 0.113, effectively indicating a relationship of 11.3% between predictors
(covariates) and the prediction (i.e. incident HF within one year of inclusion into the
cohort). Prediction success overall was 98.8%.
As shown in the final model (table 3.54), index thiazolidinedione prescription per se
does not emerge as a significant predictor, suggesting that the risk factors for
developing of incident HF are similar to those for patients prescribed metformin-
sulphonylurea combination therapy. Once again, Wald’s statistics for baseline
macrovascular disease suggest it is the strongest predictor. It is associated with more
than four times higher risk of progression to incident HF within one year of index
metformin-sulphonylurea or thiazolidinedione prescription, assuming all other
covariates are unchanged during the observation period. Likewise, a baseline serum
creatinine exceeding 130 µmol/L at index metformin-sulphonylurea or
thiazolidinedione prescription is the second most strong predictor in this model,
being associated with more than two fold higher risk of progression to HF. Each
passing year of life is associated with a 4.9 % increased risk of developing incident
HF in this scenario. Inverting odds ratios, and holding all other covariates constant,
each 1 g/dL reduction in baseline loge serum albumin at index metformin-
sulphonylurea combination or thiazolidinedione prescription results in an 3.42 fold
increased risk of developing incident HF within one year.
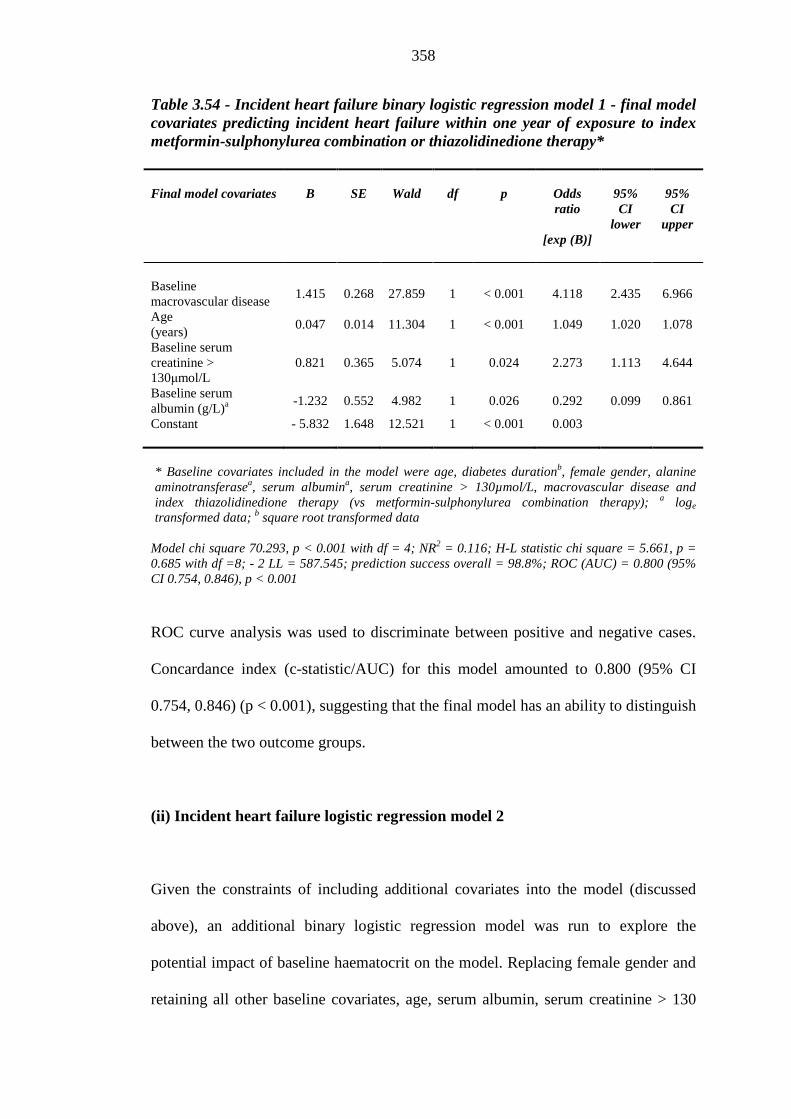
358
Table 3.54 - Incident heart failure binary logistic regression model 1 - final model covariates predicting incident heart failure within one year of exposure to index metformin-sulphonylurea combination or thiazolidinedione therapy* Final model covariates
B
SE
Wald
df
p
Odds ratio
[exp (B)]
95% CI
lower
95% CI
upper
Baseline macrovascular disease
1.415 0.268 27.859 1 < 0.001 4.118 2.435 6.966
Age (years)
0.047 0.014 11.304 1 < 0.001 1.049 1.020 1.078
Baseline serum creatinine > 130μmol/L
0.821 0.365 5.074 1 0.024 2.273 1.113 4.644
Baseline serum albumin (g/L)a
-1.232 0.552 4.982 1 0.026 0.292 0.099 0.861
Constant - 5.832 1.648 12.521 1 < 0.001 0.003 * Baseline covariates included in the model were age, diabetes durationb, female gender, alanine aminotransferasea, serum albumina, serum creatinine > 130µmol/L, macrovascular disease and index thiazolidinedione therapy (vs metformin-sulphonylurea combination therapy); a loge transformed data; b square root transformed data
Model chi square 70.293, p < 0.001 with df = 4; NR2 = 0.116; H-L statistic chi square = 5.661, p = 0.685 with df =8; - 2 LL = 587.545; prediction success overall = 98.8%; ROC (AUC) = 0.800 (95% CI 0.754, 0.846), p < 0.001 ROC curve analysis was used to discriminate between positive and negative cases.
Concardance index (c-statistic/AUC) for this model amounted to 0.800 (95% CI
0.754, 0.846) (p < 0.001), suggesting that the final model has an ability to distinguish
between the two outcome groups.
(ii) Incident heart failure logistic regression model 2
Given the constraints of including additional covariates into the model (discussed
above), an additional binary logistic regression model was run to explore the
potential impact of baseline haematocrit on the model. Replacing female gender and
retaining all other baseline covariates, age, serum albumin, serum creatinine > 130
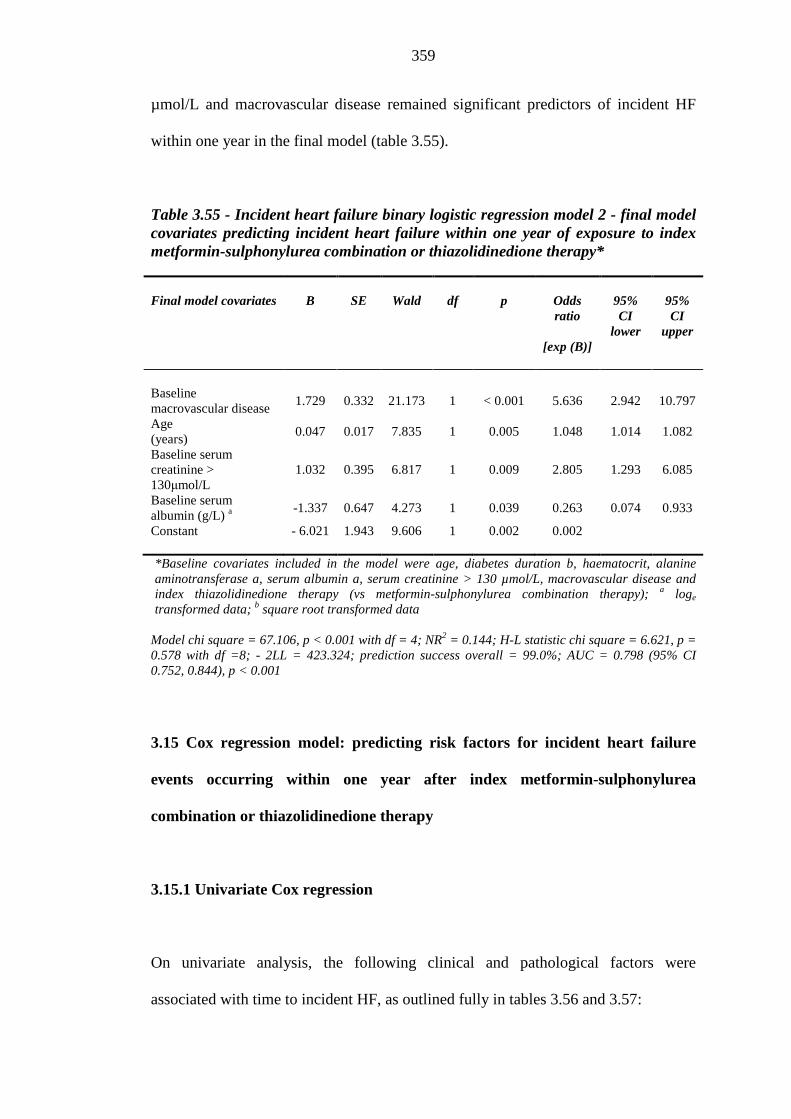
359
µmol/L and macrovascular disease remained significant predictors of incident HF
within one year in the final model (table 3.55).
Table 3.55 - Incident heart failure binary logistic regression model 2 - final model covariates predicting incident heart failure within one year of exposure to index metformin-sulphonylurea combination or thiazolidinedione therapy* Final model covariates
B
SE
Wald
df
p
Odds ratio
[exp (B)]
95% CI
lower
95% CI
upper
Baseline macrovascular disease
1.729 0.332 21.173 1 < 0.001 5.636 2.942 10.797
Age (years)
0.047 0.017 7.835 1 0.005 1.048 1.014 1.082
Baseline serum creatinine > 130μmol/L
1.032 0.395 6.817 1 0.009 2.805 1.293 6.085
Baseline serum albumin (g/L) a
-1.337 0.647 4.273 1 0.039 0.263 0.074 0.933
Constant - 6.021 1.943 9.606 1 0.002 0.002 *Baseline covariates included in the model were age, diabetes duration b, haematocrit, alanine aminotransferase a, serum albumin a, serum creatinine > 130 µmol/L, macrovascular disease and index thiazolidinedione therapy (vs metformin-sulphonylurea combination therapy); a loge transformed data; b square root transformed data
Model chi square = 67.106, p < 0.001 with df = 4; NR2 = 0.144; H-L statistic chi square = 6.621, p = 0.578 with df =8; - 2LL = 423.324; prediction success overall = 99.0%; AUC = 0.798 (95% CI 0.752, 0.844), p < 0.001
3.15 Cox regression model: predicting risk factors for incident heart failure
events occurring within one year after index metformin-sulphonylurea
combination or thiazolidinedione therapy
3.15.1 Univariate Cox regression
On univariate analysis, the following clinical and pathological factors were
associated with time to incident HF, as outlined fully in tables 3.56 and 3.57:
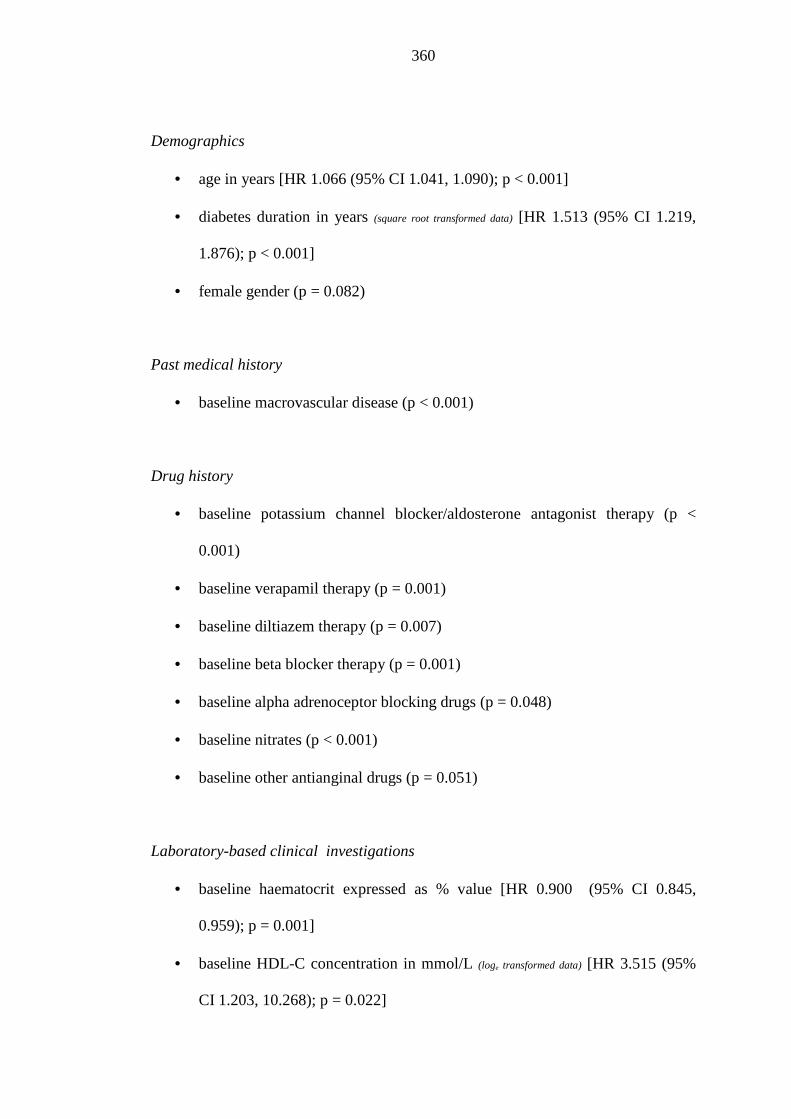
360
Demographics
• age in years [HR 1.066 (95% CI 1.041, 1.090); p < 0.001]
• diabetes duration in years (square root transformed data) [HR 1.513 (95% CI 1.219,
1.876); p < 0.001]
• female gender (p = 0.082)
Past medical history
• baseline macrovascular disease (p < 0.001)
Drug history
• baseline potassium channel blocker/aldosterone antagonist therapy (p <
0.001)
• baseline verapamil therapy (p = 0.001)
• baseline diltiazem therapy (p = 0.007)
• baseline beta blocker therapy (p = 0.001)
• baseline alpha adrenoceptor blocking drugs (p = 0.048)
• baseline nitrates (p < 0.001)
• baseline other antianginal drugs (p = 0.051)
Laboratory-based clinical investigations
• baseline haematocrit expressed as % value [HR 0.900 (95% CI 0.845,
0.959); p = 0.001]
• baseline HDL-C concentration in mmol/L (loge transformed data) [HR 3.515 (95%
CI 1.203, 10.268); p = 0.022]
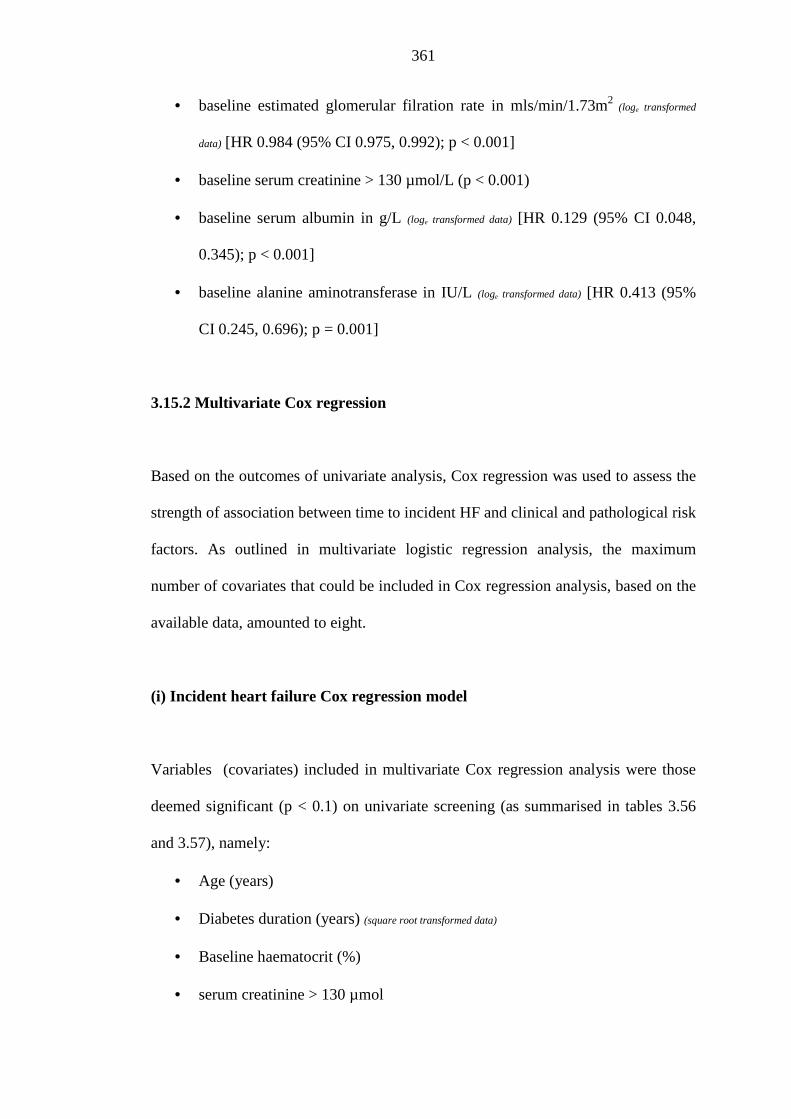
361
• baseline estimated glomerular filration rate in mls/min/1.73m2 (loge transformed
data) [HR 0.984 (95% CI 0.975, 0.992); p < 0.001]
• baseline serum creatinine > 130 µmol/L (p < 0.001)
• baseline serum albumin in g/L (loge transformed data) [HR 0.129 (95% CI 0.048,
0.345); p < 0.001]
• baseline alanine aminotransferase in IU/L (loge transformed data) [HR 0.413 (95%
CI 0.245, 0.696); p = 0.001]
3.15.2 Multivariate Cox regression
Based on the outcomes of univariate analysis, Cox regression was used to assess the
strength of association between time to incident HF and clinical and pathological risk
factors. As outlined in multivariate logistic regression analysis, the maximum
number of covariates that could be included in Cox regression analysis, based on the
available data, amounted to eight.
(i) Incident heart failure Cox regression model
Variables (covariates) included in multivariate Cox regression analysis were those
deemed significant (p < 0.1) on univariate screening (as summarised in tables 3.56
and 3.57), namely:
• Age (years)
• Diabetes duration (years) (square root transformed data)
• Baseline haematocrit (%)
• serum creatinine > 130 µmol
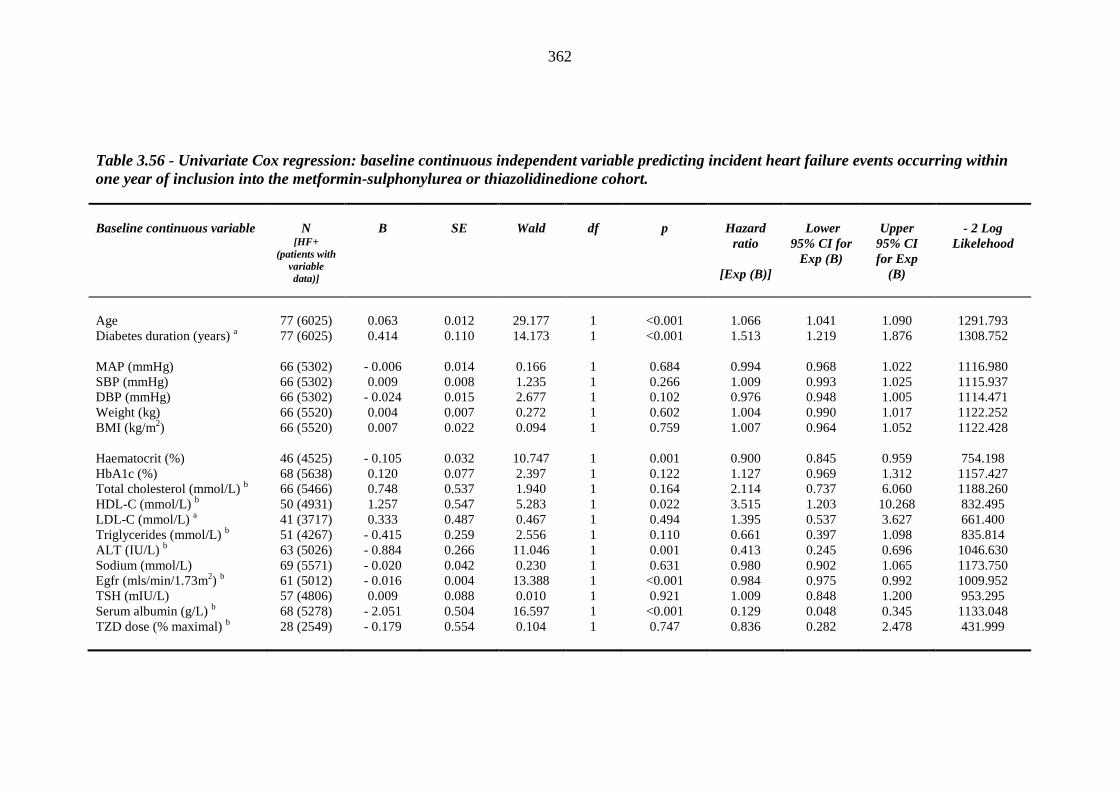
362
Table 3.56 - Univariate Cox regression: baseline continuous independent variable predicting incident heart failure events occurring within one year of inclusion into the metformin-sulphonylurea or thiazolidinedione cohort.
Baseline continuous variable
N
[HF+ (patients with
variable data)]
B
SE
Wald
df
p
Hazard
ratio
[Exp (B)]
Lower
95% CI for Exp (B)
Upper
95% CI for Exp
(B)
- 2 Log
Likelehood
Age 77 (6025) 0.063 0.012 29.177 1 <0.001 1.066 1.041 1.090 1291.793 Diabetes duration (years) a 77 (6025) 0.414 0.110 14.173 1 <0.001 1.513 1.219 1.876 1308.752 MAP (mmHg) 66 (5302) - 0.006 0.014 0.166 1 0.684 0.994 0.968 1.022 1116.980 SBP (mmHg) 66 (5302) 0.009 0.008 1.235 1 0.266 1.009 0.993 1.025 1115.937 DBP (mmHg) 66 (5302) - 0.024 0.015 2.677 1 0.102 0.976 0.948 1.005 1114.471 Weight (kg) 66 (5520) 0.004 0.007 0.272 1 0.602 1.004 0.990 1.017 1122.252 BMI (kg/m2) 66 (5520) 0.007 0.022 0.094 1 0.759 1.007 0.964 1.052 1122.428 Haematocrit (%) 46 (4525) - 0.105 0.032 10.747 1 0.001 0.900 0.845 0.959 754.198 HbA1c (%) 68 (5638) 0.120 0.077 2.397 1 0.122 1.127 0.969 1.312 1157.427 Total cholesterol (mmol/L) b 66 (5466) 0.748 0.537 1.940 1 0.164 2.114 0.737 6.060 1188.260 HDL-C (mmol/L) b 50 (4931) 1.257 0.547 5.283 1 0.022 3.515 1.203 10.268 832.495 LDL-C (mmol/L) a 41 (3717) 0.333 0.487 0.467 1 0.494 1.395 0.537 3.627 661.400 Triglycerides (mmol/L) b 51 (4267) - 0.415 0.259 2.556 1 0.110 0.661 0.397 1.098 835.814 ALT (IU/L) b 63 (5026) - 0.884 0.266 11.046 1 0.001 0.413 0.245 0.696 1046.630 Sodium (mmol/L) 69 (5571) - 0.020 0.042 0.230 1 0.631 0.980 0.902 1.065 1173.750 Egfr (mls/min/1.73m2) b 61 (5012) - 0.016 0.004 13.388 1 <0.001 0.984 0.975 0.992 1009.952 TSH (mIU/L) 57 (4806) 0.009 0.088 0.010 1 0.921 1.009 0.848 1.200 953.295 Serum albumin (g/L) b 68 (5278) - 2.051 0.504 16.597 1 <0.001 0.129 0.048 0.345 1133.048 TZD dose (% maximal) b 28 (2549) - 0.179 0.554 0.104 1 0.747 0.836 0.282 2.478 431.999
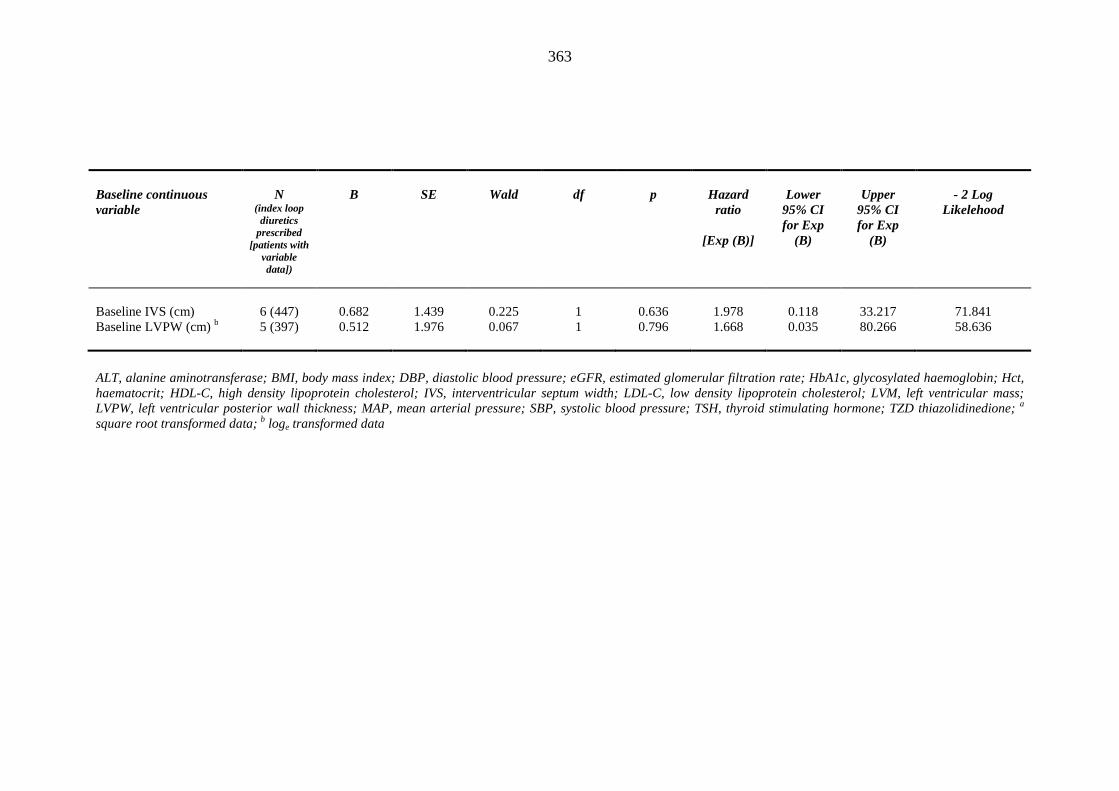
363
Baseline continuous variable
N
(index loop diuretics
prescribed [patients with
variable data])
B
SE
Wald
df
p
Hazard ratio
[Exp (B)]
Lower 95% CI for Exp
(B)
Upper
95% CI for Exp
(B)
- 2 Log
Likelehood
Baseline IVS (cm) 6 (447) 0.682 1.439 0.225 1 0.636 1.978 0.118 33.217 71.841 Baseline LVPW (cm) b 5 (397) 0.512 1.976 0.067 1 0.796 1.668 0.035 80.266 58.636
ALT, alanine aminotransferase; BMI, body mass index; DBP, diastolic blood pressure; eGFR, estimated glomerular filtration rate; HbA1c, glycosylated haemoglobin; Hct, haematocrit; HDL-C, high density lipoprotein cholesterol; IVS, interventricular septum width; LDL-C, low density lipoprotein cholesterol; LVM, left ventricular mass; LVPW, left ventricular posterior wall thickness; MAP, mean arterial pressure; SBP, systolic blood pressure; TSH, thyroid stimulating hormone; TZD thiazolidinedione; a square root transformed data; b loge transformed data
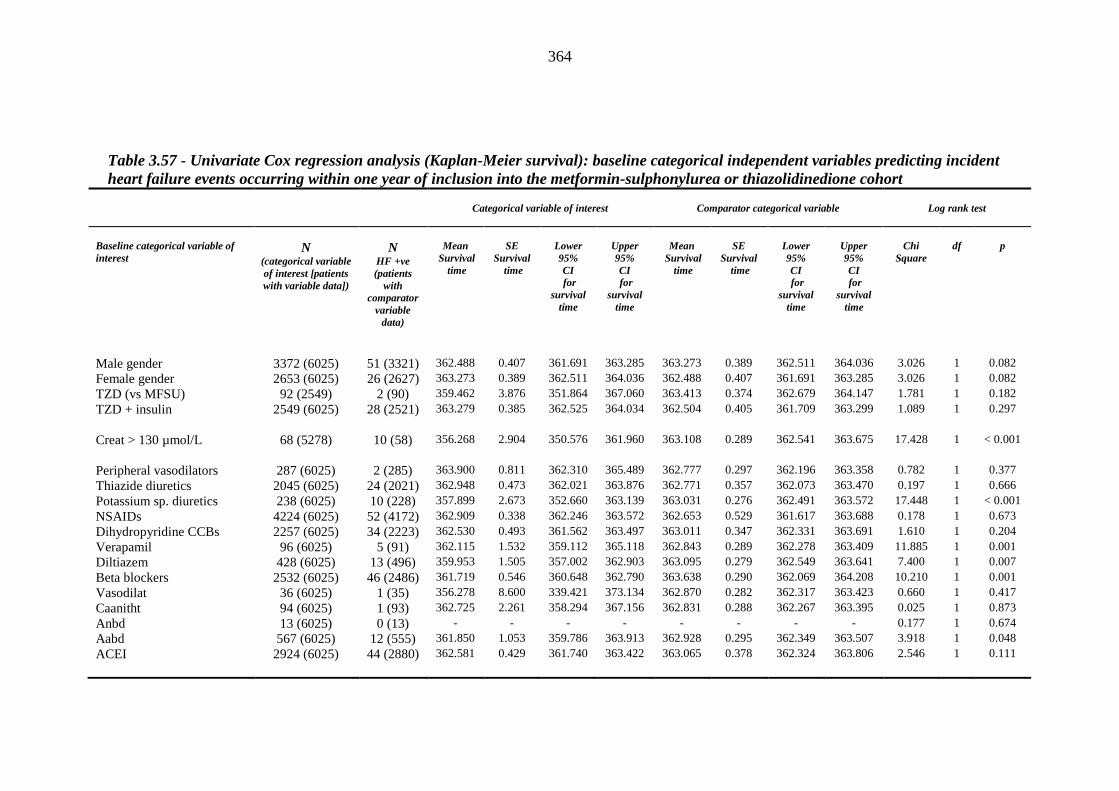
364
Table 3.57 - Univariate Cox regression analysis (Kaplan-Meier survival): baseline categorical independent variables predicting incident heart failure events occurring within one year of inclusion into the metformin-sulphonylurea or thiazolidinedione cohort
Categorical variable of interest
Comparator categorical variable
Log rank test
Baseline categorical variable of interest
N
(categorical variable of interest [patients with variable data])
N
HF +ve (patients
with comparator
variable data)
Mean
Survival time
SE
Survival time
Lower 95% CI for
survival time
Upper 95% CI for
survival time
Mean
Survival time
SE
Survival time
Lower 95% CI for
survival time
Upper 95% CI for
survival time
Chi
Square
df
p
Male gender 3372 (6025) 51 (3321) 362.488 0.407 361.691 363.285 363.273 0.389 362.511 364.036 3.026 1 0.082 Female gender 2653 (6025) 26 (2627) 363.273 0.389 362.511 364.036 362.488 0.407 361.691 363.285 3.026 1 0.082 TZD (vs MFSU) 92 (2549) 2 (90) 359.462 3.876 351.864 367.060 363.413 0.374 362.679 364.147 1.781 1 0.182 TZD + insulin 2549 (6025) 28 (2521) 363.279 0.385 362.525 364.034 362.504 0.405 361.709 363.299 1.089 1 0.297 Creat > 130 µmol/L 68 (5278) 10 (58) 356.268 2.904 350.576 361.960 363.108 0.289 362.541 363.675 17.428 1 < 0.001 Peripheral vasodilators 287 (6025) 2 (285) 363.900 0.811 362.310 365.489 362.777 0.297 362.196 363.358 0.782 1 0.377 Thiazide diuretics 2045 (6025) 24 (2021) 362.948 0.473 362.021 363.876 362.771 0.357 362.073 363.470 0.197 1 0.666 Potassium sp. diuretics 238 (6025) 10 (228) 357.899 2.673 352.660 363.139 363.031 0.276 362.491 363.572 17.448 1 < 0.001 NSAIDs 4224 (6025) 52 (4172) 362.909 0.338 362.246 363.572 362.653 0.529 361.617 363.688 0.178 1 0.673 Dihydropyridine CCBs 2257 (6025) 34 (2223) 362.530 0.493 361.562 363.497 363.011 0.347 362.331 363.691 1.610 1 0.204 Verapamil 96 (6025) 5 (91) 362.115 1.532 359.112 365.118 362.843 0.289 362.278 363.409 11.885 1 0.001 Diltiazem 428 (6025) 13 (496) 359.953 1.505 357.002 362.903 363.095 0.279 362.549 363.641 7.400 1 0.007 Beta blockers 2532 (6025) 46 (2486) 361.719 0.546 360.648 362.790 363.638 0.290 362.069 364.208 10.210 1 0.001 Vasodilat 36 (6025) 1 (35) 356.278 8.600 339.421 373.134 362.870 0.282 362.317 363.423 0.660 1 0.417 Caanitht 94 (6025) 1 (93) 362.725 2.261 358.294 367.156 362.831 0.288 362.267 363.395 0.025 1 0.873 Anbd 13 (6025) 0 (13) - - - - - - - - 0.177 1 0.674 Aabd 567 (6025) 12 (555) 361.850 1.053 359.786 363.913 362.928 0.295 362.349 363.507 3.918 1 0.048 ACEI 2924 (6025) 44 (2880) 362.581 0.429 361.740 363.422 363.065 0.378 362.324 363.806 2.546 1 0.111
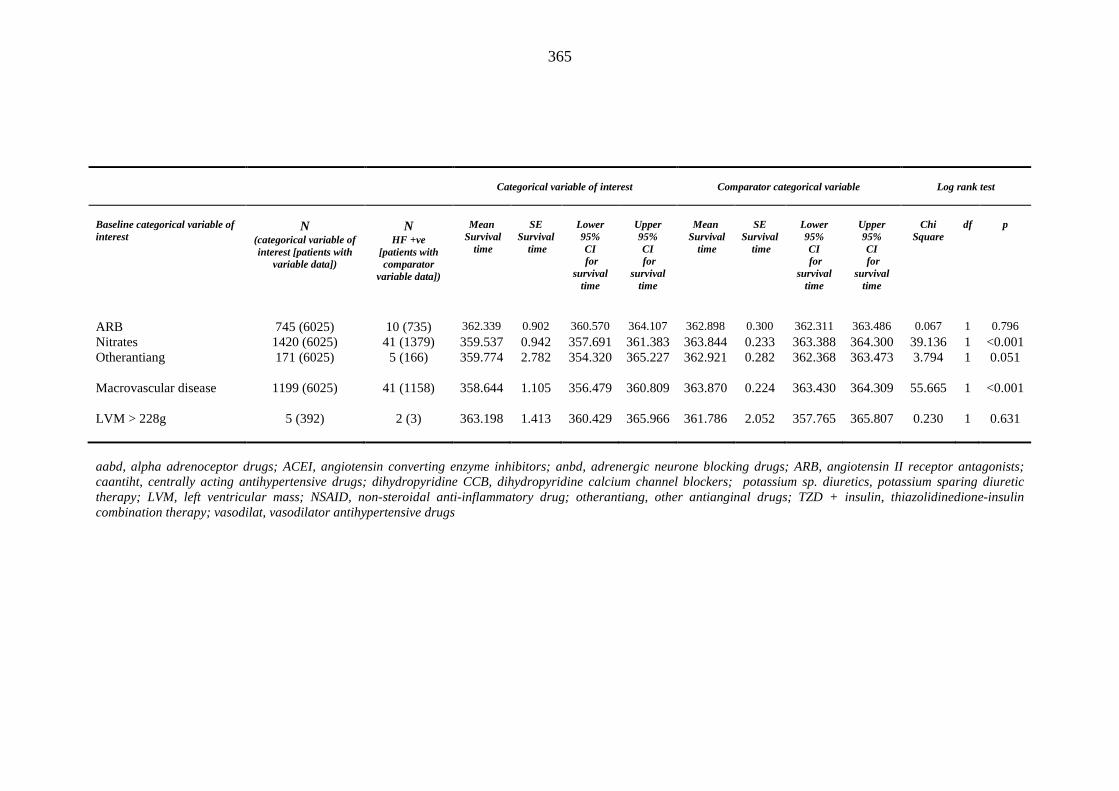
365
Categorical variable of interest
Comparator categorical variable
Log rank test
Baseline categorical variable of interest
N
(categorical variable of interest [patients with
variable data])
N
HF +ve [patients with comparator
variable data])
Mean
Survival time
SE
Survival time
Lower 95% CI for
survival time
Upper 95% CI for
survival time
Mean
Survival time
SE
Survival time
Lower 95% CI for
survival time
Upper 95% CI for
survival time
Chi
Square
df
p
ARB 745 (6025) 10 (735) 362.339 0.902 360.570 364.107 362.898 0.300 362.311 363.486 0.067 1 0.796 Nitrates 1420 (6025) 41 (1379) 359.537 0.942 357.691 361.383 363.844 0.233 363.388 364.300 39.136 1 <0.001 Otherantiang 171 (6025) 5 (166) 359.774 2.782 354.320 365.227 362.921 0.282 362.368 363.473 3.794 1 0.051 Macrovascular disease 1199 (6025) 41 (1158) 358.644 1.105 356.479 360.809 363.870 0.224 363.430 364.309 55.665 1 <0.001 LVM > 228g 5 (392) 2 (3) 363.198 1.413 360.429 365.966 361.786 2.052 357.765 365.807 0.230 1 0.631 aabd, alpha adrenoceptor drugs; ACEI, angiotensin converting enzyme inhibitors; anbd, adrenergic neurone blocking drugs; ARB, angiotensin II receptor antagonists; caantiht, centrally acting antihypertensive drugs; dihydropyridine CCB, dihydropyridine calcium channel blockers; potassium sp. diuretics, potassium sparing diuretic therapy; LVM, left ventricular mass; NSAID, non-steroidal anti-inflammatory drug; otherantiang, other antianginal drugs; TZD + insulin, thiazolidinedione-insulin combination therapy; vasodilat, vasodilator antihypertensive drugs
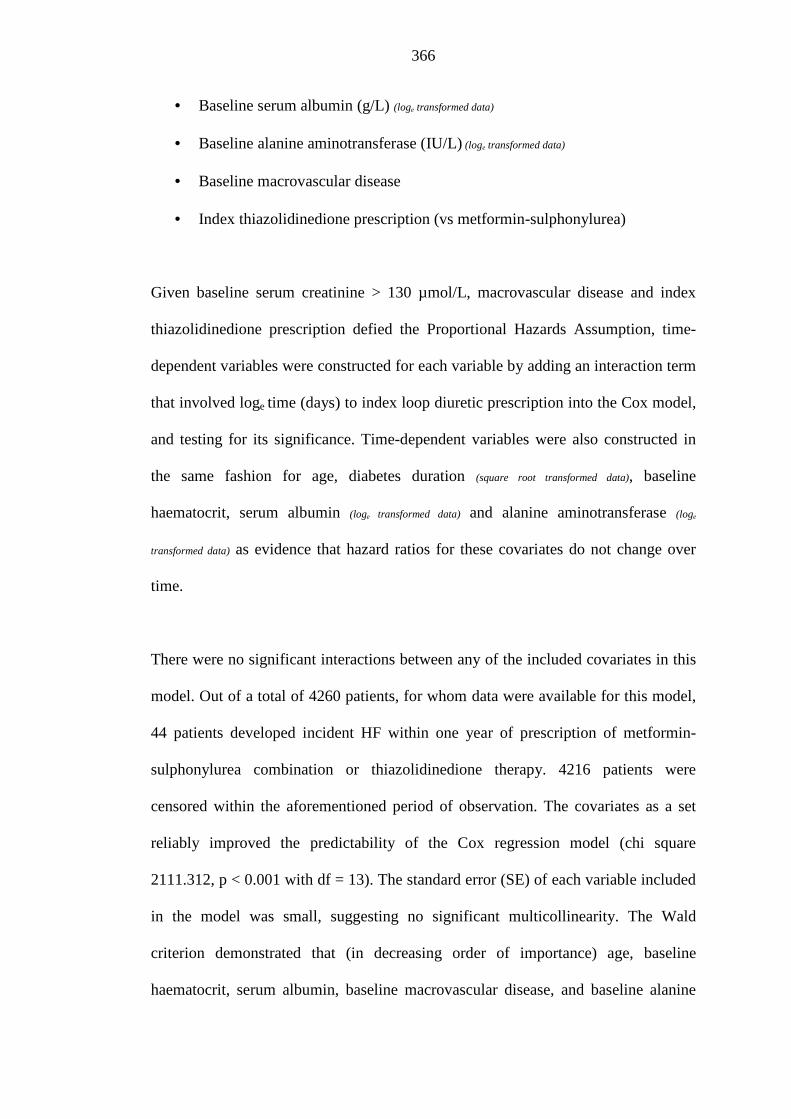
366
• Baseline serum albumin (g/L) (loge transformed data)
• Baseline alanine aminotransferase (IU/L) (loge transformed data)
• Baseline macrovascular disease
• Index thiazolidinedione prescription (vs metformin-sulphonylurea)
Given baseline serum creatinine > 130 µmol/L, macrovascular disease and index
thiazolidinedione prescription defied the Proportional Hazards Assumption, time-
dependent variables were constructed for each variable by adding an interaction term
that involved loge time (days) to index loop diuretic prescription into the Cox model,
and testing for its significance. Time-dependent variables were also constructed in
the same fashion for age, diabetes duration (square root transformed data), baseline
haematocrit, serum albumin (loge transformed data) and alanine aminotransferase (loge
transformed data) as evidence that hazard ratios for these covariates do not change over
time.
There were no significant interactions between any of the included covariates in this
model. Out of a total of 4260 patients, for whom data were available for this model,
44 patients developed incident HF within one year of prescription of metformin-
sulphonylurea combination or thiazolidinedione therapy. 4216 patients were
censored within the aforementioned period of observation. The covariates as a set
reliably improved the predictability of the Cox regression model (chi square
2111.312, p < 0.001 with df = 13). The standard error (SE) of each variable included
in the model was small, suggesting no significant multicollinearity. The Wald
criterion demonstrated that (in decreasing order of importance) age, baseline
haematocrit, serum albumin, baseline macrovascular disease, and baseline alanine
367
aminotransferase and their respective interactions with time made a significant
contribution to predicting time to index loop diuretic prescription in this setting, as
outlined in table 3.58. Baseline serum creatinine was a marginally significant
covariate (p = 0.05). Covariate*time interactions suggested a decreasing hazard ratio
over time for baseline macrovascular disease, alanine aminotransferase, serum
creatinine and serum albumin. Hazard ratios for age and haematocrit, remained
stable over the period of observation, in keeping with log-minus-log plots which had
suggested that each of the latter covaariates satisfied the Proportiona Hazards
Assumption (table 3.59, figure 3.15)
There were insufficient data to permit modelling baseline drug therapy, left
ventricular mass or interventricular septum width as covariates in a Cox regression
model predicting incident HF events.
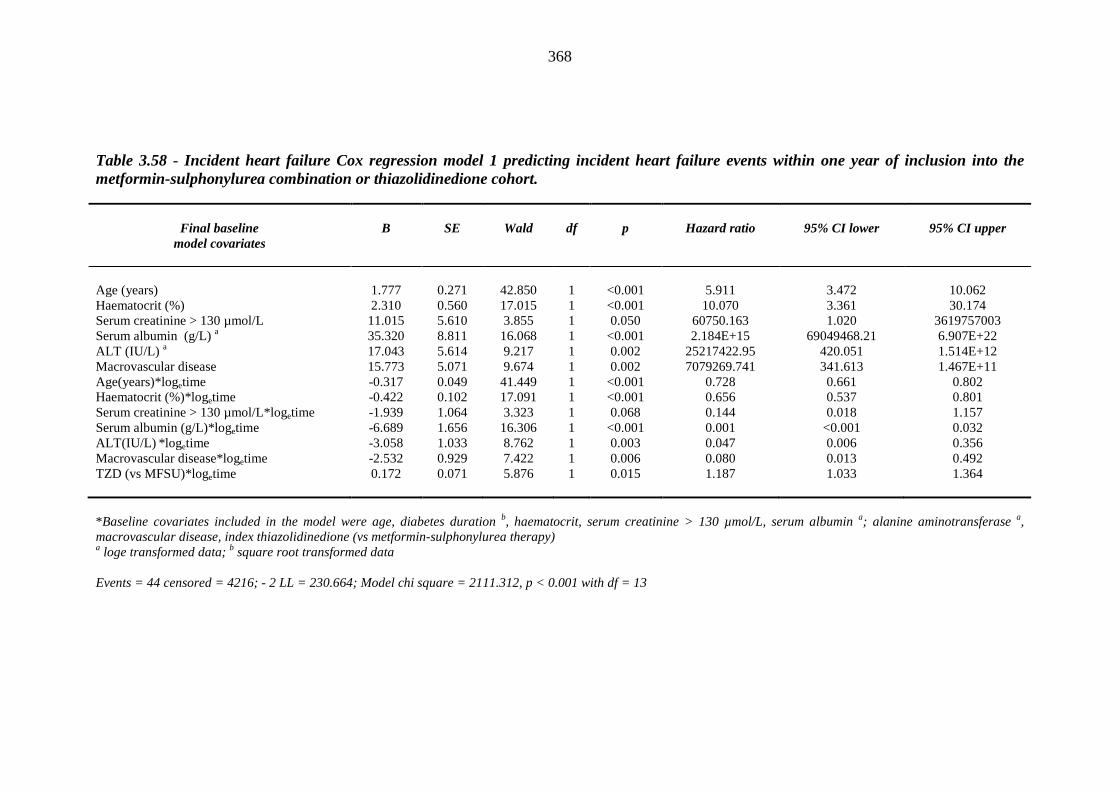
368
Table 3.58 - Incident heart failure Cox regression model 1 predicting incident heart failure events within one year of inclusion into the metformin-sulphonylurea combination or thiazolidinedione cohort.
Final baseline
model covariates
B
SE
Wald
df
p
Hazard ratio
95% CI lower
95% CI upper
Age (years) 1.777 0.271 42.850 1 <0.001 5.911 3.472 10.062 Haematocrit (%) 2.310 0.560 17.015 1 <0.001 10.070 3.361 30.174 Serum creatinine > 130 µmol/L 11.015 5.610 3.855 1 0.050 60750.163 1.020 3619757003 Serum albumin (g/L) a 35.320 8.811 16.068 1 <0.001 2.184E+15 69049468.21 6.907E+22 ALT (IU/L) a 17.043 5.614 9.217 1 0.002 25217422.95 420.051 1.514E+12 Macrovascular disease 15.773 5.071 9.674 1 0.002 7079269.741 341.613 1.467E+11 Age(years)*logetime -0.317 0.049 41.449 1 <0.001 0.728 0.661 0.802 Haematocrit (%)*logetime -0.422 0.102 17.091 1 <0.001 0.656 0.537 0.801 Serum creatinine > 130 µmol/L*logetime -1.939 1.064 3.323 1 0.068 0.144 0.018 1.157 Serum albumin (g/L)*logetime -6.689 1.656 16.306 1 <0.001 0.001 <0.001 0.032 ALT(IU/L) *logetime -3.058 1.033 8.762 1 0.003 0.047 0.006 0.356 Macrovascular disease*logetime -2.532 0.929 7.422 1 0.006 0.080 0.013 0.492 TZD (vs MFSU)*logetime 0.172 0.071 5.876 1 0.015 1.187 1.033 1.364 *Baseline covariates included in the model were age, diabetes duration b, haematocrit, serum creatinine > 130 µmol/L, serum albumin a; alanine aminotransferase a, macrovascular disease, index thiazolidinedione (vs metformin-sulphonylurea therapy) a loge transformed data; b square root transformed data Events = 44 censored = 4216; - 2 LL = 230.664; Model chi square = 2111.312, p < 0.001 with df = 13
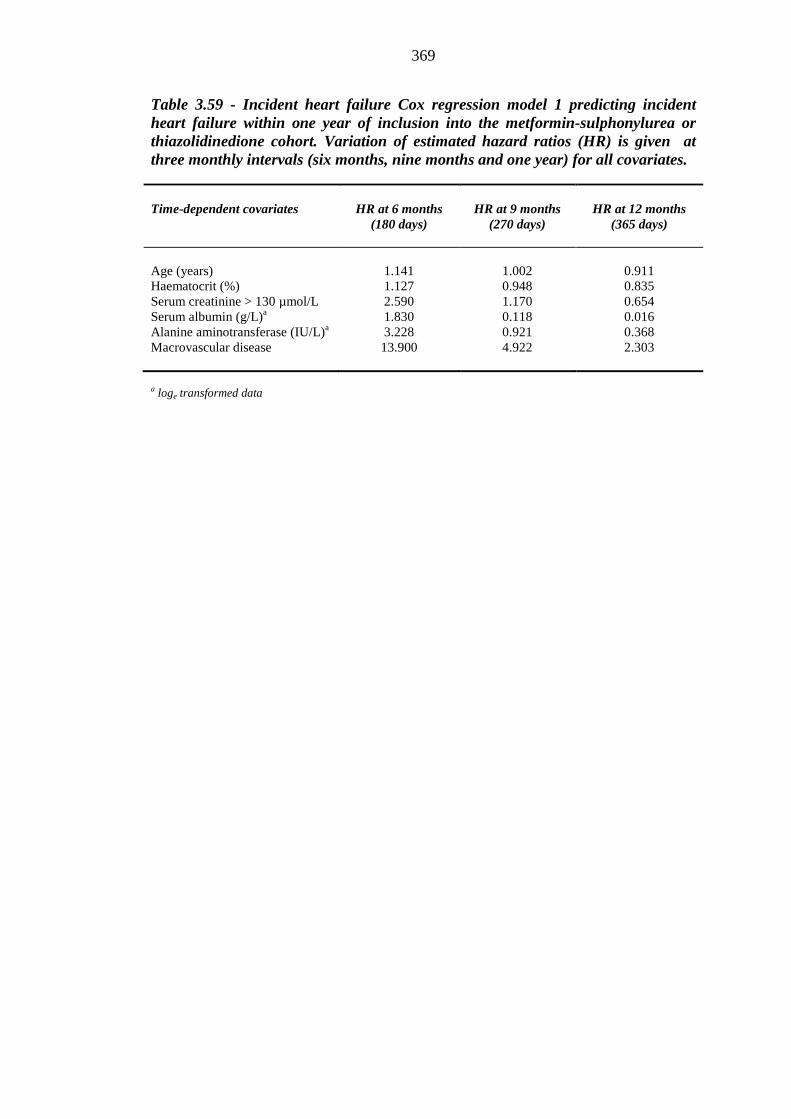
369
Table 3.59 - Incident heart failure Cox regression model 1 predicting incident heart failure within one year of inclusion into the metformin-sulphonylurea or thiazolidinedione cohort. Variation of estimated hazard ratios (HR) is given at three monthly intervals (six months, nine months and one year) for all covariates.
Time-dependent covariates
HR at 6 months
(180 days)
HR at 9 months
(270 days)
HR at 12 months
(365 days)
Age (years) 1.141 1.002 0.911 Haematocrit (%) 1.127 0.948 0.835 Serum creatinine > 130 µmol/L 2.590 1.170 0.654 Serum albumin (g/L)a 1.830 0.118 0.016 Alanine aminotransferase (IU/L)a 3.228 0.921 0.368 Macrovascular disease 13.900 4.922 2.303 a loge transformed data
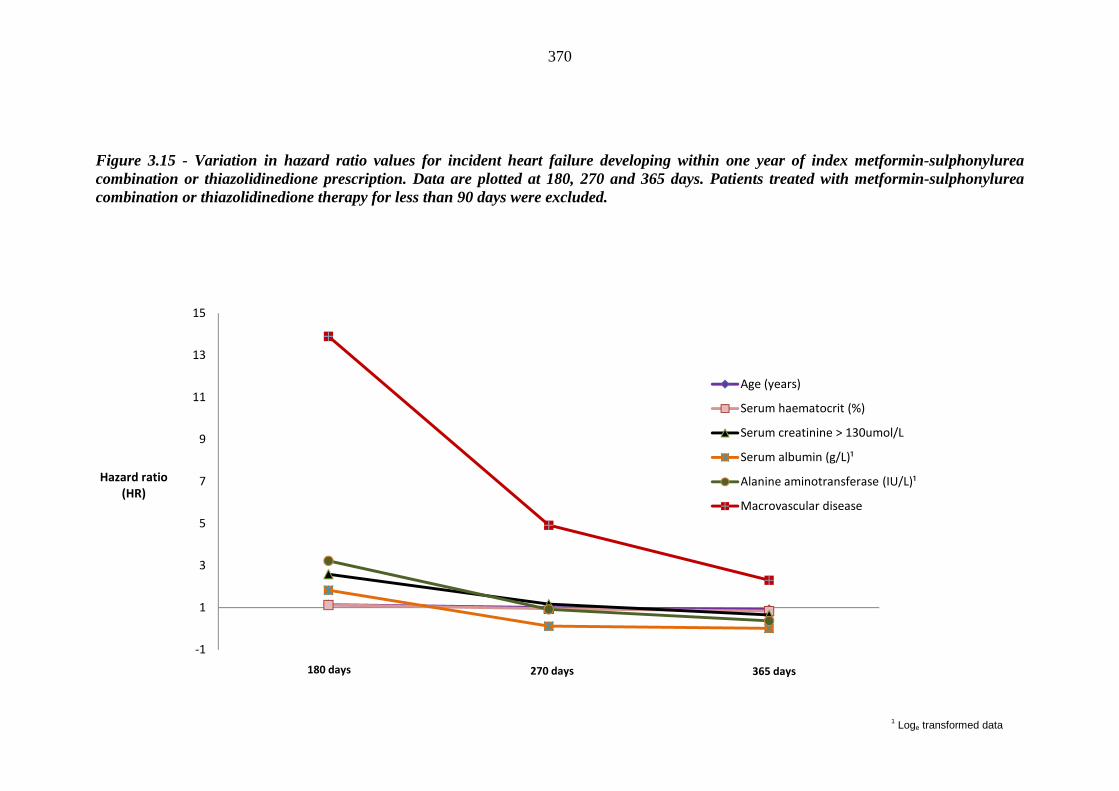
370
Figure 3.15 - Variation in hazard ratio values for incident heart failure developing within one year of index metformin-sulphonylurea combination or thiazolidinedione prescription. Data are plotted at 180, 270 and 365 days. Patients treated with metformin-sulphonylurea combination or thiazolidinedione therapy for less than 90 days were excluded.
-1
1
3
5
7
9
11
13
15
Hazard ratio
(HR)
Age (years)
Serum haematocrit (%)
Serum creatinine > 130umol/L
Serum albumin (g/L)¹
Alanine aminotransferase (IU/L)¹
Macrovascular disease
180 days 270 days 365 days
1 Loge transformed data
371
3.16 Do CYP2C8*3 and *4 genotypes infer a reduced oedematogenic risk
following thiazolidinedione exposure?
Out of a total of 2664 thiazolidinedione-treated patients, CYP2C8 data were
available for 1309 patients. Of these, 318 (24.3%) carried the CYP2C8*3 allele
(whether homozygotes, heterozygotes or compound heterozygotes with CYP2C8*4),
while 120 (9.2%) carried the CYP2C8*4 allele. Expressed differently, 888 (76.8%)
were wild type carriers (CYP2C8 *1/*1), 372 (28.4%) were heterozygotes for the *3
or *4 allele (CYP2C8 *1/*3 or *1/*4), whereas 49 (1.8%) were homozygotes or
compound heterozygotes (CYP2C8 *3/*3, *3/*4 or *4/*4)
There were no significant differences in the frequencies of index loop diuretic
prescription or incident HF rates (occurring within one year of index
thiazolidinedione prescription) between patients carrying at least one copy of the
CYP2C8*3 or CYP2C8*4 allele and wild type carriers (CYP2C88 *1/*1) (Fisher
exact test p = 0.483, 0.185 respectively). Likewise, as outlined in tables 3.60 and
3.61 below, the frequency of occurrence of index loop diuretic prescription and
incident HF was similar across heterozygous (CYP2C8 *1/*3 or CYP2C8 *1/*4),
compound heterozygous (CYP2C8 *3/*4) and homozygous (CYP2C8 *3/*3 or
CYP2C8 *4/*4) subgroups (compared to wild type carriers).
Univariate logistic regression did not identify CYP2C8*3 or *4 variants as being
significant risk factors for the outcomes of interest, whether in the heterozygous or
homozygous state (tables 3.62 and 3.63 below).
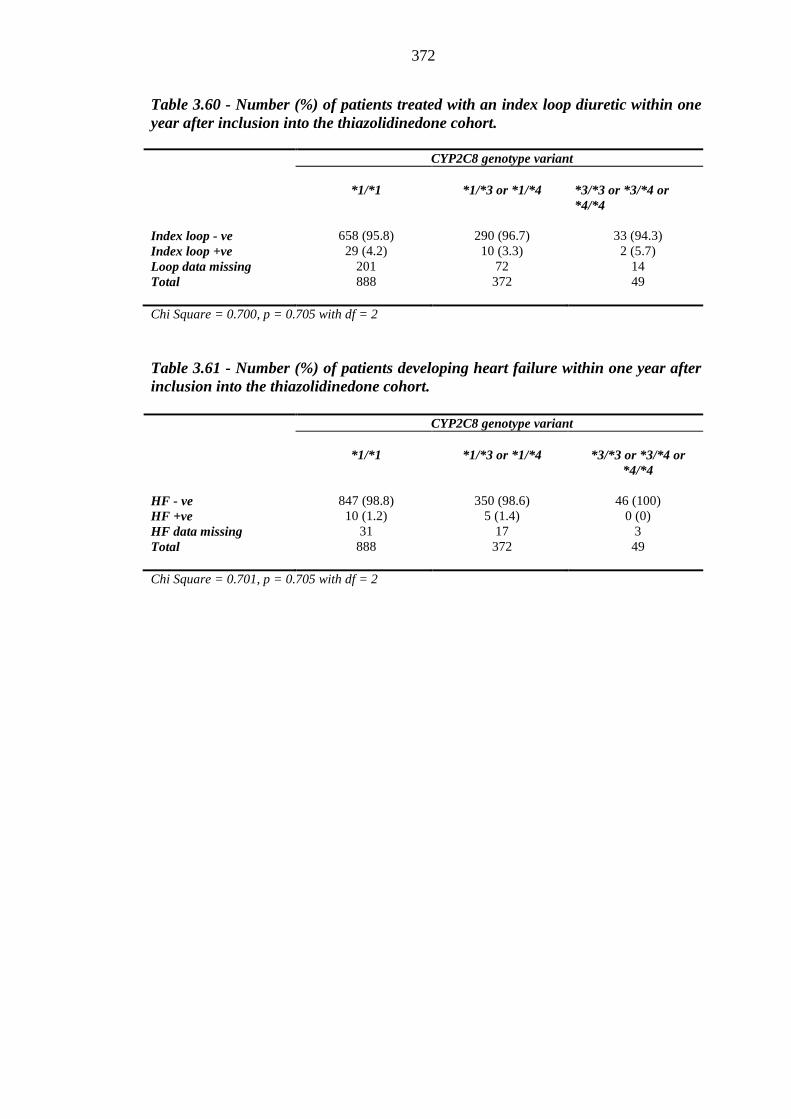
372
Table 3.60 - Number (%) of patients treated with an index loop diuretic within one year after inclusion into the thiazolidinedone cohort.
CYP2C8 genotype variant
*1/*1
*1/*3 or *1/*4
*3/*3 or *3/*4 or *4/*4
Index loop - ve 658 (95.8) 290 (96.7) 33 (94.3) Index loop +ve 29 (4.2) 10 (3.3) 2 (5.7) Loop data missing 201 72 14 Total 888 372 49 Chi Square = 0.700, p = 0.705 with df = 2 Table 3.61 - Number (%) of patients developing heart failure within one year after inclusion into the thiazolidinedone cohort.
CYP2C8 genotype variant
*1/*1
*1/*3 or *1/*4
*3/*3 or *3/*4 or
*4/*4
HF - ve 847 (98.8) 350 (98.6) 46 (100) HF +ve 10 (1.2) 5 (1.4) 0 (0) HF data missing 31 17 3 Total 888 372 49 Chi Square = 0.701, p = 0.705 with df = 2
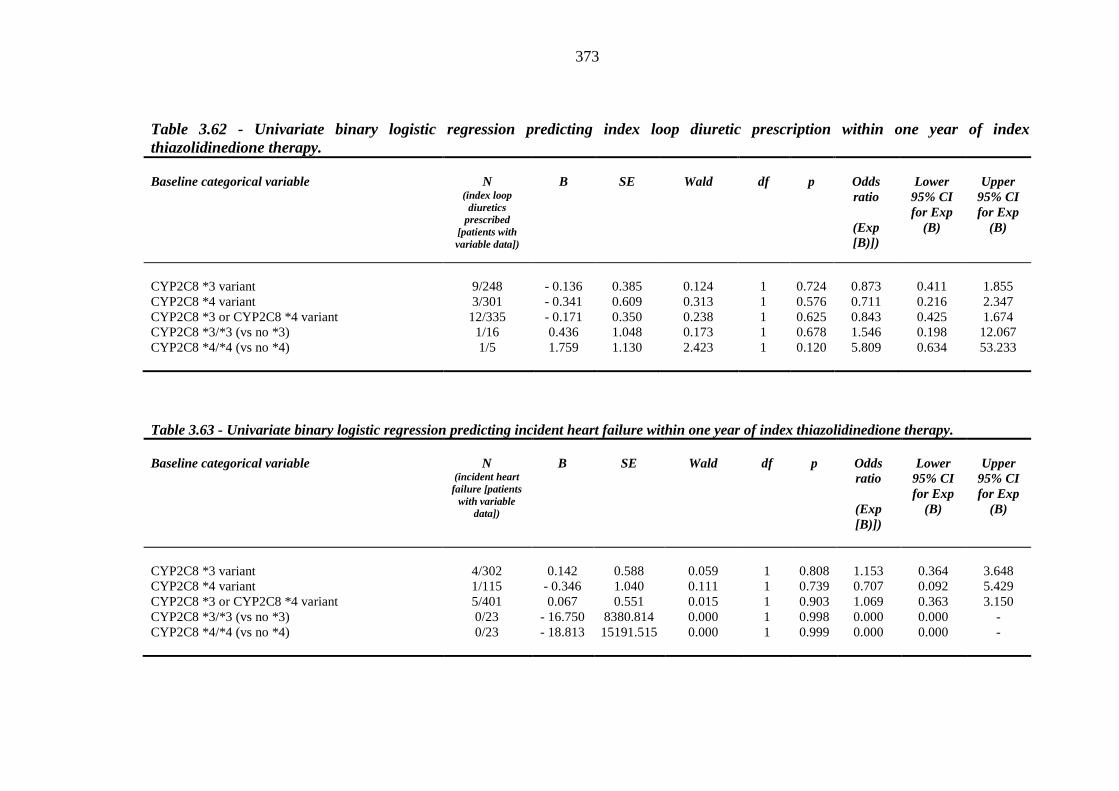
373
Table 3.62 - Univariate binary logistic regression predicting index loop diuretic prescription within one year of index thiazolidinedione therapy.
Baseline categorical variable
N
(index loop diuretics
prescribed [patients with variable data])
B
SE
Wald
df
p
Odds ratio
(Exp [B)])
Lower 95% CI for Exp
(B)
Upper
95% CI for Exp
(B)
CYP2C8 *3 variant 9/248 - 0.136 0.385 0.124 1 0.724 0.873 0.411 1.855 CYP2C8 *4 variant 3/301 - 0.341 0.609 0.313 1 0.576 0.711 0.216 2.347 CYP2C8 *3 or CYP2C8 *4 variant 12/335 - 0.171 0.350 0.238 1 0.625 0.843 0.425 1.674 CYP2C8 *3/*3 (vs no *3) 1/16 0.436 1.048 0.173 1 0.678 1.546 0.198 12.067 CYP2C8 *4/*4 (vs no *4) 1/5 1.759 1.130 2.423 1 0.120 5.809 0.634 53.233
Table 3.63 - Univariate binary logistic regression predicting incident heart failure within one year of index thiazolidinedione therapy.
Baseline categorical variable
N (incident heart failure [patients
with variable data])
B
SE
Wald
df
p
Odds ratio
(Exp [B)])
Lower 95% CI for Exp
(B)
Upper
95% CI for Exp
(B)
CYP2C8 *3 variant 4/302 0.142 0.588 0.059 1 0.808 1.153 0.364 3.648 CYP2C8 *4 variant 1/115 - 0.346 1.040 0.111 1 0.739 0.707 0.092 5.429 CYP2C8 *3 or CYP2C8 *4 variant 5/401 0.067 0.551 0.015 1 0.903 1.069 0.363 3.150 CYP2C8 *3/*3 (vs no *3) 0/23 - 16.750 8380.814 0.000 1 0.998 0.000 0.000 - CYP2C8 *4/*4 (vs no *4) 0/23 - 18.813 15191.515 0.000 1 0.999 0.000 0.000 -
374
3.17 Discussion
This study has identified risk factors for index loop diuretic prescription and incident
HF in a cohort of T2DM patients treated with the most commonly prescribed
anithyperglycaemic combination therapy (metformin and sulphonylureas) and
thiazolidinediones. Importantly, available data suggest that risk factors for index
loop diuretic prescription (a surrogate marker of fluid retention) and incident HF are
shared between patients in both treatment categories, and that neither index
metformin-sulphonylurea combination therapy nor thiazolidendione prescription are
risk factors for these adverse events on multivariate analysis.
To my knowledge, this is the first study comparing incident HF rates in these two
treatment subgroups, as most available data have compared thiazolidinediones solely
with monotherapy / placebo comparators. RECORD, an open-label prospective trial
randomising T2DM patients inadequately controlled on metformin or sulphonylurea
monotherapy to add-on rosiglitazone or metformin-sulphonylurea combination
therapy, is a notable exception. The approach in the present study may be more
generalisable as it mirrors clinical practice, particularly given the reported
differential effects of metformin and sulphonylureas on incident HF events, and
recurrent HF in T2DM patients with established HF.
Given the unanticipated difficulties recruiting patients for my clinical study, analysis
of population-based data of clinically significant peripheral oedema necessitating
index loop diuretic therapy was a novel approach to unravelling the mechanisms
underpinning thiazolidinedione-associated fluid overload. Based on available
375
evidence, one may consider this surrogate marker of fluid overload as a sentinel sign
of clinical HF or (unexplained) peripheral oedema [610]. In PROactive, 27.4% of
patients randomised to pioglitazone reported oedema [vs 15.9% (placebo); < 0.001),
while 21.6% developed serious or nonserious oedema without HF [vs 13.0%
(placebo); p < 0.001]. Oedema preceded HF in 34.2% and 24.1% of patients
randomised to pioglitazone and placebo respectively [261]. An insulin comparator
subgroup was included as a valuable source of descriptive data, given the reported
association of insulin therapy with fluid overload [352, 611-613], but was not
included in multivariate analysis, given that insulin therapy is generally reserved for
patients at a more advanced stage of T2DM.
The relative frequency of prescription of thiazolidinediones to patients with
established HF (4.32%), albeit lower than for metformin-sulphonylurea combination
(6.21%) and insulin therapy (17.60%) is rather surprising, given the unequivocal
advice voiced by multiple clinical practice guidelines. Nonetheless, thiazolidinedione
prescription among such patients was lower than that reported among Medicare
beneficiaries (7.1% for patients prescribed between 1998-1999 and 16.1% for those
prescribed between 2000-2001) [614]. Similarly, a retrospective analysis of 24 746
elderly Korean patients with T2DM reported that thiazolidinediones were prescribed
to 10.4% of patients with established HF and 8.8% of patients without [615].
While following similar trends, thiazolidinedione prescription rates among patients
prone to oedema (and hence loop diuretic prescription) were even higher (21.28%).
Differences generally reached statistical signifance with either comparator cohorts
on post-hoc testing. There were no differences in background use of loop diuretics
376
between metformin-sulphonylurea and thiazolidinedione-treated female patients, and
for background HF rates between metformin-sulphonylurea and thiazolidinedione-
treated male patients. Results of the latter two post-hoc analyses may have been
limited by sample size, and do not necessarily reflect gender related differences in
prescription practices. Despite the reported association between insulin therapy and
fluid retention / HF [352], insulin prescription was necessarily more likely in patients
prone to cardiovascular disease and renal impairment, possibly as a consequence of
progressive beta-cell exhaustion precipitating inadequate glycaemic control on
established oral glucose lowering agents.
This study reported that 1.1% of patients develop incident HF within one year of
their thiazolidinedione prescription. This rate was considerably lower than for insulin
therapy (3.5%), and comparable to metformin-sulphonylurea combination therapy
(1.4%). This study’s reported incident HF rates for thiazolidinedione-treated patients
(rosiglitazone / pioglitazone) was virtually twice that reported in the DREAM trial
(rosigitazone, 0.54%), comparable to HF events in ADOPT (rosligitazone, 1.51%)
and considerably lower than those reported in RECORD (rosiglitazone, 2.7%) and
PROactive (pioglitazone, 10.7%). 4.3% of patients in this study's cohort required
prescription of an index loop diuretic (a surrogate marker of oedema) within one
year of exposure to a thiazolidinedione. This is considerably lower than that reported
in DREAM (6.6%), ADOPT (14.1%) and ProACTIVE (21.6%). However, as has
been ascertained in the introductory chapter, these four prospective trials recruited
patients with a spectrum of glycaemia and cardiovascular risk, ranging from
prediabetes (DREAM) to pharmacologically naïve T2DM (ADOPT), high risk
T2DM inadequately controlled on metformin or sulphonylurea monotherapy
377
(RECORD) and T2DM treated with diet or oral glucose lowering agents or insulin
(PROactive).
Comparisons of incident HF rates need to be made with caution, given differences in
HF definitions across these four prospective trials. Moreover, none of these trials
were primarily designed to investigate oedema and HF rates. All four prospective
trials captured incident HF events for a longer time period ranging from 34.5 months
(PROactive) to 66 months (RECORD), and did not report outcomes after one year of
treatment. Oedema outcomes were likewise reported at the end of the observation
period in all four prospective trials (except RECORD). Given the published effects
of rosiglitazone and pioglitazone on other macrovascular outcomes, capturing
incident HF and index loop diuretic prescription within one year of prescription of a
thiazolidinedione (or comparator drug) was more likely to yield unbiased
information on the outcome of interest.
Unlike these four prospective clinical trials, this study's retrospective analyses did
not permit a comparison of incident HF events between rosiglitazone and
pioglitazone-treated patients. Patients recruited in these prospective trials were
generally younger (mean range 54.7 [DREAM] to 61.8 [PROactive] years vs mean
[SD] = 63.23 [9.77] years for this study). Additionally, patients recruited in each
study were characterised by a relatively homogenous cardiovascular risk (ranging
from low-risk pre-diabetes [DREAM] to high risk T2DM patients [PROactive]). As
15.1% of patients were known to suffer from macrovascular disease at index
thiazolidinedione prescription, this study's cohort encompasses T2DM patients with
a range of cardiovascular risk, akin to that in a T2DM population. This study's
378
observations of higher (unadjusted) incident HF rates for insulin-treated T2DM are
consistent with those reported by several observational studies on multivariate
adjustment [239, 277, 616].
Age, BMI, systolic blood pressure, haematocrit, alanine aminotransferase and
macrovascular disease emerged as significant baseline predictors of time to oedema
requiring loop diuretics on Cox regression analysis. Age, haematocrit, serum
creatinine > 130 µmol/L (borderline significance), serum albumin, alanine
aminotransferase and macrovascular disease emerged as significant baseline
predictors of time to incident HF within one year of inclusion into the metformin-
sulphonylurea combination or thiazolidinedione cohort. Modelling incident HF
events generally validated this study's predictors for loop diuretic prescription, and is
consistent with the observation that diuretic use predicts HF in T2DM patients
randomised to pioglitazone or placebo in the PROactive trial [261].
Importantly, thiazolidinedione prescription did not emerge as a significant
contributor to fluid retention requiring loop diuretics and HF on univariate or
multivariate analysis, suggesting that risk factors for developing these adverse events
following index thiazolidinedione prescription are shared with patients prescribed
metformin-sulphonylurea combination therapy. These results contrast sharply with
those reported in a post-hoc analysis of data from RECORD and PROactive for
rosiglitazone and pioglitazone respectively [258, 261]. Both ascribed an increased
risk for the respective thiazolidinedione on multivariate post-hoc analyses. However,
RECORD investigators excluded patients awaiting a cardiovascular intervention,
those hospitalized for a major cardiovascular event within the previous three months
379
and individuals with renal and/or liver impairment, uncontrolled hypertension or an
HbA1c of <7% / >9% [153]. Likewise, PROactive excluded patients on insulin
monotherapy and those with severe peripheral vascular disease, end-stage renal
disease requiring haemodialysis, significantly elevated alanine aminotransferase, and
subjects awaiting coronary or peripheral arterial revascularisation [256]. This
approach will have exluded patients at higher a priori risk of incident HF,
introducing selection bias into the post-hoc models. Patients recruited into the
PROactive trial were randomised to a placebo rather than active comparator. In
agreement with this study's findings, neither metformin nor sulphonylureas emerged
as significant predictors of incident congestive HF in multivariate Cox regression
analysis of T2DM US patients [239]. Toprani et al. were also reassuring in this
regard, ascribing a decreased risk of thiazolidinedione associated incident HF [273].
This study's findings are consistent with differences in baseline characteristics
between patients progressing to index loop diuretic prescription / incident HF and
those who did not. The association between age and incident HF has long been
established [617, 618], both in diabetic cohorts [219, 239, 277-279, 619], and in the
general population [620-625], and has been replicated in this study. Likewise,
baseline macrovascular disease predicted index loop diuretic prescription and
incident HF events in this Tayside cohort. This is consistent with results from studies
analyzing new-onset HF events in patients whose T2DM was complicated by
coronary artery disease [219, 239, 277, 278], peripheral artery disease or stroke [219,
278], and in individuals recruited from population based cohorts who suffered from
coronary artery disease at baseline [235, 621, 623, 624, 626-628].
380
In general, this study's reported findings for age, albumin, systolic blood pressure,
serum creatinine and macrovascular disease follow those reported in the Health ABC
Heart Failure Score for elderly (diabetic and non-diabetic) patients [629]. Nichols et
al. published similar findings in a cohort of 8231 patients with T2DM, additionally
attributing an increased incident HF risk to diabetes duration, baseline BMI, mean
HbA1c, insulin use, gross proteinuria, end-stage renal disease and mean DBP, and a
(surprisingly) lower risk for microalbuminuria [239]. The authors had ascribed the
latter finding to a confounding effect of ACE inhibitors. One does not exclude that
this may also have masked the effect of baseline serum creatinine on the final model
for index loop diuretic prescription in this study, in patients prone to, but not yet
developing clinical HF, given the strong association on univariate analysis (p <
0.001). Given recommendations that metformin should be used with caution in
individuals with moderate renal impairment (eGFR 30-45 mls/min/1.73 m2), and is
contraindicated in patients with severe renal impairment (eGFR < 30 mls/min/1.73
m2) [630], it is possible that metformin was not prescribed in patients with poor renal
function who are particularly prone to lactic acidosis and HF.
There were no significant differences in baseline HbA1c between metformin-
sulphonylurea combination and thiazolidinedione cohorts, or between loop diuretic
and HF categories. Most patients in either cohort had suboptimal baseline glycaemic
control. Additionally, baseline HbA1c did not predict index loop diuretic
prescription or incident HF on univariate analysis. The association between
glycaemic control and incident HF in T2DM is somewhat complex. While Nichols et
al. reported no association with baseline measurements, reduction in HbA1c values
averaged over the 30 month follow-up period predicted incident HF, suggesting a
381
role for cumulative rather than recent glycaemic burden [277]. The data in the
present study concurs with this observation, particularly given that outcomes of
interest were analysed at a relatively short time after baseline HbA1c measurement.
In contrast, analysis of data from the PROactive trial revealed that a baseline HbA1c
exceeding 7.4% predicted incident HF during a mean (± SD) follow-up period of
34.5 (± 2.3) months [261]. Several other studies suggest that poorer glycaemic
control is associated with higher incidence rates for HF, both in diabetic and in non-
diabetic patients [212, 218, 238, 631, 632]. A recently published systematic review
and meta-analysis of ten prospective epidemiological studies comprising 178 929
participants and 14 176 incident congestive HF cases ascribed an overall adjusted
risk ratio for CHF of 1.15 (95% CI 1.10, 1.21) for each percentage point higher
HbA1c. However, there was significant heterogeneity between the studies, not
explained by available study-level characteristics [633].
This study's reported lack of association between female gender and oedema on
multivariate analysis are consistent with those reported for incident HF on
multivariate survival analysis by Nichols et al. [239]. In contrast, Maru and
colleagues had reported that type 2 diabetic males were at an increased risk of
incident HF within the first year of diagnosis across all age groups [278]. However,
this study’s observation period antedated the introduction of thiazolidinediones into
the European market, and was restricted to metformin, sulphonylureas, acarbose,
guam gum and insulin (monotherapy or in combination). Concomitant use of insulin
and thiazolidinediones did not predict oedema requiring loop diuretic treatment or
incident HF on univariate analysis in this study. These results need to be interpreted
with caution, given that, as expected, only 70 patients had been prescribed
382
thiazolidinediones in combination with insulin. Nonetheless, post-hoc analysis of
PROactive data showed that baseline insulin therapy did not predict serious HF
events on multivariate analysis, despite observations that serious HF occurred more
frequently in patients treated with insulin at baseline, irrespective of pioglitazone or
placebo [261].
BMI emerged as a significant predictor of time to index loop diuretic prescription on
multivariate analysis. Rather surprisingly, this covariate was not significant on
univariate analysis for incident HF events. The latter observation may have been
limited by the small number of HF events in this dataset. Nonetheless, this study's
observations for index loop diuretic prescription are consistent with those reported
for incident HF in the Framingham study [634, 635], NHANES I [235] and in a
community-based elderly cohort [636]. In contrast, obesity did not remain a
significant predictor of incident HF when correcting for insulin resistance (measured
as euglycaemic clamp glucose diposal rate) [626] or inflammatory markers
(interleukin-6 or C-reactive protein) [620] in other studies.
As a major determinant of prevalent oncotic pressure, serum albumin would be
expected to influence the threshold for pulmonary oedema in response to an
elevation in left atrial pressure. Filippatos et al. demonstrated that baseline
hypoalbuminaemia (defined as < 3.5 g/dL) predicts incident HF in community
dwelling older adults without baseline evidence of this disease entity during ten
years of follow-up [637]. Analysis of data from the Health, Aging and Body
Composition Study revealed that baseline serum albumin concentrations are
inversely related to incident HF events in a time-dependent manner, even when
383
controlling for inflammatory markers, incident coronary heart disease [638]. In this
prospective study (median follow-up 9.4 years), Gopal et al. demonstrated that
participants developing incident HF earlier were characterised by a lower serum
albumin concentration than individuals developing HF over the remaining
observation period [638]. Patients requiring an index loop diuretic within one year of
index metformin-sulphonylurea combination or thiazolidinedione therapy were
characterised by lower baseline serum albumin concentrations in this study's cohort.
This study's time-to-event data consistently confirm this inverse relationship for both
incident HF and index loop diuretic prescription at a relatively early stage of oral
glucose lowering agent exposure (one year) across all models. Morevoer, this
association holds true even for T2DM patients whose baseline serum albumin hovers
within the normal range [mean (SD) baseline serum albumin = 43.51 (3.55) g/L
(metformin-sulphonylurea combination), 44.00 (2.88) g/L (thiazolidinediones)].
ALT was identified as a predictor of time to index loop diuretic prescription and
incident HF events. This relationship exhibited a sigificant time-varying effect which
mirrors that seen for macrovascular disease. The increased risk associated with ALT
is largely seen in the first six to nine months after index metformin-sulphonylurea
combination or thiazolidinedione therapy, and subsequently wears off to become a
protective effect. The initial increased risk is consistent with ALT's association with
non-alcoholic liver disease [639], endothelial dysfunction [640] and carotid
atherosclerosis [641]. Moreover, ALT has been shown to predict coronary artery
disease events independently of other risk factors [642, 643], including its
association with the metabolic syndrome [644]. This remarkable time-varying effect
could be explained by the insulin-sensitizing actions of metformin and
384
thiazolidinediones. A lower baseline ALT would be consistent with greater insulin
sensitivity, and could suggest a greater response to metformin and/or
thiazolidinediones, rendering such patients increasingly prone to thiazolidinedinone-
associated fluid overload.
Prevalent haematocrit levels have been associated with cardiovascular events in a
few studies [645, 646]. A higher haematocrit concentration, even within the normal
range, has recently been associated with an increased risk of new-onset HF in an
observational study capturing data from 3523 patients aged 50 to 65 years who had
been enrolled in the Framingham Heart Study [647]. Coglianese et al. partly ascribed
their observations to haemoconcentration-associated endothelial dysfunction. This
study's time-to-event data for both index loop diuretic prescription and incident HF
seemingly concur with these observations within the first six to nine months of index
metformin-sulphonylurea combination or thiazolidinedione therapy.
Logistic and Cox regression models identified baseline nitrates as predictors of index
loop diuretic prescription and time to index loop diuretic prescription. These data
partially concur with those reported by McAlister et al. in their retrospective study of
5631 newly diagnosed T2DM patients [279], who additionally ascribed an increased
risk to baseline beta-blockers and a reduced risk to ACE inhibitors and ARBs. Beta-
blockers did not emerge as significant univariate predictors of index loop diuretic
prescription (p = 0.076) and time to index loop diuretic prescription (p = 0.066) in
this study's dataset. Additionally they were not significant on multivariate analysis.
Baseline ACE inhibitors, ARBs or thiazolidinedione-insulin combination therapy
were not significant on univariate analysis. Similarly, post-hoc analysis of data from
385
the PROactive study reported no significant excess incident HF events among
patients randomised to treatment with pioglitazone on a background of nitrates, ACE
inbibitors /ARBs or insulin [648]. Percentage maximum thiazolidinedione dose was
not included in multivariate modelling of index loop diuretic prescription (despite a p
value of 0.074 on univariate logistic regression), so as not to restrict the model to
thiazolidinedione-treated patients.
In general, the present results are consistent with those reported by Castagno et al.
[649]. In a meta-analysis of HF events from the PROactive, ACCORD, VADT and
RECORD trials, these authors reported that patients allocated intensive glycaemic
control using high dose thiazolidinediones were more likely to develop incident HF
compared with those receiving low dose therapy [649]. Such a dose-dependent effect
was not seen when analysing for metformin and sulphonylureas; neither was it
investigated in this study's dataset.
The present study reported that baseline left ventricular mass (a surrogate measure of
left ventricular hypertrophy) [603] predicted index loop diuretic prescription (p =
0.015) and time to index loop diuretic prescription (p = 0.006) on univariate
modelling for metformin-sulphonylurea combination or thiazolidinedione-treated
patients (there were insufficient data for multivariate modelling). This is consistent
with this study's observation of higher baseline left ventricular mass values for index
loop diuretic requiring patients on univariate in both cohorts. While left ventricular
hypertrophy has been identified as a risk factor for incident congestive HF at a
population level in several studies [620, 621, 650], there are no such associations in
T2DM patients. The present study's observations generally agree with data
386
suggesting that T2DM patients are characterised by a higher mean left ventricular
mass (even in the absence of hypertension, albumunuria and apparent ischaemic
heart disease) [651, 652], and are thus more likely to have clinically inapparent left
ventricular dysfunction [653].
In conclusion, given the paucity of evidence from prospective clinical trials, an
epidemiological observational study was undertaken to provide information to
clarify the relationship between fluid overload, HF and thiazolidinedione exposure.
This study identified clinically relevant and applicable prediction models in a well
characterised, typical T2DM population inherently at risk of HF, exposed to
treatment with first, second and third line oral glucose lowering agents. Most of the
risk factors are potentially modifiable, providing an opportunity at risk assessment,
close follow-up of at risk patients and aggressive clinical risk management.
Moreover, given that most patients have multiple risk factors in various
combinations, multivariate modelling is likely to be more robust in predicting
individual risk.
Despite its limitations, the retrospective cohort approach offered a valuable insight
into prescribing practices in Tayside, and minimised the possibility of selection bias.
Given the widely reported association between thiazolidinediones and HF/oedema,
the possibility cannot be excluded that high risk patients were barred from
thiazolidinedione exposure by prescribers (negative allocation bias), and that this
may have impacted on the results of the present study's multivariate models.
Moreover, patients may have discontinued their thiazolidinedione therapy soon after
their prescription on account of perceived or real harm. The present study sought to
387
control for this in its cohort definitions by including only patients whose initial
thiazolidinedione prescription was followed by at least another prescription within
three months. Patients were additionally exluded from a cohort if they had been
treated with the same antihyperglycaemic agent within the previous year. Inclusion
of a metformin-sulphonylurea combination therapy control cohort in multivariate
analysis allowed contextualisation of any hypothesised thiazolidinedione effect by
comparing it to ‘standard’ ‘first’ and ‘second line’ glucose lowering agents. Access
to accurate drug dispension records ensured that the cohorts are representative of true
drug use in the population being examined while minimising misclassification of
exposure. Notwithstanding the limitations imposed by retrospective research
analysis, this study's approach permitted good characterisation of reasonably
extensive covariate data. Including index thiazolidinedione (vs metformin-
sulphonylurea combination) therapy as a covariate mitigated any measured or
unmeasured baseline differences between either treatment cohort, and avoided the
need for propensity scoring.
Nonetheless, the potential existence of other unrecognised and unmeasured
counfounding variables cannot be excluded, particularly given the paucity of
reported data predicting susceptibility to thiazolidinedione and metformin-
sulphonylurea combination therapy induced fluid retention / HF in the literature. The
present study sought to minimise (albeit not eliminate) this risk by including as many
significant covariates as possible in multivariate modelling. The relative infrequency
of incident HF events in the combined metformin-sulphonylurea and
thiazolidinedione cohorts inevitably imposed restrictions on the maximum number of
covariates that could be included into any one model. This study did not capture data
388
on race, cigarette smoking, physical activity, electrocardiography, hypoglycaemia
and cardiac valvular dysfunction, all of which have been implicated to influence
propensity for HF in other studies [235, 627, 654, 655]. Nonetheless, this study's
approach permitted recruitment of a larger sample, analysis of sequence of events
surrounding outcomes of interest, and the inclusion of a larger number of potential
confounders than would have been possible in a prospective trial.
In conclusion, on the basis of the present population-based data, thiazolidinediones
per se do not appear to contribute significantly to the risk of HF or index loop
diuretic prescription (as a surrogate for oedema). Risk factors for such adverse
events occurring after index thiazolidinedione exposure are common to patients
exposed to index metformin-sulphonylurea combination therapy. Careful patient
selection may mitigate these adverse outcomes.
389
Chapter 4
Systematic review and meta-analysis
Is there a role for adjunct metformin in
type 1 diabetes?
390
Chapter 4 - Systematic review and meta-analysis
Is there a role for adjunct metformin in type 1 diabetes?
Section I - Methods
4.1 Eligible studies
This objective was to capture all trials of metformin in T1DM which were i)
randomised, ii) used a treatment duration of at least one week, iii) used either a
comparator drug, placebo or used a crossover design, and iv) included consenting
patients. This study extracted any data on cardiovascular disease, HbA1c, body
weight or BMI, insulin dose, lipids and adverse effects.
4.2 Search strategy
All publications pertaining to T1DM and metformin for any outcomes were captured
as follows in PubMed (1950 to week 4th January 2009, updated 6th October 2009)
and EMBASE (1974 onwards). The search was conducted as follows using medical
search headings (MeSH):
1. "Diabetes Mellitus, Type 1"[MeSH]
2. (DIABET*) AND (TYPE 1[TW] OR IDDM[TW] OR ("INSULIN
DEPENDENT" not "NON-INSULIN DEPENDENT"))
3. 1 OR 2
4. "Metformin"[MeSH]
5. metformin [TW]
391
6. 4 OR 5
The abstracts of all identified publications were manually searched for studies that
attempted to evaluate the effect of metformin on any clinically relevant outcome
whether in a randomised trial or open label or other design. The citations of all
relevant publications were manually searched for any additional studies. Where
uncertainty existed, the full text of the article was obtained and reviewed. All
potentially relevant studies were assessed and data extraction performed. The
resulting tables of evidence were then reviewed. Disagreement was resolved by
discussion with Professor John Petrie and Professor Helen Colhoun; independent
adjudication was not required.
In addition all ongoing and unpublished trials were searched as follows:
• Cochrane Library 2009 issue 1
• Science Citation Index meeting abstracts (includes European Association for
the Study of Diabetes and American Diabetes Association meetings) 1980-
October 2008
• Diabetes UK meeting abstracts 2002-2008 Endocrine Society Abstracts
2005-2008
• Science Citation Index meeting Abstracts 1980-2008
• National Research Register (NRR)
• Controlled Trials.com
392
On the United Kingdom NRR, five trials were registered, all with glycaemic/
metabolic outcomes with end dates in 2005 or earlier. All were emailed to request
data:
N0176113569: Completed but unpublished (pilot study).
N0231133055: Completed and published [656].
N0394131469: Not completed.
N0301111201: Completed and published [657].
N0046091476: Not completed.
An online reference to trial N0394131469, initially accessed in the first search (week
4th January 2009), was no longer accessible on searching across multiple research
registers on relevant websites (www.nrr.org.uk; www.controlled-trials.com) in the
updated search (6th October 2009).
On the controlled-trials.com meta-register, one additional glycaemic/ metabolic trial
was found:
NCT00145379: Not completed, still recruiting (n=50).
4.2.1 Subjects
Participants were those of any age described by the authors of the publications as
having T1DM or insulin dependent diabetes or youth onset diabetes.
393
4.2.2 Analysis
A decision was made to summarise the data mostly in text and tabular form since
there was obvious heterogeneity between studies in methods, design and outcome
measures. However, some data were also presented using standard meta-analysis
techniques [658]; the two trials of very short duration [659, 660] were excluded from
these. Strictly speaking these formal meta-analysis techniques should only be used
when a group of studies is sufficiently homogeneous in terms of participants,
interventions and outcomes to provide a meaningful summary [658]. Nevertheless,
it was considered useful to have a measure of the statistical significance of apparent
effects.
With these caveats, a fixed effects model using the inverse variance method was
fitted to give a crude measure of the overall treatment effect, to assess its statistical
significance and to assess the heterogeneity of treatment effect between studies.
Outcomes of effect on %HbA1c and on insulin dose were also examined. The metan
STATA user command was used, which quantifies heterogeneity using the I-squared
measure [661]. Of the eight eligible studies, one study [657] was excluded as it may
have been incorrectly analysed as if it were a parallel group study (in which case the
standard deviations will not be valid). Three other studies could not be included as
they either did not report the outcomes of interest [659, 660], or because the data
items necessary for inclusion in a combined analysis were not reported [662]. The
data were extracted as %HbA1c and as units per day for insulin dose (using mean
weight at baseline in each treatment group to convert insulin units per kg per day to
units per day). For some studies, only attained mean levels were available rather

394
than changes from baseline by treatment group; therefore, treatment effect was
derived as the net difference in absolute units of outcome between metformin and
placebo groups. The obvious methodological heterogeneity in study design, drug
dose, age of subjects, and length of follow up render the combined estimates of
effect somewhat imprecise.
395
Section II - Results
4.3 Systematic review
The initial electronic search identified 187 studies (figure 4.1). A manual review of
the citations yielded an additional ten studies. In total, 47 of these publications were
judged to be relevant to metformin therapy in T1DM. Analysis of publications
revealed: 17 were observational studies with no random allocation and/or no
comparator group [656, 663-678]; 11 were reviews, letters or commentaries [679-
689]; two did not contain any quantitative estimates of effects [690, 691]; one
concerned an outcome (erythrocyte binding of insulin) not judged relevant [692];
and four were abstracts of later published papers [693-696]. Of the remaining 12
publications, one concerned insulin-requiring T2DM rather than T1DM (noted after
translation) [697], and one covered a treatment period of less than seven days [698].
Only 10 studies were therefore identified [657, 659, 660, 662, 699-704]. Of these,
one which was conducted on participants living in a children’s home and did not
mention informed consent, was excluded from further analysis [703].
The final nine studies [657, 659, 660, 662, 699-702, 704] covered a total of 192.8
patient years, and the number of completed subjects ranged from 10-92 (median 26)
(two studies did not report number completed [660, 662] (Table 4.1). Total
maximum daily metformin dose varied from 1000 mg to 2550 mg; duration of
therapy ranged from 7 days to 12 months (median 4 months). Two studies were only
available in abstract form [660, 662], including one of the largest studies (n = 80)
which dated from 2000 [662].
396
All nine studies evaluated at least one parameter of glycaemic control or blood
glucose in association with metformin treatment (table 4.1) but only seven reported
mean change in HbA1 or HbA1c [657, 662, 699-702, 704], which was reduced by
0.6-0.9% in four studies [657, 662, 700, 701], with no significant change in three
[699, 702, 704] (overall range +0.13% [699] to -0.9% [701]) (table 4.2). The
remaining two (shorter term) studies reported other glycaemic benefits including an
18% increase in glucose uptake (artificial pancreas hyperinsulinaemic euglycaemic
clamp) [659], and improved post-prandial glucose handling [660].
Of the seven studies in which insulin dose was not fixed by design) [657, 662, 699-
702, 704], insulin dose requirement was reduced by 5.7-10.1 units/ day in six of
seven studies (the study which reported no change was conducted in adolescents
[701]. The same seven studies were of sufficient duration to report data on changes
in weight or BMI. Metformin reduced weight by 1.7-6.0 kg in three [662, 699, 704]
of six studies [657, 662, 699, 701, 702, 704]. A sustained and statistically significant
reduction (mean 1.74 kg) was reported in the largest study, which was also of the
longest duration [699] (table 4.2).
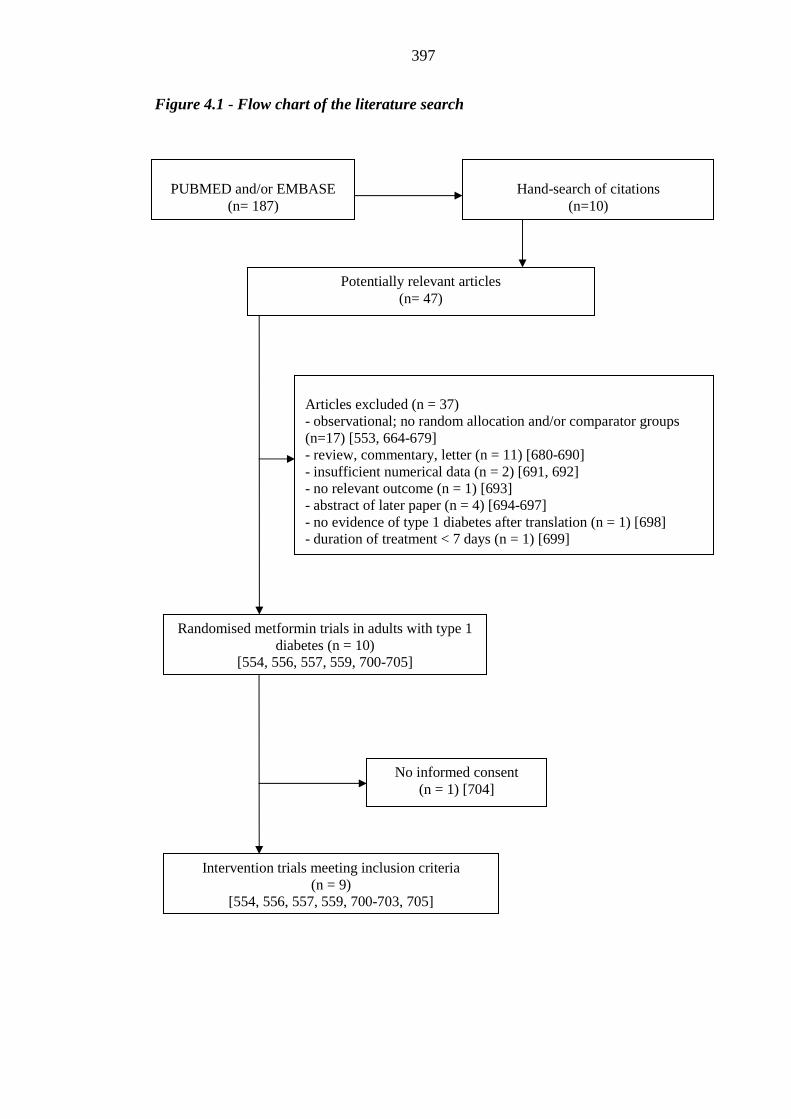
397
Figure 4.1 - Flow chart of the literature search
PUBMED and/or EMBASE
(n= 187)
Hand-search of citations
(n=10)
Potentially relevant articles (n= 47)
Articles excluded (n = 37) - observational; no random allocation and/or comparator groups (n=17) [553, 664-679] - review, commentary, letter (n = 11) [680-690] - insufficient numerical data (n = 2) [691, 692] - no relevant outcome (n = 1) [693] - abstract of later paper (n = 4) [694-697] - no evidence of type 1 diabetes after translation (n = 1) [698] - duration of treatment < 7 days (n = 1) [699]
Randomised metformin trials in adults with type 1 diabetes (n = 10)
[554, 556, 557, 559, 700-705]
No informed consent (n = 1) [704]
Intervention trials meeting inclusion criteria (n = 9)
[554, 556, 557, 559, 700-703, 705]
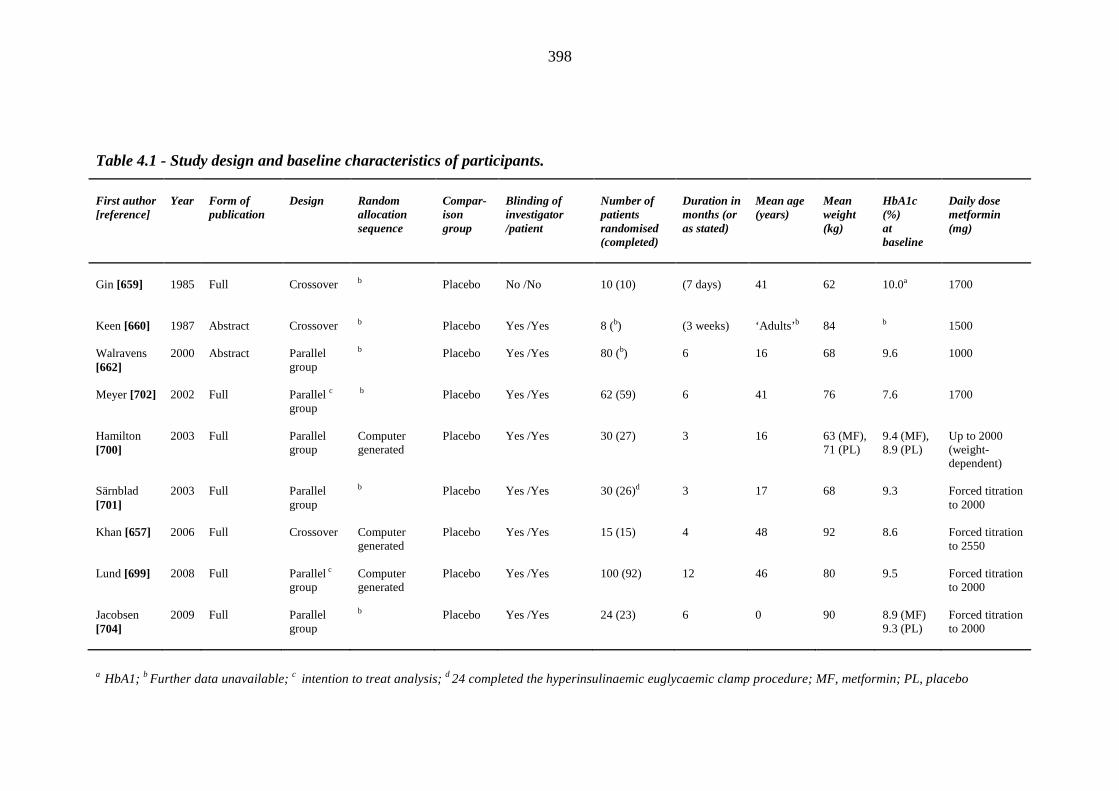
398
Table 4.1 - Study design and baseline characteristics of participants.
First author [reference]
Year
Form of publication
Design
Random allocation sequence
Compar-ison group
Blinding of investigator /patient
Number of patients randomised (completed)
Duration in months (or as stated)
Mean age (years)
Mean weight (kg)
HbA1c (%) at baseline
Daily dose metformin (mg)
Gin [659]
1985
Full
Crossover
b
Placebo
No /No
10 (10)
(7 days)
41
62
10.0a
1700
Keen [660]
1987
Abstract
Crossover
b
Placebo
Yes /Yes
8 (b)
(3 weeks)
‘Adults’b
84
b
1500
Walravens [662]
2000
Abstract
Parallel group
b Placebo
Yes /Yes
80 (b)
6
16
68
9.6
1000
Meyer [702]
2002
Full
Parallel c
group
b
Placebo
Yes /Yes
62 (59)
6
41
76
7.6
1700
Hamilton [700]
2003
Full
Parallel group
Computer generated
Placebo
Yes /Yes
30 (27)
3
16
63 (MF), 71 (PL)
9.4 (MF), 8.9 (PL)
Up to 2000 (weight-dependent)
Särnblad [701]
2003
Full
Parallel group
b
Placebo
Yes /Yes
30 (26)d
3
17
68
9.3
Forced titration to 2000
Khan [657]
2006
Full
Crossover
Computer generated
Placebo
Yes /Yes
15 (15)
4
48
92
8.6
Forced titration to 2550
Lund [699] Jacobsen [704]
2008 2009
Full Full
Parallel c group Parallel group
Computer generated b
Placebo Placebo
Yes /Yes Yes /Yes
100 (92) 24 (23)
12 6
46 0
80 90
9.5 8.9 (MF) 9.3 (PL)
Forced titration to 2000 Forced titration to 2000
a HbA1; b Further data unavailable; c intention to treat analysis; d 24 completed the hyperinsulinaemic euglycaemic clamp procedure; MF, metformin; PL, placebo
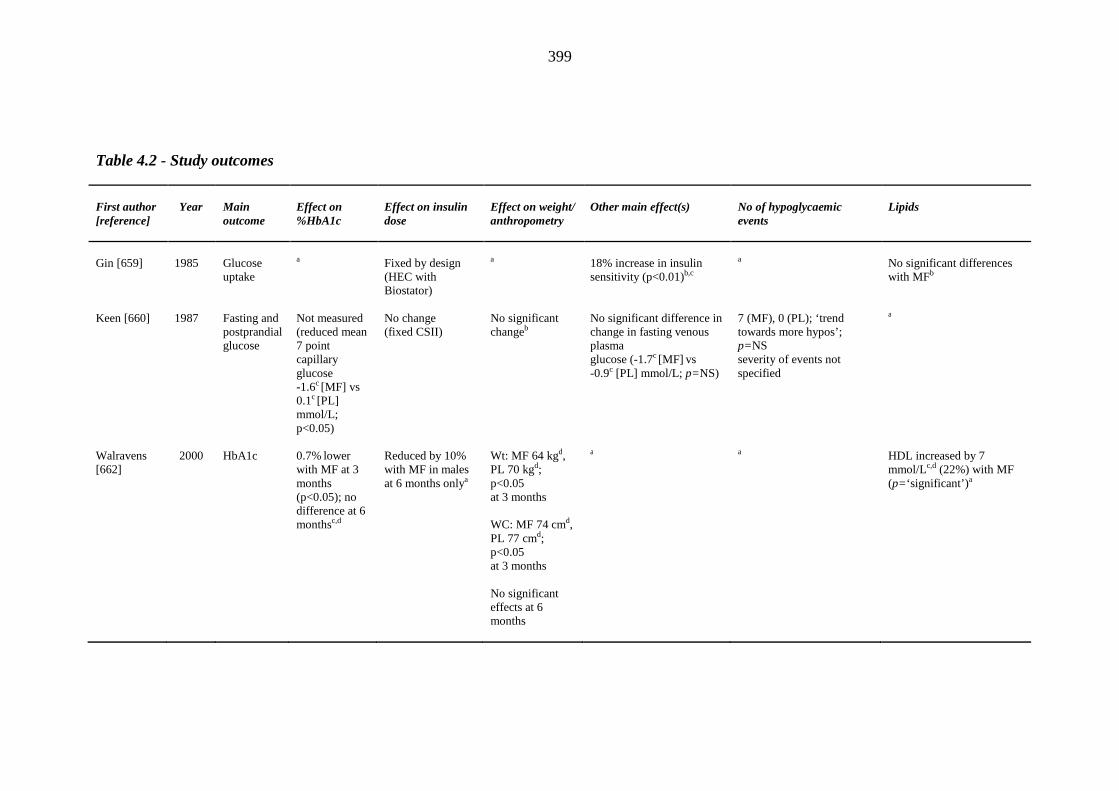
399
Table 4.2 - Study outcomes First author [reference]
Year
Main outcome
Effect on %HbA1c
Effect on insulin dose
Effect on weight/ anthropometry
Other main effect(s)
No of hypoglycaemic events
Lipids
Gin [659]
1985
Glucose uptake
a Fixed by design (HEC with Biostator)
a 18% increase in insulin sensitivity (p<0.01)b,c
a No significant differences with MFb
Keen [660] 1987 Fasting and postprandial glucose
Not measured (reduced mean 7 point capillary glucose -1.6c [MF] vs 0.1c [PL] mmol/L; p<0.05)
No change (fixed CSII)
No significant changeb
No significant difference in change in fasting venous plasma glucose (-1.7c [MF] vs -0.9c [PL] mmol/L; p=NS)
7 (MF), 0 (PL); ‘trend towards more hypos’; p=NS severity of events not specified
a
Walravens [662]
2000 HbA1c 0.7% lower with MF at 3 months (p<0.05); no difference at 6 monthsc,d
Reduced by 10% with MF in males at 6 months onlya
Wt: MF 64 kgd, PL 70 kgd; p<0.05 at 3 months WC: MF 74 cmd, PL 77 cmd; p<0.05 at 3 months No significant effects at 6 months
a a HDL increased by 7 mmol/Lc,d (22%) with MF (p=‘significant’)a
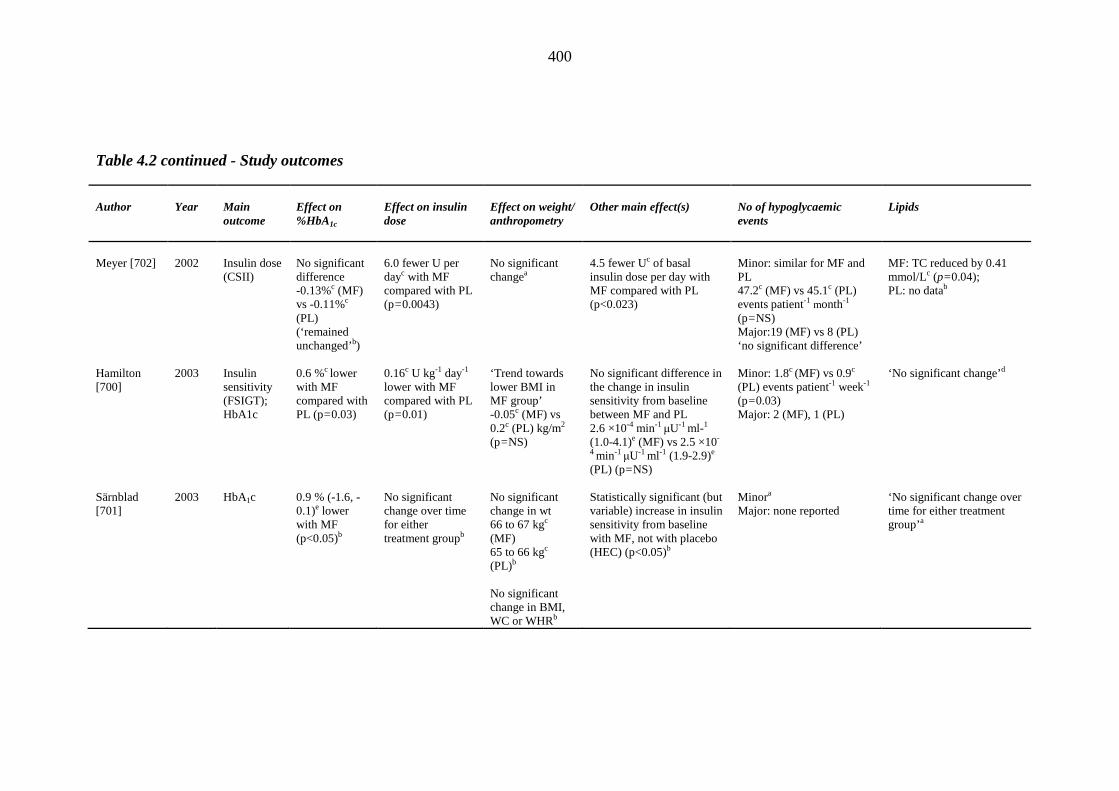
400
Table 4.2 continued - Study outcomes Author
Year
Main outcome
Effect on %HbA1c
Effect on insulin dose
Effect on weight/ anthropometry
Other main effect(s)
No of hypoglycaemic events
Lipids
Meyer [702]
2002
Insulin dose (CSII)
No significant difference -0.13%c (MF) vs -0.11%c (PL) (‘remained unchanged’b)
6.0 fewer U per dayc with MF compared with PL (p=0.0043)
No significant changea
4.5 fewer Uc of basal insulin dose per day with MF compared with PL (p<0.023)
Minor: similar for MF and PL 47.2c (MF) vs 45.1c (PL) events patient-1 month-1 (p=NS) Major:19 (MF) vs 8 (PL) ‘no significant difference’
MF: TC reduced by 0.41 mmol/Lc (p=0.04); PL: no datab
Hamilton [700]
2003
Insulin sensitivity (FSIGT); HbA1c
0.6 %c lower with MF compared with PL (p=0.03)
0.16c U kg-1 day-1 lower with MF compared with PL (p=0.01)
‘Trend towards lower BMI in MF group’ -0.05c (MF) vs 0.2c (PL) kg/m2
(p=NS)
No significant difference in the change in insulin sensitivity from baseline between MF and PL 2.6 ×10⁻⁴ min-1 μU-1 ml-1 (1.0-4.1)e (MF) vs 2.5 ×10⁻⁴ min-1 μU-1 ml-1 (1.9-2.9)e (PL) (p=NS)
Minor: 1.8c (MF) vs 0.9c (PL) events patient-1 week-1 (p=0.03) Major: 2 (MF), 1 (PL)
‘No significant change’d
Särnblad [701]
2003
HbA1c
0.9 % (-1.6, -0.1)e lower with MF (p<0.05)b
No significant change over time for either treatment groupb
No significant change in wt 66 to 67 kgc (MF) 65 to 66 kgc (PL)b No significant change in BMI, WC or WHRb
Statistically significant (but variable) increase in insulin sensitivity from baseline with MF, not with placebo (HEC) (p<0.05)b
Minora Major: none reported
‘No significant change over time for either treatment group’a
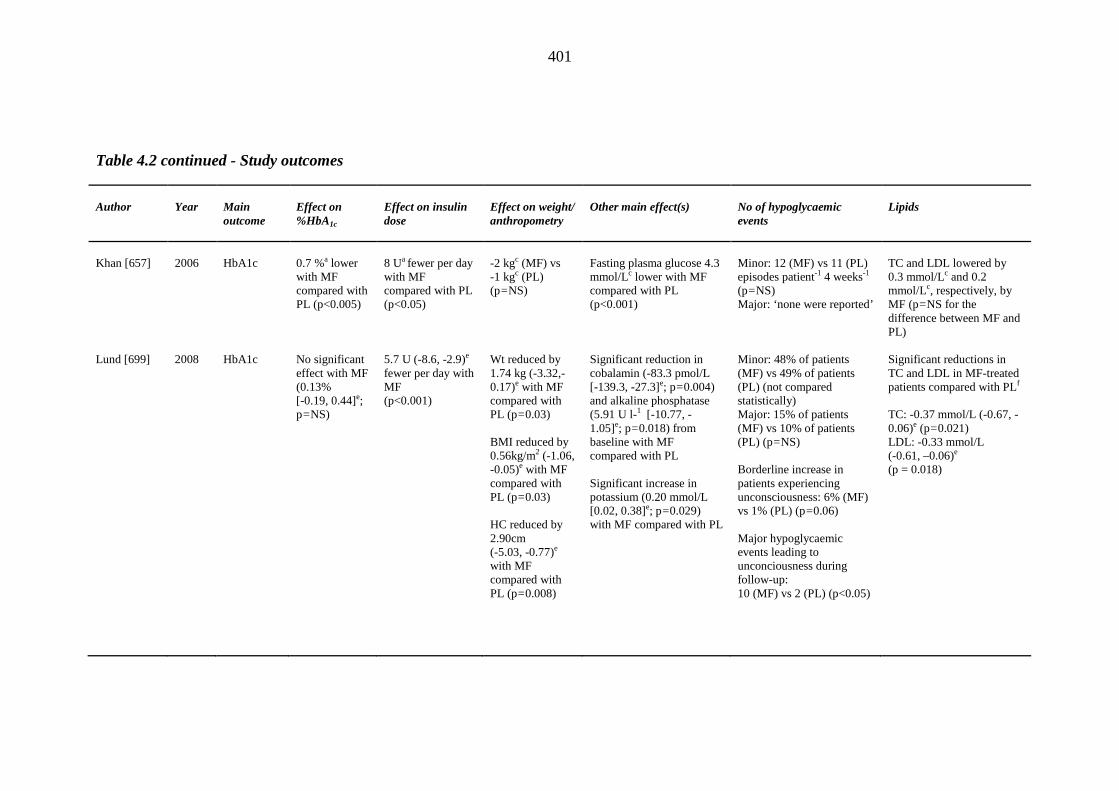
401
Table 4.2 continued - Study outcomes Author
Year
Main outcome
Effect on %HbA1c
Effect on insulin dose
Effect on weight/ anthropometry
Other main effect(s)
No of hypoglycaemic events
Lipids
Khan [657]
2006
HbA1c
0.7 %a lower with MF compared with PL (p<0.005)
8 Ua fewer per day with MF compared with PL (p<0.05)
-2 kgc (MF) vs -1 kgc (PL) (p=NS)
Fasting plasma glucose 4.3 mmol/Lc lower with MF compared with PL (p<0.001)
Minor: 12 (MF) vs 11 (PL) episodes patient-1 4 weeks-1 (p=NS) Major: ‘none were reported’
TC and LDL lowered by 0.3 mmol/Lc and 0.2 mmol/Lc, respectively, by MF (p=NS for the difference between MF and PL)
Lund [699] 2008
HbA1c No significant effect with MF (0.13% [-0.19, 0.44]e; p=NS)
5.7 U (-8.6, -2.9)e fewer per day with MF (p<0.001)
Wt reduced by 1.74 kg (-3.32,-0.17)e with MF compared with PL (p=0.03) BMI reduced by 0.56kg/m2 (-1.06, -0.05)e with MF compared with PL (p=0.03) HC reduced by 2.90cm (-5.03, -0.77)e with MF compared with PL (p=0.008)
Significant reduction in cobalamin (-83.3 pmol/L [-139.3, -27.3]e; p=0.004) and alkaline phosphatase (5.91 U l-1 [-10.77, -1.05]e; p=0.018) from baseline with MF compared with PL Significant increase in potassium (0.20 mmol/L [0.02, 0.38]e; p=0.029) with MF compared with PL
Minor: 48% of patients (MF) vs 49% of patients (PL) (not compared statistically) Major: 15% of patients (MF) vs 10% of patients (PL) (p=NS) Borderline increase in patients experiencing unconsciousness: 6% (MF) vs 1% (PL) (p=0.06) Major hypoglycaemic events leading to unconciousness during follow-up: 10 (MF) vs 2 (PL) (p<0.05)
Significant reductions in TC and LDL in MF-treated patients compared with PLf TC: -0.37 mmol/L (-0.67, -0.06)e (p=0.021) LDL: -0.33 mmol/L (-0.61, –0.06)e (p = 0.018)
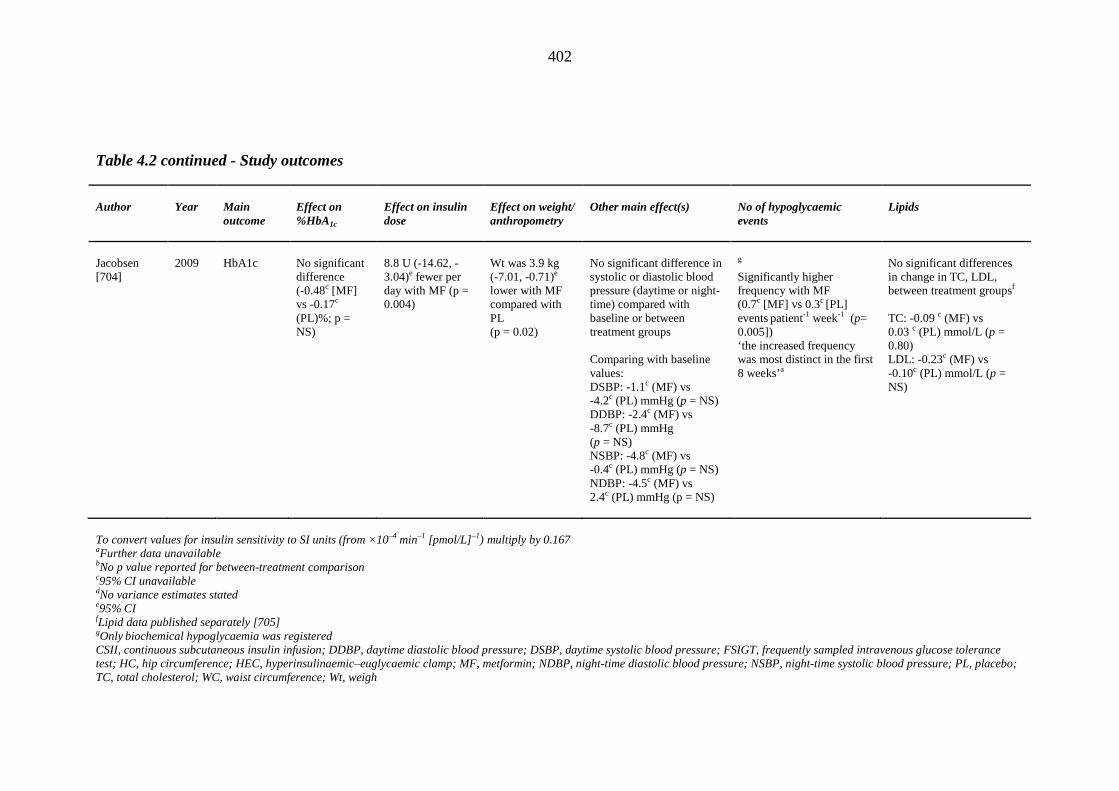
402
Table 4.2 continued - Study outcomes
Author
Year
Main outcome
Effect on %HbA1c
Effect on insulin dose
Effect on weight/ anthropometry
Other main effect(s)
No of hypoglycaemic events
Lipids
Jacobsen [704]
2009
HbA1c
No significant difference (-0.48c [MF] vs -0.17c (PL)%; p = NS)
8.8 U (-14.62, -3.04)e fewer per day with MF (p = 0.004)
Wt was 3.9 kg (-7.01, -0.71)e lower with MF compared with PL (p = 0.02)
No significant difference in systolic or diastolic blood pressure (daytime or night-time) compared with baseline or between treatment groups Comparing with baseline values: DSBP: -1.1c (MF) vs -4.2c (PL) mmHg (p = NS) DDBP: -2.4c (MF) vs -8.7c (PL) mmHg (p = NS) NSBP: -4.8c (MF) vs -0.4c (PL) mmHg (p = NS) NDBP: -4.5c (MF) vs 2.4c (PL) mmHg (p = NS)
g Significantly higher frequency with MF (0.7c [MF] vs 0.3c [PL] events patient-1 week-1 (p= 0.005]) ‘the increased frequency was most distinct in the first 8 weeks’a
No significant differences in change in TC, LDL, between treatment groupsf TC: -0.09 c (MF) vs 0.03 c (PL) mmol/L (p = 0.80) LDL: -0.23c (MF) vs -0.10c (PL) mmol/L (p = NS)
To convert values for insulin sensitivity to SI units (from ×10–4 min–1 [pmol/L]–1) multiply by 0.167 aFurther data unavailable bNo p value reported for between-treatment comparison c95% CI unavailable dNo variance estimates stated e95% CI fLipid data published separately [705] gOnly biochemical hypoglycaemia was registered CSII, continuous subcutaneous insulin infusion; DDBP, daytime diastolic blood pressure; DSBP, daytime systolic blood pressure; FSIGT, frequently sampled intravenous glucose tolerance test; HC, hip circumference; HEC, hyperinsulinaemic–euglycaemic clamp; MF, metformin; NDBP, night-time diastolic blood pressure; NSBP, night-time systolic blood pressure; PL, placebo; TC, total cholesterol; WC, waist circumference; Wt, weigh
403
Total cholesterol was reported in seven studies: it was reduced by 0.37 mmol/L in
comparison with placebo in the largest study [705], and by 0.3-0.41 mmol/L with
respect to baseline (but not placebo) in two others [657, 702]. “No change” was
reported in the other four studies [659, 700, 701, 704] (table 4.2).
4.4 Meta-analyses
For formal meta-analysis, only five studies reported the necessary means and
standard deviations for insulin dose and HbA1c [699-702, 704]; there were
insufficient data for weight and lipids. Figures 4.2 to 4.5 summarise the data in
standardised mean differences between treatment groups (i.e. the mean difference/
standard deviation of mean difference). Analysing for all five studies, the overall
effect on %HbA1c was a standardised mean difference between treatment groups of –
0.10 (i.e. 0.10 standardised units lower in the metformin group 95% CI: standardised
mean difference reduction of – 0.36 to 0.15, p = 0.42). This translates into an
absolute difference of 0.11 units lower %HbA1c in the metformin than placebo
groups (not statistically significant) (figure 4.2). As there was some suggestion of
heterogeneity (p = 0.175), we carried out a sensitivity analysis of the four smaller
and shorter studies [700-702, 704]. Thus, excluding the largest study [699] the
overall effect on %HbA1c was a standardised mean difference between treatment
groups of -0.30 (i.e. 0.30 standardised units lower in the metformin group 95% CI:
standardised mean difference of -0.64 to 0.037, p = 0.081). This translates into an
absolute difference of 0.28 units lower %HbA1c (not statistically significant) in the
metformin than placebo groups, with little evidence of heterogeneity (p = 0.353)
(figure 4.3).
404
All five studies [699-702, 704] showed a reduction in daily insulin dose with
metformin, with the overall measure of the treatment effect being a standardised
mean difference between treatment groups of -0.65 (i.e. 0.65 standardised units
lower in the metformin group 95% CI: standardised mean difference of – 0.92 to -
0.39 units, p < 0.001). This translates into an absolute difference of 6.6 insulin units
per day lower in the metformin than placebo groups. The chi-squared test of
heterogeneity was not statistically significant (p = 0.41) with most of the information
coming from the Lund et al.. study [699] (figure 4.4). A similar sensitivity analysis
of the four smaller and shorter studies [700-702, 704], excluding Lund et al. [699]
confirmed a reduction in daily insulin dose with metformin, with the overall measure
of the treatment effect being a standardised mean difference between treatment
groups of -0.55 (i.e. 0.55 standardised units lower in the metformin group 95% CI:
standardised mean difference of – 0.90 to -0.21 units, p = 0.002). This translates into
an absolute difference of 7.16 insulin units per day lower in the metformin than
placebo groups. The chi-squared test of heterogeneity was not statistically significant
(p = 0.365) with most of the information coming from Meyer et al.. [702] (figure
4.5).
There were trends for increased major and/or minor hypoglycaemia with metformin
therapy in six [657, 660, 699, 700, 702, 704] out of seven studies in which this
adverse effect was mentioned [657, 660, 699-702, 704] (table 4.2); this reached
statistical significance in two of the smaller studies [700, 704]. There were no reports
of lactic acidosis associated with metformin therapy. Rates of gastrointestinal
adverse effects were not systematically reported except in two studies [699, 704],
405
with rates being nearly identical in metformin and placebo groups in the largest
study [699],
No studies of any design evaluating cardiovascular function, structure or events were
identified.
4.5 Discussion
This study found only nine randomised studies of metformin therapy in T1DM, two
of which were small and experimental. There were only 192.8 patient years of
randomised follow-up in the literature which compares adversely with the evidence
for statin therapy in T1DM (over 6000 patient years), although even this is
inconclusive [706]. Reflecting the paucity of the evidence underpinning metformin
in T1DM, recent publication of a single study [699] from the Steno Diabetes Centre
almost doubled the available patient years of randomised follow-up. Overall the
grade of evidence according to the Cochrane GRADE system for the main outcomes
of glycaemic control and insulin dose is at best 'moderate' [658].
Only five studies [699-702, 704] could be formally combined in a meta-analysis:
there are obvious constraints to the interpretations of such sparse and heterogeneous
data. Nevertheless, there was evidence of a significant effect of metformin in
reducing daily insulin dose requirement. Overall, the evidence reviewed in this study
is consistent with a whole-body insulin-sensitising effect of metformin. A predicted
concomitant attenuation in weight gain with lowering of required insulin doses was
seen in the largest and longest trial [699], which was twice the duration of any other
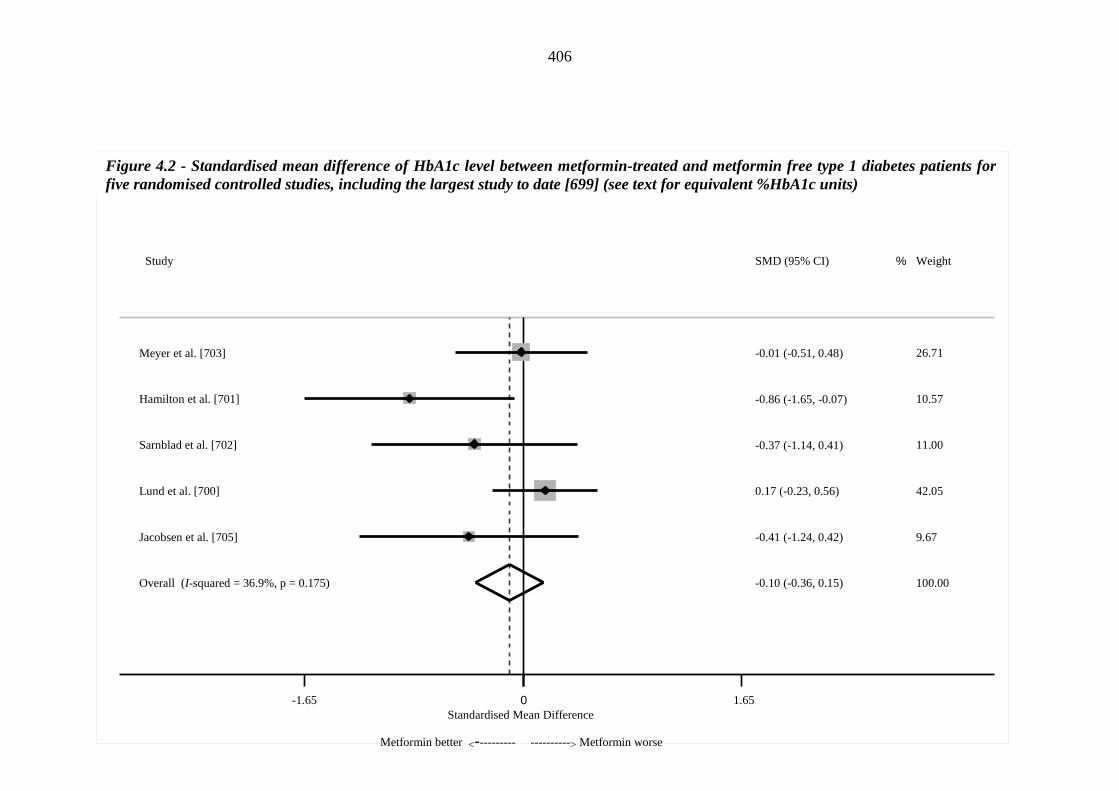
406
Overall (I-squared = 36.9%, p = 0.175)
Jacobsen et al. [705]
Lund et al. [700]
Study
Meyer et al. [703]
Hamilton et al. [701]
Sarnblad et al. [702]
-0.10 (-0.36, 0.15)
SMD (95% CI)
-0.41 (-1.24, 0.42)
0.17 (-0.23, 0.56)
-0.01 (-0.51, 0.48)
-0.86 (-1.65, -0.07)
-0.37 (-1.14, 0.41)
100.00
Weight
9.67
42.05
%
26.71
10.57
11.00
0 -1.65 1.65
Standardised Mean Difference
Metformin better <---------- ----------> Metformin worse
Figure 4.2 - Standardised mean difference of HbA1c level between metformin-treated and metformin free type 1 diabetes patients for five randomised controlled studies, including the largest study to date [699] (see text for equivalent %HbA1c units)
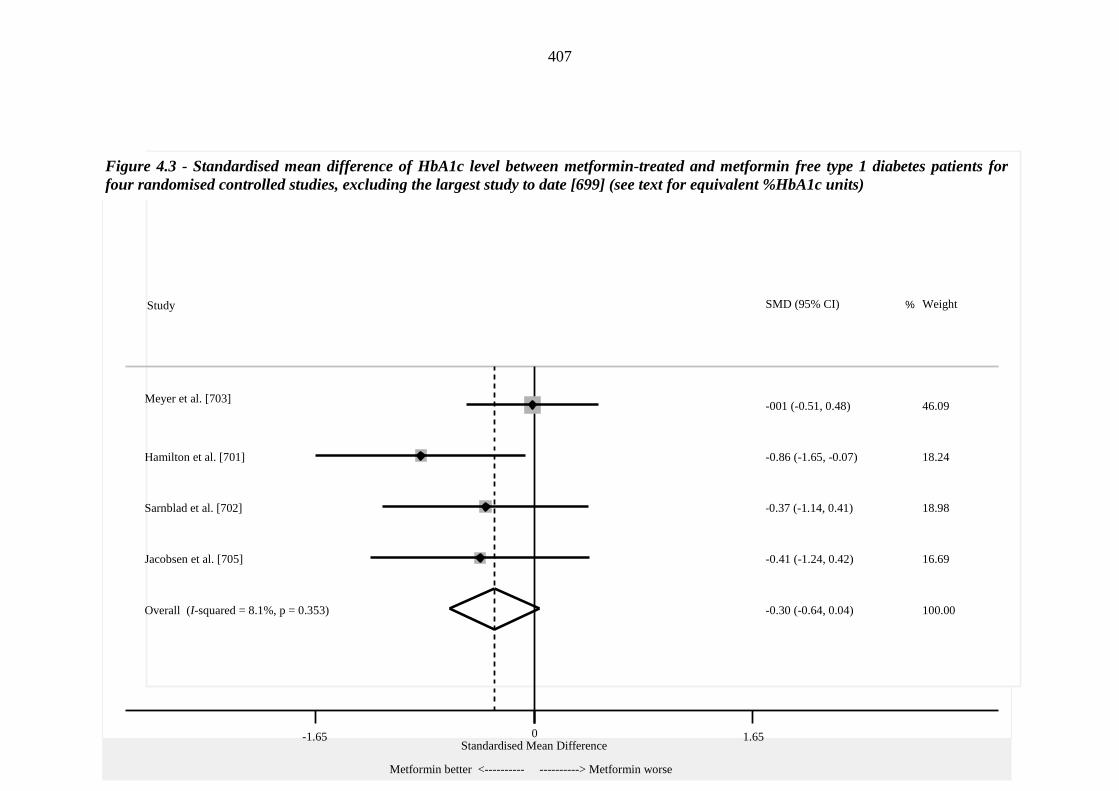
407
Overall (I-squared = 8.1%, p = 0.353)
Jacobsen et al. [705]
Sarnblad et al. [702]
Meyer et al. [703]
Study
Hamilton et al. [701]
-0.30 (-0.64, 0.04)
-0.41 (-1.24, 0.42)
-0.37 (-1.14, 0.41)
-001 (-0.51, 0.48)
SMD (95% CI)
-0.86 (-1.65, -0.07)
100.00
16.69
18.98
46.09
Weight%
18.24
0 -1.65
1.65 Standardised Mean Difference
Metformin better <---------- ----------> Metformin worse
Figure 4.3 - Standardised mean difference of HbA1c level between metformin-treated and metformin free type 1 diabetes patients for four randomised controlled studies, excluding the largest study to date [699] (see text for equivalent %HbA1c units)
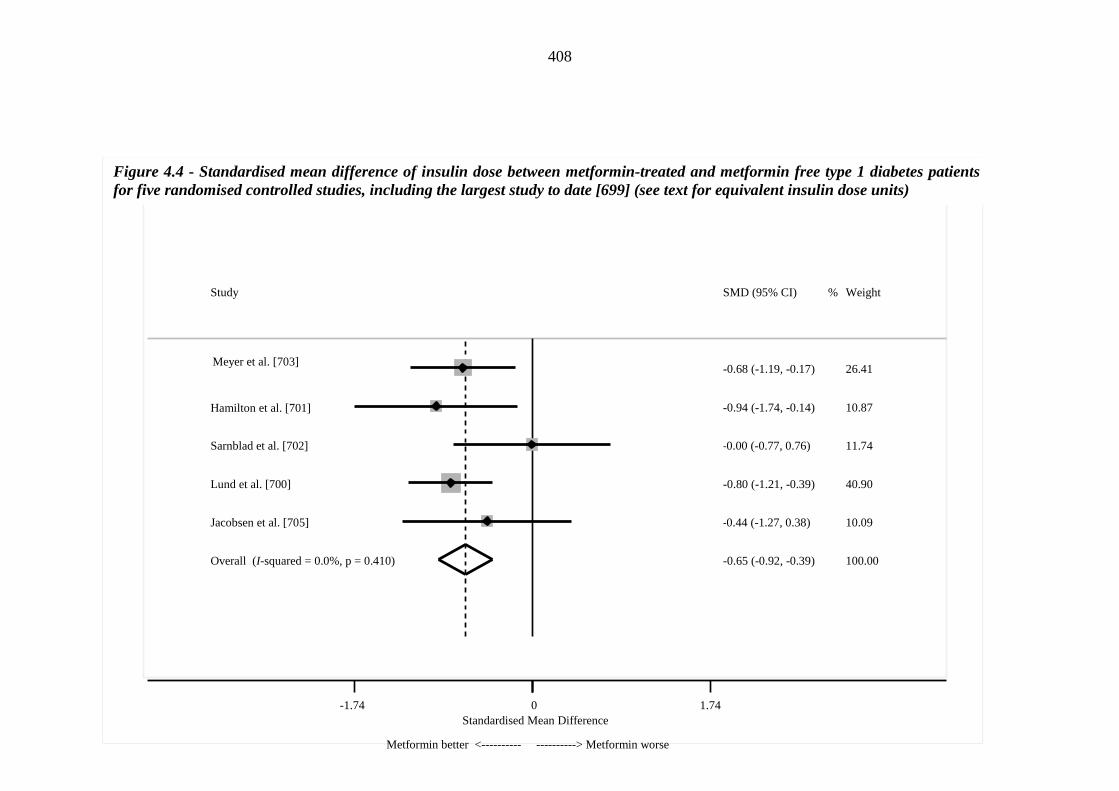
408
Overall (I-squared = 0.0%, p = 0.410)
Study
Hamilton et al. [701]
Lund et al. [700]
Jacobsen et al. [705]
Meyer et al. [703]
Sarnblad et al. [702]
-0.65 (-0.92, -0.39)
-0.94 (-1.74, -0.14)
-0.80 (-1.21, -0.39)
-0.44 (-1.27, 0.38)
-0.68 (-1.19, -0.17)
SMD (95% CI)
-0.00 (-0.77, 0.76)
100.00
%
10.87
40.90
10.09
26.41
Weight
11.74
0 -1.74 1.74
Standardised Mean Difference
Metformin better <---------- ----------> Metformin worse
Figure 4.4 - Standardised mean difference of insulin dose between metformin-treated and metformin free type 1 diabetes patients for five randomised controlled studies, including the largest study to date [699] (see text for equivalent insulin dose units)
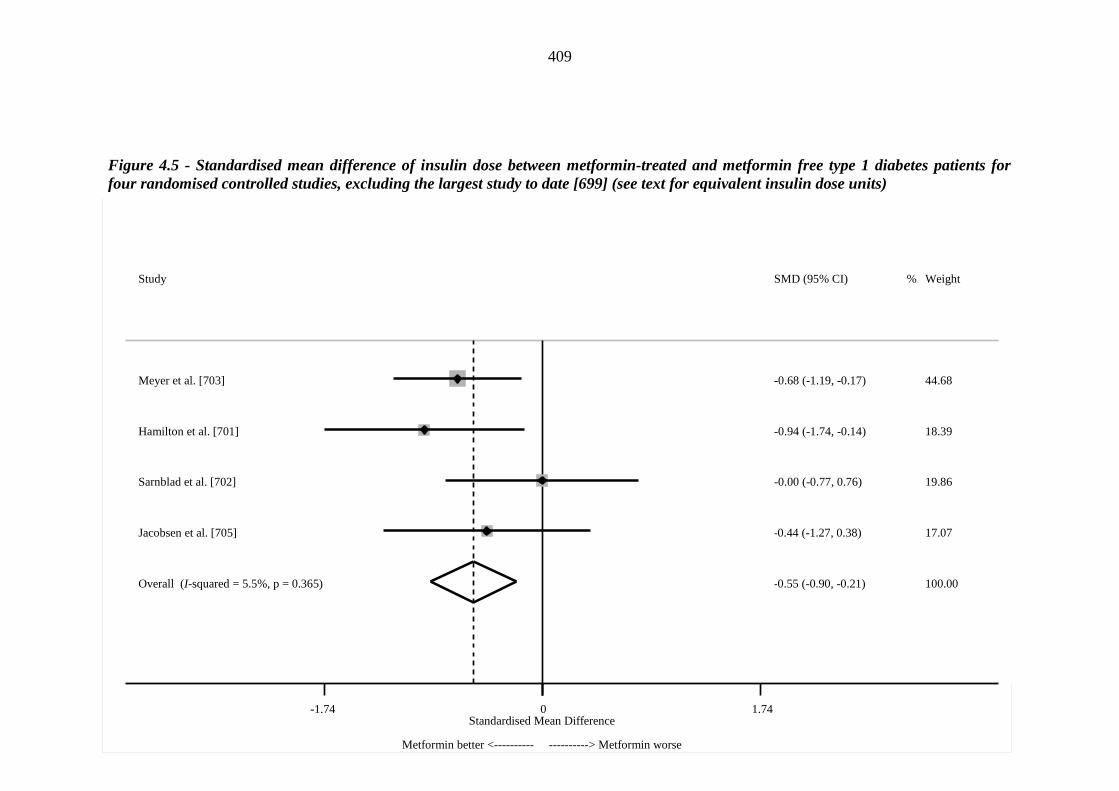
409
Overall (I-squared = 5.5%, p = 0.365)
Sarnblad et al. [702]
Study
Hamilton et al. [701]
Meyer et al. [703]
Jacobsen et al. [705]
-0.55 (-0.90, -0.21)
SMD (95% CI)
-0.00 (-0.77, 0.76)
-0.94 (-1.74, -0.14)
-0.68 (-1.19, -0.17)
-0.44 (-1.27, 0.38)
100.00
Weight
19.86
%
18.39
44.68
17.07
0 -1.74 1.74
Standardised Mean Difference
Metformin better <---------- ----------> Metformin worse
Figure 4.5 - Standardised mean difference of insulin dose between metformin-treated and metformin free type 1 diabetes patients for four randomised controlled studies, excluding the largest study to date [699] (see text for equivalent insulin dose units)
410
study. A reduction in weight was also reported over six months’ treatment in the
most recently-published study [704], in which use of a specific algorithm for insulin
titration resulted in a mean dose reduction of 20%. In keeping with the evidence in
T2DM, as recently reviewed by Wulffele et al. [607], there was also a relatively
consistent signal that metformin may reduce total and LDL cholesterol in adults with
T1DM [705].
In terms of adverse effects, this study noted trends towards increased rates of
hypoglycaemia in association with adjunct metformin therapy, although this reached
statistical significance in only two of the smaller trials [700, 704]. Furthermore,
although the largest trial did not report increased rates of metformin-associated
major or minor hypoglycaemia, there were significantly more major hypoglycaemic
events leading to unconciousness among metformin-treated T1DM individuals [699].
Clearly, even with this weak evidence, physicians contemplating a recommendation
of metformin therapy for their patients with T1DM should advise them carefully
regarding insulin dose adjustment and blood glucose monitoring. Surprisingly,
gastrointestinal adverse effects were infrequently mentioned by investigators. In the
largest trial, two of 108 patients screened dropped out for this reason in a run-in
period; thereafter, these effects occurred in almost half of the remaining patients, but
in almost exactly equal proportions in the active and placebo groups [699]. No cases
of lactic acidosis were reported in any of the trials. Although evidence from a
Cochrane review has been reassuring on this account in T2DM [707], randomised
follow-up is clearly insufficient in T1DM, and concern continues to be expressed by
some physicians [682].
411
The findings of the present review disagree to some extent from those of another
recent review [708]. Pang and Narendran reported a reduction in HbA1c with
metformin therapy in T1DM on the basis of their meta-analysis of the three smaller
trials on this topic [657, 700, 701] which they chose to combine with one of the three
larger trials [702], (but not the two largest [662, 699]), along with an observational
(controlled but non-randomised) trial which did not meet this study's inclusion
criteria [663]. At the time of their review, the largest trial [699] was only available in
abstract form [696]. Thus, although this review has the limitation of being based on
only 192.8 patient years of follow up, it is a significant advance on the 54 patient
years available in the only comparable publication to date. The conclusions of both
reviews on outcomes other than HbA1c (weight reduction, insulin dose requirement
and cholesterol) were, however, generally similar. While acknowledging that studies
as short as one to three weeks are unlikely to yield information on efficacy, this
review opted to include them simply as potential sources of information on safety
and tolerability, particularly given the paucity of evidence available. These studies
were excluded from the formal meta-analysis.
As potential chance differences (randomisation error) at baseline between groups
allocated to treatment can influence the outcome of smaller studies, an ideal
approach for meta-analysis is to base calculations on data adjusted for baseline
values. As such information was not available for all studies, this study derived the
treatment effects reported from absolute units of outcome; one acknowledges this as
a limitation, but believe it unlikely to have significantly impacted on the conclusions.
A further constraint is that magnitude of treatment effect can be influenced by
differences in entry criteria between trials (e.g. for HbA1c): I believe that such
412
methodological issues inherent to meta-analysis only strengthen the case for further
larger trials.
Following UKPDS [36] and its more recent 10-year post-randomisation follow-up
[489], metformin is widely-considered to protect against cardiovascular
complications in T2DM, which is the principal reason for its current status as first
line therapy in this condition. It should be recalled that only 753 patients were
included in this specific UKPDS randomisation, and that an effect in the other
direction was observed when it was combined with a sulphonylurea [36, 164].
Recently published results from the HOME-trial have shown that metformin
improves macrovascular outcomes in insulin-treated T2DM patients [493]. This is
consistent with some data that metformin may have intrinsic (and possibly direct)
beneficial effects independent of glucose-lowering on the cardiovascular system via
activation of AMPK [709-711] in a number of conditions [709, 712, 713]. If this is
accepted, the hypothesis that metformin might prevent cardiovascular complications
in T1DM should also be tested formally, as even young adults with this condition
have an extremely high relative risk of cardiovascular disease [714-716]. The data
reviewed herein provides useful information to guide the design of such a future
trial.
At the time of publication of this systematic review and meta-analysis, metformin
therapy was not advocated in any major national or international guidelines for the
management of T1DM, nor in Tayside's own regional guidelines. However, routine
searches the authors recently conducted of anonymised T1DM prescription data in
Tayside, Scotland [437] (population 400,000; ≅1850 classified as having T1DM and
413
diagnosed aged < 35 years), estimated that 7.9% with BMI > 27 kg/m2 were
receiving this medication, rising to 13.0% for those with BMI > 30 kg/m2. Even
allowing for any residual misclassification, it is therefore likely that many thousands
of people with T1DM worldwide are receiving an unproven therapy of unknown
long-term efficacy (albeit a familiar one with an attractive theoretical underpinning
and the potential to result in reductions in rates of cardiovascular disease).
Considering that T1DM is usually diagnosed in childhood or adolescence and is a
lifelong condition, I believe that properly-designed randomised controlled clinical
trials of sufficient size and duration to have the power to show reductions in
cardiovascular disease should be conducted forthwith. Given that metformin use in
T2DM has also been associated with reduced cancer risk [717], it would additionally
be desirable to investigate this relationship in metformin-treated people with T1DM.
Since the publication of this systematic review and meta-analysis, Burchardt et al.
published the results of a prospective pilot clinical study of 33 obese young
intensively-treated T1DM patients randomised to additional treatment with
metformin for six months (vs 19 patients treated with insulin alone) [718]. The
authors concluded that adjunct metformin was associated with a reduction in HbA1c
(1.3%), fasting plasma glucose (3.10 mmol/L), post-prandial plasma glucose (3.59
mmol/L), average daily plasma glycaemia (1.62 mmol/L), triglycerides (0.24
mmol/L), glycated-LDL-cholesterol (0.02 mmol/L) and BMI (0.6 kg/m2), albeit no
significant changes in total cholesterol, LDL-cholesterol, oxidized LDL cholesterol
and HDL cholesterol levels. Such differences were not reported among patients
treated with insulin alone [718]. This study was however limited by a small sample
414
size, high drop-out rate (an additional 16 randomised patients did not complete the
study) and open-label design.
In line with the results of this systematic review and meta-analysis, a recently
published prospective pilot study of 42 uncomplicated T1DM patients [mean (SD)
age = 46 (8) years for the metformin group; 41 (10) years for placebo] reported that
use of adjunct metformin for six months improved flow mediated dilation (a
surrogate marker of endothelial function/atherosclerosis) by 1.32% (95% CI 0.30,
2.43) and increased urinary 8-iso-prostaglandin F2α (a biomarker of oxidative stress)
by 149 pg/mg creatinine (95% CI 50, 248), irrespective of its effects on body weight
and glycaemic control [719]. It is hoped that the REducing with MetfOrmin Vascular
Adverse Lesions in type 1 diabetes (REMOVAL) study, a phase III prospective trial
currently recruiting 500 T1DM patients, will yield much-needed definitive data on
the impact of adjunct metformin on common carotid artery intima media thickness
(another surrogate marker of atherosclerosis), endothelial function, glycaemic
control, insulin dose, weight, LDL-cholesterol, renal function (change in albuminuria
and estimated glomerular filtration rate) and change in retinopathy stage [720].
In summary, this systematic review and meta-analysis of the randomised trials in the
literature indicates that metformin therapy in T1DM is associated with a reduced
insulin dose requirement but no clear evidence of an improvement in glycaemic
control. In addition, there may be small reductions in weight and total/LDL-
cholesterol, but there are no data on cardiovascular outcomes or their surrogates.
This thesis' data suggest this is an important area for future study.

415
Chapter 5
Conclusions and future work
416
Chapter 5 - Conclusions and future work
This thesis set out to examine mechanisms underlying intolerance to
thiazolidinedione therapy but concluded that oedema and heart failure as a clear
consequence of thiazolidinedione therapy was less common than anticipated.
Thiazolidinedione therapy was apparently less significant as a risk factor for
oedema/HF than other common patient characteristics shared across first and second
line oral glucose lowering agents (including metformin - sulphonylurea combination
therapy). Thus, the reported association between thiazolidinedione therapy and
oedema/HF may have been over-emphasised.
The population-based approach I employed permitted the identification of significant
time-varying risk factors, notably macrovascular disease, alanine aminotransferase
(ALT) and serum albumin. To my knowledge, such time-dependent risk variation
pertinent to thiazolidinedone or metformin-sulphonylurea combination therapy has
not been reported in the literature. Macrovascular disease consistently emerged as
the strongest predictive factor for the adverse events of interest, with its relative
contribution being highest in the first three to six months following thiazolidinedone
or metformin-sulphonylurea prescription.
The relative infrequency of incident loop diuretic prescription (4.3%) and incident
HF events (1.1%) following index thiazolidinedione therapy are consistent with the
difficulties encountered identifying suitable patients fitting strict inclusion criteria
for the exploratory, case-control study. Nonetheless, the latter renders the resulting
cohort of thiazolidinedione tolerant subjects particularly valuable in research terms,
417
and permitted a novel comprehensive, albeit exploratory, physiological
characterisation of such patients. Limited exploratory data from the two
thiazolidinedione intolerant patients failed to suggest a role for VEGF during either
acute or chronic 'high normal' salt loading. However, renin (and possibly
aldosterone) appeared to reduce in these patients beyond the boundaries of reference
intervals derived from their TZD-tolerant counterparts in this context. Moreover,
concentrations of ANP (and possibly BNP) increased to a greater extent following
chronic sodium exposure in these patients.
No echocardiographic differences were detected between the thiazolidinedione
tolerant and intolerant subgroups, but haematocrit and DBP fell in the latter to a
greater extent in response to salt loading, while cAI and pAI rose, suggesting that
patients prone to thiazolidinedone-associated fluid retention may be characterised by
a higher degree of ventricular-arterial stiffening in response to salt loading.
The systematic review and meta-analysis of publications investigating a role for
adjunct metformin in T1DM underscored the paucity of data in this field, despite the
fact that this commonly prescribed, cheap and effective first line oral glucose
lowering agent is frequently prescribed to T1DM patients, particularly those at
higher BMI ranges. A formal meta-analysis reported that use of adjunct metformin
translates into a reduction in daily insulin dose requirements (6.6 units/day), despite
no improvements in glycaemic control, possibly as T1DM patients tend to self-titrate
their insulin dose towards their usual HbA1c. Adjunct metformin was generally well
tolerated, with few reports of gastrointestinal upset and no evidence of lactic
acidosis, albeit an increased tendency for hypoglycaemia. None of the available
418
studies reported cardiovascular outcomes. This thesis' published systematic review
and meta-analysis [721] supported the successful grant application for the (currently
recruiting) REducing With MetfOrmin Vascular Adverse Lesions in Type 1 Diabetes
(REMOVAL) trial, an ongoing prospective, randomised clinical trial investigating
the potential benefits of adjunct metformin in T1DM over three years [720].
The work described in this thesis highlights the unanticipated difficulties that can be
encountered when attempting to recruit patients fitting strict inclusion criteria.
However, the detailed characterisation of those TZD 'tolerant' and 'intolerant'
patients that could be enrolled provides some information on the characteristics of
patients who may be lower risk for adverse effects; it may also help to guide research
aimed at designing modified agents with a better profile. I would be particularly
interested to pursue further research in this field, recruiting patients from a larger
catchment area. It may be prudent to subdivide the clinical study into multiple small
studies with targeted inclusion and exclusion criteria pertinent to the specific
measurements being made, so as to maximise patient recruitment without
compromising on study quality. It would also be wise to repeat the population based
study on a larger cohort of patients (possibly nation-wide), so as to validate the
(unexpected) results arising from this Tayside cohort, and possibly allow the
inclusion of a larger number of covariates in multivariate logistic and Cox regression
models.
Recent results arising from the SAVOR-TIMI trial have alerted clinicians on a
possible causal relationship between dipeptidyl peptidase-IV (DPP-IV) inhibitors
and incident heart failure [722]. My thesis' population-based study validated index
419
loop diuretic prescription as a surrogate marker of fluid retention and heart failure.
Such an approach could prove useful in the setting of DPP-IV inhibitor therapy (and
other 'novel' glucose lowering agents), particularly as none of the available
prospective clinical trials was specifically designed to investigate this adverse event.
In summary, as new pathways underpinning insulin signalling and insulin resistance
are unravelled, there is likely to be renewed interest in new pharmacological insulin
sensitizing agents to improve glycaemic control. A better understanding of licensed
agents regarded as insulin sensitizers (metformin and thiazolidinediones) should
provide beneficial insights in this regard. Published data arising from this thesis
imply a potential advantageous role for adjunct metformin in T1DM, and should
serve as a catalyst for large scale prospective research in this field. The association
between thiazolidinediones and fluid retention/HF remains incompletely understood,
and may have been over-emphasized. Population and clinical data suggest that
careful prescribing practices, such as avoiding patients with known macrovascular
disease, high BMI or raised alanine aminotransferase (ALT) may reduce the risk of
adverse events in patients at risk, without removing a therapy with considerable
efficacy from the glucose-lowering armamentarium.

420
References
421
References
[1] King H, Aubert RE, Herman WH (1998) Global burden of diabetes, 1995-2025: prevalence, numerical estimates, and projections. Diabetes Care 21: 1414-1431 [2] Shaw JE, Sicree RA, Zimmet PZ (2009) Global estimates of the prevalence of diabetes for 2010 and 2030. Diabetes Res Clin Pract 87: 4-14 [3] Alberti KG (1997) The costs of non-insulin-dependent diabetes mellitus. Diabet Med 14: 7-9 [4] Huse DM, Oster G, Killen AR, Lacey MJ, Colditz GA (1989) The economic costs of non-insulin-dependent diabetes mellitus. JAMA 262: 2708-2713 [5] Zimmet P, Alberti KG, Shaw J (2001) Global and societal implications of the diabetes epidemic. Nature 414: 782-787 [6] Bergman RN, Phillips LS, Cobelli C (1981) Physiologic evaluation of factors controlling glucose tolerance in man: measurement of insulin sensitivity and beta-cell glucose sensitivity from the response to intravenous glucose. J Clin Invest 68: 1456-1467 [7] Kahn SE, Prigeon RL, McCulloch DK, et al. (1993) Quantification of the relationship between insulin sensitivity and beta-cell function in human subjects. Evidence for a hyperbolic function. Diabetes 42: 1663-1672 [8] Holman RR (1998) Assessing the potential for alpha-glucosidase inhibitors in prediabetic states. Diabetes Res Clin Pract 40: S21-25 [9] Haffner SM, D'Agostino R, Saad MF, et al. (1996) Increased insulin resistance and insulin secretion in nondiabetic African-Americans and Hispanics compared with non-Hispanic whites. The Insulin Resistance Atherosclerosis Study. Diabetes 45: 742-748 [10] DeFronzo RA, Ferrannini E (1991) Insulin resistance. A multifaceted syndrome responsible for NIDDM, obesity, hypertension, dyslipidemia, and atherosclerotic cardiovascular disease. Diabetes Care 14: 173-194 [11] Dupuis J, Langenberg C, Prokopenko I, et al. (2010) New genetic loci implicated in fasting glucose homeostasis and their impact on type 2 diabetes risk. Nat Genet 42: 105-116 [12] Brown A, Desai M, Taneja D, Tannock LR (2010) Managing highly insulin-resistant diabetes mellitus: weight loss approaches and medical management. Postgrad Med 122: 163-171 [13] Krogh-Madsen R, Thyfault JP, Broholm C, et al. (2010) A two-week reduction of ambulatory activity attenuates peripheral insulin sensitivity. J Appl Physiol 108: 1034-1040 [14] Bouzakri K, Koistinen HA, Zierath JR (2005) Molecular mechanisms of skeletal muscle insulin resistance in type 2 diabetes. Curr Diabetes Rev 1: 167-174 [15] Krebs M, Roden M (2005) Molecular mechanisms of lipid-induced insulin resistance in muscle, liver and vasculature. Diabetes Obes Metab 7: 621-632 [16] Vettor R, Milan G, Rossato M, Federspil G (2005) Review article: adipocytokines and insulin resistance. Aliment Pharmacol Ther 22 (Suppl 2): 3-10 [17] DeFronzo RA (1988) Lilly lecture 1987. The triumvirate: beta-cell, muscle, liver. A collusion responsible for NIDDM. Diabetes 37: 667-687 [18] Maegawa H, Shigeta Y, Egawa K, Kobayashi M (1991) Impaired autophosphorylation of insulin receptors from abdominal skeletal muscles in nonobese subjects with NIDDM. Diabetes 40: 815-819 [19] Ramlal T, Rastogi S, Vranic M, Klip A (1989) Decrease in glucose transporter number in skeletal muscle of mildly diabetic (streptozotocin-treated) rats. Endocrinology 125: 890-897 [20] Vestergaard H, Lund S, Larsen FS, Bjerrum OJ, Pedersen O (1993) Glycogen synthase and phosphofructokinase protein and mRNA levels in skeletal muscle from insulin-resistant patients with non-insulin dependent diabetes mellitus. J Clin Invest 91: 2342-2350 [21] Pittas AG, Joseph NA, Greenberg AS (2004) Adipocytokines and insulin resistance. J Clin Endocrinol Metab 89: 447-452 [22] Thorn LM, Forsblom C, Fagerudd J, et al. (2005) Metabolic syndrome in type 1 diabetes: association with diabetic nephropathy and glycaemic control (the FinnDiane study). Diabetes Care 28: 2019-2024 [23] McGill M, Molyneaux L, Twigg SM, Yue DK (2008) The metabolic syndrome in type 1 diabetes: does it exist and does it matter? J Diabetes Complications 22: 18-23 [24] Kilpatrick ES, Rigby AS, Atkin SL (2007) Insulin resistance, the metabolic syndrome, and complication risk in type 1 diabetes: ''double diabetes'' in the Diabetes Control and Complications Trial. Diabetes Care 30: 707-712
422
[25] de Boer IH, Sibley SD, Kestenbaum B, et al. (2007) Central obesity, incident microalbuminuria, and change in creatinine clearance in the epidemiology of diabetes interventions and complications study. J Am Soc Nephrol 18: 235-243 [26] Chaturvedi N, Sjoelie AK, Porta M, et al. (2001) Markers of insulin resistance are strong risk factors for retinopathy incidence in type 1 diabetes. Diabetes Care 24: 284-289 [27] Orchard TJ, Olson JC, Erbey JR, et al. (2003) Insulin resistance-related factors, but not glycemia, predict coronary artery disease in type 1 diabetes: 10-year follow-up data from the Pittsburgh Epidemiology of Diabetes Complications Study. Diabetes Care 26: 1374-1379 [28] Soedamah-Muthu SS, Chaturvedi N, Toeller M, et al. (2004) Risk factors for coronary heart disease in type 1 diabetic patients in Europe: the EURODIAB Prospective Complications Study. Diabetes Care 27: 530-537 [29] Tesfaye S, Chaturvedi N, Eaton SE, et al. (2005) Vascular risk factors and diabetic neuropathy. N Engl J Med 352: 341-350 [30] Giorgino F, Laviola L, Cavallo Perin P, Solnica B, Fuller J, Chaturvedi N (2004) Factors associated with progression to macroalbuminuria in microalbuminuric Type 1 diabetic patients: the EURODIAB Prospective Complications Study. Diabetologia 47: 1020-1028 [31] Orchard TJ, Chang YF, Ferrell RE, Petro N, Ellis DE (2002) Nephropathy in type 1 diabetes: a manifestation of insulin resistance and multiple genetic susceptibilities? Further evidence from the Pittsburgh Epidemiology of Diabetes Complication Study. Kidney Int 62: 963-970 [32] Olson JC, Erbey JR, Forrest KY, Williams K, Becker DJ, Orchard TJ (2002) Glycemia (or, in women, estimated glucose disposal rate) predict lower extremity arterial disease events in type 1 diabetes. Metabolism 51: 248-254 [33] Bonora E, Formentini G, Calcaterra F, et al. (2002) HOMA-estimated insulin resistance is an independent predictor of cardiovascular disease in type 2 diabetic subjects: prospective data from the Verona Diabetes Complications Study. Diabetes Care 25: 1135-1141 [34] Hanley AJ, Williams K, Stern MP, Haffner SM (2002) Homeostasis model assessment of insulin resistance in relation to the incidence of cardiovascular disease: the San Antonio Heart Study. Diabetes Care 25: 1177-1184 [35] Jeppesen J, Hansen TW, Rasmussen S, Ibsen H, Torp-Pedersen C, Madsbad S (2007) Insulin resistance, the metabolic syndrome, and risk of incident cardiovascular disease: a population-based study. J Am Coll Cardiol 49: 2112-2119 [36] UK Prospective Diabetes Study Group (1998) Effect of intensive blood-glucose control with metformin on complications in overweight patients with type 2 diabetes (UKPDS 34). UK Prospective Diabetes Study (UKPDS) Group. Lancet 352: 854-865 [37] Knowler WC, Barrett-Connor E, Fowler SE, et al. (2002) Reduction in the incidence of type 2 diabetes with lifestyle intervention or metformin. N Engl J Med 346: 393-403 [38] Tanasescu M, Leitzmann MF, Rimm EB, Hu FB (2003) Physical activity in relation to cardiovascular disease and total mortality among men with type 2 diabetes. Circulation 107: 2435-2439 [39] Erdmann E, Charbonnel B, Wilcox RG, et al. (2007) Pioglitazone use and heart failure in patients with type 2 diabetes and preexisting cardiovascular disease: data from the PROactive study (PROactive 08). Diabetes Care 30: 2773-2778 [40] Diabetes Control and Complications Trial Research Group (1993) The effect of intensive treatment of diabetes on the development and progression of long-term complications in insulin-dependent diabetes mellitus. The Diabetes Control and Complications Trial Research Group. N Engl J Med 329: 977-986 [41] Colhoun HM, Livingstone SJ, Looker HC, et al. (2012) Hospitalised hip fracture risk with rosiglitazone and pioglitazone use compared with other glucose-lowering drugs. Diabetologia 55: 2929-2937 [42] Ferwana M, Firwana B, Hasan R, et al. (2013) Pioglitazone and risk of bladder cancer: a meta-analysis of controlled studies. Diabet Med 30: 1026-1032 [43] Lawrence MC, McKern NM, Ward CW (2007) Insulin receptor structure and its implications for the IGF-1 receptor. Curr Opin Struct Biol 17: 699-705 [44] De Meyts P (2008) The insulin receptor: a prototype for dimeric, allosteric membrane receptors. Trends Biochem Sci 33: 376-384 [45] Taniguchi CM, Emanuelli B, Kahn CR (2006) Critical nodes in signalling pathways: insights into insulin action. Nat Rev Mol Cell Biol 7: 85-96 [46] Cohen P (2006) The twentieth century struggle to decipher insulin signalling. Nat Rev Mol Cell Biol 7: 867-873
423
[47] White MF (1998) The IRS-signalling system: a network of docking proteins that mediate insulin action. Mol Cell Biochem 182: 3-11 [48] Withers DJ, White M (2000) Perspective: The insulin signaling system--a common link in the pathogenesis of type 2 diabetes. Endocrinology 141: 1917-1921 [49] Vanhaesebroeck B, Leevers SJ, Ahmadi K, et al. (2001) Synthesis and function of 3-phosphorylated inositol lipids. Annu Rev Biochem 70: 535-602 [50] Mora A, Komander D, van Aalten DM, Alessi DR (2004) PDK1, the master regulator of AGC kinase signal transduction. Semin Cell Dev Biol 15: 161-170 [51] Sutherland C, Leighton IA, Cohen P (1993) Inactivation of glycogen synthase kinase-3 beta by phosphorylation: new kinase connections in insulin and growth-factor signalling. Biochem J 296: 15-19 [52] Cross DA, Alessi DR, Cohen P, Andjelkovich M, Hemmings BA (1995) Inhibition of glycogen synthase kinase-3 by insulin mediated by protein kinase B. Nature 378: 785-789 [53] Rena G, Guo S, Cichy SC, Unterman TG, Cohen P (1999) Phosphorylation of the transcription factor forkhead family member FKHR by protein kinase B. J Biol Chem 274: 17179-17183 [54] Nakae J, Kitamura T, Ogawa W, Kasuga M, Accili D (2001) Insulin regulation of gene expression through the forkhead transcription factor Foxo1 (Fkhr) requires kinases distinct from Akt. Biochemistry 40: 11768-11776 [55] Valera A, Pujol A, Pelegrin M, Bosch F (1994) Transgenic mice overexpressing phosphoenolpyruvate carboxykinase develop non-insulin-dependent diabetes mellitus. Proc Natl Acad Sci USA 91: 9154-9154 [56] Dentin R, Liu Y, Koo SH, et al. (2007) Insulin modulates gluconeogenesis by inhibition of the coactivator TORC2. Nature 449: 366-369 [57] McKay MM, Morrison DK (2007) Integrating signals from RTKs to ERK/MAPK. Oncogene 26: 3113-3121 [58] Kyriakis JM, App H, Zhang XF, Banerjee P, Brautigan DL, Rapp UR (1992) Raf-1 activates MAP kinase-kinase. Nature 358: 417-421 [59] Payne DM, Rossomando AJ, Martino P, et al. (1991) Identification of the regulatory phosphorylation sites in pp42/mitogen-activated protein kinase (MAP kinase). EMBO J 10: 885-892 [60] Woods YL, Petrie JR, Sutherland C (2009) Dissecting insulin signaling pathways: individualised therapeutic targets for diagnosis and treatment of insulin resistant states. Endocr Metab Immune Disord Drug Targets 9: 187-198 [61] Zisman A, Peroni OD, Abel ED, et al. (2000) Targeted disruption of the glucose transporter 4 selectively in muslce causes insulin resistance and glucose intolerance. Nat Med 6: 924-928 [62] Kohn AD, Summers SA, Birnbaum MJ, Roth RA (1996) Expression of a constitutively active Akt Ser/Thr kinase in 3T3-L1 adipocytes stimulates glucose uptake and glucose transporter 4 translocation. J Biol Chem 271: 31372-31378 [63] Standaert ML, Galloway L, Karnam P, Bandyopadhyay G, Moscat J, Farese RV (1997) Protein kinase C-zeta as a downstream effector of phosphatidylinositol 3-kinase during insulin stimulation in rat adipocytes. Potential role in glucose transport. J Biol Chem 272: 30075-30082 [64] Kotani K, Ogawa W, Matsumoto M, et al. (1998) Requirement of atypical protein kinase C lambda for insulin stimulation of glucose uptake but not for Akt activation in 3T3-L1 adipocytes. Mol Cell Biol 18: 6971-6982 [65] Bruning JC, Winnay J, Bonner-Weir S, Taylor SI, Accili D, Kahn CR (1997) Development of a novel polygenic model of NIDDM in mice heterozygous for IR and IRS-1 null alleles. Cell 88: 561-572 [66] Carvalho E, Jansson PA, Axelsen M, et al. (1999) Low cellular IRS 1 gene and protein expression predict insulin resistance and NIDDM. FASEB J 13: 2173-2178 [67] Morino K, Petersen KF, Dufour S, et al. (2005) Reduced mitochondrial density and increased IRS-1 serine phosphorylation in muscle of insulin-resistant offspring of type 2 diabetic parents. J Clin Invest 115: 3587-3593 [68] Kim YB, Kotani K, Ciaraldi TP, Henry RR, Kahn BB (2003) Insulin-stimulated protein kinase C lambda/zeta activity is reduced in skeletal muscle of humans with obesity and type 2 diabetes: reversal with weight reduction. Diabetes 52: 1935-1942 [69] Beeson M, Sajan MP, Dizon M, et al. (2003) Activation of protein kinase C-zeta by insulin and phosphatidylinositol-3,4,5-(PO4)3 is defective in muscle in type 2 diabetes and impaired glucose tolerance: amelioration by rosiglitazone and exercise. Diabetes 52: 1926-1934 [70] White MF (2002) IRS proteins and the common path to diabetes. Am J Physiol Endocrinol Metab 283: E413-E422
424
[71] Gual P, Y. LM-B, Tanti JF (2005) Positive and negative regulation of insulin signaling through IRS-1 phosphorylation. Biochimie 87: 99-109 [72] Gao Z, Zuberi A, Quon MJ, Dong Z, Ye J (2003) Aspirin inhibits serine phosphorylation of insulin receptor substrate 1 in tumour necrosis factor-treated cells through targeting multiple serine kinases. J Biol Chem 278: 24944-24950 [73] Serra C, Federici M, Buongiorno A, Senni, MI, et al. (2003) Transgenic mice with dominant negative PKC-theta in skeletal muscle: a new model of insulin resistance and obesity. J Cell Physiol 196: 89-97 [74] Gao Z, Zhang X, Zuberi A, et al. (2004) Inhibition of insulin sensitivity by free fatty acids requires activation of multiple serine kinase in 3T3-L1 adipocytes. Mol Endocrinol 18: 2024-2034 [75] Prada PO, Zecchin HG, Gasparetti AL, et al. (2005) Western diet modulates insulin signaling, c-Jun N-terminal kinase activity, and insulin receptor substrate-1ser307 phosphorylation in a tissue-specific fashion. Endocrinology 146: 1576-1587 [76] Vinayagamoorthi R, Bobby Z, Sridhar MG (2008) Antioxidants preserve redox balance and inhibit c-Jun-N-terminal kinase pathway while improving insulin signalling in fat-fed cells: evidence for the role of oxidative stress on IRS-1 serine phosphorylation and insulin resistance. J Endocrinol 197: 287-296 [77] Tanti JF, Gual P, Gremeaux T, Gonzalez T, Barres R, Le Marchand-Brustel Y (2004) Alteration in insulin action: role of IRS-1 serine phosphorylation in the retroregulation of insulin signalling. Ann Endocrinol (Paris) 65: 43-48 [78] Fisher TL, White MF (2004) Signaling pathways: the benefits of good communication. Curr Biol 14: R1005-R1007 [79] Corbould A, Zhao H, Mirzoeva S, Aird F, Dunaif A (2006) Enhanced mitogenic signaling in skeletal muscle of women with polycystic ovary syndrome. Diabetes 55: 751-759 [80] Rajkhowa M, Brett S, Cuthbertson DJ, et al. (2009) Insulin resistance in polycystic ovary syndrome is associated with defective regulation of ERK1/2 by insulin in skeletal muscle in vivo. Biochem J 418: 665-671 [81] Ruiz-Alcaraz AJ, Lipina C, Petrie JR, et al. (2013) Obesity-induced insulin resistance in human skeletal muscle is characterised by defective activation of p42/p44 MAP kinase. PLoS One 8: e56928 [82] The National Collaborating Centre for Chronic Conditions and the Centre for Clinical Practice at NICE (2009) NICE clinical guideline 87. Type 2 diabetes: the management of type 2 diabetes. National Institute for Health and Clinical Excellence www.nice.org.uk, London [83] SIGN, Scottish Intercollegiate Guidelines Network (2010) Management of diabetes. A national clinical guideline (SIGN 116). Scottish Intercollegiate Guidelines Network, Edinburgh [84] Nathan DM, Buse JB, Davidson MB, et al. (2009) Medical management of hyperglycaemia in type 2 diabetes mellitus: a consensus algorithm for the initiation and adjustment of therapy: a consensus statement from the American Diabetes Association and the European Association for the Study of Diabetes. Diabetologia 52: 17-30 [85] International Diabetes Federation Clinical Guidelines Task Force (2005) Global guideline for type 2 diabetes. International Diabetes Federation, Brussels [86] Edgerton DS, Johnson KM, Cherrington AD (2009) Current strategies for the inhibition of hepatic glucose production in type 2 diabetes. Front Biosci 14: 1169-1181 [87] Wiernsperger NF, Bailey CJ (1999) The antihyperglycaemic effect of metformin: therapeutic and cellular mechanisms. Drugs 58: 31-39 [88] Zhou G, Myers R, Li Y, et al. (2001) Role of AMP-activated protein kinase in mechanism of metformin action. J Clin Invest 108: 1167-1174 [89] Fogarty S, Hardie DG (2009) Development of protein kinase activators: AMPK as a target in metabolic disorders and cancer. Biochim Biophys Acta [90] Hardie DG (2007) AMP-activated protein kinase as a drug target. Annu Rev Pharmacol Toxicol 47: 185-210 [91] Hardie DG (2007) AMP-activated/SNF1 protein kinases: conserved guardians of cellular energy. Nat Rev Mol Cell Biol 8: 774-785 [92] Hardie DG (2008) Role of AMP-activated protein kinase in the metabolic syndrome and in heart disease. FEBS Lett 582: 81-89 [93] Dzamko NL, Steinberg GR (2009) AMPK-dependent hormonal regulation of whole-body energy metabolism. Acta Physiol (Oxf) 196: 115-127 [94] Kahn BB, Alquier T, Carling D, Hardie DG (2005) AMP-activated protein kinase: ancient energy gauge provides clues to modern understanding of metabolism. Cell Metab 1: 15-25
425
[95] Woods A, Johnstone SR, Dickerson K, et al. (2003) LKB1 is the upstream kinase in the AMP-activated protein kinase cascade. Curr Biol 13: 2004-2008 [96] Hawley SA, Boudeau J, Reid JL, et al. (2003) Complexes between the LKB1 tumor suppressor, STRAD alpha/beta and MO25 alpha/beta are upstream kinases in the AMP-activated protein kinase cascade. J Biol 2: 28 [97] Shaw RJ, Kosmatka M, Bardeesy N, et al. (2004) The tumor suppressor LKB1 kinase directly activates AMP-activated kinase and regulates apoptosis in response to energy stress. Proc Natl Acad Sci USA 101: 3329-3335 [98] Hawley SA, Pan DA, Mustard KJ, et al. (2005) Calmodulin-dependent protein kinase kinase-beta is an alternative upstream kinase for AMP-activated protein kinase. Cell Metab 2: 9-19 [99] Woods A, Dickerson K, Heath R, et al. (2005) Ca2+/calmodulin-dependent protein kinase kinase-beta acts upstream of AMP-activated protein kinase in mammalian cells. Cell Metab 2: 21-33 [100] Hurley RL, Anderson KA, Franzone JM, Kemp BE, Means AR, Witters LA (2005) The Ca2+/calmodulin-dependent protein kinase kinases are AMP-activated protein kinase kinases. J Biol Chem 280: 29060-29066 [101] Polekhina G, Gupta A, Michell BJ, et al. (2003) AMPK beta subunit targets metabolic stress sensing to glycogen. Curr Biol 13: 867-871 [102] Scott JW, Hawley SA, Green KA, et al. (2004) CBS domains form energy-sensing modules whose binding of adenosine ligands is disrupted by disease mutations. J Clin Invest 113: 274-284 [103] White MF (2009) Metformin and insulin meet in a most atypical way. Cell Metab 9: 485-487 [104] Kramer HF, Witczak CA, Fujii N, et al. (2006) Distinct signals regulate AS160 phosphorylation in response to insulin, AICAR, and contraction in mouse skeletal muscle. Diabetes 55: 2067-2076 [105] Treebak JT, Glund S, Deshmukh A, et al. (2006) AMPK-mediated AS160 phosphorylation in skeletal muscle is dependent on AMPK catalytic and regulatory subunits. Diabetes 55: 2051-2058 [106] Lockhead PA, Salt IP, Walker KS, Hardie DG, Sutherland C (2000) 5-aminoimidazole-4-carboxamide riboside mimics the effects of insulin on the expression of the 2 key gluconeogenic genes PEPCK and glucose-6-phosphatase. Diabetes 49: 896-903 [107] Corton JM, Gillespie JG, Hawley SA, Hardie DG (1995) 5-aminoimidazole-4-carboxamide ribonucleoside. A specific method for activating AMP-activated protin kinase in intact cells? Eur J Biochem 229: 558-565 [108] Sullivan JE, Brocklehurst KJ, Marley AE, Carey F, Carling D, Beri RK (1994) Inhibition of lipolysis and lipogenesis in isolated rat adipocytes with AICAR, a cell-permeable activator of AMP-activated protein kinase. FEBS Lett 353: 33-36 [109] Daval M, Diot-Dupuy F, Bazin R, et al. (2005) Anti-lipolytic action of AMP-activated protein kinase in rodent adipocytes. J Biol Chem 280: 25250-25257 [110] Garton AJ, Campbell DG, Carling D, Hardie DG, Colbran RJ, Yeaman SJ (1989) Phosphorylation of bovine hormone-sensitive lipase by the AMP-activated protein kinase. A possible antilipolytic mechanism. Eur J Biochem 179: 249-254 [111] Wijkander J, Landstrom TR, Manganiello V, Belfrage P, Degerman E (1998) Insulin-induced phosphorylation and activation of phosphodiesterase 3B in rat adipocytes: possible role for protein kinase B but not mitogen-activated protein kinase or p70 S6 kinase. Endocrinology 139: 219-227 [112] Hawley SA, Gadalla AE, Olsen GS, Hardie DG (2002) The antidiabetic drug metformin activates the AMP-activated protein kinase cascade via an adenine nucleotide-independent mechanism. Diabetes 51: 2420-2425 [113] Wong AK, Howie J, Petrie JR, Lang CC (2009) AMP-activated protein kinase pathway: a potential therapeutic target in cardiometabolic disease. Clin Sci (Lond) 116: 607-620 [114] Salpeter S, Greyber E, Pasternak G, Salpeter E (2006) Risk of fatal and nonfatal lactic acidosis with metformin use in type 2 diabetes mellitus. Cochrane Database Syst Rev: CD002967 [115] Zhang L, He H, Balschi JA (2007) Metformin and phenformin activate AMP-activated protein kinase in the heart by increasing cytosolic AMP concentration. Am J Physiol Heart Circ Physiol 293: H457-466 [116] Yang J, Holman GD (2006) Long-term metformin treatment stimulates cardiomyocyte glucose transport through an AMP-activated protein kinase-dependent reduction in GLUT4 endocytosis. Endocrinology 147: 2728-2736 [117] Kovacic S, Soltys CL, Barr AJ, Shiojima I, Walsh K, Dyck JR (2003) Akt activity negatively regulates phosphorylation of AMP-activated protein kinase in the heart. J Biol Chem 278: 39422-39427
426
[118] Shaw RJ, Lamia KA, Vasquez D, et al. (2005) The kinase LKB1 mediates glucose homeostasis in liver and therapeutic effects of metformin. Science 310: 1642-1646 [119] Dentin R, Hedrick S, Xie J, Yates Jr, Montminy M (2008) Hepatic glucose sensing via the CREB coactivator CRTC2. Science 319: 1402-1405 [120] He L, Sabet A, Djedos S, et al. (2009) Metformin and insulin suppress hepatic gluconeogenesis through phosphorylation of CREB binding protein. Cell 137: 635-646 [121] Foretz M, Hebrard S, Leclerc J, et al. (2010) Metformin inhibits hepatic gluconeogenesis in mice independently of the LKB1/AMPK pathway via a decrease in hepatic energy state. J Clin Invest 120: 2355-2369 [122] Chau-Van C, Gamba M, Salvi R, Gaillard RC, Pralong FP (2007) Metformin inhibits adenosine 5'-monophosphate-activated kinase activation and prevents increases in neuropeptide Y expression in cultured hypothalamic neurones. Endocrinology 148: 507-511 [123] Defronzo RA, Buse JB, Kim T, Skare S, Barron A, Fineman M (2013) Dissociation between metformin plasma exposure and its glucose-lowering effect: a novel gut-mediated mechanism of action. Diabetes 62: A281, 1087-P [124] Kefas BA, Cai Y, Kerckhofs K, et al. (2004) Metformin-induced stimulation of AMP-activated protein kinase in beta-cells impairs their glucose responsiveness and can lead to apoptosis. Biochem Pharmacol 68: 409-416 [125] Leclerc I, Woltersdorf WW, da Silva Xavier G, et al. (2004) Metformin, but not leptin, regulates AMP-activated protein kinase in pancreatic islets: impact on glucose-stimulated insulin secretion. Am J Physiol Endocrinol Metab 286: E1023-1031 [126] Wilcock C, Bailey CJ (1991) Reconsideration of inhibitory effect of metformin on intestinal glucose absorption. J Pharm Pharmacol 43: 120-121 [127] Wilcock C, Bailey CJ (1990) Sites of metformin-stimulated glucose metabolism. Biochem Pharmacol 39: 1831-1834 [128] Wilcock C, Bailey CJ (1994) Accumulation of metformin by tissues of the normal and diabetic mouse. Xenobiotica 24: 49-57 [129] Bailey CJ, Wilcock C, Day C (1992) Effect of metformin on glucose metabolism in the splanchnic bed. Br J Pharmacol 105: 1009-1013 [130] Bailey CJ, Mynett KJ, Page T (1994) Importance of the intestine as a site of metformin-stimulated glucose utilization. Br J Pharmacol 112: 671-675 [131] Penicaud L, Hitier Y, Ferre P, Girard J (1989) Hypoglycaemic effect of metformin in genetically obese (fa/fa) rats results from an increased utilization of blood glucose by intestine. Biochem J 262: 881-885 [132] Bailey CJ, Wilcock C, Scarpello JH (2008) Metformin and the intestine. Diabetologia 51: 1552-1553 [133] Koepsell H (1998) Organic cation transporters in intestine, kidney, liver and brain. Annu Rev Physiol 60: 243-266 [134] Dresser MJ, Leabman MK, Giacomino KM (2001) Transporters involved in the elimination of drugs in the kidney: organic anion transporters and organic cation transporters. J Pharm Sci 90: 397-421 [135] Wright SH (2005) Role of organic cation transporters in the renal handling of therapeutic agents and xenobiotics. Toxicol Appl Pharmacol 204: 309-319 [136] Wang DS, Jonker JW, Kato Y, Kusuhara H, Schinkel AH, Sugiyama Y (2002) Involvement of organic cation transporter 1 in hepatic and intestinal distribution of metformin. J Pharmacol Exp Ther 302: 510-515 [137] Shu Y, Sheardown SA, Brown C, et al. (2007) Effect of genetic variation in the organic cation transporter 1 (OCT1) on metformin action. J Clin Invest 117: 1422-1431 [138] Shu Y, Brown C, Castro RA, et al. (2008) Effect of genetic variation in the organic cation transporter 1, OCT1, on metformin pharmacokinetics. Clin Pharmacol Ther 83: 273-280 [139] Hermann LS, Schersten B, Bitzen PO, Kjellstrom T, Lindgarde F, Melander A (1994) Therapeutic comparison of metformin and sulfonylurea, alone and in various combinations. A double-blind controlled study. Diabetes Care 17: 1100-1109 [140] Turner RC, Cull CA, Frighi V, Holman RR (1999) Glycemic control with diet, sulfonylurea, metformin, or insulin in patients with type 2 diabetes mellitus: progressive requirement for multiple therapies (UKPDS 49). UK Prospective Diabetes Study (UKPDS) Group. JAMA 281: 2005-2012 [141] Kimura N, Okuda M, Inui K (2005) Metformin transport by renal basolateral organic cation transporter hOCT2. Pharm Res 22: 255-259
427
[142] Masuda S, Terada T, Yonezawa A, et al. (2006) Identification and functional characterization of a new human kidney-specific H+/organic cation antiporter, kidney-specific multidrug and toxin extrusion. J Am Soc Nephrol 17: 2127-2135 [143] Muller J, Lips KS, Metzner L, Neubert RH, Koepsell H, Brandsch M (2005) Drug specificity and intestinal membrane localization of human cation transporters (OCT). Biochem Pharmacol 70: 1851-1860 [144] Wu X, Kekuda R, Huang W, et al. (1998) Identity of the organic cation transporter OCT3 as the extraneuronal monoamine transporter (uptake2) and evidence for the expression of the transporter in the brain. J Biol Chem 273: 32776-32786 [145] Zhou M, Xia L, Wang J (2007) Metformin transport by a newly cloned proton-stimulated organic cation transporter (plasma membrane monoamine transporter) espressed in human intestine. Drug Metab Dispos 35: 1956-1962 [146] Inzucchi SE, Bergenstal RM, Buse JB, et al. (2012) Management of hyperglycemia in type 2 diabetes: a patient-centered approach: position statement of the American Diabetes Association (ADA) and the European Association for the Study of Diabetes (EASD). Diabetes Care 35: 1364-1379 [147] Nissen SE, Wolski K (2007) Effect of rosiglitazone on the risk of myocardial infarction and death from cardiovascular causes. N Engl J Med 356: 2457-2471 [148] Winkelmayer WC, Setoguchi S, Levin R, Solomon DH (2008) Comparison of cardiovascular outcomes in elderly patients with diabetes who initiated rosiglitazone vs pioglitazone therapy. Arch Intern Med 168: 2368-2375 [149] Singh S, Loke YK, Furberg CD (2007) Long-term risk of cardiovascular events with rosiglitazone: a meta-analysis. JAMA 298: 1189-1195 [150] Rosen CJ (2007) The rosiglitazone story - lessons from an FDA Advisory Committee meeting. N Engl J Med 357: 844-846 [151] Diamond GA, Bax L, Kaul S (2007) Uncertain effects of rosiglitazone on the risk for myocardial infarction and cardiovascular death. Ann Intern Med 147: 578-581 [152] Gerstein HC, Yusuf S, Bosch J, et al. (2006) Effect of rosiglitazone on the frequency of diabetes in patients with impaired glucose tolerance or impaired fasting glucose: a randomised controlled trial. Lancet 368: 1096-1105 [153] Home PD, Pocock SJ, Beck-Nielsen H, et al. (2009) Rosiglitazone evaluated for cardiovascular outcomes in oral agent combination therapy for type 2 diabetes (RECORD): a multicentre, randomised, open-label trial. Lancet 373: 2125-2135 [154] Kahn SE, Haffner SM, Heise MA, et al. (2006) Glycemic durability of rosiglitazone, metformin, or glyburide monotherapy. N Engl J Med 355: 2427-2443 [155] U.S. Department of Health and Human Services Food and Drug Administration, Center for Drug Evaluation and Research (CDER) (2008) Guidance for Industry. Diabetes Mellitus — Evaluating cardiovascular risk in new antidiabetic therapies to treat type 2 diabetes. Available from http://www.fda.gov/downloads/Drugs/GuidanceComplianceRegulatoryInformation/Guidances/ucm071627.pdf [156] Nissen SE, Wolski K (2010) Rosiglitazone revisited: an updated meta-analysis of risk for myocardial infarction and cardiovascular mortality. Arch Intern Med 170: 1191-1201 [157] Graham D, Ouellet-Hellstrom R, MaCurdy TE, et al. (2010) Risk of acute myocardial infarction, stroke, heart failure and death in elderly Medicare patients treated with rosiglitazone or pioglitazone. JAMA 304: 411-418 [158] Woodcock J (2010) Decision on continued marketing of rosiglitazone (Avandia, Avandamet, Avandaryl). In: US Food and Drug Administration Administration (ed) [159] European Medicines Agency (2010) European Medicines Agency recommends suspension of Avandia, Avandamet and Avaglim. Anti-diabetes medication to be taken off the market. Available from http://www.ema.europa.eu/docs/en_GB/document_library/Press_release/2010/09/WC500096996.pdf [160] Hiatt WR, Kaul S, Smith RJ (2013) The cardiovascular safety of diabetes drugs - insights from the rosiglitazone experience. N Engl J Med 369: 1285-1287 [161] Gale EA (2001) Lessons from the glitazones: a story of drug development. Lancet 357: 1870-1875 [162] Hirsch IB, Kelly J, Cooper S (1999) Pulmonary edema associated with troglitazone therapy. Arch Intern Med 159: 1811 [163] Colhoun HM (2009) Use of insulin glargine and cancer incidence in Scotland: a study from the Scottish Diabetes Research Network Epidemiology Group. Diabetologia 52: 1755-1765
428
[164] Petrie JR (2009) Follow-up of intensive glucose control in type 2 diabetes. N Engl J Med 360: 416-417; author reply 418 [165] Lu C, Cheng SY (2010) Thyroid hormone receptors regulate adipogenesis and carcinogenesis via cross-talk signaling with peroxisome proliferator-activated receptors. J Mol Endocrinol 44: 143-154 [166] Davies SS, Pontsler AV, Marathe GK, et al. (2001) Oxidized alkyl phospholipids are specific, high affinity peroxisome proliferator-activated receptor gamma ligands and agonists. J Biol Chem 276: 16015-16023 [167] Forman BM, Tontonoz P, Chen J, Brun RP, Spiegelman BM, Evans RM (1995) 15-Deoxy-delta 12, 14-prostaglandin J2 is a ligand for the adipocyte determination factor PPAR gamma. Cell 83: 803-812 [168] Kliewer SA, Lenhard JM, Willson TM, Patel I, Morris DC, Lehmann JM (1995) A prostaglandin J2 metabolite binds peroxisome proliferator-activated receptor gamma and promotes adipocyte differentiation. Cell 83: 813-819 [169] Braissant O, Foufelle F, Scotto C, Dauca M, Wahli W (1996) Differential expression of peroxisome proliferator-activated receptors (PPARs): tissue distribution of PPAR-alpha, -beta, and -gamma in the adult rat. Endocrinology 137: 354-366 [170] Jones PS, Savory R, Barratt P, et al. (1995) Chromosomal localisation, inducibility, tissue-specific expression and strain differences in three murine peroxisome-proliferator-activated-receptor genes. Eur J Biochem 233: 219-226 [171] Yoon M (2009) The role of PPARalpha in lipid metabolism and obesity: focusing on the effects of estrogen on PPARalpha actions. Pharmacol Res 60: 151-159 [172] Dubois M, Pattou F, Kerr-Conte J, et al. (2000) Expression of peroxisome proliferator-activated receptor gamma (PPARgamma) in normal human pancreatic islet cells. Diabetologia 43: 1165-1169 [173] Willson TM, Lambert MH, Kliewer SA (2001) Peroxisome proliferator-activated receptor gamma and metabolic disease. Annu Rev Biochem 70: 341-367 [174] Norris AW, Chen L, Fisher SJ, et al. (2003) Muscle-specific PPARgamma-deficient mice develop increased adiposity and insulin resistance but respond to thiazolidinediones. J Clin Invest 112: 608-618 [175] Fajas L, Auboeuf D, Raspe E, et al. (1997) The organization, promoter analysis, and expression of the human PPARgamma gene. J Biol Chem 272: 18779-18789 [176] Fajas L, Fruchart JC, Auwerx J (1998) PPARgamma3 mRNA: a distinct PPARgamma mRNA subtype transcribed from an independent promoter. FEBS Lett 438: 55-60 [177] Zhou J, Wilson KM, Medh JD (2002) Genetic analysis of four novel peroxisome proliferator activated receptor-gamma splice variants in monkey macrophages. Biochem Biophys Res Commun 293: 274-283 [178] Mangelsdorf DJ, Thummel C, Beato M, et al. (1995) The nuclear receptor superfamily: the second decade. Cell 83: 835-839 [179] Hi R, Osada S, Yumoto N, Osumi T (1999) Characterization of the amino-terminal activation domain of peroxisome proliferator-activated receptor alpha. Importance of alpha-helical structure in the transactivating function. J Biol Chem 274: 35152-35158 [180] Adams M, Reginato MJ, Shao D, Lazar MA, Chatterjee VK (1997) Transcriptional activation by peroxisome proliferator-activated receptor gamma is inhibited by phosphorylation at a consensus mitogen-activated protein kinase site. J Biol Chem 272: 5128-5132 [181] Shao D, Rangwala SM, Bailey ST, Krakow SL, Reginato MJ, Lazar MA (1998) Interdomain communication regulating ligand binding by PPAR-gamma. Nature 396: 377-380 [182] Juge-Aubry CE, Hammar E, Siegrist-Kaiser C, et al. (1999) Regulation of the transcriptional activity of the peroxisome proliferator-activated receptor alpha by phosphorylation of a ligand-independent trans-activating domain. J Biol Chem 274: 10505-10510 [183] Ohshima T, Koga H, Shimotohno K (2004) Transcriptional activity of peroxisome proliferator-activated receptor gamma is modulated by SUMO-1 modification. J Biol Chem 279: 29551-29557 [184] Issemann I, Green S (1990) Activation of a member of the steroid hormone receptor superfamily by peroxisome proliferators. Nature 347: 645-650 [185] Desvergne B, Wahli W (1999) Peroxisome proliferator-activated receptors: nuclear control of metabolism. Endocr Rev 20: 649-688 [186] Nolte RT, Wisely GB, Westin S, et al. (1998) Ligand binding and co-activator assembly of the peroxisome proliferator-activated receptor-gamma. Nature 395: 137-143
429
[187] Xu HE, Stanley TB, Montana VG, et al. (2002) Structural basis for antagonist-mediated recruitment of nuclear co-repressors by PPARalpha. Nature 415: 813-817 [188] Glass CK, Rosenfeld MG (2000) The coregulator exchange in transcriptional functions of nuclear receptors. Genes Dev 14: 121-141 [189] Guo L, Tabrizchi R (2006) Peroxisome proliferator-activated receptor gamma as a drug target in the pathogenesis of insulin resistance. Pharmacol Ther 111: 145-173 [190] Olefsky JM (2000) Treatment of insulin resistance with peroxisome proliferator-activated receptor gamma agonists. J Clin Invest 106: 467-472 [191] Gregoire FM, Smas CM, Sul HS (1998) Understanding adipocyte differentiation. Physiol Rev 78: 783-809 [192] Tontonoz P, Hu E, Spiegelman BM (1994) Stimulation of adipogenesis in fibroblasts by PPAR gamma 2, a lipid-activated transcription factor. Cell 79: 1147-1156 [193] Cao Z, Umek RM, McKnight SL (1991) Regulated expression of three C/EBP isoforms during adipose conversion of 3T3-L1 cells. Genes Dev 5: 1538-1552 [194] Yeh WC, Cao Z, Classon M, McKnight SL (1995) Cascade regulation of terminal adipocyte differentiation by three members of the C/EBP family of leucine zipper proteins. Genes Dev 9: 168-181 [195] Wu Z, Bucher NL, Farmer SR (1996) Induction of peroxisome proliferator-activated receptor gamma during the conversion of 3T3 fibroblasts into adipocytes is mediated by C/EBPbeta, C/EBPdelta, and glucocorticoids. Mol Cell Biol 16: 4128-4136 [196] Wu Z, Xie Y, Morrison RF, Bucher NL, Farmer SR (1998) PPARgamma induces the insulin-dependent glucose transporter GLUT4 in the absence of C/EBPalpha during the conversion of 3T3 fibroblasts into adipocytes. J Clin Invest 101: 22-32 [197] El-Jack AK, Hamm JK, Pilch PF, Farmer SR (1999) Reconstitution of insulin-sensitive glucose transport in fibroblasts requires expression of both PPARgamma and C/EBPalpha. J Biol Chem 274: 7946-7951 [198] Wright HM, Clish CB, Mikami T, et al. (2000) A synthetic antagonist for the peroxisome proliferator-activated receptor gamma inhibits adipocyte differentiation. J Biol Chem 275: 1873-1877 [199] Samuelsson L, Stromberg K, Vikman K, Bjursell G, Enerback S (1991) The CCAAT/enhancer binding protein and its role in adipocyte differentiation: evidence for direct involvement in terminal adipocyte development. EMBO J 10: 3787-3793 [200] Wu Z, Xie Y, Bucher NL, Farmer SR (1995) Conditional ectopic expression of C/EBP beta in NIH-3T3 cells induces PPAR gamma and stimulates adipogenesis. Genes Dev 9: 2350-2363 [201] Hamm JK, el Jack AK, Pilch PF, Farmer SR (1999) Role of PPAR gamma in regulating adipocyte differentiation and insulin-responsive glucose uptake. Ann N Y Acad Sci 892: 134-145 [202] Berger J, Moller DE (2002) The mechanisms of action of PPARs. Annu Rev Med 53: 409-435 [203] Martin G, Schoonjans K, Staels B, Auwerx J (1998) PPARgamma activators improve glucose homeostasis by stimulating fatty acid uptake in the adipocytes. Atherosclerosis 137 (Suppl): S75-80 [204] Rangwala SM, Lazar MA (2004) Peroxisome proliferator-activated receptor gamma in diabetes and metabolism. Trends Pharmacol Sci 25: 331-336 [205] Brunmair B, Staniek K, Gras F, et al. (2004) Thiazolidinediones, like metformin, inhibit respiratory complex I: a common mechanism contributing to their antidiabetic actions? Diabetes 53: 1052-1059 [206] Fryer LG, Parbu-Patel A, Carling D (2002) The Anti-diabetic drugs rosiglitazone and metformin stimulate AMP-activated protein kinase through distinct signaling pathways. J Biol Chem 277: 25226-25232 [207] LeBrasseur NK, Kelly M, Tsao TS, et al. (2006) Thiazolidinediones can rapidly activate AMP-activated protein kinase in mammalian tissues. Am J Physiol Endocrinol Metab 291: E175-181 [208] Maeda N, Takahashi M, Funahashi T, et al. (2001) PPARgamma ligands increase expression and plasma concentrations of adiponectin, an adipose-derived protein. Diabetes 50: 2094-2099 [209] Yamauchi T, Kamon J, Minokoshi Y, et al. (2002) Adiponectin stimulates glucose utilization and fatty-acid oxidation by activating AMP-activated protein kinase. Nat Med 8: 1288-1295 [210] Kubota N, Terauchi Y, Kubota T, et al. (2006) Pioglitazone ameliorates insulin resistance and diabetes by both adiponectin-dependent and -independent pathways. J Biol Chem 281: 8748-8755 [211] Hunt SA, Baker DW, Chin MH, et al. (2001) ACC/AHA Guidelines for the Evaluation and Management of Chronic Heart Failure in the Adult: Executive Summary A Report of the American College of Cardiology/American Heart Association Task Force on Practice Guidelines (Committee to Revise the 1995 Guidelines for the Evaluation and Management of Heart Failure): Developed in
430
Collaboration With the International Society for Heart and Lung Transplantation; Endorsed by the Heart Failure Society of America. Circulation 104: 2996-3007 [212] Stratton IM, Adler AI, Neil HA, et al. (2000) Association of glycaemia with macrovascular and microvascular complications of type 2 diabetes (UKPDS 35): prospective observational study. BMJ 321: 405-412 [213] Vaur L, Gueret P, Lievre M, Chabaud S, Passa P (2003) Development of congestive heart failure in type 2 diabetic patients with microalbuminuria or proteinuria: observations from the DIABHYCAR (type 2 DIABetes, Hypertension, CArdiovascular Events and Ramipril) study. Diabetes Care 26: 855-860 [214] DCCT Research Group (1986) The Diabetes Control and Complications Trial (DCCT). Design and methodologic considerations for the feasibility phase. Diabetes 35: 530-545 [215] Colhoun HM, Thomason MJ, Mackness MI, et al. (2002) Design of the Collaborative AtoRvastatin Diabetes Study (CARDS) in patients with type 2 diabetes. Diabet Med 19: 201-211 [216] FIELD study investigators (2004) The need for a large-scale trial of fibrate therapy in diabetes: the rationale and design of the Fenofibrate Intervention and Event Lowering in Diabetes (FIELD) study. [ISRCTN64783481]. Cardiovasc Diabetol 3: 9 [217] Charbonnel B, Dormandy J, Erdmann E, Massi-Benedetti M, Skene A (2004) The prospective pioglitazone clinical trial in macrovascular events (PROactive): can pioglitazone reduce cardiovascular events in diabetes? Study design and baseline characteristics of 5238 patients. Diabetes Care 27: 1647-1653 [218] Thrainsdottir IS, Aspelund T, Thorgeirsson G, et al. (2005) The association between glucose abnormalities and heart failure in the population-based Reykjavik study. Diabetes Care 28: 612-616 [219] Bertoni AG, Hundley WG, Massing MW, Bonds DE, Burke GL, Goff DC, Jr. (2004) Heart failure prevalence, incidence, and mortality in the elderly with diabetes. Diabetes Care 27: 699-703 [220] Amato L, Paolisso G, Cacciatore F, et al. (1997) Congestive heart failure predicts the development of non-insulin-dependent diabetes mellitus in the elderly. The Osservatorio Geriatrico Regione Campania Group. Diabetes Metab 23: 213-218 [221] Mosterd A, Cost B, Hoes AW, et al. (2001) The prognosis of heart failure in the general population: The Rotterdam Study. Eur Heart J 22: 1318-1327 [222] From AM, Leibson CL, Bursi F, et al. (2006) Diabetes in heart failure: prevalence and impact on outcome in the population. Am J Med 119: 591-599 [223] Reis SE, Holubkov R, Edmundowicz D, et al. (1997) Treatment of patients admitted to the hospital with congestive heart failure: specialty-related disparities in practice patterns and outcomes. J Am Coll Cardiol 30: 733-738 [224] Deswal A, Petersen NJ, Souchek J, Ashton CM, Wray NP (2004) Impact of race on health care utilization and outcomes in veterans with congestive heart failure. J Am Coll Cardiol 43: 778-784 [225] Rathore SS, Foody JM, Wang Y, et al. (2003) Race, quality of care, and outcomes of elderly patients hospitalized with heart failure. JAMA 289: 2517-2524 [226] Bertoni AG, Tsai A, Kasper EK, Brancati FL (2003) Diabetes and idiopathic cardiomyopathy: a nationwide case-control study. Diabetes Care 26: 2791-2795 [227] Morgan S, Smith H, Simpson I, et al. (1999) Prevalence and clinical characteristics of left ventricular dysfunction among elderly patients in general practice setting: cross sectional survey. BMJ 318: 368-372 [228] Raymond I, Groenning BA, Hildebrandt PR, et al. (2003) The influence of age, sex and other variables on the plasma level of N-terminal pro brain natriuretic peptide in a large sample of the general population. Heart 89: 745-751 [229] Davies M, Hobbs F, Davis R, et al. (2001) Prevalence of left-ventricular systolic dysfunction and heart failure in the Echocardiographic Heart of England Screening study: a population based study. Lancet 358: 439-444 [230] McDonagh TA, Morrison CE, Lawrence A, et al. (1997) Symptomatic and asymptomatic left-ventricular systolic dysfunction in an urban population. Lancet 350: 829-833 [231] Hedberg P, Lonnberg I, Jonason T, Nilsson G, Pehrsson K, Ringqvist I (2001) Left ventricular systolic dysfunction in 75-year-old men and women; a population-based study. Eur Heart J 22: 676-683 [232] Redfield MM, Jacobsen SJ, Burnett JC, Jr., Mahoney DW, Bailey KR, Rodeheffer RJ (2003) Burden of systolic and diastolic ventricular dysfunction in the community: appreciating the scope of the heart failure epidemic. JAMA 289: 194-202 [233] Kistorp C, Galatius S, Gustafsson F, Faber J, Corell P, Hildebrandt P (2005) Prevalence and characteristics of diabetic patients in a chronic heart failure population. Int J Cardiol 100: 281-287
431
[234] Kannel WB, Hjortland M, Castelli WP (1974) Role of diabetes in congestive heart failure: the Framingham study. Am J Cardiol 34: 29-34 [235] He J, Ogden LG, Bazzano LA, Vupputuri S, Loria C, Whelton PK (2001) Risk factors for congestive heart failure in US men and women: NHANES I epidemiologic follow-up study. Arch Intern Med 161: 996-1002 [236] Gottdiener JS, Arnold AM, Aurigemma GP, et al. (2000) Predictors of congestive heart failure in the elderly: the Cardiovascular Health Study. J Am Coll Cardiol 35: 1628-1637 [237] Aronow WS, Ahn C (1999) Incidence of heart failure in 2,737 older persons with and without diabetes mellitus. Chest 115: 867-868 [238] Iribarren C, Karter AJ, Go AS, et al. (2001) Glycemic control and heart failure among adult patients with diabetes. Circulation 103: 2668-2673 [239] Nichols GA, Gullion CM, Koro CE, Ephross SA, Brown JB (2004) The incidence of congestive heart failure in type 2 diabetes: an update. Diabetes Care 27: 1879-1884 [240] Carr AA, Kowey PR, Devereux RB, et al. (2005) Hospitalizations for new heart failure among subjects with diabetes mellitus in the RENAAL and LIFE studies. Am J Cardiol 96: 1530-1536 [241] Mak KH, Moliterno DJ, Granger CB, et al. (1997) Influence of diabetes mellitus on clinical outcome in the thrombolytic era of acute myocardial infarction. GUSTO-I Investigators. Global Utilization of Streptokinase and Tissue Plasminogen Activator for Occluded Coronary Arteries. J Am Coll Cardiol 30: 171-179 [242] Cheung N, Wang JJ, Rogers SL, et al. (2008) Diabetic retinopathy and risk of heart failure. J Am Coll Cardiol 51: 1573-1578 [243] Cheung N, Bluemke DA, Klein R, et al. (2007) Retinal arteriolar narrowing and left ventricular remodeling: the multi-ethnic study of atherosclerosis. J Am Coll Cardiol 50: 48-55 [244] Hockensmith ML, Estacio RO, Mehler P, et al. (2004) Albuminuria as a predictor of heart failure hospitalizations in patients with type 2 diabetes. J Card Fail 10: 126-131 [245] Dries DL, Sweitzer NK, Drazner MH, Stevenson LW, Gersh BJ (2001) Prognostic impact of diabetes mellitus in patients with heart failure according to the etiology of left ventricular systolic dysfunction. J Am Coll Cardiol 38: 421-428 [246] Shindler DM, Kostis JB, Yusuf S, et al. (1996) Diabetes mellitus, a predictor of morbidity and mortality in the Studies of Left Ventricular Dysfunction (SOLVD) Trials and Registry. Am J Cardiol 77: 1017-1020 [247] Domanski M, Krause-Steinrauf H, Deedwania P, et al. (2003) The effect of diabetes on outcomes of patients with advanced heart failure in the BEST trial. J Am Coll Cardiol 42: 914-922 [248] Brophy JM, Dagenais GR, McSherry F, Williford W, Yusuf S (2004) A multivariate model for predicting mortality in patients with heart failure and systolic dysfunction. Am J Med 116: 300-304 [249] Gustafsson I, Brendorp B, Seibaek M, et al. (2004) Influence of diabetes and diabetes-gender interaction on the risk of death in patients hospitalized with congestive heart failure. J Am Coll Cardiol 43: 771-777 [250] Pocock SJ, Wang D, Pfeffer MA, et al. (2006) Predictors of mortality and morbidity in patients with chronic heart failure. Eur Heart J 27: 65-75 [251] Ho KK, Anderson KM, Kannel WB, Grossman W, Levy D (1993) Survival after the onset of congestive heart failure in Framingham Heart Study subjects. Circulation 88: 107-115 [252] Eshaghian S, Horwich TB, Fonarow GC (2006) An unexpected inverse relationship between HbA1c levels and mortality in patients with diabetes and advanced systolic heart failure. Am Heart J 151: 91 [253] Berlie HD, Kalus JS, Jaber LA (2007) Thiazolidinediones and the risk of edema: a meta-analysis. Diabetes Res Clin Pract 76: 279-289 [254] GlaxoSmithKline (2008) Avandia® [package insert] [255] Takeda Pharmaceuticals America, Inc. (2009) Actos® (pioglitazone hydrochloride) [package insert] [256] Dormandy JA, Charbonnel B, Eckland DJ, et al. (2005) Secondary prevention of macrovascular events in patients with type 2 diabetes in the PROactive Study (PROspective pioglitAzone Clinical Trial In macroVascular Events): a randomised controlled trial. Lancet 366: 1279-1289 [257] Al-Ozairi E, Sibal L, Home P (2007) Counterpoint: A Diabetes Outcome Progression Trial (ADOPT): good for sulfonylureas? Diabetes Care 30: 1677-1680 [258] Komajda M, McMurray JJ, Beck-Nielsen H, et al. (2010) Heart failure events with rosiglitazone in type 2 diabetes: data from the RECORD clinical trial. Eur Heart J 31: 824-831
432
[259] Home PD, Pocock SJ, Beck-Nielsen H, et al. (2007) Rosiglitazone evaluated for cardiovascular outcomes - an interim analysis. N Engl J Med 357: 28-38 [260] Mahaffey KW, Hafley G, Dickerson S, et al. (2013) Results of a reevaluation of cardiovascular outcomes in the RECORD trial. Am Heart J 166: 240-249.e241 [261] Erdmann E, Charbonnel B, Wilcox RG, et al. (2007) Pioglitazone use and heart failure in patients with type 2 diabetes and preexisting cardiovascular disease: data from the PROactive study (PROactive 08). Diabetes Care 30: 2773-2778 [262] Komajda M, McMurray JJ, Beck-Nielsen H, et al. (2010) Heart failure events with rosiglitazone in type 2 diabetes: data from the RECORD clinical trial. Eur Heart J 31: 824-831 [263] Lago RM, Singh PP, Nesto RW (2007) Congestive heart failure and cardiovascular death in patients with prediabetes and type 2 diabetes given thiazolidinediones: a meta-analysis of randomised clinical trials. Lancet 370: 1129-1136 [264] Lincoff AM, Wolski K, Nicholls SJ, Nissen SE (2007) Pioglitazone and risk of cardiovascular events in patients with type 2 diabetes mellitus: a meta-analysis of randomized trials. JAMA 298: 1180-1188 [265] Richter B, Bandeira-Echtler E, Bergerhoff K, Clar C, Ebrahim SH (2006) Pioglitazone for type 2 diabetes mellitus. Cochrane Database Syst Rev: CD006060 [266] Clar C, Royle P, Waugh N (2009) Adding pioglitazone to insulin containing regimens in type 2 diabetes: systematic review and meta-analysis. PLoS One 4: e6112 [267] Richter B, Bandeira-Echtler E, Bergerhoff K, Clar C, Ebrahim SH (2007) Rosiglitazone for type 2 diabetes mellitus. Cochrane Database Syst Rev: CD006063 [268] Friedrich JO, Beyene J, Adhikari NK (2009) Rosiglitazone: can meta-analysis accurately estimate excess cardiovascular risk given the available data? Re-analysis of randomized trials using various methodologic approaches. BMC Res Notes 2: 5 [269] Farkouh ME, Fuster V (2007) Meta-analysis of small trials: proceed with caution. Nat Clin Pract Cardiovasc Med 4: 635 [270] Lipscombe LL, Gomes T, Levesque LE, Hux JE, Juurlink DN, Alter DA (2007) Thiazolidinediones and cardiovascular outcomes in older patients with diabetes. JAMA 298: 2634-2643 [271] Tzoulaki I, Molokhia M, Curcin V, et al. (2009) Risk of cardiovascular disease and all cause mortality among patients with type 2 diabetes prescribed oral antidiabetes drugs: retrospective cohort study using UK general practice research database. BMJ 339: b4731 [272] Pantalone KM, Kattan MW, Yu C, et al. (2009) The risk of developing coronary artery disease or congestive heart failure, and overall mortality, in type 2 diabetic patients receiving rosiglitazone, pioglitazone, metformin, or sulfonylureas: a retrospective analysis. Acta Diabetol 46: 145-154 [273] Toprani A, Fonseca V (2011) Thiazolidinediones and congestive heart failure in veterans with type 2 diabetes. Diabetes Obes Metab 13: 276-280 [274] Juurlink DN, Gomes T, Lipscombe LL, Austin PC, Hux JE, Mamdani MM (2009) Adverse cardiovascular events during treatment with pioglitazone and rosiglitazone: population based cohort study. BMJ 339: b2942 [275] Habib ZA, Tzogias L, Havstad SL, et al. (2009) Relationship between thiazolidinedione use and cardiovascular outcomes and all-cause mortality among patients with diabetes: a time-updated propensity analysis. Pharmacoepidemiol Drug Saf 18: 437-447 [276] Nichols GA, Koro CE, Gullion CM, Ephross SA, Brown JB (2005) The incidence of congestive heart failure associated with antidiabetic therapies. Diabetes Metab Res Rev 21: 51-57 [277] Nichols GA, Hillier TA, Erbey JR, Brown JB (2001) Congestive heart failure in type 2 diabetes: prevalence, incidence, and risk factors. Diabetes Care 24: 1614-1619 [278] Maru S, Koch GG, Stender M, et al. (2005) Antidiabetic drugs and heart failure risk in patients with type 2 diabetes in the U.K. primary care setting. Diabetes Care 28: 20-26 [279] McAlister FA, Eurich DT, Majumdar SR, Johnson JA (2008) The risk of heart failure in patients with type 2 diabetes treated with oral agent monotherapy. Eur J Heart Fail 10: 703-708 [280] Aguilar D, Chan W, Bozkurt B, Ramasubbu K, Deswal A (2011) Metformin use and mortality in ambulatory patients with diabetes and heart failure. Circ Heart Fail 4: 53-58 [281] Eurich DT, Majumdar SR, McAlister FA, Tsuyuki RT, Johnson JA (2005) Improved clinical outcomes associated with metformin in patients with diabetes and heart failure. Diabetes Care 28: 2345-2351 [282] Andersson C, Olesen JB, Hansen PR, et al. (2010) Metformin treatment is associated with a low risk of mortality in diabetic patients with heart failure: a retrospective nationwide cohort study. Diabetologia 53: 2546-2553
433
[283] Masoudi FA, Inzucchi SE, Wang Y, Havranek EP, Foody JM, Krumholz HM (2005) Thiazolidinediones, metformin, and outcomes in older patients with diabetes and heart failure: an observational study. Circulation 111: 583-590 [284] Eurich DT, McAlister FA, Blackburn DF, et al. (2007) Benefits and harms of antidiabetic agents in patients with diabetes and heart failure: systematic review. BMJ 335: 497 [285] MacDonald MR, Eurich DT, Majumdar SR, et al. (2010) Treatment of type 2 diabetes and outcomes in patients with heart failure: a nested case-control study from the U.K. General Practice Research Database. Diabetes Care 33: 1213-1218 [286] George J, Hannah St, Lang CC (2009) Thiazolidinediones and the influence of media adverse reporting on prescribing attitudes in practice (TZD-IMPACT) study. Cardiovasc Ther 27: 83-88 [287] Guan Y, Zhang Y, Davis L, Breyer MD (1997) Expression of peroxisome proliferator-activated receptors in urinary tract of rabbits and humans. Am J Physiol 273: F1013-1022 [288] Guan Y, Zhang Y, Schneider A, Davis L, Breyer RM, Breyer MD (2001) Peroxisome proliferator-activated receptor-gamma activity is associated with renal microvasculature. Am J Physiol Renal Physiol 281: F1036-1046 [289] Guan Y, Breyer MD (2001) Peroxisome proliferator-activated receptors (PPARs): novel therapeutic targets in renal disease. Kidney Int 60: 14-30 [290] Zhang Y, Guan Y (2005) PPAR-gamma agonists and diabetic nephropathy. Curr Diab Rep 5: 470-475 [291] Chen L, Yang B, McNulty JA et al. GI262570, a perisome proliferator-activated receptor (gamma) agonist, changes electrolytes and water reabsorption from the distal nephron in rats. J Pharmacol Exp Ther 2005 312: 718-725 [292] Naray-Fejes-Toth A, Canessa C, Cleaveland ES, Aldrich G, Fejes-Toth G (1999) sgk is an aldosterone-induced kinase in the renal collecting duct. Effects on epithelial na+ channels. J Biol Chem 274: 16973-16978 [293] Feraille E, Mordasini D, Gonin S, et al. (2003) Mechanism of control of Na,K-ATPase in principal cells of the mammalian collecting duct. Ann N Y Acad Sci 986: 570-578 [294] Eaton DC, Malik B, Saxena NC, Al-Khalili OK, Yue G (2001) Mechanisms of aldosterone's action on epithelial Na+ transport. J Membr Biol 184: 313-319 [295] Weisz OA, Johnson JP (2003) Noncoordinate regulation of ENaC: paradigm lost? Am J Physiol Renal Physiol 285: F833-842 [296] Konstas AA, Korbmacher C. (2003) The gamma-subunit of ENaC is more important for channel surface expression than the beta-subunit. Am J Physiol Cell Physiol 284: C447-456 [297] Kobayashi T, Deak M, Morrice N, Cohen P (1999) Characterization of the structure and regulation of two novel isoforms of serum- and glucocorticoid-induced protein kinase. Biochem J 344: 189-197 [298] Friedrich B, Feng Y, Cohen P, et al. (2003) The serine/threonine kinases SGK2 and SGK3 are potent stimulators of the epithelial Na+ channel alpha,beta,gamma-ENaC. Pflugers Arch 445: 693-696 [299] Pearce D (2001) The role of SGK1 in hormone-regulated sodium transport. Trends Endocrinol Metab 12: 341-347 [300] Hong G, Lockhart A, Davis B, et al. (2003) PPARgamma activation enhances cell surface ENaCalpha via up-regulation of SGK1 in human collecting duct cells. FASEB J 17: 1966-1968 [301] Rozansky DJ, Wang J, Doan N, et al. (2002) Hypotonic induction of SGK1 and Na+ transport in A6 cells. Am J Physiol Renal Physiol 283: F105-113 [302] Guan Y, Hao C, Cha DR, et al. (2005) Thiazolidinediones expand body fluid volume through PPARgamma stimulation of ENaC-mediated renal salt absorption. Nat Med 11: 861-866 [303] Zhang H, Zhang A, Kohan DE, Nelson RD, Gonzalez FJ, Yang T (2005) Collecting duct-specific deletion of peroxisome proliferator-activated receptor gamma blocks thiazolidinedione-induced fluid retention. Proc Natl Acad Sci USA 102: 9406-9411 [304] Artunc F, Sandulache D, Nasir O, et al. (2008) Lack of the serum and glucocorticoid-inducible kinase SGK1 attenuates the volume retention after treatment with the PPARgamma agonist pioglitazone. Pflugers Arch 456: 425-436 [305] Nofziger C, Chen L, Shane MA, Smith CD, Brown KK, Blazer-Yost BL (2005) PPARgamma agonists do not directly enhance basal or insulin-stimulated Na(+) transport via the epithelial Na(+) channel. Pflugers Arch 451: 445-453 [306] Vallon V, Hummler E, Rieg T, et al. (2009) Thiazolidinedione-induced fluid retention is independent of collecting duct alphaENaC activity. J Am Soc Nephrol 20: 721-729
434
[307] Borsting E, Cheng VP, Glass CK, Vallon V, Cunard R (2012) Peroxisome proliferator-activated receptor-gamma agonists repress epithelial sodium channel expression in the kidney. Am J Physiol Renal Physiol 302: F540-551 [308] Panchapakesan U, Pollock CA, Chen XM (2004) The effect of high glucose and PPAR-gamma agonists on PPAR-gamma expression and function in HK-2 cells. Am J Physiol Renal Physiol 287: F528–534 [309] Ishibashi K, Kuwahara M, Gu Y, et al. (1997) Cloning and functional expression of a new water channel abundantly expressed in the testis permeable to water, glycerol, and urea. J Biol Chem 272: 20782-20786 [310] Sabolic I, Valenti G, Verbavatz JM, et al. (1992) Localization of the CHIP28 water channel in rat kidney. Am J Physiol 263: C1225-C1233 [311] Nielsen S, Smith BL, Christensen EI, Knepper MA, Agre P (1993) CHIP28 water channels are localized in constitutively water permeable segments of the nephron. J Cell Biol 120: 371-383 [312] Zhang R, Skach W, Hasegawa H, van Hoek AN, Verkman AS (1993) Cloning, functional analysis and cell localization of a kidney proximal tubule water transporter homologous to CHIP28. J Cell Biol 120: 359-369 [313] Ma T, Yang B, Gillespie A, Carlson EJ, Epstein CJ, Verkman AS (1998) Severely impaired urinary concentrating ability in transgenic mice lacking aquaporin-1 water channels. J Biol Chem 273: 4296-4299 [314] Schnermann J, Chou CL, Ma T, Traynor T, Knepper MA, Verkman AS (1998) Defective proximal tubular fluid reabsorption in transgenic aquaporin-1 null mice. Proc Natl Acad Sci USA 95: 9660-9664 [315] Sohara E, Rai T, Miyazaki J, Verkman AS, Sasaki S, Uchida S (2005) Defective water and glycerol transport in the proximal tubules of AQP7 knockout mice. Am J Physiol Renal Physiol 289: F1195-1200 [316] Sohara E, Rai T, Sasaki S, Uchida S (2006) Physiological roles of AQP7 in the kidney: Lessons from AQP7 knockout mice. Biochim Biophys Acta 1758: 1106-1110 [317] Kishida K, Shimomura I, Nishizawa H, et al. (2001) Enhancement of the aquaporin adipose gene expression by a peroxisome proliferator-activated receptor gamma. J Biol Chem 276: 48572-48579 [318] Saad S, Agapiou DJ, Chen XM, Stevens V, Pollock CA (2009) The role of Sgk-1 in the upregulation of transport proteins by PPARgamma agonists in human proximal tubule cells. Nephrol Dial Transplant 24: 1130-1141 [319] Song J, Knepper MA, Hu X, Verbalis JG, Ecelbarger CA (2004) Rosiglitazone activates renal sodium- and water-reabsorptive pathways and lowers blood pressure in normal rats. J Pharmacol Exp Ther 308: 426-433 [320] Muto S, Miyata Y, Imai M, Asano Y (2001) Troglitazone stimulates basolateral rheogenic Na+/HCO3-cotransport activity in rabbit proximal straight tubules. Exp Nephrol 9: 191-197 [321] Endo Y, Suzuki M, Yamada H, et al. (2011) Thiazolidinediones enhance sodium-coupled bicarbonate absorption from renal proximal tubules via PPARgamma-dependent nongenomic signaling. Cell Metab 13: 550-561 [322] Zanchi A, Chiolero A, Maillard M, Nussberger J, Brunner HR, Burnier M (2004) Effects of the peroxisomal proliferator-activated receptor-gamma agonist pioglitazone on renal and hormonal responses to salt in healthy men. J Clin Endocrinol Metab 89: 1140-1145 [323] Barroso I, Gurnell M, Crowley VE, et al. (1999) Dominant negative mutations in human PPARgamma associated with severe insulin resistance, diabetes mellitus and hypertension. Nature 402: 880-883 [324] Diep QN, El Mabrouk M, Cohn JS, et al. (2002) Structure, endothelial function, cell growth, and inflammation in blood vessels of angiotensin-II infused rats: role of peroxisome proliferator-activated receptor-gamma. Circulation 105: 2296-2302 [325] Ryan MJ, Didion SP, Mathur S, Faraci FM, Sigmund CD (2004) PPAR(gamma) agonist rosiglitazone improves vascular function and lowers blood pressure in hypertensive transgenic mice. Hypertension 43: 661-666 [326] Sugawara A, Takeuchi K, Uruno A, et al. (2001) Transcriptional suppression of type 1 angiotensin II receptor gene expression by peroxisome proliferator-activated receptor-gamma in vascular smooth muscle cells. Endocrinology 142: 3125-3134 [327] Martin-Nizard F, Furman C, Delerive P, et al. (2002) Peroxisome proliferator-activated receptor activators inhibit oxidized low-density lipoprotein-induced endothelin-1 secretion in endothelial cells. J Cardiovasc Pharmacol 40: 822-831
435
[328] Iglarz M, Touyz RM, Amiri F, Lavoie MF, Diep QN, Schiffrin EL (2003) Effect of peroxisome proliferator-activated receptor-alpha and -gamma activators in vascular remodeling in endothelin-dependent hypertension. Arterioscler Thromb Vasc Biol 23: 45-51 [329] Buchanan TA, Meehan WP, Jeng YY, et al. (1995) Blood pressure lowering by pioglitazone. Evidence for a direct vascular effect. J Clin Invest 96: 354-360 [330] Song J, Walsh MF, Igwe R, et al. (1997) Troglitazone reduces contraction by inhibition of vascular smooth muscle cell Ca2+ currents and not endothelial nitric oxide production. Diabetes 46: 659-664 [331] Tsai YS, Kim HJ, Takahashi N, et al. (2004) Hypertension and abnormal fat distribution but not insulin resistance in mice with P465L PPARgamma. J Clin Invest 114: 240-249 [332] Duan SZ, Ivashchenko CY, Whitesall SE, et al. (2007) Hypotension, lipodystrophy, and insulin resistance in generalized PPARgamma-deficient mice rescued from embryonic lethality. J Clin Invest 117: 812-822 [333] Cappuccio FP, Markandu ND, Buckley MG, Sagnella GA, Shore AC, MacGregor GA (1987) Changes in the plasma levels of atrial natriuretic peptides during mineralocorticoid escape in man. Clin Sci (Lond) 72: 531-539 [334] Zimmerman RS, Edwards BS, Schwab TR, Heublein DM, Burnett JC, Jr. (1987) Atrial natriuretic peptide during mineralocorticoid escape in the human. J Clin Endocrinol Metab 64: 624-627 [335] Goenka N, Kotonya C, Penney MD, Randeva HS, O'Hare JP (2008) Thiazolidinediones and the renal and hormonal response to water-immersion induced volume expansion in type 2 diabetes melliltus. Am J Physiol Endocrinol Metab 294: E733-739 [336] Khan O, Riazi S, Hu X, Song J, Wade JB, Ecelbarger CA (2005) Regulation of the renal thiazide-sensitive Na-Cl cotransporter, blood pressure, and natriuresis in obese Zucker rats treated with rosiglitazone. Am J Physiol Renal Physiol 289: F442-450 [337] Hansen L, Ekstrom CT, Tabanera YPR, Anant M, Wassermann K, Reinhardt RR (2006) The Pro12Ala variant of the PPARG gene is a risk factor for peroxisome proliferator-activated receptor-gamma/alpha agonist-induced edema in type 2 diabetic patients. J Clin Endocrinol Metab 91: 3446-3450 [338] Stefanski A, Majkowska L, Ciechanowicz A, et al. (2006) Association between the Pro12Ala variant of the peroxisome proliferator-activated receptor-gamma2 gene and increased 24-h diastolic blood pressure in obese patients with type II diabetes. J Hum Hypertens 20: 684-692 [339] Barbato A, Cappuccio FP, Folkerd EJ, et al. (2004) Metabolic syndrome and renal sodium handling in three ethnic groups living in England. Diabetologia 47: 40-46 [340] Stehouwer CD, Henry RM, Ferreira I (2008) Arterial stiffness in diabetes and the metabolic syndrome: a pathway to cardiovascular disease. Diabetologia 51: 527-539 [341] Rizzoni D, Porteri E, Guelfi D, et al. (2001) Endothelial dysfunction in small resistance arteries of patients with non-insulin-dependent diabetes mellitus. J Hypertens 19: 913-919 [342] Rizzoni D, Porteri E, Guelfi D, et al. (2001) Structural alterations in subcutaneous small arteries of normotensive and hypertensive patients with non-insulin-dependent diabetes mellitus. Circulation 103: 1238-1244 [343] Cardillo C, Nambi SS, Kilcoyne CM, et al. (1999) Insulin stimulates both endothelin and nitric oxide activity in the human forearm. Circulation 100: 820-825 [344] Mather K, Anderson TJ, Verma S (2001) Insulin action in the vasculature: physiology and pathophysiology. J Vasc Res 38: 415-422 [345] Vaccarino V, Holford TR, Krumholz HM (2000) Pulse pressure and risk for myocardial infarction and heart failure in the elderly. J Am Coll Cardiol 36: 130-138 [346] Fernandes VR, Polak JF, Cheng S, et al. (2008) Arterial stiffness is associated with regional ventricular systolic and diastolic dysfunction: the Multi-Ethnic Study of Atherosclerosis. Arterioscler Thromb Vasc Biol 28: 194-201 [347] Bishop-Bailey D (2000) Peroxisome proliferator-activated receptors in the cardiovascular system. Br J Pharmacol 129: 823-834 [348] Quinn CE, Hamilton PK, Lockhart CJ, McVeigh GE (2008) Thiazolidinediones: effects on insulin resistance and the cardiovascular system. Br J Pharmacol 153: 636-645 [349] Tziomalos K, Athyros VG, Karagiannis A, Mikhailidis DP (2009) Endothelial dysfunction in metabolic syndrome: Prevalence, pathogenesis and management. Nutr Metab Cardiovasc Dis 20: 140-146 [350] Harashima K, Hayashi J, Miwa T, Tsunoda T (2009) Long-term pioglitazone therapy improves arterial stiffness in patients with type 2 diabetes mellitus. Metabolism 58: 739-745
436
[351] Yu J, Jin N, Wang G, Zhang F, Mao J, Wang X (2007) Peroxisome proliferator-activated receptor gamma agonist improves arterial stiffness in patients with type 2 diabetes mellitus and coronary artery disease. Metabolism 56: 1396-1401 [352] Kalambokis GN, Tsatsoulis AA, Tsanios EV (2004) The edematogenic properties of insulin. Am J Kidney Dis 44: 575-590 [353] Horita S, Seki G, Yamada H, Suzuki M, Koike K, Fujita T (2011) Insulin resistance, obesity, hypertension, and renal sodium transport. International journal of hypertension 2011: 391762 [354] Blazer-Yost BL, Esterman MA, Vlahos CJ (2003) Insulin-stimulated trafficking of ENaC in renal cells requires PI 3-kinase activity. Am J Physiol Cell Physiol 284: C1645-1653 [355] Baum M (1987) Insulin stimulates volume absorption in the rabbit proximal convoluted tubule. J Clin Invest 79: 1104-1109 [356] Zheng Y, Yamada H, Sakamoto K, et al. (2005) Roles of insulin receptor substrates in insulin-induced stimulation of renal proximal bicarbonate absorption. J Am Soc Nephrol 16: 2288-2295 [357] Raskin P, Rendell M, Riddle MC, Dole JF, Freed MI, Rosenstock J (2001) A randomized trial of rosiglitazone therapy in patients with inadequately controlled insulin-treated type 2 diabetes. Diabetes Care 24: 1226-1232 [358] Seki G, Endo Y, Suzuki M, Yamada H, Horita S, Fujita T (2012) Role of renal proximal tubule transport in thiazolidinedione-induced volume expansion. World journal of nephrology 1: 146-150 [359] Goodyear LJ, Giorgino F, Sherman LA, Carey J, Smith RJ, Dohm GL (1995) Insulin receptor phosphorylation, insulin receptor substrate-1 phosphorylation, and phosphatidylinositol 3-kinase activity are decreased in intact skeletal muscle strips from obese subjects. J Clin Invest 95: 2195-2204 [360] Friedman JE, Ishizuka T, Shao J, Huston L, Highman T, Catalano P (1999) Impaired glucose transport and insulin receptor tyrosine phosphorylation in skeletal muscle from obese women with gestational diabetes. Diabetes 48: 1807-1814 [361] Rondinone CM, Wang LM, Lonnroth P, Wesslau C, Pierce JH, Smith U (1997) Insulin receptor substrate (IRS) 1 is reduced and IRS-2 is the main docking protein for phosphatidylinositol 3-kinase in adipocytes from subjects with non-insulin-dependent diabetes mellitus. Proc Natl Acad Sci USA 94: 4171-4175 [362] Idris I, Gray S, Donnelly R (2003) Rosiglitazone and pulmonary oedema: an acute dose-dependent effect on human endothelial cell permeability. Diabetologia 46: 288-290 [363] Dvorak HF, Nagy JA, Feng D, Brown LF, Dvorak AM (1999) Vascular permeability factor/vascular endothelial growth factor and the significance of microvascular hyperpermeability in angiogenesis. Curr Top Microbiol Immunol 237: 97-132 [364] Baumgartner I, Rauh G, Pieczek A, et al. (2000) Lower-extremity edema associated with gene transfer of naked DNA encoding vascular endothelial growth factor. Ann Intern Med 132: 880-884 [365] Emoto M, Anno T, Sato Y, et al. (2001) Troglitazone treatment increases plasma vascular endothelial growth factor in diabetic patients and its mRNA in 3T3-L1 adipocytes. Diabetes 50: 1166-1170 [366] Sotiropoulos KB, Clermont A, Yasuda Y, et al. (2006) Adipose-specific effect of rosiglitazone on vascular permeability and protein kinase C activation: novel mechanism for PPARgamma agonist's effects on edema and weight gain. FASEB J 20: 1203-1205 [367] Yamakawa K, Hosoi M, Koyama H, et al. (2000) Peroxisome proliferator-activated receptor-gamma agonists increase vascular endothelial growth factor expression in human vascular smooth muscle cells. Biochem Biophys Res Commun 271: 571-574 [368] Peeters LL, Vigne JL, Tee MK, Zhao D, Waite LL, Taylor RN (2005) PPAR gamma represses VEGF expression in human endometrial cells: implications for uterine angiogenesis. Angiogenesis 8: 373-379 [369] Sander TL, Noll L, Klinkner DB, et al. (2006) Rosiglitazone antagonizes vascular endothelial growth factor signaling and nuclear factor of activated T cells activation in cardiac valve endothelium. Endothelium 13: 181-190 [370] Sheu WH, Ou HC, Chou FP, Lin TM, Yang CH (2006) Rosiglitazone inhibits endothelial proliferation and angiogenesis. Life Sci 78: 1520-1528 [371] Tooke JE, Elston LM, Gooding KM, et al. (2006) The insulin sensitiser pioglitazone does not influence skin microcirculatory function in patients with type 2 diabetes treated with insulin. Diabetologia 49: 1064-1070
437
[372] Rosenfeld CR, Chen C, Roy T, Liu X (2003) Estrogen selectively up-regulates eNOS and nNOS in reproductive arteries by transcriptional mechanisms. J Soc Gynecol Investig 10: 205-215 [373] Davis ME, Cai H, Drummond GR, Harrison DG (2001) Shear stress regulates endothelial nitric oxide synthase expression through c-Src by divergent signaling pathways. Circ Res 89: 1073-1080 [374] Drummond GR, Cai H, Davis ME, Ramasamy S, Harrison DG (2000) Transcriptional and posttranscriptional regulation of endothelial nitric oxide synthase expression by hydrogen peroxide. Circ Res 86: 347-354 [375] Forstermann U, Pollock JS, Schmidt HH, Heller M, Murad F (1991) Calmodulin-dependent endothelium-derived relaxing factor/nitric oxide synthase activity is present in the particulate and cytosolic fractions of bovine aortic endothelial cells. Proc Natl Acad Sci USA 88: 1788-1792 [376] Garcia-Cardena G, Martasek P, Masters BS, et al. (1997) Dissecting the interaction between nitric oxide synthase (NOS) and caveolin. Functional significance of the nos caveolin binding domain in vivo. J Biol Chem 272: 25437-25440 [377] Garcia-Cardena G, Fan R, Shah V, et al. (1998) Dynamic activation of endothelial nitric oxide synthase by Hsp90. Nature 392: 821-824 [378] Kone BC (2000) Protein-protein interactions controlling nitric oxide synthases. Acta Physiol Scand 168: 27-31 [379] Harris MB, Ju H, Venema VJ, et al. (2001) Reciprocal phosphorylation and regulation of endothelial nitric-oxide synthase in response to bradykinin stimulation. J Biol Chem 276: 16587-16591 [380] Drew BG, Fidge NH, Gallon-Beaumier G, Kemp BE, Kingwell BA (2004) High-density lipoprotein and apolipoprotein AI increase endothelial NO synthase activity by protein association and multisite phosphorylation. Proc Natl Acad Sci USA 101: 6999-7004 [381] Boo YC, Jo H (2003) Flow-dependent regulation of endothelial nitric oxide synthase: role of protein kinases. Am J Physiol Cell Physiol 285: C499-C508 [382] Bauer PM, Fulton D, Boo YC, et al. (2003) Compensatory phosphorylation and protein-protein interactions revealed by loss of function and gain of function mutants of multiple serine phosphorylation sites in endothelial nitric-oxide synthase. J Biol Chem 278: 14841-14849 [383] Vinik AI, Stansberry KB, Barlow PM (2003) Rosiglitazone treatment increases nitric oxide production in human peripheral skin: a controlled clinical trial in patients with type 2 diabetes mellitus. J Diabetes Complications 17: 279-285 [384] Polikandriotis JA, Mazzella LJ, Rupnow HL, Hart CM (2005) Peroxisome proliferator-activated receptor gamma ligands stimulate endothelial nitric oxide production through distinct peroxisome proliferator-activated receptor gamma-dependent mechanisms. Arterioscler Thromb Vasc Biol 25: 1810-1816 [385] St-Pierre P, Bouffard L, Maheux P (2004) Rosiglitazone increases extravasation of macromolecules and endothelial nitric oxide synthase in skeletal muscles of the fructose-fed rat model. Biochem Pharmacol 67: 1997-2004 [386] Clarke H, Marano CW, Peralta Soler A, Mullin JM (2000) Modification of tight junction function by protein kinase C isoforms. Adv Drug Deliv Rev 41: 283-301 [387] Clarke H, Soler AP, Mullin JM (2000) Protein kinase C activation leads to dephosphorylation of occludin and tight junction permeability increase in LLC-PK1 epithelial cell sheets. J Cell Sci 113: 3187-3196 [388] Stasek JE, Jr., Garcia JG (1992) The role of protein kinase C in alpha-thrombin-mediated endothelial cell activation. Semin Thromb Hemost 18: 117-125 [389] Stasek JE, Jr., Patterson CE, Garcia JG (1992) Protein kinase C phosphorylates caldesmon77 and vimentin and enhances albumin permeability across cultured bovine pulmonary artery endothelial cell monolayers. J Cell Physiol 153: 62-75 [390] Ruano G, Bernene J, Windemuth A, et al. (2009) Physiogenomic comparison of edema and BMI in patients receiving rosiglitazone or pioglitazone. Clin Chim Acta 400: 48-55 [391] Nan YS, Feng GG, Hotta Y, et al. (2004) Neuropeptide Y enhances permeability across a rat aortic endothelial cell monolayer. Am J Physiol Heart Circ Physiol 286: H1027-H1033 [392] Hamdy O, Nishiwaki K, Yajima M, et al. (2000) Presence and quantification of neuropeptide Y in pulmonary edema fluids in rats. Exp Lung Res 26: 137-147 [393] Basterra J, Dilly PN, Perez M, Chumbley CC (1989) Vasoactive intestinal polypeptide and neuropeptide-Y, as possible mediators in laryngeal oedema. An immunofluorescence study. Acta Otorhinolaryngol Belg 43: 99-104
438
[394] Dimitrijevic M, Stanojevic S, Vujic V, et al. (2002) Effect of neuropeptide Y on inflammatory paw edema in the rat: involvement of peripheral NPY Y1 and Y5 receptors and interaction with dipeptidyl-peptidase IV (CD26). J Neuroimmunol 129: 35-42 [395] Stamatovic SM, Dimitrijevic OB, Keep RF, Andjelkovic AV (2006) Protein kinase Calpha-RhoA cross-talk in CCL2-induced alterations in brain endothelial permeability. J Biol Chem 281: 8379-8388 [396] Mehta JL, Li DY (1998) Identification and autoregulation of receptor for OX-LDL in cultured human coronary artery endothelial cells. Biochem Biophys Res Commun 248: 511-514 [397] Hu C, Dandapat A, Mehta JL (2007) Angiotensin II induces capillary formation from endothelial cells via the LOX-1 dependent redox-sensitive pathway. Hypertension 50: 952-957 [398] Nitenberg A, Valensi P, Sachs R, Dali M, Aptecar E, Attali JR (1993) Impairment of coronary vascular reserve and ACh-induced coronary vasodilation in diabetic patients with angiographically normal coronary arteries and normal left ventricular systolic function. Diabetes 42: 1017-1025 [399] Pitkanen OP, Nuutila P, Raitakari OT, et al. (1998) Coronary flow reserve is reduced in young men with IDDM. Diabetes 47: 248-254 [400] Erbas T, Erbas B, Kabakci G, Aksoyek S, Koray Z, Gedik O (2000) Plasma big-endothelin levels, cardiac autonomic neuropathy, and cardiac functions in patients with insulin-dependent diabetes mellitus. Clin Cardiol 23: 259-263 [401] Reaven GM, Lithell H, Landsberg L (1996) Hypertension and associated metabolic abnormalities - the role of insulin resistance and the sympathoadrenal system. N Engl J Med 334: 374-381 [402] Zola B, Kahn JK, Juni JE, Vinik AI (1986) Abnormal cardiac function in diabetic patients with autonomic neuropathy in the absence of ischemic heart disease. J Clin Endocrinol Metab 63: 208-214 [403] van Hoeven KH, Factor SM (1991) The diabetic heart: clinical, experimental and pathological features. Acta Cardiol 46: 329-339 [404] Taegtmeyer H, McNulty P, Young ME (2002) Adaptation and maladaptation of the heart in diabetes: Part I: general concepts. Circulation 105: 1727-1733 [405] Duan SZ, Ivashchenko CY, Russell MW, Milstone DS, Mortensen RM (2005) Cardiomyocyte-specific knockout and agonist of peroxisome proliferator-activated receptor-gamma both induce cardiac hypertrophy in mice. Circ Res 97: 372-379 [406] Asakawa M, Takano H, Nagai T, et al. (2002) Peroxisome proliferator-activated receptor gamma plays a critical role in inhibition of cardiac hypertrophy in vitro and in vivo. Circulation 105: 1240-1246 [407] Yamamoto K, Ohki R, Lee RT, Ikeda U, Shimada K (2001) Peroxisome proliferator-activated receptor gamma activators inhibit cardiac hypertrophy in cardiac myocytes. Circulation 104: 1670-1675 [408] Sakai S, Miyauchi T, Irukayama-Tomobe Y, Ogata T, Goto K, Yamaguchi I (2002) Peroxisome proliferator-activated receptor-gamma activators inhibit endothelin-1-related cardiac hypertrophy in rats. Clin Sci (Lond) 103 (Suppl 48): 16S-20S [409] Miyauchi T, Masaki T (1999) Pathophysiology of endothelin in the cardiovascular system. Annu Rev Physiol 61: 391-415 [410] Tsuji T, Mizushige K, Noma T, et al. (2001) Pioglitazone improves left ventricular diastolic function and decreases collagen accumulation in prediabetic stage of a type II diabetic rat. J Cardiovasc Pharmacol 38: 868-874 [411] Ghazzi MN, Perez JE, Antonucci TK, et al. (1997) Cardiac and glycemic benefits of troglitazone treatment in NIDDM. The Troglitazone Study Group. Diabetes 46: 433-439 [412] Furuse Y, Ogino K, Shimoyama M, Sasaki N, Hisatome I (2001) Ca(2+)-sensitizing effect is involved in the positive inotropic effect of troglitazone. Br J Pharmacol 133: 1307-1313 [413] Shimoyama M, Ogino K, Tanaka Y, Ikeda T, Hisatome I (1999) Hemodynamic basis for the acute cardiac effects of troglitazone in isolated perfused rat hearts. Diabetes 48: 609-615 [414] Shimabukuro M, Higa S, Shinzato T, Nagamine F, Komiya I, Takasu N (1996) Cardioprotective effects of troglitazone in streptozotocin-induced diabetic rats. Metabolism 45: 1168-1173 [415] Yao L, Mizushige K, Noma T, Murakami K, Ohmori K, Matsuo H (2001) Improvement of left ventricular diastolic dynamics in prediabetic stage of a type II diabetic rat model after troglitazone treatment. Angiology 52: 53-57 [416] Molkentin JD, Lu JR, Antos CL, et al. (1998) A calcineurin-dependent transcriptional pathway for cardiac hypertrophy. Cell 93: 215-228
439
[417] van Rooij E, Doevendans PA, de Theije CC, Babiker FA, Molkentin JD, de Windt LJ (2002) Requirement of nuclear factor of activated T-cells in calcineurin-mediated cardiomyocyte hypertrophy. J Biol Chem 277: 48617-48626 [418] Wilkins BJ, De Windt LJ, Bueno OF, et al. (2002) Targeted disruption of NFATc3, but not NFATc4, reveals an intrinsic defect in calcineurin-mediated cardiac hypertrophic growth. Mol Cell Biol 22: 7603-7613 [419] Crabtree GR, Olson EN (2002) NFAT signaling: choreographing the social lives of cells. Cell 109 (Suppl): S67-79 [420] Bao Y, Li R, Jiang J, et al. (2008) Activation of peroxisome proliferator-activated receptor gamma inhibits endothelin-1-induced cardiac hypertrophy via the calcineurin/NFAT signaling pathway. Mol Cell Biochem 317: 189-196 [421] Bailey SD, Xie C, Do R, et al. (2010) Variation at the NFATC2 locus increases the risk of thiazolidinedione-induced edema in the Diabetes REduction Assessment with ramipril and rosiglitazone Medication (DREAM) study. Diabetes Care 33: 2250-2253 [422] St John Sutton M, Rendell M, Dandona P, et al. (2002) A comparison of the effects of rosiglitazone and glyburide on cardiovascular function and glycemic control in patients with type 2 diabetes. Diabetes Care 25: 2058-2064 [423] Hirayama H, Sugano M, Abe N, Yonemoch H, Makino N (2001) Troglitazone, an antidiabetic drug, improves left ventricaulr mass and diastolic function in normotensive diabetic patients. Int J Cardiol 77: 75-79 [424] Dargie HJ, Hildebrandt PR, Riegger GA, et al. (2007) A randomized, placebo-controlled trial assessing the effects of rosiglitazone on echocardiographic function and cardiac status in type 2 diabetic patients with New York Heart Association Functional Class I or II Heart Failure. J Am Coll Cardiol 49: 1696-1704 [425] Horio T, Suzuki M, Suzuki K, et al. (2005) Pioglitazone improves left ventricular diastolic function in patients with essential hypertension. Am J Hypertens 18: 949-957 [426] Sena S, Rasmussen IR, Wende AR, et al. (2007) Cardiac hypertrophy caused by peroxisome proliferator-activated receptor-gamma agonist treatment occurs independently of changes in myocardial insulin signaling. Endocrinology 148: 6047-6053 [427] Yang Q, Li Y (2007) Roles of PPARs on regulating myocardial energy and lipid homeostasis. J Mol Med 85: 697-706 [428] Dorkhan M, Dencker M, Stagmo M, Groop L (2009) Effect of pioglitazone versus insulin glargine on cardiac size, function, and measures of fluid retention in patients with type 2 diabetes. Cardiovasc Diabetol 8: 15 [429] Abhayaratna WP, Seward JB, Appleton CP, et al. (2006) Left atrial size: physiologic determinants and clinical applications. J Am Coll Cardiol 47: 2357-2363 [430] Srivastava PM, Calafiore P, MacIsaac RJ, Hare DL, Jerums G, Burrell LM (2004) Thiazolidinediones and congestive heart failure--exacerbation or new onset of left ventricular dysfunction? Diabet Med 21: 945-950 [431] Bunch TJ, Birskovich LM, Eiken PW (2002) Diabetic myonecrosis in a previously healthy woman and review of a 25-year Mayo Clinic experience. Endocr Pract 8: 343-346 [432] Unger RH (2002) Lipotoxic diseases. Annu Rev Med 53: 319-336 [433] Zhou YT, Grayburn P, Karim A, et al. (2000) Lipotoxic heart disease in obese rats: implications for human obesity. Proc Natl Acad Sci USA 97: 1784-1789 [434] Szczepaniak LS, Dobbins RL, Metzger GJ, et al. (2003) Myocardial triglycerides and systolic function in humans: in vivo evaluation by localized proton spectroscopy and cardiac imaging. Magn Reson Med 49: 417-423 [435] Chiu HC, Kovacs A, Ford DA, et al. (2001) A novel mouse model of lipotoxic cardiomyopathy. J Clin Invest 107: 813-822 [436] Hosokawa M, Tsukada H, Fukuda K, et al. (1999) Troglitazone inhibits bicarbonate secretion in rat and human duodenum. J Pharmacol Exp Ther 290: 1080-1084 [437] Morris AD, Boyle DI, MacAlpine R, et al. (1997) The diabetes audit and research in Tayside Scotland (DARTS) study: electronic record linkage to create a diabetes register. DARTS/MEMO Collaboration. BMJ 315: 524-528 [438] Yki-Jarvinen H, Taskinen MR, Kiviluoto T, et al. (1984) Site of insulin resistance in type 1 diabetes: insulin-mediated glucose disposal in vivo in relation to insulin binding and action in adipocytes in vitro. J Clin Endocrinol Metab 59: 1183-1192 [439] Kahn BB, Rosen AS, Bak JF, et al. (1992) Expression of GLUT1 and GLUT4 glucose transporters in skeletal muscle of humans with insulin-dependent diabetes mellitus: regulatory effects of metabolic factors. J Clin Endocrinol Metab 74: 1101-1109
440
[440] Perseghin G, Lattuada G, Danna M, et al. (2003) Insulin resistance, intramyocellular lipid content, and plasma adinopectin in patients with type 1 diabetes. Am J Physiol Endocrinol Metab 285: E1174-E1181 [441] Celi F, Bini V, Papi F, et al. (2006) Circulating adipocytokines in non-diabetic and type 1 diabetic children: relationship to insulin therapy, glycaemic control and pubmertal development. Diabet Med 23: 660-665 [442] Luna R, Garcia-Mayor RV, Lage M, et al. (1999) High serum leptin levels in children with type 1 diabetes mellitus: contribution of age, BMI, pubertal development and metabolic status. Clin Endocrinol (Oxf) 51: 603-610 [443] Baron AD, Laakso M, Brechtel G, Edelman SV (1991) Mechanism of insulin resistance in insulin-dependent diabetes mellitus: a major role for reduced skeletal muscle blood flow. J Clin Endocrinol Metab 73: 637-643 [444] Makimattila S, Virkamaki A, Groop PH, et al. (1996) Chronic hyperglycemia impairs endothelial function and insulin sensitivity via different mechanisms in insulin-dependent diabetes mellitus. Circulation 94: 1276-1282 [445] Moran A, Jacobs DRJ, Steinberger J, et al. (1999) Insulin resistance during puberty: results from clamp studies in 357 children. Diabetes 48: 2039-2044 [446] Libman IM, Pietropaolo M, Arslanian SA, LaPorte RE, Becker DJ (2003) Changing prevalence of overweight children and adolescents at onset of insulin-treated diabetes. Diabetes Care 26: 2871-2875 [447] Taylor AM, Dunger DB, Grant DB, Preece MA (1988) Somatomedin-C/IGF-I measured by radioimmunoassay and somatomedin bioactivity in adolescents with insulin dependent diabetes compared with puberty matched controls. Diabetes Res 9: 177-181 [448] Edge JA, Dunger DB, Matthews DR, Gilbert JP, Smith CP (1990) Increased overnight growth hormone concentrations in diabetic compared with normal adolescents. J Clin Endocrinol Metab 71: 1356-1362 [449] Halldin MU, Tylleskar K, Hagenas L, Tuverno T, Gustafsson J (1998) Is growth hormone hypersecretion in diabetic adolescent girls also a daytime problem? Clin Endocrinol (Oxf) 48: 785-794 [450] Hermann R, Knip M, Veijola R, et al. (2003) Temporal changes in the frequencies of HLA genotypes in patients with Type 1 diabetes - indication of an increased environmental pressure? Diabetologia 46: 420-425 [451] Gillespie KM, Bain SC, Barnett AH, et al. (2004) The rising incidence of childhood type 1 diabetes and reduced contribution of high-risk HLA haplotypes. Lancet 364: 1699-1700 [452] Gale E (2005) Spring harvest? Reflections on the rise of type 1 diabetes. Diabetologia 48: 2445-2450 [453] Betts P, Mulligan J, Ward P, Smith B, Wilkin T (2005) Increasing body weight predicts the earlier onset of insulin-dependent diabetes in childhood: testing the 'accelerator hypothesis' (2). Diabet Med 22: 144-151 [454] Knerr I, Wolf J, Reinehr T, et al. (2005) The 'accelerator hypothesis': relationship between weight, height, body mass index and age at diagnosis in a large cohort of 9,248 German and Austrian children with type 1 diabetes mellitus. Diabetologia 48: 2501-2504 [455] Porter JR, Barrett TG (2004) Braking the accelerator hypothesis? Diabetologia 47: 352-353 [456] Dabelea D, D'Agostino RB, Jr., Mayer-Davis EJ, et al. (2006) Testing the accelerator hypothesis: body size, beta-cell function, and age at onset of type 1 (autoimmune) diabetes. Diabetes Care 29: 290-294 [457] Wilkin TJ (2006) Testing the accelerator hypothesis: body size, beta-cell function, and age at onset of type 1 (autoimmune) diabetes: response to Dabelea et al. Diabetes Care 29: 1462-1463 [458] Fourlanos S, Narendran P, Byrnes GB, Colman PG, Harrison LC (2004) Insulin resistance is a risk factor for progression to type 1 diabetes. Diabetologia 47: 1661-1667 [459] Mrena S, Virtanen SM, Laippala P, et al. (2006) Models for predicting type 1 diabetes in siblings of affected children. Diabetes Care 29: 662-667 [460] Xu P, Cuthbertson D, Greenbaum C, Palmer JP, Krischer JP, Diabetes Prevention Trial - Type 1 Study Group (2007) Role of insulin resistance in predicting progression to type 1 diabetes. Diabetes Care 30: 2314-2320 [461] Bingley PJ, Mahon JL, Gale EA, European Nicotinamide Diabetes Intervention Trial Group (2008) Insulin resistance and progression to type 1 diabetes in the European Nicotinamide Diabetes Intervention Trial (ENDIT). Diabetes Care 31: 146-150
441
[462] Hawa MI, Bonfanti R, Valeri C, Delli Castelli M, Beyan H, Leslie RD (2005) No evidence for genetically determined alteration in insulin secretion or sensitivity predisposing to type 1 diabetes: a study of identical twins. Diabetes Care 28: 1415-1418 [463] Buschard K, Buch I, Molsted-Pedersen L, Hougaard P, Kuhl C (1987) Increased incidence of true type I diabetes acquired during pregnancy. Br Med J (Clin Res Ed) 294: 275-279 [464] Tilg H, Moschen AR (2006) Adipocytokines: mediators linking adipose tissue, inflammation and immunity. Nat Rev Immunol 6: 772-783 [465] Matarese G, Sanna V, Lechler RI, et al. (2002) Leptin accelerates autoimmune diabetes in female NOD mice. Diabetes 51: 1356-1361 [466] Yki-Jarvinen H, Koivisto VA (1986) Natural course of insulin resistance in type I diabetes. N Engl J Med 315: 224-230 [467] Nijs HG, Radder JK, Frolich M, Krans HM (1988) Insulin action is normalized in newly diagnosed type I diabetic patients after three months of insulin treatment. Metabolism 37: 473-478 [468] Wilkin TJ (2009) The accelerator hypothesis: a review of the evidence for insulin resistance as the basis for type I as well as type II diabetes. Int J Obes (Lond) 33: 716-726 [469] Teupe B, Bergis K (1991) Epidemiological evidence for "double diabetes". Lancet 337: 361-362 [470] Pambianco G, Costacou T, Orchard TJ (2007) The prediction of major outcomes of type 1 diabetes: a 12-year prospective evaluation of three separate definitions of the metabolic syndrome and their components and estimated glucose disposal rate: the Pittsburgh Epidemiology of Diabetes Complications Study experience. Diabetes Care 30: 1248-1254 [471] Thorn LM, Forsblom C, Waden J, et al. (2009) Metabolic syndrome as a risk factor for cardiovascular disease, mortality, and progression of diabetic nephropathy in type 1 diabetes. Diabetes Care 32: 950-952 [472] Roglic G, Colhoun HM, Stevens LK, Lemkes HH, Manes C, Fuller JH (1998) Parental history of hypertension and parental history of diabetes and microvascular complications in insulin-dependent diabetes mellitus: the EURODIAB IDDM Complications Study. Diabet Med 15: 418-426 [473] Erbey JR, Kuller LH, Becker DJ, Orchard TJ (1998) The association between a family history of type 2 diabetes and coronary artery disease in a type 1 diabetes population. Diabetes Care 21: 610-614 [474] Nathan DM, Cleary PA, Backlund JY, et al. (2005) Intensive diabetes treatment and cardiovascular disease in patients with type 1 diabetes. N Engl J Med 353: 2643-2653 [475] Sibley SD, Palmer JP, Hirsch IB, Brunzell JD (2003) Visceral obesity, hepatic lipase activity, and dyslipidemia in type 1 diabetes. J Clin Endocrinol Metab 88: 3379-3384 [476] Purnell JQ, Hokanson JE, Marcovina SM, Steffes MW, Cleary PA, Brunzell JD (1998) Effect of excessive weight gain with intensive therapy of type 1 diabetes on lipid levels and blood pressure: results from the DCCT. Diabetes Control and Complications Trial. JAMA 280: 140-146 [477] Schaumberg DA, Glynn RJ, Jenkins AJ, et al. (2005) Effect of intensive glycemic control on levels of markers of inflammation in type 1 diabetes mellitus in the Diabetes Control and Complications Trial. Circulation 111: 2446-2453 [478] Ferriss JB, Webb D, Chaturvedi N, Fuller JH, Idzior-Walus B (2006) Weight gain is associated with improved glycaemic control but with adverse changes in plasma lipids and blood pressure isn Type 1 diabetes. Diabet Med 23: 557-564 [479] Cleland SJ, Fisher BM, Colhoun HM, Sattar N, Petrie JR (2013) Insulin resistance in type 1 diabetes: what is 'double diabetes' and what are the risks? Diabetologia 56: 1462-1470 [480] Ruotolo G, Parlavecchia M, Taskinen MR, et al. (1994) Normalization of lipoprotein composition by intraperitoneal insulin in IDDM. Role of increased hepatic lipase activity. Diabetes Care 17: 6-12 [481] Petruzzo P, Badet L, Lefrancois N, et al. (2006) Metabolic consequences of pancreatic systemic or portal venous drainage in simultaneous pancreas-kidney transplant recipients. Diabet Med 23: 654-659 [482] Nevalainen P, Lahtela JT, Mustonen J, Pasternack A (1997) The influence of peritoneal dialysis and the use of subcutaneous and intraperitoneal insulin on glucose metabolism and serum lipids in type 1 diabetic patients. Nephrol Dial Transplant 12: 145-150 [483] Selam JL, Kashyap M, Alberti KG, et al. (1989) Comparison of intraperitoneal and subcutaneous insulin administration on lipids, apolipoproteins, fuel metabolites, and hormones in type I diabetes mellitus. Metabolism 38: 908-912 [484] Lahtela JT, Mustonen J, Pasternack A (1995) Comparison of intraperitoneal and subcutaneous insulin administration on insulin sensitivity and serum lipids in type I diabetic patients on continuous ambulatory peritoneal dialysis treatment. Clin Sci (Lond) 88: 427-432
442
[485] Heptulla RA, Stewart A, Enocksson S, et al. (2003) In situ evidence that peripheral insulin resistance in adolescents with poorly controlled type 1 diabetes is associated with impaired suppression of lipolysis: a microdialysis study. Pedr Res 53: 830-835 [486] Perseghin G, Lattuada G, De Cobelli F, et al. (2005) Reduced intrahepatic fat content is associated with increased whole-body lipid oxidation in patients with type 1 diabetes. Diabetologia 48: 2615-2621 [487] Bailey CJ (2008) Metformin: effects on micro and macrovascular complications in type 2 diabetes. Cardiovasc Drugs Ther 22: 215-224 [488] UK Prospective Diabetes Study (UKPDS) Group (1998) Effect of intensive blood-glucose control with metformin on complications in overweight patients with type 2 diabetes (UKPDS 34). Lancet 352: 854-865 [489] Holman RR, Paul SK, Bethel MA, Matthews DR, Neil HA (2008) 10-year follow-up of intensive glucose control in type 2 diabetes. N Engl J Med 359: 1577-1589 [490] Kao J, Tobis J, McClelland RL, et al. (2004) Relation of metformin treatment to clinical events in diabetic patients undergoing percutaneous intervention. Am J Cardiol 93: 1347-1350, A1345 [491] Evans JM, Ogston SA, Emslie-Smith A, Morris AD (2006) Risk of mortality and adverse cardiovascular outcomes in type 2 diabetes: a comparison of patients treated with sulphonylureas and metformin. Diabetologia 49: 930-936 [492] McAfee AT, Koro C, Landon J, Ziyadeh N, Walker AM (2007) Coronary heart disease outcomes in patients receiving antidiabetic agents. Pharmacoepidemiol Drug Saf 16: 711-725 [493] Kooy A, de Jager J, Lehert P, et al. (2009) Long-term effects of metformin on metabolism and microvascular and macrovascular disease in patients with type 2 diabetes mellitus. Arch Intern Med 169: 616-625 [494] Nichols GA, Koro CE, Gullion CM, Ephross SA, Brown JB (2005) The incidence of congestive heart failure associated with antidiabetic therapies. Diabetes Metab Res Rev 21: 51-57 [495] International Conference on Harmonisation of Technical Requirements for Registration of Pharmaceuticals for Human Use (1996) ICH Harmonised Tripartite Guideline: Guideline for Good Clinical Practice E6 (R1). [496] World Medical Association (2000) Ethical principles for medical research involving human subjects. In: 52nd WMA General Assembly Edinburgh, Scotland [497] Scottish Executive Health Department (2006) Research Governance Framework for Health and Community Care, second edition, 2006. Available from http://www.cso.scot.nhs.uk/publications/ResGov/Framework/RGFEdTwo.pdf, accessed 12th October 2010 [498] UK Council of Caldicott Guardians (2010) The Caldicott Guardian Manual 2010. Department of Health [499] Evans JMM, McDevitt DG, MacDonald TM (1995) The Tayside Medicines Monitoring Unit (MEMO). A record-linkage system for pharmacovigilance. Pharmaceut Med 9: 177–184. [500] Stumvoll M, Haring H (2002) The peroxisome proliferator-activated receptor-gamma2 Pro12Ala polymorphism. Diabetes 51: 2341-2347 [501] Levey AS, Bosch JP, Lewis JB, Greene T, Rogers N, Roth D (1999) A more accurate method to estimate glomerular filtration rate from serum creatinine: a new prediction equation. Modification of Diet in Renal Disease Study Group. Ann Intern Med 130: 461-470 [502] Friedewald WT, Levy RI, Fredrickson DS (1972) Estimation of the concentration of low-density lipoprotein cholesterol in plasma, without use of the preparative ultracentrifuge. Clin Chem 18: 499-502 [503] Nagueh SF, Appleton CP, Gillebert TC, et al. (2009) Recommendations for the evaluation of left ventricular diastolic function by echocardiography. J Am Soc Echocardiogr 22: 107-133 [504] O'Rourke MF, Pauca A, Jiang XJ (2001) Pulse wave analysis. Br J Clin Pharmacol 51: 507-522 [505] Chen CH, Nevo E, Fetics B, et al. (1997) Estimation of central aortic pressure waveform by mathematical transformation of radial tonometry pressure. Validation of generalized transfer function. Circulation 95: 1827-1836 [506] Finkelstein SM, Cohn JN, Collins VR, Carlyle PF, Shelley WJ (1985) Vascular hemodynamic impedance in congestive heart failure Am J Cardiol 55: 423-427 [507] Cohn JN (1973) Vasodilator therapy for heart failure. The influence of impedance on left ventricular performance. Circulation 48: 5-8 [508] Pepine CJ, Nichols WW, Conti CR (1978) Aortic input impedance in heart failure. Circulation 58: 460-465
443
[509] Davies JI, Struthers AD (2005) Beyond blood pressure: pulse wave analysis - a better way of assessing cardiovascular risk? Future Cardiol 1: 69-78 [510] Tomlinson LA (2012) Methods for assessing arterial stiffness: technical considerations. Curr Opin Nephrol Hypertens 21: 655-660 [511] Perrone RD (1992) Means of clinical evaluation of renal disease progression. Kidney Int Suppl 36: S26-32 [512] Rahn KH, Heidenreich S, Bruckner D (1999) How to assess glomerular function and damage in humans. J Hypertens 17: 309-317 [513] Schreiner GE (1950) Determination of inulin by means of resorcinol. Proc Soc Exp Biol Med 74: 117-120 [514] Motwani JG, Lang CC, Cramb G, Struthers AD (1995) Natriuretic response to neutral endopeptidase inhibition is blunted by enalapril in healthy men. Hypertension 25: 637-642 [515] Schnurr E, Lahme W, Kuppers H (1980) Measurement of renal clearance of inulin and PAH in the steady state without urine collection. Clin Nephrol 13: 26-29 [516] Sturrock ND, Lang CC, Coutie WJ, Struthers AD (1995) Cyclosporin-induced renal vasoconstriction is augmented by frusemide and by angiotensin II in humans. J Hypertens 13: 987-991 [517] Carvounis CP, Nisar S, Guro-Razuman S (2002) Significance of the fractional excretion of urea in the differential diagnosis of acute renal failure. Kidney Int 62: 2223-2229 [518] Koomans HA, Boer WH, Dorhout Mees EJ (1989) Evaluation of lithium clearance as a marker of proximal tubule sodium handling. Kidney Int 36: 2-12 [519] Christensen S (1990) Furosemide effect during volume expansion: evidence against lithium transport in the loop. Kidney Int Suppl 28: S45-51 [520] Boer WH, Koomans HA, Dorhout Mees EJ, Gaillard CA, Rabelink AJ (1988) Lithium clearance during variations in sodium intake in man: effects of sodium restriction and amiloride. Eur J Clin Invest 18: 279-283 [521] Thomsen K (1984) Lithium clearance: a new method for determining proximal and distal tubular reabsorption of sodium and water. Nephron 37: 217-223 [522] Allon M, Pasque CB, Rodriguez M (1990) Interaction of captopril and ibuprofen on glomerular and tubular function in humans. Am J Physiol 259: F233-238 [523] Seidlerova J, Staessen JA, Maillard M, et al. (2006) Association between arterial properties and renal sodium handling in a general population. Hypertension 48: 609-615 [524] Pace N, Rathbun EN (1945) Studies on body composition: III. The body water and chemically combined nitrogen content in relation to fat content. J Biol Chem 158: 685-691 [525] Halliday D, Miller AG (1977) Precise measurement of total body water using trace quantities of deuterium oxide. Biomed Mass Spectrom 4: 82-87 [526] Schoeller DA, van Santen E, Peterson DW, Dietz W, Jaspan J, Klein PD (1980) Total body water measurement in humans with 18O and 2H labeled water. Am J Clin Nutr 33: 2686-2693 [527] International Atomic Energy Agency (2009) IAEA human health series no. 3: assessment of body composition and total energy expenditure in humans using stable isotope techniques. International Atomic Energy Agency, Vienna [528] Wang Z, Zhang J, Ying Z, Heymsfield SB (2012) New insights into scaling of fat-free mass to height across children and adults. Am J Hum Biol 24: 648-653 [529] Brijker F, Heijdra YF, Van Den Elshout FJ, Bosch FH, Folgering HT (2000) Volumetric measurements of peripheral oedema in clinical conditions. Clin Physiol 20: 56-61 [530] Fogari R, Zoppi A, Derosa G, et al. (2007) Effect of valsartan addition to amlodipine on ankle oedema and subcutaneous tissue pressure in hypertensive patients. J Hum Hypertens 21: 220-224 [531] Ueda S, Petrie JR, Cleland SJ, Elliott HL, Connell JM (1998) Insulin vasodilatation and the "arginine paradox" Lancet 351: 959-960 [532] Kaulesar Sukul DM, den Hoed PT, Johannes EJ, van Dolder R, Benda E (1993) Direct and indirect methods for the quantification of leg volume: comparison between water displacement columetry, the disk model method and the frustrum sign model method, using the correlation coefficient and the limits of agreement. J Biomed Eng 15: 477-480 [533] Stranden E (1981) A comparison between surface measurements and water displacement volumetry for the quantification of leg edema. J Oslo City Hosp 31: 153-155 [534] Auvert JF, Vayssairat M (2002) Volumetrics: an indispensable complementary test in lymphology. Rev Med Interne 23 (Suppl 3): 388s-390s
444
[535] van Hamersvelt HW, Kloke HJ, de Jong DJ, Koene RA, Huysmans FT (1996) Oedema formation with the vasodilators nifedipine and diazoxide: direct local effect or sodium retention? J Hypertens 14: 1041-1045 [536] Brodovicz KG, McNaughton K, Uemura N, Meininger G, Girman CJ, Yale SH (2009) Reliability and feasibility of methods to quantitatively assess peripheral edema. Clin Med Res 7: 21-31 [537] Goldie IF, Gunterberg B, Jacobson C (1974) Foot volumetry as an objective test of the effect of antiphlogistic drugs in ankle sprains. A preliminary study. Rheumatol Rehabil 13: 204-207 [538] Krijnen RM, de Boer EM, Ader HJ, Bruynzeel DP (1997) Venous insufficiency in male workers with a standing profession. Part 2: diurnal volume changes of the lower legs. Dermatology 194: 121-126 [539] Rabe E, Stucker M, Ottillinger B (2010) Water displacement leg volumetry in clinical studies - a discussion of error sources. BMC Med Res Methodol 10: 5 [540] Rondon-Berrios H (2011) New insights into the pathophysiology of oedema in nephrotic syndrome. Nefrologia 31: 148-154 [541] Chen L, Yang B, A. MJ, et al. (2005) GI262570, a perisome proliferator-activated receptor (gamma) agonist, changes electrolytes and water reabsorption from the distal nephron in rats. J Pharmacol Exp Ther 2005 312: 718-725 [542] Brandt I, Lambeir AM, Ketelslegers JM, Vanderheyden M, Scharpe S, De Meester I (2006) Dipeptidyl-peptidase IV converts intact B-type natriuretic peptide into its des-SerPro form. Clin Chem 52: 82-87 [543] Raine AE, Erne P, Burgisser E, et al. (1986) Atrial natriuretic peptide and atrial pressure in patients with congestive heart failure. N Engl J Med 315: 533-537 [544] Baxter GF (2004) The natriuretic peptides. Basic Res Cardiol 99: 71-75 [545] Goetze JP (2004) Biochemistry of pro-B-type natriuretic peptide-derived peptides: the endocrine heart revisited. Clin Chem 50: 1503-1510 [546] Seilhamer JJ, Arfsten A, Miller JA, et al. (1989) Human and canine gene homologs of porcine brain natriuretic peptide. Biochem Biophys Res Commun 165: 650-658 [547] Lam CS, Burnett JC, Jr., Costello-Boerrigter L, Rodeheffer RJ, Redfield MM (2007) Alternate circulating pro-B-type natriuretic peptide and B-type natriuretic peptide forms in the general population. J Am Coll Cardiol 49: 1193-1202 [548] Daniels LB, Maisel AS (2007) Natriuretic peptides. J Am Coll Cardiol 50: 2357-2368 [549] Nakagawa O, Ogawa Y, Itoh H, et al. (1995) Rapid transcriptional activation and early mRNA turnover of brain natriuretic peptide in cardiocyte hypertrophy. Evidence for brain natriuretic peptide as an "emergency" cardiac hormone against ventricular overload. J Clin Invest 96: 1280-1287 [550] Yan W, Wu F, Morser J, Wu Q (2000) Corin, a transmembrane cardiac serine protease, acts as a pro-atrial natriuretic peptide-converting enzyme. Proc Natl Acad Sci USA 97: 8525-8529 [551] Ohishi K, Hishida A, Honda N (1988) Direct vasodilatory action of atrial natriuretic factor on canine glomerular afferent arterioles. Am J Physiol 255: F415-420 [552] Sonnenberg H, Honrath U, Chong CK, Wilson DR (1986) Atrial natriuretic factor inhibits sodium transport in medullary collecting duct. Am J Physiol 250: F963-966 [553] Davis CL, Briggs JP (1987) Effect of atrial natriuretic peptides on renal medullary solute gradients. Am J Physiol 253: F679-684 [554] Del Ry S, Cabiati M, Clerico A (2013) Recent advances on natriuretic peptide system: New promising therapeutic targets for the treatment of heart failure. Pharmacol Res 76: 190-198 [555] Mair J (2008) Biochemistry of B-type natriuretic peptide--where are we now? Clinical chemistry and laboratory medicine : Clin Chem Lab Med 46: 1507-1514 [556] Yalta K, Yalta T, Sivri N, Yetkin E (2013) Copeptin and cardiovascular disease: A review of a novel neurohormone. Int J Cardiol 167: 1750-1759 [557] Szinnai G, Morgenthaler NG, Berneis K, et al. (2007) Changes in plasma copeptin, the c-terminal portion of arginine vasopressin during water deprivation and excess in healthy subjects. J Clin Endocrinol Metab 92: 3973-3978 [558] Chatterjee K (2005) Neurohormonal activation in congestive heart failure and the role of vasopressin. Am J Cardiol 95: 8b-13b [559] Redfield MM, Edwards BS, McGoon MD, Heublein DM, Aarhus LL, Burnett JC, Jr. (1989) Failure of atrial natriuretic factor to increase with volume expansion in acute and chronic congestive heart failure in the dog. Circulation 80: 651-657 [560] Volpe M, Tritto C, De Luca N, et al. (1991) Failure of atrial natriuretic factor to increase with saline load in patients with dilated cardiomyopathy and mild heart failure. J Clin Invest 88: 1481-1489
445
[561] Forfia PR, Lee M, Tunin RS, Mahmud M, Champion HC, Kass DA (2007) Acute phosphodiesterase 5 inhibition mimics hemodynamic effects of B-type natriuretic peptide and potentiates B-type natriuretic peptide effects in failing but not normal canine heart. J Am Coll Cardiol 49: 1079-1088 [562] Andreassi MG, Del Ry S, Palmieri C, Clerico A, Biagini A, Giannessi D (2001) Up-regulation of 'clearance' receptors in patients with chronic heart failure: a possible explanation for the resistance to biological effects of cardiac natriuretic hormones. Eur J Heart Fail 3: 407-414 [563] Jiang W, Cai DY, Pan CS, et al. (2005) Changes in production and metabolism of brain natriuretic peptide in rats with myocardial necrosis. Eur J Pharmacol 507: 153-162 [564] Chen S, Sen S, Young D, Wang W, Moravec CS, Wu Q (2010) Protease corin expression and activity in failing hearts. Am J Physiol Heart Circ Physiol 299: H1687-1692 [565] Newton-Cheh C, Larson MG, Vasan RS, et al. (2009) Association of common variants in NPPA and NPPB with circulating natriuretic peptides and blood pressure. Nat Genet 41: 348-353 [566] Cannone V, Boerrigter G, Cataliotti A, et al. (2011) A genetic variant of the atrial natriuretic peptide gene is associated with cardiometabolic protection in the general community. J Am Coll Cardiol 58: 629-636 [567] Cannone V, Cefalu AB, Noto D, et al. (2013) The Atrial Natriuretic Peptide Genetic Variant rs5068 Is Associated With a Favorable Cardiometabolic Phenotype in a Mediterranean Population. Diabetes Care 36: 2850-2856 [568] Dries DL, Victor RG, Rame JE, et al. (2005) Corin gene minor allele defined by 2 missense mutations is common in blacks and associated with high blood pressure and hypertension. Circulation 112: 2403-2410 [569] Stamler J (1997) The INTERSALT Study: background, methods, findings, and implications. Am J Clin Nutr 65: 626s-642s [570] Sacks FM, Svetkey LP, Vollmer WM, et al. (2001) Effects on blood pressure of reduced dietary sodium and the Dietary Approaches to Stop Hypertension (DASH) diet. DASH-Sodium Collaborative Research Group. N Engl J Med 344: 3-10 [571] He FJ, Li J, Macgregor GA (2013) Effect of longer-term modest salt reduction on blood pressure. Cochrane Database Syst Rev 4: Cd004937 [572] Cheung BM, Ho SP, Cheung AH, Lau CP (2000) Diastolic blood pressure is related to urinary sodium excretion in hypertensive Chinese patients. QJM 93: 163-168 [573] Foo M, Denver AE, Coppack SW, Yudkin JS (1998) Effect of salt-loading on blood pressure, insulin sensitivity and limb blood flow in normal subjects. Clin Sci (Lond) 95: 157-164 [574] Townsend RR, Kapoor S, McFadden CB (2007) Salt intake and insulin sensitivity in healthy human volunteers. Clin Sci (Lond) 113: 141-148 [575] Vedovato M, Lepore G, Coracina A, et al. (2004) Effect of sodium intake on blood pressure and albuminuria in Type 2 diabetic patients: the role of insulin resistance. Diabetologia 47: 300-303 [576] Trevisan R, Bruttomesso D, Vedovato M, et al. (1998) Enhanced responsiveness of blood pressure to sodium intake and to angiotensin II is associated with insulin resistance in IDDM patients with microalbuminuria. Diabetes 47: 1347-1353 [577] Strojek K, Grzeszczak W, Lacka B, Gorska J, Keller CK, Ritz E (1995) Increased prevalence of salt sensitivity of blood pressure in IDDM with and without microalbuminuria. Diabetologia 38: 1443-1448 [578] Christlieb AR, Kaldany A, D'Elia JA (1976) Plasma renin activity and hypertension in diabetes mellitus. Diabetes 25: 969-974 [579] de Chatel R, Weidmann P, Flammer J, et al. (1977) Sodium, renin, aldosterone, catecholamines, and blood pressure in diabetes mellitus. Kidney Int 12: 412-421 [580] Perez GO, Lespier L, Jacobi J, et al. (1977) Hyporeninemia and hypoaldosteronism in diabetes mellitus. Arch Intern Med 137: 852-855 [581] Bigazzi R, Bianchi S, Baldari G, Campese VM (1996) Clustering of cardiovascular risk factors in salt-sensitive patients with essential hypertension: role of insulin. Am J Hypertens 9: 24-32 [582] Giner V, Coca A, de la Sierra A (2001) Increased insulin resistance in salt sensitive essential hypertension. J Hum Hypertens 15: 481-485 [583] Price DA, Porter LE, Gordon M, et al. (1999) The paradox of the low-renin state in diabetic nephropathy. J Am Soc Nephrol 10: 2382-2391 [584] Tuck M, Corry D, Trujillo A (1990) Salt-sensitive blood pressure and exaggerated vascular reactivity in the hypertension of diabetes mellitus. Am J Med 88: 210-216 [585] Yatabe MS, Yatabe J, Yoneda M, et al. (2010) Salt sensitivity is associated with insulin resistance, sympathetic overactivity, and decreased suppression of circulating renin activity in lean patients with essential hypertension. Am J Clin Nutr 92: 77-82
446
[586] Williams JS, Williams GH, Jeunemaitre X, Hopkins PN, Conlin PR (2005) Influence of dietary sodium on the renin-angiotensin-aldosterone system and prevalence of left ventricular hypertrophy by EKG criteria. J Hum Hypertens 19: 133-138 [587] Shoback DM, Williams GH, Moore TJ, Dluhy RG, Podolsky S, Hollenberg NK (1983) Defect in the sodium-modulated tissue responsiveness to angiotensin II in essential hypertension. J Clin Invest 72: 2115-2124 [588] Williams GH, Dluhy RG, Lifton RP, et al. (1992) Non-modulation as an intermediate phenotype in essential hypertension. Hypertension 20: 788-796 [589] Underwood PC, Chamarthi B, Williams JS, et al. (2012) Nonmodulation as the mechanism for salt sensitivity of blood pressure in individuals with hypertension and type 2 diabetes mellitus. J Clin Endocrinol Metab 97: 3775-3782 [590] Van Bortel LM, Struijker-Boudier HA, Safar ME (2001) Pulse pressure, arterial stiffness, and drug treatment of hypertension. Hypertension 38: 914-921 [591] Nichols WW (2005) Clinical measurement of arterial stiffness obtained from noninvasive pressure waveforms. Am J Hypertens 18: 3s-10s [592] Kass DA, Bronzwaer JG, Paulus WJ (2004) What mechanisms underlie diastolic dysfunction in heart failure? Circ Res 94: 1533-1542 [593] Chen CH, Nakayama M, Nevo E, Fetics BJ, Maughan WL, Kass DA (1998) Coupled systolic-ventricular and vascular stiffening with age: implications for pressure regulation and cardiac reserve in the elderly. J Am Coll Cardiol 32: 1221-1227 [594] Kawaguchi M, Hay I, Fetics B, Kass DA (2003) Combined ventricular systolic and arterial stiffening in patients with heart failure and preserved ejection fraction: implications for systolic and diastolic reserve limitations. Circulation 107: 714-720 [595] Peng X, Haldar S, Deshpande S, Irani K, Kass DA (2003) Wall stiffness suppresses Akt/eNOS and cytoprotection in pulse-perfused endothelium. Hypertension 41: 378-381 [596] Zou J, Li Y, Yan CH, Wei FF, Zhang L, Wang JG (2013) Blood pressure in relation to interactions between sodium dietary intake and renal handling. Hypertension 62: 719-725 [597] Doney AS, Dannfald J, Kimber CH, et al. (2009) The FTO gene is associated with an atherogenic lipid profile and myocardial. Circulation Cardiovascular genetics 2: 255-259 [598] Zhou K, Donnelly L, Burch L, et al. (2010) Loss-of-function CYP2C9 variants improve therapeutic response to sulfonylureas in. Clin Pharmacol Ther 87: 52-56 [599] Perseghin G, Lattuada G, Danna M, et al. (2003) Insulin resistance, intramyocellular lipid content, and plasma adiponectin in patients with type 1 diabetes. Am J Physiol Endocrinol Metab 285: E1174-1181 [600] Szwejkowski BR, Elder DH, Shearer F, et al. (2012) Pulmonary hypertension predicts all-cause mortality in patients with heart. Eur J Heart Fail 14: 162-167 [601] Pearson ER, Donnelly LA, Kimber C, et al. (2007) Variation in TCF7L2 influences therapeutic response to sulfonylureas: a GoDARTs study. Diabetes 56: 2178-2182 [602] Cockcroft DW, Gault MH (1976) Prediction of creatinine clearance from serum creatinine. Nephron 16: 31-41 [603] Devereux RB, Reichek N (1977) Echocardiographic determination of left ventricular mass in man. Anatomic validation of the method. Circulation 55: 613-618 [604] Devereux RB, Alonso DR, Lutas EM, et al. (1986) Echocardiographic assessment of left ventricular hypertrophy: comparison to necropsy findings. Am J Cardiol 57: 450-458 [605] Lang RM, Bierig M, Devereux RB, et al. (2005) Recommendations for chamber quantification: a report from the American Society of Echocardiography's Guidelines and Standards Committee and the Chamber Quantification Writing Group, developed in conjunction with the European Association of Echocardiography, a branch of the European Society of Cardiology. J Am Soc Echocardiogr 18: 1440-1463 [606] Bellera CA, MacGrogan G, Debled M, de Lara CT, Brouste V, Mathoulin-Pelissier S (2010) Variables with time-varying effects and the Cox model: some statistical concepts illustrated with a prognostic factor study in breast cancer. BMC Med Res Methodol 10: 20 [607] Wulffele MG, Kooy A, de Zeeuw D, Stehouwer CD, Gansevoort RT (2004) The effect of metformin on blood pressure, plasma cholesterol and triglycerides in type 2 diabetes mellitus: a systematic review. J Intern Med 256: 1-14 [608] Wheatley T, Edwards OM (1983) Mild hypothyroidism and oedema: evidence for increased capillary permeability to protein. Clin Endocrinol (Oxf) 18: 627-635 [609] Peduzzi P, Concato J, Feinstein AR, Holford TR (1995) Importance of events per independent variable in proportional hazards regression analysis. II. Accuracy and precision of regression estimates. J Clin Epidemiol 48: 1503-1510
447
[610] Clarke KW, Gray D, Hampton JR (1995) How common is heart failure? Evidence from PACT (prescribing analysis and cost) data in Nottingham. J Public Health Med 17: 459-464 [611] Mamoulakis D, Bitsori M, Galanakis E, Raissaki M, Kalmanti M (2006) Insulin-induced oedema in children and adolescents. J Paediatr Child Health 42: 655-657 [612] Hopkins DF, Cotton SJ, Williams G (1993) Effective treatment of insulin-induced edema using ephedrine. Diabetes Care 16: 1026-1028 [613] Evans DJ, Pritchard-Jones K, Trotman-Dickenson B (1986) Insulin oedema. Postgrad Med J 62: 665-668 [614] Masoudi FA, Wang Y, Inzucchi SE, et al. (2003) Metformin and thiazolidinedione use in Medicare patients with heart failure. JAMA 290: 81-85 [615] Seong JM, Choi NK, Jung SY, et al. (2011) Thiazolidinedione use in elderly patients with type 2 diabetes: with and without heart failure. Pharmacoepidemiol Drug Saf 20: 344-350 [616] Koro CE, Bowlin SJ, Weiss SR (2005) Antidiabetic therapy and the risk of heart failure in type 2 diabetic patients: an independent effect or confounding by indication. Pharmacoepidemiol Drug Saf 14: 697-703 [617] Ho KK, Pinsky JL, Kannel WB, Levy D (1993) The epidemiology of heart failure: the Framingham Study. J Am Coll Cardiol 22: 6a-13a [618] Rodeheffer RJ, Jacobsen SJ, Gersh BJ, Kottke TE, McCann HA, Bailey KR, Ballard DJ (1993) The incidence and prevalence of congestive heart failure in Rochester, Minnesota. Mayo Clin Proc 68: 1143-1150 [619] Yang X, Ma RC, So WY, et al. (2008) Development and validation of a risk score for hospitalization for heart failure. Cardiovasc Diabetol 7: 9 [620] Bahrami H, Bluemke DA, Kronmal R, et al. (2008) Novel metabolic risk factors for incident heart failure and their relationship with obesity: the MESA (Multi-Ethnic Study of Atherosclerosis) study. J Am Coll Cardiol 51: 1775-1783 [621] Cowie MR, Wood DA, Coats AJ, et al. (1999) Incidence and aetiology of heart failure; a population-based study. Eur Heart J 20: 421-428 [622] de Giuli F, Khaw KT, Cowie MR, Sutton GC, Ferrari R, Poole-Wilson PA (2005) Incidence and outcome of persons with a clinical diagnosis of heart failure in a. Eur J Heart Fail 7: 295-302 [623] Johansson S, Wallander MA, Ruigomez A, Garcia Rodriguez LA (2001) Incidence of newly diagnosed heart failure in UK general practice. Eur J Heart Fail 3: 225-231 [624] Thrainsdottir IS, Aspelund T, Gudnason V, et al. (2007) Increasing glucose levels and BMI predict future heart failure experience from the Reykjavik Study. Eur J Heart Fail 9: 1051-1057 [625] Murphy NF, Simpson CR, McAlister FA, et al. (2004) National survey of the prevalence, incidence, primary care burden, and treatment of heart failure in Scotland. Heart 90: 1129-1136 [626] Ingelsson E, Sundstrom J, Arnlov J, Zethelius B, Lind L (2005) Insulin resistance and risk of congestive heart failure. JAMA 294: 334-341 [627] Kalogeropoulos A, Georgiopoulou V, Kritchevsky SB, et al. (2009) Epidemiology of incident heart failure in a contemporary elderly cohort: the. Arch Intern Med 169: 708-715 [628] Ingelsson E, Arnlov J, Sundstrom J, Zethelius B, Vessby B, Lind L (2005) Novel metabolic risk factors for heart failure. J Am Coll Cardiol 46: 2054-2060 [629] Butler J, Kalogeropoulos A, Georgiopoulou V, et al. (2008) Incident heart failure prediction in the elderly: the health ABC heart failure score. Circ Heart Fail 1: 125-133 [630] Sharif A (2013) Metformin for patients with diabetes and concomitant renal restrictions--is there an evidence base? QJM : monthly journal of the Association of Physicians 106: 291-294 [631] Barzilay JI, Kronmal RA, Gottdiener JS, et al. (2004) The association of fasting glucose levels with congestive heart failure in diabetic adults > or = 65 years: the Cardiovascular Health Study. J Am Coll Cardiol 43: 2236-2241 [632] Held C, Gerstein HC, Yusuf S, et al. (2007) Glucose levels predict hospitalization for congestive heart failure in patients at high cardiovascular risk. Circulation 115: 1371-1375 [633] Erqou S, Lee CT, Suffoletto M, et al. (2013) Association between glycated haemoglobin and the risk of congestive heart failure in diabetes mellitus: systematic review and meta-analysis. Eur J Heart Fail 15: 185-193 [634] Lee DS, Massaro JM, Wang TJ, et al. (2007) Antecedent blood pressure, body mass index, and the risk of incident heart failure in later life. Hypertension 50: 869-876 [635] Kenchaiah S, Evans JC, Levy D, et al. (2002) Obesity and the risk of heart failure. N Engl J Med 347: 305-313 [636] Chen YT, Vaccarino V, Williams CS, Butler J, Berkman LF, Krumholz HM (1999) Risk factors for heart failure in the elderly: a prospective community-based study. Am J Med 106: 605-612
448
[637] Filippatos GS, Desai RV, Ahmed MI, et al. (2011) Hypoalbuminaemia and incident heart failure in older adults. Eur J Heart Fail 13: 1078-1086 [638] Gopal DM, Kalogeropoulos AP, Georgiopoulou VV, et al. (2010) Serum albumin concentration and heart failure risk The Health, Aging, and Body Composition Study. Am Heart J 160: 279-285 [639] Schindhelm RK, Diamant M, Dekker JM, Tushuizen ME, Teerlink T, Heine RJ (2006) Alanine aminotransferase as a marker of non-alcoholic fatty liver disease in relation to type 2 diabetes mellitus and cardiovascular disease. Diabetes Metab Res Rev 22: 437-443 [640] Schindhelm RK, Diamant M, Bakker SJ, et al. (2005) Liver alanine aminotransferase, insulin resistance and endothelial dysfunction in normotriglyceridaemic subjects with type 2 diabetes mellitus. Eur J Clin Invest 35: 369-374 [641] Wang CC, Lin SK, Tseng YF, et al. (2009) Elevation of serum aminotransferase activity increases risk of carotid atherosclerosis in patients with non-alcoholic fatty liver disease. J Gastroenterol Hepatol 24: 1411-1416 [642] Schindhelm RK, Dekker JM, Nijpels G, et al. (2007) Alanine aminotransferase predicts coronary heart disease events: a 10-year follow-up of the Hoorn Study. Atherosclerosis 191: 391-396 [643] Bellentani S, Bedogni G, Tiribelli C (2008) Liver and heart: a new link? J Hepatol 49: 300-302 [644] Schindhelm RK, Dekker JM, Nijpels G, et al. (2007) Alanine aminotransferase and the 6-year risk of the metabolic syndrome in Caucasian men and women: the Hoorn Study. Diabet Med 24: 430-435 [645] Sorlie PD, Garcia-Palmieri MR, Costas R, Jr., Havlik RJ (1981) Hematocrit and risk of coronary heart disease: the Puerto Rico Health Program. Am Heart J 101: 456-461 [646] Gagnon DR, Zhang TJ, Brand FN, Kannel WB (1994) Hematocrit and the risk of cardiovascular disease - the Framingham study: a 34-year follow-up. Am Heart J 127: 674-682 [647] Coglianese EE, Qureshi MM, Vasan RS, Wang TJ, Moore LL (2012) Usefulness of the blood hematocrit level to predict development of heart failure in a community. Am J Cardiol 109: 241-245 [648] Erdmann E, Spanheimer R, Charbonnel B (2010) Pioglitazone and the risk of cardiovascular events in patients with Type 2. J Diabetes 2: 212-220 [649] Castagno D, Baird-Gunning J, Jhund PS, et al. (2011) Intensive glycemic control has no impact on the risk of heart failure in type 2 diabetic patients: evidence from a 37,229 patient meta-analysis. Am Heart J 162: 938-948.e932 [650] de Simone G, Gottdiener JS, Chinali M, Maurer MS (2008) Left ventricular mass predicts heart failure not related to previous myocardial. Eur Heart J 29: 741-747 [651] Santra S, Basu AK, Roychowdhury P, et al. (2011) Comparison of left ventricular mass in normotensive type 2 diabetes mellitus patients with that in the nondiabetic population. J Cardiovasc Dis Res 2: 50-56 [652] Cioffi G, Faggiano P, Lucci D, et al. (2011) Inappropriately high left ventricular mass in patients with type 2 diabetes mellitus and no overt cardiac disease. The DYDA study. J Hypertens 29: 1994-2003 [653] Boonman-de Winter LJ, Rutten FH, Cramer MJ, et al. (2012) High prevalence of previously unknown heart failure and left ventricular dysfunction in patients with type 2 diabetes. Diabetologia 55: 2154-2162 [654] Drah M, Ghose RR (1992) Hypoglycaemia and heart failure. Postgrad Med J 68: 304 [655] Zannad F, Huvelle E, Dickstein K, et al. (2007) Left bundle branch block as a risk factor for progression to heart failure. Eur J Heart Fail 9: 7-14 [656] Moon RJ, Bascombe LA, Holt RI (2007) The addition of metformin in type 1 diabetes improves insulin sensitivity, diabetic control, body composition and patient well-being. Diabetes Obes Metab 9: 143-145 [657] Khan AS, McLoughney CR, Ahmed AB (2006) The effect of metformin on blood glucose control in overweight patients with Type 1 diabetes. Diabet Med 23: 1079-1084 [658] Higgins JPT, Green S (2008) Cochrane Handbook for Systematic Reviews of Interventions 5.0.1 [updated September 2008]. In. The Cochrane Collaboration [659] Gin H, Messerchmitt C, Brottier E, Aubertin J (1985) Metformin improved insulin resistance in type I, insulin-dependent, diabetic patients. Metabolism 34: 923-925 [660] Keen H, Collins ACG, Bending JJ (1987) Metformin increases response to insulin in Type-1 (Insulin-Dependent) Diabetes. Diabetologia 30: A538 (Abstract) [661] Higgins JP, Thompson SG, Deeks JJ, Altman DG (2003) Measuring inconsistency in meta-analyses. BMJ 327: 557-560
449
[662] Walravens PA, Chase PH, Klingensmith GJ, Ellison M, Cornell C, Monahan K (2000) Low dose metformin in adolescents with type 1 diabetes mellitus: A double blind, controlled study. Diabetes 49: A128 (Abstract) [663] Lacigova S, Rusavy Z, Jankovec Z, Kyselova P (2001) Metformin in the treatment of type 1 diabetics - a placebo controlled study. Cas Lek Cesk 140: 302-306 [664] Ahmed AE, Home PD, Marshall SM (2001) Effect of metformin in blood glucose control on people with type 1 diabetes. Diabetes 50: A430 (Abstract) [665] Coscelli C, Palmari V, Saccardi F, Alpi O, Bonora E (1984) Evidence that metformin addition to insulin induces an amelioration of glycemic profile in type I (insulin-dependent) diabetes mellitus. Curr Ther Res 35: 1058-1064 [666] Desmangles J, Buchlis JG, Shine B, Quattrin T (2000) Is metformin a useful adjunct to insulin therapy in adolescents with type 1 diabetes in poor control? Endocrine Society Meeting: 444 (Abstract) [667] Gin H, Freyburger G, Boisseau M, Aubertin J (1989) Study of the effect of metformin on platelet aggregation in insulin-dependent diabetics. Diabetes Res Clin Pract 6: 61-67 [668] Gomez R, Mokhashi MH, Rao J, et al. (2002) Metformin adjunctive therapy with insulin improves glycemic control in patients with type 1 diabetes mellitus: a pilot study. J Pediatr Endocrinol Metab 15: 1147-1151 [669] Gottlieb PA, Ellis SL, Lopez P, Gutin R, Garg SK (2007) Metformin improved glycaemic control in patients with type 1 diabetes. Diabetes 56: A574 (Abstract) [670] Gunton JE, Twigg SM (2003) Metformin use as an adjunct to insulin treatment. Med J Aust 178: 591-592 [671] Janssen M, Rillaerts E, De Leeuw I (1991) Effects of metformin on haemorheology, lipid parameters and insulin resistance in insulin-dependent diabetic patients (IDDM). Biomed Pharmacother 45: 363-367 [672] Lacigova S, Rusavy Z, Kyselova P, Jankovec Z, Karova R, Cechurova D (2001) Short-term and long-term effect of metformin in type 1 diabetics. Vnitr Lek 47: 81-86 [673] Lestradet H, Labram C, Gregoire J, Billaud L, Deschamps I (1966) The limits of effectiveness of dimethylbiguanide in some cases of minor diabetes mellitus, in young patients, apparently well controlled by this sole treatment. Diabete 14: 157-171 [674] Melga P (1989) Usefulness and rationale of combined therapy with insulin and metformin in insulin-dependent diabetes (type I). G Ital Diabetol 9: 247-253 [675] Pagano G, Tagliaferro V, Carta Q, et al. (1983) Metformin reduces insulin requirement in Type 1 (insulin-dependent) diabetes. Diabetologia 24: 351-354 [676] Ravina A, Minuchin O (1990) Bedtime administration of metformin may reduce insulin requirements. Harefuah 119: 200-203 [677] Tan AB, Bandyopadhyay S, Brake J, Weston PJ (2006) Effects of metformin in type 1 diabetes mellitus. Diab Med 23 (Suppl 2): 111 (Abstract) [678] Urakami T, Morimoto S, Owada M, Harada K (2005) Usefulness of the addition of metformin to insulin in pediatric patients with type 1 diabetes mellitus. Pediatr Int 47: 430-433 [679] Aldasouqi SA, Duick DS (2003) Safety issues on metformin use. Diabetes Care 26: 3356-3357 [680] Alves C (2006) Metformin as an adjunctive therapy to insulin in adolescents with type 1 diabetes mellitus. Revista Brasileira de Medicina 63: 539-543 [681] Daniel JR, Hagmeyer KO (1997) Metformin and insulin: is there a role for combination therapy? Ann Pharmacother 31: 474-480 [682] Faichney JD, Tate PW (2003) Metformin in type 1 diabetes: is this a good or bad idea? Diabetes Care 26: 1655 [683] Fossati P, Fontaine P, Beuscart R (1985) Value of metformin-insulin association in the treatment of insulin-dependent diabetes. Diabete Metab 11: 396-398 [684] Golay A, Guillet-Dauphine N, Fendel A, Juge C, Assal JP (1995) The insulin-sparing effect of metformin in insulin-treated diabetic patients. Diabetes Metab Rev 11 (Suppl 1): S63-67 (Abstract) [685] Jefferies CA, Hamilton J, Daneman D (2004) Potential adjunctive therapies in adolescents with type 1 diabetes mellitus. Treat Endocrinol 3: 337-343 [686] Meyer L, Guerci B (2003) Metformin and insulin in type 1 diabetes: the first step. Diabetes Care 26: 1655-1656 [687] Rachmiel M, Perlman K, Daneman D (2005) Insulin analogues in children and teens with type 1 diabetes: advantages and caveats. Pediatr Clin North Am 52: 1651-1675 [688] Russell-Jones D, Khan R (2007) Insulin-associated weight gain in diabetes - causes, effects and coping strategies. Diabetes Obes Metab 9: 799-812
450
[689] Slama G (1991) The insulin sparing effect of metformin in insulin-treated diabetic patients. Diabete Metab 17: 241-243 [690] Ferguson AW, De La Harpe PL, Farquhar JW (1961) Dimethyldiguanide in the treatment of diabetic children. Lancet 1: 1367-1369 [691] Pirart J (1971) Failure of the biguanides to improve the control of unstable diabetes treated with insulin. Diabetologia 7: 283-286 [692] Rizkalla SW, Elgrably F, Tchobroutsky G, Slama G (1986) Effects of metformin treatment on erythrocyte insulin binding in normal weight subjects, in obese non diabetic subjects, in type 1 and type 2 diabetic patients. Diabete Metab 12: 219-224 [693] Slama G, Gin H, Weissbrodt P, Poynard T, Vexiau P, Klein JC (1981) Metformin reduces post-prandial insulin needs in type-1 diabetics - assessment by the artificial pancreas. Diabetologia 21: 329 (Abstract) [694] Tagliaferro V, Pagano G, Carta Q, Vitelli F, Pisu E, Cocuzza E (1981) Insulin sparing effect of metformin on insulin requirement of IDDM assessed by artificial pancreas (Biostator Ames). Diabetologia 21: 333 (Abstract) [695] Meyer L, Delbachian I, Lehert P, Cugnardey N, Drouin P, Guerci B (1999) Continuous subcutaneous insulin infusion in type 1 diabetes: Insulin-sparing effect of metformin. Diabetologia 42 (Suppl 1): A226 (Abstract) [696] Jacobsen PK, Lund SS, Tarnow L, et al. Impact of metformin treatment on glycaemic control and cardiovascular risk-factors in patients with poorly controlled type 1 diabetes (T1DM). Diabetologia 50 (Suppl 1): S107 (Abstract) [697] Leblanc H, Marre M, Billault B, Passa P (1987) Value of combined subcutaneous infusion of insulin and metformin in 10 insulin-dependent obese diabetics. Diabete Metab 13: 613-617 [698] Gin H, Slama G, Weissbrodt P, et al. (1982) Metformin reduces post-prandial insulin needs in type I (insulin-dependent) diabetic patients: assessment by the artificial pancreas. Diabetologia 23: 34-36 [699] Lund SS, Tarnow L, Astrup AS, et al. (2008) Effect of adjunct metformin treatment in patients with type-1 diabetes and persistent inadequate glycaemic control. A randomized study. PLoS One 3: e3363 [700] Hamilton J, Cummings E, Zdravkovic V, Finegood D, Daneman D (2003) Metformin as an adjunct therapy in adolescents with type 1 diabetes and insulin resistance: a randomized controlled trial. Diabetes Care 26: 138-143 [701] Sarnblad S, Kroon M, Aman J (2003) Metformin as additional therapy in adolescents with poorly controlled type 1 diabetes: randomised placebo-controlled trial with aspects on insulin sensitivity. Eur J Endocrinol 149: 323-329 [702] Meyer L, Bohme P, Delbachian I, et al. (2002) The benefits of metformin therapy during continuous subcutaneous insulin infusion treatment of type 1 diabetic patients. Diabetes Care 25: 2153-2158 [703] Schatz H, Winkler G, Jonatha EM, Pfeiffer EF (1975) Studies on juvenile-type diabetes in children. Assessment of control under treatment with constant and variable doses of insulin with or without addition of biguanides. Diabete Metab 1: 211-220 [704] Jacobsen IB, Henriksen JE, Beck-Nielsen H (2009) The effect of metformin in overweight patients with type 1 diabetes and poor metabolic control. Basic Clin Pharmacol Toxicol 105: 145-149 [705] Lund SS, Tarnow L, Astrup AS, et al. (2009) Effect of adjunct metformin treatment on levels of plasma lipids in patients with type 1 diabetes. Diabetes Obes Metab 11: 966-977 [706] Kearney PM, Blackwell L, Collins R, et al. (2008) Efficacy of cholesterol-lowering therapy in 18,686 people with diabetes in 14 randomised trials of statins: a meta-analysis. Lancet 371: 117-125 [707] Salpeter S, Greyber E, Pasternak G, Salpeter E (2003) Risk of fatal and nonfatal lactic acidosis with metformin use in type 2 diabetes mellitus. Cochrane Database Syst Rev: CD002967 [708] Pang TT, Narendran P (2008) Addressing insulin resistance in Type 1 diabetes. Diabet Med 25: 1015-1024 [709] Jadhav S, Ferrell W, Greer IA, Petrie JR, Cobbe SM, Sattar N (2006) Effects of metformin on microvascular function and exercise tolerance in women with angina and normal coronary arteries: a randomized, double-blind, placebo-controlled study. J Am Coll Cardiol 48: 956-963 [710] Morrow VA, Foufelle F, Connell JM, Petrie JR, Gould GW, Salt IP (2003) Direct activation of AMP-activated protein kinase stimulates nitric-oxide synthesis in human aortic endothelial cells. J Biol Chem 278: 31629-31639 [711] Towler MC, Hardie DG (2007) AMP-activated protein kinase in metabolic control and insulin signaling. Circ Res 100: 328-341
451
[712] Zou MH, Wu Y (2008) AMP-activated protein kinase activation as a strategy for protecting vascular endothelial function. Clin Exp Pharmacol Physiol 35: 535-545 [713] Matsumoto K, Sera Y, Abe Y, Tominaga T, Yeki Y, Miyake S (2004) Metformin attenuates progression of carotid arterial wall thickness in patients with type 2 diabetes. Diabetes Res Clin Pract 64: 225-228 [714] Laing SP, Swerdlow AJ, Carpenter LM, et al. (2003) Mortality from cerebrovascular disease in a cohort of 23 000 patients with insulin-treated diabetes. Stroke 34: 418-421 [715] Laing SP, Swerdlow AJ, Slater SD, et al. (2003) Mortality from heart disease in a cohort of 23,000 patients with insulin-treated diabetes. Diabetologia 46: 760-765 [716] Soedamah-Muthu SS, Fuller JH, Mulnier HE, Raleigh VS, Lawrenson RA, Colhoun HM (2006) All-cause mortality rates in patients with type 1 diabetes mellitus compared with a non-diabetic population from the UK general practice research database, 1992-1999. Diabetologia 49: 660-666 [717] Libby G, Donnelly LA, Donnan PT, Alessi DR, Morris AD, Evans JM (2009) New users of metformin are at low risk of incident cancer: a cohort study among people with type 2 diabetes. Diabetes Care 32: 1620-1625 [718] Burchardt P, Zawada A, Tabaczewski P, et al. (2013) Metformin added to insulin reduces plasma levels of glycated-LDL but not oxLDL in young patients with type 1 diabetes and concomitant obesity in comparison to insulin alone - pilot study. Pol Arch Med Wewn 123: 526-532 [719] Pitocco D, Zaccardi F, Tarzia P, et al. (2013) Metformin improves endothelial function in type 1 diabetic subjects: a pilot, placebo-controlled randomized study. Diabetes Obes Metab 15: 427-431 [720] (2013) REducing With MetfOrmin Vascular Adverse Lesions in Type 1 Diabetes (REMOVAL) - Full Text View - ClinicalTrials.gov. Available from http://clinicaltrials.gov/show/NCT01483560 [721] Vella S, Buetow L, Royle P, Livingstone S, Colhoun HM, Petrie JR (2010) The use of metformin in type 1 diabetes: a systematic review of efficacy. Diabetologia 53: 809-820 [722] Scirica BM, Bhatt DL, Braunwald E, et al. (2013) Saxagliptin and cardiovascular outcomes in patients with type 2 diabetes mellitus. N Engl J Med 369: 1317-1326
452
Appendix
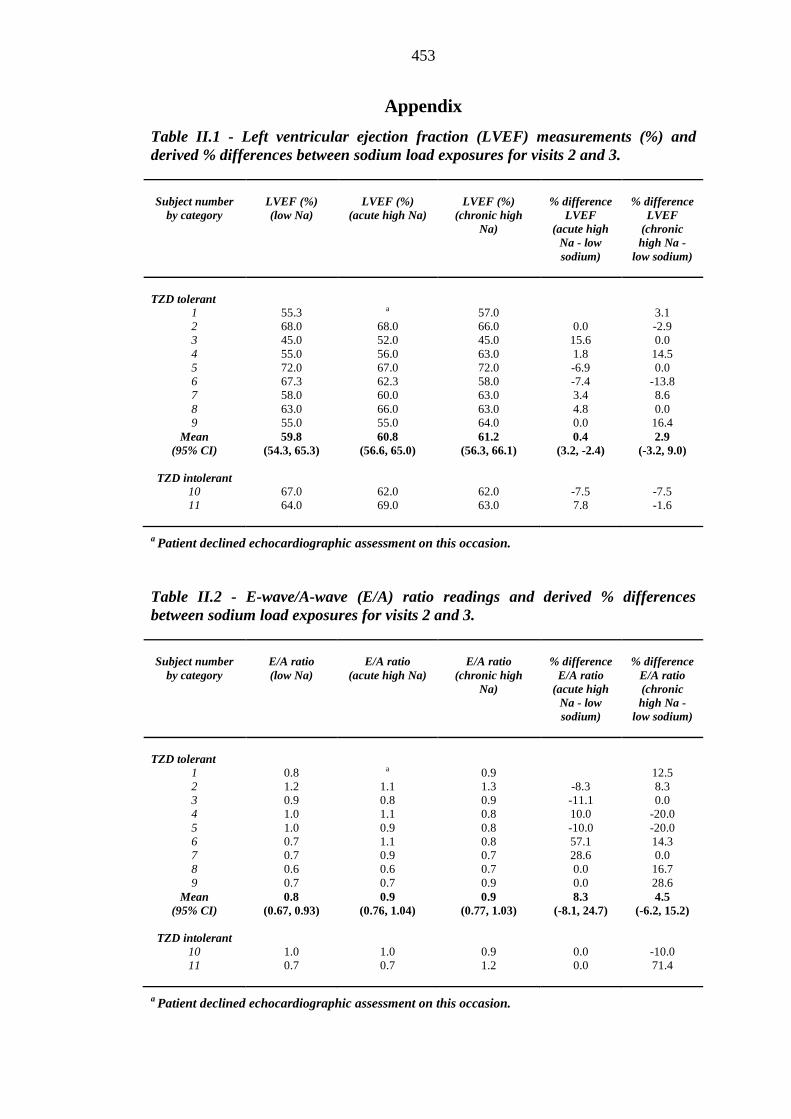
453
Appendix
Table II.1 - Left ventricular ejection fraction (LVEF) measurements (%) and derived % differences between sodium load exposures for visits 2 and 3. Subject number
by category
LVEF (%) (low Na)
LVEF (%)
(acute high Na)
LVEF (%)
(chronic high Na)
% difference
LVEF (acute high
Na - low sodium)
% difference
LVEF (chronic high Na -
low sodium)
TZD tolerant
1 55.3 a 57.0 3.1 2 68.0 68.0 66.0 0.0 -2.9 3 45.0 52.0 45.0 15.6 0.0 4 55.0 56.0 63.0 1.8 14.5 5 72.0 67.0 72.0 -6.9 0.0 6 67.3 62.3 58.0 -7.4 -13.8 7 58.0 60.0 63.0 3.4 8.6 8 63.0 66.0 63.0 4.8 0.0 9 55.0 55.0 64.0 0.0 16.4
Mean (95% CI)
59.8 (54.3, 65.3)
60.8 (56.6, 65.0)
61.2 (56.3, 66.1)
0.4 (3.2, -2.4)
2.9 (-3.2, 9.0)
TZD intolerant
10 67.0 62.0 62.0 -7.5 -7.5 11 64.0 69.0 63.0 7.8 -1.6
a Patient declined echocardiographic assessment on this occasion. Table II.2 - E-wave/A-wave (E/A) ratio readings and derived % differences between sodium load exposures for visits 2 and 3. Subject number
by category
E/A ratio (low Na)
E/A ratio
(acute high Na)
E/A ratio
(chronic high Na)
% difference
E/A ratio (acute high
Na - low sodium)
% difference
E/A ratio (chronic high Na -
low sodium)
TZD tolerant
1 0.8 a 0.9 12.5 2 1.2 1.1 1.3 -8.3 8.3 3 0.9 0.8 0.9 -11.1 0.0 4 1.0 1.1 0.8 10.0 -20.0 5 1.0 0.9 0.8 -10.0 -20.0 6 0.7 1.1 0.8 57.1 14.3 7 0.7 0.9 0.7 28.6 0.0 8 0.6 0.6 0.7 0.0 16.7 9 0.7 0.7 0.9 0.0 28.6
Mean (95% CI)
0.8 (0.67, 0.93)
0.9 (0.76, 1.04)
0.9 (0.77, 1.03)
8.3 (-8.1, 24.7)
4.5 (-6.2, 15.2)
TZD intolerant
10 1.0 1.0 0.9 0.0 -10.0 11 0.7 0.7 1.2 0.0 71.4
a Patient declined echocardiographic assessment on this occasion.
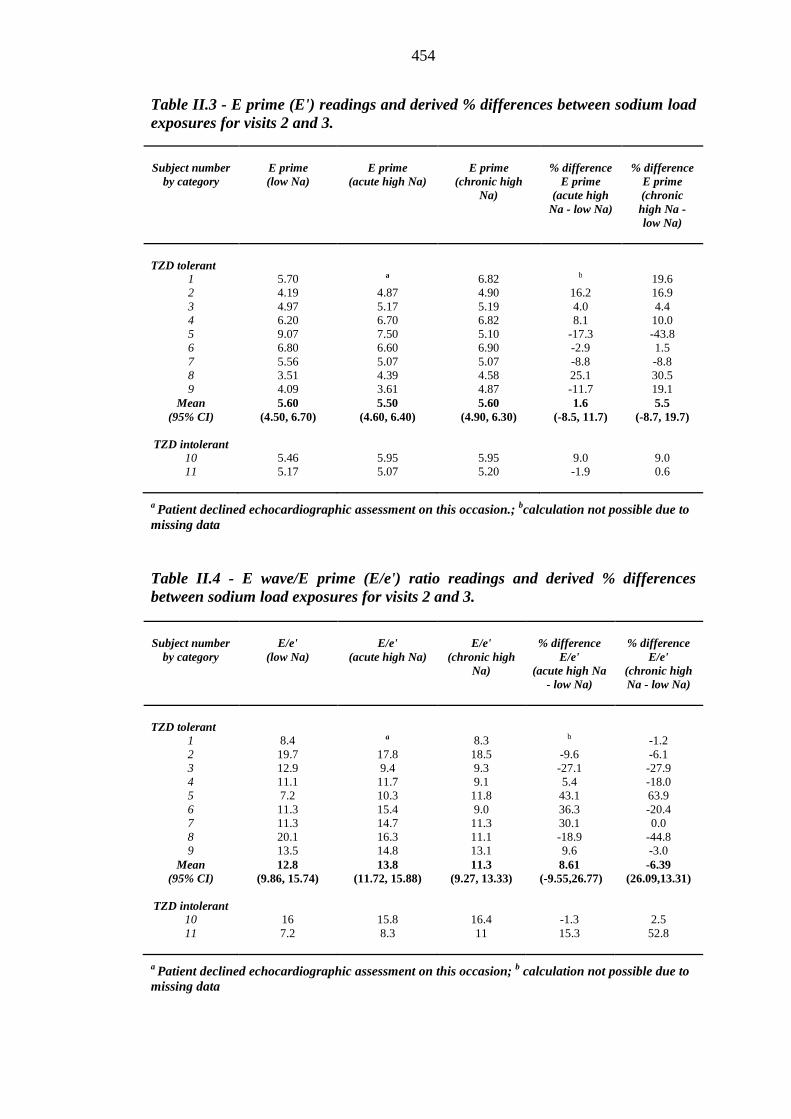
454
Table II.3 - E prime (E') readings and derived % differences between sodium load exposures for visits 2 and 3. Subject number
by category
E prime (low Na)
E prime
(acute high Na)
E prime
(chronic high Na)
% difference
E prime (acute high
Na - low Na)
% difference
E prime (chronic high Na - low Na)
TZD tolerant
1 5.70 a 6.82 b 19.6 2 4.19 4.87 4.90 16.2 16.9 3 4.97 5.17 5.19 4.0 4.4 4 6.20 6.70 6.82 8.1 10.0 5 9.07 7.50 5.10 -17.3 -43.8 6 6.80 6.60 6.90 -2.9 1.5 7 5.56 5.07 5.07 -8.8 -8.8 8 3.51 4.39 4.58 25.1 30.5 9 4.09 3.61 4.87 -11.7 19.1
Mean (95% CI)
5.60 (4.50, 6.70)
5.50 (4.60, 6.40)
5.60 (4.90, 6.30)
1.6 (-8.5, 11.7)
5.5 (-8.7, 19.7)
TZD intolerant
10 5.46 5.95 5.95 9.0 9.0 11 5.17 5.07 5.20 -1.9 0.6
a Patient declined echocardiographic assessment on this occasion.; bcalculation not possible due to missing data Table II.4 - E wave/E prime (E/e') ratio readings and derived % differences between sodium load exposures for visits 2 and 3. Subject number
by category
E/e'
(low Na)
E/e'
(acute high Na)
E/e'
(chronic high Na)
% difference
E/e' (acute high Na
- low Na)
% difference
E/e' (chronic high Na - low Na)
TZD tolerant
1 8.4 a 8.3 b -1.2 2 19.7 17.8 18.5 -9.6 -6.1 3 12.9 9.4 9.3 -27.1 -27.9 4 11.1 11.7 9.1 5.4 -18.0 5 7.2 10.3 11.8 43.1 63.9 6 11.3 15.4 9.0 36.3 -20.4 7 11.3 14.7 11.3 30.1 0.0 8 20.1 16.3 11.1 -18.9 -44.8 9 13.5 14.8 13.1 9.6 -3.0
Mean (95% CI)
12.8 (9.86, 15.74)
13.8 (11.72, 15.88)
11.3 (9.27, 13.33)
8.61 (-9.55,26.77)
-6.39 (26.09,13.31)
TZD intolerant
10 16 15.8 16.4 -1.3 2.5 11 7.2 8.3 11 15.3 52.8
a Patient declined echocardiographic assessment on this occasion; b calculation not possible due to missing data
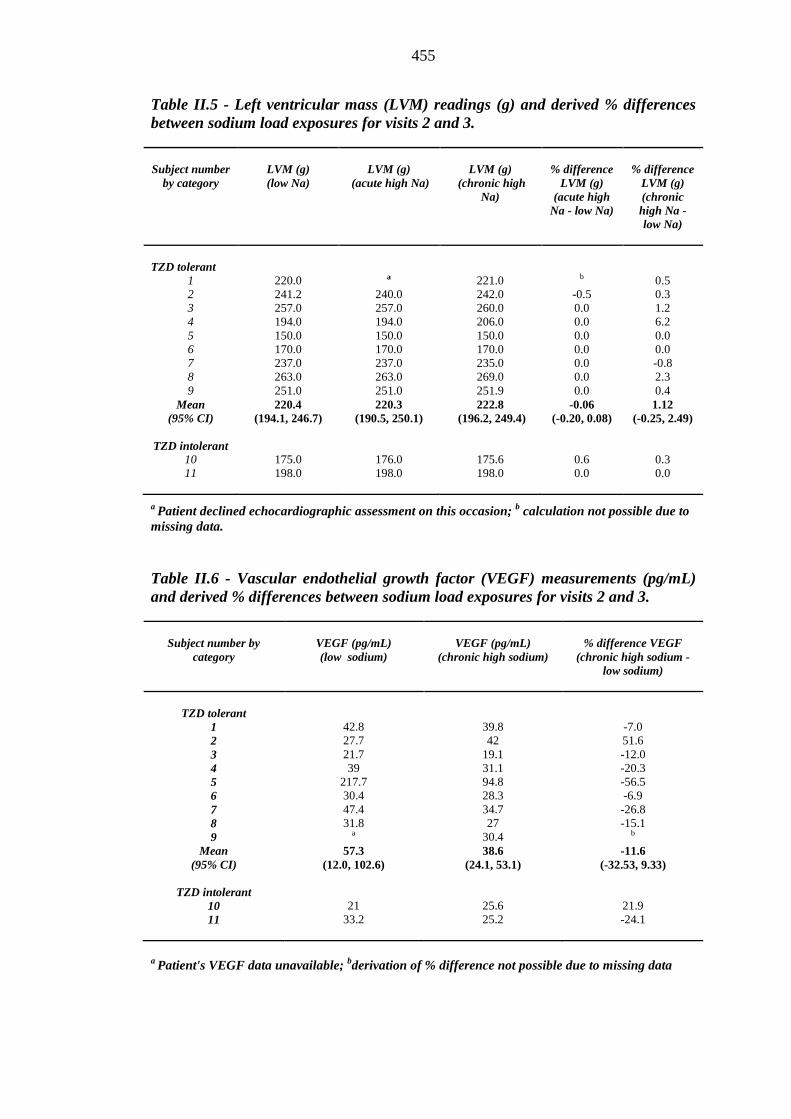
455
Table II.5 - Left ventricular mass (LVM) readings (g) and derived % differences between sodium load exposures for visits 2 and 3. Subject number
by category
LVM (g) (low Na)
LVM (g)
(acute high Na)
LVM (g)
(chronic high Na)
% difference
LVM (g) (acute high
Na - low Na)
% difference
LVM (g) (chronic high Na - low Na)
TZD tolerant
1 220.0 a 221.0 b 0.5 2 241.2 240.0 242.0 -0.5 0.3 3 257.0 257.0 260.0 0.0 1.2 4 194.0 194.0 206.0 0.0 6.2 5 150.0 150.0 150.0 0.0 0.0 6 170.0 170.0 170.0 0.0 0.0 7 237.0 237.0 235.0 0.0 -0.8 8 263.0 263.0 269.0 0.0 2.3 9 251.0 251.0 251.9 0.0 0.4
Mean (95% CI)
220.4 (194.1, 246.7)
220.3 (190.5, 250.1)
222.8 (196.2, 249.4)
-0.06 (-0.20, 0.08)
1.12 (-0.25, 2.49)
TZD intolerant
10 175.0 176.0 175.6 0.6 0.3 11 198.0 198.0 198.0 0.0 0.0
a Patient declined echocardiographic assessment on this occasion; b calculation not possible due to missing data. Table II.6 - Vascular endothelial growth factor (VEGF) measurements (pg/mL) and derived % differences between sodium load exposures for visits 2 and 3.
Subject number by category
VEGF (pg/mL) (low sodium)
VEGF (pg/mL)
(chronic high sodium)
% difference VEGF
(chronic high sodium - low sodium)
TZD tolerant 1 42.8 39.8 -7.0 2 27.7 42 51.6 3 21.7 19.1 -12.0 4 39 31.1 -20.3 5 217.7 94.8 -56.5 6 30.4 28.3 -6.9 7 47.4 34.7 -26.8 8 31.8 27 -15.1 9 a 30.4 b
Mean (95% CI)
57.3 (12.0, 102.6)
38.6 (24.1, 53.1)
-11.6 (-32.53, 9.33)
TZD intolerant
10 21 25.6 21.9 11 33.2 25.2 -24.1
a Patient's VEGF data unavailable; bderivation of % difference not possible due to missing data
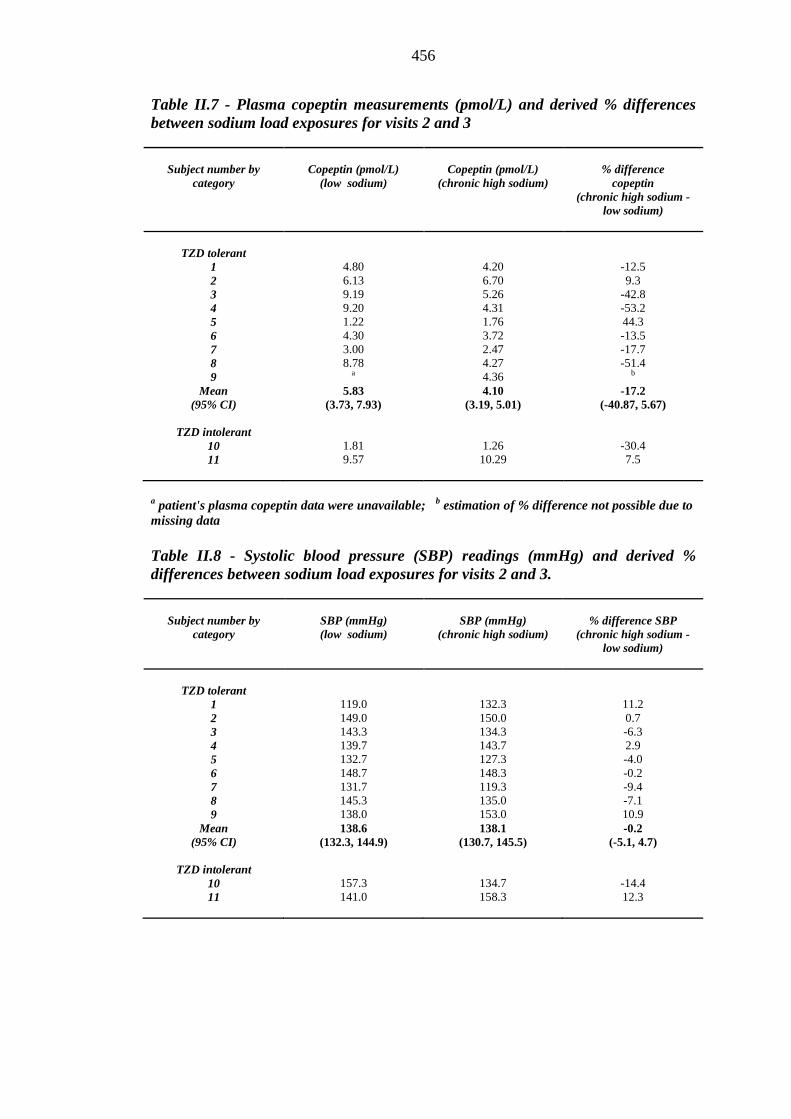
456
Table II.7 - Plasma copeptin measurements (pmol/L) and derived % differences between sodium load exposures for visits 2 and 3
Subject number by category
Copeptin (pmol/L)
(low sodium)
Copeptin (pmol/L)
(chronic high sodium)
% difference
copeptin (chronic high sodium -
low sodium)
TZD tolerant
1 4.80 4.20 -12.5 2 6.13 6.70 9.3 3 9.19 5.26 -42.8 4 9.20 4.31 -53.2 5 1.22 1.76 44.3 6 4.30 3.72 -13.5 7 3.00 2.47 -17.7 8 8.78 4.27 -51.4 9 a 4.36 b
Mean (95% CI)
5.83 (3.73, 7.93)
4.10 (3.19, 5.01)
-17.2 (-40.87, 5.67)
TZD intolerant
10 1.81 1.26 -30.4 11 9.57 10.29 7.5
a patient's plasma copeptin data were unavailable; b estimation of % difference not possible due to missing data Table II.8 - Systolic blood pressure (SBP) readings (mmHg) and derived % differences between sodium load exposures for visits 2 and 3.
Subject number by category
SBP (mmHg) (low sodium)
SBP (mmHg)
(chronic high sodium)
% difference SBP
(chronic high sodium - low sodium)
TZD tolerant 1 119.0 132.3 11.2 2 149.0 150.0 0.7 3 143.3 134.3 -6.3 4 139.7 143.7 2.9 5 132.7 127.3 -4.0 6 148.7 148.3 -0.2 7 131.7 119.3 -9.4 8 145.3 135.0 -7.1 9 138.0 153.0 10.9
Mean (95% CI)
138.6 (132.3, 144.9)
138.1 (130.7, 145.5)
-0.2 (-5.1, 4.7)
TZD intolerant
10 157.3 134.7 -14.4 11 141.0 158.3 12.3
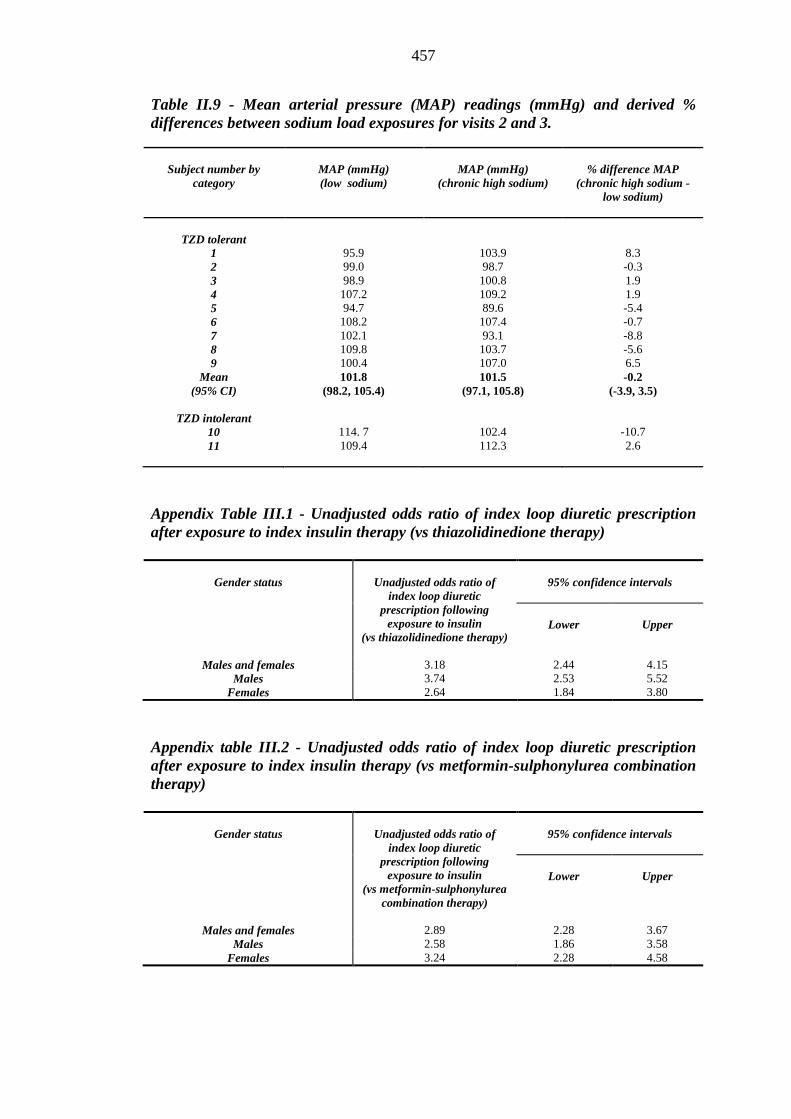
457
Table II.9 - Mean arterial pressure (MAP) readings (mmHg) and derived % differences between sodium load exposures for visits 2 and 3.
Subject number by
category
MAP (mmHg) (low sodium)
MAP (mmHg)
(chronic high sodium)
% difference MAP
(chronic high sodium - low sodium)
TZD tolerant 1 95.9 103.9 8.3 2 99.0 98.7 -0.3 3 98.9 100.8 1.9 4 107.2 109.2 1.9 5 94.7 89.6 -5.4 6 108.2 107.4 -0.7 7 102.1 93.1 -8.8 8 109.8 103.7 -5.6 9 100.4 107.0 6.5
Mean (95% CI)
101.8 (98.2, 105.4)
101.5 (97.1, 105.8)
-0.2 (-3.9, 3.5)
TZD intolerant
10 114. 7 102.4 -10.7 11 109.4 112.3 2.6
Appendix Table III.1 - Unadjusted odds ratio of index loop diuretic prescription after exposure to index insulin therapy (vs thiazolidinedione therapy)
Gender status
Unadjusted odds ratio of
index loop diuretic prescription following
exposure to insulin (vs thiazolidinedione therapy)
95% confidence intervals
Lower
Upper
Males and females 3.18 2.44 4.15 Males 3.74 2.53 5.52
Females 2.64 1.84 3.80
Appendix table III.2 - Unadjusted odds ratio of index loop diuretic prescription after exposure to index insulin therapy (vs metformin-sulphonylurea combination therapy)
Gender status
Unadjusted odds ratio of
index loop diuretic prescription following
exposure to insulin (vs metformin-sulphonylurea
combination therapy)
95% confidence intervals
Lower
Upper
Males and females 2.89 2.28 3.67 Males 2.58 1.86 3.58
Females 3.24 2.28 4.58
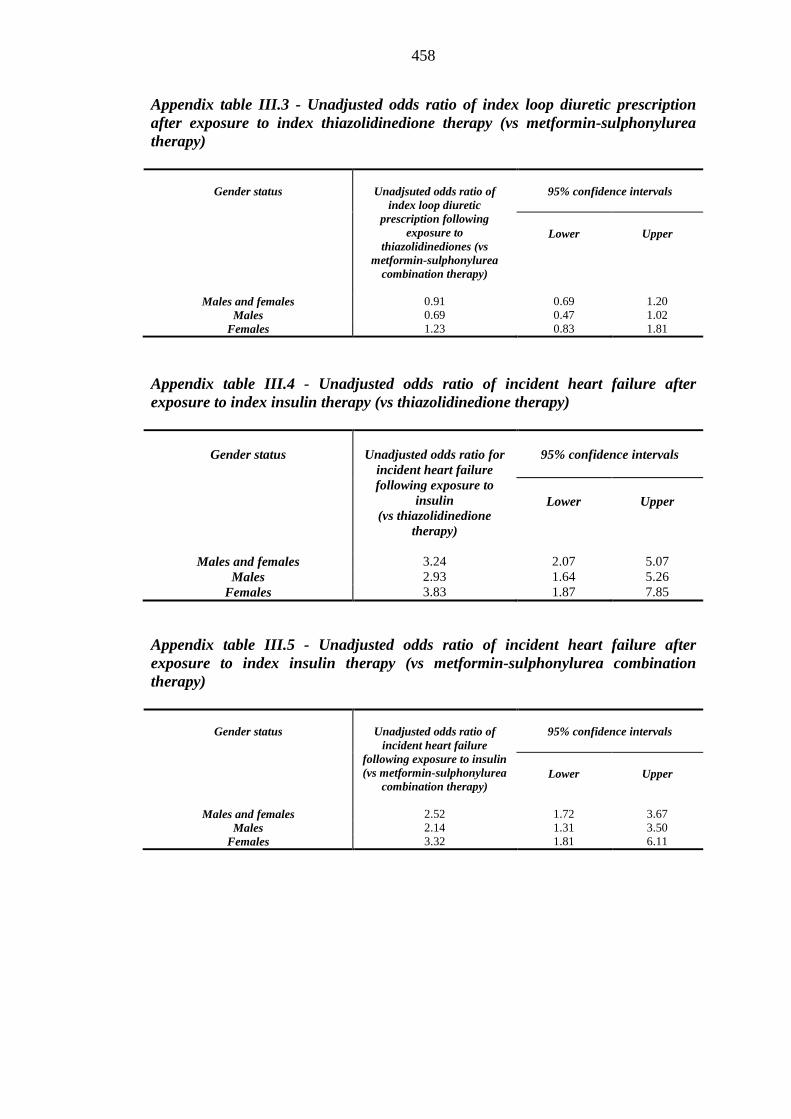
458
Appendix table III.3 - Unadjusted odds ratio of index loop diuretic prescription after exposure to index thiazolidinedione therapy (vs metformin-sulphonylurea therapy)
Gender status
Unadjsuted odds ratio of
index loop diuretic prescription following
exposure to thiazolidinediones (vs
metformin-sulphonylurea combination therapy)
95% confidence intervals
Lower
Upper
Males and females 0.91 0.69 1.20 Males 0.69 0.47 1.02
Females 1.23 0.83 1.81
Appendix table III.4 - Unadjusted odds ratio of incident heart failure after exposure to index insulin therapy (vs thiazolidinedione therapy)
Gender status
Unadjusted odds ratio for
incident heart failure following exposure to
insulin (vs thiazolidinedione
therapy)
95% confidence intervals
Lower
Upper
Males and females 3.24 2.07 5.07 Males 2.93 1.64 5.26
Females 3.83 1.87 7.85
Appendix table III.5 - Unadjusted odds ratio of incident heart failure after exposure to index insulin therapy (vs metformin-sulphonylurea combination therapy)
Gender status
Unadjusted odds ratio of
incident heart failure following exposure to insulin (vs metformin-sulphonylurea
combination therapy)
95% confidence intervals
Lower
Upper
Males and females 2.52 1.72 3.67 Males 2.14 1.31 3.50
Females 3.32 1.81 6.11
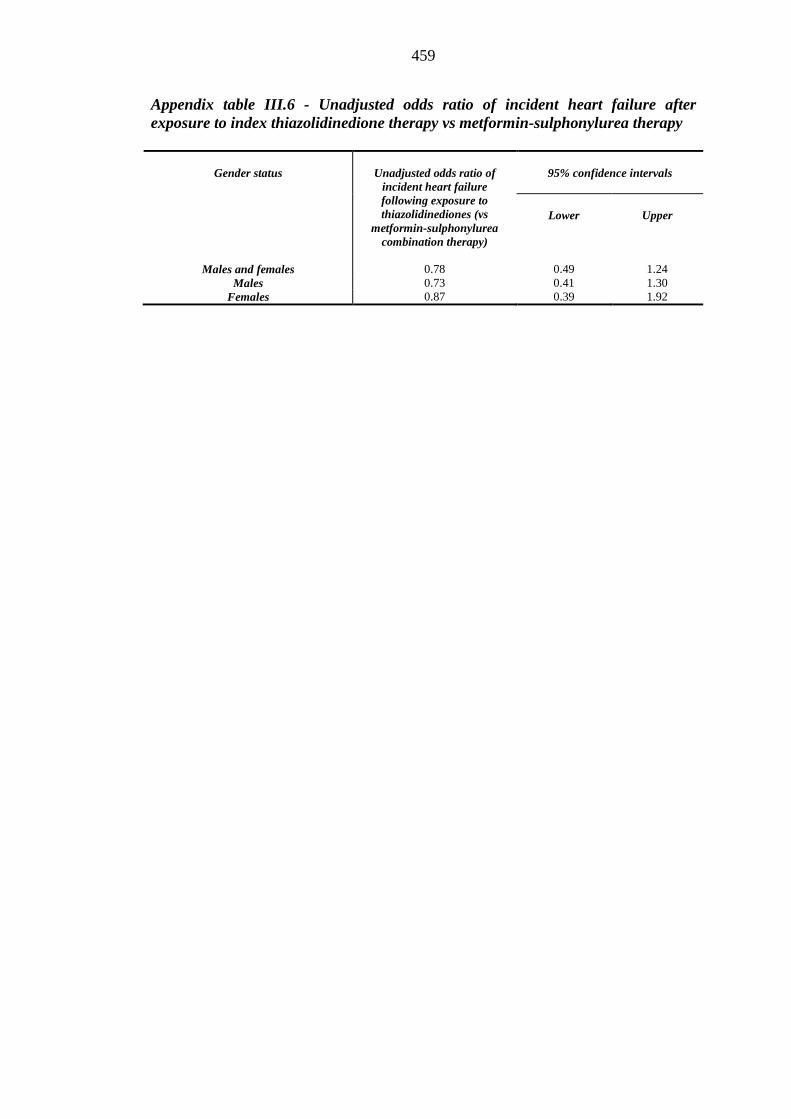
459
Appendix table III.6 - Unadjusted odds ratio of incident heart failure after exposure to index thiazolidinedione therapy vs metformin-sulphonylurea therapy
Gender status
Unadjusted odds ratio of
incident heart failure following exposure to thiazolidinediones (vs
metformin-sulphonylurea combination therapy)
95% confidence intervals
Lower
Upper
Males and females 0.78 0.49 1.24 Males 0.73 0.41 1.30
Females 0.87 0.39 1.92