bangladesh apparel industry and its workers in a changing
TRANSCRIPT

Bangladesh Apparel Industry and its Workers in a Changing World Economy
ii
Promotor: Prof.dr.ir. A.J. Oskam Hoogleraar Agrarische Economie en Plattelandsbeleid Wageningen Universiteit
Co-promotor: Dr.ir. J.H.M. Peerlings
Universitair Hoofddocent Leerstoelgroep Agrarische Economie en Plattelandsbeleid Wageningen Universiteit
Promotiecommissie: Prof.dr. A. Kuyvenhoven,
Wageningen Universiteit Dr. F.W. van Tongeren, Organisation for Economic Cooperation and Development, Parijs, Frankrijk Dr. P. Wobst, Institute for Prospective and Technological Studies European Commission, Sevilla, Spanje Prof.dr. G.C.M. Lieten, Universiteit van Amsterdam / Internationaal Instituut voor Sociale Geschiedenis
Dit onderzoek is uitgevoerd binnen de onderzoeksschool Mansholt Graduate School of Social Sciences
iii
Bangladesh apparel industry and its workers in a changing world economy
������������
Proefschrift ter verkrijging van de graad van doctor
op gezag van de rector magnificus van Wageningen Universiteit,
prof.dr. M.J. Kropff, in het openbaar te verdedigen
op woensdag 26 april 2006 des namiddags te vier uur in de Aula.
iv
Bangladesh apparel industry and its workers in a changing world economy Ph.D. thesis, Wageningen University - With references – With summaries in English and Dutch Nazneen Ahmed, 2006 ISBN 90-8504-415-4

v
To my children, Raisa and Maheer

vi
Abstract Nazneen Ahmed, 2006. Bangladesh apparel industry and its workers in a changing world economy. PhD Thesis, Wageningen University, the Netherlands. This thesis explores and analyses recent changes and challenges faced by the apparel industry of Bangladesh and the consequences of those for the Bangladesh economy. More specifically, it explores and analyses the importance of the apparel industry in the Bangladesh economy, the challenges faced by this industry, impacts of implementation of various international trade rules on the apparel industry, consequences of Bangladesh’s attempts to enter in bilateral and regional free trade agreements with its neighbouring countries, status of workers’ rights in the apparel industry of Bangladesh and how globalisation is affecting the level of addressing these workers’ rights and also impacts of increases in workers’ productivity and wage on the apparel industry and on the Bangladesh economy. This thesis has applied both a global (GTAP) and single country (IFPRI) general equilibrium model in different chapters as the thesis aimed to analyse economy-wide effects of changes in international and domestic scenarios. Part of the thesis is also based on qualitative and quantitative analyses of the relevant issues. The thesis shows that abolition of the Multi-Fibre Arrangement import quotas will negatively affect welfare and the poverty situation in Bangladesh. However regional co-operation of Bangladesh with its South Asian neighbours and with some East Asian nations will be welfare improving. The thesis has identified that in the era of globalisation, addressing workers’ rights is an important determinant of the competitiveness of an export industry like apparel. It is found that workers’ rights are widely violated in the apparel industry and this needs correction to remain competitive in the world market. The thesis has also shown that labour productivity increasing improvements in the work environment not only increase incomes of workers, but also incomes of entrepreneurs and welfare in the economy as a whole. Keywords: Bangladesh, apparel, trade, applied general equilibrium modelling, workers’ rights.

vii
Preface When I obtained the chance to pursue PhD research at the University of Wageningen, I was very excited, ambitious and a bit tense. Looking back to the last four years and a half, I feel with content how I dealt with many difficult moments, emotions and how I enjoyed the happy times. Usually students have one supervisor, but I was lucky to have two supervisors for my research and learnt different things from them. I started my PhD with Dr. Rien Komen as my daily supervisor. He helped me to confidently move forward with difficult starting times of any PhD research. He gave me much freedom to build research methodology. I would like to express my gratitude to Rien for being so cooperative with naive thoughts of a new researcher. At the mid way of my research Rien changed his job and Dr. Jack Peerlings became my daily supervisor. To me, Jack is a miracle – maker. When I started working with him I was at the most difficult stage of my research and apprehended that I would be late to finish my thesis on time. He gave me the realization that I can perform better and can work harder. He gave me freedom to proceed and also gave intensive attention to the quality of the research. Without his continuous attention, advice and encouragements I would never be able to finish by now. Pursuing study in a foreign country not only means dealing with academic issues but also integrating with a new culture and coping with loneliness. My promoter Professor, Arie Oskam keenly looked into all these matters and made my days happy whenever I was at Wageningen. He served as an excellent advisor on academic issues, a strong critique of research outcomes and also an interesting companion to discuss a variety of non-academic topics. I shall never forget the happy moments I had during the monthly breakfast and occasional dinners at Arie’s place arranged for international PhD students. In this connection, I would like to take the opportunity to express my gratitude to Mirjam Oskam who eagerly organized many enjoyable events for us, allowed us to make her kitchen a mess and still happily accompanied us in discussions. My PhD research and academic training process gave me the opportunity to travel different countries and to meet people from around the world. My special thanks to all those who cared for me, shared happy moments and helped me to find out ways at difficult times. I’m grateful to Chen Le, Ekram, Thomas, Natalia, Axel, Daan, Radhka, Popy, Sadat, Shakeel, Catherine.….. …….. I’m just mentioning a few names here though the actual list is much bigger. My special thanks to Chen Le who kept me talking and laughing for hours and of course cooked nice dishes so many times. Thanks to Thomas and Patony for

viii
being so generous and cooperative in entertaining me at your place. I am thankful to Dineke, Wilbert and Karen who made my life easier at Wageningen. I’m also grateful to Lidia and Lisbeth for letting me know Dutch culture and households closely. I would like to thank my colleagues at the Bangladesh Institute of Development Studies (BIDS) for encouraging my research. Thanks to the ‘WTO and Bangladesh’ and ‘RESPONSE’ projects of IFPRI for supporting my research. I am proud to say that the biggest encouragement to pursue PhD research originates from my family. My father, Principal Naziruddin Ahmed always dreamt that I would continue my study up to PhD level and my mother, Rahima Khatun, who always ensured that my kids are well taken care of in my absence. I also received lots of support from my mother in law, Faizunnessa Chowdhurani. Also thanks to my sister Nasreen and my niece Arshi, who gave emotional support to my kids. I’m deeply indebted to my daughter Raisa and my son Maheer for sacrificing their mother to pursue PhD research. They deserve the highest credit for whatever I achieved through this research process. I’m lucky to have Helal as my husband who is always there to support me with my studies and career. He has made me confident and sacrificed lots of his time to make my dreams come true. He is also a useful critique of my work and respects me a lot. He has made me feel valuable and gave love and care I need. In all, I feel that I’m very lucky that the Almighty gifted me the opportunity to have great experiences through my PhD research at Wageningen. Nazneen Ahmed Dhaka, March 2006
ix
Contents Chapter 1 Introduction 1.1 Background 1 1.2 Research objectives and questions 4 1.3 Model and data used in this research 4 1.4 Outline of the thesis 6 Chapter 2 The apparel industry of Bangladesh: moving from a
favoured to less – favoured situation? 2.1 Introduction 8 2.2 Production, export and employment 9 2.3 International reasons for the growth of the apparel industry 14 2.4 Domestic reasons behind the growth of the apparel industry 20 2.5 Domestically originating challenges for the apparel industry 22 2.6 Internationally originating challenges for the apparel industry 26 2.7 Discussion and conclusions 37 Appendix 2A: Production and trade of apparel 39 Chapter 3 Consequences of abolition of the multi-fibre arrangement
quotas on the apparel industry of Bangladesh – a computable general equilibrium analysis
3.1 Introduction 44 3.2 Model, data and simulations 45 3.3 Results 53 3.4 Discussion 59 3.5 Concluding remarks 63 Appendix 3A: The GTAP model 66 Appendix 3B: Simulation results 72 Chapter 4 Preferential trade arrangements in South Asia: options for
Bangladesh 4.1 Introduction 81 4.2 Intra-regional trade in South Asia: perspective of Bangladesh 84 4.3 Model, data and simulations 89 4.4 Results 92 4.5 Discussion and conclusions 96 Appendix 4A: Trade in SAFTA and BIMSTEC countries 99 Appendix 4B: Results of Indo-Lanka FTA 102

x
Appendix 4C: Results of implementing SAFTA, Bangladesh – India – Sri Lanka (BIS) tripartite FTA and BIMSTEC 104
Chapter 5 Globalisation and the workers of the apparel industry of
Bangladesh: a closer look into the workers’ rights 5.1 Introduction 113 5.2 Methodology and data 114 5.3 Workers’ rights: the regulatory framework 116 5.4 Workers’ rights situation in the apparel industry of Bangladesh 119 5.5 Globalisation, competitiveness and workers’ rights in apparel
industry 126 5.6 Addressing rights in a competitive world 131 5.7 Discussion and conclusions 132 Appendix 5A: ILO conventions ratified by Bangladesh 135 Appendix 5B: Laws on industrial workers’ establishments in Bangladesh 136 Appendix 5C: General information on interviewed workers and leaders 139 Chapter 6 Addressing workers’ rights in the textile and apparel
industry - consequences for the Bangladesh economy 6.1 Introduction 140 6.2 Data 141 6.3 Model 143 6.4 Simulations and results 149 6.5 Implications for rural households 158 6.6 Discussion and conclusions 159 Appendix 6A: Some features of the 1999-2000 Bangladesh SAM 161 Appendix 6B: Textile and apparel sector of Bangladesh (SAM 1999 -2000) 165 Appendix 6C: Simulation results 169 Chapter 7 General discussion and conclusions 7.1 Introduction 174 7.2 Discussion on methods and data 174 7.3 Conclusions from different chapters 176 7.4 Discussion and conclusions 179 Bibliography 184 Summary 196 Samenvatting (summary in Dutch) 199 About the Author 203 List of Publications 204

1
Chapter 1 Introduction 1.1 Background Apparel1 is the main export industry of Bangladesh. This industry started its venture in the late 1970s under the umbrella of the Multi-Fibre Arrangement (MFA) import quotas. Relatively less restrictive import quotas for Bangladesh compared to large apparel exporters like China and India, induced the growth of the apparel industry in Bangladesh. Trade liberalisation since the early 1990s, and financial sector liberalisation since the mid 1980s, which eased the restrictions on foreign direct investment, combined with substantial depreciation of the currency, stimulated rapid expansion of the labour intensive apparel industry in Bangladesh (e.g. Islam, 2001; Fontana et al., 2001a). By the late 1980s, apparel evolved as the main export industry of Bangladesh. Exports of the apparel industry grew from $1.0 million2 in 1978 to $5 billion in 2004 comprising 75% of total export earning and 80% of manufacturing export earning of Bangladesh. In 2004 the apparel industry had a share of 9.5% in total GDP and a share of 29.7% in manufacturing GDP.3 For the last two decades the apparel industry has been the main source of growth of export and formal employment of unskilled workers. At present nearly 1.9 million workers are employed in this industry and 90% of them are females (Razzaque, 2005; Mlachila and Yang, 2004). Around 75% of these female apparel workers are migrants from rural areas that mainly come from the poorest rural households (Afsar, 2001). The apparel industry has generated incremental employment rather than substituting for jobs in other industries (Kabeer and Mahmud, 2004). The apparel industry has been exposed to the challenges of the import quota free world since 1st January 2005, as the MFA import quotas were fully abolished on 31 December 2004. Starting in 1974, MFA governed the trade in textile and apparel until the end of the Uruguay round (31 December 1994). Since 1 January 1995 the WTO’s Agreement on Textile and Clothing (ATC) replaced the MFA.4 The ATC was a 10 year long transitional trade regime to fully integrate trade of textile and apparel into the WTO rules in 4 phases,
1 In this thesis the words apparel, wearing apparel, ready-made garment (RMG) are used interchangeably to refer to clothing. 2 Throughout this thesis $ refers to USA dollars. 3 Statistical Yearbook of Bangladesh (1982); Bangladesh Bank (the central bank of Bangladesh) web site http://www.bangladesh-bank.org/econdata/exprtrec.html (accessed on 17 February, 2005). 4 WTO agreements continue from its predecessor the General Agreement on Tariff and Trade (GATT) since 1 January 1995.

2
mainly by phasing out the MFA import quotas.5 Thus since 1 January 2005, for textile and apparel trade the free trade rules under WTO apply. This has posed challenges for the apparel industry of Bangladesh. International competitiveness of Bangladesh apparel in the post-MFA period is a frequently discussed issue in various studies (e.g. Razzaque, 2005; Ahmed, 2005; Mlachila and Yang, 2004; Lips et al., 2003; Bhattacharya and Rahman, 2000b; Islam, 2001). It is apprehended in most studies that in the MFA import quota free world, Bangladesh’s production and export of apparel will decrease as it will be less able to compete with apparel from countries like India or China6, which were facing relatively more restrictive MFA import quotas. Given this, it is important to analyse and quantify possible consequences of implementing WTO rules on textile and apparel, mainly, the consequences of the MFA import quota abolition, on production, employment and export of textile and apparel of Bangladesh vis a vis its competitors. Moreover, it is important to analyse the effects on the economy as a whole. Though textile and apparel are two closely linked industries, the analysis under the current research focuses on the apparel industry as that is the most important industry for Bangladesh in economic terms. The textile industry comes in the picture as a raw material supplier to the apparel industry but it is small in Bangladesh. While abolition of MFA import quotas is extending challenges for Bangladesh apparel, Bangladesh’s attempts to involve in various bilateral and regional preferential trade arrangements are generating hopes for trade gains - not only for apparel but also for other export industries, and for the economy as a whole. There is no study at the moment providing a comparative analysis of outcomes of different bilateral and regional preferential trade arrangement attempts of Bangladesh and this study aims to do that. The current study will compare the outcomes of the South Asian Free Trade Area (SAFTA), the Bay of Bengal Initiative for Multi-Sectoral Technical and Economic Cooperation (BIMSTEC) and bilateral free trade arrangements (of Bangladesh) with India and Sri Lanka. Globalisation has important implications for workers’ rights in manufacturing industries like the apparel industry. The level of addressing worker’s rights is becoming a crucial factor in exporting products to developed country markets. At one side, price competition among countries may induce producers in export-oriented industries to reduce production cost, which may in turn induce them not to address workers’ rights properly. On the other hand, rising concerns of consumers, trade unions and the International Labour Organisation (ILO) regarding rights of workers is extending pressure on producers to address
5 The import quotas were given under the MFA, while the ATC is a transitional agreement to implement the process of abolition of import quotas, which were imposed under the MFA. So these import quotas are mentioned as the MFA import quota; while ATC is a process. 6 Even if China is under voluntary export restrains in some markets like the EU.

3
workers’ rights properly. Thus these two opposite pressures of globalisation regarding workers’ rights are posing a challenge to the export-oriented apparel industry of Bangladesh. Many studies have noted different kinds of violation of rights in the apparel industry of Bangladesh (e.g. Zohir and Paul-Majumder, 1996; Paul-Majumder, 2003; Zohir, 2001; Kabeer and Mahmud, 2004). A comprehensive analysis of issues related to workers’ rights in the apparel industry of Bangladesh and impacts of globalisation in this connection is missing at the moment. A number of studies have pointed out that addressing workers’ rights, can increase workers’ productivity (e.g. Abdou, 1997; Fisk, 1997; Fisk and Rosenfeld, 2000). If increased productivity of workers generates higher income for producers, they will be willing to invest in worker’s rights, e.g. a better work environment. A study is, therefore, required to analyse the economy wide impacts of addressing workers’ rights in the apparel industry of Bangladesh. In general, trade liberalisation is found to have a positive contribution to economic performance (Winters, 2004) and also to poverty alleviation in the long run (Winters et al., 2004). However the required conditions under which trade liberalisation becomes growth enhancing are often absent in a less favoured area (LFA), which may be a whole country or some parts within a country (Oskam et al., 2004).7 In such an area, positive impacts of trade may not be automatically evident and there are even possibilities of adverse effects as these areas lack the capacity (in terms of institutions and infrastructure) to adjust with a more open world. It is out of the scope of this thesis to investigate in detail whether Bangladesh possesses characteristics of a LFA and/or to identify areas within Bangladesh possessing those characteristics. But some of the characteristics (e.g. infrastructure bottlenecks, low levels of investment) of a LFA are identified as important development concerns for the Bangladesh economy (chapter 2 of this thesis). Thus we may consider Bangladesh as a LFA in the world as a whole. In that context, following the predictions regarding impacts of trade liberalisation on LFAs, we may infer that impacts of MFA import quota abolition not be automatically positive for the economic performance and poverty situation of Bangladesh. Moreover income of rural households may also be affected by changes in the apparel industry if those changes affect incomes of the apparel workers, because most of the workers (dominated by females) of Bangladesh’s apparel industry are coming from rural
7 Oskam et al. (2004) have defined LFAs to be those areas where difficult physical conditions and/or lack of infrastructure and service support result in a relatively low level of income and also where private investors are reluctant to invest under present and expected future conditions. According to Ruben and Pender (2004), LFAs are those areas which are facing resource constraints occasioned either by nature or by man (e.g. fragile agricultural resource base, high and growing population density, limited access to markets, lack in infrastructure and service etc.)
4
areas (e.g. Zohir, 2001; Kibria, 2001; Afsar, 2001) and part of them send remittances to the rural households from where they originate. This thesis will address this issue. 1.2 Research objectives and questions The objective of this study is to provide an analysis of economy wide impacts of some recent challenges and opportunities posed by the changing global economy towards the apparel industry of Bangladesh. The study will also provide a comparative analysis of impacts of various preferential trade arrangement attempts of Bangladesh on the apparel industry and on the economy as a whole. From these broad objectives five research questions are derived, which are addressed in the subsequent chapters.
1. In what context has the Bangladesh apparel industry emerged and grown? What are the opportunities and threats faced by this industry?
2. How will the Bangladesh economy be affected by implementation of WTO rules regarding apparel?
3. How will various preferential trade arrangement attempts of Bangladesh affect the economy?
4. What is the state of workers’ rights in the apparel industry of Bangladesh and how are these affected by globalisation?
5. What are the economy wide effects of addressing the rights of workers in the apparel industry of Bangladesh and how do these affect rural households?
1.3 Model and data used in this research The research questions have been addressed in a general equilibrium framework. The study has used both a multi country and single country computable general equilibrium (CGE) model. The research questions aim to address economy wide impacts of trade related issues and CGE models are the appropriate tools to fulfil such aims (Scollay and Gilbert, 2000). CGE models provide a representation of an economy as a whole including the economic linkages between different agents (industries, households, government and other economies). During the last three decades CGE models have been widely applied to analyse the effects of changes originating outside an agent that have a major impact on individual interlinked agents. CGE models are also appropriate if a change within an industry has a major impact on the economy as a whole. Examples of the first group of changes are tax reforms and international trade liberalisation. Examples of the second group of changes are industry specific policy changes and technological innovations in large industries, as the apparel industry in Bangladesh. CGE models can also explore
5
impacts on various macro economic indicators (e.g. GDP, welfare, employment, trade balance) and household and industry specific economic indicators (e.g. value added, employment, savings).8 A more extensive discussion of CGE models is provided in chapters 3, 4 and 6 where CGE models are applied and also in chapter 7. International trade liberalisation and preferential trade arrangements (PTAs) have potentially major effects on the economy as a whole. International policy changes for apparel (along with textile) not only affect the large apparel industry of Bangladesh but also the Bangladesh economy as a whole. Because MFA import quota abolition and PTAs affect different countries and these countries mutually affect each other a multi country CGE model is required and therefore such a model is chosen in chapter 3 and chapter 4. Chapter 3 studies various impacts of implementation of WTO rules regarding textile and apparel applying the data and modelling framework of the Global Trade Analysis Project (GTAP). More specifically, data and model of the GTAP version 5.1 have been applied. GTAP also has been used in chapter 4 to explore effects of various PTA options for Bangladesh. Multi country CGE models are widely used for analysing the impact of PTAs as they are able to assess the net effect of such agreements after considering both trade creation and trade diversion effects of PTAs.9 To analyse the effects of a change originating in one industry, and that industry is large and has economy wide linkages with other industries and households, and the objective is to analyse the economy wide effects of the policy change then a CGE model is appropriate. Given the importance of the apparel industry in terms of exports (75%), employment (40% of the manufacturing employment), contribution to GDP (9.5%) and manufacturing GDP (29.7%) in Bangladesh, any policy change in this industry has a large potential effect on the economy as a whole and a CGE model is appropriate. Therefore a single country CGE model has been applied in chapter 6 to simulate economy wide impacts of an increase in the productivity of apparel industry workers of Bangladesh. More specifically, the study applies the CGE model of the International Food Policy Research Institute (IFPRI) using the 1999-2000 social accounting matrix (SAM) of Bangladesh.
8 There is a vast literature on CGE modelling and its applications. Construction of CGE models is discussed (among others) in Dervis, de Melo and Robinson (1982), Shoven and Whalley (1992), Devarajan et al. (1997) and in Robinson et al. (1989). The multi-country CGE modelling approach is described in Hertel (1997). Empirical applications of CGE models can be found (among others) in de Melo (1988), de Melo and Tarr (1992), Devarajan et al. (1993), de Janvry and Sadoulet (1987) and Gunning and Keyzer (1993). 9 For surveys of CGE models applied to analyse impacts of PTAs, please see Hertel et al. (1999), Scollay and Gilbert (2000) and Robinson and Thierfelder (2002).

6
To find out the state of workers’ rights in the apparel industry of Bangladesh and implications of trade liberalisation in this regard, this study has used the information collected for a study under the project titled ‘Mobilising for worker accountability in Bangladesh’, which is a joint project between the Bangladesh Institute of Development Studies (BIDS) and the Institute of Development Studies (IDS), UK (details are given in the relevant chapter, i.e. chapter 5). The information includes literature surveys, case studies of apparel workers, and interviews with different stakeholders (factory owners and managers, relevant government officials, lawyers, NGOs and trade union leaders). Analysis in other chapters are based on published secondary information from various sources like the Bangladesh Bureau of Statistics, The Central Bank of Bangladesh, Ministry of Finance, the World Bank, journal articles, etc. 1.4 Outline of the thesis After this introductory chapter there are 6 more chapters in this thesis. Outlines of those chapters are given below: Chapter 2 provides an overview of the apparel industry of Bangladesh. It elaborates on emergence and importance of this industry in the Bangladesh economy. This chapter identifies and discusses different opportunities and threats, both internationally and domestically originated, faced by this industry. In this way, the chapter provides answers to the first research question. This chapter is based on a descriptive analysis of the issues. The analysis in this chapter provides a base for analysis of subsequent chapters. Chapter 3 provides answers to the second research question by providing a quantitative analysis of impacts of implementation of WTO rules regarding textile and apparel, on the apparel industry of Bangladesh and on the Bangladesh economy as a whole vis-à– vis other countries. This chapter uses the data and modelling framework of GTAP. Underlying assumptions in the default model and data base are changed in this chapter to better reflect realities regarding Bangladesh and some other regions considered. Results give a picture of different possible outcomes and also explain Bangladesh’s situation compared to its competitors India and China. Chapter 4 is addressing the outcomes of Bangladesh’s attempts to involve in various bilateral and regional preferential trade arrangements. This chapter also applies data and modelling framework of GTAP and like in chapter 3 necessary modifications are made in the model assumptions and data base. The analysis provides a comparison of outcomes from different trade arrangement options. Special attention has been given to implications of various preferential trade arrangements on the apparel industry. Thus this chapter is answering research question number 3. Research question number 4 is answered in chapter 5. It provides an analysis of the state of workers’ rights in the apparel industry of Bangladesh and also
7
discusses impacts of globalisation in addressing workers’ rights. This chapter uses both secondary information and primary information collected under another study (mentioned above). The analysis of this chapter shows the extent of violation of workers’ rights in the apparel industry of Bangladesh and roles of globalisation in this regard. The last research question i.e. question 5 is addressed by chapter 6 where a single country CGE model of Bangladesh has been applied. The chapter looks into economy wide impacts of the increase in productivity of unskilled and low skilled workers of the textile and apparel industries of Bangladesh. It is assumed here that productivity increases when workers’ rights are addressed better. Thus the analysis in this chapter ultimately refers to the impact of addressing workers’ rights in the textile and apparel industry. The final chapter, i.e. chapter 7, provides a synthesis of results of different chapters. It also provides a general discussion of various issues covered in other chapters and points out caveats of the models used in various chapters. Finally, the thesis ends with some general conclusions.

8
Chapter 2 The apparel industry of Bangladesh: moving from a favoured to a less favoured situation?
2.1 Introduction Apparel has evolved as the main export product of Bangladesh during the late 1980s. Starting as a non-traditional export item in the late 1970s, apparel has achieved this status within a short span of time. While export earning from the apparel industry was barely $1 million in 1978, it became more than $5 billion in 2004 comprising 75% of total export earning and 80% of manufacturing export earning of Bangladesh. In 2004 the apparel industry had a share of 9.5% in total GDP and a share of 29.7% in manufacturing GDP.10 Some bold entrepreneurs without any experience in export business started apparel production in Bangladesh and later their success stories motivated others to come forward in the business (Quddus and Rashid, 2000). Both domestic and international policies have influenced such a rapid flight of the apparel industry. Moreover availability of cheap labour stimulated growth. For the last two decades, the apparel industry has been the main source of growth of export and formal employment in Bangladesh. This industry is directly employing nearly 1.9 million people comprising 40% of manufacturing sector employment and 90% of them are females (Razzaque, 2005; Mlachila and Yang, 2004). 75% of these female apparel workers are migrants from rural areas and mainly coming from the poorest rural households (Afsar, 2001). This industry has generated new employment rather than substituting for jobs in other industries (Kabeer and Mahmud, 2004). During the last decade, there have been several changes in the international trade agreements for apparel products, which are generating new challenges and opportunities for the export-oriented apparel industry of Bangladesh. In addition, there also prevail several domestic challenges. In the international market, implementation of the rules and regulations of the World Trade Organisation (WTO) and preferential trade arrangements among different groups of countries are of special concern for Bangladesh. In the domestic market, the challenges include lack of backward linkage industries (supplying inputs) for apparel, low efficiency of the workers, and lack of efficient infrastructure (Mlachila and Yang, 2004; World Bank, 200511). Thus the main export industry of Bangladesh is facing important challenges. Being the main 10 Statistical Yearbook of Bangladesh (1982), Bangladesh Bank web site, http://www.bangladesh-bank.org/econdata/exprtrec.html (accessed on 17 February, 2005) and World Bank (2005). 11 I was a member of the core team undertaken this study and worked for the part of the value chain analysis of different industries. It is thus acknowledged in the published study report.
9
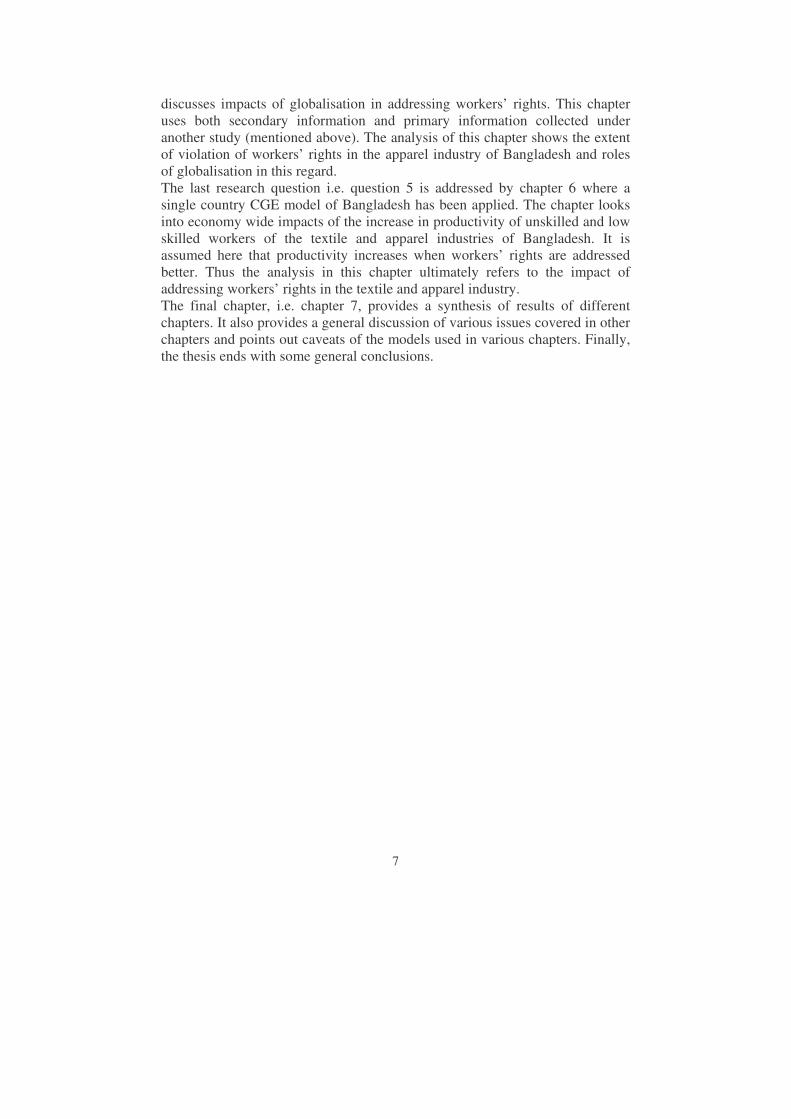
export industry of Bangladesh and having close links with the rural economy, such changes may have large welfare consequences for those who are directly and indirectly dependent on this industry as well as for the economy as a whole. Therefore it is important to analyse both domestic and international challenges faced by the apparel industry of Bangladesh. The aim of this chapter is to provide an overview of the Bangladesh apparel industry – its emergence, growth, and challenges faced. Section 2.2 provides a brief description of production, export and employment in the apparel industry of Bangladesh. Section 2.3 discusses international reasons behind the growth of the apparel industry, while section 2.4 discusses the domestic reasons behind the growth of this industry. Domestically originated challenges faced by the apparel industry are discussed in section 2.5. International market originated challenges. Faced by this industry are discussed in section 2.6. Finally section 2.7 provides a discussion and some conclusions. 2.2 Production, export and employment Production chain of apparel To analyse the growth of Bangladesh apparel industry, it is important to understand the production chain of apparel commodities. In general apparel commodities follow the production chain mentioned in figure 2.1. Up to the fabric stage the product is considered to be textile and then through the process of cutting and sewing it becomes apparel. There are various intermediate stages between textile and apparel. For example, fabrics need to be dyed and printed (where necessary) before cutting and sewing. Figure 2.1: General production chain of apparel
Spinning
Natural or man–made fibres (fibres from cotton, silk, animal hair, nylon, polyamides etc.)
Yarn Fabrics (woven or knitted)
Apparel or garment (shirts, jackets, trousers etc).
Weaving / Knitting
Cutting and sewing
10
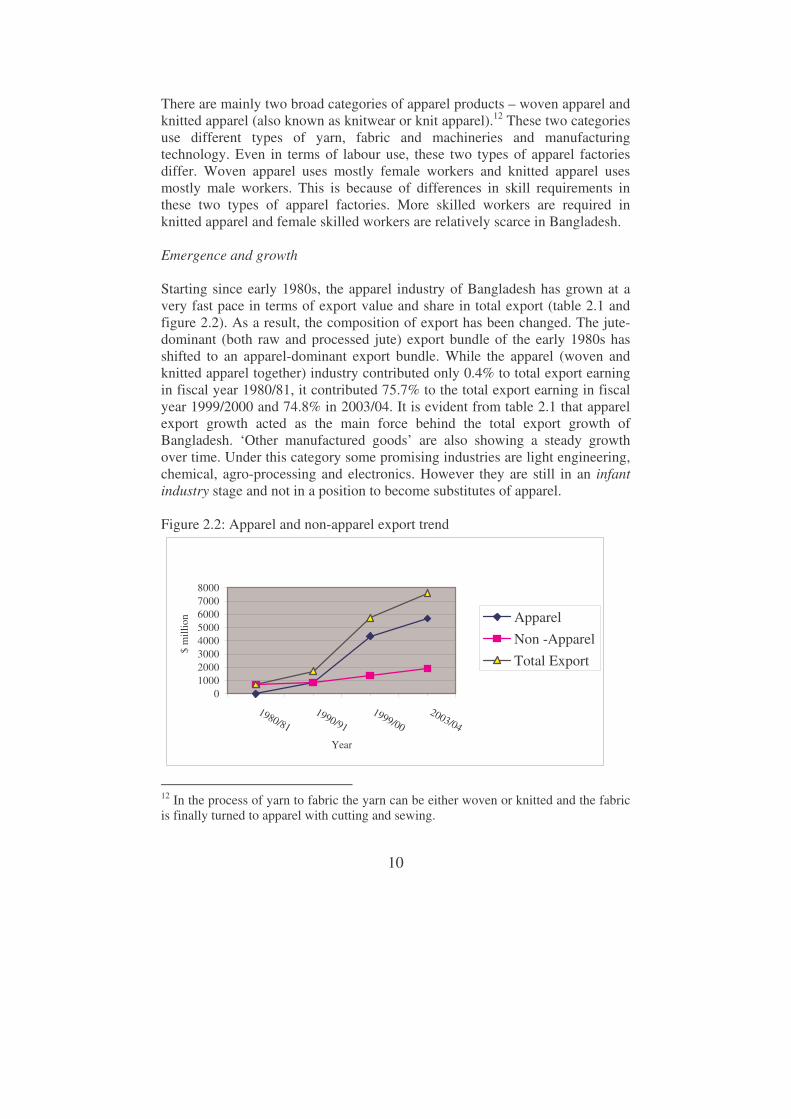
There are mainly two broad categories of apparel products – woven apparel and knitted apparel (also known as knitwear or knit apparel).12 These two categories use different types of yarn, fabric and machineries and manufacturing technology. Even in terms of labour use, these two types of apparel factories differ. Woven apparel uses mostly female workers and knitted apparel uses mostly male workers. This is because of differences in skill requirements in these two types of apparel factories. More skilled workers are required in knitted apparel and female skilled workers are relatively scarce in Bangladesh. Emergence and growth Starting since early 1980s, the apparel industry of Bangladesh has grown at a very fast pace in terms of export value and share in total export (table 2.1 and figure 2.2). As a result, the composition of export has been changed. The jute-dominant (both raw and processed jute) export bundle of the early 1980s has shifted to an apparel-dominant export bundle. While the apparel (woven and knitted apparel together) industry contributed only 0.4% to total export earning in fiscal year 1980/81, it contributed 75.7% to the total export earning in fiscal year 1999/2000 and 74.8% in 2003/04. It is evident from table 2.1 that apparel export growth acted as the main force behind the total export growth of Bangladesh. ‘Other manufactured goods’ are also showing a steady growth over time. Under this category some promising industries are light engineering, chemical, agro-processing and electronics. However they are still in an infant industry stage and not in a position to become substitutes of apparel. Figure 2.2: Apparel and non-apparel export trend
010002000300040005000600070008000
1980/811990/91
1999/002003/04
Year
$ m
illio
n ApparelNon -ApparelTotal Export
12 In the process of yarn to fabric the yarn can be either woven or knitted and the fabric is finally turned to apparel with cutting and sewing.

11
Table 2.1: Changing structure of export of Bangladesh (exports in $ million and figures within parentheses show % share in total exports) Items 1980/81 1990/91 1999/00 2003/04 Primary goods 209
(29.4) 306
(17.8) 469 (8.2)
485.8 (6.4)
Raw jute 119 (16.8)
104 (6.1)
72 (1.3)
79.7 (1.1)
Tea 41 (5.8)
43 (2.5)
18 (0.3)
15.8 (0.2)
Frozen food 40 (5.6)
142 (8.3)
344 (6)
390.3 (5.1)
Other primary goods 9 (1.3)
17 (1.0)
35 (0.6)
n.a
Manufactured goods 501 (70.6)
1411 (82.2)
5283 (91.8)
7117.2 (93.6)
Jute goods 367 (51.7)
290 (16.9)
266 (4.6)
246.5 (3.2)
Leather & leather goods 57 (8.0)
136 (7.9)
195 (3.4)
211.4 (2.8)
Woven garments 3 (0.4)
736 (42.9)
3083 (53.6)
3538.1 (46.5)
Knitted apparel 0 (0)
131 (7.6)
1270 (22.1)
2148 (28.3)
Chemical products 11 (1.5)
40 (2.3)
94 (1.6)
n.a.
Other manufactured goods 63 (8.9)
78 (4.5)
375 (6.5)
973.2 (12.8)
Total export 710 (100)
1717 (100)
5752 (100)
7603 (100)
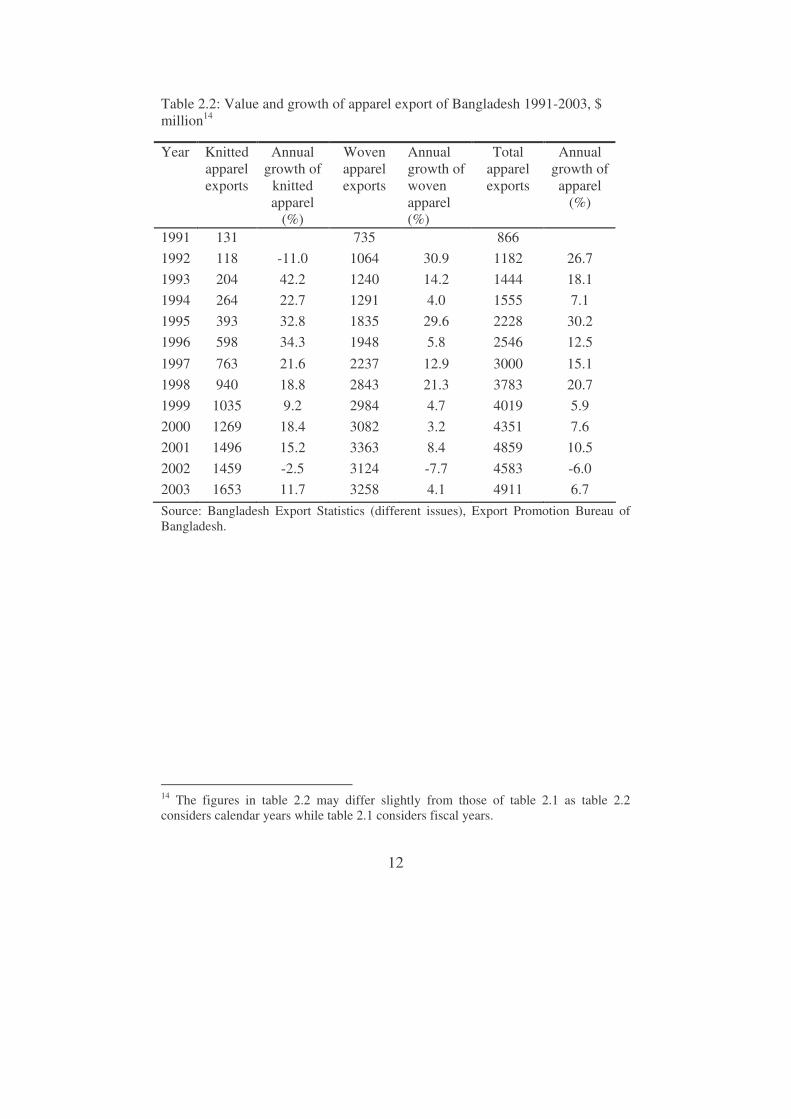
Note: A year is noted here as the fiscal year of Bangladesh, which starts on the 1st of July of every year. Source: CPD (2001) and Bangladesh Bank (http://www.bangladesh-bank.org/econdata/exprtrec.html, accessed on 17 February 2005). Initially Bangladesh was producing and exporting only woven apparel. Since the early 1990s production and exports of knitted apparel started and experienced a very robust growth (table 2.2). While the share of knitted apparel was 15.1% in total apparel export earning in 1991, it became 33.7% in 2003. Over the years the number of apparel factories rose from 134 in 1983/84 (Zohir, 2001) to 3093 in 200513.
13 http://www.bangladeshgarments.info/ (accessed on 14 March, 2005)
12
Table 2.2: Value and growth of apparel export of Bangladesh 1991-2003, $ million14
Source: Bangladesh Export Statistics (different issues), Export Promotion Bureau of Bangladesh.
14 The figures in table 2.2 may differ slightly from those of table 2.1 as table 2.2 considers calendar years while table 2.1 considers fiscal years.
Year Knitted apparel exports
Annual growth of
knitted apparel
(%)
Woven apparel exports
Annual growth of woven apparel (%)
Total apparel exports
Annual growth of apparel
(%)
1991 131 735 866 1992 118 -11.0 1064 30.9 1182 26.7 1993 204 42.2 1240 14.2 1444 18.1 1994 264 22.7 1291 4.0 1555 7.1 1995 393 32.8 1835 29.6 2228 30.2 1996 598 34.3 1948 5.8 2546 12.5 1997 763 21.6 2237 12.9 3000 15.1 1998 940 18.8 2843 21.3 3783 20.7 1999 1035 9.2 2984 4.7 4019 5.9 2000 1269 18.4 3082 3.2 4351 7.6 2001 1496 15.2 3363 8.4 4859 10.5 2002 1459 -2.5 3124 -7.7 4583 -6.0 2003 1653 11.7 3258 4.1 4911 6.7

13
Table 2.3 shows that directly and indirectly 10–12 million people are supported by the apparel industry.15 Table 2.3: Bangladesh apparel industry – at a glance Number of companies operating in the industry 3093 Employment structure People directly employed in apparel industry (2003) People engaged in accessory16 industries (2002) People indirectly dependent on sector (2002)
1.9 million (90% female) 0.8 million 10 million
Share in total export earning of Bangladesh (2003) 75% Exports (2003, in $ million) Total exports Garment exports Knitted apparel exports Woven apparel exports
6548 4912 1653 3258
Input supplying textile units (2000/2001) Spinning mills Weaving mills Dyeing, printing, finishing, other
142 109 104
Contribution to GDP(2004) 9.5% Major export markets (2003, in $ million) European Union United States Canada Japan Hong Kong India
3400 2100 170 108
90 84
Source: BGMEA (2003-2004), EPB (2002-2003), http://www.bangladeshgarments.info/ (accessed on 14 March, 2005) and World Bank (2005). A consequence of the rapid growth of the apparel industry is the growth of employment in this labour intensive industry. While the industry was employing 0.1 million people in 1985, it was employing nearly 1.9 million in 2003 (Razzaque, 2005). Table 2.4 presents employment scenario in the apparel industry. A feature of employment in apparel industry of Bangladesh is the employment of female workers. 90% of the workers of the apparel industry are females (Bhattacharya and Rahman, 2000a). Moreover 90% of the workers have migrated from the rural areas (Afsar 2001). Employment in this industry has made women visible in national employment statistics and has brought 15 Apparel is employing 1.9 million workers. This number multiplied by an average family size of 5.6 (the national average according to the Statistical Yearbook of Bangladesh, 1999) gives the number 10 million. 16 Industries supplying various accessories like button, packaging, collar etc. to the apparel industry

14
about a social change in Bangladesh (Zohir, 2001). In Bangladesh a factory job may be counted as one of the few socially acceptable ways for uneducated or low educated women to earn a living. In the rural Bangladesh women live in a traditional atmosphere, which does not permit them to go to cities (even outside the village in some cases) alone. Rural women, largely, remain outside the purview of the visible cash economy, being primarily functional in the domestic and informal economies. Thus it is quite a new development that a large number of women are going to work in the city based apparel factories, inevitably changing their status and economic relevancy. Table 2.4: Employment in the apparel industry of Bangladesh Year Employment (million) 1985/86 0.2 1990/91 0.4 1995/96 1.3 1999/00 1.6 2001/02 1.8 Source: Ahmed and Sattar (2003, cited in Mlachila and Yang, 2004). A closer look reveals that there are both international and domestic reasons for the growth of the apparel industry of Bangladesh. Domestically, export encouraging policy changes in general and some policies specific to the apparel industry contributed to a large extent to the rapid growth of this industry. Moreover availability of cheap workers acted as a major stimulator. These international and domestic reasons for the growth of the apparel industry in Bangladesh are discussed in next two sections. 2.3 International reasons for the growth of the apparel industry Before discussing the international reasons for the growth of Bangladesh apparel, some theoretical concepts have to be discussed first. Theoretical background: tariffs and import quotas According to trade theory (see for example, Krugman and Obsfeld, 2000 and Husted and Melvin, 1998) a tariff is the most common example of a trade policy instrument. Tariffs traditionally also have been used as a source of government income. A tariff is a tax levied on imported goods. Tariffs lead to a wedge between the prices at which goods are traded internationally (world price) and the prices at which they are sold domestically (domestic price). Tariffs affect both supply and demand. In figure 2.3 PW is the world price of apparel. When a country imposes a unit tariff t (a fixed amount t per unit

15
imported), the domestic price of apparel rises to PW + t. A tariff reduces import and increases domestic production. Before imposing the tariff (domestic price equals PW) domestic demand is D2 and domestic supply is S1. The excess domestic demand (D2- S1) is imported. After the tariff imposition, the domestic price level becomes PW + t, production rises to S2 and domestic demand decreases to D1. Import decreases to D1-S2.
Producers gain from the higher domestic price and the government earns revenue but the consumer surplus decreases. As a result there is a welfare loss (deadweight loss) of (b+d) in the tariff imposing country. This loss represents an efficiency loss that arises because the tariff distorts incentives to consume and produce. Here b is the production distortion loss (as the tariff induces domestic producers to produce too much of this good) and d is the consumption distortion loss (as the tariff induces consumers to consume too less of the good).17 An import quota is imposed to restrict the import quantity up to a certain limit. The restriction is usually enforced by issuing licenses to individuals or firms.
17 In case of a large country imposing tariff may not create efficiency loss if it leads to improvement of its terms of trade (when tariff lowers foreign export price) and therefore in case of large country welfare loss from tariff imposition is not straight forward.
PW
PW + t
S
D
Price
Quantity
Figure 2.3: Effects of a tariff on the importing country
S2 S1 D1 D2
a b c d
Welfare effects of a tariff: Change in consumer surplus: -(a + b + c + d) Change in producer surplus: a Change in government revenue: c Total welfare effect: -(b+d) (deadweight loss)
t

16
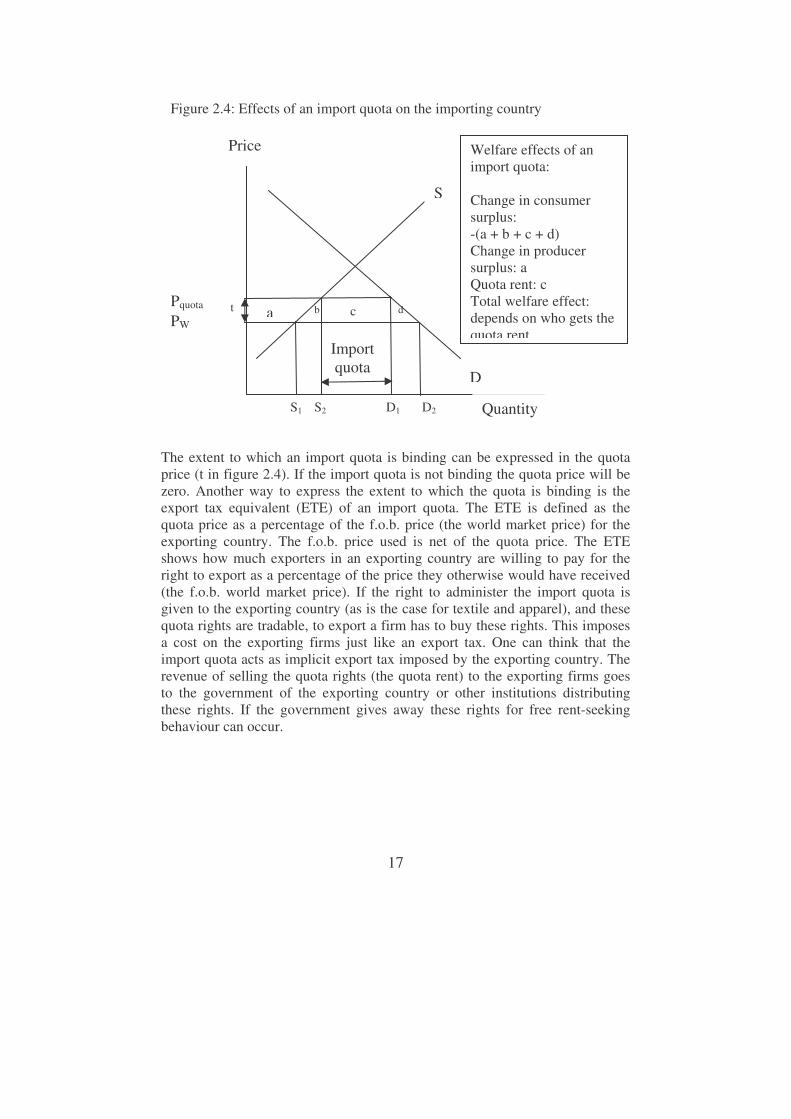
Like a tariff, an import quota also raises the domestic price of the imported good. When imports are limited (as a result of the import quota restriction), then at the original price (the world price PW), demand for the good exceeds domestic supply plus imports. This causes the domestic price to rise by the same amount as a tariff that limits imports to the same level (D1-S2 in figure 2.4). Therefore in figure 2.4, t is the unit tariff which will lead to an import of D1-S2 (the import quota) and the price PW rises to Pquota, which is equal to PW + t in figure 2.3.18 The price of the import quota is t and the value of the import quota (the import quota price times the import quota) is the import quota rent (area c in figure 2.4). The economic effects of implementing import quotas depend on how they are administered. More specifically, it is crucial to determine who gets the quota rent (area c in figure 2.4). If import quota licenses are auctioned by the importing country government in competitive auctions, then the welfare effects (on the importing country) of the import quotas are similar to that of a tariff. The value of the import quota (quota rent) goes to the government of the importing country. If the import quota licenses are given to the exporting country then import quotas produce besides the deadweight loss (b+d in figure 2.4) an extra welfare loss equal to the quota rent (c in figure 2.4) for the import quota imposing country. If for the exporting country the import quota is larger than the export capacity of the country then the import quota does not act as a barrier to trade (the import quota is not binding). If the import quota is smaller than the export capacity, then it does act as a barrier to enter the market of the importing country (the import quota is binding). Import quotas could allow individual countries to export while this would not be the case in a free market situation.
18 There is a wide literature on equivalence and non-equivalence of tariffs and quotas. For example, hagwati (1968), Rodriguez (1974) etc.
17
The extent to which an import quota is binding can be expressed in the quota price (t in figure 2.4). If the import quota is not binding the quota price will be zero. Another way to express the extent to which the quota is binding is the export tax equivalent (ETE) of an import quota. The ETE is defined as the quota price as a percentage of the f.o.b. price (the world market price) for the exporting country. The f.o.b. price used is net of the quota price. The ETE shows how much exporters in an exporting country are willing to pay for the right to export as a percentage of the price they otherwise would have received (the f.o.b. world market price). If the right to administer the import quota is given to the exporting country (as is the case for textile and apparel), and these quota rights are tradable, to export a firm has to buy these rights. This imposes a cost on the exporting firms just like an export tax. One can think that the import quota acts as implicit export tax imposed by the exporting country. The revenue of selling the quota rights (the quota rent) to the exporting firms goes to the government of the exporting country or other institutions distributing these rights. If the government gives away these rights for free rent-seeking behaviour can occur.
PW
Pquota
S
D
Price
Quantity
Figure 2.4: Effects of an import quota on the importing country
S2 S1 D1 D2
a b c d
Welfare effects of an import quota: Change in consumer surplus: -(a + b + c + d) Change in producer surplus: a Quota rent: c Total welfare effect: depends on who gets the quota rent
t
Import quota
18
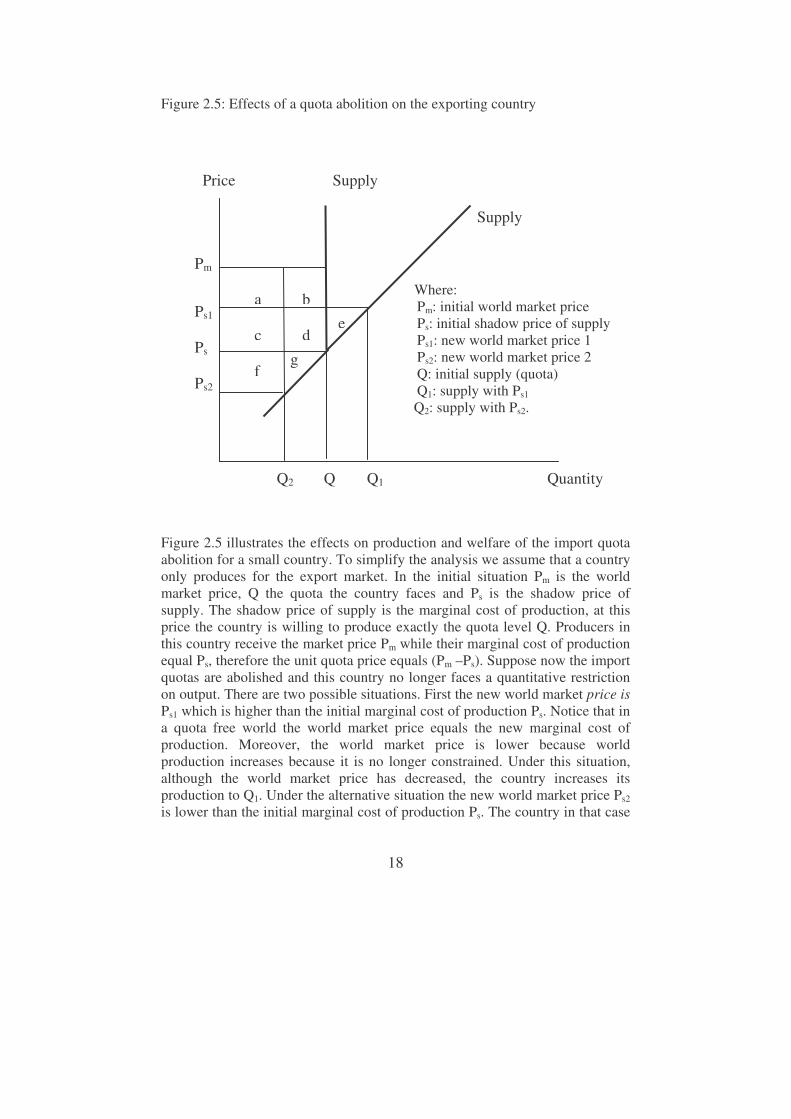
Figure 2.5: Effects of a quota abolition on the exporting country Figure 2.5 illustrates the effects on production and welfare of the import quota abolition for a small country. To simplify the analysis we assume that a country only produces for the export market. In the initial situation Pm is the world market price, Q the quota the country faces and Ps is the shadow price of supply. The shadow price of supply is the marginal cost of production, at this price the country is willing to produce exactly the quota level Q. Producers in this country receive the market price Pm while their marginal cost of production equal Ps, therefore the unit quota price equals (Pm –Ps). Suppose now the import quotas are abolished and this country no longer faces a quantitative restriction on output. There are two possible situations. First the new world market price is Ps1 which is higher than the initial marginal cost of production Ps. Notice that in a quota free world the world market price equals the new marginal cost of production. Moreover, the world market price is lower because world production increases because it is no longer constrained. Under this situation, although the world market price has decreased, the country increases its production to Q1. Under the alternative situation the new world market price Ps2 is lower than the initial marginal cost of production Ps. The country in that case
Price Supply Supply Where: Pm: initial world market price Ps: initial shadow price of supply Ps1: new world market price 1 Ps2: new world market price 2 Q: initial supply (quota) Q1: supply with Ps1 Q2: supply with Ps2. Q2 Q Q1 Quantity
a b
c d e
f g
Pm
Ps1
Ps
Ps2
19
lowers its production to Q2. The more a country is constrained by the quota the lower the shadow price of supply and the more likely it will increase its production after quota abolition. Countries that are hardly constrained by the quota have a relatively high shadow price of supply. After quota abolition it is more likely that they reduce production. In the first case the producer surplus decreases with (a+b) and increases with e. In the second situation producer surplus decreases with (a+b+c+d+f+g). Here it is assumed that the initial quota rent (a+b+c+d) was received by the producers. This is of course not always true (the government may sell the quota rights). The welfare effects also depend on the effect of trade liberalisation on input prices. If for example the price of textile as an input in apparel production falls the supply curves shift outwards and there is an extra positive welfare effect for the producers. In Bangladesh after receiving the quota by importers, the Export Promotion Bureau (EPB) handles the quota allocation by following the textile trade and quota administration rules, 1991 of the Ministry of Commerce, Bangladesh. Private traders apply for certain amounts of quotas. On the basis of the applications, the EPB allocates the quota. After this the private owners of the quotas can sell them in an open market. The international reasons Internationally the apparel industry of Bangladesh flourished under the umbrella of the Multi-Fibre Arrangement (MFA) of textile and apparel trade. The first MFA was devised in 1974. The MFA provided rules for the imposition of import quotas, either through bilateral agreements or unilateral actions, on trade in textiles and apparel between individual developed country importers and developing country exporters.19 Though the import quota imposed by the importing country should restrict the export of the exporting country, it helped the growth of the apparel industry in many developing countries like Bangladesh. Relatively less restrictive import quotas for Bangladesh under MFA compared to traditional apparel exporters (Korea, Hong Kong, Japan, China, etc.) acted as a blessing in disguise, which ensured a market for Bangladesh apparel in the USA and stimulated growth of the apparel industry (Bhattacharya and Rahman, 2000b).
19Since 1974, the MFA has been renegotiated four times and each modification has brought with it increasingly restrictive measures – covering a broader range of products, and reducing flexibility provisions in the system.

20
Table 2.5: Export tax Equivalents (ETE)20 of import quotas in selected countries, 2003 (as % of f.o.b. prices net of quota price)
Textile Apparel USA EU USA EU Bangladesh 0 0 7.6 0 India 3.0 1.0 20.0 20.0 China 20.0 1.0 36.0 54.0 Pakistan 9.8 9.4 10.3 9.2 Note: Estimates are based on the quota price information for countries other than India. For India estimates are interpolated from quota utilization data. Source: According to the information given in Mlachila and Yang, 2004. During this period, political problems in Sri Lanka and the anti-export environment in India, the two major South Asian apparel producers until early 1980s, induced the buyers to shift attention to Bangladesh (Spinanger, 2000). Another important stimulator of the growth of apparel in Bangladesh is the tariff and import quota-free access in the European Union (EU) under the Generalised System of Preference (GSP) scheme, which contributed to the expansion of apparel export in the EU market provided that Bangladesh meets the rules of origin (ROO) requirement. The GSP scheme allows EU importers to claim full tariff drawback on imports when they import from Bangladesh (Bhattacharya and Rahman, 2000b). On average the tariff rate of apparel products in the EU is 12.5%, which becomes zero for Bangladesh under the GSP. Such a preferential treatment for Bangladesh made the EU the largest apparel export market of Bangladesh. According to figure 2.3 as Bangladesh does not faces any tariff in the EU market, the price of Bangladesh’s products will be PW, while the price of products from countries like India or China will be PW + t, which is higher. In this way GSP has offered comparatively greater market access for Bangladesh in the EU. Table 2.5 also shows that Bangladesh is relatively less restricted both in the EU and the US. 2.4 Domestic reasons behind the growth of the apparel industry After achieving independence in 1971, the trade and investment policies of Bangladesh promoted an import-led growth strategy. This implied the emergence of large-scale public sector enterprises, widespread quantitative restrictions on imports, high import tariffs, foreign exchange rationing, and an
20 Export tax equivalents (ETE) of quotas are expressed as percentage of f.o.b. price (net of quota price). For detail on ETEs please see the web document by Joseph Francois and Dean Spinanger at http://www.gtap.agecon.purdue.edu/resources/download/723.pdf (accessed on 9 April 2005).

21
overvalued exchange rate. All these resulted in an “anti-export” bias, fiscal imbalance and lack of incentives for industrialisation. Since the early eighties, to enhance economic growth, Bangladesh initiated steps to deregulate, decontrol and liberalise the economy (Razzaque et al., 2003). As a result of various liberalisation policies and reforms under the Structural Adjustment Programmes (SAPs)21, average nominal tariff rates in Bangladesh came down from 89% to 17% during 1992–2000 (CPD, 2001). Easier access to imported raw materials and incentives for export-oriented activities were able to reduce the “anti-export” bias in Bangladesh and encouraged export-oriented investments. The main export incentives received by the apparel industry of Bangladesh include tariff drawback22, bonded warehouse facilities (BWF)23, cash incentives24, and back-to-back L/C facilities25. In 1980, the apparel producers were granted back-to-back letters of credit (L/C) and bonded warehouse facilities. As a result they achieved tariff free access to inputs and thus required less working capital. Foreign exchange liberalisation that allowed for
21 The adjustment programmes suggested by World Bank and IMF for developing countries. Effects of the Structural Adjustment Programmes on the economy of Bangladesh can be found, among others, in CPD (2001). 22 Under the tariff drawback facility the tariffs paid on imported inputs and the value added tax paid on local inputs used for export products are refunded. All export-oriented production units not enjoying BWF can have access to the tariff drawback. 23 Under the BWF system a firm can delay the payments of tariffs until they are ready to consume inputs imported earlier and if these inputs are used for producing export products then they are not required to pay the tariff. However, if these inputs are used to produce products to be consumed domestically, then producers have to pay the tariffs for the imported inputs. Moreover producers can maintain unutilized stocks without paying taxes/tariffs, thereby reducing the total cost of holding inventories. This is important for exporting firms since tariffs often have a large share in total production cost. Moreover, under the BWF, the entrepreneurs of an export industry can get back any import tariff they already paid for imported inputs. Thus the export-oriented apparel factories can actually access imported inputs at zero tariffs. 24 Under the cash compensation scheme of the government of Bangladesh, the domestic suppliers to export-oriented apparel factories receive a cash payment equivalent to 10% of the value addition of the exported apparel. This incentive is expected to be completely abolished by the year 2006. 25 Under the back–to-back letters of credit (L/C) extended by commercial banks, the exporters of apparel are able to import inputs (i.e. fabrics and accessories) against the export orders placed in their favour by the final apparel importers. Thus by showing the export order exporters can get credit from commercial banks to pay for imported inputs. The payment for the export of the final good can be cleared by the exporter after they pay back the credit to the commercial banks. This provision allows Bangladesh’s exporters to avoid investing their own resources to finance the working capital.
22
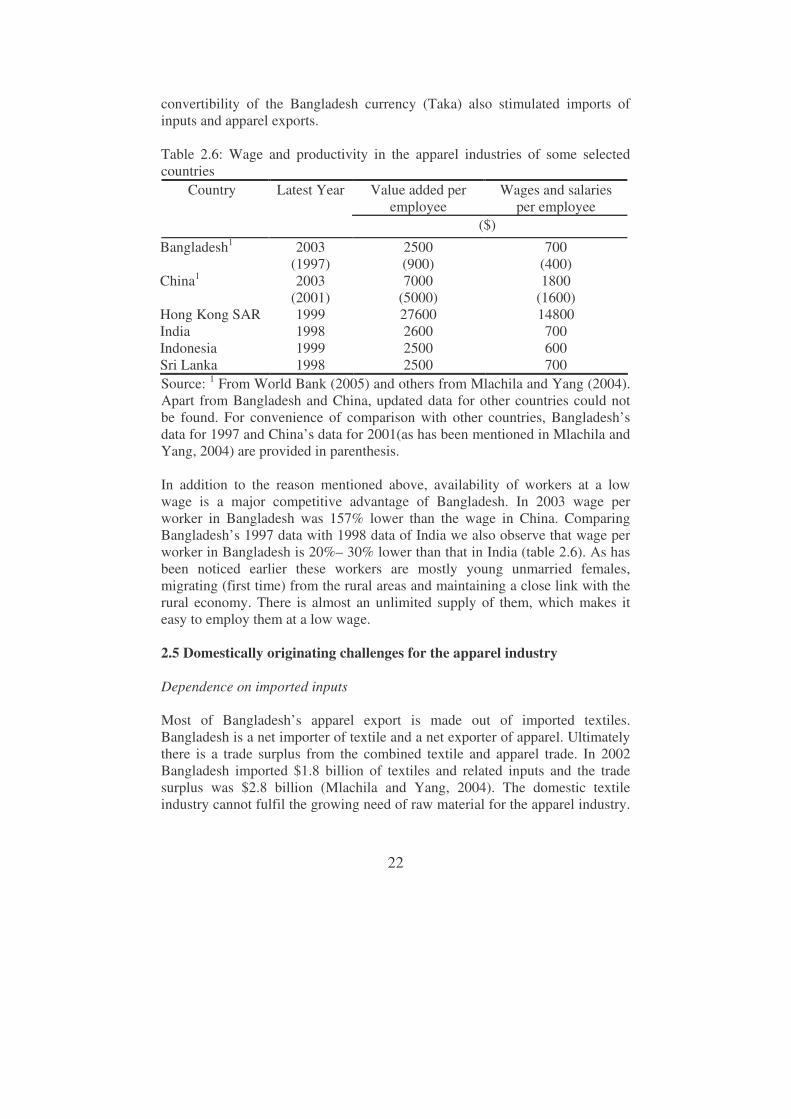
convertibility of the Bangladesh currency (Taka) also stimulated imports of inputs and apparel exports. Table 2.6: Wage and productivity in the apparel industries of some selected countries
Value added per employee
Wages and salaries per employee
Country Latest Year
($)
Bangladesh1
China1 Hong Kong SAR India Indonesia Sri Lanka
2003 (1997) 2003
(2001) 1999 1998 1999 1998
2500 (900) 7000
(5000) 27600 2600 2500 2500
700 (400) 1800
(1600) 14800 700 600 700
Source: 1 From World Bank (2005) and others from Mlachila and Yang (2004). Apart from Bangladesh and China, updated data for other countries could not be found. For convenience of comparison with other countries, Bangladesh’s data for 1997 and China’s data for 2001(as has been mentioned in Mlachila and Yang, 2004) are provided in parenthesis. In addition to the reason mentioned above, availability of workers at a low wage is a major competitive advantage of Bangladesh. In 2003 wage per worker in Bangladesh was 157% lower than the wage in China. Comparing Bangladesh’s 1997 data with 1998 data of India we also observe that wage per worker in Bangladesh is 20%– 30% lower than that in India (table 2.6). As has been noticed earlier these workers are mostly young unmarried females, migrating (first time) from the rural areas and maintaining a close link with the rural economy. There is almost an unlimited supply of them, which makes it easy to employ them at a low wage. 2.5 Domestically originating challenges for the apparel industry Dependence on imported inputs Most of Bangladesh’s apparel export is made out of imported textiles. Bangladesh is a net importer of textile and a net exporter of apparel. Ultimately there is a trade surplus from the combined textile and apparel trade. In 2002 Bangladesh imported $1.8 billion of textiles and related inputs and the trade surplus was $2.8 billion (Mlachila and Yang, 2004). The domestic textile industry cannot fulfil the growing need of raw material for the apparel industry.

23
There are three different types of apparel manufacturers in Bangladesh – i) integrated manufacturing, where factories import the cotton and do the rest of the production process (spinning, weaving/knitting, cutting and sewing) on their own, ii) factories importing yarn and then do the rest and iii) factories importing fabric and sewing the apparel26 (World Bank, 2005). Most of the knitted apparel producing factories in Bangladesh belong to the first two categories and woven apparel producing factories belong to the third category. Thus knitted apparel is relatively less dependant on imported raw materials compared to the woven apparel industry. While 85% of the fabric used in woven apparel is imported, this is only 25% of the yarn and fabrics used in knitted apparel (World Bank, 2005).27 Bangladesh imports textile fabrics, which is mainly used in the woven apparel industry. Other apparel industry imports include raw cotton, cotton and synthetic yarn, synthetic fibre and textile accessories.28 During the 1990s 85% of fabric needs of the apparel industry (mainly for woven apparel) were met by imports for which 75% of its export earnings were spent (Dowlah, 1999). It has been projected that Bangladesh would be able to produce 1.7 billion meters of fabrics out of about the 6.1 billion metres of fabrics required in 2005 (Dowlah, 1999) (table 2A.1). As a result of the heavy dependence on imported inputs, value added of the apparel industry is quite low. For woven apparel value added is only 25% to 30% of the export value (Bhattacharya and Rahman, 2000b). Because of lower dependence on imported inputs, the knitted apparel industry has a higher value added, between 40%-60%. Thus although the apparel industry has a share of 26 They are known as “cut, make and trim” (CMT) factories. 27 Discussions with experts (among others Dr. Abdul Hye Mondal, Senior Research Fellow, Bangladesh Institute of Development Studies) revealed that a huge investment is required for setting up factories producing fabrics for woven apparel, because of the type of machines and manufacturing technology required. As a result local fabric production is not enough to meet the demand of woven apparel and therefore woven apparel is highly dependant on imported fabrics. Local spinning mills are mostly producing yarn for local knitting mills and from this yarn, fabrics for knitting apparel are produced. The main reason for better integration in knitting apparel is the requirement of relatively low investment and simpler manufacturing technology. For example, a knit fabric manufacturing, dyeing and finishing unit of a minimum economic size requires an investment of about $3.5 million, while the investment requirement for a woven fabric manufacturing, dying and finishing unit of a minimum economic size is at least $35 million (noted by Mr. A.S.M. Quasem, Chairman, Newage, Bangladesh, as cited in http://www.intracen.org/textilesandclothing/textiles_clothing_sector_bangladesh.pdf (accessed on 7 August, 2005). 28 The major exporters of cotton woven fabrics to Bangladesh in 1996 were Hong Kong, China, India, Pakistan and Taiwan. However for woven fabrics of man-made fibres, Bangladesh relies on imports mainly from China, Singapore, Hong Kong, Thailand, South Korea and Japan (Islam, 2001).
24
75% in total exports, the net export earning (i.e. export earning net of the cost for imported raw materials used for the export goods) is only 40% (Rahman and Razzaque, cited in Bhattacharya and Rahman, 2000b). Dependence on imported inputs also prolongs the time for fulfilling an export order by Bangladesh exporters. As local textile mills cannot meet the demand of woven apparel, fabrics for woven apparel factories are mostly imported, and therefore, more time is required to complete production. It is too costly for manufacturers to keep an inventory, because production in woven apparel is made in accordance with orders of the buyers, where buyers specify the type and colour of the fabrics. At best manufacturers keep inventories for very basic fabrics. Product and market concentration of apparel export Bangladesh exports both woven apparel and knitted apparel. Although woven apparel contains the larger share, knitted apparel is growing faster than woven apparel (table 2.2). However the apparel export of Bangladesh is highly concentrated on a few products. It is noted that only five categories (SITC code 8423, 8429, 8441, 8451 and 8461) compiled almost 85% of total apparel export in 1997 (Islam, 2001). Ahmed (2005) has also noted that in the USA 9 categories29 (340, 341, 347, 348, 352, 359, 634, 647 and 659) constituted 60% of Bangladesh’s apparel export to the USA in 2004. Product concentration of Bangladesh apparel export is much higher than in India and China.30 Moreover apparel export of Bangladesh is concentrated in two markets – the USA and the EU. These two markets together comprise 94% of Bangladesh’s total apparel export (table 2A.2). In 2002/03, 56% went to the EU and 38% went to the USA. Thus the relative share of the EU compared to the USA is higher. Productivity of workers Though the wage rate of the apparel workers in Bangladesh is low, their productivity is also low. Table 2.6 reveals that value added per worker in
29 USA product categories are different from HS or SITC categories. To know the comparability between different categories, please see Major Shippers Report, U.S. Department of Commerce, Office of Textiles and Apparel at www.OTEXA.com (accessed on 10 August, 2005). 30 Islam (2001) calculated the Herfindahl–Hirschman index (HHI) for product concentration of export from Bangladesh, India and China and concluded this. The HHI
is defined as follows: ( ) ( ) ( )1 11 2 222 1 1/ 1iHHI S n n� � � �= − −� � � �� � � �� , where Si is the share of
the i-th category of exports in the total export of clothing and n is the number of categories of clothing. In 1997, HHI was 0.30 for Bangladesh, 0.25 for India and 0.18 for China.
25
Bangladesh is lower than for its competitors. Based on data from 1980 until 1992, Islam (2001) showed that labour productivity in Bangladesh is less than half of that of India and Sri Lanka. The average number of operatives per swing machine is 2.5 to 3 in contrast with just over 1 in modern factories (Spinanger, 2000). Moreover capital intensity is low in Bangladesh’s factories. The World Bank (2005) has shown that average capital intensity per worker in apparel factories of Bangladesh is $1500, while that of China is $4000. Low productivity partially offsets low wages as comparative advantage. Quality of products Bangladesh produces low value adding apparel items, which is supplied into the low and medium market price quartiles in the EU and USA. Even compared to the other exporters of similar products, prices of Bangladeshi products are low. Islam (2001) mentioned that for 11 out of 20 selected apparel categories imported in the USA, the unit price of Bangladesh is lower than the world average. Bangladesh apparel is also characterised by a narrow product range producing mainly basic tops, shirts, trousers, and unstructured jackets (Gherzi Report, 2002). Infrastructure bottlenecks The World Bank (2005)31 has identified three main sources of comparative disadvantage for Bangladesh’s export industries: infrastructure, corruption and high cost of finance. Electric power, telecommunication and port facilities of Bangladesh are inefficient which reduces the competitiveness of the Bangladeshi exporters. All these hamper the quality of production, increase cost and extend the lead time of supplying commodities. In this competitive world, buyers prefer to source products from countries, which can deliver products fast. In Bangladesh the lead time for apparel export varies between 120-150 days, whereas the corresponding time for Sri Lanka is about 19-45 days and for India only 12 days for similar products (Bhattacharya and Rahman, 2000b). As a result of lack of uninterrupted electric power supply, most of the factories maintain their own generator, which is relatively costly (2.5 times the cost to get power from the grid, noted in World Bank, 2005) and adds up in the price of the products. Limão and Venables (2001) have identified infrastructure to be an important determinant of transport cost and have noted that cost of transporting goods increases with poor infrastructure. This phenomenon is observed in case of
31 Also mentioned by these publications of the World Bank in 2004 (cited in World Bank, 2005): Bangladesh Investment Climate Assessment; Doing business in South Asia 2005; Trade Policies in South Asia: An Overview.

26
Bangladesh. The Chittagong port, the main seaport of Bangladesh lacks modern equipments. It has been noted by the World Bank (2005) that the container terminal of this port can handle merely 100-105 lifts per berth per day, which is far below the productivity standard of 230 lifts per day. Moreover this port performs poorly because of corruption and inefficient governance (Hossain, 2002), which increases the lead time and also the price of products. World Bank (2005) has pointed out that infrastructure bottlenecks in terms of electric power, gas, port facilities and telecommunication are negatively affecting exports of Bangladesh (including apparel). The study has also identified that bribes paid when importing equipment for the knitted apparel industry, can raise the equipment cost by 6%-10%. Large export growth of Bangladesh apparel even given all the infrastructure bottlenecks reveals that Bangladesh could produce even at a lower price if these bottlenecks were not there. This also means that the competitiveness of Bangladesh apparel in the world market could have been better. Restriction on foreign direct investment (FDI) and high cost of finance Except for the export processing zones, FDI in the apparel industry is highly restricted in Bangladesh. Though this protects the local entrepreneurs, the industry suffers in terms of restricted flow of modern technology and skills. While FDI is restricted the cost of borrowing from the local banking system is high in Bangladesh compared to its competitors (e.g. India and China). Table 2.7 points out that the real interest rate in Bangladesh (in 2002) is twice the interest rate prevailing in China and also much higher than that in India. Table 2.7: Real interest rate in some selected economies in 2002, % Countries Interest Rate Bangladesh 12.4 India 8.7 China 5.6 Sri Lanka 4.5 Source: WDI (2004). 2.6 Internationally originating challenges for the apparel industry International trade developments played a vital role in the growth of the apparel industry in Bangladesh. However changing features of the international market pose various challenges to the apparel industry. Before analysing those challenges, a discussion of the world trade of apparel is provided.
27
World trade of apparel Apparel is an important item in world merchandise exports. Table 2A.3 reveals that apparel accounted for 3.1% of world merchandise export and 4.2% of manufacturing export in 2003. In the same year textile accounted for 2.3% of world merchandise export and 3.2% of manufacturing export. Compared to the previous years, in 2003 both textile and apparel export experienced high growth rates. Table 2A.4 presents international apparel trade between different regions. It is observed that Western Europe is the leading importer and Asia is the leading exporter of apparel. Intra-Western Europe trade in apparel is more important (55.5 $ billion in 2003) than intra–Asia trade (25.2 $ billion in 2003). Asia mainly exports apparel to North–America (USA and Canada) and also to Western Europe. Table 2A.5 provides the list of the leading 15 countries in the world export and import of apparel. It reveals that import is more concentrated among the leading 15 importers than the concentration in export of apparel. It is observed that according to the 2003 statistics, Bangladesh is the 8th largest apparel exporter of the world supplying 1.9% of the world’s apparel export. China is the largest exporter (as a single country) of the world and the USA is the largest importer (as a single country). China’s share in export is rising very fast. Abolition of the MFA import quotas – the biggest challenge for Bangladesh apparel Import quotas under the MFA, which acted a blessing in disguise for the growth of the apparel industry in Bangladesh, have been abolished since 1 January 2005 and world apparel has entered an import quota free regime. Abolition of import quota was performed under the Agreements on Textile and Clothing (ATC) of the World Trade Organisation (WTO). In 1995 the ATC replaced the MFA, which had governed the trade in textile and apparel until the end of the Uruguay round. Some salient features of the ATC are given in Box 2.1. Removal of MFA import quotas has generated doubts about the future growth or even survival of the apparel industry of Bangladesh and of many other least developed countries. Possible impacts of phasing out of textile and apparel import quotas have received attention in a number of studies (e.g. Hertel et al., 1996; Yang et al., 1997; Bach et al., 1997; Diao and Somwaru, 2001; Lips et al., 2003; Mlachila and Yang, 2004; Elbehri, 2004; Nordas, 2004; Razzaque, 2005). In general, these studies have concluded that phasing out of MFA will result in an increase in world trade of apparel and a decrease in consumer price. But it has been noted that impacts will vary between countries. In case of Bangladesh pessimistic predictions have been made by studies like Lips et al., 2003, and Mlachila and Yang, 2004.
28
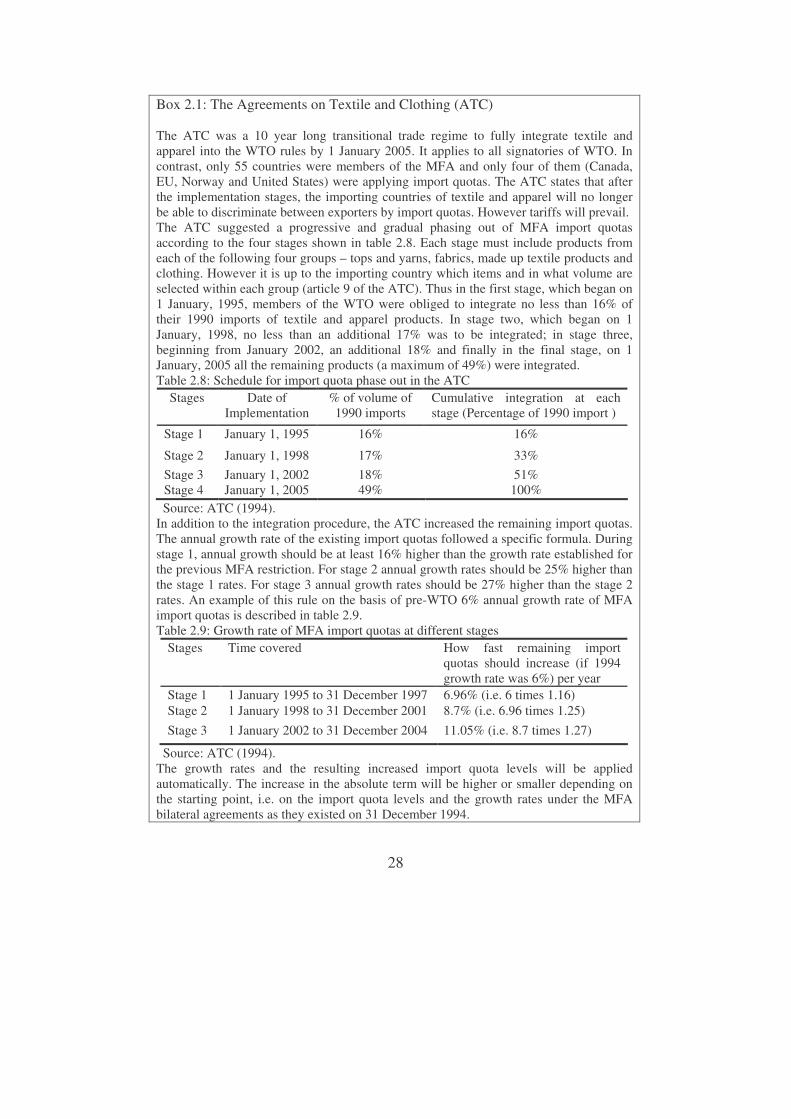
Box 2.1: The Agreements on Textile and Clothing (ATC) The ATC was a 10 year long transitional trade regime to fully integrate textile and apparel into the WTO rules by 1 January 2005. It applies to all signatories of WTO. In contrast, only 55 countries were members of the MFA and only four of them (Canada, EU, Norway and United States) were applying import quotas. The ATC states that after the implementation stages, the importing countries of textile and apparel will no longer be able to discriminate between exporters by import quotas. However tariffs will prevail. The ATC suggested a progressive and gradual phasing out of MFA import quotas according to the four stages shown in table 2.8. Each stage must include products from each of the following four groups – tops and yarns, fabrics, made up textile products and clothing. However it is up to the importing country which items and in what volume are selected within each group (article 9 of the ATC). Thus in the first stage, which began on 1 January, 1995, members of the WTO were obliged to integrate no less than 16% of their 1990 imports of textile and apparel products. In stage two, which began on 1 January, 1998, no less than an additional 17% was to be integrated; in stage three, beginning from January 2002, an additional 18% and finally in the final stage, on 1 January, 2005 all the remaining products (a maximum of 49%) were integrated. Table 2.8: Schedule for import quota phase out in the ATC
Stages Date of Implementation
% of volume of 1990 imports
Cumulative integration at each stage (Percentage of 1990 import )
Stage 1 January 1, 1995 16% 16%
Stage 2 January 1, 1998 17% 33% Stage 3 January 1, 2002 18% 51% Stage 4 January 1, 2005 49% 100%
Source: ATC (1994). In addition to the integration procedure, the ATC increased the remaining import quotas. The annual growth rate of the existing import quotas followed a specific formula. During stage 1, annual growth should be at least 16% higher than the growth rate established for the previous MFA restriction. For stage 2 annual growth rates should be 25% higher than the stage 1 rates. For stage 3 annual growth rates should be 27% higher than the stage 2 rates. An example of this rule on the basis of pre-WTO 6% annual growth rate of MFA import quotas is described in table 2.9. Table 2.9: Growth rate of MFA import quotas at different stages
Stages Time covered How fast remaining import quotas should increase (if 1994 growth rate was 6%) per year
Stage 1 1 January 1995 to 31 December 1997 6.96% (i.e. 6 times 1.16) Stage 2 1 January 1998 to 31 December 2001 8.7% (i.e. 6.96 times 1.25) Stage 3 1 January 2002 to 31 December 2004 11.05% (i.e. 8.7 times 1.27)
Source: ATC (1994). The growth rates and the resulting increased import quota levels will be applied automatically. The increase in the absolute term will be higher or smaller depending on the starting point, i.e. on the import quota levels and the growth rates under the MFA bilateral agreements as they existed on 31 December 1994.

29
Until the end of MFA, Bangladesh was facing import quotas only in the USA while import quotas and tariff restrictions in other markets had been removed already.32 While Bangladesh received both import quota and tariff removal in those restricted markets, many of her competitors were still facing tariff and import quota restrictions. This preference gave Bangladesh an advantage over her competitors in those markets (e.g. EU). With the removal of import quotas, Bangladesh will face increased competition both in the USA and the EU. The USA is the second most important market for Bangladesh’s apparel and because there is no tariff preference in this market, import quota free competition may move Bangladesh out of this market. The effects of import quota removal mainly depend on how restricted export of a country was under the MFA import quota regime in absolute terms and relative to the competitors. Table 2A.6 shows that in the USA Bangladesh was facing import quota restrictions in 30 items (in 2001-02) and 69% of apparel imports from Bangladesh were under import quotas. The average import quota fill rate of Bangladesh is also very high (Mlachila and Yang, 2004). It has been observed in table 2.5 that the ETE of quota for Bangladesh was relatively lower than that for its competitors. Mlachila and Yang (2004) have noted that in 2002 Bangladesh was the second most restricted Asian country after China. However they further pointed out that in 2003 and in early 2004 the ETEs of quotas for Bangladesh have fallen to a large extent compared to her competitors revealing less restrictiveness. This means removal of import quotas might increase the export of apparel commodities from the competitors of Bangladesh like China and India most. According to figure 2.5, the export from Bangladesh may decrease after import quota abolition. The competition in an import quota free regime is predicted to be stronger because of a high rate of similarity between the export products of Bangladesh and several other strong apparel exporters. The export similarity index33 calculated by Mlachila and Yang (2004) identifies China and India to be exporting similar products as Bangladesh to the USA and Pakistan to the EU (table 2.10). 32 The four quota restricting countries / regions were USA, EU, Canada and Norway. Under the GSP scheme, Bangladesh did not face any restrictions in the EU; Norway’s import quotas have been removed for all exporting countries, while tariffs on exports from LDCs were removed in 2002; Canada allowed tariff and import quota free access for all LDCs since January 2003. 33 The Finger-Kreinin Similarity index in Mlachila and Yang (2004) is calculated as
1
( , ) 100n
AB A Bi i
i
I Min S S=
= ×� , where AiS is share of product i in country A’s exports
to an export market, BiS is the share of product i in country B’s exports to the same
market and the number of products is denoted by n. The IAB can range from zero to 100 and higher values indicate greater similarity in exports between the considered countries. The index is sensitive to the product aggregation level.
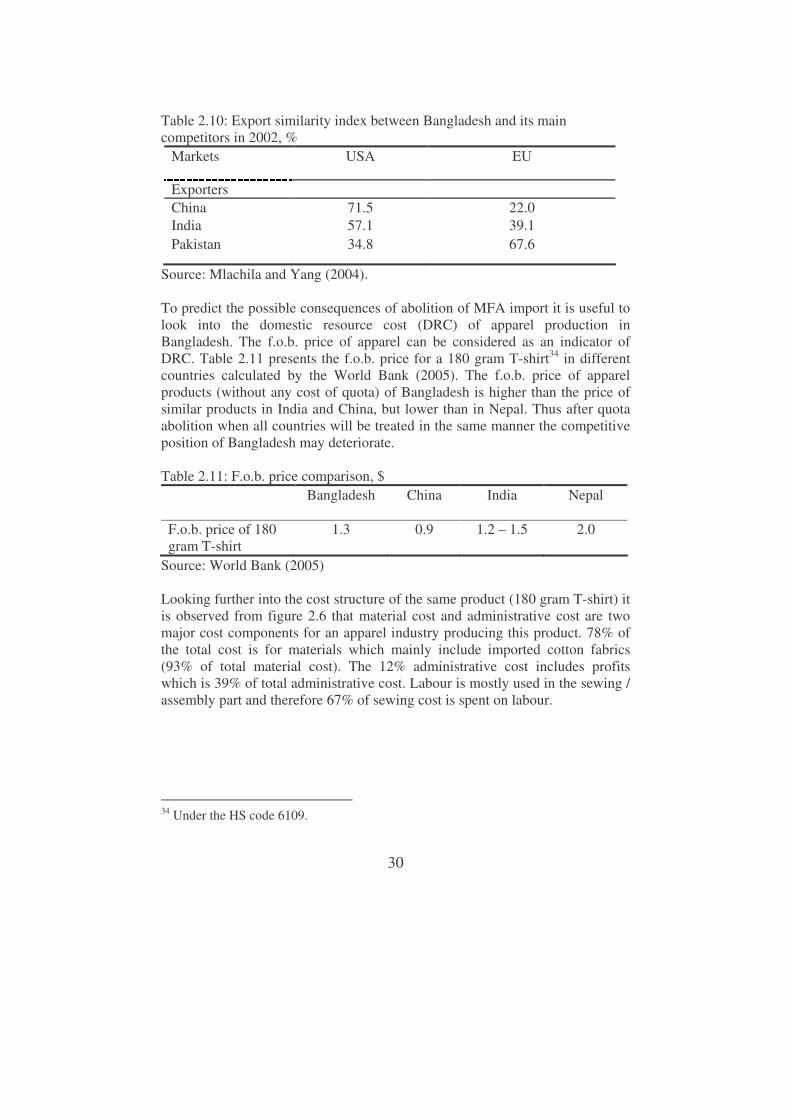
30
Table 2.10: Export similarity index between Bangladesh and its main competitors in 2002, %
Markets USA EU
Exporters China 71.5 22.0 India 57.1 39.1 Pakistan 34.8 67.6
Source: Mlachila and Yang (2004). To predict the possible consequences of abolition of MFA import it is useful to look into the domestic resource cost (DRC) of apparel production in Bangladesh. The f.o.b. price of apparel can be considered as an indicator of DRC. Table 2.11 presents the f.o.b. price for a 180 gram T-shirt34 in different countries calculated by the World Bank (2005). The f.o.b. price of apparel products (without any cost of quota) of Bangladesh is higher than the price of similar products in India and China, but lower than in Nepal. Thus after quota abolition when all countries will be treated in the same manner the competitive position of Bangladesh may deteriorate. Table 2.11: F.o.b. price comparison, $
Bangladesh
China
India
Nepal
F.o.b. price of 180 gram T-shirt
1.3
0.9 1.2 – 1.5
2.0
Source: World Bank (2005) Looking further into the cost structure of the same product (180 gram T-shirt) it is observed from figure 2.6 that material cost and administrative cost are two major cost components for an apparel industry producing this product. 78% of the total cost is for materials which mainly include imported cotton fabrics (93% of total material cost). The 12% administrative cost includes profits which is 39% of total administrative cost. Labour is mostly used in the sewing / assembly part and therefore 67% of sewing cost is spent on labour.
34 Under the HS code 6109.
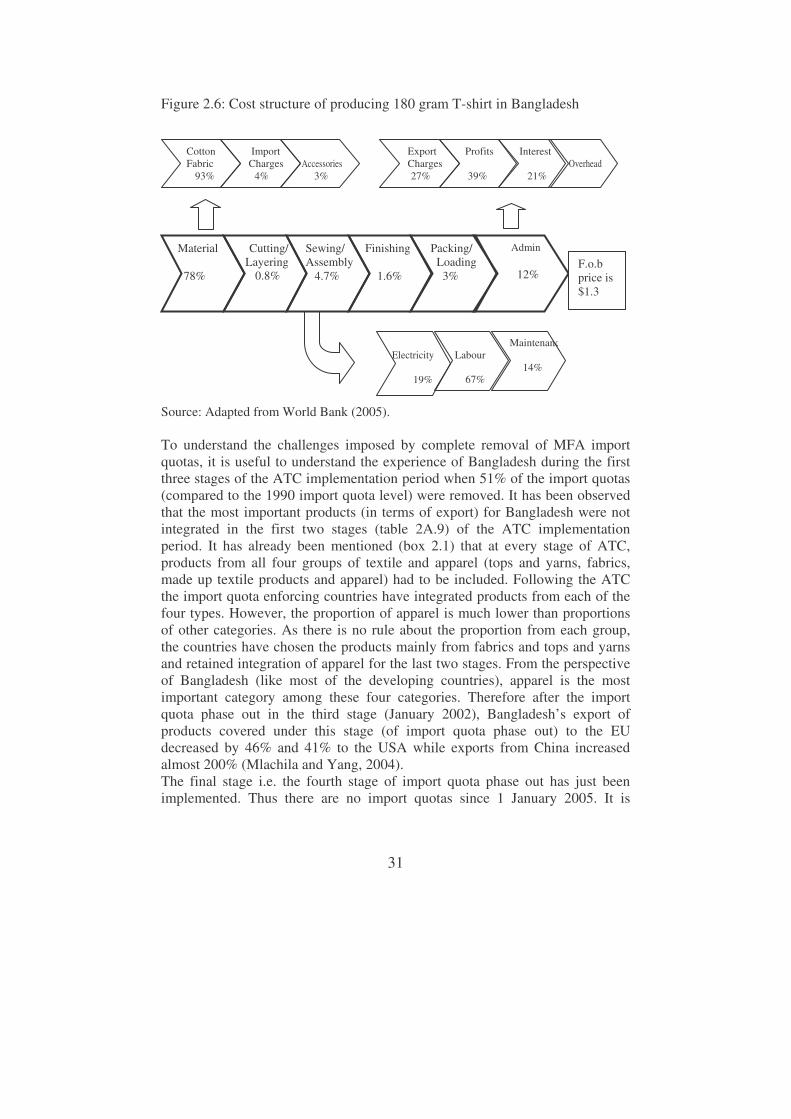
31
Figure 2.6: Cost structure of producing 180 gram T-shirt in Bangladesh Source: Adapted from World Bank (2005). To understand the challenges imposed by complete removal of MFA import quotas, it is useful to understand the experience of Bangladesh during the first three stages of the ATC implementation period when 51% of the import quotas (compared to the 1990 import quota level) were removed. It has been observed that the most important products (in terms of export) for Bangladesh were not integrated in the first two stages (table 2A.9) of the ATC implementation period. It has already been mentioned (box 2.1) that at every stage of ATC, products from all four groups of textile and apparel (tops and yarns, fabrics, made up textile products and apparel) had to be included. Following the ATC the import quota enforcing countries have integrated products from each of the four types. However, the proportion of apparel is much lower than proportions of other categories. As there is no rule about the proportion from each group, the countries have chosen the products mainly from fabrics and tops and yarns and retained integration of apparel for the last two stages. From the perspective of Bangladesh (like most of the developing countries), apparel is the most important category among these four categories. Therefore after the import quota phase out in the third stage (January 2002), Bangladesh’s export of products covered under this stage (of import quota phase out) to the EU decreased by 46% and 41% to the USA while exports from China increased almost 200% (Mlachila and Yang, 2004). The final stage i.e. the fourth stage of import quota phase out has just been implemented. Thus there are no import quotas since 1 January 2005. It is
Material 78%
Cutting/ Layering
0.8%
Sewing/ Assembly 4.7%
Finishing 1.6%
Packing/ Loading 3%
Admin 12%
Cotton Fabric
93%
Interest 21%
Profits 39%
Import Charges
4%
Electricity
19%
Labour 67%
Maintenance 14%
Overhead
12%
Accessories
3%
Export Charges
27%
F.o.b price is $1.3

32
observed that during January-April of 2005 total apparel export from Bangladesh has increased, but woven apparel has experienced a 6.6% decrease in export while knitted apparel has experienced a robust increase of 32.5% (Khondker et al., 2005). But it is too early to consider the real impact of import quota abolition on Bangladesh. It can be expected that it takes some time before the price in the USA equals the f.o.b. price net of the quota price. Moreover, many factories are not experiencing any change as they are still supplying the products which were ordered before the full phasing out of import quotas. Ahmed (2005) has observed that export of some of the important apparel products (for example, cotton sweaters, night-wears etc.) of Bangladesh to the USA is decreasing while exports of those products from China are increasing at a high rate. Besides import quotas the apparel products of Bangladesh face high import tariffs (15% to 20%) in the USA. The estimates of Razzaque (2005) suggest that tariff free access to the USA could increase exports of Bangladesh by $530 million. The EU and the rules of origin Textile and apparel export from Bangladesh has been enjoying preferential market access in the EU under the GSP since the early 1980s which allows Bangladesh a tariff and import quota free entry in this market. In contrast many competitors of Bangladesh faced import quota restrictions in this market (table 2.5). Among others the import quota facing countries included China, India, Pakistan, Sri Lanka, Indonesia, Thailand and Vietnam. Many of them also faced tariffs at an average rate of 12.5%. Therefore the post MFA competition in the EU can be more intense than in the USA.35 In the EU the existing preferential position of Bangladesh may decrease as its competitors will get import quota free access to the market. Moreover the heavily import dependant Bangladesh apparel industry may find it further difficult to fulfil the Rules of Origin (ROO) requirement in the EU. Although there is no import quota restriction, exports from Bangladesh face restrictions in the form of the ROO requirement in the EU market. Bangladesh faces now two-stage36 ROO in case of both knitted and woven apparel. However for some woven products there is a special provision that one-stage ROO is possible when the value of the imported input does not exceed a certain limit (usually 40% to 49%) of the ex-work price of the product. Thus the ROO
35 However Razzaque (2005) has predicted that Bangladesh’s apparel may continue with a better competitive position in the EU than in the USA because in contrast to the USA that applies high tariffs, the EU applies no tariffs. 36 Thus the import of yarn is possible and then the two stages are fabrics (knitted or woven) from yarn and making apparel from the fabrics.
33
requires 51% domestic value added, which is often difficult, especially for woven apparel as woven apparel is heavily dependant on imported inputs (section 2.3). The knitted apparel industry can meet this criterion, as the value added in knitted apparel is higher (around 60%, Bhattacharya and Rahman, 2000b). Since 2001 Bangladesh as a less developed country (LDC) is included under a special arrangement of EU-GSP, i.e. the Everything But Arms (EBA) initiative. The EBA extends tariff and quota free access to all products originating in LDCs, except arms and ammunition. However as the ROO provision remains the same under EBA as it is in the GSP, there is no extra benefit for the apparel industry of Bangladesh under this amendment. It is expected that EU will soften the ROO criteria under its new GSP scheme for the period 2006-2015.37 The change is expected to evolve under the so called regional cumulation or SAARC cumulation. At the moment EU-GSP includes the possibilities of regional cumulation. Under this, the members of SAARC are eligible to receive special ROO treatment if they meet a certain value added criterion. According to this treatment a product produced in a country in a regional group and then processed in another country in that group, will be considered as the product of the country where the final processing took place. However the value added in the final processing has to be higher than highest customs value of the products used originating in any of the other countries of the group. As the local value added of the apparel of Bangladesh, specially the woven apparel, is only 25%–30%, Bangladesh was unable to benefit from this regional cumulation facility of the EU-GSP. If fabrics are imported from India and the local value added is 25% and value added by India is 75% the EU will consider the product as originating from India. The tariff on the product will be the rate applicable for India (15% tariff drawback on 12.5% tariff rate), which was much higher compared to 100% tariff drawback on the 12.5% tariff rate for Bangladesh. It is expected that under the EU-GSP scheme for 2006-2015, the ROO criteria for regional cumulation will be softer so that Bangladesh will be able to take full benefit of GSP. EU’s free trade agreements with other countries are imposing extra challenges for Bangladesh, specially the free trade agreement (FTA) with Mexico. The FTA between the EU and Mexico officially entered into force on 1 July 2000. The FTA will liberalise over 96% of EU-Mexico trade by 2007 at the latest. As the export similarity in apparel is high between Bangladesh and Mexico, Bangladesh may lose market in the EU.38 Moreover the enlargement of the EU and EU’s tariff reduction agreements with the Central and East European
37 Related documents include: COM(2004)461, COM(2003)787 of the Commission of the European Communities. 38 Islam (2001) has calculated a similarity index of 45% between export products to the EU of Bangladesh and Mexico .
34
Countries (CEECs) might have trade diversion effects for Bangladesh. Further enlargement of the EU might also be a threat, specially, because of the possible membership of Turkey. Regional preferential trade arrangements – NAFTA, TDA 2000, SAPTA and SAFTA Apart from the multilateral trade rules, trade in textile and apparel can be affected by regional preferential trade arrangements (PTAs). The effects of regional PTAs on members and non-member countries have received attention in both the theoretical and empirical literature (e.g. Krugman, 1991; Winters and Chang, 1999; Ahmed, 2001). These studies considered both quantity and terms of trade effects of preferential trading arrangements. The member countries of a PTA face trade creation and/or trade diversion, which may be welfare increasing or welfare decreasing for them (see box 2.2).39 The non-members may be affected both in terms of quantity (export may decline as a result of trade diversion) and terms of trade (unfavourable to the non-members), which may ultimately affect the welfare of non-members.40 If a PTA is large and it gets a terms of trade gain by reducing its trade with the rest of the world in favour of its own members, then the rest of the world suffers a terms of trade loss (the rest of the world has to export more in order to be able to import a given bundle of goods from the PTA). Box 2.2: Trade creation and trade diversion from preferential trade arrangements (PTAs) or regional trade blocks41 In the present world preferential trade arrangements (PTAs) have become an important and abiding part of the multilateral trade regime. Under PTAs, the trade restrictions (tariffs import quotas etc.) member nations apply to each others’ products are lower than the restrictions on the same goods coming from other countries. The WTO, in general, prohibits such arrangements under its most favoured nation (MFN) clause with the exception for two main types of PTAs: free trade areas (FTAs) and customs unions (CUs).42 A FTA is an agreement between several countries to eliminate trade restrictions within the FTA, but each country retains its own external tariff for trade with countries outside the FTA. A CU also refers to elimination of tariffs on intra-union trade, but includes a common external tariff for non-member countries.
39 The concepts of trade creation and trade diversion were first developed by Viner (1950). 40 Non-members have to reduce pre-tariff prices of their exports to the PTA market and thus the terms of trade (in terms of pre-tariff prices) deteriorate for non-members. 41 Based on Husted and Melvin (1998) and handouts provided for lectures on “Regionalism and EU Enlargement” by Dr. Alison Burrell of Agricultural Economics and Rural Policy Group, University of Wageningen. 42 This is included under article XXIV of the GATT rule administered by the WTO ( http://www.wto.org/english/thewto_e/whatis_e/eol/e/wto08/wto8_55.htm#note3, accessed on 30 November 2005)
35
The welfare effect of a PTA is not straight forward. Trade creation and trade diversion are the two key concepts in the welfare theory of PTAs. When higher cost domestic production is replaced by cheaper imports as a result of a PTA that is called trade creation. When imports from a lower cost source outside the region are replaced by higher cost imports from within the region as result of a PTA that is called trade diversion. Table 2.12 shows trade creation and trade diversion of a CU. Before the CU, A levies a non-discriminatory tariff, t. When the CU is formed between A and B, there is no tariff between them and t becomes the common external tariff for non member countries. Table 2.12: Trade creation and trade diversion in trading of a shirt
Country A B C Production cost ($/unit of shirt) 50 40 30 A’s position: Price inside A ($/unit of shirt) 1) 100% tariff before CU 50 80 60
CU with B 50 40 60 2) 50% tariff before CU 50 60 45 CU with B 50 40 45
When t=100%, before the CU, A produces shirts domestically rather than importing them even though A’s production cost is the highest. After the CU is formed A imports from the cheaper source B. Thus there is trade creation, which leads to positive welfare impacts: domestic resources costing $10 for every unit of shirt are available for another use. When t=50%, A will import from C before the CU. After the CU A switches its import source from cheaper C to higher cost B. Thus there is trade diversion, which leads to negative welfare impacts: for each unit of the good, A uses domestic resources to produce exports worth $40 to import 1 unit of shirt from B, whereas before it had to produce exports worth only $30 in order to import 1 unit of shirt from C. Similar trade creation and trade diversion impacts can arise out of other PTAs.43 Though there are possibilities that forming a PTA may lead to a welfare loss for some of its members (caused by trade diversion), there are several benefits in addition to welfare improvement through trade creation that induce the countries to form PTAs. These benefits include a reduction in trade imbalance between members, possibility to attain economies of scale in production, greater market power as a group in the world market, increased political influence in international policy-making, dynamic effects like efficiency improvements due to increased competition, better investment decisions, reduction in transaction costs of foreign trade for the members, greater economic stability and policy co-ordination with trading partners etc.
43 Table 2.10 assumes that shirts are homogeneous across countries, that there are constant production costs, there are no transport costs, mark-ups etc. and demand is completely price inelastic. Real world complexities are not considered here. For example if demand is not perfectly inelastic then lowering of domestic price in A will lead to increase in consumption and the welfare gain from trade creation is enhanced and the welfare loss from trade diversion may be offset. If there are increasing production costs in A and B, there may be both trade creation and trade diversion.
36
The regional PTAs that are of special concern for apparel trade of Bangladesh are the North American Free Trade Agreement (NAFTA) and the SAARC Preferential Trading Arrangement (SAPTA), which has later been transformed in the South Asian Free Trade Area (SAFTA). NAFTA is a special concern for Bangladesh because it gives special privileges to Mexico in the USA.44 Export similarity of export products to the USA of Bangladesh and Mexico is as high as 68% (Islam, 2001). USA tariffs on apparel originating in Mexico have been eliminated on January 1, 1999. Eventually all tariffs on textile and apparel being traded between Canada, the USA and Mexico were eliminated by 2003. However the NAFTA preferential tariff only applies to products originating from a member country. For apparel, the triple transformation rules of origin must be met. According to this rule, the yarn, fabric, and garment must be made in NAFTA countries to receive the preferential tariffs and apparel goods qualify as originating if the non-NAFTA content is 7% or less. Islam (2001) has noted that trade diversion effects caused by NAFTA can cause increased imports from Mexico at the expense of Asian exporting countries. While the impact of NAFTA is a concern for Bangladesh, another concern in the USA is the implementation of the Trade and Development Act 2000 (TDA 2000). Under this act a total of 72 countries (of which 48 countries belong to Sub-Saharan Africa and the other 24 coming from the Caribbean Basin) are receiving tariff free and import quota free access to the USA for textile and apparel products if they meet certain eligibility criteria. TDA 2000 has two main parts - The African Growth and Opportunity Act (AGOA) and The United-States-Caribbean Basin Trade Partnership Act (CBTPA). For the Caribbean countries it is a process of facilitating their ultimate participation in the Free Trade Area of the Americas (FTAA). In many cases they will receive the NAFTA treatment for their exports. This act might have impacts for the apparel export from Bangladesh to the USA, especially because of preferential treatments to Jamaica and Dominican Republic that are competitors of Bangladesh. Although SAPTA was structured in the early 1990s and went through several tariff reduction stages between the members, there has not yet been a substantial impact from SAPTA. It has later been transformed into SAFTA, which is under a process of implementation (see chapter 4 for detail). Implementation of SAFTA might help to strengthen the competitiveness of Bangladesh’s apparel by allowing low cost import of inputs from the region. Though there are possibilities of trade diversion effects from SAFTA, it has high potential to extend trade creation effects and other (often non-economic) benefits (mentioned in box 2.2) among its members.
44 Though Canada is a part of NAFTA, it is not a big concern for Bangladesh as the products exported from Canada and from Bangladesh to the USA are not similar.
37
Concerns about workers’ rights Increased competition arising out of liberalised international trade compels the entrepreneurs to reduce the cost of production while maintaining the quality of the products. This is often done at the cost of violating the rights of the workers working in the export-oriented manufacturing sector (see chapter 5 for detail). However various stakeholders (e.g. consumers, trade unions, International Labour Organisation) have become concerned about this and importers are requiring the exporters to maintain certain codes of conducts in their factories. These requirements often pose additional costs for the entrepreneurs and could decrease price competitiveness. Moreover problems arise when requirements by importers are conflicting.45 Thus there is a dilemma of how to address the rights of the workers and at the same time maintaining price competitiveness. 2.7 Discussion and conclusions The purpose of this chapter was to discuss the background and the actors behind the growth of the apparel industry and also various recent challenges faced by this industry. The challenges originate both domestically and internationally. It has been observed that Bangladesh’s apparel industry has grown very fast under the umbrella of MFA import quotas and abundant supply of cheap workers, but without a strong domestic backward linkage. Too much product and market concentration and imported input dependency have raised questions about the future of this industry in a import quota free regime after the full implementation of the ATC. In addition to import quota removal, negative impacts (from trade diversion or from terms of trade effects) from various regional PTAs are also of special concern for the apparel industry. At the same time joining a regional PTA like SAFTA could positively affect the apparel industry and also the economy as a whole through economic (including trade creation) and non–economic effects. Domestically, various structural bottlenecks of Bangladesh economy in association with low labour productivity and low level of investment are intensifying the internationally originated challenges. The challenges should be handled carefully as the fates of 10 million people are associated with the success or failure of this industry. Any possible shrinking will make a large number of workers unemployed. The domestically originated problems need immediate attention, as the competitiveness in an import quota
45 Discussion with entrepreneurs (case studies used in chapter 5) reveals that buyers differ e.g. in terms of the height at which a fire extinguisher should be set or in terms of required water supply facilities.
38
free world depend on quick delivery of quality products at a low price. This requires better infrastructure, more investment and strong backward linkage industries. Especially the improvement of transport facilities and improvement of port facilities is important to ensure timely delivery of products. Lifting the ban on yarn import from India coming over land can reduce the transport cost of importing yarn from India. To ensure timely delivery setting up a central bonded house could reduce the inventory cost of individual firms. The rights of the workers have to be addressed which increases cost of production but in turn could help to improve efficiency of workers. This chapter did not attempt to quantify the possible impacts of import quota removal nor the impacts of other challenges. Part of these impacts will be quantified in subsequent chapters. Still the discussion in this chapter gives a picture of the apparel industry of Bangladesh and builds a base for the analyses in the rest of the chapters.
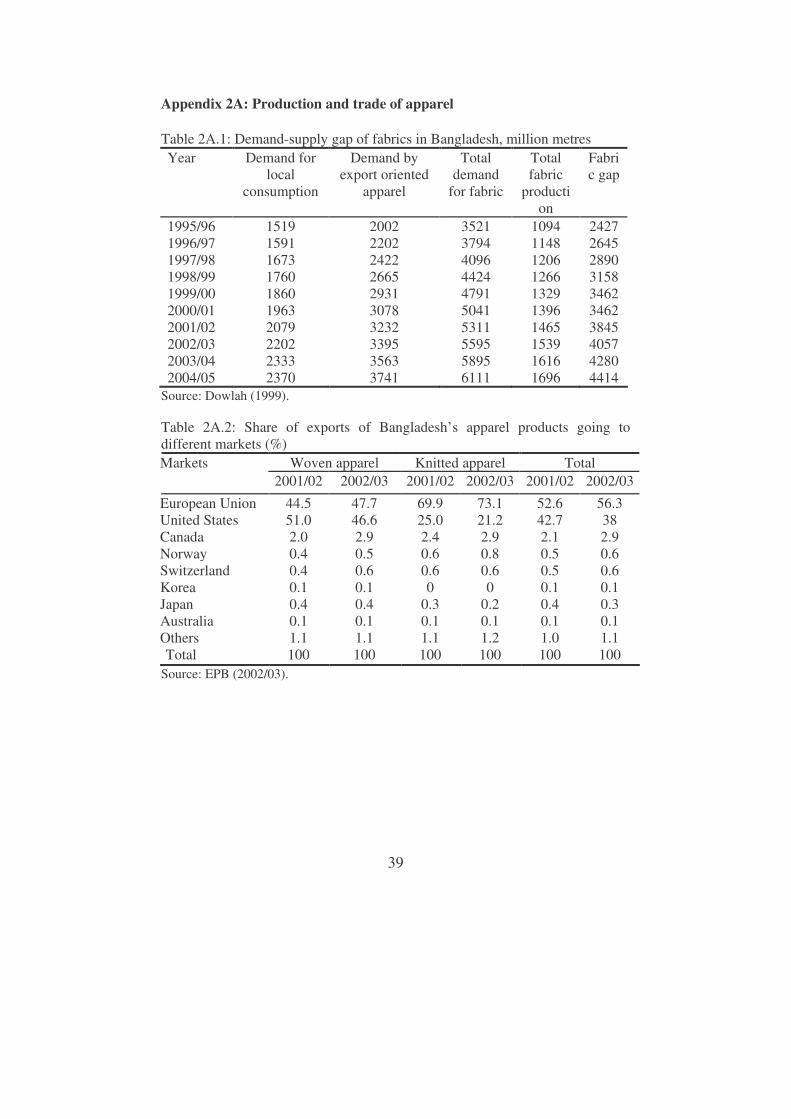
39
Appendix 2A: Production and trade of apparel Table 2A.1: Demand-supply gap of fabrics in Bangladesh, million metres Year Demand for
local consumption
Demand by export oriented
apparel
Total demand
for fabric
Total fabric
production
Fabric gap
1995/96 1996/97 1997/98 1998/99 1999/00 2000/01 2001/02 2002/03 2003/04 2004/05
1519 1591 1673 1760 1860 1963 2079 2202 2333 2370
2002 2202 2422 2665 2931 3078 3232 3395 3563 3741
3521 3794 4096 4424 4791 5041 5311 5595 5895 6111
1094 1148 1206 1266 1329 1396 1465 1539 1616 1696
2427 2645 2890 3158 3462 3462 3845 4057 4280 4414
Source: Dowlah (1999). Table 2A.2: Share of exports of Bangladesh’s apparel products going to different markets (%)
Woven apparel Knitted apparel Total Markets 2001/02 2002/03 2001/02 2002/03 2001/02 2002/03
European Union United States Canada Norway Switzerland Korea Japan Australia Others
44.5 51.0 2.0 0.4 0.4 0.1 0.4 0.1 1.1
47.7 46.6 2.9 0.5 0.6 0.1 0.4 0.1 1.1
69.9 25.0 2.4 0.6 0.6 0
0.3 0.1 1.1
73.1 21.2 2.9 0.8 0.6 0
0.2 0.1 1.2
52.6 42.7 2.1 0.5 0.5 0.1 0.4 0.1 1.0
56.3 38 2.9 0.6 0.6 0.1 0.3 0.1 1.1
Total 100 100 100 100 100 100 Source: EPB (2002/03).
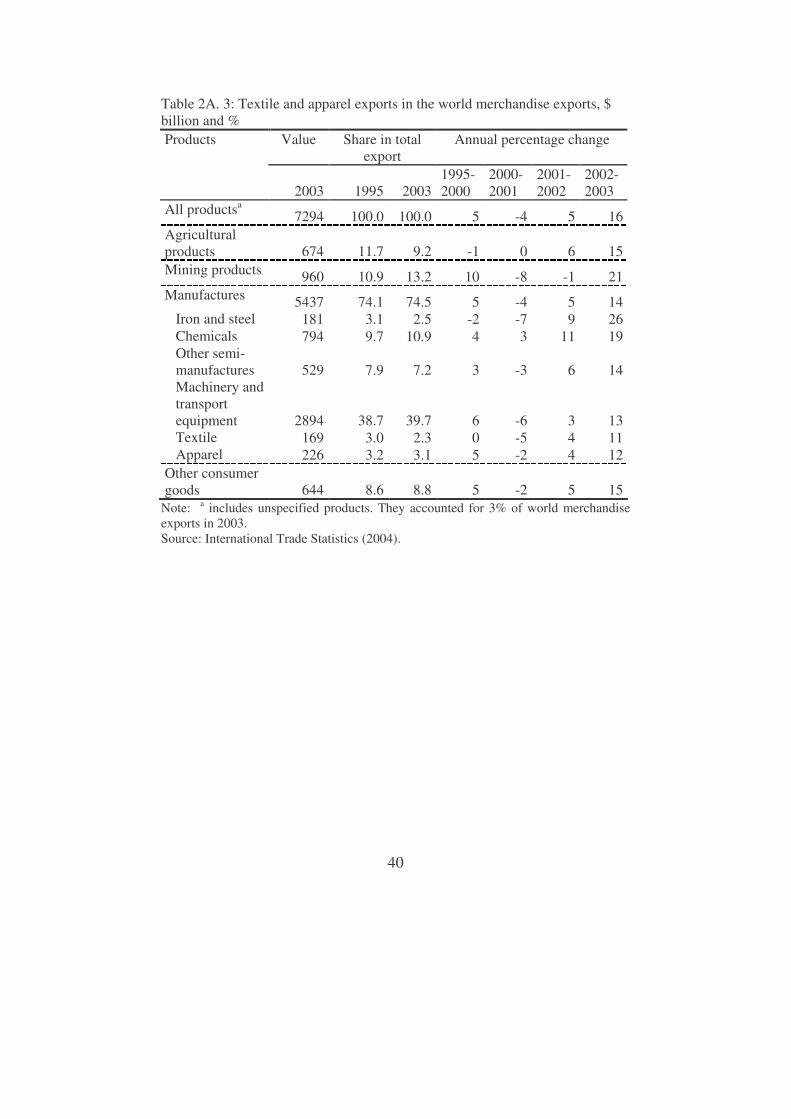
40
Table 2A. 3: Textile and apparel exports in the world merchandise exports, $ billion and % Products Value Share in total
export Annual percentage change
2003 1995 2003 1995- 2000
2000- 2001
2001- 2002
2002- 2003
All productsa 7294 100.0 100.0 5 -4 5 16 Agricultural products 674 11.7 9.2 -1 0 6 15 Mining products 960 10.9 13.2 10 -8 -1 21 Manufactures 5437 74.1 74.5 5 -4 5 14 Iron and steel 181 3.1 2.5 -2 -7 9 26 Chemicals 794 9.7 10.9 4 3 11 19 Other semi- manufactures 529 7.9 7.2 3 -3 6 14 Machinery and transport equipment 2894 38.7 39.7 6 -6 3 13 Textile 169 3.0 2.3 0 -5 4 11 Apparel 226 3.2 3.1 5 -2 4 12 Other consumer goods 644 8.6 8.8 5 -2 5 15
Note: a includes unspecified products. They accounted for 3% of world merchandise exports in 2003. Source: International Trade Statistics (2004).
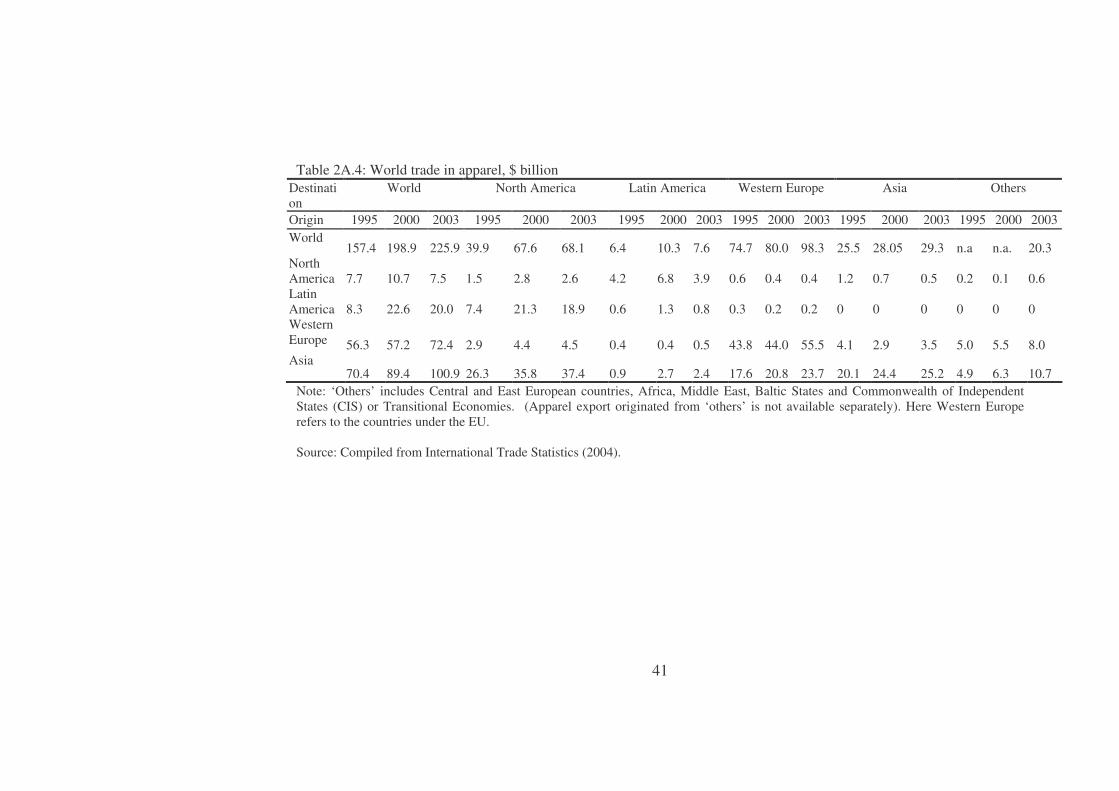
41
Table 2A.4: World trade in apparel, $ billion Destination
World North America Latin America Western Europe Asia Others
Origin 1995 2000 2003 1995 2000 2003 1995 2000 2003 1995 2000 2003 1995 2000 2003 1995 2000 2003 World
157.4 198.9 225.9 39.9 67.6 68.1 6.4 10.3 7.6 74.7 80.0 98.3 25.5 28.05 29.3 n.a n.a. 20.3 North America 7.7 10.7 7.5 1.5 2.8 2.6 4.2 6.8 3.9 0.6 0.4 0.4 1.2 0.7 0.5 0.2 0.1 0.6 Latin America 8.3 22.6 20.0 7.4 21.3 18.9 0.6 1.3 0.8 0.3 0.2 0.2 0 0 0 0 0 0 Western Europe 56.3 57.2 72.4 2.9 4.4 4.5 0.4 0.4 0.5 43.8 44.0 55.5 4.1 2.9 3.5 5.0 5.5 8.0 Asia
70.4 89.4 100.9 26.3 35.8 37.4 0.9 2.7 2.4 17.6 20.8 23.7 20.1 24.4 25.2 4.9 6.3 10.7 Note: ‘Others’ includes Central and East European countries, Africa, Middle East, Baltic States and Commonwealth of Independent States (CIS) or Transitional Economies. (Apparel export originated from ‘others’ is not available separately). Here Western Europe refers to the countries under the EU. Source: Compiled from International Trade Statistics (2004).

42
Table 2A.5: Leading exporters and importers of clothing, $ billion and % Value Share in world exports/imports Exporters and Importers
2003 1980 1990 2000 2003 Exporters European Union (15) 60.0 42.0 37.7 24.1 26.5 China1 52.1 4.0 8.9 18.3 23.0 Hong Kong, China domestic exports re-exports
23.2 8.2 15.0
n.m. n.m. n.m. n.m.
Turkey 10.0 0.3 3.1 3.3 4.4 Mexico1 7.0 0 0.5 4.4 3.2 India2 6.5 1.7 2.3 3.1 2.9 United States 5.5 3.1 2.4 4.4 2.5 Bangladesh2 4.4 0 0.6 2.1 1.9 Indonesia 4.1 0.2 1.5 2.4 1.8 Romania 4.1 n.a. 0.3 1.2 1.8 Thailand2 3.6 0.7 2.6 1.9 1.6 Republic of Korea2 3.6 7.3 7.3 2.5 1.6 Viet Nam2 3.6 n.a. n.a. 0.9 1.6 Morocco1,2 2.8 0.3 0.7 1.2 1.3 Pakistan 2.7 0.3 0.9 1.1 1.2 Above 15 178.3 71.3 77.5 75.9 78.6 Importers European Union (15) 101.3 54.3 50.6 38.7 42.9 United States 71.3 16.4 24.0 32.4 30.2 Japan 19.5 3.6 7.8 9.5 8.3 Hong Kong, China retained imports
16.0 1.0
- 0.9
- 0.7
- 0.8
- 0.4
Canada3 4.5 1.7 2.1 1.8 1.9 Switzerland 3.9 3.4 3.1 1.6 1.7 Russian Federation2 3.7 n.a. n.a. 1.3 1.6 Mexico1, 3 3.0 0.3 0.5 1.7 1.3 Republic of Korea2 2.5 0 0.1 0.6 1.1 Australia3 2.2 0.8 0.6 0.9 0.9 Singapore 1.9 0.3 0.8 0.9 0.8 United Arab Emirates3, 4 1.8 0.6 0.5 0.7 0.8 Norway 1.5 1.7 1.1 0.6 0.6 China1 1.4 0.1 0 0.6 0.6 Saudi Arabia 1.0 1.6 0.7 0.4 0.4 Above 15 220.6 85.8 92.8 92.6 93.5
Note: 1 includes significant shipments through processing zones; 2 includes WTO Secretariat estimates. 3 indicates that imports are valued f.o.b.; 4 indicates 2002 instead of 2003 and n.a. refers to very small amount or non – availability and n.m. refers of ‘not mentioned’. Source: International Trade Statistics (2004).

43
Table 2A.6: Textile and apparel import quotas in the USA, $ million and %
Imports under quotas
Total imports Imports under quota as % of total imports
Countries Quota categories
Average quota fill
rate 2001 2002 2001 2002 2001 2002
Bangladesh Cambodia China Egypt Hong Kong SAR India Indonesia Pakistan Philippines Sri Lanka Thailand Turkey
30 23 90 19 64 30 34 36 42 38 59 28
83 24 76 10 55 68 33 31 32 26 56 23
1453 548
4669 154
3848 1497 1109 1066 1437 1132 1468 850
1396 639
5315 141
3809 1714 1045 1047 1460 1065 1470 990
2235 953
9629 515
4461 2912 2586 1958 2274 1725 2534 1472
2017 1062
11476 493
4081 3294 2363 2010 2060 1552 2299 1702
65 57 48 30 86 51 43 54 63 66 58 58
69 60 46 29 93 52 44 52 71 69 64 58
Source: Mlachila and Yang (2004). Table 2A.7: ATC integration in the first two stages
In Volume (% of total 1990 imports)
In value
Country Integration Stages
Tops and Yarns
Fabrics Made-ups
Clothing (Apparel)
Total Total
Canada 1 2
Total
9.6 0.6
10.2
4.3 2.1 6.4
1.3 14.3 15.6
1.1 0.2 1.4
16.4 18.6 35.0
13.0 16.7 29.7
USA 1 2
Total
8.5 8.0
16.5
1.7 2.5 4.2
4.2 4.5 8.7
1.9 2.0 4.0
16.2 17.0 33.2
6.6 10.7 17.4
EU 1 2
Total
4.4 11.6 16.0
8.1 2.2
10.4
3.5 2.1 5.5
0.4 2.1 2.5
16.4 18.0 34.4
8.7 12.9 21.6
Norway 1 2
Total
3.5 6.6
10.1
12.0 2.4
14.3
0.7 11.1 11.1
0.2 4.2 4.3
16.3 24.3 40.5
7.4 16.6 24.0
Source: Bhattacharya and Rahman (2000b).

44
Chapter 3 Consequences of abolition of the Multi-Fibre Arrangement quotas on the apparel industry of Bangladesh – a computable general equilibrium analysis
3.1 Introduction On 1 January 2005, the Multi-Fibre Arrangement (MFA) import quotas were fully abolished. Starting in 1974, the MFA governed the trade in textile and apparel until the end of the Uruguay round (31 December 1994). Since 1 January 1995 the WTO’s Agreement on Textile and Clothing (ATC) replaced the Multi-Fibre Arrangement. The ATC was a 10 year long transitional trade regime to abolish MFA import quota in phases. In other words ATC was meant to fully integrate textile and apparel into the WTO rules in four phases ending on 31 December 2004. This has posed both opportunities and challenges to the world trade of textile and apparel. It is noted in chapter 2 that MFA import quotas and availability of cheap labour were the two main reasons behind the rapid growth of the apparel industry in Bangladesh. Relatively less restrictive MFA import quotas for Bangladesh compared to traditional apparel exporters (Korea, Hong Kong, Japan, China, etc.) ensured a market for Bangladesh apparel in the USA and stimulated the growth of this industry (Bhattacharya and Rahman, 2000a). Moreover the tariff and import quota-free access in the European Union (EU) under the Generalised System of Preference (GSP) scheme contributed to the expansion of apparel export to the EU. In the post-MFA world, the apparel industry of Bangladesh is facing important challenges. It is important to understand the possible consequences of abolition of the MFA import quotas for the economy of Bangladesh, as the apparel industry is the most important export industry. Different studies (e.g. Hertel et al., 1996; Yang et al., 1997; Bach et al., 1997; Diao and Somwaru, 2001; Lips et al., 2003; Mlachila and Yang, 2004; Elbehri, 2004; Nordas, 2004; Razzaque, 2005) have looked into the possible impacts of MFA import quota abolition. In general these studies have concluded that world trade of apparel and welfare will increase and the consumer price will decrease; however impacts will vary across countries. Among these studies Lips et al. (2003), and Mlachila and Yang (2004) show that abolition of the MFA import quotas will have negative impacts on Bangladesh apparel export and welfare. Nordas (2004) shows an increase in market share for Bangladesh apparel in the EU and a decrease in market share in the USA. This chapter aims to analyse the possible consequences of MFA import quota abolition on Bangladesh. The chapter uses the Global Trade Analysis Project (GTAP, Hertel, 1997) multi country computable general equilibrium (CGE) model and data. Given the importance of apparel for the Bangladesh economy,

45
it is most likely that abolition of the MFA import quotas will have an impact not only on the apparel industry but also on the economy as a whole. Such impacts will occur through sectoral linkages and also through changes in income, investment and savings of various actors. MFA import quota abolition also includes textile, an important input for the apparel industry. Moreover there will be changes in the relative competitiveness of Bangladesh in relation to its competitors in the international market and explicit knowledge of these changes is important to decide upon policies needed to cope with the changed situation. A multi country CGE model is the best possible way to analyse economy wide effects of international trade policy changes and changes in the relative position of a single country. Therefore, this chapter applies GTAP. Some of the previous studies also applied GTAP to analyse the impacts of MFA abolition and some of them also concentrate on Bangladesh. However these studies (except Lips et al., 2003) have not considered (in their model) the issue of existing incentives prevailing for the apparel industry of Bangladesh, specially the tariff drawback incentive. To encounter the tariff drawback issue, this study follows the approach used by Lips et al. (2003). Lips et al. (2003) assume full employment for all countries, where as unemployment among unskilled labour is evident in different countries. Therefore, the current study has incorporated unemployment in unskilled labour for those countries. In addition the database of the model has been updated to incorporate some recent realities (preferential access of Bangladesh in the EU and Canada), which is also absent in Lips et al. (2003). Section 3.2 describes the model, data and simulations, section 3.3 analyses the results and finally section 3.4 provides a discussion on the results and links them with various trade theories and section 3.5 provides concluding remarks. 3.2 Model, data and simulations This chapter applies version 5.1 of the GTAP database, which uses the year 1997 as the base (Dimaranan and McDougall, 2002).46 Data on regions and commodities are aggregated to meet the need of the analysis of this chapter. Region and commodity aggregation47 The 5.1 version of GTAP covers 66 regions, 57 commodities and 5 factors of production. The current study follows the commodity and region aggregation of Lips et al. (2003), which combined 66 regions into 14 aggregated regions and 57 commodities into 12 aggregated commodities (see table 3.1). In addition to
46 For a brief discussion of GTAP and data see appendix 3A. 47 This section follows Lips et al. (2003). The current author was a co–author of Lips et al. (2003).
46
Bangladesh, the regional aggregation includes India and Sri Lanka, two other countries of the South Asian Free Trade Area (SAFTA). All other SAFTA member countries are included in the region “rSAFTA”. China and Hong Kong build an individual region. The rest of the Asian countries are distinguished between high income countries “hASIA” and others “oASIA”. The EU, the USA and Canada are noted as individual regions as they are important apparel importers in the world. The Central and Eastern European Countries (“CEEC”) and Turkey are separated to incorporate the issues of the eastern enlargement of the EU and the preferential access to the EU. In GTAP each industry produces one commodity. So there is a one to one relation between industries and commodities. “Textiles” and “Apparel” are separately considered. “Apparel” is the main interest of this chapter, “textiles” is considered as an important input of the apparel industry. “Leather products” are also separately considered given their importance in the export of Bangladesh (3% of export earning, see table 2.1). “Rice” includes production of paddy rice as well as processed rice. All non-rice grains are included in “Grains”, while all other agricultural activities are included into the “rAGR” industry. The “Food” industry covers all food processing excluding processed rice. Forestry, fishing and extraction activities are in the “Extract” industry. Manufacturing is split into a labour intensive (“LiMANF”) and capital intensive (“CiMANF”) industry. All services are covered by a separate service industry.
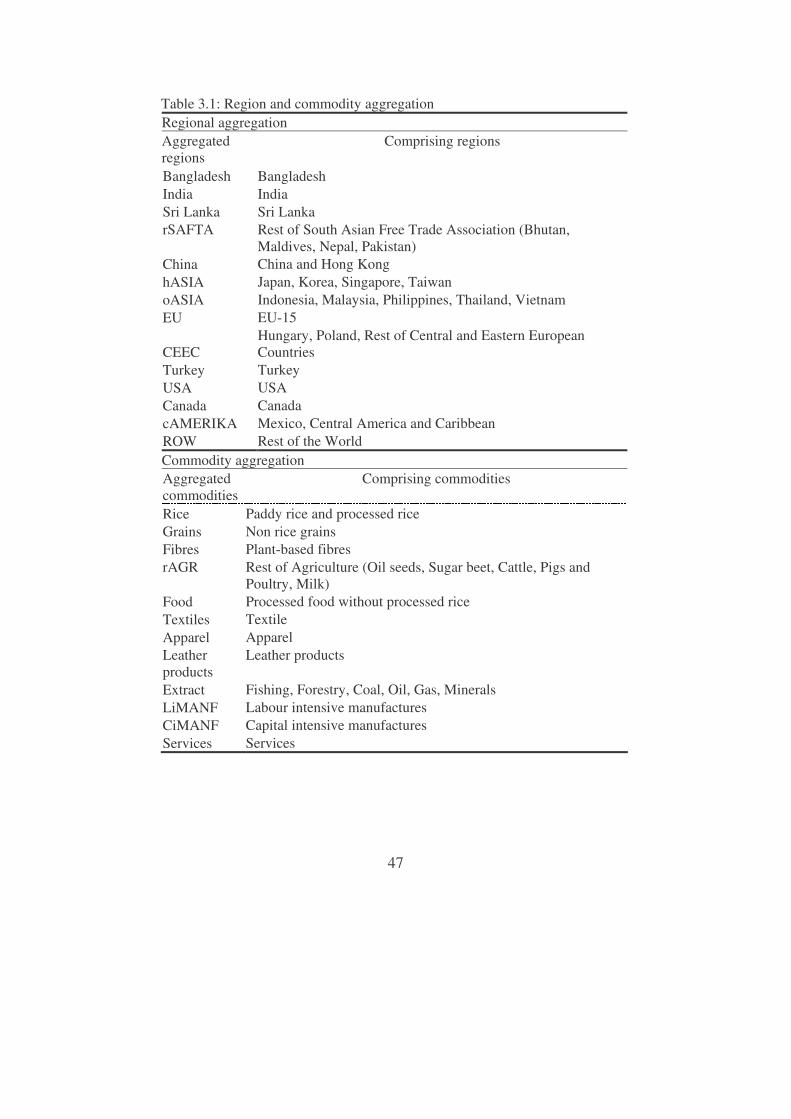
47
Table 3.1: Region and commodity aggregation Regional aggregation Aggregated regions
Comprising regions
Bangladesh Bangladesh India India Sri Lanka Sri Lanka rSAFTA Rest of South Asian Free Trade Association (Bhutan,
Maldives, Nepal, Pakistan) China China and Hong Kong hASIA Japan, Korea, Singapore, Taiwan oASIA Indonesia, Malaysia, Philippines, Thailand, Vietnam EU EU-15
CEEC Hungary, Poland, Rest of Central and Eastern European Countries
Turkey Turkey USA USA Canada Canada cAMERIKA Mexico, Central America and Caribbean ROW Rest of the World Commodity aggregation Aggregated commodities
Comprising commodities
Rice Paddy rice and processed rice Grains Non rice grains Fibres Plant-based fibres rAGR Rest of Agriculture (Oil seeds, Sugar beet, Cattle, Pigs and
Poultry, Milk) Food Processed food without processed rice Textiles Textile Apparel Apparel Leather products
Leather products
Extract Fishing, Forestry, Coal, Oil, Gas, Minerals LiMANF Labour intensive manufactures CiMANF Capital intensive manufactures Services Services
48
Model closure In the current study, there is a change in the default closure settings of GTAP. In the default setting of GTAP labour is assumed to be fully employed. Lips et al. (2003) also followed this default closure. However, in reality, large-scale unemployment, especially, among unskilled labour is a reality for Bangladesh and other South Asian countries and also for China. For example in Bangladesh, the unemployment rate is 5.0% (Labour Force Survey, 2002-2003) of the total labour force. More important is the high rate of underemployment – defined as working population working less than 35 hours in a week, which is around 34.2% according to the Labour Force Survey (2002-2003). Considering both of these phenomena, it is found that 37.6% of the working age population in Bangladesh is unemployed or underemployed. The unemployment (including underemployment) rate in China was 20% in 2003 and in India the unemployment rate (without considering potential underemployment) was 9.2% in 2004.48 Therefore, the current study has assumed that supply of unskilled labour is perfectly elastic for the South Asian countries (i.e. SAFTA member countries) as well as for China. It means the wage is fixed for the unskilled labour of these regions and thus any number of unskilled labour can be employed at this wage. This assumption has important consequences for the welfare analysis of policy changes. It implies the existence of an endowment effect. Welfare decreases if less labour is employed after a policy change. With a fixed labour amount a disadvantage policy leads to a labour price decrease but employment remains the same. So, labour will be employed then somewhere else in the economy at a lower price and the endowment effect is zero. Scenarios In order to incorporate two realities the GTAP version 5.1 database was updated.49 The first reality considered is the preferential market access in the EU. As has been mentioned earlier (and also in chapter 2), Bangladesh gets tariff and import quota free entry in the EU market under the GSP and Everything but Arms (EBA) initiatives of the EU.50 The other reality is the
48 http://www.cia.gov/cia/publications/factbook/fields/2129.html ((accessed on 6 December, 2005) 49 Lips et al. (2003) run the simulations on the default base of GTAP 5.1, where as, the current study updated the base before running the simulations as the realities considered here are important to reflect a more realistic picture. 50 The base updating initiative here has considered tariff and import quota removal for both textile and apparel. Though under the GSP and EBA initiatives of the EU, Bangladesh’s exports receive tariff and import quota free entry in EU (with some restrictions for a few agricultural products), Bangladesh cannot avail the full benefit
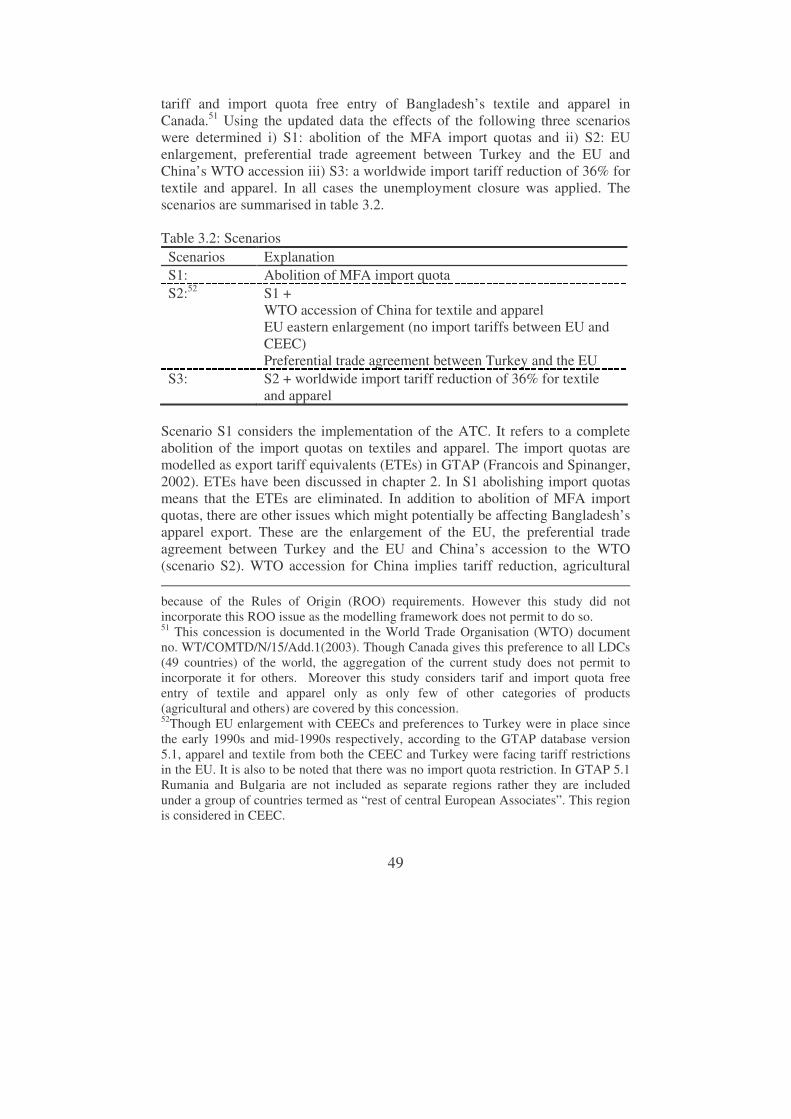
49
tariff and import quota free entry of Bangladesh’s textile and apparel in Canada.51 Using the updated data the effects of the following three scenarios were determined i) S1: abolition of the MFA import quotas and ii) S2: EU enlargement, preferential trade agreement between Turkey and the EU and China’s WTO accession iii) S3: a worldwide import tariff reduction of 36% for textile and apparel. In all cases the unemployment closure was applied. The scenarios are summarised in table 3.2. Table 3.2: Scenarios Scenarios Explanation S1: Abolition of MFA import quota S2:52 S1 +
WTO accession of China for textile and apparel EU eastern enlargement (no import tariffs between EU and CEEC) Preferential trade agreement between Turkey and the EU
S3: S2 + worldwide import tariff reduction of 36% for textile and apparel
Scenario S1 considers the implementation of the ATC. It refers to a complete abolition of the import quotas on textiles and apparel. The import quotas are modelled as export tariff equivalents (ETEs) in GTAP (Francois and Spinanger, 2002). ETEs have been discussed in chapter 2. In S1 abolishing import quotas means that the ETEs are eliminated. In addition to abolition of MFA import quotas, there are other issues which might potentially be affecting Bangladesh’s apparel export. These are the enlargement of the EU, the preferential trade agreement between Turkey and the EU and China’s accession to the WTO (scenario S2). WTO accession for China implies tariff reduction, agricultural because of the Rules of Origin (ROO) requirements. However this study did not incorporate this ROO issue as the modelling framework does not permit to do so. 51 This concession is documented in the World Trade Organisation (WTO) document no. WT/COMTD/N/15/Add.1(2003). Though Canada gives this preference to all LDCs (49 countries) of the world, the aggregation of the current study does not permit to incorporate it for others. Moreover this study considers tarif and import quota free entry of textile and apparel only as only few of other categories of products (agricultural and others) are covered by this concession. 52Though EU enlargement with CEECs and preferences to Turkey were in place since the early 1990s and mid-1990s respectively, according to the GTAP database version 5.1, apparel and textile from both the CEEC and Turkey were facing tariff restrictions in the EU. It is also to be noted that there was no import quota restriction. In GTAP 5.1 Rumania and Bulgaria are not included as separate regions rather they are included under a group of countries termed as “rest of central European Associates”. This region is considered in CEEC.

50
trade liberalisation and service trade liberalisation. EU enlargement may affect Bangladesh’s export, as the EU is the most important export market for Bangladesh and there are similarities between the apparel export items of Bangladesh and those of the CEECs (Ahmed, 2001). Turkey is also exporting apparel to the EU and is receiving a preferential treatment from the EU. EU enlargement and the preferential trade agreement (PTA) between Turkey and the EU may negatively affect the existing preferential position of Bangladesh in the EU. The geographical location of Bangladesh compared to Turkey may lead to relatively higher cost for the products of Bangladesh compared to that from Turkey, even if they have similar production cost. As Bangladesh has free entry in the EU, there is no trade diversion effect per se and the trade creation effect is not relevant for Bangladesh. Accession of China to the WTO implies an import tariff reduction for textile and apparel exported by China in order to respect the Most Favoured Nation (MFN) clause. Here such import tariff reductions for two products have been considered - textile and apparel. The last scenario (S3) includes a worldwide import tariff reduction of 36% for textile and apparel, which is a possible outcome of the on-going Doha Round of the WTO. This scenario also includes all elements of the other two scenarios. Incorporating the tariff drawback issue in the model53 In the third scenario an import tariff reduction has been applied for textile and apparel imports by Bangladesh (along with other countries). Lips et al. (2003) have pointed out that a simple tariff reduction cannot be adopted in this case, since Bangladesh applies the tariff drawback regime (TD)54. Therefore they have considered the TD issue in the model. Ianchovichina (2003) also provides an approach to depict TD in the GTAP model, in which the production of every industry is split into two sub industries - one is only producing for domestic use while the other produces for export. That approach requires a substantial change of the GTAP standard model. Lips et al. (2003) applied another
53 This section is heavily drawn from Lips et al. (2003). 54 Under various export incentive programs, inputs used for exported goods are disburdened from paying import tariffs. Such incentives are available mainly for export-oriented firms (exporting at least 70% of their production) of important export goods including apparel. Two of the most important incentives in Bangladesh are the TD facility and Bonded Warehouse Facility (BWF). Under TD, exporters are refunded not only the duties paid on the imported inputs but also the value added tax paid on domestic inputs used in the production of the exports. The BWF is even more profitable for exporters. Under this system a firm can delay the payments of duties until they are ready to consume raw materials imported earlier and if theses raw materials are used for producing export goods then they are not required to pay the tariff. It implies that the firms do not require capital to finance import tariffs.
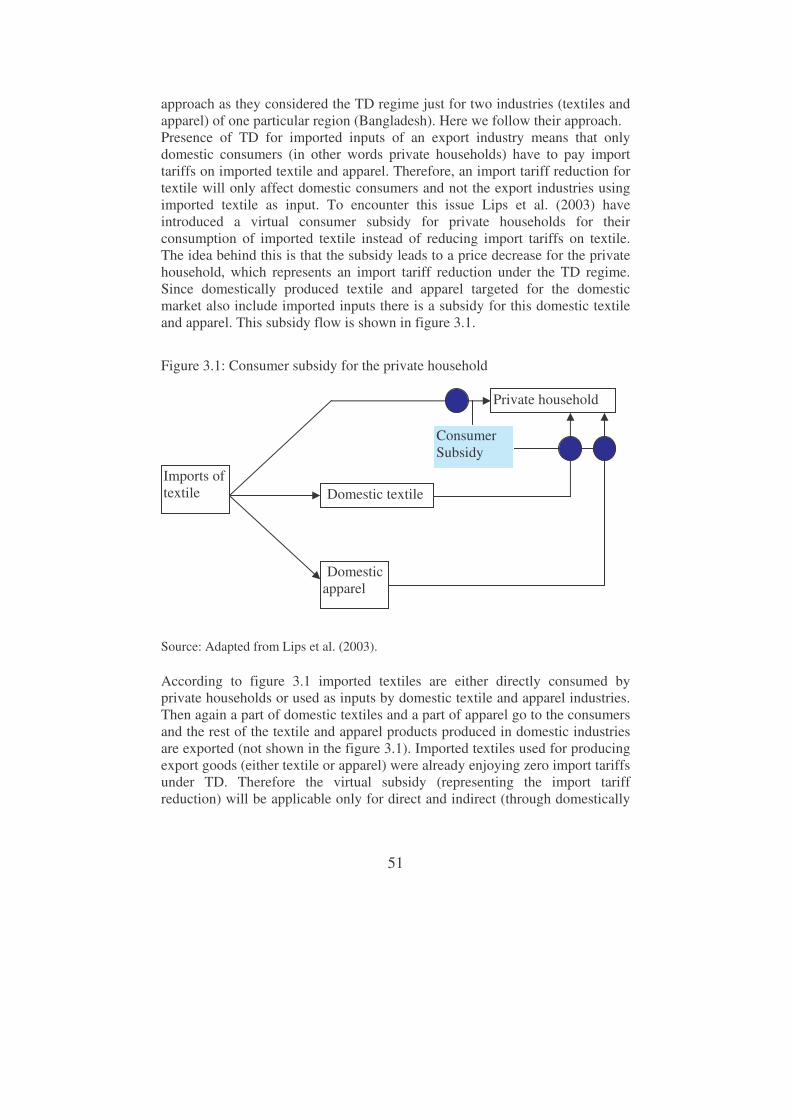
51
approach as they considered the TD regime just for two industries (textiles and apparel) of one particular region (Bangladesh). Here we follow their approach. Presence of TD for imported inputs of an export industry means that only domestic consumers (in other words private households) have to pay import tariffs on imported textile and apparel. Therefore, an import tariff reduction for textile will only affect domestic consumers and not the export industries using imported textile as input. To encounter this issue Lips et al. (2003) have introduced a virtual consumer subsidy for private households for their consumption of imported textile instead of reducing import tariffs on textile. The idea behind this is that the subsidy leads to a price decrease for the private household, which represents an import tariff reduction under the TD regime. Since domestically produced textile and apparel targeted for the domestic market also include imported inputs there is a subsidy for this domestic textile and apparel. This subsidy flow is shown in figure 3.1.
Figure 3.1: Consumer subsidy for the private household
Source: Adapted from Lips et al. (2003). According to figure 3.1 imported textiles are either directly consumed by private households or used as inputs by domestic textile and apparel industries. Then again a part of domestic textiles and a part of apparel go to the consumers and the rest of the textile and apparel products produced in domestic industries are exported (not shown in the figure 3.1). Imported textiles used for producing export goods (either textile or apparel) were already enjoying zero import tariffs under TD. Therefore the virtual subsidy (representing the import tariff reduction) will be applicable only for direct and indirect (through domestically
Domestic textile
Domestic apparel
Imports of textile
Private household
Consumer Subsidy
52
produced textile and apparel goods) consumption of imported textiles by the private households. To connect the import tariffs and the virtual consumer subsidies in the GTAP model Lips et al. (2003) introduced the coefficient TN_L(r), which expresses the relation between consumer subsidies and import tariffs for a product in region r.
��
� �+=
TEXTREG
TEXT TEXT
rsiMTAX
riIPTAXriDPTAX
rLTN),,(
),(),()(_ (3.1)
Where, DPTAX(i,r): the virtual consumer subsidy on domestic good i in region r; IPTAX(i,r): the virtual consumer subsidy on imported good i in region r 55; MTAX(i,s,r): the import tariff for good i, which is exported from region s into region r. TEXT is the set of two elements - textile and apparel and is a subset of TRAD_COMM, the set of the traded commodities. Both types of consumer subsidies DPTAX(i,r) and IPTAX(i,r) are summed over the elements of TEXT. MTAX (i,s,r) is also summed up for the elements of the set TEXT as well as for all origin regions s which are included in the set REG56. In the database there are no consumer subsidies, hence all used DPTAX and IPTAX coefficients have values zero. Lips et al. (2003) have linearised equation (1), to formulate the consumer subsidies DPTAX(i,r) and IPTAX(i,r) as differences of agent57 and market values.58 55 Both consumer subsidies [DPTAX(i,r) and IPTAX(i,r)] can also serve as taxes, depending on their value. While a negative value is a subsidy a positive indicates a tax. 56 The set REG includes all regions (table 3.1). 57 In GTAP agent’s price refer to the price paid by the agents – producers, private household and government. In case of private household and government, agent’s price is the price at which these agents (private household or government) buy a good and this price is the market price plus tax. In case of producers, when they buy intermediate goods, the concept of agent’s price is same as that in case of private household and government, but in case of final goods it is the price at which producers’ sell. Agent’s value is the quantity times the relevant agent’s price. 58 DPTAX(i,r) = VDPA(i,r) - VDPM(i,r) and IPTAX(i,r) = VIPA(i,r) - VIPM(i,r), Where, VDPA(i,r): value of expenditure on domestic commodity i by private household in region r evaluated at agents’ prices; VDPM(i,r): value of expenditure on domestic commodity i by private household in region r evaluated at market prices; VIPA(i,r): value of expenditure on imported commodity i by private household in region r
53
It is assumed that the subsidies on domestic and imported goods are changing in the same way as domestic textile and apparel incorporate a significant share of imported inputs (out of a total textile import of $1913 million, $573 million worth of imported textile goes to the domestic textile industry and $564 million to the apparel industry). Thus a new variable tz(r) has been introduced, which indicates the percentage change of the consumer subsidies on imported as well as domestic goods of the set TEXT. Two equations were added for all goods i which belong to the set TEXT: tpd(i,r) = tz(r) (3.2) tpm(i,r) = tz(r) (3.3) Where, tpd(i,r): percentage change of the subsidy for the private household of the domestic good i in region r; tpm(i,r): percentage change of the imported good i in region r.59 For S3 the value of the coefficient TN_L is exogenously changed towards –0.36 in order to offset 36% of the import tariffs by consumer subsidies.60 Using this consideration for tariff drawback following Lips et al. (2003), the current study has run S3 on the new base and also with the assumption of unemployment. 3.3 Results The results of the different scenarios are summarised in this section. As the main interest of this chapter is to look into the impacts of various scenarios on the apparel industry of Bangladesh compared to her competitors, results addressing this interest have got prime attention. A summary picture of the results under different scenarios is presented in table 3.3, while details are presented in tables 3B.1-3B.15 and figure 3.2. Results of S1 When MFA import quotas are abolished the export price of apparel decreases (table 3B.2). As has been noted in chapter 2 (figure 2.5) the magnitude of the price decrease depends on how restrictive the initial import quotas were. Export prices of apparel of Bangladesh, India and China decrease by 3.5%, 20.7% and
evaluated at agents’ prices; VIPM(i,r): value of expenditure on imported commodity i by private household in region r evaluated at market prices. 59 Capital letters indicate absolute values (like TN_L) lower case letters present the referring percentage changes. 60 The negative sign is used to represent consumer subsidies, which are denoted as negative values in the model. A consumer tax would have a positive value.
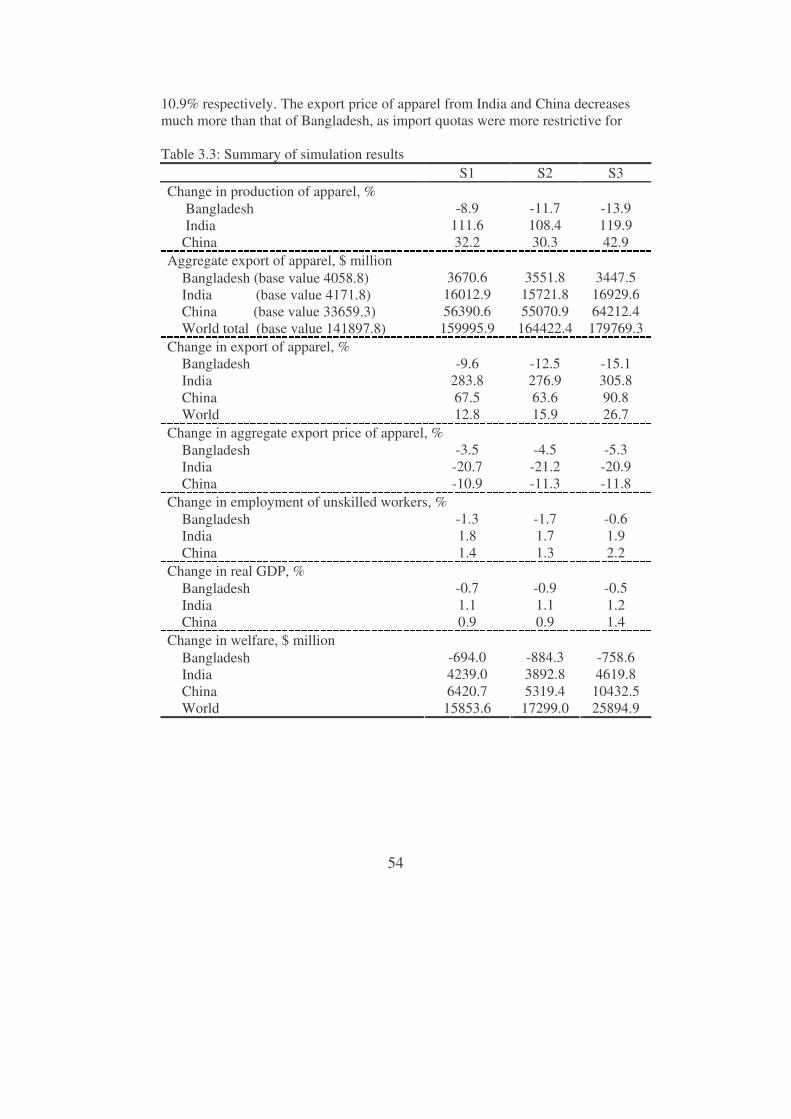
54
10.9% respectively. The export price of apparel from India and China decreases much more than that of Bangladesh, as import quotas were more restrictive for Table 3.3: Summary of simulation results
S1 S2 S3 Change in production of apparel, %
-8.9 -11.7 -13.9 111.6 108.4 119.9
Bangladesh India China 32.2 30.3 42.9 Aggregate export of apparel, $ million
3670.6 3551.8 3447.5 16012.9 15721.8 16929.6 56390.6 55070.9 64212.4
Bangladesh (base value 4058.8) India (base value 4171.8) China (base value 33659.3) World total (base value 141897.8) 159995.9 164422.4 179769.3 Change in export of apparel, % Bangladesh -9.6 -12.5 -15.1 India 283.8 276.9 305.8 China 67.5 63.6 90.8 World 12.8 15.9 26.7 Change in aggregate export price of apparel, %
-3.5 -4.5 -5.3 -20.7 -21.2 -20.9
Bangladesh India China -10.9 -11.3 -11.8 Change in employment of unskilled workers, %
-1.3 -1.7 -0.6 1.8 1.7 1.9
Bangladesh India China 1.4 1.3 2.2 Change in real GDP, %
-0.7 -0.9 -0.5 1.1 1.1 1.2
Bangladesh India China 0.9 0.9 1.4 Change in welfare, $ million
-694.0 -884.3 -758.6 4239.0 3892.8 4619.8 6420.7 5319.4 10432.5
Bangladesh India China World 15853.6 17299.0 25894.9
55
India and China than for Bangladesh (table 3B.1)61. For the same reason, exports of apparel of India and China increase while export of apparel from Bangladesh decreases by 9.6% (table 3B.3 and figure 3.2). For India, the export increases by 283.8% and for China by 67.5%. Though in percentages, the increase of Chinese export is less that that of India, the very large export base of China refers to a much larger export growth in value terms. Sri Lanka also faces an export decrease while other South Asian countries export more (as a group here). In the two main markets of apparel, i.e. EU and USA, it is noted that only India and China experience an export increase while all other regions (except Sri Lanka and the rest of South Asia in the EU) experience an export decrease (table 3B.4). Even the Central American countries experience a 54% decrease in their export to the USA. Bangladesh’s export decrease to the EU is higher as the preferences under GSP become less important as other countries get import quota free entry in this market. Table 3B.5 shows that production of apparel decreases in Bangladesh by 8.9% where as it increases by 111.6% and 32.2% in India and China respectively. Production of textile of all these countries increases. Table 3B.8 reveals that in terms of production, textile is larger than apparel in Bangladesh but this industry experiences a less than 1% production growth. Considering exports and imports of all industries of Bangladesh, it is observed that exports of all industries other than apparel increase while imports of all industries decrease (table 3B.9). There is a 10.8 % increase in the textile export. Export of another important industry of Bangladesh, leather, also increases by 23.9%. The aggregate export of Bangladesh decreases by 1.4% and aggregate import decreases by 5.7%. These results reflect the fixed balance of trade assumption. Exports of apparel fall, the exchange rate increases (which implies a devaluation of the Taka, the currency of Bangladesh), other exports increase and imports fall. With the abolition of the MFA import quotas, ultimately Bangladesh faces a 0.7% loss in GDP and a 1.5% loss in per capita utility (see appendix 3A) (table 3B.10). India and China both gain in terms of GDP and per capita household utility. The overall welfare loss of Bangladesh is $694 million (table 3B.11). Both India and China achieve large welfare gains ($4239 million and $6420 million respectively). The welfare loss of Bangladesh arises mainly out of the negative endowment effect (less labour employed) and the terms of trade effect. The $249 million negative endowment effect for Bangladesh is generated mostly by a 1.3% decrease in the unskilled labour employment in Bangladesh (tables 3B.11 and 3B.14). The decrease in unskilled labour employment is likely to affect the poor households most as the main owners of unskilled
61 Export tax equivalences reported here are different from those mentioned in chapter 2 as the GTAP 5.1 reports the rates in 1997. Even after updating the base for the current study the rates are different as chapter 2 reports very recent data.
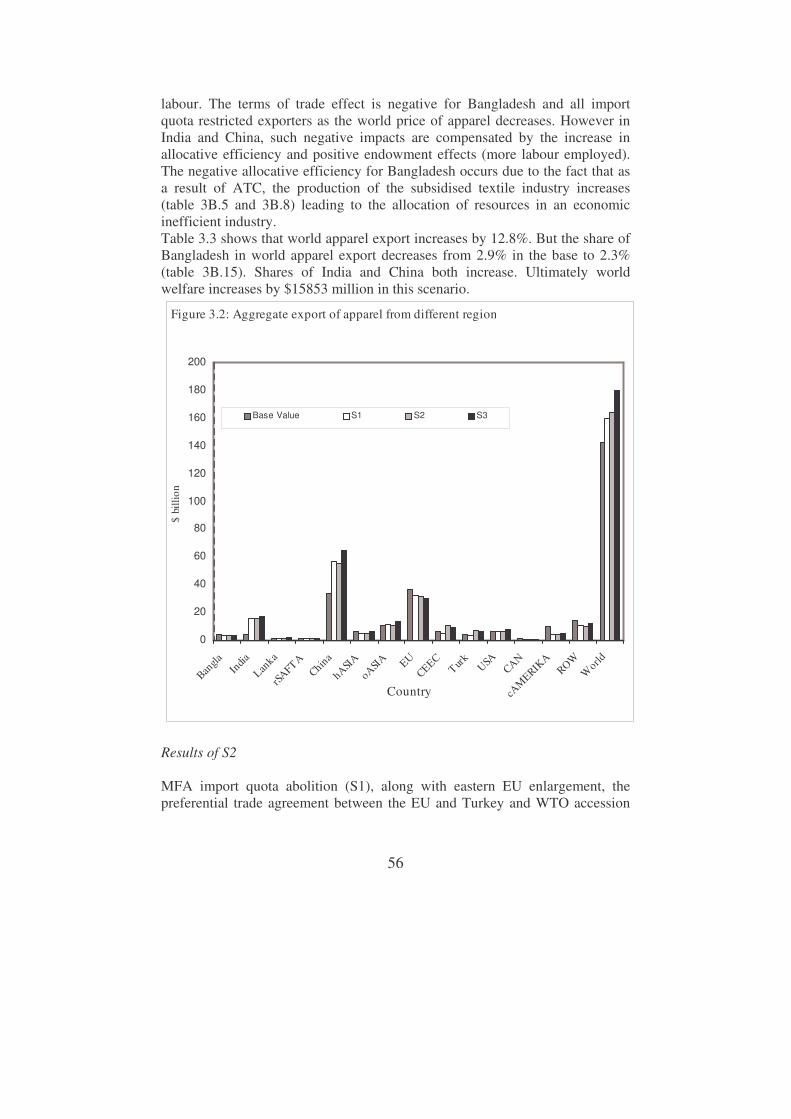
56
labour. The terms of trade effect is negative for Bangladesh and all import quota restricted exporters as the world price of apparel decreases. However in India and China, such negative impacts are compensated by the increase in allocative efficiency and positive endowment effects (more labour employed). The negative allocative efficiency for Bangladesh occurs due to the fact that as a result of ATC, the production of the subsidised textile industry increases (table 3B.5 and 3B.8) leading to the allocation of resources in an economic inefficient industry. Table 3.3 shows that world apparel export increases by 12.8%. But the share of Bangladesh in world apparel export decreases from 2.9% in the base to 2.3% (table 3B.15). Shares of India and China both increase. Ultimately world welfare increases by $15853 million in this scenario.
Figure 3.2: Aggregate export of apparel from different regions
0
20
40
60
80
100
120
140
160
180
200
Bangla
India
Lanka
rSAFTA
China
hASIAoASIA EU
CEECTurk USA
CAN
cAM
ERIKA
ROWW
orld
Country
$ bi
llion
Base Value S1 S2 S3
Results of S2 MFA import quota abolition (S1), along with eastern EU enlargement, the preferential trade agreement between the EU and Turkey and WTO accession

57
of China, results in an export price reduction of apparel of 4.5%, 21.2% and 11.3% for Bangladesh, India and China respectively (table 3B.2). As in S1, the price of apparel from India and China decreases much more than that of Bangladesh. Export of apparel of India increases by 276.9% and that of China by 63.6%. Export of Bangladesh decreases by 12.5% (table 3B.3 and figure 3.2). Compared to S1, the percentage increase of Indian and Chinese apparel export is lower in the current scenario, as CEEC and Turkey get trade preferences from the EU. For the same reason the relative position of Bangladesh deteriorates further than in S1 and the percentage decrease of apparel export is larger in S2. While CEEC and Turkey were facing a decrease in aggregate apparel export (by 17.1% and 15.4% respectively) in S1, they are now experiencing a large increase in their export (by 68.2% and 55.1% respectively). Sri Lanka also faces a larger export decrease than before and also all the other South Asian countries face an export decrease. Impacts of the trade preferences of CEEC and Turkey in the EU on apparel export of different countries are clearly visible in table 3B.4. It is noticed that apparel exports of Turkey and CEEC to the EU increase but decrease to the USA. However export of apparel from Bangladesh decreases by a higher percentage point in the EU than in the USA. Compared to S1, Bangladesh’s exports to the EU decrease more in the current scenario, but the opposite is true for exports to the USA. India and China also experience a lower increase in their apparel export to the EU than in S1. Table 3B.6 shows that production of apparel decreases in Bangladesh by 11.7% where as it increases by 108.4% and 30.3% in India and China respectively. Production of textile of all these countries increases. Compared to S1, in the current scenario, the production decrease in Bangladesh is larger and production rise in India and China is smaller. Considering exports and imports of all industries of Bangladesh, it is observed that again exports of all industries other than apparel increase while imports of all industries decrease (table 3B.9). There is a 12.3% increase in textile export. Export of leather also increases by 32.5%. The aggregate export of Bangladesh decreases by 1.9% and aggregate import decreases by 7.5%. These results reflect the fixed balance of trade assumption. Exports of apparel fall, the exchange rate increases, other exports increase and imports fall. Implementation of S2 results in a 0.9% GDP loss and 1.9% per capita household utility loss for Bangladesh (table 3B.10). India and China both gain in terms of GDP and per capita household utility though the increase is less than that in S1. The CEEC and Turkey also experience GDP and utility gains. The overall welfare loss of Bangladesh is $884 million (table 3B.12), which is higher than in S1. Welfare gains of both India and China are also lower than in S1. Where CEEC and Turkey were facing a welfare loss in S1, they are facing a welfare gain in the current scenario. The welfare loss of Bangladesh arises mainly out of the negative endowment effect (less labour employed) and terms

58
of trade effect. Further investigation reveals that the $330 million negative endowment effect for Bangladesh is generated mostly by a 1.7% decrease in the unskilled labour employment (tables 3B.12 and 3B.14). As in S1 a decrease in unskilled labour employment is likely to affect the poor households most. Moreover, in S2 the decrease in employment is higher than in S1. As in S1 the terms of trade effect is negative for Bangladesh and all import quota restricted exporters as the world price of apparel decreases. As in S1 the negative terms of trade effects for India and China, are compensated by the increase in allocative efficiency and the positive endowment effects. But in Bangladesh allocation of more resources in the inefficient textile industry results in negative allocative efficiency. Welfare of the world increases by $17299 million. Table 3.3 shows that world apparel export increases in this scenario by 15.9%. But the share of Bangladesh in world apparel export decreases from 2.9% in the base to 2.2% (table 3B.15) which is lower than that in S1. Shares of India and China both increase but less than in S1. Results of S3 In this scenario, S2 is accompanied by a reduction of worldwide import tariffs of textile and apparel. This scenario results in an export price reduction of apparel of 5.3%, 20.9% and 11.8% for Bangladesh, India and China respectively (table 3B.2). As in S2, the price of apparel from India and China decreases much more than that of Bangladesh. Export of apparel of India increases by almost 305.8% and that of China by 90.8%. Apparel export of Bangladesh decreases by 15.1% (table 3B.3 and figure 3.2). Compared to the other two scenarios the percentage increase of Indian and Chinese apparel export is highest in the current scenario as these two countries were restricted highly in the base. For Bangladesh, the percentage decrease of apparel export is highest in the present scenario. Table 3B.4 reveals that a 24.8% decrease in apparel export to the EU is the main reason for the decrease in apparel export of Bangladesh. As Bangladesh was enjoying tariff free entry in the EU market (GSP facility), the relative position of Bangladesh deteriorates when the EU reduces import tariffs for all countries including the competitors of Bangladesh. The reduction of the USA import tariff leads to an increase of exports of Bangladesh to the USA even after the MFA import quota abolition. India and China also experience an increase in their apparel export to the USA. Table 3B.7 shows that production of apparel decreases in Bangladesh by 13.9%, where as it increases by 119.9% and 42.9% in India and China respectively. Import quota abolition and import tariff reduction together result in a higher production decrease for Bangladesh compared to the other two scenarios. But India and China increase production most compared to the other two scenarios. Considering exports and imports of all industries of Bangladesh,
59
it is observed that again exports of all industries other than apparel increase while imports of all industries decrease (table 3B.9). There is a 13.8% increase in textile export and export of leather increases by 39%. The aggregate export of Bangladesh decreases by 2.4% and the aggregate import decreases by 8.2%. These results reflect the fixed balance of trade assumption. Exports of apparel fall, the exchange rate increases, other exports increase and imports fall. S3 results in a 0.5% GDP loss and 1.6% per capita household utility loss for Bangladesh (table 3B.10). India and China both gain in terms of GDP and per capita household utility and the increases are higher than those in the other two scenarios. The overall welfare loss of Bangladesh is $758.6 million (table 3B.13). The welfare loss of Bangladesh arises mainly out of the negative endowment effect (less labour employed) and terms of trade effect. The $119.4 million endowment effect for Bangladesh is generated mostly by a 0.6% decrease in the unskilled labour employment (tables 3B.12 and 3B.14). The decrease in labour employment is lower in the current scenario compared to the other two scenarios, still the loss will negatively affect the poor households who own most unskilled labour. Negative terms of trade impacts for India and China, are compensated by the increase in allocative efficiency and positive endowment effects. Table 3.3 shows that world apparel export increases in S3 by 25.7%, which is higher than in the other two scenarios. The share of Bangladesh in world apparel export decreases from 2.9% in the base to 1.9% (table 3B.15). Shares of India and China both increase but less than in S2. Ultimately world welfare increases by $25895 million in this scenario. 3.4 Discussion Comparison of findings of various studies Possible consequences of MFA import quota abolition have received considerable attention in a number of studies. Yang et al. (1997) have mentioned that MFA import quota abolition will result in a large increase of textile and apparel export from South Asia. However they also mentioned that there is a possibility that developing country textile and apparel exporters, with larger import quotas relative to their production potential, may lose from the MFA import quota abolition, because of the increased competition from their more efficient competitors and deterioration in their terms of trade. Computable general equilibrium analysis of Islam (2001) also suggests that MFA import quota abolition would strengthen the competitive positions of ASEAN, China, and South Asia in apparel at the expense of industrially developed regions such as the EU, North America and Japan, and marginally competitors from Latin America and the rest of the world. It is predicted that Bangladesh will not only face more competition from India and China, but also there may be a shortage
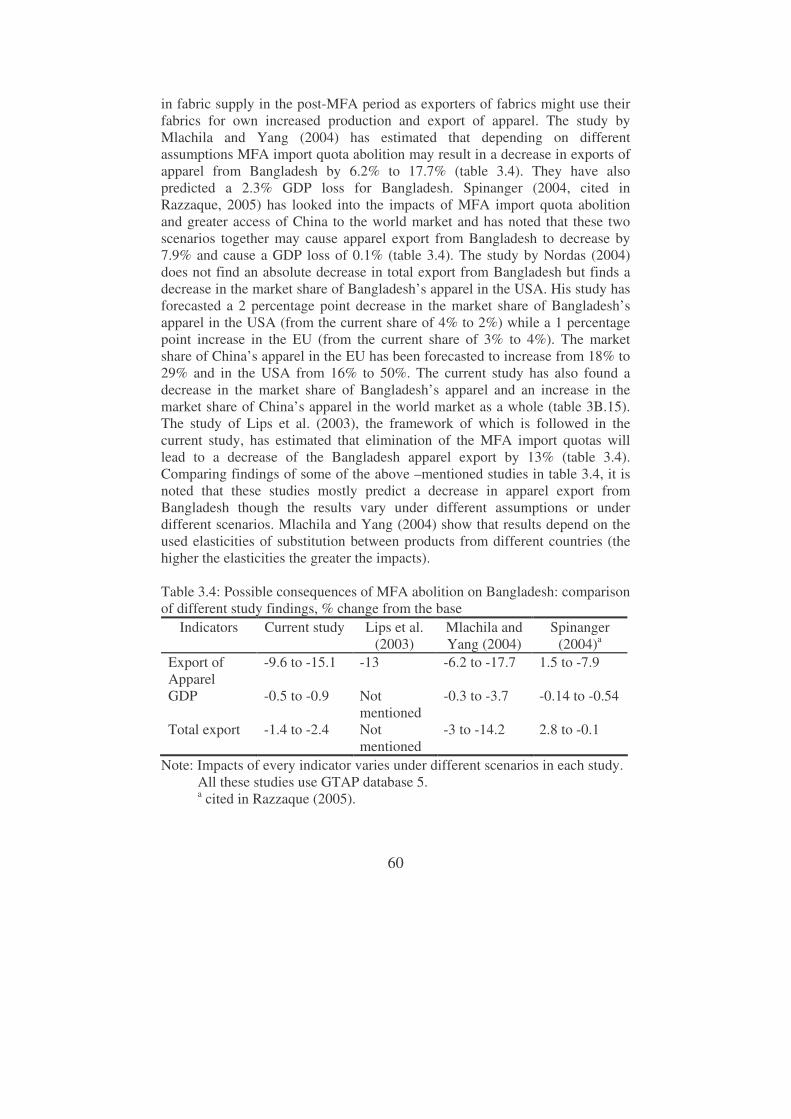
60
in fabric supply in the post-MFA period as exporters of fabrics might use their fabrics for own increased production and export of apparel. The study by Mlachila and Yang (2004) has estimated that depending on different assumptions MFA import quota abolition may result in a decrease in exports of apparel from Bangladesh by 6.2% to 17.7% (table 3.4). They have also predicted a 2.3% GDP loss for Bangladesh. Spinanger (2004, cited in Razzaque, 2005) has looked into the impacts of MFA import quota abolition and greater access of China to the world market and has noted that these two scenarios together may cause apparel export from Bangladesh to decrease by 7.9% and cause a GDP loss of 0.1% (table 3.4). The study by Nordas (2004) does not find an absolute decrease in total export from Bangladesh but finds a decrease in the market share of Bangladesh’s apparel in the USA. His study has forecasted a 2 percentage point decrease in the market share of Bangladesh’s apparel in the USA (from the current share of 4% to 2%) while a 1 percentage point increase in the EU (from the current share of 3% to 4%). The market share of China’s apparel in the EU has been forecasted to increase from 18% to 29% and in the USA from 16% to 50%. The current study has also found a decrease in the market share of Bangladesh’s apparel and an increase in the market share of China’s apparel in the world market as a whole (table 3B.15). The study of Lips et al. (2003), the framework of which is followed in the current study, has estimated that elimination of the MFA import quotas will lead to a decrease of the Bangladesh apparel export by 13% (table 3.4). Comparing findings of some of the above –mentioned studies in table 3.4, it is noted that these studies mostly predict a decrease in apparel export from Bangladesh though the results vary under different assumptions or under different scenarios. Mlachila and Yang (2004) show that results depend on the used elasticities of substitution between products from different countries (the higher the elasticities the greater the impacts). Table 3.4: Possible consequences of MFA abolition on Bangladesh: comparison of different study findings, % change from the base
Indicators
Current study
Lips et al. (2003)
Mlachila and Yang (2004)
Spinanger (2004)a
Export of Apparel
-9.6 to -15.1 -13 -6.2 to -17.7 1.5 to -7.9
GDP -0.5 to -0.9 Not mentioned
-0.3 to -3.7 -0.14 to -0.54
Total export -1.4 to -2.4 Not mentioned
-3 to -14.2 2.8 to -0.1
Note: Impacts of every indicator varies under different scenarios in each study. All these studies use GTAP database 5. a cited in Razzaque (2005).
61
In the current study Bangladesh’s production and export of apparel decrease more in the scenario where the MFA import quota abolition is accompanied by an import tariff reduction. Other countries benefit more form this import tariff reduction because they are more competitive than Bangladesh. The result of this study varies from Lips et al. (2003) because of updated base and the assumption of unemployment of unskilled workers. Consequences of MFA import quota abolition in relation to trade theory In analysing the impacts of MFA import quota abolition and reduction of import tariffs for textile and apparel, an obvious question arises regarding their implications on the economic growth and poverty situation of Bangladesh. Theories dealing with trade and economic growth have failed to reach unique conclusions regarding the impacts of trade liberalisation on growth. A number of studies have supported trade protection (e.g. Bardhan, 1970), selected trade protection (e.g. Redding, 1999), optimal level of trade protection (e.g. Dornbusch et al., 1977; Rodriguez, 1974) and apprehended no or modest benefit from trade liberalisation, specially for developing countries (e.g. Singer, 1950; Ocampo and Taylor, 1998). Another series of literature have considered trade liberalisation as an engine of growth for developing countries (e.g. Balassa, 1982; Bhagwati and Srinivasan, 1985; Krueger, 1998) and have argued that trade extends dynamic impacts through transfer of new technologies and management techniques (e.g. Romer, 1986; Lucas, 1988; Grossman and Helpman, 1991; Coe and Helpman, 1995; Barro and Sala-i-Martin, 1995; Edwards, 1998). Cross country empirical studies (e.g. Dollar, 1992; Edwards, 1992; Sachs and Warner, 1995; Greenaway et al. 1998) have found a positive relationship between trade liberalisation (often termed as openness) and growth.62 Surveying a vast range of literatures, Winters (2004) has noted that trade liberalisation contributes positively to economic performance and Winters et al. (2004) have noted that on an average trade liberalisation alleviates poverty in the long run. Winters et al. (2004) have, however, argued that some countries may suffer in the short run when the economy is adjusting as a result of liberalisation. Moreover complementary policies (e.g. investment, infrastructure development, redistribution policies) are required to ensure positive impacts of trade liberalisation on growth and poverty. We may relate trade theories with the findings of the MFA import quota abolition exercise of the current study. Table 3B.10 shows a decrease in GDP and a per capita utility loss indicating negative impacts of MFA import quota abolition on growth. GTAP does not permit to look at the poverty effect at the disaggregated household level. Winters (2005) has noted that to find out the
62 But there is huge controversy regarding the techniques and variables used in different cross-country measures (see e.g. Rodrik, 1995).

62
impacts of trade liberalisation on poverty, one has to look into (among others) the income sources and expenditure patterns of the poor. Following this notion some indicators are reported in table 3.5 to get an idea of possible poverty consequences of MFA import quota abolition. It is observed that factor return is decreasing for both land and unskilled labour. Though the GTAP database does not include disaggregated household data, the social accounting matrix of Bangladesh (discussed further in chapter 6) points out that around 36% of land is owned by poor households (agricultural and non-agricultural) in Bangladesh. Moreover around 75% of unskilled labours belong to poor households living in rural and urban areas.63 Table 3.5: Poverty implications for Bangladesh, % change from the base Indicators S1 S2 S3 Return of land -1.9 -3.1 -2.5
Return of unskilled labour -2.4 -3.5 -5.0
Private consumer price for rice -2.4 -3.6 -4.2
Private consumer price for food -1.7 -2.6 -3.0
Private consumer price for grains -1.7 -2.6 -3.0
Regional household income -3.8 -5.3 -6.4
Using this information we may say that income of poor is decreasing in all scenarios. The current study has shown that employment of unskilled labour is decreasing. However table 3.5 shows that prices of various food items are decreasing which may be beneficial for the poor. But according to Winters et al. (2004), it may be questioned whether lower consumer prices trickle down to the poor or not. What is more obvious from the results is that overall income is decreasing for all households, which indicates that not only income of the poor is decreasing but also the income transfer capacity of the rich people is decreasing and this may contribute to the increase in poverty. We may further infer that as apparel is employing mostly unskilled workers and as a quarter of these workers are sending remittances to rural households from where they have emerged (see section 6.5), the remittance flow may decrease with the decrease in income of unskilled workers. Thus there is a possibility that rural household income will decrease, specially for the households from where apparel workers are emerging. Thus findings of the current study indicate that MFA import quota abolition and worldwide import tariffs reduction for textile and apparel will extend negative impacts on growth, poverty and rural household income of Bangladesh. Following Winters et al. 63 Please see table 6B.6 (in chapter 6).

63
(2004) and Winters (2005), it may be pointed out that above mentioned poverty impact is occurring as a result of MFA import quota abolition and other trade liberalisation attempts. 3.5 Concluding remarks The current study was aimed at analysing various implications of MFA import quota abolition on Bangladesh, while it differs from other studies in terms of model used or assumptions model. A global general equilibrium model has been used to quantify the effects on different regions of the world including Bangladesh. In particular, the data and model of the Global Trade Analysis Project (GTAP) have been used. The study has considered import quota abolition under three scenarios. Before running the simulations under these scenarios, the base data in GTAP version 5.1 was updated to incorporate some realities. Three scenarios considered were i) abolition of the MFA import quotas and ii) EU enlargement, preferential trade agreement between Turkey and the EU and China’s WTO accession iii) a worldwide import tariff reduction of 36% for textile and apparel. Results show that abolition of MFA import quotas will decrease the export price of apparel in all scenarios and in all regions. The world export of apparel and world welfare increase in all scenarios. However for some regions apparel export and welfare fall. For Bangladesh, production and export of apparel decrease in every scenario. In the base Bangladesh was enjoying import tariff and import quota preferences in some important markets like the EU and Canada. Also in the USA the import quotas were less restrictive for Bangladesh compared to her competitors. As a result of abolition of the MFA import quotas and in other cases reduction of import tariffs (worldwide or region specific) the preferential position of Bangladesh ultimately deteriorates and this decreases the export and production of apparel. Depending on various scenarios, apparel export of Bangladesh decreases by 9.6% to 15.1%, while production of apparel decreases by 8.9% to 13.9%. India and China are found to be the largest gainers from liberalisation of world trade of textile and apparel. Abolition of the very restrictive import quotas for them leads to a large increase in their apparel production and exports. The study has also indicated that MFA import quota abolition and reduction of import tariffs for textile and apparel is possibly extending negative impacts on poverty and rural household income in Bangladesh. Results of the current study depend on the assumptions made in the GTAP model. For example, GTAP is a static general equilibrium model where dynamic effects cannot be taken into account. Therefore, this study does not analyse the dynamic effects for different regions from MFA import quota abolition in combination with import tariff reduction. The level of aggregation in GTAP of commodities (industries) and households is high. This implies that
64
for individual commodities (industries) and households results could be different. GTAP also assumes competitive markets (e.g. no market power) and does not take into account transaction costs and institutional constraints. Moreover it was not possible to incorporate all realities in the model. For example, in updating the base there could be a possible overvaluation of EU’s tariff preference for Bangladesh as EU’s Rules of Origin (ROO) requirement often constrains Bangladesh’s apparel export to avail tariff free access in the EU. Therefore, the impact of the different scenarios on Bangladesh could be less as the pre-simulation preferential position of Bangladesh in the EU was lower than that has been considered in updating the base. In other words because of not considering the ROO constraint, the magnitude of the deterioration of the relative position of Bangladesh in the EU under different simulations would be less. Also the GTAP model and data did not allow distinguishing between efficient and inefficient apparel factories, nor was it possible to distinguish between woven apparel and knitted apparel. As has been mentioned in chapter 2, knitted apparel has higher value added than woven apparel. Therefore the impact of MFA import quota abolition may have different impacts for efficient and inefficient factories and also for woven apparel and knitted apparel. Such disaggregation of product categories or factories is not possible in the GTAP model. Still global general equilibrium models like GTAP are the best possible way to cover interactions between domestic and international trade activities of different regions of the world as a whole. It is successful in understanding possible directions of effects for different regions of the world economy of policy changes in one region or from international trade liberalisation policies. Looking at the actual export performance of Bangladesh in the USA after abolition of the MFA import quota (table 3B.15) it is observed that in general, exports of MFA import quota restricted apparel products are growing in the USA market during the period of January – August 2005 compared to the same period in 2004. There has been a 20.4% growth in apparel export from Bangladesh. However some apparel products are facing a downturn in their export to the USA, e.g. cotton underwear, coats for women etc. However it is too early to conclude about such impacts of MFA import quota abolition. These impacts can be short term of nature and the medium to long term effects will depend on the how far Bangladesh can adjust to the changed competitive trade environment. Even with the limitations of GTAP, the study indicates that in the present import quota free world Bangladesh’s apparel is exposed to greater competition. It is also noted that a possible worldwide import tariff reduction as an outcome of the Doha Round of the WTO, will not help Bangladesh much. Bangladesh may benefit if it receives preferential treatment compared to her competitors, specially, in the USA. It has been noticed in this study that the USA import tariff reduction results in an increase in export of apparel to the

65
USA. However that increase was not enough to offset the decrease in apparel export to the EU, the most important market for Bangladesh’s apparel. Therefore Bangladesh still faces a decrease in total apparel export and production. Given these outcomes, Bangladesh needs to improve the competitiveness of the apparel industry by removing structural weaknesses like poor infrastructure (mentioned in chapter 2). Moreover diversification of apparel products can minimise the risk of losing markets with increasing competition. Also Bangladesh should attempt to take advantage of the regional cumulation facility (see chapter 2 for detail) given by the EU and in this regard implementation of the South Asian Free trade Area (SAFTA) can help. The next chapter will discuss the possible impacts of implementation of SAFTA.

66
Appendix 3A: The GTAP model The Global Trade Analysis Project (GTAP) model used in this chapter is a comparative static, global computable general equilibrium model based on neoclassical theory.64 The GTAP model is solved using the software GEMPACK (Harrison and Pearson, 1996). GTAP includes a linearised comparative static model and a common database for computable general equilibrium analysis. The model assumes that all markets are perfectly competitive, and constant returns to scale prevail in all production and trade activities. In the model, firms maximise their profits and households maximise their utility. Household income and expenditure In figure 3A.1 a multi region open economy in the GTAP model is presented. In this model each region has a single representative household, termed as the regional household. The regional household income is generated through factor payments and tax revenues (including export and import taxes) net of subsidies. Factor income (reward from using land, labour and capital) and output (VOA) flow from producers to the regional household, Taxes (TAXES) flow from the private household, producers and government to the regional household. The regional household also receives import tax (MTAX) and export tax (XTAX) revenues from its trade with the rest of the world. The regional household allocates expenditure over private household expenditure (PRIVEXP), government expenditure (GOVEXP) and savings (SAVE)65 according to a Cobb Douglas per capita utility function. Thus each component of final demand maintains a constant share of total regional income. The private household buys commodity bundles to maximise utility subject to its expenditure constraint. The constrained optimising behaviour of the private household is represented in GTAP by a CDE (Constant Difference of Elasticity) implicit expenditure function. The private household spends its income on consumption of both domestic and imported commodities denoted by VDPA and VIPA respectively and pays taxes (TAXES). The consumption bundles are CES aggregates of domestic goods and import bundles, where the import bundles are CES aggregates of imports from individual regions. Taxes paid by the private household cover commodity taxes for domestically produced and imported goods and the income tax net of subsidies.
64 Full documentation of the GTAP model and the database can be found in Hertel (1997) and also in Dimaranan and McDougall (2002). This section is heavily drawn from Brockmeier (2001) 65 Savings enter the static utility function as a proxy for future consumption

67
The government also spends its income on domestic and imported commodities denoted by VDGA and VIGA respectively and also pays taxes (TAXES). For the government, taxes consist of commodity taxes for domestically produced and imported commodities. Like the private household, government consumption is a CES composition of domestically produced goods and imports. In GTAP the demand for investment in a particular region is savings driven. Given the static nature of the GTAP model, current investment is assumed not to be installed during the considered period, and therefore does not affect the production capacity of the industries in the model. However, the demand for investment goods will affect the economic activity in the region through its effects on production. So there is an expenditure but not a capacity effect of investment. In the multi country setting the model is closed by assuming that regional savings are homogenous and contribute to a global pool of savings (global savings). This is then allocated among regions for investment responding to changes in expected rates of return in different regions. As a result of such treatment to savings and investment, if all other markets in the multi regional model are in equilibrium, all firms earn zero profits, and all households are on their budget constraint, then global investment must equal global savings and Walras' Law will be satisfied. Household Utility In the GTAP model the regional household divides total regional income according to a Cobb-Douglas per capita utility function. This function is specified over three forms of final demand: private household expenditures, government expenditures, and savings. Thus aggregate utility is expressed as INCOME(r)*u(r) =PRIVEXP(r)*up(r)+ GOVEXP(r)*[ ug(r) – pop (r )] + SAVE(r)*[ qsave(r) – pop(r)] where, INCOME(r) is income (net of capital depreciation) in region r; u(r) is percentage change in per capita utility of aggregate household expenditure, PRIVEXP(r) and GOVEXP(r) are private household and government household expenditures respectively; up(r) and ug(r) are percentage changes in per capita utility from private household expenditure and government household expenditures respectively; pop(r) is population in region r; SAVE(r) is value of net savings (price times quantity of savings) and qsave(r) is percentage change in quantity of savings demanded in region r.
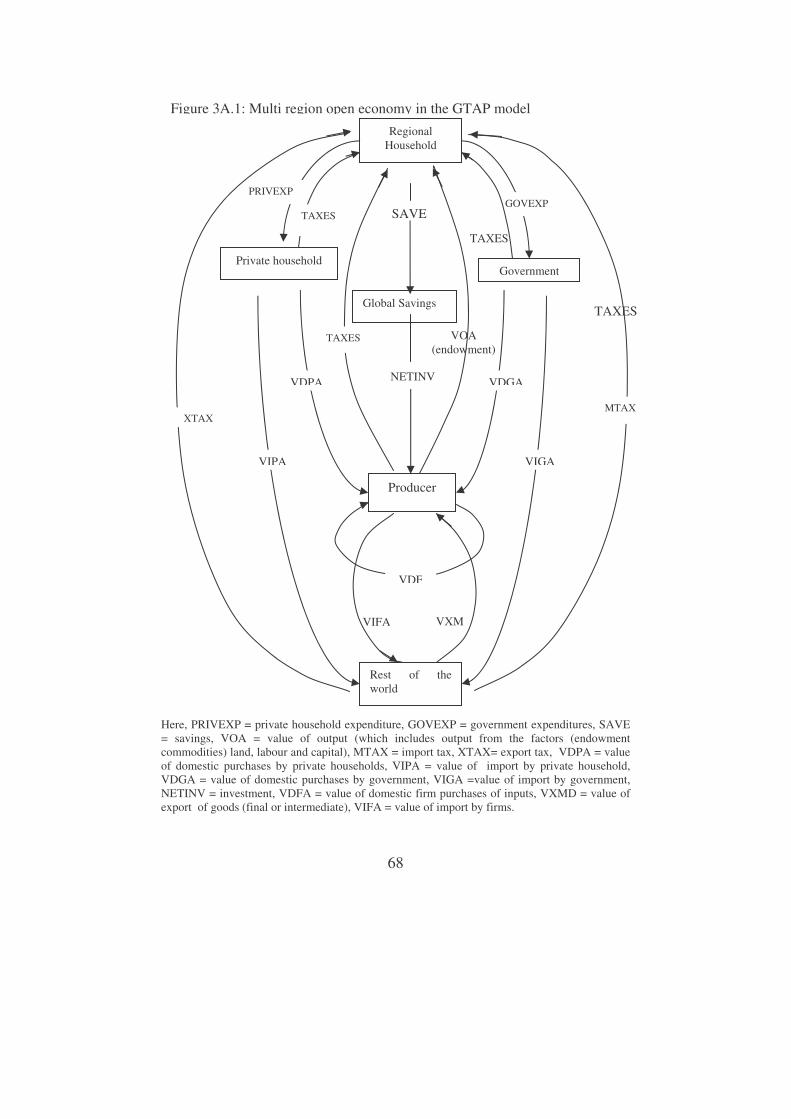
68
Here, PRIVEXP = private household expenditure, GOVEXP = government expenditures, SAVE = savings, VOA = value of output (which includes output from the factors (endowment commodities) land, labour and capital), MTAX = import tax, XTAX= export tax, VDPA = value of domestic purchases by private households, VIPA = value of import by private household, VDGA = value of domestic purchases by government, VIGA =value of import by government, NETINV = investment, VDFA = value of domestic firm purchases of inputs, VXMD = value of export of goods (final or intermediate), VIFA = value of import by firms.
Figure 3A.1: Multi region open economy in the GTAP model
TAXES
VIFA VXM
Government
NETINV
Regional Household
Private household
Global Savings
SAVE
Producer
VDPA VDGA
VDF
VOA (endowment)
PRIVEXP GOVEXP
Rest of the world
TAXES
VIGA
MTAX XTAX
VIPA
TAXES
TAXES
69
Source: Adapted from Brockmeier (2001). Production The producers receive payments for selling consumption goods and intermediate inputs both in the domestic market and to the rest of the world (ROW). They sell consumption goods to the domestic private households (VDPA) and government (VDGA) and both final goods and intermediate inputs to the rest of the world (VXMD). They sell intermediate inputs to other domestic producers (VDFA). Producers sell investment goods to the savings sector (NETINV). Under the zero profit assumption employed in GTAP, these revenues must be precisely exhausted on expenditures for domestic intermediate inputs (VDFA), imported intermediate inputs (VIFA), factor income and taxes paid to regional household (taxes on both domestic and imported intermediate inputs and production taxes net of subsidies). The nested production technology in GTAP (presented in figure 3A.2) exhibits constant returns to scale and every industry produces a single output. Furthermore, it is assumed that the technology is weakly separable between factors (labour, land and capital) and intermediate inputs. Profit maximizing industries therefore choose their optimal mix of factors independently of the prices of intermediate inputs. Using this type of separability also means that the elasticity of substitution between any individual factor and different intermediate inputs is equal. Industries have a Leontief production technology to produce their output. Industries maximise profit by choosing two broad categories of inputs namely, a composite of factors (value added) and a composite of intermediate inputs. The factor composite is a Constant Elasticity of Substitution (CES) function of labour, capital, land and natural resources. The intermediate composite is a Leontief function of material inputs, which are in turn a CES composition of domestically produced goods and imports. Imports are sourced from all regions. The GTAP model employs the Armington assumption which provides the possibility to distinguish imports by their origin and explains intra-industry trade of similar products. Following the Armington approach import shares of different regions depend on relative prices and the substitution elasticity between domestically and imported commodities.

70
Figure 3A.2: Production structure in GTAP
MFA import quotas In the GTAP model MFA import quotas have been modelled as export tax equivalents (ETEs) so that the tax has the same price and volume effects as the import quota. Chapter 2 has provided a discussion of ETEs. Welfare impacts In GTAP, welfare effects are measured using the equivalent variation (EV). The regional household equivalent variation, resulting from a shock, is equal to the difference between the expenditure required to obtain the new level of utility at initial prices and the initial expenditure. Thus, the EV uses the current prices as the base and asks what income change at the current prices would be equivalent to the proposed change in terms of its impact on utility. According to GTAP welfare effects can be decomposed into various contributors i.e., i) changes in allocative efficiency, ii) changes in the country’s terms of trade (TOT), iii) changes in factor endowments and iv) changes in
Output in industry j
Value added Intermediate inputs
Land
Labour
Capital Domestic Imported
Leontief
CES CES
Region 1 Region 2
CES
Source: Adapted from Hertel (1997)
71
technology. A welfare change may also occur from changes in foreign income flows. Allocative efficiency refers to the efficient industry-wise allocation of scarce resources to produce the optimal combination of outputs. In an open economy context it also refers to efficiency in resource use in purchasing imported products. The terms of trade (TOT) effect refers to the relative movement in prices of countries exports and imports. The TOT effect increases with a relative increase in the price of exports as compared to that of imports. TOT changes occur as producers and consumers adjust their purchasing and sale patterns in response to a policy change. The factor endowment effect is a measure of how much countries gain due to an increase in employment of factors of production such as land, labour or capital. A welfare gain from technological change occurs as a result of increased productivity with such changes. The EV in GTAP also includes (in addition to the contributors above) the investment–savings (I-S) effects. I-S effects refer to impacts of changes in the price of investment (capital goods) and savings.
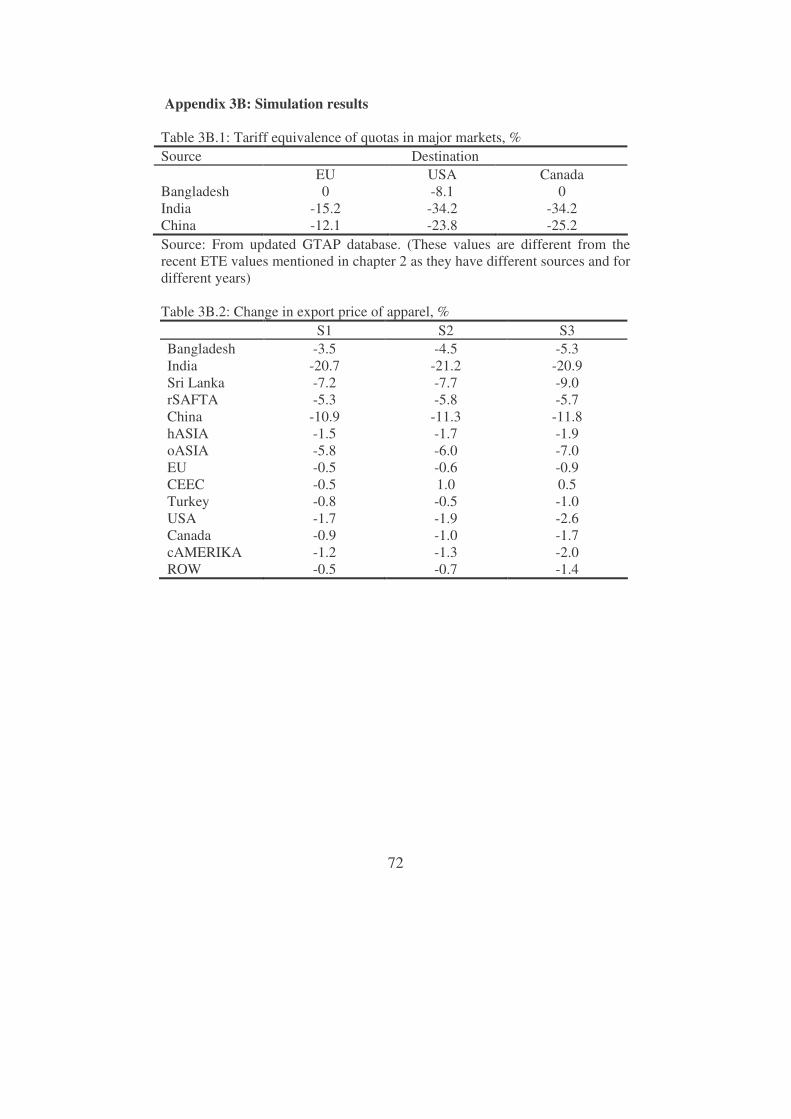
72
Appendix 3B: Simulation results Table 3B.1: Tariff equivalence of quotas in major markets, % Source Destination
EU USA Canada Bangladesh 0 -8.1 0 India -15.2 -34.2 -34.2 China -12.1 -23.8 -25.2 Source: From updated GTAP database. (These values are different from the recent ETE values mentioned in chapter 2 as they have different sources and for different years) Table 3B.2: Change in export price of apparel, % S1 S2 S3 Bangladesh -3.5 -4.5 -5.3 India -20.7 -21.2 -20.9 Sri Lanka -7.2 -7.7 -9.0 rSAFTA -5.3 -5.8 -5.7 China -10.9 -11.3 -11.8 hASIA -1.5 -1.7 -1.9 oASIA -5.8 -6.0 -7.0 EU -0.5 -0.6 -0.9 CEEC -0.5 1.0 0.5 Turkey -0.8 -0.5 -1.0 USA -1.7 -1.9 -2.6 Canada -0.9 -1.0 -1.7 cAMERIKA -1.2 -1.3 -2.0 ROW -0.5 -0.7 -1.4

73
Table 3B.3: Change in aggregate export of apparel by different regions, % S1 S2 S3 Bangladesh -9.6 -12.5 -15.1 India 283.8 276.9 305.8 Sri Lanka -0.2 -3.0 25.5 rSAFTA 0.9 -4.1 7.6 China 67.5 63.6 90.8 hASIA -22.4 -24.7 -5.2 oASIA 7.0 1.8 26.8 EU -12.6 -13.9 -17.8 CEEC -17.1 68.2 50.8 Turkey -15.4 55.1 48.7 USA 0.1 -2.0 11.9 Canada -48.2 -49.5 -54.8 cAMERIKA -52.4 -53.0 -52.0 ROW -23.6 -29.8 -13.5 World (average) 12.8 15.9 26.7
Table 3B.4: Changes in export of apparel to the EU and the USA Source S1 S2 S3 EU USA EU USA EU USA Bangladesh -10.1 -6.1 -15.8 -1.0 -24.8 12.0 India 105.2 755.4 84.3 764.0 108.5 808.0 Sri Lanka 37.8 -17.5 24.9 -15.9 70.4 4.8 rSAFTA 32.1 -27.3 19.5 -26.0 34.7 -18.0 China 94.3 206.0 73.7 208.0 115.6 240.3 hASIA -14.1 -49.9 -24.2 -50.2 -9.2 -42.1 oASIA 41.1 -8.8 24.5 -9.5 62.9 10.7 EU -16.7 -57.3 -27.0 -57.9 -36.3 -53.7 CEEC -17.7 -34.8 80.8 -43.7 59.5 -33.7 Turkey -17.7 -35.5 94.9 -38.3 72.0 -30.5 USA -7.4 -52.3 -18.5 -52.7 2.0 -62.4 Canada -12.3 -55.8 -23.1 -56.3 -9.1 -65.4 cAMERIKA 4.2 -54.8 -8.3 -55.2 11.6 -55.1 ROW -16.0 -57.1 -25.7 -57.3 -6.3 -50.1
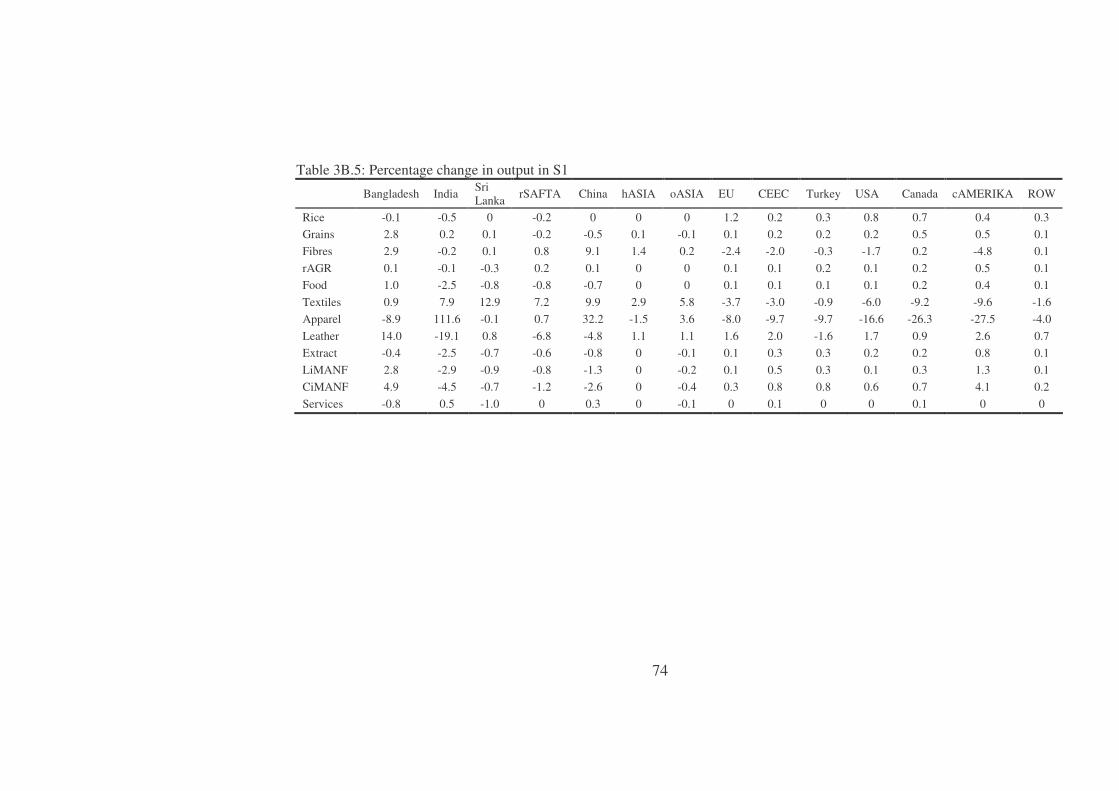
74
Table 3B.5: Percentage change in output in S1
Bangladesh India Sri Lanka rSAFTA China hASIA oASIA EU CEEC Turkey USA Canada cAMERIKA ROW
Rice -0.1 -0.5 0 -0.2 0 0 0 1.2 0.2 0.3 0.8 0.7 0.4 0.3 Grains 2.8 0.2 0.1 -0.2 -0.5 0.1 -0.1 0.1 0.2 0.2 0.2 0.5 0.5 0.1 Fibres 2.9 -0.2 0.1 0.8 9.1 1.4 0.2 -2.4 -2.0 -0.3 -1.7 0.2 -4.8 0.1 rAGR 0.1 -0.1 -0.3 0.2 0.1 0 0 0.1 0.1 0.2 0.1 0.2 0.5 0.1 Food 1.0 -2.5 -0.8 -0.8 -0.7 0 0 0.1 0.1 0.1 0.1 0.2 0.4 0.1 Textiles 0.9 7.9 12.9 7.2 9.9 2.9 5.8 -3.7 -3.0 -0.9 -6.0 -9.2 -9.6 -1.6 Apparel -8.9 111.6 -0.1 0.7 32.2 -1.5 3.6 -8.0 -9.7 -9.7 -16.6 -26.3 -27.5 -4.0 Leather 14.0 -19.1 0.8 -6.8 -4.8 1.1 1.1 1.6 2.0 -1.6 1.7 0.9 2.6 0.7 Extract -0.4 -2.5 -0.7 -0.6 -0.8 0 -0.1 0.1 0.3 0.3 0.2 0.2 0.8 0.1 LiMANF 2.8 -2.9 -0.9 -0.8 -1.3 0 -0.2 0.1 0.5 0.3 0.1 0.3 1.3 0.1 CiMANF 4.9 -4.5 -0.7 -1.2 -2.6 0 -0.4 0.3 0.8 0.8 0.6 0.7 4.1 0.2 Services -0.8 0.5 -1.0 0 0.3 0 -0.1 0 0.1 0 0 0.1 0 0
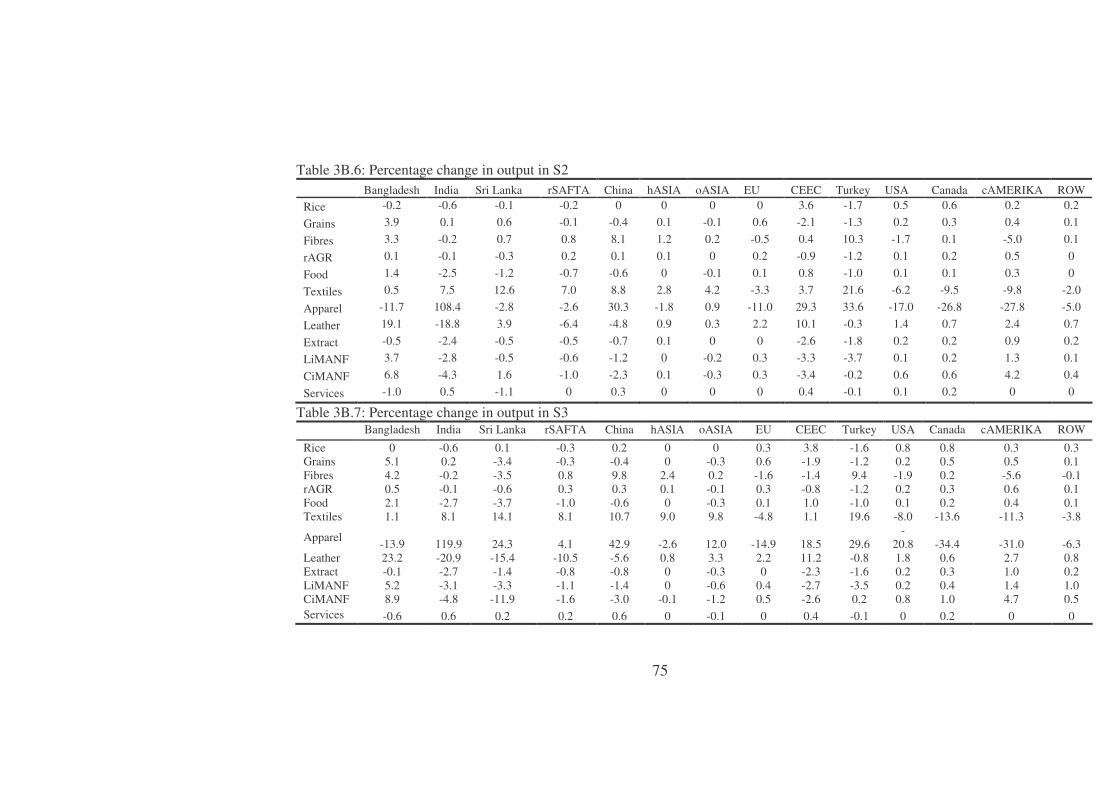
75
Table 3B.6: Percentage change in output in S2 Bangladesh India Sri Lanka rSAFTA China hASIA oASIA EU CEEC Turkey USA Canada cAMERIKA ROW Rice -0.2 -0.6 -0.1 -0.2 0 0 0 0 3.6 -1.7 0.5 0.6 0.2 0.2
Grains 3.9 0.1 0.6 -0.1 -0.4 0.1 -0.1 0.6 -2.1 -1.3 0.2 0.3 0.4 0.1
Fibres 3.3 -0.2 0.7 0.8 8.1 1.2 0.2 -0.5 0.4 10.3 -1.7 0.1 -5.0 0.1
rAGR 0.1 -0.1 -0.3 0.2 0.1 0.1 0 0.2 -0.9 -1.2 0.1 0.2 0.5 0
Food 1.4 -2.5 -1.2 -0.7 -0.6 0 -0.1 0.1 0.8 -1.0 0.1 0.1 0.3 0
Textiles 0.5 7.5 12.6 7.0 8.8 2.8 4.2 -3.3 3.7 21.6 -6.2 -9.5 -9.8 -2.0
Apparel -11.7 108.4 -2.8 -2.6 30.3 -1.8 0.9 -11.0 29.3 33.6 -17.0 -26.8 -27.8 -5.0
Leather 19.1 -18.8 3.9 -6.4 -4.8 0.9 0.3 2.2 10.1 -0.3 1.4 0.7 2.4 0.7
Extract -0.5 -2.4 -0.5 -0.5 -0.7 0.1 0 0 -2.6 -1.8 0.2 0.2 0.9 0.2
LiMANF 3.7 -2.8 -0.5 -0.6 -1.2 0 -0.2 0.3 -3.3 -3.7 0.1 0.2 1.3 0.1
CiMANF 6.8 -4.3 1.6 -1.0 -2.3 0.1 -0.3 0.3 -3.4 -0.2 0.6 0.6 4.2 0.4
Services -1.0 0.5 -1.1 0 0.3 0 0 0 0.4 -0.1 0.1 0.2 0 0
Table 3B.7: Percentage change in output in S3 Bangladesh India Sri Lanka rSAFTA China hASIA oASIA EU CEEC Turkey USA Canada cAMERIKA ROW
Rice 0 -0.6 0.1 -0.3 0.2 0 0 0.3 3.8 -1.6 0.8 0.8 0.3 0.3 Grains 5.1 0.2 -3.4 -0.3 -0.4 0 -0.3 0.6 -1.9 -1.2 0.2 0.5 0.5 0.1 Fibres 4.2 -0.2 -3.5 0.8 9.8 2.4 0.2 -1.6 -1.4 9.4 -1.9 0.2 -5.6 -0.1 rAGR 0.5 -0.1 -0.6 0.3 0.3 0.1 -0.1 0.3 -0.8 -1.2 0.2 0.3 0.6 0.1 Food 2.1 -2.7 -3.7 -1.0 -0.6 0 -0.3 0.1 1.0 -1.0 0.1 0.2 0.4 0.1 Textiles 1.1 8.1 14.1 8.1 10.7 9.0 9.8 -4.8 1.1 19.6 -8.0 -13.6 -11.3 -3.8
Apparel -13.9 119.9 24.3 4.1 42.9 -2.6 12.0 -14.9 18.5 29.6 -
20.8 -34.4 -31.0 -6.3 Leather 23.2 -20.9 -15.4 -10.5 -5.6 0.8 3.3 2.2 11.2 -0.8 1.8 0.6 2.7 0.8 Extract -0.1 -2.7 -1.4 -0.8 -0.8 0 -0.3 0 -2.3 -1.6 0.2 0.3 1.0 0.2 LiMANF 5.2 -3.1 -3.3 -1.1 -1.4 0 -0.6 0.4 -2.7 -3.5 0.2 0.4 1.4 1.0 CiMANF 8.9 -4.8 -11.9 -1.6 -3.0 -0.1 -1.2 0.5 -2.6 0.2 0.8 1.0 4.7 0.5 Services -0.6 0.6 0.2 0.2 0.6 0 -0.1 0 0.4 -0.1 0 0.2 0 0
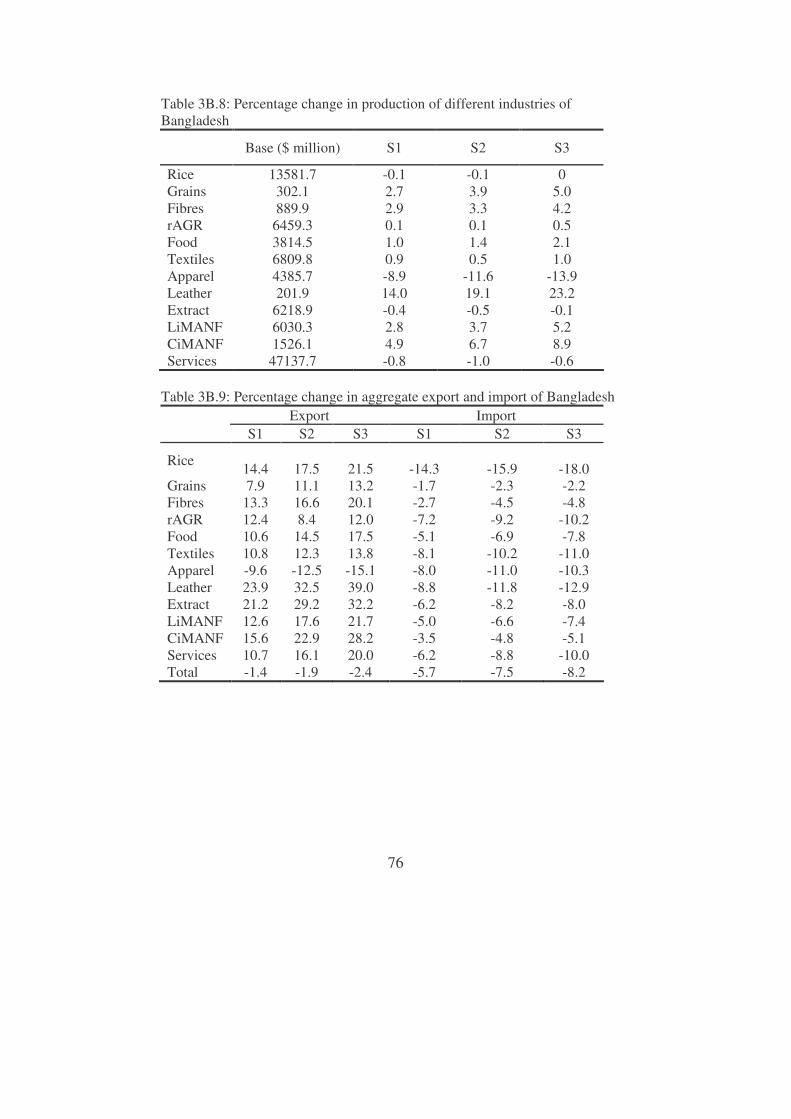
76
Table 3B.8: Percentage change in production of different industries of Bangladesh Base ($ million) S1 S2 S3
Rice 13581.7 -0.1 -0.1 0 Grains 302.1 2.7 3.9 5.0 Fibres 889.9 2.9 3.3 4.2 rAGR 6459.3 0.1 0.1 0.5 Food 3814.5 1.0 1.4 2.1 Textiles 6809.8 0.9 0.5 1.0 Apparel 4385.7 -8.9 -11.6 -13.9 Leather 201.9 14.0 19.1 23.2 Extract 6218.9 -0.4 -0.5 -0.1 LiMANF 6030.3 2.8 3.7 5.2 CiMANF 1526.1 4.9 6.7 8.9 Services 47137.7 -0.8 -1.0 -0.6
Table 3B.9: Percentage change in aggregate export and import of Bangladesh
Export Import S1 S2 S3 S1 S2 S3
Rice 14.4
17.5
21.5
-14.3
-15.9
-18.0
Grains 7.9 11.1 13.2 -1.7 -2.3 -2.2 Fibres 13.3 16.6 20.1 -2.7 -4.5 -4.8 rAGR 12.4 8.4 12.0 -7.2 -9.2 -10.2 Food 10.6 14.5 17.5 -5.1 -6.9 -7.8 Textiles 10.8 12.3 13.8 -8.1 -10.2 -11.0 Apparel -9.6 -12.5 -15.1 -8.0 -11.0 -10.3 Leather 23.9 32.5 39.0 -8.8 -11.8 -12.9 Extract 21.2 29.2 32.2 -6.2 -8.2 -8.0 LiMANF 12.6 17.6 21.7 -5.0 -6.6 -7.4 CiMANF 15.6 22.9 28.2 -3.5 -4.8 -5.1 Services 10.7 16.1 20.0 -6.2 -8.8 -10.0 Total -1.4 -1.9 -2.4 -5.7 -7.5 -8.2
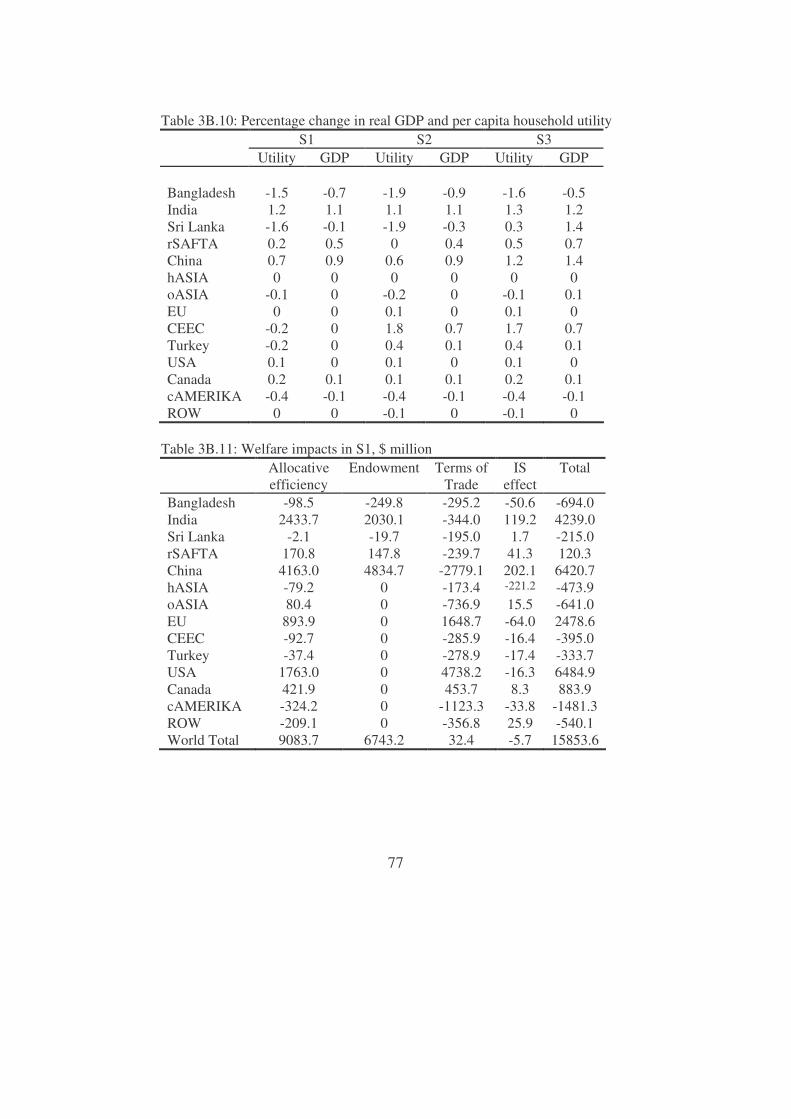
77
Table 3B.10: Percentage change in real GDP and per capita household utility S1 S2 S3 Utility GDP Utility GDP Utility GDP Bangladesh
-1.5
-0.7
-1.9
-0.9
-1.6
-0.5
India 1.2 1.1 1.1 1.1 1.3 1.2 Sri Lanka -1.6 -0.1 -1.9 -0.3 0.3 1.4 rSAFTA 0.2 0.5 0 0.4 0.5 0.7 China 0.7 0.9 0.6 0.9 1.2 1.4 hASIA 0 0 0 0 0 0 oASIA -0.1 0 -0.2 0 -0.1 0.1 EU 0 0 0.1 0 0.1 0 CEEC -0.2 0 1.8 0.7 1.7 0.7 Turkey -0.2 0 0.4 0.1 0.4 0.1 USA 0.1 0 0.1 0 0.1 0 Canada 0.2 0.1 0.1 0.1 0.2 0.1 cAMERIKA -0.4 -0.1 -0.4 -0.1 -0.4 -0.1 ROW 0 0 -0.1 0 -0.1 0
Table 3B.11: Welfare impacts in S1, $ million
Allocative efficiency
Endowment Terms of Trade
IS effect
Total
Bangladesh -98.5 -249.8 -295.2 -50.6 -694.0 India 2433.7 2030.1 -344.0 119.2 4239.0 Sri Lanka -2.1 -19.7 -195.0 1.7 -215.0 rSAFTA 170.8 147.8 -239.7 41.3 120.3 China 4163.0 4834.7 -2779.1 202.1 6420.7 hASIA -79.2 0 -173.4 -221.2 -473.9 oASIA 80.4 0 -736.9 15.5 -641.0 EU 893.9 0 1648.7 -64.0 2478.6 CEEC -92.7 0 -285.9 -16.4 -395.0 Turkey -37.4 0 -278.9 -17.4 -333.7 USA 1763.0 0 4738.2 -16.3 6484.9 Canada 421.9 0 453.7 8.3 883.9 cAMERIKA -324.2 0 -1123.3 -33.8 -1481.3 ROW -209.1 0 -356.8 25.9 -540.1 World Total 9083.7 6743.2 32.4 -5.7 15853.6

78
Table 3B.12: Welfare impacts in S2, $ million
Allocative efficiency Endowment Terms of
Trade IS
effect Total
Bangladesh -129.7 -330.9 -348.2 -75.4 -884.3 India 2356.8 1935.7 -498.4 98.7 3892.8 Sri Lanka -15.9 -35.7 -216.8 -0.9 -269.3 rSAFTA 132.2 115.3 -282.7 29.7 -5.6 China 4003.9 4504.0 -3325.2 136.7 5319.4 hASIA -246.9 0 -1254.9 -99.0 -1600.8 oASIA 7.2 0 -990.3 -2.4 -985.4 EU 2064.4 0 3090.2 -252.2 4902.3 CEEC 1925.5 0 2277.0 366.1 4568.5 Turkey 147.3 0 458.9 116.5 722.7 USA 1750.7 0 4174.7 -280.0 5645.3 Canada 404.8 0 361.6 22.0 788.4 cAMERIKA -347.3 0 -1203.8 -43.7 -1594.9 ROW -935.3 0 -2239.0 -25.9 -3200.2 World Total 11117.5 6188.4 3.0 -9.8 17299.0
Table 3B.13: Welfare impacts in S3, $ million
Allocative efficiency
Endowment Terms of Trade
IS effect
Total
Bangladesh -138.1 -119.4 -408.2 -93.0 -758.6 India 2636.6 2212.6 -348.9 119.6 4619.8 Sri Lanka 94.6 118.5 -180.0 12.4 45.5 rSAFTA 262.5 218.3 -208.7 53.3 325.5 China 5707.4 7708.3 -3204.2 221.0 10432.5 hASIA 187.2 0 -630.4 -202.7 -645.9 oASIA 378.6 0 -759.7 13.5 -367.6 EU 2497.9 0 2877.0 -205.3 5169.6 CEEC 1961.6 0 2040.8 307.1 4309.5 Turkey 139.9 0 351.7 99.6 591.2 USA 1909.6 0 3737.9 -317.1 5330.3 Canada 472.7 0 376.9 33.2 882.7 cAMERIKA -234.3 0 -1307.4 -45.3 -1586.9 ROW -122.3 0 -2321.9 -8.3 -2452.5 World Total 15753.9 10138.3 14.9 -12.1 25894.9
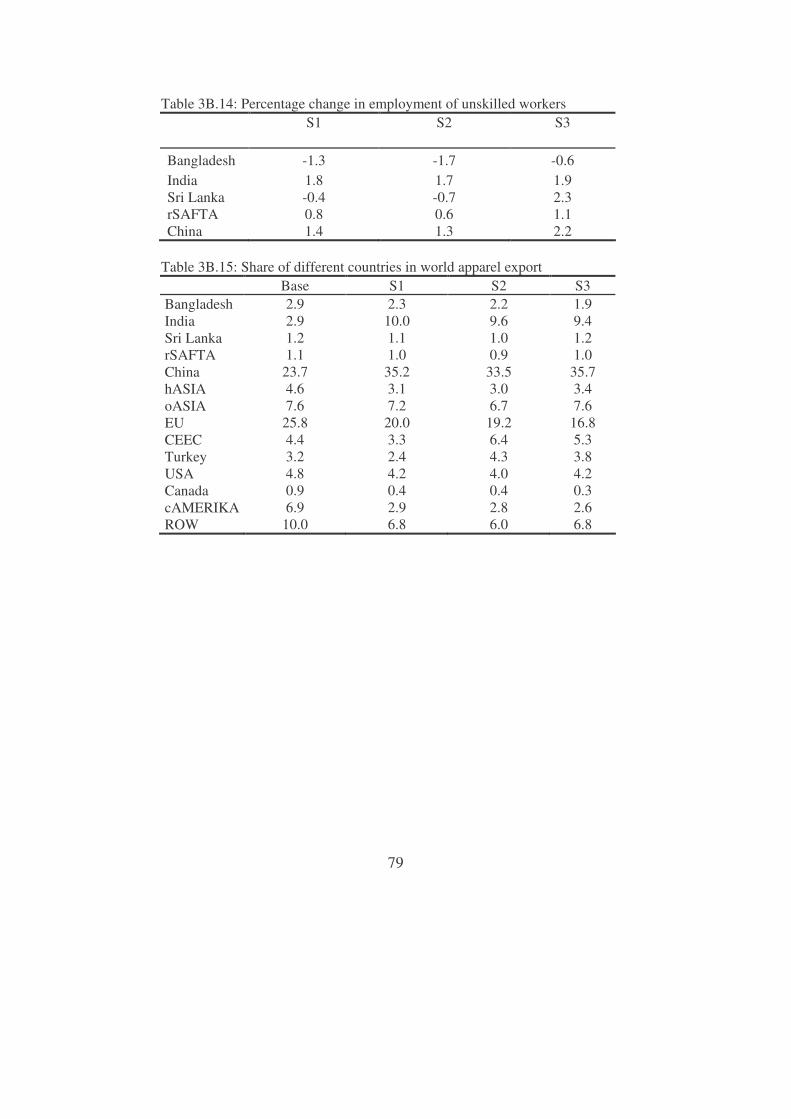
79
Table 3B.14: Percentage change in employment of unskilled workers
S1 S2 S3
Bangladesh -1.3 -1.7 -0.6 India 1.8 1.7 1.9 Sri Lanka -0.4 -0.7 2.3 rSAFTA 0.8 0.6 1.1 China 1.4 1.3 2.2
Table 3B.15: Share of different countries in world apparel export Base S1 S2 S3 Bangladesh 2.9 2.3 2.2 1.9 India 2.9 10.0 9.6 9.4 Sri Lanka 1.2 1.1 1.0 1.2 rSAFTA 1.1 1.0 0.9 1.0 China 23.7 35.2 33.5 35.7 hASIA 4.6 3.1 3.0 3.4 oASIA 7.6 7.2 6.7 7.6 EU 25.8 20.0 19.2 16.8 CEEC 4.4 3.3 6.4 5.3 Turkey 3.2 2.4 4.3 3.8 USA 4.8 4.2 4.0 4.2 Canada 0.9 0.4 0.4 0.3 cAMERIKA 6.9 2.9 2.8 2.6 ROW 10.0 6.8 6.0 6.8
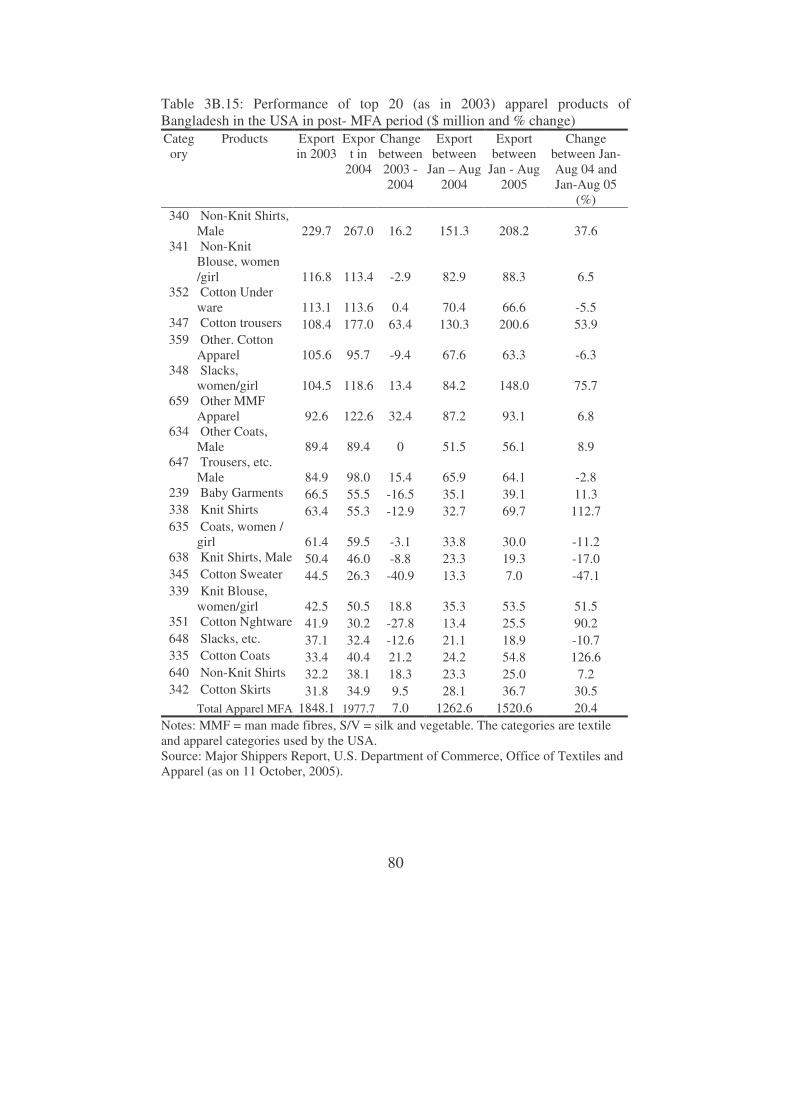
80
Table 3B.15: Performance of top 20 (as in 2003) apparel products of Bangladesh in the USA in post- MFA period ($ million and % change) Category
Products Export in 2003
Export in
2004
Change between 2003 - 2004
Export between
Jan – Aug 2004
Export between
Jan - Aug 2005
Change between Jan-Aug 04 and Jan-Aug 05
(%) 340 Non-Knit Shirts,
Male 229.7 267.0 16.2 151.3 208.2 37.6 341 Non-Knit
Blouse, women /girl 116.8 113.4 -2.9 82.9 88.3 6.5
352 Cotton Under ware 113.1 113.6 0.4 70.4 66.6 -5.5
347 Cotton trousers 108.4 177.0 63.4 130.3 200.6 53.9 359 Other. Cotton
Apparel 105.6 95.7 -9.4 67.6 63.3 -6.3 348 Slacks,
women/girl 104.5 118.6 13.4 84.2 148.0 75.7 659 Other MMF
Apparel 92.6 122.6 32.4 87.2 93.1 6.8 634 Other Coats,
Male 89.4 89.4 0 51.5 56.1 8.9 647 Trousers, etc.
Male 84.9 98.0 15.4 65.9 64.1 -2.8 239 Baby Garments 66.5 55.5 -16.5 35.1 39.1 11.3 338 Knit Shirts 63.4 55.3 -12.9 32.7 69.7 112.7 635 Coats, women /
girl 61.4 59.5 -3.1 33.8 30.0 -11.2 638 Knit Shirts, Male 50.4 46.0 -8.8 23.3 19.3 -17.0 345 Cotton Sweater 44.5 26.3 -40.9 13.3 7.0 -47.1 339 Knit Blouse,
women/girl 42.5 50.5 18.8 35.3 53.5 51.5 351 Cotton Nghtware 41.9 30.2 -27.8 13.4 25.5 90.2 648 Slacks, etc. 37.1 32.4 -12.6 21.1 18.9 -10.7 335 Cotton Coats 33.4 40.4 21.2 24.2 54.8 126.6 640 Non-Knit Shirts 32.2 38.1 18.3 23.3 25.0 7.2 342 Cotton Skirts 31.8 34.9 9.5 28.1 36.7 30.5
Total Apparel MFA 1848.1 1977.7 7.0 1262.6 1520.6 20.4 Notes: MMF = man made fibres, S/V = silk and vegetable. The categories are textile and apparel categories used by the USA. Source: Major Shippers Report, U.S. Department of Commerce, Office of Textiles and Apparel (as on 11 October, 2005).

81
Chapter 4 Preferential trade arrangements in South Asia: options for Bangladesh
4.1 Introduction Bangladesh is now standing at a pavement of entering in several preferential trade arrangements (PTAs) with its South Asian neighbours and with some Southeast Asian countries. The possible arrangements are both regional and bilateral in nature. Also as a member of the World Trade Organisation (WTO), Bangladesh is obliged to follow the rules and regulations of this world trade system. As has been noted in chapter 2 (box 2.2) the WTO, in general, prohibits PTAs under its most favoured nation (MFN) clause; but there is an exception for two main types of PTAs: free trade areas (FTAs) and customs unions (CUs). Bangladesh is attempting to involve in FTAs (regionally or bilaterally). Attempts of Bangladesh to initiate various PTAs have generated questions about the possible impacts of those initiatives on Bangladesh and on other members of those PTAs. Attempts to promote economic, social and cultural cooperation among the South Asian countries date back to 1985 when seven countries of South Asia i.e. Bangladesh, Bhutan, India, Maldives, Nepal, Pakistan and Sri Lanka formed the South Asian Association for Regional Cooperation (SAARC). In 1993, the SAARC member countries66 agreed to form the South Asian Preferential Trade Agreement (SAPTA) in order to promote greater regional trade and economic cooperation. The SAPTA came into effect from December 1995. But SAPTA resulted only in very modest trade liberalisation (Kelegama, 2004). Subsequently, the SAARC member countries planned to transform SAPTA into the South Asian Free Trade Area (SAFTA). However the process of reaching a treaty was very slow and finally the SAFTA treaty was signed at the 12th SAARC Summit in January 2004. SAFTA is scheduled to launch in 2006 with a ten-year period for full-fledged implementation (box 4.1). The motivation behind the creation of SAFTA is to enhance intra-regional trade among the SAARC member countries through removal of tariff and non-tariff barriers. Moreover it is forecasted that removal of these barriers will enable the SAARC member countries to enjoy gains of more regional trade and at the same time to become more competitive in the global market. It has been noticed in chapter 3 that Bangladesh might face a large loss in apparel export to the USA and the EU as a result of the implementation of WTO rules for textile and
66 In this chapter these countries (Bangladesh, Bhutan, India, Maldives, Nepal, Pakistan and Sri Lanka) are mentioned simultaneously as SAARC countries, SAFTA countries or South Asia.
82
apparel. In such a situation there is a possibility that SAFTA will generate a positive impact on the apparel industry of the country. While SAFTA is yet to take effect, Bangladesh is pursuing talks with India, Pakistan and Sri Lanka to initiate bilateral FTAs with each of them. Moreover Bangladesh is in the process of engaging herself in a PTA with some Southeast Asian countries, under the Bay of Bengal Initiative for Multi-Sectoral Technical and Economic Cooperation (BIMSTEC). Four countries – Bangladesh, India, Sri Lanka and Thailand, formed BIMSTEC in 1997. Later Nepal, Myanmar and Bhutan joined this group. In 2004, BIMSTEC member countries agreed to establish the BIMSTEC Free Trade Area Framework Agreement. In addition to trade cooperation, this inter-regional grouping is expected to enhance greater cooperation between the three SAARC member countries and two ASEAN67 member countries (Myanmar and Thailand). Various studies (among others Srinivasan, 1994; Srinivasan and Canonero, 1995; Pigato et al. 1997; Samaratunga, 1999; Bandara and Yu, 2001; Tennagoon, 2001) have expressed diverge views about the possible impacts of SAPTA or SAFTA on the members. While some have expressed optimism about the impacts, others are sceptical. In general most of these studies have anticipated positive impacts of SAFTA. However there is no study so far providing a comparative analysis of the impacts of SAFTA in relation to other bilateral and regional PTA options for Bangladesh. The current study aims to provide a comparative analysis of possible impacts of SAFTA and other alternative PTA options on the Bangladesh economy as well as on the other member and non–member countries. Special attention will be given to the impacts of these possible PTAs on the apparel industry of Bangladesh. The chapter uses data and computable general equilibrium (CGE) model of the Global Trade Analysis Project (GTAP, Hertel, 1997).68 More specifically version 5.1 of the database has been used. A general equilibrium modelling framework is the best possible way to analyse the economy wide and multi country impacts of a policy change. To find out the impacts of a PTA on various industries in the member countries as well as on the non-members, a multi-country CGE model like GTAP is the most appropriate. Therefore this study applies the GTAP model to reach its aims. Some earlier studies (e.g. Bandara and Yu, 2001) also used the GTAP model to analyse the impacts of SAFTA. However earlier studies did not incorporate two important changes in trade scenarios relevant for the SAFTA countries (which were not dealt with in the GTAP database version 5.1). These are i) the FTA between Sri Lanka and India, which is in operation since December 1998 and ii) free entry of products from the least developed countries (LDCs) in Canadia. Moreover other studies assume full labour employment for all countries; where as unemployment
67 Association of Southeast Asian Nations. 68 A brief description of GTAP is provided in appendix 3.A of chapter 3.
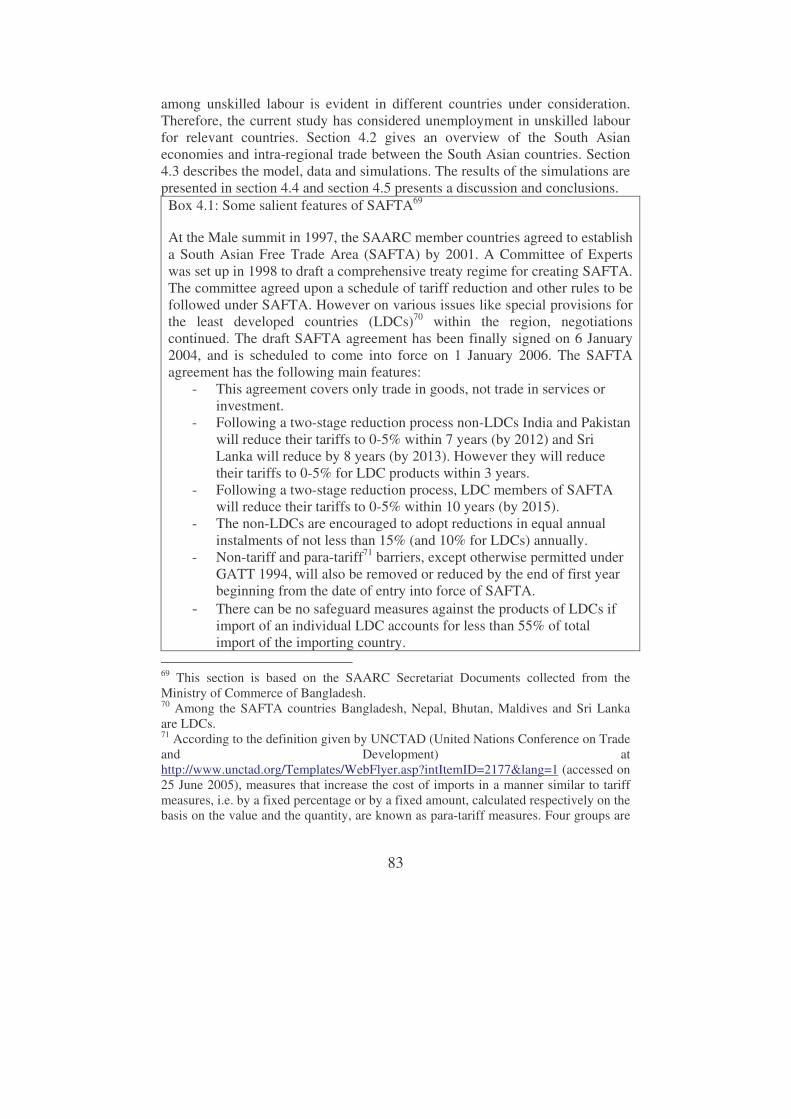
83
among unskilled labour is evident in different countries under consideration. Therefore, the current study has considered unemployment in unskilled labour for relevant countries. Section 4.2 gives an overview of the South Asian economies and intra-regional trade between the South Asian countries. Section 4.3 describes the model, data and simulations. The results of the simulations are presented in section 4.4 and section 4.5 presents a discussion and conclusions. Box 4.1: Some salient features of SAFTA69 At the Male summit in 1997, the SAARC member countries agreed to establish a South Asian Free Trade Area (SAFTA) by 2001. A Committee of Experts was set up in 1998 to draft a comprehensive treaty regime for creating SAFTA. The committee agreed upon a schedule of tariff reduction and other rules to be followed under SAFTA. However on various issues like special provisions for the least developed countries (LDCs)70 within the region, negotiations continued. The draft SAFTA agreement has been finally signed on 6 January 2004, and is scheduled to come into force on 1 January 2006. The SAFTA agreement has the following main features:
- This agreement covers only trade in goods, not trade in services or investment.
- Following a two-stage reduction process non-LDCs India and Pakistan will reduce their tariffs to 0-5% within 7 years (by 2012) and Sri Lanka will reduce by 8 years (by 2013). However they will reduce their tariffs to 0-5% for LDC products within 3 years.
- Following a two-stage reduction process, LDC members of SAFTA will reduce their tariffs to 0-5% within 10 years (by 2015).
- The non-LDCs are encouraged to adopt reductions in equal annual instalments of not less than 15% (and 10% for LDCs) annually.
- Non-tariff and para-tariff71 barriers, except otherwise permitted under GATT 1994, will also be removed or reduced by the end of first year beginning from the date of entry into force of SAFTA.
- There can be no safeguard measures against the products of LDCs if import of an individual LDC accounts for less than 55% of total import of the importing country.
69 This section is based on the SAARC Secretariat Documents collected from the Ministry of Commerce of Bangladesh. 70 Among the SAFTA countries Bangladesh, Nepal, Bhutan, Maldives and Sri Lanka are LDCs. 71 According to the definition given by UNCTAD (United Nations Conference on Trade and Development) at http://www.unctad.org/Templates/WebFlyer.asp?intItemID=2177&lang=1 (accessed on 25 June 2005), measures that increase the cost of imports in a manner similar to tariff measures, i.e. by a fixed percentage or by a fixed amount, calculated respectively on the basis on the value and the quantity, are known as para-tariff measures. Four groups are

84
4.2 Intra-regional trade in South Asia: Perspective of Bangladesh To understand possible impacts of various PTA options on Bangladesh, it is important to understand the existing patterns of intra-regional trade in South Asia. This section will present an overview of the intra-regional trade in South Asia. Moreover trade of the South Asian member countries of BIMSTEC with Thailand and Myanmar is presented at the end of this section. External sector of the South Asian countries For about two decades the South Asian countries have been shifting from a protective trade regime to a liberalised one. Such shifts in trade regime had mainly been emerged as a part of the structural adjustment policy in many countries of the world. The external sector (export and import together) of South Asia is growing day by day. Table 4A.1 presents a comprehensive picture of the economy of some selected South Asian countries. Both in terms of GDP and trade value India is the largest country in South Asia. In all these countries the service sector is dominating in their respective GDPs. The external sector is also important. Share of the external sector (sum of export and import as a percentage of GDP) is around one third of the respective GDPs of the South Asian countries. For Sri Lanka it is as high as 65% of GDP. It is noted that these countries have similarities in their import and export items. Export destinations are also quite similar. The EU and the USA are very important markets for all these countries mainly for their exports. Intra-regional trade Limited intra–regional trade in a PTA generates limited opportunities to gain from such an arrangement. This is a major criticism about the relevance of creating a free trade area in the SAARC region. Table 4.1 compares intra–regional exports of some other regional PTAs. It is observed intra–regional trade in SAFTA is much lower than in other such regional al PTAs. However it is interesting to see that intra–regional export among the countries under the South America Common Market (MERCOSUR) was also much lower before that PTA started operation (1991) and it rose significantly afterwards.
distinguished: customs surcharges; additional charges; internal taxes and charges levied on imports; and decreed customs valuation.

85
Table 4.1: Intra-regional exports in SAFTA compared to other regional PTAs in % of total export Regions 1970 1990 1995 1999 APEC 57.8 68.3 71.9 71.9 EU 59.5 65.9 62.4 62.6 NAFTA 36.0 41.4 46.2 54.6 MERCOSUR 9.4 8.9 20.3 20.5 ASEAN 22.9 19.8 25.4 22.2 SAARC 3.2 3.2 4.4 4.7 Note: APEC - Asia Pacific Economic Cooperation; NAFTA – North American Free Trade Agreement. Source: Mahbub ul Haq Human Development Centre (2002). Figure 4.1 presents the shares of different South Asian countries in intra-regional export and intra-regional import in 2003. It is observed that India is the dominant exporter in this region with a share of 79% of intra-regional export. Bangladesh’s share in the intr-regional export is miniscule, only 2%. However Bangladesh has the largest share in intra-regional import, 36%. The intra-regional import share of Sri Lanka is also high (26%). Figure 4.1: Share of the South Asian countries in intra-regional export and import in 2003
Share of the South Asian countries in intra - regional export (2003)
India 79%
Bangladesh 2%
Pakistan 7%
Sri Lanka 7% Nepal 5%

86
Share of the South Asian countries in intra-regional import (2003)
Bangladesh 36%
IIndia 14% Pakistan 7%
Sri Lanka 26%
Maldives 3%
Nepal 14%
Source: Based on the data of IMF (2005). Most of the South Asian countries have a trade deficit with the rest of the region. Bangladesh has the largest trade deficit among them all ($1499 million in 2004). Table 4A.2 presents the intra-regional trade balances in South Asia. In 2004 only India and Pakistan had a trade surplus with the rest of the region. For Bangladesh, India is the most important trade partner within South Asia. Bangladesh is heavily dependent on India for its import while export to India is much smaller. As a result Bangladesh has a large trade deficit with India. In 2001 the trade deficit of Bangladesh with India was $1.1 billion.72 Import from India comprises a significant share of the country’s total import. Bangladesh’s major imports from India are rice, grains, vegetables, fruits, nuts, fibres, sugar, textile, chemicals, rubber, plastic products and capital-intensive manufacturing. On the other hand Bangladesh’s major export to India is limited to fish, textile, leather and capital-intensive manufacturing. It is often perceived that the huge trade deficit with India has negative impacts on the Bangladesh economy. However a large part of the import comprises of raw materials, mainly for export-oriented industries like apparel. Thus part of the imports from India helps to achieve a positive trade balance with other countries. Moreover the overall trade balance is more important for a country, not the trade balance with a particular country.
72 http://news.bbc.co.uk/1/hi/business/1921500.stm (accessed on 4 June, 2005)
87
Informal trade A significant volume of informal trade (sometimes called illegal trade or border trade) takes place between the South Asian countries. Such trade does not follow the formal trade rules and regulations (Cookson, 2002). It is interesting to note that informal import of Bangladesh from India and informal export from Bangladesh to India are higher than formal import and export levels respectively (Bakht and Sen, 2002). The geographic location of these two countries is playing an important role behind such a large volume of informal trade. Bangladesh is surrounded by India on every side only except the South and the South East corner where lie the Bay of Bengal and Myanmer respectively. A trade deficit is also observed in the informal trade between Bangladesh and India. According to Rahman and Razzaque (2002) the yearly inflow of illegally imported items from India to Bangladesh is about $146 million.73 But the illegal export from Bangladesh to India is $33 million, which is 22.4% of the total illegal import by India. Bangladesh’s informal imports from India mainly include primary products like livestock, fishery, pulses, spices, rice etc. A significant part of Bangladesh's informal exports to India include items imported by Bangladesh from non-SAARC countries. These include synthetic fabrics, spices, video players and recorders, other electronic goods, ball bearings, metal scrap, etc. Nature of trade protection in South Asia Both tariffs and non-tariff barriers are the means of trade protection in South Asia. Trade liberalisation strategies since the mid-1980s have removed many of the earlier prevailing non-tariff barriers in South Asia. Bangladesh has kept wide ranging administrative control over imports, sometimes to the extent of import licensing. Pakistan has removed all its quantitative restrictions (QRs) with the special provision of banning all imports from India except for a positive list of 600 items. This is because of the complex political relation between these two countries. India does not have formal restrictions on export to or import from Pakistan, but some barriers in other forms like procedures of custom clearance, remittances etc. often act as strong restrictions, specially, on imports from Pakistan. Bangladesh also faces some of these barriers (often termed para-tariffs) in India (in terms of standard requirements, complex administrative procedures etc.). Apart from import licensing, other non-tariff barriers prevailing in South Asia include government mandated import
73 According to table 4C.5 the ‘legal export’ of India to Bangladesh is $1040 million, which is 7 times larger than the ‘illegal’ export and contradicts the earlier observation based on Bakht and Sen (2002). This may be because there is a difference in years considered in these two studies and also the areas considered are different.
88
monopolies or state trading enterprises (mainly in India), technical standards and regulations, sanitary and phytosanitary (SPS) rules etc. Tariffs are still playing an important role to protect local industries in South Asia. Sri Lanka was pioneer in this region in reducing tariffs. Starting in the late 1970s, it now has the lowest average tariffs in the region. Other countries in the region substantially reduced their tariffs mainly during the 1990s. According to the World Bank (2005), in 2003 the general maximum tariffs (which apply to most but not all products, as there are products subject to higher tariffs than these generally applied maxima) in the South Asian countries were as follows: India 30%; Pakistan 25%; Bangladesh 32.5%; Sri Lanka 25%; Nepal 25%. These are unweighted averages. However the Bangladesh Economic Review (2003) reports an average import weighted tariff of 12.4% in 2003. Political economy of trade cooperation in South Asia Historical relationships among the South Asian countries and complexities evolved during the process of their independence still play an important influence over relationships among these countries. Trade relationships are heavily influenced by such political relationships. One important reason behind scepticism about meaningful trade cooperation among the South Asian countries is the prevailing political economic conditions here. More precisely the tension between India and Pakistan over various political issues including the dispute over Kashmir, often makes other South Asian nations pessimistic about fruitful realisation of PTAs within the region. In spite of all the rhetoric on economic cooperation in South Asia, as long as Pakistan and India remain locked up in such tense relationship, security issues will dominate over all other issues (Kelegama and Adhikari, 2002). Dominance of India in the region in terms of size, volume of trade, and production competitiveness on a wide range of commodities often extends pessimism regarding the gains for other South Asian members out of SAFTA. This is often because the natural leadership of India limits the bargaining power of others during trade negotiations. Intra-regional trade between BIMSTEC members If the proposed free trade area under BIMSTEC is realised then the five South Asian countries (Bangladesh, India, Sri Lanka, Nepal and Bhutan) will be able to extend their trade relationship with two Southeast Asian countries – Myanmar and Thailand. Table 4A.3 presents existing trade patterns between these countries. It is observed that Thailand is an important import source for all the South Asian countries under BIMSTEC. It is also an important export market for Bangladesh, India and Pakistan. The export and import relation of
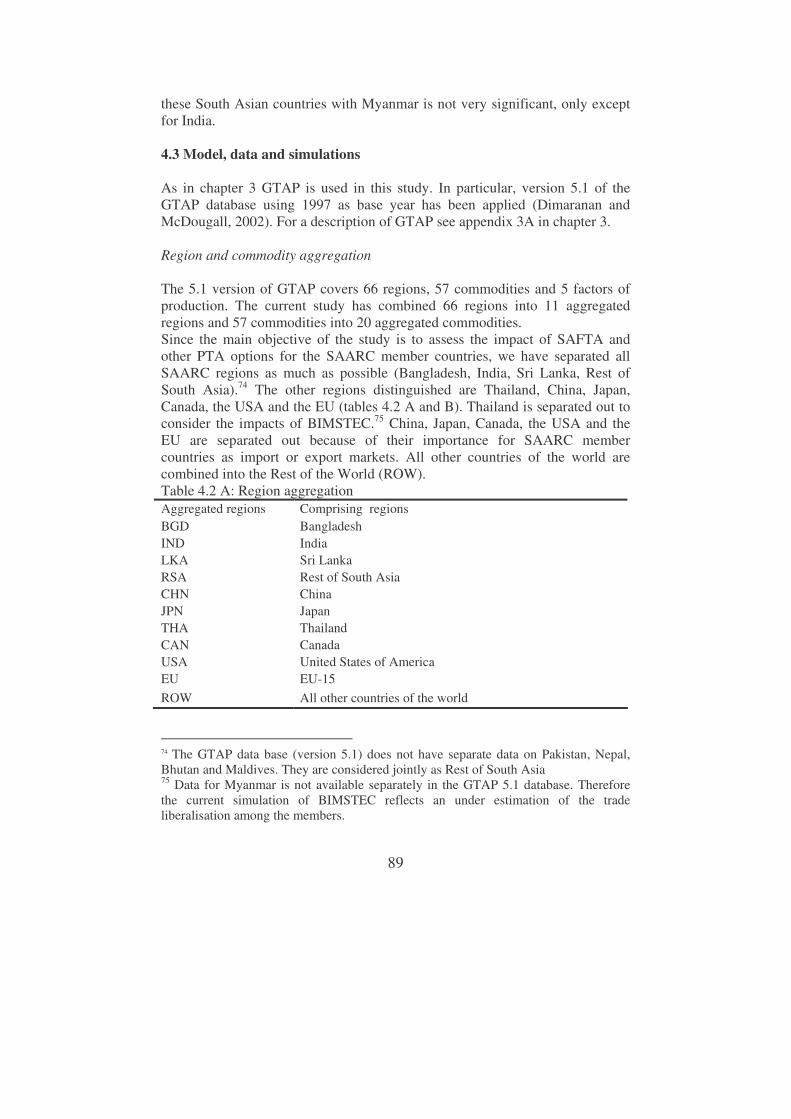
89
these South Asian countries with Myanmar is not very significant, only except for India. 4.3 Model, data and simulations As in chapter 3 GTAP is used in this study. In particular, version 5.1 of the GTAP database using 1997 as base year has been applied (Dimaranan and McDougall, 2002). For a description of GTAP see appendix 3A in chapter 3. Region and commodity aggregation The 5.1 version of GTAP covers 66 regions, 57 commodities and 5 factors of production. The current study has combined 66 regions into 11 aggregated regions and 57 commodities into 20 aggregated commodities. Since the main objective of the study is to assess the impact of SAFTA and other PTA options for the SAARC member countries, we have separated all SAARC regions as much as possible (Bangladesh, India, Sri Lanka, Rest of South Asia).74 The other regions distinguished are Thailand, China, Japan, Canada, the USA and the EU (tables 4.2 A and B). Thailand is separated out to consider the impacts of BIMSTEC.75 China, Japan, Canada, the USA and the EU are separated out because of their importance for SAARC member countries as import or export markets. All other countries of the world are combined into the Rest of the World (ROW). Table 4.2 A: Region aggregation Aggregated regions Comprising regions BGD Bangladesh IND India LKA Sri Lanka RSA Rest of South Asia CHN China JPN Japan THA Thailand CAN Canada USA United States of America EU EU-15 ROW All other countries of the world
74 The GTAP data base (version 5.1) does not have separate data on Pakistan, Nepal, Bhutan and Maldives. They are considered jointly as Rest of South Asia 75 Data for Myanmar is not available separately in the GTAP 5.1 database. Therefore the current simulation of BIMSTEC reflects an under estimation of the trade liberalisation among the members.

90
In this study, 57 commodities are aggregated into 20 commodities (table 4.2). The main strategy for this aggregation is to keep the major traded commodities of the SAARC member countries (both in terms of intra-SAARC trade and trade with rest of the world) separate and aggregate the rest. Table 4.2 B: Commodity Aggregation Aggregated commodities
Comprising commodities
Rice Paddy rice, processed rice Grains Wheat, cereal grains Oil & Oil seeds Oil seeds, vegetable oils and fats Vegetable & fruits Vegetables, fruit, nuts Fibres Plant-based fibres; other crops Raw milk & dairy Raw milk and dairy products Fishing Fishing Sugar Sugar Food products Food products Beverages & tobacco Beverages and tobacco products Other food Sugarcane, sugar beet; domestic animals, animal products,
wool, silk-worm cocoons, meat, meat products Extraction Forestry; coal, oil, gas, minerals Textiles Textiles. Apparel Apparel. Leather Leather products. Chemical & plastic Chemical, rubber, plastic products. Labour intensive manufacturing
Wood and paper products, publishing, metals, metal products.
Capital intensive manufacturing
Petroleum, coal, mineral, vehicles, parts, electronic goods, machineries
Tradable services Construction, trade, transport, communication, financial and business services, recreation and other services
Non tradable services Electricity; gas, water, public administration/ defence/health/education; dwellings
Model closure In the current study, there is a change in the default closure settings of GTAP. In the default setting of GTAP labour is assumed to be fully employed. As in chapter 3 (see section 3.2 for detail), the default closure of GTAP modelling has been changed in the current study. Given the high unemployment among unskilled workers, it is assumed that supply of unskilled labour is perfectly
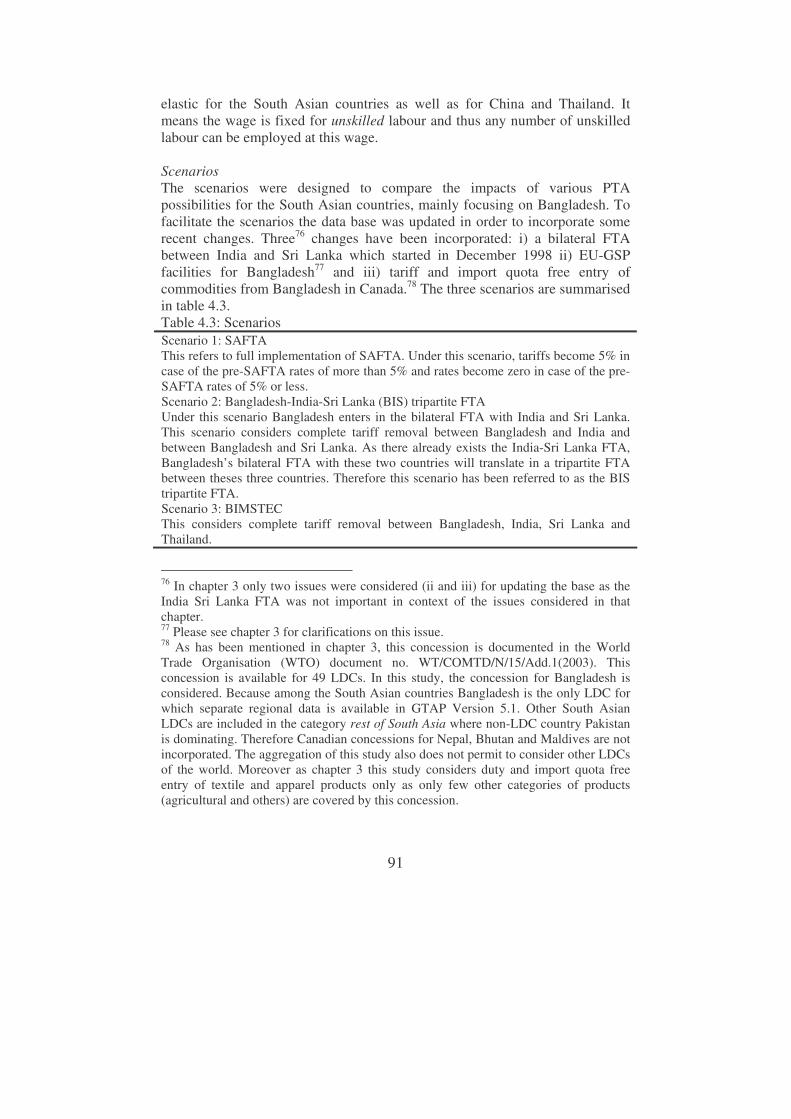
91
elastic for the South Asian countries as well as for China and Thailand. It means the wage is fixed for unskilled labour and thus any number of unskilled labour can be employed at this wage. Scenarios The scenarios were designed to compare the impacts of various PTA possibilities for the South Asian countries, mainly focusing on Bangladesh. To facilitate the scenarios the data base was updated in order to incorporate some recent changes. Three76 changes have been incorporated: i) a bilateral FTA between India and Sri Lanka which started in December 1998 ii) EU-GSP facilities for Bangladesh77 and iii) tariff and import quota free entry of commodities from Bangladesh in Canada.78 The three scenarios are summarised in table 4.3. Table 4.3: Scenarios Scenario 1: SAFTA This refers to full implementation of SAFTA. Under this scenario, tariffs become 5% in case of the pre-SAFTA rates of more than 5% and rates become zero in case of the pre-SAFTA rates of 5% or less. Scenario 2: Bangladesh-India-Sri Lanka (BIS) tripartite FTA Under this scenario Bangladesh enters in the bilateral FTA with India and Sri Lanka. This scenario considers complete tariff removal between Bangladesh and India and between Bangladesh and Sri Lanka. As there already exists the India-Sri Lanka FTA, Bangladesh’s bilateral FTA with these two countries will translate in a tripartite FTA between theses three countries. Therefore this scenario has been referred to as the BIS tripartite FTA. Scenario 3: BIMSTEC This considers complete tariff removal between Bangladesh, India, Sri Lanka and Thailand.
76 In chapter 3 only two issues were considered (ii and iii) for updating the base as the India Sri Lanka FTA was not important in context of the issues considered in that chapter. 77 Please see chapter 3 for clarifications on this issue. 78 As has been mentioned in chapter 3, this concession is documented in the World Trade Organisation (WTO) document no. WT/COMTD/N/15/Add.1(2003). This concession is available for 49 LDCs. In this study, the concession for Bangladesh is considered. Because among the South Asian countries Bangladesh is the only LDC for which separate regional data is available in GTAP Version 5.1. Other South Asian LDCs are included in the category rest of South Asia where non-LDC country Pakistan is dominating. Therefore Canadian concessions for Nepal, Bhutan and Maldives are not incorporated. The aggregation of this study also does not permit to consider other LDCs of the world. Moreover as chapter 3 this study considers duty and import quota free entry of textile and apparel products only as only few other categories of products (agricultural and others) are covered by this concession.

92
4.4 Results The base simulation includes the India-Sri Lanka FTA (Indo-Lanka FTA), EU-GSP facilities and duty and import quota free concessions by Canada. To see whether the FTA between its two neighbours is generating any negative impacts on Bangladesh the effects of only an India-Sri Lanka FTA are analysed. The results of this extra scenario are separated out from the main scenarios and have been presented in appendix 4B. Detail results of the main scenarios (table 4.3) are presented in appendix 4C. A summary of the results of the main scenarios is presented in table 4.4. Results from India-Sri Lanka FTA The simulation of only the Indo–Lanka FTA shows that Bangladesh is facing an aggregate welfare79 loss of $4.3 million due to the FTA between India and Sri- Lanka. Both India and Sri Lanka enjoy a welfare gain. The welfare loss for Bangladesh occurs mainly due to a negative endowment effect and terms of trade effect. This is because the export industry of Bangladesh is losing, as Sri Lanka is better positioned to reap the benefits of the large Indian market. It is observed from table 4B.2 that apparel production in Bangladesh decreases along with output of some other industries. Moreover table 4B.3 shows that trade of apparel increases between India and Sri Lanka. Apparel trade of Bangladesh with India and Sri Lanka either remains the same or decreases slightly which points to the trade diversion impacts of the Indo-Lanka FTA. Bangladesh also faces a 0.01% decline in her real GDP (table 4B.4). Both India and Sri Lanka experience real GDP gains as expected. Results of FTA options for Bangladesh Selected results of the various FTA options of Bangladesh are discussed in this section. It is to be noted here that a bilateral FTA in this study refers to simultaneous and complete withdrawal of all tariffs by both parties80. In reality, FTAs often deviate from this idea of complete withdrawal of tariffs and Bangladesh has already demanded a preferential status from India in case of a FTA with that country81. But no specific modalities have been discussed till now about this bilateral FTA. Therefore this study deals with the ideal case of complete removal of all tariffs between the contracting countries.
79 See appendix 3A of chapter 3. 80 In contrast, in case of SAFTA, specific tariff reduction modalities have already been proposed and simulations related to SAFTA have been performed accordingly (See scenario 1 in table 4.3) 81 The Daily Star, 23rd May, 2003.
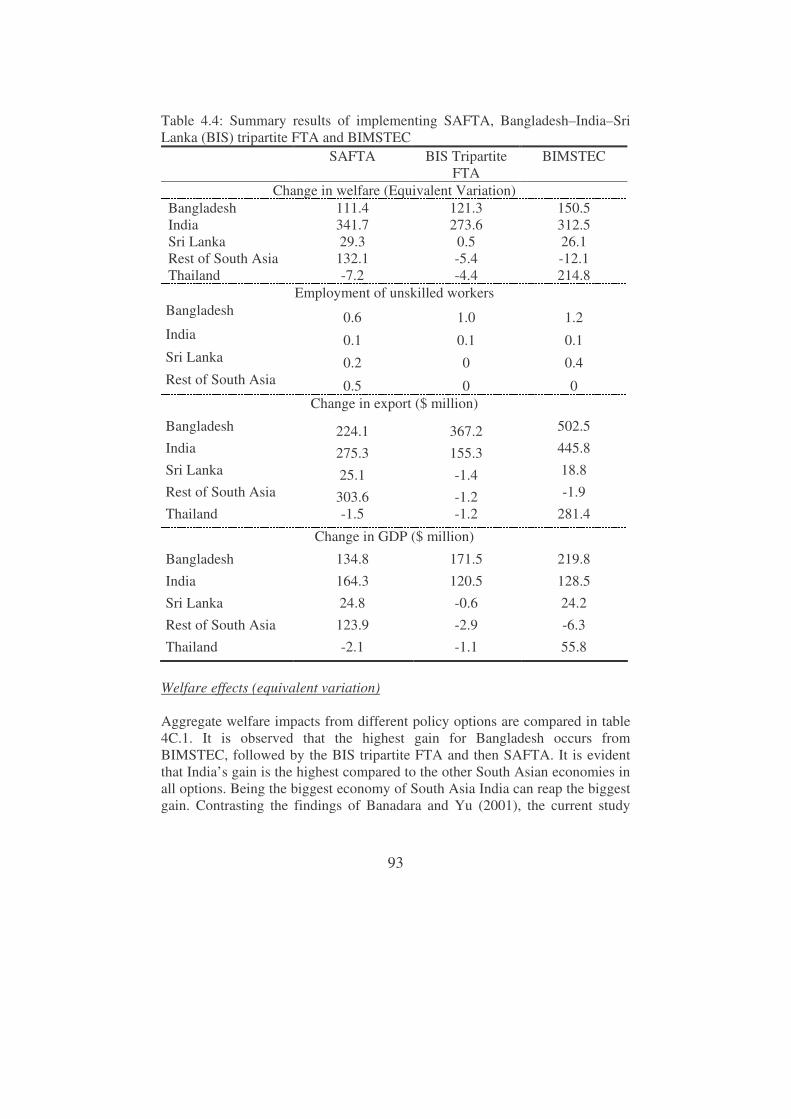
93
Table 4.4: Summary results of implementing SAFTA, Bangladesh–India–Sri Lanka (BIS) tripartite FTA and BIMSTEC
SAFTA BIS Tripartite FTA
BIMSTEC
Change in welfare (Equivalent Variation) Bangladesh 111.4 121.3 150.5 India 341.7 273.6 312.5 Sri Lanka 29.3 0.5 26.1 Rest of South Asia 132.1 -5.4 -12.1 Thailand -7.2 -4.4 214.8
Employment of unskilled workers Bangladesh 0.6 1.0 1.2 India 0.1 0.1 0.1 Sri Lanka 0.2 0 0.4 Rest of South Asia 0.5 0 0
Change in export ($ million)
Bangladesh 224.1 367.2 502.5 India 275.3 155.3 445.8 Sri Lanka 25.1 -1.4 18.8 Rest of South Asia 303.6 -1.2 -1.9 Thailand -1.5 -1.2 281.4
Change in GDP ($ million)
Bangladesh 134.8 171.5 219.8
India 164.3 120.5 128.5 Sri Lanka 24.8 -0.6 24.2 Rest of South Asia 123.9 -2.9 -6.3 Thailand -2.1 -1.1 55.8
Welfare effects (equivalent variation) Aggregate welfare impacts from different policy options are compared in table 4C.1. It is observed that the highest gain for Bangladesh occurs from BIMSTEC, followed by the BIS tripartite FTA and then SAFTA. It is evident that India’s gain is the highest compared to the other South Asian economies in all options. Being the biggest economy of South Asia India can reap the biggest gain. Contrasting the findings of Banadara and Yu (2001), the current study
94
indicates that SAFTA generates positive outcomes for Bangladesh as well as for other SAARC members. Bandara and Yu (2001) get different results possibly due to their assumption of full employment of unskilled labour. In all scenarios gains for the South Asian countries mainly (with a few exceptions) occur from the positive endowment effects (more labour employed) which mainly arise from the higher employment of unskilled workers (tables 4C.2 and 4C.4). Although the overall welfare effect is positive, in every option the terms of trade (TOT) effect on welfare is negative for Bangladesh. Allocative efficiency improves for Bangladesh only in case of SAFTA while in the other two scenarios it decreases. Further inquiry into the sources of allocative efficiency improvements in Bangladesh, it is observed that food products, fibres, sugar and apparel have a positive contribution while textile has a negative contribution (table 4C.3). This may be because the apparel industry is dependent on imported raw materials, a large part of which comes from India and Pakistan and that import is becoming cheaper. But in case of textile, it is shifting from domestic sources of raw materials to imports and also shifting away from its traditional import sources (EU, USA and East Asian countries like Korea) to FTA member countries (possible trade diversion effect). Bilateral trade – trade creation and trade diversion In order to find out the changes in bilateral trade under different scenarios, pre and post simulation bilateral trade volumes are compared. As has been noted in chapter 2, a PTA can result in both trade creation and trade diversion. By becoming a member of a PTA, a country may experience a gain due to trade creation and either a loss or gain due to trade diversion. Trade creation has a positive impact on a country’s welfare as the country can allocate resources more efficiently in production after removal of tariff. It can import commodities from cheaper sources, commodities that had been produced domestically (at a higher cost) before. Trade diversion can result in welfare loss if a PTA shifts imports from low cost non-member sources to higher cost member sources. Trade diversion may lead to a gain in welfare if the PTA shifts import from higher cost non–members to low cost members. Without production cost information for different commodities in different countries, we cannot calculate the trade creation and trade diversion effects from the PTAs under consideration. But we can get an idea about these effects by looking at the pre and post simulation bilateral trade patterns. Pre-simulation bilateral trade is presented in table 4C.5. In case of Bangladesh, the rest of the world is the biggest source of its imports. Bangladesh’s trade with China and India is also quite big. Table 4C.6 presents changes in bilateral trade volume under different scenarios. In all scenarios, Bangladesh’s imports from all respective member countries increase. This is an indication of trade creation. For example Bangladesh’s import from India under the SAFTA increases by $476.9 million.

95
In case of BIS tripartite FTA, it increases even more (by $815.2 million). But this is not true for trade between India and Sri Lanka. For example Sri Lanka’s import from India decreases under all simulations. Also India’s import from Sri Lanka either remains unchanged or decreases in different scenarios. This is because the changes in the base have already opened the bilateral trade between India and Sri Lanka and thus under another FTA the trade between them either remains the same or decreases. It is observed that Bangladesh’s import from the rest of the world decreases by $133.2 million. This is an indication of trade diversion. In addition, its imports from other non-SAFTA countries also decrease. Under the BIS tripartite FTA and BIMSTEC Bangladesh’s imports from the rest of the world decrease in a greater extent - $200 million and $275 million respectively. Table 4C.6 also shows that in most of the cases bilateral export between SAARC countries increases under all scenarios. Greater changes are observed in case of export between Bangladesh and India. Under BIMSTEC bilateral exports from Bangladesh, India and Sri Lanka to Thailand increase. Thailand’s export to these three countries also increases. Welfare impacts of various PTAs are positive for the members, which indicates that even if there are negative effects from trade diversion from the PTAs considered, they were offset by gains in welfare that result from efficiency gains from tariff removal. Unskilled labour employment Table 4C.4 shows that Bangladesh and India experience increases in the employment of unskilled labour under all scenarios. However for Bangladesh, the increase is less than 1% under SAFTA and the BIS tripartite arrangements while it is marginally higher than 1% under BIMSTEC. For Sri Lanka unskilled labour employment increases in case of the SAFTA and BIMSTEC, but not in case of the BIS tripartite FTA. For the rest of South Asia it increases only under SAFTA. It should be noted that even if the percentage changes in unskilled labour employment are small they lead to significant positive endowment effects as shown in table 4C.2. So FTAs can lead to a substantial welfare increase by employing the large pool of unemployed labourers in the region. Changes in GDP, terms of trade and household utility Tables 4C.5 and 4C.6 show that the FTAs considered increase total exports of the member countries. The member countries not only experience an increase in their export but also in real GDP (table 4C.7). Bangladesh’s real GDP gain is highest in case of BIMSTEC and lowest under SAFTA. It is important to know whether welfare and GDP gains are translated into per capita household utility improvement or not. It is observed in table 4C.8 that per capita household

96
utility82 of Bangladesh and India improves in every scenario. For Sri Lanka it increases under SAFTA and BIMSTEC but decreases under BIS tripartite FTA. For the rest of South Asia it improves only in case of SAFTA. Real GDP and utility changes occur although the terms of trade effect (TOT) is negative for Bangladesh in every option (table 4C.9). The TOT increases for India in all cases. For Sri Lanka and the rest of South Asia it increases in case of SAFTA but in other cases it remains unchanged. As a result, a negative TOT effect on welfare for Bangladesh is observed (table 4C.2) while there is positive TOT effect on welfare for India and Sri Lanka. For the rest of South Asia the TOT effect on welfare was positive in case of SAFTA and negative in the other two scenarios. Table 4C.9 shows that the largest decrease in the TOT for Bangladesh occurs in case of BIMSTEC followed by BIS tripartite FTA and SAFTA. Such decreases in TOT can result from three sources – world price effect, export price effect or import price effect. The main source of decrease in the TOT of Bangladesh is export price changes (table 4C.10). Commodity decomposition of the export price effects reveals that export prices of apparel and textile are contributing the most in the decrease of the overall export price and thus contribute most to the TOT decrease of Bangladesh. As apparel is the major export commodity of Bangladesh, its export price decrease is having large impacts on the overall export price and finally on the TOT which is negatively affecting welfare. Textile and apparel industries of Bangladesh Apparel being the main export commodity of Bangladesh is generating large impacts on the welfare of the economy as a whole. Thus it is interesting to look into impacts of different scenarios on apparel and textile as its most important input. Under different scenarios, allocation of resources changes, which results in changes in the production of different commodities (table 4C.12). In all scenarios, production of both apparel and textile are increasing. For both apparel and textile the highest increase occurs under BIMSTEC. Bangladesh’s exports of apparel and textile also increase under all scenarios (table 4C.13). Bangladesh’s export of apparel increases by $116.6 million, $246.3 million and $356.5 million under SAFTA, the BIS tripartite FTA and BIMSTEC respectively. For textile exports the respective figures are $38.1 million, $53.3 million and $59.3 million. 4.5 Discussion and conclusions The aim of this study was to provide a comparative analysis of the impacts of SAFTA and other PTAs options on the Bangladesh economy as well as on the
82 See appendix 3A in chapter 3 for detail on treatment of household utility in GTAP.

97
other SAARC member countries. A multi country computable general equilibrium model (GTAP) has been used to quantify the effects of the different PTA options. The study has considered three scenarios. To facilitate the scenarios the data base was updated in order to incorporate some recent changes. These were i) the FTA between Sri Lanka and India, ii) EU-GSP facilities iii) free entry of LDC products in Canada. Three scenarios were defined – i) full implementation of SAFTA, ii) bilateral FTAs of Bangladesh with India and Sri Lanka and iii) BIMSTEC. As there already prevails a FTA between India and Sri Lanka, the second scenario translates in a tripartite FTA between Bangladesh, India and Sri Lanka. Comparing various results of the three scenarios, it is observed that SAFTA is the best option for all SAARC countries. Under SAFTA, all SAARC countries enjoy an increase in welfare, GDP and household utility. In general, all the FTAs considered increase welfare, real GDP and household utility for the respective members. For Bangladesh, BIMSTEC is the best option in terms of welfare, GDP and household utility. This is because BIMSTEC opens bigger and more developed markets for Bangladesh, especially, Bangladesh gets access to its most important trade partner in the South Asia, India. For Bangladesh, bilateral FTAs with India and Sri Lanka also have positive impacts. However in the current situation when the SAFTA agreement has been signed and modalities for implementation of SAFTA are in process, it is desirable that every member country invests their time and resources in making this successful. If SAFTA is successfully implemented then separate bilateral FTAs between the South Asian countries will not be necessary. Moreover, the region as a whole can enjoy both economic and non-economic benefits through SAFTA. Observing the process of finalising the SAFTA agreement it became clear that the most urgent problem in the SAARC region is a political problem that seems to cut across all other areas (Kelegama and Adhikary, 2002). Specially, the tension between India and Pakistan has slowed down the SAFTA process to a large extent. Successful implementation of SAFTA may actually help to solve non-economic issues like border security, regional peace etc in the region. Political tension between counties ultimately results in economic costs. For example, consumers in Pakistan paid extra costs of $36.3 million, $48.9 million and $33.7 million over the calendar year 1992, 1993 and 1994 respectively because their government was importing 82% to 83% of their tea import requirement from outside the region. Again Pakistan usually imports steel from China at a price, which is twice that of Indian export (cited in Kelegama and Adhikary, 2002). Thus implementation of SAFTA will induce large gains from trade creation. It is also noted from the results that both textile and apparel industries are experiencing an increase in their production and export with the implementation of different FTAs. The modelling tool that has been used in this study is neo-classical. Any trade liberalisation under such a model will usually
98
be welfare increasing. In that sense the result depicting a welfare increase for FTA members is not surprising. Moreover it was not possible to incorporate all realities of the world in the model. However computable general equilibrium modelling frameworks like GTAP are the best possible way to compare impacts of various PTA options on the members of those PTAs and also on non-members. Though the static model used here cannot capture all the impacts of trade liberalisation, it is successful in comparing the impacts of different scenarios. From the results it is observed that many of the welfare gains occur due to increased employment of unskilled labour (endowment effect). While the change in output is not substantial, the total unemployment pool is so large that even a small increase in labour employment results in large aggregate welfare gains. From the analysis it can be concluded that Bangladesh might concentrate on implementation of both SAFTA and BIMSTEC. Finally, to increase gains from SAFTA additional issues have to be solved. These include – removal or minimisation of non-tariff barriers, solving the problem of illegal border trade, settling rules of origin, and expanding the tariff liberalisation span (reducing the number of goods exempted from liberalisation mentioned under the so-called negative or sensitive list).
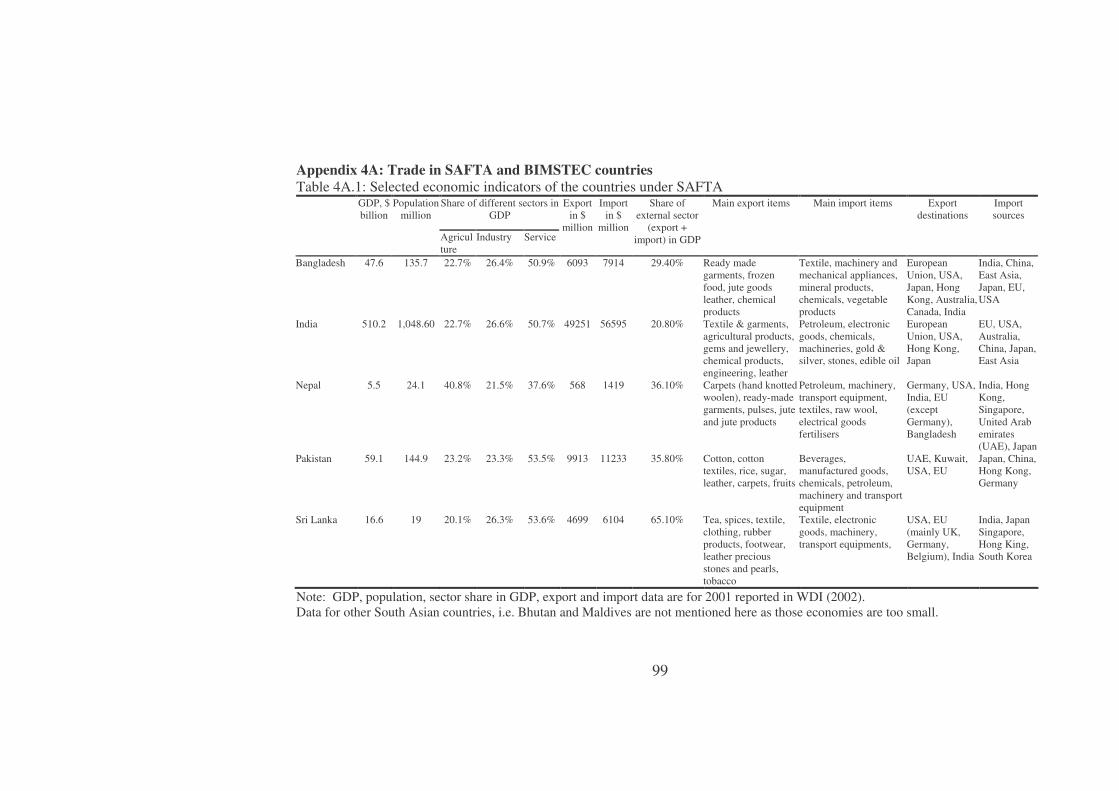
99
Appendix 4A: Trade in SAFTA and BIMSTEC countries Table 4A.1: Selected economic indicators of the countries under SAFTA
Share of different sectors in GDP
GDP, $ billion
Population million
Agriculture
Industry Service
Export in $
million
Import in $
million
Share of external sector
(export + import) in GDP
Main export items Main import items Export destinations
Import sources
Bangladesh 47.6 135.7 22.7% 26.4% 50.9% 6093 7914 29.40% Ready made garments, frozen food, jute goods leather, chemical products
Textile, machinery and mechanical appliances, mineral products, chemicals, vegetable products
European Union, USA, Japan, Hong Kong, Australia, Canada, India
India, China, East Asia, Japan, EU, USA
India 510.2 1,048.60 22.7% 26.6% 50.7% 49251 56595 20.80% Textile & garments, agricultural products, gems and jewellery, chemical products, engineering, leather
Petroleum, electronic goods, chemicals, machineries, gold & silver, stones, edible oil
European Union, USA, Hong Kong, Japan
EU, USA, Australia, China, Japan, East Asia
Nepal 5.5 24.1 40.8% 21.5% 37.6% 568 1419 36.10% Carpets (hand knotted woolen), ready-made garments, pulses, jute and jute products
Petroleum, machinery, transport equipment, textiles, raw wool, electrical goods fertilisers
Germany, USA, India, EU (except Germany), Bangladesh
India, Hong Kong, Singapore, United Arab emirates (UAE), Japan
Pakistan 59.1 144.9 23.2% 23.3% 53.5% 9913 11233 35.80% Cotton, cotton textiles, rice, sugar, leather, carpets, fruits
Beverages, manufactured goods, chemicals, petroleum, machinery and transport equipment
UAE, Kuwait, USA, EU
Japan, China, Hong Kong, Germany
Sri Lanka 16.6 19 20.1% 26.3% 53.6% 4699 6104 65.10% Tea, spices, textile, clothing, rubber products, footwear, leather precious stones and pearls, tobacco
Textile, electronic goods, machinery, transport equipments,
USA, EU (mainly UK, Germany, Belgium), India
India, Japan Singapore, Hong King, South Korea
Note: GDP, population, sector share in GDP, export and import data are for 2001 reported in WDI (2002). Data for other South Asian countries, i.e. Bhutan and Maldives are not mentioned here as those economies are too small.
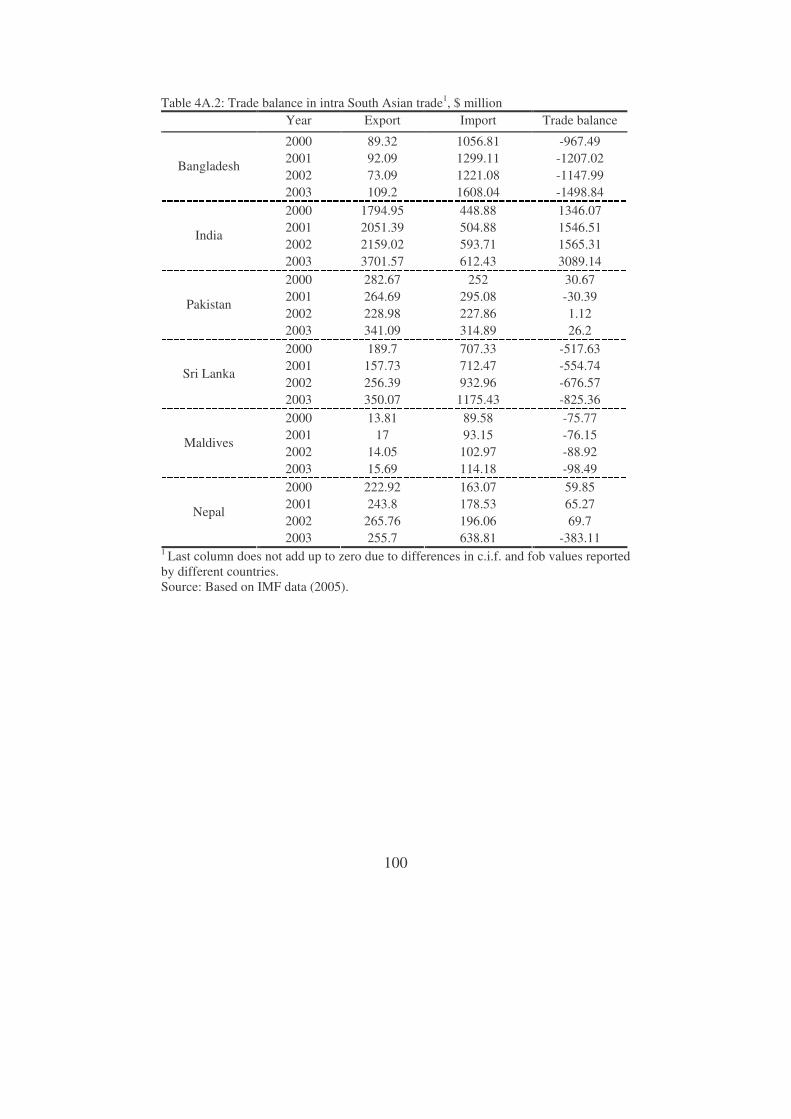
100
Table 4A.2: Trade balance in intra South Asian trade1, $ million
Year Export Import Trade balance
2000 89.32 1056.81 -967.49 2001 92.09 1299.11 -1207.02 2002 73.09 1221.08 -1147.99
Bangladesh
2003 109.2 1608.04 -1498.84 2000 1794.95 448.88 1346.07 2001 2051.39 504.88 1546.51 2002 2159.02 593.71 1565.31
India
2003 3701.57 612.43 3089.14 2000 282.67 252 30.67 2001 264.69 295.08 -30.39 2002 228.98 227.86 1.12
Pakistan
2003 341.09 314.89 26.2 2000 189.7 707.33 -517.63 2001 157.73 712.47 -554.74 2002 256.39 932.96 -676.57
Sri Lanka
2003 350.07 1175.43 -825.36 2000 13.81 89.58 -75.77 2001 17 93.15 -76.15 2002 14.05 102.97 -88.92
Maldives
2003 15.69 114.18 -98.49 2000 222.92 163.07 59.85 2001 243.8 178.53 65.27 2002 265.76 196.06 69.7
Nepal
2003 255.7 638.81 -383.11 1 Last column does not add up to zero due to differences in c.i.f. and fob values reported by different countries. Source: Based on IMF data (2005).

101
Table 4A.3: Trade balance in intra-BIMSTEC trade in 2000/03, $ million Export Import Trade balance Countries Year
Thailand Myanmar Thailand Myan
mar Thailand Myanmar
2000 37.2 0.7 188.4 22.0 -151.2 -21.3 2001 16.7 0.7 178.7 19.7 -162.0 -19.0 2002 11.1 1.0 163.3 23.8 -152.2 -22.8
Bangladesh
2003 9.5 2.4 176.6 33.2 -167.1 -30.8
2000 510.0 48.1 335.4 179.2 174.6 -131.1 2001 611.7 53.1 530.1 197.1 81.6 -144.0 2002 705.0 57.6 454.5 213.9 250.5 -156.3
India
2003 798.4 85.4 551.5 390.7 246.9 -305.3
2000 79.4 0.4 168.5 1.2 -89.2 -0.8 2001 36.9 0.6 147.4 1.3 -110.5 -0.7 2002 14.2 0.3 145.7 1.2 -131.6 -0.9
Sri Lanka
2003 11.5 0.2 145.9 2.3 -134.4 -2.1
2000 61.1 3.7 198.2 20.3 -137.1 -16.5 2001 53.2 3.3 174.6 17.5 -121.4 -14.2 2002 67.2 7.8 209.5 15.1 -142.3 -7.3
Pakistan
2003 69.4 5.3 213.8 9.2 -144.4 -3.9
2000 0.5 n.a. 31.9 n.a. -31.4 n.a. 2001 0.7 n.a. 33.0 n.a. -32.4 n.a. 2002 0.3 n.a. 24.1 n.a. -23.7 n.a.
Nepal
2003 1.2 n.a. 30.8 n.a. -29.6 n.a.
Source: Based on IMF data (2005).
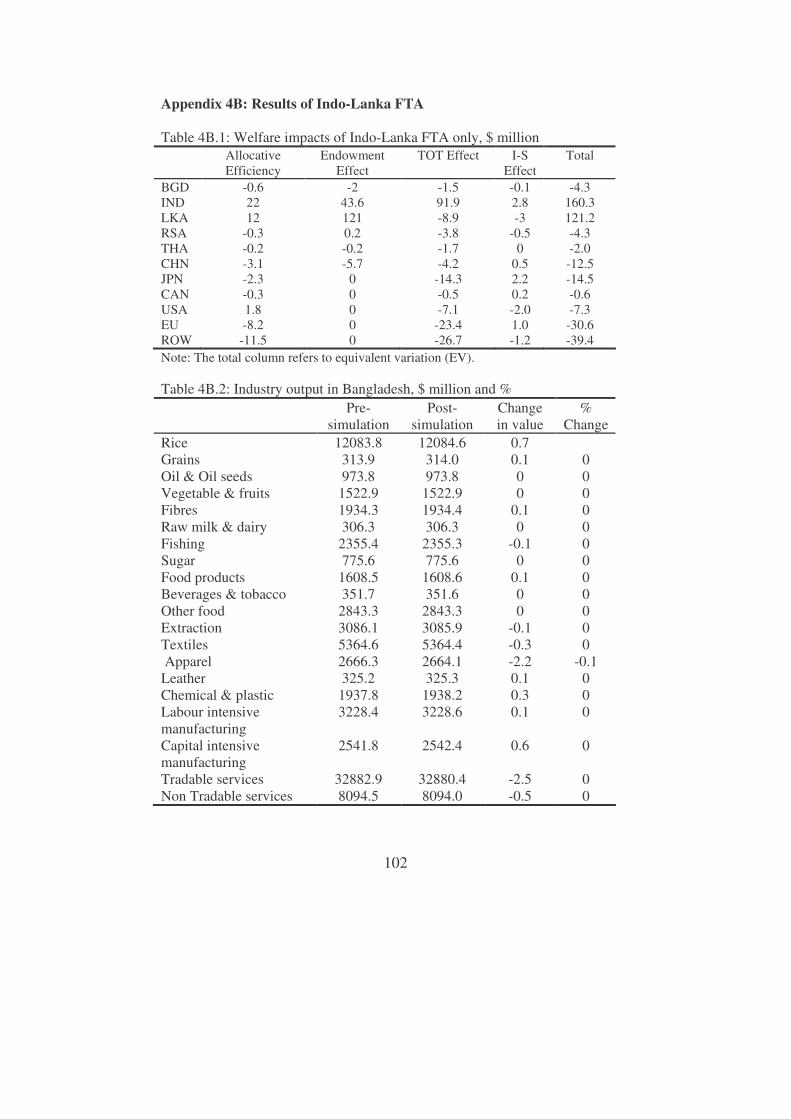
102
Appendix 4B: Results of Indo-Lanka FTA Table 4B.1: Welfare impacts of Indo-Lanka FTA only, $ million Allocative
Efficiency Endowment
Effect TOT Effect I-S
Effect Total
BGD -0.6 -2 -1.5 -0.1 -4.3 IND 22 43.6 91.9 2.8 160.3 LKA 12 121 -8.9 -3 121.2 RSA -0.3 0.2 -3.8 -0.5 -4.3 THA -0.2 -0.2 -1.7 0 -2.0 CHN -3.1 -5.7 -4.2 0.5 -12.5 JPN -2.3 0 -14.3 2.2 -14.5 CAN -0.3 0 -0.5 0.2 -0.6 USA 1.8 0 -7.1 -2.0 -7.3 EU -8.2 0 -23.4 1.0 -30.6 ROW -11.5 0 -26.7 -1.2 -39.4 Note: The total column refers to equivalent variation (EV). Table 4B.2: Industry output in Bangladesh, $ million and % Pre-
simulation Post-
simulation Change in value
% Change
Rice 12083.8 12084.6 0.7 Grains 313.9 314.0 0.1 0 Oil & Oil seeds 973.8 973.8 0 0 Vegetable & fruits 1522.9 1522.9 0 0 Fibres 1934.3 1934.4 0.1 0 Raw milk & dairy 306.3 306.3 0 0 Fishing 2355.4 2355.3 -0.1 0 Sugar 775.6 775.6 0 0 Food products 1608.5 1608.6 0.1 0 Beverages & tobacco 351.7 351.6 0 0 Other food 2843.3 2843.3 0 0 Extraction 3086.1 3085.9 -0.1 0 Textiles 5364.6 5364.4 -0.3 0 Apparel 2666.3 2664.1 -2.2 -0.1 Leather 325.2 325.3 0.1 0 Chemical & plastic 1937.8 1938.2 0.3 0 Labour intensive manufacturing
3228.4 3228.6 0.1 0
Capital intensive manufacturing
2541.8 2542.4 0.6 0
Tradable services 32882.9 32880.4 -2.5 0 Non Tradable services 8094.5 8094.0 -0.5 0
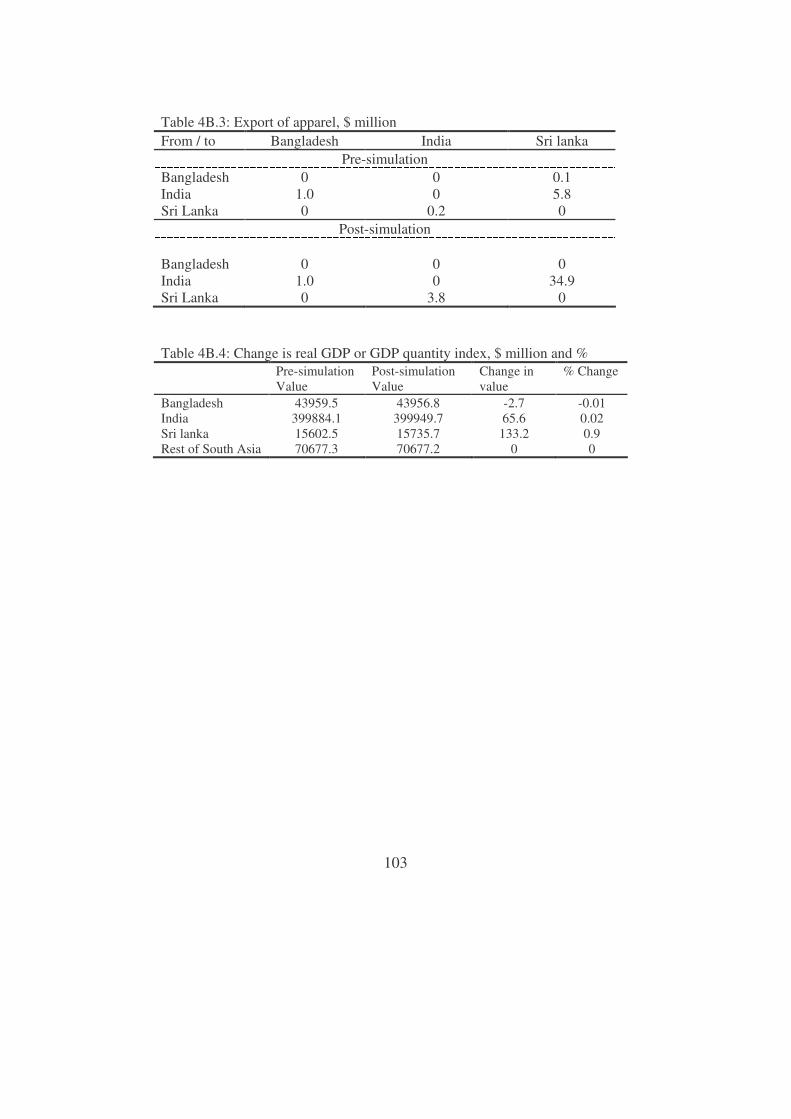
103
Table 4B.3: Export of apparel, $ million From / to Bangladesh India Sri lanka
Pre-simulation Bangladesh 0 0 0.1 India 1.0 0 5.8 Sri Lanka 0 0.2 0
Post-simulation
Bangladesh 0 0 0 India 1.0 0 34.9 Sri Lanka 0 3.8 0 Table 4B.4: Change is real GDP or GDP quantity index, $ million and % Pre-simulation
Value Post-simulation Value
Change in value
% Change
Bangladesh 43959.5 43956.8 -2.7 -0.01 India 399884.1 399949.7 65.6 0.02 Sri lanka 15602.5 15735.7 133.2 0.9 Rest of South Asia 70677.3 70677.2 0 0
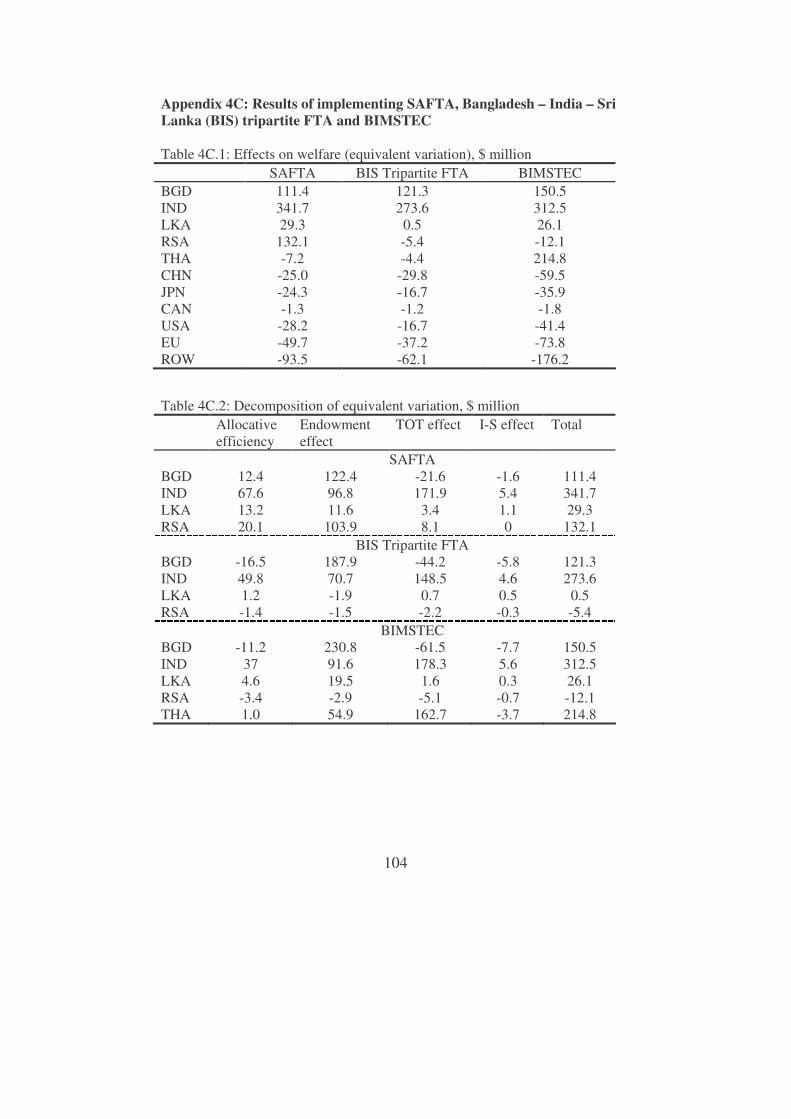
104
Appendix 4C: Results of implementing SAFTA, Bangladesh – India – Sri Lanka (BIS) tripartite FTA and BIMSTEC Table 4C.1: Effects on welfare (equivalent variation), $ million SAFTA BIS Tripartite FTA BIMSTEC BGD 111.4 121.3 150.5 IND 341.7 273.6 312.5 LKA 29.3 0.5 26.1 RSA 132.1 -5.4 -12.1 THA -7.2 -4.4 214.8 CHN -25.0 -29.8 -59.5 JPN -24.3 -16.7 -35.9 CAN -1.3 -1.2 -1.8 USA -28.2 -16.7 -41.4 EU -49.7 -37.2 -73.8 ROW -93.5 -62.1 -176.2
Table 4C.2: Decomposition of equivalent variation, $ million Allocative
efficiency Endowment effect
TOT effect I-S effect Total
SAFTA BGD 12.4 122.4 -21.6 -1.6 111.4 IND 67.6 96.8 171.9 5.4 341.7 LKA 13.2 11.6 3.4 1.1 29.3 RSA 20.1 103.9 8.1 0 132.1 BIS Tripartite FTA BGD -16.5 187.9 -44.2 -5.8 121.3 IND 49.8 70.7 148.5 4.6 273.6 LKA 1.2 -1.9 0.7 0.5 0.5 RSA -1.4 -1.5 -2.2 -0.3 -5.4 BIMSTEC BGD -11.2 230.8 -61.5 -7.7 150.5 IND 37 91.6 178.3 5.6 312.5 LKA 4.6 19.5 1.6 0.3 26.1 RSA -3.4 -2.9 -5.1 -0.7 -12.1 THA 1.0 54.9 162.7 -3.7 214.8
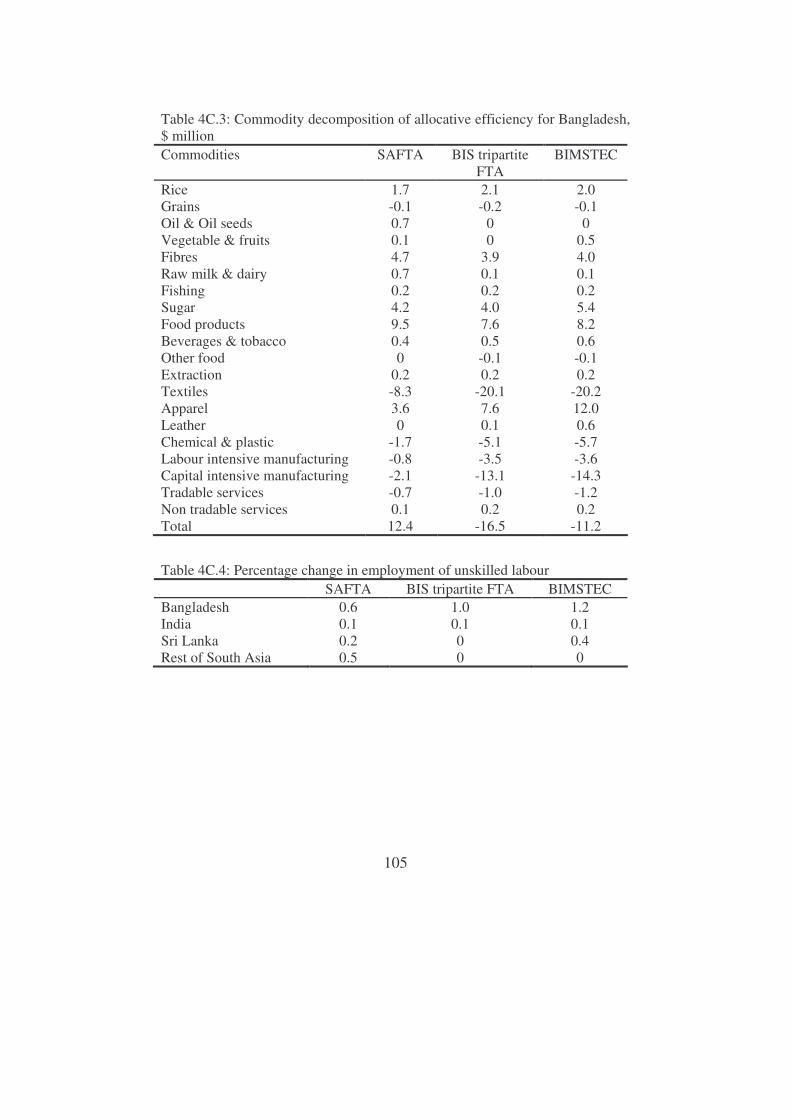
105
Table 4C.3: Commodity decomposition of allocative efficiency for Bangladesh, $ million Commodities SAFTA BIS tripartite
FTA BIMSTEC
Rice 1.7 2.1 2.0 Grains -0.1 -0.2 -0.1 Oil & Oil seeds 0.7 0 0 Vegetable & fruits 0.1 0 0.5 Fibres 4.7 3.9 4.0 Raw milk & dairy 0.7 0.1 0.1 Fishing 0.2 0.2 0.2 Sugar 4.2 4.0 5.4 Food products 9.5 7.6 8.2 Beverages & tobacco 0.4 0.5 0.6 Other food 0 -0.1 -0.1 Extraction 0.2 0.2 0.2 Textiles -8.3 -20.1 -20.2 Apparel 3.6 7.6 12.0 Leather 0 0.1 0.6 Chemical & plastic -1.7 -5.1 -5.7 Labour intensive manufacturing -0.8 -3.5 -3.6 Capital intensive manufacturing -2.1 -13.1 -14.3 Tradable services -0.7 -1.0 -1.2 Non tradable services 0.1 0.2 0.2 Total 12.4 -16.5 -11.2
Table 4C.4: Percentage change in employment of unskilled labour SAFTA BIS tripartite FTA BIMSTEC Bangladesh 0.6 1.0 1.2 India 0.1 0.1 0.1 Sri Lanka 0.2 0 0.4 Rest of South Asia 0.5 0 0

106
Table 4C.5: Pre-simulation bilateral trade, $ million From/ to
BGD IND LKA RSA THA CHN JPN CAN USA EU ROW
BGD 0 25.1 1.6 31.0 9.3 46.5 111.9 381.8 1143.2 4186.5 501.0 IND 1039.7 1.4 946.7 330.9 606.8 1181.4 2857.1 701.0 8204.3 12798.7 15594.1 LKA 15.4 94.4 0 38.5 36.3 28.8 321.7 73.9 1707.4 1607.4 747.3 RSA 142.8 172.2 65.1 8.5 59.1 622.2 682.5 202.8 2078.7 3615.9 3239.1 THA 173.4 373.2 109.4 188.1 0.1 2723.5 10338.0 1283.8 14382.1 15375.7 25473.0 CHN 1223.7 1387.3 349.4 740.1 2294.3 1.7 40193.8 3795.8 59021.9 48999.9 77952.0 JPN 511.0 2473.4 421.4 945.9 14889.4 41780.8 16.9 9032.4 125212.1 92183.7 194952.7 CAN 81.7 616.7 51.5 133.7 654.5 2406.6 9786.2 15.5 167595.7 22858.4 26706.4 USA 560.0 4791.4 302.1 1708.5 9183.3 24264.3 86210.5 135127.7 88.9 232934.7 357533.0 EU 1109.0 14523.1 1205.4 2996.5 12441.6 34161.4 85328.2 30395.9 221967.1 1324383.5 635362.9 ROW 3427.2 22557.8 1952.6 6313.8 25761.7 89369.5 160394.8 30868.4 380788.2 538490.4 617094.1
Table 4C.6: Changes in post-simulation bilateral trade compared to pre-simulation bilateral trade i) SAFTA, $ million From / to BGD IND LKA RSA THA CHN JPN CAN USA EU ROW BGD 0 52.8 2.3 40.8 0 0.1 0.4 9.8 19.9 95.8 2.1 IND 476.9 0 -32.0 570.5 -10.0 -18.9 -49.2 -12.5 -152.4 -235.9 -261.4 LKA 10.2 -1.5 0 32.2 -0.4 -0.3 -3.8 -0.3 6.5 -7.1 -10.6 RSA 46.6 227.1 65.3 3.5 -0.3 -1.6 -2.9 -0.8 -6.6 -12.8 -14.1 THA -9.8 -1.6 -0.2 -10.6 0 0.4 2.9 0.3 4.6 4.6 7.9 CHN -40.1 0.2 -3.3 -25.0 0.4 0 8.6 0.5 14.8 11.3 22.9 JPN -23.7 11.4 1.1 -14.1 1.4 -0.7 0 1.1 19.1 12.1 20.5 CAN -2.3 3.6 0.2 -0.5 0 -0.2 0.2 0 3.0 0.3 -0.1 USA -15.0 21.1 1.0 -8.7 0.2 -1.7 0.8 2.1 0 9.5 9.8 EU -49.3 81.9 2.4 -42.4 -0.4 -3.2 -1.5 0.6 8.7 34.6 7.8 ROW -133.2 89.5 -0.7 -145.5 1.8 0.1 14.8 1.9 40.5 50.2 57.2

107
ii) BIS Tripartite FTA, $ million
From / to BGD IND LKA RSA THA CHN JPN CAN USA EU ROW BGD 0 78.0 3.4 0.4 0.1 0.9 1.5 20.9 45.6 208.3 8.1 IND 815.2 0 -11.2 -4.5 -8.4 -15.4 -40.7 -11.2 -132.7 -209.2 -226.6 LKA 17.0 0 0 -0.3 -0.1 -0.1 -1.3 -0.4 -6.5 -6.7 -2.9 RSA -7.8 0.8 0.2 0 0 0.2 0.4 -0.1 1.4 1.0 2.5 THA -14.2 1.4 0.2 0.1 0 0.1 1.7 0 2.8 1.9 4.9 CHN -65.7 6.3 -0.1 0.2 0.4 0 8.3 -0.3 14.1 4.8 20.6 JPN -37.1 13.2 0.9 0 1.1 -2.3 0 0.8 15.0 7.7 15.4 CAN -3.0 3.5 0.1 0 0 -0.2 0.3 0 5.0 0.3 0.5 USA -22.1 26.4 0.4 -0.5 0.2 -2.2 0.1 -0.6 0 1.5 6.5 EU -71.1 79.7 2.4 -0.1 0 -3.1 0.2 0.3 10.2 4.4 19.9 ROW -200.3 115.6 3.2 -0.3 1.2 -5.0 8.4 -1.3 23.4 -5.8 35.6 iii) BIMSTEC, $ million From / to BGD IND LKA RSA THA CHN JPN CAN USA EU ROW BGD 0 75.8 3.3 0.4 18.6 1.1 1.9 30 64.7 296.2 10.5 IND 765.9 0 -32.4 -5.8 469.6 -19.8 -51.1 -13 -152.7 -239.9 -275.1 LKA 16.2 -2.6 0 -0.7 15.7 -0.4 -4.1 -0.3 10.6 -5.9 -9.7 RSA -10.8 -2.7 -0.7 0 -1.6 0.5 1 0 3.3 3.6 5.5 THA 325 660.8 145 -1.9 0 -28.9 -114.6 -13.9 -187 -192.4 -310.9 CHN -98.4 -15.2 -8.6 0.3 -6.4 0 23.1 0 33.8 11.1 35.9 JPN -50.6 -7.4 -8 -0.3 32 -5.1 0 0.9 24.3 7.7 23.3 CAN -3.3 2.3 -0.1 -0.1 0.7 -0.3 1.2 0 11.7 0.2 -0.2 USA -26.6 -6.5 -1.2 -1.1 -0.7 -2.3 17.1 4.3 0 9.3 26.8 EU -93.3 -15.6 -16.5 -0.8 27.9 -3 14.8 2.3 33.1 26 62.6 ROW -275 -4.8 -23.2 -1 -44.4 1.6 47.8 2.1 83.7 37.4 124.5

108
Table 4C.7: Changes in real GDP, $ million Pre simulation value Post simulation
value Change in value
SAFTA BGD 50937.7 51072.5 134.8 IND 401099.3 401263.7 164.3 LKA 15664.9 15689.7 24.8 RSA 70648.1 70772.0 123.9 THA 157757.0 157754.9 -2.1 CHN 854612.0 854599.0 -13.0 JPN 4254353.0 4254349.0 -4.0 CAN 630861.3 630859.8 -1.6 USA 7943297.0 7943295.0 -2.5 EU 7954564.0 7954549.0 -15.5 ROW 6647948.0 6647924.0 -24.0 BIS tripartite FTA BGD 50937.7 51109.2 171.5 IND 401099.3 401219.8 120.5 LKA 15664.9 15664.3 -0.6 RSA 70648.1 70645.2 -2.9 THA 157757.0 157755.8 -1.1 CHN 854612.0 854593.1 -18.9 JPN 4254353.0 4254350.0 -2.5 CAN 630861.3 630858.8 -2.5 USA 7943297.0 7943296.0 -1.0 EU 7954564.0 7954542.0 -22.5 ROW 6647948.0 6647930.0 -18.0 BIMSTEC BGD 50937.7 51157.5 219.8 IND 401099.3 401227.8 128.5 LKA 15664.9 15689.1 24.2 RSA 70648.1 70641.8 -6.3 THA 157757.0 157812.8 55.8 CHN 854612.0 854576.5 -35.5 JPN 4254353.0 4254346.0 -6.5 CAN 630861.3 630857.8 -3.5 USA 7943297.0 7943296.0 -1.0 EU 7954564.0 7954529.0 -35.5 ROW 6647948.0 6647912.0 -36.0 Note: Changes in GDP in include both price and quantity changes. Here the real GDP changes are arising out of only quantity changes.

109
Table 4C.8: Percentage changes in per capita household utility SAFTA BIS tripartite FTA BIMSTEC BGD 0.2 0.3 0.3 IND 0.1 0.1 0.1 LKA 0.2 0 0.2 RSA 0.2 0 0 THA 0 0 0.2 Note: Per capita household utility remains unchanged for other regions. Table 4C.9: Percentage changes in terms of trade SAFTA BIS tripartite FTA BIMSTEC
BGD -0.3 -0.6 -0.9 IND 0.4 0.3 0.4 LKA 0.1 0 0 RSA 0.1 0 0 THA 0 0 0.2 Note: terms of trade remain unchanged for other regions. Table 4C.10: Sources of terms of trade change in Bangladesh, % SAFTA BIS tripartite
FTA BIMSTEC
World price effect 0 0 0 Export price effect -0.3 -0.6 -0.8 Import price effect 0 0 -0.1 Total -0.3 -0.6 -0.9 Table 4C.11: Commodity disaggregation of export price effect for Bangladesh, % Commodities SAFTA BIS tripartite
FTA BIMSTEC
Textiles -0.1 -0.1 -0.1 Apparel -0.2 -0.4 -0.6 Others 0 -0.1 -0.1 Total -0.3 -0.6 -0.8
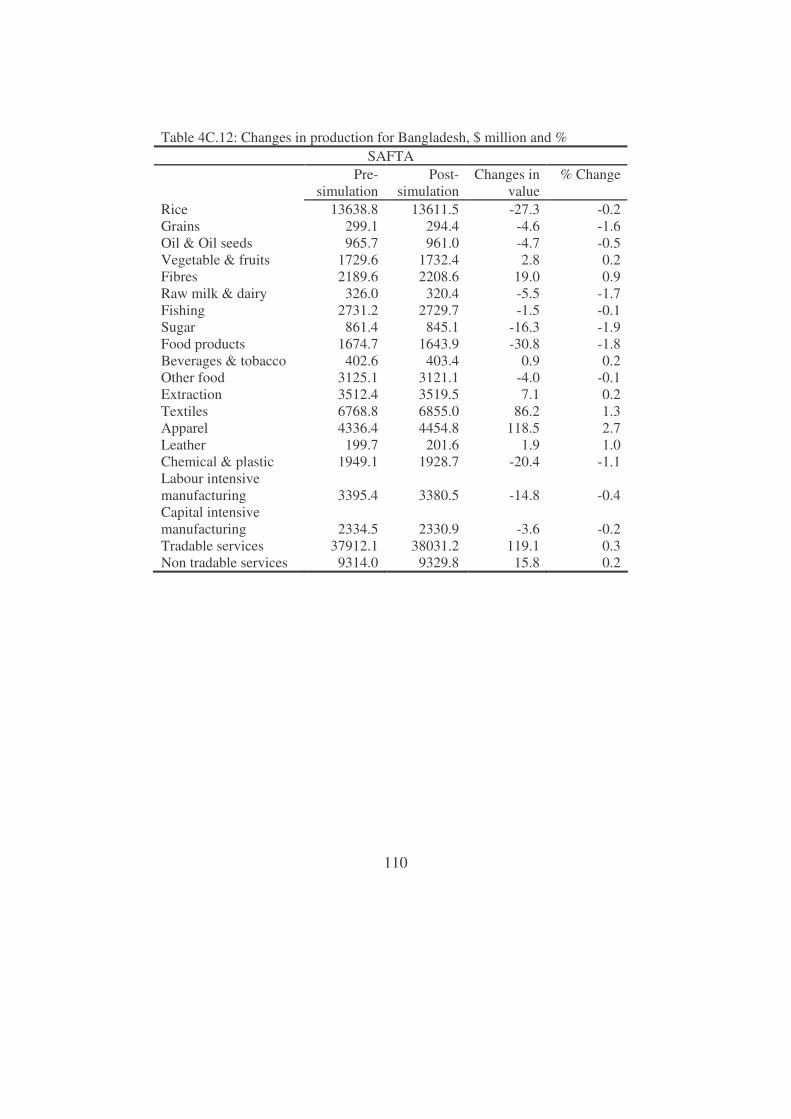
110
Table 4C.12: Changes in production for Bangladesh, $ million and %
SAFTA Pre-
simulation Post-
simulation Changes in
value % Change
Rice 13638.8 13611.5 -27.3 -0.2 Grains 299.1 294.4 -4.6 -1.6 Oil & Oil seeds 965.7 961.0 -4.7 -0.5 Vegetable & fruits 1729.6 1732.4 2.8 0.2 Fibres 2189.6 2208.6 19.0 0.9 Raw milk & dairy 326.0 320.4 -5.5 -1.7 Fishing 2731.2 2729.7 -1.5 -0.1 Sugar 861.4 845.1 -16.3 -1.9 Food products 1674.7 1643.9 -30.8 -1.8 Beverages & tobacco 402.6 403.4 0.9 0.2 Other food 3125.1 3121.1 -4.0 -0.1 Extraction 3512.4 3519.5 7.1 0.2 Textiles 6768.8 6855.0 86.2 1.3 Apparel 4336.4 4454.8 118.5 2.7 Leather 199.7 201.6 1.9 1.0 Chemical & plastic 1949.1 1928.7 -20.4 -1.1 Labour intensive manufacturing 3395.4 3380.5 -14.8 -0.4 Capital intensive manufacturing 2334.5 2330.9 -3.6 -0.2 Tradable services 37912.1 38031.2 119.1 0.3 Non tradable services 9314.0 9329.8 15.8 0.2

111
Table 4C.12 (Continued): Changes in production for Bangladesh, $ million and %
BIS Tripartite FTA Pre-
simulation Post-
simulation Changes in value
% Change
Rice 13638.8 13586.9 -51.9 -0.4 Grains 299.1 295.7 -3.4 -1.1 Oil & Oil seeds 965.7 961.6 -4.2 -0.4 Vegetable & fruits 1729.6 1734 4.5 0.3 Fibres 2189.6 2190.1 0.6 0 Raw milk & dairy 326 320.6 -5.4 -1.6 Fishing 2731.2 2731.6 0.4 0 Sugar 861.4 842.3 -19 -2.2 Food products 1674.7 1647.3 -27.4 -1.6 Beverages & tobacco 402.6 403.8 1.2 0.3 Other food 3125.1 3120.7 -4.4 -0.1 Extraction 3512.4 3518 5.6 0.2 Textiles 6768.8 6927 158.2 2.3 Apparel 4336.4 4586 249.6 5.8 Leather 199.7 204.5 4.7 2.4 Chemical & plastic products 1949.1 1921.7 -27.5 -1.4 Labour intensive manufacturing 3395.4 3376.9 -18.4 -0.5 Capital intensive manufacturing 2334.5 2330 -4.5 -0.2 Tradable services 37912.1 38080.6 168.5 0.4 Non tradable services 9314 9333.9 19.9 0.2

112
Table 4C.12 (Cont.): Changes in production for Bangladesh, $ million and % BIMSTEC
Pre-simulation
Post-simulation
Changes in value
% Change
Rice 13638.8 13588.3 -50.5 -0.4 Grains 299.1 297 -2 -0.7 Oil & Oil seeds 965.7 961.5 -4.2 -0.4 Vegetable & fruits 1729.6 1731.9 2.3 0.1 Fibres 2189.6 2193.4 3.8 0.2 Raw milk & dairy 326 320.8 -5.2 -1.6 Fishing 2731.2 2736.6 5.4 0.2 Sugar 861.4 835.4 -25.9 -3.0 Food products 1674.7 1656.8 -17.9 -1.1 Beverages & tobacco 402.6 403.8 1.3 0.3 Other food 3125.1 3115.8 -9.3 -0.3 Extraction 3512.4 3518 5.6 0.2 Textiles 6768.8 6944.4 175.5 2.6 Apparel 4336.4 4676.8 340.4 7.8 Leather 199.7 197.9 -1.8 -0.9 Chemical & plastic products 1949.1 1917.5 -31.7 -1.6 Labour intensive manufacturing 3395.4 3367.9 -27.4 -0.8 Capital intensive manufacturing 2334.5 2306.6 -27.9 -1.2 Tradable services 37912.1 38117.9 205.8 0.5 Non tradable services 9314 9336.9 22.9 0.2 Table 4C.13: Changes in export of textile and apparel from Bangladesh, $ million SAFTA BIS tripartite FTA BIMSTEC
Textile Apparel Textile Apparel Textile Apparel IND 13.6 0 19.4 0 17.4 0 LKA 1.9 0.1 2.8 0.2 2.7 0.2 RSA 8.7 1.7 0 0 0 0 THA 0 0 0 0 0.4 0.1 CHN 0 0.1 0.1 0.1 0.1 0.2 JPN 0.1 0.3 0.2 0.6 0.3 0.9 CAN 0.4 9.4 0.9 20 1.1 28.9 USA 1.2 19.2 2.6 41.5 3.3 60.1 EU 10.8 84.8 24.1 181.7 30.1 263.1 ROW 1.4 1 3.2 2.1 4.1 3.1 Total 38.1 116.6 53.3 246.3 59.3 356.5
113
Chapter 5 Globalisation and the workers of the apparel industry of Bangladesh: a closer look into the workers’ rights
5.1 Introduction Workers’ rights encompass rights of persons both as human beings and as workers. According to the 1948 declaration of the United Nations83, human rights are basic natural rights, which are inalienable and belong to all humans. Such rights are necessary for freedom and for maintenance of a reasonable quality of life. Workers’ rights include these human rights and at the same time some additional rights, which are necessary to ensure a safe, secured and dignified work life. Moreover, there are some provisions, which are not inevitable for such a work life but presence of those facilitates make it possible to combine work life with family responsibilities. All these rights of workers have received different degrees of attention in relevant international and national laws. In the era of globalisation, two different forces are extending opposite impacts on the rights of workers. On the one hand the pressure of global competition induces entrepreneurs84 to lower product price as far as possible, inducing them to cut the ‘real’ wage of the workers, which, in most cases, means violation of workers’ rights in some forms. On the other hand, unwillingness of the developed country markets to accept goods produced without adequate protection of worker’s rights compels the entrepreneurs to take measures to protect workers’ rights, which often translate into higher cost of production. As a result of such conflicting natures of motivation behind addressing workers’ rights, countries differ in addressing them. The apparel industry has been successful in converting Bangladesh into one of the few developing countries that exports manufactured goods as the prime export.85 Apparel export has brought Bangladesh, with a very low level of development, into direct contact with the most developed countries as consumers and with other developing countries through market competition. As a result, this is an industry where globalisation has visible impact on workers’ rights. Moreover the dominance of female workers in this industry makes the gender dimension of workers’ rights strongly evident, i.e. this industry reveals the importance of covering those issues under workers’ rights, which help to combine work life with reproductive or family responsibilities dominantly undertaken by females.
83 General Assembly resolution 217 A (III) of the United Nations, 10 December 1948. 84 In this chapter the words ‘entrepreneur’, ‘employer’ and ‘producer’ are used simultaneously. 85 For details on the apparel industry see chapter 2.

114
This chapter aims to study the workers’ rights situation in the Bangladesh’s apparel industry and impacts of globalisation on addressing workers’ rights. Section 5.2 presents the data and methodology and section 5.3 presents the regulatory framework prevailing in Bangladesh to protect workers’ rights. Section 5.4 describes the workers’ right situation in the apparel industry of Bangladesh. Section 5.5 discusses how globalisation is affecting workers’ rights. Section 5.6 explains how rights of the workers’ can be ensured in a competitive world and finally section 5.7 provides a discussion and conclusions. 5.2 Methodology and data This chapter is mainly based on the information collected for a study under the project titled ‘Mobilising for worker accountability in Bangladesh’, a joint project between the Bangladesh Institute of Development Studies (BIDS) and the Institute of Development Studies (IDS), UK.86 Under this project detailed information on issues related to workers’ rights were collected for one year between late 2003 – late 2004. The data collection procedures included literature surveys and interviewing various stakeholders (19 apparel workers, some of them being trade union leaders, of different apparel factories and 3 entrepreneurs / managers). Moreover the study interviewed government officials (officials of the Department of Labour Ministry of Labour and Manpower, Bangladesh), lawyers, officials of Bangladesh Garment Manufacturers and Exporters Association (BGMEA) and 2 Non-Government Organisations (NGOs) working for workers’ rights. The main objectives of the interviews were to understand the process of awareness building overtime among workers regarding their rights; how the nature of struggle for rights has changed overtime; and thus to understand the accountability mechanism to ensure workers’ rights. As issues related to workers’ rights are very sensitive in Bangladesh, it was difficult to find entrepreneurs and workers who are willing to talk. This is because extensive evidences of violating workers’ rights in the apparel industry have been identified in different studies (discussed in section 5.4) and the entrepreneurs are not willing to talk about their own factory. In case of the workers, they fear to lose their job by talking about violation of their rights (discussed in section 5.4). Therefore entrepreneurs and workers were selected through direct personal connections of interviewers or in some cases they were randomly selected after forming an initial potential group who might be willing to talk. There was no
86 As a member of the research team, I personally participated in many of the interviews taken under this project. Thanks to Ms. Simeen Mahmud (project director), Senior Research Fellow, BIDS, for permitting me to use the information collected under this project for this chapter. Also thanks to the IDS project authority in this connection.

115
alternative way but to proceed like this to retrieve detail information fulfilling the research objectives of the study mentioned above. Entrepreneurs were chosen three different types of factories – entrepreneurs from the export processing zone (EPZ) where rights are perceived to be addressed relatively well (Kabeer and Mahmud, 2004), from ‘good’ factories outside the EPZ and from ‘bad’ factories outside the EPZ.87 Finally one entrepreneur from each category was interviewed. The criteria to select the workers to be interviewed were i) working in apparel factories for at least 2 years, so that they are concerned about various workers’ rights, know the nature of violation of rights in their respective factories and in other factories and are aware of the nature of the struggle for rights and ii) workers actively involved in various struggles to ensure workers’ rights. 19 workers (out of the workers willing to talk) met the criteria. Some of these workers (4 out of 19) were chosen from an area (BSCIC, Narayanganj) where several factories were situated so that even remaining in one factory workers were aware of the situation in other factories. A list of the interviewed workers is presented in Appendix 5C. In-depth interviews with the entrepreneurs and workers were unstructured in nature. But the interviews were focused to fulfil the objectives mentioned above.88 To fulfil the aims of the current chapter, some selected information from these interviews will be used. Moreover to provide a picture of the regulatory framework regarding workers’ rights in Bangladesh, this chapter has reviewed rights of workers in manufacturing covered by international and national regulations89. To analyse the existing labour legislation and its implementation in the apparel industry of Bangladesh, this chapter follows some parts of the above-mentioned study.90 5.3 Workers’ rights: the regulatory framework
87 Good factories are considered to be the ones where workers’ rights are addressed and bad factories are the ones where these rights are not addressed properly. In selecting such factories, prior knowledge of the interviewers regarding different factories was used. 88 Entrepreneurs were asked to give information on various facilities (e.g. health, child care etc) given to the workers, whether there is any change in those facilities overtime, if so then what the reasons were behind those changes etc. The workers were asked to give a detailed history of her/his work-life, whether they are aware of their workers’ rights, how they became aware, what the nature of struggles for their rights was etc. 89 In this chapter, the words ‘legislation’ and ‘law’ are also used simultaneously with the word ‘regulation’. 90 An earlier version of this part of the chapter has been submitted for publication as a research report of Bangladesh Institute of Development Studies (BIDS) and authors for that submitted paper are Nazneen Ahmed and Simeen Mahmud.

116
Conceptual approach In the current world the issue of workers’ rights is largely guided by the concept of ‘decent work’ defined by the International Labour Organisation (ILO).91 The basic concept of ‘decent work’ refers to productive and remunerative activities taking place under the conditions of ‘freedom, equity security and human dignity’. Thus ‘decent work’ calls for certain standards for work and the social environment in which employment takes place.92 Though the ILO opts to implement the ‘decent work’ strategy for both formal and informal workers, its main tools to implement this strategy, i.e. the ILO conventions (discussed further in the next sub-section) are providing a regulatory framework mainly for formal employment. Moreover the notion of ‘decent work’ does not explicitly considers the ‘reproductive economy’ (for example unpaid domestic work and childcare), which is addressed by the gendered approach of workers’ rights. The gendered approach of workers’ rights argues for incorporating the ‘reproductive economy’ in analyses of economic activities (Barrientos et al., 2003). This ‘reproductive economy’ is closely linked (mostly inseparable) to the market-based activities and in most of the societies, activities in the ‘reproductive economy’ are undertaken by women (Elson, 1999; Whitehead, 2001, cited in Barrientos et al., 2003). Thus in most societies males are more likely to be engaged in formal permanent employment, while females are more likely to be engaged in informal employment and the females are moving on and off between paid and reproductive activities (Barrientos et al., 2003). Even if the females are in formal employment, they have to fulfil their responsibilities of reproductive life. On the basis of the concept of a gendered economy, Barrientos et al. (2003) has provided a ‘gender pyramid’ which indicates that economic activities can be distinguished at different levels, such as formal paid employment, informal paid employment and (usually) unpaid reproductive work. It is noted that in absence of gender sensitivity of formal employment, female workers move between informal and reproductive activities. However if regulations protecting various workers’ rights are gender sensitive then they can facilitate combining formal work and reproductive 91 ILO (1999) and ILO (2001). 92 Anker et al. (2002), as cited in Godfrey (2003), have noted six dimensions of ‘decent work’: i) opportunities for everyone to find work, including self-employment, family work, and wage employment in both formal and informal sectors; ii) freedom from forced and bonded labour and from slavery and unacceptable forms of child labour; iii) remunerative work providing adequate incomes and ensuring competitiveness; iv) absence of discrimination in access to and at work; v) security at work in terms of health, pensions and livelihoods; and vi) dignity at work including workers’ freedom to join organisations which represent their interests and to participate in decision making related to working conditions.
117
activities. Therefore, regulations protecting workers’ rights can be of following types – regulations protecting fundamental rights both as a human being and as a worker, regulations related to formal conditions of employment93 (work contract, wage rate etc.) and regulations which facilitate work life and at the same time help to combine reproductive responsibilities with paid work (i.e. child care facilities, transport, housing facilities etc.). The gender pyramid in Barrientos et al. (2003) mentions two broad types of regulations – formal conditions of employment and benefits related to employment. However the current study has separated out regulations for fundamental rights mentioned in the core conventions of ILO. The idea behind this is that these regulations protecting fundamental rights are the base for other formal rights and also rights people have as a human being. Thus they influence both formal and informal employment. The next section will look into the nature of the existing national and international laws prevailing in the manufacturing sector of Bangladesh. International and national labour regulations in the manufacturing sector94 ILO is the prime body formulating international regulations on labour rights. These regulations, known either as ILO Conventions or ILO Recommendations, are the tools used to help nations to improve the working conditions in their country. Conventions are international treaties, which are binding on the countries which ratify them voluntarily. Recommendations are non-binding guidelines for national policy and practice. They are not international treaties. These may encompass a particular subject or clarify the provisions in the conventions. Both conventions and recommendations are intended to have a concrete impact on working conditions and practices in every country of the world. Together, they are referred to as the ILO International Labour Standards (Cairola and Chiarabini, 1998). Starting from 1919 there are 185 conventions and 195 recommendations formulated till 2004.95 Through ratification of the ILO Conventions, countries recognise these universally accepted rules as legally binding. In addition to implementing ratified ILO Conventions, every country may have its own (industry specific)
93 From now on these will be referred to as informal rights. 94 These regulations are directed to formal paid employment. Decent work intends to ensure rights of worker also in the informal sector, however it is difficult to enforce these regulations beyond the formal economy. However the international and national regulations include (informal) provisions, which facilitate combining paid formal work with unpaid reproductive responsibilities. 95 ILOLEX database of ILO (http://www.ilo.org/ilolex/english/index), (accessed on 27 March, 2005).

118
legislation. Therefore labour legislation of a country does not only include ILO conventions but also country specific legislation. Bangladesh has ratified 33 ILO conventions till 2005 (appendix 5A).96 In addition, Bangladesh has extra labour legislation to protect the rights of workers (appendix 5B). Out of them are the Factories Act 1965 and the Factories Rules 1979. They cover regulations to address various workers’ rights in manufacturing, prescribe the working conditions and suggest necessary facilities for workers in a factory. Apart from regulations of international laws (of ILO) and the domestic labour regulations, various importing markets set certain codes of conduct to be followed by the exporting factories. Different international and national labour regulations are directed to protect the above mentioned fundamental, formal and informal of rights of workers. The fundamental rights of workers, as covered by the core ILO labour standards, have been addressed by national labour laws and regulations relating to formal employment. The core conventions of ILO cover fundamental rights in the work place. These are: freedom of association and the right to collective bargaining (Conventions 87 and 98), freedom from forced labour (Conventions 29 and 105), freedom from discrimination (Conventions 100 and 111) and freedom of children from child labour (Conventions 138 and 182). Bangladesh has ratified all of them except Convention 138. Formal rights of workers are the very basic rules of formal employment. Such rights ensure job security, regular wage payment, appropriate working conditions etc. These regulations protect the rights of workers to get letters of appointment, weekly rest and occasional leave / holiday, for reasonable working hours, to receive a minimum wage for a particular work97, regular payment of wage etc. It is interesting and unfortunate that no such law prevails in Bangladesh. The Factory Act 1965 has only specified that every factory shall maintain a register of workers, and workers should be supplied with identity cards and attendance tickets, but not an appointment letter. In addition to formal rights, labour laws also provide for some informal rights. These regulations include the rights of workers to work in safe and healthy factories and to have medical facilities at the work place, maternity leave98, rest room facilities, child care facilities at work and various fringe benefits like medical allowance, transportation allowance,
96 ILOLEX database of ILO (http://www.ilo.org/ilolex/english/newratframeE.htm), (accessed on 27 March, 2005). 97 In 1992, the Minimum Wage Commission of Bangladesh fixed the minimum wage for the public sector at Tk950 per month and for the private sector at Tk899 per month. The Minimum Wage Ordinance of 1994 has fixed the minimum wage for unskilled labour at Tk930 per month, and for skilled at TK2300 (Paul-Majumder, 2003a). (The exchange rate was Tk40 per $ in 1993-94, Economic Trends, 2005). 98 In Bangladesh there is no law for paternity leave though it is practiced in many countries.

119
accommodation allowance, food/lunch allowance, education allowance, bonus, pension, group insurance etc. A closer look to the laws prevailing in Bangladesh to protect the workers’ rights in the manufacturing sector reveals that they cover only to a certain extent fundamental, formal and informal workers’ rights. For example there is no law to provide a formal contract to a worker, there is no mechanism to adjust the minimum wage to inflation and other macro economic changes. It was found in this study that a new labour law is in the process of implementation since 1994 and there has been no change in the legal minimum wage rate in the last 10 years.99 Even given the limitations the existing laws would ensure various rights of workers if they would be implemented properly. Laws are also gender sensitive as they call for a maternity leave with full salary, arrangement of child care facilities in the factory etc. The next section will look into the status of workers’ rights in the apparel industry. It is to be noted here that female workers dominate the apparel industry of Bangladesh and therefore regulations to protect workers’ rights in this industry need be gender sensitive so that women not only can have a dignified work life but are also able to combine their formal work life with their reproductive responsibilities. 5.4 The workers’ rights situation in the apparel industry Chapter 2 has described the history of emergence and growth of the apparel industry in Bangladesh. It is noted there that this industry is employing nearly 1.9 million workers, 90% of whom are females. It is evident from different studies that workers’ rights are violated extensively in the apparel industry of Bangladesh (e.g. Zohir and Paul Majumder, 1996; Paul Majumder and Begum, 2000; Paul-Majumder 1998; Zohir, 2001, Kabeer and Mahmud, 2004). There exists a huge gap between existing labour laws and actual implementation of those laws. However factories differ in terms of the level of addressing workers’ rights. For example, Kabeer and Mahmud (2004) have noted that workers’ rights are well addressed in the factories in the EPZ. Their study has also found that workers’ rights in some factories outside the EPZ are also addressed reasonably well. Data used in this chapter also found that there are good factories even outside the EPZ. The current situation with respect to the various workers’ rights in the apparel industry is discussed below. This discussion is based on the outcomes of the interviews and also on the findings of other studies. Table 5.2 presents various opinions of workers regarding different workers’ rights.
99 Revealed during the interview of Mr. Kazi Aminul Islam, Director, Department of Labour and Mr. Kabir Ahmed Choudhury, Deputy Director, Department of Labour on 27 July, 2004.

120
Situation of fundamental rights In case of workers’ fundamental rights of freedom of association and to form collective bargaining unions, the apparel industry remains a backwater. It is observed from table 5.1 that only 1.2% of total apparel workers are unionised. Given the near absence of any association or union it is hardly surprising that less than one fifth of apparel workers know about the labour code or have heard about their fundamental rights as workers (Kabeer and Mahmud, 2004). The situation in the EPZs is special because of a government ban on the formation of unions to encourage direct foreign investment (recently a limited nature of trade unionism has been allowed in the EPZs). Table 5.1: Trade unionism in the apparel industry100 Number of unions in the apparel industry 128 Number of union members 21219 Total apparel workers 1800000 % of apparel worker unionised 1.2 Source: Collected from the registration record book of the Department of Labour, Ministry of Labour and Manpower, Bangladesh. Case studies suggest that the workers fear to lose their job by joining trade unions as the producers don’t prefer them to join in unions (table 5.2). The producers think that many trade unions are politically oriented and use the workers for their own political benefit. But the workers perceive that producers don’t want them to join in traded unions because they (producer) don’t want them (workers) to be aware of their (workers’) rights. Wage discrimination is reported by some female workers in this study, where they have pointed out that an experienced female worker is paid less than her counterpart male worker. But the study by Paul-Majumder (2003a) suggests that at the worker level average female wages are always lower than average male wages, but male workers also have slightly more years of schooling. Gender discrimination may be difficult to establish, but employers’ preference leads to a concentration of female workers into the lowest paid jobs, while the highest paid workers (supervisors, quality controllers or cutters) are predominantly males.
100 Data given are for 2004 except the total number of apparel workers, which is for 2002.

121
Despite legal restrictions, use of child labour101 had been a common phenomenon in apparel manufacturing. In the 1990s about 13% of apparel factory workers were child workers and the majority were girls (Zohir and Paul-Majumder, 1996). Later, pressure from the international community resulted in the elimination of child labour from the apparel industry. In order to eliminate the worst forms of child labour through global trade negotiations, the Child Labour Deterrence Act (often termed as the Harkin’s Bill) was presented in the USA Senate in 1992. With the fear of losing market, apparel producers and exporters, represented by the BGMEA (Bangladesh Garment Manufacturers and Exporters Association), signed a memorandum of understanding (MOU) with the ILO and UNICEF in July 1995, which aimed to eliminate child labour in the apparel export industry. Under the MOU schools and a stipend program were established for child workers and by November 1998 10,546 child workers below the age of 14 were retrenched and enrolled in schools. As a result child labour use is rare now in the apparel factories of Bangladesh. None of the workers interviewed complained about the existence of child labour. Situation of formal rights In most of the apparel factories the workers do not receive a letter of appointment or employment contract. In some factories (in the good factories) they receive an attendance card, an ID card and a gate pass. An attendance book with workers’ daily signature is also maintained. Extremely unscrupulous employers are even known to issue attendance cards that do not have the name of the factory so that these cannot be used to claim due salary in case the worker is fired. All the workers under this study have reported that they don’t get any appointment card, while some of them get an attendance card. Kabeer and Mahmud (2004) found in their study that female workers in the EPZ factories are far more likely to receive a contract letter (64% of surveyed workers) compared to a negligible proportion (1%) in other apparel factories. Absence of an appointment letter makes it easy for employers to discharge the workers when they wish to do so. One important and common complaint of the workers was that there is no job security. The employer can discharge them for small reasons. Some of the reasons mentioned by the workers for losing job
101 For Harkin’s Bill and other information provided in this section on the elimination of child labour from Bangladesh apparel please see BGMEA newsletter, special issue, July 4, 1996; Online information is provided by the Bureau of International Labour affairs, USA Department of Labour at http://www.dol.gov/ilab/media/reports/iclp/sweat/bangladesh.htm (accessed on 9 April, 2005)
122
were asking for due salaries and overtime payment, asking for more salaries, asking for pregnancy leave, short absence from work etc. One of the important violations of rights mentioned by all the interviewed workers was long working hours. It was mentioned that workers are usually compelled to work for 12 hours and overtime payment is calculated after 12 hours instead of 8 hours. During the shipment time workers have to work longer. Paul-Majumdar (2003b) found that only 12% of the surveyed workers worked normal 8 hours on the day prior to the interview, while the remaining 88% did overtime work. A large number of workers work seven days a week without a weekly holiday and 28 to 30 days a month. Especially during peak periods many workers are compelled to work through the night, although they are shown in the attendance book as working only 2 hours overtime (per working day) as permitted under existing the law. A common scenario prevailing in most of the apparel factories is that in many factories wages are not paid regularly. Sometimes the delay is 2 months and then again only part of the wage is paid. In many factories workers are required to keep 1 month’s wages with the management as ‘deposit money’. This is to ensure that the workers do not leave the factory without any prior notice. In many cases workers don’t get this money back. Overtime payment in the apparel industry is also noted to be very irregular. Moreover the overtime is not calculated according to the law, i.e. double the basic wage. The low level of education of the workers bar them to understand which part of their wage is basic and which part is the fringe benefit. The management takes the advantage of the illiteracy of the workers and considers 50% of the monthly wage as the basic wage. Thus the overtime payment becomes half of the payments they are entitled to.
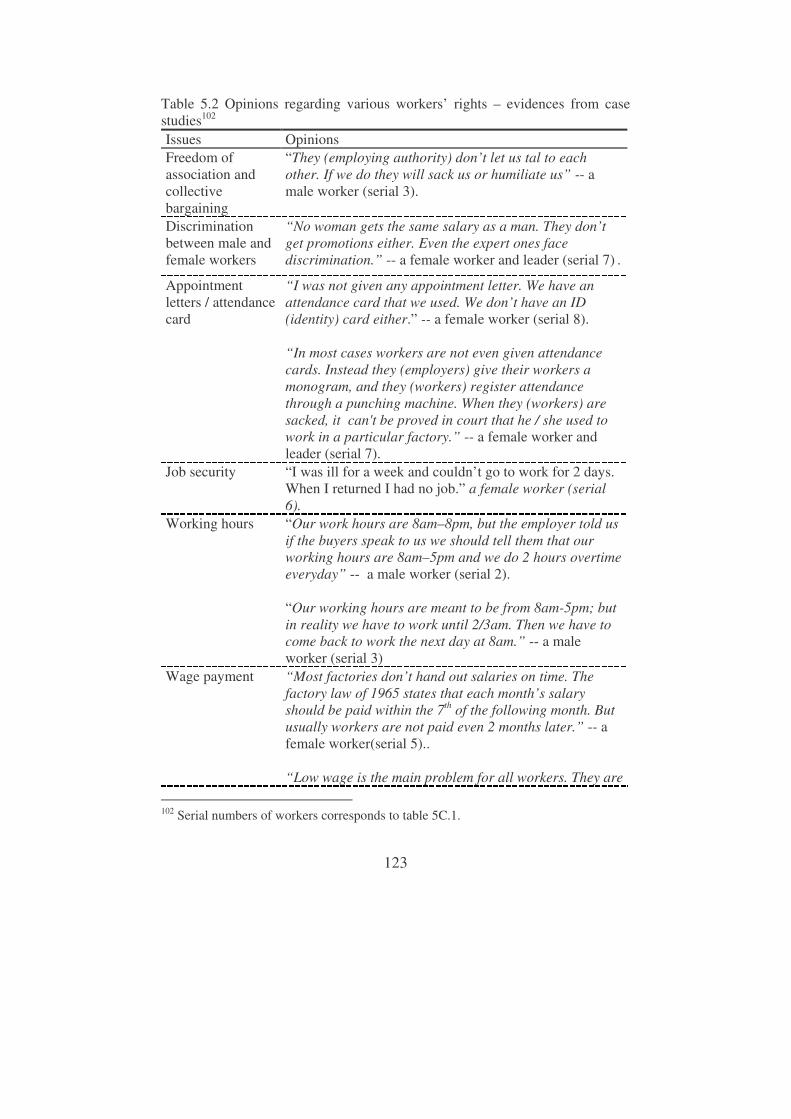
123
Table 5.2 Opinions regarding various workers’ rights – evidences from case studies102 Issues Opinions Freedom of association and collective bargaining
“They (employing authority) don’t let us tal to each other. If we do they will sack us or humiliate us” -- a male worker (serial 3).
Discrimination between male and female workers
“No woman gets the same salary as a man. They don’t get promotions either. Even the expert ones face discrimination.” -- a female worker and leader (serial 7) .
Appointment letters / attendance card
“I was not given any appointment letter. We have an attendance card that we used. We don’t have an ID (identity) card either.” -- a female worker (serial 8). “In most cases workers are not even given attendance cards. Instead they (employers) give their workers a monogram, and they (workers) register attendance through a punching machine. When they (workers) are sacked, it can't be proved in court that he / she used to work in a particular factory.” -- a female worker and leader (serial 7).
Job security
“I was ill for a week and couldn’t go to work for 2 days. When I returned I had no job.” a female worker (serial 6).
Working hours “Our work hours are 8am–8pm, but the employer told us if the buyers speak to us we should tell them that our working hours are 8am–5pm and we do 2 hours overtime everyday” -- a male worker (serial 2). “Our working hours are meant to be from 8am-5pm; but in reality we have to work until 2/3am. Then we have to come back to work the next day at 8am.” -- a male worker (serial 3)
Wage payment
“Most factories don’t hand out salaries on time. The factory law of 1965 states that each month’s salary should be paid within the 7th of the following month. But usually workers are not paid even 2 months later.” -- a female worker(serial 5).. “Low wage is the main problem for all workers. They are
102 Serial numbers of workers corresponds to table 5C.1.
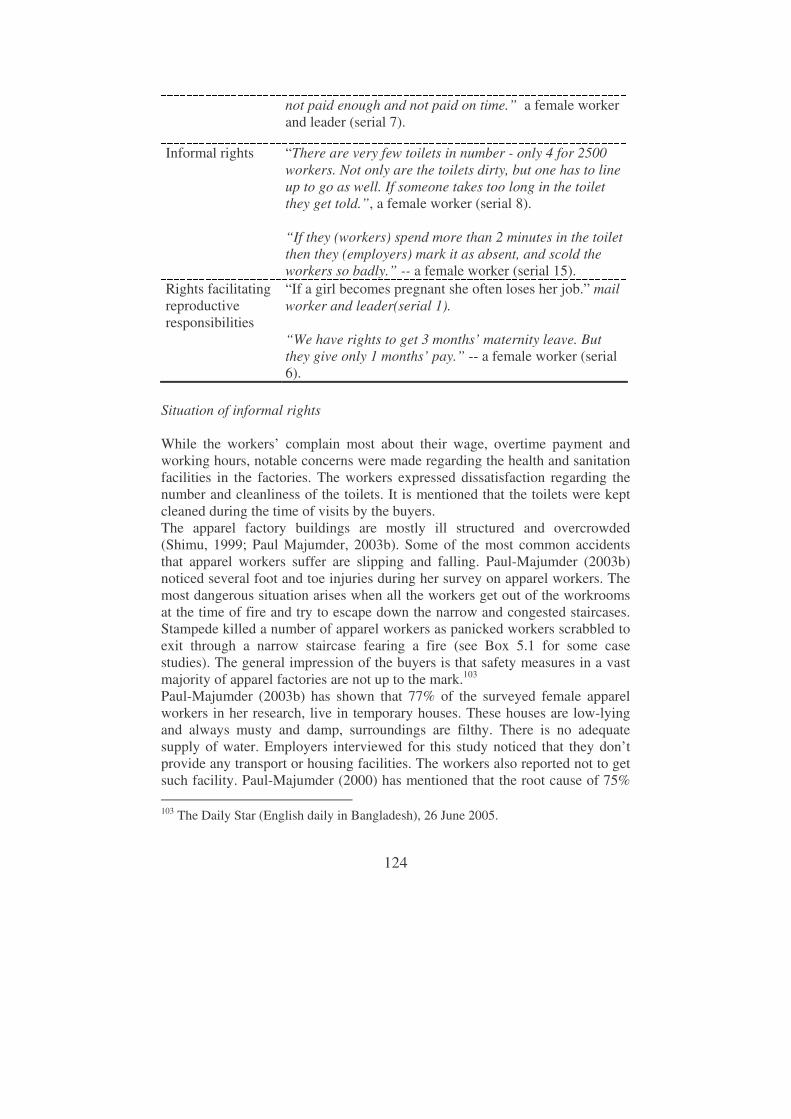
124
not paid enough and not paid on time.” a female worker and leader (serial 7).
Informal rights
“There are very few toilets in number - only 4 for 2500 workers. Not only are the toilets dirty, but one has to line up to go as well. If someone takes too long in the toilet they get told.”, a female worker (serial 8). “If they (workers) spend more than 2 minutes in the toilet then they (employers) mark it as absent, and scold the workers so badly.” -- a female worker (serial 15).
Rights facilitating reproductive responsibilities
“If a girl becomes pregnant she often loses her job.” mail worker and leader(serial 1). “We have rights to get 3 months’ maternity leave. But they give only 1 months’ pay.” -- a female worker (serial 6).
Situation of informal rights While the workers’ complain most about their wage, overtime payment and working hours, notable concerns were made regarding the health and sanitation facilities in the factories. The workers expressed dissatisfaction regarding the number and cleanliness of the toilets. It is mentioned that the toilets were kept cleaned during the time of visits by the buyers. The apparel factory buildings are mostly ill structured and overcrowded (Shimu, 1999; Paul Majumder, 2003b). Some of the most common accidents that apparel workers suffer are slipping and falling. Paul-Majumder (2003b) noticed several foot and toe injuries during her survey on apparel workers. The most dangerous situation arises when all the workers get out of the workrooms at the time of fire and try to escape down the narrow and congested staircases. Stampede killed a number of apparel workers as panicked workers scrabbled to exit through a narrow staircase fearing a fire (see Box 5.1 for some case studies). The general impression of the buyers is that safety measures in a vast majority of apparel factories are not up to the mark.103 Paul-Majumder (2003b) has shown that 77% of the surveyed female apparel workers in her research, live in temporary houses. These houses are low-lying and always musty and damp, surroundings are filthy. There is no adequate supply of water. Employers interviewed for this study noticed that they don’t provide any transport or housing facilities. The workers also reported not to get such facility. Paul-Majumder (2000) has mentioned that the root cause of 75% 103 The Daily Star (English daily in Bangladesh), 26 June 2005.

125
of sexual harassment of women workers is the absence of safe transportation and safe living areas/accommodation. Though legally entitled, very few workers get maternity leave and in many cases young mothers joined their work immediately after child-birth to protect their jobs (Paul-Majumder, 2003b). Working for long hours immediately after child-birth is detrimental to the health of new mothers and workers often complained about various female diseases. However, the situation appears to have improved considerably with nearly two thirds of workers in Dhaka factories and nearly all workers in the EPZ factories reporting that workers in their factories could have maternity leave (Kabeer and Mahmud, 2004). The interviews show that there are some factories, which are concerned about various employment benefits and they provide their workers benefits like a lunch area, annual holidays, bonuses etc.
Box 5.1: Factory fires – some cases Case 1: At around 10.30 am, a transformer near the building, where six apparel factories are situated, burst and sparks were seen to be flying in all directions. Next to the building a religious programme was going on, which completely took the narrow alley. The roofed stage temporarily prepared for the programme started smoking up as the sparks set a part of it on fire. Then a pile of waste cloth (which were mostly on street) of the factories caught fire, the smoke reached the balcony of two of the factories. Someone started screaming “Fire!” Immediately a big turmoil started. Around 3000 workers, most of them in their teens or early twenties, made a run for the main staircase, a narrow stairway barely five feet in width. Panic had spread very fast and the workers were all running together for their lives. While some workers went to the emergency exits located behind the building, most of them rushed through the main stairway only to find that the gate was locked! ‘Volunteers’ of the religious programme had taken it upon themselves to keep the gate shut so that their programme could go on without disturbance from the factories. Finally 7 young women were trampled to death in the ensuing stampede, 50 others were injured. Case 2: In November 2000, 45 apparel workers were killed and 100 injured in a factory fire in Narsingdi (a district adjacent to Dhaka) caused by an electrical short circuit. Among them 4 workers were burnt alive, others suffocated or were electrocuted or trampled in the stampede. The stairwell was so crowded that workers tried to break upon the windows and through themselves out. Some were impaled on the pointed tops of the iron buildings surrounding the factory. The collapsible gates of the building were locked and the only route of escape was closed. Source: Weekend Magazine, the Daily Star (English daily in Bangladesh) May 21, 2004

126
“I am given lunch and Tk15 as daily conveyance. My duty is from 8am-5pm. I didn’t know about women’s special benefits, as I was new. But now I know that we are entitled to 3 months maternity leave with salary. We also get annual leave and increment. There are toilet & canteen facilities.”-- a female worker (serial 4, table 5C.1). It is revealed from the results of earlier studies and the interviews that rights of the workers in the apparel industry are not well addressed in all factories. There exists wide spread violation of their fundamental, formal and informal rights. Now it is important to know the mechanisms at work to ensure the workers’ rights and more importantly what role is played by globalisation. 5.5 Globalisation, competitiveness and workers’ rights in the apparel industry It is evident from chapter 3 that abolishment of the Multi-Fibre Arrangement (MFA) import quotas leads to pressure on the export prices and some countries will experience a decrease in their relative competitiveness. Globalisation influences international competitiveness of countries by eliminating (or by reducing) discriminatory trade preferences. Competitiveness includes cost competitiveness, product quality, in-time delivery etc. Apart from the efficiency of firms, individual country’s competitiveness is influenced by several other factors like favourable geographical location (Redding and Venebles, 2003), factors associated with the investment climate and cost of doing business (Bow, 2000; World Bank, 2004; BEI and World Bank, 2003). With the rise of ‘decent work’ notion of production, various social standards have evolved as part of the competitiveness of a country. As a result while conventional economists consider that poorer countries have a ‘comparative advantage’ in the production of manufacturing goods, it is rephrased by others as an ‘unfair advantage’ as the working conditions of these manufacturing industries are ‘exploitative’ (Kabeer, 2004). Social standards (and also environmental standards) are included in various trade regulations as preconditions to receive special tariff preferences (for example, in EU the Council Regulation (EC) No. 2501/2001 of 10 December 2001). Thus indeed social standards (to ensure various rights of workers) have become an integral part of globalisation in the current world. To understand the impacts of globalisation on workers’ rights of the apparel industry, it is necessary to understand the market chain (from workers to the consumers) of apparel products and thus the market induced chain of pressure (from consumers to workers). Moreover the global workers’ struggle for rights has to be understood. In this context, the concept of global value chain (GVC) analysis has been considered
127
here.104 The extended version of GVC analysis provides a framework to understand the impacts of global issues on different groups of firms within a chain and also on the workers in those firms. Considering the GVC concept the market chain of apparel products and chains of economic and labour standard pressures of globalisation are presented in figures 5.1 and 5.2. A rational consumer always prefers to buy a product at a lower price so that she/he can attain higher utility with a given income. Producers compete with each other by offering the lowest possible price and they tend to lower their production cost. According to the conventional neoclassical competitive paradigm, with the assumption of full employment, producers pay the workers the market-clearing price. The issue of the work environment does not come in the picture. However in a labour surplus economy like Bangladesh the wage may not reflect the market clearing wage and there are ample scopes to pay workers less than what their value marginal product. Moreover producers may tend to minimise cost by not investing not in the improvement of the work environment. Price competition induced by globalisation may lead to a ‘race to the bottom’ and may induce the producers to minimise cost by violating workers’ rights (for example, compelling the workers to work long hours or paying them less than the minimum wage). In figure 5.1 broken arrows indicate the chain of flow of the product from workers to the consumers and the solid arrows indicate how international competition extends pressure to lower the price that ultimately flows to the workers. The framework in figure 5.1 indicates that price pressure flows to the producers and ultimately to the workers. This process may encourage informalisation of work and will make workers more ‘flexible’ (Standing, 1999). Thus there may be more subcontracting of various parts of production, work that will be mainly done by part-time or home-based workers. It is difficult to monitor working conditions at these levels of employment, which means greater possibility to violate workers’ rights. The price pressure not only increases informalisation105 of the production process it may also make the entrepreneurs of formal employment more reluctant to invest in improving the working environment.
104 For detail on GVC please see Humphery and Schmitz (2002); Nadvi (2003) and Nadvi (2004). 105 i.e. increase in the part of production produced under informal work arrangement.

128
Figure 5.1: Market chain of apparel products and the chain of transferring international price pressures106
A chain of pressure opposite to above-mentioned economic pressure is induced by the ‘decent work’ notion of the current world i.e. the chain of pressure to address workers’ rights. With the aim of achieving the ‘decent work’ notion of ILO, various strategies have been initiated by different bodies, mainly, to establish the core labour standards of ILO. These strategies include Ethical
106 A job in the apparel industry can be a formal job. But entrepreneurs sometimes subcontract part of their production, the work is then done by home based or part time workers with whom the main entrepreneur does not have any formal relationship and he (entrepreneur) is not thus obliged to address their workers’ rights. The wage is also paid through the subcontractor who arranges such subcontracting. Thus apparel uses both formal and informal (subcontracted) workers. While the price pressure flows to both formal and informal workers of the apparel industry, the informal workers are more vulnerable to be exploited.
Consumers
Retailers
Importers / buying houses
Producers
Formal workers in apparel
Sub-contractors
Sub-contracted or home - based workers
Consumers’ preference for lower price
Global Competition to lower price
129
Trade Initiative (ETI)107, fair trade agreements, ‘social labelling’ of products etc. 108 These initiatives are attempting to include a ‘social clause’ in various international trade agreements and to let the World Trade Organisation (WTO) exercise its power to ensure global labour standards included under this ‘social clause’ (Kabeer, 2004). It is expected that by worldwide enforcement of labour standards, workers of poorer countries will enjoy higher wages and a better work environment and that will lead to an increase in aggregate demand and employment (Charnowitz, 1987 and Cavanah, 1997; cited in Kabeer, 2004). Trade unions of richer countries are supporting such initiatives to save jobs of their own unskilled workers, who are found to be facing uneven competition from workers of poorer countries who work in a poor work environment. Studies have found a relation between rising North-South trade and increased unemployment and lower wages of unskilled workers in developed countries (Sachs and Shatz, 1994; Wood, 1994; Kucera and Milberg, 2002 and Rodrik, 2002). The initiatives to establish standards are generating positive impacts on the workers’ rights in export industries. Figure 5.2 presents the chain of pressure for addressing workers’ rights. The solid arrows show the flow of international pressure to address the rights of workers where as the broken arrows show the national mechanism at work to ensure the rights of workers. The pressure to address workers’ rights induces the retailers to sell products produced in a decent work environment. The pressure ultimately flows down to the producers and they tend to (sometimes compelled to) follow a certain code of conduct ensuring workers’ rights. Not only international pressure but also pressure from different local bodies induces the producers to address workers’ rights. Such local bodies include the government (authority for labour issues), NGOs and local trade unions. Government initiatives are again influenced by international organisations like ILO, UNICEF etc. Thus this chain of pressure for addressing rights tends to induce positive impacts on the level of workers’ rights. However, it is evident here that international pressure flows down to the formal workers. It is difficult to extend this pressure to cover rights of subcontracted and home based workers, as monitoring of the actual situation is difficult for that type of employment. The subcontracted or home-based workers may benefit from initiatives of various local bodies and international organisations.
107 This is based in the UK and has united different stakeholders (companies, NGOs and unions) to agree upon some unified codes for different companies which will be based on core conventions of ILO (ETI, 1998). 108 To know more about consumer concerns and positions of trade unions see (among others) Harcourt (1999); Barrientos (2000), www.oxfam.org (accessed on 9 April 2005), http://www.itcilo.it/english/actrav/telearn/global/ilo/guide/main.htm (Accessed on 9 April, 2005), http://www.globalexchange.org/campaigns/fairtrade/ (Accessed on 9 April 2005).
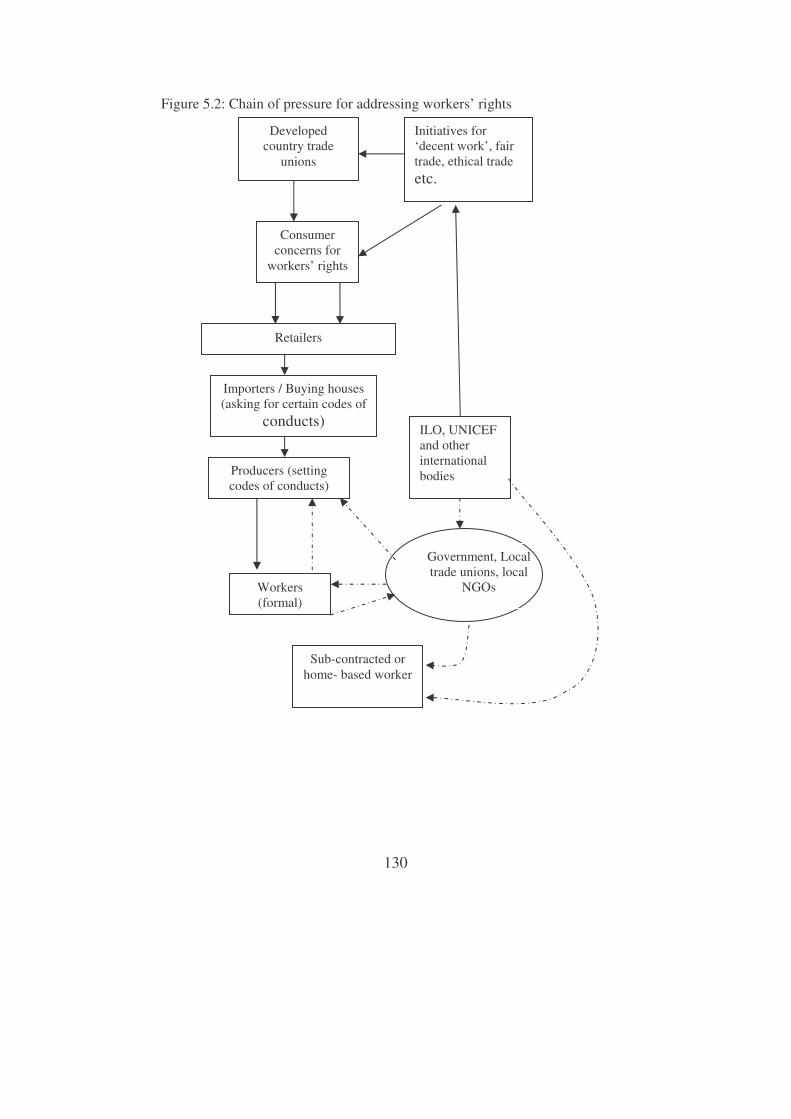
130
Figure 5.2: Chain of pressure for addressing workers’ rights
Consumer concerns for
workers’ rights
Retailers
Producers (setting codes of conducts)
Workers (formal)
Developed country trade
unions
Importers / Buying houses (asking for certain codes of
conducts)
Government, Local trade unions, local
NGOs
ILO, UNICEF and other international bodies
Initiatives for ‘decent work’, fair trade, ethical trade etc.
Sub-contracted or home- based worker
131
5.6 Addressing workers’ rights in a competitive world Figures 5.1 and 5.2 show that globalisation has both positive and negative impacts on workers’ rights. Now the question is how far these pressures are at work in the apparel industry of Bangladesh and how the two pressures can be balanced. It has already been observed that workers’ rights are widely violated in the apparel industry and price competition is rising with globalisation (specially after the MFA phase import quota abolition), which indicates the possibility that there will be an increase in the informalisation of the production process (more sub-contracting) and also the negligence of workers’ rights in factories. At the same time buyers are increasingly asking the producers to address workers’ rights. The employers are facing new labour standard requirements from buyers.109 The workers feel that pressure from buyers is effective in ensuring their rights. “If buyers come, then the employers listen to them. Because the buyers won’t purchase goods if the rules are not followed. At that time the employers accept the demands of the workers.” - a male worker (serial 18, table 5C.1). Some balance between these two pressures is required so that the products remain price competitive and at the same time workers’ rights are addressed. To handle the price pressure, cost of production can be reduced, not by informalisation of the production process or by neglecting workers’ rights, rather by improving various sources of comparative disadvantage of the apparel industry. For example improvement in infrastructure and reduction in cost of finance (discussed in chapter 2) can help to reduce cost. It has been mentioned in chapter 2 that the World Bank (2005) has identified three major comparative disadvantages of the export industries of Bangladesh. These are infrastructure bottlenecks, high cost of borrowing and corruption. In fact, labour cost constitutes only a small proportion of production cost in apparel. The integrated value chain analysis, undertaken by the World Bank (2005)110, shows that for a $1.28 (f.o.b price) T-shirt produced in Bangladesh, the labour cost accounts for only 4.7% (i.e., $0.06), while material costs including the cost of raw materials and port-related charges and accessories constitutes 78%. Interest payment for borrowing is also found to constitute a big proportion of production cost (2.5% cost). Only by eliminating bribes taken at the point of import of equipments
109As those requirements are not mutually exclusive the Bangladesh Garment Manufacturers and Exporters Association (BGMEA) has developed a unified code of conducts to be followed by all apparel producers. (noted by Ms. Zenifar Zobbar, Legal Adviser, BGMEA during her interview on 21 august, 2004). 110 I was a member of the core team undertaking this study and it is thus acknowledged in the published study report.

132
(machineries), the cost of equipments can be reduced by 6% to 10%. There is also scope to improve efficiency of the port. Thus other cost reducing possibilities exist than violating the rights of the workers. Pro-active roles of various stakeholders (government, buyers, NGOs, trade unions, ILO and other international organisations) may promote monitoring of the workers’ rights situation. Government initiatives are required for monitoring workers’ rights and reducing cost of doing business (improving infrastructural shortcomings, reducing the cost of borrowing, reducing corruption etc.). Government needs to improve the strength of its monitoring mechanism. It is observed that the inspection capacity of the Department of Labour (Ministry of Labour and Manpower) in Bangladesh is very poor. There are only 63 inspectors throughout the country to monitor thousands of factories and shops.111 The delay in implementing the new labour code112 is also giving the employers the opportunity to continue with the violation of workers’ rights. Workers have admitted that they are more aware of their workers’ rights than before and interestingly in several cases, they are even found to be fighting for their rights without any help from organisations outside the factory. “Earlier it used to be much more difficult to make the workers understand about different issues. They would ask many questions. But now they understand the importance of organisations.” - a female worker and leader (serial 5, table 5C.1). The employers of the apparel industry have an interest in addressing the workers’ rights not only to fulfil the requirements of the buyers, but also to get more productive workers (and thus to become more competitive). A number of studies have found that improving the work environment increases productivity of workers (e.g. Abdou, 1997; Fisk and Rosenfeld, 1997; Fisk, 2000). Chapter 6 analyses the possible effects of addressing workers’ rights on international competitiveness. 5.7 Discussion and conclusions The success story of the apparel industry is associated with the tireless efforts of thousands of workers who are considered to be very ‘cheap’. However, being ‘cheap’ labour does not exclude a person from enjoying the basic rights of
111 Noted by Mr. A.S.M Serajuddin and Mr. Shawkat Hayat Khan, Chief Inspector and Assistant Chief Inspector respectively, Department of Inspection under Department of Labour during their interview on 05 August 2004. 112 Noted by Mr. Kazi Aminul Islam, Director, Department of Labour and Mr. Kabir Ahmed Choudhury, Deputy Director, Department of Labour during their interview on 27 July, 2004.
133
human life as well as rights as a worker. The aim of this chapter was to analyse the workers’ rights situation in the apparel industry of Bangladesh and the impact of globalisation on workers’ rights. With that aim the chapter has explored the prevailing international and national laws to protect various categories of rights of the workers in the manufacturing sector and the way these laws are applied in the apparel industry of Bangladesh. Finally, the chapter analysed the two opposite pressures globalisation has on to the level at which workers’ rights are addressed. Though Bangladesh has not ratified a few important ILO conventions but most of the fundamental conventions are ratified and in many cases existing national laws cover the lacks. For example, Bangladesh has not yet ratified ILO conventions protecting the right of workers to receive a minimum wage but there are national laws protecting this right. Notable a gap between labour laws and the way they are implemented in the apparel industry has been identified. Such violation of rights not only hampers a decent life of workers, but also poses threat to their life (factory fire etc.). Price competition following from globalisation may further deteriorate the situation, while pressure to address rights may improve the situation. Kabeer (2004) has questioned the desirability of the current nature of international pressure to address workers’ rights. She thinks that adding a ‘social clause’ in trade agreements may lead to decrease in employment (through shrinking of the industry), push the workers (mainly the female workers) in the informal (less protected) sector and may lead to inequalities in the labour market. She prefers a universal ‘social floor’ that would protect the rights of all people regardless of their employment status. Though, a universal social floor, taking care of rights of all types of employment may be the ideal situation to think of, the path towards that requires a huge investment and consensus among developed and developing nations regarding the mechanism to achieve that. In the meantime, to ensure rights and at the same time to maintain (or even to increase) competitiveness, various sources of comparative disadvantage for the Bangladesh’s export industries have to be reduced. If the entrepreneurs can save on cost of doing business, they can invest more in workers’ rights. Reducing comparative disadvantages of the export industries (mentioned above) will also help other industries even informal employment. For example a new road or better electricity or telecommunication can increase informal job opportunities. Sometimes the absence of a law allows the employer not to address certain workers’ rights and the government may include new laws in those cases. For example, it has been noticed that there is no law in Bangladesh to give an appointment letter to the workers. Existing laws are found to be gender sensitive as they prohibit discrimination between males and females. Still there are further scopes for improvement. For example, safe transport facilities can save the female workers from facing discrimination in behaviour from people on the street when they commute to the factories. It is noted that buyers play an

134
important role in ensuring workers’ rights. Thus there is higher violation of rights in the firms which are not directly collaborating with buyers but are subcontracting. The study did not attempt to quantify the impacts of globalisation nor did it attempt to analyse the workers’ rights issues of Trans-national Companies (TNCs). It also did not elaborate on the roles of trade unions and NGOs in establishing workers’ rights. At the current stage of globalisation good quality competitively priced products are a must to survive international competition. However this cannot be at the cost of violating workers’ rights. As labour cost form only a small proportion of total cost and there are several inefficiencies, efficiency improvement efforts will contribute most to improved international competitiveness, Moreover, better socio-economic and working conditions will improve the lives of the many mainly female workers of the apparel industry.
135
Appendix 5A: ILO conventions ratified by Bangladesh 1. Hours of Work (Industry) Convention, 1919 (ILO Convention 1) 2. Night Work (Women) Convention, 1919 (ILO Convention 4) 3.Night Work of Young Persons (Industry) Convention 1919 (ILO
Convention 6) 4. Right of Association (Agriculture) Convention, 1921 (ILO Convention 11) 5. Weekly Rest (Industry) Convention, 1921 (ILO Convention 14) 6. Minimum Age (Trimmers and Stokers) Convention, 1921 (Shelved) (ILO
Convention 15) 7. Medical Examination of Young Persons (Sea) Convention, 1921 (ILO
Convention 16) 8. Workmen’s Compensation (Occupational Diseases) Convention, 1925 (ILO Convention 11) 9. Equality of Treatment (Accident Compensation) Convention, 1925 (ILO
Convention 19) 10. Inspection of Emigrants Convention, 1926 (ILO Convention 21) 11. Seamen’s Articles of Agreement Convention, 1926 (ILO Convention 22) 12. Marking of Weight (Packages Transported by Vessels) Convention, 1929
(ILO Convention 27) 13. Forced Labour Convention, 1930 (ILO Convention 29) 14. Protection Against Accidents (Dockers) Convention (Revised), 1932 (ILO Convention 32) 15. Underground Work (Women) Convention, 1935 (ILO Convention 45) 16. Minimum Age (Industry) Convention (Revised), 1937 (ILO Convention 59) 17. Final Articles Revision Convention, 1946 (ILO Convention 80) 18. Labour Inspection Convention, 1947 (ILO Convention 81) 19. Freedom of Association and Protection of the Right to Organise
Convention, 1948 (ILO Convention 87) 20. Night Work (Women) Convention (Revised), 1948 (ILO Convention 89) 21. Night Work of Young Persons (Industry) Convention (Revised), 1948 (ILO Convention 90) 22. Fee-Charging Employment Agencies Convention (Revised), 1949 (ILO
Convention 96) 23. Right to Organise and Collective Bargaining Convention, 1949 (ILO
Convention 98) 24. Equal Remuneration Convention, 1951 (ILO Convention 100) 25. Abolition of Forced Labour Convention, 1957 (ILO Convention 105) 26. Weekly Rest (Commerce and Offices) Convention, 1957 (ILO Convention
106) 27. Indigenous and Tribal Population Convention, 1957 (ILO Convention 107) 28. Discrimination (Employment and Occupation) Convention, 1958 (ILO
Convention 111)

136
29. Final Articles Revision Convention, 1961 (ILO Convention 116) 30. Equality of Treatment (Social Security) Convention, 1962 (ILO Convention
118) 31. Tripartite Consultation (International Labour Standards) Convention, 976
(ILO Convention 144) 32. Nursing Personnel Convention, 1977 (ILO Convention 149) 33. Worst Form of Child Labour Convention, 1999 (ILO Convention 182) Appendix 5B: Laws on industrial workers’ establishments in Bangladesh Laws on factories 1. The Factories Act, 1965 2. The Factories (Exemption) Rules, 1969 3. The Factories Rules, 1979 Laws on commercial establishments 1. The Shops and Establishments Act, 1965 2. The Shops and Establishments Rules, 1970 3. The Bangladesh Hotels and Restaurants Ordinance, 1982 Laws on service conditions 1. The Employment of Labour (Standing Orders) Act, 1965 2. The Employment of Labour (Standing Orders) Rules, 1968 3. The Employment of Labour (Record of Services) Act, 1951 4. The Employment of Labour (Record of Services) Rules, 1957 5. The Control of Employment Ordinance, 1965 6. The Control of Employment Rules, 1965 7. The Apprenticeship Ordinance, 1962 8. The Apprenticeship Rules, 1967 9. The State-Owned Manufacturing Industries Workers (Terms and Conditions of Service) Ordinance, 1993 10. The Employers Liability Act, 1938 Laws on wages 1. The Payment of Wages Act, 1936 2. The Payment of Wages Rules, 1937 3. The Payment of Wages (Procedural) Rules, 1940 4. The Payment of Wages (Federal Railways) Rules, 1938 5. The Agricultural Labour (Minimum wages) Ordinance, 1984

137
6. The Minimum Wages Ordinance, 1961 7. The Minimum Wages Rules, 1961 Laws on compensation 1. The Workmen’s Compensation Act, 1923 2. The Workmen’s Compensation Rules, 1924 3. The Bengal Workmen’s Compensation Rules, 1932 4. The Workmen’s Compensation (Transfer of Money) Rules, 1935 5. The Workmen’s Compensation (Registration of Cases) Rules, 1953 6. The Workmen’s Compensation Returns 7. The Fatal Accident Act, 1955 8. The Workmen’s Protection Act, 1938
Laws on industrial disputes 1. The Industrial Relations Ordinance, 1969 2. The Industrial Relations Rules, 1977 3. The Industrial Relations(Regulation) Ordinance, 1975 4. The Industrial Relations(Regulation Repeal) Ordinance, 1984 Laws on worker’s participation 1. The Companies Profits (Workers Participation) Act, 1968 2. The Companies Profits (Workers Participation) Rules, 1976 Laws on export processing 1. The Bangladesh Export Processing Zones Authority Act, 1980 2. The Bangladesh Export Processing Zones Authority (Instruction No. 1),
1989
3. The Bangladesh Export Processing Zones Authority (Instruction No.2), 1989
4. The Bangladesh Private Export Processing Zones, 1996 Laws on maternity benefit 1. The Maternity Benefit Act, 1939 2. The Maternity Benefit Rules, 1953 3. The Maternity Benefit (Tea Estates) Act, 1950 4. The Maternity Benefit (Tea Estates) Rules, 1954 5. The Mines Maternity Benefit Act, 1941
138
6. The Mines Maternity Benefit Rules, 1943 Laws on child labour
1. The Employment of Children Act, 1938 2. The Employment of Children (Workshops) Rules, 1940 3. The Employment of Children (Railways) Rules, 1940 4. The Employment of Children (major ports) rules, 1940 5. The employment of Children Rules, 1955 6. The Children (Pleading of Labour) Act, 1933 Laws on industrial statistics 1. The Industrials Labour Statistics Act, 1942 2. The Industrials Labour Statistics Rules, 1961 Other important acts, ordinances and rules 1. The Essential services (Maintenance) ACT, 1952 (Act No. LII of 1952) 2. The Essential services (Maintenance) Rules, 1962 3. The Essential services (2 nd) Ordinance, 1958 4. Act no XXXIV of 1988 Amendment to The Minimum Wages Ordinance, 1961 5. Act No. XXII of 1990 Amendment to Industrial Relations Ordinance, 1969 6. Act No. XXII of 1993 Amendment to The industrial Relation Ordinance,
1969. Moreover there are specialised laws for plantation workers, dock-workers, mines, boilers and transport services. Source: Rafiuddin and Khan (2003).
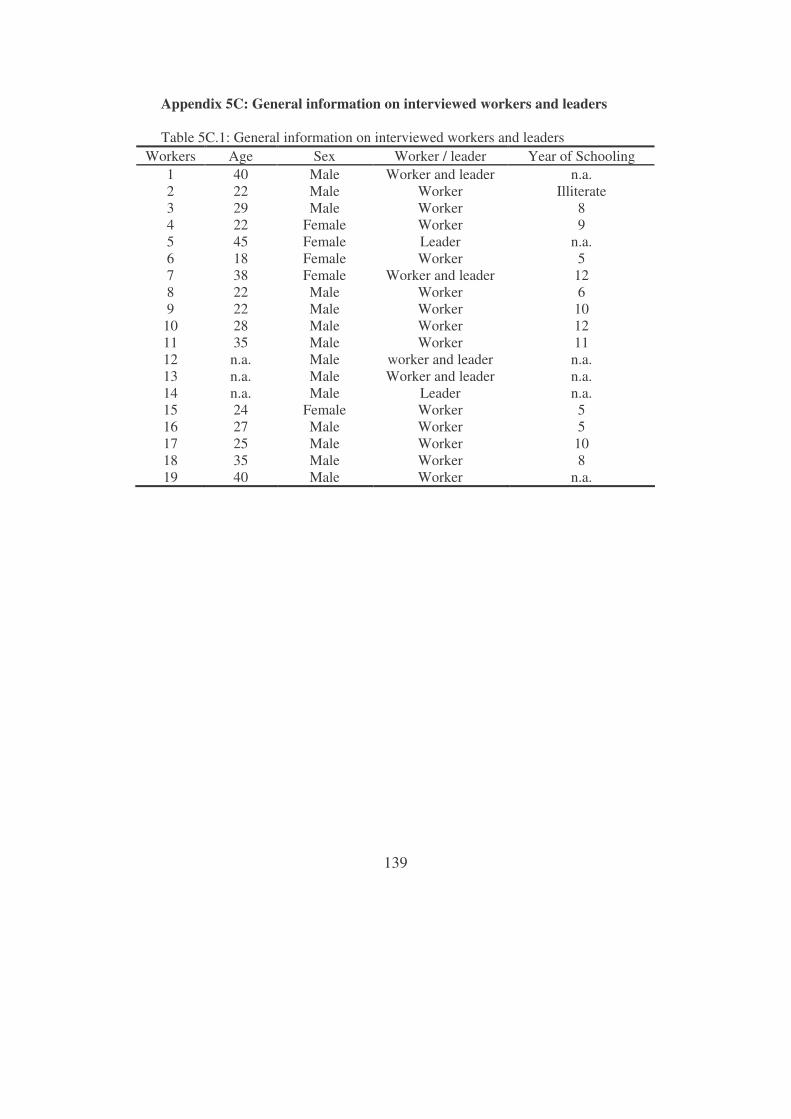
139
Appendix 5C: General information on interviewed workers and leaders Table 5C.1: General information on interviewed workers and leaders
Workers Age Sex Worker / leader Year of Schooling 1 40 Male Worker and leader n.a. 2 22 Male Worker Illiterate 3 29 Male Worker 8 4 22 Female Worker 9 5 45 Female Leader n.a. 6 18 Female Worker 5 7 38 Female Worker and leader 12 8 22 Male Worker 6 9 22 Male Worker 10
10 28 Male Worker 12 11 35 Male Worker 11 12 n.a. Male worker and leader n.a. 13 n.a. Male Worker and leader n.a. 14 n.a. Male Leader n.a. 15 24 Female Worker 5 16 27 Male Worker 5 17 25 Male Worker 10 18 35 Male Worker 8 19 40 Male Worker n.a.
140
Chapter 6 Addressing workers’ rights in the textile and apparel industry - consequences for the Bangladesh economy
6.1 Introduction One obvious consequence of globalisation is increased competition between countries. Competition may result in negligence of workers’ rights, an unhealthy working environment, lower payments, use of child labour and so on. Consequently, workers often pay the real price of globalisation. As a result of violation of workers’ rights questions about ‘ethics’ have been raised and workers’ rights are addressed more extensively than before. For example, multinational companies (MNCs)113 have adopted voluntary codes of conduct to improve the labour conditions of their suppliers in developing countries (Barrientos, 2000). Moreover, as a result of pressures from the International Labour Organisation (ILO), developed country consumers, trade unions and various non–government organisations (NGOs), entrepreneurs of export industries in the developing countries are taking initiatives to improve the working environment for workers and to better address their rights. This is an important recent reality for the textile and apparel industries of Bangladesh. Though apparel is the dominant export industry of Bangladesh, workers’ rights are poorly addressed in many apparel factories (chapter 5). With the abolition of the Multi-Fibre Arrangement (MFA)114, apparel and its input supplying textile industries are exposed to higher competition with the world. In this situation market access predominantly depends on quality and price of goods produced. Nevertheless the codes of conduct required by buyers have to be followed. Such codes could include improving the physical condition of the work place (e.g. more work space for every worker, improving the lighting, increasing the width of the stairs, building fire escape facilities, increase the number of toilets), increasing the minimum wage, providing the workers with services like health care, child care, etc. Measures to address workers’ rights involve costs and entrepreneurs often tend to avoid such measures as much as possible. The entrepreneurs are often in a dilemma in deciding whether to initiate such measures or not; and if they initiate, how far to go. Such a dilemma arises from the fact that addressing workers’ rights involve costs, while pressure from international price competition calls for lower costs.
113 Often called multinational enterprises (MNEs). 114 See chapters 2 and 3 for details.
141
Addressing workers’ rights not only satisfies ethical ground of production but also translates into a productivity rise of workers. Literature confirms that improving the work environment increases productivity of workers (e.g. Abdou, 1997; Fisk and Rosenfeld, 1997; Fisk, 2000). Consequently, attempts to address workers’ rights act as labour115 productivity augmenting technological change. As apparel is the main export industry and as the workers of this industry are often from rural households in Bangladesh, it is important to know the consequences of such productivity increase for the economy and in particular for rural areas. This chapter analyses economy wide consequences of addressing workers’ rights in the textile and apparel industries of Bangladesh. For that purpose, two ways of addressing the rights have been analysed i) increasing the wage of the workers and ii) improving the factory conditions and services for the workers. As rights are mostly violated in the low skilled segment of workers, the study assumes that improving factory conditions and services to workers increases productivity of these workers. To analyse consequences of wage and labour productivity increases, this chapter applies a computable general equilibrium (CGE) model of Bangladesh based on a 1999-2000 social accounting matrix (SAM). The model is based on the core CGE model of International Food Policy Research Institute (IFPRI) documented in Lofgren et al. (2002). CGE models enable the user to assess the disaggregated impacts of policy changes and exogenous shocks on the economy as a whole and on its actors (industries, households and government). Apparel as the main export industry of Bangladesh, and a big source of employment for non-agricultural workers, is in a position to affect the economy as a whole as a consequence of changes in this industry alone. As in the current chapter the main interest is to investigate economy wide impacts of addressing workers’ rights in the apparel industry, a CGE model is the appropriate tool. Section 6.2 provides a brief description of the SAM used in this study while section 6.3 discusses the model. Section 6.4 describes the simulations and discusses results and finally section 6.5 provides a discussion and conclusions. 6.2 Data116 The current study uses a SAM of the Bangladesh Economy of 1999–2000 (Arndt et al., 2002a). The summary structure of this SAM is presented in table 6.1 (more detail is presented in tables 6A.1–6A.3).
115 In this chapter the words ‘worker’ and ‘labour’ have been used simultaneously. 116 This section draws heavily on Arndt et al. (2002a).

142
Table 6.1: Summary structure of Bangladesh SAM 1999-2000 Accounts Elements
Industries (53) • Agricultural (12) • Manufacturing (24) • Services (17)
Commodities (52)
Same as industries. However, commodity “rice milling” (i.e. milled rice) is produced by two industries- “Aman rice milling” and “boro rice milling”
Factors of production (21)
• Agricultural labour male (4 educational levels) • Agricultural labour female (4 educational levels) • Non-agricultural labour female (4 educational levels) • Non-agricultural labour male (4 educational levels) • Land • Ponds • Poultry (capital) • Cattle (capital) • Non-agricultural capital
Institutions (15)
Households (12) • Agricultural (landless, marginal, small, large) • Non-agricultural (poor female-headed, poor male-
headed, rich female-headed, rich male-headed) • Urban (illiterate, low educated, medium educated,
highly educated) Other institutions (3)
• Enterprises • Government • Rest of the world
Capital Savings and investment
Notes: The number in the parenthesis refers to the number of elements under the respective account. The 1999-2000 SAM of Bangladesh is constructed mainly on the basis of a 1993-94 input-output table (BIDS, 1998), 1999-2000 national accounts data, the 1995-96 Bangladesh Labour Force Survey (LFS) and the 2000 Household Income and Expenditure Survey (HIES). Using this information, a ‘proto-SAM’ was built first. The final balancing of the SAM was done by the ‘cross

143
entropy’ (CE) method.117 The detail of this SAM construction process is documented in Arndt et al. (2002a). The main accounts of the Bangladesh economy reflected by this SAM are presented in table 6A.4. The key characteristics of the Bangladesh economy are evident from this table. It is observed that households receive their income mostly from factors of production; also transfers from different institutions play a big role. Bangladesh has a negative trade balance (deficit on the current-account with the rest of the world, so the value of imports is higher than the export value). This trade imbalance is covered mostly by remittances from private households abroad. Moreover capital transfers (both private and public) help to finance the trade deficit. The current study focuses on the textile and apparel industries and actors related to these industries. From chapter 2, it is clear that “apparel” refers to 2 broad categories of products in Bangladesh – woven apparel (also termed as ready-made garment or woven apparel) and knitted apparel. These 2 product categories are separately addressed in the SAM. Various industries under “textile” are mainly supplying inputs to the apparel industry. In the study “textile” refers to 5 products – yarn, mill cloth, jute textile, cloth, and other textiles.118 Large disaggregation of labour categories and household types (appendix tables 6A.1 and 6A.2) in the SAM allows elaborate analysis of income distribution effects of policy changes. 6.3 Model 119 The Bangladesh CGE model used in this study is the Standard CGE model of IFPRI (Lofgren, et al., 2002) including additional considerations used in Arndt et al. (2002a). 120 For the present study some modifications were made to the value added production function, which is described in the next sub-section.
117 The CE method originates from information theory. The maximum entropy (ME) principle and its sister formulation, CE, are used in various areas to estimate and provide analysis when information is incomplete, highly scattered, and /or inconsistent (Kapur and Kesavan, 1992, cited in Arndt et al., 2002b). 118 Here ‘mill cloth’ refers to milled cotton, silk and synthetic cloth; ‘cloth’ refers to handloom cloth, dyeing and bleaching; ‘other textile’ includes woollen textile, narrow fabrics, made-up textiles, spooling and thread ball, hats and caps, embroidery of textiles and miscellaneous textile. 119 This section draws on Lofgren et al. (2002) and partly from Fontana et al. (2001) and Arndt et al. (2002a). All these authors used the standard CGE model of IFPRI which is also used in the current study. 120 We acknowledge the work done by the researchers in the “Bangladesh and the WTO” project (Tripartite project of the Bangladesh Institute of Development Studies, International Food Policy Research Institute, Washington and Agricultural Economics

144
The applied Bangladesh CGE model is a comparative static model. The model contains a set of simultaneous equations, many of which are non-linear. The equations include a set of constraints that have to be satisfied by the system as a whole but not necessarily considered by any individual actor. These constraints cover market equilibriums (for factors and commodities) and macroeconomic aggregates (savings equal investments, balanced government budget, and a fixed deficit on the current-account with the rest of the world and a closure on the model by means of an endogenous exchange rate). Production In the model, producers (termed as industries) minimise cost subject to a nested (separable) constant returns to scale production technology. The technology structure is provided in figure 6.1. Each industry produces one or more commodities according to fixed yield coefficients (Leontief transformation function) from an aggregate output. Each industry is specified by either a Leontief or a Constant Elasticity of Substitution (CES) function of value added and an aggregate intermediate input.121 It is assumed to be Leontief for all industries in the current study. In the technology nest, value added is a CES aggregate of factors whereas the aggregate intermediate input is a Leontief aggregate of disaggregated intermediate inputs. The CES production function of value added for each industry a can be expressed as
1vaava
ava vaa a fa fa
f F
QVA QFρ
ρα δ−
−
∈
� �= � �
� �� (6.1)
where ( )FFf ′=∈ : set of primary factors; QVA a : quantity of aggregate value
added of industry a; vaaα : industry specific efficiency parameter in the CES
Research Institutes, the Netherlands) and thank them for permitting us to use the modified Bangladesh CGE model. 121 A CES production function yields an elasticity of substitution (denoted by σ) with a constant value (if σ=0 we have a Leontief production function, with σ=1 we have a Cobb-Douglas production function). The CES function is expressed as
1
i ii
Q A xρ
ρδ−
−� �= � �� �� where Q is output, ix factor of production I, A efficiency
parameter, iδ distribution parameter and ρ substitution parameter; A > 0; 0 <δ < 1; -1< ρ ≠ 0. The elasticity of substitution (σ) is yielded as σ = 1 /(1+ρ), where is σ is a constant whose value is determined by the value of ρ. For detail please see Chiang (1984).
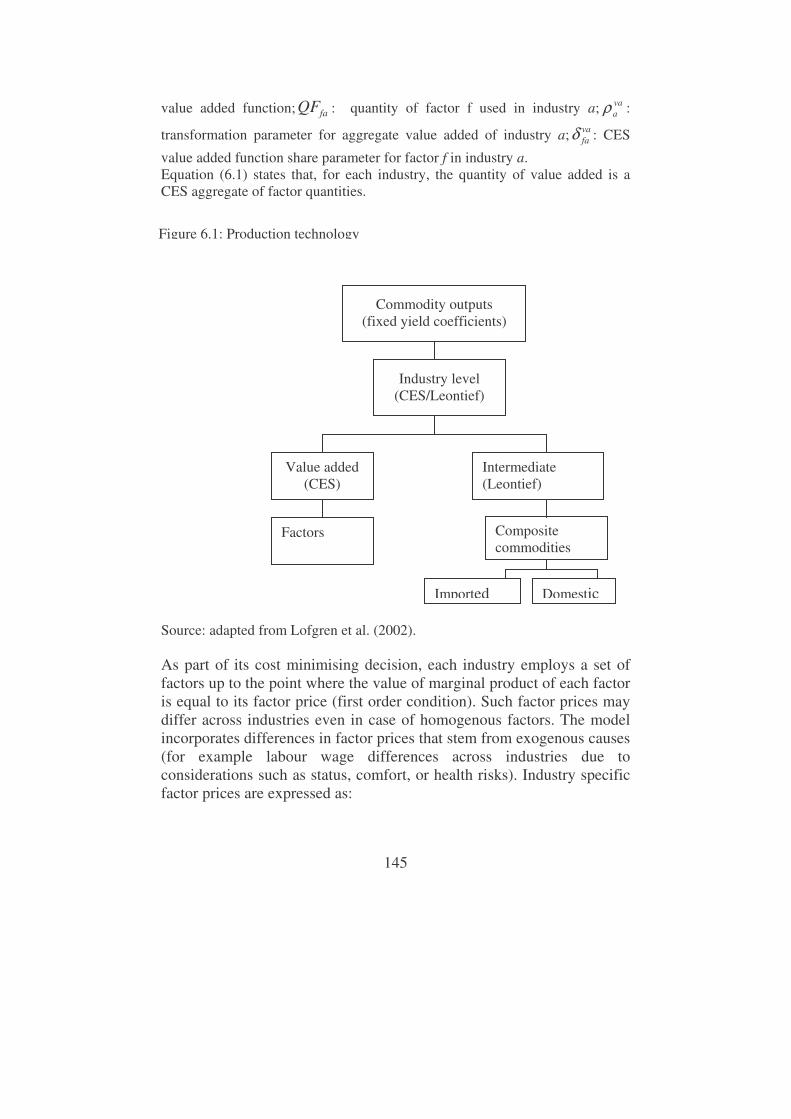
145
value added function; faQF : quantity of factor f used in industry a; vaaρ :
transformation parameter for aggregate value added of industry a; vafaδ : CES
value added function share parameter for factor f in industry a. Equation (6.1) states that, for each industry, the quantity of value added is a CES aggregate of factor quantities. Source: adapted from Lofgren et al. (2002). As part of its cost minimising decision, each industry employs a set of factors up to the point where the value of marginal product of each factor is equal to its factor price (first order condition). Such factor prices may differ across industries even in case of homogenous factors. The model incorporates differences in factor prices that stem from exogenous causes (for example labour wage differences across industries due to considerations such as status, comfort, or health risks). Industry specific factor prices are expressed as:
Intermediate (Leontief)
Industry level (CES/Leontief)
Composite commodities
Value added (CES)
Factors
Commodity outputs (fixed yield coefficients)
Imported Domestic
Figure 6.1: Production technology

146
. fafa fWF WF WFDIST= (6.2) Where, faWF : industry specific factor prices; WFf : average factor price;
faWFDIST : factor price distortion factor for industry a. The value of marginal product of a factor is the marginal product (MP) of a factor multiplied by the price (net of taxes) of the value added produced. MP of a factor can be obtained by differentiating equation (6.1):
1 1
1
1
1
vaava va
a a
va vaa a
va va vaaa a fa fa fa fa
f Ffa
va va vaa a fa fa fa fa
f F
dQVAMP QF QF
dQF
QVA QF QF
ρρ ρ
ρ ρ
α δ δ
α δ δ
− −
− − −
∈
−
− − −
∈
� �= = =� �
� �
� �� �� �
�
�
(6.3)
The first order condition equals:
( )1
1. 1va vaa ava va va
faf a a a a fa fa fa faf F
WF WFDIST PVA tva QVA QF QFρ ρα δ δ−
− − −
∈
� �= − � �
� ��
(6.4)
Where, aPVA : price of aggregate value added of industry a; atva : rate of value added tax for industry a. The substitution parameter va
aρ is a transformation of the elasticity of substitution. In a CES production function the elasticity of substitution (�) is expressed as122:
vaa
va
ρσ
+=
11
The smaller the value of vaaρ , the higher the elasticity ( )vaσ , and the larger the
substitution possibilities in response to changes in relative factor prices. Factor augmenting technological change Assume there is factor augmenting technological change (Chambers, 1988: 210). Factor augmenting technological change implies that less of input f is
122 For detail on the derivation, see Chiang (1984: 428).
147
needed to produce the same amount of output, or equivalently, more output can be produced with the same amount of inputs. Thus factor augmenting technological change is an improvement of the productivity or effectiveness of an input. To consider factor augmenting technological change, the production function of value added expressed in equation (6.1) can now be written as:
( )1
vava aava vaa a fa fa fa
f F
QVA QFρρ
α δ τ−
−
∈
� �= � �
� �� (6.5)
Where, fafa QF.τ : effective factor f in industry a; faτ : effectiveness of factor f
in industry a. Following equation (6.4), the first order condition of factor demand (with technological change) is
( ) ( )1
1. 1va
va va aa ava va va
faf a a a a fa fa fa fa fa faf F
WF WFDIST PVA tva QVA QF QFρρ ρα δ τ δ τ
−−− − −
∈
� �= − � �
� ��
(6.6) Factor market closures and macroeconomic balances Closures and assumptions considered in the simulations are presented in table 6.2. With some exceptions, the model assumes that factors (land, labour, and capital) are fully employed. An economy wide factor price (e.g. rental rate for land, wage rate, rate of return on capital presented in equation 6.2 above) varies freely to make the sum of demands (for factors) from all activities equal to the fixed quantity supplied. However non–agricultural labour with no education and low education are assumed to be unemployed as the unemployment rate is very high in Bangladesh (see section 3.2 in chapter 3). Their respective wage remains fixed and supply moves to bring equilibrium in the market. Capital is not only fully employed but also industry specific. Government consumption is fixed in real terms. Government savings move to keep the equilibrium. A flexible exchange rate is assumed and the foreign savings are fixed. In the model, the amount of savings determines the level of investment.
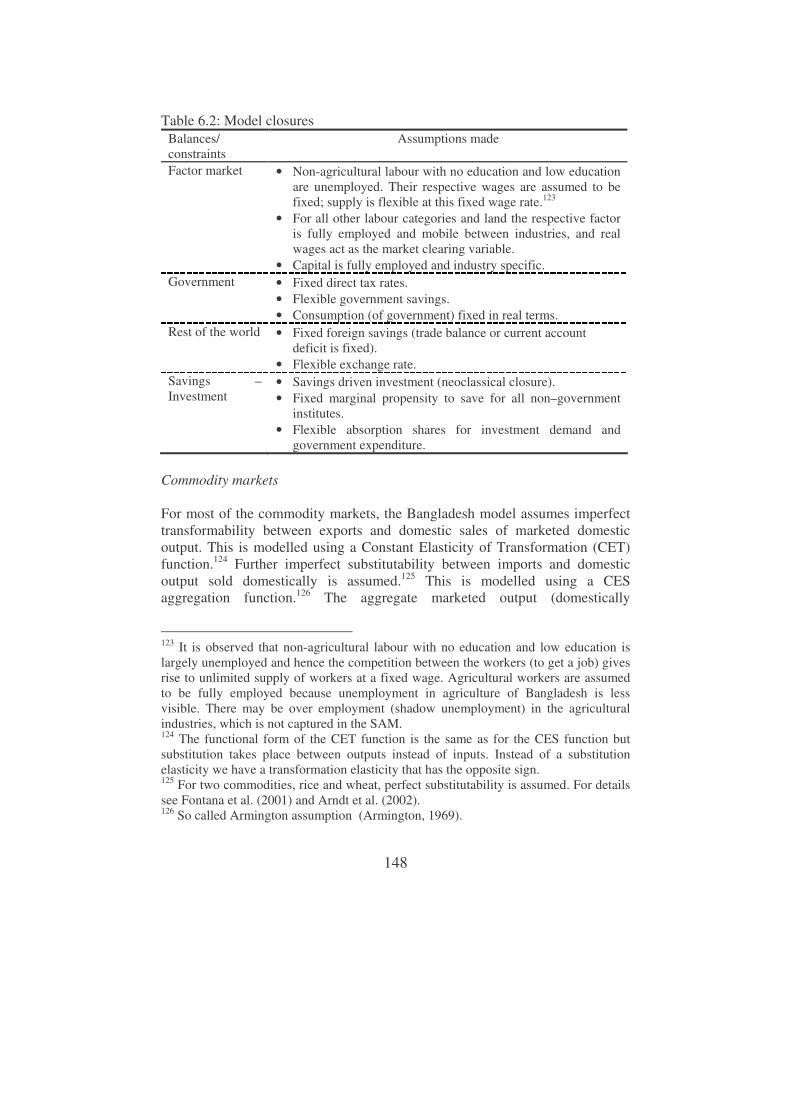
148
Table 6.2: Model closures
Balances/ constraints
Assumptions made
Factor market
• Non-agricultural labour with no education and low education are unemployed. Their respective wages are assumed to be fixed; supply is flexible at this fixed wage rate.123
• For all other labour categories and land the respective factor is fully employed and mobile between industries, and real wages act as the market clearing variable.
• Capital is fully employed and industry specific. Government • Fixed direct tax rates.
• Flexible government savings. • Consumption (of government) fixed in real terms.
Rest of the world • Fixed foreign savings (trade balance or current account deficit is fixed).
• Flexible exchange rate. Savings – Investment
• Savings driven investment (neoclassical closure). • Fixed marginal propensity to save for all non–government
institutes. • Flexible absorption shares for investment demand and
government expenditure. Commodity markets For most of the commodity markets, the Bangladesh model assumes imperfect transformability between exports and domestic sales of marketed domestic output. This is modelled using a Constant Elasticity of Transformation (CET) function.124 Further imperfect substitutability between imports and domestic output sold domestically is assumed.125 This is modelled using a CES aggregation function.126 The aggregate marketed output (domestically
123 It is observed that non-agricultural labour with no education and low education is largely unemployed and hence the competition between the workers (to get a job) gives rise to unlimited supply of workers at a fixed wage. Agricultural workers are assumed to be fully employed because unemployment in agriculture of Bangladesh is less visible. There may be over employment (shadow unemployment) in the agricultural industries, which is not captured in the SAM. 124 The functional form of the CET function is the same as for the CES function but substitution takes place between outputs instead of inputs. Instead of a substitution elasticity we have a transformation elasticity that has the opposite sign. 125 For two commodities, rice and wheat, perfect substitutability is assumed. For details see Fontana et al. (2001) and Arndt et al. (2002). 126 So called Armington assumption (Armington, 1969).
149
produced) is a CES aggregate of the marketed output levels of the different domestic industries producing the commodity. Industry-specific commodity prices clear the implicit market for each disaggregated commodity. Domestic sales satisfy the domestic demands from households, government, investment and intermediate use. In the international markets export demand and import supply are infinitely elastic (constant world market prices). Institutions Institutions cover households, enterprises, the government and the rest of the world (ROW). Households receive income from the supply of factors and transfers from other institutions including government, enterprises and remittances from the ROW. Households exploit their income in paying taxes, savings, consumption and making transfers to other institutions. The government income is composed of taxes and transfers from other institutions including the ROW. This income is spent on consumption and CPI127 indexed transfers to other institutions. Enterprises are the owners of capital and they receive income from capital and also from government transfers. The enterprises pay government taxes and transfer income to different households. The ROW involves in commodity trade and also transfers payments to domestic institutions. The transfer payments and the deficit on the current account are assumed fixed expressed in foreign currency to make welfare analyses more transparent (welfare of the ROW does not change). 6.4 Simulations and results This chapter attempts to quantify the economy wide effects of addressing workers’ rights in the textile and apparel industries of Bangladesh.128 For this purpose, two ways of addressing the rights have been taken into account i) increasing the wage of the workers and ii) improving the factory conditions and services for the workers, which is assumed to lead to an increase in labour productivity. Initiatives of the entrepreneurs in textile and apparel industries to address the rights of workers are considered to be focused on workers with no,
127 CPI refers to the consumer price index. It is fixed in the model and functions as the numériare. The model is homogeneous of degree zero in prices. Therefore a doubling of the value of the numériare would double all prices but leave real quantities unchanged. All simulated price and income changes should be interpreted as changes vis-à-vis CPI or the numériare price index. 128 Though the SAM includes 5 categories of textiles, the categories “jute textile” and “cloth” have not been considered for simulation as these products are mainly used for domestic consumption and are not influenced by international trade scenarios and addressing workers’ rights.
150
low and medium education. These groups constitute 90% of the employees in the textile and apparel industries and they are the most oppressed in terms of workers’ rights. Increasing wages is considered as the first way of addressing workers’ rights. The minimum wage for unskilled workers was set (by law) at Tk930 in 1994 (chapter 5). There has been no change in this since then though this minimum wage is no longer sufficient to fulfil basic needs and workers are demanding an increase in their wage.129 From this notion simulation S1 considers a 10% increase in wage of only no, low and medium skilled apparel workers. In the model this is modelled by increasing the distortion variable (not in the average wage). A sensitivity analysis has been performed to find out what the difference is between assuming unemployment (fixed wage) used in S1 and assuming full employment for all types of workers. The second way of addressing rights is to improve the working environment, which increases the productivity of workers. Improving the physical conditions of the factories (building fire escapes, wide staircases, proper lighting, increasing the number of toilets etc.) together with given special facilities to the workers (maternity leave, freedom to unionise etc.) are assumed to result in a labour augmenting technological change. Thus this study assumes that addressing the workers’ rights in terms of improving the working environment, increases productivity of workers. In order to decide on the nature and magnitude of the increase in productivity following from an improved work environment, the current research has consulted the existing literature. Fisk and Rosenfeld (1997) and Fisk (2000) have noted that with the improvement of work environment, productivity gains mainly occur in two ways – gains from less illness of workers and a direct labour productivity increase. These studies have taken into consideration findings of several other studies on productivity gains from an improved work environment. It is found that gains depend much on the initial levels of the work environment. On the basis of findings of different studies, Fisk and Rosenfeld (1997) have noted that an improved work environment can increase performance of workers at a rate of 2% to 20% for different workers in different types of work places. Using different considerations Fisk and Rosenfeld (1997) have estimated productivity increases of 0.5 to 5% for the USA. Moreover an improved work environment can minimise productivity loss from illness, which can be 10% to 25%. Most of the studies considered by Fisk and Rosenfeld (1997) are based on USA data. To the best of my knowledge there is no comparable study on Bangladesh. Considering the existing poor work environment and other shortcomings in
129 Concerns expressed by different organisations, viz. the participants of the seminar “Tripartite meeting regarding the labour law in order to establish rights of the female workers”, organised by ‘Karmojibi Nari’ on 4 March, 2004 at the Press Club Auditorium, Dhaka, Bangladesh. (e-mail: [email protected]).
151
addressing workers’ rights (chapter 5), we assume a 10% increase in the productivity of workers in the textile and apparel industries of Bangladesh arising out of a better work environment or better address of their rights. Simulation S2 reflects this 10% labour productivity increase. The current study did not take any further attempt to assess the actual magnitude of the linkage between improving rights of workers and the resulting labour productivity increase as that was out of the scope of this study. Improving working conditions or addressing workers’ rights better involves costs. In other words labour augmenting technological change is not free. The results of simulation S2 refer to the situation where the working environment has been improved to increase productivity, without incurring cost. Calculating the magnitude of costs for addressing rights needs an in depth research on costs associated with different labour augmenting technological change attempts and relating those costs with a certain magnitude of productivity change. Currently there is no such estimate. However the resulting gain of S2 in value added linked to capital (if any) from improving the rights reflects the maximum amount of cost that can be incurred for such a productivity increase. Simulation S3 is a combination of S1 and S2 which includes both a wage increase and productivity increase. Moreover a sensitivity analysis has been performed to determine the effects of an alternative assumption on the magnitude of the increase in wage and labour productivity. On the basis of the considerations above, three scenarios are defined. Outcomes of these scenarios are compared with the base run, the situation as described in the SAM. Scenarios are: S1) A 10% increase in the wage of workers with no, low and medium
education in the textile and apparel industries.130 (Plus sensitivity of the outcomes with respect to the fixed wage assumption and the alternative full employment assumption is explored).
S2) A 10% productivity increase of workers with no, low and medium education in the textile and apparel industries.
S3) Combination of S1 and S2, i.e. a 10% increase in the wage of workers with no, low and medium education in the textile and apparel industries in combination with a 10% productivity increase of workers with no, low and medium education in the textile and apparel industries. (Plus a sensitivity analysis assuming a 5% increase in wage combined with a 5% increase in labour productivity has been performed.)
130 In the simulations textile and apparel industries refer to yarn, mill cloth, other textile, woven apparel and knitwear together.
152
Textile and apparel industries in the base economy131 In Bangladesh the service industries contribute most to GDP. The manufacturing industries earn 94% of export earnings. Export earning is mostly coming from exports of apparel products – woven apparel and knitted apparel (table 6B.1). Some salient features of the woven and knitted apparel industries in the base economy are presented in table 6.3. More detail is presented in appendix 6B. The apparel industry is heavily dependent on imported inputs (table 6B.3). 82% of mill cloth, an important input for woven apparel (41% of production value), is imported. Similarly 67% of yarn, an important input in knitted apparel (64% of production value) is imported. The share of value added in total production value in woven and knitted apparel is 31% and 23% respectively. Table 6.3: Textile and apparel industries in the base economy Woven apparel Knitted apparel
Labour intensive: • 57% of woven apparel value
added • 18% of total woven apparel
value
Capital intensive: • 90% of value added • 21% of total knitted apparel
value
Dominance of unskilled workers: • 30.5% unskilled • 32.4% low skilled
Dominance of skilled workers: • 24.4% is medium skilled • 26.9% is high skilled
Share of value added in total production value is 31%
Share of value added in total production value is 23%
The woven apparel industry is labour intensive while knitted apparel is more capital intensive. Moreover woven apparel is dominated by female workers and knitted apparel uses only male workers (tables 6B.4 and 6B.5).132 Woven apparel mostly uses unskilled and low skilled workers. According to table 6B.5, in Bangladesh 31% of unskilled non-agricultural female workers and more than 50% of non-agricultural low and medium skilled female workers are employed
131 Statistics mentioned in this section are derived from the Bangladesh SAM 1999–2000. 132 This observation seems to be too strong as a small percentage of female labour is observed in knitwear, which is not reflected in the SAM. The reason behind more male participation in knitwear is the skill required (mostly medium and high) and the nature of job (more physical activities) in knitwear production. Female workers are less capable or less interested to involve in this kind of job.
153
in woven apparel.133 Knitted apparel uses mostly medium and high skilled non-agricultural labour. Unskilled and low skilled workers are coming mostly from rural marginal and small farm households and from illiterate and low educated urban households (table 6B.6). Also a notable proportion of these categories of workers belong to rural non-agricultural poor male-headed households. Increase in wage (S1) A summary of the simulation results is presented in table 6.4 while details are presented in tables 6C.1-6C.6. In the first scenario, the increase in real wage of unskilled, low and medium skilled workers in the textile and apparel industries (together ‘TexApp’ from now on) has been captured by a 10% increase in the variable WFDIST (see section 6.3) for TexApp. First this simulation has been performed with the assumption of unemployment of unskilled and low skilled non-agricultural workers (table 6.2). Increase in wage results in a decrease in demand for all types of non-agricultural workers in TexApp (table 6C.2). Table 6C.1 reveals that in the economy as a whole demand for medium and high skilled workers mostly remains unchanged (except high skilled females) and decreases for unskilled and low skilled workers. The supply of unskilled and low skilled workers decreases in the economy. For these types of workers the unemployment assumption applies. Supply of other types of workers remains constant as they are assumed to be fully employed. The economy wide average wage (WF) for unskilled and low skilled male and female workers does not change because of the fixed wage (unemployment) assumption. However the average wage for medium and high skilled male and female workers decreases because of the full employment assumption. The decrease is higher for female workers compared to male workers. The explanation for this is that a relative high share of female labour is employed in TexApp. In the simulation we have increased the distortion variable WFDIST in TexApp and WF is fixed for unskilled and low skilled workers. This implies that with the increase in WFDIST, the overall factor price of labour increases in TexApp. As a result less labour is demanded in TexApp. However what also happens is that apparel and textile are large industries and employ a big proportion of non-agricultural workers, specially unskilled and low skilled workers. Therefore, a large decrease in demand for unskilled worker in TexApp implies a decrease in their demand in the economy as a whole, though to a lesser degree than the rate of decrease in their demand in TexApp. For medium and high skilled workers WF decreases and therefore demand for this type of labour in the economy as a whole either increases or remains almost unchanged.
133 Share of those who are already employed.

154
Income of all categories of non-agricultural workers decreases. Income of capital in the economy also decreases. Return on capital ( . fafWF WFDIST for
capital) decreases for both woven and knitted apparel (table 6C.2). Table 6C.2 shows that production in all industries under TexApp decreases because of the real wage increase and there is a decrease in labour demand. Woven apparel production decreases by 5.3% while knitted apparel production decreases by 0.7%. Production decreases more in woven apparel as it is more labour intensive. Production of yarn, mill cloth and other textiles decreases by 1.8%, 5.8% and 5.3% respectively. Value added in woven and knitted apparel also decreases. It decreases more for woven apparel than for knitted apparel as woven apparel is more labour intensive than knitted apparel. Prices of TexApp products increase leading to a deterioration of the demand for these products. Exports of woven and knitted apparel decrease by 5.7% and 0.7% respectively. Imports of mill cloth and yarn (main inputs in woven apparel and knitted apparel respectively) decrease also. Ultimately there is a 3.2% decrease in total export of the country and a 1.4% decrease in import (table 6.4). As in the base year imports are more than twice as big as exports, a relatively small decrease in imports can compensate for a relatively large decrease in exports maintaining the fixed current account deficit (assumed in the model). The share of local production in total supply of textile products decreases reflecting more import dependence (table 6C.2). The real exchange rate increases by 0.3% referring to a depreciation (devaluation) of the local currency, Taka (table 6.4). In aggregate, incomes of all types of domestic households decrease (table 6C.4) including the entrepreneurs who are the owners of capital goods. There is a marginal decrease in household consumption (table 6C.5). Table 6C.3 reveals that Gross Domestic Product (GDP) decreases. Ultimately, welfare (in terms of Equivalent Variation or EV) of all types of households in the economy decreases (table 6C.6).134
134 EV measures the income change that, at base prices, would be equivalent to the welfare change of the scenario simulated.

155
Table 6.4: Summary of simulation results, billion Taka for base and % change from base for other scenarios
BASE S1 S2 S3
With unemployment of unskilled non agricultural workers
Full employment
Total exports 249.2 -3.2 -1.8 3.7 0.4 Woven apparel 140.5 -5.7 -3.3 6.6 0.7 Knitted apparel 45.6 -0.7 -0.6 0.7 0
Total imports -547.9 -1.4 -0.8 1.6 0.2 Yarn 54.8 -0.8 -0.4 0.9 0.1 Mill Cloth 66.2 -4.6 -2.5 5.3 0.6 Other Textile 2.3 -3.6 -1.9 4.3 0.5 Capital income 759.8 -0.6 -0.1 0.8 0.1 Private consumption
2102.3 -0.2 0 0.3 0.1
GDP at market prices (spending)
2373.3 -0.2 0 0.3 0.1
Real exchange rate (Taka per $ for base & % change for non-base)
50.3 0.3 0.3 -0.3 0
The sign of the effects of S1, when the full employment assumption instead of the unemployment assumption is made, remains the same. However the magnitude of effects is less in the full employment situation. Demand for all types of workers decreases in TexApp except for high skilled male workers, which exhibits a 0.6% increase. Increase in wage of unskilled and low skilled workers increases the demand for high skilled workers. With the full employment assumption for unskilled workers WF decreases, and therefore, the decrease in demand for this type of labour in TexApp is less than with the fixed wage assumption. Income of only urban households decreases and the same is true for household consumption. There is also no change in GDP. Welfare of households decreases for rural non-agricultural poor households and all types of urban households. However welfare of rural agricultural households and non agricultural rich households either increases or remains same (table 6C.6). Overall the effect of the increase in wage is more positive under the full employment assumption. Increasing labour productivity (S2) In this scenario productivity of unskilled, low and medium skilled workers in TexApp increases by 10%. Table 6C.2 shows that in TexApp demand for all
156
types of non-agricultural female workers and high skilled male workers increases. However, in the economy as a whole demand for all types of non-agricultural workers increases except for medium and high skilled female workers (table 6C.1). The supply of unskilled and low skilled workers increases in the economy (unemployment assumption). Supply of other types of workers remains constant because of the full employment assumption for those categories. The economy wide average wage (WF) for unskilled and low skilled male and female workers does not change because the wage remains fixed with the unemployment assumption applying for these categories. However the average wage for medium and high skilled male and female workers increases because of the full employment assumption. Income of all types of non-agricultural workers and capital increases. Return on capital increases in both woven and knitted apparel (table 6C.2). According to table 6C.2, with the rise in labour productivity, production in all industries under TexApp increases. 10% labour productivity increase leads to a 6.1% increase in woven apparel production but only to a 0.7% increase in the more capital-intensive knitted apparel production. Among the textile products, production of yarn rises by 1.9%, mill cloth by 6.5% and other textile by 6.1%. Value added in both woven and knitted apparel increases and the magnitude of increase is higher for the labour intensive woven apparel industry. Prices of TexApp decrease which stimulates demand. Exports of woven and knitted apparel increase by 6.6% and 0.7% respectively. The labour (especially, female) in the intensive woven apparel industry experiences a relatively greater increase in production and export. Total export of the economy increases by 3.7% and import rises by 1.6% (table 6.4). Import of textile rises to meet the increased input demand from apparel production. However the share of local production in the total supply of textile products increases as local production increases at a higher rate (table 6C.2). This is a result of increased productivity in the textile industry, so that this industry can supply a larger share of input needed by the apparel industry. The real exchange rate decreases by 0.3% referring to an appreciation (revaluation) of Taka (table 6.4). In aggregate, incomes of all types of domestic households increase (table 6C.4) including the entrepreneurs who are the owners of capital. There is also an increase in their consumption (table 6C.5). Table 6.4 reveals that GDP increases under this scenario. Ultimately welfare (in terms of EV) of all types of households in the economy increases (table 6C.6). In S2, it has been assumed that workers’ productivity increases as a result of an improved working environment. It is also assumed that there is no cost involved in improving the working environment. This is unrealistic. However from the results it can be inferred that for improving the working environment an entrepreneur may consider a maximum spending of the amount of increase in income of the entrepreneurs. This increase in income equals the increase in value added linked to capital from textile and apparel. For example, in woven

157
apparel the value added increases by 2.3 billion Taka with the increase in 10% labour productivity, out of which 1.3 billion Taka is linked to capital. So the entrepreneurs can invest 1.3 billion Taka in achieving a 10% increase in the productivity of workers before value added goes down. Increase in both wage and labour productivity (S3) This scenario is a combination of S1 and S2. Both a 10% wage increase for unskilled, low and medium skilled workers and a 10% productivity increase is simulated. As a result of these changes, except for high skilled male and female workers, demand for all categories of workers in TexApp decreases (table 6C.2). Table 6C.1 shows that in the economy as a whole, demand for non-agricultural workers either remains the same or decreases. The supply of unskilled and low skilled workers decreases in the economy (unemployment assumption). Supply of other types of workers remains constant because of the full employment assumption. Average wage (WF) for unskilled and low skilled male and female workers does not change because there is unemployment among them and their wage is fixed. However the average wage for medium skilled male and female workers decreases, that of high skilled male workers remains the same and that of high skilled female workers increases. In case of medium skilled workers, negative effects from the wage increase dominate the positive effects of the productivity increase. Income of all categories of non-agricultural workers except medium skilled male and female workers increases. Decrease in the income of medium skilled female workers results from a decrease in both the average wage and demand for this type of workers. Income of capital in the economy also increases. Table 6C.2 reveals that return on capital decreases for woven apparel. In case of the capital-intensive knitted apparel, capital return remains unchanged. Table 6C.2 shows that with the increase in labour productivity, production of woven apparel increases while that of knitted apparel remains unchanged. As knitted apparel is capital intensive and as the labour share in its production is only 2.4% (table 6B.2), increase in the labour productivity accompanied by an increase in wage does not have any impact on the production of knitted apparel. Value added in woven apparel increases, while in knitted apparel it remains unchanged just as production. The price of woven apparel marginally decreases, while it remains unchanged for knitted apparel. Export of woven apparel increases but that of knitted apparel remains unchanged. Import of the main input of woven apparel, i.e. mill cloth, increases to meet the increased demand. However the share of local production in total supply of textile products remains the same as local production also increases. Ultimately there is an increase in total export of the country (table 6.4). Total import also increases. However rates of increase in both export and import are less than under S2. The real exchange rate remains unchanged (table 6.4).
158
In aggregate, income of all types of domestic households either remains the same or changes marginally (table 6C.4) including the entrepreneurs who are the owners of capital. There is also a marginal increase in household consumption (table 6C.5). Table 6.4 reveals that GDP increases marginally. Ultimately, welfare (in terms of EV) of all types of households in the economy marginally increases (table 6C.6). As an extra simulation the effects of a 5% increase in wage and 5% increase in productivity of unskilled, low and medium skilled workers of TexApp are calculated.135 The sign of the changes is identical to the calculated changes in S3, however, with a lower magnitude. Thus ultimately GDP, household income, and household welfare remain unchanged. 6.5 Implications for rural households As a large proportion of the apparel workers originate from rural areas, it is worth to elaborate further on the impacts of different scenarios on the rural economy. From table 6A.5 it is observed that 67.6% of the population (in 1999-2000) belongs to rural households and most of them are poor (52.6% of total population). As has been described in section 6.4 (under the subsection textile and apparel industries in the base economy) and also in tables 6B.4 and 6B.6, most of the apparel workers possess no, low and medium skills and a large proportion of these categories of workers (in general) originate from rural households, specially, from poor rural households. For example around 70% of male unskilled workers and around 62% of female unskilled workers in general originate from rural households. Though this information does not explicitly say what proportion of unskilled, low and medium skilled apparel workers are coming from rural areas, it is noted in Afsar (2001) that 90% of the workers in the apparel factories are migrants from rural areas. They maintain close connections with the rural economy and a portion of their income is sent as remittance to the rural households from where they originate. On the basis of a ‘sample survey of migrant workers of Dhaka’s formal manufacturing sector, 1996’ 136 Afsar (2001) has noted that more than a quarter of the income of apparel workers is remitted to their rural household. Recent migrants (who migrated during the last 5 years from the survey year) remit about 40% of their income, while long time migrants remit around 26% to 34% of their income. Afsar (2001) has also shown that this remitted money is mostly sent for family maintenance and education of younger family members. Thus any change in the income of the apparel workers has impacts for rural households.
135 Results are not presented in tables, but just mentioned here. 136 This survey was conducted among 273 workers in manufacturing of which 213 were apparel workers.
159
If the average elasticity to remit remains the same as has been found in the study of Afsar (2001), it can be inferred from the current findings that under S1 when incomes of unskilled, low and medium skilled workers (both male and female) decrease, they will remit less (in value), income of rural household depending on this remitted money will decrease and their welfare will be negatively affected. From table 6C.4, we do not observe any income effect on rural agricultural households, but we observe a decrease in income of rural non-agricultural households. This may be because the unskilled, low and medium skilled workers of the apparel industry are coming mostly from rural non-agricultural households. Tables 6C.5 and 6C.6 show that consumption and welfare of rural households decreases under S1. But an opposite outcome is observed when income of apparel workers increases as a result of an increase in their productivity. Therefore, under S2, we observe increases in income, consumption and welfare of rural households. Under these scenarios, workers have a larger capacity to remit to the rural household and that may contribute in rural income. It is to be noted that remittance is not the only channel through which rural household income and consumption are affected; rather there are other factors like changes in enterprise income, transfers from relatively richer households etc. A picture of inter household transfer is presented in table 6B.7. When the workers from rural households are coming to work in the urban apparel industry, they are often leaving behind their family and relatives and an increase in their productivity through better work environment (or in other words by addressing their rights) may extend positive impacts to their rural households. 6.6 Discussion and conclusions This chapter quantifies the economy wide effects of addressing workers’ rights in the textile and apparel industries of Bangladesh. For that purpose, two ways of addressing the rights have been taken into account – i) increasing the wage of the workers and ii) improving the factory conditions and services for the workers resulting in a 10% labour productivity increase of unskilled, low and medium skilled workers. A CGE model has been used to quantify the economy wide effects. Results show that an increase in the minimum wage for unskilled, low and medium skilled workers in the textile and apparel industries results in negative impacts for these groups of workers in aggregate and also for the economy as a whole in terms of export, GDP and welfare. With the wage increase the cost of production and the output price increase. This decreases the demand for labour and also the level of production. Increase in the wage for unskilled, low and medium skilled workers in the textile and apparel industries decreases the
160
demand for respective labour categories not only in these two industries but also in the economy as a whole (with a few exceptions). Results do not change substantially with the full employment assumption applied for unskilled and low skilled workers except for the decrease in employment. However, under the full employment assumption the magnitude of the results is smaller. Productivity stimulating improvements in factory conditions and services to workers increase income of workers of most categories and also the welfare in the economy as a whole. The entrepreneurs as the owners of capital also enjoy a higher income. One important finding is that demand for unskilled and low skilled female workers increases with the increase in labour productivity. The female workers in the textile and apparel industries of Bangladesh have close ties with rural households from where they originate to a large extent (table 6B.5 and 6B.6). As a result increased employment opportunity for female workers has direct positive impacts for rural households. Thus addressing workers’ rights increases workers’ productivity, which in turn increases income of all types of households and ultimately the economy as a whole benefits. In this chapter improving the work environment is assumed to be costless. However in reality such attempts incur costs. For improvement of the work environment the entrepreneurs may spend an amount equal to the change in their income caused by the increased labour productivity. If rights of workers are addressed by both an increase in wage and increase in productivity, then the positive outcomes from the productivity increase are offset by negative effects from the wage increase. The current study has shown that in the textile and apparel industries of Bangladesh, productivity increases, coming from addressing workers’ rights, can improve economic welfare of the country as a whole. The outcome of the study depends on the level of the costs of improving workers’ rights. More research in this area is needed. Results of the current study should be considered in the light of the assumptions made in the used CGE model. For example, the CGE model used is static, constant returns to scale are assumed, and world prices are constant. However CGE models enable the user to assess the disaggregated impacts of policy changes and exogenous shocks on the economy as a whole and on its actors (industries, households and government). This study took no attempt to investigate the dynamic effects of a productivity increase, which would possibly bring greater positive impacts as cost can be spread over more years. When the entrepreneurs of Bangladesh’s textile and apparel industries are in a dilemma whether or not they should go for addressing workers’ rights, even if they are costly, the results of this study suggest that such attempts can be profitable for them, for the workers and for the economy as a whole.

161
Appendix 6A: Some features of the 1999-2000 Bangladesh SAM Table 6A.1: Accounts in the Bangladesh SAM 1999-2000
Industries (53)
Agricultural (12)
Manufacturing (24) Services (17)
Paddy Aman Rice milling Aman Urban building Paddy Boro Rice milling Boro Rural building Grains Ata and flour Construction (electricity) Jute Edible oil Construction (roads) Sugarcane Sugar Construction (others) Commercial crops Other food Utilities (electricity)
Other crops Leather Utilities (gas) Livestock Jute textiles Trade services Poultry Yarn Transportation services Shrimps Mill cloth Housing Fish Other cloth Health Forestry Woven apparel Education Knitted apparel Public administration Other textiles Financial services Tobacco products Hotels and restaurants Wood products Communications Chemicals Other services Fertiliser Petroleum products Clay Steel Machinery Other industries Natural Gas
Commodities (52): Same as industries, but only one rice milling
Factors of production (21) Agricultural labour female (4 educational levels) Poultry capital Land Agricultural labour male (4 educational levels) Cattle capital Ponds Non-agricultural labour female (4 educational levels) Non-agricultural capital Non-agricultural labour male (4 educational levels)
Households (12)
Landless Rural non-agr poor female head Urban illiterate Marginal farmers
Rural non-agr poor male head Urban low educated Small farmers
Rural non-agr rich female head Urban medium educated Large farmers
Rural non-agr rich male head Urban highly educated Other institutions (3)
Enterprises Government Rest of the world

162
Table 6A.2 – Household types and their definition Types of households Definition Agricultural landless Rural agricultural households who own no land Agricultural marginal Rural agricultural households who own up to 0.49
acres Agricultural small Rural agricultural households who own between 0.5
and 2.49 acres Agricultural large Rural agricultural households who own more than 2.49
acres Non-agricultural poor female-headed
Rural households whose head is female and not engaged in agricultural industries, and who own less than 0.5 acres of land
Non-agricultural poor male-headed
Rural households whose head is male and not engaged in agricultural industries, and who own less than 0.5 acres of land
Non-agricultural rich female-headed
Rural households whose head is female and not engaged in agricultural industries, and who own more than 0.5 acres of land
Non-agricultural rich male-headed
Rural households whose head is male and not engaged in agricultural industries, and who own more than 0.5 acres of land
Urban illiterate Urban households whose head has no schooling Urban low educated Urban households whose head's education is 'I-V class'
(LFS definition) Urban medium educated Urban households whose head's education is either 'VI-
VIII class' or 'IX-X class' (LFS definition) Urban highly educated Urban households whose head's education is either
'SSC/HSC' or 'graduate and above' (LFS definition) Note: ‘LFS definition’ refers to definition in accordance with the Labour Force Survey of Bangladesh 1995 – 96. SSC = Secondary School Certificate (this is a nation wide examination takes place after 10 years of schooling); HSC = Higher Secondary Certificate (this is also a nation wide examination for which one has to study for 2 years after passing SSC. After passing HSC one is able to enter graduation programme) Table 6A.3: Definition of education levels for labour
Labour categories Education levels
Labour with 0 level of education (unskilled labour) No formal / school education
Labour with education level 1 (low skilled labour) 1- 5 years of formal education
Labour with education level 2 (medium skilled labour)
5-10 years of formal education
Labour with education level 3 (high skilled labour) More than 10 years of formal education
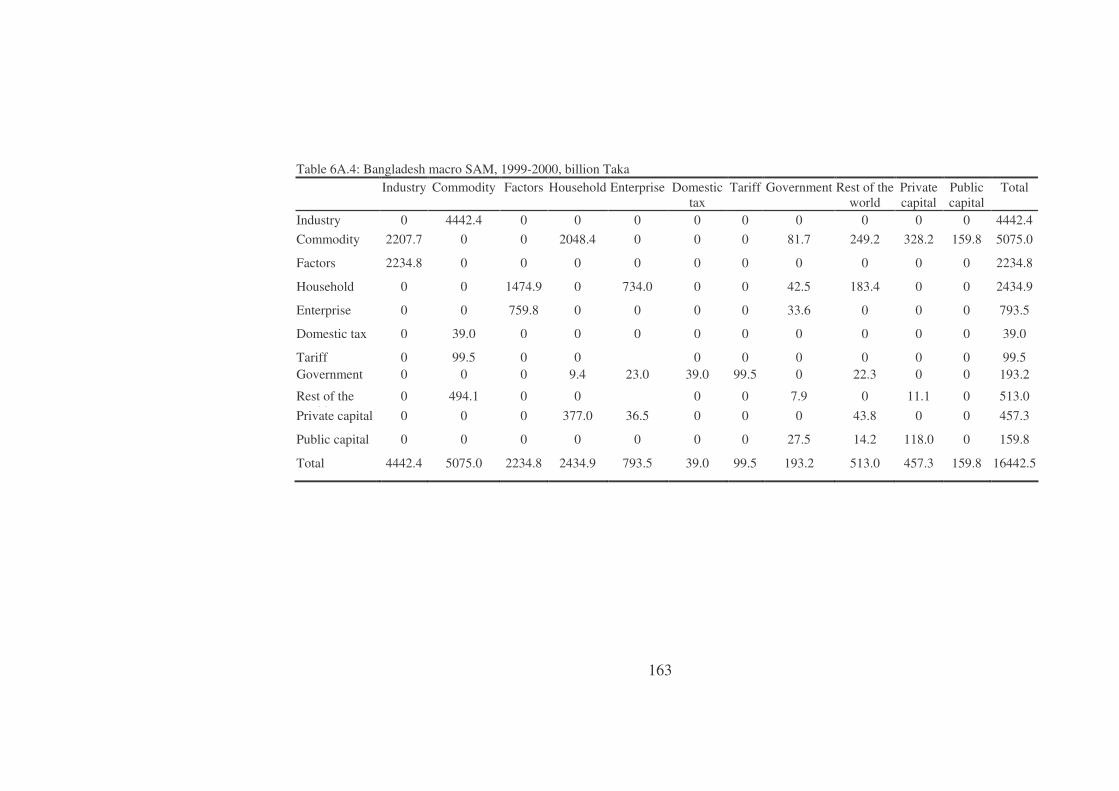
163
Table 6A.4: Bangladesh macro SAM, 1999-2000, billion Taka Industry Commodity Factors Household Enterprise Domestic
tax Tariff Government Rest of the
world Private capital
Public capital
Total
Industry 0 4442.4 0 0 0 0 0 0 0 0 0 4442.4 Commodity 2207.7 0 0 2048.4 0 0 0 81.7 249.2 328.2 159.8 5075.0
Factors 2234.8 0 0 0 0 0 0 0 0 0 0 2234.8
Household 0 0 1474.9 0 734.0 0 0 42.5 183.4 0 0 2434.9
Enterprise 0 0 759.8 0 0 0 0 33.6 0 0 0 793.5
Domestic tax 0 39.0 0 0 0 0 0 0 0 0 0 39.0
Tariff 0 99.5 0 0 0 0 0 0 0 0 99.5 Government 0 0 0 9.4 23.0 39.0 99.5 0 22.3 0 0 193.2
Rest of the world
0 494.1 0 0 0 0 7.9 0 11.1 0 513.0 Private capital 0 0 0 377.0 36.5 0 0 0 43.8 0 0 457.3
Public capital 0 0 0 0 0 0 0 27.5 14.2 118.0 0 159.8
Total 4442.4 5075.0 2234.8 2434.9 793.5 39.0 99.5 193.2 513.0 457.3 159.8 16442.5
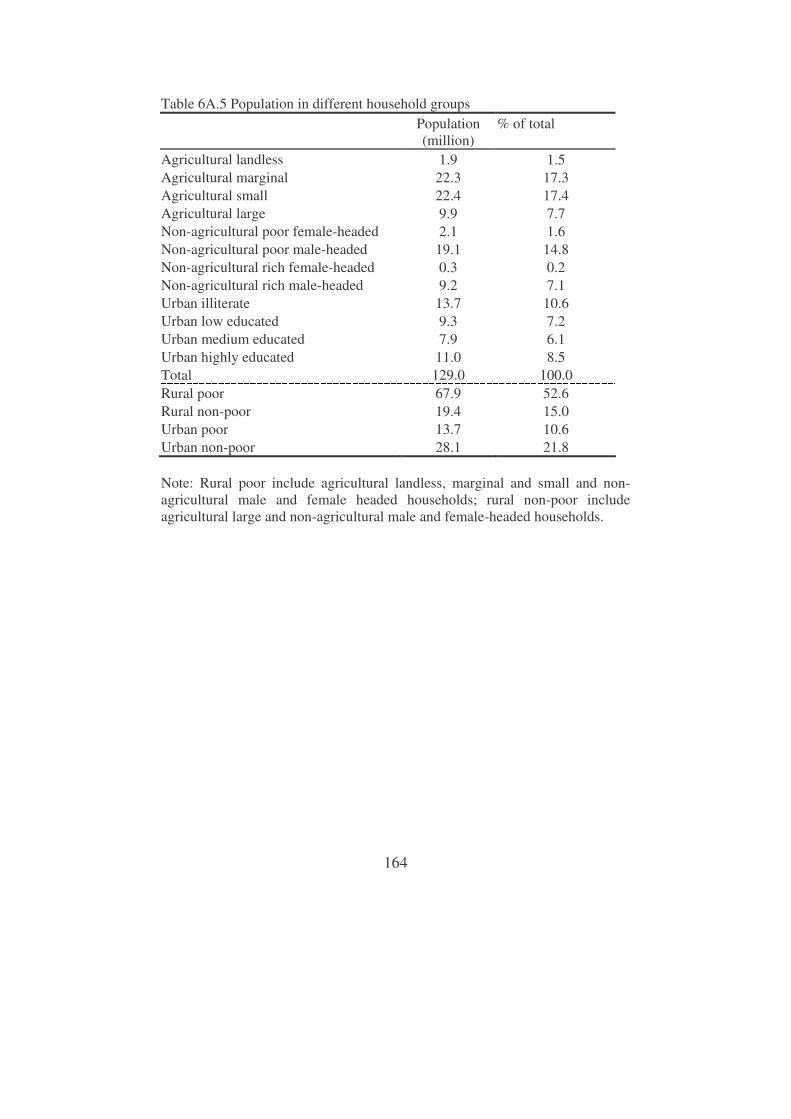
164
Table 6A.5 Population in different household groups
Population (million)
% of total
Agricultural landless 1.9 1.5 Agricultural marginal 22.3 17.3 Agricultural small 22.4 17.4 Agricultural large 9.9 7.7 Non-agricultural poor female-headed 2.1 1.6 Non-agricultural poor male-headed 19.1 14.8 Non-agricultural rich female-headed 0.3 0.2 Non-agricultural rich male-headed 9.2 7.1 Urban illiterate 13.7 10.6 Urban low educated 9.3 7.2 Urban medium educated 7.9 6.1 Urban highly educated 11.0 8.5 Total 129.0 100.0 Rural poor 67.9 52.6 Rural non-poor 19.4 15.0 Urban poor 13.7 10.6 Urban non-poor 28.1 21.8 Note: Rural poor include agricultural landless, marginal and small and non- agricultural male and female headed households; rural non-poor include agricultural large and non-agricultural male and female-headed households.

165
Appendix 6B: Textile and apparel industries of Bangladesh (SAM 1999 -2000) Table 6B.1: Position of textile and apparel industries in he Bangladesh economy
Value added share (%)
Production share (%)
Employment share (%)
Share in total export (%)
Agriculture 25.3 24.9 16.1 6 Manufacturing 22.9 36.8 13 94 Service and utilities 51.8 38.3 70.9 0 Total 100 100 100 100 Textile and Apparel (included under manufacturing) Yarn 0.3 0.6 0.5 0.1 Mill cloth 0.2 0.3 0.3 0 Other cloth 1.0 1.9 1.5 Woven apparel 2.4 3.9 2.8 56.4 Knitted apparel 0.5 1.1 0.1 18.3 Other textile 0.1 0.2 0.2 0
Table 6B.2: Structure of woven apparel and knitted apparel industries, billion Taka and %
Woven apparel (value)
Share in total woven apparel
value (%)
Knitted apparel (value)
Share in total knitted apparel
value (%) Production 172.9 50.1 Inputs 118.5 68.5 38.4 76.7 Yarn 0.6 0.3 32.5 64.8 mill cloth 70.9 41.0 0.2 0.4 other textile 9.0 5.2 0.5 1.1 other inputs 38.0 22.0 5.2 10.4 Value added 54.4 31.5 11.7 23.3 male labour 8.3 4.8 1.2 2.4 female labour 22.7 13.1 capital 23.5 13.6 10.5 20.9 Export 140.5 45.6 Export as % of production 81.3 91.1

166
Table 6B.3: Textile supply as intermediate good, billion Taka Yarn Mill cloth Other textile Import 50.6 58.8 2.2 Tariff 4.2 7.4 0.1 Import including tariff 54.8 66.2 2.3 Local production 25.9 14.3 7.8 Total supply in domestic market 80.7 80.4 10.0 Share of import in total supply(%) 67.9 82.2 22.7
Table 6B.4: Share of different labour categories in employment woven apparel and knitted apparel Woven apparel Knitted apparel Unskilled male labour 5.6 21.0 Low skilled male labour 7.3 27.7 Medium skilled male labour 6.5 24.4 High skilled male labour 7.2 26.9 Unskilled female labour 24.9 0 Low skilled female labour 25.1 0 Medium skilled female labour 12.9 0 High skilled female labour 10.4 0 Total 100 100
Table 6B.5: Share of woven apparel and knitted apparel in employment of different categories of non-agricultural labour in Bangladesh
Non-agricultural labour categories Woven apparel
(%) Knitted apparel
(%) Unskilled male labour 0.8 0.1 Low skilled male labour 1.2 0.2 Medium skilled male labour 1.2 0.2 High skilled male labour 0.8 0.1 Unskilled female labour 31.0 0 Low skilled female labour 58.4 0 Medium skilled female labour 50.9 0 High skilled female labour 17.5 0

167
Table 6B.6: Household share of different non-agricultural labour categories, %
Note: In the model value added from various factors is distributed among the households according to their shares in ownership of the respective factors. Therefore this table also reflects the share of households in income of non-agricultural labour categories.
Unskilled male
Low skilled male
Medium skilled male
High skilled male
Unskilled female
Low skilled female
Medium skilled female
High skilled female
Agricultural landless 2.2 0.7 0.3 0 1.5 0.5 0 0 Agricultural marginal 25.9 12.5 5.0 0.7 18.8 8.2 3.0 1.4 Agricultural small 17.7 17.6 13.2 5.7 16.2 16.0 10.1 7.3 Agricultural large 6.2 7.9 11.7 7.2 7.1 10.0 11.6 7.8 Non-agricultural poor female-headed
0.3 0.3 0.2 0.1 3.5 1.0 0.6 1.4
Non-agricultural poor male-headed
14.5 14.9 10.0 5.5 11.2 10.2 7.0 3.1
Non-agricultural rich female-headed
0.1 0 0 0.1 0.3 0.2 0 0.6
Non-agricultural rich male-headed
2.9 7.3 8.9 12.3 3.7 8.3 11.1 11.6
Urban illiterate 28.8 6.3 4.1 1.5 23.8 9.4 7.3 1.0 Urban low educated 1.0 30.5 6.5 2.7 4.7 22.8 7.3 3.7 Urban medium educated 0.2 1.2 37.3 4.0 2.5 7.3 23.6 4.8 Urban highly educated 0.2 0.7 3.0 60.2 6.7 6.2 18.5 57.3 Total 100 100 100 100 100 100 100 100

168
Table 6B.7: Inter household transfer of income (as a share of household income, %)
Note: Some household groups are not included in the table. Rural poor household do not transfer money to other households. Rural non-agricultural rich and urban highly educated household do not receive any household transfer.
Agricultural large
Non-agricultural rich female-
headed
Non-agricultural rich male-headed
Urban illiterate
Urban low educated
Urban medium educated
Urban highly
educated Agricultural landless 0.3 0 0.5 0.8 0 0 0 Agricultural marginal 2.7 10.3 4.0 2.7 2.5 0 1.7 Agricultural small 0 0 1.4 0 3.3 3.4 0.5 Agricultural large 0 0 0 0 0 2.5 1.8 Non-agricultural poor female-headed
0.4 0 0 0 0 0
Non-agricultural poor male-headed
1.3 0 0 0 0 0 0
Non-agricultural rich female-headed
0.6 0 0 0 0 0 0
Urban illiterate 0 0 0 0 1.2 1.2 1.7 Urban low educated 0 0 0 0 0 1.0 0.6 Urban medium educated 0 0 0 0 0 0 0.4
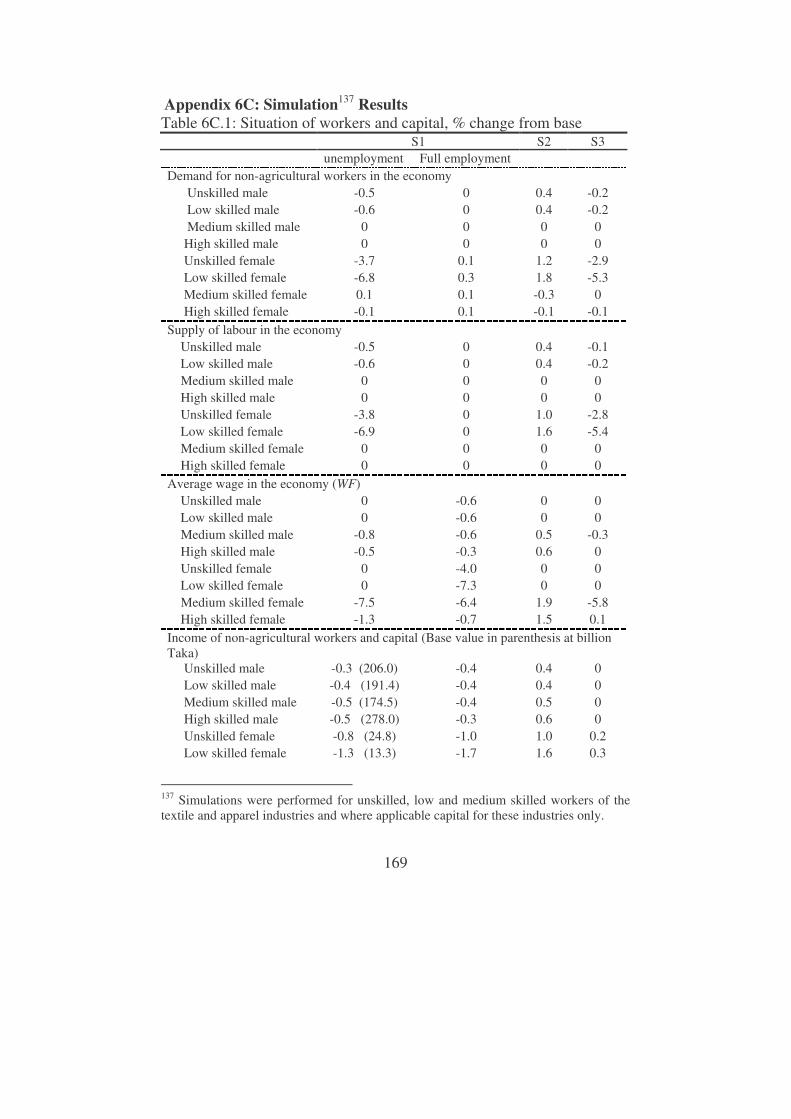
169
Appendix 6C: Simulation137 Results Table 6C.1: Situation of workers and capital, % change from base
S1 S2 S3 unemployment Full employment Demand for non-agricultural workers in the economy Unskilled male -0.5 0 0.4 -0.2 Low skilled male -0.6 0 0.4 -0.2 Medium skilled male 0 0 0 0 High skilled male 0 0 0 0 Unskilled female -3.7 0.1 1.2 -2.9 Low skilled female -6.8 0.3 1.8 -5.3 Medium skilled female 0.1 0.1 -0.3 0 High skilled female -0.1 0.1 -0.1 -0.1 Supply of labour in the economy Unskilled male -0.5 0 0.4 -0.1 Low skilled male -0.6 0 0.4 -0.2 Medium skilled male 0 0 0 0 High skilled male 0 0 0 0 Unskilled female -3.8 0 1.0 -2.8 Low skilled female -6.9 0 1.6 -5.4 Medium skilled female 0 0 0 0 High skilled female 0 0 0 0 Average wage in the economy (WF) Unskilled male 0 -0.6 0 0 Low skilled male 0 -0.6 0 0 Medium skilled male -0.8 -0.6 0.5 -0.3 High skilled male -0.5 -0.3 0.6 0 Unskilled female 0 -4.0 0 0 Low skilled female 0 -7.3 0 0 Medium skilled female -7.5 -6.4 1.9 -5.8 High skilled female -1.3 -0.7 1.5 0.1 Income of non-agricultural workers and capital (Base value in parenthesis at billion Taka) Unskilled male -0.3 (206.0) -0.4 0.4 0 Low skilled male -0.4 (191.4) -0.4 0.4 0 Medium skilled male -0.5 (174.5) -0.4 0.5 0 High skilled male -0.5 (278.0) -0.3 0.6 0 Unskilled female -0.8 (24.8) -1.0 1.0 0.2 Low skilled female -1.3 (13.3) -1.7 1.6 0.3
137 Simulations were performed for unskilled, low and medium skilled workers of the textile and apparel industries and where applicable capital for these industries only.
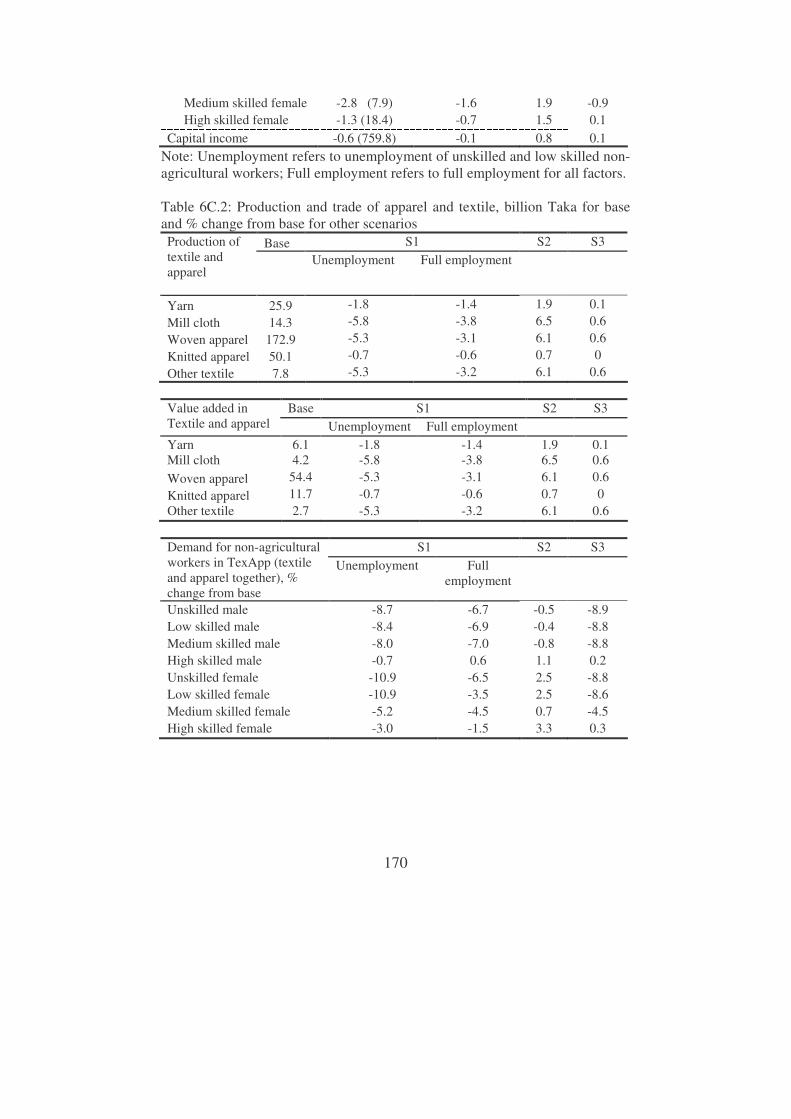
170
Medium skilled female -2.8 (7.9) -1.6 1.9 -0.9 High skilled female -1.3 (18.4) -0.7 1.5 0.1 Capital income -0.6 (759.8) -0.1 0.8 0.1
Note: Unemployment refers to unemployment of unskilled and low skilled non- agricultural workers; Full employment refers to full employment for all factors. Table 6C.2: Production and trade of apparel and textile, billion Taka for base and % change from base for other scenarios
Base S1 S2 S3 Production of textile and apparel
Unemployment Full employment
Yarn 25.9 -1.8 -1.4 1.9 0.1 Mill cloth 14.3 -5.8 -3.8 6.5 0.6 Woven apparel 172.9 -5.3 -3.1 6.1 0.6 Knitted apparel 50.1 -0.7 -0.6 0.7 0 Other textile 7.8 -5.3 -3.2 6.1 0.6
Base S1 S2 S3 Value added in
Textile and apparel Unemployment Full employment Yarn 6.1 -1.8 -1.4 1.9 0.1 Mill cloth 4.2 -5.8 -3.8 6.5 0.6 Woven apparel 54.4 -5.3 -3.1 6.1 0.6 Knitted apparel 11.7 -0.7 -0.6 0.7 0 Other textile 2.7 -5.3 -3.2 6.1 0.6
S1 S2 S3 Demand for non-agricultural
workers in TexApp (textile and apparel together), % change from base
Unemployment Full employment
Unskilled male -8.7 -6.7 -0.5 -8.9 Low skilled male -8.4 -6.9 -0.4 -8.8 Medium skilled male -8.0 -7.0 -0.8 -8.8 High skilled male -0.7 0.6 1.1 0.2 Unskilled female -10.9 -6.5 2.5 -8.8 Low skilled female -10.9 -3.5 2.5 -8.6 Medium skilled female -5.2 -4.5 0.7 -4.5 High skilled female -3.0 -1.5 3.3 0.3
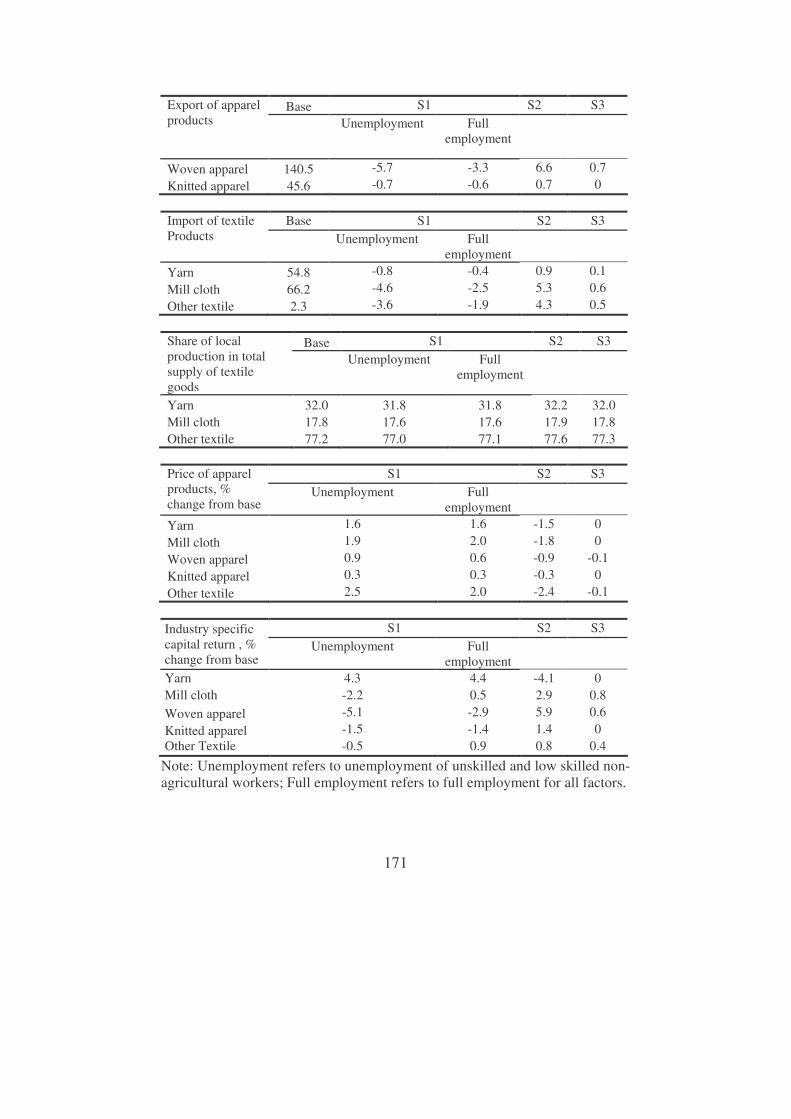
171
Base S1 S2 S3 Export of apparel products
Unemployment Full employment
Woven apparel 140.5 -5.7 -3.3 6.6 0.7 Knitted apparel 45.6 -0.7 -0.6 0.7 0
Base S1 S2 S3 Import of textile
Products
Unemployment Full employment
Yarn 54.8 -0.8 -0.4 0.9 0.1 Mill cloth 66.2 -4.6 -2.5 5.3 0.6 Other textile 2.3 -3.6 -1.9 4.3 0.5
Base S1 S2 S3 Share of local
production in total supply of textile goods
Unemployment Full employment
Yarn 32.0 31.8 31.8 32.2 32.0 Mill cloth 17.8 17.6 17.6 17.9 17.8 Other textile 77.2 77.0 77.1 77.6 77.3
S1 S2 S3 Price of apparel
products, % change from base
Unemployment Full employment
Yarn 1.6 1.6 -1.5 0 Mill cloth 1.9 2.0 -1.8 0 Woven apparel 0.9 0.6 -0.9 -0.1 Knitted apparel 0.3 0.3 -0.3 0 Other textile 2.5 2.0 -2.4 -0.1
S1 S2 S3 Industry specific
capital return , % change from base
Unemployment Full employment
Yarn 4.3 4.4 -4.1 0 Mill cloth -2.2 0.5 2.9 0.8 Woven apparel -5.1 -2.9 5.9 0.6 Knitted apparel -1.5 -1.4 1.4 0 Other Textile -0.5 0.9 0.8 0.4
Note: Unemployment refers to unemployment of unskilled and low skilled non- agricultural workers; Full employment refers to full employment for all factors.

172
Table 6C.3: Macro indicators, billion Taka for base and % change from base for other scenarios Base S1 S2 S3
Unemploy
ment Full
employment Private consumption 2102.3 -0.2 0 0.3 0.1 Fixed investment 488.0 0 0 0 0 Government consumption 81.7 Exports 249.2 -3.2 -1.8 3.7 0.4 Imports -547.9 -1.5 -0.8 1.7 0.2 GDP at market prices (spending) 2373.3 -0.2 0 0.3 0.1 Real exchange rate (Taka per $ for base & % change for non-base) 50.3 0.3 0.3 -0.3 0
Note: Unemployment refers to unemployment of unskilled and low skilled non- agricultural workers; Full employment refers to full employment for all factors. Table 6C.4: Income of households and enterprises, billion Taka for base and % change from base for other scenarios
Base S1 S2 S3
Unemployment
Full employment
Agricultural landless 18.2 0 0 0 0 Agricultural marginal 241.3 0 0.1 0.1 0 Agricultural small 335.2 0 0.1 0.1 0 Agricultural large 307.7 0 0.2 0 0.1 Non-agricultural poor female-headed 18.7
-0.3 0 0.4 0.1
Non-agricultural poor male-headed 245.7
-0.2 0 0.3 0.1
Non-agricultural rich female-headed 9.9
-0.1 0.2 0.2 0.1
Non-agricultural rich male-headed 229.2
-0.2 0.1 0.2 0.1
Urban illiterate 149.3 -0.3 -0.2 0.3 0 Urban low educated 169.5 -0.4 -0.2 0.5 0.1 Urban medium educated 242.8 -0.5 -0.2 0.6 0.1 Urban highly educated 578.7 -0.5 -0.2 0.6 0.1 Enterprises 794.5 -0.6 -0.1 0.7 0.1
Note: Unemployment refers to unemployment of unskilled and low skilled non- agricultural workers; Full employment refers to full employment for all factors.

173
Table 6C. 5: Disaggregated real household consumption, billion Taka for base and % change from base for other scenarios Base S1 S2 S3
Unemployment
Full employment
Agricultural landless 16 0 0 0 0 Agricultural marginal 231 0 0.1 0.1 0 Agricultural small 307 0 0.1 0.1 0 Agricultural large 238 0 0.2 0 0.1 Non-agricultural poor female-headed 17 -0.3 0 0.4 0.1 Non-agricultural poor male-headed 223 -0.2 0 0.3 0.1 Non-agricultural rich female-headed 7 -0.1 0.2 0.2 0.1 Non-agricultural rich male-headed 190 -0.2 0.1 0.2 0.1 Urban illiterate 140 -0.3 -0.2 0.3 0 Urban low educated 147 -0.4 -0.2 0.5 0.1 Urban medium educated 183 -0.5 -0.2 0.6 0.1 Urban highly educated 403 -0.5 -0.2 0.6 0.1 TOTAL 2102 -0.2 0 0.3 0.1
Note: Unemployment refers to unemployment of unskilled and low skilled non- agricultural workers; Full employment refers to full employment for all factors. Table 6C.6: Household welfare levels and changes (Equivalent Variation), billion Taka for base and % change from base for other scenarios Base S1 S2 S3 Unemploy
ment Full employment
Agricultural landless 16.0 -0.1 0 0.1 0 Agricultural marginal 231.0 -0.1 0 0.1 0 Agricultural small 307.0 -0.1 0.1 0.1 0 Agricultural large 238.0 0 0.2 0.1 0.1 Non-agricultural poor female-headed 17.0 -0.3 -0.1 0.4 0.1 Non-agricultural poor male-headed 223.0 -0.3 -0.1 0.3 0.1 Non-agricultural rich female-headed 7.0 -0.1 0.3 0.1 0.1 Non-agricultural rich male-headed 190.0 -0.2 0.1 0.3 0.1 Urban illiterate 140.0 -0.3 -0.2 0.3 0 Urban low educated 147.0 -0.3 -0.2 0.4 0.1 Urban medium educated 183.0 -0.5 -0.2 0.6 0.1 Urban highly educated 403.0 -0.5 -0.1 0.6 0.1
Note: In the Base column, consumption is valued at base-year prices. The non-BASE columns show EV as a percentage of the BASE consumption value. Unemployment refers to unemployment of unskilled and low skilled non- agricultural workers; Full employment refers to full employment for all factors.

174
Chapter 7 General discussion and conclusions 7.1 Introduction This thesis was aimed at exploring and analysing some recent changes and challenges faced by the apparel industry of Bangladesh and by the economy as a whole. More specifically, the objectives were to explore and analyse the importance of the apparel industry in the Bangladesh economy, the challenges faced by this industry, impacts of implementing various international trade rules on the apparel industry, consequences of Bangladesh’s attempts to enter in bilateral and regional preferential trade agreements with its neighbouring countries, status of workers’ rights in the apparel industry of Bangladesh and how globalisation is affecting the level of addressing these rights and also impacts of increases in workers’ productivity and wage on the apparel industry and on the Bangladesh economy. Earlier chapters addressed these objectives providing both quantitative and qualitative analyses of the relevant issues. This final chapter provides a summary of the main findings of the previous chapters and also provides discussions on limitations and advantages of the analyses of the thesis. Section 7.2 discusses models and data used in different chapters, section 7.3 provides a synthesis of the results and finally section 7.4 provides an overall discussion and final conclusions. 7.2 Discussion on methods and data This section provides a general discussion on methods and data used in various chapters of this thesis. The thesis has addressed its objectives using two computable general equilibrium (CGE) models. Both a global and single country CGE model has been applied in different chapters. Some of the chapters are also based on qualitative discussions of the issues. Global or multi-country general equilibrium model – the GTAP model A global CGE model helps to analyse impacts of international policy changes on various countries and different industries and other actors within a country. Such a CGE model captures both income and product transfers between countries and thus can simulate impacts arising out of any international policy change on different countries. As one important objective of this thesis is to explore the effects of implementing WTO rules on the apparel industry of Bangladesh and on the Bangladesh economy as a whole, a global CGE model has been applied (chapter 3). This model has also been applied to analyse impacts of regional and bilateral preferential trade arrangements attempts by Bangladesh (chapter 4). In particular the thesis has applied the model and the
175
data of the Global Trade Analysis Project (GTAP) version 5.1. The assumptions and base of the default model have been updated wherever necessary in order to incorporate important recent realities. In the default settings full employment was assumed for all countries, while the current thesis has assumed unemployment for some types of labour in countries for which there are evidences of large unemployment and/or underemployment. The results from GTAP should be taken with some cautions, as it is a linearised comparative static model and assumes that all markets are perfectly competitive, and constant returns to scale prevail in all production and trade activities. The model and data also do not incorporate the illegal trade issue, which is very large in case of Bangladesh (chapter 4). The commodity aggregation level in GTAP is quite high, this does not permit to analyse impacts in a more disaggregated level, for example, impacts on specific types of apparel. The base year of the data used here is 1997. Though some important realities that occurred after this year have been incorporated and the base has been updated on the basis of that, still this may differ from the actual situation. Therefore the results should be interpreted in the light of the assumptions made and constraints in the model. Single country CGE model – the IFPRI model Single country CGE models are extensively used to analyse relationships between different industries in an economy. In particular, such CGE models enable the user to assess the disaggregated impacts of policy changes and exogenous shocks on the structure of the economy and on its actors (industries, households and government). Apparel being the main export industry of Bangladesh and a big source of employment for non-agricultural workers, has the potential to affect the economy as a whole as a consequence of changes in this industry alone. Therefore a single country CGE framework has been applied in chapter 6 to analyse how the Bangladesh economy is affected by changes in workers’ productivity and wages in the apparel industry. This chapter applies a single country CGE model of Bangladesh used in Arndt et al. (2002), which is based on a 1999-2000 social accounting matrix (SAM). The model is based on the core CGE model of the International Food Policy Research Institute (IFPRI) documented in Lofgren et al. (2002). The single country CGE model is also not free from limitations as this is also a static model based on some stringent assumptions. For example, the model assumes capital to be industry specific. Moreover in international markets, export demand and import supply are considered to be infinitely elastic, which means constant world market prices. Therefore, the results should be interpreted in light with the assumptions used in the model. In this research no explicit link between the multi-country and single country CGE models has been made given the different levels of aggregation and basic assumptions

176
underlying the models. However it could be a useful exercise to link both models. Analytical chapter based on quantitative information Chapters 2 of this thesis is an analytical chapter based on quantitative information. These information were collected from various secondary sources which include reported information of the Bangladesh Bureau of Statistics, the World Bank and different research studies. This chapter also analyses the trade theories which are root of the analysis of subsequent chapters. Qualitative analysis Chapter 5 of this thesis is based on qualitative analyses of the issues. This chapter is mainly based on information collected during 2003-2004 for a study under the project titled ‘Mobilising for worker accountability in Bangladesh’, a joint project between Bangladesh institute of Development Studies (BIDS) and the Institute of Development Studies (IDS), UK. Even with the limitations discussed, the thesis has rightly sketched the current picture of challenges and opportunities associated with the apparel industry of Bangladesh and issues concerning future survival of this industry. The thesis has also analysed how regional preferential trade arrangements can be beneficial for the Bangladesh economy. Though solved under stringent constraints, CGE modelling frameworks are the best possible way to cover interactions between different countries of the world (global CGE) or different actors in a particular economy (single country CGE). It is successful in understanding possible effects for the disaggregated economy from changes in one segment of the economy. Moreover the analyses of chapters 2 and 5 have complemented the CGE analyses. 7.3 Conclusions from different chapters The objectives and research questions elaborated in chapter 1 have been addressed in chapters 2 to 6. Chapter 2 has provided an overview of the apparel industry of Bangladesh, the main export industry comprising about 75% of export earning of Bangladesh. Chapter 2 has also discussed relevant trade theories for the thesis. It has presented a comprehensive analysis of the nature of growth of the apparel industry, actors behind the growth and also various challenges faced by this industry. It is revealed from the analysis that both domestically originated and international market originated challenges are faced by the apparel industry. The most challenging international issue for Bangladesh apparel is the abolition of the Multi-Fibre Arrangement (MFA) import quotas since 1 January 2005. This chapter has apprehended that with the

177
abolition of import quotas Bangladesh apparel might face a downturn in its production and export, which might decrease employment and welfare of the country. Among the domestically originated challenges limited product and market diversification, low productivity of workers, and infrastructural constraints are identified to be crucial. The potential negative impacts of abolition of MFA import quotas on Bangladesh apparel, is investigated using a global CGE model in chapter 3. For that purpose the data and model of the Global Trade Analysis Project (GTAP) has been applied. It is evident from the results that abolition of MFA import quotas will decrease the aggregate export price of apparel in all regions and will increase the world export of apparel as well as world welfare. However abolition of import quotas extends negative impacts on production and export of apparel of Bangladesh, which in turn decreases GDP, per capita household utility and welfare of Bangladesh. It is also found that China and India, two important competitors of Bangladesh, experience positive impacts. Before MFA import quota abolition Bangladesh was enjoying tariff preferences and relatively less restrictive import quotas in some important markets. For example there was no tariff or import quota restriction in the EU and Canada. Moreover in the USA the import quota restriction for Bangladesh was less compared to its competitors. Abolition of the MFA import quota deteriorates the preferential position of Bangladesh compared to the countries that were facing relatively more restrictive import quota restrictions. As a result of import quota abolition Bangladesh loses it competitive position and the economy experiences negative impacts. Even in scenarios containing tariff reduction along with quota removal, Bangladesh faces negative impacts. Depending on various scenarios, apparel export of Bangladesh decreases by 9.6% to 15.1%, while production of apparel decreases by 8.9% to 13.9%. There is a 0.5% to 0.9% decrease in GDP and the poverty situation also deteriorates. Employment of unskilled workers decreases by 0.6% to 1.7% and returns of unskilled workers by 2.4% to 5%. Average household income also decreases by 3.8% to 6.4%. Thus this chapter reveals that world wide liberalisation of textile and apparel trade generates negative outcomes for Bangladesh. While quota abolition is posing negative effects on apparel as the major export industry of Bangladesh, Bangladesh attempts to engage in preferential trade arrangements with its South Asian neighbours as well as with some East Asian countries is posing opportunity to increase not only export of apparel but also over all export and welfare. Such arrangements are also expected to generate product and market diversification for Bangladesh. Chapter 4 provides a comparative picture of possible implications of Bangladesh’s initiatives to engage in various preferential trade arrangements. This chapter has also applied the global general equilibrium model of GTAP. It is evident that though intra-regional trade among the South Asian countries is insignificant, a preferential trade arrangement among them through the South Asian Free Trade Area
178
(SAFTA) can be welfare increasing for all of them. It is observed that much of the welfare gains occur due to increased employment of unskilled labour. The region as a whole can enjoy both economic and non-economic benefits through successful implementation of SAFTA. For Bangladesh another preferential trade arrangement opportunity, the Bay of Bengal Initiative for Multi-Sectoral Technical and Economic Cooperation (BIMSTEC) is even more beneficial. Therefore this chapter concluded that Bangladesh might concentrate in implementing both SAFTA and BIMSTEC. An important issue concerning international trade performance in the present world is the level of addressing workers’ rights. While chapter 2 identified that the level of addressing workers’ rights is an important determinant of competitiveness of the apparel industry of Bangladesh in the current world, chapter 5 has elaborated further on this issue. It has looked into the status of workers’ rights in the apparel industry of Bangladesh and impacts of globalisation in addressing workers’ rights. The analysis of this chapter reveals that existing international and national rules and regulations protecting various rights of workers are largely violated in the apparel industry of Bangladesh. However there are both good and bad factories. It is also evident that globalisation is posing two opposite pressures in relation to addressing workers’ rights. At one side international market competition compels producers to reduce production cost, which often results in violation of workers’ rights; on the other hand concerns of developed country buyers (which is induced by consumers and trade unions) about status of addressing workers’ rights compel producers to address rights, which increases cost of production. Depending on which pressure mechanism dominates, globalisation is either increasing the level of addressing rights or reducing it in various apparel factories. It is also pointed out that if various shortcomings of the apparel industry (e.g. infrastructure bottlenecks, high cost of investment and corruption) are reduced, that will reduce the cost of production and will reduce the impacts of price pressure of globalisation. This means entrepreneurs will be able to reduce prices of their products even after addressing workers’ rights. The chapter has concluded that better socio-economic and working conditions of the workers will go a long way to improve the lives of workers, mainly female, of the apparel industry and can also improve the competitive position of this industry. The issue of workers’ rights gets further attention in chapter 6 where a single country CGE model has been applied to analyse the effects of a labour productivity increase resulting from better addressing worker’s rights. This chapter also considers the impacts of addressing workers’ rights in terms of increasing their wage. It is observed from the results that only an increase in the minimum wage for unskilled, low and medium skilled workers in the textile and apparel industries has negative impacts for these groups of workers in aggregate and also for the economy as a whole in terms of export, GDP and welfare. This mainly evolves from the decrease in labour demand as a result of

179
increased wage costs for entrepreneurs. However labour productivity increasing improvements in factory conditions and services to workers not only increase incomes of workers of most categories, but also the welfare in the economy as a whole. The entrepreneurs as the owners of capital also enjoy higher incomes. Moreover employment of female workers also increases. This chapter has indicated that for improvement of the work environment the entrepreneurs may spend an amount equal to the change in value added linked to capital caused by the increased labour productivity. When both wage and productivity of workers increase, then the income and welfare increase is smaller than with the labour productivity change alone. The findings of different chapters of this thesis imply that the major export industry of Bangladesh, the apparel industry, is going through a challenging phase and it is posing challenges and opportunities to the economy as a whole (discussed further in the next section). The chapters have revealed how changes in international and regional trade policies have various effects on the apparel industry but also on export and welfare as a whole and on the poverty situation and rural household income. The thesis has also revealed that addressing rights of workers has become a crucial determinant of competitiveness in the current liberalised world. 7.4 Discussion and conclusions For the last one and a half decade the apparel industry of Bangladesh has been the main force of export growth in Bangladesh. It is revealed in this thesis that this major export industry of Bangladesh is facing various challenges among which, abolition of the MFA import quota is a major concern. Though trade literatures generally consider trade liberalisation to be beneficial for economic performance (e.g. Winters, 2004) and poverty (e.g. Winters et al., 2004), the current study indicates that liberalisation of world trade of textile and apparel (abolition of the MFA import quotas and tariff liberalisation of textile and apparel) leads to deterioration of the economic performance and poverty situation of Bangladesh. Though the world export of apparel and aggregate welfare of the world increases (table 3.3), the impacts are negative for Bangladesh. Earlier studies by Mlachila and Yang (2004), Lips et al. (2003) have also predicted such pessimistic impacts for Bangladesh as a result of textile and apparel trade liberalisation. It is also pointed out in the current thesis that people who are directly or indirectly linked to the apparel industry may suffer in terms of employment and income loss. The GDP loss of 0.5% to 0.9% may seem small, but the crucial issue is that poor people are affected most by liberalisation of textile and apparel trade. Before the MFA import quota abolition, Bangladesh’s apparel industry was enjoying less restrictive import quotas and the industry grew not on the basis of real comparative advantage but under special preferences. The liberalisation of world trade of apparel is

180
reducing these existing preferences for Bangladesh’s apparel. The development of the apparel industry under the special preferences may have resulted in some competitive factories and commodities and some uncompetitive factories and commodities. The global CGE model did not permit to check the performance of individual factories and commodities. It is noticed in Ahmed (2005) that even after abolition of the import quota knitted apparel is growing, while growth in woven apparel is less. It has also been noticed that among different categories of woven apparel products, some are growing at a higher degree while some others are even facing negative growth. Thus the experience is mixed for different products categories, which could not be checked in the CGE frame work. The calculated negative impacts of trade liberalisation for apparel may therefore be relative to a growth path of individual commodities. Winters et al. (2004) have noted that unemployment arising out of trade liberalization and other negative impacts like reduction in well-being of people may be transitional (short run) in nature. They have argued that poverty implications of trade liberalisation depend on the starting point of a country, the nature of the reform measure and also on the nature of the poor and their sustainability mechanism. These considerations along with the institutional framework (determining the price impact of liberalisation), will determine the nature of impacts of liberalisation. Also they have not found any support for the notion that trade liberalisation in general will extend adverse effects. As the current study does not include changing dynamics of the coping mechanism of Bangladesh (new investment, changes in redistribution, improvement in the efficiency etc.) after the MFA import quota abolition, it cannot be said whether the negative impacts will remain for a transitional period or for a longer period. However, following Oskam et al. (2004), development of institutions and infrastructure could be beneficial for Bangladesh in terms of reducing negative impacts of liberalisation and/or in terms of stimulating positive impacts of trade liberalisation. Wobst (2003) has also suggested that either for domestic or for global trade liberalisation, improved infrastructure may lead to lower marketing cost and better market integration. Though the data and model used in chapter 3 did not permit to see effects of liberalisation of textile and apparel industries on the rural economy, mainly in terms of changes in remittance sent by apparel workers, linking the findings of this chapter with the analysis of chapter 6 (section 6.5), we may infer some consequences. Most of the workers working in the apparel industry are unskilled (also low and medium skilled according to chapter 6 where a further disaggregation of unskilled workers has been made) workers and a quarter of them send remittances to their rural households. When employment of unskilled workers and their real income decrease as a result of the MFA import quota abolition and tariff liberalisation of textile and apparel, their aggregate capacity to send remittances to rural households will also decrease. Moreover the decrease in income of households on average may lead to a decrease of transfer income (income from other households) to rural

181
households. Both effects lead to negative impacts of the MFA import quota abolition on rural income. It is also revealed in this thesis that an increase in workers’ productivity will generate positive impacts on the earnings of the apparel workers and thus on the rural economy. Though the MFA import quotas have been completely abolished since 1 January 2005, and following the discussions above, we may expect to observe a downturn in apparel production and export. However the performance of the industry until May 2005 does not show such a downturn (Ahmed, 2005). Chapter 3 (table 3B.15) also noted that in general, exports of the MFA import quota restricted apparel products are growing in the USA market during the period of January – August 2005 compared to the export in similar period in 2004. However some apparel products are facing downturn in their export to the USA, e.g. cotton under wares, coats for women etc. But it is too early to judge impacts of international policy changes. Therefore future research in this connection is needed to explore real effects of the MFA import quota abolition on Bangladesh. In the meantime performance of the apparel industry should be backed by improvement of various shortcomings of this industry (mentioned in chapter 2 and chapter 5). These include development of infrastructure, better investment facilities, and initiatives for capacity building of workers. More specific port, electricity and telecommunication facilities need special attention. The analysis of this thesis has revealed that Bangladesh produces a small variety of apparel products and it sells its products in few markets. Such a situation increases the risk of losing business if other competitors capture the markets for those few products. Therefore, product diversification in apparel may help to minimise risk of losing markets. It is to be remembered that in the import quota free competitive world, delivery of good quality products within a short span of time is crucial to sustain. Success of knitted apparel in terms of higher value added138 and there by in meeting ROO requirements in the EU, woven apparel may also attempt to build integrated factories (every process under the same roof), which will save on lead time and will let the woven apparel take the advantage of EU-GSP facilities by fulfilling their ROO requirements. But higher investment is needed to build woven apparel (chapter 2) and therefore the government may encourage investment in this industry. While abolition of the MFA import quotas is posing a pessimistic picture of the Bangladesh economy, potential preferential trade agreements with different countries are predicted to be welfare improving for Bangladesh. The trade gains may be small out of SAFTA, BIMSTEC and bilateral preferential trade
138 The high value addition by knitted apparel is not reflected in the Bangladesh SAM of chapter 6 because the 1999-2000 SAM of Bangladesh used in that chapter is constructed mainly on the basis of a 1993-94 input-output table and at the time of construction of the input-output table the value addition of the knitted apparel was not as high as present.
182
arrangements with India and Sri Lanka, but other benefits like improvement in intra-country relationships in South Asia may prove to be substantial. Currently Bangladesh and other South Asian countries are moving forward to make SAFTA a success and it is expected that such attempts will bring both trade and non trade benefits for Bangladesh. Considering the importance of the issue of workers’ rights for remaining competitive, apparel factories should address rights of their workers according to the rules covered by ILO labour standards and by national labour legislations. Government initiatives for effective implementation of existing labour laws and modification of laws, where necessary, can improve state of addressing workers’ rights and their productivity. Capacity enhancing training for apparel workers can be highly beneficial to increase their productivity. Employers in association with the government can take such initiatives. In this connection future research may elaborate on mechanisms to increase labour productivity by addressing workers’ rights. It is reflected in this thesis that infrastructure bottlenecks in terms of port facilities, electricity, telecommunications etc. are important shortcomings of the apparel industry. Minimising such shortcomings along with reducing high cost of finance and corruption may help this industry to remain competitive in an import quota free world and also that may induce the apparel entrepreneurs not to pass price pressure of international competition on the rights of workers for the purpose of reducing cost of production. Thus adding on to the notion expressed in Oskam et al. (2004) that long term growth strategies for LFAs require the development of institutions and infrastructure, we may also say that in case of Bangladesh, development of infrastructure may help to prevent the deterioration of the workers’ rights situation in a liberal and competitive world. Bangladesh, a densely populated LDC with limited export base, is passing a challenging phase as its main export industry is in challenge by international policy changes. The general equilibrium analyses of the current thesis have identified various effects of trade policies. Even with the limitations of CGE models and data, the thesis points to the following principal conclusions:
1. Abolition of the MFA import quota and tariff liberalisation of textile and apparel will decrease production and export of apparel of Bangladesh by 8.9% to 13.9% and by 9.6% to 15.1% respectively. This results in a welfare loss of $694 million - $884.3 million for the economy. Return of unskilled workers, who mainly belong to poor households, decreases by 2.4% to 5%. All these indicate negative impacts on the poverty situation of the country.
2. Preferential free trade agreements like SAFTA or BIMSTEC can positively affect the Bangladesh economy and also the apparel industry. Welfare gains from SAFTA and BIMSTEC are $111 million and $150
183
million respectively. Production of apparel increases by 2.7% and 7.8% respectively. These regional trade arrangements will not only generate economic benefits but there is also scope for non-economic benefits in terms of better relationships among South Asian countries.
3. Workers’ rights are heavily violated in the apparel industry of Bangladesh and price pressure of globalisation may deteriorate the situation further. But the status of addressing rights of workers is an important determinant of competitiveness in the current world as consumers negatively weight products produced by violating rights. In addition to initiatives of the entrepreneurs, trade unions, ILO and other international organisations, government initiatives to monitor and implement existing labour laws are necessary.
4. Addressing rights of workers in terms of productivity increasing improvements in work environment in factories increases production of apparel. This increases incomes of the apparel workers and the households where they belong. Ultimately GDP and income of entrepreneurs will also increase. As most of the workers of apparel industry are unskilled and they remit a part of their income to the rural households from where they are originating, increase in their income has the potential to increase rural household income.

184
Bibliography Abdou, O.A. 1997. "Effects of Luminous Environment on Worker Productivity in Building Spaces." Journal of Architectural Engineering, 3:3, pp. 124-32. Afsar, R. 2001. "Sociological Implications of Female Labour Migration in Bangladesh," in Globalisation and Gender: Changing Patterns of Women's Employment in Bangladesh. R. Sobhan and N. Khundker eds. Dhaka: Centre for Policy Dialogue and University Press Limited, pp. 91-165. Ahmed, N. 2001. "Trade Diversion Due to the Europe Agreements: Should Bangladesh Care?" Research Report, 171, Bangladesh Institute of Development Studies, Dhaka, Bangladesh. Ahmed, N. 2005. "External Sector: Performance and Prospects." paper presented in the seminar on National Budget for 2005-06 and PRSP, organised by Bangladesh Institute of Development Studies, 29 May 2005, Dhaka, Bangladesh. Armington, P.A. 1969. "A Theory of Demand for Products Distinguished by Place of Production." IMF Staff Papers, 16:1, pp. 159-78. Arndt, C., P. Dorosh, M. Fontana, and S. Zohir with M. El-Said and C. Lungren. 2002a. "Opportunities And Challenges In Agriculture and Garments: A General Equilibrium Analysis of The Bangladesh Economy." TMD Discussion Paper, 107, International Food Policy Research Institute: Washington DC. Arndt, C., S. Robinson, and F. Tarp. 2002b. "Parameter estimation for a computable general equilibrium model: a maximum entropy approach." Economic Modelling, 19, pp. 375-398. ATC, 1994. "Agreement on Textile and Clothing", The World Trade Organisation. Bach, C.F., B. Dimaranan, T.W. Hertel, and W. Martin. 1997. "Market Growth Structural Change and the Gain From the Uruguay Round." DERG Working Paper, 3, Development Economics Research Group, University of Copenhagen, Institute of Economics.
185
Bakht, Z., and B. Sen. 2002. "Border Trade in the South Asian Growth Quadrangle (Bangladesh, Bhutan, India and Nepal)." Bangladesh Institute of Development Studies, Dhaka, Bangladesh, mimeo. Balassa, B. 1982. Development Strategies in Semi-industrial Countries. Oxford: Oxford University Press. Bandara, S. J., and W. Yu. 2001. "How Desirable is the South Asian Free Trade Area? - A Quantitative Economic Assissment." SJFI – Working Paper no. 16. Bardhan, P.K. 1970. Economic Growth, Development and Foreign Trade. New York: Wiley. Barrientos, S. 2000. "Globalization and Ethical Trade: Assessing the Implications for Development." Journal of International Development, 12, pp. 559-70. Barrientos, S.,C. Dolan, and A Tallontire. 2003. "A Gendered value Chain Approach to Codes of Conduct in African Horticulture." World Development, 31:9, pp. 1511-26. Barro, R.J., and X. Sala-i- Martin. 1995. Economic Growth. New York: McGraw-Hill. Bhagwati, J., and T.N. Srinivasan. 1985. "Trade Policy and Development," in Dependence and Interdependence. G. Grossman ed. Oxford: Basil Blackwell, pp. 88-122. Bhagwati, J. 1968."More on the Equivalence of Tariffs and Quotas", American Economic Review, 58:1, pp. 142-146. BEI and World Bank, 2003. "Improving the Investment Climate in Bangladesh." Bangladesh Enterprise Institute and World Bank: Dhaka. BGMEA. 2003-2004. Members’ Directory, 2003-2004, Bangladesh Garment Manufacturers and Exporters Association: Dhaka. Bhattacharya, D., and R. Rahman. 2000a. "Bangladesh's Apparel Sector: Growth Trends and The Post-MFA Challenges." Paper presented at the seminar on Growth of Garments Industry in Bangladesh: Economic and Social Dimensions. organised by BIDS & OXFAM, 21-22 January 2005: Bangladesh.
186
Bhattacharya, D., and R. Rahman. 2000b. "Experience with Implementation of WTO-ATC and Implications for Bangladesh." CPD Occasional Paper Series, no. 7, Centre for Policy Dialogue: Dhaka. Bow, J. 2001. "Bangladesh's Export - Apparel Industry: into the 21st Century - The next Challenges." Asia Foundation, Bangladesh. Brockmeier, M. 2001. "A Graphical Exposition of the GTAP model", GTAP Technical Paper, no. 8, Center for Global Trade Analysis, Purdue University, West Lafayette, IN. Cairola, E., and A. Chiarabini. 1998. "International Labour standards: A Trade Union Training Guide." International Training Centre of the ILO: Turin. Chambers, R.G. 1988. Applied Production Analysis, a dual approach. Cambridge: Cambridge University Press. Chiang, A.C. 1984. Fundamental Methods of Mathematical Economics: McGraw-Hill International Editions. Coe, D.T., and E. Helpman. 1995. "International R & D Spillovers." European Economic Review, 39, pp. 859-87. Cookson, F.E. 2002. "Overview of Sub-regional Economic Cooperation," in Towards Greater Sub-regional Economic Cooperation: Limitations, Obstacles and Benefits. In F. E. Cookson and A.K.M.S. Islam ed. Dhaka, Bangladesh: The University Press. CPD. 2001. "Policy Brief on Industry and Trade." CPD Task Force Report, Centre for Policy Dialogue: Dhaka. de Janvry, A. and E. Sadoulet. 1987. "Agricultural Price Policy in General Equilibrium models: Results and Comparisons." American Journal of Agricultural Economics, 69, pp. 230-246. de Melo, J., and D. Tarr. 1992. A General Equilibrium Analysis of Us Foreign Trade Policy. Cambridge: MIT Press. de Melo, J. 1988. "Computable General Equilibrium Models for Trade Policy Analysis in Developing Countries: A Survey", Journal of Policy Modelling 10: 4, pp. 469–503. Dervis, K. , J. de Melo and S. Robinson. 1998. General Equilibrium Models for Development Policy, Cambridge: Cambridge University Press.

187
Devarajan S., D.S. Go, J.D. Lewis, S. Robinson and P. Sinko. 1997. "Simple General Equilibrium Modeling", in Applied Methods for Trade Policy Analysis: A Handbook, Cambridge: Cambridge University Press. Devarajan, S., J.D.Lewis, and S. Robinson. 1993."External Shocks, Purchasing Power Parity and the Equilibrium Real Exchange Rate." World Bank Economic Review, 7, pp. 45-63. Diao, X., and A. Somwaru. 2001. "Impact of the MFA Phase-Out on the World Economy: An Intertemporal Global Equilibrium Analysis." TMD Discussion paper, 79, International Food Policy Research Institute. Dimaranan, B.V., and R.A. McDougall eds. 2002. The GTAP 5 Data Base. West Lafayette, IN: Center for Global Trade Analysis, Purdue University. Dollar, D. 1992. "Outward-Oriented Developing Economies Really do Grow More Rapidly: Evidence from 95 LDCs, 1976-85." Economic Development and Cultural Change, 40:3, pp. 523-44. Dornbusch, R., S. Fischer, and P.A. Samuelson. 1977. "Comparative Advantage, Trade, and Payments in a Ricardian Model with a Continuum of Goods." American Economic Review, 67:5, pp. 823-39. Dowlah, C.A.F. 1999. "The Future of the Readymade Clothing Industry of Bangladesh in the Post-Uruguay Round World." World Economy, 22:7, pp. 933-53. Edwards, S. 1992. "Trade Orientation, Distortions and Growth in Developing Countries." Journal of Development Economics, 39:1, pp. 31-58. Edwards, S. 1998. "Openness, Productivity and Growth : what do we really know?" Economic Journal, 108, pp. 383-98. Elbehri, A. 2004. "MFA Quota Removal and Global Textile and Cotton Trade: Estimating Quota trade Restrictiveness and Quantifying Post-MFA Trade Patterns." Paper Presented at the 7th Annual Conference of Global economic Analysis: Washington DC, USA. Elson, D. 1999. " Labour Markets as Gendered Institutions: Equality, Efficiency and Empowerment Issues." World Development, 27:3, pp. 611-27.
188
EPB, 2002/03. Export Statistics, 2002 -2003, Export Promotion Bureau of Bangladesh: Dhaka. ETI. 1998. Purpose, Principles, Program - Membership Information. London: Ethical Trading Initiative. Fisk, W.J., and A.H. Rosenfeld. 1997. "Estimates of Improved Productivity and Health from Better Indoor Environments." Indoor Air, 7, pp. 158-72. Fisk, W.J. 2000. "Health and Productivity Gains from Better Environments and Their Relationship with Building Energy Efficiency." Indoor Environment, 25, pp. 537-66. Fontana, M., P. Wobst, and P. Dorosh. 2001. "Macro Policies and the Food Sector in Bangladesh: A General Equilibrium Analysis." TMD Discussion Paper, 73, International Food Policy Research Institute. Francois, J., and D. Spinanger. 2000. "Hong Kong's Textile and Clothing Industry: The Impact of Quotas, the UR and China's WTO Accession." Kiel Institute of World Economics. Francois, J., and D. Spinanger ed. 2002. ATC Export Tax Equivalents. Center for Global Trade Analysis, Purdue University, West Lafayette, IN. Gherzi report, 2002. "Strategic Development and Marketing Plans for RMG and Related Industries", report submitted by the Gherzi Textile and Project Promotion and Management Associates to the Ministry of Commerce, Government of Bangladesh, December. Godfrey, M. 2003. "Employment Dimensions of Decent Work: Trade-offs and Complimentarities." Discussion Paper, 148, International Institute for Labour Studies: Geneva. Greenaway, D., W. Morgan, and P. Wright. 1998. "Trade Reform, Adjustment and Growth: What Does the Evidence Tell Us?" The Economic Journal, 108:450, pp. 1547-61. Grossman, G., and E. Helpman. 1991. Innovation and Growth in the Global Economy. Cambridge: MIT press.
189
Gunning, J.W. and Keyzer, M.A. 1993. "Applied general equilibrium models for policy analysis" in Handbook of Development Economics, volume 3, T. N. Srinivasan and J. Behrman eds. Amsterdam: North-Holland, Harcourt, T. 1999. "Last Line of Resistance or a Golden Opportunity: Australian Trade Union Responses to Globalisation." Australian Council of Trade Unions. Harrison, W.J., and K.R. Pearson. 1996. " Computing Solutions for Large General Equilibrium Models Using GEMPACK." Computational Economics, 9, pp. 83-127. Hertel, T.W. 1997. Global Trade Analysis Modeling and Applications. New York, USA: Cambridge University Press. Hertel, T.W., W. Martin, K. Yanagishima, and B. Dimaranan. 1996. "Liberalizing Manufactures Trade in a Changing World Economy," in The Uruguay Round and the Developing Countries. W. Martin and L.A. Winters eds: Cambridge University Press, Cambridge, pp. 183-215. Hossain, B.M. 2002. "Chittagong Port: Potentials, Performance and Private Sector Participation in a Globalised Situation." Working Paper, BIDS Millennium Series, Bangladesh Institute of Development Studies: Dhaka. Humphrey, J., and H. Schmitz. 2001. "Governance in Global Value Chains." IDS Bulletin, Vol. 32(3): 19-30: Brighton, UK. Husted, S. and M. Melvin. 1998. International Economics: Addison-Wesley, International Editions. Ianchovichina, E. 2003. "GTAP-DD: A Model for Analyzing Trade Reforms on the Presence of Duty Drawback." GTAP Technical Paper, no. 21, Center for Global Trade Analysis, Purdue University, West Lafayette, IN. ILO. 1999. "Report of the Director General on Decent Work." 87th Session, International Labour Organisation: Geneva. ILO. 2001. "World Employment Report." International Labour Organisation: Geneva. IMF. 2005. Direction of Trade Statistics (CD ROM), International Monetary Fund.

190
International Trade Statistics. 2004. World Trade Organisation. Islam, S. 2001. The Textile and Clothing Industry of Bangladesh in a Changing World Economy. Dhaka: Centre For Policy Dialogue and the University Press Limited. Kabeer, N. 2004. "Globalization, Labor Standards, and Women's Rights: Dilemmas of Collective (in) Action in an Interdependent World." Feminist Economics, 10:1, pp. 3-35. Kabeer, N., and S. Mahmud. 2004. "Globalization, Garments and Poverty: Bangladeshi Garment Workers in Global & Domestic Markets." Journal of International Development, 16:1, pp. 93-109. Kelegama, S. 2004. "SAFTA: A Critique." South Asian Free Media, July 6. Kelegama, S., and R. Adhikari. 2002. "Regional Integration in the WTO ERA: South Asia At Cross Roads." Discussion paper, 85. SAWTEE, Kathmandu and Jaipur. Khondker, B.H., A. Razzaque, and N. Ahmed. 2005. "Exports, Employment and Working Conditions: Emerging Issues in the Post -MFA RMG Industry." Report prepared for International Labour Organisation, Dhaka Office, Bangladesh, Mimeo. Kibria, N. 2001. "Becoming a Garments Worker: The Mobilisation of Women into the Garment Factories of Bangladesh,," in Globalisation and Gender: Changing Patterns of Women's Employment in Bangladesh,. R. Sobhan and N. Khundker ed. Dhaka, Bangladesh., pp. 61-90. Krueger, A.1998. "Why Trade Liberalisation is Good for Growth." Economic Journal, 108:450, pp.1513-22. Krugman P. R. and M. Obsfeld. 2000. International Economics, Theory and Policy: Addison-Wesley, International Editions. Kucera, D. and W. Milberg. 2002. "Trade and the Loss of manufacturing Jobs in the OECD: New Factor Content Calculations for 1978-1995." Discussion Paper, DP/135/2002, OECD. Labour Force Survey. 2002-2003. Bangladesh Bureau of Statistics, Dhaka.
191
Limão, N., and A.J. Venebles. 2001. "Infrastructure, Geographycal Disadvantage, Transport Costs and Trade." World Bank Economic Review, 15:3, pp. 451-79. Lips, M.,A. Tabeau, F. van Tongeren, N. Ahmed, and C. Herok. 2003. "Textile and Wearing Apparel Sector Liberalization - Consequences for the Bangladesh Economy." paper presented at the 6th Conference on Global Economic Analysis: The Hague, The Netherlands. Lofgren, H., R.Harris, and S. Robinson with the assistance of M. Thomas and M. El-Said. 2001. "A Standard CGE Model in GAMS." TMD Discussion Paper, 75. International Food Policy Research Institute (IFPRI): Washington, D.C. Lucas, R.E., Jr. 1988. "On the Mechanics of Economic Development." Journal of Monetary Economics, 22:1, pp. 3-42. Mahbub ul Haq Human Development Centre. 2002. Human Development in South Asia 2001. Oxford University Press: Oxford. Mlachila, M., and Y. Yang. 2004. "The End of Textile Quotas: A Case Study of the Impact on Bangladesh." IMF Working Paper, WP/04/108, International Monetary Fund. Nadvi, K. 2003. "Globalization and the Challenges to Bangladesh's Garment Industry." paper presented at the seminar on A Value Chain Analysis of the RMG Sector in Bangladesh: Beyond MFA: Bangladesh Institute of Development Studies and OXFAM-GB Bangladesh Programme, January 18-19. Nadvi, K. 2004. "The Effect of Global Standards on local Producers: A Pakistani Case Study," in Local Enterprises in The Global Economy: Issues of Governance and Upgrading. H. Schmitz ed. Cheltenham: Edward Elgar. Nordas, H.K. 2004. "The Global Textile and Clothing Industry Post the Agreement on Textitles and Clothing." WTO Discussion Paper, World Trade Organisation, Geneva. Ocampo, J.A., and L. Taylor. 1998. "Trade Liberalisation in Developing Economies: Modest Benefits but Problems with Productivity Growth, Macro Prices, and Income Distribution." Economic Journal, 108:450, pp. 1523 - 46.
192
Oskam, A.J., M.H.C. Komen, P. Wobst, and A. Yalew. 2004. "Trade Policies and Development of Less-Favoured Areas: Evidence From the Literature." Food Policy, 29, pp. 445–66. Paul-Majumder, P. 2003a. "Health Status of the Garment Workers in Bangladesh," Project Report, no. 1, Bangladesh Institute of Development Studies. ____. 2003b. "Gender Discrimination in Bangladesh Labour Market," in Gender Equality in Bangladesh-Still a Ling Way to Go. Shahiduzzaman and Mahfuzur Rahman ed. Dhaka: News Network. Paul-Majumder, P., and A. Begum. 2000. "The Gender Differentiated Effects of the Growth of Export-Oriented Manufacturing: A Case for the Ready-Made Garment Industry in Bangladesh." Policy Research Report on Gender and Development, World Bank.: Dhaka. Paul-Majumder, P., and S. Begum. 1997. "Upward Occupational Mobility Among Female Workers in the Garment Industry of Bangladesh." Research Report, 153, Bangladesh Institute of Development Studies: Dhaka. Pigato, M., C. Farah, K.J. Itakura, W. Martin, K. Murrell, and T.G. Srinivasan. 1997. "South Asia's Integration into the World Economy." World Bank: Washington DC. Quddus, M. and S. Rashid. 2000. Entrepreneurs and Economic Development, The Remarkable Story of Garment Export from Bangladesh. Dhaka: The University Press Ltd. Rafiuddin, M., and A.A. Khan. 2003. Labour and Industrial laws of Bangladesh. Dhaka: Khoshroz Kitab Mahal. Rahman, A., and A. Razzaque. 2002. "Informal Botder Trade Between Bangladesh and India: An Empirical Study in Selected Areas," in Towards Greater Sub-rgional Economic Cooperation: Limitations, Obstacles and Benefits. F.E. Cookson and A. K. M. S. Islam ed. Dhaka: The University Press Limited. Razzaque, A. 2005. "Sustaining RMG Export Growth after MFA Phase-out: An Analysis of Relevant Issues with Reference to Trade and Human Development." Study conducted for Ministry of Commerce, Government of Bangladesh and United Nations Development Programme, mimeo.

193
Redding, S. 1999. "Dynamic Comparative Advantage and the welfare effects of trade." Oxford Economic Papers, 51: pp.15 - 39. Redding, S., and A.J. Venables. 2003. "Economic Geography and International Inequality." Globalization programme, Centre for Economic Performance, London School of Economics. Robinson, S. and K. Thierfelder. 2002. "Trade liberalisation and regional integration: the search for large numbers", Australian Journal of Agricultural and Resource Economics, 46:4, pp. 585 - 604. Robinson, S. 1989. "Multisectoral Models", in Handbook of Development Economics, Vol. 2, H. Chenery and T.N. Srinivasan eds. Amsterdam: Elsvier Science. Rodriguez, C.A. 1974. "The Non-Equivalence of Tariffs and Quotas under Retaliation." Journal of International Economics, 4:3, pp. 295-98. Rodrik, D. 2002. "Has Globlisation Gone too Far?" Institute for International Economics: Washington. Rodrik, D. 1995. "Trade and Industrial Policy Reform," in Handbook of Development Economics. J. Behrman and T. N. Srinivasan eds. Amsterdam: North Holland. Romer, P.M. 1986. "Increasing Returns and Long-run Growth." J. Polit. Econ., 94:5, pp. 1002-37. Ruben, R., and J. Pender. 2004. "Rural diversity and heterogeneity in less-favoured areas: the quest for policy targeting." Food Policy, 29:4, pp. 303-20. Sachs, J.D., and A. Warner. 1995. "Economic reform and the process of global integration." Brookings papers on economic activity, 1, pp. 1-118. Sachs, J.D., and H.J. Shatz. 1994. "Trade and Jobs in US Manufacturing." Brookings papers on economic activity, 1, pp. 1-84. Samaratunga, R.H.S. 1999. "Essays in Trade Policy and Economic Integration with Special Reference to South Asia,." La Trobe University: Melbourne. Scollay, R. and J. Gilbert, 2000. "Measuring the Gains from APEC Trade Liberalisation: An Overview of CGE Assessments", World Economy, 23:2, pp.175 - 197.
194
Shimu, S.D. 1999. Garments Workers: Movement & Strugle. Dhaka: Narigrantha Probartona. Shoven, J. B. and J. Whalley. 1992. Applying General Equilibrium, Cambridge: Cambridge University Press. Singer, H.W. 1950. "U.S. Foreign Investment in Underdeveloped Areas: The Distribution of Gains Between Investing and Borrowing Countries." American Economic Review, Papers and Proceedings:40, pp. 473-485. Spinanger, D. 2000. "The WTO and Textile and Clothing in a Global Perspective: What's in it for Bangladesh?" Centre for Policy Dialogue: Dhaka, Bangladesh. Srinivasan, T.N. 1994. "Regional Trading Arrangements and Beyond: Exploring Some Options for South Asia, Theory, Empirics and Policy." World Bank: Washington, DC. Srinivasan, T.N. and G. Canonero. 1995. "Preferential Agreements in South Asia: Theory, Empirics and Policy." Yale Growth Centre, Yale University (mimeographed). Standing, G. 1999. Global Labour Flexibility: Seeking Distributive Justice. Basingstoke, UK: Macmillan. Statistical Yearbook of Bangladesh, 1982. Bangladesh Bureau of Statistics, Dhaka. Statistical Yearbook of Bangladesh, 1999. Bangladesh Bureau of Statistics, Dhaka. Tennagoon, A. 2001. "The Welfare Impact of Trade Liberalization on Sri Lanka: A CGE Analysis." paper presented at the 2nd Annual Doctoral Students Conference, the Association of Pacific Rim Universities: 1-4, February, Auckland, New Zealand. Winters, L.A. 2004. "Trade Liberalisation and Economic Performance." The Economic Journal, February:114, pp. F4-F21. Winters, L.A. 2005. "The European Agricultural Trade Policies and Poverty." European Review of Agricultural Economics, 32:3, pp. 319–46.

195
Winters, L.A., N. McCulloch, and A. McKay. 2004. "Trade Liberalization and Poverty: the Evidence So Far." Journal of Economic Literature, XLII:March, pp. 72-115. Wobst, P. 2003. "The Impact of Domestic and Global Trade Liberalisation on Five Southern African Countries." Journal of Development Studies, 40:2, pp. 70-92. Wood, A. 1994. North -South Trade, Employment and Inequality: Changing Fortunes in a Skill Driven World. Oxford: Clarendon. World Bank, 2005. "Bangladesh: Growth and Export Competitiveness." World Bank: Dhaka. WDI. 2002. World Development Indicators (CD-ROM), the World Bank. WDI. 2004. World Development Indicators (CD-ROM), the World Bank. Yang, Y., W. Martin, and K. Yanagishima. 1997. "Evaluating the Benefits of Abolishing the MFA in the Uruguay Round Package," in Global Trade Analysis: Modeling and Applications. T. W. Hertal ed. Cambridge: Cambridge University Press, pp. 271-98. Zohir, S.C. 2001. "Beyond 2004: Strategies for the RMG Sector in Bangladesh," in Bangladesh Economy 2000, Selected Issues. A. Abdullah ed. Dhaka: The Bangladesh Institute of Development Studies, pp. 137-63. Zohir, S.C., and P. Paul-Majumder. 1996. "Garment Workers in Bangladesh: Economic, Social and Health Condition." Bangladesh Institute of Development Studies: Dhaka.

196
Summary Apparel, otherwise known as ready-made garments or clothing is the main export industry of Bangladesh. This industry earns 75% of total export earnings, 80% of manufacturing export earnings and 9.5% of GDP of Bangladesh. Around 1.9 million workers, heavily dominated by females, are employed in this industry. 90% of these workers come from rural areas. The current thesis explores and analyses recent changes and challenges faced by the apparel industry of Bangladesh and the consequences of those for the Bangladesh economy. More specifically, it explores and analyses the importance of the apparel industry in the Bangladesh economy, the challenges faced by this industry, impacts of implementation of various international trade rules on the apparel industry, consequences of Bangladesh’s attempts to enter in bilateral and regional free trade agreements with its neighbouring countries, status of workers’ rights in the apparel industry of Bangladesh and how globalisation is affecting the level of addressing these workers’ rights and also impacts of increases in workers’ productivity and wage on the apparel industry and on the Bangladesh economy. This thesis has applied both a global and single country general equilibrium model in different chapters as the thesis aimed to analyse economy-wide effects of changes in international and domestic scenarios. In case of the global CGE model, the model and data of the Global Trade Analysis Project (GTAP) version 5.1 have been applied. The single country CGE model of Bangladesh, applied in this thesis, is based on the core CGE model of the International Food Policy Research Institute (IFPRI). Part of the thesis is also based on qualitative and quantitative analyses of the relevant issues. The apparel industry of Bangladesh grew under the umbrella of the Multi-Fibre Arrangement (MFA) as the import quota restriction on its competitors like China and India was relatively higher than that on Bangladesh. Starting in 1974, MFA governed the trade in textile and apparel until the end of the Uruguay round (31 December 1994). Since 1 January 1995 the WTO’s Agreement on Textile and Clothing (ATC) started. The ATC was a 10 year long transitional trade regime to abolish MFA import quotas in phases. In other words the ATC was meant to fully integrate textile and apparel into the free trade rules of the WTO. The biggest challenge currently faced by the apparel industry of Bangladesh is the possible consequences of the MFA import quota abolition. The model and data of GTAP have been applied to explore various consequences of MFA import quota abolition and worldwide tariff liberalisation of textile and apparel. It is observed that depending on various scenarios, apparel export of Bangladesh decreases by 9.6% to 15.1%, while production of apparel decreases by 8.9% to 13.9%. These changes also affect welfare and the poverty situation of the country. There is 0.5% to 0.9% decrease in GDP and the poverty situation also deteriorates. Employment of

197
unskilled workers decreases by 0.6% to 1.7% and returns of unskilled workers by 2.4% to 5%. Average household income decreases by 3.8% to 6.4%. Ultimately welfare (in terms of equivalent variation) of Bangladesh decreases by $694 million to $884.3 million. The thesis argues that there are possible negative consequences of MFA import quota abolition on rural income. Most of the apparel workers have their family in rural areas to whom they send remittances and their capacity to remit decreases with the decrease in employment and real income after MFA import quota abolition. Moreover the decrease in the income of households on average may also lead to a decrease in transfer income (income from other households) going to rural households. While abolition of MFA import quotas is posing negative effects on the apparel industry of Bangladesh, various attempts of Bangladesh to engage itself in preferential trade arrangements with its South Asian neighbours as well as with some East Asian countries is posing opportunities to increase not only export of apparel but also overall exports and welfare. Simulations with GTAP show that trade co-operation between the South Asian countries through the South Asian Free Trade Area (SAFTA) can be welfare increasing for all of them. For Bangladesh another preferential trade arrangement opportunity, the Bay of Bengal Initiative for Multi-Sectoral Technical and Economic Cooperation (BIMSTEC) is even more beneficial. For Bangladesh welfare gains from these two initiatives can be $111.4 million and $150.5 million respectively. The production of apparel also increases by 2.7% and 7.8% respectively. It is observed that much of the welfare gains occur due to increased employment of unskilled labour. Moreover these regional trade arrangements will not only generate economic benefits but there is also scope for non-economic benefits in terms of better relationships among South Asian countries. The level at which workers’ rights are addressed is an important issue concerning international trade performance in the present world. Globalisation is posing two opposite pressures on addressing workers’ rights. On the one hand international price competition compels producers to reduce production cost, which often results in violation of workers’ rights. On the other hand concerns of developed country buyers (which is induced by consumers and trade unions) about the status of addressing workers’ rights compel producers to address workers’ rights, which increases cost of production. Depending on which pressure mechanism dominates, globalisation is either increasing the level of addressing workers’ rights or reducing it. The thesis has noticed that workers’ rights are heavily violated in the apparel industry of Bangladesh and price pressure of globalisation may deteriorate the situation further. Therefore, in addition to initiatives of the entrepreneurs, trade unions and various international organisations, government initiatives to monitor and implement existing labour laws are necessary to improve the workers’ rights situation in Bangladesh.

198
The thesis argues that addressing workers’ rights in terms of improving the work environment increases labour productivity. A single country CGE model has been applied to find out how addressing workers’ rights can affect different stakeholders in the economy. Special attention has been given to the consequences for the rural economy. Two ways of addressing workers’ rights have been analysed i) increasing the wage of the workers and ii) improving the work environment. It is observed that an increase in the wage of unskilled, low and medium skilled workers in the textile and apparel industries decreases the demand for these labour categories. Results do not change substantially with the full employment assumption applied for unskilled and low skilled workers except for the decrease in employment that is lower. The reason for this is that with the full employment assumption the wage increase in the textile and apparel industries is partly offset by an overall decrease in the wage for unskilled and low skilled workers. Improving the work environment can increase labour productivity, and therefore, increases income of workers of most categories and also the welfare in the economy as a whole. The entrepreneurs as the owners of capital also enjoy a higher income. Demand for unskilled and low skilled female workers also increases with the increase in labour productivity. As a result of these changes the income of rural households increases. Such increase in rural income is observed both for agricultural and non-agricultural households. In this chapter improving the work environment is assumed to be costless. However in reality such attempts incur costs. For improvement of the work environment the entrepreneurs may spend an amount equal to the change in their income caused by the increased labour productivity. The thesis has stressed that to reduce the negative impacts of MFA import quota abolition, to induce entrepreneurs not to violate workers’ rights as a means of cost reduction and also to encourage entrepreneurs to invest for a better work environment, infrastructure bottlenecks have to be minimised. Moreover, high investment costs and corruption have to be reduced. This would enable entrepreneurs to reduce (or maintain) the price of their products even after addressing workers’ rights properly. The results found from both the global and single country general equilibrium analysis should considered with some caution as both of these models are static in nature and are based on several assumptions. However, CGE models are the best possible way to cover interactions between different countries of the world (global CGE model) or actors in a particular economy (both global and single country CGE models). It is successful in understanding possible effects for the disaggregated economy from changes in one segment of the economy. Therefore, with some limitations, the thesis has rightly sketched the current picture of challenges and opportunities associated with the apparel industry of Bangladesh and issues concerning the future of this industry.
199
Samenvatting Met een aandeel van 75% in de totale export en een aandeel van 80% in de industriële export is de kledingindustrie de belangrijkste exportindustrie van Bangladesh. Verder heeft zij een aandeel van 9,5% in het BNP. Ongeveer 1,9 miljoen werknemers, het overgrote deel vrouwen, werken in deze bedrijfstak. 90% van de werknemers komt van het platteland. Dit proefschrift beschrijft en analyseert recente veranderingen in én uitdagingen voor de kledingindustrie en de gevolgen hiervan voor de economie van Bangladesh. Meer in het bijzonder, het analyseert het belang van de kledingindustrie voor de economie van Bangladesh, de uitdagingen waarvoor de kledingindustrie zich gesteld ziet, de gevolgen van het invoeren van verschillende internationale handelsverdragen over kleding, de consequenties van pogingen om te komen tot regionale vrijhandelsverdragen tussen Bangladesh en haar buurlanden, hoe het is gesteld met de rechten van werknemers in de kledingindustrie en het gevolg van globalisering voor deze werknemersrechten evenals voor de ontwikkeling in arbeidsproductiviteit en lonen in de kledingindustrie van Bangladesh. In de verschillende hoofdstukken van dit proefschrift wordt gebruik gemaakt van zowel een wereldwijd als landspecifiek toegepast algemene evenwichtsmodel (CGE model). In het geval van het wereldwijde CGE model zijn het model en de gegevens van het Global Trade Analysis Project (GTAP) versie 5.1 toegepast. Het landspecifieke CGE model voor Bangladesh is gebaseerd op het basis CGE model van het International Food Policy Research Institute (IFPRI). In het proefschrift worden de onderwerpen verder zowel kwalitatief als kwantitatief geanalyseerd. De kledingindustrie in Bangladesh is gegroeid onder het Multi-Fibre Akkoord (MFA) doordat de invoerquota restrictiever waren voor China en India dan voor Bangladesh. De MFA beheerste de handel in textiel en kleding vanaf 1974 tot het einde van de Uruguay ronde (31 december 1994). Vanaf 1 januari 1995 is de MFA vervangen door het Agreement on Textile and Clothing (ATC) van de World Trade Organisation (WTO). Het ATC was een tienjarig durend handelsregime met als doel de MFA invoerquota voor textiel en kleding in fases af te schaffen. Met andere woorden de ATC was er op gericht textiel en kleding volledig onder de vrijhandelsregels van de WTO te brengen. De grootste uitdaging op dit moment voor de kledingindustrie in Bangladesh zijn de mogelijke gevolgen van het afschaffen van de MFA invoerquota voor kleding. GTAP is gebruikt om de gevolgen van het afschaffen van de MFA invoerquota en wereldwijde tariefliberalisatie voor textiel en kleding te onderzoeken. Bevindingen zijn dat, afhankelijk van verschillende scenario’s, de export van kleding door Bangladesh 9.6% tot 15.1% afneemt terwijl de productie van
200
kleding afneemt met 8.9% tot 13.9%. Deze veranderingen hebben ook invloed op de welvaart en de armoedesituatie in Bangladesh. Er is een afname van 0.5% tot 0.9% in het BNP en de armoedesituatie verslechtert. De werkgelegenheid voor ongeschoolden neemt af met 0.6% tot 1.7% en de inkomsten voor ongeschoolden dalen met 2.4% tot 5%. Het gemiddelde huishoudinkomen neemt af met 3.8% tot 6.4%. De absolute welvaart van Bangladesh (uitgedrukt in de Equivalent Variation) daalt met $694 miljoen tot $884.3 miljoen. Dit proefschrift laat ook zien dat er mogelijk negatieve consequenties zijn van het afschaffen de MFA invoerquota voor de inkomens van huishoudens op het platteland. De meeste arbeiders in de kledingindustrie hebben familie op het platteland naar wie ze geld overmaken en de mogelijkheid dit te doen neemt af als de werkgelegenheid en het reële inkomen daalt na het afschaffen van de MFA invoerquota. Terwijl het afschaffen van de MFA invoerquota negatieve effecten heeft voor de kledingindustrie van Bangladesh, probeert Bangladesh regionale handelsverdragen te sluiten met haar Zuid Aziatische buurlanden evenals met sommige Oost Aziatische landen om niet alleen de export van kleding maar de export en welvaart als geheel te vergroten. Simulaties met GTAP laten zien dat handelssamenwerking tussen de Zuid Aziatische landen binnen het Zuid Aziatisch Vrijhandelsgebied (SAFTA) de welvaart voor alle deelnemende landen kan verhogen. Voor Bangladesh biedt het handelsverdrag ‘het Baai van Bengalen Initiatief voor Technische en Economische Samenwerking voor meerdere Sectoren’ (BIMSTEC) nog meer voordelen. De welvaartstijging van deze twee initiatieven in Bangladesh kunnen respectievelijk $111.4 miljoen en $150.5 miljoen bedragen. Ook de productie van kleding stijgt met respectievelijk 2.7% en 7.8%. Het blijkt dat veel van de welvaartstijging wordt veroorzaakt door een toename van de werkgelegenheid voor ongeschoolden. De regionale handelsverdragen zullen niet alleen economische voordelen hebben, maar creëren ook de mogelijkheid voor niet-economische voordelen in termen van betere samenwerking tussen de Zuid Aziatische landen. Een belangrijk onderdeel bij de beoordeling van de internationale concurrentiepositie is de mate waarin werknemersrechten worden gewaarborgd. De globalisering beïnvloedt de werknemersrechten op twee tegengestelde manieren. Aan de ene kant dwingt de internationale prijsconcurrentie producenten hun kosten te drukken, wat vaak resulteert in schending van de werknemersrechten. Aan de andere kant dwingen de zorgen van kopers in de ontwikkelde landen (meestal tot uiting gebracht door consumentenorganisaties en vakbonden) over werknemersrechten producenten de werknemersrechten te waarborgen wat de productiekosten verhoogt. Afhankelijk van welk mechanisme domineert, zal globalisering de waarborging van werknemersrechten in de kledingindustrie verslechteren of verbeteren. Dit proefschrift laat zien dat werknemersrechten in grote mate worden geschonden
201
in de kledingindustrie in Bangladesh en dat prijsdruk als gevolg van globalisering de situatie verder kan verslechteren. Daarom is het noodzakelijk dat naast de initiatieven van ondernemers, vakbonden en verschillende internationale organisaties, overheidsinitiatieven worden ontwikkeld om bestaande arbeidswetten te controleren en implementeren om de situatie van de werknemersrechten in Bangladesh te verbeteren. Dit proefschrift laat zien dat aandacht voor werknemersrechten in termen van het verbeteren van de werkomstandigheden de arbeidsproductiviteit verbetert. Het landspecifieke algemene evenwichtsmodel is toegepast om te achterhalen hoe een toename van de arbeidsproductiviteit de verschillende belanghebbenden in de economie beïnvloedt. Speciale aandacht is er gegeven aan de gevolgen voor de plattelandseconomie. Twee manieren om de werknemersrechten te verbeteren zijn doorgerekend i) het verhogen van de lonen van de werknemers en ii) het verbeteren van de werkomstandigheden. De uitkomsten laten zien dat door een verhoging van de lonen van ongeschoolde, laag geschoolde en gemiddeld geschoolde werknemers in de textiel- en kledingindustrie de vraag naar deze arbeid daalt. De resultaten veranderen niet wezenlijk indien op nationaal niveau volledige werkgelegenheid wordt verondersteld. Wel daalt de werkgelegenheid in de textiel- en kledingindustrie minder maar daar tegenover staan lagere lonen. Het verbeteren van de werkomstandigheden kan de arbeidsproductiviteit verhogen waardoor het inkomen van de werknemers en de welvaart van de economie als geheel stijgen. Ook de ondernemers als de eigenaren van het geïnvesteerd kapitaal in de kledingindustrie zien hun inkomen stijgen. De vraag naar ongeschoolde en laag geschoolde vrouwelijke werknemers stijgt ook door de stijging in de arbeidsproductiviteit. Als gevolg hiervan stijgen de inkomens van de huishoudens op het platteland. Er is verondersteld dat aan het verbeteren van de werkomstandigheden geen kosten zijn verbonden. In werkelijkheid is dat natuurlijk wel zo. De ondernemers kunnen de inkomensstijging die ontstaat door de stijging van de arbeidsproductiviteit besteden aan verbetering van de werkomstandigheden. Dit proefschrift heeft benadrukt dat om de negatieve gevolgen van het afschaffen van de MFA invoerquota te verminderen, om ondernemers over te halen werknemersrechten niet te schenden uit kostenoverwegingen en om ondernemers aan te moedigen te investeren in een betere werkomstandigheden, knelpunten in de infrastructuur moeten worden opgeheven. Verder zouden de hoge investeringskosten en corruptie moeten worden verminderd. Hierdoor zouden de ondernemers in staat zijn de prijzen van hun producten te laten dalen (of gelijk te houden) ook als de werknemersrechten voldoende in acht worden genomen. De resultaten gevonden met het wereldwijde en landspecifieke algemene evenwichtsmodel moeten met enige terughoudendheid worden gehanteerd omdat beide modellen statisch zijn en gebaseerd zijn op een aantal restrictieve
202
aannames. Ondanks deze beperkingen zijn algemene evenwichtsmodellen het beste instrument om interacties tussen verschillende landen in de wereld (wereldwijde CGE model) of actoren binnen een bepaalde economie (zowel landspecifieke als wereldwijde CGE model) te analyseren. CGE modellen zijn in staat de mogelijke gevolgen voor specifieke delen van een economie te bepalen als gevolg van veranderingen in één onderdeel van die economie. Daarom geeft dit proefschrift, met enige beperkingen, een goed beeld van de huidige uitdagingen en mogelijkheden voor de kledingindustrie in Bangladesh.

203
About the author Nazneen Ahmed was born on July 21, 1972 in Dhaka, Bangladesh. After finishing her secondary school and higher secondary education, she began her study at the University of Dhaka and graduated (with honors) in economics. Then she completed her Masters in economics from the same university. The title of her Masters thesis at Dhaka University was ‘A theoretical study on optimality of free trade’. She got the prestigious Chevenning Scholarship of the British Government and did a MA in development economics at the University of Sussex in 1999. The title of her thesis at the University of Sussex was ‘trade diversion from the Europe Agreements: should Bangladesh care?’ which was conducted under the supervision of Prof. L. Alan Winters. In September 2001 she started her PhD research at the Agricultural Economics and Rural Policy group of Wageningen University under the RESPONSE project. She followed her PhD education programme at the Mansholt Graduate School of Wageningen University and completed a number of courses and workshops at the Netherlands Network of Economics (known as NAKE in Dutch acronyms, http://www.nake.nl). During the training process she also successfully completed a course on Computable General Equilibrium Modeling using GAMS held at the University of Cape Town, South Africa and a course on Global Trade Analysis Project (GTAP) at the University of Purdue, USA. In 2004 she worked as a core member of a World Bank research team performing value chain analysis of different export industries of Bangladesh. She was also a co-researcher in the research titled ‘Mobilising for worker accountability in Bangladesh’, which was a joint project between the Bangladesh Institute of Development Studies (BIDS) and the Institute of Development Studies (IDS), UK. She is currently working as a research fellow at the Bangladesh Institute of Development Studies.
204
List of Publications
• Ahmed, Nazneen. “Impact of MFA Expiry on Bangladesh”, in Saman Kelegama edited “South Asia After the Quota System: Impact of the MFA Phase Out”, published by Institute of Policy Studies, Sri Lanka in association with Friedrich- Ebert – Stiftung, Colombo. (October 2005).
• Ahmed, Nazneen. ‘Sholponnoto Deshe Bostro o Toiree Poshak Shilper
shombhabona: Bangladesh Prekkhit’, (Co- Author), Bangladesh Unnayan Shomikkha, 1410, (Bengali Publication) (Future prospects of textile and clothing sectors in the least developed countries), 2004.
• Ahmed, Nazneen. ‘Udarikoron o Probriddhi: Kotipoy Tottogoto o
Bastob Obhiggota Porjobekkhon’, Bangladesh Unnayan Shomikkha, 1409 (Bengali Publication). [‘Liberalisation and Growth: Observations of Some Theoretical and Empirical Evidences’] (2003).
• Ahmed, Nazneen. ‘Trade Diversion Due to European Agreement:
Should Bangladesh Care?’ Research Report, no.171, Bangladesh Institute of Development Studies. (2001).
• Ahmed, Nazneen. Boishommo – o - Probriddhi : A Prekkhite Shikkhar
Gurutta-- Notun Probriddhi Totter Alochona ebong Bangladesher Obosthan’. Bangladesh Unnayan Shomikkha, 1407. (Bengali publication). [Inequality and Growth and Role of Education in this Context: New growth Theories and Bangladesh’](2000).
• Razzaque, M.A. and Nazneen Ahmed. ‘A Re-Examination of Domestic
Saving -Foreign Aid Relationship in the Context of Bangladesh’, Bangladesh Development Studies, vol. XXVI, December 2000.
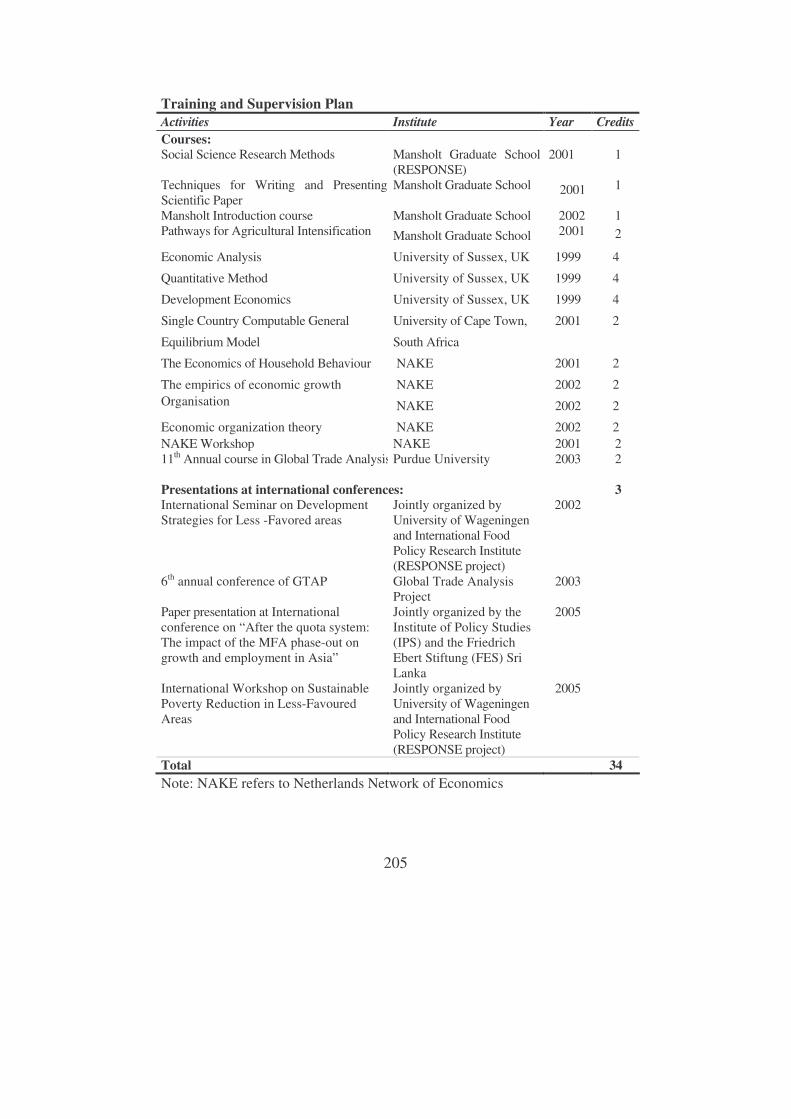
205
Training and Supervision Plan Activities Institute Year Credits Courses: Social Science Research Methods Mansholt Graduate School &
(RESPONSE) 2001 1
Techniques for Writing and Presenting a Scientific Paper
Mansholt Graduate School 2001 1
Mansholt Introduction course Mansholt Graduate School 2002 1 Pathways for Agricultural Intensification Mansholt Graduate School 2001 2
Economic Analysis University of Sussex, UK 1999 4
Quantitative Method University of Sussex, UK 1999 4
Development Economics University of Sussex, UK 1999 4
Single Country Computable General
Equilibrium Model
University of Cape Town,
South Africa
2001 2
The Economics of Household Behaviour NAKE 2001 2
The empirics of economic growth NAKE 2002 2 Organisation NAKE 2002 2
Economic organization theory NAKE 2002 2 NAKE Workshop NAKE 2001 2 11th Annual course in Global Trade Analysis Purdue University 2003 2 Presentations at international conferences:
3
International Seminar on Development Strategies for Less -Favored areas
Jointly organized by University of Wageningen and International Food Policy Research Institute (RESPONSE project)
2002
6th annual conference of GTAP Global Trade Analysis Project
2003
Paper presentation at International conference on “After the quota system: The impact of the MFA phase-out on growth and employment in Asia”
Jointly organized by the Institute of Policy Studies (IPS) and the Friedrich Ebert Stiftung (FES) Sri Lanka
2005
International Workshop on Sustainable Poverty Reduction in Less-Favoured Areas
Jointly organized by University of Wageningen and International Food Policy Research Institute (RESPONSE project)
2005
Total 34 Note: NAKE refers to Netherlands Network of Economics
206
Regional Food Security
Policies for Natural
Resource Management
and Sustainable Economies
The research presented in this thesis was carried out within the framework of the RESPONSE (Regional Food Security Policies for Sustainable Natural Resource Management and Sustainable Economies) programme, a joint initiative of Mansholt Graduate School for Social Sciences, CT de Wit Graduate School for Production Ecology and Resource Conservation and Wageningen Institute for Animal Sciences (WIAS) at Wageningen University and Research Centre (WUR) in cooperation with the International Food Policy Research Institute (IFPRI) in Washington D.C. The programme aims at supporting policy makers in identifying alternatives for addressing poverty, food security and natural resource degradation in less-favoured areas. RESPONSE is one of the six multi-annual research programmes of the Interdisciplinary Research and Education Fund (INREF) of Wageningen University, launched in 2000. INREF enables the cooperation of Wageningen University researchers with international and local institutions in the South. The RESPONSE Programme includes 10 sandwich PhD students from East Africa (Ethiopia, Kenya and Uganda) and Southeast Asia (China, Bangladesh and the Philippines). Fieldwork activities have been co-funded by the Dutch Ministry of Foreign Affairs (Directorate General for International Cooperation/DGIS), the European Union and the Neys-van Hoogstraten Foundation.