avid - bibliothèque et archives canada
TRANSCRIPT

Examination of Creatine Deposits and Environs in
TgCRND8 Mouse Brain by Raman and FTIR
Microspectroscopy
By
Avid Khamenehfar
A thesis submitted to
The Faculty of Graduate Studies
In partial fulfilment of
The requirements for the degree of
MASTER OF SCIENCE
Department of Chemistry
Faculty of Science
University of Manitoba
Winnipeg, Manitoba
Copyright @2011 by Avid Khamenehfar

978-0-494-84558-5
Your file Votre référence
Library and ArchivesCanada
Bibliothèque etArchives Canada
Published HeritageBranch
395 Wellington StreetOttawa ON K1A 0N4Canada
Direction duPatrimoine de l'édition
395, rue WellingtonOttawa ON K1A 0N4Canada
NOTICE:
ISBN:
Our file Notre référence
978-0-494-84558-5ISBN:
The author has granted a non-exclusive license allowing Library andArchives Canada to reproduce,publish, archive, preserve, conserve,communicate to the public bytelecommunication or on the Internet,loan, distrbute and sell thesesworldwide, for commercial or non-commercial purposes, in microform,paper, electronic and/or any otherformats.
The author retains copyrightownership and moral rights in thisthesis. Neither the thesis norsubstantial extracts from it may beprinted or otherwise reproducedwithout the author's permission.
In compliance with the CanadianPrivacy Act some supporting formsmay have been removed from thisthesis.
While these forms may be included in the document page count, theirremoval does not represent any lossof content from the thesis.
AVIS:
L'auteur a accordé une licence non exclusivepermettant à la Bibliothèque et Archives Canada de reproduire, publier, archiver,sauvegarder, conserver, transmettre au public par télécommunication ou par l'Internet, prêter,distribuer et vendre des thèses partout dans lemonde, à des fins commerciales ou autres, sursupport microforme, papier, électronique et/ouautres formats.
L'auteur conserve la propriété du droit d'auteur et des droits moraux qui protege cette thèse. Nila thèse ni des extraits substantiels de celle-ci ne doivent être imprimés ou autrement reproduits sans son autorisation.
Conformément à la loi canadienne sur laprotection de la vie privée, quelques formulaires secondaires ont été enlevés decette thèse.
Bien que ces formulaires aient inclus dansla pagination, il n'y aura aucun contenu manquant.
Abstract
Alzheimer Disease (AD) is a progressive neurodegenerative disorder characterized by
memory loss and dementia. The pathological hallmarks of AD include deposits of β-
Amyloid peptides, neurofibrillary tangles (NFT), activated microglial cells, synaptic dys-
function and neuronal death. Both energy metabolism and the function of creatine kinase
are known to be affected in Alzheimer diseased brain and in cells exposed to the β-
amyloid peptide. Fourier Transform infrared (FTIR) and Raman microspectroscopy im-
aging techniques have proved to be important methods for in situ investigation of tissue
sections from a transgenic mouse model for AD. With synchrotron FTIR microscopy, ex-
tensive deposits of crystalline creatine (Cr) had been discovered by previous students in
our lab. Deposits were in hippocampal tissue of TgCRND8 mice, an AD model express-
ing doubly mutant (K670N/M671L and V717F) amyloid precursor protein. These depos-
its increased in size and number with age, compared to nontransgenic littermates.
In this thesis, regions of hippocampus and caudate of 5 pairs of transgenic mice and
their non-transgenic littermate controls were mapped using Raman and IR microspectro-
scopy to find clues to Cr origin in transgenic mouse brain. Raman spectra obtained at
higher spatial resolution (1-2 µm) were used for better delineation of the Cr crystalline
deposits and their environs.
Since Cr can be endogenously synthesized in liver and kidney and carried out
through the blood brain barrier by Cr transporters to get into the brain, blood vessels in
the hippocampus of transgenic mice were analyzed by IR and Raman. The analyzed maps

show no co-localization found between these Cr deposits and the blood vessels. This sug-
gests that the Cr deposits were formed in the brain.
Serial sections from 14 month-old mouse, previously imaged by FTIR, were ana-
lyzed by Raman microscopy. Maps of two plaques known to contain creatine were ana-
lyzed for Cr (symmetric CN3+ band at 830 cm
-1), lipid (CH2 deformation band at 1440
cm-1
), and amyloid plaque (antiparallel β-sheet protein at 1670 cm-1
). No specific associa-
tion between Cr deposits and either Aβ plaques or lipid membrane was detected. The
maps were analyzed for other spectral markers such as sphingomyelin (CN+
stretching
mode at 730 cm-1
), nucleic acids (PO2 symmetric band of DNA and RNA at 790, 1085
cm-1
; and a distinct band corresponding to RNA at 920 cm-1
), phospholipids (PO2 sym-
metric band of phospholipids at 860, 1098 cm-1
; =CH bending of unsaturated lipid at 980
cm-1
) and amino acids mostly phenylalanine (distinct bands correspond to phenylalanine
at 930, 1003 cm-1
; C=C deformation of phenylalanine 1590 cm-1
). No association was
identified between these biochemical signatures and Cr deposits.
The known polarization dependence of some vibrational modes of Cr was used to es-
timate Cr crystal form, orientation and dimension. Processed IR images of pure Cr
monohydrate crystal and of Cr deposits in brain tissue were acquired using a polarizer at
settings from 0° to 180°. Analysis showed that the Cr streaks were formed as single crys-
tals and not multiple microcrystalline deposits.
These results along with lack of any specific association between Cr deposits and any
other biochemical signatures, indicate that Cr crystals were formed after snap-freezing
and desiccation of brain tissue. Therefore, it can be speculated that Cr might be exist in
solution form in vivo.

i
Acknowledgments
First and foremost, I would like to thank God for the knowledge and strength and
guidance He provides me daily. I could not have accomlplished this without Him.
To my supervisor Prof. Kathleen M. Gough, thank you for encouragement and sup-
port. You saw my potential and believed in and supported me, and I thank you for that.
To my committee members, Dr. Mazdak Khajehpour and Dr. Melanie Martin. Your
encourgment and advice were really important.
Thanks to all in our research group and Department of Chemistry.
Thank you also to my funding supports; University of Manitoba Graduate Fellowship
(UMGF), Manitoba Graduate Scholarship (MGS), Alzheimer’s Society of Manitoba
Graduate Fellowship, McCrorrie-West Family Fellowship for Alzheimer Research, CIHR
training Award, International Graduate Scholarship, and several awards and scholarships
from Department of Chemistry.
Last but mostly important, special thanks to my mother and father. You are my shin-
ing light and inspiration. Thank you for being such amazing role models, and for encour-
aging me to always reach for the stars. I could not have done this without your support
and encourage. Thanks my beloved brothers. Special thanks to my brother, Farbod. Your
encouragemnet and support were really valuable.
ii
Contents
Front Matter
Acknowledgments ......................................................................................................................... vii
Contents .............................................................................................................................................. ii
List of Tables..................................................................................................................................... vi
List of Figures .................................................................................................................................. vii
List of Presentations .................................................................................................................... xiv
List of Abbreviations .................................................................................................................... xv
Introduction 1
1.1 Goals and objectives .............................................................................................................. 1
1.2 Previous work from this lab ................................................................................................. 4
1.3 Alzheimer Disease .................................................................................................................. 5
1.4 Genetics of AD and risk factors ......................................................................................... 7
1.5 Histopathological hallmarks of AD ................................................................................... 8
1.5.1 Amyloid beta plaques .............................................................................................. 8
1.5.2 Neurofibrilary tangles .......................................................................................... 10
1.5.3 Synaptic dysfunction and neuronal loss .......................................................... 11
1.5.4 Activated microglia ............................................................................................... 12
1.6 Disease mechanism ............................................................................................................. 12
1.6.1 Amyloid beta cascade hypothesis ..................................................................... 13
1.6.2 Tau hypothesis ........................................................................................................ 14
1.6.3 Oxidative stress ...................................................................................................... 15
1.6.4 Amyloid beta toxicity ........................................................................................... 17
iii
1.6.5 Inflammation in AD .............................................................................................. 19
1.7 Creatine/Phosphocreatine system ................................................................................... 20
1.7.1 Creatine synthesis in the body ........................................................................... 22
1.7.2 Disturbed energy metabolism in AD ............................................................... 24
1.7.3 Focally elevated Cr deposits in AD brain tissue .......................................... 25
FTIR and Raman Spectromicroscopy 27
2.1 Fourier Transform Infrared Spectroscopy .................................................................... 27
2.1.1 Principles of IR spectroscopy ............................................................................ 28
2.1.2 Infrared spectroscopy instrumentation ............................................................ 32
2.1.3 Principles of Fourier Transform Infrared Spectroscopy ............................ 34
2.1.4 Advantages of FTIR versus dispersive infrared spectrometer ................. 36
2.1.5 Instrumentation for Infrared microspectroscopy .......................................... 37
2.1.6 Infrared analysis of biological samples ........................................................... 42
2.2 Raman Spectroscopy .......................................................................................................... 45
2.2.1 Principles of Raman spectroscopy .................................................................... 45
2.2.2 Raman spectroscopy instrumentation .............................................................. 48
2.2.3 Raman microscopy ................................................................................................ 50
2.2.4 Instrumentation of Raman microscope ........................................................... 50
2.2.5 Raman scattering and fluorescence .................................................................. 53
2.2.6 Raman analysis of biological samples ............................................................. 54
Materials and methods 56
3.1 Transgenic mouse model ................................................................................................... 56
3.2 Sample preparation........................................................................................................... 59
3.2.1 Brain tissue preparation ....................................................................................... 59
3.2.2 Creatine crystal preparation ................................................................................ 60
3.3 FTIR and Raman Microscopy .......................................................................................... 60
3.3.1 FPA-FTIR data acquisition ................................................................................. 60
3.3.2 Synchrotron FTIR data acquisition .................................................................. 62
3.3.3 Raman data acquisition ........................................................................................ 63

iv
3.4 Theoretical calculations .................................................................................................. 65
Results 66
4.1 Parameter optimization with Raman microscope ....................................................... 68
4.2 IR and Raman spectra of biochemical signatures in brain tissue ........................... 80
4.2.1 IR and Raman spectra of white matter, gray matter, plaque and neuron in
mouse brain tissue ............................................................................................................... 83
4.2.2 IR and Raman creatine peak assignments from experimental and
theoritical studies ................................................................................................................. 89
4.3 Infrared and Raman analysis processing tools ............................................................ 96
4.3.1 IR Processing using Omnic software ............................................................... 96
4.3.2 IR Processing using Resolution-Pro software ............................................... 97
4.3.3 Raman processing using WiRE software ....................................................... 99
4.4 Analysis of creatine and distribution of creatine in mouse brain tissue ............. 102
4.4.1 Creatine deposits and blood vessel ................................................................. 102
4.4.2 Depth profile of Cr and environs on Tg mouse serial sections .............. 115
4.4.3 Creatine deposits in Caudate ............................................................................ 134
4.5 Creatine crystal orientation effect ................................................................................. 149
4.5.1 Reprocessed previous sFTIR maps of serial sections ............................... 151
4.5.2 Spectra collected by IR and Raman from neat Cr crystal using polarizer
155
4.5.3 Maps collected by IR Microscope in different brain tissue regions using
polarizer ................................................................................................................................ 159
Discussion 175
5.1 Questions to be addressed about FTIR and Raman microspectroscopy of Tg
mice 175
5.2 Calculation peaks assignment and polarization ........................................................ 178
5.3 Raman parameters that were optimized ...................................................................... 180
5.4 IR data thermal source FPA and synchrotron source single pixel data .............. 182
5.5 IR and Raman spectra of blood vessel ......................................................................... 183

v
5.6 Investigation of creatine distribution in brain tissue ............................................... 184
5.6.1 Depth profile plaque in hippocampus ............................................................ 185
5.6.2 Creatine distribution in caudate of transgenic mice ............................ 189
5.7 Exploration of creatine crystal structure with polarized Raman and IR
Microspectroscopy ....................................................................................................................... 190
5.8 Some speculation for the cause of creatine deposits in AD brain tissue ........... 193
5.9 The correlation between creatine deposits in AD brain tissue and activated
microglial cells is still unknown .............................................................................................. 196
5.10 The neuroprotective or neurotoxic effect of Cr in AD is still unknown ............ 198
Conclusions 201
Future work 203
References 205

vi
List of Tables
Table 3.1: Age and sex of transgenic and non-transgenic littermate mice ……………...57
Table 4.1: Assignments of peaks in IR spectra of brain tissue…………………………..81
Table 4.2: Assignments of peaks in IR spectra of brain tissue…………………………..82
Table 4.3: IR and Raman assignments of the most affected modes in Cr…………...…..91
vii
List of Figures
Figure 1.1: Non Amyloidogenic and amyloidogenic processing of APP ......................... 10
Figure 1.2: Cr/PCr shuttle system ..................................................................................... 21
Figure 1.3: Synthesis of creatine.. ..................................................................................... 23
Figure 2.1: The potential energy of the harmonic oscillator ............................................. 29
Figure 2.2: The potential energy of the anharmonic oscillator ......................................... 31
Figure 2.3: Vibrational modes for a non-linear group (CH2)............................................ 32
Figure 2.4: Schematic of FTIR spectrometer .................................................................... 34
Figure 2.5: Interferogram and spectrum ........................................................................... 36
Figure 2.6: Schematic of FPA-FTIR microscope.. ........................................................... 40
Figure 2.7: The structure of Choline, Phosphatidylcholine, and Sphingomyelin ............. 44
Figure 2.8: Energy level diagram to show elastic and inelastic Raman scattering ........... 46
Figure 2.9: Photographs of the Renishaw InVia Raman microscope. .............................. 52
Figure 2.10: Raman scatter vs. Fluorescence. ................................................................... 53
Figure 3.1: Schematic of TgCRND8 double genetic mutation ......................................... 58
Figure 4.1: Sagittal section of the 14 month-old TgCRND8 mouse brain. ...................... 67
Figure 4.2: Laser wavelength optimization. ..................................................................... 69
Figure 4.3: Charcoal bands observed by taking spectra with 50% power at 633 nm ....... 70
Figure 4.4: Laser power optimization. .............................................................................. 71
viii
Figure 4.5: Laser power optimization. .............................................................................. 72
Figure 4.6: Laser power optimization.. ............................................................................. 73
Figure 4.7: Exposure time optimization............................................................................ 74
Figure 4.8: Schematic of line focus laser vs. pinhole ....................................................... 75
Figure 4.9: Peak intensity of silicon versus position of vertical and horizontal mapped
line with pinhole, and without pinhole ............................................................................. 76
Figure 4.10: The Raman extended spectra taken with pinhole. ........................................ 77
Figure 4.11: The Raman extended spectra taken with pinhole. ........................................ 78
Figure 4.12: The Raman extended spectra taken without pinhole and with pinhole. ...... 79
Figure 4.13: IR spectra of white matter and grey matter. ................................................. 84
Figure 4.14: IR spectra of plaque and neuron. .................................................................. 85
Figure 4.15: Raman spectra of white matter and grey matter. .......................................... 87
Figure 4.16: Raman spectra of plaque and neuron ........................................................... 88
Figure 4.17: Creatine monohydrate after optimization ..................................................... 90
Figure 4.18: Atom numbering of Cr.H2O ......................................................................... 91
Figure 4.19: Identification of creatine in mouse brain tissue by IR microscope. ............. 93
Figure 4.20: Identification of creatine in mouse brain tissue by Raman microscope. . ... 95
Figure 4.21: Creatine processing parameter using Omnic/Atlμs software. ...................... 96
Figure 4.22: Creatine processing parameter using Resolution Pro-software. ................... 97
Figure 4.23: Lipid processing using Resolution-Pro software.......................................... 98
Figure 4.24: Creatine processing parameters using WiRE software ................................ 99
Figure 4.25: Plaque processing parameter using WiRE software. .................................. 100
Figure 4.26: processing parameter using WiRE software. ............................................. 101
ix
Figure 4.27: IR maps of blood vessel in mouse hippocampi through age ...................... 104
Figure 4.28: Depth Profile of blood vessel in hippocampus through A14(10) section of
transgenic 14-month-old mouse brain.. .......................................................................... 106
Figure 4.29: Depth Profile of blood vessel in hippocampus through A14(11) section of
transgenic 14-month-old mouse brain ............................................................................ 107
Figure 4.30: Depth Profile of blood vessel in hippocampus through A14(12) section of
transgenic 14-month-old mouse brain ............................................................................ 108
Figure 4.31: Depth Profile of blood vessel in hippocampus through A14(13) section of
transgenic 14-month-old mouse brain ............................................................................ 109
Figure 4.32: Depth Profile of blood vessel in hippocampus through A14(14) section of
transgenic 14-month-old mouse brain. ........................................................................... 110
Figure 4.33: Depth Profile of blood vessel in hippocampus through A14(15) section of
transgenic 14-month-old mouse brain ........................................................................... 111
Figure 4.34: Depth Profile of blood vessel in hippocampus through A14(16) section of
transgenic 14-month-old mouse brain. ........................................................................... 112
Figure 4.35: Depth Profile of Aβ plaque through A14(17) section of transgenic 14-
month-old mouse brain. .................................................................................................. 113
Figure 4.36: Depth Profile of blood vessel in hippocampus through A14(19) section of
transgenic 14-month-old mouse brain. ........................................................................... 114
Figure 4.37: Depth Profile of Aβ plaque through A14(10) section of transgenic 14-
month-old mouse brain. ................................................................................................ 116
Figure 4.38: Spectra correspond to the pixels marked in the mapped plaque in hippocam-
pus of A14(10) section of transgenic 14 month-old mouse brain. .................................. 117
x
Figure 4.39: Depth Profile of Aβ plaque through A14(11) section of transgenic 14-
month-old mouse brain.. ................................................................................................. 118
Figure 4.40: Spectra correspond to the pixels marked in the mapped plaque in
hippocampus of A14(11) section of transgenic 14 month-old mouse brain. .................. 119
Figure 4.41: Depth Profile of Aβ plaque through A14(12) section of transgenic 14-
month-old mouse brain.. ................................................................................................. 120
Figure 4.42: Spectra correspond to the pixels marked in the mapped plaque in
hippocampus of A14(12) section of transgenic 14 month-old mouse brain.. ................. 121
Figure 4.43: Depth Profile of Aβ plaque through A14(13) section of transgenic 14-
month-old mouse brain ................................................................................................... 122
Figure 4.44: Spectra correspond to the pixels marked in the mapped plaque in
hippocampus of A14(13) section of transgenic 14 month-old mouse brain. .................. 123
Figure 4.45: Depth Profile of Aβ plaque through A14(14) section of transgenic 14-
month-old mouse brain ................................................................................................... 124
Figure 4.46: Spectra correspond to the pixels marked in the mapped plaque in
hippocampus of A14(14) section of transgenic 14 month-old mouse brain. .................. 125
Figure 4.47: Depth Profile of Aβ plaque through A14(15) section of transgenic 14-
month-old mouse brain ................................................................................................... 126
Figure 4.48: Spectra correspond to the pixels marked in the mapped plaque in
hippocampus of A14(15) section of transgenic 14 month-old mouse brain. .................. 127
Figure 4.49: Depth Profile of Aβ plaque through A14(16) section of transgenic 14-
month-old mouse brain. .................................................................................................. 128
xi
Figure 4.50: Spectra correspond to the pixels marked in the mapped plaque in
hippocampus of A14(16) section of transgenic 14 month-old mouse brain.. ................. 129
Figure 4.51: Depth Profile of Aβ plaque through A14(17) section of transgenic 14-
month-old mouse brain. .................................................................................................. 130
Figure 4.52: Spectra correspond to the pixels marked in the mapped plaque in
hippocampus of A14(17) section of transgenic 14 month-old mouse brain.. ................. 131
Figure 4.53: Depth Profile of Aβ plaque through A14(19) section of transgenic 14-
month-old mouse brain ................................................................................................... 132
Figure 4.54: Spectra correspond to the pixels marked in the mapped plaque in
hippocampus of A14(19) section of transgenic 14 month-old mouse brain .................. 133
Figure 4.55: Creatine and lipid distribution in the caudate of Tg7(3), 5 months old Tg
mouse.. ............................................................................................................................ 136
Figure 4.56: Creatine and lipid distribution in the caudate of TgADF 15(5c), 5 months old
non-Tg control litter mate mouse.. .................................................................................. 137
Figure 4.57: Creatine and lipid distribution in the caudate of A25(4), 8 months old Tg
mouse . .......................................................................................................................... 138
Figure 4.58: Creatine and lipid distribution in the caudate of A24(4), 8 months old non-
Tg mouse. ...................................................................................................................... 139
Figure 4.59: Creatine and lipid distribution in serial sections from the caudate of A14(2),
14 month-old Tg mouse. .............................................................................................. 140
Figure 4.60: Creatine and lipid distribution in the caudate of A13(2), 14 month-old non-
Tg mouse. ...................................................................................................................... 141
xii
Figure 4.61: Creatine and lipid distribution in the caudate of A03(5), 17 months old Tg
mouse. ............................................................................................................................. 142
Figure 4.62: Creatine and lipid distribution in the caudate of A04(4), 17 month-old non-
Tg mouse. ........................................................................................................................ 143
Figure 4.63: Raman map of an area in caudate of 14 month-old TgCRND8 mouse.. .... 145
Figure 4.64: Raman map of an area in caudate of 14 month-old TgCRND8 mouse. ..... 146
Figure 4.65: Raman map of an area in caudate of 14 month-old TgCRND8 mouse ...... 147
Figure 4.66: Raman map of an area in caudate of 14 month-old TgCRND8 mouse….. 148
Figure 4.67: Creatine crystal with different orientation interact in the different ways with
the polarized synchrotron light. ...................................................................................... 150
Figure 4.68: Comparison of the location of creatine deposits processed in only 1305 cm-1
and peaks between 1408 and 1384 cm-1
in serial sections of 14 month-old Tg mouse. 152
Figure 4.69: Comparison Cr spectra in hippocampus of 14 month-old Tg mouse. ...... 154
Figure 4.70: IR spectra of horizontal Cr crystal taken by FPA-FTIR Microscope……..156
Figure 4.71: Raman spectra of pure horizontal Cr monohydrate crystal taken by Ren-
ishaw InVia Raman Microscope ..................................................................................... 158
Figure 4.72: Maps processed at 1305 cm-1
in the caudate regions of 14 months-old trans-
genic mouse using polarizer angles of 0° to 180°, at 10° intervals. ............................. 161
Figure 4.73: Maps processed at 1405 cm-1
in the caudate regions of 14 months-old trans-
genic mouse using polarizer angles of 0° to 180°, at 10° intervals. ............................... 162
Figure 4.74: The absorption intensity versus polarization angle in the caudate region.. 164
Figure 4.75: The absorption intensity versus polarization angle in the caudate region. 165
xiii
Figure 4.76: Maps processed at 1305 cm-1
in the hippocampus regions of 14 months-old
transgenic mouse using polarizer angles of 0° to 180°, at 10° intervals ......................... 167
Figure 4.77: Maps processed at 1405 cm-1
in the hippocampus regions of 14 months-old
transgenic mouse using polarizer angles of 0° to 180°, at 10° intervals. ........................ 168
Figure 4.78: The absorption intensity versus polarization angle in the mapped hippocam-
pus region. .................................................................................................................... 170
Figure 4.79: The absorption intensity versus polarization angle in the mapped hippocam-
pus region. .................................................................................................................... 171
Figure 4.80: The absorption intensity versus polarization angle in the mapped hippocam-
pus region. .................................................................................................................... 172
Figure 4.81: The absorption intensity versus polarization angle in the mapped hippocam-
pus region. .................................................................................................................... 173
Figure 4.82: The absorption intensity versus polarization angle in the mapped hippocam-
pus region. .................................................................................................................... 174
xiv
List of Presentations
1. Faraz Khorasani, F., Khamenehfar, A., & Gough, K. M. Computational, FTIR and
Raman study of Oriented Creatine Crystals in Brain Tissue from Alzheimer Disease
Mouse Model. Spec 2010, Manchester, UK, June 28, 2010.
2. Khamenehfar, A., Faraz Khorasani, F., Kastyak, M., & Gough, K. M. FTIR and Ra-
man Imaging Of Brain Tissue from Transgenic Mouse Models. Manitoba Neuroscinece
Network, Winnipeg, June 14, 2010.
3. Isenor, M., Khamenehfar, A., Faraz Khorasani, F., Kastyak, M., Stitt, D., & Gough, K.
M. FTIR and Raman Imaging of Biological Materials. Graduate Student Poster Presen-
tation, University of Manitoba, May 25, 2010.
4. Khamenehfar, A., Szeghalmi, A., Del Bigio, M., Westaway, D., Julian, R., & Gough,
K. M. Examination of Creatine Deposits and Environs in Brain Tissue from TgCRND8
Mice by Raman and FTIR Spectromicroscopy, Health Science Graduate Students Asso-
ciation (HSGSA), Winnipeg, June 01-03, 2009.
5. Khamenehfar, A., Szeghalmi, A., Del Bigio, M.,& Gough, K. M. Examination of
Creatine Deposits and Environs in Brain Tissue from TgCRND8 Mice by Raman and
FTIR Microscopy, Federation of Analytical Chemistry and Spectroscopy Societies,
FACSS 2008, Reno-NV, Sept 29, 2008.
6. Khamenehfar, A., Szeghalmi, A., Del Bigio, M., Westaway, D., Julian, R., & Gough,
K.M. Raman Microscopy and Synchrotron FT IR Spectromicroscopy of Focally Elevated
Creatine in Brain Tissue from AD Mice, 54th
International Conference on Analytical Sci-
ences and Spectroscopy (ICASS 2008), Montreal, August 06, 2008.
7. Khamenehfar, A., Gajjeraman, S., Del Bigio, M., Westaway, D., Julian, R., & Gough,
K. M . Evaluation of Creatine Deposits in Brain Tissue of TgCRND8 Mouse Model of
Alzheimer’s Disease By Raman Microscopy and Synchrotron FT IR Spectromicroscopy,
CLS conference, Saskatoon, June 11, 2008.
8. Khamenehfar, A., Del Bigio, M. R., Westaway, D., & Gough, K. M. Raman micros-
copy and infrared spectromicroscopy of focally elevated Creatine in brain tissue from
Amyloid Precursor Protein (APP) transgenic mice, 91st Canadian Chemistry Conference
(CSC2008), Edmonton–Canada, May 27, 2008.
xv
List of Abbreviations
AD .......................................................................................................... Alzheimer disease
ADP................................................................................................. adenosine diphosphate
AGAT ................................................................... L-arginine: glycine amidinotransferase
ApoE .........................................................................................................apolipoprotein E
APP ............................................................................................ amyloid precursor protein
ATP .................................................................................................adenosine triphosphate
Aβ ........................................................................................................................ amyloid β
BACE-1……………………………beta-site amyloid precursor protein cleaving enzyme
BB-CK……………………………………………......cytosolic brain-type creatine kinase
CA ............................................................................................................ Cornu Ammonis
CK ...............................................................................................................Creatine kinase
Cr............................................................................................................................ Creatine
CRT ..................................................................................................... Creatine transporter
DNA………………………………………………………………...deoxyribonucleic acid
FPA ......................................................................................................... Focal plane-array
FT ............................................................................................................ Fourier transform
GAA ...................................................................................................guanidine acetic acid
GAMT ...........................S-adenosyl-L-methionine:N-guanidinoacetate methyltransferase
IR............................................................................................................................ Infrared
MCT ......................................................................................... mercury/cadmium telluride
MRS ............................................................................... magnetic resonance spectroscopy
NFT ................................................................................................... neurofibrillary tangle
OCT...................................................................................... Optimal Cutting Temperature
PS1 ....................................................................................................................presenilin 1

xvi
PS2 ....................................................................................................................presenilin 2
PCr ............................................................................................................ phosphocreatine
ROS ............................................................................................ reactive oxidizing species
RNA……………………………………………………………………….ribonucleic acid
uMt-CK…………………………………………ubiquitous mitochondrial creatine kinase
1
Chapter 1
Introduction
1.1 Goals and objectives
The spectral signature of creatine (Cr) deposits was discovered in some of the IR
plaque maps in the brains of transgenic mice (Rak, 2007; Gallant, 2007). The first publi-
cation reported the in situ detection of focally elevated Cr deposits in post mortem AD
brain tissue and in Tg mouse brain (Gallant et al, 2006). The Cr deposits are sometimes
found in the most aged control mice, but are fewer and much smaller compared to those
observed in Tg mouse brain. The number and size of Cr deposits in hippocampus appear
to increase with age (Kuzyk et al, 2010). The focally-elevated Cr deposits had not been
previously reported before its discovery by Dr. Gough’s research group (Rak, 2007; Gal-
lant et al, 2006).
The goal of research in this thesis is to explore why more Cr found in transgenic
mouse brain. In this project, I was trying to find clues to the origin of Cr in transgenic
mouse brain by IR and Raman microspectroscopy. As the creatine deposits were identi-
2
fied in frozen and desiccated brain tissue, it was important to know whether these
creatine crystals were formed after snap freezing and at desiccating of brain tissue.
Since Cr can be endogenously synthesized in the liver and kidney and carried out
through the blood brain barrier (BBB) by Cr transporters (CrT) to get into the brain,
blood vessels in the hippocampus of transgenic mice were analyzed by IR and Raman to
understand whether any co-localization could be found between these Cr deposits and the
blood vessels, alternating the creatine might be synthesized by microglial cells in brain
tissue.
In this work, the regions of hippocampus and caudate of 5 pairs of TgCRND8 or
Tg19959 (transgenic mice with the same mutations but maintained on a different genetic
background) and their littermate controls were mapped using Raman and IR Microspec-
troscopy. After data collection, the results were analysed to determine whether any other
biochemical signatures could be identified as being localized with the Cr deposits.
To investigate whether Cr deposits distributed ubiquitously in brain tissue, the cau-
date of Tg and non-Tg mice at different ages were IR mapped.
It was discovered by Veena Agrawal (a summer student in Dr. Gough’s group, 2007-
2008) that creatine spectra taken by synchrotron FTIR Microspectroscopy gave different
spectra for various deposits. Spectra of pure Cr crystal were examined with polarized
synchrotron light, and with thermal source FTIR and FPA, with polarizer to establish the
oriented Cr spectral profiles. Since the polarized light could reveal Cr crystal orientation,
FPA-FTIR maps of Cr deposits in caudate and hippocampus of 14 month-old TgCRND8
mouse were recorded, using a polarizer setting from 0° to 180°, and analyzed to estimate
the form, orientation and dimension of crystalline Cr deposits. These IR maps were proc-
3
essed at 1305 cm-1
and 1405 cm-1
as these peaks exhibit extreme polarization effects and
have less overlap with tissue bands compared to other Cr peaks. A combined experimen-
tal and theoretical study (in collaboration with Fatemeh Farazkhorasani, another graduate
student in Dr. Gough’s group) was undertaken to better understand Cr crystal structure
and orientation. These theoretical calculations gave both vibrational modes and polariza-
tion information to enable a better interpretation of the Cr spectra.
Two imaging techniques, FTIR and Raman microscopy were used to investigate Cr
deposits and surrounding tissue. FTIR and Raman Microscopy are compatible, that
means the same section can be mapped by FTIR and then by Raman, repeatedly. The
Raman spectra can be obtained at higher spatial resolution (1-2 μm for Raman compared
to 5-10 μm for FTIR). These techniques have some advantages compared to other stan-
dard visualization techniques. For instance, staining methods, commonly used to study
tissue sections, involve various solvent treatments; therefore, small soluble molecules like
Cr would not be detected because of being washed away. Sample preparation for both IR
and Raman methods involves snap freezing of tissue excised at time of animal sacrifice,
cryosectioning and then desiccation of the sections; therefore, water is the only compo-
nent removed, and no new components are added. These techniques are also non-
destructive (note that illumination with infrared or visible light at very low power does
not damage tissue), thus the sections remain suitable for further analysis such as X-ray
fluorescence imaging (XRF) or immunostaining.
With discovery of Cr, the question remains whether detected Cr deposits have neuro-
protective or neurotoxic effect in AD.
4
1.2 Previous work from this lab
Work completed by other members of Dr. Gough’s lab is briefly reviewed here, fol-
lowed by a description of AD, pathological hallmarks and the disease mechanisms. The
role of inflammation and the possible connection to creatine is then described in more de-
tail.
The research in the field of Alzheimer disease has been ongoing in Dr. Gough’s
group since 1999. The first studies on non-demented and Alzheimer’s diseased (AD) au-
topsy human brain were followed by studies on TgCRND8 and littermate non-transgenic
mouse brain sections with IR microspectroscopic mapping to evaluate β-Amyloid
plaques in the tissue (Rak et al, 2007; Gallant et al, 2006; Ogg, 2002). TgCRND8, a
transgenic mouse model of Alzheimer disease expressing a double mutant human amy-
loid protein precursor (APP695), with the “Swedish” mutation (K670N/M671L) and the
“Indiana” mutation (V717F), presents early amyloid plaque loads appearing at 3 months
old (Woodhouse 2009; Herringa et al, 2008; Chishti 2001).
From the published results of this research group (Rak et al, 2007; Gallant et al,
2006), it has been illustrated that Fourier Transform Infrared and Raman Microscopy can
be used to identify dense-core plaques, diffuse plaques and the surrounding elevated lip-
ids in snap-frozen TgCRND8 mouse brain tissue sections (Rak et al, 2007). In using
FTIR microscopy to analyze plaques, a spectral anomaly was noted in many infrared
maps. This was determined later to be due to crystalline creatine (Cr) deposits in the brain
tissue of TgCRND8 mouse. Cr is a small molecule found in tissue with high energy de-
mands including the brain, and plays an important role in cellular energetic. The role of
5
the Cr/phosphocreatine (PCr) system in energy storage has been well established (Andres
et al, 2008).
The deposits of Cr in brain tissue had previously escaped attention. The first publica-
tion reported the in situ detection of focally elevated Cr deposits in post mortem AD
brain tissue and in Tg mouse brain, by infrared (IR) and Raman microspectroscopy (Gal-
lant et al, 2006). It was shown that creatine was found more abundantly in hippocampus
of mouse brain compared to their non-transgenic littermates and increased with age
(Kuzyk et al, 2010).
1.3 Alzheimer Disease
Alzheimer Disease is the most common form of dementia; it is characterized by pro-
gressive deterioration of memory and higher cortical function that ultimately results in to-
tal degradation of memory and intellectual activities (Patterson et al, 2008; Apostolova et
al, 2007). The major neuropathological changes in the brains of AD patients are neuronal
death, activated microglial cells, and the presence of abnormal intra- and extra-cellular
protein aggregates, known as neurofibrillary tangles and β-Amyloid plaques, respectively
(Querfurth et al, 2010; Jakob-Roetne, 2009; Nelson et al, 2009). These histopathological
lesions, prerequisites for a confirmed clinical diagnosis of AD after death, are found
throughout the brain, usually more common in the hippocampus, a centre to transfer
memory from short term to long term, and the cerebral cortex, which is involved in rea-
soning, memory, language and other important thought processing (Mattson et al, 2004).
These brain regions are reduced in size in AD patients as the result of degeneration of
synapses and neuronal death (Takahashi et al, 2010).
6
Unfortunately, many people all around the world suffer from this harmful disease and
it is a huge drain on health care resources. Despite the progress made in AD research in
the last decades, no reliable, effective long-term treatments are yet available (Panza et al,
2010).
Dr. Alois Alzheimer (1864–1915), who first described the disease, was a German
psychiatrist and pathologist. In 1906, he carried out an autopsy on the brain of a 56-year-
old woman who died after several years of progressive mental deterioration characterized
by confusion and memory loss. In her cerebral cortex, he found strange bundles in neu-
rons, which he termed neurofibrillary tangles, and accumulations of cellular debris
around the neurons, which he termed senile plaques (Baek et al, 2002). He presented his
findings at a meeting in late 1906, and published them in 1907, speculating that the tan-
gles and plaques were responsible for patient’s dementia (Herz, 2007).
Generally, the prevalence of AD increases with age, affecting approximately 1 to 3%
of the population in the 6th
decade of life, 3 to 12 % of the population between 70 and 80
years, and up to 25 to 35 % older than 85 years (Walsh et al, 2004). It is estimated that
300,000 Canadians over 65 are affected by this neurodegenerative disorder and the
number of people with AD is expected to grow due to the aging population
(www.alzheimersociety.com). According to the World Health Organization, approxi-
mately 18 million people are currently living with Alzheimer disease worldwide. This
number is predicted to become almost double by 2025 (www.sciencedaily.com).
7
1.4 Genetics of AD and risk factors
There are two main types of Alzheimer disease: sporadic or late-onset Alzheimer
Disease (LOAD), and Familial Alzheimer Disease (FAD) or early-onset, the latter of
which accounts for only about 5 percent of cases.
FAD is due to inherited genetic mutations, some of which include mutation in the
presenilin 1 (PS-1) gene on chromosome 14, the presenilin 2 (PS-2) gene on chromosome
1, and the APP gene on chromosome 21 (Bettens et al, 2010; Shepherd et al, 2009; Herz,
2007). People with trisomy 21 (Down Syndrome) who have an extra gene copy develop
AD symptoms at an early age (Bettens et al, 2010; Herz 2007; Selkoe et al, 2002).
Sporadic AD is a multifactorial disease, while its symptoms are similar to FAD. In
addition to genetic abnormalities, several environmental factors may increase the risk of
AD (Stampfer et al, 2006). It has been suggested by in vivo studies that history of head
trauma and high cholesterol may increase the risk of occurrence of AD (Mattson et al,
2003; Lee et al, 2002). Researchers are investigating whether diseases that affect the
heart and vascular (blood vessel) system may increase the risk of Alzheimer disease
(Pereira et al, 2005). These conditions include high blood pressure, unhealthy cholesterol
levels, and diabetes. There is some evidence that controlling these conditions may help
prevent Alzheimer disease (Pereira et al, 2005). Insulin resistance may also be a risk fac-
tor for the development of AD (Iwata et al, 2004; Watson et al, 2003). Generally, insulin
appears important for learning and memory. It has been reported that insulin can inhibit
neurofibrilary tangle formation, stimulate α-secretase (Solano et al, 2000), and reduce the
intracellular pool of Aβ in transgenic mouse brain (Zhao et al, 2004; Gasparani et al,
2001).
8
The causes of Aβ aggregation in sporadic cases of AD are not understood, but may
include age-related increases in oxidative stress, impaired energy metabolism and dis-
turbed ion homeostasis (Jakob-Roetne, 2009).
The mice studied in this thesis are TgCRND8, a transgenic mouse model of Alz-
heimer disease expressing a double mutated human amyloid protein precursor (APP695),
with the “Swedish” mutation (K670N/M671L) and the “Indiana” mutation (V717F). This
transgenic mouse presents early amyloid plaque loads appearing at 3 month-old (Wood-
house 2009; Herringa et al, 2008; Chishti 2001). (See section 3.1 for more information)
1.5 Histopathological hallmarks of AD
Macroscopically, brain from individuals with AD shows a reduction of volume and
enlarging of the ventricles, due to a loss of grey matter. The histopathological hallmarks
of AD include Aβ plaques, neurofibrillary tangles, neuron and synaptic loss, activated
glial cells, and deposition of Aβ in the small blood vessels (Congophil angiopathy)
(Apostolova et al, 2007).
1.5.1 Amyloid beta plaques
In 1964, Aβ was identified in a fibrillar form within the senile plaques by electron
microscopy (Terry, 1964). Since Aβ was identified as an important constituent of the
amyloid-β aggregations that characterise the AD brain, this small peptide has received in-
tense research focus as an important factor that contributes directly to development of the
disease (Crouch et al, 2008). Aβ peptide is a natural product and is present in the brain
and cerebrospinal fluid (CSF) of normal humans throughout life (Walsh et al, 2000).
9
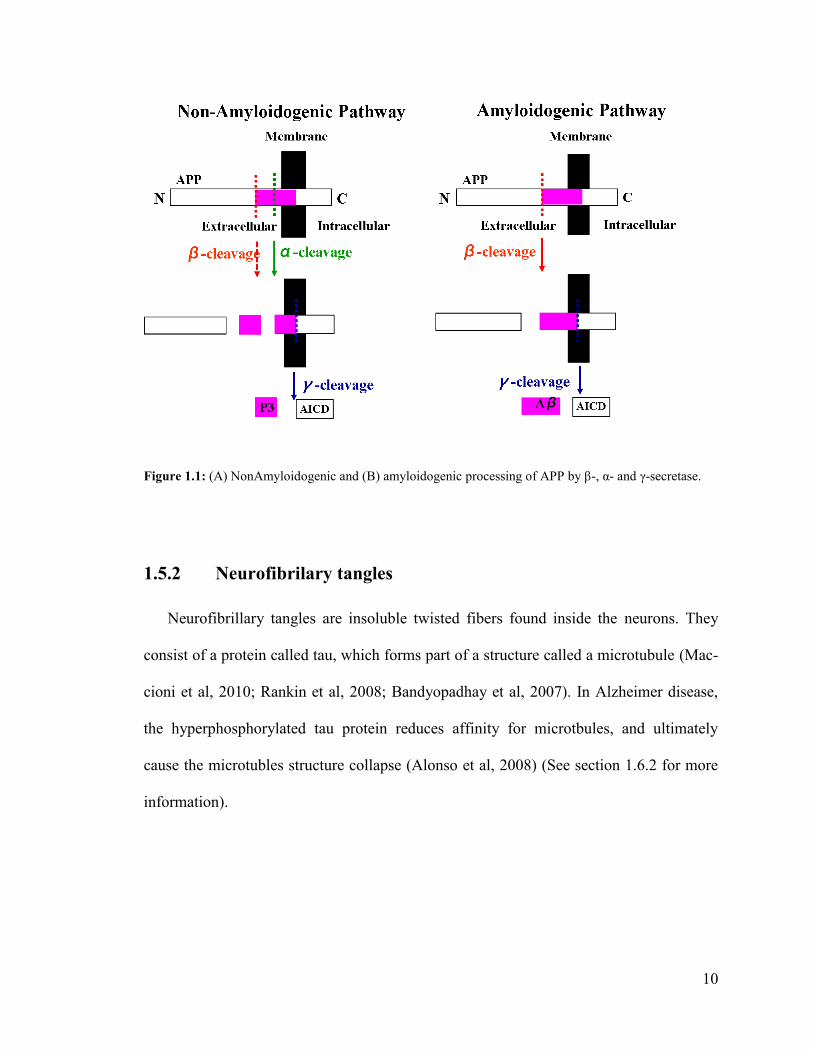
Aβ is produced by proteolytic cleavage of the Amyloid Precursor Protein (APP) by β-
and γ-secretases, respectively (Nerelius et al, 2009). APP is a transmembrane protein, ex-
pressed in many tissues and concentrated in the synapses of neurons (Crouch et al, 2008).
Its primary function is unknown, although it has been reported as a regulator of synapse
formation. In humans, the gene for APP is located on chromosome 21. It can be up to 770
amino acids long, with three isoforms: APP 695, APP 751, and APP 770. APP can be
cleaved by three protein secretases: α, β, and γ in two different ways (Walsh et al, 2007).
The non-amyloidogenic pathway includes the cleavage of APP by α- and γ-secretases, re-
spectivly, and prevents the generation of Aβ (Figure 1.1A). On the other hand, as illus-
trated in Figure 1.1B, the beta-site amyloid precursor protein cleaving enzyme (BACE-1)
initiates Aβ generation and the amyloidogenic pathway. The proteolytic cleavage of α, β
and γ-secretase results in the generation of a truncated non-amyloidogenic peptide (P3)
which does not play any role in Alzheimer disease (Hartmann et al, 2007).
Senile plaques are composed of aggregates of 39-43 amino acid Aβ peptide (Wirths et
al, 2008). The Aβ in length with 40 and 42 amino acids are the main components of
plaques. Aβ40 accounts for 90% of the total Aβ; Aβ42 aggregates much faster than Aβ40
and is more neurotoxic (Waldo et al, 2008).
10
Figure 1.1: (A) NonAmyloidogenic and (B) amyloidogenic processing of APP by β-, α- and γ-secretase.
1.5.2 Neurofibrilary tangles
Neurofibrillary tangles are insoluble twisted fibers found inside the neurons. They
consist of a protein called tau, which forms part of a structure called a microtubule (Mac-
cioni et al, 2010; Rankin et al, 2008; Bandyopadhay et al, 2007). In Alzheimer disease,
the hyperphosphorylated tau protein reduces affinity for microtbules, and ultimately
cause the microtubles structure collapse (Alonso et al, 2008) (See section 1.6.2 for more
information).
11
1.5.3 Synaptic dysfunction and neuronal loss
Synaptic dysfunction is a very early event. It can happen before reduction of acetyl-
choline level, and continue with plaque and tangles formation (Apostolova et al, 2007;
Tiraboschi, 2000). Synaptic dysfunction is evident before synapses and neurons are lost
(Coleman et al, 2004). A 50% decrease in synapse-to-neuron ratio in AD suggests that
many surviving neurons have lost their synaptic function prior to cell death (Coleman et
al, 2004). So far the exact causes of synaptic loss have not been completely understood.
In AD, synaptic density correlates inversely with soluble amyloid beta levels but not
amyloid plaques (Mucke, 2000). The oligomeric Aβ forms are synaptotoxic and severely
interfere with synaptic function in the long-term (Kayed, 2003).
The earliest reduction in neuronal counts has been observed in entorhinal cortex (EC)
and later shows up in CA1 region of hippocampus. Neuronal loss is ubiquitous in ad-
vanced AD (West et al, 2004). Generally, the regions of brain tissue, where more than
50% of the neuronal population is severely affected, are entorhinal cortex, olfactory nu-
cleus, hippocampus and temporal neocortex (Apostolova et al, 2007; Duyckaerts et al,
2003). Although it was believed that neuroinflammation can threaten neurons, some evi-
dence suggests that neurons themselves are able to produce inflammatory mediators
(Heneka et al, 2007; Simard et al, 2006). It has been reported that glia and neurons can
synthesize nitric oxide (NO) and proxynitrite (ONOO-) which can cause neuronal dys-
function and cell death in vitro and in vivo (Heneka et al, 2007).
12
1.5.4 Activated microglia
Microglia cells form around 10% of all cells in the nervous system. They represent
the first line of defence against invading pathogens (Brent et al, 2010; Napoli et al, 2009;
Benhardi et al, 2006; Conde 2006). Under the pathological situation in AD, these cells
become activated, migrate and surround damaged neurons to fight against Aβ plaque ag-
gregations (Combs et al, 2009; Fetler et al, 2005). They also undergo dramatic morpho-
logical changes (enlarged size and distorted shape) and release a variety of pro-
inflammatory mediators including cytokines, and free radical species both of which are
neurotoxic (Heneka et al, 2007; Mark et al, 2005). Along with microglia, astrocytes di-
rectly react and contribute to defence against Aβ plaque aggregation (Heneka et al, 2007).
Although it is generally accepted that Aβ deposition is a potent glial activator, activation
of microglia and astrocytes could be an early event in the disease, occurring even in the
absence of insoluble Aβ aggregation (Nunomura et al, 2001). It has been reported that in
3 month old APP transgenic mice, both cognitive deficits and focal glial cytokine produc-
tion has been observed well before Aβ plaque deposition (Heneka et al, 2005). It means
at least at the beginning of the disease, the senile plaques do not cause glial activation,
and the neuroprotective effect of glial cells is a response against small Aβ oligomers or
protofibrils instead of senile plaques (Schlachetzki et al, 2009; White et al, 2005).
1.6 Disease mechanism
Having depicted the pathological hallmarks, hypotheses concerning the disease
mechanism are described here.
13
1.6.1 Amyloid beta cascade hypothesis
For over a decade, the main argument of the “Amyloid Cascade Hypothesis” has
maintained that accumulated Aβ is the principal cause leading to both sporadic and FAD
(Pimplikar et al, 2009; Jakob-Roetne et al, 2009; Hardy et al, 1992; Selkoe, 1991). This
hypothesis implies that non-fibrilar forms of Aβ, including small oligomers and protofi-
brils (PF), may be responsible for memory impairment in AD human patients and AD
animal models (Cerpa et al, 2008; Walsh et al, 2007; Klein WL, 2004). The insoluble
amyloid fibril deposits of Aβ were thought for a long time to contribute to the progres-
sion of dementia of AD (Hardy et al, 2002). However, a poor correlation was obtained
between the insoluble fibrilar Aβ aggregation with the progression of AD (Bharadwaj et
al, 2009; Pierrot et al, 2008; Cerpa et al, 2008; Walsh et al, 2007). In contrast, soluble Aβ
oligomers have been found in the brain of AD patients (Yu et al, 2009), and the loss of
synapses and cognitive perception seems to correlate better with soluble oligomers of Aβ
42. Increasing evidence suggests that these early stage oligomers of Aβ may be much
more important in AD (Jakob-Roetne et al, 2009). The levels of Aβ oligomers and its af-
fect on altered synaptic morphology were shown to be increased in hippocampus and cor-
tex of AD patients in the absence of amyloid plaques and NFT as well (Tkahashi et al,
2004; Funato et al, 1999). These results suggest that accumulation of Aβ oligomers oc-
curs very early in the disease process and is linked to memory failure in AD (Kawaraba-
yashi et al, 2004).
The Aβ cascade hypothesis also considers that amyloid plaques are formed by Aβ42
rather than Aβ40 (Jan et al, 2008; D’Andrea et al, 2001). Aβ42 can develop dense-cored

14
plaques, diffuse plaques and vascular amyloid deposits, while Aβ40 fail to do so (Jan et
al, 2008; McGowan et al, 2006).
Amyloid pathology in AD may occur as a result of increased intracellular Aβ levels.
Neurons in the hippocampus and cortex from the brain of Down’s syndrome patients
showed strong intraneuronal Aβ42 immunoreactivity, which declined with the deposition
of extracellular Aβ plaques (Busciglio et al, 2002). It has also been demonstrated that Aβ
plaques are dynamic structures; Aβ can be internalized again, thereby increasing the in-
traneuronal pool of Aβ42, which in turn increases the neurotoxic intracellular events
(Friedrich et al, 2010; Christensen et al, 2009; Billings et al, 2008; Wirths et al, 2004).
1.6.2 Tau hypothesis
The hyperphosphorylated forms of tau protein were discovered during the 1980s
(Kosik et al, 1986). Tau is a microtubule-associated protein that stabilizes the cytoskele-
ton, constantly undergoing phosphorylation and dephosphorylation to achieve this
(Alonso et al, 2008; Rankin et al, 2008; Stoothoff et al, 2005). In adult human brain, six
isoforms of tau ranging from 352 to 441 amino acids are present (Lucas et al, 2001). In
AD, tau neurotoxicity is, at least in part, due to hyperphosphorylation of all six isoforms
leading to reduced microtubule binding, destabilization of the cytoskeleton, reduced ax-
onal transport (Stoothoff et al, 2005) and insoluble intracellular fibril formation (Mac-
cioni et al, 2010; Alonso et al, 2008; Kobayashi et al, 2003). As a result of neuronal
death, oligomeric forms and tau filaments are released to the extracellular environment,
and contribute to activation of microglial cells leading to progressive neuronal degenera-
tion (Maccioni et al, 2010; Gong et al, 2010; Ramos et al, 2006).

15
According to the amyloid cascade hypothesis, Aβ aggregation causes inflammation
that is a part of the pathology of AD, and leads to hyperphosphorylation of tau protein. It
has been shown that in the absence of fibrils, small oligomers stimulate tau phosphoryla-
tion in mature cultures of hippocampal neurons; therefore, Aβ oligomer activity may be
directly linked to tau hyperphosphorylation in AD pathology (De Felice et al, 2008).
NFTs are reported to lead to dementia in the absence of amyloid plaques (Ramos et al,
2006). The precise molecular mechanism of such toxicity is not clear, as tau is modified
by a series of complex methods, such as hyperphosphorylation, glycosylation, and nitra-
tion (Alonso et al, 2008). The relative toxic effect of NFTs to cells is still controversial.
According to the dual pathway hypothesis, Aβ aggregation and tau hyperphosphory-
lation can be linked by separate mechanisms; resulting in synaptic dysfunction and neu-
ronal death (Small et al, 2008).
1.6.3 Oxidative stress
Currently it is believed that oxidative stress plays a significant role in AD pathogene-
sis (Ansari et al, 2010). A considerable number of oxidative stress markers are found in
the brain of AD patients associated with plaque aggregation and NFT (Martinez et al,
2010; Butterfield et al, 2001). Indirect evidence of oxidative stress in AD brains comes
from studies of AD patients treated with antioxidant like Vitamin E, and 17-Estradiol,
phenolic compound, display a postponement in progression of disease (Uttara et al, 2009;
Pratico, et al, 2008; Green et al, 2000). However, from another publication, it was reprted
that an antioxidant diet reducing oxidized end products could not reduce plaque aggrega-
tion and cognitive deficite in APP mice (Siedlak et al, 2009).
16
Aβ peptides have been reported as a source of oxidative stress in this neurodegenera-
tive disorder (Nunomura et al, 2010). H2O2 is directly generated during the process of Aβ
aggregation (Koppenal et al, 2004). In the presence of Fe2+
, it can generate OH˙ (Fenton
reaction) (Uttara et al, 2009) and cause oxidative stress, which in turn may induce Aβ
production (Jackob-Roetne et al, 2009).
This cycle of oxidative stress and Aβ accumulation eventually leads to neurodegen-
eration (Xu et al, 2008). Oxidative stress can induce amyloidogenic processing of βAPP,
resulting in production and aggregation of Aβ as a result of the increased activity of β-
secretase (Quiroz-Baeza et al, 2009).
Several lines of evidence suggest that synaptic dysfunction induced by Aβ occurs
through oxidative stress mediated mechanisms (De Felice et al, 2008). It is also known
that mitochondrial dysfunction often leads to excessive generation of free radicals and
subsequent oxidative damage (Pereira et al, 2005). Generally, oxygen takes part in glu-
cose break down in mitochondria through oxidative phosphorylation and generates ATP.
Any mutation in mitochondrial DNA leads to impaired ATP generation, preventing oxi-
dative phosphorylation (Mancuso et al, 2008; Guido et al, 2000). Neurons require more
oxygen and glucose consumption to generate ATP pool for normal functioning of brain;
therefore, they are more susceptible toward oxygen overload and generation of free radi-
cals (Pereira et al, 2005; Lepoirve et al, 1994). In the normal situation, 1-2% of consumed
O2 is converted to reactive oxygen species (ROS) but in aged brain this number goes up
because of low regenerative capacity of aged brain (Pereira et al, 2005).
Some important Reactive Oxygen Species (ROS) are hydrogen peroxide (H2O2),
highly reactive hydroxyl radicals (OH˙), and nitric oxide radical (NO˙). OH˙ can react
17
with Aβ to further promote Aβ aggregation. As mentioned above, damaged mitochondria
and activated microglia act as reservoir of ROS. Free radicals have been reported to con-
tribute to neuronal loss in AD (Uttara et al, 2009). The brain is also rich in molecules
such as unsaturated fatty acids that are susceptible to oxidative damage. Double bonds of
unsaturated fatty acids are vulnerable to attack by free radicals and ultimately cause chain
reactions to damage neighbouring unsaturated fatty acids (Butterfield et al, 2002). Oxida-
tive overload in neuronal microenvironment causes oxidation of lipids, and proteins. The
generation of lipid peroxidation products and the lipoperoxidation of membranes are as-
sociated with amyloid plaques in Tg mice and there is a correlation between amyloid
plaques and lipid peroxidation in AD (Uttara et al, 2009). Antioxidant therapy has been
examined in scavenging ROS to postpone disease progress (Pratico, et al, 2008). How-
ever, it has not been shown to prevent neuronal degeneration.
1.6.4 Amyloid beta toxicity
Numerous studies show that Aβ42 has a neurotoxic effect (Gotz et al, 2008). Amyloid
beta is postulated to cause cognitive deficits and neuronal damage, mitochondrial dys-
function, increasing inflammation in the brain, the production of the reactive oxygen spe-
cies (ROS), interruption of synaptic transmission, and intracellular calcium dyshomeosta-
sis (Querfurth et al, 2010; Nerelius et al, 2009; Kawahara et al, 2009; Tanzi et al, 2005;
Reddy et al, 2005).
Generally, Aβ readily interacts with other Aβ molecules to progressively form a wide
range of oligomers and soluble aggregates (Nerelius et al, 2009). Continued amyloido-
genesis gives rise to the high molecular weight insoluble Aβ fibrils. Initial AD research
18
focused on extracellular Aβ fibrils. Although it is still not very clear whether the Aβ oli-
gomers or fibrils are the most important toxic species, it has been shown that Aβ fibrils
induce extensive dystrophic neurites, but only modest neuronal death. On the other hand,
the Aβ oligomers produced extensive neuronal death (Nerelius et al, 2009; Waldo et al,
2008; Walsh et al, 2007). Recently, more attention has been focused on oligomers (Walsh
et al, 2005). The soluble Aβ oligomers have been shown to inhibit hippocampal long
term potentiation and cause memory loss and synaptic dysfunction when injected into rat
brain (Cerpa et al, 2009).
On the basis of Aβ hypothesis, while extracellular amyloid aggregation is one of the
most important pathological hallmarks of AD, intracellular Aβ may be even more impor-
tant than extracellular Aβ (Friedrich et al, 2010; Nunomura et al, 2009). Intraneuronal Aβ
accumulation has been reported to commonly precede extracellular Aβ deposition in sev-
eral familial AD-related mutant PS-1 transgenic mice (Ohyagi et al, 2008). It has also
been demonstrated that as Aβ plaques are dynamic structures, Aβ can be internalized
again, thereby increasing the intraneuronal pool of Aβ42, which ultimately results in
various pathogenic mechanisms such as mitochondrial toxicity and synaptic damage
(Ohyagi et al, 2008; Wirths et al, 2004). While prevention of Aβ production and anti-Aβ
immunotherapies are likely to attenuate both intraneuronal and extracellular Aβ toxicity,
more specific anti-intraneuronal Aβ therapies may be useful (Ohyagi et al, 2008).
Some studies demonstrate that lipids, surrounding the Aβ plaque aggregate, can revert
aggregated Aβ fibrils into neurotoxic protofibrils (Martins et al, 2008). Injection of such
reverted protofibrils into mice reveals the same memory impairment as protofibrils

19
formed from monomeric Aβ (Martins et al, 2008). It means that the step from protofibril
to fibril formation can be reversible.
1.6.5 Inflammation in AD
The involvement of inflammatory processes in the pathogenesis of AD is shown from
studies indicating that use of non-steroidal anti-inflammatory dugs significantly reduces
the risk of disease (Moore et al, 2010; Szekely et al, 2010; Stewart et al, 1997). The in-
flammatory reaction is the first line of protection against Aβ aggregation, but an exces-
sive inflammatory response can be gradually harmful (Schlachetzki et al, 2009). Gener-
ally, the inflammatory process involves microglia cells, and astrocytes. The presence of
activated microglia surrounding Aβ aggregation supports the postulated role of these cells
in the clearance of amyloid aggregation (Rogers et al, 2002). Microglia activation in AD
was discovered two decades ago, and activated microglia are generally believed to be in-
volved in AD-associated inflammatory response (Heneka et al, 2007), although the pre-
cise role of microglial cells in AD pathogenesis remains to be calrify.
Before the development of clinical symptoms for AD, microglia becomes activated
by Aβ possibly in order to prevent plaque formation or restrict plaque growth (Rodriguez
et al, 2010; Schlachetzki et al, 2009). Activation of microglia results in enlarged size, and
increased secretion of cytokines, reactive oxygen intermediates and nitric oxide, all of
which contribute to neuronal dysfunction and cell death. As the disease progress, micro-
glia contribute to altered calcium homeostasis, increased production of ROS, neuritic and
synaptic dysfunction caused by oxidative stress, and possibly generation of tangles, ulti-
mately causing neuronal death (Butterfield et al, 2002; Selkoe, 2001). Over the following

20
years, more plaques and NFT are generated, and the patient develops severe dementia
(Schlachetzki et al, 2009).
Although the role of astrocytes in the inflammatory process associated with neurode-
generative disorders is not very clear, it is known that activated astrocytes produce high
levels of pro-inflammatory cytokines, ROS, similar to and overlapping with those pro-
duced by microglia (Bernhardi et al, 2007). The degree of inflammation has been re-
ported to correlate with brain atrophy and the severity of dementia in early AD (Para-
chikova et al, 2006; Cagin et al, 2002). Activated microglia can be found very early in
disease progression. In the APP/PS1 AD transgenic mouse model, microglial activation
has been observed at 4-6 months of age, along with the deposition of amyloid plaques
(Ruan et al, 2009; Wirths et al, 2008). In the single APP mouse model, microglial activa-
tion has been reported before the onset of amyloid deposition, possibly in order to fight
against oligomers (Heneka et al, 2005).
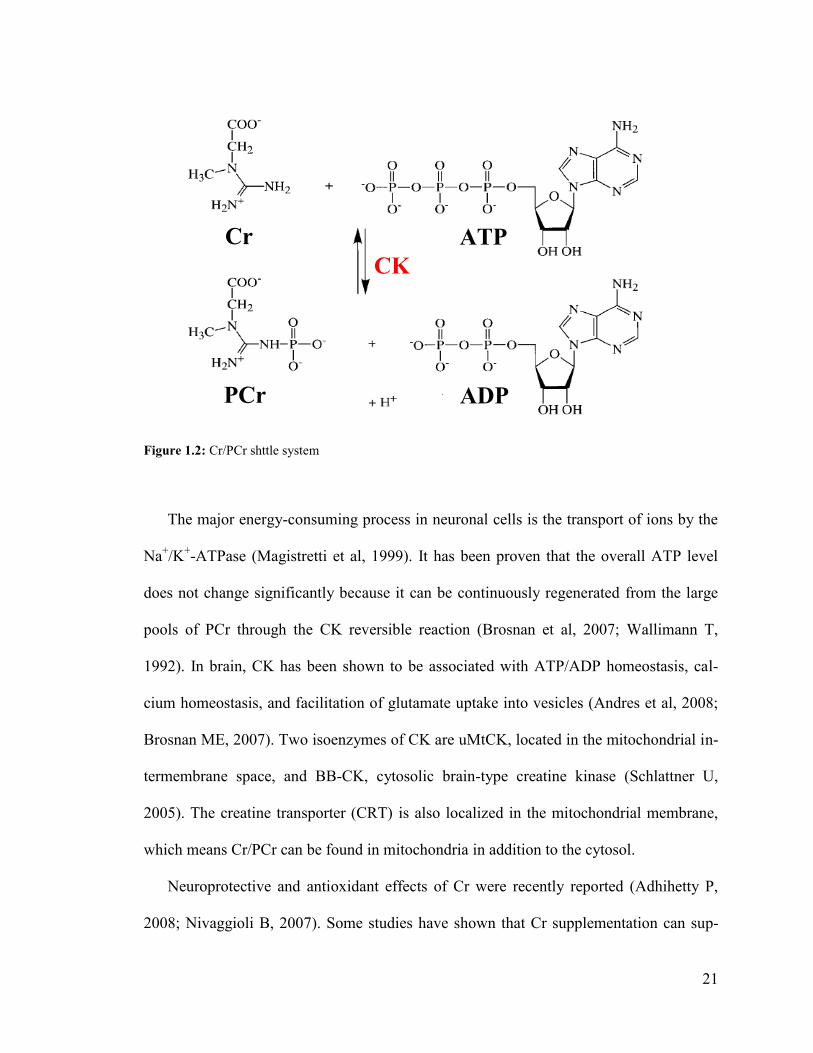
1.7 Creatine/Phosphocreatine system
Since elevated Cr has been found in Tg mouse model and it is the focus of this study,
its role in the body is described here.
The creatine (N-aminoiminomethyl-N-methylglycine) /phosphocreatine system plays
a crucial role in energy metabolism in tissue with high demand for energy, such as mus-
cles and brain. This shuttle system can maintain ATP/ADP homeostasis catalyzed by
creatine kinase (CK) as shown in the following reversible reaction (Figure 1.2) to transfer
phosphate group from ATP to Cr, and form ADP and phosphorylcreatine (PCr) (Brosnan
et al, 2007).
21
Cr
PCr
ATP
ADP
CK
Cr
PCr
ATP
ADP
CK
Figure 1.2: Cr/PCr shttle system
The major energy-consuming process in neuronal cells is the transport of ions by the
Na+/K
+-ATPase (Magistretti et al, 1999). It has been proven that the overall ATP level
does not change significantly because it can be continuously regenerated from the large
pools of PCr through the CK reversible reaction (Brosnan et al, 2007; Wallimann T,
1992). In brain, CK has been shown to be associated with ATP/ADP homeostasis, cal-
cium homeostasis, and facilitation of glutamate uptake into vesicles (Andres et al, 2008;
Brosnan ME, 2007). Two isoenzymes of CK are uMtCK, located in the mitochondrial in-
termembrane space, and BB-CK, cytosolic brain-type creatine kinase (Schlattner U,
2005). The creatine transporter (CRT) is also localized in the mitochondrial membrane,
which means Cr/PCr can be found in mitochondria in addition to the cytosol.
Neuroprotective and antioxidant effects of Cr were recently reported (Adhihetty P,
2008; Nivaggioli B, 2007). Some studies have shown that Cr supplementation can sup-
22
port maintenance of mitochondrial function and preservation of ATP levels (Bruno et al,
2010; Adhihetty et al, 2008; Andres et al, 2008). Cr supplied from Cr supplementation is
phosphorylated inside the neurons by the catalytic activity of CK, leading to an increas-
ing PCr/ATP ratio, thus a higher energy charge in the cell. However, this procedure can
not happen if CK is damaged by oxidative stress.
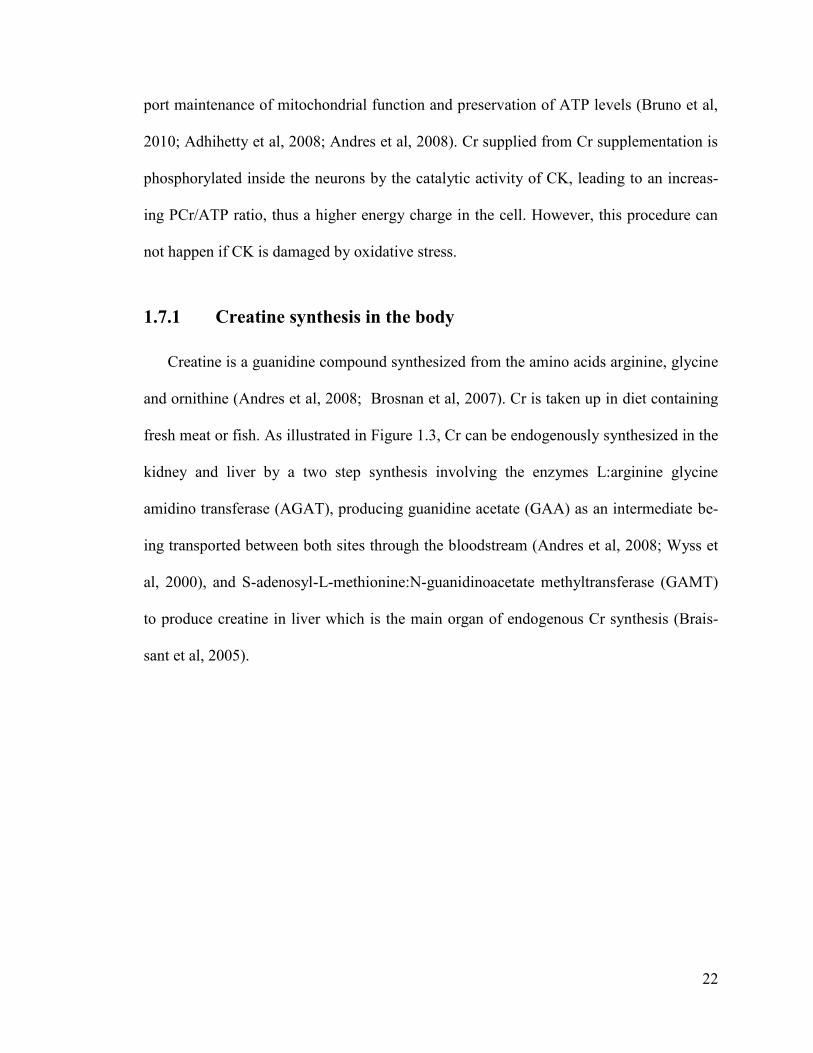
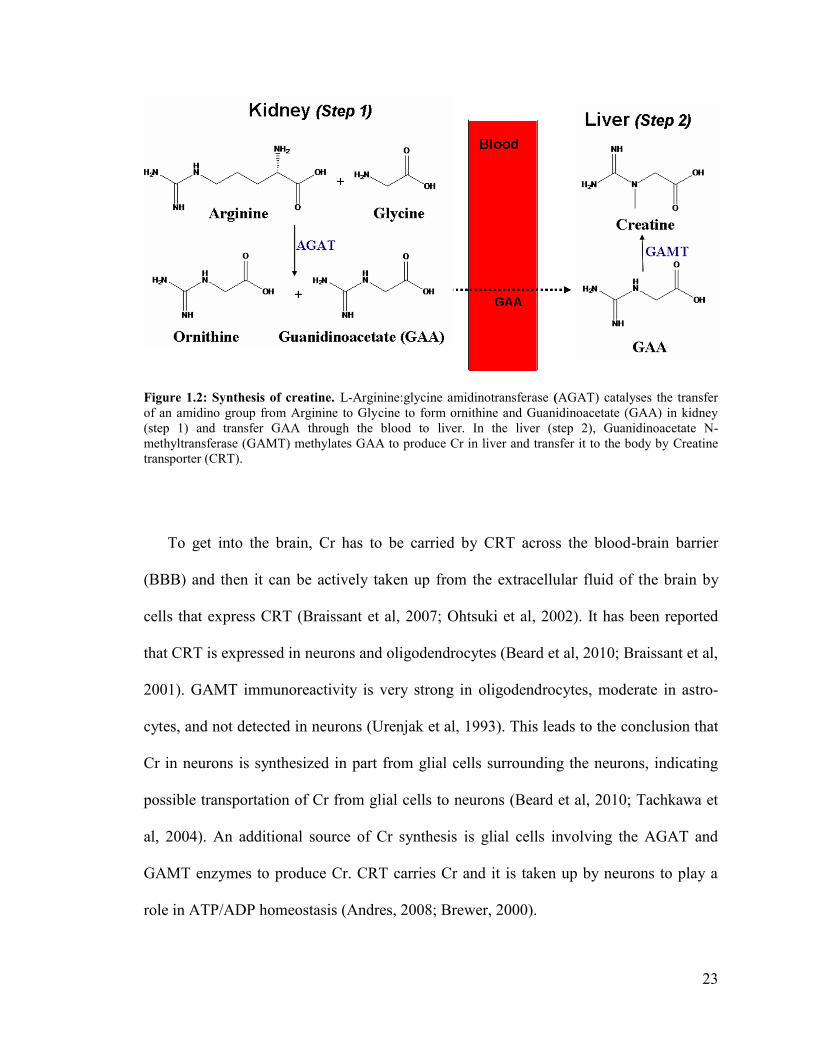
1.7.1 Creatine synthesis in the body
Creatine is a guanidine compound synthesized from the amino acids arginine, glycine
and ornithine (Andres et al, 2008; Brosnan et al, 2007). Cr is taken up in diet containing
fresh meat or fish. As illustrated in Figure 1.3, Cr can be endogenously synthesized in the
kidney and liver by a two step synthesis involving the enzymes L:arginine glycine
amidino transferase (AGAT), producing guanidine acetate (GAA) as an intermediate be-
ing transported between both sites through the bloodstream (Andres et al, 2008; Wyss et
al, 2000), and S-adenosyl-L-methionine:N-guanidinoacetate methyltransferase (GAMT)
to produce creatine in liver which is the main organ of endogenous Cr synthesis (Brais-
sant et al, 2005).
23
Figure 1.2: Synthesis of creatine. L-Arginine:glycine amidinotransferase (AGAT) catalyses the transfer
of an amidino group from Arginine to Glycine to form ornithine and Guanidinoacetate (GAA) in kidney
(step 1) and transfer GAA through the blood to liver. In the liver (step 2), Guanidinoacetate N-
methyltransferase (GAMT) methylates GAA to produce Cr in liver and transfer it to the body by Creatine
transporter (CRT).
To get into the brain, Cr has to be carried by CRT across the blood-brain barrier
(BBB) and then it can be actively taken up from the extracellular fluid of the brain by
cells that express CRT (Braissant et al, 2007; Ohtsuki et al, 2002). It has been reported
that CRT is expressed in neurons and oligodendrocytes (Beard et al, 2010; Braissant et al,
2001). GAMT immunoreactivity is very strong in oligodendrocytes, moderate in astro-
cytes, and not detected in neurons (Urenjak et al, 1993). This leads to the conclusion that
Cr in neurons is synthesized in part from glial cells surrounding the neurons, indicating
possible transportation of Cr from glial cells to neurons (Beard et al, 2010; Tachkawa et
al, 2004). An additional source of Cr synthesis is glial cells involving the AGAT and
GAMT enzymes to produce Cr. CRT carries Cr and it is taken up by neurons to play a
role in ATP/ADP homeostasis (Andres, 2008; Brewer, 2000).

24
1.7.2 Disturbed energy metabolism in AD
The energy impairment in diseased and elderly brain has been investigated during the
last decade (Andres et al, 2008; Griffiths et al, 2008; Bürklen et al, 2006; Parihar et al,
2006). Mitochondrial dysfunction often leads to the excessive generation of free radicals
and subsequent oxidative damage, which can contribute to the aging process (Mancuso et
al, 2008; Lustbader et al, 2004). Studies of patients and transgenic mouse brain indicate
that the Aβ-binding alcohol dehydrogenase (ABAD) interacts with Aβ in the mitochon-
dria to increase free-radical generation in neurons (Lustbader et al, 2004). There is an-
other hypothesis that the characteristic loss of synapses in AD arises in part from mito-
chondrial dysfunction (Pereira et al, 2005). It is reasonable that increased oxidative modi-
fication of brain proteins may disturb neuronal functions by decreasing activities of key
metabolic enzymes and affecting cellular signalling systems (Uttara et al, 2009; Aksenov
et al, 2000). Brain energy metabolism is characterized by high and fluctuating rates of
ATP synthesis. A high level of CK, catalyzing the reversible transfer of the phosphate
group of PCr to ADP in order to regenerate ATP, is reached in the brain. PCr/Cr/ATP
levels are regulated by the enzyme CK.
Damage to the CK function may be an important part of a neurodegenerative pathway
that leads to neuronal loss in the brain (Andres et al 2008; Bürklen et al, 2006; Aksenov
et al, 2000). BB-CK has been shown to be significantly inactivated by oxidation in AD
patients, and it is one of the biochemical markers of the Central Nervous System (CNS)
cell damage in AD (Bürklen et al, 2006). A direct connection between AD and uMt-CK
was discovered when it was shown that it can interact with the short cytoplasmic tail of
APP family proteins, and affects the correct import of uMtCK into mitochondria and thus
25
would negatively interfere with cellular energetics (Li et al, 2005). It has been revealed
that mice lacking both brain isozymes of CK show severely impaired spatial learning and
reduced body weight (Streijger et al, 2005). The inactivation of PCr causes an increase in
the level of Cr. It should be noted that the PCr is depleted at death, and Cr remains as the
only existing form.
1.7.3 Focally elevated Cr deposits in AD brain tissue
Discovery of creatine deposits in the brains of transgenic mice raises many questions
about its role in this neurodegenerative disorder. Decreased brain metabolism is always
associated with AD (Andres et al, 2008; Parihar et al, 2006; Blass et al, 2002). The role
of Cr/PCr system in energy metabolism has been recognized. Intracellularly, under nor-
mal energetic conditions, 2/3 of total Cr is in the form of PCr (Wallimann, 1994). During
cellular energy stress, mitochondrial function is disrupted, and ATP levels are reduced
(Mancuso et al, 2008; Casley et al, 2002). CK is very sensitive to oxidative stress; there-
fore, under this situation, oxidation of CK isoenzymes, BB-CK and uMtCK, could limit
PCr formation, consequently reducing PCr/Cr ratio in vivo (Andres et al, 2008; Li et al,
2006). Some part of Cr is synthesized in microglial cells in brain. Under massive neu-
ronal death, Cr trafficking between glial cells and neurons could be limited, because the
uptake of Cr via CRT is associated with Na+/ K
+ to transport into the neuron; ultimately,
the result is accumulation of Cr in the extracelluar space gradually, that shows up as sig-
nificant amounts of Cr released in the extracellular space (Straumann et al, 2005; Tachi-
kawa et al, 2004). The other way that Cr can be released in the extracellular space can be
leakage of Cr from dying neurons (Burklen et al, 2006).
26
As explained more in section (1.6.5), AD is accompanied by activated microglial
cells (Moore 2010; Schlachetzki et al, 2009); therefore, inflammation and an increase in
the number of glial cells could provide additional source of Cr because more Cr can be
produced and released in the extracellular space.
In next chapters, IR and Raman microspectroscopic techniques, which were used in
this work, are introduced, followed by description in more detail about results, discus-
sion, conclusion, and future works.

27
Chapter 2
FTIR and Raman Spectromicroscopy
2.1 Fourier Transform Infrared Spectroscopy
Infrared spectrometers have been commercially available since the 1940s. With the
advent of Fourier Transform Infrared spectroscopy, the time required to obtain good
quality data has been shortened.
Infrared studies are based on the absorption of the electromagnetic radiation that lies
between 1 and 1000 μm. This spectral range is sub-divided into three areas: near IR (1-
2.5 μm), mid-IR (2.5-25 μm) and Far-IR (beyond 25 μm). The mid-IR region provides
more information about the structures of compounds and is used to identify functional
groups of organic compounds (Rouessac et al, 2007). For a molecule to be infrared ac-
tive, the electric dipole moment must change during the vibration (Stuart, 2003). This
technique is very suitable for biological investigation because many common bio-
molecules such as proteins, lipids, nucleic acids and carbonhydrates have characteristic
and well-known vibrational fingerprints (Stuart, 2004; Dumas et al, 2003).
28
2.1.1 Principles of IR spectroscopy
In the classical model, when the frequency of specific vibration is equal to the fre-
quency of IR radiation directed on the molecule, the molecule may absorb the radiation.
The simplest vibration of a bond in a molecule can be modelled with two masses which
are connected by a spring. One mass is stationary and the other one moves back and forth
(Rouessac et al, 2007).
According to the classical mechanics, when the moving mass or atom moves back
and forth, the restoring force can be described by Hooke’s law:
F kx (1)
where F is the restoring force of the spring, k is the force constant of the spring, and x is
the displacement of moving mass. The potential this energy of this harmonic oscillator
changes when the atom or mass moves back and forth from the equilibrium position. The
minimum potential energy occurs when the moving atom is at the equilibrium position.
The potential energy, U, is obtained by integration of:
. . .dU dU
f K x dU K x dxdx dx
(2)
2
0 0
1. .
2
U x
dU K x dx U K x (3)
The change in potential energy of a harmonic oscillator as a function of x (internuclear
distance) is shown in Figure 2.1.
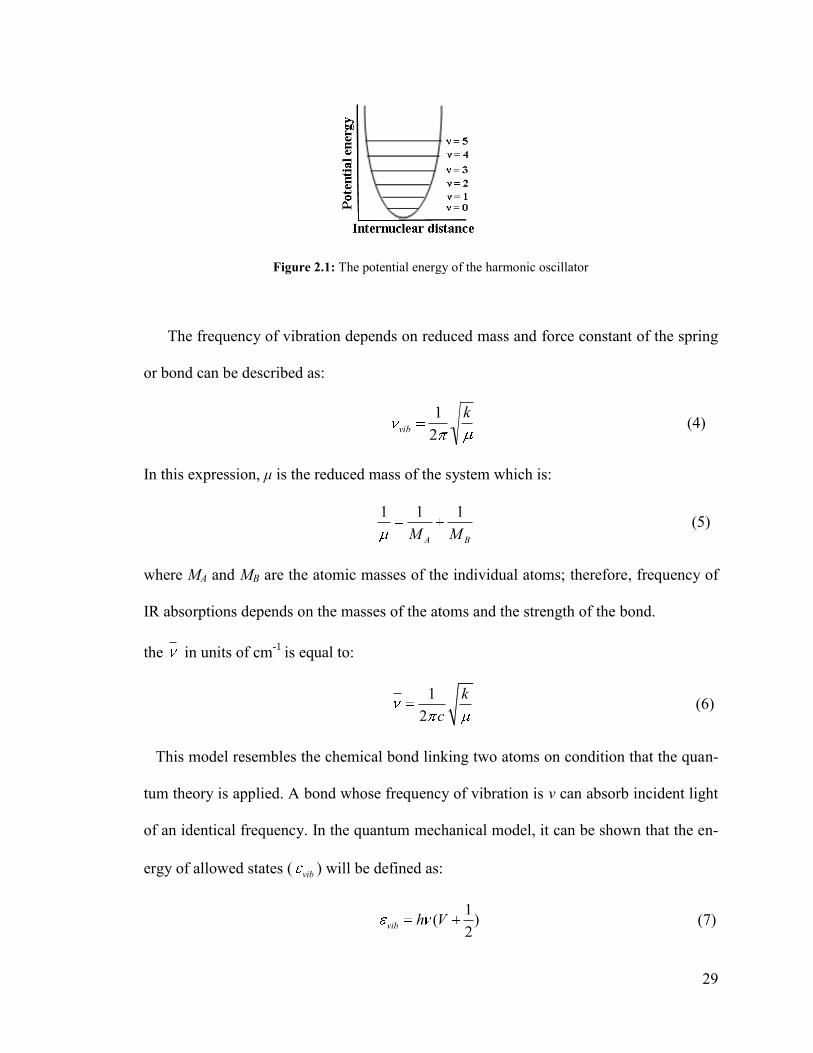
29
Figure 2.1: The potential energy of the harmonic oscillator
The frequency of vibration depends on reduced mass and force constant of the spring
or bond can be described as:
vib
1
2
k (4)
In this expression, μ is the reduced mass of the system which is:
BA MM
111 (5)
where MA and MB are the atomic masses of the individual atoms; therefore, frequency of
IR absorptions depends on the masses of the atoms and the strength of the bond.
the in units of cm-1
is equal to:
1
2
k
c (6)
This model resembles the chemical bond linking two atoms on condition that the quan-
tum theory is applied. A bond whose frequency of vibration is v can absorb incident light
of an identical frequency. In the quantum mechanical model, it can be shown that the en-
ergy of allowed states ( vib ) will be defined as:
1
( )2
vib h V (7)

30
1
( )2 2
vib
h kV (8)
In this expression, V=0,1,2,… is called the vibrational quantum number. According to
quantum mechanics, only certain vibrational energy state are allowed (Rouessac, 2007;
Griffiths, 2007). As most molecules at room temperature are at the ground vibrational
state, transitions are typically to the first vibrational exited state. The lowest energy level,
called zero point energy, is equal to ½ hvvib, and the next vibrational level has 3/2 hvvib
energy. According to the selection rule for harmonic oscillator, only transitions to the
next energy level are allowed; therefore, the molecule will absorb an amount of energy
equal to hvvib. However, the transition can sometimes happen from v=0 to v=2 or v=3
called overtones in an IR spectrum and they are of lower intensity than the fundamental
band. This is because the harmonic oscillator model is inadequate to describe vibration
properly.
Since the bond can break, a molecule is actually an anharmonic oscillator. The Morse
oscillator offers a more accurate model for vibrations of higher energy levels. Using
Morse function produces a curve for potential energy versus interneuclear distance (Fig-
ure 2.2). The equation is defined as:
( ) 2( ) (1 )er r
e eU r r D e (9)
This function involves the dissociation energy De in units of cm-1
and α parameter which
can be obtained from:
1/22
( )e
eD (10)
Where the ve can be obtained from:
e eh (11)
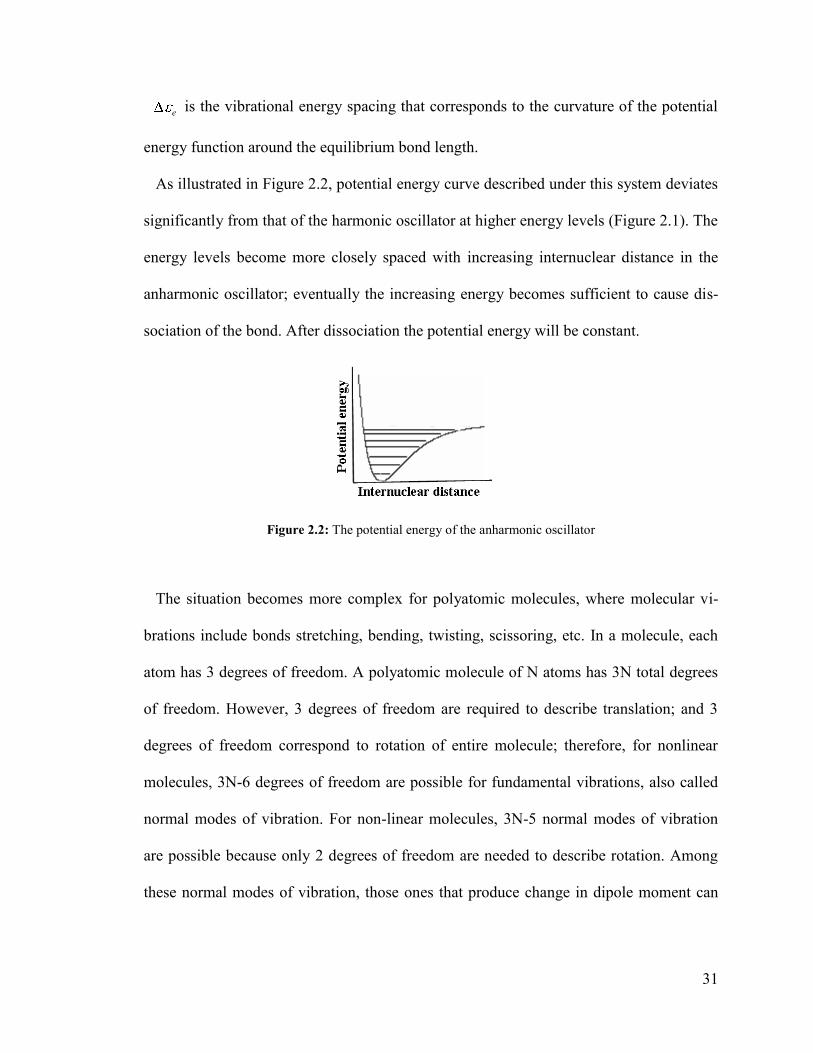
31
e is the vibrational energy spacing that corresponds to the curvature of the potential
energy function around the equilibrium bond length.
As illustrated in Figure 2.2, potential energy curve described under this system deviates
significantly from that of the harmonic oscillator at higher energy levels (Figure 2.1). The
energy levels become more closely spaced with increasing internuclear distance in the
anharmonic oscillator; eventually the increasing energy becomes sufficient to cause dis-
sociation of the bond. After dissociation the potential energy will be constant.
Figure 2.2: The potential energy of the anharmonic oscillator
The situation becomes more complex for polyatomic molecules, where molecular vi-
brations include bonds stretching, bending, twisting, scissoring, etc. In a molecule, each
atom has 3 degrees of freedom. A polyatomic molecule of N atoms has 3N total degrees
of freedom. However, 3 degrees of freedom are required to describe translation; and 3
degrees of freedom correspond to rotation of entire molecule; therefore, for nonlinear
molecules, 3N-6 degrees of freedom are possible for fundamental vibrations, also called
normal modes of vibration. For non-linear molecules, 3N-5 normal modes of vibration
are possible because only 2 degrees of freedom are needed to describe rotation. Among
these normal modes of vibration, those ones that produce change in dipole moment can
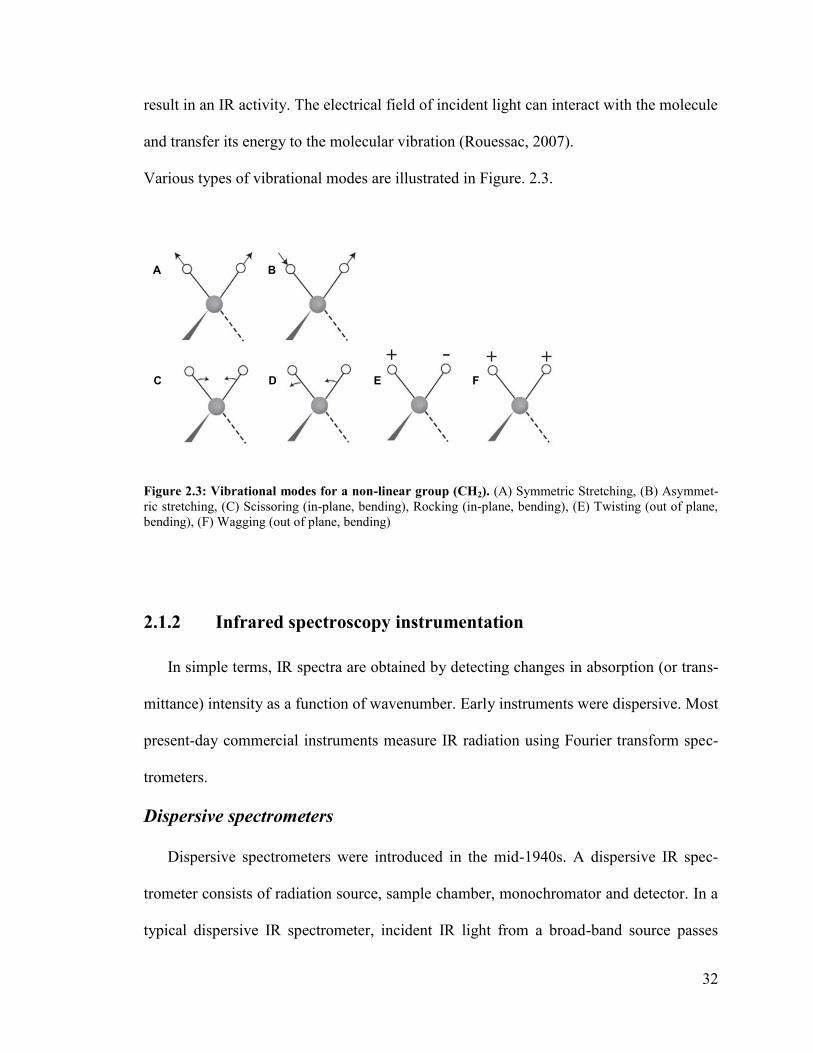
32
result in an IR activity. The electrical field of incident light can interact with the molecule
and transfer its energy to the molecular vibration (Rouessac, 2007).
Various types of vibrational modes are illustrated in Figure. 2.3.
Figure 2.3: Vibrational modes for a non-linear group (CH2). (A) Symmetric Stretching, (B) Asymmet-
ric stretching, (C) Scissoring (in-plane, bending), Rocking (in-plane, bending), (E) Twisting (out of plane,
bending), (F) Wagging (out of plane, bending)
2.1.2 Infrared spectroscopy instrumentation
In simple terms, IR spectra are obtained by detecting changes in absorption (or trans-
mittance) intensity as a function of wavenumber. Early instruments were dispersive. Most
present-day commercial instruments measure IR radiation using Fourier transform spec-
trometers.
Dispersive spectrometers
Dispersive spectrometers were introduced in the mid-1940s. A dispersive IR spec-
trometer consists of radiation source, sample chamber, monochromator and detector. In a
typical dispersive IR spectrometer, incident IR light from a broad-band source passes
A B
C D E F
33
through the sample and is dispersed by a monochromator with a slit to select only a small
band width. The selected portion of the light goes to the detector, which generates an
electrical signal and ultimately results in a recorder response. Most dispersive spectrome-
ters have a double-beam design in which two equivalent beams from the source pass
through the sample and reference chambers, respectively. By using an optical chopper
such as a sector mirror, the reference and sample beams are alternately focused on the de-
tector (Rouessac, 2007).
The whole idea for a dispersive instrument is that it is based on rejection of all of the
other light and acceptance of only very small range of wavelengths of light, after dispers-
ing all other light; therefore, only a small portion of the spectrum is detected at one time.
Non-Dispersive spectrometers
Fourier transform spectrometers have replaced dispersive instruments for most appli-
cations due to their speed and sensitivity. In FTIR spectroscopy, all frequencies are ex-
amined simultaneously instead of viewing small region of frequency sequentially. This
technique has greatly extended the capabilities of infrared spectroscopy and been applied
to many areas such as biological materials, polymers and petrochemical compounds.
The basic components of an FTIR spectrometer are light source, interferometer, sample
chamber, detector, amplifier, convertor of analogue to digital and computer. Generally,
the radiation emerging from the source is passed through an interferometer to the sample
before reaching the detector (Figure 2.4). In FT-IR spectroscopy, the entire spectrum is
collected as time domain function, and is converted mathematically into the frequency
domain (Salzer, 2009; Rouessac, 2007; Griffiths, 2007).
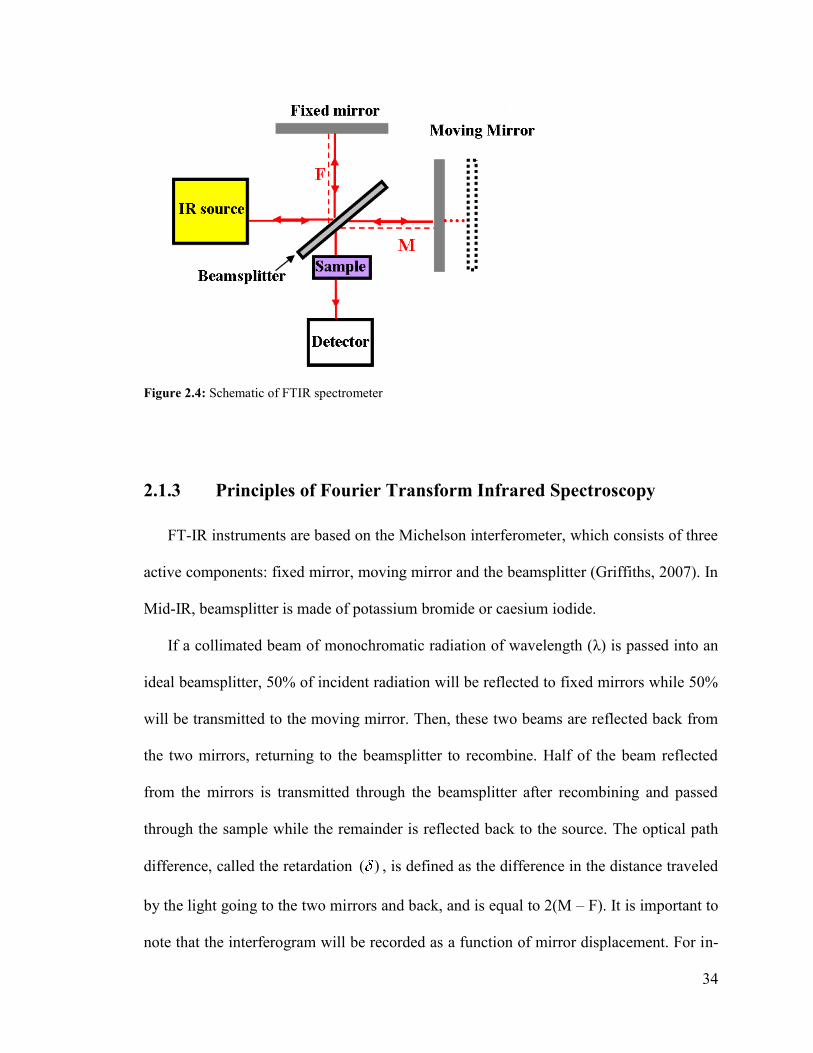
34
Figure 2.4: Schematic of FTIR spectrometer
2.1.3 Principles of Fourier Transform Infrared Spectroscopy
FT-IR instruments are based on the Michelson interferometer, which consists of three
active components: fixed mirror, moving mirror and the beamsplitter (Griffiths, 2007). In
Mid-IR, beamsplitter is made of potassium bromide or caesium iodide.
If a collimated beam of monochromatic radiation of wavelength (λ) is passed into an
ideal beamsplitter, 50% of incident radiation will be reflected to fixed mirrors while 50%
will be transmitted to the moving mirror. Then, these two beams are reflected back from
the two mirrors, returning to the beamsplitter to recombine. Half of the beam reflected
from the mirrors is transmitted through the beamsplitter after recombining and passed
through the sample while the remainder is reflected back to the source. The optical path
difference, called the retardation ( ) , is defined as the difference in the distance traveled
by the light going to the two mirrors and back, and is equal to 2(M – F). It is important to
note that the interferogram will be recorded as a function of mirror displacement. For in-
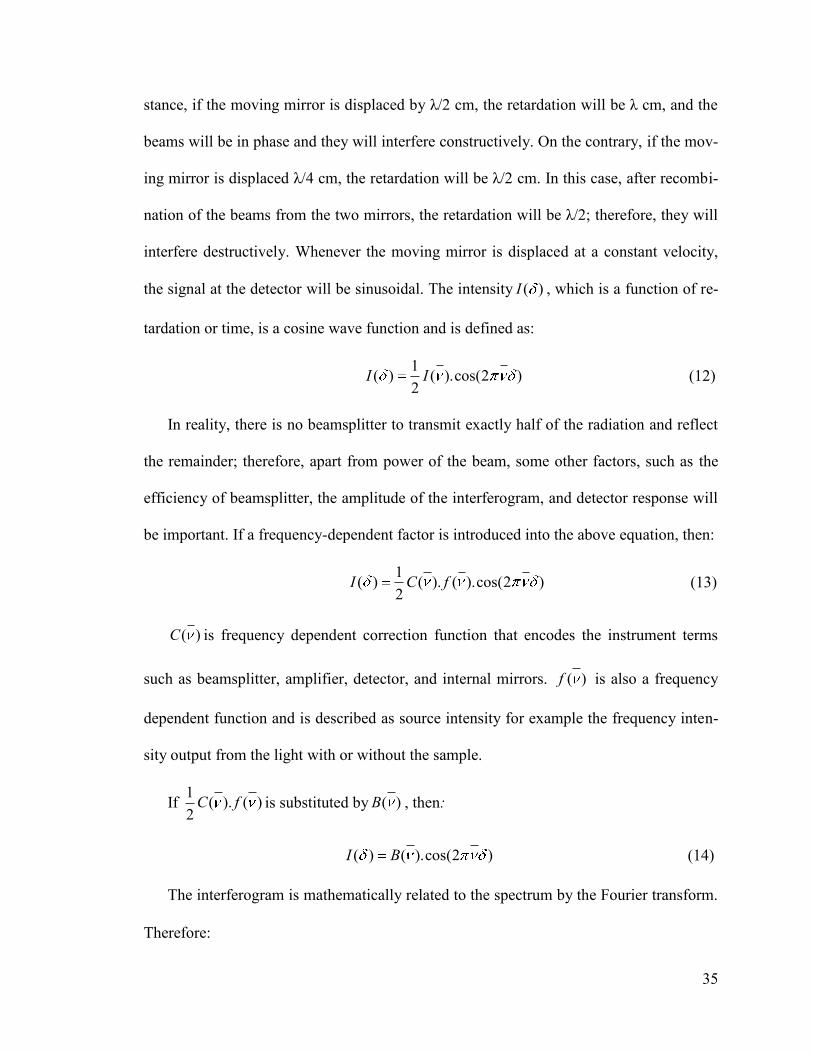
35
stance, if the moving mirror is displaced by λ/2 cm, the retardation will be λ cm, and the
beams will be in phase and they will interfere constructively. On the contrary, if the mov-
ing mirror is displaced λ/4 cm, the retardation will be λ/2 cm. In this case, after recombi-
nation of the beams from the two mirrors, the retardation will be λ/2; therefore, they will
interfere destructively. Whenever the moving mirror is displaced at a constant velocity,
the signal at the detector will be sinusoidal. The intensity ( )I , which is a function of re-
tardation or time, is a cosine wave function and is defined as:
1
( ) ( ).cos(2 )2
I I (12)
In reality, there is no beamsplitter to transmit exactly half of the radiation and reflect
the remainder; therefore, apart from power of the beam, some other factors, such as the
efficiency of beamsplitter, the amplitude of the interferogram, and detector response will
be important. If a frequency-dependent factor is introduced into the above equation, then:
1
( ) ( ). ( ).cos(2 )2
I C f (13)
( )C is frequency dependent correction function that encodes the instrument terms
such as beamsplitter, amplifier, detector, and internal mirrors. ( )f is also a frequency
dependent function and is described as source intensity for example the frequency inten-
sity output from the light with or without the sample.
If 1
( ). ( )2
C f is substituted by ( )B , then:
( ) ( ).cos(2 )I B (14)
The interferogram is mathematically related to the spectrum by the Fourier transform.
Therefore:

36
( ) ( ).cos(2 )B I (15)
These two above equations are called a cosine Fourier transform pair. ( )I is called
the interferogram, while the plot of ( )B is known as the spectrum.
When various frequencies are emitted by light source, the interferogram and spectrum
are represented by the integral:
( ) ( ).cos(2 ).I B d
(16)
( ) ( ).cos(2 ).B I d
(17)
FT-IR spectroscopy can be considered as time-domain spectroscopy (Figure 2.5A),
because the entire spectrum is collected as the mirror moves at a constant velocity; then,
it is converted mathematically into the frequency domain (Figure 2.5B).
Figure 2.5: (A) Interferogram (A), and (B) spectrum
2.1.4 Advantages of FTIR versus dispersive infrared spectrometer
The two most important advantages of FTIR spectroscopy are Fellgett (or multiplex)
advantage and Jaquinot (or throughput) advantage.
37
In FTIR spectroscopy, all wavelengths are detected simultaneously and at many times
in one interferogram. A large number of spectra can be acquired rapidly and averaged, to
increase S/N ratio. This is known as the Fellgett or multiplex advantage.
Another benefit of the FTIR spectrometer is that in this instrument there is no slit to
throw away any intensity from the light source; therefore, it is possible to get the bright-
ness of light. This is called Jacquinot advantage and also increases the S/N ratio.
FTIR interferometers are also much faster, more reproducible, and more sensitive
compared to dispersive spectrometers (Griffiths et al, 2007). These advantages have
caused the common choice of FTIR over dispersive instruments.
2.1.5 Instrumentation for Infrared microspectroscopy
The major advance in the kinds of biological samples that can be analyzed by FTIR
occurred with the introduction of the commercial FTIR microscope in the 1980s. An IR
microspectroscope combines the molecular-level information of FT-IR spectroscopy with
the spatial resolution of microscopy. The factors that will influence the performance of an
IR spectromicroscope include the optics, light source and detector.
Early work in this lab was done at synchrotron with single pixel raster scan mapping.
With this technique, software allows to collect the spectrum of the small pixel at the cen-
tre. A series of spectra can also be acquired by raster scanning the sample, to allow for
spectral analysis over broad areas of a sample. With single-point measurements, the aper-
ture size can be reduced considerably more by using synchrotron radiation as compared
to radiation produced by a thermal light source. With a globar light source, the aperture
needs to be at least 20 μm. Using a synchrotron source, the aperture can be reduced until
38
resolution becomes diffraction-limited. It should be note that the spatial resolution is lim-
ited by wavelength of light, brightness of light source, and the aperture size. When the
aperture size become equal to the wavelength of the light passing through, diffraction of
light becomes evident. For microscopes using a single aperture, the spatial resolution at
the diffraction limit is approximately 2λ/3, while the limit for confocal microscopes, us-
ing a second aperture, is approximately λ/2 (Salzer, 2009; Miller, 2005). With a conven-
tional thermal light source, the best spatial resolution that can be obtained is approxi-
mately 20 μm, well below the diffraction limit for mid-IR region.
Two types of detectors are used for this FTIR microscope: Focal Plane Array (FPA)
and single element detector.
Figure 2.6B illustrates FPA-FTIR microscope which was used for IR data collection
in this project at University of Manitoba (Figure 2.6). In this instrument, a globar light
source, which is the most common thermal light source, is used for the IR spectrometer.
A globar is a silicon carbide rod that is electrically heated up to 1000 to 1650 °C to emit
continuous IR radiation. The light from the globar light source travels through the spec-
trometer, then into the IR microscope, onto the sample, and finally is collected at the de-
tector. The FPA detector (Figure 2.6B) consists of an array of IR detector elements that
enables spectra at each pixel to be collected simultaneously, while the interferometer por-
tion of the system allows all the spectral frequencies to be measured concurrently. By us-
ing FPA detector, collection of large IR images is dramatically improved (Salzer, 2009;
Bhargava, 2005). For instance, our FPA-FTIR miscrospectroscope equipped with a 64 x
64 pixel focal plane array detector enables simultaneous detection of 4096 individual
spectra in a few minutes. For instance, it is possible to take a single tile map including
39
4096 pixel in 7 min by 128 scan number, while to collect the 4096 single pixel raster scan
with globar light source, it will take around 20 days.
The single point detector that is used in this instrument is a single element detector
(Figure 2.6B). With single-point detector, an aperture is used to limit the spot size of the
light before it reaches the sample, defining the size of the pixel, where a spectrum will be
acquired.
Mercury cadmium telluride (MCT), a semiconductor, is the most common single
element detector in IR spectromicroscopes. When radiation strikes the MCT detector,
electrons in the semi-conducting surface are excited to a higher conducting state, and the
magnitude of this change is a function of the power of the incident radiation. Sensitivity
of MCT detectors improves when cooled down to liquid nitrogen temperature (77K).
As illustrated in Figure. 2.6C, in order to allow mapping, the instrument has a computer-
controlled sample stage.
This FPA-FTIR microscope, like most of the IR microspectroscopes, can operate in
either transmission or reflectance mode. In transmission mode, the light from the source
passes through the sample and onto the detector (Figure 2.6D (top)). In reflectance mode,
the light passes through the sample, reflects from the substrate, and passes through the
sample again before going to the detector (Figure 2.6D (bottom)). The spectrum of a
sample mounted on a reflective substrate is called a transflection spectrum.
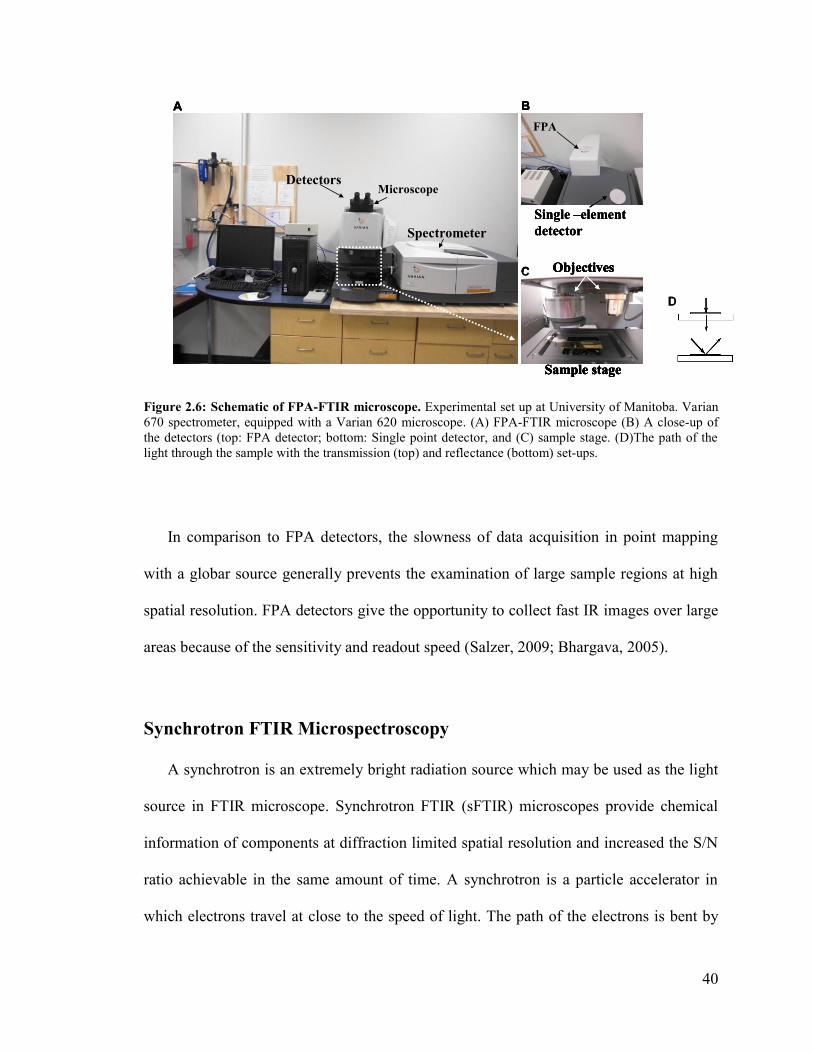
40
Single –element
detectorSpectrometer
FPA
MicroscopeDetectors
Objectives
Sample stage
A B
C
D
Single –element
detectorSpectrometer
FPA
MicroscopeDetectors
Objectives
Sample stage
A B
C
Single –element
detectorSpectrometer
FPA
MicroscopeDetectors
Objectives
Sample stage
Spectrometer
FPA
MicroscopeDetectors
Objectives
Sample stage
Objectives
Sample stage
A B
C
D
Figure 2.6: Schematic of FPA-FTIR microscope. Experimental set up at University of Manitoba. Varian
670 spectrometer, equipped with a Varian 620 microscope. (A) FPA-FTIR microscope (B) A close-up of
the detectors (top: FPA detector; bottom: Single point detector, and (C) sample stage. (D)The path of the
light through the sample with the transmission (top) and reflectance (bottom) set-ups.
In comparison to FPA detectors, the slowness of data acquisition in point mapping
with a globar source generally prevents the examination of large sample regions at high
spatial resolution. FPA detectors give the opportunity to collect fast IR images over large
areas because of the sensitivity and readout speed (Salzer, 2009; Bhargava, 2005).
Synchrotron FTIR Microspectroscopy
A synchrotron is an extremely bright radiation source which may be used as the light
source in FTIR microscope. Synchrotron FTIR (sFTIR) microscopes provide chemical
information of components at diffraction limited spatial resolution and increased the S/N
ratio achievable in the same amount of time. A synchrotron is a particle accelerator in
which electrons travel at close to the speed of light. The path of the electrons is bent by
41
magnetic fields. The change in path causes the electrons to change acceleration and emit
electromagnetic radiation, light that is known as synchrotron radiation. Synchrotron light
has several unique properties. It is low noise, polarized, highly collimated and spans from
high energy x-rays to the infrared region. Most importantly it is very bright. In the IR re-
gion, it is around 1000 times more intense than a blackbody source such as a globar for
the same spot size (Salzer, 2009; Miller, 2005). In a sFTIR microscope, light from the
synchrotron ring travels through the beamline into the interferometer, then into the IR
microscope.
With single-point measurements, the aperture size can be reduced more by using syn-
chrotron radiation as compared to radiation produced by a globar source. When the aper-
ture setting is around 100 μm, the globar source is quite bright, while for samples where
spatial resolution of interest is less than 20 μm, diffraction effects become appeared and
synchrotron radiation is recommended. For samples where the spatial resolution of inter-
est is greater than 20 μm, a conventional globar source will suffice, and there is little or
no advantage to using a synchrotron source (Salzer, 2009; Miller, 2005).
As mentioned above, synchrotron radiation is 1000 times brighter than a globar light
source; therefore, this brightness advantage allows smaller regions to be probed with
acceptable S/N ratio. It is important to note that its brightness is because the effective
source size is very small and the light is emitted into a narrow range of angles (Salzer,
2009; Miller, 2005).

42
2.1.6 Infrared analysis of biological samples
IR spectroscopy is a valuable technique to elucidate comprehensive structural infor-
mation of numerous biological samples. This technique is capable to analyse a wide
range of components with only small amounts of sample preparation. It is also a non-
destructive technique, so the sample is available for other analyses such as staining. IR
microspectroscopy has been applied to biological materials. With the development of
FTIR spectrometers, particularly with synchrotron IR sources, great improvements have
been made in the quality of data (Salzer, 2009; Miller et al, 2005). FPA-FTIR microspec-
troscopes increase the speed of data collection (Bhargava R, 2005). Biological tissues are
composed of various types of molecules and the average molecular composition of the
sample can be detected with IR, by analyzing bands due to the functional groups found in
proteins, lipids, and other molecules (Stuart, 2004).
IR spectroscopy is widely used to study proteins (Movasaghi et al, 2008; Barth, 2007;
Stuart, 2004). Proteins are linear polymers of amino acids linked through the peptide
bond, and folded into three-dimensional structures. The amide bonds of proteins display
three characteristic absorbance bands including the amide I (represent 80% of the C=O
stretching vibration of the amide group coupled to the N-H bending and C-N stretching;
profile ranges from 1600-1700 cm-1
), the amide II (represent 60% N-H bending with 40%
C-N stretching; profile ranges from 1500-1600 cm-1
) and the amide III (profile from
1200-1350 cm-1
). The amide I band is broad and very complex. An amide I between
1662-1650 cm-1
usually indicates -helix, and 1640-1620 indicates -sheet; therefore, it
can be used to evaluate relative levels of β-sheet and α-helix within amyloid- β plaque
aggregation.
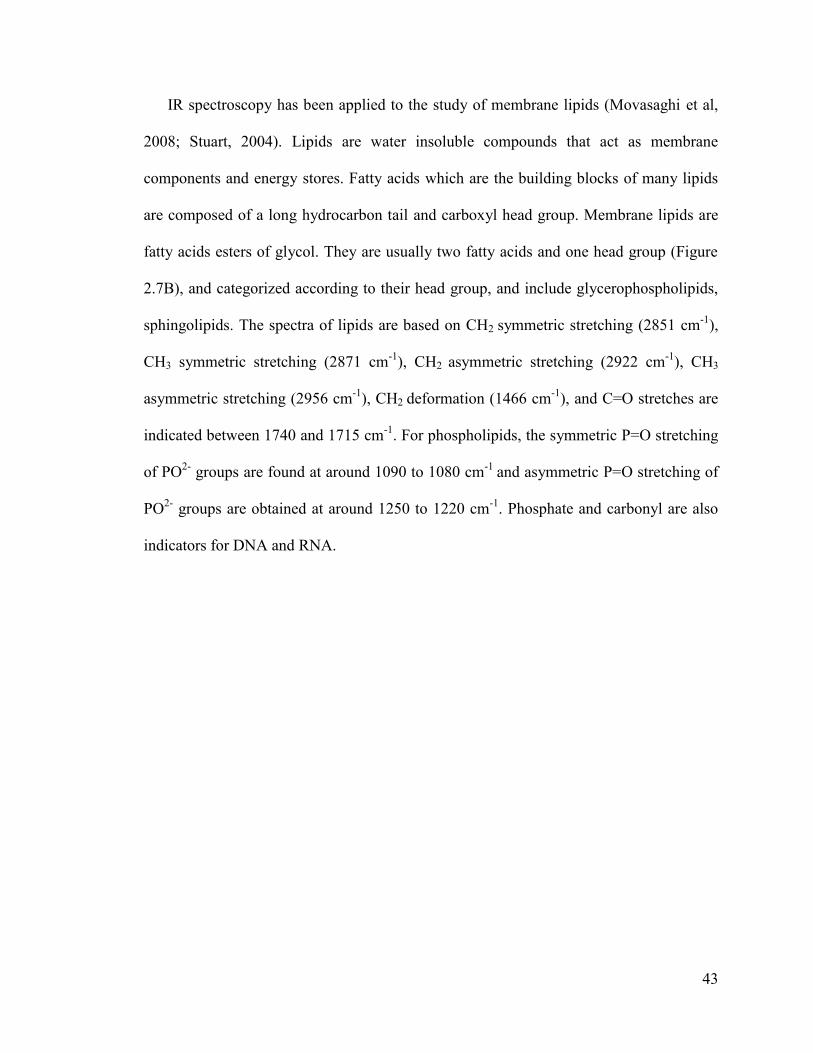
43
IR spectroscopy has been applied to the study of membrane lipids (Movasaghi et al,
2008; Stuart, 2004). Lipids are water insoluble compounds that act as membrane
components and energy stores. Fatty acids which are the building blocks of many lipids
are composed of a long hydrocarbon tail and carboxyl head group. Membrane lipids are
fatty acids esters of glycol. They are usually two fatty acids and one head group (Figure
2.7B), and categorized according to their head group, and include glycerophospholipids,
sphingolipids. The spectra of lipids are based on CH2 symmetric stretching (2851 cm-1
),
CH3 symmetric stretching (2871 cm-1
), CH2 asymmetric stretching (2922 cm-1
), CH3
asymmetric stretching (2956 cm-1
), CH2 deformation (1466 cm-1
), and C=O stretches are
indicated between 1740 and 1715 cm-1
. For phospholipids, the symmetric P=O stretching
of PO2-
groups are found at around 1090 to 1080 cm-1
and asymmetric P=O stretching of
PO2-
groups are obtained at around 1250 to 1220 cm-1
. Phosphate and carbonyl are also
indicators for DNA and RNA.

44
Figure 2.7: The structure of A) Choline, (B) Phosphatidylcholine which is the main constituent of cell
membrane, (C) Sphingomyelin which makes up the myelin sheath and is a major constituent of brain tissue.
45
2.2 Raman Spectroscopy
Raman spectroscopy is a technique for recording molecular vibrations that derives
from two photon, inelastic light scattering process. With Raman spectroscopy, a photon is
scattered by a sample molecule and loses or gains energy during the process (Ozaki et al,
2008). This energy exchange is characteristic for a particular vibration in the molecule.
This spectroscopic technique is simple, nondestructive, and only small amounts of ma-
terial with minimum sample preparations required. This spectroscopy technique provides
molecular-level information, allowing investigation of functional groups, bonding types,
and molecular conformations, spectra provide direct information about the biochemical
composition of the sample (Bista 2009; Shih 2009).
2.2.1 Principles of Raman spectroscopy
When monochromatic radiation is incident upon a molecule, it may be reflected, ab-
sorbed or scattered in some manner. In Raman technique, it is the inelastic scattering of
the radiation that occurs and can tell about the sample’s molecular structure.
The incident light with the frequency v0 upon a certain molecule brings a number of
photons with the energy hv0 to the molecule. Most photons interacting with molecules do
not change their energy during the collision; it means that they have an elastic collision.
This is called Rayleigh scattering, and consists of scattered photons having the same fre-
quency as the incident light. If an incident photon transfers an hv quantum of energy to
the molecule, the frequency of the scattered photon becomes equal to v0-v. This is called
Stokes Raman scattering, and arises when energy from the photon is transferred to the
molecule, raising it to a higher energy state. In some cases, the incident photon receives
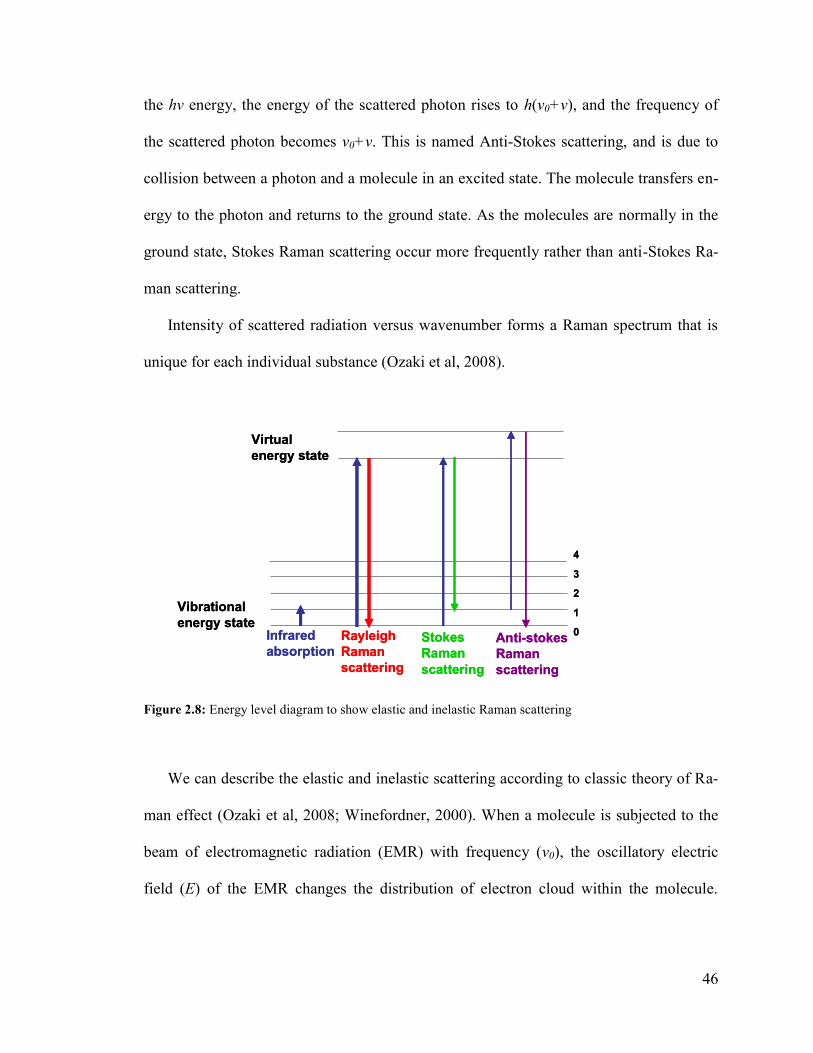
46
the hv energy, the energy of the scattered photon rises to h(v0+v), and the frequency of
the scattered photon becomes v0+v. This is named Anti-Stokes scattering, and is due to
collision between a photon and a molecule in an excited state. The molecule transfers en-
ergy to the photon and returns to the ground state. As the molecules are normally in the
ground state, Stokes Raman scattering occur more frequently rather than anti-Stokes Ra-
man scattering.
Intensity of scattered radiation versus wavenumber forms a Raman spectrum that is
unique for each individual substance (Ozaki et al, 2008).
Infrared
absorption
Rayleigh
Raman
scattering
Stokes
Raman
scattering
Anti-stokes
Raman
scattering
Virtual
energy state
Vibrational
energy state
4
3
2
1
0Infrared
absorption
Rayleigh
Raman
scattering
Stokes
Raman
scattering
Anti-stokes
Raman
scattering
Virtual
energy state
Vibrational
energy state
4
3
2
1
0
Figure 2.8: Energy level diagram to show elastic and inelastic Raman scattering
We can describe the elastic and inelastic scattering according to classic theory of Ra-
man effect (Ozaki et al, 2008; Winefordner, 2000). When a molecule is subjected to the
beam of electromagnetic radiation (EMR) with frequency (v0), the oscillatory electric
field (E) of the EMR changes the distribution of electron cloud within the molecule.
47
When the electric field is weak enough, the induced polarization (P) is proportional to
this electric field and defined by following equation:
P = α . E (18)
The polarizability can be defined as how easily the electron cloud becomes distorted.
As the vectors P and E are generally in different directions, the polarizability shown by α,
a tensor quantity that is called polarizability tensor:
x xxx xy xz
y yx yy yz y
zx zy zzz z
P E
P E
P E
(19)
Raman scattering is based on the effects of molecular vibrations on the tensor po-
larizability, α, in equation (18). If we assume that P and E are values along one coordi-
nate axis, the oscillatory electric field of electromagnetic radiation is governed by:
E = E0 . cos2πv0t (20)
where v0 is the frequency of the laser light. The molecular vibrations are usually con-
sidered to be composed of normal modes, Qj , of which there are 3N-6 for non-linear and
3N-5 for a linear molecule with N atoms and can be defined as:
0.cos2j j jQ Q t (21)
where vj is the frequency of the jth normal mode. The polarizability of electrons in the
molecule will be modulated by the molecular vibration so that:
0 ( ) ...j
j
(22)
As already mentioned, the polarization (P) is the product of E and α. Since
cos(a).cos(b)=[cos(a+b)+cos(a-b)]/2; therefore, the polarization is equal to:
48
0 00
0 0 0 0
cos 2 ( ) cos 2 ( )cos 2 ( )
2
j j
j
j
t tP E t E Q
Q (23)
This equation demonstrates that light will be scattered at three frequencies. The first
term is Rayleigh scattering, which is at the same frequency as the laser (v0 = vj). The sec-
ond term is anti-Stokes Raman scattering, which occurs at v0 + vj and the third term is
Stokes Raman scattering at v0 - vj . It is important to note that only vibrations that change
the polarizability (consequently ( )jQ
≠ 0) yield Raman scattering. This statement is the
basis of the primary selection rule for Raman scattering.
2.2.2 Raman spectroscopy instrumentation
Four major elements for a Raman instrument are: the light source (laser light), spec-
trometer, detector and optical setup.
Lasers
Raman spectrometers that operate at laser wavelengths up to 785 nm are most com-
mon in dispersive systems, while those ones with laser at 1064 nm and above are usually
employed in FT-Raman systems.
It is important to note that the high photon flux produced by laser 514 nm (air cooled
Ar ion) and 633 nm (He-Ne laser) can cause sample oxidation; therefore, samples can be
damaged if high percentage of laser power is used. The most practical choice for biologi-
cal samples is a diode laser which produces light of 785 nm. This laser is suggested for
experiments with biological samples, because a number of components present in such
samples usually fluoresce strongly under 500-700 nm light. Fluorescence will be very
strong and will obscure the Raman scattered light (see section 2.2.5).
49
Spectrometer
There are two types of spectrometer: Dispersive and Non-dispersive.
The dispersive spectrometers are based on dispersing the scattered radiation by a grat-
ing. These spectrometers are used with the system equipped with visible and up to 785
nm excitation.
Nondespersive Raman spectrometers are almost exclusively associated with FT
modulation of the signal and do not include physical separation of the wavelength. This
spectrometer is used in FT-Raman instruments with the excitation at 1064 nm. FT-Raman
was not used in this work and is not described further.
Detector
Charge coupled devices (CCD) are popular in Raman instruments. CCD detectors are
produced from silicon or other semiconductors. These detectors consist of two-
dimensional arrays of pixels, such that each of them can be considered as an independent
detector. The horizontal pixels are calibrated corresponding to wavenumber axis, while
the vertical pixels measure the strength of Raman signal. The image on the CCD camera
is an electric Raman signal that is then converted into a spectrum.
Optics
There are two common configurations: 90° and 180
°. The 180
° configuration is most
convenient for a microscope. In this configuration, the incident laser beam and scattered
light are on the same axis. There are different ways to combine lenses and mirrors to
form a proper setup in the instrument. In section (2.2.4), more information about the op-
tics in Raman Microscope will be given.
50
2.2.3 Raman microscopy
Raman microscopy involves connecting a Raman spectrometer to a regular micro-
scope (Salzer, 2009). This technique was developed in 1970s in order to be capable to
probe the molecular changes associated with biological samples (Salzer 2009, Ferraro et
al, 2003).
This technique combines the spatial resolution of microscopy with the molecular-
level information of Raman spectroscopy. The map of area on the sample can be proc-
essed to create a false colour image that represents intensity of peaks of interest on a
color scale, also called chemical mapping. Like FTIR spectromicroscopy, this technique
is non-destructive, and needs minimum sample preparation. The sample is sectioned, and
mounted on the appropriate substrate and examined, so nothing is added or taken away
from it except water.
Raman microscopy is attractive because spatial resolution is improved (1-2 microns)
by an order of magnitude compared to conventional globar FTIR microscopy. It is possi-
ble to focus visible or Near-IR laser light to a much smaller spot size compared to mid-IR
radiation. FTIR and Raman imaging techniques are compatible; therefore, the same sec-
tion may be mapped by FTIR and then by Raman microscope to probe a small area, re-
peatedly.
2.2.4 Instrumentation of Raman microscope
A Raman microscope is composed of different parts (Figure 2.8). The first part is the
laser source. As shown in Figure 2.8B, there are three laser lines in the Renishaw Invia
Raman microscope that was used in this project. The Ar ion laser, producing 514 nm
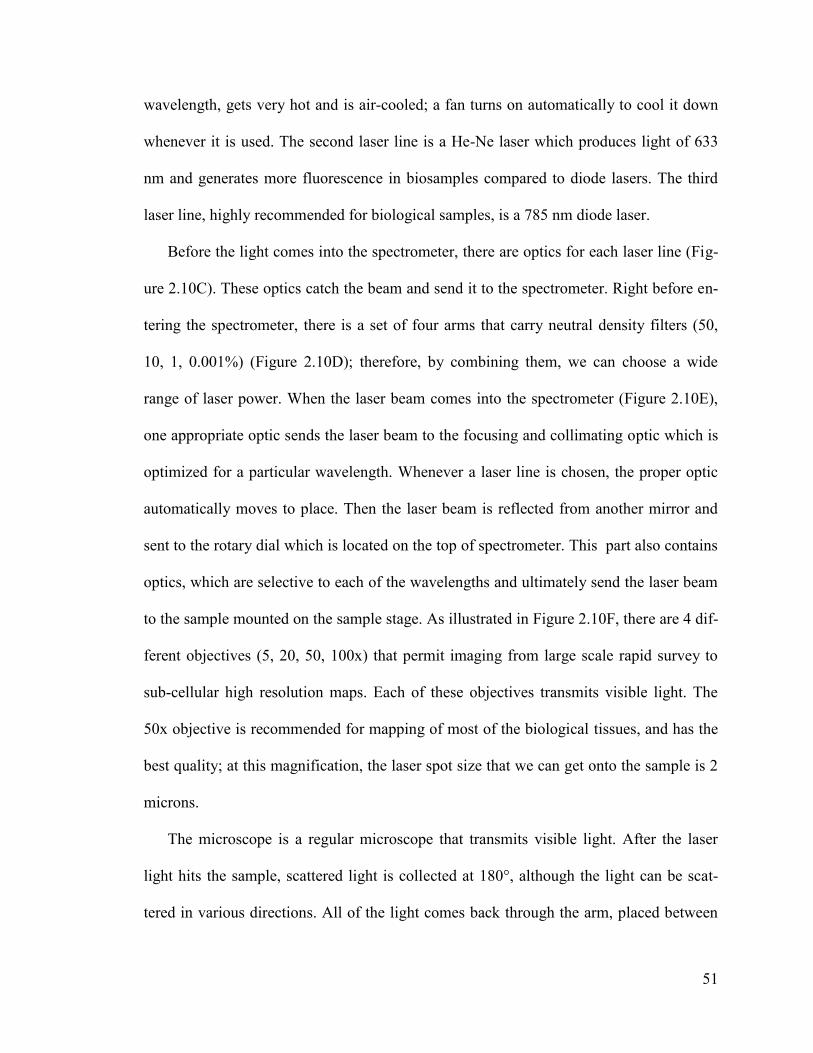
51
wavelength, gets very hot and is air-cooled; a fan turns on automatically to cool it down
whenever it is used. The second laser line is a He-Ne laser which produces light of 633
nm and generates more fluorescence in biosamples compared to diode lasers. The third
laser line, highly recommended for biological samples, is a 785 nm diode laser.
Before the light comes into the spectrometer, there are optics for each laser line (Fig-
ure 2.10C). These optics catch the beam and send it to the spectrometer. Right before en-
tering the spectrometer, there is a set of four arms that carry neutral density filters (50,
10, 1, 0.001%) (Figure 2.10D); therefore, by combining them, we can choose a wide
range of laser power. When the laser beam comes into the spectrometer (Figure 2.10E),
one appropriate optic sends the laser beam to the focusing and collimating optic which is
optimized for a particular wavelength. Whenever a laser line is chosen, the proper optic
automatically moves to place. Then the laser beam is reflected from another mirror and
sent to the rotary dial which is located on the top of spectrometer. This part also contains
optics, which are selective to each of the wavelengths and ultimately send the laser beam
to the sample mounted on the sample stage. As illustrated in Figure 2.10F, there are 4 dif-
ferent objectives (5, 20, 50, 100x) that permit imaging from large scale rapid survey to
sub-cellular high resolution maps. Each of these objectives transmits visible light. The
50x objective is recommended for mapping of most of the biological tissues, and has the
best quality; at this magnification, the laser spot size that we can get onto the sample is 2
microns.
The microscope is a regular microscope that transmits visible light. After the laser
light hits the sample, scattered light is collected at 180°, although the light can be scat-
tered in various directions. All of the light comes back through the arm, placed between
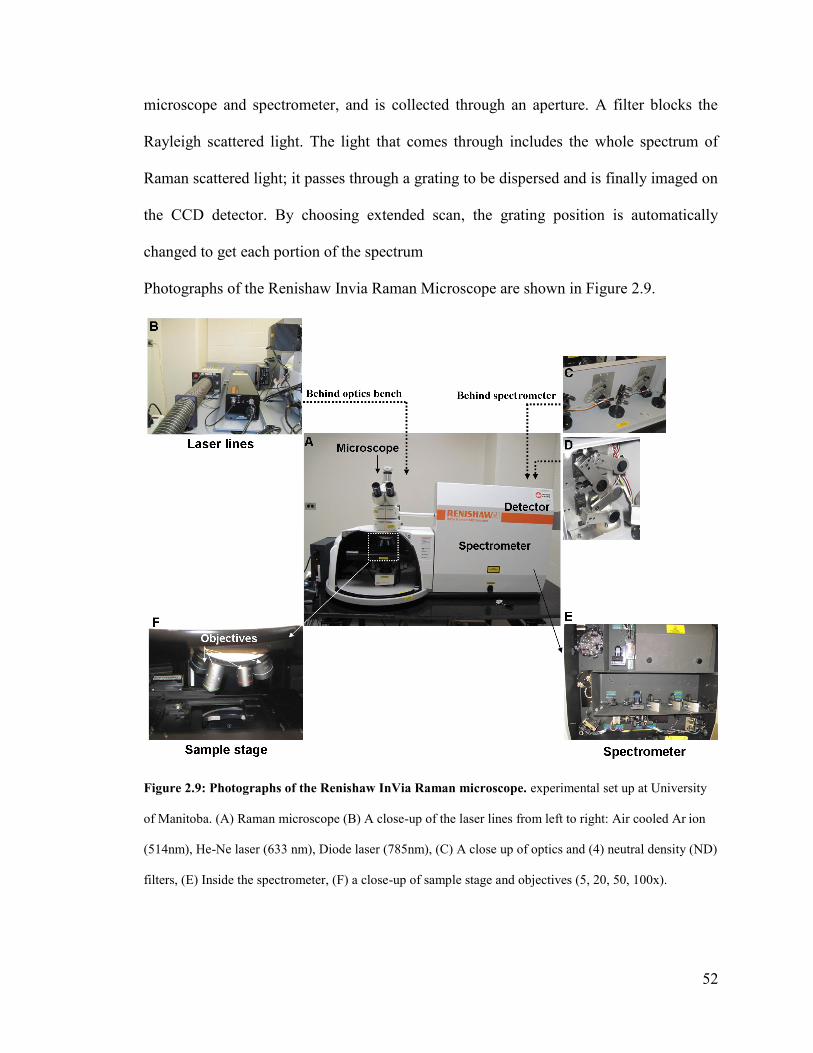
52
microscope and spectrometer, and is collected through an aperture. A filter blocks the
Rayleigh scattered light. The light that comes through includes the whole spectrum of
Raman scattered light; it passes through a grating to be dispersed and is finally imaged on
the CCD detector. By choosing extended scan, the grating position is automatically
changed to get each portion of the spectrum
Photographs of the Renishaw Invia Raman Microscope are shown in Figure 2.9.
Figure 2.9: Photographs of the Renishaw InVia Raman microscope. experimental set up at University
of Manitoba. (A) Raman microscope (B) A close-up of the laser lines from left to right: Air cooled Ar ion
(514nm), He-Ne laser (633 nm), Diode laser (785nm), (C) A close up of optics and (4) neutral density (ND)
filters, (E) Inside the spectrometer, (F) a close-up of sample stage and objectives (5, 20, 50, 100x).
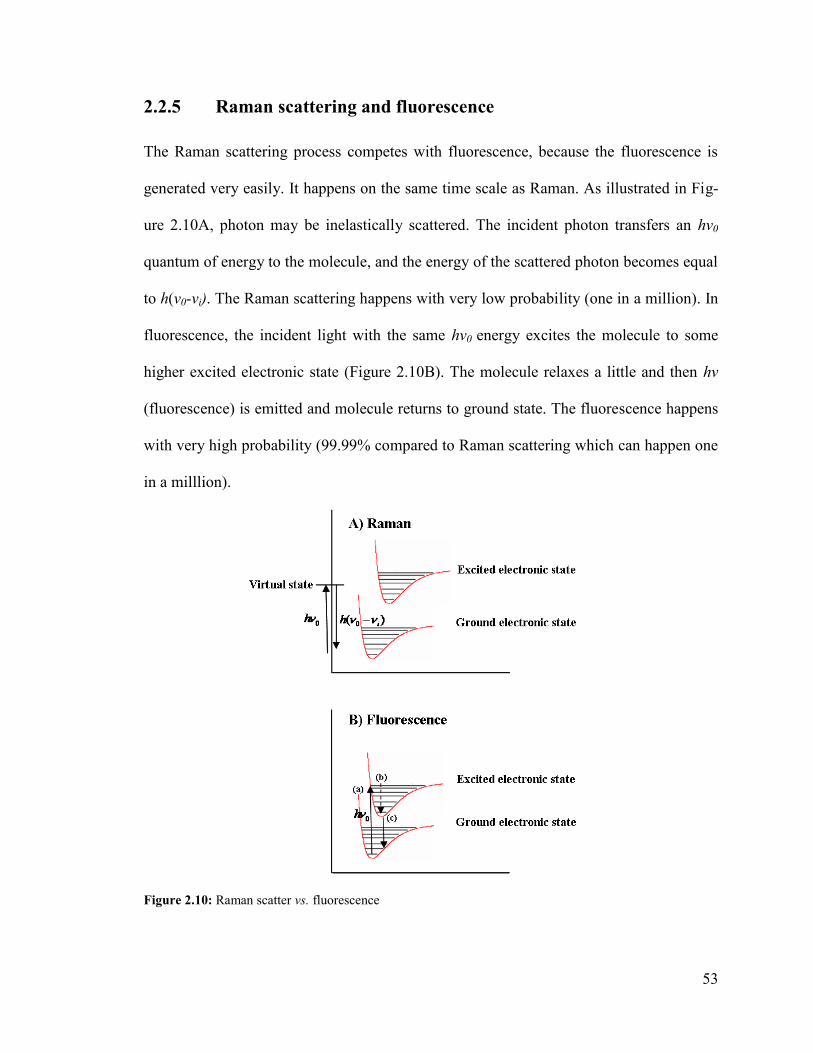
53
2.2.5 Raman scattering and fluorescence
The Raman scattering process competes with fluorescence, because the fluorescence is
generated very easily. It happens on the same time scale as Raman. As illustrated in Fig-
ure 2.10A, photon may be inelastically scattered. The incident photon transfers an hv0
quantum of energy to the molecule, and the energy of the scattered photon becomes equal
to h(v0-vi). The Raman scattering happens with very low probability (one in a million). In
fluorescence, the incident light with the same hv0 energy excites the molecule to some
higher excited electronic state (Figure 2.10B). The molecule relaxes a little and then hv
(fluorescence) is emitted and molecule returns to ground state. The fluorescence happens
with very high probability (99.99% compared to Raman scattering which can happen one
in a milllion).
Figure 2.10: Raman scatter vs. fluorescence
54
Fluorescence is really strong particularly when the biological samples are probed;
therefore, a huge amount of fluorescence is observed from biological molecules. This is
the reason why a laser at 785 nm is suggested for biological samples because the laser
with longer wavelength, lower energy can not excite the molecule to higher excited elec-
tronic state; therefore, the probability of causing fluorescence is less compared with la-
sers with shorter wavelength (He-Ne laser and Ar ion laser).
2.2.6 Raman analysis of biological samples
Raman microscopy has been employed for the characterization of biological mole-
cules, particularly proteins and lipids (Köhler et al, 2009; Movassaghi et al, 2007; Krafft
et al, 2005; Ong et al, 1999), for many years. This technique can provide valuable struc-
tural information about many components, just as with FTIR. The region from 3232 to
3300 cm-1
contains broad peaks due to O-H and N-H stretching. The C-H stretching vi-
brations dominate the region from 2960 to 2851 cm-1
(asymmetric vibration of CH3 at
2960 cm-1
, asymmetric vibration of CH2 at 2934 cm-1
, symmetric vibration of CH3 at
2885 cm-1
, and symmetric vibration of CH2 at 2851 cm-1
). The C=O stretching vibrations
of lipid groups are found at 1730-1750 cm-1
. Several bands due to C-H deformation
modes are found both at 1300 cm-1
and 1440-1454 cm-1
. The asymmetric P=O stretch of
phospholipids occurs at 1085 cm-1
and the symmetric P=O stretch at 1065 cm-1
. CN
stretching modes from the choline head in phosphatidylcholine and sphingomyelin (Fig-
ure 2.7) are found between 700 and 720 cm-1
. The Raman spectra of proteins exhibit ab-
sorption bands associated with their characteristic amide group. The region from 1655 to
1672 cm-1
contains the amide I bands of proteins (Amide I; antiparallel β-sheet at 1672

55
cm-1
, α-helix at 1655 cm-1
. The amide II and III bands of proteins are found at 1545-1555
and around 1280 cm-1
, respectively. Some peaks unique to Raman are also seen. For ex-
ample, at 1003 cm-1
, there is a very strong sharp peak from phenylalanine. This is diag-
nostic for protein in general.
56
Chapter 3.
Materials and methods
3.1 Transgenic mouse model
The transgenic mice used in this project were provided by the Centre for Research in
Neurodegenerative Disease (CRND) at the University of Toronto, by Dr David Westa-
way, presently at the University of Alberta.
The first set of 16 included TgCRND8 mice and non-transgenic littermates at 5
months and 11 months was provided. Subsequently, a second set of 25 much older ani-
mals included TgCRND8, control littermates, and Tg19959 and control littermates was
provided. The brain tissues were sent from CRND and processed at the University of
Manitoba by Dr. Gough and previous members of Dr. Gough’s group in 2002 and 2004.
Labels beginning Tg are for 2002 sets, labels beginning A are the 2004 set. A selection of
tissue from both sets was studied in this work (see Table 3.1).
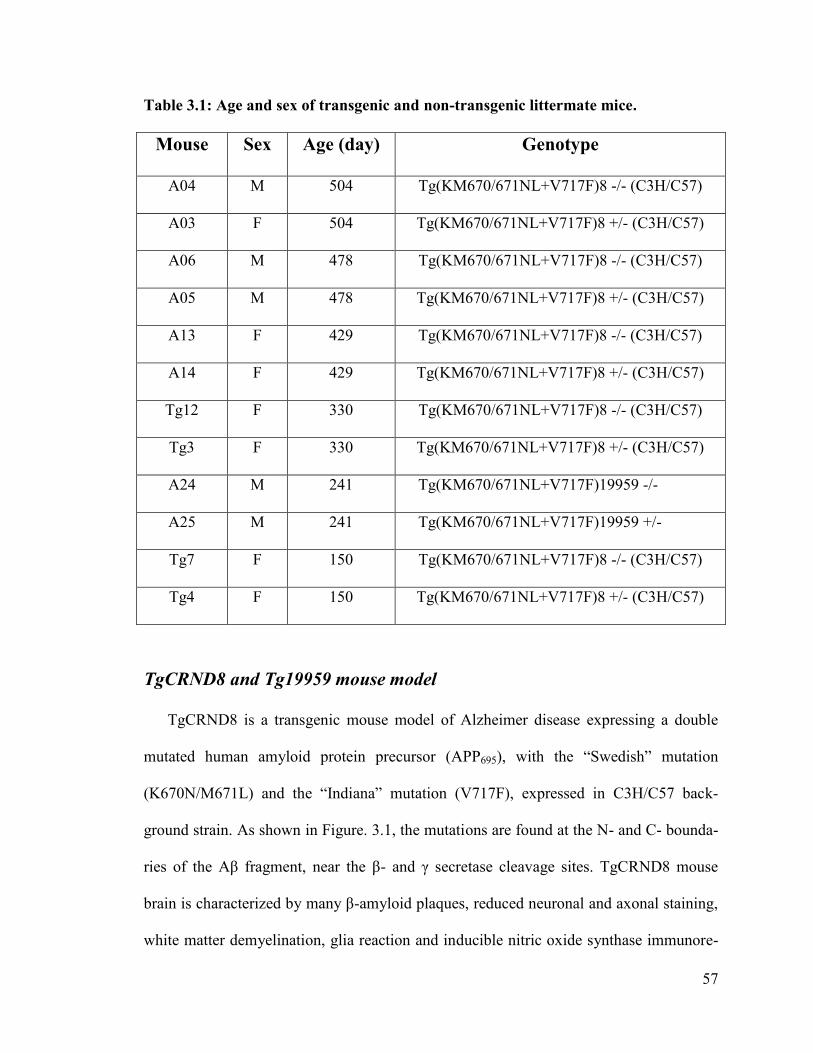
57
Table 3.1: Age and sex of transgenic and non-transgenic littermate mice.
Mouse Sex Age (day) Genotype
A04 M 504 Tg(KM670/671NL+V717F)8 -/- (C3H/C57)
A03 F 504 Tg(KM670/671NL+V717F)8 +/- (C3H/C57)
A06 M 478 Tg(KM670/671NL+V717F)8 -/- (C3H/C57)
A05 M 478 Tg(KM670/671NL+V717F)8 +/- (C3H/C57)
A13 F 429 Tg(KM670/671NL+V717F)8 -/- (C3H/C57)
A14 F 429 Tg(KM670/671NL+V717F)8 +/- (C3H/C57)
Tg12 F 330 Tg(KM670/671NL+V717F)8 -/- (C3H/C57)
Tg3 F 330 Tg(KM670/671NL+V717F)8 +/- (C3H/C57)
A24 M 241 Tg(KM670/671NL+V717F)19959 -/-
A25 M 241 Tg(KM670/671NL+V717F)19959 +/-
Tg7 F 150 Tg(KM670/671NL+V717F)8 -/- (C3H/C57)
Tg4 F 150 Tg(KM670/671NL+V717F)8 +/- (C3H/C57)
TgCRND8 and Tg19959 mouse model
TgCRND8 is a transgenic mouse model of Alzheimer disease expressing a double
mutated human amyloid protein precursor (APP695), with the “Swedish” mutation
(K670N/M671L) and the “Indiana” mutation (V717F), expressed in C3H/C57 back-
ground strain. As shown in Figure. 3.1, the mutations are found at the N- and C- bounda-
ries of the Aβ fragment, near the β- and γ secretase cleavage sites. TgCRND8 mouse
brain is characterized by many β-amyloid plaques, reduced neuronal and axonal staining,
white matter demyelination, glia reaction and inducible nitric oxide synthase immunore-
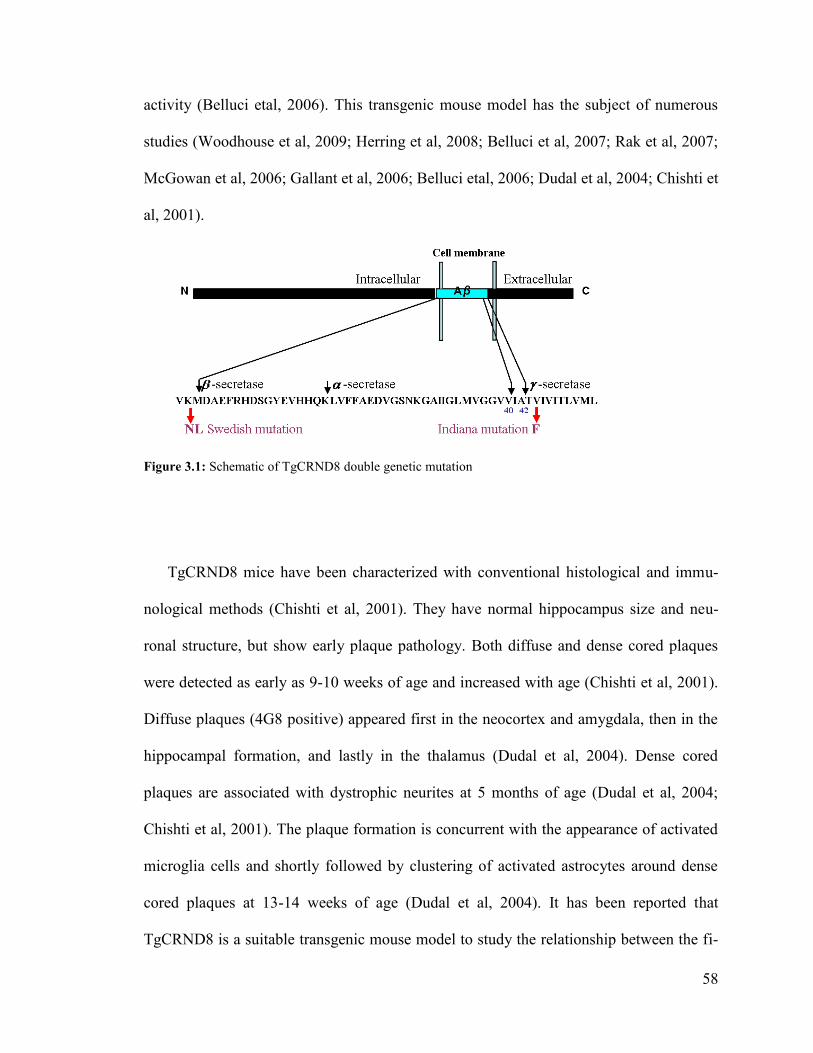
58
activity (Belluci etal, 2006). This transgenic mouse model has the subject of numerous
studies (Woodhouse et al, 2009; Herring et al, 2008; Belluci et al, 2007; Rak et al, 2007;
McGowan et al, 2006; Gallant et al, 2006; Belluci etal, 2006; Dudal et al, 2004; Chishti et
al, 2001).
Figure 3.1: Schematic of TgCRND8 double genetic mutation
TgCRND8 mice have been characterized with conventional histological and immu-
nological methods (Chishti et al, 2001). They have normal hippocampus size and neu-
ronal structure, but show early plaque pathology. Both diffuse and dense cored plaques
were detected as early as 9-10 weeks of age and increased with age (Chishti et al, 2001).
Diffuse plaques (4G8 positive) appeared first in the neocortex and amygdala, then in the
hippocampal formation, and lastly in the thalamus (Dudal et al, 2004). Dense cored
plaques are associated with dystrophic neurites at 5 months of age (Dudal et al, 2004;
Chishti et al, 2001). The plaque formation is concurrent with the appearance of activated
microglia cells and shortly followed by clustering of activated astrocytes around dense
cored plaques at 13-14 weeks of age (Dudal et al, 2004). It has been reported that
TgCRND8 is a suitable transgenic mouse model to study the relationship between the fi-
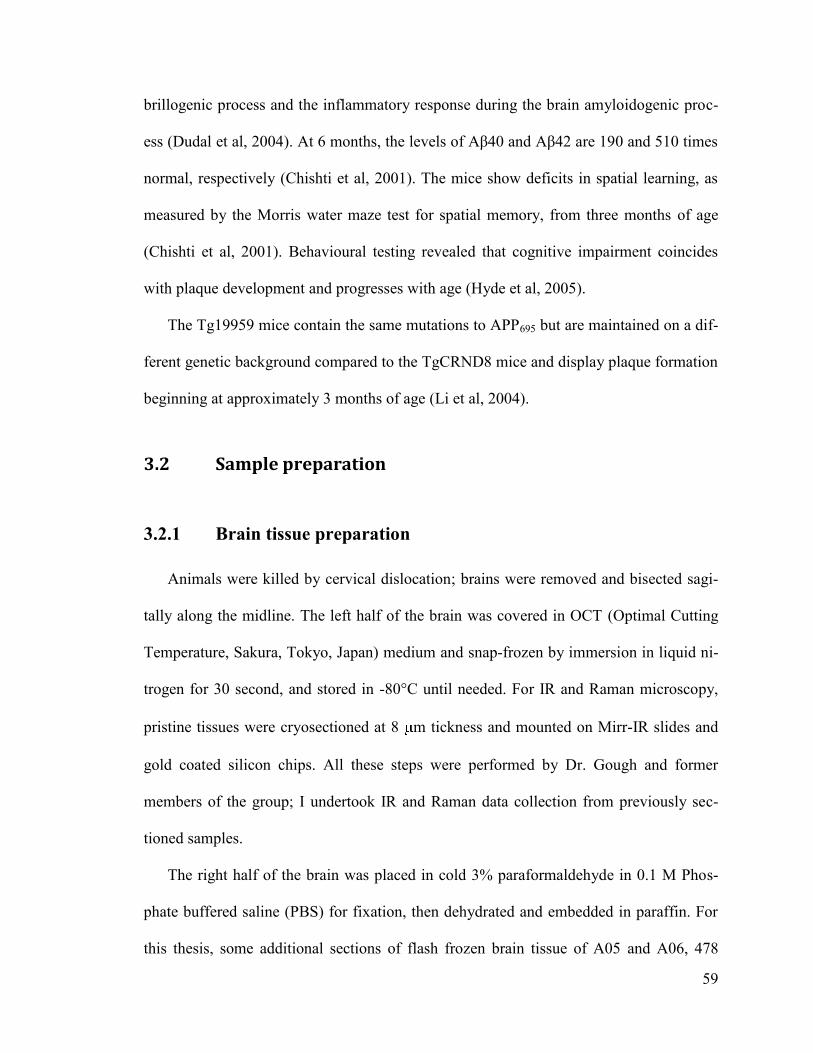
59
brillogenic process and the inflammatory response during the brain amyloidogenic proc-
ess (Dudal et al, 2004). At 6 months, the levels of Aβ40 and Aβ42 are 190 and 510 times
normal, respectively (Chishti et al, 2001). The mice show deficits in spatial learning, as
measured by the Morris water maze test for spatial memory, from three months of age
(Chishti et al, 2001). Behavioural testing revealed that cognitive impairment coincides
with plaque development and progresses with age (Hyde et al, 2005).
The Tg19959 mice contain the same mutations to APP695 but are maintained on a dif-
ferent genetic background compared to the TgCRND8 mice and display plaque formation
beginning at approximately 3 months of age (Li et al, 2004).
3.2 Sample preparation
3.2.1 Brain tissue preparation
Animals were killed by cervical dislocation; brains were removed and bisected sagi-
tally along the midline. The left half of the brain was covered in OCT (Optimal Cutting
Temperature, Sakura, Tokyo, Japan) medium and snap-frozen by immersion in liquid ni-
trogen for 30 second, and stored in -80°C until needed. For IR and Raman microscopy,
pristine tissues were cryosectioned at 8 m tickness and mounted on Mirr-IR slides and
gold coated silicon chips. All these steps were performed by Dr. Gough and former
members of the group; I undertook IR and Raman data collection from previously sec-
tioned samples.
The right half of the brain was placed in cold 3% paraformaldehyde in 0.1 M Phos-
phate buffered saline (PBS) for fixation, then dehydrated and embedded in paraffin. For
this thesis, some additional sections of flash frozen brain tissue of A05 and A06, 478
60
days Tg and non-Tg control littermate, were cryosectioned by Dr. Marzena Kastyak (a
member of Dr. Gough’s group) and me; stored at -80°C till required for Congo-red and
4G8 antibody staining methods.
Animals were treated in accordance with the guidelines of the Canadian Council of
Animal Care. Protocols were approved by the University of Toronto and the University
of Manitoba.
3.2.2 Creatine crystal preparation
In order to obtain reference spectra of creatine crystals, some creatine monohy-
drate powder, purity > 99% (C3630, Sigma), was dissolved in distilled water, and a small
amount was placed on a gold coated silicon wafer (manufactured at Clean room, Electri-
cal Engineering Department at University of Manitoba). A more dilute solution (ap-
proximately 0.5 mg/ml) gave better crystals. The slide was left to dry at room tempera-
ture in a desiccator overnight; thin crystals that were suitable for spectromicroscopic
analysis formed readily. Several creatine crystals on various gold silicon chips were pre-
pared and the best crystals were chosen for IR and Raman data collection.
3.3 FTIR and Raman Microscopy
3.3.1 FPA-FTIR data acquisition
Spectra were obtained with the Varian 670 spectrometer, attached to a Varian 620
microscope equipped with a single element detector and a focal plane array (FPA) detec-
tor. The single element detector was MCT with a spectral range of 8000-450 cm-1
. This
61
detector can acquire spectra from samples as small as 20-10 μm. The 64 x 64 pixel FPA
detector enabled simultaneous detection of 4096 individual spectra in a few minutes. The
size of each single tile map was 350 x 350 μm and the pixel resolution was 5.5 x 5.5 μm.
FPA detector covered the IR spectral range from 4000 to 900 cm-1
; spectra were recorded
at 4 cm-1
spectral resolution. All spectra were taken in transflection mode using Happ-
Genzel apodization function. All the spectra were saved in log (1/R) format. As already
mentioned in section 2.1.5, in transflectance mode, the light passes through the sample
and is then reflected from the slide, therefore, making two passes through the tissue; ul-
timately, the absorbance is defined as log(1/R), where R is the ratio of the signal from
brain tissue and that of background recorded from a clean region of the substrate.
Images including both single tile maps and multiple tile mosaics were collected
across the caudate and hippocampus of transgenic mice and non-transgenic control lit-
termates, then processed with Varian Resolution-Pro software. Results were analyzed for
distribution of Cr, lipid and plaque aggregation across the hippocampus and caudate of
transgenic mouse at different ages (5, 8, 11, 14, 17 months). A sum of 128 scans were ac-
cumulated in order to increase S/N ratio. Background scans were acquired first and the
sample spectra were ratioed against the background.
To analyze the effect of polarized light on the spectra of crystalline creatine deposits
in brain tissue, single tile images of neat creatine crystals prepared on a gold slide and ly-
ing at horizontal or vertical to the stage were taken without polarizer, and with polarizer
(0° and 90°), then processed on the same peaks selected for brain tissue. In addition, sev-
eral single tile images were acquired in hippocampus and caudate with a Varian FPA-
FTIR microscope and a 64 x 64 Focal Plane Array detector, using polarizer angles of 0°
62
to 180°, at 10° intervals. The polarizer is inserted above the objectives for infrared polari-
zation studies and could easily be adjusted manually to allow for spectral acquisition at
different polarization. Background scans of clean gold slide were also acquired for each
polarizer angle of 0° to 180°, at 10° intervals, before taking single tile images of brain tis-
sue. All data were processed with specific focus on peaks at 1304 cm-1
and 1404 cm-1
, as
these exhibited extreme polarization effects and had less overlap with tissue bands com-
pared to other Cr peaks (See chapter 4 for further information).
3.3.2 Synchrotron FTIR data acquisition
Synchrotron FTIR (sFTIR) data were recorded on a Nicolet Magna 550 FTIR with a
Nicolet Magna 860 FTIR with Spectra Tech Continnum IR microscope (SRC, University
of Wisconsin, Madison, WI, USA). Some single Cr crystal spectra at different orienta-
tions were also taken at SRC by Dr. Gough in October 2007. In addition, maps were ac-
quired by Meghan Gallant (M.Sc. 2008, Dr. Gough’s group) across the hippocampus of
transgenic mice, using a step size of 10 microns and aperture of 12 × 12 µm2. These
sFTIR maps were reprocessed by me with Omnic/Atlµs software (Version 7.3, Thermo-
Nicolet). Results were analyzed for distribution of Cr deposits across the hippocampal se-
rial section tissue of 14 months old transgenic mouse. All of the sFTIR data were ac-
quired at SRC previously, and I re-processed the data for creatine deposits at 1410-1384
cm-1
instead of 1305 cm-1
, because it was discovered by Veena Agrawal (summer student
in Dr. Gough’s group 2007-2008) that creatine spectra taken by synchrotron FTIR Micro-
scope gave different spectra for various deposits. A depth profile through nine
consecutive sections on a plaque located inside the dentate gyrus of 14-month old
63
TgCRND8 mouse were acquired by Nicolet Magna 550 FTIR with Continuum IR
microscope (SRC, University of Wisconsin, Madison). These maps were taken by Alex
Kuzyk and Veena Agrawal, and analyzed for lipid, protein, creatine, and dense core
plaque with Omnic/Atlμs software (Version 7.3; Thermo-Nicolet) (Kuzyk et al, 2010).
3.3.3 Raman data acquisition
Spectra of TgCRND8 mouse brain and pure Cr (Sigma), mounted on gold-coated sili-
con chips, were recorded with a Renishaw inVia Raman microscope. The parameters re-
quired for successfully mapping brain tissue with Raman microscope such as laser wave-
length, spatial resolution, exposure and acquisition time were determined to permit Ra-
man mapping of Cr deposits in transgenic mouse brain (See chapter 4 for more detail).
One of the problems in taking the spectra of brain tissue is that with higher energy
wavelengths, the sample may burn and two charcoal bands appear at 1589 cm-1
and 1324
cm-1
. To reduce the risk of damaging the specimen, it was found out the 10% of 785 nm
diode laser as the light source was adequate to reduce the risk; therefore, 21 mW of 785
nm laser excitation from a diode laser was used to generate the Raman scattering under a
50x objective. As explained in section 2.2.4, 50x objective has the best quality; therefore,
all the maps and spectra were acquired at this magnification with 2 μm spatial resolution.
With the 50x objective and 1200 l/mm grating, spectra were obtained with
1 cm-1
/pixel spectral resolution and spatial resolution of 2 μm. The exposure time for all
the streamline maps was 300 second to improve S/N ratio.
With WiRE software, there is an option to minimize the cosmic ray and the laser ex-
posure on sample during taking spectra. Cosmic rays are highly energy particles passing

64
through the CCD detector, generating electrons that are interpreted as signal in spectrum.
The position and time of occurrence of cosmic ray is completely random. Cosmic rays
appear much more frequently in scans with long exposure time. These peaks can be re-
moved by activating cosmic ray removal through the acquisition set up software. By us-
ing this option, two extra accumulation are performed. Another option through acquisi-
tion set up is minimize laser exposure on sample to close the laser shutter when data is
not collected during the time switching from one row of maps to the next one.
Silicon calibration was performed before collecting data with the same laser line used
for data collection. The static scan should be centered at 520 cm-1
; 1s exposure time, 1
accumulation, and 10% of 785 nm laser power were chosen as adequate. This calibration
was done to ensure the instrument is calibrated to the Si peak at 520 cm-1
and that the
number of counts was sufficient. Two options of scanning are possible on software: static
and extended scan. Static scan covers very small wavenumber range (about 200 cm-1
) ei-
ther side of the chosen centre. A static scan is quicker than extended scan, but only covers
a limited range of spectrum. With choosing this option, the grating position is automati-
cally changed. Raman spectra were recorded across a spectral range of 600 to 3100 cm-1
to get each portion of the spectrum.
Maps were collected in the caudate and hippocampus of transgenic mice, and proc-
essed with WiRE software (version 3.0, Renishaw) for distribution of Cr, lipid and plaque
aggregation in the hippocampus and caudate of transgenic mouse brain. The brain tissue
regions mapped by Raman microscope were processed at 830 cm-1
to identify Cr deposits
since this band is very strong for Cr crystal.
65
Spectra of pure Cr were recorded on gold-coated silicon wafer attached to a glass
slide. Raman spectra of pure Cr monohydrate crystals were collected with polarizer
placed into the laser pathway between microscope and spectrometer. The polarizer is
comprised of two parts: a polarizer and a half-wave plate which rotates the light by 90°.
Single spectra of neat Cr crystals were collected using polarizer and half-wave plate to
determine the effect of polarized light on spectra of oriented Cr crystals (See chapter 4
for more information).
3.4 Theoretical calculations
All the calculations were performed with Gauss View molecular visualization pro-
gram and GAUSSIAN03 Package by Fatemeh FarazKhorasani (Ph.D. student in Dr.
Gough’s group).
The optimized geometry and vibrational spectrum of Creatine monohydrate (Cr.H2O)
was modelled using density functional theory (DFT) by B3LYP correlation functional
with the 6-311G (d,p) basis set, to obtain optimized geometry and vibrational modes. The
starting geometry of the molecule was extracted from its single-crystal neutron structure,
followed by converting X-ray fractional coordinates to Gaussian input (Cartesian coordi-
nates) using Mol2Mol (version 5.6.1) software. The geometry was fully optimized before
proceeding to vibrational calculations.
66
Chapter 4.
Results
Previous research in Dr. Gough’s group included acquisition and analysis of infrared
maps of the Aβ plaques that characterize Alzheimer Disease (Rak, 2007; Gallant, 2007;
Ogg, 2002). In using IR technique to analyze plaques, a spectral anomaly was noted in
many infrared maps. A literature search suggested a match between the IR spectra of pure
creatine and the unknown compound. The discovery was first published in JBC 2006
(Gallant et al, 2006). In a recent paper, it was illustrated that creatine was found more
abundantly in hippocampus of transgenic mouse brain compared to their non-transgenic
littermates and increased with age (Kuzyk et al, 2010).
The goal of research in this thesis is to explore why more Cr was found in transgenic
mouse brain and whether it is a marker of AD. As the creatine deposits were identified in
frozen and desiccated brain tissue, it was important to investigate whether these creatine
crystals were formed after snap-freezing and desiccating of brain tissue. Cr deposits were
mapped in hippocampus and caudate of transgenic mouse for understanding possible co-
localization between Cr, lipid and plaque, and also to learn more about the shape and spa-
tial extent of the deposits.

67
Figure 4.1A illustrates the sagittal section of 14 month-old TgCRND8 mouse brain to
show hippocampus, cortex and caudate, regions of interest that were mapped in this
work. The unstained, flash frozen tissue was sectioned at 8 μm thickness, and mounted on
gold coated silicon wafers to map with IR and Raman and process for levels of Cr, lipid
and plaque.
Figure 4.1: Sagittal section of the 14 month-old TgCRND8 mouse brain. (A) Sagittal section of transgenic
mouse brain showing major regions of interest mounted on gold silicon slide and (B) a close up of the hip-
pocampus. Densely packed neurons are located in the dentate gyrus and the Cornu Ammonis (CA) which is
subdivided into four regions: CA1, 2, 3,4. Scale bar = 200μm.
68
4.1 Parameter optimization with Raman microscope
Spectra of pure Cr monohydrate, and Cr in transgenic mouse brain tissue and some
biochemical signatures like lipid, amyloid plaque, phenylalanine, and CN+ mode of cho-
line head group of sphengomyeline in TgCRND8 mouse brain were recorded with Ren-
ishaw InVia Raman microscope. Before taking maps, the parameters required for suc-
cessfully mapping brain tissue with the Raman microscope such as laser wavelength, spa-
tial resolution, exposure time and laser power were determined to permit Raman mapping
of Cr deposits and environs in transgenic mice.
In order to understand which laser wavelength is suitable for this study, some single
scan tests were acquired on cortical tissue by using 10% laser power at 633 nm (He-Ne
laser) as the light source. As shown in Figure 4.2A, the test was performed with 1s expo-
sure time and 1 accumulation. In this test, automatic cycles were used to view at least 30
spectra. The background fluorescence was about 4500-5000 counts, fluorescence was ob-
served with each cycle, and no tissue peaks were observed. With this laser power, no
charcoal band was seen at 1589 cm-1
and 1324cm-1
; therefore, this laser power did not
burn the brain tissue. The exposure time is the time that the detector is exposed to Raman
signal. Longer exposure time gives better signal to noise ratio. However, a sample like
brain tissue has a high fluorescence background. A long scan will saturate the detector,
whereas several short scans will not. This allows an improvement in the signal to noise
ratio; therefore, the single scan test was repeated with the same exposure time and 10
scans were accumulated. The background fluorescence was approximately 25600-28400
counts and like the first test, fluorescence was observed with each cycle, but no tissue
peaks were obtained (Figure 4.2B). Even by increasing the accumulation to 100, no
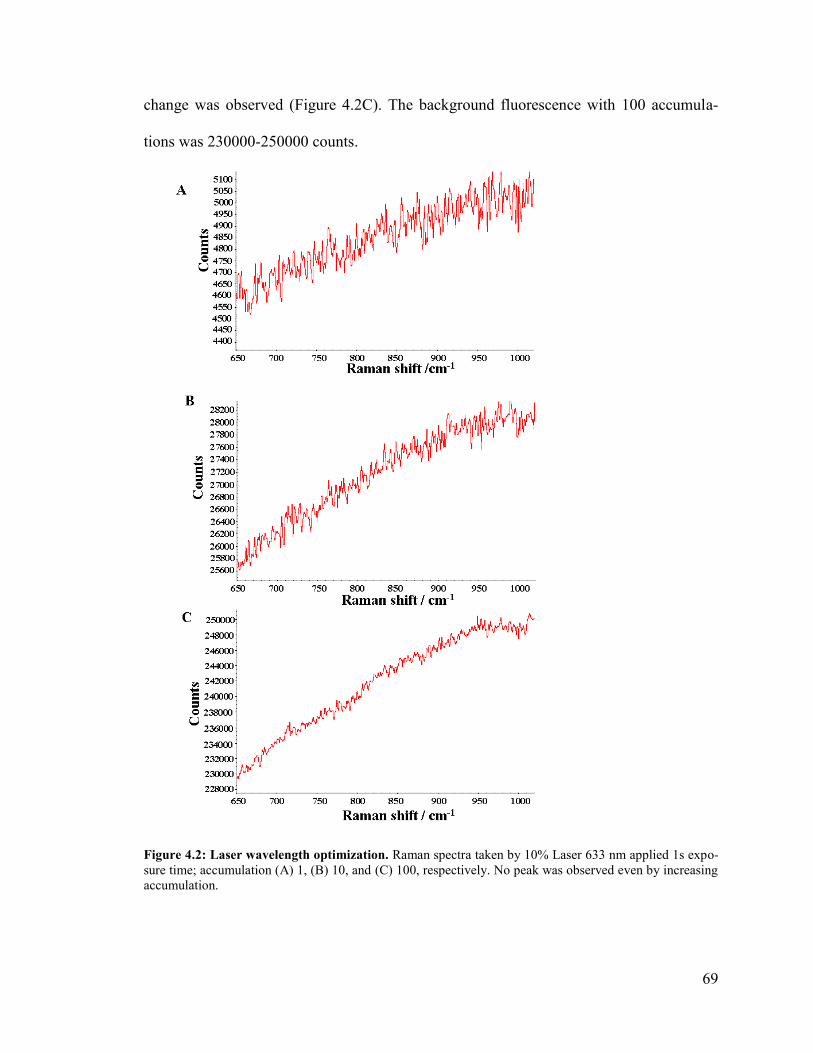
69
change was observed (Figure 4.2C). The background fluorescence with 100 accumula-
tions was 230000-250000 counts.
Figure 4.2: Laser wavelength optimization. Raman spectra taken by 10% Laser 633 nm applied 1s expo-
sure time; accumulation (A) 1, (B) 10, and (C) 100, respectively. No peak was observed even by increasing
accumulation.
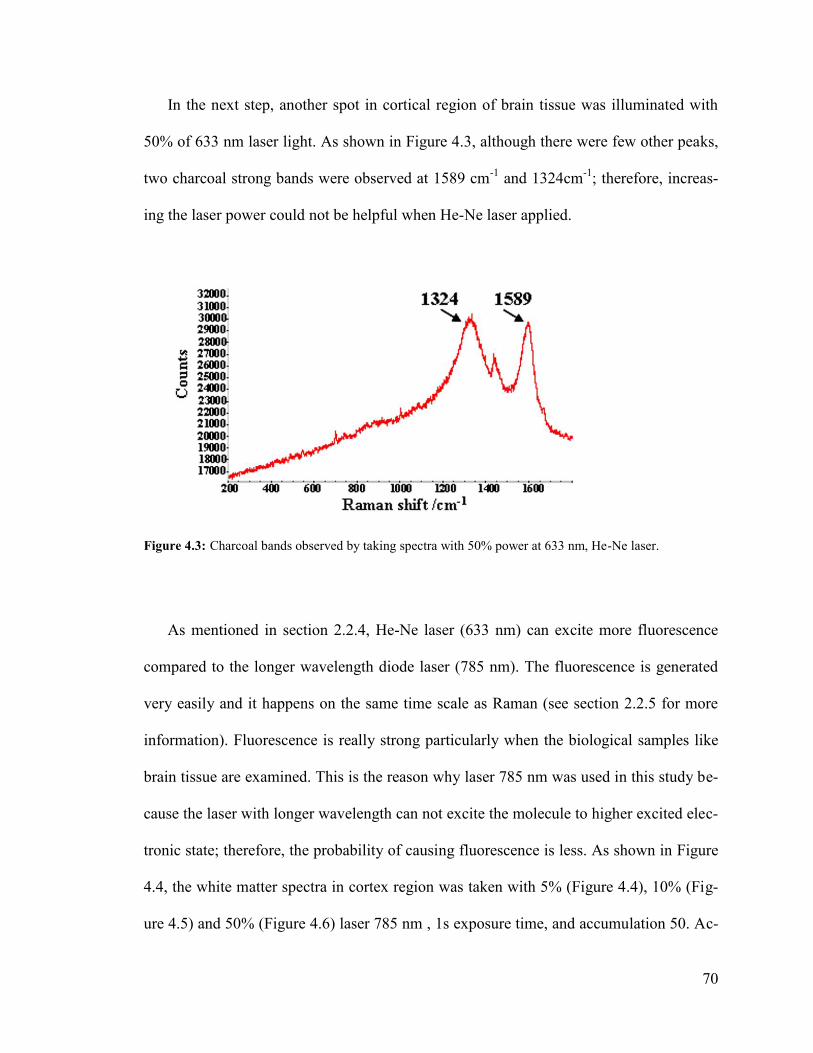
70
In the next step, another spot in cortical region of brain tissue was illuminated with
50% of 633 nm laser light. As shown in Figure 4.3, although there were few other peaks,
two charcoal strong bands were observed at 1589 cm-1
and 1324cm-1
; therefore, increas-
ing the laser power could not be helpful when He-Ne laser applied.
Figure 4.3: Charcoal bands observed by taking spectra with 50% power at 633 nm, He-Ne laser.
As mentioned in section 2.2.4, He-Ne laser (633 nm) can excite more fluorescence
compared to the longer wavelength diode laser (785 nm). The fluorescence is generated
very easily and it happens on the same time scale as Raman (see section 2.2.5 for more
information). Fluorescence is really strong particularly when the biological samples like
brain tissue are examined. This is the reason why laser 785 nm was used in this study be-
cause the laser with longer wavelength can not excite the molecule to higher excited elec-
tronic state; therefore, the probability of causing fluorescence is less. As shown in Figure
4.4, the white matter spectra in cortex region was taken with 5% (Figure 4.4), 10% (Fig-
ure 4.5) and 50% (Figure 4.6) laser 785 nm , 1s exposure time, and accumulation 50. Ac-
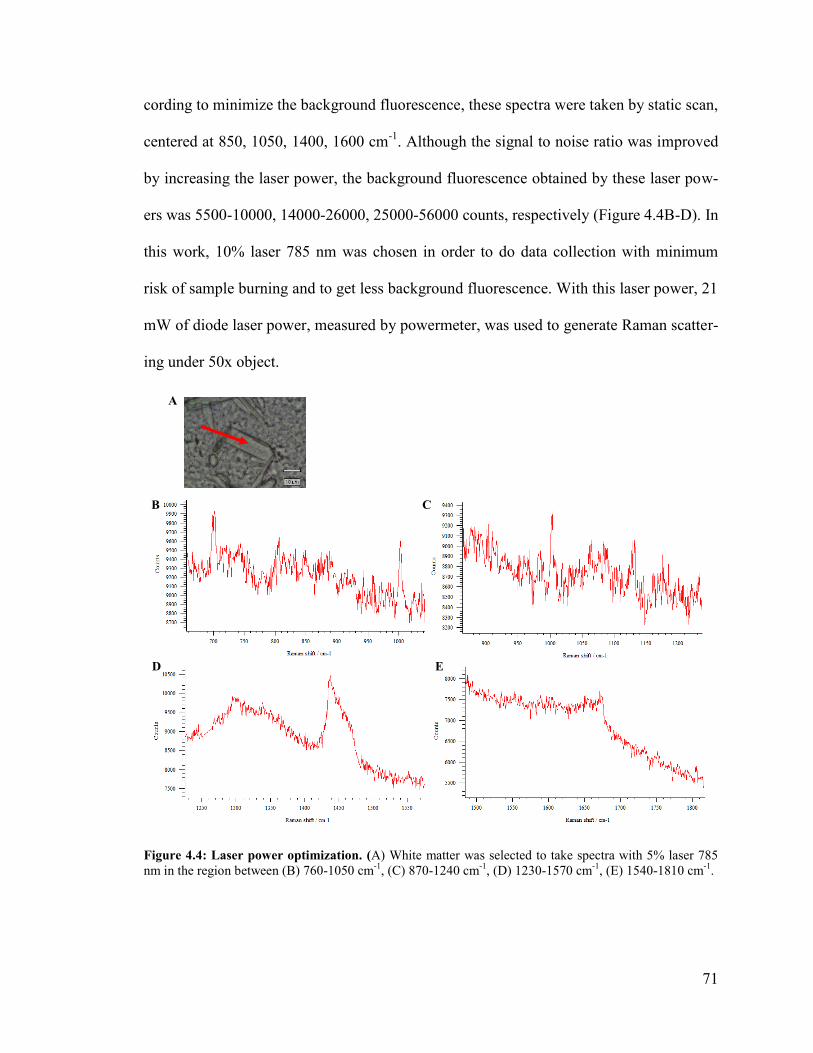
71
cording to minimize the background fluorescence, these spectra were taken by static scan,
centered at 850, 1050, 1400, 1600 cm-1
. Although the signal to noise ratio was improved
by increasing the laser power, the background fluorescence obtained by these laser pow-
ers was 5500-10000, 14000-26000, 25000-56000 counts, respectively (Figure 4.4B-D). In
this work, 10% laser 785 nm was chosen in order to do data collection with minimum
risk of sample burning and to get less background fluorescence. With this laser power, 21
mW of diode laser power, measured by powermeter, was used to generate Raman scatter-
ing under 50x object.
Figure 4.4: Laser power optimization. (A) White matter was selected to take spectra with 5% laser 785
nm in the region between (B) 760-1050 cm-1
, (C) 870-1240 cm-1
, (D) 1230-1570 cm-1
, (E) 1540-1810 cm-1
.
A
B C
D E
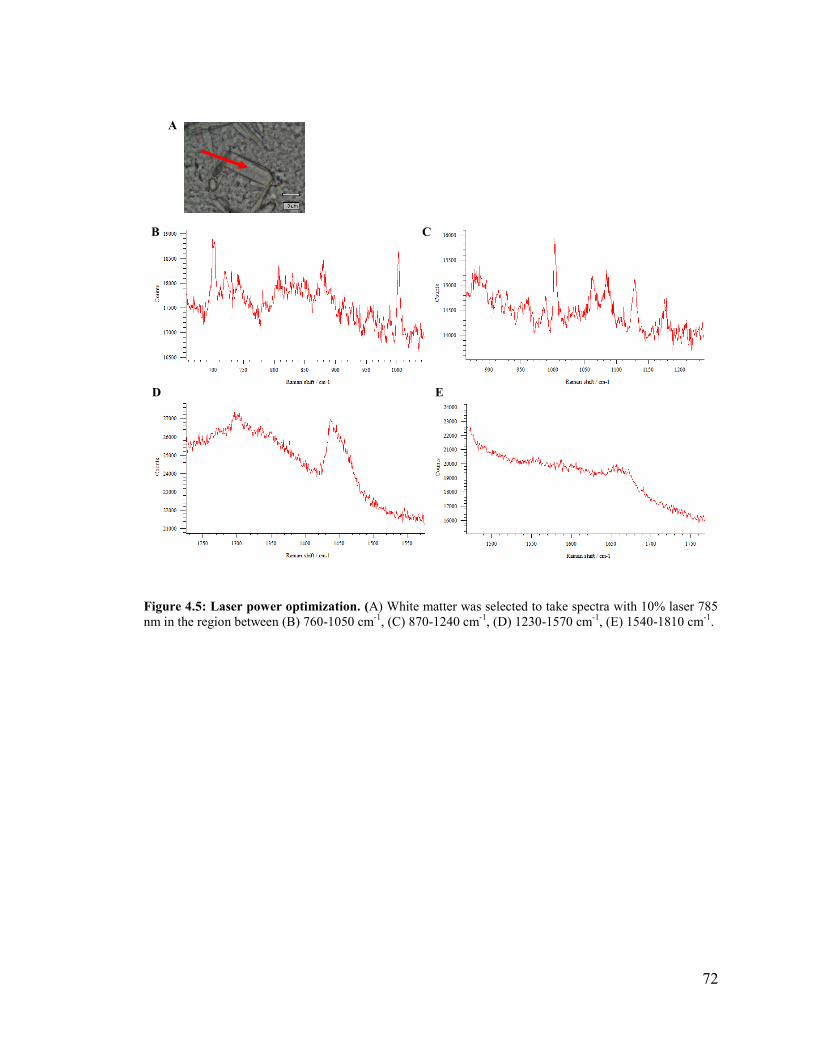
72
Figure 4.5: Laser power optimization. (A) White matter was selected to take spectra with 10% laser 785
nm in the region between (B) 760-1050 cm-1
, (C) 870-1240 cm-1
, (D) 1230-1570 cm-1
, (E) 1540-1810 cm-1
.
A
B C
D E
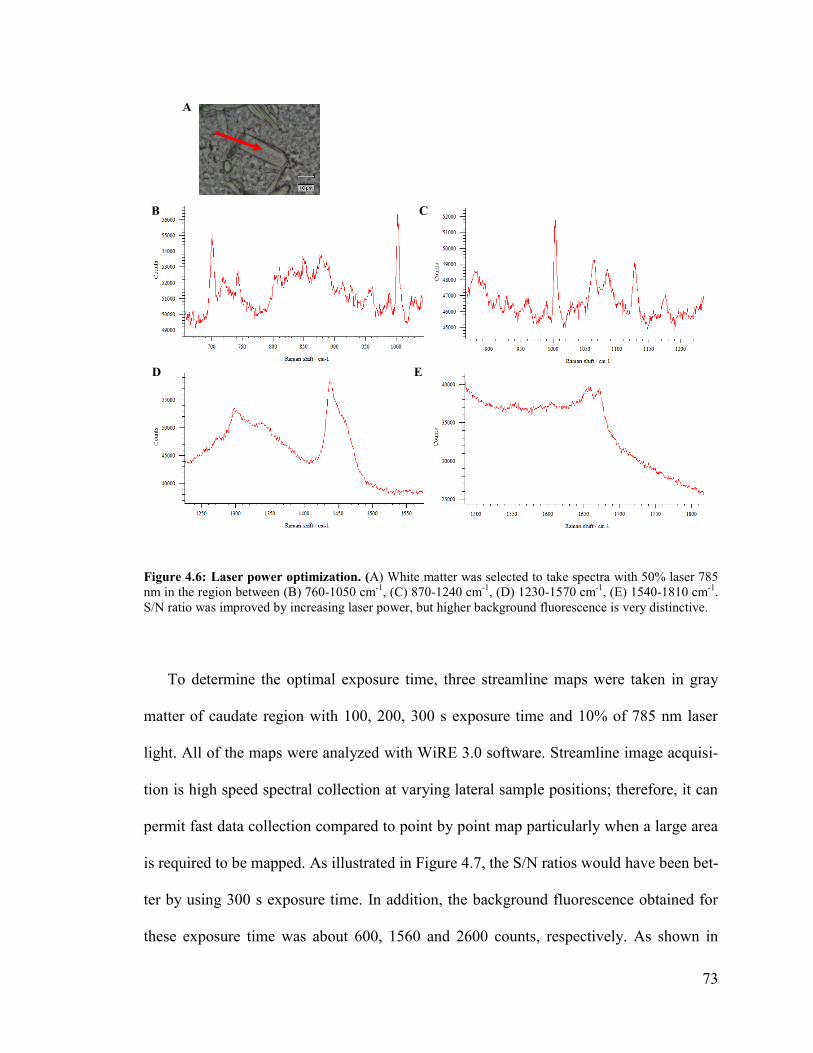
73
Figure 4.6: Laser power optimization. (A) White matter was selected to take spectra with 50% laser 785
nm in the region between (B) 760-1050 cm-1
, (C) 870-1240 cm-1
, (D) 1230-1570 cm-1
, (E) 1540-1810 cm-1
.
S/N ratio was improved by increasing laser power, but higher background fluorescence is very distinctive.
To determine the optimal exposure time, three streamline maps were taken in gray
matter of caudate region with 100, 200, 300 s exposure time and 10% of 785 nm laser
light. All of the maps were analyzed with WiRE 3.0 software. Streamline image acquisi-
tion is high speed spectral collection at varying lateral sample positions; therefore, it can
permit fast data collection compared to point by point map particularly when a large area
is required to be mapped. As illustrated in Figure 4.7, the S/N ratios would have been bet-
ter by using 300 s exposure time. In addition, the background fluorescence obtained for
these exposure time was about 600, 1560 and 2600 counts, respectively. As shown in
A
B C
D E
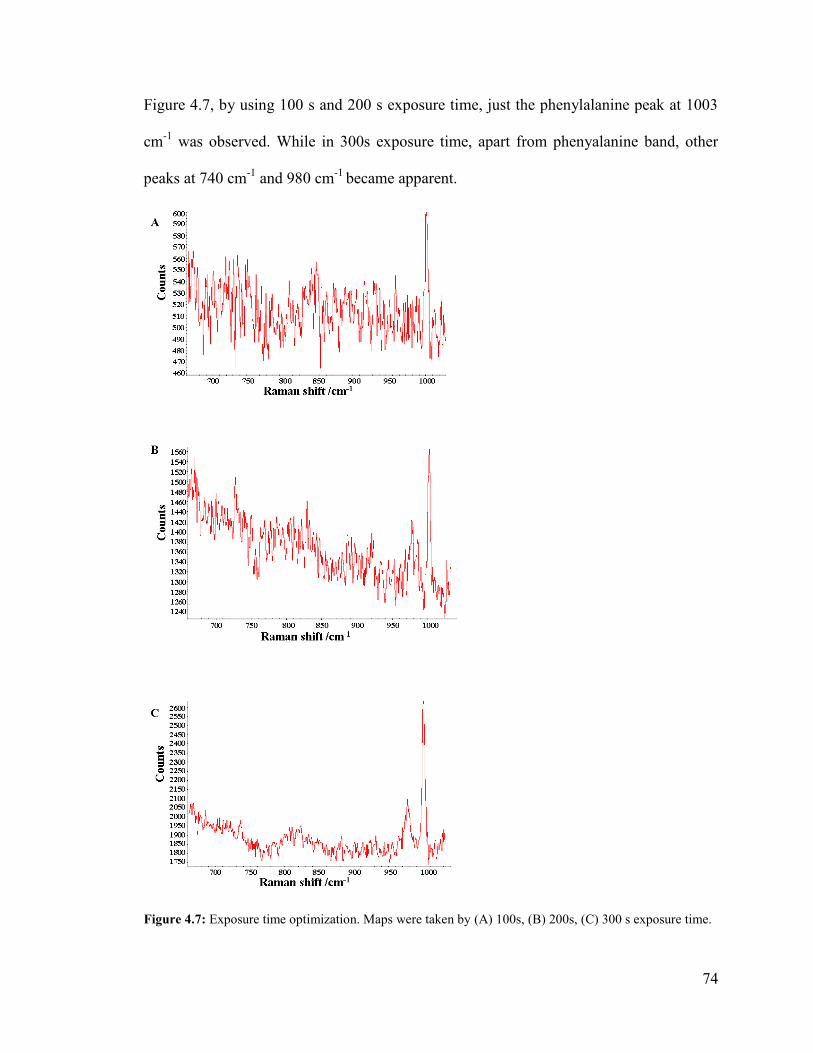
74
Figure 4.7, by using 100 s and 200 s exposure time, just the phenylalanine peak at 1003
cm-1
was observed. While in 300s exposure time, apart from phenyalanine band, other
peaks at 740 cm-1
and 980 cm-1
became apparent.
Figure 4.7: Exposure time optimization. Maps were taken by (A) 100s, (B) 200s, (C) 300 s exposure time.
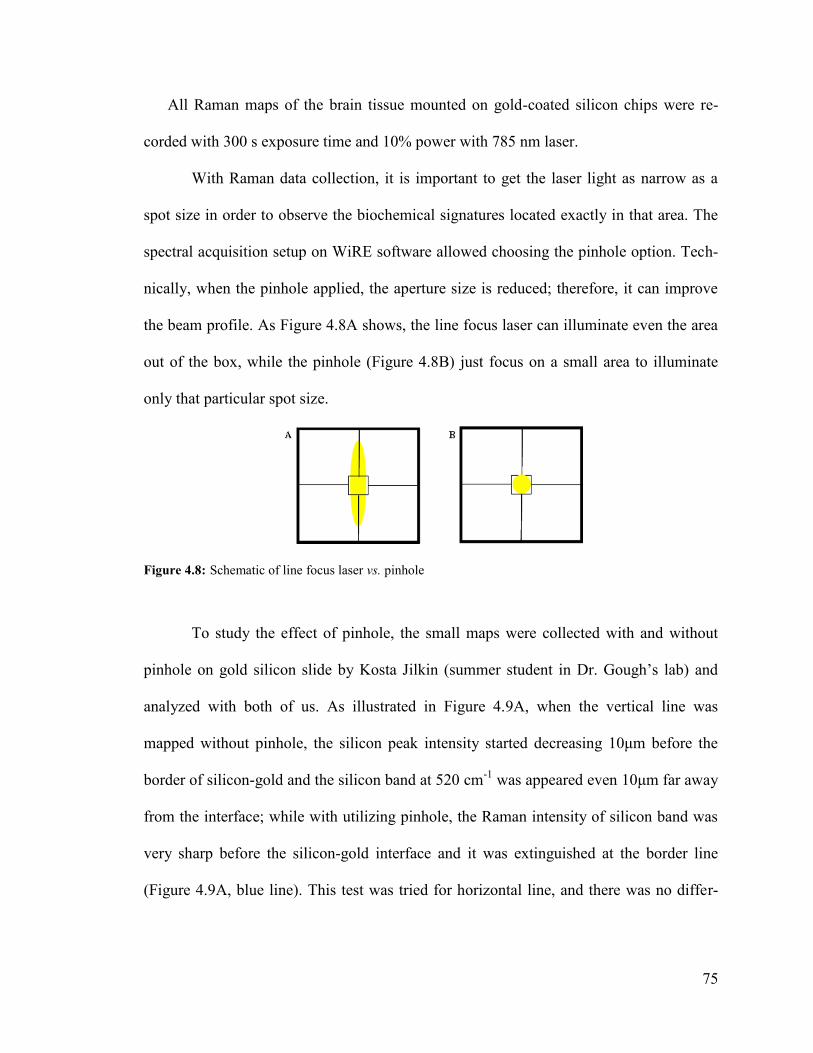
75
All Raman maps of the brain tissue mounted on gold-coated silicon chips were re-
corded with 300 s exposure time and 10% power with 785 nm laser.
With Raman data collection, it is important to get the laser light as narrow as a
spot size in order to observe the biochemical signatures located exactly in that area. The
spectral acquisition setup on WiRE software allowed choosing the pinhole option. Tech-
nically, when the pinhole applied, the aperture size is reduced; therefore, it can improve
the beam profile. As Figure 4.8A shows, the line focus laser can illuminate even the area
out of the box, while the pinhole (Figure 4.8B) just focus on a small area to illuminate
only that particular spot size.
Figure 4.8: Schematic of line focus laser vs. pinhole
To study the effect of pinhole, the small maps were collected with and without
pinhole on gold silicon slide by Kosta Jilkin (summer student in Dr. Gough’s lab) and
analyzed with both of us. As illustrated in Figure 4.9A, when the vertical line was
mapped without pinhole, the silicon peak intensity started decreasing 10μm before the
border of silicon-gold and the silicon band at 520 cm-1
was appeared even 10μm far away
from the interface; while with utilizing pinhole, the Raman intensity of silicon band was
very sharp before the silicon-gold interface and it was extinguished at the border line
(Figure 4.9A, blue line). This test was tried for horizontal line, and there was no differ-

76
ence between the results obtained with pinhole and without pinhole (Figure 4.9B). It
could point that the advantage of pinhole is for taking vertical map not the horizontal one.
Figure 4.9: Peak intensity of silicon versus position of (A) vertical mapped line and (B) horizontal mapped
line with pinhole (blue line), and without pinhole (red line)
To investigate the effect of pinhole on brain tissue spectra, some single scan tests
were acquired on caudate tissue by using 10% laser power at 785 nm as the light source.
As shown in Figure 4.10A-F, the test was performed first with 1 accumulation and 10,
20, 50, 100, 200, 300s exposure time. The signal to noise ratio was very low and just in
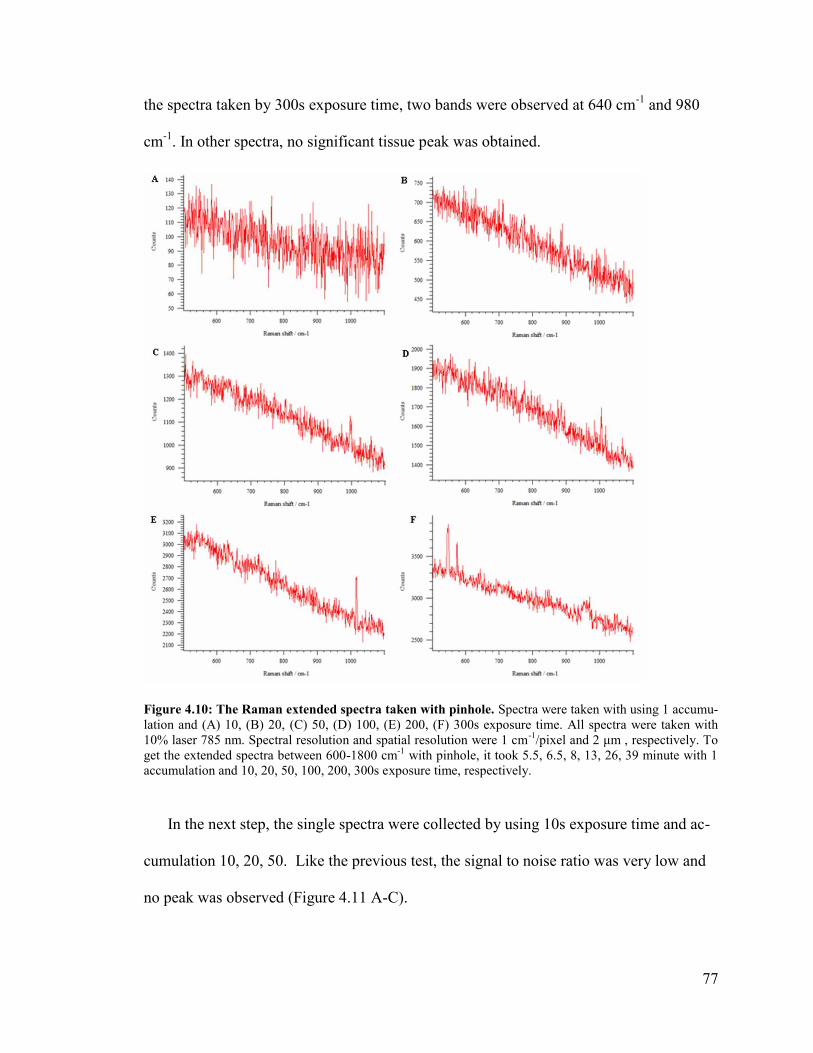
77
the spectra taken by 300s exposure time, two bands were observed at 640 cm-1
and 980
cm-1
. In other spectra, no significant tissue peak was obtained.
Figure 4.10: The Raman extended spectra taken with pinhole. Spectra were taken with using 1 accumu-
lation and (A) 10, (B) 20, (C) 50, (D) 100, (E) 200, (F) 300s exposure time. All spectra were taken with
10% laser 785 nm. Spectral resolution and spatial resolution were 1 cm-1
/pixel and 2 μm , respectively. To
get the extended spectra between 600-1800 cm-1
with pinhole, it took 5.5, 6.5, 8, 13, 26, 39 minute with 1
accumulation and 10, 20, 50, 100, 200, 300s exposure time, respectively.
In the next step, the single spectra were collected by using 10s exposure time and ac-
cumulation 10, 20, 50. Like the previous test, the signal to noise ratio was very low and
no peak was observed (Figure 4.11 A-C).

78
Figure 4.11: The Raman extended spectra taken with pinhole. Spectra were taken with using 10s expo-
sure time and accumulation (A) 10, (B) 20, (C) 50. All spectra were taken with 10% laser 785 nm. Spectral
resolution and spatial resolution were 1 cm-1
/pixel and 2 μm , respectively. To get the extended spectra be-
tween 600-1800 cm-1
with pinhole, it took 15, 30, 52 minute with 10s exposure time and accumulation 10,
20, 50, respectively.
The comparison of S/N ratio in two spectra taken without pinhole and with pinhole
are present in Figure 4.12A and 4.12B, respectively. The exposure time in both spectra
was 10s and the difference was only in accumulation which was 10 and 200 for taking
spectra without and with pinhole, respectively. These parameters were chosen to get ap-
proximately the same S/N ratio (approximately equal to 3). As shown in Figure 4.12A-B,
Cr bands were observed at 830, 916, 982 and 1054 cm-1. The other distinctive bands cor-
respond to lipid bands at 1300, 1420, 1650 cm-1
and phenylalanine at 1003 cm-1
. To get
the extended spectra between 600-1800 cm-1
with pinhole, it took 264 min while without
pinhole it was 15 min. Empirically, this method can be useful when just very small point
by point map is required to be collected, but for larger maps, time consuming is an impor-
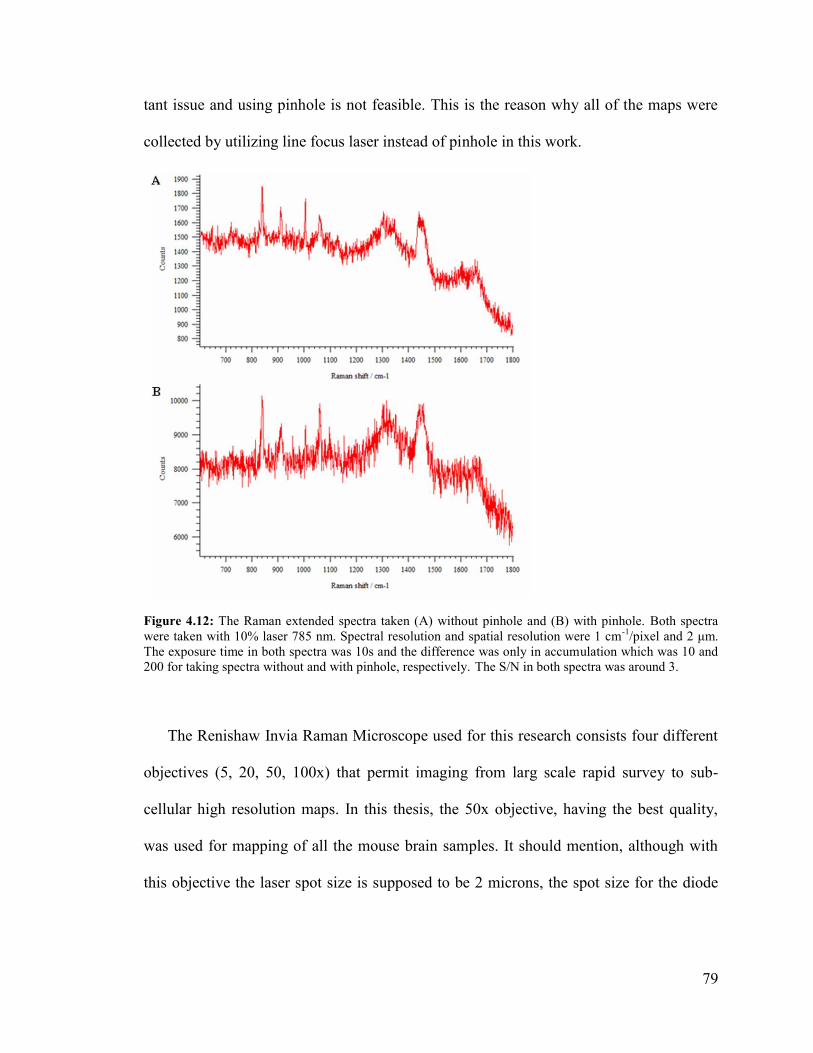
79
tant issue and using pinhole is not feasible. This is the reason why all of the maps were
collected by utilizing line focus laser instead of pinhole in this work.
Figure 4.12: The Raman extended spectra taken (A) without pinhole and (B) with pinhole. Both spectra
were taken with 10% laser 785 nm. Spectral resolution and spatial resolution were 1 cm-1
/pixel and 2 μm.
The exposure time in both spectra was 10s and the difference was only in accumulation which was 10 and
200 for taking spectra without and with pinhole, respectively. The S/N in both spectra was around 3.
The Renishaw Invia Raman Microscope used for this research consists four different
objectives (5, 20, 50, 100x) that permit imaging from larg scale rapid survey to sub-
cellular high resolution maps. In this thesis, the 50x objective, having the best quality,
was used for mapping of all the mouse brain samples. It should mention, although with
this objective the laser spot size is supposed to be 2 microns, the spot size for the diode
80
laser 785 was actually a line; therefore, the spot size as determined by the microscope
was slightly blurred in the y direction.
4.2 IR and Raman spectra of biochemical signatures in brain tis-
sue
IR and Raman mapping were performed in the hippocampus and caudate of Tg and
non-Tg control mice. Characteristic IR and Raman spectra for white matter, gray matter,
plaque, neuron, and Cr in the transgenic mouse brain are shown in this section. The tissue
bands were referred to literatures (Köhler et al, 2009; Movasaghi et al, 2008; Barth, 2007;
Ellepola et al, 2006; Krafft et al, 2005; Stuart, 2004) . To characterize both IR and Raman
Cr crystal vibrational modes, we performed combination of experimental and theoretical
studies (using Gaussian software in collaboration with Fatemeh Farazkhorasani, another
graduate student in Dr. Gough’s group).
Tables 4.1& 4.2 summarize the main IR and Raman spectral peak positions of bio-
logical molecules in mouse brain tissue.
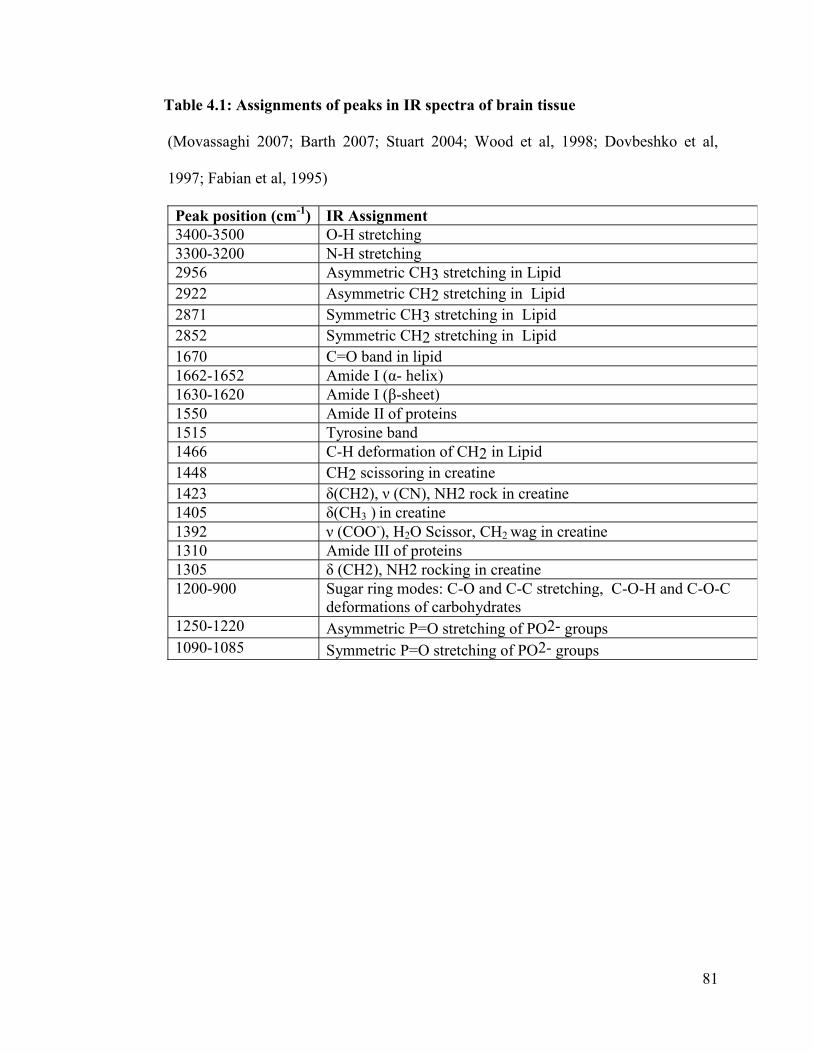
81
Table 4.1: Assignments of peaks in IR spectra of brain tissue
(Movassaghi 2007; Barth 2007; Stuart 2004; Wood et al, 1998; Dovbeshko et al,
1997; Fabian et al, 1995)
Peak position (cm-1
)
IR Assignment
3400-3500 O-H stretching
3300-3200 N-H stretching
2956 Asymmetric CH3 stretching in Lipid
2922 Asymmetric CH2 stretching in Lipid
2871 Symmetric CH3 stretching in Lipid
2852 Symmetric CH2 stretching in Lipid
1670 C=O band in lipid
1662-1652 Amide I (α- helix)
1630-1620 Amide I (β-sheet)
1550 Amide II of proteins
1515 Tyrosine band
1466 C-H deformation of CH2 in Lipid
1448 CH2 scissoring in creatine
1423 δ(CH2), ν (CN), NH2 rock in creatine
1405 δ(CH3 ) in creatine
1392 ν (COO-), H2O Scissor, CH2 wag in creatine
1310 Amide III of proteins
1305 δ (CH2), NH2 rocking in creatine
1200-900 Sugar ring modes: C-O and C-C stretching, C-O-H and C-O-C
deformations of carbohydrates
1250-1220 Asymmetric P=O stretching of PO2- groups
1090-1085 Symmetric P=O stretching of PO2- groups
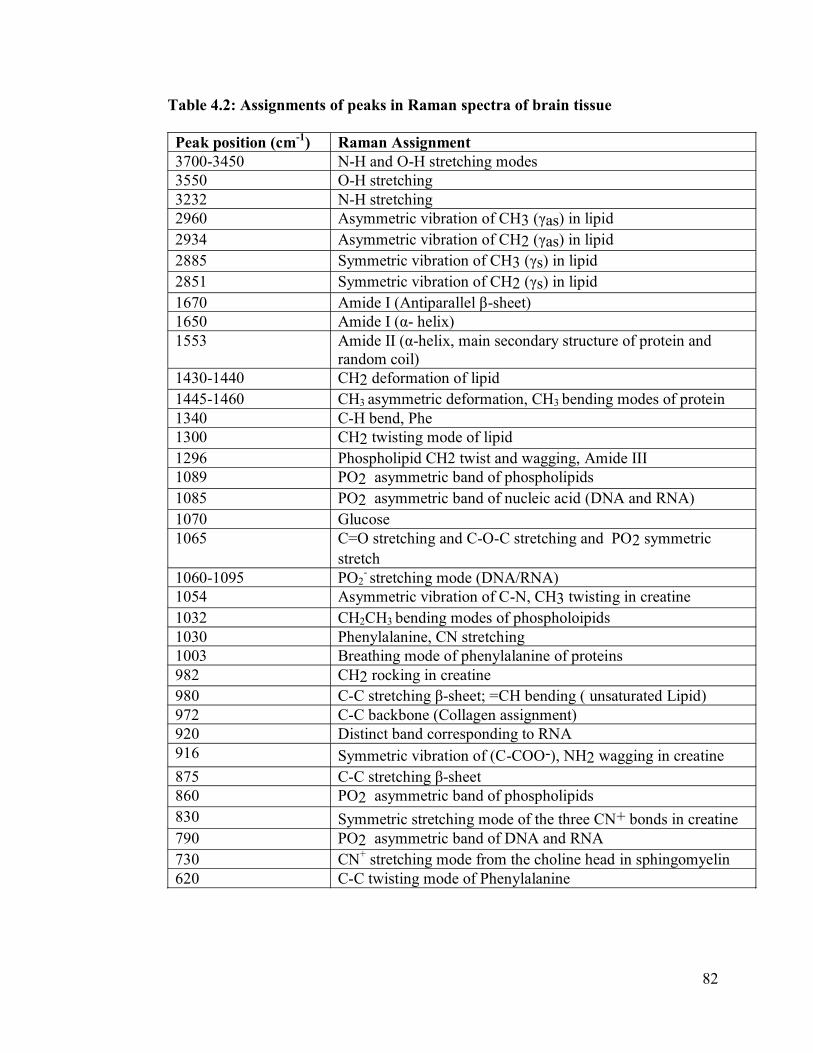
82
Table 4.2: Assignments of peaks in Raman spectra of brain tissue
Peak position (cm-1
)
Raman Assignment
3700-3450 N-H and O-H stretching modes
3550 O-H stretching
3232 N-H stretching
2960 Asymmetric vibration of CH3 (γas) in lipid
2934 Asymmetric vibration of CH2 (γas) in lipid
2885 Symmetric vibration of CH3 (γs) in lipid
2851 Symmetric vibration of CH2 (γs) in lipid
1670 Amide I (Antiparallel β-sheet)
1650 Amide I (α- helix)
1553 Amide II (α-helix, main secondary structure of protein and
random coil)
1430-1440 CH2 deformation of lipid
1445-1460 CH3 asymmetric deformation, CH3 bending modes of protein
1340 C-H bend, Phe
1300 CH2 twisting mode of lipid
1296 Phospholipid CH2 twist and wagging, Amide III
1089 PO2 asymmetric band of phospholipids
1085 PO2 asymmetric band of nucleic acid (DNA and RNA)
1070 Glucose
1065 C=O stretching and C-O-C stretching and PO2 symmetric
stretch
1060-1095 PO2- stretching mode (DNA/RNA)
1054 Asymmetric vibration of C-N, CH3 twisting in creatine
1032 CH2CH3 bending modes of phospholoipids
1030 Phenylalanine, CN stretching
1003 Breathing mode of phenylalanine of proteins
982 CH2 rocking in creatine
980 C-C stretching β-sheet; =CH bending ( unsaturated Lipid)
972 C-C backbone (Collagen assignment)
920 Distinct band corresponding to RNA
916 Symmetric vibration of (C-COO-), NH2 wagging in creatine
875 C-C stretching β-sheet
860 PO2 asymmetric band of phospholipids
830 Symmetric stretching mode of the three CN+ bonds in creatine
790 PO2 asymmetric band of DNA and RNA
730 CN+ stretching mode from the choline head in sphingomyelin
620 C-C twisting mode of Phenylalanine

83
4.2.1 IR and Raman spectra of white matter, gray matter, plaque
and neuron in mouse brain tissue
IR spectra of mouse brain show absorption peaks due to the functional groups of the
biological molecules. All IR spectra were taken in transflection mode using happ-Genzel
appodization function and spectral resolution of 4 cm-1
, pixel resolution 5.5 x 5.5 μm.
The white matter and gray matter spectra shown in Figure 4.13 were mapped and
processed for lipid distribution. The region from 3700-3100 cm-1
contains broad peaks
corresponding to OH and NH stretching. The strong peaks at 2956 cm-1
and 2922 cm-1
are
due to CH3 and CH2 asymmetric stretch modes and peaks at 2871cm-1
and 2851cm-1
are
corresponded to CH3 and CH2 symmetric stretch modes, respectively. Gray matter shows
very low intensity of the symmetric stretch CH2 peak at 2851 cm-1
and carbonyl band at
1670 cm-1
(Fabian et al, 1995). Contrastingly, white matter which has high lipid content,
displays high intensity of the lipid bands (Figure 4.13).
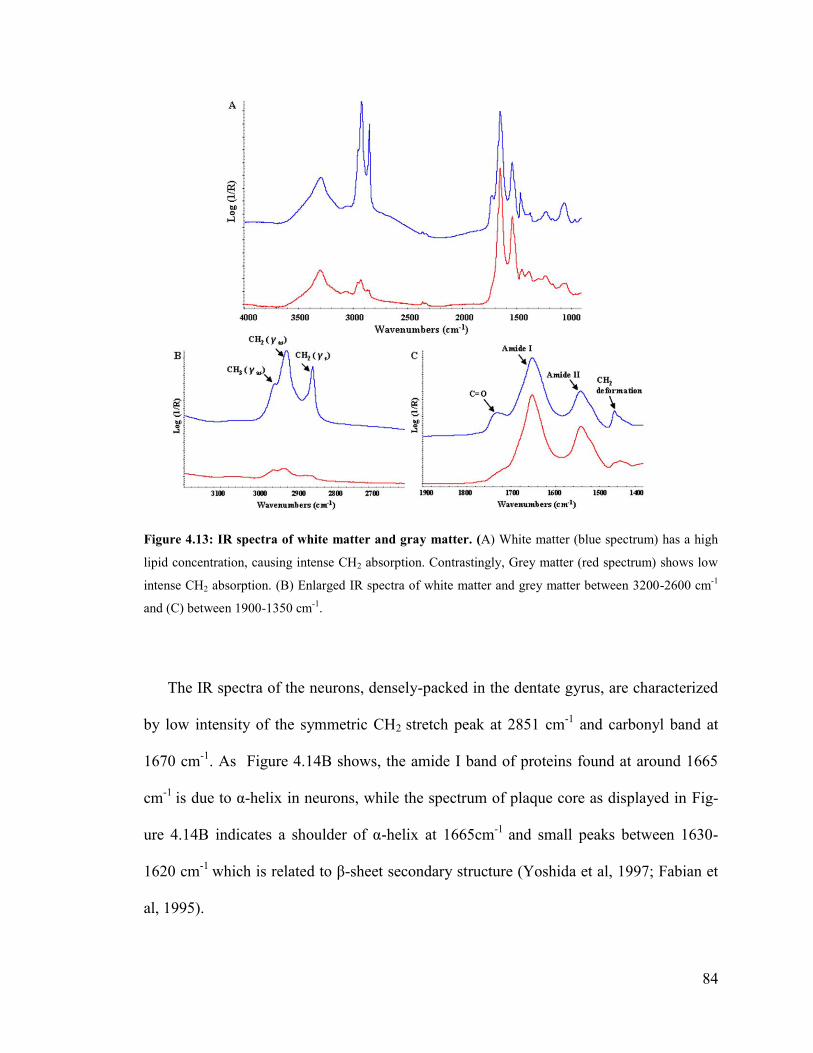
84
Figure 4.13: IR spectra of white matter and gray matter. (A) White matter (blue spectrum) has a high
lipid concentration, causing intense CH2 absorption. Contrastingly, Grey matter (red spectrum) shows low
intense CH2 absorption. (B) Enlarged IR spectra of white matter and grey matter between 3200-2600 cm-1
and (C) between 1900-1350 cm-1
.
The IR spectra of the neurons, densely-packed in the dentate gyrus, are characterized
by low intensity of the symmetric CH2 stretch peak at 2851 cm-1
and carbonyl band at
1670 cm-1
. As Figure 4.14B shows, the amide I band of proteins found at around 1665
cm-1
is due to α-helix in neurons, while the spectrum of plaque core as displayed in Fig-
ure 4.14B indicates a shoulder of α-helix at 1665cm-1
and small peaks between 1630-
1620 cm-1
which is related to β-sheet secondary structure (Yoshida et al, 1997; Fabian et
al, 1995).
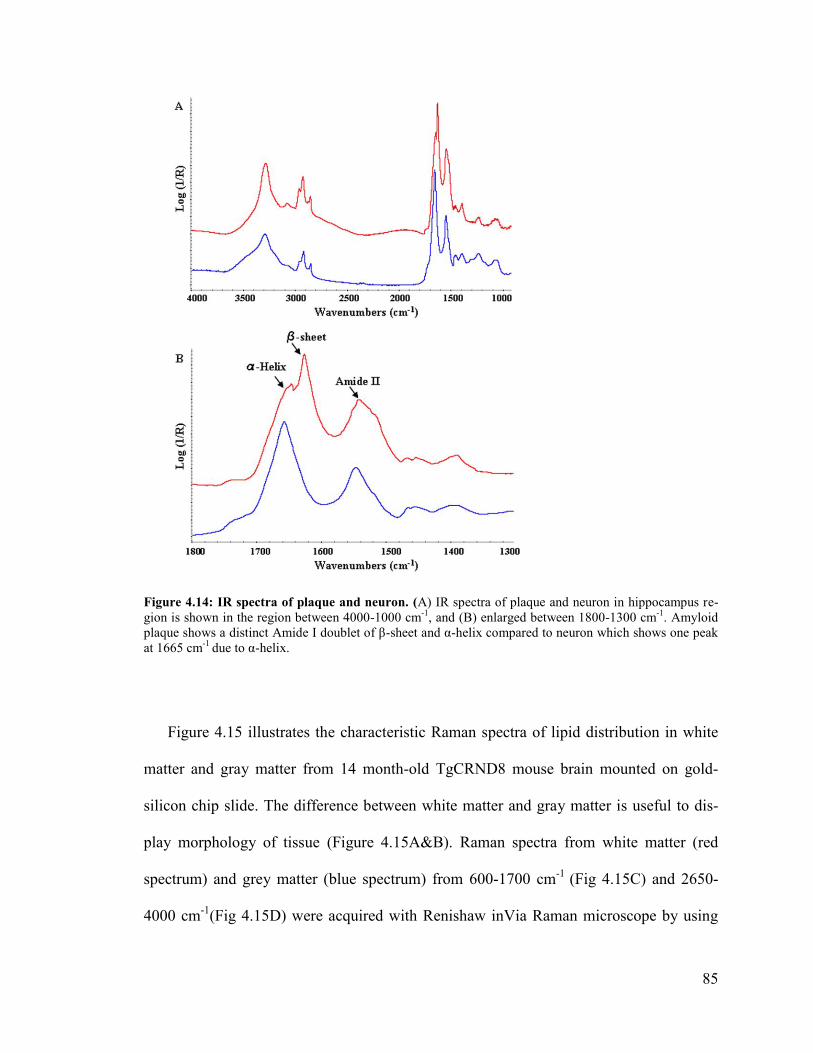
85
Figure 4.14: IR spectra of plaque and neuron. (A) IR spectra of plaque and neuron in hippocampus re-
gion is shown in the region between 4000-1000 cm-1
, and (B) enlarged between 1800-1300 cm-1
. Amyloid
plaque shows a distinct Amide I doublet of β-sheet and α-helix compared to neuron which shows one peak
at 1665 cm-1
due to α-helix.
Figure 4.15 illustrates the characteristic Raman spectra of lipid distribution in white
matter and gray matter from 14 month-old TgCRND8 mouse brain mounted on gold-
silicon chip slide. The difference between white matter and gray matter is useful to dis-
play morphology of tissue (Figure 4.15A&B). Raman spectra from white matter (red
spectrum) and grey matter (blue spectrum) from 600-1700 cm-1
(Fig 4.15C) and 2650-
4000 cm-1
(Fig 4.15D) were acquired with Renishaw inVia Raman microscope by using

86
10% laser power 785 nm. The spectra were performed with 10s exposure time and 30 ac-
cumulations. White matter shows typical profile of high lipid content, including many
fatty acid ester peaks, and some protein bands. Gray matter is distinguished mainly by
protein proxy: distinctive phenylalanine peak at 1003 cm-1
. The peaks at 2960 cm-1
and
2934 cm-1
are due to asymmetric CH3 and CH2 and peaks at 2885 cm-1
and 2851 cm-1
are
due to symmetric CH3 and CH2, respectively (Köhler et al, 2009; Kolijenovic et al, 2005;
Ong, 1999). The main differences for the two types of tissues were observed in the region
of CH2 stretching at 2851 cm-1
and bending modes at 1430-1440 cm-1
due to CH2 defor-
mation mode for lipid (Köhler et al, 2009; Krafft et al, 2005). This is consistent with the
fact that the white matter of the brain tissue is rich in lipid membrane containing long
acyl chain of CH2 groups whereas the gray matter contains more cellular material: pro-
tein, sugar, phosphate, nucleic acid. The peak at 1445-1455 cm-1
is due to CH3 bending
mode of lipid (Köhler et al, 2009; Kateinen et al, 2007) and protein (Köhler et al, 2009;
Lakshimi et al, 2002). Another peak that helps to differentiate the white matter and grey
matter is that at 1300 cm-1
. This peak is particularly strong in the white matter compared
with that in the gray matter and is assigned to the CH2 twisting modes (Köhler et al,
2009). The other peak which is very strong in white matter is at 720-730 cm-1
due to CN+
stretching mode from the choline head in phosphatidylcholine and sphingomyeline (Ma-
lini et al, 2006).
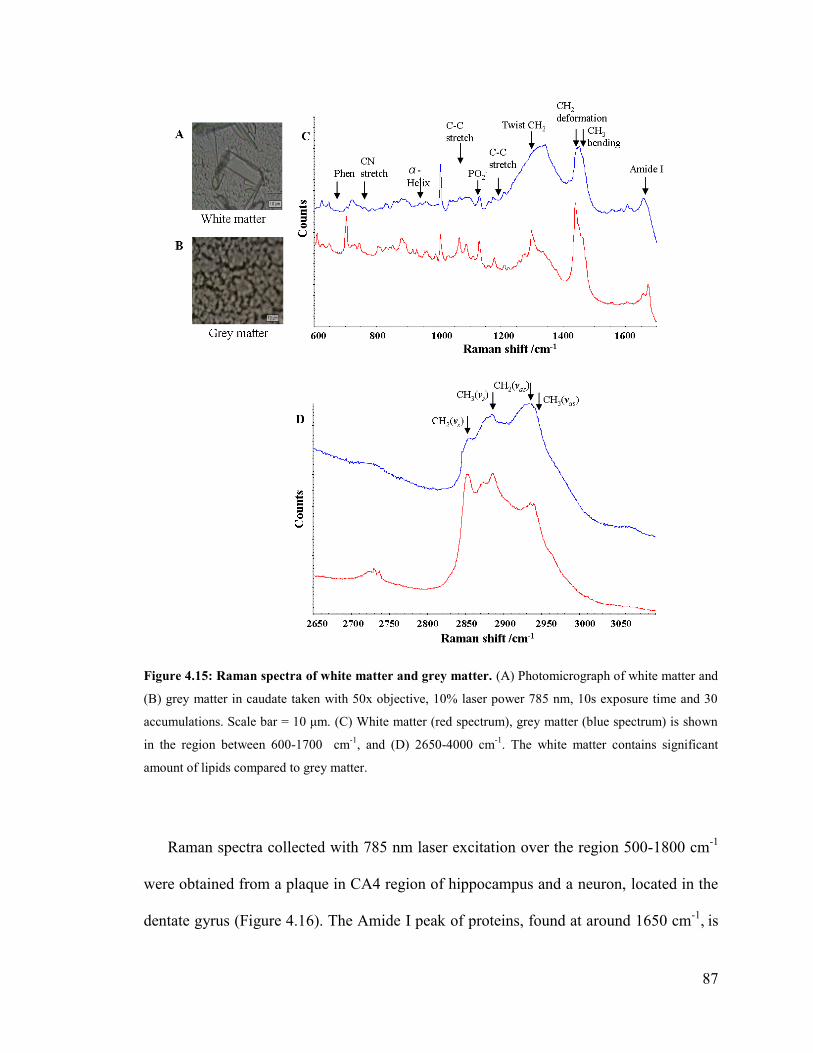
87
Figure 4.15: Raman spectra of white matter and grey matter. (A) Photomicrograph of white matter and
(B) grey matter in caudate taken with 50x objective, 10% laser power 785 nm, 10s exposure time and 30
accumulations. Scale bar = 10 μm. (C) White matter (red spectrum), grey matter (blue spectrum) is shown
in the region between 600-1700 cm-1
, and (D) 2650-4000 cm-1
. The white matter contains significant
amount of lipids compared to grey matter.
Raman spectra collected with 785 nm laser excitation over the region 500-1800 cm-1
were obtained from a plaque in CA4 region of hippocampus and a neuron, located in the
dentate gyrus (Figure 4.16). The Amide I peak of proteins, found at around 1650 cm-1
, is
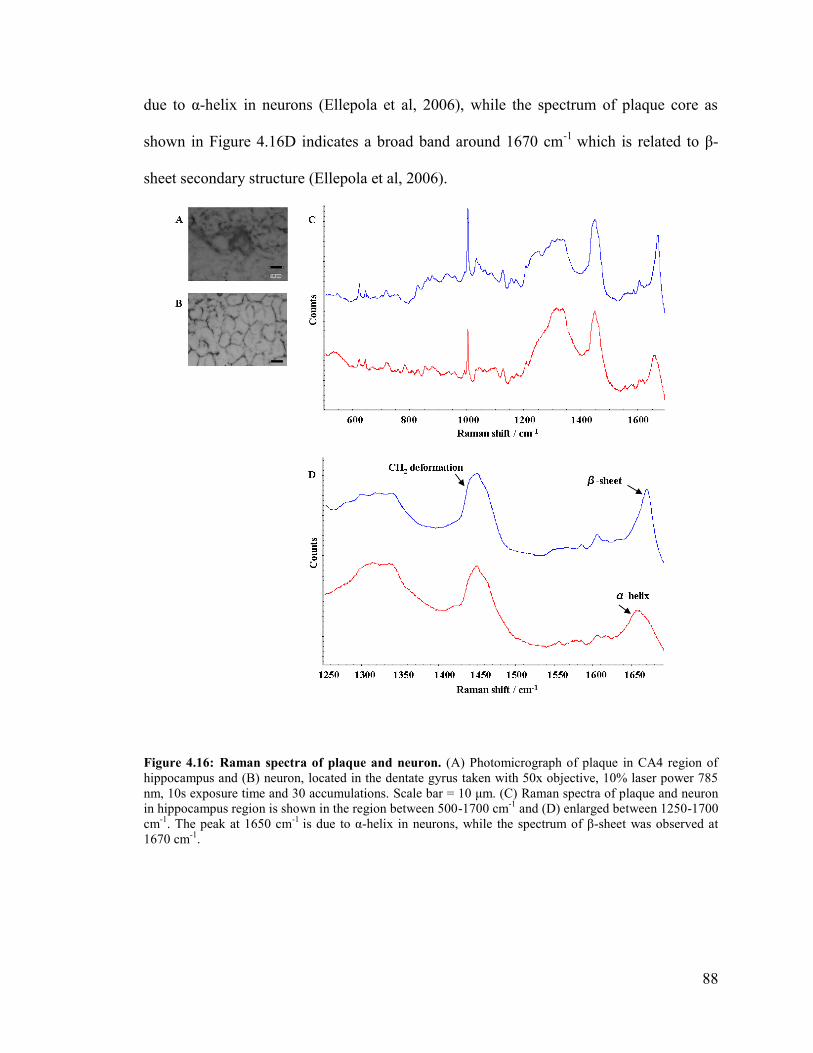
88
due to α-helix in neurons (Ellepola et al, 2006), while the spectrum of plaque core as
shown in Figure 4.16D indicates a broad band around 1670 cm-1
which is related to β-
sheet secondary structure (Ellepola et al, 2006).
Figure 4.16: Raman spectra of plaque and neuron. (A) Photomicrograph of plaque in CA4 region of
hippocampus and (B) neuron, located in the dentate gyrus taken with 50x objective, 10% laser power 785
nm, 10s exposure time and 30 accumulations. Scale bar = 10 μm. (C) Raman spectra of plaque and neuron
in hippocampus region is shown in the region between 500-1700 cm-1
and (D) enlarged between 1250-1700
cm-1
. The peak at 1650 cm-1
is due to α-helix in neurons, while the spectrum of β-sheet was observed at
1670 cm-1
.
89
4.2.2 IR and Raman creatine peak assignments from experimental
and theoritical studies
In this thesis, we investigate the vibrational modes of creatine to calrify the spec-
tral analysis of creatine crystals found in barin tissue. Experimental results obtained from
FTIR and Raman were compared with calculations at B3LYP/6-311G (d,p) level of the-
ory. The theoretical calculation was performed by Fatemeh FarazKhorasani (Graduate
student in Dr. Gough’s lab). A detailed vibrational analysis of Cr was carried out based
on density functional theory (DFT) calculations of the neutral, anionic, cationic, and Cr
monohydrate form to characterize the principal bands chosen for Cr identification. Par-
ticular bands which show the most affect when polarizer applied (see section for more
information) for IR and Raman analysis were characterized through DFT calculations,
performed within the Gaussian program with the B3LYP functional and 6-311G (d,p) ba-
sis set. From all of the computed forms, the results obtained with Cr monhydrate were
much closer to the experimental acquired data.
Two orientations of the creatine monohydrate optimized structure are displayed in
Fig. 4.17. It can be seen that a CN3 stretching coordinate (green arrows, left figure) must
lie in a plane that is nearly perpendicular to the plane of a COO- stretching coordinate
(blue arrows, right figure), while the C-C bond is perpendicular to both. These intrinsic
features of the structure are postulated to be the basis of the responses observed in modes
excited by polarizations of light.
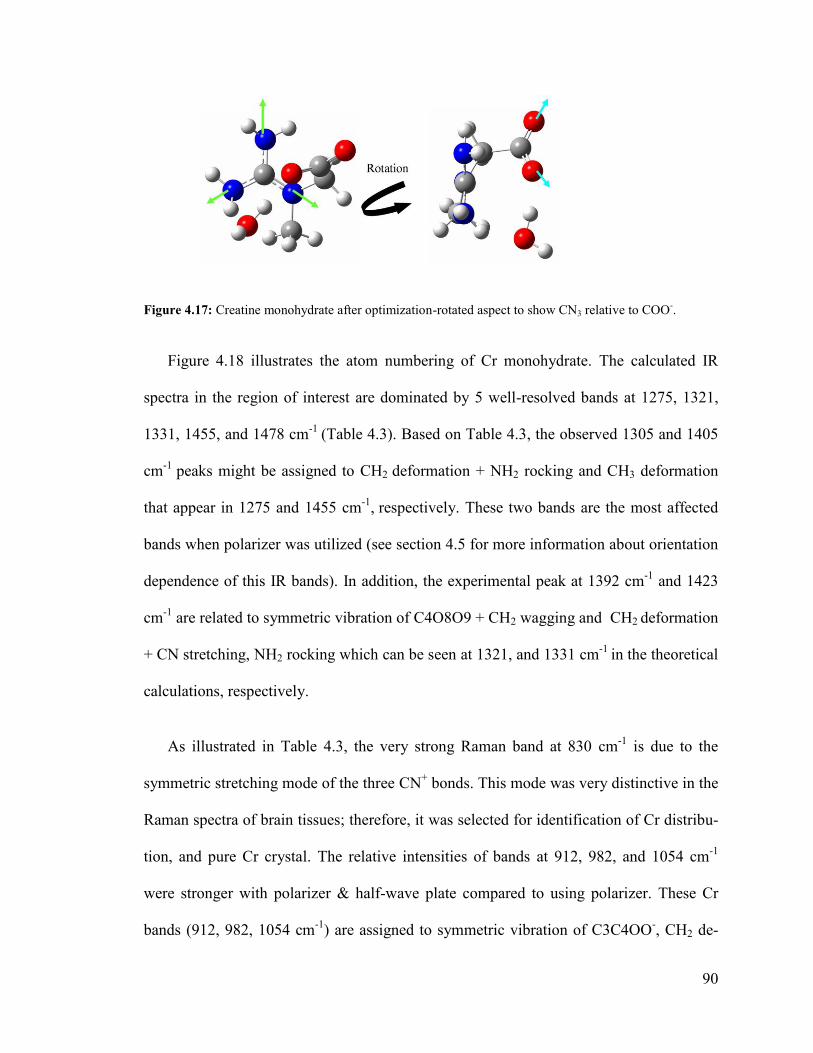
90
Figure 4.17: Creatine monohydrate after optimization-rotated aspect to show CN3 relative to COO-.
Figure 4.18 illustrates the atom numbering of Cr monohydrate. The calculated IR
spectra in the region of interest are dominated by 5 well-resolved bands at 1275, 1321,
1331, 1455, and 1478 cm-1
(Table 4.3). Based on Table 4.3, the observed 1305 and 1405
cm-1
peaks might be assigned to CH2 deformation + NH2 rocking and CH3 deformation
that appear in 1275 and 1455 cm-1
, respectively. These two bands are the most affected
bands when polarizer was utilized (see section 4.5 for more information about orientation
dependence of this IR bands). In addition, the experimental peak at 1392 cm-1
and 1423
cm-1
are related to symmetric vibration of C4O8O9 + CH2 wagging and CH2 deformation
+ CN stretching, NH2 rocking which can be seen at 1321, and 1331 cm-1
in the theoretical
calculations, respectively.
As illustrated in Table 4.3, the very strong Raman band at 830 cm-1
is due to the
symmetric stretching mode of the three CN+ bonds. This mode was very distinctive in the
Raman spectra of brain tissues; therefore, it was selected for identification of Cr distribu-
tion, and pure Cr crystal. The relative intensities of bands at 912, 982, and 1054 cm-1
were stronger with polarizer & half-wave plate compared to using polarizer. These Cr
bands (912, 982, 1054 cm-1
) are assigned to symmetric vibration of C3C4OO-, CH2 de-
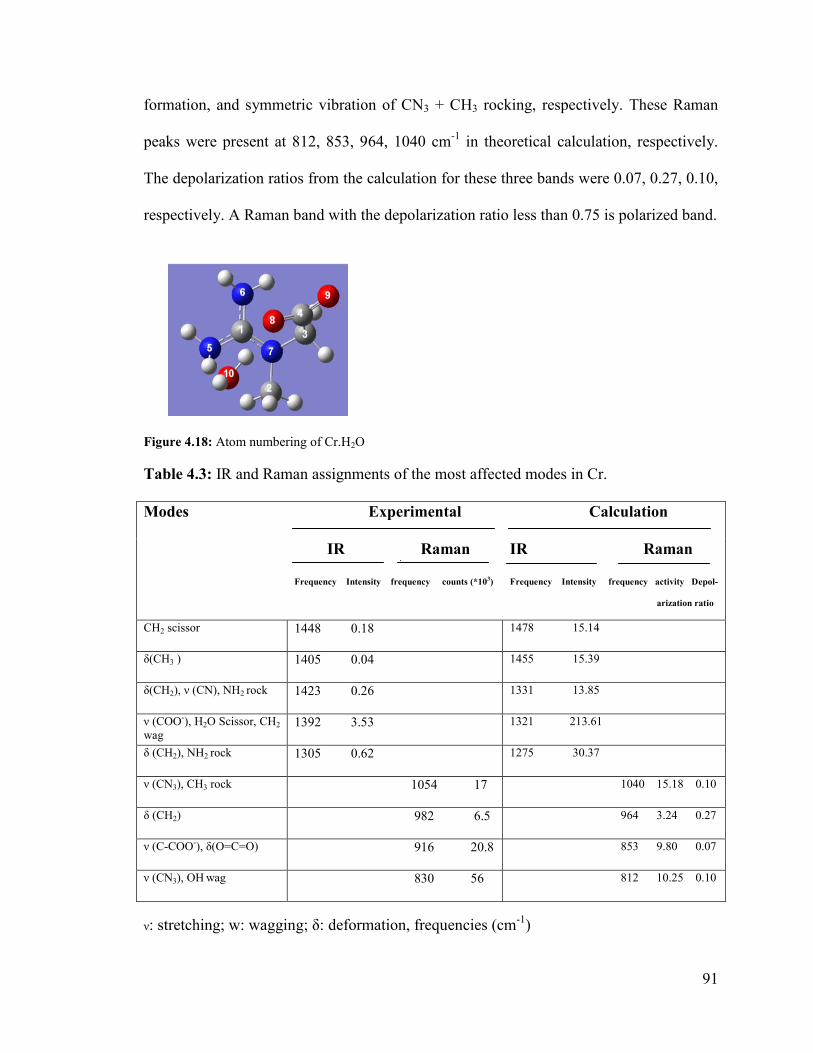
91
formation, and symmetric vibration of CN3 + CH3 rocking, respectively. These Raman
peaks were present at 812, 853, 964, 1040 cm-1
in theoretical calculation, respectively.
The depolarization ratios from the calculation for these three bands were 0.07, 0.27, 0.10,
respectively. A Raman band with the depolarization ratio less than 0.75 is polarized band.
Figure 4.18: Atom numbering of Cr.H2O
Table 4.3: IR and Raman assignments of the most affected modes in Cr.
Modes Experimental Calculation
IR Raman
Frequency Intensity frequency counts (*103)
IR Raman
Frequency Intensity frequency activity Depol-
arization ratio
CH2 scissor 1448 0.18 1478 15.14
δ(CH3 ) 1405 0.04 1455 15.39
δ(CH2), ν (CN), NH2 rock 1423 0.26 1331 13.85
ν (COO-), H2O Scissor, CH2
wag 1392 3.53 1321 213.61
δ (CH2), NH2 rock 1305 0.62 1275 30.37
ν (CN3), CH3 rock 1054 17 1040 15.18 0.10
δ (CH2) 982 6.5 964 3.24 0.27
ν (C-COO-), δ(O=C=O) 916 20.8 853 9.80 0.07
ν (CN3), OH wag 830 56 812 10.25 0.10
ν: stretching; w: wagging; δ: deformation, frequencies (cm-1
)
92
FTIR and Raman are effective microspectroscopic thecinques for molecular structure
determination especially when coupled with theoritical methods.
Figure 4.19 displays IR spectra of creatine in brain tissue (red spectrum), pure
creatine (blue spectrum), and normal tissue (green spectrum) taken in the region between
4000-1000 cm-1
. As obtained from theoritical studies, the peaks at 1305 cm-1
due to de-
formation of CH2 + NH2 rocking and the peak at 1405 cm-1
assigned to deformation of
CH3 were used for identification of creatine in brain tissue, because these peaks had less
overlap with tissue bands compared to other Cr peaks. Another distinct Cr peak observed
at 1392 cm-1
is due to symmetric vibration of COO- and CH2 wagging. As shown in Fig-
ure 4.19B, all three peaks, 1305 cm-1
and the doublet at 1392 and 1405 cm-1
were ob-
served with FPA-FTIR spectra; however the creatine spectra taken by synchrotron FT-IR
gave different spectra for various deposits (see section 4.5.1 for more detail).
The normal tissue spectra (green spectrum) were composed of the broad absorbance
at 3300 cm-1
which is due to NH and OH stretching (Dovbeshko et al, 1997). The peaks
at 2956 cm-1
and 2922cm-1
are due to asymmetric CH3 and CH2 and peaks at 2871 cm-1
and 2851 cm-1
are due to symmetric CH3 and CH2, respectively. Amide I band of proteins
was found at 1660 cm-1
, followed by the amide II 1550 cm-1
, amide III and phosphate as-
signed at 1240cm-1
. The peak at 1080 cm-1
is due to symmetric phosphate stretch over-
lapped with sugar bands (Wood et al, 1998).
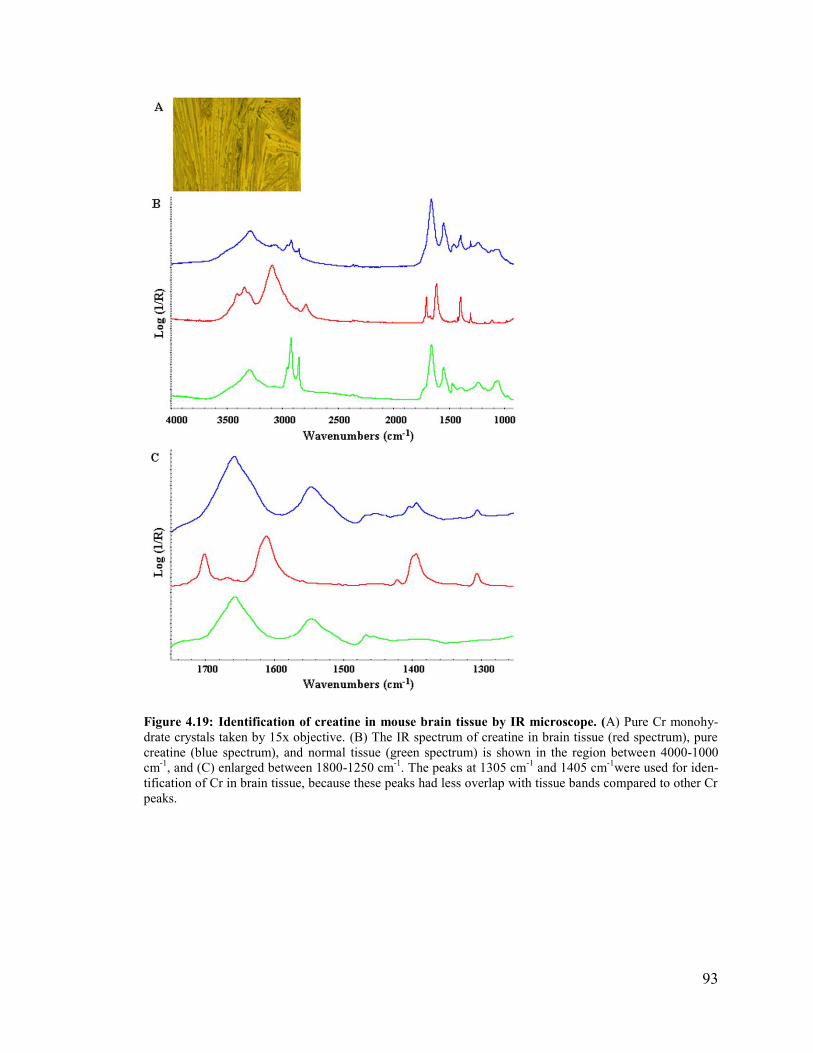
93
Figure 4.19: Identification of creatine in mouse brain tissue by IR microscope. (A) Pure Cr monohy-
drate crystals taken by 15x objective. (B) The IR spectrum of creatine in brain tissue (red spectrum), pure
creatine (blue spectrum), and normal tissue (green spectrum) is shown in the region between 4000-1000
cm-1
, and (C) enlarged between 1800-1250 cm-1
. The peaks at 1305 cm-1
and 1405 cm-1
were used for iden-
tification of Cr in brain tissue, because these peaks had less overlap with tissue bands compared to other Cr
peaks.
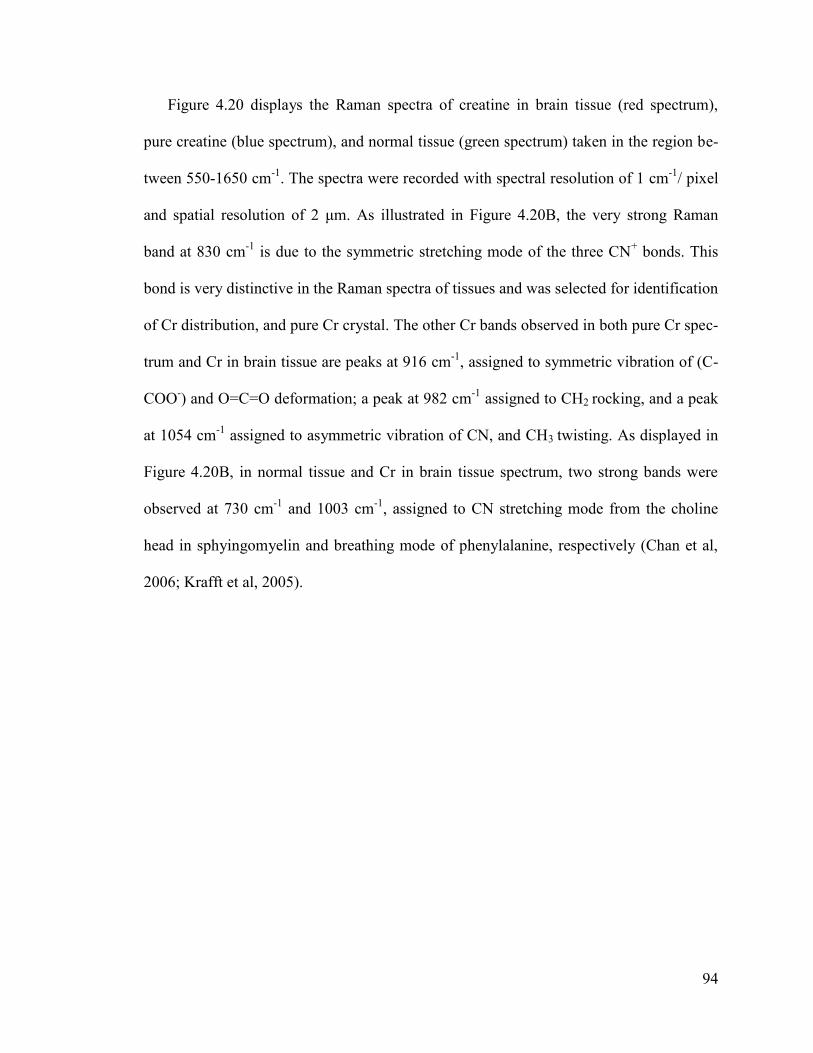
94
Figure 4.20 displays the Raman spectra of creatine in brain tissue (red spectrum),
pure creatine (blue spectrum), and normal tissue (green spectrum) taken in the region be-
tween 550-1650 cm-1
. The spectra were recorded with spectral resolution of 1 cm-1
/ pixel
and spatial resolution of 2 μm. As illustrated in Figure 4.20B, the very strong Raman
band at 830 cm-1
is due to the symmetric stretching mode of the three CN+ bonds. This
bond is very distinctive in the Raman spectra of tissues and was selected for identification
of Cr distribution, and pure Cr crystal. The other Cr bands observed in both pure Cr spec-
trum and Cr in brain tissue are peaks at 916 cm-1
, assigned to symmetric vibration of (C-
COO-) and O=C=O deformation; a peak at 982 cm
-1 assigned to CH2 rocking, and a peak
at 1054 cm-1
assigned to asymmetric vibration of CN, and CH3 twisting. As displayed in
Figure 4.20B, in normal tissue and Cr in brain tissue spectrum, two strong bands were
observed at 730 cm-1
and 1003 cm-1
, assigned to CN stretching mode from the choline
head in sphyingomyelin and breathing mode of phenylalanine, respectively (Chan et al,
2006; Krafft et al, 2005).

95
Figure 4.20: Identification of creatine in mouse brain tissue by Raman microscope. (A) The Raman
spectrum of creatine in brain tissue (red spectrum), pure creatine (blue spectrum), and normal tissue (green
spectrum) is shown in the region between 550-1650 cm-1and and (B) enlarged between 800-1100 cm-1.
The peak at 1650 cm-1
The peaks at 830, 916, 982, and 1054 cm-1
were used for identification of creatine in
brain tissue.
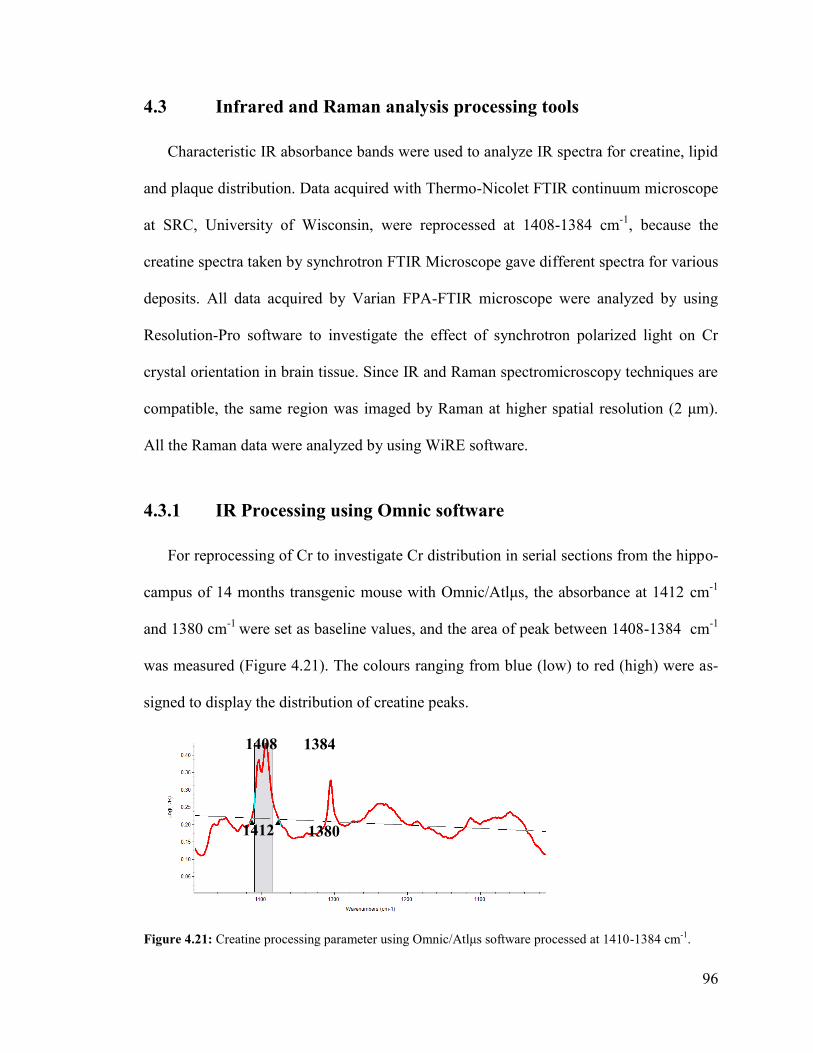
96
4.3 Infrared and Raman analysis processing tools
Characteristic IR absorbance bands were used to analyze IR spectra for creatine, lipid
and plaque distribution. Data acquired with Thermo-Nicolet FTIR continuum microscope
at SRC, University of Wisconsin, were reprocessed at 1408-1384 cm-1
, because the
creatine spectra taken by synchrotron FTIR Microscope gave different spectra for various
deposits. All data acquired by Varian FPA-FTIR microscope were analyzed by using
Resolution-Pro software to investigate the effect of synchrotron polarized light on Cr
crystal orientation in brain tissue. Since IR and Raman spectromicroscopy techniques are
compatible, the same region was imaged by Raman at higher spatial resolution (2 μm).
All the Raman data were analyzed by using WiRE software.
4.3.1 IR Processing using Omnic software
For reprocessing of Cr to investigate Cr distribution in serial sections from the hippo-
campus of 14 months transgenic mouse with Omnic/Atlμs, the absorbance at 1412 cm-1
and 1380 cm-1
were set as baseline values, and the area of peak between 1408-1384 cm-1
was measured (Figure 4.21). The colours ranging from blue (low) to red (high) were as-
signed to display the distribution of creatine peaks.
Figure 4.21: Creatine processing parameter using Omnic/Atlμs software processed at 1410-1384 cm-1
.
1408 1384
1412 1380
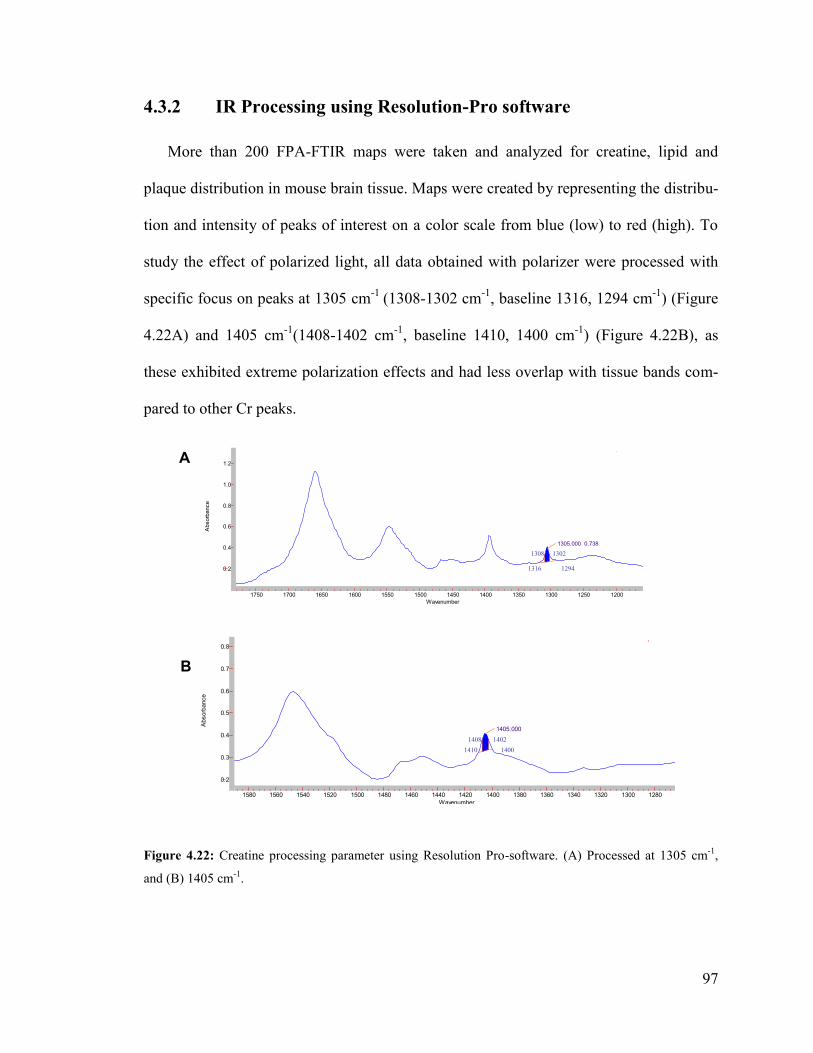
97
4.3.2 IR Processing using Resolution-Pro software
More than 200 FPA-FTIR maps were taken and analyzed for creatine, lipid and
plaque distribution in mouse brain tissue. Maps were created by representing the distribu-
tion and intensity of peaks of interest on a color scale from blue (low) to red (high). To
study the effect of polarized light, all data obtained with polarizer were processed with
specific focus on peaks at 1305 cm-1
(1308-1302 cm-1
, baseline 1316, 1294 cm-1
) (Figure
4.22A) and 1405 cm-1
(1408-1402 cm-1
, baseline 1410, 1400 cm-1
) (Figure 4.22B), as
these exhibited extreme polarization effects and had less overlap with tissue bands com-
pared to other Cr peaks.
Figure 4.22: Creatine processing parameter using Resolution Pro-software. (A) Processed at 1305 cm
-1,
and (B) 1405 cm-1
.
1405.000 0.303
Row = 10 Col = 21
1580 1560 1540 1520 1500 1480 1460 1440 1420 1400 1380 1360 1340 1320 1300 1280
0.8
0.7
0.6
0.5
0.4
0.3
0.2
Wavenumber
Absorb
ance
1408 1402 1410 1400
1305.000 0.738
Row = 11 Col = 19
1750 1700 1650 1600 1550 1500 1450 1400 1350 1300 1250 1200 1150
1.2
1.0
0.8
0.6
0.4
0.2
Wavenumber
Absorb
ance
1308 1302 1316 1294
A
A
B
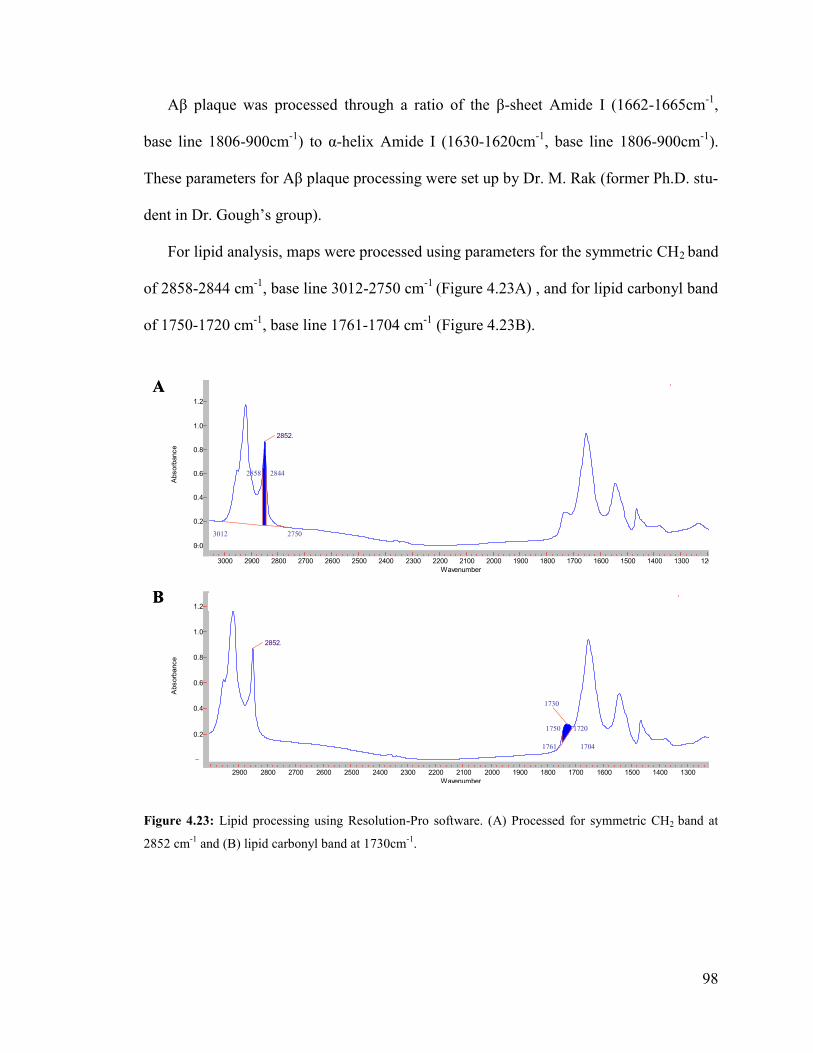
98
Aβ plaque was processed through a ratio of the β-sheet Amide I (1662-1665cm-1
,
base line 1806-900cm-1
) to α-helix Amide I (1630-1620cm-1
, base line 1806-900cm-1
).
These parameters for Aβ plaque processing were set up by Dr. M. Rak (former Ph.D. stu-
dent in Dr. Gough’s group).
For lipid analysis, maps were processed using parameters for the symmetric CH2 band
of 2858-2844 cm-1
, base line 3012-2750 cm-1
(Figure 4.23A) , and for lipid carbonyl band
of 1750-1720 cm-1
, base line 1761-1704 cm-1
(Figure 4.23B).
2852.000 7.125
Row = 61 Col = 46
3000 2900 2800 2700 2600 2500 2400 2300 2200 2100 2000 1900 1800 1700 1600 1500 1400 1300 1200
1.2
1.0
0.8
0.6
0.4
0.2
0.0
Wavenumber
Absorb
ance
1730.000 2.640
2852.000 7.125
Row = 61 Col = 46
2900 2800 2700 2600 2500 2400 2300 2200 2100 2000 1900 1800 1700 1600 1500 1400 1300
1.2
1.0
0.8
0.6
0.4
0.2
Wavenumber
Absorb
ance
A
B
2858 2844
3012 2750
1750 1720
1761 1704
1730
2852.000 7.125
Row = 61 Col = 46
3000 2900 2800 2700 2600 2500 2400 2300 2200 2100 2000 1900 1800 1700 1600 1500 1400 1300 1200
1.2
1.0
0.8
0.6
0.4
0.2
0.0
Wavenumber
Absorb
ance
1730.000 2.640
2852.000 7.125
Row = 61 Col = 46
2900 2800 2700 2600 2500 2400 2300 2200 2100 2000 1900 1800 1700 1600 1500 1400 1300
1.2
1.0
0.8
0.6
0.4
0.2
Wavenumber
Absorb
ance
A
B
2858 2844
3012 2750
1750 1720
1761 1704
1730
Figure 4.23: Lipid processing using Resolution-Pro software. (A) Processed for symmetric CH2 band at
2852 cm-1
and (B) lipid carbonyl band at 1730cm-1
.
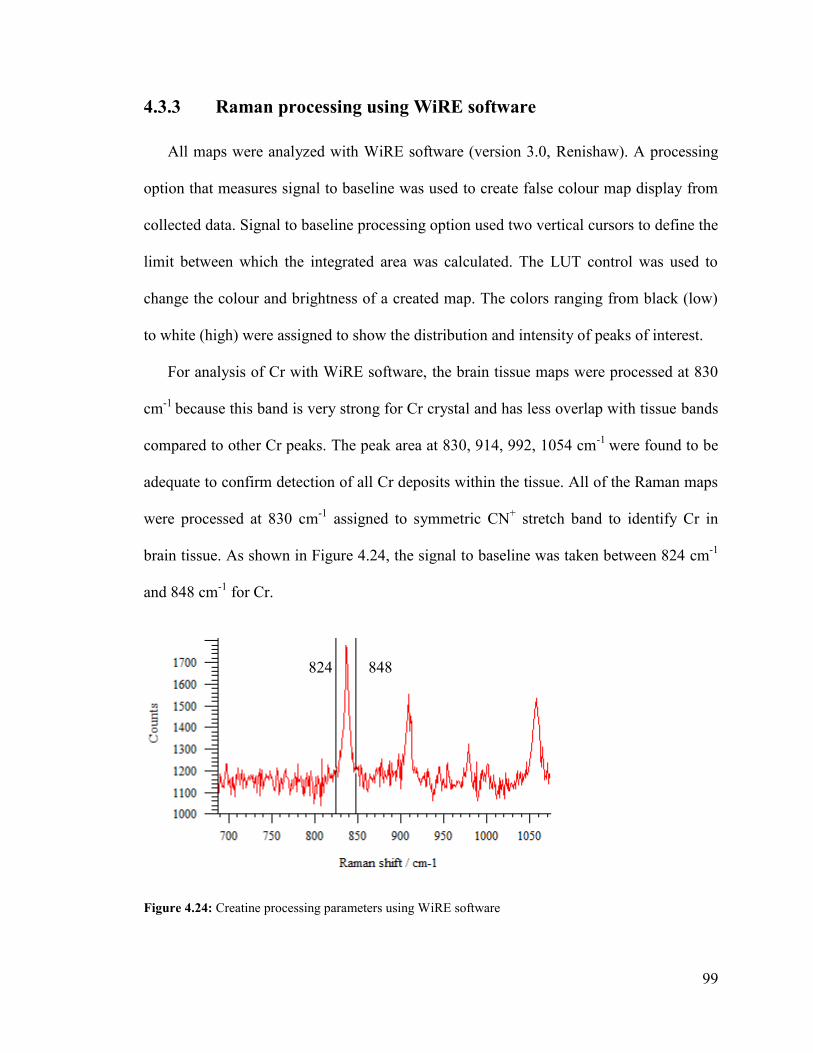
99
4.3.3 Raman processing using WiRE software
All maps were analyzed with WiRE software (version 3.0, Renishaw). A processing
option that measures signal to baseline was used to create false colour map display from
collected data. Signal to baseline processing option used two vertical cursors to define the
limit between which the integrated area was calculated. The LUT control was used to
change the colour and brightness of a created map. The colors ranging from black (low)
to white (high) were assigned to show the distribution and intensity of peaks of interest.
For analysis of Cr with WiRE software, the brain tissue maps were processed at 830
cm-1
because this band is very strong for Cr crystal and has less overlap with tissue bands
compared to other Cr peaks. The peak area at 830, 914, 992, 1054 cm-1
were found to be
adequate to confirm detection of all Cr deposits within the tissue. All of the Raman maps
were processed at 830 cm-1
assigned to symmetric CN+ stretch band to identify Cr in
brain tissue. As shown in Figure 4.24, the signal to baseline was taken between 824 cm-1
and 848 cm-1
for Cr.
Figure 4.24: Creatine processing parameters using WiRE software
824 848
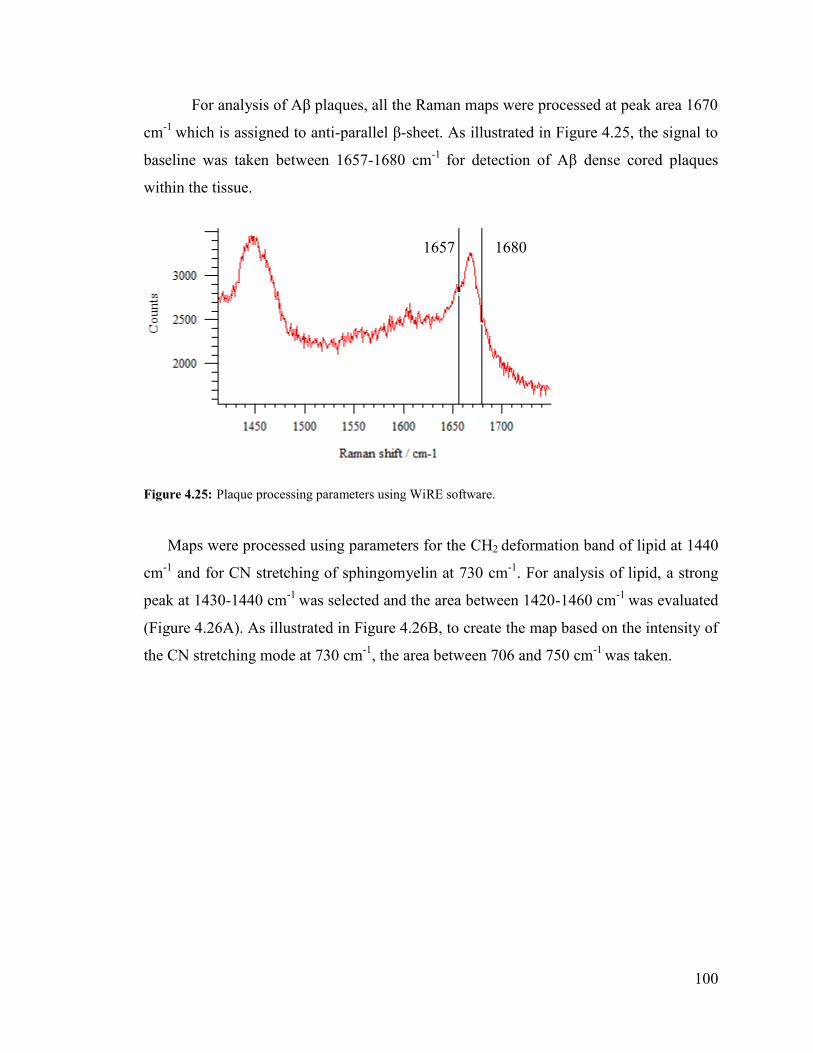
100
For analysis of Aβ plaques, all the Raman maps were processed at peak area 1670
cm-1
which is assigned to anti-parallel β-sheet. As illustrated in Figure 4.25, the signal to
baseline was taken between 1657-1680 cm-1
for detection of Aβ dense cored plaques
within the tissue.
Figure 4.25: Plaque processing parameters using WiRE software.
Maps were processed using parameters for the CH2 deformation band of lipid at 1440
cm-1
and for CN stretching of sphingomyelin at 730 cm-1
. For analysis of lipid, a strong
peak at 1430-1440 cm-1
was selected and the area between 1420-1460 cm-1
was evaluated
(Figure 4.26A). As illustrated in Figure 4.26B, to create the map based on the intensity of
the CN stretching mode at 730 cm-1
, the area between 706 and 750 cm-1
was taken.
1657 1680
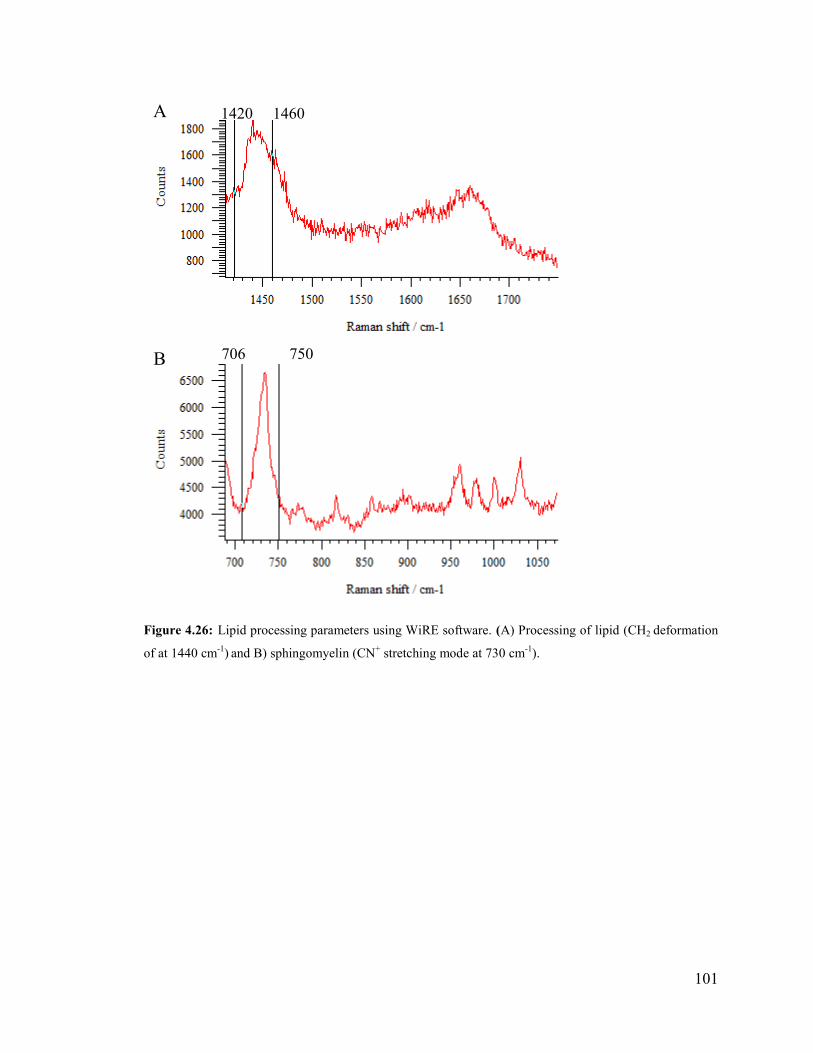
101
Figure 4.26: Lipid processing parameters using WiRE software. (A) Processing of lipid (CH2 deformation
of at 1440 cm-1
) and B) sphingomyelin (CN
+ stretching mode at 730 cm
-1).
706 750
A
B
1420 1460
102
4.4 Analysis of creatine and distribution of creatine in mouse brain
tissue
As mentioned, with using FTIR imageing to study snap-frozen, unfixed tissue sec-
tions from transgenic mouse brain, some unusual spectral signature was initially found in
several maps (Rak, 2007). This spectrum was identical to spectra observed in IR maps of
human AD brain (Ogg, 2002). A spectral library search identified it as Creatine. The first
publication reported the in situ detection of focally elevated creatine deposits in Tg
mouse brain and post mortem AD brain tissue (Gallant et al, 2006). It was shown that
creatine was found more in size and number in hippocampus of mouse brain compared to
their non-transgenic littermate and increased with age (Kuzyk et al, 2010).
In this thesis, the main goal was to find clues to the origin of creatine in transgenic
mouse brain tissue. Since the creatine deposits were found in frozen and desiccated brain
tissue, it was important to investigate whether these creatine deposits were formed after
snap freezing and dessication of brain tissue or any other possibility cause formation of
these crystals like synthesis in situ or transfering cross blood brain barrier.
In this section the imaged blood bvessels were explained, followed by a discription of
depth profile of creatine and environs by Raman microscope and imaged large area of
caudate by FPA-FTIR.
4.4.1 Creatine deposits and blood vessel
Processed IR maps revealed that almost all of the larger deposits, found in the older
transgenic mice, took the form of streak and these larger deposits were not usually asso-
ciated with plaques (Rak M, 2007). Since Cr can be endogenously synthesized in the liver
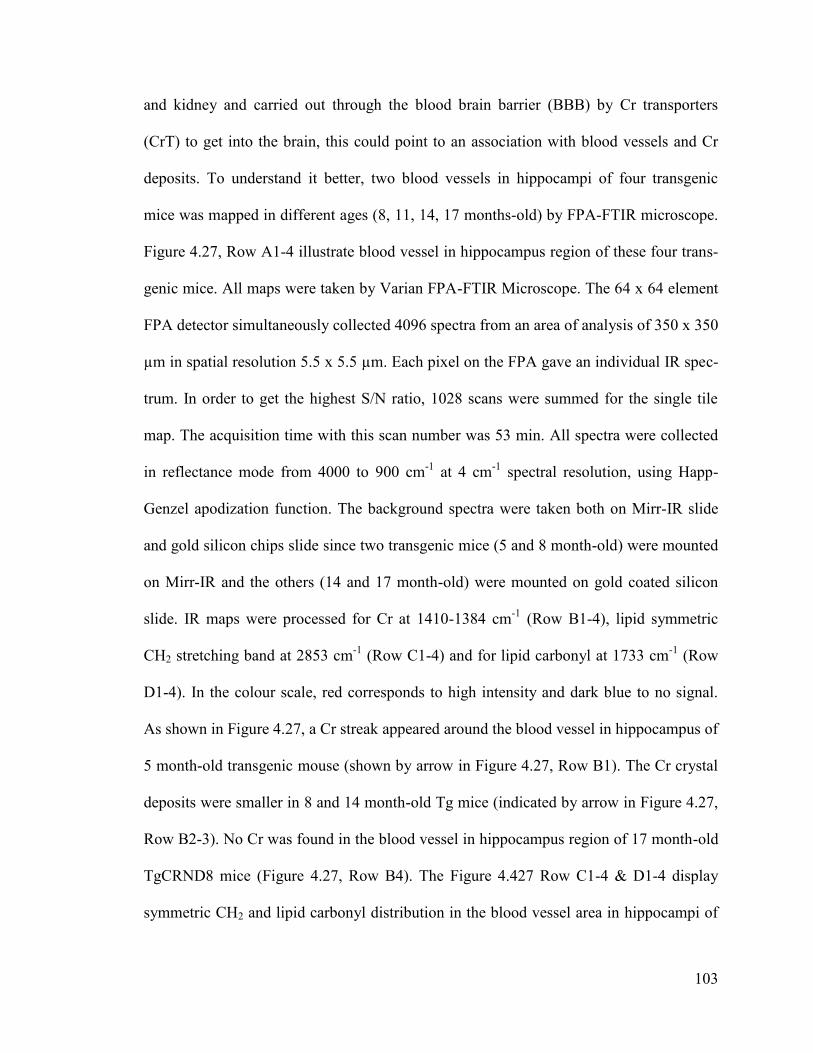
103
and kidney and carried out through the blood brain barrier (BBB) by Cr transporters
(CrT) to get into the brain, this could point to an association with blood vessels and Cr
deposits. To understand it better, two blood vessels in hippocampi of four transgenic
mice was mapped in different ages (8, 11, 14, 17 months-old) by FPA-FTIR microscope.
Figure 4.27, Row A1-4 illustrate blood vessel in hippocampus region of these four trans-
genic mice. All maps were taken by Varian FPA-FTIR Microscope. The 64 x 64 element
FPA detector simultaneously collected 4096 spectra from an area of analysis of 350 x 350
µm in spatial resolution 5.5 x 5.5 µm. Each pixel on the FPA gave an individual IR spec-
trum. In order to get the highest S/N ratio, 1028 scans were summed for the single tile
map. The acquisition time with this scan number was 53 min. All spectra were collected
in reflectance mode from 4000 to 900 cm-1
at 4 cm-1
spectral resolution, using Happ-
Genzel apodization function. The background spectra were taken both on Mirr-IR slide
and gold silicon chips slide since two transgenic mice (5 and 8 month-old) were mounted
on Mirr-IR and the others (14 and 17 month-old) were mounted on gold coated silicon
slide. IR maps were processed for Cr at 1410-1384 cm-1
(Row B1-4), lipid symmetric
CH2 stretching band at 2853 cm-1
(Row C1-4) and for lipid carbonyl at 1733 cm-1
(Row
D1-4). In the colour scale, red corresponds to high intensity and dark blue to no signal.
As shown in Figure 4.27, a Cr streak appeared around the blood vessel in hippocampus of
5 month-old transgenic mouse (shown by arrow in Figure 4.27, Row B1). The Cr crystal
deposits were smaller in 8 and 14 month-old Tg mice (indicated by arrow in Figure 4.27,
Row B2-3). No Cr was found in the blood vessel in hippocampus region of 17 month-old
TgCRND8 mice (Figure 4.27, Row B4). The Figure 4.427 Row C1-4 & D1-4 display
symmetric CH2 and lipid carbonyl distribution in the blood vessel area in hippocampi of

104
these Tg mice, respectively. As shown in Figure 4.27, no correlation was found between
Cr deposits and lipid distribution.
Figure 4.27: IR maps of blood vessel in mouse hippocampi through age (8, 11, 14, 17 months-old). (Row
A1-4) illustrate blood vessel in hippocampus region of transgenic mice at 5, 8, 14 and 17 month-old. IR
maps were processed for Cr (Row B1-4), for lipid symmetrical CH2 stretching band of lipid (Row C1-4)
and for lipid carbonyl (Row D1-4). Map area = 350 x 350 µm. Acquisition time = 53 min. Scan number =
1028. Colour scale: red corresponds to high intensity, dark blue to no signal. Scale bar = 100 µm.
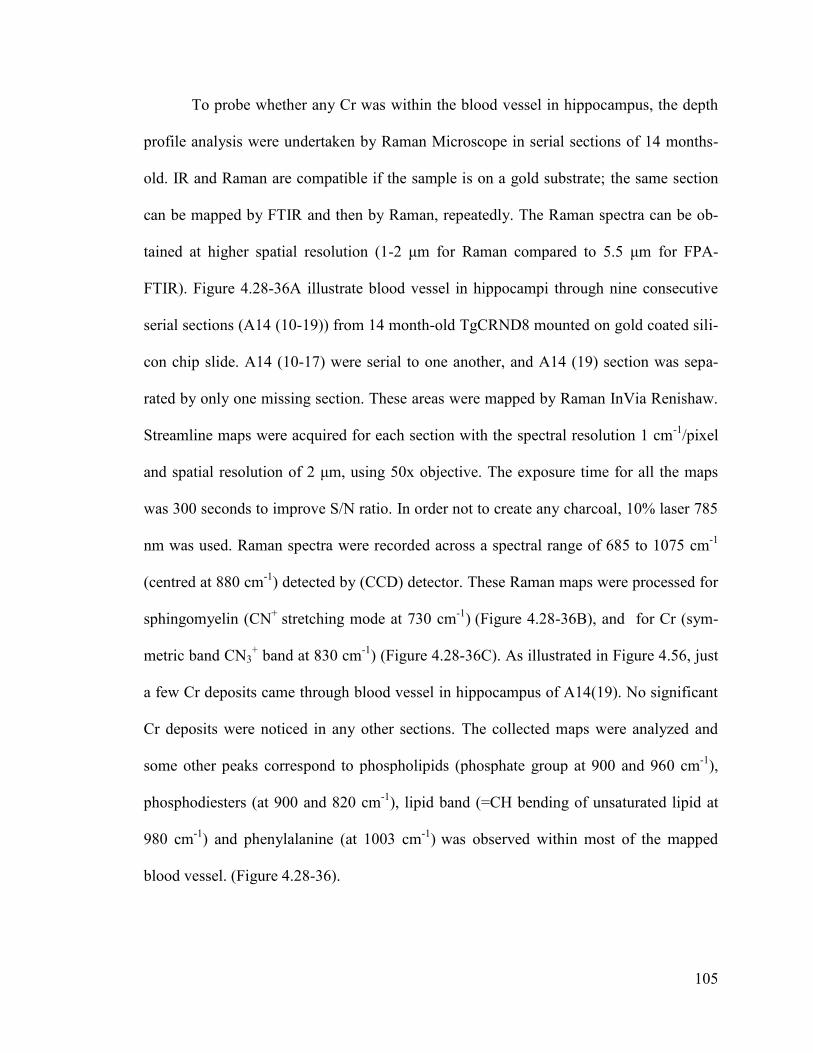
105
To probe whether any Cr was within the blood vessel in hippocampus, the depth
profile analysis were undertaken by Raman Microscope in serial sections of 14 months-
old. IR and Raman are compatible if the sample is on a gold substrate; the same section
can be mapped by FTIR and then by Raman, repeatedly. The Raman spectra can be ob-
tained at higher spatial resolution (1-2 μm for Raman compared to 5.5 μm for FPA-
FTIR). Figure 4.28-36A illustrate blood vessel in hippocampi through nine consecutive
serial sections (A14 (10-19)) from 14 month-old TgCRND8 mounted on gold coated sili-
con chip slide. A14 (10-17) were serial to one another, and A14 (19) section was sepa-
rated by only one missing section. These areas were mapped by Raman InVia Renishaw.
Streamline maps were acquired for each section with the spectral resolution 1 cm-1
/pixel
and spatial resolution of 2 μm, using 50x objective. The exposure time for all the maps
was 300 seconds to improve S/N ratio. In order not to create any charcoal, 10% laser 785
nm was used. Raman spectra were recorded across a spectral range of 685 to 1075 cm-1
(centred at 880 cm-1
) detected by (CCD) detector. These Raman maps were processed for
sphingomyelin (CN+
stretching mode at 730 cm-1
) (Figure 4.28-36B), and for Cr (sym-
metric band CN3+ band at 830 cm
-1) (Figure 4.28-36C). As illustrated in Figure 4.56, just
a few Cr deposits came through blood vessel in hippocampus of A14(19). No significant
Cr deposits were noticed in any other sections. The collected maps were analyzed and
some other peaks correspond to phospholipids (phosphate group at 900 and 960 cm-1
),
phosphodiesters (at 900 and 820 cm-1
), lipid band (=CH bending of unsaturated lipid at
980 cm-1
) and phenylalanine (at 1003 cm-1
) was observed within most of the mapped
blood vessel. (Figure 4.28-36).
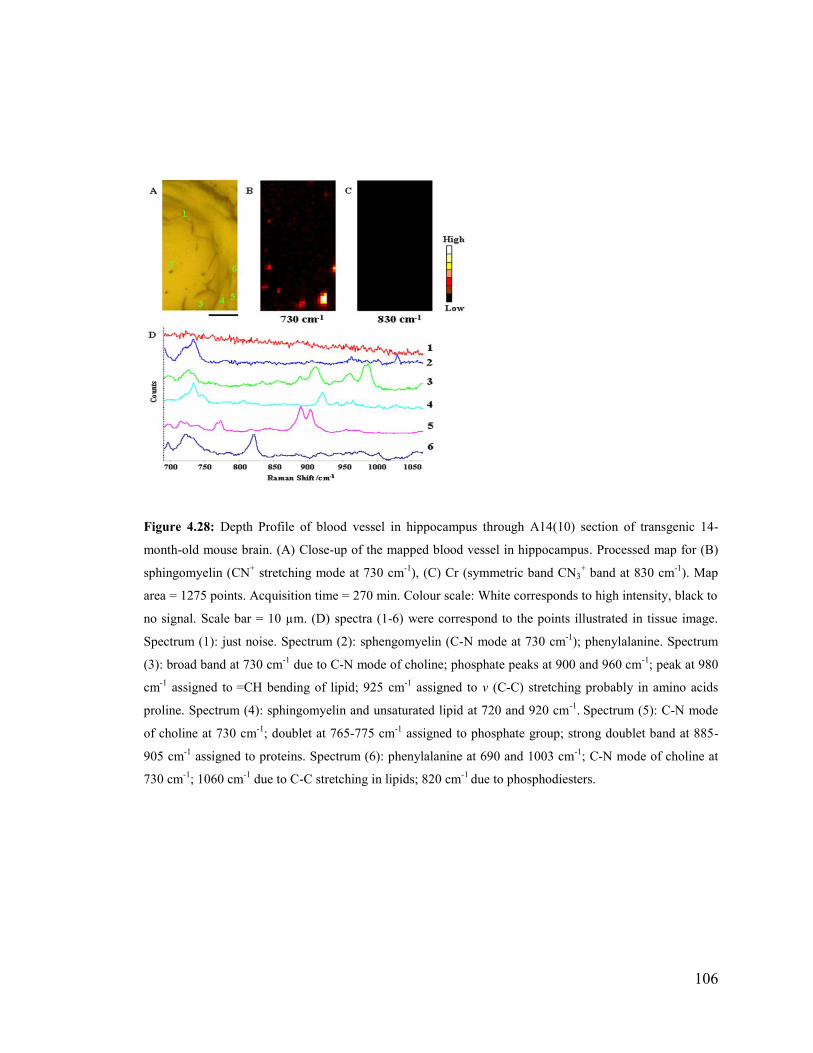
106
Figure 4.28: Depth Profile of blood vessel in hippocampus through A14(10) section of transgenic 14-
month-old mouse brain. (A) Close-up of the mapped blood vessel in hippocampus. Processed map for (B)
sphingomyelin (CN+ stretching mode at 730 cm
-1), (C) Cr (symmetric band CN3
+ band at 830 cm
-1). Map
area = 1275 points. Acquisition time = 270 min. Colour scale: White corresponds to high intensity, black to
no signal. Scale bar = 10 µm. (D) spectra (1-6) were correspond to the points illustrated in tissue image.
Spectrum (1): just noise. Spectrum (2): sphengomyelin (C-N mode at 730 cm-1
); phenylalanine. Spectrum
(3): broad band at 730 cm-1
due to C-N mode of choline; phosphate peaks at 900 and 960 cm-1
; peak at 980
cm-1
assigned to =CH bending of lipid; 925 cm
-1 assigned to v (C-C) stretching probably in amino acids
proline. Spectrum (4): sphingomyelin and unsaturated lipid at 720 and 920 cm-1
. Spectrum (5): C-N mode
of choline at 730 cm-1
; doublet at 765-775 cm-1
assigned to phosphate group; strong doublet band at 885-
905 cm-1
assigned to proteins. Spectrum (6): phenylalanine at 690 and 1003 cm-1
; C-N mode of choline at
730 cm-1
; 1060 cm-1
due to C-C stretching in lipids; 820 cm-1
due to phosphodiesters.
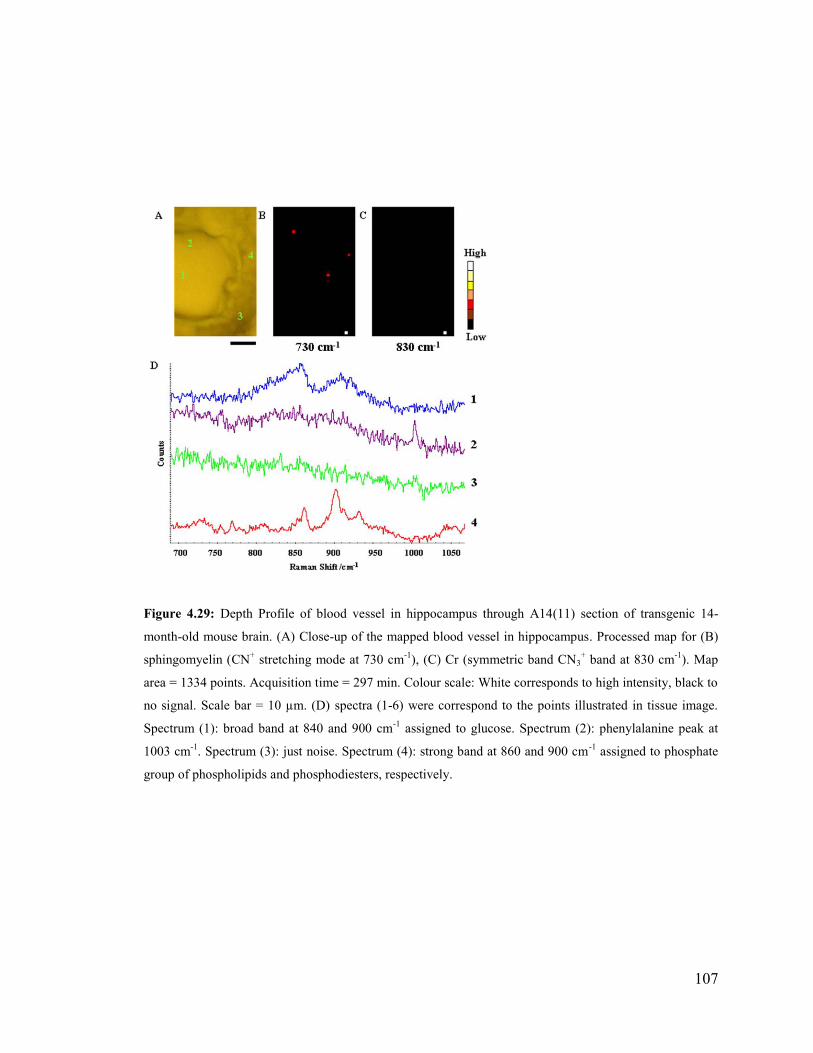
107
Figure 4.29: Depth Profile of blood vessel in hippocampus through A14(11) section of transgenic 14-
month-old mouse brain. (A) Close-up of the mapped blood vessel in hippocampus. Processed map for (B)
sphingomyelin (CN+ stretching mode at 730 cm
-1), (C) Cr (symmetric band CN3
+ band at 830 cm
-1). Map
area = 1334 points. Acquisition time = 297 min. Colour scale: White corresponds to high intensity, black to
no signal. Scale bar = 10 µm. (D) spectra (1-6) were correspond to the points illustrated in tissue image.
Spectrum (1): broad band at 840 and 900 cm-1
assigned to glucose. Spectrum (2): phenylalanine peak at
1003 cm-1
. Spectrum (3): just noise. Spectrum (4): strong band at 860 and 900 cm-1
assigned to phosphate
group of phospholipids and phosphodiesters, respectively.
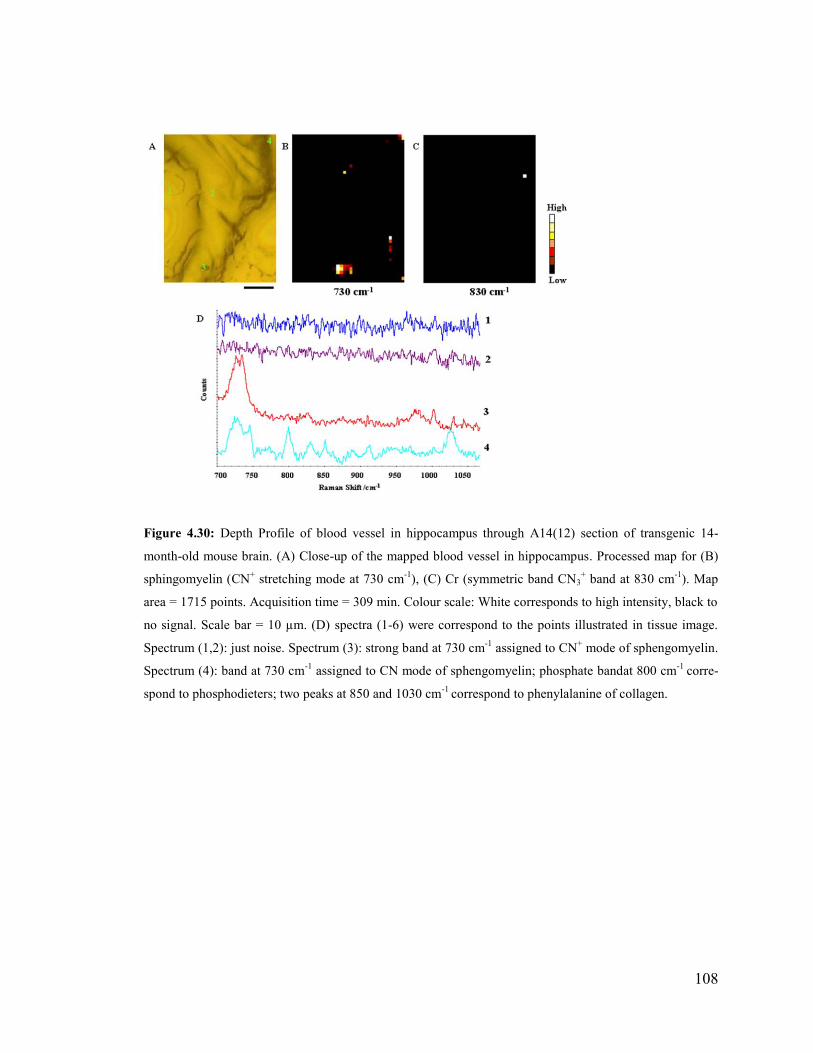
108
Figure 4.30: Depth Profile of blood vessel in hippocampus through A14(12) section of transgenic 14-
month-old mouse brain. (A) Close-up of the mapped blood vessel in hippocampus. Processed map for (B)
sphingomyelin (CN+ stretching mode at 730 cm
-1), (C) Cr (symmetric band CN3
+ band at 830 cm
-1). Map
area = 1715 points. Acquisition time = 309 min. Colour scale: White corresponds to high intensity, black to
no signal. Scale bar = 10 µm. (D) spectra (1-6) were correspond to the points illustrated in tissue image.
Spectrum (1,2): just noise. Spectrum (3): strong band at 730 cm-1
assigned to CN+ mode of sphengomyelin.
Spectrum (4): band at 730 cm-1
assigned to CN mode of sphengomyelin; phosphate bandat 800 cm-1
corre-
spond to phosphodieters; two peaks at 850 and 1030 cm-1
correspond to phenylalanine of collagen.
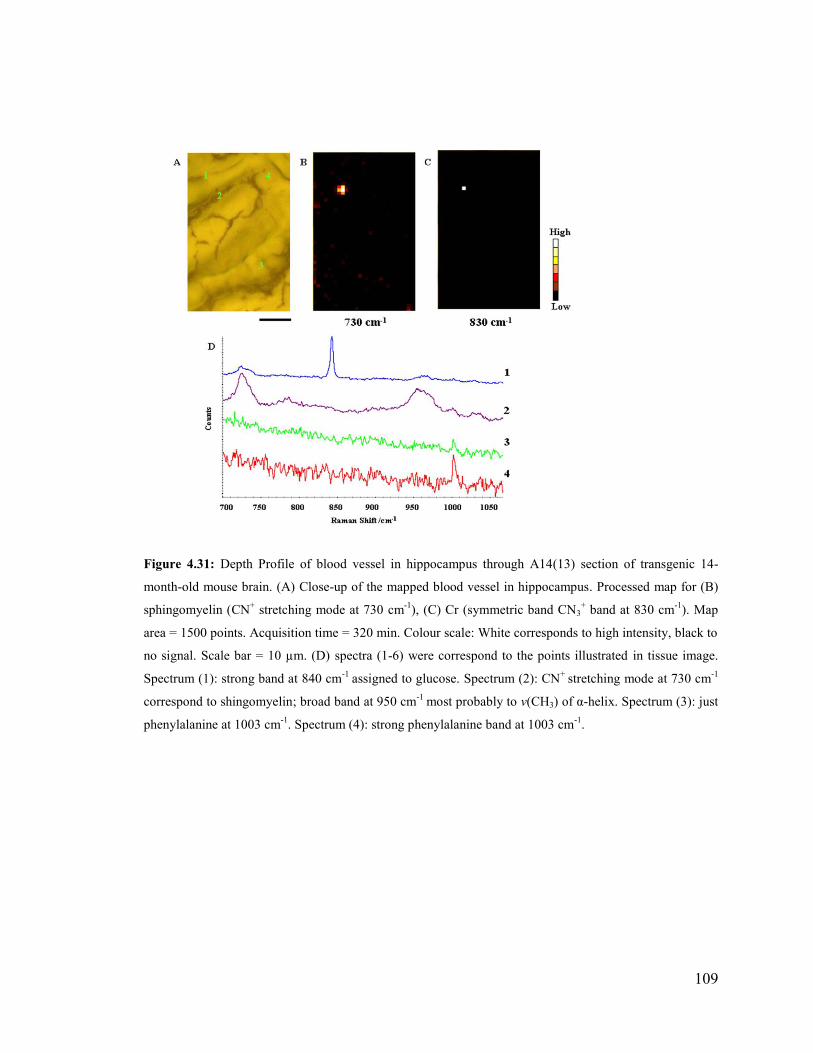
109
Figure 4.31: Depth Profile of blood vessel in hippocampus through A14(13) section of transgenic 14-
month-old mouse brain. (A) Close-up of the mapped blood vessel in hippocampus. Processed map for (B)
sphingomyelin (CN+ stretching mode at 730 cm
-1), (C) Cr (symmetric band CN3
+ band at 830 cm
-1). Map
area = 1500 points. Acquisition time = 320 min. Colour scale: White corresponds to high intensity, black to
no signal. Scale bar = 10 µm. (D) spectra (1-6) were correspond to the points illustrated in tissue image.
Spectrum (1): strong band at 840 cm-1
assigned to glucose. Spectrum (2): CN+
stretching mode at 730 cm-1
correspond to shingomyelin; broad band at 950 cm-1
most probably to v(CH3) of α-helix. Spectrum (3): just
phenylalanine at 1003 cm-1
. Spectrum (4): strong phenylalanine band at 1003 cm-1
.
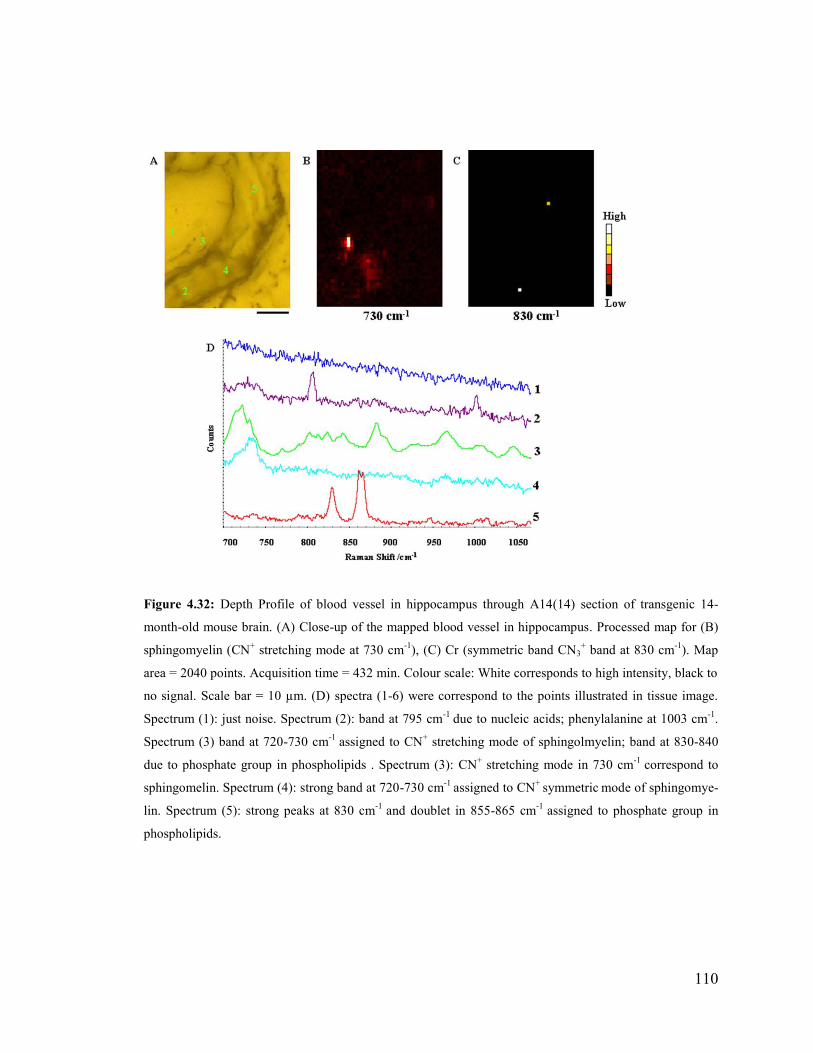
110
Figure 4.32: Depth Profile of blood vessel in hippocampus through A14(14) section of transgenic 14-
month-old mouse brain. (A) Close-up of the mapped blood vessel in hippocampus. Processed map for (B)
sphingomyelin (CN+ stretching mode at 730 cm
-1), (C) Cr (symmetric band CN3
+ band at 830 cm
-1). Map
area = 2040 points. Acquisition time = 432 min. Colour scale: White corresponds to high intensity, black to
no signal. Scale bar = 10 µm. (D) spectra (1-6) were correspond to the points illustrated in tissue image.
Spectrum (1): just noise. Spectrum (2): band at 795 cm-1
due to nucleic acids; phenylalanine at 1003 cm-1
.
Spectrum (3) band at 720-730 cm-1
assigned to CN+ stretching mode of sphingolmyelin; band at 830-840
due to phosphate group in phospholipids . Spectrum (3): CN+ stretching mode in 730 cm
-1 correspond to
sphingomelin. Spectrum (4): strong band at 720-730 cm-1
assigned to CN+
symmetric mode of sphingomye-
lin. Spectrum (5): strong peaks at 830 cm-1
and doublet in 855-865 cm-1
assigned to phosphate group in
phospholipids.
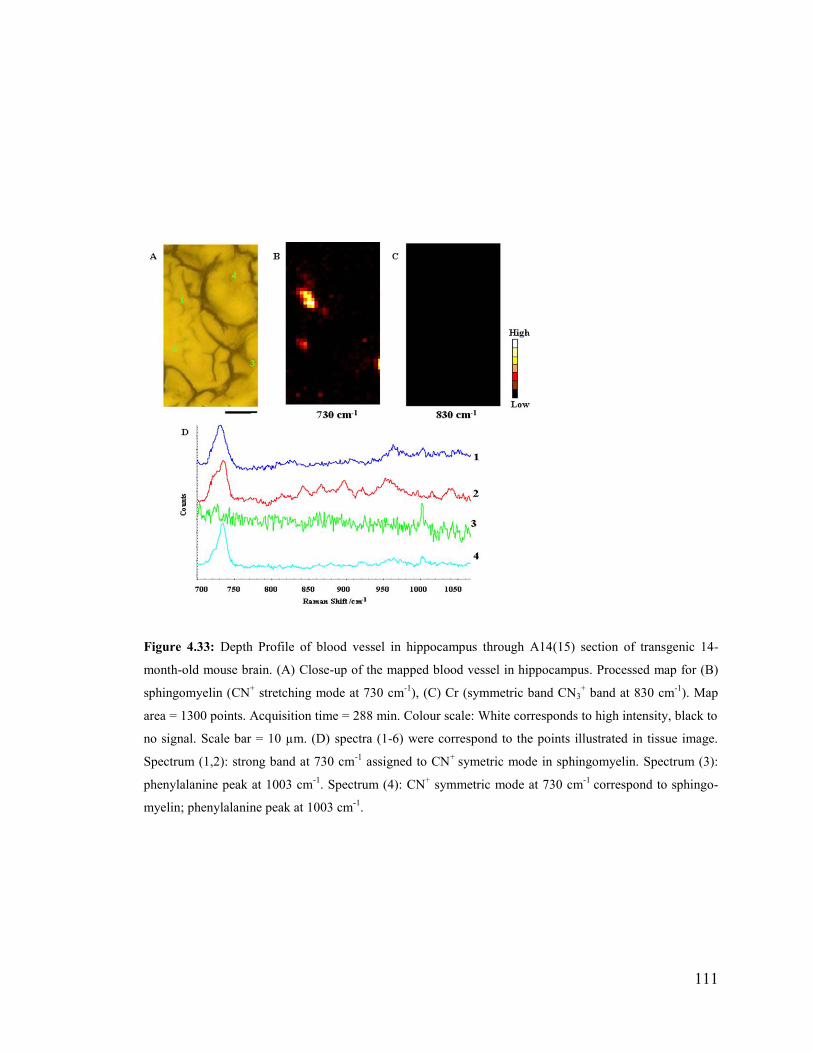
111
Figure 4.33: Depth Profile of blood vessel in hippocampus through A14(15) section of transgenic 14-
month-old mouse brain. (A) Close-up of the mapped blood vessel in hippocampus. Processed map for (B)
sphingomyelin (CN+ stretching mode at 730 cm
-1), (C) Cr (symmetric band CN3
+ band at 830 cm
-1). Map
area = 1300 points. Acquisition time = 288 min. Colour scale: White corresponds to high intensity, black to
no signal. Scale bar = 10 µm. (D) spectra (1-6) were correspond to the points illustrated in tissue image.
Spectrum (1,2): strong band at 730 cm-1
assigned to CN+
symetric mode in sphingomyelin. Spectrum (3):
phenylalanine peak at 1003 cm-1
. Spectrum (4): CN+ symmetric mode at 730 cm
-1 correspond to sphingo-
myelin; phenylalanine peak at 1003 cm-1
.
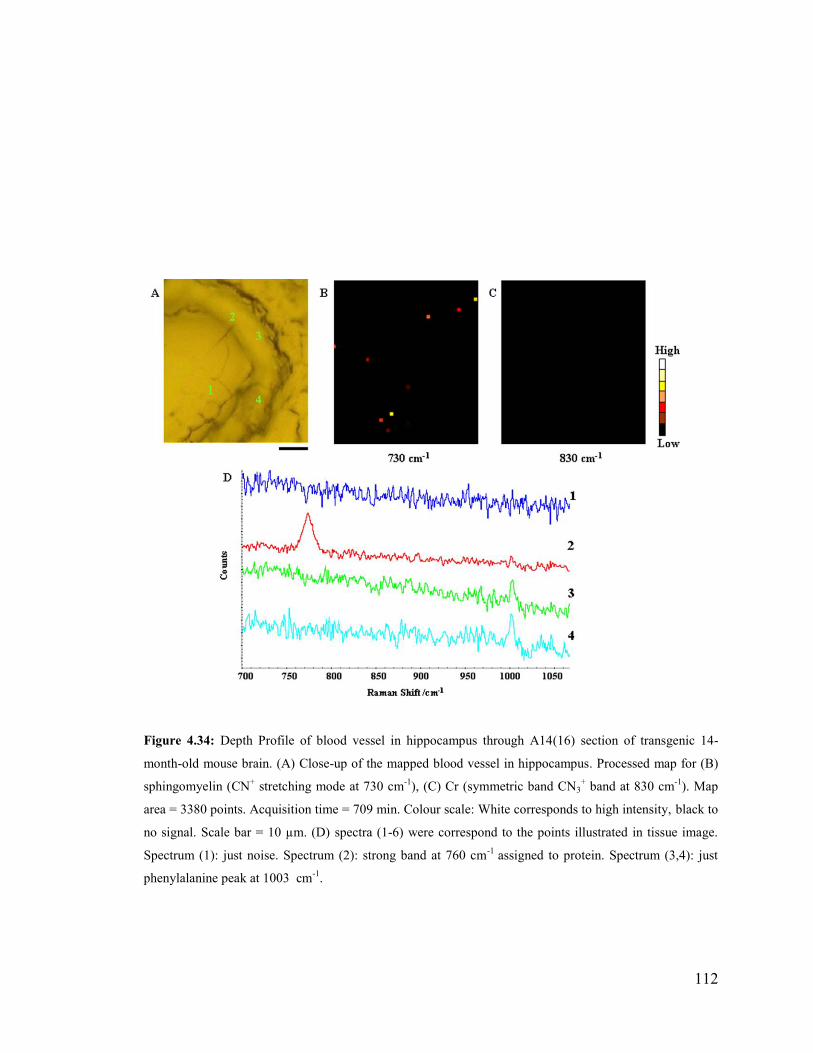
112
Figure 4.34: Depth Profile of blood vessel in hippocampus through A14(16) section of transgenic 14-
month-old mouse brain. (A) Close-up of the mapped blood vessel in hippocampus. Processed map for (B)
sphingomyelin (CN+ stretching mode at 730 cm
-1), (C) Cr (symmetric band CN3
+ band at 830 cm
-1). Map
area = 3380 points. Acquisition time = 709 min. Colour scale: White corresponds to high intensity, black to
no signal. Scale bar = 10 µm. (D) spectra (1-6) were correspond to the points illustrated in tissue image.
Spectrum (1): just noise. Spectrum (2): strong band at 760 cm-1
assigned to protein. Spectrum (3,4): just
phenylalanine peak at 1003 cm-1
.
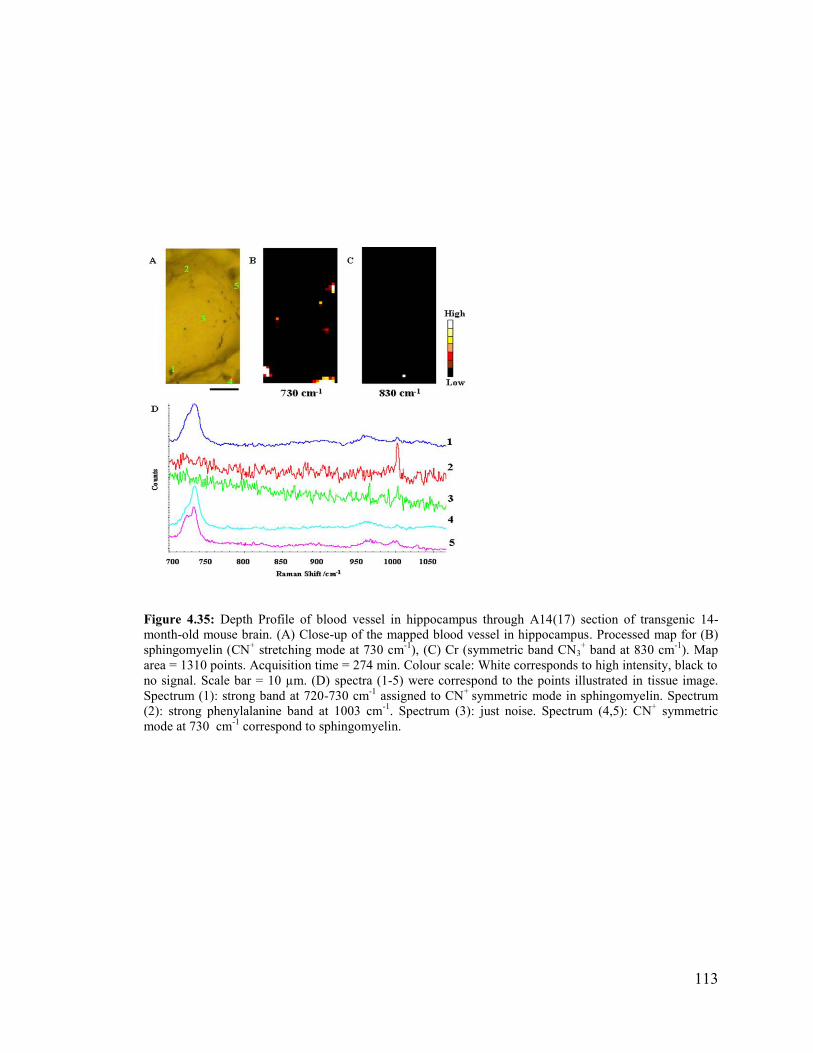
113
Figure 4.35: Depth Profile of blood vessel in hippocampus through A14(17) section of transgenic 14-
month-old mouse brain. (A) Close-up of the mapped blood vessel in hippocampus. Processed map for (B)
sphingomyelin (CN+ stretching mode at 730 cm
-1), (C) Cr (symmetric band CN3
+ band at 830 cm
-1). Map
area = 1310 points. Acquisition time = 274 min. Colour scale: White corresponds to high intensity, black to
no signal. Scale bar = 10 µm. (D) spectra (1-5) were correspond to the points illustrated in tissue image.
Spectrum (1): strong band at 720-730 cm-1
assigned to CN+
symmetric mode in sphingomyelin. Spectrum
(2): strong phenylalanine band at 1003 cm-1
. Spectrum (3): just noise. Spectrum (4,5): CN+ symmetric
mode at 730 cm-1
correspond to sphingomyelin.
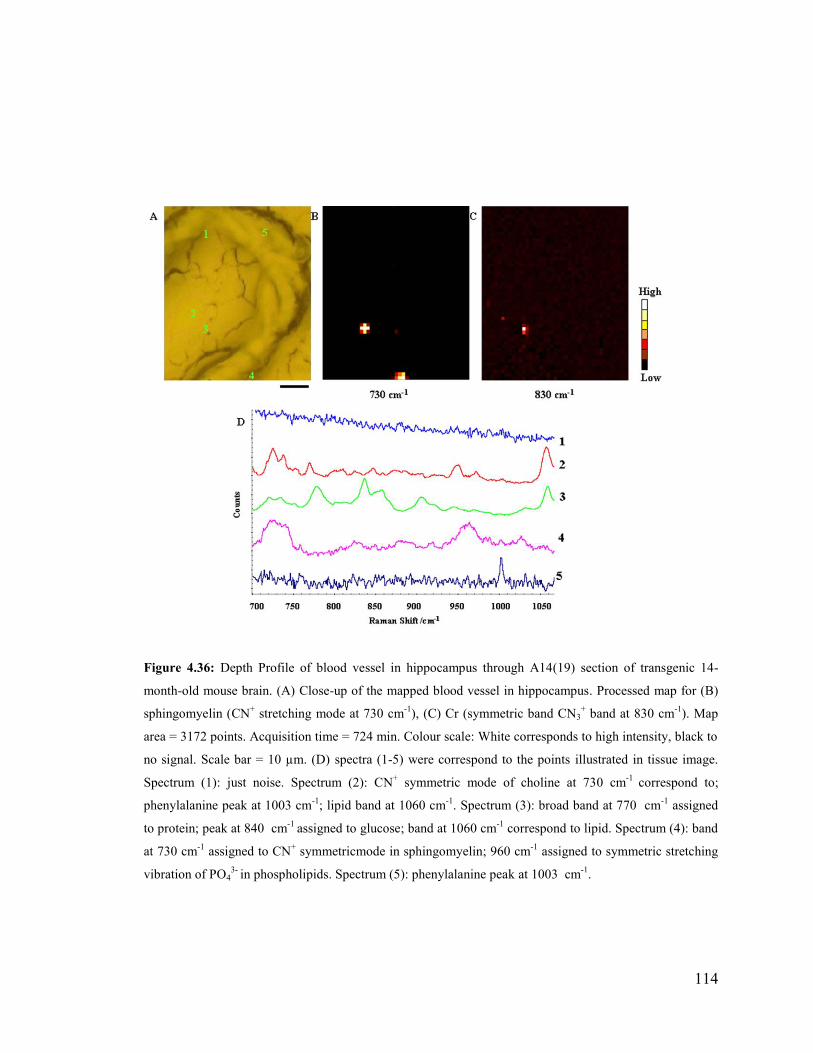
114
Figure 4.36: Depth Profile of blood vessel in hippocampus through A14(19) section of transgenic 14-
month-old mouse brain. (A) Close-up of the mapped blood vessel in hippocampus. Processed map for (B)
sphingomyelin (CN+ stretching mode at 730 cm
-1), (C) Cr (symmetric band CN3
+ band at 830 cm
-1). Map
area = 3172 points. Acquisition time = 724 min. Colour scale: White corresponds to high intensity, black to
no signal. Scale bar = 10 µm. (D) spectra (1-5) were correspond to the points illustrated in tissue image.
Spectrum (1): just noise. Spectrum (2): CN+ symmetric mode of choline at 730 cm
-1 correspond to;
phenylalanine peak at 1003 cm-1
; lipid band at 1060 cm-1
. Spectrum (3): broad band at 770 cm-1
assigned
to protein; peak at 840 cm-1
assigned to glucose; band at 1060 cm-1
correspond to lipid. Spectrum (4): band
at 730 cm-1
assigned to CN+ symmetricmode in sphingomyelin; 960 cm
-1 assigned to symmetric stretching
vibration of PO43-
in phospholipids. Spectrum (5): phenylalanine peak at 1003 cm-1
.
115
4.4.2 Depth profile of Cr and environs on Tg mouse serial sections
Depth profiling data, by analysis of serial sections, was undertaken in an effort to de-
termine whether any other biochemical signatures can be identified as being localized
with the Cr deposits. Since Aβ aggregation is one of the most important pathological
hallmarks of Alzheimer disease (Querfurth et al, 2010; Nerelius et al, 2009; Gotz et al,
2008; Tanzi et al, 2005; Reddy et al, 2005), an Aβ plaque located in CA4 region of hip-
pocampus was selected to map through serial sections. As shown in Figure 4.37-54, the
map of tissue of nine consecutive sections (A14 (10-19)) of 14 month-old TgCRND8
mouse brain were taken with Raman microscope. A14 (10-17) were serial to one another,
and A14 (19) section was separated by only one missing section. The plaque located in
hippocampus region was selected because Cr deposit was detected in IR maps of this
area. The IR data collection was already done by Veena Agrawal and Alex Kuzyk (other
members of Dr. Gough’s research group) on the same plaque and published in JBC 2010
(Kuzyk et al, 2010). As the IR and Raman imaging techniques are compatibale, the same
plaque was mapped with Raman microscope at higher spatial resolution to understand
any co-localization between creatine deposits and either lipid, amyloid plaque or lipid.
These maps were analyzed to investigate the association of Cr deposit with any other
spectral markers such as sphingomyelin, phospholipid, nucleic acid, and phenylalanine.
Two streamline maps were acquired for each section with spectral resolution
1 cm-1
/pixel and spatial resolution of 2 μm because of using 50x objective. The exposure
time for all the maps was 300 second to improve S/N ratio. In order not to get any char-
coal band, 10% laser 785 nm was used. Raman spectra were recorded across a spectral
range of 685 to 1075 cm-1
(centred at 880 cm-1
) and the other map across a spectral
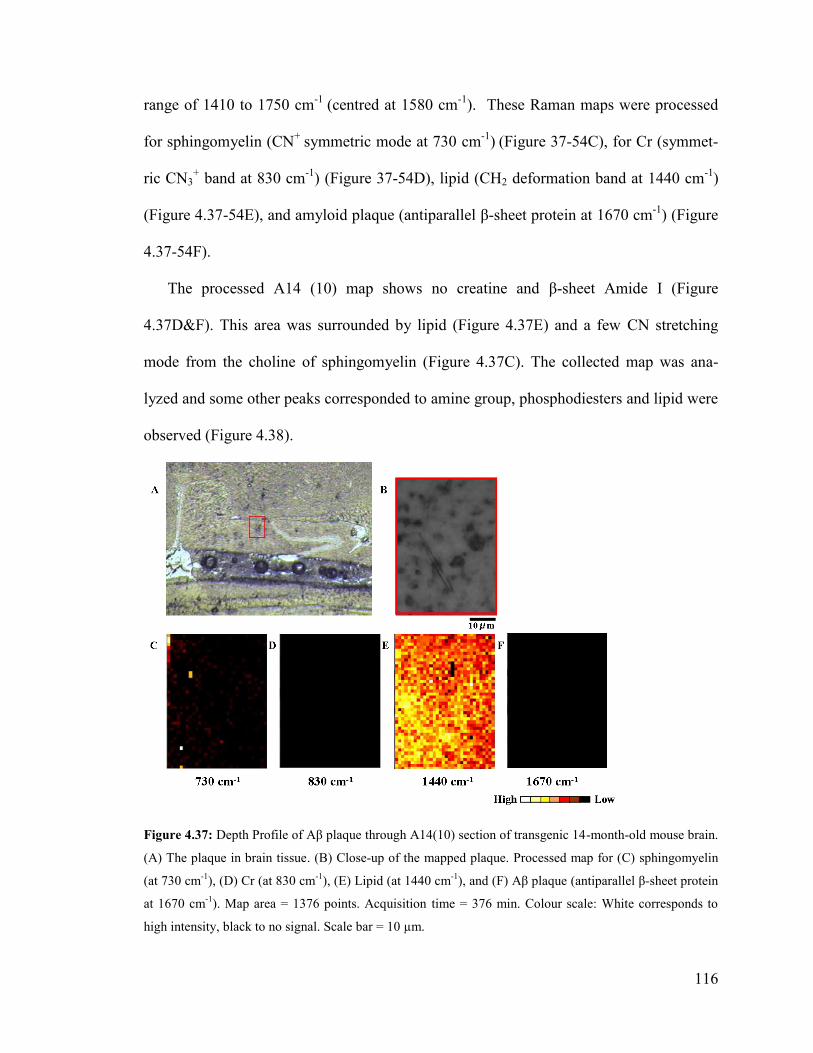
116
range of 1410 to 1750 cm-1
(centred at 1580 cm-1
). These Raman maps were processed
for sphingomyelin (CN+
symmetric mode at 730 cm-1
) (Figure 37-54C), for Cr (symmet-
ric CN3+ band at 830 cm
-1) (Figure 37-54D), lipid (CH2 deformation band at 1440 cm
-1)
(Figure 4.37-54E), and amyloid plaque (antiparallel β-sheet protein at 1670 cm-1
) (Figure
4.37-54F).
The processed A14 (10) map shows no creatine and β-sheet Amide I (Figure
4.37D&F). This area was surrounded by lipid (Figure 4.37E) and a few CN stretching
mode from the choline of sphingomyelin (Figure 4.37C). The collected map was ana-
lyzed and some other peaks corresponded to amine group, phosphodiesters and lipid were
observed (Figure 4.38).
Figure 4.37: Depth Profile of Aβ plaque through A14(10) section of transgenic 14-month-old mouse brain.
(A) The plaque in brain tissue. (B) Close-up of the mapped plaque. Processed map for (C) sphingomyelin
(at 730 cm-1
), (D) Cr (at 830 cm-1
), (E) Lipid (at 1440 cm-1
), and (F) Aβ plaque (antiparallel β-sheet protein
at 1670 cm-1
). Map area = 1376 points. Acquisition time = 376 min. Colour scale: White corresponds to
high intensity, black to no signal. Scale bar = 10 µm.
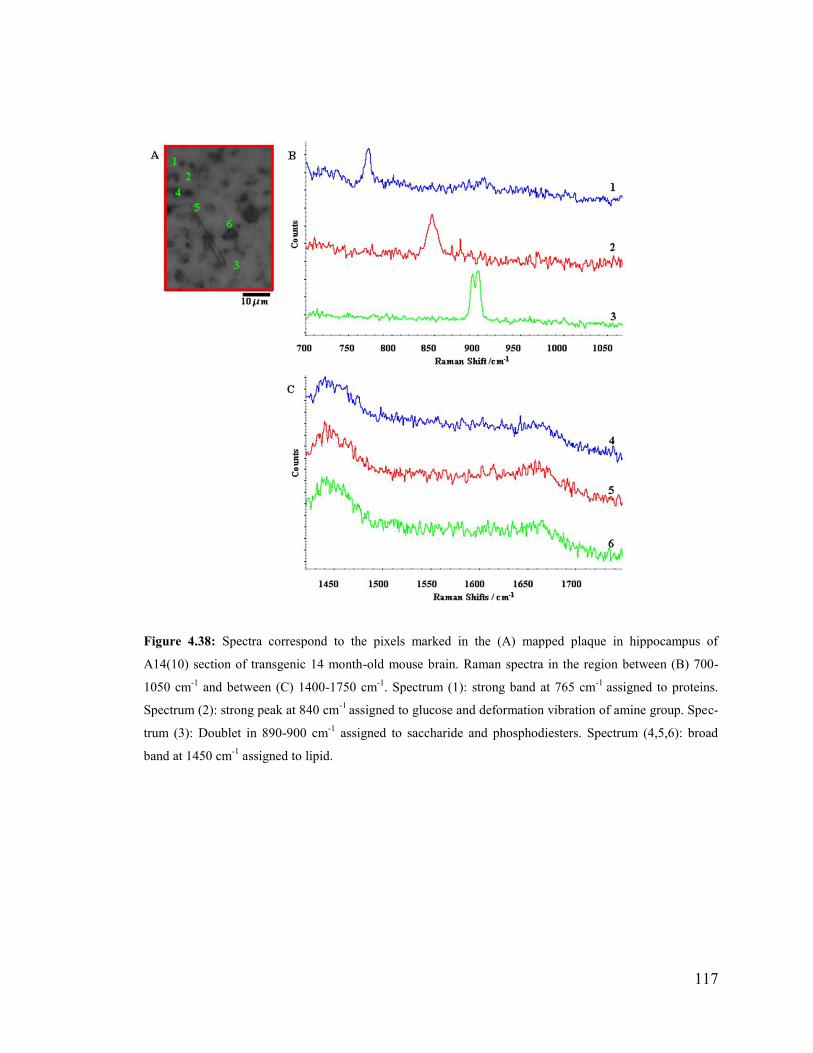
117
Figure 4.38: Spectra correspond to the pixels marked in the (A) mapped plaque in hippocampus of
A14(10) section of transgenic 14 month-old mouse brain. Raman spectra in the region between (B) 700-
1050 cm-1
and between (C) 1400-1750 cm-1
. Spectrum (1): strong band at 765 cm-1
assigned to proteins.
Spectrum (2): strong peak at 840 cm-1
assigned to glucose and deformation vibration of amine group. Spec-
trum (3): Doublet in 890-900 cm-1
assigned to saccharide and phosphodiesters. Spectrum (4,5,6): broad
band at 1450 cm-1
assigned to lipid.
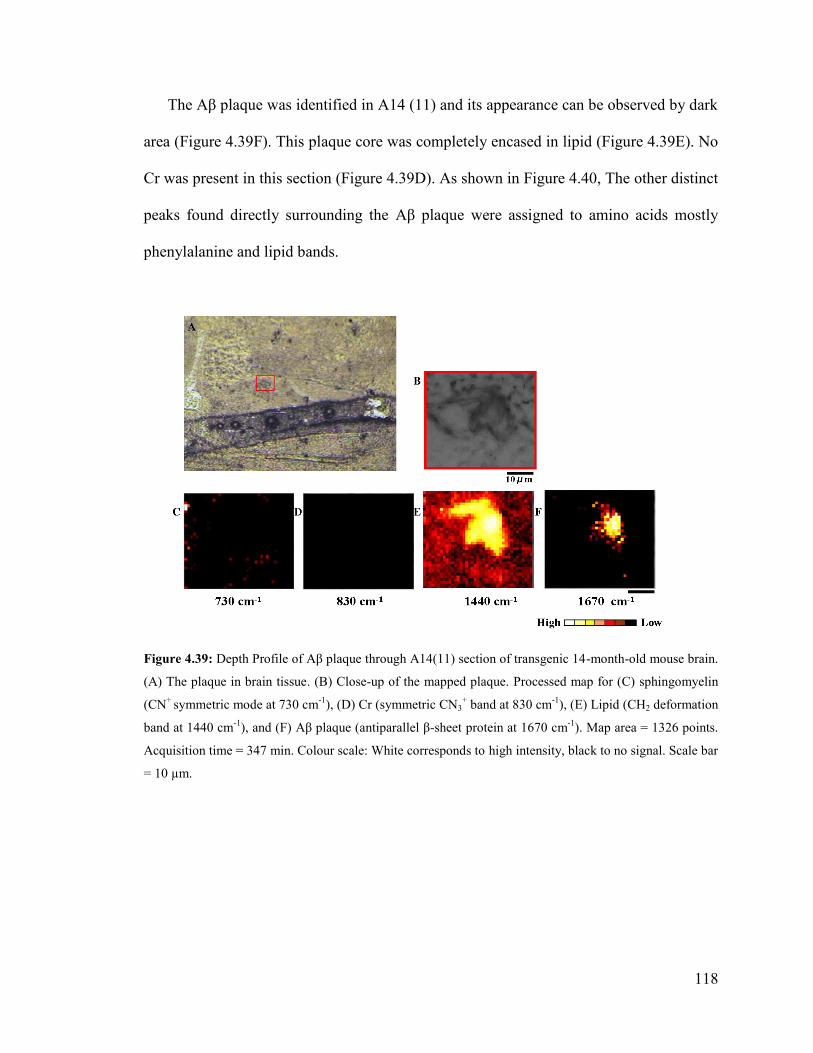
118
The Aβ plaque was identified in A14 (11) and its appearance can be observed by dark
area (Figure 4.39F). This plaque core was completely encased in lipid (Figure 4.39E). No
Cr was present in this section (Figure 4.39D). As shown in Figure 4.40, The other distinct
peaks found directly surrounding the Aβ plaque were assigned to amino acids mostly
phenylalanine and lipid bands.
Figure 4.39: Depth Profile of Aβ plaque through A14(11) section of transgenic 14-month-old mouse brain.
(A) The plaque in brain tissue. (B) Close-up of the mapped plaque. Processed map for (C) sphingomyelin
(CN+
symmetric mode at 730 cm-1
), (D) Cr (symmetric CN3+ band at 830 cm
-1), (E) Lipid (CH2 deformation
band at 1440 cm-1
), and (F) Aβ plaque (antiparallel β-sheet protein at 1670 cm-1
). Map area = 1326 points.
Acquisition time = 347 min. Colour scale: White corresponds to high intensity, black to no signal. Scale bar
= 10 µm.
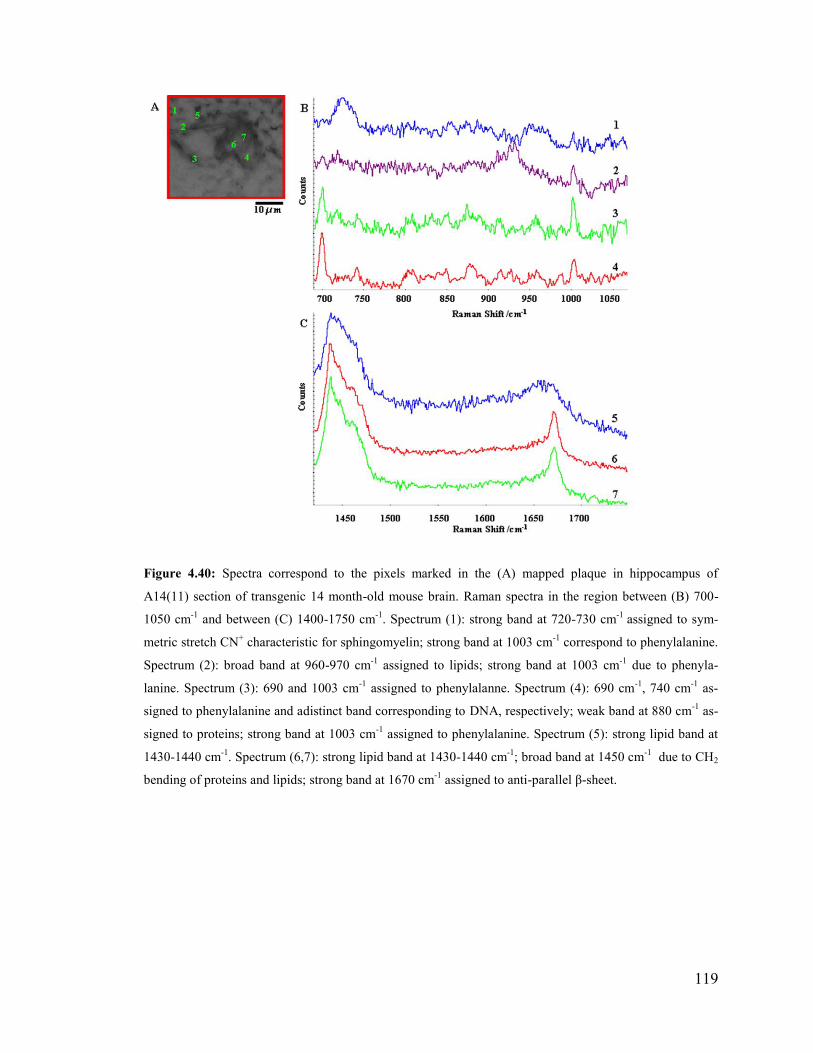
119
Figure 4.40: Spectra correspond to the pixels marked in the (A) mapped plaque in hippocampus of
A14(11) section of transgenic 14 month-old mouse brain. Raman spectra in the region between (B) 700-
1050 cm-1
and between (C) 1400-1750 cm-1
. Spectrum (1): strong band at 720-730 cm-1
assigned to sym-
metric stretch CN+ characteristic for sphingomyelin; strong band at 1003 cm
-1 correspond to phenylalanine.
Spectrum (2): broad band at 960-970 cm-1
assigned to lipids; strong band at 1003 cm-1
due to phenyla-
lanine. Spectrum (3): 690 and 1003 cm-1
assigned to phenylalanne. Spectrum (4): 690 cm-1
, 740 cm-1
as-
signed to phenylalanine and adistinct band corresponding to DNA, respectively; weak band at 880 cm-1
as-
signed to proteins; strong band at 1003 cm-1
assigned to phenylalanine. Spectrum (5): strong lipid band at
1430-1440 cm-1
. Spectrum (6,7): strong lipid band at 1430-1440 cm-1
; broad band at 1450 cm-1
due to CH2
bending of proteins and lipids; strong band at 1670 cm-1
assigned to anti-parallel β-sheet.
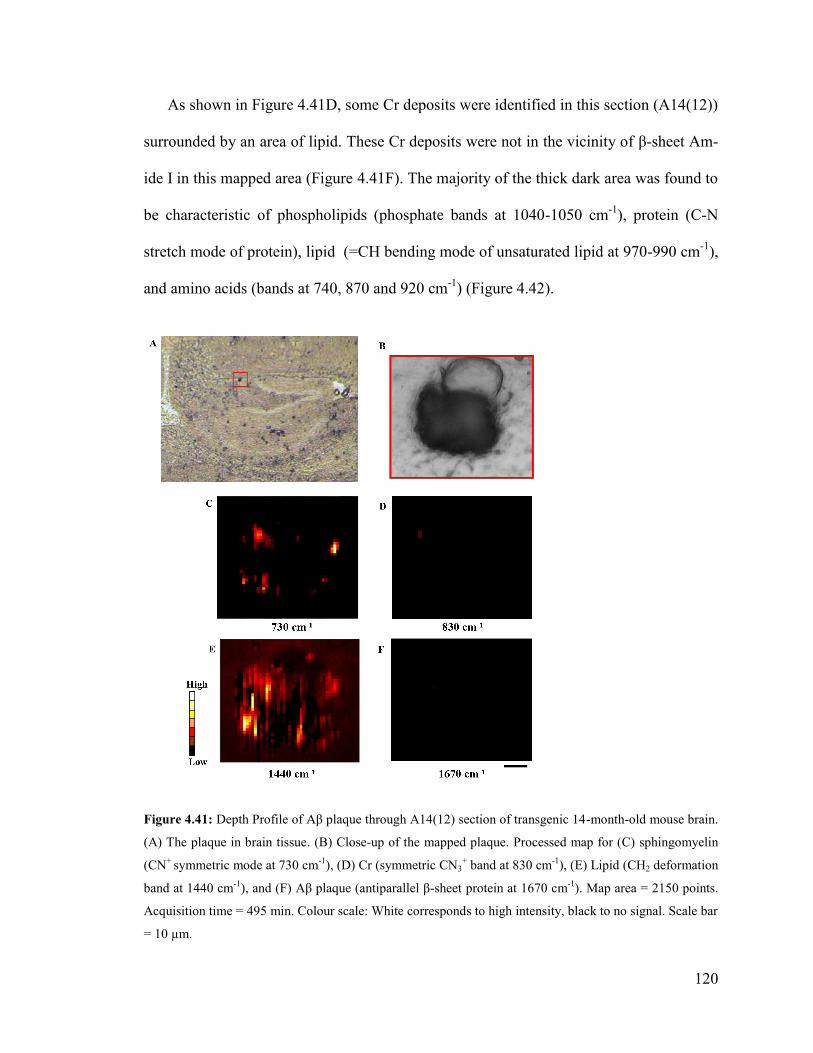
120
As shown in Figure 4.41D, some Cr deposits were identified in this section (A14(12))
surrounded by an area of lipid. These Cr deposits were not in the vicinity of β-sheet Am-
ide I in this mapped area (Figure 4.41F). The majority of the thick dark area was found to
be characteristic of phospholipids (phosphate bands at 1040-1050 cm-1
), protein (C-N
stretch mode of protein), lipid (=CH bending mode of unsaturated lipid at 970-990 cm-1
),
and amino acids (bands at 740, 870 and 920 cm-1
) (Figure 4.42).
Figure 4.41: Depth Profile of Aβ plaque through A14(12) section of transgenic 14-month-old mouse brain.
(A) The plaque in brain tissue. (B) Close-up of the mapped plaque. Processed map for (C) sphingomyelin
(CN+
symmetric mode at 730 cm-1
), (D) Cr (symmetric CN3+ band at 830 cm
-1), (E) Lipid (CH2 deformation
band at 1440 cm-1
), and (F) Aβ plaque (antiparallel β-sheet protein at 1670 cm-1
). Map area = 2150 points.
Acquisition time = 495 min. Colour scale: White corresponds to high intensity, black to no signal. Scale bar
= 10 µm.
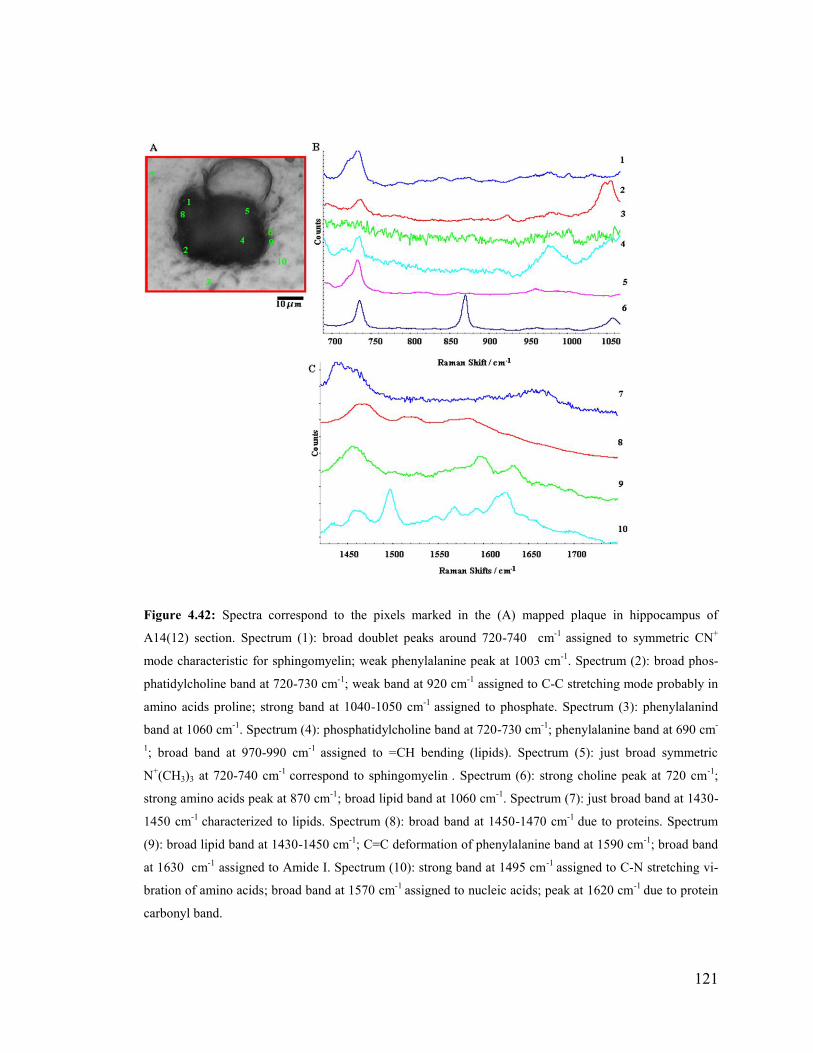
121
Figure 4.42: Spectra correspond to the pixels marked in the (A) mapped plaque in hippocampus of
A14(12) section. Spectrum (1): broad doublet peaks around 720-740 cm-1
assigned to symmetric CN+
mode characteristic for sphingomyelin; weak phenylalanine peak at 1003 cm-1
. Spectrum (2): broad phos-
phatidylcholine band at 720-730 cm-1
; weak band at 920 cm-1
assigned to C-C stretching mode probably in
amino acids proline; strong band at 1040-1050 cm-1
assigned to phosphate. Spectrum (3): phenylalanind
band at 1060 cm-1
. Spectrum (4): phosphatidylcholine band at 720-730 cm-1
; phenylalanine band at 690 cm-
1; broad band at 970-990 cm
-1 assigned to =CH bending (lipids). Spectrum (5): just broad symmetric
N+(CH3)3 at 720-740 cm
-1 correspond to sphingomyelin
. Spectrum (6): strong choline peak at 720 cm
-1;
strong amino acids peak at 870 cm-1
; broad lipid band at 1060 cm-1
. Spectrum (7): just broad band at 1430-
1450 cm-1
characterized to lipids. Spectrum (8): broad band at 1450-1470 cm-1
due to proteins. Spectrum
(9): broad lipid band at 1430-1450 cm-1
; C=C deformation of phenylalanine band at 1590 cm-1
; broad band
at 1630 cm-1
assigned to Amide I. Spectrum (10): strong band at 1495 cm-1
assigned to C-N stretching vi-
bration of amino acids; broad band at 1570 cm-1
assigned to nucleic acids; peak at 1620 cm-1
due to protein
carbonyl band.
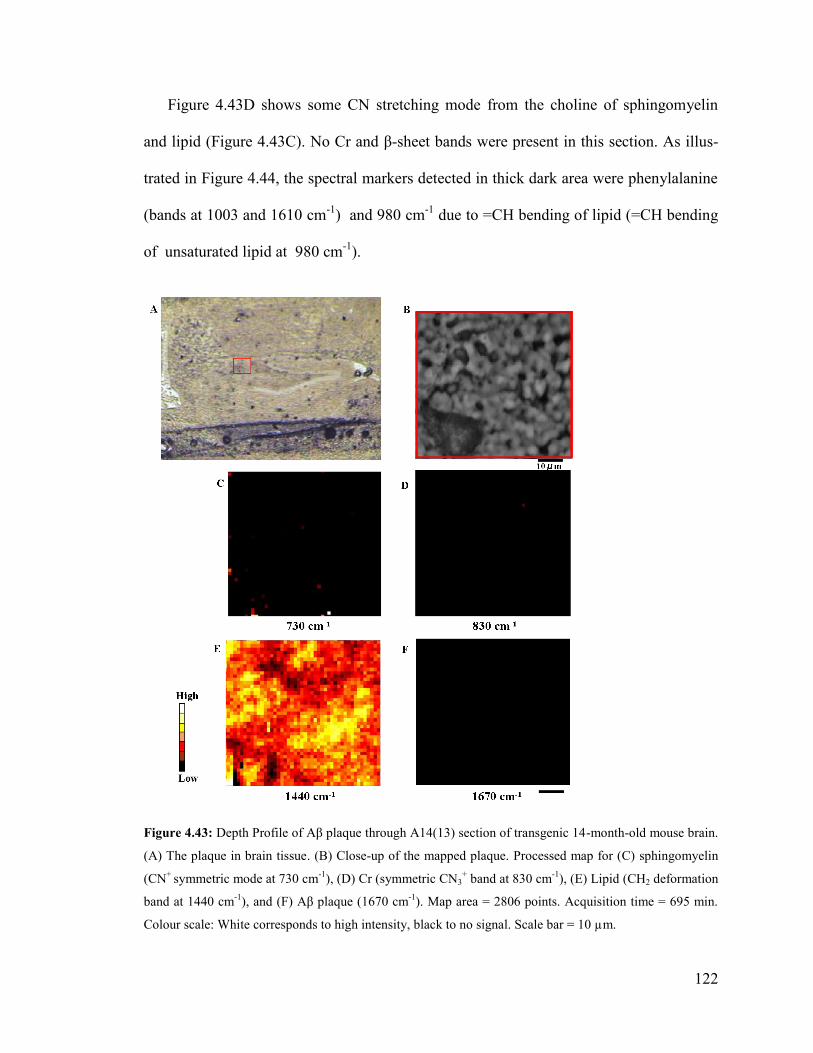
122
Figure 4.43D shows some CN stretching mode from the choline of sphingomyelin
and lipid (Figure 4.43C). No Cr and β-sheet bands were present in this section. As illus-
trated in Figure 4.44, the spectral markers detected in thick dark area were phenylalanine
(bands at 1003 and 1610 cm-1
) and 980 cm-1
due to =CH bending of lipid (=CH bending
of unsaturated lipid at 980 cm-1
).
Figure 4.43: Depth Profile of Aβ plaque through A14(13) section of transgenic 14-month-old mouse brain.
(A) The plaque in brain tissue. (B) Close-up of the mapped plaque. Processed map for (C) sphingomyelin
(CN+
symmetric mode at 730 cm-1
), (D) Cr (symmetric CN3+ band at 830 cm
-1), (E) Lipid (CH2 deformation
band at 1440 cm-1
), and (F) Aβ plaque (1670 cm-1
). Map area = 2806 points. Acquisition time = 695 min.
Colour scale: White corresponds to high intensity, black to no signal. Scale bar = 10 µm.
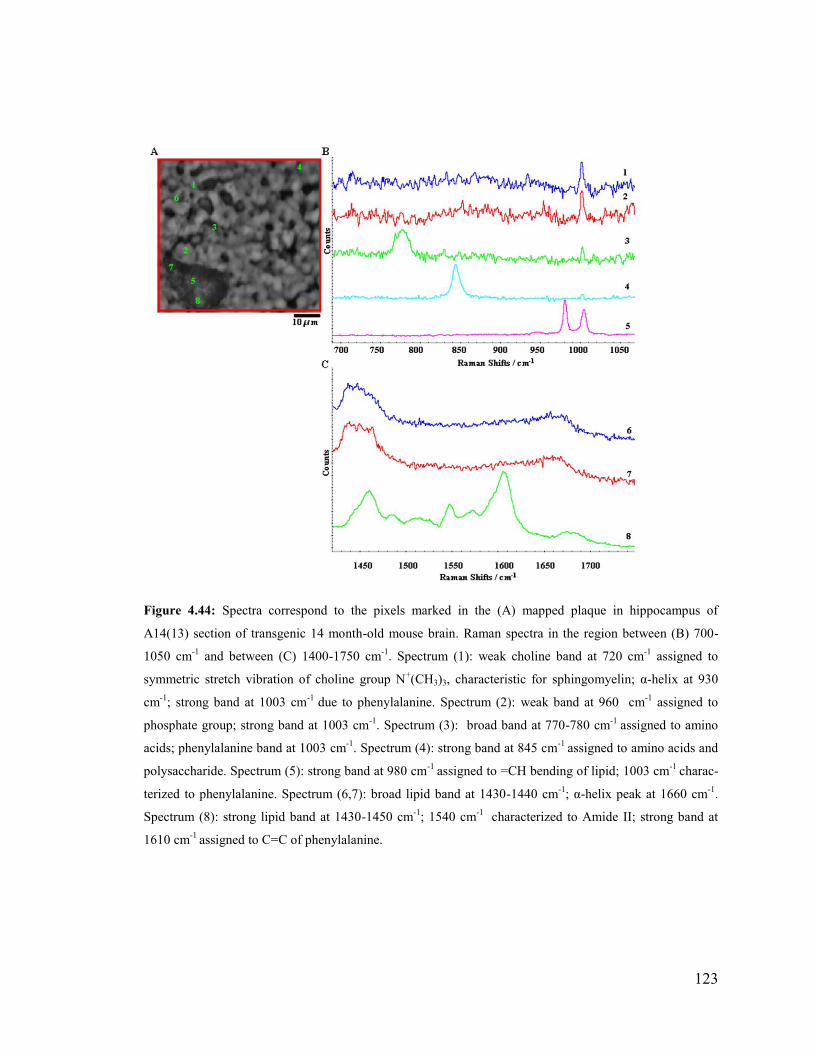
123
Figure 4.44: Spectra correspond to the pixels marked in the (A) mapped plaque in hippocampus of
A14(13) section of transgenic 14 month-old mouse brain. Raman spectra in the region between (B) 700-
1050 cm-1
and between (C) 1400-1750 cm-1
. Spectrum (1): weak choline band at 720 cm-1
assigned to
symmetric stretch vibration of choline group N+(CH3)3, characteristic for sphingomyelin; α-helix at 930
cm-1
; strong band at 1003 cm-1
due to phenylalanine. Spectrum (2): weak band at 960 cm-1
assigned to
phosphate group; strong band at 1003 cm-1
. Spectrum (3): broad band at 770-780 cm-1
assigned to amino
acids; phenylalanine band at 1003 cm-1
. Spectrum (4): strong band at 845 cm-1
assigned to amino acids and
polysaccharide. Spectrum (5): strong band at 980 cm-1
assigned to =CH bending of lipid; 1003 cm-1
charac-
terized to phenylalanine. Spectrum (6,7): broad lipid band at 1430-1440 cm-1
; α-helix peak at 1660 cm-1
.
Spectrum (8): strong lipid band at 1430-1450 cm-1
; 1540 cm-1
characterized to Amide II; strong band at
1610 cm-1
assigned to C=C of phenylalanine.
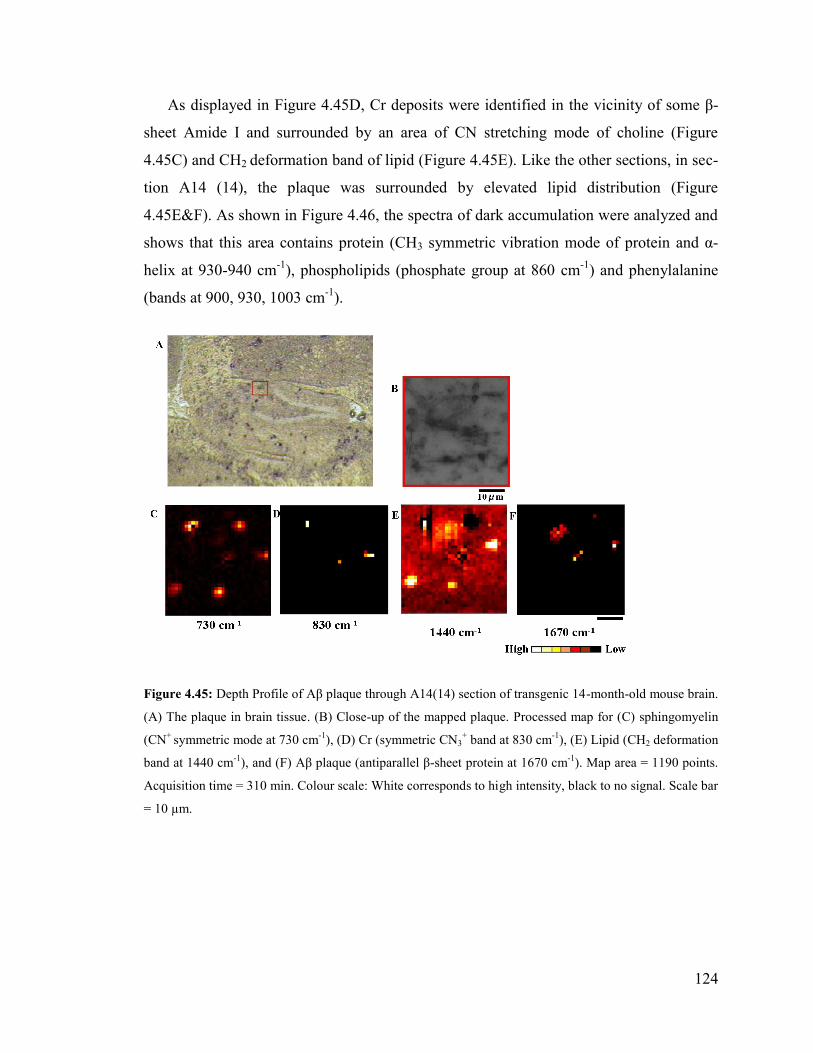
124
As displayed in Figure 4.45D, Cr deposits were identified in the vicinity of some β-
sheet Amide I and surrounded by an area of CN stretching mode of choline (Figure
4.45C) and CH2 deformation band of lipid (Figure 4.45E). Like the other sections, in sec-
tion A14 (14), the plaque was surrounded by elevated lipid distribution (Figure
4.45E&F). As shown in Figure 4.46, the spectra of dark accumulation were analyzed and
shows that this area contains protein (CH3 symmetric vibration mode of protein and α-
helix at 930-940 cm-1
), phospholipids (phosphate group at 860 cm-1
) and phenylalanine
(bands at 900, 930, 1003 cm-1
).
Figure 4.45: Depth Profile of Aβ plaque through A14(14) section of transgenic 14-month-old mouse brain.
(A) The plaque in brain tissue. (B) Close-up of the mapped plaque. Processed map for (C) sphingomyelin
(CN+
symmetric mode at 730 cm-1
), (D) Cr (symmetric CN3+ band at 830 cm
-1), (E) Lipid (CH2 deformation
band at 1440 cm-1
), and (F) Aβ plaque (antiparallel β-sheet protein at 1670 cm-1
). Map area = 1190 points.
Acquisition time = 310 min. Colour scale: White corresponds to high intensity, black to no signal. Scale bar
= 10 µm.
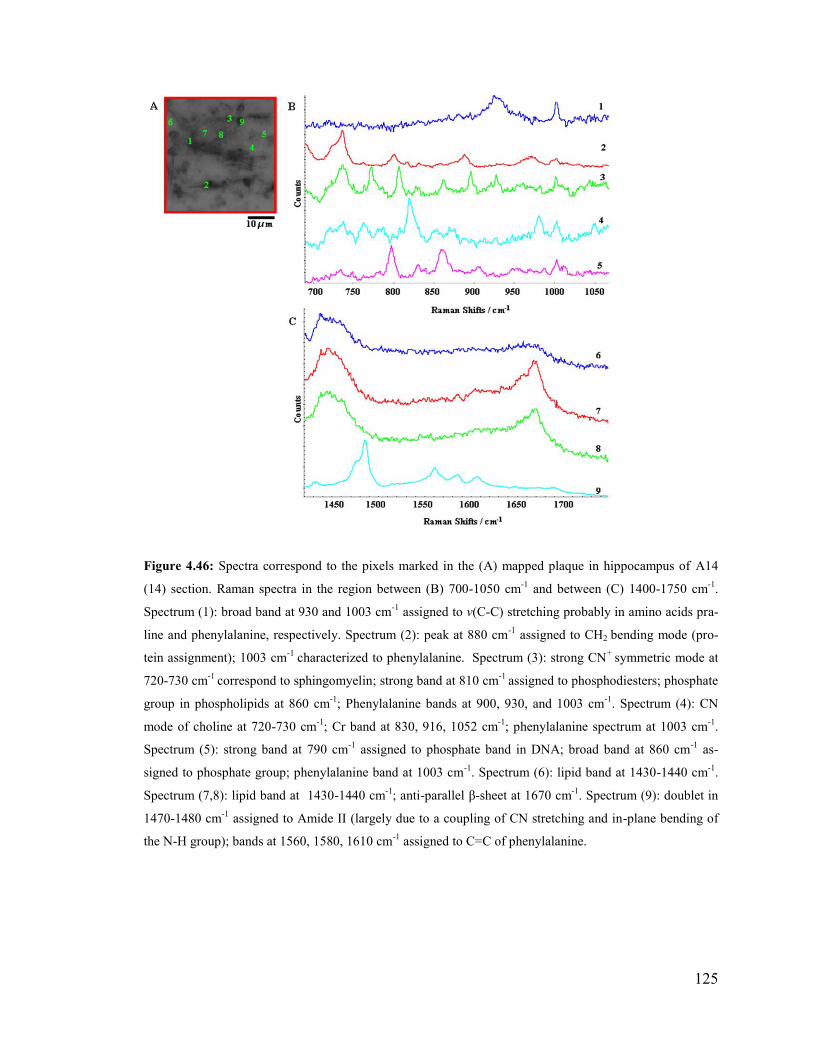
125
Figure 4.46: Spectra correspond to the pixels marked in the (A) mapped plaque in hippocampus of A14
(14) section. Raman spectra in the region between (B) 700-1050 cm-1
and between (C) 1400-1750 cm-1
.
Spectrum (1): broad band at 930 and 1003 cm-1
assigned to ν(C-C) stretching probably in amino acids pra-
line and phenylalanine, respectively. Spectrum (2): peak at 880 cm-1
assigned to CH2 bending mode (pro-
tein assignment); 1003 cm-1
characterized to phenylalanine. Spectrum (3): strong CN
+ symmetric mode at
720-730 cm-1
correspond to sphingomyelin; strong band at 810 cm-1
assigned to phosphodiesters; phosphate
group in phospholipids at 860 cm-1
; Phenylalanine bands at 900, 930, and 1003 cm-1
. Spectrum (4): CN
mode of choline at 720-730 cm-1
; Cr band at 830, 916, 1052 cm-1
; phenylalanine spectrum at 1003 cm-1
.
Spectrum (5): strong band at 790 cm-1
assigned to phosphate band in DNA; broad band at 860 cm-1
as-
signed to phosphate group; phenylalanine band at 1003 cm-1
. Spectrum (6): lipid band at 1430-1440 cm-1
.
Spectrum (7,8): lipid band at 1430-1440 cm-1
; anti-parallel β-sheet at 1670 cm-1
. Spectrum (9): doublet in
1470-1480 cm-1
assigned to Amide II (largely due to a coupling of CN stretching and in-plane bending of
the N-H group); bands at 1560, 1580, 1610 cm-1
assigned to C=C of phenylalanine.
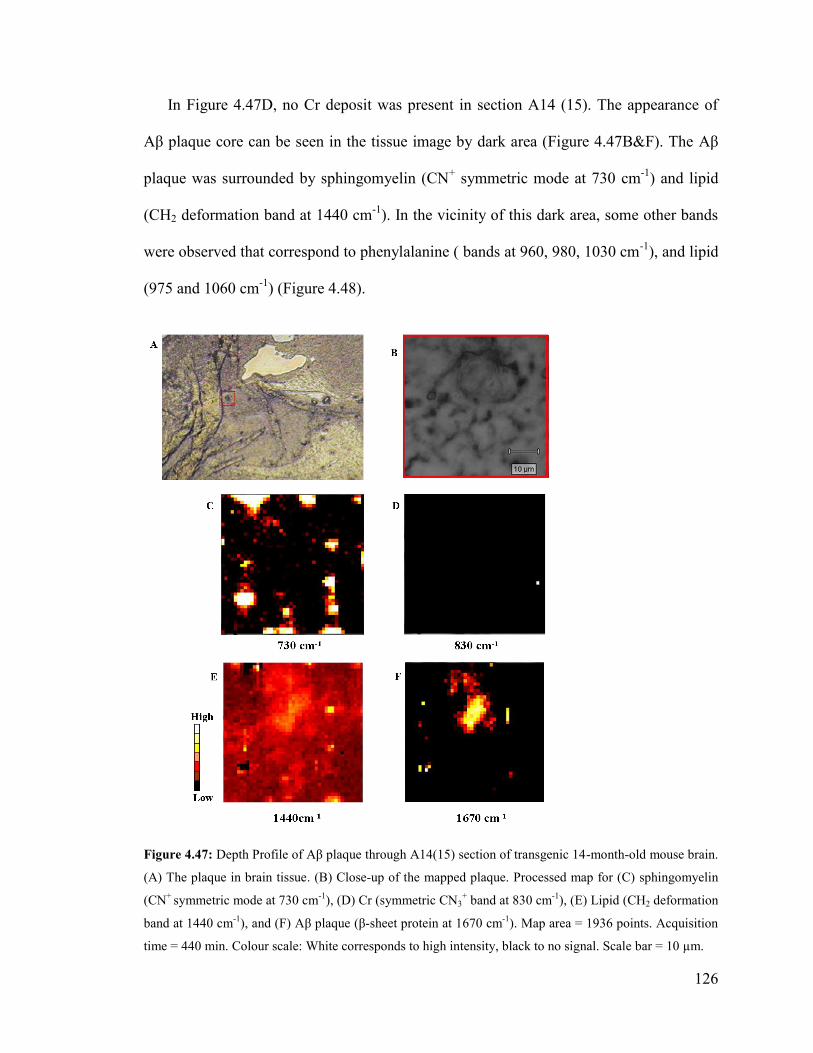
126
In Figure 4.47D, no Cr deposit was present in section A14 (15). The appearance of
Aβ plaque core can be seen in the tissue image by dark area (Figure 4.47B&F). The Aβ
plaque was surrounded by sphingomyelin (CN+ symmetric mode at 730 cm
-1) and lipid
(CH2 deformation band at 1440 cm-1
). In the vicinity of this dark area, some other bands
were observed that correspond to phenylalanine ( bands at 960, 980, 1030 cm-1
), and lipid
(975 and 1060 cm-1
) (Figure 4.48).
Figure 4.47: Depth Profile of Aβ plaque through A14(15) section of transgenic 14-month-old mouse brain.
(A) The plaque in brain tissue. (B) Close-up of the mapped plaque. Processed map for (C) sphingomyelin
(CN+
symmetric mode at 730 cm-1
), (D) Cr (symmetric CN3+ band at 830 cm
-1), (E) Lipid (CH2 deformation
band at 1440 cm-1
), and (F) Aβ plaque (β-sheet protein at 1670 cm-1
). Map area = 1936 points. Acquisition
time = 440 min. Colour scale: White corresponds to high intensity, black to no signal. Scale bar = 10 µm.
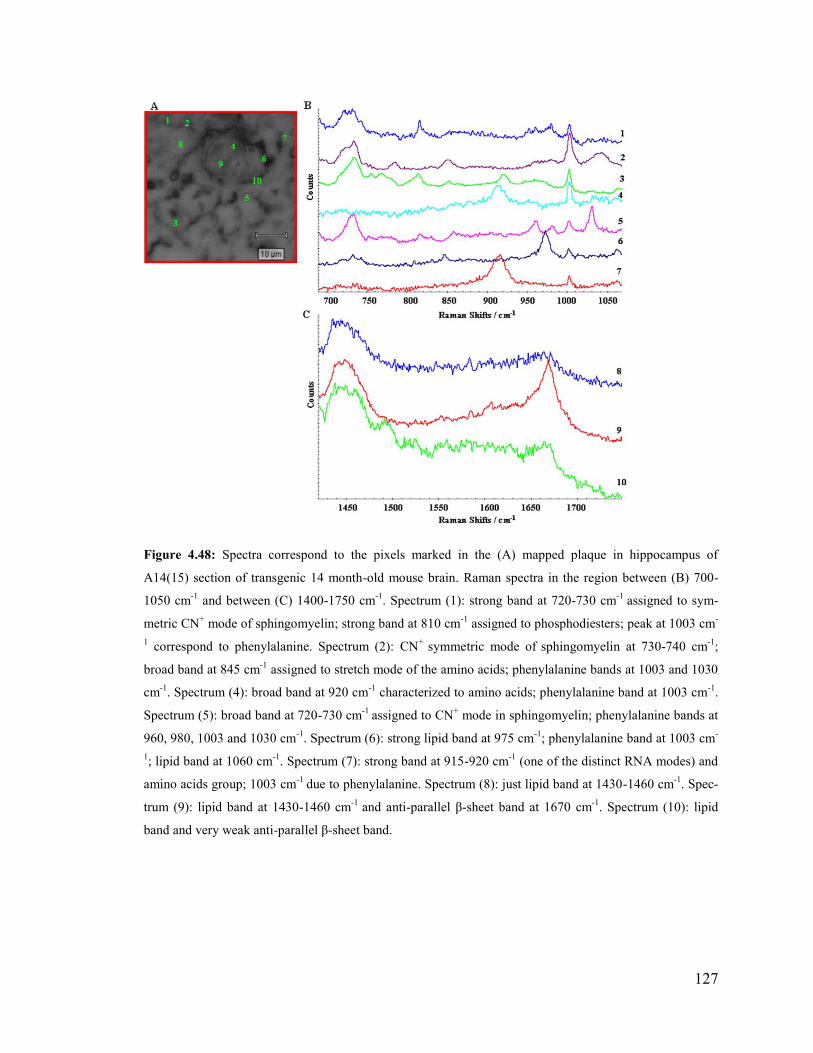
127
Figure 4.48: Spectra correspond to the pixels marked in the (A) mapped plaque in hippocampus of
A14(15) section of transgenic 14 month-old mouse brain. Raman spectra in the region between (B) 700-
1050 cm-1
and between (C) 1400-1750 cm-1
. Spectrum (1): strong band at 720-730 cm-1
assigned to sym-
metric CN+ mode of sphingomyelin; strong band at 810 cm
-1 assigned to phosphodiesters; peak at 1003 cm
-
1 correspond to phenylalanine. Spectrum (2): CN
+ symmetric mode of
sphingomyelin at 730-740 cm
-1;
broad band at 845 cm-1
assigned to stretch mode of the amino acids; phenylalanine bands at 1003 and 1030
cm-1
. Spectrum (4): broad band at 920 cm-1
characterized to amino acids; phenylalanine band at 1003 cm-1
.
Spectrum (5): broad band at 720-730 cm-1
assigned to CN+ mode in sphingomyelin; phenylalanine bands at
960, 980, 1003 and 1030 cm-1
. Spectrum (6): strong lipid band at 975 cm-1
; phenylalanine band at 1003 cm-
1; lipid band at 1060 cm
-1. Spectrum (7): strong band at 915-920 cm
-1 (one of the distinct RNA modes) and
amino acids group; 1003 cm-1
due to phenylalanine. Spectrum (8): just lipid band at 1430-1460 cm-1
. Spec-
trum (9): lipid band at 1430-1460 cm-1
and anti-parallel β-sheet band at 1670 cm-1
. Spectrum (10): lipid
band and very weak anti-parallel β-sheet band.
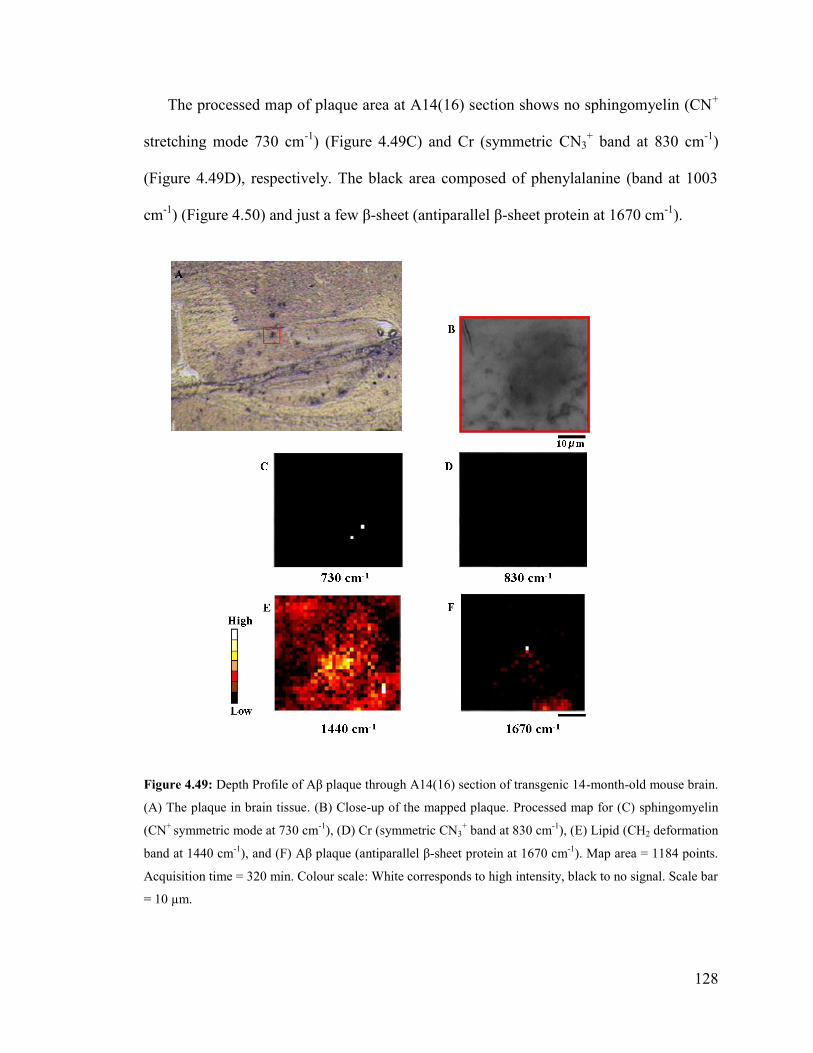
128
The processed map of plaque area at A14(16) section shows no sphingomyelin (CN+
stretching mode 730 cm-1
) (Figure 4.49C) and Cr (symmetric CN3+ band at 830 cm
-1)
(Figure 4.49D), respectively. The black area composed of phenylalanine (band at 1003
cm-1
) (Figure 4.50) and just a few β-sheet (antiparallel β-sheet protein at 1670 cm-1
).
Figure 4.49: Depth Profile of Aβ plaque through A14(16) section of transgenic 14-month-old mouse brain.
(A) The plaque in brain tissue. (B) Close-up of the mapped plaque. Processed map for (C) sphingomyelin
(CN+
symmetric mode at 730 cm-1
), (D) Cr (symmetric CN3+ band at 830 cm
-1), (E) Lipid (CH2 deformation
band at 1440 cm-1
), and (F) Aβ plaque (antiparallel β-sheet protein at 1670 cm-1
). Map area = 1184 points.
Acquisition time = 320 min. Colour scale: White corresponds to high intensity, black to no signal. Scale bar
= 10 µm.
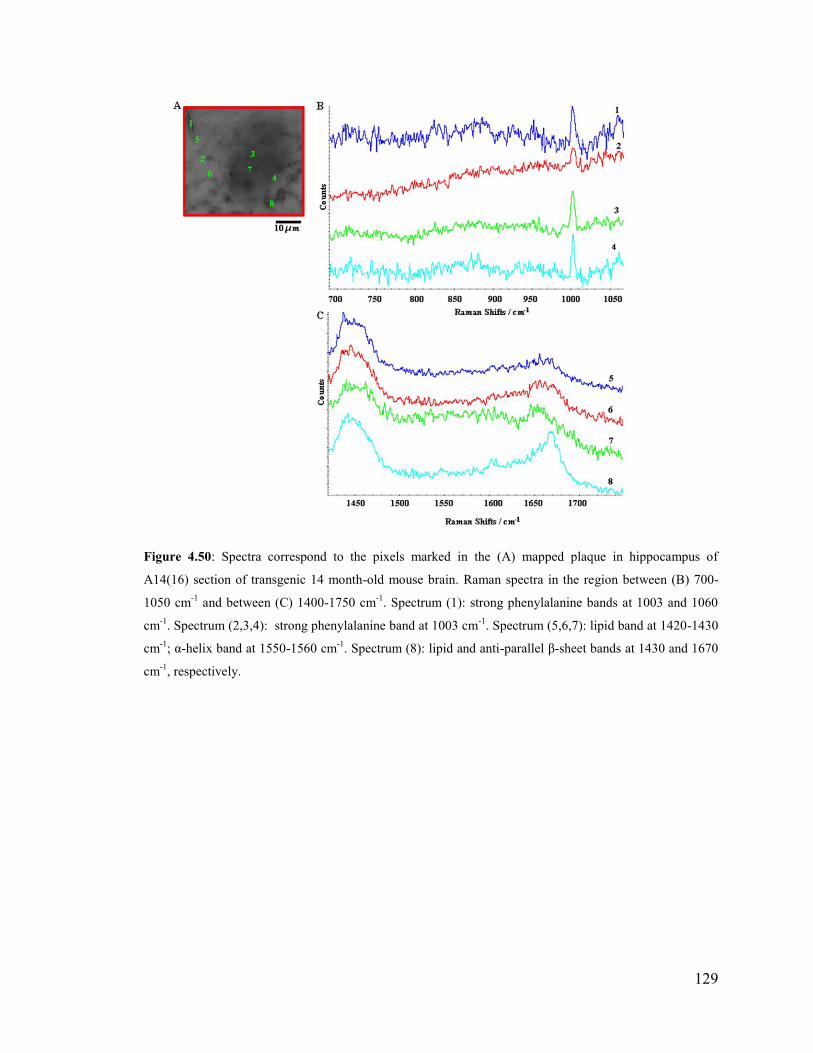
129
Figure 4.50: Spectra correspond to the pixels marked in the (A) mapped plaque in hippocampus of
A14(16) section of transgenic 14 month-old mouse brain. Raman spectra in the region between (B) 700-
1050 cm-1
and between (C) 1400-1750 cm-1
. Spectrum (1): strong phenylalanine bands at 1003 and 1060
cm-1
. Spectrum (2,3,4): strong phenylalanine band at 1003 cm-1
. Spectrum (5,6,7): lipid band at 1420-1430
cm-1
; α-helix band at 1550-1560 cm-1
. Spectrum (8): lipid and anti-parallel β-sheet bands at 1430 and 1670
cm-1
, respectively.

130
As displayed in Figure 4.51D, Cr was present in this map surrounded by CN stretch-
ing mode at 730 cm-1
(Figure 4.51C), CH2 deformation of lipid at 1440 cm-1
(Figure
4.51E) and β-sheet Amide I at 1670 cm-1
(Figure 4.51). As shown in Figure 4.52, in the
vicinity of Aβ plaque, some sharp lipid (=CH bending of unsaturated lipid at 985 cm-1
)
and phenylalanine (bands at 695, 1003, 1585 cm-1
) were identified.
Figure 4.51: Depth Profile of Aβ plaque through A14(17) section of transgenic 14-month-old mouse brain.
(A) The plaque in brain tissue. (B) Close-up of the mapped plaque. Processed map for (C) sphingomyelin
(CN+
symmetric mode at 730 cm-1
), (D) Cr (symmetric CN3+ band at 830 cm
-1), (E) Lipid (CH2 deformation
band at 1440 cm-1
), and (F) Aβ plaque (antiparallel β-sheet protein at 1670 cm-1
). Map area = 1680 points.
Acquisition time = 356 min. Colour scale: White corresponds to high intensity, black to no signal. Scale bar
= 10 µm.
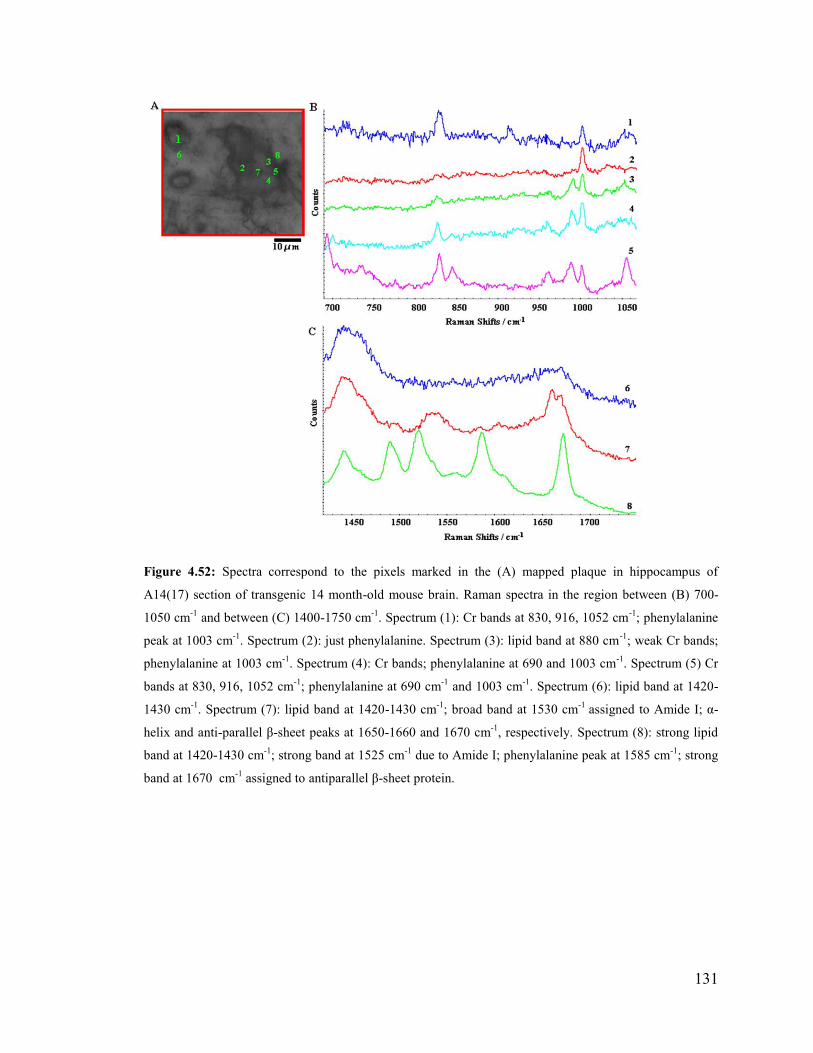
131
Figure 4.52: Spectra correspond to the pixels marked in the (A) mapped plaque in hippocampus of
A14(17) section of transgenic 14 month-old mouse brain. Raman spectra in the region between (B) 700-
1050 cm-1
and between (C) 1400-1750 cm-1
. Spectrum (1): Cr bands at 830, 916, 1052 cm-1
; phenylalanine
peak at 1003 cm-1
. Spectrum (2): just phenylalanine. Spectrum (3): lipid band at 880 cm-1
; weak Cr bands;
phenylalanine at 1003 cm-1
. Spectrum (4): Cr bands; phenylalanine at 690 and 1003 cm-1
. Spectrum (5) Cr
bands at 830, 916, 1052 cm-1
; phenylalanine at 690 cm-1
and 1003 cm-1
. Spectrum (6): lipid band at 1420-
1430 cm-1
. Spectrum (7): lipid band at 1420-1430 cm-1
; broad band at 1530 cm-1
assigned to Amide I; α-
helix and anti-parallel β-sheet peaks at 1650-1660 and 1670 cm-1
, respectively. Spectrum (8): strong lipid
band at 1420-1430 cm-1
; strong band at 1525 cm-1
due to Amide I; phenylalanine peak at 1585 cm-1
; strong
band at 1670 cm-1
assigned to antiparallel β-sheet protein.
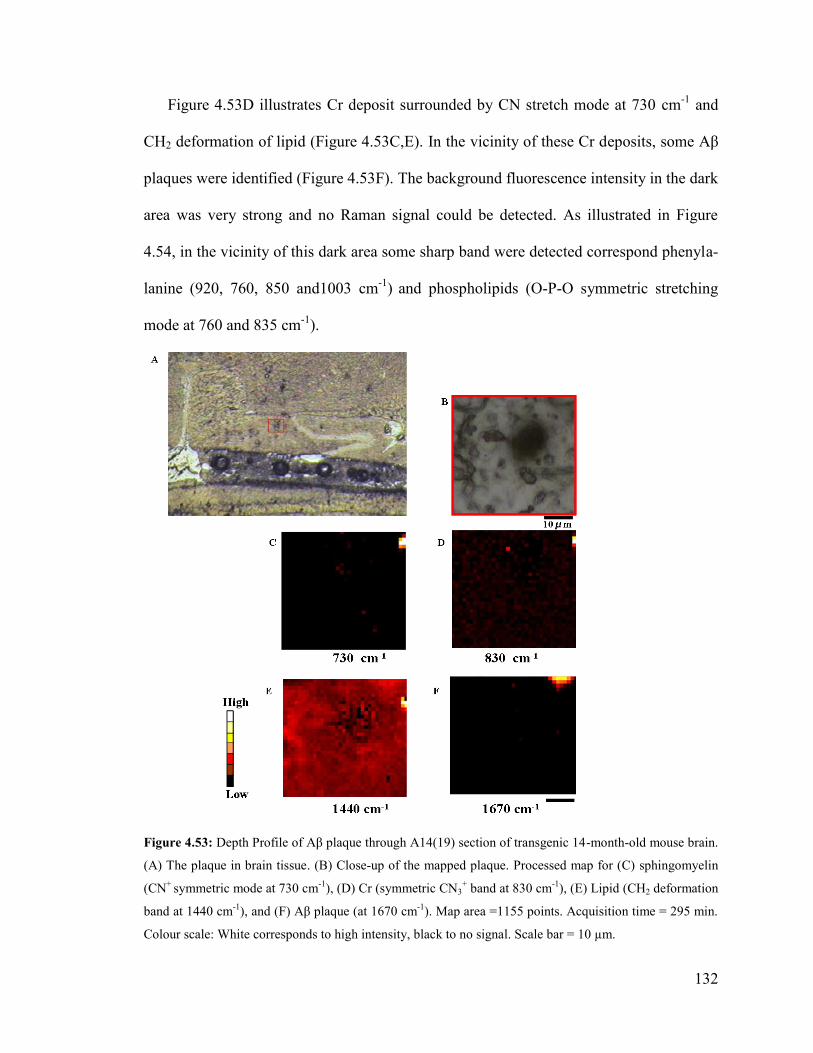
132
Figure 4.53D illustrates Cr deposit surrounded by CN stretch mode at 730 cm-1
and
CH2 deformation of lipid (Figure 4.53C,E). In the vicinity of these Cr deposits, some Aβ
plaques were identified (Figure 4.53F). The background fluorescence intensity in the dark
area was very strong and no Raman signal could be detected. As illustrated in Figure
4.54, in the vicinity of this dark area some sharp band were detected correspond phenyla-
lanine (920, 760, 850 and1003 cm-1
) and phospholipids (O-P-O symmetric stretching
mode at 760 and 835 cm-1
).
Figure 4.53: Depth Profile of Aβ plaque through A14(19) section of transgenic 14-month-old mouse brain.
(A) The plaque in brain tissue. (B) Close-up of the mapped plaque. Processed map for (C) sphingomyelin
(CN+
symmetric mode at 730 cm-1
), (D) Cr (symmetric CN3+ band at 830 cm
-1), (E) Lipid (CH2 deformation
band at 1440 cm-1
), and (F) Aβ plaque (at 1670 cm-1
). Map area =1155 points. Acquisition time = 295 min.
Colour scale: White corresponds to high intensity, black to no signal. Scale bar = 10 µm.
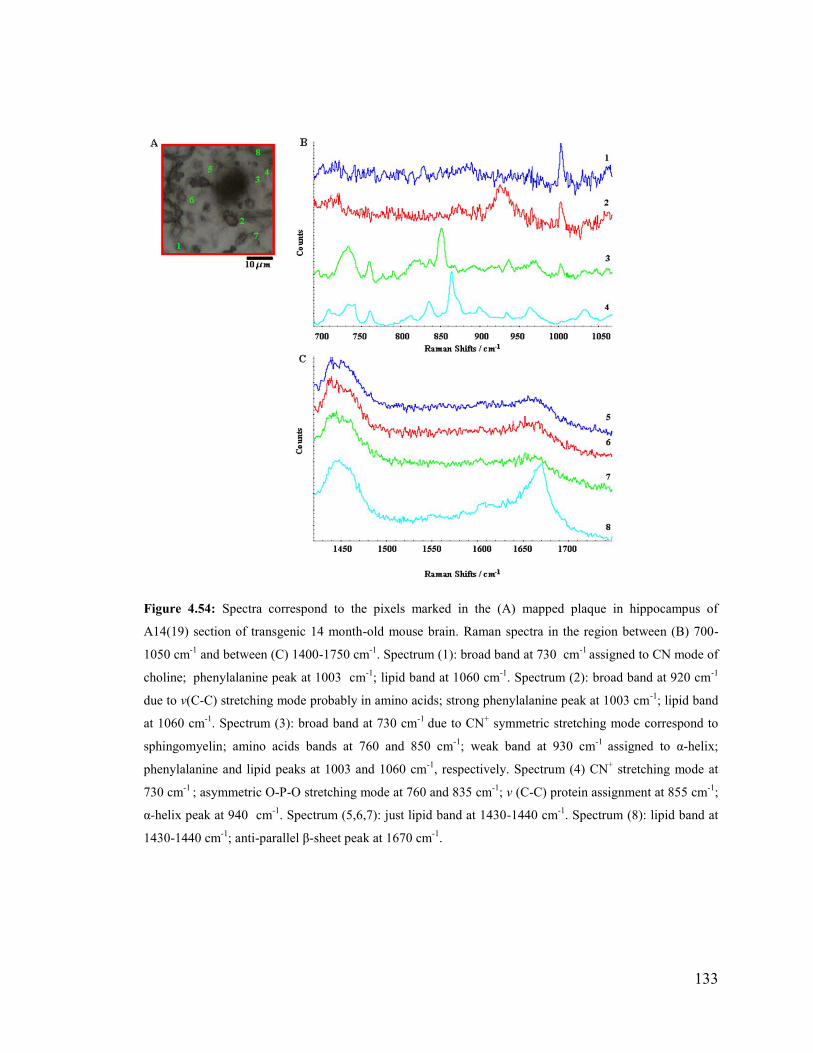
133
Figure 4.54: Spectra correspond to the pixels marked in the (A) mapped plaque in hippocampus of
A14(19) section of transgenic 14 month-old mouse brain. Raman spectra in the region between (B) 700-
1050 cm-1
and between (C) 1400-1750 cm-1
. Spectrum (1): broad band at 730 cm-1
assigned to CN mode of
choline; phenylalanine peak at 1003 cm
-1; lipid band at 1060 cm
-1. Spectrum (2): broad band at 920 cm
-1
due to v(C-C) stretching mode probably in amino acids; strong phenylalanine peak at 1003 cm-1
; lipid band
at 1060 cm-1
. Spectrum (3): broad band at 730 cm-1
due to CN+ symmetric stretching mode correspond to
sphingomyelin; amino acids bands at 760 and 850 cm-1
; weak band at 930 cm-1
assigned to α-helix;
phenylalanine and lipid peaks at 1003 and 1060 cm-1
, respectively. Spectrum (4) CN+ stretching mode at
730 cm-1
; asymmetric O-P-O stretching mode at 760 and 835 cm-1
; v (C-C) protein assignment at 855 cm-1
;
α-helix peak at 940 cm-1
. Spectrum (5,6,7): just lipid band at 1430-1440 cm-1
. Spectrum (8): lipid band at
1430-1440 cm-1
; anti-parallel β-sheet peak at 1670 cm-1
.
134
On conclusion, processed maps of amyloid plaque in serial sections of 14 month-old
transgenic mouse, Cr deposits were observed in A14(14), A14(17) and A14(19). The ap-
pearance of Aβ plaque core in tissue sections A14(11), A14(14), A14(15), and A14(17)
was much more distinctive. In these sections, the Aβ plaque was surrounded by elevated
lipid distribution and sometimes near by deposits of Cr. The Cr deposits associated with
plaques were not large in size. Lipid distribution was observed in all consecutive serial
sections.
4.4.3 Creatine deposits in Caudate
The caudate of five transgenic mice and littermate controls were mosaic mapped with
FPA-FTIR through 5, 8, 11, 14 and 17 month-old to explore any creatine distribution in
the caudate region. Infrared spectra were collected with a Varian FPA-FTIR microscope,
at 4 cm-1
spectral resolution, using Happ-Genzel apodization. An average of 128 spectra
was co-added for each spectrum. In order to take the whole caudate area map, a mosaic
was created. This technique involves combining a motorized stage to collect high resolu-
tion data from larger sample areas. The mosaic capability involves mapping the FPA im-
age across a large field of view, whereby the images are tiled together to form a larger
overall image consisting of many individual single tiles each 64 x 64 pixels. To collect
the mosaic map, the center of the area of interest was selected and the mosaic map was
taken first with 4 scan to make sure the collected mosaic was perfectly matched with the
assigned area; then, the mosaic was collected with 128 scan per tile to increase the S/N
ratio. IR maps were processed for Cr at 1410-1384 cm-1
(Figure 4.55B-62B), lipid sym-
metric CH2 stretching band at 2853 cm-1
(Figure 4.55C-62C) and lipid carbonyl at 1733
135
cm-1
(Figure 4.55D-62D). In the colour scale, red corresponds to high intensity, and dark
blue to no signal.
Areas of localized lipid elevation were observed in the caudate of almost all sec-
tions. Cr deposits were identified in sections A25(4), and A14(2) transgenic mice caudate
tissue(Figure 4.57B&59B). Areas with strong absorption of the lipid band were located
near Cr deposits (Figure 4.60B). Few Cr deposits were observed in the 14 month control
mouse caudate (Figure 4.60C&D), but the size and amount of Cr deposits was greater in
the same age transgenic section. No Cr was observed in 17 month-old Tg mouse (Figure
4.61B). It may be explained that the caudate region of most of the brain tissue sections
was distorted at the time of sectioning. As shown in Figure 4.59B&60B, some Cr depos-
its were present in the caudate region of both Tg and non-Tg 14 month-old which the as-
signed region had been not folded and torn.
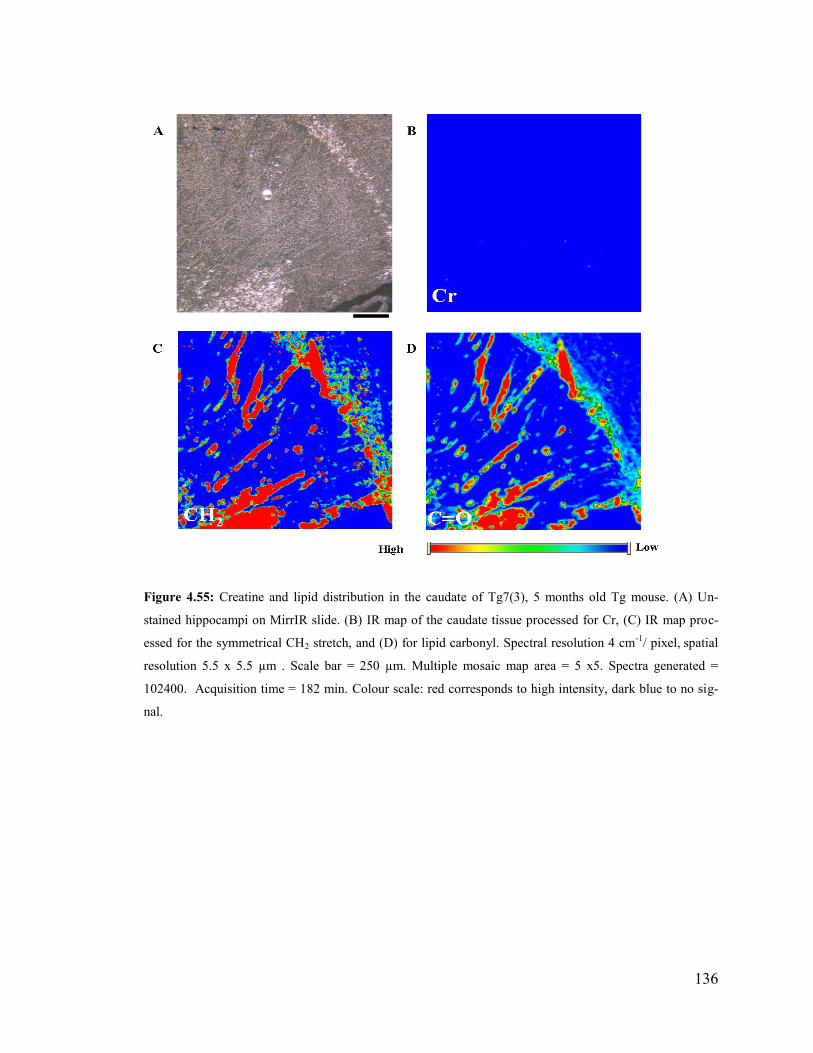
136
Figure 4.55: Creatine and lipid distribution in the caudate of Tg7(3), 5 months old Tg mouse. (A) Un-
stained hippocampi on MirrIR slide. (B) IR map of the caudate tissue processed for Cr, (C) IR map proc-
essed for the symmetrical CH2 stretch, and (D) for lipid carbonyl. Spectral resolution 4 cm-1
/ pixel, spatial
resolution 5.5 x 5.5 µm . Scale bar = 250 µm. Multiple mosaic map area = 5 x5. Spectra generated =
102400. Acquisition time = 182 min. Colour scale: red corresponds to high intensity, dark blue to no sig-
nal.
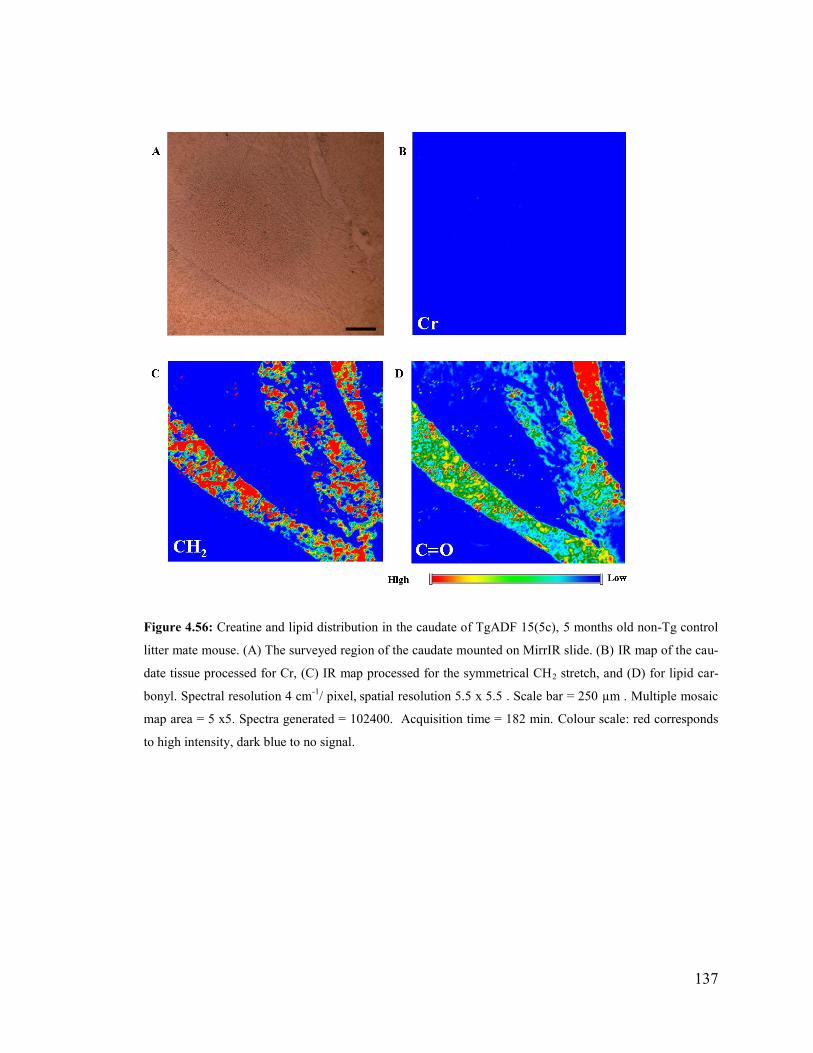
137
Figure 4.56: Creatine and lipid distribution in the caudate of TgADF 15(5c), 5 months old non-Tg control
litter mate mouse. (A) The surveyed region of the caudate mounted on MirrIR slide. (B) IR map of the cau-
date tissue processed for Cr, (C) IR map processed for the symmetrical CH2 stretch, and (D) for lipid car-
bonyl. Spectral resolution 4 cm-1
/ pixel, spatial resolution 5.5 x 5.5 . Scale bar = 250 µm . Multiple mosaic
map area = 5 x5. Spectra generated = 102400. Acquisition time = 182 min. Colour scale: red corresponds
to high intensity, dark blue to no signal.
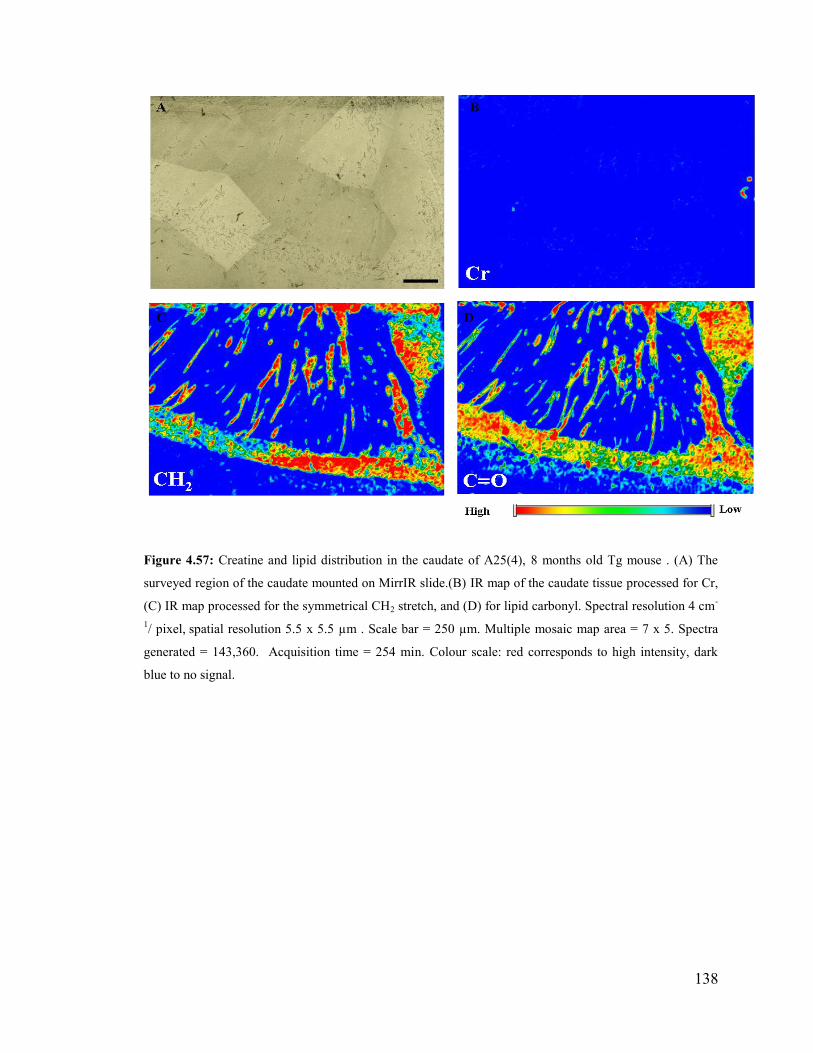
138
Figure 4.57: Creatine and lipid distribution in the caudate of A25(4), 8 months old Tg mouse . (A) The
surveyed region of the caudate mounted on MirrIR slide.(B) IR map of the caudate tissue processed for Cr,
(C) IR map processed for the symmetrical CH2 stretch, and (D) for lipid carbonyl. Spectral resolution 4 cm-
1/ pixel,
spatial resolution 5.5 x 5.5 µm . Scale bar = 250 µm. Multiple mosaic map area = 7 x 5. Spectra
generated = 143,360. Acquisition time = 254 min. Colour scale: red corresponds to high intensity, dark
blue to no signal.
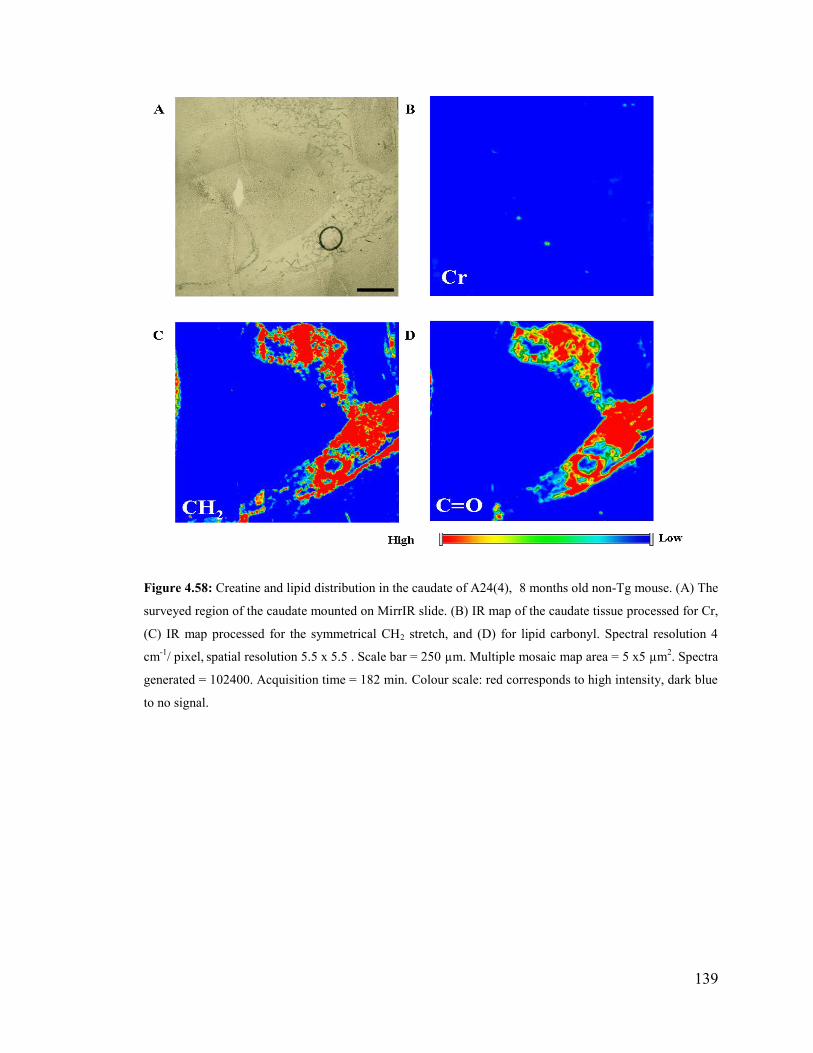
139
Figure 4.58: Creatine and lipid distribution in the caudate of A24(4), 8 months old non-Tg mouse. (A) The
surveyed region of the caudate mounted on MirrIR slide. (B) IR map of the caudate tissue processed for Cr,
(C) IR map processed for the symmetrical CH2 stretch, and (D) for lipid carbonyl. Spectral resolution 4
cm-1
/ pixel, spatial resolution 5.5 x 5.5 . Scale bar = 250 µm. Multiple mosaic map area = 5 x5 µm
2. Spectra
generated = 102400. Acquisition time = 182 min. Colour scale: red corresponds to high intensity, dark blue
to no signal.
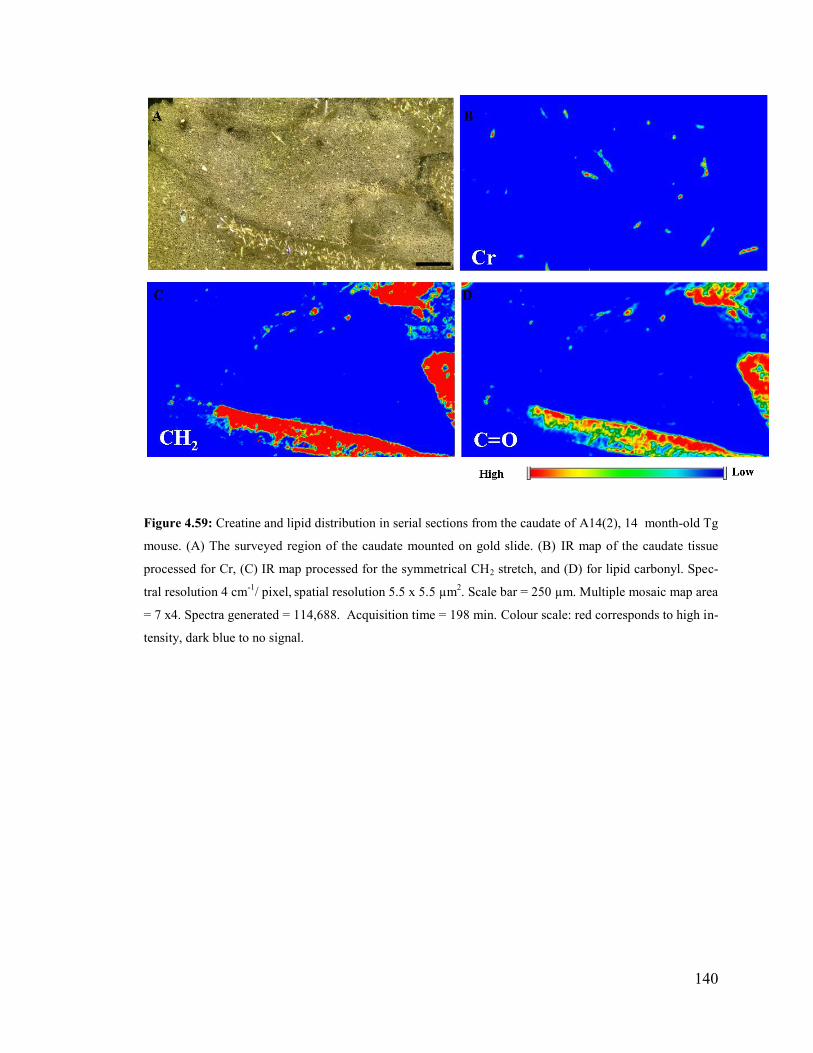
140
Figure 4.59: Creatine and lipid distribution in serial sections from the caudate of A14(2), 14 month-old Tg
mouse. (A) The surveyed region of the caudate mounted on gold slide. (B) IR map of the caudate tissue
processed for Cr, (C) IR map processed for the symmetrical CH2 stretch, and (D) for lipid carbonyl. Spec-
tral resolution 4 cm-1
/ pixel, spatial resolution 5.5 x 5.5 µm
2. Scale bar = 250 µm. Multiple mosaic map area
= 7 x4. Spectra generated = 114,688. Acquisition time = 198 min. Colour scale: red corresponds to high in-
tensity, dark blue to no signal.
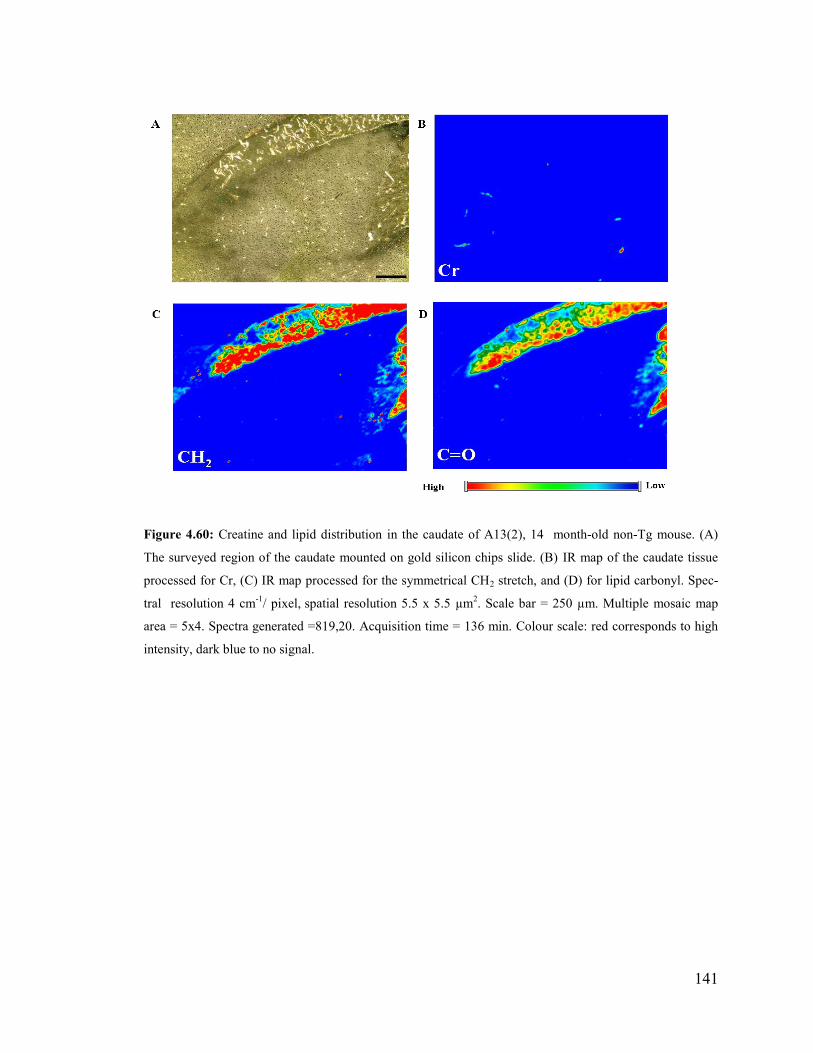
141
Figure 4.60: Creatine and lipid distribution in the caudate of A13(2), 14 month-old non-Tg mouse. (A)
The surveyed region of the caudate mounted on gold silicon chips slide. (B) IR map of the caudate tissue
processed for Cr, (C) IR map processed for the symmetrical CH2 stretch, and (D) for lipid carbonyl. Spec-
tral resolution 4 cm-1
/ pixel, spatial resolution 5.5 x 5.5 µm
2. Scale bar = 250 µm. Multiple mosaic map
area = 5x4. Spectra generated =819,20. Acquisition time = 136 min. Colour scale: red corresponds to high
intensity, dark blue to no signal.
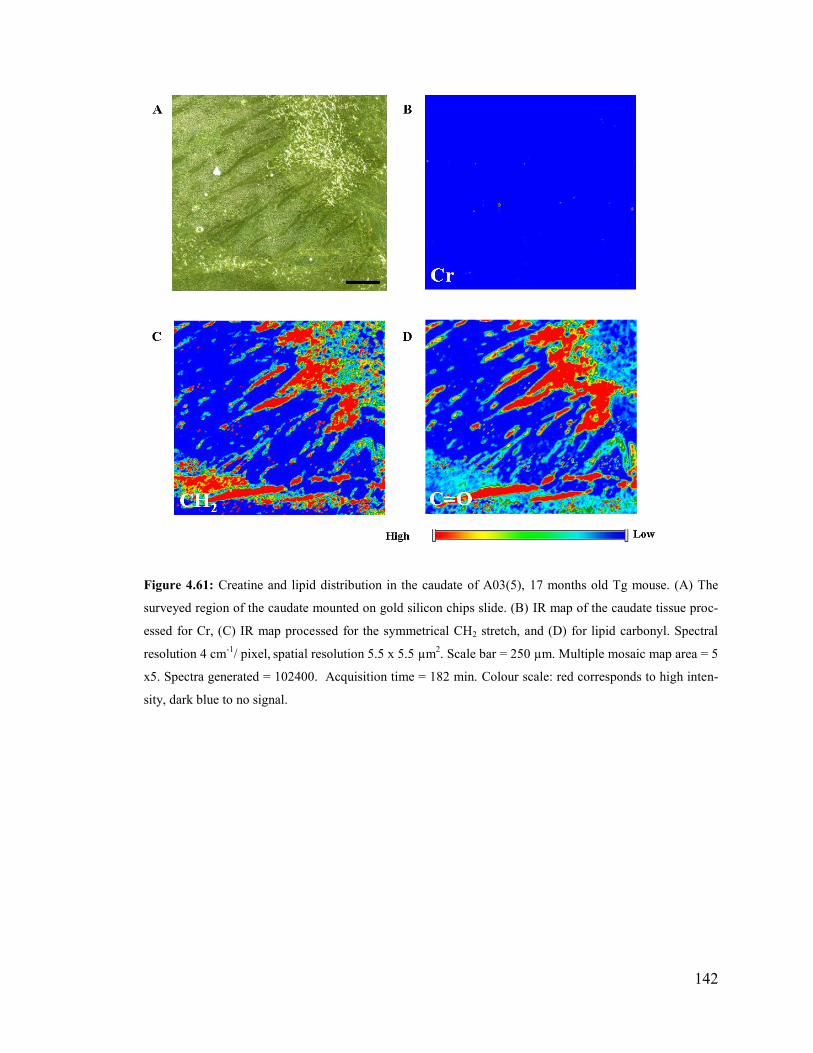
142
Figure 4.61: Creatine and lipid distribution in the caudate of A03(5), 17 months old Tg mouse. (A) The
surveyed region of the caudate mounted on gold silicon chips slide. (B) IR map of the caudate tissue proc-
essed for Cr, (C) IR map processed for the symmetrical CH2 stretch, and (D) for lipid carbonyl. Spectral
resolution 4 cm-1
/ pixel, spatial resolution 5.5 x 5.5 µm
2. Scale bar = 250 µm. Multiple mosaic map area = 5
x5. Spectra generated = 102400. Acquisition time = 182 min. Colour scale: red corresponds to high inten-
sity, dark blue to no signal.
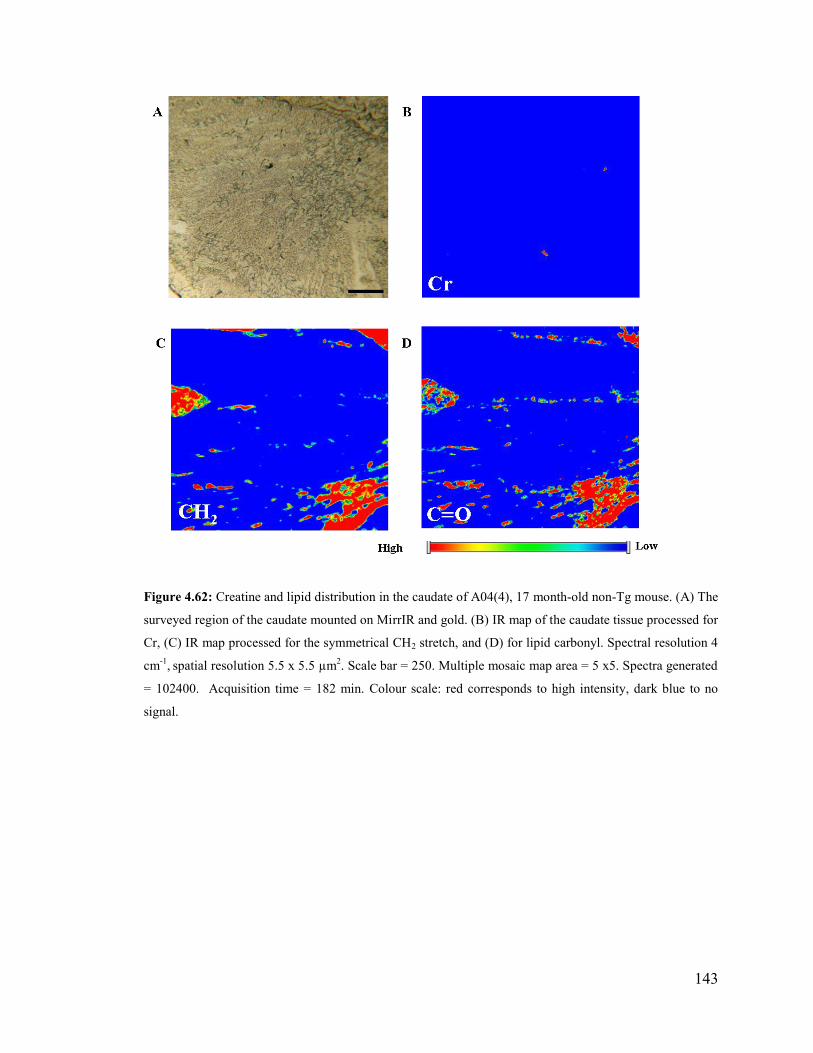
143
Figure 4.62: Creatine and lipid distribution in the caudate of A04(4), 17 month-old non-Tg mouse. (A) The
surveyed region of the caudate mounted on MirrIR and gold. (B) IR map of the caudate tissue processed for
Cr, (C) IR map processed for the symmetrical CH2 stretch, and (D) for lipid carbonyl. Spectral resolution 4
cm-1
, spatial resolution 5.5 x 5.5 µm
2. Scale bar = 250. Multiple mosaic map area = 5 x5. Spectra generated
= 102400. Acquisition time = 182 min. Colour scale: red corresponds to high intensity, dark blue to no
signal.
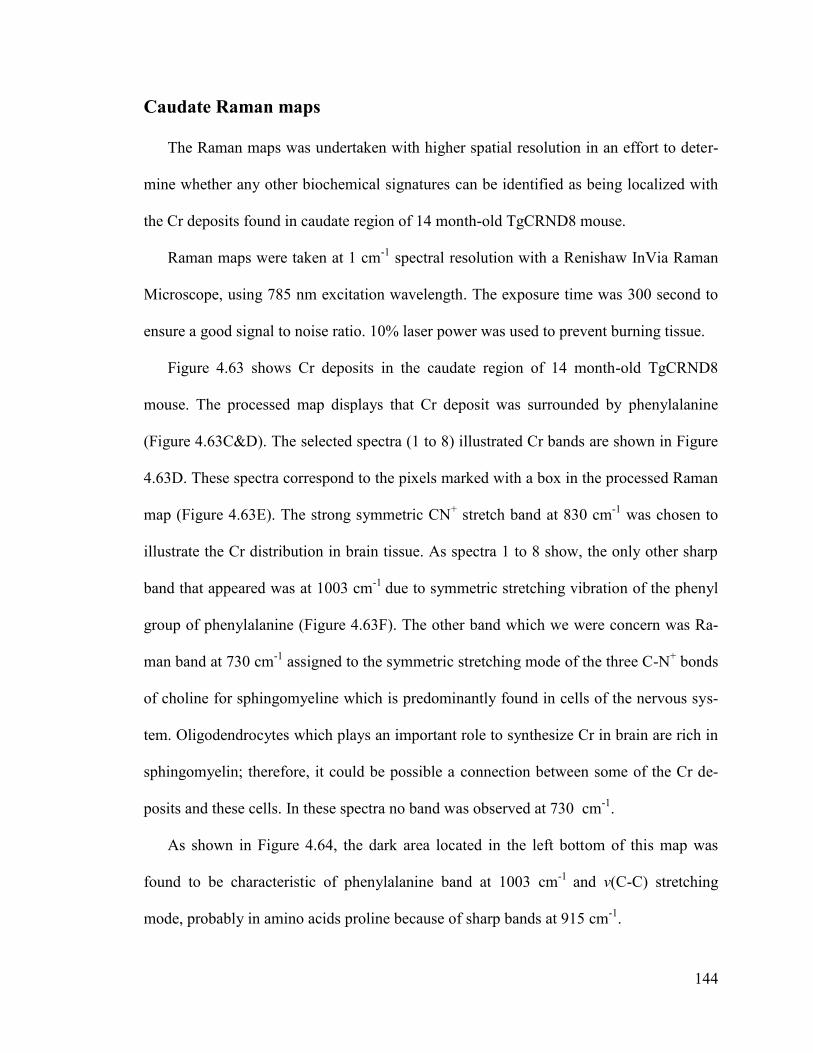
144
Caudate Raman maps
The Raman maps was undertaken with higher spatial resolution in an effort to deter-
mine whether any other biochemical signatures can be identified as being localized with
the Cr deposits found in caudate region of 14 month-old TgCRND8 mouse.
Raman maps were taken at 1 cm-1
spectral resolution with a Renishaw InVia Raman
Microscope, using 785 nm excitation wavelength. The exposure time was 300 second to
ensure a good signal to noise ratio. 10% laser power was used to prevent burning tissue.
Figure 4.63 shows Cr deposits in the caudate region of 14 month-old TgCRND8
mouse. The processed map displays that Cr deposit was surrounded by phenylalanine
(Figure 4.63C&D). The selected spectra (1 to 8) illustrated Cr bands are shown in Figure
4.63D. These spectra correspond to the pixels marked with a box in the processed Raman
map (Figure 4.63E). The strong symmetric CN+ stretch band at 830 cm
-1 was chosen to
illustrate the Cr distribution in brain tissue. As spectra 1 to 8 show, the only other sharp
band that appeared was at 1003 cm-1
due to symmetric stretching vibration of the phenyl
group of phenylalanine (Figure 4.63F). The other band which we were concern was Ra-
man band at 730 cm-1
assigned to the symmetric stretching mode of the three C-N+ bonds
of choline for sphingomyeline which is predominantly found in cells of the nervous sys-
tem. Oligodendrocytes which plays an important role to synthesize Cr in brain are rich in
sphingomyelin; therefore, it could be possible a connection between some of the Cr de-
posits and these cells. In these spectra no band was observed at 730 cm-1
.
As shown in Figure 4.64, the dark area located in the left bottom of this map was
found to be characteristic of phenylalanine band at 1003 cm-1
and ν(C-C) stretching
mode, probably in amino acids proline because of sharp bands at 915 cm-1
.
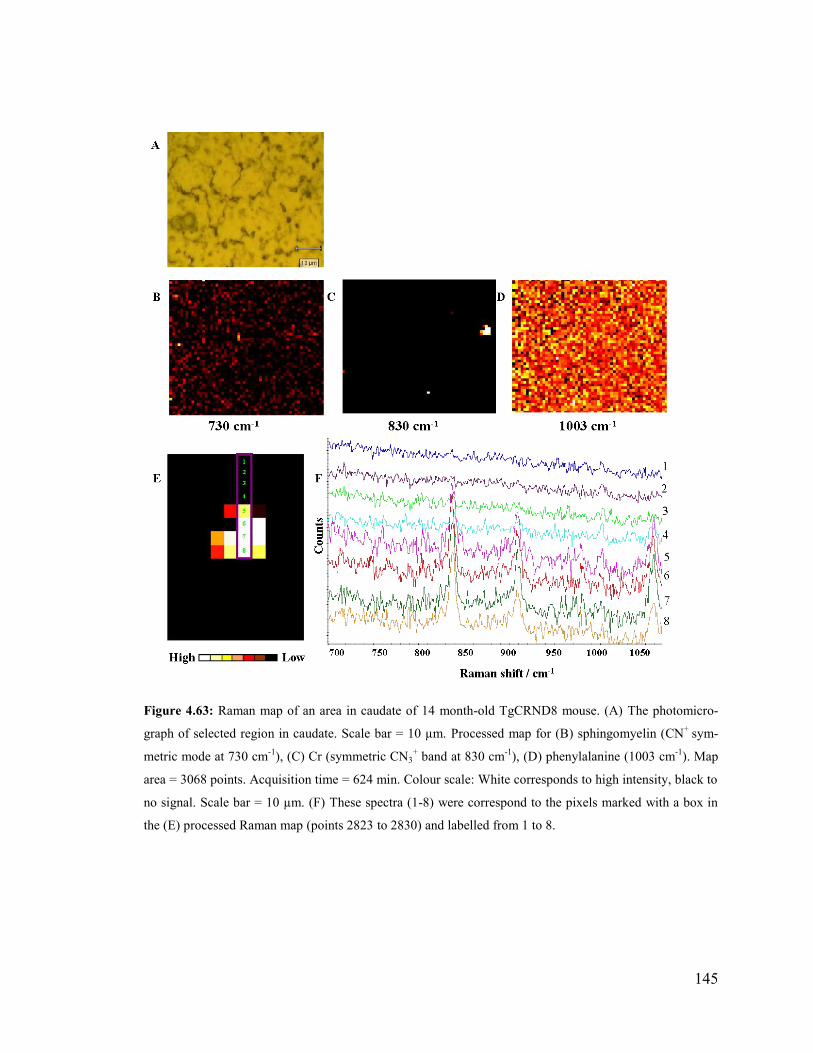
145
Figure 4.63: Raman map of an area in caudate of 14 month-old TgCRND8 mouse. (A) The photomicro-
graph of selected region in caudate. Scale bar = 10 µm. Processed map for (B) sphingomyelin (CN+
sym-
metric mode at 730 cm-1
), (C) Cr (symmetric CN3+ band at 830 cm
-1), (D) phenylalanine (1003 cm
-1). Map
area = 3068 points. Acquisition time = 624 min. Colour scale: White corresponds to high intensity, black to
no signal. Scale bar = 10 µm. (F) These spectra (1-8) were correspond to the pixels marked with a box in
the (E) processed Raman map (points 2823 to 2830) and labelled from 1 to 8.
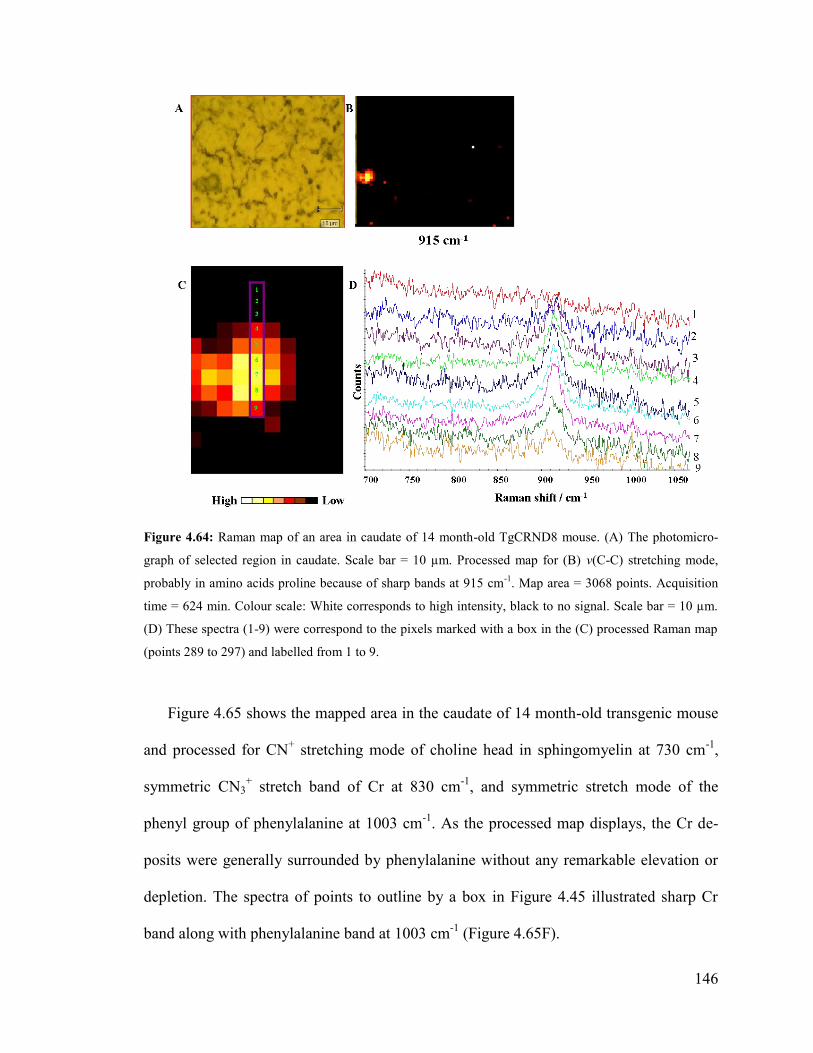
146
Figure 4.64: Raman map of an area in caudate of 14 month-old TgCRND8 mouse. (A) The photomicro-
graph of selected region in caudate. Scale bar = 10 µm. Processed map for (B) ν(C-C) stretching mode,
probably in amino acids proline because of sharp bands at 915 cm-1
. Map area = 3068 points. Acquisition
time = 624 min. Colour scale: White corresponds to high intensity, black to no signal. Scale bar = 10 µm.
(D) These spectra (1-9) were correspond to the pixels marked with a box in the (C) processed Raman map
(points 289 to 297) and labelled from 1 to 9.
Figure 4.65 shows the mapped area in the caudate of 14 month-old transgenic mouse
and processed for CN+ stretching mode of choline head in sphingomyelin at 730 cm
-1,
symmetric CN3+ stretch band of Cr at 830 cm
-1, and symmetric stretch mode of the
phenyl group of phenylalanine at 1003 cm-1
. As the processed map displays, the Cr de-
posits were generally surrounded by phenylalanine without any remarkable elevation or
depletion. The spectra of points to outline by a box in Figure 4.45 illustrated sharp Cr
band along with phenylalanine band at 1003 cm-1
(Figure 4.65F).
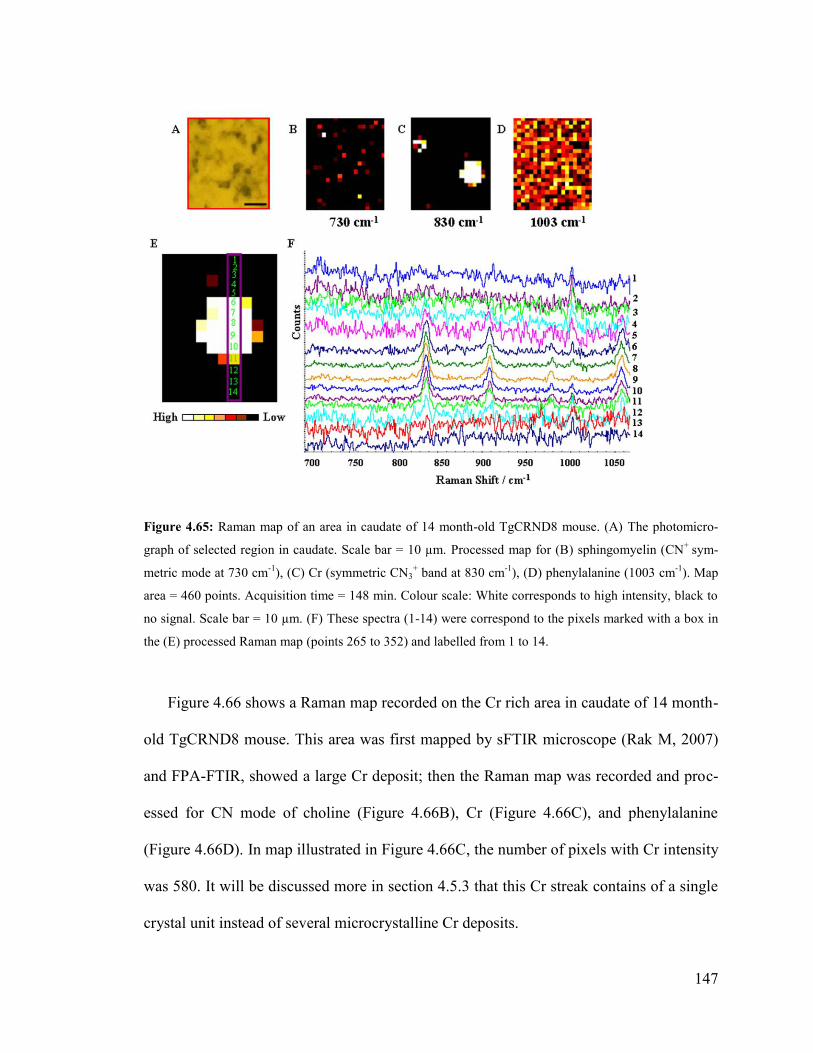
147
Figure 4.65: Raman map of an area in caudate of 14 month-old TgCRND8 mouse. (A) The photomicro-
graph of selected region in caudate. Scale bar = 10 µm. Processed map for (B) sphingomyelin (CN+
sym-
metric mode at 730 cm-1
), (C) Cr (symmetric CN3+ band at 830 cm
-1), (D) phenylalanine (1003 cm
-1). Map
area = 460 points. Acquisition time = 148 min. Colour scale: White corresponds to high intensity, black to
no signal. Scale bar = 10 µm. (F) These spectra (1-14) were correspond to the pixels marked with a box in
the (E) processed Raman map (points 265 to 352) and labelled from 1 to 14.
Figure 4.66 shows a Raman map recorded on the Cr rich area in caudate of 14 month-
old TgCRND8 mouse. This area was first mapped by sFTIR microscope (Rak M, 2007)
and FPA-FTIR, showed a large Cr deposit; then the Raman map was recorded and proc-
essed for CN mode of choline (Figure 4.66B), Cr (Figure 4.66C), and phenylalanine
(Figure 4.66D). In map illustrated in Figure 4.66C, the number of pixels with Cr intensity
was 580. It will be discussed more in section 4.5.3 that this Cr streak contains of a single
crystal unit instead of several microcrystalline Cr deposits.
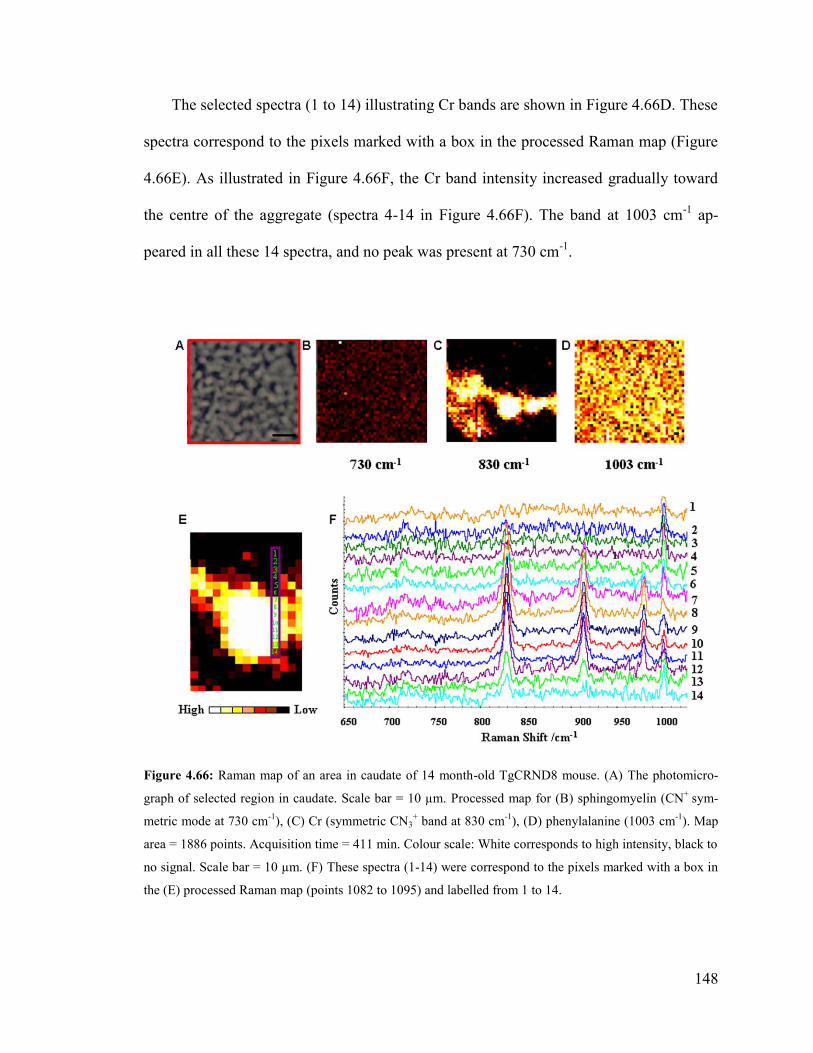
148
The selected spectra (1 to 14) illustrating Cr bands are shown in Figure 4.66D. These
spectra correspond to the pixels marked with a box in the processed Raman map (Figure
4.66E). As illustrated in Figure 4.66F, the Cr band intensity increased gradually toward
the centre of the aggregate (spectra 4-14 in Figure 4.66F). The band at 1003 cm-1
ap-
peared in all these 14 spectra, and no peak was present at 730 cm-1
.
Figure 4.66: Raman map of an area in caudate of 14 month-old TgCRND8 mouse. (A) The photomicro-
graph of selected region in caudate. Scale bar = 10 µm. Processed map for (B) sphingomyelin (CN+
sym-
metric mode at 730 cm-1
), (C) Cr (symmetric CN3+ band at 830 cm
-1), (D) phenylalanine (1003 cm
-1). Map
area = 1886 points. Acquisition time = 411 min. Colour scale: White corresponds to high intensity, black to
no signal. Scale bar = 10 µm. (F) These spectra (1-14) were correspond to the pixels marked with a box in
the (E) processed Raman map (points 1082 to 1095) and labelled from 1 to 14.
149
4.5 Creatine crystal orientation effect
From the IR spectra collected at SRC, it was discovered by Veena Agrawal (summer
student in Dr. Gough’s lab) that those creatine spectra taken by synchrotron FT-IR spec-
tromicroscopy gave different spectrum for various deposits.
Because the spectral markers were critical to identifying tissue components, a com-
bined theoretical (collaboration with Fatemeh FarazKhorasani, graduate student in Dr.
Gough’s group) and experimental study was undertaken to better evaluate Cr crystal ori-
entation in brain tissue. The combination of theoretical and experimental helped us make
better interpretation of the experimental data.
After Cr monohydrate crystal prepared, the sFTIR spectra of three crystals in hori-
zontal, 45° and vertical orientation (Figure 4.67A) were recorded across a spectral range
of 2000 to 900 cm-1
on a Nicolet Magna 550 FTIR with Continuum microscope. The data
collection was performed by Dr. Gough at SRC, University of Wisconsin (Madison, WI,
USA, 2007).
As Figure 4.67C shows, the spectrum of horizontal Cr monohydrate crystal (red spec-
trum) reveals that the peak at 1405 cm-1
was present very strong, but the two other Cr
peaks (1305, 1394 cm-1
) were totally disappeared. In the spectrum of pure Cr crystal at
45°, the peak at 1405 cm-1
was part of a doublet, with the second peak at a lower fre-
quency of 1394 cm-1
and the peak at 1305 cm-1
was also strong (Figure 4.67C; green
spectrum). However the spectrum obtained from a vertical Cr monohydrate crystal taken
by sFTIR displays strong peak at 1305 cm-1
which is usually very distinct Cr peak from
surrounding tissue. This peak was identified along with other peak at 1394 cm-1
and a
small peak at 1422 cm-1
while the peak at 1405 cm-1
was not present (Figure 4.67C; blue

150
spectrum). This phenomenon is due to creatine deposits of different orientations interact-
ing in the different ways with the polarized light of synchrotron.
Figure 4.67: Creatine crystal with different orientation interact in the different ways with the polarized
synchrotron light. (A) Pure creatine crystals prepared on gold coated silicon slide. a) Horizontal, b) 45°,
and c) vertical crystal. (B) sFTIR spectra of horizontal crystals (red spectrum), 45° (green spectrum), and
vertical (blue spectrum) taken by synchrotron light source with 512 san number between 2000-900 cm-1
and
(C) Enlarged sFTIR between 1500-1200 cm-1
region. Data collection was performed by Dr. Gough at SRC,
University of Wisconsin (2007).
151
4.5.1 Reprocessed previous sFTIR maps of serial sections
Previously, depth profiling of serial sections was undertaken in an effort to better
characterize the creatine deposits and their distribution through the hippocampus of
TgCRND8 mouse (Gallant, 2007). These maps were acquired across the hippocampus of
each section using the Nicolet Continuum IR microscope at the Synchrotron Radiation
Centre in Wisconsin and were processed for creatine at 1305 cm-1
(Figure 4.68 E,F,G,H)
by Megan Gallant (former graduate student in Dr. Gough’s lab). Meanwhile, it was dis-
covered by Veena Agrawal (a summer student in Dr. Gough’s group, 2007-2008) that
creatine spectra taken by synchrotron FTIR spectromicroscopy gave different spectra for
various deposits. Since the spectral markers were critical to identifying tissue compo-
nents, these maps were reprocessed with Omnic/Atlμs software. The absorbance level at
1412 cm-1
and 1380 cm-1
were set as baseline values and the peak between 1408-1384
cm-1
was measured (Figure 4.68 I,J,K,L). The colors ranging from blue (low) to red
(high) were assigned to display the distribution of creatine peaks on a colour scale. As
shown in Figure 4.68 I,J,K,L, several horizontal deposits were appeared after reprocess-
ing maps at 1408-1384 cm-1
that were not represented in maps processed at 1305 cm-1
.
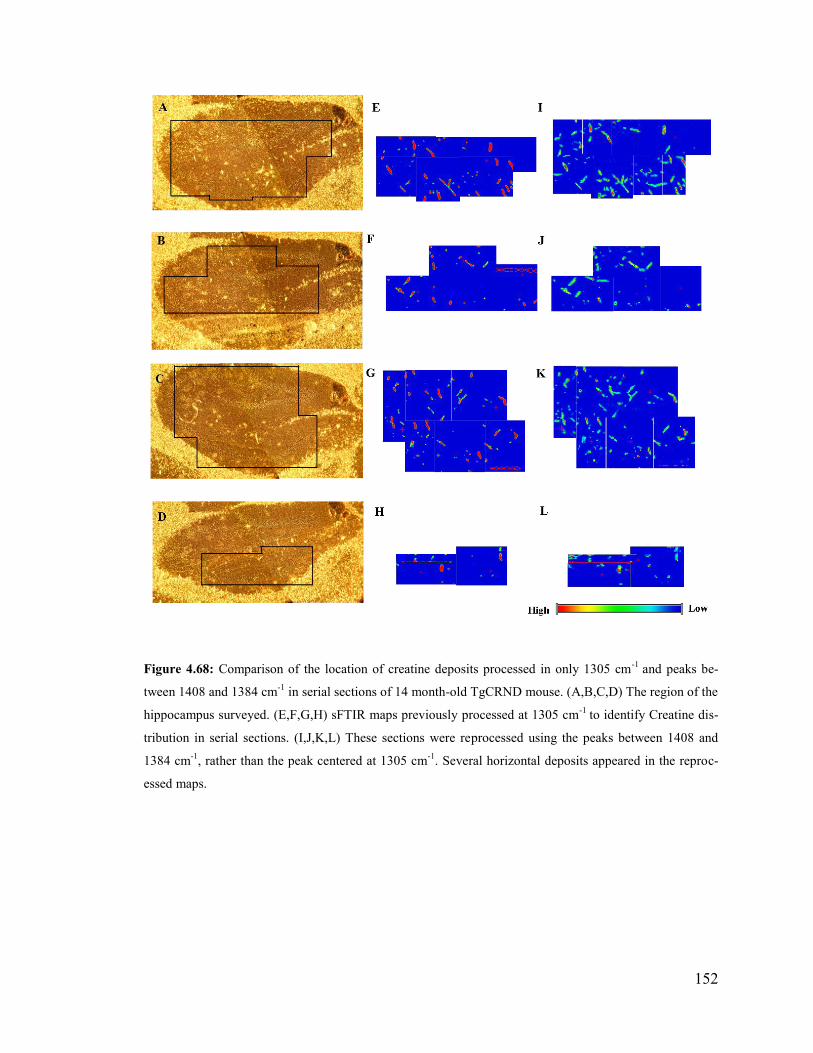
152
Figure 4.68: Comparison of the location of creatine deposits processed in only 1305 cm-1
and peaks be-
tween 1408 and 1384 cm-1
in serial sections of 14 month-old TgCRND mouse. (A,B,C,D) The region of the
hippocampus surveyed. (E,F,G,H) sFTIR maps previously processed at 1305 cm-1
to identify Creatine dis-
tribution in serial sections. (I,J,K,L) These sections were reprocessed using the peaks between 1408 and
1384 cm-1
, rather than the peak centered at 1305 cm-1
. Several horizontal deposits appeared in the reproc-
essed maps.
153
Figure 4.69 shows the spectra from two points (A,B) in the synchrotron map (line
green and aqua) and FPA map (blue and red) taken by Alex Kuzyk (summer student in
Dr. Gough’s lab). As illustrated in this Figure, spectrum A1 which related to vertical Cr
deposit shows the strong peaks at 1305, 1395 cm-1
; while, spectrum B2 displays these two
peaks were disappeared and only a strong band at 1405 was present. The spectra of the
same points recorded by FPA-FTIR microscope shows that all Cr peaks at 1305, 1394
and 1405 cm-1
were appeared since the globar light is not polarized. These spectra clearly
shows the effect of synchrotron polarized light on Cr crystal orientation.
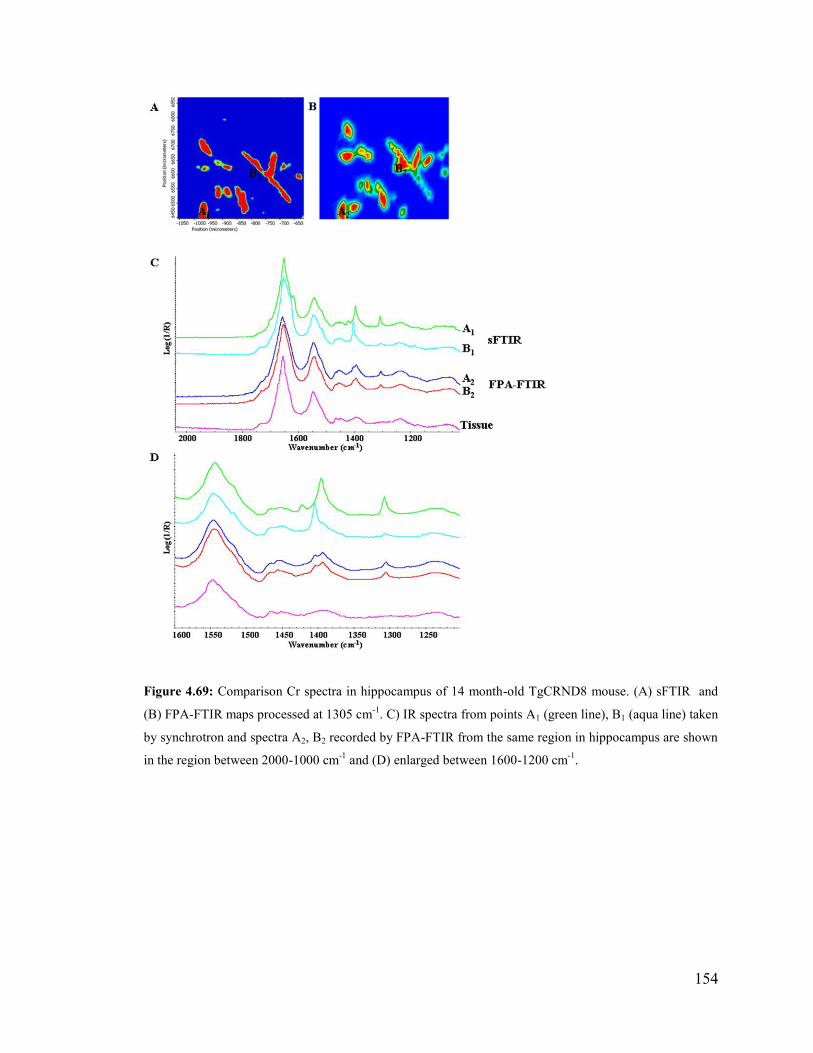
154
Figure 4.69: Comparison Cr spectra in hippocampus of 14 month-old TgCRND8 mouse. (A) sFTIR and
(B) FPA-FTIR maps processed at 1305 cm-1
. C) IR spectra from points A1 (green line), B1 (aqua line) taken
by synchrotron and spectra A2, B2 recorded by FPA-FTIR from the same region in hippocampus are shown
in the region between 2000-1000 cm-1
and (D) enlarged between 1600-1200 cm-1
.
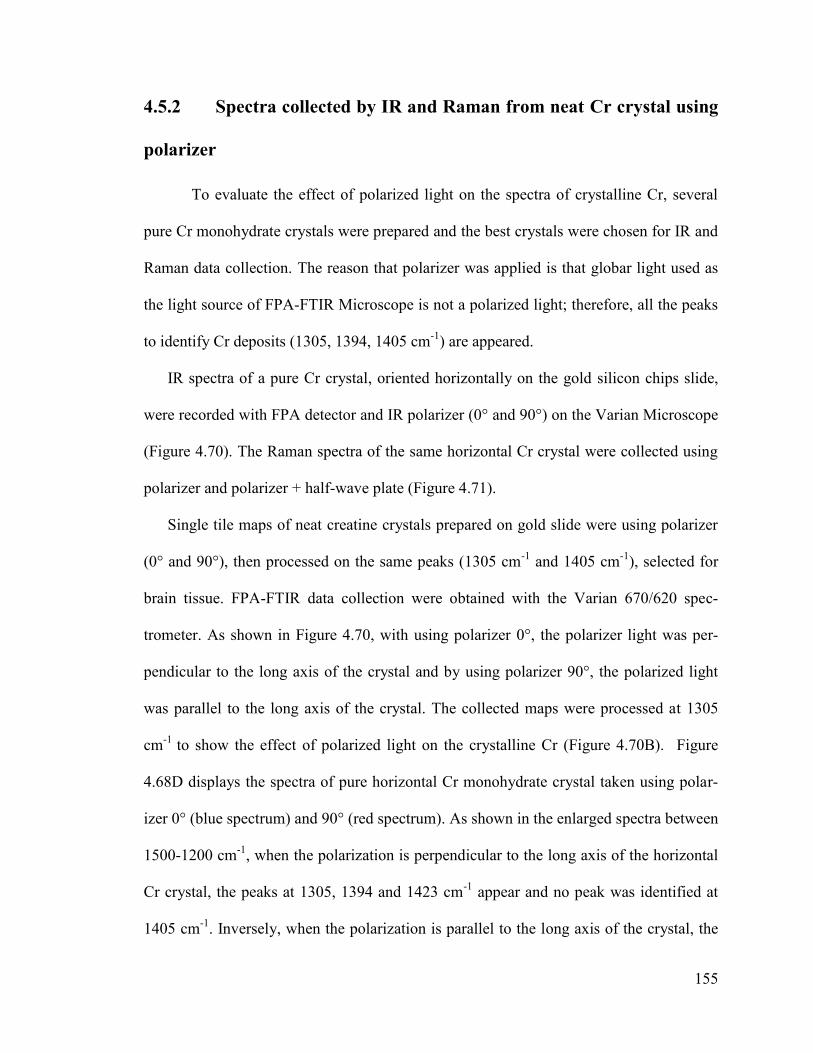
155
4.5.2 Spectra collected by IR and Raman from neat Cr crystal using
polarizer
To evaluate the effect of polarized light on the spectra of crystalline Cr, several
pure Cr monohydrate crystals were prepared and the best crystals were chosen for IR and
Raman data collection. The reason that polarizer was applied is that globar light used as
the light source of FPA-FTIR Microscope is not a polarized light; therefore, all the peaks
to identify Cr deposits (1305, 1394, 1405 cm-1
) are appeared.
IR spectra of a pure Cr crystal, oriented horizontally on the gold silicon chips slide,
were recorded with FPA detector and IR polarizer (0° and 90°) on the Varian Microscope
(Figure 4.70). The Raman spectra of the same horizontal Cr crystal were collected using
polarizer and polarizer + half-wave plate (Figure 4.71).
Single tile maps of neat creatine crystals prepared on gold slide were using polarizer
(0° and 90°), then processed on the same peaks (1305 cm-1
and 1405 cm-1
), selected for
brain tissue. FPA-FTIR data collection were obtained with the Varian 670/620 spec-
trometer. As shown in Figure 4.70, with using polarizer 0°, the polarizer light was per-
pendicular to the long axis of the crystal and by using polarizer 90°, the polarized light
was parallel to the long axis of the crystal. The collected maps were processed at 1305
cm-1
to show the effect of polarized light on the crystalline Cr (Figure 4.70B). Figure
4.68D displays the spectra of pure horizontal Cr monohydrate crystal taken using polar-
izer 0° (blue spectrum) and 90° (red spectrum). As shown in the enlarged spectra between
1500-1200 cm-1
, when the polarization is perpendicular to the long axis of the horizontal
Cr crystal, the peaks at 1305, 1394 and 1423 cm-1
appear and no peak was identified at
1405 cm-1
. Inversely, when the polarization is parallel to the long axis of the crystal, the
156
peak at 1405 and 1447 cm-1
were present. This result compared to the spectra taken at
SRC from different Cr crystal orientation (Figure 4.67). The spectra obtained by using
polarizer 0° on horizontal Cr crystal was exactly like the spectra of vertical pure Cr crys-
tals taken by sFTIR Microscope and the spectra taken with using polarizer 90° was re-
semble to the spectra of horizontal pure Cr crystals taken by sFTIR Microscope. This
similarity on the spectral behaviour could point that the the collected synchrotron radia-
tion has more horizontal polarization.
Figure 4.70: IR spectra of pure horizontal Cr crystal taken by FPA-FTIR Microscope. (A) The surveyed
region of the pure Cr monohydrate crystal mounted on gold silicon chips slide. (B) Processed map at 1305
cm-1
and 1405 cm-1
. (C) IR spectra of pure Cr crystal taken by using polarizer at 0° (blue spectrum) and 90°
(red spectrum) in the region between 4000-900 cm-1
, and (D) enlarged between 1500-1200 cm-1
.
157
Raman spectra of a small point of the same neat horizontal Cr monohydrate crystal
outline in Figure 4.71A were recorded across a spectral range of 200-2000 cm-1
and de-
tected by charge-coupled device (CCD). These spectra of pure Cr crystal were recorded
with a polarizer and polarizer + half-wave plate. As displayed in Figure. 4.67C, the band
at 830 cm-1
was very sharp in both Raman spectra taken with the polarizer (blue spec-
trum), and using polarizer & half-wave plate; therefore, the difference is between inten-
sity of peak area at 912, 982, and 1054 cm-1
. As mentioned, in Raman spectrum, the band
830 cm-1
was selected for identification of Cr distribution. This band was always very
strong, but as displayed in Figure 4.71C, the relative intensities of bands at 912, 982, and
1054 cm-1
were stronger with polarizer & half-wave plate compared to using polarizer.
As with FT-IR, the selection rules for the polarizability derivatives govern the modes that
will be active relative to the polarized laser light. The polarizability is defined as how
easily the electron cloud becomes distorted. As the vectors P and E are not along one co-
ordinate axis, the polarizability shown by polarizability tensor (α). The Raman intensity
is related to the changes in the derivative of the polarizability tensor for each mode and
these derivatives can be significantly large in different direction. This is the reason why
all the Cr identified bands can be observed even by using polarizer and polarizer + half-
wave plate. To get the effect of polarized light, all the data on brain tissue were recorded
using FPA-FTIR microscope with polarizer through a wide range of angles.

158
Figure 4.71: Raman spectra of pure horizontal Cr monohydrate crystal taken by Renishaw InVia Raman
Microscope. (A) The surveyed region of the pure horizontal Cr monohydrate crystal mounted on gold sili-
con chips slide. (B) Raman spectra of pure horizontal Cr crystal taken by using polarizer (blue spectrum)
and polarizer & half-wave plate (red spectrum) in the region between 200-2000 cm-1
, and (C) enlarged be-
tween 800-1100 cm-1
.

159
4.5.3 Maps collected by IR Microscope in different brain tissue re-
gions using polarizer
To evaluate Cr crystal orientation and explore whether Cr deposits in brain tissue are
composed of microcrystalline Cr deposits or a unit single crystal, single tile maps in cau-
date and hippocampus regions of 14 months-old transgenic mouse were recorded with the
Varian FTIR microscope.
Figure 4.72 presents the caudate of 14 month-old transgenic mouse mapped with a 64
x 64 Focal Plane Array detector, at a range of polarizer angles from 0° to 180°, at 10° in-
tervals. 19 maps were acquired with polarizer and one without polarizer. It took 7 min to
collect each map with 128 scan number. FPA detector covered the IR spectral range from
4000 to 900 cm-1
at 4 cm-1
spectral resolution. All spectra were taken in reflection mode
using Happ-Genzel apodization function.
For each of the maps, the background was taken with the same parameters and also
same polarizer angle was applied. All data were processed with specific focus on peaks
at 1305 cm-1
and 1405 cm-1
, as these exhibited extreme polarization effects and had less
overlap with tissue bands compared to other Cr peaks.
As displayed in Figure 4.72C, the processed map at 1305 cm-1
shows that the Cr signal
for Cr streak (a), located on the left bottom side of mapped area, was weak at 0° and
started being strong at around 60° and gradually by increasing the polarizer angle started
being weak again till for polarizer set at 150° disappeared, then at higher polarization of
incident radiation, it started to appear again (Figure 4.72C).Conversely, the processed
160
map at 1405 cm-1
showed the Cr signal disappeared by applying 60° polarizer and was
strong at around 150° (Figure 4.73C). As illustrated in Figure 4.70C, the processed map
at 1305 cm-1
shows the Cr signal for Cr streak (b) increased from 0° to around 40° and
extinguished at around 130° and then appeared again by utilizing higher polarizer angle
(Figure 4.72C). Like to first Cr deposit, The Cr signal was inverse when the maps were
processed at 1405 cm-1
(Figure 4.73C). This on and off in the Cr signal shows the orienta-
tion dependence of Cr crystal.
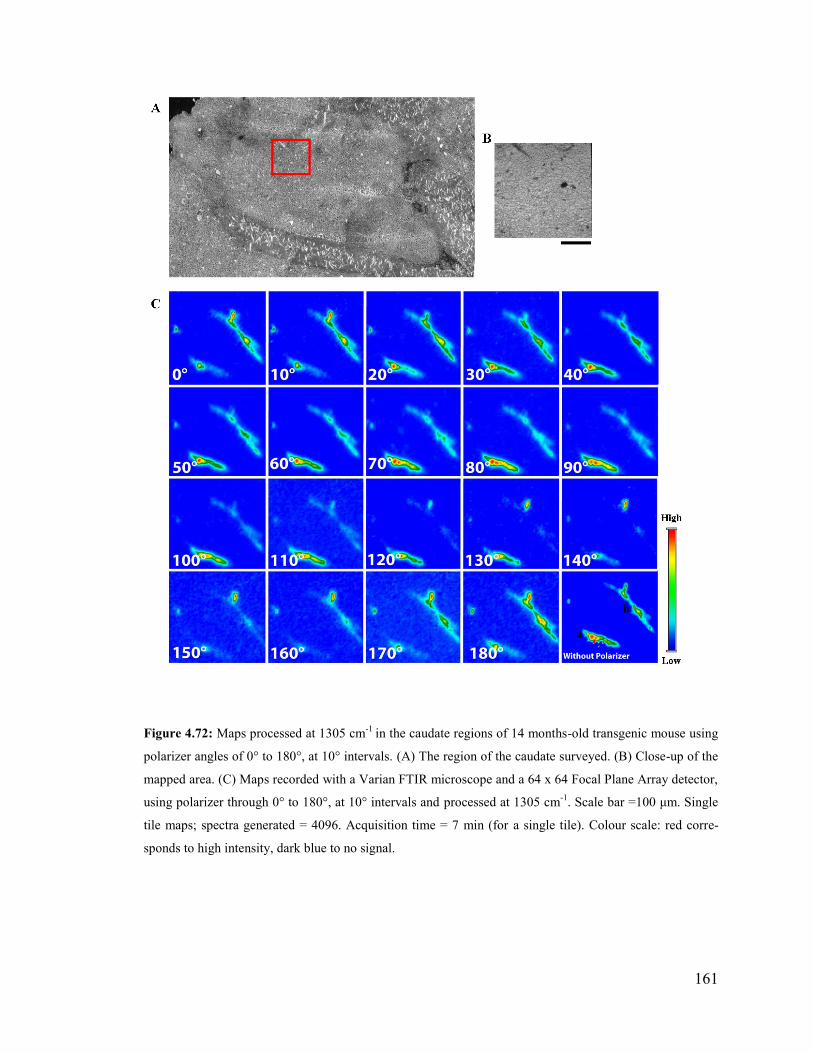
161
Figure 4.72: Maps processed at 1305 cm-1
in the caudate regions of 14 months-old transgenic mouse using
polarizer angles of 0° to 180°, at 10° intervals. (A) The region of the caudate surveyed. (B) Close-up of the
mapped area. (C) Maps recorded with a Varian FTIR microscope and a 64 x 64 Focal Plane Array detector,
using polarizer through 0° to 180°, at 10° intervals and processed at 1305 cm-1
. Scale bar =100 μm. Single
tile maps; spectra generated = 4096. Acquisition time = 7 min (for a single tile). Colour scale: red corre-
sponds to high intensity, dark blue to no signal.
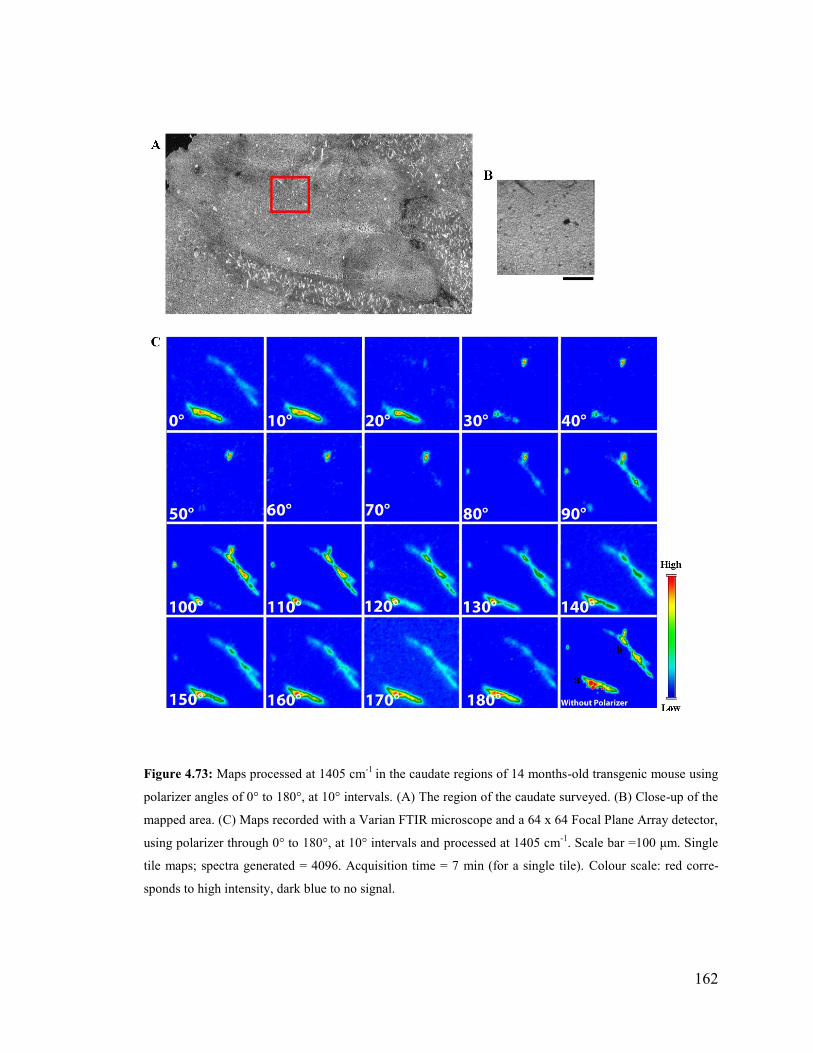
162
Figure 4.73: Maps processed at 1405 cm-1
in the caudate regions of 14 months-old transgenic mouse using
polarizer angles of 0° to 180°, at 10° intervals. (A) The region of the caudate surveyed. (B) Close-up of the
mapped area. (C) Maps recorded with a Varian FTIR microscope and a 64 x 64 Focal Plane Array detector,
using polarizer through 0° to 180°, at 10° intervals and processed at 1405 cm-1
. Scale bar =100 μm. Single
tile maps; spectra generated = 4096. Acquisition time = 7 min (for a single tile). Colour scale: red corre-
sponds to high intensity, dark blue to no signal.
163
In the next step, the spectra of different points on the Cr streak (a,b) were examined
by Varian Resolution-Pro software through the range of polarizer angles. Figures 4.74,
4.73 show the absorption intensity versus the polarization angle processed at 1305 and
1405 cm-1
for these two Cr streaks mapped by FPA-FTIR Microscope.
As presented in Figure 4.74, the intensity of four points marked in the Cr streak (a)
has its maximum around 40° and gets to its minimum around 130° when analyzed at
1305 cm-1
(Figure 4.74C), while the intensity at 1405 has its minimum around 40° and
gets to its maximum around 130° (Figure 4.74D).
As shown in Figure 4.75, five points in Cr streak (b) were chosen and the absorption
intensity versus the polarization angle was probed for processed maps at 1305 and 1405
cm-1
. It can be seen that the intensity at 1305 cm-1
has its maximum around 60° and gets
to its minimum around 150° (Figure 4.75C). In contrast, the intensity at 1405 cm-1
has its
minimum around 60° and gets to its maximum around 150° (Figure 4.75D).
The same maximum and minimum intensity was obtained for examined points on
each Cr streak. It shows that the along a Cr streak, the orientation dependency are similar
and hence these points belong to a single crystal instead of composing several microcrys-
talline Cr crystal deposits.

164
Figure 4.74: The absorption intensity versus polarization angle in the mapped caudate region. (A) Proc-
essed map of 14 month-old TgCRND8 mouse. (B) Close-up to indicate four points in Cr streak (a). The ab-
sorption intensity versus polarization angle to compare the processed map at (C) 1305 cm-1
and (D) 1405
cm-1
. The intensity at 1305 cm-1
has its maximum around 40° and gets to minimum around 130°, while the
intensity at 1405 cm-1
has its minimum around 40° and gets to maximum around 130°.
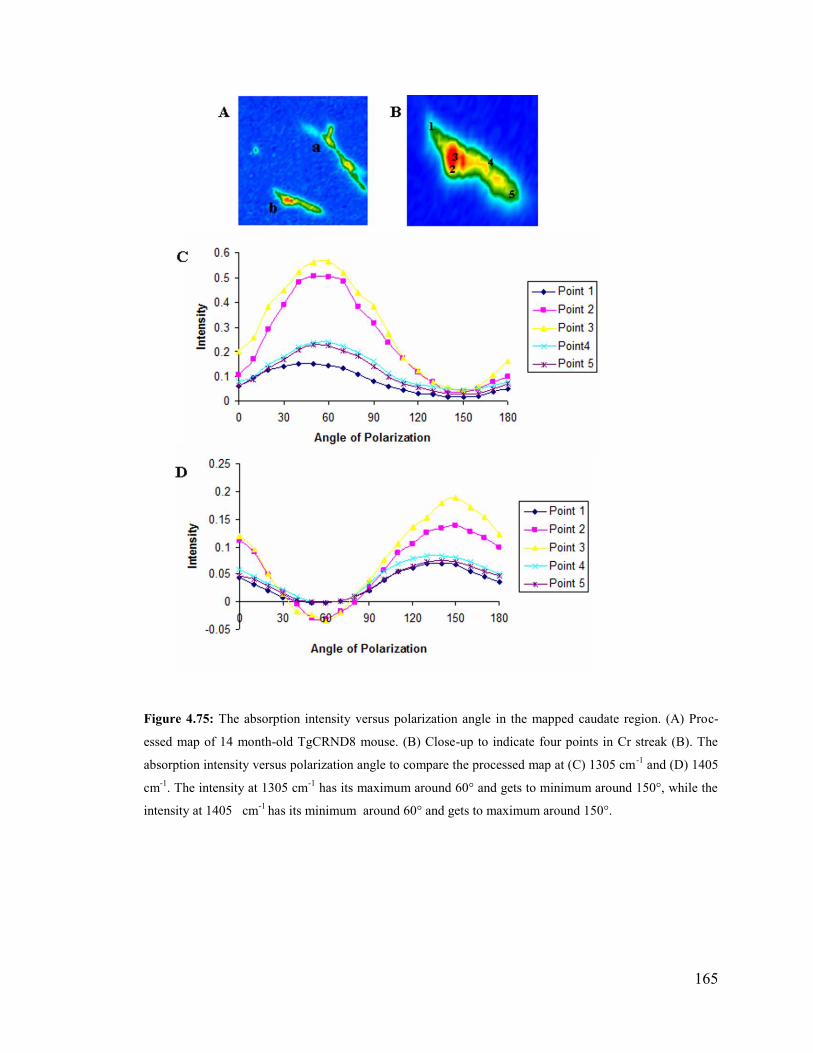
165
Figure 4.75: The absorption intensity versus polarization angle in the mapped caudate region. (A) Proc-
essed map of 14 month-old TgCRND8 mouse. (B) Close-up to indicate four points in Cr streak (B). The
absorption intensity versus polarization angle to compare the processed map at (C) 1305 cm-1
and (D) 1405
cm-1
. The intensity at 1305 cm-1
has its maximum around 60° and gets to minimum around 150°, while the
intensity at 1405 cm-1
has its minimum around 60° and gets to maximum around 150°.
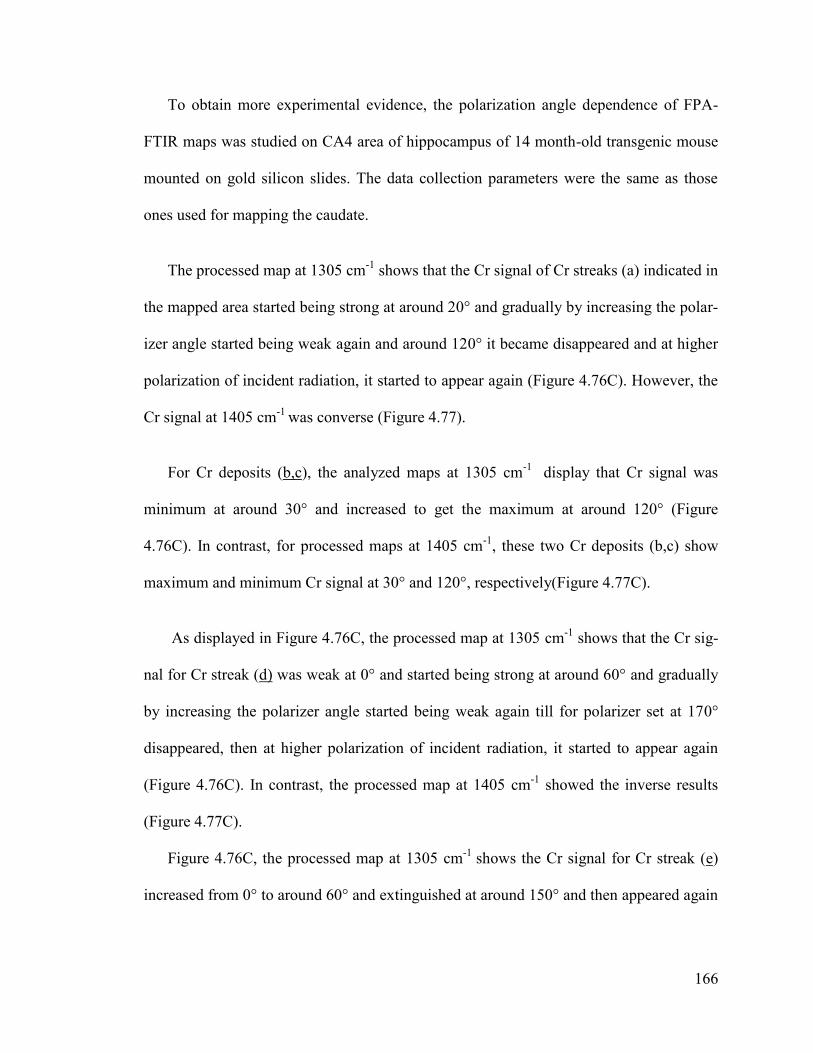
166
To obtain more experimental evidence, the polarization angle dependence of FPA-
FTIR maps was studied on CA4 area of hippocampus of 14 month-old transgenic mouse
mounted on gold silicon slides. The data collection parameters were the same as those
ones used for mapping the caudate.
The processed map at 1305 cm-1
shows that the Cr signal of Cr streaks (a) indicated in
the mapped area started being strong at around 20° and gradually by increasing the polar-
izer angle started being weak again and around 120° it became disappeared and at higher
polarization of incident radiation, it started to appear again (Figure 4.76C). However, the
Cr signal at 1405 cm-1
was converse (Figure 4.77).
For Cr deposits (b,c), the analyzed maps at 1305 cm-1
display that Cr signal was
minimum at around 30° and increased to get the maximum at around 120° (Figure
4.76C). In contrast, for processed maps at 1405 cm-1
, these two Cr deposits (b,c) show
maximum and minimum Cr signal at 30° and 120°, respectively(Figure 4.77C).
As displayed in Figure 4.76C, the processed map at 1305 cm-1
shows that the Cr sig-
nal for Cr streak (d) was weak at 0° and started being strong at around 60° and gradually
by increasing the polarizer angle started being weak again till for polarizer set at 170°
disappeared, then at higher polarization of incident radiation, it started to appear again
(Figure 4.76C). In contrast, the processed map at 1405 cm-1
showed the inverse results
(Figure 4.77C).
Figure 4.76C, the processed map at 1305 cm-1
shows the Cr signal for Cr streak (e)
increased from 0° to around 60° and extinguished at around 150° and then appeared again

167
by utilizing higher polarizer angle. Like the other Cr deposits, the Cr signal was converse
when the maps were processed at 1405 cm-1
(Figure 4.77C).
Figure 4.76: Maps processed at 1305 cm-1
in the hippocampus regions of 14 months-old transgenic mouse
using polarizer angles of 0° to 180°, at 10° intervals. (A) The region of the hippocampus surveyed. (B)
Close-up of the mapped area. (C) Maps recorded with a Varian FTIR microscope and a 64 x 64 Focal Plane
Array detector, using polarizer angles of 0° to 180°, at 10° intervals and processed at 1305 cm-1
. Scale bar
=100 μm. Single tile maps; spectra generated = 4096. Acquisition time = 7 min (for a single tile map). Col-
our scale: red corresponds to high intensity, dark blue to no signal.

168
Figure 4.77: Maps processed at 1405 cm-1
in the hippocampus regions of 14 months-old transgenic mouse
using polarizer angles of 0° to 180°, at 10° intervals. (A) The region of the hippocampus surveyed. (B)
Close-up of the mapped area. (C) Maps recorded with a Varian FTIR microscope and a 64 x 64 Focal Plane
Array detector, using polarizer angles of 0° to 180°, at 10° intervals and processed at 1405 cm-1
. Scale bar
=100 μm. Multiple mosaic map area = 5 x5. Spectra generated = 4096. Acquisition time = 7 min (for a sin-
gle tile map). Colour scale: red corresponds to high intensity, dark blue to no signal.

169
Like maps taken on caudate region, the spectra of different points located on various
Cr streak (a, b, c, d, e) were examined through the range of polarizer angles 0° to 180° at
a step of 10° (Figure 4.78-82).
Figure 4.78 shows the absorption intensity versus the polarization angle processed at
1305 and 1405 cm-1
for three different points marked on mapped Cr deposit (a). It can be
seen that the intensity at 1305 cm-1
has its maximum around 20° and gets to its minimum
around 120° (Figure 4.78C), while the intensity at 1405 cm-1
has its minimum around 20°
and gets to its maximum around 120° (Figure 4.78D).
As shown in Figure 4.79, 4.80 three points in each Cr streak (b,c) were chosen and
the absorption intensity versus the polarization angle were probed for processed maps at
1305 and 1405 cm-1
. It can be seen that the intensity at 1305 cm-1
has its minimum at
around 30° and gets to its maximum around 120° (Figure 4.79, 4.80C). In contrast, the
intensity at 1405 cm-1
has its maximum around 30° and gets to its maximum around 120°
(Figure 4.79, 4.80D).
Figure 4.81C shows the intensity for Cr deposit (d) which was processed at 1305 cm-1
was got maximum at around 80° and minimum at around 170°. The intensity obtained
from three points in Cr streak (d) processed at 1405 got the highest amount at 170° and
lowest amount at 80° (Figure 4.81D).
Figure 4.82C shows the intensity versus angle of polarization for three points marked
on Cr deposit (e). The processed map at 1305 cm-1
shows the highest intensity at around
60° and lowest intensity at around 150° (Figure 4.82D). By processing at 1405 cm-1
, the
maximum and minimum intensity was at 60° and 150°, respectively (Figure 4.82D).
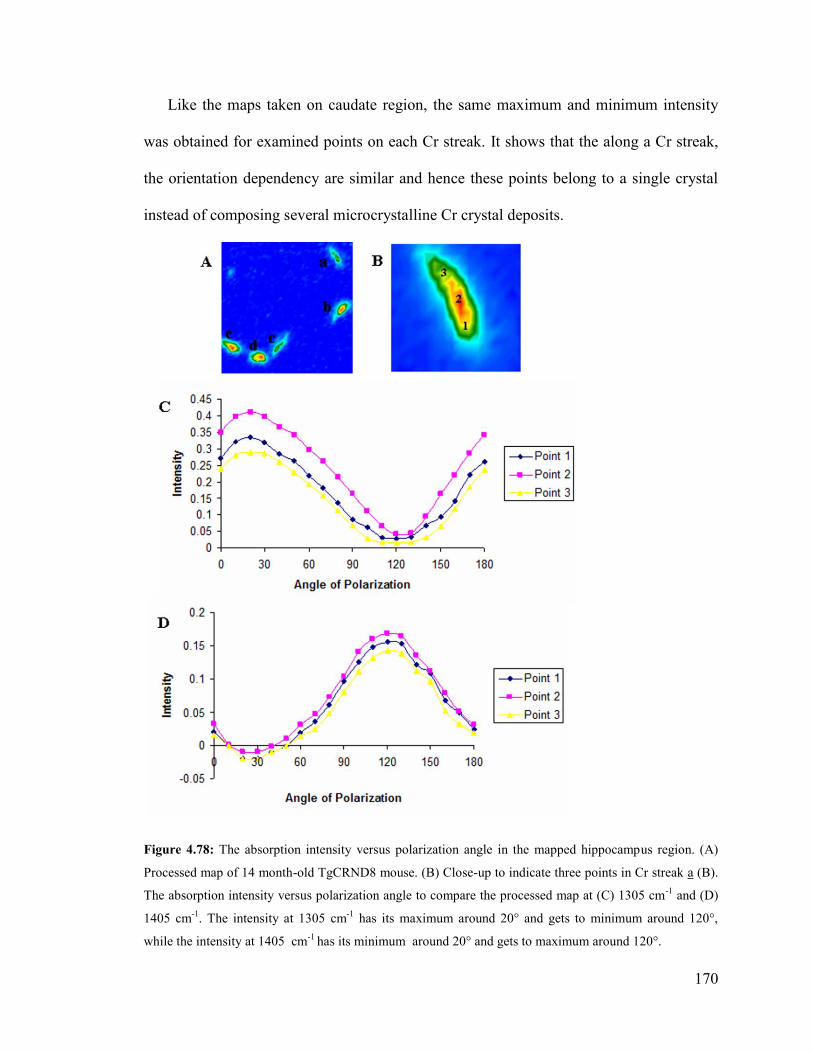
170
Like the maps taken on caudate region, the same maximum and minimum intensity
was obtained for examined points on each Cr streak. It shows that the along a Cr streak,
the orientation dependency are similar and hence these points belong to a single crystal
instead of composing several microcrystalline Cr crystal deposits.
Figure 4.78: The absorption intensity versus polarization angle in the mapped hippocampus region. (A)
Processed map of 14 month-old TgCRND8 mouse. (B) Close-up to indicate three points in Cr streak a (B).
The absorption intensity versus polarization angle to compare the processed map at (C) 1305 cm-1
and (D)
1405 cm-1
. The intensity at 1305 cm-1
has its maximum around 20° and gets to minimum around 120°,
while the intensity at 1405 cm-1
has its minimum around 20° and gets to maximum around 120°.

171
Figure 4.79: The absorption intensity versus polarization angle in the mapped hippocampus region. (A)
Processed map of 14 month-old TgCRND8 mouse. (B) Close-up to indicate four points in Cr streak b (B).
The absorption intensity versus polarization angle to compare the processed map at (C) 1305 cm-1
and (D)
1405 cm-1
. The intensity at 1305 cm-1
has its maximum around 120° and gets to minimum around 30°,
while the intensity at 1405 cm-1
has its minimum around 120° and gets to maximum around 30°.
172
Figure 4.80: The absorption intensity versus polarization angle in the mapped hippocampus region. (A)
Processed map of 14 month-old TgCRND8 mouse. (B) Close-up to indicate four points in Cr streak c (B).
The absorption intensity versus polarization angle to compare the processed map at (C) 1305 cm-1
and (D)
1405 cm-1
. The intensity at 1305 cm-1
has its maximum around 30° and gets to minimum around 120°,
while the intensity at 1405 cm-1
has its minimum around 120° and gets to maximum around 30°.
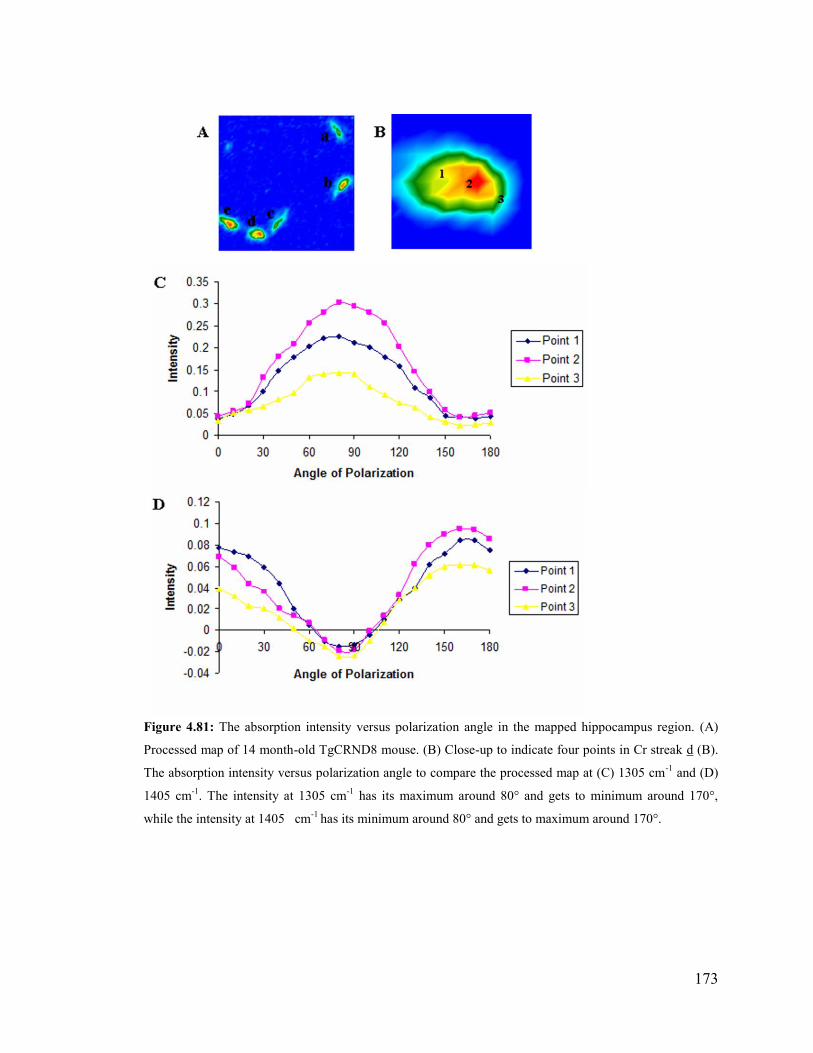
173
Figure 4.81: The absorption intensity versus polarization angle in the mapped hippocampus region. (A)
Processed map of 14 month-old TgCRND8 mouse. (B) Close-up to indicate four points in Cr streak d (B).
The absorption intensity versus polarization angle to compare the processed map at (C) 1305 cm-1
and (D)
1405 cm-1
. The intensity at 1305 cm-1
has its maximum around 80° and gets to minimum around 170°,
while the intensity at 1405 cm-1
has its minimum around 80° and gets to maximum around 170°.

174
Figure 4.82: The absorption intensity versus polarization angle in the mapped hippocampus region. (A)
Processed map of 14 month-old TgCRND8 mouse. (B) Close-up to indicate four points in Cr streak e (B).
The absorption intensity versus polarization angle to compare the processed map at (C) 1305 cm-1
and (D)
1405 cm-1
. The intensity at 1305 cm-1
has its maximum around 60° and gets to minimum around 150°,
while the intensity at 1405 cm-1
has its minimum around 60° and gets to maximum around 150°.
175
Chapter 5.
Discussion
5.1 Questions to be addressed about FTIR and Raman microspec-
troscopy of Tg mice
In this project, two imaging techniques, FTIR and Raman microscopy, were used
to examine Cr deposits and surrounding tissue. The ability to detect Cr deposits and other
biochemical signatures in tissue sections at micron level spatial resolution is specific to
vibrational microspectroscopy of sections as prepared by snap freezing of unfixed tissues,
method employed in this thesis. The reason that all IR and Raman spectra corresponded
to Cr not PCr is that all PCr would be depleted at death, leaving Cr as the only existing
form.
These spectroscopic techniques have some advantages compared to other standard
visualization techniques. For instance, staining methods, commonly used to study tissue
sections, involve various solvent treatments; therefore, small soluble molecules like Cr
would not be detected because of being washed away. Sample preparation for both IR
and Raman methods involves snap freezing of tissue excised at time of animal sacrifice,
176
cryosectioning and then desiccation of the sections; therefore, water is the only compo-
nent removed, and no new components are added. In these techniques, a chemical map
can be created by representing the distribution and intensity of peaks of interest on a
color scale. These techniques are also non-destructive (note that illumination with infra-
red or visible light at very low power does not damage tissue), thus the sections remain
suitable for further analysis such as X-ray fluorescence imaging (XRF) or staining.
FTIR and Raman imaging techniques are compatible; that means the same section
can be mapped by FTIR and then by Raman, repeatedly. The Raman spectra can be ob-
tained at higher spatial resolution (1-2 μm for Raman compared to 5-10 μm for FTIR) by
an order of magnitude; therefore, FPA-FTIR microspectroscopy could be used for large
area surveys to find elevated Cr deposits in hippocampus and caudate regions in order to
do faster data collection and then the smaller areas identified to contain Cr deposits could
be mapped by Raman microscopy to understand any association between creatine depos-
its and any other biochemical signatures, with 1-2 μm spot size.
It has been noted that substantial impairment of energy metabolism in the brains
of patients with AD was found in numerous imaging studies, such as Magnetic Reso-
nance Spectroscopy (MRS) (Mandal, 2008; Mandal, 2007; Morene-Torres et al, 2005).
These studies reported higher variation of the total Cr (PCr and Cr) concentration in the
gray matter than white matter of elderly individuals’ brain. In the living brain, creatine
may be crystalline or soluble and deposits may also be extra- or intracellular. These con-
ditions can not be determined by MRS. One advantage of the MRS technique is that
measurements can be made on living subjects. However, the spatial resolution is quite
177
low (1-8 cm3 for
1H-MRS, and 15-40 cm
3 for
31P-MRS); therefore, this technique does
not offer the spatial resolution provided by IR and Raman microspectroscopy. Several
MRS studies have used total creatine levels as the internal standard when levels of other
metabolites such as glutamate-glutamine complex, and choline are investigated (Godbolt
et al, 2006). So far, the creatine distribution was assumed to be homogeneous, that is
evenly distributed throughout the brain tissue.
Previous members of the Dr. Gough’s group showed the in situ detection of crys-
talline Cr deposits in Tg mouse brain and in post mortem AD brain tissue, by IR mico-
spectroscopy (Kuzyk et al, 2010; Rak, 2007; Gallant, 2007; Gallant et al, 2006).
The principal goal in this thesis was to find clues to the origin of creatine in trans-
genic mouse brain. As the creatine deposits were found in frozen and desiccated brain tis-
sue, it was important to investigate whether these creatine crystals were formed after snap
freezing and desiccation of brain tissue or there is any other possibility like synthesizing
in situ or carrying out cross blood brain barrier (BBB).
Since Cr can be endogenously synthesized in kidney and liver, and carried out
through the blood brain barrier by Cr transporters to get into the brain, blood vessels in
the hippocampus of transgenic mice were analyzed by IR and Raman to discover whether
any co-localization could be found between these Cr deposits and the blood vessels.
Depth profiling data, by analysis of serial sections, was undertaken in an effort to
determine whether any association could be detected between Cr deposits and either
palque or lipid. These maps were analyzed for other spectral markers such sphengomye-
lin, phospholipid, nucleic acids, and phenylalanine to investigate whethere these bio-
chemical signatures were localized with the Cr deposits. Since Raman spectra can be ob-
178
tained at higher spatial resolution (1-2 μm for Raman compared to 5-10 μm for FTIR), all
the depth profile analysis were performed by this spectroscopic technique.
To investigate whether Cr deposits distribute ubiquitously in brain tissue, it is
necessary to collect IR maps from different brain tissue areas. It was shown that (Kuzyk
et al, 2010) creatine was found more abundantly in hippocampus of mouse brain com-
pared to their non-transgenic littermates and increased in size and number with age. In
this thesis, the caudate of Tg and non-Tg mice at different ages were IR mapped, in order
to evaluate whether focally elevated creatine levels detected in the hippocampus of trans-
genic mice are found in other parts of the brain.
To better evaluate Cr crystal structure and orientation, we undertook a combined
theoritical and experimental study into the effect of polarized light on the spectra of crys-
talline Cr in both pure Cr and brain tissue deposits. Vibrational modes and intensities for
both Raman and IR creatine spectra were calculated by density functional theory (DFT).
Pure Cr crystals, prepared on gold silicon chip slide, were analyzed by FPA-FTIR micro-
scope adjusted with polarizer, and by Raman microscope with polarizer and a polarizer+
half wave plate. In order to estimate Cr crystal form, orientation and dimension, several
Cr deposits in hippocampus and caudate of TgCRND8 mouse brain tissue sections were
imaged by FTIR with polarizer, setting from a wide range of angles (0° to 180°).
5.2 Calculation peaks assignment and polarization
The theoritical calculation, density functional theory (DFT), gives both frequency and po-
larization information to make a more detailed interpretation of the Cr spectra.
179
For IR spectra, six modes were calculated to lie in the region of experimental interest
at 1247, 1275, 1321, 1332, 1455, and 1478 cm-1
. The observed 1305 and 1405 cm-1
peaks
might be assigned to CH2 deformation + NH2 rocking and CH3 deformation that appear in
theoritical calculation at 1275 and 1455 cm-1
, respectively (Table 4.3). These two bands
are the most affected bands when polarizer was put into the optical path. The experimen-
tal peak at 1392 cm-1
and 1423 cm-1
and 1448 cm-1
are corresponded to symmetric vibra-
tion of C4O8O9 + CH2 wagging; CH2 deformation + CN stretching, NH2 rocking; CH2
scissoring which can be seen at 1321, 1331 cm-1
, and 1478 cm-1
in the theoretical calcula-
tions, respectively. From the optimized, it was found that the guanidine and carboxylic
portions of creatine monohydrate molecule are nearly perpendecular to each other. This
intrinsic feature of creatine structure may cause the effect of polarized light on the spectra
of crystalline creatine. As explained in section 5.7, this polarization dependence of
creatine vibrational modes helped us better estimate the creatine form, orientation and
dimension.
From the theoritical calculation, it was found that the very strong Raman band at 830
cm-1
is assigned to the symmetric stretching mode of the three CN+ bonds. This mode
was very distinctive in the Raman spectra of brain tissues; therefore, it was selected for
identification of Cr distribution, and pure Cr crystal. The relative intensities of bands at
912, 982, and 1054 cm-1
were stronger with polarizer & half-wave plate compared to us-
ing polarizer. These Cr bands (912, 982, 1054 cm-1
) are assigned to symmetric vibration
of C3C4OO-, CH2 deformation, and symmetric vibration of CN3 + CH3 rocking, respec-
tively. These Raman peaks were present at 812, 853, 964, 1040 cm-1
in theoretical calcu-
lation, respectively.
180
The vibrational energies calculated with DFT are generally overestimated com-
pared to experimental values. In the theoretical calculation, one isolated Cr monohydrate
molecule was regarded as being in gas phase, while the experimental analysis was in
solid phase. Another effective parameter is the formation of molecular hydrogen bonding.
The supermolecular lattice of the Cr monohydrate crystal allows for a network of six hy-
drogen bonds between each creatine molecule and its neighbours. However, in the theo-
retical process, just a single unit Cr monohydrate was calculated. To reduce the vibra-
tional energies calculated by theoretical process, it has been suggested to apply a scale
factor, one for the fingerprint region (0.9846 for wavenumbers below 1800 cm-1
) and the
other one (0.9544 for wavenumbers above 1800 cm-1
). However, in this work, no scale
factor was used, because it was proposed that the vibrational modes will probably be
similar, although the intensities might be altered by the environment.
5.3 Raman parameters that were optimized
Before taking Raman maps, some parameters must be optimized for successfully
mapping brain tissue, such as; laser wavelength, spatial resolution, exposure time and la-
ser power. These parameters were determined to permit Raman mapping of Cr deposits
and environs with higher S/N ratio in tissue sections from mice. With Raman, the fluo-
rescence is generated very easily. It happens on the same time scale as Raman. The Ra-
man scattering happens with very low probability (one in a million), while the fluores-
cence happens with very high probability (99.99% compared to Raman scattering). Fluo-
rescence is really strong particularly when the biological samples like brain tissue are ex-
amined. Generally, conjugated systems, connecting p-orbital in compounds with alternat-
181
ing single and multiple bonds, are high fluoresce. Since brain tissue composed of differ-
ent organic compounds like nucleic acids, amino acids, lipids and proteins, which have p-
orbital as a source to maintain conjugation, can be more sensetive to fluorescence. It is
important to choose a proper laser wavelength to get less fluorescence to be able to see
Raman peaks in brain tissue. In this thesis, both laser 633 nm and 785 nm were tested.
The laser at 785 nm is selected because the laser with longer wavelength, lower energy
can not excite the molecule to higher excited electronic state; therefore, the probability of
causing fluorescence is less compared with He-Ne laser (633 nm) and Ar ion laser (514
nm). (See section 4.1 for more information about optimization to take Raman data).
In this thesis, all Raman images were taken by streamline map which permits fast
data collection compared to point by point map particularly when a large area is required
to be mapped. All Raman maps were recorded with 300 second exposure time. For single
spectra a sum of 10 accumulations with exposure time of 30 seconds was chosen to im-
prove S/N ratio. The 785 nm laser at 10% power was used for excitation to prevent burn-
ing the sample and the appearance of charcoal bands at 1589 cm-1
and 1324 cm-1
.
The 50x objective, having the best quality, was used for mapping of all the mouse
brain samples; therefore, the all spectra were measured with spectral resolution
1cm-1
/pixel and spatial resolution of 2 μm. Since the spot size for the diode laser was ac-
tually a line; therefore, the spot size as determined by the microscope was slightly blurred
in the y direction.
182
5.4 IR data thermal source FPA and synchrotron source single
pixel data
One of the most important advantages of FPA-FTIR microscopy is to collect mo-
saic maps in order to image a large area in brain tissue in very short time compared to
single pixel raster scan data collection by using synchrotron FTIR.
With sFTIR microscope that was used in the previous research work in Dr.
Gough’s group, many maps had to be acquired separately and then manually pasted to-
gether to cover a full hippocampus. The time needed to acquire sufficient maps was at
least 4 days to collect IR maps with synchrotron source with 10 x10 μm pixel size, for a
single hippocampus section.
The Varian FPA-FTIR microscope combines a motorized stage to rapidly collect
high spatial resolution data (5-10 μm) from larger sample areas. The mosaic capability
involves moving the sample under the field of view of the FPA, collecting a series of
tiles. The tiles are stitched together to form a single larger overall image consisting of
many individual single tiles. The FPA detector contains an array of 64 x 64 elements;
4096 spectra are collected simultaneously from an area of analysis of 350 x 350 µm with
spatial resolution of about 5.5 x 5.5 µm, to collect a single tile map.
Although this technique is very useful for acquisition of the mosaic image in a
short time, it is not suitable to detect amyloid plaques. Unlike spectra taken by sFTIR mi-
croscope, it is not easy to observe the β-sheet shoulder, related to β-sheet Amide I (at
1630-1620cm-1
) and to α-helix Amide I (at 1662-1665cm-1
). At first time, it was assumed
183
that this problem probably happened because the brightness of globar light source is quite
low. As noted in chapter 2, synchrotron radiation is 1000 times brighter than a globar
light source. It is important to note that its brightness is because the effective source size
is very small and the light is emitted into a narrow range of angles (Salzer, 2009; Miller,
2005).
In this thesis, all of the sFTIR data were acquired at SRC previously, and I just re-
processed the data for creatine deposits. The only FTIR images taken for this thesis were
thermal source FPA-FTIR images from the Varian at University of Manitoba. The sFTIR
spectra of dense core Aβ plaque could be marked by a distinct amide I doublet but even
by taking the FPA-FTIR map of plaques with highest intensity of globar light, it was not
easy to see any β-sheet shoulder. This has now been attributed in part to the software im-
age belnding on the Varian Resolution-Pro software (K. M. Gough & J. B. Morison, Uni-
versity of Manitoba). This might cause to see a braod band instead of seeing double band
correspond to α-helix and β-sheet.
5.5 IR and Raman spectra of blood vessel
Processed IR maps reveal that almost all of the larger deposits, found in older
transgenic mice, took the form of streaks and these larger deposits were not usually asso-
ciated with plaques. Since Cr can be endogenously synthesized in liver and kidney and
carried out through the blood brain barrier by Cr transporters to get into the brain, this
could point to an association with blood vessels. To detect whether any Cr was coming
through the blood vessel in hippocampus, two blood vessels in hippocampi of four trans-
genic mice were mapped in different ages (5, 8, 14, 17 months-old) by FPA-FTIR micro-
184
scope (Figure 4.27). The processed IR maps show that a Cr streak appeared nearby the
blood vessel in the hippocampus of the 5 month-old transgenic mouse (Figure 4.27, Row
B1). The Cr crystal deposits were smaller in 8 and 14 month-old Tg mice (Figure 4247,
Row B2-3). No Cr was found in the blood vessel in hippocampus region of 17 month-old
TgCRND8 mice (Figure 4.27, Row B4). The symmetric CH2 and lipid carbonyl distribu-
tion was obsereved nearby the blood vessels (Figure 4.27, Row C1&D1). The processed
depth profile Raman maps in serial sections of 14 month-old TgCRND8 mouse illustrate
that just a few Cr deposits came through blood vessel in hippocampus of A14 (19) (Fig-
ure 4.36). No significant Cr deposits were found in any other sections. In all depth profile
maps, sphingomyelin (CN+ stretching mode at 730 cm
-1) and phenylalanine (distinct band
at 1003 cm-1
) were detected. The depth profile data were analyzed and some other bio-
chemical signatures were observed (Figure 4.28-36). In section A14(10) and A14(19),
lipid (C-C stretching mode at 1060 cm-1
and =CH bending mode at 980 cm-1
) were identi-
fied (Figure 4.28, 36). In sections A14(10), A14(11), A14(12), A14(14) and A14(19),
phospholipid (stretching vibration of PO43-
of phospholipid at 840-900 cm-1
and 960 cm-
1) was observed (Figure 4.28, 29, 30, 32, 36). Depth profile Raman maps shows no asso-
ciation has been obtained between Cr deposits and blood vessels so far. Therefore, de-
tected Cr deposits were formed within brain tissue and not transported across the blood
brain barrier.
5.6 Investigation of creatine distribution in brain tissue
As mentioned, the principal goal of this thesis is to explore the Cr origin in trans-
genic mice.
185
In this thesis, Depth profiling data, by analysis of serial sections, was undertaken
in hippocampus in an effort to determine whether lipid membrane and amyloid plaques
can be identified to be localized with Cr deposits. These images were also analyzed to see
whethere any other biochemical signatures such as sphengomyelin, phospholipid, nucleic
acids, sugar, and phenylalanine can be detected with the Cr deposits.
In order to evaluate whether focally elevated creatine levels detected in the hippo-
campus of transgenic mice are found in other parts of the brain, the caudate of Tg and
non-Tg mice at different ages were IR mapped. Some Cr deposits detected in cauadte
were recorded by Raman microscopy with higher spatial resolution to find whether any
other biochemical signatures were observed to be co-localized with these deposits.
5.6.1 Depth profile plaque in hippocampus
In order to determine whether any other biochemical signatures could be identi-
fied as being specifically localized with the creatine deposits, the hippocampus and cau-
date regions in brain tissue transgenic mice were mapped by FTIR and Raman micros-
copy.
Since Aβ aggregation is one of the most important pathological hallmarks of Alz-
heimer disease, an Aβ plaque located in CA4 region of hippocampus was selected to map
through serial sections. The plaque located in hippocampus region was selected because
Cr deposit was detected in IR maps of this area (Kuzyk, 2010). The IR data collection
was already done by Alex Kuzyk (member of Dr. Gough’s research group) on the same
plaque and published (Kuzyk et al, 2010). As the IR and Raman imaging techniques are
compatible, the same plaque was mapped with the Raman microscope at higher spatial
186
resolution to search for co-localization between creatine deposits and any other bio-
chemical signatures.
The processed Raman maps of amyloid plaque (antiparalell β-sheet protein at
1670 cm-1
) in serial sections of 14 month-old transgenic mouse revealed that Cr deposits
were detected in A14(14), A14(17) and A14(19). Although Cr deposits were present in
the vicinity of some amyloid plaques, so far no association was found between them.
Lipid was detected in all consecutive serial sections. From the processed Raman
maps for lipid (CH2 deformation band at 1440 cm-1
), it was found out that β-sheet aggre-
gation was identified in areas where lipid appeared, and no β-sheet was found without
lipid bands (Figure 4.39, 45, 47, 51). A lipid connection to AD has been proposed by
other groups (Florent-Bechard et al, 2009; Bevhard et al, 2009; Debomay et al, 2008;
Hartmann et al, 2007). The aggregation of Aβ is due in part, to hydrophobic nature of the
peptides; therefore, lipids may have a physical role in the aggregation reaction because of
their affinity to hydrophobic surfaces (Verdier et al, 2004). In addition, a study has dem-
onstrated that lipid can revert aggregated Aβ fibrils into neurotoxic protofibrils, and that
injection of such reverted protofibrils into mice causes the same memory impairment as
protofibrils formed from monomeric Aβ (Martins et al, 2008). Those authors concluded
that the step from protofibril to fibril formation can be reversible. The role of lipid distri-
bution to AD is beyond the scope of this project.
All of the Raman maps were processed for sphingomyelin (CN+ stretching mode
at 730 cm-1
). Sphingomyelin is a type of sphingolipid that is found in animal cell mem-
branes especially in the myelin sheath surrounding nerve cell axons. Since oligodendro-
187
cytes are rich in sphingomyelin and synthesize creatine in large amounts in brain, the
Raman data could indicate a possible connection between some of the Cr deposits and
sphingomyelin. Apart from section A14(11) and A14(16), CN+ mode at 730 cm
-1 was de-
tected in all other serial sections. Although this band was present in the vicinity of some
of the Cr deposits in sections A14(14), A14(17) and A14(19), no specific association be-
tween Cr deposits and C-N+ bond of choline at sphengomyelin was observed particulary
in maps collected in caudate region. It could be concluded that probably no co-
localization is between large Cr streaks and axons.
The collected maps were analyzed to see any other biochemical signatures in brain
tissue. The processed A14(10) map shows spectral markers of proteins (CN deformation
of amine group at 840 cm-1
) and phosphodiesters (doublet bands in 890-900 cm
-1) (Figure
4.41). In section A14(11), the distinct phenylalanine (at 1003 cm-1
), lipid (broad band at
960-970 cm-1
; CH2 bending of proteins and lipids), and protein (weak band at 880 cm-1
)
were present (Figure 4.42). The majority of the thick dark area in section A14(12) was
detected with phospholipids (phosphate bands at 1040-1050 cm-1
; =CH bending mode of
unsaturated lipid at 970-990 cm-1
), protein (C-N stretch mode of protein; protein carbonyl
band at 1620 cm-1
), and amino acids (bands at 740, 870, 920 cm-1
, C-N stretching vibra-
tion of amino acids at 1630 cm-1
and C=C deformation of phenylalanine band at 1590
cm-1
) , and nucleic acids (broad band at 1570 cm-1
) (Figure 4.43). The thick dark area in
A14(13) was found to be characteristic of phenylalanine (at 1003 and 1610 cm-1
) and
lipid membrane (=CH bending at 980 cm-1
). The other distinct peaks in this section were
α-helix (symmetric CH3 band at 930 cm-1
), phospholipids (weak band at 960 cm-1
as-
signed to phosphate group in phospholipids), amino acids (broad band at 770-780 cm-1
;
188
strong band at 845 cm-1
assigned to amino acids (Figure 4.44). The spectra of dark accu-
mulation in section A14(14) consist of α-helix (symmetric CH3 band at 930-940 cm-1
),
phospholipids (phosphate group at 860 cm-1
) and phenylalanine ( at 900, 930, 1003,
1560, 1610 cm-1
). The other biochemical markers in this section include protein (CH2
bending mode of protein at 880 cm-1
; CN stretching and in-plane bending of the N-H
group at 1470-1480 cm-1
), phosphodiesters (strong band at 810 cm-1
), and DNA (strong
band at 790 cm-1
assigned to phosphate band) (Figure 4.46). In the vicinity of amyloid
plaque in section A14(15), some other bands were observed that correspond to phenyla-
lanine (at 960, 980, 1030 cm-1
), and lipid (bands at 975 and 1060 cm-1
), amino acids
(broad band at 845 and 920 cm-1
), RNA (strong band at 915-920 cm-1
) (Figure 4.48). The
processed map of plaque area at A14(16) was composed of phenylalanine (band at 1003
cm-1
), α-helix (at 1550-1560 cm-1
) (Figure 4.49). In the vicinity of Aβ plaque in section
A14(17), some sharp bands of of lipid (=CH bending at 985 cm-1
) and phenylalanine
(bands at 695, 1003, 1585 cm-1
) were detected (Figure 4.51). In section A14(19), some
sharp bands were found corresponding to amino acids mostly phenylalanine (at 920, 760,
850 and 1003 cm-1
), phospholipids (asymmetric O-P-O stretching mode at 760 and 835
cm-1
), protein ( v(C-C) at 855 cm-1
and α-helix protein at 940 cm-1
).
In conclusion, these processed depth profile maps from selected plaque in hippocam-
pal tissue shows that Aβ plaque was enveloped by elevated lipid. Although, the Aβ
plaque was found sometimes nearby deposits of Cr, no specific association was indicated
between them. It could point to this fact that there is no possible interaction among de-
tected Cr deposits, and either dense core plaque or lipid in the progression of AD. So far,

189
no specific association was obtained between Cr peaks and any other biochemical signa-
tures in brain tissue.
5.6.2 Creatine distribution in caudate of transgenic mice
Of four Tg and non-Tg mice, ages through 5, 8, 14, and 17 month-old, analyzed
for creatine distribution in caudate, the sections of both Tg and non-Tg mice from 14
month-old displayed creatine deposits, and it was illustrated that creatine was found more
abundantly in size and number in caudate of transgenic mouse brain compared to its non-
transgenic littermate (Figure 4.59, 4.60). The size of Cr deposits in the caudate of 14
month-old Tg mouse was recorded between 50-200 μm. It is important to note that cau-
date of these two tissue samples were not torn or folded at all. Apart from some small Cr
deposits appeared in A25(4), 8 month-old Tg mouse (Figure 4.57), no Cr was detected in
any other mice even in the oldest one, 17 month-old Tg mouse (Figure 4.61). Despite
these sections being selected based on the quality of the samples, apart from A14(2) and
A13(2), Tg and non-Tg 14 month-old mice sections show folding that would have oc-
curred on sectioning. At the time of crysectioning, the most important part to examine
was the hippocampus, not the caudate region. This suggests that any compression of the
sample may prevent detection of Cr deposits; therefore, it is hard to draw any conclusion
concerning the Cr distribution through different ages in caudate region with these sam-
ples.
The Raman maps were recorded with higher spatial resolution in an effort to deter-
mine whether any other biochemical signatures can be identified as being localized with
the Cr deposits found in caudate region of 14 month-old TgCRND8 mouse. The proc-
190
essed map displays that Cr deposits were surrounded by phenylalanine without any re-
markable elevation or depletion (Figure 4.63, 65, 66 C&D). All the maps were processed
for sphengomyelin (symmetric stretching mode of the CN+ at 730 cm
-1). No distinctive
band was observed at 730 cm-1
in these processed maps. As noted, sphingomyelin is
found in the myelin sheath surrounding axons. Since oligodendrocytes synthesizing Cr in
brain are rich in sphingomyelin, it suggests to this fact that no co-localization is between
detected Cr deposits and axons.
5.7 Exploration of creatine crystal structure with polarized Raman
and IR Microspectroscopy
It was discovered by Veena Agrawal (a summer student in Dr. Gough’s group)
that creatine spectra taken by synchrotron FT-IR spectromicroscopy gave different spec-
tra for various deposits because synchrotron radiation is polarized, and some vibrational
modes are only excited if the molecule is oriented correctly relative to the polarized light.
From the maps taken previously by M. Gallant (former Master student) and processed at
1304 cm-1
to examine Cr distribution in serial sections from the hippocampus of 14
month-old Tg, it was revealed that several horizontal deposits, not represented in maps
processed at 1305 cm-1
, appeared after reprocessing maps at 1408-1384 cm-1
(Figure 4.68
I,J,K,L). It was perfectly matched with the spectra of pure Cr crystal prepared and
mapped by sFTIR (Figure 4.70). Since the spectral markers were critical to identifying
tissue components, a combined experimental and theoretical study was undertaken (See
section 5.2 for more details about theoritical results).
191
In order to better evaluate creatine crystal orientation, we undertook a combined
theoritical and experimental studies into the effect of polarized light on the spectra of
crystalline Cr. Pure creatine monohydrate crystals were pepared and analyzed by FTIR
microspectroscopy with FPA detector and IR polarzier adjusted through a wide range of
angles, and by Raman microspectroscopy with a polarizer and polarizer + half wave
plate. (Figure 4.70, 71).
When the polarizer and half-wave plate were used, the light was rotated by 90°. It is
important to note that the vibrational modes are Raman active when the molecular po-
larizability changes, not the dipole moment. The spectra taken with polarizer and with
polarizer + half-wave plate presented a very strong Raman band at 830 cm-1
. This band
which corresponds to the symmetric stretching mode of the three CN+ bonds, does not
change with polarizer orientation. Three other affected bands were the peak at 916 cm-1
,
assigned to symmetric vibration of (C-COO-) and NH2 wagging, the peak at 982 cm
-1 as-
signed to CH2 rocking, and a peak at 1054 cm-1
assigned to asymmetric vibration of CN,
and CH3 twisting. These assignments were acquired from theoritical calculation (See Ta-
ble 4.3). The depolarization ratios from the calculation for these three bands were 0.07,
0.27, 0.10, respectively. A Raman band with the depolarization ratio less than 0.75 is a
polarized band. Although the intensity of these bands was different when the light was
rotated by 90°, all of these bands were seen in all spectra for Cr crystals. This is because
Raman intensities arise from changes in the derivative of the molecular polarizability ten-
sor for each mode. These derivatives are reasonably large in each direction; therefore, no
bands are completely extinguished at any direction. To get the effect of polarized light,
192
all the data on brain tissue were recorded using FPA-FTIR microscope with polarizer
through a wide range of angles (0° to 180°).
From the IR spectra of Cr crystals in mouse brain tissue obtained with FPA-FTIR mi-
croscope (Kuzyk et al, 2010) and sFTIR (Gallant, 2007), Spectra from points A and B il-
lustrate that unlike the sFTIR, all Cr peaks at 1305, 1394 cm-1
and 1405 cm-1
appeared
because the globar light is not polarized (Figure 4.69). These spectra clearly illustrate the
effect of synchrotron polarized light on Cr crystal orientation. When the polarization is
perpendicular to the long axis of the Cr crystal, the bands at 1305, 1395 and 1423 cm-1
are
observed and the bands at 1405 and 1447 cm
-1 are disappeared. Conversely, when the po-
larization is parallel to the long axis of the crystal, only the peaks at 1405 and 1447 cm-1
appear and the other peaks vanish (Figure 4.70). Spectra from horizontal pure creatine
crystals examined at SRC show the same behaviour, without using any polarizer (Figure
4.67). It could point that the collected radiation has more horizontal rather than vertical
orientation.
Generally, the electrical field of unpolarized light oscillates in all possible directions.
When a polarizer is put into the optical path, only one plane of oscillation passes through.
The polarization dependence of the modes was used to identify the presence of Cr in tis-
sue. To estimate crystal form, orientation and dimension, single tile maps in caudate and
hippocampus regions of 14 months-old transgenic mouse were recorded with a 64 x 64
Focal Plane Array detector, using polarizer at settings from 0° to 180°, at 10° intervals.
As explained, Cr peaks at 1305 cm-1
and 1405 cm-1
exhibit extreme polarization effects
and have less overlap with tissue bands compared to other Cr peaks. Since the light
193
source of FPA-FTIR microscope was globar radiation which generated unpolarized light,
all the Cr vibrational modes could be excited irrespective of Cr deposits in different ori-
entations. The polarization filter provided the capability to study the creatine crystals
(Figure 4.72, 4-73, 4.76, 4.77). The absorption intensity versus the polarization angle
processed at 1305 and 1405 cm-1
for different points marked on mapped Cr deposit in
caudate and hippocampus of Tg mouse show similar orientation for all analyzed points in
a large creatine streak (Figure 4.74, 75, 76-82). From these results it was found that Cr
streaks were formed of a single crystal unit instead of multiple microcrystalline deposit.
So far, the form and location of the Cr deposits in vivo is unknown. The sharp IR
bands of Cr prove that it is a crystalline structure, but as the tissue desiccated, the crystal-
lization could be artifact, formed after death.
All of these results along with the absence of any specific association between de-
tected Cr deposits and any other biochemical signatures indicate that Cr crystals were
formed after snap-freezing and desiccation of brain tissue.
5.8 Some speculation for the cause of creatine deposits in AD brain
tissue
As mentioned in section 1.5, the pathological hallmarks of AD involve Aβ
plaques, neurofibrillary tangles, inflammation, synaptic dysfunction and neuronal death.
Discovery of creatine deposits in the brains of transgenic mice raises many questions
about the role of Cr in this neurodegenerative disorder. Decreased energy metabolism is
always associated with AD (Andres et al, 2008; Parihar et al, 2006). The role of Cr/PCr

194
system in energy metabolism has been recognized (Andres, 2008; Bürklen et al, 2006).
IR and Raman maps enabled the identification of numerous Cr deposits in the transgenic
mouse brain. Some Aβ plaques and lipids were detected in the vicinity of the Cr deposits
in the Raman maps, but so far no specific correlation was identified between them.
The Cr deposits may be intra or extracellular. If they are located intracellular, they
may be compartmentalized in mitochondria in addition to cytosol. The current Raman
and IR images illustrated a large range in size for the Cr crystal deposits. These deposits
could be generated either by Cr leakage from dying nerve cells or by impaired Cr traf-
ficking between glial cells (actrocytes and oligodandrocytes) and neurons (Bürklen et al,
2006).
Cr may be associated with a particular cell types like neurons and microglial cells.
Activated microglia is generally believed to be involved in AD-associated inflammatory
response (Moore, 2010; Schlachetzki et al, 2009; Heneka et al, 2007). As noted, micro-
glia cells can synthesize Cr in brain, and one of the pathological hallmarks of AD is acti-
vated microglia cells (Moore 2010; Schlachetzki et al, 2009; Bürklen et al, 2006); There-
fore, inflammation and an increase in the number of glial cells can provide additional
source of Cr because more Cr can be produced and released in the extracellular space
(Bürklen et al, 2006).
Cr deposits were found in post mortem AD brain tissue and in Tg mouse brain
(Gallant et al, 2006). Although the Cr deposits were sometimes found in the most aged
control mice, those were fewer and much smaller compared to those observed in Tg
mouse brain (Kuzyk et al, 2010). They could be result of a process associated with nor-
195
mal aging. The energy impairment in diseased and elderly brain has been intensively in-
vestigated during the last decades (Andres et al, 2008; Griffiths et al, 2008; Bürklen et al,
2006; Parihar et al, 2006). Mitochondrial dysfunction often leads to the excessive genera-
tion of free radicals and subsequent oxidative damage which can contribute to the age
process (Lustbader et al, 2004). It is conceivable that increased oxidative modification of
brain proteins may disturb neuronal functions by decreasing activities of key metabolic
enzymes and affecting cellular signalling systems (Aksenov et al, 2000). Brain energy
metabolism is characterized by high and fluctuating rates of ATP synthesis. High levels
of CK, catalyzing the reversible transfer of the phosphate group of PCr to ADP in order
to regenerate ATP, were found in the brain. The PCr level was found to decrease in the
brains of patients with AD. PCr/Cr/ATP level are regulated by the enzyme CK. The in-
terplay between cytosolic and mitochondrial CK isoenzymes accomplishes multiple roles
in cellular energy homeostasis (Braissant et al, 2007; Bürklen et al, 2006). It was con-
cluded that damage of CK function may be an important part of a neurodegenerative
pathway that lead to neuronal loss in the brain (Aksenov et al, 2000). From that study by
Bürklen, it was shown that BB-CK is significantly inactivated by oxidation in AD pa-
tients, and is one of the biochemical markers of the Central Nervous System (CNS) cell
damage in AD. A direct connection between AD and uMt-CK was discovered by show-
ing that uMt-CK can interact with the short cytoplasmic tail of APP family proteins;
therefore, this interaction can affect the correct import of uMtCK into mitochondria and
thus would negatively interfere with cellular energetic (Li et al, 2006). The inactivation
of PCr causes an increase in the level of Cr, which may then form the deposits (Bürklen
et al, 2006).
196
Although there is some speculation for the cause of Cr deposits in AD brain, no
clear reason for the existences of the Cr deposits exists at this time.
5.9 The correlation between creatine deposits in AD brain tissue
and activated microglial cells is still unknown
Most of the Cr deposits in the serial sections were elevated in CA1 area of hippo-
campus (Kuzyk et al, 2010). As neuronal activity in CA1 region of hippocampus has
been strongly linked to memory formation (Walsh et al, 2004), this region in hippocam-
pus was shown susceptible to Aβ pathology in both AD patients and transgenic mouse
model (Rodrigues et al, 2010). It has been reported that the formation of amyloid plaques
is concurrent with the appearance of activated microglial cells and shortly followed by
the clustering of activated astrocytes around Aβ plaques (Dudal et al, 2004). Activation
of microglia results in altered morphology of these cells, and increased secretion of cyto-
kines, reactive oxygen intermediates all of which contribute to neuronal dysfunction and
ultimately cell death (Schlachetzki et al, 2009). It was reported that the earliest reduction
in neuronal counts was observed in CA1 region of hippocampus (West et al, 2004).
Cr biosynthesis involves two sequential steps catalyzed by two enzymes AGAT
and GAMT (Braissant et al, 2005). The immunoreactivity of GAMT is very strong in oli-
godendrocytes, moderate in astrocytes, and not detected in neurons (Bürklen et al, 2006;
Braissant et al, 2005). It might be hypothesized that discovered creatine deposits were
originated from microglial cells.
When the processed maps of younger transgenic mice were investigated, Cr de-
posits were observed in hippocampus and the size and numbers was much lower com-
197
pared to older ones (Kuzyk et al, 2010). Although it is generally accepted that Aβ aggre-
gation is a potent glial activator, activation of microglia and astrocytes could be an early
event in the disease, occurring even in the absence of focal Aβ aggregation (Nunomura et
al, 2001). It has been reported that in 3 months old APP transgenic mice, both cognitive
deficits and focal glial cytokine production has been observed well before Aβ plaque
deposition (Heneka et al, 2005). It means at least at the beginning of the disease, the se-
nile plaques do not cause glial activation, and the neuroprotective effect of glial cells is a
response against Aβ oligomers or protofibrils instead of senile plaques (Schlachetzki et
al, 2009; White et al, 2005).
To investigate the possible correlation between Cr deposits and activated micro-
glia, more data collection of even older mice, along with a staining will be needed. How-
ever, the required antibodies are not commercial stains, so they need to be created. From
the publications, staining methods like preparing monoclonal OX-6 antibody (Bellucci et
al, 2006) and Mac-1 antibody (Rodrguez et al, 2010) were reported to do staining micro-
glial cells. From that study by Rodrguez, it was shown the activated microglial cells
stained with Mac-1 antibody were normally present in multiple clusters, revealing an ac-
tivity against amyloid plaques as shown by a high co-localization with Aβ (Rodrguez et
al, 2010). Moreover, from the published paper by Belluci, it was illustrated that staining
with OX-6 antibodies in TgCRND8 mouse brain shows clusters of large round-shaped
microglial cells, surrounded Aβ plaques (Bellucci et al, 2006). Since most of the creatine
deposits were reported in CA1 region of hippocampus, it makes this question that
creatine might be originated from microglial cells. However, the processed data in CA1
area of hippocampus of older transgenic mouse shows most of these deposits were large
198
streaks (100-200 μm) (Kuzyk et al, 2010). Comparison of creatine dimension to the size
of activated microglial cells stained by OX-6 and Mac-1 antibodies (10-30 μm) (Rodr-
guez 2010; Bellucci, 2006) remains this question that the origin of these large creatine
streaks may not be from activated glial cells. However, the IR (Kuzyk et al, 2010) and
Raman depth profile analysis show the creatine deposits co-localized with plaque in CA4
area of hipocapus of 14 month-old TgCRND8 mouse were small in size (10-80 μm).
With these data, it is hard to draw any conclusion whethere the origin of identified
creatine deposits may or may not be from activated microglial cells.
5.10 The neuroprotective or neurotoxic effect of creatine in AD is
still unknown
Neuroprotective effects of Cr supplementation as a treatment of Alzheimer dis-
ease have been examined with different research groups (Bruno et al, 2010; Adhihetty et
al, 2008; Andres et al, 2008). Cr supplementation has been shown to protect neurons
against glutamate and Aβ toxicity (Adhihetty et al, 2008; Nivaggioli et al, 2007; Tar-
nopolsky et al, 2000). In addition, it has been reported that it can involve maintenance of
mitochondrial function and preservation of ATP levels. This is due to the fact that newly
entered Cr is phosphorylated inside the neurons by the catalytic activity of CK, leading to
an increasing PCr/ATP ratio. Therefore, a higher energy charge in the cell. However, it
can not happen if CK is damaged by oxidative stress. It has been speculated that Cr sup-
plementation at an early time point of the disease may prevent or delay the course of this
neurodegenerative disorder (Bürklen et al, 2006). With discovery of Cr deposits in the
brain of transgenic mice, there is a concern whether Cr plays a neuroprotective or neuro-

199
toxic role in Alzheimer disease. Since the cause of Cr deposits in AD brain tissue is still
not very clear, it is difficult to draw any conclusion about positive or negative effect of Cr
in this neurodegenerative disorder. This part is beyond the scope of this thesis.
200
Conclusions
The discovery of creatine deposits in the brains of TgCRND8 mice raises many ques-
tions about the possible role of Cr in this neurodegenerative disorder. In this thesis, the
principal goal was to find clues to the origin of creatine in transgenic mouse brain by ana-
lyzing IR and Raman microscopic images.
Since Cr can be endogenously synthesized in liver and kidney and transferred through
the blood brain barrier by Cr transporters to get into the brain, blood vessels in the hippo-
campus of transgenic mice were analyzed by IR and Raman microscopy. The processed
data show no createin could be detected in or around theses vessels, hence no association
was identified between Cr deposits and blood vessels. Therefore, it can be concluded that
these Cr deposits were most likely formed within brain tissue and not transported across
the blood brain barrier.
The processed Raman depth profile maps confirm results, already seen in IR, that Aβ
plaque was surrounded by lipid. Serial sections were analyzed for Cr (symmetric CN3+
band at 830 cm-1
), lipid (CH2 deformation band at 1440 cm-1
), and amyloid plaque (anti-
parallel β-sheet protein at 1670 cm-1
). No specific association between Cr deposits and ei-
ther Aβ plaques or lipid membrane was detected. The maps were analyzed for other spec-
tral markers such as sphingomyelin (CN+
stretching mode at 730 cm-1
), nucleic acids
(symmetric PO2 band of DNA and RNA at 790, 1085 cm-1
; and a distinct band corre-
201
sponding to RNA at 920 cm-1
), phospholipids (symmetric PO2 band of phospholipids at
860, 1098 cm-1
; =CH bending of unsaturated lipid at 980 cm-1
) and amino acids mostly
phenylalanine (distinct bands correspond to phenylalanine at 930, 1003 cm-1
; C=C de-
formation of phenylalanine 1590 cm-1
). No correlation was found between Cr deposits
and these biochemical signatures
To investigate whether Cr deposits are distributed ubiquitously in brain tissue, the
caudate of Tg and non-Tg mice at different ages were imaged with IR. Cr was observed
in the caudate of two 14 month-old mice, one TgCRND8 and its non-Tg littermate. The
size and number of detected Cr streaks were much greater in Tg compared to non-Tg.
Another student (Veena Agrawal) discovered that some Cr bands in synchrotron IR
images appeared or disappeared completely. This resulted from the effect of polarized
synchrotron light. To better understand Cr crystal structure and orientation, combined
theoretical and experimental studies were undertaken into the effect of polarized light on
the spectra of crystalline Cr in both pure Cr and tissue deposits. Theoretical calculation
conducted by Fatemeh Faraz Khorasani gave both frequency and polarization information
to enable a more detailed interpretation of the Cr spectra. As the IR bands are dependent
on crystal orientation, polarized IR images were used to estimate the form, orientation
and dimension of crystalline Cr deposits in tissue. IR images of large Cr streaks in hippo-
campus and caudate of 14 months-old TgCRND8 mouse were recorded with FPA-FTIR
microscope, using a polarizer at settings from 0° to 180°, at 10° intervals. The absorption
intensity, processed at 1305 cm-1
and 1405 cm-1
, versus polarization angle shows similar
orientation for all analyzed points in a single large creatine streak. The same maximum
and minimum intensity obtained for points examined along each Cr streak shows that
202
these Cr streaks must exist as a single crystal unit instead of multiple microcrystalline de-
posits. While the state of the Cr in the living mouse and the causes for these deposits are
still unclear, it can be concluded that Cr could have been intracellular or extracellular and
formed as crystal deposits after snap-freezing and desiccating of brain tissue. Therefore,
it can be speculated from this research that Cr might be exist in solution form in vivo.
In Magnetic Resonance spectroscopy (MRS) studies, the Cr/PCr signal has been used
as an internal standard to obtain the relative concentrations of other components such as
glutamate-glutamine complex, and choline. Because of the focally elevated creatine lev-
els already detected in the hippocampus and some cortex and now found in caudate of
TgCRND8 mice, the use of creatine as an internal standard should be reconsidered. If Cr
is used as internal standard when levels of other metabolites are investigated, errors may
occur.
Cr deposits were identified in the brain of transgenic mice and increased in size and
number with age. Evidence above suggests that it is formed in the brain and is found
throughout hippocampus and caudate. The questions remain as to why the Cr is there
whether it has any active role in the progression of the disease, and whether the role of Cr
is neurotoxic or neuroprotective.
203
Future work
Further of large regions mapping in mice of different ages should be performed to in-
vestigate whether or not creatine deposits are common features in other regions of brain,
such as cerebellum, thalamus and olfactory bulb, regions typically developing Aβ plaques
in TgCRND8 mouse.
To investigate the possible correlation between Cr deposits and activated microglia,
more data collection from even older mice is recommended, along with the staining of
microglia and actrocytes through different ages of Tg and non-Tg mice. It should be men-
tioned that the required antibodies are not commercial stains, so they need to be created.
Staining for enzymes AGAT and GAMT involving in the synthesis of creatine can be
performed to probe whether any changes in these enzymes is a factor in the increased
creatine deposits observed in TgCRND8 mice. Two CK isoenzymes, uMt-CK and BB-
CK, can be stained to determine whether the levels are altered, as they might play a role
to increase the Cr levels. In Dr. Gough’s lab, 5 antibodies to detect enzymes including
AGAT, GAMT, BB-CK, uMt-CK, and CrT were donated and stained by Fred Zeiler
(summer 2006). The only antibody that showed any slight indication of positive results
was the uMt-CK. The antibodies my have been too old.
Mapping different brain tissue regions by IRENI (InfraRed ENvironmental Imaging),
combining 12 brilliant synchrotron source beams with multi-element detection, can be
204
used to obtain chemical images with excellent S/N at 0.54 m pixel resolution in min-
utes. This technique can be performed to record data at higher spatial resolution from se-
rial sections, previously imaged by FTIR and Raman in order to investigate whether any
other biochemical signature can be identified to be localized with Cr deposits.
X-ray Fluorescence Imaging (XRF) can be performed to probe metal distribution in
different brain tissue regions. The results from XRF can be compared with IR and Raman
processed for Aβ plaque aggregation and Cr deposits to determine whether there is any
co-localization between them. So far, these techniques have not been addressed by other
groups in order to investigate Cr origin in transgenic mouse brain.
205
References
Adhihetty, P. J., & Beal, M. F. (2008) Creatine and its potential therapeutic value for
targeting cellular energy impairment in neurodegenerative diseases. NeuroMolecular
Medicine, 10, 4, 275-290.
Aksenov, M., Aksenov, M., Butterfield, D. A., & Markesbery, W. R. (2000) Oxidative
modification of creatine kinase BB in Alzheimer’s disease brain. Journal of Neurochem-
istry. 74, 6, 2520-2527.
Alonso, A. D. C., Li, B., Grundke-Iqbal, I., & Iqbal, K. (2008) Mechanism of tau-induced
neurodegeneration in Alzheimer disease and related tauopathies. Current Alzheimer Re-
search, 5, 375-384.
Andres, R. H., Ducray, A. D., Schlattner, U., Wallimann, T., & Widmer, H. R. (2008)
Functions and effects of creatine in the central nervous system. Brain Research Bulletin,
76, 329-343.
Ansari, M. A., & Scheff, S. W. (2010) Oxidative Stress in the Progression of Alzheimer
Disease in the Frontal Cortex. Journal of Neuropathology & Experimental Neurology.
69(2), 155-167.
Apostolova, L. G., & Cummings, J. L. (2007) The pathogenesis of Alzheimer’s disease:
General overview. Protein overviews, 6, 3-29.
206
Bandyopadhyay, B., Li, G., Yin, H., & Kuert. (2007) Tau aggregation and toxicity in a
cell culture model of tauopathy, Journal of Biological Chemistry, 282, 16454-16464.
Barth, A. (2007) Review: Infrared Spectroscopy of proteins. Biochemica et Biophysica
Acta. 1767, 1073-1101.
Beard, E., & Braissant, O. (2010) Synthesis and transport of creatine in the CNS: impor-
tance for cerebral functions. Journal of Neurochemistry, 115(2), 297-313.
Belluci, A., Cristina, M., Grossi, C., Fiorentini, A., Lucccarini, I., & Casamenti, F. (2007)
Abnormal processing of tau in the brain og aged TgCRND8 mice. Neurobiology of Dis-
ease, 27, 328-338.
Bellucci, A., Luccaraini, I., Scail, C., Prosperi, C., Giovannini, M. G., Pepeu, G., &
Casamenti, F. (2006) Cholinergic dysfunction, neuronal damage and axonal loss in
TgCRND8 mice. Neurobiology of Disease, 23, 260-272.
Bernhardy, R. V. (2007) Glial cell dysregulation: A new perspective on Alzheimer Dis-
ease. Neurotoxicity Research, 12, 4, 215-232.
Bettens, K., Sleegers, K., & Broeckhoven, C. V. (2010) Current status on Alzheimer dis-
ease molecular genetics: from past, to present, to future. Human Molecular Genetics, 19,
1, R4-R11.
Bharadwaj, P. R., Dubey, A. K., Masters, C. L., Martins, R. N., & Macreadie, I. G.
(2009) Journal of Cellular and Molecular Medicine. 13(3), 412-421
Bhargava, R., & Levin, I. W. (2005) Spectrochemical analysis using Infrared Multichan-
nel detectors. Blackwell Publishing. Pages: 311.
207
Billings, L. M., Green, K. N., McGough, J. L., & LaFerla, F. M. (2007) Learning
dcreases amyloid beta 56 an dtau pathology and ameliorates behavioural decline in 3xTg-
AD mice. The Journal of Neuroscience, 24, 4, 751-761.
Bista, R. K., Bruch, R. F., & Convington, A. M. (2009) Reviews: Vibrational spectro-
scopic studies of newly developed synthetic. Biopolymers. Vol. 93, No. 5, 403-41.
Blass, J., Gibson, G. E., & Hoyer, S. (2002) The role of the metabolic lesion in Alz-
heimer’s disease. J. Alziemer’s Disease, 2, 225-232.
Braissant, O., Henry, H., Villard, A. M., Speer, O., Wallimann, T., & Bachmann, C.
(2005) Creatine synthesis and transport during rat embryogenesis: Spatitomporal expres-
sion of AGAT, GAMT and CTI. BMC Developmental Biology. 4, 5-9.
Braissant, O., Henry, H., Villard, A., Speer, O., Wallimann, T., & Bachmann, C. (2005)
Creatine synthesis and transport during rat embryogenesis. BMC Development Biology,
5:9, 1-16.
Brent, C., & Landreth, G. E. (2010) Inflammation, microglia, and Alzheimer’s Disease.
Neurobiology of Disease, 37, 503-509.
Brewer, G. J., & Wallimann, T. W. (2000) Protective effect of the energy precursor
creatine against toxicity of glutamate an dbeta-Amyloid in rat hippocampal neurons. J of
Neurochemistry, 74, 1968-1978.
Brosnan , M. E., Edison, E. E., Da Silva, R., & Brosnan, J. T. (2007) New insights into
creatine function and synthesis. Advan. Enzyme. Regul, 47, 252-260.
Bruno, E., Quattrocchi, G., Nicoletti, A., Le Pira, F., Maci, T., Mostile, G., Andreoli, V.,
Quattrone, A., & Zappia, M. (2010) Lack of interaction between LRP1 and A2M poly-
morphisms for the risk of Alzheimer disease. Neuroscience Letters, 482, 2, 112-116.
208
Bürklen, T. S., Schlattner, U., Homayouni, R., Gough, K., Rak, M., Szeghalmi, A., &
Wallimann, T. (2006) The creatine kinase/creatine connection to Alzheimer's disease: CK
inactivation, APP-CK complexes, and focal creatine deposits. J of Biomed & Biotech, 1-
11
Busciglio, J., Pelsman, A., Wong, C., Pigino, G., Yuan, M., Mori, H., & Yankner, B. A.
(2002) Altered metabolism of the amyloid precursor protein is associated with mitochon-
drial dysfunction in Down's syndrome. Neuron, 33, 677-688.
Butterfield, D. A, Drake, J., Pocernich, C., & Castegna, A. (2001) Evidence of oxidative
damage in Alzheimer's disease brain: central role for amyloid beta-peptide. Trends in mo-
lecular medicine, 7(12), 548-54.
Cagin, A., Gerhard, A., & Banati, R. (2002) In vivo imaging of neuroinflammation. Eur
Neuropsychopharmacol. 12(6) 581-586
Casely, C. S., Canevari, L., Lan, J, M., Clark, J. B., & Sharpe, M. A. (2002) Beta-
Amyloid inhibits integrated mitochondrial respiration and key enzyme activities. J Neu-
rochem, 80, 91-100.
Cerpa, W., Dinamarca, M. C., & Inestrosa, N. C. (2009) Structure-function implications
in Alzheimer’s disease: Effect of Aβ oligomers at central synapses. Current Alzheimer
Research. 5, 233-243
Cerpa, W., Dinamarca, M. C., & Inestrosa, N. C. (2008) Structure-function implications
in Alzheimer’s Disease: Effect of amyloid beta oligomers at central synapses. Current
Alzheimer’s Research, 5, 233-243.
Chan, J. W., Taylor, D. S., Zwerdling, T., Lane, S. T., Ihara, K., & Huse, T. (2006) Mi-
cro-Raman spectroscopy detects individual neoplastic and normal hematopoietic cells.
Biophysical Journal, 90, 648-656.
209
Chishti, M. A., Yang, D. S., Janus, C., Phinney, A. L., Horne, P., Pearson, J., Strome, R.,
Zuker, N., Loukides, J., French, J., Turner, S., Lozza, G., Grilli, M., Kunicki, S., Moris-
sette, C., Paquette, J., Gervais, F., Bergeron, C., Fraser, P. E., Carlson, G. A., St. George-
Hyslop, P., & Westaway, D. (2001) Early-onset amyloid deposition and cognitive defi-
cits in transgenic mice expressing a double mutant form of amyloid precursor protein
695. Journal of Biological Chemistry, 276(24), 21562-21570.
Christensen, D. Z., Bayer, T.A., & Wirths, O. (2009) Formic acid is essential for immu-
nohistochemical detection of aggregated intarneuronal amyloid beta peptides in mouse
models of Alzheimer’s Disease. Brain Research, 1301, 116-125.
Coleman, P., Federoff, H., & Kurlan, R. (2004) A focuse on the synapse for neuroprotec-
tion in Alzheimer disease and other dementias. Neurology. 63, 1155-1162.
Combs, A. K. (2009) Inflammation and microglia actions in Alzheimer’s Disease. Jour-
nal of Neuroimmune Pharmacology, 4, 380-388.
Conde, J. R., & Streit, W. J. (2006) Microglia in the aging brain. J. Neuropathol. Exp.
Neurol, 65, 199-203.
Courch, P. J., Harding, S. E., White, A. R., Camakaris, J., Bush, A. I., & Masters, C. L.
(2008) Mechanisms of amyloid beta mediated neurodegeneration in Alzheimer’s disease.
IJBCB. 40, 181-198.
D’Andrea, M. R, Nagele, R. G, Wang, H. Y, Peterson, P. A, & Lee, D. H .(2001)
Evidence that neurones accumulating amyloid can undergo lysis to form amyloid plaques
in Alzheimer's disease. Histopathology. 38, 120
Debomay, L. D. (2008) Current Alzheimer research: Update on lipids, estrogen, neuro-
trophins and the roles in neurodegeneration. Current Alzheimer Research, 5, 1, 1-3.

210
De Felic, F.G., Wu, D., Lamber, M. P., Fernandez, S. J., Velasco, P. T., Lacor, P. N.,
Bigio, E. H., Jerecic ,J., Acton, P. J., Shughure, P. J., Kinney, G. G., & Klein., W. L.
(2008) Alzheimer’s disease – type neuronal tau hyperphosphorylation induced by Aβ oli-
gomers. Neurobiology of aging. 29, 1334-1347
Dovebeshko, G. I., Girdina, N. Y., Kruglova, E. B., & Pashchuk, O. P. (2000) FTIR spec-
troscopy studies of nucleic acid damage. Talanta, 53, 233-246.
Dudal, S., Krzywkowski, P., Paquette, J., Morissette, C., Lacombe, D., Tremblay, P., &
Gervais, F. (2004) Inflammation occurs early during the amyloid beta depostion process
in TgCRND8 mice. Neurobiology of aging, 25, 861-871.
Dumas, P., & Miller, L. (2004) The use of synchrotron infrared microspectroscopy in
biological and biomedical investigations. Vibrational Spectroscopy. 32, 3-21.
Duyckaerts, C., & Dickson, D. W., (2003). Neuropathology of Alzheimer’s disease. The
molecular pathology of dementia and movement disorders. ISN Neuropath Press, Basel,
pp. 47-65.
Ellepola, S. W., Choi, S. M., Philips, D. L., & Ma. C. Y. (2006) Raman spectroscopics
study of rice globulin. Journal of Cereal Science, 43, 85-93.
Fabian, H., Jackson, M., Murphy, L., Watson, P. H., Fichtner, I., & Mantsch, H. H.
(1995) A comparative infrared spectroscopic study of human breast tumors and breast
tumor cell xenografts. Biospectroscopy, 1, 1, 37-45.
Ferraro, J. R., Nakamoto, K., & Brown, C. W. (2003) Introductory Raman Spectroscopy,
Elsevier. 434 pp.
211
Fetler, L., & Amigorena, S. (2005) Neuroscience brain under surveillance. The microglia
patrol Science, 309, 392-393.
Florent- Bechard, S. F., Desbene, C., Garcia, P., Allouche, A., Youssef, I., Escayne, M.
C., Koziel, V., Hanse, M., Malaplate-Armand, C., Stenger, C., Krein, B., Yen-Potin, F.
T., Oliver, J. L., Pillot, T., & Oster, T. (2009) The essential role of lipids in Alzheimer’s
disease. Bichimie, 91, 804-809.
Friedrich, R. P., Tepper, K., Roenicke, R., Soom, M., Westermann, M., Reymann, K.,
Kaether, C., & Faendrich, M. (2010) Mechanism of amyloid plaque formation suggests
an intracellular basis of Amyloid beta pathogenicity. Proceedings of the National Acad-
emy of Sciences of the United States of America, 1-6.
Funato, H., Enya, M., Yoshimaro, M., & Ihara, A. M. (1999) Presence of sodium dodecyl
sulfate-stable amyloid beta-protein dimers in the hippocampus CA1 not exhibiting
neurofibrillary tangle formation. The American Journal of Pathology, 155, 1, 23-28.
Gallant, M., Rak, M., Szeghalmi, A., Del Bigio, M. R., Westaway, D., Yang, J., Julian,
R., & Gough, K. M. (2006) Focally elevated creatine detected in amyloid precursor pro-
tein (APP) transgenic mice and Alzheimer's disease brain tissue. The Journal of Biologi-
cal Chemistry, 281(1), 5-8.
Gallant, M. (2007) Infrared Microspectroscopy of focally elevated creatine in brain tissue
from Amyloid Precursor Protein (APP) Transgenic mioce, M.Sc. Thesis, University of
Manitoba.
Gasparani, L., Gouras, G. K., Wang, R., Gross, R. S., Beal, M. F., Greengard, P., & Xu,
H. (2001) Stimulation of beta-amyloid precursor protein trafficking by insulin reduces in-
traneuronal beta- amyloid and requires mitogen-activated protein kinase signalling. The
Journal of Neuroscience, 21(8), 2561-70.
212
Godbolt, A. K., Waldman, A. D., MacManus, D. G., Schott, J. M., Frost, C., Cipolotti, L.,
Fox, N. C., & Rossor, M. N. (2006) MRS shows abnormalities before symptoms in fa-
milial Alzheimer disease. Neurology, 66, 718-722.
Gotz, L., Ittner, L. M., Schonrock, N., & Cappai, R. (2008) An update on the toxicity of
amyloid beta in Alzheimer’s disease. Neuropsychiatric Disease and Treatment, 4, 6,
1033-1042.
Green, P. S., & Simpkins, J.W. (2000) Estrogens and estrogen-like non-feminizing com-
pounds: Their role in the prevention and treatment of Alzheimer's disease. Annals of the
New York Academy of Sciences, 924, 93-98.
Griffiths, H. H., Morten, I. J., & Hooper, N. M. (2008) Emerging and potential therapies
for Alzheimer's disease. Expert Opinion on Therapeutic Targets, 12, 6, 693-704.
Griffiths, P. (2007) Fourier Transform Infrared Spectroscopy. Wiley. Pages. 704.
Gong, C., Grundke-Iqbal, I., & Iqbal, K. (2010) Targeting tau protein in Alzheimer's dis-
ease. Drugs & Aging. 27(5), 351-365.
Gotz, J., Ittner, L. M., Schonrock, N., & Cappai, R. (2008) An update on the toxicity of
A.beta. in Alzheimer's disease. Neuropsychiatric Disease and Treatment, 4(6), 1033-
1042
Guido, K., & John, R. C. (2000) Mitochondrial control of cell death. Nal. Med, 6 (5) 513-
519.
Hammes, G. G. (2005) Spectroscopy for the biological sciences. Wiely, Pages: 179.
Hardy, J., & Selkoe, D. J. (2002) The amyloid hypothesis of Alzheimer’s disease:
preogress and problems on the road to therapeutics. Science, 297, 353-356.
213
Hardy, J. A., & Higgins, G. A. (1992) Alzheimer siease: the amyloid cascade hypothesis.
Science, 256 (5054). 184-185 1992
Heneka, M. T., & O’Banion, M. K. (2007) Inflammatory processes in Alzheimer’s dis-
ease. J. Neuroimmunology. 184, 69-91.
Heneka, M. T., Sastre, M., Dumitrescu-Ozimek, L., Dewachter, I., Walter, J., & Klock-
gether, T. (2005) Focal glial activation coincides with increased BACE1 activation and
precedes amyloid plaque deposition in APP[V717I] transgenic mice. J. Neuroinflamma-
tion, 2, 22.
Herringa, A., Yasin, H., Ambree, O., Sachser, N., Paulus, W., & Keyvani, K. (2008) En-
viromental enrichment counteracts Alzheimer’s neurovascular dysfunction in TgCRND8
mice. Brain Pathology, 18, 32-39.
Herz, J. (2007) Overview: The long and winding road to understand Alzheimer’s disease.
Neuron, 53, 477-79.
Iwata, N., Mizukami, H., Shirotni, K., Takaki, Y., Muramatsu, S. I., Lu, B., Gerard, N. P.,
Gerard, C., Ozawa, K., & Saido, T. C. (2004) Presynaptic localization of Neprilysin con-
tributes to efficient clearance of amyloid beta peptide in mouse brain. The Journal of
Neuroscience, 81, 2, 742-66.
Jan, a., Gokce, o., Luthi-Carter, r., & Lashuel, H. A. (2008) The Ratio of monomeric to
aggregated forms of Amyloid-Beta 40 and Amyloid-Beta 42 is an important determinant
of amyloid-.beta. aggregation, fibrillogenesis, and toxicity. Journal of Biological
Chemistry, 283, 42, 28176-28189.
Jakob-Roetne, R., & Jacobsen, H. (2009) Alzheimer’s Disease: From pathology to
therapeutic appoaches. Angewandte Chemie, International Edition. 48(17), 3030-3059.

214
Kateinen, E., Elomaa, M., Laakkonen, U. M., Sippola, E., Niemela, P., Suhonen, J., &
Jarninen, K. (2007) Qualification of the amphetamine content in seized street samples by
Ramn spectroscopy. Journal of Forensic Science, 52, 1, 88-92.
Kawahara, M., Negishi-Kato, M., & Sadakane, Y. (2009) Calcium dyshomeostasis and
neurotoxicity of Alzheimer's beta-amyloid protein.
Kawarabayashi, T., Shoji, M., Younkin, L. H., Dikson, D. W., & Younkin, S. G. (2004)
Dimeric amyloid-β protein rapidly accumulates in lipid rafts followed by apolipoprotein
E and phosphorylated tau accumulation in the Tg2576 mouse model of Alzheimer's
disease. Journal of Neuroscience, 24, 3801-3809.
Kayad, R., Head, E., Thompson, J. L., McIntire, T. M., Milton, S. C., Cotman, C. W., &
Glabe, C. G. (2003) Common structure of soluble amyloid oligomers implies common
mechanism of pathogenesis. Science. 300, 486-489.
Klein, W. L., Stine, J. R., & Teplow, D. B. (2004) mall assemblies of unmodified amy-
loid -β protein are the proximate neurotoxin in Alzheimer's disease. Neurobiology of Ag-
ing, 25, 569-80.
Kobayashi, K,. Nakano, H., & Hayashi, M. (2003) Association of phosphorylation site of
tau protein with neuronal apoptosis in Alzheimer’s disease. J Neurol Sci, 208(1–2):17–24
Köehler, M., Machill, S., Salzer, R.,& Krafft, C. (2009) Characterization of lipid extracts
from brain tissue and tumors using Raman spectroscopy and mass spectrometry. Analyti-
cal and Bioanalytical Chemistry, 393, 5, 1513-1520.
Kolijenovice, S., Scut, T. B., Vincent, A., Kros, J. M., & Pupples, G. J. (2005) Detection
of meningioma in dura mater by Raman spectroscopy. Analytical Chemistry, 77, 24,
7958-7965.
215
Koppenal, C., Finefrock, A. E., Bush, A. I., & Doraiswamy, P. M. (2004) Copper, iron
and zinc as therapeutic targets in Alzheimer's disease. Research and Practice in Alz-
heimer's Disease, 9, 250-255.
Kosik, K. S., Joachim, C. L., & Selkoe, D. J. (1986) Microtubule-associated protein tau
is a major antigenic component of paired helical filaments in Alzheimer disease. Proc
Natl Acad Sci, 83, 4044-4048
Krafft, C., Knetschke, T., Funk, R. H. W., & Salze, R. (2006) Studies on stress-induced
changes at the subcellular level by Raman Microspectroscopic mapping. Analytical.
Chemistry, 78, 4424-4429.
Krafft, C., Sobottka, S. B., Schackert, G., & Salzer, R. (2005) Near Infrared Raman Spec-
troscopic mapping of native brain tissue and intracranial tumors. Analyst, 130, 1070-
1077.
Krafft, C., Neudert, L., Simat, T., & Salzer, R. (2005) Near Infrared Raman spectra of
human brain lipids. Spectrochimica Acta, Part A, 61, 1529-1535.
Kraftt, C. (2004) Bioanalytical applications of Raman Spectroscopy. Analytical Bioana-
lytical Chemistry, 378: 60-62.
Kuzyk, A., Kastyak, M., Agrawal, V., Gallant, M., Sivakumar, G., Rak, M., Del Bigio,
M. R., Westaway, D., Julian, R., & Gough, K. M. (2010) Association among amyloid
plaque, lipid, and creatine in hippocampus of TgCRND8 mouse model for Alzheimer
disease. The Journal of biological chemistry, 285(41), 31202-7.
Lakshimi, R. J., Kartha, V. B., Krishna, C. M., Solomon, J. G. R., Ullas, G., & Devi, U.
(2002) Tissue Raman spectroscopy for the study of radiation damage: Brain irradiation of
mice. Radiation Research, 157, 175-182.
216
Lee, Y. B., Nagai, A., & Kim, S. U. (2002) Cytokines, chemokines, and cytokine recep-
tors in human microglia. Journal of Neuroscience Research, 69, 94-103.
Lepoirve, M., Flaman, J.M., Bobe, P., Lemaire, G., & Henry, Y. (1994) Quenching of
the tyrosyl free radical of ribonucleotide reductase by nitric oxide. Journal of Biological.
Chemistry. 269, 21891-21897
Li, X., Bürklen, T, Yuan, X., Schlattner, U., Desiderio, D. M., Wallimann, T., & Homay-
ouni, R. (2006) Stabilization of ubiquitous mitochondrial creatine kinase preprotein by
APP family proteins. Molecular and Cellular Neuroscience, 31, 263-272.
Li, R., Lindholm, K., Yang, L., Yue, X., Citon, M., Yan, R., Beach, T., Sue, L., Sabbagh,
M., Cai, H., Wong, P., Price, D., & Shen, Y. (2004) Amyloid beta peptide load is corre-
lated with increased beta secratse activity in sporadic Alzheimer’s disease patients.
PNAS, 101, 10, 3632-3637.
Lustbader, J. W., Cirilli, M., & Lin, C. (2004). ABAD directly links Abeta to
mitochondrial toxicity in Alzheimer's disease. Science, 304, 448-452.
Lucas, J. J., Hernandez, F., & Gomez-Ramos, P. (2001) Decreased nuclear beta-catenin,
tau hyperphosphorylation and neurodegeneration in GSK-3beta conditional transgenic
mice. EMBO J, 20(1–2):27–39
Maccioni, R. B., Farias, G., Morales, I., & Navarrete, L. (2010) The revitalized tau hy-
pothesis on Alzheimer’s disease. Archives of Medical Research, 41, 226-231.
Magistretti, P. J., & Pellerin, L. (1999) Cellular mechanisms of brain energy metabolism
and their relevance to functional brain imaging. Biological Science, 1977, 55, 637-653.
217
Malini, R., Venkatarkrishma, K., & Kurien, J. (2006) Discrimination of normal, inflam-
matory, premalignant, and malignant oral tissue: A Raman spectroscopy study, Biopoly-
mers, 81, 3, 179-193.
Mancuso, M., Orsucci, D., Siciliano, G., & Murri, L. (2008) Mitochondria, mitochon-
drial DNA and Alzheimer's disease. What comes first? Current Alzheimer Research, 5, 5,
457-468.
Mandal, P. K. (2008) Magnetic resonance spectroscopy (MRS) and its application in
Alzheimer's disease. Bridging Education and Research, 32A, 5, 407.
Mandal, P. K., (2007) Magnetic resonance spectroscopy (MRS) and its application in
Alzheimer's disease. Bridging Education and Research, 30A(1) 40-64
Martinez , A., Portero-Otin, M., Pamplona, R., & Ferre, I. (2010) Protein targets of oxi-
dative damage in human neurodegenerative disease with abnormal protein aggregates.
Brain Pathology, 20, 281-297.
Martins, I. C., Kuperstein, I., Wilkinson, H., Maes, E., Mieke V., Jonckheere, W.,
D’Hooge, R., De Strooper, B., Schymkowitz, J., & Rousseau. A. (2008) Lipids revert in-
ert amyloid beta fibrils to neurotoxic protofibrils that affect learning in mice. The EMBO
Journal, 27, 224-233.
Matteson, M. P. (2004) Ways towards and away from Alzheimer’s disease. Nature, 430,
631-639.
McGown, E. J., & Erksend, A. (2006) A decade of modeling Alzheimer’s disease in tras-
gneic mice. Trends Genet, 22, 5, 281-289
218
Miller, L. M., & Smith, R. J. (2005) Synchrotron versus golbars, point-detectors versus
focal plane arrays: Selecting the best source and detector for specific infrared microspec-
troscopy and imaging applications. Vibrational Spectroscopy. 38, 237-240.
Moreno-Torres, A., Pujol, J., Soriano-Mas, C., Deus, J., Iranzo A., & Santainaria, J.
(2005) Neurobiology of Aging. 26, 1051-1059.
Moore, A. H., Bigbee, M. J., Boynton, G. E., Wakeham, C. M., Rosenheim, H. M., Sta-
ral, C. J., Morrissey, J. L., & Hund, A K. (2010) Non-steroidal anti-inflammatory drugs
in Alzheimer's disease and Parkinson's disease: reconsidering the role of neuroinflamma-
tion. Pharmaceuticals, 3, 1812-1841.
Movasaghi, Z., Rehman, S., & Rehman, I. U. (2007) Fourier Transform Infrared (FTIR)
Spectroscopy of biological tissues. Applied Spectroscopy Reviws, 43: 134-179.
Movasaghi, Z., Rehman, S., & Rehman, I. U. (2007) Raman Spectroscopy of biological
tissues. Applied Spectroscopy Reviws, 42: 493-541.
Mucke, L., Msliah, E., Yu, G. O., Mallory, M., Rockenstein, E. M., Tatsuno, G., Kholo-
denko, D., & McConologue, L. (2000) High-level neuronal expression of amyloid beta 1-
42 in wild-type human APP transgenic mice: Synaptotoxicity without plaque formation.
Journal of Neuroscience, 20, 4050-4058.
Napoli, I., & Neumann, H. (2009) Microglial clearance function in health and disease.
Neuroscience, 158, 1030-1038.
Nelson, P. T., Abner, E. L., Schmitt, F. A., Kryscio, R. J., Jicha, G. A., Santacruz, K.,
Smith, C., Patel, E., & Markesbery, W. R. (2008) Brains with medial temporal lobe neu-
rofibrillary tangles but no neuritic amyloid plaques are a diagnostic dilemma but have
pathogenetic aspects distinct from Alzheimer disease. Journal of Neuropathology and
Experimental Neurology, 68, 7, 774-784.
219
Nerelius, C., Johnsson, J., & Sandegren, A. (2009) Amyloid beta-peptide aggregation.
What does it result in and how can be prevented? Frontiers in Bioscience, 14, 1716-1729.
Nivaggioli, B. T. (2007) Methods for treating a neurological disorder with creatine
monohydrate. U.S. Pat. Appl. Publ, 16pp.
Nunomura, C., Tamoki, T., Tanaka, K., Motohashi, N., Nakamura, M., Hayashi, T., Ya-
maguchi, H., Shimohama, S., Lee, H., Zhu, X., Smith, M. A., & Perry, G. (2010) Intra-
neuronal amyloid β accumulation and oxidative damage to nucleic acids in Alzheimer
disease. Neurobiology of Disease, 37, 731-737.
Nunomura, A., Perry, G., Aliev, G., Hirai, K., Takeda, A., Balraj, E. K., Jones, P. K., Pe-
tersen, R. B., & Smith, M. A., (2007) Oxidative damage is the earliest event in Alzheimer
disease. J. Neuropathol. EXP. Neurol, 60, 759-767.
Ogg, M. (2002) Vibrational Microspectroscopy of Alzheimer Diseased Hippocampus tis-
sue. M.Sc. Thesis, University of Manitoba.
Ohtsuki, S., Tachikawa, M., & Takanaga, H. (2002) The blood-brain barrier creatine
transporter is a major pathway for supplying creatine to the brain. J. of Cerebral Blood
Flow and Metabolism, 22, 11, 1327-1335.
Ohyagi, Y. (2008) Intracellular amyloid .beta.-protein as a therapeutic target for treating
Alzheimer's disease. Current Alzheimer Research, 5(6), 555-561.
Ong, C. W., Shen, Z. X., Lee, Y., & Tang, S. H. (1999) Raman Microspectroscopy of the
brain tissues in the substantia nigra and MPTP-induced parkinson’s disease. J of Raman
Spectroscopy, 30, 91-96.
220
Ozaki, Y. Y. (2008) Introduction to Raman spectroscopy. Pharmaceutical applications of
Raman spectroscopy, 1, 28, 1-28.
Panza, F., Solfrizzi, V., Frisardi, V., Capurso, C., D'Introno, A., Colacicco, A. M.,
Vendemiale, G., Capurso, A. I., & Bruno, P. (2009) Disease-Modifying Approach to the
Treatment of Alzheimer's Disease. Drugs & Aging, 26 - Issue 7, 537-555.
Parachikova, A., Agadjanyan, M., & Cribbs, D. (2006) Inflammatory changes parallel the
early stages of Alzheimer disease. Neurobiol Aging. 28 (12) 1821- 1833
Parihar, M. S., & Brewer, G. J. (2007) Mitoenergetic failure in Alzheimer disease. AM J
Physiol Cell Physiol, 292: C8-C23.
Patterson, C., Feighter, J. W., Garcia, A., Hsiung, G. R., Macknight, C., & Sadovink, D.
(2008) Diagnosis and treatment of dementia: Risk assessment and primary prevention of
Alzheimer disease. CMAJ, 26, 178(5), 548-586.
Pereira, C., Agostinbo, P., Moreira, P. I., Cardoso, S. M., & Oliveira, C. R. (2005) Alz-
heimer’s disease-associated neurotoxic mechanisms and neuroprotective strategies. Cur-
rent Drug Targets-CNS & Neurological Disorders, 4, 383-403.
Pierrot, N., & Octave, J. (2008) Processing of amyloid precursor protein and amyloid
peptide neurotoxicity. Current Alzheimer Research, 5(2), 92-99
Pimplikar, S. W. (2009) Reassessing the amyloid cascade hypothesis of Alzheimer’s dis-
ease. The international Journal of Biochemistry & Cell Biology, 41, 1261-1268.
Pratico, D. (2008) Oxidative stress hypothesis in Alzheimer's disease: a reappraisal.
Trends in Pharmacological Sciences, 29(12), 609-615.
221
Querfurth, H. W., & LeFerla, F. W. (2010) Mechanisms of disease; Alzheimer’s disease.
The New England Journal of Medicine, 362, 329-344.
Quiroz-Baeza, R., Emilio, R., & Clorinda, A. (2009) Oxidative stress promotes amyloi-
dogenic processing of normally expressed human APP by differential modification of α-,
β- and γ-secretase expression. Neuroche Inter, 55, 7, 662-670
Ramos, A., Diaz-Hernandez, M., Cuadros, R., Hernandez, R., & Ávila, J (2006)
Extracellular tau is toxic to neuronal cells. FEBS Lett, 580:4842–4850.
Rankin, C. A., & Gamblin, T. C. (2008) Assessing the toxicity of Tau aggregation. J of
Alzheimer’s Disease, 14, 411-416.
Rak, M. (2007) Synchrotron infrared microspectroscopy of biological tissues: brain tis-
sue from TgCRND8 Alzheimer’s disease mice and developing scar tissue in rats. Ph.D.
Thesis, University of Manitoba.
Rak, M., Del Bigio, M. R., Mai, S., Westaway, D., & Gough, K. M. (2007) Dense-core
and diffuse Aβ plaques in TgCRND8 mice studies with synchrotron FTIR microspectro-
scopy. Biopolymers, 87, 4, 207-217.
Reddy, P. H., & Beal, M. F. (2005) Are mitochondria critical in the pathogenesis of Alz-
heimer’s disease? Brain Research Reviews. 49, 618-632.
Rodriguez, J. J., Witton, J., Olabarria, M., Noristani, H. N., & Verkhratsky, A. (2010) In-
crease in the density of resting microglia precedes neuritic plaque formation and micro-
glia activation in a transgenic model of Alzheimer’s disease. Cell Death and Disease. 1,
10, 1038, 1-6.

222
Rogers, J., Lue, L. F., Walker, D. G., Yan, S. D., Stern, D., Strohmeyer, R., &
Kovelowski, C. J. (2002) Elucidating molecular mechanisms of Alzheimer's disease in
microglial cultures. Ernst Schering Research Foundation Workshop, 39 25-44.
Rouessac, F., & Rouessac, A. (2007) Chemical analysis. Modern instrumentation meth-
ods and techniques. Wiley. Pages. 574.
Ruan, L. (2009) Amyloid deposition and inflammation in APP/PS1 mouse model of AD.
Current Alziemer Research, 6, 6, 531-540.
Salzer, R., Krafft, C. (2009) Infrared and Raman Spectroscopy Imaging. Wiley. Pages.
510.
Schlachetzki, J. C. M., & Hull M., (2009) Microglial activation in Alzheimer’s disease.
Current Alzheimer Research, 6, 6, 554-563.
Selkoe, D. J. (1991) The molecular pathology of Alzheimer’s disease. Neuron, 6(4) 487-
498
Shih, W., & Chuan, W. (2009) Quantitative biological Raman spectroscopy. Handbook of
optical sensing of Glucose in biological fluids and tissues, 353-385.
Siedlak, S. L., Casadesus, G., Webber, K. M., Pappolla, M. A., Atwood, C. S., Smith, M.
A., & Perry, G. (2009) Chronic antioxidant therapy reduces oxidative stress in a mouse
model of Alzheimer's disease. Free radical Research, 43, 2, 156-164.
Simard, A. R., Soulet, D., Gowing, G., Julien, J. P., & Rivest, S. (2006) Bone marrow-
derived microglia play a critical role in restricting senile plaque formation in Alzheimer’s
disease. Neuron, 49, 489-502.
223
Small, S. A., & Duff, K. (2008) Linking Aβ AND Tau in late-onset Alzheimer’s disease:
A dual pathway hypothesis. Neurons, 60, 534-542
Solano, D. C., Sironi, M., Bonfini, C., Solerte, B., Govoni, S., & Racchi, M. (2000) Insu-
lin Regulates Soluble Amyloid Precursor Protein Release Via Phosphatidyl Inositol 3
Kinase-dependent Pathway. The FASEB, 14, 10115-1022.
Stampfer, M. J. (2006) Cardiovascular disease and Alzheimer’s disease: common links.
Journal of Internal Medicine, 260, 211-23. Risk of Alzheimer's disease and duration of
NSAID use. Neurology, 48(3), 626-32.
Stoothoff, W. H., & Johnson, G.V. (2005) Tau phosphorylation: physiological and patho-
logical consequences. Biochem Biophys Acta, 1739(2–3):280–297
Streijger F., Oerlemans F., Elenbroek BA., Jost C. R, & Wieringa, B. (2005) Structural
and behavioural consequences of double deficiency for creatine kinases. Behav Brain
Res, 157, 219-23
Stuart, B. (2004) Infrared Spectroscopy: Fundamentals and applications. Wiley. Pages.
203.
Szekely, C. A., & Zandi, P. P. (2010) Non-steroidal anti-inflammatory drugs and Alz-
heimer's disease: the epidemiological evidence. CNS & Neurological Disorders: Drug
Targets, 9(2), 132-139.
Tachkawa, M., Fukaya, M., Terasaki, T., Ohtsuki, S., & Watanabe, M. (2004) Distinct
cellular expressions of creatine synthetic enzyme GAMT and creatine kinases uCK-Mi
and CK-B suggest a novel neuron-glia relationship for brain energy homeostasis. The
European Journal of Neuroscience, 20, 144-160.
224
Takahashi, R. H., Capetillo-Zarate, E., Lin, M.T., Milner, T. A., &Gouras, G. K. (2010)
Co-occurrence of Alzheimer's disease .beta.-amyloid and tau pathologies at synapses.
Neurobiology of Aging, 31, 7, 1145-1152.
Tanzi, R. E. (2005) The synaptic Amyloid beta hypothesis of Alzheimer Disease. Nat
Neurosci. 8(8), 977-979.
Tarnopolsky, M. A. (2000) The mitochondrial cocktail: Rationale for combined nutraceu-
tical therapy in mitochondrial cytopanthies. Advanced Drug Delivery Reviws, 60, 1561-
1567.
Terry, R. D., Gonatas, N. K.,& Weiss, M. (1964) The uktrastructure of the cerebral cortex
in Alzheimer’s disease. Am Neuro Assoc, 89, 12.
Tiraboschi, P., Hansen, L. A., Masliah, E., Thal, L., & Corey-Bloom, J. (2000) The de-
cline in synapses and cholinergic activity is asynchronous in Alzheimer’s disease. Neu-
rology. 55, 1278-1283.
Tkahashi, R. H., Amedia, C. G., Keanery, P. F., Lin, M. T., Milner, T. A., & Gouras G.
K. (2004) Oligomerization of Alzheimer's .beta.-amyloid within processes and synapses
of cultured neurons and brain. Journal of Neurscience, 24, 3592-3599.
Urenjak, J., Williams, S. R., Gadian, D. G., & Noble, M. (1993) Protein nuclear magnetic
resonance spectroscopy unambiguously identified different neural cell types. J. Neurosci,
13, 981-989.
Uttara, B., Singh, A. V., Zamboni, P., & Mahajan, R. T. (2009) Oxidative stress and neu-
rodegenerative diseases: A review of upstream and downstream antioxidant therapeutic
options. Current Neuropharmacologu, 7, 65, 74.
225
Verdier , Y., Zarandi, M., & Penke, B. (2004) Amyloid beta-peptide interactions with
neuronal and glial cell plasma membrane: Binding sites and implications for Alzheimer’s
Disease. Journal of Peptide Science, (2004) 10, 229-248.
Walsh, D. M., & Selko, D. J., (2004) Deciphering the molecular basis of memory failure
in Alzheimer’s disease. Neuron, 44, 181-193.
Waldo, C. W., Dinamarca, M. C, & Inestrosa, N. C. (2008) Structure-function implica-
tions in Alzheimer’s disease: Effect of amyloid beta oligomers at central synapses.
Cuurent Alzheimer Research, 5, 233-243.
Wallimann, T., & Hermmer, W. (1994) III-2 creatine kinase in non-muscle tissue and
cells. Molecular and Cellular Biochemistry, 133/134, 193-220.
Wallimann, T., Wyss, M., Brdiczka, D., Nicolay, K., & Eppenberger, H. M. (1992) Intra-
cellular compartmentation, structure and function of creatine kinase isoenzymes in tissue
with high and fluctuating energy homeostasis. The Biochemical Journal. 281, 21-40.
Walsh, D. M., Minogue, A. M., Frigerio, C. S., Fadeeva, J. V., Wasco, W., & Selkoe, D.
J. (2007) The APP family of proteins: similarities and differences. Biochhemical Society
Transactions, 35, part2, 416-420.
Walsh, D. M., & Selkoe, D. J. (2007) Amyloid beta oligomers-a decade of discovery.
Journal of Neurochemistry, 101, 1172-1184.
Walsh, D. M., Klyubin ,G. M., Shankar, M., Townsend, J. V., Rowan, M. J., & Selkoe,
D. J. (2005) The role of cell-derived oligomers of Aβ in Alzheimer’s disease and avenues
for therapeutic intervention. 33, 1087-1090
226
Walsh, D. M., Tseng, B. P., Rydel, R. E., Podisny, M. B., & Selkoe, D. J. (2000) The oli-
gomerization of amyloid beta-protein begins intracellular in cells derived from human
brain. Bio Chem, 39, 10831-10839.
Watson, D., Castano, E., Kokjohn, T. A., Kuo, Y., Lyubchenko, Y., Pinsky, D., Con-
nolly, E. S., Esh, C., Luehrs, D. C., Stine, W. B., RowseM, L. M., Emmerling, M. R., &
Roher, A. E. (2005) Physiolochemical characteristics of soluble oligomeric amyloid beta
an dtheir pathologic role in Alzheimer’s disease. Neurol Res, 27, 869-881.
West, M. J., Kawas, C. H., Stewart, W. F., Rudow, G. L., & Troncoso, J. C. (2004) Hip-
pocampal neurons in pre-clinical Alzheimer’s disease. Neurobiol Aging, 25, 1205-1212.
White, J. A., Maneli, A. M., Holmberg, K. H., & Ladu, M. J. (2005) Differential eefects
of oligomeric and fibrillar amyloid-beta 1-42 on astrocyte-mediated inflammation.
Neurobiol. Dis, 18, 459-465.
Wirths, O., Multhaup, G., & Bayer, T. A. (2004) Amodified beta-amyloid hypothesis:
INtraneuronal accumulation of the beta-amyloid peptide-th efirst step of fatal cascade.
Journal of Neurochemistry, 91, 513-520.
Wirths, O., Breyhan, H., Marcello, A., Cotel, M. C., Bruck, W., & Bayer, T. A. (2008)
Inflammatory of changes are tightly associated with neurodegeneration in the brain and
spinal cord of the APP/PS1K1 mouse model of Alzheimer’s disease. Neurobiol. Aging,
31, 747-757.
Wirths , O., Multhaup, G., & Bayer, T. A. (2004) A modified beta-amyloid hypothesis:
Intraneuronal accumulation of the beta-amyloid peptide-the first step of a fatal cascade.
Journal of Neurochemistry, 91, 513-520.
227
Wood, B. R., Quinn, M. A., Tait, B., Ashdown, M., Hislop, T., Romeo, M., & McNaugh-
ton, D. (1998) FTIR microspectroscopic study of cell types and potential confounding
variables in screeing for cervical malignancies. Biospectroscopy, 4, 75, 91.
Woodhouse, A., Vickers, J. C., Aldard, P. A., & Dickson, T. C. (2009) Dystrophic neuri-
tis in TgCRND8 and Tg2576 mice mimic human pathological brain aging. Neurobiology
of Aging, 30, 864-874.
Wyss, M., & Kaddurah, R. (2000) Creatine and creatine metabolism. Physiol Rev, 80,
1107-1213.
Xu, H., Wang, H., Zhuang, L., Yan, B., Yu, Y., Wei, Z., Zhang, Y., Dyck, L., Steven, J.,
He, J., Jiming, L,. & Xin, M. (2008) Demonstration of an anti-oxidative stress mecha-
nism of quetiapine: Implications for the treatment of Alzheimer's disease. FEBS Journal,
275(14), 3718-3728.
Yoshida, S., Miyazaki, M., Sakai, K., Takeshita, M., Yuasa, S., Sato, A., Kobayashi, T.,
Watanabe, S., & Okuyama, H. (1997) Fourier transform infrared spectroscopic analysis
of rat brain microsomal membranes modified by dietary fatty acids: possible correlation
with altered learning behavior. Biospectroscopy, 3, 281-290.
Yu, L., Edalji, R., Harlan, J. E., Holzman, T. F., Pereda, L. A., Labkovsky, B., Hillen, H.,
Barghorn, S., Ebert, U., Richardson, P. L., Miesbauer, L., Solomon, L., Bartley, D., Wal-
ter, K., Johnson, R. W., Hajduk, P. J., & Olejniczak, E. T. (2009) Biochemistry, 48(9),
1870-1877
Zhao, L., Teter, B., Morihara, T., Lim, G. P., Ambegaokar, S. S., Ubeda, O., Frautschy,
S. A., & Cole, G. M. (2004) Insulin-degrading enzyme as a downstream target of insulin
receptor signalling cascade: implications for Alzheimer’s disease intervention. The Jour-
nal of Neuroscience, 8, 24(49), 11120-11126.