automated feature extraction for early detection of diabetic retinopathy in fundus images
TRANSCRIPT
Automated Feature Extraction for Early Detection of Diabetic Retinopathy inFundus Images
Saiprasad Ravishankar∗, Arpit Jain∗, Anurag MittalUniversity of Illinois at Urbana-Champaign, University of Maryland College Park ,
Indian Institute of Technology [email protected], [email protected], [email protected]
Abstract
Automated detection of lesions in retinal images can as-sist in early diagnosis and screening of a common dis-ease:Diabetic Retinopathy. A robust and computationallyefficient approach for the localization of the different fea-tures and lesions in a fundus retinal image is presentedin this paper. Since many features have common intensityproperties, geometric features and correlations are used todistinguish between them. We propose a new constraint foroptic disk detection where we first detect the major bloodvessels and use the intersection of these to find the approxi-mate location of the optic disk. This is further localized us-ing color properties. We also show that many of the featuressuch as the blood vessels, exudates and microaneurysmsand hemorrhages can be detected quite accurately usingdifferent morphological operations applied appropriately.Extensive evaluation of the algorithm on a database of516 images with varied contrast, illumination and diseasestages yields 97.1% success rate for optic disk localization,a sensitivity and specificity of 95.7% and 94.2% respectivelyfor exudate detection and 95.1% and 90.5% for microa-neurysm/hemorrhage detection. These compare very favor-ably with existing systems and promise real deployment ofthese systems.
1. Introduction
Diabetic retinopathy (DR) is a common retinal compli-cation associated with diabetes. It is a major cause of blind-ness in both middle and advanced age groups. Accordingto the National Diabetes Information data (US) 1, a total of23.6 million people i.e. 7.8 percent of the US populationhave diabetes out of which only 17.9 million cases are diag-nosed. Early detection of the disease via regular screeningis particularly important to prevent vision loss. Since a large
∗The work was done while the authors were at IIT Madras1http://www.diabetes.niddk.nih.gov/dm/pubs/statistics/#estimation
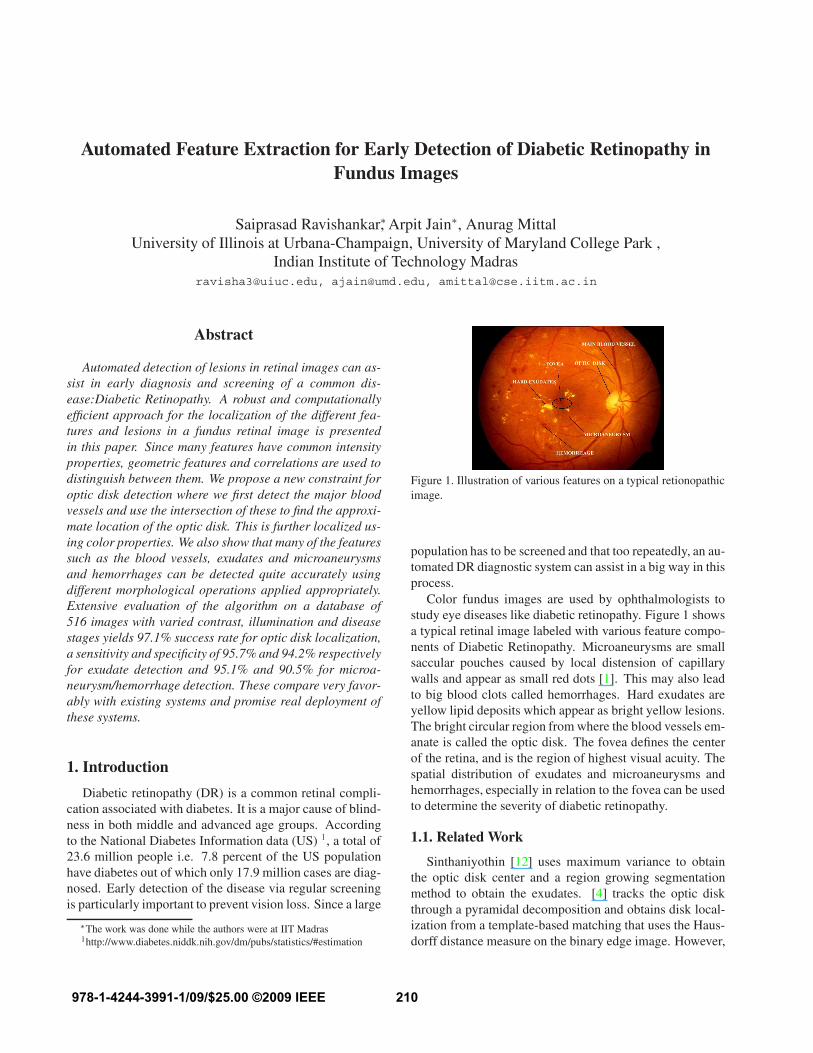
Figure 1. Illustration of various features on a typical retionopathicimage.
population has to be screened and that too repeatedly, an au-tomated DR diagnostic system can assist in a big way in thisprocess.
Color fundus images are used by ophthalmologists tostudy eye diseases like diabetic retinopathy. Figure 1 showsa typical retinal image labeled with various feature compo-nents of Diabetic Retinopathy. Microaneurysms are smallsaccular pouches caused by local distension of capillarywalls and appear as small red dots [1]. This may also leadto big blood clots called hemorrhages. Hard exudates areyellow lipid deposits which appear as bright yellow lesions.The bright circular region from where the blood vessels em-anate is called the optic disk. The fovea defines the centerof the retina, and is the region of highest visual acuity. Thespatial distribution of exudates and microaneurysms andhemorrhages, especially in relation to the fovea can be usedto determine the severity of diabetic retinopathy.
1.1. Related Work
Sinthaniyothin [12] uses maximum variance to obtainthe optic disk center and a region growing segmentationmethod to obtain the exudates. [4] tracks the optic diskthrough a pyramidal decomposition and obtains disk local-ization from a template-based matching that uses the Haus-dorff distance measure on the binary edge image. However,
210978-1-4244-3991-1/09/$25.00 ©2009 IEEE
the above methods will fail if exudates similar in bright-ness and size to the optic disk are present. [13] combinesmatched-filter responses, confidence measures and vesselboundary measures to obtain blood vessels robustly. Butthe paper doesn’t extend it to identify diabetic retinopathyin images.
[1, 7] used blood vessel intersection property to obtainthe optic disk. However, they use the whole blood vesselnetwork which can lead to wrong or inconclusive resultsbecause of noise from the fringe blood vessels. In contrast,we use only the main blood vessels, which is more robust.
Statistical classification techniques have been very pop-ular lately for the problem of lesion classification. Exudateshave color properties similar to the optic disk while Microa-neurysms are difficult to segment due to their similarity incolor and proximity with blood vessels. In order to classifydetected features, typically, candidate regions are detectedusing color/morphological techniques and then classifica-tion is done on these regions using some classifier. Manyclassifiers have been tried including Neural Networks [12],PCA [9], Fuzzy C-means clustering [10], SVMs ([17],[2],[16]) and simple Bayesian classification ([16], [14]).
STARE is a complete system for various retinal diseases[6]. The optic disk is detected using blood vessel conver-gence and high intensity property. In order to determinethe features and classification method to be used for a givenlesion, a Bayesian probabilistic system is used.
In this paper, we develop methods to automatically de-tect all of these features in a fundus image using imageprocessing techniques. We show that many of the featuressuch as the blood vessels, exudates and microaneurysmsand hemorrhages can be detected quite accurately usingdifferent morphological operations applied appropriately.Blood vessels of different thicknesses can be extracted us-ing open and close operations. Exudates appear as brightpatches with sharp edges in retinal images and can be ex-tracted using open and close operations using filters of dif-ferent sizes. Microaneurysms and Hemorrhages (MAHMs)are segmented using morphological filters that exploit theirlocal ’dark patch’ property. These are further classified aslesion/non-lesion using a color model extracted from theblood vessels. We propose a new constraint for optic diskdetection where we first detect the major blood vessels andthen use the intersection of these to find the approximatelocation of the optic disk. This is further localized usingcolor properties. Detection of the Optic disk, fovea and theblood vessels is used not only for distinguishing them fromlesions but also for extracting color information for betterlesion detection.
The rest of the paper is organized as follows: Sec-tion 2 details the blood vessel extraction algorithm whilesection 3 elucidates the exudate detection procedure; Sec-tion 4 describes the optic disk detection method and sec-
tion 5 presents the method for detection of fovea, microa-neurysms and hemorrhages. Section 6 describes determin-ing the severity of the disease using lesion detection whilein section 7, the results of the algorithm over an extensivedataset are presented.
2. Multi-Scale Blood Vessel Extraction
In our approach, color images input from the funduscamera are initially resized to a standard size of 768 × 576pixels while maintaining the original aspect ratio. We se-lect the green channel for all our operations because retinalimages are almost always saturated in the red channel andhave very low contrast in the blue channel.
A closing operation is performed on the green channelimage using two different sizes of a structuring element (fil-ter). Closing operation is defined as dilation (Max filter) fol-lowed by erosion (Min filter). The formulations of dilationand erosion for gray scale images are as follows.
Dilation:
A ⊕ B = A1(x, y) = supi,j∈b
(A(x − i, y − j) + B(i, j))
Erosion:
A ⊖ B = A2(x, y) = infi,j∈b1
(A(x − i, y − j) + B1(i, j))
where A is the input image, B and B1 are the structur-ing elements or masks used for dilation and erosion respec-tively. b and b1 are grids over which the structuring ele-ments are defined.
Dilation in gray scale enlarges brighter regions andcloses small dark regions. The erosion is necessary to shrinkthe dilated objects back to their original size and shape.The dark regions closed by dilation do not respond to ero-sion. Thus, the vessels being thin dark segments laid out ona brighter background are closed by such a closing opera-tion. A subtraction of the closed images across two differentscales (let S1 and S2 be the sizes of the structuring elementsB1 and B2) will thus give the blood vessel segments of thegreen channel image. The operation is as follows:
C′ = (A ⊕ B2) ⊖ B2 − (A ⊕ B1) ⊖ B1
We use a disk shaped structuring element for morphologicaloperations. The radius of the larger disk (S2) is fixed ata high value (we use 6 pixels for an image of size 768 ×
576 pixels) so that all the vessels including the main bloodvessel get closed. The size of the structuring element ischosen based on [6] which describes the blood vessels tobe ranging from 1.5-6 pixels in radius on an average. S1 ischosen adaptively as follows:
1. 1 or 2 pixels below S2 if we want to obtain only thethicker vessels emanating from the optic disk.
211
(a) (b)
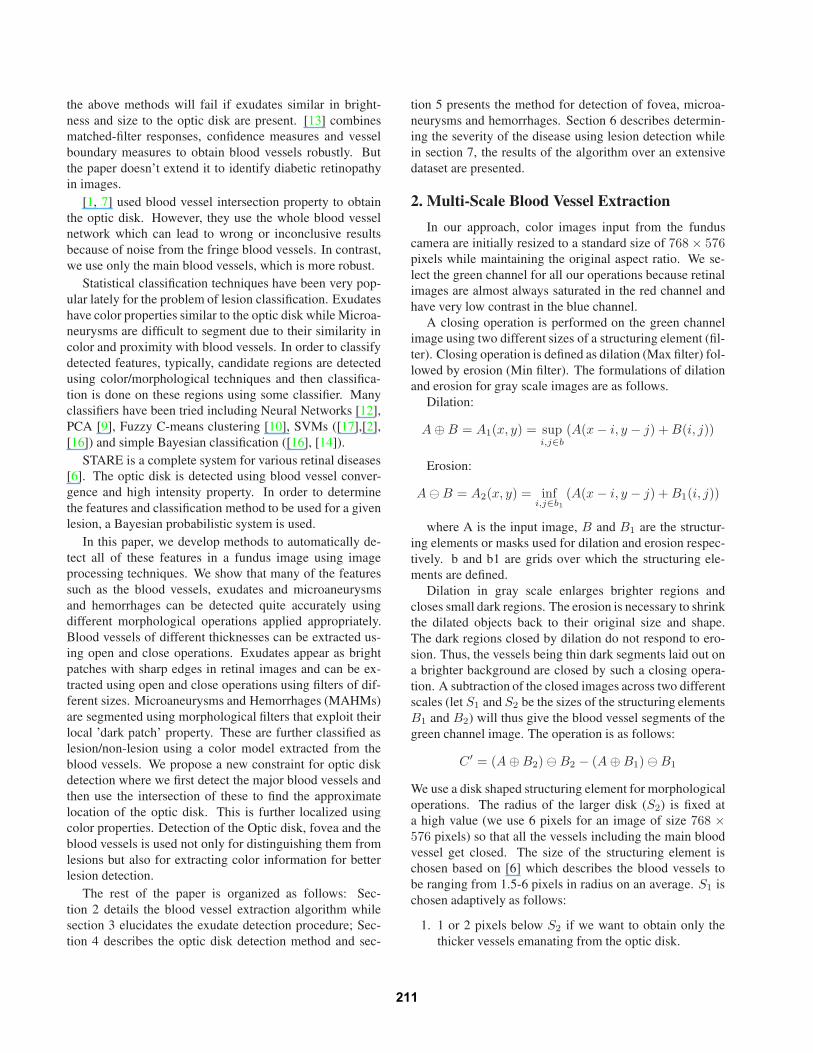
(c) (d)Figure 2. Illustration of the multi-scale vessel extraction algorithmon an image of our dataset: (a) The original green channel im-age, (b) The green image dilated at scale S2, (c) The entire vesselnetwork obtained at lower scale S1 (criterion 2), (d) The thickervessels obtained using higher S1 (criterion 1).
2. At least 4 pixels below S2 to obtain the entire bloodvessel network.
Criterion 1 is used for optic disk localization whereascriterion 2 is used in microaneurysms and hemorrhages de-tection. The image C′ is thresholded (90% of the max-imum intensity) and median filtered to obtain the binaryimage of the blood vessels (U). Morphological thinning isthen performed on U to obtain the skeleton of the bloodvessel network. Thinning operation is implemented asU − (U ⊖ B1 − U ⊖ B2), where B1 and B2 are disjointstructuring elements and U is the complement of the imageU. Noise can occur in the thinned image usually in the formof dots. A 2 × 2 median filtering operation is performed toremove the isolated specks of noise. The vessel segmentsbeing connected structures are unaffected by this operation.An additional source of noise in retinopathic images couldbe exudates, the removal of which is detailed in section 6.Figure 2 shows the results of the vessel extraction algorithmon an image having no exudates.
3. Exudate Localization and Detection
Exudates appear as bright lesions in retinopathic im-ages and have sharp edges and high contrast with the back-ground. Most of the standard edge detectors like Sobel andCanny add a lot of noise and miss out key edges when usedfor extracting exudate edges and hence are not suitable forthis application. We perform boundary detection for exu-dates using morphological operations.
Dilation is performed on the green channel at 2 differ-ent scales: S3 and S4, both of which are greater than S2
which was used for vessel extraction. Hence, at both S3
and S4, the blood vessels do not appear in the dilated result.The exudates being bright with sharp edges respond to dila-tion. Subtraction of the results across the 2 scales gives theboundaries of the exudates: P = (A ⊕ B4) − (A ⊕ B3).The image P is thresholded in intensity to obtain the binaryboundaries. The threshold is chosen as α times the maxi-mum intensity in P where α is obtained by training. Hardexudates give closed boundaries in the thresholded result.Short breaks in the contours are connected by smoothingsplines. This bridging of short breaks in boundaries is use-ful for extracting softer exudates. A morphological filling(reconstruction) operation is then used to search for regionsbounded by closed contours in the result. It is defined asfollows:
Ek = (Ek−1⊕ B) ∩ Hc (1)
This is iterated starting from k = 1 until Ek = Ek−1.Here, Hc is the complement of the thresholded binary im-age which act as mask, B is a 4-connected structuring ele-ment and E0 is an image containing a seed point. A seedis a single pixel or a collection of pixels where the changeis selected to begin. Each seed pixel and its 4 neighboringpixels are flipped and the process is continued subject tothe mask constraint. This process will eventually fill all theholes in the image whose boundaries are defined by H.
Morphological filling operation on the binary image thusgives us the candidate exudate patches. However, the candi-date regions may contain artifacts. Therefore, a linear clas-sifier is built which uses the brightness and edge propertiesof exudates. Exudates are bright yellow or white in colorand have high intensity in the green channel. We localizethe exudate patches more accurately by taking all the candi-date regions whose mean intensities in the green channel aregreater than a fraction β (obtained by training) of the max-imum intensity in the channel. For classifying the patchesbased on their edge strength, the gradient magnitude imageof the green channel is chosen. This gradient magnitudeimage is thresholded (the absolute threshold γ obtained bytraining) and the number of white pixels in the thresholdedimage for each exudate patch is counted. We denote this asthe gradient count of each patch. Patches which do not havesufficient gradient count (δ) are discarded.
Patches that satisfy both the brightness criterion and gra-dient count are retained. In each of the patches classified asexudates, the exact lesion boundary is tracked starting fromthe pixel with the highest gradient magnitude and complet-ing the contour based on continuity of gradient magnitudeand direction. Pixels in the interior of these contours arethen accurately classified as exudate pixels. The optic diskwhich may invariably appear in the result is masked out us-ing the procedure outlined in the next section.
212
(a) (b)
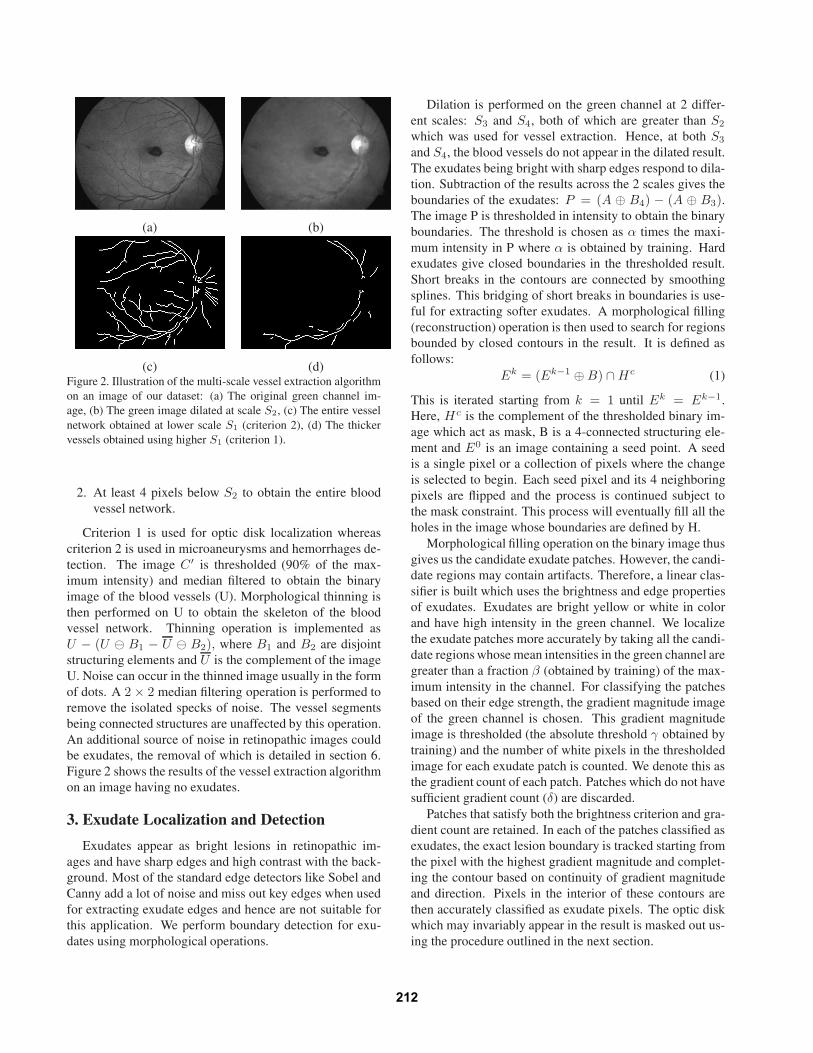
(c)Figure 3. Illustration of the exudate algorithm on an image of ourdataset: (a) The original image, (b) Localized candidate regions,(c) Final result with exudate pixels in black color and optic diskmasked out.
The various thresholds like α, β etc. were obtainedby training the exudate algorithm on an additional set of50 color fundus images obtained from ophthalmologists.Ground truth images were obtained for this set with exu-dates pre-marked and the parameter values that gave opti-mal results (in terms of detecting true exudates and not de-tecting artifacts) were chosen. The values we obtained areα = 0.06, β = 0.52, γ = 3 and δ = 4.
Figure 3 shows the steps of the exudate detection algo-rithm on an image of our dataset. The candidate regions ob-tained after morphological segmentation are shown in Fig-ure 3 (b) and the result after classification, pixel identifica-tion and optic disk removal is shown in Figure 3 (c).
4. Optic Disk Detection
The detection of the optic disk in fundus images is a veryimportant task because of its similarity in brightness, colorand contrast to the exudates. It invariably appears in exudatedetection results and hence there is a need to mask it out.Moreover, the optic disk is an important retinal feature andcan be used for registration of retinal images. It can also beused to diagnose other diseases like Glaucoma.
In this paper, we use a constraint that has been over-looked so far which is to detect the optic disk using con-vergence of only the thicker blood vessels arising from it.This significantly improves the performance compared toexisting techniques that use the entire vessel network. Also,this thicker vessel convergence is almost always present inthe image as opposed to other features of the optic disk such
as color or circular shape. This approach is combined withthe high intensity property of disk regions in a cost functionto improve the robustness of optic disk detection comparedto existing methods.
4.1. Exudate Subtraction
The vessel extraction algorithm detailed in section 2 (us-ing criterion 1) yields the skeleton of the thicker blood ves-sels. These ’thicker’ vessels include the main blood vesseland other smaller but thick vessels emanating from the op-tic disk. Exudates have the potential of occurring as noisein the vessel segmentation because closing and subtract-ing the irregularly shaped exudates using regular structur-ing elements is not an exact operation (i.e. the shape ofexudates does not remain the same after the closing oper-ation). Hence, we perform an additional step to overcomethis limitation. The result of the exudate detection algo-rithm is dilated and subtracted from the blood vessel result.This removes any noise due to exudates in the extraction ofthe main blood vessel. The resulting image after exudatesubtraction is then processed to obtain the optic disk center.
4.2. Vessel Convergence
The segments of the thicker blood vessel skeletonare modeled as lines. We transform the vessel imageinto the Hough space using the Hough Transform (HT)(x, y) HT
−−−→(r, θ) to obtain the lines. The dataset of lines
thus generated is reduced by eliminating lines with slopesθ < 450. This can be done as the vessels converging at theoptic disk typically have a high slope in the vicinity of thedisk. This reduced dataset of lines is intersected pairwiseto generate an intersection map. Lines close to each otherand with nearly the same slope are not intersected due to ahigher triangulation error.
Weighted Convergence Optimization: The intersectionmap generated from candidate line segments of the thickervessels is used to find the location of the optic disk. Themap is dilated to make the region of convergence more ap-parent.
Dilation and erosion in binary images are implementedas OR and AND filters (extension of Max and Min filtersin gray scale). Let the dilated intersection image be M andthe green channel image be A. Then, we define a weightedimage (J) as follows:
J = M + wA
where w is obtained as follows:
w =
{
1, if N ≤ N0
(N0/N)β , if N > N0
(2)
213
(a) (b) (c)
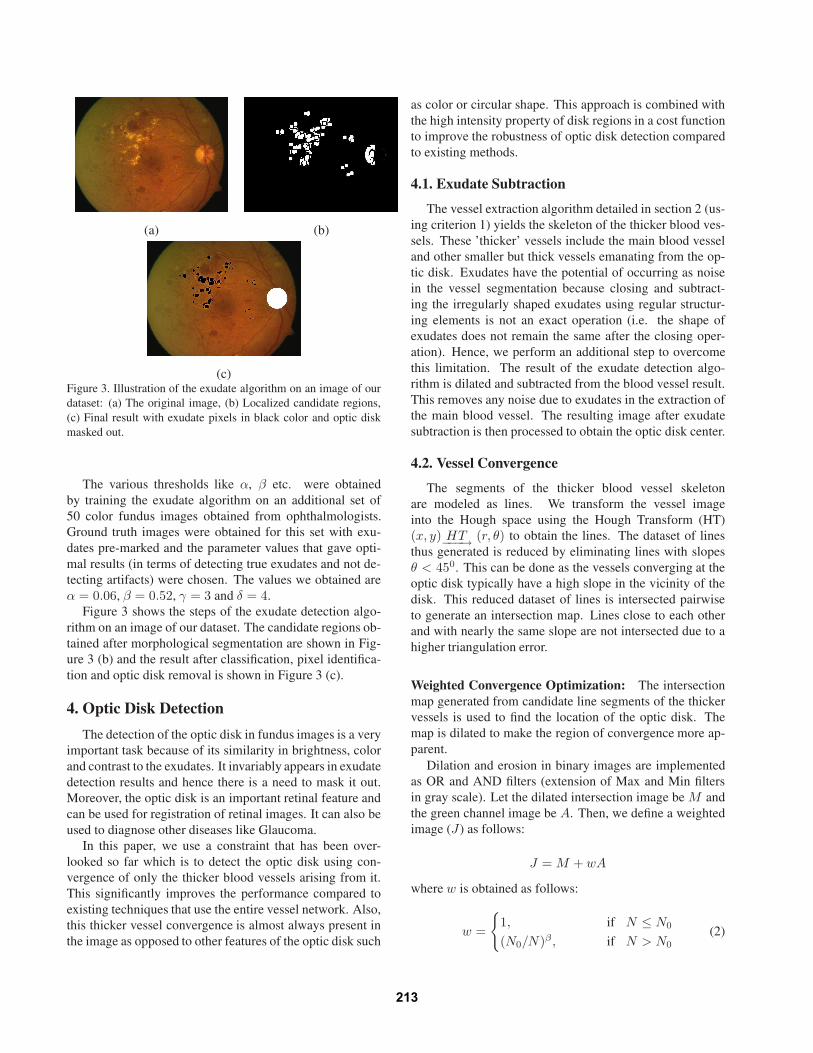
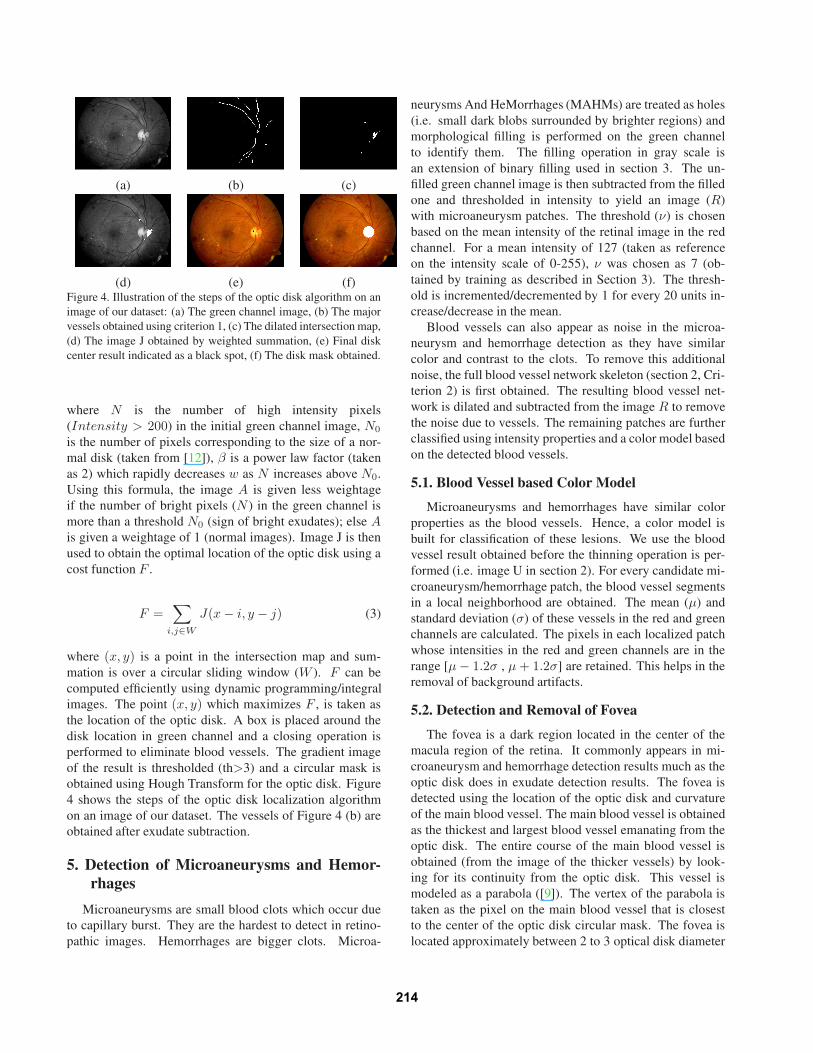
(d) (e) (f)Figure 4. Illustration of the steps of the optic disk algorithm on animage of our dataset: (a) The green channel image, (b) The majorvessels obtained using criterion 1, (c) The dilated intersection map,(d) The image J obtained by weighted summation, (e) Final diskcenter result indicated as a black spot, (f) The disk mask obtained.
where N is the number of high intensity pixels(Intensity > 200) in the initial green channel image, N0
is the number of pixels corresponding to the size of a nor-mal disk (taken from [12]), β is a power law factor (takenas 2) which rapidly decreases w as N increases above N0.Using this formula, the image A is given less weightageif the number of bright pixels (N ) in the green channel ismore than a threshold N0 (sign of bright exudates); else Ais given a weightage of 1 (normal images). Image J is thenused to obtain the optimal location of the optic disk using acost function F .
F =∑
i,j∈W
J(x − i, y − j) (3)
where (x, y) is a point in the intersection map and sum-mation is over a circular sliding window (W ). F can becomputed efficiently using dynamic programming/integralimages. The point (x, y) which maximizes F , is taken asthe location of the optic disk. A box is placed around thedisk location in green channel and a closing operation isperformed to eliminate blood vessels. The gradient imageof the result is thresholded (th>3) and a circular mask isobtained using Hough Transform for the optic disk. Figure4 shows the steps of the optic disk localization algorithmon an image of our dataset. The vessels of Figure 4 (b) areobtained after exudate subtraction.
5. Detection of Microaneurysms and Hemor-rhages
Microaneurysms are small blood clots which occur dueto capillary burst. They are the hardest to detect in retino-pathic images. Hemorrhages are bigger clots. Microa-
neurysms And HeMorrhages (MAHMs) are treated as holes(i.e. small dark blobs surrounded by brighter regions) andmorphological filling is performed on the green channelto identify them. The filling operation in gray scale isan extension of binary filling used in section 3. The un-filled green channel image is then subtracted from the filledone and thresholded in intensity to yield an image (R)with microaneurysm patches. The threshold (ν) is chosenbased on the mean intensity of the retinal image in the redchannel. For a mean intensity of 127 (taken as referenceon the intensity scale of 0-255), ν was chosen as 7 (ob-tained by training as described in Section 3). The thresh-old is incremented/decremented by 1 for every 20 units in-crease/decrease in the mean.
Blood vessels can also appear as noise in the microa-neurysm and hemorrhage detection as they have similarcolor and contrast to the clots. To remove this additionalnoise, the full blood vessel network skeleton (section 2, Cri-terion 2) is first obtained. The resulting blood vessel net-work is dilated and subtracted from the image R to removethe noise due to vessels. The remaining patches are furtherclassified using intensity properties and a color model basedon the detected blood vessels.
5.1. Blood Vessel based Color Model
Microaneurysms and hemorrhages have similar colorproperties as the blood vessels. Hence, a color model isbuilt for classification of these lesions. We use the bloodvessel result obtained before the thinning operation is per-formed (i.e. image U in section 2). For every candidate mi-croaneurysm/hemorrhage patch, the blood vessel segmentsin a local neighborhood are obtained. The mean (µ) andstandard deviation (σ) of these vessels in the red and greenchannels are calculated. The pixels in each localized patchwhose intensities in the red and green channels are in therange [µ − 1.2σ , µ + 1.2σ] are retained. This helps in theremoval of background artifacts.
5.2. Detection and Removal of Fovea
The fovea is a dark region located in the center of themacula region of the retina. It commonly appears in mi-croaneurysm and hemorrhage detection results much as theoptic disk does in exudate detection results. The fovea isdetected using the location of the optic disk and curvatureof the main blood vessel. The main blood vessel is obtainedas the thickest and largest blood vessel emanating from theoptic disk. The entire course of the main blood vessel isobtained (from the image of the thicker vessels) by look-ing for its continuity from the optic disk. This vessel ismodeled as a parabola ([9]). The vertex of the parabola istaken as the pixel on the main blood vessel that is closestto the center of the optic disk circular mask. The fovea islocated approximately between 2 to 3 optical disk diameter
214
(a) (b)
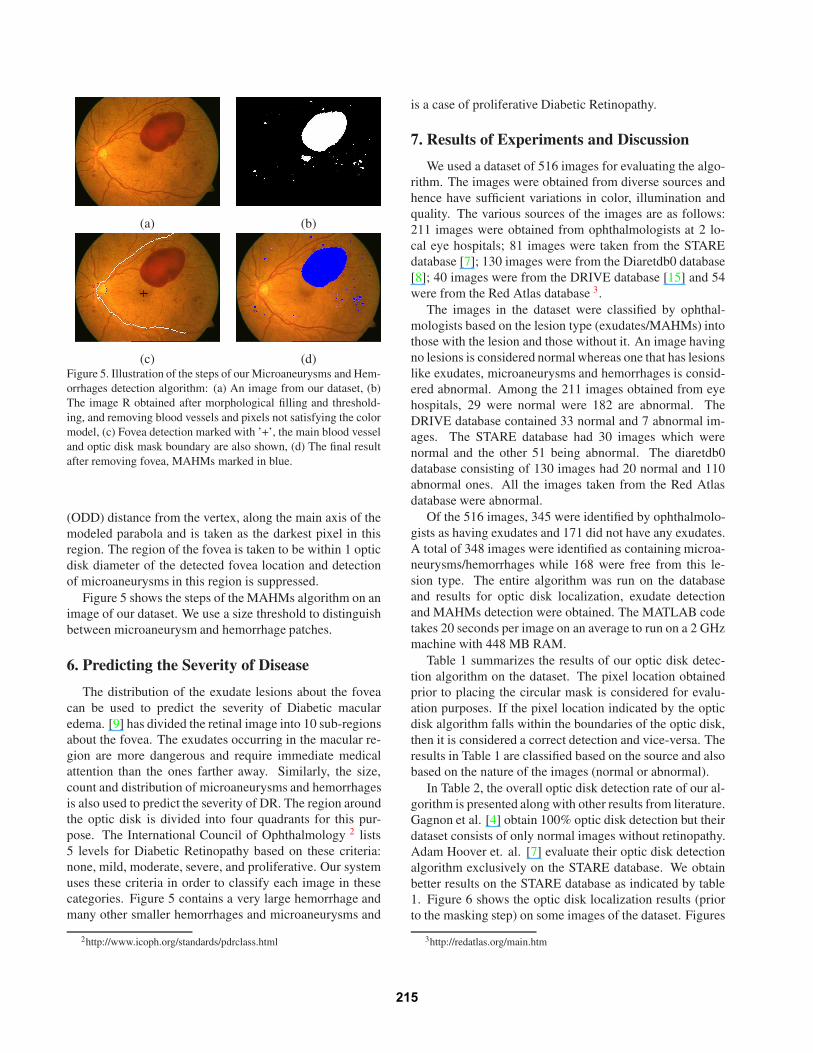
(c) (d)Figure 5. Illustration of the steps of our Microaneurysms and Hem-orrhages detection algorithm: (a) An image from our dataset, (b)The image R obtained after morphological filling and threshold-ing, and removing blood vessels and pixels not satisfying the colormodel, (c) Fovea detection marked with ’+’, the main blood vesseland optic disk mask boundary are also shown, (d) The final resultafter removing fovea, MAHMs marked in blue.
(ODD) distance from the vertex, along the main axis of themodeled parabola and is taken as the darkest pixel in thisregion. The region of the fovea is taken to be within 1 opticdisk diameter of the detected fovea location and detectionof microaneurysms in this region is suppressed.
Figure 5 shows the steps of the MAHMs algorithm on animage of our dataset. We use a size threshold to distinguishbetween microaneurysm and hemorrhage patches.
6. Predicting the Severity of Disease
The distribution of the exudate lesions about the foveacan be used to predict the severity of Diabetic macularedema. [9] has divided the retinal image into 10 sub-regionsabout the fovea. The exudates occurring in the macular re-gion are more dangerous and require immediate medicalattention than the ones farther away. Similarly, the size,count and distribution of microaneurysms and hemorrhagesis also used to predict the severity of DR. The region aroundthe optic disk is divided into four quadrants for this pur-pose. The International Council of Ophthalmology 2 lists5 levels for Diabetic Retinopathy based on these criteria:none, mild, moderate, severe, and proliferative. Our systemuses these criteria in order to classify each image in thesecategories. Figure 5 contains a very large hemorrhage andmany other smaller hemorrhages and microaneurysms and
2http://www.icoph.org/standards/pdrclass.html
is a case of proliferative Diabetic Retinopathy.
7. Results of Experiments and Discussion
We used a dataset of 516 images for evaluating the algo-rithm. The images were obtained from diverse sources andhence have sufficient variations in color, illumination andquality. The various sources of the images are as follows:211 images were obtained from ophthalmologists at 2 lo-cal eye hospitals; 81 images were taken from the STAREdatabase [7]; 130 images were from the Diaretdb0 database[8]; 40 images were from the DRIVE database [15] and 54were from the Red Atlas database 3.
The images in the dataset were classified by ophthal-mologists based on the lesion type (exudates/MAHMs) intothose with the lesion and those without it. An image havingno lesions is considered normal whereas one that has lesionslike exudates, microaneurysms and hemorrhages is consid-ered abnormal. Among the 211 images obtained from eyehospitals, 29 were normal were 182 are abnormal. TheDRIVE database contained 33 normal and 7 abnormal im-ages. The STARE database had 30 images which werenormal and the other 51 being abnormal. The diaretdb0database consisting of 130 images had 20 normal and 110abnormal ones. All the images taken from the Red Atlasdatabase were abnormal.
Of the 516 images, 345 were identified by ophthalmolo-gists as having exudates and 171 did not have any exudates.A total of 348 images were identified as containing microa-neurysms/hemorrhages while 168 were free from this le-sion type. The entire algorithm was run on the databaseand results for optic disk localization, exudate detectionand MAHMs detection were obtained. The MATLAB codetakes 20 seconds per image on an average to run on a 2 GHzmachine with 448 MB RAM.
Table 1 summarizes the results of our optic disk detec-tion algorithm on the dataset. The pixel location obtainedprior to placing the circular mask is considered for evalu-ation purposes. If the pixel location indicated by the opticdisk algorithm falls within the boundaries of the optic disk,then it is considered a correct detection and vice-versa. Theresults in Table 1 are classified based on the source and alsobased on the nature of the images (normal or abnormal).
In Table 2, the overall optic disk detection rate of our al-gorithm is presented along with other results from literature.Gagnon et al. [4] obtain 100% optic disk detection but theirdataset consists of only normal images without retinopathy.Adam Hoover et. al. [7] evaluate their optic disk detectionalgorithm exclusively on the STARE database. We obtainbetter results on the STARE database as indicated by table1. Figure 6 shows the optic disk localization results (priorto the masking step) on some images of the dataset. Figures
3http://redatlas.org/main.htm
215
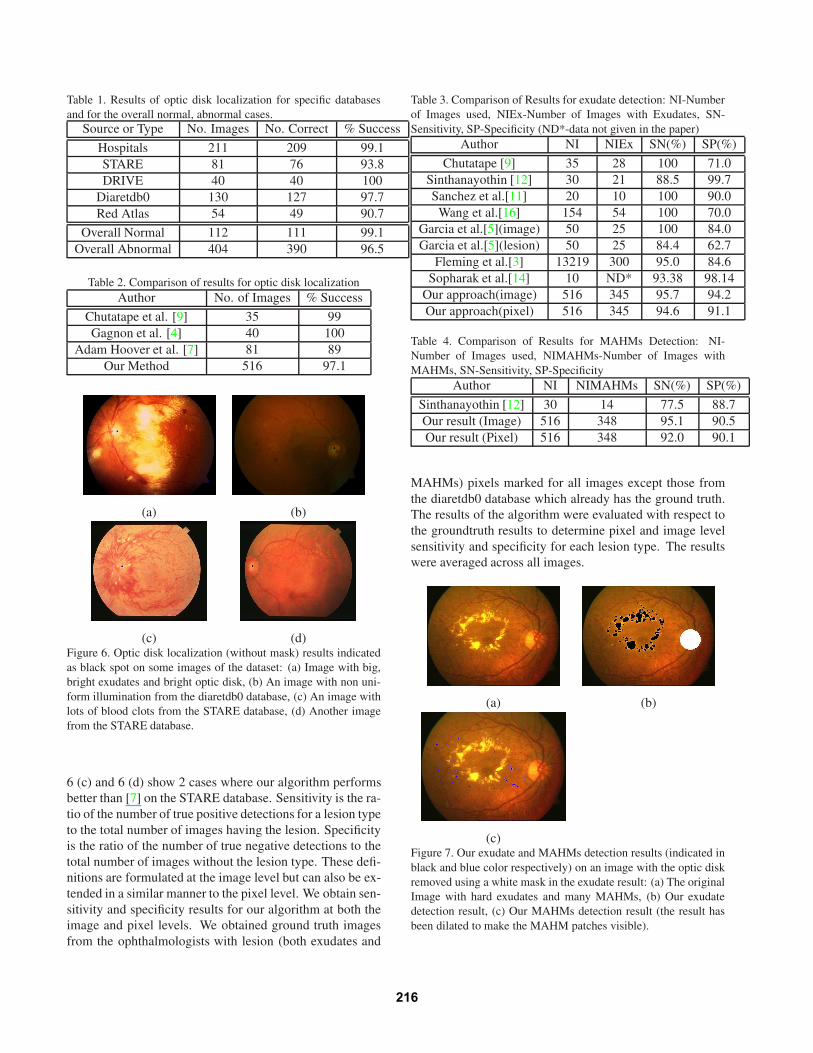
Table 1. Results of optic disk localization for specific databasesand for the overall normal, abnormal cases.
Source or Type No. Images No. Correct % Success
Hospitals 211 209 99.1STARE 81 76 93.8DRIVE 40 40 100
Diaretdb0 130 127 97.7Red Atlas 54 49 90.7
Overall Normal 112 111 99.1Overall Abnormal 404 390 96.5
Table 2. Comparison of results for optic disk localizationAuthor No. of Images % Success
Chutatape et al. [9] 35 99Gagnon et al. [4] 40 100
Adam Hoover et al. [7] 81 89Our Method 516 97.1
(a) (b)
(c) (d)Figure 6. Optic disk localization (without mask) results indicatedas black spot on some images of the dataset: (a) Image with big,bright exudates and bright optic disk, (b) An image with non uni-form illumination from the diaretdb0 database, (c) An image withlots of blood clots from the STARE database, (d) Another imagefrom the STARE database.
6 (c) and 6 (d) show 2 cases where our algorithm performsbetter than [7] on the STARE database. Sensitivity is the ra-tio of the number of true positive detections for a lesion typeto the total number of images having the lesion. Specificityis the ratio of the number of true negative detections to thetotal number of images without the lesion type. These defi-nitions are formulated at the image level but can also be ex-tended in a similar manner to the pixel level. We obtain sen-sitivity and specificity results for our algorithm at both theimage and pixel levels. We obtained ground truth imagesfrom the ophthalmologists with lesion (both exudates and
Table 3. Comparison of Results for exudate detection: NI-Numberof Images used, NIEx-Number of Images with Exudates, SN-Sensitivity, SP-Specificity (ND*-data not given in the paper)
Author NI NIEx SN(%) SP(%)
Chutatape [9] 35 28 100 71.0Sinthanayothin [12] 30 21 88.5 99.7Sanchez et al.[11] 20 10 100 90.0
Wang et al.[16] 154 54 100 70.0Garcia et al.[5](image) 50 25 100 84.0Garcia et al.[5](lesion) 50 25 84.4 62.7
Fleming et al.[3] 13219 300 95.0 84.6Sopharak et al.[14] 10 ND* 93.38 98.14
Our approach(image) 516 345 95.7 94.2Our approach(pixel) 516 345 94.6 91.1
Table 4. Comparison of Results for MAHMs Detection: NI-Number of Images used, NIMAHMs-Number of Images withMAHMs, SN-Sensitivity, SP-Specificity
Author NI NIMAHMs SN(%) SP(%)
Sinthanayothin [12] 30 14 77.5 88.7Our result (Image) 516 348 95.1 90.5Our result (Pixel) 516 348 92.0 90.1
MAHMs) pixels marked for all images except those fromthe diaretdb0 database which already has the ground truth.The results of the algorithm were evaluated with respect tothe groundtruth results to determine pixel and image levelsensitivity and specificity for each lesion type. The resultswere averaged across all images.
(a) (b)
(c)Figure 7. Our exudate and MAHMs detection results (indicated inblack and blue color respectively) on an image with the optic diskremoved using a white mask in the exudate result: (a) The originalImage with hard exudates and many MAHMs, (b) Our exudatedetection result, (c) Our MAHMs detection result (the result hasbeen dilated to make the MAHM patches visible).
216
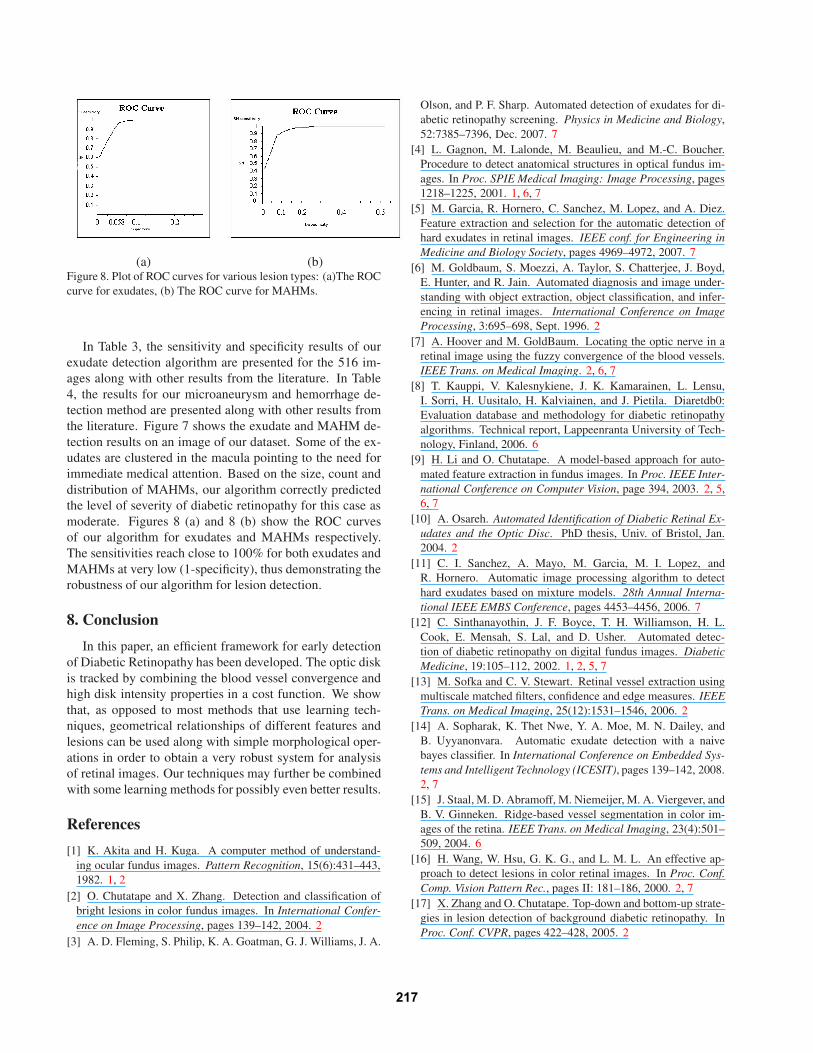
(a) (b)Figure 8. Plot of ROC curves for various lesion types: (a)The ROCcurve for exudates, (b) The ROC curve for MAHMs.
In Table 3, the sensitivity and specificity results of ourexudate detection algorithm are presented for the 516 im-ages along with other results from the literature. In Table4, the results for our microaneurysm and hemorrhage de-tection method are presented along with other results fromthe literature. Figure 7 shows the exudate and MAHM de-tection results on an image of our dataset. Some of the ex-udates are clustered in the macula pointing to the need forimmediate medical attention. Based on the size, count anddistribution of MAHMs, our algorithm correctly predictedthe level of severity of diabetic retinopathy for this case asmoderate. Figures 8 (a) and 8 (b) show the ROC curvesof our algorithm for exudates and MAHMs respectively.The sensitivities reach close to 100% for both exudates andMAHMs at very low (1-specificity), thus demonstrating therobustness of our algorithm for lesion detection.
8. Conclusion
In this paper, an efficient framework for early detectionof Diabetic Retinopathy has been developed. The optic diskis tracked by combining the blood vessel convergence andhigh disk intensity properties in a cost function. We showthat, as opposed to most methods that use learning tech-niques, geometrical relationships of different features andlesions can be used along with simple morphological oper-ations in order to obtain a very robust system for analysisof retinal images. Our techniques may further be combinedwith some learning methods for possibly even better results.
References
[1] K. Akita and H. Kuga. A computer method of understand-ing ocular fundus images. Pattern Recognition, 15(6):431–443,1982. 1, 2
[2] O. Chutatape and X. Zhang. Detection and classification ofbright lesions in color fundus images. In International Confer-ence on Image Processing, pages 139–142, 2004. 2
[3] A. D. Fleming, S. Philip, K. A. Goatman, G. J. Williams, J. A.
Olson, and P. F. Sharp. Automated detection of exudates for di-abetic retinopathy screening. Physics in Medicine and Biology,52:7385–7396, Dec. 2007. 7
[4] L. Gagnon, M. Lalonde, M. Beaulieu, and M.-C. Boucher.Procedure to detect anatomical structures in optical fundus im-ages. In Proc. SPIE Medical Imaging: Image Processing, pages1218–1225, 2001. 1, 6, 7
[5] M. Garcia, R. Hornero, C. Sanchez, M. Lopez, and A. Diez.Feature extraction and selection for the automatic detection ofhard exudates in retinal images. IEEE conf. for Engineering inMedicine and Biology Society, pages 4969–4972, 2007. 7
[6] M. Goldbaum, S. Moezzi, A. Taylor, S. Chatterjee, J. Boyd,E. Hunter, and R. Jain. Automated diagnosis and image under-standing with object extraction, object classification, and infer-encing in retinal images. International Conference on ImageProcessing, 3:695–698, Sept. 1996. 2
[7] A. Hoover and M. GoldBaum. Locating the optic nerve in aretinal image using the fuzzy convergence of the blood vessels.IEEE Trans. on Medical Imaging. 2, 6, 7
[8] T. Kauppi, V. Kalesnykiene, J. K. Kamarainen, L. Lensu,I. Sorri, H. Uusitalo, H. Kalviainen, and J. Pietila. Diaretdb0:Evaluation database and methodology for diabetic retinopathyalgorithms. Technical report, Lappeenranta University of Tech-nology, Finland, 2006. 6
[9] H. Li and O. Chutatape. A model-based approach for auto-mated feature extraction in fundus images. In Proc. IEEE Inter-national Conference on Computer Vision, page 394, 2003. 2, 5,6, 7
[10] A. Osareh. Automated Identification of Diabetic Retinal Ex-udates and the Optic Disc. PhD thesis, Univ. of Bristol, Jan.2004. 2
[11] C. I. Sanchez, A. Mayo, M. Garcia, M. I. Lopez, andR. Hornero. Automatic image processing algorithm to detecthard exudates based on mixture models. 28th Annual Interna-tional IEEE EMBS Conference, pages 4453–4456, 2006. 7
[12] C. Sinthanayothin, J. F. Boyce, T. H. Williamson, H. L.Cook, E. Mensah, S. Lal, and D. Usher. Automated detec-tion of diabetic retinopathy on digital fundus images. DiabeticMedicine, 19:105–112, 2002. 1, 2, 5, 7
[13] M. Sofka and C. V. Stewart. Retinal vessel extraction usingmultiscale matched filters, confidence and edge measures. IEEETrans. on Medical Imaging, 25(12):1531–1546, 2006. 2
[14] A. Sopharak, K. Thet Nwe, Y. A. Moe, M. N. Dailey, andB. Uyyanonvara. Automatic exudate detection with a naivebayes classifier. In International Conference on Embedded Sys-tems and Intelligent Technology (ICESIT), pages 139–142, 2008.2, 7
[15] J. Staal, M. D. Abramoff, M. Niemeijer, M. A. Viergever, andB. V. Ginneken. Ridge-based vessel segmentation in color im-ages of the retina. IEEE Trans. on Medical Imaging, 23(4):501–509, 2004. 6
[16] H. Wang, W. Hsu, G. K. G., and L. M. L. An effective ap-proach to detect lesions in color retinal images. In Proc. Conf.Comp. Vision Pattern Rec., pages II: 181–186, 2000. 2, 7
[17] X. Zhang and O. Chutatape. Top-down and bottom-up strate-gies in lesion detection of background diabetic retinopathy. InProc. Conf. CVPR, pages 422–428, 2005. 2
217