autochthonous and allochthonous carbon cycling in a eutrophic flow-through wetland
TRANSCRIPT
1 23
WetlandsOfficial Scholarly Journal of the Societyof Wetland Scientists ISSN 0277-5212Volume 34Number 2 Wetlands (2014) 34:285-296DOI 10.1007/s13157-013-0474-1
Autochthonous and Allochthonous CarbonCycling in a Eutrophic Flow-ThroughWetland
Jonathan J. Maynard, RandyA. Dahlgren & Anthony T. O’Geen

1 23
Your article is protected by copyright and
all rights are held exclusively by Society
of Wetland Scientists. This e-offprint is for
personal use only and shall not be self-
archived in electronic repositories. If you wish
to self-archive your article, please use the
accepted manuscript version for posting on
your own website. You may further deposit
the accepted manuscript version in any
repository, provided it is only made publicly
available 12 months after official publication
or later and provided acknowledgement is
given to the original source of publication
and a link is inserted to the published article
on Springer's website. The link must be
accompanied by the following text: "The final
publication is available at link.springer.com”.
ARTICLE
Autochthonous and Allochthonous Carbon Cyclingin a Eutrophic Flow-Through Wetland
Jonathan J. Maynard & Randy A. Dahlgren &
Anthony T. O’Geen
Received: 9 January 2013 /Accepted: 6 August 2013 /Published online: 23 January 2014# Society of Wetland Scientists 2014
Abstract Wetland environments are important sites for thecycling and retention of terrestrially derived organic matterand nutrients. Wetland treatment of agricultural runoff hasbeen shown to improve water quality and promote carbonsequestration. However, the potential role of eutrophic wet-lands as a source of algal loading contributing to downstreamhypoxia has prompted interest in understanding algal produc-tivity and export from these systems. This study, in the SanJoaquin Valley, California, quantified a mass balance of car-bon and nutrients within a seasonally-saturated constructedwetland receiving agricultural runoff, as well as quantifyingautochthonous carbon production on four sampling datesduring a year with minimal emergent vegetation. Results fromthis study show that the wetland was a net-sink for nutrientsand particulate/dissolved organic carbon. Despite high con-centrations of inflowing nutrients and high rates of primaryproductivity, high respiration rates limited net organic C pro-duction and export due to high heterotrophic activity. Theaddition of high C loads in inflowing water and moderateretention efficiencies, however, resulted in a positive C reten-tion during most sampling dates. This study provides valuableinsight into the connection between elevated carbon and nu-trient inflows, their effects on autochthonous carbon produc-tion, and resulting carbon and nutrient outflows.
Keywords Carbon cycling . Aquatic metabolism .
Autochthonous carbon . Allochthonous carbon . Constructedwetlands . Primary productivity . Eutrophication .Waterquality
Introduction
Wetlands provide a critical interface between terrestrial andaquatic environments, regulating the transport of material fluxesto down gradient aquatic ecosystems. These transitional envi-ronments are important sites for the retention, production, andexport of allochthonous and autochthonous carbon sources(Jordan et al. 2003; O’Geen et al. 2007; Maynard et al. 2011).With nearly half of all wetland habitat lost in the contiguousU.S.by the mid-1980s, the ability of wetlands to serve as buffersbetween upland and aquatic systems has been greatly dimin-ished, often resulting in widespread degradation of surface waterbodies. Wetland losses have been even more dramatic inCalifornia’s Central Valley, where less than 9 % (~198,000 ha)of the original 2 million ha of wetlands remain (Dahl 1990).Wetland restoration efforts along California’s San Joaquin River(SJR), one of two major river systems within the Central Valley(Fig. 1), are gaining attention as a means to mitigate non-pointsource pollution associated with irrigated agriculture. Whileconstructed wetlands may be effective sinks for suspendedsolids, nutrients and pesticides (O’Geen et al. 2010), they mayalso be major sources of oxygen demanding substances (i.e.,algal biomass, dissolved organic carbon [DOC], and particulateorganic matter) (Tockner et al. 1999). Thus, flow-through wet-landsmay potentially serve as incubators, transforming nutrientsinto algal biomass, resulting in no beneficial effect on biologicaloxygen demand (BOD) loads and dissolved oxygen (DO) con-centration in downstream surface waters.
LowDO conditions frequently occur in the lower SJR due toexcessive amounts of oxygen demanding substances, principal-ly high algal biomass loading from upstream sources (Volkmar
J. J. MaynardU.S. Environmental Protection Agency, 200 SW 35th Street,Corvallis, OR 97333, USA
R. A. Dahlgren :A. T. O’GeenDepartment of Land, Air and Water Resources, University ofCalifornia, Davis, One Shields Ave, Davis, CA 95618-8627, USA
Present Address:J. J. Maynard (*)USDA-ARS Jornada Experimental Range,MSC 3 JER,NMSU, Box30003, Las Cruces, NM 88003-8003, USAe-mail: [email protected]
Wetlands (2014) 34:285–296DOI 10.1007/s13157-013-0474-1
Author's personal copy

andDahlgren 2006). Despite growing interest in using wetlandsto intercept agricultural runoff, much is unknown concerningtheir ability to prevent algal loading and low DO conditions.This is particularly true for seasonally-saturated riparian wet-lands of this region that experience annual oscillations betweenpredominately vegetated and non-vegetated states. This annualvariation is due to the timing and duration of spring floodingand its subsequent effect on the germination of emergent mac-rophytes. As a result, many of these constructed wetlandsexperience years dominated by open water environments, andthus, may become incubators of algal biomass due to high lightand nutrient availability combined with long hydrologic resi-dence times. The algal seed source contributed by wetlands canundergo a doubling per day within eutrophic rivers, such as theSan Joaquin River, contributing to large increases in BODduring downstream transport (Volkmar and Dahlgren 2006;Ohte et al. 2007; Volkmar et al. 2011). There are currently72,000 ha of managed seasonally-saturated wetlands in theCentral Valley, with the majority of these wetlands receivinghigh annual loads of nutrients, sediment, and organic carbon(Central Valley Joint Venture 2006). Consequently, growingconcern over seasonal hypoxia in the lower reaches of theSJR and the potential role of eutrophic wetlands as a sourceof algal loading has prompted interest in understanding algalproductivity and export from these systems.
To better understand the role of eutrophic wetlands as algalproducers, this study calculated a carbon and nutrient massbalance in a seasonally-saturated constructed wetland duringan open-water year. Additionally, this study employed aspatially-explicit quantification of aquatic metabolism on foursampling dates during the irrigation season, thus allowing a
mass-balance calculation of autochthonous carbon production.The main objective of this study was to determine the dailymass-balance of autochthonous and allochthonous carbonloads within the wetland, thus allowing us to determine wheth-er the wetland attenuates or amplifies algal loading and carbonexport into the San Joaquin River. Specific objectives were to:(i) conduct a mass-balance of wetland organic C; (ii) determinethe relative contribution of autochthonous and allochthonous Csources; and (iii) evaluate the effects of elevated carbon andnutrient loading on wetland metabolism and carbon export.
Materials and Methods
Study Area
The study was conducted in a constructed, flow-through wet-land located on the west side of the San Joaquin River inCalifornia’s Central Valley (37.395119, −120.993897). Thestudy site was once part of the historic San Joaquin Riverfloodplain that was converted to agriculture in the 1930’s andthen restored into a wetland in the early 1990’s. The area has aMediterranean climate with hot dry summers (mean summertemperature of 24 °C) and cool moist winters (mean wintertemperature of 8 °C; mean annual precipitation of 28 cm). Thewetland is seasonally saturated, receiving agricultural runoffduring the summer irrigation season (April–September) fromapproximately 2,300 ha of irrigated agricultural lands, and rainand flood events in winter and early spring, followed by a briefdry-down period (March–April). This results in a hydroperiodthat lasts from 9 to 11 months each year. Soils in the
Fig. 1 Schematic of study site,sediment oxygen demandsampling locations (S1, S2, andS3), inflow and outflow locations,and main flow-path
286 Wetlands (2014) 34:285–296
Author's personal copy
surrounding agricultural watershed are predominately classi-fied as Calcic Haploxerepts, Typic Haploxerepts, and MollicHaploxeralfs, with surface soil texture ranging from loams toclay loams. The dominant agricultural crops include alfalfa(Medicago sativa L.; 34 % of catchment area), bean(Phaseolus lunatus L.; 30 % of catchment area), corn (Zeamays L.; 13 % of catchment area), tomato (Solanumlycopersicum L.) (9 % of catchment area), walnut (Juglansregia L.; 6 % of catchment area), and almond (Prunusamygdalus ; 5 % of catchment area). This study was conductedduring the 2007 summer irrigation season (April-September).
The wetland has an ellipsoidal shape (380 m long, 140 mwide) with a surface area of 4.5 ha and an average water depthof 0.73 m (Fig. 1). Due to early spring flooding in 2007,emergent vegetation (pale smartweed, Polygonumlapathifolium ) failed to establish resulting in a predominantlyopen-water environment. Since its construction in 1993, thewetland has oscillated between vegetated (i.e., >70 % plantcover in 1994, 1996, 1999, 2003, and 2004) and non-vegetated (i.e., <10 % plant cover in 1995, 1998, 2000,2001, 2002, 2005, and 2007) states. The wetland was drainedfor repair following severe flooding in 1997 and 2006. Thistype of annual variation in vegetation dynamics is common inseasonally-saturated floodplain wetlands of this region. Thestudied wetland was found to be functionally similar to otherflow-through wetlands in the San Joaquin Valley suggestingthat the results of this study may be representative for similarwetlands in the region (Díaz et al. 2012).
Water Budget
Awater budget was used to calculate hydrologic fluxes forthe study period (April–September, 2007). Water inflowand outflow rates were measured every 15 min using ISCO2150 (ISCO, Lincoln, NE, USA) area-velocity metersinstalled in inlet and outlet pipes. Due to minimal plantcover in the wetland, a daily evaporation rate was calculatedin place of evapotranspiration using a mass transfer evapo-ration equation given by Dunne and Leopold (1978). Envi-ronmental data were obtained from a local weather station(Patterson, CA; 37.440000, −121.140000) located approx-imately 15 km from the studywetland andmaintained by theCalifornia Irrigation Management Information System(CIMIS 2007). There was no recorded precipitation duringthe study period. Seepage was calculated as: Seepage=Inflow−(Outflow+Evaporation).
To account for deviations from plug flow conditions, active(i.e., area surrounding the main flow path) and passive (i.e.,backwater region) hydrologic zones were estimated within thewetland (Maynard et al. 2009b). The delineation of eachhydrologic zone was accomplished through observation ofboth flow path and sedimentation patterns. Due to the closeproximity of inflow and outflow structures in the northern
portion of the wetland, significant hydrologic short-circuitingoccurs within the northern section, creating distinct hydrolog-ic environments between the northern and southern sections(Fig. 1). The wetland has an average water volume of32,700 m3 and an average inflow rate of 9,720 m3 d−1,resulting in a nominal residence time of 4.0 days (range: 2.6to 6.7 days). However, moment analysis of the residence timedistribution (RTD) (Levenspiel 1972), calculated from a bro-mide tracer study conducted on 06August, 2007, revealed thatthe wetland has an effective residence time of 0.90 days at themedian inflow rate of 8,300 m3 d−1 (variance: 18.6 days)(Table 1). The variance of the effective residence time indi-cates the degree of short-circuiting within the wetland and iscalculated from the second moment of the RTD (Levenspiel1972).
Inflow and Outflow Carbon and Nutrient Mass Balance
Weekly grab samples (2 L) were collected from the top 30 cmof water column in acid-washed polyethylene bottles frominflow and outflow locations during the 2007 irrigation season(April-Sept; n =20). Electrical conductivity (EC) was mea-sured with a Fisher Accumet AB30 conductivity meter (FisherScientific, Pittsburgh, PA, USA) and reported on a standard-ized 25 °C basis. Turbidity was measured and reported asNTU (Nephelometric Turbidity Unit) using a Hach 2100Pturbidimeter (Hach, Loveland, CO, USA). Total suspendedsolids (TSS) was measured by filtration through a 0.45 μmpre-combusted, pre-weighed glass fiber filter (Millipore) witha limit of detection (LOD) of ~0.5 mg L−1. The filter was driedat 60 °C for 24 h and weighed again, the difference givingTSS. The filter was further combusted at 550 °C for 3 h with
Table 1 Wetland characteristics and hydrologic data during the summerirrigation season (April-Sept) in 2007
Inflow (m3) 1,422,208 100%a
Outflow (m3) 1,233,933 86.8%a
Evapotranspiration (m3) 20,233 1.4%a
Seepage (m3) 153,287 11.8%a
Mean Wetland Area (m2) 44,798
Mean Wetland Volume (m3) 32,700
Mean Wetland Depth (m) 0.73
Mean Inflow Rate (m3 d-1) 9,720
Active Hydrologic Area (m2) ~20,000
Nominal Residence Time (days) 4.0
Effective Residence Time (days) 0.90±18.6b
Flow Path Length (m) 250
a Percent of total flowb Effective residence time calculated from tracer study±variance. Vari-ance calculated from the second moment of the residence timedistribution
Wetlands (2014) 34:285–296 287
Author's personal copy
the difference in mass giving volatile suspended solids (VSS)(i.e., organic matter) (APHA 1998). VSS values wereconverted to particulate organic carbon (POC) using a previ-ously established C: VSS ratio of 0.194 (std. error=0.009) forthe study wetland (Maynard et al. 2011). The POC fractionincludes both autochthonous (e.g., algal C) and allochthonous(e.g., soil organic C) carbon sources. Chlorophyll-a (Chl-a)was measured using ethanol extraction and standard fluorom-etry techniques (APHA 1998). Chlorophyll-a values wereconverted to algal-carbon using a C: Chl ratio of 40:1(Lehman et al. 2004). Total phosphorus (TP) and total nitro-gen (TN) were measured following persulfate digestion of anon-filtered sample (APHA 1998).
A subsample was filtered through a 0.2 μm polycarbonatemembrane (Millipore) for quantification of dissolved reactivephosphorus (DRP), nitrate-N (NO3-N), ammonium (NH4-N),and dissolved organic carbon (DOC). TP and DRP weremeasured using the ammonium molybdate spectrophotomet-ric method (LOD~5 μg L−1; APHA 1998). TN and NO3-Nwere measured using the vanadium (III) chloride method(LOD~10 μg L−1; Doane and Horwath 2003). NH4
+-N wasdetermined spectroscopically with the Berthelot reaction,using a salicylate analog of indophenol blue (LOD~10 μg L−1; Forster 1995) . DOC was measured using aDohrmann UV enhanced-persulfate TOC analyzer (LOD=0.1 mg L−1; Phoenix 8000). Constituent loads were estimatedusing the period-weighted approach with weekly constituentconcentration and weekly water flux (Moldan and Cerny1994).
Autochthonous Carbon Calculations
The procedure for calculating a spatially contiguous estimateof aquatic metabolism has been described in detail elsewhere(Maynard et al. 2012). Briefly, gross primary productivity(GPP) and community respiration (CR) were determinedusing a modification of the one-station diel dissolved oxygen(DO) change method, the difference between GPP and CRequaling net ecosystem production (NEP) (Odum 1956;Odum and Hoskin 1958). Spatially-explicit sampling of DO,EC, temperature, turbidity, and fluorescence (a proxy for Chl-a) were conducted with YSI 6600 multiparameter sondes(Yellow Springs Instruments, Yellow Springs, OH, USA),recorded at a constant water column depth (~0.4 m), andcalibrated according to manufacturer’s instructions beforeeach deployment. Fluorescence values were converted toChl-a (μg L−1) based on a field-established regression equa-tion developed for this wetland site (r2=0.92, p <0.001, n =16). Sondes were interfaced with a Global Positioning System(GPS; Garmin Rino 120; WAAS enabled; Garmin Interna-tional Inc., Olathe, KS, USA) and used to rove across thewetland logging position and water quality parameters every10 m on average. There were four sampling campaigns during
the 2007 irrigation season (06 June, 11 July, 15 August, 13September), with each campaign consisting of three consecu-tive spatial sampling events over a two-day period: dusk-Day1, dawn-Day 2, and dusk-Day 2. For each spatial samplingevent, ~300 georeferenced data points were recorded and usedto interpolate the spatial distribution of DO, Chl-a, turbidity,temperature and EC at unsampled locations. All metabolismcalculations were conducted using spatially interpolatedvalues for each water column parameter (i.e., DO, temp),resulting in 44,798 contiguous 1 m grid values across thewetland. The wetland water column was maintained at aconstant depth throughout the irrigation season via a watercontrol structure at the outflow. Water column depth wasmeasured using a meter stick (accuracy: ±0.01 m) with around plexi-glass disc attached at the bottom to prevent inser-tion into the loose wetland surface sediment. Water columndepth was measured at 75 points within the wetland using anon-aligned grid sampling design and recorded values wereused to interpolate water depth at all unsampled locations.Reaeration coefficients were determined using the floatingdiffusion dome method (Copeland and Duffer 1964). Volu-metric rates were converted to areal units (g O2 m
−2 day−1) bymultiplying by the depth of the water column. For comparisonto water column C measurements, metabolism measurementswere converted to C units following Bott (2006).
Sediment Oxygen Demand
Sediment oxygen demand (SOD) chambers were constructedbased on a design by Murphy and Hicks (1986), with slightmodifications (Rounds and Doyle 1997; Wood 2001). TheSOD chamber was constructed from the top of a 210 L plasticbarrel, which enclosed 116 L and exposed a 0.268 m2 area ofsediment. Each chamber was fitted with a bilge pump to re-circulate water from the main chamber through three flowdiffusers. A YSI 556 multiparameter sonde was connected toeach chamber through a sealed port and continuous measure-ments of DO and temperature were logged at 1-min intervalsover a period of 1–2 h. SOD chambers were carefully placedin the wetland sediment to minimize sediment resuspension.SOD was calculated based on the regression line describingthe change in O2 concentration over time:
SODT ¼ 1:44V
Ab
where SODT is the sediment oxygen demand (g O2m−2 d−1) at
temperature T, b is the slope of the regression (mg L-1 min−1),V is the volume of the chamber (L), A is the area of sedimentcovered by the chamber (m2), and 1.44 is a factor for unitconversion. A total of eight SOD measurements were taken atthe following three sites (S1, S2, and S3) during the course ofthe 2007 sampling season: S1 on 06 June, 11 July, 15 August,
288 Wetlands (2014) 34:285–296
Author's personal copy
and 13 September; S2 on 11 July and 13 September; and, S3on 15 August and 13 September: (Fig. 1). Dates with a singlemeasurement are reported as that value, while dates withmultiple measurements are reported as the mean value±stan-dard deviation.
Data Analysis
Statistical and geostatistical analyses were conducted using Rsoftware (R Development Core Team 2009). All spatial inter-polation was conducted using ordinary kriging (Goovaerts1999). Kriging analysis was performed with the “gstat” pack-age (Pebesma 2004). Variogram fitting for each variable wasoptimized using iterative re-weighted least squares using the“automap” package (Hiemstra et al. 2009). PairwiseWilcoxonRank Sum Test was used to compare statistical differencesbetween inflow and outflow nutrients, sediment and carbonloads. Statistical differences were tested at p =0.01 unlessotherwise noted and adjusted using Bonferroni correction.
Results
Wetland Carbon, Nutrient and Sediment Mass Balance
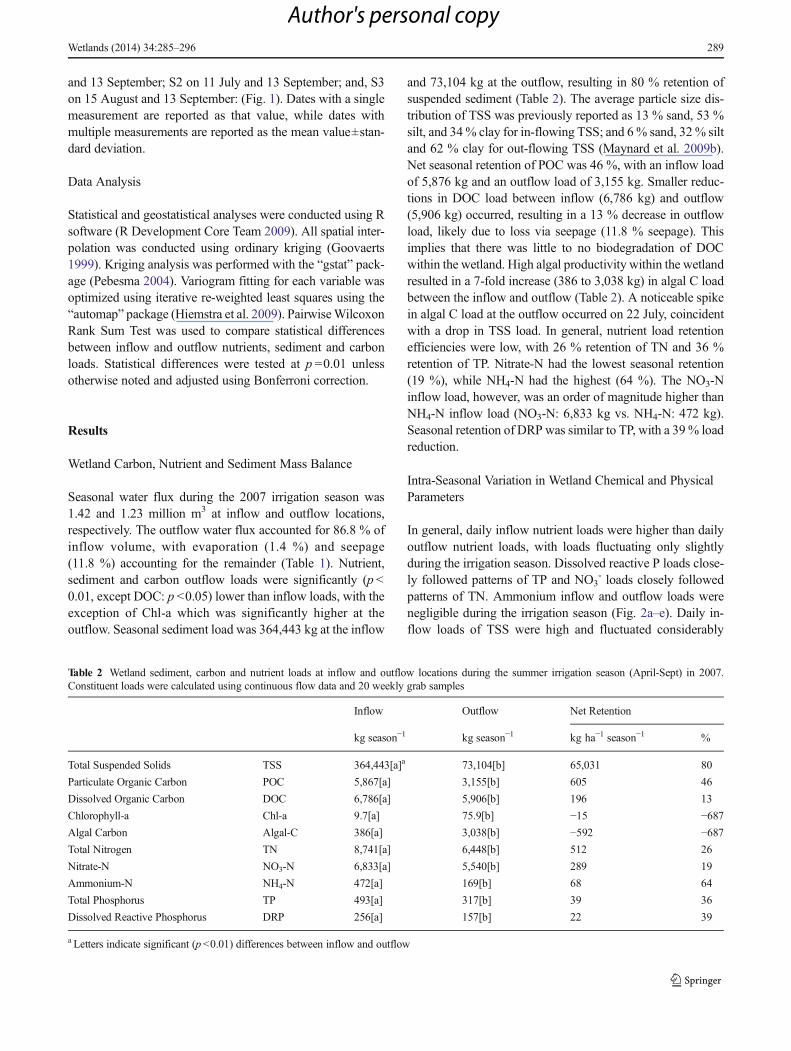
Seasonal water flux during the 2007 irrigation season was1.42 and 1.23 million m3 at inflow and outflow locations,respectively. The outflow water flux accounted for 86.8 % ofinflow volume, with evaporation (1.4 %) and seepage(11.8 %) accounting for the remainder (Table 1). Nutrient,sediment and carbon outflow loads were significantly (p <0.01, except DOC: p <0.05) lower than inflow loads, with theexception of Chl-a which was significantly higher at theoutflow. Seasonal sediment load was 364,443 kg at the inflow
and 73,104 kg at the outflow, resulting in 80 % retention ofsuspended sediment (Table 2). The average particle size dis-tribution of TSS was previously reported as 13 % sand, 53 %silt, and 34% clay for in-flowing TSS; and 6% sand, 32% siltand 62 % clay for out-flowing TSS (Maynard et al. 2009b).Net seasonal retention of POC was 46 %, with an inflow loadof 5,876 kg and an outflow load of 3,155 kg. Smaller reduc-tions in DOC load between inflow (6,786 kg) and outflow(5,906 kg) occurred, resulting in a 13 % decrease in outflowload, likely due to loss via seepage (11.8 % seepage). Thisimplies that there was little to no biodegradation of DOCwithin the wetland. High algal productivity within the wetlandresulted in a 7-fold increase (386 to 3,038 kg) in algal C loadbetween the inflow and outflow (Table 2). A noticeable spikein algal C load at the outflow occurred on 22 July, coincidentwith a drop in TSS load. In general, nutrient load retentionefficiencies were low, with 26 % retention of TN and 36 %retention of TP. Nitrate-N had the lowest seasonal retention(19 %), while NH4-N had the highest (64 %). The NO3-Ninflow load, however, was an order of magnitude higher thanNH4-N inflow load (NO3-N: 6,833 kg vs. NH4-N: 472 kg).Seasonal retention of DRPwas similar to TP, with a 39% loadreduction.
Intra-Seasonal Variation in Wetland Chemical and PhysicalParameters
In general, daily inflow nutrient loads were higher than dailyoutflow nutrient loads, with loads fluctuating only slightlyduring the irrigation season. Dissolved reactive P loads close-ly followed patterns of TP and NO3
- loads closely followedpatterns of TN. Ammonium inflow and outflow loads werenegligible during the irrigation season (Fig. 2a–e). Daily in-flow loads of TSS were high and fluctuated considerably
Table 2 Wetland sediment, carbon and nutrient loads at inflow and outflow locations during the summer irrigation season (April-Sept) in 2007.Constituent loads were calculated using continuous flow data and 20 weekly grab samples
Inflow Outflow Net Retention
kg season−1 kg season−1 kg ha−1 season−1 %
Total Suspended Solids TSS 364,443[a]a 73,104[b] 65,031 80
Particulate Organic Carbon POC 5,867[a] 3,155[b] 605 46
Dissolved Organic Carbon DOC 6,786[a] 5,906[b] 196 13
Chlorophyll-a Chl-a 9.7[a] 75.9[b] −15 −687
Algal Carbon Algal-C 386[a] 3,038[b] −592 −687
Total Nitrogen TN 8,741[a] 6,448[b] 512 26
Nitrate-N NO3-N 6,833[a] 5,540[b] 289 19
Ammonium-N NH4-N 472[a] 169[b] 68 64
Total Phosphorus TP 493[a] 317[b] 39 36
Dissolved Reactive Phosphorus DRP 256[a] 157[b] 22 39
a Letters indicate significant (p<0.01) differences between inflow and outflow
Wetlands (2014) 34:285–296 289
Author's personal copy
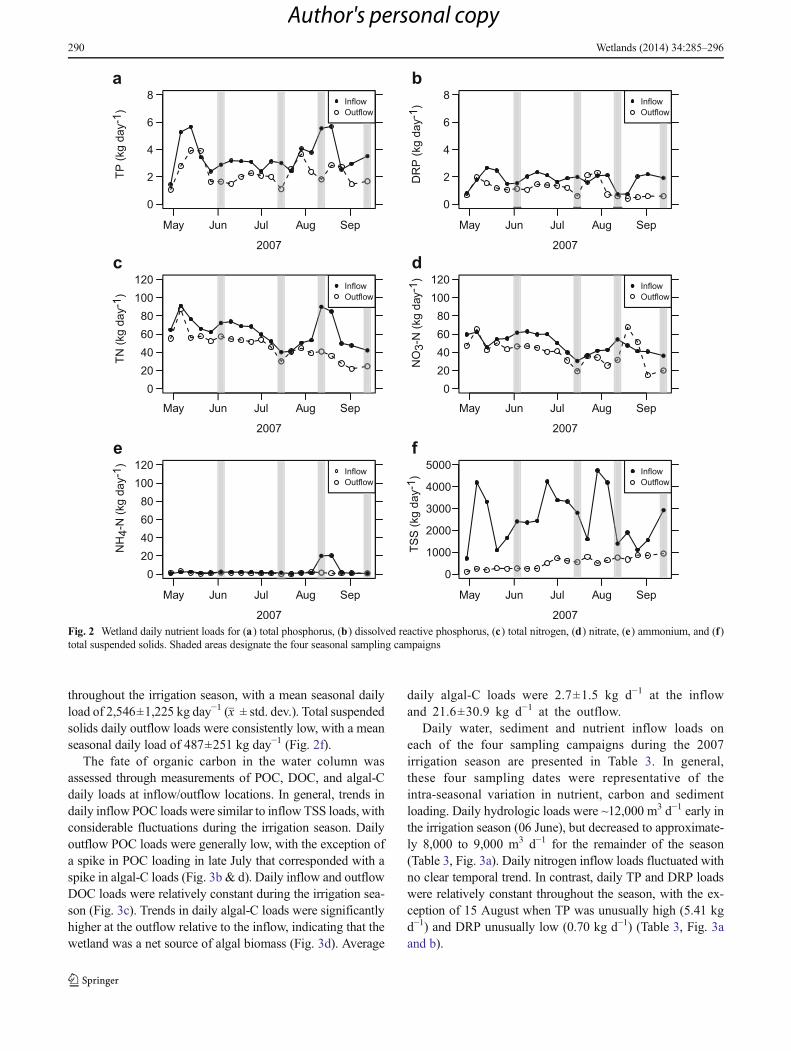
throughout the irrigation season, with a mean seasonal dailyload of 2,546±1,225 kg day−1 (x ± std. dev.). Total suspendedsolids daily outflow loads were consistently low, with a meanseasonal daily load of 487±251 kg day−1 (Fig. 2f).
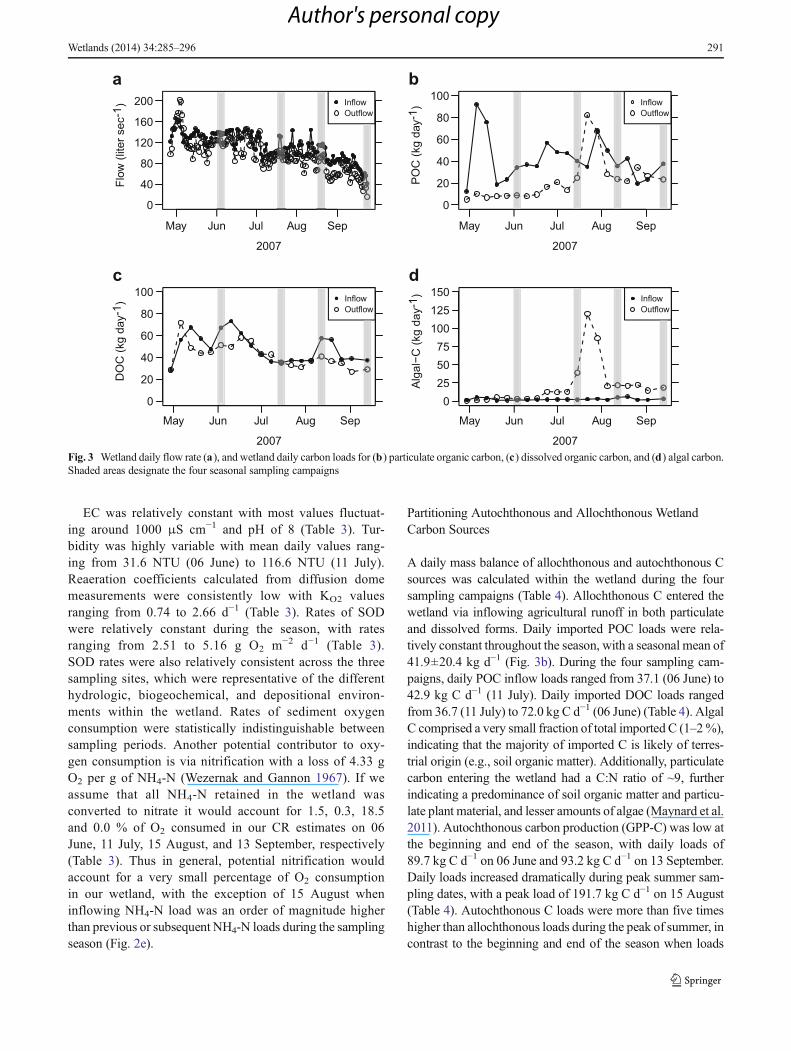
The fate of organic carbon in the water column wasassessed through measurements of POC, DOC, and algal-Cdaily loads at inflow/outflow locations. In general, trends indaily inflow POC loads were similar to inflow TSS loads, withconsiderable fluctuations during the irrigation season. Dailyoutflow POC loads were generally low, with the exception ofa spike in POC loading in late July that corresponded with aspike in algal-C loads (Fig. 3b & d). Daily inflow and outflowDOC loads were relatively constant during the irrigation sea-son (Fig. 3c). Trends in daily algal-C loads were significantlyhigher at the outflow relative to the inflow, indicating that thewetland was a net source of algal biomass (Fig. 3d). Average
daily algal-C loads were 2.7±1.5 kg d−1 at the inflowand 21.6±30.9 kg d−1 at the outflow.
Daily water, sediment and nutrient inflow loads oneach of the four sampling campaigns during the 2007irrigation season are presented in Table 3. In general,these four sampling dates were representative of theintra-seasonal variation in nutrient, carbon and sedimentloading. Daily hydrologic loads were ~12,000 m3 d−1 early inthe irrigation season (06 June), but decreased to approximate-ly 8,000 to 9,000 m3 d−1 for the remainder of the season(Table 3, Fig. 3a). Daily nitrogen inflow loads fluctuated withno clear temporal trend. In contrast, daily TP and DRP loadswere relatively constant throughout the season, with the ex-ception of 15 August when TP was unusually high (5.41 kgd−1) and DRP unusually low (0.70 kg d−1) (Table 3, Fig. 3aand b).
Fig. 2 Wetland daily nutrient loads for (a) total phosphorus, (b) dissolved reactive phosphorus, (c) total nitrogen, (d) nitrate, (e) ammonium, and (f)total suspended solids. Shaded areas designate the four seasonal sampling campaigns
290 Wetlands (2014) 34:285–296
Author's personal copy
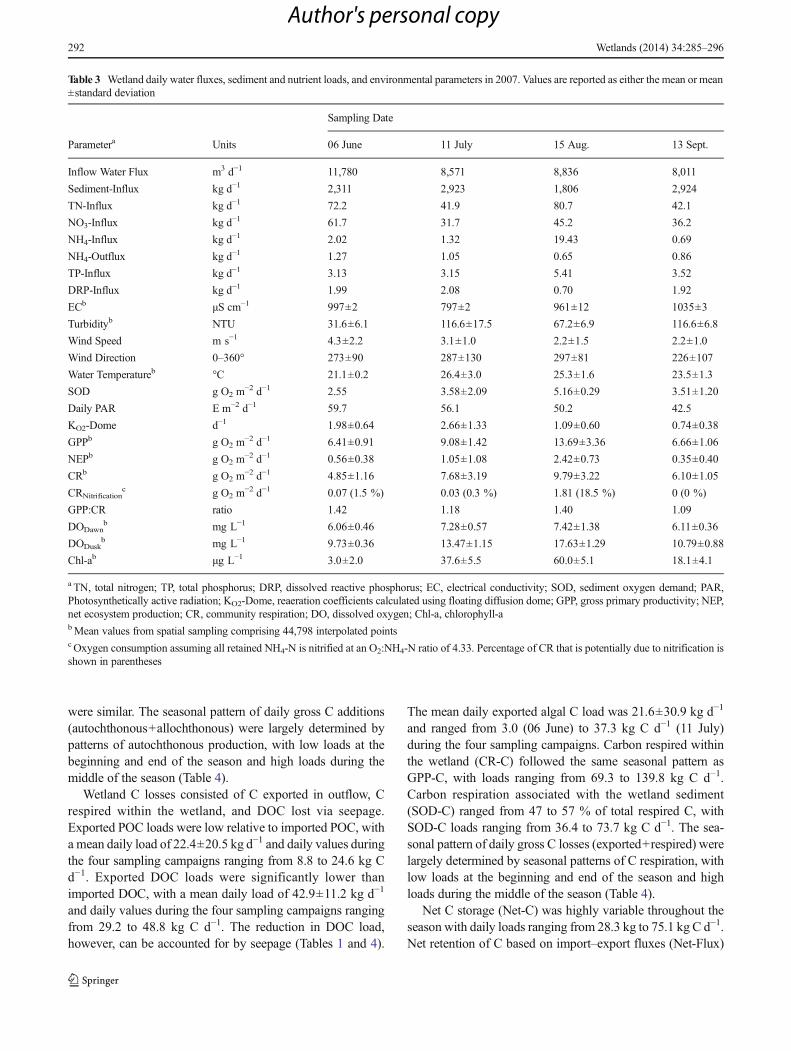
EC was relatively constant with most values fluctuat-ing around 1000 μS cm−1 and pH of 8 (Table 3). Tur-bidity was highly variable with mean daily values rang-ing from 31.6 NTU (06 June) to 116.6 NTU (11 July).Reaeration coefficients calculated from diffusion domemeasurements were consistently low with KO2 valuesranging from 0.74 to 2.66 d−1 (Table 3). Rates of SODwere relatively constant during the season, with ratesranging from 2.51 to 5.16 g O2 m−2 d−1 (Table 3).SOD rates were also relatively consistent across the threesampling sites, which were representative of the differenthydrologic, biogeochemical, and depositional environ-ments within the wetland. Rates of sediment oxygenconsumption were statistically indistinguishable betweensampling periods. Another potential contributor to oxy-gen consumption is via nitrification with a loss of 4.33 gO2 per g of NH4-N (Wezernak and Gannon 1967). If weassume that all NH4-N retained in the wetland wasconverted to nitrate it would account for 1.5, 0.3, 18.5and 0.0 % of O2 consumed in our CR estimates on 06June, 11 July, 15 August, and 13 September, respectively(Table 3). Thus in general, potential nitrification wouldaccount for a very small percentage of O2 consumptionin our wetland, with the exception of 15 August wheninflowing NH4-N load was an order of magnitude higherthan previous or subsequent NH4-N loads during the samplingseason (Fig. 2e).
Partitioning Autochthonous and Allochthonous WetlandCarbon Sources
A daily mass balance of allochthonous and autochthonous Csources was calculated within the wetland during the foursampling campaigns (Table 4). Allochthonous C entered thewetland via inflowing agricultural runoff in both particulateand dissolved forms. Daily imported POC loads were rela-tively constant throughout the season, with a seasonal mean of41.9±20.4 kg d−1 (Fig. 3b). During the four sampling cam-paigns, daily POC inflow loads ranged from 37.1 (06 June) to42.9 kg C d−1 (11 July). Daily imported DOC loads rangedfrom 36.7 (11 July) to 72.0 kg C d−1 (06 June) (Table 4). AlgalC comprised a very small fraction of total imported C (1–2%),indicating that the majority of imported C is likely of terres-trial origin (e.g., soil organic matter). Additionally, particulatecarbon entering the wetland had a C:N ratio of ~9, furtherindicating a predominance of soil organic matter and particu-late plant material, and lesser amounts of algae (Maynard et al.2011). Autochthonous carbon production (GPP-C) was low atthe beginning and end of the season, with daily loads of89.7 kg C d−1 on 06 June and 93.2 kg C d−1 on 13 September.Daily loads increased dramatically during peak summer sam-pling dates, with a peak load of 191.7 kg C d−1 on 15 August(Table 4). Autochthonous C loads were more than five timeshigher than allochthonous loads during the peak of summer, incontrast to the beginning and end of the season when loads
Fig. 3 Wetland daily flow rate (a), and wetland daily carbon loads for (b) particulate organic carbon, (c) dissolved organic carbon, and (d) algal carbon.Shaded areas designate the four seasonal sampling campaigns
Wetlands (2014) 34:285–296 291
Author's personal copy
were similar. The seasonal pattern of daily gross C additions(autochthonous+allochthonous) were largely determined bypatterns of autochthonous production, with low loads at thebeginning and end of the season and high loads during themiddle of the season (Table 4).
Wetland C losses consisted of C exported in outflow, Crespired within the wetland, and DOC lost via seepage.Exported POC loads were low relative to imported POC, witha mean daily load of 22.4±20.5 kg d−1 and daily values duringthe four sampling campaigns ranging from 8.8 to 24.6 kg Cd−1. Exported DOC loads were significantly lower thanimported DOC, with a mean daily load of 42.9±11.2 kg d−1
and daily values during the four sampling campaigns rangingfrom 29.2 to 48.8 kg C d−1. The reduction in DOC load,however, can be accounted for by seepage (Tables 1 and 4).
The mean daily exported algal C load was 21.6±30.9 kg d−1
and ranged from 3.0 (06 June) to 37.3 kg C d−1 (11 July)during the four sampling campaigns. Carbon respired withinthe wetland (CR-C) followed the same seasonal pattern asGPP-C, with loads ranging from 69.3 to 139.8 kg C d−1.Carbon respiration associated with the wetland sediment(SOD-C) ranged from 47 to 57 % of total respired C, withSOD-C loads ranging from 36.4 to 73.7 kg C d−1. The sea-sonal pattern of daily gross C losses (exported+respired) werelargely determined by seasonal patterns of C respiration, withlow loads at the beginning and end of the season and highloads during the middle of the season (Table 4).
Net C storage (Net-C) was highly variable throughout theseason with daily loads ranging from 28.3 kg to 75.1 kg C d−1.Net retention of C based on import–export fluxes (Net-Flux)
Table 3 Wetland daily water fluxes, sediment and nutrient loads, and environmental parameters in 2007. Values are reported as either the mean or mean±standard deviation
Sampling Date
Parametera Units 06 June 11 July 15 Aug. 13 Sept.
Inflow Water Flux m3 d−1 11,780 8,571 8,836 8,011
Sediment-Influx kg d−1 2,311 2,923 1,806 2,924
TN-Influx kg d−1 72.2 41.9 80.7 42.1
NO3-Influx kg d−1 61.7 31.7 45.2 36.2
NH4-Influx kg d−1 2.02 1.32 19.43 0.69
NH4-Outflux kg d−1 1.27 1.05 0.65 0.86
TP-Influx kg d−1 3.13 3.15 5.41 3.52
DRP-Influx kg d−1 1.99 2.08 0.70 1.92
ECb μS cm−1 997±2 797±2 961±12 1035±3
Turbidityb NTU 31.6±6.1 116.6±17.5 67.2±6.9 116.6±6.8
Wind Speed m s−1 4.3±2.2 3.1±1.0 2.2±1.5 2.2±1.0
Wind Direction 0–360° 273±90 287±130 297±81 226±107
Water Temperatureb °C 21.1±0.2 26.4±3.0 25.3±1.6 23.5±1.3
SOD g O2 m−2 d−1 2.55 3.58±2.09 5.16±0.29 3.51±1.20
Daily PAR E m−2 d−1 59.7 56.1 50.2 42.5
KO2-Dome d−1 1.98±0.64 2.66±1.33 1.09±0.60 0.74±0.38
GPPb g O2 m−2 d−1 6.41±0.91 9.08±1.42 13.69±3.36 6.66±1.06
NEPb g O2 m−2 d−1 0.56±0.38 1.05±1.08 2.42±0.73 0.35±0.40
CRb g O2 m−2 d−1 4.85±1.16 7.68±3.19 9.79±3.22 6.10±1.05
CRNitrificationc g O2 m
−2 d−1 0.07 (1.5 %) 0.03 (0.3 %) 1.81 (18.5 %) 0 (0 %)
GPP:CR ratio 1.42 1.18 1.40 1.09
DODawnb mg L−1 6.06±0.46 7.28±0.57 7.42±1.38 6.11±0.36
DODuskb mg L−1 9.73±0.36 13.47±1.15 17.63±1.29 10.79±0.88
Chl-ab μg L−1 3.0±2.0 37.6±5.5 60.0±5.1 18.1±4.1
a TN, total nitrogen; TP, total phosphorus; DRP, dissolved reactive phosphorus; EC, electrical conductivity; SOD, sediment oxygen demand; PAR,Photosynthetically active radiation; KO2-Dome, reaeration coefficients calculated using floating diffusion dome; GPP, gross primary productivity; NEP,net ecosystem production; CR, community respiration; DO, dissolved oxygen; Chl-a, chlorophyll-abMean values from spatial sampling comprising 44,798 interpolated pointsc Oxygen consumption assuming all retained NH4-N is nitrified at an O2:NH4-N ratio of 4.33. Percentage of CR that is potentially due to nitrification isshown in parentheses
292 Wetlands (2014) 34:285–296
Author's personal copy
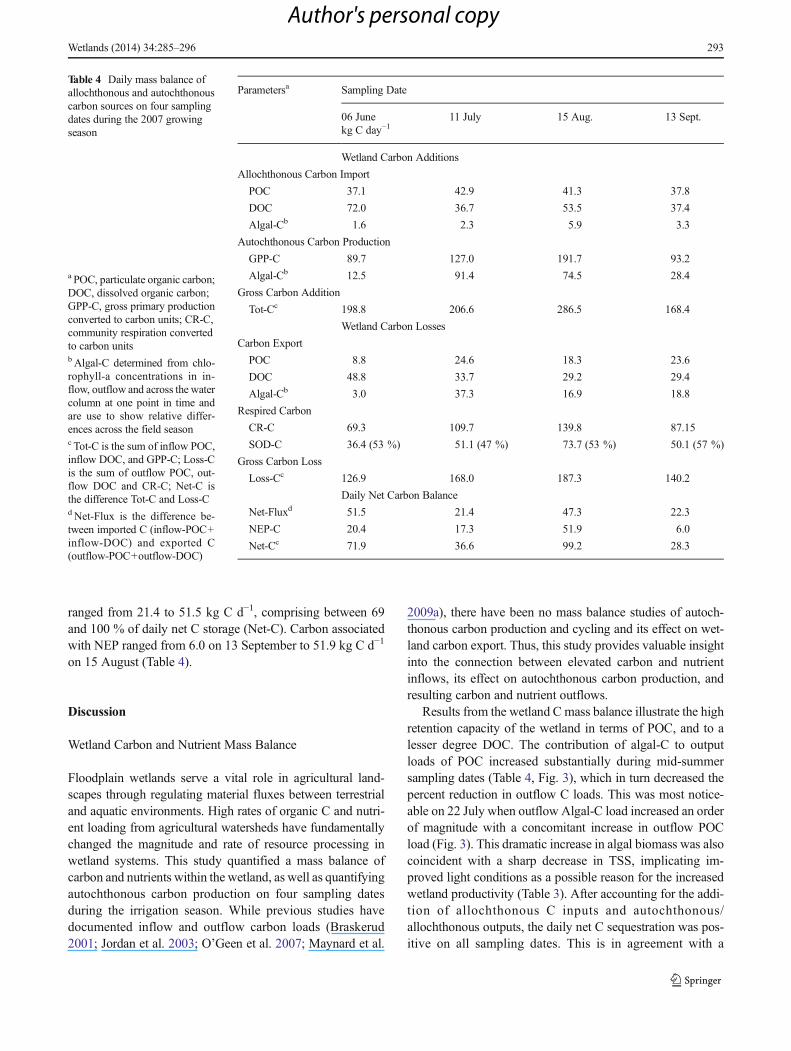
ranged from 21.4 to 51.5 kg C d−1, comprising between 69and 100 % of daily net C storage (Net-C). Carbon associatedwith NEP ranged from 6.0 on 13 September to 51.9 kg C d−1
on 15 August (Table 4).
Discussion
Wetland Carbon and Nutrient Mass Balance
Floodplain wetlands serve a vital role in agricultural land-scapes through regulating material fluxes between terrestrialand aquatic environments. High rates of organic C and nutri-ent loading from agricultural watersheds have fundamentallychanged the magnitude and rate of resource processing inwetland systems. This study quantified a mass balance ofcarbon and nutrients within the wetland, as well as quantifyingautochthonous carbon production on four sampling datesduring the irrigation season. While previous studies havedocumented inflow and outflow carbon loads (Braskerud2001; Jordan et al. 2003; O’Geen et al. 2007; Maynard et al.
2009a), there have been no mass balance studies of autoch-thonous carbon production and cycling and its effect on wet-land carbon export. Thus, this study provides valuable insightinto the connection between elevated carbon and nutrientinflows, its effect on autochthonous carbon production, andresulting carbon and nutrient outflows.
Results from the wetland C mass balance illustrate the highretention capacity of the wetland in terms of POC, and to alesser degree DOC. The contribution of algal-C to outputloads of POC increased substantially during mid-summersampling dates (Table 4, Fig. 3), which in turn decreased thepercent reduction in outflow C loads. This was most notice-able on 22 July when outflow Algal-C load increased an orderof magnitude with a concomitant increase in outflow POCload (Fig. 3). This dramatic increase in algal biomass was alsocoincident with a sharp decrease in TSS, implicating im-proved light conditions as a possible reason for the increasedwetland productivity (Table 3). After accounting for the addi-tion of allochthonous C inputs and autochthonous/allochthonous outputs, the daily net C sequestration was pos-itive on all sampling dates. This is in agreement with a
Table 4 Daily mass balance ofallochthonous and autochthonouscarbon sources on four samplingdates during the 2007 growingseason
a POC, particulate organic carbon;DOC, dissolved organic carbon;GPP-C, gross primary productionconverted to carbon units; CR-C,community respiration convertedto carbon unitsb Algal-C determined from chlo-rophyll-a concentrations in in-flow, outflow and across the watercolumn at one point in time andare use to show relative differ-ences across the field seasonc Tot-C is the sum of inflow POC,inflow DOC, and GPP-C; Loss-Cis the sum of outflow POC, out-flow DOC and CR-C; Net-C isthe difference Tot-C and Loss-Cd Net-Flux is the difference be-tween imported C (inflow-POC+inflow-DOC) and exported C(outflow-POC+outflow-DOC)
Parametersa Sampling Date
06 June 11 July 15 Aug. 13 Sept.kg C day−1
Wetland Carbon Additions
Allochthonous Carbon Import
POC 37.1 42.9 41.3 37.8
DOC 72.0 36.7 53.5 37.4
Algal-Cb 1.6 2.3 5.9 3.3
Autochthonous Carbon Production
GPP-C 89.7 127.0 191.7 93.2
Algal-Cb 12.5 91.4 74.5 28.4
Gross Carbon Addition
Tot-Cc 198.8 206.6 286.5 168.4
Wetland Carbon Losses
Carbon Export
POC 8.8 24.6 18.3 23.6
DOC 48.8 33.7 29.2 29.4
Algal-Cb 3.0 37.3 16.9 18.8
Respired Carbon
CR-C 69.3 109.7 139.8 87.15
SOD-C 36.4 (53 %) 51.1 (47 %) 73.7 (53 %) 50.1 (57 %)
Gross Carbon Loss
Loss-Cc 126.9 168.0 187.3 140.2
Daily Net Carbon Balance
Net-Fluxd 51.5 21.4 47.3 22.3
NEP-C 20.4 17.3 51.9 6.0
Net-Cc 71.9 36.6 99.2 28.3
Wetlands (2014) 34:285–296 293
Author's personal copy
previous study in this system that showed significant seasonalenrichment of deposited sediment and organic C within thewetland (Maynard et al. 2011).
Autochthonous and Allochthonous Carbon Loads
The balance between GPP and CR (i.e., aquatic metabolism),provides an important indicator of ecosystem function inresponse to environmental change. The ratio of GPP to CR(GPP:CR) is used extensively as an indication of wetlandtrophic status, where ecosystems are classified as either auto-trophic (i.e. net producer of C, GPP:CR>1) or heterotrophic(i.e., net consumer of C, GPP:CR<1) (López-Archilla et al.2004; Iwata et al. 2007). Overall, the GPP/CR ratio was closeto 1 (range: 1.09–1.42), indicating the important role of theautotrophic community in maintaining positive rates of NEP,as well as the important role of the heterotrophic communityin regulatingNEP in a systemwith high rates ofGPP (Table 3).Thus, large inputs of allochthonous POC during peak periodsof GPP (i.e., 11 July) likely contribute to increased heterotro-phic energy mobilization, limiting net ecosystem production(NEP) and the potential export of BOD loads (Table 4). Al-lochthonous C inputs can play an important role in wholeecosystem metabolism, with inputs that can equal or exceedinternal primary productivity (Hynes 1970; Cummins et al.1973; Fisher and Likens 1973; Caraco and Cole 2004; Coleet al. 2006). For example, many lake ecosystems experiencenegative NEP due to high respiration rates, but maintain apositive net C storage due to the high influx of allochthonousC (Del Giorgio and Peters 1994; Del Giorgio et al. 1999; Coleet al. 2000). In our study wetland we documented a similartrend, with low rates of NEP due to high respiratory demand;but a substantial positive carbon balance in the system due tohigh inputs of allochthonous POC..
Autochthonous C is considered relatively labile and easilymetabolized, in contrast to allochthonous sources which areconsidered largely recalcitrant (Wetzel 1992). Results frombioassays on the short-term lability of DOC in lakes suggestthat less than 15 % of terrestrial DOC is available for micro-bial use (Sondergaard et al. 1995; Volkmar and Dahlgren2006). However, recent studies have shown that allochtho-nous C is important in subsidizing aquatic food webs in lakeecosystems, with 30–70 % of organismal C originating fromterrestrial sources (Carpenter et al. 2005; Cole et al. 2006;Karlsson et al. 2002; Pace et al. 2004). Additionally, greaterthan 90 % of ecosystem decomposition in rivers and lakes isestimated to originate from non-pelagic sources (Wetzel1992). The high influx of POC in this wetland, and its activerecirculation as a result of resuspension, results in the contin-ual exposure of allochthonous POC to metabolic processing.Furthermore, deposited C on the wetland floor is subjected tobenthic metabolism, which has been shown to account for asmuch as 50 % of total O2 consumption in rivers (Hanes and
Irvine 1968) and as much as 80 % of total O2 consumption inlakes (Burns and Ross 1972). SOD in our system was rela-tively constant throughout the season as well as across sam-pling sites, with the relative contribution of SOD to total O2
consumption ranging from 47 to 57 % of total areal O2
consumption. It should be noted that the limited number ofSOD measurements taken both at individual sites andthroughout the season, results in an approximate averageestimate of SOD within the wetland. Despite this caveat,estimated areal rates provide an approximation of the relativecontribution of SOD to total respiratory demand (Table 4).
Effect of Elevated Nutrient, Carbon, and Sediment Loadson Wetland Metabolism
The balance between heterotrophic and autotrophic energymobilization is largely controlled by the ratio of allochthonousorganic C to inorganic nutrients (Blomqvist et al. 2001; Coleet al. 2002; Jansson et al. 2006). In systems with high avail-ability of organic C relative to inorganic nutrients,bacterioplankton will outcompete phytoplankton for limitingnutrients (e.g., P and N) (Vadstein 2000). In contrast, loworganic C availability relative to inorganic nutrients will favorphytoplankton productivity due to the dependence ofbacterioplankton on an external C source. Our study revealedtemporal patterns of wetland aquatic metabolism typical ofseasonal fluctuations in temperature and irradiance. High Cloads entering our wetland prevented C limitation. Thus,regulation of phytoplankton and bacterioplankton growthwas likely controlled by light availability, temperature, andnutrients (i.e., N and P). A concurrent study in this wetlandshowed that GPP was most strongly correlated with turbidityand NEP was most strongly correlated with DRP (Maynardet al. 2012). The resuspension of sediment organic C has alsobeen shown to be an important factor in regulating CR(Bachmann et al. 2000). Sediment resuspension was a majorsource of turbidity in our wetland, which limited light avail-ability for algal growth, while at the same time, potentiallyincreasing C and nutrient availability for heterotrophic bacte-ria, resulting in a general shift of the system towards hetero-trophic metabolism (Maynard et al. 2012). Additionally,bacterioplankton growth and respiration is dependent on tem-perature, resulting in lower rates of CR during colder months(Uehlinger et al. 2000), as seen on 06 June and 13 September(Table 3). This relationship between CR and temperature wasalso shown in a concurrent study in this system, where CRwas most strongly correlated with temperature (Maynard et al.2012).
With the increasing use of constructed and restored riparianwetlands for mitigating sediment and nutrient loads fromagricultural runoff, it is important to also evaluate their poten-tial role as algal seed sources for down gradient water bodies.This is particularly relevant for seasonally-saturated riparian
294 Wetlands (2014) 34:285–296
Author's personal copy
wetlands of this region that experience annual oscillationsbetween predominately vegetated and non-vegetated states.This study documented wetland algal dynamics during a non-vegetated year and showed a highly significant increase inalgal carbon exported from the system. While the overallcarbon budget showed a positive net retention of carbonwithin the system, it appears that the high retention ofimported allochthonous carbon is being partly offset by thehigh production of algal C, part of which is being exportedfrom the system. Previous work in this system during avegetated year documented moderate Chl-a concentrationsin spring during early stages of emergent macrophyte growth,followed by extremely low Chl-a concentrations due to shad-ing by the fully established vegetative canopy (O’Geen et al.2007). Thus it appears that promoting the establishment ofwetland vegetation may be an effective management practicefor reducing algal productivity, however, further research isneeded to evaluate the effects of wetland vegetation on algalexport loads.
Conclusions
The widespread degradation of surface water bodies, coinci-dent with dramatic losses of wetland habitat, has promptedinterest in using constructed and/or restored wetlands to mit-igate non-point source pollution. While constructed wetlandshave been shown to be effective at retaining sediment andnutrients, less is known regarding their effect on algal produc-tivity and export. Results from this study show that: (i) thewetland had a high retention capacity for sediment, nutrientsand POC; (ii) despite high rates of primary productivity(GPP), high respiration rates (CR) limited net C production(NEP) and export from this wetland; and (iii) while there wasa net retention of C within the system, the high retention ofimported allochthonous carbon is being partly offset by theproduction and partial export of algal C. Consequently, addi-tional research evaluating management practices that mini-mize algal productivity within constructed flow-through wet-lands (i.e., vegetation) should be examined in an ongoingeffort to mitigate seasonal hypoxia in the SJR and other waterbodies.
Acknowledgments Funding for this project was provided through anagreement with the California State Water Resources Control Board andthe Kearney Foundation of Soil Science. The information in this docu-ment has been subjected to review by the US Environmental ProtectionAgency and approved for publication. The contents of this document donot necessarily reflect the views and policies of the California StateWaterResources Control Board or the US Environmental Protection Agency,nor does mention of trade names or commercial products constituteendorsement or recommendation for use. We would like to thank MickeySaso for his cooperation and support. We would also like to thank JamesChang and Jiayou Deng for help with field sampling and laboratoryanalysis.
References
APHA (1998) Standard methods for the examination of water and waste-water 20th edition. American Public Health Association,Washington
Bachmann RW, Hoyer MV, Canfield DE (2000) Internal heterotrophyfollowing the switch from macrophytes to algae in Lake Apopka,Florida. Hydrobiologia 418:217–227
Blomqvist P, Jansson M, Drakare S, Bergström AK, Brydsten L (2001)Effects of additions of DOC on pelagic biota in a Clearwater system:Results from a whole lake experiment in northern Sweden. Micro-bial Ecology 42:383–394
Bott TL (2006) Primary productivity and community respiration. In F. R.Hauer and G. A. Lamberti (eds) Methods in stream ecology. Aca-demic Press/Elsevier, pp 663–690
Braskerud B (2001) The influence of vegetation on sedimentation andresuspension of soil particles in small constructed wetlands. Journalof Environmental Quality 30:1447–1457
Burns NM, Ross R (1972) Oxygen-nutrient relationships within theCentral Basin of Lake Erie. In N. M. Burns and C. Ross (eds)Project Hypo-an Intensive Study of the Lake Erie Central BasinHypolimnion and Related Surface Water Phenomena. U.S.E.P.ATechnical Report TS-05-71-208-24., pp
Caraco NF, Cole JJ (2004) When terrestrial organic matter is sent downthe river: The importance of allochthonous C inputs to the metabo-lism of streams and rivers. In G. A. Polis, M. E. Power and G. R.Huxel (eds) Foodwebs at the landscape level. University of ChicagoPress, pp 301–316
Carpenter SR, Cole JJ, Pace ML, Van De Bogert M, Bade DL, BastvikenD, Gille CM, Hodgson JR, Kitchell JF, Kritzberg ES (2005) Eco-system subsidies: Terrestrial support of aquatic foodwebs from 13Caddition to contrasting lakes. Ecology 86:2737–2750
Central Valley Joint Venture (2006) Central Valley Joint Venture Imple-mentation Plan-Conserving Bird Habitat. Sacramento
California Irrigation Management Information System (2007) Weatherstation data. Available at http://wwwcimis.water.ca.gov/cimis/(accessed 09 Jan 2014)
Cole JJ, Carpenter SR, Kitchell JF, Pace ML (2002) Pathways of organiccarbon utilization in small lakes: Results from a whole-lake 13 Caddition and coupled model. Limnology and Oceanography47:1664–1675
Cole JJ, Carpenter SR, Pace ML, Van De Bogert MC, Kitchell JL,Hodgson JR (2006) Differential support of lake food webs by threetypes of terrestrial organic carbon. Ecology Letters 9:558–568
Cole JJ, Pace ML, Carpenter SR, Kitchell JF (2000) Persistence of netheterotrophy in lakes during nutrient addition and food web manip-ulations. Limnology and Oceanography 45:1718–1730
Copeland BJ, Duffer WR (1964) Use of a clear plastic dome to measuregaseous diffusion rates in natural waters. Limnology and Oceanog-raphy 9:494–499
Cummins KW, Petersen RC, Howard FO, Wuycheck JC, Holt VI (1973)The utilization of leaf litter by stream detritivores. Ecology 54:336–345
Dahl TE (1990) Wetlands losses in the United States 1780’s to 1980’s.Changes. U.S. Department of the Interior, Fish andWildlife Service,Washington, p 13
Del Giorgio PA, Cole JJ, Caraco NF, Peters RH (1999) Linking plank-tonic biomass and metabolism to net gas fluxes in northern temper-ate lakes. Ecology 80:1422–1431
Del Giorgio PA, Peters RH (1994) Patterns in planktonic P:R ratios inlakes: Influence of lake trophy and dissolved organic carbon. Lim-nology and Oceanography 39:772–787
Díaz FJ, O’Geen AT, Dahlgren RA (2012) Agricultural pollutant removalby constructed wetlands: Implications for water management anddesign. Agricultural Water Management 104:171–183
Doane TA, Horwath WR (2003) Spectrophotometric determination ofnitrate with a single reagent. Analytical Letters 36:2713–2722
Wetlands (2014) 34:285–296 295
Author's personal copy
Dunne T, Leopold LB (1978) Water in environmental planning. WHFreeman
Fisher S, Likens G (1973) Energy flows in Bear Brook, New Hampshire:An integrative approach to stream ecosystem metabolism. Ecolog-ical Monographs 43:421–439
Forster JC (1995) Methods in applied soil microbiology and biochemis-try. Academic, London
Goovaerts P (1999) Geostatistics in soil science: State-of-the-art andperspectives. Geoderma 89:1–45
Hanes BN, Irvine RL (1968) New technique for measuring oxygenuptake rates of benthal systems. 40:223–232
Hiemstra PH, Pebesma EJ, Twenhöfel CJW, Heuvelink G (2009) Real-time automatic interpolation of ambient gamma dose rates from theDutch radioactivity monitoring network. Computers & Geosciences35:1711–1721
Hynes HBN (1970) The Ecology of Running Waters. University ofToronto Press
Iwata T, Takahashi T, Kazama F, Hiraga Y, Fukuda N, Honda M, KimuraY, Kota K, Kubota D, Nakagawa S, Nakamura T, Shimura M,Yanagida S, Xeu L, Fukasawa E, Hiratsuka Y, Ikebe T, Ikeno N,Kohno A, Kubota K, Kuwata K, Misonou T, Osada Y, Sato Y,Shimizu R, Shindo K (2007) Metabolic balance of streams drainingurban and agricultural watersheds in central Japan. Limnology8:243–250
Jansson M, Bergström AK, Lymer D, Vrede K, Karlsson J (2006)Bacterioplankton growth and nutrient use efficiencies under variableorganic carbon and inorganic phosphorus ratios. Microbial Ecology52:358–364
Jordan TE, Whigham DF, Hofmockel KH, Pittek MA (2003) Nutrientand sediment removal by a restored wetland receiving agriculturalrunoff. Journal of Environmental Quality 32:1534–1547
Karlsson J, Jansson M, Jonsson A (2002) Similar relationships betweenpelagic primary and bacterial production in clearwater and humiclakes. Ecology 83:2902–2910
Lehman PW, Sevier J, Giulianotti J, JohnsonM (2004) Sources of oxygendemand in the lower San Joaquin River, California. Estuaries andCoasts 27:405–418
Levenspiel O (1972) Chemical Reaction Engineering. WileyLópez-Archilla AI, Mollá S, ColetoMC, Guerrero MC,Montes C (2004)
Ecosystem metabolism in a Mediterranean shallow lake (Laguna deSanta Olalla, Doñana National Park, SW Spain). Wetlands 24:848–858
Maynard JJ, Dahlgren RA, O’Geen AT (2012) Quantifying spatial vari-ability and biogeochemical controls of ecosystem metabolism in aeutrophic flow-through wetland. Ecological Engineering 47:221–236
Maynard JJ, Dahlgren RA, O’Geen AT (2011) Soil carbon cycling andsequestration in a seasonally saturated wetland receiving agriculturalrunoff. Biogeosciences 8:3391–3406
Maynard JJ, O’GeenAT, Dahlgren RA (2009a) Bioavailability and fate ofphosphorus in constructed wetlands receiving agricultural runoff inthe San Joaquin Valley, California. Journal of Environmental Qual-ity 38:360–372
Maynard JJ, O’Geen AT, Dahlgren RA (2009b) Spatial relationships ofphosphorus sorption in a seasonally saturated constructed wetlandsoil. Soil Science Society of America Journal 73:1741–1753
Moldan B, Cerny J (1994) Small watershed research. In: Molden B,Cerny J (eds) Biogeochemistry of small watersheds: A tool for
environmental research. Scope 51. John Wiley & Sons, New York,pp 189–206
Murphy PJ, Hicks DB (1986) In-situ method for measuring sedimentoxygen demand. In: Hatcher KJ (ed) Sediment oxygen demand-processes, modeling, and measurement. Institute of Natural Re-sources, University of Georgia, Athens
O’Geen A, Budd R, Gan J, Maynard J, Parikh S, Dahlgren R (2010)Mitigating nonpoint source pollution in agriculture with constructedand restored wetlands. Advances in Agronomy 108:1–76
O’Geen AT, Maynard JJ, Dahlgren RA (2007) Efficacy of constructedwetlands to mitigate non-point source pollution from irrigationtailwaters in the San Joaquin Valley, California, USA.Water Science& Technology 55:55–61
Odum HT (1956) Primary production in flowing waters. Limnology andOceanography 1:102–117
OdumHT, Hoskin CM (1958) Comparative studies on the metabolism ofmarine waters. Publications of the Institute of Marine Science Uni-versity of Texas 5:16–46
Ohte N, Dahlgren RA, Silva SR, Kendall C, Kratzer CR, Doctor DH(2007) Sources and transport of algae and nutrients in a Californianriver in a semi-arid climate. Freshwater Biology 52:2476–2493
Pace ML, Cole JJ, Carpenter SR, Kitchell JF, Hodgson JR, Bogert VDMc (2004)Whole lake carbon-13 additions reveal terrestrial supportof aquatic food webs. Nature 427:240–243
Pebesma E (2004) Multivariable geostatistics in S: the gstat package.Computers and Geosciences 30:683–691
R Development Core Team (2009) R: A language and environment forstatistical computing. R Foundation for Statistical Computing,ISBN. R Foundation for Statistical Computing, Vienna, Austria
Rounds SA, Doyle MC (1997) Sediment oxygen demand in the TualatinRiver Basin, Oregon, 1992–1996. p. 19. U.S. Geological Survey
Sondergaard M, Hansen B, Markager S (1995) Dynamics of dissolvedorganic carbon lability in a eutrophic lake. Limnology and Ocean-ography 40:46–54
Tockner K, Pennetzdorfer D, Reiner N, Schiemer F, Ward J (1999)Hydrological connectivity, and the exchange of organic matter andnutrients in a dynamic river–floodplain system (Danube, Austria).Freshwater Biology 41:521–535
Uehlinger U, König C, Reichert P (2000) Variability of photosynthesis-irradiance curves and ecosystem respiration in a small river. Fresh-water Biology 44:493–507
Vadstein O (2000) Heterotrophic, planktonic bacteria and cycling ofphosphorus - Phosphorus requirements, competitive ability, andfood web interactions. Advances in Microbial Ecology Vol 16.Kluwer Academic / Plenum Publ, New York, pp 115–167
Volkmar EC, Dahlgren RA (2006) Biological oxygen demand dynamicsin the lower San Joaquin River, California. Environmental Science& Technology 40:5653–5660
Volkmar EC, Henson SS, Dahlgren RA, O’Geen AT, Van NieuwenhuyseEE (2011)Diel patterns of algae and water quality constituents in theSan Joaquin River, California, USA. Chemical Geology 283:56–67
Wetzel RG (1992) Gradient-dominated ecosystems: Sources and regula-tory functions of dissolved organic matter in freshwater ecosystems.Hydrobiologia 229:181–198
Wezernak C, Gannon J (1967) Oxygen-nitrogen relationships in autotro-phic nitrification. Applied Microbiology 15:1211–1215
Wood TM (2001) Sediment oxygen demand in Upper Klamath andAgency Lakes, Oregon, 1999. p. 13. U.S. Geological Survey
296 Wetlands (2014) 34:285–296
Author's personal copy