association of total body and visceral fat mass with iron deficiency in preadolescents: the healthy...
TRANSCRIPT
British Journal of Nutritionhttp://journals.cambridge.org/BJN
Additional services for British Journal of Nutrition:
Email alerts: Click hereSubscriptions: Click hereCommercial reprints: Click hereTerms of use : Click here
Association of total body and visceral fat mass with iron deficiency in preadolescents: the Healthy Growth Study
George Moschonis, George P. Chrousos, Christos Lionis, Vassilis Mougios and Yannis Manios
British Journal of Nutrition / Volume 108 / Issue 04 / August 2012, pp 710 719DOI: 10.1017/S0007114511005952, Published online: 16 November 2011
Link to this article: http://journals.cambridge.org/abstract_S0007114511005952
How to cite this article:George Moschonis, George P. Chrousos, Christos Lionis, Vassilis Mougios and Yannis Manios (2012). Association of total body and visceral fat mass with iron deficiency in preadolescents: the Healthy Growth Study. British Journal of Nutrition, 108, pp 710719 doi:10.1017/S0007114511005952
Request Permissions : Click here
Downloaded from http://journals.cambridge.org/BJN, IP address: 155.207.181.175 on 29 Oct 2012

Association of total body and visceral fat mass with iron deficiencyin preadolescents: the Healthy Growth Study
George Moschonis1, George P. Chrousos2, Christos Lionis3, Vassilis Mougios4 and Yannis Manios1*on behalf of the Healthy Growth Study group1Department of Nutrition and Dietetics, Harokopio University of Athens, 70, El. Venizelou Avenue, 17671 Kallithea-Athenes,
Greece2First Department of Pediatrics, Athens University Medical School, Aghia Sophia Children’s Hospital, Athens, Greece3Clinic of Social and Family Medicine, School of Medicine, Heraklion, University of Crete, Crete, Greece4Department of Physical Education and Sport Science, Aristotle University of Thessaloniki, Thessaloniki, Greece
(Submitted 27 April 2011 – Final revision received 4 October 2011 – Accepted 5 October 2011 – First published online 16 November 2011)
Abstract
The aim of the present study was to examine the associations of obesity, percentage body fat and visceral fat mass with body Fe status
in a representative sample of 1493 schoolchildren aged 9–13 years. Anthropometric, body composition, biochemical, clinical
(Tanner stage, age of menarche) and dietary intake data were collected. Fe deficiency (ID) was defined as transferrin saturation
(TS) , 16 %; and Fe-deficiency anaemia (IDA) as ID with Hb , 120 g/l. Obese boys and girls and those in the highest quartiles of
percentage body fat mass had significantly higher levels of serum ferritin (P#0·05) compared to their normal-weight peers and those
in the corresponding lowest quartiles. Similarly, obese boys and girls and those in the highest quartiles of percentage body fat and visceral
fat mass had significantly lower levels of TS (P#0·05) compared to normal-weight children and those in the corresponding lowest
quartiles. The prevalence of ID and IDA was significantly higher in boys and girls in the highest quartiles of percentage body fat than
in peers in the lowest quartile. Higher quartiles of percentage body fat and visceral fat mass were the main significant predictors of ID
in boys, after controlling for other important confounders, with OR of 2·48 (95 % CI, 1·26, 4·88) and 2·12 (95 % CI, 1·07, 4·19), respectively.
Similar significant associations were observed for girls. In conclusion, percentage body fat and visceral fat mass were positively associated
with ID in both sexes of preadolescents. These associations might be attributed to the chronic inflammation induced by excess adiposity.
Key words: Iron deficiency: Obesity: Children: Adipose tissue
Many reports have indicated that the prevalence of obesity in
childhood and adolescence has been increasing worldwide
at an alarming rate(1,2). On the basis of recent studies, the
number of overweight children has doubled and the number
of overweight adolescents has tripled since 1970(3). Following
the worldwide trends, obesity among Greek children and
adolescents is also on the rise over the last 30 years(4).
It is well established that excess adiposity in both adults
and children is strongly associated with several metabolic
complications (i.e. metabolic syndrome, insulin resistance,
dyslipidaemias)(5,6). In addition, although contradictory at
first sight, obesity has also been associated with nutritional
deficiencies(7,8). Specifically, overweight and obese individ-
uals seem to be at higher risk of Fe deficiency (ID) than
those having normal body weight(9–11). These findings were
consistent in both children(12–15) and adults(15–17).
Prevention of ID is crucial from a public health perspective,
because it is associated with behavioural and cognitive delays
in infancy and early childhood, such as impaired learning(18),
decreased school achievements(19,20) and lower scores on tests
of mental and motor development(21). The aetiology of this
phenomenon remains uncertain. Suggested contributing fac-
tors are poor Fe intake, repeated short-term restrictive diets,
increases in blood volume when children enter adolescence,
early onset of menstruation, limited physical activity, rapid
growth and genetics(12,14). However, these factors seem not
to be significant predictors of the low serum Fe levels
observed in overweight and obese individuals(16). In contrast,
ID could partially be explained by the fact that obesity is a
low-grade chronic inflammatory state(22). In particular, studies
show that increased levels of inflammatory biomarkers, such
as C-reactive protein, are inversely associated with serum Fe
*Corresponding author: Dr Y. Manios, fax þ30 210 9514759, email [email protected]
Abbreviations: ID, Fe-deficiency; IDA, Fe-deficiency anaemia; TIBC, total Fe-binding capacity; TS, transferrin saturation; WC, waist circumference.
British Journal of Nutrition (2012), 108, 710–719 doi:10.1017/S0007114511005952q The Authors 2011
British
Journal
ofNutrition
levels in centrally obese adolescents(10). The hypothesis that
the association between ID and obesity is mediated by an
obesity-induced low-grade chronic inflammation is strength-
ened by the higher levels of serum ferritin usually observed
in overweight and obese individuals. Although ferritin serves
as an index of Fe stores in the body, it is also an acute-
phase protein that increases in inflammatory states, such as
excess visceral fat accumulation(23).
The studies showing an inverse association between adi-
posity and Fe status in children and adolescents(10,12,14) have
relied on BMI. However, BMI is not always a direct measure
of adiposity, especially in children(24). Furthermore, to our
knowledge based on the available literature, no study so far
has ever examined the relationship between more direct
measures of adiposity and Fe status. Such studies may explore
a more accurate association between obesity and ID in chil-
dren and highlight further the discussion of dietary rec-
ommendations of Fe intake in them. The present study
reports on the associations between central obesity, percen-
tage body fat and visceral fat mass and ID in a representative
sample of preadolescent Greek children.
Methods and procedures
Sampling
The Healthy Growth Study was a large-scale, cross-sectional,
epidemiological study initiated in May 2007. This study was
conducted according to the guidelines laid down in the
Declaration of Helsinki and all procedures involving human
subjects were approved by the Ethics Committee of Haroko-
pio University of Athens. Approval to conduct the study was
also granted by the Greek Ministry of National Education.
The population under study comprised schoolchildren aged
9–13 years, attending the 5th and 6th grades of primary
schools located in municipalities within the prefectures of
Attica, Etoloakarnania, Thessaloniki and Iraklio. The sampling
of schools was random, multi-stage and stratified by parents’
educational level and total population of students attending
schools within these municipalities. Specifically, the municipa-
lities in the prefectures under study were divided into three
groups on the basis of average educational level of their
adult population (25–65 years old) that was estimated from
data provided by the National Statistical Service of Greece
(2001 census). This procedure yielded two parents’ education
cut-off points that allowed us to categorise municipalities
into three different socio-economic levels, i.e. higher, middle
and lower. Consequently, again on the basis of data from
the National Statistical Service, a certain number of muni-
cipalities, proportional to the size of their preadolescent
population (9–13 years old), was randomly selected from
each socio-economic level. Finally, a number of schools
were randomly selected from each municipality, proportional
to the population of schoolchildren registered in the 5th
and 6th grades, according to data obtained from the Greek
Ministry of Education.
All seventy-seven primary schools that were invited to
participate in the study responded positively. Weight and
height were measured in all pupils attending the 5th and 6th
grades in these primary schools as part of a school-based
health and nutrition education programme. Full medical
examination (i.e. anthropometric and body composition
measurements, blood collection, clinical examination etc.)
and questionnaire data were obtained from a subgroup of
pupils whose parents signed an informed consent form.
Signed parental consent forms were collected for 2655 out
of 4145 children (response rate 64·1 %). Still no significant
differences with respect to parental educational level were
observed between families that consented to data collection
and those that did not.
Physical examination and anthropometry
Participants underwent a physical examination by two trained
members of the research team. The protocol and equipment
used were the same in all schools. Weight was measured to
the nearest 10 g using a Seca digital scale (Seca Alpha, Model
770, Hamburg, Germany). Pupils were weighed without
shoes in the minimum clothing possible. Height was measured
to the nearest 0·1 cm using a commercial stadiometer (Leicester
Height Measure; Invicta Plastics, Oadby, UK), with the pupil
standing barefoot, keeping shoulders in a relaxed position,
arms hanging freely and head in Frankfurt horizontal plane.
Weight and height were used to calculate BMI using Quetelet’s
equation (weight (kg)/height (m)2). The International Obesity
Task Force cut-off points(25,26) were used to categorise partici-
pants as ‘normal weight’, ‘overweight’ or ‘obese’. Waist circum-
ference (WC) was measured to the nearest 0·1 cm with the use
of a non-elastic tape (Hoechstmass, Germany), with the pupil
standing, at the end of a gentle expiration after placing the
measuring tape on a horizontal plane around the trunk, at
the level of umbilicus midway, between the lower rib margin
and the iliac crest. The age- and sex-specific WC percentiles
were used for the classification of central obesity ($90th
percentile)(27). One well-trained and experienced female
paediatrician in each prefecture determined pubertal matu-
ration (Tanner stage) after thorough visual inspection of
breast development in girls and genital development in
boys(28). Finally, each girl was asked by the paediatrician
about her menstruation status and age of menarche.
Assessment of percentage body fat and visceral fat mass
Bioelectrical impedance analysis was used for the assessment
of percentage body fat (Akkern BIA 101; Akkern Srl., Florence,
Italy) and for abdominal–visceral fat mass (Tanita Viscan
AB-140, Kowloon, Hong Kong). In abdominal bioelectrical
impedance analysis, an electric current is passed between
the regions near the umbilicus and spinal cord at the umbili-
cus level, and the voltage generated in the lateral abdomen
is recorded. Because the equipotential line that passes
through visceral fat appears on the lateral abdominal surface,
the amount of visceral fat can be estimated by measure-
ment of the voltage generated at this location using a
regression equation determined by computed tomography(29).
Participants were instructed to abstain from any food or liquid
Body fat mass and iron deficiency 711
British
Journal
ofNutrition

intake and from any intensive exercise for 4 h before measure-
ment. They were also instructed not to wear any metallic
object during measurement. The assessments took place
with the pupils lying on a non-conductive surface at ambient
room temperature. Percentage body fat was calculated from
the resistance and reactance values using valid equations
derived from a similar preadolescent population(30), while
visceral fat mass was read directly from the instrument in a
rating scale from 1 to 59 units, with 0·5 increments. On the
basis of these data, children were categorised into four
sex-specific quartiles of percentage body fat and visceral fat
mass. As there were only two Tanita Viscan devices available,
data on trunk–visceral fat mass were collected for a represen-
tative sub-sample of 1500 children.
Biochemical indices
Blood samples were obtained for biochemical and haematolo-
gical screening tests between 08.30 and 10.30 hours after a
12 h overnight fast. Reminders were distributed the previous
day to both parents and children in order to ensure compli-
ance with fasting. Professional staff performed venepuncture,
using two types of test tubes, one of which contained EDTA, to
obtain a maximum of 10 ml blood. The EDTA-blood was trans-
ferred on the same day of collection to a local laboratory,
where it was analysed in a CELL-DYN haematological autoa-
nalyser (Abbott Diagnostics, Abbott Park, IL, USA) for the
determination of haematological indices, including erythro-
cyte count, Hb and mean corpuscular volume. The remaining
blood was collected in plain test tubes for the preparation of
serum, which was divided into aliquots and stored at 2808C.
When blood collection was completed in Aitoloakarnania,
Thessaloniki and Iraklio, all serum samples were transported
in dry ice to the Laboratory of Nutrition and Clinical Dietetics
at Harokopio University, where biochemical analyses and cen-
tral storage of back-up samples at 2808C took place. Serum Fe
and total Fe-binding capacity (TIBC) levels were determined
by colorimetric assays (Roche Diagnostics SA, Basel, Switzer-
land). Transferin saturation (TS) was calculated by dividing
serum Fe by TIBC and multiplying by 100. Finally, serum ferritin
was measured by using a chemiluminescence immunoassay
(Siemens Healthcare Diagnostics, Tarrytown, NY, USA).
Fe deficiency (with or without anaemia) and Fe-deficiency
anaemia (IDA) were defined using the following age- and
sex-specific thresholds proposed by UNICEF and the
WHO(31): ID was defined as TS , 16 %; IDA was defined as
TS , 16 % and Hb concentration , 120 g/l, which is the
threshold value for anaemia for children aged 9–13 years.
The Mentzer Index (MCV (fl)/RBC (M/ml))(32) was also
calculated for all pupils participating in the present study to
differentiate beta-thalassaemia from ID. On the basis of this
index, children with thalassaemia minor (eighteen cases)
were excluded from further analysis.
Dietary assessment
Dietary intake data were obtained by trained dieticians and
nutritionists via morning interviews with the children at
school-site for two consecutive weekdays and one weekend
day, using the 24 h recall technique. Specifically, all study
participants were asked to describe the type and amount
of foods, as well as all beverages consumed during the
previous day, provided that it was a usual day according
to the participant’s perception. To improve the accuracy of
food description, standard household measures (cups,
tablespoons, etc.) and food models were used to define
amounts where appropriate. At the end of each interview,
the interviewers, who were dieticians rigorously trained to
minimise the interviewer’s effect, reviewed the collected
data with the respondent in order to clarify entries, servings
and possible forgotten foods. Food intake data were analysed
using the Nutritionist V diet analysis software (version 2.1,
1999; First Databank, San Bruno, CA, USA), which was exten-
sively amended to include traditional Greek recipes, as
described(33). Furthermore, the database was updated with
nutritional information of processed foods provided by
independent research institutes, food companies and fast-
food chains.
Socio-economic and demographic variables
Family socio-economic and demographic data (i.e. total years
of education for the father and mother and annual family
income) were collected during scheduled interviews at the
school with the parents (mainly with the mother). For those
parents not able to attend (approximately 5 % of the total
sample), data were collected via telephonic interviews. All
interviews were conducted with the use of a standardised
questionnaire by a research team that was rigorously trained
to minimise the interviewer’s effect.
Statistical analysis
Statistical analysis was conducted for the sub-sample of
children with full anthropometric, biochemical, dietary, body
composition and socio-economic data and no thalassaemia
minor (n 1493). Continuous variables were expressed as
mean values and standard deviations and categorical vari-
ables were reported as frequencies (%). Comparisons
between levels of the continuous variables were conducted
using Student’s t test or ANOVA, using the Bonferroni cor-
rection for post hoc multiple comparisons among groups.
Comparisons between levels of the categorical variables
were conducted using the x 2 test or the Fisher’s exact
test, as appropriate. The two-sample Z-test was also used
to perform pair-wise comparisons of the prevalence of ID
and IDA between quartiles of percentage body fat and visc-
eral fat mass. In order to test the effect of the independent
variables examined on ID, multivariate logistic regression
analysis was conducted and adjusted OR with 95 % CI
were computed. All reported P values were based on two-
sided tests. The level of statistical significance was set at
a¼0·05. Statistical analysis was conducted using STATA
(Stata Corporation, College Station, TX, USA) for the two-
sample Z-test and SPSS version 17.0 (SPSS, Inc., TX, USA)
for all other tests.
G. Moschonis et al.712
British
Journal
ofNutrition

Results
The sample consisted of 1493 children attending the 5th and
6th grades of primary school. Table 1 presents the main
descriptive characteristics of the study population. The age
of the study participants was 11·2 (SD 0·7) years. No significant
differences were found between boys and girls with respect to
nationality and socio-economic characteristics (i.e. socio-econ-
omic level of school region, paternal and maternal educational
level and family income). Similarly, no significant sex differ-
ences were found with respect to the prevalence of ID. On
the other hand, more girls than boys were found to be at
Tanner stages 3–5 (P,0·05), while the prevalence of obesity
was higher in boys than in girls (12·5 v. 10·2 %, P,0·05).
Table 2 displays the biochemical indices of Fe status across
weight groups in both boys and girls. In boys, serum Fe and
TS differed significantly among weight groups (P,0·05),
being lower in obese and overweight than in normal-weight
ones. In contrast, serum ferritin was lowest in normal-weight
boys (P,0·05). In girls, TS exhibited lower values in obese
than in normal-weight girls. On the contrary, ferritin was
higher in obese than in normal-weight girls; and TIBC exhib-
ited higher values in obese and overweight than in normal-
weight girls. Moreover, the prevalence of ID was higher in
obese boys and girls compared to their normal-weight peers
(P¼0·009 in boys and P¼0·017 in girls). Similarly, the preva-
lence of IDA was higher in obese than in overweight or
normal-weight girls (P¼0·002). Table 3 also presents the
biochemical indices of Fe status in the categories of normal
WC and central obesity. TS in centrally obese boys was signifi-
cantly lower (P¼0·033) compared to peers of normal WC,
while the prevalence of IDA was significantly higher in
centrally obese boys than in boys of normal WC (P¼0·006).
Furthermore, centrally obese girls exhibited higher prevalence
of both ID and IDA than girls of normal WC (P¼0·001 and
0·042, respectively).
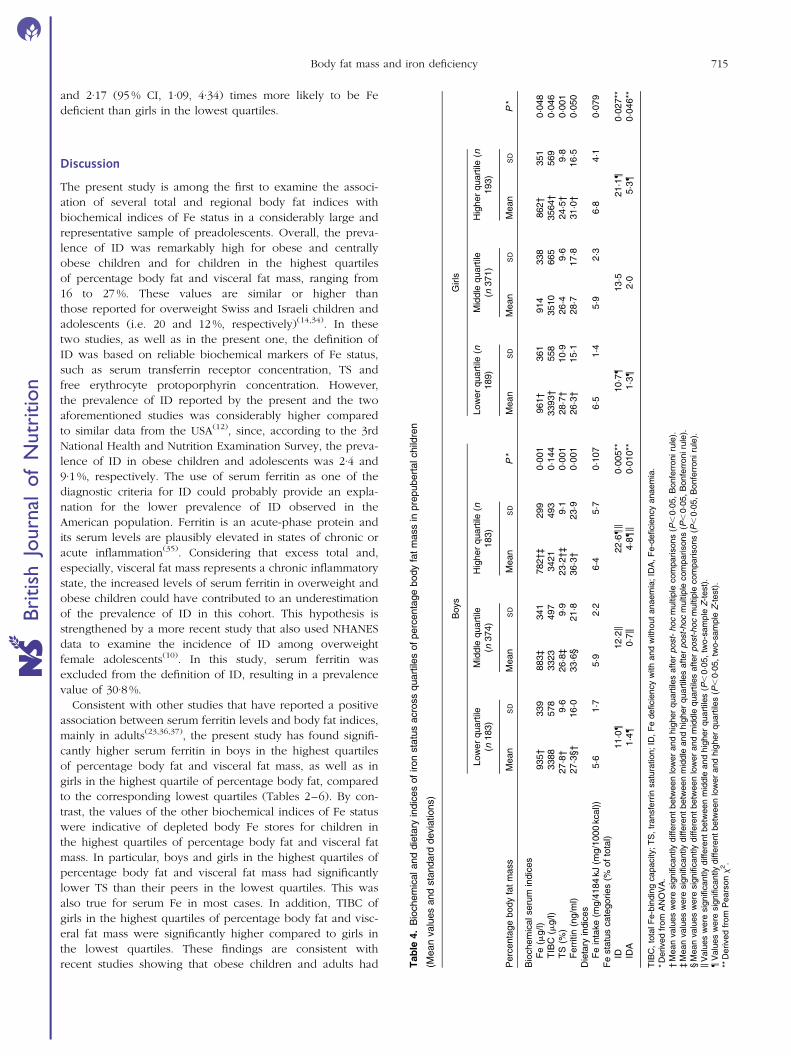
Table 4 summarises the biochemical indices of Fe status
across quartiles of percentage body fat. As far as boys were
concerned, serum Fe and TS were found to differ significantly
among quartiles, being lowest in the highest quartile. On the
contrary, serum ferritin was lowest in the lowest
quartile (P¼0·001). Furthermore, the prevalence of ID and
IDA was significantly higher for boys in the highest quartile
of percentage body fat compared to the middle and lowest
ones (P¼0·005 and 0·010, respectively). In girls, serum Fe
and TS exhibited lower values in the highest compared to
the lowest quartile, whereas TIBC and ferritin exhibited
higher values in the highest compared to the lowest quartile.
Furthermore, the prevalence of ID and IDA was significantly
higher for girls in the highest quartile of percentage body fat
than for those in the lowest quartile (P¼0·027 and 0·046,
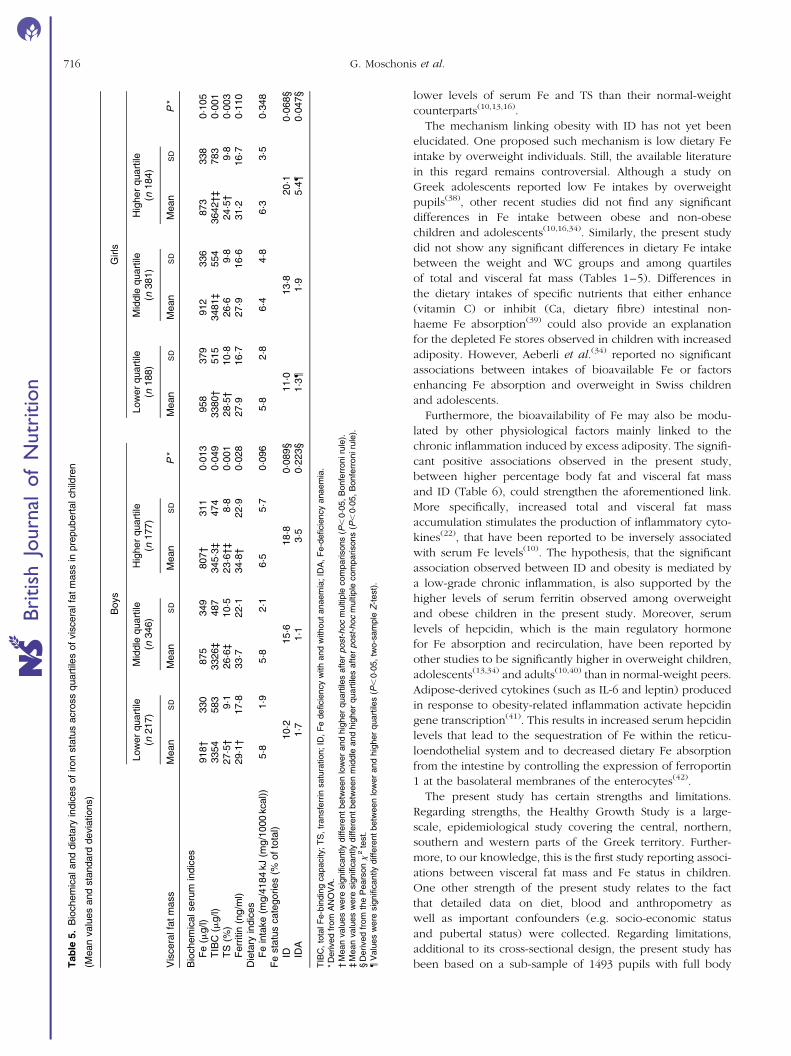
respectively). Additionally, Table 5 also presents the same
indices of Fe status across quartiles of visceral fat mass. In
boys, serum Fe and TS differed significantly among quartiles
(P,0·05), being lower in the highest than in the lowest quar-
tile. On the other hand, TIBC and ferritin differed significantly
among quartiles (P,0·05), but were higher in the highest
than in the lowest quartile. As far as girls were concerned,
TIBC was higher and TS was lower in the highest compared
to the lowest quartile of visceral fat mass (P,0·05).
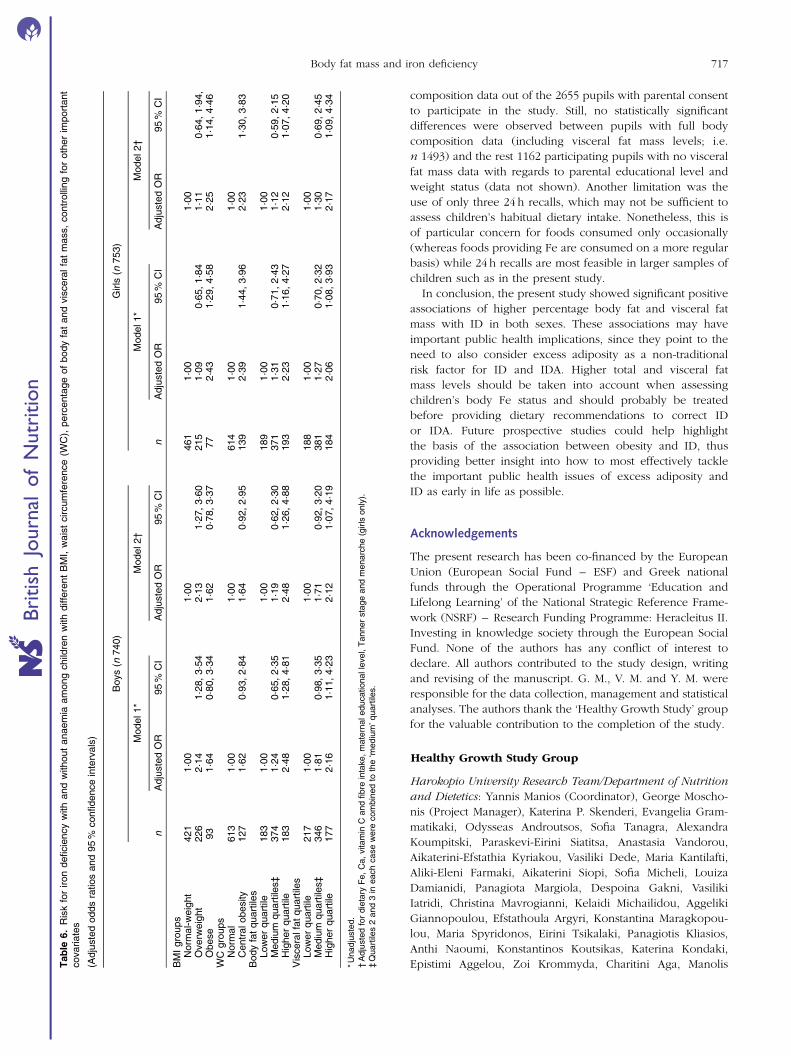
The logistic regression analysis showed that overweight
boys and obese girls were 2·13 (95 % CI, 1·27, 3·60) and 2·25
(95 % CI 1·14, 4·46) times more likely to be Fe deficient than
normal-weight boys after controlling for several important
covariates (Table 6). Furthermore, centrally obese girls were
2·23 (95 % CI, 1·30, 3·83) times more likely to be Fe deficient
in comparison with girls of normal WC. Boys in the highest
quartiles of percentage body fat and visceral fat mass were
2·48 (95 % CI, 1·26, 4·88) and 2·12 (95 % CI, 1·07, 4·19) times
more likely to be Fe deficient than boys in the lowest quartiles
(Table 6). Similarly, girls in the highest quartiles of percentage
body fat and visceral fat mass were 2·12 (95 % CI, 1·07, 4·20)
Table 1. Descriptive characteristics of the study population
Percentageof boys (n 740)
Percentageof girls (n 753)
Totalpercentage
(n 1493)
Age (years)9–11 38·7 39·1 38·911–13 61·3 60·9 61·1
SEL of schoolLower 25·9 24·8 25·4Medium 28·5 30·8 29·7Higher 45·5 44·4 44·9
Grade5th 47·0 47·4 47·26th 53·0 52·6 52·8
NationalityGreek 89·7 87·8 88·7Other 10·3 12·2 11·3
Tanner stage1 44·8 21·6* 32·82 43·4 37·6* 40·43 10·6 26·6* 18·84 1·1 10·9* 6·25 0·1 3·3* 1·8
MenarcheYes – 77·4 –No – 22·6 –
Paternal education (years), 9 25·0 27·0 26·09–12 40·0 37·0 38·5. 12 34·9 36·0 35·5
Maternal education (years), 9 20·7 24·1 22·49–12 39·7 37·6 38·7. 12 39·6 38·3 38·9
Family income (e/year), 12 000 18·3 21·9 20·112 000–20 000 24·8 24·9 24·920 000–30 000 24·1 24·2 24·230 000–40 000 15·9 15·6 15·740 000–50 000 8·4 6·2 7·3. 50 000 8·4 7·2 7·8
Weight groupsNormal-weight 57·0 61·3 59·2Overweight 30·5 28·6 29·5Obese 12·5 10·2* 11·3
IDNormal 85·2 85·4 85·3ID (TS , 16 %) 14·8 14·6 14·7
SEL, socio-economic level; ID, Fe deficiency; TS, transferin saturation.* Values were significantly different from boys (P,0·05, derived from the two-
sample Z-test for proportions).
Body fat mass and iron deficiency 713
British
Journal
ofNutrition

Table 2. Biochemical and dietary indices of iron status across BMI groups in prepubertal children
(Mean values and standard deviations)
Boys Girls
Normal-weight(n 421)
Overweight(n 226)
Obese(n 93)
Normal-weight(n 461)
Overweight(n 215)
Obese(n 77)
BMI groups Mean SD Mean SD Mean SD P * Mean SD Mean SD Mean SD P*
Biochemical serum indicesFe (mg/l) 905†‡ 329 836† 354 816‡ 304 0·024 920 349 926 340 835 361 0·166TIBC (mg/l) 3338 534 3372 515 3462 430 0·160 3422†‡ 535 360·2† 610 3600‡ 943 0·002TS (%) 27·3†‡ 9·5 25·2† 10·6 23·5‡ 8·2 0·002 27·2‡ 10·2 26·1 9·7 23·7‡ 10·3 0·032Ferritin (ng/ml) 30·6†‡ 20·7 35·3† 22·9 35·8‡ 19·1 0·021 27·3‡ 15·5 30·5 19·4 31·6‡ 14·4 0·036
Dietary indicesFe intake (mg/4184 kJ (mg/1000 kcal)) 5·8 1·9 6·3 2·2 5·9 2·9 0·246 6·0 4·4 6·7 3·6 6·4 3·9 0·176
Fe status categories (% of total)ID 10·7§{ 20·7§ 16·0{ 0·009k 12·9{ 13·9 26·6{ 0·017kIDA 0·9 2·8 3·9 0·113k 1·6{ 2·2** 9·4{** 0·002k
TIBC, total Fe-binding capacity; TS, transferrin saturation; ID, Fe deficiency with or without anaemia; IDA, Fe-deficiency anaemia.* Derived from ANOVA.† Mean values were significantly different between normal-weight and overweight children after post-hoc multiple comparisons (P,0·05, Bonferroni rule).‡ Mean values were significantly different between normal-weight and obese children after post-hoc multiple comparisons (P,0·05, Bonferroni rule).§ Values were significantly different between normal-weight and overweight children (P,0·05, two-sample Z-test).kDerived from the Pearson x 2 test.{Values were significantly different between normal-weight and obese children (P,0·05, two-sample Z-test).** Values were significantly different between over-weight and obese children (P,0·05, two-sample Z-test).
Table 3. Biochemical and dietary indices of iron status across waist circumference (WC) groups in prepubertal children
(Mean values and standard deviations)
Boys Girls
Normal WC (n 613)Central obesity* (n
127) Normal WC (n 614)Central obesity* (n
139)
WC groups Mean SD Mean SD P † Mean SD Mean SD P †
Biochemical serum indicesFe (mg/l) 892 340 769 299 0·165 933 349 820 330 0·267TIBC (mg/l) 3343 526 3468 461 0·285 3474 563 3583 811 0·153TS (%) 27·0 9·9 22·3 8·3 0·033 27·2 10·1 23·4 9·7 0·304Ferritin (ng/ml) 32·3 21·5 34·5 19·9 0·683 28·3 16·8 30·0 16·1 0·799
Dietary indicesFe intake (mg/4184 kJ (mg/1000 kcal)) 5·9 3·4 6·2 3·2 0·483 6·2 4·1 6·5 4·2 0·563
Fe status categories (% of total)ID 13·5 20·2 0·093‡ 12·4 25·2 0·001‡IDA 1·0 5·8 0·006‡ 2·0 5·4 0·042‡
TIBC, total Fe-binding capacity; TS, transferrin saturation; ID, Fe deficiency with or without anaemia; IDA, Fe-deficiency anaemia.* WC$90th age- and sex-specific percentile.† Derived from Student’s t test.‡ Derived from Pearson x2.
G.M
osch
onis
eta
l.714
British Journal of Nutrition
and 2·17 (95 % CI, 1·09, 4·34) times more likely to be Fe
deficient than girls in the lowest quartiles.
Discussion
The present study is among the first to examine the associ-
ation of several total and regional body fat indices with
biochemical indices of Fe status in a considerably large and
representative sample of preadolescents. Overall, the preva-
lence of ID was remarkably high for obese and centrally
obese children and for children in the highest quartiles
of percentage body fat and visceral fat mass, ranging from
16 to 27 %. These values are similar or higher than
those reported for overweight Swiss and Israeli children and
adolescents (i.e. 20 and 12 %, respectively)(14,34). In these
two studies, as well as in the present one, the definition of
ID was based on reliable biochemical markers of Fe status,
such as serum transferrin receptor concentration, TS and
free erythrocyte protoporphyrin concentration. However,
the prevalence of ID reported by the present and the two
aforementioned studies was considerably higher compared
to similar data from the USA(12), since, according to the 3rd
National Health and Nutrition Examination Survey, the preva-
lence of ID in obese children and adolescents was 2·4 and
9·1 %, respectively. The use of serum ferritin as one of the
diagnostic criteria for ID could probably provide an expla-
nation for the lower prevalence of ID observed in the
American population. Ferritin is an acute-phase protein and
its serum levels are plausibly elevated in states of chronic or
acute inflammation(35). Considering that excess total and,
especially, visceral fat mass represents a chronic inflammatory
state, the increased levels of serum ferritin in overweight and
obese children could have contributed to an underestimation
of the prevalence of ID in this cohort. This hypothesis is
strengthened by a more recent study that also used NHANES
data to examine the incidence of ID among overweight
female adolescents(10). In this study, serum ferritin was
excluded from the definition of ID, resulting in a prevalence
value of 30·8 %.
Consistent with other studies that have reported a positive
association between serum ferritin levels and body fat indices,
mainly in adults(23,36,37), the present study has found signifi-
cantly higher serum ferritin in boys in the highest quartiles
of percentage body fat and visceral fat mass, as well as in
girls in the highest quartile of percentage body fat, compared
to the corresponding lowest quartiles (Tables 2–6). By con-
trast, the values of the other biochemical indices of Fe status
were indicative of depleted body Fe stores for children in
the highest quartiles of percentage body fat and visceral fat
mass. In particular, boys and girls in the highest quartiles of
percentage body fat and visceral fat mass had significantly
lower TS than their peers in the lowest quartiles. This was
also true for serum Fe in most cases. In addition, TIBC of
girls in the highest quartiles of percentage body fat and visc-
eral fat mass were significantly higher compared to girls in
the lowest quartiles. These findings are consistent with
recent studies showing that obese children and adults had Table
4.
Bio
chem
icaland
die
tary
indic
es
of
iron
sta
tus
acro
ss
quart
iles
of
perc
enta
ge
body
fat
mass
inpre
pubert
alchild
ren
(Mean
valu
es
and
sta
ndard
devia
tions)
Boys
Girls
Low
er
quart
ile(n
183)
Mid
dle
quart
ile(n
374)
Hig
her
quart
ile(n
183)
Low
er
quart
ile(n
189)
Mid
dle
quart
ile(n
371)
Hig
her
quart
ile(n
193)
Perc
enta
ge
body
fat
mass
Mean
SD
Mean
SD
Mean
SD
P*
Mean
SD
Mean
SD
Mean
SD
P*
Bio
chem
icalseru
min
dic
es
Fe
(mg/l)
935†
339
883‡
341
782†‡
299
0·0
01
961†
361
914
338
862†
351
0·0
48
TIB
C(m
g/l)
3388
578
3323
497
3421
493
0·1
44
3393†
558
3510
665
3564†
569
0·0
46
TS
(%)
27·8
†9·6
26·8
‡9·9
23·2
†‡
9·1
0·0
01
28·7
†10·9
26·4
9·6
24·5
†9·8
0·0
01
Ferr
itin
(ng/m
l)27·3
§†
16·0
33·6
§21·8
36·3
†23·9
0·0
01
26·3
†15·1
28·7
17·8
31·0
†16·5
0·0
50
Die
tary
indic
es
Fe
inta
ke
(mg/4
184
kJ
(mg/1
000
kcal))
5·6
1·7
5·9
2·2
6·4
5·7
0·1
07
6·5
1·4
5·9
2·3
6·8
4·1
0·0
79
Fe
sta
tus
cate
gories
(%of
tota
l)ID
11·0{
12·2k
22·6{k
0·0
05**
10·7{
13·5
21·1{
0·0
27**
IDA
1·4{
0·7k
4·8{k
0·0
10**
1·3{
2·0
5·3{
0·0
46**
TIB
C,
tota
lF
e-b
indin
gcapacity;
TS
,tr
ansfe
rrin
satu
ration;
ID,
Fe
deficie
ncy
with
and
without
anaem
ia;
IDA
,F
e-d
eficie
ncy
anaem
ia.
*D
erived
from
AN
OV
A.
†M
ean
valu
es
were
sig
nifi
cantly
diffe
rent
betw
een
low
er
and
hig
her
quart
iles
aft
erpost-hoc
multip
lecom
parisons
(P,
0·0
5,
Bonfe
rroniru
le).
‡M
ean
valu
es
were
sig
nifi
cantly
diffe
rent
betw
een
mid
dle
and
hig
her
quart
iles
aft
erpost-hoc
multip
lecom
parisons
(P,
0·0
5,
Bonfe
rroniru
le).
§M
ean
valu
es
were
sig
nifi
cantly
diffe
rent
betw
een
low
er
and
mid
dle
quart
iles
aft
erpost-hoc
multip
lecom
parisons
(P,
0·0
5,
Bonfe
rroniru
le).
kV
alu
es
were
sig
nifi
cantly
diffe
rent
betw
een
mid
dle
and
hig
her
quart
iles
(P,
0·0
5,
two-s
am
ple
Z-t
est)
.{
Valu
es
were
sig
nifi
cantly
diffe
rent
betw
een
low
er
and
hig
her
quart
iles
(P,
0·0
5,
two-s
am
ple
Z-t
est)
.**
Derived
from
Pears
onx
2.
Body fat mass and iron deficiency 715
British
Journal
ofNutrition
lower levels of serum Fe and TS than their normal-weight
counterparts(10,13,16).
The mechanism linking obesity with ID has not yet been
elucidated. One proposed such mechanism is low dietary Fe
intake by overweight individuals. Still, the available literature
in this regard remains controversial. Although a study on
Greek adolescents reported low Fe intakes by overweight
pupils(38), other recent studies did not find any significant
differences in Fe intake between obese and non-obese
children and adolescents(10,16,34). Similarly, the present study
did not show any significant differences in dietary Fe intake
between the weight and WC groups and among quartiles
of total and visceral fat mass (Tables 1–5). Differences in
the dietary intakes of specific nutrients that either enhance
(vitamin C) or inhibit (Ca, dietary fibre) intestinal non-
haeme Fe absorption(39) could also provide an explanation
for the depleted Fe stores observed in children with increased
adiposity. However, Aeberli et al.(34) reported no significant
associations between intakes of bioavailable Fe or factors
enhancing Fe absorption and overweight in Swiss children
and adolescents.
Furthermore, the bioavailability of Fe may also be modu-
lated by other physiological factors mainly linked to the
chronic inflammation induced by excess adiposity. The signifi-
cant positive associations observed in the present study,
between higher percentage body fat and visceral fat mass
and ID (Table 6), could strengthen the aforementioned link.
More specifically, increased total and visceral fat mass
accumulation stimulates the production of inflammatory cyto-
kines(22), that have been reported to be inversely associated
with serum Fe levels(10). The hypothesis, that the significant
association observed between ID and obesity is mediated by
a low-grade chronic inflammation, is also supported by the
higher levels of serum ferritin observed among overweight
and obese children in the present study. Moreover, serum
levels of hepcidin, which is the main regulatory hormone
for Fe absorption and recirculation, have been reported by
other studies to be significantly higher in overweight children,
adolescents(13,34) and adults(10,40) than in normal-weight peers.
Adipose-derived cytokines (such as IL-6 and leptin) produced
in response to obesity-related inflammation activate hepcidin
gene transcription(41). This results in increased serum hepcidin
levels that lead to the sequestration of Fe within the reticu-
loendothelial system and to decreased dietary Fe absorption
from the intestine by controlling the expression of ferroportin
1 at the basolateral membranes of the enterocytes(42).
The present study has certain strengths and limitations.
Regarding strengths, the Healthy Growth Study is a large-
scale, epidemiological study covering the central, northern,
southern and western parts of the Greek territory. Further-
more, to our knowledge, this is the first study reporting associ-
ations between visceral fat mass and Fe status in children.
One other strength of the present study relates to the fact
that detailed data on diet, blood and anthropometry as
well as important confounders (e.g. socio-economic status
and pubertal status) were collected. Regarding limitations,
additional to its cross-sectional design, the present study has
been based on a sub-sample of 1493 pupils with full bodyTable
5.
Bio
chem
icaland
die
tary
indic
es
of
iron
sta
tus
acro
ss
quart
iles
of
vis
cera
lfa
tm
ass
inpre
pubert
alchild
ren
(Mean
valu
es
and
sta
ndard
devia
tions)
Boys
Girls
Low
er
quart
ile(n
217)
Mid
dle
quart
ile(n
346)
Hig
her
quart
ile(n
177)
Low
er
quart
ile(n
188)
Mid
dle
quart
ile(n
381)
Hig
her
quart
ile(n
184)
Vis
cera
lfa
tm
ass
Mean
SD
Mean
SD
Mean
SD
P*
Mean
SD
Mean
SD
Mean
SD
P*
Bio
chem
icalseru
min
dic
es
Fe
(mg/l)
918†
330
875
349
807†
311
0·0
13
958
379
912
336
873
338
0·1
05
TIB
C(m
g/l)
3354
583
3326‡
487
345·3
‡474
0·0
49
3380†
515
3481‡
554
3642†‡
783
0·0
01
TS
(%)
27·5
†9·1
26
·6‡
10·5
23·6
†‡
8·8
0·0
01
28·5
†10
·826
·69·8
24
·5†
9·8
0·0
03
Ferr
itin
(ng/m
l)29·1
†17·8
33
·722·1
34·8
†22·9
0·0
28
27·9
16
·727
·916
·631
·216
·70·1
10
Die
tary
indic
es
Fe
inta
ke
(mg/4
184
kJ
(mg/1
000
kcal))
5·8
1·9
5·8
2·1
6·5
5·7
0·0
96
5·8
2·8
6·4
4·8
6·3
3·5
0·3
48
Fe
sta
tus
cate
gories
(%of
tota
l)ID
10·2
15
·618
·80·0
89§
11·0
13·8
20
·10·0
68§
IDA
1·7
1·1
3·5
0·2
23§
1·3{
1·9
5·4{
0·0
47§
TIB
C,
tota
lF
e-b
indin
gcapacity;
TS
,tr
ansfe
rrin
satu
ration;
ID,
Fe
deficie
ncy
with
and
without
anaem
ia;
IDA
,F
e-d
eficie
ncy
anaem
ia.
*D
erived
from
AN
OV
A.
†M
ean
valu
es
were
sig
nifi
cantly
diffe
rent
betw
een
low
er
and
hig
her
quart
iles
aft
erpost-hoc
multip
lecom
parisons
(P,
0·0
5,
Bonfe
rroniru
le).
‡M
ean
valu
es
were
sig
nifi
cantly
diffe
rent
betw
een
mid
dle
and
hig
her
quart
iles
aft
erpost-hoc
multip
lecom
parisons
(P,
0·0
5,
Bonfe
rroniru
le).
§D
erived
from
the
Pears
onx
2te
st.
{V
alu
es
were
sig
nifi
cantly
diffe
rent
betw
een
low
er
and
hig
her
quart
iles
(P,
0·0
5,
two-s
am
ple
Z-t
est)
.
G. Moschonis et al.716
British
Journal
ofNutrition
composition data out of the 2655 pupils with parental consent
to participate in the study. Still, no statistically significant
differences were observed between pupils with full body
composition data (including visceral fat mass levels; i.e.
n 1493) and the rest 1162 participating pupils with no visceral
fat mass data with regards to parental educational level and
weight status (data not shown). Another limitation was the
use of only three 24 h recalls, which may not be sufficient to
assess children’s habitual dietary intake. Nonetheless, this is
of particular concern for foods consumed only occasionally
(whereas foods providing Fe are consumed on a more regular
basis) while 24 h recalls are most feasible in larger samples of
children such as in the present study.
In conclusion, the present study showed significant positive
associations of higher percentage body fat and visceral fat
mass with ID in both sexes. These associations may have
important public health implications, since they point to the
need to also consider excess adiposity as a non-traditional
risk factor for ID and IDA. Higher total and visceral fat
mass levels should be taken into account when assessing
children’s body Fe status and should probably be treated
before providing dietary recommendations to correct ID
or IDA. Future prospective studies could help highlight
the basis of the association between obesity and ID, thus
providing better insight into how to most effectively tackle
the important public health issues of excess adiposity and
ID as early in life as possible.
Acknowledgements
The present research has been co-financed by the European
Union (European Social Fund – ESF) and Greek national
funds through the Operational Programme ‘Education and
Lifelong Learning’ of the National Strategic Reference Frame-
work (NSRF) – Research Funding Programme: Heracleitus II.
Investing in knowledge society through the European Social
Fund. None of the authors has any conflict of interest to
declare. All authors contributed to the study design, writing
and revising of the manuscript. G. M., V. M. and Y. M. were
responsible for the data collection, management and statistical
analyses. The authors thank the ‘Healthy Growth Study’ group
for the valuable contribution to the completion of the study.
Healthy Growth Study Group
Harokopio University Research Team/Department of Nutrition
and Dietetics: Yannis Manios (Coordinator), George Moscho-
nis (Project Manager), Katerina P. Skenderi, Evangelia Gram-
matikaki, Odysseas Androutsos, Sofia Tanagra, Alexandra
Koumpitski, Paraskevi-Eirini Siatitsa, Anastasia Vandorou,
Aikaterini-Efstathia Kyriakou, Vasiliki Dede, Maria Kantilafti,
Aliki-Eleni Farmaki, Aikaterini Siopi, Sofia Micheli, Louiza
Damianidi, Panagiota Margiola, Despoina Gakni, Vasiliki
Iatridi, Christina Mavrogianni, Kelaidi Michailidou, Aggeliki
Giannopoulou, Efstathoula Argyri, Konstantina Maragkopou-
lou, Maria Spyridonos, Eirini Tsikalaki, Panagiotis Kliasios,
Anthi Naoumi, Konstantinos Koutsikas, Katerina Kondaki,
Epistimi Aggelou, Zoi Krommyda, Charitini Aga, ManolisTable
6.
Ris
kfo
riron
deficie
ncy
with
and
without
anaem
iaam
ong
child
ren
with
diffe
rent
BM
I,w
ais
tcircum
fere
nce
(WC
),perc
enta
ge
of
body
fat
and
vis
cera
lfa
tm
ass,
contr
olli
ng
for
oth
er
import
ant
covariate
s
(Adju
ste
dodds
ratios
and
95
%confidence
inte
rvals
)
Boys
(n740)
Girls
(n753)
Model1*
Model2†
Model1*
Model2†
nA
dju
ste
dO
R95
%C
IA
dju
ste
dO
R95
%C
In
Adju
ste
dO
R95
%C
IA
dju
ste
dO
R95
%C
I
BM
Igro
ups
Norm
al-w
eig
ht
421
1·0
01·0
0461
1·0
01·0
0O
verw
eig
ht
226
2·1
41·2
8,
3·5
42·1
31·2
7,
3·6
0215
1·0
90·6
5,
1·8
41·1
10·6
4,
1·9
4,
Obese
93
1·6
40·8
0,
3·3
41·6
20·7
8,
3·3
777
2·4
31·2
9,
4·5
82·2
51·1
4,
4·4
6W
Cgro
ups
Norm
al
613
1·0
01·0
0614
1·0
01·0
0C
entr
alobesity
127
1·6
20·9
3,
2·8
41·6
40·9
2,
2·9
5139
2·3
91·4
4,
3·9
62·2
31·3
0,
3·8
3B
ody
fat
quart
iles
Low
er
quart
ile183
1·0
01·0
0189
1·0
01·0
0M
ediu
mquart
iles‡
374
1·2
40·6
5,
2·3
51·1
90·6
2,
2·3
0371
1·3
10·7
1,
2·4
31·1
20·5
9,
2·1
5H
igher
quart
ile183
2·4
81·2
8,
4·8
12·4
81·2
6,
4·8
8193
2·2
31·1
6,
4·2
72·1
21·0
7,
4·2
0V
iscera
lfa
tquart
iles
Low
er
quart
ile217
1·0
01·0
0188
1·0
01·0
0M
ediu
mquart
iles‡
346
1·8
10·9
8,
3·3
51·7
10·9
2,
3·2
0381
1·2
70·7
0,
2·3
21·3
00·6
9,
2·4
5H
igher
quart
ile177
2·1
61·1
1,
4·2
32·1
21·0
7,
4·1
9184
2·0
61·0
8,
3·9
32·1
71·0
9,
4·3
4
*U
nadju
ste
d.
†A
dju
ste
dfo
rdie
tary
Fe,
Ca,
vitam
inC
and
fibre
inta
ke,
mate
rnaleducationalle
vel,
Tanner
sta
ge
and
menarc
he
(girls
only
).‡
Quart
iles
2and
3in
each
case
were
com
bin
ed
toth
e‘m
ediu
m’quart
iles.
Body fat mass and iron deficiency 717
British
Journal
ofNutrition

Birbilis, Ioanna Kosteria, Amalia Zlatintsi, Elpida Voutsadaki,
Eleni-Zouboulia Papadopoulou, Zoi Papazi, Maria Papado-
giorgakaki, Fanouria Chlouveraki, Maria Lyberi, Nora Karatsi-
kaki-Vlami, Eva Dionysopoulou, Efstratia Daskalou.
Aristotle University of Thessaloniki/School of Physical
Education and Sports Sciences: Vassilis Mougios, Anatoli
Petridou, Konstantinos Papaioannou, Georgios Tsalis, Ananis
Karagkiozidis, Konstantinos Bougioukas, Afroditi Sakellaro-
poulou, Georgia Skouli.
University of Athens/Medical School: George P. Chrousos,
Maria Drakopoulou, Evangelia Charmandari, Neni Pervanidou.
References
1. Cattaneo A, Monasta L, Stamatakis E, et al. (2010)Overweight and obesity in infants and pre-school childrenin the European Union: a review of existing data. Obes Rev11, 389–398.
2. Ogden CL, Carroll MD, Curtin LR, et al. (2009) Prevalenceof high body mass index in US children and adolescents,2007–2008. JAMA 303, 242–249.
3. Wang Y & Lobstein T (2006) Worldwide trends in childhoodoverweight and obesity. Int J Pediatr Obes 1, 11–25.
4. Manios Y, Magkos F, Christakis G, et al. (2005) Twenty-yeardynamics in adiposity and blood lipids of Greek children:regional differences in Crete persist. Acta Paediatr 94,859–865.
5. Jean-Claude D (2006) Our children and the metabolicsyndrome. Drug Dev Res 67, 602–606.
6. Gade W, Schmit J, Collins M, et al. (2010) Beyond obesity:the diagnosis and pathophysiology of metabolic syndrome.Clin Lab Sci 23, 51–61, quiz 62–55.
7. Kimmons JE, Blanck HM, Tohill BC, et al. (2006)Associations between body mass index and the prevalenceof low micronutrient levels among US adults. MedGenmed8, 59.
8. Kaidar-Person O, Person B, Szomstein S, et al. (2008) Nutri-tional deficiencies in morbidly obese patients: a new form ofmalnutrition? Obes Surg 18, 870–876.
9. Wenzel BJ, Stults HB & Mayer J (1962) Hypoferraemia inobese adolescents. Lancet ii, 327–328.
10. Tussing-Humphreys LM, Nemeth E, Fantuzzi G, et al. (2010)Elevated systemic hepcidin and iron depletion in obesepremenopausal females. Obesity (Silver Spring) 18,1449–1456.
11. Brotanek JM, Gosz J, Weitzman M, et al. (2007)Iron deficiency in early childhood in the United States: riskfactors and racial/ethnic disparities. Pediatrics 120, 568–575.
12. Nead KG, Halterman JS, Kaczorowski JM, et al. (2004)Overweight children and adolescents: a risk group for irondeficiency. Pediatrics 114, 104–108.
13. Amato A, Santoro N, Calabro P, et al. (2010) Effect of bodymass index reduction on serum hepcidin levels and ironstatus in obese children. Int J Obes (Lond) 34, 1772–1774.
14. Pinhas-Hamiel O, Newfield RS, Koren I, et al. (2003) Greaterprevalence of iron deficiency in overweight and obesechildren and adolescents. Int J Obes Relat Metab Disord27, 416–418.
15. Cepeda-Lopez AC, Aeberli I & Zimmermann MB (2010) Doesobesity increase risk for iron deficiency? A review of the lit-erature and the potential mechanisms. Int J Vitam Nutr Res80, 263–270.
16. Menzie CM, Yanoff LB, Denkinger BI, et al. (2008) Obesity-related hypoferremia is not explained by differences
in reported intake of heme and nonheme iron or intake ofdietary factors that can affect iron absorption. J Am DietAssoc 108, 145–148.
17. Lecube A, Carrera A, Losada E, et al. (2006) Iron deficiencyin obese postmenopausal women. Obesity (Silver Spring)14, 1724–1730.
18. Pollitt E (2001) The developmental and probabilistic natureof the functional consequences of iron-deficiency anemiain children. J Nutr 131, 669S–675S.
19. Halterman JS, Kaczorowski JM, Aligne CA, et al. (2001) Irondeficiency and cognitive achievement among schoolagedchildren and adolescents in the United States. Pediatrics107, 1381–1386.
20. Lozoff B, Jimenez E & Wolf AW (1991) Long-term develop-mental outcomes of infants with iron deficiency. N Engl JMed 325, 687–694.
21. Lozoff B, Smith J, Liberzon T, et al. (2004) Longitudinal anal-ysis of cognitive and motor effects of iron deficiency ininfancy. Pediatr Res 55, 23A.
22. Subramanian V & Ferrante AW Jr (2009) Obesity, inflam-mation, and macrophages. Nestle Nutr Workshop Ser PediatrProgram 63, 151–159, 259–168.
23. Iwasaki T, Nakajima A, Yoneda M, et al. (2005) Serum ferritinis associated with visceral fat area and subcutaneous fat area.Diabetes Care 28, 2486–2491.
24. Taylor RW, Jones IE, Williams SM, et al. (2002) Body fatpercentages measured by dual-energy X-ray absorptiometrycorresponding to recently recommended body mass indexcutoffs for overweight and obesity in children and adoles-cents aged 3–18 y. Am J Clin Nutr 76, 1416–1421.
25. Cole TJ, Flegal KM, Nicholls D, et al. (2007) Body massindex cut offs to define thinness in children and adolescents:international survey. BMJ 335, 194.
26. Cole TJ, Bellizzi MC, Flegal KM, et al. (2000) Establishinga standard definition for child overweight and obesityworldwide: international survey. BMJ 320, 1240–1243.
27. Fernandez JR, Redden DT, Pietrobelli A, et al. (2004)Waist circumference percentiles in nationally representativesamples of African-American, European-American, andMexican-American children and adolescents. J Pediatr 145,439–444.
28. Tanner JM (1955) Growth at Adolescence. Oxford: BlackwellScientific.
29. Ryo M, Maeda K, Onda T, et al. (2005) A new simplemethod for the measurement of visceral fat accumulationby bioelectrical impedance. Diabetes Care 28, 451–453.
30. Nielsen BM, Dencker M, Ward L, et al. (2007) Predictionof fat-free body mass from bioelectrical impedance among9- to 11-year-old Swedish children. Diabetes Obes Metab 9,521–539.
31. World Health Organization (2001) Iron Deficiency Anaemia:Assessment, Prevention and Control. A Guide for Pro-gramme Managers. Geneva: WHO.
32. Mentzer WC Jr (1973) Differentiation of iron deficiency fromthalassaemia trait. Lancet i, 882.
33. Trichopoulou A (2004) Composition Tables of Foods andGreek Dishes. Athens: School of Medicine, Department ofHygiene and Epidemiology.
34. Aeberli I, Henschen I, Molinari L, et al. (2009) Stabilizationof the prevalence of childhood obesity in Switzerland.Swiss Med Wkly 140, w13046.
35. Wisse BE (2004) The inflammatory syndrome: the role ofadipose tissue cytokines in metabolic disorders linked toobesity. J Am Soc Nephrol 15, 2792–2800.
36. Gillum RF (2001) Association of serum ferritin and indicesof body fat distribution and obesity in Mexican American
G. Moschonis et al.718
British
Journal
ofNutrition

men – the Third National Health and Nutrition ExaminationSurvey. Int J Obes Relat Metab Disord 25, 639–645.
37. Wrede CE, Buettner R, Bollheimer LC, et al. (2006) Associ-ation between serum ferritin and the insulin resistancesyndrome in a representative population. Eur J Endocrinol154, 333–340.
38. Hassapidou M, Fotiadou E, Maglara E, et al. (2006) Energyintake, diet composition, energy expenditure, and bodyfatness of adolescents in northern Greece. Obesity (SilverSpring) 14, 855–862.
39. Ahmed F, Coyne T, Dobson A, et al. (2008) Iron statusamong Australian adults: findings of a population based
study in Queensland, Australia. Asia Pac J Clin Nutr 17,40–47.
40. Tussing-Humphreys LM, Nemeth E, Fantuzzi G, et al. (2010)Decreased serum hepcidin and improved functional ironstatus 6 months after restrictive bariatric surgery. Obesity(Silver Spring) 18, 2010–2016.
41. Verga Falzacappa MV, Vujic Spasic M & Kessler R (2007)STAT3 mediates hepatic hepcidin expression and its inflam-matory stimulation. Blood 109, 353–358.
42. Zafon C, Lecube A & Simo R (2009) Iron in obesity.An ancient micronutrient for a modern disease. Obes Rev11, 322–328.
Body fat mass and iron deficiency 719
British
Journal
ofNutrition