assessment of surface and groundwater quality of the akure
TRANSCRIPT
Journal of Environment and Earth Science www.iiste.org
ISSN 2224-3216 (Paper) ISSN 2225-0948 (Online)
Vol.4, No.23, 2014
150
Assessment of Surface and Groundwater Quality of the Akure
Metropolis, Southwestern Nigeria.
John Sunday Ojo 1*
Marthin Olusola Olorunfemi2*
Idowu Adedeji Aduwo3*
Sunday Bayode1*
Olaoluwa James
Akintorinwa1*
Gregory Oluwole Omosuyi1*
Frances Omowonuola Akinluyi4*
1. Department of Applied Geophysics, The Federal University of Technology, PMB 704 Akure, Nigeria
2. Department of Geology, Obafemi Awolowo University, Ile-Ife, Nigeria
3. Department of Zoology, Obafemi Awolowo University, Ile-Ife, Nigeria
4. Department of Remote Sensing and GIS, The Federal University of Technology, PMB 704 Akure, Nigeria
* E-mail of the Corresponding author: [email protected]
This research was funded by the Educational Trust Fund (ETF) through the University Research Grant of The
Federal University of Technology, PMB 704 Akure,. Nigeria..
Abstract
Hydrochemical analysis was carried out on surface and groundwater samples collected from Akure metropolis
with a view to determining their quality. Hydrochemical data on groundwater samples from fifty six (56)
boreholes were sourced from the Ondo State Water Corporation. Twenty five (25) surface water samples from
streams and rivers in the study area were collected and analyzed using standard analytical techniques. The
analyzed physical parameters include colour, odour, turbidity, conductivity and chemical properties such as pH,
dissolved solid, hardness, cations, anions and heavy metals. All the groundwater samples were colourless,
odourless and tasteless. Some surface water samples were coloured and turbid in appearance while some had
objectionable odour. Although the NO3- concentration levels in both surface and groundwater samples were
generally below the WHO threshold value of 10 mgl-1
, relatively high concentration range (2.5-6.0 mgl-1
) was
recorded within the city centre indicating some level of pollution from cumulative anthropogenetic activities.
Only few surface water samples contain Pb while Mn was identified in some surface and groundwater samples.
The elevated Pb concentration levels (0.41-3.41 mgl-1
) and relatively high Mn concentration levels (up to 2.18
mgl-1
) (both much higher than the WHO and NIS thresholds) in some surface water samples was an indication of
heavy metal pollution. Conductivity values of the groundwater samples generally ranged from 42.0 – 1400.0
µScm-1
. Only surface water sample 17 was moderately saline while other surface water samples were of
freshwater type. Based on TDS values, all the groundwater and surface water samples were of freshwater type
(TDS < 1000 mgl-1
).
Keywords: Physico-chemical Analysis, Surface/Groundwater, Quality, Akure Metropolis.
1. Introduction
The Akure Metropolis has witnessed rapid development in infrastructures (housing and estate development,
surface/groundwater development etc), establishment of new industries and expansion of older ones. Population
explosion, aggravated by rural-urban migration and infrastructural growth, are accompanied by increase in
industrial and domestic wastes. In the metropolis, municipal wastes are dumped in drainage channels, streams,
indiscriminately located dump sites and market places. There are evidences of both surface and groundwater
pollution from biodegradation of wastes and the resulted leachate (Bayode, 2010; Bayode et al., 2011a and
Bayode et al., 2011b). A significant proportion of the inhabitants of the metropolis depend on surface and
groundwater for their domestic use, due to inadequate public water supply.
In recent times, the impact of leachate on groundwater and other water resources has attracted a lot of attention
because of its overwhelming environmental significance (Olayinka and Olayiwola, 2001; Ikem et al., 2002;
Obase et al., 2009; Bayode, 2010; Bayode et al., 2011a and Bayode et al., 2011b). Combined geoelectric
measurements, hydrogeological and chemical analysis of water samples are often used to identify the
underground aquifers, estimate porosity and permeability of geologic materials, assess groundwater quality,
direction of groundwater flow and spread and possible migration paths of contaminants in a polluted area
(Bayode et al., 2011b). This study intends to use hydro-chemical analysis of surface and groundwater (well
water) samples to assess the quality of the waters (surface and groundwater) within the Akure metropolis.

Journal of Environment and Earth Science www.iiste.org
ISSN 2224-3216 (Paper) ISSN 2225-0948 (Online)
Vol.4, No.23, 2014
151
2. Site Description
The study area (Akure Metropolis) lies within Latitudes 07o 09' and 07
o 19'N and Longitudes 05
o 07' and 05
o 17'E
(Northings 790820 – 809277 mN and Eastings 733726 – 752139 mE, UTM Minna Zone 31) (Fig. 1). It covers an
areal extent of about 340 km2. The metropolis is located on a gently undulating terrain surrounded by isolated hills
and inselbergs. Topographic elevations vary between 260 and 470 m above sea level (Owoyemi, 1996). The
metropolis is drained by several streams and rivers.
Fig. 1: Map of Akure Metropolis – The Study Area, Showing the Topographic Variations.
3. Geology and Hydrogeology
The geological mapping and other related studies of the area around the Akure Metropolis have been carried out
by several workers amongst whom are Olarewaju (1981), Anifowose (1989), Owoyemi, 1996, Odeyemi et al.
(1999), Aluko (2008) and Sobogun (2008). The area around the Akure Metropolis is underlain by the Basement
Complex rocks of Southwestern Nigeria (Fig. 2). The petrological units include Migmatite-Gneiss-Quartzite
Complex, Charnockitic and Dioritic rocks, Older Granites and Unmetamorphosed dolerite dykes
(Rahaman,1988).
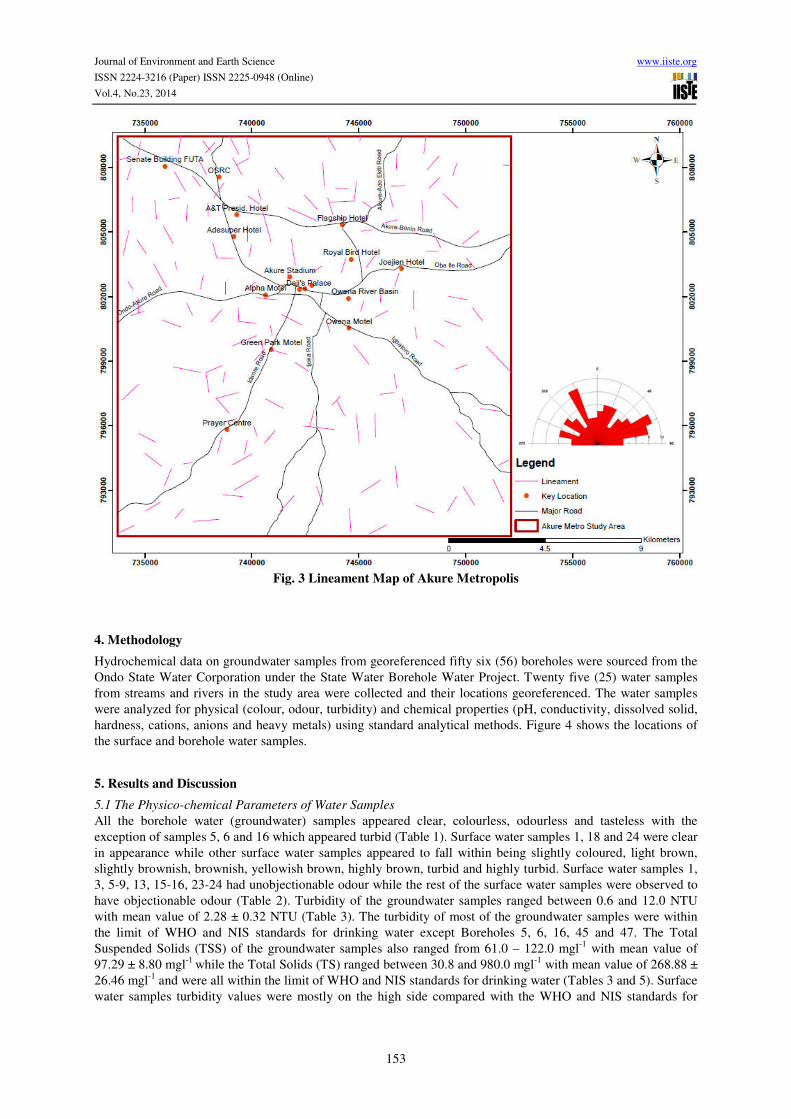
The study area exhibits varieties of structures such as foliation, schistosity, folds, faults, joints and fractures.
Generally, the structural trends in the study area are NNW-SSE and NNE-SSW. These structural trends fall
within the principal basement complex fracture direction identified by Oluyide, 1988. The lineament map
generated by Owoyemi, 1996 showed high density of lineament and lineament intersections in the eastern,
southwestern and north central part of the metropolis underlain by granites and migmatite gneiss while the north
central part underlain by charnockites has very low lineament density. The satellite-imagery-delineated
lineaments are shown in (Fig. 3). The lineaments show predominantly NNW-SSE, ENE-WSW and NNE-SSW
orientations and subsidiary NW-SE and W-E trends that are typical of the Basement Complex region of Nigeria
(Oluyide, 1988, Owoyemi, 1996 and Odeyemi et al., 1999).
The groundwater in a typical basement complex area like the Akure Metropolis, is contained in two major
aquifer units, namely weathered and fractured basement aquifers (Ako and Olorunfemi, 1989; Aniya and
Journal of Environment and Earth Science www.iiste.org
ISSN 2224-3216 (Paper) ISSN 2225-0948 (Online)
Vol.4, No.23, 2014
152
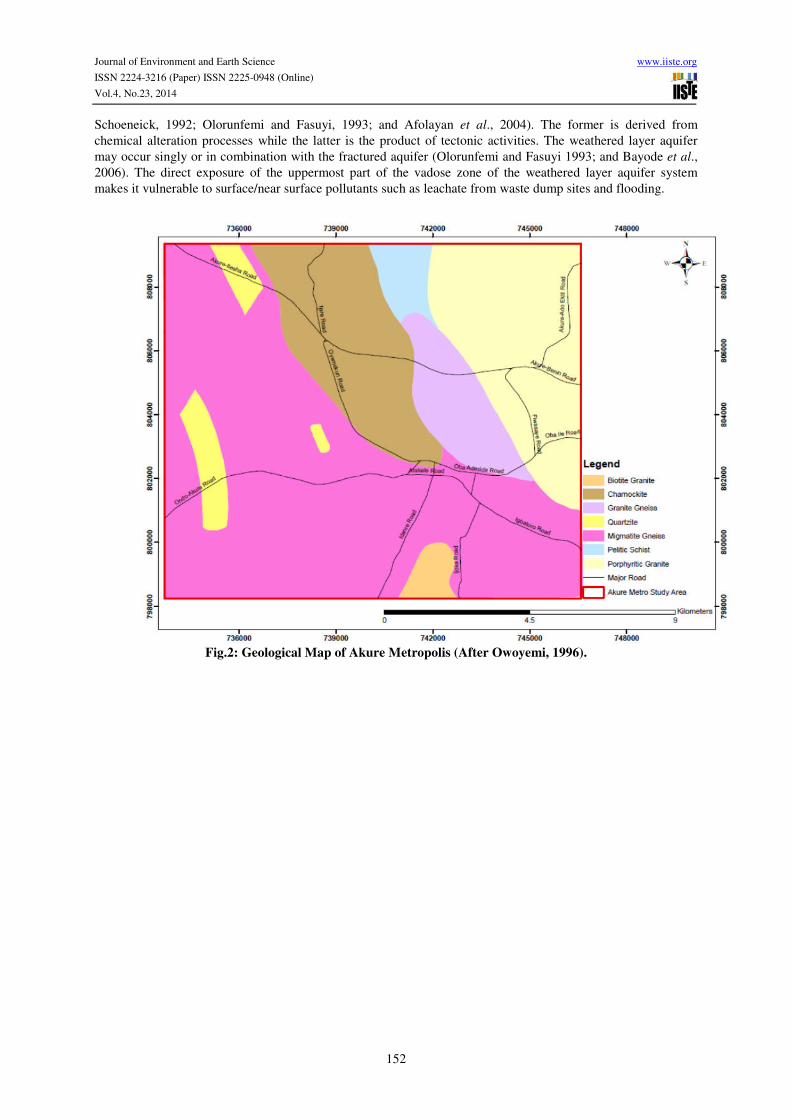
Schoeneick, 1992; Olorunfemi and Fasuyi, 1993; and Afolayan et al., 2004). The former is derived from
chemical alteration processes while the latter is the product of tectonic activities. The weathered layer aquifer
may occur singly or in combination with the fractured aquifer (Olorunfemi and Fasuyi 1993; and Bayode et al.,
2006). The direct exposure of the uppermost part of the vadose zone of the weathered layer aquifer system
makes it vulnerable to surface/near surface pollutants such as leachate from waste dump sites and flooding.
Fig.2: Geological Map of Akure Metropolis (After Owoyemi, 1996).
Journal of Environment and Earth Science www.iiste.org
ISSN 2224-3216 (Paper) ISSN 2225-0948 (Online)
Vol.4, No.23, 2014
153
Fig. 3 Lineament Map of Akure Metropolis
4. Methodology
Hydrochemical data on groundwater samples from georeferenced fifty six (56) boreholes were sourced from the
Ondo State Water Corporation under the State Water Borehole Water Project. Twenty five (25) water samples
from streams and rivers in the study area were collected and their locations georeferenced. The water samples
were analyzed for physical (colour, odour, turbidity) and chemical properties (pH, conductivity, dissolved solid,
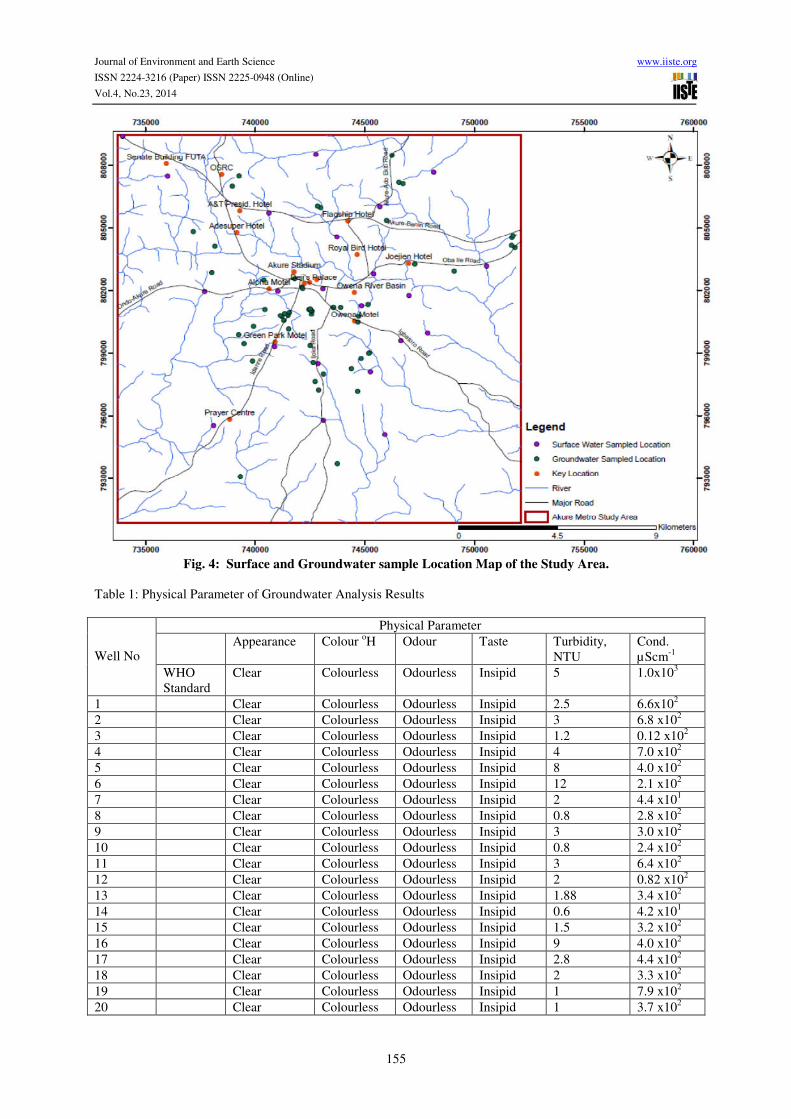
hardness, cations, anions and heavy metals) using standard analytical methods. Figure 4 shows the locations of
the surface and borehole water samples.
5. Results and Discussion
5.1 The Physico-chemical Parameters of Water Samples
All the borehole water (groundwater) samples appeared clear, colourless, odourless and tasteless with the
exception of samples 5, 6 and 16 which appeared turbid (Table 1). Surface water samples 1, 18 and 24 were clear
in appearance while other surface water samples appeared to fall within being slightly coloured, light brown,
slightly brownish, brownish, yellowish brown, highly brown, turbid and highly turbid. Surface water samples 1,
3, 5-9, 13, 15-16, 23-24 had unobjectionable odour while the rest of the surface water samples were observed to
have objectionable odour (Table 2). Turbidity of the groundwater samples ranged between 0.6 and 12.0 NTU
with mean value of 2.28 ± 0.32 NTU (Table 3). The turbidity of most of the groundwater samples were within
the limit of WHO and NIS standards for drinking water except Boreholes 5, 6, 16, 45 and 47. The Total
Suspended Solids (TSS) of the groundwater samples also ranged from 61.0 – 122.0 mgl-1
with mean value of
97.29 ± 8.80 mgl-1
while the Total Solids (TS) ranged between 30.8 and 980.0 mgl-1
with mean value of 268.88 ±
26.46 mgl-1
and were all within the limit of WHO and NIS standards for drinking water (Tables 3 and 5). Surface
water samples turbidity values were mostly on the high side compared with the WHO and NIS standards for
Journal of Environment and Earth Science www.iiste.org
ISSN 2224-3216 (Paper) ISSN 2225-0948 (Online)
Vol.4, No.23, 2014
154
drinking water ranging from 0.1 - 327.0 NTU with a mean value of 54.12 ± 13.81 NTU (Table 4). Only samples
1 (3.92 NTU) and 18 (0.1 NTU) were within the limit of WHO and NIS standards (Table 6).
5.2 Chemical Parameters of Groundwater and Surface Water Samples
The water bodies from the study area varied from moderately acidic to alkaline with a range of pH values of 6.0
– 8.0. The groundwater samples varied from moderately acidic to neutral (pH 6.0 -7.1) while the surface water
samples varied from slightly acidic to alkaline (6.5 – 8.0). On the average the groundwater samples were slightly
acidic (average pH 6.55 ± 0.04) while the surface water samples were neutral (average pH 7.00 ± 0.08). The
average pH values of both sources of water (i.e. borehole and surface water) were all within the limit of WHO
and NIS standards for drinking water (Tables 5 and 6) but groundwater samples: 6, 8-10, 13, 19, 36, 48-49, 51
and 54-55 had pH values lower than that of these standards suggesting that they are acidic.
Conductivity values of the groundwater samples ranged from 42.0 – 1400.0 µScm-1
with average value of 374.25
± 37.11 µScm-1
while that of the surface water samples ranged from 40 – 890 µScm-1
with average value of
154.80 ± 34.56 µScm-1
. Except in groundwater samples 23, 46, 47 and surface water sample 17, the other water
samples investigated had their conductivity values within the limit of WHO and NIS standards for drinking
water. The Total Dissolved Solid (TDS) values ranged from 30.8 – 870.0 mgl-1
with a mean value of 256.72 ±
24.22 mgl-1
, and 30 – 620 mgl-1
with mean value of 108.00 ± 24.07 mgl-1
in borehole and surface water sources
respectively. All the TDS values of the groundwater samples were within the WHO standard for drinking water
but some did not comply with the NIS standard. The surface water samples TDS values all fell within the limit of
WHO and NIS standards for drinking water except in sample 17 with TDS value of 620 mgl-1
. The total
alkalinity was quite variable in the water sources (range = 2.0 – 260.0 mgl-1
CaCO3; mean = 77.71 ± 7.89 mgl-
1CaCO3) and (range = 12.0 – 250.0 mgl
-1CaCO3; mean = 43.52 ± 9.35 mgl
-1CaCO3) for groundwater and surface
water samples respectively. Except in well water samples 2, 46-47, 49-51, 55 and surface water sample 17 the
total alkalinity values were found to be within the WHO standard for drinking water. Total hardness values
ranged from 7.5 – 329.8 mgl-1
CaCO3 with an average of 105.52 ± 10.15 mgl-1
CaCO3 for groundwater samples as
well as 7.2 – 286.6 mgl-1
CaCO3 with an average of 43.47 ± 11.31 mgl-1
CaCO3 for surface water samples. The
total hardness values from both water sources were all within the WHO standard for drinking water except in
surface water sample 17 (total hardness = 286.6 mgl-1
CaCO3) (Tables 3 and 4).
5.3 Major Ions of Groundwater and Surface Water Samples
Ca2+
ranged from 1.2 – 62.4 mgl-1
with an average of 23.63 ± 2.33 mgl
-1; Mg
2+ ranged from 0.8 – 42.4 mgl
-1 with
an average of 11.40 ± 1.21 mgl
-1; Na
+ varied from 2.0 - 55.0 mgl
-1 with an average of
20.5 ± 1.81 mgl
-1; K
+
ranged from 1.0 – 75.0 mgl-1
with an average of 28.19 ± 2.46 mgl
-1; Cl
- varied from 1.5 – 145.0 mgl
-1 with an
average of 24.02 ± 3.05 mgl
-1; SO4
2- ranged from 0.6 – 72.0 mgl
-1 with an average of
16.73 ± 2.00 mgl
-1; HCO3
-
ranged from 3.6 - 312.0 mgl-1
with an average of 93.28 ± 9.46 mgl
-1; and NO3
- varied from 0.6 – 6.0 mgl
-1 with
an average of 2.64 ± 0.34 mgl
-1 in groundwater samples from the study area. For surface water samples Ca
2+
(range = 1.6 – 6.2 mgl-1
; mean = 10.53 ± 2.55 mgl-1
); Mg2+
(range = 0.6 – 26.0 mgl-1
; mean = 3.94 ± 1.05 mgl-1
);
Na+
(range = 2.0 – 23.0 mgl-1
; mean = 5.12 ± 0.84 mgl-1
); K+
(range = 0.3 - 25.0 mgl-1
; mean = 4.13 ± 1.08 mgl-
1); Cl
- (range = 2.0 – 75.0 mgl
-1; mean = 12.6 ± 3.58 mgl
-1);
Journal of Environment and Earth Science www.iiste.org
ISSN 2224-3216 (Paper) ISSN 2225-0948 (Online)
Vol.4, No.23, 2014
155
Fig. 4: Surface and Groundwater sample Location Map of the Study Area.
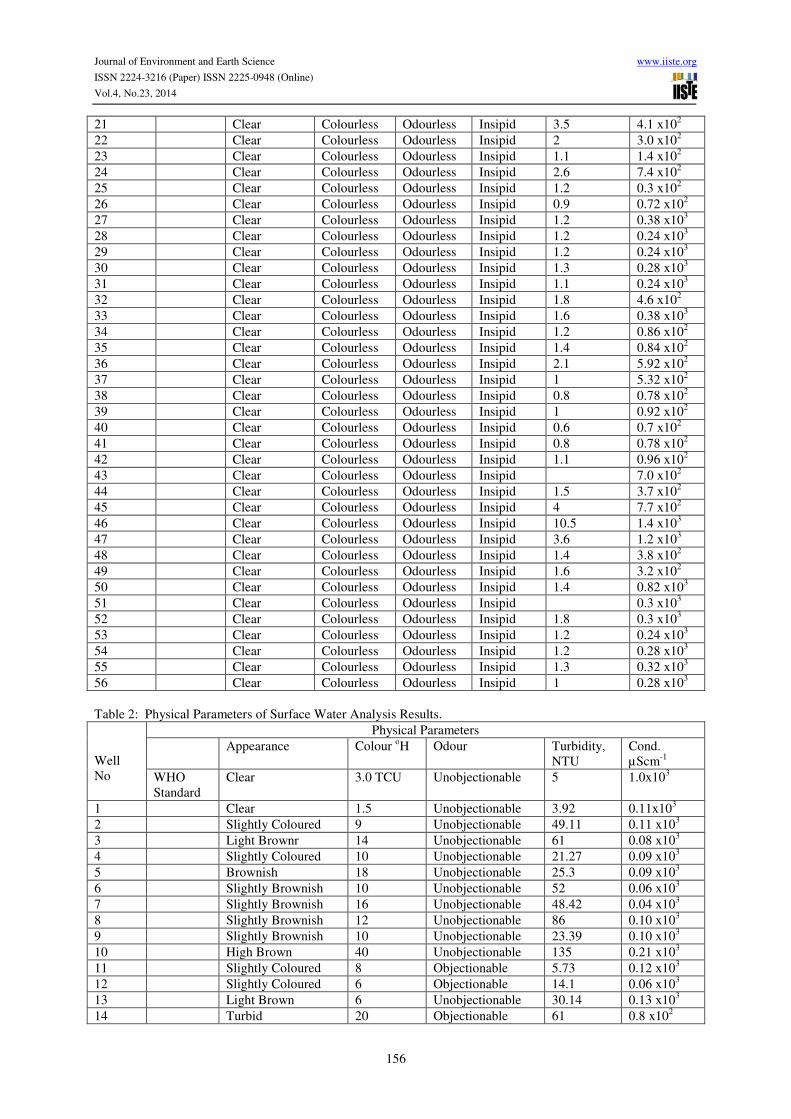
Table 1: Physical Parameter of Groundwater Analysis Results
Well No
Physical Parameter
Appearance Colour oH Odour Taste Turbidity,
NTU
Cond.
µScm-1
WHO
Standard
Clear Colourless Odourless Insipid 5 1.0x10³
1 Clear Colourless Odourless Insipid 2.5 6.6x10²
2 Clear Colourless Odourless Insipid 3 6.8 x10²
3 Clear Colourless Odourless Insipid 1.2 0.12 x10²
4 Clear Colourless Odourless Insipid 4 7.0 x10²
5 Clear Colourless Odourless Insipid 8 4.0 x10²
6 Clear Colourless Odourless Insipid 12 2.1 x10²
7 Clear Colourless Odourless Insipid 2 4.4 x101
8 Clear Colourless Odourless Insipid 0.8 2.8 x10²
9 Clear Colourless Odourless Insipid 3 3.0 x10²
10 Clear Colourless Odourless Insipid 0.8 2.4 x10²
11 Clear Colourless Odourless Insipid 3 6.4 x10²
12 Clear Colourless Odourless Insipid 2 0.82 x10²
13 Clear Colourless Odourless Insipid 1.88 3.4 x10²
14 Clear Colourless Odourless Insipid 0.6 4.2 x101
15 Clear Colourless Odourless Insipid 1.5 3.2 x10²
16 Clear Colourless Odourless Insipid 9 4.0 x10²
17 Clear Colourless Odourless Insipid 2.8 4.4 x10²
18 Clear Colourless Odourless Insipid 2 3.3 x10²
19 Clear Colourless Odourless Insipid 1 7.9 x10²
20 Clear Colourless Odourless Insipid 1 3.7 x10²
Journal of Environment and Earth Science www.iiste.org
ISSN 2224-3216 (Paper) ISSN 2225-0948 (Online)
Vol.4, No.23, 2014
156
21 Clear Colourless Odourless Insipid 3.5 4.1 x10²
22 Clear Colourless Odourless Insipid 2 3.0 x10²
23 Clear Colourless Odourless Insipid 1.1 1.4 x10²
24 Clear Colourless Odourless Insipid 2.6 7.4 x10²
25 Clear Colourless Odourless Insipid 1.2 0.3 x10²
26 Clear Colourless Odourless Insipid 0.9 0.72 x10²
27 Clear Colourless Odourless Insipid 1.2 0.38 x10³
28 Clear Colourless Odourless Insipid 1.2 0.24 x10³
29 Clear Colourless Odourless Insipid 1.2 0.24 x10³
30 Clear Colourless Odourless Insipid 1.3 0.28 x10³
31 Clear Colourless Odourless Insipid 1.1 0.24 x10³
32 Clear Colourless Odourless Insipid 1.8 4.6 x10²
33 Clear Colourless Odourless Insipid 1.6 0.38 x10³
34 Clear Colourless Odourless Insipid 1.2 0.86 x10²
35 Clear Colourless Odourless Insipid 1.4 0.84 x10²
36 Clear Colourless Odourless Insipid 2.1 5.92 x10²
37 Clear Colourless Odourless Insipid 1 5.32 x10²
38 Clear Colourless Odourless Insipid 0.8 0.78 x10²
39 Clear Colourless Odourless Insipid 1 0.92 x10²
40 Clear Colourless Odourless Insipid 0.6 0.7 x10²
41 Clear Colourless Odourless Insipid 0.8 0.78 x10²
42 Clear Colourless Odourless Insipid 1.1 0.96 x10²
43 Clear Colourless Odourless Insipid 7.0 x10²
44 Clear Colourless Odourless Insipid 1.5 3.7 x10²
45 Clear Colourless Odourless Insipid 4 7.7 x10²
46 Clear Colourless Odourless Insipid 10.5 1.4 x10³
47 Clear Colourless Odourless Insipid 3.6 1.2 x10³
48 Clear Colourless Odourless Insipid 1.4 3.8 x10²
49 Clear Colourless Odourless Insipid 1.6 3.2 x10²
50 Clear Colourless Odourless Insipid 1.4 0.82 x10³
51 Clear Colourless Odourless Insipid 0.3 x10³
52 Clear Colourless Odourless Insipid 1.8 0.3 x10³
53 Clear Colourless Odourless Insipid 1.2 0.24 x10³
54 Clear Colourless Odourless Insipid 1.2 0.28 x10³
55 Clear Colourless Odourless Insipid 1.3 0.32 x10³
56 Clear Colourless Odourless Insipid 1 0.28 x10³
Table 2: Physical Parameters of Surface Water Analysis Results.
Well
No
Physical Parameters
Appearance Colour oH Odour Turbidity,
NTU
Cond.
µScm-1
WHO
Standard
Clear 3.0 TCU Unobjectionable 5 1.0x10³
1 Clear 1.5 Unobjectionable 3.92 0.11x10³
2 Slightly Coloured 9 Unobjectionable 49.11 0.11 x10³
3 Light Brownr 14 Unobjectionable 61 0.08 x10³
4 Slightly Coloured 10 Unobjectionable 21.27 0.09 x10³
5 Brownish 18 Unobjectionable 25.3 0.09 x10³
6 Slightly Brownish 10 Unobjectionable 52 0.06 x10³
7 Slightly Brownish 16 Unobjectionable 48.42 0.04 x10³
8 Slightly Brownish 12 Unobjectionable 86 0.10 x10³
9 Slightly Brownish 10 Unobjectionable 23.39 0.10 x10³
10 High Brown 40 Unobjectionable 135 0.21 x10³
11 Slightly Coloured 8 Objectionable 5.73 0.12 x10³
12 Slightly Coloured 6 Objectionable 14.1 0.06 x10³
13 Light Brown 6 Unobjectionable 30.14 0.13 x10³
14 Turbid 20 Objectionable 61 0.8 x10²

Journal of Environment and Earth Science www.iiste.org
ISSN 2224-3216 (Paper) ISSN 2225-0948 (Online)
Vol.4, No.23, 2014
157
15 Slightly Brownish 20 Unobjectionable 69 0.06 x10³
16 Slightly Coloured 10 Unobjectionable 42.37 0.19 x10³
17 Brownish 26 Objectionable 28.03 0.89 x10³
18 Clear 0.8 Objectionable 0.1 0.30 x10³
19 Hidhly Turbid 25 Objectionable 327 0.26 x10³
20 Yellowish Brown 12 Objectionable 41.34 0.08 x10³
21 Light Brown 9 Objectionable 9.73 0.05 x10³
22 Turbid 27 Objectionable 164 0.11 x10³
23 Slighly Coloured 10 Unobjectionable 20.53 0.08 x10³
24 Clear 3 Unobjectionable 28.85 0.11 x10³
25 Slighly Coloured 7 Objectionable 5.57 0.36 x10³
Table 3: Descriptive Statistics of the Physico-chemical Parameters of Water Quality of Groundwater Samples
from Akure, Ondo State
S/N PARAMETER STATISTICS
N Min. Max. Median St. Dev. Mean±S.E.
Physical
1 Turbidity (NTU) 54 0.6 12.0 1.4 2.37 2.28 ± 0.32
2 Total Suspended Solids (TSS)
(mgl-1
)
7 61.0 122.0 100.0 23.27 97.29 ± 8.80
3 Total Solids (TS) (mgl-1
) 56 30.8 980.0 224.0 197.99 268.88 ± 26.46
General chemical
4 pH 56 6.0 7.1 6.5 0.28 6.55 ± 0.04
5 Conductivity (µScm-1
) 56 42.0 1400.0 310.0 277.69 374.25 ± 37.11
6 Total Dissolved Solids (TDS)
(mgl-1
) 56 30.8 870.0 217.0 181.26 256.72 ± 24.22
7 Total Alkalinity (mgl-1
CaCO3) 56 2.0 260.0 62.0 59.01 77.71 ± 7.89
8 Total Hardness (mgl-1
CaCO3) 56 7.5 329.8 87.6 75.99 105.52 ± 10.15
9 Non Carbonate Hardness (mgl-
1CaCO3)
56 0.0 241.2 22.5 42.51 33.64 ± 5.68
Major ions
10 Calcium (Ca2+
) (mgl-1
) 56 1.2 62.4 19.6 17.43 23.63 ± 2.33
11 Magnesium (Mg2+
) (mgl-1
) 56 0.8 42.4 9.8 9.07 11.40 ± 1.21
12 Sodium (Na+) (mgl
-1) 54 2.0 55.0 20.0 13.33 20.5 ± 1.81
13 Potassium (K+) (mgl
-1) 54 1.0 75.0 30.0 18.09 28.19 ± 2.46
14 Chloride (Cl-) (mgl
-1) 56 1.5 145.0 18.0 22.80 24.02 ± 3.05
15 Sulphate (SO42-
) (mgl-1
) 49 0.6 72.0 15.0 13.99 16.73 ± 2.00
16 Bicarbonate (HCO3-) (mgl
-1) 56 3.6 312.0 74.4 70.79 93.28 ± 9.46
17 Nitrate (NO3-) (mgl
-1) 33 0.6 11.0 2.0 1.93 2.64 ± 0.34
Heavy Metals
18 Manganese (Mn) (mgl-1
) 14 0.01 0.60 0.04 0.15 0.08 ± 0.04
19 Lead (Pb) (mgl-1
) N.D N.D. N.D. N.D. N.D. N.D.
20 Total Iron (Fe) (mgl-1
) 51 0.005 2.50 0.10 0.54 0.28 ± 0.08
NOTE: N = Sample number; N.D. = Not detected; Max. = Maximum value;
Min. = Minimum value; St. Dev. = Standard Deviation; S.E. = Standard Error
Table 4: Descriptive Statistics of the Physico-chemical Parameters of Water Quality of Surface Water Samples
from Akure, Ondo State
S/N PARAMETER STATISTICS
N Min. Max. Median St. Dev. Mean±S.E.
Physical
1 Colour (0H) 25 0.8 40.0 10.0 9.10 13.21 ± 1.82
2 Turbidity (NTU) 25 0.1 327.0 30.1 69.00 54.12 ± 13.81
General chemical
3 pH 25 6.5 8.0 7.0 0.40 7.00 ± 0.08

Journal of Environment and Earth Science www.iiste.org
ISSN 2224-3216 (Paper) ISSN 2225-0948 (Online)
Vol.4, No.23, 2014
158
4 Conductivity (µScm-1
) 25 40.0 890.0 100.0 172.82 154.80 ± 34.56
5 Total Dissolved Solids (TDS) (mgl-1
) 25 30.0 620.0 70.0 120.35 108.00 ± 24.07
6 Total Alkalinity (mgl-1
CaCO3) 25 12.0 250.0 30.0 9.35 43.52 ± 9.35
7 Total Hardness (mgl-1
CaCO3) 25 7.2 286.6 22.7 56.53 43.47 ± 11.31
8 Non Carbonate Hardness (mgl-
1CaCO3)
25 0.0 36.6 0.0 9.82 5.31 ± 1.96
Major ions
9 Calcium (Ca2+
) (mgl-1
) 25 1.6 62.0 5.4 12.73 10.53 ± 2.55
10 Magnesium (Mg2+
) (mgl-1
) 25 0.6 26.0 2.0 5.27 3.94 ± 1.05
11 Sodium (Na+) (mgl
-1) 25 2.0 23.0 4.0 4.21 5.12 ± 0.84
12 Potassium (K+) (mgl
-1) 25 0.3 25.0 2.0 5.39 4.13 ± 1.08
13 Chloride (Cl-) (mgl
-1) 25 2.0 75.0 5.6 17.88 12.6 ± 3.58
14 Bicarbonate (HCO3-) (mgl
-1) 25 14.4 300.0 36.0 56.11 52.22 ± 11.22
15 Nitrate (NO3-) (mgl
-1) 25 0.15 4.24 1.5 1.30 1.83 ± 0.26
Heavy Metals
16 Manganese (Mn) (mgl-1
) 10 0.003 2.18 0.39 0.87 0.83 ± 0.27
17 Copper (Cu) (mgl-1
) 5 0.03 0.84 0.14 0.33 0.26 ± 0.15
18 Chromium (Cr) (mgl-1
) 5 0.03 1.16 0.62 0.43 0.54 ± 0.19
19 Cadmium (Cd) (mgl-1
) 2 0.05 0.26 0.16 0.15 0.16 ± 0.11
20 Lead (Pb) (mgl-1
) 7 0.41 3.41 1.39 1.17 1.63 ± 0.44
21 Total Iron (Fe) (mgl-1
) 12 0.002 0.20 0.03 0.07 0.06 ± 0.02
22 Zinc (Zn) (mgl-1
) N.D. N.D. N.D. N.D. N.D. N.D.
NOTE: N = Sample number; N.D. = Not detected; Max. = Maximum value;
Min. = Minimum value; St. Dev. = Standard Deviation; S.E. = Standard Error
Table 5: Comparison of the Values of the Current Study with Approved Standard Water Quality Guides
(Groundwater Sample)
S/N
PARAMETER
CURRENT STUDY STANDARD
HEALTH
IMPACT
(NIS, 2007)
Range Mean±S.E. (WHO,
2004)
(NIS, 2007)
Physical
1 Colour (0H) Colourless Colourless Colourless 15 (TCU) None
2 Turbidity (NTU) 0.6 -12.0 2.28 ± 0.32 5.0 5.0 None
3 Total Suspended Solids
(TSS) (mgl-1
)
61.0 – 122.0 97.29 ± 8.80 No Value
No Value None
4 Total Solids (TS) (mgl-1
) 30.8 – 980.0 268.88 ± 26.46 1000 No Value None
General chemical
5 pH 6.0 -7.1 6.55 ± 0.04 6.5 - 8.5 6.5 - 8.5 None
6 Conductivity (µScm-1
) 42.0 –
1400.0
374.25 ± 37.11 1000 1000 None
7 Total Dissolved Solids
(TDS) (mgl-1
)
30.8 – 870.0 256.72 ± 24.22 1000 500 None
8 Total Alkalinity (mgl-
1CaCO3)
2.0 – 260.0 77.71 ± 7.89 200 No Value None
9 Total Hardness (mgl-
1CaCO3)
7.5 – 329.8 105.52 ± 10.15 400 No Value None
10 Non Carbonate Hardness
(mgl-1
CaCO3)
0.0 241.2 33.64 ± 5.68 No Value No Value None
Major ions
11 Calcium (Ca2+
) (mgl-1
) 1.2 – 62.4 23.63 ± 2.33 75 No Value None
12 Magnesium (Mg2+
) (mgl-
1)
0.8 – 42.4 11.40 ± 1.21 30 0.20 Consumer
acceptability
13 Sodium (Na+) (mgl
-1) 2.0 - 55.0 20.5 ± 1.81 No Value 200 None
14 Potassium (K+) (mgl
-1) 1.0 – 75.0 28.19 ± 2.46 No Value No Value None
15 Chloride (Cl-) (mgl
-1) 1.5 – 145.0 24.02 ± 3.05 250 250 None

Journal of Environment and Earth Science www.iiste.org
ISSN 2224-3216 (Paper) ISSN 2225-0948 (Online)
Vol.4, No.23, 2014
159
16 Sulphate (SO42-
) (mgl-1
) 0.6 – 72.0 16.73 ± 2.00 200 100 None
17 Bicarbonate (HCO3-)
(mgl-1
)
3.6 - 312.0 93.28 ± 9.46 No Value No Value None
18 Nitrate (NO3-) (mgl
-1) 0.6 – 11.0 2.64 ± 0.34 50 50 Cyanosis, and
asphyxia
(blue-baby
syndrome) in
infants under 3
months
Heavy Metals
19 Manganese (Mn) (mgl-1
) 0.01 – 0.60 0.08 ± 0.04 0.10 0.20 Neurological
disorder
20 Total Iron (Fe) (mgl-1
) 0.005 – 2.50 0.28 ± 0.08 0.01 0.30 None
S.E. = Standard Error; WHO = World Health Organisation; NIS = Nigerian Industrial Standard
Table 6: Comparison of the Values of the Current Study with Approved Standard Water Quality Guides (Surface
Water Sample)
S/N
PARAMETER
CURRENT STUDY STANDARD HEALTH IMPACT
(NIS, 2007) Range Mean±S.E. (WHO,
2004)
(NIS, 2007)
Physical
1 Colour (0H) 0.8 - 40.0 13.21 ± 1.82 3.0 TCU) 15 (TCU) None
2 Turbidity (NTU) 0.1 - 327.0 54.12 ± 13.81 5.0 5.0 None
General chemical
3 pH 6.5 – 8.0 7.00 ± 0.08 6.5 - 8.5 6.5 - 8.5 None
4 Conductivity (µScm-
1)
40 - 890 154.80 ± 34.56 1000 1000 None
5 Total Dissolved
Solids (TDS) (mgl-1
)
30 - 620 108.00 ± 24.07 500 500 None
6 Total Alkalinity (mgl-
1CaCO3)
12.0 – 250.0 43.52 ± 9.35 100 No Value None
7 Total Hardness (mgl-
1CaCO3)
7.2 – 286.6 43.47 ± 11.31 100 No Value None
8 Non Carbonate
Hardness (mgl-
1CaCO3)
0.0 – 36.6 5.31 ± 1.96 No Value No Value None
Major ions
9 Calcium (Ca2+
) (mgl-
1)
1.6 – 6.2 10.53 ± 2.55 75 No Value None
10 Magnesium (Mg2+
)
(mgl-1
)
0.6 – 26.0 3.94 ± 1.05 30 0.20 Consumer
acceptability
11 Sodium (Na+) (mgl
-1) 2.0 – 23.0 5.12 ± 0.84 200 200 None
12 Potassium (K+) (mgl
-
1)
0.3 - 25.0 4.13 ± 1.08 10 No Value None
13 Chloride (Cl-) (mgl
-1) 2.0 – 75.0 12.6 ± 3.58 100 250 None
14 Bicarbonate (HCO3-)
(mgl-1
)
14.4 – 300.0 52.22 ± 11.22 No Value No Value None
15 Nitrate (NO3-) (mgl
-1) 0.15 – 4.24 1.83 ± 0.26 10 50 Cyanosis, and
asphyxia (blue-
baby syndrome) in
infants under 3
months
Heavy Metals
16 Manganese (Mn) 0.003 – 2.28 0.83 ± 0.27 0.05 0.20 Neurological
Journal of Environment and Earth Science www.iiste.org
ISSN 2224-3216 (Paper) ISSN 2225-0948 (Online)
Vol.4, No.23, 2014
160
(mgl-1
) disorder
17 Total Iron (Fe) (mgl-
1)
0.002 – 0.20 0.06 ± 0.02 0.3 0.30 None
18 Copper (Cu) (mgl-1
) 0.03 – 0.84 0.26 ± 0.15 1.0 1.0 Gastrointestinal
disorder
19 Chromium (Cr) (mgl-
1)
0.03 -1.16 0.54 ± 0.19 0.05
0.05
Cancer
20 Cadmium (Cd) (mgl-
1)
0.05 – 0.26 0.16 ± 0.11 0.003 0.003 Toxic to the kidney
21 Lead (Pb) (mgl-1
) 0.002 – 0.20 1.63 ± 0.44 0.01 0.01
Cancer,
interference with
Vitamin D
metabolism, Affect
mental
development in
infants, Toxic to
the Central and
Peripheral Nervous
Systems
S.E. = Standard Error; WHO = World Health Organisation; NIS = Nigerian Industrial Standard
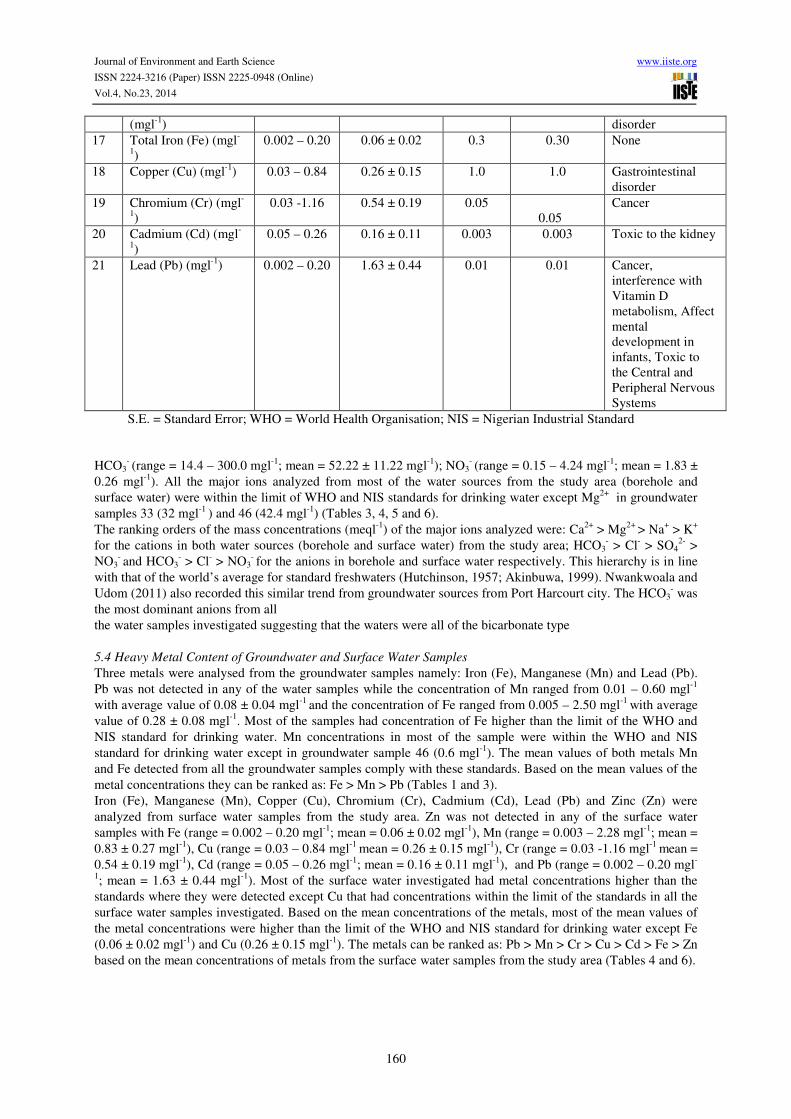
HCO3- (range = 14.4 – 300.0 mgl
-1; mean = 52.22 ± 11.22 mgl
-1); NO3
- (range = 0.15 – 4.24 mgl
-1; mean = 1.83 ±
0.26 mgl-1
). All the major ions analyzed from most of the water sources from the study area (borehole and
surface water) were within the limit of WHO and NIS standards for drinking water except Mg2+
in groundwater
samples 33 (32 mgl-1
) and 46 (42.4 mgl-1
) (Tables 3, 4, 5 and 6). The ranking orders of the mass concentrations (meql
-1) of the major ions analyzed were: Ca
2+ > Mg
2+ > Na
+ > K
+
for the cations in both water sources (borehole and surface water) from the study area; HCO3- > Cl
- > SO4
2- >
NO3- and HCO3
- > Cl
- > NO3
- for the anions in borehole and surface water respectively. This hierarchy is in line
with that of the world’s average for standard freshwaters (Hutchinson, 1957; Akinbuwa, 1999). Nwankwoala and
Udom (2011) also recorded this similar trend from groundwater sources from Port Harcourt city. The HCO3- was
the most dominant anions from all
the water samples investigated suggesting that the waters were all of the bicarbonate type
5.4 Heavy Metal Content of Groundwater and Surface Water Samples
Three metals were analysed from the groundwater samples namely: Iron (Fe), Manganese (Mn) and Lead (Pb).
Pb was not detected in any of the water samples while the concentration of Mn ranged from 0.01 – 0.60 mgl-1
with average value of 0.08 ± 0.04 mgl-1
and the concentration of Fe ranged from 0.005 – 2.50 mgl-1
with average
value of 0.28 ± 0.08 mgl-1
. Most of the samples had concentration of Fe higher than the limit of the WHO and
NIS standard for drinking water. Mn concentrations in most of the sample were within the WHO and NIS
standard for drinking water except in groundwater sample 46 (0.6 mgl-1
). The mean values of both metals Mn
and Fe detected from all the groundwater samples comply with these standards. Based on the mean values of the
metal concentrations they can be ranked as: Fe > Mn > Pb (Tables 1 and 3).
Iron (Fe), Manganese (Mn), Copper (Cu), Chromium (Cr), Cadmium (Cd), Lead (Pb) and Zinc (Zn) were
analyzed from surface water samples from the study area. Zn was not detected in any of the surface water
samples with Fe (range = 0.002 – 0.20 mgl-1
; mean = 0.06 ± 0.02 mgl-1
), Mn (range = 0.003 – 2.28 mgl-1
; mean =
0.83 ± 0.27 mgl-1
), Cu (range = 0.03 – 0.84 mgl-1
mean = 0.26 ± 0.15 mgl-1
), Cr (range = 0.03 -1.16 mgl-1
mean =
0.54 ± 0.19 mgl-1
), Cd (range = 0.05 – 0.26 mgl-1
; mean = 0.16 ± 0.11 mgl-1
), and Pb (range = 0.002 – 0.20 mgl-
1; mean = 1.63 ± 0.44 mgl
-1). Most of the surface water investigated had metal concentrations higher than the
standards where they were detected except Cu that had concentrations within the limit of the standards in all the
surface water samples investigated. Based on the mean concentrations of the metals, most of the mean values of
the metal concentrations were higher than the limit of the WHO and NIS standard for drinking water except Fe
(0.06 ± 0.02 mgl-1
) and Cu (0.26 ± 0.15 mgl-1
). The metals can be ranked as: Pb > Mn > Cr > Cu > Cd > Fe > Zn
based on the mean concentrations of metals from the surface water samples from the study area (Tables 4 and 6).
Journal of Environment and Earth Science www.iiste.org
ISSN 2224-3216 (Paper) ISSN 2225-0948 (Online)
Vol.4, No.23, 2014
161
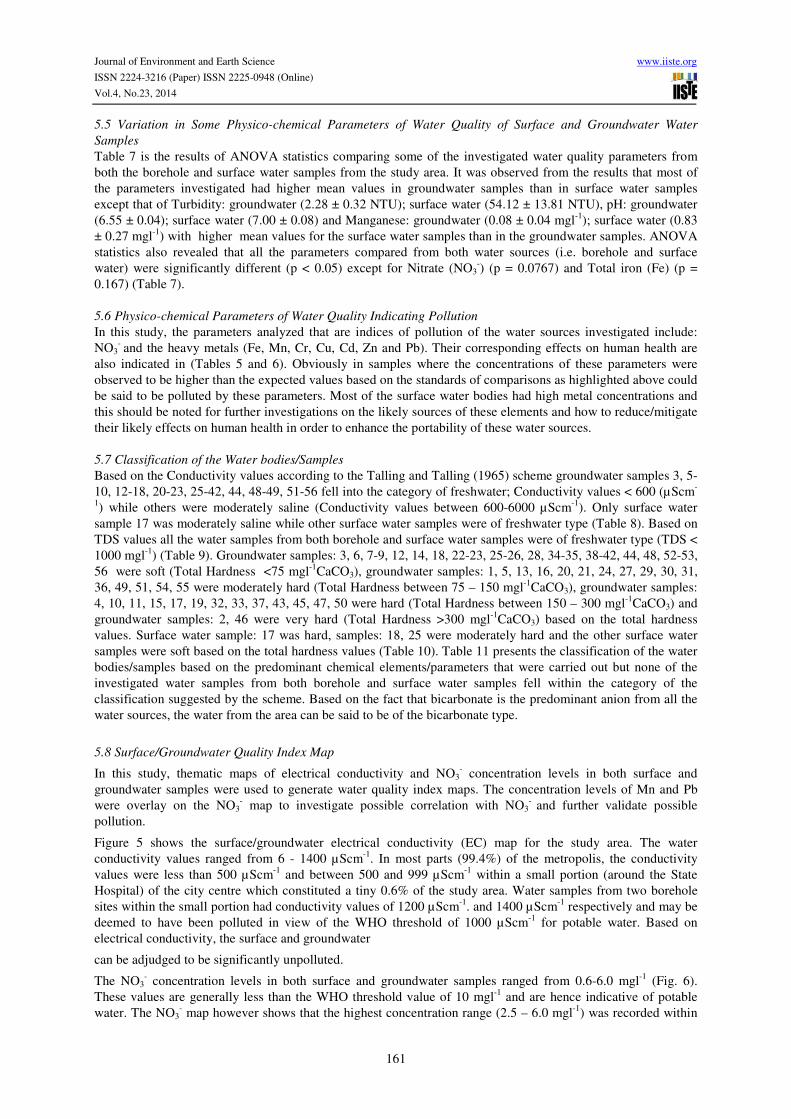
5.5 Variation in Some Physico-chemical Parameters of Water Quality of Surface and Groundwater Water
Samples
Table 7 is the results of ANOVA statistics comparing some of the investigated water quality parameters from
both the borehole and surface water samples from the study area. It was observed from the results that most of
the parameters investigated had higher mean values in groundwater samples than in surface water samples
except that of Turbidity: groundwater (2.28 ± 0.32 NTU); surface water (54.12 ± 13.81 NTU), pH: groundwater
(6.55 ± 0.04); surface water (7.00 ± 0.08) and Manganese: groundwater (0.08 ± 0.04 mgl-1
); surface water (0.83
± 0.27 mgl-1
) with higher mean values for the surface water samples than in the groundwater samples. ANOVA
statistics also revealed that all the parameters compared from both water sources (i.e. borehole and surface
water) were significantly different (p < 0.05) except for Nitrate (NO3-) (p = 0.0767) and Total iron (Fe) (p =
0.167) (Table 7).
5.6 Physico-chemical Parameters of Water Quality Indicating Pollution
In this study, the parameters analyzed that are indices of pollution of the water sources investigated include:
NO3- and the heavy metals (Fe, Mn, Cr, Cu, Cd, Zn and Pb). Their corresponding effects on human health are
also indicated in (Tables 5 and 6). Obviously in samples where the concentrations of these parameters were
observed to be higher than the expected values based on the standards of comparisons as highlighted above could
be said to be polluted by these parameters. Most of the surface water bodies had high metal concentrations and
this should be noted for further investigations on the likely sources of these elements and how to reduce/mitigate
their likely effects on human health in order to enhance the portability of these water sources.
5.7 Classification of the Water bodies/Samples
Based on the Conductivity values according to the Talling and Talling (1965) scheme groundwater samples 3, 5-
10, 12-18, 20-23, 25-42, 44, 48-49, 51-56 fell into the category of freshwater; Conductivity values < 600 (µScm-
1) while others were moderately saline (Conductivity values between 600-6000 µScm
-1). Only surface water
sample 17 was moderately saline while other surface water samples were of freshwater type (Table 8). Based on
TDS values all the water samples from both borehole and surface water samples were of freshwater type (TDS <
1000 mgl-1
) (Table 9). Groundwater samples: 3, 6, 7-9, 12, 14, 18, 22-23, 25-26, 28, 34-35, 38-42, 44, 48, 52-53,
56 were soft (Total Hardness <75 mgl-1
CaCO3), groundwater samples: 1, 5, 13, 16, 20, 21, 24, 27, 29, 30, 31,
36, 49, 51, 54, 55 were moderately hard (Total Hardness between 75 – 150 mgl-1
CaCO3), groundwater samples:
4, 10, 11, 15, 17, 19, 32, 33, 37, 43, 45, 47, 50 were hard (Total Hardness between 150 – 300 mgl-1
CaCO3) and
groundwater samples: 2, 46 were very hard (Total Hardness >300 mgl-1
CaCO3) based on the total hardness
values. Surface water sample: 17 was hard, samples: 18, 25 were moderately hard and the other surface water
samples were soft based on the total hardness values (Table 10). Table 11 presents the classification of the water
bodies/samples based on the predominant chemical elements/parameters that were carried out but none of the
investigated water samples from both borehole and surface water samples fell within the category of the
classification suggested by the scheme. Based on the fact that bicarbonate is the predominant anion from all the
water sources, the water from the area can be said to be of the bicarbonate type.
5.8 Surface/Groundwater Quality Index Map
In this study, thematic maps of electrical conductivity and NO3- concentration levels in both surface and
groundwater samples were used to generate water quality index maps. The concentration levels of Mn and Pb
were overlay on the NO3- map to investigate possible correlation with NO3
- and further validate possible
pollution.
Figure 5 shows the surface/groundwater electrical conductivity (EC) map for the study area. The water
conductivity values ranged from 6 - 1400 µScm-1
. In most parts (99.4%) of the metropolis, the conductivity
values were less than 500 µScm-1
and between 500 and 999 µScm-1
within a small portion (around the State
Hospital) of the city centre which constituted a tiny 0.6% of the study area. Water samples from two borehole
sites within the small portion had conductivity values of 1200 µScm-1
. and 1400 µScm-1
respectively and may be
deemed to have been polluted in view of the WHO threshold of 1000 µScm-1
for potable water. Based on
electrical conductivity, the surface and groundwater
can be adjudged to be significantly unpolluted.
The NO3- concentration levels in both surface and groundwater samples ranged from 0.6-6.0 mgl
-1 (Fig. 6).
These values are generally less than the WHO threshold value of 10 mgl-1
and are hence indicative of potable
water. The NO3- map however shows that the highest concentration range (2.5 – 6.0 mgl
-1) was recorded within
Journal of Environment and Earth Science www.iiste.org
ISSN 2224-3216 (Paper) ISSN 2225-0948 (Online)
Vol.4, No.23, 2014
162
Akure city centre – the ancient Akure settlement. The concentration levels decreased away from the city centre
into the recently developed and developing areas. The elevated NO3- concentration levels within the city centre
(including Aule, Ilesha Garage, Oba Nla, Oke-Ijebu, School of Agriculture, State Hospital area, Oshinle, Ijoka)
indicate some level of pollution, possibly from cumulative anthropogenetic activities.
Figures 7 and 8 contain an overlay of the concentration levels of Mn and Pb respectively on the NO3- map. Only
few surface water samples contain Pb while Mn was identified in some surface and groundwater samples. The
overlay was to check if any correlation existed between NO3- and the heavy metals. The Mn concentration levels
did not show any correlation with the NO3- (Fig. 7) with Mn concentration levels relatively lower (< 0.1 mgl
-1)
within the city centre where NO3- concentration levels were highest. Higher concentration levels (1.61 and 2.01
mgl-1
) were recorded outside the city centre and within areas with lower NO3- concentration levels. This could
imply that the point sources of NO3- and Mn were different.
However some of the surface water samples within the city centre showed elevated concentration levels of Pb
(2.18 - 3.41 mgl-1
) both within and outside the city centre (see Fig. 8) also indicating non-correlation between the
sources of NO3- and Pb. The sources of Pb could be independent, just like Mn. The WHO permissible
concentration levels for Mn and Pb in water (surface and groundwater) are 0.1 mgl-1
and 0.01mgl-1
respectively.
Figures 7 and 8 show that some of the surface water samples are heavy metal polluted. The groundwater
(borehole water) analyzed gave heavy metal concentration levels that are generally less than the WHO
permissible levels and hence not heavy metal polluted.
6. Conclusions
The groundwaters were colourless, odourless and tasteless with the exception of samples 5, 6 and 16 which were
turbid. Surface water samples 1, 18 and 24 were clear while others fall within being slightly coloured, light
brown, slightly brownish, brownish, yellowish brown, highly brown, turbid and highly turbid in appearance.
Surface water samples 1, 3, 5-9, 13, 15-16, 23-24 had unobjectionable odour while the rest surface water
samples were observed to have objectionable odour. Surface water samples turbidity values were mostly on the
high side compared with the WHO and NIS standards for drinking water ranging from 0.1 - 327.0 NTU with
mean values of 54.12 ± 13.81 NTU. Only samples 1 (3.92 NTU) and 18 (0.1 NTU) were within the limit of these
standards.
ANOVA statistics results comparing some of the investigated water quality parameters from borehole and
surface water samples showed higher mean values in groundwater samples than in surface water samples except
that of Turbidity: Groundwater (2.28 ± 0.32 NTU); surface water (54.12 ± 13.81 NTU), pH: Groundwater (6.55
± 0.04); surface water (7.00 ± 0.08) and Manganese: Groundwater (0.08 ± 0.04 mgl-1
); surface water (0.83 ±
0.27 mgl-1
) with higher mean values for the surface water samples than in the groundwater samples. ANOVA
statistics also revealed that all the parameters compared from both water sources (i.e. borehole and surface
water) were significantly different (p < 0.05) except for Nitrate (NO3-) (p = 0.0767) and Total iron (Fe) (p =
0.167).
Although the NO3- concentration levels in both surface and groundwater samples were generally less than the
WHO threshold value of 10 mgl-1
, relatively high concentration range (2.5-6.0 mgl-1
) was recorded within the
city centre

Journal of Environment and Earth Science www.iiste.org
ISSN 2224-3216 (Paper) ISSN 2225-0948 (Online)
Vol.4, No.23, 2014
163
Table 7: ANOVA Statistics of the Variation in Some Physico-chemical Parameters of Water Quality of Surface
and Groundwater Samples from Akure, Ondo State .
NOTE: N = Sample number; S.E. = Standard Error
Table 8: Classification of the Water Bodies/Samples Based on their Conductivity Values (Talling and Talling,
1965)
S/N Conductivity (µScm-1
) Nature of Water Groundwater Surface-Water
1 <600 Freshwater
3, 5-10, 12-18, 20-23, 25-
42, 44, 48-49, 51-56
1-16, 18-25
2 600-6000 Moderately saline
1, 2, 4, 11, 19, 24, 43, 45,
46, 47, 50
17
3 >6000 Saline Nil
Table 9: Classification of the Water Bodies/Samples Based on their Total Dissolved Solid (TDS) values
(Okiongbo
and Douglas, 2013)
S/N Total Dissolved Solids (TDS) (mgl-1
) Nature of Water Groundwater Surface-Water
1 <1000 Fresh water 1 – 56 1 -25
2 1000 – 10000 Brackish water Nil Nil
3 10000 – 100000 Saline water Nil Nil
4 >100000 Brine water Nil Nil
S/N
PARAMETER
STATISTICS
GROUNDWATER SURFACE WATER ANOVA
N Mean±S.E. N Mean±S.E. F P
Physical
1 Turbidity (NTU) 54 2.28 ± 0.32 25 54.12 ± 13.81 30.82 3.85 X 10⁻⁷
General chemical
2 pH 56 6.55 ± 0.04 25 7.00 ± 0.08 35.13 7.69 X 10⁻⁸
3 Conductivity (µScm-1
) 56 374.25 ± 37.11 25 154.80 ± 34.56 13.26 5.00 X 10⁻⁴
4 Total Dissolved Solids (TDS)
(mgl-1
)
56 256.72 ± 24.22 25 108.00 ± 24.07 14.02 3.43 X 10⁻⁴
5 Total Alkalinity (mgl-1
CaCO3) 56 77.71 ± 7.89 25 43.52 ± 9.35 6.54 1.24 X 10⁻²
6 Total Hardness (mgl-1
CaCO3) 56 105.52 ± 10.15 25 43.47 ± 11.31 13.33 4.67 X 10⁻⁴
7 Non Carbonate Hardness (mgl-
1CaCO3)
56 33.64 ± 5.68 25 5.31 ± 1.96 10.78 1.53 X 10⁻³
Major ions
8 Calcium (Ca2+
) (mgl-1
) 56 23.63 ± 2.33 25 10.53 ± 2.55 11.38 1.15 X 10⁻³
9 Magnesium (Mg2+
) (mgl-1
) 56 11.40 ± 1.21 25 3.94 ± 1.05 14.62 2.61 X 10⁻⁴
10 Sodium (Na+) (mgl
-1) 54 20.5 ± 1.81 25 5.12 ± 0.84 31.64 2.87 X 10
-7
11 Potassium (K+) (mgl
-1) 54 28.19 ± 2.46 25 4.13 ± 1.08 42.20 7.36 X 10
-9
12 Chloride (Cl-) (mgl
-1) 56 24.02 ± 3.05 25 12.6 ± 3.58 4.91 2.96 X 10
-2
13 Bicarbonate (HCO3-) (mgl
-1) 56 93.28 ± 9.46 25 52.22 ± 11.22 6.55 1.24 X 10
-2
14 Nitrate (NO3-) (mgl
-1) 33 2.64 ± 0.34 25 1.83 ± 0.26 3.25 7.67 X 10
-2
Heavy Metals
15 Manganese (Mn) (mgl-1
) 14 0.08 ± 0.04 10 0.83 ± 0.27 10.12 4.31 X 10⁻³
16 Total Iron (Fe) (mgl-1
) 51 0.28 ± 0.08 12 0.06 ± 0.02 1.96 1.67 X 10⁻¹

Journal of Environment and Earth Science www.iiste.org
ISSN 2224-3216 (Paper) ISSN 2225-0948 (Online)
Vol.4, No.23, 2014
164
Table 10: Classification of the Water Bodies/Samples Based on their Total Hardness Values (Okiongbo and
Douglas, 2013)
S/N Total Hardness (mgl-1
CaCO3) Nature of
Water
Groundwater Surface-Water
1 <75 Soft 3, 6, 7-9, 12, 14, 18, 22-23, 25-26,
28, 34-35, 38-42, 44, 48, 52-53,
56
1 – 16, 19-24
2 75 – 150 Moderately
Hard
1, 5, 13, 16, 20, 21, 24, 27, 29, 30,
31, 36, 49, 51, 54, 55
18, 25
3 150 – 300 Hard 4, 10, 11, 15, 17, 19, 32, 33, 37,
43, 45, 47, 50
17
4 > 300 Very Hard 2, 46 Nil
Table 11: Classification of the Water Bodies/Samples Based on Predominant Chemical Elements/Parameters
(Petraccia et al., 2006)
S/N Parameter Nature of Water Groundwater Surface-Water
1 Calcium (Ca2+
) >150 (mgl-1
) Calcium water Nil Nil
2 Magnesium (Mg2+
) >50 (mgl-1
) Magnesium water Nil Nil
3 Sodium (Na+) >200 (mgl
-1) Sodium water Nil Nil
4 Bicarbonate (HCO3-) >600 (mgl
-1) Bicarbonate water Nil Nil
5 Sulphate (SO42-
) >200 (mgl-1
) Sulphate water Nil Nil
6 Chloride (Cl-) >200 (mgl
-1) Chlorinated water Nil Nil
7 Bivalent iron (Fe2+
) >1 (mgl-1
) Ferrous water Nil Nil
Fig. 5: Surface/Groundwater Pollution Index Map – Variation in Electrical Conductivity

Journal of Environment and Earth Science www.iiste.org
ISSN 2224-3216 (Paper) ISSN 2225-0948 (Online)
Vol.4, No.23, 2014
165
Fig. 6: Surface/Groundwater Pollution Index Map – Variations in Nitrate Concentration Levels
Fig. 7: Surface/Groundwater Pollution Index Map – Variations in Nitrate Concentration
Levels with Mn Distribution

Journal of Environment and Earth Science www.iiste.org
ISSN 2224-3216 (Paper) ISSN 2225-0948 (Online)
Vol.4, No.23, 2014
166
Fig. 8: Surface/Groundwater Pollution Index Map – Variations in Nitrate Concentration
Levels with Pb Distribution
indicating some level of pollution from cumulative anthropogenetic activities. Only few surface water samples
contain Pb while Mn was identified in some surface and groundwater samples. The elevated Pb concentration
levels (0.41-3.41 mgl-1
) and relatively high Mn concentration levels (up to 2.18 mgl-1
) (both higher higher than
the WHO and NIS thresholds) in some surface water samples was an indication of heavy metal pollution.
Conductivity values of the well water samples generally ranged from 42.0 – 1400.0 µScm-1
. Only surface water
sample 17 was moderately saline while other surface water samples were of freshwater type. Based on TDS
values, all the groundwater and surface water samples were of freshwater type (TDS < 1000 mgl-1
). The Total
Hardness of values for both groundwater and surface water were well within the WHO threshold for potable
water except surface water sample 17. Based on the fact that bicarbonate is the predominant anion from all the
water sources. It can be concluded that the water from the area can be said to be the bicarbonate type.
Acknowledgement
This research was funded by the Educational Trust Fund (ETF) through the University Research Grant of The
Federal University of Technology, PMB 704 Akure, Nigeria. The authors are immensely grateful.
References
Afolayan, J.F., Olorunfemi, M.O. and Afolabi, O. (2004), “Geoelectric/Electromagnetic VLF Survey for
Groundwater Development in a Basement Terrain – A Case Study”, Ife Journal of Science, 6, (i), 74-78.
Akinbuwa, O. (1999), “The rotifera fuana and physico-chemical conditions of Erinle Lake and
Journal of Environment and Earth Science www.iiste.org
ISSN 2224-3216 (Paper) ISSN 2225-0948 (Online)
Vol.4, No.23, 2014
167
its major inflows at Ede, Osun State, Nigeria”, Unpublished Ph. D. Thesis, Obafemi Awolowo University, Ile-Ife,
Nigeria. 333.
Ako, B.D. and Olorunfemi, M.O. (1989), “Geoelectric Survey for Groundwater in the Newer Basalts of Vom,
Plateau State”, Journal of Mining and Geology, 25(1), 247-250.
Aluko, A.B. (2008), “Geology of Akure Area Southwestern Nigeria”, Unpublished B.Tech. Thesis, Federal
University of Technology, Akure, 70.
Anifowose, A.Y.B. (1989), “The Performance of Some Soils Under Stabilization in Ondo State, Nigeria”,
Bulletin International Association of Engineering Geology, 40, 79-83.
Aniya, F.B and Shoeneick, K. (1992), “Hydrogeological Investigation of the Aquifer of Bauchi Area”, Journal
of Mining and Geology, 28(1), 45-53.
Bayode, S. (2010), “Geophysical Investigation of the Impact of Some Waste Dump Sites on Groundwater
Quality in Akure Metropolis”, Unpublished Ph.D. Thesis., Federal University of Technology, Akure, 232.
Bayode, S.; Ojo, J.S. and Olorunfemi, M.O. (2006), “Geoelectric Characterization of Aquifer Types in the
Basement Complex Terrain of Pats of Osun State, Nigeria”, Global Journal of Pure and Applied Sciences, 12(3),
377-385.
Bayode, S.; Olorunfemi, M.O. and Ojo, J.S. (2011a), “Geoelectric Mapping of Some Ancient Dumpsites and the
Associated Pollution Plume in Akure Metropolis, Southwestern Nigeria”, International Journal of Physical
Science, 3(1), 68-80.
Bayode, S., G.O. Omosuyi, K. A. Mogaji and S. T. Adebayo, (2011b), “Geoelectric Delineation of Structurally-
Controlled Leachate Plume Around Otutubiosun Dumpsite, Akure, Southwestern Nigeria”, Journal of Emerging
Trends in Engineering and Applied Sciences (JETEAS), 2(6), 987-992.
Hutchinson, G. E. (1957), “A treatise on Limnology, Vol. 1. Geography, Physics and Chemistry”, John Wiley and
Sons, New York. 1015.
Ikem, A., Osibanjo, O.; Sridhar, M.K.C and Sobande, A.(2002), “Evaluation of Groundwater Quality
Characteristic Near Two Waste Sites in Ibadan and Lagos, Nigeria”, Water, Air And Soil Pollution, 140, 307-
333
Nigerian Industrial Standards (NIS) (2007), “Nigerian Standard for Drinking Water Quality”, (Price group D, ©
SON 2007 NIS 554: 20; ICS 13.060.20. 07). 30.
Nwankwoala, H. O. and Udom, G. J. (2011), “Hydrogeochemistry of groundwater in Port Harcourt City,
Southern Nigeria”, Journal of Oceanography and Marine Science, 2(3): 78–90.
Obase, K.O.; Olorunfemi, M.O. and Akintorinwa, O.J. (2009), “Geophysical and Hydro-Chemical Investigation
of the Area Around a Waste Dump Site in Ile-Ife, Southwestern Nigeria”, Global Journal of Geological
Sciences, 7(1), 47-54.
Odeyemi, I.B.; Asiwaju-Bello, Y.A. and Anifowose, A.Y.B. (1999), “Remote Sensing Fracture Characteristics
of the Pan African Granite Batholiths in the Basement Complex of Parts of Southwestern Nigeria”, Journal of
Techno-Science, 3, 56-60.
Okiongbo, K.S. and Douglas, R. (2003), “Hydrogeochemical Ananalysis and Evaluation of Groundwater Quality
in Yenegoa City and Environs, Southern Nigeria”, Ife Journal of Science, 15(2), 209-222.
Olarewaju, V.O. (1981), “Geochemistry of Charnockitic and Granitic Rocks of the Basement Complex Around
Ado-Ekiti – Akure, Southwestern Nigeria”, Unpublished Ph.D. Thesis, University of London, London. 383.
Olayinka, A.I. and Olayiwola, M.A. (2001), “Integrated use of Geoelectrical Imaging and Hydrochemical
Methods in Delineating Limits of Polluted Surface abd Groundwater at a Landfill Site in Ibadan Area,
Southwestern Nigeria”, Journal of Mining and Geology, 37(1), 53-68.
Olorunfemi, M.O. and Fasuyi, S.A. (1993), “Aquifer Types and the Geoelectric/Hydrogeologic Characteristics
of Part of the Central Basement Terrain of Nigeria (Niger State)”, Journal of African Earth Sciences, 16, 3, 309-
317.
Oluyide, P.O. (1988), “Structural trends in the Nigeria Basement Complex”, In Precambrian Geology of Nigeria
by P.O. Oluyide (ed.). Geological Survey of Nigeria Publication, 93-98.
Owoyemi, F.B. (1996), “A Geologic-geophysical Investigation of Rain-induced Erosional Features in Akure
Metropolis”, Unpublished M.Sc. Thesis, Federal University of Technology, Akure. 11 – 18.

Journal of Environment and Earth Science www.iiste.org
ISSN 2224-3216 (Paper) ISSN 2225-0948 (Online)
Vol.4, No.23, 2014
168
Petraccia, L.; Liberati, G.; Masciullo, S. G.; Grassi, M. and Fraioli, A. (2006), “Water, Mineral Waters and
Health”, Clinical Nutrition, vol. 25, 377-385.
Rahaman, M.A. (1988), “Recent Advances in the Study of the Basement Complex of Nigeria”, In Oluyide, P.O.,
Mbonu, W.C, Ogezi, A.E., Egbuniwe, I.G., Ajibade, A.C. and Umeji, A.C. (Eds.). Precambrian Geology of
Nigeria. Geological Survey of Nigeria Special Publication, 11-41.
Sobogun, A.A. (2009), “Geology of Parts of Akure Area, Southwestern Nigeria”, Unpublished B.Tech. Thesis,
Federal University of Technology, Akure. 68.
Talling, J. F. and Talling, I. B. (1965), “The Chemical Composition of African Lake Waters”, Internat. Rev. ges.
Hydrobiol. 50, 421-463.
World Health Organization (WHO) (2004), “Guidelines for Drinking Water Quality”, Incorporating 1st and 2
nd
Agenda, 1, Recommendations; 3rd
Edition, Geneva.