assessment of natural resources and watershed conditions
TRANSCRIPT
National Park Service U.S. Department of the Interior Natural Resource Program Center
Assessment of Natural Resources and Watershed Conditions for Kalaupapa National Historical Park Natural Resource Report NPS/NPRC/WRD/NRR—2010/261

ON THE COVER Aerial view of the Kalaupapa Peninsula and the Offshore Islets. Photograph by Guy Hughes
Assessment of Natural Resources and Watershed Conditions for Kalaupapa National Historical Park Natural Resource Report NPS/NPRC/WRD/NRR—2010/261 Fung Associates Inc. 1833 Kalakaua Avenue, Suite 1008 Honolulu, Hawaii 96815 SWCA Environmental Consultants 201 Merchant Street, Suite 2310 Honolulu, Hawaii 96813
October 2010 U.S. Department of the Interior National Park Service Natural Resource Program Center Fort Collins, Colorado
ii
The National Park Service Natural Resource Program Center publishes a range of reports that address natural resource topics of interest and applicability to a broad audience in the National Park Service and others in natural resource management, including scientists, conservation and environmental constituencies, and the public. The Natural Resource Report Series is used to disseminate high-priority, current natural resource management information with managerial application. The series targets a general, diverse audience, and may contain NPS policy considerations or address sensitive issues of management applicability. All manuscripts in the series receive the appropriate level of peer review to ensure that the information is scientifically credible, technically accurate, appropriately written for the intended audience, and designed and published in a professional manner. This report received formal peer review by subject-matter experts who were not directly involved in the collection, analysis, or reporting of the data, and whose background and expertise put them on par technically and scientifically with the authors of the information. Views, statements, findings, conclusions, recommendations, and data in this report do not necessarily reflect views and policies of the National Park Service, U.S. Department of the Interior. Mention of trade names or commercial products does not constitute endorsement or recommendation for use by the U.S. Government. This report is available from the Water Resources Division website (http://www.nature.nps.gov/water/wrdpub.cfm) and the Natural Resource Publications Management website (http://www.nature.nps.gov/publications/NRPM). Please cite this publication as: Fung Associates Inc. and SWCA Environmental Consultants. 2010. Assessment of natural resources and watershed conditions for Kalaupapa National Historical Park. Natural Resource Report NPS/NRPC/WRD/NRR—2010/261. National Park Service, Fort Collins, Colorado.
NPS 491/105912, October 2010
iii
Contents
Page Figures............................................................................................................................................. x
Tables ........................................................................................................................................... xiii
Executive Summary .................................................................................................................... xvii
Acknowledgments....................................................................................................................... xxii
Chapter 1: Park and Resources Context .......................................................................................... 1
1.1 Biogeographic and Physical Setting .................................................................................. 1
1.2 Historic Context and Park Purpose .................................................................................... 1
1.3 Land Ownership and Management .................................................................................... 2
1.4 Unique and Significant Park Natural Resources ............................................................... 5
1.4.1 Special Ecological Areas ........................................................................................... 8
1.5 Marine, Freshwater, & Terrestrial Ecosystems ................................................................. 8
Chapter 2: Description and Assessment of Park Natural Resources ............................................ 11
2.1 Terrestrial ......................................................................................................................... 11
2.1.1 Kauhakō Crater ....................................................................................................... 11
2.1.1.1 Previous and Ongoing Studies and Inventories ............................................. 13
2.1.1.2 Physical Environment .................................................................................... 15
2.1.1.3 Ecological Community .................................................................................. 15
2.1.1.4 Information Gaps ........................................................................................... 24
2.1.2 Coastal Spray Zone .................................................................................................. 25
2.1.2.1 Previous and Ongoing Studies and Inventories ............................................. 25
2.1.2.2 Physical Environment .................................................................................... 27
2.1.2.3 Ecological Community .................................................................................. 28
2.1.2.4 Information Gaps ........................................................................................... 35
iv
2.1.3 Offshore Islets .......................................................................................................... 36
2.1.3.1 Previous and Ongoing Studies and Inventories ............................................. 36
2.1.3.2 Physical Environment .................................................................................... 38
2.1.3.3 Ecological Community .................................................................................. 38
2.1.3.4 Information Gaps ........................................................................................... 41
2.1.4 Pu‘u Ali‘i Natural Area Reserve .............................................................................. 42
2.1.4.1 Previous and Ongoing Studies and Inventories ............................................. 43
2.1.4.2 Physical Environment .................................................................................... 45
2.1.4.3 Ecological Community .................................................................................. 46
2.1.4.4 Information Gaps ........................................................................................... 57
2.1.5 Moloka‘i Forest Reserve .......................................................................................... 58
2.1.5.1 Previous and Ongoing Studies and Inventories ............................................. 58
2.1.5.2 Physical Environment .................................................................................... 60
2.1.5.3 Ecological Community .................................................................................. 61
2.1.5.4 Information Gaps ........................................................................................... 66
2.1.6 North Shore Cliffs National Natural Landmark ...................................................... 66
2.1.6.1 Previous and Ongoing Studies and Inventories ............................................. 67
2.1.6.2 Physical Environment .................................................................................... 68
2.1.6.3 Ecological Community .................................................................................. 69
2.1.6.4 Information Gaps ........................................................................................... 73
2.1.7 Lowland Coastal Area ............................................................................................. 75
2.1.7.1 Previous and Ongoing Studies and Inventories ............................................. 75
2.1.7.2 Physical Environment .................................................................................... 78
2.1.7.3 Ecological Community .................................................................................. 78
2.1.7.4 Information Gaps ........................................................................................... 87
v
2.2 Freshwater Ecosystem ..................................................................................................... 88
2.2.1 Palustrine ................................................................................................................. 89
2.2.1.1 Previous and Ongoing Studies and Inventories ............................................. 89
2.2.1.2 Physical Environment .................................................................................... 89
2.2.1.3 Ecological Community .................................................................................. 91
2.2.1.4 Information Gaps ........................................................................................... 91
2.2.2 Lacustrine ................................................................................................................ 92
2.2.2.1 Previous and Ongoing Studies and Inventories ............................................. 92
2.2.2.2 Physical Environment .................................................................................... 93
2.2.2.3 Ecological Community .................................................................................. 96
2.2.2.4 Information Gaps ........................................................................................... 97
2.2.3 Anchialine ................................................................................................................ 98
2.2.3.1 Previous and Ongoing Studies and Inventories ............................................. 99
2.2.3.2 Physical Environment .................................................................................... 99
2.2.3.3 Ecological Community .................................................................................. 99
2.2.3.4 Information Gaps ........................................................................................... 99
2.2.4 Riverine .................................................................................................................. 100
2.2.4.1 Previous and Ongoing Studies and Inventories ........................................... 100
2.2.4.2 Physical Environment .................................................................................. 104
2.2.4.3 Ecological Community ................................................................................ 111
2.2.4.4 Information Gaps ......................................................................................... 117
2.3 Marine and Intertidal Zones ........................................................................................... 117
2.3.1 Coastal Reefs ......................................................................................................... 118
2.3.1.1 Previous and Ongoing Studies and Inventories ........................................... 118
2.3.1.2 Physical Environment .................................................................................. 119
vi
2.3.1.3 Ecological Community ................................................................................ 122
2.3.1.4 Information Gaps ......................................................................................... 131
2.3.2 Offshore Islets ........................................................................................................ 131
2.3.2.1 Previous Studies and Inventories ................................................................. 131
2.3.2.2 Physical Environment and Water Quality ................................................... 131
2.3.2.3 Ecological Community ................................................................................ 132
2.3.2.4 Information Gaps ......................................................................................... 134
2.3.3 Intertidal Zone ....................................................................................................... 134
2.3.3.1 Previous and Ongoing Studies and Inventories ........................................... 134
2.3.3.2 Physical Environment and Water Quality ................................................... 136
2.3.3.3 Ecological Community ................................................................................ 136
2.3.3.4 Information Gaps ......................................................................................... 143
Chapter 3: Threats & Stressors ................................................................................................... 146
3.1 Invasive Species ............................................................................................................. 146
3.1.1 Invasive Ungulates ................................................................................................. 146
3.1.1.1 Impacts to the Terrestrial Ecosystem ........................................................... 147
3.1.1.2 Impacts to the Freshwater Ecosystem .......................................................... 148
3.1.1.3 Impacts to the Marine Ecosystem ................................................................ 148
3.1.2 Invasive Terrestrial Flora ...................................................................................... 149
3.1.2.1 Impacts to the Terrestrial Ecosystem ........................................................... 152
3.1.2.2 Impacts to the Freshwater Ecosystem .......................................................... 152
3.1.2.3 Impacts to the Marine Ecosystem ................................................................ 152
3.1.3 Invasive Small Mammals ....................................................................................... 152
3.1.3.1 Impacts to the Terrestrial Ecosystem ........................................................... 153
3.1.3.2 Impacts to the Freshwater Ecosystem .......................................................... 153

vii
3.1.4 Invasive Insects ...................................................................................................... 153
3.1.4.1 Impacts to the Terrestrial Ecosystem ........................................................... 153
3.1.4.2 Impacts to the Freshwater Ecosystem .......................................................... 154
3.1.5 Invasive Reptiles and Amphibians ......................................................................... 154
3.1.5.1 Impacts to the Terrestrial Ecosystem ........................................................... 155
3.1.5.2 Impacts to the Freshwater Ecosystem .......................................................... 155
3.1.6 Invasive Fish .......................................................................................................... 155
3.1.6.1 Impacts to the Freshwater Ecosystem .......................................................... 155
3.1.6.2 Impacts to the Marine Ecosystem ................................................................ 155
3.1.7 Other Invasive Invertebrates.................................................................................. 156
3.1.7.1 Impacts to the Freshwater Ecosystem .......................................................... 156
3.1.7.2 Impacts to the Marine Ecosystem ................................................................ 156
3.1.8 Invasive Algae ........................................................................................................ 157
3.1.8.1 Impacts to the Marine Ecosystem ................................................................ 157
3.2 Diseases and Pathogens ................................................................................................. 157
3.2.1 Impacts to the Terrestrial Ecosystem ..................................................................... 157
3.2.2 Impacts to the Freshwater Ecosystem .................................................................... 158
3.2.3 Impacts to the Marine Ecosystem .......................................................................... 158
3.3 Habitat Loss, Degradation, and Fragmentation ............................................................. 158
3.3.1 Impacts to the Terrestrial Ecosystem ..................................................................... 158
3.3.2 Impacts to the Freshwater Ecosystem .................................................................... 159
3.3.3 Impacts to the Marine Ecosystem .......................................................................... 159
3.4 Harvest, Hunt, and Take ................................................................................................ 160
3.4.1 Impacts to the Terrestrial Ecosystem ..................................................................... 160
3.4.2 Impacts to the Freshwater Ecosystem .................................................................... 160
viii
3.4.3 Impacts to the Marine Ecosystem .......................................................................... 161
3.5 Visitor Use ..................................................................................................................... 161
3.5.1 Impacts to the Terrestrial Ecosystem ..................................................................... 162
3.5.2 Impacts to the Freshwater Ecosystem .................................................................... 162
3.5.3 Impacts to the Marine Ecosystem .......................................................................... 162
3.6 Climate Change ............................................................................................................. 163
3.6.1 Impacts to the Terrestrial Ecosystem ..................................................................... 163
3.6.1.1 Species Range and Distribution ................................................................... 163
3.6.1.2 Phenology and Physiology .......................................................................... 163
3.6.1.3 Community Composition and Interaction ................................................... 164
3.6.1.4 Trade-wind Inversion ................................................................................... 164
3.6.1.5 Sea-Level Rise ............................................................................................. 164
3.6.1.6 Fire ............................................................................................................... 164
3.6.2 Impacts to the Freshwater Ecosystem .................................................................... 164
3.6.2.1 Sea-Level Rise ............................................................................................. 165
3.6.3 Impacts to the Marine Ecosystem .......................................................................... 165
3.6.3.1 Sea Surface Temperatures (SSTs) ............................................................... 165
3.6.3.2 Sea-Level Rise ............................................................................................. 165
3.6.3.3 Ocean Acidification ..................................................................................... 167
3.6.3.4 Storm Events ................................................................................................ 167
3.6.3.5 Increasing Resistance and Resilience of Coral Reefs to Climate Change ... 167
3.7 Erosion and Landslides .................................................................................................. 167
3.7.1 Impacts to the Terrestrial Ecosystem ..................................................................... 167
3.7.2 Impacts to the Freshwater Ecosystem .................................................................... 168
3.7.3 Impacts to the Marine Ecosystem .......................................................................... 168
ix
3.8 Contaminants, Sewage, and Debris ............................................................................... 168
3.8.1 Impacts to the Terrestrial Ecosystem ..................................................................... 168
3.8.2 Impacts to the Freshwater Ecosystem .................................................................... 168
3.8.3 Impacts to the Marine Ecosystem .......................................................................... 170
3.9 Fire ................................................................................................................................. 170
3.9.1 Impacts to the Terrestrial Ecosystem ..................................................................... 170
3.10 Other Random Stochastic Events ................................................................................ 170
3.10.1 Impacts to the Terrestrial Ecosystem ................................................................... 171
3.10.2 Impacts to the Freshwater Ecosystem .................................................................. 171
3.10.3 Impacts to the Marine Ecosystem ........................................................................ 171
3.11 Summary of Threats and Stressors .............................................................................. 172
3.11.1 Identifying the Extent of the Problem at KALA ................................................... 172
3.11.2 Describing the Knowledge Base of Threats and Stressors .................................. 173
3.11.3 Quantifying the Magnitude of Impact on Ecosystems .......................................... 177
Chapter 4: Conclusion................................................................................................................. 178
Literature Cited ........................................................................................................................... 183
Appendices .................................................................................................................................. 214
x
Figures
Page
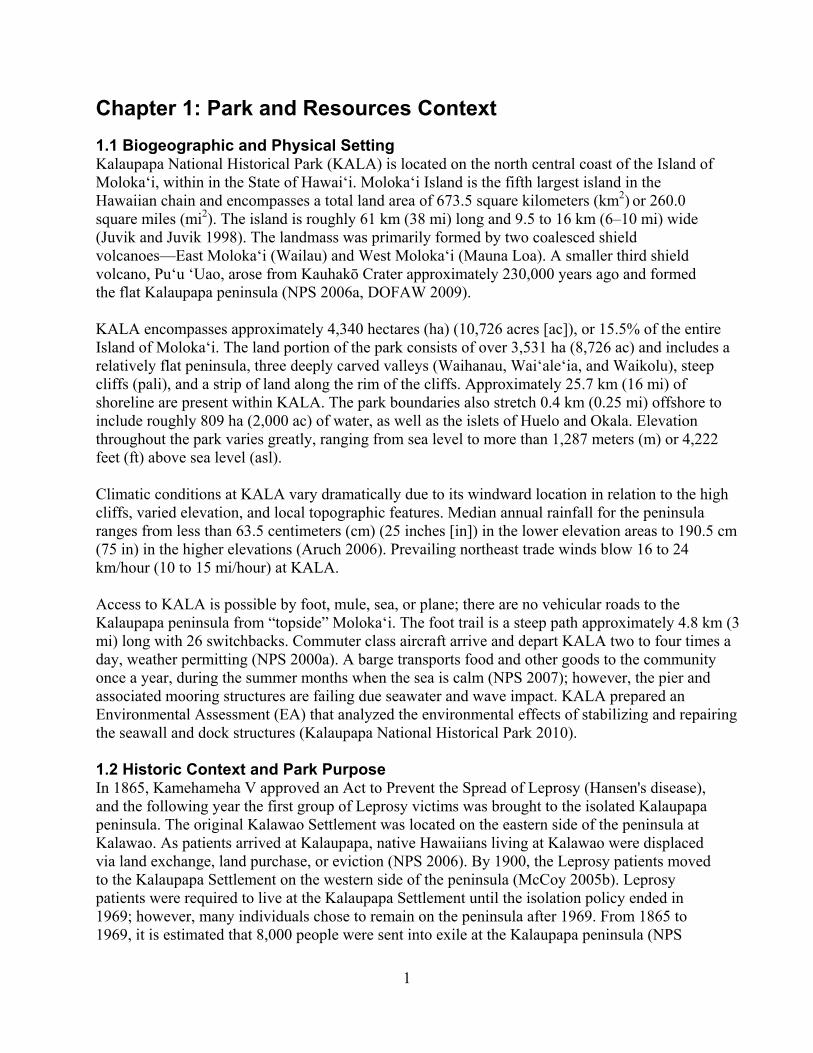
Figure 1.3-1. Land ownership at KALA and the vicinity. ............................................................. 4
Figure 1.4-1. Percentage of vegetation cover throughout KALA per NPS Class. ......................... 6
Figure 1.4-2. Vegetation cover and NPS vegetation classes throughout KALA. .......................... 7
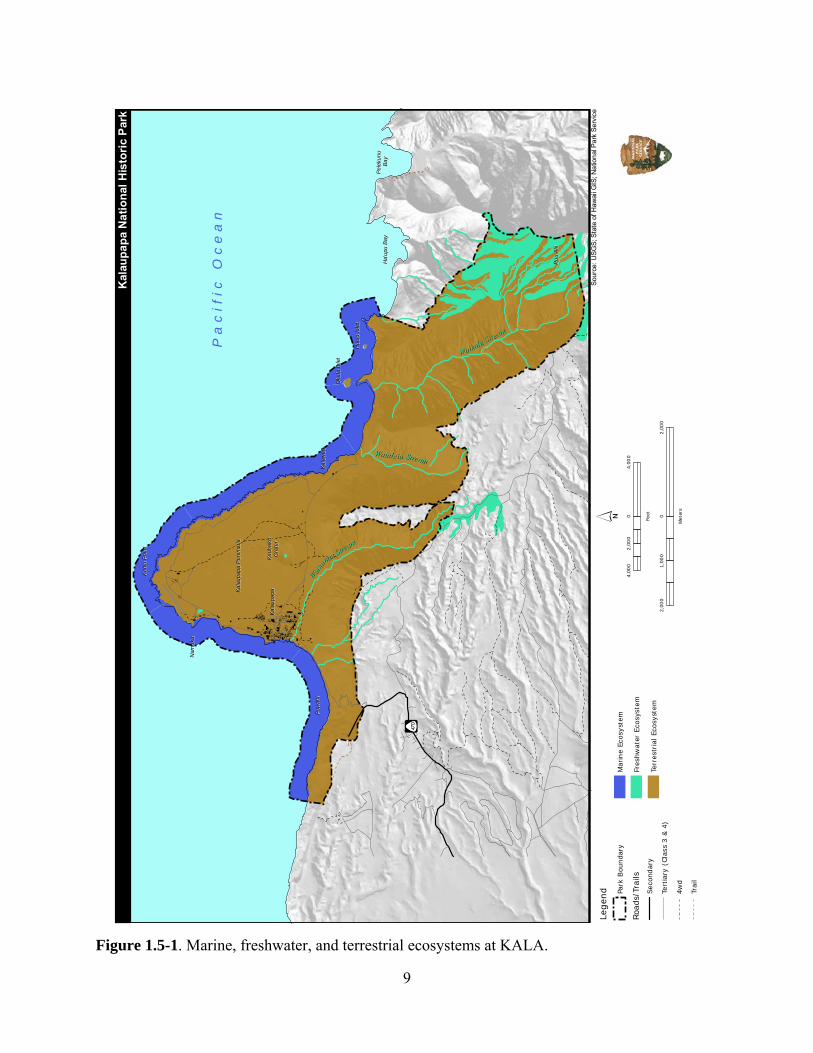
Figure 1.5-1. Marine, freshwater, and terrestrial ecosystems at KALA. ....................................... 9
Figure 2.1-1. Terrestrial management zones at KALA. ............................................................... 12
Figure 2.1-2. Soil types within the terrestrial management zones at KALA. .............................. 16
Figure 2.1-3. Percentage of native and non-native species in Kauhakō Crater. .......................... 18
Figure 2.1-4. Vegetation cover and NPS vegetation classes in Kauhakō Crater. ........................ 19
Figure 2.1-5. Selective native plants in the Kauhakō Crater. ...................................................... 20
Figure 2.1-6. Percentage of native and non-native vascular plant species in the Coastal Spray Zone. ................................................................................................................................... 29
Figure 2.1-7. Plant communities in the Coastal Spray Zone. ...................................................... 31
Figure 2.1-8. Vegetation cover and NPS vegetation classes in the Coastal Spray Zone. ............ 32
Figure 2.1-9. Critical habitat for threatened and endangered species in the Coastal Spray Zone. ............................................................................................................................................. 34
Figure 2.1-10. Percentage of native and non-native vascular plant species on the Offshore Islets. ............................................................................................................................................. 40
Figure 2.1-11. Vegetation communities within the Pu‘u Ali‘i NAR. .......................................... 47
Figure 2.1-12. Percentage of native and non-native plant species in the Pu‘u Ali‘i NAR. ......... 48
Figure 2.1-13. Vegetation cover and NPS vegetation classes in the Pu‘u Ali‘i NAR. ................ 50
Figure 2.1-14. Ungulate activity documented during hunting tests in Pu‘u Ali‘i NAR. ............. 52
Figure 2.1-15. Critical habitat for threatened and endangered species in the Pu‘u Ali‘i NAR. .. 55
Figure 2.1-16. Vegetation cover and NPS vegetation classes in the Molokai Forest Reserve. ... 62
Figure 2.1-17. Critical habitat for threatened and endangered species in the Molokai Forest Reserve. ......................................................................................................................................... 65
xi
Figure 2.1-18. Vegetation cover and NPS vegetation classes in the North Shore Cliffs NNL. ... 71
Figure 2.1-19. Critical habitat for threatened and endangered species in the North Shore Cliffs NNL. ................................................................................................................................... 74
Figure 2.1-20. Vegetation cover and NPS vegetation classes in the Lowland Coastal Area. ...... 80
Figure 2.1-21. Critical habitat for threatened and endangered species in the Lowland Coastal Area. ................................................................................................................................. 85
Figure 2.2-1. Palustrine habitats at KALA. ................................................................................. 90
Figure 2.2-2. Bathometry of Lake Kauhakō redrawn by Donachie et al. (1999) from Maciolek (1982). ........................................................................................................................... 94
Figure 2.2-3. Parameters in Kauhakō Crater from Donachie et al. (1999).A) Salinity (□) and temperature (solid line) profiles; B) Concentrations of oxygen (○), hydrogen sulfide (■), and nitrous oxide (+); C) DIC ( ), TOC (●), and alkalinity ( ). ...................................................... 95
Figure 2.2-4. Salinity, alkalinity, and sulfide concentrations as a function of depth between 1997 and 2002 from Donachie et al. (2004). ................................................................................ 96
Figure 2.2-5. Vertical distribution of A) heterotrophic (○) and autoflurescent (■) Bacteria, and B) Synechococcius-like cells (□), filamentous cyanobacteria ( ) and other autofluorescent cells (●) in Lake Kauhakō from Donachie et al. (1999). .................................... 98
Figure 2.2-6. Streams within KALA. ......................................................................................... 101
Figure 2.2-7. Molokai irrigation system in Waikolu Valley. ..................................................... 106
Figure 2.2-8. Daily discharge at USGS gage 16408000 over the period of record. .................. 108
Figure 2.2-9. Daily discharge at USGS gage 16405500 over the period of record. .................. 108
Figure 2.2-10. Daily discharge at USGS gage 16405100 over the period of record. ................ 109
Figure 2.2-11. Temperature measurements at three USGS gaging stations on Waikolu Stream between 1969 and 1989 from DeVerse and DiDonato (2006). ...................................... 109
Figure 2.2-12. pH values measured at two USGS continuous record stations between 1969 and 1985 from DeVerse and DiDonato (2006). USEPA maximum and minimum water quality standards (WQS) are shown by solid red lines and the State of Hawaii WQS are indicated by green. ...................................................................................................................... 110
Figure 2.2-13. Instantaneous discharge from three USGS gaging stations along Waikolu stream in KALA between 1969 and 1989 from DeVerse and DiDonato (2006). ....................... 110
Figure 2.2-14. Monthly discharge at USGS gage (16410000) on Keolea Stream over the period of record. .......................................................................................................................... 112
xii
Figure 2.3-1. Average cignificant wave heights (radial axis in metres) for Different Wave Directions (degrees) at KALA. Data are pooled from 2001 to 2008. ......................................... 120
Figure 2.3-2. Wave energy zones and wave direction. .............................................................. 121
Figure 2.3-3. Benthic cover - top five algae and coral species by wave energy zone (2004–2007). .......................................................................................................................................... 123
Figure 2.3-4. Average percent cover of benthic substrate on coastal reefs at KALA. Data are pooled from 2004 to 2007. .......................................................................................................... 124
Figure 2.3-5. Average relative abundance of the top five corals at KALA. Data are pooled from 2004 to 2007. ...................................................................................................................... 124
Figure 2.3-6. Coral settlement at KALA from 2006-2008. Error bars are standard error. ........ 125
Figure 2.3-7. Relative abundance of top five alga in KALA from 2004–2007. ........................ 126
Figure 2.3-8. (a) Top 10 species of fish at KALA by mean percent abundance. (b) Mean percent abundance from 2004–2008.separated out by trophic group. P= primary consumer, S = secondary consumer, A = apex predator. ................................................................................ 127
Figure 2.3-9. Fish trophic abundance and biomass summary by wave energy zone from 2006 to 2008). ............................................................................................................................. 128
Figure 2.3-10. (a) Top 10 species of fish at KALA by mean percent biomass from 2004 - 2008. (b) Mean percent biomass from 2004–2008.separated out by trophic group. P= primary consumer, S = secondary consumer, A = apex predator. .............................................. 129
Figure 2.3-11. Intertidal substrates and survey locations. .......................................................... 137
Figure 2.3-12. Monk seal survey locations. ............................................................................... 138
Figure 2.3-13. Number of invertebrate species represented within their respective phyla and the percentage of each phyla represented within the intertidal zone at KALA. ......................... 140
Figure 2.3-14. Locations of bird sightings within the Intertidal Zone in 2005. ......................... 144
Figure 2.3-15. Monk seal sighting frequencies at different sites at KALA. .............................. 145
Figure 2.3-16. Monk seal observations at KALA for different months (all sites combined). ... 145
Figure 3.6-1. Coastline elevation map. ...................................................................................... 166
Figure 3.8-1. Existing and previous landfills at KALA. ............................................................ 169
xiii
Tables Page
Table 1.3-1. Formal cooperative agreements with NPS at KALA. ................................................ 3
Table 1.4-1. Number of federally and state listed species within KALA. ..................................... 6
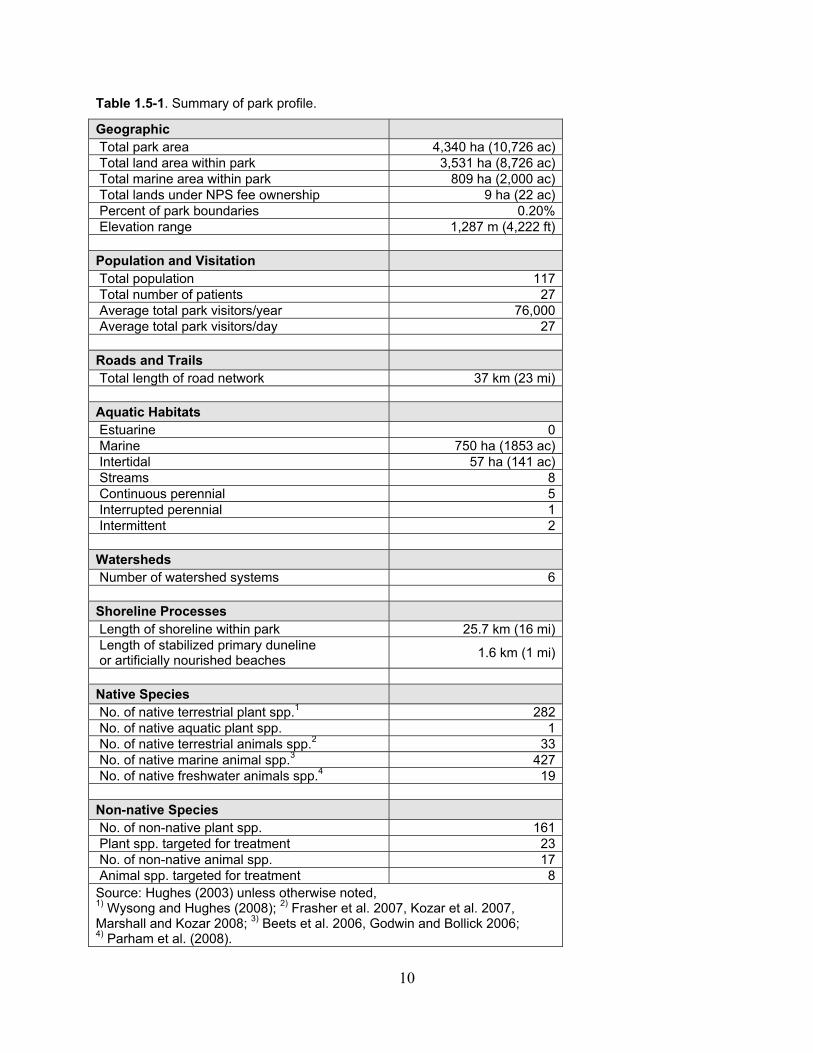
Table 1.5-1. Summary of park profile. ......................................................................................... 10
Table 2.1-1. Terrestrial ecological management zones at KALA. ............................................... 11
Table 2.1-2. Soil types and key soil characteristics in Kauhakō Crater management zone. ........ 15
Table 2.1-3. Origin of plant species documented in Kauhakō Crater and immediate environs. ........................................................................................................................................ 18
Table 2.1-4. Vegetation cover and NPS vegetation classes in Kauhakō Crater. .......................... 21
Table 2.1-5. Summary of small mammal data in Kauhakō Crater. .............................................. 22
Table 2.1-6. Soil types and key soil characteristics in Coastal Spray Zone management zone. .............................................................................................................................................. 27
Table 2.1-7. Origin of plant species documented in Coastal Spray Zone. ................................... 29
Table 2.1-8. Plant communities in the Coastal Spray Zone. ........................................................ 30
Table 2.1-9. Vegetation cover and NPS vegetation vlasses in the Coastal Spray Zone. ............. 30
Table 2.1-10. Total critical habitat area for threatened and endangered plants in the Coastal Spray Zone. ................................................................................................................................... 33
Table 2.1-11. Origin of plant species documented on the offshore islets. ................................... 40
Table 2.1-12. Federally threatened and endangered species currently occurring on the offshore islets. ............................................................................................................................... 41
Table 2.1-13. Soil types and key soil characteristics in Pu‘u Ali‘i NAR management zone. ...... 45
Table 2.1-14. Vegetation communities and estimated acreage within the Pu‘u Ali‘i NAR. ....... 46
Table 2.1-15. Origin of plant species documented in the Pu‘u Ali‘i NAR. ................................. 48
Table 2.1-16. Vegetation cover and NPS vegetation classes in the Pu‘u Ali‘i NAR. .................. 49
Table 2.1-17. Percent occurrence and birds per station for the two HFBS transects in 1979 and 2004/2005. .............................................................................................................................. 51
Table 2.1-18. Summary of small mammal data in the Pu‘u Ali‘i NAR. ...................................... 51
xiv
Table 2.1-19. Endangered, threatened, candidate, or rare plants species that occur or potentially occur in the Pu‘u Ali‘i NAR and surrounding area. ................................................... 54
Table 2.1-20. Total critical habitat area for threatened and endangered plants in the Pu‘u Ali‘i NAR...................................................................................................................................... 56
Table 2.1-21. Endangered, threatened, or rare avifauna that occur or potentially occur in the Pu‘u Ali‘i NAR and surrounding area. ......................................................................................... 56
Table 2.1-22. Rare snails within the Pu‘u Ali‘i NAR and surrounding area. .............................. 57
Table 2.1-23. Soil types and key soil characteristics in Moloka‘i Forest Reserve management zone.......................................................................................................................... 60
Table 2.1-24. Vegetation cover and NPS vegetation classes in the Moloka‘i Forest Reserve. ... 61
Table 2.1-25. Relative abundance and total individuals of various forest birds recorded in the Moloka‘i Forest Reserve in 1977. ........................................................................................... 63
Table 2.1-26. Summary of small mammal data in the Moloka‘i Forest Reserve. ....................... 64
Table 2.1-27. Total critical habitat area for threatened and endangered plants in the Moloka‘i Forest Reserve. .............................................................................................................. 64
Table 2.1-28. Soil types and key soil characteristics in North Shore Cliffs NNL management zone. .............................................................................................................................................. 69
Table 2.1-29. Vegetation cover and NPS vegetation classes in the North Shore Cliffs NNL. .... 70
Table 2.1-30. Summary of small mammal data in the North Shore Cliffs NNL. ........................ 72
Table 2.1-31. Total critical habitat area for threatened and endangered plants in the North Shore Cliffs NNL. ......................................................................................................................... 73
Table 2.1-32. Soil types and key soil characteristics in Lowland Coastal Area management zone. .............................................................................................................................................. 79
Table 2.1-33. Vegetation cover and NPS vegetation classes in the Lowland Coastal Area. ....... 81
Table 2.1-34. Percent cover of native and non-native species inside and outside the Tetramolopium rockii var. rockii exclosure. ................................................................................. 82
Table 2.1-35. Percent cover of native and non-native species inside the Centaurium sebaeoides exclosure. .................................................................................................................... 82
Table 2.1-36. Summary of small mammal data in the Lowland Coastal Area. ........................... 84
Table 2.1-37. Total critical habitat area for threatened and endangered plants in the Lowland Coastal Area. ................................................................................................................................. 84
xv
Table 2.2-1. Palustrine habitats identified at KALA from the National Wetlands Inventory (NWI) Program. ............................................................................................................................ 91
Table 2.2-2. Streams within KALA, from West to East. ........................................................... 104
Table 2.2-3. Resource assessment for the KALA streams from Hawaii Stream Assessment. .. 104
Table 2.2-4. USGS stream gages in Waikolu Valley. ................................................................ 105
Table 2.2-5. Characteristic stream fauna reported from riverine habitats at KALA. ................. 115
Table 2.3-1. Species richness on the reefs of the offshore islets (From Coles et al. 2008). ...... 132
Table 2.3-2. Benthic cover at the offshore islets. ....................................................................... 133
Table 2.3-3. Introduced and cryptogenic invertebrate species for the offshore islets. ............... 133
Table 2.3-4. Species composition of invertebrates in the intertidal zone. ................................. 139
Table 2.3-5. Bird species observed from the shoreline of KALA. ............................................. 142
Table 3.1-1. Invasive plant species believed to have the greatest impact to the natural resources within the terrestrial ecosystem at KALA. ................................................................. 150
Table 3.1-2. Characteristics of invasive plant species believed to have the greatest impact to the natural resources within the terrestrial ecosystem at KALA. ............................................... 151
Table 3.11-1. Summary of threats and stressors in the terrestrial environment at KALA. ........ 174
Table 3.11-2. Summary of threats and stressors in the freshwater environment at KALA. ...... 175
Table 3.11-3. Summary of threats and stressors in the marine environment at KALA. ............ 176
Table 3.11-4. Magnitude of impact of threats and stressors on ecosystems at KALA. ............. 178

xvi
xvii
Executive Summary
This report is an assessment of the current natural resource conditions within Kalaupapa National Historic Park (KALA). This report will summarize: 1) condition/ecological status of the terrestrial, freshwater, and marine resources at the park based on available surveys; 2) existing and emerging threats or stressors that act on those resources; and 3) important information gaps and recommended future studies that address additional information needs (e.g., condition of park natural resources, known threats, and unacceptable conditions). An important component of the report is the development of a geographical information system (GIS) data base which assembles geospatial data layers to provide an integrated measure of current park resource conditions relative to National Park Service (NPS) Vital Signs indicators or other relevant indicators of resource conditions. This report is divided into the following four sections, and a brief summary of each section is provided below. Chapter 1 provides an overview of KALA, including a general description of the physical setting, historic context of the park, and land ownership and management issues. KALA is located on the north central coast of the Island of Moloka‘i, within the State of Hawai‘i. The park encompasses a total area of 4,340 hectares (ha) or 10,726 acres (ac), including roughly 3,531 ha (8,726 ac) of land and 809 ha (2,000 ac) of water. The Kalaupapa peninsula was established as a quarantine settlement for people with leprosy (Hansen's disease) beginning in 1865. The historic Kalaupapa Settlement and the surrounding area were incorporated into the National Park System in December 1980. Most of the land within the park boundaries is not owned by the National Park Service, but is managed by the NPS through formal cooperative agreements with various federal and state agencies, as well as private entities. Although the original intention of KALA was to ensure the protection of unique cultural resources, the park contains significant natural resources. The National Park Service is accountable for preserving, maintaining, and protecting various unique habitats, as well as the native species that occur within those habitats. Notable habitats at KALA include the Pu‘u Ali‘i Natural Area Reserve (NAR), Waikolu Valley, Kauhakō Crater, offshore islets, steep cliffs (pali), caves and lava tubes, and submerged lands surrounding the peninsula. Over 282 species of native terrestrial plants, 33 species of native terrestrial fauna, 19 species of native freshwater fauna, and 427 species of native subtidal and intertidal marine fauna are known within KALA. Of those, approximately 35 plant species and eight animal species are currently listed as federal or state endangered, proposed endangered, threatened, or candidate species. An additional 18 native plant and 6 native animal species are considered federal species of concern. Chapter 2 lists previous and ongoing surveys and inventories at KALA, describes and assesses the physical environment and ecological communities, and identifies areas that require more information to better evaluate current conditions, identify existing factors negatively impacting those resources, and quantify potential threats. The chapter is organized into the park’s three primary ecosystems—Marine, Freshwater, and Terrestrial (Figure 1.5-1).
xviii
The terrestrial environment within KALA is divided into the following seven ecological management zones: Kauhakō Crater, Coastal Spray Zone, Offshore Islets, Pu‘u Ali‘i NAR, Moloka‘i State Forest Reserve, North Shore Cliffs National Natural Landmark, and the Lowland Coastal Area (Figure 2.1-1). Similar to other areas in Hawai‘i, a myriad of factors have altered the native terrestrial flora and fauna that historically occurred at KALA (e.g., invasive plants, ungulates, rodents, human development, and cultivation practices). However, select portions of the park contain remnant areas of native vegetation and support native fauna. The Coastal Spray Zone supports a diverse and extensive native coastal vegetation community; both Huelo and Ōkala Islet support unusual relict vegetation and rich native species diversity; several native-dominated vegetation communities occur in the Pu‘u Ali‘i NAR; and large, relatively healthy Erythrina sandwicensis (wiliwili) occur in Kauhakō Crater. Currently, the terrestrial ecosystem contains 35 federally endangered, threatened, or candidate terrestrial plant species and provides critical habitat for 12 plants. Some vegetation communities are known to support essential habitat for native forest birds, migrant shorebirds, and several seabird species. Furthermore, caves and cavernous features in the terrestrial environment provide refuge for rare obligate cave-adapted plants and animals and preserve paleontological resources. Most survey efforts in this ecosystem are limited to species checklists. Long-term monitoring programs with regularly monitored permanent plots (or transects) and consistent methodology would document the presence and abundance of native and non-native species over time to inform future management or restoration strategies. The freshwater ecosystem within KALA includes palustrine, lacustrine, anchialine, and riverine habitats (Figure 1.4-1). It is difficult to assess the distribution and status of the palustrine and anchialine habitats within the freshwater ecosystems at KALA due to the lack of information available for these habitats. However, the lacustrine and riverine habitats contain unique macrofauna and habitats. Lake Kauhakō is considered to be the forth-deepest lake in the United States and has the greatest relative depth (ratio of depth to surface area) of any lake in the world. The lake supports a dense and highly productive phytoplankton community and fauna including a native paleomonid shrimp, copepods, and other microzooplankton. Two of the 10 streams within the boundaries of KALA (Waikolu and Waihanau) were identified as candidate streams for preservation protection in the Hawaii Stream Assessment. This is significant given that few streams in Hawai‘i have any sort of protected status. Although diversion of Waikolu Stream at higher elevations has altered the natural base flow of the stream, the lower reaches of Waikolu Stream contain a rich assemblage of all five native amphidromous fish species. Overall, Waikolu Stream has one of the highest densities of stream gobies in the Hawaiian Islands and supports a dense population of the uncommon native stream snail Neritina granosa. The proposed federally endangered damselfly Megalagrion pacificum and federal candidate damselfly Megalagrion xanthomelas are also found in the streams at KALA. The marine ecosystem at KALA is divided into three habitats—intertidal, coastal reefs, and offshore islet reefs. The coastal and offshore reef ecosystems of KALA are healthy and robust compared to other reefs in the main Hawaiian Islands. For the nearshore coral reefs, long-term monitoring of the oceanographic factors, and biological monitoring of the benthos, fish assemblages, coral disease, and coral settlement are ongoing. Intertidal invertebrates have been
xix
inventoried twice, and yearly surveys are conducted to monitor the distribution and abundance of the commonly harvested invertebrate, Cellana spp. (opihi). Large, reproductively mature Cellana spp. are currently present in the intertidal habitat of KALA. The endangered Monachus schauinslandi (monk seal) uses the intertidal habitat at KALA for pupping, resting, and feeding, and their presence is closely monitored. Successful nesting by the threatened Chelonia mydas (green sea turtle) has been also documented. Introduced species (algae, fish, and invertebrates) present in the various habitats have also been documented, and eradication efforts are underway for the potentially invasive algae Acanthophora spicifera in the intertidal. Although these ecosystems differ, many of the natural resources within KALA are ecologically connected and therefore interactions between these three ecosystems are significant. Chapter 3 discusses existing and potential threats and stressors to the physical environment and ecological communities within the marine, freshwater, and terrestrial ecosystems at KALA. A total of 12 biotic and five abiotic existing and potential threats and stressors were identified for KALA. The physical environment and ecological communities within the marine, freshwater, and terrestrial ecosystems at KALA have been adversely impacted and risk further degradation by a myriad of threats and stressors. Threats are defined as environmental trends with potentially negative impacts, and stressors are physical, chemical, or biological perturbations to a system that cause significant changes in the ecological components, patterns, and processes in natural systems. This assessment identified a total of 12 biotic (caused by biological or anthropogenic activities) and five abiotic (caused by physical or chemical processes) existing and potential threats and stressors at KALA. Because of the uncertainty surrounding future land management and ownership at the park, some issues that are not currently a problem at KALA may have the potential to become a problem in the long-term (>20 years) if the park is opened to the wider public, resulting in the potential of increased anthropogenic impacts (e.g., increased harvesting, sewage, spread of invasive species). These potential problems are also addressed. Seven threats and stressors were determined to have a significant impact on at least one of the ecosystems at KALA (i.e., marine, terrestrial, and freshwater). The impact of these threats and stressor is considered significant due to the 1) spatial scale at which they act; 2) frequency with which they act; and 3) number of trophic levels impacted. Threats and stressors that are significantly impacting resources at KALA are briefly summarized below. Invasive ungulates: Feral ungulates, including Sus scrofa (pig), Capra hircus (goat), and Axis axis (deer) are a significant threat to the natural resources at KALA. Of these, A. axis are believed to be the most damaging. Throughout the Hawaiian Islands ungulate activity results in various impacts including land erosion; stream and reef siltation; spread of invasive plants and diseases; loss of native, threatened, and endangered plant and animal species; and degradation of native species’ habitat. Invasive terrestrial flora: Although the exact extent of specific invasive plants in the park is not known, invasive plant taxa have been documented in all of the terrestrial management zones in KALA. In Hawai‘i, invasive plants compete with native plants for resources, modify fire regimes, alter nutrient cycling patterns, change hydrologic regimes, and remove wildlife habitats.
xx
Invasive small mammals: Rattus rattus (black rats), Mus musculus (house mice), Herpestes javanicus (small Indian mongooses), and Felis catus (feral cats) present at KALA represent significant threats to park resources. These small, non-native mammals are known to consume a variety of native birds, invertebrates, and plants throughout the Hawaiian Islands. Invasive insects: Invasive non-native insects have been documented to adversely affect native biodiversity through herbivory, predation, parasitism, pollination disruption, and hybridization and competition with native species. Insects have the greatest rate of yearly establishment of all animal or plant groups in Hawai‘i. Few invasive insects have been documented at KALA (including Sophonia rufofascia [two-spotted leafhopper], Quadrastichus erythrinae [erythrina gall wasp], and Specularius impressithorax [erythrina seed beetle]), but others likely occur within the park boundaries. Diseases and pathogens: Mosquito-borne avian diseases, principally Plasmodium relictum (avian malaria) and the virus Avipoxvirus sp. (avian pox), have been implicated as the main reason for mortality of the native Hawaiian forest birds in low-elevation areas. The entire Island of Moloka‘i lies within the elevation range of the primary vector of these diseases; therefore, all native (and non-native) avifauna at KALA are threatened by these diseases. In addition, coral disease and coral bleaching has been documented at KALA for two years (2006–2007). Habitat loss and degradation: Historic and modern human activities have modified, fragmented, or destroyed some of the original habitat at KALA. During the prehistoric and historic eras, residential and religious structures, as well as extensive agriculture, removed the original habitat of portions of the park. The Molokai Irrigation System, which began diverting water from Waikolu Stream in 1960, has altered the volume and frequency of flows in the stream. Densities of native stream fauna were found to be substantially lower in, and upstream of, the diverted sections of Waikolu Stream compared to the lower reaches of Waikolu Stream and to comparable areas on the undiverted Pelekunu Stream, likely due to the effects of dewaterment on habitat availability. The construction of an upgraded harbor at KALA also has the potential to impact the benthic and fish communities and marine mammals in adjacent areas. Climate change: Although the maritime location of the Hawaiian Islands makes the archipelago relatively well buffered climatically, climatic changes have been documented throughout the state. Potential impacts of climate change are widespread throughout the park. Based on information from outside the park, the following could be impacted at KALA as a result of climate change: species ranges and geographical distribution; physiology and phenology; community composition and interaction; trade wind inversion layer; frequency of fires; sea surface temperatures; sea level; ocean chemistry; and intensity of storms. For most threats and stressors at KALA, available information is limited to the presence/absence of a particular species, group of species, activity, or abiotic process in a specific area of the park. There is an overall lack of information that quantifies the extent of the problem on a park-wide level. In addition, there is a paucity of information that identifies and/or quantifies the direct and indirect impacts of the potential threats and stressors present throughout KALA. Because of the known adverse impacts of invasive species on native species and ecosystems in other areas in Hawai‘i (particularly mammals, plants, and invertebrates), this represents a major data gap.
xxi
Chapter 4 provides a brief summary of the overall current condition of the natural resources at KALA based on the information discussed in Chapters 2 and 3 and summarizes recommendations to document, maintain, or improve the current conditions. Despite the threats and stressors present at KALA, intact examples of native Hawaiian ecosystems and unique native species remain, and regular monitoring of these habitats and species is essential to preserving these resources.

xxii
Acknowledgments
Fung Associates Inc. and SWCA Environmental Consultants would like to acknowledge the staff at the Kalaupapa National Historic Park, in particular Eric Brown and Guy Hughes, for sharing previous reports, data, and their local knowledge of the park. We are grateful to Eva DiDonato, Jeff Hughes, Sandy Margriter, and other reviewers at the National Park Service for their insightful comments on the draft report, as well as supplemental unpublished data. Finally, we thank the residents of Kalaupapa for their kind hospitality.
1
Chapter 1: Park and Resources Context
1.1 Biogeographic and Physical Setting Kalaupapa National Historical Park (KALA) is located on the north central coast of the Island of Moloka‘i, within in the State of Hawai‘i. Moloka‘i Island is the fifth largest island in the Hawaiian chain and encompasses a total land area of 673.5 square kilometers (km2) or 260.0 square miles (mi2). The island is roughly 61 km (38 mi) long and 9.5 to 16 km (6–10 mi) wide (Juvik and Juvik 1998). The landmass was primarily formed by two coalesced shield volcanoes—East Moloka‘i (Wailau) and West Moloka‘i (Mauna Loa). A smaller third shield volcano, Pu‘u ‘Uao, arose from Kauhakō Crater approximately 230,000 years ago and formed the flat Kalaupapa peninsula (NPS 2006a, DOFAW 2009). KALA encompasses approximately 4,340 hectares (ha) (10,726 acres [ac]), or 15.5% of the entire Island of Moloka‘i. The land portion of the park consists of over 3,531 ha (8,726 ac) and includes a relatively flat peninsula, three deeply carved valleys (Waihanau, Wai‘ale‘ia, and Waikolu), steep cliffs (pali), and a strip of land along the rim of the cliffs. Approximately 25.7 km (16 mi) of shoreline are present within KALA. The park boundaries also stretch 0.4 km (0.25 mi) offshore to include roughly 809 ha (2,000 ac) of water, as well as the islets of Huelo and Okala. Elevation throughout the park varies greatly, ranging from sea level to more than 1,287 meters (m) or 4,222 feet (ft) above sea level (asl). Climatic conditions at KALA vary dramatically due to its windward location in relation to the high cliffs, varied elevation, and local topographic features. Median annual rainfall for the peninsula ranges from less than 63.5 centimeters (cm) (25 inches [in]) in the lower elevation areas to 190.5 cm (75 in) in the higher elevations (Aruch 2006). Prevailing northeast trade winds blow 16 to 24 km/hour (10 to 15 mi/hour) at KALA. Access to KALA is possible by foot, mule, sea, or plane; there are no vehicular roads to the Kalaupapa peninsula from “topside” Moloka‘i. The foot trail is a steep path approximately 4.8 km (3 mi) long with 26 switchbacks. Commuter class aircraft arrive and depart KALA two to four times a day, weather permitting (NPS 2000a). A barge transports food and other goods to the community once a year, during the summer months when the sea is calm (NPS 2007); however, the pier and associated mooring structures are failing due seawater and wave impact. KALA prepared an Environmental Assessment (EA) that analyzed the environmental effects of stabilizing and repairing the seawall and dock structures (Kalaupapa National Historical Park 2010). 1.2 Historic Context and Park Purpose In 1865, Kamehameha V approved an Act to Prevent the Spread of Leprosy (Hansen's disease), and the following year the first group of Leprosy victims was brought to the isolated Kalaupapa peninsula. The original Kalawao Settlement was located on the eastern side of the peninsula at Kalawao. As patients arrived at Kalaupapa, native Hawaiians living at Kalawao were displaced via land exchange, land purchase, or eviction (NPS 2006). By 1900, the Leprosy patients moved to the Kalaupapa Settlement on the western side of the peninsula (McCoy 2005b). Leprosy patients were required to live at the Kalaupapa Settlement until the isolation policy ended in 1969; however, many individuals chose to remain on the peninsula after 1969. From 1865 to 1969, it is estimated that 8,000 people were sent into exile at the Kalaupapa peninsula (NPS
2
2006). Today, KALA is home to only 27 patients. The current Kalaupapa Settlement includes residences, dormitories, churches, a hospital, a small grocery store, maintenance and storage buildings, and other infrastructure to support the small community (NPS 2006a). The Kalaupapa Settlement was designated as a National Historic Landmark District in 1976 and many historic buildings on the peninsula have been placed on the National Register of Historic Places (NPS 1997, 2006). In December 1980, KALA was incorporated into the National Park System. The Act authorizing Kalaupapa National Historical Park (Public Law 96-565 enacted December 22, 1980) set forth the following as the principal purposes of the park:
Preserve and interpret the Kalaupapa settlement for the education and inspiration of present and future generations;
Provide a well-maintained community in which the Kalaupapa Hansen's disease patients are guaranteed that they may remain at Kalaupapa as long as they wish;
Protect the current lifestyle of these patients and their individual privacy; Research, preserve, and maintain the present character of the community; Research, preserve, and maintain important historic structures, traditional Hawaiian sites,
cultural values, and natural features; Provide for limited visitation by the general public; Provide that the preservation and interpretation of the settlement be managed and performed
by patients and native Hawaiians to the extent practical; and Provide training opportunities to such persons in management and interpretation of the
settlement's cultural, historical, educational, and scenic resources. Although the original intent of KALA was to ensure the protection of unique cultural resources, the park contains significant natural resources. These resources are summarized in Section 1.4 and a detailed description and assessment is provided in Chapter 2. 1.3 Land Ownership and Management The Kalaupapa peninsula is located in Kalawao County, which is governed by the State of Hawai‘i Department of Health (DOH). Public Law 96-565, the enabling legislation for KALA (Appendix 1), outlines the primary management for the park. Additional rules and regulations of Kalawao County are adopted as necessary to manage the community. The general statutes that guide NPS land management nationwide are also applicable at KALA. These include the National Park Service Organic Act (16 U.S.C. sec 1 et seq.), the Act for Administration (16 U.S.C. 1a-1), the Endangered Species Act, and the Historic Preservation Act (NPS 2000). Most of the land within the park boundaries is not owned by the National Park Service. Of the total park area, the National Park Service owns only nine ha (23 ac), or 0.2 percent of KALA. This area was formerly owned by the U.S. Coast Guard and includes two historic houses and four buildings that surround the Moloka‘i Light Station (NPS 2006a). The remainder of the park is managed through formal cooperative agreements with various federal and state agencies, as well as private entities (Table 1.3-1). The National Park Service has formal cooperative agreements with the State DOH, Department of Land and Natural Resources (DLNR), Department of Transportation (DOT), and Department of Hawaiian Home Lands (DHHL). The majority of the land (approximately 505 ha or 1,247 ac) is leased from DHHL. Roughly 29 ha (72 ac) of small private holdings occur within the
3
authorized park boundary at the top of the cliffs. Figure 1.3-1 shows land ownership in the park boundaries and the surrounding areas. Table 1.3-1. Formal cooperative agreements with NPS at KALA.
Agency Date
Entered Agreement
Duration Expiration
Date Hawaii Department of Health April 2004 20 yrs April 2024
Hawaii Department of Hawaiian Homelands July 1991 50 yrs July 2041
Hawaii Department of Land & Natural Resources August 1989 20 yrs August 2009
Hawaii Department of Transportation March 1987 20 yrs March 2007
Source: NPS (2000a, 2006a).
Public Law 96-565 outlines the rights of the residents of KALA. According to this legislation, visitation is limited to only 100 people per day. This includes tourists on commercial tours, volunteers performing services projects, cultural practitioners, and guests of residents. In addition, no individuals under 16 years of age are allowed at KALA, except in special cases. Under this law, residents have the right to take fish and wildlife resources without regard to federal fish and game regulations and the right to take plant and other natural resources for traditional purposes in accordance with applicable state and federal laws (NPS 1999, 2000a, 2006). By restricting public visitation, Public Law 96-565 limits impacts to the natural and cultural resources within KALA.
Under Public Law 96-565, the National Park Service is responsible for managing the park and protecting the lifestyle of the patients. This includes preserving, maintaining, and protecting historic buildings, and prehistoric and historic cultural resources and values. The National Park Service is also accountable for preserving, maintaining, and protecting over 282 species of native plants, 33 species of native terrestrial fauna, 19 species of native freshwater fauna, and 427 species of native subtidal and intertidal marine fauna known throughout the park. This is primarily accomplished by controlling non-native, invasive species. Approximately 23 of the over 160 non-native plant species that have been recorded in the park are targeted for treatment. Of the 17 non-native animal species known in the boundaries of KALA, eight are targeted for treatment (Hughes 2003). Additonally, the National Park Service is responsible for providing fire protection, as well as operating and maintaining the drinking water, electrical distribution, and solid waste management systems (NPS 2006a). Land ownership and management of KALA will likely shift as the patient population at Kalaupapa decreases. The National Park Service can only obtain state lands by donation or exchange; therefore, the NPS role in the future of Kalaupapa is unknown (NPS 2000a). Specific areas owned and/or managed by entities other than NPS include: Pu‘u Ali‘i National Area Reserve: The State of Hawai‘i DLNR, Division of Forestry and Wildlife (DOFAW), is responsible for the National Area Reserve System (NARS). NARs are managed according to Hawaii Administrative Rules (HAR) Title 13, Chapter 209.
4
Figure 1.3-1. Land ownership at KALA and vicinity.
Sou
rce:
Sta
te o
f Haw
aii
GIS
; N
atio
nal P
ark
Ser
vice
Legen
d Park
Boun
dary
Lan
d O
wn
ers
Gov
t. F
eder
al
Gov
t. S
tate
Gov
t. S
tate
DH
HL
Gov
t. C
ounty
of
Mau
i
Mol
okai
Ran
ch
Kua
lapu
`u R
anch
The
Nat
ure
Cons
erva
ncy
F.R.W
. M
eyer
Geo
rge
Bro
wn
Mia
la I
nc.
Oth
er
4,00
00
4,00
02,
000
Feet
2,00
00
2,00
01,
000
Met
ers
Pa
cif
ic
Oc
ea
n
Go
vt. S
tate
Ge
orge
Bro
wn
Go
vt. S
tate
Go
vt. S
tate
DH
HL
Mia
la I
nc.
Go
vt. S
tate
Mo
loka
i Ran
ch
Mo
loka
i Ran
ch
F.R
.W. M
eye
r
Go
vt. S
tate
DH
HL
Mo
loka
i Ran
ch
Kua
lapu
`u R
anc
h
Mo
loka
i Ran
ch
oth
er
oth
er
oth
er
Mo
loka
i Ran
ch
Go
vt. S
tate
DH
HL
oth
er
The
Nat
ure
Con
serv
ancy
Ge
orge
Bro
wn
Kal
aup
ap
a N
ati
on
al H
isto
ric
Pa
rk
5
Moloka‘i Forest Reserve: The State of Hawai‘i Forest Reserve (FR) System is managed by the State of Hawai‘i DLNR, DOFAW. Management of this system is guided by HAR Chapter 104 and Hawaii Revised Statutes (HRS) Chapter 183. Seabird Sanctuaries: The two islets off the coast of KALA (Huelo and Okala) are designated as State Seabird Sanctuaries. These islets are owned by DOFAW and co-managed by the National Park Service. HAR Title 13, Chapter 125, protects wildlife and plants and restricts human activities in seabird sanctuaries (Swenson 2008). Pala‘au State Park: Pala‘au State Park is a 95-ha (234 ac) park providing a scenic overview of KALA. Picnicking and camping is permitted in Pala‘au State Park. This park is administered by the State of Hawai‘i DLNR, Division of State Parks (Division of State Parks 2008). North Shore Cliffs National Natural Landmark: KALA includes a portion of the North Shore Cliffs National Natural Landmark (NNL). Established in 1972, the NNL is a federal designation identifying and encouraging preservation of pristine ecological and geological examples of the nation’s natural heritage (NPS 1999). The area is considered a significant remaining example of sea cliffs within the United States. East Molokai Watershed Partnership: KALA is also part of the East Moloka‘i Watershed Partnership, a coalition formed in November 1999 for the purpose of protecting the best remaining native forest watershed areas on the East Moloka‘i Mountains. The partnership, which protects more than 10,117 ha (25,000 ac), is composed of a group of landowners, government agencies, and non-governmental organizations. 1.4 Unique and Significant Park Natural Resources KALA abounds in significant natural resources. Rare lowland and coastal plant species occur on the Islets of Huelo and Okala and in areas along the coast and unique lacustrine macrofauna are present in the Lake Kauhakō. The marine ecosystem at KALA has a high fish biomass compared to other areas of the main Hawaiian Islands. There is also a high potential for undocumented rare obligate cave-adapted plants and animals, as well as paleontological resources, to occur in the caves at KALA. Appendix 2 provides the scientific, Hawaiian, and common names of all species mentioned throughout this assessment.1 Numerous federally and state threatened, endangered, and rare plants and animals are known to occur within the park boundaries (Table 1.4-1, Appendix 3). Over 580 species of terrestrial plant taxa have been recorded within KALA. Of these, roughly 282 species are native to the Hawaiian Islands. Currently 35 native plant species within KALA are listed as federally endangered, threatened, or candidate species and an additional 18 plant species are considered federal species of concern. Of the 33 native terrestrial and 427 native marine fauna known within the park boundaries, six species are federally listed as endangered, proposed endangered, threatened, or candidate species, and one additional species is considered endangered by the State of Hawai‘i. Six invertebrate species present at KALA are considered federal species of concern (Hughes 2003). Threatened, endangered, and rare species are listed in Appendix 3.
1 Because many native plants lack unique Hawaiian or common names, scientific names are used throughout the report with Hawaiian names in parentheses when applicable.
6
Table 1.4-1. Number of federally and state listed species within KALA.
Plants
(terrestrial) Animals
(terrestrial)Animals (aquatic)
Federally Listed
Endangered 29 2 1
Proposed Endangered 0 1 0
Threatened 2 1 1
Candidate 4 1 0
Species of Concern 18 6 0
State Listed
Endangered 0 1 0
Source: Hughes (2003).
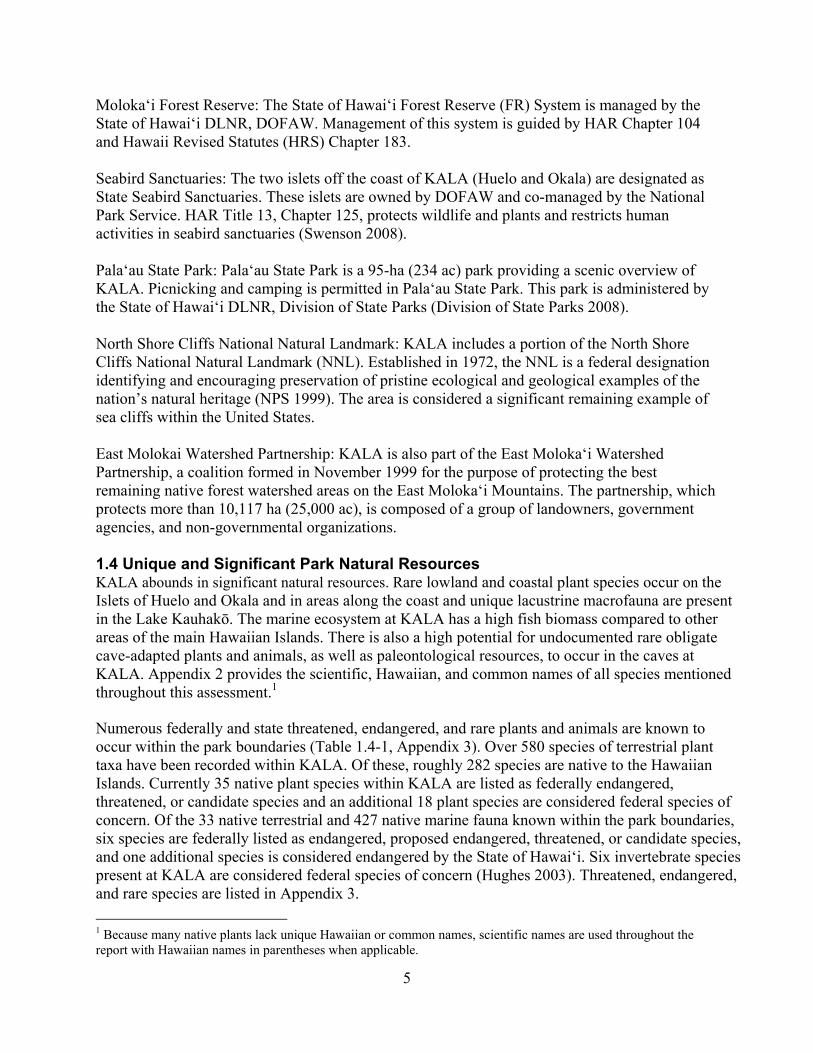
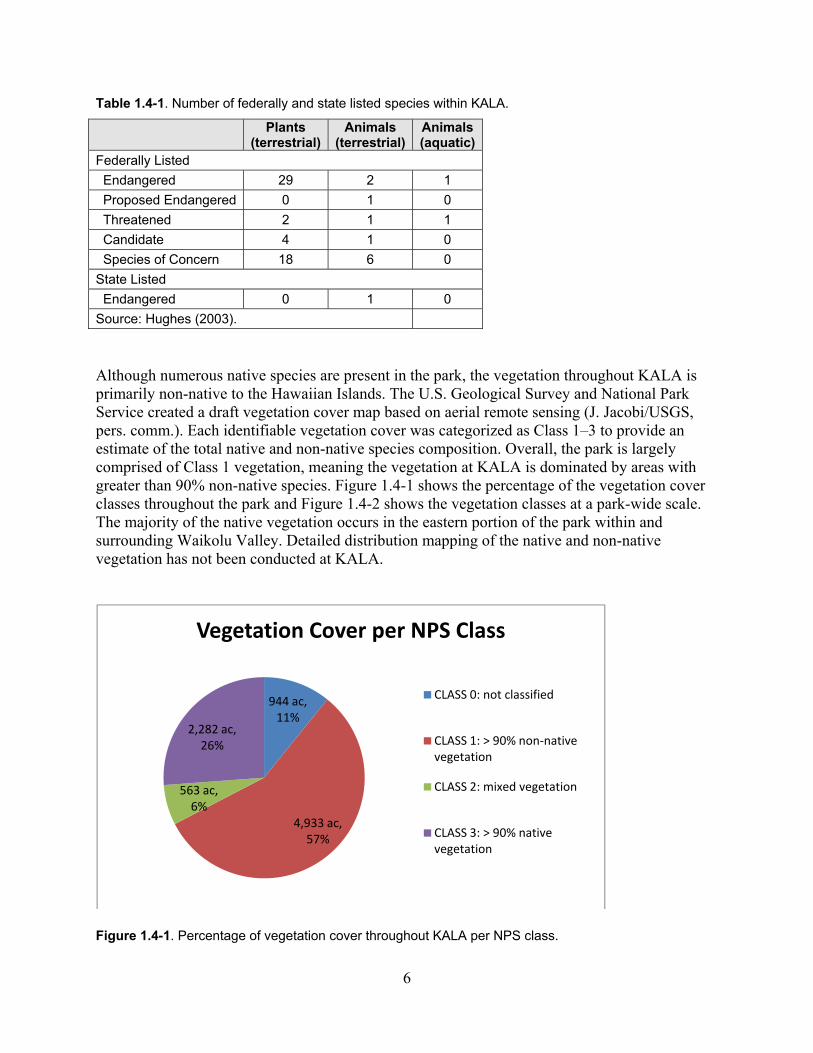
Although numerous native species are present in the park, the vegetation throughout KALA is primarily non-native to the Hawaiian Islands. The U.S. Geological Survey and National Park Service created a draft vegetation cover map based on aerial remote sensing (J. Jacobi/USGS, pers. comm.). Each identifiable vegetation cover was categorized as Class 1–3 to provide an estimate of the total native and non-native species composition. Overall, the park is largely comprised of Class 1 vegetation, meaning the vegetation at KALA is dominated by areas with greater than 90% non-native species. Figure 1.4-1 shows the percentage of the vegetation cover classes throughout the park and Figure 1.4-2 shows the vegetation classes at a park-wide scale. The majority of the native vegetation occurs in the eastern portion of the park within and surrounding Waikolu Valley. Detailed distribution mapping of the native and non-native vegetation has not been conducted at KALA.
Figure 1.4-1. Percentage of vegetation cover throughout KALA per NPS class.
944 ac, 11%
4,933 ac, 57%
563 ac, 6%
2,282 ac, 26%
Vegetation Cover per NPS Class
CLASS 0: not classified
CLASS 1: > 90% non‐native vegetation
CLASS 2: mixed vegetation
CLASS 3: > 90% native vegetation
7
Figure 1.4-2. Vegetation cover and NPS vegetation classes throughout KALA.
Legen
d
Park
Bou
nda
ry
Terr
estr
ial M
anag
emen
t Zon
es
Veg
eta
tio
n C
lass
Typ
e
0 -
no
fact
or -
11%
1 -
>90%
alie
n v
eg -
57%
2 -
mix
- 6
%
3 -
>90%
nat
ive
veg -
26%
4,00
00
4,00
02,
000
Feet
2,00
00
2,00
01,
000
Met
ers
Sou
rce:
Nat
iona
l Par
k S
ervi
ce
Pa
cif
ic
Oc
ea
n
Hue
lo I
slet
Hue
lo I
slet
Oka
la I
slet
Oka
la I
slet
Nam
oku
Nam
oku
Lo
wla
nd
Co
ast
al
Are
a
Pu
u A
lii
NA
R
Kauh
ak
o C
rate
rO
ffsh
ore
Isl
ets
No
rth
Sh
ore
Cli
ffs
NN
L
Co
ast
al S
pra
y Z
on
e
No
rth
Sh
ore
Cliff
s N
NL
Mo
lok
ai Fo
rest
Rese
rve
(DO
FA
W)
Kal
aup
ap
a N
ati
on
al H
isto
ric
Par
k
8
1.4.1 Special Ecological Areas The National Park Service has designated areas containing valuable natural resources as Special Ecological Areas (SEAs). These areas have been determined to be the most intact, diverse, unique, and manageable sites in the park. SEAs are managed to preserve the ecosystem as a whole and and, in doing so, preserve the individual native plant and animal species (NPS 2000a). There are eight SEAs within KALA including the coastal spray zone; Pu‘u Ali‘i Natural Area Reserve; Waikolu Valley; Kauhakō Crater; caves and lava tubes; Kauhakō Trench/Lava Tube; the cliffs (pali); and the submerged lands surrounding the peninsula. These SEAs are treated in the corresponding ecosystems defined below. 1.5 Marine, Freshwater, & Terrestrial Ecosystems This assessment considers not only lands owned by the NPS, but also other lands within KALA. The natural resources within the park’s boundaries are divided into three primary ecosystems—marine, freshwater, and terrestrial (Figure 1.5-1). Although these ecosystems differ, many of the natural resources within KALA are ecologically connected, and therefore interactions between these ecosystems are significant. The terrestrial environment within KALA is comprised of the following seven ecological management zones: Kauhakō Crater, Coastal Spray Zone, Offshore Islets, Pu‘u Ali‘i Natural Area Reserve, Moloka‘i State Forest Reserve, North Shore Cliffs National Natural Landmark, and the Lowland Coastal Area. Four habitats—palustrine, lacustrine, anchialine, and riverine—are present in the freshwater ecosystem. The marine ecosystem at KALA is divided into three habitats—intertidal, coastal reefs, and offshore islet reefs. A summary of the park’s profile is provided in Table 1.5-1.
9
Figure 1.5-1. Marine, freshwater, and terrestrial ecosystems at KALA.
Sou
rce:
US
GS
; Sta
te o
f H
awai
i GIS
; Na
tion
al P
ark
Se
rvic
e
Legen
d Park
Bou
nda
ry
Roa
ds/T
rails
Sec
ondar
y
Tert
iary
(Cla
ss 3
& 4
)
4wd
Trai
l
Mar
ine
Ecos
yste
m
Fres
hwat
er E
cosy
stem
Terr
estr
ial Ec
osys
tem
4,00
00
4,00
02,
000
Feet
2,00
00
2,00
01,
000
Met
ers
Pa
cif
ic
Oc
ea
n
Hue
lo I
slet
Hue
lo I
slet
Oka
la I
slet
Oka
la I
slet
Ka
law
ao
Ka
law
ao
Ha'
upu
Ba
yH
a'u
pu B
ay
Pe
leku
nu
P
ele
kun
u
Ba
yB
ay
Ka
hiu
Po
int
Ka
hiu
Po
int
Ka
lau
pa
paK
ala
up
apa
Ka
uha
koK
auh
ako
Cra
ter
Cra
ter
Ka
lau
pa
pa P
en
insu
laK
ala
up
apa
Pe
nin
sula
Pu
u A
liiP
uu
Alii
470
Nam
oku
Nam
oku
Pu
wah
iP
uw
ahi
WWaaii hh
aannaauu SS ttrreeaamm
WWaaiiaallee iiaa SSttrreeaamm
WWaaii kkoolluu SS ttrreeaamm
Kal
aup
ap
a N
ati
on
al H
isto
ric
Par
k
10
Table 1.5-1. Summary of park profile.
Geographic Total park area 4,340 ha (10,726 ac) Total land area within park 3,531 ha (8,726 ac) Total marine area within park 809 ha (2,000 ac) Total lands under NPS fee ownership 9 ha (22 ac) Percent of park boundaries 0.20% Elevation range 1,287 m (4,222 ft) Population and Visitation Total population 117 Total number of patients 27 Average total park visitors/year 76,000 Average total park visitors/day 27 Roads and Trails Total length of road network 37 km (23 mi) Aquatic Habitats Estuarine 0 Marine 750 ha (1853 ac) Intertidal 57 ha (141 ac) Streams 8 Continuous perennial 5 Interrupted perennial 1 Intermittent 2 Watersheds Number of watershed systems 6 Shoreline Processes Length of shoreline within park 25.7 km (16 mi) Length of stabilized primary duneline or artificially nourished beaches
1.6 km (1 mi)
Native Species No. of native terrestrial plant spp.1 282 No. of native aquatic plant spp. 1 No. of native terrestrial animals spp.2 33 No. of native marine animal spp.3 427 No. of native freshwater animals spp.4 19 Non-native Species No. of non-native plant spp. 161 Plant spp. targeted for treatment 23 No. of non-native animal spp. 17 Animal spp. targeted for treatment 8Source: Hughes (2003) unless otherwise noted, 1) Wysong and Hughes (2008); 2) Frasher et al. 2007, Kozar et al. 2007, Marshall and Kozar 2008; 3) Beets et al. 2006, Godwin and Bollick 2006; 4) Parham et al. (2008).
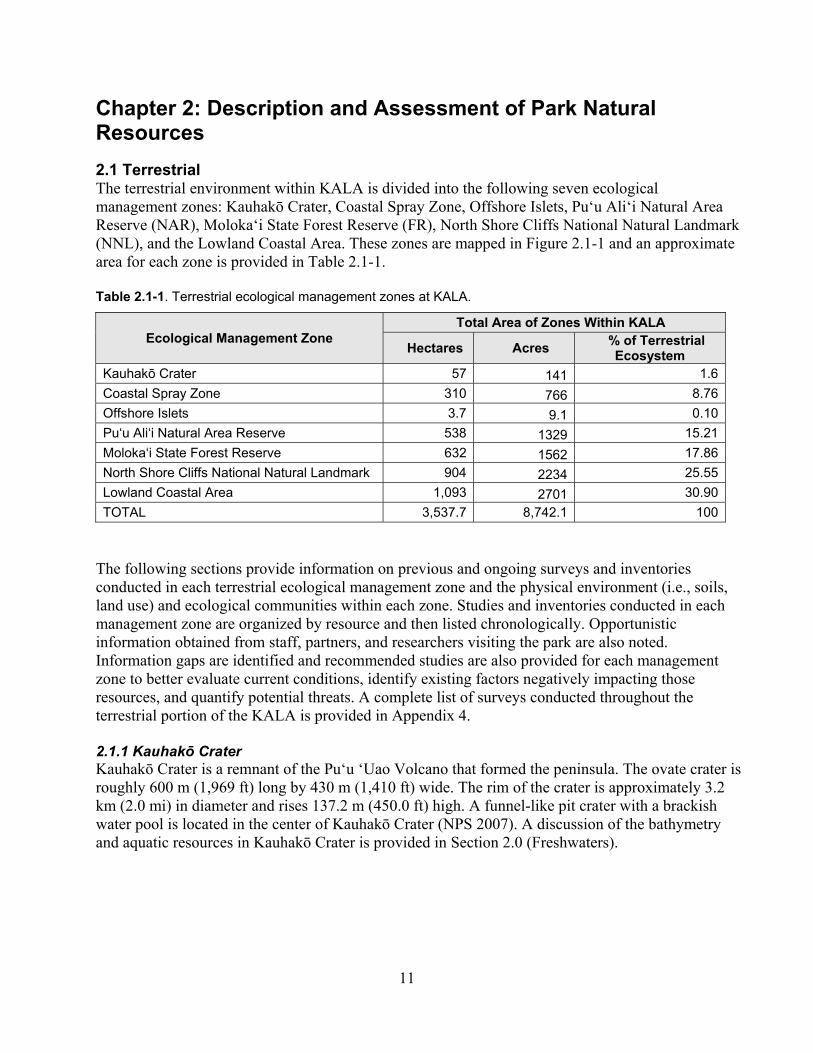
11
Chapter 2: Description and Assessment of Park Natural Resources
2.1 Terrestrial The terrestrial environment within KALA is divided into the following seven ecological management zones: Kauhakō Crater, Coastal Spray Zone, Offshore Islets, Pu‘u Ali‘i Natural Area Reserve (NAR), Moloka‘i State Forest Reserve (FR), North Shore Cliffs National Natural Landmark (NNL), and the Lowland Coastal Area. These zones are mapped in Figure 2.1-1 and an approximate area for each zone is provided in Table 2.1-1. Table 2.1-1. Terrestrial ecological management zones at KALA.
Ecological Management Zone Total Area of Zones Within KALA
Hectares Acres % of Terrestrial Ecosystem
Kauhakō Crater 57 141 1.6
Coastal Spray Zone 310 766 8.76
Offshore Islets 3.7 9.1 0.10
Pu‘u Ali‘i Natural Area Reserve 538 1329 15.21
Moloka‘i State Forest Reserve 632 1562 17.86
North Shore Cliffs National Natural Landmark 904 2234 25.55
Lowland Coastal Area 1,093 2701 30.90
TOTAL 3,537.7 8,742.1 100
The following sections provide information on previous and ongoing surveys and inventories conducted in each terrestrial ecological management zone and the physical environment (i.e., soils, land use) and ecological communities within each zone. Studies and inventories conducted in each management zone are organized by resource and then listed chronologically. Opportunistic information obtained from staff, partners, and researchers visiting the park are also noted. Information gaps are identified and recommended studies are also provided for each management zone to better evaluate current conditions, identify existing factors negatively impacting those resources, and quantify potential threats. A complete list of surveys conducted throughout the terrestrial portion of the KALA is provided in Appendix 4. 2.1.1 Kauhakō Crater Kauhakō Crater is a remnant of the Pu‘u ‘Uao Volcano that formed the peninsula. The ovate crater is roughly 600 m (1,969 ft) long by 430 m (1,410 ft) wide. The rim of the crater is approximately 3.2 km (2.0 mi) in diameter and rises 137.2 m (450.0 ft) high. A funnel-like pit crater with a brackish water pool is located in the center of Kauhakō Crater (NPS 2007). A discussion of the bathymetry and aquatic resources in Kauhakō Crater is provided in Section 2.0 (Freshwaters).
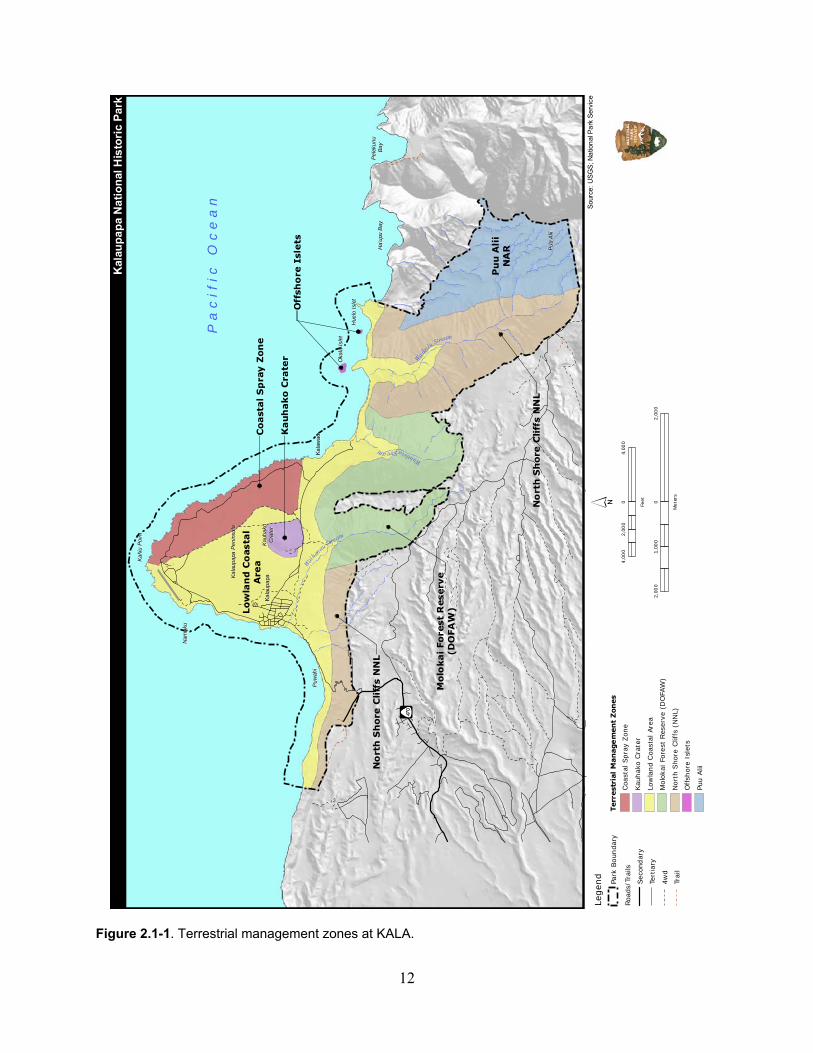
12
Figure 2.1-1. Terrestrial management zones at KALA.
Sou
rce:
US
GS
; Na
tion
al P
ark
Se
rvic
eLe
gen
d
Park
Boun
dary
Roa
ds/T
rails
Sec
ondar
y
Tert
iary
4wd
Trai
l
Terr
est
rial
Man
age
men
t Z
on
es
Coa
stal
Spra
y Zon
e
Kau
hak
o C
rate
r
Low
land
Coa
stal
Are
a
Mol
okai
For
est
Res
erve
(D
OFA
W)
Nor
th S
hore
Clif
fs (
NN
L)
Offsh
ore
Isle
ts
Puu A
lii
4,00
00
4,00
02,
000
Feet
2,00
00
2,00
01,
000
Met
ers
Pa
cif
ic
Oc
ea
n
Hue
lo I
slet
Hue
lo I
slet
Oka
la I
slet
Oka
la I
slet
Ka
law
ao
Ka
law
ao
Ha'
upu
Ba
yH
a'u
pu B
ay
Pe
leku
nu
Pe
leku
nu
Ba
yB
ay
Ka
hiu
Po
int
Ka
hiu
Po
int
Ka
lau
pa
paK
ala
up
apa
Ka
uha
koK
auh
ako
Cra
ter
Cra
ter
Ka
lau
pa
pa P
en
insu
laK
ala
up
apa
Pe
nin
sula
Pu
u A
liiP
uu
Alii
470
Nam
oku
Nam
oku
Pu
wah
iP
uw
ahi
Waialeia Stream
Wai
hanau S
tream
Wai
kolu Stream
Molo
kai
Fo
rest
Reserv
e(D
OFA
W)
No
rth
Sh
ore
Cli
ffs
NN
L
Co
ast
al
Sp
ray
Zon
e
No
rth
Sh
ore
Cliff
s N
NL
Off
sho
re I
sle
tsK
auh
ako
Cra
ter
Pu
u A
lii
NA
R
Low
lan
d C
oasta
lA
rea
Kal
aup
ap
a N
ati
on
al H
isto
ric
Pa
rk
13
2.1.1.1 Previous and Ongoing Studies and Inventories: Soils & Climate:
Soils on the Island of Moloka‘i were classified by the U.S. Department of Agriculture (USDA) Soil Conservation Service (Foote et al. 1972). The survey was primarily designed to offer useful information for planning agriculture; therefore, mapping was conducted on agricultural land and generalized for other areas.
Flora: Linney (1987) described the dominant plant communities within the crater and along the
crater’s outer slopes. Linney’s conclusion that the botanical resources in the crater are “unexcelled elsewhere in Hawai‘i” tagged the area for more intensive monitoring.
Asherman et al. (1990) conducted a reconnaissance survey along the rim and in the interior
of the crater, creating plant species lists, collecting voucher specimens, and documenting localities of rare plants.
Based on previous vegetation surveys in the park and additional supplemental surveys, Funk
(1991) described 20 plant communities throughout KALA. This included communities within Kauhakō Crater.
Medeiros et al. (1996) provided baseline data on vegetation components of the crater and
established a permanent monitoring system to document vegetation changes following fencing and the removal of browsing herbivores. The study focused on three key native trees present in the crater to provide an overall picture of health and status of the forest, while also tagging and monitoring a few other native species.
Wood et al. (2005) created plant checklists for 32 sites in KALA. Kauhakō Crater was
included as a site in this study. In 2006, NPS initiated the Erythrina sandwicensis (wiliwili) seed production monitoring,
which documented the status of E. sandwicensis trees in the crater. Every five years, this survey collects data on E. sandwicensis flower color and phenology, leaf phenology, and predation by Specularius impressithorax (erythrina seed beetle) and Quadrastichus erythrinae (erythrina gall wasp). This information exists primarily as raw data.
Analyzing data from 32 transects established in KALA, Hughes et al. (2007) examined plant
diversity and distribution in the park. Kauhakō Crater was included as a site in this study. Wysong and Hughes (2008) updated plant checklists and collected voucher specimens for
the entire park, including Kauhakō Crater.
In 2007, the U.S. Geological Survey and National Park Service also created a draft vegetation cover map based on aerial remote sensing. Each identifiable vegetation cover is categorized as Class 1–3 to provide an estimate of the total native and non-native species composition. The final report for this project, including mapping methods and a detailed
14
description of the plant communities, is anticipated in early 2010 (J. Jacobi/USGS, pers. comm.).
In 2010, the National Park Service plans to re-examine legacy vegetation data within Kauhakō Crater to document vegetation changes within legacy vegetation plots during the last 10 to 20 years.
Avifauna: Marshall and Kozar (2008) conducted a forest bird survey throughout the park, including in
the crater, to determine presence/absence and abundance. The transect at Kauhakō Crater ran along the crater rim and descended along the plateau above the crater’s lake.
Mammals:
Although impacts by feral ungulates were not specifically focused upon during the survey by Medeiros et al. (1996), the presence of droppings was recorded in monitoring plots to help quantify the extent and distribution of feral ungulates in the crater.
Goltz et al. (2001) conducted a 13-month study on the population of Axis axis (axis deer)
throughout the park, including in Kauhakō Crater, to gather information on movement patterns and home ranges of Axis axis.
Frasher et al. (2007) surveyed Lasiurus cinereus semotus (Hawaiian hoary bats) in the crater
using acoustic detection systems along with visual observations to document the presence/absence of the species and general associations with habitats and elevations. The survey was conducted on a single night at two points in the crater–one point mid-way down the trail to the crater lake and another approximately 25 m (82 ft) above the lake.
Semi-annual monitoring of Lasiurus cinereus semotus by the National Park Service began in
2008. The purpose of this study is to determine long-term trends in bat occupancy and distribution.
Marshall et al. (2008) conducted a one-night presence/absence survey for small mammals
along a transect in the crater that ran along the crater rim at roughly 100 m (328 ft) elevation and descended to the plateau above the lake at approximately 30 m (98 ft) elevation. Large and small snap traps, Tomahawk® live traps, tracking tunnels, and glue boards were used.
Reptiles and Amphibians:
Kraus (2005) conducted day and night surveys for reptiles and amphibians across KALA and along the upper rim of the park.
Insects and Other Invertebrates:
No surveys specifically targeting insects or other invertebrates have been conducted in Kauhakō Crater; however, Medeiros et al. (1996) noted insect pests and insect signs on key native plant species. Furthermore, the National Park Service’s ongoing Erythrina sandwicensis seed production monitoring also notes damage from Quadrastichus erythrinae and Specularius impressithorax on E. sandwicensis.
15
Other: The geological setting of the Kalaupapa peninsula and Kauhakō Crater was described by
Clague et al. (1982). Samples were collected in the crater and the vicinity and analyzed for major elements.
Coombs et al. (1990) described the geology, morphology, and volcanic history of Kauhakō Crater and channel, as well as provided measurements of caves and cavernous features.
The most recent survey speleological investigations within Kauhakō Crater and the vicinity were conducted by Halliday (2001). Unpublished data and maps from earlier work by Neller were an integral part of this report.
Additional cave animal inventories (invertebrates and vertebrates) at KALA are anticipated
to resume in 2010. 2.1.1.2 Physical Environment: Soil types found within the Kauhakō Crater management zone are mapped in Figure 2.1-2 and key characteristics of the soils found within the zone are listed in Table 2.1-2. There are two primary soil types within the crater - Kalaupapa Very Rocky Silty Clay Loam and Rough Mountainous Land. The Kalaupapa series soil is shallow with many stones and cobblestones on the surface and the Rough Mountainous Land is considered very steep land with a thin soil mantel. Table 2.1-2. Soil types and key soil characteristics in Kauhakō Crater management zone.
Soil Type Farmland Erodible Soil Coverage in
Zone (m2) Kalaupapa Very Rocky Silty Clay Loam, 3 to 25 % Slopes
Not prime farmland
Highly erodible 321,981
Rough Mountainous Land Not prime farmland
Highly erodible 248,714
Haleiwa Silty Clay Loam, 0 to 10 % Slopes Prime farmland
(if irrigated) Potentially highly
erodible 6,645
Source: Foote et al. (1972).
Historically, land in the crater was used for agriculture, presumably because it was sheltered from the elements. Patients and caretakers living in the Kalaupapa Settlement continued to cultivate crops in the crater, such as potatoes and vegetables (Greene 1985). The exact date when crop cultivation ceased is not known (Linney 1987). 2.1.1.3 Ecological Community: Flora: Kauhakō Crater is a low elevation summer deciduous remnant dry forest. Historically, botanists described the crater as “one of the finer examples of dryland forest remaining on Moloka‘i or elsewhere in the Hawaiian Islands” (Medeiros et al. 1996) containing an area of “pristine native lowland forest” that is “unexcelled elsewhere in Hawaii” (Linney 1987). However, the original condition of the forest at Kauhakō Crater has been severely degraded by a myriad of factors. Although the crater does contain native dry forest species, it is no longer considered a pristine dry forest (G. Hughes/NPS, pers. comm.).
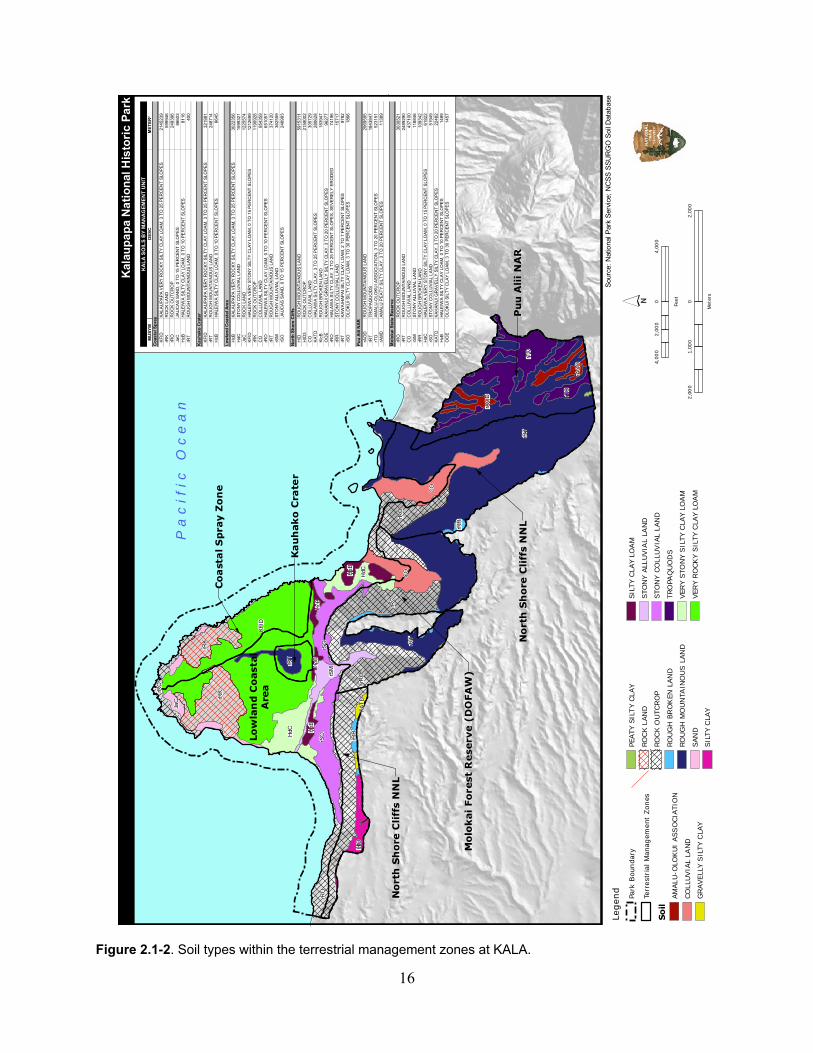
16
Figure 2.1-2. Soil types within the terrestrial management zones at KALA.
Sou
rce:
Nat
iona
l Par
k S
ervi
ce;
NC
SS
SS
UR
GO
Soi
l Dat
abas
eLe
gen
d
Park
Bou
nda
ry
Terr
estr
ial M
anag
emen
t Zon
es
So
ilAM
ALU
-OLO
KUI
ASS
OCIA
TIO
N
CO
LLUVIA
L LA
ND
GRAVELL
Y S
ILTY
CLA
Y
PEATY
SIL
TY
CLA
Y
RO
CK L
AN
D
RO
CK O
UTC
RO
P
RO
UG
H B
RO
KEN
LAN
D
RO
UG
H M
OUN
TAIN
OUS L
AN
D
SAN
D
SIL
TY C
LAY
SIL
TY C
LAY
LOA
M
STO
NY A
LLUVIA
L LA
ND
STO
NY C
OLL
UV
IAL
LAN
D
TRO
PAQ
UO
DS
VER
Y STO
NY
SIL
TY C
LAY
LOA
M
VER
Y RO
CKY
SIL
TY C
LAY
LOA
M
Pa
cif
ic
Oc
ea
n
Pu
u A
lii
NA
R
Low
lan
d C
oast
al
Are
a
No
rth
Sh
ore
Cli
ffs
NN
L
Mo
lok
ai
Fo
rest
Rese
rve (
DO
FA
W)
Co
ast
al S
pra
y Z
on
e
No
rth
Sh
ore
Cli
ffs
NN
L
Ka
uh
ak
o C
rate
r
rRT
rRO
KF
ID
rTO
rRK
rRO
CO
rRT
rSO
CO
rSO
HdC
rRK
rSM
rRT
rTO
HID
HcB
rAO
D
rAO
D
rRR
HdC
JaC
rRO
rRR
KA
TD
HcB
HcB
rRO
rRO
HcB
MU
SY
MD
ES
C M
ET
ER
²C
oa
sta
l Sp
ray
KF
IDK
ALA
UP
AP
A V
ER
Y R
OC
KY
SIL
TY
CL
AY
LO
AM
, 3 T
O 2
5 P
ER
CE
NT
SL
OP
ES
2145
239
rRK
RO
CK
LA
ND
599
946
rRO
RO
CK
OU
TC
RO
P2
4839
6Ja
CJA
UC
AS
SA
ND
, 0
TO
15
PE
RC
EN
T S
LOP
ES
8660
3H
cBH
AL
EIW
A S
ILT
Y C
LAY
LO
AM
, 0
TO
10
PE
RC
EN
T S
LOP
ES
811
6rR
TR
OU
GH
MO
UN
TA
INO
US
LA
ND
400
Kau
hak
o C
rate
r
KF
IDK
ALA
UP
AP
A V
ER
Y R
OC
KY
SIL
TY
CL
AY
LO
AM
, 3 T
O 2
5 P
ER
CE
NT
SL
OP
ES
321
981
rRT
RO
UG
H M
OU
NT
AIN
OU
S L
AN
D2
4871
4H
cBH
AL
EIW
A S
ILT
Y C
LAY
LO
AM
, 0
TO
10
PE
RC
EN
T S
LOP
ES
664
5
Lo
wla
nd
Co
ast
al A
rea
HcB
KA
LAU
PA
PA
VE
RY
RO
CK
Y S
ILT
Y C
LA
Y L
OA
M, 3
TO
25
PE
RC
EN
T S
LO
PE
S30
2235
6H
dC
ST
ON
Y C
OL
LUV
IAL
LA
ND
1599
321
JaC
RO
CK
LA
ND
1225
574
KF
IDH
AL
EIW
A V
ER
Y S
TO
NY
SIL
TY
CL
AY
LO
AM
, 0
TO
15
PE
RC
EN
T S
LO
PE
S12
1269
9rR
KR
OC
K O
UT
CR
OP
1190
928
CO
CO
LLU
VIA
L L
AN
D9
5435
9rR
OH
AL
EIW
A S
ILT
Y C
LAY
LO
AM
, 0
TO
10
PE
RC
EN
T S
LOP
ES
651
057
rRT
RO
UG
H M
OU
NT
AIN
OU
S L
AN
D3
7412
0rS
MS
TO
NY
ALL
UV
IAL
LA
ND
362
559
rSO
JAU
CA
S S
AN
D,
0 T
O 1
5 P
ER
CE
NT
SLO
PE
S2
4699
3
No
rth
Sh
ore
Clif
fs
HID
RO
UG
H M
OU
NT
AIN
OU
S L
AN
D59
1531
1H
ID3
RO
CK
OU
TC
RO
P21
5900
2C
OC
OLL
UV
IAL
LA
ND
305
729
KA
TD
HA
LA
WA
SIL
TY
CL
AY
, 3
TO
25
PE
RC
EN
T S
LOP
ES
280
628
Klc
BR
OU
GH
BR
OK
EN
LA
ND
183
947
OO
EK
AH
AN
UI
GR
AV
EL
LY S
ILT
Y C
LAY
, 3 T
O 2
0 P
ER
CE
NT
SL
OP
ES
9627
7rR
OH
AL
AW
A S
ILT
Y C
LA
Y,
3 T
O 2
5 P
ER
CE
NT
SLO
PE
S,
SE
VE
RE
LY
ER
OD
ED
7419
6rR
RS
TO
NY
CO
LLU
VIA
L L
AN
D15
717
rRT
KA
WA
IHA
PA
I S
ILT
Y C
LA
Y L
OA
M,
2 T
O 7
PE
RC
EN
T S
LO
PE
S9
782
rSO
OL
OK
UI
SIL
TY
CLA
Y L
OA
M,
3 T
O 3
0 P
ER
CE
NT
SLO
PE
S1
866
Pu
u A
lii N
AR
rAO
DR
OU
GH
MO
UN
TA
INO
US
LA
ND
2969
595
rRT
TR
OP
AQ
UO
DS
1843
847
rTO
AM
ALU
-OL
OK
UI
AS
SO
CIA
TIO
N,
3 T
O 2
0 P
ER
CE
NT
SLO
PE
S5
2315
1rA
MD
AM
ALU
PE
AT
Y S
ILT
Y C
LAY
, 3 T
O 2
0 P
ER
CE
NT
SL
OP
ES
1138
9
Mo
loka
i S
tate
Res
erv
e
rRO
RO
CK
OU
TC
RO
P30
3052
1rR
TR
OU
GH
MO
UN
TA
INO
US
LA
ND
2489
290
CO
CO
LLU
VIA
L L
AN
D4
3710
0rS
MS
TO
NY
ALL
UV
IAL
LA
ND
118
846
rRR
RO
UG
H B
RO
KE
N L
AN
D1
0934
2H
dC
HA
LE
IWA
VE
RY
ST
ON
Y S
ILT
Y C
LA
Y L
OA
M,
0 T
O 1
5 P
ER
CE
NT
SL
OP
ES
6182
2rS
OS
TO
NY
CO
LLU
VIA
L L
AN
D51
949
KA
TD
KA
HA
NU
I G
RA
VE
LLY
SIL
TY
CLA
Y, 3
TO
20
PE
RC
EN
T S
LO
PE
S22
482
HcB
HA
LE
IWA
SIL
TY
CLA
Y L
OA
M,
0 T
O 1
0 P
ER
CE
NT
SLO
PE
S1
489
OO
EO
LO
KU
I S
ILT
Y C
LAY
LO
AM
, 3
TO
30
PE
RC
EN
T S
LOP
ES
145
7
KA
LA
SO
ILS
BY
MA
NA
GE
ME
NT
UN
IT
Kal
aup
ap
a N
ati
on
al H
isto
ric
Pa
rk
4,00
00
4,00
02,
000
Feet
2,00
00
2,00
01,
000
Met
ers
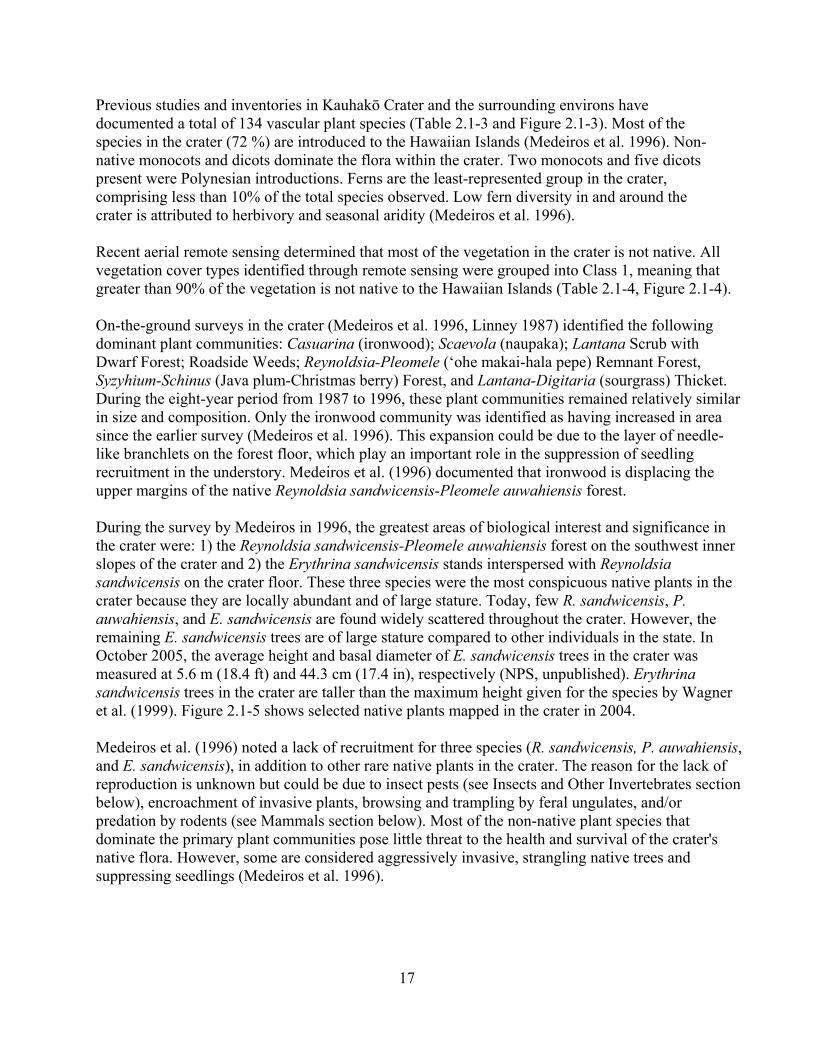
17
Previous studies and inventories in Kauhakō Crater and the surrounding environs have documented a total of 134 vascular plant species (Table 2.1-3 and Figure 2.1-3). Most of the species in the crater (72 %) are introduced to the Hawaiian Islands (Medeiros et al. 1996). Non-native monocots and dicots dominate the flora within the crater. Two monocots and five dicots present were Polynesian introductions. Ferns are the least-represented group in the crater, comprising less than 10% of the total species observed. Low fern diversity in and around the crater is attributed to herbivory and seasonal aridity (Medeiros et al. 1996). Recent aerial remote sensing determined that most of the vegetation in the crater is not native. All vegetation cover types identified through remote sensing were grouped into Class 1, meaning that greater than 90% of the vegetation is not native to the Hawaiian Islands (Table 2.1-4, Figure 2.1-4). On-the-ground surveys in the crater (Medeiros et al. 1996, Linney 1987) identified the following dominant plant communities: Casuarina (ironwood); Scaevola (naupaka); Lantana Scrub with Dwarf Forest; Roadside Weeds; Reynoldsia-Pleomele (‘ohe makai-hala pepe) Remnant Forest, Syzyhium-Schinus (Java plum-Christmas berry) Forest, and Lantana-Digitaria (sourgrass) Thicket. During the eight-year period from 1987 to 1996, these plant communities remained relatively similar in size and composition. Only the ironwood community was identified as having increased in area since the earlier survey (Medeiros et al. 1996). This expansion could be due to the layer of needle-like branchlets on the forest floor, which play an important role in the suppression of seedling recruitment in the understory. Medeiros et al. (1996) documented that ironwood is displacing the upper margins of the native Reynoldsia sandwicensis-Pleomele auwahiensis forest. During the survey by Medeiros in 1996, the greatest areas of biological interest and significance in the crater were: 1) the Reynoldsia sandwicensis-Pleomele auwahiensis forest on the southwest inner slopes of the crater and 2) the Erythrina sandwicensis stands interspersed with Reynoldsia sandwicensis on the crater floor. These three species were the most conspicuous native plants in the crater because they are locally abundant and of large stature. Today, few R. sandwicensis, P. auwahiensis, and E. sandwicensis are found widely scattered throughout the crater. However, the remaining E. sandwicensis trees are of large stature compared to other individuals in the state. In October 2005, the average height and basal diameter of E. sandwicensis trees in the crater was measured at 5.6 m (18.4 ft) and 44.3 cm (17.4 in), respectively (NPS, unpublished). Erythrina sandwicensis trees in the crater are taller than the maximum height given for the species by Wagner et al. (1999). Figure 2.1-5 shows selected native plants mapped in the crater in 2004. Medeiros et al. (1996) noted a lack of recruitment for three species (R. sandwicensis, P. auwahiensis, and E. sandwicensis), in addition to other rare native plants in the crater. The reason for the lack of reproduction is unknown but could be due to insect pests (see Insects and Other Invertebrates section below), encroachment of invasive plants, browsing and trampling by feral ungulates, and/or predation by rodents (see Mammals section below). Most of the non-native plant species that dominate the primary plant communities pose little threat to the health and survival of the crater's native flora. However, some are considered aggressively invasive, strangling native trees and suppressing seedlings (Medeiros et al. 1996).
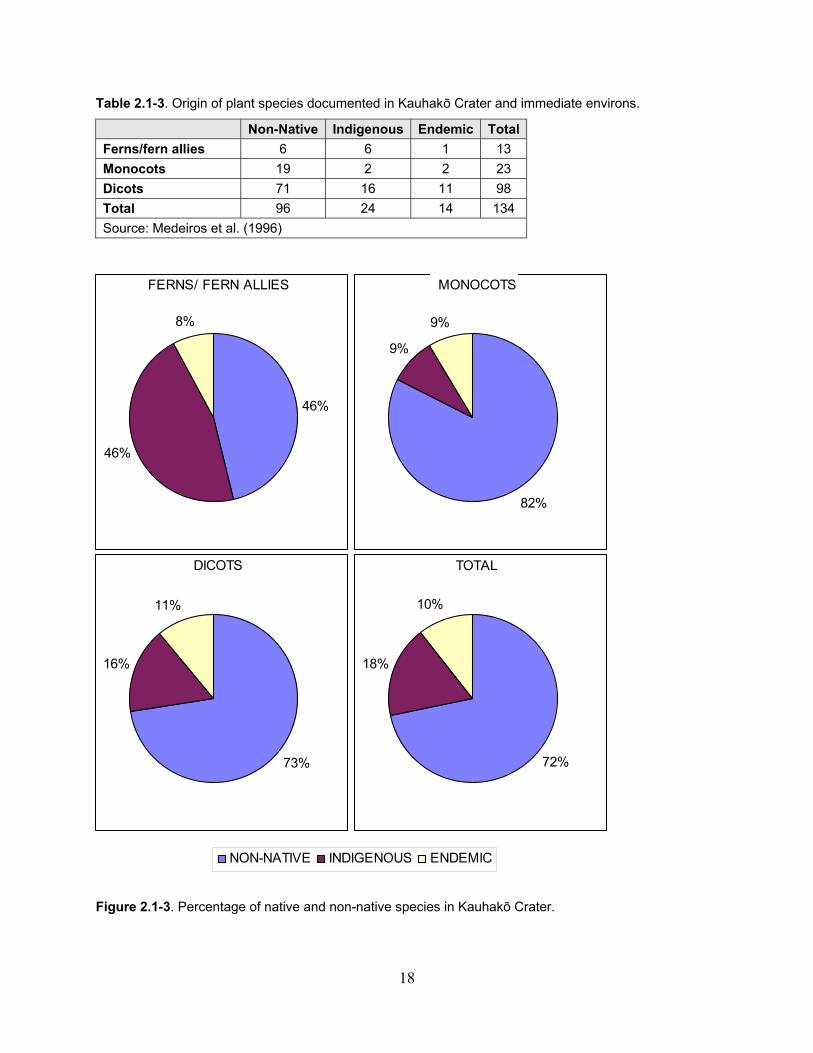
18
Table 2.1-3. Origin of plant species documented in Kauhakō Crater and immediate environs.
Non-Native Indigenous Endemic Total
Ferns/fern allies 6 6 1 13
Monocots 19 2 2 23
Dicots 71 16 11 98
Total 96 24 14 134
Source: Medeiros et al. (1996)
Figure 2.1-3. Percentage of native and non-native species in Kauhakō Crater.
72%
18%
10%
TOTAL
46%
46%
8%
FERNS/ FERN ALLIES
73%
16%
11%
DICOTS
82%
9%
9%
MONOCOTS
NON-NATIVE INDIGENOUS ENDEMIC
19
Figure 2.1-4. Vegetation cover and NPS vegetation classes in Kauhakō Crater.
Class Name Acres
unclassified 0.7
shadow 3.0
Class 0 TOTAL 3.8
Dry Schinus terebinthifolius Shrub 66.0
Dry Schinus terebinthifolius and Syzygium cumini Forest 24.9
Dry Alien Shrubs 19.7
Mesic Mixed Syzygium cumini and Psidium sp. Forest + Other Alien Trees 18.9
Dry Lantana camara + Alien Shrubs and Grasses 6.2
Dry Alien Grassland 3.1
Class 1 TOTAL 138.9
TOTAL 142.7
Figure 2.1-4Source: USGS; National Park Service
Lowland CoastalArea
CoastalSprayZone
Kauhako Crater
Lowland CoastalArea
CoastalSprayZone
Kauhako Crater
Kalaupapa National Historic Park
Legend
Vegetation Class Name
Dry Alien Shrub
Dry Alien grassland
Dry Lantana camara + Alien Shrubs and Grasses
Dry Schinus terebinthifolius Shrub
Dry Schinus terebinthifolius and Syzygium cumini Forest
Mesic Mixed Syzygium cumini and Psidium sp. Forest + Other Alien Trees
unclassified
shadow
Legend
Vegetation Class Type
0 - no factor
1 - >90% alien veg
2 - mix
3 - >90% native veg
500 0 500250
Feet
200 0 200100
Meters

20
Figure 2.1-5. Selected native plants in the Kauhakō Crater.
Legend
‘akoko (Chamaesvce celastroides)
wiliwili (Erythrina sandwicensis)
lama (Diospyros sandwicensis)
‘ohe makai (Reynoldsia sandwicensis)
hala pepe (Pleomele auwahiensis)
Ulei (Osteomeles anthyllidifolia) Patch
Fences
Selective Native Plant Speciesin Kauhakō Crater
200 0 200100
Feet
100 0 10050
Meters
Source: National Park Service
Kalaupapa National Historic Park
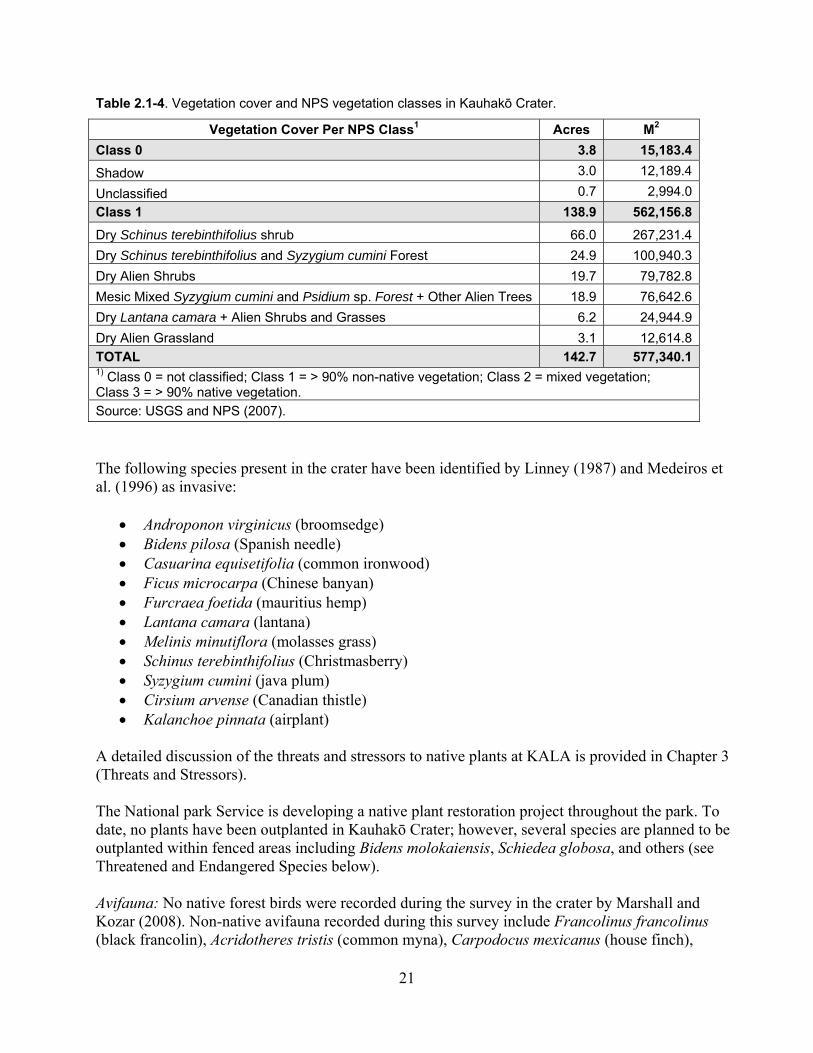
21
Table 2.1-4. Vegetation cover and NPS vegetation classes in Kauhakō Crater.
Vegetation Cover Per NPS Class1 Acres M2
Class 0 3.8 15,183.4
Shadow 3.0 12,189.4
Unclassified 0.7 2,994.0
Class 1 138.9 562,156.8
Dry Schinus terebinthifolius shrub 66.0 267,231.4
Dry Schinus terebinthifolius and Syzygium cumini Forest 24.9 100,940.3
Dry Alien Shrubs 19.7 79,782.8
Mesic Mixed Syzygium cumini and Psidium sp. Forest + Other Alien Trees 18.9 76,642.6
Dry Lantana camara + Alien Shrubs and Grasses 6.2 24,944.9
Dry Alien Grassland 3.1 12,614.8
TOTAL 142.7 577,340.11) Class 0 = not classified; Class 1 = > 90% non-native vegetation; Class 2 = mixed vegetation; Class 3 = > 90% native vegetation.
Source: USGS and NPS (2007).
The following species present in the crater have been identified by Linney (1987) and Medeiros et al. (1996) as invasive:
Androponon virginicus (broomsedge) Bidens pilosa (Spanish needle) Casuarina equisetifolia (common ironwood) Ficus microcarpa (Chinese banyan) Furcraea foetida (mauritius hemp) Lantana camara (lantana) Melinis minutiflora (molasses grass) Schinus terebinthifolius (Christmasberry) Syzygium cumini (java plum) Cirsium arvense (Canadian thistle) Kalanchoe pinnata (airplant)
A detailed discussion of the threats and stressors to native plants at KALA is provided in Chapter 3 (Threats and Stressors). The National park Service is developing a native plant restoration project throughout the park. To date, no plants have been outplanted in Kauhakō Crater; however, several species are planned to be outplanted within fenced areas including Bidens molokaiensis, Schiedea globosa, and others (see Threatened and Endangered Species below). Avifauna: No native forest birds were recorded during the survey in the crater by Marshall and Kozar (2008). Non-native avifauna recorded during this survey include Francolinus francolinus (black francolin), Acridotheres tristis (common myna), Carpodocus mexicanus (house finch),
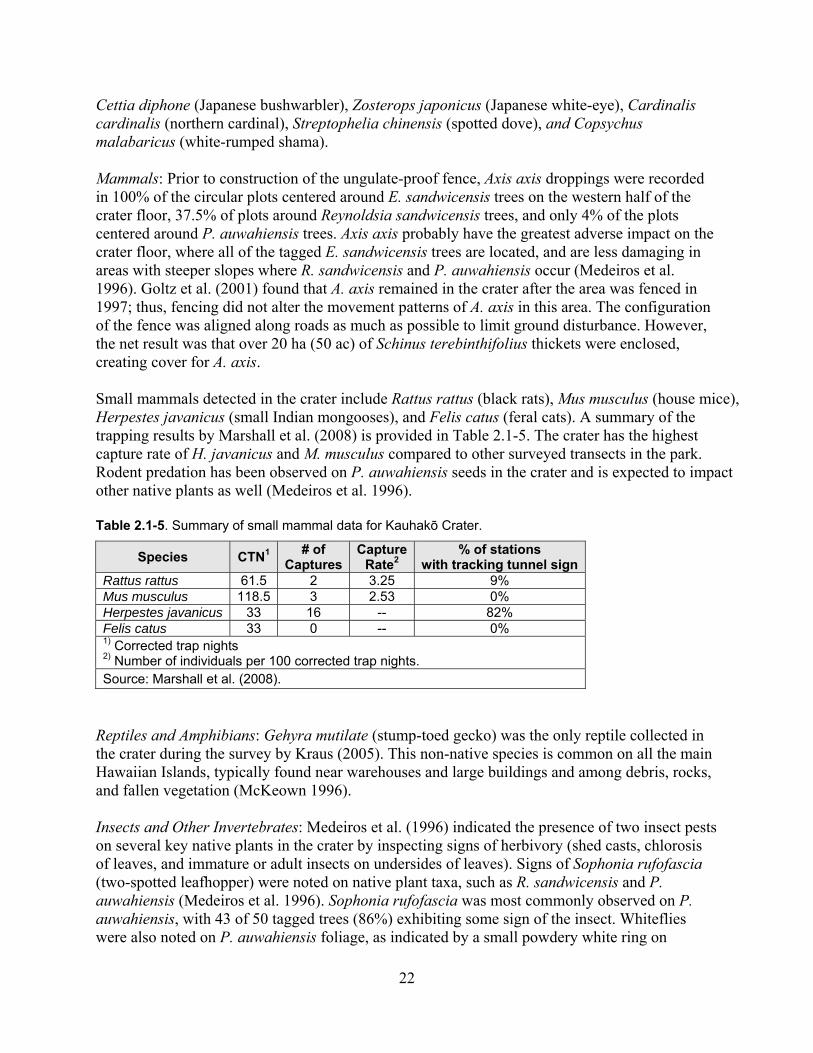
22
Cettia diphone (Japanese bushwarbler), Zosterops japonicus (Japanese white-eye), Cardinalis cardinalis (northern cardinal), Streptophelia chinensis (spotted dove), and Copsychus malabaricus (white-rumped shama). Mammals: Prior to construction of the ungulate-proof fence, Axis axis droppings were recorded in 100% of the circular plots centered around E. sandwicensis trees on the western half of the crater floor, 37.5% of plots around Reynoldsia sandwicensis trees, and only 4% of the plots centered around P. auwahiensis trees. Axis axis probably have the greatest adverse impact on the crater floor, where all of the tagged E. sandwicensis trees are located, and are less damaging in areas with steeper slopes where R. sandwicensis and P. auwahiensis occur (Medeiros et al. 1996). Goltz et al. (2001) found that A. axis remained in the crater after the area was fenced in 1997; thus, fencing did not alter the movement patterns of A. axis in this area. The configuration of the fence was aligned along roads as much as possible to limit ground disturbance. However, the net result was that over 20 ha (50 ac) of Schinus terebinthifolius thickets were enclosed, creating cover for A. axis. Small mammals detected in the crater include Rattus rattus (black rats), Mus musculus (house mice), Herpestes javanicus (small Indian mongooses), and Felis catus (feral cats). A summary of the trapping results by Marshall et al. (2008) is provided in Table 2.1-5. The crater has the highest capture rate of H. javanicus and M. musculus compared to other surveyed transects in the park. Rodent predation has been observed on P. auwahiensis seeds in the crater and is expected to impact other native plants as well (Medeiros et al. 1996). Table 2.1-5. Summary of small mammal data for Kauhakō Crater.
Species CTN1 # of
CapturesCapture
Rate2 % of stations
with tracking tunnel sign Rattus rattus 61.5 2 3.25 9% Mus musculus 118.5 3 2.53 0% Herpestes javanicus 33 16 -- 82% Felis catus 33 0 -- 0% 1) Corrected trap nights 2) Number of individuals per 100 corrected trap nights. Source: Marshall et al. (2008).
Reptiles and Amphibians: Gehyra mutilate (stump-toed gecko) was the only reptile collected in the crater during the survey by Kraus (2005). This non-native species is common on all the main Hawaiian Islands, typically found near warehouses and large buildings and among debris, rocks, and fallen vegetation (McKeown 1996). Insects and Other Invertebrates: Medeiros et al. (1996) indicated the presence of two insect pests on several key native plants in the crater by inspecting signs of herbivory (shed casts, chlorosis of leaves, and immature or adult insects on undersides of leaves). Signs of Sophonia rufofascia (two-spotted leafhopper) were noted on native plant taxa, such as R. sandwicensis and P. auwahiensis (Medeiros et al. 1996). Sophonia rufofascia was most commonly observed on P. auwahiensis, with 43 of 50 tagged trees (86%) exhibiting some sign of the insect. Whiteflies were also noted on P. auwahiensis foliage, as indicated by a small powdery white ring on
23
affected leaves. The feeding of both insects is known to be detrimental to the health of affected individuals and could contribute to a more rapid decline of the remaining senescent trees in the crater (Medeiros et al. 1996). None of the E. sandwicensis inspected in the crater in October 2005 by the National Park Service exhibited damage by Quadrastichus erythrinae; however, data from more recent surveys have not been summarized. The National Park Service did see extensive damage from Specularius impressithorax on seeds on the ground and in the trees during the October 2005 survey. Threatened and Endangered Species: No threatened or endangered plant species currently occur in the crater. Portulaca villosa (ihi), a USFWS species of concern, occurs at the southwestern rim of the crater at roughly 155 m (508 ft) above sea level (a.s.l.). There were six P. villosa individuals in 1990 (Asherman et al. 1990). The National Park Service has developed a Species Action Plan to stabilize populations of federally endangered, threatened, and candidate plants at KALA, as well as species of concern. In addition to outplanting more common native species, the federally endangered Canavalia molokaiensis (‘āwikiwiki) and federally threatened Peucedanum sandwicense (makou) are planned to be outplanted at Kauhakō Crater. The walls of the Kauhakō Crater are suitable nesting areas for the threatened Puffinus auricularis newelli (Newell’s shearwater or ‘a‘o) and the endangered Pterodroma sandwichensis (Hawaiian petrel or ua‘u). No reliable information on the occurrence of these species in the crater exists. It has been suggested that overgrowth of non-native vegetation in the Kauhakō Crater may have decreased habitat for these species (NPS 1990). The federally endangered Lasiurus cinereus semotus is the only extant native terrestrial mammal from the Hawaiian archipelago (USFWS 1998). Lasiurus cinereus semotus were not detected during the survey by Frasher et al. (2007); however, Kauhakō Crater is believed to be a suitable location for bat activity, due to the proximity to water, shelter from winds, and intact canopy cover. Ongoing bat surveys may detect the use of the crater environment by L. cinereus semotus. Important Habitats: Caves and cavernous features occur in the Kauhakō Crater and the surrounding vicinity (Halliday 2001). Any material or substance occurring naturally in caves (including animals, plants, paleontological deposits, sediments, minerals, and relief features) are considered cave resources (16 U.S.C. §§ 4301-4310). These habitats have the potential to contain interesting geological formations, provide refuge for rare and highly specialized invertebrates and native plants (Howarth et al. 2007), and preserve paleontological resources, such as fossil bird bones (James et al. 1987). A complex cavernous structure, known as Kaluaokahoalii or Kauhakō Iki, lies beneath the inner pit of the crater (Halliday 2001). Bird bones of two different species (Pterodroma hypoleuca and Apteribis glenos) were collected within this feature in 1976. Kaluaokahoalii intersects a sinuous lava channel complex (or lava tube) that extends roughly 1.0 km (0.6 mi) from the northeast side of the crater. It is unknown whether this feature is a large collapsed lava tube (Clague et al. 1982, Coombs et al. 1990) or a lava channel complex that produced a variety of geomorphic features (Halliday 2001). The caves and cave resources at KALA are highly threatened, primarily from over-grazing by
24
feral mammals (F. Howarth/Bishop Museum, pers. comm.). Human-mediated subsurface alterations (i.e., alteration of cave entrances and passages that change the cave microclimate) may also be impacting these communities (Stone and Howarth 2007). 2.1.1.4 Information Gaps: Land Use: The Nature Conservancy’s (TNC’s) Measuring Conservation Actions in East Molokai, Hawaii (2003a) recommends that conservation managers assess changes in land use and ownership every seven to 10 years. An assessment of land uses adjacent to the park would allow the National Park Service to evaluate conservation progress or threats at the broader landscape scale. Invasive Fauna: Little data exist with respect to range, population estimates, and carrying capacity of ungulates in the crater (and KALA in general) (NPS 1990). Because of their known adverse impacts to native species and ecosystems in the crater, this represents a major data gap. This information may be obtained by on-the-ground transect monitoring (see Medeiros 1996) that calculates the percentage of transects with ungulate sign or direct counts using forward-looking infrared aerial surveys. TNC (2003a) suggests that baseline ungulate monitoring should precede management activities by one to two years (TNC 2003a). This work could be conducted in cooperation with the East Molokai Watershed Partnership. Relatively little information has been obtained on the impacts of non-native rodents (particularly Rattus spp.) and insects (particularly Sophonia rufofascia) on native plants in the crater. Studies focusing on these species could help to devise future management or restoration strategies in this zone, including the use of snap traps as predator control, diphacinone application, or biocontrol. Flora: Implementation of a long-term vegetation monitoring program with permanent transects would be an effective study for Kauhakō Crater. Regularly monitored plots (or transects) would document the presence and abundance (percent cover) of individual species and vegetation associations over time, as well as quantify trends in plant diversity (TNC 2003a). In addition to data gathering, a vital component of this program is data analysis in order to highlight useful information and inform management decisions. Furthermore, mapping that shows native vegetation fragments and patch size, both in the canopy and understory, would help to monitor areas of native relic vegetation (Aruch 2006). Mapping the distribution and abundance of high-priority, habitat-modifying weeds in relation to impacted native resources and subsequently focusing control efforts on these species and sites (TNC 2003a) would address an important gap. As noted by Hughes et al. (2007), “monitoring can be an early warning system for detecting and eradicating invasive species that are just becoming established. It also serves in detecting changes in plant communities over time as a means for measuring the success of management strategies.” Once native plant restoration activities in the crater commence, monitoring will be useful in evaluating whether restoration goals have been achieved (SER International Science & Policy Working Group 2004). Developing monitoring protocols geared specifically to performance standards and establishing permanent monitoring fixtures (transect lines, photopoints, etc.) can decrease project costs and increase the success of the restoration project (Clewell et al. 2005).
25
Avifauna: Although no native forest birds were noted in the crater, Marshall and Kozar (2008) recommended conducting systematic bird surveys during periods of peak vocalization (breeding seasons) to ensure high detectability of native species. Mammals: Frasher et al. (2007) suggested continuing surveys for Lasiurus cinereus semotus in Kauhakō Crater and its surroundings because these areas provide intact non-native canopy cover and adequate protection from the strong winds (Frasher et al. 2007). Systematic surveys using Anabat detectors (Titley Electronics, NSW, Australia) could be conducted at various elevations in the crater at different times of the year. Anabat detectors are instruments that can record the ultrasonic echolocation calls of bats, which can then be analyzed to determine the presence/absence of bats as well as their activity patterns. Surveys are recommended particularly between the months of April to August as L. cinereus semotus show seasonal altitudinal movements and have been documented to increase in numbers at low altitudes during these months on the Island of Hawai‘i (Menard 2001). Insects and Other Invertebrates: No studies have been conducted in the crater specifically targeting insects or other invertebrates. Native tree snails have been found in the nearby TNC Kamakou Preserve (TNC 2003a); therefore, there may be some interest in expanding these surveys to areas of the park, including the crater. A study of the invertebrate pollinators in the crater may be useful to understand the future of native plants in the crater. Caves and Cavernous Features: At least two cave-adapted species endemic to KALA have been identified within the park, although outside of the crater. The potential to come across additional obligate cave-adapted plants and animals, as well as paleontological resources, is significant (F. Howarth/Bishop Museum, pers. comm.). To better evaluate the condition of the crater’s caves and cave resources, additional studies need to be conducted including identifying and mapping features, and inventorying faunal and floral resources in the features. An important component of this work is the development of a Cave Management Plan to ensure that cave exploration does not result in damage to these resources (F. Howarth/Bishop Museum, pers.comm.). 2.1.2 Coastal Spray Zone The Coastal Spray Zone is a strip of land approximately 3.2 km (2.0 mi) long located along the northeast shore of the Kalaupapa peninsula. The area supports a diversity of habitats, including dunes, rock strand, and sea cliffs. Due to the prevailing northeast tradewinds combined with the low topography of this area, this area is characterized by high winds and abundant sea spray. As a result, minimal human activity has occurred in this management zone. 2.1.2.1 Previous and Ongoing Studies and Inventories: Soils & Climate:
Soils on the Island of Moloka‘i were classified by the U.S. Department of Agriculture (USDA) Soil Conservation Service (Foote et al. 1972). The survey was primarily designed to offer useful information for planning agriculture; therefore, mapping was conducted on agricultural land and generalized for other areas.
Canfield (1990) noted more detailed descriptions of the soils and substrate in the Coastal
Spray Zone during a vegetation survey.
26
One Remote Automated Weather Station (RAWS) Network site (Makapulapai) currently operates in the Coastal Spray Zone. The Makapulapai site has a data record extending back to 1993 and measures temperature, wind, humidity, solar radiation, barometric pressure, fuel temperature, and precipitation (Davey et al. 2006).
Flora:
In January 1987, Canfield (1990) identified and documented cover and abundance of all plant species in the Coastal Spray Zone. This study also mapped and described associations and disturbances in each vegetation community.
Asherman et al. (1990) conducted an eight-day reconnaissance survey in six areas of the park, including the Coastal Spray Zone from the Kalawao coastline to the lighthouse. Species list and voucher specimens were collected for plants within the area.
The plant communities in the Coastal Spray Zone were re-described by Funk (1991) based
on previous vegetation surveys and additional supplemental surveys. Hughes et al. (2007) examined plant diversity and distribution for species occurring in the
Coastal Spray Zone by analyzing data from previously surveyed transects. This analysis was entirely based on the survey by Canfield (1990).
A complete inventory of the flora of KALA (including the Coastal Spray Zone) was
conducted by Wysong and Hughes (2008). This included collecting voucher specimens to create a permanent and usable herbarium.
The U.S. Geological Survey and National Park Service also created a draft vegetation cover map of the Coastal Spray Zone in 2007 based on aerial remote sensing. Each identifiable vegetation cover was categorized as Class 1–3 to provide an estimate of the total native and non-native species composition. The final report for this project, including mapping methods and a detailed description of the plant communities, is anticipated in early 2010 (J. Jacobi/USGS, pers. comm.).
In 2009, the National Park Service will begin an inventory to collect and identify plant
driftseeds along the high-tide driftline at Ho‘olehua beach, located at the tip of the Coastal Spray Zone.
In 2010, the National Park Service plans to re-examine legacy vegetation data within the
Coastal Spray Zone to document recent (10–20 years) vegetation changes within legacy vegetation plots.
Avifauna:
Hodges carried out a boat-based survey in the summer of 1996 and observed sea birds in the Coastal Spray Zone (Hodges 1996).
Marshall and Aruch (2003) completed a shoreline seabird inventory during the fall of 2003.
It was conducted from various locations in the park, including along the Coastal Spray Zone.
27
An additional shoreline bird survey was conducted along the KALA coastline by Kozar et al.
(2007) during two days in 2005. Seasonal migrants (waterfowl, shorebirds) were the primary focus of the routine surveys, but seabirds, raptors, and waterbirds were also recorded.
Since 2008, annual seabird monitoring has been conducted throughout the park to determine
whether Puffinus auricularis newelli and Pterodroma sandwichensis are present. Visual and auditory methods are used to detect seabirds.
Mammals:
No surveys have been conducted to identify mammals within the Coastal Spray Zone; however, radio-collared Axis axis were tracked throughout the park by Goltz et al. (2001).
Reptiles and Amphibians:
No previous reptile or amphibian surveys have been conducted in the Coastal Spray Zone.
Insects and Other Invertebrates: No insect or other invertebrate studies have been conducted in the Coastal Spray Zone.
Other:
Coombs et al. (1990) described the geology and morphology of various caves and cavernous features in the Coastal Spray Zone.
Unpublished investigations of the flora and paleontological resources in caves throughout the
Coastal Spray Zone have been conducted by Radewagen and Neller (unpublished).
Howarth and Taiti (1995) and Taiti and Howarth (1997) surveyed cave invertebrates within caves in the management zone. These investigations specifically focused on rare species.
Visual searches for obligately cavernicolous Oliarus species were conducted by Hoch and Howarth (1999) in lava tubes at KALA.
Rivera et al. (2002) sampled known populations of troglobitic Hawaiioscia and Littorophiloscia from caves in the Coastal Spray Zone.
Speleological investigations were conducted along the Kalaupapa peninsula by Halliday (2001). Unpublished data and maps from earlier studies were also included in the report.
2.1.2.2 Physical Environment: Soil development in the Coastal Spray Zone is relatively minimal (Canfield 1990). The USDA Soil Conservation Service identified six soil or substrate types in the Coastal Spray Zone (Table 2.1-6 and Figure 2.1-2). Canfield (1990) found that a more extensive sand area exists than indicated in the earlier soil survey. This sand area extends from Kahio benchmark to Kaupikiawa. Table 2.1-6. Soil types and key soil characteristics in Coastal Spray Zone management zone.

28
Soil Type Farmland Erodible Coverage in
Zone (m2) Kalaupapa Very Rocky Silty Clay Loam, 3 to 25 % Slopes
Not prime farmland Highly erodible 2,145,239
Rock Land Not prime farmland Potentially highly
erodible 599,946
Rock Outcrop Not prime farmland Not highly erodible 248,396
Jaucas Sand, 0 to 15 % Slopes Not prime farmland Potentially highly
erodible 86,603
Haleiwa Silty Clay Loam, 0 to 10 % Slopes Prime farmland (if
irrigated) Potentially highly
erodible 8,116
Rough Mountainous Land Not prime farmland Highly erodible 400
Source: Foote et al. (1972).
Former land uses that impacted the Coastal Spray Zone include agriculture, rubbish dumping, an old boat landing south of Kuololimu, and the Mormon beach house steps south of Lae Ho‘olehua. Domestic and feral ungulates brought to KALA for the leprosy settlement have had a significant negative impact on native resources. The previous leprosy settlement at Kalawao just south of the Coastal Spray Zone had minimal influence on the nearby area due to the limited mobility of the patients (Canfield 1990). 2.1.2.3 Ecological Community: Flora: Due to the great diversity of habitats, the Coastal Spray Zone maintains a parallel diversity of native plant associations. Compared to other coastal areas in the main Hawaiian Islands, the Coastal Spray Zone at KALA supports a diverse and extensive native coastal vegetation community. The relatively intact nature of this area is largely due to the minimal amount of human contact (Canfield 1990). However, grazing by ungulates, cultivation practices, the introduction of alien vegetation, and other activities have altered the historic vegetation. Two lichens, two ferns, and 66 flowering plant species have been identified in this zone. Of this total, 25 species are native. Non-native species comprise the largest percentage of the plants in the Coastal Spray Zone (Table 2.1-7, Figure 2.1-6). Fourteen non-native species documented in the Coastal Spray Zone are considered noxious by the State Department of Agriculture (DOA). Non-native plants are concentrated along the roadsides in the area. The most abundant non-native plants in the zone are Cynodon dactylon (Bermudagrass) and Digitaria adscendens (Henry’s crabgrass). Fimbristylis cymosa (mau‘u ‘aki‘aki) is the most common native species. Canfield (1990) identified the following five plant communities within the Coastal Spray Zone: 1) native dominated community on sandy strand directly in the salt spray, 2) a half native community on flat basalt with clayey soil above sea cliffs in the most intense salt spray, 3) native community on rocky strand slightly protected from salt spray, 4) small area of native-dominated prostrate shrubs on raised basalt domes, and 5) an alien-dominated grassland less influenced by spray. In addition, an adjacent non-native scrub community is present mauka2 of the spray zone. Twenty-five localized plant associations were defined within the five spray zone communities.
2 Hawaiian adverb meaning toward the mountains; inland.
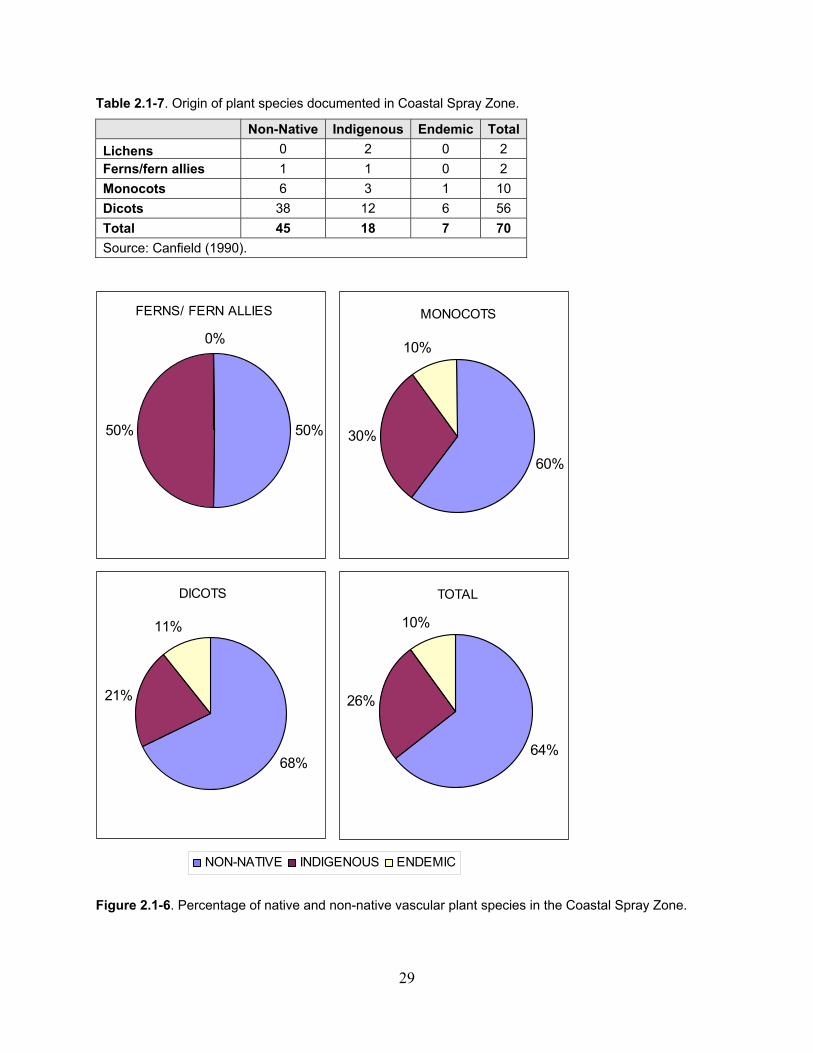
29
Table 2.1-7. Origin of plant species documented in Coastal Spray Zone.
Non-Native Indigenous Endemic Total
Lichens 0 2 0 2
Ferns/fern allies 1 1 0 2
Monocots 6 3 1 10
Dicots 38 12 6 56
Total 45 18 7 70
Source: Canfield (1990).
Figure 2.1-6. Percentage of native and non-native vascular plant species in the Coastal Spray Zone.
60%
30%
10%
MONOCOTS
68%
21%
11%
DICOTS
64%
26%
10%
TOTAL
50%50%
0%
FERNS/ FERN ALLIES
NON-NATIVE INDIGENOUS ENDEMIC
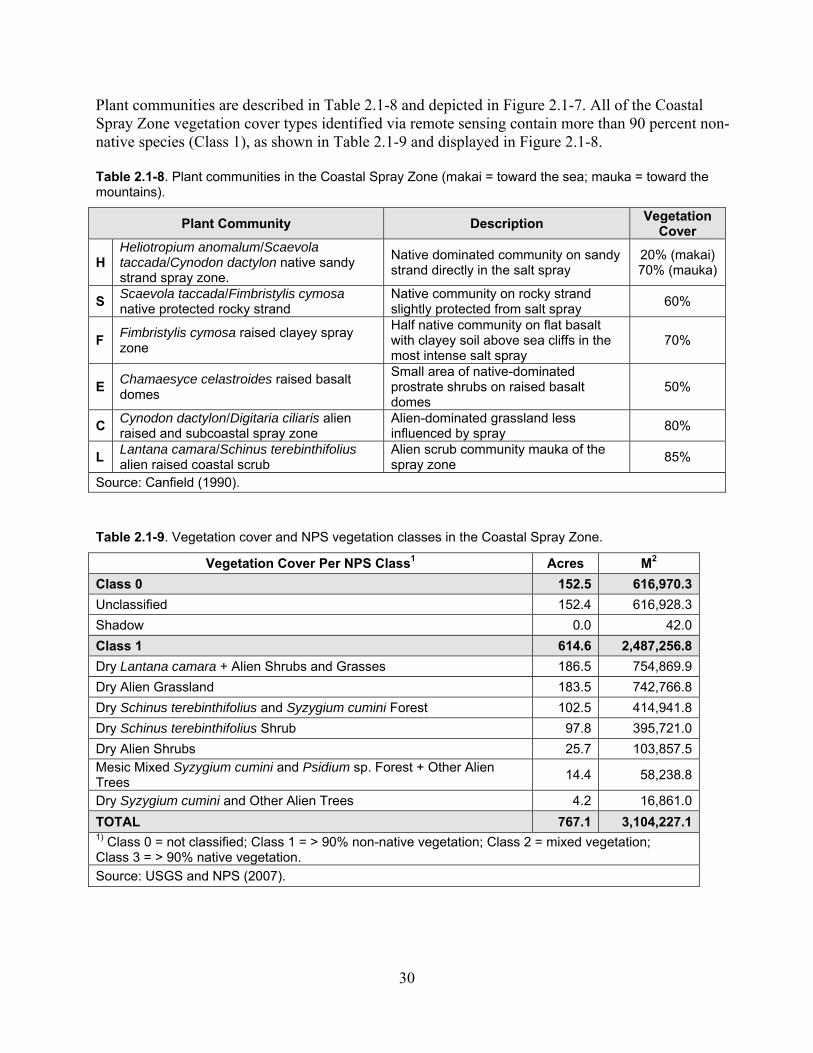
30
Plant communities are described in Table 2.1-8 and depicted in Figure 2.1-7. All of the Coastal Spray Zone vegetation cover types identified via remote sensing contain more than 90 percent non-native species (Class 1), as shown in Table 2.1-9 and displayed in Figure 2.1-8. Table 2.1-8. Plant communities in the Coastal Spray Zone (makai = toward the sea; mauka = toward the mountains).
Plant Community Description Vegetation
Cover
H Heliotropium anomalum/Scaevola taccada/Cynodon dactylon native sandy strand spray zone.
Native dominated community on sandy strand directly in the salt spray
20% (makai) 70% (mauka)
S Scaevola taccada/Fimbristylis cymosa native protected rocky strand
Native community on rocky strand slightly protected from salt spray
60%
F Fimbristylis cymosa raised clayey spray zone
Half native community on flat basalt with clayey soil above sea cliffs in the most intense salt spray
70%
E Chamaesyce celastroides raised basalt domes
Small area of native-dominated prostrate shrubs on raised basalt domes
50%
C Cynodon dactylon/Digitaria ciliaris alien raised and subcoastal spray zone
Alien-dominated grassland less influenced by spray
80%
L Lantana camara/Schinus terebinthifolius alien raised coastal scrub
Alien scrub community mauka of the spray zone
85%
Source: Canfield (1990).
Table 2.1-9. Vegetation cover and NPS vegetation classes in the Coastal Spray Zone.
Vegetation Cover Per NPS Class1 Acres M2
Class 0 152.5 616,970.3
Unclassified 152.4 616,928.3
Shadow 0.0 42.0
Class 1 614.6 2,487,256.8
Dry Lantana camara + Alien Shrubs and Grasses 186.5 754,869.9
Dry Alien Grassland 183.5 742,766.8
Dry Schinus terebinthifolius and Syzygium cumini Forest 102.5 414,941.8
Dry Schinus terebinthifolius Shrub 97.8 395,721.0
Dry Alien Shrubs 25.7 103,857.5Mesic Mixed Syzygium cumini and Psidium sp. Forest + Other Alien Trees
14.4 58,238.8
Dry Syzygium cumini and Other Alien Trees 4.2 16,861.0
TOTAL 767.1 3,104,227.11) Class 0 = not classified; Class 1 = > 90% non-native vegetation; Class 2 = mixed vegetation; Class 3 = > 90% native vegetation.
Source: USGS and NPS (2007).
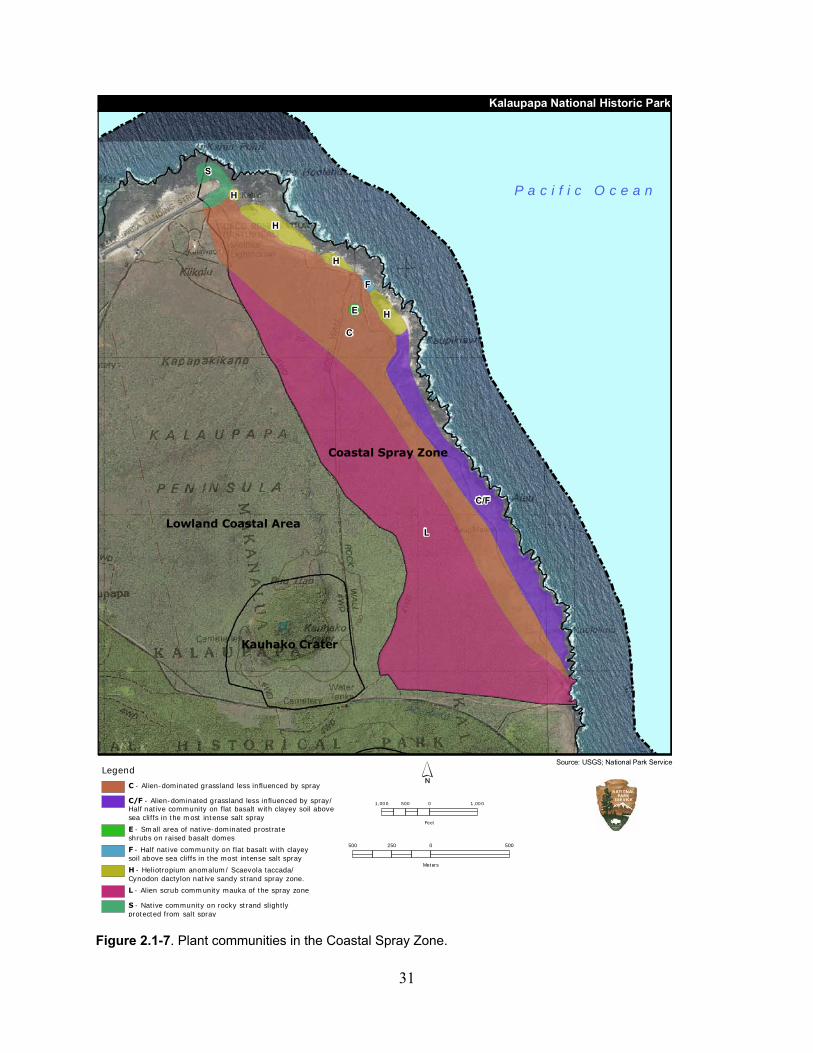
31
Figure 2.1-7. Plant communities in the Coastal Spray Zone.
Source: USGS; National Park ServiceLegend
C - Alien-dominated grassland less influenced by spray
C/F - Alien-dominated grassland less influenced by spray/Half native community on flat basalt with clayey soil above sea cliffs in the most intense salt spray
E - Small area of native-dominated prostrateshrubs on raised basalt domes
F - Half native community on flat basalt with clayeysoil above sea cliffs in the most intense salt spray
H - Heliotropium anomalum/ Scaevola taccada/ Cynodon dactylon native sandy strand spray zone.
L - Alien scrub community mauka of the spray zone
S - Native community on rocky strand slightlyprotected from salt spray
1,000 0 1,000500
Feet
500 0 500250
Meters
P a c i f i c O c e a n
Lowland Coastal Area
Coastal Spray Zone
Kauhako Crater
L
C
C/F
H
S
H
H
F
E
H
Kalaupapa National Historic Park
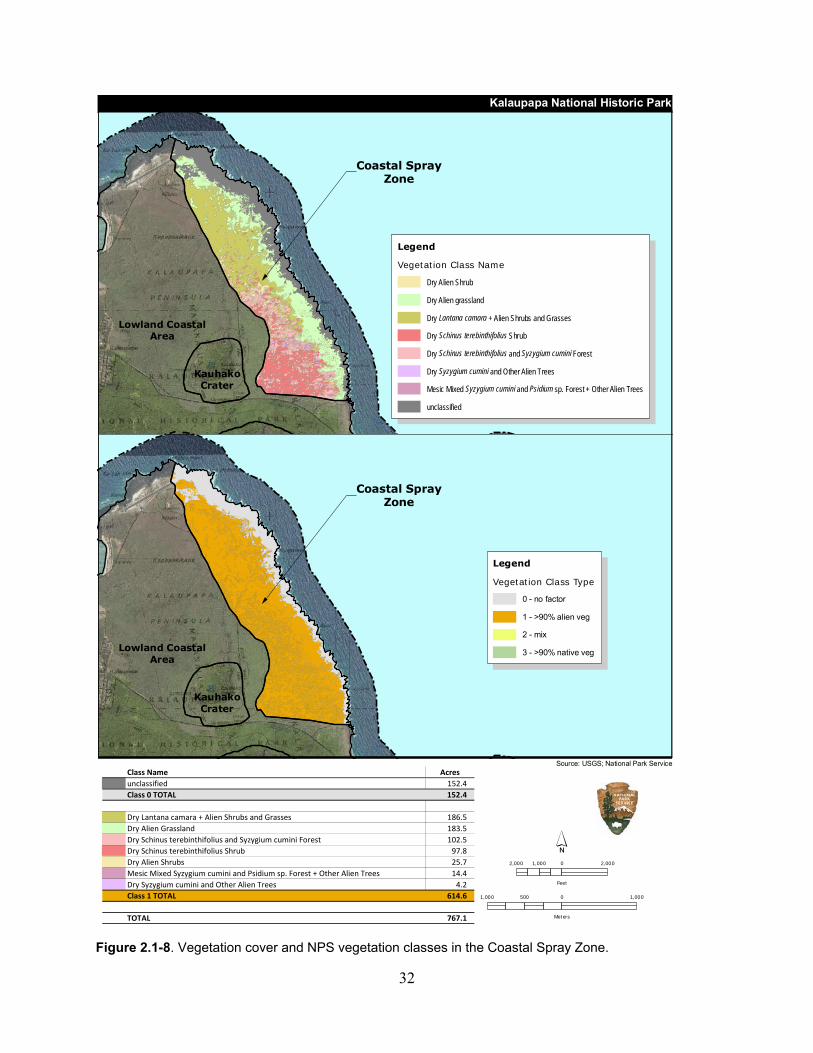
32
Figure 2.1-8. Vegetation cover and NPS vegetation classes in the Coastal Spray Zone.
Class Name Acres
unclassified 152.4
Class 0 TOTAL 152.4
Dry Lantana camara + Alien Shrubs and Grasses 186.5
Dry Alien Grassland 183.5
Dry Schinus terebinthifolius and Syzygium cumini Forest 102.5
Dry Schinus terebinthifolius Shrub 97.8
Dry Alien Shrubs 25.7
Mesic Mixed Syzygium cumini and Psidium sp. Forest + Other Alien Trees 14.4
Dry Syzygium cumini and Other Alien Trees 4.2
Class 1 TOTAL 614.6
TOTAL 767.1
Source: USGS; National Park Service
Lowland CoastalArea
KauhakoCrater
Coastal SprayZone
Legend
Vegetation Class Name
Dry Alien Shrub
Dry Alien grassland
Dry Lantana camara + Alien Shrubs and Grasses
Dry Schinus terebinthifolius Shrub
Dry Schinus terebinthifolius and Syzygium cumini Forest
Dry Syzygium cumini and Other Alien Trees
Mesic Mixed Syzygium cumini and Psidium sp. Forest + Other Alien Trees
unclassified
Lowland CoastalArea
KauhakoCrater
Coastal SprayZone
Legend
Vegetation Class Type
0 - no factor
1 - >90% alien veg
2 - mix
3 - >90% native veg
Kalaupapa National Historic Park
2,000 0 2,0001,000
Feet
1,000 0 1,000500
Meters
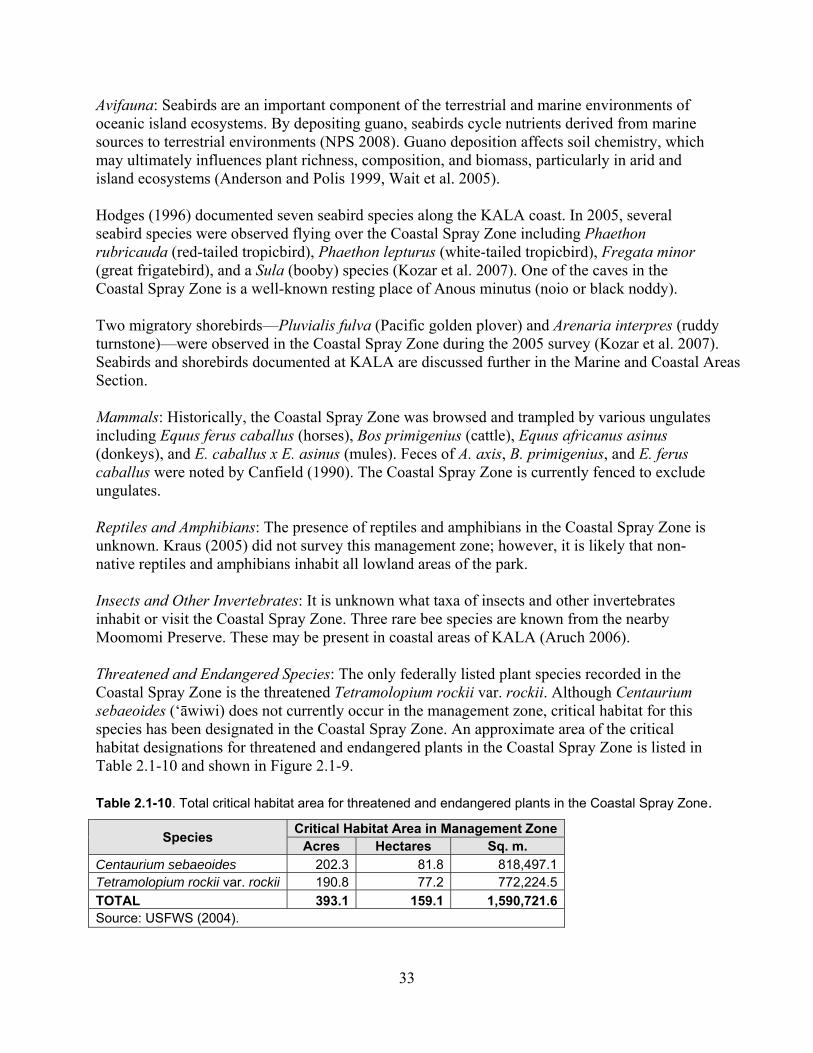
33
Avifauna: Seabirds are an important component of the terrestrial and marine environments of oceanic island ecosystems. By depositing guano, seabirds cycle nutrients derived from marine sources to terrestrial environments (NPS 2008). Guano deposition affects soil chemistry, which may ultimately influences plant richness, composition, and biomass, particularly in arid and island ecosystems (Anderson and Polis 1999, Wait et al. 2005). Hodges (1996) documented seven seabird species along the KALA coast. In 2005, several seabird species were observed flying over the Coastal Spray Zone including Phaethon rubricauda (red-tailed tropicbird), Phaethon lepturus (white-tailed tropicbird), Fregata minor (great frigatebird), and a Sula (booby) species (Kozar et al. 2007). One of the caves in the Coastal Spray Zone is a well-known resting place of Anous minutus (noio or black noddy). Two migratory shorebirds—Pluvialis fulva (Pacific golden plover) and Arenaria interpres (ruddy turnstone)—were observed in the Coastal Spray Zone during the 2005 survey (Kozar et al. 2007). Seabirds and shorebirds documented at KALA are discussed further in the Marine and Coastal Areas Section. Mammals: Historically, the Coastal Spray Zone was browsed and trampled by various ungulates including Equus ferus caballus (horses), Bos primigenius (cattle), Equus africanus asinus (donkeys), and E. caballus x E. asinus (mules). Feces of A. axis, B. primigenius, and E. ferus caballus were noted by Canfield (1990). The Coastal Spray Zone is currently fenced to exclude ungulates. Reptiles and Amphibians: The presence of reptiles and amphibians in the Coastal Spray Zone is unknown. Kraus (2005) did not survey this management zone; however, it is likely that non-native reptiles and amphibians inhabit all lowland areas of the park. Insects and Other Invertebrates: It is unknown what taxa of insects and other invertebrates inhabit or visit the Coastal Spray Zone. Three rare bee species are known from the nearby Moomomi Preserve. These may be present in coastal areas of KALA (Aruch 2006). Threatened and Endangered Species: The only federally listed plant species recorded in the Coastal Spray Zone is the threatened Tetramolopium rockii var. rockii. Although Centaurium sebaeoides (‘āwiwi) does not currently occur in the management zone, critical habitat for this species has been designated in the Coastal Spray Zone. An approximate area of the critical habitat designations for threatened and endangered plants in the Coastal Spray Zone is listed in Table 2.1-10 and shown in Figure 2.1-9. Table 2.1-10. Total critical habitat area for threatened and endangered plants in the Coastal Spray Zone.
Species Critical Habitat Area in Management Zone
Acres Hectares Sq. m. Centaurium sebaeoides 202.3 81.8 818,497.1Tetramolopium rockii var. rockii 190.8 77.2 772,224.5
TOTAL 393.1 159.1 1,590,721.6Source: USFWS (2004).
34
Figure 2.1-9. Critical habitat for threatened and endangered species in the Coastal Spray Zone.
Figure 2.1-9
Critical Habitats for Threatenedand Endangered Species
in the Coastal Spray Zone
SPECIES ACRES HECTARESCentaurium sebaeoides 202.3 81.8Tetramolopium rockii 190.8 77.2
393.1 159.1
Source: USFWS 2004; USGS; National Park Service
0 2,000 4,0001,000
ft
0 500 1,000250
M
Lowland CoastalArea
KauhakoCrater
Coastal SprayZone
Lowland CoastalArea
KauhakoCrater
Coastal SprayZone
Centaurium sebaeoides
Tetramolopium rockii
Kalaupapa National Historic Park
35
NPS plans to outplant Portulaca villosa (a federal species of concern) in the Coastal Spray Zone between Kalawao and Kahiu point on the northern tip of the peninsula. The goal of this outplanting is to augment the existing population and create two new populations of P. villosa comprising 500 reproducing plants (NPS, unpublished). The threatened Puffinus auricularis newelli and the endangered Pterodroma sandwichensis may fly over the Coastal Spray Zone. These species are believed to nest in the valleys of northeastern Moloka‘i (Day and Cooper 2002). Important Habitats: The Kaupikiawa Cave System is composed of roughly ten caves located in the Coastal Spray Zone. This system contains the largest lava tube known on the Kalaupapa peninsula (Halliday 2001). One of the best known caves on the peninsula is Old Ladies Caves or Ananaluawahine. This cave is located outside of the Kaupikiawa Cave System (Halliday 2001) within the Coastal Spray Zone. Rare cave invertebrates have been documented in the Costal Spray Zone by various researchers (Howarth and Taiti 1995, Taiti and Howarth 1997, Hoch and Howarth 1999). Biospeleologists found a new species of blind isopod, Hawaiioscia paeninsulae, in the Kaupikiawa Cave System. This endemic species is distinct from similar species on Maui (Taiti and Howarth 1997, Rivera et al. 2002). Another obligate cave species, Oliarus kalaupapae, was observed in two different caves in the Coastal Spray Zone of KALA (Hoch and Howarth 1999). This species was determined to be the least cave-adapted species of the genus, although it is found in the oldest lava tube. Hoch and Howarth (1999) suggest that potentially “the ancestor of O. kulaupupae colonized the lava tubes at Kalaupapa some time after their formation, and the population has been living in situ and adapting to the caves ever since.” Several native plants have been documented in the entrances to caves in this area, including Sesuvium portulacastrum (‘ākulikuli), Boerhavia repens (alena), Sida fallax (‘ilima), Heliotropium anomalum (hinhina), and Fimbristylis cymosa (mau‘u ‘aki‘aki) (Halliday 2001, Radewagen and Neller, unpublished). Paleontological remains (Radewagen and Neller, unpublished) have been recorded in the Kaupikiawa Cave System. 2.1.2.4 Information Gaps: Invasive Fauna: No studies have been conducted to document the presence, concentration, or impacts of non-native mammals (particularly rodents) or non-native insects on native plants in the Coastal Spray Zone. Studies focusing on these species could help to devise future management or restoration strategies, such as predator or ungulate control. Flora: To document changes and trends within the vegetation, the National Park Service could re-survey established transects within the Coastal Spray Zone. In addition to non-native plant species, this survey could also determine the current distribution and abundance of invasive plant species. If coastal strand restoration efforts are initiated, long-term monitoring of restoration would provide valuable information for the National Park Service to ensure funds are properly allocated. Canfield (1990) recommended conducting an experimental salt water application study to control alien plants in the area. Following up on this recommendation may provide management strategies to promote
36
native plant growth and control invasives. Where species show poor regeneration, targeted studies could seek to determine the causes and make recommendations to mitigate threats. Avifauna: Ornithological radar and night-visual observations in the Coastal Spray Zone would provide information on the movement rates of threatened and endangered seabirds, such as Puffinus auricularis newelli and Pterodroma sandwichensis. These surveys should be conducted between 1900 and 2200 hours in the evening to coincide with the peak time of inland movement toward their nesting colonies (Day et al. 2003). Insects and Other Invertebrates: Outside of the cave system, no studies of insects have occurred in the Coastal Spray Zone. Because rare insects are known to occur in nearby coastal areas, a study of the invertebrate pollinators in this zone may be useful to understand the future of the coastal strand vegetation. Caves and Cavernous Features: No recent surveys have been conducted in the extensive cave system to document features or resources within the caves. Similar to Kauhakō Crater, the potential to come across more obligate cave-adapted plants and animals, as well as paleontological resources, is significant (F. Howarth/Bishop Museum, pers. comm.). To better evaluate the condition of the caves and cave resources, additional studies need to be conducted in the Coastal Spray Zone including identifying the locating of these features, mapping features, and inventorying faunal and floral resources in the features. An important component of this work is the development of a Cave Management Plan to ensure that cave exploration does not damage the very resources that need protection (F. Howarth/Bishop Museum, pers. comm.). 2.1.3 Offshore Islets Two offshore islets—Ōkala and Huelo—are currently under the jurisdiction of the National Park Service as part of KALA. Both islets are managed as State Seabird Sanctuaries by the National Park Service and the Hawai‘i Division of Forestry and Wildlife (DOFAW). Mokapu Islet is located within the park boundaries but is entirely under the jurisdiction of Hawai‘i DOFAW. 2.1.3.1 Previous and Ongoing Studies and Inventories: Soils & Climate:
Specific soil surveys have not been conducted on the Offshore Islets management zone; however, studies focusing on the ecological communities (Duvall 2000, Wood 2001, Wood and Legrande 2003, Wood 2008) have documented soil types and conditions on the islets.
Flora:
Wood (2000, 2001) conducted vegetation surveys on Huelo Islet. These surveys recorded general information on the vegetation community and listed all plants on the islet.
Wood and LeGrande (2002) documented observations and created a plant checklist of the
vegetation on Huelo and Ōkala Islets. In 2003, Wood and LeGrande created another checklist of vascular plants found on four
islets offshore of Moloka‘i, including Ōkala and Huelo (Wood and Legrande 2003).
37
Hughes et al. (2007) compiled data from the survey by Wood and Legrande (2003) to estimate plant diversity and distribution for the offshore islets.
In 2008, Wood provided detailed descriptions of Huelo and Ōkala Islets. This report provided a history of conditions on the islets, plant diversity estimates, and descriptions of abiotic conditions (Wood 2008).
Various accession data is available for Huelo Islet from 1999 to 2003 and for Ōkala Islet
between 2002 and 2003. This data provides species location information, plant descriptions, abiotic condition summaries, population structure information, and identifies associated species and major threats (NPS, unpublished).
Based on aerial remote sensing, the U.S. Geological Survey and National Park Service also created a draft vegetation cover map with estimates of total percent native cover on the offshore islets. Most of the area was unclassified (Class 0) due to the small size of the islands and shadowing. Therefore, the results are not presented in this report. However, a more detailed vegetation mapping project of the entire park is scheduled to be conducted.
Avifauna: Due to their small size and the difficulty of access, the offshore islets have not been
intensively surveyed for seabirds. Most avian surveys are conducted on the peninsula, and birds seen in the vicinity of the islets are noted. One seabird survey was conducted by boat (Hodges 1996), but shorebirds were not present due to the timing of the survey.
In the fall of 2003, Marshall and Aruch (2003) conducted a shoreline seabird inventory throughout areas of KALA, making observations of birds in the vicinity of the offshore islets.
Kozar et al. (2007) inventoried the relative abundance and habitat use of avian species at
KALA. Although this survey was not conducted on the islets, birds could be seen flying over the islets from the Coastal Spray Zone and Lowland Coastal Area.
Mammals:
No specific studies have been conducted to document mammals on the islets. Reptiles and Amphibians:
Duvall (2000) surveyed the reptiles on both Ōkala Islet and Huelo Islet. No inventories of amphibian species have been done for the offshore islets, although none
were detected by Duvall (2000). Insects and Other Invertebrates:
No insect survey data is known from Ōkala Islet.
Limited insect collection has occurred opportunistically on Huelo Islet (Bishop Museum 2008, Swenson 2008).
38
2.1.3.2 Physical Environment: Huelo, which is approximately 0.7 ha (1.8 ac) in size, is located 2.5 km (1.6 mi) to the east of the Kalaupapa peninsula. The islet is roughly 61 m (200 ft) tall (Swenson 2008, Wood 2008). Huelo Islet is underlain by a mixture of guano, decomposing palm leaf litter, and humus (Duvall 2000, Wood 2001, Wood 2008). The islet has occasional pockets of rich, black-brown, fine-textured soil along with pockets of 3 to 4 mm (0.19 to 0.16 in) brown, granular soil. At the top of the islet, large basalt talus boulders of 1 to 2 m (3.3-6.6 ft) diameter are randomly scattered and smaller talus evenly dispersed (Wood 2008). Ōkala Islet is located 1.5 km (0.9 mi) to the east of the Kalaupapa peninsula and has an estimated area of 3.0 ha (7.4 ac). The islet reaches 122 m (400 ft) high and is the tallest and third largest of Moloka‘i’s offshore islets (Swenson 2008, Wood 2008). Ōkala Islet is underlain by crumbly basalt talus and boulder outcrops interspersed with pockets of brown granular soil (Sweson 2008). It is believed that humans never occupied the islets (NPS 1990). However, it has been suggested that a man-made ahu (Hawaiian cairn) approximately 1 m2 (3.2 ft2) in size lies at the very top of the south-central rim on Huelo (Wood 2008). Ancient Hawaiian legends also recount stories of Hawaiians using native palm leaves to glide from Huelo’s summit to the sea (Swenson 2008). 2.1.3.3 Ecological Community: Flora: The offshore islets “represent the last strongholds where some of the rarest lowland and coastal plant species in the archipelago occur in natural populations” (Wood 2008). Both Huelo and Ōkala Islet support unusual relict vegetation and rich native species diversity. However, the native flora on the offshore islets is threatened by competition with non-native plant taxa, landslides, possible rat predation (only Ōkala), and loss of reproductive vigor (NPS, unpublished). Approximately 24 native plant taxa have been recorded on Huelo Islet, of which 16 are endemic and eight are indigenous to the Hawaiian Islands. An additional 18 non-native plants occur on the islet (Hughes et al. 2007, Wood 2008). Huelo is considered one of the most pristine natural areas in Hawai‘i likely because it never supported permanent humans occupants (NPS 1990). Wood (2008) has reported Huelo as the “most botanically significant islet in the Hawaiian chain” because it contains one of the two Pritchardia hillebrandii (loulu) coastal forests remaining in the Hawaiian Islands. The other P. hillebrandii forest is located on the remote Island of Nihoa. The P. hillebrandii forest on Huelo is approximately 1,800 m2 (20,000 ft2) in size and is composed of approximately 224 mature P. hillebrandii trees between 4 and 7 m (13–23 ft) in height. The trees form a dense canopy on the upper slopes and small cliff terraces of the islet (Wood 2001, Wood and LeGrande 2002, Wood 2008). A healthy combination of juvenile and seedling palms occur in the understory, including 52 immature and 35 seedlings of P. hillebrandii. Other native plant species occur in light gaps in the understory (Wood and LeGrande 2002, Wood 2008). Along the borders of the palm forest, a diversified shrubland encircles the islet. This shrubland is dominated by Chamaesyce celastroides var. amplectens (‘akoko). Several additional taxa of native
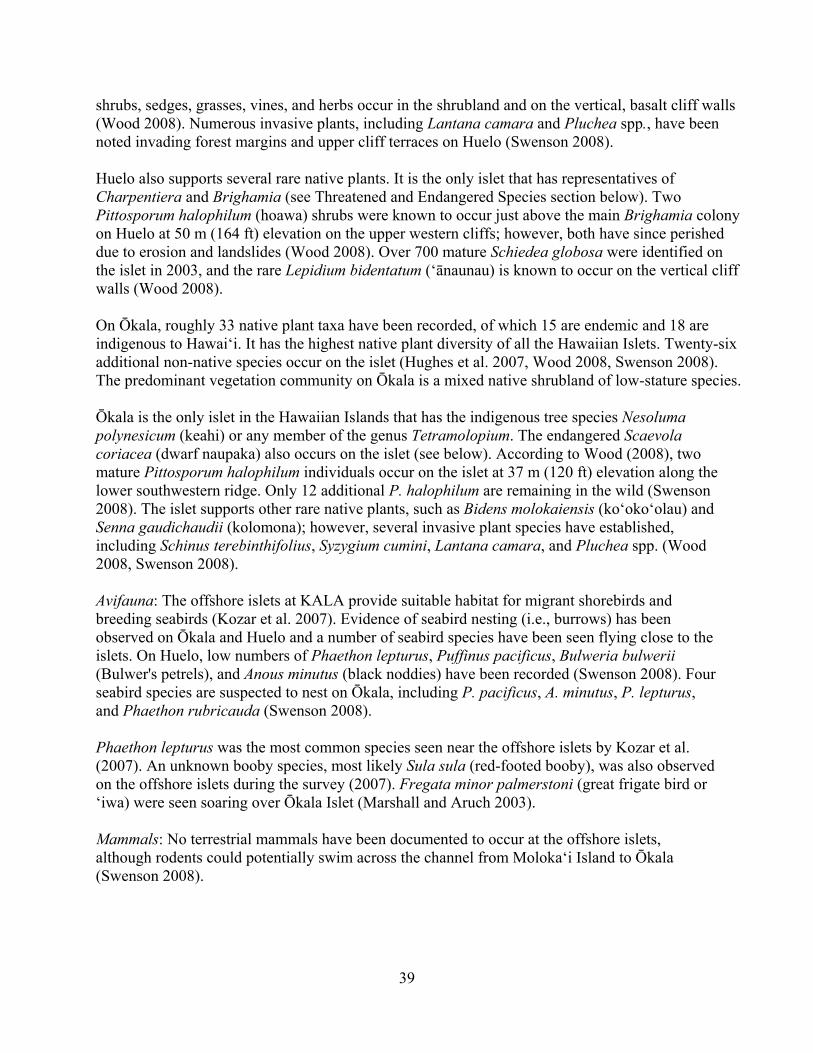
39
shrubs, sedges, grasses, vines, and herbs occur in the shrubland and on the vertical, basalt cliff walls (Wood 2008). Numerous invasive plants, including Lantana camara and Pluchea spp., have been noted invading forest margins and upper cliff terraces on Huelo (Swenson 2008). Huelo also supports several rare native plants. It is the only islet that has representatives of Charpentiera and Brighamia (see Threatened and Endangered Species section below). Two Pittosporum halophilum (hoawa) shrubs were known to occur just above the main Brighamia colony on Huelo at 50 m (164 ft) elevation on the upper western cliffs; however, both have since perished due to erosion and landslides (Wood 2008). Over 700 mature Schiedea globosa were identified on the islet in 2003, and the rare Lepidium bidentatum (‘ānaunau) is known to occur on the vertical cliff walls (Wood 2008). On Ōkala, roughly 33 native plant taxa have been recorded, of which 15 are endemic and 18 are indigenous to Hawai‘i. It has the highest native plant diversity of all the Hawaiian Islets. Twenty-six additional non-native species occur on the islet (Hughes et al. 2007, Wood 2008, Swenson 2008). The predominant vegetation community on Ōkala is a mixed native shrubland of low-stature species. Ōkala is the only islet in the Hawaiian Islands that has the indigenous tree species Nesoluma polynesicum (keahi) or any member of the genus Tetramolopium. The endangered Scaevola coriacea (dwarf naupaka) also occurs on the islet (see below). According to Wood (2008), two mature Pittosporum halophilum individuals occur on the islet at 37 m (120 ft) elevation along the lower southwestern ridge. Only 12 additional P. halophilum are remaining in the wild (Swenson 2008). The islet supports other rare native plants, such as Bidens molokaiensis (ko‘oko‘olau) and Senna gaudichaudii (kolomona); however, several invasive plant species have established, including Schinus terebinthifolius, Syzygium cumini, Lantana camara, and Pluchea spp. (Wood 2008, Swenson 2008). Avifauna: The offshore islets at KALA provide suitable habitat for migrant shorebirds and breeding seabirds (Kozar et al. 2007). Evidence of seabird nesting (i.e., burrows) has been observed on Ōkala and Huelo and a number of seabird species have been seen flying close to the islets. On Huelo, low numbers of Phaethon lepturus, Puffinus pacificus, Bulweria bulwerii (Bulwer's petrels), and Anous minutus (black noddies) have been recorded (Swenson 2008). Four seabird species are suspected to nest on Ōkala, including P. pacificus, A. minutus, P. lepturus, and Phaethon rubricauda (Swenson 2008). Phaethon lepturus was the most common species seen near the offshore islets by Kozar et al. (2007). An unknown booby species, most likely Sula sula (red-footed booby), was also observed on the offshore islets during the survey (2007). Fregata minor palmerstoni (great frigate bird or ‘iwa) were seen soaring over Ōkala Islet (Marshall and Aruch 2003). Mammals: No terrestrial mammals have been documented to occur at the offshore islets, although rodents could potentially swim across the channel from Moloka‘i Island to Ōkala (Swenson 2008).
40
Table 2.1-11. Origin of plant species documented on the offshore islets.
Non-Native Indigenous Endemic Total
Huelo Islet 18 8 16 42
Ōkala Islet 26 18 15 59
Total 44 26 31 101
Source: Wood (2008).
Figure 2.1-10. Percentage of native and non-native vascular plant species on the offshore islets.
NON-NATIVE INDIGENOUS ENDEMIC
43%
19%
38%
Huelo Islet
43%
26%
31%
TOTAL
44%
31%
25%
Okala Islet
41
Reptiles and Amphibians: During the survey of Huelo Islet, Duvall (2000) collected specimens of the Lipinia noctua (moth skink), which inhibits the leaf litter among the native Pritchardia palms (Kraus 2005). Lepidodactylus lugubris (mourning gecko) were also collected on the islet (Duvall 2000). Insects and Other Invertebrates: Opportunistic surveys on Huelo Islet collected three endemic species of moths including Hyposmocoma sp. (Cosmopterigidae), Mestelobes sp. (Crambidae), and Philodoria sp. (Gracillariidae). A single non-native moth, Erechthias minuscula (Tineidae), was also collected (Bishop Museum 2008). Threatened and Endangered Species: Several threatened and endangered plant species occur on the islets (Table 2.1-12). Although no critical habitat has been designated on the offshore islets, the endangered Brighamia rockii (pua‘ala) and threatened Peucedanum sandwicense occur on Huelo Islet. Roughly 50 mature B. rockii individuals were recorded on the west side of the seastack in 1994, but this population has decreased over time. Only five B. rockii individuals were documented on the islet in 2003 (Wood 2008), and only one was noted in the most recent USFWS review (USFWS 2008b). Approximately 90% of the loss of B. rockii on Huelo is attributed to landslides, although lack of natural pollinators likely contributed to its small population size (Wood 2008). Eight mature Scaevola coriacea currently occur on Ōkala Islet (Wood 2008). This endangered plant is currently known from five locations in Hawai‘i, of which three are on offshore islets (Swenson 2008). Table 2.1-12. Federally threatened and endangered species currently occurring on the offshore islets.
Species Name Common Name Family Date Listed Status
Brighamia rockii pua‘ala Campanulaceae 10/8/1992 E
Peucedanum sandwicense makou Apiaceae 2/25/1994 T
Scaevola coriacea dwarf naupaka Goodeniaceae 5/16/1986 E
Source: USFWS (2008b), Wood (2008).
Important Habitats: Sea caves have been observed around the base of the islet (Swenson 2008); however, features and resources within these caves have not been described. 2.1.3.4 Information Gaps: Visitor Use: The current unauthorized use of the offshore islets is unknown. It may be useful to conduct reconnaissance-level public use surveys of Huelo and Ōkala Islet to acquire information on the extent that public use threatens the natural resources of the islets. These surveys should be conducted from the KALA shoreline using binoculars. Useful information that could be collected during the survey may include number of visitors, activity types, duration of stay on the islets, types of organisms removed, and extent of habitat disturbance (Coastal Resources Management, Inc. 2008). Motion sensing cameras may also be an option to determine unauthorized use.
42
Invasive Species: Because the offshore islets contain only small populations of some of the rarest lowland and coastal plant species in the archipelago, these species are especially vulnerable to invasive flora and fauna. To ensure protection of rare native species and the communities at large, it is important to regularly monitor the islets for incipient invasive plants, mammals, or insects. Early detection will facilitate containment or eradication of the target species as soon as possible. Surveys for invasive species can be conducted concurrently with general vegetation surveys. Scientists and resource managers should observe strict biosecurity protocols before going on the island to prevent accidental introduction of more invaders. Flora: Implementation of a long-term vegetation monitoring program with permanent transects in the coastal Pritchardia forest at Huelo Islet and the mixed native shrubland at Ōkala Islet could be used to document population dynamics. Regularly monitored plots (or transects) would document the presence and abundance of vegetation associations over time, as well as quantify trends in plant diversity (TNC 2003a). The small size and isolation of the offshore islets in Hawai‘i makes restoration a feasible management option to help safeguard remaining native populations (Eijzenga and Preston 2008). Any vegetation restoration on the offshore islets should be monitored to evaluate whether restoration goals have been achieved (SER International Science & Policy Working Group 2004). Avifauna: Currently, only presence/absence data is available for the avifauna on the offshore islets. More detailed studies of these species could demonstrate the need for seabird nest protection and active management. The first step for this research would require locating colonies of burrow-nesting seabirds by identifying signs of nesting (e.g., scat outside crevices or holes, feathers, carcasses) during systematic daytime surveys. Reptiles and Amphibians: The National Park Service has not reached the national objective to determine the presence or absence of 90% of all reptiles and amphibians that may occur at KALA. Minimal surveys for these species have been conducted on the offshore islets at KALA; however, offshore islands are known to be refugia for herpetofauna (Towns and Robb 1986). Although the impacts of these non-native species are understudied, surveys for reptiles and amphibians have the potential to identify predatory species which may impact native ecosystems (see Threats and Stressors). Insects and Other Invertebrates: Both Huelo and Ōkala Islet have a high richness of native vegetation; therefore, additional collection efforts would likely discover more native insects (Swenson 2008). A variety of collection methods can be used including pitfall traps, ant cards, sweep nets, or ground searches. Night surveys should also be conducted because many insects are nocturnal (Eijzenga and Preston 2008). Caves and Cavernous Features: As noted above, sea caves around the base of the islet may contain unique features and resources. A survey at these sites could evaluate the condition of the caves and cave resources and identify faunal and floral resources. 2.1.4 Pu‘u Ali‘i Natural Area Reserve The Pu‘u Ali‘i NAR encompasses 538 ha (1,330 ac) on the southeast corner of the park between Pelekunu and Waikolu Valleys. Elevations in the reserve range from 686 m (2,250 ft) at the top of
43
the sea cliffs on the northern edge to 1,287 m (4,222 ft) at the summit (DOFAW 1991). The topography is difficult to transverse, composed of a northwest sloping plateau surrounded by steep valleys. The NAR is bordered on the south by the Kamakou Preserve, which is managed by The Nature Conservancy (TNC). The Pu‘u Ali‘i NAR, which was established in October 1985, is part of the National Area Reserve System. This system is managed by the State of Hawai‘i DLNR, DOFAW, according to Hawaii Administrative Rules (HAR) Title 13, Chapter 209. The NPS has a cooperative-operating agreement with DLNR to access the area. The Pu‘u Ali‘i NAR is divided into two management units—Pu‘u Ali‘i Unit and the Ohialele Unit. The Pu‘u Ali‘i Unit encloses 260 ha (640 ac) in the higher elevation portion of the reserve, while the Ohialele Unit makes up the remaining 280 ha (690 ac) in the lower portion of the reserve (Figure 2.1-11). 2.1.4.1 Previous and Ongoing Studies and Inventories: Soils & Climate:
Soils on the Island of Moloka‘i were classified by the USDA Soil Conservation Service (Foote et al. 1972). The survey was primarily focused on agricultural land and generalized for other areas. More recent soil surveys have not been conducted on Moloka‘i.
Flora:
In 1988, the Hawaii Heritage Program (HINHP) documented the presence and abundance of native and non-native vegetation along eight transects throughout the NAR. This document mapped and described vegetation communities based on aerial photographs, published and unpublished reports, personal interviews, and field inventory data; however, information gathered during the survey was largely incidental, and the survey was not intended to be a comprehensive biological inventory.
In 1989, Jacobi created vegetation maps for areas of the Island of Moloka‘i, including the
Pu‘u Ali‘i NAR, based on black and white aerial photographs and subsequent field verification (Jacobi 1989). The maps were designed to provide a regional habitat framework to determine the current status of native forest birds.
Funk (1991) consolidated earlier surveys and maps of the park to describe 20 plant
communities throughout KALA. This included the planeze around Pu‘u Ali‘i.
In 2003, Wood and Hughes developed a regional checklist of vascular plants, which included the Pu‘u Ali‘i NAR (Wood and Hughes 2003).
Between 2003 and 2005, Wood et al. (2005) created plant checklists for five transects in the
Pu‘u Ali‘i NAR. These transects covered a total area of 462 ha (1,142 ac).
Compiling data from Wood et al. (2005), Hughes et al. (2007) estimated plant diversity and distribution in the Pu‘u Ali‘i NAR to compare floristic assemblages and identify priority areas for conservation throughout the park.

44
Wysong and Hughes (2008) updated plant checklists and collected voucher specimens for the entire park, including transects inside the Pu‘u Ali‘i NAR.
Using data from remote aerial sensing, the U.S. Geological Survey and National Park Service created a draft vegetation cover map of the Pu‘u Ali‘i NAR with estimates of percent native cover for each vegetation cover category. The draft map was created in 2007, and the final report for this project, including mapping methods and a detailed description of the plant communities, is anticipated in early 2010 (J. Jacobi/USGS, pers. comm.).
KALA is planning to survey the distributional extent of Ehrharta stipoides (meadow ricegrass) in Pu‘u Ali‘i NAR. Eradication of this species is considered feasible because E. stipoides was only recently introduced to KALA (Wysong and Hughes 2008).
Avifauna:
A single transect from the State of Hawai‘i Forest Bird Survey (the Pu‘u Ali‘i NAR transect or HFBS 4) is located within the boundaries of KALA. The Pu‘u Ali‘i NAR transect bisects the NAR longitudinally, extending from 1,280 m (4,200 ft) at the southern boundary of the NAR to 940 m (3,084 ft) at the rim of Waikolu Valley. An additional HFBS transect is located in the upper Waikolu Valley (HFBS 3) just mauka of the Pu‘u Ali‘i NAR along the Hanalilolilo Trail. These transects were surveyed in 1979.
DOFAW collected data for the Molokai Forest Bird Survey at the two HFBS transects between March and April 2004, as reported in Marshall and Kozar (2008).
An avian disease study was conducted in the Pu‘u Ali‘i NAR and the surrounding Pelekunu
and Kamakou Preserve in 2003 (as reported in Aruch 2006). This study was designed to assess the severity and urgency of disease risks to native avifauna.
Marshall and Kozar (2008) re-surveyed the two existing HFBS transects from March to May 2005. This survey calculated the number of birds per station (BPS) and percent of occurrence of each species.
Mammals:
The Hawaii Heritage Program survey (HINHP 1989) noted above documented and mapped ungulate damage along eight transects throughout the NAR.
Since 1993, the National Park Service has conducted annual surveys in the NAR to document ungulate activity. Most of this data was collected during hunting tests.
Goltz et al. (2001) conducted a 13-month study on the population of Axis axis throughout the park, gathering information on movement patterns and home ranges.
In March 2005, Marshall et al. (2008) conducted a small mammal survey at a single transect in Pu‘u Ali‘i NAR at roughly 1,160 m (3,806 ft) elevation. The transect coincides with the pre-existing HFBS. Snap traps, a Tomahawk® live cage trap, a tracking tunnel, and Catchmaster® glue traps were used to census the species present.
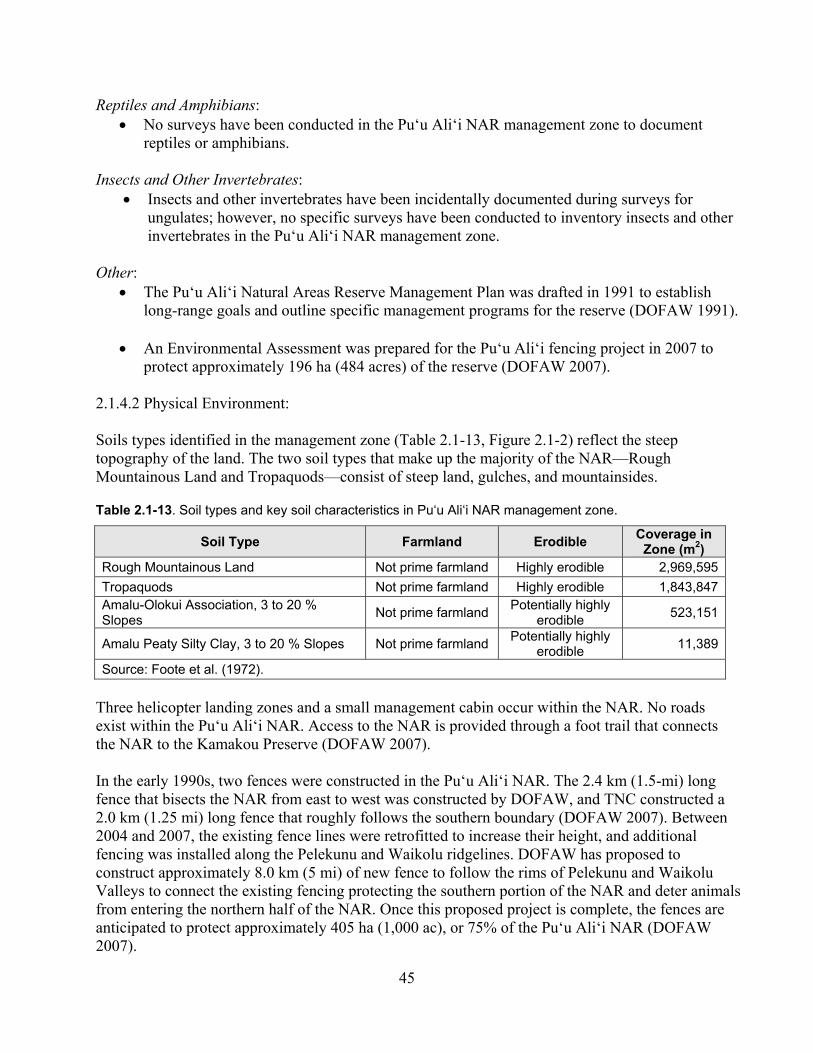
45
Reptiles and Amphibians: No surveys have been conducted in the Pu‘u Ali‘i NAR management zone to document
reptiles or amphibians.
Insects and Other Invertebrates: Insects and other invertebrates have been incidentally documented during surveys for
ungulates; however, no specific surveys have been conducted to inventory insects and other invertebrates in the Pu‘u Ali‘i NAR management zone.
Other:
The Pu‘u Ali‘i Natural Areas Reserve Management Plan was drafted in 1991 to establish long-range goals and outline specific management programs for the reserve (DOFAW 1991).
An Environmental Assessment was prepared for the Pu‘u Ali‘i fencing project in 2007 to
protect approximately 196 ha (484 acres) of the reserve (DOFAW 2007). 2.1.4.2 Physical Environment: Soils types identified in the management zone (Table 2.1-13, Figure 2.1-2) reflect the steep topography of the land. The two soil types that make up the majority of the NAR—Rough Mountainous Land and Tropaquods—consist of steep land, gulches, and mountainsides. Table 2.1-13. Soil types and key soil characteristics in Pu‘u Ali‘i NAR management zone.
Soil Type Farmland Erodible Coverage in
Zone (m2) Rough Mountainous Land Not prime farmland Highly erodible 2,969,595
Tropaquods Not prime farmland Highly erodible 1,843,847Amalu-Olokui Association, 3 to 20 % Slopes
Not prime farmland Potentially highly
erodible 523,151
Amalu Peaty Silty Clay, 3 to 20 % Slopes Not prime farmland Potentially highly
erodible 11,389
Source: Foote et al. (1972).
Three helicopter landing zones and a small management cabin occur within the NAR. No roads exist within the Pu‘u Ali‘i NAR. Access to the NAR is provided through a foot trail that connects the NAR to the Kamakou Preserve (DOFAW 2007). In the early 1990s, two fences were constructed in the Pu‘u Ali‘i NAR. The 2.4 km (1.5-mi) long fence that bisects the NAR from east to west was constructed by DOFAW, and TNC constructed a 2.0 km (1.25 mi) long fence that roughly follows the southern boundary (DOFAW 2007). Between 2004 and 2007, the existing fence lines were retrofitted to increase their height, and additional fencing was installed along the Pelekunu and Waikolu ridgelines. DOFAW has proposed to construct approximately 8.0 km (5 mi) of new fence to follow the rims of Pelekunu and Waikolu Valleys to connect the existing fencing protecting the southern portion of the NAR and deter animals from entering the northern half of the NAR. Once this proposed project is complete, the fences are anticipated to protect approximately 405 ha (1,000 ac), or 75% of the Pu‘u Ali‘i NAR (DOFAW 2007).
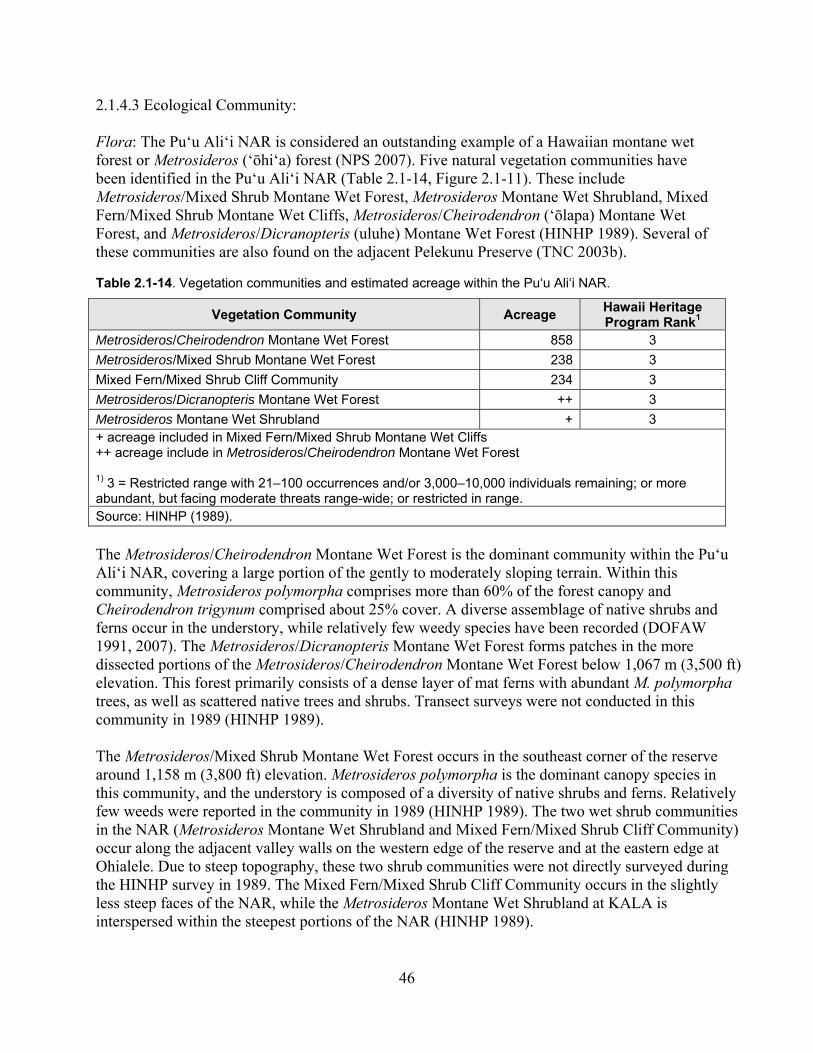
46
2.1.4.3 Ecological Community: Flora: The Pu‘u Ali‘i NAR is considered an outstanding example of a Hawaiian montane wet forest or Metrosideros (‘ōhi‘a) forest (NPS 2007). Five natural vegetation communities have been identified in the Pu‘u Ali‘i NAR (Table 2.1-14, Figure 2.1-11). These include Metrosideros/Mixed Shrub Montane Wet Forest, Metrosideros Montane Wet Shrubland, Mixed Fern/Mixed Shrub Montane Wet Cliffs, Metrosideros/Cheirodendron (‘ōlapa) Montane Wet Forest, and Metrosideros/Dicranopteris (uluhe) Montane Wet Forest (HINHP 1989). Several of these communities are also found on the adjacent Pelekunu Preserve (TNC 2003b). Table 2.1-14. Vegetation communities and estimated acreage within the Pu‘u Ali‘i NAR.
Vegetation Community Acreage Hawaii Heritage Program Rank1
Metrosideros/Cheirodendron Montane Wet Forest 858 3
Metrosideros/Mixed Shrub Montane Wet Forest 238 3
Mixed Fern/Mixed Shrub Cliff Community 234 3
Metrosideros/Dicranopteris Montane Wet Forest ++ 3
Metrosideros Montane Wet Shrubland + 3 + acreage included in Mixed Fern/Mixed Shrub Montane Wet Cliffs ++ acreage include in Metrosideros/Cheirodendron Montane Wet Forest 1) 3 = Restricted range with 21–100 occurrences and/or 3,000–10,000 individuals remaining; or more abundant, but facing moderate threats range-wide; or restricted in range. Source: HINHP (1989).
The Metrosideros/Cheirodendron Montane Wet Forest is the dominant community within the Pu‘u Ali‘i NAR, covering a large portion of the gently to moderately sloping terrain. Within this community, Metrosideros polymorpha comprises more than 60% of the forest canopy and Cheirodendron trigynum comprised about 25% cover. A diverse assemblage of native shrubs and ferns occur in the understory, while relatively few weedy species have been recorded (DOFAW 1991, 2007). The Metrosideros/Dicranopteris Montane Wet Forest forms patches in the more dissected portions of the Metrosideros/Cheirodendron Montane Wet Forest below 1,067 m (3,500 ft) elevation. This forest primarily consists of a dense layer of mat ferns with abundant M. polymorpha trees, as well as scattered native trees and shrubs. Transect surveys were not conducted in this community in 1989 (HINHP 1989). The Metrosideros/Mixed Shrub Montane Wet Forest occurs in the southeast corner of the reserve around 1,158 m (3,800 ft) elevation. Metrosideros polymorpha is the dominant canopy species in this community, and the understory is composed of a diversity of native shrubs and ferns. Relatively few weeds were reported in the community in 1989 (HINHP 1989). The two wet shrub communities in the NAR (Metrosideros Montane Wet Shrubland and Mixed Fern/Mixed Shrub Cliff Community) occur along the adjacent valley walls on the western edge of the reserve and at the eastern edge at Ohialele. Due to steep topography, these two shrub communities were not directly surveyed during the HINHP survey in 1989. The Mixed Fern/Mixed Shrub Cliff Community occurs in the slightly less steep faces of the NAR, while the Metrosideros Montane Wet Shrubland at KALA is interspersed within the steepest portions of the NAR (HINHP 1989).
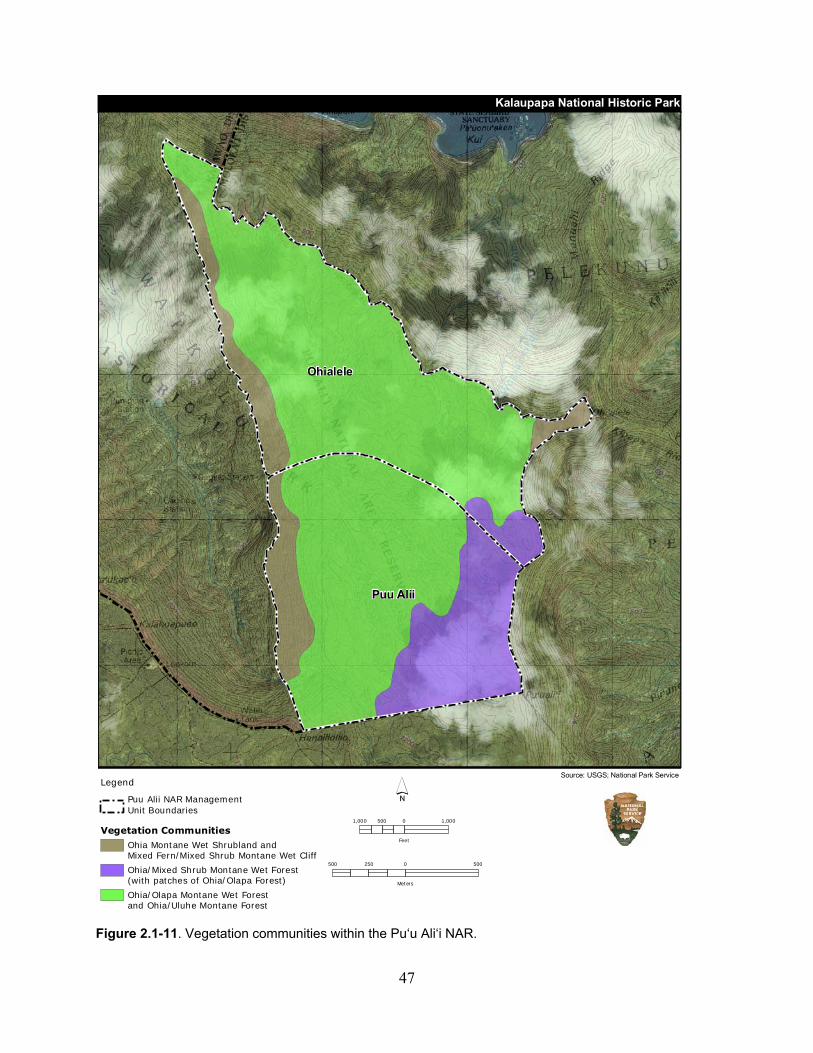
47
Figure 2.1-11. Vegetation communities within the Pu‘u Ali‘i NAR.
Legend
Puu Alii NAR ManagementUnit Boundaries
Vegetation Communities
Ohia Montane Wet Shrubland and Mixed Fern/Mixed Shrub Montane Wet Cliff
Ohia/Mixed Shrub Montane Wet Forest (with patches of Ohia/Olapa Forest)
Ohia/Olapa Montane Wet Forest and Ohia/Uluhe Montane Forest
Source: USGS; National Park Service
1,000 0 1,000500
Feet
500 0 500250
Meters
Puu Alii
Ohialele
Kalaupapa National Historic Park
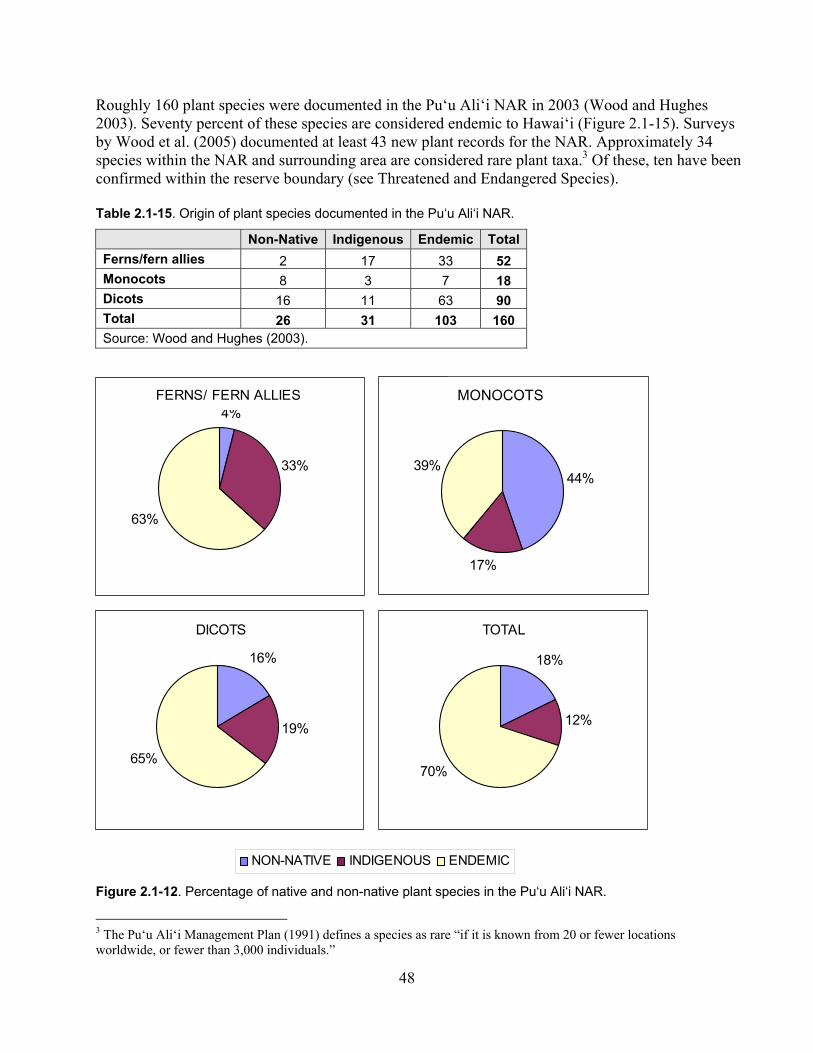
48
Roughly 160 plant species were documented in the Pu‘u Ali‘i NAR in 2003 (Wood and Hughes 2003). Seventy percent of these species are considered endemic to Hawai‘i (Figure 2.1-15). Surveys by Wood et al. (2005) documented at least 43 new plant records for the NAR. Approximately 34 species within the NAR and surrounding area are considered rare plant taxa.3 Of these, ten have been confirmed within the reserve boundary (see Threatened and Endangered Species). Table 2.1-15. Origin of plant species documented in the Pu‘u Ali‘i NAR.
Non-Native Indigenous Endemic Total
Ferns/fern allies 2 17 33 52 Monocots 8 3 7 18 Dicots 16 11 63 90 Total 26 31 103 160 Source: Wood and Hughes (2003).
m Figure 2.1-12. Percentage of native and non-native plant species in the Pu‘u Ali‘i NAR.
3 The Pu‘u Ali‘i Management Plan (1991) defines a species as rare “if it is known from 20 or fewer locations worldwide, or fewer than 3,000 individuals.”
44%
17%
39%
NON-NATIVE INDIGENOUS ENDEMIC
16%
19%
65%
DICOTS
MONOCOTS 4%
33%
63%
FERNS/ FERN ALLIES
18%
12%
70%
TOTAL
49
Most of the vegetation cover in the NAR falls within Class 3, meaning that the vegetation cover types are composed of greater than 90% native species (Table 2.1-16 and displayed in Figure 2.1-13). According to Hughes et al. (2007), the plateau areas of the Pu‘u Ali‘i NAR support the highest species richness of the entire park, with numerous species documented. Less diversity occurs in the lower, more disturbed potion (Ohialele Unit). Table 2.1-16. Vegetation cover and NPS vegetation classes in the Pu‘u Ali‘i NAR.
Vegetation Cover Per NPS Class1 Acres M2
Class 0 7.5 30,392.7
No Factor 6.2 25,031.4
Unclassified 1.3 5,355.4
Shadow 0.0 5.9
Class 1 8.4 33,997.8
Wet Psidium sp. 6.9 27,827.1Wet Aleurites moluccana and Psidium guajava Forest + Shrubs and Alien Grasses
1.5 6,170.7
Class 2 71.1 287,660.3Mesic Native Trees and Scattered Exotic Trees with Shrubs and Grasses
64.2 259,642.2
Mesic Exotic Grass and Native Shrub Community with Scattered Native Trees
6.9 28,018.1
Class 3 1,234.5 4,995,894.1
Wet Metrosideros polymorpha Forest with Tree Ferns and Native Shrubs 1,208.9 4,892,406.8Wet Matted Ferns or Native Shrubs with Scattered Metrosideros polymorpha
25.6 103,487.4
TOTAL 1,321.5 5,347,944.91) Class 0 = not classified; Class 1 = > 90% non-native vegetation; Class 2 = mixed vegetation; Class 3 = > 90% native vegetation.
Source: USGS and NPS (2007).
Avifauna: The vegetation communities described above support essential habitat for native forest birds, including rare and endangered species (NPS 1997). Six native forest birds have historically been recorded in Pu‘u Ali‘i NAR and the vicinity. Three are currently protected by federal or state law (see Threatened and Endangered Species below). More common native forest birds that have been recorded in the NAR include Himatione sanguinea (‘apapane), Hemignathus virens wilsoni (Maui ‘amakihi), and Asio flammeus sandwichensis (Hawaiian short-eared owl or pueo). During the 1979 HFBS, H. sanguinea and H. virens wilsoni were detected along the Pu‘u Ali‘i and Upper Waikolu transects (Marshall and Kozar 2008). Both species were observed along the Pu‘u Ali‘i transect in the 2004 and 2005 surveys, and H. sanguinea was also observed in the Upper Waikolu transect during these years. Himatione sanguinea are believed to forage up and down the valley walls at KALA (Marshall and Kozar 2008).
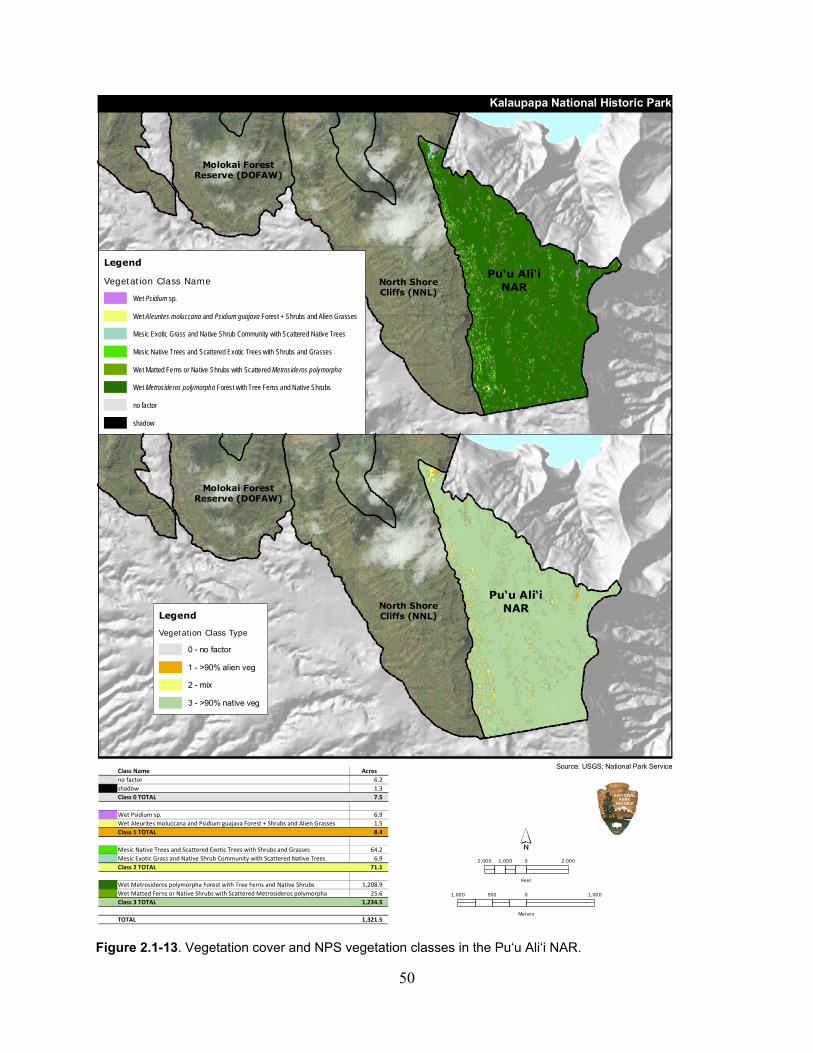
50
Figure 2.1-13. Vegetation cover and NPS vegetation classes in the Pu‘u Ali‘i NAR.
Class Name Acres
no factor 6.2
shadow 1.3
Class 0 TOTAL 7.5
Wet Psidium sp. 6.9
Wet Aleurites moluccana and Psidium guajava Forest + Shrubs and Alien Grasses 1.5
Class 1 TOTAL 8.4
Mesic Native Trees and Scattered Exotic Trees with Shrubs and Grasses 64.2
Mesic Exotic Grass and Native Shrub Community with Scattered Native Trees 6.9
Class 2 TOTAL 71.1
Wet Metrosideros polymorpha Forest with Tree Ferns and Native Shrubs 1,208.9
Wet Matted Ferns or Native Shrubs with Scattered Metrosideros polymorpha 25.6
Class 3 TOTAL 1,234.5
TOTAL 1,321.5
Figure 2.1-13Source: USGS; National Park Service
North ShoreCliffs (NNL)
Molokai ForestReserve (DOFAW)
Pu‘u Ali‘iNAR
Legend
Vegetation Class Name
Wet Psidium sp.
Wet Aleurites moluccana and Psidium guajava Forest + Shrubs and Alien Grasses
Mesic Exotic Grass and Native Shrub Community with Scattered Native Trees
Mesic Native Trees and Scattered Exotic Trees with Shrubs and Grasses
Wet Matted Ferns or Native Shrubs with Scattered Metrosideros polymorpha
Wet Metrosideros polymorpha Forest with Tree Ferns and Native Shrubs
no factor
shadow
North ShoreCliffs (NNL)
Molokai ForestReserve (DOFAW)
Pu‘u Ali‘iNAR
Legend
Vegetation Class Type
0 - no factor
1 - >90% alien veg
2 - mix
3 - >90% native veg
Kalaupapa National Historic Park
2,000 0 2,0001,000
Feet
1,000 0 1,000500
Meters
51
Seven non-native forest birds have been reported in the Pu‘u Ali‘i NAR and surrounding area. Non-native forest birds commonly seen or heard in the Pu‘u Ali‘i NAR include Zosterops japonicus (Japanese white-eye), Leiothrix lutea (red-billed leiothrix), and Cettia diphone (Japanese bush-warbler) (DOFAW 1991, 2007). Of these, only C. diphone was not detected in 1979, likely because it was first detected on Moloka‘i in the late 1970s (Marshall and Kozar 2008). The percent occurrence and birds per station found along the two HFBS transects in 1979 compared to 2004/2005 are listed in Table 2.1-17. Table 2.1-17. Percent occurrence and birds per station for the two HFBS transects in 1979 and 2004/2005.
Mammals: During the small mammal survey, Marshall et al. (2008) caught Rattus rattus, Mus musculus, Herpestes javanicus, and Felis catus along the single transect in the Pu‘u Ali‘i NAR (Table 2.1-18). Canis familiaris (feral dog) tracks were also noted along the Pu‘u Ali‘i NAR transect during the survey. These stray animals were likely left behind from ungulate hunts in the NAR and other adjacent reserves (Marshall et al. 2008). Table 2.1-18. Summary of small mammal data in the Pu‘u Ali‘i NAR.
Species CTN1 # of
capturesCapture
Rate2 % of stations
with tracking tunnel signRattus rattus 67.5 3 4.4 0% Mus musculus 129.5 2 1.54 0% Herpestes javanicus 33 2 -- 9% Felis catus 33 1 -- 0% 1) Corrected trap nights 2) Number of individuals per 100 corrected trap nights. Source: Marshall et al. (2008)
Sus scrofa (pig) and Capra hircus (goats) have been reported within the NAR, and Axis axis are also likely to occur. Sus scrofa seem to have the greatest impact in lower elevations, with moderate to heavy damage noted below 1,067 m (3,500 ft) elevation (HINHP 1989). Conversely,
Species Common Names % Occurrence1 BPS2
1979 2004/2005 1979 2004/2005
Carpodacus mexicanus house finch 4% 6% 0.04 0.06
Cettia diphone Japanese bush-warbler -- 100% -- 4.32
Francolinus francolinus black francolin 20% -- 0.42 --
Hemignathus virens wilsoni* Maui ‘amakihi 23% 6% 0.4 0.03
Himatione sanguine* ‘apapane 100% 94% 6.4 3.14
Leiothrix lutea red-billed leothrix 70% 70% 2.96 1.7
Lonchura punctulata nutmeg mannikin -- 2% -- 0.00
Streptopelia chinensis spotted dove 34% 4% 0.88 0.04
Zosterops japonicus Japanese white-eye 100% 88% 7.34 2.36 * = Native species 1) Percent occurrence is calculated by dividing the number of stations occupied by birds by the number of stations surveyed. 2) Birds per station (BPS) is calculated by dividing the number detected by the number of stations surveyed. Source: Marshall and Kozar (2008)
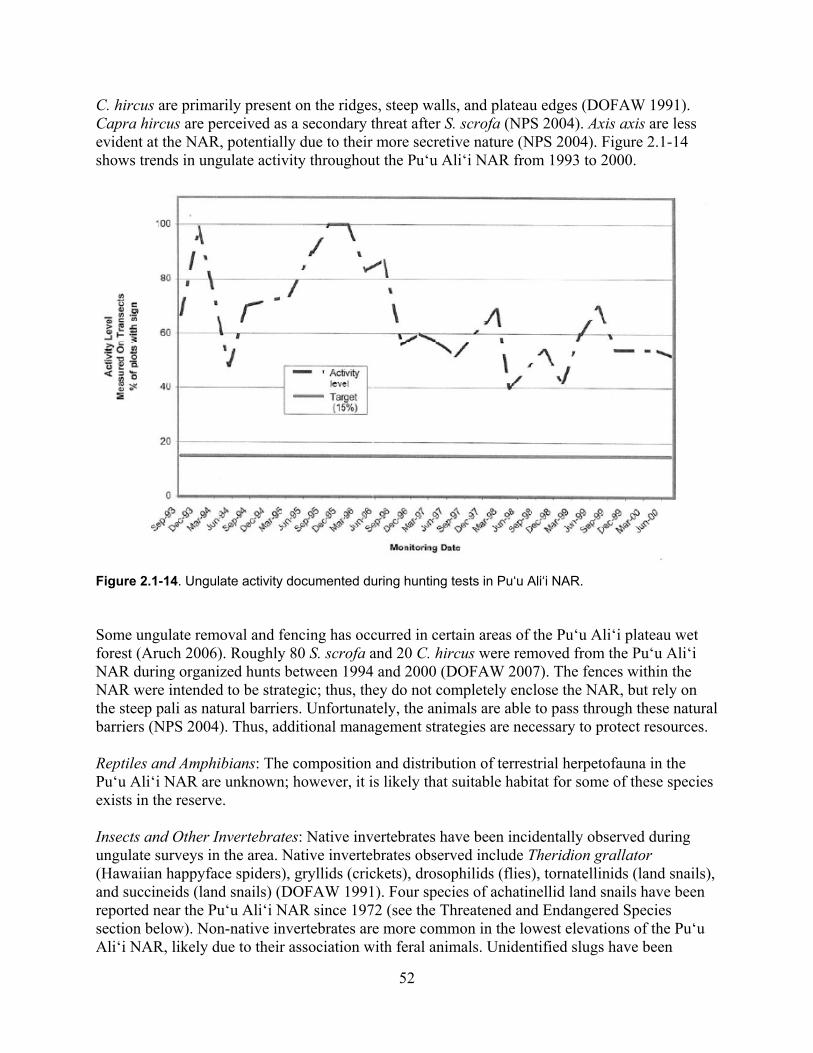
52
C. hircus are primarily present on the ridges, steep walls, and plateau edges (DOFAW 1991). Capra hircus are perceived as a secondary threat after S. scrofa (NPS 2004). Axis axis are less evident at the NAR, potentially due to their more secretive nature (NPS 2004). Figure 2.1-14 shows trends in ungulate activity throughout the Pu‘u Ali‘i NAR from 1993 to 2000.
Figure 2.1-14. Ungulate activity documented during hunting tests in Pu‘u Ali‘i NAR. Some ungulate removal and fencing has occurred in certain areas of the Pu‘u Ali‘i plateau wet forest (Aruch 2006). Roughly 80 S. scrofa and 20 C. hircus were removed from the Pu‘u Ali‘i NAR during organized hunts between 1994 and 2000 (DOFAW 2007). The fences within the NAR were intended to be strategic; thus, they do not completely enclose the NAR, but rely on the steep pali as natural barriers. Unfortunately, the animals are able to pass through these natural barriers (NPS 2004). Thus, additional management strategies are necessary to protect resources. Reptiles and Amphibians: The composition and distribution of terrestrial herpetofauna in the Pu‘u Ali‘i NAR are unknown; however, it is likely that suitable habitat for some of these species exists in the reserve. Insects and Other Invertebrates: Native invertebrates have been incidentally observed during ungulate surveys in the area. Native invertebrates observed include Theridion grallator (Hawaiian happyface spiders), gryllids (crickets), drosophilids (flies), tornatellinids (land snails), and succineids (land snails) (DOFAW 1991). Four species of achatinellid land snails have been reported near the Pu‘u Ali‘i NAR since 1972 (see the Threatened and Endangered Species section below). Non-native invertebrates are more common in the lowest elevations of the Pu‘u Ali‘i NAR, likely due to their association with feral animals. Unidentified slugs have been

53
documented in the NAR. No other known invasive invertebrates were noted during the survey (DOFAW 1991). Threatened and Endangered Species: Several threatened and endangered plant species occur or potentially occur within the boundaries of the Pu‘u Ali‘i NAR and the surrounding area (Table 2.1-19). Many of the taxa known from adjacent areas were recorded prior to the 1920s but may still occur in the reserve or surrounding area (DOFAW 2007). Six plant species have critical habitat in the NAR (Table 2.1-20, Figure 2.1-15) but are not known to currently occur there. Phyllostegia hispida is a proposed endangered species only known from eastern Moloka‘i. Currently, only one naturally occurring individual is located within the Pu‘u Ali‘i NAR, and 23 additional naturally occurring individuals are known in the adjacent TNC's Kamakou Preserve (USFWS 2009a). An estimated 214 individuals have been outplanted in these areas. In 1997, a single Phyllostegia individual was discovered on the rim of Pelekunu Valley in the Pu‘u Ali‘i NAR; however, it was unclear whether this individual was P. hispida or P. manni (USFWS 2009a). Phylostegia mannii is planned to be outplanted at Pu‘u Ali‘i NAR using propagules from Ohialele forest. The goal of this outplanting is to create one new population consisting of 150 reproducing plants (NPS, unpublished). Two of the plant species seen during the 1989 survey, Cyanea solenocalyx (haha) and Cytrandra biserrata (ha‘iwale), are considered federal species of concern. Cyanea solenocalyx and Cytrandra biserrata were observed within the Metrosideros/Cheirodendron Montane Wet Forest near Waikolu Stream. Cyanea solenocalyx was also observed along the NAR’s eastern boundary on the rim of Pelekunu Valley (DOFAW 1991). The federally endangered Paroreomyza flammea (Molokai creeper or kākāwahie) and Myadestes lanaiesnsis rutha (Moloka‘i thrush or oloma‘o), which are both presumed extinct, have historically been documented in the NAR. Paroreomyza flammea is small creeper endemic to the forests of eastern Moloka‘i. This species was last recorded on the eastern boundary of the NAR in 1963 (DOFAW 1991, Mitchell et al. 2005). Until the early 1900s, the endangered Myadestes lanaiesnsis was abundant in eastern Moloka‘i. This species was sighted three times in the adjacent Kamakou Preserve in 1980, but no confirmed sightings have been documented since (Marshall and Kozar 2008). The Molokai population of the Vestiaria cocinea (i‘iwi) is considered endangered by the State of Hawai‘i. This species is common on Maui, Kaua‘i, and Hawai‘i Island, however, only about 80 (±65) individuals are believed to occur on Moloka‘i (Mitchell et al. 2005). A single V. cocinea was detected in the Upper Waikolu Valley during the 2004/2005 survey just mauka of the reserve boundary (Marshall and Kozar (2008). During the 1979 HFBS, three V. cocinea were detected on the Pu‘u Ali‘i NAR transect.
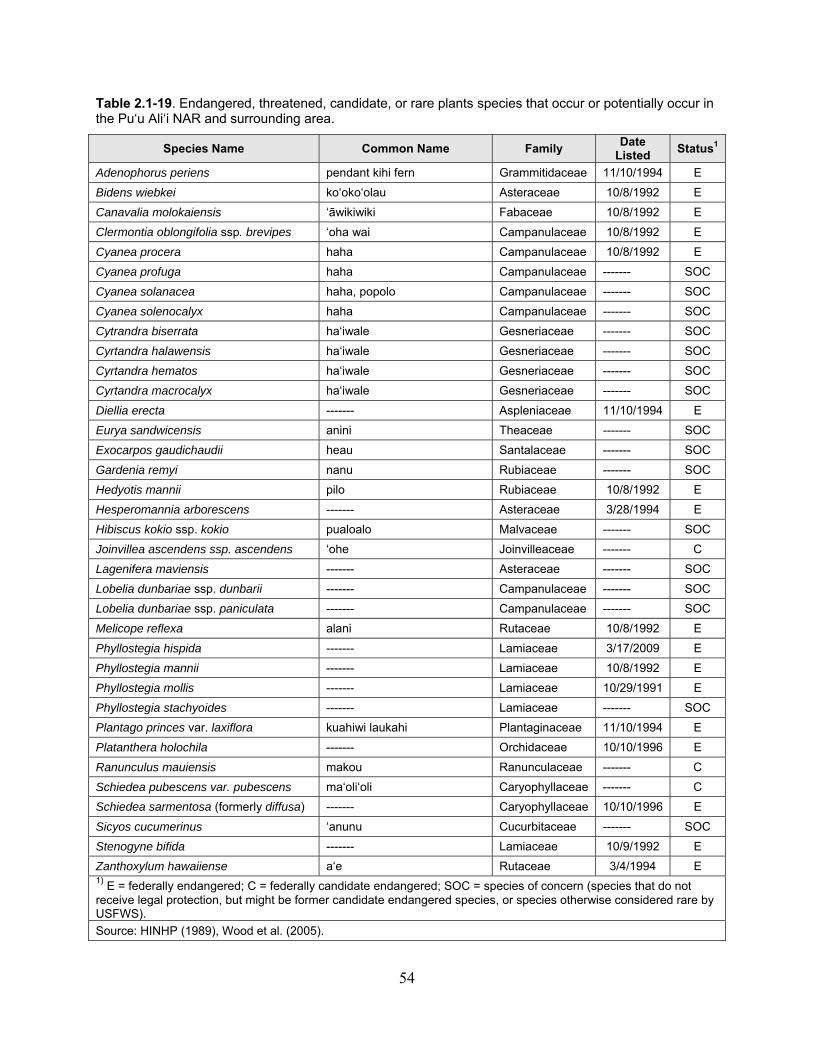
54
Table 2.1-19. Endangered, threatened, candidate, or rare plants species that occur or potentially occur in the Pu‘u Ali‘i NAR and surrounding area.
Species Name Common Name Family Date
Listed Status1
Adenophorus periens pendant kihi fern Grammitidaceae 11/10/1994 E
Bidens wiebkei ko‘oko‘olau Asteraceae 10/8/1992 E
Canavalia molokaiensis ‘āwikiwiki Fabaceae 10/8/1992 E
Clermontia oblongifolia ssp. brevipes ‘oha wai Campanulaceae 10/8/1992 E
Cyanea procera haha Campanulaceae 10/8/1992 E
Cyanea profuga haha Campanulaceae ------- SOC
Cyanea solanacea haha, popolo Campanulaceae ------- SOC
Cyanea solenocalyx haha Campanulaceae ------- SOC
Cytrandra biserrata ha‘iwale Gesneriaceae ------- SOC
Cyrtandra halawensis ha‘iwale Gesneriaceae ------- SOC
Cyrtandra hematos ha‘iwale Gesneriaceae ------- SOC
Cyrtandra macrocalyx ha‘iwale Gesneriaceae ------- SOC
Diellia erecta ------- Aspleniaceae 11/10/1994 E
Eurya sandwicensis anini Theaceae ------- SOC
Exocarpos gaudichaudii heau Santalaceae ------- SOC
Gardenia remyi nanu Rubiaceae ------- SOC
Hedyotis mannii pilo Rubiaceae 10/8/1992 E
Hesperomannia arborescens ------- Asteraceae 3/28/1994 E
Hibiscus kokio ssp. kokio pualoalo Malvaceae ------- SOC
Joinvillea ascendens ssp. ascendens ‘ohe Joinvilleaceae ------- C
Lagenifera maviensis ------- Asteraceae ------- SOC
Lobelia dunbariae ssp. dunbarii ------- Campanulaceae ------- SOC
Lobelia dunbariae ssp. paniculata ------- Campanulaceae ------- SOC
Melicope reflexa alani Rutaceae 10/8/1992 E
Phyllostegia hispida ------- Lamiaceae 3/17/2009 E
Phyllostegia mannii ------- Lamiaceae 10/8/1992 E
Phyllostegia mollis ------- Lamiaceae 10/29/1991 E
Phyllostegia stachyoides ------- Lamiaceae ------- SOC
Plantago princes var. laxiflora kuahiwi laukahi Plantaginaceae 11/10/1994 E
Platanthera holochila ------- Orchidaceae 10/10/1996 E
Ranunculus mauiensis makou Ranunculaceae ------- C
Schiedea pubescens var. pubescens ma‘oli‘oli Caryophyllaceae ------- C
Schiedea sarmentosa (formerly diffusa) ------- Caryophyllaceae 10/10/1996 E
Sicyos cucumerinus ‘anunu Cucurbitaceae ------- SOC
Stenogyne bifida ------- Lamiaceae 10/9/1992 E
Zanthoxylum hawaiiense a‘e Rutaceae 3/4/1994 E 1) E = federally endangered; C = federally candidate endangered; SOC = species of concern (species that do not receive legal protection, but might be former candidate endangered species, or species otherwise considered rare by USFWS).
Source: HINHP (1989), Wood et al. (2005).
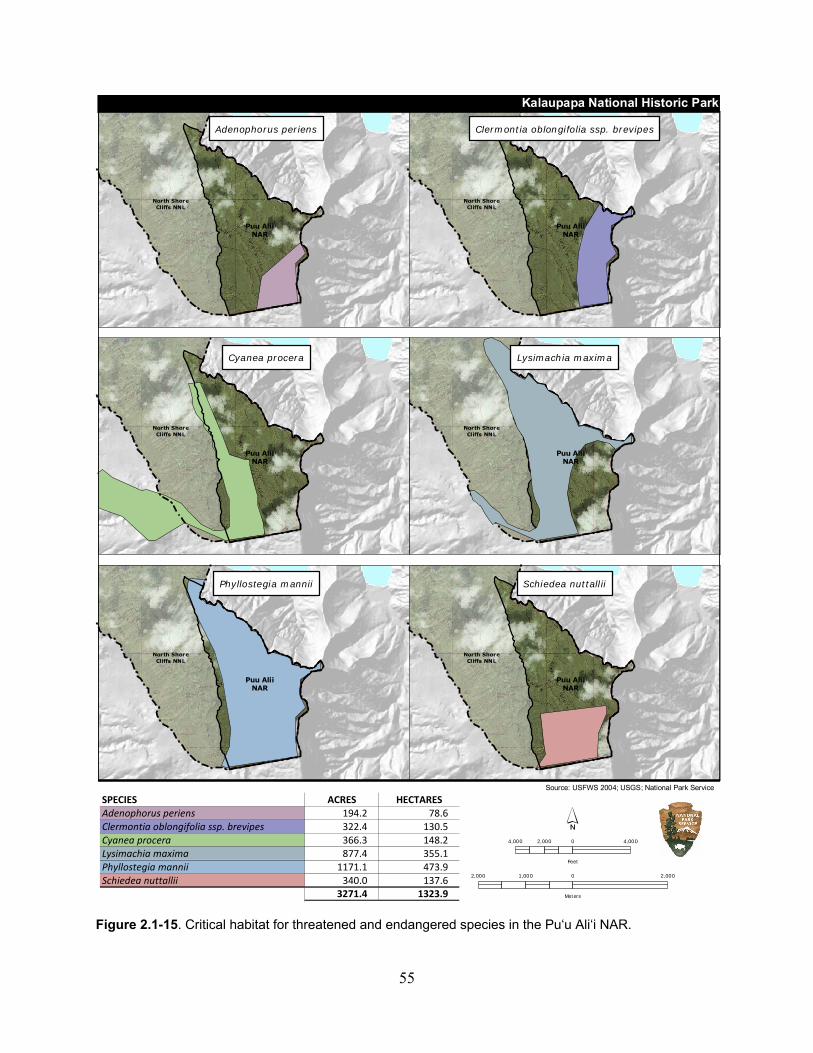
55
Figure 2.1-15. Critical habitat for threatened and endangered species in the Pu‘u Ali‘i NAR.
SPECIES ACRES HECTARESAdenophorus periens 194.2 78.6Clermontia oblongifolia ssp. brevipes 322.4 130.5Cyanea procera 366.3 148.2Lysimachia maxima 877.4 355.1Phyllostegia mannii 1171.1 473.9Schiedea nuttallii 340.0 137.6
3271.4 1323.9
Source: USFWS 2004; USGS; National Park Service
4,000 0 4,0002,000
Feet
2,000 0 2,0001,000
Meters
Puu AliiNAR
North ShoreCliffs NNL
Puu AliiNAR
North ShoreCliffs NNL
Puu AliiNAR
North ShoreCliffs NNL
Puu AliiNAR
North ShoreCliffs NNL
Adenophorus periens Clermontia oblongifolia ssp. brevipes
Cyanea procera Lysimachia maxima
Kalaupapa National Historic Park
Puu AliiNAR
North ShoreCliffs NNL
Puu AliiNAR
North ShoreCliffs NNL
Phyllostegia mannii Schiedea nuttallii
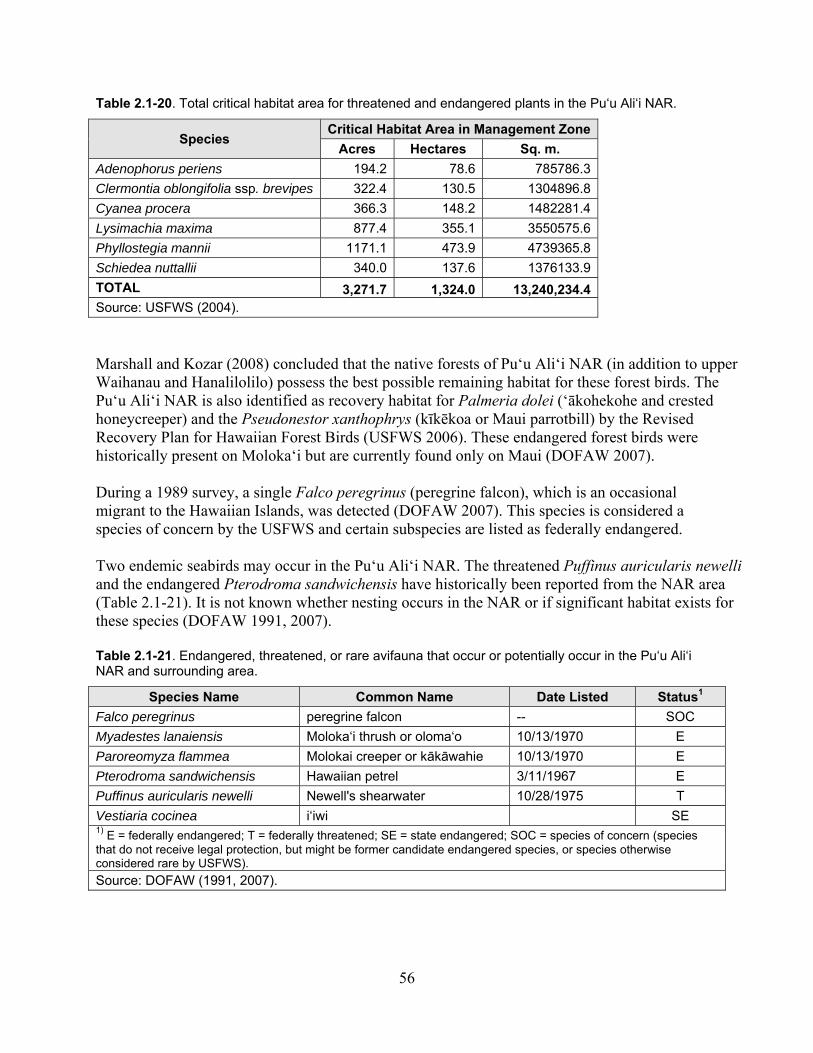
56
Table 2.1-20. Total critical habitat area for threatened and endangered plants in the Pu‘u Ali‘i NAR.
Species Critical Habitat Area in Management Zone
Acres Hectares Sq. m.
Adenophorus periens 194.2 78.6 785786.3
Clermontia oblongifolia ssp. brevipes 322.4 130.5 1304896.8
Cyanea procera 366.3 148.2 1482281.4
Lysimachia maxima 877.4 355.1 3550575.6
Phyllostegia mannii 1171.1 473.9 4739365.8
Schiedea nuttallii 340.0 137.6 1376133.9
TOTAL 3,271.7 1,324.0 13,240,234.4 Source: USFWS (2004).
Marshall and Kozar (2008) concluded that the native forests of Pu‘u Ali‘i NAR (in addition to upper Waihanau and Hanalilolilo) possess the best possible remaining habitat for these forest birds. The Pu‘u Ali‘i NAR is also identified as recovery habitat for Palmeria dolei (‘ākohekohe and crested honeycreeper) and the Pseudonestor xanthophrys (kīkēkoa or Maui parrotbill) by the Revised Recovery Plan for Hawaiian Forest Birds (USFWS 2006). These endangered forest birds were historically present on Moloka‘i but are currently found only on Maui (DOFAW 2007). During a 1989 survey, a single Falco peregrinus (peregrine falcon), which is an occasional migrant to the Hawaiian Islands, was detected (DOFAW 2007). This species is considered a species of concern by the USFWS and certain subspecies are listed as federally endangered. Two endemic seabirds may occur in the Pu‘u Ali‘i NAR. The threatened Puffinus auricularis newelli and the endangered Pterodroma sandwichensis have historically been reported from the NAR area (Table 2.1-21). It is not known whether nesting occurs in the NAR or if significant habitat exists for these species (DOFAW 1991, 2007). Table 2.1-21. Endangered, threatened, or rare avifauna that occur or potentially occur in the Pu‘u Ali‘i NAR and surrounding area.
Species Name Common Name Date Listed Status1
Falco peregrinus peregrine falcon -- SOC
Myadestes lanaiensis Moloka‘i thrush or oloma‘o 10/13/1970 E
Paroreomyza flammea Molokai creeper or kākāwahie 10/13/1970 E
Pterodroma sandwichensis Hawaiian petrel 3/11/1967 E
Puffinus auricularis newelli Newell's shearwater 10/28/1975 T
Vestiaria cocinea i‘iwi SE 1) E = federally endangered; T = federally threatened; SE = state endangered; SOC = species of concern (species that do not receive legal protection, but might be former candidate endangered species, or species otherwise considered rare by USFWS).
Source: DOFAW (1991, 2007).
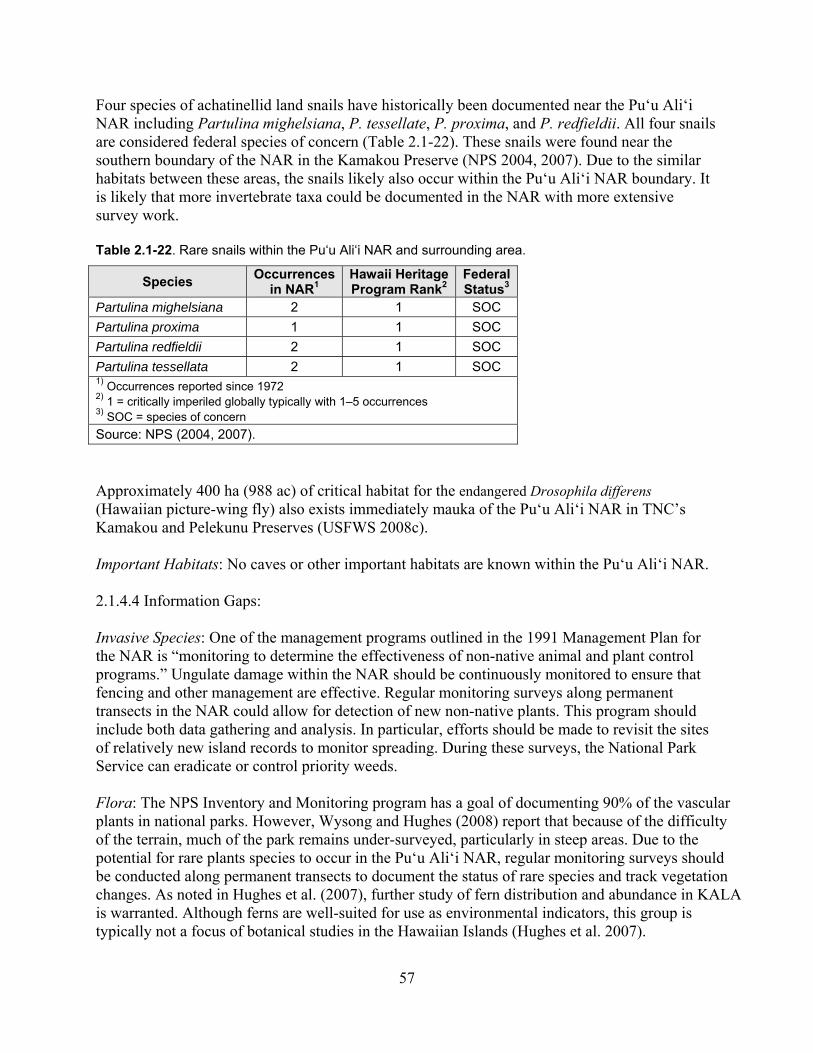
57
Four species of achatinellid land snails have historically been documented near the Pu‘u Ali‘i NAR including Partulina mighelsiana, P. tessellate, P. proxima, and P. redfieldii. All four snails are considered federal species of concern (Table 2.1-22). These snails were found near the southern boundary of the NAR in the Kamakou Preserve (NPS 2004, 2007). Due to the similar habitats between these areas, the snails likely also occur within the Pu‘u Ali‘i NAR boundary. It is likely that more invertebrate taxa could be documented in the NAR with more extensive survey work. Table 2.1-22. Rare snails within the Pu‘u Ali‘i NAR and surrounding area.
Species Occurrences
in NAR1 Hawaii Heritage Program Rank2
FederalStatus3
Partulina mighelsiana 2 1 SOC
Partulina proxima 1 1 SOC
Partulina redfieldii 2 1 SOC
Partulina tessellata 2 1 SOC 1) Occurrences reported since 1972 2) 1 = critically imperiled globally typically with 1–5 occurrences 3) SOC = species of concern Source: NPS (2004, 2007).
Approximately 400 ha (988 ac) of critical habitat for the endangered Drosophila differens (Hawaiian picture-wing fly) also exists immediately mauka of the Pu‘u Ali‘i NAR in TNC’s Kamakou and Pelekunu Preserves (USFWS 2008c). Important Habitats: No caves or other important habitats are known within the Pu‘u Ali‘i NAR. 2.1.4.4 Information Gaps: Invasive Species: One of the management programs outlined in the 1991 Management Plan for the NAR is “monitoring to determine the effectiveness of non-native animal and plant control programs.” Ungulate damage within the NAR should be continuously monitored to ensure that fencing and other management are effective. Regular monitoring surveys along permanent transects in the NAR could allow for detection of new non-native plants. This program should include both data gathering and analysis. In particular, efforts should be made to revisit the sites of relatively new island records to monitor spreading. During these surveys, the National Park Service can eradicate or control priority weeds. Flora: The NPS Inventory and Monitoring program has a goal of documenting 90% of the vascular plants in national parks. However, Wysong and Hughes (2008) report that because of the difficulty of the terrain, much of the park remains under-surveyed, particularly in steep areas. Due to the potential for rare plants species to occur in the Pu‘u Ali‘i NAR, regular monitoring surveys should be conducted along permanent transects to document the status of rare species and track vegetation changes. As noted in Hughes et al. (2007), further study of fern distribution and abundance in KALA is warranted. Although ferns are well-suited for use as environmental indicators, this group is typically not a focus of botanical studies in the Hawaiian Islands (Hughes et al. 2007).
58
Avifauna: Marshall and Kozar (2008) recommended that future bird surveys in KALA should be conducted during periods of peak vocalization to ensure high detectability. Furthermore, more appropriate methods, such the Rare Bird Search protocol, should be conducted in the high-elevation intact forests of the NAR to detect rare species such as M. lanaiesnsis rutha and P. flammea (Marshall and Kozar 2008). Ornithological radar and night-visual observations in the NAR would provide information on the movement rates of Puffinus auricularis newelli and Pterodroma sandwichensis, which may nest in upper elevation areas of Moloka‘i. These surveys should be conducted between 1900 and 2200 hours in the evening to coincide with the peak time of inland movement toward their nesting colonies (Day et al. 2003). Insects and Other Invertebrates: Rather than noting species incidentally, focused invertebrate studies should be conducted in the Pu‘u Ali‘i NAR. To identify molluscan fauna, an experienced individual could sample areas likely to harbor these species (e.g., rotting logs, tree bark, undersides of leaves, and inside fern stipes). Leaf litter samples could also be collected, sieved, and sorted in the lab. However, due to the huge diversity of invertebrates species, it may not be feasible to identify all of the specimens to the species level. Thus, a more cost-effective rapid assessment of invertebrate fauna could approximate the relative richness of invertebrate species without directly counting the number of species present (Haines and Foote 2005). 2.1.5 Moloka‘i Forest Reserve The Moloka‘i Forest Reserve (FR) was established in September 1912 “to protect and to permanently maintain the forest cover on the upper mountainous parts of the island, so that the sources of water—the springs and streams thereon—may be safeguarded, and as far as possible the regularity of their flow assured” (Hosmer 1912, as reported in DOFAW 2009). It is the only State of Hawai‘i Forest Reserve on the Island of Moloka‘i (DOFAW 2009). The FR is managed by DOFAW and guided by Hawaii Revised Statutes (HRS) Chapter 183 (Forest Reserves, Water Development, Zoning) and HAR, Title 13, Chapter 104 (Rules Regulating Activities within Forest). Currently, the Moloka‘i FR is comprised of several non-contiguous land units that encompass a total of roughly 4,730 ha (11,690 ac). The initial boundaries proposed for the Moloka‘i FR included a large amount of private land, and various boundaries changes have occurred over time. Two units of the Moloka‘i FR occur within KALA—Makanalua and Kalawao. These units were added to the reserve in 1930 (DOFAW 2009). 2.1.5.1 Previous and Ongoing Studies and Inventories: Soils & Climate:
Soils on the Island of Moloka‘i were classified by the USDA Soil Conservation Service (Foote et al. 1972). The survey was primarily designed to offer useful information for planning agriculture; therefore, mapping was conducted on agricultural land and generalized for other areas.
59
Flora: Asherman et al. (1990) conducted a reconnaissance survey at six locations throughout the
park, including a portion of the Moloka‘i FR along the east side of Wai‘ale‘ia Valley.
The plant communities in the Waihanau and Wai‘ale‘ia Valleys were described by Funk (1991) based on previous vegetation surveys and additional supplemental surveys.
Four of the 32 transects inventoried by Wood et al. (2005) were located in the Moloka‘i FR. Two transects were surveyed along the Moloka‘i FR/North Shore Cliffs NNL boundary between Wai‘ale‘ia and Waikolu Valley, and three transects were inventoried just mauka of the FR.
Hughes et al. (2007) analyzed data from various transects in the park to examine plant diversity and distribution in KALA. Wai‘ale‘ia Valley and Waikolu Valley were included in this study.
Wysong and Hughes (2008) inventoried flora and collected voucher specimens opportunistically in areas of the Moloka‘i FR. These specimens are included in an electronic herbarium.
Using data from remote aerial sensing, the U.S. Geological Survey and National Park Service created a draft vegetation cover map of the Moloka‘i FR in 2007. Identifiable vegetation cover was grouped into vegetation class (Class 1–3) depending on percent native species composition. The final report for this project, including mapping methods and a detailed description of the plant communities, is anticipated in early 2010 (J. Jacobi/USGS, pers. comm.).
Avifauna:
Scott et al. (1977) recorded observations of the forest birds in the Moloka‘i FR in July 1975.
Two transects were surveyed for forest birds in the Moloka‘i FR by Marshall and Kozar (2008). The Lower Waihanau transect was located between 160 and 320 m (525 and 1050 ft) elevation and the Upper Waihanau transect followed Pu‘u Kauwa Road between 700 and 800 m (2,297 and 2,625 ft) elevation.
Mammals:
The 13-month study of Axis axis by Goltz et al. (2001) tracked six radio-collared deer throughout KALA. This study was designed to gather information on movement patterns and home ranges of A. axis.
Frasher et al. (2007) conducted a brief survey for Lasiurus cinereus semotus in the lower and middle elevation portions of Waihanau Valley using acoustic detection systems along with visual observations.
The small mammal survey conducted by Marshall et al. (2008) at KALA surveyed two transects in the Moloka‘i FR. The lower Waihanau transect, located at 180 m (591 ft)

60
elevation, runs north-south along the narrow floor of the valley and the upper Waihanau transect occurs at about 750 m (2,460 ft) elevation.
Reptiles and Amphibians:
No herpetofauna surveys have been conducted in the Moloka‘i FR management zone.
Insects and Other Invertebrates: No surveys have been conducted to inventory insects and other invertebrates in the Moloka‘i
FR management zone. However, when surveying known populations of troglobitic Hawaiioscia and Littorophiloscia, Rivera et al. (2002) collected a single isopod.
Other: A Draft Management Plan was recently released for the FR in June 2009 (DOFAW 2009). In
addition to describing the existing environment, the plan describes and prioritizes resource management objectives and strategies.
2.1.5.2 Physical Environment: Although various soil types are present in the Moloka‘i FR at KALA, the management zone is dominated by two types—Rock Outcrop and Rough Mountainous Land (Table 2.1-23, Figure 2.1-2). Rock Outcrop primarily consists of exposed bedrock and Rough Mountainous Land is characterized by steep valley walls and a very thin soil mantle (Foote et al. 1972). Notable geographic features within the KALA portions of the Moloka‘i FR include Waihanau Valley and Stream, Pu‘u kauwā, and Wai‘ale‘ia Valley and Stream (DOFAW 2009). Table 2.1-23. Soil types and key soil characteristics in Moloka‘i Forest Reserve management zone.
Soil Type Farmland Erodible Coverage in
Unit (m2)
Rock Outcrop Not prime farmland Not highly erodible
3,030,521
Rough Mountainous Land Not prime farmland Highly erodible 2,489,290
Colluvial Land Not prime farmland Highly erodible 437,100
Stony Alluvial Land Not prime farmland Potentially highly
erodible 118,846
Rough Broken Land Not prime farmland Highly erodible 109,342Haleiwa Very Stony Silty Clay Loam, 0 to 15 % Slopes
Not prime farmland Potentially highly
erodible 61,822
Stony Colluvial land Not prime farmland Highly erodible 51,949Kahanui Gravelly Silty Clay, 3 to 20 % Slopes
Not prime farmland Potentially highly
erodible 22,482
Haleiwa Silty Clay Loam, 0 to 10 % Slopes Prime farmland (if
irrigated) Potentially highly
erodible 1,489
Olokui Silty Clay Loam, 3 to 30 % Slopes Not prime farmland Potentially highly
erodible 1,457
Source: Foote et al. (1972).
Archaeological evidence shows that land in the Moloka‘i FR was used for agriculture, habitat, religious uses, and other human activities. Since the reserve was established, a variety of more recent
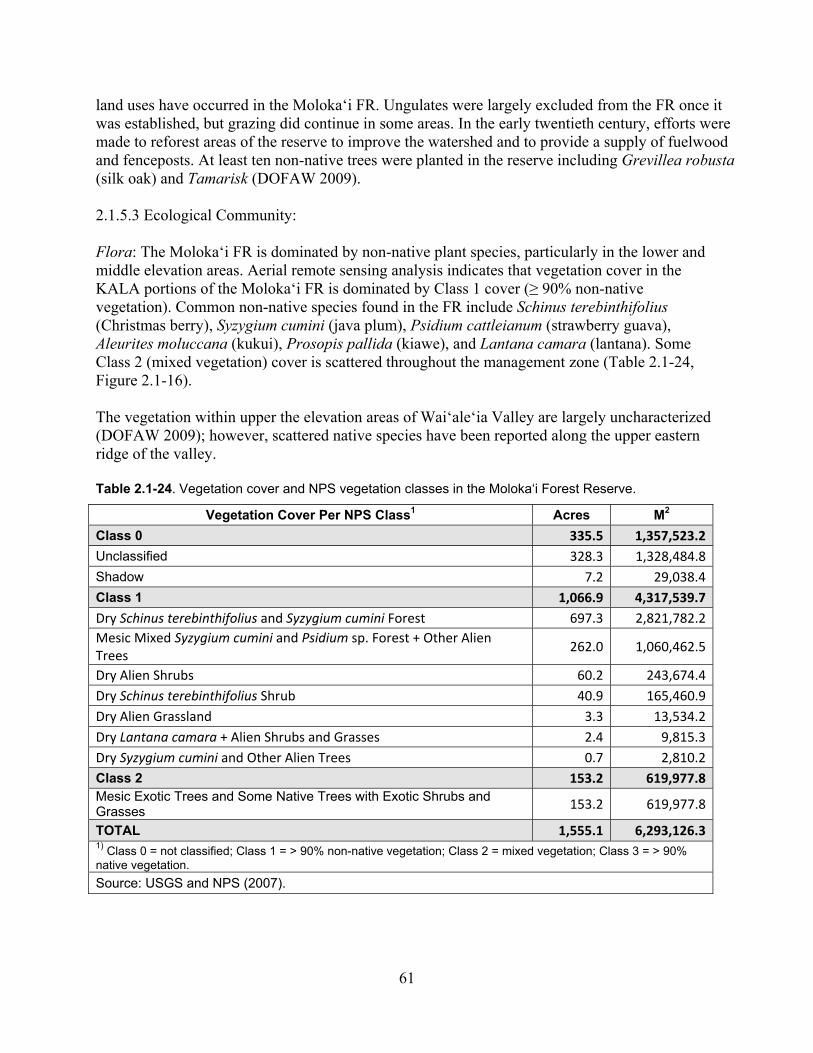
61
land uses have occurred in the Moloka‘i FR. Ungulates were largely excluded from the FR once it was established, but grazing did continue in some areas. In the early twentieth century, efforts were made to reforest areas of the reserve to improve the watershed and to provide a supply of fuelwood and fenceposts. At least ten non-native trees were planted in the reserve including Grevillea robusta (silk oak) and Tamarisk (DOFAW 2009). 2.1.5.3 Ecological Community: Flora: The Moloka‘i FR is dominated by non-native plant species, particularly in the lower and middle elevation areas. Aerial remote sensing analysis indicates that vegetation cover in the KALA portions of the Moloka‘i FR is dominated by Class 1 cover (≥ 90% non-native vegetation). Common non-native species found in the FR include Schinus terebinthifolius (Christmas berry), Syzygium cumini (java plum), Psidium cattleianum (strawberry guava), Aleurites moluccana (kukui), Prosopis pallida (kiawe), and Lantana camara (lantana). Some Class 2 (mixed vegetation) cover is scattered throughout the management zone (Table 2.1-24, Figure 2.1-16). The vegetation within upper the elevation areas of Wai‘ale‘ia Valley are largely uncharacterized (DOFAW 2009); however, scattered native species have been reported along the upper eastern ridge of the valley. Table 2.1-24. Vegetation cover and NPS vegetation classes in the Moloka‘i Forest Reserve.
Vegetation Cover Per NPS Class1 Acres M2
Class 0 335.5 1,357,523.2
Unclassified 328.3 1,328,484.8
Shadow 7.2 29,038.4
Class 1 1,066.9 4,317,539.7
Dry Schinus terebinthifolius and Syzygium cumini Forest 697.3 2,821,782.2
Mesic Mixed Syzygium cumini and Psidium sp. Forest + Other Alien Trees
262.0 1,060,462.5
Dry Alien Shrubs 60.2 243,674.4
Dry Schinus terebinthifolius Shrub 40.9 165,460.9
Dry Alien Grassland 3.3 13,534.2
Dry Lantana camara + Alien Shrubs and Grasses 2.4 9,815.3
Dry Syzygium cumini and Other Alien Trees 0.7 2,810.2
Class 2 153.2 619,977.8Mesic Exotic Trees and Some Native Trees with Exotic Shrubs and Grasses 153.2 619,977.8
TOTAL 1,555.1 6,293,126.31) Class 0 = not classified; Class 1 = > 90% non-native vegetation; Class 2 = mixed vegetation; Class 3 = > 90% native vegetation. Source: USGS and NPS (2007).
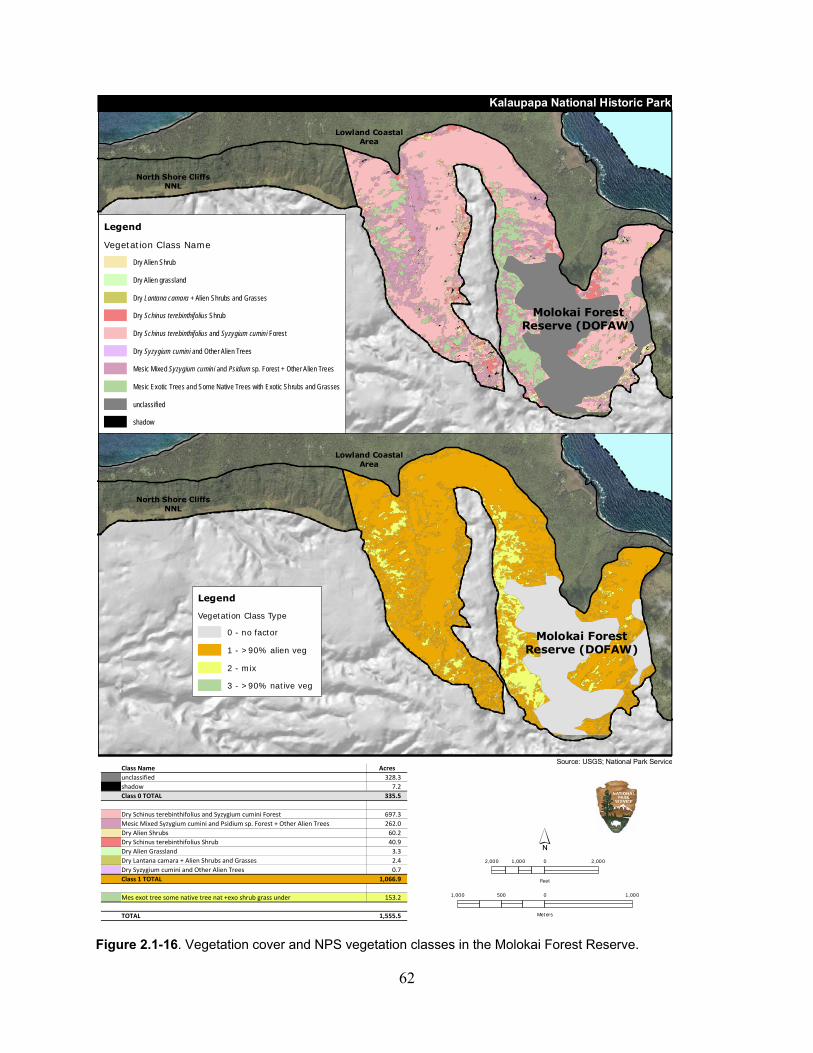
62
Figure 2.1-16. Vegetation cover and NPS vegetation classes in the Molokai Forest Reserve.
Class Name Acres
unclassified 328.3
shadow 7.2
Class 0 TOTAL 335.5
Dry Schinus terebinthifolius and Syzygium cumini Forest 697.3
Mesic Mixed Syzygium cumini and Psidium sp. Forest + Other Alien Trees 262.0
Dry Alien Shrubs 60.2
Dry Schinus terebinthifolius Shrub 40.9
Dry Alien Grassland 3.3
Dry Lantana camara + Alien Shrubs and Grasses 2.4
Dry Syzygium cumini and Other Alien Trees 0.7
Class 1 TOTAL 1,066.9
Mes exot tree some native tree nat +exo shrub grass under 153.2
TOTAL 1,555.5
Figure 2.1-16
Vegetation Cover and NPS VegetationClasses in the Molokai Forest Reserve
Source: USGS; National Park Service
2,000 0 2,0001,000
Feet
1,000 0 1,000500
Meters
Lowland CoastalArea
North Shore CliffsNNL
Molokai ForestReserve (DOFAW)
Legend
Vegetation Class Name
Dry Alien Shrub
Dry Alien grassland
Dry Lantana camara + Alien Shrubs and Grasses
Dry Schinus terebinthifolius Shrub
Dry Schinus terebinthifolius and Syzygium cumini Forest
Dry Syzygium cumini and Other Alien Trees
Mesic Mixed Syzygium cumini and Psidium sp. Forest + Other Alien Trees
Mesic Exotic Trees and Some Native Trees with Exotic Shrubs and Grasses
unclassified
shadow
Lowland CoastalArea
North Shore CliffsNNL
Molokai ForestReserve (DOFAW)
Legend
Vegetation Class Type
0 - no factor
1 - >90% alien veg
2 - mix
3 - >90% native veg
Kalaupapa National Historic Park
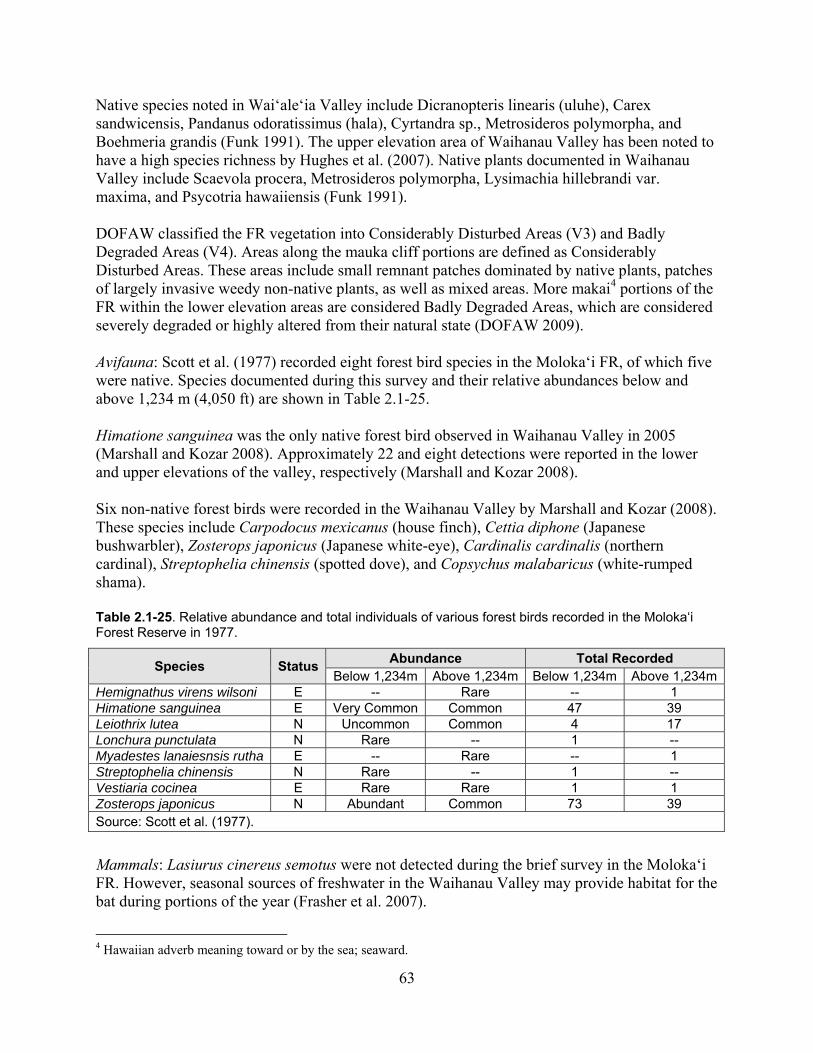
63
Native species noted in Wai‘ale‘ia Valley include Dicranopteris linearis (uluhe), Carex sandwicensis, Pandanus odoratissimus (hala), Cyrtandra sp., Metrosideros polymorpha, and Boehmeria grandis (Funk 1991). The upper elevation area of Waihanau Valley has been noted to have a high species richness by Hughes et al. (2007). Native plants documented in Waihanau Valley include Scaevola procera, Metrosideros polymorpha, Lysimachia hillebrandi var. maxima, and Psycotria hawaiiensis (Funk 1991). DOFAW classified the FR vegetation into Considerably Disturbed Areas (V3) and Badly Degraded Areas (V4). Areas along the mauka cliff portions are defined as Considerably Disturbed Areas. These areas include small remnant patches dominated by native plants, patches of largely invasive weedy non-native plants, as well as mixed areas. More makai4 portions of the FR within the lower elevation areas are considered Badly Degraded Areas, which are considered severely degraded or highly altered from their natural state (DOFAW 2009). Avifauna: Scott et al. (1977) recorded eight forest bird species in the Moloka‘i FR, of which five were native. Species documented during this survey and their relative abundances below and above 1,234 m (4,050 ft) are shown in Table 2.1-25. Himatione sanguinea was the only native forest bird observed in Waihanau Valley in 2005 (Marshall and Kozar 2008). Approximately 22 and eight detections were reported in the lower and upper elevations of the valley, respectively (Marshall and Kozar 2008). Six non-native forest birds were recorded in the Waihanau Valley by Marshall and Kozar (2008). These species include Carpodocus mexicanus (house finch), Cettia diphone (Japanese bushwarbler), Zosterops japonicus (Japanese white-eye), Cardinalis cardinalis (northern cardinal), Streptophelia chinensis (spotted dove), and Copsychus malabaricus (white-rumped shama). Table 2.1-25. Relative abundance and total individuals of various forest birds recorded in the Moloka‘i Forest Reserve in 1977.
Species Status Abundance Total Recorded
Below 1,234m Above 1,234m Below 1,234m Above 1,234mHemignathus virens wilsoni E -- Rare -- 1 Himatione sanguinea E Very Common Common 47 39 Leiothrix lutea N Uncommon Common 4 17 Lonchura punctulata N Rare -- 1 -- Myadestes lanaiesnsis rutha E -- Rare -- 1 Streptophelia chinensis N Rare -- 1 -- Vestiaria cocinea E Rare Rare 1 1 Zosterops japonicus N Abundant Common 73 39 Source: Scott et al. (1977).
Mammals: Lasiurus cinereus semotus were not detected during the brief survey in the Moloka‘i FR. However, seasonal sources of freshwater in the Waihanau Valley may provide habitat for the bat during portions of the year (Frasher et al. 2007).
4 Hawaiian adverb meaning toward or by the sea; seaward.
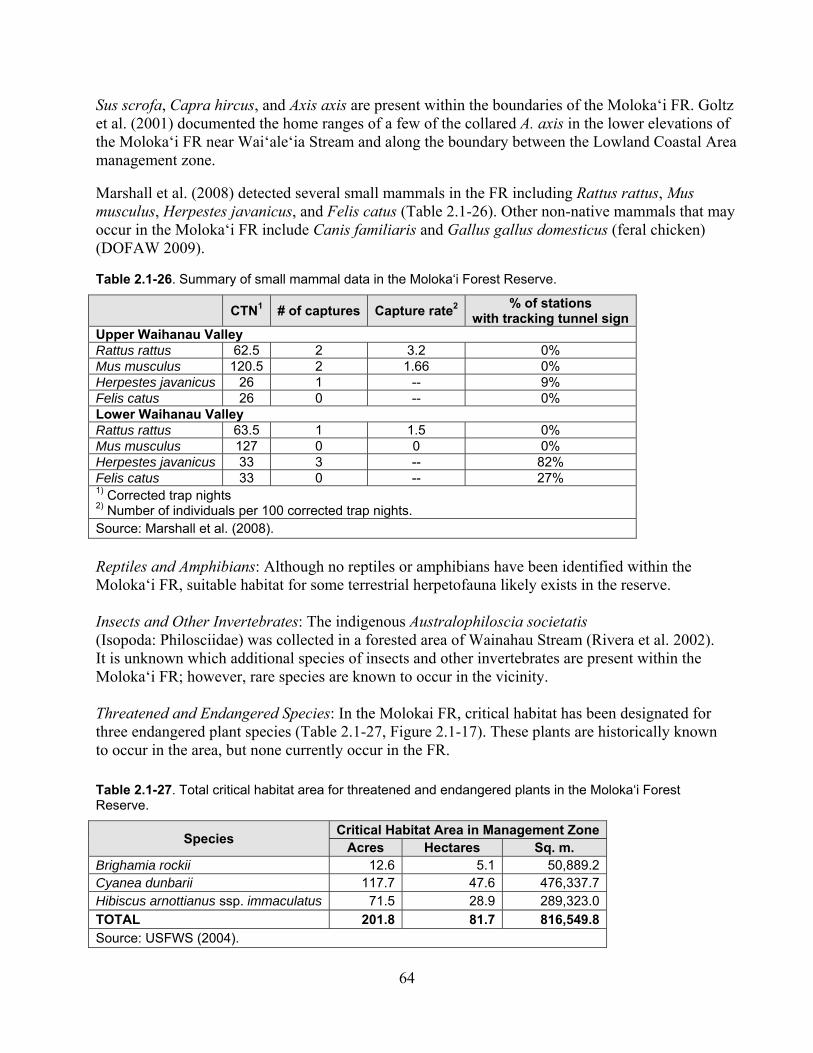
64
Sus scrofa, Capra hircus, and Axis axis are present within the boundaries of the Moloka‘i FR. Goltz et al. (2001) documented the home ranges of a few of the collared A. axis in the lower elevations of the Moloka‘i FR near Wai‘ale‘ia Stream and along the boundary between the Lowland Coastal Area management zone. Marshall et al. (2008) detected several small mammals in the FR including Rattus rattus, Mus musculus, Herpestes javanicus, and Felis catus (Table 2.1-26). Other non-native mammals that may occur in the Moloka‘i FR include Canis familiaris and Gallus gallus domesticus (feral chicken) (DOFAW 2009). Table 2.1-26. Summary of small mammal data in the Moloka‘i Forest Reserve.
CTN1 # of captures Capture rate2 % of stations with tracking tunnel sign
Upper Waihanau Valley Rattus rattus 62.5 2 3.2 0% Mus musculus 120.5 2 1.66 0% Herpestes javanicus 26 1 -- 9% Felis catus 26 0 -- 0% Lower Waihanau Valley Rattus rattus 63.5 1 1.5 0% Mus musculus 127 0 0 0% Herpestes javanicus 33 3 -- 82% Felis catus 33 0 -- 27% 1) Corrected trap nights 2) Number of individuals per 100 corrected trap nights. Source: Marshall et al. (2008).
Reptiles and Amphibians: Although no reptiles or amphibians have been identified within the Moloka‘i FR, suitable habitat for some terrestrial herpetofauna likely exists in the reserve. Insects and Other Invertebrates: The indigenous Australophiloscia societatis (Isopoda: Philosciidae) was collected in a forested area of Wainahau Stream (Rivera et al. 2002). It is unknown which additional species of insects and other invertebrates are present within the Moloka‘i FR; however, rare species are known to occur in the vicinity. Threatened and Endangered Species: In the Molokai FR, critical habitat has been designated for three endangered plant species (Table 2.1-27, Figure 2.1-17). These plants are historically known to occur in the area, but none currently occur in the FR.
Table 2.1-27. Total critical habitat area for threatened and endangered plants in the Moloka‘i Forest Reserve.
Species Critical Habitat Area in Management Zone
Acres Hectares Sq. m. Brighamia rockii 12.6 5.1 50,889.2 Cyanea dunbarii 117.7 47.6 476,337.7 Hibiscus arnottianus ssp. immaculatus 71.5 28.9 289,323.0
TOTAL 201.8 81.7 816,549.8 Source: USFWS (2004).

65
Figure 2.1-17. Critical habitat for threatened and endangered species in the Molokai Forest Reserve.
Sou
rce:
US
FW
S 2
004
; US
GS
; N
atio
nal P
ark
Ser
vice
SPEC
IES
ACRES
HECTARES
Brighamia rockii
12.6
5.1
Cyanea
dunbarii
117.7
47.6
Hibiscus arnottianus ssp. immaculatus
71.5
28.9
201.8
81.7
Mo
lokai Fore
stR
eserv
e
Low
lan
d C
oa
stal
Are
a
Co
asta
l S
pra
y Z
on
eK
au
ha
ko
Cra
ter
Mo
lokai Fore
stR
eserv
e
Low
lan
d C
oa
stal
Are
a
Co
asta
l S
pra
y Z
on
eK
au
ha
ko
Cra
ter
Mo
lokai Fore
stR
eserv
e
Low
lan
d C
oa
stal
Are
a
Co
asta
l S
pra
y Z
on
eK
au
ha
ko
Cra
ter
Brigham
ia r
ock
iiCya
nea
dunbar
iiH
ibis
cus
arnot
tianus
ssp.
imm
acula
tus
Kal
aup
ap
a N
ati
on
al H
isto
ric
Pa
rk
2,00
00
2,00
01,
000
Feet
1,00
00
1,00
050
0
Met
ers
66
Although no threatened or endangered forest birds have been documented in the Moloka‘i FR, the upper Waihanau Valley was noted by Marshall and Kozar (2008) to “possess the best possible remaining habitat” for rare native forest birds. Important Habitats: No caves or other important habitats are known within the Moloka‘i FR. 2.1.5.4 Information Gaps: Land Use: An assessment of adjacent land uses and ownership would allow NPS to evaluate conservation progress at a broader landscape scale. Invasive Species: Because rare native species exist within the vicinity of the reserve, it is important to monitor and control incipient invasive flora and fauna in the Moloka‘i FR. Furthermore, conducting annual ungulate surveys would help to protect native habitat and species. Flora: Hughes et al. (2007) suggested that the upper confluences of Wai‘ale‘ia and Waihanau Valleys should be a priority conservation area due to the high species richness. Potential activities in these areas may include conducting regular surveys along permanent transects in order to collect baseline data that will inform management. Based on these surveys, plant exclosures can be constructed to protect existing rare plants or outplants. Avifauna: No forest bird surveys have been conducted in Wai‘ale‘ia Valley, although the area has been noted as potential habitat for rare native forest birds (Marshall and Kozar 2008). These surveys should be conducted in the higher elevation intact forests during periods of peak vocalization. Collecting data on ground nesting seabirds would also assist in future conservation efforts for these species. These surveys would consist of ornithological radar and night-visual observations between 1900 and 2200 hours in the evening to coincide with the peak time of inland movement toward their nesting colonies (Day et al. 2003). Mammals: The single survey for Lasiurus cinereus semotus should be supplemented with additional studies, particularly in areas with intact canopy cover, such as Wai‘ale‘ia Valley, as suggested by Frasher et al. (2007). Insects and Other Invertebrates: Specific studies to inventory endemic insects and other invertebrate taxa may reveal rare species that have been noted to occur in the vicinity of the Moloka‘i FR. Suggested methodology for these surveys is summarized in Section 2.1.4.4. 2.1.6 North Shore Cliffs National Natural Landmark The North Shore Cliffs isolate the Kalaupapa peninsula from the remainder of Moloka‘i Island. The cliffs exceed 914 m (3,000 ft) in elevation and are considered the highest sea cliffs in the world (Funk 1991). The North Shore Cliffs were formed roughly 1.5 million years ago when the northern third of the East Molokai Volcano suddenly collapsed into the ocean (NPS 2000b, Ziegler 2002). This landslide is also referred to as the Wailau slide (NPS 2000b). The North Shore Cliffs area was designated as a National Natural Landmark (NNL) in 1972. The landmark includes 10,967 ha (27,100 acres) between the villages of Kalaupapa and Halawa. Approximately one-fifth of the NNL is located within the boundaries of KALA (NPS 2007).
67
2.1.6.1 Previous and Ongoing Studies and Inventories: Soils & Climate:
The USDA Soil Conservation Service classified soils on Molokai to gather useful information for planning agriculture (Foote et al. 1972). Soil mapping was conducted on agricultural land and generalized for other areas.
A single Cooperative Observer Program (COOP) site (Waikolu 540) operates in Waikolu Valley at roughly 1,082 m (3,550 ft). This site measures precipitation and has a largely complete data record extending back to 1965, with only occasional data gaps (Davey et al. 2006).
Flora:
In March 1981, Kepler and Kepler (1981) recorded vascular plants species during a forest bird survey in Waikolu Valley.
Various portions of the North Shore Cliffs NNL were included in the reconnaissance vegetation survey by Asherman et al. (1990), including Waikolu Valley, Kalaupapa Trail, and the coastal cliffs of Nihoa.
Based on previous vegetation surveys in the park and additional supplemental surveys, Funk (1991) described plant communities along the coastal cliffs and in Waikolu Valley, as well as other locations in the park.
Wood et al. (2005) surveyed six transects in Waikolu Valley, two transects on the boundary
between Waikolu Valley and the Moloka‘i Forest Reserve, and one transect on the cliff at the western end of the park.
Hughes et al. (2007) compiled data from 32 transects at various locations in the park, including the North Shore Cliffs NNL, to estimate plant diversity and distribution.
Plant specimens throughout KALA were opportunistically collected and put into an electronic herbarium by Wysong and Hughes (2008).
In 2007, the U.S. Geological Survey and National Park Service created a draft vegetation cover map based on aerial remote sensing. Each identifiable vegetation cover is categorized as Class 1–3, which estimates the total native and non-native species composition within the NNL. The final report for this project, including mapping methods and a detailed description of the plant communities, is anticipated in early 2010 (J. Jacobi/USGS, pers. comm.).
Avifauna:
Marshall and Aruch (2003) completed a shoreline seabird inventory during the fall of 2003. Kalaupapa Cliff Trail and the bottom of Waikolu Valley were included in the survey area.
Marshall and Kozar (2008) inventoried forest birds along the entire Kalaupapa Cliff Trail.
This survey used the variable circular plot method. Two additional transects were surveyed
68
just outside the NNL boundaries. These two transects are located in the Lowland Coastal Area and Pu‘u Ali‘i NAR management zone, respectively.
Mammals: The 13-month study of Axis axis by Goltz et al. (2001) gathered information on the
movement patterns and home ranges of Axis axis throughout the park, including in the North Shore Cliffs NNL.
Frasher et al. (2007) surveyed for Lasiurus cinereus semotus from the top of the Kalaupapa
Cliff Trail to the Lowland Coastal Area using acoustic detection systems along with visual observations.
In 2005, Marshall et al. (2008) conducted a small-mammal survey at the upper Waikolu rim between 1,100 and 1,140 m (3,610 to 3,740 ft) elevation along the Hanalilolilo Trail.
Reptiles and Amphibians:
Kraus (2005) conducted day and night surveys for reptiles and amphibians across KALA including in the North Shore Cliffs NNL.
Insects and Other Invertebrates:
Aquatic insect surveys conducted in Waikolu Stream are listed in Section 2.2.
No insect or invertebrate studies have been conducted in the western portion of the NNL, from Nihoa to Waihanau Valley.
Other:
The National Park Service (2000b) studied and analyzed lands to the east of KALA within the boundary of the North Shore Cliffs NNL to determine if these lands should be included in KALA. Although the study area is outside of KALA, the report provides descriptions of the general area.
2.1.6.2 Physical Environment: The dominant soil types in the management zone, Rough Mountainous Land and Rock Outcrop, are characterized by a very thin soil mantle and exposed bedrock (Table 2.1-28; Foote et al. 1972). This soil occurs on the steepest areas of the park. This management zone encompasses Waikolu Valley and the coastal cliffs stretching from Nihoa to the western boundary of Waihanau Valley. Waikolu Valley is approximately 6.4 km (4 mi) long and about 1.6 km (1 mi) wide at the mouth of the valley (Brasher 1996). Archaeological evidence indicates that Waikolu Valley was the first area of the park occupied by humans, with pondfield deposits dating occupation to around 1200 A.D. (McCoy 2005b). Early Hawaiians likely occupied Waikolu Valley because the permanent stream could support agricultural activities. Currently, the most common land use in the NNL is hiking or mule riding along the Kalaupapa Cliff Trail. The Kalaupapa Cliff Trail is a 4.7 km (2.9 mi) historic trail that begins at sea level and transverses 26 switchbacks to reach the top of the cliffs. Visitor or residents can hike or ride mules down the trail.
69
Table 2.1-28. Soil types and key soil characteristics in North Shore Cliffs NNL management zone.
Soil Type Farmland Erodible Coverage in
Zone (m2) Rough Mountainous Land Not prime farmland Highly erodible 5,915,311
Rock Outcrop Not prime farmland Not highly erodible
2,159,002
Colluvial Land Not prime farmland Highly erodible 305,729
Halawa Silty Clay, 3 to 25 % Slopes Not prime farmland Potentially highly
erodible 280,628
Rough Broken Land Not prime farmland Highly erodible 183,947Kahanui Gravelly Silty Clay, 3 to 20 % Slopes
Not prime farmland Potentially highly
erodible 96,277
Halawa Silty Clay, 3 to 25 % Slopes, Severly Eroded
Not prime farmland Potentially highly
erodible 74,196
Stony Colluvial Land Not prime farmland Highly erodible 15,717Kawaihapai Silty Clay Loam, 2 to 7 % Slopes
Prime farmland (if irrigated)
Potentially highly erodible
9,782
Olokui Silty Clay Loam, 3 to 30 % Slopes Not prime farmland Potentially highly
erodible 1,866
Source: Foote et al. (1972).
2.1.6.3 Ecological Community: Flora: Vegetation in the North Shore Cliffs NNL differs on the western portion of the park compared to the eastern side of KALA. On the western portion of the NNL, from Nihoa to the western boundary of Waihanau Valley, the vegetation is composed of non-native forest dominated by Schinus terebinthifolius and Syzygium cumini. Lantana camara, along with other non-native shrubs and grasses, are also common in this area. The flora in Waikolu Valley, on the eastern portion of the NNL, is comprised of more native species. Flowering native plant species reported in the valley include Cyperus odoratus, Cyperus polystachyus var. polystachyus, Euphorbia celastroides, Cyanea sp., Metrosideros polymorpha, Pisonia sandwicensis, Canthium odoratum, Hedyotis acuminata, Psycotria hawaiiensis, Psycotria mariniana, Boehmeria grandis, and Touchardia latifolia (Funk 1991). Native fern species noted in Waikolu Valley include Dryopteris unidentata (Kepler and Kepler 1981), Dicranopteris linearis, Adiantum hispidulum, Pteridium aquilinum var. decompositum, Sadleria pallida, and Tectaria gaudichaudii. Hughes et al. (2007) found that portions of Waikolu Valley have low species richness; however, one area in the valley was noted as having a high diversity of non-native ferns (Hughes et al. 2007). Vegetation cover in the North Shore Cliffs NNL, based on aerial remote sensing, is provided in Table 2.1-29 and shown in Figure 2.1-18. All three identifiable vegetation cover classes are present in the North Shore Cliffs NNL; however, Class 3 (> 90% native vegetation) is the most common, covering roughly 44% of the NNL. There are stark differences between the vegetation cover classifications in the western and eastern portions of the park, with a significantly higher native species cover in the eastern portion of the NNL (i.e., Waikolu Valley). Although this difference may be largely the result of disproportionate human use throughout the park, different aerial remote sensing scales may also contribute to differences between the two areas.
70
Table 2.1-29. Vegetation cover and NPS vegetation classes in the North Shore Cliffs NNL.
Vegetation Cover Per NPS Class1 Acres M2
Class 0 193.8 784,325.5
unclassified 95.6 386,969.7
no factor 69.7 281,906.2
shadow 28.5 115,449.6
Class 1 745.8 3,018,092.8
Dry Schinus terebinthifolius and Syzygium cumini Forest 342.4 1,385,490.2
Wet Psidium sp. 154.1 623,656.2
Dry Alien Shrubs 58.3 235,839.5
Dry Alien Grassland 44.0 177,891.5
Dry Lantana camara + Alien Shrubs and Grasses 42.8 173,186.9
Wet Aleurites moluccana and Psidium guajava Forest + Shrubs and Alien Grasses
41.4 167,741.0
Mesic Mixed Syzygium cumini and Psidium sp. Forest + Other Alien Trees
32.5 131,628.4
Dry Schinus terebinthifolius Shrub 29.5 119,524.4
Dry Syzygium cumini and Other Alien Trees 0.8 3,134.7
Class 2 316.9 1,282,414.0Mesic Exotic Grass and Native Shrub Community with Scattered Native Trees
170.9 691,780.4
Mesic Native Trees and Scattered Exotic Trees with Shrubs and Grasses
139.9 566,009.6
Mesic Exotic Trees and Some Native Trees with Exotic Shrubs and Grasses
6.1 24,624.0
Class 3 977.9 3,957,570.9
Wet Metrosideros polymorpha Forest with Tree Ferns and Native Shrubs 853.4 3,453,616.7Wet Matted Ferns or Native Shrubs with Scattered Metrosideros polymorpha
124.5 503,954.3
TOTAL 2,234.4 9,042,403.21) Class 0 = not classified; Class 1 = > 90% non-native vegetation; Class 2 = mixed vegetation; Class 3 = > 90% native vegetation.
Source: USGS and NPS (2007).
Avifauna: Five Himatione sanguinea sanguinea were detected in the North Shore Cliffs NNL near the mid-elevation area of the Kalaupapa Cliff Trail (Marshall and Kozar 2008). Non-native birds observed along the Kalaupapa Cliff Trail include Alauda arvensis (skylark), Francolinus francolinus, Acridotheres tristis, Carpodacus mexicanus, Cettia diphone, Zosterops japonicus, Cardinalis cardinalis, Streptopelia chinensis, and Copsychus malabaricus (Marshall and Kozar 2008). Marshall and Aruch (2003) heard Puffinus pacificus (wedge-tailed shearwater) from the Waikolu Valley beach. Phaethon lepturus dorotheae (white-tailed tropicbird) was also observed soaring over Waikolu Valley (Marshall and Aruch 2003). Sterna fuscata (sooty terns) have been detected flying over Waikolu Valley during the survey by Marshall et al. (2008), as reported in Kozar et al. (2007).
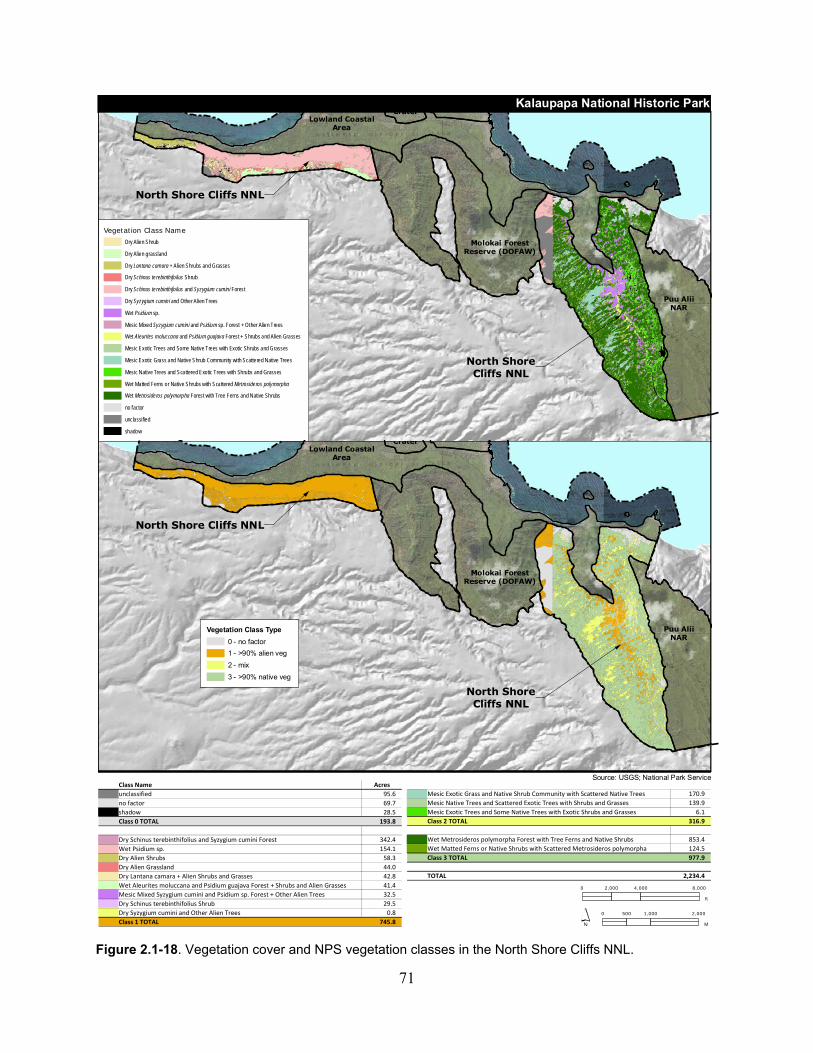
71
Figure 2.1-18. Vegetation cover and NPS vegetation classes in the North Shore Cliffs NNL.
Source: USGS; National Park ServiceClass Name Acres
unclassified 95.6
no factor 69.7
shadow 28.5
Class 0 TOTAL 193.8
Dry Schinus terebinthifolius and Syzygium cumini Forest 342.4
Wet Psidium sp. 154.1
Dry Alien Shrubs 58.3
Dry Alien Grassland 44.0
Dry Lantana camara + Alien Shrubs and Grasses 42.8
Wet Aleurites moluccana and Psidium guajava Forest + Shrubs and Alien Grasses 41.4
Mesic Mixed Syzygium cumini and Psidium sp. Forest + Other Alien Trees 32.5
Dry Schinus terebinthifolius Shrub 29.5
Dry Syzygium cumini and Other Alien Trees 0.8
Class 1 TOTAL 745.8
Mesic Exotic Grass and Native Shrub Community with Scattered Native Trees 170.9
Mesic Native Trees and Scattered Exotic Trees with Shrubs and Grasses 139.9
Mesic Exotic Trees and Some Native Trees with Exotic Shrubs and Grasses 6.1
Class 2 TOTAL 316.9
Wet Metrosideros polymorpha Forest with Tree Ferns and Native Shrubs 853.4
Wet Matted Ferns or Native Shrubs with Scattered Metrosideros polymorpha 124.5
Class 3 TOTAL 977.9
TOTAL 2,234.4
0 4,000 8,0002,000
ft
0 1,000 2,000500
M
Puu AliiNAR
Molokai ForestReserve (DOFAW)
CraterLowland Coastal
Area
North ShoreCliffs NNL
North Shore Cliffs NNL
Vegetation Class Name
Dry Alien Shrub
Dry Alien grassland
Dry Lantana camara + Alien Shrubs and Grasses
Dry Schinus terebinthifolius Shrub
Dry Schinus terebinthifolius and Syzygium cumini Forest
Dry Syzygium cumini and Other Alien Trees
Wet Psidium sp.
Mesic Mixed Syzygium cumini and Psidium sp. Forest + Other Alien Trees
Wet Aleurites moluccana and Psidium guajava Forest + Shrubs and Alien Grasses
Mesic Exotic Trees and Some Native Trees with Exotic Shrubs and Grasses
Mesic Exotic Grass and Native Shrub Community with Scattered Native Trees
Mesic Native Trees and Scattered Exotic Trees with Shrubs and Grasses
Wet Matted Ferns or Native Shrubs with Scattered Metrosideros polymorpha
Wet Metrosideros polymorpha Forest with Tree Ferns and Native Shrubs
no factor
unclassified
shadow
Puu AliiNAR
Molokai ForestReserve (DOFAW)
CraterLowland Coastal
Area
North ShoreCliffs NNL
North Shore Cliffs NNL
Vegetation Class Type
0 - no factor
1 - >90% alien veg
2 - mix
3 - >90% native veg
Kalaupapa National Historic Park
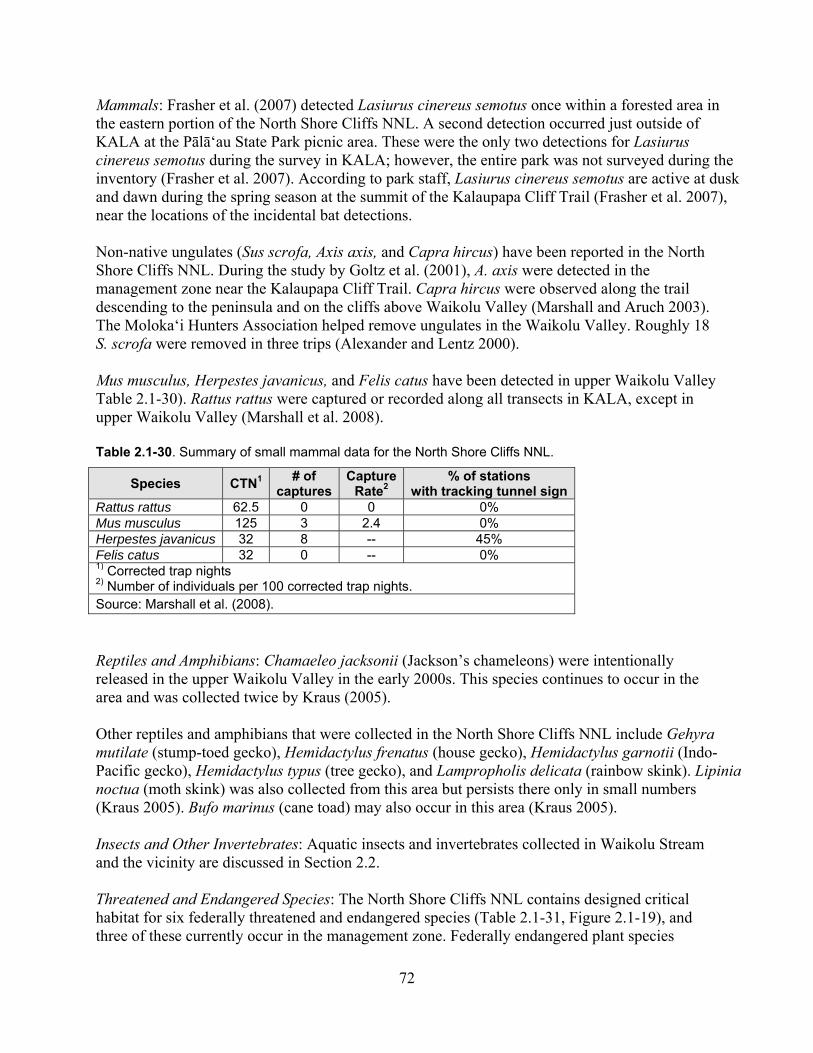
72
Mammals: Frasher et al. (2007) detected Lasiurus cinereus semotus once within a forested area in the eastern portion of the North Shore Cliffs NNL. A second detection occurred just outside of KALA at the Pālā‘au State Park picnic area. These were the only two detections for Lasiurus cinereus semotus during the survey in KALA; however, the entire park was not surveyed during the inventory (Frasher et al. 2007). According to park staff, Lasiurus cinereus semotus are active at dusk and dawn during the spring season at the summit of the Kalaupapa Cliff Trail (Frasher et al. 2007), near the locations of the incidental bat detections. Non-native ungulates (Sus scrofa, Axis axis, and Capra hircus) have been reported in the North Shore Cliffs NNL. During the study by Goltz et al. (2001), A. axis were detected in the management zone near the Kalaupapa Cliff Trail. Capra hircus were observed along the trail descending to the peninsula and on the cliffs above Waikolu Valley (Marshall and Aruch 2003). The Moloka‘i Hunters Association helped remove ungulates in the Waikolu Valley. Roughly 18 S. scrofa were removed in three trips (Alexander and Lentz 2000). Mus musculus, Herpestes javanicus, and Felis catus have been detected in upper Waikolu Valley Table 2.1-30). Rattus rattus were captured or recorded along all transects in KALA, except in upper Waikolu Valley (Marshall et al. 2008). Table 2.1-30. Summary of small mammal data for the North Shore Cliffs NNL.
Species CTN1 # of
capturesCapture
Rate2 % of stations
with tracking tunnel signRattus rattus 62.5 0 0 0% Mus musculus 125 3 2.4 0% Herpestes javanicus 32 8 -- 45% Felis catus 32 0 -- 0% 1) Corrected trap nights 2) Number of individuals per 100 corrected trap nights. Source: Marshall et al. (2008).
Reptiles and Amphibians: Chamaeleo jacksonii (Jackson’s chameleons) were intentionally released in the upper Waikolu Valley in the early 2000s. This species continues to occur in the area and was collected twice by Kraus (2005). Other reptiles and amphibians that were collected in the North Shore Cliffs NNL include Gehyra mutilate (stump-toed gecko), Hemidactylus frenatus (house gecko), Hemidactylus garnotii (Indo-Pacific gecko), Hemidactylus typus (tree gecko), and Lampropholis delicata (rainbow skink). Lipinia noctua (moth skink) was also collected from this area but persists there only in small numbers (Kraus 2005). Bufo marinus (cane toad) may also occur in this area (Kraus 2005). Insects and Other Invertebrates: Aquatic insects and invertebrates collected in Waikolu Stream and the vicinity are discussed in Section 2.2. Threatened and Endangered Species: The North Shore Cliffs NNL contains designed critical habitat for six federally threatened and endangered species (Table 2.1-31, Figure 2.1-19), and three of these currently occur in the management zone. Federally endangered plant species
73
located in Waikolu Valley include Cyanea procera (haha), Panicum fauriei var. carteri (Carter’s panicgrass), and Melicope reflexa (alani). Other endangered and threatened plants known to grow on the coastal cliffs of KALA include Canavalia molokaiensis (‘āwikiwiki), Schiedea lydgatei, and Peucedanum sandwicense (makou). In 2005, the National Park Service fenced a small population of about five mature P. sandwicense individuals near the top of the Kalaupapa Cliff Trail between switchbacks 2 and 3. An additional population of 12 P. sandwicense individuals occurs off the trail just below switchback 3. Evidence of herbivory has been documented on these individuals (USFWS 2003). The National Park Service outplanted four Brighamia rockii (pua‘ala) individuals along the Kalaupapa Trail switchbacks and one individual at the top of Kalaupapa Trail (USFWS 2008b). Other endangered species planned to be outplanted in the North Shore Cliffs NNL include Canavalia molokaiensis, Peucedanum sandwicense, and Hibiscus arnottianus ssp. immaculatus (koki‘o ke‘oke‘o). Table 2.1-31. Total critical habitat area for threatened and endangered plants in the North Shore Cliffs NNL.
Species Critical Habitat Area in Management Zone
Acres Hectares Sq. m. Brighamia rockii 71.9 29.1 290,801.8 Cyanea procera 93.0 37.6 376,461.7 Hibiscus arnottianus ssp. immaculatus 330.4 133.7 1,337,171.5
Lysimachia maxima 117.3 47.5 474,833.3
Peucedanum sandwicense 102.7 41.6 415,741.3
Phyllostegia mannii 13.7 5.5 55,397.0
TOTAL 729.5 295.2 2,952,352.2
Source: USFWS (2004).
No threatened or endangered avifauna were observed in the North Shore Cliffs NNL by Marshall and Aruch (2003) or Marshall and Kozar (2008). However, the coastal cliffs and the walls of Waikolu Valley may provide nesting sites for Puffinus auricularis newelli and Pterodroma sandwichensis. Important Habitats: The cliffs within the North Shore Cliffs NNL probably contain caves and lava tubes; however, cave features and the resources within them have not been surveyed or described. 2.1.6.4 Information Gaps: Flora: Due to the potential for rare plants species to occur in the NNL, regular monitoring surveys should be conducted along permanent transects to document the status of rare species and track vegetation changes. This program should also include detection of new non-native species. During these surveys, the National Park Service can eradicate or control priority invasive plants.
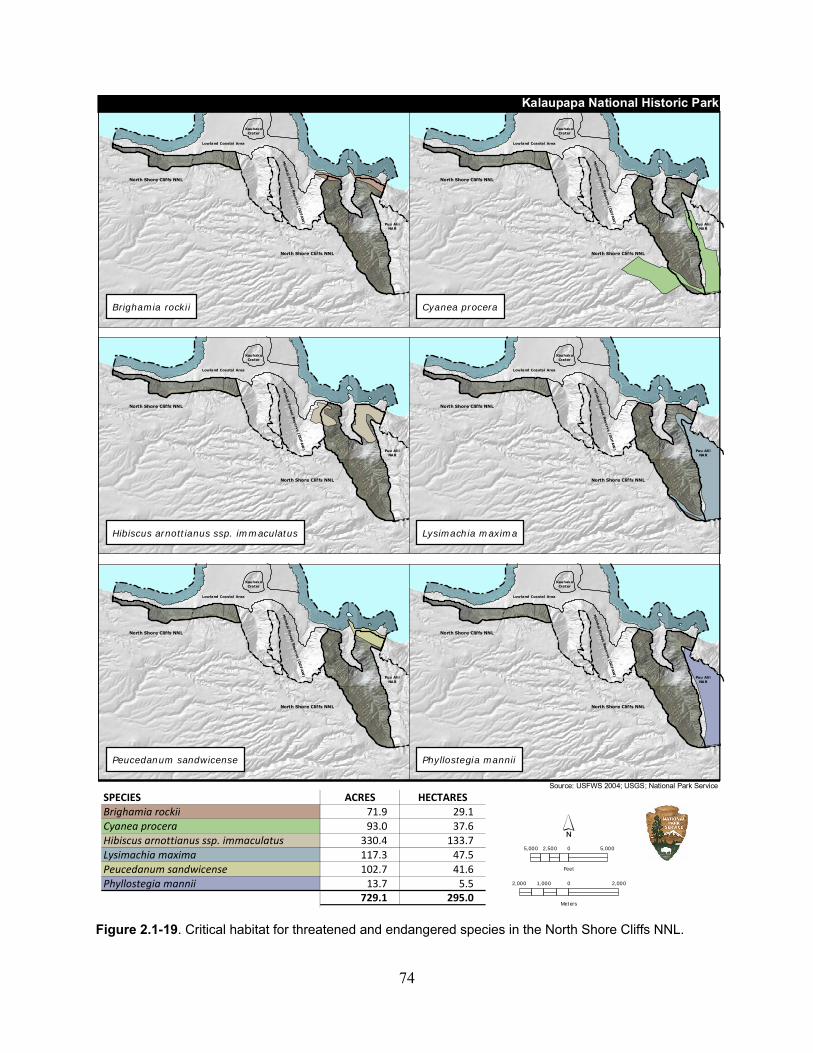
74
Figure 2.1-19. Critical habitat for threatened and endangered species in the North Shore Cliffs NNL.
Source: USFWS 2004; USGS; National Park Service
SPECIES ACRES HECTARESBrighamia rockii 71.9 29.1Cyanea procera 93.0 37.6Hibiscus arnottianus ssp. immaculatus 330.4 133.7Lysimachia maxima 117.3 47.5Peucedanum sandwicense 102.7 41.6Phyllostegia mannii 13.7 5.5
729.1 295.0
5,000 0 5,0002,500
Feet
2,000 0 2,0001,000
Meters
Puu AliiNAR
Lowland Coastal Area
North Shore Cliffs NNL
North Shore Cliffs NNL
Mo
lokai Fo
rest Rese
rve (DO
FA
W)
KauhakoCrater
Brighamia rockii
Puu AliiNAR
Lowland Coastal Area
North Shore Cliffs NNL
North Shore Cliffs NNL
Mo
lokai Fo
rest Rese
rve (DO
FA
W)
KauhakoCrater
Puu AliiNAR
Lowland Coastal Area
North Shore Cliffs NNL
North Shore Cliffs NNL
Mo
lokai Fo
rest Rese
rve (DO
FA
W)
KauhakoCrater
Puu AliiNAR
Lowland Coastal Area
North Shore Cliffs NNL
North Shore Cliffs NNL
Mo
lokai Fo
rest Rese
rve (DO
FA
W)
KauhakoCrater
Cyanea procera
Hibiscus arnottianus ssp. immaculatus Lysimachia maxima
Kalaupapa National Historic Park
Puu AliiNAR
Lowland Coastal Area
North Shore Cliffs NNL
North Shore Cliffs NNL
Mo
lokai Fo
rest Rese
rve (DO
FA
W)
KauhakoCrater
Puu AliiNAR
Lowland Coastal Area
North Shore Cliffs NNL
North Shore Cliffs NNL
Mo
lokai Fo
rest Rese
rve (DO
FA
W)
KauhakoCrater
Phyllostegia manniiPeucedanum sandwicense
75
Avifauna: Radar surveys may reveal that the coastal cliffs near Nihoa and the walls of Waikolu Valley provide nesting sites for seabirds, including Puffinus auricularis newelli and Pterodroma sandwichensis. Additional forest bird inventories are warranted in the upper elevation areas of the Waikolu Valley, where dense forests remains. Mammals: The only two detections for Lasiurus cinereus semotus at KALA were in and adjacent to the NNL. More regular surveys for Lasiurus cinereus semotus in this management zone, particularly along the Kalaupapa Cliff Trail and in Waikolu Valley, may provide valuable information on this species’ occurrence and habitat use in the park. Insects and Other Invertebrates: More extensive invertebrate studies in Waikolu Valley could reveal rare and native species, such as tree snails that have been found in the nearby TNC Kamakou Preserve (TNC 2003a). 2.1.7 Lowland Coastal Area The Lowland Coastal Area of KALA includes the entire coastal plain of the Kalaupapa peninsula. This management zone was created by lavas that emanated from Kauhakō Crater. Along the western coastline of the Lowland Coastal Area, small perched carbonate beaches and narrow vegetated sand dunes occur (Fletcher et al. 2002). Sand dunes are also present on the northeastern tip south of Lae Ho‘olehua. Kūka‘iwa‘a is a small peninsula approximately 15 ha (37 acres) in size within the Lowland Coastal Area. The peninsula, located at 30 m (98 ft) elevation, lies just east of Waikolu Valley close to the offshore islets. It is completely isolated by sheer cliffs stretching to the native forest roughly 914 m (3,000 ft) above (Kozar et al. 2007, Marshall et al. 2008). A 250 m (820 ft) fence transects the Kūka‘iwa‘a peninsula from east to west (Marshall et al. 2008). 2.1.7.1 Previous and Ongoing Studies and Inventories: Soils & Climate:
The only soil survey in the Lowland Coastal Area was conducted by the USDA Soil Conservation Service (Foote et al. 1972). The survey was primarily designed to offer useful information for planning agriculture; therefore, mapping was conducted on agricultural land and generalized for other areas.
Kalaupapa 563, a COOP site near the Kalaupapa Settlement, records both temperature and precipitation. The temperature data record exists for the 1950s and from the late 1990s to present, while the precipitation data record extends from 1933 to present, with a data gap during the 1960s (Davey et al. 2006).
Flora:
Asherman et al. (1990) conducted a reconnaissance survey along the lower elevation areas of the peninsula, including Puwahi, the Kalaupapa Cliff Trail at the beach, and the entire coastline from Kalawao to the Kalaupapa Settlement. This survey involved creating plant species lists, collecting voucher specimens, and documenting localities of rare plants.
76
Based on previous vegetation surveys in the park and additional supplemental surveys, Funk (1991) described 20 plant communities throughout KALA.
In 1994, Jessel and Agliam (1994) established permanent monitoring transects (using rebar)
at Kūka‘iwa‘a to document the health, distribution, and population size of Panicum faurei var. carteri (Carter’s panicgrass). This monitoring was conducted annually to track trends in the population.
In 1997, members of the USGS–BRD Haleakala Field Station established monitoring transects inside and immediately outside of the exclosure on the northeastern coast of the peninsula. The transects were intended to qualitatively and quantitatively document trends in populations of Tetramolopium rockii var. rockii and Centaurium sebaeoides, as well as other vegetation (Medeiros and Chimera 1997a, 1997b).
LeGrande (2002) documented vegetation observations and created a plant species checklist
for Kūka‘iwa‘a in 2002. In 2003, the National Park Service began a Kūka‘iwa‘a canopy gap study to examine
succession process in 100, 200, and 400 m2 (1,076, 2,153, and 4,306 ft2) sized gaps in canopy. This is conducted every five years.
The Kūka‘iwa‘a grass/sedge competition study began in 2004 to quantify sedge grass
abundance in the coastal spray zone. The study is conducted annually. Permanent photopoints were established at the Kūka‘iwa‘a fence in 2005. These points have
been re-photographed annually to document the height and recruitment of Pandanus spp. (hala) in time series following animal exclusion.
Wood et al. (2005) created a plant checklist along a single transect in the Lowland Coastal Area in lower Wai‘ale‘ia Valley.
Hughes et al. (2007) examined plant diversity and distribution for species in the Lowland Coastal Area by analyzing data previous vegetation transects established in the area.
A complete vegetation description of the Kūka‘iwa‘a peninsula is provided by Wood (2008).
This report summarizes descriptions from earlier surveys, updates the status of rare species, and provides information on outplanting on the peninsula.
Wysong and Hughes (2008) updated plant checklists, collected voucher specimens, and created a herbarium for the entire park, including the Lowland Coastal Area
Based on aerial remote sensing, the U.S. Geological Survey and National Park Service created a draft vegetation cover map of the entire management zone in 2007. Identifiable vegetation cover types were categorized as Class 1–3 to provide an estimate of the total native and non-native species composition. The final report for this project, including

77
mapping methods and a detailed description of the plant communities, is anticipated in early 2010 (J. Jacobi/USGS, pers. comm.).
The National Park Service created detailed vegetation maps of areas within the settlement, including the Bishop Home, Bay View Home, Kana‘ana Hou Church, Doctor’s Residence, and McVeight Home. These maps depict individual plant species in the area.
In 2010, the National Park Service plans to re-examine legacy Panicum fauriei var. carteri at
Kūka‘iwa‘a to document occurrence and distribution changes within legacy surveys.
Avifauna: Marshall and Aruch (2003) completed a shoreline seabird inventory during the fall of 2003.
This survey area included portions of the Lowland Coastal Area.
An additional shoreline bird survey was conducted along the KALA coastline by Kozar et al. (2007) during two days in 2005. Seasonal migrants (waterfowl, shorebirds) were the primary focus, but seabirds, raptors, and waterbirds were also recorded.
Within the Lowland Coastal Area, Marshall and Kozar (2008) conducted forest bird surveys along a predator fence at Kūka‘iwa‘a and in the lower Waikolu Valley along an old aqueduct pipe, from 80 to 180 m (262 to 590 ft) in elevation.
Mammals:
To gather information on movement patterns and home ranges of Axis axis, Goltz et al. (2001) tracked six radio-collared Axis axis over a 13-month study.
LeGrande noted rodent and ungulate evidence during her vegetation survey of Kūka‘iwa‘a in 2002 (LeGrande 2002).
Frasher et al. (2007) surveyed Lasiurus cinereus semotus in the Lowland Coastal Area using acoustic detection systems along with visual observations to document the presence/absence of the species and general associations with habitats and elevations. The survey was conducted along the coastline from Puwahi to the Kalaupapa Landing Strip, throughout the Kalaupapa Settlement, and along the road from the settlement toward Wai‘ale‘ia Valley.
Marshall et al. (2008) conducted a presence/absence survey for small mammals in 2005 at two transects in the Lowland Coastal Area; one along the fence transecting the Kūka‘iwa‘a peninsula and another in Lower Waikolu between 140 and 160 m (460 and 525 ft) elevation.
Reptiles and Amphibians:
Kraus (2005) conducted day and night surveys for reptiles and amphibians across KALA, including in portions of the Lowland Coastal Area.
Insects and Other Invertebrates:
78
No focused invertebrate studies have been conducted in the management zone; however, Legrande incidentally noted several arthropod species on the Kūka‘iwa‘a peninsula during her vegetation survey (Legrande 2002).
Other:
Cave investigations were initially conducted at KALA by Pearson in 1966 and 1967 (Pearson et al. 1974).
Clague et al. (1982) depicted cavernous features in the Lowland Costal Area and described the geological setting of the peninsula.
Coombs et al. (1990) described the geology and morphology of the discontinuous lava
channel or tube extending from Kauhakō Crater.
In 1991, Neller investigated and mapped some of the caves and cavernous features in the eruptive alignment north of Kauhakō Crater within the Lowland Coastal Area.
Speleological investigations were conducted by Halliday in 2000 along the eruptive
alignment north of Kauhakō Crater. This report also summarizes and analyzes other published and unpublished cave investigations at KALA (Halliday 2001).
Additional cave animal inventories (invertebrates and vertebrates) at KALA are anticipated
to resume in 2010. 2.1.7.2 Physical Environment: In contrast to most areas of the park, the Lowland Coastal Area is a flat, slightly sloping terrace located at a low elevation. The majority of the Lowland Coastal Area is underlain with Kalaupapa Very Rocky Silty Clay Loam (Table 2.1-32). Five beaches occur along the western side of the peninsula: ‘Awahua, Papaloa, ‘Iliopi‘i, Kāhili, and Ho‘olehua. Most of the beaches are composed of white carbonate sand derived from coral and shell (Funk 1991). At ‘Awahua, or Black Sands Beach, the sand has a large terrigenous detrital component (Fletcher et al. 2002). The remaining beaches are fairly wide and composed of white carbonate sand (Clark 1989). Besides early agriculture that took place in the valleys, most human activities at KALA have occurred in the Lowland Coastal Area. Both the Kalawao Settlement, which was located on the eastern side of the peninsula immediately below the Coastal Spray Zone, and the Kalaupapa Settlement on the western side of the peninsula occur in the Lowland Coastal Area (McCoy 2005a, 2005b). The Kalaupapa Settlement includes residences, dormitories, churches, a hospital, a small grocery store, maintenance and storage buildings, and other infrastructure to support the small community (NPS 2006a). 2.1.7.3 Ecological Community: Flora: The majority of the vegetation in the Lowland Coastal Area is composed of non-native species. In particular, Psidium sp., Schinus terebinthifolius, Lantana camara, and Syzygium cumini are common. Although all three identifiable NPS vegetation classes (Class 1–3) are present in the
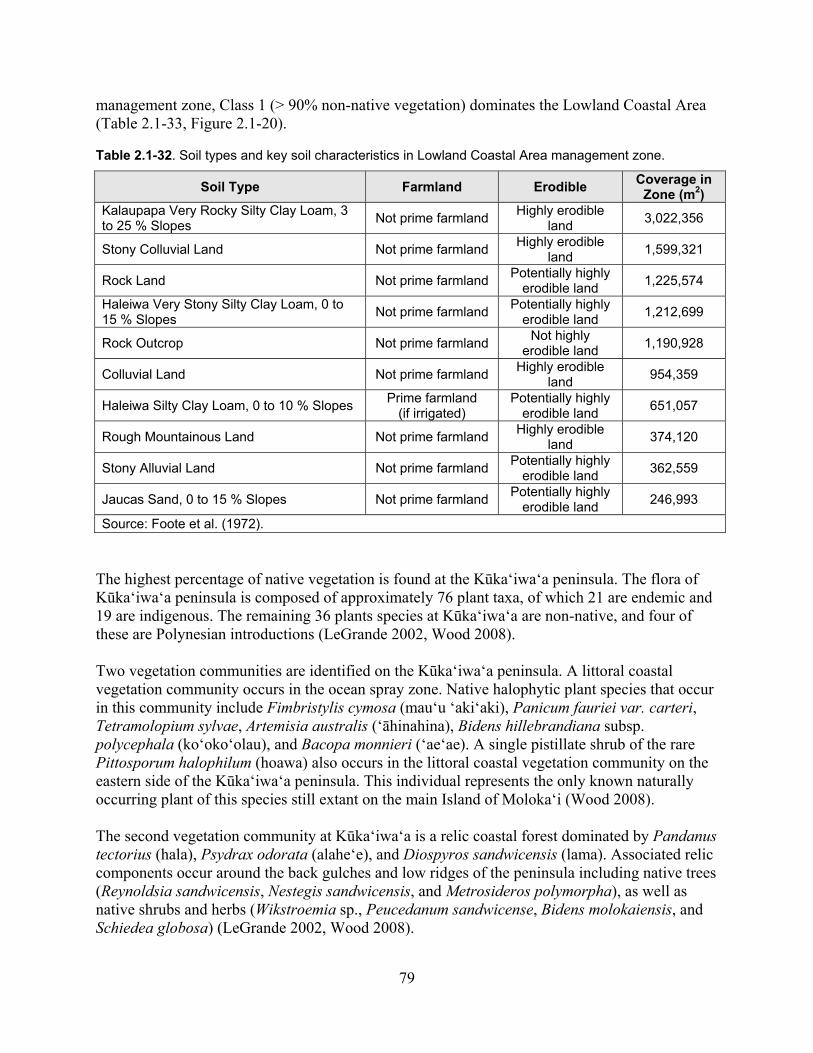
79
management zone, Class 1 (> 90% non-native vegetation) dominates the Lowland Coastal Area (Table 2.1-33, Figure 2.1-20). Table 2.1-32. Soil types and key soil characteristics in Lowland Coastal Area management zone.
Soil Type Farmland Erodible Coverage in
Zone (m2) Kalaupapa Very Rocky Silty Clay Loam, 3 to 25 % Slopes
Not prime farmland Highly erodible
land 3,022,356
Stony Colluvial Land Not prime farmland Highly erodible
land 1,599,321
Rock Land Not prime farmland Potentially highly
erodible land 1,225,574
Haleiwa Very Stony Silty Clay Loam, 0 to 15 % Slopes
Not prime farmland Potentially highly
erodible land 1,212,699
Rock Outcrop Not prime farmland Not highly
erodible land 1,190,928
Colluvial Land Not prime farmland Highly erodible
land 954,359
Haleiwa Silty Clay Loam, 0 to 10 % Slopes Prime farmland
(if irrigated) Potentially highly
erodible land 651,057
Rough Mountainous Land Not prime farmland Highly erodible
land 374,120
Stony Alluvial Land Not prime farmland Potentially highly
erodible land 362,559
Jaucas Sand, 0 to 15 % Slopes Not prime farmland Potentially highly
erodible land 246,993
Source: Foote et al. (1972).
The highest percentage of native vegetation is found at the Kūka‘iwa‘a peninsula. The flora of Kūka‘iwa‘a peninsula is composed of approximately 76 plant taxa, of which 21 are endemic and 19 are indigenous. The remaining 36 plants species at Kūka‘iwa‘a are non-native, and four of these are Polynesian introductions (LeGrande 2002, Wood 2008). Two vegetation communities are identified on the Kūka‘iwa‘a peninsula. A littoral coastal vegetation community occurs in the ocean spray zone. Native halophytic plant species that occur in this community include Fimbristylis cymosa (mau‘u ‘aki‘aki), Panicum fauriei var. carteri, Tetramolopium sylvae, Artemisia australis (‘āhinahina), Bidens hillebrandiana subsp. polycephala (ko‘oko‘olau), and Bacopa monnieri (‘ae‘ae). A single pistillate shrub of the rare Pittosporum halophilum (hoawa) also occurs in the littoral coastal vegetation community on the eastern side of the Kūka‘iwa‘a peninsula. This individual represents the only known naturally occurring plant of this species still extant on the main Island of Moloka‘i (Wood 2008). The second vegetation community at Kūka‘iwa‘a is a relic coastal forest dominated by Pandanus tectorius (hala), Psydrax odorata (alahe‘e), and Diospyros sandwicensis (lama). Associated relic components occur around the back gulches and low ridges of the peninsula including native trees (Reynoldsia sandwicensis, Nestegis sandwicensis, and Metrosideros polymorpha), as well as native shrubs and herbs (Wikstroemia sp., Peucedanum sandwicense, Bidens molokaiensis, and Schiedea globosa) (LeGrande 2002, Wood 2008).

80
Figure 2.1-20. Vegetation cover and NPS vegetation classes in the Lowland Coastal Area.
Class Name Acres
unclassified 173.8
no factor 40.0
shadow 29.8
Class 0 TOTAL 243.7
Mesic Mixed Syzygium cumini and Psidium sp. Forest + Other Alien Trees 474.6
Dry Schinus terebinthifolius and Syzygium cumini Forest 456.8
Dry Lantana camara + Alien Shrubs and Grasses 409.0
Dry Schinus terebinthifolius Shrub 371.2
Dry Alien Shrubs 300.2
Dry Alien Grassland 180.8
Wet Psidium sp. 142.4
Dry Syzygium cumini and Other Alien Trees 12.0
Wet Aleurites moluccana and Psidium guajava Forest + Shrubs and Alien Grasses 11.5
Class 1 TOTAL 2,358.6
Mesic Exotic Grass and Native Shrub Community with Scattered Native Trees 17.6
Mesic Exotic Trees and Some Native Trees with Exotic Shrubs and Grasses 2.3
Mesic Native Trees and Scattered Exotic Trees with Shrubs and Grasses 2.0
Class 2 TOTAL 21.8
Wet Metrosideros polymorpha Forest with Tree Ferns and Native Shrubs 55.4
Wet Matted Ferns or Native Shrubs with Scattered Metrosideros polymorpha 14.0
Class 3 TOTAL 69.4
TOTAL 2,693.4
Source: USGS; National Park Service
North ShoreCliffs NNLMolokai Forest
Reserve (DOFAW)
North Shore Cliffs (NNL)
KauhakoCrater
CoastalSprayZone
Lowland CoastalArea
Vegetation Class Name
Dry Alien Shrub
Dry Alien grassland
Dry Lantana camara + Alien Shrubs and Grasses
Dry Schinus terebinthifolius Shrub
Dry Schinus terebinthifolius and Syzygium cumini Forest
Dry Syzygium cumini and Other Alien Trees
Wet Psidium sp.
Mesic Mixed Syzygium cumini and Psidium sp. Forest + Other Alien Trees
Wet Aleurites moluccana and Psidium guajava Forest + Shrubs and Alien Grasses
Mesic Exotic Trees and Some Native Trees with Exotic Shrubs and Grasses
Mesic Exotic Grass and Native Shrub Community with Scattered Native Trees
Mesic Native Trees and Scattered Exotic Trees with Shrubs and Grasses
Wet Matted Ferns or Native Shrubs with Scattered Metrosideros polymorpha
Wet Metrosideros polymorpha Forest with Tree Ferns and Native Shrubs
no factor
unclassified
shadow
North ShoreCliffs NNLMolokai Forest
Reserve (DOFAW)
North Shore Cliffs (NNL)
KauhakoCrater
CoastalSprayZone
Lowland CoastalArea
Vegetation Class Type
0 - no factor
1 - >90% alien veg
2 - mix
3 - >90% native veg
Kalaupapa National Historic Park
0 4,000 8,0002,000
ft
0 1,000 2,000500
M
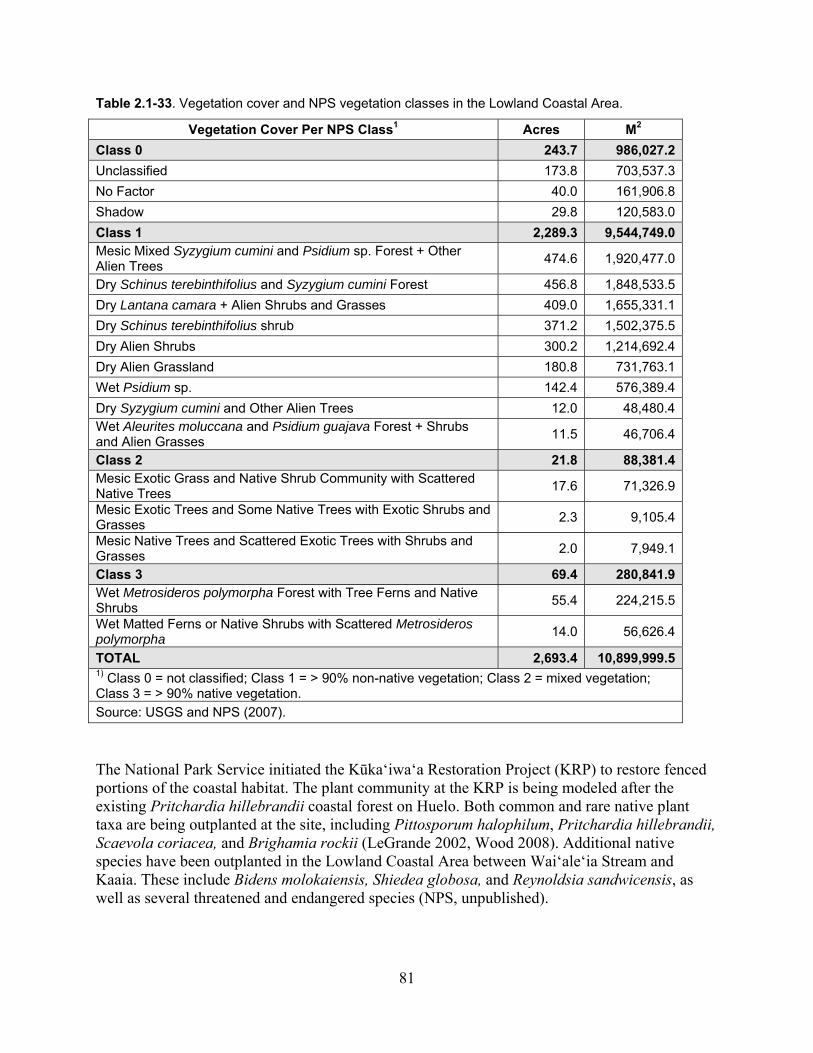
81
Table 2.1-33. Vegetation cover and NPS vegetation classes in the Lowland Coastal Area.
Vegetation Cover Per NPS Class1 Acres M2
Class 0 243.7 986,027.2
Unclassified 173.8 703,537.3
No Factor 40.0 161,906.8
Shadow 29.8 120,583.0
Class 1 2,289.3 9,544,749.0Mesic Mixed Syzygium cumini and Psidium sp. Forest + Other Alien Trees
474.6 1,920,477.0
Dry Schinus terebinthifolius and Syzygium cumini Forest 456.8 1,848,533.5
Dry Lantana camara + Alien Shrubs and Grasses 409.0 1,655,331.1
Dry Schinus terebinthifolius shrub 371.2 1,502,375.5
Dry Alien Shrubs 300.2 1,214,692.4
Dry Alien Grassland 180.8 731,763.1
Wet Psidium sp. 142.4 576,389.4
Dry Syzygium cumini and Other Alien Trees 12.0 48,480.4Wet Aleurites moluccana and Psidium guajava Forest + Shrubs and Alien Grasses
11.5 46,706.4
Class 2 21.8 88,381.4Mesic Exotic Grass and Native Shrub Community with Scattered Native Trees
17.6 71,326.9
Mesic Exotic Trees and Some Native Trees with Exotic Shrubs and Grasses
2.3 9,105.4
Mesic Native Trees and Scattered Exotic Trees with Shrubs and Grasses
2.0 7,949.1
Class 3 69.4 280,841.9Wet Metrosideros polymorpha Forest with Tree Ferns and Native Shrubs
55.4 224,215.5
Wet Matted Ferns or Native Shrubs with Scattered Metrosideros polymorpha
14.0 56,626.4
TOTAL 2,693.4 10,899,999.51) Class 0 = not classified; Class 1 = > 90% non-native vegetation; Class 2 = mixed vegetation; Class 3 = > 90% native vegetation.
Source: USGS and NPS (2007).
The National Park Service initiated the Kūka‘iwa‘a Restoration Project (KRP) to restore fenced portions of the coastal habitat. The plant community at the KRP is being modeled after the existing Pritchardia hillebrandii coastal forest on Huelo. Both common and rare native plant taxa are being outplanted at the site, including Pittosporum halophilum, Pritchardia hillebrandii, Scaevola coriacea, and Brighamia rockii (LeGrande 2002, Wood 2008). Additional native species have been outplanted in the Lowland Coastal Area between Wai‘ale‘ia Stream and Kaaia. These include Bidens molokaiensis, Shiedea globosa, and Reynoldsia sandwicensis, as well as several threatened and endangered species (NPS, unpublished).
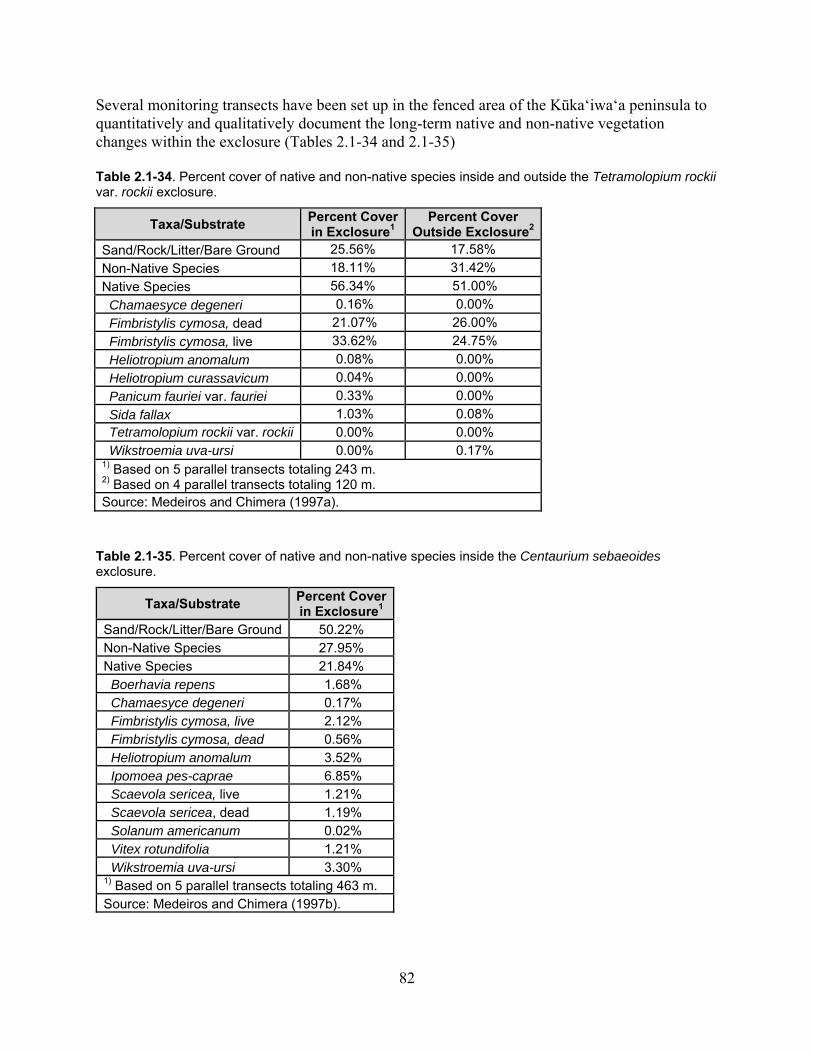
82
Several monitoring transects have been set up in the fenced area of the Kūka‘iwa‘a peninsula to quantitatively and qualitatively document the long-term native and non-native vegetation changes within the exclosure (Tables 2.1-34 and 2.1-35) Table 2.1-34. Percent cover of native and non-native species inside and outside the Tetramolopium rockii var. rockii exclosure.
Taxa/Substrate Percent Coverin Exclosure1
Percent Cover Outside Exclosure2
Sand/Rock/Litter/Bare Ground 25.56% 17.58%
Non-Native Species 18.11% 31.42%
Native Species 56.34% 51.00%
Chamaesyce degeneri 0.16% 0.00%
Fimbristylis cymosa, dead 21.07% 26.00%
Fimbristylis cymosa, live 33.62% 24.75%
Heliotropium anomalum 0.08% 0.00%
Heliotropium curassavicum 0.04% 0.00%
Panicum fauriei var. fauriei 0.33% 0.00%
Sida fallax 1.03% 0.08% Tetramolopium rockii var. rockii 0.00% 0.00% Wikstroemia uva-ursi 0.00% 0.17% 1) Based on 5 parallel transects totaling 243 m. 2) Based on 4 parallel transects totaling 120 m. Source: Medeiros and Chimera (1997a).
Table 2.1-35. Percent cover of native and non-native species inside the Centaurium sebaeoides exclosure.
Taxa/Substrate Percent Coverin Exclosure1
Sand/Rock/Litter/Bare Ground 50.22% Non-Native Species 27.95% Native Species 21.84% Boerhavia repens 1.68% Chamaesyce degeneri 0.17% Fimbristylis cymosa, live 2.12% Fimbristylis cymosa, dead 0.56% Heliotropium anomalum 3.52% Ipomoea pes-caprae 6.85% Scaevola sericea, live 1.21% Scaevola sericea, dead 1.19% Solanum americanum 0.02% Vitex rotundifolia 1.21% Wikstroemia uva-ursi 3.30% 1) Based on 5 parallel transects totaling 463 m. Source: Medeiros and Chimera (1997b).
83
Avifauna: In Lower Waikolu Valley, both Himatione sanguinea sanguinea and Hemignathus virens wilsoni were observed, with 22 and 17 detections, respectively. Seven non-native forest bird species were recorded in the area including the Tyto alba (barn owl), Acridotheres tristis, Cettia diphone, Zosterops japonicus, Cardinalis cardinalis, Streptopelia chinensis, and Copsychus malabaricus (Marshall and Kozar 2008). Seven non-native forest birds were also documented at Kūka‘iwa‘a by Marshall and Kozar (2008). These include Acridotheres tristis, Carpodacus mexicanus, Cettia diphone, Zosterops japonicus, Cardinalis cardinalis, Lonchura punctulata (nutmeg mannikin), and Copsychus malabaricus (Marshall and Kozar 2008). Several shorebird and seabird species were recorded at Kūka‘iwa‘a during a 2005 survey. Anous minutus (black noddy) were observed flying among the cliffs and feeding in the ocean and Heteroscelus incanus (wandering tattlers) were noted in and around the rocky shore and tidepools. Vocalizations of Puffinus pacificus were also heard at Kūka‘iwa‘a in the evenings (Kozar et al. 2007). Observations of the rare Pterodroma sandwichensis have been noted at the Kūka‘iwa‘a Peninsula in the past, as reported in Kozar et al. (2007), but this species was not seen in the most recent survey. Legrande (2002) suggests that lack of seabird nesting on Kūka‘iwa‘a peninsula may be due to predation by non-native small mammals. On the western side of the peninsula along the Lowland Coastal Area, Pluvialis fulva (Pacific golden plover) were commonly seen during the 2005 survey. Heteroscelus incanus (wandering tattlers) were also observed on the rocky shoreline (Kozar et al. 2007). Puffinus pacificus, Phaethon rubricauda, and Phaethon lepturus were observed flying over this area during the 2005 survey. Sterna fuscata have previously been detected flying over the Kalaupapa Settlement and Anous minutus are known to nest in the rocky cliffs along the coastline (Kozar et al. 2007). Diomedea immutabilis (albatross) have been reported in the airport area. Nycticorax nycticorax (black-crowed night heron) and Asio flammeus sandwicensis (Hawaiian short-eared owl) may occasionally forage in the airport and the surroundings (GK & Associates 1991). Mammals: The study by Goltz et al. (2001) found that the radio-collared Axis axis remained primarily within the Lowland Coastal Area of KALA. During the day, the deer were located in thick forest of Schinus terebinthifolius or Psidium spp. at the base of the cliffs. At night, the ungulates traveled a short distance to nearby open grassy areas (Goltz et al. 2001). LeGrande (2002) did not observe signs of ungulates within the fenced area of the Kūka‘iwa‘a peninsula. No Lasiurus cinereus semotus were detected in the Lowland Coastal Area during the single survey in 2005. Year-round heavy winds are believed to discourage bat activity on the Kalaupapa peninsula (Frasher et al. 2007). Kūka‘iwa‘a had the highest R. rattus capture rate in the park, with 8.3 individuals captured per 100 corrected nights (Table 2.1-36). A transect in the lower Waikolu Valley, which runs north-south along an old aqueduct pipe, had the second highest R. rattus capture rate of any site surveyed in the park (4.72 individuals per 100 corrected trap nights). Rattus spp. have been noted caching large piles
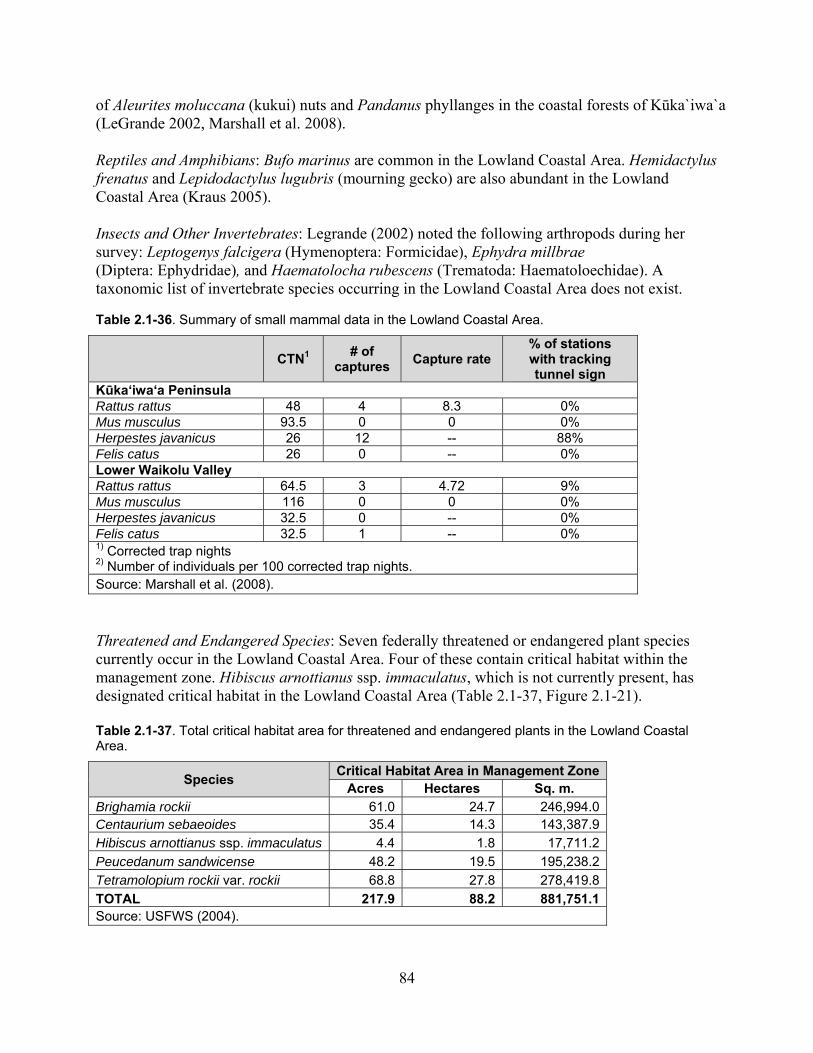
84
of Aleurites moluccana (kukui) nuts and Pandanus phyllanges in the coastal forests of Kūka`iwa`a (LeGrande 2002, Marshall et al. 2008). Reptiles and Amphibians: Bufo marinus are common in the Lowland Coastal Area. Hemidactylus frenatus and Lepidodactylus lugubris (mourning gecko) are also abundant in the Lowland Coastal Area (Kraus 2005). Insects and Other Invertebrates: Legrande (2002) noted the following arthropods during her survey: Leptogenys falcigera (Hymenoptera: Formicidae), Ephydra millbrae (Diptera: Ephydridae), and Haematolocha rubescens (Trematoda: Haematoloechidae). A taxonomic list of invertebrate species occurring in the Lowland Coastal Area does not exist. Table 2.1-36. Summary of small mammal data in the Lowland Coastal Area.
CTN1 # of
captures Capture rate
% of stations with tracking tunnel sign
Kūka‘iwa‘a Peninsula Rattus rattus 48 4 8.3 0% Mus musculus 93.5 0 0 0% Herpestes javanicus 26 12 -- 88% Felis catus 26 0 -- 0% Lower Waikolu Valley Rattus rattus 64.5 3 4.72 9% Mus musculus 116 0 0 0% Herpestes javanicus 32.5 0 -- 0% Felis catus 32.5 1 -- 0% 1) Corrected trap nights 2) Number of individuals per 100 corrected trap nights. Source: Marshall et al. (2008).
Threatened and Endangered Species: Seven federally threatened or endangered plant species currently occur in the Lowland Coastal Area. Four of these contain critical habitat within the management zone. Hibiscus arnottianus ssp. immaculatus, which is not currently present, has designated critical habitat in the Lowland Coastal Area (Table 2.1-37, Figure 2.1-21). Table 2.1-37. Total critical habitat area for threatened and endangered plants in the Lowland Coastal Area.
Species Critical Habitat Area in Management Zone
Acres Hectares Sq. m. Brighamia rockii 61.0 24.7 246,994.0 Centaurium sebaeoides 35.4 14.3 143,387.9
Hibiscus arnottianus ssp. immaculatus 4.4 1.8 17,711.2
Peucedanum sandwicense 48.2 19.5 195,238.2
Tetramolopium rockii var. rockii 68.8 27.8 278,419.8
TOTAL 217.9 88.2 881,751.1 Source: USFWS (2004).
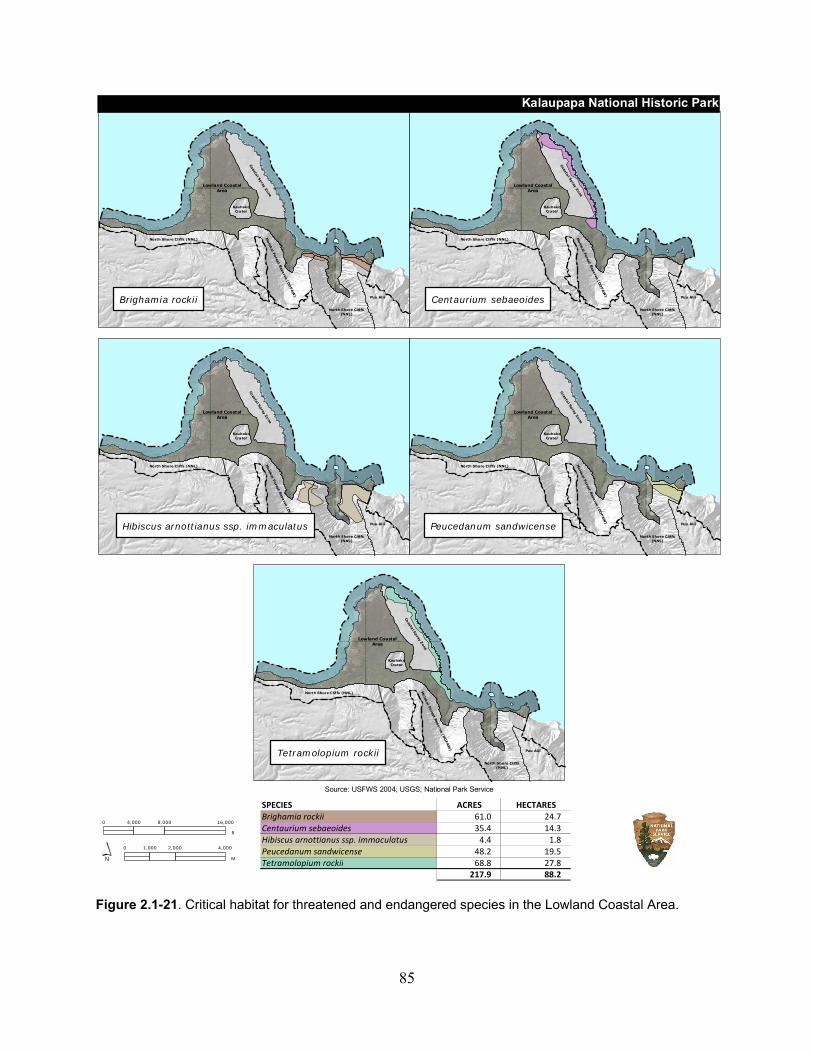
85
Figure 2.1-21. Critical habitat for threatened and endangered species in the Lowland Coastal Area.
Source: USFWS 2004; USGS; National Park Service
Lowland CoastalArea
Molok
ai Forest R
eserve (D
OFAW
)
Coasta
l Spray Z
one
KauhakoCrater
North Shore Cliffs (NNL)
North Shore Cliffs(NNL)
Puu AliiPeucedanum sandwicense
0 8,000 16,0004,000
ft
0 2,000 4,0001,000
M
Lowland CoastalArea
Molok
ai Forest R
eserve (D
OFAW
)
Coasta
l Spray Z
one
KauhakoCrater
North Shore Cliffs (NNL)
North Shore Cliffs(NNL)
Puu AliiHibiscus arnottianus ssp. immaculatus
Lowland CoastalArea
Mo
lokai Fo
rest Rese
rve (DO
FAW
)
Coasta
l Spray Z
one
KauhakoCrater
North Shore Cliffs (NNL)
North Shore Cliffs(NNL)
Puu AliiTetramolopium rockii
Lowland CoastalArea
Molok
ai Forest R
eserve (D
OFAW
)
Coasta
l Spray Z
one
KauhakoCrater
North Shore Cliffs (NNL)
North Shore Cliffs(NNL)
Puu Alii
Lowland CoastalArea
Molok
ai Forest R
eserve (D
OFAW
)
Coasta
l Spray Z
one
KauhakoCrater
North Shore Cliffs (NNL)
North Shore Cliffs(NNL)
Puu Alii
SPECIES ACRES HECTARESBrighamia rockii 61.0 24.7Centaurium sebaeoides 35.4 14.3Hibiscus arnottianus ssp. immaculatus 4.4 1.8Peucedanum sandwicense 48.2 19.5Tetramolopium rockii 68.8 27.8
217.9 88.2
Kalaupapa National Historic Park
Centaurium sebaeoidesBrighamia rockii
86
Numerous Panicum fauriei var. carteri individuals were documented at Kūka‘iwa‘a in 1992. The species was noted to grow at the edge of the cliffs likely because this area has minimal grazing and trampling pressure by non-native ungulates and competition from non-native plants (Jessel and Agliam 1994, NPS 2000a). In 2000, a total of 457 individuals were counted along the coast of the peninsula at the previously established monitoring stations (LeGrande 2002). The endangered Centaurium sebaeoides (‘āwiwi) is also known to occur in the Lowland Coastal Area. Centaurium sebaeoides is the only native Hawaiian gentian. It is an annual with a total population of approximately 6,300 to 6,600 individuals. The population on KALA is comprised of approximately 4,020 plants in 1997 (Medeiros et al. 2000). During the study by Medeiros and Chimera (1997b), no individuals were found on the transects inside the exclosure. Follow-up data and analysis have not been conducted to document long-term vegetation changes within the exclosure. The threatened Tetramolopium rockii var. rockii has been observed near Kalawao. The main concentration of this species in 1990 occurred along the coast from Kalawao to about 0.6 km (0.4 miles) to the north (Asherman et al. 1990). No Tetramolopium rockii var. rockii individuals were observed inside or outside of the exclosure transects during the study at Kūka‘iwa‘a by Medeiros and Chimera (1997b). A large patch of Canavalia molokaiensis (‘āwikiwiki) has been found on the east side of the mouth of Wai‘ale‘ia Stream between 10 and 15 m (33 and 49 ft) elevation. At least six additional plants were seen along the coast between the mouth of Wai‘ale‘ia Stream and Waikolu at Keanakua (Asherman et al. 1990). Several of these plants are planned to be outplanted in the Lowland Coastal Area between Wai‘ale‘ia Stream and Kaaia, including the endangered Canavalia molokaiensis, endangered Brighamia rockii, and threatened Peucedanum sandwicensis. The National Park Service also has outplanted 117 Brighamia rockii individuals at Kūka‘iwa‘a (USFWS 2008b), as well as the endangered Scaevola coriaceae (dwarf naupaka). In 2005, LeGrande noted 21 Brighamia rockii and two Scaevola coriaceae individuals. Results from the radar survey conducted for the seabird inventory in 2002 suggest that both Pterodroma sandwichensis and Puffinus auricularis newelli nest in the valleys of northeastern Moloka‘i, with the Pelekunu and Wailau Valleys having the greatest potential for nesting birds (Day and Cooper 2002). Thus, these endangered seabirds likely transit the Lowland Coastal Area during the breeding season, returning to nesting colonies in March or April and leaving in June or July. Important Habitats: A sinuous lava channel or tube extends roughly 1.0 km (0.6 mi) from the northeast side of the Kauhakō Crater and the north end of the Kalaupapa peninsula. The feature is 100 to 150 m (328–492 ft) wide and up to 30 m (98 ft) deep. This alignment was first described by Stearns and Macdonald (1947) as a “large lava tube that has collapsed,” and this hypothesis has since been adopted by subsequent researchers (Clague et al. 1982, Coombs et al. 1990, Medeiros et al. 1996). During his investigations, Halliday (2001) found no evidence that the feature is a lava tube but rather suggests that it is an aligned “lava channel complex with eruptive foci, which produced a variety of geomorphic features.”
87
The channel is comprised of two sections. A mauka section extends north from a wall of lava talus; it is about 450 m (1,476 ft) long, 90 to 100 m (295-328 ft) wide, and up to 50 m (164 ft) deep. The other (makai) section of the channel is narrower, shallower, and more linear than the mauka section. Halliday concluded that no caves or cavernous features occur in the channel complex, except a single structure in the mauka section. This small cavity is about 1.5 m (5 ft) in diameter and 3 m (9.8 ft) above the channel floor (Halliday 2001). Several cavernous features occur makai of the alignment. “Anakahalele” is a small cave approximately 2.7 m (8.9 ft) wide and 2 m (6.6 ft) high. “New Crater” is a lava dome with a small summit extrusion, some rockshelters, and other cavernous features. This dome shares a common wall with a rockshelter named “Shelter Cave,” which is a large asymmetrical lava tumulus. On the west wall of “New Crater” is a small rockshelter approximately 3 m (9.8 ft) long and 1.3 m (4.3 ft) wide. Another rockshelter was found by Halliday (2001) in the vicinity, which had two boulder overhangs. “Noni Tree Cave” is a complex collapse sink with two short fragments of exposed lava tube. Several additional features have been documented north of Makapulapai (Black Hill) including an unnamed rockshelter, a small hollow tumulus, a small lava shield, and a small cavernous structure near the lighthouse (Halliday 2001). 2.1.7.4 Information Gaps: Invasive Fauna: Due to the high amount of rodent capture rates during the survey by Marshall et al. (2008), it might be important to study seed removal/predation rates on native plants occurring on the Kūka‘iwa‘a peninsula. Flora: A large amount of raw data exists on the vegetation at the Kūka‘iwa‘a peninsula; however, data collected during several studies in this area—including permanent monitoring transects for endangered species, Kūka‘iwa‘a canopy gap study, Kūka‘iwa‘a grass/sedge competition study, and Kūka‘iwa‘a Fence Effects Photo Points—have not been analyzed. Before collecting additional data on this area of the park, it would be useful to analyze any trends in the existing data over the years. It is important to track the response of both native and non-native vegetation to ungulate control (i.e., fencing) to ensure that removal of ungulates did not result in a secondary increase in other invasive plant species. The monitoring should be conducted together with regular monitoring of endangered plant populations known to occur in the Lowland Coastal Area. Insects and Other Invertebrates: Invertebrate studies should be conducted in the Lowland Coastal Area. Invertebrate species (snails, insects, and other arthropods) play an essential role in supporting native Hawaiian ecosystems. Conducting a baseline invertebrate survey would increase the knowledge of invertebrate species present in the Lowland Coastal Area. Caves and Cavernous Features: Although the caves and cavernous features in the Lowland Coastal Area were recently described by Halliday (2001), this study did not focus on inventorying faunal and floral resources in the features. The potential to come across additional obligate cave-adapted plants and animals is significant (F. Howarth/Bishop Museum, pers. comm.). An important component of additional studies is the development of a Cave Management Plan to ensure that cave exploration does not result in damage to these unique resources (F. Howarth/Bishop Museum, pers. comm.).
88
2.2 Freshwater Ecosystem The freshwater ecosystem within KALA includes palustrine, lacustrine, anchialine, and riverine habitats (Figure 1.4-1). Palustrine habitats are lentic (standing or still), non-tidal wetlands usually less than 2 m (6 ft) deep (Cowardin et al. 1979). This classification includes both high- and low-elevation wetlands. For purposes of identifying wetlands under the jurisdiction of the Department of the Army under Section 404 of the Clean Water Act and Section 10 of the Rivers and Harbors Act, the U.S. Army, U.S. Environmental Protection Agency (EPA), and Hawai‘i Department of Health (HDOH) define wetlands as “Those areas that are inundated or saturated by surface or groundwater at a frequency and duration sufficient to support, and that under normal circumstances do support, a prevalence of vegetation typically adapted for life in saturated soil conditions” (Erickson and Puttock 2006). Jurisdictional wetland boundary determinations involve an assessment of the relationship between indicators of vegetation, soil, and hydrologic regimes. This definition is subject to frequent amendment by Congress based upon political and legal issues and is not cited further in this document. Lacustrine habitats are lentic waters in definite basins with a depth exceeding 2 m (6 ft). Natural lacustrine habitats are rare in Hawai‘i and the insular tropical Pacific primarily due to substrate permeability (Maciolek 1975, 1982). Only four natural-formed freshwater lakes are known to occur in Hawai‘i (Polhemus et al. 1992). Anchialine pools are exposed portions of the groundwater table that have a subsurface connection to the sea (Holthuis 1973). Anchialine pools are generally found on geologically young and porous lavas within the coastal tropics and subtropics (Chai et al. 1989). Approximately 80 percent of the world’s known anchialine ponds occur on Hawai‘i Island (Mitchell et al. 2005). These aquatic habitats are highly threatened throughout the State of Hawai‘i (Stone 1989, Mitchell et al. 2005, USGS 2005). Riverine habitats are “limnetic surface waters flowing unidirectionally” down elevational gradients (Polhemus et al. 1992). These can be classified into perennial or intermittent streams. Perennial streams are flowing waters that drain land surfaces in discrete channels year-round, (Polhemus et al. 1992). Perennial can be either continuous (discharging continuously into the ocean) or interrupted (flowing perennially in the upper reaches but discharging only seasonally into the ocean). Intermittent streams contain flowing water for only part of the year. Biologically, intermittent streams also usually lack the amphidromous fish species present in perennial streams (Cowardin et al. 1979, Polhemus et al. 1992). The following sections provide information on previous and ongoing surveys and inventories conducted in the freshwater habitats of KALA, as well as the physical environment and ecological communities within each habitat. Studies and inventories conducted in each habitat are organized by resource and then listed chronologically. Information gaps are identified and recommendations for future studies are provided for each area. These recommended studies will allow better evaluation of conditions, identify existing factors negatively impacting the park’s resources, and indicate potential future threats.
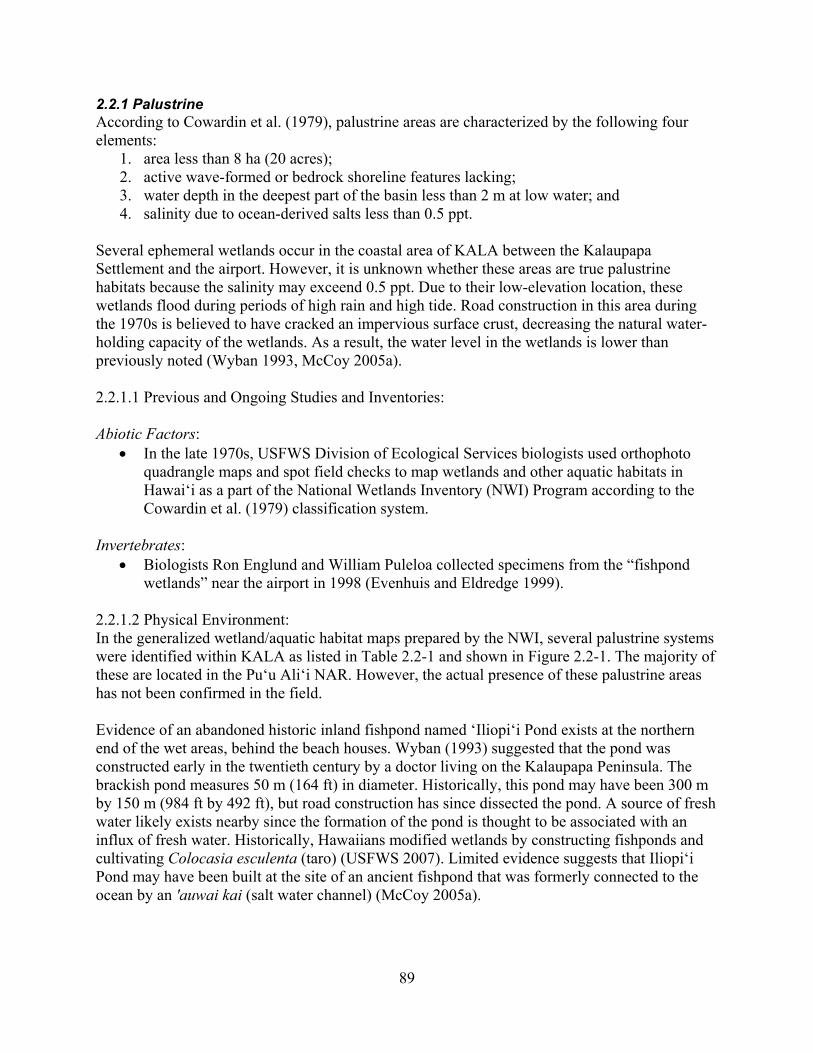
89
2.2.1 Palustrine According to Cowardin et al. (1979), palustrine areas are characterized by the following four elements:
1. area less than 8 ha (20 acres); 2. active wave-formed or bedrock shoreline features lacking; 3. water depth in the deepest part of the basin less than 2 m at low water; and 4. salinity due to ocean-derived salts less than 0.5 ppt.
Several ephemeral wetlands occur in the coastal area of KALA between the Kalaupapa Settlement and the airport. However, it is unknown whether these areas are true palustrine habitats because the salinity may exceend 0.5 ppt. Due to their low-elevation location, these wetlands flood during periods of high rain and high tide. Road construction in this area during the 1970s is believed to have cracked an impervious surface crust, decreasing the natural water-holding capacity of the wetlands. As a result, the water level in the wetlands is lower than previously noted (Wyban 1993, McCoy 2005a). 2.2.1.1 Previous and Ongoing Studies and Inventories: Abiotic Factors:
In the late 1970s, USFWS Division of Ecological Services biologists used orthophoto quadrangle maps and spot field checks to map wetlands and other aquatic habitats in Hawai‘i as a part of the National Wetlands Inventory (NWI) Program according to the Cowardin et al. (1979) classification system.
Invertebrates:
Biologists Ron Englund and William Puleloa collected specimens from the “fishpond wetlands” near the airport in 1998 (Evenhuis and Eldredge 1999).
2.2.1.2 Physical Environment: In the generalized wetland/aquatic habitat maps prepared by the NWI, several palustrine systems were identified within KALA as listed in Table 2.2-1 and shown in Figure 2.2-1. The majority of these are located in the Pu‘u Ali‘i NAR. However, the actual presence of these palustrine areas has not been confirmed in the field. Evidence of an abandoned historic inland fishpond named ‘Iliopi‘i Pond exists at the northern end of the wet areas, behind the beach houses. Wyban (1993) suggested that the pond was constructed early in the twentieth century by a doctor living on the Kalaupapa Peninsula. The brackish pond measures 50 m (164 ft) in diameter. Historically, this pond may have been 300 m by 150 m (984 ft by 492 ft), but road construction has since dissected the pond. A source of fresh water likely exists nearby since the formation of the pond is thought to be associated with an influx of fresh water. Historically, Hawaiians modified wetlands by constructing fishponds and cultivating Colocasia esculenta (taro) (USFWS 2007). Limited evidence suggests that Iliopi‘i Pond may have been built at the site of an ancient fishpond that was formerly connected to the ocean by an 'auwai kai (salt water channel) (McCoy 2005a).

90
Figure 2.2-1. Palustrine habitats at KALA.
Sou
rce:
US
GS
; Sta
te o
f Haw
aii G
IS; N
atio
nal P
ark
Se
rvic
eLe
gen
d Park
Boun
dary
Str
eam
s
Roa
ds/T
rails
Sec
ondar
y
Tert
iary
4wd
Trai
l
4,00
00
4,00
02,
000
Feet
2,00
00
2,00
01,
000
Met
ers
Pa
cif
ic
Oc
ea
n
Hue
lo I
slet
Hue
lo I
slet
Oka
la I
slet
Oka
la I
slet
Ka
law
ao
Ka
law
ao
Ha'
upu
Ba
yH
a'u
pu B
ay
Pe
leku
nu
Pe
leku
nu
Ba
yB
ay
Ka
hiu
Po
int
Ka
hiu
Po
int
Ka
lau
pa
paK
ala
up
apa
Ka
uha
ko L
ake
Ka
uha
ko L
ake
Ka
lau
pa
pa P
en
insu
laK
ala
up
apa
Pe
nin
sula
Pu
u A
liiP
uu
Alii
470
Iliop
ii P
on
dIli
opii
Po
nd
Nam
oku
Nam
oku
PF
O3C
PF
O3F
PF
O3C
PF
O3F
PS
S3F
PF
O3F
PS
S3C
PS
S3F
PS
S3C
PS
S3F
PU
B3C
PO
WH
PFO3A
Wa i
hana
u Stre
am
Waialeia Stream
Waikolu Stream
Co
wa
rdin
Cla
ss
Co
un
t A
rea
(m
) P
eri
me
ter/
L
en
gth
(m
)
PF
O3C
P
alus
trin
e, f
ores
ted,
bro
ad-le
afed
e
verg
reen
, se
ason
al
2 1,
690,
506.
9
18,7
24.
9
PF
O3F
P
alus
trin
e, f
ores
ted,
bro
ad-le
afed
e
verg
reen
, se
mip
erm
ane
nt
3 89
3,9
50.5
14
,65
3.3
PF
O3A
1
Pal
ustr
ine,
for
este
d, b
road
-leaf
ed
eve
rgre
en,
tem
por
ary
1
--
1,64
7.3
PO
WH
2
Pal
ustr
ine,
ope
n w
ate
r, p
erm
anen
t
1 4,
219.
0
260.
6
PS
S3C
P
alus
trin
e, s
crub
/sh
rub,
bro
ad-l
eafe
d e
verg
reen
, se
ason
al
2 23
6,2
48.8
4,
702.
9
PS
S3F
P
alus
trin
e, s
crub
/sh
rub,
bro
ad-l
eafe
d e
verg
reen
, se
mip
erm
ane
nt
2 4,
233,
324.
0
345,
56.
7
PU
B3C
P
alus
trin
e, u
ncon
solid
ated
bot
tom
, m
ud,
seas
onal
1
8,99
8.5
37
9.1
TO
TA
L
12
7,
067,
247.
70
40
,36
8.10
1
) Wai
hana
u S
trea
m is
cla
ssifi
ed a
s ri
verin
e.
2) L
ake
Kau
hak
o is
cla
ssifi
ed a
s la
cust
rine.
Kal
aup
ap
a N
ati
on
al H
isto
ric
Pa
rk
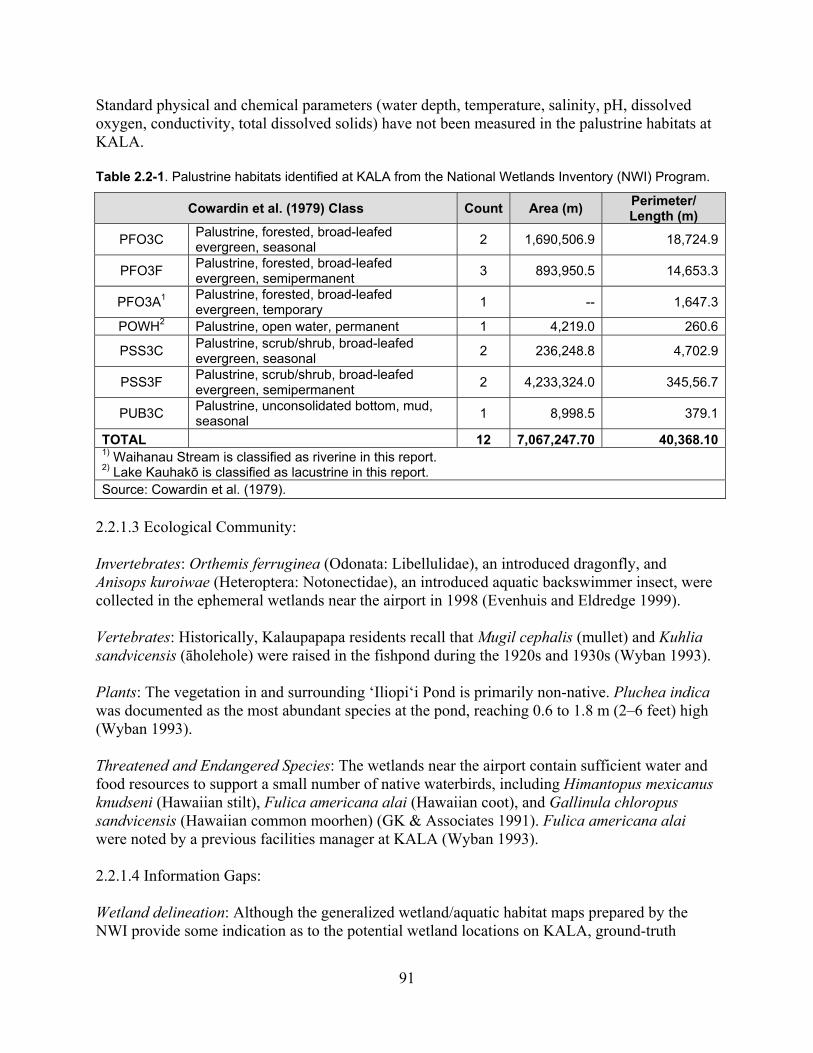
91
Standard physical and chemical parameters (water depth, temperature, salinity, pH, dissolved oxygen, conductivity, total dissolved solids) have not been measured in the palustrine habitats at KALA. Table 2.2-1. Palustrine habitats identified at KALA from the National Wetlands Inventory (NWI) Program.
Cowardin et al. (1979) Class Count Area (m) Perimeter/ Length (m)
PFO3C Palustrine, forested, broad-leafed evergreen, seasonal
2 1,690,506.9 18,724.9
PFO3F Palustrine, forested, broad-leafed evergreen, semipermanent
3 893,950.5 14,653.3
PFO3A1 Palustrine, forested, broad-leafed evergreen, temporary
1 -- 1,647.3
POWH2 Palustrine, open water, permanent 1 4,219.0 260.6
PSS3C Palustrine, scrub/shrub, broad-leafed evergreen, seasonal
2 236,248.8 4,702.9
PSS3F Palustrine, scrub/shrub, broad-leafed evergreen, semipermanent
2 4,233,324.0 345,56.7
PUB3C Palustrine, unconsolidated bottom, mud, seasonal
1 8,998.5 379.1
TOTAL 12 7,067,247.70 40,368.101) Waihanau Stream is classified as riverine in this report. 2) Lake Kauhakō is classified as lacustrine in this report. Source: Cowardin et al. (1979).
2.2.1.3 Ecological Community: Invertebrates: Orthemis ferruginea (Odonata: Libellulidae), an introduced dragonfly, and Anisops kuroiwae (Heteroptera: Notonectidae), an introduced aquatic backswimmer insect, were collected in the ephemeral wetlands near the airport in 1998 (Evenhuis and Eldredge 1999). Vertebrates: Historically, Kalaupapapa residents recall that Mugil cephalis (mullet) and Kuhlia sandvicensis (āholehole) were raised in the fishpond during the 1920s and 1930s (Wyban 1993). Plants: The vegetation in and surrounding ‘Iliopi‘i Pond is primarily non-native. Pluchea indica was documented as the most abundant species at the pond, reaching 0.6 to 1.8 m (2–6 feet) high (Wyban 1993). Threatened and Endangered Species: The wetlands near the airport contain sufficient water and food resources to support a small number of native waterbirds, including Himantopus mexicanus knudseni (Hawaiian stilt), Fulica americana alai (Hawaiian coot), and Gallinula chloropus sandvicensis (Hawaiian common moorhen) (GK & Associates 1991). Fulica americana alai were noted by a previous facilities manager at KALA (Wyban 1993). 2.2.1.4 Information Gaps: Wetland delineation: Although the generalized wetland/aquatic habitat maps prepared by the NWI provide some indication as to the potential wetland locations on KALA, ground-truth
92
surveys would more accurately determine the presence of wetlands. In particular, the palustrine areas identified in the Pu‘u Ali‘i NAR should be examined to determine if these are true palustrine systems. Wetlands at KALA could be delineated utilizing accepted methods prescribed in the 1987 Army Corps of Engineers Wetlands Delineation Manual, as amended, in accordance with the Honolulu Engineering District, U.S. Army Corps of Engineers. The manual is available online at http://www.wetlands.com/regs/tlpge02e.htm. Physical environment: Standard physical and chemical parameters are not available for the palustrine habitats at KALA. Future studies to obtain these parameters would clarify the type of habitat located between the Kalaupapa Settlement and the airport. Ecological community: There is little to no information on the faunal and floral communities in the palustrine habitats at KALA. Additional information is needed on the biota in and surrounding the fishpond/wetlands between the Kalaupapa Settlement and the airport. These surveys would be part of the wetland delineation process described above. 2.2.2 Lacustrine Lake Kauhakō lies at the bottom of Kauhakō Crater’s inner pit on the Kalaupapa peninsula. This lake has brackish water salinity in its surface waters and has marine salinity at depths greater than 3 m (9.8 ft) (Maciolek 1975, Donachie et al. 1999); therefore, it is not considered a freshwater lake. The lake is considered to be the forth deepest lake in the United States and has the greatest relative depth (ratio of depth to surface area) of any lake in the world (Donachie et al. 1999). 2.2.2.1 Previous and Ongoing Studies and Inventories: Abiotic:
The first geochemical study of Lake Kauhakō was conducted by Dr. John A. Maciolek and his limnology students of the University of Hawai‘i at Mānoa in 1973 to 1974 (Maciolek 1975). During this time he collected data on water quality parameters.
The U.S. Navy together with scientists from MDSU conducted large-scale reconnaissance surveys of Lake Kauhakō in April 1988 to assess the lake’s bathymetry and archaeological resources. Their experiences at Kauhako Lake were glamorized by Lenihan 2002.
Coombs et al. (1990) described and mapped the geology, morphology, and volcanic history of Kauhakō Crater.
Dr. Robert Kinzie III and his limnology students at the University of Hawai‘i at Mānoa have collected physiochemical data (temperature, conductivity, salinity, etc.) at the crater lake at various time intervals since 1995.
Donachie et al. (1999) conducted a microbiological and hydrochemical study of the Lake Kauhakō in 1997. Water samples taken from the center of the lake were analyzed for conductivity, dissolved oxygen, sulfide, nitrous oxide, dissolved inorganic carbon (DIC)
93
and alkalinity, dissolved organic carbon (DOC), and nutrients. Temperature data were also collected by a data logger.
Donachie and Zaborsky collected salinity, alkalinity, and sulfide data in the lake in March 1999 (as reported in Donachie et al. 2004)
In 1999, Kempe collected and analyzed water samples up to 150 m (492 ft) deep in the
lake (Garman et al. 2000).
Halliday (2001) summarized the findings from various studies in the crater and provided additional descriptions of the crater features.
Water was collected from the surface to 200 m (656 ft) in Lake Kauhakō between August 2000 and June 2002 (Donachie et al. 2004) and analyzed for salinity, total alkalinity, hydrogen sulfide, and chlorophyll a concentrations.
Invertebrates:
Dr. John A. Maciolek and his students also collected invertebrates in the lake in 1973 and 1974 (Maciolek 1975).
In 1996, Polhemus (1996) described the current distribution of Megalagrion xanthomelas throughout the state, including the Lake Kauhakō area.
Phytoplankton & Bacteria:
The water samples collected by Donachie et al. (1999) were also analyzed for eukaryotic and prokaryotic pigments, microbial ectoenzyme activities, autofluorescent Bacteria, filamentous cyanobacteria, and 'Synechococcus'-like autotrophic picoplankton.
In 2000, three mixed breathing gas dive surveys were conducted in the lake (Garman et
al. 2000). The deepest dive descended to 123 m (405 ft).
Donachie et al. (2004) cultivated bacteria from the water samples and soil samples taken from the lake. Aerobic, heterotrophic bacteria were also cultivated from the stomach contents of Palaemon debilis, a penaeid shrimp found in the lake.
2.2.2.2 Physical Environment: Lake Kauhakō has a surface area of approximately 3,500 m2 (37,675 ft2) and is estimated to reach 248 m (814 ft) deep. The bathymetry of the pit was first mapped in 1975 (Maciolek 1982). Surveys by the U.S. Navy in 1988 found that the crater narrows to 20 m (66 ft) in diameter at a depth of roughly 100 m (328 ft) on the southern side of the lake (Coombs et al. 1990). The vertical profile and bathymetry of the lake are shown in Figure 2.2-2. Researchers have noted the presence of a stable and well-defined pycnocline (rapid change in water density with depth) at about 4.5 m (15 ft), indicating meromixis (Donachie et al. 1999). Meromixis is characterized by the formation of a layer of oxygenated surface water separated by
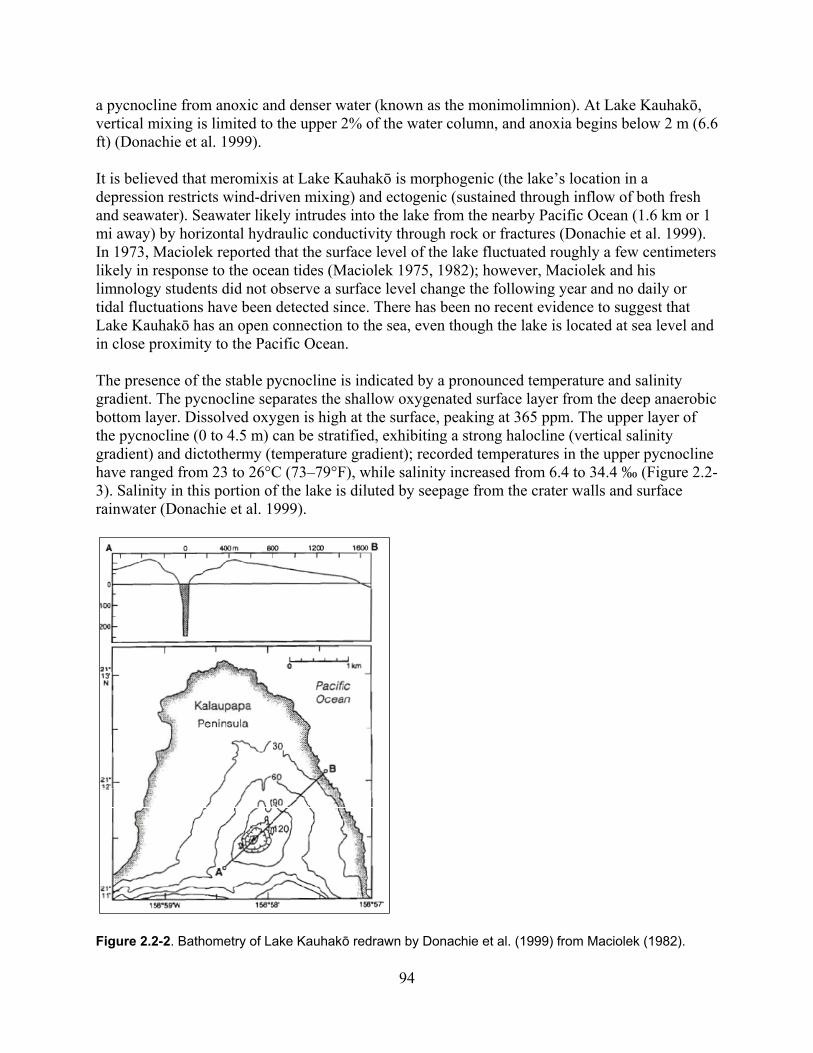
94
a pycnocline from anoxic and denser water (known as the monimolimnion). At Lake Kauhakō, vertical mixing is limited to the upper 2% of the water column, and anoxia begins below 2 m (6.6 ft) (Donachie et al. 1999). It is believed that meromixis at Lake Kauhakō is morphogenic (the lake’s location in a depression restricts wind-driven mixing) and ectogenic (sustained through inflow of both fresh and seawater). Seawater likely intrudes into the lake from the nearby Pacific Ocean (1.6 km or 1 mi away) by horizontal hydraulic conductivity through rock or fractures (Donachie et al. 1999). In 1973, Maciolek reported that the surface level of the lake fluctuated roughly a few centimeters likely in response to the ocean tides (Maciolek 1975, 1982); however, Maciolek and his limnology students did not observe a surface level change the following year and no daily or tidal fluctuations have been detected since. There has been no recent evidence to suggest that Lake Kauhakō has an open connection to the sea, even though the lake is located at sea level and in close proximity to the Pacific Ocean. The presence of the stable pycnocline is indicated by a pronounced temperature and salinity gradient. The pycnocline separates the shallow oxygenated surface layer from the deep anaerobic bottom layer. Dissolved oxygen is high at the surface, peaking at 365 ppm. The upper layer of the pycnocline (0 to 4.5 m) can be stratified, exhibiting a strong halocline (vertical salinity gradient) and dictothermy (temperature gradient); recorded temperatures in the upper pycnocline have ranged from 23 to 26°C (73–79°F), while salinity increased from 6.4 to 34.4 ‰ (Figure 2.2-3). Salinity in this portion of the lake is diluted by seepage from the crater walls and surface rainwater (Donachie et al. 1999).
Figure 2.2-2. Bathometry of Lake Kauhakō redrawn by Donachie et al. (1999) from Maciolek (1982).
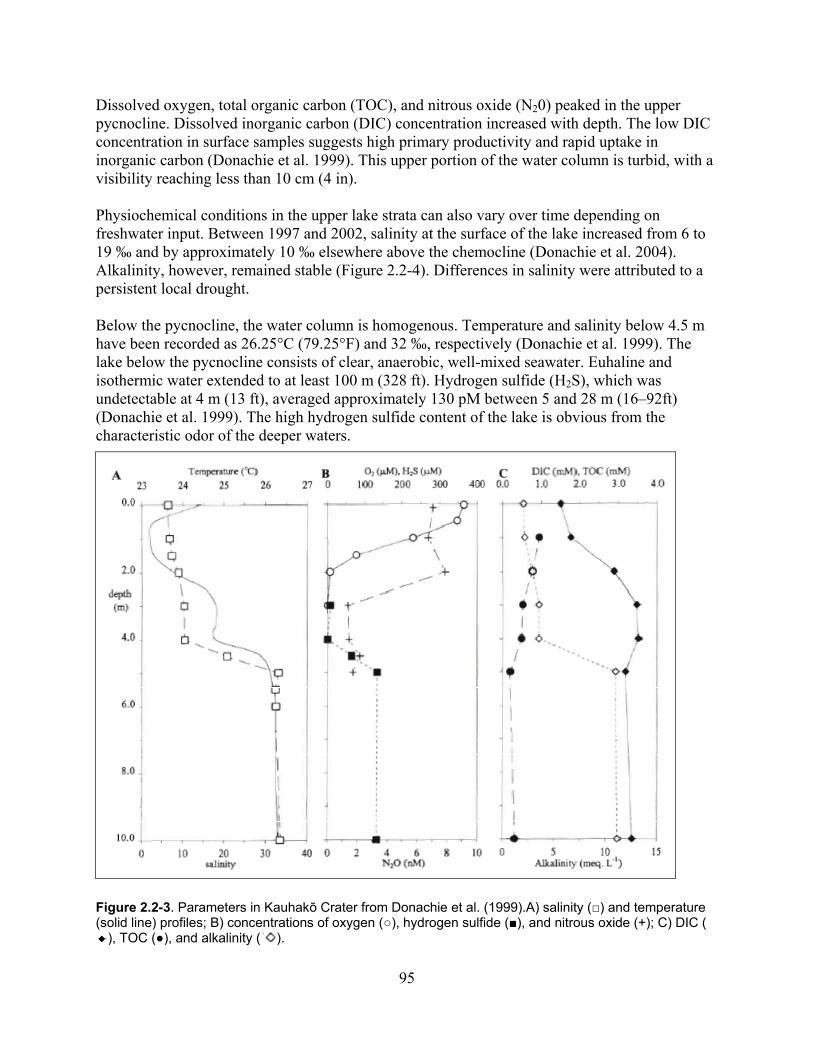
95
Dissolved oxygen, total organic carbon (TOC), and nitrous oxide (N20) peaked in the upper pycnocline. Dissolved inorganic carbon (DIC) concentration increased with depth. The low DIC concentration in surface samples suggests high primary productivity and rapid uptake in inorganic carbon (Donachie et al. 1999). This upper portion of the water column is turbid, with a visibility reaching less than 10 cm (4 in). Physiochemical conditions in the upper lake strata can also vary over time depending on freshwater input. Between 1997 and 2002, salinity at the surface of the lake increased from 6 to 19 ‰ and by approximately 10 ‰ elsewhere above the chemocline (Donachie et al. 2004). Alkalinity, however, remained stable (Figure 2.2-4). Differences in salinity were attributed to a persistent local drought. Below the pycnocline, the water column is homogenous. Temperature and salinity below 4.5 m have been recorded as 26.25°C (79.25°F) and 32 ‰, respectively (Donachie et al. 1999). The lake below the pycnocline consists of clear, anaerobic, well-mixed seawater. Euhaline and isothermic water extended to at least 100 m (328 ft). Hydrogen sulfide (H2S), which was undetectable at 4 m (13 ft), averaged approximately 130 pM between 5 and 28 m (16–92ft) (Donachie et al. 1999). The high hydrogen sulfide content of the lake is obvious from the characteristic odor of the deeper waters.
Figure 2.2-3. Parameters in Kauhakō Crater from Donachie et al. (1999).A) salinity (□) and temperature (solid line) profiles; B) concentrations of oxygen (○), hydrogen sulfide (■), and nitrous oxide (+); C) DIC (
), TOC (●), and alkalinity ( ).

96
Figure 2.2-4. Salinity, alkalinity, and sulfide concentrations as a function of depth between 1997 and 2002 from Donachie et al. (2004). Garman (2000) reported blunt stalactitic lava pendants on the pit walls. A biogenic carbonate coating, consisting primarily of aragonite, was noted beneath a microbial growth. Calcium sulfate and iron sulfice minerals may also be present (Halliday 2001). There are also calcareous, bacteria-rich deposits on the lake walls at the surface. 2.2.2.3 Ecological Community: The isolated flora and macrofauna in Lake Kauhakō appears restricted to the shallow oxygenated strata of the lake. Invertebrates: Palaemon debilis, a native paleomonid shrimp, was first observed in Lake Kauhakō by Maciolek and his students in 1973 and 1974 (Aruch 2006). This species is exceedingly abundant in the lake. Palaemon debilis is common in anchialine pools throughout Hawai‘i, occurring in ponds in nearshore areas, and in the interstitial spaces of the basalt in myxohaline environments (Mitchell et al. 2005). Palaemon debilis is known to have a marine larval stage; however, no connection to the ocean has been noted since Maciolek (1975) so P. debilis in Lake Kauhakō may be completing their entire life cycle in the lake and may be a genetically isolated population (R. Kinzie/Zoology Department University of Hawai‘i, pers. comm.). Maciolek (1982) noted that the endemic anchialine shrimp Halocaridina rubra (‘opae ‘ula) was also observed in the lake, suggesting that at least the upper layer was connected to the sea. However, this species has not been recently seen in the lake. Rotifers (Rotifera) and copepods (Maxillopoda) have been taken from the lake in plankton tows. Juveniles of an unidentified ostracod and a small gastropod have been found (Kempe, pers. obs. as reported by Donachie et al. 2004).
97
Insect fauna in the lake and around the lake margin includes Anisops kuroiwae, an introduced aquatic backswimmer insect, which was collected in Lake Kauhakō in 1998. Ephydrid (shore fly) larvae, Coleoptera (beetles) individuals, and Zygoptera (damselfly) nymphs have also been documented (Evenhuis and Eldredge 1999). Phytoplankton & Bacteria: Nutrients above the pycnocline support a dense and highly productive phytoplankton fauna community. Diatoms, cyanobacteria (or bluegreen algae), dinoflagellates, and chromophytes have been reported by various researchers (Maciolek 1982, Halliday 2001, Donachie et al. 1999). Filamentous cyanobacteria were only documented in the upper 2 m (6.6 ft), and cells similar to Synechococcus spp. were detected below 3 m (9.8 ft). Prochlorococcus-like autotrophs, which were documented in the upper 2 m, were not previously reported in brackish waters such as Lake Kauhakō (Donachie et al. 1999). Pigment diversity in the upper 2 m of Lake Kauhakō is low and dominated by Chlorophyll a (chl a). At 0.5 m (1.6 ft) chl a was found in excess of 150 mg L-1. Below 3 m, chl a was largely replaced by a diverse suite of bacterial pigments (Donachie et al. 1999). Large populations of heterotrophic and autofluorescent bacteria have been collected at the surface of the lake (Donachie et al. 1999). Bacteria cell numbers increased 2.75-fold from 3 to 4.5 m (14.8 ft) (Figure 2.2-5). The fact that heterotrophic bacterial numbers were high in anoxic water above the pycnocline suggests a switch to nitrate respiration (Donachie et al. 1999). Garman et al. (2000) also collected matted colonies of sulfur-reducing bacteria during their dives in the lake.
Seventy operational taxonomic units (OTUs) from 13 bacteria phyla and subphyla were cultivated from samples collected at Lake Kauhakō by Donachie et al. (2004). Five of these OTUs could not be assigned to existing phyla. The majority of -Proteobacteria OTUs were derived from samples taken below the pycnocline. Donachie et al. (2004) suggested that rare Bacteroidetes and Planctomycetes OTUs collected from the anoxic waters below the pycnocline are likely from sinking cells due to upland sedimentation.
Threatened and Endangered Species: In 1995, a single Megalagrion xanthomelas naiad (a candidate endangered species) was seen along the margins of Kauhakō Lake. This individual was collected and reared to adulthood to confirm its identity (Evenhuis and Eldredge 1999). No adult M. xanthomelas have been observed or collected in the crater.
2.2.2.4 Information Gaps: Biota: A complete biotic inventory of the lake, including invertebrates, has not been completed since 1973 (Maciolek 1975). Much more information is needed on the lake zooplankton, particularly depth zonation and seasonal patterns. An inventory of the lake should also assess the integrity of biological assemblages and habitat issues.
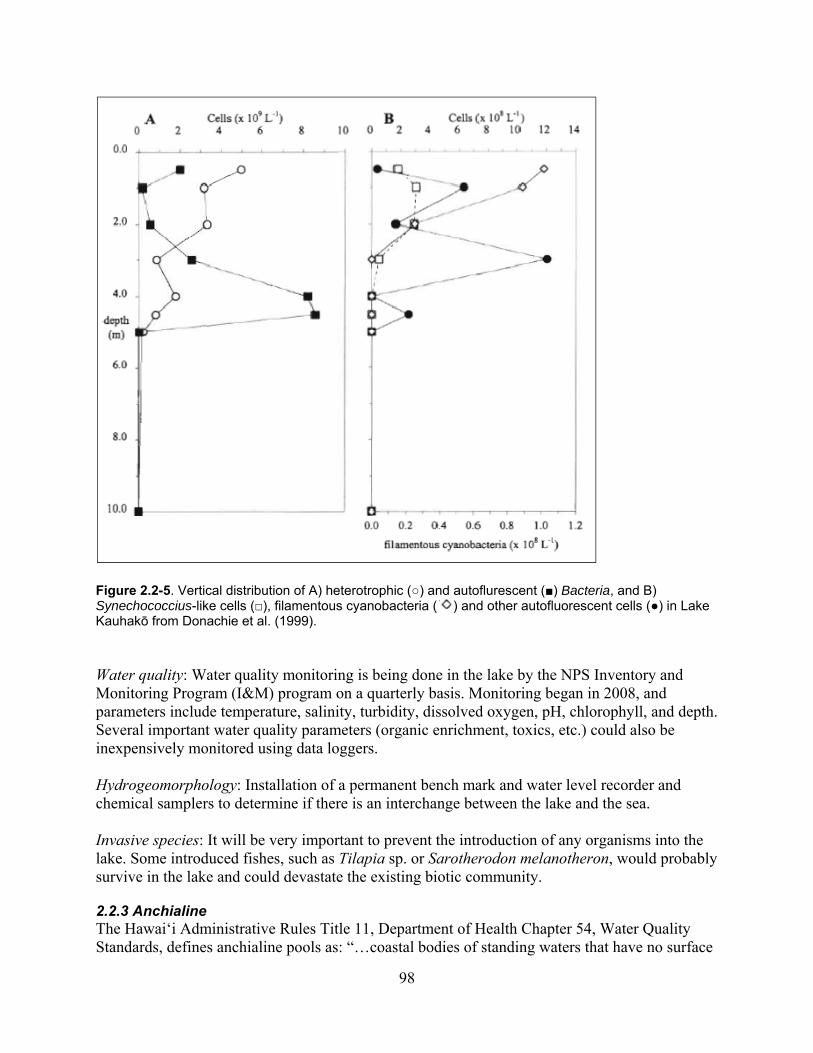
98
Figure 2.2-5. Vertical distribution of A) heterotrophic (○) and autoflurescent (■) Bacteria, and B) Synechococcius-like cells (□), filamentous cyanobacteria ( ) and other autofluorescent cells (●) in Lake Kauhakō from Donachie et al. (1999). Water quality: Water quality monitoring is being done in the lake by the NPS Inventory and Monitoring Program (I&M) program on a quarterly basis. Monitoring began in 2008, and parameters include temperature, salinity, turbidity, dissolved oxygen, pH, chlorophyll, and depth. Several important water quality parameters (organic enrichment, toxics, etc.) could also be inexpensively monitored using data loggers. Hydrogeomorphology: Installation of a permanent bench mark and water level recorder and chemical samplers to determine if there is an interchange between the lake and the sea. Invasive species: It will be very important to prevent the introduction of any organisms into the lake. Some introduced fishes, such as Tilapia sp. or Sarotherodon melanotheron, would probably survive in the lake and could devastate the existing biotic community. 2.2.3 Anchialine The Hawai‘i Administrative Rules Title 11, Department of Health Chapter 54, Water Quality Standards, defines anchialine pools as: “…coastal bodies of standing waters that have no surface
99
connections to the ocean but display both tidal fluctuations and salinity ranges characteristic of fresh and brackish waters, indicating the presence of subsurface connections to the water table and ocean.” According to Polhemus et al. (1992), the surface level of these euhaline to mixohaline lentic waters is an “inland extension of marine water table, with mixohaline water resulting from diluting of intruding ocean water with seawater-percolating groundwater.” There are numerous caves within KALA, and many of them may be deep enough to extend into hypogeal water table. Thus, it is likely that anchialine pools exist within the park. However, due to the sensitivity of these features and the archeological resources within them, the National Park Service has not investigated anchialine components of the caves. 2.2.3.1 Previous and Ongoing Studies and Inventories: No previous studies or inventories for anchialine pools, if in fact they do occur, have been conducted at KALA. 2.2.3.2 Physical Environment: Since no anchialine pools have been located or identified, there is no information available on the physical environment of these habitats. 2.2.3.3 Ecological Community: Anchialine pools represent a unique coastal ecosystem dominated by bacterial mats, algae, emergent aquatic plants, mollusks, and crustaceans under natural, undisturbed conditions (Maciolek and Brock 1974). Anchialine ponds are considered to be windows into a far more extensive subterranean brackish water ecosystem that is home to a unique assemblage of native species. The fauna of anchialine habitats usually consists of marine invertebrates that have invaded through subterranean interstices (Polhemus et al. 1992). The only anchialine species known from KALA is Halocardina rubra. This species was noted in Lake Kauhakō by Maciolek (1982). Although H.rubra have not recently been recorded, it is likely that it (as well as other anchialine creatures) continues to occur on the peninsula in anchialine pools and in the ground waters (R. Kinzie/Zoology Department University of Hawai‘i, pers. comm.).
Threatened and Endangered Species: Anchialine ponds harbor four species of endemic anchialine shrimp that are listed as candidate endangered species by the USFWS. These are: Metabetaeus lohena, Vetericaris chaceorum, Palaemonella burnsi, and Procaris hawaiiana. None of these species has been recorded from KALA.
2.2.3.4 Information Gaps: Anchialine pools: The primary information gap of this freshwater habitat is to determine whether anchialine pools exist in KALA and the extent of these pools. Water quality: The water quality of the anchialine pools at KALA has not been described (DeVerse and DiDonato 2006). Nutrient levels in anchialine ponds are indicative of land use practices, on-site cultural activities, and biological process. Chemical and microbial
100
contaminants can leach into anchialine pools from terrestrial sources (DeVerse and DiDonato 2006). Monitoring data will provide warning indicators if these systems are altered (NPS 2003). Biota: Once anchialine pools are identified at KALA, surveys could be conducted to inventory species present in these habitats and the integrity of the biological assemblages and habitats. 2.2.4 Riverine Eight named streams plus two unnamed streams occur within the boundaries of KALA (Table 2.2-2 and Figure 2.2-6). The principal drainages include Waikolu Stream, Wai‘ale‘ia Stream, and Waihanau Stream. Only small, intermittent streams reach the sea west of Waihanau Stream. 2.2.4.1 Previous and Ongoing Studies and Inventories: Abiotic:
The U.S. Geological Survey formerly operated three stream gages on Waikolu Stream and a single gage on the Molokai Tunnel to measure stream discharge. The earliest gage began operating in 1919. The most recently operating gage was discontinued in 2003. Stream discharge data can be obtained from the USGS Surface-Water Data for Hawaii website (http://waterdata.usgs.gov/hi/nwis/sw).
In 1983, Takasaki drilled three wells in lower Waihanau Valley to explore groundwater
conditions in the area. The wells were pumped to determine potential yields, and chemical analyses were also performed on well water samples. The purpose of this program was to determine the feasibility of using Waihanau groundwater as a water source for Kalaupapa residents as opposed to the more distant Waikolu Stream (Takasaki 1986).
In 1991, GK & Associates prepared an Environmental Assessment for a boulder removal
project at Waihanau Stream. The purpose of the project was to remove a limited quantity of boulders from the stream bed to contain flow within the banks and minimize flood hazard during high flow events (GK & Associates 1991).
Between 1993 and 1996, the NPS Water Resources Division (WRD) collected discharge
data at two locations on Waikolu Stream; one just downstream of the lower-most surface water diversion (pump house location), and the second just above the upper-most surface water diversion (J. Hughes/NPS, pers. comm.). The intent of this data collection was to demonstrate the impact the diversions and well pumping had on the natural flow regime of Waikolu Stream and provide technical evidence to support a request for instream flow standards from the Hawaii Commission on Water Resource Management (CWRM), the state agency that regulates instream uses of water (J. Hughes/NPS, pers. comm.).
The Hawaii Division of Water and Land Development published a Draft Environmental
Assessment and Negative Declaration for Waikolu Valley Wells Development in 1994. This project was designed to supplement existing surface water diversion with groundwater (Division of Water and Land Development 1994).
101
Figure 2.2-6. Streams within KALA.
Sou
rce:
US
GS
; Sta
te o
f H
awai
i GIS
; Na
tion
al P
ark
Se
rvic
e
Legen
d
Park
Bou
nda
ry
Str
eam
Gag
es
Wel
ls
Div
ersi
ons
Pum
pin
g S
tation
Spr
ings
Str
eam
s
Pere
nni
al
Inte
rmitte
nt
Wa
ter
Rou
tes
ARTI
FIC
IAL
PATH
CO
NN
EC
TOR
PIPE
LIN
E/D
ITC
H
4,00
00
4,00
02,
000
Feet
2,00
00
2,00
01,
000
Met
ers
Pa
cif
ic
Oc
ea
n
Hue
lo I
slet
Hue
lo I
slet
Oka
la I
slet
Oka
la I
slet
Ka
law
ao
Ka
law
ao
Ha'
upu
Ba
yH
a'u
pu B
ay
Pe
leku
nu
P
ele
kun
u
Ba
yB
ay
Ka
hiu
Po
int
Ka
hiu
Po
int
Ka
lau
pa
paK
ala
up
apa
Ka
uha
ko L
ake
Ka
uha
ko L
ake
Ka
lau
pa
pa P
en
insu
laK
ala
up
apa
Pe
nin
sula
Pu
u A
liiP
uu
Alii
Iliop
ii P
on
dIli
opii
Po
nd
Wai
han
au S
t rea
m
Waialeia Stream
Waikolu Stream
Waiohookalo Str
eam
Anapuhi
Wainene
Puwahi
Awahua
1640
600
0
1640
550
0
1640
900
016
4080
00
1640
510
0
Kal
aup
ap
a N
ati
on
al H
isto
ric
Par
k

102
Diaz et al. (1995) compared the geological, climatic, hydrological, and geomorphological similarities between the three large valleys of windward northeast Moloka‘i (Waikolu within KALA and the adjacent Pelekunu and Wailau basins) using GIS.
In 2006, DeVerse and DiDonato produced a water quality report for national parks in
Hawai‘i as part of the Pacific Island Network Vital Signs Monitoring Plan. The report analyzed data from three USGS stations (lower, middle, upper) that measured temperature, pH, and discharge on Waikolu Stream from 1969 to 1976 (DeVerse and DiDonato 2006).
The National Park Service currently measures stream height, temperature, and discharge
at the mouths of five streams in KALA—Awahua, Puwahi, Waihanau, Wai‘ale‘ia, and Waikolu (2 sites). Data collection began at three of the sites (Waihanau, Wai‘ale‘ia, and Waikolu) in January 2006, while the remainder began in January 2008. Data from these measurements are still being processed and were not available for this report.
Fauna:
In 1986, the Hawai‘i Division of Aquatic Resources surveyed the freshwater aquatic fauna in Waikolu Stream (DAR 1986).
In 1987, John Ford and Andy Yuen of the USFWS Division of Ecological Services and
John Naughton of the National Marine Fisheries Service conducted a biological reconnaissance of Waikolu Stream (Ford and Yuen 1987).
A visual goby survey was conducted in Waikolu Stream in 1987 by Bill Devick of the Hawaii Division of Aquatic Resources (Devick 1989).
Between October and December 1990, Kinzie et al. (1990) made three visits to Waikolu Stream to obtain baseline information on stream conditions. The surveys assessed aquatic macrofauna at various stations and compared results to the earlier studies by the U.S. Fish and Wildlife Service and Division of Aquatic Resources.
In 1991, William Puleloa, Molokai biologist for the Hawaii Division of Aquatic Resources, surveyed Waikolu Stream (Puleloa 1991).
A preliminary report on the aquatic insect fauna of Waikolu Stream was prepared by Dr. Dan Polhemus of the Hawaii Biological Survey Bishop Museum in 1992 (Polhemus 1992).
Polhemus (1996) described the current distribution of Megalagrion xanthomelas throughout the state, including in KALA in 1996.
Brasher (1996) quantified composition and abundance of native stream fish species utilizing quadrats at permanent monitoring stations from the mouth to the headwaters in Waikolu and Pelekunu streams. Surveys were conducted quarterly over a two-year period
103
to provide substantial baseline data and to determine natural variation in distribution and density over time.
Brasher (1997a) used six-sampling station in Waikolu Stream to evaluate longitudinal changes in physical parameters and habitat use by fishes, crustaceans, and mollusks. By comparing Waikolu with adjacent Pelekunu Stream, the study also investigated the impact of stream diversions on freshwater biota.
Between 1992 and 1994, Brasher studied the distribution and abundance of Neritina granosa (hihiwai) at 27 permanent monitoring stations in Waikolu Stream. This study also investigated the live-history characteristics of the species, including reproduction, recruitment, growth, and movement (Brasher 1997b).
Kondratieff et al. (1997) investigated the life cycle of Cheumatopsyche pettiti (caddisfly) in Waikolu Stream from 1992 to 1994. Samples were collected at three sites on the stream using a modified Hess bottom sampler.
Ron Englund and Randall Filbert of the Hawaii Biological Survey, Bishop Museum,
conducted biological monitoring in Waikolu Stream in 1997 (Englund and Filbert 1997).
Way et al. (1998) examined the reproductive biology of Lentipes concolor in Waikolu Stream. Another objective of this study was to determine the impacts of diversions on the reproductive cycle of L. concolor by comparing diverted Waikolu with undistributed Makamaka‘ole Stream on West Maui.
In 2005, a USGS team conducted faunal inventories in Wai‘ale‘ia and Waikolu Streams.
This study focused on insects, fishes, mollusks, and crustaceans. A publication from this study is still in progress.
In 2006, Polhemus collected survey notes and created a map of damselfly locations in
numerous streams, including Waihanau, Wai‘ale‘ia, Waikolu, and Waioho‘okalo streams. Other:
The Hawai‘i Stream Assessment inventoried streams and rivers throughout the state and assessed their overall aquatic, riparian, cultural, and recreational value (Hawai‘i Cooperative National Park Studies Unit 1990).
The Hawaii Agriculture Research Center initiated a review of the Molokai Irrigation System in 2001, which described the existing system and recommended changes to mitigate the current water shortage problem on the island (Santo 2001).
In 2002, botanist Maya LeGrande collected freshwater algae near the Kūka‘iwa‘a
peninsula. These algae were identified by Dr. Alison Sherwood at the University of Hawaii at Manoa (LeGrande 2002).
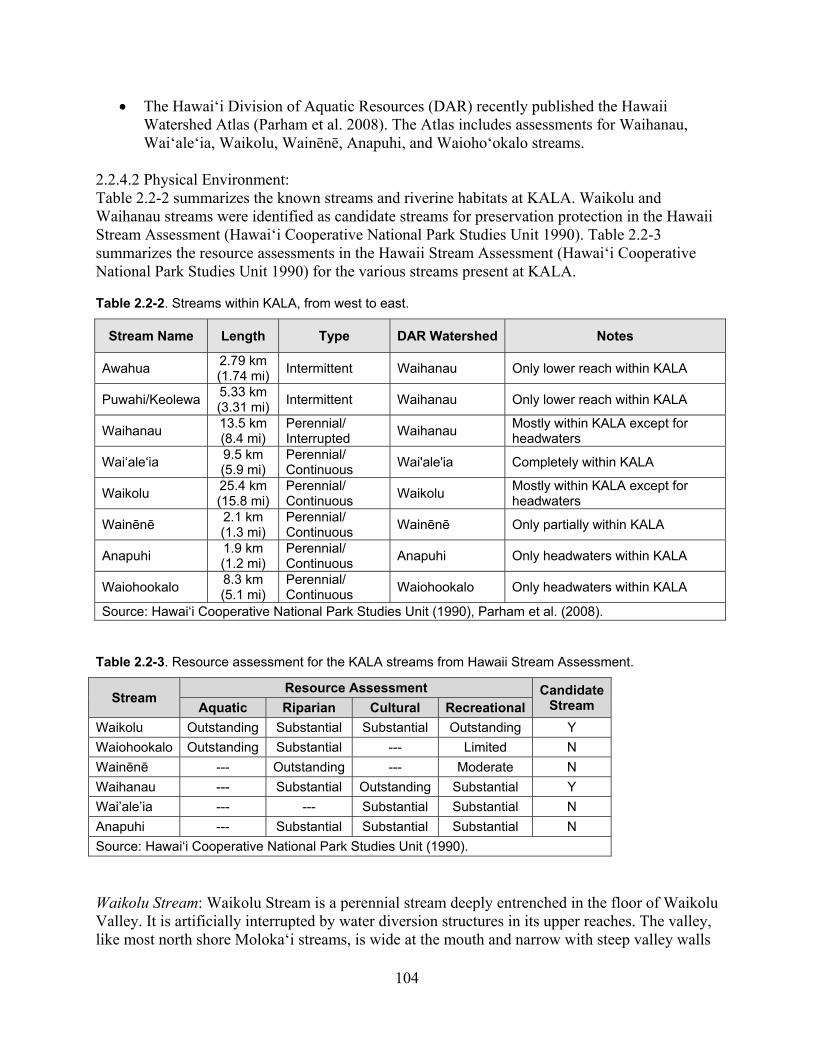
104
The Hawai‘i Division of Aquatic Resources (DAR) recently published the Hawaii Watershed Atlas (Parham et al. 2008). The Atlas includes assessments for Waihanau, Wai‘ale‘ia, Waikolu, Wainēnē, Anapuhi, and Waioho‘okalo streams.
2.2.4.2 Physical Environment: Table 2.2-2 summarizes the known streams and riverine habitats at KALA. Waikolu and Waihanau streams were identified as candidate streams for preservation protection in the Hawaii Stream Assessment (Hawai‘i Cooperative National Park Studies Unit 1990). Table 2.2-3 summarizes the resource assessments in the Hawaii Stream Assessment (Hawai‘i Cooperative National Park Studies Unit 1990) for the various streams present at KALA. Table 2.2-2. Streams within KALA, from west to east.
Stream Name Length Type DAR Watershed Notes
Awahua 2.79 km (1.74 mi)
Intermittent Waihanau Only lower reach within KALA
Puwahi/Keolewa 5.33 km (3.31 mi)
Intermittent Waihanau Only lower reach within KALA
Waihanau 13.5 km (8.4 mi)
Perennial/ Interrupted
Waihanau Mostly within KALA except for headwaters
Wai‘ale‘ia 9.5 km (5.9 mi)
Perennial/ Continuous
Wai'ale'ia Completely within KALA
Waikolu 25.4 km (15.8 mi)
Perennial/ Continuous
Waikolu Mostly within KALA except for headwaters
Wainēnē 2.1 km (1.3 mi)
Perennial/ Continuous
Wainēnē Only partially within KALA
Anapuhi 1.9 km (1.2 mi)
Perennial/ Continuous
Anapuhi Only headwaters within KALA
Waiohookalo 8.3 km (5.1 mi)
Perennial/ Continuous
Waiohookalo Only headwaters within KALA
Source: Hawai‘i Cooperative National Park Studies Unit (1990), Parham et al. (2008).
Table 2.2-3. Resource assessment for the KALA streams from Hawaii Stream Assessment.
Stream Resource Assessment Candidate
Stream Aquatic Riparian Cultural Recreational
Waikolu Outstanding Substantial Substantial Outstanding Y
Waiohookalo Outstanding Substantial --- Limited N
Wainēnē --- Outstanding --- Moderate N
Waihanau --- Substantial Outstanding Substantial Y
Wai’ale’ia --- --- Substantial Substantial N
Anapuhi --- Substantial Substantial Substantial N
Source: Hawai‘i Cooperative National Park Studies Unit (1990).
Waikolu Stream: Waikolu Stream is a perennial stream deeply entrenched in the floor of Waikolu Valley. It is artificially interrupted by water diversion structures in its upper reaches. The valley, like most north shore Moloka‘i streams, is wide at the mouth and narrow with steep valley walls
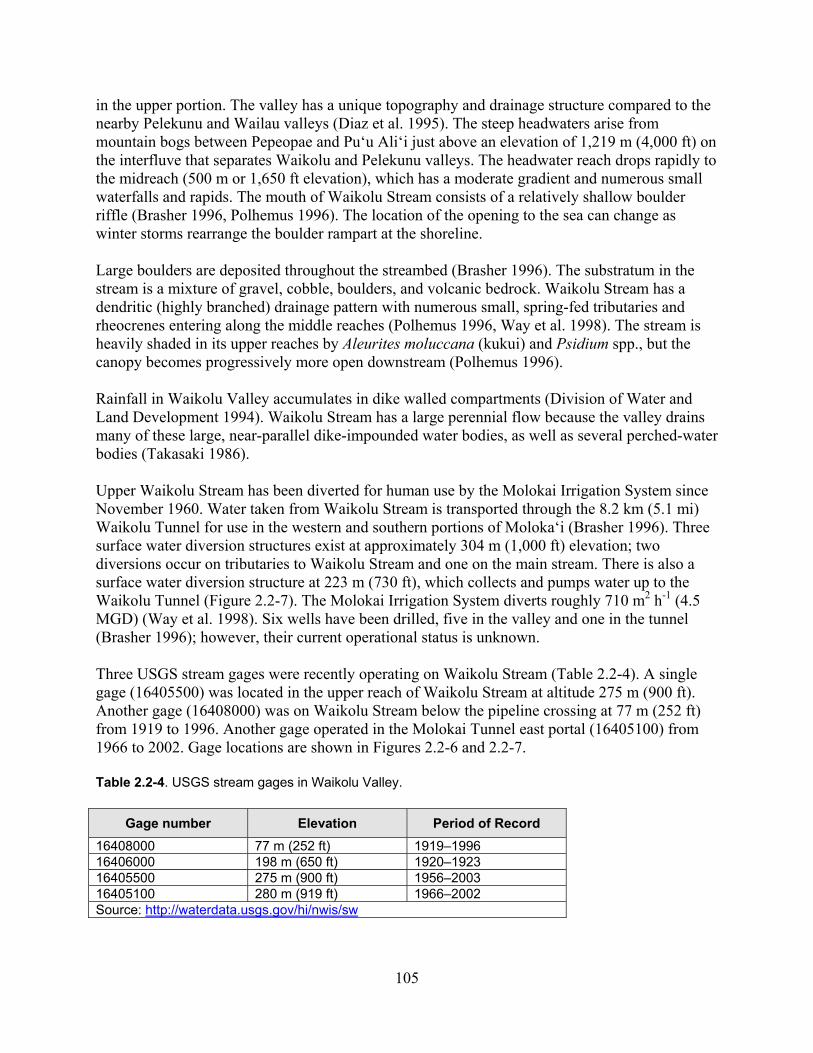
105
in the upper portion. The valley has a unique topography and drainage structure compared to the nearby Pelekunu and Wailau valleys (Diaz et al. 1995). The steep headwaters arise from mountain bogs between Pepeopae and Pu‘u Ali‘i just above an elevation of 1,219 m (4,000 ft) on the interfluve that separates Waikolu and Pelekunu valleys. The headwater reach drops rapidly to the midreach (500 m or 1,650 ft elevation), which has a moderate gradient and numerous small waterfalls and rapids. The mouth of Waikolu Stream consists of a relatively shallow boulder riffle (Brasher 1996, Polhemus 1996). The location of the opening to the sea can change as winter storms rearrange the boulder rampart at the shoreline. Large boulders are deposited throughout the streambed (Brasher 1996). The substratum in the stream is a mixture of gravel, cobble, boulders, and volcanic bedrock. Waikolu Stream has a dendritic (highly branched) drainage pattern with numerous small, spring-fed tributaries and rheocrenes entering along the middle reaches (Polhemus 1996, Way et al. 1998). The stream is heavily shaded in its upper reaches by Aleurites moluccana (kukui) and Psidium spp., but the canopy becomes progressively more open downstream (Polhemus 1996). Rainfall in Waikolu Valley accumulates in dike walled compartments (Division of Water and Land Development 1994). Waikolu Stream has a large perennial flow because the valley drains many of these large, near-parallel dike-impounded water bodies, as well as several perched-water bodies (Takasaki 1986). Upper Waikolu Stream has been diverted for human use by the Molokai Irrigation System since November 1960. Water taken from Waikolu Stream is transported through the 8.2 km (5.1 mi) Waikolu Tunnel for use in the western and southern portions of Moloka‘i (Brasher 1996). Three surface water diversion structures exist at approximately 304 m (1,000 ft) elevation; two diversions occur on tributaries to Waikolu Stream and one on the main stream. There is also a surface water diversion structure at 223 m (730 ft), which collects and pumps water up to the Waikolu Tunnel (Figure 2.2-7). The Molokai Irrigation System diverts roughly 710 m2 h-1 (4.5 MGD) (Way et al. 1998). Six wells have been drilled, five in the valley and one in the tunnel (Brasher 1996); however, their current operational status is unknown. Three USGS stream gages were recently operating on Waikolu Stream (Table 2.2-4). A single gage (16405500) was located in the upper reach of Waikolu Stream at altitude 275 m (900 ft). Another gage (16408000) was on Waikolu Stream below the pipeline crossing at 77 m (252 ft) from 1919 to 1996. Another gage operated in the Molokai Tunnel east portal (16405100) from 1966 to 2002. Gage locations are shown in Figures 2.2-6 and 2.2-7. Table 2.2-4. USGS stream gages in Waikolu Valley.
Gage number Elevation Period of Record
16408000 77 m (252 ft) 1919–1996 16406000 198 m (650 ft) 1920–1923 16405500 275 m (900 ft) 1956–2003 16405100 280 m (919 ft) 1966–2002 Source: http://waterdata.usgs.gov/hi/nwis/sw
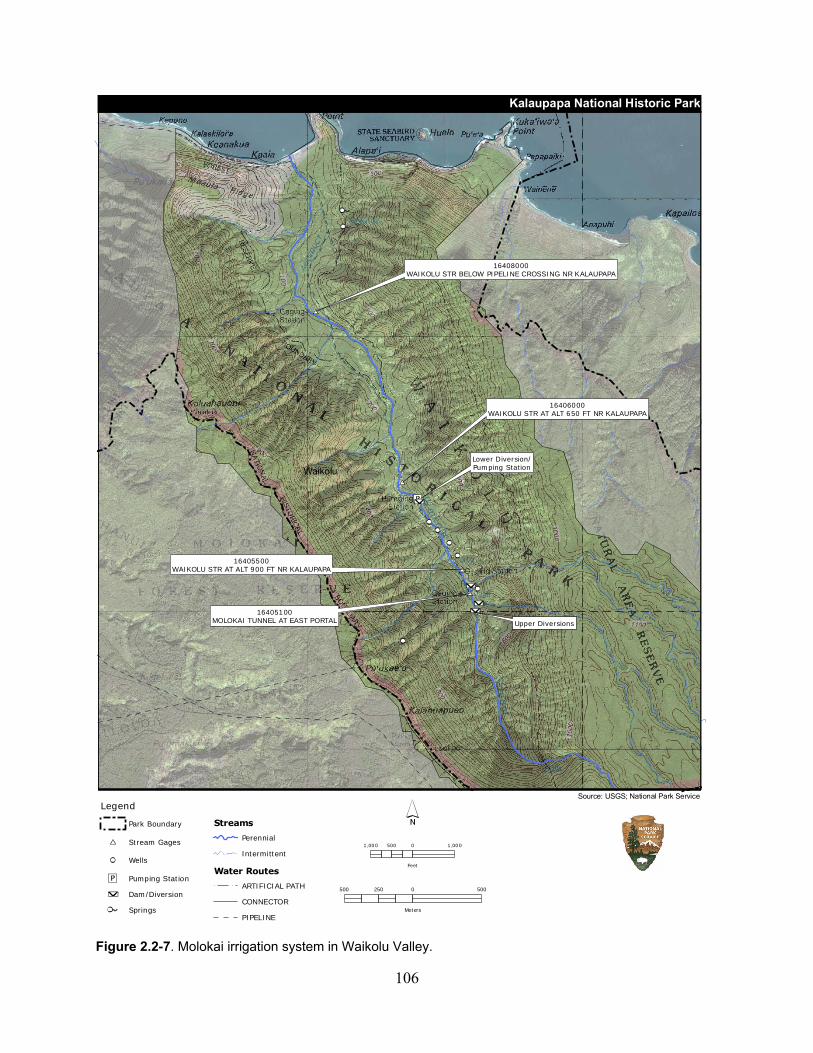
106
Figure 2.2-7. Molokai irrigation system in Waikolu Valley.
Source: USGS; National Park Service
Legend
Park Boundary
Stream Gages
Wells
Pumping Station
Dam/Diversion
Springs
Streams
Perennial
Intermittent
Water Routes
ARTIFICIAL PATH
CONNECTOR
PIPELINE
1,000 0 1,000500
Feet
500 0 500250
Meters
16405100MOLOKAI TUNNEL AT EAST PORTAL
16406000WAIKOLU STR AT ALT 650 FT NR KALAUPAPA
16405500WAIKOLU STR AT ALT 900 FT NR KALAUPAPA
16408000WAIKOLU STR BELOW PIPELINE CROSSING NR KALAUPAPA
Upper Diversions
Lower Diversion/Pumping StationWaikolu
Kalaupapa National Historic Park
107
Daily discharge at USGS stations 16408000, 16405500, and 16405100 is shown in Figures 2.2-8 to 2.2-10, respectively. There are often high peaks in the mean daily flows. Base flows at the USGS gaging station near the mouth of Waikolu Stream (16408000) ranged from 0.28 to 0.85 m3 s-1 (9.89 to 30 cfs) during the rainy season and less than 0.28 m3 s-1 (9.89 cfs) during the dry season (Kondratieff et al. 1997). Temperature measurements taken at three USGS gaging stations on Waikolu Stream increased slightly between 1969 and 1898 (Figure 2.2-11). Polhemus (1996) found that water temperatures along the main channel of Waikolu Stream ranged from 18°C at 180 m (590 ft) to 21°C at 80 m (262 ft). The water temperature in the spring-fed tributaries was slightly colder, measured as 19°C (Polhemus 1996). From 1969 to 1985, the lower and middle USGS stations experienced a drop in pH (Figure 2.2-12). During this period, the State of Hawaii Water Quality Standards (WQS) upper limit for pH levels in surface water resources was exceeded nine times (DeVerse and DiDonato 2006). Water diversion has altered the natural base flow of the stream. The lower reach maintains continuous flow due to intermediate surface runoff and groundwater accretion. In contrast, intermediate reaches below the diversion are dry for most of the year. It has been estimated that the intermediate reaches of Waikolu Stream carry only 50% of the natural undiverted flow conditions, while the lower reaches carry 70% (Brasher 1996); however, the accuracy of these estimates may be in question due to the short duration of these studies. Impact of these diversions to stream flow is shown in Figure 2.2-13. The instantaneous measurements of discharge at the upper level intake are generally higher (mean = 3.9 cfs) than at the station just below it (mean = 2.7 cfs) and much lower than the lowest elevation station (10.4 cfs) (DeVerse and DiDonato 2006). The impact of water withdrawals by the diversions is also dependent on the amount of stream flow. The diversions have the greatest hydrological impact on low flows, with levels of depletions reaching 50%, and the least impact on very high flows (Diaz et al. 1995). Historic USGS data indicate that before the stream was diverted, periods of high flow greater than 0.30 m3 s-1 occurred in the winter and spring, followed by drier periods of greater than 0.14 m3 s-1 in the summer and fall. Once the Molokai Irrigation System became operational, there was a reduction in flow for all months. Concerned about the potential impacts of stream dewaterment upon the native amphidromous fauna in Waikolu Stream, WRD initiated a project to demonstrate the impact of the diversions and well pumping on the natural flow regime of the stream. As stated above, WRD collected discharge data at two locations on Waikolu Stream between 1993 and 1996 (J. Hughes/NPS, pers. comm.). Immediately downstream of the lower-most diversion, the lowest and highest daily mean discharge collected during this time period was 0.12 and 149 cfs, respectively. Above the upper-most surface water diversion, the lowest and highest daily mean discharge was reported as 0.3 and 63 cfs, respectively (NPS, unpublished).

108
Figure 2.2-8. Daily discharge at USGS gage 16408000 over the period of record.
Figure 2.2-9. Daily discharge at USGS gage 16405500 over the period of record.
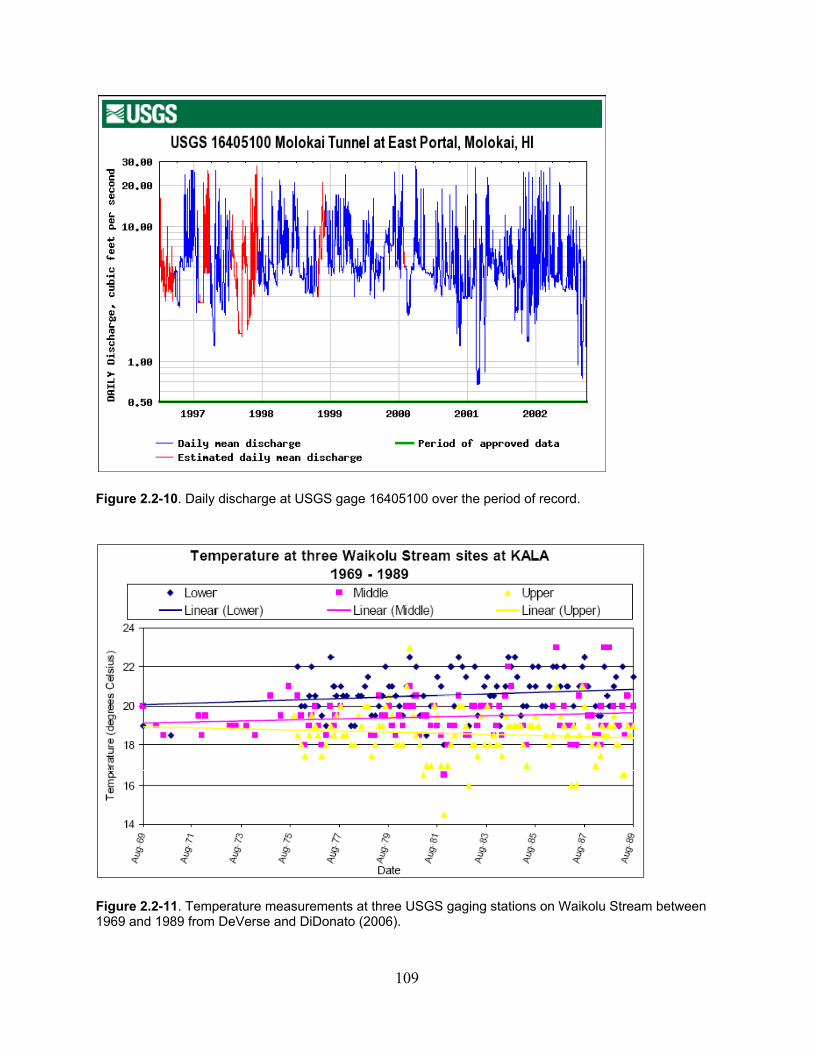
109
Figure 2.2-10. Daily discharge at USGS gage 16405100 over the period of record.
Figure 2.2-11. Temperature measurements at three USGS gaging stations on Waikolu Stream between 1969 and 1989 from DeVerse and DiDonato (2006).
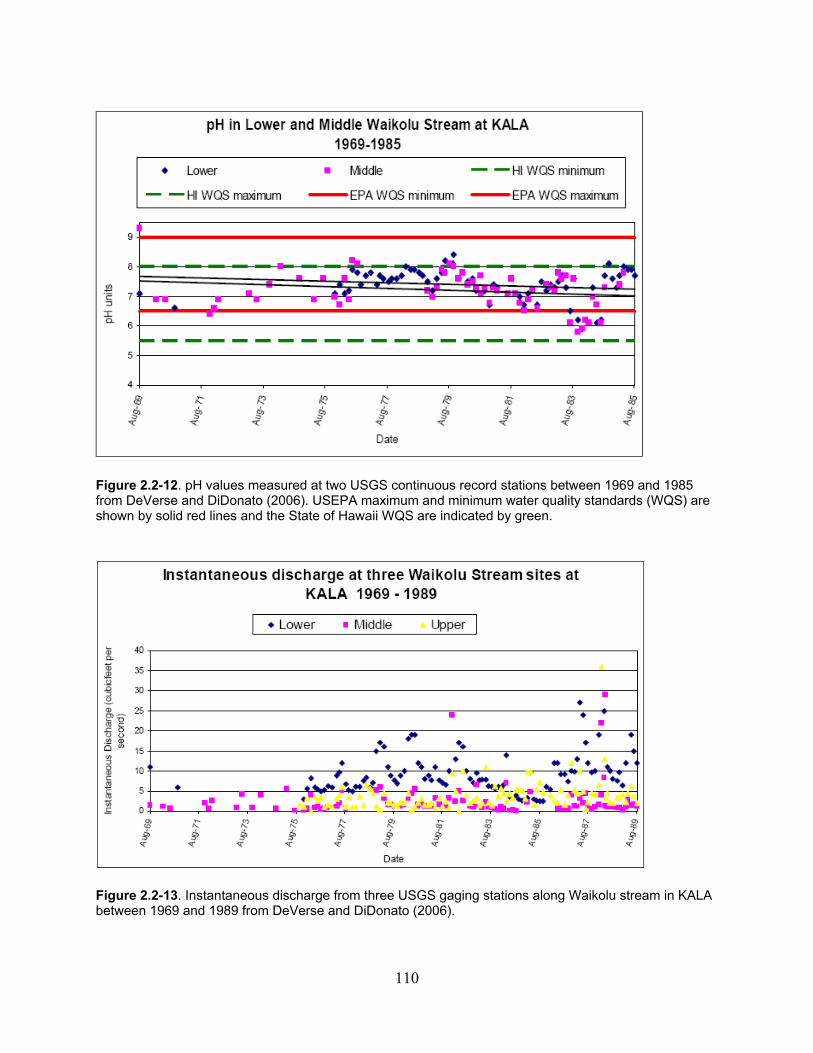
110
Figure 2.2-12. pH values measured at two USGS continuous record stations between 1969 and 1985 from DeVerse and DiDonato (2006). USEPA maximum and minimum water quality standards (WQS) are shown by solid red lines and the State of Hawaii WQS are indicated by green.
Figure 2.2-13. Instantaneous discharge from three USGS gaging stations along Waikolu stream in KALA between 1969 and 1989 from DeVerse and DiDonato (2006).
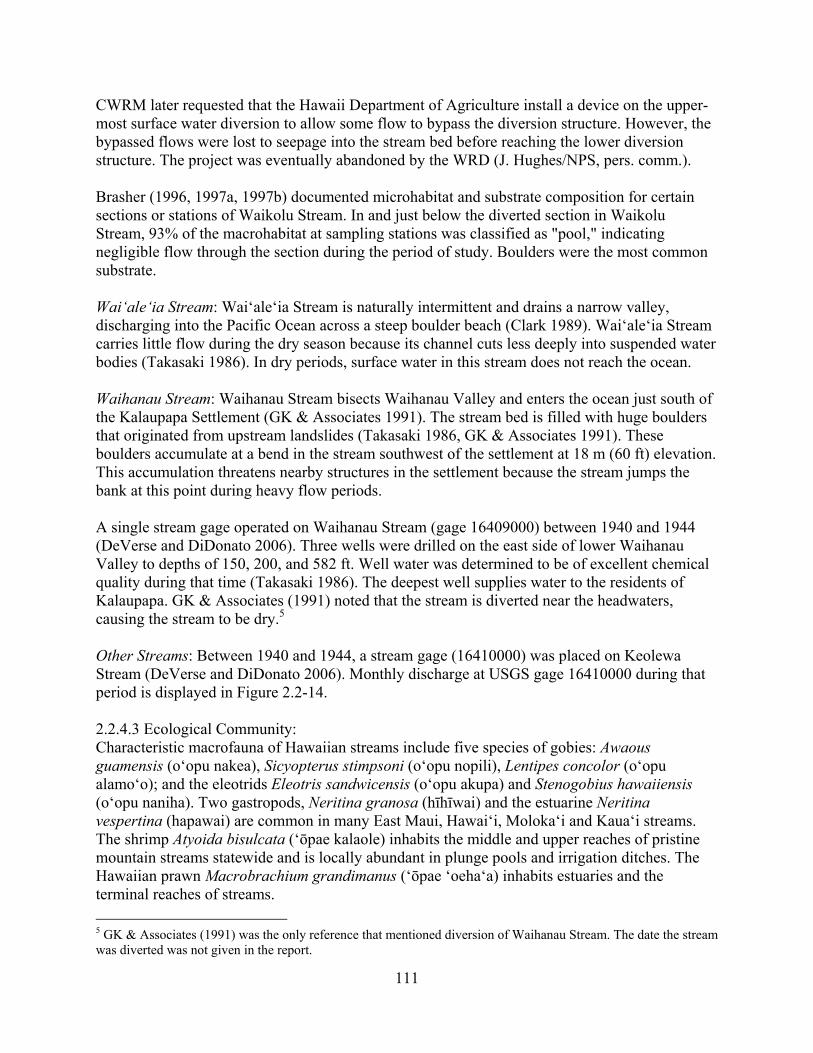
111
CWRM later requested that the Hawaii Department of Agriculture install a device on the upper-most surface water diversion to allow some flow to bypass the diversion structure. However, the bypassed flows were lost to seepage into the stream bed before reaching the lower diversion structure. The project was eventually abandoned by the WRD (J. Hughes/NPS, pers. comm.). Brasher (1996, 1997a, 1997b) documented microhabitat and substrate composition for certain sections or stations of Waikolu Stream. In and just below the diverted section in Waikolu Stream, 93% of the macrohabitat at sampling stations was classified as "pool," indicating negligible flow through the section during the period of study. Boulders were the most common substrate. Wai‘ale‘ia Stream: Wai‘ale‘ia Stream is naturally intermittent and drains a narrow valley, discharging into the Pacific Ocean across a steep boulder beach (Clark 1989). Wai‘ale‘ia Stream carries little flow during the dry season because its channel cuts less deeply into suspended water bodies (Takasaki 1986). In dry periods, surface water in this stream does not reach the ocean. Waihanau Stream: Waihanau Stream bisects Waihanau Valley and enters the ocean just south of the Kalaupapa Settlement (GK & Associates 1991). The stream bed is filled with huge boulders that originated from upstream landslides (Takasaki 1986, GK & Associates 1991). These boulders accumulate at a bend in the stream southwest of the settlement at 18 m (60 ft) elevation. This accumulation threatens nearby structures in the settlement because the stream jumps the bank at this point during heavy flow periods. A single stream gage operated on Waihanau Stream (gage 16409000) between 1940 and 1944 (DeVerse and DiDonato 2006). Three wells were drilled on the east side of lower Waihanau Valley to depths of 150, 200, and 582 ft. Well water was determined to be of excellent chemical quality during that time (Takasaki 1986). The deepest well supplies water to the residents of Kalaupapa. GK & Associates (1991) noted that the stream is diverted near the headwaters, causing the stream to be dry.5 Other Streams: Between 1940 and 1944, a stream gage (16410000) was placed on Keolewa Stream (DeVerse and DiDonato 2006). Monthly discharge at USGS gage 16410000 during that period is displayed in Figure 2.2-14. 2.2.4.3 Ecological Community: Characteristic macrofauna of Hawaiian streams include five species of gobies: Awaous guamensis (o‘opu nakea), Sicyopterus stimpsoni (o‘opu nopili), Lentipes concolor (o‘opu alamo‘o); and the eleotrids Eleotris sandwicensis (o‘opu akupa) and Stenogobius hawaiiensis (o‘opu naniha). Two gastropods, Neritina granosa (hīhīwai) and the estuarine Neritina vespertina (hapawai) are common in many East Maui, Hawai‘i, Moloka‘i and Kaua‘i streams. The shrimp Atyoida bisulcata (‘ōpae kalaole) inhabits the middle and upper reaches of pristine mountain streams statewide and is locally abundant in plunge pools and irrigation ditches. The Hawaiian prawn Macrobrachium grandimanus (‘ōpae ‘oeha‘a) inhabits estuaries and the terminal reaches of streams.
5 GK & Associates (1991) was the only reference that mentioned diversion of Waihanau Stream. The date the stream was diverted was not given in the report.
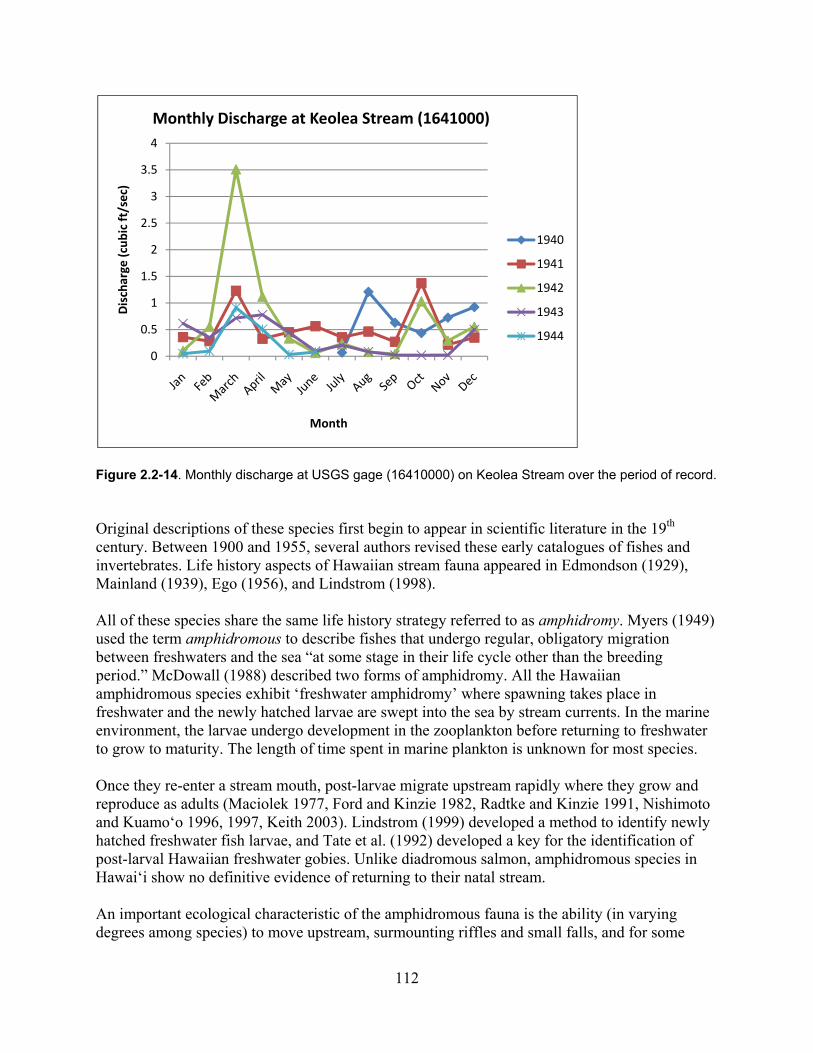
112
Figure 2.2-14. Monthly discharge at USGS gage (16410000) on Keolea Stream over the period of record. Original descriptions of these species first begin to appear in scientific literature in the 19th century. Between 1900 and 1955, several authors revised these early catalogues of fishes and invertebrates. Life history aspects of Hawaiian stream fauna appeared in Edmondson (1929), Mainland (1939), Ego (1956), and Lindstrom (1998). All of these species share the same life history strategy referred to as amphidromy. Myers (1949) used the term amphidromous to describe fishes that undergo regular, obligatory migration between freshwaters and the sea “at some stage in their life cycle other than the breeding period.” McDowall (1988) described two forms of amphidromy. All the Hawaiian amphidromous species exhibit ‘freshwater amphidromy’ where spawning takes place in freshwater and the newly hatched larvae are swept into the sea by stream currents. In the marine environment, the larvae undergo development in the zooplankton before returning to freshwater to grow to maturity. The length of time spent in marine plankton is unknown for most species. Once they re-enter a stream mouth, post-larvae migrate upstream rapidly where they grow and reproduce as adults (Maciolek 1977, Ford and Kinzie 1982, Radtke and Kinzie 1991, Nishimoto and Kuamo‘o 1996, 1997, Keith 2003). Lindstrom (1999) developed a method to identify newly hatched freshwater fish larvae, and Tate et al. (1992) developed a key for the identification of post-larval Hawaiian freshwater gobies. Unlike diadromous salmon, amphidromous species in Hawai‘i show no definitive evidence of returning to their natal stream. An important ecological characteristic of the amphidromous fauna is the ability (in varying degrees among species) to move upstream, surmounting riffles and small falls, and for some
0
0.5
1
1.5
2
2.5
3
3.5
4
Discharge
(cubic ft/sec)
Month
Monthly Discharge at Keolea Stream (1641000)
1940
1941
1942
1943
1944
113
species even high waterfalls (Ford and Kinzie 1982, Radtke and Kinzie 1996). Amphidromous species occur throughout the world’s tropical and subtropical freshwater streams, especially high islands. The native Hawaiian species are descendents from amphidromous species elsewhere and developed this life style prior to their arrival in Hawai‘i (Myers 1949, Kinzie 1991, McDowall 2003). The life history characteristics and ecological requirements of these species reflect a pattern common to amphidromous species throughout the world, not one specific to the Hawaiian Islands.
In addition to the amphidromous macrofauna, some native marine species are important in Hawaiian stream ecology. Until fairly recently, these species received less attention than the amphidromous species. However the native insects, snails, and other invertebrates are important for their diversity, endemism, and their contribution to the freshwater ecosystem dynamics.
Fishes commonly found in the terminal and lower reaches of small Hawaiian streams include the endemic predatory flagtails Kuhlia xenura and K. sandvicensis (‘āholehole). Kuhlia spp. are not amphidromous, but are itinerant marine species. Adults live and breed in nearshore coastal reefs, but juveniles commonly invade stream mouths in large schools, presumably to avoid predation and to use post-larval and juvenile gobies as a food source. Many other itinerant marine species may undergo juvenile development in estuaries of large streams. Kuhlia spp. are known to attack nests of goby eggs (Ha and Kinzie 1996) and may also consume returning post-larval gobies. These non-amphidromous species, however, do not have the ability to climb waterfalls so they typically occur only in streams with low-gradient terminal reaches or estuaries. Additionally, numerous alien stream animals, both amphidromous (e.g., Macrobrachium lar) and those restricted to freshwater, are impacting native Hawaiian species including fishes, amphibians, and crustaceans (Yamamoto and Tagawa 2000). Most prior research on Hawaiian freshwater ecology has dealt with individual species and populations of the characteristic macrofauna. Little is known about the response of Hawaiian streams to changes in stream flow (Covich 1988, Chong et al. 2000, Larned 2000, Larned et al. 2003, Kido 1996a, 1996b, and Kinzie et al. 2006). Research over the past decade on the genetics of stream fishes suggests that each of the Hawaiian freshwater gobies is a member of a statewide metapopulation (Fitzsimons et al. 1990, Zink et al. 1996, Chubb et al. 1998, D. Lindstrom/ University of North Carolina, pers. comm.). A metapopulation is of a group of spatially separated populations of the same species in which gene flow occurs with sufficient frequency to prevent isolation and subsequent speciation. The native Hawaiian amphidromous fishes, shrimp, and mollusks found in Moloka‘i streams are members of the same metapopulations found in ‘Oahu, Maui, Kaua‘i, and Hawai‘i Island streams. In the case of native amphidromous species, spatially separated (by island and stream) populations exchange individuals via their oceanic larval pool and recolonize sites from which the species has been extirpated. There is no evidence of within-archipelago diversification or speciation of the Hawaiian stream fishes, indicating among-island gene flow attributable to amphidromy (Zink et al. 1996, Chubb et al. 1998). When larvae hatch, they are swept into the sea by stream currents and temporarily undergo development in the marine zooplankton before returning to freshwater as 10–15mm long post-larvae to migrate upstream and continue their growth to maturity. Species with extended ocean
114
larval lives and those capable of delaying metamorphosis are able to achieve greater dispersal among island streams. Radtke et al. (1988), Radtke and Kinzie (1991), and Radtke et al. (2001) provide excellent data on the length of larval life (LLL) in four species of amphidromous gobies from Hawaiian Island streams. The mean LLL for the endemic Lentipes concolor was 84 days (n=236), while the mean LLL for the indigenous Awaous guamensis was 161 days (n=8) (Radtke et al. 2001). Recruitment of post-larvae from the oceanic pool, a characteristic of amphidromy, allows rapid recolonization of streams after catastrophic events such as landslides, floods, hurricanes, and droughts (Ford and Yuen 1986; Fitzsimons and Nishimoto 1995; Kido 1996a, 1996b; Kinzie 1988; Chubb et al. 1998; Way et al. 1998; McIntosh et al. 2002; Keith 2003; and McDowall 1993, 1995, 2003), and prevents genetic isolation of populations. Holmquist et al. (1998) noted that gobies will recruit to any freshwater source regardless of the suitability of the habitat from which it flows. In the recent past, aquatic biologists in Hawai‘i considered the presence of all the native amphidromous species described above as an indicator of outstanding environmental quality. Conversely, the total absence of these species in streams between sea level and 457 m (1,500 ft) elevation was considered a possible indicator of environmental degradation (Hawaii Cooperative National Park Studies Unit 1990). However, community structure in a given Hawaiian stream may change frequently due to random processes affecting reproduction, recruitment of post-larvae, migration, predation, competition, and survival (Kinzie and Ford 1982, Kinzie 1988). Therefore, the absence of a given species at any reach and time must not be interpreted as a negative indicator of stream quality (Parham et al. 2008). Stream fauna reported from riverine habitats in KALA is summarized in Table 2.2-5. Waikolu Stream: The lower reaches of Waikolu Stream contain a dense and diverse assemblage of native macrofauna (Table 2.2-5). This portion of the stream provides habitat for all five native amphidromous fish species. Waikolu Stream has one of the highest densities of stream gobies in the Hawaiian Islands, with total fish densities approaching 4 to 8 individuals per m2 (Brasher 1996, 1997a). Waikolu also supports a dense population of the native Hawaiian stream snail Neritina granosa, which can be uncommon in some streams due to overfishing or other causes. Overall densities of Awaous guamensis were much lower in Waikolu Stream compared to Pelekunu Stream. Awaous guamensis was observed in the upper stations of Waikolu Stream above the diversion. Brasher (1996) suggested that the lack of fish in this area may be due to restricted upstream movement by the two dams and the reduction of flow (Brasher 1996). Sicyopterus stimpsoni are slightly more abundant in Pelekunu Stream than in Waikolu Stream. In Hawaii, Lentipes concolor typically increase in abundance with increasing distance upstream; however, L. concolor were more abundant in the lower reaches of Waikolu Stream, and less abundant in the higher reaches, especially above the diverted section. Brasher (1996) suggested that the lower number of L. concolor in the mid- and upper reaches of Waikolu Stream may be a result of the decreased flow and periodic dewatering of the stream section below the upper dam, reducing available habitat for the gobies and inhibiting upstream migration.
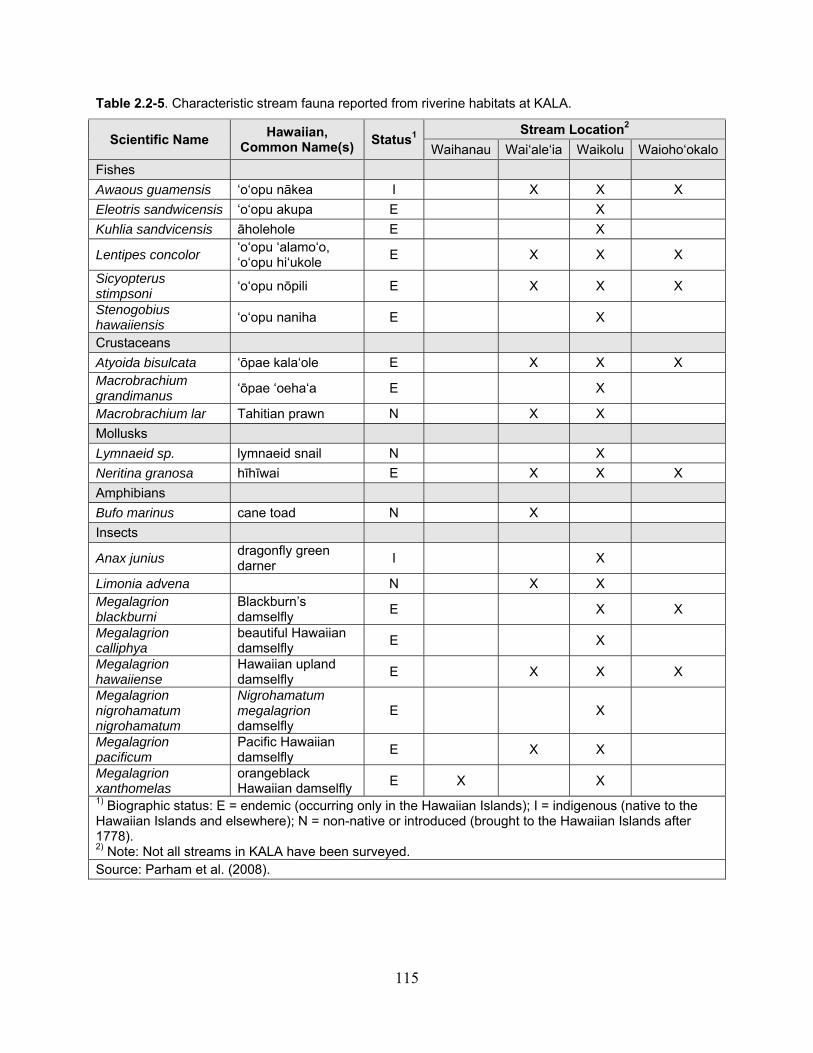
115
Table 2.2-5. Characteristic stream fauna reported from riverine habitats at KALA.
Scientific Name Hawaiian,
Common Name(s) Status1 Stream Location2
Waihanau Wai‘ale‘ia Waikolu Waioho‘okalo
Fishes
Awaous guamensis ‘o‘opu nākea I X X X
Eleotris sandwicensis ‘o‘opu akupa E X
Kuhlia sandvicensis āholehole E X
Lentipes concolor ‘o‘opu ‘alamo‘o, ‘o‘opu hi‘ukole
E X X X
Sicyopterus stimpsoni
‘o‘opu nōpili E X X X
Stenogobius hawaiiensis
‘o‘opu naniha E X
Crustaceans
Atyoida bisulcata ‘ōpae kala‘ole E X X X Macrobrachium grandimanus
‘ōpae ‘oeha‘a E X
Macrobrachium lar Tahitian prawn N X X
Mollusks
Lymnaeid sp. lymnaeid snail N X
Neritina granosa hīhīwai E X X X
Amphibians
Bufo marinus cane toad N X
Insects
Anax junius dragonfly green darner
I X
Limonia advena N X X Megalagrion blackburni
Blackburn’s damselfly
E X X
Megalagrion calliphya
beautiful Hawaiian damselfly
E X
Megalagrion hawaiiense
Hawaiian upland damselfly
E X X X
Megalagrion nigrohamatum nigrohamatum
Nigrohamatum megalagrion damselfly
E X
Megalagrion pacificum
Pacific Hawaiian damselfly
E X X
Megalagrion xanthomelas
orangeblack Hawaiian damselfly
E X X 1) Biographic status: E = endemic (occurring only in the Hawaiian Islands); I = indigenous (native to the Hawaiian Islands and elsewhere); N = non-native or introduced (brought to the Hawaiian Islands after 1778). 2) Note: Not all streams in KALA have been surveyed. Source: Parham et al. (2008).
116
In comparison, the 1986 survey by DAR biologists, found large native fish and crustaceans above the upper diversion dam, suggesting that stream flows are of sufficient volume and frequency to provide continuous ecological connectivity for amphidromous species from the mouth to the upper reaches. It also suggests that the diversion dam itself is not a physical barrier to upstream migration. Insects: Hawaiian stream insects primarily inhabit the algae or moss mats on rocks wetted by the stream. Cheumatopsyche pettiti, a North American net-spinning caddisfly, was unintentionally introduced to ‘Oahu and has since spread to Maui, Moloka‘i, and Kaua‘i. The larvae of C. pettiti have become an important part of the diet of native stream fish (Kondratieff et al. 1997). Cheumatopsyche pettiti has been recorded in Waikolu Stream. Other insects documented in the riverine habitat at KALA are listed in Table 2.2-5. Limonia advena (Diptera: Tipulidae) were collected from 43 to 335 m (141 to 1099 ft) in Waikolu, Wailau, and Wai‘ale‘ia streams (Evenhuis and Eldredge 1999). Algae: Three genera of freshwater algae have been identified in the freshwater pools and seeps near the Kūka‘iwa‘a peninsula. Vaucheria sp., which is a new record for the Hawaiian Islands, is a mat-forming Tribophyte (yellow-green algae). Two filamentous Chlorophyta (green algae) were also identified—Spirogya sp. and Mougeotia sp. (LeGrande 2002).
Threatened and Endangered Species: A proposed rule was published by the U.S. Fish and Wildlife Service in July 2009 to list Megalagrion pacificum as endangered (USFWS 2009b). It has been a candidate endangered species since 1994. Historically, M. pacificum was the most common and widespread of the native damselfly species (Gagne and Howarth 1982). Current populations are known to occur on Maui, Moloka‘i, and Hawai‘i Island. The species is believed to be restricted to seepage-fed pools along overflow channels at low elevations in the terminal reaches of perennial streams (USFWS 2007).
Megalagrion xanthomelas is a candidate endangered species known to occur on ‘Oahu, Maui, Moloka‘i, and Hawai‘i Island. The species was historically abundant throughout all the main Hawaiian Islands. A translocation program for Megalagrion xanthomeles was initiated on ‘Oahu in July 2003 (USFWS 2007, 2008a).
Both M. pacificum and M. xanthomeles have been recorded from Waikolu Stream. Megalagrion pacificum has been recorded in Wai‘ale‘ia Stream, and M. xanthomeles has been observed in Waihanau Stream. Several individuals of M. xanthomeles were observed flying along the margins of five slow, shallow, stream pools in July 1995 (Polhemus 1996). Megalagrion nigrohamatum nigrohamatum, a USFWS species of concern, has only been documented in Waikolu Stream. In the 1980s, the USFWS listed Lentipes concolor as a category 1 candidate endangered species based on limited distribution and abundance data (Dodd et al. 1985). Statewide reconnaissance surveys by DAR biologists greatly increased the number of streams in which L. concolor was found (Fitzsimons 1990, Higashi and Yamamoto 1993, Devick et al. 1995), leading to the subsequent delisting of L. concolor in 1996.
117
2.2.4.4 Information Gaps: Water Quality: Surface water quality monitoring was initiated by the National Park Service in 2008, but no results have been reported to date. Additional studies should include water, soil, and tissue contaminants, organic enrichment, and sedimentation. Poor water quality can impact growth, survival, and reproduction rates among benthic organisms (DeVerse and DiDonato 2006). Algae: There is a need to expand the knowledge of algal diversity in Hawaiian freshwater systems. It is also necessary to sample more stream segments, particularly concentrating on remote locations (Filkin et al. 2003). Algal communities can serve as indicators of ambient water quality conditions (DeVerse and DiDonato 2006). Macroalgae (benthic algae that have a discrete thallus visible to the naked eye) are important in stream ecology by serving as food and structural materials for fishes and invertebrates (Sherwood 2006). Fauna: Renewed baseline inventories of macrofauna and invertebrates in all streams are needed. In particular, no faunal information exists for the intermittent streams (Wainēnē, Anapuhi). Integrity of biological assemblages, habitat issues, and impacts of diversions also needs to be addressed. Invasive Species: Brasher (1997b) recommended that Waikolu Stream provides an ideal opportunity to investigate the impacts of predation by the introduced prawn Macrobrachium lar on Neritina granosa and on other native macrofauna. Disease: There are no studies on the extent of parasites on native stream animals. This study can influence the conservation and management of native stream fishes and invertebrates (Font 2007). Diversion Impacts: It would be useful to follow up on Brasher’s work in Waikolu Stream to determine if there has been an improvement in the flows over the dam and/or any changes in the distribution of Hawaiian stream species. It would also be important to install a pressure gauge below the lower diversion dam (where USGS gauge 16406000 was previously operated). This reach is sometimes dewatered, and documenting the percentage of time this occurs is critical for assessing the continuity of the upper reaches. More continuous stream monitoring on all streams with records of daily discharge would allow the National Park Service to better assess their water availability situation. In the future, it is possible that CWRM may require that Interim Instream Flow Standards (IIFS) be established for Waikolu Stream, which may require execution of instream studies to evaluate the potential impacts of incremental flow changes on native amphidromous species. 2.3 Marine and Intertidal Zones The park boundary of KALA extends 0.4 km (0.25 mi) off the coastline and encompasses two offshore islets, ‘Ōkala and Huelo, along with one emergent pinnacle, Nāmoku. Three marine habitat types are identified in this report, the intertidal, the coastal reefs, and the surrounding reefs of the offshore islets (Figure 1.4-1). The intertidal habitat at KALA encompasses 0.57 km2 (0.22 mi2) of the coastline and is present along both the east and west side of the peninsula. The
118
vertical extent of this habitat zone is defined by the Mean Higher High Water (MHHW) and Mean Lower Low Water (MLLW) elevations. Approximately 7.5 km2 (2.9 mi2) of marine habitat exists within the park boundaries to a depth of 40 m and is comprised of coral communities on volcanic hardbottom and sandy bottoms or unconsolidated sediments. The submerged lands within the KALA boundary are considered a Special Ecological Area by the National Park Service. 2.3.1 Coastal Reefs 2.3.1.1 Previous and Ongoing Studies and Inventories: Information from abiotic monitoring and biological studies of the coastal reefs are available for KALA. These studies are listed below. Abiotic Factors:
The National Park Service and I&M have monitored water quality in the marine environment since 2008 (unpublished).
NPS staff has monitored temperature at two stations on the east and west side of the peninsula since 2005.
NPS staff has monitored the physical oceanographic factors (e.g., wave height, currents, salinity, temperature) of the nearshore environment since 2007 using one fixed station on the west side of the peninsula (unpublished).
A long term climate trend study was scheduled to begin in 2009. Algae and Invertebrates:
UH-Manoa conducted a marine algae inventory in 2005 and then the NPS I&M program started monitoring marine algae at KALA in 2006 as part of the marine benthic protocol (unpublished).
NPS staff is monitoring the marine benthic community between 10 m and 20 m depths to determine its composition and physical structure (unpublished). Annual monitoring commenced in 2006. Fifteen fixed (permanent) transects were established at KALA in 2006 to document long-term changes in benthic cover. An additional 15 temporary transects are also surveyed each year to increase the spatial characterization of the benthic community at KALA.
NPS staff also initiated studies on the annual rate of coral settlement for different species within KALA (unpublished). In 2005, one fixed site was randomly selected within three strata (east, west, and north) around the park as part of a pilot project. These three sites were subsequently incorporated into the 15 fixed sites/transects that have been monitored annually since 2006.
KALA staff initiated a marine algae study in 2006 to document changes in the nitrogen 15 isotope ratios of three different algal species before and after the cesspool upgrade at

119
KALA. A classic before, after, control, and impact (BACI) design was used. Subsequent surveys were conducted in 2007 and 2008.
Brown et al. (2008) conducted a study of the coral reef benthos within KALA harbor.
The monitoring was initiated in 2005 to assess impacts of proposed structural improvements. Subsequent surveys have been conducted in 2007 and 2008.
Acanthaster planci population genetics were documented in 2007as part of a UH-Hilo master’s thesis project for Molly Timmers (unpublished).
Vertebrates:
Beets et al. (2006) conducted an inventory of marine fishes at KALA as part of an assessment of marine vertebrates in at four national parks in Hawai‘i. The other three national parks were on the Island of Hawai'i: Pu`ukoholā Heiau National Historical Park (PUHE), Kaloko - Honokōhau National Historical Park (KAHO), and Pu`uhonua o Hōnaunau National Historical Park (PUHO).
NPS staff has monitored marine fish abundance, size, and biomass between 10 m and 20 m depth annually since 2006 to document long term trends (unpublished). The same fixed transects and temporary transects as for algae and invertebrates are employed.
Brown et al. (2008) monitored marine fish abundance, size, and biomass in 2005, 2007, and 2008 as part of the KALA harbor survey.
At present, there is insufficient monitoring data to determine biologically significant long-term trends (E. Brown/NPS, pers. comm.); therefore, no statistical analyses of benthic cover or species compositions have been conducted. All comparisons between years or areas of coastal reefs are purely descriptive at this time. 2.3.1.2 Physical Environment: Wave Energy: The wave energy along the KALA coast is dominated by the year-round tradewind swell and the seasonal North Pacific swell generated by winter storms (Aucan 2006). North Pacific swells occur in the winter and are predominantly from the north-west, though directionality can vary between 282° and 45° (Vitousek et al. 2008). Significant wave heights of north Pacific swells arriving in Hawai‘i average 7.7 m (25 ft) in deep water with peak periods of 14–18 s. Tradewinds occur about 75% of the year, generating northeasterly tradewind swells resulting in choppy seas with an average wave height of 2 m (6.6 ft) and periods of 9 seconds (Vitousek et al 2008). However, the size and number of swell events is highly variable from year to year. Wave climate data has been collected in the nearshore environment of KALA since 2001 from three different stations (NPS unpublished, see Figures 2.3-1, 2.3-2). The North Pacific swells begin in October and continue through March. The average significant wave heights range from 1.2 to 2.3 m (3.9–7.4 ft) with the highest waves (though less frequent) approaching from a north-
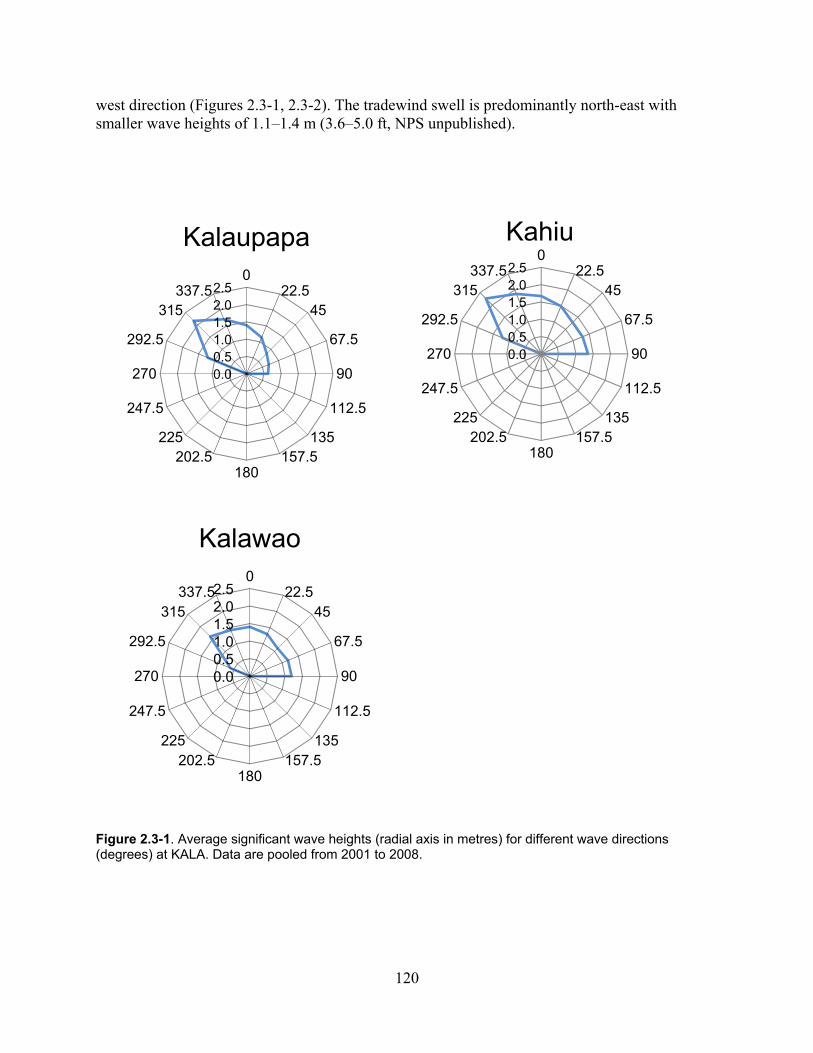
120
west direction (Figures 2.3-1, 2.3-2). The tradewind swell is predominantly north-east with smaller wave heights of 1.1–1.4 m (3.6–5.0 ft, NPS unpublished).
Figure 2.3-1. Average significant wave heights (radial axis in metres) for different wave directions (degrees) at KALA. Data are pooled from 2001 to 2008.
0.00.51.01.52.02.5
022.5
45
67.5
90
112.5
135157.5
180202.5
225
247.5
270
292.5
315337.5
Kalaupapa
0.00.51.01.52.02.5
022.5
45
67.5
90
112.5
135157.5
180202.5
225
247.5
270
292.5
315337.5
Kahiu
0.00.51.01.52.02.5
022.5
45
67.5
90
112.5
135157.5
180202.5
225
247.5
270
292.5
315337.5
Kalawao
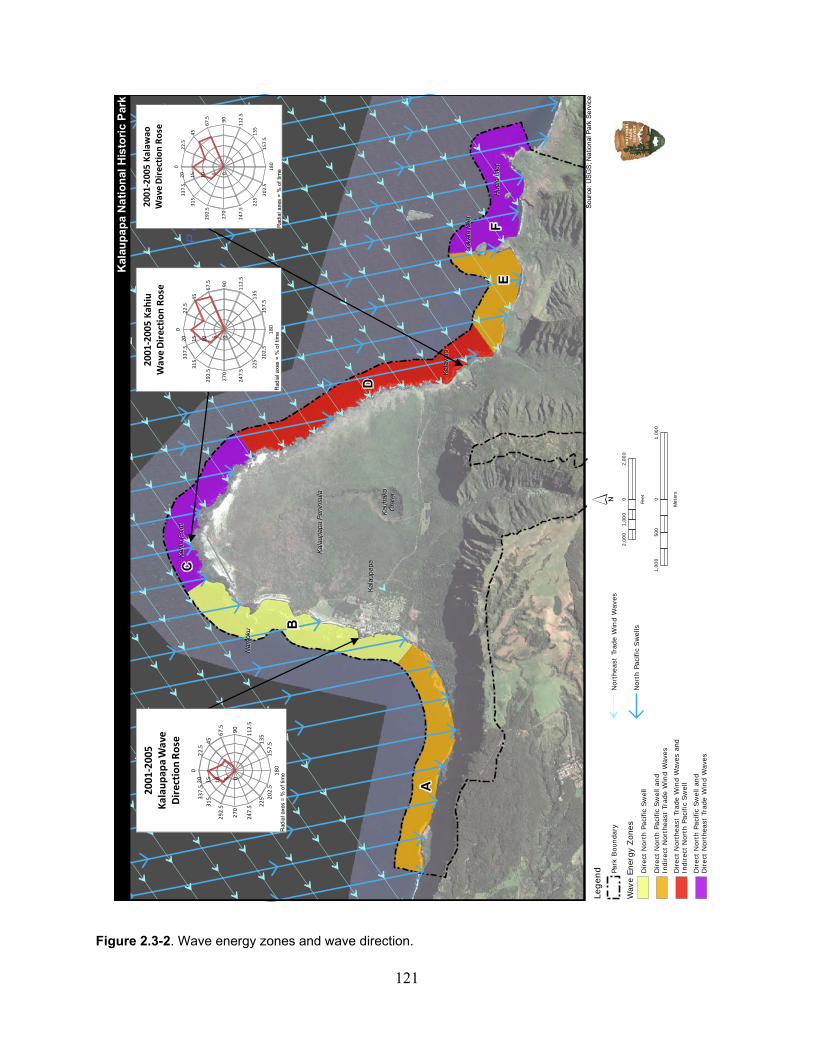
121
Figure 2.3-2. Wave energy zones and wave direction.
Sou
rce:
US
GS
; Na
tion
al P
ark
Se
rvic
eLe
gen
d Park
Bou
nda
ry
Wav
e Ener
gy Z
ones
Direc
t N
orth
Pac
ific
Sw
ell
Direc
t N
orth
Pac
ific
Sw
ell an
dIn
direc
t N
orth
east
Tra
de W
ind
Wav
es
Direc
t N
orth
east
Tra
de W
ind
Wav
es a
ndIn
direc
t N
orth
Pac
ific
Sw
ell
Direc
t N
orth
Pac
ific
Sw
ell an
dD
irec
t N
orth
east
Tra
de W
ind
Wav
es
Nor
thea
st T
rade
Win
d W
aves
Nor
th P
acifi
c S
wel
ls
2,00
00
2,00
01,
000
Feet
1,00
00
1,00
050
0
Met
ers
Pa
cif
ic
Oc
ea
n
Hue
lo Is
let
Hue
lo Is
let
Oka
la Is
let
Oka
la Is
let
Kal
awao
Kal
awao
Kah
iu P
oint
Kah
iu P
oint
Kal
aup
apa
Kal
aup
apa
Kau
hak
oK
auh
ako
Cra
ter
Cra
ter
Kal
aup
apa
Pen
insu
laK
alau
pap
a P
enin
sula
Nam
oku
Nam
oku
D
B
F
A
C
E
0510
15
20
022.5
45
67.5
90
112.5
135
157.5
180
202.5
225
247.5
270
292.53
15337.52001‐2005
Kalaupap
a Wave
Direction Rose
05
10
15
20
022.5
45
67.5
90
112.5
135
157.5
180
202.5
225
247.5
270
292.5
315
337.5
2001
‐2005 Kah
iu
Wave Direction Rose
0510
15
20
0
22.5
45
67.5 90
112.5
135
157.5
180
202.5
225
247.5
270
292.5
315
337.5
2001‐2005 Kalawao
Wave Direction Rose
Rad
ial a
xes
= %
of
time
Rad
ial a
xes
= %
of
time
Rad
ial a
xes
= %
of
time
Kal
aup
ap
a N
ati
on
al H
isto
ric
Par
k
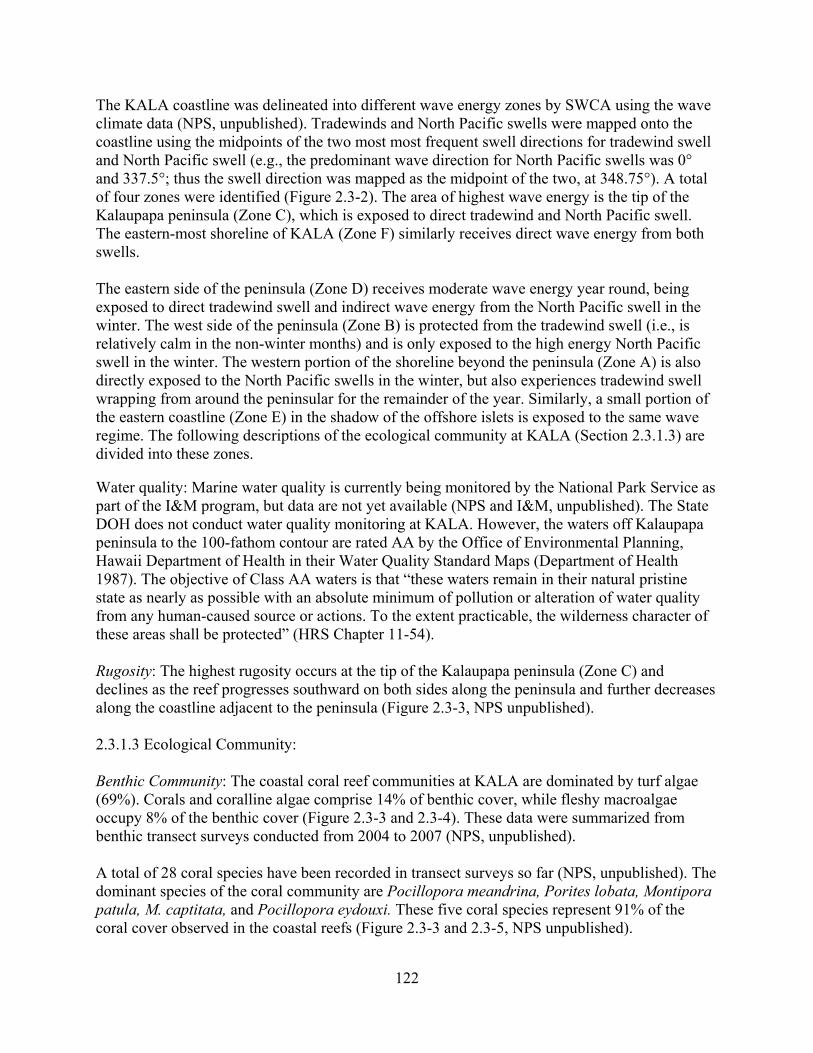
122
The KALA coastline was delineated into different wave energy zones by SWCA using the wave climate data (NPS, unpublished). Tradewinds and North Pacific swells were mapped onto the coastline using the midpoints of the two most most frequent swell directions for tradewind swell and North Pacific swell (e.g., the predominant wave direction for North Pacific swells was 0° and 337.5°; thus the swell direction was mapped as the midpoint of the two, at 348.75°). A total of four zones were identified (Figure 2.3-2). The area of highest wave energy is the tip of the Kalaupapa peninsula (Zone C), which is exposed to direct tradewind and North Pacific swell. The eastern-most shoreline of KALA (Zone F) similarly receives direct wave energy from both swells. The eastern side of the peninsula (Zone D) receives moderate wave energy year round, being exposed to direct tradewind swell and indirect wave energy from the North Pacific swell in the winter. The west side of the peninsula (Zone B) is protected from the tradewind swell (i.e., is relatively calm in the non-winter months) and is only exposed to the high energy North Pacific swell in the winter. The western portion of the shoreline beyond the peninsula (Zone A) is also directly exposed to the North Pacific swells in the winter, but also experiences tradewind swell wrapping from around the peninsular for the remainder of the year. Similarly, a small portion of the eastern coastline (Zone E) in the shadow of the offshore islets is exposed to the same wave regime. The following descriptions of the ecological community at KALA (Section 2.3.1.3) are divided into these zones. Water quality: Marine water quality is currently being monitored by the National Park Service as part of the I&M program, but data are not yet available (NPS and I&M, unpublished). The State DOH does not conduct water quality monitoring at KALA. However, the waters off Kalaupapa peninsula to the 100-fathom contour are rated AA by the Office of Environmental Planning, Hawaii Department of Health in their Water Quality Standard Maps (Department of Health 1987). The objective of Class AA waters is that “these waters remain in their natural pristine state as nearly as possible with an absolute minimum of pollution or alteration of water quality from any human-caused source or actions. To the extent practicable, the wilderness character of these areas shall be protected” (HRS Chapter 11-54). Rugosity: The highest rugosity occurs at the tip of the Kalaupapa peninsula (Zone C) and declines as the reef progresses southward on both sides along the peninsula and further decreases along the coastline adjacent to the peninsula (Figure 2.3-3, NPS unpublished). 2.3.1.3 Ecological Community: Benthic Community: The coastal coral reef communities at KALA are dominated by turf algae (69%). Corals and coralline algae comprise 14% of benthic cover, while fleshy macroalgae occupy 8% of the benthic cover (Figure 2.3-3 and 2.3-4). These data were summarized from benthic transect surveys conducted from 2004 to 2007 (NPS, unpublished). A total of 28 coral species have been recorded in transect surveys so far (NPS, unpublished). The dominant species of the coral community are Pocillopora meandrina, Porites lobata, Montipora patula, M. captitata, and Pocillopora eydouxi. These five coral species represent 91% of the coral cover observed in the coastal reefs (Figure 2.3-3 and 2.3-5, NPS unpublished).
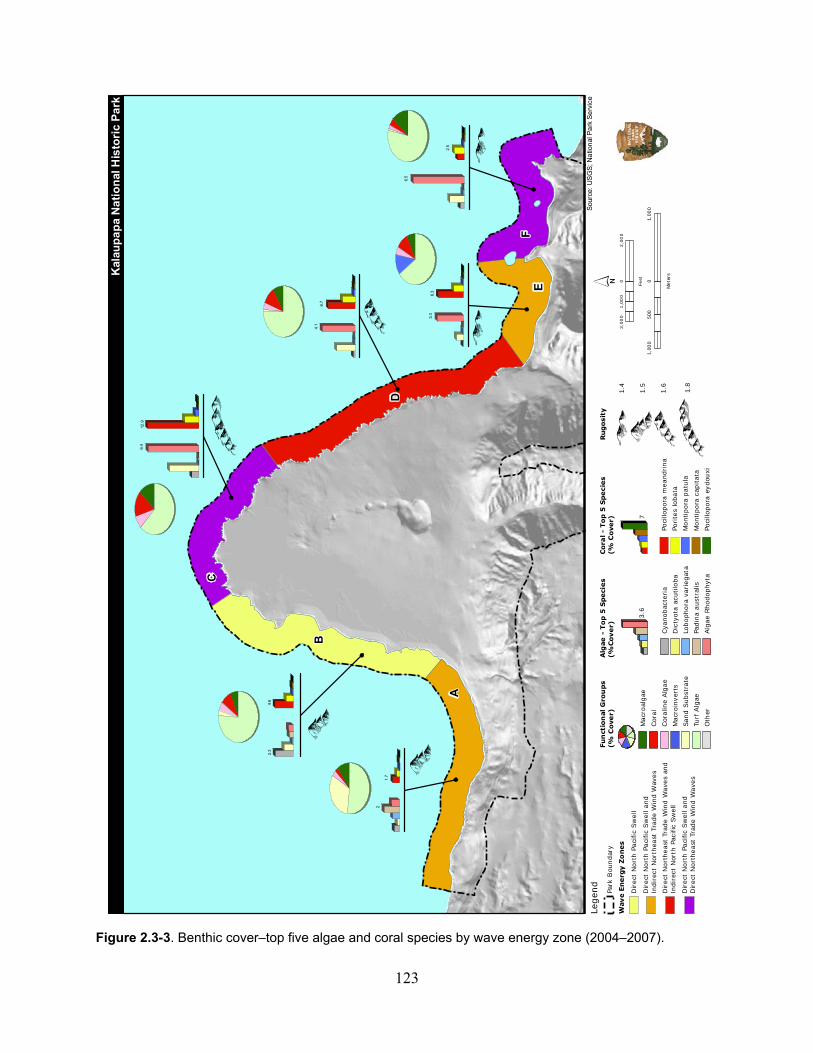
123
Figure 2.3-3. Benthic cover–top five algae and coral species by wave energy zone (2004–2007).
Legen
d
Park
Bou
ndar
y
Wav
e E
nerg
y Z
on
es
Direct
Nort
h P
aci
fic
Sw
ell
Direct
Nort
h P
aci
fic
Sw
ell and
Indir
ect
Nor
thea
st T
rade W
ind W
aves
Direct
Nort
heast
Tra
de W
ind W
ave
s an
dIn
dir
ect
Nor
th P
acific
Sw
ell
Direct
Nort
h P
aci
fic
Sw
ell and
Direct
Nort
heast
Tra
de W
ind W
ave
s
Sou
rce:
US
GS
; Na
tion
al P
ark
Se
rvic
e
Alg
ae
- T
op 5
Speci
es
(%C
ove
r)
Cya
nobac
teria
Dic
tyota
acu
tilo
ba
Lobophora
variegat
a
Padin
a a
ust
ralis
Alg
ae
Rhodophyt
a
3.6
Fu
nct
ion
al G
rou
ps
(% C
ove
r)
Macr
oal
gae
Cor
al
Cor
alin
e Alg
ae
Macr
oin
ver
ts
Sand S
ubst
rate
Turf
Alg
ae
Oth
er
Cora
l -
Top
5 S
pe
cie
s(%
Co
ver)
Poci
llopora
meandrina
Porite
s lo
bata
Montipora
patu
la
Montipora
cap
itata
Poci
llopora
eydou
xi
7
Rug
osit
y
1.4
1.5
1.6 1.8
2,0
00
02,0
00
1,0
00
Feet
1,00
00
1,00
050
0
Met
ers
6.7
4.6
1.7
12.9
6.3
2.5
4.1
6.4
6.5
3.3
2.3
2
D
B
A
F
C
E
Kal
aup
ap
a N
ati
on
al H
isto
ric
Pa
rk
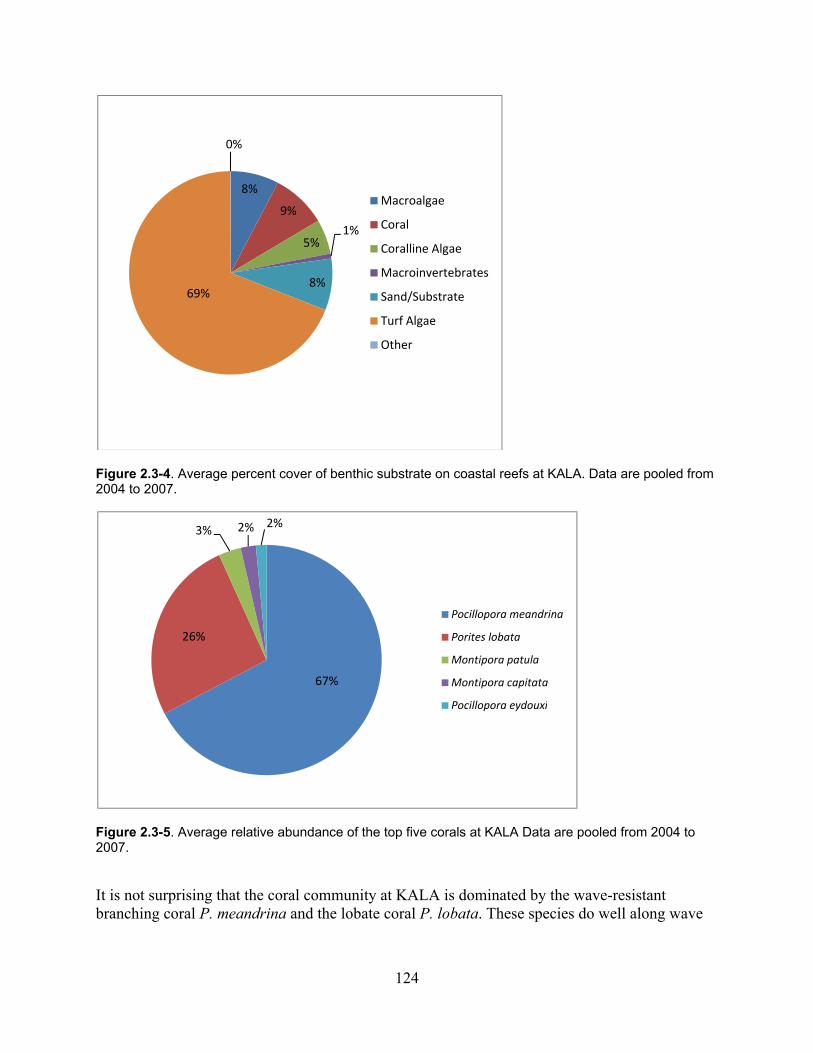
124
Figure 2.3-4. Average percent cover of benthic substrate on coastal reefs at KALA. Data are pooled from 2004 to 2007.
Figure 2.3-5. Average relative abundance of the top five corals at KALA Data are pooled from 2004 to 2007. It is not surprising that the coral community at KALA is dominated by the wave-resistant branching coral P. meandrina and the lobate coral P. lobata. These species do well along wave
8%
9%
5%1%
8%69%
0%
Macroalgae
Coral
Coralline Algae
Macroinvertebrates
Sand/Substrate
Turf Algae
Other
67%
26%
3% 2% 2%
Pocillopora meandrina
Porites lobata
Montipora patula
Montipora capitata
Pocillopora eydouxi
125
exposed north shore coastlines in Hawai‘i that are subjected to high wave energy from North Pacific storms (Jokiel et al. 2004). The highest coral and coralline algae cover (18.4% and 8.8% respectively) occurs in Zone C, the tip of the Kalaupapa peninsula, which partly accounts for the high rugosity in the zone (Figure 2.3-3, NPS unpublished). However, there are few transects in this zone, and more transects should to be conducted by the National Park Service to determine if Zone C differs from surrounding zones (see Appendix 5 for transect level data). P. meandrina is the dominant coral species in the area. All other zones have similar coral cover to each other, and Zone A encompasses a wide stretch of sandy bottom (Appendix 5). The dominant coral species also show yearly settlement of larvae back into the population (Fig. 2.3-6, NPS unpublished). Since coral settlement surveys started in 2006 (data from 2006–2008), there has been an upward trend for coral settlement for Montipora species in contrast to other genera. More years of data are needed to determine long-term trends due to the episodic nature of coral settlement.
Figure 2.3-6. Coral settlement at KALA from 2006 to 2008. Error bars are standard error. A total of 39 macroalgal species was recorded in surveys (2004–2007) (NPS, unpublished). The dominant species of the macroalgal community are fleshy Rhodophyta (red algae), the brown algae (Padina australis, Lobophora variegata, and Dictyota acutiloba), and cyanobacteria (while not algae, these bacteria were included in the macroalgal category, Figure 2.3-3). The five algal taxa represent 81% of the macroalga cover observed in the coastal reefs (Figure 2.3-7 and 2.3-3). Macroalgal cover is also highest in zone C and F where wave energy is highest, and the macroalgal community is dominated by fleshy Rhodophytes. Fleshy Rhodophytes are also more prevalent on the east side of KALA than on the west side (Figure 2.3-3).
0.0
50.0
100.0
150.0
200.0
250.0
300.0
350.0
400.0
2006 2007 2008
Coral settlement (no./m
2/5
months)
Other
Porites
Pocillopora
Montipora
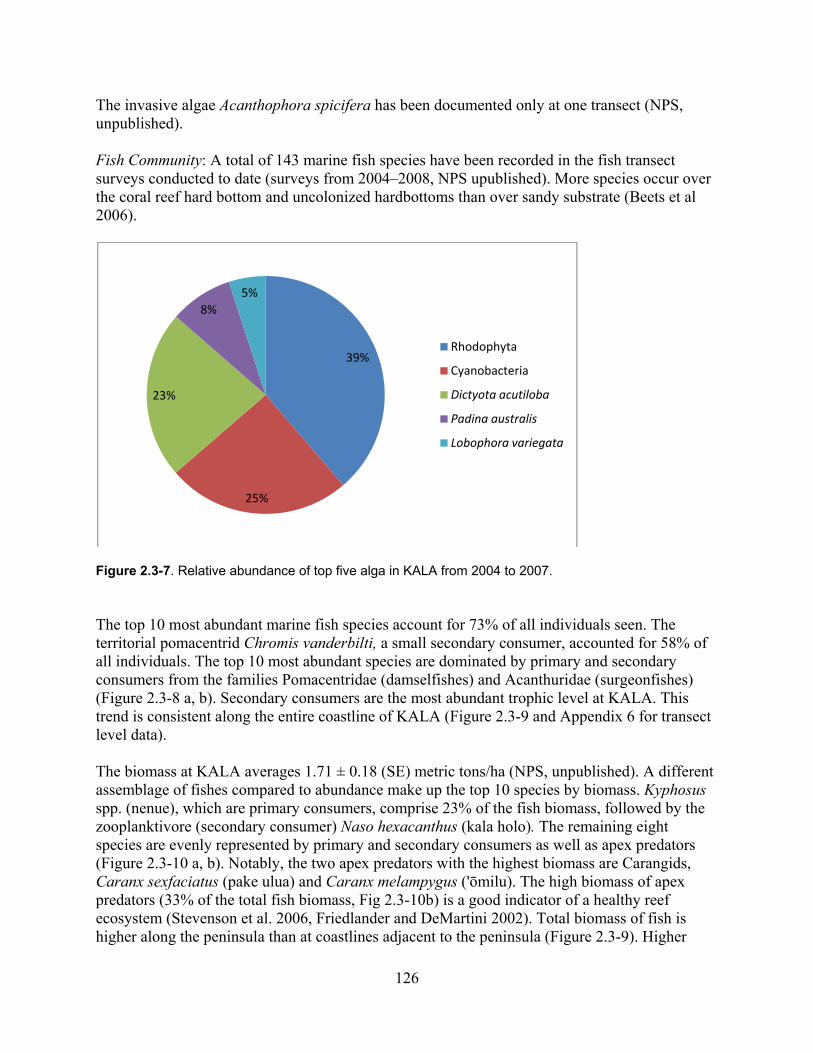
126
The invasive algae Acanthophora spicifera has been documented only at one transect (NPS, unpublished). Fish Community: A total of 143 marine fish species have been recorded in the fish transect surveys conducted to date (surveys from 2004–2008, NPS upublished). More species occur over the coral reef hard bottom and uncolonized hardbottoms than over sandy substrate (Beets et al 2006).
Figure 2.3-7. Relative abundance of top five alga in KALA from 2004 to 2007. The top 10 most abundant marine fish species account for 73% of all individuals seen. The territorial pomacentrid Chromis vanderbilti, a small secondary consumer, accounted for 58% of all individuals. The top 10 most abundant species are dominated by primary and secondary consumers from the families Pomacentridae (damselfishes) and Acanthuridae (surgeonfishes) (Figure 2.3-8 a, b). Secondary consumers are the most abundant trophic level at KALA. This trend is consistent along the entire coastline of KALA (Figure 2.3-9 and Appendix 6 for transect level data). The biomass at KALA averages 1.71 ± 0.18 (SE) metric tons/ha (NPS, unpublished). A different assemblage of fishes compared to abundance make up the top 10 species by biomass. Kyphosus spp. (nenue), which are primary consumers, comprise 23% of the fish biomass, followed by the zooplanktivore (secondary consumer) Naso hexacanthus (kala holo). The remaining eight species are evenly represented by primary and secondary consumers as well as apex predators (Figure 2.3-10 a, b). Notably, the two apex predators with the highest biomass are Carangids, Caranx sexfaciatus (pake ulua) and Caranx melampygus ('ōmilu). The high biomass of apex predators (33% of the total fish biomass, Fig 2.3-10b) is a good indicator of a healthy reef ecosystem (Stevenson et al. 2006, Friedlander and DeMartini 2002). Total biomass of fish is higher along the peninsula than at coastlines adjacent to the peninsula (Figure 2.3-9). Higher
39%
25%
23%
8%
5%
Rhodophyta
Cyanobacteria
Dictyota acutiloba
Padina australis
Lobophora variegata
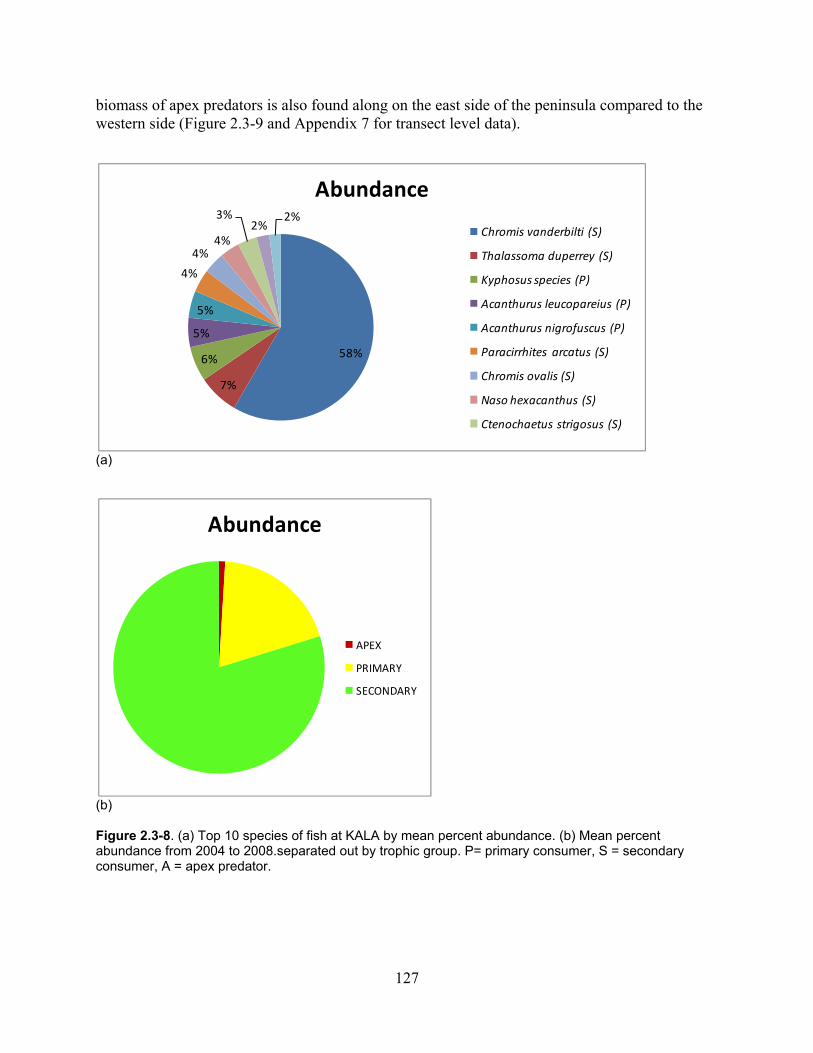
127
biomass of apex predators is also found along on the east side of the peninsula compared to the western side (Figure 2.3-9 and Appendix 7 for transect level data).
(a)
(b) Figure 2.3-8. (a) Top 10 species of fish at KALA by mean percent abundance. (b) Mean percent abundance from 2004 to 2008.separated out by trophic group. P= primary consumer, S = secondary consumer, A = apex predator.
58%
7%
6%
5%
5%
4%
4%4%
3%2%
2%
Abundance
Chromis vanderbilti (S)
Thalassoma duperrey (S)
Kyphosus species (P)
Acanthurus leucopareius (P)
Acanthurus nigrofuscus (P)
Paracirrhites arcatus (S)
Chromis ovalis (S)
Naso hexacanthus (S)
Ctenochaetus strigosus (S)
Abundance
APEX
PRIMARY
SECONDARY
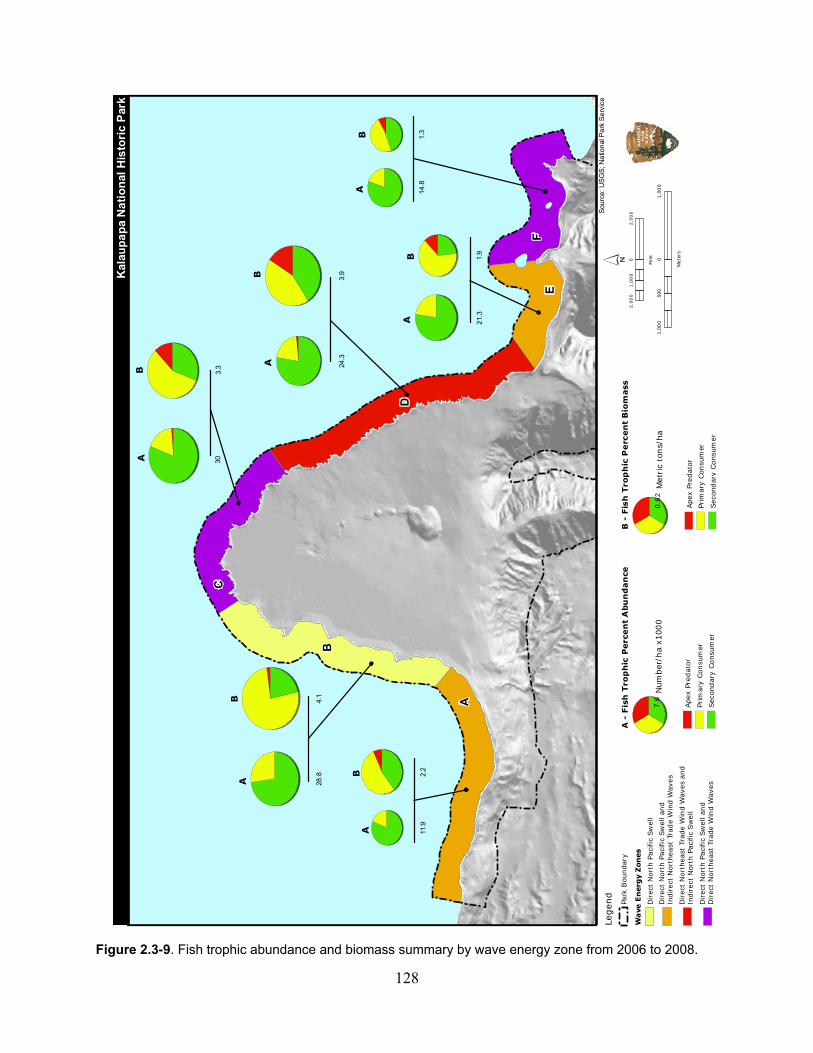
128
Figure 2.3-9. Fish trophic abundance and biomass summary by wave energy zone from 2006 to 2008.
2,0
00
02,0
00
1,0
00
Feet
1,00
00
1,00
050
0
Met
ers
Legen
d
Park
Bou
nda
ry
Wa
ve E
nerg
y Z
on
es
Dir
ect
Nor
th P
acifi
c Sw
ell
Dir
ect
Nor
th P
acifi
c Sw
ell a
nd
Indirec
t N
orth
east
Tra
de
Win
d W
aves
Dir
ect
Nor
thea
st T
rade
Win
d W
aves
and
Indirec
t N
orth
Pac
ific
Sw
ell
Dir
ect
Nor
th P
acifi
c Sw
ell a
nd
Dir
ect
Nor
thea
st T
rade
Win
d W
aves
A -
Fis
h T
rop
hic
Perc
en
t A
bu
nd
an
ce
7.6
Ape
x Pr
edat
or
Prim
ary
Con
sum
er
Sec
ondar
y Cons
umer
B -
Fis
h T
rop
hic
Pe
rcen
t B
iom
ass
0.82
Ape
x Pr
edat
or
Prim
ary
Con
sum
er
Sec
ondar
y Cons
umer
Num
ber
/ha
x100
0M
etric
tons/
ha
Sou
rce:
US
GS
; Na
tion
al P
ark
Se
rvic
e
30
11.9
14.8
21.3
24.3
28.8
3.9
4.1
2.2
3.3
1.3
1.9
D
B
A
F
C
E
AB
AB
AB
AB
AB
AB
Kal
aup
ap
a N
ati
on
al H
isto
ric
Par
k
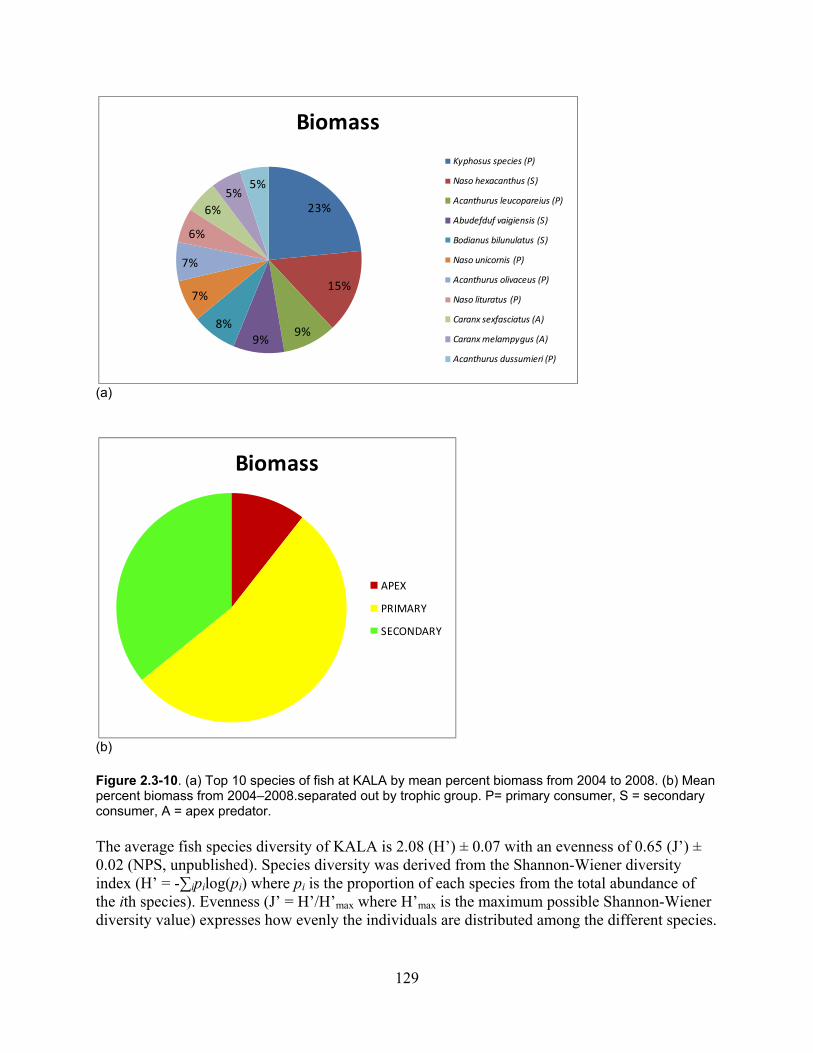
129
(a)
(b) Figure 2.3-10. (a) Top 10 species of fish at KALA by mean percent biomass from 2004 to 2008. (b) Mean percent biomass from 2004–2008.separated out by trophic group. P= primary consumer, S = secondary consumer, A = apex predator. The average fish species diversity of KALA is 2.08 (H’) ± 0.07 with an evenness of 0.65 (J’) ± 0.02 (NPS, unpublished). Species diversity was derived from the Shannon-Wiener diversity index (H’ = -∑ipilog(pi) where pi is the proportion of each species from the total abundance of the ith species). Evenness (J’ = H’/H’max where H’max is the maximum possible Shannon-Wiener diversity value) expresses how evenly the individuals are distributed among the different species.
23%
15%
9%9%
8%
7%
7%
6%
6%
5%5%
Biomass
Kyphosus species (P)
Naso hexacanthus (S)
Acanthurus leucopareius (P)
Abudefduf vaigiensis (S)
Bodianus bilunulatus (S)
Naso unicornis (P)
Acanthurus olivaceus (P)
Naso lituratus (P)
Caranx sexfasciatus (A)
Caranx melampygus (A)
Acanthurus dussumieri (P)
Biomass
APEX
PRIMARY
SECONDARY

130
Both species of introduced Lutjantids (snappers), Lutjanus kasmira (ta‘ape) and L. fulvus (to‘au), as well as the introduced grouper Cephalopholis argus (roi) were present on the coastal reefs of KALA. However, all three species were present at very low densities (NPS, unpublished). Comparison with Other Areas in Hawai‘i: Beets et al. (2006) compared fish habitat utilization patterns at KALA on Moloka‘i with Pu‘ukoholā Heiau National Historical Park (PUHE), Kaloko - Honokōhau National Historical Park (KAHO), and Pu‘uhonua o Hōnaunau National Historical Park (PUHO) on the Island of Hawai`i. Benthic cover comparisons among these four national parks in Hawai‘i indicated that KALA has higher percent cover of turf algae, marcoalage, and the coral P. meandrina than at the other three parks. However, the cover of P. lobata and P. compressa was lower than at the other parks (Beets et al. 2006). Fish species richness, diversity, and densities at KALA were higher than PUHE but similar to the other two national parks (Beets et al. 2006). However, fish biomass was higher at KALA compared to all the other parks, suggesting larger and more abundant fish than at the other parks. The biomass present at KALA is also similar to the biomass of the top two Marine Life Conservation Districts (MLCD) in Hawai‘i (Molokini on Maui and Old Kona Airport on the Island of Hawai‘i) (Friedlander et al. 2007). On a statewide scale, a comparison of fish assemblages with other sites in the main Hawaiian Islands (MHI) and North-west Hawaiian Islands (NWHI), shows that the biomass at KALA (mean 1.71 ± 0.18 (SE) mt/ha) is more than two times higher than the mean for the MHI (0.68 mt /ha, Friedlander at al. 2008a). In contrast, the average biomass in the NWHI, which is a marine sanctuary, is 2.44 mt/ha. Some islands, however, such as Kure, Mokumanamana (formerly known as Necker), and Maro reef had similar levels of fish biomass to KALA. These three reefs are at the lower end of the range of fish biomass in the NWHI (Frieldlander et al. 2008b). Kaho‘olawe, an uninhabited and largely unfished island in the MHI, also has a high fish biomass, more closely resembling those of the NWHI (Friedlander et al. 2008a). The composition of the trophic levels of fish is often used as an indicator of reef health. Apex predators are often well represented on a healthy reef ecosystem and are quickly depleted on a reef that is fished (Stevenson et al. 2006, Friedlander and DeMartini 2002). The composition of the trophic levels at KALA more closely resembles those that are found in the NWHI. In the NWHI, the apex predators comprise 54% of the total biomass compared to 33% at KALA and only 3% for the MHI. The proportion of apex predators at KALA also surpasses the proportion of apex predators found at Kahoolawe (12%) (Friedlander et al. 2007, 2008a). The characteristics of the fish assemblage at KALA, which are similar to reefs that experience minimal human impact, are likely due to the relatively light fishing pressure present at KALA (see section 3.4.3 and 3.5.3). For the more mobile fishes such as the Carangids (Weatherbee et al. 2004, Holland et al 1996) that likely move beyond the boundaries of KALA, their biomass is also a reflection of the fishing the occurs along the adjacent coastlines. Compared to other areas in the MHI, KALA has one of the healthiest fish assemblages. In the absence of fishing, the fish biomass may increase to approximate more closely the biomass at the NWHI, though for more mobile fishes such as the apex predators that would move beyond the park boundaries, the effects may be attenuated to some degree by fishing that would occur beyond the park.
131
Threatened and Endangered Species: Threatened and endangered species reported from the waters at KALA include Chelonia mydas (green sea turtle–threatened) and Megaptera novaeangliae (humback whale–endangered) (Brown et al. 2008). Monachus schauinslandi (Hawaiian monk seal–endangered) is regularly seen using the beaches and would therefore be expected to transit the coastal areas of KALA (Brown et al. 2008, section 2.3.3.3, Threatened and Endangered Species). 2.3.1.4 Information Gaps: Monitoring of the ecological community and abiotic factors needs to be continued to determine long-term trends occurring in the coastal reefs at KALA and to identify threats early. Annual monitoring will develop a robust data set upon which changes in the fish and benthic cover can be determined over time. More transects are needed in zones C, E, and F, which are inaccessible frequently due to weather conditions, but should be surveyed as weather permits. Macroinvertebrate surveys documenting species and abundance are also recommended. 2.3.2 Offshore Islets 2.3.2.1 Previous Studies and Inventories:
Coles et al (2008) conducted reconnaissance and quantitative surveys at the two offshore islets, ‘Ōkala and Nāmoku, within the KALA boundary by Bishop Museum in 2007. An additional islet, Mōkapu, which lies offshore of the KALA boundary, was also surveyed in this study.
Surveys by Coles et al. (2008) were conducted on the lee sides of the islands. Species occurrences were recorded during the reconnaissance surveys, followed by transect surveys where quantitative measurements were taken to determine the abundance of corals, algae, and fish density and size classes. Methods employed were adapted from the rapid assessment techniques established during the 2000 Northwestern Hawaiian Islands Expedition (Maragos and Gulko 2002) and later modified by Gulko (2005). Only one marine survey of the offshore islets has been conducted thus far. 2.3.2.2 Physical Environment and Water Quality: Mokapu, Ōkala, and Huelo islets off the coast of the KALA peninsula are exposed to the tradewind swells year round and also to the North Pacific swells in the winter (see section 2.3.1.2). Another small emergent pinnacle, Nāmoku, is on the leeward side of Kalaupapa peninsula. The shallow water surrounding Nāmoku was surveyed from a depth of 11–22 m (36–72 ft) (Coles et al 2008). The substratum was dominated by a flat basalt bench with cracks and grooves. Outside of this zone are numerous channels extending down to 22 m (72 ft), with large basalt boulders. Ōkala Islet is approximately 130 m (430 ft) north of Leinaopapio Point and 1.5 km (0.9 mi) to the east of Kalaupapa peninsula. The western end of Ōkala Islet is dominated by a large cave that extends through the islet. Mokapu is the farthest offshore (1.1 km northeast of Leinaopapio Point) and like the other islets has a basalt substratum. Both Mokapu and Ōkala are characterized by vertical walls around the island extending down to sand substrates at depths of 50 m (165 ft) and 24 m (80 ft) respectively.
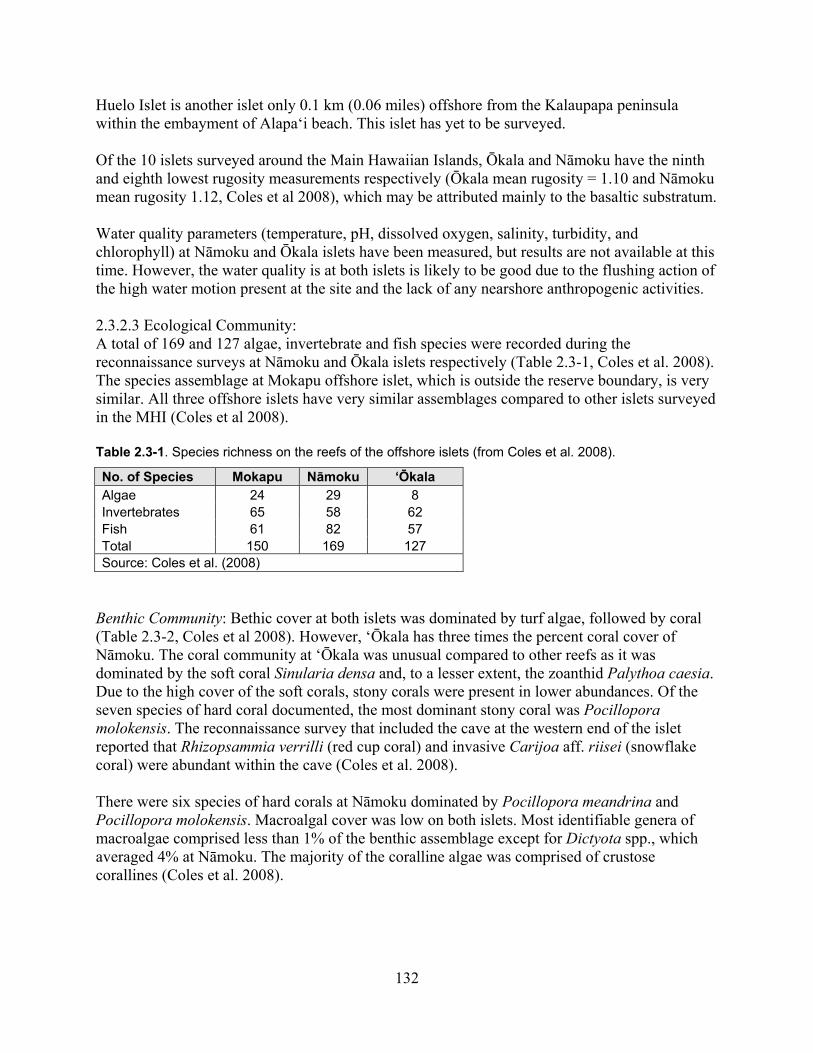
132
Huelo Islet is another islet only 0.1 km (0.06 miles) offshore from the Kalaupapa peninsula within the embayment of Alapa‘i beach. This islet has yet to be surveyed. Of the 10 islets surveyed around the Main Hawaiian Islands, Ōkala and Nāmoku have the ninth and eighth lowest rugosity measurements respectively (Ōkala mean rugosity = 1.10 and Nāmoku mean rugosity 1.12, Coles et al 2008), which may be attributed mainly to the basaltic substratum. Water quality parameters (temperature, pH, dissolved oxygen, salinity, turbidity, and chlorophyll) at Nāmoku and Ōkala islets have been measured, but results are not available at this time. However, the water quality is at both islets is likely to be good due to the flushing action of the high water motion present at the site and the lack of any nearshore anthropogenic activities. 2.3.2.3 Ecological Community: A total of 169 and 127 algae, invertebrate and fish species were recorded during the reconnaissance surveys at Nāmoku and Ōkala islets respectively (Table 2.3-1, Coles et al. 2008). The species assemblage at Mokapu offshore islet, which is outside the reserve boundary, is very similar. All three offshore islets have very similar assemblages compared to other islets surveyed in the MHI (Coles et al 2008). Table 2.3-1. Species richness on the reefs of the offshore islets (from Coles et al. 2008).
No. of Species Mokapu Nāmoku ‘Ōkala Algae 24 29 8 Invertebrates 65 58 62 Fish 61 82 57 Total 150 169 127 Source: Coles et al. (2008)
Benthic Community: Bethic cover at both islets was dominated by turf algae, followed by coral (Table 2.3-2, Coles et al 2008). However, ‘Ōkala has three times the percent coral cover of Nāmoku. The coral community at ‘Ōkala was unusual compared to other reefs as it was dominated by the soft coral Sinularia densa and, to a lesser extent, the zoanthid Palythoa caesia. Due to the high cover of the soft corals, stony corals were present in lower abundances. Of the seven species of hard coral documented, the most dominant stony coral was Pocillopora molokensis. The reconnaissance survey that included the cave at the western end of the islet reported that Rhizopsammia verrilli (red cup coral) and invasive Carijoa aff. riisei (snowflake coral) were abundant within the cave (Coles et al. 2008). There were six species of hard corals at Nāmoku dominated by Pocillopora meandrina and Pocillopora molokensis. Macroalgal cover was low on both islets. Most identifiable genera of macroalgae comprised less than 1% of the benthic assemblage except for Dictyota spp., which averaged 4% at Nāmoku. The majority of the coralline algae was comprised of crustose corallines (Coles et al. 2008).

133
Table 2.3-2. Benthic cover at the offshore islets.
Hard and Soft Coral
Macroalgae Coralline Turf Cyano-bacteria
Substratum Other
‘Ōkala 30.3 0.7 5.6 55.0 4.1 2.8 1.4 Nāmoku 9.5 4.3 6.4 71.8 7.8 0.15 0.1 Source: Coles et al. (2008).
Cryptogenic species are those that are not demonstrably native or introduced but considered potentially introduced (Chapman 1988, Chapman and Carlton 1991). A total of two cryptogenic species and two introduced invertebrate species were recorded on Nāmoku, and two cryptogenic species and three introduced invertebrate species on ‘Ōkala (see Table 2.3-3). No introduced or invasive algal species were found on either islet. The introduced invasive snowflake coral Carijoa aff. riisei occurred on both islets and was very abundant in the cave at ‘Ōkala. Other introduced invertebrates include the serpulid polychaete Salmacina disticha, present on both islets, and the bryozoan Bugula dentata on ‘Ōkala (Coles et al. 2008). Cryptogenic species for both islets consisted mostly of Hydroids (class: Hydrozoa). One possible source of these cryptogenic introductions could be from the hulls of boats that dock at Kalaupapa Harbor or from the emptying of ballast water in waters off the peninsula. Table 2.3-3. Introduced and cryptogenic invertebrate species for the offshore islets.
Taxa Family Scientific name Origin Nāmoku ‘Ōkala
Hydrozoa Halopterididae Antennella secundaria Cryptogenic X Plumulariidae Plumularia strictocarpa Cryptogenic X Sertulariidae Sertularella diaphana Cryptogenic X Sertularella tongensis Cryptogenic X Anthozoa Telestidae Carijoa aff. riisei Introduced X X Polychaeta Serpulidae Samacina dysteri Introduced X X Entoprocta Bugulidae Bugula dentata Introduced X Source: Coles et al. (2008).
Fish Community: The number of fish species within each trophic level is shown in Table 2.3-1. ‘Ōkala had slightly fewer fish species than the average for the Main Hawaiian Islands (Coles et al 2008). However, ‘Ōkala exceeded the Main Hawaiian Islands in the biomass of herbivores and target species. Target species are fish commonly targeted by fishermen (Coles et al. 2008). Nāmoku also exceeded the average fish biomass as well as the target fish biomass levels of the MHI. Nāmoku was also one of two islets in the entire offshore islet survey (out of a total of ten) that recorded the presence of apex predators. Of the ten surveyed islets, ‘Ōkala and Nāmoku were ranked 5th and 8th respectively in terms of total fish biomass (Coles et al. 2008). Both species of introduced Lutjantids, Lutjanus kasmira (ta‘ape) and L. fulvus (to‘au), were present at Nāmoku, while the introduced grouper Cephalopholis argus (roi) was reported only from ‘Ōkala (Coles et al. 2008). All three introduced fish species were also found in the sub-tidal zones of the Kalaupapa Peninsula (NPS, unpublished), thus, even if not recorded are likely to be found on both islets as well. Other notable fish include the frequently targeted food fish
134
Monotaxis grandoculis (mu) at Nāmoku, and a prized aquarium fish, Desmoholacanthus arcuatus (bandit angelfish), at shallow depths (<30 m) at ‘Ōkala (Coles et al. 2008). Both species are also present at the coastal reefs of the Kalaupapa peninsula (NPS, unpublished), and are likely to occur on both islets even if not recorded thus far. Parupeneus cyclostomus (moana kea), a less common goatfish, was seen on both islets and is also present on the Kalaupapa peninsula (Coles et al. 2008). Threatened and Endangered Species: Coles et al. (2008) did not observe any threatened or endangered species during their surveys. Rare species include the alga Sporochnus dotyi at Nāmoku. Small colonies of the valuable black coral Myriopathes ulex are present at ‘Ōkala. This black coral is listed under CITES Appendix II. The rare cup coral Rhizopsammia verrilli was also present in the cave that extends through the islet. The densities of the soft coral Sinularis densa, while not rare, was unusually abundant at ‘Ōkala (Coles et al. 2008). 2.3.2.4 Information Gaps: Water quality at the offshore islets should be sampled to obtain a baseline for future comparisons. Should nearshore water quality start to deteriorate, regular water quality monitoring at the offshore islets should be implemented to document if water quality at the offshore islets are also being affected. Since only one survey has been conducted at the offshore islets and it was restricted to the lee side of the islets, there is clearly more information needed for these sites. The islet Huelo has yet to be surveyed. Yearly monitoring should be conducted to document changes in the benthic habitat and fish assemblages and particularly to monitor the documented invasive species (e.g., C. riisei and introduced fish species). Surveys should also be conducted to document and quantify benthic habitat and species found on the windward side of the islets when weather permits. 2.3.3 Intertidal Zone The intertidal zone at KALA encompasses sandy beaches, cobble and boulder beaches, sea cliffs, raised basalt and limestone benches and tide pools (Figure 2.3-11).The supra-littoral beach zones present at KALA consist of boulder/cobble, calcareous and basaltic rubble and sandy substrate or are a composite of more than one substrate. The entire range of supra-littoral zones described in the Hawaiian Islands are present at KALA (Godwin and Bolick, 2006). Sea cliffs dominate the areas immediately inland of the intertidal zone to the west of the peninsula. 2.3.3.1 Previous and Ongoing Studies and Inventories: Information from abiotic monitoring and biological studies of the intertidal zone are available for KALA. These studies are listed below. Abiotic Factors:
The National Park Service and I&M have monitored water quality in the marine environment since 2008 (unpublished).
Algae and Plants:
UH-Manoa initiated a marine algae inventory in 2005 but the study is still ongoing.
135
NPS staff has monitored the presence of the alien red algae Acanthophora spicifera found in tide pools around the peninsula since 2005 and eradication efforts are ongoing.
Surveys by the National Park Service to collect and identify driftseeds along the high tide drift line at Ho‘olehua Beach were scheduled to begin in 2009.
Invertebrates:
Minton and Carnevale (2006) surveyed marine invertebrates in August 2003 at seven intertidal locations, most of which were located on the west side of the peninsula.
Godwin and Bolick (2006) surveyed 12 sites for marine invertebrates, six of which were the same sites as those examined by Minton and Carnevale (2006) in September 2004.
The survey locations for both studies are shown in Figure 2.3-11. Both reports presented species inventories and quantitative surveys; however, their results are not directly comparable due to the differences in methodology. Minton and Carnevale (2006) surveyed transects from the supra-littoral zone to within the surf zone, while Godwin and Bolick (2006) terminated their transects at the low-tide mark.
NPS staff at KALA initiated intertidal habitat surveys in 2002 with emphasis on
quantifying the distribution and abundance of Cellana spp. (opihi) (Hughes and Carnevale 2004, E. Brown/NPS, pers. comm.). These surveys are ongoing and will be conducted semi-annually in collaboration with UH-Hilo.
Kay et al. (2005) undertook a study of Cellana spp. at KALA between May 2004 and May 2005. This was part of a larger statewide assessment of the population structure and reproductive patterns of C. exarata, C. sandwicensis, and C. talcosa.
Bird et al. (2007) sampled Cellana spp. at KALA between 2003 and 2005 to determine the population genetic structure of the three species within the state (main Hawaiian Islands and North-west Hawaiian Islands) and within individual islands.
Avifauna:
Marshall and Aruch (2003) conducted shoreline bird surveys of seabirds, migratory shorebirds, and waterbirds in September and November 2003. Kozar et al. (2007) completed a similar study in April 2005.
Mammals: NPS staff is conducting surveys to document abundance of and habitat use by Monachus
schauinslandi (monk seals) along the west side of the KALA peninsula (see Figure 2.3-12). These surveys commenced in August 2005 and are ongoing. As of 2007, each location is surveyed weekly.
NPS staff and UH-Hilo commenced a study in 2008 recording daily observations of monk seal nursing behavior and mother and pup distribution patterns during the Monachus schauinslandi pupping season (February to July).
136
Other: The National Park Service has been conducting ongoing surveys since 2005 to quantify
and describe the composition of debris at Ho‘olehua Beach. The surveys are conducted opportunistically two to three times a year.
2.3.3.2 Physical Environment and Water Quality: Physical Environment: The eastern coastline of KALA from the mouth of Waikolu Stream to Kahiu Point is exposed to tradewind-driven waves and is considered a high wave energy area. The shoreline here consists of steep high cliffs, microfjords, and basalt/boulder/cobble beaches (Eichenlaub 2001, Minton and Carnevale 2006). The western shore from Kahiu Point to Awahua Beach is characterized by zones of medium and low wave energy. The shoreline consists of lower cliffs, basalt sand beaches/boulders, and carbonate sand beaches (Figure 2.3-11) (Eichenlaub 2001, Minton and Carnevale 2006). Rugosity measurements of the shoreline were reported only by Minton and Carnevale (2006). The upper portion of Puwah Bench had the highest rugosity at 4.68, followed by Ka Lea Mau at 2.93. All other sites had rugosity values ranging from 1.07 to 1.52. Water Quality: Water quality in the intertidal is currently being monitored but data are not yet available (NPS and I&M, unpublished). 2.3.3.3 Ecological Community: Algae and Plants: UH-Manoa initiated a marine algae inventory in 2005, but results are not yet published. The red algae Acanthophora spicifera has been found in some of the tide pools around the peninsula (E. Brown/NPS, pers. comm.). NPS staff is monitoring the presence of the algae, and eradication efforts are ongoing. A few mangrove seedlings have also been documented but generally do not survive the winters (E. Brown/NPS, pers. comm.). Invertebrates: Surveys of the intertidal zone by Minton and Carnevale (2006), Godwin and Bolick (2006), and KALA biologists have identified 326 species of invertebrates comprising 11 phyla and 24 classes (see Figure 2.3-13 and Table 2.3-4). Arthropods were the most speciose (123 species) with more than half the species consisting of decapod crustaceans within the class Malacostraca. Mollusks were represented by 95 species and dominated by gastropods. Mollusks had the highest degree of endemism to the Hawaiian islands of all the phyla present. Echinoderms are considered abundant and diverse at KALA (Godwin and Bolick 2006) with two new species of holothurians (as yet unnamed) discovered at KALA in 2004. One new species of amphipod (Psuedambasia kalaupapa, Longenecker and Bolick 2006) was also found in the same survey.
137
Figure 2.3-11. Intertidal substrates and survey locations.
Sou
rce:
US
GS
; Na
tion
al P
ark
Se
rvic
eLe
gen
d
Park
Bou
nda
ry
Inte
rtid
al S
urve
y Lo
cati
ons
Min
ton e
t al
2006
(Surv
eyed
in 2
003
)
Godw
in a
nd B
olic
k 20
06
(Surv
eyed
in 2
004
)
Inte
rtid
al S
ubst
rate
sBas
alt
sand
bea
ch/b
ould
ers
Car
bon
ate
sand
bea
ch
Low
bas
alt
cliff
s
Mic
rofj
ords
Ste
ep C
liffs
2,00
00
2,00
01,
000
Feet
1,00
00
1,00
050
0
Met
ers
Pa
cif
ic
Oc
ea
n
Do
ck
Pu
wah
Kau
wo
Kah
ili
Pik
o'o
ne
Ka
Lae
ma
u
Lig
hth
ou
se
Mo
rmo
n P
on
d
Pu
wah
Ben
ch
Lae
Ho
ole
hu
a
Ka
Lae
mil
o P
t
Old
Lad
y C
ave
Pap
alo
a B
eac
h
Ch
urc
h P
ast
ure
Pik
o’o
ne
Ben
chCar
pen
ter
Ben
ch
Mo
rmo
n P
on
d/C
hu
rch
Pas
ture
Kal
aup
ap
a N
ati
on
al H
isto
ric
Pa
rk
138
Figure 2.3-12. Monk seal survey locations.
Source: USGS; National Park ServiceLegend
Park Boundary
Monk Seal Survey Areas
Ilio Pt
Kahikilo
Kalaemilo
Papaloa
Tomio Pt
1,000 0 1,000500
Feet
500 0 500250
Meters
P a c i f i c O c e a n
NamokuNamoku
Tomio Pt
Papaloa
Ilio Pt
Kalaemilo
Kahikilo
Kalaupapa National Historic Park
139
Table 2.3-4. Species composition of invertebrates in the intertidal zone.
Phylum Class No. of
species No. of native and endemic species
No. of Species Introduced (I),
Cryptogenic (C) Annelida Polychaeta 32 29 2I
Arthropoda Insecta 1 1
Arthropoda Malacostraca 119 116 2I, 1C
Arthropoda Maxillopoda 3 3
Cnidaria Anthozoa 15 15
Cnidaria Hydrozoa 1 0 1I
Echinodermata Asteroidea 3 3
Echinodermata Echinoidea 12 12
Echinodermata Holothuroidea 19 19
Echinodermata Ophiuroidea 6 6
Echuria Echiuroidea 1 1
Hemichordata Enteropneusta 1 1
Mollusca Bivalvia 6 6
Mollusca Cephalopoda 1 1
Mollusca Gastropoda 78 77 1C
Mollusca Nudibranchia 1 1
Mollusca Opisthobranchia 6 6
Mollusca Polyplacophora 3 3
Nemertina Anopla 2 2
Porifera 2 2
Sipuncula Phascolosomatidea 3 3 Urochordata Ascidiacea 11 6 4I, 1C
326 314 9I, 3C
Source: Minton and Carnevale (2006) and Godwin and Bolick (2006).
The marine invertebrate assemblage at KALA is similar to other windward intertidal zones throughout the Hawaiian Islands (Godwin and Bolick 2006). Analysis of similarity by Godwin and Bolick (2006), which include many of the sites surveyed by Minton and Carnevale (2006), indicate that the species assemblages cluster into two main groupings. One group consists of the assemblage found on high wave energy basaltic flows fringed by boulders. The second group encompassed all other habitats. The intertidal zones at Kahili (basaltic substrate with boulders throughout) and Ka Lae Mau (extensive tide pools) were identified as unique habitats with unique species (a new species of holothurid found at each site). Mormon Pond (entirely boulder habitat) and Papaloa Beach (drowned reef substrate) were identified as habitats with a high abundance of rare species (Figure 2.3-11).
140
Figure 2.3-13. Number of invertebrate species represented within their respective phyla and the percentage of each phylum represented within the intertidal zone at KALA. Nerita picea, an endemic intertidal neritid gastropod, was commonly found by both studies [0.5–196 indiv/m2 (Minton and Carnevale 2006), 0.2 – 43.5 indiv/m2 (Godwin and Bolick 2006)], and was present at nearly all transects. This species was particularly abundant at Puwah Bench in 2003 but was present in low numbers in 2004. Another gastropod, the indigenous Littoraria pintado (2.2–170.2 indiv/m2), was also common, occurring in particularly high numbers at Papaloa Beach (Godwin and Bolick 2006). Nesochthamalus intertextus, a barnacle (1–219.5 indiv/m2), was common at Puwah Bench and Papaloa Beach (Godwin and Bolick 2006). Minton and Carnevale (2006) also documented Cellana abundance and two species, C. exerata (2.2–37.6 indiv/m2) and C. sandwicensis (2.1–9.7 indiv/m2) were common. The third species, C. talcosa (0.7–3.l indiv/m2), occurred in smaller numbers (Minton and Carnevale 2006). The three species of Cellana are separated spatially: C. exarata resides high above the waterline; C. sandwicensis typically resides mid- to low levels above the waterline; and C. talcosa resides subtidally. Minton and Carnevale (2006) also stated in their report that “Hawaiian opihi [at KALA] are numerous and large, among the largest observed in the main eight Hawaiian Islands.”
Annelida, 32, 9.8%
Arthropoda, 123, 37.7%
Cnidaria, 16, 4.9%
Echinodermata, 40, 12.3%
Echuria, 1, 0.3%
Hemichordata, 1, 0.3%
Mollusca, 95, 29.1%
Nemertina, 2, 0.6%
Porifera, 2, 0.6% Sipuncula, 3, 0.9%
Urochordata, 11, 3.4%
141
The population genetics of all three species of Cellana (opihi) at KALA were studied by Kay et al. (2005) and Bird et al. (2007). The results of these studies suggested that high connectivity in C. exerata and C. sandwicensis exists between communities on the main Hawaiian Islands, while C. talcosa in Kaua‘i was separate from the population of Moloka‘i, Maui, and Hawai‘i. On a finer scale, connectivity along coastlines was higher than connectivity between adjacent islands (Kay et al. 2005, Bird et al. 2007). Cellana sandwicensis and C. exarata become reproductively mature between 20 and 25 mm (0.8–1.0 in) shell length (Kay 1977). Cellana talcosa matures at a larger size, 35 mm (1.4 in) shell length or 75% longer than C. sandwicensis. However, C. talcosa at KALA appears to grow faster than the other two species. Thus, C. talcosa may not necessarily take longer than C. sandwicensis and C. exarata to reach sexual maturity. A study conducted in 2002 (Hughes and Carnevale 2004) report mean sizes of Cellana spp. at 27 mm. This would indicate that reproductively mature individuals of C. sandwicensis and C. exarata are present. Hughes and Carnevale (2004) also indicated that larger individuals are found further down in the intertidal than smaller individuals. This observation is contrary to the behavior of other limpet species (Patella vulgate) where larger individuals, presumably more resistant to dessication, migrate upwards in the intertidal zone as they get larger (Hughes and Carnevale 2004). Possible explanations for this pattern reversal are pressures due to harvesting in the intertidal or the differences in growth rates of the different Cellana species that were not accounted for. Temporal growth rate measurements of opihi at KALA indicate that C. talcosa have growth rates that increase from May through September. Conversely, the growth rates of C. sandwicensis and C. exarata decrease from May through October, with a slight increase occurring from August to September. When the relationship between size and growth rates are examined, C. sandwicensis and C. talcosa have a significant negative relationship between growth rate (mm shell length/day) and body size (i.e., larger individuals grow more slowly). For C. exarata, the growth rate was not affected by size. There was also no detectable relationship between growth rate and the reproductive state of all species of Cellana at KALA (Kay et al. 2005). All three species exhibited a maximum of two spawning events a year at the national parks in Hawai‘i. C. exarata typically exhibited a May–July spawning event and a November–January spawning event but at KALA the summer spawning event occurred earlier between March and May. Due to heavy surf, no sampling of opihi occurred at KALA in winter, and winter reproductive data is not available (Kay et al. 2005). C. sandwicensis studied at other national parks in Hawai‘i spawned primarily between November and March, with sporadic summer spawning events. No C. sandwicensis spawning events were observed at KALA. C. talcosa spawned year round with the exception of October and the timing of spawning events was site specific. Spawning occurred between July and August at KALA. Winter spawning also occurred at other national parks. The timing of spawning of the different species is believed to be linked to their zonation in the intertidal. C. sandwicensis and C. exarata reside above the waterline and utilize submergence as a spawning cue, which may account for the synchronicity of spawning events between sites (Kay et al. 2005; Bird et al. 2007). C. talcosa resides subtidally, and its spawning may be driven by other factors. Currently, it is hypothesized that spawning for C. exarata or C. sandwicensis at KALA may be driven by the presence of the large
142
winter northwest waves (Kay et al. 2005). Spawning for both species is likely to occur at the end of the winter wave season due to the high percentage of spent gonads found during sampling that commenced after the season (Kay et al. 2005). Introduced and Invasive Invertebrate Species: Minton and Carnevale (2006) and Godwin and Bolick (2006) recorded a total of nine introduced invertebrate species and three cryptogenic species in the surveyed locations in the intertidal zone (see Table 2.3-4). Only one species, the stomatopod Gonodactylaceus falcatus, is reported to compete with native fauna and has been documented to aggressively displace the native stomatopod Pseudosquilla ciliata (Kinzie 1968), which was not found at KALA. None of the introduced species were considered invasive by Godwin and Bolick (2006) at KALA. Birds: Shoreline bird surveys were conducted in September and November 2003 (Marshall and Aruch 2003) and April 2005 (Kozar et al. 2007). Table 2.3-5 lists the species sighted during the 2003 and 2005 surveys. Figure 2.3-14 shows the locations of bird sightings during the April 2005 survey. Table 2.3-5. Bird species observed from the shoreline of KALA.
Black-crowned Night Heron, Pacific Golden Plover, Ruddy Turnstone, and Wandering Tattler were all observed foraging in the tide pools along the shoreline, on the beaches, or among the strand vegetation (Marshall and Aruch 2003; Kozar et al. 2007). Black Noddies are known to nest along the cliffs of the eastern coastline of the peninsula and possibly at Kūka‘iwa‘a (Kozar et al. 2007). Sooty Terns (Sterna fuscata) and Hawaiian Petrels (Pterodroma sandwichensis) have also been detected incidentally (Kozar et al. 2007). Wedge-tailed Shearwaters were detected audibly from Waikolu Valler Beach in 2003 (Marshall and Aruch 2003). Threatened and Endangered Species: The beaches of Kalaupapa have become a premier birthing location for the endangered Hawaiian monk seal (Monachus schauinslandi) (Brown et al. 2008). As of 2008, a total of 40 endangered M. schauinslandi, 22 males and 18 females, utilize the intertidal zone of KALA and up to seven pups are born annually on the peninsula (Brown et al. 2008, NPS unpublished). M. schauinslandi has a preference for the sandy habitat found on Papalaoa Beach and ‘Ilio Point (Figure 2.3-15), where pupping takes place in spring and
Species Name Type Scientific Name 2003
Survey 2005
Survey Black-crowned Night Heron
Waterbird Nycticorax nycticorax X
Black Noddy Seabird Anous minutus X
Brown Booby Seabird Sula leucogaster X X
(Sula sp.) Great Frigate Bird Seabird Fregata minor X X Pacific Golden Plover Migratory shorebird Pluvialis fulva X X Red-tailed Tropic Bird Seabird Phaethon rubricauda X X Ruddy Turnstone Migratory shorebird Arenaria interpres X X Wandering Tattler Migratory shorebird Heteroscelus incanus X X Wedge-tailed Shearwater Seabird Puffinus pacificus X X White-tailed Tropic Bird Seabird Phaethon lepturus X X Source: Marshall and Aruch (2003) and Kozar et al. (2007).
143
summer. Fewer sighting occur on the neighboring basaltic habitats. A total of 38 pups have been born at KALA since 1997 (E. Brown/NPS, pers. comm., Molokai Dispatch June 18, 2008. http://www.themolokaidispatch.com/node/2160). Monk seals are most often observed from the months of May through August (Figure 2.3-15) and decrease in density from January to March as M. schauinslandi depart the peninsula (Figure 2.3-16). Threatened green sea turtles (Chelonia mydas) have been regularly seen foraging in the nearshore environment, but have not been observed to haul out in the intertidal to rest (Brown et al. 2008). Nesting activities have been recorded on the main black sand beach (Piko‘one) every year since 2005, but prior to 2009 most of these nests appeared to be false nests. In 2009, however, two successful nests hatched on August 20th and September 5th, releasing 49 and 50 hatchlings respectively (E. Brown/NPS, pers. comm.). 2.3.3.4 Information Gaps: The mollusk and echinoderm inventories are probably the most complete (33–66 % complete, Minton and Carnevale 2006). Surveys of all other phyla of invertebrates have yet to approach this level (Minton and Carnevale 2006). The two existing surveys of marine invertebrates in the intertidal also do not adequately document fast-moving species due to the sampling methodology. As sampling was conducted in the day, nocturnal species are under-represented (Minton and Carnevale 2006), as are species found in the sediment (infaunal species) and micro-invertebrates (under approximately 1 cm in size).
144
Figure 2.3-14. Locations of bird sightings within the intertidal zone in 2005.

145
Figure 2.3-15. Monk seal sighting frequencies at different sites at KALA.
Figure 2.3-16. Monk seal observations at KALA for different months (all sites combined).
0
10
20
30
40
50
60
Tomio Pt Ilio Pii Kalaemilo Papaloa Kahikilo
Average
no. of sightings per year
0
5
10
15
20
25
30
Jan Feb Mar Apr May Jun Jul Aug Sep Oct Nov Dec
Average
no. of sightings per month
146
Chapter 3: Threats & Stressors
The following section discusses existing and potential threats and stressors to the physical environment and ecological communities within the marine, freshwater, and terrestrial ecosystems at KALA. Threats are defined as “environmental trends with potentially negative impacts” (Bruckner et al. 2005). According to the National Park Service, stressors are the “physical, chemical, or biological perturbations to a system that are either (a) foreign to that system or (b) natural to the system but applied at an excessive [or deficient] level. Stressors cause significant changes in the ecological components, patterns, and processes in natural systems” (NPS 2006b). In this report, threats and stressors are classified as biotic or abiotic. Biotic threats and stressors are caused by biological or anthropogenic activities, while abiotic threats and stressors are caused by physical or chemical processes, such as weather patterns. It is recognized that the origins of the abiotic threats and stressors (such as climate change) may be biotic or anthropogenic. A total of 12 biotic and five abiotic existing and potential threats and stressors were identified for KALA. These are discussed in detail in Sections 3.1 to 3.10 below. A summary of the threats and stressors and their knowledge base is presented in Section 3.11. The various threats and stressors are also ranked based on the estimated magnitude of impact of each threat or stressor on the different ecosystems. 3.1 Invasive Species An invasive species is defined as “an alien species whose introduction does or is likely to cause economic or environmental harm or harm to human health” (Executive Order 13112). Isolated island ecosystems, such as Hawai‘i, are vulnerable to non-native species due to a variety of factors (Loope and Muller-Dombois 1989, Clements and Daehler 2007). Islands typically have high habitat diversity, favorable climate, high resource availability, low biotic resistance, small populations, and limited social capital (Denslow et al. 2008). Invasive species are recognized as a major threat to native ecosystems and to the survival of threatened and endangered species (Pimental 2005). They affect island ecosystems in a variety of ways. Invasive species compete with native flora and fauna, carry diseases, affect trophic structure, change fire regimes, alter nutrient cycling patterns, modify surface runoff of water, and alter biodiversity (Vitousek 1990; D’Antonio and Vitousek 1992; Vitousek 1992; Belt Collins Hawai‘i LTD 2008). Due to the prevalence of invasive plant and animal species at KALA, invasive species are separated into several categories to better characterize the impacts. 3.1.1 Invasive Ungulates Feral ungulates, including Sus scrofa, Capra hircus, and Axis axis, are a significant threat to the natural resources at KALA. Of these, A. axis are believed to be the most damaging (Aruch 2006). Ungulates are known to adversely affect the Hawaiian Islands wherever they occur and are attributed as some of the leading causes for the decline of Hawai‘i’s natural ecosystems. By grazing, browsing, wallowing, and rooting, ungulate activity results in a myriad of impacts including land erosion; stream and reef siltation; spread of invasive plants and diseases; loss of native, threatened, and endangered plant and animal species; and degradation of native species’ habitat (Scowcroft and Conrad 1992, Stone et al. 1992, Nowak 1999, Aruch 2006).
147
Sus scrofa were introduced to the Hawaiian Islands by Polynesian settlers as early as 400 A.D. and again by the European explorer Captain James Cook in 1778 (Katahira et al. 1993). At KALA, Sus scrofa and evidence of S. scrofa are primarily concentrated on the outskirts of the existing Kalaupapa Settlement, specifically near the landfill and in the woody areas south of Kalawao Road (NPS 2006a). Over 50 S. scrofa are believed to occur in the fenced coastal area of KALA (G. Hughes/NPS, pers. comm.). Extensive S. scrofa damage has been noted on the Pu‘u Ali‘i plateau and in Waikolu Valley (Aruch 2006). In 2002, NPS staff estimated that S. scrofa inhabited roughly 2,833 ha (7,000 ac). Captain Cook first introduced Capra hircus to Ni‘ihau in 1778 (Spatz and Mueller-Dombois 1973, Coblentz 1978, Stone and Anderson 1988). By 1793, C. hircus appeared common on most of the inhabited Hawaiian Islands and have since dispersed into all vegetation types where dry seasons occur on the islands of Kaua‘i, Maui, Moloka‘i, Kaho‘olawe, and Hawai‘i (Spatz and Mueller-Dombois 1973, Stone and Anderson 1988, KWA 2005). Capra hircus primarily occur in the more remote areas of KALA. NPS staff estimated that C. hircus inhabited roughly ha 2,428 ha (6,000 ac) of KALA in 2002. Axis axis were released on Moloka‘i in 1868 as a gift to King Kamehameha V (Canfield 1990, Goltz et al. 2001). Between 1868 and 1898 the number of deer jumped from 1,868 to 7,000. In 1961, after several professional hunts, the population was estimated at 3,000. By 1998, the deer population on the peninsula had declined to over 1,000, with more than 400 occurring inside the settlement (NPS, unpublished). Goltz et al. (2001) reported that A. axis at KALA have a relatively small, localized home range size relative to the available landscape compared to other locations. This is likely due to abundant cover, forage, and water in close proximity, limiting the need for deer to travel far for resources. Of the five deer tracked throughout KALA, the average home range size was 52.7 ha (130 ac). During daytime, A. axis concentrate in areas with the thickest vegetation cover (usually Schinus terebinthefolius), while at night they graze in grassy areas. Goltz et al. (2001) reported that A. axis at KALA seem relatively habituated to human disturbance, such as construction and activity at landfills. 3.1.1.1 Impacts to the Terrestrial Ecosystem: The behavior and activities of S. scrofa, C. hircus, and A. axis have significant, cascading adverse impacts on all of the terrestrial management zones at KALA (except the ungulate-free offshore islets). Because native Hawaiian species did not evolve with mammals, plants are not adapted to grazing by ungulate herbivores, and native birds are susceptible to mammalian depredation (Stone 1985; Moors et al. 1992; Scowcroft and Conrad 1992; Stone et al. 1992). Non-native ungulates contribute to the loss of native plant habitat and alter or destroy ecological relationships (Ikuma et al. 2002, Courchamp et al. 2003, Cruz et al. 2009). These animals trample, graze, and consume a variety of plant material, including leaves, fruits, flowers, bark, seeds, rhizomes, and tubers (Diong 1982, Chimera et al. 1995, DEH 2004, Shi et al. 2005). Sus scrofa also forage for plant material and invertebrates using their noses to dig in the soil and expose fresh roots and shoots (Conry 1989, KWA 2005, Department of Navy 2006). These activities can decrease the distribution of single species, as well as overall forest composition and canopy cover, which ultimately can disrupt ecological processes, such as succession (Lowe et al.
148
2000). Sus scrofa disturbance also negatively affects seedling regeneration by reducing the density and basal area of seedlings (Diong 1982, Busby in press). Foraging behaviors may also indirectly impact native birds by reducing the amount of nectar produced by understory plants (Stone 1985, Nogueira-Filho, in press). Axis axis have been specifically identified in the decline of local populations of several native plants, including Scaevola gaudichaudii (naupaka), Vitex rotendifolia (pohinahina), and Sida fallax (‘ilima) (Yost and Wright 1999, Goltz et al. 2001). Damage to the understory creates forest gaps for colonization by new plants and seeds, thereby facilitating the spread of invasive plant species that out-compete native species (Diong 1982, Linney 1987, LaRosa 1992, Stone et al. 1992). Ungulates can further spread invasive plant seeds by consuming fruits and large seeds. Conversely, the consumption of native fruit and large seeds by non-native ungulates further reduces the potential for successful plant reproduction and forest regeneration (Wiles et al. 1999, Ali 2004). Invasive species can also be vectors for pathogens and diseases (Atkinson et al. 2005), which is discussed further in Section 3.2. Overgrazing, rooting, trampling, and other behaviors can denude areas and cause extensive soil erosion (Tep and Gaines 2003, Liddle et al. 2006). By reducing canopy cover and disturbing soil, ungulates also increase the amount of sunlight reaching the soil surface, which alters soil properties such as temperature, salinity, elevation, and soil structure. Cascading effects of changes to soil properties cause a disruption to ecosystem function by increasing the rate of decomposition and evaporation (Ford and Grace 1998). Constant trampling causes soil compaction that can deplete the soil of needed oxygen (Van Driesche and Van Driesche 2004). Furthermore, ungulates directly influence understory invertebrates by removing food resources from lower trophic levels (Allombert et al. 2005). Caves and cave resources throughout KALA are highly threatened due to removal or modification of surface vegetation (F. Howarth/Bishop Museum, pers. comm.). Plant roots that penetrate deep underground to obtain water and nutrients are the main energy source for cave ecosystems. This important food base is disrupted by grazing and trampling of ungulates (Stone and Howarth 2007). 3.1.1.2 Impacts to the Freshwater Ecosystem: Invasive ungulates degrade freshwater resources by facilitating erosion and subsequent siltation and pollution of surface waters. Riparian vegetation prevents erosion and traps sediments during heavy rain events. By trampling and removing this vegetation and compacting the soil, ungulates can alter the rate of infiltration and surface runoff (Strauch et al. 2009). Ungulate activity can cause geomorphological changes to riparian ecosystems by increasing bank instability and widening stream channels (McIver and McInnis 2007). Erosion and geomorphological alterations have been documented to reduce water quality and also impact benthic macroinvertebrate communities (Magner et al. 2008, Strauch et al. 2009). 3.1.1.3 Impacts to the Marine Ecosystem: Ungulates have the potential to indirectly degrade coastal marine ecosystems and water quality through sedimentation carried to the sea by storm waters and winds. Rooting and digging by pigs, deer, and goats result in barren land and accelerate erosion and subsequent sedimentation on the coral reefs (Stone et al. 1992, Ikagawa 2006). During rainstorms, sediments generated from upland areas can cascade onto the beach area (CRAMP 2008).
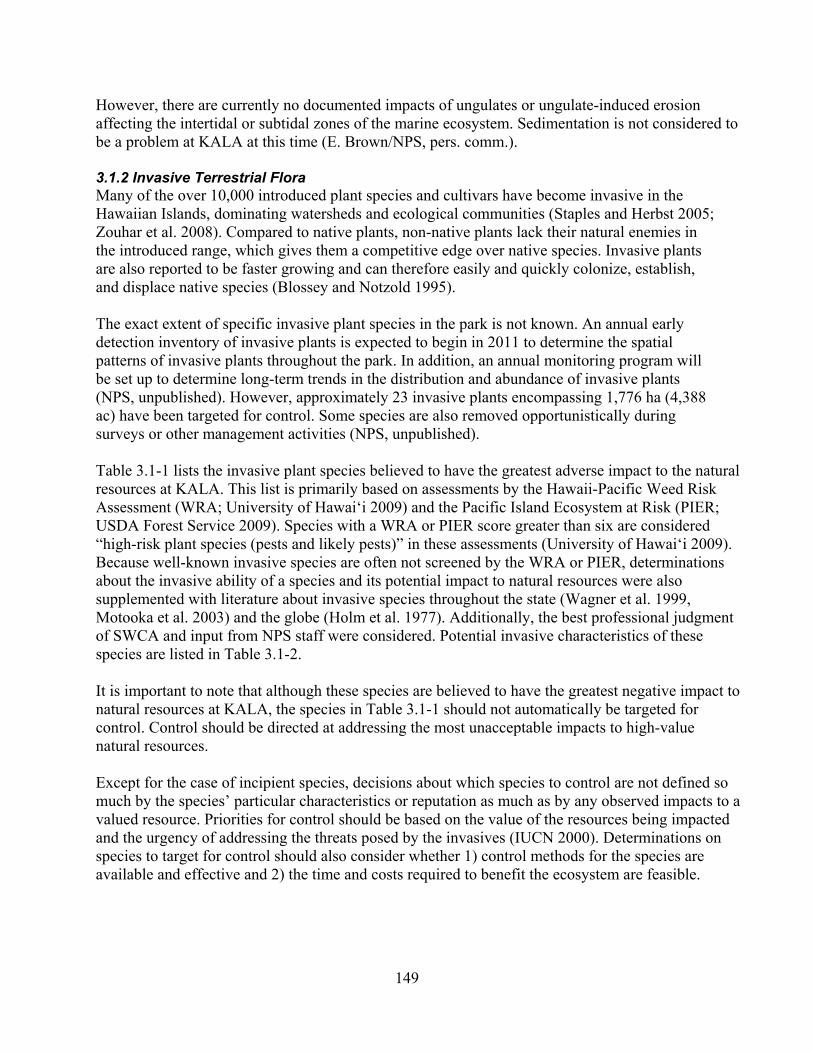
149
However, there are currently no documented impacts of ungulates or ungulate-induced erosion affecting the intertidal or subtidal zones of the marine ecosystem. Sedimentation is not considered to be a problem at KALA at this time (E. Brown/NPS, pers. comm.). 3.1.2 Invasive Terrestrial Flora Many of the over 10,000 introduced plant species and cultivars have become invasive in the Hawaiian Islands, dominating watersheds and ecological communities (Staples and Herbst 2005; Zouhar et al. 2008). Compared to native plants, non-native plants lack their natural enemies in the introduced range, which gives them a competitive edge over native species. Invasive plants are also reported to be faster growing and can therefore easily and quickly colonize, establish, and displace native species (Blossey and Notzold 1995). The exact extent of specific invasive plant species in the park is not known. An annual early detection inventory of invasive plants is expected to begin in 2011 to determine the spatial patterns of invasive plants throughout the park. In addition, an annual monitoring program will be set up to determine long-term trends in the distribution and abundance of invasive plants (NPS, unpublished). However, approximately 23 invasive plants encompassing 1,776 ha (4,388 ac) have been targeted for control. Some species are also removed opportunistically during surveys or other management activities (NPS, unpublished). Table 3.1-1 lists the invasive plant species believed to have the greatest adverse impact to the natural resources at KALA. This list is primarily based on assessments by the Hawaii-Pacific Weed Risk Assessment (WRA; University of Hawai‘i 2009) and the Pacific Island Ecosystem at Risk (PIER; USDA Forest Service 2009). Species with a WRA or PIER score greater than six are considered “high-risk plant species (pests and likely pests)” in these assessments (University of Hawai‘i 2009). Because well-known invasive species are often not screened by the WRA or PIER, determinations about the invasive ability of a species and its potential impact to natural resources were also supplemented with literature about invasive species throughout the state (Wagner et al. 1999, Motooka et al. 2003) and the globe (Holm et al. 1977). Additionally, the best professional judgment of SWCA and input from NPS staff were considered. Potential invasive characteristics of these species are listed in Table 3.1-2. It is important to note that although these species are believed to have the greatest negative impact to natural resources at KALA, the species in Table 3.1-1 should not automatically be targeted for control. Control should be directed at addressing the most unacceptable impacts to high-value natural resources. Except for the case of incipient species, decisions about which species to control are not defined so much by the species’ particular characteristics or reputation as much as by any observed impacts to a valued resource. Priorities for control should be based on the value of the resources being impacted and the urgency of addressing the threats posed by the invasives (IUCN 2000). Determinations on species to target for control should also consider whether 1) control methods for the species are available and effective and 2) the time and costs required to benefit the ecosystem are feasible.
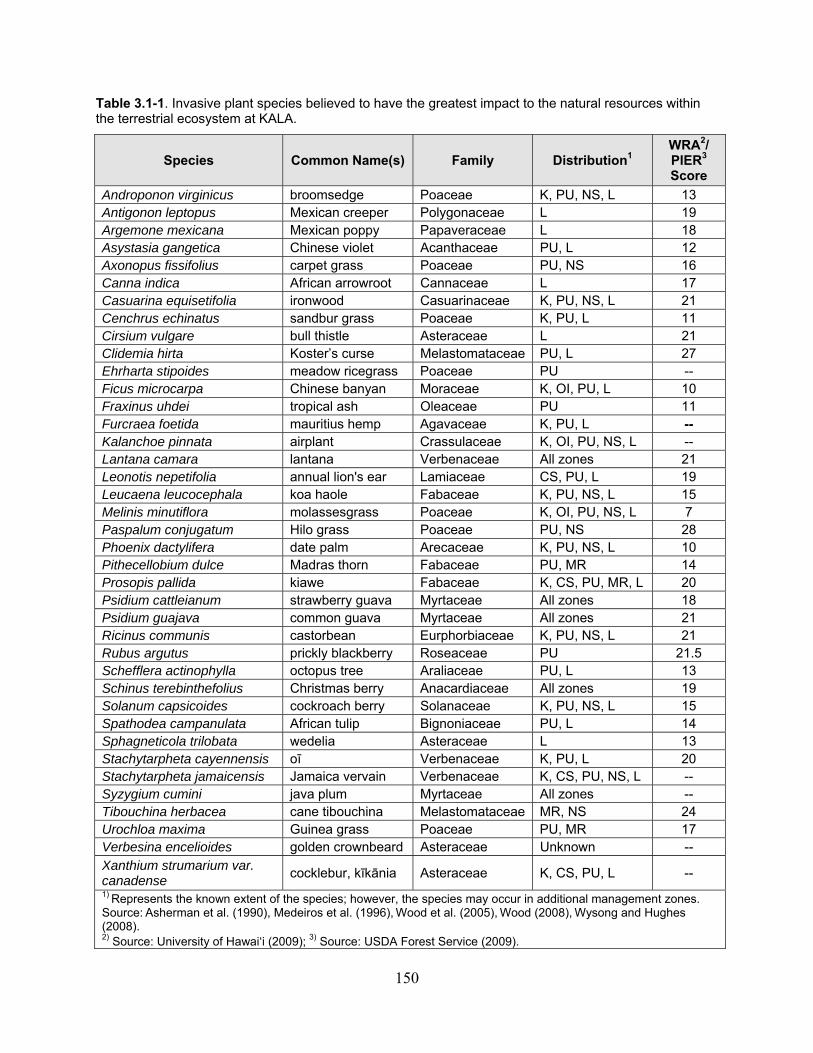
150
Table 3.1-1. Invasive plant species believed to have the greatest impact to the natural resources within the terrestrial ecosystem at KALA.
Species Common Name(s) Family Distribution1 WRA2/ PIER3 Score
Androponon virginicus broomsedge Poaceae K, PU, NS, L 13 Antigonon leptopus Mexican creeper Polygonaceae L 19 Argemone mexicana Mexican poppy Papaveraceae L 18 Asystasia gangetica Chinese violet Acanthaceae PU, L 12 Axonopus fissifolius carpet grass Poaceae PU, NS 16 Canna indica African arrowroot Cannaceae L 17 Casuarina equisetifolia ironwood Casuarinaceae K, PU, NS, L 21 Cenchrus echinatus sandbur grass Poaceae K, PU, L 11 Cirsium vulgare bull thistle Asteraceae L 21 Clidemia hirta Koster’s curse Melastomataceae PU, L 27 Ehrharta stipoides meadow ricegrass Poaceae PU -- Ficus microcarpa Chinese banyan Moraceae K, OI, PU, L 10 Fraxinus uhdei tropical ash Oleaceae PU 11 Furcraea foetida mauritius hemp Agavaceae K, PU, L -- Kalanchoe pinnata airplant Crassulaceae K, OI, PU, NS, L -- Lantana camara lantana Verbenaceae All zones 21 Leonotis nepetifolia annual lion's ear Lamiaceae CS, PU, L 19 Leucaena leucocephala koa haole Fabaceae K, PU, NS, L 15 Melinis minutiflora molassesgrass Poaceae K, OI, PU, NS, L 7 Paspalum conjugatum Hilo grass Poaceae PU, NS 28 Phoenix dactylifera date palm Arecaceae K, PU, NS, L 10 Pithecellobium dulce Madras thorn Fabaceae PU, MR 14 Prosopis pallida kiawe Fabaceae K, CS, PU, MR, L 20 Psidium cattleianum strawberry guava Myrtaceae All zones 18 Psidium guajava common guava Myrtaceae All zones 21 Ricinus communis castorbean Eurphorbiaceae K, PU, NS, L 21 Rubus argutus prickly blackberry Roseaceae PU 21.5 Schefflera actinophylla octopus tree Araliaceae PU, L 13 Schinus terebinthefolius Christmas berry Anacardiaceae All zones 19 Solanum capsicoides cockroach berry Solanaceae K, PU, NS, L 15 Spathodea campanulata African tulip Bignoniaceae PU, L 14 Sphagneticola trilobata wedelia Asteraceae L 13 Stachytarpheta cayennensis oī Verbenaceae K, PU, L 20 Stachytarpheta jamaicensis Jamaica vervain Verbenaceae K, CS, PU, NS, L -- Syzygium cumini java plum Myrtaceae All zones -- Tibouchina herbacea cane tibouchina Melastomataceae MR, NS 24 Urochloa maxima Guinea grass Poaceae PU, MR 17 Verbesina encelioides golden crownbeard Asteraceae Unknown -- Xanthium strumarium var. canadense
cocklebur, kīkānia Asteraceae K, CS, PU, L --
1) Represents the known extent of the species; however, the species may occur in additional management zones.Source: Asherman et al. (1990), Medeiros et al. (1996), Wood et al. (2005), Wood (2008), Wysong and Hughes (2008). 2) Source: University of Hawai‘i (2009); 3) Source: USDA Forest Service (2009).
151
Table 3.1-2. Characteristics of invasive plant species believed to have the greatest impact to the natural resources within the terrestrial ecosystem at KALA.
Species Forms Dense
Thickets
Vegetative Reproduction
Prolific Seed Production
Persistent Propagule
bank
Androponon virginicus N -- -- -- Antigonon leptopus N Y -- -- Argemone mexicana -- N Y Y Asystasia gangetica Y Y Y Y Axonopus fissifolius N Y Y -- Canna indica Y Y -- Y Casuarina equisetifolia Y Y Y Y Cenchrus echinatus N -- N -- Cirsium vulgare N Y N Y Clidemia hirta Y Y Y Y Ehrharta stipoides -- -- -- -- Ficus microcarpa N N Y -- Fraxinus uhdei Y N -- Y Furcraea foetida Y Y -- -- Kalanchoe pinnata Y Y -- -- Lantana camara Y N Y Y Leonotis nepetifolia Y N Y Y Leucaena leucocephala Y N N Y Melinis minutiflora -- Y -- -- Panicum maximum Y Y Y N Paspalum conjugatum Y Y Y Y Phoenix dactylifera Y Y N Y Pithecellobium dulce Y Y N N Prosopis pallida Y -- N Y Psidium cattleianum Y Y Y N Psidium guajava Y N Y N Ricinus communis Y N Y Y Rubus argutus Y Y -- Y Schefflera actinophylla Y N Y N Schinus terebinthefolius Y Y Y N Solanum capsicoides N N -- -- Spathodea campanulata N N Y -- Sphagneticola trilobata N Y N -- Stachytarpheta cayennensis Y Y -- -- Stachytarpheta jamaicensis -- -- -- -- Syzygium cumini Y -- -- N Tibouchina herbacea Y Y Y Y Verbesina encelioides Y N Y -- Xanthium strumarium var. canadense Y N -- -- Source: Wagner et al. (1999), Motooka et al. (2003), University of Hawai‘i (2009), USDA Forest Service (2009).
152
3.1.2.1 Impacts to the Terrestrial Ecosystem: Invasive plants have been documented in all of the terrestrial management zones in KALA. Some of the invasive plants species in the park (Syzygium cumini and Psidium spp.) have an open understory due to grazing by ungulates, while others (Schinus terebinthefolius and Lantana camara) form dense thickets (NPS 2000a, 2004, Marshall et al. 2008). Invasive plant species pose a serious threat to terrestrial ecosystems in Hawai‘i by competing with native plants for space, light, and nutrients. Native plants are generally slower growing than non-natives and thus are often physically displaced after disturbances. This enables invasives to form monotypic stands, reducing biodiversity (Smith 1985). At the ecosystem level, invasive plants have been shown to be capable of changing fire regimes (D’Antonio and Vitosek 1992), altering nutrient cycling patterns (Vitousek 1990), and modifying the surface runoff of water (Vitousek 1992). By impacting native plants, invasive plant species in turn impact the animals that depend on them (CTAHR 2003). 3.1.2.2 Impacts to the Freshwater Ecosystem: Invasive vegetation can change hydrologic regimes in lakes, streams, wetlands, and other freshwater habitats. These species can eliminate open water (USFWS 2007) and remove wildlife habitat, such as egg-laying sites for stream fishes and invertebrates (Parham et al. 2008). Invasive plants can alter exposure to solar radiation; shading influences stream ecosystems by modifying water temperature and primary production of aquatic plants, which can have important consequences on water quality (Wilcock et al. 2002). Compared to native plants, invasive (or non-native) plants can have greater transpiration rates (Going and Dudley 2008, Kagawa et al. 2009). This difference in water use can impact several hydrological processes, such as streamflow or groundwater recharge (Gordon 1998, Kagawa et al. 2009). 3.1.2.3 Impacts to the Marine Ecosystem: A few mangrove seedlings have been found along the coastal area of the park; however, there is no stand or grove of these trees and most of them have not survived the winters. Consequently, there is no intensive eradication effort (E. Brown/NPS, pers. comm.), and the presence of the mangrove seedlings is currently not a cause for concern. 3.1.3 Invasive Small Mammals Rattus rattus, Mus musculus, Herpestes javanicus, and Felis catus are present in the park boundaries. Marshall et al. (2008) found that R. rattus was the most ubiquitous species at KALA, followed by H. javanicus, M. musculus, and F. catus. However, H. javanicus had the most captures and the most evidence recorded of all four species. Rattus norvegicus (Norway rats) and Rattus exulans (Polynesian rats) were not detected during the survey potentially due to the relatively low elevation of the island or the relatively low number of trap nights. Canis familiaris were heard and tracks were seen within the Pu‘u Ali‘i NAR (Marshall et al. 2008). Because many residents own or feed F. catus within the Kalaupapa Settlement, control of these animals is an extremely sensitive issue. Occasionally, F. catus are trapped, neutered, and released to decrease threats to natural resources (G. Hughes/NPS, pers. comm.). NPS staff and volunteer veterinarians captured and spayed or neutered 481 F. catus between January 1998 and March 2007 (Marshall et al. 2008).
153
3.1.3.1 Impacts to the Terrestrial Ecosystem: Small, non-native mammals consume a variety of native bird, invertebrate, and plant foods, including snails, plant seeds, and bird eggs (Courchamp et al. 2003, Aruch 2006, Wanless et al. 2007, Marshall et al. 2008). These animals not only impact above ground ecosystems but also prey on or compete with native species in caves (Stone and Howarth 2007). Rattus spp., H. javanicus, F. catus, and C. familiaris have been observed preying upon ground-nesting seabirds or contributing to seabird nesting failures (Simons 1983, Stone 1985, Winter 2003, Kozar et al. 2007). The most serious land-based threat to Puffinus newelli and Pterodroma sandwichensis populations is predation of eggs and young in the breeding colonies by introduced small mammalian predators (Ainley et al. 1997, Mitchell et al. 2005, Hays and Conant 2007). Although the KALA coastline has good habitat for nesting seabirds, relatively low numbers of species and individuals of species were observed, possibly due to the abundance of predatory threats (Kozar et al. 2007). Rattus rattus are known to strip the bark from native trees, thereby inhibiting growth (Scowcroft and Sakai 1984, Hess et al. 2004). Similar stripping of Reynoldsia sandwicensis by Rattus spp. been observed at Kauhakō Crater. Rattus spp. also consume seeds and fruits and prevent the regeneration of rare and endangered plants. Marshall et al. (2008) noted evidence of predation by Rattus spp. on Diospyros sandwicensis, Pittosporum halophilum, and Pandanus tectorius in coastal forests at Kūka‘iwa‘a and Ka‘aloa and on Pritchardia hillebrandii seeds at higher elevation forest at the back of Wai‘ale‘ia Valley (Hughes, unpublished data). 3.1.3.2 Impacts to the Freshwater Ecosystem: Rattus spp. may potentially wade into streams to feed on Neritina granosa; however, this activity has not been quantified and is therefore uncertain (J. Ford/SWCA, pers. comm.). 3.1.4 Invasive Insects Invasive non-native insects have been documented to adversely affect native biodiversity through herbivory, predation, parasitism, pollination disruption, and hybridization and competition with native species. Insects have the greatest rate of yearly establishment of all animal or plant groups in Hawai’i (Staples and Cowie 2001). More than 2,500 non-native insects have established in Hawai‘i (Kenis et al. 2009). Although few studies have been conducted on the impact of invasive insects at KALA, it is presumed that few insects are negatively impacting native flora, fauna, and ecosystem processes. Invasive insects known to occur at KALA include ants, Sophonia rufofascia, Quadrastichus erythrinae, and Specularius impressithorax. Other non-native insects known to impact native ecosystems in the Hawaiian Islands, such as cockroaches, millipedes, Klambothrips myopori, and Vespula pensylvanica (western yellowjacket wasps), have not been documented at KALA, but may occur within the park boundaries (Staples and Cowie 2001, Mitchell et al. 2005, Stone and Howarth 2007). 3.1.4.1 Impacts to the Terrestrial Ecosystem: Approximately 45 species of ants have established in Hawai‘i from coastal strand to subalpine shrubland over 2,700 m (8,858 ft) elevation. Invasive ants threaten native arthropod species and community structure by directly preying upon native arthropods or competing for food resources,
154
nesting areas, or shelter sites (Krushelnyckyet al. 2005). Ants also have the potential to reduce hatching success, growth rates, and overall reproductive success of ground-nesting birds in Hawai‘i. These insects also indirectly impact native plants by preying on pollinators or excluding pollinators from flowers or other floral resources (Gillespie and Reimer 1993, Krushelnyckyet al. 2005). Finally, ants may impact native plants, as well as the animals that depend on them, by interfering with biological control of invasive plants (Krushelnyckyet al. 2005). It is unknown which ant species occur at KALA and the extent of their impact; however, Swenson (2008) noted that ant species present on the offshore islets may be preying on native insects, seeds, and seabird chicks. Sophonia rufofascia was discovered in Hawai‘i in 1987. It has subsequently been recorded on more than 310 plant species in 87 families, of which 67 species are endemic or indigenous and 14 are either federally endangered or candidates for listing (Jones et al. 2000; Lenz and Taylor 2001). Feeding and oviposition on plants results in leaf chlorosis, stunting, necrosis, and even plant death. At KALA, S. rufofascia has been noted to adversely affect seedling recruitment for many of the native species in the crater by impacting seeds. Currently, a management strategy has not been developed to control S. rufofascia. Quadrastichus erythrinae was first described in the Hawaiian Islands in April 2005. The adult female wasps insert their eggs into young leaves and stems and the developing larvae feed on the leaf tissue. Erythrina species respond to this feeding by producing galls. After pupation, the wasp exits through a small hole in the gall. Heavy infestations of Q. erythrinae result in loss of tree growth and vigor, and possibly death (Heu et al. 2006, Xu et al. 2006). Chemical injection systems and soil drenches have been shown to be effective for some E. sandwicensis; however, these treatments are expensive and time consuming (HDOA 2008). Eurytoma sp. (Hymenoptera: Eurytomidae) was released in areas of the state as a biological control agent to suppress infestations of Q. erythrinae. Specularius impressithorax feeds on the seeds of various Erythrina species. Alkaloids and amino acids present in Erythrina seeds typically thwart attacks of most bruchid species (Kingsolver and Decelle 1979); however, extensive feeding damage to E. sandwicensis seeds shows that these toxic components have little effect on S. impressithorax. NPS staff found extensive damage from S. impressithorax on E. sandwicensis seeds on the ground and in the trees in Kauhakō Crater (G. Hughes/NPS, pers. comm.). 3.1.4.2 Impacts to the Freshwater Ecosystem: Several species of non-native backswimmers, including Buenoa pallipes, Anisops kuroiwae, and Notonecta indica, are known to feed on damselfly naiads (Polhemus 1995, USFWS 2007). Native damselflies are also potentially threatened by non-native caddisflies (Trichoptera); these species compete with native damselflies for space and resources (USFWS 2007). Non-native caddisflies and A. kuroiwae have been collected from KALA. 3.1.5 Invasive Reptiles and Amphibians The impacts of non-native reptiles and amphibians in island ecosystems are generally understudied (Sin et al. 2008). However, the predatory nature of these species suggests impacts to native ecosystems (Staples and Cowie 2001). On Guam, herpetofauna have been found to displace native species and provide food for other introduced species (Christy et al. 2007).
155
Kraus (2005) identified several reptiles and amphibians at KALA with the potential to become invasive. Chamaeleo jacksonii, which were brought to Hawai‘i in 1972, are known to occur in the upper elevations along Waikolu Valley, but probably inhabit all mesic and wet forests in KALA. Lampropholis delicata was collected from the North Shore Cliffs NNL. Bufo marinus are common on the peninsula and were recorded in Wai‘ale‘ia Stream, but likely occur in low densities throughout KALA (Kraus 2005). 3.1.5.1 Impacts to the Terrestrial Ecosystem: Chamaeleo jacksonii eat native insects, tree snails, birds eggs, and potentially passerine nestlings (Loope et al. 2001; Staples and Cowie 2001; Kraus 2005). Recently, they have been observed preying on native Achatinella snails (V. Costello/University of Hawai‘i, pers. comm.). These lizards introduce a novel feeding mechanism to Hawai‘i, capturing prey with its long tongue. The ecological consequences of this are not known. Control options for this species are complicated because it is cryptic and inhabits canopies (Kraus 2005). Lampropholis delicata may also adversely impact native soil invertebrates, but this has not been investigated (Kraus 2005). 3.1.5.2 Impacts to the Freshwater Ecosystem: Bufo marinus are indiscriminate eaters, feeding on a wide range of insects and aquatic plant material (Staples and Cowie 2001, Yamamoto and Tagawa 2000). Breeding habitat for B. marinus occurs in the park boundaries, but the impact of this species is believed to be minimal because it forms only moderate densities (Kraus 2005). 3.1.6 Invasive Fish 3.1.6.1 Impacts to the Freshwater Ecosystem: Numerous non-native fish have been introduced to Hawaiian streams. Invasive fish can impact the freshwater ecosystem through predation, competition, and interference (Font 2007). Hawaiian damselflies are particularly vulnerable to predation by non-native fish introductions (Englund 1999). Non-native fish can transfer their parasites to native hosts (see Section 3.2). Currently no non-native fishes have been reported from the freshwater habitats at KALA; however, the National Park Service should make every effort to insure that no non-native fish are introduced to these habitats. Potential predatory fish species include Gambusia affinis (mosquito fish), Poecilia latipinna (sailfin molly), Xiphophorus helleri (green swordtail), Xiphophorus maculatus (moonfish), and Poecilia reticulata (guppy). Introduction of these non-native fishes could completely alter existing biotic systems. 3.1.6.2 Impacts to the Marine Ecosystem: No marine fish are currently considered invasive in Hawai‘i, though the biomass of introduced species such as Lutjanus kasmira (ta‘ape) and Cephalopholis argus (roi) can be high in some areas of the main Hawaiian Islands. These two species have been documented in the coastal reefs of KALA (Beets et al. 2006, NPS unpublished). L. kasmira does not appear to compete with the native Mullids (goatfishes) for food as previously perceived (Schumacher and Parrish 2008), but large numbers of L. kasmira have been demonstrated to affect the schooling behavior of Mulloidichthys vanicolensis (weke ‘ula). Individuals of M. vanicolensis were found higher up in the water column when schools of L.
156
kasmira were present, thereby potentially increasing their vulnerability to predators or fishers (Schumacher and Parrish 2006). C. argus can also consume significant quantities of juvenile reef fish, though no negative impact on the population of native fish has been recorded (Dierking 2007). It is presumed that C. argus has filled in as an apex predator in the reef ecosystem due to the overfishing of native apex predators such as Carangids (http://hawaii.gov/dlnr/dar/coral/pdfs/10_FISHTALK_Roi.pdf, Dierking 2007). L. kasmira and C. argus comprise only 1.6% and 2.5% of the fish biomass present on the coastal reefs of KALA, respectively (Beets et al. 2006). These species are likely to be found on both offshore islets as well, even though they have yet to be recorded. However, due to their low biomass, the current presence of these introduced species is not likely to be negatively impacting the marine ecosystem. 3.1.7 Other Invasive Invertebrates 3.1.7.1 Impacts to the Freshwater Ecosystem: Macrobrachium lar (Tahitian prawn) is a non-native amphidromous species common in Hawaiian streams. It has been observed in Wai‘ale‘ia and Waikolu streams at KALA. This species impacts stream systems by predating on and competing with native fishes, crustaceans, and mollusks (Brasher 1997b, Staples and Cowie 2001, Yamamoto and Tagawa 2000). However, there are few published studies available that quantify these impacts. 3.1.7.2 Impacts to the Marine Ecosystem: Introduced Carijoa aff. riisei (snowflake coral) occurred on both offshore islets but was very abundant in the caves at ‘Ōkala. Carijoa aff. riisei has been described as the most invasive of the 287 non-indigenous marine invertebrates in Hawai‘i (Toonen 2004, ISSG 2005, http://www.hawaiiinvasivespecies.org/pests/snowflakecoral.html). C. aff. riisei can compete with other fauna for benthic substrate; inferring from its abundance at ‘Ōkala, this is likely to be occurring. This species can propagate vegetatively or sexually by planktonic larvae. They are also commonly transported to new locations as hull fouling on ships (http://www.hawaiiinvasivespecies.org/pests/snowflakecoral.html). Currently, there exists no established method of control for C. aff. riisei but the introduced nudibranch, Phyllodesmium poindimiei, which is also found in Hawai‘i, is believed to be an obligate predator of C. aff. riisei (Wagner et al. 2007). Only one invasive species, the stomatopod Gonodactylaceus falcatus, was reported in the intertidal zone. This species is known to compete with native fauna and has been documented to aggressively displace the native stomatopod Pseudosquilla ciliata (Kinzie 1968). However, P. ciliate was not found at KALA, and G. falcatus is not likely to be a problem at this time.
157
3.1.8 Invasive Algae 3.1.8.1 Impacts to the Marine Ecosystem: The red algae Acanthophora spicifera has been found in some of the tide pools at KALA (E. Brown/NPS, pers. comm.) and from one transect on the coastal reef. Acanthophora spicifera often outcompetes with other native species such as Laurencia and Hypnea (Russell 1992, http://www.hawaii.edu/reefalgae/invasive_algae/rhodo/acanthophora_spicifera.htm) and Laurencia has been documented on the coastal reef of KALA. Currently, efforts are underway to remove A. spicifera by hand-collecting the invasive algae from the tide pools with the help of volunteers. These efforts began in 2005 and are ongoing, occurring opportunistically two to three times a year. In 2009 this algae was discovered in several new locations, but is it not known if this algae is spreading since these locations were not previously surveyed. The presence of A. spicifera in the coastal reefs is very low and is unlikely to be displacing native benthic communities at this time. A. spicifera is also a preferred algae for numerous herbivorous fishes (Stimson et al. 2001, Weijerman et al. 2008), and the high biomass of herbivores at KALA likely contributes to the containment of this introduced algae. 3.2 Diseases and Pathogens Endemic island species are particularly susceptible to introduced pathogens and disease, which have been recognized as a major threat to global biodiversity (Bataille et al. 2009). 3.2.1 Impacts to the Terrestrial Ecosystem Mosquito-borne avian diseases, principally Plasmodium relictum (avian malaria) and the virus Avipoxvirus sp. (avian pox), have been implicated as the main reason for mortality of the native Hawaiian forest birds in low-elevation areas. Although other species transmit these diseases, Culex quinquefasciatus (southern house mosquito) has been identified as the primary vector (Van Riper et al. 2002, LaPointe et al. 2005, Reiter and LaPoint 2007). Other non-native species augment the spread of these pathogens. S. scrofa create large, nutrient-rich mud wallows that serve as breeding habitat for C. quinquefasciatus (Atkinson et al. 2005, USGS 2006, LaPointe 2008) and introduced birds, which are relatively resistant to these diseases, serve as reservoirs for the diseases (DOFAW 2009). The entire Island of Moloka‘i lies within the elevation range of C. quinquefasciatus; therefore, all native (and non-native) avifauna are threatened by these diseases (Marshall and Kozar 2008). An avian disease study was conducted at Kalaupapa (Pu‘u Ali‘i NAR) and the surrounding Pelekunu and Kamakou preserves in 2003. Reiter et al. (2003) found that 95% of forest birds in the adjacent Kamakou Preserve were infected with avian malaria, and 50% were infected with avian pox. In other islands in the state, detections of Hemignathus flavus (‘Oahu ‘amakihi) and H. virens (Hawai‘i ‘amakihi) at low elevations may indicate that some populations are developing a resistance to avian malaria that can be passed to their offspring, thereby facilitating the repopulation of low-elevation areas (Shehata et al. 2001, Woodworth et al. 2005, Kilpatrick et al. 2006, Foster et al. 2007). The presence of Himatione sanguinea and Hemignathus virens wilsoni at the low-elevation sites in KALA may be evidence of some immunity or resistance to disease (Marshall and Kozar 2008).

158
3.2.2 Impacts to the Freshwater Ecosystem Approximately 14 species of helminths (worms) parasitize native gobioid stream fishes. Of these, approximately six are non-native to Hawai‘i, introduced through alien Poeciliids or other anthropogenic activities. Although no parasites have been observed on fish in KALA, these freshwater helminthes represent a potential disease threat to the five species of native gobioid fishes (Font 2007). 3.2.3 Impacts to the Marine Ecosystem Coral disease is rapidly emerging as a threat to the reefs of Hawaii (Aeby 2008 http://hawaii.conference-services.net/resources/337/1232/pdf/HCC16_0067.pdf) with 18 disease states documented. Coral disease frequency has been examined at all sites (100% frequency) surveyed on O‘ahu, Maui, and the Island of Hawai‘i, averaging a 1.0–1.4 % of the colonies inspected (Friedlander et al. 2008a). Disease and coral bleaching have only been documented at KALA for two years (2006–2007). In 2006, the prevalence of disease/bleaching averaged 3.7% (range 0–15.4%). However, in 2007, the incidence of disease/bleaching had dropped to 0.3% (range 0–3.8%). Given the high occurrence of disease/bleaching in 2006, disease/bleaching could be a potential threat to KALA and should be closely monitored. 3.3 Habitat Loss, Degradation, and Fragmentation Habitat loss and degradation have been acknowledged as a major threat to terrestrial, freshwater, and marine environments in the Pacific (Kingsford et al. 2009). Although historic and modern human activities (habitation, agriculture, water diversions, land clearing, etc.) have modified, fragmented, or destroyed some of the original habitats at KALA, these developments have been relatively small and concentrated compared to other areas in the state. However, human-related activities have promoted encroachment of invasive species, which has decreased suitable habitat for native species. 3.3.1 Impacts to the Terrestrial Ecosystem Archaeological research suggests that permanent settlers first established in the Waikolu Valley and later on the peninsula itself. Evidence of early human habitation has been found on the peninsula, in the valleys, and in Kauhakō Crater through several periods of history (Greene 1985, McCoy 2005a, 2005b). Heiau (altars) and alawai (waterways) were noted in Waikolu and Wai‘ale‘ia valleys (Asherman et al. 1990) and house sites, cemeteries, a hōlua (sled), and other archaeological features have been noted elsewhere in KALA (Greene 1985). Development was more intensive during the period of the Kalawao and Kalaupapa settlements (1866–present). Over 300 resident and guest houses were built on the peninsula during this time. Other buildings included cemeteries, churches, a hospital complex, schools, dormitories, a store, a recreation hall, a drug-shop, a storehouse, a prison, and a slaughtering house (Greene 1985). These structures removed the original habitat in these areas. Agriculture has also resulted in habitat loss, degradation, and fragmentation. Evidence shows that portions of KALA were altered for agriculture during the prehistoric era (A.D. 1778–1200) and historic era (A.D. 1866–1778) (McCoy 2005b). Agriculture occurred in Kauhakō Crater, along the Coastal Spray Zone, in the Lowland Coastal Area, and within the deep valleys of the park. Prior to the establishment of the leprosy settlement, large areas of the peninsula were cultivated with sweet potatoes (NPS 2006a). To prevent strong winds from affecting crop growth, stone field walls were constructed to act as windbreaks (McCoy 2005b). Once the Kalaupapa Settlement was established,
159
most of the peninsula was grazed over by livestock, including horses, cows, and mules. Patients also constructed lo‘i, or terraces of Colocasia esculenta (taro), in Waikolu Valley (NPS 2006a). Small amounts of other crops were also grown on the peninsula and in the valleys (Greene 1985). 3.3.2 Impacts to the Freshwater Ecosystem The Molokai Irrigation System began diverting water from Waikolu Stream in 1960. The impacts of diversion structures have been examined by various researchers in Hawai‘i. Dams, diversions, and similar man-made structures can disturb longitudinal or linear connectivity of Hawaiian stream habitats by altering the volume and frequency of flows necessary to sustain native amphidromous species. Dewatering prevents both downstream dispersal by larvae and upstream migration by post-larvae and juveniles. Prolonged low-flow conditions have the potential to reduce available habitat and food supply for benthic invertebrates, alter invertebrate drift, and affect trophic interactions (Brasher 1997a, Brasher 1997b, Way et al. 1998, Benbow 1999, Kinzie et al. 2006, McIntosh et al. 2002). Diversions also indirectly impact native species by creating a favorable environment (e.g., lower flow velocity and increased water temperature) for non-native predatory species, such as M. lar (Brasher 1997b). Way et al. (1998) concluded that the diversion structure on Waikolu Stream has “dampened the natural seasonal discharge cycle of the stream, exacerbated natural low flow conditions, and increased the likelihood of prolonged periods of extremely low flow” (Way et al. 1998). Since it was diverted, Waikolu Stream commonly experiences prolonged periods of extremely low flows (<0.06 m3 s-1). Brasher (1996, 1997a, 1997b) investigated the impacts of diversion structures and dewaterment on native species in Waikolu Stream. Her studies found that densities of three native fish species were substantially lower in, and upstream of, the diverted sections of Waikolu Stream compared to the lower reaches of Waikolu Stream and to comparable areas on undiverted Pelekunu Stream (Brasher 1997a). There was also a dramatic decrease in Neritina granosa densities in and above the areas affected by water diversion. These results are likely due to the effects of dewaterment on habitat availability. Some native Hawaiian amphidromous species are able to surmount many low dams and weirs to inhabit upstream reaches (Gingerich and Wolff 2005, DAR 2008, SWCA 2007, SWCA 2008); however, this ability is strongly influenced by the location and type of diversion structures (March et al. 2003, Resh 2005, SWCA 2004 and 2005). Furthermore, ecological connectivity can be restored when dry stream reaches below diversion structures are wetted by freshets, allowing migration to occur (Gingerich and Wolff 2005). NPS staff review the monthly summary of applications for surface and groundwater use on Moloka‘i that are published in CWRM’s Water Resource Bulletin. New applications are evaluated to determine if proposed uses might affect the surface or groundwater resources of KALA (J. Hughes/NPS, pers. comm.). Staff comments are prepared and forwarded for consideration by CWRM, as appropriate. 3.3.3 Impacts to the Marine Ecosystem There are currently plans to upgrade the harbor at KALA to ensure that future barge operations continue to supply the settlement. An Environmental Impact Statement (EIS) is being prepared to assess the environmental impacts of proposed improvements to the existing pier and associated structures (http://parkplanning.nps.gov/projectHome.cfm--parkID=313&projectId=17209). One
160
of the alternative plans calls for dredging the turning basin. The construction has potential to impact the benthic and fish communities through habitat loss, displacement, sedimentation, and temporarily alteration of habitat use by the endangered monk seal and other marine mammals in adjacent areas. Compared to reef communities outside of the harbor and surrounding the park, the substrate within the harbor has substantially less coral, less coralline algae, less macroalgae, and more sand (Brown et al 2008). This construction is likely to result in some loss of coral cover (estimated 1,783 ft2 [164 m2]), which may be mitigated in part by the creation of new habitat with the installation of the mooring dolphin and the increase in surface area from the deeper turning basin. It may take up to 10–15 years to recolonize these surfaces. Construction may also temporarily displace fish assemblages, but the fish are expected to recolonize the habitat within 16 months (Walsh 1983). The construction will also cause temporary suspension of sediments but as KALA does not have fine sediment, the sediment is not expected to smother coral present in the area. The North Pacific swell will most likely flush out any sediment generated during construction. Consequently, is not expected that the sediment dynamics in the area will be altered much (Brown et al 2008). Construction may also cause acoustic disturbance to marine mammals, such as the endangered monk seal, resulting in temporary avoidance of the surrounding areas (Brown et al. 2008). It is recommended that construction, when it occurs, be regulated and timed to avoid disturbance to the monk seal (Brown et al. 2008). 3.4 Harvest, Hunt, and Take Excessive fishing, hunting, or gathering has the potential for adverse ecological impacts. Due to the minimal human population and limited access to KALA, however, the current impacts of these activities are considered negligible. 3.4.1 Impacts to the Terrestrial Ecosystem Currently, there is no documented harvesting or hunting of native terrestrial species at KALA. Hunting of non-native ungulates is permitted in the park. Because these species are known to have an adverse impact on native species and ecosystem, ungulate hunting is not perceived as a threat or stressor to KALA. Non-timber forest products may be collected within the Molokai State Forest Reserve if individuals obtain a Special Use Permit from DOFAW. None of these species can be designated as federal or state threatened or endangered species (DOFAW 2009). 3.4.2 Impacts to the Freshwater Ecosystem Historically, pre-Captain Cook Hawaiians directly influenced stream fauna by fishing and collecting returning post-larvae, or hinana (Titcomb 1972). In the 1950s, the Hawai‘i State Fish and Game Division (now Division of Aquatic Resources) outlawed the practice of collecting goby fry or hinana in response to declining stocks. Brasher (1997b) noted that few people have access to the mouth of Waikolu Stream and the upper reaches can only be accessed by driving through the water diversion tunnel. Because of the relative isolation, human predation pressure is likely less than in other Hawaiian streams.
161
3.4.3 Impacts to the Marine Ecosystem The only harvesting of marine resources that occurs in the intertidal zone is opihi picking. However, fishing regulations at KALA only allow patients to pick opihi. Take is also limited to a shell diameter of at least 1.25 in long (HAR 13-92). There is an ongoing project to assess the impact of subsistence opihi picking at KALA, but given the large size of opihi still present (e.g., Hughes and Carnevale 2004, Minton and Carnevale 2006) the current rate of harvesting is likely to be sustainable. Due to the small human population present on the peninsula and the remoteness of the area, fishing pressure is very low and concentrated around a few access points such as the harbor (Brown et al. 2008). The fish assemblage of KALA is healthy with a good representation of apex predators and large herbivores. However, there are is potential for the biomass of target fish, particularly of apex predators, to further increase if fishing stops. While the two islets are within the KALA park boundary, there are no fishing restrictions for waters around the islets. Residents at KALA typically do not fish off the islets, but these waters are occasionally visited by fishing boats from other areas during periods of good weather (E. Brown/NPS, pers. comm.). The remoteness of the islets and their relative inaccessibility from shore probably accounts for the high biomass of target fish species in the area. As future land use and management practices for KALA remain uncertain, it is not possible to predict how much, if any, the human population will increase, or what fishing management rules may be emplaced in the future. It is likely that fishing pressure may increase due to relaxed fishing rules or an influx of people to the peninsula. In such an event, fishing pressure at all marine zones (intertidal, coastal, and offshore islets) will also likely increase and may cause a significant drop in the biomass of target species present (Friedlander et al 2007). 3.5 Visitor Use Visitor impacts on the natural resources at KALA are minimized as a result of legislation, geography, and costs. Public Law 96-565 states that only 100 people per day are provided permits to visit the peninsula. This includes tourists on commercial tours, volunteers performing services projects, and friends or relatives of residents, but does not include people providing contracted services or government officials. Additionally, no individuals under 16 years of age are allowed at KALA, except in special cases (NPS 1999). Public access into the Pu‘u Ali‘i NAR is also limited due to rugged terrain and impacts to natural communities (DOFAW 1991). Furthermore, the physical access down the steep cliffs restricts access to KALA and controls visitor impacts on terrestrial habitats. In 1998, approximately 10,318 individuals visited the peninsula, the majority of which arrived by plane. Over 150 of these visitors were volunteers (NPS 1999). Other access includes mule rides, hiking, or by boat. On average, about 58,000 people visit the overlook in Pala‘au State Park each year (USFWS 2006). Visitors with permits to KALA participate in the following recreational activities: pole fishing, swimming, visiting wayside exhibits, visiting the Americans of Japanese Ancestry (AJA) visitor center, hiking the three-mile Kalaupapa Trail, and riding a mule down the trail (via an NPS concession, Molokai’i Mule Rides, Inc.). Tour groups have been a regular feature at KALA since
162
the 1970s (NPS 2000a). Damien Tours, a patient-owned and operated commercial tour service, provides tours six days a week. It stops at several locations within the settlement, and visitors are allowed off the bus (NPS 1999). Currently the National Park Service does not manage visitation. Because of the uncertainty surrounding future land management and ownership, the National Park Service’s role in managing visitation in the future is unknown. It is possible that visitor services and interpretation programs will be expanded in the future (NPS 1999). 3.5.1 Impacts to the Terrestrial Ecosystem The current impact of visitor use on the terrestrial ecosystem is minimal. In general, visitors remain along maintained trails or roadways, thereby minimizing impacts to more intact habitats. The management zones that receive the most visitor use are the Lowland Coastal Area, Kauhakō Crater, and the North Shore Cliffs NNL. The number of visitors to the offshore islets is unknown because these areas are not easily monitored by the National Park Service. Overuse or improper visitation to the offshore islands has been listed as a potential threat to the natural resources by NPS staff (NPS, unpublished). If visitor services and interpretation programs increase in the future, threats due to visitor impacts could also increase. Potential impacts of increased visitation could include loss of native vegetation due to trampling, introduction of additional non-native species, soil erosion or compaction, and disturbance of sensitive native avifauna or mammals. Many of the rare species present in KALA, notably Panicum fauriei var. carteri, are particularly vulnerable to trampling (USFWS 1994). 3.5.2 Impacts to the Freshwater Ecosystem Similar to the terrestrial ecosystem, visitor use is not believed to be adversely impacting the freshwater habitats at KALA. However, if visitor use increases due to changes in land management, the freshwater habitats would be more vulnerable to the introduction of invasive species (see Sections 3.1.2.2 and 3.1.6.1). 3.5.3 Impacts to the Marine Ecosystem The State of Hawai‘i Department of Health (DOH) regulations indicate that visitors are only allowed to fish with poles from shore. Short-term (<1 month) volunteers are also allowed to fish with poles from shore. Visitors and volunteers are not allowed to pick opihi, spearfish, or net fish and may not take marine life on behalf of the patients, employees, or long-term (>1 month) volunteers. Residents/employees are allowed to participate in the other activities with the exception of opihi harvesting. Only patients are allowed to pick opihi. In addition, no SCUBA diving, surfing, or boogie boarding is allowed for visitors and residents so impacts are further reduced. The KALA marine program staff has been granted an exemption for SCUBA diving for research purposes. All state and federal fish and game rules apply for both visitors and residents. It should be noted, however, that visitors entering park waters by boat and not landing on shore are exempt from the DOH regulations specific to the settlement. At present, current visitor impact on the marine environment is negligible. However, if visitor use increases due to changes in management, and visitors are allowed to freely harvest the marine resources, the population of Cellana species and biomass of fish at KALA could significantly decrease.
163
3.6 Climate Change It is now recognized that climate change is not speculative, but rather that “the harms associated with climate change are serious and well-recognized” (Massachusetts v. EPA, 127 S.Ct. at 1455). During the twentieth century, the global environment experienced variations in climatic conditions. According to the Fourth Assessment Report by the Intergovernmental Panel on Climate Change (IPCC), global temperatures on the Earth’s surface have increased by 0.74°C (1.33°F) over the last 100 years. This warming trend has accelerated within the last 50 years, increasing by 0.13°C (0.23°F) each decade (Solomon et al. 2007). Global ocean temperatures have also increased, rising by 0.10°C (0.18°F) between 1961 and 2003. Global mean sea levels are also rising at twice the rate of the 20th century (3 mm/yr instead of 1.6 mm/yr). A 1 m (3.3 ft) rise in sea level is expected by the end of the century for Hawai‘i (Fletcher 2009). The expected increase of carbon dioxide (CO2) in the atmosphere will also result in the additional acidification of ocean waters (Anthony et al. 2008). The maritime location of the Hawaiian Islands makes the archipelago relatively well buffered climatically (Benning et al. 2002). However, climatic changes have been documented throughout the state. Sea surface temperatures near the islands has been increasing recently (Jokiel and Brown 2004), showing a 0.4°C (0.72°F) rise between 1957 and 1987 (Giambelluca et al. 1996) and is expected to rise a minimum of 1.5–2 °C by the end of the century (IPCC 2007). The increase in sea surface temperatures has been associated with more intense hurricanes in the Pacific and Atlantic (Webster et. al 2005, US Climate Change Science Program 2009) and could result in higher peak wind speeds and heavier rainfall (IPCC 2007). Air temperature increases of 0.1776 °C /decade have also been recorded in Hawai‘i (Giambelluca et al. 2008), with higher elevations warming faster than lower elevations. The temperature range has also decreased, largely because of an increase in the minimum temperatures at night (Giambelluca et al. 2008). In addition, studies show the tradewind inversion has already responded substantially to past climate changes (Benning et al. 2002). The tradewind inversion is currently present about 80% of the time in Hawai‘I, and it is suggested that the persistence of the trade-wind inversion due to climate change will result in a 5–10% decrease in rainfall during the wet season. All these climatic changes could potentially impact the natural resources at KALA. 3.6.1 Impacts to the Terrestrial Ecosystem 3.6.1.1 Species Range and Distribution: Plant and animal range boundaries are often determined by tolerances to certain temperatures, precipitation amounts, and other climatic factors. Changes in these factors can produce range shifts, or changes in the geographical distribution of species. Shifts in habitat composition can also influence species’ distributions (Both and Visser 2001). Globally, climate shifts have already caused species to migrate to new areas, particularly towards higher altitudes (Dow and Downing 2006, Parmesan and Matthews 2006). 3.6.1.2 Phenology and Physiology: The reproductive physiology and population dynamics of insects, amphibians, reptiles, seabirds, and waterbirds are highly influenced by environmental conditions such as temperature and humidity (Duffy 1993, Benning et al. 2002, Baker et al. 2006). Sex is often determined by the temperature of the nest environment; thus, higher temperatures could result in a higher female to male ratio (Baker et al. 2006).
164
Furthermore, global climate change has already caused changes in the timing of biological events, such as breeding and flower blooming (Parmesan and Matthews 2006). Increased temperature and CO2 levels have shown to influence flowering and seed production of perennial woody dicots. Flowering in perennial grass populations has also shown potential to increase as a result of warming (Hovenden et al. 2007). 3.6.1.3 Community Composition and Interaction: Changes in climatic conditions can alter community composition and competition. Increases in CO2 levels can impact plant photosynthetic rates, alter plant species composition, decrease nutrient levels, and lower herbivore weights (Ehleringer et al. 2002). Similarly, increases in nitrogen availability can alter species composition by favoring those plant species that respond to nitrogen rises (Vitousek 1994). Furthermore, climate change may enhance existing invasive species issues. Alterations in the environment may increase the dispersal ability of non-native flora or fauna (Walther et al. 2002). Parmesan and Matthews (2006) suggest that invasive species might be better able to adapt to a changing climate than native ones. 3.6.1.4 Trade-wind Inversion: Climate change may raise or lower the altitude at which the current orographic trade wind inversion layer occurs (Pounds et al. 1999, Still et al. 1999). A lowering of the trade-wind inversion will result in a lower elevational cap on rainfall (Miller 2008). By altering this formation, critical precipitation inputs from mist and fog drip will be reduced (Benning et al. 2002). Changes in precipitation will further influence hydrologic process and stress vegetation. 3.6.1.5 Sea-Level Rise: Tide gauges at sea level at the Honolulu Harbor estimate that sea level has risen at 1.4 ± 0.3 mm/yr over the past century. The sea-level rise rate at Hilo Harbor is 3.1 ± 0.6 mm/yr since 1946 variable subsidence of the Hawaiian Islands interdecadal variations in upper ocean temperature (Caccamise et al. 2005). Fletcher et al. (2002) determined that the threat of sea-level rise is moderately low along the Kalaupapa peninsula and low on either side of the isthmus. Rising sea levels will inundate low-lying areas, decreasing habitat for marine and terrestrial species. For example, coastal inundation will result in a loss of coastal vegetation, waterbird habitat, and nesting sites. 3.6.1.6 Fire: It is predicted that the warmer temperatures and hydrological changes related to climate change could enhance drought conditions throughout the state and increase the possibility and frequency of fires (USEPA 1998). Fires have larger ecosystems impacts; because non-native plant species are more adapted to fires, increased fires may further enhance the competitive ability of non-native species, increase dominance of non-native species, and limit forest structural complexity (HDBEDT and DOH 1999, Ainsworth and Kauffman 2009). 3.6.2 Impacts to the Freshwater Ecosystem The impact of climate change on freshwater resources is dependent on shifts in precipitation amounts, evaporation rates, storms, and climatic events such as the El Niño Southern Oscillation (ENSO).
165
3.6.2.1 Sea-Level Rise: Sea-level rise will affect freshwater resources, particularly coastal wetlands, anchialine pools, and historical fishponds (DeVerse and DiDonato 2006). In addition to changing depths, freshwater habitats near the coast will experience increases in salinity. Salinity alterations have the potential to shift aquatic plants and animal communities that do not tolerate high salinity. 3.6.3 Impacts to the Marine Ecosystem It is expected that all marine habitats in KALA will be affected by increasing sea surface temperatures, sea-level rise, ocean acidification, and an increase in intensity of storms (Friedlander et al. 2008a). 3.6.3.1 Sea Surface Temperatures (SSTs): An increase in SST in Hawai‘i is expected to increase the frequency of bleaching events (Friedlander 2008a). Bleaching usually occurs when temperatures exceed a ‘threshold’ of about 0.8–1°C above mean summer maximum levels for at least four weeks (Rosenzweig et al. 2007). This is well within the estimated increase of a minimum of 1.5–2 °C that is expected for Hawai‘i by the end of the century (IPCC 2007). Local bleaching events have already been documented at KALA from 2006 to 2009 but only on isolated coral colonies. Only three bleaching events have been documented in Hawai‘i, with one occurring in the MHI (1996) and two in the NWHI (2002, 2004) (Friedlander et al. 2008a,b). As SSTs are expected to further increase in the waters of Hawai‘i, it is anticipated that bleaching will be observed with increasing frequency at KALA and around the MHI and will be the dominant cause of reef decline in the middle of the century (Jokiel et al. 2009). Bleaching that occurs for an extended period of time results in coral mortality, which can lead to a loss of structural complexity and shifts in reef fish species composition (Rosenzweig et al. 2007). It has also been documented that branching corals (such as those in the genus Pocillopora) are less likely to recover from bleaching (Grimsditch and Salm 2006). This is a cause for concern at KALA since the branching corals P.meandrina and P. edouxi constitute 69% of the coral cover currently present (Figure 2.3-5). However, lobate corals such as Porites lobata may be more resilient and there could be a shift in community structure towards Porites species at KALA and perhaps a loss of coral diversity (Grimsditch and Salm 2006). 3.6.3.2 Sea-Level Rise: The sea level is expected to increase by approximately 1 m by the end of the century. It is expected that coral growth will be able to keep apace of the sea-level rise (Buddermeir et al. 2004). As there is no high-resolution elevation dataset for the terrestrial portion of the park at this time, a detailed analysis of sea-level rise within the park is not possible. Instead a more coarse-scale analysis was conducted using the U.S. Geological Survey 10-meter resolution National Elevation Dataset (NED). NED datasets have an absolute vertical accuracy of 3.99 m (National Map Accuracy Standards 90% confidence intervals). Therefore, an actual 1 m rise in sea level should not extend past the 5- m elevation mark in the NED dataset. The area within KALA with 5 m elevation or less was mapped to represent the maximum extent of additional submerged land possible due to sea-level rise (Figure 3.6-1). Results show that an increase in sea level of 1 m is expected to submerge at most 40 ha (98.9 ac) of coastal land (1.2 % of the land area of the park). This would result in a small increase in available coastal habitat for corals on the KALA peninsula and offshore islets and a shift of the intertidal zone landward from its current distribution.
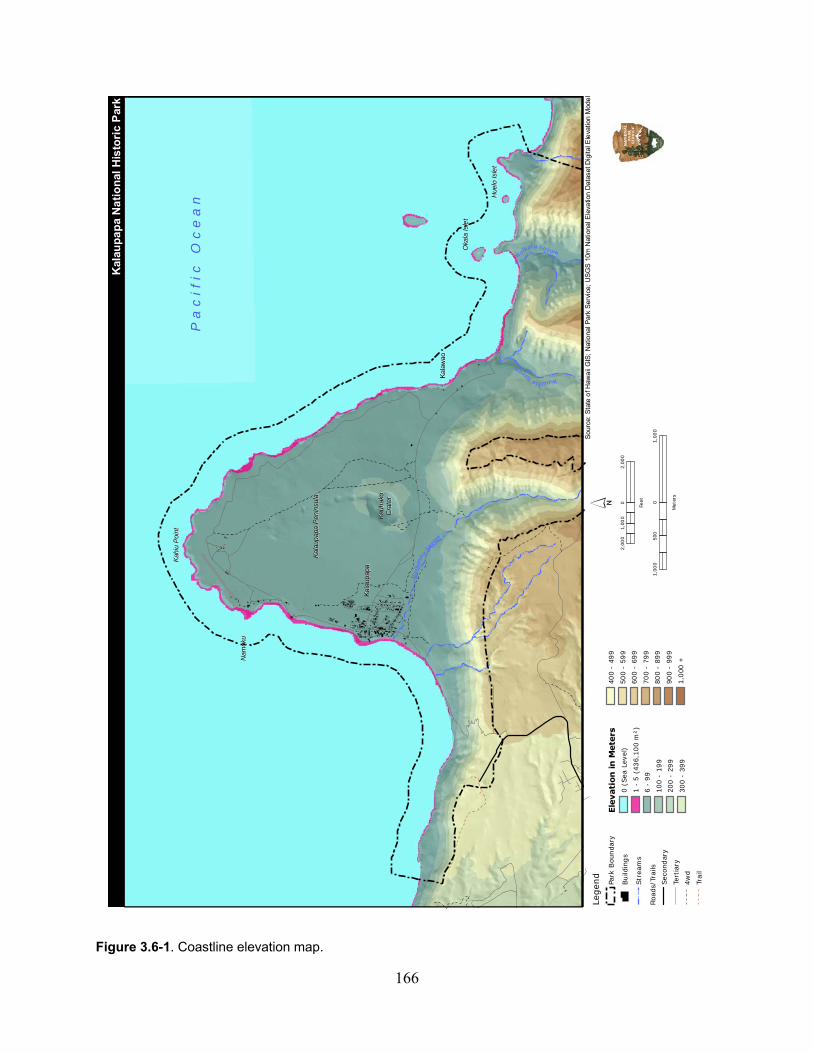
166
Figure 3.6-1. Coastline elevation map.
Sou
rce:
Sta
te o
f Haw
aii
GIS
; N
atio
nal P
ark
Ser
vice
; U
SG
S 1
0m N
atio
nal E
leva
tion
Dat
aset
Dig
ital E
leva
tion
Mod
el
Legen
d
Park
Bou
nda
ry
Build
ings
Str
eam
s
Roa
ds/T
rails
Sec
ondar
y
Tert
iary
4wd
Trai
l
Ele
vati
on
in
Mete
rs0
(Sea
Lev
el)
1 -
5 (
436,
100
m²)
6 -
99
100
- 19
9
200
- 29
9
300
- 39
9
400
- 49
9
500
- 59
9
600
- 69
9
700
- 79
9
800
- 89
9
900
- 99
9
1,000
+
Pa
cif
ic
Oc
ea
n Hue
lo Is
let
Hue
lo Is
let
Oka
la Is
let
Oka
la Is
let
Kal
awao
Kal
awao
Kah
iu P
oint
Kah
iu P
oint
Kal
aup
apa
Kal
aup
apa
Kau
hak
oK
auh
ako
Cra
ter
Cra
ter
Kal
aup
apa
Pen
insu
laK
alau
pap
a P
enin
sula
Nam
oku
Nam
oku
Wai
han
au S
tream
Waialeia Stream
Waikolu Stream
Kal
aup
ap
a N
ati
on
al H
isto
ric
Par
k
2,00
00
2,00
01,
000
Feet
1,00
00
1,00
050
0
Met
ers
167
3.6.3.3 Ocean Acidification: It is expected that ocean acidification will become a dominant cause of reef decline in the latter part of this century (Jokiel et al. 2009). Research in Hawai‘i has shown that the recruitment and growth of coralline algae will be reduced by 80–90 % with expected rates of ocean acidification. Coralline algae are important for cementing the reef framework together, and a lack of growth or recruitment of coralline algae may affect the structural integrity of the reef. Coral calcification will also decrease by 15–30 % under increased acidification and will result in decreased structural resilience to storms and an increased vulnerability to bleaching (Jokiel et al. 2009, Anthony et al. 2008). Due to the expected rapid increase in ocean acidification, it is generally assumed that genetic adaptation by corals and coralline algae to the change will not be possible. 3.6.3.4 Storm Events: Storm events (tropical storms and hurricanes) in the Pacific have intensified in the past 35 years (Webster et al. 2005). Increased intensity results in greater wind speed and higher surf (IPCC 2007) and consequently greater coral damage from the waves and storm surge. It has not yet been documented that storm frequency will increase. The recovery of corals from the damage of Hurricane Iwa (1982) and Hurricane Iniki (1992) has varied widely even at sites in close proximity (100 m–1 km) (Coles and Brown 2007). Recovery is driven by recruitment pulses that are decadal, varying from 10–12 years for P. meandrina and 15 years or more for P. lobata (Coles and Brown 2007). Coral damage may be exacerbated in storm events if the coral structure is weakened due to ocean acidification (see above). 3.6.3.5 Increasing Resistance and Resilience of Coral Reefs to Climate Change: Recommendations for increasing coral reef resistance and resilience to bleaching include establishment of Marine Protected Areas (MPAs), implementing Integrated Coastal Management (ICM), and fisheries management (Grimsditch and Salm 2006). All three measures protect biodiversity and reduce other anthropogenic stressors, thereby increasing resistance to bleaching. MPAs should be situated at sites that show low occurrence of bleaching events and have high diversity of corals. A few large MPAs are favored over numerous small ones. Fisheries management is also recommended to prevent the overharvesting of keystone functional groups such as grazers or apex predators, which can result in losses of biodiversity and functional diversity, thereby decreasing resilience of the reef. ICM would address other issues related to human activity, such as coastal development and land-based sources of pollution and sedimentation (Grimsditch and Salm 2006). It is expected that these recommendations will similarly buffer the coral reefs from other stressors that can occur with climate change, such as increased resistance to storm damage or faster recovery (resilience) of a reef from a storm event. 3.7 Erosion and Landslides Erosion and landslides are a significant concern for the vegetation on the two offshore islets. Signs of landslides and subsequent erosion were observed along the western cliffs of Huelo Islet. 3.7.1 Impacts to the Terrestrial Ecosystem Landslides often completely remove vegetation, including rare native species. Wood (2008) attributed the 90% loss of Brighamia rockii on Huelo Islet to landslides. In addition, two Pittosporum halophilum were lost on the islet due to landslides. By denuding slopes, landslides strongly affect soil characteristics and disrupt soil seed banks. These events can also favor the establishment of non-native species; shallow rooted non-native plants that establish following
168
landslides could increase the frequency of landslides and further spread non-native plants (Restrepo and Vitousek 2001). 3.7.2 Impacts to the Freshwater Ecosystem Erosion and landslides can pollute surface waters by increased sedimentation. These events often remove riparian vegetation that traps sediments during heavy rain events. Because sedimentation reduces water quality, erosion and landslides can also adversely impact biotic communities in wetlands, lakes, and streams. No erosions or landslides have been documented to impact the freshwater ecosystem at KALA. 3.7.3 Impacts to the Marine Ecosystem Landslides and erosion can lead to subsequent sedimentation on the coral reefs. The quantity of land-based sediment on the reef has yet to be quantified, but currently there is no evidence that the intertidal, coastal, or offshore reefs are threatened by sedimentation. 3.8 Contaminants, Sewage, and Debris There are two active landfills at KALA—the household waste landfill and the commercial waste landfill. Both are located west of Damien Road roughly 305 m (1,000 ft) from the Kalaupapa Settlement. About 79% of the solid waste generated at KALA is disposed of in these landfills (NPS 2006a). Neither landfill meets EPA standards as they are not lined and are within the coastal zone. Due to the lack of nearby soil to cover the landfills, solid waste is occasionally found lying around, and debris is blown from the landfills during storm events. An old landfill/disposal area also exists on the shoreline south of Kalawao Road near ‘Awahua Beach (Figure 3.8-1). The National Park Service is currently investigating options to improve solid waste operations on the peninsula. Household wastewater from Kalaupapa residents, State of Hawai‘i employees, and NPS staff goes into cesspools. Some of the cesspools at public facilities (e.g., the hospital) were replaced by septic tanks with leach fields in the summer of 2007. Upland agriculture and urban development may also contribute sewage and contaminants to the peninsula. Debris (fishing nets, plastic bags, etc.) is also carried to KALA on oceanic currents. These items can accumulate on beaches and shoreline areas. 3.8.1 Impacts to the Terrestrial Ecosystem Debris blown from the lands and brought from sea can threaten the survival and health of some terrestrial wildlife, especially seabirds that nest in the terrestrial ecosystem. Wildlife can ingest and become entangled in debris, resulting in digestive issues and restricted movements. 3.8.2 Impacts to the Freshwater Ecosystem The commercial waste landfill is located 90–360 m (300–1190 ft) south of Waihanau Stream (NPS 2006a). The impact of the landfills on this stream and other freshwater habitats is unknown. It is not known whether cesspools are impacting the freshwater ecosystem; however, most human habitation is not close to the freshwater habitats.
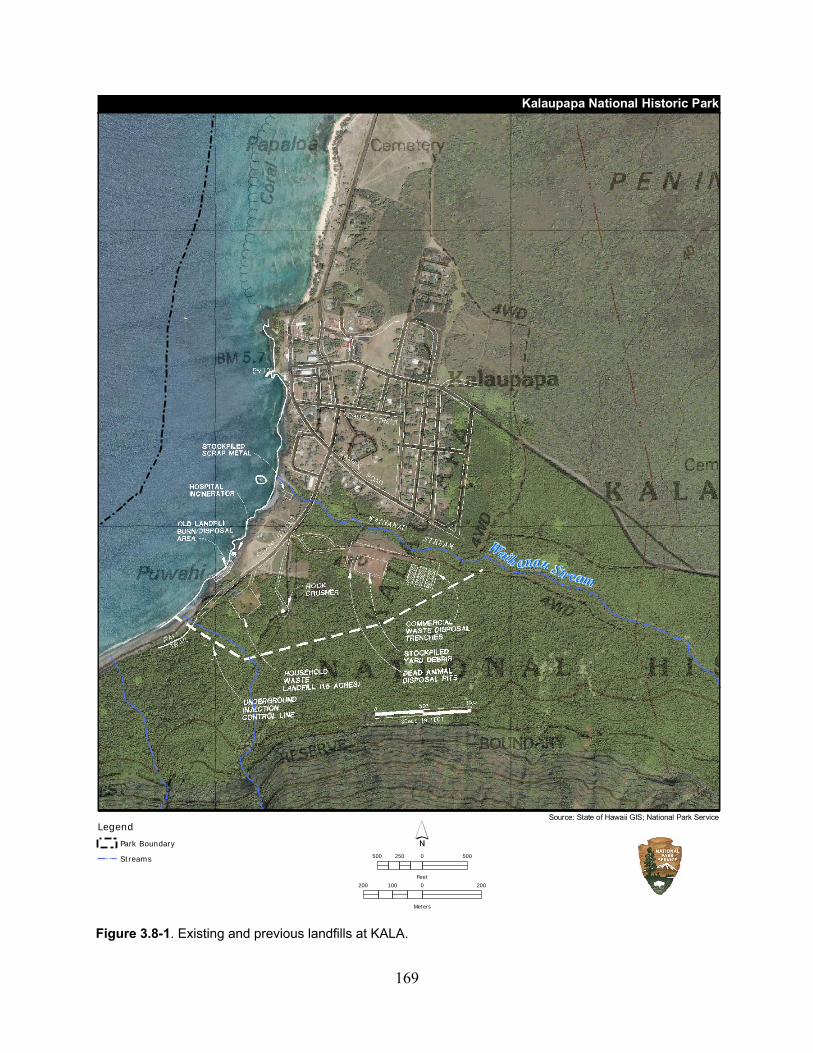
169
Figure 3.8-1. Existing and previous landfills at KALA.
Source: State of Hawaii GIS; National Park ServiceLegend
Park Boundary
Streams 500 0 500250
Feet
200 0 200100
Meters
Waih anau Stream
Kalaupapa National Historic Park
170
3.8.3 Impacts to the Marine Ecosystem The presence of blue-green algae fronting the settlement at depths of 0–10 m suggested localized high nutrients that may be associated with cesspool leaching. However, 15N tracer studies, conducted before and after the installation of the septic tanks, indicate that the excess nutrients from the settlement were minimal compared to other sources such as upslope agriculture (E. Brown/NPS, pers. comm.). It is possible that contaminants from the two landfills are affecting the water quality in the intertidal, but at present, no measurements have been made for contaminants. The landfill near ‘Awahua Beach spans approximately 250 m (820 ft) of the shoreline. Debris, such as glass from bottles and rusted metal from discarded vehicles, is exposed on the surface and has been washed out and deposited elsewhere along the shore by storm waves (G. Hughes/NPS, pers. comm.). Some beaches (such as Ho‘olehua Beach) also concentrate marine debris brought in by the tradewinds (E. Brown/NPS, pers. comm.). 3.9 Fire No known fires have occurred at KALA. Currently, the threat of fire is minimized by the presence of ungulates grazing understory species, particularly non-native grasses. Non-native vegetation that is not grazed by ungulates becomes fuel for wildfires (CTAHR 2003). The threat of wildland fire associated with an accumulation in fuel biomass could increase in certain areas (such as the crater) if management shifts and the exclusion of feral ungulates increases (Mederios et al. 1996). According to the Molokai Forest Reserve Draft Management Plan (DOFAW 2009), fire is a threat in the drier western section of the reserve, such as those within KALA. Areas near TNC’s Kamakou Preserve have a history of frequent fire activity (DOFAW 2009). 3.9.1 Impacts to the Terrestrial Ecosystem Plants with a high standing biomass and a high dead-to-live biomass ratio (notably non-native grasses) facilitate the spread of fire and recover rapidly after fire with increased vigor. The presence of these species can alter fuel characteristics of the communities (Ainsworth et al. 2005, D’Antonio et al. 2000), creating an invasive plant-fire cycle that is self-sustaining and persistent (Hughes et al. 1991, D’Antonio and Vitousek 1992). Fire resulting from invasion by introduced grasses has the potential to increase the abundance of non-native invasive plants, reduce native species diversity, convert native communities to grasslands, and alter ecosystem functions, such as primary productivity, decomposition, and nutrient cycling (D’Antonio et al. 2001). 3.10 Other Random Stochastic Events Random stochastic events (e.g., tsunamis, hurricanes, earthquakes, volcanoes, massive droughts, lake turnovers) have the potential to threaten the natural resources at KALA. These events can damage species or habitats and have the potential to cause the extinction of entire species if populations are composed of very small numbers of individuals (USFWS 2003). In general, stochastic events have a stronger influence on smaller populations because larger populations are better buffered against stochasticity (Maschinski 2006). Tsunamis are a series of ocean waves with very long wavelengths that can travel great distances at high speed. These events are usually generated by an underwater earthquake or landslide, but are occasionally caused by volcanic eruptions or major landslides into the ocean (Morrissey
171
2005). Tsunamis have historically been recorded on the Kalaupapa peninsula in 1946 and 1960, and the threat of tsunamis is considered high (Fletcher et al. 2002). KALA is vulnerable to hurricanes and tropical storms, which have been recorded to hit KALA in the past. The threat of storms is considered moderately high along the peninsula and moderately low to either side of the peninsula (Fletcher et al. 2002). The threat of volcanic activity and earthquakes is considered moderately high throughout the entire region due to the proximity to the active volcano on the Big Island and the Molokai Seismic Zone (Fletcher et al. 2002). 3.10.1 Impacts to the Terrestrial Ecosystem At KALA, locally generated and teleseismic tsunamis (from Alaska or Chile), hurricanes, and tropical storms can impact terrestrial areas of the park due to flooding and wave impacts. Tsunamis can inundate low-lying coastal areas, exposing vegetation to excessive salt and water stress. Hurricanes and tropical storms bring strong winds and heavy rains that can knock down plants and snap branches, as well as accelerate erosion. Earthquakes trigger slope failures (landslides) and subsequent removal of vegetation. Random stochastic events are particularly harmful to the small populations present in the terrestrial ecosystem at KALA, such as on the offshore islets. 3.10.2 Impacts to the Freshwater Ecosystem Tsunamis, hurricanes, and earthquakes can result in flash floods, landslides, and other unpredictable changes that alter freshwater resources. Hurricanes have been shown to impact the abundance, distribution, and social behavior of native Hawaiian stream fishes (Fitzsimons and Nishimoto 1995). Meromictic lakes can experience turnovers in which the water column is no longer stratified, but anoxia and sulfide are present throughout. By shifting the typical ecological conditions of the lake, this event can result in massive death of planktonic and benthic organisms (Ciglenecki et al. 2005). As hydrogen sulfide reaches the surface, this gas can also affect vegetation and fauna surrounding the lake. 3.10.3 Impacts to the Marine Ecosystem Coral reefs are particularly susceptible to damage by tsunamis because severe wave action can break, overturn, crush, or dislodge corals (Scheffers et al. 2009). Furthermore, sedimentation produced by tsunamis can smother coral colonies, and large vegetation washing across the reef can also be damaging (Foster et al. 2006). The impact of hurricanes on the marine ecosystem is discussed in section 3.6.3.4. Earthquakes may result in erosion and landslides, which will increase sedimentation in the marine environment. Eroded soil can bury coral and other substrates leading to direct mortality and reduced recruitment due to loss of available habitat and attachment sites for marine species (Field et al. 2008). In addition, the suspended sediment inhibits light penetration, thereby reducing photosynthesis. The stress results in bleaching from expulsion of the zooxanthellae and further coral mortality. Sediment from run-off can also block gills and the filter feeder apparatus for fish and other invertebrates. Furthermore, corals can be forced to expend valuable energy to remove the
172
sediment, which decreases survival. All of these factors can lead to altered species composition, shallower depth distribution limits, and a loss of biodiversity in coastal marine ecosystems (Field et al. 2008). 3.11 Summary of Threats and Stressors This section summarizes the extent of the problem, describes the knowledge base, and quantifies the magnitude of the impact for each of the threats and stressors discussed above. For most terrestrial threats and stressors at KALA, available information is limited to the presence/absence of a particular species, group of species, activity, or abiotic process in a specific area of the park. There is an overall lack of information that quantifies the extent of the problem on a park-wide level. In addition, there is a paucity of information that identifies and/or quantifies the direct and indirect impacts of the potential threats and stressors present throughout KALA. For the marine environment, more quantitative data exists, which allows for greater confidence in the assessment of the extent of the problem. Therefore, the determinations provided below are primarily based on 1) available data from investigations conducted by various researchers at KALA, 2) discussions with KALA staff and other knowledgeable researchers, and 3) SWCA’s best professional judgment derived from experiences in other ecosystems in Hawai‘i and the Pacific. 3.11.1 Identifying the Extent of the Problem at KALA Threats and stressors are classified into the four categories based on available data. If no data or observations were available for the threat and stressor at KALA during the drafting of this report, and no information could be derived from outside of KALA, it was not possible to confidently assess the extent of the problem, and the threat/stressor was classified as unknown. The categories are as follows: Not Currently a
Problem The issue has been investigated and it does not seem to represent a problem based on available data, which may be limited.
Potential Problem
No recent, reliable evidence exists to show that the problem is currently occurring at KALA; however, anecdotal evidence or evidence external to KALA suggests that there might be a problem at KALA.
Existing Problem
Recent, reliable evidence shows that the problem is currently occurring at KALA.
Unknown Not enough evidence to determine if a problem exists at KALA.
Potentially Increasing Problem
Problem likely to increase if KALA is opened to the wider public.
Because of the uncertainty surrounding future land management and ownership at the park, some issues may have the potential to become a problem in the long-term (>20 years) if the park is opened to the wider public. This action could potentially result in increased anthropogenic impacts (e.g., increased harvesting, sewage, spread of invasive species). If a threat or stressor is anticipated to increase under this scenario, an up arrow () is included in that cell.
173
3.11.2 Describing the Knowledge Base of Threats and Stressors Threats and stressors are accompanied with a determination of the extent of the knowledge base available for each problem. This categorization is designed to identify both the quality and quantity of the information present for each problem.
Ranking Level of Analysis Description
A Data w/ Trends Quantitative data collected over multiple years at KALA.
B Status Data Quantitative data collected only once at KALA.
C Limited Data Quantitative data collected at KALA without analysis (i.e., raw data) or knowledge base limited to presence/absence information or anecdotal evidence/observations at KALA.
D Inferred All information derived entirely from outside of KALA.
F No Data
Tables for all three ecosystems identifying problems and their knowledge base are included below (Table 3.11-1 to 3.11-3).
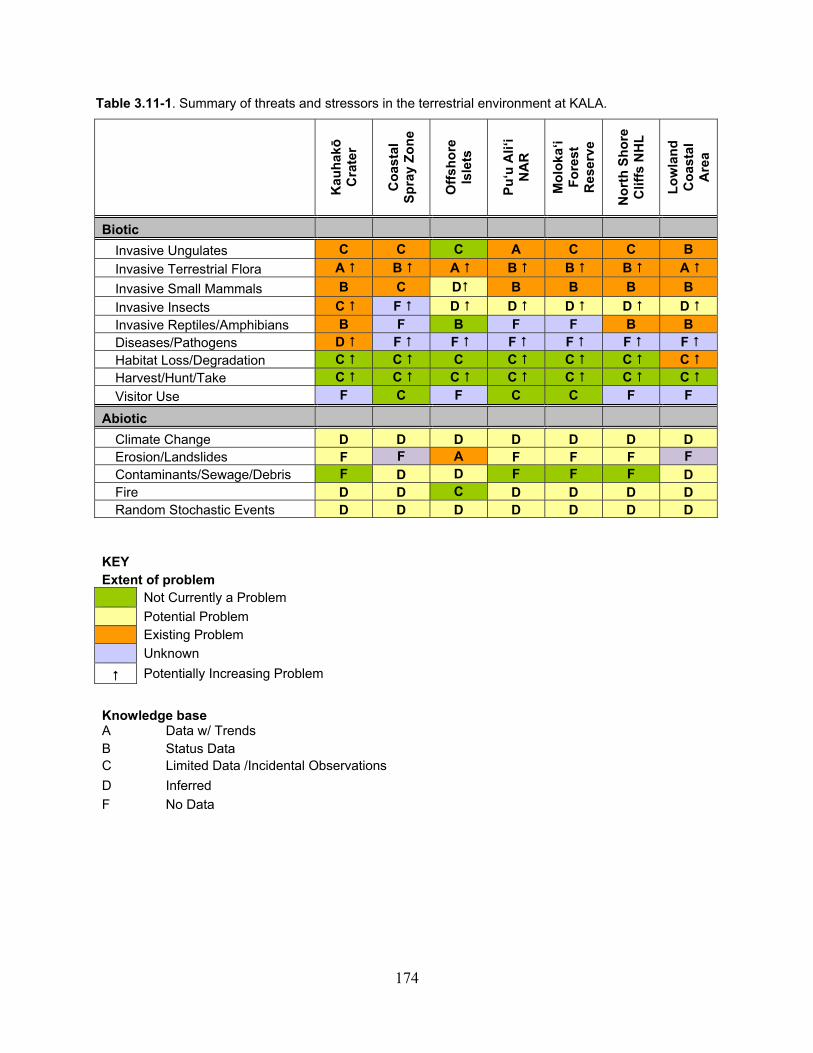
174
Table 3.11-1. Summary of threats and stressors in the terrestrial environment at KALA.
Kau
hakō
C
rate
r
Co
asta
l S
pra
y Z
on
e
Off
sho
re
Isle
ts
Pu
‘u A
li‘i
NA
R
Mo
loka
‘i F
ore
st
Res
erve
No
rth
Sh
ore
C
liff
s N
HL
Lo
wla
nd
C
oas
tal
Are
a
Biotic
Invasive Ungulates C C C A C C B
Invasive Terrestrial Flora A B A B B B A
Invasive Small Mammals B C D B B B B
Invasive Insects C F D D D D D
Invasive Reptiles/Amphibians B F B F F B B Diseases/Pathogens D F F F F F F Habitat Loss/Degradation C C C C C C C Harvest/Hunt/Take C C C C C C C
Visitor Use F C F C C F F
Abiotic
Climate Change D D D D D D D Erosion/Landslides F F A F F F F Contaminants/Sewage/Debris F D D F F F D Fire D D C D D D D Random Stochastic Events D D D D D D D
KEY Extent of problem
Not Currently a Problem
Potential Problem
Existing Problem
Unknown
Potentially Increasing Problem
Knowledge base A Data w/ Trends B Status Data C Limited Data /Incidental Observations
D Inferred
F No Data

175
Table 3.11-2. Summary of threats and stressors in the freshwater environment at KALA.
Palustrine Lacustrine Anchialine Riverine
Biotic
Invasive Ungulates D D D D
Invasive Terrestrial Flora D D D D
Invasive Small Mammals F F F D
Invasive Insects F F F D
Invasive Reptiles/Amphibians F F F D Invasive Fish C C C A Other Invasive Invertebrates F F F A Diseases/Pathogens F F F D Habitat Loss/Degradation F F F A Harvest/Hunt/Take C C C C
Visitor Use C C C C
Abiotic
Climate Change D D D D Erosion/Landslides F F F F Contaminants/Sewage/Debris F F F F Fire C C C C Random Stochastic Events D D D D
KEY Extent of problem
Not Currently a Problem
Potential Problem
Existing Problem
Unknown
Potentially Increasing Problem
Knowledge base A Data w/ Trends B Status Data C Limited Data/Incidental Observations
D Inferred
F No Data
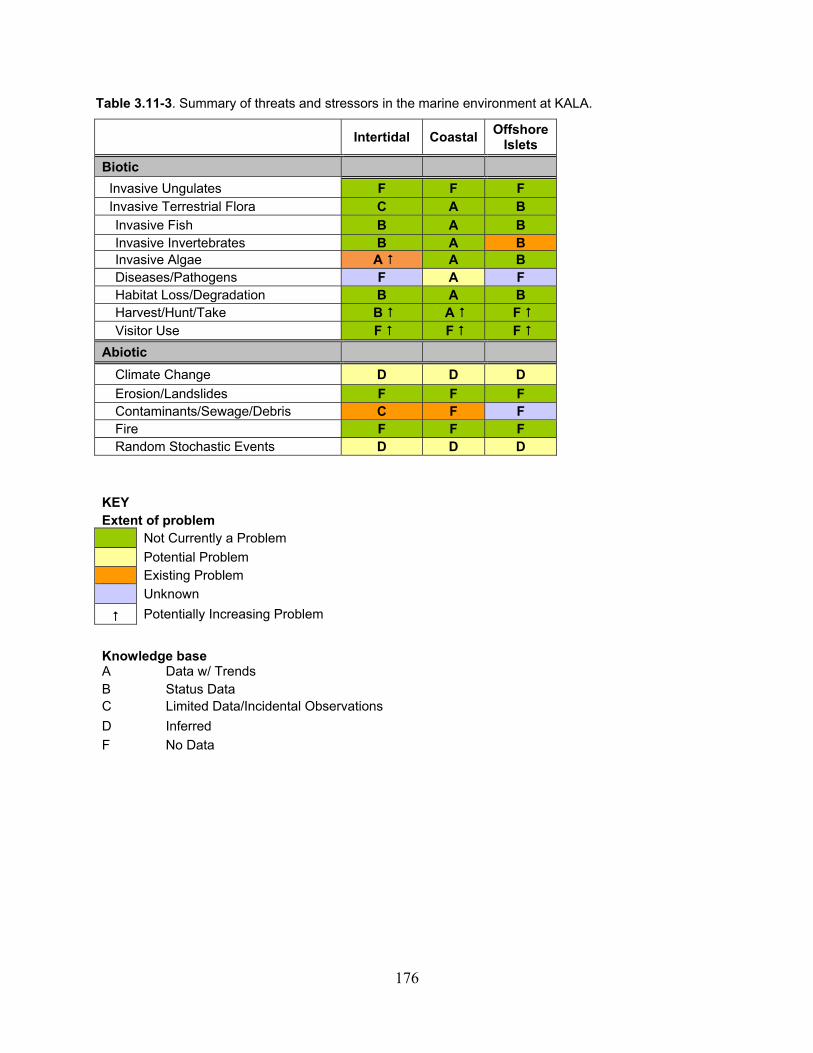
176
Table 3.11-3. Summary of threats and stressors in the marine environment at KALA.
Intertidal Coastal
Offshore Islets
Biotic
Invasive Ungulates F F F Invasive Terrestrial Flora C A B
Invasive Fish B A B Invasive Invertebrates B A B Invasive Algae A A B Diseases/Pathogens F A F Habitat Loss/Degradation B A B Harvest/Hunt/Take B A F Visitor Use F F F
Abiotic
Climate Change D D D
Erosion/Landslides F F F Contaminants/Sewage/Debris C F F Fire F F F Random Stochastic Events D D D
KEY Extent of problem
Not Currently a Problem
Potential Problem
Existing Problem
Unknown
Potentially Increasing Problem
Knowledge base A Data w/ Trends B Status Data C Limited Data/Incidental Observations
D Inferred
F No Data
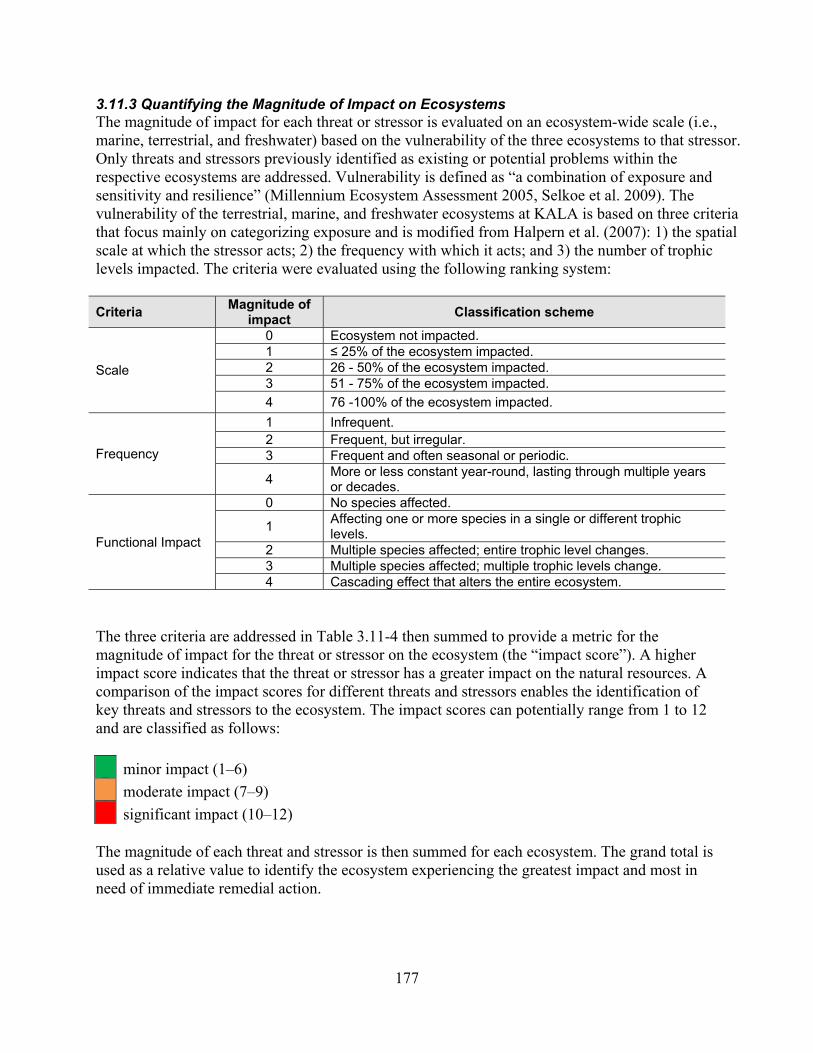
177
3.11.3 Quantifying the Magnitude of Impact on Ecosystems The magnitude of impact for each threat or stressor is evaluated on an ecosystem-wide scale (i.e., marine, terrestrial, and freshwater) based on the vulnerability of the three ecosystems to that stressor. Only threats and stressors previously identified as existing or potential problems within the respective ecosystems are addressed. Vulnerability is defined as “a combination of exposure and sensitivity and resilience” (Millennium Ecosystem Assessment 2005, Selkoe et al. 2009). The vulnerability of the terrestrial, marine, and freshwater ecosystems at KALA is based on three criteria that focus mainly on categorizing exposure and is modified from Halpern et al. (2007): 1) the spatial scale at which the stressor acts; 2) the frequency with which it acts; and 3) the number of trophic levels impacted. The criteria were evaluated using the following ranking system:
Criteria Magnitude of
impact Classification scheme
Scale
0 Ecosystem not impacted. 1 ≤ 25% of the ecosystem impacted. 2 26 - 50% of the ecosystem impacted. 3 51 - 75% of the ecosystem impacted.
4 76 -100% of the ecosystem impacted.
Frequency
1 Infrequent. 2 Frequent, but irregular. 3 Frequent and often seasonal or periodic.
4 More or less constant year-round, lasting through multiple years or decades.
Functional Impact
0 No species affected.
1 Affecting one or more species in a single or different trophic levels.
2 Multiple species affected; entire trophic level changes. 3 Multiple species affected; multiple trophic levels change. 4 Cascading effect that alters the entire ecosystem.
The three criteria are addressed in Table 3.11-4 then summed to provide a metric for the magnitude of impact for the threat or stressor on the ecosystem (the “impact score”). A higher impact score indicates that the threat or stressor has a greater impact on the natural resources. A comparison of the impact scores for different threats and stressors enables the identification of key threats and stressors to the ecosystem. The impact scores can potentially range from 1 to 12 and are classified as follows:
minor impact (1–6)
moderate impact (7–9)
significant impact (10–12) The magnitude of each threat and stressor is then summed for each ecosystem. The grand total is used as a relative value to identify the ecosystem experiencing the greatest impact and most in need of immediate remedial action.

178
Table 3.11-4. Magnitude of impact of threats and stressors on ecosystems at KALA.
Threat or Stressor
Spatial Scale Frequency Species/Trophic
Level Impact Total
Mar
ine
Fre
shw
ater
Ter
rest
rial
Mar
ine
Fre
shw
ater
Ter
rest
rial
Mar
ine
Fre
shw
ater
Ter
rest
rial
Mar
ine
Fre
shw
ater
Ter
rest
rial
Biotic
Invasive Species
Ungulates 0 4 4 4 4 4 0 4 4 4 12 12
Terrestrial flora 1 3 3 4 4 4 0 4 4 5 11 11
Small mammals - 2 4 - 2 4 - 1 3 - 5 11
Insects - 4 4 - 4 4 - 1 2 - 9 10
Reptiles & amphibians - 2 1 - 3 3 - 2 3 - 7 7
Fish 1 - - 4 - - 1 - - 6 - -
Other Invertebrates 1 2 - 4 4 - 1 3 - 6 9 -
Algae 1 - - 4 - - 1 - - 6 - -
Diseases & Pathogens 1 - 4 2 - 4 2 - 2 5 - 10
Habitat Loss & Degradation 1 2 2 1 4 4 1 4 4 3 10 10
Harvest, Hunt & Take 1 1 1 2 1 1 1 1 2 4 3 4
Visitor Use 1 2 2 2 2 2 1 2 2 4 6 6
Abiotic
Climate Change 4 4 4 4 4 4 4 4 4 12 12 12
Erosion & Landslides 1 3 3 1 1 1 0 2 2 2 6 6
Contaminants, Sewage, & Debris
1 - 1 2 - 4 1 - 2 4 - 7
Fire - - - - - - - - - - - -
Other Random Stochastic Events
4 2 4 1 1 1 4 4 4 9 7 9
Grand total for ecosystem 70 97 115
KEY Impact score
minor impact (1–6)
moderate impact (7–9)
significant impact (10–12)
Chapter 4: Conclusion
Despite the threats and stressors present at KALA (see Chapter 3), intact native Hawaiian ecosystems and unique native species persist in the terrestrial, freshwater, and marine ecosystems. To preserve these resources, additional surveys and regular monitoring of these habitats and species are essential. Specific recommendations to address information needs (e.g., condition of park natural resources, known threats, and unacceptable conditions) are summarized for each ecosystem. Of the three ecosystems, the terrestrial ecosystem probably requires the most immediate action to address potential and existing problems. The threats and stressors that have the most significant impact on this ecosystem are invasive non-native ungulates, terrestrial flora, and small mammals. These groups of organisms continuously degrade habitat and prevent regeneration/reproduction of native species. The information available for the terrestrial ecosystem at KALA is mainly data describing the status of each zone. Additional surveys are recommended in each terrestrial management zone to obtain long-term data to document ecological changes and emerging threats. Major data gaps in the terrestrial ecosystem are: Invasive Species: There is a paucity of data that identifies and quantifies the range, density, and impacts of non-native mammals, particularly ungulates and rodents. This is significant because non-native mammals are adversely impacting native species and ecosystems in other areas in Hawai‘i. Information is also lacking on the distribution and abundance of invasive plant taxa throughout the park. It would be useful for the National Park Service to map the distribution and abundance of high-priority, habitat-modifying weeds in relation to impacted native resources to focus control efforts. This information could be collected during the vegetation inventory project at KALA, which will classify, describe, and map detailed vegetation communities throughout the park. The inventory project is scheduled to begin in 2010, and the complete final report, metadata, and GIS layers from the inventory project are anticipated in 2013 (G. Kudray/NPS, pers. comm.). Furthermore, regular monitoring for incipient invasive plants could reduce the severity of future invasions. Native Flora: Due to the potential for rare plants to occur throughout the park, regular monitoring surveys should be conducted along permanent transects. Implementation of a long-term vegetation monitoring program would document the status of rare species, as well as track the presence and abundance of vegetation associations over time. Data analysis is a vital component of this program in order to highlight useful information and inform management decisions. Data collected during several flora studies at KALA have not been analyzed or compared to previous surveys. Native Fauna: Additional systematic bird surveys during periods of peak vocalization (breeding seasons) are needed to ensure high detectability of native avifauna. Ornithological radar and night-visual observations would provide information on the movement rates of rare seabirds, which may nest in upper elevation areas of Moloka‘i. More regular surveys for Lasiurus cinereus semotus would be useful in specific areas of the terrestrial ecosystem. Statewide, information on this species is limited.

179
Insects and Invertebrates: No focused invertebrate studies have been conducted at KALA. Specific studies are needed to inventory native insects and other invertebrate taxa (snails, insects, and other arthropods), which play an essential role in supporting native Hawaiian ecosystems. Caves: No recent surveys have been conducted in the extensive cave system at KALA to document features or resources within the caves. However, the potential for more obligate cave-adapted plants and animals, as well as paleontological resources, is significant. The development of a Cave Management Plan would ensure that cave exploration does not result in damage to these resources. Very little information exists for the freshwater habitats at KALA. Information is lacking for the status of palustrine, lacustine, and anchialine habitats, with slightly more information on the riverine habitat. The ephemeral nature of the palustrine habitats and the National Park Service’s desire to restrict location information for caves and lava tubes is, in part, responsible for this lack of information. Invasive ungulates and terrestrial plants are the largest potential problems to the freshwater ecosystem. These species can cause significant adverse impacts due to erosion, siltation, and changes in the hydrologic regime. More surveys should be conducted in the freshwater ecosystem to better document the resources present. Specifically, the following studies are recommended: Anchialine Pools: An important gap in the freshwater ecosystem is the documentation and mapping of anchialine pools, as well as determining the biota present in these pools. The National Park Service’s understandable concern for the security of lava tubes and caves at KALA, which may have important cultural value, needs to be balanced by the need to fill the information gap regarding anchialine systems. Once anchialine pools are identified at KALA, surveys could be conducted to inventory species present in these habitats and the integrity of the biological assemblages and habitats by collecting water quality parameters. Data from monitoring efforts would provide warning indicators if these systems are being altered from chemical and microbial contaminants leaching into the pools from aboveground terrestrial sources. Wetland Delineation: Ground-truth surveys should be conducted to more accurately determine whether wetlands are present, particularly in the Pu‘u Ali‘i NAR, as indicated by the NWI. Wetlands could be delineated utilizing accepted methods prescribed in the 1987 Army Corps of Engineers Wetlands Delineation Manual, as amended, in accordance with the U.S. Army Corps of Engineers (http://www.wetlands.com/regs/tlpge02e.htm). These surveys should also include collecting standard physical and chemical parameters in potential wetland areas. Water Quality: Several important water quality parameters (water, soil, and tissue contaminants; organic enrichment; sedimentation; toxics; etc.) could be monitored in the lake and rivers. Some of these parameters could be inexpensively monitored using data loggers. Poor water quality can impact growth, survival, and reproduction rates of benthic organisms. Because freshwater resources at KALA are used for domestic purposes, water quality is also a human health concern. Ecological Communities: There is little to no information on the faunal and floral communities in the palustrine habitats at KALA. Furthermore, a complete biotic inventory of the lake,
180
including invertebrates, has not been completed since 1973 (Maciolek 1975). Much more information is needed on the lake zooplankton, particularly depth zonation and seasonal patterns, and the integrity of biological assemblages and habitat issues. Renewed baseline inventories of macrofauna and invertebrates in all streams are needed and baseline inventories of fauna in the intermittent streams (Wainēnē, Anapuhi) are needed. Ecological community studies could also indicate whether ecologically harmful invasive species have been introduced into the freshwater habitats and the extent of parasites on native freshwater animals. Status data for the offshore islets and intertidal zones describe the resources present in these habitats. Long-term monitoring is in place for the coastal reefs of KALA. Currently, the main threats to the marine ecosystem at KALA are invasive algae and invasive marine invertebrates; however, the impacts to the marine ecosystem are relatively minor at present. An area of future concern is the potential for increased harvesting of intertidal invertebrates and marine life, should the existing fishing regulations be relaxed and human population increase in the area. Should harvesting and fishing pressure increase, a decrease in biomass and reduction of size of harvested species could be observed within a short period of time (a few years). Specifically, the following studies are recommended: Intertidal: An invertebrate inventory of the KALA intertidal needs to be completed. The mollusk and echinoderm inventories are the most complete (33–66%) and other phyla less so. Emphasis also needs to be placed on nocturnal species, fast-moving species, infaunal (sediment) species, and microinvertebrates (under 1 cm in size) that have not been targeted in the existing surveys to date. Offshore Islets: Water quality at the offshore islets should be sampled. A marine survey of the benthos and fauna for the offshore islet Huelo should be conducted. Both windward and leeward sites of all the offshore islets should be surveyed on a yearly basis to document changes in the benthic habitat and fish assemblages and particularly to monitor the documented invasive species (e.g., C. riisei and introduced fish species). Windward sites may be difficult to access due to weather conditions. Coastal Reefs: A good baseline documenting the relatively pristine condition of the coastal reefs of KALA has been established with the surveys conducted to date. The continued monitoring of the ecological community and abiotic factors using the existing protocol is recommended. More transects are needed in zones C, E, and F, which are inaccessible frequently due to weather conditions but should be surveyed as weather permits. Macroinvertebrate surveys documenting species and abundance are also recommended.

183
Literature Cited
Aeby, G., T. Work, T. Lewis, S. Coles, and J. Kenyon. 2008. Coral disease across the Hawaiian Archipelago. 2008 Hawaii Conservation Conference.
Ainley, D. G., T. C. Telfer, and M. H. Reynolds. 1997. Townsend’s and Newell’s shearwater
Pufinus auricularis. In A. Poole and F. Gill, editors. The Birds of North America, No. 297. The Birds of North America, Inc., Philadelphia, Pennsylvania.
Ainsworth, A., M. Tetteh, and B. J. Kaufmann. 2005. Relationships of an alien plant, fuel
dynamics, fire weather, and unprecedented wildfires in Hawaiian rain forests: implications for fire management at Hawaii Volcanoes National Park. Unpublished report, on file at Hawai`i Volcanoes National Park, Hawai‘i National Park, Hawaii.
Ainsworth, A. and J. B. Kauffman. 2009. Response of native Hawaiian woody species to lava-
ignited wildfires in tropical forests and shrublands. Plant Ecology 201(1):197–209. Alexander, D. and D. Lentz. 2000. Kalaupapa National Historical Park superintendent’s annual
report, fiscal year 2000. National Park Service, Kalaupapa, Molokai, Hawaii. Allombert, S., S. Stockton, and J. Martin. 2005. A natural experiment on the impact of
overabundant deer on forest invertebrates. Conservation Biology 19:1917–1929. Ali, R. 2004. The effect of introduced herbivores on vegetation in the Andaman Islands. Current
Science 86(8):1103–1112. Anderson, W. B. and G. A. Polis. 1999. Nutrient fluxes from water to land: seabirds affect plant
nutrient status on Gulf of California islands. Oecologia 118(3):324–332. Anthony, R. N., D. I. Kline, G. Diaz-Pulido, S. Dove, and O. Hoegh-Guldberg. 2008. Ocean
acidification causes bleaching and productivity loss in coral reef builders. PNAS 105(45), doi.10.1073, pnas. 0804478105.
Aruch, S. 2006. Appendix A: Kalaupapa National Historical Park resource overview. In L.
HaySmith, F. L. Klasner, S. H. Stephens, and G.H. Dicus. Pacific Island Network vital signs monitoring plan. Natural Resource Report NPS/PACN/NRR-2006/003 National Park Service, Fort Collins, Colorado.
Asherman, K. E., J. M. Crumme, and J. Q. C. Lau. 1990. A botanical reconnaissance of
Kalaupapa National Historical Park, November 27–December 5, 1989. Unpublished report. Atkinson, C. T., J. K. Lease, R.J. Dusek, and M. D. Samuel. 2005. Prevalence of pox-like lesions
and malaria in forest bird communities on leeward Mauna Loa Volcano, Hawaii. The Condor 107:537–546.
184
Aucan J. 2006. Directional wave climatology for the Hawaiian Islands from buoy data and the influence of ENSP on extreme wave events from the wave model hindcast. 9th international workshop on wave hindcasting and forecasting, 2006, Victoria, Canada.
Baker, J. D., C. L. Littnan, and D. W. Johnston. 2006. Potential effects of sea level rise on the
terrestrial habitats of endangered and endemic megafauna in the Northwestern Hawaiian Islands. Endangered Species Research 2:21–30.
Bataille, A., A. A. Cunningham, V. Cedeño, L. Patiño, A. Constantinou, L. D. Kramer, and S. J.
Goodman. 2009. Natural colonization and adaptation of a mosquito species in Galapagos and its implications for disease threats to endemic wildlife. PNAS 106(25):10230–10235.
Beets, J., E. Brown, and A. Friedlander. 2006. Inventory of marine vertebrate species and fish-
habitat utilization patterns in coastal waters off four national parks in Hawai’i. USDI National Park Service, Inventory and Monitoring Program, Pacific Island Network. Hawaii Volcanoes National Park, Hawaii.
Belt Collins Hawai‘i LTD. 2008. Statewide large-capacity inter-island ferry, draft environmental
impact statement. Prepared for State of Hawai‘i Department of Transportation, Harbors Division.
Benbow, M. E. 1999. Natural spate disturbance and decreased discharge in a Hawaiian stream:
fluctuating stability in a torrential environment. Dissertation. University of Dayton, Dayton, Ohio.
Benbow, M. E., A. J. Burky and C. M. Way. 1997. Larval habitat preference of the endemic
Hawaiian midge, Telmatogeton torrenticola Terry (Telmatogetoninae). Hydrobiologia 346: 129–136.
Benning T. L., D. LaPointe, C. T. Atkinson, and P. M. Vitousek. 2002. Interactions of climate
change with biological invasions and land use in the Hawaiian Islands: Modeling the fate of endemic birds using a geographic information system. PNAS 99(22):14246–14249.
Blossey, B. and R. Notzold. 1995. Evolution of increased competitive ability in invasive
nonindigenous plants: a hypothesis. Journal of Ecology 83:887–889. Bird C. E., B. S. Holland, B. W. Bowen, R. J. Toonen. 2007. Contrasting phylogeography in
three endemic Hawaiian limpets (Cellana spp.) with similar life histories. Molecular Ecology (15):3173–86
Bishop Museum. 2008. Offshore islet project. Available from http://www2.bishopmuseum.org/
HBS/islets/?isl=Moloka'i (accessed 10 November 2009). Both, C. and M. E. Visser. 2001. Adjustment to climate change is constrained by arrival date in a
long-distance migrant bird. Nature 411:296–298.
185
Brasher, A. M. 1996. Monitoring the distribution and abundance of native gobies (‘o‘opu) in Waikolu and Pelekunu Stream on the Island of Moloka‘i. Cooperative National Park Resources Studies Unit Technical Report 113. University of Hawaii at Manoa.
Brasher, A. M. 1997a. Habitat use by fish (‘o‘opu), snails (hihiwai), shrimp (‘opae) and prawns
in two streams on the Island of Moloka’i. Cooperative National Park Resources Studies Unit Technical Report 116. University of Hawaii at Manoa, Honolulu, Hawaii.
Brasher, A. M. 1997b. Life history characteristics of the native Hawaiian stream snail Neritina
granosa (hihiwai). Cooperative National Park Resources Studies Unit Technical Report 114. University of Hawaii at Manoa.
Brown, E., K. Kageyama, and R. Watanuki. 2008. Biological Assessment of Marine Resources
in Kalaupapa Harbor, Moloka‘i, Hawai‘i. Natural Resource Report NPS/MWR/HTLN/NRR—2008/001. National Park Service, Omaha, Nebraska.
Bruckner, A., K. Buja, L. Fairey, K. Gleason, M. Harmon, S. Heron, T. Hourigan, C. Jeffrey, J.
Kellner, R. Kelty, B. Leeworthy, G. Liu, S. Pittman, A. Shapiro, A. Strong, J. Waddell, P. Wiley. Threats and stressors to U.S. coral reef ecosystems. Pages 12–44 in J. Waddell, editor. The state of coral reef ecosystems of the United States and Pacific freely associated states: 2005. NOAA Technical Memorandum NOS NCCOS 11. NOAA/NCCOS Center for Coastal Monitoring and Assessment’s Biogeography Team. Silver Spring, Maryland.
Buddemeir, R. W., J. A. Kleypas, R. B. Aronson. 2004. Coral reefs and global climate change:
potential contributions of climate change to stresses on coral reef ecosystems. Pew Center on Global Climate Change.
Busby, P. E, P. Vitousek, and R. Dirzo. 2010. Prevalence of tree regeneration by sprouting and
seeding along a rainfall gradient in Hawai’i. Biotropica 42:80–86. Caccamise, D. J., M. A. Merrifield, M. Bevis, J. Foster, Y. L. Firing, M. S. Schenewerk, F. W.
Taylor, D. A. Thomas. 2005. Sea level rise at Honolulu and Hilo, Hawaii: GPS estimates of differential land motion. Geophysical Research Letters 32, L03607.
Canfield, J. E. 1990. Description and map of the plant communities of the northeast coastal spray
zone of Kalaupapa National Historical Park. Cooperative National Park Resources Studies Unit Technical Report 71. University of Hawaii at Manoa, Honolulu, Hawaii.
Chai, D. K., L. W. Cuddihy, and C. P. Stone. 1989. An inventory and assessment of anchialine
pools in Hawaii Volcanoes National Park from Waha'uia to Ka'aha, Puna and Ka'a, Hawai'i. Cooperative National Park Resources Studies Unit Technical Report 69.
Chapman, J. W. and J. T. Carlton. 1991. A test of criteria for introduced species: the global
invasion by the isopod Synidotea laevidorsalis (Miers, 1881). J. Crustacean Biol. 11:386–400.
186
Chapman, J. W. 1988. Invasions of the northeast Pacific by Asian and Atlantic gammaridean amphipod crustaceans, including a new species of Corophium. J. Crustacean Biol. 8:364–382.
Chimera, C., M. C. Coleman, and J. P. Parkes. 1995. Diet of feral goats and feral pigs on
Auckland Island, New Zealand. New Zealand Journal of Ecology 19(2):203–207. Chong, C. T., S. T. Larned, A. P. Covich and R. A. Kinzie III. 2000. Species interactions
between estuarine detritivores: inhibition or facilitation? Hydrobiologia 387:1–6. Christy, M. T., C. S. Clark, D. E. Gee, II, D. Vice, D. S. Vice, M. P. Warner, C. L. Tyrrell, G. H.
Rodda, and J. A. Savidge. 2007. Recent records of alien anurans on the Pacific island of Guam. Pacific Science 61:469–483.
Chubb, A. L., R. M. Zink, and J. M. Fitzsimons. 1998. Patterns of mtDNA variation in Hawaiian
freshwater fishes; the phylogenetic consequences of amphidromy. Journal of Heredity 89:8–16.
Ciglenecki, I., M. Caric, F. Krsinic, D. Vilicic, B. Cosovic. 2005. The extinction by sulfide—
turnover and recovery of a naturally eutrophic, meromictic seawater lake. Journal of Marine Systems 56(1–2):29–44.
Clague, D. A., C. Dao-Gong, R. Murnane, M. H. Beeson, M. A. Lanphere, G. B. Dalrymple, W.
Friesen, and R. T. Holcomb. 1982. Age and petrology of the Kalaupapa Basalt, Molokai, Hawaii. Pacific Science 36(4):411–420.
Clark, J. R. K. 1989. The Beaches of Maui County: revised and updated. A Latitude 20 Book,
University of Hawaii Press, Honolulu, Hawaii. Clements, D. R. and C. C. Daehler. 2007. Introducing a new series: biology and impacts of
Pacific Island invasive species. Pacific Science 61(1):1. Clewell, A., J. Rieger, and J. Munro. 2005. Society for Ecological Restoration International:
Guidelines for developing and managing ecological restoration projects, 2nd edition. www.ser.org and Tucson: Society for Ecological Restoration International. Available from http://www.ser.org/content/guidelines_ecological_restoration.asp (accessed 6 November 2009).
Coastal Resources Management, Inc. 2008. Treasure Island public use monitoring final report,
2002–2006 monitoring surveys. Prepared for City of Laguna Beach Water Quality Division. Coblentz, B. E. and D. W. Baber. 1987. Biology and control of feral pigs on Isla Santiago,
Galapagos, Equador. Journal of Applied Ecology 24:403–418. Coles, S. L. and E. K. Brown. 2007. Twenty-five years of change in coral coverage on a
hurricane impacted reef in Hawai‘i: the importance of recruitment. Coral Reefs 26:705–717.
187
Coles, S. L., L. Giuseffi, and M. Hutchinson. 2008. Assessment of species composition, diversity and biomass in marine habitats and sunhabitats around offshore islets in the main Hawaiian islands. Bishop Museum Technical Report Report No. 39. Honolulu, Hawai‘i.
Coombs, C, B. R. Hawke, and L. Wilson. 1990. Terrestrial analogues to lunar sinuous rilles:
Kauhako Crater and channel, Kalaupapa, Molokai, and other Hawaiian lava conduit systems. Proc. 20th Lunar and Planetary Sci. Conf., Houston, Lunar and Planetary Institute, 195–206.
Conry, P. J. 1989. Ecology of the wild (feral) pig (Sus scrofa) on Guam. Technical report no. 7,
Guam, Division of Aquatic and Wildlife Resources, Mangilao, Guam. Courchamp, F., J. Chapuis, and M. Pascal. 2003. Mammal invaders on islands: impact, control
and control impact. Biol. Rev. 78:347–383. Covich, A. P. 1988. Geographical and historical comparisons of neotropical streams: biotic
diversity and detrital processing in highly variable habitats. JNABS 7: 361–386 Cowardin, L. M., V. Carter, F. C. Golet, and E. T. LaRoe. 1979. Classification of wetlands and
deepwater habitats of the United States. U.S. Department of the Interior, Fish and Wildlife Service, Washington, D.C. (Version 04DEC98).
CRAMP (Coral Reef Assessment & Monitoring Program). 2008. Miloli‘i sampling site
description. Coral Reef Assessment & Monitoring Program, Hawaii Institute of Marine Biology, University of Hawaii. Available from http://cramp.wcc.hawaii.edu/ LT_Montoring_files/lt_study_sites_Kauai_Milolii_NaPali.htm (accessed 2 June 2008).
Cruz, F., C. J. Donlan, K. Campbell, K., and V. Carrion. 2005. Conservation action in the
Gala´pagos: feral pig (Sus scrofa) eradication from Santiago Island. Biological Conservation 121:473–478.
CTAHR (College of Tropical Agriculture and Human Resources). 2003. Weeds of Hawai‘i’s
pastures and natural areas: an identification and management guide. University of Hawaii at Manoa, Honolulu, Hawaii.
D’Antonio, C. M., J. T. Tunison, R. K. Loh. 2000. Variations in impact of exotic grasses and fire
on native plant communities in Hawaii. Journal of Australian Ecology. 25:507–22. D’Antonio, C. M. and P. M Vitousek. 1992. Biological invasions by exotic grasses, the grass/fire
cycle, and global change. Annual Review of Ecology and Systematics. 23:63–87. DAR (Division of Aquatic Resources), Hawaii Department of Land and Natural Resources
(DLNR). 1986. Survey of the freshwater aquatic fauna in Waikolu Stream, Island of Molokai.
DAR, Hawaii DLNR. 2008. Freshwater Database. Available from
http://www.state.hi.us/dlnr/dar/streams/stream_data.htm (accessed 23 July 23 2009).
188
Day, R. H. and B. A. Cooper. 2002. Petrel and Shearwater surveys near Kalaupapa, Molokai Island, June 2002. Final report, prepared by ABR, Inc.—Environmental Research & Services. Fairbanks, AK.
Day, R. H., B. A. Cooper, and R. J. Blaha. 2003. Movement Patterns of Hawaiian Petrels and Newell’s Shearwaters on the Island of Hawai‘i. Pacific Science 57(2):147–159. Davey, C. A., K. T. Redmond, and D. B. Simeral. 2006. Weather and climate inventory, National
Park Service, Pacific Island Network. Natural Resource Technical Report NPS/PACN/NRTR—2006/003. National Park Service, Fort Collins, Colorado.
DEH (Department of the Environment and Heritage). 2004. The feral goat (Capra hircus).
Australian Government, Canberra. Denslow, J. S, S. C. Space, and P. H. Thomas. 2008. Invasive exotic plants in the tropical Pacific
Islands: patterns of diversity. Biotropica 41:162–170. DBEDT (Department of Business, Economic Development & Tourism) and DOH (Department
of Health). 1998. Hawaii climate change action plan. Available from http://hawaii.gov/dbedt/info/energy/publications/ccap.pdf (accessed 16 January 2008).
Department of Health. 1987. Water quality standards maps. Available from
http://hawaii.gov/health/environmental/water/cleanwater/wqsmaps/index.html (accessed 6 November 2009).
Department of the Navy. 2006. Integrated natural resources management plan guidance gor Navy
installations. Headquarters, U.S. Marine Corps, Washington D.C. DeVerse, K. and E. DiDonato. 2006. Appendix I: Water Quality Report. In L. HaySmith, F. L.
Klasner, S. H. Stephens, and G. H. Dicus. Pacific Island Network Vital Signs Monitoring Plan: Phase III (draft) report. National Park Service, Pacific Island Network, Hawaii National Park, Hawaii.
Devick, W. S. 1989. Analysis of October Waikolu visual survey for gobies. Unpblished report,
State of Hawaii DLNR, Division of Aquatic Resources. Devick, W. S., J. M. Fitzsimons and R. T. Nishimoto. 1995. Threatened fishes of the world:
Lentipes concolor Gill 1860 (Gobiidae). Environmental Biology of Fishes 44:325–326. Diaz, G. E., O. Elbadawy, J. C. Hughes and J. D. Salas. 1995. In search of hydrologic similarity:
a case study on Molokai, Hawaii. In Proceedings of the Summer Symposium, American Water Resources Association. June 25–28, 1995. Edited by R. Herrmann, W. Black,R.C. Sidle and A.I. Johnson. Honolulu, Hawaii.

189
Dierking, J. 2007. Effects of the introduced predatory fish Cephalopholis argus on native reef fish populations on Hawaii. Ph.D. dissertation, Department of Zoology, University of Hawaii at Manoa.
Diong, C. H. 1982. Population biology and management of the feral pig (Sus scrofa L.) in
Kipahulu Valley, Maui. Dissertation. University of Hawai‘i, Honolulu, Hawai‘i. DOFAW (Division of Forestry and Wildlife), Hawaii DLNR. 1991. Puu Alii Natural Area
Reserve management plan. Natural Area Reserves System Program. DOFAW, Hawaii DLNR. 2007. Final environmental assessment Pu‘u Ali‘i conservation fencing
project, Upper Pu‘u Ali‘i Plateau Pu‘u Ali‘i Natural Area Reserve, Molokai. DOFAW, Hawaii DLNR. 2009. Molokai Forest Reserve draft management plan. State of
Hawaii, Department of Land and Natural Resources, Division of Forestry and Wildlife, Forest Management Section. Available from http://hawaii.gov/dlnr/dofaw/forestry/FRS/reserves/mauinuifr/molokai-forest-reserve/Molokai%20FINAL_small%20file.pdf (accessed 5 January 2010).
Division of State Parks, Hawaii DLNR. 2008. Hawaii State Parks website. Available from
http://www.hawaiistateparks.org/parks/hawaii/ (accessed 26 March 2009). Division of Water and Land Development, Hawaii DLNR. 1994. Draft environmental
assessment and negative declaration for Waikolu Valley Wells Development (0855–05 & 06) Pump Controls and Connecting Pipeline, Molokai Irrigation System, Kalawao, Molokai, Hawaii.
Dodd, C. K., Jr., G. E. Drewry, R. M. Nowak, J. M. Sheppard, and J. D. Williams. 1985.
Endangered and threatened wildlife and plants; review of vertebrate wildlife. Federal Register 50:37957–37967.
Donachie, S. P., R. A. Kinzie III, R. R. Bidigare, D. W. Sadler, D. M. Karl. 1999. Lake Kauhakō,
Moloka‘i, Hawai‘i: biological and chemical aspects of a morpho-ectogenic meromictic lake. Aquatic Mircobial Ecology Vol. 19:93–103.
Donachie, S. P., S. Hou, K. S. Lee, C. W. Riley, A. Pikina, C. Belisle, S. Kempe, T. S. Gregory,
A. Bossuyt, J. Boerema, J. Liu, T. A. Freitas, A. Malahoff, and M. Alam. 2004. The Hawaiian Archipelago: a microbial diversity hotspot. Microbial Ecology 48:509–520.
Dow, K. and T. E. Downing. 2006. The atlas of climate change. University of California Press,
Berkeley and Los Angeles, California. Duffy, D. C. 1993. Stalking the Southern Oscillation: environmental uncertainty, climate change,
and North Pacific seabirds. The status, ecology, and conservation of marine birds of the North Pacific. Can. Wildl. Serv. Spec. Publ., Ottawa, Canada.
190
Duvall, F. 2000. Report on 2-day biological survey Huelo Islet: vertebrates. Draft report, Department of Land and Natural Resources, Kahului, Maui, Hawaii.
Edmondson, C. H. 1929. Hawaiian Atyidae. Bernice P. Bishop Museum Bulletin 66, Honolulu,
Hawaii. Ego, K. 1956. Life history of freshwater gobies. Project Number 4-4-R, freshwater game fish
management research, Department of Land and Natural Resources, Honolulu, Hawaii. Ehleringer, J. R., T. E. Cerling, and D. Dearing. 2002. Atmospheric CO2 as a global change
driver influencing plant-animal interactions. Integrated and Comparative Physiology 42:424–430.
Eichenlaub B. 2001. Introduction to the Kalaupapa marine environment. Unpublished report. Eijzenga, H. and D. J. Preston. 2008. Inventory of seabirds, plants, and arthropods on twenty
offshore islets in the main Hawaiian Islands. Bishop Museum Technical Report 43. Englund R. A. 1999. The impacts of introduced poeciliid fish and Odonata on the endemic
Megalagrion (Odonata) damselflies of Oahu Island, Hawaii. Journal of Insect Conservation. 3:225–243.
Englund, R. A. and R. B. Filbert. 1997. Waikolu Stream, Molokai Biological Monitoring. Erickson, T. A. and C. F. Puttock. 2006. Hawai’i wetland field guide: An ecological and
identification guide to wetlands and wetland plants of the Hawaiian Islands. Bess Press Books, Honolulu, Hawaii.
Evenhuis, N. L. and L. G. Eldredge. 1999. Records of the Hawaii Biological Survey for 1998:
Part 2: Notes. Bishop Mus. Occas. Pap. 59:1–55. Filkin, N. R., A. R. Sherwood, and M. L. Vis. 2003. Macroalgae from 23 stream segments in the
Hawaiian Islands. Pacific Science 57(4):421–431. Fitzsimons, J. M. 1990. Letter to Mr. Ernest Kosaka, Field Supervisor, Fish and Wildlife
Enhancement, US Fish and Wildlife Service, Pacific Islands Office, Honolulu, Hawaii. Fitzsimons, J. M. and R. T. Nishimoto 1995. Use of fish behavior in assessing the effects of
Hurricane Iniki on the Hawaiian Island of Kauai. Environmental Biology of Fishes 43(1):39–50.
Fitzsimons, J. M., R. M Zink, and R. T. Nishimoto. 1990. Genetic variation in the Hawaiian
stream goby, Lentipes concolor. Biochemical Systematics and Ecology 18(1):81–83 Fletcher, C. H. 2009. Sea level by the end of the 21st century: a review. Shore and Beach
77(4):1–9.
191
Fletcher, C. H. III, E. E. Grossman, B. M. Richmond, and A. E. Gibbs. 2002. Atlas of natural hazards in the Hawaiian Coastal Zone. USGS Geologic Investigations Series I-2761. U.S. Government Printing Office.
Foote, D. E., E. L. Hill, S. Nakamura, and F. Stephens. 1972. Soil survey of the islands of
Kaua‘i, O‘ahu, Maui, Moloka‘i, and Lana‘i, State of Hawai‘i. U. S. Department of Agriculture, Soil Conservation Service.
Font, W. F. 2007. Parasites of Hawaiian stream fishes: sources and impacts. Biology of
Hawaiian Streams and Estuaries. Edited by N.L. Evenhuis & J.M. Fitzsimons. Bishop Museum Bulletin in Cultural and Environmental Studies 3:157–169.
Ford, J. I. and R. A. Kinzie III. 1982. Life crawls upstream. Natural History 91(12):51–66. Ford, J. I. and A. R. Yuen. 1986. Biological survey of Pelekunu Stream, Moloka’i. USFWS
contract report prepared for The Nature Conservancy of Hawaii, Honolulu, Hawaii. Ford, M. A. and J. B. Grace. 1998. Effects of vertebrate herbivores on soil processes, plant
biomass, litter accumulation and soil elevation changes in a coastal marsh. The Journal of Ecology 86(6):974–982.
Foster, J. T., B. L. Woodworht, L. E. Eggert, P. J. Hart, D. Palmer, D. C. Duffy, and R. D.
Fleischer. 2007. Genetic structure and evolved malaria resistance in Hawaiian honeycreepers. Molecular Ecology 16:4738–4746.
Foster R., A Hagan, N. Perera, C. A. Gunawan, I. Silaban, Y. Yaha, Y. Manuputty, I. Hazam,
and G. Hodgson. 2006. Tsunami and earthquake damage to coral reefs of Aceh, Indonesia. Reef check foundation, Pacific Palisades, California.
Frasher, H. R., V. Parker-Geisman, and G.R. Parish. 2007. Hawaiian hoary bat inventory in
national parks on the islands of Hawai‘i, Maui, and Moloka‘i. Pacific Cooperative Studies Unit Technical Report 140. University of Hawaii at Manoa, Honolulu, Hawaii.
Friedlander, A. M. and E. E. DeMartini. 2002. Contrasts in density, size, and biomass of reef
fishes between the northwestern and the main Hawaiian Islands: the effects of fishing down apex predators. Mar Ecol Prog Ser 230:253–264.
Friedlander, A. M., E. Brown, and M. E. Monaco. 2007. Defining reef fish habitat utilization
patterns in Hawaii: comparisons between marine protected areas and areas open to fishing. Marine Ecology Progress Series 351:221–233.
Friedlander, A., G. Aeby, R. Brainard, E. Brown, K. Chaston, A. Clark, P. McGowan, T.
Montgomery, W. Walsh, I. Williams, and W. Wiltse. 2008a. The state of coral reef ecosystems of the main Hawaiian Islands. Pages 219–261 in J. E. Waddell and A. M. Clarke, editors. The state of coral reef ecosystems of the United States and Pacific Freely Associated
192
States: 2008. NOAA Technical Memorandum NOS NCCOS 11. NOAA/NCCOS Center for Coastal Monitoring and Assessment’s Biogeography Team. Silver Spring, Maryland.
Friedlander A., G. Aeby, S. Balwani, B. Bowen, R. Brainard, A. Clark, J. Kenyon, J. Maragos,
C. Meyer, P. Vroom and J. Zamzow. 2008b. The state of coral reef ecosystems of the northwest Hawaiian Islands. Pages 263–306 in J. E. Waddell and A. M. Clarke, editors. The state of coral reef ecosystems of the United States and Pacific Freely Associated States: 2008. NOAA Technical Memorandum NOS NCCOS 11. NOAA/NCCOS Center for Coastal Monitoring and Assessment’s Biogeography Team. Silver Spring, Maryland.
Funk, E. J. 1991. Vegetation Map of Kalaupapa National Historical Park, Molokai, Hawaii.
Cooperative National Park Resource Studies Unit. Technical Report 77. Gagne, W. C. and F. G. Howarth. 1982. Assessment of endangered and threatened status of
Hawaiian arthropods. Report to the U.S. Fish and Wildlife Service, Honolulu. Garman, M. 2000. Preliminary report, March 2000 research diving, Kauhako Crater Lake,
Kalaupapa National Historical Park. Garman, M., S. Garman, and S. Kempe. 2000. First dives into Kauhako Crater Lake, Kalaupapa,
Molokai, Hawaii: a deep volcanic vent dominated by microbial life. 2000 National Speleological Society Convention. Elkins, West Virginia.
Giambelluca, T., M. Ridgley, M. Nullet. 1996. Water balance, climate change and land-use
planning in the Pearl Harbor Basin, Hawaii. Water Resources Development 12(4):515–530. Giambelluca, T. W., Diaz, H. F., and Luke, M. S. A. 2008. Secular temperature changes in
Hawai‘i. Geophysical Research Letters 35, L12702. Gillespie, R. G. and N. Reimer. 1993. The effect of alien predatory ants (Hymenoptera:
Formicidae) on Hawaiian endemic spiders (Araneae: Tetragnathidae). Pac Sci 47:21–33. Gingerich, S. B. and R. H. Wolff. 2005. Effects of surface-water diversion on habitat availability
for native macrofauna, Northeast Maui, Hawaii. Honolulu, Hawaii, U.S. Geological Survey, Scientific Investigations Report 2005-5213.
GK & Associates. 1991. Environmental assessment for boulder removal project, Waihanau
Stream, Kalaupapa National Historical Park, Molokai, Hawaii. Prepared for Edward K. Noda and Associated, Inc.
Godwin, S. and H. Bollick. 2006. Inventory of intertidal and shallow subtidal marine invertebrate
at Kalaupapa National Historic Park Moloka‘i, Hawai‘i. The Bishop Museum Contribution No. 2006–003 to the Hawaii Biological Survey for the National Park Service.
Going, B. M. and T. L. Dudley. 2008. Invasive riparian plant litter alters aquatic insect growth.
Biol Invasions 10:1041–1051.
193
Goltz, D. M., A. M. Agness and P. C. Banko. 2001. Axis deer home range, movements, and survival at Kalaupapa, Molokai. USGS-BRD unpublished report, Hawaii Volcanoes National Park.
Gordon, D. R. 1998. Effects of invasive, non-indigenous plant species on ecosystem processes:
lessons from Florida. Ecological Applications 8(4):975–989. Greene, L. W. 1985. Historic resource study, exile in paradise: the isolation of Hawaii’s leprosy
victims and development of Kalaupapa Settlement, 1986 to present. Unpublished report. Grimsditch, G. D. and R. V. Salm. 2006. Coral reef resilience and resistance to bleaching. IUCN,
Gland, Switzerland. Gulko, D. A. 2005. Main Hawaiian Island remote islet coral reef rapid ecological assessments,
Final Technical Report. Coral Reef Management Program, National Ocean Service, NOAA, #NA03NOS4260112.
Ha, P. Y. and R. A. Kinzie III. 1996. Reproductive biology of Awaous guamensis, an
amphidromous Hawaiian goby. Environmental Biology of Fishes 45:383–396 Haines, W. and D. Foote. 2005. Rapid assessment of invertebrate fauna of the Kona Forest Unit
of Hakalau National Wildlife Refuge. Hawai‘i Cooperative Studies Unit, Technical Report HCSU- 001. University of Hawai‘i at Hilo, Hawaii.
Halliday, W. R. 2001. Caves and cavernous features of Kalaupapa Peninsula. Hawaii
Speleological Survey of the National Speleological Society Report #01-1. Halpern, B. S., K. A. Selkoe, F. Micheli, C. V. Kappel. 2007. Evaluating and ranking the
vulnerability of marine ecosystems to anthropogenic threats. Conserv Biol 21:1301–1315. Hawai‘i Cooperative National Park Studies Unit. 1990. Hawai‘i stream assessment: a
preliminary appraisal of Hawai‘i stream resources. Report R84. Prepared for the Commission of Water Resources Management. Honolulu, Hawai’i.
HDOA (Hawai‘i Department of Agriculture), Plant Quarantine Branch. 2008. Final
environmental assessment: field release of Eurytoma sp. (Hymenoptera: Eurytomidae), for biological control of the Erythrina gall wasp, Quadrastichus erythrinae Kim (Hymenoptera: Eulophidae), in Hawaii. Plant Pest Control Branch, Hawaii Department of Agriculture, Honolulu, Hawaii.
HINHP (Hawaii Heritage Program). 1989. Puu Alii Natural Area Reserve resource information,
notebook 1. Prepared for State of Hawaii, Natural Area Reserves System. Hawaii Heritage Program, The Natural Conservancy of Hawaii. Honolulu, Hawaii.
194
Hays, W. S. T. and S. Conant. 2007. Biology and impacts of Pacific Island invasive species. 1. A worldwide review of effects of the small Indian mongoose, Herpestes javanicus (Carnivora: Herpestidae). Pacific Science 61(1):3–16.
Hess, S. C., J. J. Jeffrey, D. L. Ball, and L. Babich. 2006. Efficacy of feral pig removals at
Hakalau Forest National Wildlife Refuge. Hawai`i Cooperative Studies Unit Technical Report HCSU-004. University of Hawai‘i, Hilo, Hawaii.
Heu, R. A., D. M. Tsuda, W. T. Nagamine, J. A. Yalemar, and T. H. Suh. 2006. Erythrina gall wasp Quadrastichus erythrinae Kim (Hymenoptera: Eulophidae), new pest advisory. Department of Agriculture, Manoa, Hawaii.
Higashi, G. R. and M. N. Yamamoto. 1993. Rediscovery of “Extinct” Lentipes concolor (Pisces:
Gobiidae) on the Island of Oahu. Hawaii. Pac. Sci. 47:115-117. Hoch, H. and F. G. Howarth. 1999. Multiple cave invasions by species of the planthopper genus
Oliarus in Hawaii (Homoptera: Fulgoroidea: Cixiidae). Zoological Journal of the Linnean Society. 127(4):453–475.
Hodges, C. N. 1996. Observation of seabird survey at Kalaupapa. Memorandum to Rick Potts,
KALA Wildlife Biologist. June 27, 1996. Holland, K. N., C. G. Lowe, and B. M. Wetherbee. 1996. Movements and dispersal patterns of
blue trevally (Caranx melampygus) in a fisheries conservation zone. Fisheries Research 25: 279–292.
Holthuis, L. B. 1973. Caridean shrimps found in land-locked saltwater pools at four Indo-west
Pacific localities (Sinai Peninsula, Funafuti Atoll, Maui and Hawaii Islands), with the description of one new genus and four new species. Zool. Verhadenlingen 128:3–55.
Holm, L. G., D. L. Plucknett, J. V. Pancho, and J. P. Herberger. 1977. The world’s worst weeds:
distribution and biology. University of Hawai‘i Press, Honolulu, Hawaii. Holmquist, J. G., J. M. Schmidt-Gengenbach, and B. B Yoshioka. 1998. High dams and marine-
freshwater linkages: Effects on native and introduced fauna in the Caribbean. Conservation Biology 12(3):621–630.
Hovenden, M. J., K. E. Wills, J. K. Vander Schoor, R. E. Chaplin, A. L. Williams, M. J. Nolan,
and P. C. D. Newton. 2007. Flowering, seed production and seed mass in a species-rich temperate grassland exposed to FACE and warming. Australian Journal of Botany 55:780–794.
Howarth, F. and S. Taiti. 1995. Trip report for Kalaupapa National Historical Park, Molokai, 14–
16 November 1995. B.P. Bishop Museum, Honolulu, Hawaii.
195
Howarth, F. G., S. James, W. McDowell, D. Preston, C. Imada. 2007. Identification of roots in lava tube caves using molecular techniques: implications for conservation of cave arthropod faunas. Journal of Insect Conservation 11(3):251–261.
Hughes, G. 2003. R-Map park profile input. Unpublished document dated January 1, 2003. Hughes, G. D., K. R. Wood, M. L. Wysong, and E. K. Brown. 2007. Kalaupapa National
Historical Park, vascular plant inventory, Kalawao, Molokai, Hawaii. National Park Service, Inventory and Monitoring Program, Pacific Island Network.
Hughes, G. and M. Carnevale. 2004. Protocol development assessing opihi (Cellana spp.)
densities and population structure. Unpublished report. Hughes, R. F., P. M. Vitousek, J. T. Tunison. 1991. Alien grass invasion and fire in the seasonal
submontane zone of Hawaii. Ecology 72:743–746. Ikagawa, M. Wildllife in the garden. Honolulu Star-Bulletin 6 August 2006, 11. Available from
http://archives.starbulletin.com/2006/08/06/editorial/special.html (accessed 3 March 2009). Ikuma, E. K., D. Sugano, and J. K. Mardfin. 2002. Filling the gaps in the fight against invasive
species. Legislative Reference Bureau, Honolulu, Hawaii. ISSG (Invasive Species Specialist Group). 2005. Carijoa riisei (coral). Available from
http://www.issg.org/database/species/ecology.asp?si=694&fr=1&sts= (accessed 20 August 2009).
IPCC (Intergovermental Panel on Climate Change). 2007. 2007: Summary for policymakers. In
S. Solomon, D. Qin, M. Manning, Z. Chen, M. Marquis, K. B. Averyt, M. Tignor and H. L. Miller, editors. Climate change 2007: the physical science basis, contribution of Working Group I to the fourth assessment report of the Intergovernmental Panel on Climate Change. Cambridge University Press, Cambridge, United Kingdom, and New York, New York.
IUCN (International Union for Conservation of Nature). 2000. Guidelines for the prevention of
biodiversity loss caused by alien invasive species. Prepared by the IUCN/SSC Invasive Species Specialist Group (ISSG) and approved by the 51st meeting of the IUCN Council, Gland, Switzerland.
Jacobi, J. D. 1989. Vegetation maps of the upland plant communities on the islands of Hawaii,
Maui, Molokai, and Lanai. Cooperative National Park Resources Studies Unit Technical Report 68. University of Hawaii at Manoa, Honolulu, Hawaii.
James, H. F., T. W. Stafford, D. W. Steadman, S. L. Olson, P. S. Martin, A. J. T. Jull, P. C.
McCoy. 1987. Radiocarbon dates on bones of extinct birds from Hawaii. PNAS 84(8):2350–2354.
196
Jessel, S. and R. Agliam. 1994. Kukaiwaa, North Shore Molokai, Carter's panic grass (Panicum fauriei var. carteri), August 22–25, 1994. Unpublished report.
Jokiel, P. L. and E. K. Brown. 2004. Global warming, regional trends and inshore environmental
conditions influence coral bleaching in Hawaii. Global Change Biology 10:1627–1641. Jokiel, P. L., E. K. Brown, A. M. Friedlander, S. K. Rodgers, and W. R. Smith. 2004. Hawaii
coral reef assessment and monitoring program: Spatial patterns and temporal dynamics in reef coral communities. Pacific Science 58:159–174.
Jokiel P., K. Rodgers, I. Kuffner, A. Anderson, F. Cox, F. Mackenzie. 2009. Impact of ocean
acidification on Hawaiian coral reefs in the 21st century abstract. In Hawai‘i Conservation Conference 2009, Hawai‘i in a changing climate: ecological, cultural, economic and policy challenges and solutions. Abstracts of the 2009 Hawaii Conservation Conference. Available from http://hawaiiconservation.org/_library/documents/2009hcc/ 2009hccabstractbookfinal2.pdf (accessed 22 September 2009).
Jones, V. P., P. Anderson-Wong, P. A. Follett, P. Yang, D. M. Westcot, J. S. Hu, and D. E.
Ullman. 2000. Feeding damage of the introduced leafhopper Sophonia rufofascia (Homoptera: Cicadellidae) to plants in forests and watersheds of the Hawaiian Islands. Environmental Entomology 29(2):71–180.
Juvik, S. P. and J. O. Juvik. 1998. Atlas of Hawai‘i, third edition. University of Hawai‘i Press,
Honolulu, Hawaii. Kagawa, A., L. Sack, K. Duarte, and S. James. 2009. Hawaiian native forest conserves water
relative to timber plantation: Species and stand traits influence water use. Ecological Applications 19(6):1429–1443.
Kalaupapa National Historic Park. 2010. Project to repair the Kalaupapa dock structures
environmental assessment. Kalaupapa National Historic Park, Kalaupapa, Hawaii. Katahira, L. 1995. Draft environmental assessment. Construct feral animal proof fence at
Kauhakō Crater, Kalaupapa National Historical Park, Molokai. Unpublished report. Katahira, L. K., P. Finnegan, and C.P. Stone. 1993. Eradicating feral pigs in montane mesic
habitat at Hawaii Volcanoes National Park. Wildl. Soc. Bull. 21:269–273. Kay, E.A. 1977. The biology of opihi. Department of Planning and Economic Development,
Honolulu, Hawaii. Kay, E. A., C. E. Bird, B. S. Holland, and C. M. Smith. 2005. Growth rates, reproductive cycles,
and population genetics of Opihi from the national parks in the Hawaiian Islands. Unpublished report.
197
Keith, P. 2003. Biology and ecology of amphidromous Gobiidae of the Indo-Pacific and the Caribbean regions. Journal of Fish Biology 63:831–847
Kenis, M., M. A. Auger-Rozenberg, A. Roques, L. Timms, C. Pere, M. J. W. Cock, J. Settele, S.
Augustin, and C. Lopez-Vaamonde. 2009. Ecological effects of invasive alien insects. Biol Invasions 11:12–45.
Kepler, C. and K. Kepler. 1981. Plant notes, including transects 26 and 27, USFWS Surveys,
Kalaupapa Peninsula - Waikolu Valley. Mar 28–31, 1981. Kido, M. H. 1996a. Recovery processes in Hawaiian streams. In W. Devick, editor. Proceedings
of the Hawaii Stream Restoration Symposium, 1994, Honolulu, Hawaii. Technical Report 96-01. State of Hawaii Department of Land and Natural Resources, Aquatic Resources Division.
Kido, M. H. 1996b. Diet and food selection in the endemic Hawaiian amphidromous goby,
Sicyopterus stimpsoni (Pisces: Gobiidae). Environmental Biology of Fishes 45:199–209 Kilpatrick, A. M., D. A. LaPointe, C. T. Atkinson, B. L. Woodworth, J. K. Lease, M. E. Reiter,
and K. Gross. 2006. Effects of chronic avian malaria (Plasmodium relictum) infection on the reproductive success of the Hawaii amakihi (Hemignathus virens) The Auk 123(3):764–774.
Kingsford, R. T., J. E. M. Watson, C. J. Lundquist, O. Venter, L. Hughes, E. L. Johnston, J.
Atherton, M. Gawel, D. A. Keith, B. G. Mackey, C. Morley, H. P. Possingham, B. Raynor, H. F. Recher, and K. A. Wilson. 2009. Major conservation policy issues for biodiversity in Oceania. Conservation Biology 23(4):834–840.
Kingsolver, J. M. and J. E. Decelle. 1979. Host associations of Specularius impressithorax
(Insecta, Coleoptera, Bruchidae) with species of Erythrina (Fabales, Fabaceae). Annuals of the Missouri Botanical Garden 66(3):528–532.
Kinzie, R. A. III. 1968. The ecology of replacement of Pseudosquilla ciliata (Fabricius) by
Gondactylus falcatus (Forskål) (Crustacea: Stomatopoda) recently introduced into the Hawaiian Islands. Pacific Science 22(4):465–475.
Kinzie, R. A. III. 1988. Habitat utilization by Hawaiian stream fishes with reference to
community structure in oceanic island streams. Environmental Biology of Fishes 22:179–192.
Kinzie, R. A., III. 1991. How unique are Hawaiian freshwater gobies? Pages 142–150 in W.
Devick, editor. Invitational symposium on freshwater stream biology and fisheries management. State of Hawaii Department of Land and Natural Resources, Division of Aquatic Resources, Honolulu, Hawaii.
Kinzie, R. A. III. 1997. Evolution and life history patterns in freshwater gobies. Micronesica 30:
27–40.
198
Kinzie, R. A., III., J. I. Ford. 1982. Population biology in small Hawaiian streams. Water
Resources Research Center Cooperative Report No. 147, Hawai’i Cooperative Fishery Research Unit, No. A-080-HI.
Kinzie, R. A. III, A. M. Brasher and G. Smith. 1990. Reconnaissance Survey of Waikolu Stream.
Report prepared for the Cooperative National Park Resources Studies Unit. University of Hawaii, Manoa, Hawaii.
Kinzie, R. A. III., C. Chong, J. Devrell, D. Lindstrom, and R. Wolff. 2006. Effects of water
removal on a Hawaiian stream ecosystem. Pacific Science 60(1):1–47. Kondratieff, B. C., R. J. Bishop, A. M. Brasher. 1997. The life cycle of an introduced caddisfly,
Cheumatopsyche pettiti (Banks) (Trichoptera: Hydropsychidae) in Waikolu stream, Molokai, Hawaii. Hydrobiologia 350:81–85.
Kozar, K., R. Swift, and S. Marshall. 2007. Shoreline bird inventories in three national parks in
Hawaii: Kalaupapa National Historical Park, Haleakala National Park, and Hawaii Volcanoes National Park. Pacific Cooperative Studies Unit Technical Report 149. University of Hawaii at Manoa, Honolulu, Hawaii.
Kraus, F. 2005. Inventory of reptiles and amphibians in Hawaii Volcanoes, Haleakala, and
Kalaupapa national parks. Contribution No. 2005-013 to the Hawaii Biological Survey. Prepared for Pacific Cooperative Studies Unit. University of Hawai‘i at Manoa, Honolulu, Hawaii.
Krushelnyckyet, P. D., L. L. Loope, and N. J. Reimer. 2005. The ecology, policy, and
management of ants in Hawaii. Proc. Hawaiian Entomol. Soc. 37:1–25. KWA (Kaua‘i Watershed Alliance). 2005. Kaua‘i Watershed Management Plan: overall
management strategy – April 2005. Available from http://www.kauaiwatershed.org/KWA_management_plan.pdf (accessed 9 September 2009).
LaPointe, D. A., M. L. Goff, and C. T. Atkinson. 2005. Comparative susceptibility of introduced
forest-dwelling mosquitoes in Hawaii to avian malaria Plasmodium relictum. J. Parasitol. 91: 843–849.
LaPointe, D. A. 2008. Dispersal of Culex quinquefasciatus (Diptera: Culicidae) in a Hawaiian rain
forest. Journal of Medical Entomology 45(4):600–609. Larned, S.T. 2000. Dynamics of riparian detritus in a Hawaiian stream ecosystem: a comparison
of drought and post-drought conditions. JNABS 19:215–234 Larned, S. T., R. A. Kinzie III, A. P. Covich, and C. T. Chong. 2003. Detritus processing by
endemic and non-native Hawaiian stream invertebrates: a microcosm study of species-specific interactions. Arch. fur Hydrobiologia 156:241–254
199
LaRosa, A. M. 1992. The status of banana poka in Hawaii. Pages 271–299 in C. P. Stone, C. W. Smith, and J. T. Tunison, editors. Alien plant invasions in native ecosystems of Hawaii: management and research. Cooperative National Park Resources Studies Unit, University of Hawaii, Honolulu, Hawaii.
LeGrande, M. 2002. Survey of Kukaiwaa Peninsula, Kalaupapa National Historical Park,
Molokai, Hawaii, Special Report Prepared for Kalaupapa National Historical Park. Lenz L., J. A. Taylor. 2001. The influence of an invasive tree species (Myrica faya) on the
abundance of an alien insect (Sophonia rufofascia) in Hawai'i Volcanoes National Park. Biological Conservation 102(3):301–307.
Liddle, D. T., B. W. Brook, J. Matthews, S. M. Taylor, P. Caley. 2006. Threat and response: A
decade of decline in a regionally endangered rainforest palm affected by fire and introduced animals. Biological Conservation 132:362–375.
Lindstrom, D. P. 1998. Complete watershed reproductive patterns for amphidromous Hawaiian
gobioids. PhD Dissertation, Department of Zoology, University of Hawaii at Manoa. Lindstrom, D. P. 1999. Molecular species identification of newly hatched Hawaiian
amphidromous gobioid larvae. Molecular Marine Biology and Biotechnology 1:167–174 Linney, G. 1987. Botanical survey of Kauhakō Crater, Kalaupapa National Historical Park,
Molokai. National Park Service, Kalaupapa National Park files, Kalupapa, Hawaii. Loope, L. and D. Mueller-Dombois. 1989. Characteristics of invaded islands, with special
reference to Hawaii. In J. Drake et al., editors. Biological invasions: a global perspective. John Wiley & Sons. SCOPE 37:257–280.
Loope. L. L., F. G. Howarth, F. Kraus, and T. K. Pratt. 2001. Newly emergent and future threats
of alien species to Pacific birds and ecosystems. Studies in Avian Biology 22:291–304. Lowe, S., M. Browne, S. Boudjelas, M. De Poorter. 2000. 100 of the world’s worst invasive
alien species, a selection from the Global Invasive Species Database. Invasive Species Specialist Group (ISSG), a specialist group of the Species Survival Commission (SSC) of the World Conservation Union (IUCN).
Maciolek, J. A. 1975. Limnological ecosystems and Hawaii’s preservational planning. Intl. Ver.
Theor. Angew. Limnol. Ver. 19:1461–1467. Maciolek, J. A. 1977. Taxonomic status, biology, and distribution of Hawaiian Lentipes, a
diadromous goby. Pacific Science 31(4):355–362 Maciolek, J. A. 1982. Lakes and lake-like waters of the Hawaiian archipelago. Occas Pap
Bernice P Bishop Mus 25:1–14.
200
Maciolek, J. A. and R. E. Brock. 1974. Aquatic survey of the Kona Coast ponds, Hawaii Island. Sea Grant Advisory Report. UNIHI-SEAGRANT-AR-74-04.
Magner, J. A., B. Vondracek, K. N. Brooks. 2008. Grazed riparian management and stream
channel response in southeastern Minnesota (USA) streams. Environmental Management 42(3):377–390.
Mainland, G. B. 1939. Gobioidea and freshwater fishes on the Island of O’ahu. M.A. Thesis.
University of Hawaii, Honolulu.
Maragos, J. E. and D. A. Gulko. 2002. Coral reef ecosystems of the northwestern Hawaiian Islands: results of the 2000 expeditions. U.S. Fish & Wildlife Service and the Department of Land and Natural Resources, Honolulu, Hawaii.
March, J. G., J. P. Benstead, C. M. Pringle, and F. N. Scatena. 2003. Damming tropical island
streams: problems, solutions, and alternatives. BioScience 53(11):1069–1078. Marshall, S. and S. N. R. Aruch 2003. Kalaupapa shoreline seabird survey, 1 December 2003.
Unpublished report. Marshall, S. and K. Kozar. 2008. Forest bird inventory, Kalaupapa National Historical Park.
Pacific Cooperative Studies Unit Technical Report 154. University of Hawaii at Manoa, Honolulu, Hawaii.
Marshall S., G. Hughes and K. Kozar. 2008. Small, non-native mammal inventory in Kalaupapa
National Historical Park. Pacific Cooperative Studies Unit Technical Report 158. National Park Service Inventory and Monitoring Program, Pacific Island Network, Hawaii National Park, Hawaii.
Maschinski, J. 2006. Implications of population dynamic and metapopulation theory for
restoration. Pages 59–87 in D. A. Falk, M. A. Palmer, and J. B. Zedler, editors. Foundations of Restoration Ecology. Society of Ecological Restoration International. Island Press, Washington, DC.
McCoy, M. D. 2005a. Kalaupapa archaeology: a collection of five archaeological surveys in
Kalaupapa National Historical Park, Hawai‘i. Unpublished report. McCoy, M. 2005b. The lands of Hina: an archaeological overview and assessment of Kalaupapa
National Historic Park, Molokai. Pacific Cooperative Studies Unit Technical Report 135. University of Hawaii at Manoa, Honolulu, Hawaii.
McDowall, R. M. 1988. Diadromy in fishes. Timber Press, Portland, Oregon. McDowall, R. M. 1993. Implications of diadromy for the structuring and modeling of riverine
fish communities in New Zealand. New Zealand Journal of Marine and Freshwater Research 27(4):453–462
201
McDowall, R. M. 1995. Seasonal pulses in migrations of New Zealand diadromous fish and the potential impacts of river mouth closure. New Zealand Journal of Marine and Freshwater Research 29:517–526.
McDowall, R. M. 2003. Hawaiian biogeography and the islands freshwater fish fauna. Journal of
Biogeography 30:703–710. McIntosh, M. D., M. E. Benbow, and A. J. Burky. 2002. Effects of stream diversion on riffle
macroinvertebrate communities in a Maui, Hawaii, stream. River Research and Applications 18:569–581.
McIver, J. D. and M. L. McInnis. 2007. Cattle grazing effects on macroinvertebrates in an Oregon mountain stream. Rangeland Ecology & Management 60(3):293–303.
McKeown, S. 1996. A field guide to reptiles and amphibians in the Hawaiian Islands. Diamond
Head Publishing, Inc., Los Osos, California. Medeiros, A. C. and C. G. Chimera. 1997a. Monitoring methods for Tetramolopium rockii
exclosure, Kalaupapa NHP, Molokai April 8–9. Unpublished report. Medeiros, A.C. and C. G. Chimera. 1997b. Monitoring methods for Centaurium sebaeoides
exclosure, Kalaupapa NHP, Molokai April 9–10, 1997. Unpublished report. Medeiros, A. C., C. G. Chimera, and L. L. Loope. 1996. Kauhakō Crater botanical resource and
treat monitoring, Kalaupapa National Historical Park, Island of Moloka‘i, Hawai‘i. Cooperative National Park Resources Studies Unit Technical Report 110. University of Hawai‘i at Manoa. Honolulu, Hawaii.
Medeiros, A. C., C. G. Chimera, and L. L. Loope, S. M. Joe, and P. D. Krushelnycky. 2000.
Notes on status and ecology of the endangered Hawaiian annual ‘Āwiwi, Centaurium sebaeoides (Gentianaceae). Pacific Science 54(4):417–422.
Menard, T. 2001. Activity patterns of the Hawaiian hoary bat (Lasiurus cinereus semotus) in
relation to reproductive time periods. M.S. Thesis, University of Hawaii, Honolulu. Hawaii. Millennium Ecosystem Assessment. 2005. Ecosystems and human well-being: biodiversity
synthesis. World Resources Institute, Washington, D.C. Miller, S. E. 2008. Presentation: HCA climate change forum. Presented at the Hawaii
Conservation Conference, July 29, 2008, Honolulu, Hawaii. Minton, D. and M. Carnevale. 2006. A preliminary survey of the marine and intertidal
invertebrates at Kalaupapa National Historical Park (Molokai, Hawaii). Report submitted to Kalaupapa National Historical Park, Natural Resources Division.
Mitchell, C., C. Ogura, D. W. Meadows, A. Kane, L. Strommer, S. Fretz, D. Leonard, and A.
McClung. 2005. Hawaii’s comprehensive wildlife conservation strategy. Department of Land
202
and Natural Resources. Honolulu, Hawaii. Available from http://www.state.hi.us/lnr/ofaw/ wcs/index.html (accessed 21 August 2008).
Moors, P. J., I. A. E. Atkinson, and G. H. Shelly. 1992. Reducing the rat threat to island birds.
Bird Conservation International 2:93–114. Morrissey, W. A. 2005. Tsunamis: monitoring, detection, and early warning systems.
Congressional Research Service, The Library of Congress, Washington D.C. Myers, G. S. 1949. Usage of anadromous, catadromous and allied terms in migratory fishes.
Copeia 1949:89–97. Nishimoto, R. T. and D. G. K. Kuamo'o. 1996. Recruitment of decapod crustacean postlarvae
into Hakalau Stream, Hawaii Island. Western Association of Fish and Wildlife Agencies, Sustainable Natural Resource Management in the 21st Century. Waikiki Beach, Honolulu, Hawaii, July 22–26, 1996.
Nishimoto, R. T. and D. G. K. Kuamo’o. 1997. Recruitment of goby post larvae into Hakalau
Stream, Hawaii Island. Micronesica 30: 41–49. Nogueira-Filho, S. L .G., S. S. C. Nogueira, J. M. V. Fragoso. In press. Ecological impacts of
feral pigs in the Hawaiian Islands. Biodivers Conserv. Nowak, R. M. 1999. Walker’s mammals of the world. Volume 2. Johns Hopkins Press,
Baltimore, Maryland. NPS (National Park Service). 1990. Resource management plan. Kalaupapa National Historical
Park, Kalaupapa, Hawaii. NPS. 1997. Kalaupapa National Historic Park Strategic Plan, Government Performance and
Results Act. National Park Service, Kalaupapa, Molokai, Hawaii NPS. 1999. Long-range interpretative plan. Kalaupapa National Historic Park. National Park
Service, Kalaupapa, Molokai, Hawaii. NPS. 2000a. Resource management plan, Kalaupapa National Historical Park, Kalaupapa, Hawaii.
National Park Service, Kalaupapa, Molokai, Hawaii. NPS. 2000b. Section VI: Kalaupapa settlement boundary study along north shore to Halawa Valley,
Molokai. Of Hawaii Area Studies Public Law 105-355, Section 511. NPS. 2003. A planning meeting for water quality monitoring, Pacific Island I&M Network, 12–
14 August 2003, Kailua-Kona, Hawaii. NPS. 2004. Final environmental assessment, construction of ungulate-proof fencing, Upper Pu‘u
Ali‘i Plateau. Pu‘u Ali‘i Natural Areas Reserve, Moloka‘i, Hawai‘i. Unpublished report.
203
NPS. 2006a. Environmental assessment, solid waste management, Kalaupapa National Historical Park. National Park Service, Kalaupapa, Molokai, Hawaii.
NPS. 2006b. Glossary of terms used by the NPS Inventory & Monitoring Program. Available
from http://science.nature.nps.gov/im/monitor/Glossary.cfm (accessed 14 August 2009). NPS. 2007. Draft foundation statement Kalaupapa National Historical Park, Molokai, Hawaii.
National Park Service, Kalaupapa, Molokai, Hawaii. NPS. 2008. Seabird monitoring. Quarterly newsletter of the Pacific Island Network Inventory &
Monitoring Program. July–September 2008, issue no. 13. Parham, J. E., G. R. Higashi, E. K. Lapp, D. G. K. Kuamoo, R. T. Nishimoto, S. Hau, J. M.
Fitzsimons, D. A. Polhemus, and W. S. Devick. 2008. Atlas of Hawaiian watersheds & their aquatic resources, Island of Kauai, Bishop Museum & Division of Aquatic Resources. Available from http://www.hawaiiwatershedatlas.com/ (accessed 10 December 2009).
Parmesan, C. and J. Matthews. 2006. Biological impact of climate change. Pages 333–374 in M.
J. Groom, G. K. Meffe, and C. R. Carroll, editors. Principles of Conservation Biology, Third Edition. Sinauer Associates, Sunderland, Massachusetts.
Pearson, R. , J. Hirata , L. Potts , and F. Harby . 1974. Test pitting of Cave 1, Kalaupapa
Peninsula, Molokai, Hawaii. N. Z. Archaeol. Assoc. Newsl 17:44–49. Pimental, D. R. Zuniga and D. Morrison. 2005. Update on the environmental and economic costs
associated with alien-invasive species in the United States. Ecological Economics 52:273–288.
Polhemus, D. A. 1992. A preliminary report on the aquatic insect fauna of Waikolu Stream,
Molokai, Hawaii. Unpublished report for Division of Aquatic Resources, Department of Land and Natural Resources, Honolulu, Hawaii.
Polhemus, D. A. 1995. New Heteroptera and Odonata (Insecta) records and range extensions in
the Hawaiian Islands. Bishop Mus. Occas. Pap. 42:42–43. Polhemus, D. A. 1996. The orangeblack Hawaiian damselfly, Megalagrion xanthomelas
(Odonata: Coenagrionidae): clarifying the current range of a threatened species. Bishop Museum Occasional Papers 45:30–53.
Polhemus, D. A., J. Maciolek, and J. Ford. 1992. An ecosystem classification of inland waters
for the tropical Pacific Islands. Micronesica 25(2):155–173. Pounds, A. J., M. P. Fogden, and J. H. Campbell. 1999. Biological response to climate change on
a tropical mountain. Nature 398:611–614.

204
Puleloa, B. 1991. Waikolu stream survey, Molokai. State of Hawaii DLNR, Division of Aquatic Resources, unpublished report.
Radewagen, E. and E. Neller. An interim report on the Kaupikiawa lava tube system, Kalaupapa,
Molokai, Hawaii. Third draft on file, Kalaupapa National Historical Park, Kalaupapa, Hawaii.
Radtke, R. L., R. A. Kinzie III, and D. J. Shafer. 2001. Temporal and spatial variation in length
of larval life and size at settlement of the Hawaiian amphidromous goby Lentipes concolor. Journal of Fish Biology 58:928–938.
Radtke, R. L. and R. A. Kinzie III. 1996. Evidence of a marine larval stage in endemic Hawaiian
stream gobies from isolated high-elevation localities. Trans. Am. Fish. Soc. 125:613–621. Radtke, R. L., and R. A. Kinzie III. 1991. Hawaiian amphidromous gobies: perspectives on
recruitment process and life history events. Pages 125–141 in Proceedings of the 1990 symposium on fresh water stream biology and fisheries management. State of Hawaii Department of Land and Natural Resources, Division of Aquatic Resources, Honolulu, Hawaii.
Reiter, M. E. and D. A. Lapointe. 2007. Landscape factors influencing the spatial distribution
and abundance of mosquito vector Culex quinquefasciatus (Diptera: Culicidae) in a mixed residential–agricultural community in Hawai‘i. Journal of Medical Entomology 44(5):861–868.
Reiter, M. E., J. K. Lease, C. T. Atkinson, and D. A. LaPointe. 2003. Evaluating the potential for
management of avian disease (Plasmodium relictum) in a mesic dry forest of Hawai‘i Volcanoes National Park. Talk presented at the 2003 Hawai‘i Conservation Conference, Honolulu, Hawaii. July 11, 2003.
Resh, V. H. 2005. Stream crossings and the conservation of diadromous invertebrates in South
Pacific island streams. Aquatic Conservation: Marine and Freshwater Ecosystems 15:313–317.
Restrepo, C. and P. Vitousek. 2001. Landslides, alien species, and the diversity of a Hawaiian
montane mesic ecosystem. BioiTropica 33(3):409–420. Rivera, M. A. J., F. G. Howarth, S. Taiti, and G.K. Roderick. 2002. Evolution in Hawaiian cave-
adapted isopods (Oniscidea: Philosciidae): vicariant speciation or adaptive shift. Molecular Phylogenetics and Evolution 25:1–9.
Rosenzweig, C., G. Casassa, D. J. Karoly, A. Imeson, C. Liu, A. Menzel, S. Rawlins, T. L. Root,
B. Seguin, P. Tryjanowski. 2007. Assessment of observed changes and responses in natural and managed systems. Pages 79–131 in M. L. Parry, O. F. Canziani, J. P. Palutikof, P. J. van der Linden and C. E. Hanson, editors. Climate change 2007: impacts, adaptation and
205
vulnerability. Contribution of Working Group II to the Fourth Assessment Report of the Intergovernmental Panel on Climate Change. Cambridge University Press, Cambridge, UK.
Russell, D. J., 1992. The ecological invasion of Hawaiian reefs by two marine red algae,
Acanthophora spicifera (Vahl) Bøerg. and Hypnea musciformis (Wulfen) J.Ag., and their association with two native species, Laurencia nidifica and Hypnea cervicornis J.Ag. ICES Mar. Sci. Symp. 194:110–125.
Santo, L. T. 2001. Assessment and improvement recommendations for the Molokai Irrigation
System. Hawaii Agriculture Research Center. Aiea, Hawaii. Scheffers, S. R. J. Haviser, T. Browne, and A. Scheffers. 2009. Tsunamis, hurricanes, the demise
of coral reefs and shifts in prehistoric human populations in the Caribbean. Quaternary International 195:69–87.
Schumacher, B. and J. Parrish. 2006. Spatial relationships between an introduced snapper and
native goatfishes on Hawaiian Reefs. Biological Invasions 7(6):925–933. Schumacher, B. and J. Parrish. 2008. Comparison of the feeding ecology of the introduced
snapper Lutjanus kasmira and native goatfishes in Hawai‘i. Abstract. Proceedings of the 11th International Coral Reef Symposium, Ft. Lauderdale, Florida.
Scowcroft, P. G. and H. F. Sakai. 1984. Stripping of Acacia koa bark by rats on Hawaii and
Maui. Pacific Science 38(1):80–86. Scott, J. M., D. H. Woodside, and T. L. C. Casey. 1977. Observations of birds in the Molokai
Forest Reserve, July 1975. Journal of the Hawaii Audubon Society 38(3):25–27. Scowcroft, P.G. and C.E. Conrad. 1992. Alien and native plant response to release from feral
sheep browsing on Mauna Kea. Pages 625–665 in C. P. Stone, C. W. Smith, and J. T. Tunison, editors. Alien plant invasions in native ecosystems of Hawaii: management and research. Cooperative National Park Resources Studies Unit, University of Hawaii, Honolulu, Hawaii.
Shehata, C., L. Freed and R. L. Cann. 2001. Changes in native and introduced bird populations
on Oahu: infectious disease and species replacement. Studies in Avian Biology 22:264–273. Sherwood, A. R. and Kido, M. H. 2002. Watershed-scale comparisons of algal biodiversity in
high quality proximate Hawaiian stream ecosystems. Pacific Science 56:431–440. Sherwood, A. R. 2006. Stream macroalgae of the Hawaiian Islands: a floristic survey. Pacific
Science 60(2):191–205. Shi, J., R. I. M. Dunbar, D. Buckland, and D. Miller. 2005. Dynamics of grouping patterns and
social segregation in feral goats (Capra hircus) on the Isle of Rum, NW Scotland. Mammalia 69:185–199.
206
Simons, T. R. 1983. Biology and conservation of the endangered Hawaiian dark-rumped petrel (Pterodroma phaeopygia sandwichensis). National Park Service, Cooperative Park Studies Unit, College of Forest Resources, University of Washington, Seattle, Washington. CPSU/UW 83-2.
Sin, H., K. H. Beard, and W. C. Pitt. 2008. An invasive frog, Eleutherodactylus coqui, increases
new leaf production and leaf litter decomposition rates through nutrient cycling in Hawaii. Biological Invasions 10(3):335–345.
Smith, C.W. 1985. Impact of alien plants on Hawaii's native biota. Pages 180–250 in C. P. Stone
and J. M. Scott, editors. Hawaii’s terrestrial ecosystems: preservation and management. University of Hawaii, Cooperative national Park Resources Studies Unit, Honolulu, Hawaii.
Society for Ecological Restoration (SER) International Science & Policy Working Group. 2004.
The SER international primer on ecological restoration. Available from http://www.ser.org/pdf/primer3.pdf (accessed 2 November 2009).
Solomon, S., D. Qin, M. Manning, Z. Chen, M. Marquis, K. B. Averyt, M. Tignor and H. L.
Miller. 2007. Climate change 2007: the physical science basis. Contribution of Working Group I to the Fourth Assessment Report of the Intergovernmental Panel on Climate Change. Cambridge University Press: Cambridge, United Kingdom, and New York, New York.
Spatz, G. and D. Mueller-Dombois. 1973. The influence of feral goats on Koa tree reproduction
in Hawaii Volcanoes National Park. Ecology 54(4):870–876. Staples, G. W. and R. H. Cowie. 2001. Hawai'i's invasive species. A guide to invasive plants and
animals in the Hawaiian Islands. Mutual Publishing & Bishop Museum Press, Honolulu, Hawaii.
Staples, G. W. and D. H. Herbst. 2005. A tropical garden flora. Bishop Museum Press, Honolulu,
Hawaii. Sterns, H. T. and G. A. Macdonald. 1947. Geology and ground-water resourcesw of the island of
Molokai, Hawaii. Bulletin No. 11, Hawaii Division of Hydrography, Honolulu, Hawaii. Stevenson C., L. S. Katz, F. Micheli , B. Block, K. W. Heiman, C. Perle, K. Weng, R. Dunbar
and J. Witting. 2006. High apex predator biomass on remote Pacific island. Earth and Environmental Science 26(1):47–51
Still, C. J., P. N. Foster, and S. Schneider. 1999. Simulating the effects of climate change on
tropical montane cloud forests. Nature 398:608–610. Stimson, J. S. T. Larned , and E. J. Conklin . 2001. Effects of herbivory, nutrient levels, and
introduced algae on the distribution and abundance of the invasive alga Dictyosphaeria cavernosa in Kane'ohe Bay, Hawai'i. Coral Reefs 19(4):343–357.
207
Stone, C. P. 1985. Alien animals in Hawaii's native ecosystems: toward controlling the adverse effects of introduced vertebrates. Pages 251–297 in C.P. Stone and J.M. Scott, editors. Hawaii's terrestrial ecosystems: preservation and management. University of Hawaii Cooperative Resources Studies Unit, University of Hawaii Press, Honolulu, Hawaii.
Stone, C. P. 1989. Hawaii wetlands, streams, fishponds and pools. Pages 125–136 in C. P. Stone
and D. B. Stone, editors. Conservation biology in Hawaii. Univ. of Hawaii Press, Honolulu, Hawaii.
Stone, C. P., and S. J. Anderson. 1988. Introduced animals and Hawaii’s natural area.
Proceedings of the Vertebrate Pest Conference 13:134–140. Stone, C. P., L. W. Cuddihy, and J. T. Tunison. 1992. Responses of Hawaiian ecosystems to the
removal of feral pigs and goats. Pages 666–704 in C.P. Stone, C.W. Smith, and J.T. Tunison, editors. Alien plant invasions in native ecosystems of Hawaii: management and research. Cooperative National Park Resources Studies Unit, University of Hawaii, Honolulu, Hawaii.
Stone, F. D. and F. G. Howarth. 2007. Hawaiian cave biology: status of conservation and
mangement. In T. Rea, editor. Proceedings of the 2005 National Cave and Karst Management Symposium 19:21–26.
Strauch, A. M., A. R. Kapust, and C. C. Jost. 2009. Impact of livestock management on water
quality and streambank structure in a semi-arid, African ecosystem. Journal of Arid Environments 73(9):795–803.
SWCA. 2004. Biological assessment of Honokohau Stream and Bay, West Maui, Hawai’i.
Contract report prepared for Kapalua Land Company, Ltd., Kapalua, Hawaii. SWCA. 2005. Biological monitoring study of Honokohau Stream, West Maui, Hawai’i: First
post-flow release assessment. Contract report prepared for Kapalua Land Company, Ltd., Kapalua, Hawaii.
SWCA. 2007. Long-term biological monitoring survey of Honokohau Stream, West Maui
Hawai’i: spring 2007 report. Contract report prepared for Kapalua Land Company, Ltd., Kapalua, Hawaii.
SWCA. 2008. Survey of native Hawaiian stream fauna in Nā Wai ‘Ehā, West Maui. Contract
report prepared for Cades Schutte, LLC, Honolulu, Hawaii. Swenson, C. 2008. Offshore Islet Restoration Committee (OIRC). Available from
http://www.hawaiioirc.org/OIRC-ISLETS.htm (accessed 26 March 2009). Taiti, S., and F. G. Howarth. 1997. Terrestrial isopods (Crustacea, Oniscoidea) from Hawaiian
caves. Memoires de Biospeologie 24:97–118.
208
Takasaki, K. J. 1986. Results of exploratory drilling for water in Waihanau Valley, Molokai, Hawaii. USGS Water-Resources Investigations Report 85-4332.
Tate, D. C., J. M. Fitzsimons and R. P. Cody. 1992. Hawaii freshwater fishes (Osteichthyes,
Gobiodei): a field key to the species of larvae and postlarvae during recruitment into freshwater. Occasional Papers of the Museum of Natural Science, Louisiana State University 65:1–10.
Tep, P. and K. Gaines, 2003. Reversing the impacts of feral pig on the Hawaiian tropical
rainforest ecosystem. Restoration and Reclamation Review, University of Minnesota. Available from http://conservancy.umn.edu/bitstream/60237/1/8.3.TepGaines.pdf (accessed 7 November 2009).
Titcomb, M. 1972. Native use of fish in Hawai‘i. University of Hawai’i Press, Honolulu, Hawaii. Toonen, R. 2004. Reproduction and developmental characteristics of an alien soft coral (Carijoa
riisei) in Hawai‘i (FY 2004–2005). Technical Report of the Hawai’i Institute of Marine Biology, Kaneohe, Hawaii.
TNC (The Nature Conservancy). 2003a. Draft: measuring conservation actions in East Molokai,
Hawaii. Unpublished report. TNC. 2003b. Pelekunu Preserve long-range management plan, fiscal years 2004–2009. Molokai,
Hawaii. Submitted to the Department of Land & Natural Resources, Natural Area Partnership Program. Unpublished report.
Towns, D. R. and J. Robb. 1986. The importance of northern offshore islands as refugia for
endangered lizard and frog species. The offshore islands of northern New Zealand. New Zealand Department of Lands and Survey Information Series 16:197–210.
University of Hawai‘i. 2009. Weed risk assessments for Hawaii and Pacific Islands.
Available from http://www.botany.hawaii.edu/faculty/daehler/wra/ (accessed 20 July 2009). U.S. Climate Change Science Program. 2009. Climate and coasts. Abstracts of the Hawai‘i
Conservation Conference 2009, Concurrent Session 1, July 28, 2009. Honolulu, Hawaii. USDA (U.S. Department of Agriculture) Forest Service. 2009. Pacific Island Ecosystems at Risk
(PIER). Available from http://www.hear.org/pier (accessed 11 August 2009). U.S. Environmental Protection Agency (EPA). 1998. Climate change and Hawaii. EPA 236-F-
98-007e. Office of Policy, Washington, D.C.,. USFWS (U.S. Fish and Wildlife Service). 1994. Recovery plan for Panicum fauriei var. carteri.
U.S. Fish and Wildlife Service, Portland, Oregon.

209
USFWS. 1998. Recovery plan for the Hawaiian hoary bat (Lasiurus cinereus semotus). U.S. Fish and Wildlife Service, Portland, Oregon.
USFWS. 2003. Endangered and threatened wildlife and plants; final designations and
nondesignations of critical habitat for 42 plant species from the Island of Molokai, Hawaii; final rule. 68(52):12982– 13030.
USFWS. 2004. Final critical habitat for the 41 plant species from the Hawaiian Island of
Molokai. ESRI Shapefiles. Available from http://mercury.ornl.gov/clearinghouse/send/xsltText2?fileURL=http://mercury.ornl.gov/metadata/nbii/html/usfws/www.fws.gov_filedownloads_ftp_gis_fws_metadata_doi_fws_itm_d_mo_crhb_plant.html&full_datasource=U.S.%20Fish%20and%20Wildlife%20Service&full_queryString=%20text%20:%20molokai%20text%20:%20critical%20text%20:%20habitat%20AND%20Decade:2000%20to%202009%20AND%20Presentation%20Category:Maps%20and%20Data%20AND%20Originator:usfws&ds_id.
USFWS. 2006. Revised recovery plan for Hawaiian forest birds. Region 1, Portland, Oregon. USFWS. 2007. Candidate assessment and listing priority assignment form Magalagrion
pacificum. U.S. Fish and Wildlife Service, Pacific Islands Office. USFWS. 2008a. Megalagrion xanthomelas, species assessment and listing priority assignment
form. U.S. Fish and Wildlife Service, Pacific Islands Office. USFWS. 2008b. Brighamia rockii (Pua‘ala) 5-year review: summary and evaluation. Pacific
Islands Fish and Wildlife Office, Honolulu, Hawaii. USFWS. 2008c. Endangered and threatened wildlife and plants; designation of critical habitat for
12 species of picture-wing flies from the Hawaiian Islands. Federal Register 73(234):73794–73843.
USFWS. 2009a. Endangered and threatened wildlife and plants; listing Phyllostegia hispida (no
common name) as endangered throughout its range. Federal Register 74(50):11319–11327. USFWS. 2009b. Endangered and threatened wildlife and plants; proposed endangered status for
flying earwig Hawaiian damselfly (Megalagrion nesiotes) and Pacific Hawaiian damselfly (M. pacificum) throughout their ranges. Federal Register 74(129):32490–32510.
USGS (U.S. Geological Survey). 2005. Inventory of anchialine pools in Hawai‘i’s national
parks. USGS FS 2005–3129. USGS. 2006. Feral pigs, introduced mosquitoes, and the decline of Hawai‘i’s native birds.
Available from http://biology.usgs.gov/pierc/Fact_Sheets/Pigs_and_mosquitoes.pdf (accessed 5 November 2009).

210
Van Driesche, J. and R. Van Driesche. 2004. Nature out of place, biological invasions in the global age. Island Press, Washington, D.C.
Van Riper, C., III, S. G. Van Riper, and W. R. Hansen. 2002. Epizootiology and effect of avian
pox on Hawaiian forest birds. Auk 119:929–942. Vitousek, P. M. 1990. Biological invasions and ecosystem processes: towards an integration of
population biology and ecosystem studies. Oikos 57:7–13. Vitousek, P. M. 1992. Effects of alien plants on native ecosystems. Pages 29–41 in C. P. Stone,
C. W. Smith, and J. T. Tunison, editors. Alien plant invasions in native ecosystems of Hawai‘i: management and research. Cooperative National Park Resources Studies Unit, University of Hawai‘i, Honolulu, Hawaii.
Vitousek, P. M. 1994. Beyond global warming: ecology and global change. Ecology 75(7):
1861–1876. Vitousek, S., C. H. Fletcher, M. M. Barbee. 2008. A practical approach to mapping extreme
wave inundation: consequences of sea-level rise and coastal erosion. Pages 85–96 in ASCE Solutions to Coastal Disasters 2008, Wallendorf, L., L. Ewing, C. Jones, and B. Jaffe, (eds.). ASCE / COPRI, 978-0-7844-0968-8, Reston, Virginia.
Vitousek, S., M. M.Barbee, C. H. Fletcher, B. M. Richmond, and A. S. Genz. 2009. Pu‘ukoholā
Heiau National Historic Site and Kaloko-Honokōhau Historical Park, Big Island of Hawai‘i. Coastal Hazard Analysis Report. Unpublished report.
Wagner, D., S. E. Kahng, R. J. Toonen. 2007. New report of predators (Order Nudibranchia) of
the alien octocoral Carijoa riisei in the main Hawaiian Islands. Coral Reefs 26(2):411. Wait, D. A., D. P. Aubrey, and W. B. Anderson. 2005. Seabird guano influences on desert
islands: soil chemistry and herbaceous species richness and productivity. Journal of Arid Environments 60(4): 681–695.
Wagner, W. L., D. R. Herbst, and S. H. Sohmer. 1999. Manual of the flowering plants of
Hawai'i, revised edition. 2 vols, Bishop Museum Special Publication 97. University of Hawaii Press and Bishop Museum Press, Honolulu, Hawaii.
Walsh, W. J. 1983. Stability of a coral reef fish community following a catastrophic storm. Coral
Reefs 2:49–63. Walther, G., E. Post, P. Convey, A. Menzel, C. Parmesan, T. J. C. Beebee, J. Fromentin, O.
Hoegh-Guldberg, and F. Bairlein. 2002. Ecological responses to recent climate change. Nature 416:389–395.
Wanless, R. M., A. Angel, R. J. Cuthbert, G. M. Hilton, and P. G. Ryan. 2007. Can predation by
invasive mice drive seabird extinctions? Biology Letters 3:241–244.
211
Way, C. M, A. J. Burky, J. M. Harding, S. Hau, W. K. L. C. Puleloa. 1998. Reproductive biology of the endemic goby, Lentipes concolor, from Makamaka'ole Stream, Maui and Waikolu Stream, Moloka'i. Environmental Biology of Fishes 51(1):53–65.
Webster, P. J., G. J. Holland, J. A. Curry, and H. R. Chang. 2005. Changes in tropical cyclone
number, duration, and intensity in a warming environment. Science 309(5742):1844–1846. Weijerman M., R. Most, K. Wong, and S. Beavers. 2008. Attempt to control the invasive red
alga Acanthophora spicifera (Rhodophyta: Ceramiales) in a Hawaiian fishpond: an assessment of removal techniques and management pptions. Pacific Science 62(4):517–532.
Wetherbee, B. M., K. N. Holland, C. G. Meyer, and C. G. Lowe. 2004. Use of a marine reserve
in Hawaii by the giant trevally, Caranx ignobilis. Fisheries Research 67:253–263 Wilcock, R. J., M. R. Scarsbrook, K. J. Costley, and J. W. Nagels. 2002. Controlled release
experiments to determine the effects of shade and plants on nutrient retention in a lowland stream. HYDROBIOLOGIA 485(1–3):153–162.
Wiles, G. J., D. W. Buden, and D. J. Worthington. 1999. History of introduction, population
status, and management of Philippine deer (Cervus mariannus) on Micronesian Islands. Mammalia 63:193–215.
Winter, L. 2003. Popoki and Hawai‘i’s native birds. ‘Elepaio 63:43–46. Wood, K. R. 2000. Personal observations and checklist of vascular plants: Huelo Islet, Moloka‘i,
Hawai‘i. Biological report prepared for Kalaupapa National Historic Park. Unpublished report.
Wood, K. R. 2001. Pritchardia coastal forest on Huelo Islet, Moloka‘i, Hawai‘i. Biological
Report prepared for Kalaupapa National Historic Park. Unpublished report. Wood, K. R. 2008. Vegetation descriptions of the offshore islets, Kalaupapa, Moloka‘i, Hawai‘i
and Kukaiwa‘a Peninsula. Special Report prepared for Kalaupapa National Historic Historical Park. Unpublished report.
Wood, K. R. and G. O. Hughes. 2003. Regional checklist of vascular plants, Pu‘u Ali‘i Natural
Area Reserve, Moloka‘i, Hawai‘i. Wood, K. R. and M. LeGrande. 2002. Personal observations of Okala Islet, Moloka‘i, Hawai‘i,
including a regional checklist of vascular plants, Pritchardia coastal forest on Huelo Islet, Molokai, Hawaii. Special Report prepared for Kalaupapa National Historic Historical Park. Unpublished report.
Wood, K. R. and M. Legrande. 2003. Checklist of vascular plants found on four offshore islets
Huelo, Mokapu, Okala and Mokuhooniki, Molokai, Hawaii.

212
Wood, K. R., G. O. Hughes, M. L. Wysong, and J. Espaniola. 2005. Plant distributional checklist of 32 sites in Kalaupapa National Historical Park, Kalawao County, Molokai. Unpublished.
Woodworth, B. L., C. Atkinson, D. A. LaPointe, P. J. Hart, C. Spiegel, E. J. Tweed, C.
Henneman, J. LeBrun, T. Denette, R. DeMots, K. L. Kozar, D. Triglia, D. Lease, A. Gregor, T. Smith, and D. Duffy. 2005. Host population persistence in the face of introduced vector-borne diseases: Hawaii Amakihi and avian malaria. PNAS 102:1531–1536.
Woodworth, B. L., C. T. Atkinson, D. A. LaPointe. 2005. Host population persistence in the face
of introduced vectorborne diseases: Hawaii amakihi and avian malaria. PNAS 102:1532–1536.
Wyban, C. A., 1993. Report on the Kalaupapa Fishpond. On file with the National Park Service,
U.S. Department of the Interior. Wysong, M. L. and G. D. Hughes. 2005. Plant collections of Kalaupapa National Historical Park. Wysong, M. and G. Hughes. 2008. New Hawaiian plant records for the Island of Molokai. In N.
L. Evenhuis and L. G. Eldredge, editors. Records of the Hawaii Biological Survey for 2006, Part 2: Notes. Bishop Museum Occasional Papers 96:1–8.
Wysong, M. L. and G. D. Hughes. 2008. Kalaupapa National Historical Park, vascular plant
inventory, voucher collections, and electronic herbarium. Cooperative National Park Resources Studies Unit Technical Report #159. University of Hawai‘i at Manoa, Honolulu, Hawaii.
Xu, T., C. M. Jacobsen, I. K.CHO, A. H Hara, and Q. X. Li. 2006. Application of an enzyme-
linked immunosorbent assay for the analysis of imidacloprid in Wiliwili tree, Erythrina sandwicensis O. Deg, for control of the wasp Quadrastichus erythrinae. J. Agric. Food Chem. 54:8444–8449.
Yamamoto, M. N. and A. W. Tagawa. 2000. Hawai’i’s native & exotic freshwater animals.
Mutual Publishing, Honolulu, Hawaii. Yost, A. and R. G. Wright. 1999. A preliminary study of axis deer distribution, movements and
food habits at Kalaupapa National Historic Park–Final Report. Idaho Cooperative Fish and Wildlife Research Unit, Moscow, Idaho.
Ziegler, A. L. 2002. Hawaiian natural history, ecology, and evolution. University of Hawai‘i
Press, Honolulu, Hawaii. Zink, R. M., J. M. Fitzsimons, D. L. Dittmann, D. R. Reynolds, R. T. Nishimoto. 1996.
Evolutionary genetics of Hawaiian freshwater fish. Copeia 2:330–335.

213
Zouhar, K., J. K. Smith, S. Sutherland, M. L. Brooks. 2008. Wildland fire in ecosystems: fire and nonnative invasive plants. Gen. Tech. Rep. RMRS-GTR-42-vol. 6. U.S. Department of Agriculture, Forest Service, Rocky Mountain Research Station, Ogden, Utah.

214

215
Appendices

216
Appendix 1. Park Enabling Legislation.
217
National Park Service U.S. Department of the Interior
Kalaupapa National Historical Park
Enabling Legislation
as of 12 April 2005
Public Law 95-565
Public Law 100-202
National Park Service U.S. Department of the Interior
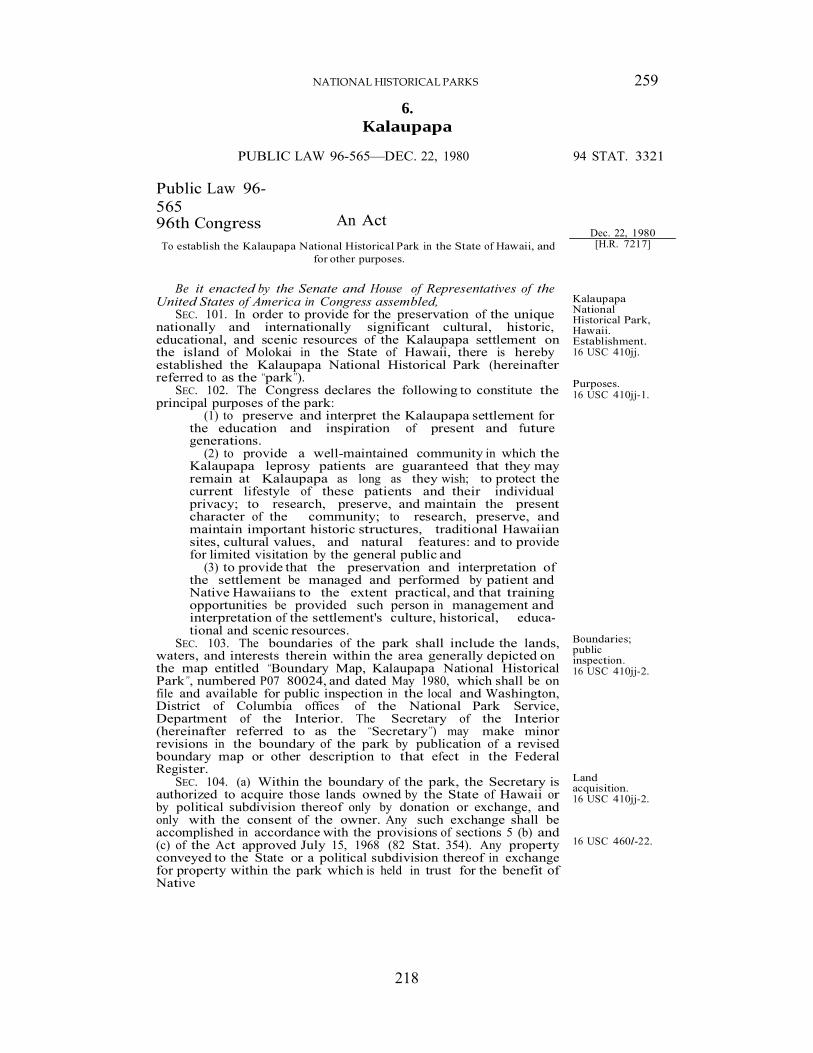
218
NATIONAL HISTORICAL PARKS 259
6. Kalaupapa
PUBLIC LAW 96-565—DEC. 22, 1980 94 STAT. 3321
Public Law 96-565 96th Congress
An Act
Dec. 22, 1980
To establish the Kalaupapa National Historical Park in the State of Hawaii, and for other purposes.
[H.R. 7217]
Be it enacted by the Senate and House of Representatives of the
United States of America in Congress assembled, SEC. 101. In order to provide for the preservation of the unique
nationally and internationally significant cultural, historic, educational, and scenic resources of the Kalaupapa settlement on the island of Molokai in the State of Hawaii, there is hereby established the Kalaupapa National Historical Park (hereinafter referred to as the “park”).
SEC. 102. The Congress declares the following to constitute the principal purposes of the park:
(1) to preserve and interpret the Kalaupapa settlement for the education and inspiration of present and future generations.
(2) to provide a well-maintained community in which the Kalaupapa leprosy patients are guaranteed that they may remain at Kalaupapa as long as they wish; to protect the current lifestyle of these patients and their individual privacy; to research, preserve, and maintain the present character of the community; to research, preserve, and maintain important historic structures, traditional Hawaiian sites, cultural values, and natural features: and to provide for limited visitation by the general public and
(3) to provide that the preservation and interpretation of the settlement be managed and performed by patient and Native Hawaiians to the extent practical, and that training opportunities be provided such person in management and interpretation of the settlement's culture, historical, educa- tional and scenic resources.
SEC. 103. The boundaries of the park shall include the lands, waters, and interests therein within the area generally depicted on the map entitled “Boundary Map, Kalaupapa National Historical Park”, numbered P07 80024, and dated May 1980, which shall be on file and available for public inspection in the local and Washington, District of Columbia offices of the National Park Service, Department of the Interior. The Secretary of the Interior (hereinafter referred to as the “Secretary”) may make minor revisions in the boundary of the park by publication of a revised boundary map or other description to that efect in the Federal Register.
SEC. 104. (a) Within the boundary of the park, the Secretary is authorized to acquire those lands owned by the State of Hawaii or by political subdivision thereof only by donation or exchange, and only with the consent of the owner. Any such exchange shall be accomplished in accordance with the provisions of sections 5 (b) and (c) of the Act approved July 15, 1968 (82 Stat. 354). Any property conveyed to the State or a political subdivision thereof in exchange for property within the park which is held in trust for the benefit of Native
Kalaupapa National Historical Park, Hawaii. Establishment. 16 USC 410jj.
Purposes. 16 USC 410jj-1.
Boundaries; public inspection. 16 USC 410jj-2. Land acquisition. 16 USC 410jj-2. 16 USC 460l-22.
219
260 NATIONAL HISTORICAL PARKS
94 STAT. 3322 PUBLIC LAW 96-565—DEC. 22, 1980
48 USC 691.
48 USC 697. 48 USC 698.
Administration. 16 USC 410jj-4. 43 USC 1457, 16 USC 1, 2, 3, 4, 22, 43. 16 USC 461-467.
Cooperative agreements.
Hawaiians, as defined in the Hawaiian Homes Commission Act of 1920 shall, as a matter of Federal law, be held by the grantee subject to an equitable estate of the same class and degree as encumbers the property within the preserve; and “available lands” defined in section 203 of the Hawaiian Homes Commission Act may be exchanged in accordance with section 204 of said Act. The vesting of title in the United States to property within the park shall operate to extinguish any such equitable estate with respect to property acquired by exchange within the park.
(b) The Secretary is authorized to acquire privately–owned lands within the boundary of the park by donation, purchase with donated or appropriated funds, or exchange.
(c) The Secretary is authorized to acquire by any of the forgoing methods except condemnation, lands, waters and interests therein outside the boundary of the park and outside the boundaries of any other unit of the National Park System but within the State of Hawaii, and to convey the same to the Department of Hawaiian Home Lands in exchange for lands, waters, and interests therein within the park owned by that Department. Any such exchange shall be accomplished in accordance with the provisions defined in subsection (a) of this section.
SEC. 105. (a) The Secretary shall administer the park in accordance with the provisions of the Act of August 25, 1916 (39 Stat. 535), the Act of August 21, 1935 (49 Stat. 666), and the provisions of this Act.
(b)(1) With the approval of the owner thereof, the Secretary may undertake critical or emergency stabilization of utilities and historic structures, develop and occupy temporary office space, and conduct interim interpretive and visitor services on non-Federal property within the park.
(2) The Secretary shall seek and may enter into cooperative agreements with the owner or owners of property within the park pursuant to which the Secretary may preserve, protect, maintain, construct, reconstruct, develop, improve, and interpret sites, facilities, and resources of historic, natural, architectural, and cultural significance. Such agreements shall be of not less than twenty years duration, may be extended and amended by mutual agreement, and shall include, without limitation, provisions that the Secretary shall have the right of access at reasonable times to public portions of the property for interpretive and other purpose, and that no changes or alterations shall be made in the property except by mutual agreement. Each such agreement shall also provide that the owner shall be liable to the United States in an amount equal to the fair market value of any capital improvements made to or placed upon the property in the event the agreement is terminated prior to its natural expiration, or any extension thereof, by the owner, such value to be determined as of the date of such termination, or, at the election of the Secretary, that the Secretary be permitted to remove such capital improvements within a reasonable time of such termination. Upon the expiration of such agreement, the improvements thereon shall become the property of the owner, unless the United States desires to remove such capital improvements and restore the property to its natural state within a reasonable time for such expiration.
(3) Except for emergency, temporary, and interim activity as authorized in paragraph (1) of this subsection, no funds appropriated pursuant to this Act shall be expended on non-Federal property unless such expenditure is pursuant to a cooperative agreement with the owner.
220
NATIONAL HISTORICAL PARKS 261
PUBLIC LAW 96-565—DEC. 22, 1980 94 STAT. 3323
(4) The Secretary may stabilize and rehabilitate structures and other properties used for religious or sectarian purposes only if such properties constitute a substantial and integral part of the historical fabric of the Kalaupapa settlement, and only to the extent necessary and appropriate to interpret adequately the nationally significant historical features and events of the settlement for the benefit of the public.
SEC. 106. The following provisions are made with respect to the special needs of the leprosy patients residing in the Kalaupapa settlement—
(1) So long as the patient may direct, the Secretary shall not permit public visitation to the settlement in excess of one hundred persons in any one day.
(2) Heath care for the patient shall continue to be provided by the State of Hawaii, with assistance from Federal programs other than those authorized herein.
(3) Notwithstanding any other provision of law, the Secretary shall provide patients a first right of refusal to provide revenue–producing visitor services, including such services as providing food, accommodations, transportation, tours, and guides.
(4) Patients shall continue to have the right to take and utilize fish and wildlife resources without regard to Federal fish and game laws and regulations.
(5) Patients shall continue to have the right to take and utilize plant and other natural resources for traditional purposes in accordance with applicable State and Federal laws.
SEC. 107. The following provisions are made with respect to additional needs of the leprosy patients and Native Hawaiians for employment and training. (The term “Native Hawaiian” as used in this title, means a descendant of not less than one-half part of the blood of the races inhabiting the Hawaiian Islands previous to the year 1778.)—
(1) Notwithstanding any other provision of law, the Secretary shall give first preference to qualified patients and Native Hawaiians in making appointments to positions established for the administration of the park, and the appointment of patients and Native Hawaiians shall be without regard to any provision of the Federal civil service laws giving an employment preference to any other class of applicant and without regard to any numerical limitation on personnel otherwise applicable.
(2) The Secretary shall provide training opportunities for patients and Native Hawaiians to develop skills necessary to qualify for the provision of visitor services and for appointment to positions referred to in paragraph (1).
SEC. 108 (a) There is hereby established the Kalaupapa National Historical Park Advisory Commission (hereinafter referred to as the “Commission”), which shall consist of eleven members each appointed by the Secretary for a term of five years as followers:
(1) seven members who shall be present or former patients, elected by the patient community, and
(2) four members appointed from recommendations submitted by the Governor of Hawaii, at least one of whom shall be a Native Hawaiian.
Religious structures. Leprosy patients. 16 USC 410jj-5
Employment and training. 16 USC 410jj-6. “Native Hawaiian.” Kalaupapa National Historical Park Advisory Commission. Establishment. Membership. 16 USC 410jj-7.
221
262 NATIONAL HISTORICAL PARKS
94 STAT. 3323 PUBLIC LAW 96-565—DEC. 22, 1980
Chairman. Vacancies.
Compensation. Expenses.
94 STAT. 3324
Expiration.
Reevaluation. 16 USC 410jj-8.
Appropriation Authorization. 16 USC 410jj-9.
(b) The Secretary shall designate one member to be Chairman.
Any vacancy in the Commission shall be filled in the same manner in which the original appointment was made.
(c) A member of the Commission shall serve without compensation as such. The Secretary is authorized to pay the expenses reasonably incurred by the Commission in carrying out its responsibilities under this Act on vouchers signed by the Chairman.
(d) The Secretary shall consult with and seek the advice of the Commission with respect to the development and operation of the park including training program The Commission shall, in addition, advise the Secretary concerning public visitation to the park, and such advice with respect to numbers of visitors shall be binding upon the Secretary if the Commission certifies to him that such advice is based on a referendum, held under the auspices of the Commission, of all patients on the official Kalaupapa Registry.
(e) The Commission shall expire twenty-five years from the date of enactment of this Act.
SEC. 109. At such time when there is no longer a resident patient community at Kalaupapa, the Secretary shall reevaluate the policies governing the management, administration, and public use of the park is order to identify any changes deemed to be appropriate.
SEC. 110. Effective October 1, 1981, there are hereby authorized to be appropriated such sums as may be necessary to carry out the purposes of this title but not to exceed $2,500,000 for acquisition of lands and interests in lands and $1,000,000 for development.
* * * * * * *
222
NATIONAL HISTORICAL PARKS 263
PUBLIC LAW 96-565—DEC. 22, 1980
Approved December 22, 1980.
LEGISLATIVE HISTORY: HOUSE REPORT No. 96–1019 (Comm. on Interior and Insular Affairs). SENATE REPORT No. 96–1027 (Comm. on Energy and Natural Resources). CONGRESSIONAL RECORD. Vol. 126 (1980):
May 19, considered and passed House. Dec. 4, considered and passed Senate, amended. Dec. 5, House concurred in Senate amendments.
94 STAT. 3327
223
NATIONAL HISTORICAL PARKS 465
7. Kalaupapa
PUBLIC LAW 100–202—DEC. 22, 1987 101 STAT. 1329
Public Law 100–202 100th Congress
Joint Resolution
Making further continuing appropriations for the fiscal year 1988, and for other Dec. 22, 1987
purposes. [H.J. Res. 395]
Resolved by the Senate and House of Representatives of the United States of America in Congress assembled,
* * * * * * * AN ACT
Making appropriations for the Department of the Interior and Related Agencies
for the fiscal Year ending September 30, 1988, and for other purposes.
TITLE I—DEPARTMENT OF THE INTERIOR
* * * * * * * NATIONAL PARK SERVICE
OPERATION OF THE NATIONAL PARK SYSTEM
* * * * * * *
. . . Provided further, That notwithstanding any other provision of law, Public Law 96–565 is amended by adding the following at the end of section 104(a): “The Secretary may lease from the Department of Hawaiian Home Lands said trust lands until such time as said lands may be acquired by exchange as set forth herein or otherwise acquired. The Secretary may enter into such a lease without regard to fiscal year limitations.”: . . .
* * * * * * *
Approved December 22, 1987.
Certified April 20, 1988. * * * * * * *
LEGISLATIVE HISTORY—H.J. Res. 395: HOUSE REPORTS: No. 100–415 (Comm. on Appropriations) and No. 100–
498 (Comm. of Conference).
SENATE REPORTS: No. 100–238 (Comm. on Appropriations). CONGRESSIONAL RECORD, Vol. 133 (1987):
Dec. 3, considered and passed House. Dec. 11, considered and passed Senate, amended. Dec. 21, House and Senate agreed to conference report.
WEEKLY COMPILATION OF PRESIDENTIAL DOCUMENTS, Vol. 23 (1987): Dec. 22, Presidential remarks.
101 STAT. 1329-214 101 STAT. 1329-218 101 STAT. 1329-220 16 USC 410jj-3. 101 STAT. 1329-450
224
Appendix 2. Species Scientific, Hawaiian, and Common Names.
Scientific Name Hawaiian/Common Name(s) Status1
Achatina fulica giant African snail X
Acridotheres tristis common myna X
Adenophorus periens pendant kihi fern, palai la‘au E
Alauda arvensis skylark X
Androponon virginicus broomsedge X
Anous minutus noio, black noddy V
Arenaria interpres ruddy turnstone V
Artemisia australis ‘ahinahina, hinahina, hinahina kuahiwi
E
Asio flammeus sandwichensis pueo, Hawaiian owl E
Atyoida bisulcata ‘opae kala‘ole E
Awaous guamensis ‘o‘opu nākea I
Axis axis axis deer X
Bacopa monnieri ‘ae‘ae I
Bidens hillebrandiana subsp. polycephala
ko‘oko‘olau E
Bidens molokaiensis ko‘oko‘olau E
Bidens pilosa Spanish needle X
Bidens wiebkei ko‘oko‘olau E
Boerhavia repens alena I
Bos primigenius cattle X
Brighamia rockii pua‘ala E
Bulweria bulwerii Bulwer's petrel I
Canavalia molokaiensis ‘āwikiwiki E
Canis familiaris feral dog X
Capra hircus goat X
Cardinalis cardinalis northern cardinal X
Carpodacus mexicanus house finch X
Casuarina equisetifolia common ironwood X
Centaurium sebaeoides ‘āwiwi E
Cettia diphone Japanese bush-warbler X
Chamaeleo jacksonii Jackson’s chameleons X
Chamaesyce celastroides var. amplectens
‘akoko E
Cheirodendron ‘ōlapa E
Cirsium arvense Canadian thistle X
225
Scientific Name Hawaiian/Common Name(s) Status1
Clermontia oblongifolia ssp. brevipes ‘oha wai E
Copsychus malabaricus white-rumped shama X
Cyanea dunbarii haha E
Cyanea procera haha E
Cyanea profuga haha E
Cyanea solanaceae popolo E
Cyanea solenocalyx haha E
Cynodon dactylon Bermudagrass X
Cyrtandra halawensis ha‘iwale E
Cyrtandra hematos ha‘iwale E
Cyrtandra macrocalyx ha‘iwale E
Cyrtrandra biserrata ha‘iwale E
Dicranopteris linearis uluhe I
Diellia erecta ------- E
Digitaria adscendens Henry's crabgrass X
Digitariai nsularis sourgrass X
Diospyros sandwicensis lama E
Drosophila differens Hawaiian picture-wing fly E
Ehrharta stipoides meadow ricegrass X
Emoia impar azure-tailed skink X
Equus africanus asinus donkey X
Equus caballus x Equus asinus mule X
Equus ferus caballus horse X
Erythrina sandwicensis wiliwili E
Euglandina rosea rosy wolf snail X
Eurya sandwicensis anini, wanini E
Exocarpos gaudichaudii hulumoa, kaumahana, heau, au E
Falco peregrinus peregrine falcon V
Felis catus feral cat X
Ficus microcarpa Chinese banyan X
Fimbristylis cymosa mau‘u ‘aki‘aki I
Francolinus erckelii Erckel francolin X
Francolinus francolinus black francolin X
Fregata minor great frigatebird, ‘iwa I
Furcraea foetida mauritius hemp X
Gallus gallus domesticus feral chicken X
Gardenia remyi nanu E
Gehyra mutilate stump-toed gecko X
226
Scientific Name Hawaiian/Common Name(s) Status1
Geopelia striata zebra dove X
Hawaiioscia paeninsulae blind isopod E
Hedyotis mannii pilo E
Heliotropium anomalum hinahina E
Hemidactylus frenatus house gecko X
Hemidactylus garnotii Indo-Pacific gecko X
Hemidactylus typus tree gecko X
Hemignathus virens wilsoni Maui ‘amakihi E
Herpestes javanicus small Indian mongoose X
Hesperomannia arborescens ------- E
Heteroscelus incanus wandering tattler, ‘ulili V
Hibiscus arnottianus ssp. immaculatus koki‘o ke‘oke‘o E
Hibiscus kokio ssp. kokio pualoalo E
Himatione sanguinea sanguinea ‘apapane E
Joinvillea ascendens ssp. ascendens ‘ohe E
Kalanchoe pinnata airplant X
Kuhlia sandvicensis āholehole I
Lagenifera maviensi howaiaulu E
Lantana camara lantana X
Lasiurus cinereus semotus Hawaiian hoary bat E
Leiothrix lutea red-billed leiothrix X
Lentipes concolor ‘o‘opu ‘alamo‘o E
Lepidium bidentatum ‘ānaunau E
Lepidodactylus lugubris mourning gecko X
Lipinia noctua moth skink X
Lobelia dunbariae ssp. paniculata ------- E
Lobelia dunbariae subsp. dunbariae ------- E
Lonchura punctulata nutmeg mannikin, spotted munia X
Melicope reflexa alani E
Macrobrachium lar Tahitian prawn X
Macrobrachium grandimanus ‘opae ‘oeha‘a E
Melinis minutiflora molasses grass X
Metrosideros polymorpha ‘ōhi‘a E
Mugil cephalis mullet X
Mus musculus house mouse X
Myadestes lanaiensis rutha oloma`o, Molokai thrush E
Neritina granosa hīhīwai E
Nesoluma polynesicum keahi I

227
Scientific Name Hawaiian/Common Name(s) Status1
Oreochromis tilapia X
Palmeria dolei ‘ākohekohe, crested honeycreeper E
Pandanus tectorius hala I
Panicum fauriei var. carteri Carter’s panicgrass E
Paroreomyza flammea kakawaihie, Molokai creeper E
Peucedanum sandwicense makou E
Phaethon lepturus white-tailed tropicbird I
Phaethon rubricauda red-tailed tropicbird I
Phyllostegia hispida ------- E
Phyllostegia mannii ------- E
Phyllostegia mollis ------- E
Phyllostegia stachyoides ------- E
Pittosporum halophilum hoawa E
Plantago princes var. laxiflora kuahiwi laukahi E
Platanthera holochila fringed orchid E
Pleomele auwahiensis hala pepe E
Pluchea indica Indian fleabane, marsh fleabane X
Pluvialis fulva Pacific golden plover V
Poecilia reticulata guppy X
Portulaca villosa ihi E
Pritchardia hillebrandii loulu E
Pseudonestor xanthophrys kīkēkoa, Maui parrotbill E
Psydrax odorata alahe‘e I
Pterodroma sandwichensis Hawaiian dark-rumped petrel or ua‘u E
Puffinus auricularis newelli Newell's shearwater or ‘a‘o E
Puffinus pacificus wedge-tailed shearwater I
Quadrastichus erythrinae erythrina gall wasp X
Ranunculus mauiensis makou E
Rattus rattus black rat X
Reynoldsia sandwicensis ‘ohe makai E
Sarotherodon tilapia X
Scaevola coriacea dwarf naupaka E
Schiedea diffusa ------- E
Schiedea lydgatei ------- E
Schiedea pubescens var. pubescens ma‘oli‘oli E
Schinus terebinthifolius Christmasberry X
Senna gaudichaudii kolomona I
Sesuvium portulacastrum ‘äkulikuli, sea purslane I
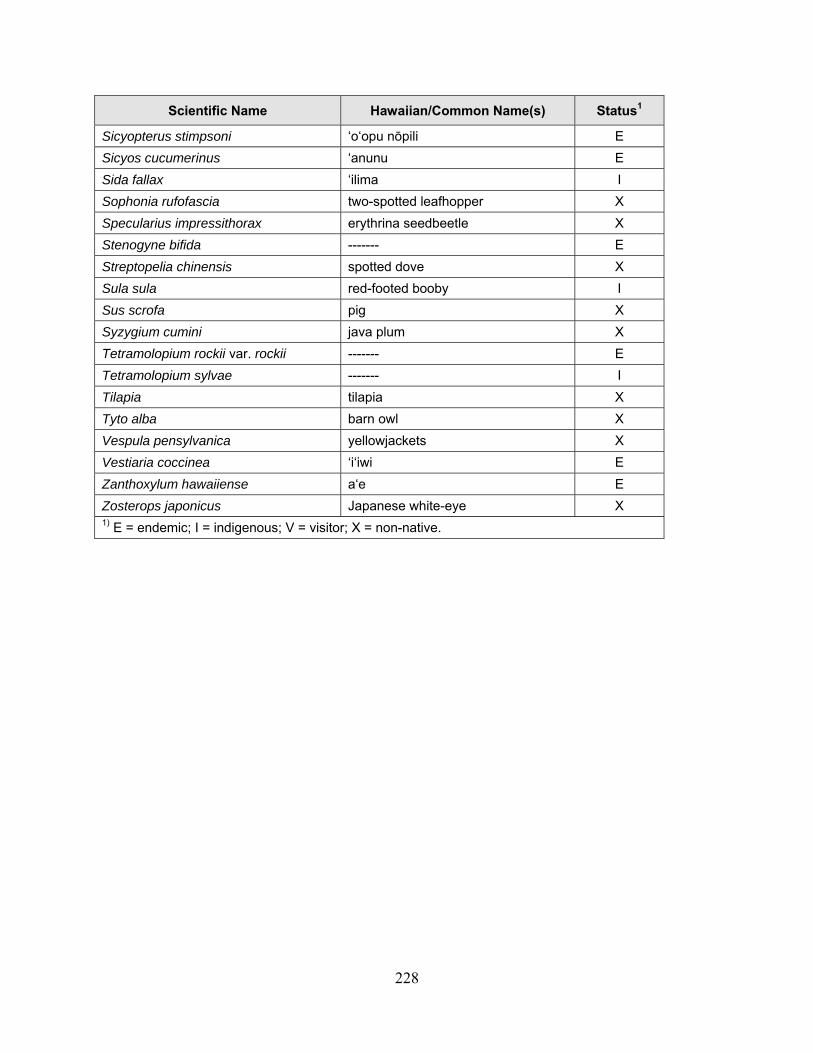
228
Scientific Name Hawaiian/Common Name(s) Status1
Sicyopterus stimpsoni ‘o‘opu nōpili E
Sicyos cucumerinus ‘anunu E
Sida fallax ‘ilima I
Sophonia rufofascia two-spotted leafhopper X
Specularius impressithorax erythrina seedbeetle X
Stenogyne bifida ------- E
Streptopelia chinensis spotted dove X
Sula sula red-footed booby I
Sus scrofa pig X
Syzygium cumini java plum X
Tetramolopium rockii var. rockii ------- E
Tetramolopium sylvae ------- I
Tilapia tilapia X
Tyto alba barn owl X
Vespula pensylvanica yellowjackets X
Vestiaria coccinea ‘i‘iwi E
Zanthoxylum hawaiiense a‘e E
Zosterops japonicus Japanese white-eye X 1) E = endemic; I = indigenous; V = visitor; X = non-native.

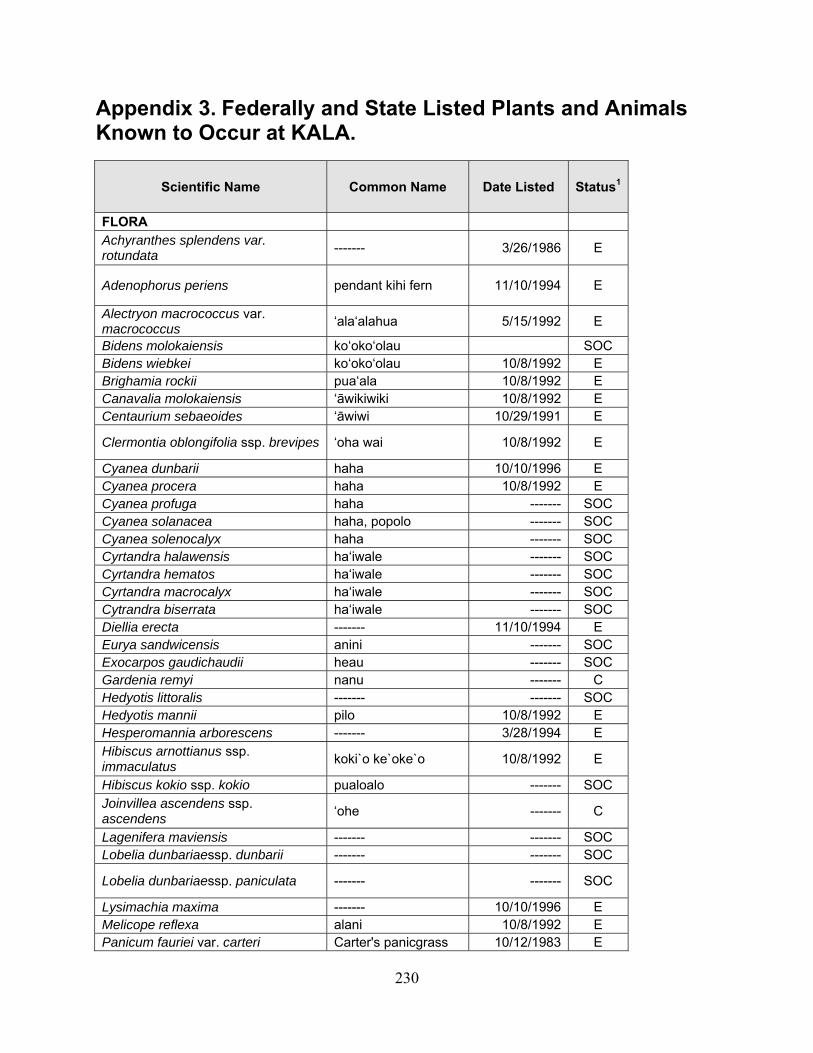
230
Appendix 3. Federally and State Listed Plants and Animals Known to Occur at KALA.
Scientific Name Common Name Date Listed Status1
FLORA Achyranthes splendens var. rotundata
------- 3/26/1986 E
Adenophorus periens pendant kihi fern 11/10/1994 E
Alectryon macrococcus var. macrococcus
‘ala‘alahua 5/15/1992 E
Bidens molokaiensis ko‘oko‘olau SOC Bidens wiebkei ko‘oko‘olau 10/8/1992 E Brighamia rockii pua‘ala 10/8/1992 E Canavalia molokaiensis ‘āwikiwiki 10/8/1992 E Centaurium sebaeoides ‘āwiwi 10/29/1991 E
Clermontia oblongifolia ssp. brevipes ‘oha wai 10/8/1992 E
Cyanea dunbarii haha 10/10/1996 E Cyanea procera haha 10/8/1992 E Cyanea profuga haha ------- SOC Cyanea solanacea haha, popolo ------- SOC Cyanea solenocalyx haha ------- SOC Cyrtandra halawensis ha‘iwale ------- SOC Cyrtandra hematos ha‘iwale ------- SOC Cyrtandra macrocalyx ha‘iwale ------- SOC Cytrandra biserrata ha‘iwale ------- SOC Diellia erecta ------- 11/10/1994 E Eurya sandwicensis anini ------- SOC Exocarpos gaudichaudii heau ------- SOC Gardenia remyi nanu ------- C Hedyotis littoralis ------- ------- SOC Hedyotis mannii pilo 10/8/1992 E Hesperomannia arborescens ------- 3/28/1994 E Hibiscus arnottianus ssp. immaculatus
koki`o ke`oke`o 10/8/1992 E
Hibiscus kokio ssp. kokio pualoalo ------- SOC Joinvillea ascendens ssp. ascendens
‘ohe ------- C
Lagenifera maviensis ------- ------- SOC Lobelia dunbariaessp. dunbarii ------- ------- SOC
Lobelia dunbariaessp. paniculata ------- ------- SOC
Lysimachia maxima ------- 10/10/1996 E Melicope reflexa alani 10/8/1992 E Panicum fauriei var. carteri Carter's panicgrass 10/12/1983 E
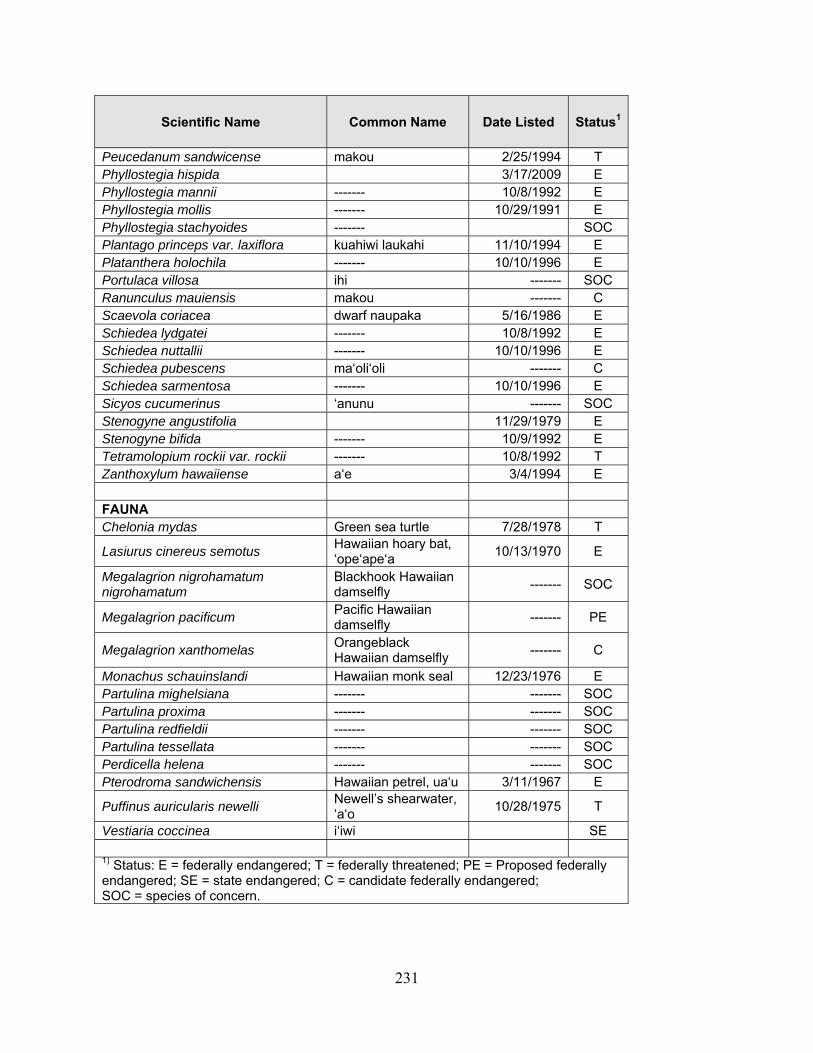
231
Scientific Name Common Name Date Listed Status1
Peucedanum sandwicense makou 2/25/1994 T Phyllostegia hispida 3/17/2009 E Phyllostegia mannii ------- 10/8/1992 E Phyllostegia mollis ------- 10/29/1991 E Phyllostegia stachyoides ------- SOC Plantago princeps var. laxiflora kuahiwi laukahi 11/10/1994 E Platanthera holochila ------- 10/10/1996 E Portulaca villosa ihi ------- SOC Ranunculus mauiensis makou ------- C Scaevola coriacea dwarf naupaka 5/16/1986 E Schiedea lydgatei ------- 10/8/1992 E Schiedea nuttallii ------- 10/10/1996 E Schiedea pubescens ma‘oli‘oli ------- C Schiedea sarmentosa ------- 10/10/1996 E Sicyos cucumerinus ‘anunu ------- SOC Stenogyne angustifolia 11/29/1979 E Stenogyne bifida ------- 10/9/1992 E Tetramolopium rockii var. rockii ------- 10/8/1992 T Zanthoxylum hawaiiense a‘e 3/4/1994 E
FAUNA Chelonia mydas Green sea turtle 7/28/1978 T
Lasiurus cinereus semotus Hawaiian hoary bat, ‘ope‘ape‘a
10/13/1970 E
Megalagrion nigrohamatum nigrohamatum
Blackhook Hawaiian damselfly
------- SOC
Megalagrion pacificum Pacific Hawaiian damselfly
------- PE
Megalagrion xanthomelas Orangeblack Hawaiian damselfly
------- C
Monachus schauinslandi Hawaiian monk seal 12/23/1976 E Partulina mighelsiana ------- ------- SOC Partulina proxima ------- ------- SOC Partulina redfieldii ------- ------- SOC Partulina tessellata ------- ------- SOC Perdicella helena ------- ------- SOC Pterodroma sandwichensis Hawaiian petrel, ua‘u 3/11/1967 E
Puffinus auricularis newelli Newell’s shearwater, ‘a‘o
10/28/1975 T
Vestiaria coccinea i‘iwi SE
1) Status: E = federally endangered; T = federally threatened; PE = Proposed federally endangered; SE = state endangered; C = candidate federally endangered; SOC = species of concern.
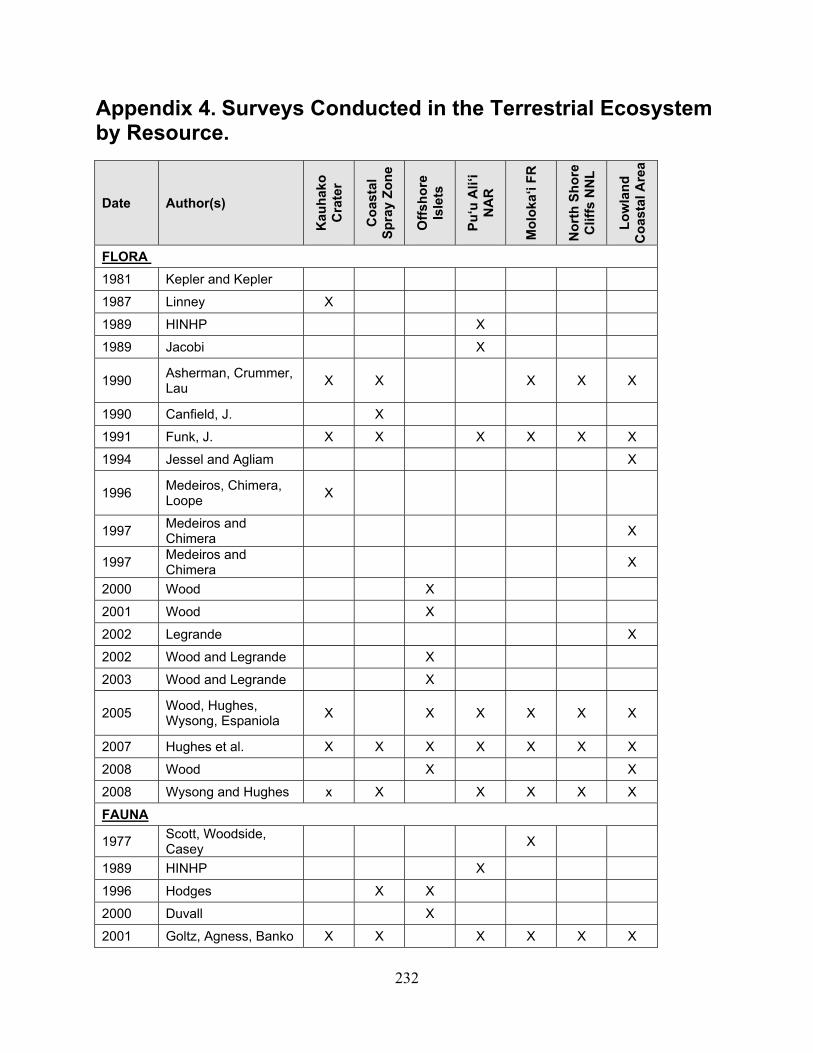
232
Appendix 4. Surveys Conducted in the Terrestrial Ecosystem by Resource.
Date Author(s)
Kau
hak
o
Cra
ter
Co
asta
l S
pra
y Z
on
e
Off
sho
re
Isle
ts
Pu
‘u A
li‘i
N
AR
Mo
loka
‘i F
R
No
rth
Sh
ore
C
liff
s N
NL
Lo
wla
nd
C
oas
tal A
rea
FLORA
1981 Kepler and Kepler
1987 Linney X
1989 HINHP X
1989 Jacobi X
1990 Asherman, Crummer, Lau
X X
X X X
1990 Canfield, J. X
1991 Funk, J. X X X X X X
1994 Jessel and Agliam X
1996 Medeiros, Chimera, Loope
X
1997 Medeiros and Chimera
X
1997 Medeiros and Chimera
X
2000 Wood X
2001 Wood X
2002 Legrande X
2002 Wood and Legrande X
2003 Wood and Legrande X
2005 Wood, Hughes, Wysong, Espaniola
X
X X X X X
2007 Hughes et al. X X X X X X X
2008 Wood X X
2008 Wysong and Hughes x X X X X X
FAUNA
1977 Scott, Woodside, Casey
X
1989 HINHP X
1996 Hodges X X
2000 Duvall X
2001 Goltz, Agness, Banko X X X X X X
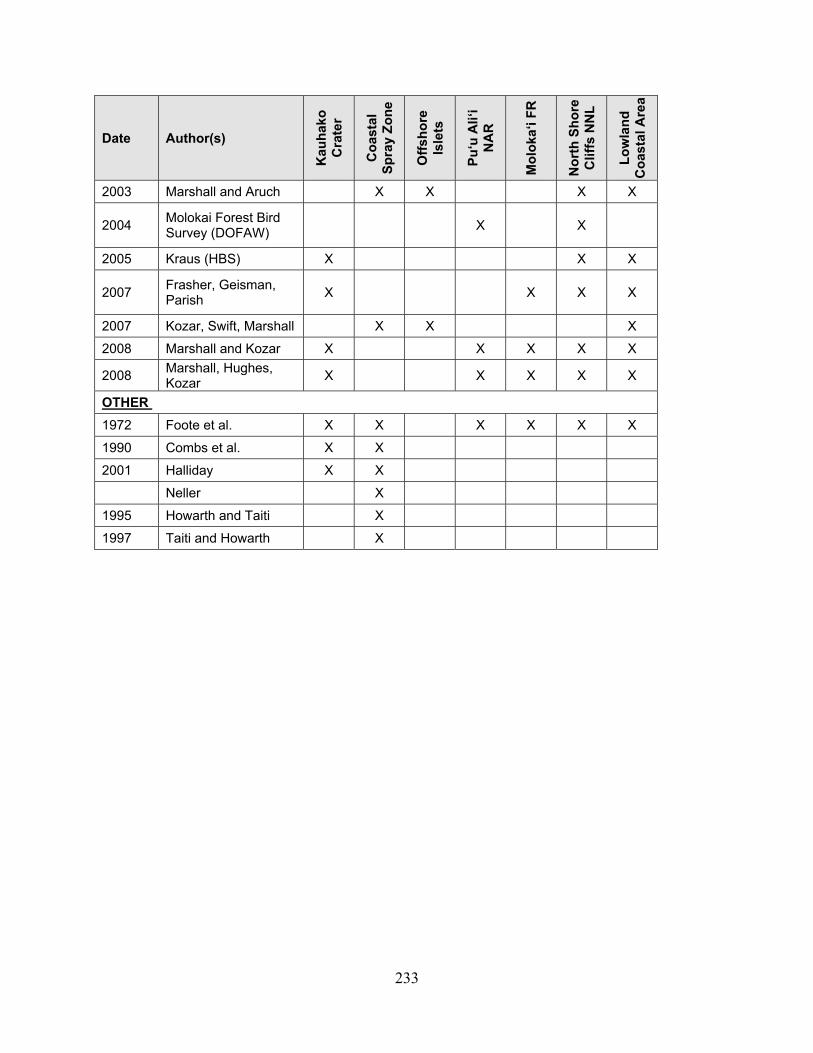
233
Date Author(s)
Kau
hak
o
Cra
ter
Co
asta
l S
pra
y Z
on
e
Off
sho
re
Isle
ts
Pu
‘u A
li‘i
N
AR
Mo
loka
‘i F
R
No
rth
Sh
ore
C
liff
s N
NL
Lo
wla
nd
C
oas
tal A
rea
2003 Marshall and Aruch X X X X
2004 Molokai Forest Bird Survey (DOFAW)
X
X
2005 Kraus (HBS) X X X
2007 Frasher, Geisman, Parish
X
X X X
2007 Kozar, Swift, Marshall X X X
2008 Marshall and Kozar X X X X X
2008 Marshall, Hughes, Kozar
X
X X X X
OTHER
1972 Foote et al. X X X X X X
1990 Combs et al. X X
2001 Halliday X X
Neller X
1995 Howarth and Taiti X
1997 Taiti and Howarth X
234
Appendix 5. Benthic data by transect for coastal reefs at KALA.
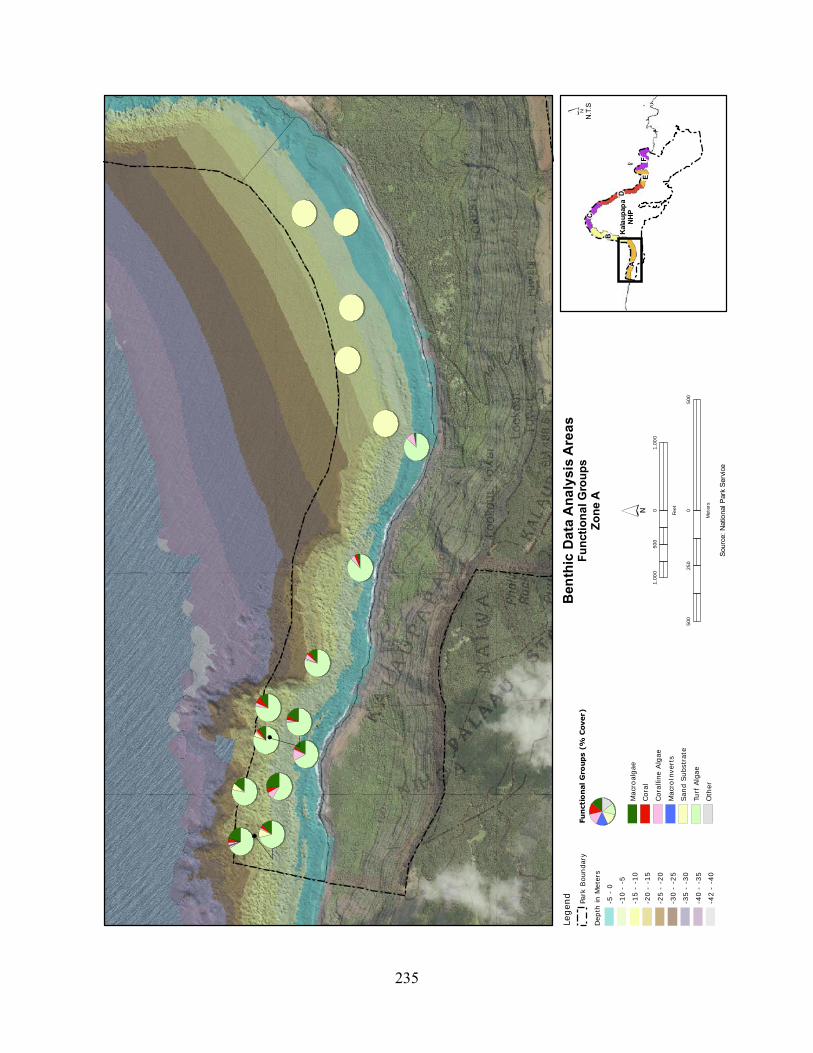
235
Ben
thic
Da
ta A
na
lysi
s A
rea
sF
un
ctio
na
l Gro
up
sZ
on
e A
Kal
au
pap
aN
HP
D
B
A
F
C
E
Legen
d
Park
Bou
nda
ry
Dep
th in
Met
ers
-5 -
0
-10
- -5
-15
- -1
0
-20
- -1
5
-25
- -2
0
-30
- -2
5
-35
- -3
0
-40
- -3
5
-42
- -4
0
Fun
ctio
nal G
roup
s (%
Cover)
Mac
roal
gae
Cor
al
Cor
allin
e A
lgae
Mac
roIn
vert
s
San
d Subs
trat
e
Turf
Alg
ae
Oth
er
1,00
00
1,00
050
0
Feet
500
050
025
0
Met
ers
Sou
rce:
Nat
iona
l Par
k S
ervi
ce
N.T
.S
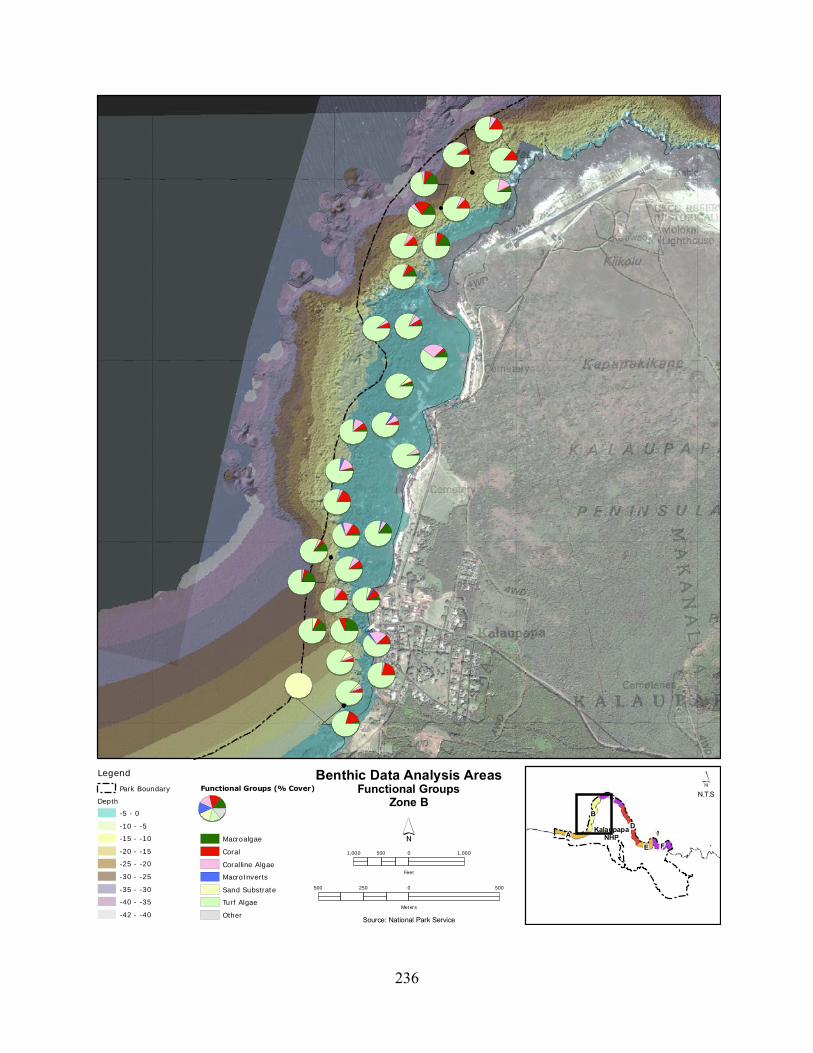
236
KalaupapaNHP
D
B
A
F
C
E
Legend
Park Boundary
Depth
-5 - 0
-10 - -5
-15 - -10
-20 - -15
-25 - -20
-30 - -25
-35 - -30
-40 - -35
-42 - -40
Functional Groups (% Cover)
Macroalgae
Coral
Coralline Algae
MacroInverts
Sand Substrate
Turf Algae
Other
1,000 0 1,000500
Feet
500 0 500250
Meters
Benthic Data Analysis AreasFunctional Groups
Zone B
Source: National Park Service
N.T.S
237
Ben
thic
Da
ta A
na
lysi
s A
rea
sF
un
ctio
na
l Gro
up
sZ
on
e C
Kal
au
pap
aN
HP
D
B
A
F
C
E
Legen
d
Park
Bou
nda
ry
Dep
th in
Met
ers
-5 -
0
-10
- -5
-15
- -1
0
-20
- -1
5
-25
- -2
0
-30
- -2
5
-35
- -3
0
-40
- -3
5
-42
- -4
0
Fun
ctio
nal G
roup
s (%
Cover)
Mac
roal
gae
Cor
al
Cor
allin
e Alg
ae
Mac
roIn
vert
s
San
d Subs
trat
e
Turf
Alg
ae
Oth
er
1,00
00
1,00
050
0
Feet
500
050
025
0
Met
ers
Sou
rce:
Nat
iona
l Par
k S
ervi
ce
N.T
.S
238
KalaupapaNHP
D
B
A
F
C
E
Legend
Park Boundary
Depth
-5 - 0
-10 - -5
-15 - -10
-20 - -15
-25 - -20
-30 - -25
-35 - -30
-40 - -35
-42 - -40
Functional Groups (% Cover)
Macroalgae
Coral
Coralline Algae
MacroInverts
Sand Substrate
Turf Algae
Other
1,000 0 1,000500
Feet
500 0 500250
Meters
Benthic Data Analysis AreasFunctional Groups
Zone D
Source: National Park Service
N.T.S
239
Ben
thic
Da
ta A
na
lysi
s A
reas
Fu
nc
tio
nal
Gro
up
sZ
on
e E
an
d F
Kal
au
pap
aN
HP
D
B
A
F
C
E
Legen
d
Park
Boun
dary
Fun
ctio
nal G
roup
s (%
Cover)
Mac
roal
gae
Cor
al
Cor
allin
e Alg
ae
Mac
roIn
vert
s
San
d S
ubs
trat
e
Turf
Alg
ae
Oth
er
1,00
00
1,00
050
0
Feet
500
050
025
0
Met
ers
Sou
rce:
Nat
iona
l Par
k S
ervi
ce
N.T
.S
240
Appendix 6. Fish abundance by trophic levels for coastal reefs at KALA.

241
Fis
h A
bu
nd
an
ce
Tro
ph
icZ
on
e A
Kal
au
pap
aN
HP
D
B
A
F
C
E
Legen
d
Park
Bou
nda
ry
Dep
th in
Met
ers
-5 -
0
-10
- -5
-15
- -1
0
-20
- -1
5
-25
- -2
0
-30
- -2
5
-35
- -3
0
-40
- -3
5
-42
- -4
0
Fish
Tro
ph
ic P
erc
en
t A
bu
ndan
ce
37 Ape
x Pr
edat
or
Prim
ary
Con
sum
er
Sec
ondar
y Con
sum
er
1,0
00
01,0
00
500
Feet
500
0500
250
Mete
rs
Sou
rce:
Nat
iona
l Par
k S
ervi
ce
N.T
.S
Num
ber/
ha x
100
0
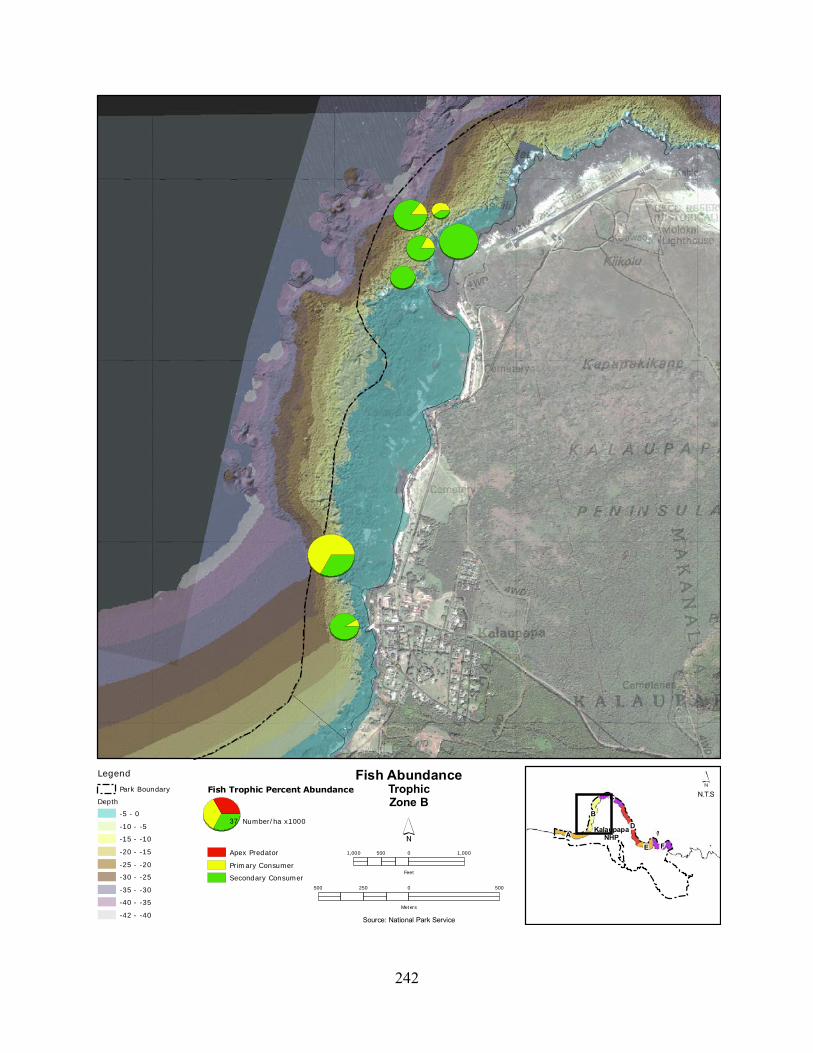
242
KalaupapaNHP
D
B
A
F
C
E
Legend
Park Boundary
Depth
-5 - 0
-10 - -5
-15 - -10
-20 - -15
-25 - -20
-30 - -25
-35 - -30
-40 - -35
-42 - -40
Fish Trophic Percent Abundance
37
Apex Predator
Primary Consumer
Secondary Consumer
1,000 0 1,000500
Feet
500 0 500250
Meters
Fish AbundanceTrophicZone B
Source: National Park Service
N.T.S
Number/ha x1000
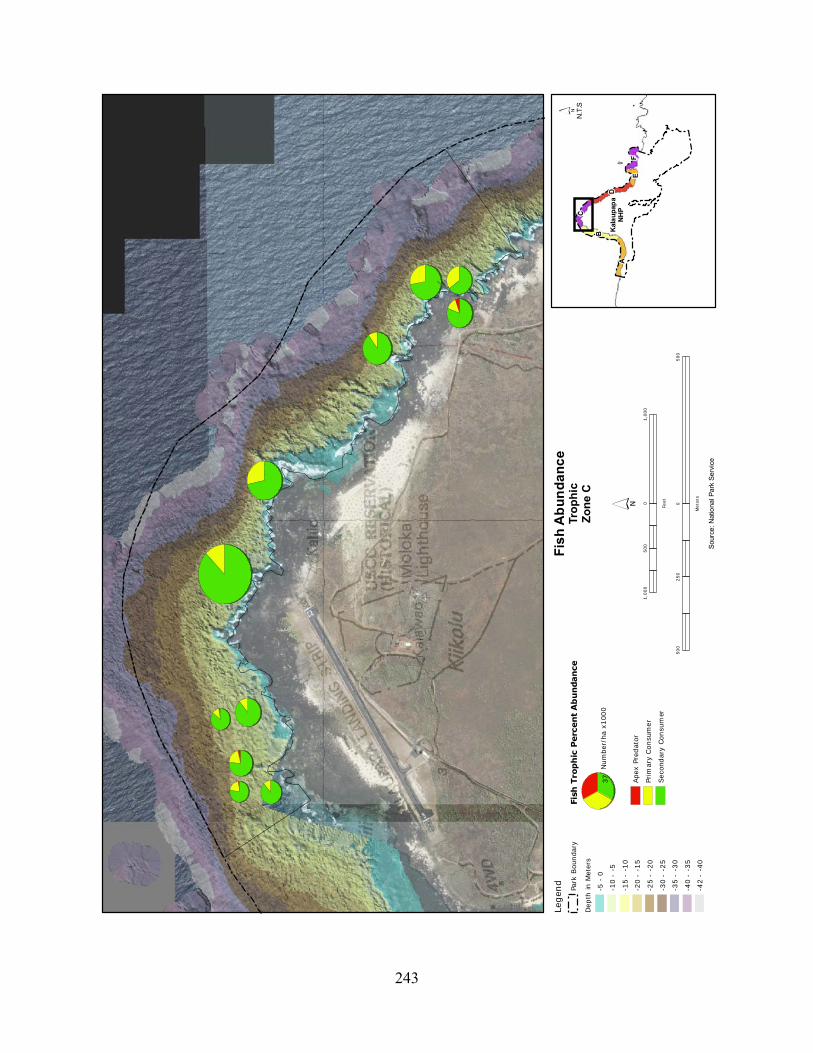
243
Fis
h A
bu
nd
an
ce
Tro
ph
icZ
on
e C
Kal
au
pap
aN
HP
D
B
A
F
C
E
Legen
d
Park
Bou
nda
ry
Dep
th in
Met
ers
-5 -
0
-10
- -5
-15
- -1
0
-20
- -1
5
-25
- -2
0
-30
- -2
5
-35
- -3
0
-40
- -3
5
-42
- -4
0
Fish
Tro
ph
ic P
erc
en
t A
bu
ndan
ce
37 Ape
x Pr
edat
or
Prim
ary
Con
sum
er
Sec
ondar
y Con
sum
er
1,0
00
01,0
00
500
Feet
500
0500
250
Mete
rs
Sou
rce:
Nat
iona
l Par
k S
ervi
ce
N.T
.S
Num
ber/
ha x
100
0
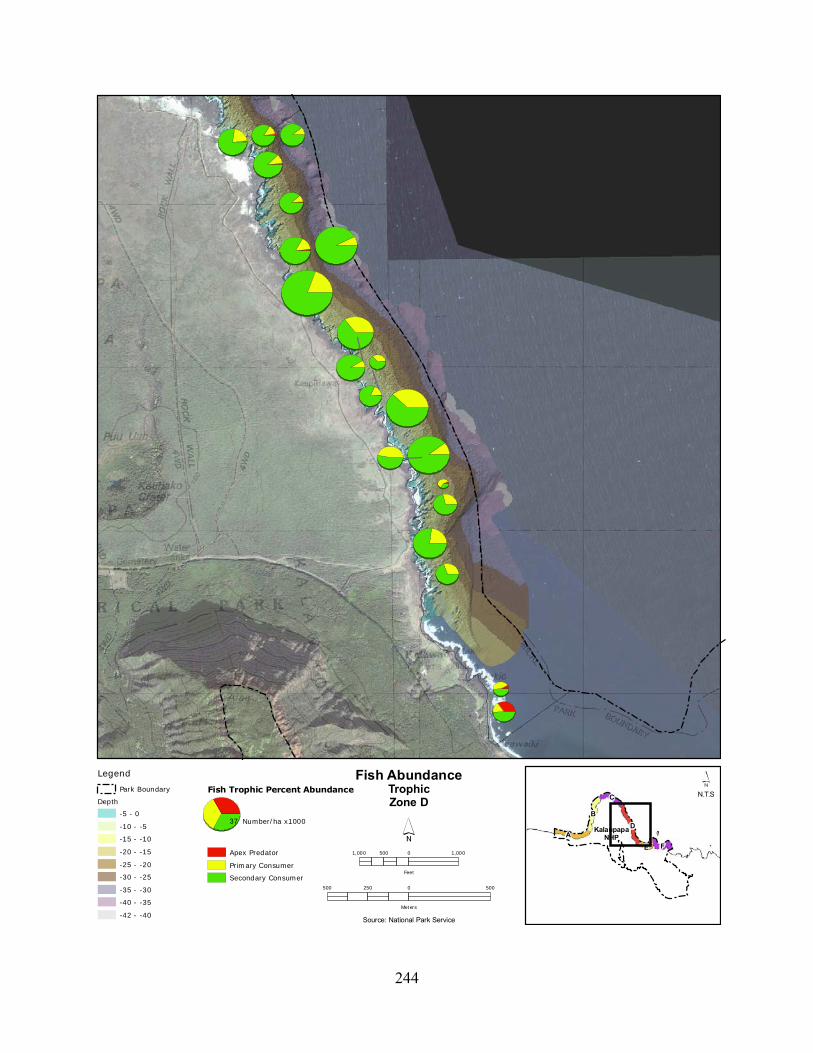
244
KalaupapaNHP
D
B
A
F
C
E
Legend
Park Boundary
Depth
-5 - 0
-10 - -5
-15 - -10
-20 - -15
-25 - -20
-30 - -25
-35 - -30
-40 - -35
-42 - -40
Fish Trophic Percent Abundance
37
Apex Predator
Primary Consumer
Secondary Consumer
1,000 0 1,000500
Feet
500 0 500250
Meters
Fish AbundanceTrophicZone D
Source: National Park Service
N.T.S
Number/ha x1000

245
Fis
h A
bu
nd
an
ce
Tro
ph
icZ
on
e E
an
d F
Kal
au
pap
aN
HP
D
B
A
F
C
E
Legen
d
Park
Bou
nda
ry
Fis
h T
rop
hic
Perc
en
t A
bu
ndan
ce
37 Ape
x Pr
edat
or
Prim
ary
Con
sum
er
Sec
ondar
y Con
sum
er
1,0
00
01,0
00
500
Feet
500
0500
250
Mete
rs
Sou
rce:
Nat
iona
l Par
k S
ervi
ce
N.T
.S
Num
ber/
ha x
100
0

246
Appendix 7. Fish biomass by trophic levels for coastal reefs at KALA.
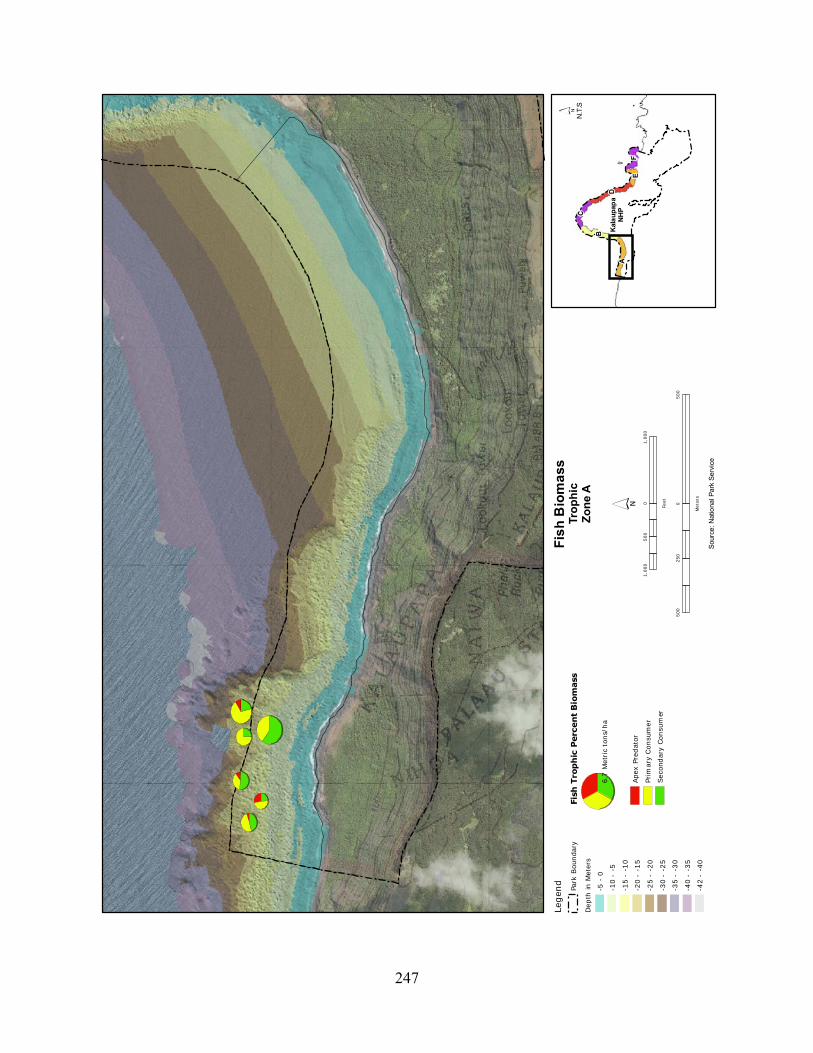
247
Fis
h B
iom
ass
Tro
ph
icZ
on
e A
Kal
au
pap
aN
HP
D
B
A
F
C
E
Legen
d
Park
Bou
nda
ry
Dep
th in
Met
ers
-5 -
0
-10
- -5
-15
- -1
0
-20
- -1
5
-25
- -2
0
-30
- -2
5
-35
- -3
0
-40
- -3
5
-42
- -4
0
Fish
Tro
ph
ic P
erc
en
t B
iom
ass
6.7
Ape
x Pr
edat
or
Prim
ary
Con
sum
er
Sec
ondar
y Con
sum
er
1,0
00
01,0
00
500
Feet
500
0500
250
Mete
rs
Sou
rce:
Nat
iona
l Par
k S
ervi
ce
N.T
.S
Met
ric
tons/
ha
248
KalaupapaNHP
D
B
A
F
C
E
Legend
Park Boundary
Depth
-5 - 0
-10 - -5
-15 - -10
-20 - -15
-25 - -20
-30 - -25
-35 - -30
-40 - -35
-42 - -40
Fish Trophic Percent Biomass
6.7
Apex Predator
Primary Consumer
Secondary Consumer
1,000 0 1,000500
Feet
500 0 500250
Meters
Fish BiomassTrophicZone B
Source: National Park Service
N.T.S
Metric tons/ha
249
Fis
h B
iom
ass
Tro
ph
icZ
on
e C
Kal
au
pap
aN
HP
D
B
A
F
C
E
Legen
d
Park
Bou
nda
ry
Dep
th in
Met
ers
-5 -
0
-10
- -5
-15
- -1
0
-20
- -1
5
-25
- -2
0
-30
- -2
5
-35
- -3
0
-40
- -3
5
-42
- -4
0
Fish
Tro
ph
ic P
erc
en
t B
iom
ass
6.7
Ape
x Pr
edat
or
Prim
ary
Con
sum
er
Sec
ondar
y Con
sum
er
1,0
00
01,0
00
500
Feet
500
0500
250
Mete
rs
Sou
rce:
Nat
iona
l Par
k S
ervi
ce
N.T
.S
Met
ric
tons/
ha
250
KalaupapaNHP
D
B
A
F
C
E
Legend
Park Boundary
Depth
-5 - 0
-10 - -5
-15 - -10
-20 - -15
-25 - -20
-30 - -25
-35 - -30
-40 - -35
-42 - -40
Fish Trophic Percent Biomass
6.7
Apex Predator
Primary Consumer
Secondary Consumer
1,000 0 1,000500
Feet
500 0 500250
Meters
Fish BiomassTrophicZone D
Source: National Park Service
N.T.S
Metric tons/ha
251
Fis
h B
iom
ass
Tro
ph
icZ
on
e E
an
d F
Kal
au
pap
aN
HP
D
B
A
F
C
E
Legen
d
Park
Bou
nda
ry
Fis
h T
rop
hic
Perc
en
t B
iom
ass
6.7
Ape
x Pr
edat
or
Prim
ary
Con
sum
er
Sec
ondar
y Con
sum
er
1,0
00
01,0
00
500
Feet
500
0500
250
Mete
rs
Sou
rce:
Nat
iona
l Par
k S
ervi
ce
N.T
.S
Met
ric
tons/
ha


The Department of the Interior protects and manages the nation’s natural resources and cultural heritage; provides scientific and other information about those resources; and honors its special responsibilities to American Indians, Alaska Natives, and affiliated Island Communities. NPS 491/105912, October 2010
National Park Service U.S. Department of the Interior
Natural Resource Program Center 1201 Oakridge Drive, Suite 150 Fort Collins, CO 80525 www.nature.nps.gov
EXPERIENCE YOUR AMERICA TM