assessment of aquifer vulnerability in parts of indo gangetic plain, india
TRANSCRIPT

International Journal of the Physical Sciences Vol. 5(11), pp. 1711-1720, 18 September, 2010 Available online at http://www.academicjournals.org/IJPS ISSN 1992 - 1950 ©2010 Academic Journals Full Length Research Paper
Assessment of aquifer vulnerability in parts of Indo Gangetic plain, India
Mohammad Muqtada Ali Khan1*, Rashid Umar2 and Habibah Lateh1
1School of Distance Education, University Sains Malaysia, 11800 Penang, Malaysia. 2Department of Geology, Aligarh Muslim University, Aligarh 202002, India.
Accepted 20 August, 2010
Indo-Gangetic plain encompassed a large alluvial track consisting of multi-tier aquifer system. Due to stride developmental activities and agricultural advancement, shallow groundwater regime was under potential threats to get contaminated. In the present study, ‘DRASTIC’ methodology was adopted to demarcate the zones based on their vulnerability to contamination. In CGP, both quality and quantity of shallow aquifers to a large extent was governed by land use pattern. Therefore, landuse pattern was included in the widely applied ‘DRASTIC’ methodology. The landuse pattern was classified into different categories, for example, industrial, agriculture and rural and a numeric rating was assigned for each category based on probable risk. The model provided a numerical basis for estimating vulnerability indices and the map that is thus prepared depicts that 5, 39, 33 and 23% of the area studied correspond to low, moderate, high and very high vulnerable zones, respectively. As chemical studies unequivocally demonstrated that pollution is the major source of solutes in groundwater, a good match between TDS values and vulnerability indices gave credibility in the estimation of vulnerability to contamination. Key words: Assessment, aquifer vulnerability, Indo Gangetic plain, India.
INTRODUCTION Groundwater vulnerability assessment is an important process for understanding the intrinsic fragility that a certain region opposes to a given natural or anthropogenic threat. Vulnerability assessment is more meaningful in areas where water resources are under stress due to industrial or agricultural activities, as it can provide valuable information for planning prevention of further deterioration of the environment (Mendoza et al., 2006; Antonakos et al., 2007).
Central Ganga plain, one of the most densely populated regions in the subcontinent of which the study area is a part of, has always been a region with copious agricultural activities, but the last three decades witnessed large scale industrialization in the region too. Multi-crop agriculture, development of industrial belts and population explosion put great stress on both surface and subsurface water resources, quantitatively as well as *Corresponding author. E-mail: [email protected]. Tel: 006046535289.
qualitatively. Consequently, it became relevant to carry out aquifer vulnerability mapping in the entire plain.
Keeping this objective in view, an attempt has been made to prepare vulnerability map for the interfluve area between river Krishni and Hindon in the western part of CGP. With minor changes in the ‘DRASTIC’ model, DRASIC- LU was developed and used to categorize the area in various vulnerable zones. Study area The study area lying between rivers Hindon and Krishni and measuring 650 km2 (29°05’N - 29°30’N: 77°20’ E - 77o32’ E) is located in the western part of Muzaffarnagar district in the state of Uttar Pradesh, India (Figure 1). Drainage was controlled by the two north to south flowing rivers, while elevation varies between 224 and 256 m above sea level (Figure 2).
The area experiences subtropical climate with three seasons and average mean daily temperature of 20 to 32°C. The highest and lowest temperatures of about 45

1712 Int. J. Phys. Sci.
Figure 1. Location map of the study area. and 4°C are recorded in the months of June and January, respectively. The area receives an average annual rainfall of 588 to 697 mm as recorded at two raingauge stations, that is, Budhana and Shamli.
Fertilizers and pesticides, sugar factories, pulp and paper factory and other minor manufacturing units are the most likely sources of groundwater contamination.
The land cover changes had an important bearing on the quality of both surface and ground water. Landsat Orthorectified Multispectral Imagery for September, 1992 and October, 1999 were downloaded from www.landsat.org and used for preparation of land use and land cover map. The land use map was used as one of the parameter in vulnerability study.

Khan et al. 1713
Figure 2. Digital elevation model.
1714 Int. J. Phys. Sci.
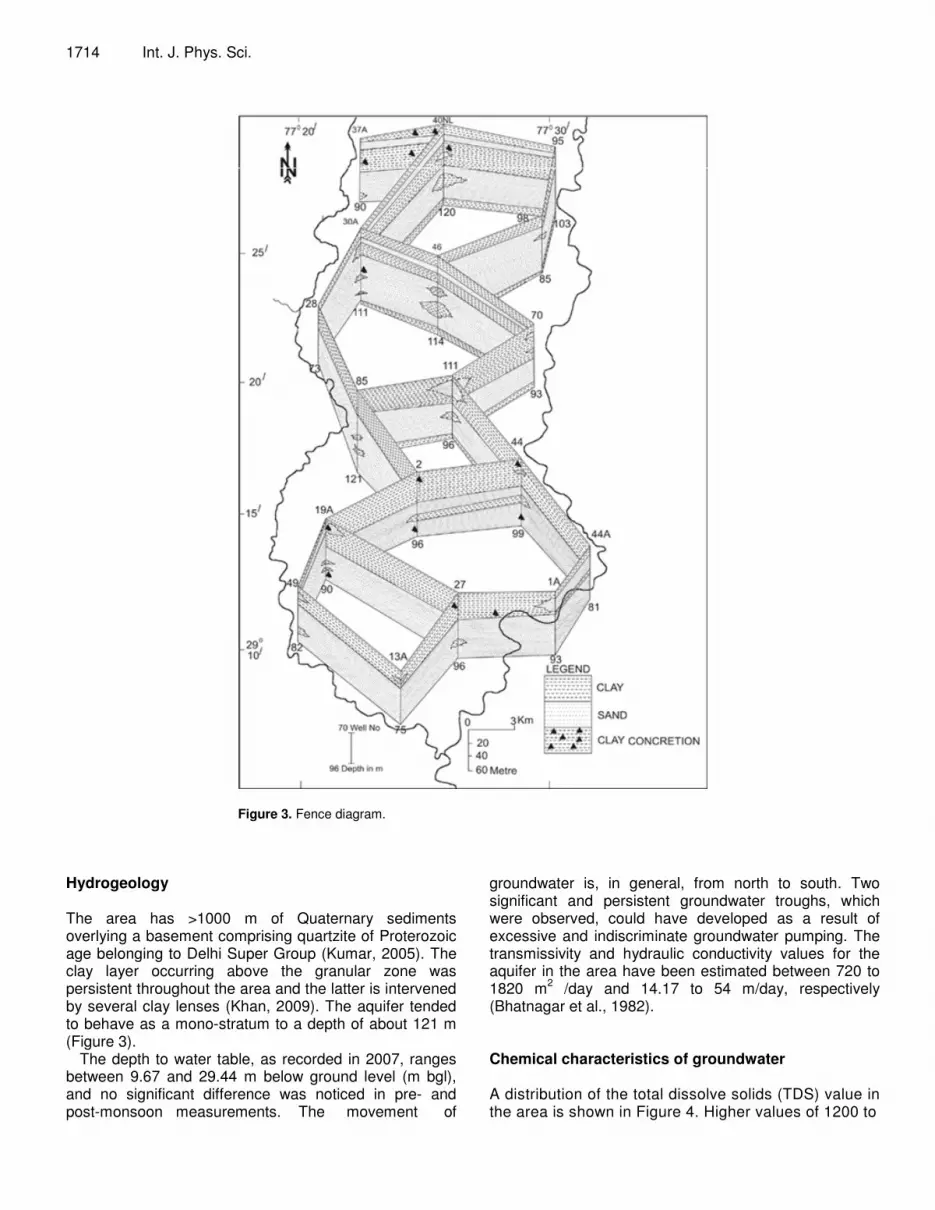
Figure 3. Fence diagram.
Hydrogeology The area has >1000 m of Quaternary sediments overlying a basement comprising quartzite of Proterozoic age belonging to Delhi Super Group (Kumar, 2005). The clay layer occurring above the granular zone was persistent throughout the area and the latter is intervened by several clay lenses (Khan, 2009). The aquifer tended to behave as a mono-stratum to a depth of about 121 m (Figure 3).
The depth to water table, as recorded in 2007, ranges between 9.67 and 29.44 m below ground level (m bgl), and no significant difference was noticed in pre- and post-monsoon measurements. The movement of
groundwater is, in general, from north to south. Two significant and persistent groundwater troughs, which were observed, could have developed as a result of excessive and indiscriminate groundwater pumping. The transmissivity and hydraulic conductivity values for the aquifer in the area have been estimated between 720 to 1820 m2 /day and 14.17 to 54 m/day, respectively (Bhatnagar et al., 1982). Chemical characteristics of groundwater A distribution of the total dissolve solids (TDS) value in the area is shown in Figure 4. Higher values of 1200 to

Khan et al. 1715
Figure 4. Distributions of TDS.
1550 mg/l were confined to some portions along the right bank of river Hindon. These are intervened by lower values of <1200 mg/l. However, the situation is different along the left bank of river Krishni. Although values of 1200 to >1550 mg/l were reported at Gagnoli, in general, lower values of >500 to 1200 mg/l were encountered along this river. Similar values were recorded in the southern part of the area and the north of the confluence of the two rivers. The rest of the area was characterized by moderate TDS values of 850 to 1200 mg/l, with the exception being Jaula and Rajpur Aterna
The samples from Krishni river show very high values of TDS and in particular enrichment of HCO3, SO4 and Na. The bicarbonate content was as high as about 1000 mg/l, while the concentration levels for sulphate reached up to 500 mg/l. This was clearly a case of a highly polluted river, that is, a common situation in the Ganga
plain, which attained its present composition due to mixing of discharges from sugar, paper and acid factories and also sewage and other organic wastes. The samples from River Hindon showed comparatively less TDS, which confirm less pollution within Hindon River. MATERIALS AND METHODS Methodology of aquifer vulnerability The methodology was based on seven parameters, which are: (i) depth to water table (D), (ii) net recharge (R), (iii) aquifer media (A), (iv) soil media (S), (v) topography (T), (vi) impact of vadose zone (I) and (vii) hydraulic conductivity (C). The model employed a numerical ranking system that assigns relative weights to various parameters. It helped in the evaluation of relative groundwater vulnerability to contamination. However, some minor modifications were made in the present study. Realizing that the surface activity has strong bearing on groundwater regime, the effect of land use

1716 Int. J. Phys. Sci.
Observation
wells
Groundwater balance studies
Lithological chart
Harmonic mean
Field/lab studies and
previous data
Field studies and previous
data
Imageries and data from
administration
Depth to water
Net recharge
Aquifer media
Soil media
Impact of vadose zone
Hydraulic conductivity
Land use/ land cover
Vulnerability hazard map
Figure 5. Flow chart of methodology.
Table 1. Assigned weight for DRASIC-LU parameters.
Parameters Rating (R) Weight scale (W) Depth to water table (D) 2, 3 and 5 5 Net recharge (R) 9 4 Aquifer media (A) 8 3 Soil media (S) 5 and 6 2 Impact of vadose zone (I) 1 and 2 5 Hydraulic conductivity (C) 4, 8 and 10 3 LULC (L) 8, 9 and 10 5
pattern was included. Further, in view of the little variation in topography and consequential negligible contribution of this parameter to the groundwater vulnerability (Umar et al., 2009), it was removed from the vulnerability assessment studies. The developed model is being referred here as DRASIC- LU. All the parameters of the model were assigned a subjective rating and weight multipliers were used for each parameter to balance and enhance its importance (Rehman, 2008). The final vulnerability map was based on the DRASIC-LU index (Di).
Every parameter in the model has a fixed weight indicating the relative influence of the parameter in transporting contaminants to groundwater. The parameter ratings, which are variable, allowed the user to calibrate the model to suit a given region (Dixon, 2005). Once the Di is computed, it is possible to identify areas that are more susceptible to groundwater contamination than others. However, the higher the Di, the greater the chance of groundwater getting contaminated. The flow chart of the methodology is shown
in Figure 5. Depth to water (D) The depth to water is important as it determines the depth to which aquifer (a contaminant) must travel and the time involved in the descent (Aller et al., 1987). Shallow water tables were more conducive for the contaminant to reach the groundwater level compared to deeper water tables under similar surface conditions. Depth to water was also important from the point of view of oxidation by atmospheric oxygen (Herlinger et al., 2007). Based on November, 2007 data from observation wells, it varied from 9.67 to 29.38 m bgl and based on the contour interval of 2 m, the area was divisible in 10 water level zones, the shallowest being <10 to 12 m and the deepest > 28 m. However, the depth to water table was assigned the ratings of 5, 3 and 2 in the model (Table 1).

Khan et al. 1717
Table 2. Hydraulic conductivity ranges and their rating (After Aller et al., 1987 and Qinghai et al., 2007).
Hydraulic conductivity (m/day) (original range) Hydraulic conductivity (m/day) (New range) Rating 0.005 - 0.5 0 - 5 1
0.5 - 1.5 5 - 10 2 1.5 - 3.5 10 - 15 4 3.5 - 5.0 15 - 20 7
5.0 - 10.0 20 - 25 8 >10.0 >25 10
Net recharge (R) Net recharge component was estimated using groundwater estimation committee (GEC) norms, (Ministry of Water Resources, 1997) based on the ground water balance method. Recharge water was a significant vehicle for percolating and transporting contaminants within the vadose zone to the saturated zone. It carried both solid and liquid contaminants to the water table and also tended to make it rise (Rehman, 2008). Higher net recharge would obviously provide more chances for transport of contaminants to groundwater table and this would be even more facilitated under unconfined aquifer conditions. The net recharge in the study area was >254 mm and was assigned common rating of 9 and a relative weight of 4 in the model (Table 1). Aquifer media (A) The aquifer media exerts major control over the route and path length that a contaminant must follow, which, in turn, is an important control, in addition to hydraulic conductivity and gradient, in determining the time available to contamination processes and the effective surface area of materials contacted in the aquifer (Aller et al., 1987). In general, bigger the grain size and higher the permeability, greater is the pollution potential. In the study area, the aquifer material was relatively homogeneous, in which it has been assigned a uniform rating of 8; however, the weight for the aquifer media is 3. Soil media (S) In general, the pollution potential of soil was largely affected by the type of clay present and the grain size of the soil. The quantity of organic material present in the soil may also be an important factor. The study area is characterized by two types of soil such as loam and sandy loam which corresponds to a rating of 5 and 6. However, the parameter was assigned a weight of 2. Impact of vadose zone (I) In the present study, the impact of vadose zone parameter is calculated by the harmonic mean approach (Hussain et al., 2006) and is applied to calculate the exact rating values at each location. The following equation is used for the above purpose:
�=
=N
i i
ir
IrT
TI
1
Table 3. Ratings of land use categories.
Land use category Rating Urban and industrial 10 Rural and industrial 9 Rural and agriculture 8
where Ir is the weighted harmonic mean of the vadose zone, T is the total thickness of the vadose zone, Ti is thickness of the layer i and Iri is the rating of layer i.
Based on the geological description of the study area, vadose zone is observed to consist of clay, silt, fine and loamy sand which correspond to ratings 1 and 2 (Hussain et al., 2006). However, this parameter was assigned a weight of 5 (Table 1). Characterization of vadose zone is more significant when clay and fine sand, both possessing distinct hydrological characters, exhibit intercalation. In the study area, thickness of the top clay layer was persistent throughout the study and it determined the behavior of each location in terms of susceptibility to contamination and downgrading of the vadose zone impact. Hydraulic conductivity (C) In the study area, the hydraulic conductivity values of 14 to 54 m/day were reported (Bhatnagar et al., 1982). Thus, the range proposed by Aller et al. (1987), does not seem to be applicable. Alternatively, values proposed by Qinghai et al. (2007) were used (Table 2), according to which the assigned ratings were 4, 8, and 10. Landuse pattern (LU) Groundwater quality in the study area has deteriorated due to industrial and sewage pollution (Umar and Ahmed, 2007). Analyses of groundwater and surface water for the present study indicate that industrial and sewage pollution in urban areas and pesticides and fertilizers in rural areas are the main cause of groundwater contamination. Similar studies were conducted by Hussain et al. (2006) and Umar et al. (2009). Ratings based on these studies are given in Table 3. However, the assigned weight of this parameter is 5. Vulnerability index The DRASIC index (Table 4), which is a measure of the pollution

1718 Int. J. Phys. Sci.
Table 4. Location wise vulnerability index of the study area.
S/No. Location x y Depth to
water (Dr*Dw)
Net recharge (Rr*Rw)
Aquifer media Ar*Aw
Soil media
(Sr*Sw)
Vadose zone (Ir*Iw)
Hydraulic conductivity
(Cr*Cw)
Landuse pattern (Lr*Lw)
Vulnerability index (VI)
1 Fatehpur 8036 41280 15 36 24 10 6 30 40 161 2 Bantikhera 10696 43028 15 36 24 10 9 30 40 164 3 Babri 13276 44495 15 36 24 10 5 30 40 160 4 Lalukheri 16539 42262 15 36 24 10 6 30 40 161 5 Jasoi 20561 44696 25 36 24 12 6 30 40 173 6 BudhinaKalan 19841 40593 25 36 24 12 7 30 40 174 7 Mohammadpur Madan 17340 39207 15 36 24 10 6 30 40 161 8 sathu 20563 36894 25 36 24 12 7 30 40 174 9 Sisauli 17385 36188 15 36 24 10 11 12 45 153
10 Kudana 7367 37491 15 36 24 10 6 30 40 161 11 Bhaju 12100 35469 10 36 24 10 7 12 40 139 12 BahurnaKalan 15204 33477 15 36 24 10 10 12 40 147 13 Shikarpur 19581 30405 25 36 24 12 5 30 40 172 14 Mohammadpur Raising 16324 29257 15 36 24 10 6 30 40 161 15 Budhana 17726 22905 15 36 24 12 5 24 50 166 16 Raipur Aterna 13031 25853 10 36 24 10 8 30 40 158 17 Kharar 12030 30074 10 36 24 10 6 30 40 156 18 Lank 8966 31986 10 36 24 10 7 24 40 151 19 Lisadh 5194 29787 15 36 24 10 5 24 40 154 20 Bitawda 16543 17704 10 36 24 10 7 30 40 157 21 Qutubpur 22269 16252 25 36 24 12 7 30 40 174 22 Nagwa 20447 12778 25 36 24 12 7 30 40 174 23 Garhi Banjara 16356 11261 15 36 24 12 5 30 40 162 24 Daha 11744 12358 10 36 24 10 5 30 45 160 25 Shajahanpur 11832 7246 10 36 24 10 6 30 40 156 26 Barnawa 12952 3348 25 36 24 12 5 30 40 172 27 Rahatna 9571 4896 10 36 24 10 6 30 40 156 28 Phusar 9166 8798 10 36 24 10 5 30 45 160 29 Phugana 9650 27602 10 36 24 10 9 30 40 159 30 Jaula 12203 22023 10 36 24 10 7 24 40 151 31 Biral 5850 18640 10 36 24 10 11 30 40 161 32 Tikri 6770 15345 10 36 24 10 7 30 45 162 33 Doghat 8128 11891 10 36 24 10 6 30 45 161

Khan et al. 1719
Table 4. Contd.
34 Gagnoli 3595 12908 25 36 24 10 7 30 40 172 35 Mozizabad Nangal 3996 10737 25 36 24 10 8 30 40 173 36 Dhanura Tikri 15396 14918 10 36 24 10 11 30 40 161 37 Nirpura 10784 15733 10 36 24 10 7 24 40 151 38 Satheri 15547 19267 15 36 24 10 8 24 40 157 39 Chajpur 5883 22384 15 36 24 10 7 30 40 162
potential was computed by summation of the products of rating and weights for each factor as follows: DRASIC index = D r D w + R r R w + A r A w + S r S w + I r I w + C r C w + L r Lw Where: Dr = Ratings to the depth of the water table; Dw = Weights assigned to the depth of the water table; Rr = Ratings for ranges of the aquifer recharge; Rw = Weights for the aquifer recharge; Ar = Ratings assigned to the aquifer media; Aw = Weights assigned to the aquifer media; Sr = Ratings for the soil media; Sw = Weights for the soil media; Ir = Ratings assigned to the vadose zone; Iw = Weights assigned to the vadose zone; Cr = Ratings assigned to hydraulic conductivity; Cw = Weights given to hydraulic conductivity; Lr = Ratings assigned to land use; Lw = Weights assigned to land use. The vulnerability index ranges from 140 to 180 and for convenience, it is classified into four categories, that is, <140 - 150, 150 - 160, 160 - 170 and 170 - 180, which might be taken to correspond to low, moderate, high and very high vulnerability zones, respectively. DISCUSSION The vulnerability increases towards both rivers and therefore these regions suggested the possibility of contamination of groundwater originating from the surface water resources. The area in the vicinity of Krishni River showed high vulnerability zone, but its middle part showed
moderate vulnerability and this was consistent with the very high TDS in Hindon discharge and its potential to descend to groundwater. High to very high vulnerability zones were inferred to be related to high values of hydraulic conductivity and shallower water levels. The low vulnerability was the middle part in all likelihood, due to the presence of thick clay horizons. The groundwater vulnerability potential map showed that 5 and 39% of the area falls in low and moderate vulnerable zones, respectively. On the other hand, over half of the study area fell in the high (33%) to very high (23%) vulnerability zones, respectively (Figure 6).
There was a fairly good correlation between TDS and groundwater vulnerability to contami-nations. TDS values of >1200 mg/l coincided with the vulnerability index of 170 to 180, and those of 500 to 850 mg/l fall in zones of vulnerability index values of 140 to 160. Ascertaining that chemical parameters are related to attributes of ground-water pollution vulnerability, estimated by using DRASIC - LU model and taking into consideration hydrological and hydro-geological parameters, gave credibility to the approach. Conclusion Major portion of the study area showed high to very high vulnerability to pollution of its
Figure 6. Aquifer vulnerability map of the area.

1720 Int. J. Phys. Sci. groundwater resources. The vulnerability increased towards both rivers and high values were encountered all along the course of river Hindon and also along Krishni, except in its central stretch. This suggested susceptibility of groundwater to pollution from the rivers. Credibility of this approach was suggested by the observation that chemical parameters were relatable to hydrological and hydrogeological attributes as implied in the application of DRASIC - LU model. ACKNOWLEDGEMENTS The authors gratefully acknowledge the financial assistance received by the first author from the Council of Scientific and Industrial Research (CSIR), New Delhi, Ministry of HRD, India. The first author wishes to acknowledge the present support provided by the Research Grant (PJJAUH/817007), University Sains Malaysia. The authors are also thankful to the reviewers of the manuscript, whose suggestions improved the quality of the paper. REFERENCES Aller L, Bennett T, Lehr JH, Petty RJ (1987). DRASTIC: a standardized
system for evaluating groundwater pollution potential using hydrogeologic settings. J. Geol. Soc. India, 29(1): 23-37.
Antonakos AK, Lambrakis NJ (2007). Development and testing of three hybrid methods for the assessment of aquifer vulnerability to nitrates, based on the drastic model, an example from NE Korinthia, Greece. J. Hydrol., 333: 288-304.
Bhatnagar NC, Agashe RM, Mishra AK (1982). “Subsurface Mapping of Aquifer System” Water balance study of Upper Yamuna Basin, Section-Hydrogeology, Technical report No. 2, Upper Yamuna Project, CGWB, NW region, Chandigarh.
Dixon B (2005). Groundwater vulnerability mapping: A GIS and fuzzy
rule based integrated tool. Appl. Geography, 25(4): 327-347. Herlinger RJr, Antonio PV (2007). Groundwater vulnerability
assessment in coastal plain of Rio Grande do Sul State, Brazil, using drastic and adsorption capacity of soils. Environ. Geol., 52: 819-829.
http://www.landsat.org/ortho/index.php Hussain MH, Singhal DC, Joshi H, Kumar S (2006). Assessment of
Groundwater vulnerability in tropical alluvial interfluves, India, Bhu-Jal News J., 21(1-4): 31-43.
Khan MMuqtada A (2009). Sustainability of groundwater system in parts of Krishni-Hindon interstream Western Uttar Pradesh: A Quantitative and Qualitative Assessment. PhD thesis, Aligarh Muslim University, India.
Kumar G (2005). Geology of Uttar Pradesh and Uttranchal, Geological Society of India, Bangalore, pp. 267-291.
Mendoza JA, Barmen G (2006). Assessment of groundwater vulnerability in the Rio Artiguas basin, Nicaragna. Environ. Geol., 50: 569-580.
Ministry of Water Resources (1997). Report of the groundwater resource estimation committee- Groundwater resource estimation methodology, Government of India, New Delhi.
Qinghai G, Yanxin W, Xubo G, Teng M (2007). A new model (DRARCH) for assessing groundwater vulnerability to arsenic contamination at basin scale: a case study in Taiyuan basin, northern China. Environ Geol., 52: 923-932.
Rehman A (2008). A GIS based DRASTIC model for assessing groundwater vulnerability in shallow aquifers in Aligarh, India. J. Appl. Geography, 28(1): 32-53.
Umar R, Ahmed I (2007). Hydrochemical characteristics of groundwater in parts of Krishni-Yamuna Basin, Muzaffarnagar district, U.P. J. Geol. Soc. India, 69: 989-995.
Umar R, Ahmed I, Alam F (2009). Mapping Groundwater Vulnerable Zones Using Modified DRASTIC Approach of an Alluvial Aquifer in Parts of Central Ganga Plain, Western Uttar Pradesh, J. Geol. Soc. India, 73(2): 193-201.