assessing trends in abundance for vaquita using acoustic monitoring: within refuge plan and outside...
TRANSCRIPT
MAY 2010
NOAA-TM-NMFS-SWFSC-459
U.S. DEPARTMENT OF COMMERCENational Oceanic and Atmospheric AdministrationNational Marine Fisheries ServiceSouthwest Fisheries Science Center
NOAA Technical Memorandum NMFS
U
AN
CI IT
RE
EDMS ATA FT OE S
OFT CN OE MM MT
R E
A R
P C
E E
D
Lorenzo Rojas-Bracho Armando Jaramillo-Legoretta
Gustavo CardenasEdwyna Nieto
Paloma Ladron de GuevaraBarbara Taylor
Jay BarlowTim GerrodetteAnnette HenryNick Tregenza
Rene SwiftTomonari Akamatsu
ASSESSING TRENDS IN ABUNDANCE FOR
VAQUITA USING ACOUSTIC MONITORING:
WITHIN REFUGE PLAN AND OUTSIDE REFUGE RESEARCH NEEDS.
WORKSHOP REPORT--OCTOBER 19-23, 2009
The National Oceanic and Atmospheric Administration (NOAA), organized in 1970, has evolved into an agency that establishes national policies and manages and conserves our oceanic, coastal, and atmospheric resources. An organizational element within NOAA, the Office of Fisheries is responsible for fisheries policy and the direction of the National Marine Fisheries Service (NMFS).
In addition to its formal publications, the NMFS uses the NOAA Technical Memorandum series to issue informal scientific and technical publications when complete formal review and editorial processing are not appropriate or feasible. Documents within this series, however, reflect sound professional work and may be referenced in the formal scientific and technical literature.
2 2 2Lorenzo Rojas-Bracho , Armando Jaramillo-Legoretta , Gustavo Cardenas
, 2 1 1 1Edwyna Nieto2 Paloma Ladron de Guevara , Barbara Taylor , Jay Barlow , Tim Gerrodette ,
1 3 4 5Annette Henry , Nick Tregenza , Rene Swift , Tomonari Akamatsu
1 Southwest Fisheries Science Center, National Marine Fisheries Service, NOAA
3333 North Torrey Pines Court, La Jolla, California 920372 Instituto Nacional de Ecologia3 Chelonia, ltd.4 St. Andrews Unioversity, UK5 Fisheries Research Agency of Japan
MOSTA PHD EN RA ICCI AN DA ME IC N
O IS
L T
A R
N ATOI IOT
A N
N
U
E.S C. RD EE MPA MR OT CM FENT O
NOAA Technical Memorandum NMFSThis TM series is used for documentation and timely communication of preliminary results, interim reports, or specialpurpose information. The TMs have not received complete formal review, editorial control, or detailed editing.
NOAA-TM-NMFS-SWFSC-459
MAY 2010
U.S. DEPARTMENT OF COMMERCEGary F. Locke, SecretaryNational Oceanic and Atmospheric AdministrationJane Lubchenco, Undersecretary for Oceans and AtmosphereNational Marine Fisheries ServiceJames W. Balsiger, Acting Assistant Administrator for Fisheries
ASSESSING TRENDS IN ABUNDANCE FOR
VAQUITA USING ACOUSTIC MONITORING:
WITHIN REFUGE PLAN AND OUTSIDE REFUGE RESEARCH NEEDS.
WORKSHOP REPORT--OCTOBER 19-23, 2009

2
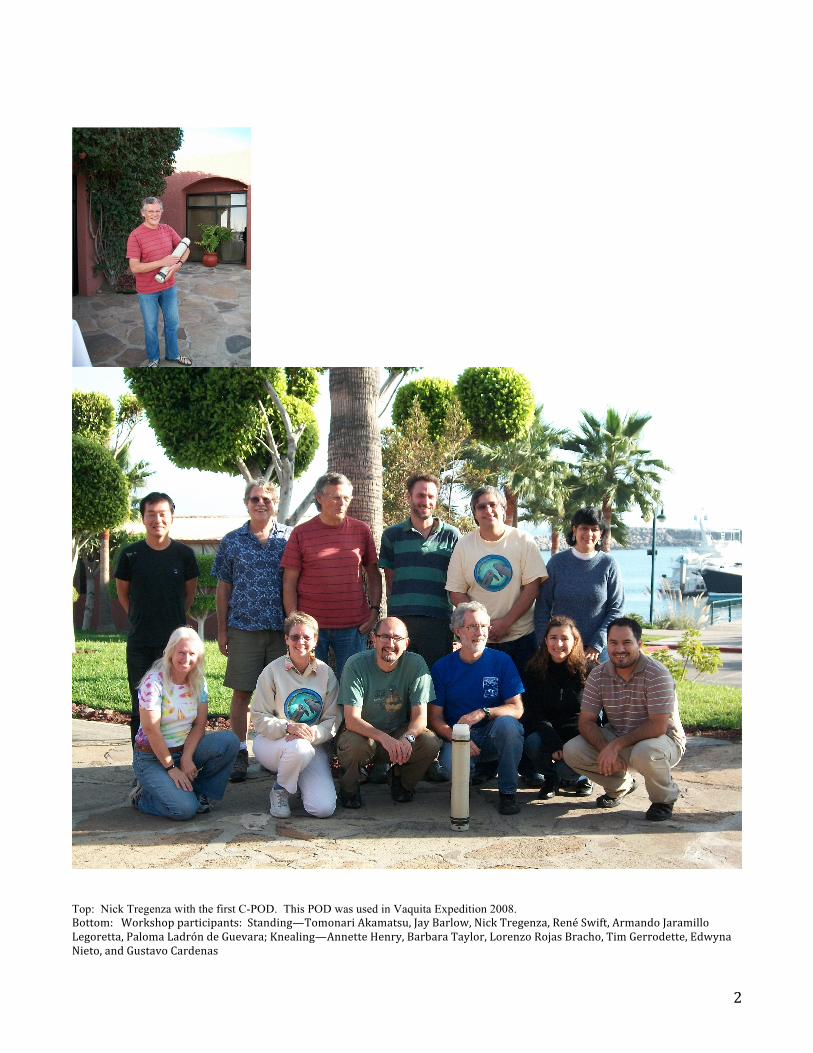
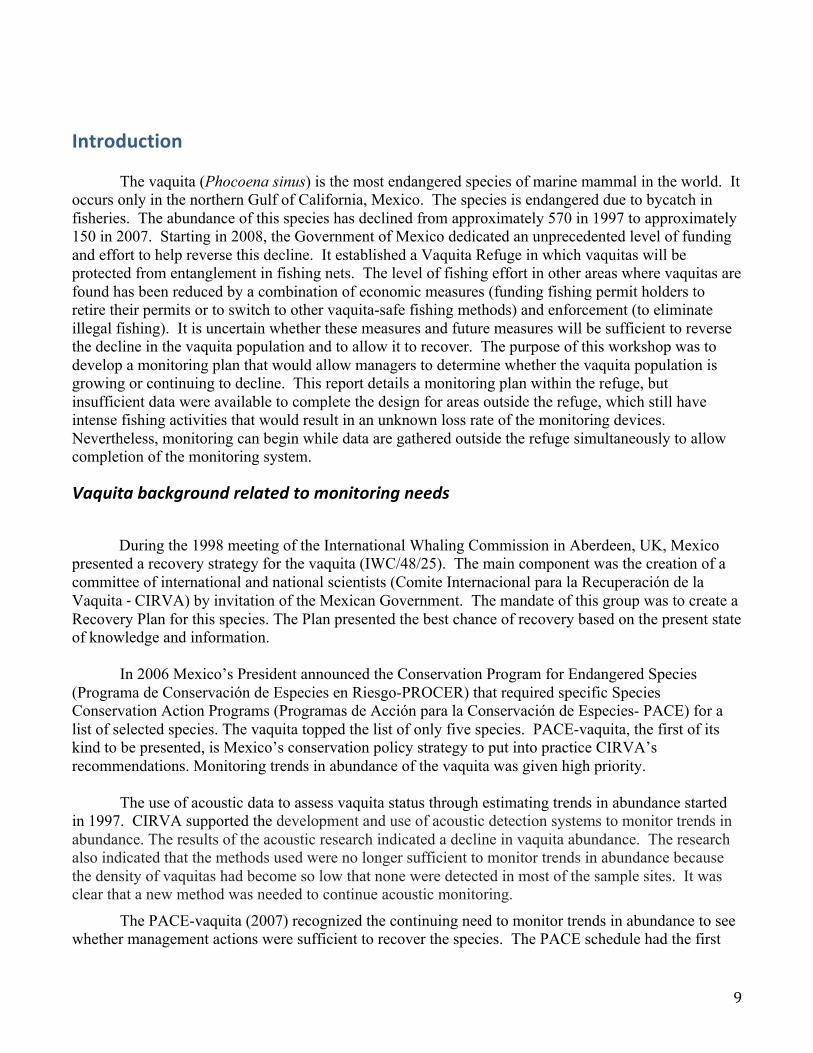
Top: Nick Tregenza with the first C-POD. This POD was used in Vaquita Expedition 2008. Bottom:Workshopparticipants:Standing—TomonariAkamatsu,JayBarlow,NickTregenza,RenéSwift,ArmandoJaramilloLegoretta,PalomaLadróndeGuevara;Knealing—AnnetteHenry,BarbaraTaylor,LorenzoRojasBracho,TimGerrodette,EdwynaNieto,andGustavoCardenas
3
TableofContents
ExecutiveSummary............................................................................................................................ 4Workshoprecommendations ...............................................................................................................................................................8Budget.............................................................................................................................................................................................................8
Introduction....................................................................................................................................... 9Vaquitabackgroundrelatedtomonitoringneeds.......................................................................................................................9Monitoringdesignrelevanttovaquitas ........................................................................................................................................ 11
ReviewofVaquitaExpedition2008data/results .............................................................................. 12Visual results .............................................................................................................................................................................................. 13Towed array results .................................................................................................................................................................................. 14Anchoredstationresults...................................................................................................................................................................... 14Temporaryresearchbuoyresults ................................................................................................................................................... 15CPODresults ............................................................................................................................................................................................. 15Atagresults ............................................................................................................................................................................................... 16
Monitoringdesignelements ............................................................................................................ 17Statisticalcalculations/considerations ......................................................................................................................................... 17Naturalfluctuationsinpopulationsize ......................................................................................................................................... 17SamplingVariabilityandRequiredSamplingEfforttoDetectTrendsinAbundance .............................................. 19
Monitoringimplementationplan ..................................................................................................... 22Pre‐implementationresearch ........................................................................................................................................................... 25Mooringdesign ........................................................................................................................................................................................ 25MooringdesignforVaquitaRefugeperimeterbuoys .............................................................................................................. 25MooringdesignforsubsurfaceCPODsinsidetheVaquitaRefuge .................................................................................. 26Fieldtesting................................................................................................................................................................................................ 28
Fullimplementationspatialandtemporalsamplingdesign ............................................................................................... 28Researchtomonitorthedistributionofvaquitas..................................................................................................................... 29Methodsofanalysis................................................................................................................................................................................ 30
Monitoringbudget........................................................................................................................... 30Projectdetails........................................................................................................................................................................................... 31
Recommendations ........................................................................................................................... 34
Acknowledgments ........................................................................................................................... 34
References ....................................................................................................................................... 35
Appendix:Alternatespatialmonitoringdesignsconsidered ............................................................ 36
4
ExecutiveSummary The vaquita marina (Phocoena sinus) is the most endangered species of marine mammal in the world. It occurs only in the northern Gulf of California, Mexico. The species is endangered due to bycatch in fisheries. The abundance of this species has declined from approximately 570 in 1997 to approximately 150 in 2007. Starting in 2008, the Government of Mexico dedicated an unprecedented level of funding and effort to help reverse this decline. It established a Vaquita Refuge in which vaquitas will be protected from entanglement in fishing nets. The level of fishing effort in other areas where vaquitas are found has been reduced by a combination of economic measures (funding fishing permit holders to retire their permits or to switch to other vaquita-safe fishing methods) and enforcement (to eliminate illegal fishing). It is uncertain whether these measures and future measures will be sufficient to reverse the decline in the vaquita population and to allow it to recover. The purpose of this workshop was to develop a monitoring plan that would allow managers to determine whether the vaquita population is growing or continuing to decline. This report details a monitoring plan within the refuge, but insufficient data were available to complete the design for areas outside the refuge, which still has intense fishing activities that would result in an unknown loss rate of the monitoring devices. Nevertheless, monitoring can begin while data are gathered simultaneously outside the refuge to allow completion of the monitoring system. Visual survey methods (such as the 1997 and 2008 surveys from large ships) are not sufficiently precise to detect trends in vaquita abundance over short time periods. Passive acoustic methods (recording the sounds they make) have been used to monitor abundance from a single vessel from 1997-2008, but currently the vaquita detection rate is very low. Vaquitas have become too rare to use either of these two previous methods to measure population trends in the near future (i.e. during the next 10 years). The maximum growth rate of the vaquita is only about 4% per year, meaning that on average only 4 new animals would be added to the population for every 100 existing individuals. Such small changes are exceedingly difficult to measure. Because scientists recognize the inadequacy of previous methods (both visual and acoustic) to monitor vaquitas a major effort (Vaquita Expedition 2008) was made to see whether new technologies could be used. This workshop examined data from that effort and addressed whether they were sufficiently precise to monitor the abundance of this very small population. Prior to the workshop, we set the goal of being able to detect a catastrophic 10% per year decline with 3 years of monitoring. We also set goals of being able to detect smaller declines (5% per year) or the maximum expected rate of increase (4% per year) with 5 years of monitoring. At the workshop, evidence was presented that the first goal was not achievable with any level of monitoring effort because natural variations in vaquita abundance would obscure trends over such a short time period. Even with a 4% average growth rate, vaquitas would be expected to decrease in some years and increase in other years. The second goal (detecting a 5% decrease or 4% increase in 5 years) might be achievable, but it would require monitoring methods that achieve an unprecedented level of sampling precision. In statistical terms, the precision (measured as the coefficient of variation (CV)) of an annual index of vaquita abundance would need to be less than 3% in order to obtain a high probability of achieving the second goal.
5
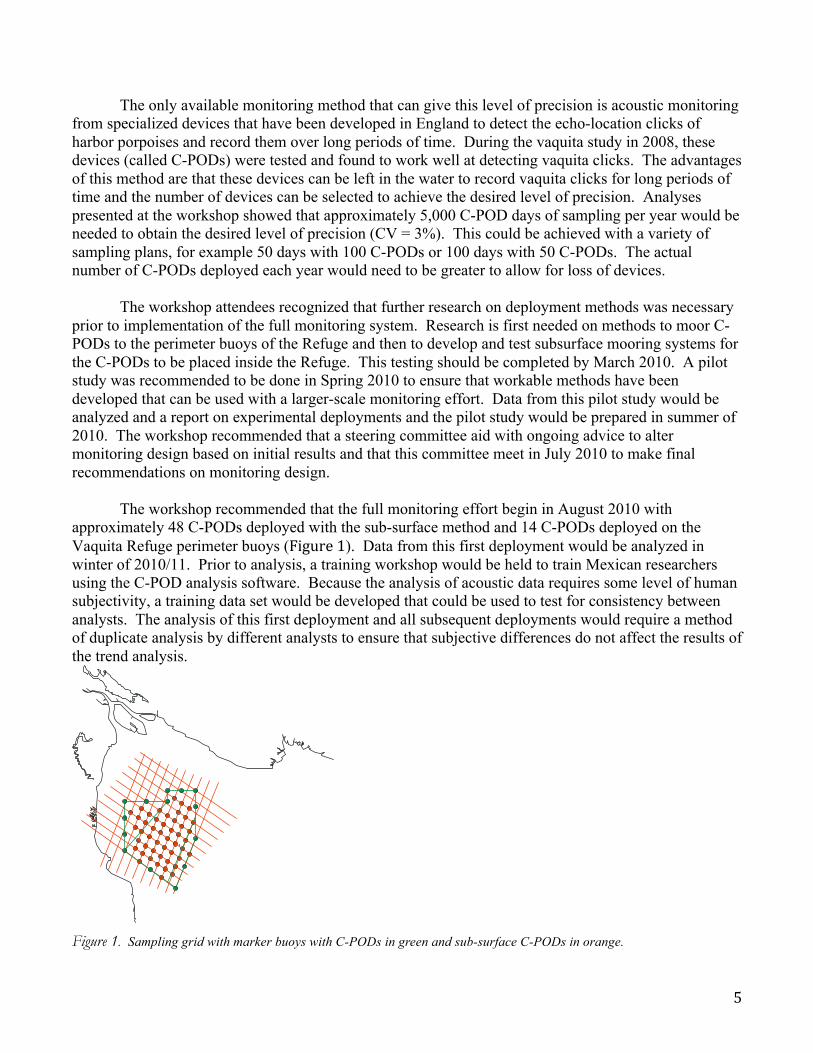
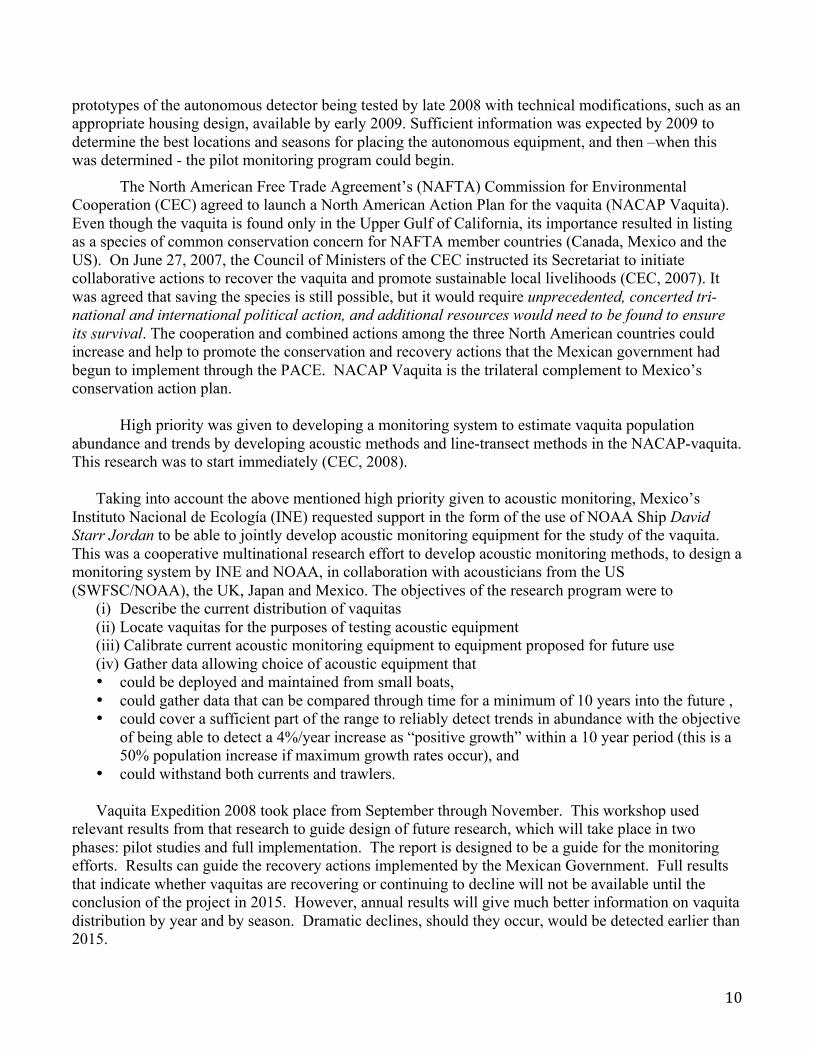
The only available monitoring method that can give this level of precision is acoustic monitoring from specialized devices that have been developed in England to detect the echo-location clicks of harbor porpoises and record them over long periods of time. During the vaquita study in 2008, these devices (called C-PODs) were tested and found to work well at detecting vaquita clicks. The advantages of this method are that these devices can be left in the water to record vaquita clicks for long periods of time and the number of devices can be selected to achieve the desired level of precision. Analyses presented at the workshop showed that approximately 5,000 C-POD days of sampling per year would be needed to obtain the desired level of precision (CV = 3%). This could be achieved with a variety of sampling plans, for example 50 days with 100 C-PODs or 100 days with 50 C-PODs. The actual number of C-PODs deployed each year would need to be greater to allow for loss of devices. The workshop attendees recognized that further research on deployment methods was necessary prior to implementation of the full monitoring system. Research is first needed on methods to moor C-PODs to the perimeter buoys of the Refuge and then to develop and test subsurface mooring systems for the C-PODs to be placed inside the Refuge. This testing should be completed by March 2010. A pilot study was recommended to be done in Spring 2010 to ensure that workable methods have been developed that can be used with a larger-scale monitoring effort. Data from this pilot study would be analyzed and a report on experimental deployments and the pilot study would be prepared in summer of 2010. The workshop recommended that a steering committee aid with ongoing advice to alter monitoring design based on initial results and that this committee meet in July 2010 to make final recommendations on monitoring design. The workshop recommended that the full monitoring effort begin in August 2010 with approximately 48 C-PODs deployed with the sub-surface method and 14 C-PODs deployed on the Vaquita Refuge perimeter buoys (Figure1). Data from this first deployment would be analyzed in winter of 2010/11. Prior to analysis, a training workshop would be held to train Mexican researchers using the C-POD analysis software. Because the analysis of acoustic data requires some level of human subjectivity, a training data set would be developed that could be used to test for consistency between analysts. The analysis of this first deployment and all subsequent deployments would require a method of duplicate analysis by different analysts to ensure that subjective differences do not affect the results of the trend analysis.
Figure 1. Sampling grid with marker buoys with C-PODs in green and sub-surface C-PODs in orange.
6
Although the majority of vaquitas are expected to be within the Vaquita Refuge, substantial numbers exist outside the Refuge. Workshop participants recognized that even small shifts in vaquita distribution could affect the monitoring program if all monitoring is done inside the Refuge (Figure2). However, monitoring vaquita abundance with C-PODs would be difficult outside the Vaquita Refuge’s no-fishing area because they could be entangled in gillnets and trawl nets. The workshop considered using a hydrophone array towed by a quiet vessel as an alternative method to monitor vaquita abundance. This method also detects echo-location clicks produced by vaquitas and was shown to be effective during a survey conducted in 2008. The precision of estimates from towed hydrophone surveys is not anticipated to be adequate to detect changes in vaquita abundance within 5 years. It has not been determined whether this method would be effective in detecting shifts in distribution given the low density of vaquitas found outside the Refuge. The workshop also recommended that research explore whether C-PODs could be used in some areas outside the Vaquita Refuge, perhaps during the summer period of reduced fishing effort. Monitoring effort outside the Refuge might also be important in documenting the presence of vaquitas in areas where they are still at risk for entanglement in fishing nets. In the end, the workshop concluded that insufficient information was currently available to design a monitoring system for waters outside the Vaquita Refuge. The workshop attendees recommended additional research in support of designing such a monitoring program. The workshop also recommended a number of other research projects that would facilitate this monitoring effort.
7
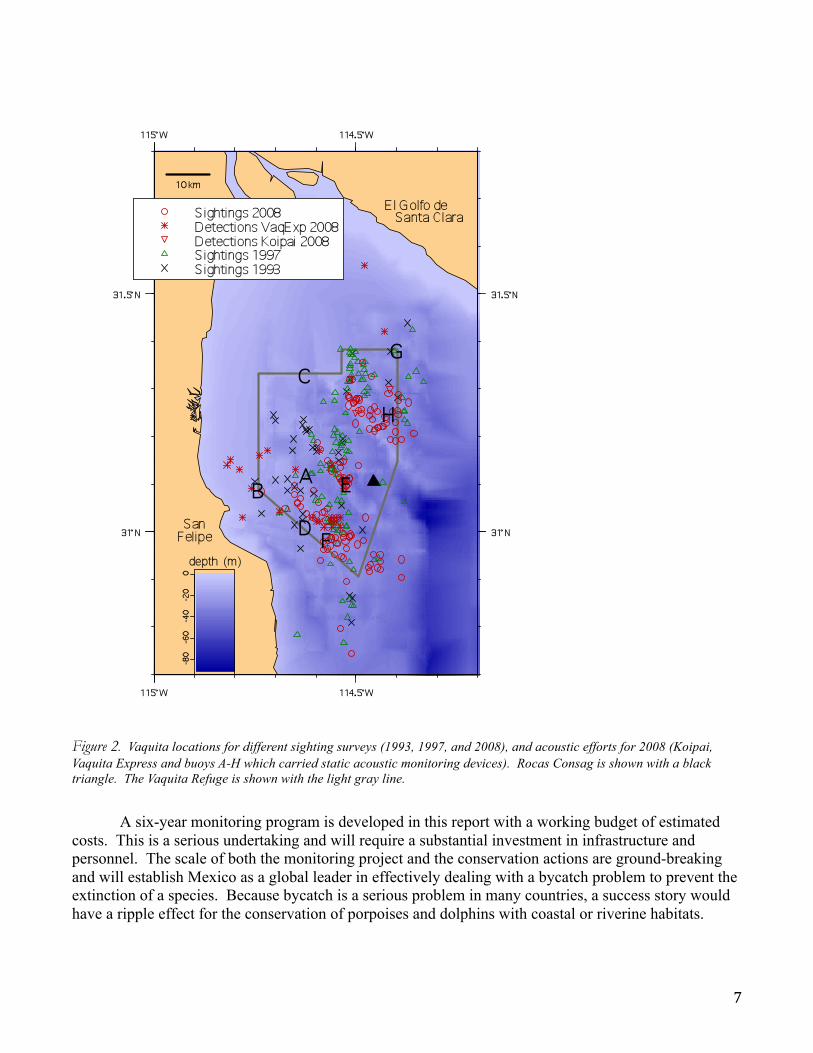
Figure 2. Vaquita locations for different sighting surveys (1993, 1997, and 2008), and acoustic efforts for 2008 (Koipai, Vaquita Express and buoys A-H which carried static acoustic monitoring devices). Rocas Consag is shown with a black triangle. The Vaquita Refuge is shown with the light gray line.
A six-year monitoring program is developed in this report with a working budget of estimated costs. This is a serious undertaking and will require a substantial investment in infrastructure and personnel. The scale of both the monitoring project and the conservation actions are ground-breaking and will establish Mexico as a global leader in effectively dealing with a bycatch problem to prevent the extinction of a species. Because bycatch is a serious problem in many countries, a success story would have a ripple effect for the conservation of porpoises and dolphins with coastal or riverine habitats.

8
Workshoprecommendations
• Large-scale monitoring of the Vaquita Refuge with acoustic recorders (C-PODs) should begin in August 2010 and continue through November 2015.
• Substantial research and a pilot study are necessary before this monitoring can begin and should start immediately.
• Net fishing (gillnets or trawlers) in the Vaquita Refuge should continue to be banned during the vaquita monitoring period to allow deployments of instruments.
• A steering committee should be established to oversee vaquita monitoring efforts and to provide frequent advice during the initiation of the project.
• Progress reports should be submitted to funders and the steering committee twice per year. • A full meeting of the steering committee should be convened after the pilot study and before the
full-scale monitoring begins in the Vaquita Refuge (July 2010). • Research should be initiated in 2010 to develop cost-effective methods to monitor potential shifts
in vaquita distribution outside the Vaquita Refuge.
Budget For this report, we present the budget for the monitoring in the Refuge only. The table below contains annual totals in US dollars with details presented in the budget section of the report. Presenting a budget for monitoring the entire spatial distribution was deemed premature at this time until further research is complete on whether further C-PODs, a towed acoustic survey or both will fulfill this critical need. It is anticipated that full spatial monitoring will be a substantial expense in addition to what is shown here and will need to be done at least twice and perhaps annually between 2010 and 2015.
Nov 2009 to Oct 2010
Nov 2010 to Oct 2011
Nov 2011 to Oct 2012
Nov 2012 to Oct 2013
Nov 2013 to Oct 2014
Nov 2014 to Oct 2015 Grand total
Total for Vaquita Refuge Static Acoustic Monitoring (pesos) $4,867,777 $2,370,089 $2,370,089 $2,370,089 $2,370,089 $2,370,089 $16,718,235 Total for Vaquita Refuge Static Acoustic Monitoring (US Dollars) $373,439 $181,825 $181,825 $181,825 $181,825 $181,825 $1,282,565
9
Introduction The vaquita (Phocoena sinus) is the most endangered species of marine mammal in the world. It occurs only in the northern Gulf of California, Mexico. The species is endangered due to bycatch in fisheries. The abundance of this species has declined from approximately 570 in 1997 to approximately 150 in 2007. Starting in 2008, the Government of Mexico dedicated an unprecedented level of funding and effort to help reverse this decline. It established a Vaquita Refuge in which vaquitas will be protected from entanglement in fishing nets. The level of fishing effort in other areas where vaquitas are found has been reduced by a combination of economic measures (funding fishing permit holders to retire their permits or to switch to other vaquita-safe fishing methods) and enforcement (to eliminate illegal fishing). It is uncertain whether these measures and future measures will be sufficient to reverse the decline in the vaquita population and to allow it to recover. The purpose of this workshop was to develop a monitoring plan that would allow managers to determine whether the vaquita population is growing or continuing to decline. This report details a monitoring plan within the refuge, but insufficient data were available to complete the design for areas outside the refuge, which still have intense fishing activities that would result in an unknown loss rate of the monitoring devices. Nevertheless, monitoring can begin while data are gathered outside the refuge simultaneously to allow completion of the monitoring system.
Vaquitabackgroundrelatedtomonitoringneeds
During the 1998 meeting of the International Whaling Commission in Aberdeen, UK, Mexico presented a recovery strategy for the vaquita (IWC/48/25). The main component was the creation of a committee of international and national scientists (Comite Internacional para la Recuperación de la Vaquita‐CIRVA) by invitation of the Mexican Government. The mandate of this group was to create a Recovery Plan for this species. The Plan presented the best chance of recovery based on the present state of knowledge and information.
In 2006 Mexico’s President announced the Conservation Program for Endangered Species (Programa de Conservación de Especies en Riesgo-PROCER) that required specific Species Conservation Action Programs (Programas de Acción para la Conservación de Especies- PACE) for a list of selected species. The vaquita topped the list of only five species. PACE-vaquita, the first of its kind to be presented, is Mexico’s conservation policy strategy to put into practice CIRVA’s recommendations. Monitoring trends in abundance of the vaquita was given high priority.
The use of acoustic data to assess vaquita status through estimating trends in abundance started in 1997. CIRVA supported the development and use of acoustic detection systems to monitor trends in abundance. The results of the acoustic research indicated a decline in vaquita abundance. The research also indicated that the methods used were no longer sufficient to monitor trends in abundance because the density of vaquitas had become so low that none were detected in most of the sample sites. It was clear that a new method was needed to continue acoustic monitoring.
The PACE-vaquita (2007) recognized the continuing need to monitor trends in abundance to see whether management actions were sufficient to recover the species. The PACE schedule had the first
10
prototypes of the autonomous detector being tested by late 2008 with technical modifications, such as an appropriate housing design, available by early 2009. Sufficient information was expected by 2009 to determine the best locations and seasons for placing the autonomous equipment, and then –when this was determined - the pilot monitoring program could begin.
The North American Free Trade Agreement’s (NAFTA) Commission for Environmental Cooperation (CEC) agreed to launch a North American Action Plan for the vaquita (NACAP Vaquita). Even though the vaquita is found only in the Upper Gulf of California, its importance resulted in listing as a species of common conservation concern for NAFTA member countries (Canada, Mexico and the US). On June 27, 2007, the Council of Ministers of the CEC instructed its Secretariat to initiate collaborative actions to recover the vaquita and promote sustainable local livelihoods (CEC, 2007). It was agreed that saving the species is still possible, but it would require unprecedented, concerted tri-national and international political action, and additional resources would need to be found to ensure its survival. The cooperation and combined actions among the three North American countries could increase and help to promote the conservation and recovery actions that the Mexican government had begun to implement through the PACE. NACAP Vaquita is the trilateral complement to Mexico’s conservation action plan.
High priority was given to developing a monitoring system to estimate vaquita population
abundance and trends by developing acoustic methods and line-transect methods in the NACAP-vaquita. This research was to start immediately (CEC, 2008).
Taking into account the above mentioned high priority given to acoustic monitoring, Mexico’s
Instituto Nacional de Ecología (INE) requested support in the form of the use of NOAA Ship David Starr Jordan to be able to jointly develop acoustic monitoring equipment for the study of the vaquita. This was a cooperative multinational research effort to develop acoustic monitoring methods, to design a monitoring system by INE and NOAA, in collaboration with acousticians from the US (SWFSC/NOAA), the UK, Japan and Mexico. The objectives of the research program were to
(i) Describe the current distribution of vaquitas (ii) Locate vaquitas for the purposes of testing acoustic equipment (iii) Calibrate current acoustic monitoring equipment to equipment proposed for future use (iv) Gather data allowing choice of acoustic equipment that • could be deployed and maintained from small boats, • could gather data that can be compared through time for a minimum of 10 years into the future , • could cover a sufficient part of the range to reliably detect trends in abundance with the objective
of being able to detect a 4%/year increase as “positive growth” within a 10 year period (this is a 50% population increase if maximum growth rates occur), and
• could withstand both currents and trawlers.
Vaquita Expedition 2008 took place from September through November. This workshop used relevant results from that research to guide design of future research, which will take place in two phases: pilot studies and full implementation. The report is designed to be a guide for the monitoring efforts. Results can guide the recovery actions implemented by the Mexican Government. Full results that indicate whether vaquitas are recovering or continuing to decline will not be available until the conclusion of the project in 2015. However, annual results will give much better information on vaquita distribution by year and by season. Dramatic declines, should they occur, would be detected earlier than 2015.
11
Monitoringdesignrelevanttovaquitas
Vaquita abundance has been estimated using visual line-transect surveys from a large ship. However, these line-transect surveys have 3 important disadvantages: (1) they are expensive, (2) the large ship cannot survey in shallow areas where vaquitas occur, and (3) the estimates of abundance produced by such surveys have a large amount of uncertainty. Large uncertainty means that it is difficult to detect a change in abundance (either an increase or a decrease).
Monitoring vaquita abundance with a system of acoustic devices can potentially overcome all of
these disadvantages: (1) they are inexpensive (compared to a ship); (2) they can be deployed in all areas where vaquitas occur; and (3) the indices of abundance can have low variability if a large number of acoustic devices are used.
Acoustic monitoring of vaquita abundance is possible because vaquitas make distinctive clicks.
The rate of clicking is measured by some metric such as clicks/day, and the assumption is that the rate of clicking is proportional to vaquita abundance. More clicking means more vaquitas, and less clicking means fewer vaquitas. Thus, the goal of the acoustic monitoring program is to produce an index of relative abundance from which a trend or change in vaquita abundance can be estimated. The acoustic monitoring program does not attempt to estimate the actual number of vaquitas but rather the relative change in their abundance.
Because the vaquita is critically endangered, the monitoring program should be designed so that
changes in vaquita abundance can be reliably detected. The Mexican government has spent a large amount of money to reduce fishing and to protect the vaquita. It is critical to know if these measures are being successful and the vaquita population is growing. It is also critical to know if the measures are unsuccessful and the vaquita population is continuing to decline. Also, because of the very small number of vaquitas remaining, these changes, either positive or negative, must be detected in a relatively short period of time, such as 3-5 years.
The requirements of detecting small changes in the abundance of a rare animal in a short period
of time means that the acoustic monitoring program must be large. It is important to understand that changes in vaquita abundance cannot be reliably detected with a small number of acoustic detectors. If there are a small number of detectors, we will only be able to detect very large changes, or we have to wait a long time to detect changes, or both.
The goal of the design for the acoustic monitoring system was to be able to detect a large decline
(more than 10%/year) over 3 years or smaller change of either a 4% recovery or a 5% decline over 5 years. Note that if gillnet mortality is not reduced to zero, abundance may continue to decline and, if so, precision will decrease because of the effects of small population size on natural fluctuations in abundance (see section below).
12
ReviewofVaquitaExpedition2008data/results
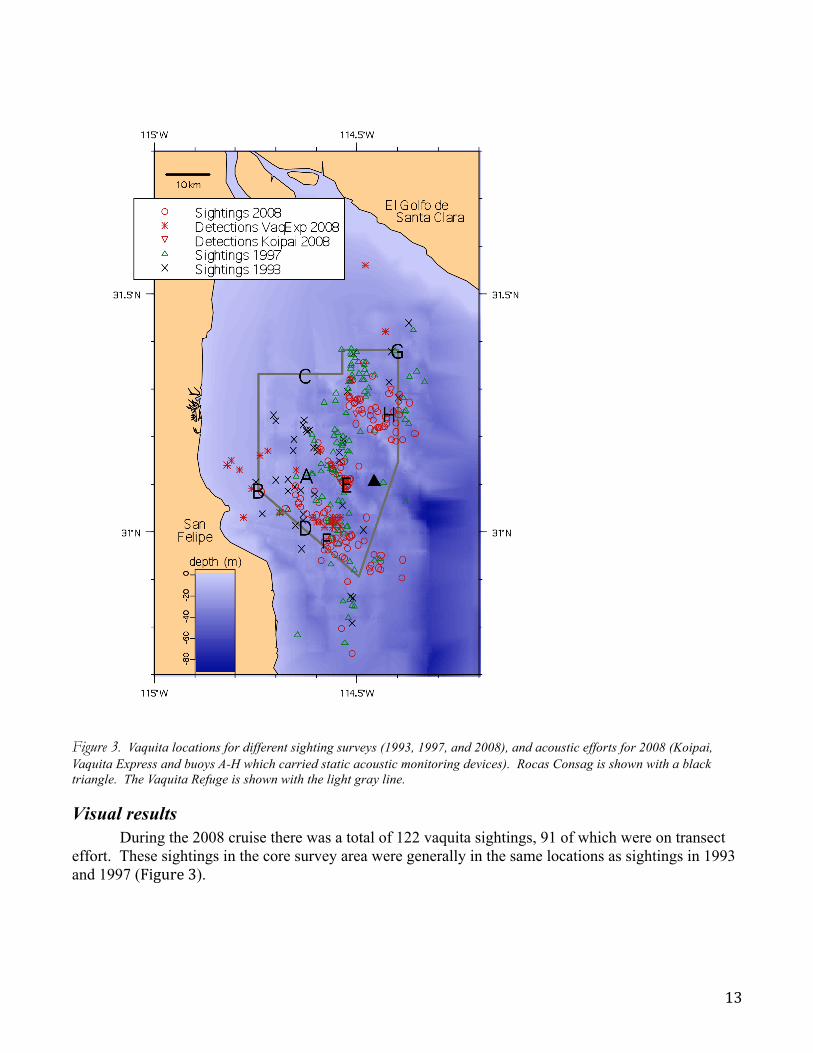
We summarize results of the Vaquita Expedition 2008 here because these data form the basis for the monitoring design. The Expedition had both visual and acoustic aspects that give us the most current understanding of vaquita distribution and density. There were four relevant components to the research: sightings from the R/V David Starr Jordan (large NOAA ship), acoustic detections from a towed array in shallow waters from the Vaquita Express (8-m sailboat), acoustic detections from stations with an anchored vessel (the Koipai Yú-Xá, called the Koipai for brevity) and acoustic detections from static acoustic monitoring devices (C-POD, T-POD and A-tag) placed on buoys.
The vaquita distribution can be seen in Figure3, with all recent sightings and most acoustic
detections (only 2008 detections from the Koipai). Buoy locations are shown with letters and are referred to throughout the text by those letters. Most vaquita detections were in depths of10-30 meters. A number of ridges can be seen and appear to be important features in the vaquita habitat. These features are stable over a period of at least decades, with deep soft mud in the “valleys” and some sand on the ridges (G. Alvarez pers. comm.4)
4TheworkshopbenefittedfromavisitbyDr.GustavoÁlvarezwhoisanexpertinsedimentsoftheUpperGulfofCaliforniafromCICESE.Dr.Álvarezreportedonbottomtypesandonmooringmethods.
13
Figure 3. Vaquita locations for different sighting surveys (1993, 1997, and 2008), and acoustic efforts for 2008 (Koipai, Vaquita Express and buoys A-H which carried static acoustic monitoring devices). Rocas Consag is shown with a black triangle. The Vaquita Refuge is shown with the light gray line.
Visual results During the 2008 cruise there was a total of 122 vaquita sightings, 91 of which were on transect
effort. These sightings in the core survey area were generally in the same locations as sightings in 1993 and 1997 (Figure3).
14
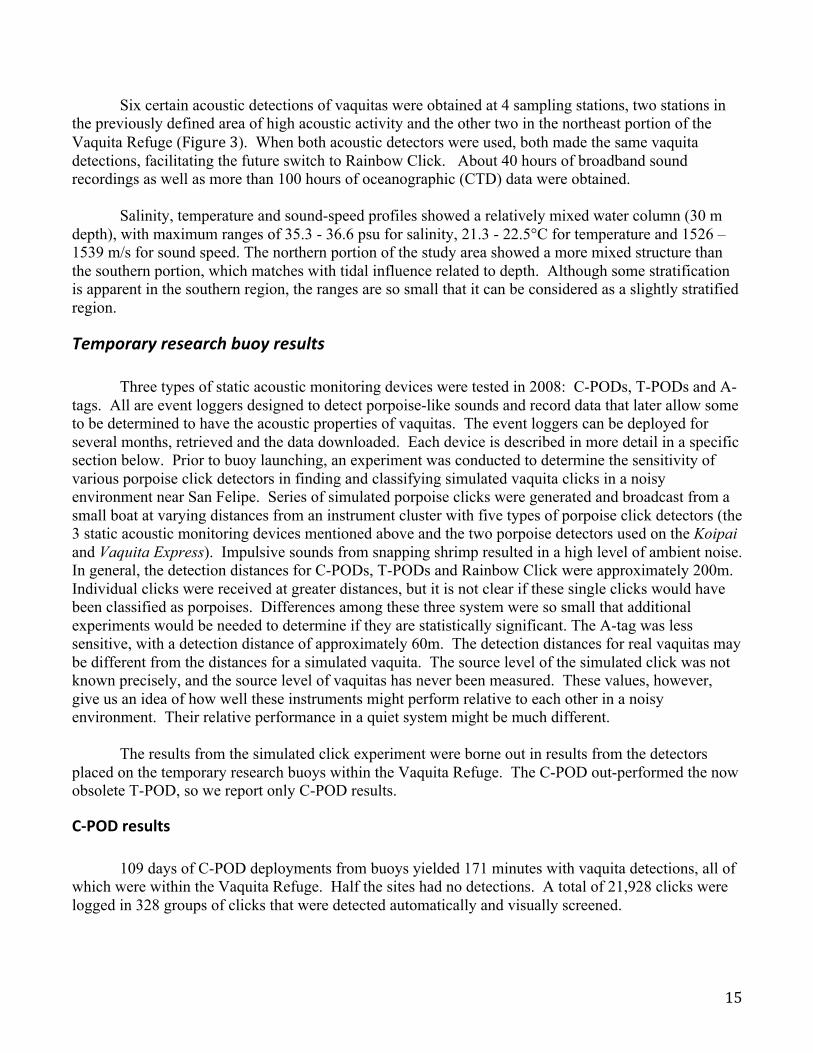
Towed array results A 100-m stereo hydrophone array was towed from a small quiet vessel with a shallow draft, the
Vaquita Express (a 24' Corsair trimaran). The design of the Vaquita Express allowed it to survey areas of vaquita habitat that had not been previously surveyed by other larger vessels; including shallow-water areas west and north of the Vaquita Refuge. The Vaquita Express successfully covered 1450km on effort in areas too shallow for the R/V David Starr Jordan and other areas in tandem with the Jordan to provide calibration data between visual and acoustic survey methods. A total of 33 vaquitas were detected (Figure3). Perpendicular distance to the trackline was estimated within each vaquita event by estimating the most likely position of the animal by triangulating using sequential bearings to detected clicks. These data were analyzed in the software Distance v6.0 to estimate a global detection function, density estimates, and stratified density estimates. The estimated strip width for vaquitas (265.7m) is not dissimilar to that calculated for harbor porpoises (194.8m) as part of a large scale survey to assess the status of porpoise populations in European waters (SCANS-II 2008). The number of estimated detection distances (n=28) was too small to determine if vaquitas avoided the survey platform, however in-situ observations suggest that there was no avoidance.
High levels of noise were associated with recordings in certain parts of the survey area, and these appear to be associated with areas of high current speed and sediment loading. This noise reduces detection probability as a result of masking and increases the number of false positives and analysis effort. Future work is being planned to improve automatic click classification and detection parameters and reduce analysis effort.
Further work is required to determine the probability of detecting vaquitas on the trackline (known as g(0) in line-transect terminology). During the current analysis it was assumed that this probability was 1.0. Additional work is also required to understand vaquita acoustic behavior in groups, as there appears to be a discrepancy between average acoustic group size (1) and average visual group size (2).
The Vaquita Express surveys in 2008 successfully tested the feasibility of using towed hydrophone surveys to determine vaquita density and distribution. This survey recorded the most northerly and westerly documented detections of vaquitas. Data from this survey were successfully used to produce a preliminary density estimate consistent with preliminary visual density estimates. The system is ready to be deployed, and Mexican scientists have been trained in the analysis of this acoustic information.
Anchoredstationresults During the 2008 expedition the Koipai Yú-Xá (hereafter referred to as the Koipai) recorded
vaquita detections during a total of 270 hours at 16 sampling stations. Two kinds of acoustic detectors were used (Porpoise Detector and Rainbow Click) to listen for vaquitas while anchored at quasi-randomly selected spots within the known distribution of the vaquita. Performance of the acoustic detectors was compared, so that the Rainbow Click system can replace the now obsolete Porpoise Detector. CTD profiles and time series were gathered as well as broad-band (330 KHz) sound recordings (15 minutes out of every hour).
15
Six certain acoustic detections of vaquitas were obtained at 4 sampling stations, two stations in the previously defined area of high acoustic activity and the other two in the northeast portion of the Vaquita Refuge (Figure3). When both acoustic detectors were used, both made the same vaquita detections, facilitating the future switch to Rainbow Click. About 40 hours of broadband sound recordings as well as more than 100 hours of oceanographic (CTD) data were obtained.
Salinity, temperature and sound-speed profiles showed a relatively mixed water column (30 m depth), with maximum ranges of 35.3 - 36.6 psu for salinity, 21.3 - 22.5°C for temperature and 1526 – 1539 m/s for sound speed. The northern portion of the study area showed a more mixed structure than the southern portion, which matches with tidal influence related to depth. Although some stratification is apparent in the southern region, the ranges are so small that it can be considered as a slightly stratified region.
Temporaryresearchbuoyresults
Three types of static acoustic monitoring devices were tested in 2008: C-PODs, T-PODs and A-tags. All are event loggers designed to detect porpoise-like sounds and record data that later allow some to be determined to have the acoustic properties of vaquitas. The event loggers can be deployed for several months, retrieved and the data downloaded. Each device is described in more detail in a specific section below. Prior to buoy launching, an experiment was conducted to determine the sensitivity of various porpoise click detectors in finding and classifying simulated vaquita clicks in a noisy environment near San Felipe. Series of simulated porpoise clicks were generated and broadcast from a small boat at varying distances from an instrument cluster with five types of porpoise click detectors (the 3 static acoustic monitoring devices mentioned above and the two porpoise detectors used on the Koipai and Vaquita Express). Impulsive sounds from snapping shrimp resulted in a high level of ambient noise. In general, the detection distances for C-PODs, T-PODs and Rainbow Click were approximately 200m. Individual clicks were received at greater distances, but it is not clear if these single clicks would have been classified as porpoises. Differences among these three system were so small that additional experiments would be needed to determine if they are statistically significant. The A-tag was less sensitive, with a detection distance of approximately 60m. The detection distances for real vaquitas may be different from the distances for a simulated vaquita. The source level of the simulated click was not known precisely, and the source level of vaquitas has never been measured. These values, however, give us an idea of how well these instruments might perform relative to each other in a noisy environment. Their relative performance in a quiet system might be much different. The results from the simulated click experiment were borne out in results from the detectors placed on the temporary research buoys within the Vaquita Refuge. The C-POD out-performed the now obsolete T-POD, so we report only C-POD results.
C‐PODresults 109 days of C-POD deployments from buoys yielded 171 minutes with vaquita detections, all of
which were within the Vaquita Refuge. Half the sites had no detections. A total of 21,928 clicks were logged in 328 groups of clicks that were detected automatically and visually screened.
16
Before the survey, several issues that affect static acoustic monitoring were known, and these were assessed during the trial:
• Mooring issues (loss of loggers and moorings to theft, trawling and storms dragging moorings or wear on moorings e.g. abrasion of lines, loss of shackles etc.): These issues were not evaluated in the survey except for the large surface buoys used. The buoys were large and servicing the PODs in strong currents was difficult. The last buoy was lost. Further work is needed to optimize moorings.
• Sources of false positive detections (ambient noise, boat sonars and weak unknown train sources
or ‘WUTS’): Ambient noise levels were high and came from both snapping shrimp and movement of marine sediments. These sources greatly increased the numbers of clicks logged but did not produce ‘trains’ of clicks closely resembling those of vaquitas. Boat sonars occurred less frequently than in most locations where C-PODs are deployed and were not a significant problem. WUTS were more common in the trial than has been previously seen elsewhere and will require careful evaluation. The logged data show that clicks within trains of clicks produced by WUTS have some differences from vaquita clicks. The trains showed higher click rates and different patterns of modulation of click rate from vaquita sounds.
• Masking of detections by noise: The propellers of passing boats, boat sonars, surface and
sediment noise can all be so intense that vaquita detections will be masked. This effect may be so severe that for some periods the data must be excluded. However, these periods amounted to less than 5% of the total logging time, despite unusually severe weather. In less noisy conditions estimation of the degree of reduction in detection range will be appropriate, but it cannot be precisely estimated from the present small data set.
In general, the C-POD performed well and can be used in future static acoustic monitoring for vaquitas. Almost 17 days of CPOD data (average sound pressure level (SPL) on five frequency bands between 1 to 200 kHz and number of clicks stored per time) were plotted against tide height and wind speed (daily average of surface wind as measured by “SeaWinds Scatterometer” onboard QuickSCAT satellite, http://manati.orbit.nesdis.noaa.gov/doc/oceanwinds1.html). It was evident that the lower frequency bands were noisiest (between 1 to 50 KHz). The higher frequency bands were the quietest. The neap – spring tidal cycle did show an effect on fluctuation of SPL but not on number of clicks recorded. The daily tidal cycle showed a strong effect on number of clicks stored. When tidal height is replaced by rate of tidal height change (averages per 10 minutes periods) the correlation is even more evident. Wind speed did not show any effect on properties of the acoustic data gathered. These noise effects did not appreciably affect the ability of the C-PODs to detect vaquitas.
A‐tagresults Acoustic data loggers (A-tags, Marine Micro Technology, Saitama, Japan) were deployed at
buoy A, B, E and F during October to November, 2008. The A-tag is an ultrasonic pulse event recorder with stereo hydrophone to identify each sound source for the observation of group size. Two hydrophones sensitive at different frequencies (120 kHz and 70kHz) were used to discriminate vaquita sonar sounds from those of other species such as bottlenose dolphins.
17
Many biosonar signals were detected at buoys B, E and F, but no detections were made at buoy
A. Most detections were made at night. Vaquita clicks have energy in a high frequency range above 120kHz whereas bottlenose dolphin sounds have a broadband spectrum; this difference was used to discriminate between the two species. Employing strict criteria, all of the detections were categorized as dolphins. Based on less strict criteria, four detections at buoy B and E were categorized as vaquitas. The detection rates were 0.36 and 0.16 detections/day/buoy, for buoy B and E, respectively. It will be important to exclude false positives caused by bottlenose dolphins and other noise sources in future applications of acoustic monitoring of vaquitas.
The A-tag differs from the C-POD by having two hydrophones, which gives an angle to the
sound source and allows discrimination of individuals. Although the A-tag had a shorter detection range, it did capture some groups of dolphins. Eight dolphins were observed acoustically and confirmed visually at buoy E on November 1.
Periodic change in noise contamination was observed. Noise was high when the tidal current was
weak at slack tide. The A-tag towed by the Vaquita Express showed spatial variability in noise likely matching the distribution of snapping shrimp. Noise could result in false positive detections of vaquitas if the noise pattern could not be discriminated from vaquita clicks. A noise map would be helpful in designing future acoustic surveys.
Monitoringdesignelements
Statisticalcalculations/considerations
Naturalfluctuationsinpopulationsize
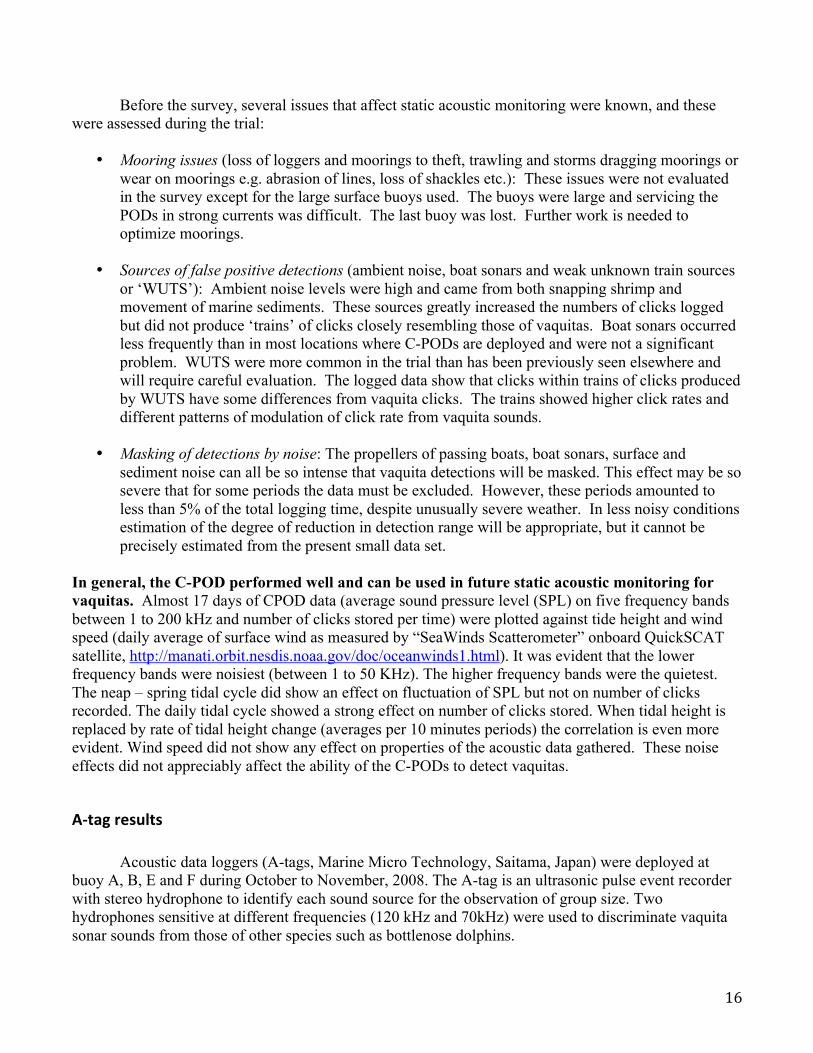
Thefirststepindevelopingamonitoringsystemistoconsiderwhatisfeasiblegivennaturalpopulationfluctuations.Small populations vary considerably from year to year due to random birth and death effects. For example, if each individual has a 95% chance of living to the next year and there are ten individuals, then in any one year the realized number surviving cannot be 9.5, but rather there will be 10, 9 or rarely 8 survivors. This variability means that even if a population is on average stable, it will fluctuate around that stable number (Figure4). The magnitude of these fluctuations will be relatively greater for small than for large populations. Monitoring trends in abundance of very small populations is particularly difficult because the monitoring method cannot be any more precise than the variance in population size. For example, each of the five hypothrtical populations in Figure4 are simulated as stable in the long term, but looking at any one of them for only five years it is difficult to say whether the population that started at 150 and ended at 141 is decreasing, stable or even increasing.
18
Figure 4. Five possible trajectories of a stable population with a starting abundance of 150 individuals with random birth and death events resulting in fluctuations in abundance over a five year period.
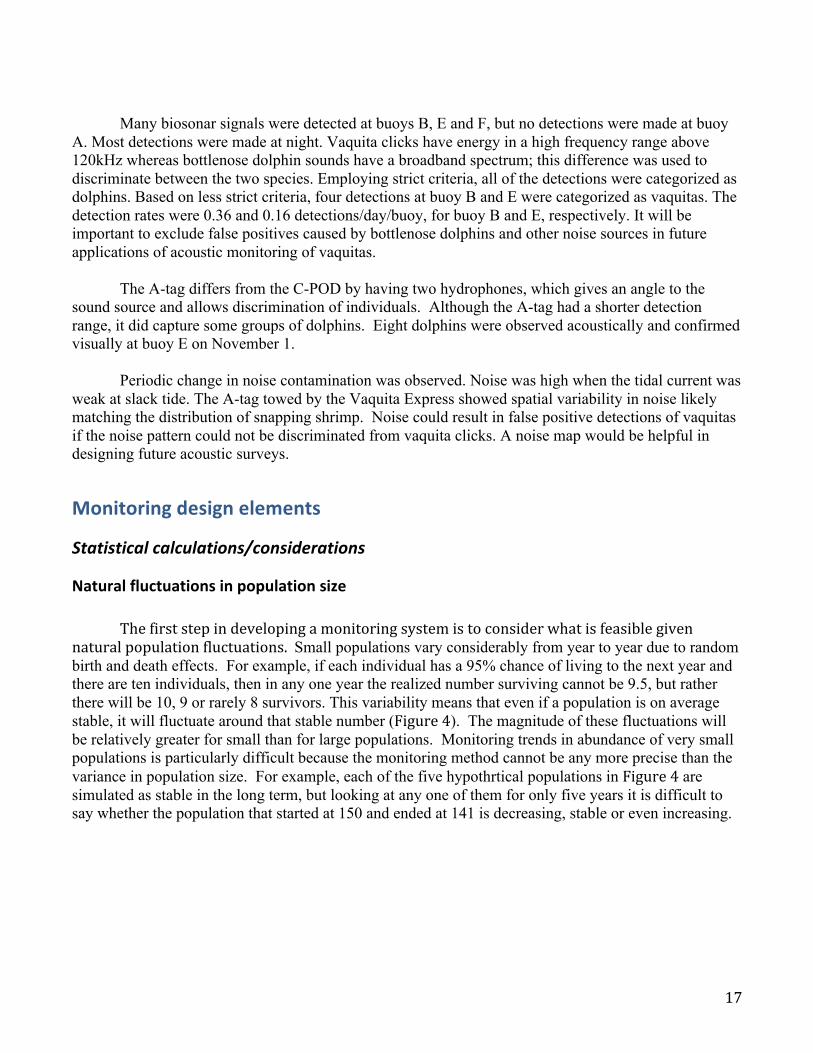
Consider ten simulated vaquita populations starting with 150 individuals and growing at 4% per
year (solid lines) and declining at 5% per year (dotted lines) (Figure5). One of the populations declining at 5% per year was greater than 150 when measured after 5 years (top dotted line at year 5), but it had dropped to less than 110 when measured after 10 years.
Figure 5. Natural fluctuations in abundance of simulated vaquita populations over a ten year period with populations growing at 4%/year (solid lines) and declining at 5%/year (dotted lines).
19
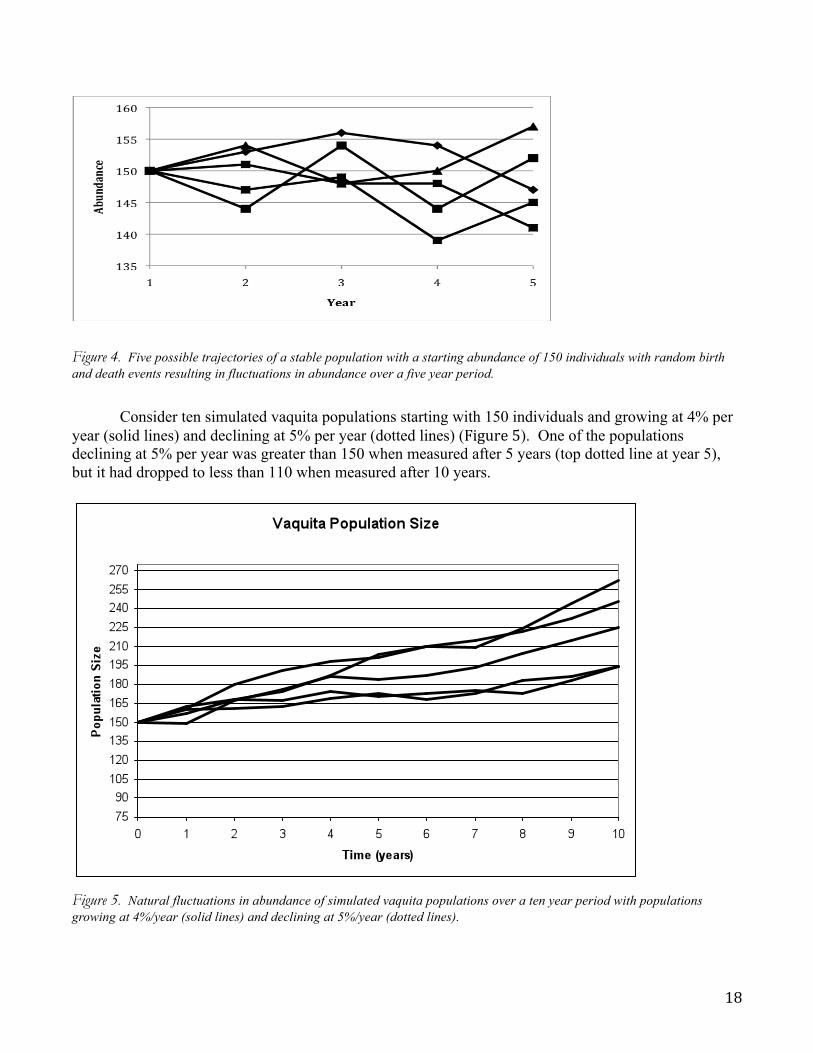
The variance in abundance for the vaquita was estimated by stochastic realizations of estimated birth and death rates. Assumptions were that the population was stable and in stable age distribution with parameters from Taylor et al. 2007: age of first reproduction = 6, interbirth interval = 2, calf survival = 0.798, non-calf survival = 0.95, oldest age = 21 and birth rate is solved to yield a stable growth rate (r = 0). Variance was estimated for abundances from 50 to 350 (Table 1). To obtain the coefficient of variation (standard deviation divided by the mean), 10,000 replicates were made of the following one-year stochastic process. For each individual (i.e., when N = 50, for each of 50 individuals) randomly determine whether the individual is a calf, a subadult or an adult; randomly determine whether the individual survived; for adults, randomly determine whether it is an adult female and gives birth. The new population is the number that survived plus the number of births. Table 1. Fluctuation in abundance for different abundances reflected in the statistical measure of the distribution (Coefficient of Variation). This is the maximum level of precision that can be achieved in measuring trends in abundance.
Abundance Coefficient of Variation (CVs)
50 0.058 100 0.041 150 0.033 200 0.029 250 0.027 300 0.023 350 0.022
The CVs in Table1 are the minimum plausible levels and account for no year-to-year changes resulting from environmental factors such as good and bad feeding opportunities or losses resulting from chance storms, etc. Other uncertainties not accounted for are age distribution, sex ratio, age at first reproduction, and birth and death rates (rates used are mostly from harbor porpoise). Further sensitivity tests should be done to incorporate other plausible sources of natural variability.
SamplingVariabilityandRequiredSamplingEfforttoDetectTrendsinAbundance In addition to natural fluctuations, there is variability due to sampling. Although we cannot do anything to reduce natural variability, we can reduce sampling variability by increasing sample size. The goal is to be able to detect increases or decreases in abundance of vaquitas by monitoring their echolocation clicks. We assume that the number of echolocation clicks produced by each individual is not going to change over time and that the total number of clicks produced will be proportional to the number of individuals in the population. In planning for the workshop, we set three goals for this monitoring program. We wanted to detect a catastrophic decline quickly (within 3 years of the start of monitoring). We knew that smaller changes are harder to detect, so we set a longer time goal for detecting smaller changes (5% decreases or 4% increases). Our goals prior to the workshop were:
1. to be able to detect a decline of 10% per year within three years, 2. to be able to detect a decline of 5% per year within five years, and 3. to be able to detect an increase of 4% per year within five years.
20
Ability to achieve these goals will depend on how much the samples vary between years. The
required precision to meet these goals can be expressed as the coefficient of variation (CV) in the total counts of vaquita groups that are acoustically detected in one year. Using the program TRENDS (Gerrodette 1993), we estimated that a CV of 1% is required to meet the first goal and that a CV of 3% is required to accomplish the second and third goals. These estimates use traditional analyses and a constant population growth rate. One of the recommendations of the workshop was to improve analytical methods, which should improve our abilities to interpret the data over what is shown here.
Variability comes from two primary sources. The growth of any population will naturally vary
due to the random processes of birth and death. In the section above, we estimate that this source of variation results in a coefficient of variation (CV) of approximately 3.3% for a population size of 150 animals (Table 1, gray row). Therefore, the workshop concluded that the first goal is not attainable with any level of sampling effort. We set our goal to sample with a CV of less than 3% per year.
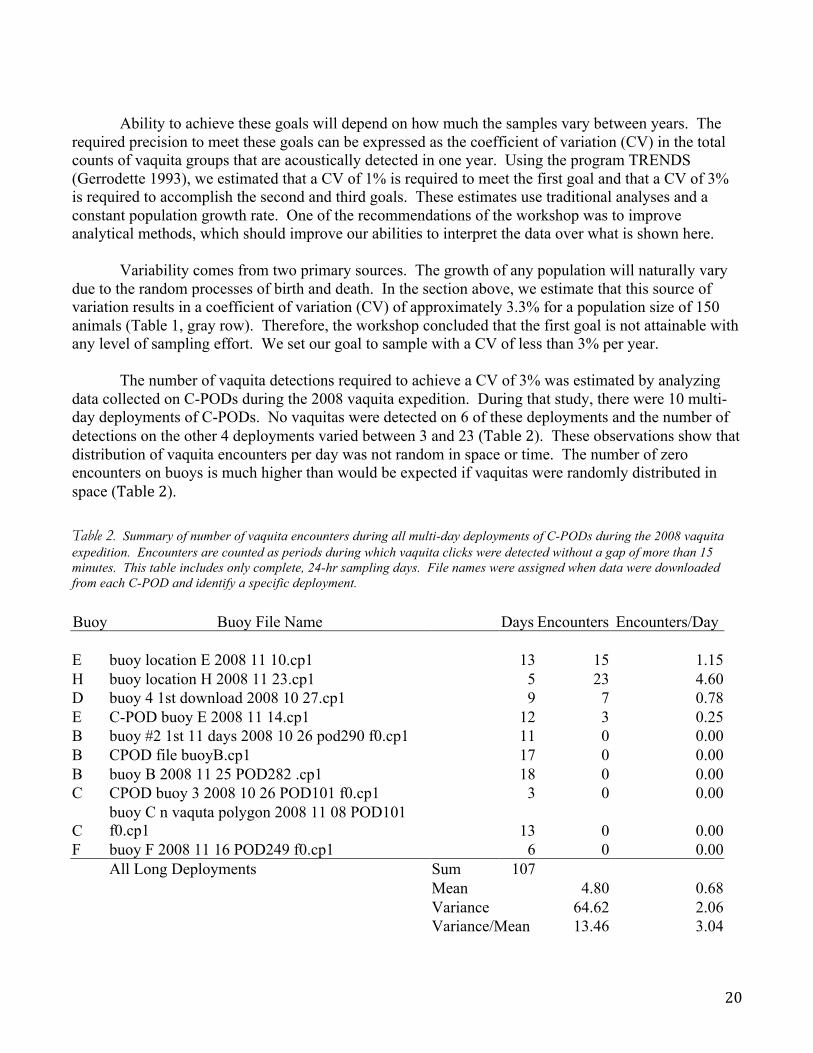
The number of vaquita detections required to achieve a CV of 3% was estimated by analyzing
data collected on C-PODs during the 2008 vaquita expedition. During that study, there were 10 multi-day deployments of C-PODs. No vaquitas were detected on 6 of these deployments and the number of detections on the other 4 deployments varied between 3 and 23 (Table2). These observations show that distribution of vaquita encounters per day was not random in space or time. The number of zero encounters on buoys is much higher than would be expected if vaquitas were randomly distributed in space (Table2). Table 2. Summary of number of vaquita encounters during all multi-day deployments of C-PODs during the 2008 vaquita expedition. Encounters are counted as periods during which vaquita clicks were detected without a gap of more than 15 minutes. This table includes only complete, 24-hr sampling days. File names were assigned when data were downloaded from each C-POD and identify a specific deployment.
Buoy Buoy File Name Days Encounters Encounters/Day E buoy location E 2008 11 10.cp1 13 15 1.15 H buoy location H 2008 11 23.cp1 5 23 4.60 D buoy 4 1st download 2008 10 27.cp1 9 7 0.78 E C-POD buoy E 2008 11 14.cp1 12 3 0.25 B buoy #2 1st 11 days 2008 10 26 pod290 f0.cp1 11 0 0.00 B CPOD file buoyB.cp1 17 0 0.00 B buoy B 2008 11 25 POD282 .cp1 18 0 0.00 C CPOD buoy 3 2008 10 26 POD101 f0.cp1 3 0 0.00
C buoy C n vaquta polygon 2008 11 08 POD101 f0.cp1 13 0 0.00
F buoy F 2008 11 16 POD249 f0.cp1 6 0 0.00 All Long Deployments Sum 107 Mean 4.80 0.68 Variance 64.62 2.06 Variance/Mean 13.46 3.04
21
The variation in the number of encounters per day on non-zero buoys is higher than would be
expected if vaquita encounters were random with respect to time (see Barlow working paper). This difference from a random distribution can be expressed as the ratio of the variance to the mean. For a purely random distribution in space or time, this ratio would be 1.0 (a Poisson distribution). For the C-POD data collected on the 2008 expedition, the ratio of the variance to the mean is approximately 3.0 (Table2). This knowledge allows us to estimate the sample size (n) required to achieve a given CV based on the daily encounter rate (E) and the ratio of the variance to the mean (R):
n = R / E / CV2 Equation (1).
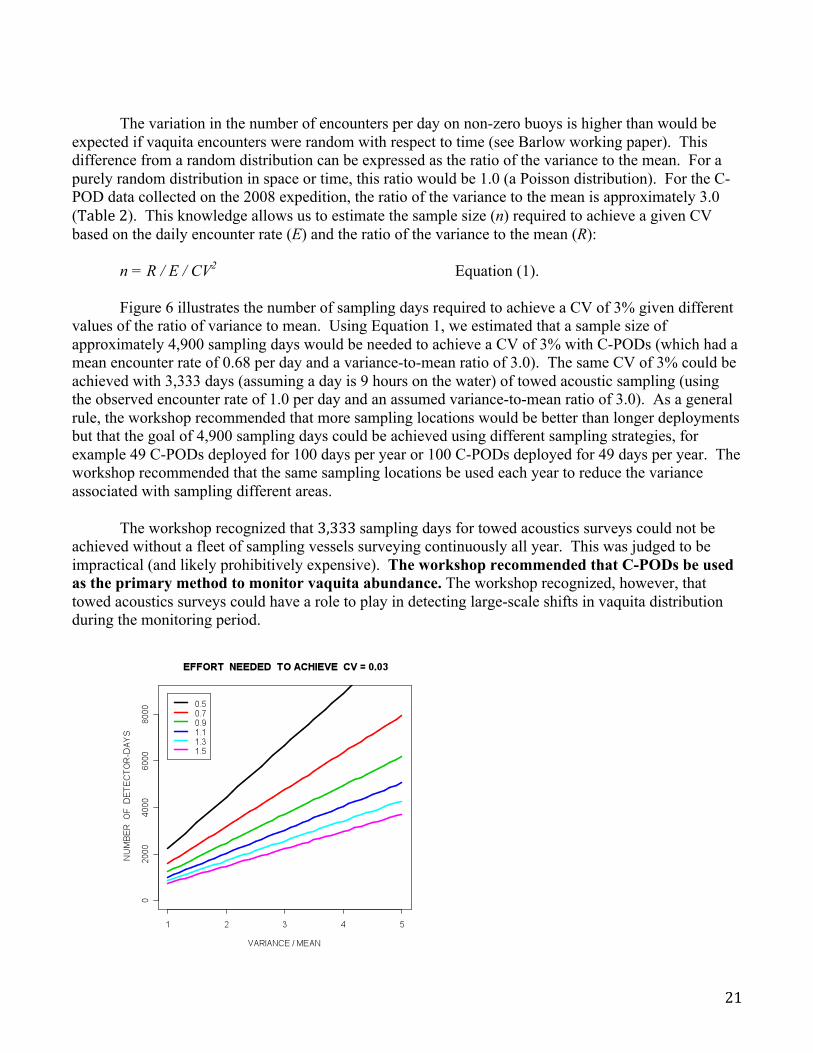
Figure 6 illustrates the number of sampling days required to achieve a CV of 3% given different values of the ratio of variance to mean. Using Equation 1, we estimated that a sample size of approximately 4,900 sampling days would be needed to achieve a CV of 3% with C-PODs (which had a mean encounter rate of 0.68 per day and a variance-to-mean ratio of 3.0). The same CV of 3% could be achieved with 3,333 days (assuming a day is 9 hours on the water) of towed acoustic sampling (using the observed encounter rate of 1.0 per day and an assumed variance-to-mean ratio of 3.0). As a general rule, the workshop recommended that more sampling locations would be better than longer deployments but that the goal of 4,900 sampling days could be achieved using different sampling strategies, for example 49 C-PODs deployed for 100 days per year or 100 C-PODs deployed for 49 days per year. The workshop recommended that the same sampling locations be used each year to reduce the variance associated with sampling different areas.
The workshop recognized that 3,333sampling days for towed acoustics surveys could not be
achieved without a fleet of sampling vessels surveying continuously all year. This was judged to be impractical (and likely prohibitively expensive). The workshop recommended that C-PODs be used as the primary method to monitor vaquita abundance. The workshop recognized, however, that towed acoustics surveys could have a role to play in detecting large-scale shifts in vaquita distribution during the monitoring period.
22
Figure 6. Number of sampling days required to achieve a coefficient of variation (CV) of 3% in an estimate of relative abundance. Values are estimated for encounter rates per day ranging from 0.5 to 1.5 (colored lines) based on a random encounter model in which the variance is proportional to the mean. The x-axis gives different values of the variance-to-mean ratio.
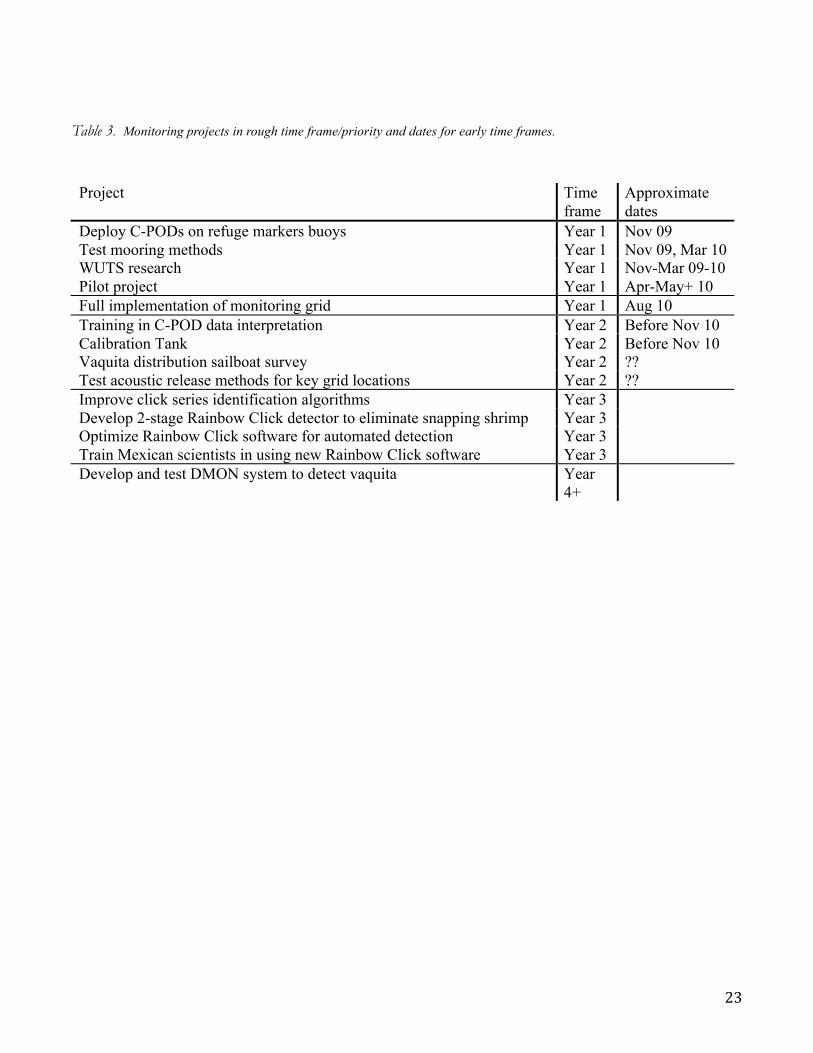
Monitoringimplementationplan Once the scale of implementation was apparent, i.e. that somewhere in excess of 50 C-PODs would be needed, it was clear that research was needed to solve the practical issues prior to the full implementation. The group considered a list of 16 research projects related to monitoring trends in vaquita abundance and prioritized the list by voting for one of four categories according to the time by which the project needed to be completed (or in the case of the full monitoring system, the time to start). Time categories were: first year, second year, third year, fourth or later year (symbolized 4+). The group then decided the time category/priority by consensus. Those with the shorter time have the highest priority, as the research projects must be accomplished sequentially (for example, mooring experiments must be completed before the full monitoring system can be implemented). Results are in Table 3 roughly in the order they need to be accomplished. Note that the full implementation of C-PODs would occur at the end of Year 1. Brief explanations of each project follow.
23
Table 3. Monitoring projects in rough time frame/priority and dates for early time frames.
Project Time frame
Approximate dates
Deploy C-PODs on refuge markers buoys Year 1 Nov 09 Test mooring methods Year 1 Nov 09, Mar 10 WUTS research Year 1 Nov-Mar 09-10 Pilot project Year 1 Apr-May+ 10 Full implementation of monitoring grid Year 1 Aug 10 Training in C-POD data interpretation Year 2 Before Nov 10 Calibration Tank Year 2 Before Nov 10 Vaquita distribution sailboat survey Year 2 ?? Test acoustic release methods for key grid locations Year 2 ?? Improve click series identification algorithms Year 3 Develop 2-stage Rainbow Click detector to eliminate snapping shrimp Year 3 Optimize Rainbow Click software for automated detection Year 3 Train Mexican scientists in using new Rainbow Click software Year 3 Develop and test DMON system to detect vaquita Year
4+
24
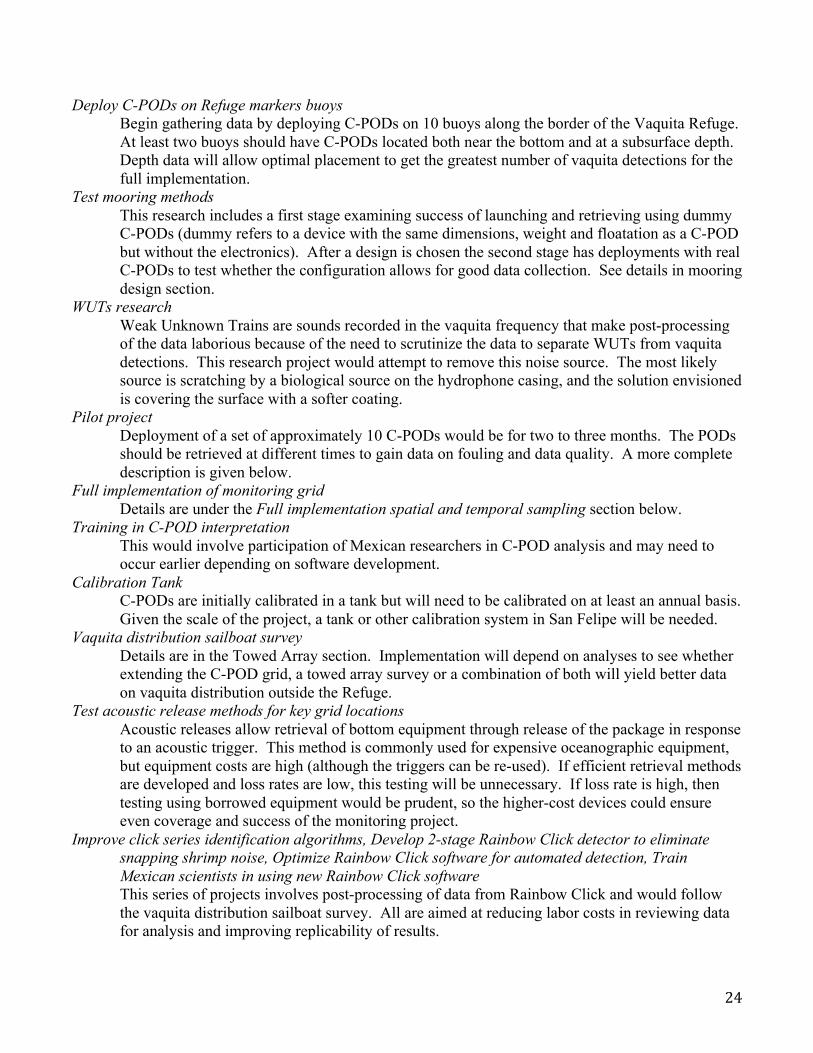
Deploy C-PODs on Refuge markers buoys Begin gathering data by deploying C-PODs on 10 buoys along the border of the Vaquita Refuge.
At least two buoys should have C-PODs located both near the bottom and at a subsurface depth. Depth data will allow optimal placement to get the greatest number of vaquita detections for the full implementation.
Test mooring methods This research includes a first stage examining success of launching and retrieving using dummy
C-PODs (dummy refers to a device with the same dimensions, weight and floatation as a C-POD but without the electronics). After a design is chosen the second stage has deployments with real C-PODs to test whether the configuration allows for good data collection. See details in mooring design section.
WUTs research Weak Unknown Trains are sounds recorded in the vaquita frequency that make post-processing
of the data laborious because of the need to scrutinize the data to separate WUTs from vaquita detections. This research project would attempt to remove this noise source. The most likely source is scratching by a biological source on the hydrophone casing, and the solution envisioned is covering the surface with a softer coating.
Pilot project Deployment of a set of approximately 10 C-PODs would be for two to three months. The PODs
should be retrieved at different times to gain data on fouling and data quality. A more complete description is given below.
Full implementation of monitoring grid Details are under the Full implementation spatial and temporal sampling section below. Training in C-POD interpretation This would involve participation of Mexican researchers in C-POD analysis and may need to
occur earlier depending on software development. Calibration Tank C-PODs are initially calibrated in a tank but will need to be calibrated on at least an annual basis.
Given the scale of the project, a tank or other calibration system in San Felipe will be needed. Vaquita distribution sailboat survey Details are in the Towed Array section. Implementation will depend on analyses to see whether
extending the C-POD grid, a towed array survey or a combination of both will yield better data on vaquita distribution outside the Refuge.
Test acoustic release methods for key grid locations Acoustic releases allow retrieval of bottom equipment through release of the package in response
to an acoustic trigger. This method is commonly used for expensive oceanographic equipment, but equipment costs are high (although the triggers can be re-used). If efficient retrieval methods are developed and loss rates are low, this testing will be unnecessary. If loss rate is high, then testing using borrowed equipment would be prudent, so the higher-cost devices could ensure even coverage and success of the monitoring project.
Improve click series identification algorithms, Develop 2-stage Rainbow Click detector to eliminate snapping shrimp noise, Optimize Rainbow Click software for automated detection, Train Mexican scientists in using new Rainbow Click software
This series of projects involves post-processing of data from Rainbow Click and would follow the vaquita distribution sailboat survey. All are aimed at reducing labor costs in reviewing data for analysis and improving replicability of results.
25
Develop and test DMON system to detect vaquitas This is a research and development project to develop a stationary version of Rainbow Click
with further sophistication that would be tested against the C-PODs to see whether performance is enhanced.
Pre‐implementationresearch
Pre-implementation research is needed to design moorings that will minimize loss of C-PODs and be feasible and safe to deploy and retrieve. This research phase will involve incremental learning by experimenting with various designs that can be launched and retrieved from a small boat (panga) (detailed below). As retrieval becomes more reliable, actual C-PODs can be deployed. Approximately 20 dummy C-PODs will be deployed in a variety of conditions and left for varying periods, including some over the winter, to gather data on loss rate by time. By April sufficient experience should be gained to do a full pilot experiment where 10 C-PODs will be deployed in the actual fashion and duration of the full implementation.
Mooringdesign
Two main types of mooring designs were considered: those for attachment to Vaquita Refuge buoys and subsurface moorings for inside the Vaquita Refuge.
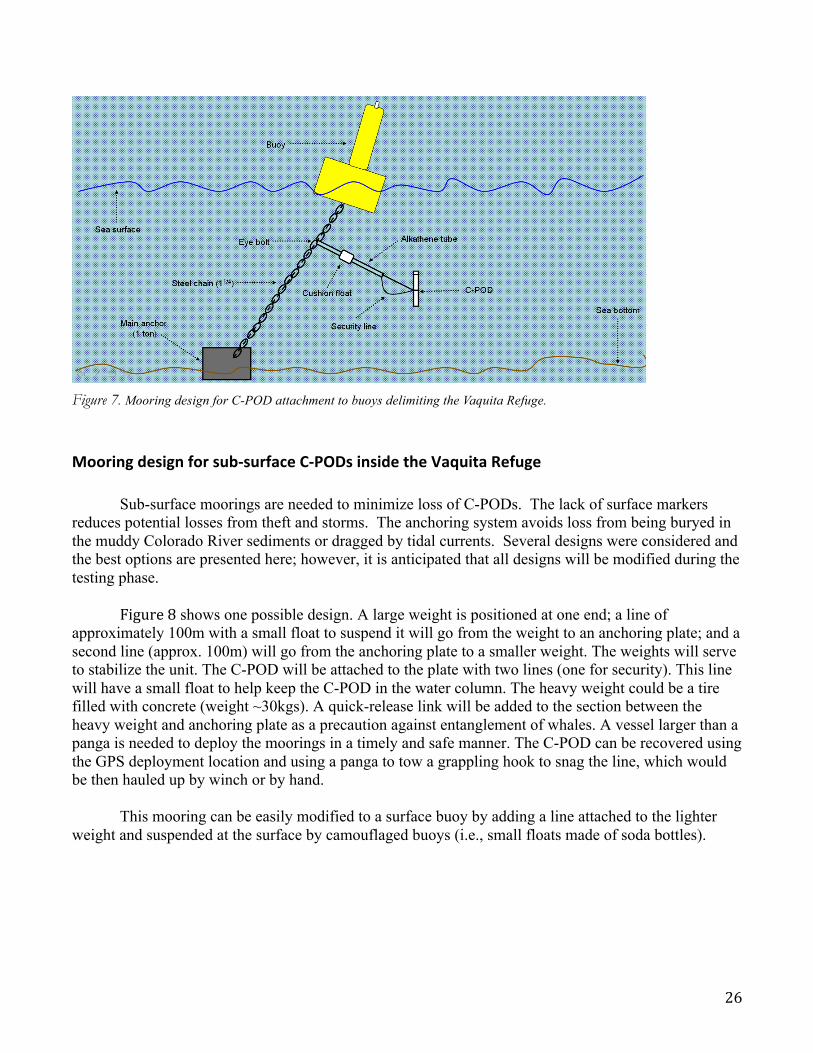
MooringdesignforVaquitaRefugeperimeterbuoys To utilize the 16 buoys that delimit the Vaquita Refuge, a subsurface buoy attached to the buoy chain was designed (Figure7). To suspend the C-POD approximately 5m below the surface, an alkathene (or ABS or other tough plastic) tube will be attached to the chain at a depth of 3m using an eyebolt and shackle setup. This setup is intended to give flexibility (swivel) at the point of attachment. The plastic tube will be about 2.5m in length and will have a cushion float near the point of attachment to prevent the POD from coming in contact with the chain. The C-POD will be attached at the distal end of the tube. The C-POD will be a sinking pod that requires a lead shield or some other weight to offset its buoyancy. A security line will be added to prevent loss of the C-POD.
Deployment requires a scuba diver to attach the unit to the buoy chain. A panga will be used to recover the C-POD using a line rope and grappling hook to bring the unit to the surface. Other methods of attachment, including a two point attachment to the chain using stainless steel flat bar with a security line, will be tested.
26
Figure 7. Mooring design for C-POD attachment to buoys delimiting the Vaquita Refuge.
Mooringdesignforsub‐surfaceC‐PODsinsidetheVaquitaRefuge Sub-surface moorings are needed to minimize loss of C-PODs. The lack of surface markers
reduces potential losses from theft and storms. The anchoring system avoids loss from being buryed in the muddy Colorado River sediments or dragged by tidal currents. Several designs were considered and the best options are presented here; however, it is anticipated that all designs will be modified during the testing phase.
Figure8 shows one possible design. A large weight is positioned at one end; a line of
approximately 100m with a small float to suspend it will go from the weight to an anchoring plate; and a second line (approx. 100m) will go from the anchoring plate to a smaller weight. The weights will serve to stabilize the unit. The C-POD will be attached to the plate with two lines (one for security). This line will have a small float to help keep the C-POD in the water column. The heavy weight could be a tire filled with concrete (weight ~30kgs). A quick-release link will be added to the section between the heavy weight and anchoring plate as a precaution against entanglement of whales. A vessel larger than a panga is needed to deploy the moorings in a timely and safe manner. The C-POD can be recovered using the GPS deployment location and using a panga to tow a grappling hook to snag the line, which would be then hauled up by winch or by hand.
This mooring can be easily modified to a surface buoy by adding a line attached to the lighter weight and suspended at the surface by camouflaged buoys (i.e., small floats made of soda bottles).
27
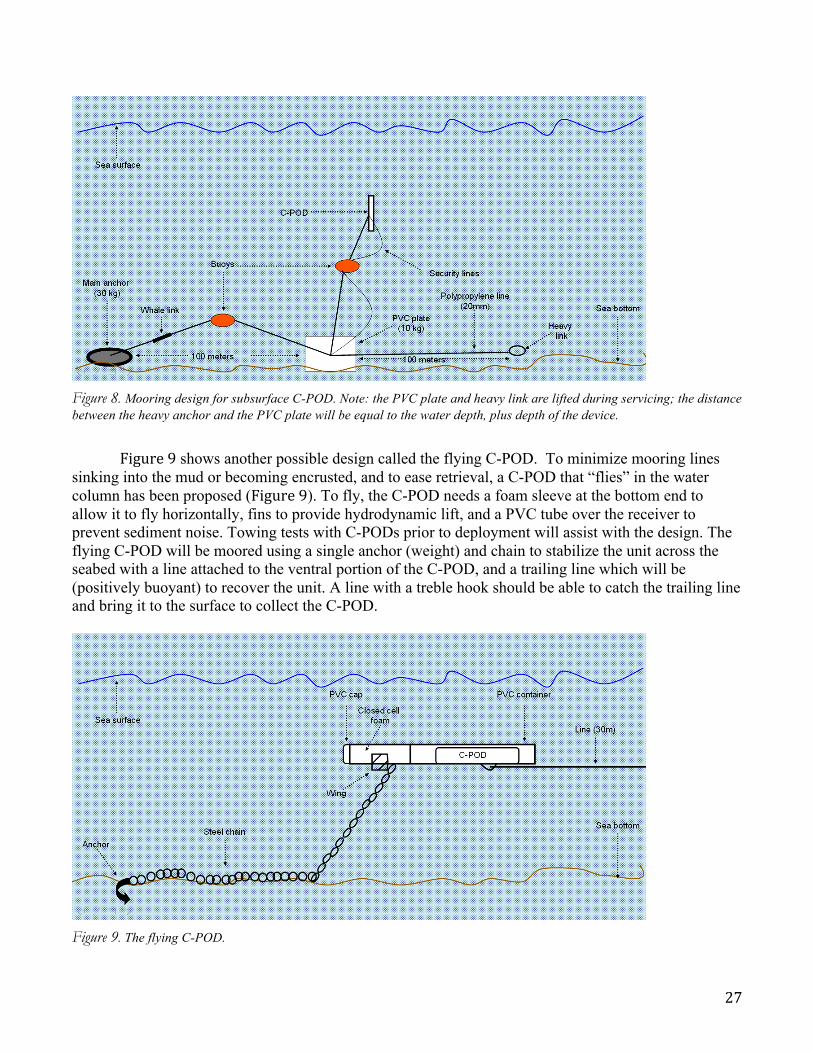
Figure 8. Mooring design for subsurface C-POD. Note: the PVC plate and heavy link are lifted during servicing; the distance between the heavy anchor and the PVC plate will be equal to the water depth, plus depth of the device.
Figure9 shows another possible design called the flying C-POD. To minimize mooring lines
sinking into the mud or becoming encrusted, and to ease retrieval, a C-POD that “flies” in the water column has been proposed (Figure9). To fly, the C-POD needs a foam sleeve at the bottom end to allow it to fly horizontally, fins to provide hydrodynamic lift, and a PVC tube over the receiver to prevent sediment noise. Towing tests with C-PODs prior to deployment will assist with the design. The flying C-POD will be moored using a single anchor (weight) and chain to stabilize the unit across the seabed with a line attached to the ventral portion of the C-POD, and a trailing line which will be (positively buoyant) to recover the unit. A line with a treble hook should be able to catch the trailing line and bring it to the surface to collect the C-POD.
Figure 9. The flying C-POD.
28
Fieldtesting
Successful C-POD deployment depends on the mooring design. Currently, there is no proven successful mooring for the Gulf of California, and field testing is required. Because the Vaquita Refuge perimeter buoys are in place, 10 C-PODs will be deployed on the buoys as soon as possible. The optimal distance below the surface to record vaquitas has not been determined, so a second C-POD will be attached close to the seabed on two buoys in order to answer this question. The C-PODs should be rotated every 30 days during this testing period to evaluate their performance.
The testing phase of subsurface moorings, including the flying C-POD, should begin as soon as 2
mooring rigs similar to those in figure 8 are fabricated and weather permits trials. Dummy C-PODs will be used while evaluating the mooring rigs to minimize loss and damage. Designs will be modified and retested as needed until an acceptable setup is achieved. After a design is chosen the second stage has deployments with real C-PODs to test whether the configuration results in good data. C-POD modifications to eliminate WUTs can be concomitantly tested with the mooring evaluation. Field tests need to answer the following questions.
1) Do the moorings move with changes in currents? 2) Are the moorings subject to theft and/or vandalism 3) Does the orientation of the mooring original deployment change? 4) Can the mooring setup be grappled? 5) Can the mooring setup be lifted easily using a panga? 6) Do the floats sink in the tidal flow? 7) Where does abrasion occur? What time period is associated with abrasion? 8) Do the sharks/large fish gnaw on the line? 9) Do moorings become more difficult to retrieve over the course of 4 months? 10) Do mooring lines become entangled with one another or the C-POD?
Fullimplementationspatialandtemporalsamplingdesign The PODs need to be deployed for at least 100 days/year. As detailed above, research on moorings and a pilot study to estimate loss rate for different seasons will inform the needed scheduling to accomplish the requisite 5,000 C-POD days. To minimize losses due to weather deployments should likely not occur in winter. The peak of summer is also likely unsafe for maintenance because of sudden violent storms that make working from pangas unsafe. Deployment in both the spring (March-May) and late-summer/fall (August-October) would be optimal. Exact timing for the full deployment should be guided by a steering committee and based on the pilot study (see below).
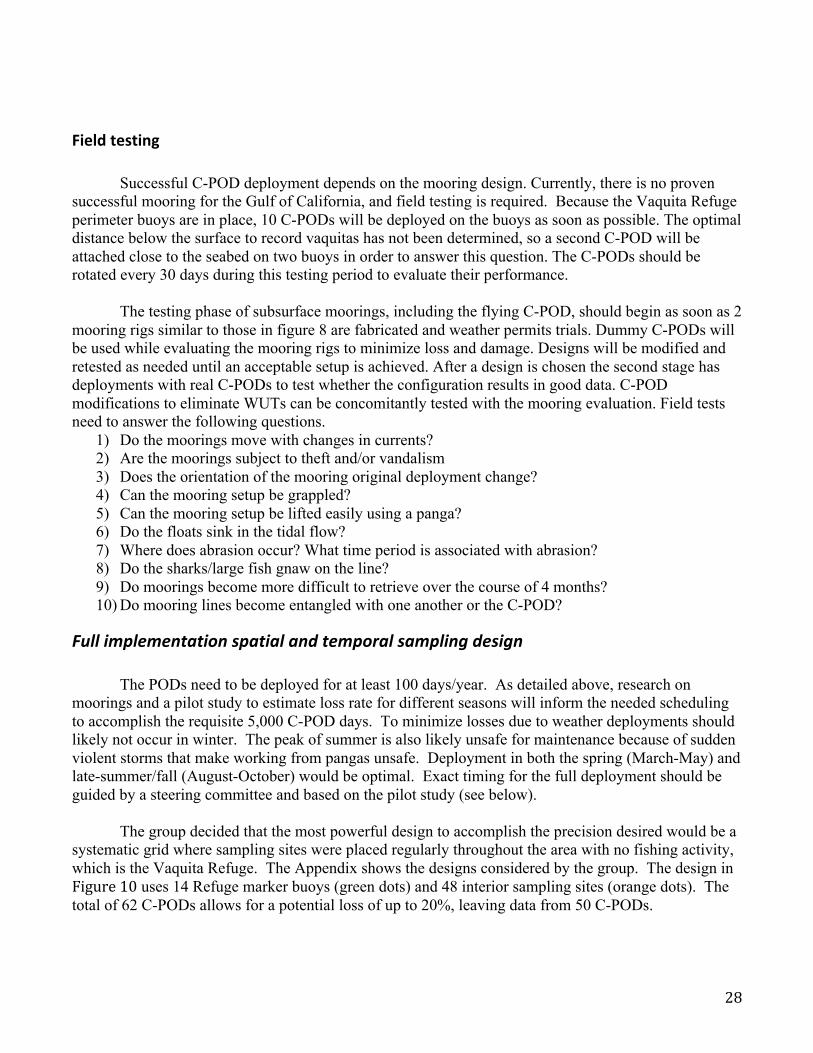
The group decided that the most powerful design to accomplish the precision desired would be a systematic grid where sampling sites were placed regularly throughout the area with no fishing activity, which is the Vaquita Refuge. The Appendix shows the designs considered by the group. The design in Figure10 uses 14 Refuge marker buoys (green dots) and 48 interior sampling sites (orange dots). The total of 62 C-PODs allows for a potential loss of up to 20%, leaving data from 50 C-PODs.
29
Figure 10. Spatial sampling design for C-POD locations.
The PODs need to be deployed for at least 100 days/year. As detailed above, research on moorings and a pilot study to estimate loss rate for different seasons will inform the needed scheduling to accomplish the requisite 5,000 C-POD days. To minimize losses due to weather deployments should likely not occur in winter. The peak of summer is also likely unsafe for maintenance because of sudden violent storms that make working from pangas unsafe. Deployment in both the spring (March-May) and late-summer/fall (August-October) would be optimal. Exact timing for the full deployment should be guided by a steering committee and based on the pilot study (see below).
Researchtomonitorthedistributionofvaquitas After learning that the level of precision made towed surveys unfeasible for the purposes of monitoring, the workshop considered a preliminary design to use a towed survey to account for potential shifts in vaquita distribution. Potential shifts in abundance are a serious concern for interpreting trends in abundance based on monitoring an area (the Vaquita Refuge) known to contain only part of the distribution of the species, especially when the expected changes in abundance over the monitoring period are likely to be small. Consider, for example, the case where the Refuge contains 80% of the vaquitas most of the time. Figure 3 shows that the vaquita distribution is fairly dense right up to the border near where buoy H was located. If the distribution shifted a few miles to the east, it would not be difficult to imagine that 75% of the vaquita population remained in the Refuge and make it appear as if the acoustic monitoring indicated a decline. Currently, fishing effort just outside the Refuge can be very intense, which makes the likelihood of losing subsurface moored C-PODs high. Interactions with fisheries would be especially intense along the western edge near San Felipe and at times on both the southerly and northerly borders. Workshop participants suggested that further research was needed to decide whether a towed array survey, more C-PODs with a higher loss rate or a combination of both would be needed to address potential distributional shifts. Costs for the towed array are included in the budget for future reference of the steering committee.
30
Methodsofanalysis Research on methods of analysis will focus on 4 topics: (1) Methods to ensure consistency of vaquita acoustic detections
Identifying acoustic detections of vaquitas requires training of technicians in the use of the software. Periodic testing will be required to ensure that technicians work comparably and consistently over the duration of the project. Lack of consistency could introduce a false trend in vaquita detection rate, either positively or negatively.
(2) Optimal metric The rate of vaquita clicking can be summarized in different ways. To speed analysis of the large amount of data expected, for example, the data could be summarized as “vaquita-positive hours” – that is, each hour of recording is classified as either containing a vaquita click or not – but this simplification loses some information if several detections occur within the hour. Alternatively, the number of detections could be reported per hour or per day. Choosing the optimal metric involves a tradeoff between metrics that are easier and faster but represent minimal loss of information.
(3) Analysis to determine trend Given acoustic data over several years, they could be analyzed in different ways. Research will focus on determining optimal methods to detect change for the particular kind of acoustic data we anticipate. For example, rates of clicking will probably be affected by factors such as season, location, tidal cycle, and time of day. Including such covariates in the analysis will increase the ability to detect trends. Classical methods of determining trends usually use a linear regression of the index of relative abundance against time and determine whether a change has actually occurred using a test of significance. However, modern statistical methods are far more powerful. In particular, we will investigate Bayesian methods to detect trends.
(4) Decision statistic After data have been analyzed, a decision will be made about whether the evidence from the data is sufficiently strong to indicate whether a change has occurred or not. What is “sufficiently strong” is a policy decision. In the classical null hypothesis testing framework, this policy decision requires choosing Type 1 and Type 2 error levels – that is, the rates at which we will accept false positives and false negatives, respectively. In the Bayesian paradigm, the policy decision can be made in terms of the odds ratio.
Monitoringbudget For this report, we present the budget for the monitoring of the Refuge only. Table4 numbers the projects so that project details can be given separately below. Presenting a budget for monitoring the total spatial distribution was deemed premature at this time until further research is complete on whether further C-PODs, a towed acoustic survey or both will fulfill this critical need. It is anticipated that total spatial monitoring will add a substantial expense to the summary below and will need to be done at least twice and perhaps annually between 2010 and 2015.
31
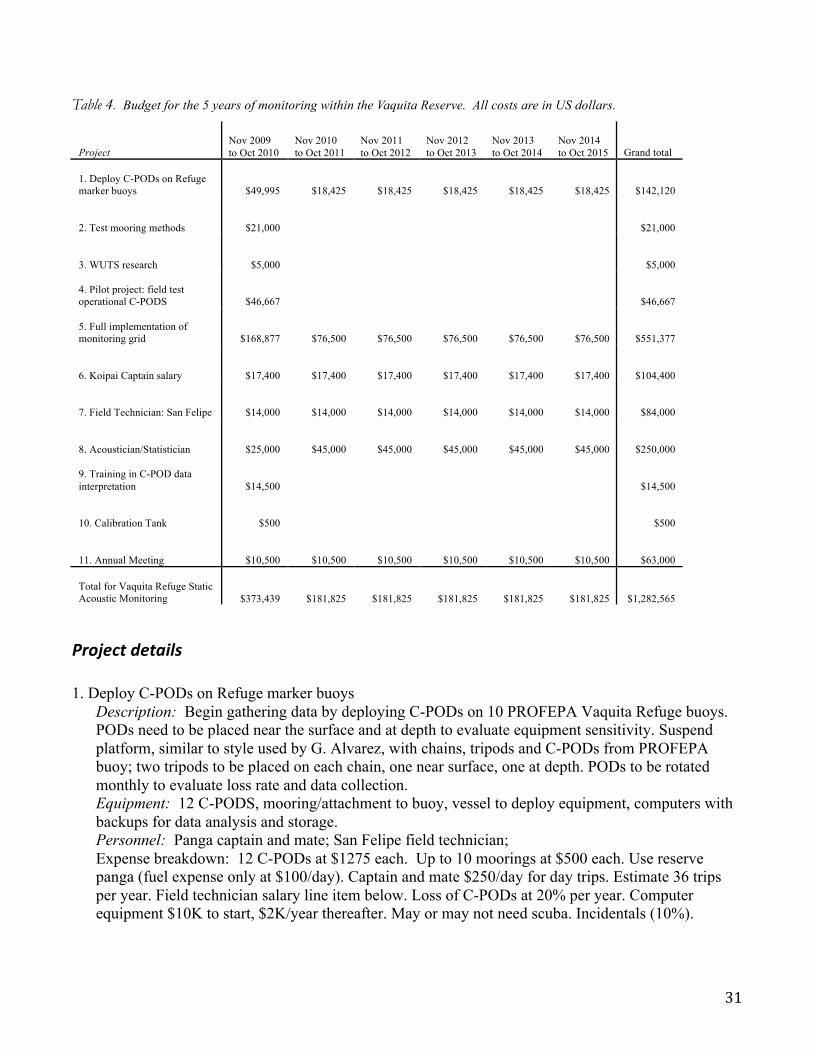
Table 4. Budget for the 5 years of monitoring within the Vaquita Reserve. All costs are in US dollars.
Project Nov 2009 to Oct 2010
Nov 2010 to Oct 2011
Nov 2011 to Oct 2012
Nov 2012 to Oct 2013
Nov 2013 to Oct 2014
Nov 2014 to Oct 2015 Grand total
1. Deploy C-PODs on Refuge marker buoys $49,995 $18,425 $18,425 $18,425 $18,425 $18,425 $142,120
2. Test mooring methods $21,000 $21,000
3. WUTS research $5,000 $5,000
4. Pilot project: field test operational C-PODS $46,667 $46,667
5. Full implementation of monitoring grid $168,877 $76,500 $76,500 $76,500 $76,500 $76,500 $551,377
6. Koipai Captain salary $17,400 $17,400 $17,400 $17,400 $17,400 $17,400 $104,400
7. Field Technician: San Felipe $14,000 $14,000 $14,000 $14,000 $14,000 $14,000 $84,000
8. Acoustician/Statistician $25,000 $45,000 $45,000 $45,000 $45,000 $45,000 $250,000
9. Training in C-POD data interpretation $14,500 $14,500
10. Calibration Tank $500 $500
11. Annual Meeting $10,500 $10,500 $10,500 $10,500 $10,500 $10,500 $63,000
Total for Vaquita Refuge Static Acoustic Monitoring $373,439 $181,825 $181,825 $181,825 $181,825 $181,825 $1,282,565
Projectdetails 1. Deploy C-PODs on Refuge marker buoys
Description: Begin gathering data by deploying C-PODs on 10 PROFEPA Vaquita Refuge buoys. PODs need to be placed near the surface and at depth to evaluate equipment sensitivity. Suspend platform, similar to style used by G. Alvarez, with chains, tripods and C-PODs from PROFEPA buoy; two tripods to be placed on each chain, one near surface, one at depth. PODs to be rotated monthly to evaluate loss rate and data collection. Equipment: 12 C-PODS, mooring/attachment to buoy, vessel to deploy equipment, computers with backups for data analysis and storage. Personnel: Panga captain and mate; San Felipe field technician; Expense breakdown: 12 C-PODs at $1275 each. Up to 10 moorings at $500 each. Use reserve panga (fuel expense only at $100/day). Captain and mate $250/day for day trips. Estimate 36 trips per year. Field technician salary line item below. Loss of C-PODs at 20% per year. Computer equipment $10K to start, $2K/year thereafter. May or may not need scuba. Incidentals (10%).
32
2. Test mooring methods Description: Deploy and test recovery of mooring; modify as needed. Leave minimum of 5 moorings for different time periods and throughout the winter to test recovery after sediment deposition. Moorings should be deployed from San Felipe. Reserve panga should be used for deployment and recovery. Dummy C-PODs should be used. May provide information on potential C-POD loss rate. Equipment: Dummy C-PODs; 10 moorings (includes equipment and labor); reserve panga Personnel: Panga captain and mate; research assistant from Ensenada; field technician from San Felipe Expense breakdown: 12 dummy C-PODs at $100/each. Up to 20 moorings at $500 each. Use reserve panga (fuel $100/dayexpense only). Captain and mate $250/day for day trips (est: 20 days). Research assistant from Ensenada lodging and meals ($150/day, 15 days in Nov 09 and Spring 15). Field technician salary line item below. Gas from Ensenada to San Felipe and return ($300).
3. WUTS research Description: WUTS (Weak Unknown Train Sources), although different from vaquita trains, slow down C-POD analysis. Research to prevent their attachment to C-PODs would be beneficial, as well as knowing time of year WUTS heard. Equipment: Modifications to C-POD to prevent attachment Personnel: Chelonia personnel to modify equipment and /or propose solutions to prevent attachment. Equipment sent to INE for deployment. Expense breakdown: Flat rate estimated by Chelonia, Ltd
4. Pilot project: field test operational C-PODS Description: Deployment of a set of approximately 10 C-PODS for two to three months on subsurface moorings. C-PODs to be retrieved after different periods to gain data on fouling and the effect on data quality, as well as obtain data on loss rate Equipment: 15 C-PODS. Reserve panga. Koipai as support vessel and hotel. Fuel/oil. Miscellaneous incidentals. Personnel: Panga Captain and mate ($250/day). Researcher and research assistant from Ensenada. San Felipe field technician. Koipai Captain. Expense breakdown: 15 C-PODS ($1275 each). 40 days reserve panga personnel ($250/day) and fuel ($100/day+travel to Pto Peñasco (2 people). Koipai as support vessel and hotel. Fuel/oil. Meals/incidentals $20/day/person (4 people). Gasoline for truck $500. Miscellaneous incidentals (10%).
5. Full implementation of monitoring grid Description: Deploy C-PODs in systematic grid where sampling sites are placed regularly throughout the area with no fishing activity, which is the Vaquita Refuge; length of deployment to depend on previous testing (dummy C-POD deployment and pilot projects) Equipment: C-PODs; moorings, reserve panga; computer equipment; Koipai, miscellaneous incidentals Personnel: Monitoring Project manager; research assistant; field technicians from San Felipe; Panga captain and mate; Koipai captain Expense breakdown: 73 C-PODs + 20 C-PODs potential loss @$1275 + 50 subsurface moorings @$400+annual loss rate of 20%; 30 days on Koipai (deployment: 2500*2); MI&E: Koipai (4 people, 20/day for 30 days); retrieval (Koipai hotel 4x year at 15 days each); Pto Peñasco boat pickup expenses (2 people*150/day*2 trips+500gas); gas to transport moorings to San Felipe
33
($100); 6 annual trips for retrieval and redeployment ($250/day, 6 trips per year, 20 days per trip; year 1 only 4 trips); computer equipment/radios/sundries ($12000 first year, $2500 following years)
6. Koipai Captain salary Description: Salary of captain to operate Koipai. INE vessel needed year-round to complete vaquita projects Expense breakdown: Rate: 17,400/yr
7. Field technician: San Felipe Description: INE Portion of salary for field technician in San Felipe; needed year-round to complete vaquita projects Expense breakdown: Rate: 14,000/yr
8. Acoustician/statistician Description: Personnel to work with program manager to analyze data collected on C-PODs and assist with modeling of vaquita trends Expense breakdown: Post doc rate: 45,000/yr for two years; salary after this time to be reviewed
9. Training in C-POD data interpretation Description: Train INE personnel in C-POD data analysis and interpretation Equipment: Computer equipment from C-POD testing needs to have been purchased Personnel: Nick Tregenza from Chelonia to come to Ensenada to train Expense breakdown: Airfare: UK to Ensenada ($2000); hotel and per diem for 10 days ($250/day); training salary ($1000/day)
10. Calibration tank Description: C-PODs will need to be calibrated on at least an annual basis; tank to be located at San Felipe Equipment: Cylindrical tank for calibrating C-PODs Expense breakdown: Tank cost of approximately $500
11. Annual meeting Description: Annual meeting to start assessing data and produce interim reports Personnel: Mexican scientists and international team Expense breakdown: Assuming location is Ensenada (3SWFSC $200/day) 3 international (200/day+1500 travel/person)
34
Recommendations Workshop attendees recommend:
• Large-scale monitoring of the Vaquita Refuge with acoustic recorders (C-PODs) should begin in August 2010 and continue through November 2015.
• Substantial research and a pilot study are necessary before this monitoring can begin, this research and pilot study should start immediately.
• Net fishing in the Vaquita Refuge should continue to be banned during the vaquita monitoring period.
• A steering committee should be established to oversee monitoring efforts and to provide frequent advice during the initiation of the project.
• Progress reports should be submitted to funders and the steering committee twice per year. • A full meeting of the steering committee should be convened after the pilot study and before the
full-scale monitoring begins in the Vaquita Refuge (July 2010). • Research should be initiated to develop cost-effective methods to monitor potential shifts in
vaquita distribution outside the Vaquita Refuge.
Acknowledgments
The Coordinación de Investigación y Conservación de Mamíferos Marinos/Instituto Nacional de Ecología would like to express its deepest appreciation to Annette Henry, Barb Taylor, Jay Barlow, Nick Tregenza, René Swift, Tim Gerrodette and Tom Akamatsu for contributing with their wisdom and experience for the success of this workshop. Jonathan Gordon and Doug Gillespie made important contributions and suggestions via email. We thank the following reviewers: Bill Perrin, Andy Read and Tim Ragen.
This workshop would not have taken place without the generous support from WWF-Mexico.
All the participants are particularly grateful to Omar Vidal, Georgina Saad and Luís Servin. Thanks to the Coral and Marina Hotel, especially Estela Juarez, for helping again the vaquita cause. The workshop would like to acknowledge Luis Gustavo Álvarez for the special talk that was very useful for the monitoring design. Thanks to Horacio de la Cueva for the closing dinner. The data from Vaquita Expedition 2008 were critical to the workshop and we would like to thank the funders: INE, NOAA Fisheries Service, the Pacific Life Foundation and the Marine Mammal Commission.
Thanks to Paula Olson for the cover photo. Photo taken under permit (Oficio No. DR/488/08 from the Comisión de Áreas Naturales Protegidas (CONANP/Secretaría del Medio Ambiente Y Recursos Naturales (SEMARNAT), within a natural protected area subject to special management and decreed as such by the Mexican Government. This work was made possible thanks to the collaboration and support of the Coordinador de Investigación y Conservación de Mamíferos Marinos at the Instituto Nacional de Ecología (INE).
35
ReferencesD’Agrosa, C., C.E. Lennert-Cody & O. Vidal. 2000. Vaquita by-catch in Mexico’s artisanal entangling net fisheries: driving a small population to extinction. Conservation Biology 14: 1110-1119. Barlow, Jay. Sample sizes of C-PODs required to monitor vaquita trends in abundance. AworkingpaperfortheOctober2009WorkshoponMonitoring trends in abundance of vaquita. Gerrodette, Tim. 1993. TRENDS: Software for a power analysis of linear regression. Wildlife Society Bulletin 21:515-516. Gerrodette,Tim.Analysisofacousticdatatodetectchangesinvaquitapopulationsize.AworkingpaperfortheOctober2009WorkshoponMonitoring trends in abundance of vaquita. Jaramillo-Legoretta, A., L. Rojas-Bracho & T. Gerrodette. 1999. A new abundance estimate for vaquitas: first step for recovery. Marine Mammal Science 15: 957-973. Jaramillo-Legorreta, A., L. Rojas-Bracho, R.L. Brownell, A.J. Read, R.R. Reeves, K. Ralls, and B.L. Taylor. 2007. Saving the vaquita: immediate action, not more data. Conservation Biology 21:1653-1655. Swift, René. Towed array surveys for monitoring trends in abundance and for estimating absolute abundance. A working paper for the October 2009 Workshop on monitoring trends in abundance of vaquita.
Taylor, B.L., S.J. Chivers, J. Larese, and W.F. Perrin. 2007. Generation length and percent mature estimates for IUCN assessments of cetaceans. Administrative Report LJ-07-01 available from Southwest Fisheries Science Center, National Marine Fisheries Service, 8604 La Jolla Shores Dr., La Jolla, CA 92038 USA.
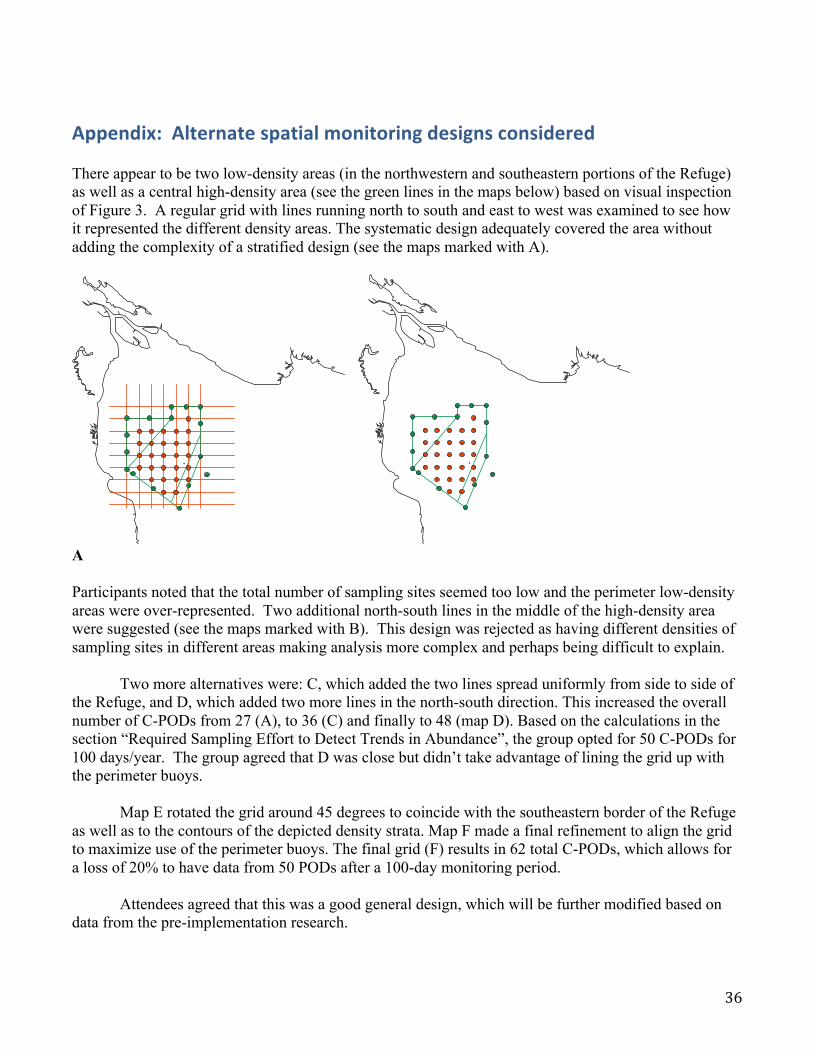
36
Appendix:Alternatespatialmonitoringdesignsconsidered There appear to be two low-density areas (in the northwestern and southeastern portions of the Refuge) as well as a central high-density area (see the green lines in the maps below) based on visual inspection of Figure 3. A regular grid with lines running north to south and east to west was examined to see how it represented the different density areas. The systematic design adequately covered the area without adding the complexity of a stratified design (see the maps marked with A).
A Participants noted that the total number of sampling sites seemed too low and the perimeter low-density areas were over-represented. Two additional north-south lines in the middle of the high-density area were suggested (see the maps marked with B). This design was rejected as having different densities of sampling sites in different areas making analysis more complex and perhaps being difficult to explain.
Two more alternatives were: C, which added the two lines spread uniformly from side to side of the Refuge, and D, which added two more lines in the north-south direction. This increased the overall number of C-PODs from 27 (A), to 36 (C) and finally to 48 (map D). Based on the calculations in the section “Required Sampling Effort to Detect Trends in Abundance”, the group opted for 50 C-PODs for 100 days/year. The group agreed that D was close but didn’t take advantage of lining the grid up with the perimeter buoys.
Map E rotated the grid around 45 degrees to coincide with the southeastern border of the Refuge as well as to the contours of the depicted density strata. Map F made a final refinement to align the grid to maximize use of the perimeter buoys. The final grid (F) results in 62 total C-PODs, which allows for a loss of 20% to have data from 50 PODs after a 100-day monitoring period.
Attendees agreed that this was a good general design, which will be further modified based on data from the pre-implementation research.
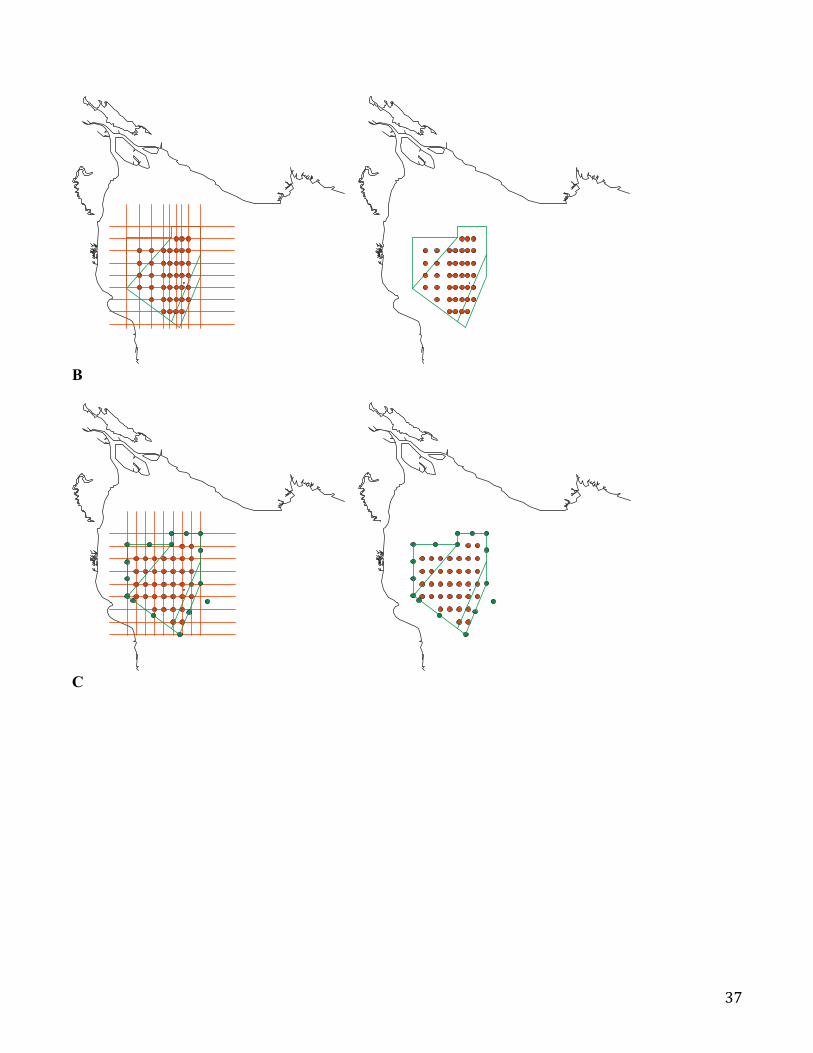
37
B
C
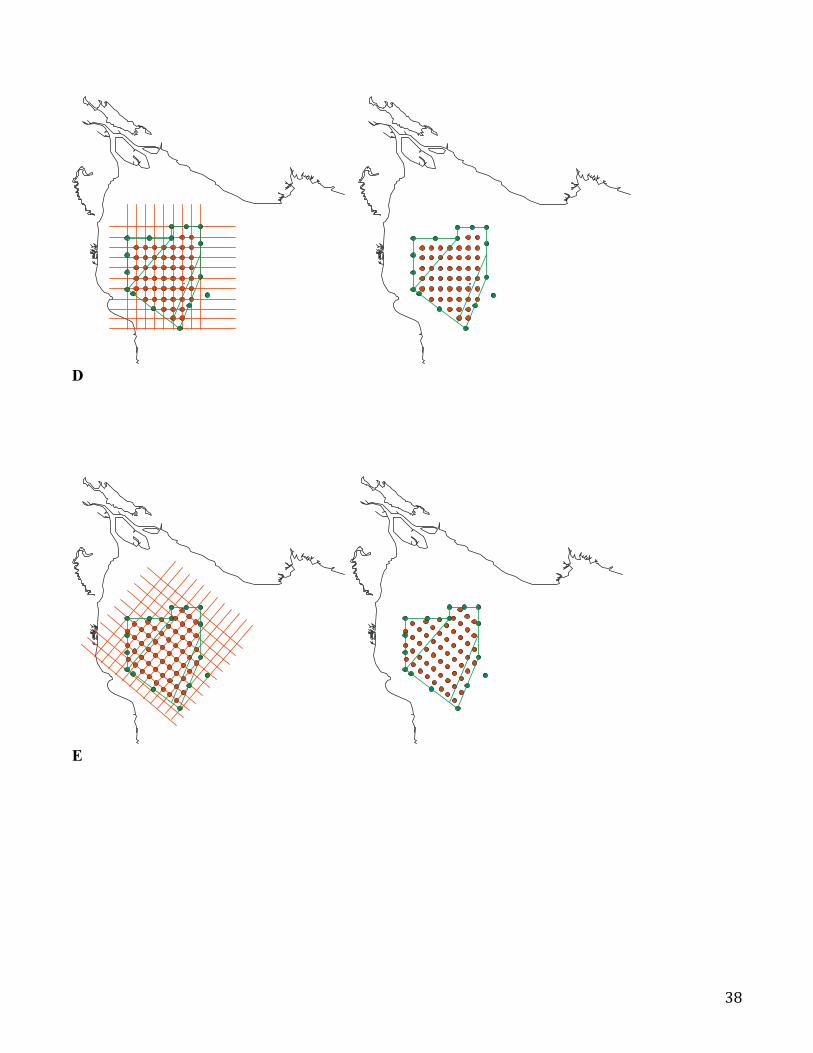
38
D
E
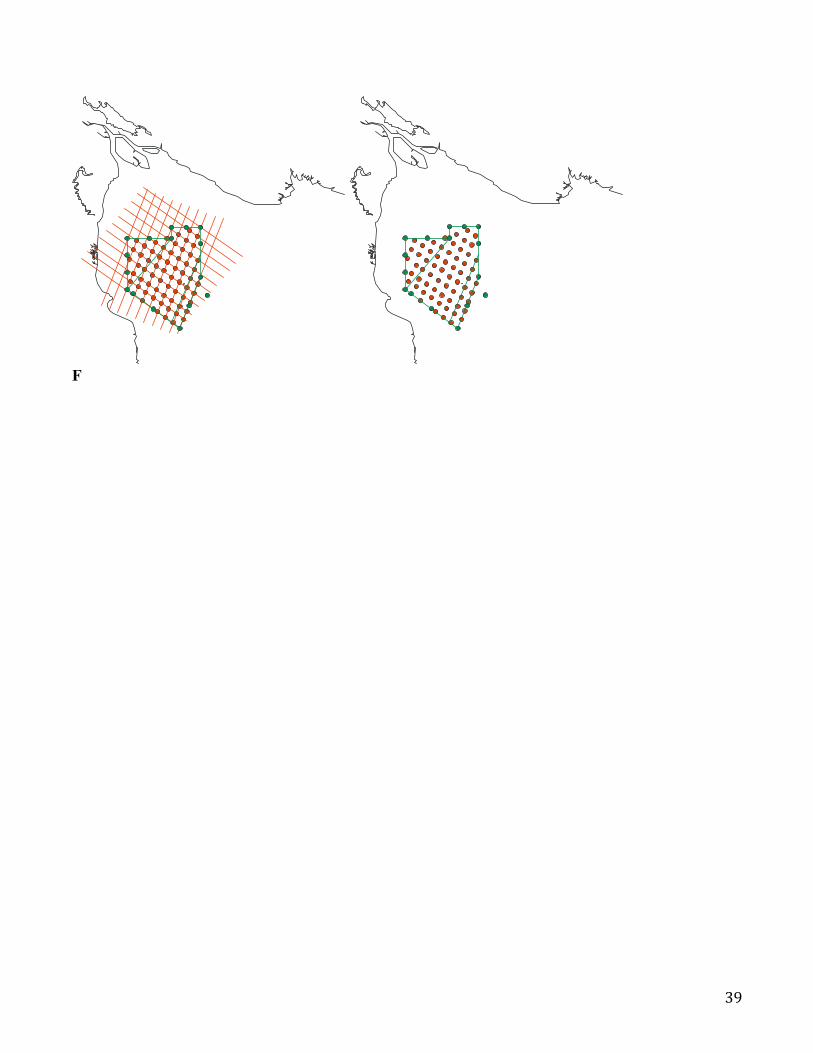
39
F
RECENT TECHNICAL MEMORANDUMSSWFSC Technical Memorandums are accessible online at the SWFSC web site (http://swfsc.noaa.gov). Copies are also available form the National Technical Information Service, 5285 Port Royal Road, Springfield, VA 22161 (http://www.ntis.gov). Recent issues of NOAA Technical Memorandums from the NMFS Southwest Fisheries Science Center are listed below:
NOAA-TM-NMFS-SWFSC-449 Spawning biomass of Pacific sardine (Sardinops sagax) off California in 2009. N.C.H. LO, B.J. MACEWICZ, and D.A, GRIFFITH (October 2009)
450 Review of the evidence used in the description of currently recognized cetacean subspecies. W.F. PERRIN, J.G., J.G. MEAD and R.L. BROWNELL, JR. (December 2009)
451 Climate change in California: Implications for the recovery and protection of Pacific salmon and steelhead. F. SCHWING, S. LINDLEY, E. DANNER, and D. BOUGHTON
452 Assessment of the Pacific sardine resource in 2009 for U.S. management in 2010. K.T. HILL,N.C.H. LO, B.J. MACEWICZ, P.R. CRONE and R. FELIX-URAGA (December 2009)
453 U.S. Pacific marine mammal stock assessments: 2009 J.V. CARRETTA, K.A. FORNEY, M.S. LOWRY, J. BARLOW, J. BAKER, D. JOHNSTON, B. HANSON, R.L. BROWNELL, JR., J. ROBBINS, D.K. MATTILA, K. RALLS, M.M. MUTO, D. LYNCH, and L. CARSWELL (January 2010)
454 Operation of dual-frequency identification sonar (DIDSON) to monitor adult steelhead (Oncorhynchus mykiss) in the central Calidornia coast. K. PIPAL, M. JESSOP, G. HOLT, and P. ADAMS (February 2010)
455 Evaluation of a Marine Mammal Excluder Device (MMED) for a Nordic 264 Midwater Rope Trawl. R.C. DOTSON, D.A. GRIFFITH, D.L. KING, and R.L. EMMETT (February 2010)
456 Cetacean abundance in the California Current estimated from a 2008 ship-based line-transect survey. J. BARLOW (February 2010)
457 Variation and Predictors of Vessel-Response Behavior in a Tropical Dolphin Community. F.I. ARCHER, S.L. MESNICK, A.C. ALLEN (March 2010)
458 Evidence of genetic differentiation for Hawai’i insular false killer whales (Pseudorca crassidens). S.J. CHIVERS, R.W. BAIRD, K.M. MARTIEN, B.L. TAYLOR, E. ARCHER, A.M. GORGONE, B.L. HANCOCK, N.M. HEDRICK, D. MATILLA, D.J. McSWEENEY, E.M. OLESON, C.L. PALMER, V. PEASE, K.M. ROBERTSON, J. ROBBINS, J.C. SALINAS G.S. SCHORR, M. SCHULTZ, J.L. THEILEKING, and D.L. WEBSTER (May 2010)