assessing the preparedness of the veterinary profession to
TRANSCRIPT
Purdue UniversityPurdue e-Pubs
Open Access Dissertations Theses and Dissertations
Fall 2013
Assessing the Preparedness of the VeterinaryProfession to Communicate with Limited EnglishProficient Spanish-Speaking Pet OwnersRuth Ellen LandauPurdue University
Follow this and additional works at: https://docs.lib.purdue.edu/open_access_dissertations
Part of the Communication Commons, Latin American Languages and Societies Commons, andthe Veterinary Medicine Commons
This document has been made available through Purdue e-Pubs, a service of the Purdue University Libraries. Please contact [email protected] foradditional information.
Recommended CitationLandau, Ruth Ellen, "Assessing the Preparedness of the Veterinary Profession to Communicate with Limited English ProficientSpanish-Speaking Pet Owners" (2013). Open Access Dissertations. 137.https://docs.lib.purdue.edu/open_access_dissertations/137
Graduate School ETD Form 9 (Revised 12/07)
PURDUE UNIVERSITY GRADUATE SCHOOL
Thesis/Dissertation Acceptance
This is to certify that the thesis/dissertation prepared
By
Entitled
For the degree of
Is approved by the final examining committee:
Chair
To the best of my knowledge and as understood by the student in the Research Integrity and Copyright Disclaimer (Graduate School Form 20), this thesis/dissertation adheres to the provisions of Purdue University’s “Policy on Integrity in Research” and the use of copyrighted material.
Approved by Major Professor(s): ____________________________________
____________________________________
Approved by: Head of the Graduate Program Date
Ruth Ellen Landau
Assessing the Preparedness of the Veterinary Profession to Communicate with Limited EnglishProficient Spanish-Speaking Pet Owners
Doctor of Philosophy
George E. Moore Annette Litster
Larry Glickman Alan Beck
Nicole Olynk Widmar
George E. Moore
Ramesh Vemulapalli 11/25/2013
i
ASSESSING THE PREPAREDNESS OF THE VETERINARY PROFESSION
TO COMMUNICATE WITH LIMITED ENGLISH PROFICIENT
SPANISH-SPEAKING PET OWNERS
A Dissertation
Submitted to the Faculty
of
Purdue University
by
Ruth Ellen Landau, DVM, MSEd
In Partial Fulfillment of the
Requirements for the Degree
of
Doctor of Philosophy
December 2013
Purdue University
West Lafayette, Indiana
ii
I dedicate this thesis to my beloved Leila Frances Peters.
No words can describe the lifetime of love and
support I have been so blessed to receive from my
parents, siblings, family and friends who are family.
You have each supported me to make this project
possible.
I thank the fuzzy 4-legged gang who remind me daily
what the real priorities are in Life.
I send these words up to Nana and Aunt Marcia, who
are most certainly playing cards together in Heaven.
iii
ACKNOWLEDGEMENTS
Funding for this study was generously provided by Maddie’s Shelter Medicine Fund and
the College of Veterinary Medicine at Purdue University. A four-year fellowship in
Epidemiology and Public Health was provided by Maddie’s Fund.
I wish to acknowledge the valuable assistance of Social Science Research Solutions of
Media PA, its staff, particularly David Dutwin and Kathy Langdale for their assistance
with the Pet Owner survey; Leila Peters and Viviana Vallin for their contributions to the
Veterinary Practitioner survey; and Lisa Greenhill and colleagues at the Association of
American Veterinary Medical Colleges for their assistance with the Veterinary Student
survey.
I would like to give very special thanks to each individual whose time and creative
energy fueled and guided this project:
Enormous thanks to each member of my committee: Alan Beck, Larry Glickman,
Annette Litster, George Moore, and Nicole Olynk Widmar for all the patient support,
critical feedback, humorous encouragement, and thoughtful guidance that has made me a
better person than I was before this undertaking.
iv
Special thank you to Barb White, who may not realize just how much her support and
encouragement has meant along the way.
Thank you to each of my interviewers: Rae Baskin, Viviana Vallin, Amber Freiwald,
Lauren Lemmons, Kristy Oates, Jacqueline Lynch, Jose Alfonso, and superstar
interviewer, Leila Peters, whose effort and tenacity was supreme!
Thank you to the following individuals for compelling suggestions and listening ears:
Dr. Laurie Peek, Dean Willie Reed, Dr. Sandy San Miguel, Dr. Kauline Davis, Ms.
Marisol Uribe, Ms. Maricela Alvarado, Ms. Lisa Greenhill, Dr. Mark Rishniw, Dr. Ron
DeHaven, Dr. Dave Granstrom, Dr. Kevin Dajka, Ms. Allison Shepherd, Ms. Barbara
Baldwin, Mr. Mike Cathey, Dr. Beth Sabin, Mr. Tom Jackowiak, Ms. Michelle
DeKinder-Smith, Ms. Miriam Acevedo-Davis, Dr. Jasmine Gonzalvo, Mr. Bob Chase,
Mr. Mark Hugo Lopez, Dr. Gary Patronek, Dr. Mark Jerome Walters, Dr. Amalia de
Gortari, and all of my “beloved survey critics”!
Gracias to all of the pet owners, veterinarians, veterinary staff, and veterinary students
v
TABLE OF CONTENTS
Page LIST OF TABLES ............................................................................................................ vii LIST OF FIGURES ............................................................................................................ x ABSTRACT…….. ............................................................................................................. xi CHAPTER 1. INTRODUCTION ................................................................................. 1
1.1 Significance of Latino Pet Owner Survey ................................................. 6
1.2 Significance of Veterinary Practitioner Survey ........................................ 7
1.3 Significance of Veterinary Student Survey ............................................... 7
1.4 Research Goal ........................................................................................... 9
1.5 Specific Aims of this Research and Hypotheses ....................................... 9
CHAPTER 2. LITERATURE REVIEW .................................................................... 13 2.1 Introduction ............................................................................................. 13
2.2 The Challenges ........................................................................................ 16
2.2.1 Low Health Literacy ......................................................................... 16 2.2.2 Limited English Proficiency ............................................................. 22
2.3 Strategies for Addressing the Challenges ................................................ 37
2.3.1 Improving communication via language concordance and interpreter models .............................................................................................. 37 2.3.2 Improving communication via hospital, pharmacy & educational models .............................................................................................. 47
2.4 The Cost of Communication Gaps .......................................................... 53
2.5 Justification for Current Research ........................................................... 55
CHAPTER 3. DOG AND CAT OWNERSHIP AND USE OF VETERINARY SERVICES BY ENGLISH PROFICIENT AND LIMITED ENGLISH PROFICIENT LATINO PET OWNERS .................................................................................................. 57
3.1 Introduction ............................................................................................. 57
3.2 Materials and Methods ............................................................................ 60
3.3 Results ..................................................................................................... 65
3.4 Discussion ............................................................................................... 74
vi
Page CHAPTER 4. PREPAREDNESS OF SMALL ANIMAL VETERINARY PRACTICES TO WORK WITH LEP SPANISH-SPEAKING CLIENTS AND THEIR PETS……………. .......................................................................................................... 104
4.1 Introduction ........................................................................................... 104
4.2 Materials and Methods .......................................................................... 108
4.3 Results ................................................................................................... 113
4.4 Discussion ............................................................................................. 123
CHAPTER 5. SURVEY OF US VETERINARY STUDENTS REGARDING LEP SPANISH-SPEAKING CLIENTS AND THEIR PETS ................................................ 164
5.1 Introduction ........................................................................................... 164
5.2 Materials and Methods .......................................................................... 167
5.3 Results ................................................................................................... 171
5.4 Discussion ............................................................................................. 176
CHAPTER 6. CONCLUSIONS AND RECOMMENDATIONS ............................ 214 LIST OF REFERENCES ................................................................................................ 221 APPENDICES
Appendix A Latino Pet Owner Survey Instrument .................................................... 234
Appendix B Veterinary Practitioner Script and Survey Instrument .......................... 246
Appendix C Veterinary Student Survey & Supporting Documentation .................... 253
VITA…………….. ......................................................................................................... 265
vii
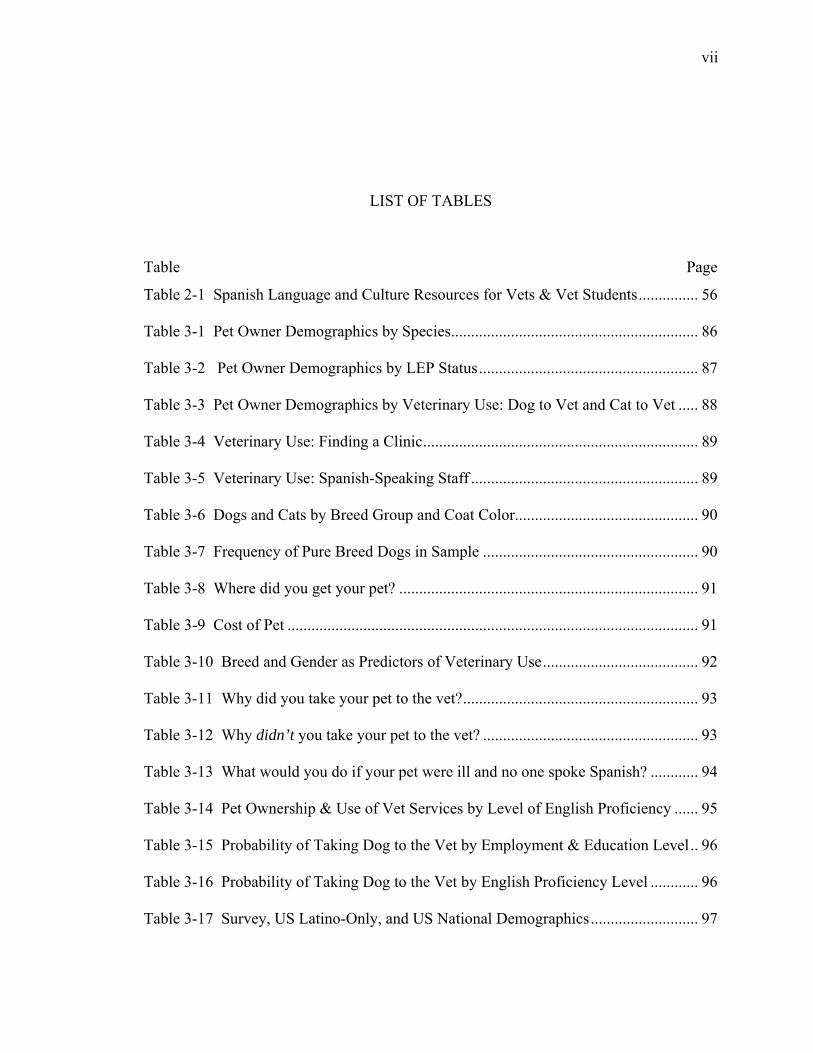
LIST OF TABLES
Table .............................................................................................................................. Page
Table 2-1 Spanish Language and Culture Resources for Vets & Vet Students ............... 56
Table 3-1 Pet Owner Demographics by Species .............................................................. 86
Table 3-2 Pet Owner Demographics by LEP Status ....................................................... 87
Table 3-3 Pet Owner Demographics by Veterinary Use: Dog to Vet and Cat to Vet ..... 88
Table 3-4 Veterinary Use: Finding a Clinic ..................................................................... 89
Table 3-5 Veterinary Use: Spanish-Speaking Staff ......................................................... 89
Table 3-6 Dogs and Cats by Breed Group and Coat Color .............................................. 90
Table 3-7 Frequency of Pure Breed Dogs in Sample ...................................................... 90
Table 3-8 Where did you get your pet? ........................................................................... 91
Table 3-9 Cost of Pet ....................................................................................................... 91
Table 3-10 Breed and Gender as Predictors of Veterinary Use ....................................... 92
Table 3-11 Why did you take your pet to the vet? ........................................................... 93
Table 3-12 Why didn’t you take your pet to the vet? ...................................................... 93
Table 3-13 What would you do if your pet were ill and no one spoke Spanish? ............ 94
Table 3-14 Pet Ownership & Use of Vet Services by Level of English Proficiency ...... 95
Table 3-15 Probability of Taking Dog to the Vet by Employment & Education Level .. 96
Table 3-16 Probability of Taking Dog to the Vet by English Proficiency Level ............ 96
Table 3-17 Survey, US Latino-Only, and US National Demographics ........................... 97
viii
Table .............................................................................................................................. Page
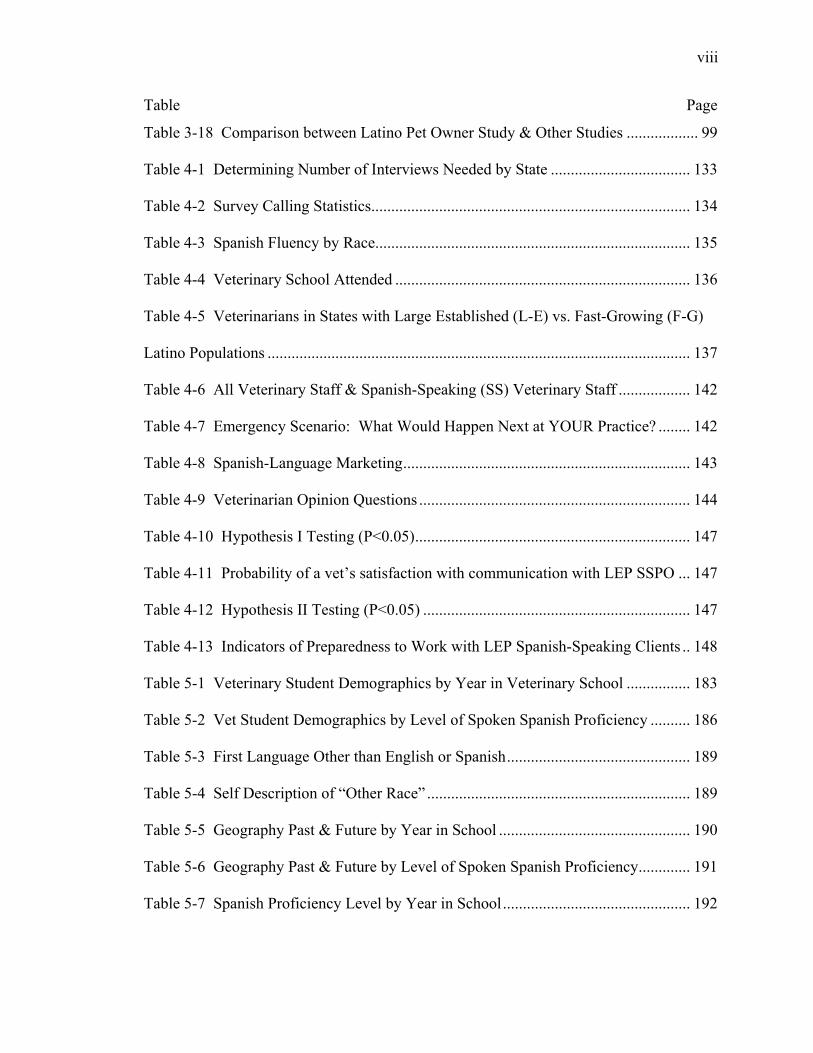
Table 3-18 Comparison between Latino Pet Owner Study & Other Studies .................. 99
Table 4-1 Determining Number of Interviews Needed by State ................................... 133
Table 4-2 Survey Calling Statistics ................................................................................ 134
Table 4-3 Spanish Fluency by Race ............................................................................... 135
Table 4-4 Veterinary School Attended .......................................................................... 136
Table 4-5 Veterinarians in States with Large Established (L-E) vs. Fast-Growing (F-G)
Latino Populations .......................................................................................................... 137
Table 4-6 All Veterinary Staff & Spanish-Speaking (SS) Veterinary Staff .................. 142
Table 4-7 Emergency Scenario: What Would Happen Next at YOUR Practice? ........ 142
Table 4-8 Spanish-Language Marketing ........................................................................ 143
Table 4-9 Veterinarian Opinion Questions .................................................................... 144
Table 4-10 Hypothesis I Testing (P<0.05) ..................................................................... 147
Table 4-11 Probability of a vet’s satisfaction with communication with LEP SSPO ... 147
Table 4-12 Hypothesis II Testing (P<0.05) ................................................................... 147
Table 4-13 Indicators of Preparedness to Work with LEP Spanish-Speaking Clients .. 148
Table 5-1 Veterinary Student Demographics by Year in Veterinary School ................ 183
Table 5-2 Vet Student Demographics by Level of Spoken Spanish Proficiency .......... 186
Table 5-3 First Language Other than English or Spanish .............................................. 189
Table 5-4 Self Description of “Other Race” .................................................................. 189
Table 5-5 Geography Past & Future by Year in School ................................................ 190
Table 5-6 Geography Past & Future by Level of Spoken Spanish Proficiency ............. 191
Table 5-7 Spanish Proficiency Level by Year in School ............................................... 192
ix
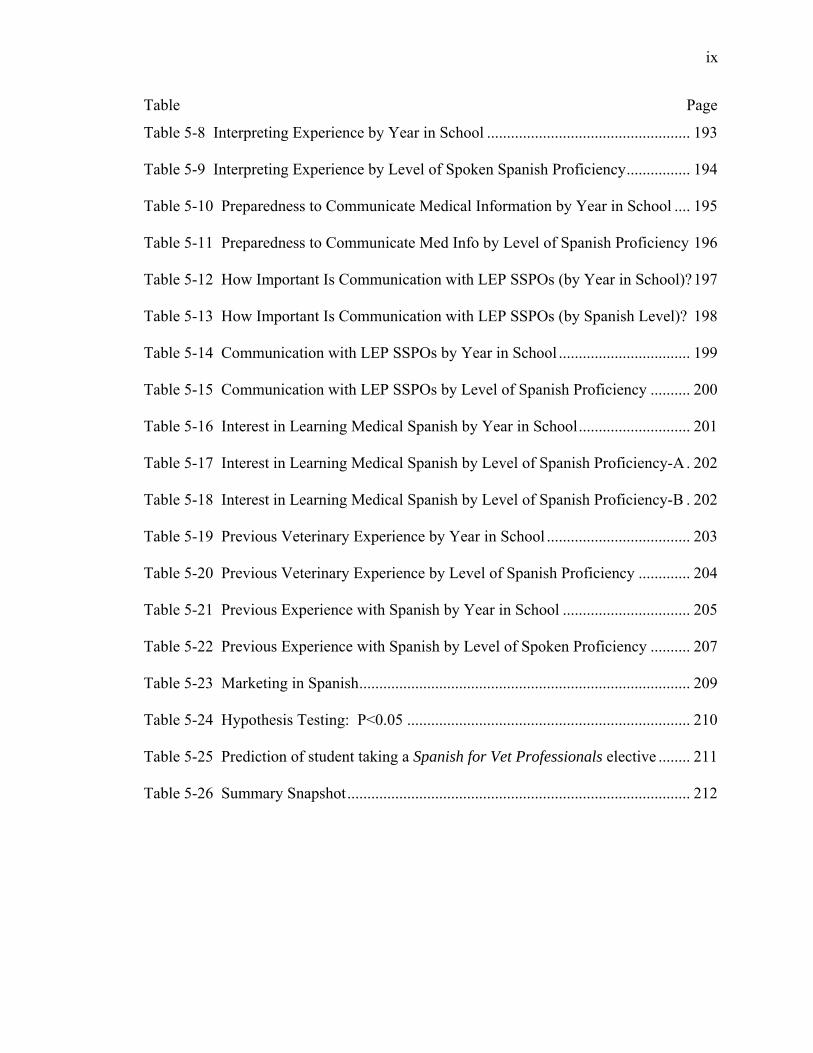
Table .............................................................................................................................. Page
Table 5-8 Interpreting Experience by Year in School ................................................... 193
Table 5-9 Interpreting Experience by Level of Spoken Spanish Proficiency ................ 194
Table 5-10 Preparedness to Communicate Medical Information by Year in School .... 195
Table 5-11 Preparedness to Communicate Med Info by Level of Spanish Proficiency 196
Table 5-12 How Important Is Communication with LEP SSPOs (by Year in School)? 197
Table 5-13 How Important Is Communication with LEP SSPOs (by Spanish Level)? 198
Table 5-14 Communication with LEP SSPOs by Year in School ................................. 199
Table 5-15 Communication with LEP SSPOs by Level of Spanish Proficiency .......... 200
Table 5-16 Interest in Learning Medical Spanish by Year in School ............................ 201
Table 5-17 Interest in Learning Medical Spanish by Level of Spanish Proficiency-A . 202
Table 5-18 Interest in Learning Medical Spanish by Level of Spanish Proficiency-B . 202
Table 5-19 Previous Veterinary Experience by Year in School .................................... 203
Table 5-20 Previous Veterinary Experience by Level of Spanish Proficiency ............. 204
Table 5-21 Previous Experience with Spanish by Year in School ................................ 205
Table 5-22 Previous Experience with Spanish by Level of Spoken Proficiency .......... 207
Table 5-23 Marketing in Spanish ................................................................................... 209
Table 5-24 Hypothesis Testing: P<0.05 ....................................................................... 210
Table 5-25 Prediction of student taking a Spanish for Vet Professionals elective ........ 211
Table 5-26 Summary Snapshot ...................................................................................... 212
x
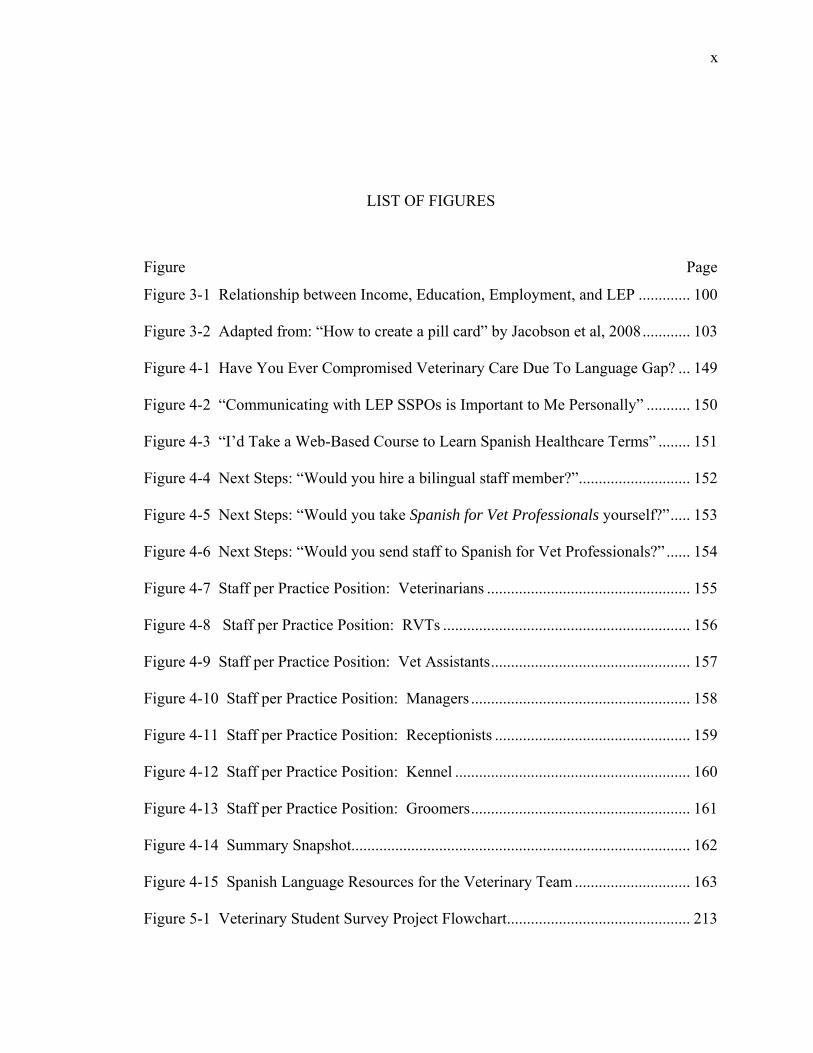
LIST OF FIGURES
Figure ............................................................................................................................. Page
Figure 3-1 Relationship between Income, Education, Employment, and LEP ............. 100
Figure 3-2 Adapted from: “How to create a pill card” by Jacobson et al, 2008 ............ 103
Figure 4-1 Have You Ever Compromised Veterinary Care Due To Language Gap? ... 149
Figure 4-2 “Communicating with LEP SSPOs is Important to Me Personally” ........... 150
Figure 4-3 “I’d Take a Web-Based Course to Learn Spanish Healthcare Terms” ........ 151
Figure 4-4 Next Steps: “Would you hire a bilingual staff member?” ............................ 152
Figure 4-5 Next Steps: “Would you take Spanish for Vet Professionals yourself?” ..... 153
Figure 4-6 Next Steps: “Would you send staff to Spanish for Vet Professionals?” ...... 154
Figure 4-7 Staff per Practice Position: Veterinarians ................................................... 155
Figure 4-8 Staff per Practice Position: RVTs .............................................................. 156
Figure 4-9 Staff per Practice Position: Vet Assistants .................................................. 157
Figure 4-10 Staff per Practice Position: Managers ....................................................... 158
Figure 4-11 Staff per Practice Position: Receptionists ................................................. 159
Figure 4-12 Staff per Practice Position: Kennel ........................................................... 160
Figure 4-13 Staff per Practice Position: Groomers ....................................................... 161
Figure 4-14 Summary Snapshot..................................................................................... 162
Figure 4-15 Spanish Language Resources for the Veterinary Team ............................. 163
Figure 5-1 Veterinary Student Survey Project Flowchart .............................................. 213
xi
ABSTRACT
Landau, Ruth Ellen. Ph.D., Purdue University, December 2013. Assessing the Preparedness of the Veterinary Profession to Communicate with Limited English Proficient Spanish-Speaking Pet Owners. Major Professor: George E. Moore. The purpose of the present study was to assess the preparedness of the veterinary
profession to communicate with limited English proficient Spanish-speaking pet owners
(LEP SSPOs). Results of surveys with 393 Latino pet owners, 383 small animal
veterinarians and staff, and over 2000 veterinary students indicate that interaction
between veterinary professionals and LEP SSPOs is not a rare occurrence: Veterinarians
in states with large established or fast-growing Latino communities are seeing LEP
SSPOs and their pets on a regular basis: 89% of veterinarians have LEP Spanish-
speaking clients, over half of these practitioners are seeing LEP SSPOs weekly, and over
half of veterinary students surveyed worked at a practice or shelter that sees LEP SSPOs.
Pet owners in general were more likely not to take their dog to the veterinarian if
they had limited income, employment, or education, and more likely not to take their cat
to the veterinarian if they had young children living at home. However, individuals with
LEP were significantly more likely to earn less than $15,000 per year, have less than full-
time employment, have less than a high school education, and have young children at
xii
home. Thus decreased use of veterinary services is confounded by one’s LEP status,
rather than being directly attributable to accompanying language challenges.
Veterinarians who utilized a pet owner’s family or friends as interpreters were
significantly less satisfied with their communication with LEP SSPOs than veterinarians
who used bilingual staff to interpret for them. Only 8% of small animal practice staff
could communicate in Spanish with LEP SSPOs. Recommendations to improve
communication with LEP SSPOs include: using a Spanish-English dictionary, phrase
book, brochures and handouts; using software to translate English text to written and
voiced Spanish; using toll-free telephone services to interpret live conversations; and
hiring bilingual staff. Veterinarians who employed Spanish-speaking staff and offered
Spanish-language written materials and translations reported greater satisfaction
communicating with LEP SSPOs.
Veterinarians (75%) and veterinary students (67%) agreed that Spanish for
Veterinary Professionals should become an elective course in the DVM curriculum.
Most (89%) practices did no marketing of services in Spanish to their LEP SSPOs.
Marketing suggestions included: Add Spanish-language messages to signage, phone
messages, Facebook accounts, websites and blogs; distribute Spanish-language flyers to
churches and Latino Community centers; provide practice listing in Latino Yellow Pages;
partner with Spanish-speaking organizations in the community; and capitalize on word-
of-mouth advertising. This study demonstrated that the number of LEP SSPOs is greater
than the number of Spanish-speaking veterinary professionals and students available to
work with them. Implementing some of the strategies suggested by respondents can help
to bridge this growing communication gap.
1
CHAPTER 1. INTRODUCTION
The Veterinarian-Client-Pet Relationship (VCPR) is the focal point of
communication in veterinary medicine. It is within the context of the VCPR that
communication about the pet takes place between client and veterinarian. Legally and
ethically, there must be a VCPR, whereby a veterinarian examines a pet in person, before
prescribing medication or recommending treatment to the client (AVMA 2013). But
what if the client and veterinarian don’t speak the same language? What if there is a
language gap between pet owner and veterinary staff such that effective communication
is compromised? How does this impact the veterinarian’s ability to obtain informed
consent and provide state-of-the-art veterinary care? The goal of this thesis was to assess
preparedness of US veterinarians, veterinary staff, and veterinary students to
communicate with limited English proficient Spanish-speaking pet owners (LEP SSPOs).
The terms Latino and Hispanic are used interchangeably to describe: "a person of
Cuban, Mexican, Puerto Rican, South or Central American, or other Spanish culture or
origin regardless of race” (U.S. Census Bureau 2010). Latinos are the largest minority
group in 25 of the fifty US states, and as of 2010, the US had the second-largest Latino
population in the world, second only to Mexico (U.S. Census Bureau 2011). Currently
Latinos number 51.9 million people and comprise 16.7% of the nation’s 311 million
inhabitants, up from 13% in 2000 (U.S. Census Bureau 2011). While the US national
2
population grew 10% from 2000 to 2011, the Latino population grew by 48% during that
same time period (U.S. Census Bureau 2011). Between 2000 and 2010, the Latino
population doubled in at least one in every four US counties (U.S. Census Bureau 2011).
By the year 2050, it is projected that Latinos will number 132.8 million or 30% of the US
population (U.S. Census Bureau 2011; Motel S and Patten E 2013).
Spanish is spoken by ten times more people than any other non-English language
in the US. According to the Modern Language Association, there are 381 non-English
languages being spoken at home in the US by one in five people over the age of 5 years
(Ryan 2013). Of those speaking languages other than English, more than 62%, or 37.6
million individuals, speak Spanish. No other non-English language, including Chinese,
Tagalog, Vietnamese, German, or Korean, represents even 5% of the non-English
languages spoken in the US (Shin and Kominski 2010).
The term “limited English proficient,” or LEP, describes an individual who does
not speak English as his or her primary language and who has a limited ability to speak,
read, write, or understand the English language (LEP.gov 2013). The percentage of LEP
individuals in the US over the age of 5 years is currently estimated to be 8.7%, meaning
25.3 million people speak English less than “very well” (Shin and Kominski 2010; U.S.
Census Bureau 2010; Pandya C, Batalova J et al. 2011). Of these 25.3 million LEP
individuals, 16.2 million speak Spanish (Shin and Kominski 2010). Not all Latinos speak
Spanish, nor do all Latinos who speak Spanish have limited English proficiency. But
among all individuals in the US who do have LEP, 64% speak Spanish.
Health literacy often goes hand-in-hand with LEP. Health literacy has been
defined as: “The degree to which individuals have the capacity to obtain, process and
3
understand basic health information and services needed to make appropriate health
decisions” (Ratzan SC and Parker RM 2000). While health literacy is a public health
issue affecting all ages, races and income levels, a disproportionate number of minorities
and immigrants are estimated to have health literacy problems: 50% of Hispanics, 40% of
Blacks, 33% of Asians (Nielsen-Bohlman, Panzer et al. 2004). Furthermore, low health
literacy affects more adults who have LEP (Kirsh I, Jungeblut A et al. 1993; Gazmararian,
Baker et al. 1999; Beers BB, McDonald VJ et al. 2003; Nielsen-Bohlman, Panzer et al.
2004; Sanders L, Federico S et al. 2009). A person with low health literacy might have
difficulty understanding and acting on health information, might be unable to perform
health tasks like dosing over-the-counter medication for themselves or their pets, or
might not understand their pet’s post-operative discharge instructions.
This growing number of US LEP Spanish-speakers, some of who might also have
low health literacy, includes pet owners who visit veterinarians with their pet. It is
estimated that between 36% (Pew Research Center 2006) and 38% (Social Science
Research Solutions 2012) of Latinos currently own a pet. If there are 25.3 million LEP
persons, 64% of whom speak Spanish, and 37% of whom are pet owners, then there are
approximately 6 million LEP SSPOs in the U.S. Despite the Latino and LEP population
explosion however, little is known about the type and quality of veterinary care provided
to pets of Spanish-speaking owners who have limited English proficiency.
Several peer-reviewed studies have been conducted comparing non-Latino to
Latino pet owners with respect to the strength of the human-animal bond, species of pet
preferred, and attitudes toward pet sterilization. Results from a study by Schoenfeld-
Tacher et al. (2010) suggest that Latino pet owners were more likely to consider their pet
4
to be a “family member” than non-Latino owners (Schoenfeld-Tacher, Kogan et al. 2010).
Surveys of 144 Latino pet-owning university students in south Texas by Faver and
Cavazos (2008) revealed that over 80% of the pet-owning students identified
companionship and unconditional love as benefits offered by their dog or cat, and 92% of
these students regarded their dog or cat as a family member (Faver and Cavazos Jr 2008).
Risley-Curtiss et al. (2006) found that Latino pet owners were less likely to have cats or
birds, and 3.4 times more likely not to sterilize their pets, especially male dogs, than non-
Latino owners. Additionally, Latino pet owners were 55% more likely to report that their
pets give them a sense of personal safety and 73% more likely not to have a veterinarian
for their pet than non-Latino owners (Risley-Curtiss 2006).
In a study exploring attitudes toward sterilization of companion animals, Faver
(2009) found that south Texan, Latino pet-owning students were more likely to own dogs
than cats, but more likely to sterilize cats than dogs: “…In Latino families, when cats are
owned, they are regarded as highly as dogs” (p. 327) (Faver 2009). In their exploration
of Latino residents’ attitudes and behaviors toward companion animals in El Paso County,
TX, Poss and Bader (2007) discovered that while one-fourth of the dog owners surveyed
allowed their dogs to roam free in the street, the majority interviewed felt that free-
roaming dogs (both stray and owned) were a problem that prevented residents from
walking outdoors (Poss and Bader 2007). They also learned that while most respondents
in this impoverished US-Mexico border community believed it was a good idea to
sterilize dogs and cats, only 11% of the dogs and 27% of the cats belonging to these
owners were sterilized. A second study by Poss and Bader (2008) demonstrated that 82%
5
of residents of this Hispanic colonia1 (U.S. Department of Housing and Urban
Development 2005) reported they were willing to participate in a free, bilingual mobile
spay/neuter program with their dogs and cats. Over an eight-month period, the program
increased the community’s sterilization rate of dogs from 11% to 47% and that of cats
from 27% to 38% (Poss and Bader 2008).
To this author’s knowledge there have been no studies published to date that
examine pet ownership characteristics of LEP Spanish-speaking pet owners, factors
associated with their use of veterinary services, nor the degree of Spanish language
proficiency and prevalence of interpreter and translation services utilized by veterinarians,
veterinary staff, or veterinary students when working with LEP SSPOs. As the Latino
population in the United States continues to grow, so will the LEP Spanish-speaking, pet-
owning population. The ability to communicate effectively with LEP SSPOs in order to
provide their pets with high quality veterinary care is becoming increasingly vital in
many parts of the United States.
There is a large literature on the impact of LEP and low health literacy on the
quality of health care received for human patients, and in particular on the quality of care
received by children of LEP caregivers. There is also a large literature on the use of
interpreters in health care interactions with LEP patients, and on the frequency of using
children as ad hoc interpreters in these settings. But there is virtually no information on
the impact of LEP and low literacy on the quality of veterinary health care received by
1 The US Department of Housing and Urban Development defines a colonia as a community located within 150 miles of the U.S.-Mexico border that lacks at least one of the following: (a) a potable water supply; (b) adequate sewage and drainage systems; (c) decent, safe, and sanitary housing; or (d) paved road (U.S. Department of Housing and Urban Development 2005).
6
LEP pet owners for their pets, nor on the frequency of using children as ad hoc
interpreters in veterinary medical settings.
The purpose of this study was to assess the impact of LEP on the quality of
veterinary health care provided to pets of LEP Spanish-speakers, determine the extent to
which LEP pet owners are offered Spanish-language translation, interpreting and
educational information, and estimate the level of spoken Spanish proficiency, interest,
and preparedness of veterinary students to communicate with LEP SSPOs.
Three national surveys were conducted to demonstrate that the proportion of LEP
SSPOs is significantly greater than the proportion of Spanish-speaking veterinary
professionals and students who are available to work with these pet owners.
1.1 Significance of Latino Pet Owner Survey
The veterinary medical and animal shelter communities would benefit from
knowing what types of pets are owned and what veterinary services are needed for pets of
LEP SSPOs, in order to better communicate with LEP SSPOs and meet their pets’
veterinary needs. While the need for Spanish-speaking veterinarians and staff will not be
identical in every state or county in the US, an awareness of the prevalence of LEP
SSPOs is important for Spanish-speaking staff planning and preparedness. The human
medical literature has abundant examples of healthcare providers caught unprepared for
the influx of LEP Spanish-speaking patients. Veterinary practices and shelters have an
opportunity now to improve their language services in order to communicate with current
LEP SSPOs and to meet future demands.
7
1.2 Significance of Veterinary Practitioner Survey
The Veterinary Practitioner survey generates a baseline for how prepared US
veterinary practices are to communicate with LEP SSPOs by measuring the extent to
which language access services are currently available in small animal practices.
“Language access services” refers to any service that helps a person with LEP obtain “the
same access to and understanding of health care as a non-LEP person would have” (Roat
2005). Language access services include the use of bilingual staff and interpreters and/or
written material that is translated into the LEP person’s native language. In human
medicine, studies have shown that language access services favorably impact the quality
of care received, the cost of care received, and the access to care itself (Roat 2005). To
this author’s knowledge, no previous research has estimated how many LEP SSPOs are
seen weekly at veterinary practices; how many small animal practices employ Spanish-
English bilingual staff members and doctors; how emergency situations are handled when
there is a language barrier; and what, if any, marketing strategies are being used to reach
the ever-growing demographic of LEP SSPOs in the US.
1.3 Significance of Veterinary Student Survey
Veterinary students are future practitioners who are likely to encounter an
increasing number of LEP SSPOs in their practice career. Results of this study will
provide an estimate of the proportion of veterinary students who can communicate basic
medical information in Spanish, as well as an estimate of interest in a Spanish for
Veterinary Professionals elective for veterinary students. Results of this study may well
demonstrate a need to enhance the veterinary curricula to help students meet the goals for
8
Professional Competency in the areas of communication and diversity/multicultural
awareness, especially as these goals pertain to working with LEP pet owners.
The goals for Professional Competency, as set forth in 2011 by North American
Veterinary Medical Education Consortium, include:
Communication
Veterinarians sustain effective, professional relationships and skillful,
sensitive, appropriate communications with clients, colleagues, other
healthcare professionals, and the public. They communicate in various ways
and in a variety of settings with the purpose of achieving the best
outcomes/results. They are able to establish and maintain effective
communication in the face of cultural differences and challenging
situations… (p. 57, bold added)(NAVMEC 2011).
Diversity/Multicultural Awareness
Diversity enhances the quality of education and results in more effective and
culturally competent veterinarians who are better prepared to serve an
increasingly heterogeneous population. Veterinarians demonstrate an
understanding of the manner in which culture and belief systems impact
delivery of veterinary medical care while recognizing and appropriately
addressing biases in themselves, in others, and in the process of veterinary
medical care delivery.
Diversity refers to differences among people with respect to race, gender, age,
ethnicity, sexual orientation, mental/physical ability, religion, job level,
9
personality traits, education, health, stature, culture, language, and other
human differences (p.60, bold added) (NAVMEC 2011).
The more ethnically and linguistically diverse the US becomes, the more US
veterinarians, veterinary staff and veterinary students will need to hone their
communication and cultural competency skills to address this diversity.
1.4 Research Goal
Assess the preparedness of the veterinary profession to communicate with limited
English proficient Spanish-speaking pet owners (LEP SSPOs). Determine if there is
congruence between what LEP SSPOs need, and what veterinary practitioners, staff, and
students currently provide.
1.5 Specific Aims of this Research and Hypotheses
1. Describe the current patterns of pet ownership among Latino pet owners, identify
factors associated Latino pet owners’ use of veterinary services, and describe Latino
pet owners’ satisfaction with their pet’s veterinary care and their own communication
with members of the veterinary team.
Hypothesis 1.1: LEP among Latinos is not a barrier for obtaining quality
veterinary care for their pets. English-proficient and LEP Latino pet owners are equally
likely to take their dogs or cats to a veterinarian annually.
Hypothesis 1.2: LEP among Latinos is not a barrier to veterinary customer
satisfaction. English-proficient and LEP Latino pet owners are equally satisfied with
10
their pet’s care and with their ability to communicate with members of the veterinary
team.
2. Determine the proportion of small animal veterinary practices which provide Spanish
language access services (bilingual staff, Spanish-language client-education materials,
Spanish-language marketing) to LEP SSPOs. Assess veterinarian’s satisfaction with
communication with LEP SSPOs.
Hypothesis 2.1: Veterinarians who utilize Spanish-speaking staff, Spanish-
language handouts, and/or Spanish-language marketing materials have the same number
of LEP Spanish-speaking clients as veterinarians who do not provide these Spanish
language access services.
Hypothesis 2.2: Veterinarians who utilize client friends or family as ad hoc
translators are as satisfied with their communication with LEP Spanish-speaking clients
as veterinarians who utilize bilingual staff to translate.
3. Estimate the proportion of students who have experience working with LEP SSPOs in
a veterinary medical or shelter setting, can communicate basic medical information in
Spanish to clients without the help of a translator, and are interested in taking a Spanish
for Veterinary Professionals elective.
Hypothesis 3.1: A student’s interest in taking a Spanish for Veterinary
Professionals elective is not associated with that student’s past experience working with
LEP SSPOs.
11
Hypothesis 3.2: A student’s interest in taking a Spanish for Veterinary
Professionals elective is not associated with that student’s self-assessed level of spoken
Spanish proficiency.
These hypotheses were tested using data collected by telephone surveys and on-
line surveys of Latino pet owners, small animal veterinarians and staff, and veterinary
students during 2012-13. Chapter 3 describes the proportion of Latino pet owners who
took their dog and/or cat to the veterinarian in the past 12 months. Factors significantly
associated with going to the veterinarian included: employment status, household
composition, education level, income level, and voter registration status, and whether or
not the pet owner also had children under the age of 18. Although a trend was seen
between increasing limited English proficiency level and decreased veterinary visits, it
was not a statistically significant factor associated with taking a pet to the veterinarian.
Chapter 4 describes the number of LEP SSPOs currently seen in small animal veterinary
practices, along with the proportion of practices which provide Spanish language access
services to LEP SSPOs in the form of bilingual staff, Spanish-language client education
information, and Spanish-language marketing. Veterinary practices which provide
Spanish-language access services are seeing a greater number of LEP SSPOs weekly than
those practices which do not provide these services. Veterinarians who utilize bilingual
staff to interpret expressed higher levels of satisfaction with communication than those
using a client’s family and friends to interpret. Chapter 5 describes the proportion of
veterinary students who have experience working with Spanish-speaking LEP clients in a
veterinary medical or shelter setting, and approximates the percentage of veterinary

12
students who can communicate basic medical information in Spanish. A student’s past
experience working with LEP SSPOs was not significantly associated with his/her
interest in taking a Spanish for Veterinary Professionals elective. A student’s current
level of Spanish proficiency was associated with his/her interest in taking this elective.
13
CHAPTER 2. LITERATURE REVIEW
“It’s said that a medical history accounts for 70 percent of the data used to make a diagnosis. If so, taking dangerous language risks
is akin to operating with a rusty scalpel.” (Warren Ferguson, 2008, Un Poquito:
The benefits and perils of knowing “a little bit” of Spanish when communicating with Spanish-speaking patients)
2.1 Introduction
The purpose of this literature review is to summarize what is known about the
impact of limited English proficiency and low health literacy in human medicine; to
compare these research findings to veterinary medicine; and to provide a rationale for
examining communication strategies used by physicians and pharmacists when working
with LEP and low health literate patients. The large human health literacy and LEP
literature were chosen for review because to this author’s knowledge, there is virtually no
published research on these topics in veterinary medicine. Also, the parallels between
veterinary and human medical health care suggest that the LEP literature is a logical place
to start when trying to understand the impact of communication challenges between
veterinarians and their clients.
As the number of LEP and low health literate pet owners continues to increase, and
the human-animal bond continues to strengthen, developing effective communication
strategies to deal with veterinary exam room language barriers is essential. Similar to
14
findings in the human health literature, improved communication with LEP pet owners in
the veterinary clinical setting has the potential to positively impact the patient’s physical
well being, the pet owner’s emotional experience, and the economic health of the
veterinary profession.
Parallels between the veterinary medical profession and the human medical
profession abound. Pets are increasingly seen and treated as family members (Burns K
2013). According to recent survey results, 56% of US households currently own 70
million dogs and 74 million cats (Burns K 2013). When asked about their relationship
with these 144 million pets, almost two-thirds (63%) of respondents stated that they
viewed their pets as family members (Burns K 2013). Researchers examining pet-related
economic trends over a recent 25-year period conclude: “…Inflation-adjusted US
consumer pet-related expenditures increased in aggregate approximately 186% from 1980
to 2005… In a broad sense, these trends speak to the evolving role of pets in American
culture and support the widely held opinion that the human-animal bond2 is strengthening”
(p. 409) (Wolf, Lloyd et al. 2008).
Two peer-reviewed studies conducted to investigate the strength of the human-
animal bond in Latino families specifically also revealed that pets have family-member
status: Schoenfeld-Tacher et al. (2010) discovered that Latino pet owners were more
likely than non-Latino owners to consider their pet to be a family member (Schoenfeld-
Tacher, Kogan et al. 2010), and Faver and Cavazos (2008) found that 92% of Latino
2 “The human-animal bond is a mutually beneficial and dynamic relationship between people and other animals that is influenced by behaviors that are essential to the health and well being of both. This includes, but is not limited to, emotional, psychological, and physical interactions of people, other animals, and the environment. The veterinarian's role in the human-animal bond is to maximize the potentials of this relationship between people and other animals” (definition provided by the AVMA, published in JAVMA on 6/1/98).
15
students surveyed regarded their dog or cat as a family member (Faver and Cavazos Jr
2008).
In addition to parallels in family member status, there are legal, ethical, and
communication parallels between the veterinary and human medical professions: Legally
and ethically, there must be a Veterinarian-Client-Pet Relationship (VCPR), whereby a
veterinarian examines a pet, before prescribing medication or recommending treatment to
the client (AVMA 2013). Similarly, there must be a Physician-Patient3 relationship,
whereby a physician examines a patient, before prescribing medication or recommending
treatment (2006). The Veterinarian-Client-Pet Relationship, like the Physician-Patient
Relationship, is the focal point of communication between provider, caregiver, and patient.
Communication issues are among the most cited causes underlying human medical
malpractice litigation (Hickson, Federspiel et al. 2002), just as they are in veterinary
medical malpractice litigation (Ellis L 2103). Although this trend is similar between the
two professions, the monetary outcome in malpractice litigation is different because pets
are still legally property.
Further elucidating parallels between the professions, Shaw et al. observe: “…Both
physicians and veterinarians are health care professionals and service providers who use
their talents and resources to care for living beings. Physicians and veterinarians share
the common goals of improving patient health, promoting adherence to medical
recommendations, and ensuring satisfaction with care. In both professions, the success of
the medical encounter is dependent on human-human interactions and satisfaction is
3 Physician-Patient Relationship has been defined as "a consensual relationship in which the patient knowingly seeks the physician's assistance and in which the physician knowingly accepts the person as a patient." (QT, Inc. v. Mayo Clinic, 2006)
16
derived from those interactions. Beyond this, the structure and content of the medical
interview are similar in human medical and veterinary medical practice, and the tasks that
make up the clinical interview in human medicine (i.e., initiating the session, gathering
information, building the relationship, explaining and planning, and closing the session)
are also used in veterinary clinical medicine” (Shaw, Adams et al. 2004).
But what if the provider and caregiver/patient don’t speak the same language?
What if there is a language and/or literacy barrier between those seeking and those
providing medical services, such that effective communication and subsequent
understanding is compromised? Communication challenges occur in both veterinary and
human medicine. The parallels between a veterinarian’s and physician’s role in the
provision of health care to family members in the face of communication challenges
suggest that veterinary practitioners can learn from the experience of our human medical
colleagues.
2.2 The Challenges
2.2.1 Low Health Literacy
Health literacy has been defined as: “The degree to which individuals have the
capacity to obtain, process and understand basic health information and services needed
to make appropriate health decisions” (Ratzan SC and Parker RM 2000). Health literacy
is closely related to functional literacy, which describes an individual’s ability to read,
write, listen, process information, memorize, problem-solve, and handle numerical
problems. Health literacy can be considered a context-specific form of functional literacy
(Sharp, Ureste et al. 2013), born out of the recognition that functional literacy and health
17
outcomes are closely related: Where education, health services, and social and cultural
factors converge, health literacy emerges (Nielsen-Bohlman, Panzer et al. 2004).
Scope of low health literacy
It is estimated that at least 1 in 3 adults in the US have low health literacy (Nielsen-
Bohlman, Panzer et al. 2004; Kutner 2006; Sanders L, Federico S et al. 2009), and only 12%
of US adults have proficient health literacy (National Center for Education Statistics 2003).
While health literacy is a public health issue affecting all ages, races and income levels, a
disproportionate number of minorities and immigrants are estimated to have health literacy
problems: 50% of Hispanics, 40% of Blacks, 33% of Asians (Nielsen-Bohlman, Panzer et
al. 2004). Furthermore, low health literacy affects more adults who are older, have
poverty-level income, a learning disability, physical disability, less than a high-school
education, and/or limited English proficiency (Kirsh I, Jungeblut A et al. 1993;
Gazmararian, Baker et al. 1999; Beers BB, McDonald VJ et al. 2003; Nielsen-Bohlman,
Panzer et al. 2004; Sanders L, Federico S et al. 2009).
Individuals with low health literacy are often ashamed to speak up about their
challenges navigating the health care system. In a study by Parikh et al., 91% of adults
with low literacy skills never told their supervisor, 68% never told their spouse, and 19%
never told anyone (Parikh, Parker et al. 1996). Physicians, nurses, pharmacists, dentists,
veterinarians and other health professionals may never know that among the clients and
patients they have seen for years, some have low health literacy that severely limits their
understanding of health care issues.
18
Mismatch between reading ability and written health care materials
While most health care materials are written at or above the 10th grade level (where
readability is determined in part by sentence length and number of syllables per word), the
average American reads at the 8th or 9th grade level. An estimated one in five adults in the
US read at the 5th grade level or below, and for minorities and adults over 65, that estimate
doubles to two in five (Maximus 2005). More than 300 studies conducted over 30 years
have found a mismatch between reading skills of the intended audience and reading levels
of health care materials, including informed consent forms, medication package inserts,
and medication labels (Rudd RE, Colton T et al. 2000).
Links between low health literacy and poor health outcomes in adults
The impact of low health literacy in adults is complex: First, annual health care
costs for patients with low literacy are on average four-fold higher than those with
adequate literacy skills, perhaps because low-health-literate patients having a 50%
increased risk of hospitalization. Second, low health literacy leads to lack of compliance
and medical errors; only about half of all patients take their medications as directed. Third,
patients with low health literacy who have chronic diseases like hypertension, asthma, or
diabetes, have poorer understanding of their disease and its treatment, and fewer correct
self-management skills than patients with adequate health literacy (Williams MV, Baker
DW et al. 1998; National Patient Safety Foundation 2011). Fourth and finally, low health
literacy negatively impacts patient safety:
“Health literacy issues and ineffective communications place patients at greater
risk of preventable adverse events. If a patient does not understand the
implications of her or his diagnosis and the importance of prevention and
19
treatment plans, or cannot access health care services because of
communications problems, an untoward event may occur. The same is true if the
treating physician does not understand the patient or the cultural context within
which the patient receives critical information. Cultural, language and
communication barriers – together or alone – have great potential to lead to
mutual misunderstandings between patients and their health care providers”
(p. 6, bold added) (Joint Commission 2007).
Links between low health literacy of adults and poor health outcomes in children
Health outcomes in children and pets depend on the caregiver’s capacity to
understand medical regimens, nutritional recommendations, and dosing calendars. Sander
et al. (2009) conducted a systematic review of the literature of studies that assessed (i) the
health literacy of adolescents, young adults, or caregivers of young children; (ii) the
readability of child health information; and (iii) the relationship between literacy and child
health outcomes. They found that over 100 million adults in the US could have difficulty
understanding and acting on health information; 1 in 10 are unable to perform health tasks
like dosing an over-the-counter medication for themselves or their children, reading a
clinic appointment slip, or understanding discharge instructions (Sanders L, Federico S et
al. 2009). The authors conclude that “caregiver literacy may serve as an important
modifiable factor influencing child health disparities” (p.136).
As a result of the growing body of evidence that health literacy impacts health
outcomes, the Institute of Medicine has identified health literacy “as one of the most
important cross-cutting themes in efforts to address health disparities, patient safety, and
quality improvement” (Sanders L, Federico S et al. 2009), and included health literacy in
20
five of the six Healthy People 2010 health communications objectives (Sanders L,
Federico S et al. 2009). DeWalt and Hink (2009) also conducted a systematic review of
the literature to understand how caregiver literacy skills are related to child health
outcomes4, and what interventions might improve health outcomes for children whose
parents have low literacy (DeWalt and Hink 2009). One study they reviewed
demonstrated that children whose parents have low literacy have a higher rate of persistent
asthma and more hospitalizations and emergency department visits than do children whose
parents have higher literacy (DeWalt, Dilling et al. 2007). Another study found a
significant relationship between maternal literacy level and the child’s glycemic control
(Ross, Frier et al. 2001). Since children are dependent upon their caregivers, Sanders et al.
suggest that we consider the ‘collective health literacy’ of all people responsible for a
child’s care – including parents, siblings, family members, and others – as a form of
‘social capital’(Sanders L, Federico S et al. 2009). Since pets are also dependent upon
their caregivers, veterinarians might consider the “collective health literacy” of all those
responsible for the pet’s care.
Techniques for overcoming low health literacy: Help the client to help him/herself
To overcome low health literacy, researchers recommend communication
techniques which enhance understanding and empower the patient to help him/herself.
Strategies include: reduce the complexity of health information by using pictograms,
models, audio-recorded instructions, interactive video, and plain language written at 6th
grade literacy levels or below; enhance the communication skills of health professionals
4 “Health outcomes” include: health knowledge; health behaviors; biochemical outcomes; measures of disease incidence, prevalence, morbidity and/or mortality; self-reported general health assessment; utilization of health care services; and/or cost of care (Dewalt 2009).
21
by limiting the number of messages given at once to just two or three, using jargon-free
language, and asking the patient or caregiver to “teach-back” and “show back” what they
just understood; encourage the patient or caregiver to ask questions; and directly improve
the health literacy of patients and caregivers by recommending adult literacy classes and
offering literacy classes on site at the clinic or hospital (Houts PS, Witmer JT et al. 2001;
Yin HS, Dreyer BP et al. 2008; Sanders L, Federico S et al. 2009; Barrow 2012; Sharp,
Ureste et al. 2013). Veterinarians and veterinary staff can emulate these communication
strategies to help clients with low health literacy help their pets. When patients and clients
have access to information in a language and format they can understand, they are more
self-reliant and empowered to make informed choices about health care decisions for
themselves and their dependents, two-legged and four-legged.
Through the use of posters, brochures and buttons, the National Patient Safety
Foundation Ask Me 3 campaign tries to empower patients by encouraging them to ask
their health care providers three key questions: “What is my main problem?” “What do I
need to do?” “Why is it important?” (National Patient Safety Foundation 2011; National
Patient Safety Foundation 2013). The AVMA might consider a similar client
empowerment campaign: “What is my pet’s main problem?” “What do I need to do for
him/her?” “Why is it important?”
How to determine if a patient or client has low health literacy?
The literature highlights associations between low health literacy and adverse
health outcomes, but how can a health care provider determine if a patient or client has
low health literacy? Assistant secretary for health at the Department of Health and Human
Services, Howard Koh, MD, suggests, “Our model calls for first approaching all patients
22
with the assumption that they are at risk of not understanding their health conditions or
how to deal with them, and them subsequently confirming and ensuring patients’ health
understanding” (Koh, Brach et al. 2013). Staff who are trained to notice simple clues --
patients or clients who say they forgot their glasses, ask to take paperwork home to
complete, or ask a friend or family member to complete the forms – are more likely to
assist a low-health-literate patient or client.
There are many formal, validated instruments now being used to measure health
literacy in medicine and dentistry that can be given during a new patient intake (Davis TC,
Long SW et al. 1993; Parker RM, Baker DW et al. 1995; Baker, Williams et al. 1999; Lee,
Stucky et al. 2010; Lee, Stucky et al. 2013). But researchers Sharp et al. wanted to find a
fast, unobtrusive method to assess low health literacy without giving a new patient a test.
They devised a study in which they measured the time it took (in seconds) for a patient to
sign their name to a form, and correlated that time with the patient’s score on a health
literacy test. Signature time was longest for those with inadequate health literacy,
compared with marginal and adequate health literacy. They concluded that signature time
may provide a quick, practical, non-invasive approach to health literacy screening in the
health care setting (Sharp, Ureste et al. 2013). A veterinary receptionist observing a client
who is slow to sign might consider asking if s/he can help the client fill out paperwork.
2.2.2 Limited English Proficiency
Definition of “limited English proficiency” (LEP)
Individuals with limited English proficiency (LEP) “are not able to speak, read,
write, or understand the English language at a level that permits them to interact
23
effectively” (Office for Civil Rights 2013). In the 1900 census, language questions were
formulated as: “Can read?” “Can write?” “Can speak English?” In the 2010 census,
language questions read: “Does this person speak a language other than English at
home?” “What is this language?” “How well does this person speak English (very well,
well, not well, not at all)?” (Shin and Kominski 2010). Those who respond that they
speak English less than “very well” are identified as “LEP”: Limited English Proficient.
Scope of limited English proficiency (LEP)
Of the 292 million people currently living in the US age 5 and over, 20.8% (60.6
million) speak a language other than English at home, and 8.7% (25.3 million) self-
identify as LEP (Ryan 2013). Some of these individuals are pet owners. According to
2010 data from the US Census Bureau and American Community Survey (ACS), the
number of LEP individuals speaking a language other than English at home has been
increasing steadily for the past twenty years. The majority of these 25.3 million LEP
individuals live in CA, TX, NY, FL, IL, and NJ, which have historically been
immigration-destination states (Pandya C, Batalova J et al. 2011). However, many LEP
individuals are now moving to new destination states, with the highest growth of LEP
populations occurring in the states of NV, NC, GA, AR, and TN (Shin and Kominski
2010; Pandya C, Batalova J et al. 2011) This recent growth in LEP populations has
resulted in increased communication challenges in both human and veterinary medical
settings.
Of the 60.6 million people in the US who speak a non-English language at home,
62% (37.6 million) speak Spanish. Of the 25.3 million US LEP individuals over age 5, 64%
(16.2 million) speak Spanish (Shin and Kominski 2010). Although there is tremendous
24
linguistic diversity in the US, Spanish remains the predominant language spoken by LEP
individuals at the national, state, and metropolitan area levels. Spanish also remains the
top language spoken in each of the ten states with the fastest LEP growth in the past 20
years (Shin and Kominski 2010; Pandya C, Batalova J et al. 2011). This pattern of
language diversity and LEP growth is expected to continue in the US, and is the central
reason for spotlighting LEP Spanish-speaking pet owners and Spanish-speaking veterinary
staff and students for this research.
Legal Protection for LEPs: A brief history of what it is and what it isn’t
Title VI of the 1964 Civil Rights Act prohibits discrimination based on race, color,
or country of national origin. In 1974, in the case of Lau v. Nichols, the Supreme Court
ruled that language is an aspect of country of national origin. Any US organization
receiving federal funding is bound by the 1964 Civil Rights Act and must provide
language access services to its program participants. In practical terms, language access
services are what enable service providers to communicate with patients, clients or owners
who speak limited English (Roat 2005).
On August 11, 2000, President Clinton signed the LEP Executive Order to ensure
that LEP individuals had access to federally conducted and funded programs and activities
(The White House 2000). In 2001, the national Culturally and Linguistically Appropriate
Services (CLAS) Standards in Health and Health Care were issued, mandating the
provision of language access services for LEP people under Title VI of the Civil Rights
Act. The Standards were formally enacted in 2003, requiring health care service plans to
provide translation, interpretation, and culturally competent health care services.
25
Title VI of the 1964 Civil Rights Act, the LEP Executive Order, and the CLAS
Standards were never intended to be disincentives to learn English: “The Federal
Government is committed to improving the accessibility of these programs and activities to
eligible LEP persons, a goal that reinforces its equally important commitment to
promoting programs and activities designed to help individuals learn English”
(Department of Justice 2002).
Legal Protection for LEPs: What is working and what isn’t
Title VI of the 1964 Civil Rights Act, the LEP Executive Order, and the CLAS
Standards all were created to help LEP individuals gain access to federally-funded
programs and services at a rate equal to that of English-proficient individuals. The CLAS
standards have increased pressure on agencies to hire professional bilingual interpreters
and to train human health professionals to be conversant in Spanish. Although these
Standards are not mandates for the veterinary profession, they can serve as “how to”
guides to improve access to veterinary care for LEP pet owners.
While these federal mandates and guidelines apply to virtually all human hospitals,
they are not obligatory in other settings that are not federally funded, such as veterinary
hospitals or universities. They do not, for example, require institutional review boards to
enroll LEP patients in human medical research, which limits the generalizability of
research study results and benefits to LEP participants (Glickman, Ndubuizu et al. 2011).
In 2008, Glickman et al. examined LEP consent requirements from the web sites of 134
US academic health centers. They found that IRB policies dealing with enrollment of LEP
patients in research span a wide spectrum, ranging from policies which encourage LEP
research participation (“A potential participant’s inability to read or to speak English is
26
not an appropriate basis for exclusion from most research”) to policies which discourage
LEP research participation (“The institution strongly cautions investigators to carefully
consider the ethical/legal implications of enrolling subjects who do not understand
English”) (p. 390). Authors highlighted legal issues and cost (of translating documents
and providing bilingual staff) as primary barriers to inclusion of LEP patients in IRB-
approved clinical research. Based on their review, they recommend developing
enrollment processes which encourage LEP individuals to participate in clinical research.
Such participation could benefit LEP individuals personally, and could benefit society at
large by guaranteeing the generalizability of findings (Glickman, Ndubuizu et al. 2011).
Despite gaps in enforceability, several states have developed model programs to
strive to meet the CLAS standards. In 2000, California established “The Task Force on
Culturally and Linguistically Competent Physicians and Dentists,” in order to provide
language and cross-cultural training to California physicians and dentists. In 2001,
Massachusetts enacted the “Emergency Room Interpreter Bill.” Rhode Island requires
hospitals to provide a qualified interpreter for all services for every non-English-speaking
patient when a bilingual clinician is unavailable (Hunt 2007). Perhaps high-volume
veterinary centers located in large Spanish-speaking communities, like the Animal
Medical Center in New York, would also benefit from Spanish language training and
cross-cultural training for veterinary staff.
North Carolina has made exemplary efforts to rise to the challenge of the CLAS
standards: A 1998 survey of human healthcare providers in North Carolina, a state which
experienced nearly 400% growth in the number of Latinos from 1990 to 2000, revealed
that the rapid change in population demographics “caught healthcare providers
27
unprepared” (Bender, Clawson et al. 2004). Very few doctors and nurses had any
Spanish language training, only 9% of respondents reported being able to speak at a high
intermediate or advanced level; less than 15% had a Spanish-speaking receptionist, and
only 8% had agency signs posted in Spanish and English. The conclusion was that
“…lack of ability to communicate with Latino patients or family members may result in
errors in diagnosis, misunderstanding of the nature of the problem, or reduced compliance
with recommended treatments – all of which compromise the quality of healthcare services”
(Bender, Clawson et al. 2004).
As a result, the North Carolina Area Health Education Center, which provides a
statewide infrastructure for training and continuing education of health professionals,
accepted the challenge of preparing physicians, nurses, and other providers with Spanish
language skills. They implemented a Language and Cultural Learning Initiative, the goal
of which was “to improve access through the provision of language and cultural training
for health professionals appropriate to the healthcare needs of Latino immigrant
populations” (Bender et al., 2004, p. 198). While the cornerstone of the initiative was the
Health Spanish Immersion workshop, there were also other less intensive offerings, each
intended to promote Spanish fluency by strengthening communication skills, teaching
health vocabulary and practical grammar, and linking language and cultural awareness in
order to improve health care access and promote quality health care for Latino immigrants.
Results of the workshop were extremely positive: participants improved their Spanish
language skill, improved their cultural proficiency, and subsequently reported improved
quality of care for their immigrant LEP Latino patients. The question remains whether
similar immersion programs and workshops are possible in veterinary medicine.
28
Language access, language barriers, and health care disparities
With a US LEP population of 25.3 million individuals and growing, anything that
improves language access helps to reduce language barriers. Language access is improved
and language barriers reduced when a hospital provides: language concordant clinicians
and staff; in-person oral interpretation by professional medical interpreters; in-person oral
interpretation by ad hoc bilingual staff or community volunteers; telephone interpreter
language lines and/or interpreted videoconferencing; written translation in the form of
translated consent forms, discharge instructions, prescription labels, and financial
statements; and multilingual signage (Hunt 2007). Without language access services,
language barriers aggravate health disparities for LEP patients (Jacobs EA, Agger-Gupta
N et al. 2003; Jacobs EA, Shepard DS et al. 2004; Eamranond PP, Davis RB et al. 2011)
(Brach C, Fraser I et al. 2005; Ku L and Flores G 2005; Karliner LS, Jacobs EA et al. 2007;
Ngo-Metzger Q, Sorkin DH et al. 2007). How these language barriers lead to health
disparities is complex (Kim G, Worley CB et al. 2011) (Abbe M, Simon C et al. 2006)
(Fiscella K, Franks P et al. 2002; Flores 2006; Hunt 2007; Karliner LS, Napoles-Springer
AM et al. 2008). Researchers have identified language barriers as important contributors
to health care disparities, with LEP patients more likely to have:
(i) less access to usual sources of care (Hu DJ and Covell RM 1986; Kirkman-Liff B
and Mondragon D 1991; Lee LJ, Batal HA et al. 2002; Pippins, Alegría et al. 2007)
(ii) lower rates of use of preventive services (Fiscella K, Franks P et al. 2002)
(iii) poorer quality of health care (Hu DJ and Covell RM 1986; Kirkman-Liff B and
Mondragon D 1991)
29
(iv) poorer adherence to treatment and follow-up (Westberg and Sorensen 2005;
Phokeo and Hyman 2007)
(v) decreased satisfaction with care (Baker DW, Hayes R et al. 1998; Lee, Batal et al.
2002; Mutchler, Bacigalupe et al. 2007) (David RA and Rhee M 1998; Kuo D and
Fagan MJ 1999)
(vi) increased misdiagnoses (Flores 2006; Van Kempen A 2007)
(vii) increased medical errors (Flores G, Laws MB et al. 2003; Divi C, Koss RG et al.
2007)
(viii) increased adverse events resulting in physical harm to patient (Divi C, Koss RG et
al. 2007)
(ix) increased medication complications (Gandhi, Burstin et al. 2000)
(x) medication side-effects not explained (David RA and Rhee M 1998; Lasater LM,
Davidson AJ et al. 2001)
(xi) medications or instructions not understood (Wilson, Chen et al. 2005)
(xii) more diagnostic tests at a higher overall cost (Hampers and McNulty 2002)
(xiii) hospitalization / longer hospital stays (Baker, Parker et al. 1996; Hampers and
McNulty 2002), and
(xiv) increased costs, referred to as “language barrier premiums” (Hampers and
McNulty 2002).
Conversely, when the language barrier is overcome, LEP patients tend to have:
(i) higher rates of doctor visits (Bell, Branston et al. 1999; Jacobs, Lauderdale et al.
2001)
30
(ii) increased satisfaction with care (Kuo D and Fagan MJ 1999; Lee, Batal et al. 2002)
(Baker DW, Hayes R et al. 1998)
(iii) improved patient-reported health status (Perez-Stable, Napoles-Springer et al. 1997)
(iv) increased use of preventive services (David RA and Rhee M 1998; Bell, Branston
et al. 1999; Jacobs, Lauderdale et al. 2001)
(v) more prescriptions filled (Bell, Branston et al. 1999; Jacobs, Lauderdale et al. 2001)
(vi) better adherence to medication (Yin H, Dreyer BP et al. 2008) and
(vii) better adherence to follow-up visits (Ngo-Metzger Q, Sorkin DH et al. 2007).
Do language barriers contribute to health care disparities similarly in veterinary medicine?
Links between LEP and poor health outcomes in adults
Over the past 15 years, the literature on language barriers in human health care
settings has grown rapidly. Researchers have found that LEP patients might have poorer
adherence to treatment recommendations (Apter, Reisine et al. 1998) and lower trust in the
medical setting (Mutchler, Bacigalupe et al. 2007) due to impeded communication with
physicians and pharmacists. These communication barriers in turn eroded their confidence
in the medical setting and ultimately resulted in decreased satisfaction with care. Kim et
al. (2011) examined the implications of LEP for health disparities in health status and
healthcare service use in older Latino and Asian immigrants. Investigators found that,
compared with immigrant peers who were proficient in English or spoke only English,
older Latino immigrants with LEP had significantly greater numbers of chronic health
conditions and higher scores of psychological distress. In addition to physical and mental
health disparities, they also found that older LEP Latino immigrants had more barriers to
health service use than their English-proficient and English-only contemporaries,
31
including: difficulty understanding their doctor, difficulty understanding written
information from their doctor, and difficulty reading instructions on a prescription label
(Kim G, Worley CB et al. 2011).
Lasater and colleagues (2001) conducted a retrospective cohort study of Latino
patients with type 2 diabetes mellitus and found a significant difference between patients’
ability to understand their prescriptions: 22% of LEP Spanish-speaking patients had no
comprehension of their prescriptions, versus only 3% of English-proficient patients
(Lasater LM, Davidson AJ et al. 2001). It is not difficult to extrapolate from these studies
that improved communication with LEP pet owners could lead to improved health
outcomes for their pets.
Links between adult LEP and poor health outcomes in children
Adult LEP is strongly negatively associated with health status, access to care, and
use of health services in children (Flores, Abreu et al. 2005; Flores, Olson et al. 2005).
Like children, pets depend upon their caregivers’ level understanding of treatment for
appropriate medical care. Compromised caregiver understanding could result in treatment
deficits in both groups of dependents. In a Boston study of 1,100 children and their
families, Flores, Abreu et al. (2005) found that parents with LEP were associated with
double the odds of the child spending at least one day per year in bed for illness, triple the
odds of the child having fair or poor health status, and significantly greater odds of the
child not getting medical care for six out of nine access barriers to care. Access barriers to
care included: cost, transportation challenges, lack of health insurance, medical staff
cultural misunderstanding, scheduling challenges, and travel distance (Flores, Abreu et al.
2005). In an earlier review by Flores et al. (1998), Latino parents cited language issues as
32
“…the single greatest barrier to health care access for their children,” with 1 in 17
parents in one study not bringing their child in for needed medical care because of
language issues (Flores, Abreu et al. 1998). It is conceivable that LEP pet owners have
similar access barriers to veterinary care for their pets.
Communication breakdowns, barriers and medical errors
While study after study demonstrates that a patient’s low health literacy and
limited English proficiency greatly impacts how much health information s/he understands,
there are clinicians and pharmacists who are still “blind” to these issues and feel that these
are not problems that affect their practice (Praska, Kripalani et al. 2005). Overall,
however, there is growing acknowledgement that ineffective communication, including
language discordance, lack of interpreting, use of medical jargon, and cultural insensitivity,
all contribute to unsafe, poor quality patient care and poor health outcomes (Wilson, Chen
et al. 2005; Joint Commission 2007; Pippins, Alegría et al. 2007). In a study by Brach et
al. (2005) 19% of all patients said they had problems communicating with physicians.
That proportion rose to 23% for African Americans, 27% for Asian Americans, and 33%
for Hispanics (Brach C, Fraser I et al. 2005). What would this proportion rise to in the
veterinary arena, where there is a persistent lack of ethnic and racial diversity among
practitioners (Adams 2004; Elmore 2004; Greenhill LM 2004; Kendall 2004; Maccabe
2004; Nelson 2004; Chastain, Horrell et al. 2007; Greenhill 2007; Greenhill 2009; Lowrie
2009) and the proportion of African American, Asian, and Hispanic veterinarians
combined is less than 10% of all veterinarians (Elmore 2003), while the national
population is comprised of 35% racial and ethnic minorities (U.S. Census 2013)?
33
In human medicine, “…communication breakdown, whether between care
providers or between care providers and their patients, is the primary root cause of the
nearly 3,000 sentinel events – defined as unexpected deaths and catastrophic injuries –
that have been reported to The Joint Commission” (Joint Commission 2012). Of those
sentinel events, LEP patients were significantly more likely than English-proficient
patients to experience permanent harm (Oliva 2008). The Institute of Medicine report,
Preventing Medication Errors, concluded that methods for communicating about
medications with patients are inadequate and contribute to incidences of medication errors.
Among its recommendations, the report emphasized the importance of effective patient-
provider communications, and the role of the practitioner in providing definitive education
on drug usage. The report also recommended that written instructions from pharmacies –
on which patients most frequently rely for drug information – must be significantly
improved to take into account the literacy, language, age and visual acuity of the patient
(Institute of Medicine 2006).
Pharmacy studies
The problems of low health literacy and limited English proficiency pose
significant challenges for pharmacists trying to educate patients on proper use of their
medication and disease self-management. Since veterinarians too have the responsibility
of educating clients on proper use of medication for their pets and disease management of
their pets, the veterinary profession can learn much from human pharmacy studies.
Patients with low health literacy and/or limited English proficiency are at increased risk
for not understanding medication directions, not understanding medication side effects,
and not adhering to a medication regimen for themselves or their child (Xu and Rojas-
34
Fernandez 2003; Youmans and Schillinger 2003; Praska, Kripalani et al. 2005; Westberg
and Sorensen 2005).
In studies conducted by Xu et al. (2003) and Mutchler et al (2007), researchers
found that when language is a barrier to communication with pharmacy staff, patients
often have difficulty accessing pharmacy services and understanding their medication (Xu
and Rojas-Fernandez 2003; Mutchler, Bacigalupe et al. 2007). A review of the literature
conducted by Dilworth et al. (2009) examined pharmacists’ communication strategies with
Spanish-speaking patients and concluded: “…there is a risk that Spanish-speaking patients’
level of English literacy mirrors the level of care they receive in pharmacy” (p.115)
(Dilworth, Pharm et al. 2009). It is possible that the veterinary client’s level of English
literacy mirrors the level of care the pet receives in the veterinary clinical setting as well.
Praska et al. (2005) attempted to estimate the frequency with which pharmacies in
Atlanta proactively seek to identify and assist those with limited literacy skills. At the
time of their survey, only 2 of the 30 (7%) of pharmacies surveyed reported that they tried
to identify the literacy needs of their patients. When a patient did have limited literacy,
pharmacists used additional verbal counseling on medication instructions, involved family
members, and had patients “teach back” instructions to verify understanding (Praska,
Kripalani et al. 2005). They also found that one-quarter of the pharmacies surveyed used
“adherence aids” such as pill boxes, blister packages, unit dosing services, and dosing cups,
spoons or syringes for liquid formulations. Several pharmacies also provided refill
services including: telephone contact when a patient was overdue for a medication refill,
automated refills, medication delivery, and refill reminder cards. Four of the pharmacies
35
used graphics and multimedia aids, including: warning labels, educational videos, pill
charts with pill images, or sign language.
Pictograms and graphic pill cards, where the actual pills are taped onto a page that
uses sun and moon images to indicate time of dosing, are now being used to help low
literacy clients better adhere to their medication regimen (Jacobson KL, Kripalani S et al.
2008). In a randomized, controlled trial of a pictogram-based intervention, medication
dosing errors were decreased and adherence increased when caregivers administered liquid
medication to young children (Yin H, Dreyer BP et al. 2008). In a study investigating 4-
week recall of patients with low literacy, recall of spoken medical instructions was 14%,
while recall of spoken medical instructions plus pictographs were 85% immediately after
training, and 71% four weeks after training. Such multimedia interventions help
pharmacists help their patients, and could easily help veterinarians help their clients.
Communication challenges between patients and pharmacy staff have been
improving over time but still need further improvement. Over the past decade, multiple
researchers have found that even when pharmacists know little or no Spanish, they still
counsel LEP Spanish-speakers on medication use and assess their own medication
counseling as effective (Sleath B 2002; Muzyk, Muzyk et al. 2004; Bradshaw M, Tomany-
Korman S et al. 2007). Gonzalvo et al. reported that 82% of pharmacies they surveyed
still do not have a Spanish-speaking pharmacist (Gonzalvo J, Schmelz A et al. 2012).
Prescription medication labels
Translation and interpretation are used to help overcome pharmacist-patient
language barriers so that patients can safely and effectively use their medications.
Translation of drug leaflet information, lifestyle modification brochures, and prescription
36
labels, either by computer software programs, bilingual employees, or online translation
engines, is critical to improve pharmacist-patient communication (Bailey, Pandit et al.
2009; Sharif and Tse 2010). In 2007, it was estimated that as many as 168 million
prescriptions were written for patients with LEP “in a language that patients cannot fully
understand, which poses potentially serious risks of medical errors and injury” (Bradshaw
M, Tomany-Korman S et al. 2007). That same year, the Institute of Medicine Roundtable
on Health Literacy organized a workshop to discuss prescription container labels:
“As a patient’s most tangible source of information about what drug has
been prescribed and how that drug is to be taken, the label on a container
of prescription medication is a crucial line of defense against [adverse
drug events], yet…46 percent of patients across all literacy levels
misunderstand one or more dosage instructions and 54 percent
misunderstand one or more auxiliary warnings that accompany those
medications” (p.1) (Institute of Medicine 2008).
Multiple studies have looked at the issue of prescription label translation over the
past decade. Researchers have found that many pharmacies still do not print prescription
labels in Spanish. When pharmacies do have the capability of printing prescription labels
in Spanish, either the LEP Spanish-speaking patient needs to know to ask in advance for a
Spanish-language label, or the accuracy of translated Spanish-language labels is
inconsistent, with incomplete translations and spelling and/or grammatical errors
(Westberg and Sorensen 2005; Sharif, Lo et al. 2006; Bradshaw M, Tomany-Korman S et
al. 2007; Bailey, Pandit et al. 2009; Sharif and Tse 2010).
37
Most pharmacies use computer translations which are not verified by a Spanish-
speaking pharmacist, and which often mis-translate commonly used terms, like
“dropperful” and “for thirty days” (Sharif, Lo et al. 2006; Sharif and Tse 2010). Therefore,
despite the increasing trend of pharmacies to translate medication labels, hire Spanish-
speaking pharmacists or staff, and utilize telephone and internet interpreter services,
researchers conclude that there are still an insufficient proportion of Spanish-speaking
pharmacists and staff who are able to meet the needs of their LEP Spanish-speaking
clientele and prevent medication errors that result from language barriers (Westberg and
Sorensen 2005; Bailey, Pandit et al. 2009; Gonzalvo J, Schmelz A et al. 2012). How
many veterinary practices dispense a pet’s medication to an LEP client with a medication
label written in a language the client doesn’t fully understand, accompanied by an
“educational” brochure s/he can’t read or comprehend?
2.3 Strategies for Addressing the Challenges
2.3.1 Improving communication via language concordance and interpreter models
The quality of communication between provider and patient has been shown to
have a major impact on health outcomes (Brach C, Fraser I et al. 2005). For veterinarians
as well as human physicians, medical history taking, diagnosing, explaining, and
prescribing all rely on clear communication; any barrier to that communication can
negatively impact the quality of care the patient or pet receives: “It is taken as given that
communication and understanding between provider and patient are essential to the
successful provision of health care. For this essential communication to take place, the
two parties must share a common language” (Downing and Roat 2002). The situation
38
where a health provider and patient literally do not speak the same language has been
referred to as a “language chasm in the health care system” (p.424) (Brach C, Fraser I et
al. 2005). Many strategies are being used to bridge this chasm, including the use of
language concordant providers, professional interpreters, ad hoc interpreters, and
telephone interpreters.
Language Concordant providers
When the clinician and patient/client speak the same language, there is language
concordance and oral communication occurs directly between clinician and patient/client
during the clinical interaction. When the clinician and patient/client don’t speak the same
language, there is language discordance and a third-party interpreter is needed to facilitate
communication. The need for language concordant communication is great and growing.
LEP Spanish-speaking patients attended by native Spanish-speaking physicians
and/or utilizing professional interpreter services have reported better well-being,
compliance, and less emergency department use than peers who did not receive language-
concordant care (Brach C, Fraser I et al. 2005). A 2010 Chicago-based study looking at
hospital costs and patient satisfaction found that Spanish-speaking attending physicians
reduced costs of care by lowering return emergency department visits (Jacobs, Diamond et
al. 2010). A 2009 Boston-based study demonstrated that monolingual Spanish-speaking
patients were significantly more likely to be counseled on diet and exercise modifications
by Spanish-speaking primary care providers than they were by language-discordant
practitioners (Eamranond, Davis et al. 2009). Do veterinarians counsel LEP clients as
often as English-proficient clients on their pet’s diet and exercise?
39
Determining the accuracy of a provider’s self-assessment of his or her level of
fluency is challenging. The gold standard for assessing level of fluency in a non-English
language is a standardized oral fluency exam, but most health care agencies simply depend
on the doctor’s self-assessment to call him/her bilingual. This might be changing. The
Palo Alto Medical Foundation (PAMF) in the San Francisco Bay Area sees over 90,000
patients whose preferred language is non-English. In an effort to provide patients with
language concordant care providers, PAMF used to ask their doctors to describe their non-
English language(s) proficiency as “basic,” “conversational,” or “fluent.” But since these
terms had not been validated, PAMF really didn’t know how accurate the proficiency
description was. In 2009, PAMF’s Research Institute did a study of best methods for
characterizing physician fluency, and opted to use the Interagency Language Roundtable
(ILR) scale to characterize doctor non-English proficiency (Diamond, Luft et al. 2012).
This scale was originally developed by the US Foreign Service Institute for evaluation of
fluency of its Foreign Service officers, and has been revised and validated by the ILR.
The ILR scale describes language proficiency as “poor,” “fair,” “good,” “very good,” and
“excellent.” Of the 258 doctors who updated their language fluency self-assessment using
the ILR scale, almost half (47%) spoke Spanish. Thirty-one of the doctors who had
originally rated their proficiency as “fluent” downgraded on the ILR scale to “Good” or
“Fair” (Diamond, Luft et al. 2012).
Kaiser Permanente (an integrated managed care consortium, based in Oakland, CA)
recognizes language concordance as so important that they now offer financial and time-
off incentives to doctors who participate in their Language Concordance Program. Any
doctor who is fluent or willing to become fluent in Arabic, Armenian, Cambodian,
40
Cantonese, Farsi, French, Japanese, Korean, Mandarin, Portuguese, Russian, Spanish,
Tagalog or Vietnamese is offered “educational time” to enroll in language classes, a cash
bonus for passing an approved fluency exam in one of these languages, tuition remission
for the cost of the course itself, and extended educational leave to participate in a language
immersion program. Their goal is to create a pool of physicians who can be matched to
LEP patients in order to offer more “culturally responsive care” (Kaiser Permanente 2013).
Perhaps the veterinary profession could intentionally create a pool of bilingual, bicultural
veterinarians and veterinary technicians by encouraging pre-veterinary and veterinary
technology students to minor in Spanish.
Even with innovative Language Concordance Programs, however, the fact remains
that with 381 non-English languages currently spoken in the US, it is not always possible
to provide language concordant health care, especially for less commonly spoken
languages or to individuals living in more remote areas of the US (Pandya C, Batalova J et
al. 2011). Therefore professional interpreters are needed.
Professional interpreters
Even when an LEP patient and provider truly speak the same language, language
concordance often vanishes when a patient goes for lab work, imaging, or billing (Karliner
LS, Jacobs EA et al. 2007). So the most commonly used strategy for communicating with
LEP patients is the use of an interpreter. An interpreter has been defined as “a person
who renders a message spoken or signed in one language into a second language.” A
professional interpreter has been defined as “any individual paid and provided by the
hospital or health system to interpret” who abides by a code of professional ethics
(Karliner LS, Jacobs EA et al. 2007; NCIHC 2008). Professional interpreters might be
41
employed in-house by the hospital, or contracted hourly through an outside interpreter
agency. Because medical interpreting is not (yet) a universally licensed field, training can
vary from “on-the-job” to formal 40-hours of medical terminology and skills to supervised
interpreting in a medical setting (Karliner LS, Jacobs EA et al. 2007).
Ideally, the use of trained, professional interpreters who augment the use of
bilingual clinicians and staff is recommended to improve the quality of healthcare
delivered and to decrease health disparities (Brach C, Fraser I et al. 2005; Flores G 2005;
Karliner LS, Jacobs EA et al. 2007; Ngo-Metzger Q, Sorkin DH et al. 2007; Regenstein
2007). But medical interpretation requires more than language proficiency. Professional
medical interpretation training programs ideally have curricula that include anatomy and
common illnesses and procedures; interpreter skills, such as managing communication
flow and triadic communication; general language and medical terminology; legal and
ethical issues, including patient confidentiality; reading comprehension; and cultural
competence training (Jacobs, Diamond et al. 2010; Hablamos Juntos 2013). Perhaps
veterinary technology programs could incorporate interpreter training for students who
enter the program with an advanced level of Spanish language proficiency.
The training that professional interpreters receive not only helps to decrease
interpretation errors, but also helps to reduce behaviors that negatively impact the doctor-
patient relationship. Specifically, trained interpreters: (i) set up and explain their role at
the beginning of the medical encounter; (ii) transmit information between doctor and
patient accurately and completely; (iii) manage the flow of communication between all
parties; (iv) encouraging doctor and patient to address the other directly; and (v) assist
42
with closure, including follow-up instructions and patient referrals (Baker DW, Hayes R et
al. 1998).
Karliner et al. found that “…professional interpreters are associated with an
overall improvement of care for LEP patients. They appear to decrease communication
errors, increase patient comprehension, equalize health care utilization, improve clinical
outcomes, and increase satisfaction with communication and clinical services for limited
English proficient patients” (p. 748) (Karliner LS, Jacobs EA et al. 2007). The authors
conclude, “Professional interpreters, through their experience, training, and knowledge of
both medical and lay terminology are better able to communicate patients’ symptoms and
questions to clinicians, and clinicians’ rationale for treatment and explanations of proper
use of therapy to patients. Lower interpretation error rates and improved patient
comprehension lead to greater patient acceptance of tests, adherence to follow-up and
treatments, and thus improved health outcomes” (p. 750) (Karliner LS, Jacobs EA et al.
2007). It is likely that professional interpreter services would have similar positive effects
on LEP veterinary clients’ experiences.
Ad hoc interpreters - adults
An ad hoc interpreter has been defined as “an untrained person who is called
upon to interpret, such as a family member interpreting for her parents, a bilingual staff
member pulled away from other duties to interpret, or a self-declared bilingual in a
hospital waiting-room who volunteers to interpret” (Karliner LS, Jacobs EA et al. 2007;
NCIHC 2008). Unfortunately, ad hoc interpreters are rarely trained, and often make
mistakes that impact communication and patient satisfaction: They might respond to
questions without letting the patient answer, interject their own opinions, have conflicts of
43
interest, fail to interpret fully and accurately, and might commit errors leading to adverse
clinical consequences (Baker DW, Hayes R et al. 1998; Flores G 2005; Flores 2006;
Gadon M, Balch G et al. 2007).
Flores et al. (2003) found that ad hoc interpreters were significantly more likely to
commit “errors of clinical consequence” than professional interpreters, including:
omitting questions about drug allergies; incorrectly instructing parent to put oral
amoxicillin in child’s ears to treat otitis media; and omitting instructions on the dose,
frequency, and duration of antibiotics and rehydration fluids (Flores G, Laws MB et al.
2003). Albeit convenient, the use of family members and friends as ad hoc interpreters is
strongly discouraged. Family and friends, although trusted, often “are not competent to
provide quality and accurate interpretations” (p. 41462) (Department of Justice 2002).
One resident physician shared his observations of family members acting as ad hoc
interpreters: “[Y]ou see…relatives doing their best to try to be the mediator and the
translator. As soon as they don’t have to play that role anymore they suddenly have so
much more to say because they’re not trying to figure out how to say it in English” (p. 259)
(Diamond, Schenker et al. 2009).
Ad hoc interpreters - children
Of particular interest to this research is the ad-hoc interpreter model which uses
children to interpret, since children frequently act as interpreters in the veterinary medical
setting. Downing and Roat (2002) share their concerns about children serving as ad hoc
interpreters in human medical settings: “Children’s vocabulary is even more limited than
an adult family member, and children are likely to be unaware of the purpose of the
communication, leading to increased inaccuracies. Children can be traumatized by the
44
responsibility of negotiating… and may feel responsible (or even be held responsible) for
the outcome of the encounter.” (p. 11) (Downing and Roat 2002).
In a letter written on behalf of the National Council on Interpreting in Health Care
to a senior Civil Rights Analyst in Washington DC, Roat et al. (2003) stated, “There is no
acceptable clinical situation in which a minor should be used to interpret. In addition to
the facts that they are not likely to be competent interpreters and conflicts of interest may
arise in this situation, it is unethical. This situation completely changes the dynamic of a
parent-child relationship such that it places an unacceptable burden of responsibility on a
child. No child should be placed in this position” (Roat, Jacobs et al. 2003). In clinical
veterinary practice, using children to interpret discussions about euthanasia decisions and
finances is especially discouraged.
Telephone interpreters
When language concordant providers and face-to-face interpreters are not available,
veterinarians and human health care providers can use pay-as-you-go telephone and video
interpreting services. These national services charge by the minute, and can provide
medical interpretation in many languages. Lee et al. found that satisfaction with provider
characteristics were similar among English-proficient patients, LEP patients with bilingual
providers, and LEP patients using telephone interpreters, while less satisfactory with ad
hoc interpreters (Lee, Batal et al. 2002). For the veterinarian who sees an occasional LEP
client, using a pay-as-you go telephone interpreter service could be an efficient, cost-
effective communication strategy.
45
Interpreting Errors
Despite attempts to interpret accurately and effectively, interpreting errors can and
do occur. False fluency describes a physician’s or veterinarian’s well-intentioned but
inaccurate attempts to speak a patient’s or client’s language: “A candidate at this level will
cause misunderstandings between himself and the listener based on lack of ability to
clearly convey his message” (p. 1698) (Ferguson WJ 2008). At the most basic level,
clinics and hospitals should have some mechanism for evaluating an individual’s bilingual
language proficiency (Wu, Ridgely et al. 2007; Hablamos Juntos 2013). In a questionnaire
administered to medical residents in an urban, university-affiliated children’s hospital that
served a population in which 10-20% have LEP, Burbano O’Leary et al. (2003) found that
despite the self-perception that they provided inadequate communication in Spanish,
residents rarely used professional interpreters. Instead, they engaged in false fluency and
relied on their own suboptimal language skills, asked proficient colleagues to intervene, or
simply avoided communication with LEP Spanish-speaking families altogether (Burbano
O'Leary, Federico et al. 2003). It is possible that veterinarians and staff do the same.
Failure to interpret accurately or at all can have tragic consequences:
• A paramedic misinterpreted a young boy’s Spanish and interpreted “intoxicado” as
“intoxicated” rather than “nauseated” as intended. The misinterpretation led to a
workup for a drug overdose, rather than a workup for an intracerebellar hematoma
with brain-stem compression and a subdural hematoma secondary to a ruptured artery.
The delay in treatment left the boy quadriplegic (Flores 2006).
46
• In AZ, lack of an interpreter for a 13-year-old girl resulted in death when doctors ran a
pregnancy test, sent her home with the diagnosis of “gastritis”, and failed to discover
that the girl’s appendix had burst (Flores 2006).
• In NM, a Spanish-speaking patient was prescribed a medication to be applied topically,
but as the label was printed in English, misunderstood how to use the medicine and
took it by mouth, ending up in the ER due to toxicity from ingestion (Flores 2006).
• In southern US, a non-English speaking woman was not able to explain that she was
pregnant with twins and was vaccinated with a live attenuated virus. The patient lost
both the babies secondary to the vaccine (Flores 2006).
How easy would it be for an LEP client to misunderstand dosing instructions and give the
pet a topical medication orally, or a veterinarian to inadvertently vaccinate a pregnant
animal if the owner could not communicate that the pet was recently bred?
Despite evidence of the benefits of professional interpreter use, studies reveal that
professional interpreters are underused by providers even when they are available
(Karliner, Perez-Stable et al. 2004; Lee KC, Winickoff JP et al. 2006) (Regenstein 2007;
Schyve 2007). Instead of using available interpreters, resident physicians often use their
own limited Spanish skills (false fluency), or use family members or staff to provide ad
hoc interpreting, even when the LEP patient feels that a professional interpreter should be
called (Baker, Parker et al. 1996; Burbano O'Leary, Federico et al. 2003; Yawman,
McIntosh et al. 2006; Schenker, Wang et al. 2007). In a survey of medical trainees at one
university hospital, of the 83% of respondents who reported less than conversational-level
Spanish language skills, over half had taken a history or provided medical advice to the
LEP Spanish-speaking patient without an interpreter present (Yawman, McIntosh et al.
47
2006). When asked how they decided it was time to call for an interpreter, residents
explained that they weighed the tension between time constraints against advancing the
patient’s care with the help of a translator, and frequently chose to forego the help: “…I
often can hobble by without [an interpreter]” (p. 258) (Diamond and Reuland 2009).
How often do veterinarians “hobble by” when working with LEP SSPOs?
2.3.2 Improving communication via hospital, pharmacy & educational models
In 2002, at the request of Congress, the Institute of Medicine published Unequal
Treatment, a report documenting the extent of racial and ethnic disparities in the quality of
medicine delivered in the US (Institute of Medicine 2003) To help remedy these
disparities, cross-cultural competency curricula was recommended in the training of all
physicians, from undergraduate to continuing medical education. In 2004, the Liaison
Committee on Medical Education announced its cultural competence accreditation
standard, requiring all US medical schools to integrate cultural competence education into
their curricula. Many states also now require continuing education in the area of cultural
competence. New Jersey, for example, passed legislation mandating cultural competency
training as part of medical education and/or licensure. Training on how to work with
interpreters is also recommended as a critical component of this mandated cultural
competency training and of the education of medical students and other health professions
trainees (Hunt 2007; Flores, Torres et al. 2008).
Improving communication and cross-cultural understanding between patients,
clients and providers is the first step toward reducing patient health care disparities for
those with low health literacy and limited English proficiency. Because providers
48
encounter patients of many different languages and cultures, it’s important that providers
develop general skills which can be used in cross-cultural encounters, in addition to
language- and culture-specific skills (Carrillo, Green et al. 1999). Improving
communication is a process that can take place in hospital, clinic, pharmacy, and
educational settings.
Improving communication in pharmacies, hospitals and clinics
In community pharmacy work, Sleath et al. (2009) recommend that pharmacies
work with local Latino community organizations to learn about the culture and preferences
of Latino patients served by that pharmacy, and that they find ways to provide written and
verbal medication instruction in Spanish (Sleath, Blalock et al. 2009; Sleath, Blalock et al.
2009). Bradshaw et al. (2007) elicited concrete suggestions from pharmacies for
improving communication with LEP patients including: enroll pharmacists and pharmacy
staff in Spanish-language continuing education courses; hire bilingual staff members; use
existing telephone interpretation services; verify translation accuracy of written materials;
and add more languages to pharmacy computer software (Bradshaw M, Tomany-Korman
S et al. 2007). Bailey et al. (2009) recommended that pharmacies located in communities
with a high proportion of LEP Spanish-speakers acquire translation capabilities or improve
pharmacist familiarity with software translation programs that can be used to translate
medical instructions on prescription labels (Bailey, Pandit et al. 2009).
In human medicine, many hospitals and physician practices assume direct
responsibility for providing language assistance services to LEP patients in the form of
language concordant care or interpretation. Recently, umbrella health plans have become
involved with language assistance programs, helping to facilitate, organize and finance
49
such programs in clinical settings (Brach C, Fraser I et al. 2005). Brach et al. studied
fourteen model health plans which are promoting “culturally and linguistically
appropriate services” (p. 426) (Brach C, Fraser I et al. 2005). The majority of these
organizations are performing four key functions related to working with low literacy and
LEP patients: (i) collecting data on patients’ languages; (ii) recruiting and identifying
bilingual staff and physicians; (iii) organizing and financing interpreter services; and (iv)
educating members and physicians about interpreter services. The AVMA and state
VMAs could do the same, by identifying bilingual staff and educating members about
interpreter service availability.
Improving communication in medical and pharmacy educational settings
Since the 1950s, there has been a tension in medical, pharmacy, and veterinary
education between the teaching of clinical skills and the development of communication
skills. Educators have resisted giving up precious time in the curriculum to teach
communication skills (Ludermer 1999). That tension continues today, but studies show
that strong communication skills are linked to higher provider and patient satisfaction,
greater adherence to medical regimens, improved patient outlook regarding disease control,
and enhanced physical and mental health status (Roter, Hall et al. 2002).
Acknowledging the importance of effective communication in clinical human
medicine, the US Medical Licensing Examination requires medical students, between the
third and fourth year of school, to take a clinical skills examination using standardized
patients (United States Medical Licensing Examination 2013). The goal of the exam is to
evaluate the ability of the medical student to gather information from patients, perform a
physical exam, and communicate their finding to patients and colleagues. Communication
50
skills are also an expected competency of medical residents under the standards of the
Accreditation Council for Graduate Medical Education and a key component of the
Maintenance of Certification model developed by the American Board of Medical
Specialties (Makoul 2003). Today, the extent to which communication skills are taught –
and how those skills are assessed – is highly variable across US medical schools.
In 2000, it was estimated that every US pharmacist was responsible for the care of
approximately 1400 patients, of whom 12% were Latino. By 2010, it was projected that
every US pharmacist would be responsible for the care of approximately 1400 patients, of
whom 48% would be Latino. The researchers conclude: “As such, it is essential that all
pharmacists be able to communicate effectively with members of the Hispanic population”
(Gonzalvo J, Schmelz A et al. 2012). To that end, the National Work Group on Health
and Literacy recommends that pharmacists be educated to understand the relationship
between literacy and health, and taught how to effectively communicate medication
information to patients with low health literacy and limited English proficiency.
In their surveys of community pharmacists in North Carolina, Georgia, and
nationally, researchers have found that many pharmacists feel that Spanish-language
courses should be implemented in pharmacy school curricula as a requirement or elective,
or should be a prerequisite or continuing education supplement (Sleath B 2002; Sleath and
Wallace 2002; Muzyk, Muzyk et al. 2004; Gonzalvo J, Schmelz A et al. 2012).
Recognizing the link between the pharmacist’s ability to communicate in Spanish with
LEP Spanish-speaking patients and the quality of health care that pharmacists can provide
to these patients (VanTyle, Kennedy et al. 2011), the 2007 accreditation standards for US
colleges of pharmacy now require pharmacists to provide patient-centered care through
51
their ability to: “…design, implement, monitor, evaluate, and adjust pharmacy care plans
that are patient-specific; address health literacy, cultural diversity, and behavioral
psychosocial issues…” (Standard 12, Guideline 12.1) (Accreditation Council for
Pharmacy Education 2011).
The Indiana State Department of Health has established a priority objective to
“promote a culturally and linguistically competent system of health care” and “reduce
provider-based barriers that impact health care encounters and provider-patient
communication” (Indiana State Department of Health - Minority Health Advisory
Committee 2003). To meet that objective, Butler University College of Pharmacy has
designed and implemented a model Spanish language and culture initiative in its PharmD
curriculum. The program’s didactic and immersion experiences improve pharmacy
students’ cultural competence and Spanish language skills, graduating pharmacists who
are better able to provide competent pharmacy care to LEP Spanish-speaking patients.
Since the program began in 2004, the percentage of students graduating with a PharmD
degree with a major or minor in Spanish has grown from 1% to 11% (Indiana State
Department of Health - Minority Health Advisory Committee 2003).
Improving communication in veterinary educational settings
In veterinary medical education, several concurrent strategies are in place to
improve communication skills and cross-cultural competencies of practicing veterinarians
by targeting the development of those skills and competencies in veterinary students.
First, recognizing the critical shortage of racially and ethnically diverse applicants to
veterinary programs, tremendous recruitment efforts continue to be made to introduce
underrepresented minority students (African American, Asian, Hispanic and Native
52
American) into the veterinary profession (Greenhill LM 2004; Greenhill 2009) (Kendall
2004; Greenhill 2007) (Adams 2004; Cannedy 2004; Elmore 2004; Maccabe 2004; Nelson
2004; Chastain, Horrell et al. 2007; Lowrie 2009). Currently only 4% of the national
veterinary student body is Latino (AAVMC 2012), while 17% of the nation is Latino (U.S.
Census 2013). Increasing the national pool of potentially bilingual, bicultural Latino
veterinary students now will increase the number of veterinary practitioners who can
communicate with LEP SSPOs in the future. Diversity within the profession is vital:
“…because of the unquestionable demographic trends related to race and ethnicity in the
United States, the veterinary profession cannot afford to delay efforts to enhance its
diversity and cultural competence toward a truly inclusive environment” (p. 413) (Wolf,
Lloyd et al. 2008).
Second, a great deal has been learned about how to teach communication skills in
veterinary medical programs by studying the teaching of those skills in human medical
programs, and the formal teaching of these skills is well underway (Shaw, Adams et al.
2004; Shaw 2006; Cornell and Kopcha 2007). The Association of American Veterinary
Medical Colleges (AAVMC) recognizes the importance of communication skills training,
stating in their 2011 NAVMEC report: “Communication skills are a critical part of all
aspects of veterinary medicine. Colleges need to develop plans for teaching and
evaluating verbal and written communication skills. These plans should include means of
sustaining effective, professional relationships and skillful, sensitive, and appropriate
communication with clients, healthcare professionals, and the public. These skills need to
be incorporated throughout the curriculum so that the new graduate is comfortable and
competent in providing this information” (AAVMC Board of Directors 2011).
53
Third, Spanish language and culture resources are being developed for veterinary
students and practitioners by professional organizations and colleges of veterinary
medicine, including: the American Veterinary Medical Association, the American Animal
Hospital Association, Maddie’s Fund, as well as colleges of veterinary medicine at
Washington State University, Colorado State University, Texas A & M University, and
Purdue University (see Table 2-1). As of 2013, Texas A&M University is requiring all
veterinary students to take a Medical Spanish course during their second year of training.5
One Health Initiative Vision
The vision statement of the One Health Initiative includes “…improving the lives
of all species – human and animal – through the integration of human medicine,
veterinary medicine and environmental science” via “joint educational efforts between
human medical, veterinary medical schools, and schools of public health and the
environment” (One Health Initiative 2013). A shared, online curriculum for health
professional students in schools of medicine, pharmacy, veterinary medicine, veterinary
technology, dentistry and nursing could be the next step in a collective effort to provide
timely, cost-effective, Spanish language healthcare terminology and cultural competency
training (Gonzalvo J, Schmelz A et al. 2012).
2.4 The Cost of Communication Gaps
Failure to bridge the communication gap between LEP patients and providers due
to patients’ low health literacy and limited English proficiency could be costly
impediments to the provision of medical care (Hampers and McNulty 2002). With
5 Personal communication with Dr. Dan Posey, Director of Special Programs, Texas A & M College of Veterinary Medicine, November 4, 2013
54
provider-patient language-discordant care, providers can’t elicit a thorough history, can’t
be certain they understand the patient’s self-described symptoms, and can’t be sure their
discharge instructions are understood. Veterinarians providing language-discordant care
could encounter similar communication challenges with pet owners.
Legally, there are several areas of concern for practitioners when there is
ineffective communication between provider and patient: (i) medical malpractice suits
due to inadequate or inappropriate medical care; (ii) legal vulnerability due to lack of
informed consent; and (iii) legal vulnerability due to a breach of the duty to warn of risks
associated with medications and treatment (Van Kempen A 2007). Informed consent
“…is ethically required of healthcare practitioners in their relationships with all patients,
not a luxury for a few” (President's commission for the study of ethical problems in
medicine and biomedical and behavioral research 1982; Schenker, Wang et al. 2007).
There is legal precedent for the decision that informed consent is not obtained if
explanations are conducted in a language the patient does not understand (Quintero v
Encarnacion, Lexis 30228 (10th Cir. 2000)). Legally, a provider is at risk if s/he can’t
communicate how and when a patient should take a medication, or convey potential side
effects of that medication. Thus the cost of not providing professional interpreters could
be significantly higher than the cost of providing them if legal liability develops.
Interpreter services need to be viewed as an investment now to avoid higher costs later.
The cost of language access services is miniscule relative to the cost of providing
inadequate, delayed, dangerous, or erroneous care (Roat, Jacobs et al. 2003) (Karliner LS,
Jacobs EA et al. 2007). Benefits of providing language access services in human medicine
include: increased access of LEP patients to quality healthcare, improved communication,
55
increased patient satisfaction, decreased medical costs, improved health, decreased
medical misdiagnoses, decreased medical errors, decreased malpractice, and true informed
consent (p.20) (Office of Management and Budget 2002). Future research will
demonstrate whether language access services will similarly benefit veterinary medicine.
2.5 Justification for Current Research
As the extensive human health literacy and limited English proficiency literatures
reveal, when health care providers are able to bridge the communication gap with clients
and patients who have limited English proficiency and low health literacy, improved
health outcomes and increased satisfaction with care result. Failure to recognize and
overcome these barriers will be costly at an individual and societal level. The following
research uses surveys of LEP SSPOs, veterinary practitioners, and veterinary students to
investigate the communication challenges faced in the veterinary medical encounter.
Results of these surveys will reveal the extent to which language gaps impact current
veterinary-client interactions, and will facilitate an assessment of the preparedness of the
veterinary profession to communicate with LEP SSPOs.
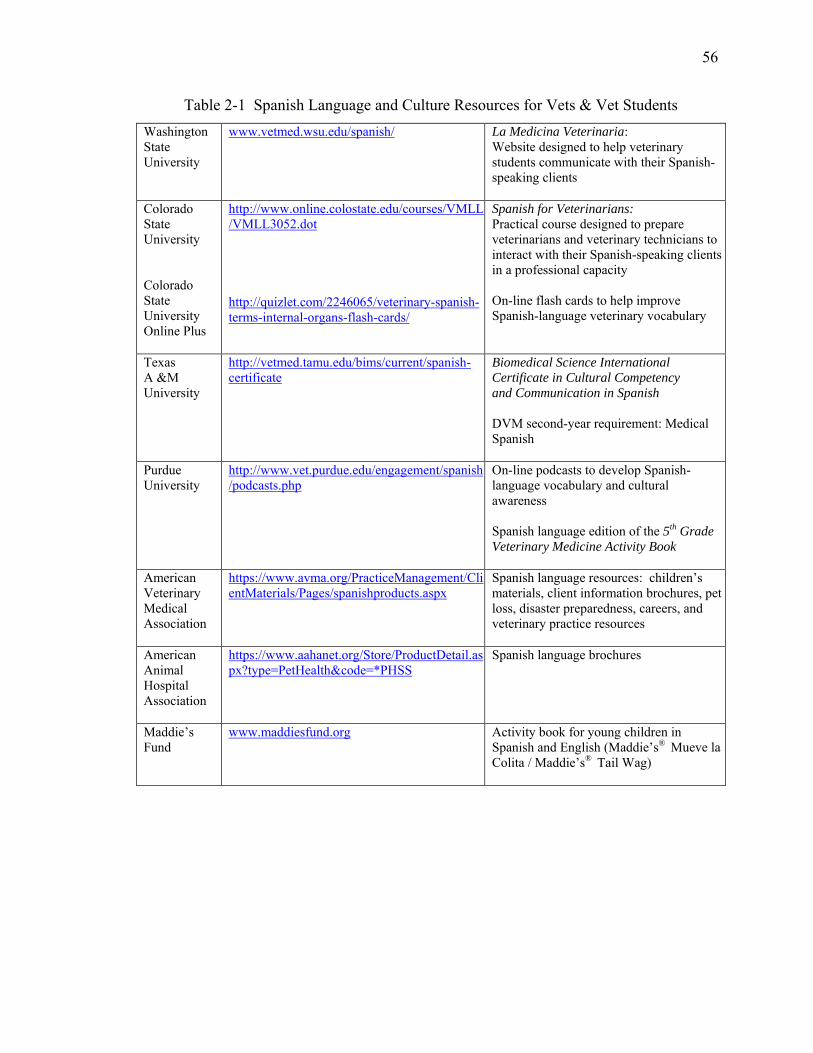
56
Table 2-1 Spanish Language and Culture Resources for Vets & Vet Students Washington State University
www.vetmed.wsu.edu/spanish/ La Medicina Veterinaria: Website designed to help veterinary students communicate with their Spanish-speaking clients
Colorado State University Colorado State University Online Plus
http://www.online.colostate.edu/courses/VMLL/VMLL3052.dot http://quizlet.com/2246065/veterinary-spanish-terms-internal-organs-flash-cards/
Spanish for Veterinarians: Practical course designed to prepare veterinarians and veterinary technicians to interact with their Spanish-speaking clients in a professional capacity On-line flash cards to help improve Spanish-language veterinary vocabulary
Texas A &M University
http://vetmed.tamu.edu/bims/current/spanish-certificate
Biomedical Science International Certificate in Cultural Competency and Communication in Spanish DVM second-year requirement: Medical Spanish
Purdue University
http://www.vet.purdue.edu/engagement/spanish/podcasts.php
On-line podcasts to develop Spanish-language vocabulary and cultural awareness Spanish language edition of the 5th Grade Veterinary Medicine Activity Book
American Veterinary Medical Association
https://www.avma.org/PracticeManagement/ClientMaterials/Pages/spanishproducts.aspx
Spanish language resources: children’s materials, client information brochures, pet loss, disaster preparedness, careers, and veterinary practice resources
American Animal Hospital Association
https://www.aahanet.org/Store/ProductDetail.aspx?type=PetHealth&code=*PHSS
Spanish language brochures
Maddie’s Fund
www.maddiesfund.org Activity book for young children in Spanish and English (Maddie’s® Mueve la Colita / Maddie’s® Tail Wag)
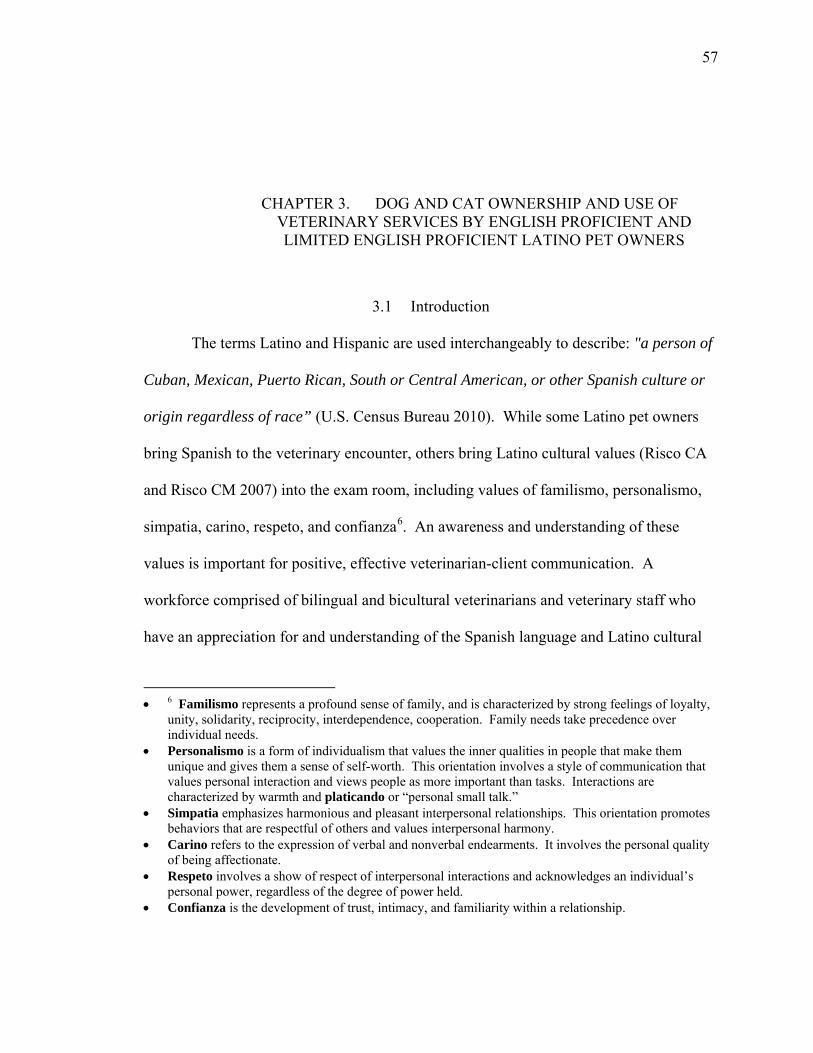
57
CHAPTER 3. DOG AND CAT OWNERSHIP AND USE OF VETERINARY SERVICES BY ENGLISH PROFICIENT AND LIMITED ENGLISH PROFICIENT LATINO PET OWNERS
3.1 Introduction
The terms Latino and Hispanic are used interchangeably to describe: "a person of
Cuban, Mexican, Puerto Rican, South or Central American, or other Spanish culture or
origin regardless of race” (U.S. Census Bureau 2010). While some Latino pet owners
bring Spanish to the veterinary encounter, others bring Latino cultural values (Risco CA
and Risco CM 2007) into the exam room, including values of familismo, personalismo,
simpatia, carino, respeto, and confianza6. An awareness and understanding of these
values is important for positive, effective veterinarian-client communication. A
workforce comprised of bilingual and bicultural veterinarians and veterinary staff who
have an appreciation for and understanding of the Spanish language and Latino cultural
• 6 Familismo represents a profound sense of family, and is characterized by strong feelings of loyalty,
unity, solidarity, reciprocity, interdependence, cooperation. Family needs take precedence over individual needs.
• Personalismo is a form of individualism that values the inner qualities in people that make them unique and gives them a sense of self-worth. This orientation involves a style of communication that values personal interaction and views people as more important than tasks. Interactions are characterized by warmth and platicando or “personal small talk.”
• Simpatia emphasizes harmonious and pleasant interpersonal relationships. This orientation promotes behaviors that are respectful of others and values interpersonal harmony.
• Carino refers to the expression of verbal and nonverbal endearments. It involves the personal quality of being affectionate.
• Respeto involves a show of respect of interpersonal interactions and acknowledges an individual’s personal power, regardless of the degree of power held.
• Confianza is the development of trust, intimacy, and familiarity within a relationship.
58
values could improve communication with LEP SSPOs. However, since only 5% or
2400 of the nation’s 48,800 small animal AVMA veterinarians self-identify as Latino or
Hispanic (Kansas State University 2009; AVMA 2012), a cultural and linguistic
provider-client incongruence is highly likely.
Latinos are the largest minority group in 25 of the fifty US states, and as of 2010,
the US had the second-largest Latino population in the world, second only to Mexico
(U.S. Census Bureau 2010). Currently Latinos number 51.9 million people and
comprise 16.7% of the nation’s 311 million inhabitants (U.S. Census Bureau 2011). By
the year 2050, it is projected that Latinos will number 132.8 million or 30% of the US
population (U.S. Census Bureau 2011).
Spanish is the most common non-English language spoken in the US. As of 2010,
Spanish speakers numbered 37.6 million people and comprised more than 62% of the
non-English speaking US population (U.S. Census Bureau 2010). An estimated 16.2
million US Spanish-speakers over five years of age speak English less than “very well”
and are therefore described as limited English proficient or LEP (U.S. Census Bureau
2010). This large and growing number of Latinos includes pet owners who visit
veterinarians with their pets. It is estimated that between 36% (Pew Research Center
2006) and 38% (Social Science Research Solutions 2012) of Latinos currently own a pet.
By extrapolation, 19 million Latinos and 6 million LEP Spanish-speakers are pet owners
in the US today.
Despite the recent Latino population explosion, little is known about pet
ownership and use of veterinary services in this demographic group. Information is also
lacking on the proportion of veterinarians and veterinary staff who can communicate
59
effectively with LEP pet owners without a translator being present. As the Latino and
LEP Spanish-speaking populations in the US continue to grow, the number of Latino and
LEP Spanish-speaking people who own pets and seek veterinary care is also expected to
grow. An ability of veterinarians to communicate effectively with LEP SSPOs could
influence the quality of veterinary care provided for their pets.
Specific Objectives and Hypotheses
The overall objectives of this study were to describe the current patterns of pet
ownership among Latino pet owners, identify factors associated with Latino pet owners’
use of veterinary services, and describe Latino pet owners’ satisfaction with their pet’s
veterinary care and their own communication with members of the veterinary team. To
accomplish these objectives, a bilingual Latino Pet Owner survey was created and
conducted in the US. The null hypotheses tested were:
(i) LEP among Latinos is not a barrier for obtaining quality veterinary care for
their pets. English proficient and LEP Latino pet owners are equally likely to
take their dogs or cats to a veterinarian annually.
(ii) LEP among Latinos is not a barrier to veterinary customer satisfaction.
English proficient and LEP Latino pet owners are equally satisfied with their
pet’s care and with their ability to communicate with members of the
veterinary team.
60
3.2 Materials and Methods
Study design and population
The target population for this study was Latino pet owners in the US estimated to
be 19.8 million (38%7 of 52 million) Latinos. The sample frame was comprised of the
randomly generated call list of landline and wireless phone numbers used by Social
Science Research Solutions (SSRS, Media PA). The sample itself consisted of all
eligible individuals contacted by telephone by SSRS for the EXCEL Omnibus Survey
from July 19, 2012 through October 17, 2012. An eligible individual was: 18 years of
age or older who self-identified as Latino/Latina/Hispanic and was a current owner or
caretaker of at least one dog or cat. Epi-Info® version 7.0 – StatCalc - Sample Size and
Power was used to calculate the needed sample size assuming a total population of 52
million Latinos of whom 19.8 million were estimated to be pet owners. Based on an
expected frequency of response of 50%, a precision of 5%, and a confidence level of 95%
(a = 0.05), 384 completed interviews with Latino pet owners were needed to have
sufficient statistical power to reject the null hypotheses if they were false.
Self-identified Latino dog and cat owners were interviewed as part of a national,
population-based, random digit dial, dual-frame (landline and cell phone) telephone
survey. The Latino Pet Owner survey was appended to the weekly EXCEL omnibus
survey conducted by SSRS. Bilingual interviewers from SSRS used a computer-aided
telephone interview (CATI) system to call a randomized sample of landline and wireless
telephone numbers in the US. Calls were made Wednesday through Friday 5:30pm to
7 Social Science Research Solutions. "Previous survey found 38% of Hispanics are pet owners". Personal communication: February 23 2012.
61
9pm, Saturday 10am to 5pm, and Sunday noon to 9pm. If a respondent was not reached
on the initial attempt the number was redialed up to six times. If a non-irate respondent
declined to participate they were contacted by a trained caller who encouraged an 18-year
old or older member of the household to participate.
Professional interviewers conducted the survey in either Spanish or English
according to the respondent’s stated preferred language. Among the demographic
questions in the omnibus survey was one about ethnicity. A respondent who self-
identified as Latino during the course of the EXCEL survey was later asked if s/he had
any dogs or cats. Latino respondents with at least one dog or cat were then asked a series
of questions pertaining to pet ownership and veterinary use. Pet owners who had more
than one dog and or cat were asked questions about up to three dogs and three cats.
Survey instrument
Two distinct surveys were used. The first was the SSRS EXCEL Omnibus, an
ongoing weekly survey conducted by Social Science Research Solutions with 1000
respondents per week. The second (shown in Appendix A) was the Latino Pet Owner
survey which was appended to the Omnibus survey and conducted by SSRS with
approximately 30 Latino pet owners each week for thirteen weeks. The SSRS EXCEL
omnibus survey consisted of two sections: a respondent demographics section and a
household characteristics section. The Latino Pet Owner survey consisted of three
sections, namely a pet ownership section, a veterinary use section, and an owner self-
assessment section. The Latino Pet Owner survey consisted of 14 dog-, 14 cat-, and 4
owner-related multiple choice, yes/no and open-ended questions that were worded in a
conversational style including the name of the pet.
62
During the development phase of the Latino Pet Owner survey, questions were
reviewed and critiqued by four colleagues with expertise in survey design, survey
methodology, and topical content. Cognitive interviews were conducted on early
versions of the instrument where non-expert pre-test respondents “thought aloud” as they
answered each question and shared what was going through his/her mind while
answering the question. Think-aloud exercises helped to identify confusing wording and
revisions were made accordingly. Once pre-tested and revised to its final form the
English version of the Latino Pet Owner survey underwent translation into Spanish. First,
a native Spanish-speaker from Mexico translated the survey into Spanish. Next, this
translation was reviewed by three other Spanish speakers including one native speaker
from Argentina, one native speaker from Mexico, and one non-native speaker from the
US. Once a translation was agreed upon the Spanish version was back-translated into
English to ensure that expressions and concepts matched in both languages. Both the
English and Spanish versions were then submitted to, and approved by, Purdue’s
Institutional Review Board8 and sent to SSRS for review and implementation by a team
of bilingual interviewers. No incentives or honorariums were offered to participants.
Statistical analyses
Study variables
Descriptive statistics were used to summarize distributions of the explanatory
variables. Frequencies and percentages were used to describe distributions of the
categorical variables; the median or mean was reported for quantitative variables.
8 Human Research Protection Program - Approved IRB Protocol #1207012472
63
Significance testing
Significance testing was performed to compare pet owner demographics by
species (dog, cat, or both), by English proficiency level of pet owner (English-proficient
versus LEP), and by veterinary use (took dog or cat to vet or not). Significance tests
included the Student’s two-sample t-test with equal variances to compare means of
continuous variables, Pearson chi-square and Fishers exact tests to assess homogeneity of
categorical variables, and Mann-Whitney tests to compare non-normally distributed
variables (see Tables 3-1, 3-2 and 3-3). Analyses of pet owner demographic variables
were conducted with weighting (see below for explanation of weighting scheme).
Analyses of pet ownership and veterinary use variables were conducted without
weighting. The statistical software package Stata® Version 11.2 (Stata Corporation,
College Station, TX) was used for both descriptive and analytic analyses.
Statistics
This study used odds ratios (ORs) to measure the effects of the explanatory
variables on the possibility of taking a pet to the veterinarian in the past 12 months.
Potential predictors of veterinary use were determined using bivariate and multivariate
logistic regression. Estimates for the OR and 95% confidence intervals (95% CI) for
each predictor were obtained by exponentiation of the regression coefficients.
Independent variables retained in the final multivariate model were assessed for
correlation. Maximum likelihood estimates of the logistic parameters and fit of the final
model was assessed using a global test of goodness-of-fit. Variables with a P-value of
<0.20 in the bivariate models were included for analysis in the multivariate models; a P-
value of <0.05 was considered statistically significant in the multivariate models.
64
Population weights supplied by Social Science Research Solutions were applied when
analyzing the pet owner demographic variables. The variable representing population
weight was created using post-stratification iterative proportional fitting (aka "raking').
The weighted sample did not use clustering or stratification.
Each EXCEL survey was weighted to provide nationally representative estimates of
the adult population 18 years of age and older. The weighting process took into account
the unequal probabilities of household selection due to the number of separate telephone
lines and the probability associated with the random selection of an individual household
member. Following the application of population weights, the sample was post-stratified
and balanced by key demographics such as age, race, sex, region, and education. The
sample was also weighted to reflect the distribution of phone use in the general population,
namely cell phone only users, cell phone mostly users, landline only users, and mixed users.
Two types of post-survey corrections were used to avoid selection bias and
account for households having an unequal chance of being selected: Dual-Usage
Correction (DUC) and Within-Household Correction (WHC). DUC ensures that
respondents whose households answer both landlines and cell phones are not more likely to
respond to the Excel survey than those in single-usage households. This is done by
weighting the data first to the known distribution of households that are cell-phone only
(CPO), landline only and dual-usage (or “dual frame”) households (DF). This distribution
is based on the most recent report in the National Health Interview Survey (NHIS)
published biannually by the Centers for Disease Control and Prevention. WHC ensures
that a person’s probability of selection in a landline household depends on the number of
eligible respondents in the household. In the landline sample, a person residing in a
65
household with one adult has a 100% probability of selection, whereas if there are two
eligible adults, each of them has a 50% probability of selection if reached by landline. To
avoid underrepresentation of adults living in multiple-adult households, single-adult
landline households were assigned a weight half the size of multiple-adult households.
Respondents who refused to reveal the number of adults in their households received the
mean weight. Cell phone only respondents received a weight of 1 since there was no
selection within their households (SSRS, personal communication).
3.3 Results
Descriptive Statistics: Pet Owner Demographics
From a pool of 13,278 completed telephone interviews, 1026 (7.7%) respondents
self-identified as Latino or Hispanic. Of those 1026 Latino respondents, 393 (38.3%)
indicated that they were dog and/or cat owners. Survey respondents came from 95
different counties in 41 US states, with a maximum of 25 respondents from any one
county. More than a quarter of those interviewed (26%) had income levels below the US
poverty threshold (U.S. Census Bureau 2012). Foreign-born respondents had lived in the
US from 2 to 67 years. Of those respondents not working full-time, 13% worked part-
time outside the home, and the remaining 43% were categorized as “other”: homemaker,
student, retired, unemployed or unable to work (see Table 3-1 and Figure 3-1-A, B, C).
Four questions were asked of all pet owners: How did you find out about the last
clinic you visited? Who spoke Spanish at the veterinary clinic? How well do you speak
English? Would you like to receive written pet health information in Spanish? Twenty-
one percent of all respondents stated they would like to receive the information in
66
Spanish. Of those who wanted to receive written information in Spanish, 42% spoke
English “well” or “very well” (see Tables 3-4 and 3-5).
Descriptive Statistics: Pet Owners and their Dogs
Of the 393 Latino pet owners interviewed for this study, 366 (93%) had owned a
dog in their lifetime. Amount of time as a dog owner ranged from one week to 75 years.
At the time of the interview, 330 (84%) of the 393 respondents currently owned or
continuously cared for a total of 515 dogs, and 52 (16%) of current dog owners also had a
cat. The majority (59%) of these owners had one dog; 94% had 3 or fewer dogs. The
mean number of dogs owned was 1.65, the median number of dogs owned was 1, and the
maximum number of dogs owned by a single respondent was seven. Two-thirds (341) of
the 515 dogs owned were pure breed dogs (Tables 3-6 and 3-7).
Source of dog, cost of dog, gender and sterilization status was asked about each
dog. Of the 35 dogs adopted from the shelter, none were adopted by LEP owners.
Gender and sterilization status was reported for 226 females and 276 males in the dog
sample. The sterilization rate of all dogs in the survey was 54%: 56% of the female dogs
in this sample were spayed and 52% of the male dogs were neutered (Tables 3-8, 3-9 and
3-10). This is lower than the sterilization rate of 78% for all owned dogs nationally in
2011.9
Of the 259 (78.5%) dog owners who took their dog to the veterinarian in the past
12 months, the number of veterinarian visits averaged 2.5. Owners were asked why they
brought their dog(s) to the veterinarian and why they didn’t bring the dog(s) to the
9 Source: 2011–2012 APPA National Pet Owners Survey and estimated by The Humane Society of the United States using statistics provided by The National Council on Pet Population Study and Policy.
67
veterinarian (Tables 3-11 and 3-12). They were asked to evaluate their satisfaction with
the care, communication, and cost of their veterinary visit on a scale of 1 to 5, where
1=extremely dissatisfied and 5=extremely satisfied. Of these three criteria for rating the
veterinary visit, owners were most satisfied with “care” (mean=4.63), least satisfied with
“cost” (mean=3.98), and moderately satisfied with “communication” (mean=4.52).
Finally, respondents were given details of a scenario10 in which they discovered
their dog had become acutely ill with vomiting and diarrhea. They rushed the dog to the
veterinary hospital, only to discover upon arrival that no one at the veterinary hospital
spoke Spanish. They were asked to describe what they would do next in this situation
(Table 3-13).
Descriptive Statistics: Pet Owners and their Cats
Of the 393 Latino pet owners interviewed, 40% (157) had owned a cat in their
lifetime. Amount of time as a cat owner ranged from one week to 75 years. At the time
of the interview, 115 (29.3%) of the 393 respondents currently owned or continuously
cared for a total of 184 cats, and 52 (45%) of current cat owners also had a dog. The
majority (57%) of these owners had one cat; 97% had 3 or fewer cats. The mean number
of cats owned by a single respondent was 1.6; the maximum number of cats owned was
six. One-fourth of the sample was pure breed cats (Table 3-6).
Source of cat, cost of cat, gender and sterilization status was asked about each cat.
Gender and sterilization status was reported for 76 females and 92 males in the cat
sample. The sterilization rate of all cats was 79%: 83% of the female cats in this sample
10 See Appendix A, Survey Question #14 for full text of scenario
68
were spayed and 76% of the male cats were neutered. This is lower than the sterilization
rate of 88% for all owned cats nationally in 201111 (Tables 3-8, 3-9, and 3-10).
Of the 70 (61%) cat owners who took their cat to the veterinarian in the past 12
months, the number of veterinarian visits averaged 1.6. Owners were asked why they
brought their cat(s) to the veterinarian and why they didn’t bring the cat(s) to the
veterinarian (Tables 3-11 and 3-12). They were asked to evaluate their satisfaction with
the care, communication, and cost of their veterinary visit on a scale of 1 to 5, where
1=extremely dissatisfied and 5=extremely satisfied. Of these three criteria for rating the
veterinary visit, cat owners were most satisfied with “care” (mean=4.36), least satisfied
with “cost” (mean=3.81), and moderately satisfied with “communication” (mean=4.27).
Finally, respondents were given details of a scenario12 in which they discovered
that their cat had become acutely ill with vomiting and diarrhea. They rushed the cat to
the veterinary hospital, only to discover upon arrival that no one at the veterinary hospital
spoke Spanish. They were asked to describe what they would do next in this situation
(Table 3-13).
Analytic Statistics: Pet Owner Demographics by Level of English Proficiency
The question “How well do you speak English?” was used to estimate the
percentage of Latino pet owners in this sample who had LEP. The US Census defines
“LEP” as anyone who speaks English less than “very well” (LEP.gov 2013). By this
definition, of 393 Latino pet owners, 116 (32.3%) were LEP. In the bivariate analysis of
11 Source: 2011–2012 APPA National Pet Owners Survey and estimated by The Humane Society of the United States using statistics provided by The National Council on Pet Population Study and Policy 12 See Appendix A, Survey Question #28 for full text of scenario
69
factors predictive of veterinary use, LEP was not significant when analyzed as a 4-level
variable (speaks English very well, well, not well, not at all). However, when collapsed
into two categories and analyzed as a dichotomous variable (speaks English very well or
well versus speaks English not well or not at all), LEP was significant at P<0.20
(P=0.067). By this 2-level definition, 62 (16%) of those surveyed were LEP.
Throughout this analysis LEP was therefore used as a 2-level variable: LEP and English-
proficient (EP).
The Student’s t-test of continuous variables and Pearson chi-square test of
categorical variables were run to analyze differences between LEP and EP pet owners.
Specifically, the LEP pet owner was significantly more likely to: be older than the EP
pet owner (P<0.001); earn less than $15K per year (P<0.001); be married or living with a
partner (P<0.001); be a parent or guardian to a child under eighteen years of age
(P<0.001); have been born outside of the US or Puerto Rico (P<0.001); and be living in
the US for fewer years than the EP pet owner (P=0.028). Conversely, the LEP pet owner
was significantly less likely to: have completed high school (P<0.001); be white or
Caucasian (P=0.039); and be registered to vote (P<0.001) (Table 3-2 and Figure 3-1-D, E,
F, G, H, I).
Analytic Statistics: Pet Ownership Characteristics and Veterinary Use by Level of
English Proficiency
A two-sample t-test of continuous variables and Pearson chi-square test of
categorical variables revealed several statistically significant differences in pet ownership
characteristics and veterinary use between LEP and EP pet owners. In particular, EP dog
owners had dogs for twice the length of time as LEP dog owners (P<0.001) and EP cat
70
owners had cats for triple the length of time as LEP cat owners (P=0.007). EP dog
owners paid 2.5 times more for their dog on average than did LEP dog owners (P=0.032).
Significantly more LEP than EP dog owners acquired their dog from a friend or family
member (P=0.003); whereas significantly more EP owners got their dog from an animal
shelter than did LEP dog owners (P=0.006). Significantly more LEP than EP owners
took their pet to the vet for vaccinations (P=0.044), while more EP than LEP owners took
their dog to the vet for wellness exams (P=0.019). LEP dog owners mentioned
transportation as a barrier to veterinary use significantly more often than EP owners
(P=0.049). When faced with a scenario about taking their sick dog to a veterinary
hospital where no one on staff spoke Spanish, significantly more LEP than EP dog
owners said they would sign a consent form even if they didn’t understand it (P=0.020),
ask for telephone interpreter services (P<0.001), ask for an on-site interpreter (P<0.001),
or simply go elsewhere (P<0.001). During the clinical encounter, LEP pet owners were
aware of more Spanish-speaking veterinary staff members than were EP owners
(P=0.015). When asked if they wanted to receive their pet’s health information in
Spanish, 76% of LEP owners said yes, while 15% of EP owners said yes (P<0.001)
(Table 3-14).
Analytic Statistics: Pet Owners and their Dogs
Fitting the Model: Bivariate analyses identified seven variables that had a
statistically significant impact (P<0.20) on use of veterinary services by dog owners
when analyzed using logistic regression with weighting, including employment,
household composition, number of adults in household, owner’s level of education,
owner’s level of income, whether or not the owner was registered to vote, and LEP.
71
Multivariable logistic regression using backward stepwise selection reduced the model to
three variables significantly associated with bringing a dog to the veterinarian namely
employment, education, and income. However, because income was highly correlated
with employment and education (0.44 and 0.55, respectively), employment and education
were dropped from the model. The final model retained income and LEP (due to a priori
interest in level of English proficiency) as predictors of taking the dog to the veterinarian:
Pr(dog to vet) = F(bo + bincome*income + bLEP*LEP).
Testing the Estimates: An adjusted Wald test was used to test the estimates in the
final reduced model. The effect of income on the probability of taking the dog to the vet
was significant (P<0.001). The effect of level of LEP on the probability of taking the dog
to the vet was not significant (P=0.945).
Assessing Model Fit: The goodness-of-fit test was not significant (P=0.894).
Therefore the assumptions of fit were not violated and the reduced model did reasonably
describe the factors which were significantly associated with bringing a dog to the
veterinarian.
Interpreting predicted values of outcome: As income increased, the probability
of an owner bringing his or her dog to the veterinarian significantly increased 46%
(OR=1.46, df=2, p=0.005, 95% CI=1.12 to 1.90). Those owners with the lowest
probability of bringing their dog to the veterinarian can be characterized as having less
than a high school education, not employed full- or part-time, annual income less than
$15K, not registered to vote, and speak English “not well” or “not at all.” Conversely,
those owners with the highest probability of bringing their dog to the veterinarian can be
72
characterized as having graduated from college, employed full-time, annual income
above $50K, registered to vote, and speak English “very well” or “well.”
Although the variables employment and education were too highly correlated with
income to be included in the final model, they demonstrated important monotonic trends
of probability of bringing a dog to the vet. The pattern suggests that as education
increases and as employment moves toward full-time (while all other variables were held
at their mean value), there is an increased probability of use of veterinary services (Table
3-15). Additionally, the variable measuring EP revealed a clear but statistically non-
significant monotonic trend: The probability of bringing a dog to the veterinarian
increases as English language proficiency increases (Table 3-16).
Analytic Statistics: Pet Owners and their Cats
Fitting the Model: Bivariate analyses identified five variables that had a
statistically significant impact (P<0.20) on use of veterinary services by cat owners when
analyzed using logistic regression with weighting including: owner’s level of education,
metro vs. non-metro, home ownership, parent/guardian, and age of owner. To determine
the impact of English proficiency on the outcome variable (taking the cat to the vet), LEP
was also retained in the initial model even though it was not significantly associated with
the outcome variable. Due to its previous significance in the dog model, owner’s level
of income was also retained for comparison in the cat model even though it was not
significantly associated with taking the cat to the vet. Multivariable logistic regression
using backward stepwise selection identified one variable significantly associated with
bringing a cat to the veterinarian: whether or not the owner was a parent/guardian of a
child less than 18 years of age. The final model retained parent and LEP (due to a priori
73
interest in LEP) as predictors of veterinary use: Pr(cat to vet) = F(bo + bparent*parent +
bLEP*LEP).
Testing the Estimates: An adjusted Wald test was used to test the estimates in the
final reduced model. The effect of being a parent/guardian of a child under 18 years of
age on the probability of taking the cat to the vet was significant (P=0.031). The effect of
owner’s level of EP on the probability of taking the cat to the vet was not significant
(P=0.449).
Assessing Model Fit: The goodness-of-fit test was not significant (P=0.985).
Therefore the assumptions of fit were not violated and the reduced model did reasonably
describe the factors which were significantly associated with bringing a cat to the
veterinarian.
Interpreting predicted values of outcome: Cat owners without children under 18
years of age were more than twice as likely to bring the cat to the vet than cat owners
with minor children (OR=2.54, df=2, p=0.043, 95% CI=1.12 to 5.76). Those owners
with the lowest probability of bringing their cat to the veterinarian can be characterized
by: less than a high school education, annual income less than $50K, renter, parent of
child(ren) under 18, aged 20-39. Conversely, those with the highest probability of
bringing their cat to the veterinarian can be characterized by: high school graduate,
annual income greater than $50K, home owner, not a parent of a child under 18 years of
age, and not themselves in their twenties or thirties.
Analytic Statistics: Hypothesis Testing
Although results indicated that both LEP dog and cat owners were less likely than
EP owners to take their pet to the vet, these results did not reach statistical significance
74
and therefore did not permit rejection of the null hypothesis that LEP and EP pet owners
are equally likely to take their pet to the veterinarian annually (dog owners P=0.227; cat
owners P=0.264). Furthermore, although results demonstrated that LEP dog and cat
owners were less satisfied with the communication and care at the veterinary hospital
than EP pet owners, these results also did not reach statistical significance (LEP versus
EP dog owners’ satisfaction with communication P=0.057 and care P=0.257; LEP versus
EP cat owners’ satisfaction with communication P=0.937 and care P=0.468). Therefore
the null hypothesis that LEP and EP pet owners experience equal satisfaction with
communication and care could not be rejected (Table 3-14).
3.4 Discussion
This study investigated the current state of pet ownership among EP and LEP
Latino pet owners in the US and identified factors significantly associated with the use of
veterinary services. Results suggest that Latino pet ownership and veterinary use are
interrelated with socio-demographic factors including the owner’s level of education,
income, employment, and English proficiency, as well as age, parental status, and
nativity (native-born or foreign-born).
The study was unable to reject the null hypothesis that LEP among Latinos is not
a barrier for obtaining quality care for their pets. Although there was a clear monotonic
trend demonstrating that EP dog owners were actually more likely to take their dog to the
veterinarian than LEP dog owners (Table 3-16), that trend did not reach a level of
statistical significance. Similarly, the study was unable to reject the null hypothesis that
LEP among Latinos is not a barrier to veterinary customer satisfaction. Again, although
75
EP dog and cat owners were more likely than LEP dog and cat owners to be satisfied
with veterinary care and communication, the trend did not reach a level of statistical
significance.
This failure to reject the null hypothesis can be explained in one of two ways:
Either the study was underpowered to demonstrate a difference if it existed, especially for
cat data (LEP sample N=62, LEP cat sample N=12), or there truly was no difference
between LEPs and EPs bringing their pet to vet and being satisfied with care and
communication. If there was truly no difference, perhaps this can be explained by
“immigrant tenacity”; that is, despite challenges of language, income, and education,
these dedicated pet owners find a way to care for their pets. The focus then shifts away
from the question, “Did the owner bring the pet to the veterinary practice?” and shifts
toward the question “How prepared was the veterinary team to communicate with this
LEP client once s/he arrived at the practice?”
One challenge encountered in conducting this study was to obtain a nationally
representative sample of Latino dog and cat owners. A nationally representative sample
was sought by appending the Latino Pet Owner survey to the weekly Social Science
Research Solutions (SSRS) EXCEL national omnibus survey, because SSRS uses
random sampling methods and post-survey iterative proportional fitting in order create
sample weights that are nationally representative estimates of the adult population 18 years
of age and older. The weighted sample closely matched Latino national demographics in
terms of nativity, gender, marital status, household size, poverty level, and level of
English proficiency for both native-born and foreign-born Latinos. Higher levels of
education and income were found in the survey sample than in the Latino national
76
population, which could be explained by: (i) respondent’s desire to be seen as wealthier
and more highly educated than s/he actually was (social desirability bias); (ii) actual
oversampling of wealthier and more highly educated respondents; or (iii) a combination
of these two factors (Table 3-17).
The survey sample and national sample also differed by average age of the
respondent: on average, the survey sample respondent was older. It is possible that this
survey cohort was older because younger Latinos were not interested in participating in
the telephone survey (response bias). Alternatively, it is possible that the age group was
skewed toward older respondents because the older respondent was more often available
to answer the phone at the times the survey calls were made (Table 3-17).
Another challenge of this study was to minimize potential coverage error, non-
response error, and measurement error of the survey instrument itself. Since SSRS used
both wireless and random-digit-dialing (RDD) landline phone lists, coverage error was
minimized except for individuals who do not have any phone service at all, which
currently constitutes 1.9% of the US adult population (Blumberg SJ and Luke JV 2012).
If a random-digit-dial national landline listing had been used, the cell-phone only and
cell-phone mostly users would have been excluded from the study, which would have
severely biased the results, omitting contact information for over half of all potential
respondents. If a web-based survey had been conducted, not only would there have been
no list (i.e. no sampling frame) from which to draw the sample, but there would have
been potential for high coverage error, because non-whites, people with lower incomes,
and people with less education have lower Internet access and are likely to be left out of
internet surveys (Dillman DA, Smyth JD et al. 2009; Pew Internet & American Life
77
Project 2013). There was also potential for non-response error in the study. The question
of whether or not Latino pet owners who chose not to participate in the SSRS survey
differ in significant ways from Latino pet owners who did participate in study, such as
whether or not they took their dog or cat to the veterinarian within the past 12 months, is
unknown.
The survey instrument was pre-tested with cognitive interviews to eliminate
confusing wording before initiating the survey. But final survey wording was not entirely
unambiguous and might have contributed to measurement error. For example, the
EXCEL Omnibus survey had a question which read, “What is your pre-tax income?”
Some respondents might have answered by giving their individual pre-tax income level,
while others might have given their household pre-tax income level. Moreover, since
income can be a sensitive issue, some respondents might not have shared honestly, or at
all, the precise answer to this question, which could have contributed to the reason why
the survey mean income was higher than the national Latino mean income. Income was a
significant independent variable for analysis in this study, so it could have been an
important source of measurement error.
Many demographic variables examined in this study could be surrogate measures
of acculturation including length of time in the U.S., voter registration status, level of
education, nativity, and level of English proficiency. Acculturation has been described
as “…a long-term, fluid process in which individuals simultaneously move along at least
two cultural continua (or dimensions) and whereby individuals learn and/or modify
certain aspects of the new culture and of their culture of origin” (Marin Gerardo and
Gamba Raymond J. 1996). Of these surrogate measures for acculturation, education
78
level and voter registration status were significantly associated with whether or not a pet
owner took his/her dog or cat to the veterinarian in the past 12 months. Those who were
registered to vote not only had lived in the US for a significantly longer period of time
(P<0.001) and were significantly more likely to speak English well or very well
(P<0.001), but they were also significantly more likely to bring their dog (P=0.018) and
their cat (P=0.042) to the veterinarian. Level of English proficiency itself was not shown
to be a statistically significant factor in whether or not an owner brought their dog or cat
to the vet in the past 12 months.
Results from this study were comparable to results from other recent national
studies in terms of percentage of Latinos who are pet owners, number of annual vet visits
with dog, number of dogs owned, and reasons for going to the vet (Table 3-18).
Surprisingly, despite a reported income of less than $50K for two-thirds of respondents,
and a below-poverty level income for a quarter of the respondents, 79% of respondents
said they took their dog to the veterinarian in the past 12 months, suggesting high use of
veterinary services despite low income.
Results from this study were also comparable to results from other recent national
studies in terms of number of annual vet visits with cat and reasons for going to the vet
(Table 3-18). On average, pet owners in this sample had fewer cats than that found in the
2012 AVMA study. However, other previous studies have also found that Latino pet
owners are less likely to have cats than dogs (Risley-Curtiss 2006; Faver 2009), so this is
likely a real phenomenon, explainable by cultural differences in species preference. This
cultural difference in species preference is further supported by the fact that owners in
79
this study had almost three times more dogs than cats, and were willing to pay almost
five times as much to acquire a dog than a cat (Table 3-18).
The only variable found to be predictive of veterinary use by cat owners in this
study was whether or not an owner was also a parent or guardian of a child under 18
years of age. Although it is conceivable that someone with young children would be too
busy to bring their cat to the veterinarian, or not have sufficient disposable income to
spend on their cat, the same finding (that parents of young children were less likely to
bring the pet to the veterinarian) did not hold for dog owners. Results might highlight the
problem that cats often don’t travel well, which is compounded by the challenge of
traveling with young children.
Although 47 (58%) of those who said they would like to receive their pet’s health
information in Spanish were LEP, 34 (42%) of those who wanted Spanish-language
written materials described themselves as speaking English well or very well. This
highlights the need to ask every client to identify their preferred language. Despite a high
level of conversational English, these clients indicated that they still prefer to read about
their pet’s health information in their first language. Of those respondents who were LEP,
more than three-fourths indicated that they preferred to receive their pet’s written health
information in Spanish.
Limitations of the study
First, although the final sample consisted of 393 pet owners and 699 pets, upon
analysis there were only 115 cat owners (29% of respondents) with 184 cats (26% of
pets). In retrospect a sample triple this size of pet owners would be necessary to reach
80
384 cat owners. As currently designed, this study was underpowered for the analysis of
the cat ownership and veterinary use data. This study revealed that the number of Latino
cat owners in general, and LEP Spanish-speaking cat owners in particular, was much
smaller than that of Latino dog owners, limiting the ability to predict probabilities for
taking cats to the vet.
Second, despite survey instrument pre-testing and cognitive interviews, some
veterinary jargon remained in the survey instrument which might have been unfamiliar to
respondents and which could have negatively affected responses. Specifically, in the
English language version of the Latino Pet Owner survey, dog and cat owners were asked
if they ever took their pet to the veterinarian for a “fecal examination”. Surprisingly, not
one respondent answered “yes” to this question. In retrospect, “fecal examination” might
not have been understood; “check for worms” might have been better wording for this
question.
Third, it would have been valuable to ask more specifically about owner’s place
of birth and ethnicity. There could be significant pet ownership and veterinary use
differences between various groups of Hispanic origin, including: Mexican, Puerto Rican,
Cuban, Dominican, Costa Rican, Guatemalan, Honduran, Nicaraguan, Panamanian,
Salvadoran, other Central American, Argentinean, Bolivian, Chilean, Colombian,
Ecuadorian, Paraguayan, Peruvian, Uruguayan, Venezuelan, other South American, or
Spaniard. For example, does attitude toward spay/neuter, especially of male dogs and
cats, differ among various groups of Hispanic origin?
Fourth, it would have been beneficial to have asked explicitly if the respondent
was the primary person in the household responsible for pet’s care. For the purpose of
81
the analysis, an assumption was made that the respondent was the primary caregiver,
when in fact responsibilities might have been shared by the entire household.
Conclusions
Based on completed surveys with 393 Latino pet owners, 62 of who were LEP,
pet ownership patterns among Latinos can best be described as follows: As a group,
Latino pet owners preferred dogs to cats almost 3:1, and Latino dog owners in this study
preferred Chihuahuas and Pitbulls to all other pure breed dogs. When searching for a
veterinary clinic for their pet, Latino pet owners were most likely to ask a friend or
family member for a practice recommendation above all other search strategies.
Veterinarians could offer a referral incentive (free nail trim for pet, e.g.) to harness the
power of referrals in this word-of-mouth community.
Latino pet owners responding to this survey were more likely to visit the vet with
a sterilized dog or cat than an intact pet, and more likely to bring in a dog than a cat.
When bringing their pet to the vet, the pet owner was most likely to be coming in for the
pet’s vaccinations or wellness exam. The visit is therefore the ideal opportunity for the
veterinary team to ask if there are any other pets at home, especially cats, and to
encourage owners to bring in all pets for an annual examination, even when the pet is
healthy. The vaccination appointment is also the ideal time to have a frank conversation
about spaying and neutering all pets, and to find out what the client’s beliefs are about
sterilization. The sterilization rate for dogs and cats in this study was lower than the
national spay/neuter rates, with male pets being sterilized less often than female pets.
Veterinarians might consider offering a surgical option such as placement of neuticals
82
during the dog neuter. A future study could evaluate the impact of this option: Does
offering insertion of neuticals during neuter to offset the appearance of castration increase
an owner’s willingness to have a male dog castrated?
Latino cat owners who participated in this study often reported that they had
adopted their cat as a stray from the neighborhood. If available in the community,
veterinary team members could educate these cat owners about local feral cat programs
and encourage them to participate as volunteers in a feral cat Spay Day event. These cat
owners could become neighborhood cat advocates and liaisons to the feral cat program in
their community. Similarly, owners of pit bulls (the second most popular breed reported
in this study) could be given handouts or links to websites about bully breeds such as Pit
Bull Rescue Central (www.pbrc.net) or other on-line bilingual resources for responsible
pit bull ownership.
For the foreign-born LEP SSPO, there was a 50% chance that the owner had less
than a high school education. Thus veterinary team members needs to tailor pet health
conversations to both the level of education as well as the level of English language
proficiency of the client for optimal client understanding. Many LEP SSPOs stated they
were willing to sign informed consent forms even if they didn’t understood what was
written on the form. To maximize an LEP client’s understanding and minimize a
practice’s legal liability, the veterinary practice might consider using a translated
Spanish-language version of the consent form, and having a bilingual staff member read
the form aloud to the pet owner before obtaining a signature. If the practice does not
employ any bilingual staff and the owner has low literacy skills, the Spanish-language
text could be pasted into translation software on an iPhone, iPad or computer, and then
83
played back (in Spanish) for the client to hear before signing. Additionally, for low-
literate LEP clients, practices might create a Spanish/English Pill Card to demonstrate
when and how to give medication to their pet (Figure 3-2). Physicians have found that
sending this tool home with patients has increased compliance with taking medication
(Jacobson KL, Kripalani S et al. 2008). Similarly, sending this tool home with the
veterinary client could increase owner compliance with giving their pet medication.
When a language barrier existed at the veterinary practice, LEP pet owners in this
study were most likely to call a family or friend to help interpret. Veterinarians might
consider developing a rapport with these adult interpreters, or offering an incentive for
their help with other LEP clients (e.g. barter veterinary services for interpreter services).
These interactions are both opportunities for the veterinarian to get help with English-to-
Spanish communication, as well as opportunities to introduce a bilingual individual to the
veterinary profession. Similarly, veterinarians might consider developing a rapport with
the individuals who supplied the pet to the owner. Latino pet owners shared that most
often they got their pet from a friend or family member. Those friends and relatives
could be invited to an Open House to become future clients and to learn about the health
benefits of spaying and neutering.
Results from this Latino pet owner survey suggest that compared with English-
proficient pet owners, LEP SSPOs are significantly more likely to earn less than $15,000
per year, have less than full-time employment, and have less than a high school education.
Furthermore, even though study results did not demonstrate a statistically significant
decline in veterinary visits when a communication gap was present, there was a clear
monotonic trend pointing to a decreased probability of use of veterinary services when
84
low income, low education, and communications barrier existed. Given the fact that
some LEP SSPOs are bringing their pet to the veterinarian despite these socioeconomic
challenges and language barriers suggests that LEP SSPOs presenting to the veterinary
practice are highly motivated owners who care deeply about their pets.
Veterinary practices can implement a few simple changes to become more
responsive to these highly motivated owners. First, practices can learn more about the
demographics of their community. This study revealed that over 1 in 3 Latinos are pet
owners. A veterinary practice located in a community that has a large established or fast-
growing Latino population has great potential for growth by reaching out to this
community. Next, team members can assess their clients’ language needs by asking
every client in what language they prefer to receive their pet’s health information and
noting this language preference in the pet’s file. In this study, 1 in 5 Latino clients
wanted their pet’s medical information in Spanish. Almost half of these Spanish-
preferring owners considered themselves to be proficient English speakers. Additionally,
practices might encourage clients to attend English as a Second Language (ESL) classes.
In this study, the probability of bringing a pet to the vet increased as English language
proficiency increased.
Finally, practices could learn more about the adoption policies and procedures at
their local shelter. In this study, only 1 out of 55 pets adopted from a shelter was adopted
by an LEP SSPO. Was this due to a lack of interest in shelter adoptions, communication
barriers at the shelter, or other unmet adopter requirements, such as not renting, being
employed full-time, or earning a particular minimum annual salary? Practitioners might
ask clients with a new pet if s/he attempted to adopt from a shelter, and if so, if any
85
obstacles to adoption were encountered. A future study could examine the adoption
policies of shelters to determine if LEP SSPOs are being screened out as potential
adopters. If the primary reason for so few LEP adoptions is a language barrier, bilingual
staff members might consider working with local shelters to create Spanish-language
Public Service Announcements (PSAs) and placing Spanish-language flyers on bulletin
boards in popular gathering places (e.g. Latino community center, church, community
grocery) which describe the local shelter pet adoption program. Highlighting the
availability of Chihuahuas, Pitbulls, Shih Tzus and Poodles, as well as the presence of
Spanish-speaking staff, might encourage LEP future adopters to visit the shelter.
Implementing some or all of these recommendations could greatly enhance
communication between pet owners and veterinarians resulting in improved healthcare of
pets. Future studies comparing LEP owners seen by Spanish-speaking staff and given
Spanish-language resources to LEP owners who do not receive language-concordant care
and information could be conducted. Compliance with recommendations could be
measured to see if language concordance is significantly associated with an increase in
use of veterinary services.
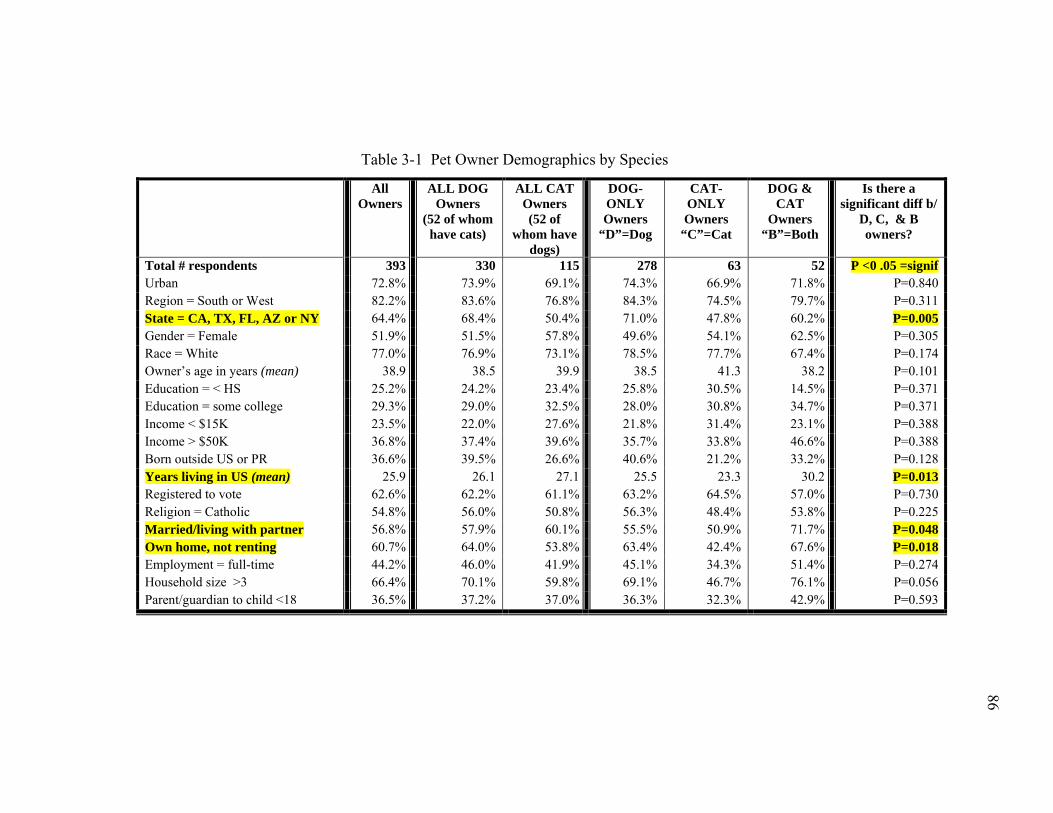
86
86
Table 3-1 Pet Owner Demographics by Species
All Owners
ALL DOG Owners
(52 of whom have cats)
ALL CAT Owners (52 of
whom have dogs)
DOG-ONLY Owners
“D”=Dog
CAT-ONLY Owners
“C”=Cat
DOG & CAT
Owners “B”=Both
Is there a significant diff b/
D, C, & B owners?
Total # respondents 393 330 115 278 63 52 P <0 .05 =signif Urban 72.8% 73.9% 69.1% 74.3% 66.9% 71.8% P=0.840 Region = South or West 82.2% 83.6% 76.8% 84.3% 74.5% 79.7% P=0.311 State = CA, TX, FL, AZ or NY 64.4% 68.4% 50.4% 71.0% 47.8% 60.2% P=0.005 Gender = Female 51.9% 51.5% 57.8% 49.6% 54.1% 62.5% P=0.305 Race = White 77.0% 76.9% 73.1% 78.5% 77.7% 67.4% P=0.174 Owner’s age in years (mean) 38.9 38.5 39.9 38.5 41.3 38.2 P=0.101 Education = < HS 25.2% 24.2% 23.4% 25.8% 30.5% 14.5% P=0.371 Education = some college 29.3% 29.0% 32.5% 28.0% 30.8% 34.7% P=0.371 Income < $15K 23.5% 22.0% 27.6% 21.8% 31.4% 23.1% P=0.388 Income > $50K 36.8% 37.4% 39.6% 35.7% 33.8% 46.6% P=0.388 Born outside US or PR 36.6% 39.5% 26.6% 40.6% 21.2% 33.2% P=0.128 Years living in US (mean) 25.9 26.1 27.1 25.5 23.3 30.2 P=0.013 Registered to vote 62.6% 62.2% 61.1% 63.2% 64.5% 57.0% P=0.730 Religion = Catholic 54.8% 56.0% 50.8% 56.3% 48.4% 53.8% P=0.225 Married/living with partner 56.8% 57.9% 60.1% 55.5% 50.9% 71.7% P=0.048 Own home, not renting 60.7% 64.0% 53.8% 63.4% 42.4% 67.6% P=0.018 Employment = full-time 44.2% 46.0% 41.9% 45.1% 34.3% 51.4% P=0.274 Household size >3 66.4% 70.1% 59.8% 69.1% 46.7% 76.1% P=0.056 Parent/guardian to child <18 36.5% 37.2% 37.0% 36.3% 32.3% 42.9% P=0.593
86
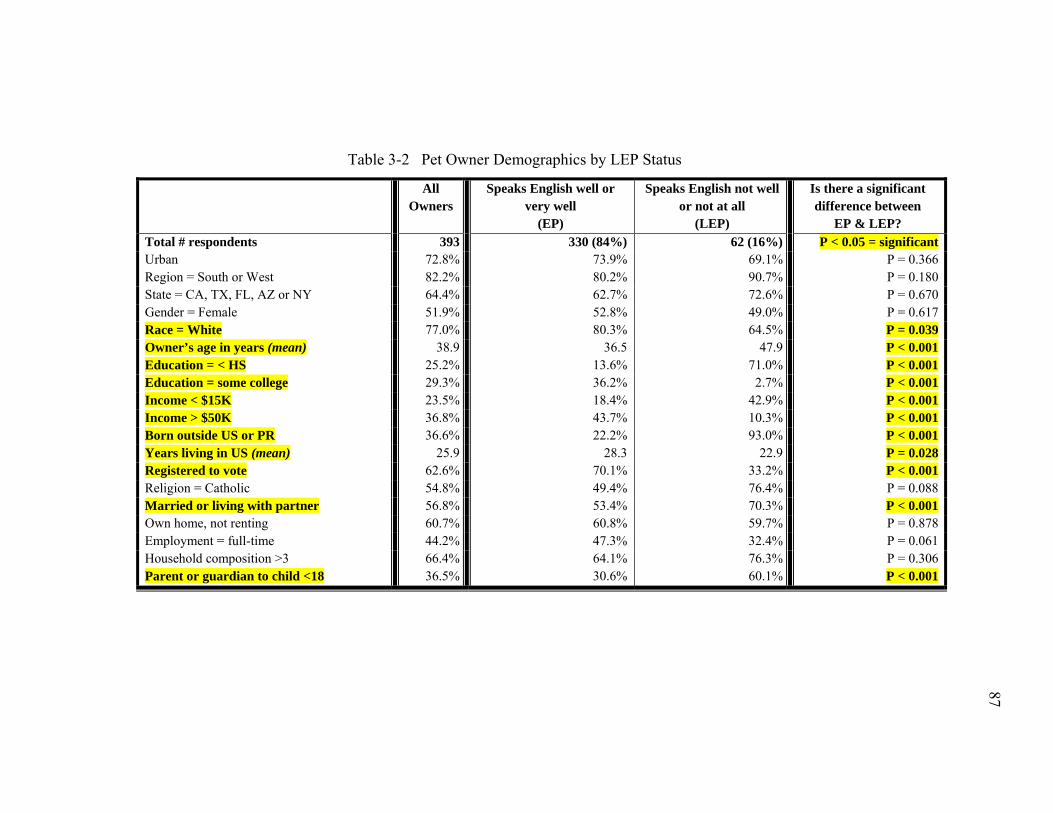
87
87
Table 3-2 Pet Owner Demographics by LEP Status
All Owners
Speaks English well or very well
(EP)
Speaks English not well or not at all
(LEP)
Is there a significant difference between
EP & LEP? Total # respondents 393 330 (84%) 62 (16%) P < 0.05 = significant Urban 72.8% 73.9% 69.1% P = 0.366 Region = South or West 82.2% 80.2% 90.7% P = 0.180 State = CA, TX, FL, AZ or NY 64.4% 62.7% 72.6% P = 0.670 Gender = Female 51.9% 52.8% 49.0% P = 0.617 Race = White 77.0% 80.3% 64.5% P = 0.039 Owner’s age in years (mean) 38.9 36.5 47.9 P < 0.001 Education = < HS 25.2% 13.6% 71.0% P < 0.001 Education = some college 29.3% 36.2% 2.7% P < 0.001 Income < $15K 23.5% 18.4% 42.9% P < 0.001 Income > $50K 36.8% 43.7% 10.3% P < 0.001 Born outside US or PR 36.6% 22.2% 93.0% P < 0.001 Years living in US (mean) 25.9 28.3 22.9 P = 0.028 Registered to vote 62.6% 70.1% 33.2% P < 0.001 Religion = Catholic 54.8% 49.4% 76.4% P = 0.088 Married or living with partner 56.8% 53.4% 70.3% P < 0.001 Own home, not renting 60.7% 60.8% 59.7% P = 0.878 Employment = full-time 44.2% 47.3% 32.4% P = 0.061 Household composition >3 66.4% 64.1% 76.3% P = 0.306 Parent or guardian to child <18 36.5% 30.6% 60.1% P < 0.001
87
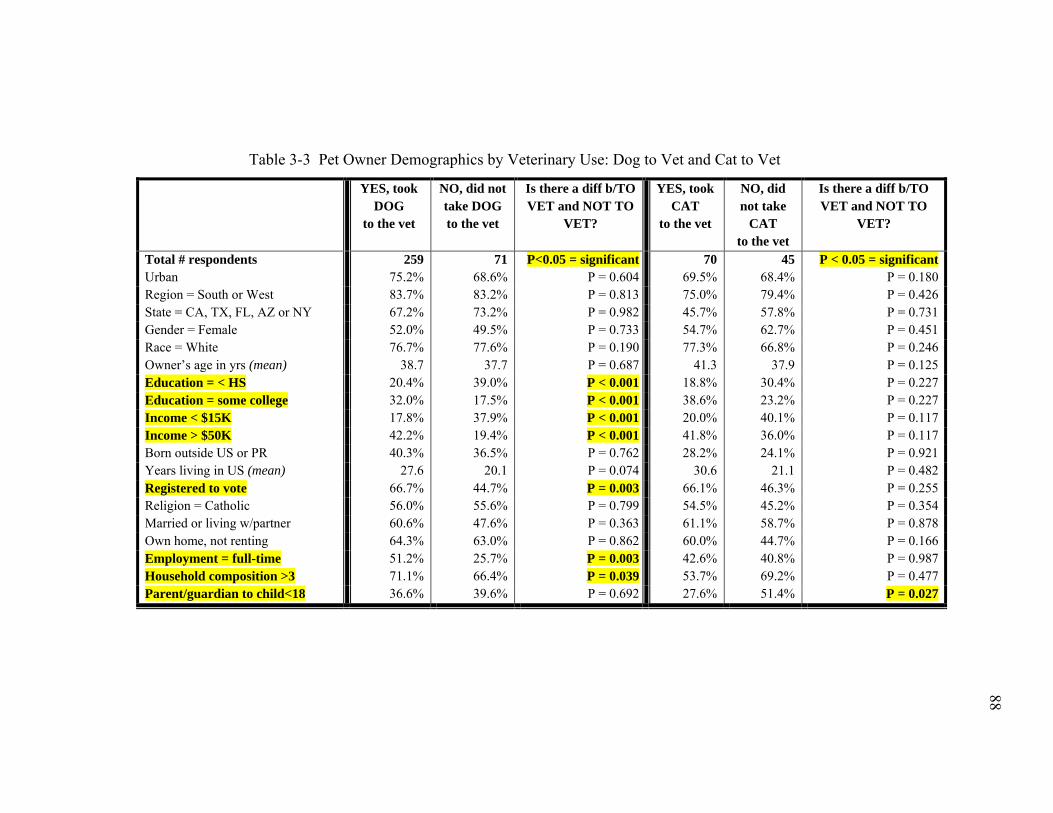
88
88
Table 3-3 Pet Owner Demographics by Veterinary Use: Dog to Vet and Cat to Vet
YES, took DOG
to the vet
NO, did not take DOG to the vet
Is there a diff b/TO VET and NOT TO
VET?
YES, took CAT
to the vet
NO, did not take
CAT to the vet
Is there a diff b/TO VET and NOT TO
VET?
Total # respondents 259 71 P<0.05 = significant 70 45 P < 0.05 = significant Urban 75.2% 68.6% P = 0.604 69.5% 68.4% P = 0.180 Region = South or West 83.7% 83.2% P = 0.813 75.0% 79.4% P = 0.426 State = CA, TX, FL, AZ or NY 67.2% 73.2% P = 0.982 45.7% 57.8% P = 0.731 Gender = Female 52.0% 49.5% P = 0.733 54.7% 62.7% P = 0.451 Race = White 76.7% 77.6% P = 0.190 77.3% 66.8% P = 0.246 Owner’s age in yrs (mean) 38.7 37.7 P = 0.687 41.3 37.9 P = 0.125 Education = < HS 20.4% 39.0% P < 0.001 18.8% 30.4% P = 0.227 Education = some college 32.0% 17.5% P < 0.001 38.6% 23.2% P = 0.227 Income < $15K 17.8% 37.9% P < 0.001 20.0% 40.1% P = 0.117 Income > $50K 42.2% 19.4% P < 0.001 41.8% 36.0% P = 0.117 Born outside US or PR 40.3% 36.5% P = 0.762 28.2% 24.1% P = 0.921 Years living in US (mean) 27.6 20.1 P = 0.074 30.6 21.1 P = 0.482 Registered to vote 66.7% 44.7% P = 0.003 66.1% 46.3% P = 0.255 Religion = Catholic 56.0% 55.6% P = 0.799 54.5% 45.2% P = 0.354 Married or living w/partner 60.6% 47.6% P = 0.363 61.1% 58.7% P = 0.878 Own home, not renting 64.3% 63.0% P = 0.862 60.0% 44.7% P = 0.166 Employment = full-time 51.2% 25.7% P = 0.003 42.6% 40.8% P = 0.987 Household composition >3 71.1% 66.4% P = 0.039 53.7% 69.2% P = 0.477 Parent/guardian to child<18 36.6% 39.6% P = 0.692 27.6% 51.4% P = 0.027
88
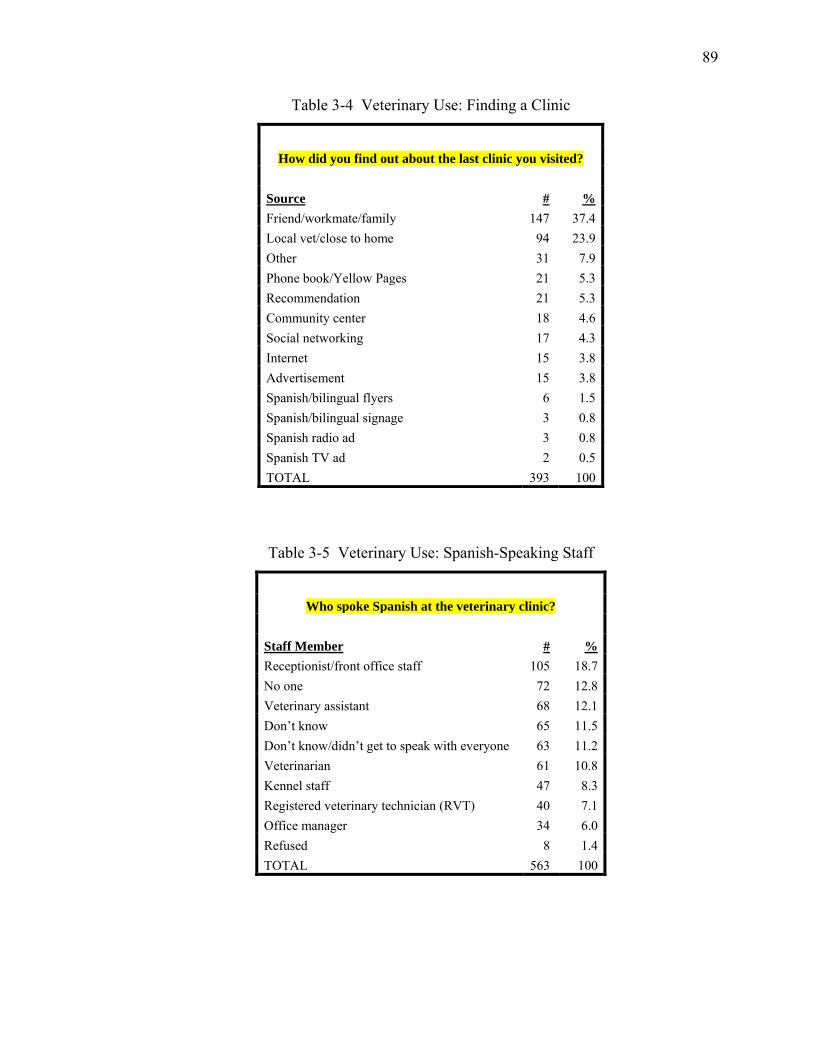
89
Table 3-4 Veterinary Use: Finding a Clinic
How did you find out about the last clinic you visited?
Source # % Friend/workmate/family 147 37.4 Local vet/close to home 94 23.9 Other 31 7.9 Phone book/Yellow Pages 21 5.3 Recommendation 21 5.3 Community center 18 4.6 Social networking 17 4.3 Internet 15 3.8 Advertisement 15 3.8 Spanish/bilingual flyers 6 1.5 Spanish/bilingual signage 3 0.8 Spanish radio ad 3 0.8 Spanish TV ad 2 0.5 TOTAL 393 100
Table 3-5 Veterinary Use: Spanish-Speaking Staff
Who spoke Spanish at the veterinary clinic?
Staff Member # % Receptionist/front office staff 105 18.7 No one 72 12.8 Veterinary assistant 68 12.1 Don’t know 65 11.5 Don’t know/didn’t get to speak with everyone 63 11.2 Veterinarian 61 10.8 Kennel staff 47 8.3 Registered veterinary technician (RVT) 40 7.1 Office manager 34 6.0 Refused 8 1.4 TOTAL 563 100
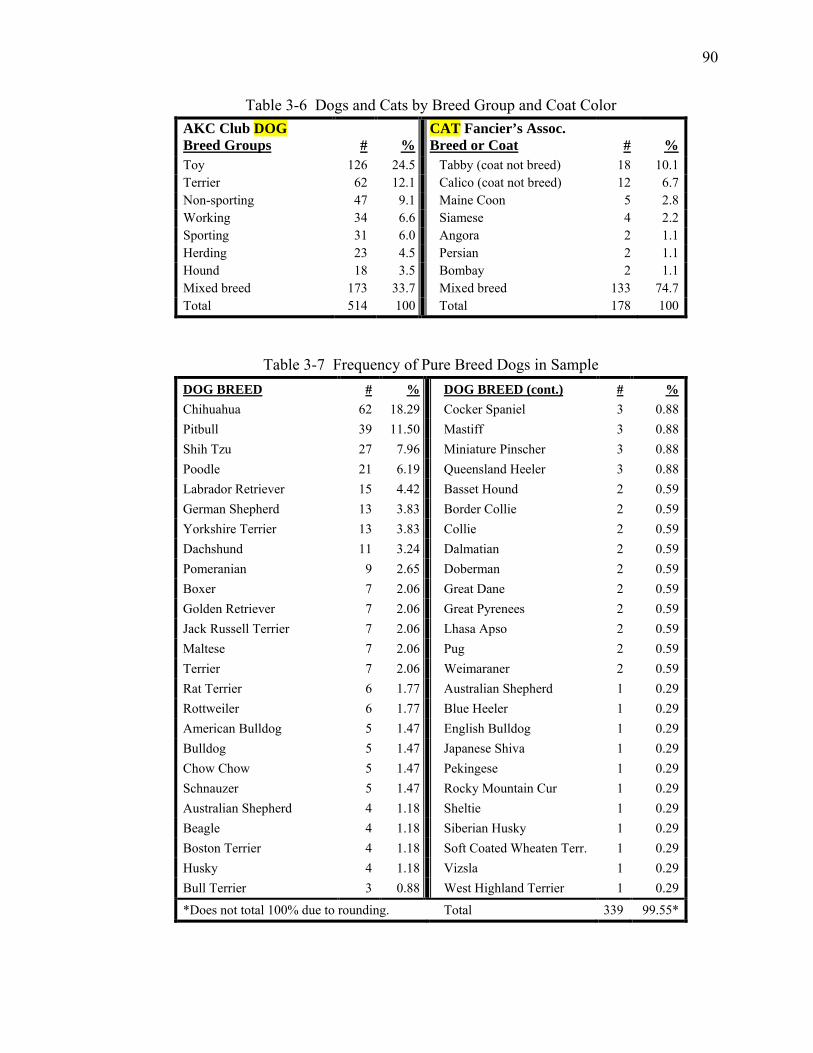
90
Table 3-6 Dogs and Cats by Breed Group and Coat Color
Table 3-7 Frequency of Pure Breed Dogs in Sample DOG BREED # % DOG BREED (cont.) # % Chihuahua 62 18.29 Cocker Spaniel 3 0.88 Pitbull 39 11.50 Mastiff 3 0.88 Shih Tzu 27 7.96 Miniature Pinscher 3 0.88 Poodle 21 6.19 Queensland Heeler 3 0.88 Labrador Retriever 15 4.42 Basset Hound 2 0.59 German Shepherd 13 3.83 Border Collie 2 0.59 Yorkshire Terrier 13 3.83 Collie 2 0.59 Dachshund 11 3.24 Dalmatian 2 0.59 Pomeranian 9 2.65 Doberman 2 0.59 Boxer 7 2.06 Great Dane 2 0.59 Golden Retriever 7 2.06 Great Pyrenees 2 0.59 Jack Russell Terrier 7 2.06 Lhasa Apso 2 0.59 Maltese 7 2.06 Pug 2 0.59 Terrier 7 2.06 Weimaraner 2 0.59 Rat Terrier 6 1.77 Australian Shepherd 1 0.29 Rottweiler 6 1.77 Blue Heeler 1 0.29 American Bulldog 5 1.47 English Bulldog 1 0.29 Bulldog 5 1.47 Japanese Shiva 1 0.29 Chow Chow 5 1.47 Pekingese 1 0.29 Schnauzer 5 1.47 Rocky Mountain Cur 1 0.29 Australian Shepherd 4 1.18 Sheltie 1 0.29 Beagle 4 1.18 Siberian Husky 1 0.29 Boston Terrier 4 1.18 Soft Coated Wheaten Terr. 1 0.29 Husky 4 1.18 Vizsla 1 0.29 Bull Terrier 3 0.88 West Highland Terrier 1 0.29
*Does not total 100% due to rounding. Total 339 99.55*
AKC Club DOG Breed Groups
#
%
CAT Fancier’s Assoc. Breed or Coat
#
%
Toy 126 24.5 Tabby (coat not breed) 18 10.1 Terrier 62 12.1 Calico (coat not breed) 12 6.7 Non-sporting 47 9.1 Maine Coon 5 2.8 Working 34 6.6 Siamese 4 2.2 Sporting 31 6.0 Angora 2 1.1 Herding 23 4.5 Persian 2 1.1 Hound 18 3.5 Bombay 2 1.1 Mixed breed 173 33.7 Mixed breed 133 74.7 Total 514 100 Total 178 100
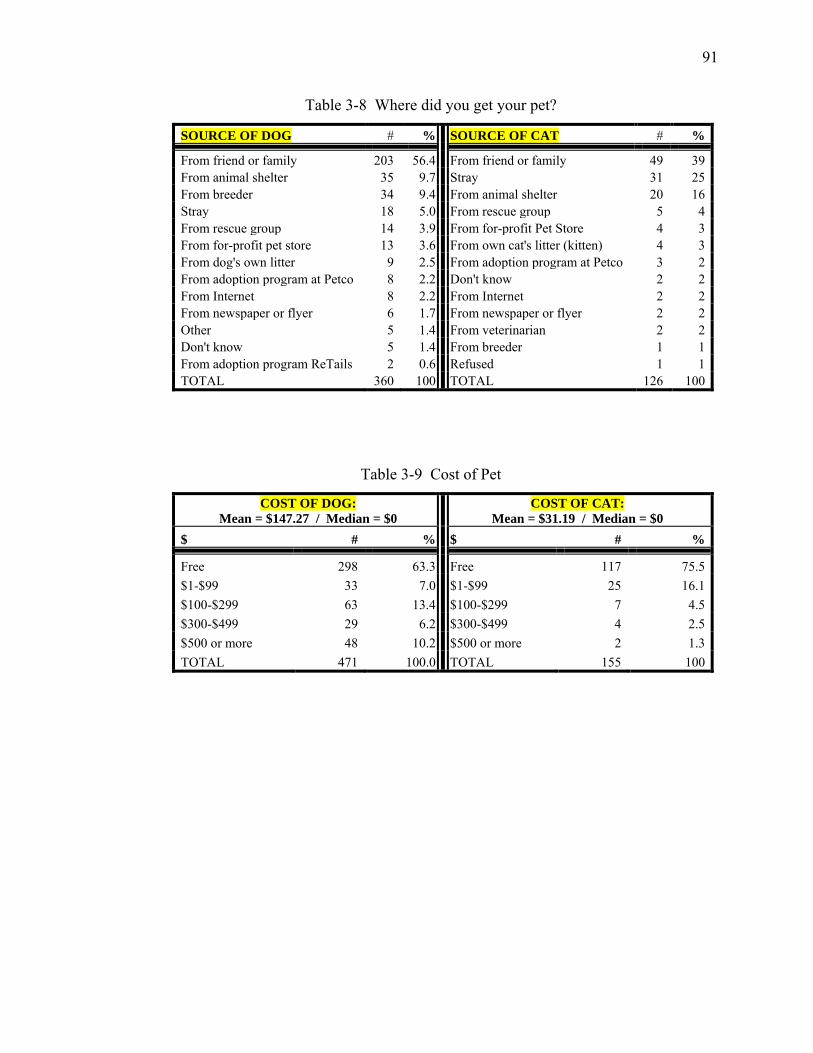
91
Table 3-8 Where did you get your pet?
SOURCE OF DOG # % SOURCE OF CAT # %
From friend or family 203 56.4 From friend or family 49 39 From animal shelter 35 9.7 Stray 31 25 From breeder 34 9.4 From animal shelter 20 16 Stray 18 5.0 From rescue group 5 4 From rescue group 14 3.9 From for-profit Pet Store 4 3 From for-profit pet store 13 3.6 From own cat's litter (kitten) 4 3 From dog's own litter 9 2.5 From adoption program at Petco 3 2 From adoption program at Petco 8 2.2 Don't know 2 2 From Internet 8 2.2 From Internet 2 2 From newspaper or flyer 6 1.7 From newspaper or flyer 2 2 Other 5 1.4 From veterinarian 2 2 Don't know 5 1.4 From breeder 1 1 From adoption program ReTails 2 0.6 Refused 1 1 TOTAL 360 100 TOTAL 126 100
Table 3-9 Cost of Pet
COST OF DOG: Mean = $147.27 / Median = $0
COST OF CAT: Mean = $31.19 / Median = $0
$ # % $ # %
Free 298 63.3 Free 117 75.5 $1-$99 33 7.0 $1-$99 25 16.1 $100-$299 63 13.4 $100-$299 7 4.5 $300-$499 29 6.2 $300-$499 4 2.5 $500 or more 48 10.2 $500 or more 2 1.3 TOTAL 471 100.0 TOTAL 155 100
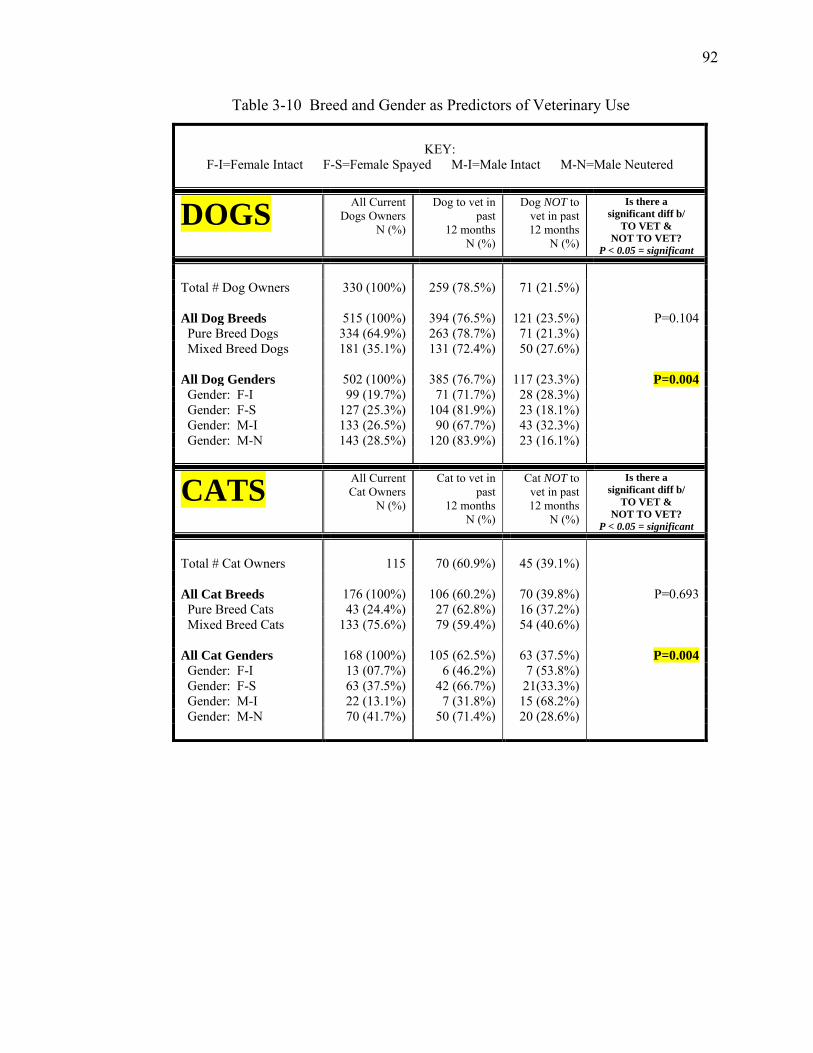
92
Table 3-10 Breed and Gender as Predictors of Veterinary Use
KEY:
F-I=Female Intact F-S=Female Spayed M-I=Male Intact M-N=Male Neutered
DOGS All Current Dogs Owners
N (%)
Dog to vet in past
12 months N (%)
Dog NOT to vet in past
12 months N (%)
Is there a significant diff b/
TO VET & NOT TO VET?
P < 0.05 = significant
Total # Dog Owners 330 (100%) 259 (78.5%) 71 (21.5%) All Dog Breeds 515 (100%) 394 (76.5%) 121 (23.5%) P=0.104 Pure Breed Dogs 334 (64.9%) 263 (78.7%) 71 (21.3%) Mixed Breed Dogs 181 (35.1%) 131 (72.4%) 50 (27.6%) All Dog Genders 502 (100%) 385 (76.7%) 117 (23.3%) P=0.004 Gender: F-I 99 (19.7%) 71 (71.7%) 28 (28.3%) Gender: F-S 127 (25.3%) 104 (81.9%) 23 (18.1%) Gender: M-I 133 (26.5%) 90 (67.7%) 43 (32.3%) Gender: M-N 143 (28.5%) 120 (83.9%) 23 (16.1%)
CATS All Current Cat Owners
N (%)
Cat to vet in past
12 months N (%)
Cat NOT to vet in past 12 months
N (%)
Is there a significant diff b/
TO VET & NOT TO VET?
P < 0.05 = significant
Total # Cat Owners
115
70 (60.9%)
45 (39.1%)
All Cat Breeds 176 (100%) 106 (60.2%) 70 (39.8%) P=0.693 Pure Breed Cats 43 (24.4%) 27 (62.8%) 16 (37.2%) Mixed Breed Cats 133 (75.6%) 79 (59.4%) 54 (40.6%) All Cat Genders 168 (100%) 105 (62.5%) 63 (37.5%) P=0.004 Gender: F-I 13 (07.7%) 6 (46.2%) 7 (53.8%) Gender: F-S 63 (37.5%) 42 (66.7%) 21(33.3%) Gender: M-I 22 (13.1%) 7 (31.8%) 15 (68.2%) Gender: M-N 70 (41.7%) 50 (71.4%) 20 (28.6%)
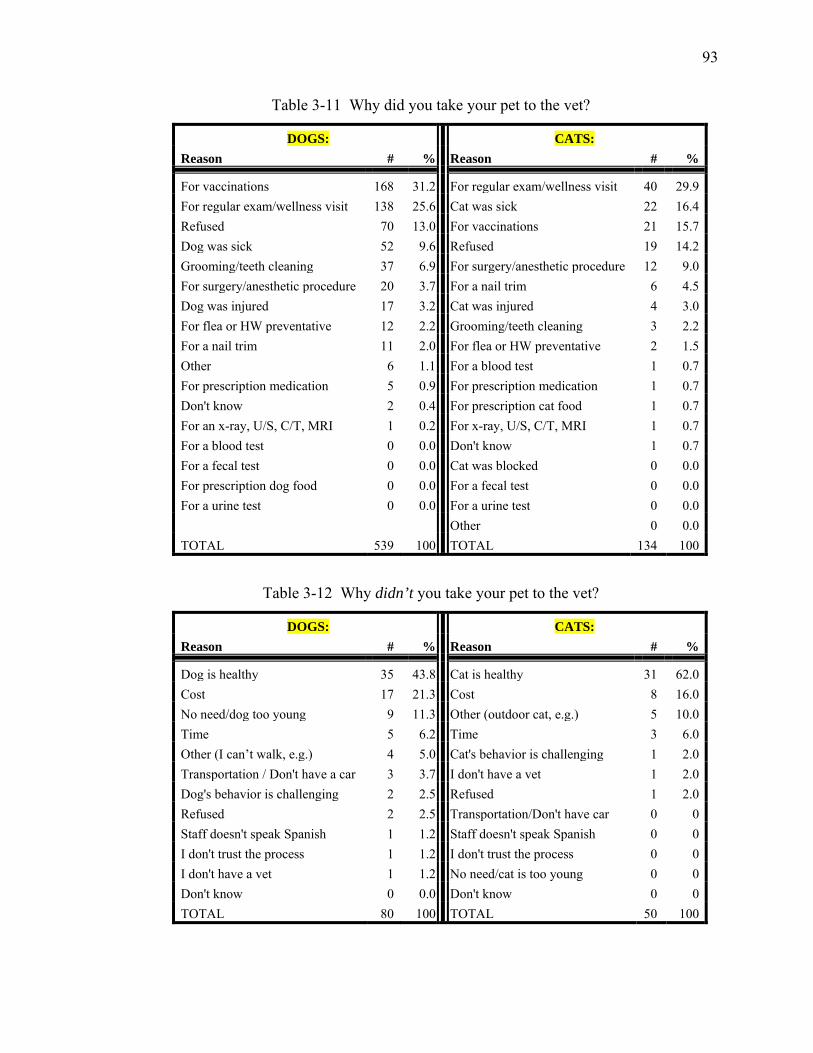
93
Table 3-11 Why did you take your pet to the vet?
DOGS: CATS: Reason # % Reason # %
For vaccinations 168 31.2 For regular exam/wellness visit 40 29.9 For regular exam/wellness visit 138 25.6 Cat was sick 22 16.4 Refused 70 13.0 For vaccinations 21 15.7 Dog was sick 52 9.6 Refused 19 14.2 Grooming/teeth cleaning 37 6.9 For surgery/anesthetic procedure 12 9.0 For surgery/anesthetic procedure 20 3.7 For a nail trim 6 4.5 Dog was injured 17 3.2 Cat was injured 4 3.0 For flea or HW preventative 12 2.2 Grooming/teeth cleaning 3 2.2 For a nail trim 11 2.0 For flea or HW preventative 2 1.5 Other 6 1.1 For a blood test 1 0.7 For prescription medication 5 0.9 For prescription medication 1 0.7 Don't know 2 0.4 For prescription cat food 1 0.7 For an x-ray, U/S, C/T, MRI 1 0.2 For x-ray, U/S, C/T, MRI 1 0.7 For a blood test 0 0.0 Don't know 1 0.7 For a fecal test 0 0.0 Cat was blocked 0 0.0 For prescription dog food 0 0.0 For a fecal test 0 0.0 For a urine test 0 0.0 For a urine test 0 0.0
Other 0 0.0
TOTAL 539 100 TOTAL 134 100
Table 3-12 Why didn’t you take your pet to the vet?
DOGS: CATS: Reason # % Reason # %
Dog is healthy 35 43.8 Cat is healthy 31 62.0 Cost 17 21.3 Cost 8 16.0 No need/dog too young 9 11.3 Other (outdoor cat, e.g.) 5 10.0 Time 5 6.2 Time 3 6.0 Other (I can’t walk, e.g.) 4 5.0 Cat's behavior is challenging 1 2.0 Transportation / Don't have a car 3 3.7 I don't have a vet 1 2.0 Dog's behavior is challenging 2 2.5 Refused 1 2.0 Refused 2 2.5 Transportation/Don't have car 0 0 Staff doesn't speak Spanish 1 1.2 Staff doesn't speak Spanish 0 0 I don't trust the process 1 1.2 I don't trust the process 0 0 I don't have a vet 1 1.2 No need/cat is too young 0 0 Don't know 0 0.0 Don't know 0 0 TOTAL 80 100 TOTAL 50 100
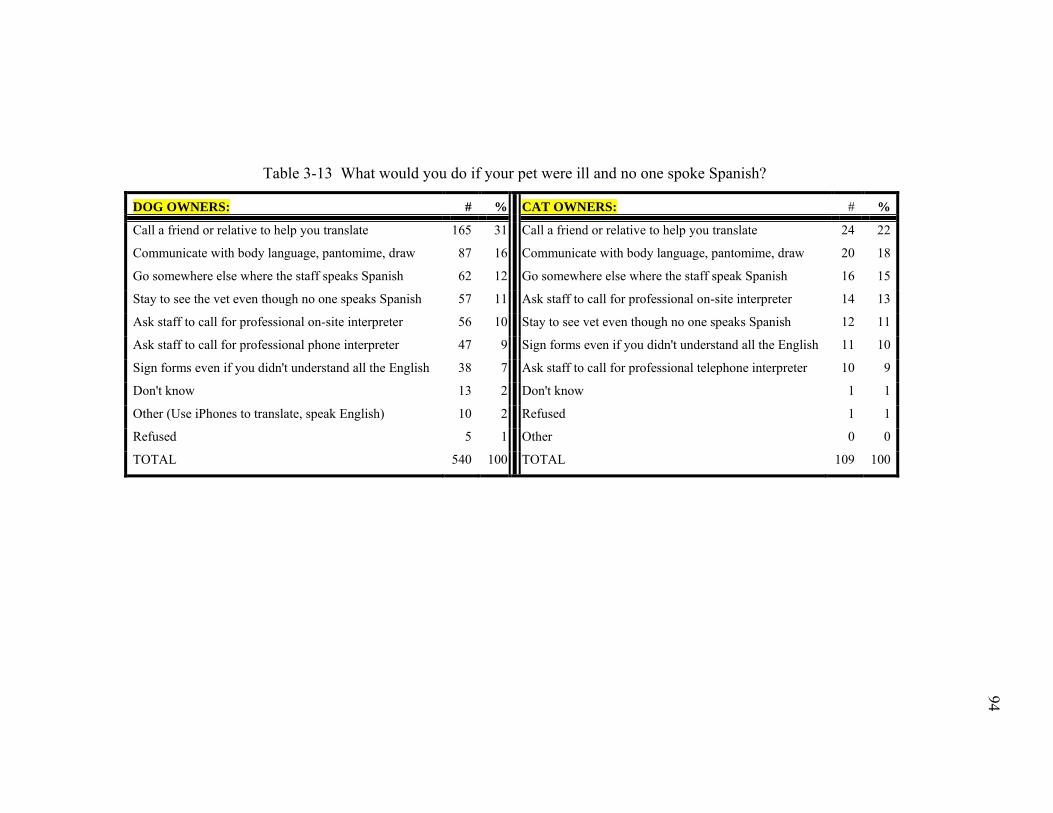
94
94
Table 3-13 What would you do if your pet were ill and no one spoke Spanish?
DOG OWNERS: # % CAT OWNERS: # %
Call a friend or relative to help you translate 165 31 Call a friend or relative to help you translate 24 22
Communicate with body language, pantomime, draw 87 16 Communicate with body language, pantomime, draw 20 18
Go somewhere else where the staff speaks Spanish 62 12 Go somewhere else where the staff speak Spanish 16 15
Stay to see the vet even though no one speaks Spanish 57 11 Ask staff to call for professional on-site interpreter 14 13
Ask staff to call for professional on-site interpreter 56 10 Stay to see vet even though no one speaks Spanish 12 11
Ask staff to call for professional phone interpreter 47 9 Sign forms even if you didn't understand all the English 11 10
Sign forms even if you didn't understand all the English 38 7 Ask staff to call for professional telephone interpreter 10 9
Don't know 13 2 Don't know 1 1
Other (Use iPhones to translate, speak English) 10 2 Refused 1 1
Refused 5 1 Other 0 0
TOTAL 540 100 TOTAL 109 100
94
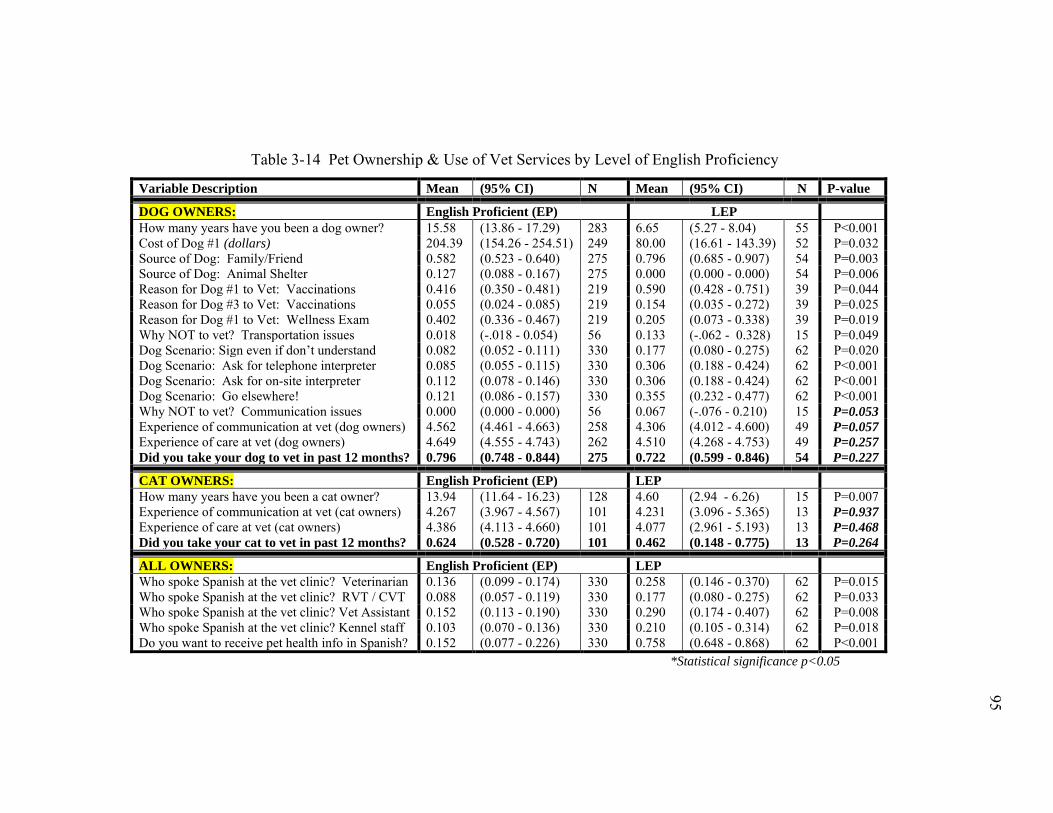
95
95
Table 3-14 Pet Ownership & Use of Vet Services by Level of English Proficiency
Variable Description Mean (95% CI) N Mean (95% CI) N P-value
DOG OWNERS: English Proficient (EP) LEP How many years have you been a dog owner? 15.58 (13.86 - 17.29) 283 6.65 (5.27 - 8.04) 55 P<0.001 Cost of Dog #1 (dollars) 204.39 (154.26 - 254.51) 249 80.00 (16.61 - 143.39) 52 P=0.032 Source of Dog: Family/Friend 0.582 (0.523 - 0.640) 275 0.796 (0.685 - 0.907) 54 P=0.003 Source of Dog: Animal Shelter 0.127 (0.088 - 0.167) 275 0.000 (0.000 - 0.000) 54 P=0.006 Reason for Dog #1 to Vet: Vaccinations 0.416 (0.350 - 0.481) 219 0.590 (0.428 - 0.751) 39 P=0.044 Reason for Dog #3 to Vet: Vaccinations 0.055 (0.024 - 0.085) 219 0.154 (0.035 - 0.272) 39 P=0.025 Reason for Dog #1 to Vet: Wellness Exam 0.402 (0.336 - 0.467) 219 0.205 (0.073 - 0.338) 39 P=0.019 Why NOT to vet? Transportation issues 0.018 (-.018 - 0.054) 56 0.133 (-.062 - 0.328) 15 P=0.049 Dog Scenario: Sign even if don’t understand 0.082 (0.052 - 0.111) 330 0.177 (0.080 - 0.275) 62 P=0.020 Dog Scenario: Ask for telephone interpreter 0.085 (0.055 - 0.115) 330 0.306 (0.188 - 0.424) 62 P<0.001 Dog Scenario: Ask for on-site interpreter 0.112 (0.078 - 0.146) 330 0.306 (0.188 - 0.424) 62 P<0.001 Dog Scenario: Go elsewhere! 0.121 (0.086 - 0.157) 330 0.355 (0.232 - 0.477) 62 P<0.001 Why NOT to vet? Communication issues 0.000 (0.000 - 0.000) 56 0.067 (-.076 - 0.210) 15 P=0.053 Experience of communication at vet (dog owners) 4.562 (4.461 - 4.663) 258 4.306 (4.012 - 4.600) 49 P=0.057 Experience of care at vet (dog owners) 4.649 (4.555 - 4.743) 262 4.510 (4.268 - 4.753) 49 P=0.257 Did you take your dog to vet in past 12 months? 0.796 (0.748 - 0.844) 275 0.722 (0.599 - 0.846) 54 P=0.227
CAT OWNERS: English Proficient (EP) LEP How many years have you been a cat owner? 13.94 (11.64 - 16.23) 128 4.60 (2.94 - 6.26) 15 P=0.007 Experience of communication at vet (cat owners) 4.267 (3.967 - 4.567) 101 4.231 (3.096 - 5.365) 13 P=0.937 Experience of care at vet (cat owners) 4.386 (4.113 - 4.660) 101 4.077 (2.961 - 5.193) 13 P=0.468 Did you take your cat to vet in past 12 months? 0.624 (0.528 - 0.720) 101 0.462 (0.148 - 0.775) 13 P=0.264
ALL OWNERS: English Proficient (EP) LEP Who spoke Spanish at the vet clinic? Veterinarian 0.136 (0.099 - 0.174) 330 0.258 (0.146 - 0.370) 62 P=0.015 Who spoke Spanish at the vet clinic? RVT / CVT 0.088 (0.057 - 0.119) 330 0.177 (0.080 - 0.275) 62 P=0.033 Who spoke Spanish at the vet clinic? Vet Assistant 0.152 (0.113 - 0.190) 330 0.290 (0.174 - 0.407) 62 P=0.008 Who spoke Spanish at the vet clinic? Kennel staff 0.103 (0.070 - 0.136) 330 0.210 (0.105 - 0.314) 62 P=0.018 Do you want to receive pet health info in Spanish? 0.152 (0.077 - 0.226) 330 0.758 (0.648 - 0.868) 62 P<0.001
*Statistical significance p<0.05
95
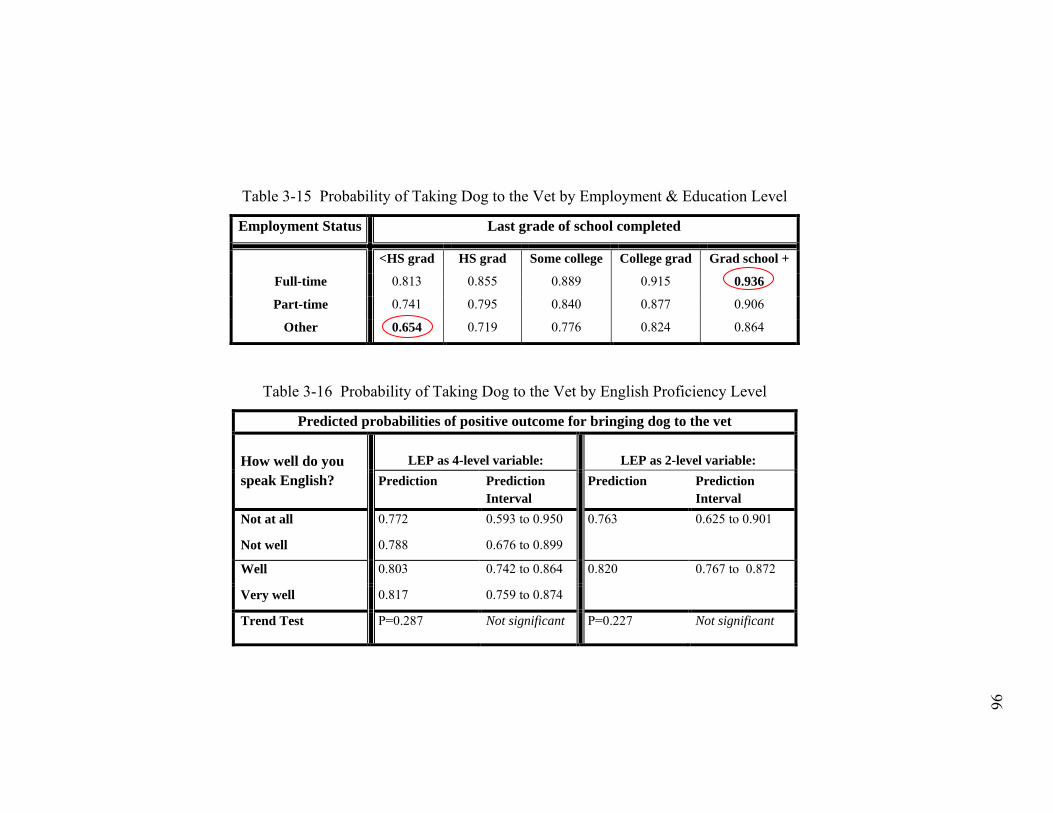
96
96
Table 3-15 Probability of Taking Dog to the Vet by Employment & Education Level
Employment Status Last grade of school completed
<HS grad HS grad Some college College grad Grad school +
Full-time 0.813 0.855 0.889 0.915 0.936
Part-time 0.741 0.795 0.840 0.877 0.906
Other 0.654 0.719 0.776 0.824 0.864
Table 3-16 Probability of Taking Dog to the Vet by English Proficiency Level
Predicted probabilities of positive outcome for bringing dog to the vet How well do you speak English?
LEP as 4-level variable:
LEP as 2-level variable:
Prediction Prediction Interval
Prediction Prediction Interval
Not at all 0.772 0.593 to 0.950 0.763 0.625 to 0.901
Not well 0.788 0.676 to 0.899
Well 0.803 0.742 to 0.864 0.820 0.767 to 0.872
Very well 0.817 0.759 to 0.874
Trend Test P=0.287 Not significant P=0.227 Not significant
96
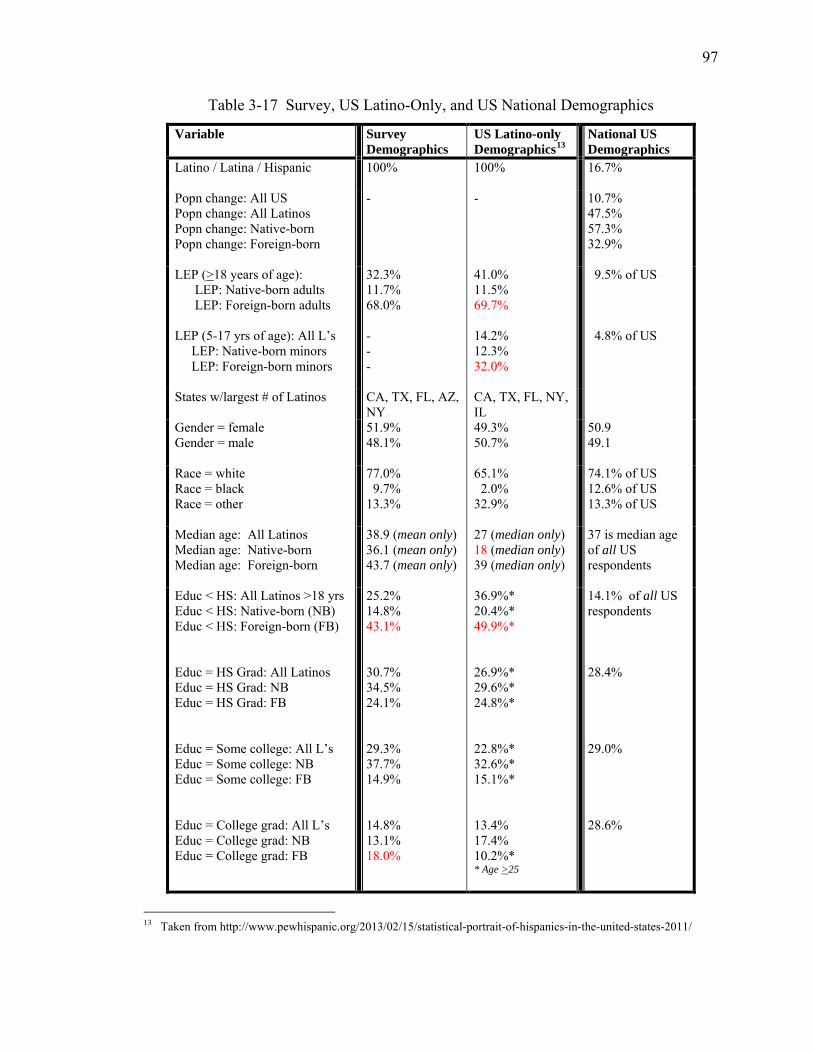
97
Table 3-17 Survey, US Latino-Only, and US National Demographics
Variable Survey Demographics
US Latino-only Demographics13
National US Demographics
Latino / Latina / Hispanic 100% 100% 16.7%
Popn change: All US Popn change: All Latinos Popn change: Native-born Popn change: Foreign-born
- - 10.7% 47.5% 57.3% 32.9%
LEP (>18 years of age): LEP: Native-born adults LEP: Foreign-born adults LEP (5-17 yrs of age): All L’s LEP: Native-born minors LEP: Foreign-born minors
32.3% 11.7% 68.0% - - -
41.0% 11.5% 69.7% 14.2% 12.3% 32.0%
9.5% of US 4.8% of US
States w/largest # of Latinos
CA, TX, FL, AZ, NY
CA, TX, FL, NY, IL
Gender = female Gender = male
51.9% 48.1%
49.3% 50.7%
50.9 49.1
Race = white Race = black Race = other
77.0% 9.7% 13.3%
65.1% 2.0% 32.9%
74.1% of US 12.6% of US 13.3% of US
Median age: All Latinos Median age: Native-born Median age: Foreign-born
38.9 (mean only) 36.1 (mean only) 43.7 (mean only)
27 (median only) 18 (median only) 39 (median only)
37 is median age of all US respondents
Educ < HS: All Latinos >18 yrs Educ < HS: Native-born (NB) Educ < HS: Foreign-born (FB) Educ = HS Grad: All Latinos Educ = HS Grad: NB Educ = HS Grad: FB Educ = Some college: All L’s Educ = Some college: NB Educ = Some college: FB Educ = College grad: All L’s Educ = College grad: NB Educ = College grad: FB
25.2% 14.8% 43.1% 30.7% 34.5% 24.1% 29.3% 37.7% 14.9% 14.8% 13.1% 18.0%
36.9%* 20.4%* 49.9%* 26.9%* 29.6%* 24.8%* 22.8%* 32.6%* 15.1%* 13.4% 17.4% 10.2%* * Age >25
14.1% of all US respondents 28.4% 29.0% 28.6%
13 Taken from http://www.pewhispanic.org/2013/02/15/statistical-portrait-of-hispanics-in-the-united-states-2011/
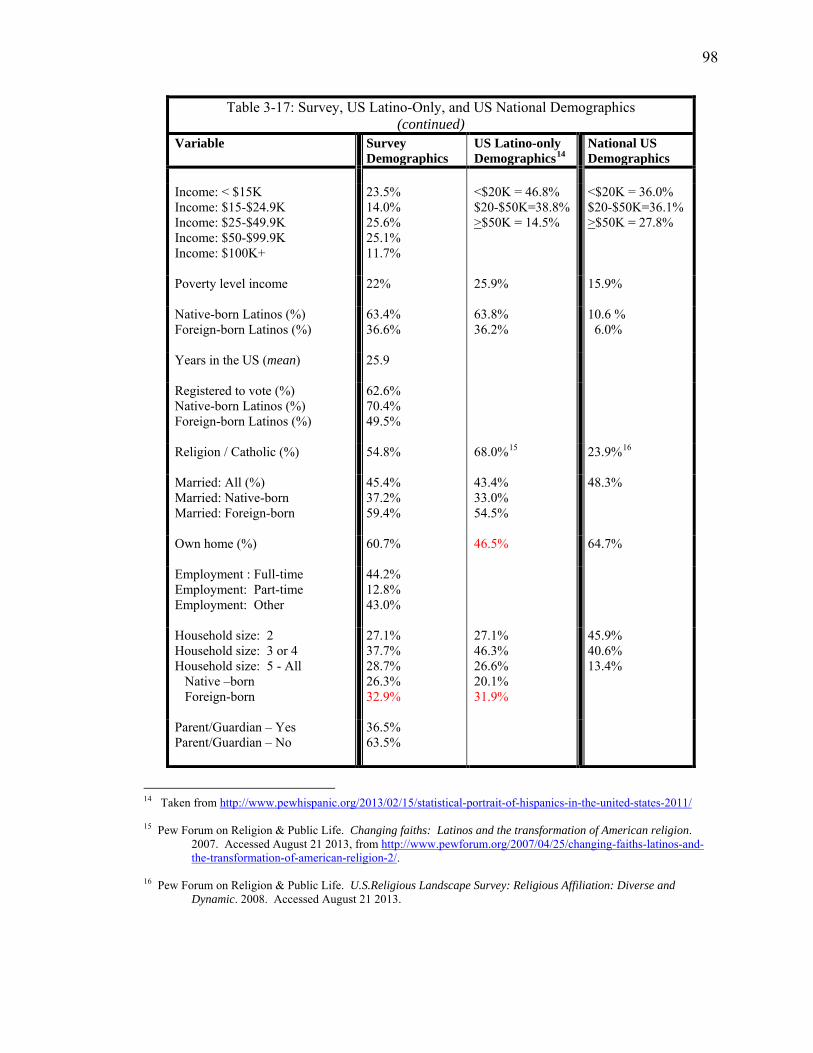
98
Table 3-17: Survey, US Latino-Only, and US National Demographics (continued)
Variable Survey Demographics
US Latino-only Demographics14
National US Demographics
Income: < $15K Income: $15-$24.9K Income: $25-$49.9K Income: $50-$99.9K Income: $100K+
23.5% 14.0% 25.6% 25.1% 11.7%
<$20K = 46.8% $20-$50K=38.8% >$50K = 14.5%
<$20K = 36.0% $20-$50K=36.1% >$50K = 27.8%
Poverty level income
22% 25.9%
15.9%
Native-born Latinos (%) Foreign-born Latinos (%)
63.4% 36.6%
63.8% 36.2%
10.6 % 6.0%
Years in the US (mean)
25.9
Registered to vote (%) Native-born Latinos (%) Foreign-born Latinos (%)
62.6% 70.4% 49.5%
Religion / Catholic (%)
54.8% 68.0%15 23.9%16
Married: All (%) Married: Native-born Married: Foreign-born
45.4% 37.2% 59.4%
43.4% 33.0% 54.5%
48.3%
Own home (%)
60.7% 46.5% 64.7%
Employment : Full-time Employment: Part-time Employment: Other
44.2% 12.8% 43.0%
Household size: 2 Household size: 3 or 4 Household size: 5 - All Native –born Foreign-born
27.1% 37.7% 28.7% 26.3% 32.9%
27.1% 46.3% 26.6% 20.1% 31.9%
45.9% 40.6% 13.4%
Parent/Guardian – Yes Parent/Guardian – No
36.5% 63.5%
14 Taken from http://www.pewhispanic.org/2013/02/15/statistical-portrait-of-hispanics-in-the-united-states-2011/ 15 Pew Forum on Religion & Public Life. Changing faiths: Latinos and the transformation of American religion.
2007. Accessed August 21 2013, from http://www.pewforum.org/2007/04/25/changing-faiths-latinos-and-the-transformation-of-american-religion-2/.
16 Pew Forum on Religion & Public Life. U.S.Religious Landscape Survey: Religious Affiliation: Diverse and
Dynamic. 2008. Accessed August 21 2013.
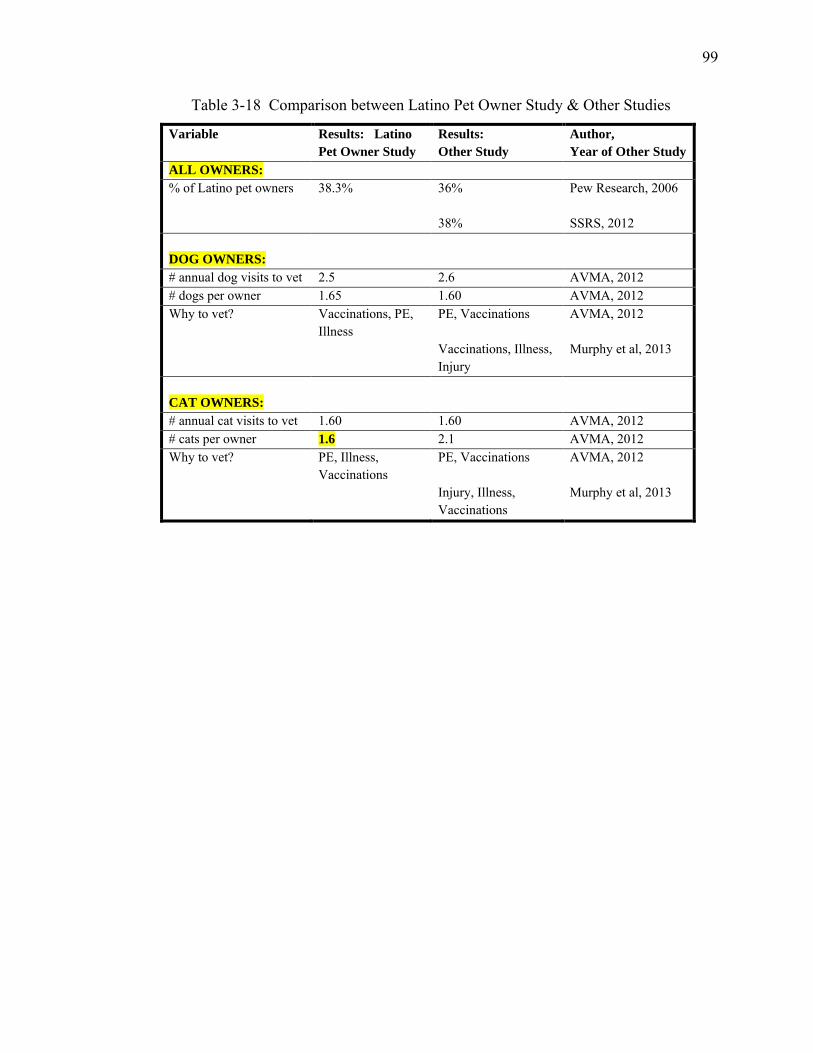
99
Table 3-18 Comparison between Latino Pet Owner Study & Other Studies
Variable Results: Latino Pet Owner Study
Results: Other Study
Author, Year of Other Study
ALL OWNERS: % of Latino pet owners 38.3% 36%
38%
Pew Research, 2006 SSRS, 2012
DOG OWNERS: # annual dog visits to vet 2.5 2.6 AVMA, 2012 # dogs per owner 1.65 1.60 AVMA, 2012 Why to vet? Vaccinations, PE,
Illness
PE, Vaccinations Vaccinations, Illness, Injury
AVMA, 2012 Murphy et al, 2013
CAT OWNERS: # annual cat visits to vet 1.60 1.60 AVMA, 2012 # cats per owner 1.6 2.1 AVMA, 2012 Why to vet? PE, Illness,
Vaccinations
PE, Vaccinations Injury, Illness, Vaccinations
AVMA, 2012 Murphy et al, 2013
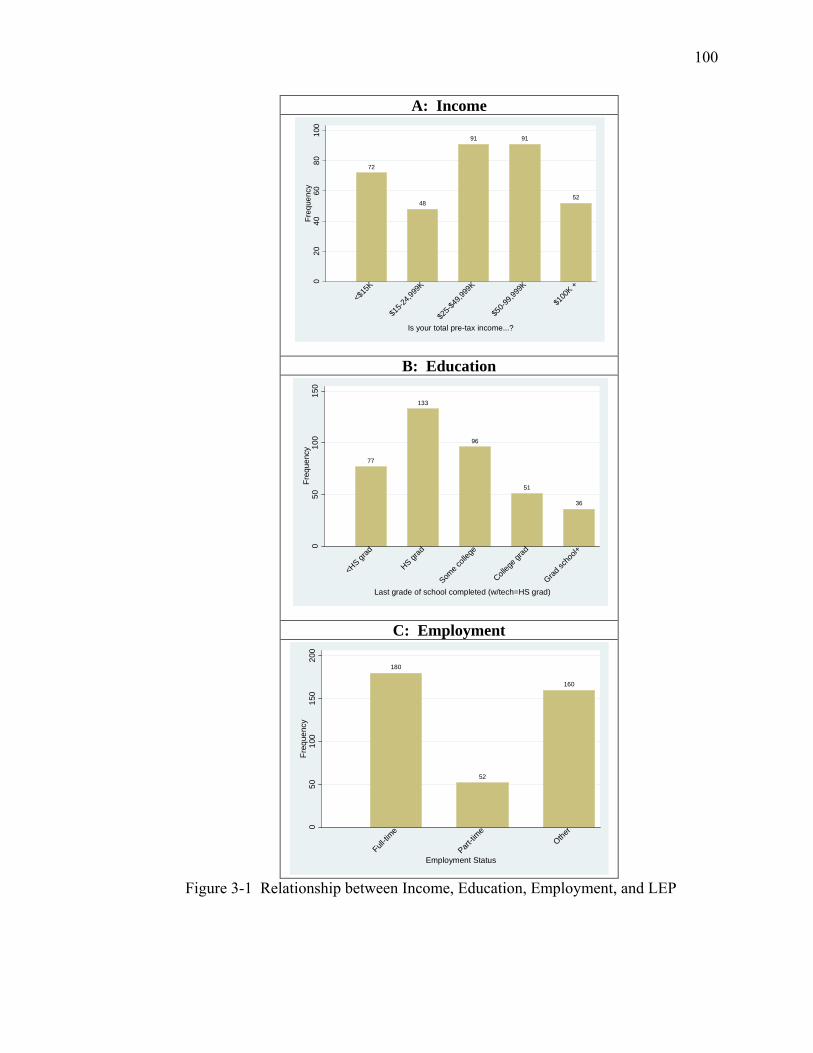
100
A: Income
B: Education
C: Employment
Figure 3-1 Relationship between Income, Education, Employment, and LEP
72
48
91 91
52
020
4060
8010
0Fr
eque
ncy
<$15
K
$15-2
4,999
K
$25-$
49,99
9K
$50-9
9,999
K
$100
K +
Is your total pre-tax income...?
77
133
96
51
36
050
100
150
Freq
uenc
y
<HS gr
ad
HS grad
Some c
olleg
e
Colleg
e grad
Grad sc
hool+
Last grade of school completed (w/tech=HS grad)
180
52
160
050
100
150
200
Freq
uenc
y
Full-tim
e
Part-tim
eOthe
r
Employment Status
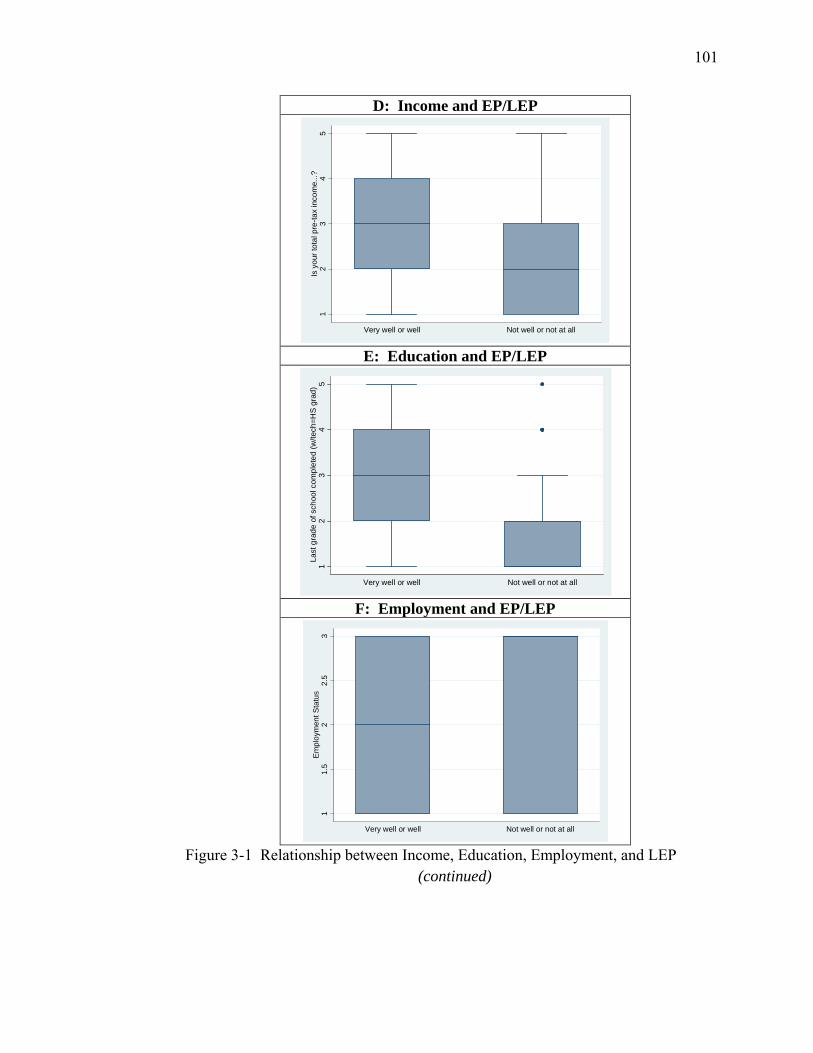
101
D: Income and EP/LEP
E: Education and EP/LEP
F: Employment and EP/LEP
Figure 3-1 Relationship between Income, Education, Employment, and LEP (continued)
12
34
5Is
you
r tot
al p
re-ta
x in
com
e...?
Very well or well Not well or not at all1
23
45
Last
gra
de o
f sch
ool c
ompl
eted
(w/te
ch=H
S g
rad)
Very well or well Not well or not at all
11.
52
2.5
3E
mpl
oym
ent S
tatu
s
Very well or well Not well or not at all
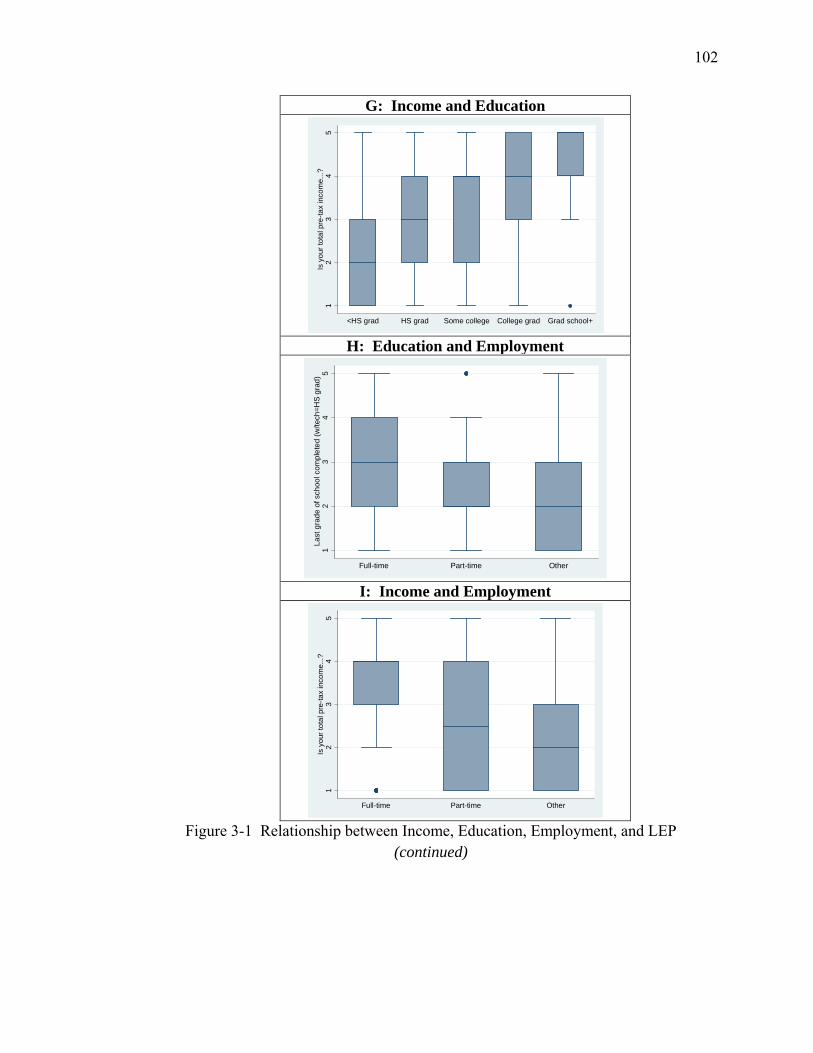
102
G: Income and Education
H: Education and Employment
I: Income and Employment
Figure 3-1 Relationship between Income, Education, Employment, and LEP (continued)
12
34
5Is
you
r tot
al p
re-ta
x in
com
e...?
<HS grad HS grad Some college College grad Grad school+1
23
45
Last
gra
de o
f sch
ool c
ompl
eted
(w/te
ch=H
S g
rad)
Full-time Part-time Other
12
34
5Is
you
r tot
al p
re-ta
x in
com
e...?
Full-time Part-time Other
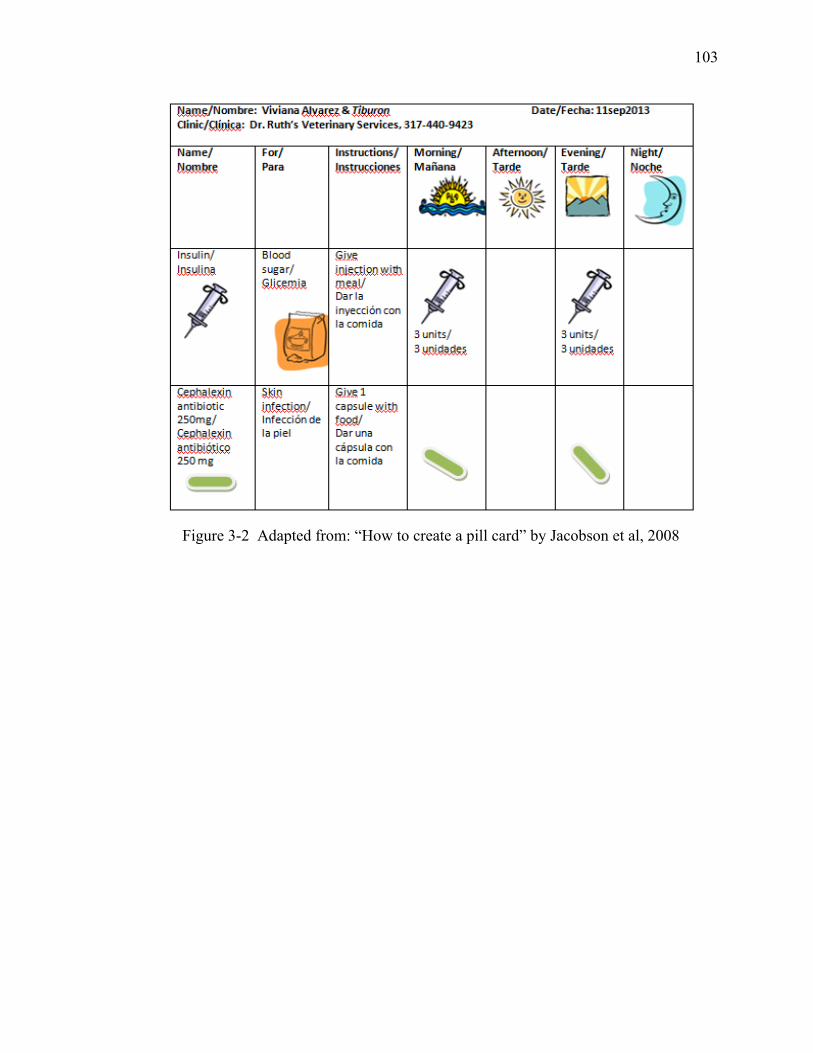
103
Figure 3-2 Adapted from: “How to create a pill card” by Jacobson et al, 2008
104
CHAPTER 4. PREPAREDNESS OF SMALL ANIMAL VETERINARY PRACTICES TO WORK WITH LEP SPANISH-SPEAKING CLIENTS
AND THEIR PETS
4.1 Introduction
The Veterinarian-Client-Pet Relationship (VCPR) is the focal point of
communication in veterinary practice. It is within the context of the VCPR that
communication about the pet takes place between client and veterinarian. Legally and
ethically, there must be a VCPR, whereby a veterinarian establishes a doctor-pet
relationship before prescribing medication or recommending treatment (AVMA 2013).
But what if there is a language barrier between pet owner and veterinary staff such that
effective communication is compromised? How does this impact the veterinarian’s
ability to obtain informed consent and provide state-of-the-art veterinary care? How
does this impact the client’s ability to convey their concerns and understand the
veterinarian’s medical recommendations? These communication challenges likely occur
with increasing frequency in veterinary medicine.
Latinos are the largest minority group in 25 of the fifty US states, and as of 2010,
the US had the second-largest Latino population in the world, second only to Mexico
(U.S. Census Bureau 2010). Currently Latinos number 52 million people and comprise
16.7% of the nation’s 311 million inhabitants (U.S. Census Bureau 2011). By the year
105
2050, it is projected that Latinos will number 132.8 million or 30% of the US population
(U.S. Census Bureau 2011).
Spanish is currently spoken by 37 million individuals in the U.S., which is at least
five times more than any other non-English language (U.S. Census Bureau 2011). Of
those 37 million Spanish speakers, 16.2 million have limited English proficiency (LEP),
meaning they speak English less than “very well” (U.S. Census Bureau 2010). Not all
Latinos speak Spanish, nor do all Latinos who speak Spanish have limited English
proficiency. Among all LEP adults in the US, 64% speak Spanish.
Low health literacy often goes hand-in-hand with LEP. Health literacy has been
defined as: “The degree to which individuals have the capacity to obtain, process and
understand basic health information and services needed to make appropriate health
decisions” (Ratzan SC and Parker RM 2000). A person with low health literacy might
have difficulty understanding and acting on health information such as accurately
administering medication for themselves or their pets, or difficulty following post-
operative discharge instructions. An estimated 50% of Hispanics in the US have low
health literacy (Nielsen-Bohlman, Panzer et al. 2004; Sanders L, Federico S et al. 2009).
As explored in Chapter 2, there is increasing recognition of the association of LEP with
low health literacy and compromised health care received by children of LEP caregivers.
However, there is little information on the impact of LEP on the quality of veterinary
health care for pets of LEP owners or on the frequency and risks of using friends and
family as ad hoc interpreters in veterinary medical settings.
This growing number of LEP Spanish-speakers, many of who might also have
low health literacy, includes pet owners who take their pets to a veterinarian. There are
106
an estimated 6 million LEP Spanish-speaking pet owners in the US today (Landau,
Chapter 3). Yet information is lacking on the proportion of veterinarians and veterinary
staff who can communicate effectively with these individuals without an interpreter
present. Also unknown is the proportion of veterinary practices that utilize Spanish-
language client-educational or marketing materials. As the Latino population in the US
continues to grow, so will the number of LEP Spanish-speaking pet-owners. A national
Veterinary Practitioner survey was conducted in 10 US states to investigate how often
veterinarians provide care to pets of LEP SSPOs and what strategies are used to
overcome language barriers.
Significance of the Veterinary Practitioner Survey
This study evaluated the preparedness of US small animal veterinary practices to
communicate with LEP Spanish-speaking clients by measuring the extent to which
language access services are needed and available. “Language access services” refers to
any service that helps a person with LEP obtain “the same access to and understanding
of health care as a non-LEP person would have” (p.4) (Roat 2005). Language access
services include the use of bilingual staff and interpreters as well as written materials that
are translated into the LEP person’s native language. In human medicine, studies have
shown that language access services significantly impact the quality of care received, the
cost of care received, and the access to health care itself (Roat 2005).
To this author’s knowledge, no previous research has estimated the number of
LEP Spanish-speaking clients seen in veterinary practices; how many small animal
practices employ Spanish-English bilingual staff; how emergency situations are handled
when there is a language barrier; and what, if any, marketing strategies are being used to
107
reach the ever-growing population of LEP Spanish-speaking pet owners in the US. If
findings suggest that the proportion of LEP SSPOs is significantly greater than the
proportion of Spanish-speaking veterinary professionals available to work with these pet
owners, then strategies need to be developed to bridge this language gap.
Specific Objectives and Hypotheses
The overall objectives of this study were to estimate the number of LEP SSPOs
visiting small animal veterinary practices, determine the proportion of practices that
provide Spanish language access services (bilingual staff, Spanish-language client-
education materials, Spanish-language marketing), and assess the veterinarian’s
satisfaction with communication with LEP SSPOs. Small animal practices were targeted
in two settings, namely practices located in states with fast-growing17 Latino populations
(NV, NC, GA, AR, TN) and practices located in states with large, established18 Latino
populations (CA, TX, FL, NY and IL). The null hypotheses tested were:
(i) Veterinarians who utilize client friends or family as ad hoc translators are as
satisfied with their communication with LEP Spanish-speaking clients as
veterinarians who utilize bilingual staff to translate.
(ii) Veterinarians who utilize Spanish-speaking staff, Spanish-language handouts,
and/or Spanish-language marketing materials have the same number of
Spanish-speaking LEP clients as veterinarians who do not provide these
Spanish language access services.
17 States with “fast-growing” Latino populations had 2010 Latino population < 300,000 and 2000-2010 Latino population growth > 110%. 18 States with “large established” Latino populations had 2010 Latino population >2 million and 2000-2010 Latino population growth < 60%.
108
4.2 Materials and Methods
Study design and population
From August 16, 2012 to March 24, 2013, a random sample of small animal
veterinary practitioners in 10 US states (CA, TX, FL, NY, IL, NV, NC, GA, AR, and TN)
were contacted via telephone and asked to participate in a survey on the topic of
“working with non-English-speaking clients.” Phone numbers for these practices were
obtained from a public domain retail database (VetListDownload.com), sorted by state,
randomized, and stripped of duplicate phone numbers. Calls were made by nine trained,
Collaborative Institutional Training Initiative (CITI)-certified telephone interviewers
Monday through Saturday during normal business hours according to the time zone of the
practice. Following an IRB-approved script, interviewers first asked if they had reached
a small animal veterinary practice. (The IRB approved script and survey are provided in
Appendix B.) If they had not, they thanked the individual for his/her time and
terminated the call. If they had reached a small animal practice, they asked to speak
with a veterinarian, office manager (OM), or practice manager (PM). Interviewers
informed the veterinarian or OM/PM of their goal of learning about the practice’s
experiences working with LEP Spanish-speaking clients. Respondents were informed
that the telephone interview would take approximately ten minutes to complete and were
asked if they would participate. If yes, the interview began. If no, they were asked when
the interviewer could call back. Each practice was called back repeatedly until either a
veterinarian or OM/PM participated in the survey, the practice declined to participate, or
six unsuccessful attempts were made to reach a doctor or OM/PM. Managers who took
the survey on behalf of the veterinarian were directed to answer all doctor demographic
109
questions with the same doctor consistently in mind. Occasionally, upon request by the
veterinarian or OM/PM, the survey was sent to the practice via fax or email. Ineligible
contacts (large and mixed animal practitioners, non-practicing veterinarians, non-
veterinary practices) were dropped from the sample frame and not called again.
The target population for the survey was the estimated 42,695 active small animal
veterinarians in the U.S19. The sample frame was comprised of VetListDownload.com
listings in the 10 states of interest (CA, TX, FL, NY, IL, NV, NC, GA, AR, and TN).
Listings were captured by database retailer VetListDownload.com in the first fiscal
quarter of 2012 from a variety of public domain sources, including on-line Yellow Pages.
Inclusion criteria consisted of having a Standard Industrial Classification (SIC) code of
#74203 or #74201 (Veterinary Practice or Veterinarian) and/or a having a North
American Industry Classification System (NAICS) code of #54194002 or #54194009
(Veterinary Services). After stripping out duplicates from the listing of 21,831 entries
which met the inclusion criteria in the ten states of interest, the final sample frame
consisted of 13,245 non-duplicate phone numbers. A random number generator in
Excel® was used to randomize every listing in the sampling frame. The state-by-state,
randomized, duplicate-free listings were then distributed to interviewers to call.
Inclusion criteria consisted of veterinarians and veterinary practices located in the
10 states of interest that described themselves as small animal general, small animal
specialty or referral, small animal emergency, small animal relief, small animal housecall,
feline only, exotic animal only or mostly, mobile, housecall, or spay/neuter exclusive.
Epi-Info® version 7.0 – StatCalc - Sample Size and Power was used to calculate sample
19 https://www.avma.org/KB/Resources/Statistics/Pages/Market-research-statistics-US-veterinarians.aspx
110
size. A total population of 42,695 active small animal veterinarians with 13,245 non-
duplicate listings from our 10 states of interest was assumed. Based on an expected
response rate of 50%, precision of 5%, and confidence level of 95% (a = 0.05), 373
completed interviews were needed to have sufficient statistical power to reject the null
hypotheses if they were false.
During the development phase of the survey, questions were reviewed and
critiqued by four colleagues with expertise in survey design and topical content.
Cognitive interviews were conducted on early versions of the survey instrument, where
non-expert pretest respondents “thought aloud” as they answered each question and
shared what they were thinking while answering the question. Cognitive interviews with
think-aloud exercises helped to identify confusing wording and revisions were made
accordingly. The final survey instrument was approved by Purdue’s Institutional Review
Board.
Following approval, the survey was conducted with a random sample of
veterinarians in Indiana by the CITI-certified interviewers. Once interviewers felt
comfortable with both the scripted interview and response-recording process, they began
from the top of their randomized call list in one of the ten states of interest. A target
number of completed interviews was set in advance for each state based on the number of
veterinarians in that state relative to the entire sample frame. Once the targeted number
of interviews was reached for that state, the interviewer began making calls to veterinary
practices in the next state of interest (Table 4-1). No incentives or honorariums were
offered for participation in this study, other than offering to email the participant a copy
of the study findings upon completion.
111
Survey instrument
The survey instrument used for this study consisted of 8 veterinarian demographic
questions, 9 practice demographic questions, 9 clientele/Spanish questions, and 12
veterinarian opinion/communication questions. These thirty-eight questions were
formatted as multiple choice, yes/no, open-ended, or 5-point Likert-scale questions.
Pre-survey training and testing
The survey was conducted by nine trained telephone interviewers, who had all
earned their CITI certification prior to conducting any interviews. CITI-certified
interviewers practiced and role-played the Veterinary Practitioner survey with the survey
author until the interviewer felt comfortable conducting the interview. Three of the nine
interviewers piloted the survey on a group of small animal veterinary practitioners
randomly selected from the Indiana state veterinary list (acquired from the public-domain
database VetListDownload.com) to ensure smooth interviewing and response-recording
processes.
After completing the pilot interviews, the survey was formally launched in the ten
states of interest. As interviewing progressed, it became apparent that veterinarians and
managers were sometimes willing to participate in the study if they could do so by email
or fax, because they simply did not have time to complete the survey by phone during
work hours. Therefore an addendum to the IRB application was submitted and approved,
permitting an emailed and/or faxed version of the questionnaire to be sent to a practice
112
upon request. Purdue IRB approval was received for training, testing, piloting and
implementation of telephone, email, and fax modes of this survey.20
Statistical analyses
Study variables
Descriptive statistics were used to summarize the distributions of the explanatory
variables. Frequencies and percentages were used to describe the distributions of the
categorical variables and the median or mean was reported for quantitative variables.
Significance testing
Significance testing was performed to compare veterinarians and veterinary
practices located in states with large established Latino populations to veterinarians and
veterinary practices in states with fast-growing Latino populations. Significance testing
was also performed to compare indicators of preparedness to work with LEP Spanish-
speaking clients. Significance tests included the Student’s two-sample t-test with equal
variances to compare means of continuous variables, Pearson chi-square and Fishers
exact tests to assess homogeneity of categorical variables, and Mann-Whitney tests to
compare non-normally distributed variables. The statistical software package Stata®
Version 11.2 (Stata Corporation, College Station, TX) was used for both descriptive and
analytic analyses.
Statistics
This study used odds ratios (ORs) to measure the effects of the explanatory
variables on (i) the likelihood of the veterinarian being “very satisfied” or “extremely
satisfied” with his/her communication with LEP Spanish-speaking clients, and (ii)
20 Human Research Protection Program – Approved IRB Protocol #1206012429
113
whether a practice saw more than 7 LEP Spanish-speaking clients weekly. Potential
predictors of satisfaction with communication and odds of seeing more than 7 LEP
clients seen weekly were determined using bivariate and multivariate logistic regression.
Estimates for the OR and 95% confidence intervals (95% CI) for each predictor
were obtained by exponentiation of the regression coefficients. Data were assessed for
outliers and influential points. Independent variables retained in the final multivariate
model were assessed for correlation. Maximum likelihood estimates of the logistic
parameters and fit of the final model was assessed using Hosmer-Lemeshow goodness-
of-fit test. Variables with a P-value of <0.20 in the bivariate models were included for
analysis in the multivariate models; a P-value of <0.05 was considered statistically
significant in the multivariate models.
4.3 Results
Descriptive Statistics: Survey Calling Statistics
From a sample pool of 13,245 listings, 2,704 calls were made to 1,404 practices.
Of the practices called, 159 (11%) were deemed ineligible (large and mixed animal
practitioners, non-practicing veterinarians, non-veterinary practices). Of the remaining
1245 practices, 295 declined to participate, 567 repeatedly asked for a callback
throughout the study, and 383 successfully completed the survey. On average, each
practice was called 1.9 times, with a maximum of six attempts made to complete the
survey. The participation rate based on all completed interviews divided by all declined
interviews x 100 was 56%. The participation rate based on all completed interviews
divided by all eligible interviews (including those pending) x 100 was 31% (Table 4-2).
114
Nine CITI-certified callers conducted the interviews, with 93% of the successfully
completed interviews being conducted by 3 callers, and 62% of the interviews being
conducted by one caller. Ninety-five percent of the interviews were conducted by
telephone; 4% were submitted by fax and 1% by email. Seventy percent of the
interviews were conducted with the veterinarian; 30% of the interviews were conducted
with the OM or PM who spoke on behalf of the doctor.
Descriptive Statistics: Veterinarian Demographics
Fifteen (4%) veterinarians in this study described themselves as Latino. Three
percent spoke Spanish as their first language, while another 3% spoke French, Bengali,
Korean, Arabic, Swedish, Hebrew, German or Danish as their first language. When
asked how well the veterinarian could speak Spanish, 16% could communicate with a
client in Spanish either as a conversant, fluent or native Spanish speaker. Fifteen percent
of Caucasian and 31% of non-Caucasian veterinarians were able to converse with their
LEP clients in Spanish (Table 4-3). No association was seen between years in practice
and the veterinarian’s ability to speak Spanish.
For veterinarians interviewed for this study, years in practice ranged from less
than one year to 54 years. Female veterinarians comprised the majority (63%) of
veterinarians in practice 10 years or less, and male veterinarians comprised the majority
(69%) of veterinarians in practice more than 20 years. Participating veterinarians
graduated from thirty-nine different schools or colleges of veterinary medicine in the U.S.,
Canada and abroad. More respondents graduated from Texas A & M University,
University of Georgia, and Auburn University than any other programs (Table 4-4).
115
Descriptive Statistics: Practice Demographics
By design, half of the practices surveyed were located in the five US states with
the largest established Latino populations. The other half were located in the five US
states with the fastest-growing Latino populations in 2012 (Table 4-5). Of the 383
participating practices, 43 (11%) were group practices. Banfield21 (N=9), VCA22 (N=6),
and NVA23 (N=3) were the group practices most frequently mentioned. The remaining
25 group practices were owned by individuals or partnerships of veterinarians.
The number of employees per practice ranged from a solo practitioner with no
support staff to a specialty practice employing 27 veterinarians and 136 support staff.
Although there were as many as 5 Spanish-speaking veterinarians, 15 Spanish-speaking
RVTs, 10 Spanish-speaking VAs, 2 Spanish-speaking OMs, 10 Spanish-speaking
receptionists, 8 Spanish-speaking kennel staff, and 2 Spanish-speaking groomers in any
one practice, the median number of Spanish-speaking staff members per practice for
every position across all practices surveyed was zero (Table 4-6).
Descriptive Statistics: Clientele / Spanish
When asked how many clients were seen in a typical week in the practice,
responses ranged from less than 25 to a maximum of 1000. The majority (71%) of
practices saw more than 75 clients weekly, with a median of 175 clients per week. When
asked how many LEP SSPOs were seen in a typical week, responses ranged from none to
21 Banfield: As of 2013, Banfield operates over 800 companion animal veterinary hospitals inside PetSmart stores throughout the US (www.Banfield.com) 22 VCA: As of 2013, VCA Antech owns over 600 companion animal veterinary hospitals in 42 states and Canada (www.VCAAntech.com) 23 NVA: As of 2013, National Veterinary Associates owns over 186 companion animal veterinary hospitals in 34 states (www.NVA.com)
116
a maximum of 200, with the median being “1 to 7” LEP SSPOs per week (Table 4-5).
Across all 10 states surveyed, 89% of practices worked with LEP SSPOs.
All respondents were asked to imagine an emergency scenario24 in which a new
LEP SSPO arrives with a visibly sick dog. The respondent was asked what would
happen next at their practice. Two-thirds of respondents (61%) indicated that they would
have the client ask a friend or family member to translate (Table 4-7). Respondents were
also asked how often the Spanish-speaking client’s limited English compromised their
ability to provide their best veterinary care. Overall, 59% of respondents indicated that
care was never compromised (Table 4-5). When examined by respondent type, however,
a different picture emerged: 37% of OMs, 44% of owners, and 61% of associates
indicated that care was compromised due to the language gap (Figure 4-1).
Practices varied with regard to their use of written Spanish language client
educational materials, industry brochures, and practice-generated handouts. While 32%
of respondents indicated that they used Spanish-language industry brochures, over half
(52%) were interested in using these brochures. Similarly while less than a fourth (21%)
used Spanish-language practice-generated handouts (e.g. consent forms, discharge
instructions), nearly two-thirds (63%) were interested in using these materials. When
asked what types of Spanish-language marketing strategies they used, a large majority
(87%) stated they did no marketing whatsoever. “Word of mouth" was “their best form
of marketing” (Table 4-8).
24 Exact text of scenario: “If a new client who speaks Spanish (and little or no English) comes in with a sick puppy (lethargic, weak and dehydrated), what would happen next at YOUR practice?”
117
Descriptive Statistics: Veterinarian Opinion / Communication
Veterinarians were asked eight opinion questions on communication and Spanish
language training, all of which used a 5-point Likert response scale where: 1=strongly
disagree, 2=disagree, 3=neither agree nor disagree, 4=agree, and 5=strongly agree.
Veterinarians were also asked how satisfied they were with their communication with
English-speaking clients and LEP Spanish-speaking clients. A final opinion question
asked whether veterinarians would invest in “next steps” to bridge the communication
gap with their LEP Spanish-speaking clients. Median scores for all questions were
calculated (Table 4-9). In four of the fourteen opinion questions, responses from
veterinary associates were significantly different from that of veterinary owners or
OMs/PMs speaking on behalf of the DVM (Figures 4-1 through 4-6).
Analytic Statistics: States with large established versus fast-growing Latino populations
When comparing states with large established versus fast-growing Latino
populations, significant differences emerged within multiple variables (Table 4-5).
Analytic Statistics: Fitting the SATISFACTION Model and Hypothesis I Testing
Fitting the SATISFACTION Model: Bivariate analyses identified 21 variables that
had a statistically significant association with a veterinarian’s satisfaction communicating
with LEP Spanish-speaking owners. Multivariable logistic regression using backward
stepwise selection reduced this list to four variables significantly associated with a
veterinarian’s satisfaction with communication with LEP Spanish-speaking owners:
veterinarian’s level of spoken Spanish proficiency, Spanish-speaking RVTs, using
family/friends to translate, pantomiming/drawing (Table 4-10).
118
Testing the Estimates: An adjusted Wald test was used to test the estimates in the
final reduced model. The effect of the veterinarian’s level of spoken Spanish proficiency
on the probability of the vet being satisfied with communication with an LEP Spanish-
speaking client was significant (P<0.001); the effect of having a Spanish-speaking RVT
was significant (P<0.001); the effect of having friends/family translate was significant
(P=0.004); and the effect of pantomiming/drawing was significant (P= 0.032).
Assessing Model Fit: The Hosmer-Lemeshow goodness-of-fit test was not
significant (P=0.587). Therefore the assumptions of fit were not violated and the
reduced model did reasonably describe the factors which were significantly associated
with vet’s satisfaction with communication with LEP Spanish-speaking client.
Interpreting predicted values of outcome: Veterinary practices with the highest
probability of the veterinarian communicating satisfactorily with an LEP SSPO can be
characterized as having a veterinarian who is at least conversant in Spanish, at least one
Spanish-speaking RVT on staff, friends and family not translating, and not
communicating via pantomiming and drawing (Table 4-11). Based on these results,
Hypothesis I is rejected in favor of the conclusion that veterinarians in practices that
utilize friends or family as ad hoc translators are significantly less satisfied with their
communication with LEP SSPOs than veterinarians in practices that utilize bilingual staff
(especially DVMs and RVTs) to translate.
Results also demonstrated that significantly more veterinarians from states with
established Latino populations were “very satisfied” or “extremely satisfied” with their
communication with LEP Spanish-speaking clients (P=0.010) compared with vets from
states with fast-growing Latino populations. There was no significant difference between
119
responses of owners, associates, and OMs/PMs to the question “How satisfied are you
with your communication with LEP Spanish-speaking clients?”
Analytic Statistics: Fitting the LANGUAGE ACCESS SERVICES Model and
Hypothesis II Testing
Fitting the LANGUAGE ACCESS SERVICES Model: Bivariate analyses
identified 11 variables that were significantly associated (P<0.20) with whether a practice
saw more than 7 LEP Spanish-speaking clients weekly when analyzed using logistic
regression. Multivariable logistic regression using backward stepwise selection followed
by model fitting reduced this list to two variables significantly associated with whether a
practice saw more than 7 LEP Spanish-speaking clients weekly, namely Spanish-
speaking staff helps during emergency scenario and practice used Spanish-language
marketing materials (Table 4-12).
Testing the Estimates: An adjusted Wald test was used to test the estimates in the
final reduced model. The effect of having a Spanish-speaking staff member to help in an
emergency scenario on the probability of the practice seeing more than 7 LEP Spanish-
speaking clients weekly was significant (P<0.001); the effect of the marketing in Spanish
was also significant (P<0.001).
Assessing Model Fit: The Hosmer-Lemeshow goodness-of-fit test was not
significant (P=0.980). Therefore the assumptions of fit were not violated and the
reduced model did reasonably describe the factors which were significantly associated
with having more than 7 LEP Spanish-speaking clients visit the practice weekly.
Interpreting predicted values of outcome: Utilizing Spanish-speaking staff
during an emergency and implementing Spanish-language marketing was significantly
120
associated with the number of LEP Spanish-speaking clients seen (Table 4-13). The
probability of a practice seeing more than 7 LEP Spanish-speaking clients weekly
increased 2.8-fold when there was at least one Spanish-speaking staff member to assist
during an emergency (OR=2.75, P=0.010, 95% CI=1.27 to 5.94), and increased nearly
2.5-fold when a practice used Spanish-language marketing materials (OR=2.47, P=0.021,
95% CI=1.15 to 5.30). Based on these results, Hypothesis II is rejected in favor of the
conclusion that veterinarians in practices that utilize language access services in the form
of Spanish-speaking staff and Spanish-language marketing are significantly more likely
to see more than 7 LEP Spanish-speaking clients weekly than practices which do not
utilize these language access services. Results also demonstrated that significantly more
practices located in states with established Latino populations were likely to have
Spanish-speaking staff to help in an emergency (P<0.001) compared with practices
located in states with fast-growing Latino populations (see Figures 4-7 to 4-13).
Qualitative Results
Over two-thirds of respondents had additional opinions and perspectives to share
on the topic of working with LEP Spanish-speaking clients. These ideas were not
captured by survey questions alone. They are summarized below:
“Clients should learn to speak English.” Some respondents felt that it was not
the veterinarian’s job to learn Spanish, but rather the client’s job to learn English: “We
need to focus on what we need to do medically, not focus on learning to speak Spanish.
The client needs to communicate with us; [taking Spanish classes] dilutes our primary
purpose.” One respondent stated that taking time out of the veterinary curriculum to
121
teach Spanish was a “sociopolitical agenda": “Isn’t America’s first language English?
This is a ridiculous waste of time!” Several veterinarians mentioned that teaching a
business course would be a better use of curricular time. A few respondents who
frequently work with LEP clients mentioned that they actively encourage their LEP
clients to take English as a Second Language (ESL) classes. Others felt this language
gap is a temporary problem: “This is not an important issue because second-generation
immigrants will probably speak English and it will become a non-issue…I hope.”
“It’s not a matter of language; it’s a matter of education and money.” Several
veterinarians mentioned that LEP Spanish-speaking clients are not coming to their
practice for preventative care, but only for emergency care when their dog contracts
parvovirus or gets hit by a car (“Maybe they’re going elsewhere for vaccinations and
spay-neuter, like the Humane Society or low-cost practices.”) As one practitioner shared,
“I have been in practice for 37 years. Last year I saw over 100 parvo cases. Several of
these cases were from ‘repeat families’…families which we had already helped with a
previous parvo puppy, families which we had tried to educate about the value of
vaccination. Instead, the pet owner shows up and says, ‘I have no money…please help
my dog.’ We were sending home fluids and medication for $50 a day, instead of treating
the pet in the hospital at $200 to $400 per day. We were literally giving away medication
and services. We need to educate the pet owners. The message of prevention and
husbandry didn’t get through.” Another respondent approached the parvovirus outbreak
in her community by calling an interpreter from the Latino community and asking her to
spread the word that owners should bring their puppies in for DHPP vaccinations
immediately. It was a successful strategy; many puppies were vaccinated and survived
122
the outbreak. One experienced veterinarian remarked, “I’ve been at this for 40 years.
First-generation immigrants aren’t into preventive care; therefore we see a lot of parvo,
especially in 6 to 16 week old Pitbull puppies. Second-generation immigrants are fluent
in their native language as well as English; third-generation immigrants are fluent in
English and can’t speak the native language anymore!”
“Whether or not vets and staff need to learn Spanish is a region-specific issue.”
“It’s important to speak Spanish if you practice in a state with a large Spanish-speaking
population.” Practitioners also mentioned other ongoing communication challenges,
such as trying to meet the communication needs of deaf owners and LEP owners who
speak Japanese, Korean, Chinese, Vietnamese, Thai, Russian, German, French and Polish:
“Currently the language gap limits how much information I can share with a client.”
“It’s important to speak Spanish if you work for a spay/neuter service or vaccine practice.
Higher SES Latino clients speak English.”
“Spanish should be studied outside of vet school, not in vet school.” Multiple
respondents suggested that Spanish should be taken well before veterinary school, and
several shared that in their communities, Spanish language education begins in
elementary school. Many felt that if Spanish was to be a requirement of vet school, it
should be taken at the undergraduate college level or earlier. Others felt that learning
Spanish should be accomplished outside of the practice, on one’s own time. “It’s hard
enough getting through vet school. Speaking Spanish is one of those ‘nice’ things. It
looks good on your resume but won’t make you a better clinician.” One self-described
fluent Spanish-speaker explained that he learned his Spanish in high school and college
and twenty years of mission work in Honduras: “I’d send my staff to learn Spanish, but
123
I’m not convinced they’d be interested!” Another Texan veterinarian shared, “Any time
you communicate, it’s important! Twenty years ago Texan vets were advised to hire
bilingual receptionists. But if we put Spanish in the DVM curriculum, what is it taking
the place of? Students interested in learning Spanish should use Rosetta Stone.”
“Lost in translation!” “I really wish we had bilingual staff. It’s challenging to
translate through a child. Recently a parent was asking the child to translate a question
about castration; the child said “capitation”…which led us to wonder if they were
concerned about rabies and decapitation. We quickly realized the child simply used the
wrong word!” “Most clients comprehend English even if they don’t speak English.”
4.4 Discussion
This study investigated the preparedness of small animal veterinary practices to
work with LEP SSPOs and their pets. Preparedness was measured by the extent to which
language access services were available when needed. In this study, language access
services included Spanish-English bilingual staff, Spanish-language client educational
and informational materials, and Spanish-language marketing. The study estimated the
percentage of small animal veterinary practices that see LEP SSPOs and their pets
weekly, and the median number of LEP SSPOs seen in those vet visits. The study
estimated the percentage of small animal veterinary practices that employ Spanish-
speaking staff, and the number of Spanish-speakers among all veterinary staff. The study
estimated the percentage of veterinary practices which use industry-generated and/or
practice-generated Spanish language resource materials. Finally, the study estimated the
percentage of practices which market in Spanish. The findings revealed that the
124
percentage of LEP SSPOs is greater than the number of small animal veterinary practices
offering language access services, especially in states with fast-growing LEP Spanish-
speaking populations (Figure 4-14).
The first methodological challenge of this study was to select an effective and
affordable survey mode. A web-based survey was ruled out based on lack of a sample
frame; access to a current e-mail list of small animal veterinarians in the 10 states of
interest was unavailable. A US postal mail survey was ruled out, based on the low
anticipated response rate25 of 13%. Ultimately a mixed-mode survey was conducted,
consisting primarily of telephone interviewers with occasional faxes or emails used to
complete the survey. Although conducting this survey via US postal mail would have
been comparable in cost to the telephone interviews ($16.50 versus $16.88 per completed
survey), the expected response rate (13%) would have been a fraction of what was
achieved by mixed-mode telephone-fax-email (31%), and the opportunity to delve deeper
into the practitioners’ experiences would have been missed completely.
Another methodological challenge of this study was to maximize survey response
rates while minimizing sources of error. By using a national, public-domain, retail
database of veterinarians and veterinary hospitals purchased from VetListDownload.com,
coverage error was minimized except for those veterinarians and veterinary practices
which did not have a public domain listing of their telephone number. It is highly
unlikely that an active, practicing veterinary hospital in the US would not have, at
minimum, a white pages or yellow pages listing. Hospitals opened after the first quarter
25 Mail survey estimate provided by Irwin Broh Research, Des Plaines, IL – personal communication, November 08, 2011
125
of 2012 and therefore not included in the VetListDownload database of phone numbers
would have been missed systematically.
Getting a DVM or OM/PM to take the telephone call and participate in the survey
was the most challenging aspect of this study. Once a DVM or OM/PM agreed to
participate in the study, there was a negligible nonresponse rate to any individual
questions. When a veterinary practice met the inclusion criteria and initially declined to
participate in the telephone interview, interviewers asked if the DVM or OM/PM would
accept an emailed or faxed survey. When a practice stated that the DVM or OM/PM was
unavailable, interviewers called back at a later time or date. Almost half of all practices
called remained in “pending” status at the end of the study. It was not possible to
determine if these “pending” practices would have eventually converted to “completed”
or “declined” status.
Staff members at corporate practices (VCA, Banfield) often stated that “corporate
policy” barred them from participating in any outside survey, thus resulting in a
nonresponse bias against corporate practices. Are corporate practices different from non-
corporate practices in ways that matter about communicating with LEP clients? By
mentioning “situations where clients are not fluent in English” in the introductory script,
the nature of the study was transparent but might have immediately deterred practices
with no interest in this topic, potentially contributing to nonresponse error. Are
nonresponders in general different from responders in ways that matter about working
with LEP clients?
The Veterinary Practitioner survey was vulnerable to measurement error for
several reasons. Sometimes the DVM answered all questions by telephone interview;
126
sometimes the OM/PM answered demographic questions by telephone interview
followed by the DVM completing opinion questions by email or fax; and sometimes the
OM/PM answered all questions on behalf of the DVM by telephone interview. Would
the doctor have given the same responses that the OM/PM gave on his/her behalf?
Furthermore, the fact that some respondents completed the entire survey aurally (listening
to questions by phone), while others completed some or all of the survey visually
(responding to an emailed or faxed survey), is a potential source of measurement error.
In an aural interviewer-administered survey, respondents tend to remember and choose
the last category heard, whereas in a visual self-administered survey, respondents tend to
remember and choose the first category seen (Dillman DA, Smyth JD et al. 2009). Would
the respondent have given the same response verbally to an interviewer as s/he gave on a
faxed or emailed version of the survey?
Nine different interviewers conducted this survey, which is another source of
potential measurement error. Although each interviewer was CITI-certified and went
through scripted trainings and role-plays to standardize the interview, differences in
personality, age, gender and ethnicity were detectable by voice, and respondents might
have tempered their responses based on these interviewer differences. Differences in
response could represent social desirability bias and/or acquiescence bias.
There was an assumption underlying the intentional comparison of practices
located in states with large, established versus fast-growing Latino populations: Practices
located in states where there has been a long-term, ongoing demand for Spanish language
access services would be better prepared to offer these services than practices located in
states in which there was a sudden or more recent surge in demand. Results of the
127
current study bear this out: Veterinary practices located in states with large established
Latino populations had significantly more Spanish-speaking DVMs, RVTs, VAs and
receptionists available to work with LEP SSPOs, as well as significantly more Spanish-
language practice-generated written materials to use with their LEP SSPOs. What is
compelling is that this study did not find a significant difference in the number of LEP
SSPOs seen in L-E states versus F-G states. With equal demand for language access
services but fewer resources available in F-G states, the possibility that the F-G states
will be unprepared to meet the communication needs of LEP SSPOs and their pets is real.
The shift in gender demographics in the veterinary profession from predominantly
male to predominantly female DVMs could have significant implications for
communication with LEP SSPOs. Since 2009, there are more female than male DVMs in
practice, and women currently comprise 78% of the US veterinary school population
nationally (Tremayne J 2013). This study found that female DVMs were significantly
more likely than male DVMs to agree that veterinary care was compromised due to
language gap, say they would take an on-line Spanish for Veterinary Professionals class,
and say they would send their staff to a Spanish for Veterinary Professionals class.
Gender was highly correlated with ownership status: female DVMs in this study were
significantly more likely to be associates/employees than owners/partners.
There are a variety of ways to interpret these results. It is possible that female
DVMs value communication with LEP SSPOs more than male DVMs. It is possible that
female DVMs are more likely than male DVMs to demonstrate social desirability bias or
acquiescence bias when responding to a survey. It is possible that female DVMs, as
associates rather than owners, have more time to invest in taking an on-line Spanish for
128
Veterinary Professionals class to bridge the communication gap. Whatever the
underlying reason for these significantly different results, the shift in gender
demographics to a majority of female DVMs has the potential to positively impact the
profession’s interest in communicating with LEP SSPOs.
One finding of this study is that veterinarians who use the skill of a Spanish-
speaking RVT to interpret and who do not use family and friends as interpreters were
significantly more likely to be satisfied with their communication with LEP clients. For
the veterinarian who speaks little or no Spanish, s/he is dependent upon the RVT for
accurate translation and interpretation. What is the legal liability of the DVM in this
situation? Should both the DVM and the RVT write their recommendations in the
patient’s record? Should Spanish-language discharge instructions that go home with the
owner have an English-language equivalent that remains in the pet’s medical record?
Conversely, when an LEP client signs an English-language consent form, is it really
informed consent and will that document be legally binding? These are issues that will
need legal attention as more bilingual communication occurs in small animal practices.
Limitations of the study
As large corporate practices like Banfield, VCA and NVA become a larger
proportion of veterinary practices nationwide, it is of interest to understand what type of
communication skills training is taking place in these practices, especially with regard to
communicating with LEP SSPOs. Unfortunately, Banfield and VCA’s corporate policy
(“We don’t participate in surveys”) limited what could be learned from and about group
veterinary practices with regard to working with LEP clients. Respondents from 43
129
group practices did participate in this survey. The Banfield veterinarians and OMs who
did participate mentioned using Banfield’s proprietary software, PetWare®, for English-
to-Spanish translation, as well as offering “Spanish-language pay” for bilingual staff in
the form of an add-on to hourly wages.
Despite survey instrument pre-testing and cognitive interviewing, question
wording could also have impacted the interpretation of some survey questions. An
example is the question, “How satisfied are you with your communication with Spanish-
speaking clients?” A veterinarian who interpreted “you” as a plural pronoun might have
considered the collective, staff-wide ability to communicate in Spanish. Another
veterinarian who interpreted “you” as a singular pronoun might have considered only
his/her own ability to communicate in Spanish. Thus a DVM who spoke no Spanish
might have responded that s/he was extremely satisfied with the communication with
LEP Spanish-speaking clients because the practice employed bilingual staff members
who helped with communication. Conversely, a DVM who spoke no Spanish might have
responded that s/he was extremely dissatisfied with the communication, even though
several staff members communicated fluently in Spanish.
It would have been ideal to ask all practice demographic questions of the OM/PM
or owner, while asking the opinion questions of only a DVM in the practice. In addition
to knowing how many years the DVM had been in practice, it would have been beneficial
to know how long that DVM had been with that particular practice. A doctor who was
new to the practice might not have had the same perspective or experience of LEP clients
as a veterinarian who had been with the practice for a longer period of time.
130
Most significantly, a telephone survey to small animal veterinarians at their
practice during work hours was not an ideal place or time for the doctor or office
manager to participate in the study. Responses were limited to who had time to
participate. Thus there could have been systematic bias against the busiest practices.
Conclusions
Based on completed interviews with veterinarians, office managers and practice
managers from 383 small animal practices in 10 US states, the status of communication
between LEP SSPOs and small animal veterinary practices can be described as follows:
In states where there are large established or fast-growing Latino communities, there is
room to improve language access services for LEP SSPOs. Almost 90% of practices
surveyed had LEP Spanish-speaking clients, and over half of those practices were seeing
an average of 1 to 7 LEP SSPOs weekly. Yet overall only 8% of the small animal
practice workforce represented by this study could communicate with LEP SSPOs
without an interpreter present.
Additionally, almost two-thirds of practices surveyed used no Spanish-language
written materials with their LEP SSPOs. One-third of the practices used some industry-
generated Spanish-language brochures and information. One-fifth of those responding
used some practice-generated Spanish-language materials. Almost 90% did no
marketing of services in Spanish to their LEP SSPOs, and almost 90% of the
veterinarians represented by this study spoke little or no Spanish. Not unexpected, three-
fourths of veterinarians interviewed were not satisfied with their communication with
LEP SSPOs.
131
Language access services for LEP SSPOs can be improved in small animal
private practice veterinary settings in order to enhance communication and understanding
between these pet owners and the veterinary team. This study found that veterinarians
who employed Spanish-speaking staff and offered Spanish-language practice-generated
materials reported greater numbers of LEP Spanish-speaking clients and greater
satisfaction in their communication with these clients. Practitioners specifically
recommended the use of the following Spanish-language resources: Spanish-English
dictionary for translation of individual words; Spanish terminology phrase book for
translation of phrases; Spanish-language industry-generated brochures from AAHA,
AVMA, and manufacturers for product and health condition information; and Spanish-
language handouts from resources like Small Animal Practice Client Handouts (by Rhea
Morgan), Clinical Veterinary Advisor: Dogs and Cats (by Etienne Côté) and ClientEd
Online® (by Lifelearn.com, Guelph, Ontario) for more in-depth explanations of health
conditions and surgical procedures in Spanish (Figure 4-15).
Many non-Spanish-speaking practitioners shared that they have found translation
software applications like Google Translate®, BabelFish®, and Jibbigo® to be helpful.
Once downloaded onto an iPhone®, iPad®, and/or computer, veterinary staff members
cut-and-pasted client education information into the application, which then translated the
English text into written and voiced Spanish. Other practices mentioned using the
translation feature in their existing practice management software, such as Cornerstone®
(by IDEXX) and PetWare Client® (by Banfield).
When asked what steps they would take next to improve communication with
their LEP SSPOs, almost half of the practices said they would consider expanding their

132
human resources by hiring a bilingual staff member. For those practitioners seeing only
an occasional LEP SSPO, using a toll-free telephone interpreter service like Certified
Languages International® to have a live, interpreted conversation using the skill of a
trained medical interpreter was mentioned as another cost-effective alternative.26
Practitioners who were not conversant in Spanish and did not employ bilingual staff
offered additional creative solutions to overcome the communication gap, including
calling a bilingual colleague or spouse to interpret, and encouraging LEP clients to bring
English-speaking family members or friends to the pet’s appointment.
Looking to the future, over half of the associates surveyed said they were
interested in taking an on-line Spanish for Veterinary Professionals course, and more
than three-fourths of all respondents agreed or strongly agreed that Spanish for
Veterinary Professionals should become an elective in both the RVT and DVM curricula.
Suggestions from the 11% of practices which did offer Spanish-language marketing
included: Add Spanish-language messages to signage, phone message, websites,
Facebook accounts and blogs; distribute Spanish-language flyers to churches, Latino
Community centers, and other popular Latino gathering places; and provide a practice
listing in coupon books and the Latino Yellow Pages. Above all, capitalize on the word-
of-mouth advertising that is still the most relied-upon form of marketing for the majority
of respondents. Incorporating some or all of these practitioner-generated
recommendations could greatly enhance communication between LEP SSPOs and the
veterinary practices which serve them.
26 2013 pricing: $1.45/minute
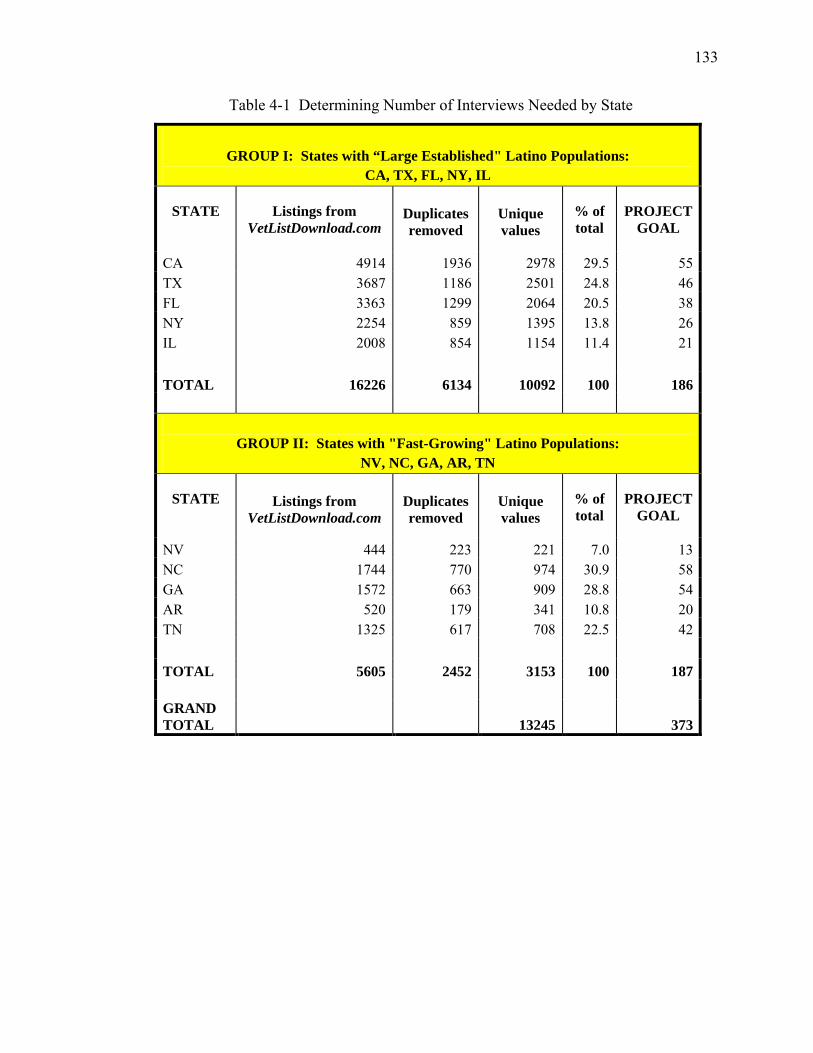
133
Table 4-1 Determining Number of Interviews Needed by State
GROUP I: States with “Large Established" Latino Populations:
CA, TX, FL, NY, IL
STATE Listings from VetListDownload.com
Duplicates removed
Unique values
% of total
PROJECT GOAL
CA 4914 1936 2978 29.5 55 TX 3687 1186 2501 24.8 46 FL 3363 1299 2064 20.5 38 NY 2254 859 1395 13.8 26 IL 2008 854 1154 11.4 21
TOTAL 16226 6134 10092 100 186
GROUP II: States with "Fast-Growing" Latino Populations:
NV, NC, GA, AR, TN
STATE
Listings from VetListDownload.com
Duplicates removed
Unique values
% of total
PROJECT GOAL
NV 444 223 221 7.0 13 NC 1744 770 974 30.9 58 GA 1572 663 909 28.8 54 AR 520 179 341 10.8 20 TN 1325 617 708 22.5 42
TOTAL 5605 2452 3153 100 187
GRAND TOTAL
13245
373
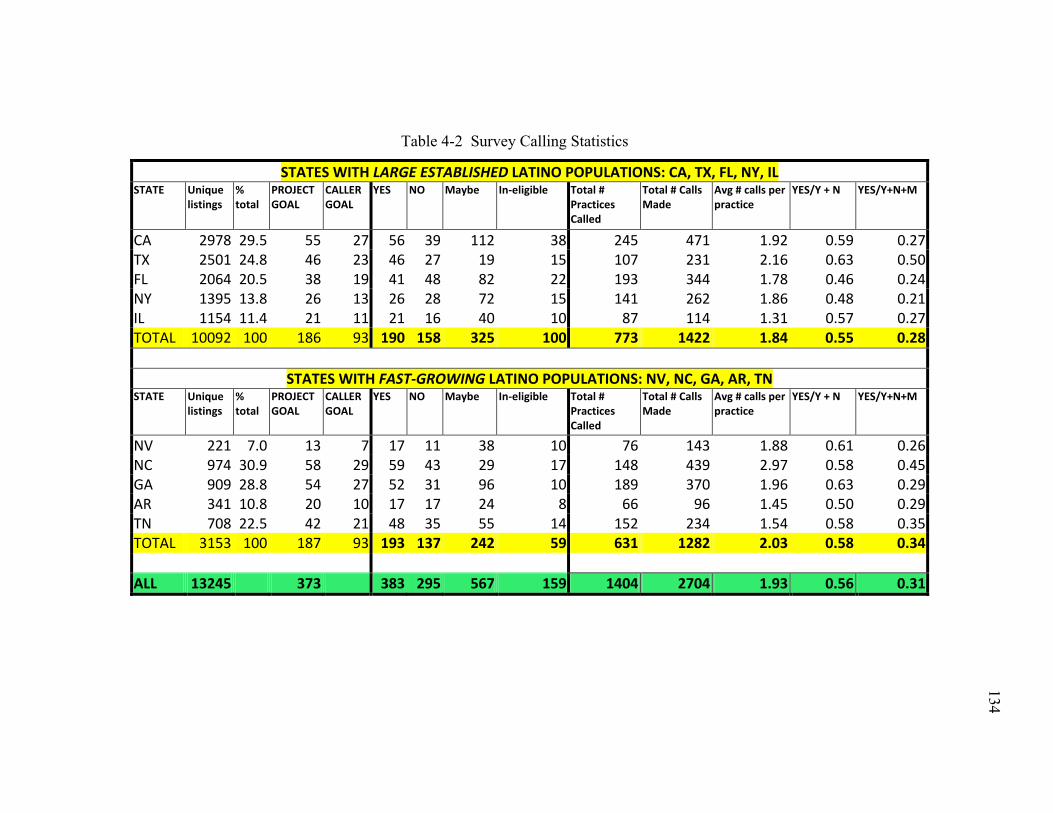
134
134
Table 4-2 Survey Calling Statistics
STATES WITH LARGE ESTABLISHED LATINO POPULATIONS: CA, TX, FL, NY, IL STATE Unique
listings % total
PROJECT GOAL
CALLER GOAL
YES NO Maybe In-eligible Total # Practices Called
Total # Calls Made
Avg # calls per practice
YES/Y + N YES/Y+N+M
CA 2978 29.5 55 27 56 39 112 38 245 471 1.92 0.59 0.27 TX 2501 24.8 46 23 46 27 19 15 107 231 2.16 0.63 0.50 FL 2064 20.5 38 19 41 48 82 22 193 344 1.78 0.46 0.24 NY 1395 13.8 26 13 26 28 72 15 141 262 1.86 0.48 0.21 IL 1154 11.4 21 11 21 16 40 10 87 114 1.31 0.57 0.27 TOTAL 10092 100 186 93 190 158 325 100 773 1422 1.84 0.55 0.28
STATES WITH FAST-GROWING LATINO POPULATIONS: NV, NC, GA, AR, TN
STATE Unique listings
% total
PROJECT GOAL
CALLER GOAL
YES NO Maybe In-eligible Total # Practices Called
Total # Calls Made
Avg # calls per practice
YES/Y + N YES/Y+N+M
NV 221 7.0 13 7 17 11 38 10 76 143 1.88 0.61 0.26 NC 974 30.9 58 29 59 43 29 17 148 439 2.97 0.58 0.45 GA 909 28.8 54 27 52 31 96 10 189 370 1.96 0.63 0.29 AR 341 10.8 20 10 17 17 24 8 66 96 1.45 0.50 0.29 TN 708 22.5 42 21 48 35 55 14 152 234 1.54 0.58 0.35 TOTAL 3153 100 187 93 193 137 242 59 631 1282 2.03 0.58 0.34
ALL 13245 373 383 295 567 159 1404 2704 1.93 0.56 0.31
134
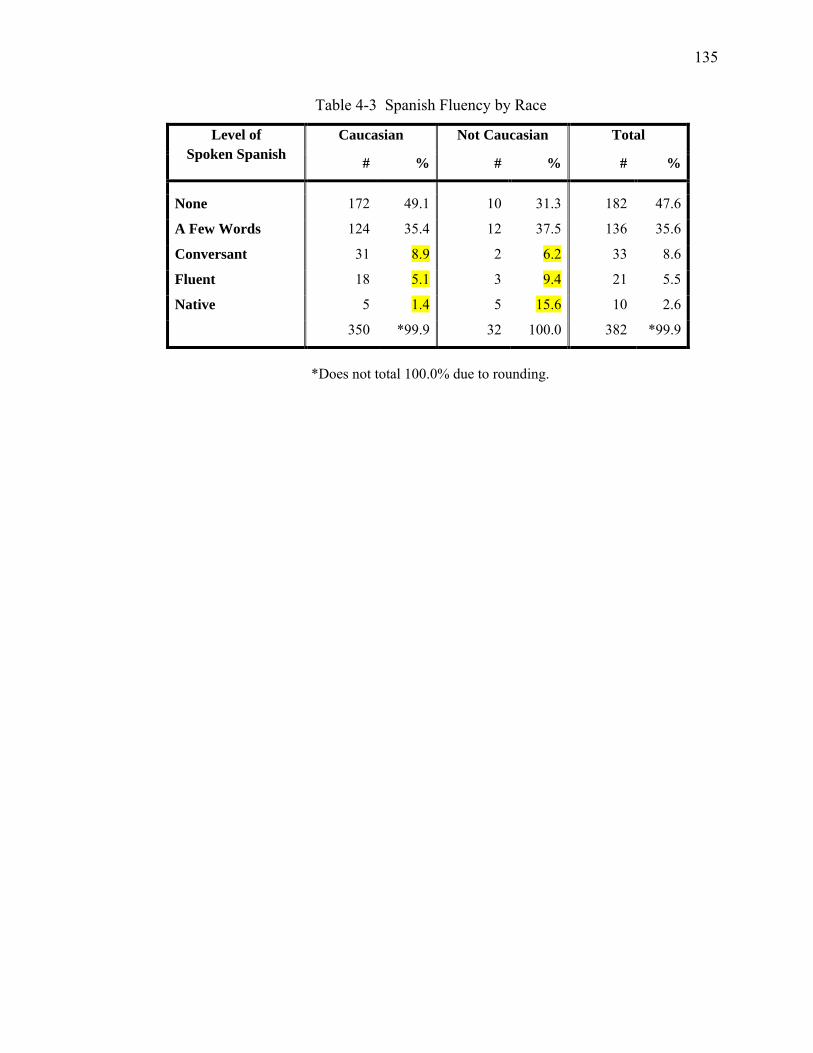
135
Table 4-3 Spanish Fluency by Race
Level of Spoken Spanish
Caucasian Not Caucasian Total
# % # % # %
None 172 49.1 10 31.3 182 47.6
A Few Words 124 35.4 12 37.5 136 35.6
Conversant 31 8.9 2 6.2 33 8.6
Fluent 18 5.1 3 9.4 21 5.5
Native 5 1.4 5 15.6 10 2.6
350 *99.9 32 100.0 382 *99.9
*Does not total 100.0% due to rounding.
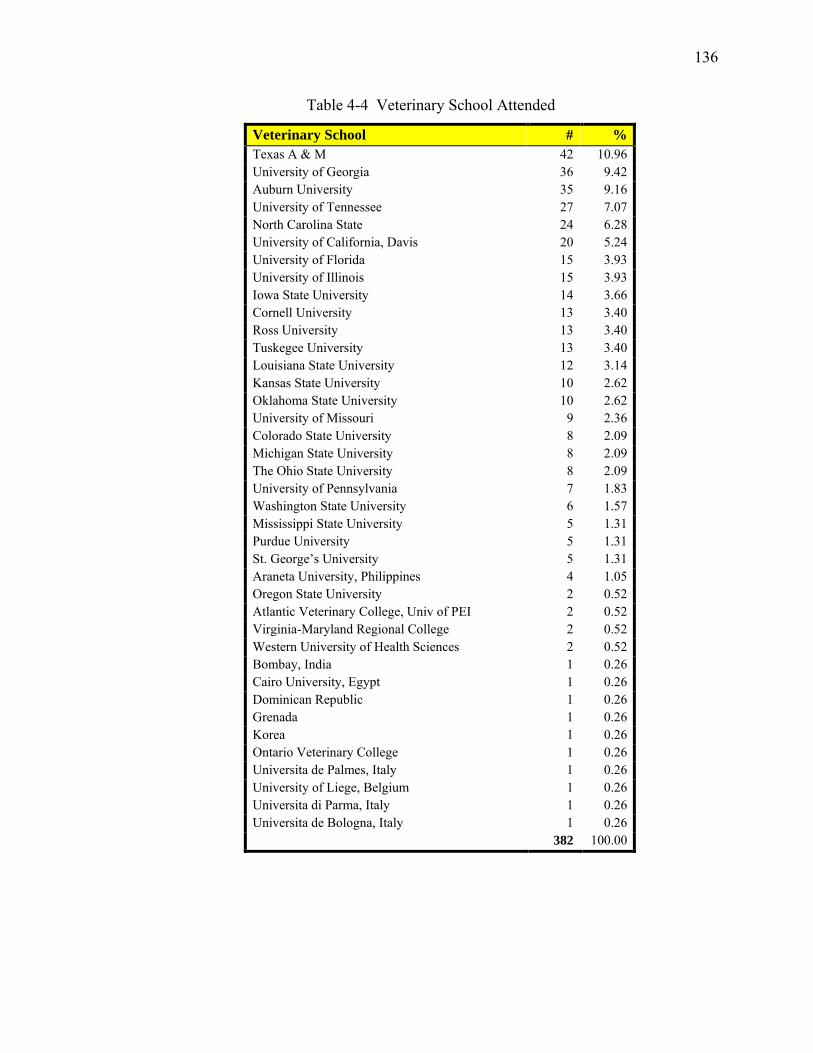
136
Table 4-4 Veterinary School Attended
Veterinary School # % Texas A & M 42 10.96 University of Georgia 36 9.42 Auburn University 35 9.16 University of Tennessee 27 7.07 North Carolina State 24 6.28 University of California, Davis 20 5.24 University of Florida 15 3.93 University of Illinois 15 3.93 Iowa State University 14 3.66 Cornell University 13 3.40 Ross University 13 3.40 Tuskegee University 13 3.40 Louisiana State University 12 3.14 Kansas State University 10 2.62 Oklahoma State University 10 2.62 University of Missouri 9 2.36 Colorado State University 8 2.09 Michigan State University 8 2.09 The Ohio State University 8 2.09 University of Pennsylvania 7 1.83 Washington State University 6 1.57 Mississippi State University 5 1.31 Purdue University 5 1.31 St. George’s University 5 1.31 Araneta University, Philippines 4 1.05 Oregon State University 2 0.52 Atlantic Veterinary College, Univ of PEI 2 0.52 Virginia-Maryland Regional College 2 0.52 Western University of Health Sciences 2 0.52 Bombay, India 1 0.26 Cairo University, Egypt 1 0.26 Dominican Republic 1 0.26 Grenada 1 0.26 Korea 1 0.26 Ontario Veterinary College 1 0.26 Universita de Palmes, Italy 1 0.26 University of Liege, Belgium 1 0.26 Universita di Parma, Italy 1 0.26 Universita de Bologna, Italy 1 0.26 382 100.00
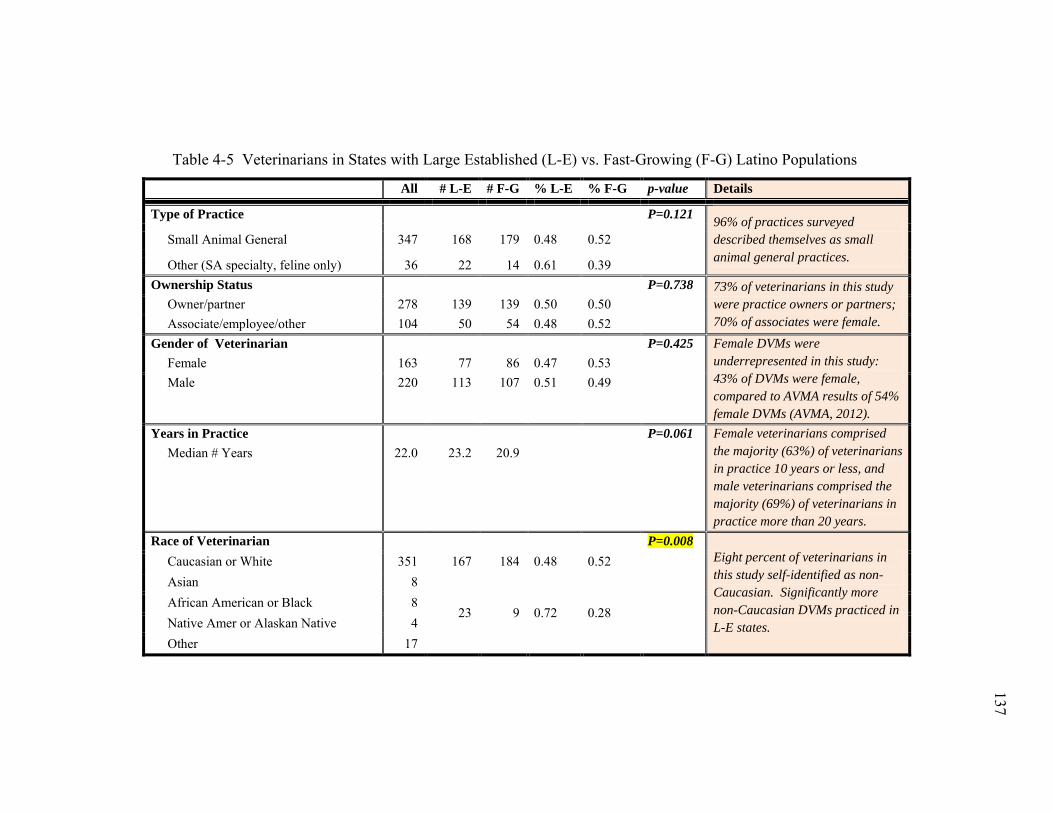
137
137
Table 4-5 Veterinarians in States with Large Established (L-E) vs. Fast-Growing (F-G) Latino Populations
All # L-E # F-G % L-E % F-G p-value Details
Type of Practice P=0.121 96% of practices surveyed described themselves as small animal general practices.
Small Animal General 347 168 179 0.48 0.52
Other (SA specialty, feline only) 36 22 14 0.61 0.39 Ownership Status P=0.738 73% of veterinarians in this study
were practice owners or partners; 70% of associates were female.
Owner/partner 278 139 139 0.50 0.50 Associate/employee/other 104 50 54 0.48 0.52 Gender of Veterinarian P=0.425 Female DVMs were
underrepresented in this study: 43% of DVMs were female, compared to AVMA results of 54% female DVMs (AVMA, 2012).
Female 163 77 86 0.47 0.53 Male 220 113 107 0.51 0.49
Years in Practice P=0.061 Female veterinarians comprised the majority (63%) of veterinarians in practice 10 years or less, and male veterinarians comprised the majority (69%) of veterinarians in practice more than 20 years.
Median # Years 22.0 23.2 20.9
Race of Veterinarian P=0.008 Eight percent of veterinarians in this study self-identified as non-Caucasian. Significantly more non-Caucasian DVMs practiced in L-E states.
Caucasian or White 351 167 184 0.48 0.52 Asian 8
23 9 0.72 0.28
African American or Black 8 Native Amer or Alaskan Native 4 Other 17
137
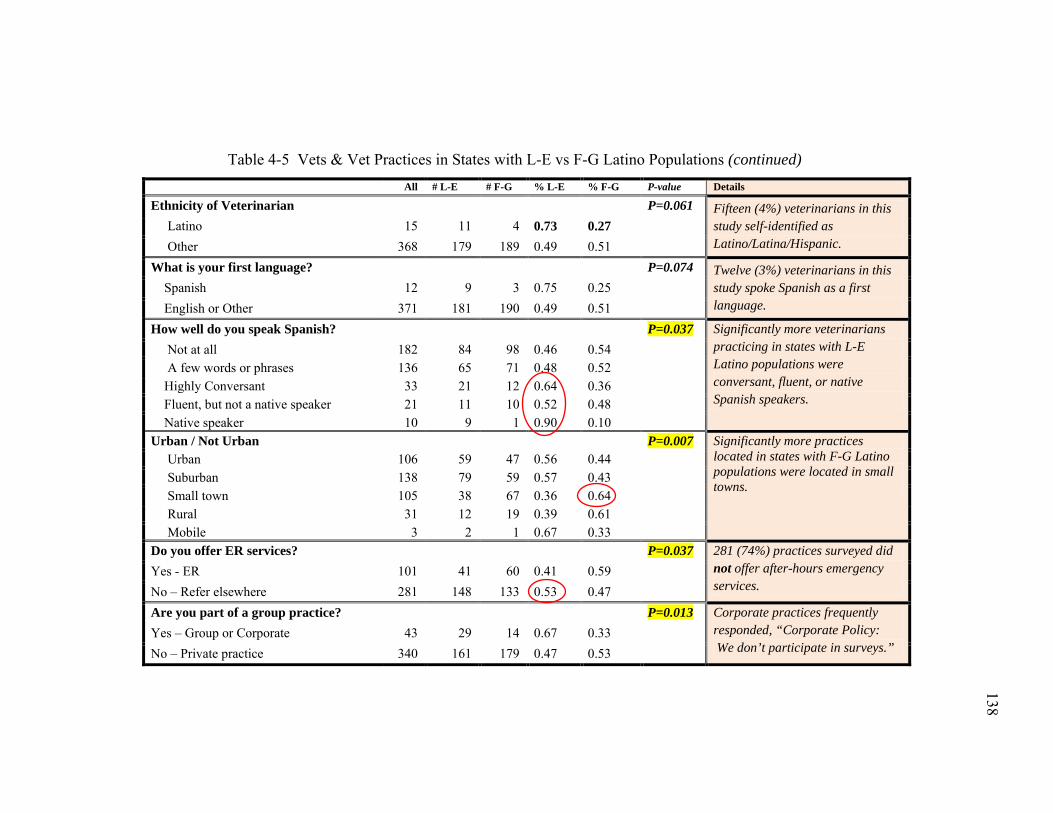
138
138
Table 4-5 Vets & Vet Practices in States with L-E vs F-G Latino Populations (continued)
All # L-E # F-G % L-E % F-G P-value Details
Ethnicity of Veterinarian P=0.061 Fifteen (4%) veterinarians in this study self-identified as Latino/Latina/Hispanic.
Latino 15 11 4 0.73 0.27 Other 368 179 189 0.49 0.51 What is your first language? P=0.074 Twelve (3%) veterinarians in this
study spoke Spanish as a first language.
Spanish 12 9 3 0.75 0.25 English or Other 371 181 190 0.49 0.51 How well do you speak Spanish? P=0.037 Significantly more veterinarians
practicing in states with L-E Latino populations were conversant, fluent, or native Spanish speakers.
Not at all 182 84 98 0.46 0.54 A few words or phrases 136 65 71 0.48 0.52 Highly Conversant 33 21 12 0.64 0.36 Fluent, but not a native speaker 21 11 10 0.52 0.48 Native speaker 10 9 1 0.90 0.10 Urban / Not Urban P=0.007 Significantly more practices
located in states with F-G Latino populations were located in small towns.
Urban 106 59 47 0.56 0.44 Suburban 138 79 59 0.57 0.43 Small town 105 38 67 0.36 0.64 Rural 31 12 19 0.39 0.61 Mobile 3 2 1 0.67 0.33 Do you offer ER services? P=0.037 281 (74%) practices surveyed did
not offer after-hours emergency services.
Yes - ER 101 41 60 0.41 0.59 No – Refer elsewhere 281 148 133 0.53 0.47 Are you part of a group practice? P=0.013 Corporate practices frequently
responded, “Corporate Policy: We don’t participate in surveys.”
Yes – Group or Corporate 43 29 14 0.67 0.33 No – Private practice 340 161 179 0.47 0.53
138
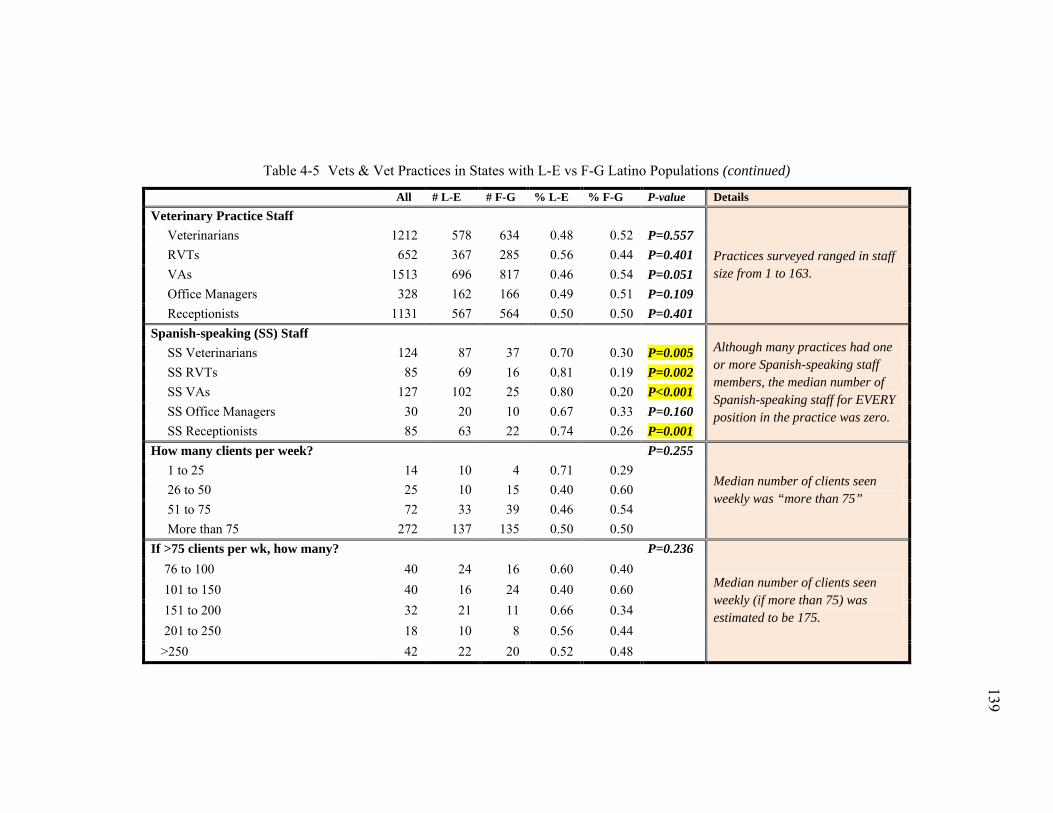
139
139
Table 4-5 Vets & Vet Practices in States with L-E vs F-G Latino Populations (continued)
All # L-E # F-G % L-E % F-G P-value Details Veterinary Practice Staff
Practices surveyed ranged in staff size from 1 to 163.
Veterinarians 1212 578 634 0.48 0.52 P=0.557 RVTs 652 367 285 0.56 0.44 P=0.401 VAs 1513 696 817 0.46 0.54 P=0.051 Office Managers 328 162 166 0.49 0.51 P=0.109 Receptionists 1131 567 564 0.50 0.50 P=0.401 Spanish-speaking (SS) Staff
Although many practices had one or more Spanish-speaking staff members, the median number of Spanish-speaking staff for EVERY position in the practice was zero.
SS Veterinarians 124 87 37 0.70 0.30 P=0.005 SS RVTs 85 69 16 0.81 0.19 P=0.002 SS VAs 127 102 25 0.80 0.20 P<0.001 SS Office Managers 30 20 10 0.67 0.33 P=0.160 SS Receptionists 85 63 22 0.74 0.26 P=0.001 How many clients per week? P=0.255
Median number of clients seen weekly was “more than 75”
1 to 25 14 10 4 0.71 0.29 26 to 50 25 10 15 0.40 0.60 51 to 75 72 33 39 0.46 0.54 More than 75 272 137 135 0.50 0.50 If >75 clients per wk, how many? P=0.236
Median number of clients seen weekly (if more than 75) was estimated to be 175.
76 to 100 40 24 16 0.60 0.40 101 to 150 40 16 24 0.40 0.60 151 to 200 32 21 11 0.66 0.34 201 to 250 18 10 8 0.56 0.44 >250 42 22 20 0.52 0.48
139
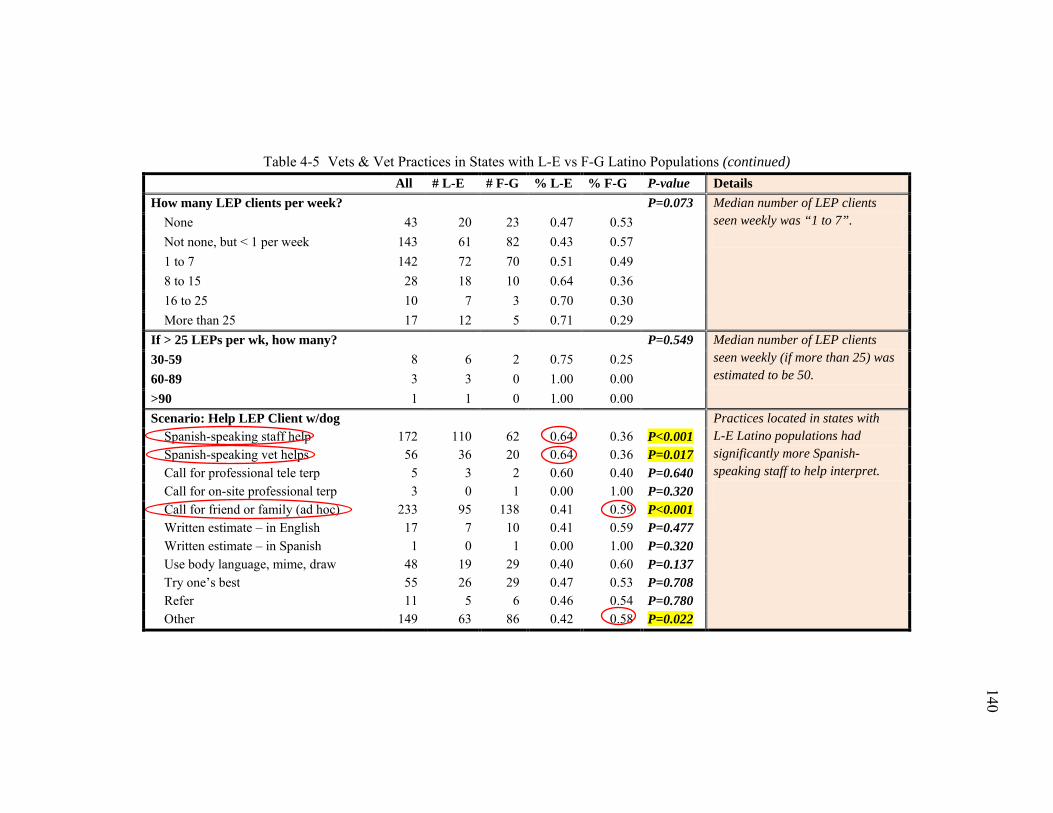
140
140
Table 4-5 Vets & Vet Practices in States with L-E vs F-G Latino Populations (continued) All # L-E # F-G % L-E % F-G P-value Details How many LEP clients per week? P=0.073 Median number of LEP clients
seen weekly was “1 to 7”.
None 43 20 23 0.47 0.53 Not none, but < 1 per week 143 61 82 0.43 0.57 1 to 7 142 72 70 0.51 0.49 8 to 15 28 18 10 0.64 0.36 16 to 25 10 7 3 0.70 0.30 More than 25 17 12 5 0.71 0.29 If > 25 LEPs per wk, how many? P=0.549 Median number of LEP clients
seen weekly (if more than 25) was estimated to be 50.
30-59 8 6 2 0.75 0.25 60-89 3 3 0 1.00 0.00 >90 1 1 0 1.00 0.00 Scenario: Help LEP Client w/dog
Practices located in states with L-E Latino populations had significantly more Spanish-speaking staff to help interpret.
Spanish-speaking staff help 172 110 62 0.64 0.36 P<0.001 Spanish-speaking vet helps 56 36 20 0.64 0.36 P=0.017 Call for professional tele terp 5 3 2 0.60 0.40 P=0.640 Call for on-site professional terp 3 0 1 0.00 1.00 P=0.320 Call for friend or family (ad hoc) 233 95 138 0.41 0.59 P<0.001 Written estimate – in English 17 7 10 0.41 0.59 P=0.477 Written estimate – in Spanish 1 0 1 0.00 1.00 P=0.320 Use body language, mime, draw 48 19 29 0.40 0.60 P=0.137 Try one’s best 55 26 29 0.47 0.53 P=0.708 Refer 11 5 6 0.46 0.54 P=0.780 Other 149 63 86 0.42 0.58 P=0.022
140
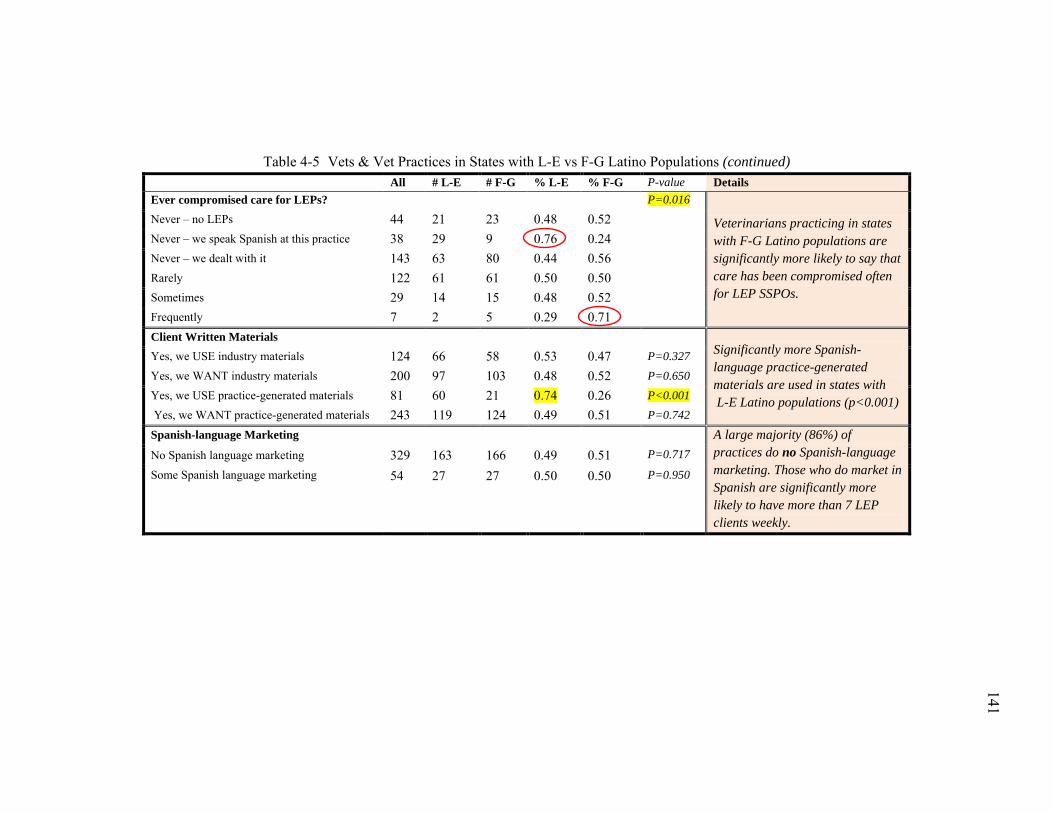
141
141
Table 4-5 Vets & Vet Practices in States with L-E vs F-G Latino Populations (continued) All # L-E # F-G % L-E % F-G P-value Details Ever compromised care for LEPs? P=0.016
Veterinarians practicing in states with F-G Latino populations are significantly more likely to say that care has been compromised often for LEP SSPOs.
Never – no LEPs 44 21 23 0.48 0.52 Never – we speak Spanish at this practice 38 29 9 0.76 0.24 Never – we dealt with it 143 63 80 0.44 0.56 Rarely 122 61 61 0.50 0.50 Sometimes 29 14 15 0.48 0.52 Frequently 7 2 5 0.29 0.71
Client Written Materials Significantly more Spanish-language practice-generated materials are used in states with L-E Latino populations (p<0.001)
Yes, we USE industry materials 124 66 58 0.53 0.47 P=0.327 Yes, we WANT industry materials 200 97 103 0.48 0.52 P=0.650 Yes, we USE practice-generated materials 81 60 21 0.74 0.26 P<0.001 Yes, we WANT practice-generated materials 243 119 124 0.49 0.51 P=0.742
Spanish-language Marketing A large majority (86%) of practices do no Spanish-language marketing. Those who do market in Spanish are significantly more likely to have more than 7 LEP clients weekly.
No Spanish language marketing 329 163 166 0.49 0.51 P=0.717
Some Spanish language marketing 54 27 27 0.50 0.50 P=0.950
141
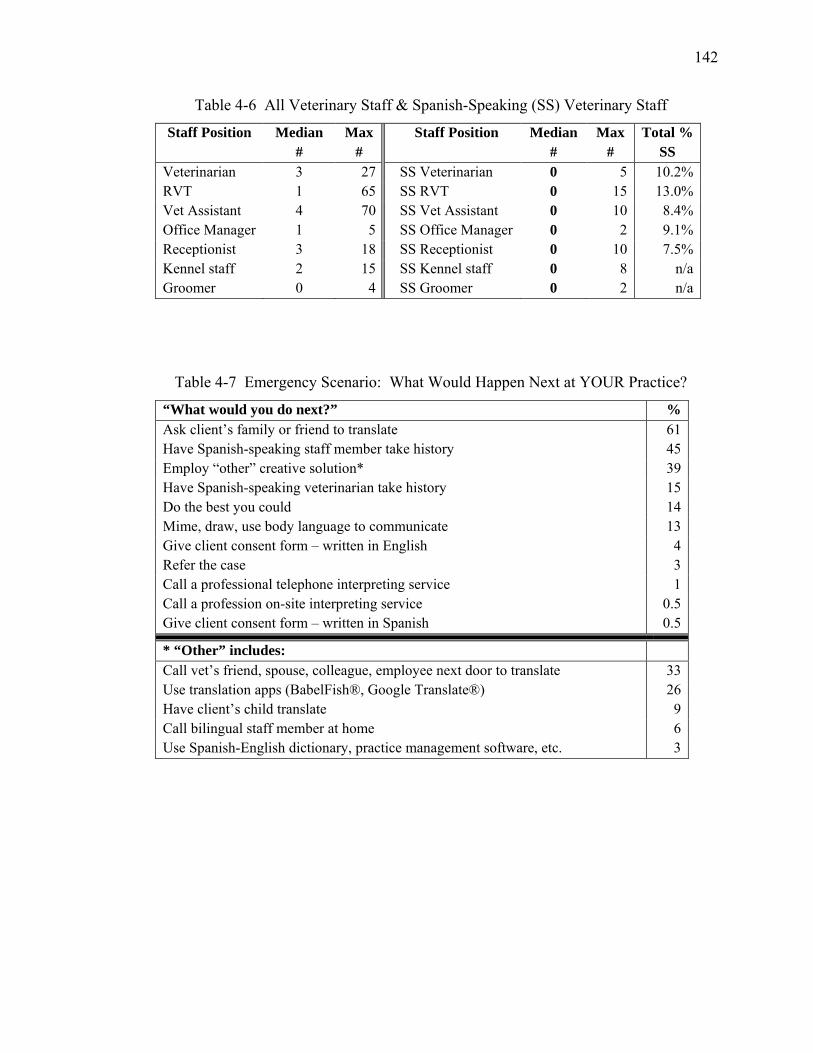
142
Table 4-6 All Veterinary Staff & Spanish-Speaking (SS) Veterinary Staff
Staff Position Median #
Max #
Staff Position Median #
Max #
Total % SS
Veterinarian 3 27 SS Veterinarian 0 5 10.2% RVT 1 65 SS RVT 0 15 13.0% Vet Assistant 4 70 SS Vet Assistant 0 10 8.4% Office Manager 1 5 SS Office Manager 0 2 9.1% Receptionist 3 18 SS Receptionist 0 10 7.5% Kennel staff 2 15 SS Kennel staff 0 8 n/a Groomer 0 4 SS Groomer 0 2 n/a
Table 4-7 Emergency Scenario: What Would Happen Next at YOUR Practice?
“What would you do next?” % Ask client’s family or friend to translate 61 Have Spanish-speaking staff member take history 45 Employ “other” creative solution* 39 Have Spanish-speaking veterinarian take history 15 Do the best you could 14 Mime, draw, use body language to communicate 13 Give client consent form – written in English 4 Refer the case 3 Call a professional telephone interpreting service 1 Call a profession on-site interpreting service 0.5 Give client consent form – written in Spanish 0.5
* “Other” includes: Call vet’s friend, spouse, colleague, employee next door to translate 33 Use translation apps (BabelFish®, Google Translate®) 26 Have client’s child translate 9 Call bilingual staff member at home 6 Use Spanish-English dictionary, practice management software, etc. 3
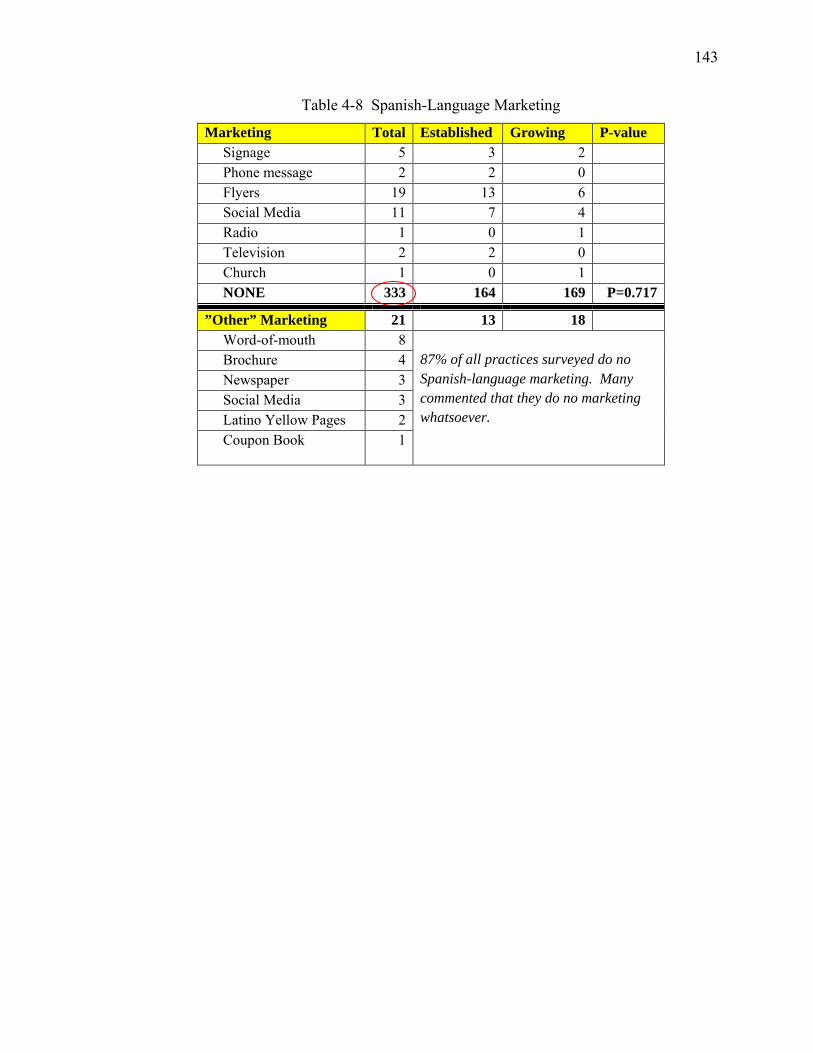
143
Table 4-8 Spanish-Language Marketing
Marketing Total Established Growing P-value Signage 5 3 2 Phone message 2 2 0 Flyers 19 13 6 Social Media 11 7 4 Radio 1 0 1 Television 2 2 0 Church 1 0 1 NONE 333 164 169 P=0.717
”Other” Marketing 21 13 18 Word-of-mouth 8
87% of all practices surveyed do no Spanish-language marketing. Many commented that they do no marketing whatsoever.
Brochure 4 Newspaper 3 Social Media 3 Latino Yellow Pages 2 Coupon Book 1
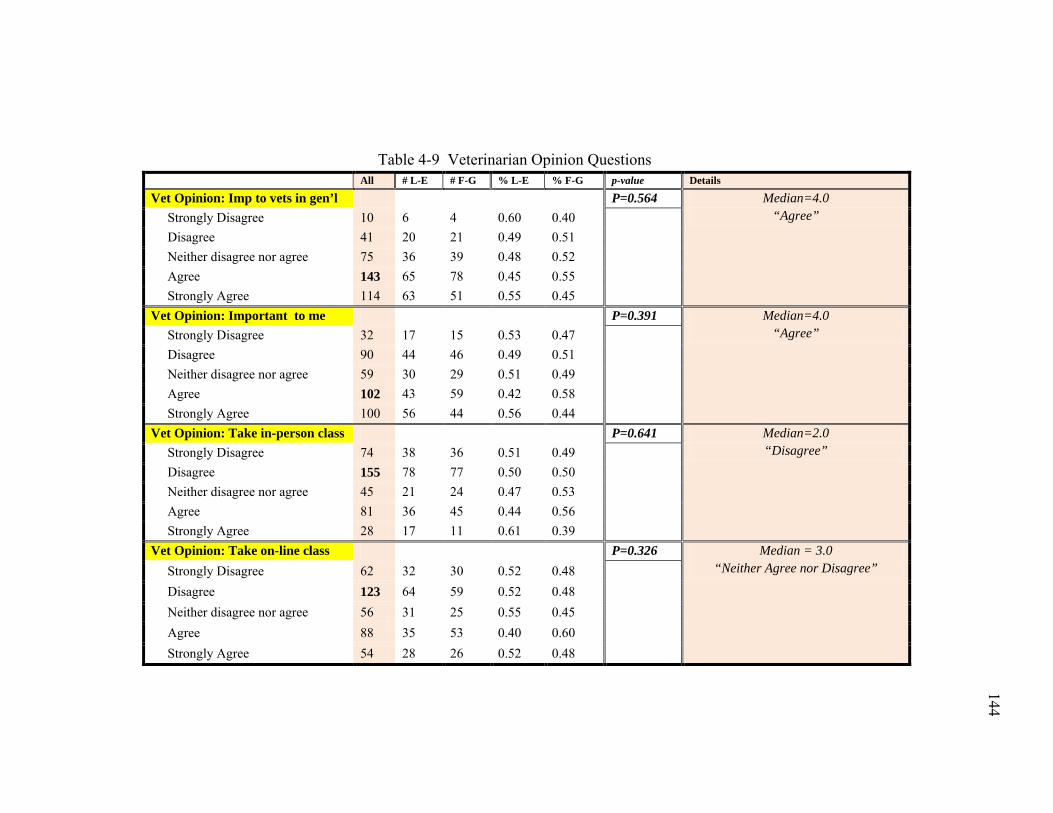
144
144
Table 4-9 Veterinarian Opinion Questions All # L-E # F-G % L-E % F-G p-value Details
Vet Opinion: Imp to vets in gen’l P=0.564 Median=4.0 “Agree” Strongly Disagree 10 6 4 0.60 0.40
Disagree 41 20 21 0.49 0.51 Neither disagree nor agree 75 36 39 0.48 0.52 Agree 143 65 78 0.45 0.55 Strongly Agree 114 63 51 0.55 0.45 Vet Opinion: Important to me P=0.391 Median=4.0
“Agree” Strongly Disagree 32 17 15 0.53 0.47
Disagree 90 44 46 0.49 0.51 Neither disagree nor agree 59 30 29 0.51 0.49 Agree 102 43 59 0.42 0.58 Strongly Agree 100 56 44 0.56 0.44 Vet Opinion: Take in-person class P=0.641 Median=2.0
“Disagree” Strongly Disagree 74 38 36 0.51 0.49
Disagree 155 78 77 0.50 0.50 Neither disagree nor agree 45 21 24 0.47 0.53 Agree 81 36 45 0.44 0.56 Strongly Agree 28 17 11 0.61 0.39 Vet Opinion: Take on-line class P=0.326 Median = 3.0
“Neither Agree nor Disagree” Strongly Disagree 62 32 30 0.52 0.48
Disagree 123 64 59 0.52 0.48 Neither disagree nor agree 56 31 25 0.55 0.45 Agree 88 35 53 0.40 0.60 Strongly Agree 54 28 26 0.52 0.48
144
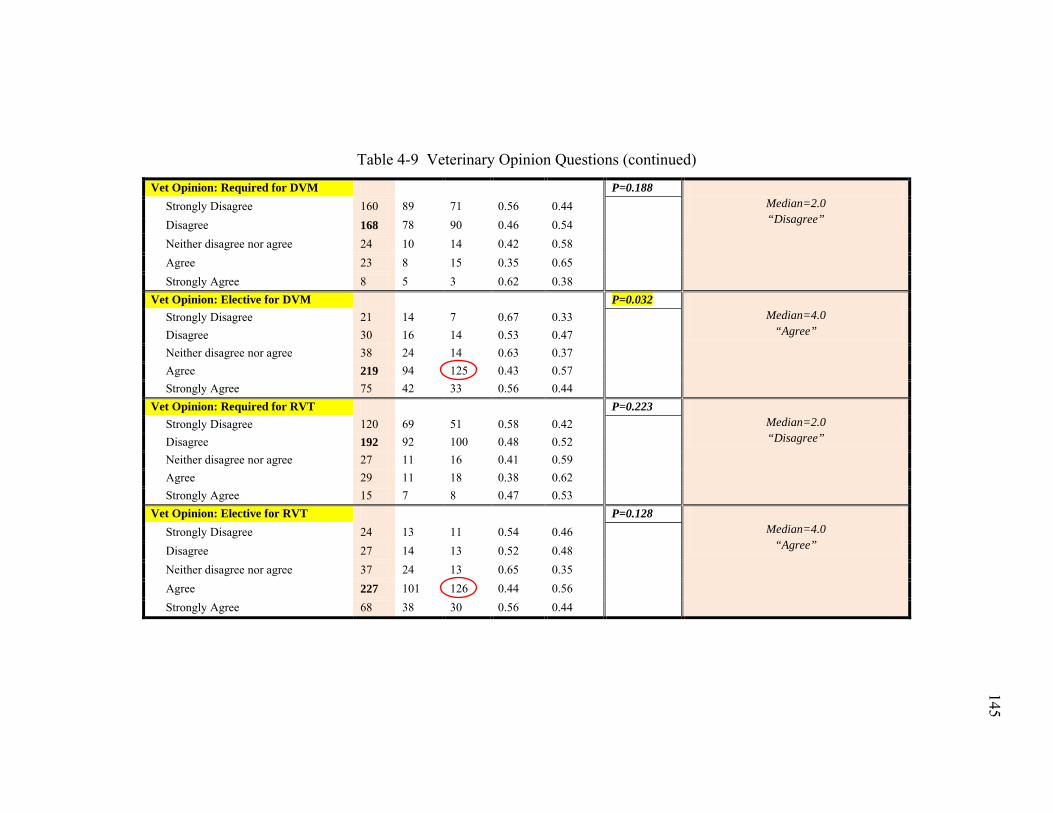
145
145
Table 4-9 Veterinary Opinion Questions (continued)
Vet Opinion: Required for DVM P=0.188 Median=2.0 “Disagree”
Strongly Disagree 160 89 71 0.56 0.44
Disagree 168 78 90 0.46 0.54 Neither disagree nor agree 24 10 14 0.42 0.58 Agree 23 8 15 0.35 0.65 Strongly Agree 8 5 3 0.62 0.38 Vet Opinion: Elective for DVM P=0.032
Median=4.0 “Agree”
Strongly Disagree 21 14 7 0.67 0.33
Disagree 30 16 14 0.53 0.47 Neither disagree nor agree 38 24 14 0.63 0.37 Agree 219 94 125 0.43 0.57 Strongly Agree 75 42 33 0.56 0.44 Vet Opinion: Required for RVT P=0.223
Median=2.0 “Disagree”
Strongly Disagree 120 69 51 0.58 0.42
Disagree 192 92 100 0.48 0.52 Neither disagree nor agree 27 11 16 0.41 0.59 Agree 29 11 18 0.38 0.62 Strongly Agree 15 7 8 0.47 0.53 Vet Opinion: Elective for RVT P=0.128
Median=4.0 “Agree”
Strongly Disagree 24 13 11 0.54 0.46
Disagree 27 14 13 0.52 0.48 Neither disagree nor agree 37 24 13 0.65 0.35 Agree 227 101 126 0.44 0.56 Strongly Agree 68 38 30 0.56 0.44
145
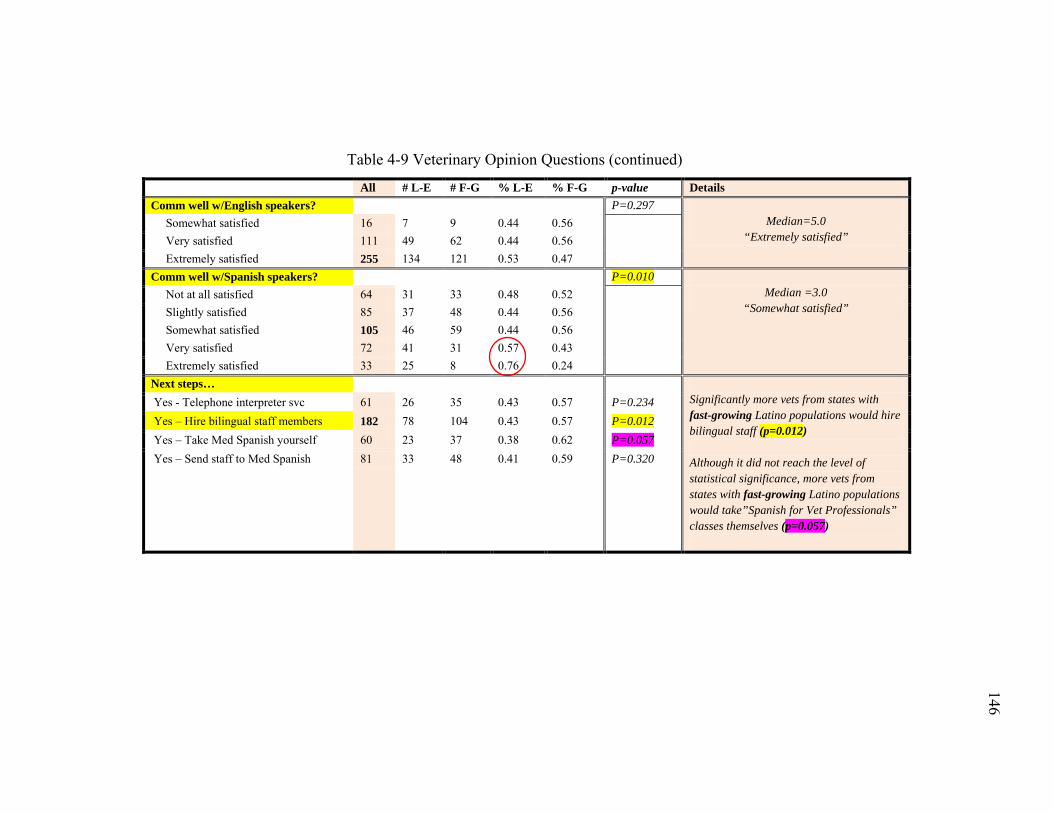
146
146
Table 4-9 Veterinary Opinion Questions (continued)
All # L-E # F-G % L-E % F-G p-value Details Comm well w/English speakers? P=0.297
Median=5.0 “Extremely satisfied”
Somewhat satisfied 16 7 9 0.44 0.56
Very satisfied 111 49 62 0.44 0.56 Extremely satisfied 255 134 121 0.53 0.47 Comm well w/Spanish speakers? P=0.010
Median =3.0 “Somewhat satisfied”
Not at all satisfied 64 31 33 0.48 0.52
Slightly satisfied 85 37 48 0.44 0.56 Somewhat satisfied 105 46 59 0.44 0.56 Very satisfied 72 41 31 0.57 0.43 Extremely satisfied 33 25 8 0.76 0.24 Next steps…
Significantly more vets from states with fast-growing Latino populations would hire bilingual staff (p=0.012) Although it did not reach the level of statistical significance, more vets from states with fast-growing Latino populations would take”Spanish for Vet Professionals” classes themselves (p=0.057)
Yes - Telephone interpreter svc 61 26 35 0.43 0.57 P=0.234 Yes – Hire bilingual staff members 182 78 104 0.43 0.57 P=0.012 Yes – Take Med Spanish yourself 60 23 37 0.38 0.62 P=0.057 Yes – Send staff to Med Spanish 81 33 48 0.41 0.59 P=0.320
146
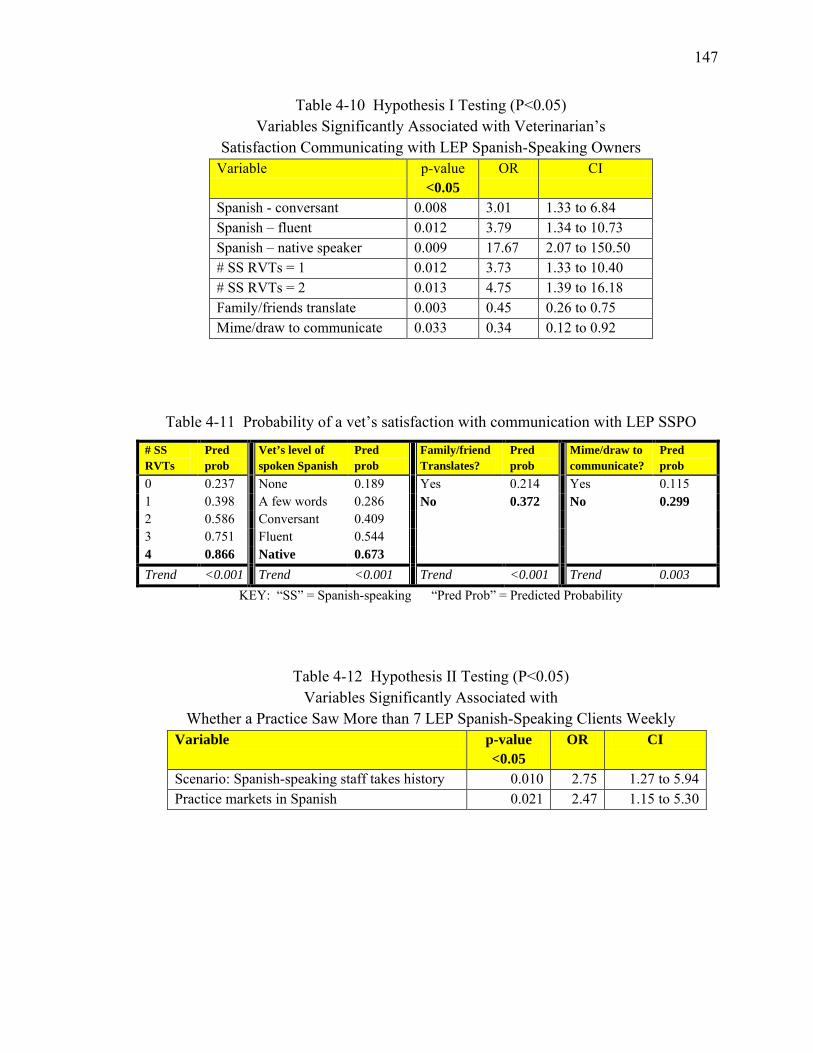
147
Table 4-10 Hypothesis I Testing (P<0.05) Variables Significantly Associated with Veterinarian’s
Satisfaction Communicating with LEP Spanish-Speaking Owners Variable p-value
<0.05 OR CI
Spanish - conversant 0.008 3.01 1.33 to 6.84 Spanish – fluent 0.012 3.79 1.34 to 10.73 Spanish – native speaker 0.009 17.67 2.07 to 150.50 # SS RVTs = 1 0.012 3.73 1.33 to 10.40 # SS RVTs = 2 0.013 4.75 1.39 to 16.18 Family/friends translate 0.003 0.45 0.26 to 0.75 Mime/draw to communicate 0.033 0.34 0.12 to 0.92
Table 4-11 Probability of a vet’s satisfaction with communication with LEP SSPO
# SS RVTs
Pred prob
Vet’s level of spoken Spanish
Pred prob
Family/friend Translates?
Pred prob
Mime/draw to communicate?
Pred prob
0 0.237 None 0.189 Yes 0.214 Yes 0.115 1 0.398 A few words 0.286 No 0.372 No 0.299 2 0.586 Conversant 0.409 3 0.751 Fluent 0.544 4 0.866 Native 0.673 Trend <0.001 Trend <0.001 Trend <0.001 Trend 0.003
KEY: “SS” = Spanish-speaking “Pred Prob” = Predicted Probability
Table 4-12 Hypothesis II Testing (P<0.05) Variables Significantly Associated with
Whether a Practice Saw More than 7 LEP Spanish-Speaking Clients Weekly Variable p-value
<0.05 OR CI
Scenario: Spanish-speaking staff takes history 0.010 2.75 1.27 to 5.94 Practice markets in Spanish 0.021 2.47 1.15 to 5.30
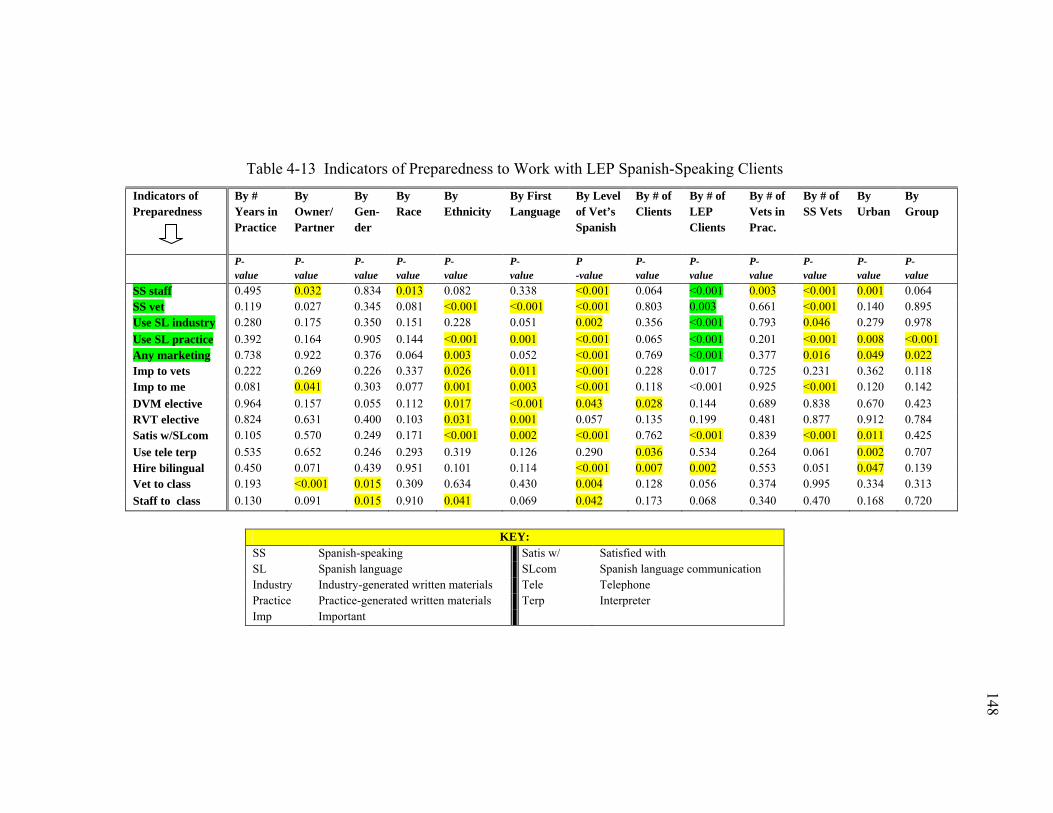
148
148
Table 4-13 Indicators of Preparedness to Work with LEP Spanish-Speaking Clients Indicators of Preparedness
By # Years in Practice
By Owner/ Partner
By Gen-der
By Race
By Ethnicity
By First Language
By Level of Vet’s Spanish
By # of Clients
By # of LEP Clients
By # of Vets in Prac.
By # of SS Vets
By Urban
By Group
P- value
P- value
P-value
P-value
P- value
P- value
P -value
P- value
P- value
P- value
P- value
P-value
P- value
SS staff 0.495 0.032 0.834 0.013 0.082 0.338 <0.001 0.064 <0.001 0.003 <0.001 0.001 0.064 SS vet 0.119 0.027 0.345 0.081 <0.001 <0.001 <0.001 0.803 0.003 0.661 <0.001 0.140 0.895 Use SL industry 0.280 0.175 0.350 0.151 0.228 0.051 0.002 0.356 <0.001 0.793 0.046 0.279 0.978 Use SL practice 0.392 0.164 0.905 0.144 <0.001 0.001 <0.001 0.065 <0.001 0.201 <0.001 0.008 <0.001 Any marketing 0.738 0.922 0.376 0.064 0.003 0.052 <0.001 0.769 <0.001 0.377 0.016 0.049 0.022 Imp to vets 0.222 0.269 0.226 0.337 0.026 0.011 <0.001 0.228 0.017 0.725 0.231 0.362 0.118 Imp to me 0.081 0.041 0.303 0.077 0.001 0.003 <0.001 0.118 <0.001 0.925 <0.001 0.120 0.142 DVM elective 0.964 0.157 0.055 0.112 0.017 <0.001 0.043 0.028 0.144 0.689 0.838 0.670 0.423 RVT elective 0.824 0.631 0.400 0.103 0.031 0.001 0.057 0.135 0.199 0.481 0.877 0.912 0.784 Satis w/SLcom 0.105 0.570 0.249 0.171 <0.001 0.002 <0.001 0.762 <0.001 0.839 <0.001 0.011 0.425 Use tele terp 0.535 0.652 0.246 0.293 0.319 0.126 0.290 0.036 0.534 0.264 0.061 0.002 0.707 Hire bilingual 0.450 0.071 0.439 0.951 0.101 0.114 <0.001 0.007 0.002 0.553 0.051 0.047 0.139 Vet to class 0.193 <0.001 0.015 0.309 0.634 0.430 0.004 0.128 0.056 0.374 0.995 0.334 0.313 Staff to class 0.130 0.091 0.015 0.910 0.041 0.069 0.042 0.173 0.068 0.340 0.470 0.168 0.720
KEY:
SS Spanish-speaking Satis w/ Satisfied with SL Spanish language SLcom Spanish language communication Industry Industry-generated written materials Tele Telephone Practice Practice-generated written materials Terp Interpreter Imp Important
148
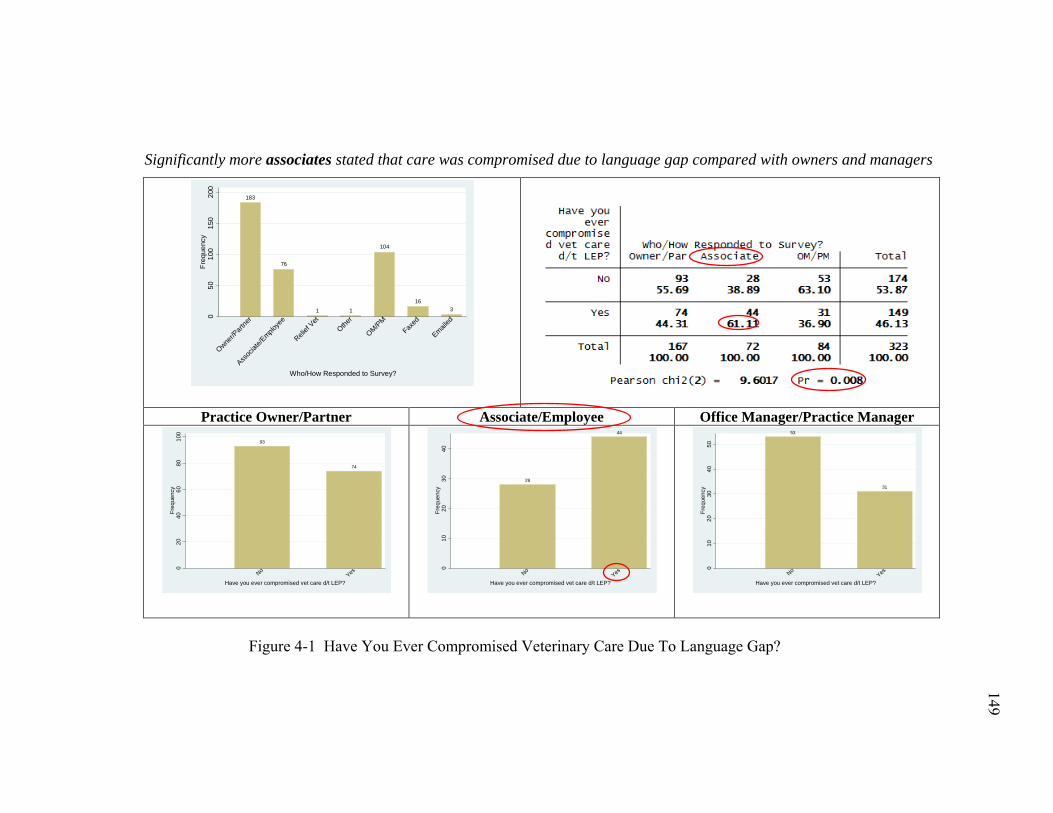
149
149
Significantly more associates stated that care was compromised due to language gap compared with owners and managers
Practice Owner/Partner Associate/Employee Office Manager/Practice Manager
Figure 4-1 Have You Ever Compromised Veterinary Care Due To Language Gap?
183
76
1 1
104
163
050
100
150
200
Freq
uenc
y
Owner/P
artne
r
Assoc
iate/E
mploye
e
Relief
VetOthe
r
OM/PMFax
ed
Emailed
Who/How Responded to Survey?
93
74
020
4060
8010
0Fr
eque
ncy
NoYes
Have you ever compromised vet care d/t LEP?
28
44
010
2030
40Fr
eque
ncy
NoYes
Have you ever compromised vet care d/t LEP?
53
31
010
2030
4050
Freq
uenc
y
NoYes
Have you ever compromised vet care d/t LEP?
149
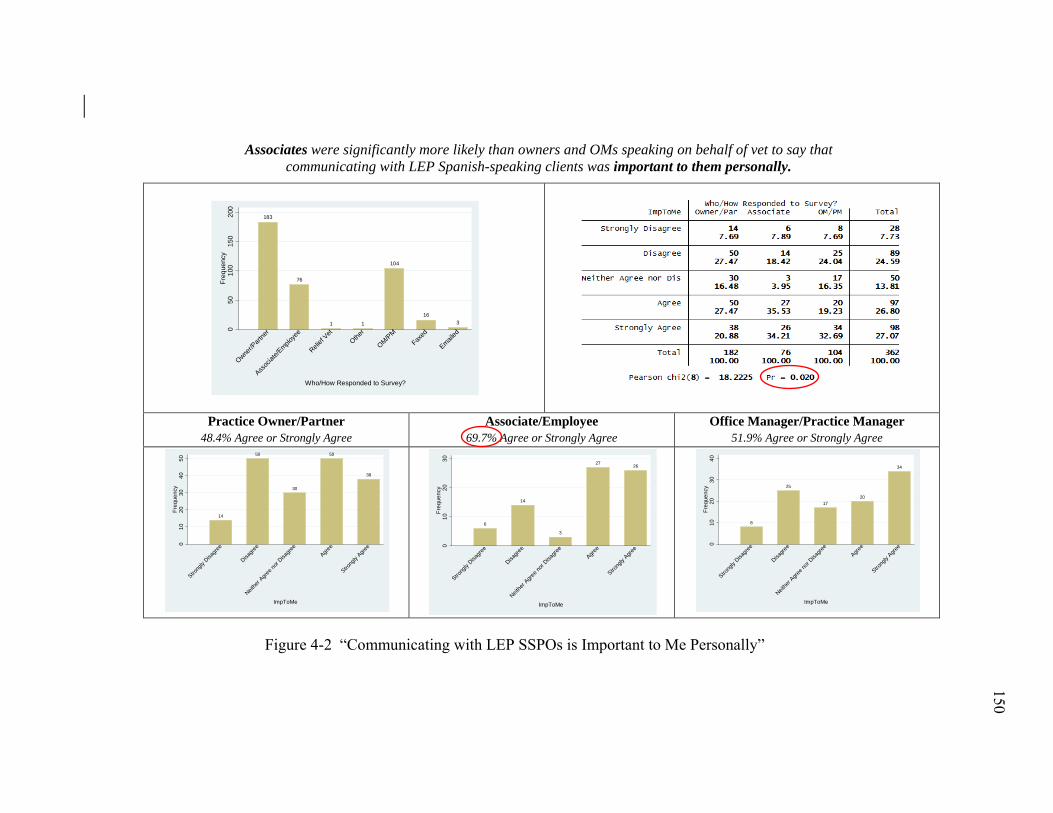
150
150
Associates were significantly more likely than owners and OMs speaking on behalf of vet to say that communicating with LEP Spanish-speaking clients was important to them personally.
Practice Owner/Partner 48.4% Agree or Strongly Agree
Associate/Employee 69.7% Agree or Strongly Agree
Office Manager/Practice Manager 51.9% Agree or Strongly Agree
Figure 4-2 “Communicating with LEP SSPOs is Important to Me Personally”
183
76
1 1
104
163
050
100
150
200
Freq
uenc
y
Owner/P
artne
r
Assoc
iate/E
mploye
e
Relief
VetOthe
r
OM/PMFax
ed
Emailed
Who/How Responded to Survey?
14
50
30
50
38
010
2030
4050
Freq
uenc
y
Strong
ly Disa
gree
Disagre
e
Neithe
r Agre
e nor
Disagre
eAgre
e
Strong
ly Agre
e
ImpToMe
6
14
3
2726
010
2030
Freq
uenc
y
Strong
ly Disa
gree
Disagre
e
Neithe
r Agre
e nor
Disagre
eAgre
e
Strong
ly Agre
e
ImpToMe
8
25
1720
34
010
2030
40Fr
eque
ncy
Strong
ly Disa
gree
Disagre
e
Neithe
r Agre
e nor
Disagre
eAgre
e
Strong
ly Agre
e
ImpToMe
150
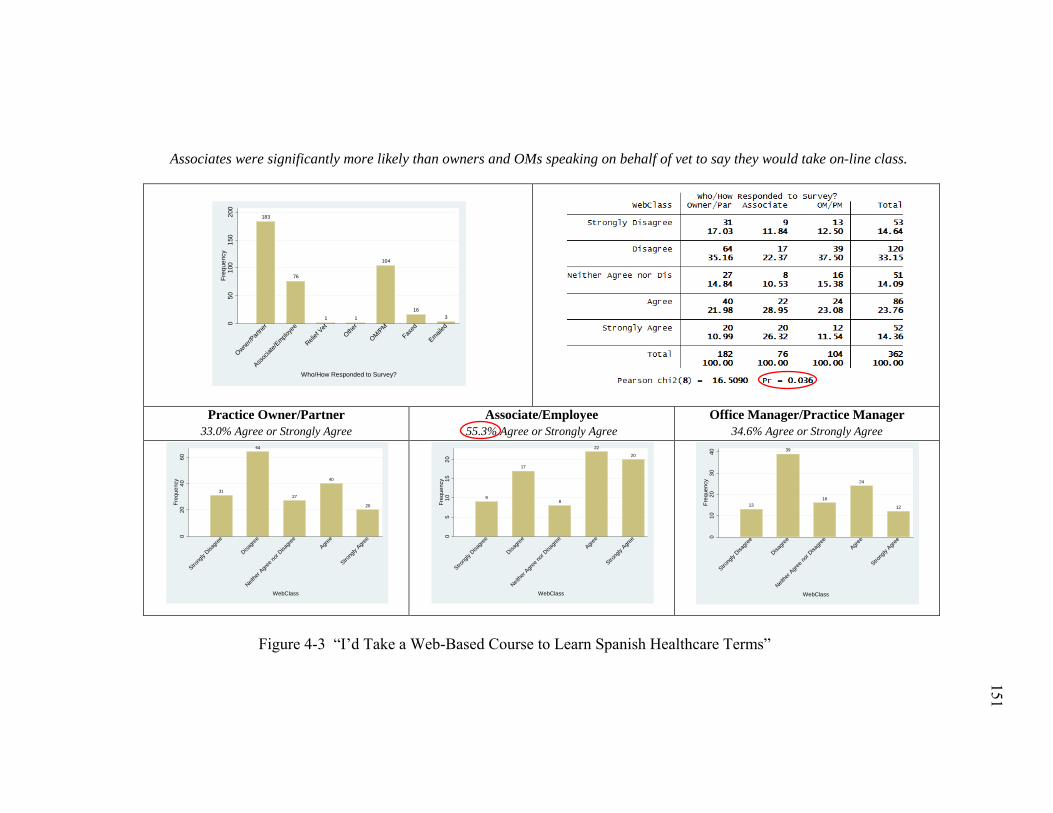
151
151
Associates were significantly more likely than owners and OMs speaking on behalf of vet to say they would take on-line class.
Practice Owner/Partner 33.0% Agree or Strongly Agree
Associate/Employee 55.3% Agree or Strongly Agree
Office Manager/Practice Manager 34.6% Agree or Strongly Agree
Figure 4-3 “I’d Take a Web-Based Course to Learn Spanish Healthcare Terms”
183
76
1 1
104
163
050
100
150
200
Freq
uenc
y
Owner/P
artne
r
Assoc
iate/E
mploye
e
Relief
VetOthe
r
OM/PMFax
ed
Emailed
Who/How Responded to Survey?
31
64
27
40
20
020
4060
Freq
uenc
y
Strong
ly Disa
gree
Disagre
e
Neithe
r Agre
e nor
Disagre
eAgre
e
Strong
ly Agre
e
WebClass
9
17
8
22
20
05
1015
20Fr
eque
ncy
Strong
ly Disa
gree
Disagre
e
Neithe
r Agre
e nor
Disagre
eAgre
e
Strong
ly Agre
e
WebClass
13
39
16
24
12
010
2030
40Fr
eque
ncy
Strong
ly Disa
gree
Disagre
e
Neithe
r Agre
e nor
Disagre
eAgre
e
Strong
ly Agre
e
WebClass
151
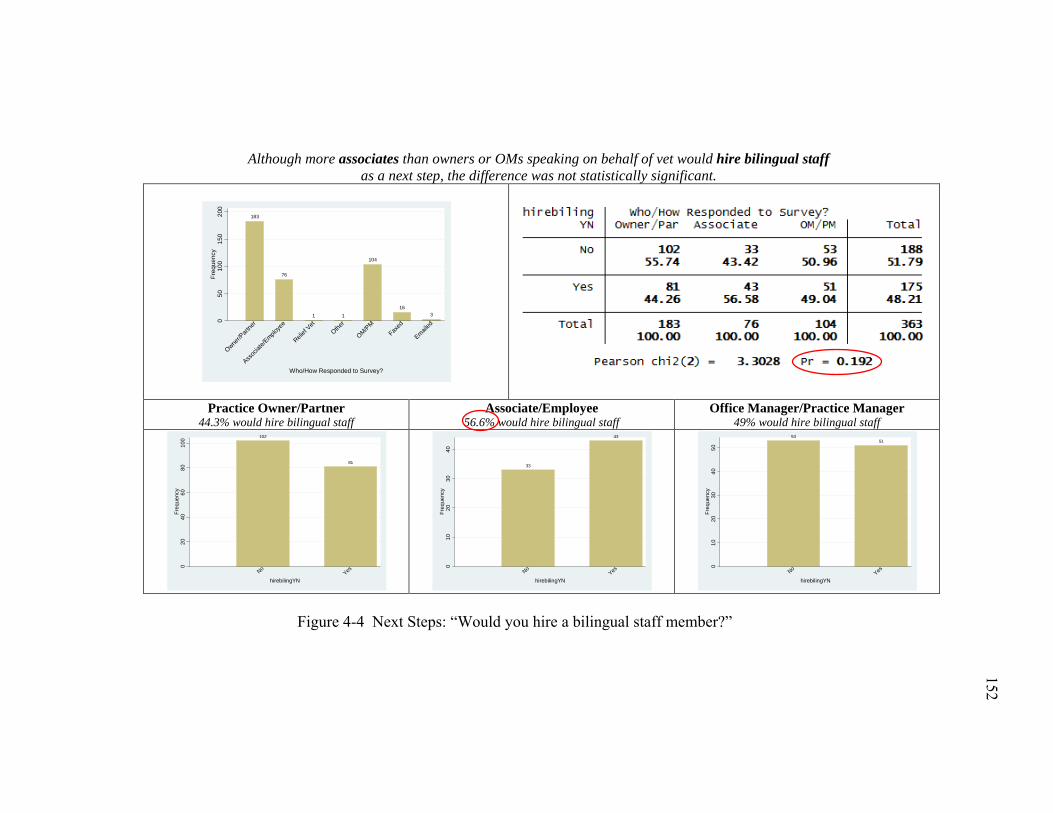
152
152
Although more associates than owners or OMs speaking on behalf of vet would hire bilingual staff as a next step, the difference was not statistically significant.
Practice Owner/Partner 44.3% would hire bilingual staff
Associate/Employee 56.6% would hire bilingual staff
Office Manager/Practice Manager 49% would hire bilingual staff
Figure 4-4 Next Steps: “Would you hire a bilingual staff member?”
183
76
1 1
104
163
050
100
150
200
Freq
uenc
y
Owner/P
artne
r
Assoc
iate/E
mploye
e
Relief
VetOthe
r
OM/PMFax
ed
Emailed
Who/How Responded to Survey?
102
81
020
4060
8010
0Fr
eque
ncy
NoYes
hirebilingYN
33
43
010
2030
40Fr
eque
ncy
NoYes
hirebilingYN
5351
010
2030
4050
Freq
uenc
y
NoYes
hirebilingYN
152
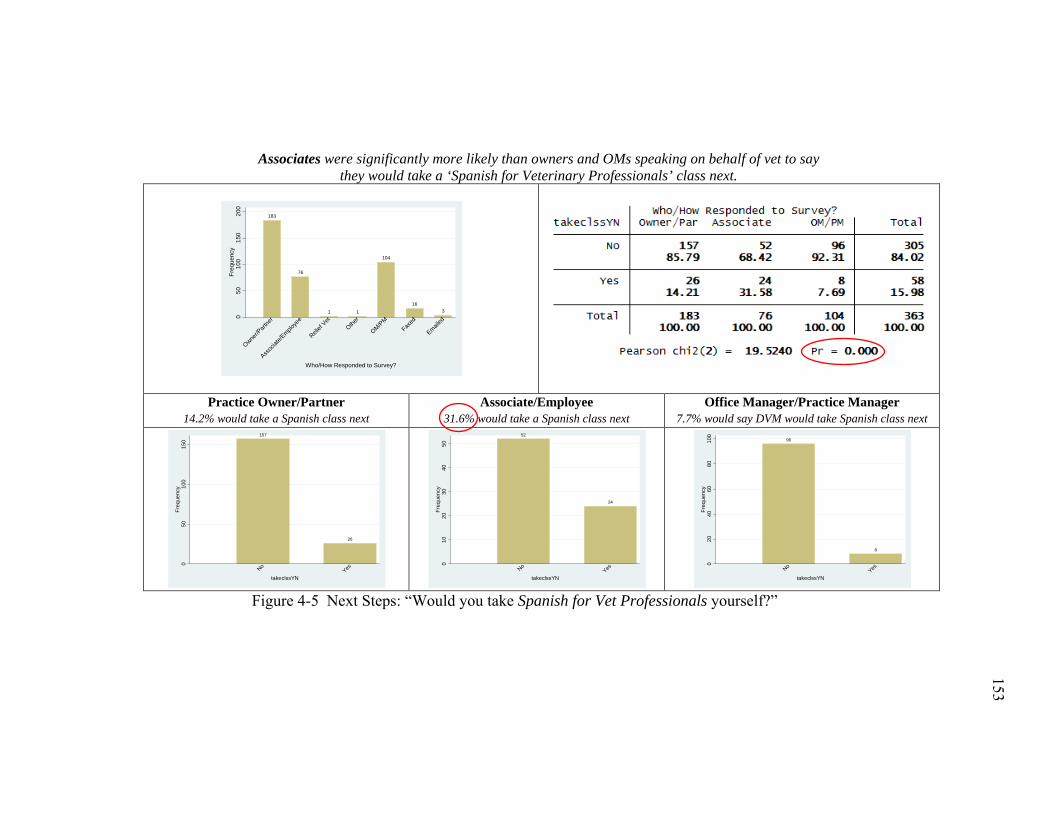
153
153
Associates were significantly more likely than owners and OMs speaking on behalf of vet to say they would take a ‘Spanish for Veterinary Professionals’ class next.
Practice Owner/Partner 14.2% would take a Spanish class next
Associate/Employee 31.6% would take a Spanish class next
Office Manager/Practice Manager 7.7% would say DVM would take Spanish class next
Figure 4-5 Next Steps: “Would you take Spanish for Vet Professionals yourself?”
183
76
1 1
104
163
050
100
150
200
Freq
uenc
y
Owner/P
artne
r
Assoc
iate/E
mploye
e
Relief
VetOthe
r
OM/PMFax
ed
Emailed
Who/How Responded to Survey?
157
26
050
100
150
Freq
uenc
y
NoYes
takeclssYN
52
24
010
2030
4050
Freq
uenc
y
NoYes
takeclssYN
96
8
020
4060
8010
0Fr
eque
ncy
NoYes
takeclssYN
153
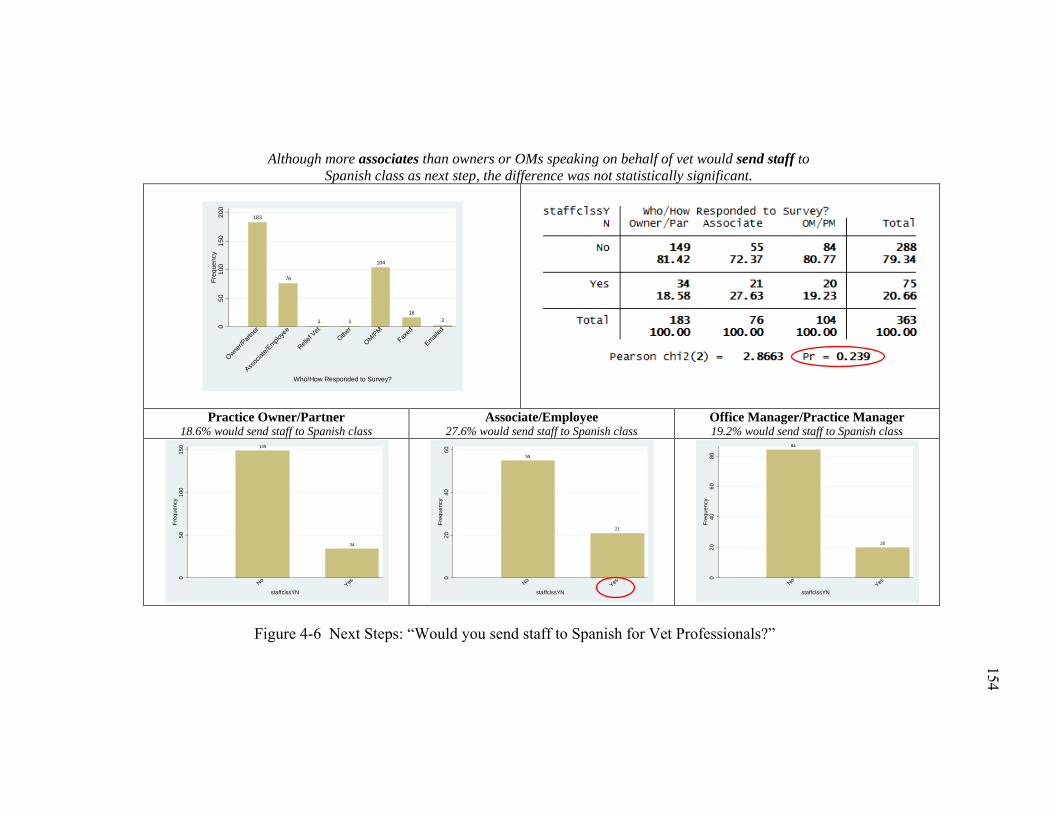
154
154
Although more associates than owners or OMs speaking on behalf of vet would send staff to Spanish class as next step, the difference was not statistically significant.
Practice Owner/Partner 18.6% would send staff to Spanish class
Associate/Employee 27.6% would send staff to Spanish class
Office Manager/Practice Manager 19.2% would send staff to Spanish class
Figure 4-6 Next Steps: “Would you send staff to Spanish for Vet Professionals?”
183
76
1 1
104
163
050
100
150
200
Freq
uenc
y
Owner/P
artne
r
Assoc
iate/E
mploye
e
Relief
VetOthe
r
OM/PMFax
ed
Emailed
Who/How Responded to Survey?
149
34
050
100
150
Freq
uenc
y
NoYes
staffclssYN
55
21
020
4060
Freq
uenc
y
NoYes
staffclssYN
84
20
020
4060
80Fr
eque
ncy
NoYes
staffclssYN
154
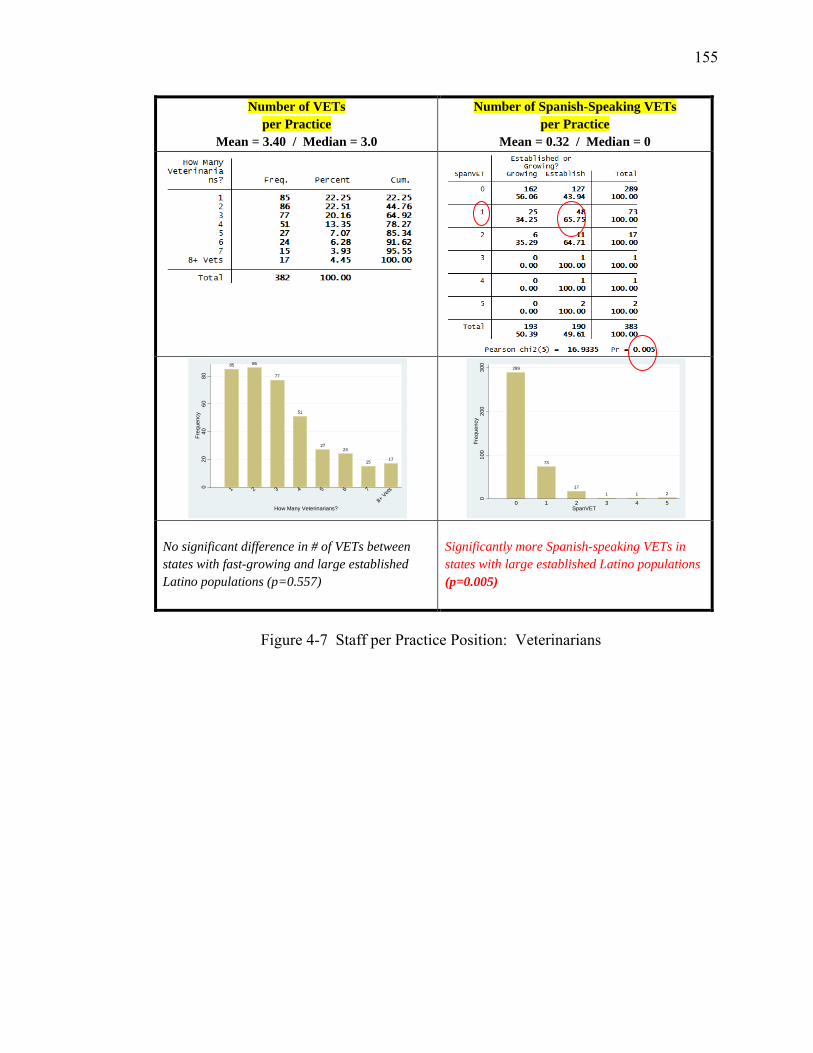
155
Number of VETs per Practice
Mean = 3.40 / Median = 3.0
Number of Spanish-Speaking VETs per Practice
Mean = 0.32 / Median = 0
No significant difference in # of VETs between states with fast-growing and large established Latino populations (p=0.557)
Significantly more Spanish-speaking VETs in states with large established Latino populations (p=0.005)
Figure 4-7 Staff per Practice Position: Veterinarians
85 86
77
51
2724
15 17
020
4060
80Fr
eque
ncy
1 2 3 4 5 6 7
8+ Vets
How Many Veterinarians?
289
73
171 1 2
010
020
030
0Fr
eque
ncy
0 1 2 3 4 5SpanVET
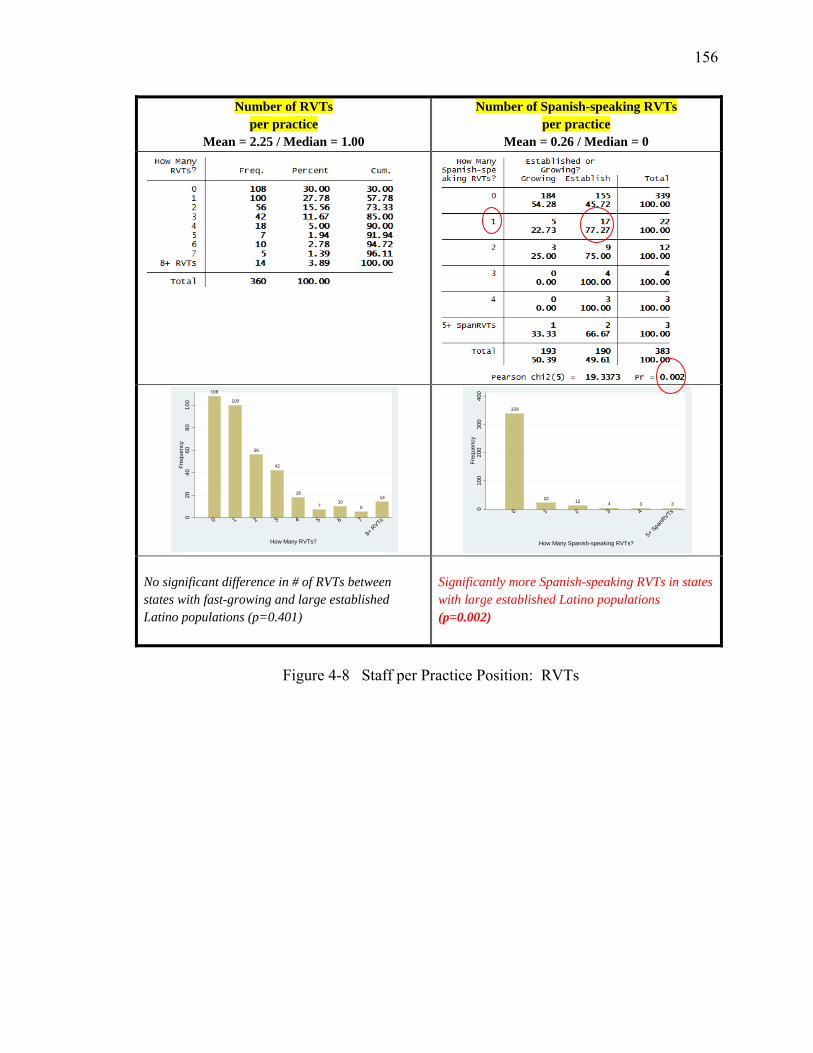
156
Number of RVTs per practice
Mean = 2.25 / Median = 1.00
Number of Spanish-speaking RVTs per practice
Mean = 0.26 / Median = 0
No significant difference in # of RVTs between states with fast-growing and large established Latino populations (p=0.401)
Significantly more Spanish-speaking RVTs in states with large established Latino populations (p=0.002)
Figure 4-8 Staff per Practice Position: RVTs
108
100
56
42
18
710
5
14
020
4060
8010
0Fr
eque
ncy
0 1 2 3 4 5 6 7
8+ R
VTs
How Many RVTs?
339
22 12 4 3 3
010
020
030
040
0Fr
eque
ncy
0 1 2 3 4
5+ Spa
nRVTs
How Many Spanish-speaking RVTs?
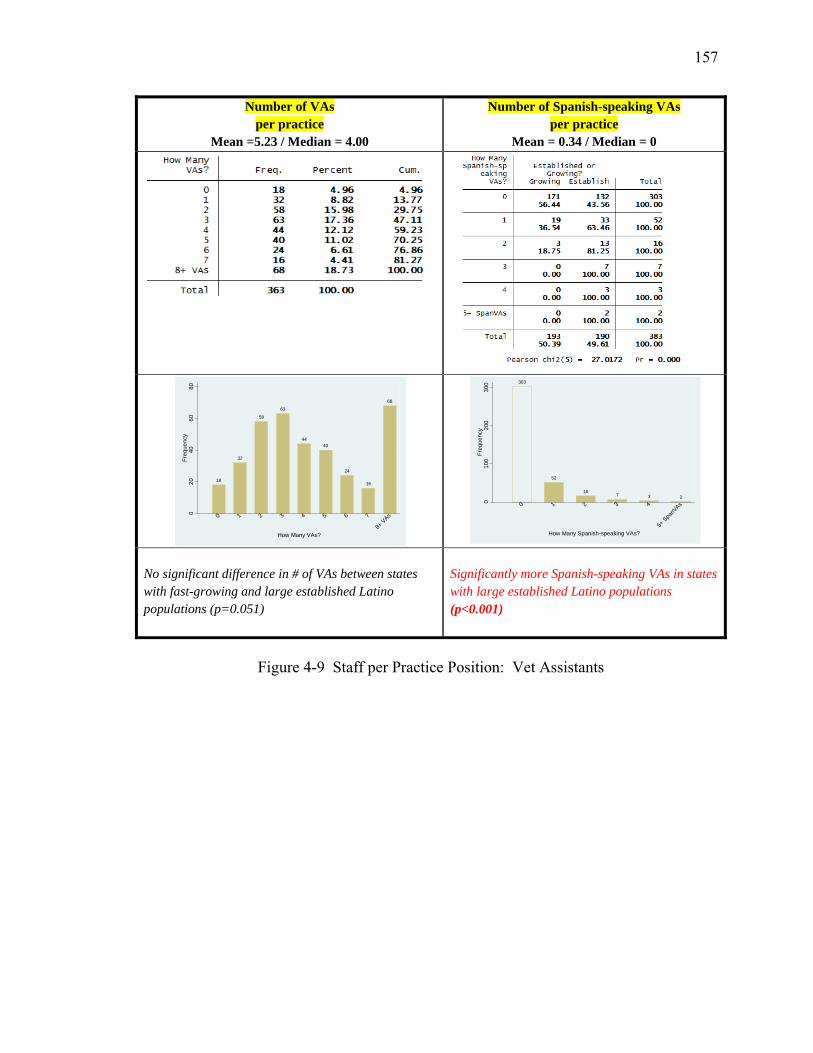
157
Number of VAs per practice
Mean =5.23 / Median = 4.00
Number of Spanish-speaking VAs per practice
Mean = 0.34 / Median = 0
No significant difference in # of VAs between states with fast-growing and large established Latino populations (p=0.051)
Significantly more Spanish-speaking VAs in states with large established Latino populations (p<0.001)
Figure 4-9 Staff per Practice Position: Vet Assistants
18
32
58
63
4440
24
16
68
020
4060
80Fr
eque
ncy
0 1 2 3 4 5 6 7
8+ VAs
How Many VAs?
303
52
167 3 2
010
020
030
0Fr
eque
ncy
0 1 2 3 4
5+ Spa
nVAs
How Many Spanish-speaking VAs?
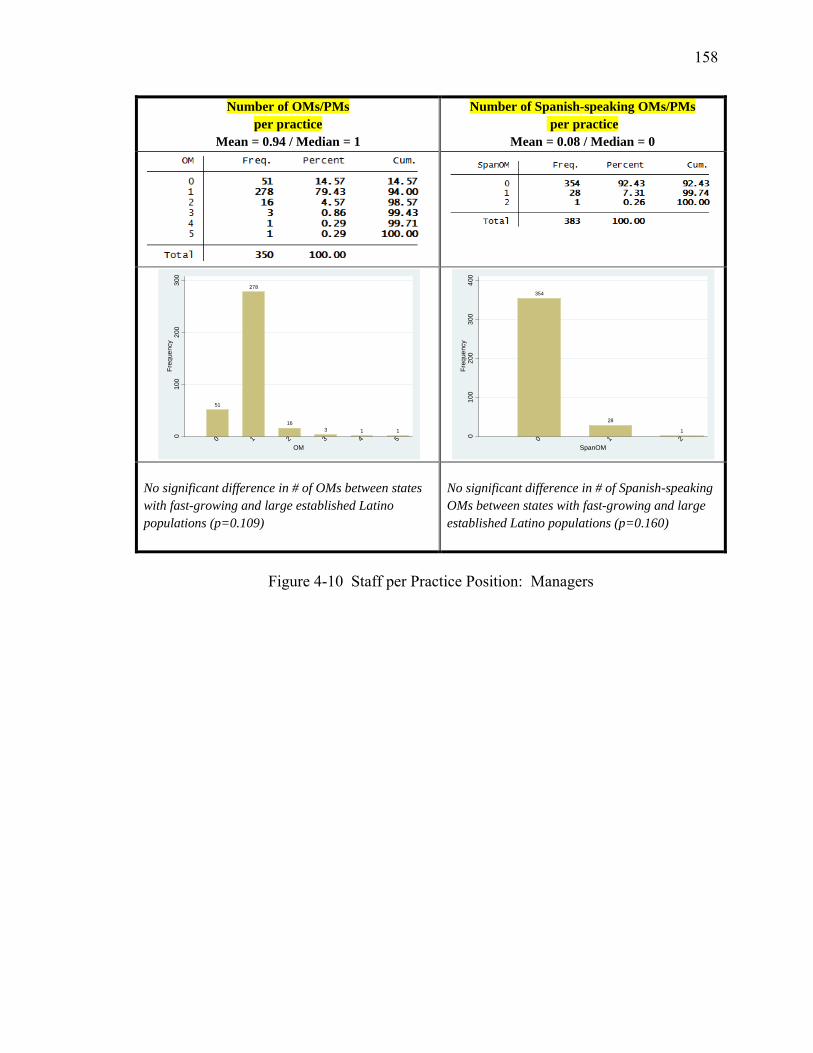
158
Number of OMs/PMs per practice
Mean = 0.94 / Median = 1
Number of Spanish-speaking OMs/PMs per practice
Mean = 0.08 / Median = 0
No significant difference in # of OMs between states with fast-growing and large established Latino populations (p=0.109)
No significant difference in # of Spanish-speaking OMs between states with fast-growing and large established Latino populations (p=0.160)
Figure 4-10 Staff per Practice Position: Managers
51
278
163 1 1
010
020
030
0Fr
eque
ncy
0 1 2 3 4 5OM
354
28
1
010
020
030
040
0Fr
eque
ncy
0 1 2SpanOM
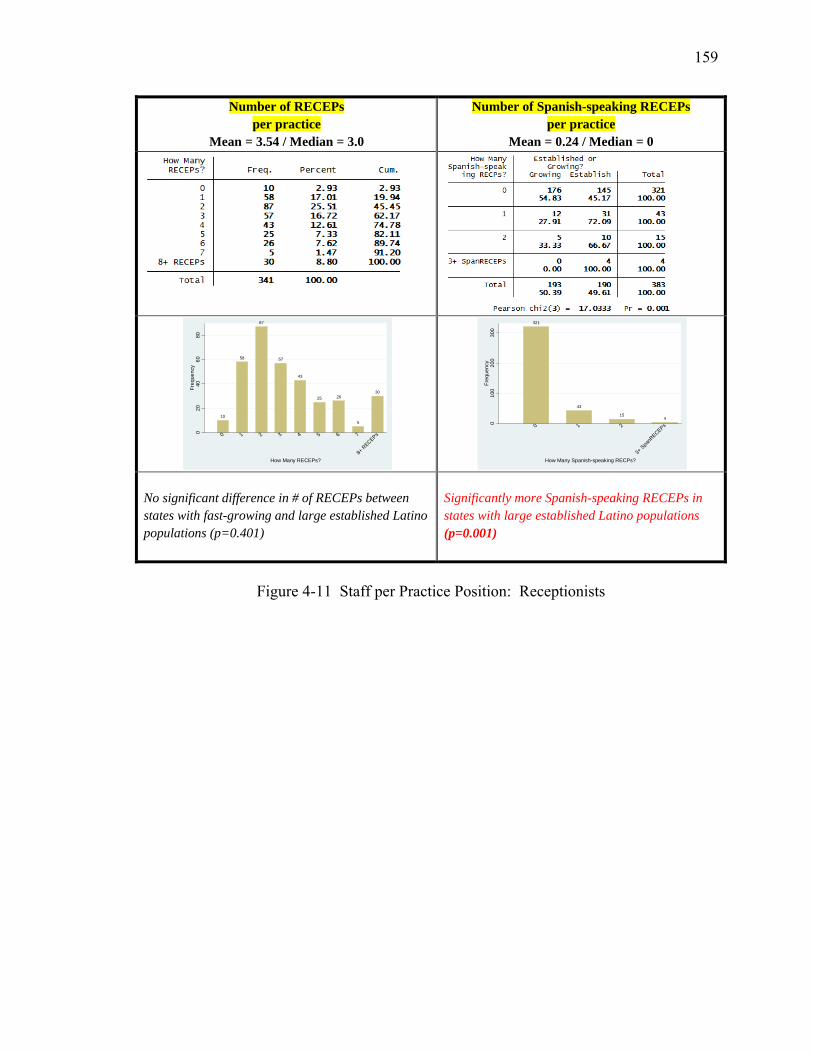
159
Number of RECEPs per practice
Mean = 3.54 / Median = 3.0
Number of Spanish-speaking RECEPs per practice
Mean = 0.24 / Median = 0
No significant difference in # of RECEPs between states with fast-growing and large established Latino populations (p=0.401)
Significantly more Spanish-speaking RECEPs in states with large established Latino populations (p=0.001)
Figure 4-11 Staff per Practice Position: Receptionists
10
58
87
57
43
25 26
5
30
020
4060
80Fr
eque
ncy
0 1 2 3 4 5 6 7
8+ R
ECEPs
How Many RECEPs?
321
43
154
010
020
030
0Fr
eque
ncy
0 1 2
3+ Spa
nRECEPs
How Many Spanish-speaking RECPs?
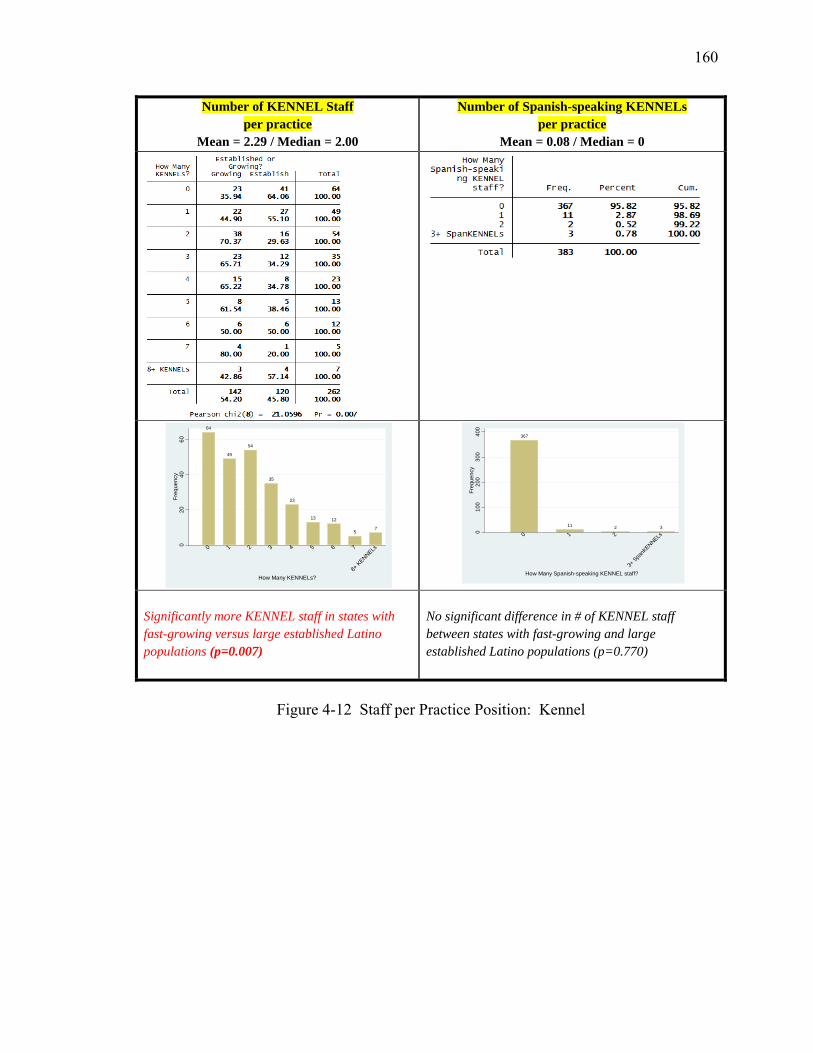
160
Number of KENNEL Staff per practice
Mean = 2.29 / Median = 2.00
Number of Spanish-speaking KENNELs per practice
Mean = 0.08 / Median = 0
Significantly more KENNEL staff in states with fast-growing versus large established Latino populations (p=0.007)
No significant difference in # of KENNEL staff between states with fast-growing and large established Latino populations (p=0.770)
Figure 4-12 Staff per Practice Position: Kennel
64
49
54
35
23
13 12
57
020
4060
Freq
uenc
y
0 1 2 3 4 5 6 7
8+ KENNELs
How Many KENNELs?
367
11 2 3
010
020
030
040
0Fr
eque
ncy
0 1 2
3+ Spa
nKENNELs
How Many Spanish-speaking KENNEL staff?
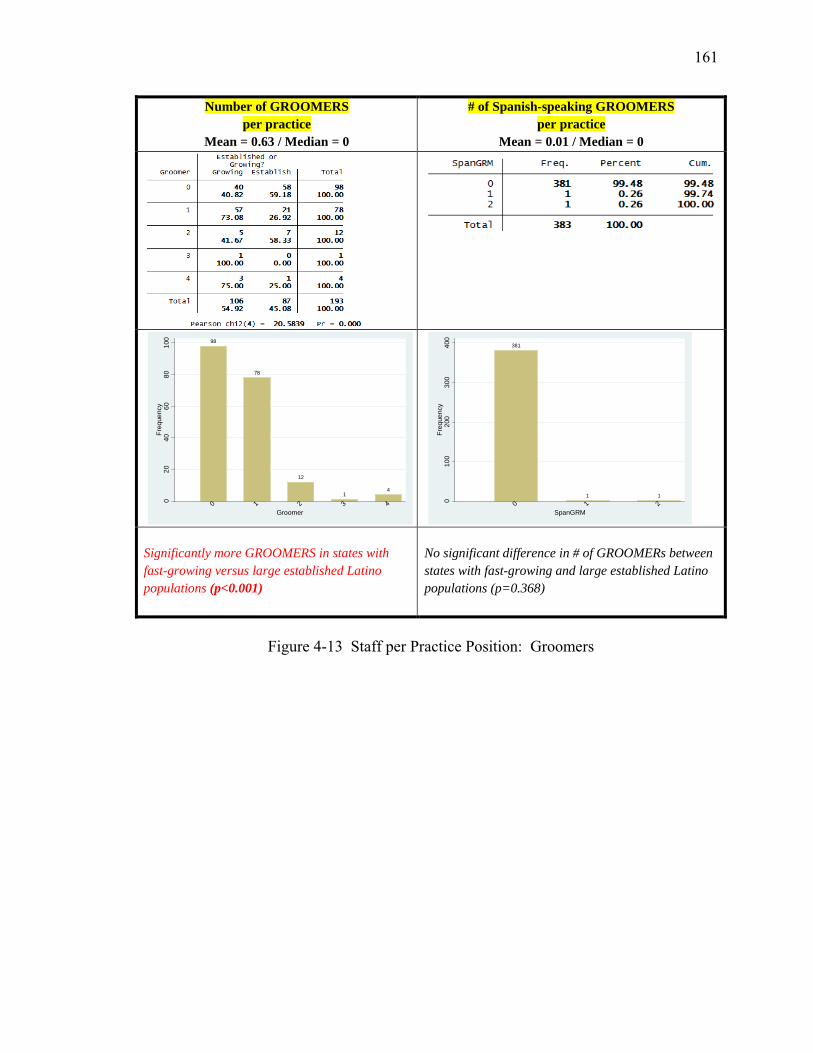
161
Number of GROOMERS per practice
Mean = 0.63 / Median = 0
# of Spanish-speaking GROOMERS per practice
Mean = 0.01 / Median = 0
Significantly more GROOMERS in states with fast-growing versus large established Latino populations (p<0.001)
No significant difference in # of GROOMERs between states with fast-growing and large established Latino populations (p=0.368)
Figure 4-13 Staff per Practice Position: Groomers
98
78
12
14
020
4060
8010
0Fr
eque
ncy
0 1 2 3 4Groomer
381
1 1
010
020
030
040
0Fr
eque
ncy
0 1 2SpanGRM
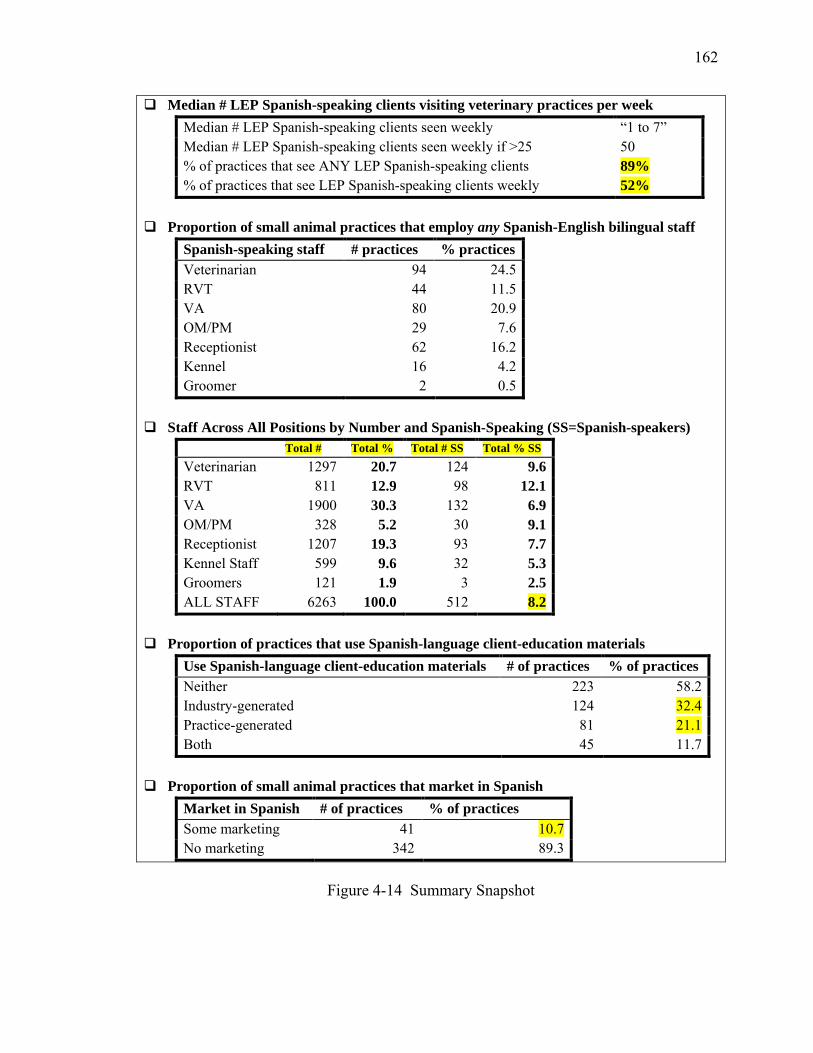
162
Median # LEP Spanish-speaking clients visiting veterinary practices per week Median # LEP Spanish-speaking clients seen weekly “1 to 7” Median # LEP Spanish-speaking clients seen weekly if >25 50 % of practices that see ANY LEP Spanish-speaking clients 89% % of practices that see LEP Spanish-speaking clients weekly 52%
Proportion of small animal practices that employ any Spanish-English bilingual staff
Spanish-speaking staff # practices % practices Veterinarian 94 24.5 RVT 44 11.5 VA 80 20.9 OM/PM 29 7.6 Receptionist 62 16.2 Kennel 16 4.2 Groomer 2 0.5
Staff Across All Positions by Number and Spanish-Speaking (SS=Spanish-speakers)
Total # Total % Total # SS Total % SS Veterinarian 1297 20.7 124 9.6 RVT 811 12.9 98 12.1 VA 1900 30.3 132 6.9 OM/PM 328 5.2 30 9.1 Receptionist 1207 19.3 93 7.7 Kennel Staff 599 9.6 32 5.3 Groomers 121 1.9 3 2.5 ALL STAFF 6263 100.0 512 8.2
Proportion of practices that use Spanish-language client-education materials
Use Spanish-language client-education materials # of practices % of practices Neither 223 58.2 Industry-generated 124 32.4 Practice-generated 81 21.1 Both 45 11.7
Proportion of small animal practices that market in Spanish
Market in Spanish # of practices % of practices Some marketing 41 10.7 No marketing 342 89.3
Figure 4-14 Summary Snapshot
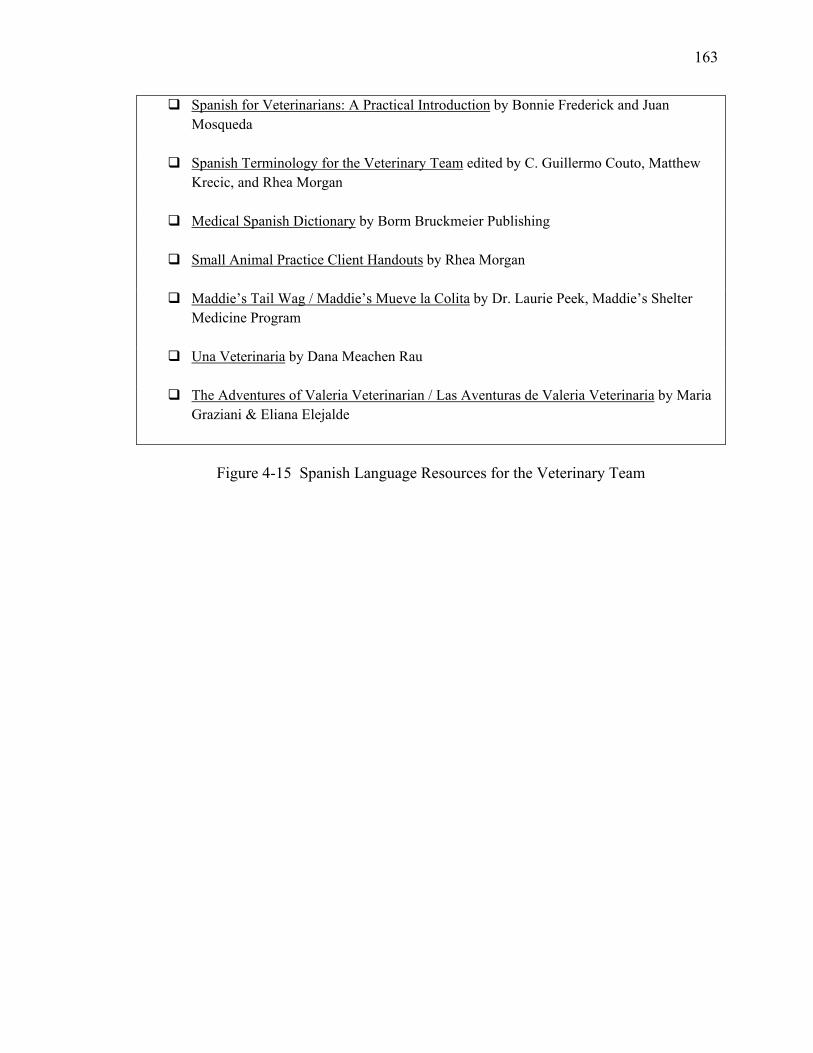
163
Spanish for Veterinarians: A Practical Introduction by Bonnie Frederick and Juan Mosqueda
Spanish Terminology for the Veterinary Team edited by C. Guillermo Couto, Matthew
Krecic, and Rhea Morgan Medical Spanish Dictionary by Borm Bruckmeier Publishing
Small Animal Practice Client Handouts by Rhea Morgan
Maddie’s Tail Wag / Maddie’s Mueve la Colita by Dr. Laurie Peek, Maddie’s Shelter
Medicine Program Una Veterinaria by Dana Meachen Rau
The Adventures of Valeria Veterinarian / Las Aventuras de Valeria Veterinaria by Maria
Graziani & Eliana Elejalde
Figure 4-15 Spanish Language Resources for the Veterinary Team
164
CHAPTER 5. SURVEY OF US VETERINARY STUDENTS REGARDING LEP SPANISH-SPEAKING CLIENTS AND THEIR
PETS
5.1 Introduction
The environment for veterinarians is changing. The introduction to the 2007
Association of American Veterinary Medical Colleges report, Envisioning the Future of
Veterinary Medical Education reads: “To remain relevant, academic veterinary
medicine must prepare veterinarians for what may come in the future. In order to be
recognized and remunerated for their knowledge, compassion, integrity, and judgment,
veterinarians must first demonstrate their relevance to new societal trends” (p.1) (Willis
NG, Monroe FA et al. 2007).
One trend in the 21st century is the growing language gap between veterinary
medical professionals and their clients. A recent study (Landau, Chapter 3) estimated
there are 6 million limited English proficient Spanish-speaking pet owners (LEP SSPOs)
in the US who care for an estimated 9.2 million dogs and 3.8 million cats27. Another
recent study (Landau, Chapter 4) found that 89% of small animal practices surveyed
regularly encounter LEP SSPOs and over half of these practices see them weekly.
27 A previous study of Latino pet owners (Landau, Chapter 3) found that 38.3% of Latinos surveyed own pets; 93% of Latino pet owners have dogs and 40% have cats. The mean number of Latino-owned dogs and cats was 1.65 and 1.60, respectively. Extrapolating these results to the 16.2 LEP Spanish-speakers in the US (US Census 2010), there are an estimated 6 million LEP Latino pet owners caring for 9.2 million dogs and 3.8 million cats in the US today.
165
There are approximately 11,40028 veterinary students currently enrolled in the 28
US veterinary schools or colleges. The proportion of veterinary students with the ability
or interest to effectively communicate with LEP SSPOs without the help of an interpreter
is unknown. Although veterinary schools have increasingly incorporated communication
skills training into their curriculum (Adams CL and Kurtz SM 2006; Kurtz 2006; Hecker,
Adams et al. 2012), little has been done to address communication challenges resulting
from language gaps. As the number of LEP Spanish-speakers grows, veterinarians must
address this communication gap.
Significance of the Veterinary Student Survey
Today’s veterinary students are likely to encounter an increasing number of LEP
SSPOs when they enter practice. This study attempted to illuminate veterinary students’
past experiences, current level of preparedness, and future interest in communicating with
LEP SSPOs. To this author’s knowledge, no previous study has tried to estimate the
proportion of veterinary students who have experience working with LEP SSPOs in a
veterinary medical or shelter setting, currently speak Spanish at an advanced29 level, can
communicate basic medical information to clients without the help of an interpreter, or
are interested in taking a Spanish for Veterinary Professionals elective in veterinary
school.
Results from this survey provide a snapshot of the experience, preparedness, and
interest of 1st-, 2nd-, and 3rd-year veterinary students nationwide to communicate more
effectively with LEP SSPOs. If results demonstrate that the proportion of students who 28 Personal communication, Association of American Veterinary Medical Colleges (AAVMC), January 23, 2013. 29 Language proficiency definitions taken from the American Council for the Teaching of Foreign Languages (ACTFL) and Interagency Language Roundtable (ILR), retrieved from http://www.sil.org.
166
have encountered LEP SSPOs at their practice or shelter is significantly greater than the
proportion of Spanish-speaking veterinary students who will be able to work with these
pet owners, then strategies need to be developed to bridge the language gap. Results of
this study illuminate the degree to which veterinary students nationwide are meeting the
goals for Professional Competency in the areas of communication and diversity/
multicultural awareness, especially as they pertain to working with non-English-speaking
pet owners. The goals, set forth in 2011 by North American Veterinary Medical
Education Consortium, include:
Communication
Veterinarians sustain effective, professional relationships and skillful, sensitive,
appropriate communications with clients, colleagues, other healthcare professionals, and
the public. They communicate in various ways and in a variety of settings with the
purpose of achieving the best outcomes/results. They are able to establish and maintain
effective communication in the face of cultural differences and challenging situations
(p. 57, bold added) (NAVMEC 2011).
Diversity/Multicultural Awareness
Diversity enhances the quality of education and results in more effective and culturally
competent veterinarians who are better prepared to serve an increasingly heterogeneous
population. Veterinarians demonstrate an understanding of the manner in which
culture and belief systems impact delivery of veterinary medical care while recognizing
and appropriately addressing biases in themselves, in others, and in the process of
veterinary medical care delivery.
167
Diversity refers to differences among people with respect to race, gender, age, ethnicity,
sexual orientation, mental/physical ability, religion, job level, personality traits,
education, health, stature, culture, language, and other human differences (p.60, bold
added) (NAVMEC 2011).
Specific Objectives and Hypotheses
The overall objectives of this study are to estimate the proportion of veterinary
students who (i) have experience working with LEP SSPOs in a veterinary or shelter
setting, (ii) can effectively communicate basic medical information in Spanish to clients
without the help of a translator, and (iii) are interested in taking a Spanish for Veterinary
Professionals course. The null hypotheses tested were:
(i) A student’s interest in taking a Spanish for Veterinary Professionals elective
is not associated with the student’s past experience working with LEP SSPOs.
(ii) A student’s interest in taking a Spanish for Veterinary Professionals elective
is not associated with the student’s self-assessed level of spoken Spanish
proficiency.
5.2 Materials and Methods
Study design and population
The target population for the Veterinary Student survey was all first-, second-,
and third-year veterinary students enrolled in one of the 28 US veterinary schools or
colleges on January 8, 2013. The total number of enrolled veterinary students as of
168
January 2013 was 11,40830. Assuming that first-, second-, and third-year students
comprised 75% of total veterinary student enrollment, the target population was 8,556
students from the veterinary medical classes of 2014, 2015 and 2016. Epi-Info® version
7.0 – StatCalc - Sample Size and Power was used to calculate sample size. Based on an
expected response rate of 50%, precision of 5%, and confidence level of 95% (a = 0.05),
365 completed interviews were needed to have sufficient statistical power to reject the
null hypotheses if they were false.
On January 6, 2013, the academic deans of all 28 US veterinary schools and
colleges were contacted with an email that included a copy of the survey and informed
them that the study had received prior approval by both the Association of American
Veterinary Colleges (AAVMC) Study Committee and Purdue’s Institutional Review
Board (IRB). The deans were informed that a second email would be sent two days later
with an invitation to their veterinary students to participate in the survey and a live link to
the survey itself. They were asked to forward this invitation to their first-, second-, and
third-year veterinary students on January 8, 2013, along with the embedded live link.
Students received the invitation to participate directly from one of their school
administrators. The survey link remained open from 6am on January 8, 2013 until
midnight on January 28, 2013.
Students were introduced to the on-line survey with the following: “As you
participate in your veterinary training, we want to understand the degree to which you
feel prepared to work with Spanish-speaking clients with limited English
proficiency.” They were informed that the on-line survey would take approximately five
30 Personal communication, AAVMC, January 23, 2013
169
minutes to complete. The survey was designed so that the respondent was unidentifiable
and could exit the survey at any point in time. Students were under no obligation to
participate. Those who chose to participate did so by clicking on the live link and
completing the survey on-line. All 28 school administrators shared the email invitation
with their students. No reminder request for student participation was made. (See Figure
1 and Appendix C for Veterinary Student Survey and supporting documentation.)
Respondents to the Veterinary Student Survey were offered an incentive to
participate in the form of an opportunity to enter a random drawing for one of fifty $25
iTunes gift cards. Respondents who elected to participate submitted an email address that
was entered into the drawing at the close of the survey. This email address was stripped
from the data prior to analysis to protect the anonymity of the respondent. Student
American Veterinary Medical Association (SAVMA) delegates from each school were
contacted in advance via email and asked to serve as “delivery person” for the gift card
winner(s) at their school. All delegates agreed to help deliver the gift cards. At the close
of the survey, fifty email addresses were randomly selected as gift card winners. Since
each email address contained a school identifier, cards were easily matched to SAVMA
delegates and mailed to the delegate, along with a $10 gift card for the SAVMA
representative as a thank you for their help with delivery. All respondents to the survey
were sent an automated electronic thank you message distributed by Qualtrics® survey
software when they submitted their input.
During development of the survey all questions were reviewed and critiqued by
four colleagues with expertise in survey methodology as well as topical content. A pilot
version of the survey instrument was approved by Purdue’s IRB for evaluation of the
170
instrument’s retest reliability. The pilot survey was tested and retested two weeks later
on second-year and fourth-year Purdue University veterinary students. Early phase
testing of the survey instrument also included cognitive interviews in which student
respondents “thought aloud” as they answered each question and shared what they were
thinking while answering the question. The survey instrument was revised to its final
version based on feedback from cognitive interviews and suggestions from the AAVMC
Study Approval committee. Once AAVMC approval was received on November 12,
2012, the final survey instrument was submitted to and approved by Purdue’s IRB.31
Survey instrument
The survey instrument used for this study consisted of 6 student demographic
questions, 6 Spanish language ability and experience questions, 9 preparedness opinion
questions, and 12 LEP/language access services experience questions. These thirty-three
questions were formatted as multiple choice, yes/no, open-ended, or 5-point Likert-scale
questions (see Appendix C).
Statistical analyses
Study variables
Descriptive statistics were used to summarize the distributions of the explanatory
variables. Frequencies and percentages were used to describe the distributions of the
categorical variables.
Significance testing
Significance testing was performed to compare veterinary student demographics
by year in school (first, second or third) and by level of spoken Spanish proficiency
31 Human Research Protection Program – Approved IRB Protocol #1203012084
171
(conversant or not conversant). Significance tests included Pearson chi-square and
Fishers exact tests to assess homogeneity of categorical variables. The statistical
software package Stata® Version 11.2 (Stata Corporation, College Station, TX) was used
for both descriptive and analytic analyses.
Statistics
This study used odds ratios (ORs) to measure the effects of the explanatory
variables on the veterinary student’s interest in taking a Spanish for Veterinary
Professionals elective. Potential predictors of a student’s interest in taking a Spanish for
Veterinary Professionals elective were determined using bivariate and multivariate
logistic regression. Estimates for the OR and 95% confidence intervals (95% CI) for
each predictor were obtained by exponentiation of the regression coefficients. Data were
assessed for outliers and influential points. Independent variables retained in the final
multivariate model were assessed for correlation. Maximum likelihood estimates of the
logistic parameters and fit of the final model was assessed using Hosmer-Lemeshow
goodness-of-fit test. Variables with a P-value of <0.20 in the bivariate models were
included in the multivariate models; a P-value of <0.05 was considered statistically
significant in the multivariate models.
5.3 Results
Descriptive Statistics: Survey Responses
From a sample pool of an estimated 8,556 first-, second- and third-year veterinary
students, 2080 (24.3%) surveys were completed representing all 28 (100%) of US
veterinary schools or colleges. A maximum of 123, a minimum of 17, and mean of 68
172
students participated from each institution. Twenty-five fourth-year students responded
to the survey; their responses were excluded from the analysis.
Descriptive Statistics: Veterinary Student Demographics
Five percent of students in this study described themselves as Latino. Two
percent spoke Spanish as their first language, while another 2% spoke one of fifteen other
non-English languages, most commonly Cantonese or Mandarin Chinese. A large
majority of respondents were Caucasian (92.5%) and female (84.7%), reflecting current
veterinary medical school enrollment nationwide. (See Tables 5-1 to 5-6 for detailed
information on race, ethnicity, gender, first language, and geography.)
Descriptive Statistics: Proficiency in Spoken Spanish and Interest in a Spanish for
Veterinary Professionals Elective
A student’s level of spoken Spanish proficiency was described by their self-
assessment score on a language proficiency scale, their past experience working as a
Spanish-English interpreter (formally or informally), and their self-assessment of
preparedness to convey social and medical information to an LEP SSPO. When asked
how well they could speak Spanish, 16.4% of Caucasian and 26.1% of non-Caucasian
veterinary students described themselves as having advanced proficiency or higher.
Student interpreting experience was varied, depending on the formality of their role and
the medical setting (human vs. veterinary) in which they interpreted (Tables 5-7 to 5-9).
While almost two-thirds (62.6%) of students agreed or strongly agreed that an
ability to communicate with LEP Spanish-speaking clients will be important for
themselves as a veterinarian, between 8% and 18% described themselves as prepared to
give medical information to a Spanish-speaking patient, depending upon the question.
173
Overall, two-thirds of students were interested in taking a Spanish for Veterinary
Professionals elective, with the strongest interest (90.9%) expressed by those with
advanced proficiency in spoken Spanish (Tables 5-10 to 5-18).
Descriptive Statistics: Previous Experience Working with Spanish-Speaking Clients and
Veterinary Staff
Veterinary students were asked about their past work experience in small animal,
large animal, mixed animal, equine, and shelter settings and asked to recall the presence
of Spanish-speaking clients, veterinarians, staff, owners, producers, and/or workers in
those settings. They were asked if they had encountered any Spanish-language industry
brochures, practice-generated forms, or marketing materials in those settings. Over half
(52.2%) of the students surveyed reported being aware of LEP Spanish-speaking clients
at their workplace, while less than 5% were aware of any Spanish-language marketing
offered by the veterinary practice or shelter (Tables 5-19 to 5-23).
Analytic Statistics: Fitting the Model & Hypothesis Testing
One goal of this study was to identify factors associated with a student’s interest
in taking a Spanish for Veterinary Professionals elective during veterinary school.
Fitting the Model: Bivariate analyses identified 26 variables that had a
statistically significant association with a student’s interest in taking a Spanish for
Veterinary Professionals elective. Multivariate logistic regression using backward
stepwise selection reduced this list to six variables significantly associated with a
veterinary student’s interest in taking this elective: “Communication with LEP Spanish-
speaking clients will be important to me as a vet”; “I will be able to communicate socially
with my Spanish-speaking clients”; “I will be prepared to give medical information to
174
Spanish-speaking clients”; “I will be prepared to give medical information to English-
speaking clients”; being African American or Black; and being aware of LEP Spanish-
speaking clients at the practice or shelter (Table 5-24).
Testing the Estimates: An adjusted Wald test was used to test the estimates in the
final reduced model. The effect of “important to me” on the probability of the student
being interested in taking a Spanish for Veterinary Professionals elective was significant
( P<0.001); the effect of being able to communicate socially in Spanish was significant
(P<0.001); the effect of preparedness to give medical information to a Spanish-speaking
client was significant (P<0.001); the effect of preparedness to give medical information
to an English-speaking client was significant (P<0.001); the effect of student’s race being
African American or Black was significant (P=0.013), and the effect of an awareness of
LEP Spanish-speaking clients in the practice or shelter was not significant (P=0.069).
This last variable, though not statistically significant, was retained in the model due to a
priori interest in the effect of a student’s past experience working with LEP SSPOs.
Assessing Model Fit: The Hosmer-Lemeshow goodness-of-fit test was not
significant (P=0.462). Therefore the assumptions of fit were not violated and the
reduced model did reasonably describe the factors which were significantly associated
with the student’s interest in taking a Spanish for Veterinary Professionals elective.
Interpreting predicted values of outcome: Veterinary students with the highest
probability of interest in taking a Spanish for Veterinary Professionals elective can be
characterized as (i) agreeing or strongly agreeing that an ability to communicate with
Spanish-speaking clients will be important to them personally; (ii) agreeing or strongly
agreeing that they speak Spanish well enough to communicate socially with Spanish-
175
speaking clients; (iii) being well-prepared or extremely well prepared to communicate
medical information to English-speaking clients; (iv) being less than well-prepared to
communicate medical information to Spanish-speaking clients; and (iv) identifying as
African American or Black (Table 5-25).
The probability of a veterinary student indicating interest in taking a Spanish for
Veterinary Professionals elective tripled when the student perceived that communication
with LEP Spanish-speakers was personally important (OR=2.99, P<0.001, 95% CI=2.62
to 3.42), and increased 30% when the student already had an ability to communicate
socially in Spanish (OR=1.30, P<0.001, 95% CI=1.17 to 1.44). Students who felt well-
prepared to communicate medical information to English-speaking clients were 25%
more likely to indicate interest in the elective (OR=1.25, P<0.001, 95% CI= 1.11 to 1.41),
whereas students who already felt well-prepared to communicate medical information to
Spanish-speaking clients were 34% less likely to be interested in the elective (OR=0.66,
P<0.001, 95% CI=0.55 to 0.79). Describing one’s race as African American or Black
increased the odds of an interest in the language elective almost five-fold (OR=4.91,
P=0.013, 95% CI=1.40 to 17.25). Having an awareness of LEP SSPOs at the veterinary
practice or shelter increased the odds of interest in the elective by 23%, but this finding
did not reach a level of statistical significance (OR=1.23, P=0.069, 95% CI=0.98 to 1.53).
Based on these results, the first hypothesis (a student’s interest in taking a Spanish
for Veterinary Professionals elective is not associated with the student’s past experience
working with LEP Spanish-speaking pet owners) cannot be rejected. However, the
second hypothesis (a student’s interest in taking a Spanish for Veterinary Professionals
elective is not associated with the student’s level of Spanish proficiency) is rejected in
176
favor of the conclusion that students who were able to communicate socially in Spanish
were more likely to take an interest in this elective, while students who were already able
to communicate medical information in Spanish were less likely to demonstrate an
interest in this elective (Table 5-26).
5.4 Discussion
The study revealed that the percentage of students who have experience working
with LEP SSPOs is more than triple the percentage of students conversant in Spanish,
highlighting a language gap that needs to be bridged.
Although responses were received from veterinary students from all 28 US
veterinary schools, there was not equal representation between schools or within schools
(e.g. more first-year students responded than second- and third-year students). Do
students attending veterinary schools with low response rates differ significantly in their
beliefs about and interest in working with LEP clients relative to students attending
veterinary schools with high response rates? Do students who chose not to respond to
the survey differ significantly in their beliefs about and interest in working with LEP
clients compared to students who did respond? Or are these differences an artifact of
timing of winter break schedule, curriculum burden, “survey fatigue”, or other factors?
The reasons for the between-school and within-school differing response rates might
have impacted the level of non-response error.
As a self-administered survey, the Veterinary Student survey was less vulnerable
to social desirability and acquiescence biases than it would have been if it was an
interviewer-administered survey. Nonetheless, these biases were still possible. Since this
177
was an on-line survey, if a student was confused about the way a question was worded,
there was no opportunity for that student to get clarification about the meaning of the
question. Thus the on-line mode itself could have unintentionally contributed to
measurement error if a question was unclear to the respondent.
Constructing an inclusive survey which accurately captured a respondent’s
experience of race, ethnicity, nativity and gender was not simple. Offered five categories
for race, respondents filled out “other” with 20 different entries. Race is a complex
construct that, for some, encompasses ethnicity, nativity, and religion. Offered four
categories for gender, six respondents selected options other than male or female. These
self-descriptors would not have been captured had the survey not been constructed with
“other” options.
The attempt to evaluate the retest reliability of the survey instrument failed. With
prior IRB approval, the survey instrument was piloted on 2nd- and 4th-year veterinary
students at one institution, and then resent to those same students two weeks later.
Despite explicit directions to students to use the same personal identifier code on both
tests, only a handful did so. The number of survey responses that could be matched
between the original and retest version of the survey were so few as to be unusable for
retest reliability evaluation. In the future, assigning the student the code, rather than
inviting them to create their own code, would eliminate this problem. It would not,
however, impact the number of students who chose to participate.
On every question asked of students about their awareness of Spanish-speakers
and Spanish-language materials at the practice or shelter at which they worked, those
who indicated that they were conversant in Spanish were significantly more likely to
178
indicate an awareness of Spanish-speaking clients, veterinarians, staff, owners, producers,
herdsmen and dairymen, as well as an awareness of Spanish-language written materials
and marketing materials. One possible explanation for the significant difference in
awareness is that students who were conversant in Spanish worked in environments that
employed more Spanish-speaking staff and saw more Spanish-speaking clients. Another
possible explanation is that Spanish-speakers might be more aware of the presence of
other Spanish-speakers, and conversely, non-Spanish-speakers might be less aware of the
presence of Spanish-speakers. If the latter is true, then it is possible that non-Spanish
speakers underestimate the presence of LEP SSPOs. It is also possible that non-Spanish-
speakers underestimate the need for language access services for these LEP clients in the
form of Spanish-speaking staff and Spanish-language materials.
A self-identified gap between social and medical Spanish language proficiency
emerged from this study. Of those who agreed or strongly agreed with the statement “I
will be able to communicate socially with my Spanish-speaking clients,” just over half
agreed or strongly agreed that they would be able to communicate medically with those
same clients. Even students who assessed their spoken Spanish proficiency as “superior”
often indicated that they were not prepared to explain medical information to LEP
Spanish-speaking clients. A previous study (Landau, Chapter 4) found that over half of
the small-animal practitioners surveyed see LEP clients weekly. Students will see these
clients in practice. This is a gap in practice-readiness.
An unexpected finding was that over half of the students who indicated that they
had served as an informal Spanish-English interpreter with friends or family in either a
human or veterinary medical setting did not consider themselves to be conversant in
179
Spanish. Over a third of those who had served as a formal Spanish-English interpreter
with patients or clients in a human or veterinary medical setting did not consider
themselves to be conversant in Spanish. This “false fluency” (Ferguson WJ 2008) has
potential to lead to miscommunication, misdiagnosis, or worse.
When asked for other ideas for how to bridge the communication gap with LEP
SSPOs, several students wrote in “they should learn English.” Preparing future
practitioners with medical Spanish skills does not need to take place at the exclusion of
LEP SSPOs learning English. Second-language learning takes time, and in the meantime
while the client is taking English as a Second Language (ESL) classes, how will a
practitioner best obtain a thorough pet health history, explain recommendations, and
otherwise bridge the language gap?
Results of this study indicate that there is room to improve on meeting the
NAVMEC goals for Professional Competency in the areas of communication and
diversity/multicultural awareness, especially as these goals pertain to working with non-
English-speaking pet owners. Specifically, there is room to improve upon helping
students develop “skillful, sensitive, appropriate communications with clients…in the
face of cultural differences and challenging situations (p. 57) (NAVMEC 2011).
The majority of students responding to this survey have had first-hand experience
with LEP SSPOs at a practice or shelter and expressed a personal interest in taking a
course that could improve their medical Spanish proficiency. The challenge will be to
find ways to integrate this learning into an already full curriculum.
180
Limitations of the study
Much of the statistical analysis contained in this study depended upon the
student’s self-assessment of his or her spoken Spanish language proficiency, which may
or may not be an accurate assessment. Assessment of language proficiency is not simple,
evidenced by the myriad of proficiency frameworks and proficiency tests in use today.
The scale used in this survey is taken from the American Council on the Teaching of
Foreign Languages (ACTFL) and the Interagency Language Roundtable (ILR). It has its
origins in language proficiency evaluations conducted by the United States Foreign
Service Institute. Although the scale might be valid and reliable, without an oral
evaluation by an outside evaluator, a student may or may not have an accurate assessment
of his/her own Spanish language proficiency. In the future, it would be valuable to have
students assessed for language proficiency by an outside evaluator, and then compare
self-assessed with evaluator-assessed scores on language proficiency.
Only the aggregate number of veterinary students was available for use in this
study. Denominator information by graduation year (class size) and/or by school was not
accessible. As of January 2013, national total enrollment of veterinary students stood at
11,40832. Estimating that all first-, second-, and third-year students comprised 75% of
total veterinary student enrollment, a target population of 8,556 students from the
veterinary medical classes of 2014, 2015 and 2016 was assumed. A greater number of
first-year students responded to the survey than second- or third-year students. Without
denominator data, it is unclear whether this represents a higher percentage of first-year
student respondents, or larger 2016 class size.
32 Personal communication, AAVMC, January 23, 2013
181
Two questions with slightly different wording were asked to determine how
prepared the student is to convey medical information in Spanish to an LEP SSPO (see
Appendix C, Question 10(2) and Question 11(4)). The results of these two questions
differed by ten percentage points. The questions need to be reworded if used in a future
survey on this topic.
Conclusions
Results from completed surveys with over 2000 first-, second- and third-year US
veterinary students revealed that current veterinary students are both experienced with
and interested in working with LEP SSPOs. More than half of the students surveyed
have worked at a practice or shelter that had LEP Spanish-speaking clients. Over three-
fourths of all respondents agreed that communication with LEP SSPOs was important for
veterinarians in general, and two-thirds agreed that communication with LEP SSPOs was
important for themselves personally. Those figures also rose above 80% if the student
was already conversant in Spanish.
However, even when a student assessed him/herself as socially conversant in
Spanish, fewer than half felt prepared to deliver medical information to veterinary clients
in Spanish. Two-thirds of students surveyed said they would take a Spanish for
Veterinary Professionals course if available; again that figure rose above 80% if the
student was already conversant in Spanish. A Spanish for Veterinary Professionals
elective, building on a vet student’s existing Spanish-language skills, could be the starting
point from which to bridge this communication gap with LEP SSPOs. Results of this
study also revealed an increased probability that African American students were
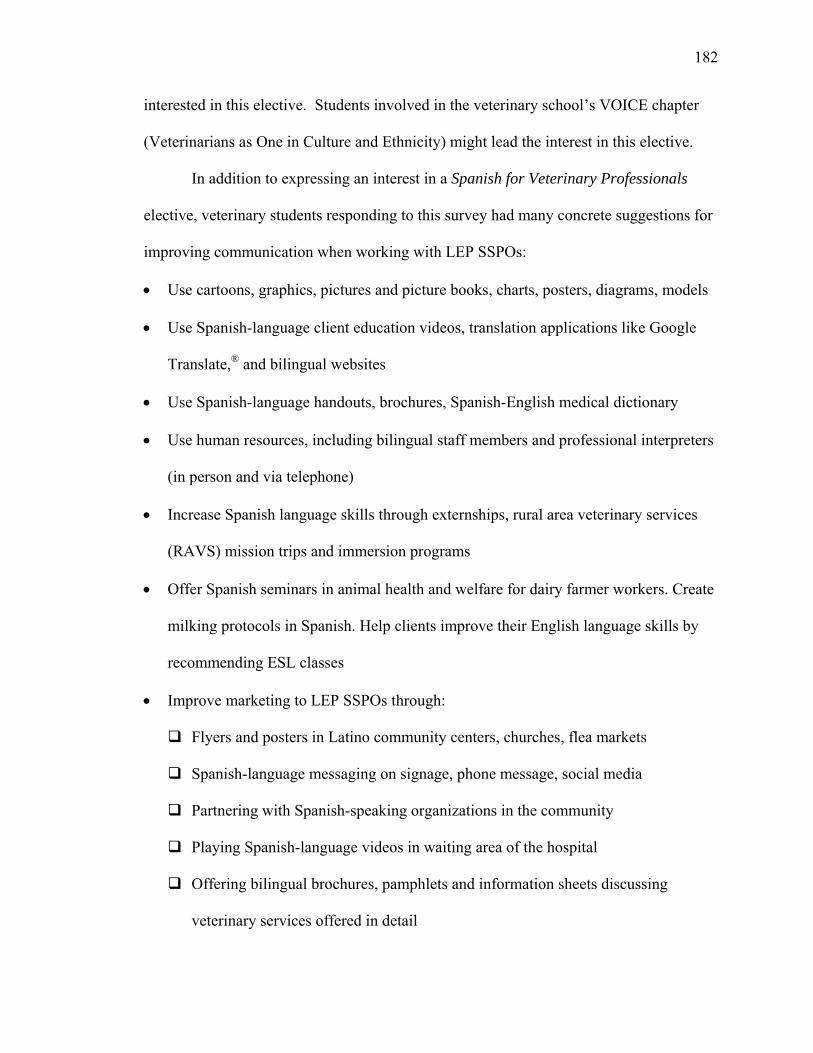
182
interested in this elective. Students involved in the veterinary school’s VOICE chapter
(Veterinarians as One in Culture and Ethnicity) might lead the interest in this elective.
In addition to expressing an interest in a Spanish for Veterinary Professionals
elective, veterinary students responding to this survey had many concrete suggestions for
improving communication when working with LEP SSPOs:
• Use cartoons, graphics, pictures and picture books, charts, posters, diagrams, models
• Use Spanish-language client education videos, translation applications like Google
Translate,® and bilingual websites
• Use Spanish-language handouts, brochures, Spanish-English medical dictionary
• Use human resources, including bilingual staff members and professional interpreters
(in person and via telephone)
• Increase Spanish language skills through externships, rural area veterinary services
(RAVS) mission trips and immersion programs
• Offer Spanish seminars in animal health and welfare for dairy farmer workers. Create
milking protocols in Spanish. Help clients improve their English language skills by
recommending ESL classes
• Improve marketing to LEP SSPOs through:
Flyers and posters in Latino community centers, churches, flea markets
Spanish-language messaging on signage, phone message, social media
Partnering with Spanish-speaking organizations in the community
Playing Spanish-language videos in waiting area of the hospital
Offering bilingual brochures, pamphlets and information sheets discussing
veterinary services offered in detail
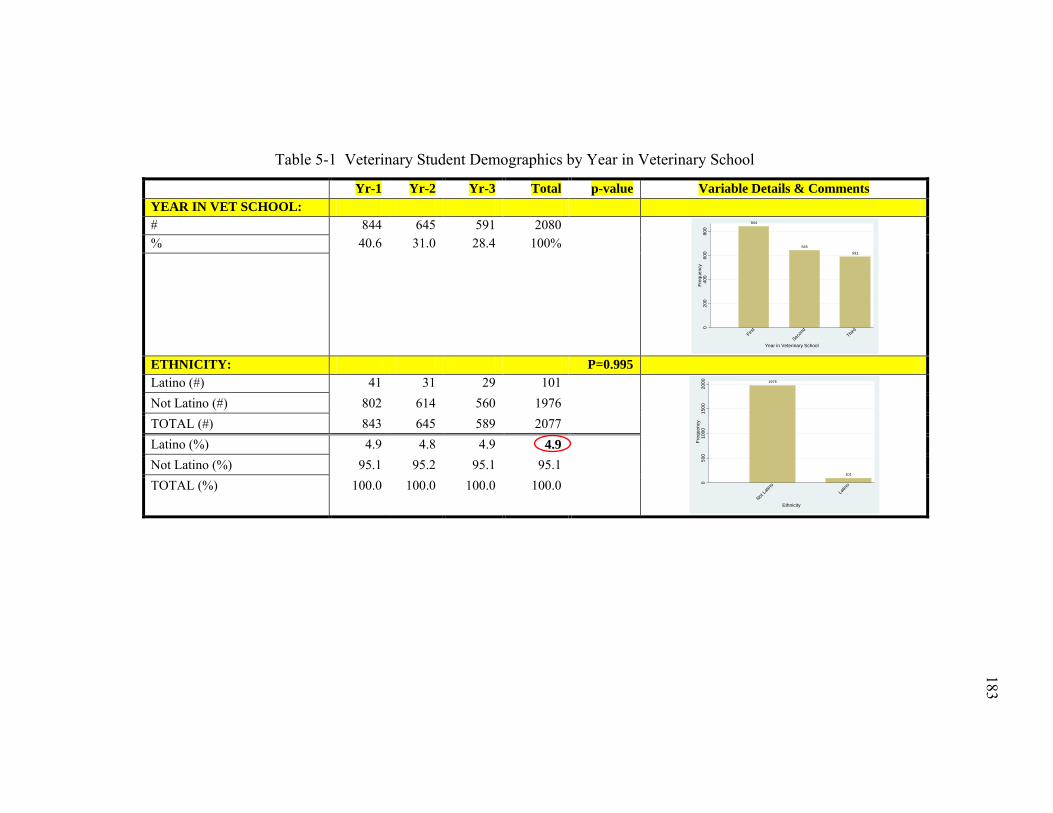
183
183
Table 5-1 Veterinary Student Demographics by Year in Veterinary School
Yr-1 Yr-2 Yr-3 Total p-value Variable Details & Comments YEAR IN VET SCHOOL: # 844 645 591 2080
% 40.6 31.0 28.4 100%
ETHNICITY: P=0.995 Latino (#) 41 31 29 101
Not Latino (#) 802 614 560 1976 TOTAL (#) 843 645 589 2077 Latino (%) 4.9 4.8 4.9 4.9 Not Latino (%) 95.1 95.2 95.1 95.1 TOTAL (%) 100.0 100.0 100.0 100.0
844
645
591
020
040
060
080
0Fr
eque
ncy
First
Secon
dThir
d
Year in Veterinary School
1976
101
050
010
0015
0020
00Fr
eque
ncy
Not La
tino
Latin
o
Ethnicity
183
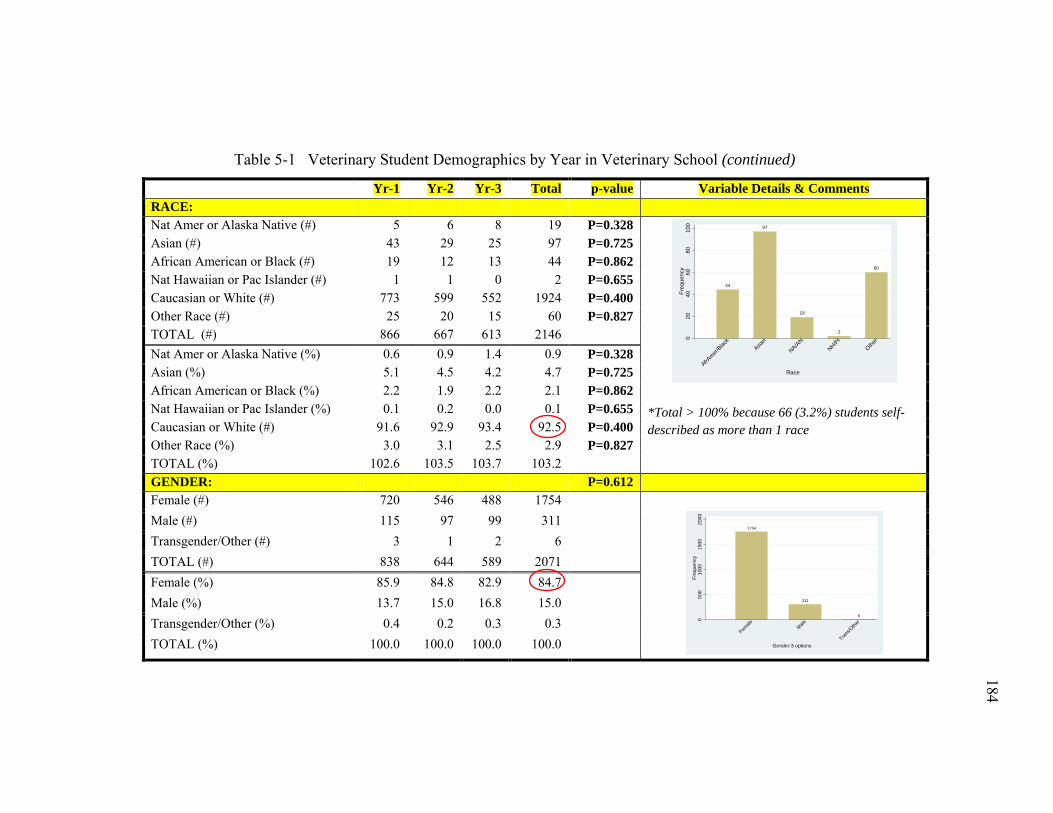
184
184
Table 5-1 Veterinary Student Demographics by Year in Veterinary School (continued)
Yr-1 Yr-2 Yr-3 Total p-value Variable Details & Comments RACE: Nat Amer or Alaska Native (#) 5 6 8 19 P=0.328
*Total > 100% because 66 (3.2%) students self-described as more than 1 race
Asian (#) 43 29 25 97 P=0.725 African American or Black (#) 19 12 13 44 P=0.862 Nat Hawaiian or Pac Islander (#) 1 1 0 2 P=0.655 Caucasian or White (#) 773 599 552 1924 P=0.400 Other Race (#) 25 20 15 60 P=0.827 TOTAL (#) 866 667 613 2146 Nat Amer or Alaska Native (%) 0.6 0.9 1.4 0.9 P=0.328 Asian (%) 5.1 4.5 4.2 4.7 P=0.725 African American or Black (%) 2.2 1.9 2.2 2.1 P=0.862 Nat Hawaiian or Pac Islander (%) 0.1 0.2 0.0 0.1 P=0.655 Caucasian or White (#) 91.6 92.9 93.4 92.5 P=0.400 Other Race (%) 3.0 3.1 2.5 2.9 P=0.827 TOTAL (%) 102.6 103.5 103.7 103.2 GENDER: P=0.612 Female (#) 720 546 488 1754
Male (#) 115 97 99 311 Transgender/Other (#) 3 1 2 6 TOTAL (#) 838 644 589 2071 Female (%) 85.9 84.8 82.9 84.7 Male (%) 13.7 15.0 16.8 15.0 Transgender/Other (%) 0.4 0.2 0.3 0.3 TOTAL (%) 100.0 100.0 100.0 100.0
44
97
19
2
60
020
4060
8010
0Fr
eque
ncy
AfrAmer/
Black
Asian
NA/AN
NH/PIOthe
r
Race
1754
311
6
050
010
0015
0020
00Fr
eque
ncy
Female Male
Trans/O
ther
Gender-3 options
184
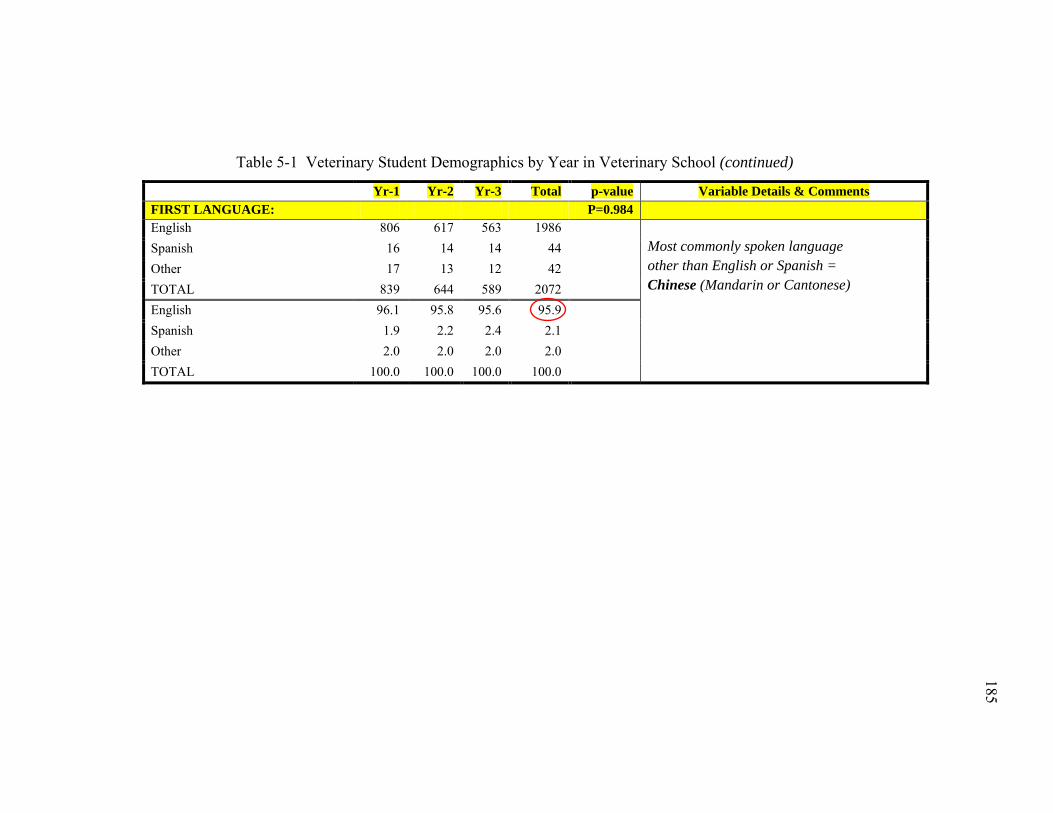
185
185
Table 5-1 Veterinary Student Demographics by Year in Veterinary School (continued)
Yr-1 Yr-2 Yr-3 Total p-value Variable Details & Comments FIRST LANGUAGE: P=0.984 English 806 617 563 1986
Most commonly spoken language other than English or Spanish = Chinese (Mandarin or Cantonese)
Spanish 16 14 14 44 Other 17 13 12 42 TOTAL 839 644 589 2072 English 96.1 95.8 95.6 95.9 Spanish 1.9 2.2 2.4 2.1 Other 2.0 2.0 2.0 2.0 TOTAL 100.0 100.0 100.0 100.0
185
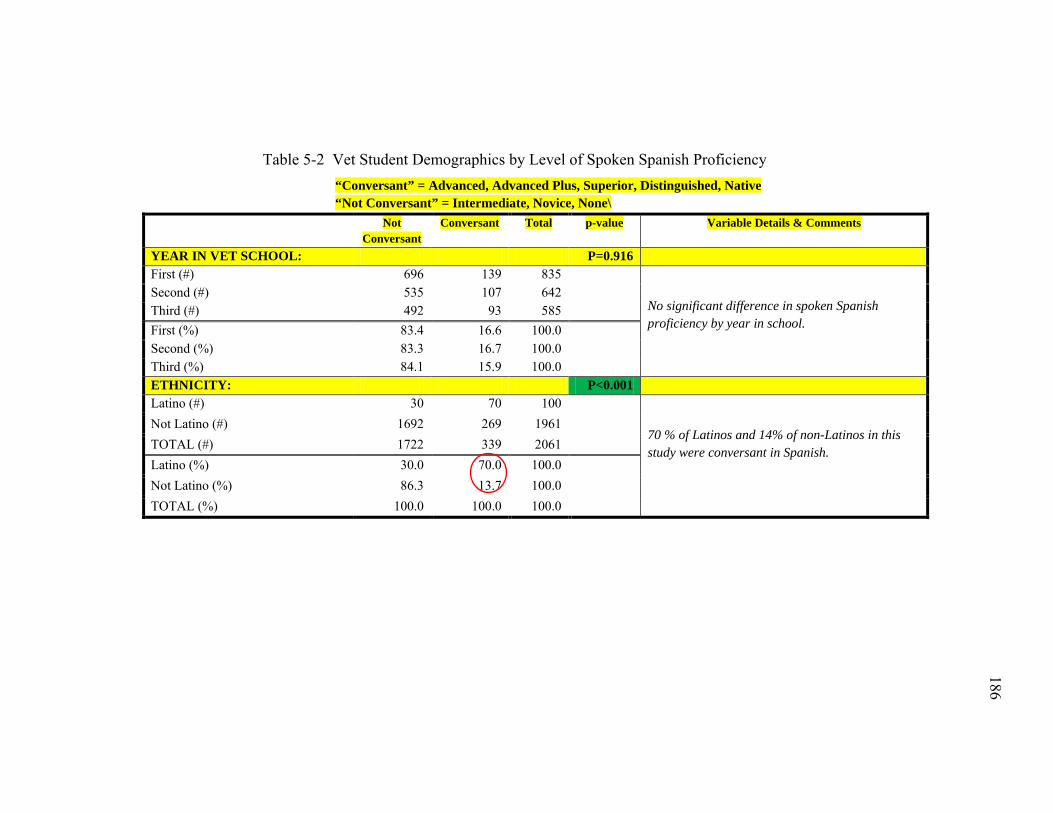
186
186
Table 5-2 Vet Student Demographics by Level of Spoken Spanish Proficiency “Conversant” = Advanced, Advanced Plus, Superior, Distinguished, Native “Not Conversant” = Intermediate, Novice, None\
Not Conversant
Conversant Total p-value Variable Details & Comments
YEAR IN VET SCHOOL: P=0.916 First (#) 696 139 835
No significant difference in spoken Spanish proficiency by year in school.
Second (#) 535 107 642 Third (#) 492 93 585 First (%) 83.4 16.6 100.0 Second (%) 83.3 16.7 100.0 Third (%) 84.1 15.9 100.0 ETHNICITY: P<0.001 Latino (#) 30 70 100
70 % of Latinos and 14% of non-Latinos in this study were conversant in Spanish.
Not Latino (#) 1692 269 1961 TOTAL (#) 1722 339 2061 Latino (%) 30.0 70.0 100.0 Not Latino (%) 86.3 13.7 100.0 TOTAL (%) 100.0 100.0 100.0
186
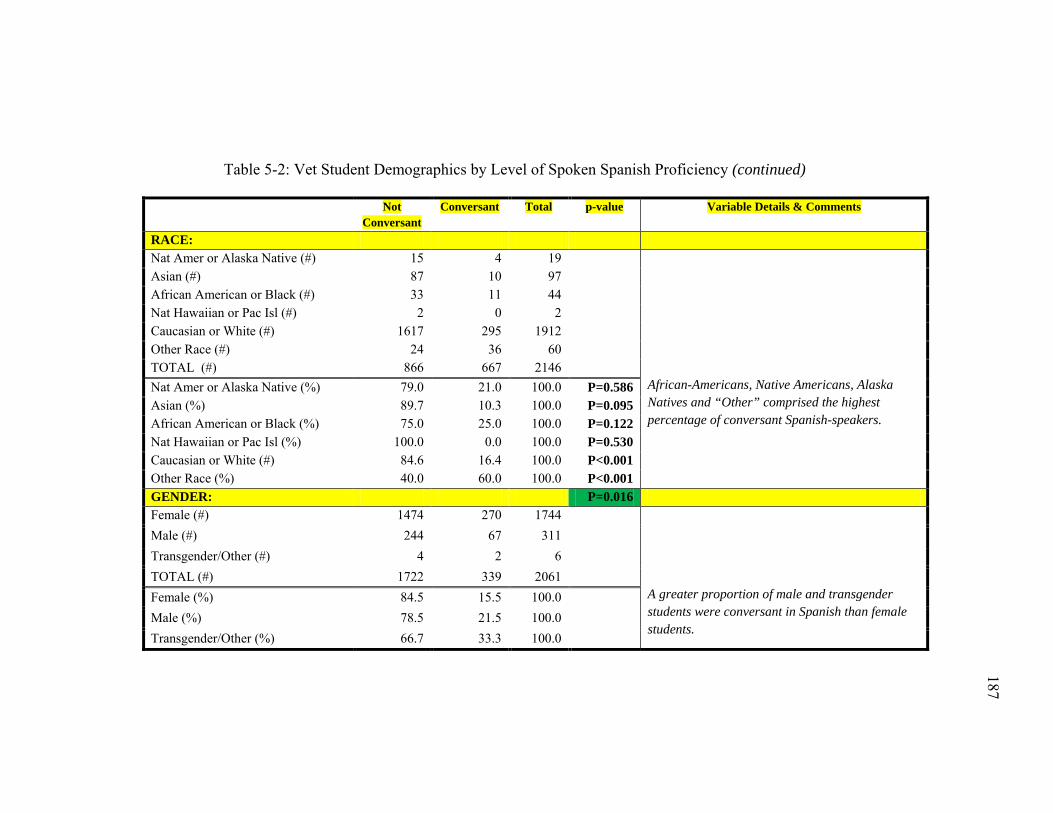
187
187
Table 5-2: Vet Student Demographics by Level of Spoken Spanish Proficiency (continued)
Not Conversant
Conversant Total p-value Variable Details & Comments
RACE: Nat Amer or Alaska Native (#) 15 4 19
African-Americans, Native Americans, Alaska Natives and “Other” comprised the highest percentage of conversant Spanish-speakers.
Asian (#) 87 10 97 African American or Black (#) 33 11 44 Nat Hawaiian or Pac Isl (#) 2 0 2 Caucasian or White (#) 1617 295 1912 Other Race (#) 24 36 60 TOTAL (#) 866 667 2146 Nat Amer or Alaska Native (%) 79.0 21.0 100.0 P=0.586 Asian (%) 89.7 10.3 100.0 P=0.095 African American or Black (%) 75.0 25.0 100.0 P=0.122 Nat Hawaiian or Pac Isl (%) 100.0 0.0 100.0 P=0.530 Caucasian or White (#) 84.6 16.4 100.0 P<0.001 Other Race (%) 40.0 60.0 100.0 P<0.001 GENDER: P=0.016 Female (#) 1474 270 1744
A greater proportion of male and transgender students were conversant in Spanish than female students.
Male (#) 244 67 311 Transgender/Other (#) 4 2 6 TOTAL (#) 1722 339 2061 Female (%) 84.5 15.5 100.0 Male (%) 78.5 21.5 100.0 Transgender/Other (%) 66.7 33.3 100.0
187
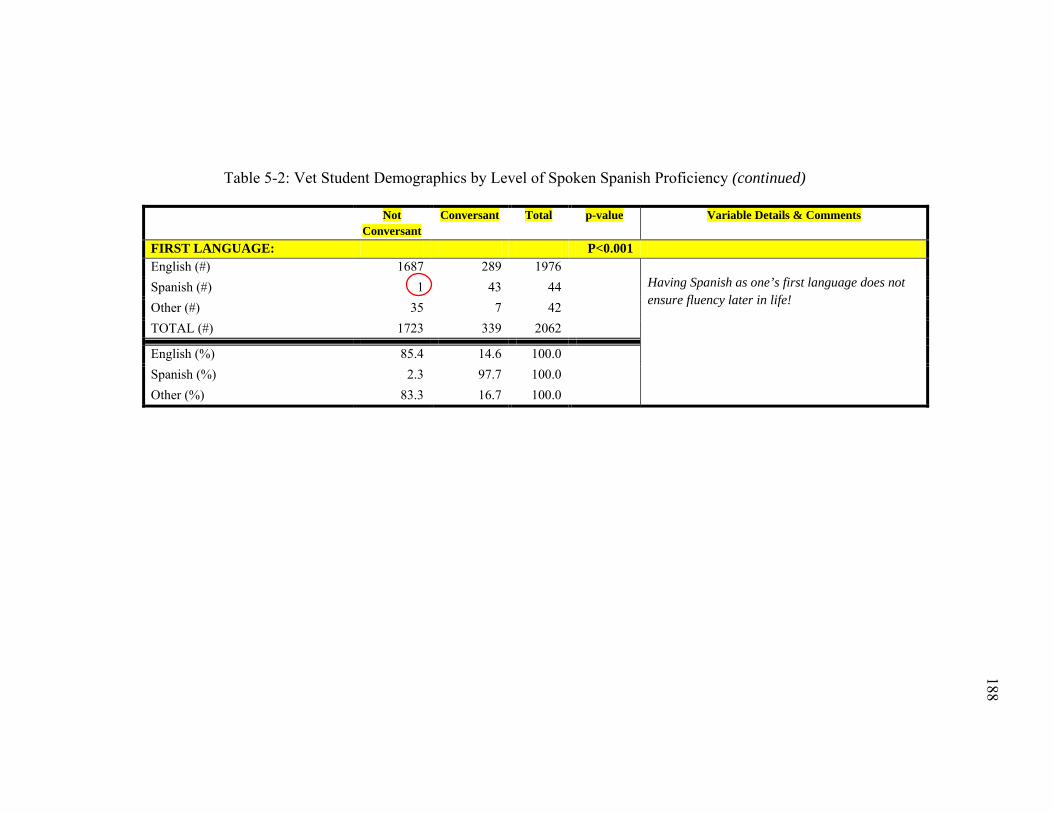
188
188
Table 5-2: Vet Student Demographics by Level of Spoken Spanish Proficiency (continued)
Not Conversant
Conversant Total p-value Variable Details & Comments
FIRST LANGUAGE: P<0.001 English (#) 1687 289 1976
Having Spanish as one’s first language does not ensure fluency later in life!
Spanish (#) 1 43 44 Other (#) 35 7 42 TOTAL (#) 1723 339 2062
English (%) 85.4 14.6 100.0 Spanish (%) 2.3 97.7 100.0 Other (%) 83.3 16.7 100.0
188
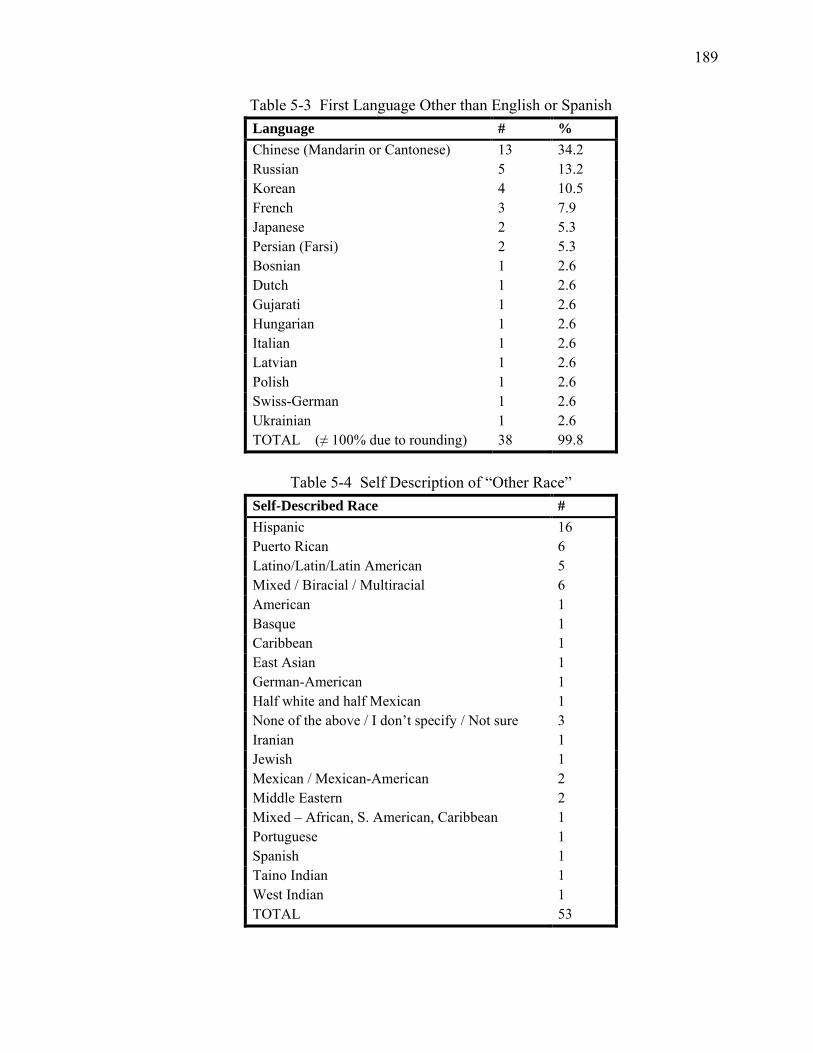
189
Table 5-3 First Language Other than English or Spanish Language # % Chinese (Mandarin or Cantonese) 13 34.2 Russian 5 13.2 Korean 4 10.5 French 3 7.9 Japanese 2 5.3 Persian (Farsi) 2 5.3 Bosnian 1 2.6 Dutch 1 2.6 Gujarati 1 2.6 Hungarian 1 2.6 Italian 1 2.6 Latvian 1 2.6 Polish 1 2.6 Swiss-German 1 2.6 Ukrainian 1 2.6 TOTAL (≠ 100% due to rounding) 38 99.8
Table 5-4 Self Description of “Other Race”
Self-Described Race # Hispanic 16 Puerto Rican 6 Latino/Latin/Latin American 5 Mixed / Biracial / Multiracial 6 American 1 Basque 1 Caribbean 1 East Asian 1 German-American 1 Half white and half Mexican 1 None of the above / I don’t specify / Not sure 3 Iranian 1 Jewish 1 Mexican / Mexican-American 2 Middle Eastern 2 Mixed – African, S. American, Caribbean 1 Portuguese 1 Spanish 1 Taino Indian 1 West Indian 1 TOTAL 53
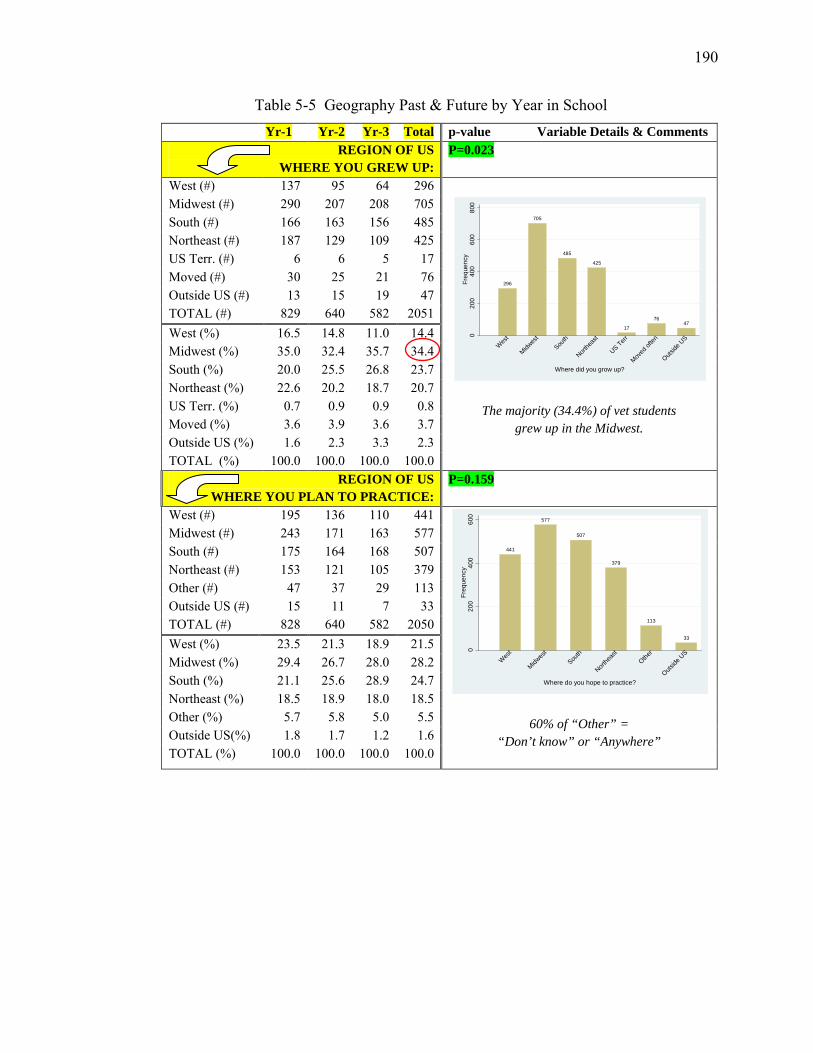
190
Table 5-5 Geography Past & Future by Year in School Yr-1 Yr-2 Yr-3 Total p-value Variable Details & Comments
REGION OF US WHERE YOU GREW UP:
P=0.023
West (#) 137 95 64 296
The majority (34.4%) of vet students grew up in the Midwest.
Midwest (#) 290 207 208 705 South (#) 166 163 156 485 Northeast (#) 187 129 109 425 US Terr. (#) 6 6 5 17 Moved (#) 30 25 21 76 Outside US (#) 13 15 19 47 TOTAL (#) 829 640 582 2051 West (%) 16.5 14.8 11.0 14.4 Midwest (%) 35.0 32.4 35.7 34.4 South (%) 20.0 25.5 26.8 23.7 Northeast (%) 22.6 20.2 18.7 20.7 US Terr. (%) 0.7 0.9 0.9 0.8 Moved (%) 3.6 3.9 3.6 3.7 Outside US (%) 1.6 2.3 3.3 2.3 TOTAL (%) 100.0 100.0 100.0 100.0
REGION OF US WHERE YOU PLAN TO PRACTICE:
P=0.159
West (#) 195 136 110 441
60% of “Other” = “Don’t know” or “Anywhere”
Midwest (#) 243 171 163 577 South (#) 175 164 168 507 Northeast (#) 153 121 105 379 Other (#) 47 37 29 113 Outside US (#) 15 11 7 33 TOTAL (#) 828 640 582 2050 West (%) 23.5 21.3 18.9 21.5 Midwest (%) 29.4 26.7 28.0 28.2 South (%) 21.1 25.6 28.9 24.7 Northeast (%) 18.5 18.9 18.0 18.5 Other (%) 5.7 5.8 5.0 5.5 Outside US(%) 1.8 1.7 1.2 1.6 TOTAL (%) 100.0 100.0 100.0 100.0
296
705
485
425
17
7647
020
040
060
080
0Fr
eque
ncy
Wes
t
Midwes
tSou
th
Northe
ast
US Terr
Moved
often
Outside
US
Where did you grow up?
441
577
507
379
113
33
020
040
060
0Fr
eque
ncy
Wes
t
Midwes
tSou
th
Northe
ast
Other
Outside
US
Where do you hope to practice?
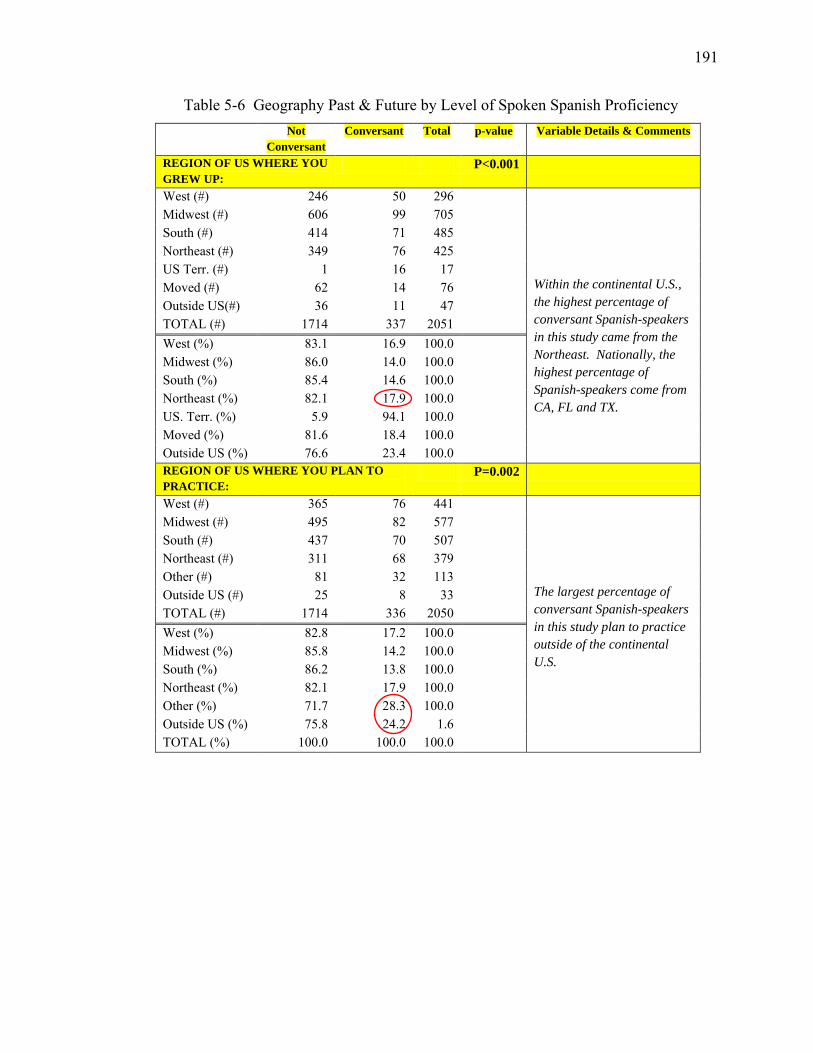
191
Table 5-6 Geography Past & Future by Level of Spoken Spanish Proficiency Not
Conversant Conversant Total p-value Variable Details & Comments
REGION OF US WHERE YOU GREW UP:
P<0.001
West (#) 246 50 296 Within the continental U.S., the highest percentage of conversant Spanish-speakers in this study came from the Northeast. Nationally, the highest percentage of Spanish-speakers come from CA, FL and TX.
Midwest (#) 606 99 705 South (#) 414 71 485 Northeast (#) 349 76 425 US Terr. (#) 1 16 17 Moved (#) 62 14 76 Outside US(#) 36 11 47 TOTAL (#) 1714 337 2051 West (%) 83.1 16.9 100.0 Midwest (%) 86.0 14.0 100.0 South (%) 85.4 14.6 100.0 Northeast (%) 82.1 17.9 100.0 US. Terr. (%) 5.9 94.1 100.0 Moved (%) 81.6 18.4 100.0 Outside US (%) 76.6 23.4 100.0 REGION OF US WHERE YOU PLAN TO PRACTICE:
P=0.002
West (#) 365 76 441
The largest percentage of conversant Spanish-speakers in this study plan to practice outside of the continental U.S.
Midwest (#) 495 82 577 South (#) 437 70 507 Northeast (#) 311 68 379 Other (#) 81 32 113 Outside US (#) 25 8 33 TOTAL (#) 1714 336 2050 West (%) 82.8 17.2 100.0 Midwest (%) 85.8 14.2 100.0 South (%) 86.2 13.8 100.0 Northeast (%) 82.1 17.9 100.0 Other (%) 71.7 28.3 100.0 Outside US (%) 75.8 24.2 1.6 TOTAL (%) 100.0 100.0 100.0
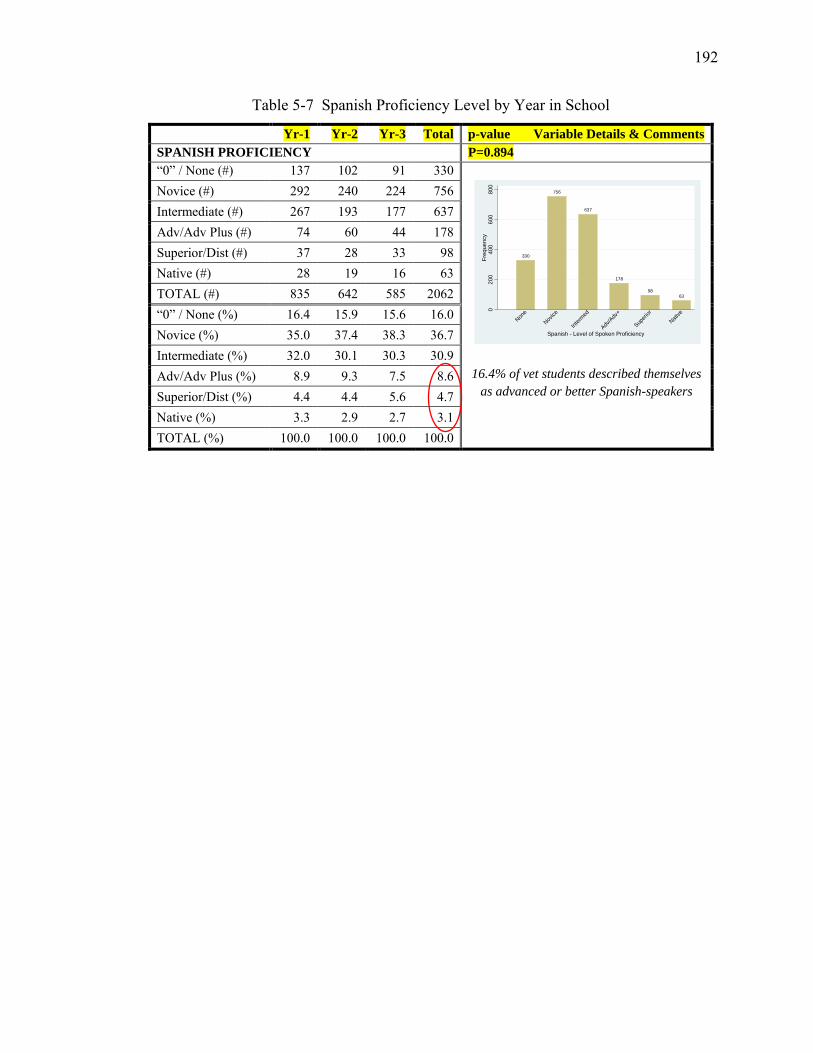
192
Table 5-7 Spanish Proficiency Level by Year in School
Yr-1 Yr-2 Yr-3 Total p-value Variable Details & Comments SPANISH PROFICIENCY P=0.894 “0” / None (#) 137 102 91 330
16.4% of vet students described themselves as advanced or better Spanish-speakers
Novice (#) 292 240 224 756 Intermediate (#) 267 193 177 637 Adv/Adv Plus (#) 74 60 44 178 Superior/Dist (#) 37 28 33 98 Native (#) 28 19 16 63 TOTAL (#) 835 642 585 2062 “0” / None (%) 16.4 15.9 15.6 16.0 Novice (%) 35.0 37.4 38.3 36.7 Intermediate (%) 32.0 30.1 30.3 30.9 Adv/Adv Plus (%) 8.9 9.3 7.5 8.6 Superior/Dist (%) 4.4 4.4 5.6 4.7 Native (%) 3.3 2.9 2.7 3.1 TOTAL (%) 100.0 100.0 100.0 100.0
330
756
637
178
9863
020
040
060
080
0Fr
eque
ncy
None
Novice
Interm
ed
Adv/A
dv+
Superi
or
Native
Spanish - Level of Spoken Proficiency
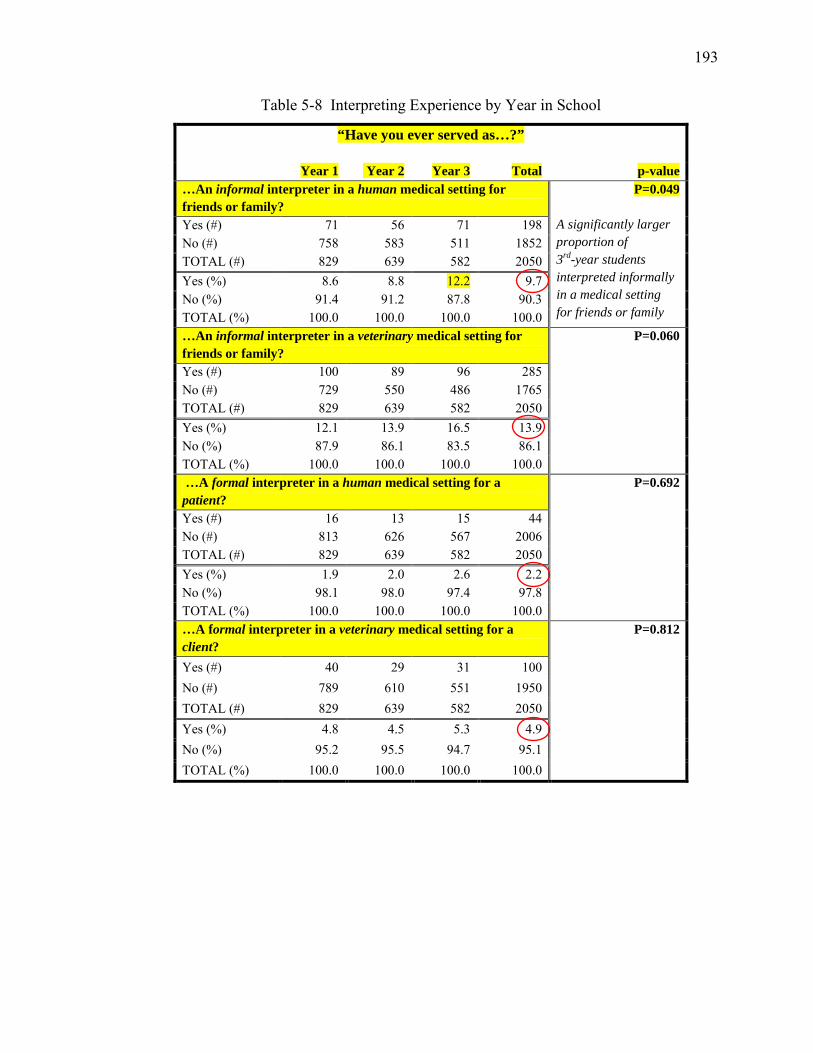
193
Table 5-8 Interpreting Experience by Year in School
“Have you ever served as…?”
Year 1 Year 2 Year 3 Total p-value …An informal interpreter in a human medical setting for friends or family?
P=0.049 A significantly larger proportion of 3rd-year students interpreted informally in a medical setting for friends or family
Yes (#) 71 56 71 198 No (#) 758 583 511 1852 TOTAL (#) 829 639 582 2050 Yes (%) 8.6 8.8 12.2 9.7 No (%) 91.4 91.2 87.8 90.3 TOTAL (%) 100.0 100.0 100.0 100.0 …An informal interpreter in a veterinary medical setting for friends or family?
P=0.060
Yes (#) 100 89 96 285 No (#) 729 550 486 1765 TOTAL (#) 829 639 582 2050 Yes (%) 12.1 13.9 16.5 13.9 No (%) 87.9 86.1 83.5 86.1 TOTAL (%) 100.0 100.0 100.0 100.0 …A formal interpreter in a human medical setting for a patient?
P=0.692
Yes (#) 16 13 15 44 No (#) 813 626 567 2006 TOTAL (#) 829 639 582 2050 Yes (%) 1.9 2.0 2.6 2.2 No (%) 98.1 98.0 97.4 97.8 TOTAL (%) 100.0 100.0 100.0 100.0 …A formal interpreter in a veterinary medical setting for a client?
P=0.812
Yes (#) 40 29 31 100 No (#) 789 610 551 1950 TOTAL (#) 829 639 582 2050 Yes (%) 4.8 4.5 5.3 4.9 No (%) 95.2 95.5 94.7 95.1 TOTAL (%) 100.0 100.0 100.0 100.0
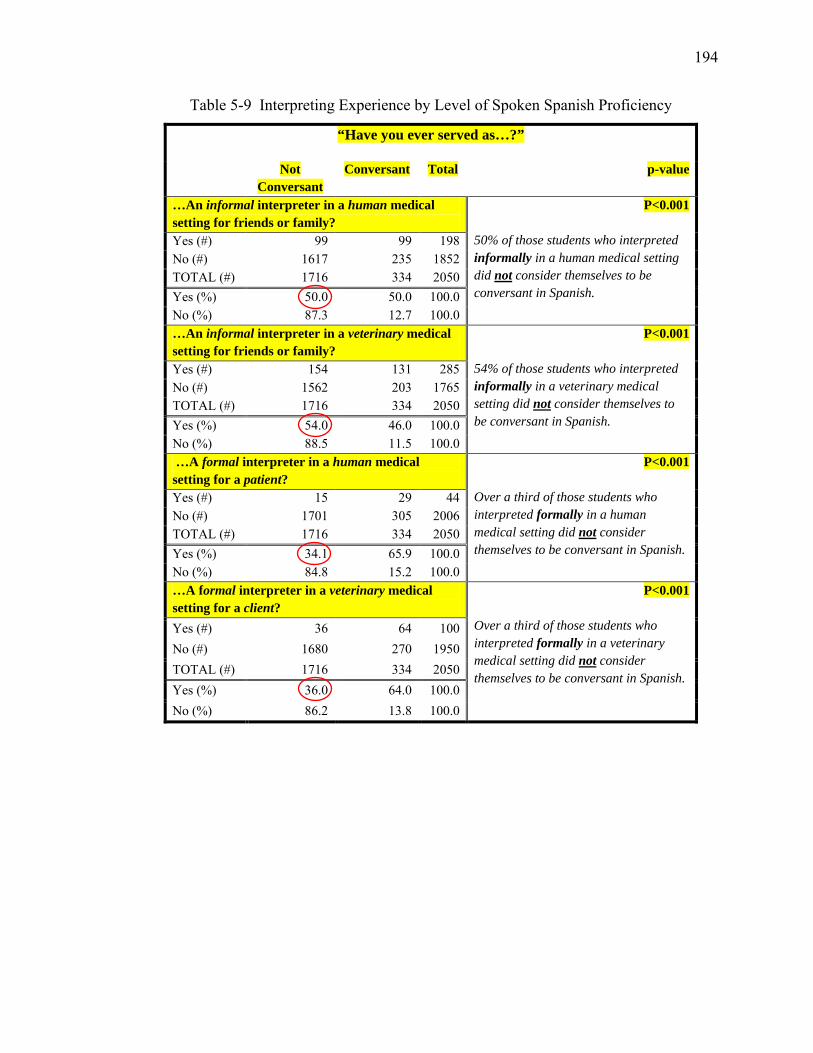
194
Table 5-9 Interpreting Experience by Level of Spoken Spanish Proficiency
“Have you ever served as…?”
Not Conversant
Conversant Total p-value
…An informal interpreter in a human medical setting for friends or family?
P<0.001 50% of those students who interpreted informally in a human medical setting did not consider themselves to be conversant in Spanish.
Yes (#) 99 99 198 No (#) 1617 235 1852 TOTAL (#) 1716 334 2050 Yes (%) 50.0 50.0 100.0 No (%) 87.3 12.7 100.0 …An informal interpreter in a veterinary medical setting for friends or family?
P<0.001 54% of those students who interpreted informally in a veterinary medical setting did not consider themselves to be conversant in Spanish.
Yes (#) 154 131 285 No (#) 1562 203 1765 TOTAL (#) 1716 334 2050 Yes (%) 54.0 46.0 100.0 No (%) 88.5 11.5 100.0 …A formal interpreter in a human medical setting for a patient?
P<0.001 Over a third of those students who interpreted formally in a human medical setting did not consider themselves to be conversant in Spanish.
Yes (#) 15 29 44 No (#) 1701 305 2006 TOTAL (#) 1716 334 2050 Yes (%) 34.1 65.9 100.0 No (%) 84.8 15.2 100.0 …A formal interpreter in a veterinary medical setting for a client?
P<0.001 Over a third of those students who interpreted formally in a veterinary medical setting did not consider themselves to be conversant in Spanish.
Yes (#) 36 64 100 No (#) 1680 270 1950 TOTAL (#) 1716 334 2050 Yes (%) 36.0 64.0 100.0 No (%) 86.2 13.8 100.0
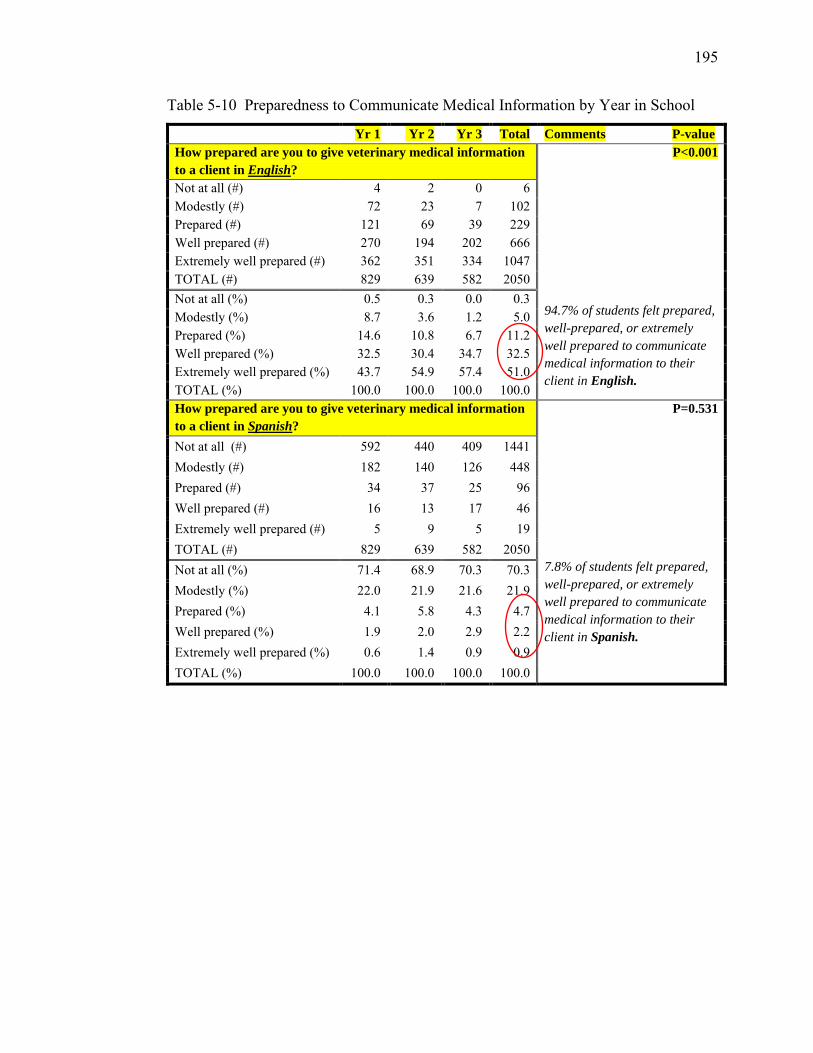
195
Table 5-10 Preparedness to Communicate Medical Information by Year in School
Yr 1 Yr 2 Yr 3 Total Comments P-value How prepared are you to give veterinary medical information to a client in English?
P<0.001 94.7% of students felt prepared, well-prepared, or extremely well prepared to communicate medical information to their client in English.
Not at all (#) 4 2 0 6 Modestly (#) 72 23 7 102 Prepared (#) 121 69 39 229 Well prepared (#) 270 194 202 666 Extremely well prepared (#) 362 351 334 1047 TOTAL (#) 829 639 582 2050 Not at all (%) 0.5 0.3 0.0 0.3 Modestly (%) 8.7 3.6 1.2 5.0 Prepared (%) 14.6 10.8 6.7 11.2 Well prepared (%) 32.5 30.4 34.7 32.5 Extremely well prepared (%) 43.7 54.9 57.4 51.0 TOTAL (%) 100.0 100.0 100.0 100.0 How prepared are you to give veterinary medical information to a client in Spanish?
P=0.531
7.8% of students felt prepared, well-prepared, or extremely well prepared to communicate medical information to their client in Spanish.
Not at all (#) 592 440 409 1441 Modestly (#) 182 140 126 448 Prepared (#) 34 37 25 96 Well prepared (#) 16 13 17 46 Extremely well prepared (#) 5 9 5 19 TOTAL (#) 829 639 582 2050 Not at all (%) 71.4 68.9 70.3 70.3 Modestly (%) 22.0 21.9 21.6 21.9 Prepared (%) 4.1 5.8 4.3 4.7 Well prepared (%) 1.9 2.0 2.9 2.2 Extremely well prepared (%) 0.6 1.4 0.9 0.9 TOTAL (%) 100.0 100.0 100.0 100.0
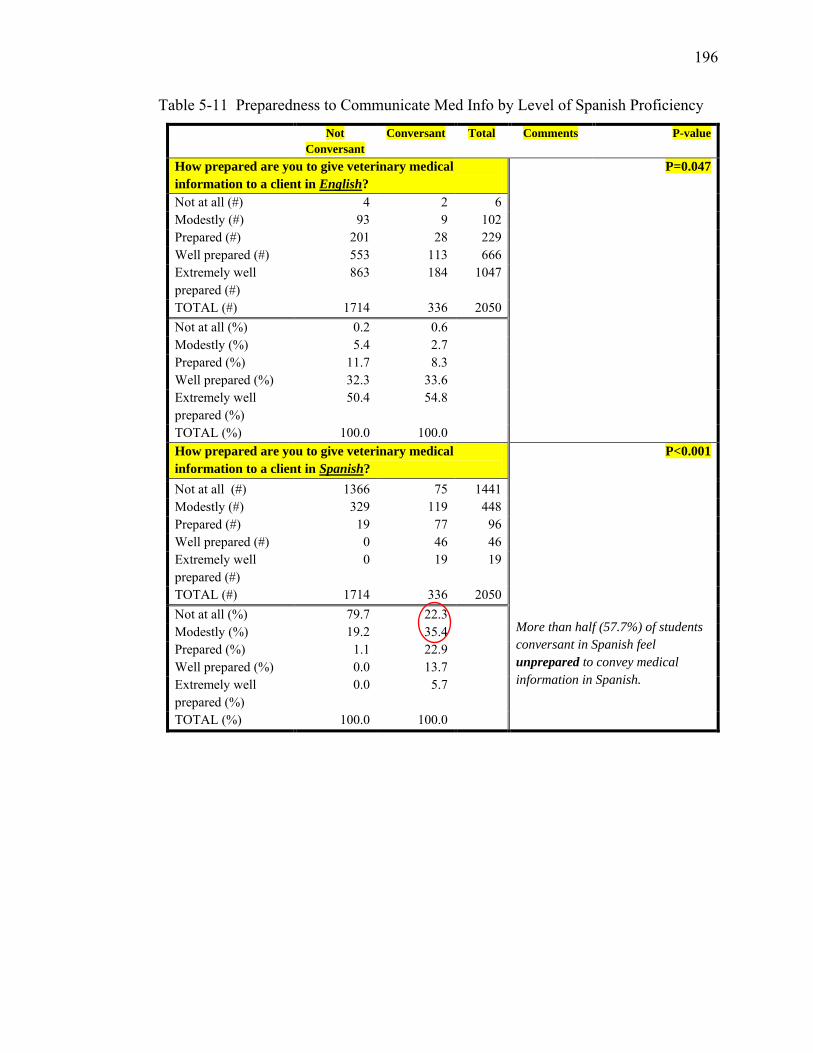
196
Table 5-11 Preparedness to Communicate Med Info by Level of Spanish Proficiency
Not Conversant
Conversant Total Comments P-value
How prepared are you to give veterinary medical information to a client in English?
P=0.047
Not at all (#) 4 2 6 Modestly (#) 93 9 102 Prepared (#) 201 28 229 Well prepared (#) 553 113 666 Extremely well prepared (#)
863 184 1047
TOTAL (#) 1714 336 2050 Not at all (%) 0.2 0.6 Modestly (%) 5.4 2.7 Prepared (%) 11.7 8.3 Well prepared (%) 32.3 33.6 Extremely well prepared (%)
50.4 54.8
TOTAL (%) 100.0 100.0 How prepared are you to give veterinary medical information to a client in Spanish?
P<0.001 More than half (57.7%) of students conversant in Spanish feel unprepared to convey medical information in Spanish.
Not at all (#) 1366 75 1441 Modestly (#) 329 119 448 Prepared (#) 19 77 96 Well prepared (#) 0 46 46 Extremely well prepared (#)
0 19 19
TOTAL (#) 1714 336 2050 Not at all (%) 79.7 22.3 Modestly (%) 19.2 35.4 Prepared (%) 1.1 22.9 Well prepared (%) 0.0 13.7 Extremely well prepared (%)
0.0 5.7
TOTAL (%) 100.0 100.0
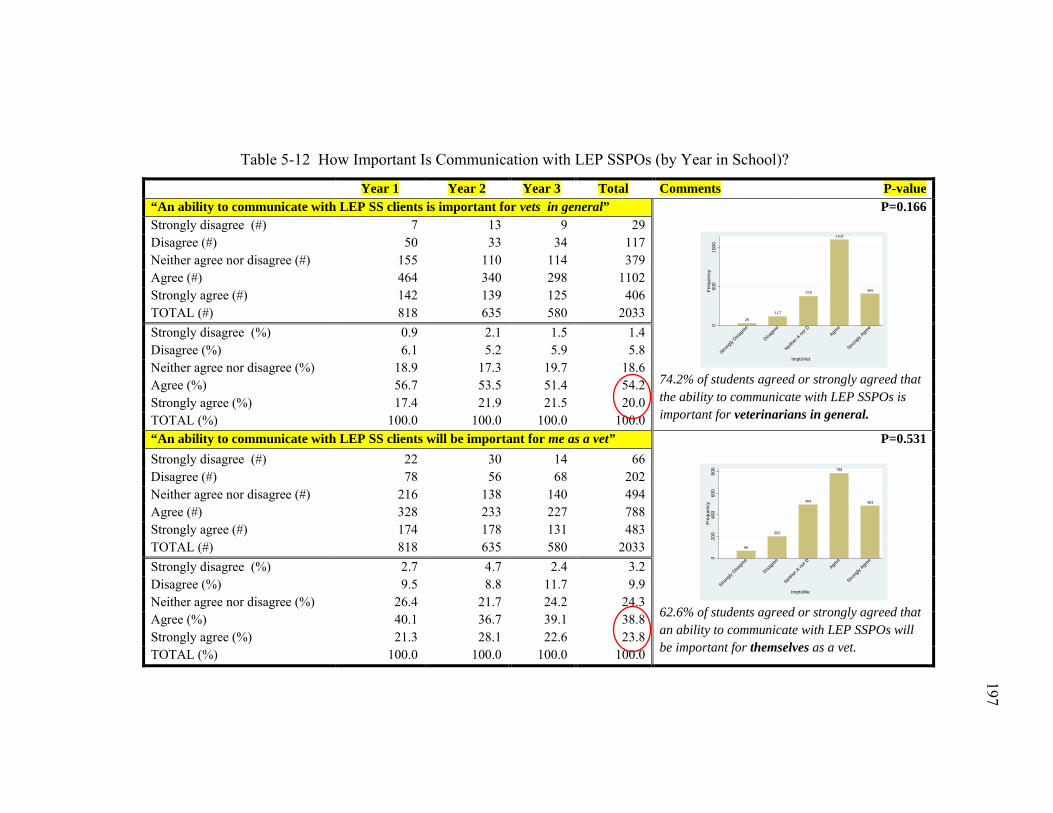
197
197
Table 5-12 How Important Is Communication with LEP SSPOs (by Year in School)?
Year 1 Year 2 Year 3 Total Comments P-value “An ability to communicate with LEP SS clients is important for vets in general” P=0.166
74.2% of students agreed or strongly agreed that the ability to communicate with LEP SSPOs is important for veterinarians in general.
Strongly disagree (#) 7 13 9 29 Disagree (#) 50 33 34 117 Neither agree nor disagree (#) 155 110 114 379 Agree (#) 464 340 298 1102 Strongly agree (#) 142 139 125 406 TOTAL (#) 818 635 580 2033 Strongly disagree (%) 0.9 2.1 1.5 1.4 Disagree (%) 6.1 5.2 5.9 5.8 Neither agree nor disagree (%) 18.9 17.3 19.7 18.6 Agree (%) 56.7 53.5 51.4 54.2 Strongly agree (%) 17.4 21.9 21.5 20.0 TOTAL (%) 100.0 100.0 100.0 100.0 “An ability to communicate with LEP SS clients will be important for me as a vet” P=0.531
62.6% of students agreed or strongly agreed that an ability to communicate with LEP SSPOs will be important for themselves as a vet.
Strongly disagree (#) 22 30 14 66 Disagree (#) 78 56 68 202 Neither agree nor disagree (#) 216 138 140 494 Agree (#) 328 233 227 788 Strongly agree (#) 174 178 131 483 TOTAL (#) 818 635 580 2033 Strongly disagree (%) 2.7 4.7 2.4 3.2 Disagree (%) 9.5 8.8 11.7 9.9 Neither agree nor disagree (%) 26.4 21.7 24.2 24.3 Agree (%) 40.1 36.7 39.1 38.8 Strongly agree (%) 21.3 28.1 22.6 23.8 TOTAL (%) 100.0 100.0 100.0 100.0
29
117
379
1102
406
050
010
00Fr
eque
ncy
Strong
ly Disa
gree
Disagre
e
Neithe
r A no
r DAgre
e
Strong
ly Agre
e
ImptoVet
66
202
494
788
483
020
040
060
080
0Fr
eque
ncy
Strong
ly Disa
gree
Disagre
e
Neithe
r A no
r DAgre
e
Strong
ly Agre
e
ImptoMe
197
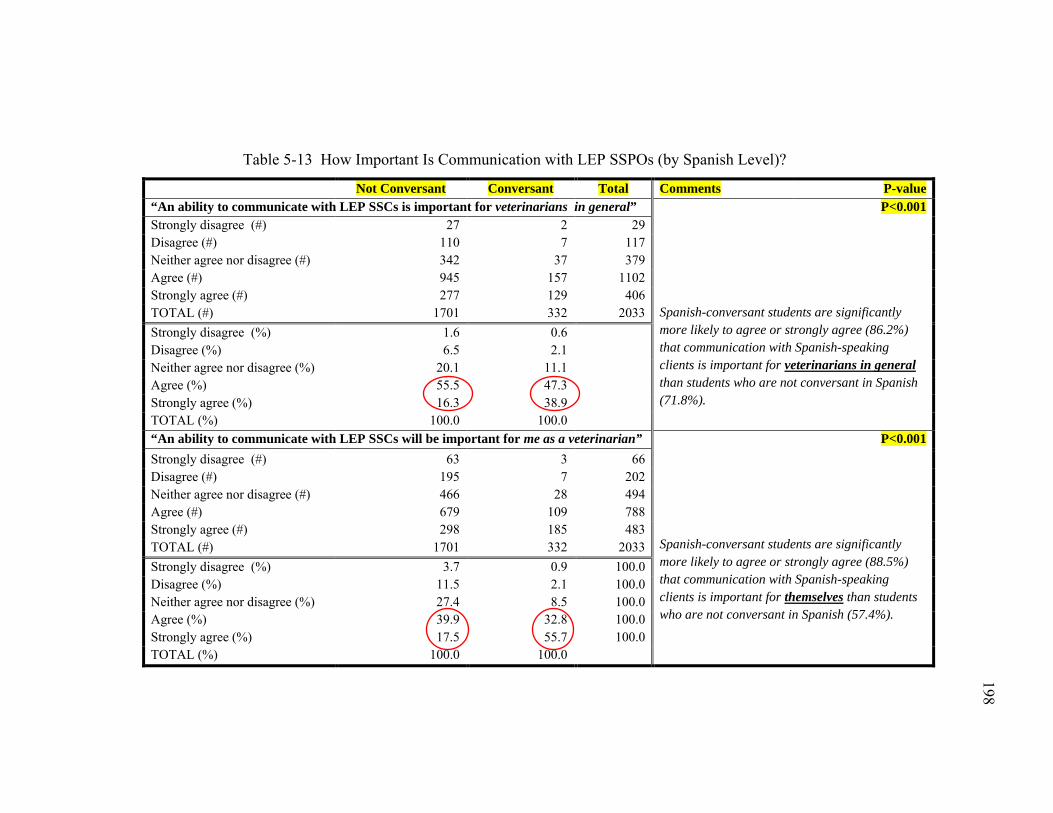
198
198
Table 5-13 How Important Is Communication with LEP SSPOs (by Spanish Level)?
Not Conversant Conversant Total Comments P-value “An ability to communicate with LEP SSCs is important for veterinarians in general” P<0.001
Spanish-conversant students are significantly more likely to agree or strongly agree (86.2%) that communication with Spanish-speaking clients is important for veterinarians in general than students who are not conversant in Spanish (71.8%).
Strongly disagree (#) 27 2 29 Disagree (#) 110 7 117 Neither agree nor disagree (#) 342 37 379 Agree (#) 945 157 1102 Strongly agree (#) 277 129 406 TOTAL (#) 1701 332 2033 Strongly disagree (%) 1.6 0.6 Disagree (%) 6.5 2.1 Neither agree nor disagree (%) 20.1 11.1 Agree (%) 55.5 47.3 Strongly agree (%) 16.3 38.9 TOTAL (%) 100.0 100.0 “An ability to communicate with LEP SSCs will be important for me as a veterinarian” P<0.001
Spanish-conversant students are significantly more likely to agree or strongly agree (88.5%) that communication with Spanish-speaking clients is important for themselves than students who are not conversant in Spanish (57.4%).
Strongly disagree (#) 63 3 66 Disagree (#) 195 7 202 Neither agree nor disagree (#) 466 28 494 Agree (#) 679 109 788 Strongly agree (#) 298 185 483 TOTAL (#) 1701 332 2033 Strongly disagree (%) 3.7 0.9 100.0 Disagree (%) 11.5 2.1 100.0 Neither agree nor disagree (%) 27.4 8.5 100.0 Agree (%) 39.9 32.8 100.0 Strongly agree (%) 17.5 55.7 100.0 TOTAL (%) 100.0 100.0
198
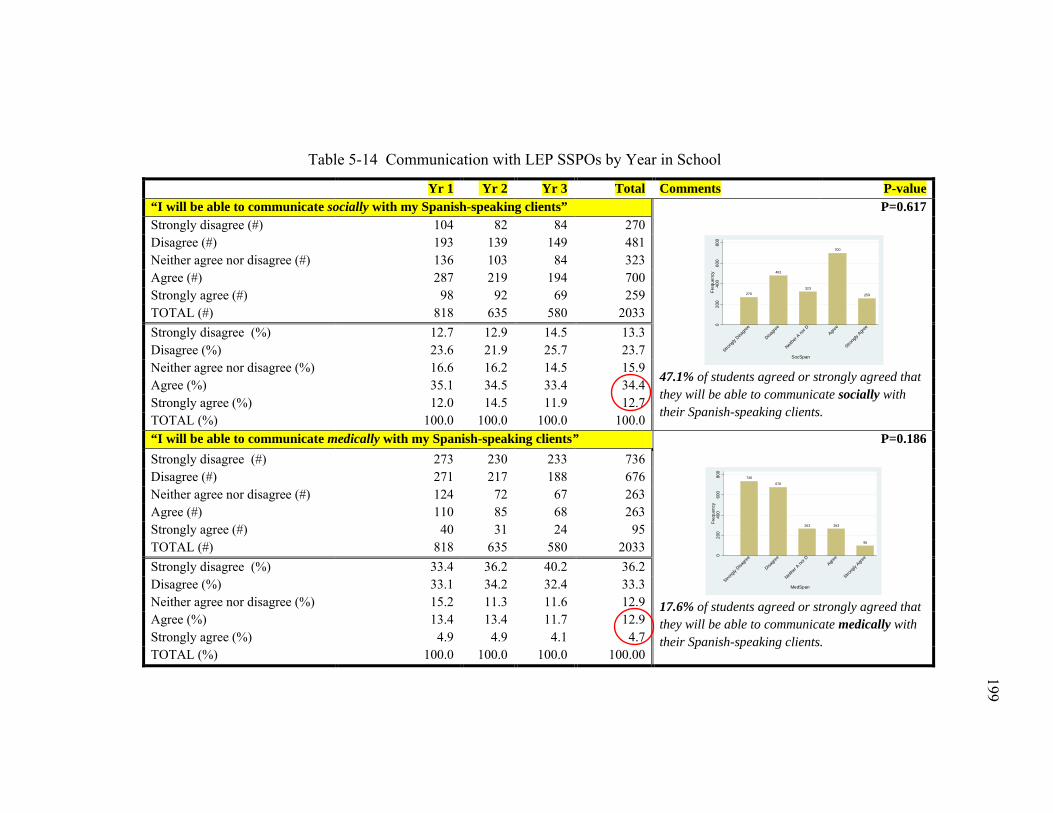
199
199
Table 5-14 Communication with LEP SSPOs by Year in School
Yr 1 Yr 2 Yr 3 Total Comments P-value “I will be able to communicate socially with my Spanish-speaking clients” P=0.617
47.1% of students agreed or strongly agreed that they will be able to communicate socially with their Spanish-speaking clients.
Strongly disagree (#) 104 82 84 270 Disagree (#) 193 139 149 481 Neither agree nor disagree (#) 136 103 84 323 Agree (#) 287 219 194 700 Strongly agree (#) 98 92 69 259 TOTAL (#) 818 635 580 2033 Strongly disagree (%) 12.7 12.9 14.5 13.3 Disagree (%) 23.6 21.9 25.7 23.7 Neither agree nor disagree (%) 16.6 16.2 14.5 15.9 Agree (%) 35.1 34.5 33.4 34.4 Strongly agree (%) 12.0 14.5 11.9 12.7 TOTAL (%) 100.0 100.0 100.0 100.0 “I will be able to communicate medically with my Spanish-speaking clients” P=0.186
17.6% of students agreed or strongly agreed that they will be able to communicate medically with their Spanish-speaking clients.
Strongly disagree (#) 273 230 233 736 Disagree (#) 271 217 188 676 Neither agree nor disagree (#) 124 72 67 263 Agree (#) 110 85 68 263 Strongly agree (#) 40 31 24 95 TOTAL (#) 818 635 580 2033 Strongly disagree (%) 33.4 36.2 40.2 36.2 Disagree (%) 33.1 34.2 32.4 33.3 Neither agree nor disagree (%) 15.2 11.3 11.6 12.9 Agree (%) 13.4 13.4 11.7 12.9 Strongly agree (%) 4.9 4.9 4.1 4.7 TOTAL (%) 100.0 100.0 100.0 100.00
270
481
323
700
259
020
040
060
080
0Fr
eque
ncy
Strong
ly Disa
gree
Disagre
e
Neithe
r A no
r DAgre
e
Strong
ly Agre
e
SocSpan
736
676
263 263
95
020
040
060
080
0Fr
eque
ncy
Strong
ly Disa
gree
Disagre
e
Neithe
r A no
r DAgre
e
Strong
ly Agre
e
MedSpan
199
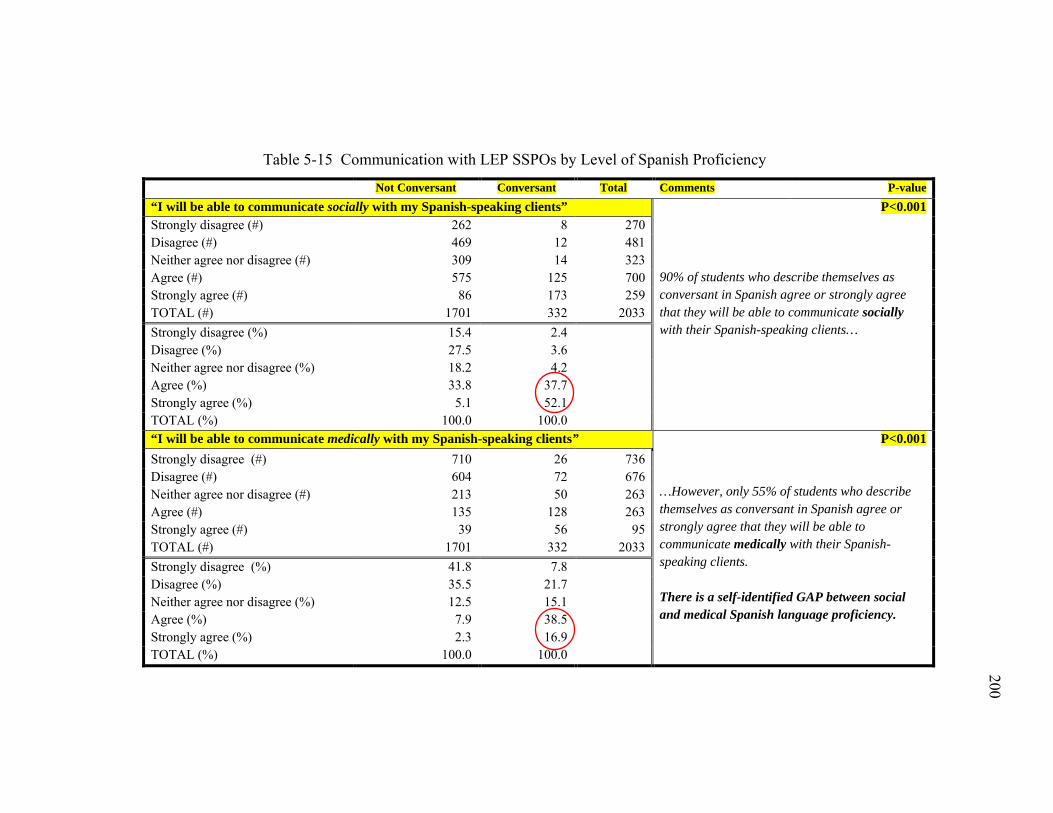
200
200
Table 5-15 Communication with LEP SSPOs by Level of Spanish Proficiency
Not Conversant Conversant Total Comments P-value “I will be able to communicate socially with my Spanish-speaking clients” P<0.001
90% of students who describe themselves as conversant in Spanish agree or strongly agree that they will be able to communicate socially with their Spanish-speaking clients…
Strongly disagree (#) 262 8 270 Disagree (#) 469 12 481 Neither agree nor disagree (#) 309 14 323 Agree (#) 575 125 700 Strongly agree (#) 86 173 259 TOTAL (#) 1701 332 2033 Strongly disagree (%) 15.4 2.4 Disagree (%) 27.5 3.6 Neither agree nor disagree (%) 18.2 4.2 Agree (%) 33.8 37.7 Strongly agree (%) 5.1 52.1 TOTAL (%) 100.0 100.0 “I will be able to communicate medically with my Spanish-speaking clients” P<0.001
…However, only 55% of students who describe themselves as conversant in Spanish agree or strongly agree that they will be able to communicate medically with their Spanish-speaking clients. There is a self-identified GAP between social and medical Spanish language proficiency.
Strongly disagree (#) 710 26 736 Disagree (#) 604 72 676 Neither agree nor disagree (#) 213 50 263 Agree (#) 135 128 263 Strongly agree (#) 39 56 95 TOTAL (#) 1701 332 2033 Strongly disagree (%) 41.8 7.8 Disagree (%) 35.5 21.7 Neither agree nor disagree (%) 12.5 15.1 Agree (%) 7.9 38.5 Strongly agree (%) 2.3 16.9 TOTAL (%) 100.0 100.0
200
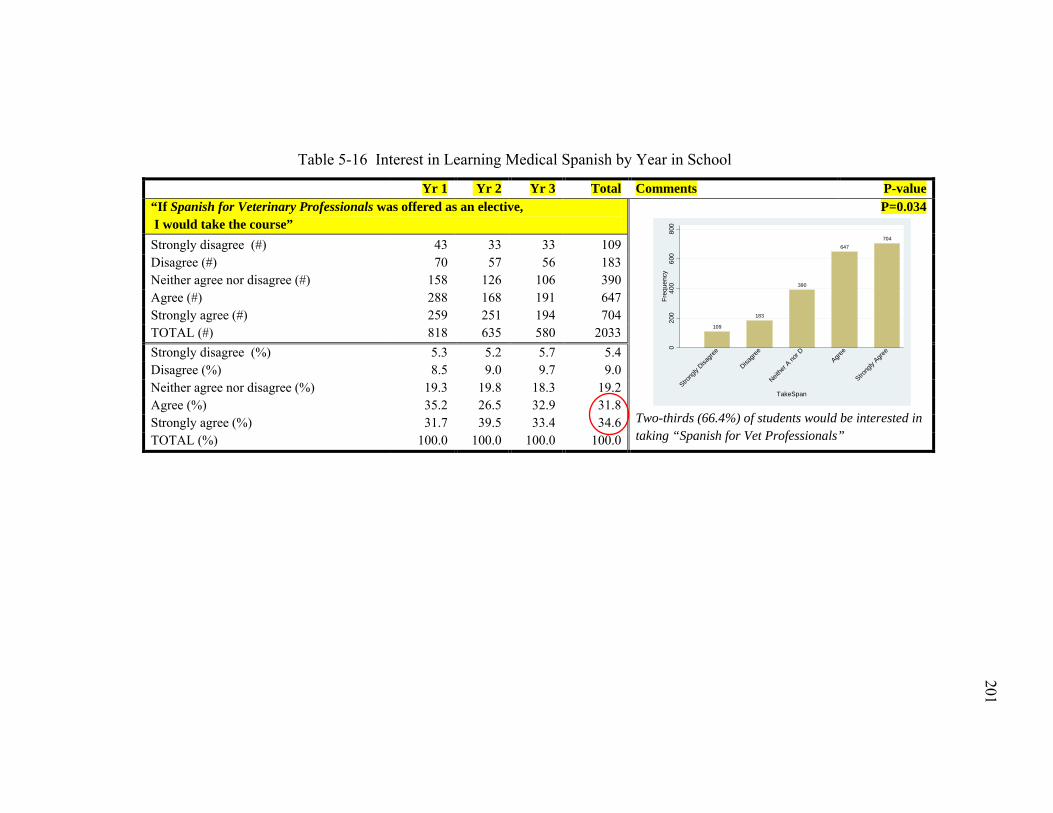
201
201
Table 5-16 Interest in Learning Medical Spanish by Year in School
Yr 1 Yr 2 Yr 3 Total Comments P-value “If Spanish for Veterinary Professionals was offered as an elective, I would take the course”
P=0.034
Two-thirds (66.4%) of students would be interested in taking “Spanish for Vet Professionals”
Strongly disagree (#) 43 33 33 109 Disagree (#) 70 57 56 183 Neither agree nor disagree (#) 158 126 106 390 Agree (#) 288 168 191 647 Strongly agree (#) 259 251 194 704 TOTAL (#) 818 635 580 2033 Strongly disagree (%) 5.3 5.2 5.7 5.4 Disagree (%) 8.5 9.0 9.7 9.0 Neither agree nor disagree (%) 19.3 19.8 18.3 19.2 Agree (%) 35.2 26.5 32.9 31.8 Strongly agree (%) 31.7 39.5 33.4 34.6 TOTAL (%) 100.0 100.0 100.0 100.0
109
183
390
647704
020
040
060
080
0Fr
eque
ncy
Strong
ly Disa
gree
Disagre
e
Neithe
r A no
r DAgre
e
Strong
ly Agre
e
TakeSpan
201
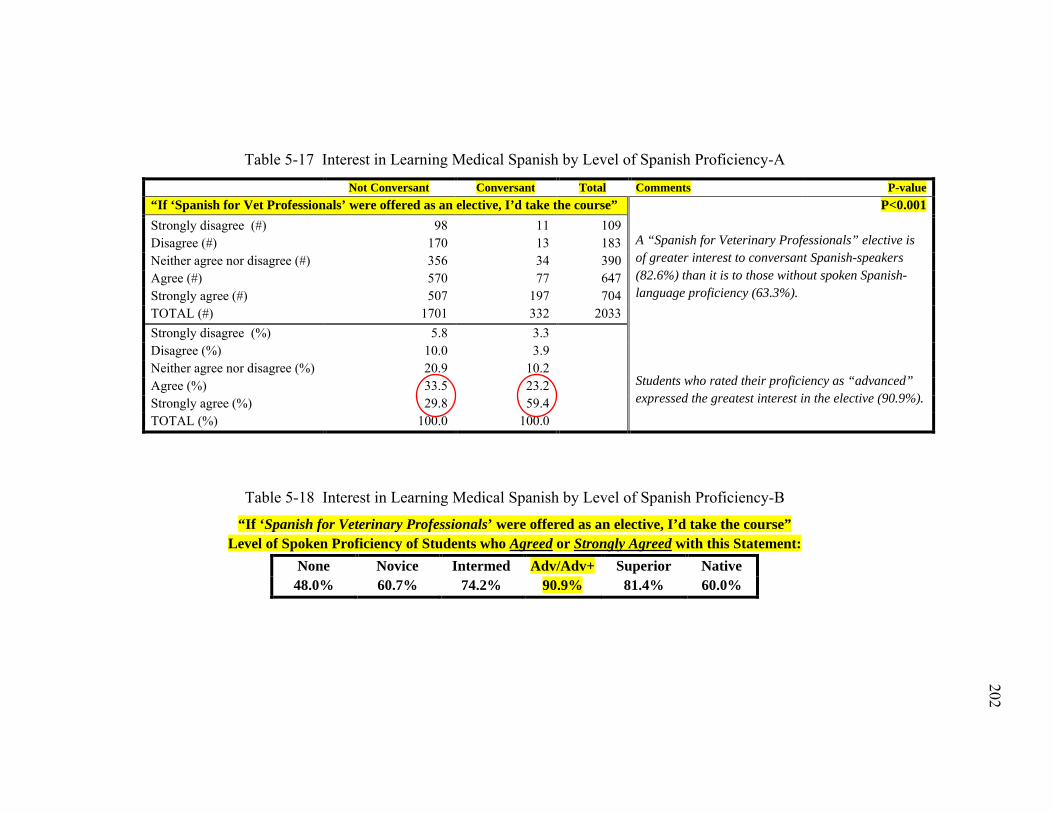
202
202
Table 5-17 Interest in Learning Medical Spanish by Level of Spanish Proficiency-A
Not Conversant Conversant Total Comments P-value “If ‘Spanish for Vet Professionals’ were offered as an elective, I’d take the course” P<0.001
A “Spanish for Veterinary Professionals” elective is of greater interest to conversant Spanish-speakers (82.6%) than it is to those without spoken Spanish-language proficiency (63.3%). Students who rated their proficiency as “advanced” expressed the greatest interest in the elective (90.9%).
Strongly disagree (#) 98 11 109 Disagree (#) 170 13 183 Neither agree nor disagree (#) 356 34 390 Agree (#) 570 77 647 Strongly agree (#) 507 197 704 TOTAL (#) 1701 332 2033 Strongly disagree (%) 5.8 3.3 Disagree (%) 10.0 3.9 Neither agree nor disagree (%) 20.9 10.2 Agree (%) 33.5 23.2 Strongly agree (%) 29.8 59.4 TOTAL (%) 100.0 100.0
Table 5-18 Interest in Learning Medical Spanish by Level of Spanish Proficiency-B
“If ‘Spanish for Veterinary Professionals’ were offered as an elective, I’d take the course” Level of Spoken Proficiency of Students who Agreed or Strongly Agreed with this Statement:
None Novice Intermed Adv/Adv+ Superior Native 48.0% 60.7% 74.2% 90.9% 81.4% 60.0%
202
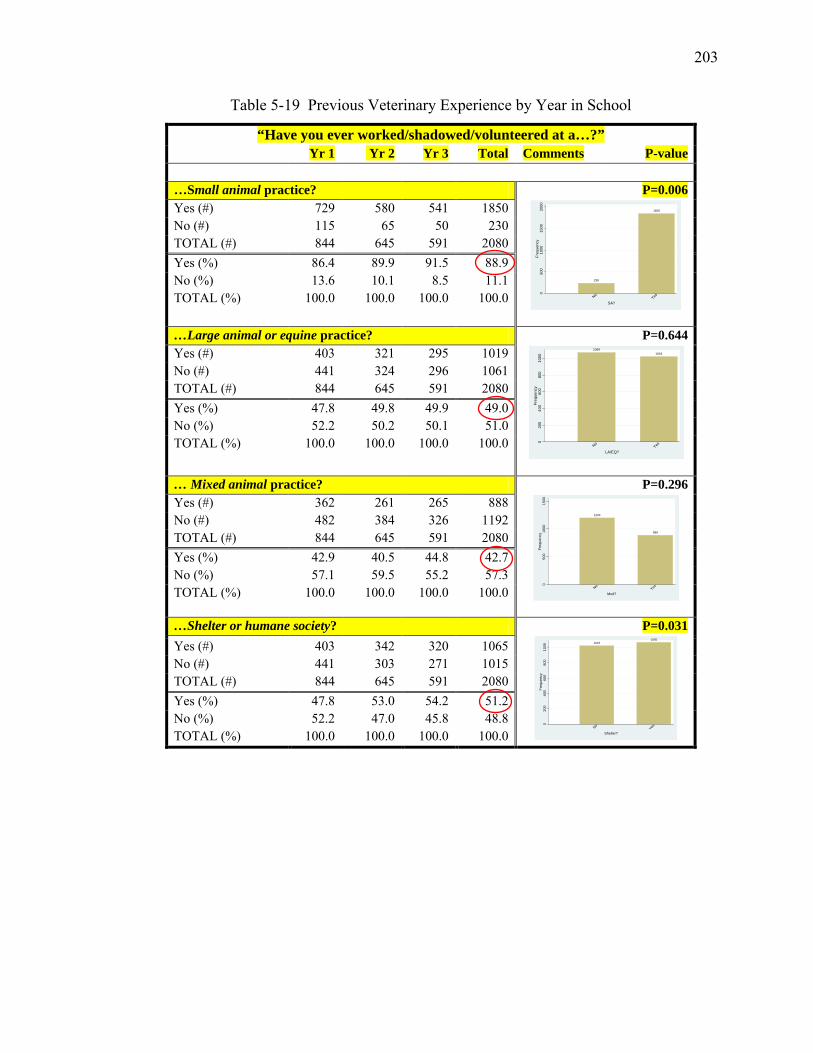
203
Table 5-19 Previous Veterinary Experience by Year in School
“Have you ever worked/shadowed/volunteered at a…?” Yr 1 Yr 2 Yr 3 Total Comments P-value …Small animal practice? P=0.006
Yes (#) 729 580 541 1850 No (#) 115 65 50 230 TOTAL (#) 844 645 591 2080 Yes (%) 86.4 89.9 91.5 88.9 No (%) 13.6 10.1 8.5 11.1 TOTAL (%) 100.0 100.0 100.0 100.0
…Large animal or equine practice? P=0.644
Yes (#) 403 321 295 1019 No (#) 441 324 296 1061 TOTAL (#) 844 645 591 2080 Yes (%) 47.8 49.8 49.9 49.0 No (%) 52.2 50.2 50.1 51.0 TOTAL (%) 100.0 100.0 100.0 100.0
… Mixed animal practice? P=0.296
Yes (#) 362 261 265 888 No (#) 482 384 326 1192 TOTAL (#) 844 645 591 2080 Yes (%) 42.9 40.5 44.8 42.7 No (%) 57.1 59.5 55.2 57.3 TOTAL (%) 100.0 100.0 100.0 100.0
…Shelter or humane society? P=0.031
Yes (#) 403 342 320 1065 No (#) 441 303 271 1015 TOTAL (#) 844 645 591 2080 Yes (%) 47.8 53.0 54.2 51.2 No (%) 52.2 47.0 45.8 48.8 TOTAL (%) 100.0 100.0 100.0 100.0
238
1850
050
010
0015
0020
00Fr
eque
ncy
NoYes
SA?
10691019
020
040
060
080
010
00Fr
eque
ncy
NoYes
LA/EQ?
1200
888
050
010
0015
00Fr
eque
ncy
NoYes
Mxd?
10231065
020
040
060
080
010
00Fr
eque
ncy
NoYes
Shelter?
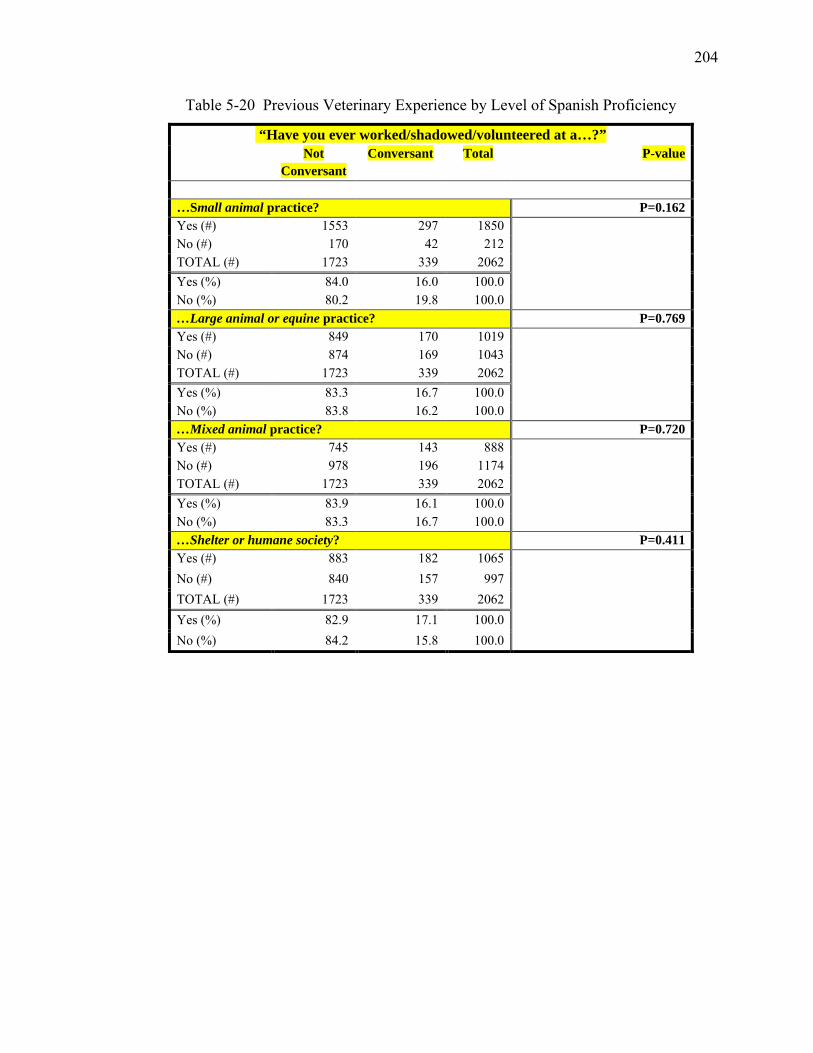
204
Table 5-20 Previous Veterinary Experience by Level of Spanish Proficiency
“Have you ever worked/shadowed/volunteered at a…?” Not
Conversant Conversant Total P-value
…Small animal practice? P=0.162 Yes (#) 1553 297 1850
No (#) 170 42 212 TOTAL (#) 1723 339 2062 Yes (%) 84.0 16.0 100.0 No (%) 80.2 19.8 100.0 …Large animal or equine practice? P=0.769 Yes (#) 849 170 1019
No (#) 874 169 1043 TOTAL (#) 1723 339 2062 Yes (%) 83.3 16.7 100.0 No (%) 83.8 16.2 100.0 …Mixed animal practice? P=0.720 Yes (#) 745 143 888
No (#) 978 196 1174 TOTAL (#) 1723 339 2062 Yes (%) 83.9 16.1 100.0 No (%) 83.3 16.7 100.0 …Shelter or humane society? P=0.411 Yes (#) 883 182 1065
No (#) 840 157 997 TOTAL (#) 1723 339 2062 Yes (%) 82.9 17.1 100.0 No (%) 84.2 15.8 100.0
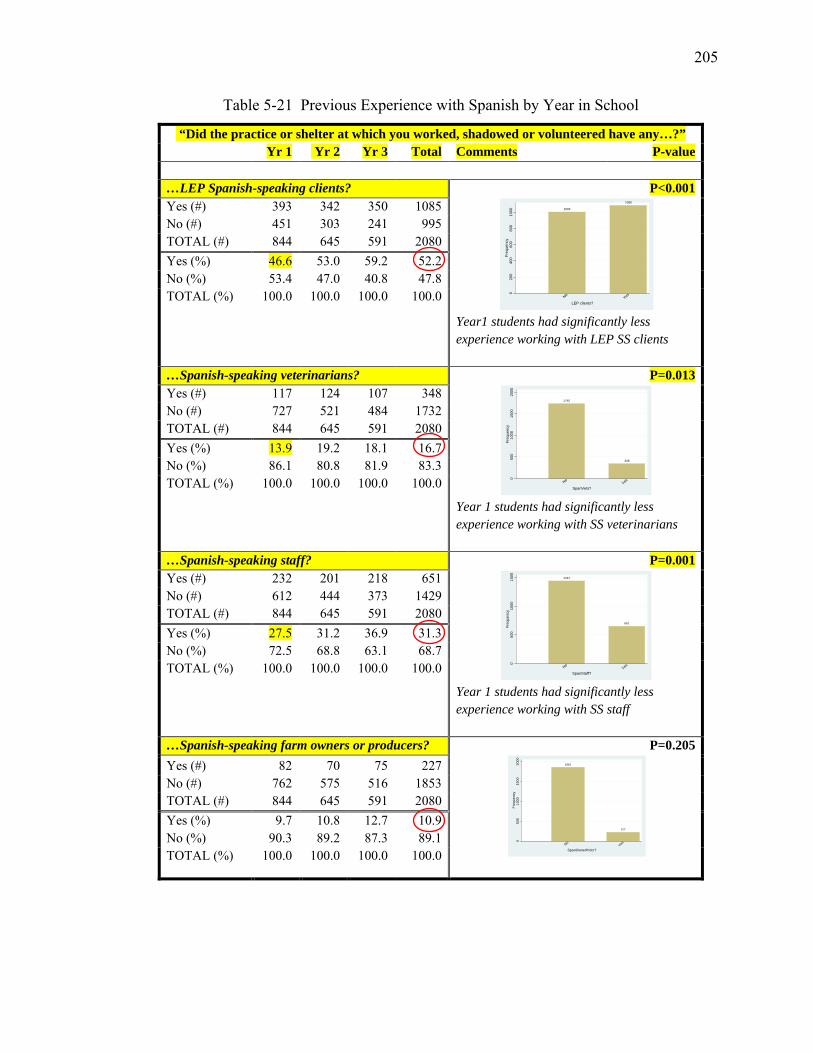
205
Table 5-21 Previous Experience with Spanish by Year in School
“Did the practice or shelter at which you worked, shadowed or volunteered have any…?” Yr 1 Yr 2 Yr 3 Total Comments P-value …LEP Spanish-speaking clients? P<0.001
Year1 students had significantly less experience working with LEP SS clients
Yes (#) 393 342 350 1085 No (#) 451 303 241 995 TOTAL (#) 844 645 591 2080 Yes (%) 46.6 53.0 59.2 52.2 No (%) 53.4 47.0 40.8 47.8 TOTAL (%) 100.0 100.0 100.0 100.0
…Spanish-speaking veterinarians? P=0.013
Year 1 students had significantly less experience working with SS veterinarians
Yes (#) 117 124 107 348 No (#) 727 521 484 1732 TOTAL (#) 844 645 591 2080 Yes (%) 13.9 19.2 18.1 16.7 No (%) 86.1 80.8 81.9 83.3 TOTAL (%) 100.0 100.0 100.0 100.0
…Spanish-speaking staff? P=0.001
Year 1 students had significantly less experience working with SS staff
Yes (#) 232 201 218 651 No (#) 612 444 373 1429 TOTAL (#) 844 645 591 2080 Yes (%) 27.5 31.2 36.9 31.3 No (%) 72.5 68.8 63.1 68.7 TOTAL (%) 100.0 100.0 100.0 100.0
…Spanish-speaking farm owners or producers? P=0.205
Yes (#) 82 70 75 227 No (#) 762 575 516 1853 TOTAL (#) 844 645 591 2080 Yes (%) 9.7 10.8 12.7 10.9 No (%) 90.3 89.2 87.3 89.1 TOTAL (%) 100.0 100.0 100.0 100.0
1003
1085
020
040
060
080
010
00Fr
eque
ncy
NoYes
LEP clients?
1740
348
050
010
0015
0020
00Fr
eque
ncy
NoYes
SpanVets?
1437
651
050
010
0015
00Fr
eque
ncy
NoYes
SpanStaff?
1861
227
050
010
0015
0020
00Fr
eque
ncy
NoYes
SpanOwnerPrdcr?
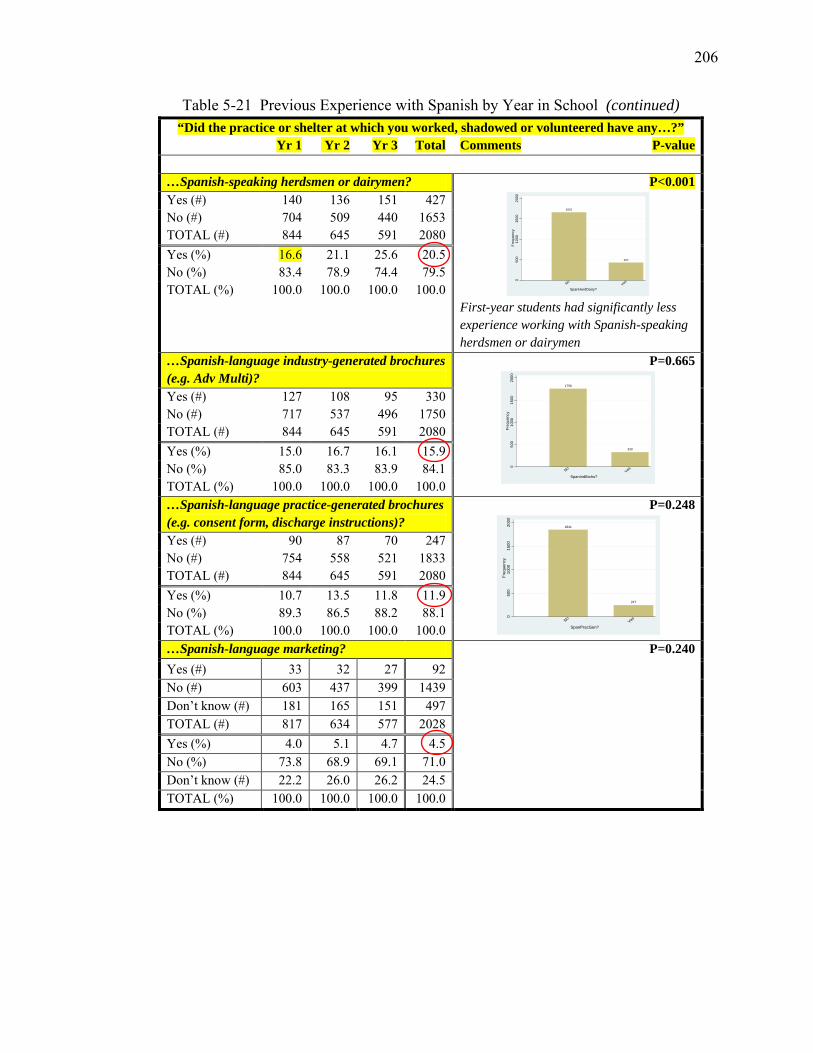
206
Table 5-21 Previous Experience with Spanish by Year in School (continued) “Did the practice or shelter at which you worked, shadowed or volunteered have any…?”
Yr 1 Yr 2 Yr 3 Total Comments P-value …Spanish-speaking herdsmen or dairymen? P<0.001
First-year students had significantly less experience working with Spanish-speaking herdsmen or dairymen
Yes (#) 140 136 151 427 No (#) 704 509 440 1653 TOTAL (#) 844 645 591 2080 Yes (%) 16.6 21.1 25.6 20.5 No (%) 83.4 78.9 74.4 79.5 TOTAL (%) 100.0 100.0 100.0 100.0
…Spanish-language industry-generated brochures (e.g. Adv Multi)?
P=0.665
Yes (#) 127 108 95 330 No (#) 717 537 496 1750 TOTAL (#) 844 645 591 2080 Yes (%) 15.0 16.7 16.1 15.9 No (%) 85.0 83.3 83.9 84.1 TOTAL (%) 100.0 100.0 100.0 100.0 …Spanish-language practice-generated brochures (e.g. consent form, discharge instructions)?
P=0.248
Yes (#) 90 87 70 247 No (#) 754 558 521 1833 TOTAL (#) 844 645 591 2080 Yes (%) 10.7 13.5 11.8 11.9 No (%) 89.3 86.5 88.2 88.1 TOTAL (%) 100.0 100.0 100.0 100.0 …Spanish-language marketing? P=0.240
Yes (#) 33 32 27 92 No (#) 603 437 399 1439 Don’t know (#) 181 165 151 497 TOTAL (#) 817 634 577 2028 Yes (%) 4.0 5.1 4.7 4.5 No (%) 73.8 68.9 69.1 71.0 Don’t know (#) 22.2 26.0 26.2 24.5 TOTAL (%) 100.0 100.0 100.0 100.0
1661
427
050
010
0015
0020
00Fr
eque
ncy
NoYes
SpanHerdDairy?
1758
330
050
010
0015
0020
00Fr
eque
ncy
NoYes
SpanIndBrchs?
1841
247
050
010
0015
0020
00Fr
eque
ncy
NoYes
SpanPracGen?
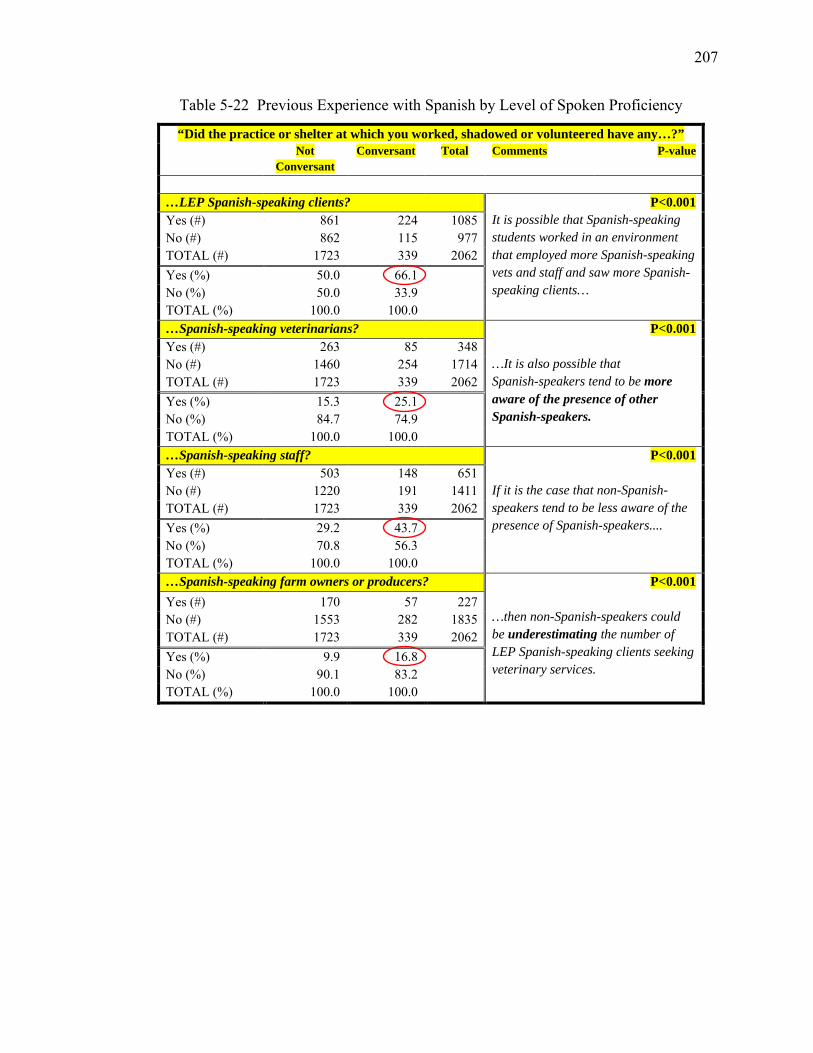
207
Table 5-22 Previous Experience with Spanish by Level of Spoken Proficiency
“Did the practice or shelter at which you worked, shadowed or volunteered have any…?” Not
Conversant Conversant Total Comments P-value
…LEP Spanish-speaking clients? P<0.001
It is possible that Spanish-speaking students worked in an environment that employed more Spanish-speaking vets and staff and saw more Spanish-speaking clients…
Yes (#) 861 224 1085 No (#) 862 115 977 TOTAL (#) 1723 339 2062 Yes (%) 50.0 66.1 No (%) 50.0 33.9 TOTAL (%) 100.0 100.0 …Spanish-speaking veterinarians? P<0.001
…It is also possible that Spanish-speakers tend to be more aware of the presence of other Spanish-speakers.
Yes (#) 263 85 348 No (#) 1460 254 1714 TOTAL (#) 1723 339 2062 Yes (%) 15.3 25.1 No (%) 84.7 74.9 TOTAL (%) 100.0 100.0 …Spanish-speaking staff? P<0.001
If it is the case that non-Spanish-speakers tend to be less aware of the presence of Spanish-speakers....
Yes (#) 503 148 651 No (#) 1220 191 1411 TOTAL (#) 1723 339 2062 Yes (%) 29.2 43.7 No (%) 70.8 56.3 TOTAL (%) 100.0 100.0 …Spanish-speaking farm owners or producers? P<0.001
…then non-Spanish-speakers could be underestimating the number of LEP Spanish-speaking clients seeking veterinary services.
Yes (#) 170 57 227 No (#) 1553 282 1835 TOTAL (#) 1723 339 2062 Yes (%) 9.9 16.8 No (%) 90.1 83.2 TOTAL (%) 100.0 100.0
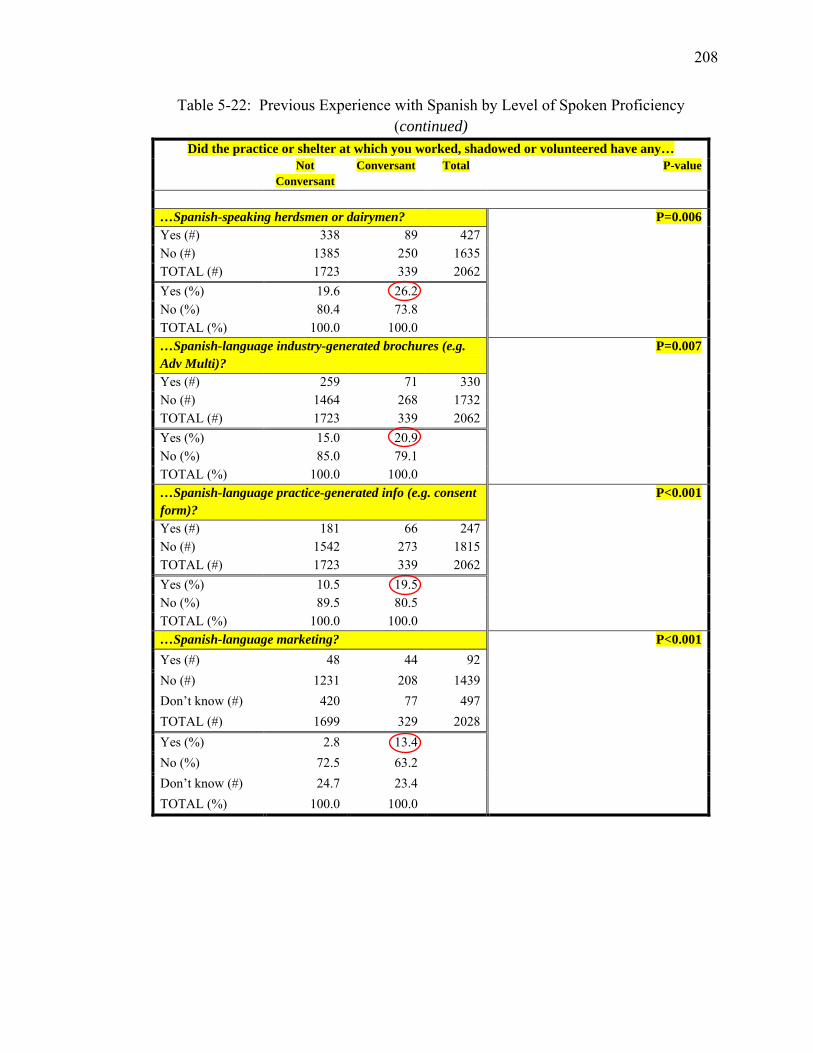
208
Table 5-22: Previous Experience with Spanish by Level of Spoken Proficiency (continued)
Did the practice or shelter at which you worked, shadowed or volunteered have any… Not
Conversant Conversant Total P-value
…Spanish-speaking herdsmen or dairymen? P=0.006 Yes (#) 338 89 427 No (#) 1385 250 1635 TOTAL (#) 1723 339 2062 Yes (%) 19.6 26.2 No (%) 80.4 73.8 TOTAL (%) 100.0 100.0 …Spanish-language industry-generated brochures (e.g. Adv Multi)?
P=0.007
Yes (#) 259 71 330 No (#) 1464 268 1732 TOTAL (#) 1723 339 2062 Yes (%) 15.0 20.9 No (%) 85.0 79.1 TOTAL (%) 100.0 100.0 …Spanish-language practice-generated info (e.g. consent form)?
P<0.001 Yes (#) 181 66 247
No (#) 1542 273 1815 TOTAL (#) 1723 339 2062 Yes (%) 10.5 19.5 No (%) 89.5 80.5 TOTAL (%) 100.0 100.0 …Spanish-language marketing? P<0.001
Yes (#) 48 44 92 No (#) 1231 208 1439 Don’t know (#) 420 77 497 TOTAL (#) 1699 329 2028 Yes (%) 2.8 13.4 No (%) 72.5 63.2 Don’t know (#) 24.7 23.4 TOTAL (%) 100.0 100.0
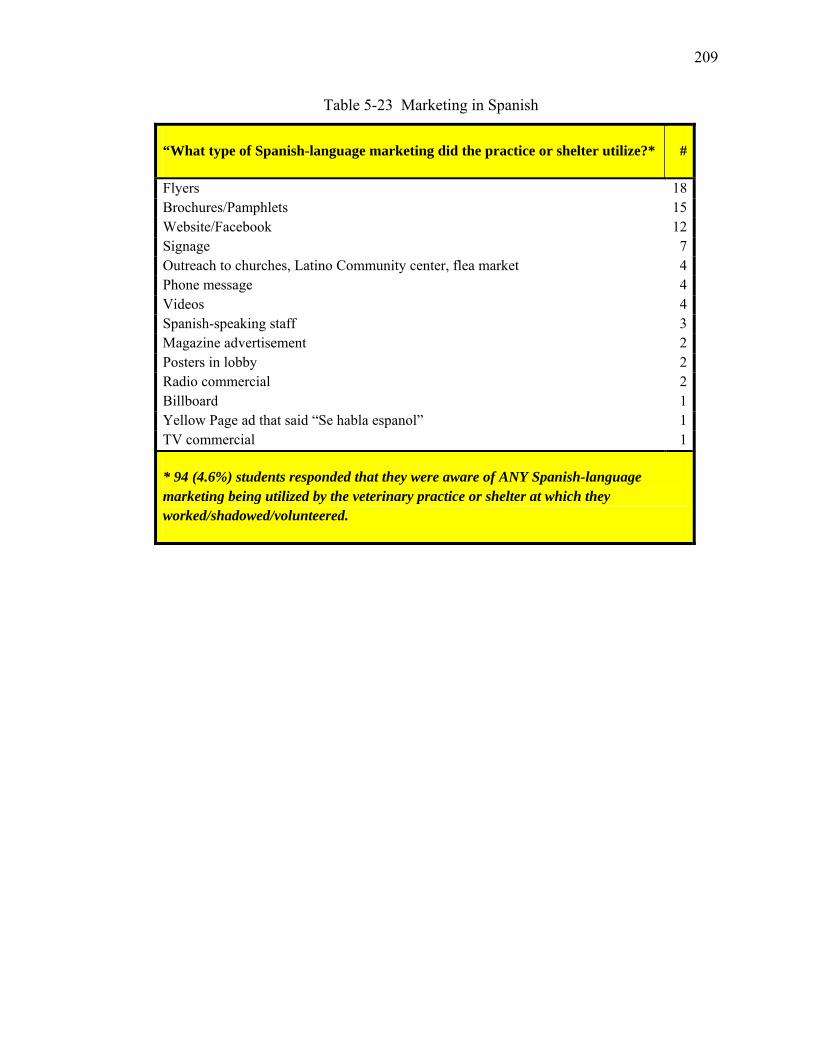
209
Table 5-23 Marketing in Spanish
“What type of Spanish-language marketing did the practice or shelter utilize?* #
Flyers 18 Brochures/Pamphlets 15 Website/Facebook 12 Signage 7 Outreach to churches, Latino Community center, flea market 4 Phone message 4 Videos 4 Spanish-speaking staff 3 Magazine advertisement 2 Posters in lobby 2 Radio commercial 2 Billboard 1 Yellow Page ad that said “Se habla espanol” 1 TV commercial 1
* 94 (4.6%) students responded that they were aware of ANY Spanish-language marketing being utilized by the veterinary practice or shelter at which they worked/shadowed/volunteered.
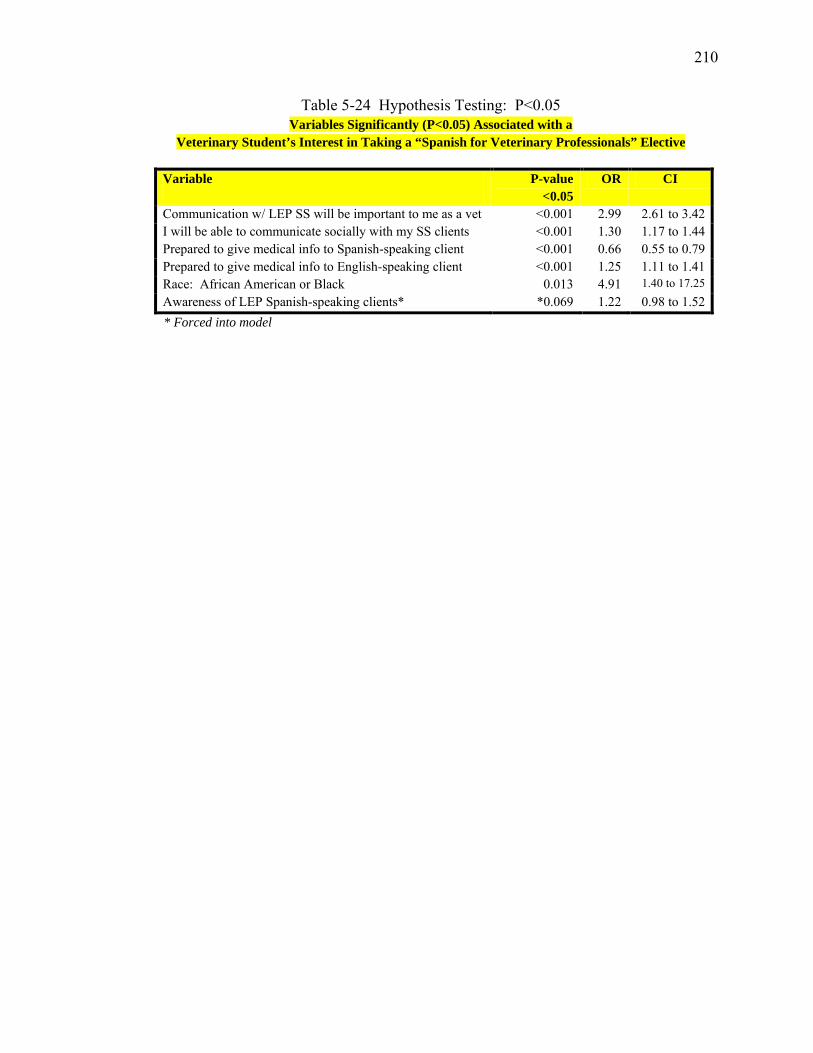
210
Table 5-24 Hypothesis Testing: P<0.05 Variables Significantly (P<0.05) Associated with a
Veterinary Student’s Interest in Taking a “Spanish for Veterinary Professionals” Elective
Variable P-value <0.05
OR CI
Communication w/ LEP SS will be important to me as a vet <0.001 2.99 2.61 to 3.42 I will be able to communicate socially with my SS clients <0.001 1.30 1.17 to 1.44 Prepared to give medical info to Spanish-speaking client <0.001 0.66 0.55 to 0.79 Prepared to give medical info to English-speaking client <0.001 1.25 1.11 to 1.41 Race: African American or Black 0.013 4.91 1.40 to 17.25 Awareness of LEP Spanish-speaking clients* *0.069 1.22 0.98 to 1.52
* Forced into model
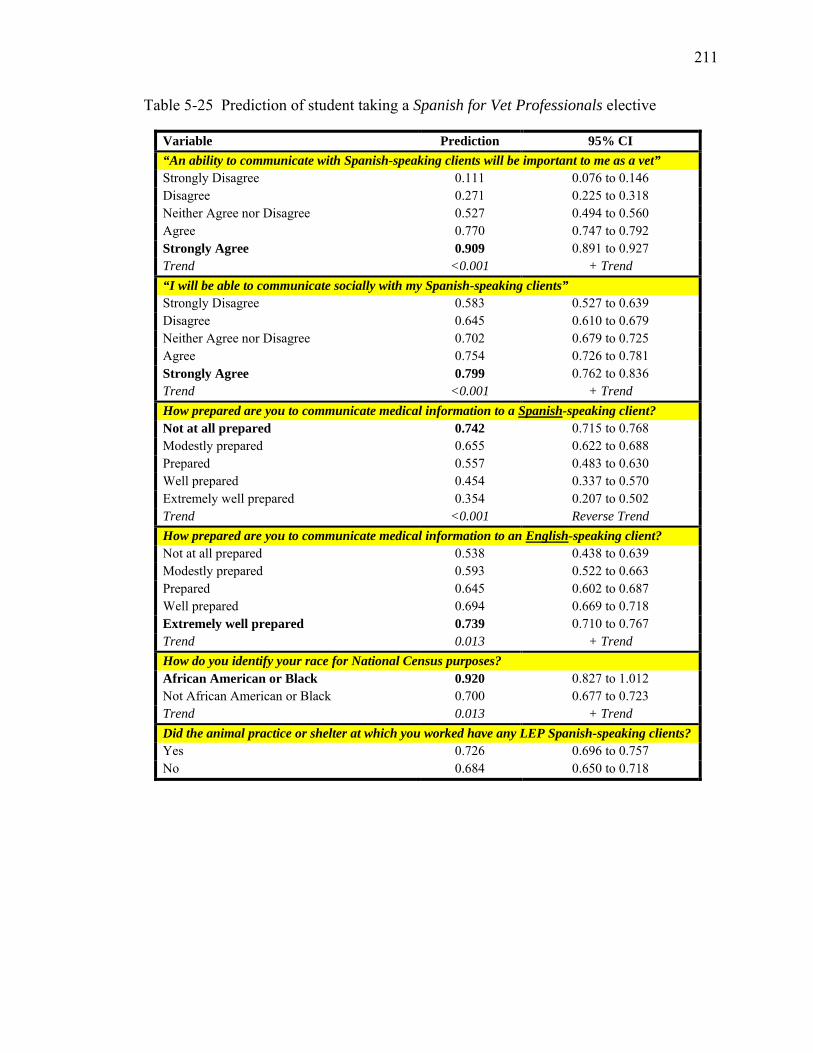
211
Table 5-25 Prediction of student taking a Spanish for Vet Professionals elective
Variable Prediction 95% CI “An ability to communicate with Spanish-speaking clients will be important to me as a vet” Strongly Disagree 0.111 0.076 to 0.146 Disagree 0.271 0.225 to 0.318 Neither Agree nor Disagree 0.527 0.494 to 0.560 Agree 0.770 0.747 to 0.792 Strongly Agree 0.909 0.891 to 0.927 Trend <0.001 + Trend “I will be able to communicate socially with my Spanish-speaking clients” Strongly Disagree 0.583 0.527 to 0.639 Disagree 0.645 0.610 to 0.679 Neither Agree nor Disagree 0.702 0.679 to 0.725 Agree 0.754 0.726 to 0.781 Strongly Agree 0.799 0.762 to 0.836 Trend <0.001 + Trend How prepared are you to communicate medical information to a Spanish-speaking client? Not at all prepared 0.742 0.715 to 0.768 Modestly prepared 0.655 0.622 to 0.688 Prepared 0.557 0.483 to 0.630 Well prepared 0.454 0.337 to 0.570 Extremely well prepared 0.354 0.207 to 0.502 Trend <0.001 Reverse Trend How prepared are you to communicate medical information to an English-speaking client? Not at all prepared 0.538 0.438 to 0.639 Modestly prepared 0.593 0.522 to 0.663 Prepared 0.645 0.602 to 0.687 Well prepared 0.694 0.669 to 0.718 Extremely well prepared 0.739 0.710 to 0.767 Trend 0.013 + Trend How do you identify your race for National Census purposes? African American or Black 0.920 0.827 to 1.012 Not African American or Black 0.700 0.677 to 0.723 Trend 0.013 + Trend Did the animal practice or shelter at which you worked have any LEP Spanish-speaking clients? Yes 0.726 0.696 to 0.757 No 0.684 0.650 to 0.718
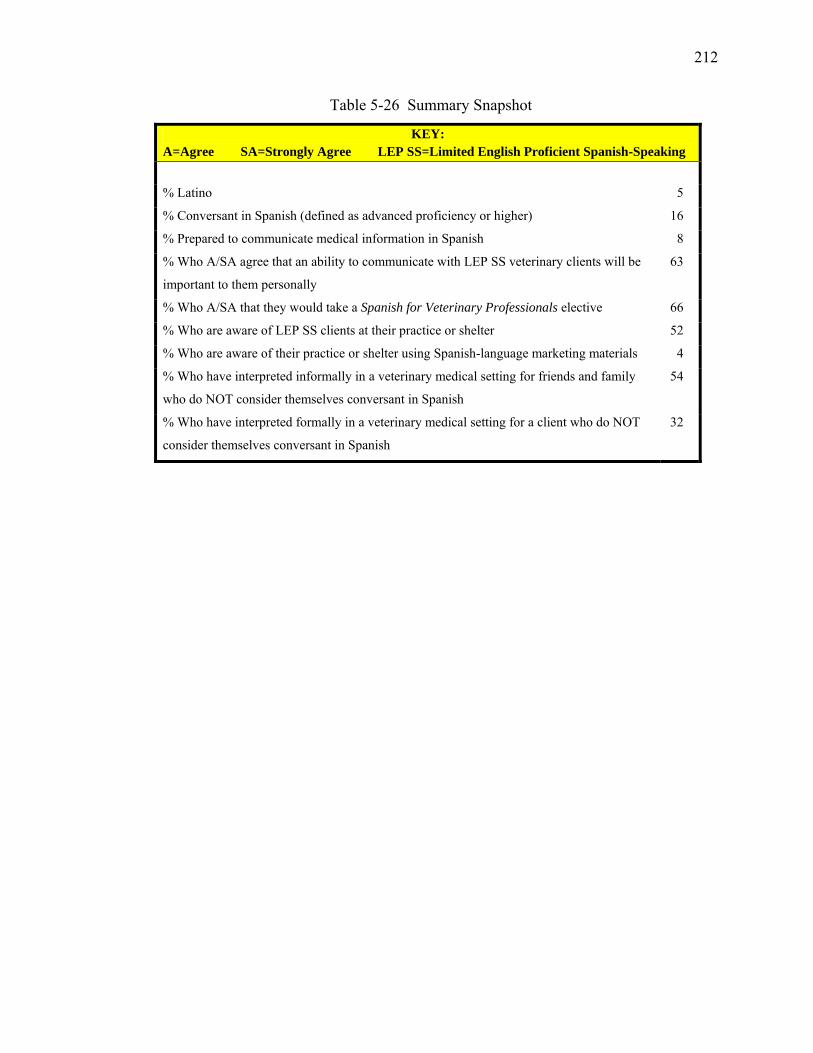
212
Table 5-26 Summary Snapshot
KEY: A=Agree SA=Strongly Agree LEP SS=Limited English Proficient Spanish-Speaking
% Latino 5
% Conversant in Spanish (defined as advanced proficiency or higher) 16
% Prepared to communicate medical information in Spanish 8
% Who A/SA agree that an ability to communicate with LEP SS veterinary clients will be
important to them personally
63
% Who A/SA that they would take a Spanish for Veterinary Professionals elective 66
% Who are aware of LEP SS clients at their practice or shelter 52
% Who are aware of their practice or shelter using Spanish-language marketing materials 4
% Who have interpreted informally in a veterinary medical setting for friends and family
who do NOT consider themselves conversant in Spanish
54
% Who have interpreted formally in a veterinary medical setting for a client who do NOT
consider themselves conversant in Spanish
32
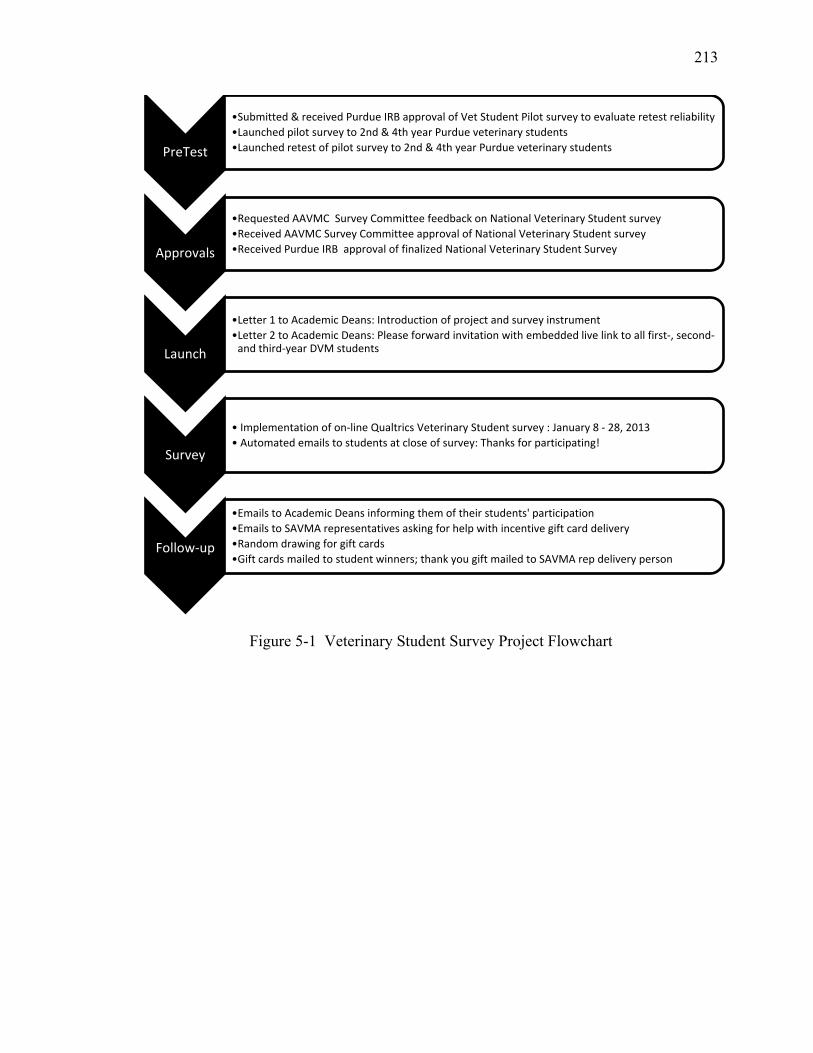
213
Figure 5-1 Veterinary Student Survey Project Flowchart
PreTest
•Submitted & received Purdue IRB approval of Vet Student Pilot survey to evaluate retest reliability •Launched pilot survey to 2nd & 4th year Purdue veterinary students •Launched retest of pilot survey to 2nd & 4th year Purdue veterinary students
Approvals
•Requested AAVMC Survey Committee feedback on National Veterinary Student survey •Received AAVMC Survey Committee approval of National Veterinary Student survey •Received Purdue IRB approval of finalized National Veterinary Student Survey
Launch
•Letter 1 to Academic Deans: Introduction of project and survey instrument •Letter 2 to Academic Deans: Please forward invitation with embedded live link to all first-, second-
and third-year DVM students
Survey
• Implementation of on-line Qualtrics Veterinary Student survey : January 8 - 28, 2013 • Automated emails to students at close of survey: Thanks for participating!
Follow-up
•Emails to Academic Deans informing them of their students' participation •Emails to SAVMA representatives asking for help with incentive gift card delivery •Random drawing for gift cards •Gift cards mailed to student winners; thank you gift mailed to SAVMA rep delivery person
214
CHAPTER 6. CONCLUSIONS AND RECOMMENDATIONS
Interaction between veterinary professionals and LEP SSPOs is not a rare
occurrence. Veterinarians who are practicing in states with large established or fast-
growing Latino communities are seeing LEP SSPOs and their pets on a regular basis: 89%
of veterinarians interviewed for this study have LEP Spanish-speaking clients, and over
half of these practitioners are seeing LEP SSPOs weekly. Also, more than half of the
veterinary students surveyed have worked at a practice or shelter that sees LEP Spanish-
speaking clients.
Similar to previous findings (Pew Research Center 2006; Social Science Research
Solutions 2012), this study found that one in three Latinos have a pet. By extrapolation
there are approximately 20 million Latino pet owners in the US, 6 million of who have
limited English proficiency. These 6 million LEP SSPOs are caring for an estimated 9.2
million dogs and 3.8 million cats. By the year 2050, there will be approximately 51
million Latino pet owners in the US, 15 million of who could have limited English
proficiency.
In this study, Latino pet owners who took their pet to the veterinarian were most
likely to: have found out about the practice from a family member or friend, be coming
in for their pet’s vaccinations, be bringing a dog rather than a cat, be bringing a sterilized
pet over an intact pet, and have a Chihuahua or Pit Bull over any other pure breed dog. If
215
the owner him/herself was a foreign-born Latino/Latina with limited English proficiency,
there was a 50% chance that the owner had less than a high school education. Therefore,
when presenting pet health information to an LEP client, ideally the client’s level of
education and level of English language proficiency are taken into consideration for
optimal communication.
Communication challenges arising from having limited proficiency in spoken
English were not directly associated with a lack of veterinary use in this study. Rather,
pet owners in this study were more likely not to take their dog to the veterinarian if they
had limited income, employment, or education, and more likely not to take their cat to the
veterinarian if they had young children living at home. However, individuals with LEP
were significantly more likely to earn less than $15,000 per year, have less than full-time
employment, have less than a high school education, and have young children at home.
Thus the non-use of veterinary services is confounded by one’s LEP status, but not
necessarily due to accompanying language challenges.
This study found that once LEP SSPOs arrived at the veterinary practice,
language barriers could present a challenge for both the client and the staff. When faced
with a hypothetical pet emergency at a veterinary practice where no one speaks Spanish,
LEP SSPOs said they would sign an informed consent form even when they haven’t
understood what is written on the form, and leave for another practice if they couldn’t
communicate satisfactorily. To maximize an LEP client’s understanding and minimize a
veterinary practice’s legal liability, the veterinary practice might consider using a
translated Spanish-language version of the consent form, and having a bilingual staff
member read the form aloud to the pet owner before obtaining a signature.
216
Veterinary practices which did not employ bilingual staff or doctors said they
often encouraged LEP SSPOs to bring family members or friends to help interpret.
Ironically, this study found that veterinarians who utilized family members or friends to
interpret were significantly less satisfied with their communication with the LEP client
than DVMs who used bilingual staff to interpret. For both the client and the veterinary
staff, communication barriers presented challenges.
Veterinary staff might assume that because a Latino client speaks English well or
very well, they prefer to read their pet’s medical information in English. This study
found that, of those preferring to read medical information in Spanish, 42% considered
themselves to be proficient in English. This suggests that veterinary staff members could
improve communication with Latino pet owners by asking each client what language they
prefer for reading about their pet’s health information, and then providing materials in
that language whenever possible.
In this study, only 1 out of 55 pets adopted from a shelter was adopted by an LEP
SSPO. It is unclear whether this was due to communication barriers at the shelter, due to
other unmet adopter requirements (such as owning one’s home, being employed full-time,
or earning a particular minimum annual salary), or due to the LEP SSPOs lack of
awareness or interest of the shelter as a possible source of adoption. When taking a pet
health history, veterinary team members might ask clients if they had attempted to adopt
from a shelter, and if any obstacles to adoption were encountered. A future study could
examine the adoption policies of shelters to determine if LEP SSPOs are being screened
out as potential adopters.
217
Only 8% of the small animal practice workforce represented by this study could
communicate in Spanish with LEP SSPOs. As the LEP Spanish-speaking population
continues to grow, recruiting bilingual veterinarians and staff members who have
comparable technical skill to monolinguals could help bridge the communication gap
encountered in private practice settings. Almost half of the practices surveyed said they
would consider expanding their human resources by hiring a bilingual staff member. For
those practitioners seeing only an occasional LEP SSPO, using a toll-free telephone
interpreter service like Certified Languages International® to have a live, interpreted
conversation using the skill of a trained medical interpreter was mentioned as a cost-
effective alternative to hiring a bilingual staff member.
Almost two-thirds of practices surveyed used no Spanish-language written
materials with their LEP SSPOs. There are an increasing number of Spanish-language
resources available to veterinarians, including brochures from Zoetis, AAHA, AVMA,
and others. Spanish-language versions of many client handouts are now available, and
there are advances in technology that make translation inexpensive and straightforward.
Practitioners surveyed specifically recommended using: Spanish-English dictionary for
translation of individual words; Spanish terminology phrase book for translation of
phrases; and Spanish-language handouts from resources like Small Animal Practice
Client Handouts (by Rhea Morgan), Clinical Veterinary Advisor: Dogs and Cats (by
Etienne Côté) and ClientEd Online® (by Lifelearn.com, Guelph, Ontario) for more in-
depth explanations of health conditions and surgical procedures in Spanish.
Practitioners also recommended using translation software applications like
Google Translate®, BabelFish®, and Jibbigo.® Once downloaded onto an iPhone®, iPad®,
218
and/or computer, veterinary staff members cut-and-paste client education information
into the application, which then translates the English text into written and spoken
Spanish. Other practices recommended using the translation features in their existing
practice management software, such as Cornerstone® (by IDEXX) and PetWare Client®
(by Banfield). This study found that veterinarians who employed Spanish-speaking staff
and offered Spanish-language materials reported greater numbers of LEP Spanish-
speaking clients and greater satisfaction in their communication with these clients.
Looking to the future, over half of the associates surveyed said they were
interested in taking an on-line Spanish for Veterinary Professionals course, and more
than three-fourths of all respondents agreed that Spanish for Veterinary Professionals
should become an elective in both the RVT and DVM curricula. Two-thirds of the
veterinary students surveyed also expressed an interest in a Spanish for Veterinary
Professionals elective; that percentage climbed above 80% for students who were already
socially conversant in Spanish. Building on the veterinary students’ existing language
skills and interest is a logical place to start.
For veterinary practices interested in reaching the ever-growing population of
Latino pet owners, one consistent recommendation emerged from these studies: Market!
Eighty-nine percent of practices surveyed did no marketing of services in Spanish to their
LEP SSPOs. Veterinarian and veterinary student marketing suggestions included: Add
Spanish-language messages to signage, phone message, websites, Facebook accounts,
websites and blogs; distribute Spanish-language flyers to churches, Latino Community
centers, and other popular Latino gathering places; provide a practice listing in coupon
books and the Latino Yellow Pages; partner with Spanish-speaking organizations in the
219
community; sponsor a Spanish-language billboard, radio announcement or television ad;
and above all, capitalize on the word-of-mouth advertising that is still the most relied-
upon form of marketing for the majority of respondents.
Results of these three national surveys demonstrated that the proportion of LEP
SSPOs is greater than the proportion of Spanish-speaking veterinary professionals and
students who are available to work with these pet owners, leaving a language gap
between LEP SSPOs and veterinary health care providers and future providers. If
implemented, the aforementioned suggestions offered by respondents could greatly
enhance communication and improve the veterinary profession’s preparedness to work
with LEP SSPOs.
Currently, when an LEP SSPO arrives at a small animal hospital to have their pet
seen, one of three communication scenarios is likely. First, the LEP Spanish-speaking
client is seen by a Spanish-speaking veterinarian and/or bilingual staff members, making
clear communication simple. Second, the LEP SSPO is seen by an English-speaking
veterinarian and staff members, but s/he has brought along a friend or relative who can
translate, making clear communication possible. Third, the LEP SSPO arrives alone and
is seen by a monolingual English-speaking veterinarian and staff members, who have
little ability to communicate beyond pantomiming and gesturing and drawing pictures,
making clear communication challenging.
Results from these three national surveys reveal the distinct possibility of a fourth
communication scenario: The LEP SSPO is seen by a monolingual English-speaking
veterinarian and staff members, who make use of translation applications on their
iPhones, offer consent forms which have been translated into Spanish, and utilize a live

220
Spanish-English bilingual telephone interpreter who participates in the conversation via
speakerphone as the veterinarian or RVT elicits a pet health history from the owner.
Clear communication occurs, within the normal time frame of the office call, and has
only cost the client a few dollars more to cover the cost of the interpreter.

221
LIST OF REFERENCES
221
LIST OF REFERENCES
(2006). QT Inc. v. Mayo Clinic Jacksonville. U.S. Dist. LEXIS 33668.
AAVMC (2012). Annual Data Report 2011-2012, Association of American Veterinary Medical Colleges.
AAVMC Board of Directors (2011). Roadmap for Veterinary Medical Education in the 21st Century: Responsive, Collaborative, Flexible.
Abbe M, Simon C, et al. (2006). "A survey of language barriers from the perspective of pediatric oncologists, interpreters, and parents." Pediatr Blood Cancer 47(6): 819-824.
Accreditation Council for Pharmacy Education. (2011). "Accreditation Standards and Guidelines for the Professional Program in Pharmacy Leading to the Doctor of Pharmacy Degree." Retrieved July 16 2013, from https://www.acpe-accredit.org/pdf/S2007Guidelines2.0_ChangesIdentifiedInRed.pdf.
Adams CL and Kurtz SM (2006). "Building on existing models from human medical education to develop a communication curriculum in veterinary medicine." Journal of Veterinary Medical Education 33(1): 28-37.
Adams EW (2004). "A historical overview of African American veterinarians in the United States, 1889- 2000." J Vet Med Educ 31(4): 409-413.
Apter AJ, Reisine ST, et al. (1998). "Adherence with twice-daily dosing of inhaled steroids. Socioeconomic and health-belief differences." Am J Respir Crit Care Med 157(6 Pt 1): 1810-1817.
AVMA (2012). "Market Research Statistics - U.S. Veterinarians - 2012." Retrieved July 29, 2013, from https://www.avma.org/KB/Resources/Statistics/Pages/Market-research-statistics-US-veterinarians.aspx.
AVMA (2013). "Veterinarian-Client-Patient Relationship: VCPR (FAQ)." Retrieved July 24 2013.
Bailey SC, Pandit AU, et al. (2009). "Availability of Spanish prescription labels: a multi-state pharmacy survey." Medical care 47(6): 707-710.
221
Baker DW, Hayes R, et al. (1998). "Interpreter Use and Satisfaction with Interpersonal Aspects of Care for Spanish-Speaking Patients." Medical Care 36(10): 1461-1470.
Baker DW, Parker RM, et al. (1996). "Use and effectiveness of interpreters in an emergency department." JAMA 275(10): 783-788.
Baker DW, Williams MV, et al. (1999). "Development of a brief test to measure functional health literacy." Patient Education and Counseling 38(1): 33-42.
Barrow S-Y L. (2012). "Health literacy: why is it important?" Access January: 20-22.
Beers BB, McDonald VJ, et al. (2003). "Disparities in health literacy between African American and non-African American primary care patients." J of Gen Int Med 18(Suppl 1): 169.
Bell TS, Branston LK, et al. (1999). "Interventions to improve uptake of breast screening in inner city Cardiff general practices with ethnic minority lists." Ethn Health 4(4): 277-284.
Bender DE, Clawson M, et al. (2004). "Improving access for Latino immigrants: evaluation of language training adapted to the needs of health professionals." J Immigr Health 6(4): 197-209.
Blumberg SJ and Luke JV (2012) "Wireless substitution: Early release of estimates from the National Health Interview Survey, January-June 2012."
Brach C, Fraser I, et al. (2005). "Crossing the language chasm." Health Aff (Millwood) 24(2): 424-434.
Bradshaw M, Tomany-Korman S, et al. (2007). "Language barriers to prescriptions for patients with limited English proficiency: a survey of pharmacies." Pediatrics 120(2): e225-e235.
Burbano O'Leary SC, Federico S, et al. (2003). "The truth about language barriers: one residency program's experience." Pediatrics 111(5 Pt 1): 569-573.
Burns K (2013). "Vital statistics." JAVMA 242(3): 280-285.
Cannedy AL (2004). "Veterinary medical colleges' diversity awareness." J Vet Med Educ 31(4): 417-420.
Carrillo JE, Green AR, et al. (1999). "Cross-cultural primary care: a patient-based approach." Ann Intern Med 130(10): 829-834.
Chastain CB, Horrell BA, et al. (2007). "Pathways: Missouri model for enhancing diversity." J Vet Med Educ 34(2): 56-59.
222
Cornell KK and Kopcha M (2007). "Client-veterinarian communication: skills for client centered dialogue and shared decision making." Vet Clin North Am Small Anim Pract 37(1): 37-47; abstract vii.
David RA and Rhee M (1998). "The impact of language as a barrier to effective health care in an underserved urban Hispanic community." Mt Sinai J Med 65(5&6): 393-397.
Davis TC, Long SW, et al. (1993). "Rapid Estimate of Adult Literacy in Medicine: a shortened screening instrument." Fam Med 25(6): 391-395.
Department of Justice (2002). "Guidance to Federal Financial Assistance Recipients Regarding Title VI Prohibition Against National Origin Discrimination Affecting Limited English Proficient Persons." Federal Register 67(117): 41455-41472.
DeWalt DA, Dilling MH, et al. (2007). "Low parental literacy is associated with worse asthma care measures in children." Ambul Pediatr 7(1): 25-31.
DeWalt DA and Hink A (2009). "Health Literacy and Child Health Outcomes: A Systematic Review of the Literature." Pediatrics 124(Supplement 3): S265-S274.
Diamond LC, Luft HS, et al. (2012). ""Does this doctor speak my language?" Improving the characterization of physician non-English language skills." Health Serv Res 47(1 Pt 2): 556-569.
Diamond LC and Reuland DS (2009). "Describing physician language fluency: deconstructing medical Spanish." JAMA 301(4): 426-428.
Diamond LC, Schenker Y, et al. (2009). "Getting by: underuse of interpreters by resident physicians." J Gen Intern Med 24(2): 256-262.
Dillman DA, Smyth JD, et al. (2009). Internet, Mail, and Mixed-Mode Surveys: The Tailored Design Approach. Hoboken, NJ, John Wiley & Sons, Inc.
Dilworth TJ, Pharm DS, et al. (2009). "Pharmacists' communication with Spanish-speaking patients: a review of the literature to establish an agenda for future research." Research in social & administrative pharmacy : RSAP 5(2): 108-120.
Divi C, Koss RG, et al. (2007). "Language proficiency and adverse events in US hospitals: a pilot study." Int J Qual Health Care 19(2): 60-67.
Downing B and Roat CE (2002). "Models for the provision of language access in health care settings." California: National Council on Interpreting in Health Care and Hablamos Juntos.
223
Eamranond PP, Davis RB, et al. (2011). "Patient-physician language concordance and primary care screening among spanish-speaking patients." Med Care 49(7): 668-672.
Eamranond PP, Davis RB, et al. (2009). "Patient-physician language concordance and lifestyle counseling among Spanish-speaking patients." J Immigr Minor Health 11(6): 494-498.
Ellis L (2103). "Veterinary Malpractice Risk Management: Pitfalls and Positives." Retrieved July 25, 2013, from http://www.gvma.net/files/ECVC2013/Ellis-Veterinary_Malpractice_Risk_Management.pdf.
Elmore RG (2003). "The lack of racial diversity in veterinary medicine." J Am Vet Med Assoc 222(1): 24-26.
Elmore RG (2004). "Reasons for the lack of racial diversity in veterinary medicine." J Vet Med Educ 31(4): 414-416.
Faver C (2009). "Sterilization of companion animals: exploring the attitudes and behaviors of Latino students in south Texas." J Applied Animal Welfare Science 12: 314-330.
Faver CA and Cavazos Jr AM (2008). "Love, Safety, and Companionship: The Human-Animal Bond and Latino Families." Journal of Family Social Work 11(3): 254-271.
Ferguson WJ (2008). "Un Poquito: The benefits and perils of knowing "a little bit" of Spanish when communicating with Spanish-speaking patients." Health Aff 27(6): 1695-1700.
Fiscella K, Franks P, et al. (2002). "Disparities in health care by race, ethnicity, and language among the insured: findings from a national sample." Med Care 40(1): 52-59.
Flores G (2006). "Language barriers to health care in the United States." N Engl J Med 355(3): 229-231.
Flores G (2005). "The impact of medical interpreter services on the quality of health care: a systematic review." Med Care Res Rev 62(3): 255-299.
Flores G, Laws MB, et al. (2003). "Errors in medical interpretation and their potential clinical consequences in pediatric encounters." Pediatrics 111(1): 6-14.
Flores G, Abreu M, et al. (1998). "Access barriers to health care for Latino children." Arch Pediatr Adolesc Med 152(11): 1119-1125.
224
Flores G, Abreu M, et al. (2005). "Limited English proficiency, primary language at home, and disparities in children's health care: how language barriers are measured matters." Public Health Rep 120(4): 418-430.
Flores G, Olson L, et al. (2005). "Racial and Ethnic Disparities in Early Childhood Health and Health Care." Pediatrics 115(2): e183-e193.
Flores G, Torres S, et al. (2008). "Access to hospital interpreter services for limited English proficient patients in New Jersey: a statewide evaluation." J Health Care Poor Underserved 19(2): 391-415.
Gadon M, Balch G, et al. (2007). "Caring for patients with limited English proficiency." J Gen Intern Med 22(2): 341-346.
Gandhi TK, Burstin HR, et al. (2000). "Drug complications in outpatients." J Gen Intern Med 15(3): 149-154.
Gazmararian JA, Baker DW, et al. (1999). "Health literacy among Medicare enrollees in a managed care organization." JAMA 281(6): 545-551.
Glickman SW, Ndubuizu A, et al. (2011). "Perspective: The case for research justice: inclusion of patients with limited English proficiency in clinical research." Acad Med 86(3): 389-393.
Gonzalvo J, Schmelz A, et al. (2012). "Community pharmacist and technician communication with Spanish-speaking patients: needs assessment." J Am Pharm Assoc 52(3): 363-366.
Greenhill LM (2007). "Introducing DVM: DiVersity Matters (an Association of American Veterinary Medical Colleges Initiative)." J Vet Med Educ 34(2): 43-46.
Greenhill LM (2009). "DiVersity Matters: a review of the diversity initiative of the Association of American Veterinary Medical Colleges." J Vet Med Educ 36(4): 359-362.
Greenhill LM (2004). "Diversity in Veterinary Medicine: A Professional Imperative." JVME 31(4): 401.
Hablamos Juntos. (2013). "Hablamos Juntos: Improving Patient-Provider Communication for Latinos " Retrieved February 16 2013, from http://www.hablamosjuntos.org/.
Hampers LC and McNulty JE (2002). "Professional interpreters and bilingual physicians in a pediatric emergency department: effect on resource utilization." Arch Pediatr Adolesc Med 156(11): 1108-1113.
225
Hecker KG, Adams CL, et al. (2012). "Assessment of first-year veterinary students' communication skills using an objective structured clinical examination: the importance of context." J Vet Med Educ 39(3): 304-310.
Hickson GB, Federspiel CF, et al. (2002). "Patient complaints and malpractice risk." JAMA 287(22): 2951-2957.
Houts PS, Witmer JT, et al. (2001). "Using pictographs to enhance recall of spoken medical instructions II." Patient Educ Couns 43: 231-242.
Hu DJ and Covell RM (1986). "Health care usage by Hispanic outpatients as function of primary language." West J Med 144(4): 490-493.
Hunt D (2007). Language Assistance for Limited English Proficient Patients: Legal Issues. Immigrant Medicine. Walker PF and Barnett ED. Philadelphia, PA, Saunders Elsevier: 37-56.
Indiana State Department of Health - Minority Health Advisory Committee (2003). "Healthy Indiana - A minority health plan for the state of Indiana." Retrieved July 16 2013, from http://www.in.gov/isdh/files/mh_plan_april_2003.pdf.
Institute of Medicine (2003). Unequal Treatment: Confronting Racial and Ethnic Disparities in Health Care (full printed version), The National Academies Press.
Institute of Medicine (2006). Preventing medication errors. The Quality Chasm Series.
Institute of Medicine (2008). Standardizing Medication Labels: Confusing Patients Less. Worskshop Summary. Washington, DC, National Academy Press.
Jacobs EA, Agger-Gupta N, et al. (2003) "Language barriers in health care settings: an annotated bibliography of the research literature." 1-80.
Jacobs EA, Shepard DS, et al. (2004). "Overcoming language barriers in health care: costs and benefits of interpreter services." Am J Public Health 94(5): 866-869.
Jacobs EA, Diamond LC, et al. (2010). "The importance of teaching clinicians when and how to work with interpreters." Patient Educ Couns 78(2): 149-153.
Jacobs EA, Lauderdale DS, et al. (2001). "Impact of interpreter services on delivery of health care to limited-English-proficient patients." J Gen Intern Med 16(7): 468-474.
Jacobson KL, Kripalani S, et al. (2008). How to create a pill card. The Pharmacy Intervention for Limited Literacy (PILL). Rockville, MD, Agency for Healthcare Research and Quality.
226
Joint Commission (2007). "What did the doctor say?": Improving health literacy to protect patient safety. Health Care at the Crossroads. Oakbrook Terrace, IL.
Joint Commission (2012). "Root causes of sentinel events." Retrieved July 19, 2013, from http://www.jointcommission.org/assets/1/18/root_causes_event_type_2004_2Q2012.pdf.
Kaiser Permanente (2013). "Language Concordance Program." Retrieved July 12 2013, from http://physiciancareers.kp.org/scal/diversity-lcp.html.
Kansas State University (2009). "Demographics." Retrieved July 21 2013, from http://www.vet.k-state.edu/diversity/demo.htm.
Karliner LS, Jacobs EA, et al. (2007). "Do professional interpreters improve clinical care for patients with limited English proficiency? A systematic review of the literature." Health Serv Res 42(2): 727-754.
Karliner LS, Napoles-Springer AM, et al. (2008). "Identification of limited English proficient patients in clinical care." J Gen Intern Med 23(10): 1555-1560.
Karliner LS, Perez-Stable EJ, et al. (2004). "The language divide. The importance of training in the use of interpreters for outpatient practice." J Gen Intern Med 19(2): 175-183.
Kendall T (2004). "Diversity and changing demographics: how they will affect veterinary medicine." J Vet Med Educ 31(4): 406-408.
Kim G, Worley CB, et al. (2011). "Vulnerability of older Latino and Asian immigrants with limited English proficiency." J Am Geriatr Soc 59(7): 1246-1252.
Kirkman-Liff B and Mondragon D (1991). "Language of interview: relevance for research of southwest Hispanics." Am J Public Health 81(11): 1399-1404.
Kirsh I, Jungeblut A, et al. (1993). Adult literacy in America: a first look at the findings of the National Adult Literacy Survey. National Center for Education Statistics. Washington, DC, US Department of Education.
Koh HK, Brach C, et al. (2013). "A proposed 'health literate care model' would constitute a systems approach to improving patients' engagement in care." Health Aff (Millwood) 32(2): 357-367.
Ku L and Flores G (2005). "Pay now or pay later: providing interpreter services in health care." Health Aff (Millwood) 24(2): 435-444.
Kuo D and Fagan MJ (1999). "Satisfaction with methods of Spanish interpretation in an ambulatory care clinic." J Gen Intern Med 14(9): 547-550.
227
Kurtz S (2006). "Teaching and learning communication in veterinary medicine." J Vet Med Educ 33(1): 11-19.
Kutner MA (2006). Health Literacy of America’s Adults. National Assessment for Adult Literacy, American Institutes for Research.
Lasater LM, Davidson AJ, et al. (2001). "Glycemic control in English- vs Spanish-speaking Hispanic patients with type 2 diabetes mellitus." Arch Intern Med 161(1): 77-82.
Lee J, Stucky B, et al. (2013). "Oral Health Literacy Assessment: development of an oral health literacy instrument for Spanish speakers." J Public Health Dent 73(1): 1-8.
Lee KC, Winickoff JP, et al. (2006). "Resident physicians' use of professional and nonprofessional interpreters: A national survey." JAMA 296(9): 1049-1054.
Lee LJ, Batal HA, et al. (2002). "Effect of Spanish interpretation method on patient satisfaction in an urban walk-in clinic." J Gen Intern Med 17(8): 641-645.
Lee LJ, Batal HA, et al. (2002). "Effect of Spanish interpretation method on patient satisfaction in an urban walk-in clinic." J Gen Intern Med 17(8): 641-645.
Lee SY, Stucky BD, et al. (2010). "Short Assessment of Health Literacy-Spanish and English: a comparable test of health literacy for Spanish and English speakers." Health Serv Res 45(4): 1105-1120.
LEP.gov (2013). "Limited English Proficiency (LEP)." Retrieved May 30, 2013, from http://www.lep.gov/resources/resources.html.
Lowrie PM (2009). "Tying Art and Science to Reality for Recruiting Minorities to Veterinary Medicine." Journal of Veterinary Medical Education 36(4): 382-387.
Ludermer K (1999). Time to Heal: American Medical Education from the Turn of the Century to the Era of Managed Care, Oxford University Press.
Maccabe AT (2004). "Affirmative action in college admissions: the case for diversity." J Vet Med Educ 31(4): 421-424.
Makoul G (2003). "Communication skills education in medical school and beyond." JAMA 289(1).
Marin G and Gamba RJ (1996). "A New Measurement of Acculturation for Hispanics: The Bidimensional Acculturation Scale for Hispanics (BAS)." Hispanic Journal of Behavioral Sciences 18(3): 297-316.
Maximus (2005). The Health Literacy Style Manual. Columbia, SC, Southern Institute on Children and Families.
228
Motel S and Patten E (2013). "Statistical Portrait of Hispanics in the United States, 2011 " Hispanic Trends Project Retrieved August 20 2013, from http://www.pewhispanic.org/2013/02/15/hispanic-population-trends/ph_13-01-23_ss_hispanics2/.
Mutchler JE, Bacigalupe G, et al. (2007). "Language barriers surrounding medication use among older Latinos." Journal of cross-cultural gerontology 22(1): 101-114.
Muzyk AJ, Muzyk TL, et al. (2004). "Counseling Spanish-speaking patients: Atlanta pharmacists' cultural sensitivity, use of language-assistance services, and attitudes." J Am Pharm Assoc 44(3): 366-374.
National Center for Education Statistics (2003). "2003 National Assessment of Adult Literacy (NAAL)." Retrieved July 17 2013, from http://nces.ed.gov/naal/.
National Patient Safety Foundation (2011). "Health literacy: statistics at-a-glance." Retrieved April 27, 2013, from www.npsf.org.
National Patient Safety Foundation (2013). "Ask me 3." Retrieved July 17 2013, from http://www.npsf.org/for-healthcare-professionals/programs/ask-me-3/.
NAVMEC (2011). Roadmap for Veterinary Medical Education in the 21st Century: Responsive, Collaborative, Flexible.
NCIHC (2008) "The terminology of health care interpreting: A glossary of terms." Working Paper Series: The National Council on Interpreting in Health Care, 1-10.
Nelson P (2004). "Diversity: a professional imperative." J Vet Med Educ 31(4): 403-405.
Ngo-Metzger Q, Sorkin DH, et al. (2007). "Providing high-quality care for limited English proficient patients: the importance of language concordance and interpreter use." J Gen Intern Med 22 Suppl 2: 324-330.
Nielsen-Bohlman LT, Panzer AM, et al. (2004). Health Literacy: A Prescription to End Confusion. Washington, DC, National Academies Press.
Office for Civil Rights (2013). "Limited English Proficiency (LEP)." Retrieved May 1 2013, from http://www.hhs.gov/ocr/civilrights/resources/specialtopics/lep/index.html.
Office of Management and Budget (2002). Report to Congress: Assessment of the Total Benefits and Costs of Implementing Executive Order No. 13166: Improving Access for Persons with Limited English Proficiency. Washington, DC, Office of Management and Budget. 56.
Oliva NL (2008). "When language intervenes: improving care for patients with limited English proficiency." Am J Nurs 108(3): 73-75.
229
One Health Initiative (2013). Retrieved July 17 2013, from http://www.onehealthinitiative.com/.
Pandya C, Batalova J, et al. (2011). Limited English Proficient Individuals in the United States: Number, Share, Growth, and Linguistic Diversity. Washington, DC, Migration Policy Institute.
Parikh NS, Parker RM, et al. (1996). "Shame and health literacy: the unspoken connection." Patient Educ Couns 27(1): 33-39.
Parker RM, Baker DW, et al. (1995). "The Test of Functional Health Literacy in Adults: a new instrument for measuring patients' literacy skills." J Gen Intern Med 10(10): 537-541.
Perez-Stable EJ, Napoles-Springer A, et al. (1997). "The effects of ethnicity and language on medical outcomes of patients with hypertension or diabetes." Med Care 35(12): 1212-1219.
Pew Internet & American Life Project (2013) "Health online 2013."
Pew Research Center (2006). "Gauging Family Intimacy: Dogs Edge Cats (Dads Trail Both)." Retrieved January 14 2011, from http://pewresearch.org/assets/social/pdf/Pets.pdf.
Phokeo V and Hyman I (2007). "Provision of pharmaceutical care to patients with limited English proficiency." American Journal of Health-System Pharmacy 64(4): 423-429.
Pippins JR, Alegría M, et al. (2007). "Association between Language Proficiency and the Quality of Primary Care among a National Sample of Insured Latinos." Medical Care 45(11): 1020-1025.
Poss JE and Bader JO (2007). "Attitudes Toward Companion Animals Among Hispanic Residents of a Texas Border Community." Journal of Applied Animal Welfare Science 10(3): 243-253.
Poss JE and Bader JO (2008). "Results of a Free Spay/Neuter Program in a Hispanic Colonia on the Texas-Mexico Border." Journal of Applied Animal Welfare Science 11(4): 346-351.
Praska JL, Kripalani S, et al. (2005). "Identifying and assisting low-literacy patients with medication use: a survey of community pharmacies." Ann Pharmacother 39(9): 1441-1445.
230
President's commission for the study of ethical problems in medicine and biomedical and behavioral research (1982). "Making healthcare decisions: the ethical and legal implications of informed consent in the patient-practitioner relationship." Retrieved July 19 2013, from http://bioethics.georgetown.edu/pcbe/reports/past_commissions/making_health_care_decisions.pdf.
Ratzan SC and Parker RM (2000). Introduction: National Library of Medicine Current Bibliographies in Medicine: Health Literacy. Selden CR, Zorn M, Ratzan SC and Parker RM. Bethesda, MD, National Institutes of Health, U.S. Department of Health and Human Services. NLM Pub. No. 2000-1.
Regenstein M (2007). "Measuring and improving the quality of hospital language services: insights from the Speaking Together collaborative." J Gen Intern Med 22 Suppl 2: 356-359.
Risco CA and Risco CM (2007). Opportunities for training a culturally diverse workforce of dairies. Western Veterinary Conference 2007, Las Vegas, NV.
Risley-Curtiss C, Holley LC, et al. (2006). "The animal-human bond and ethnic diversity." Soc Work 51: 257-268.
Roat CE (2005). "Addressing Language Access Issues in Your Practice: A Toolkit for Physicians and Their Staff Members." Retrieved 05/07/2012, from http://www.calendow.org/uploadedFiles/language_access_issues.pdf.
Roat CE, Jacobs EA, et al. (2003). Letter to Deanna Jang re: "Guidance to Federal Financial Assistance Recipients Regarding Titile VI Prohibition Against National Origin Discrimination Affecting LEP Persons". J. Deanna Jang. Washington DC, National Council on Interpreting in Health Care.
Ross LA, Frier BM, et al. (2001). "Child and parental mental ability and glycaemic control in children with Type 1 diabetes." Diabet Med 18(5): 364-369.
Roter DL, Hall JA, et al. (2002). "Physician gender effects in medical communication: a meta-analytic review." JAMA 288(6): 756-764.
Rudd RE, Colton T, et al. (2000). An overview of medical and public health literature addressing literacy issues: an annotated bibliography. Harvard School of Public Health. Cambridge, MA, Harvard Graduate School of Education.
Ryan C (2013). Language Use in the United States: 2011. American Community Survey Reports, U.S. Census Bureau.
Sanders L, Federico S, et al. (2009). "Literacy and child health: A systematic review." Archives of Pediatrics & Adolescent Medicine 163(2): 131-140.
231
Schenker Y, Wang F, et al. (2007). "The impact of language barriers on documentation of informed consent at a hospital with on-site interpreter services." J Gen Intern Med 22 Suppl 2: 294-299.
Schoenfeld-Tacher R, Kogan LR, et al. (2010). "Comparison of strength of the human-animal bond between Hispanic and non-Hispanic owners of pet dogs and cats." J Am Vet Med Assoc 236(5): 529-534.
Schyve PM (2007). "Language differences as a barrier to quality and safety in health care: the Joint Commission perspective." J Gen Intern Med 22 Suppl 2: 360-361.
Sharif I, Lo S, et al. (2006). "Availability of Spanish prescription labels." Journal of health care for the poor and underserved 17(1): 65-69.
Sharif I and Tse J (2010). "Accuracy of computer-generated, spanish-language medicine labels." Pediatrics 125(5): 960-965.
Sharp LK, Ureste PJ, et al. (2013). "Time to sign: The relationship between health literacy and signature time." Patient Education and Counseling 90(1): 18-22.
Shaw JR (2006). "Four Core Communication Skills of Highly Effective Practitioners." Veterinary Clinics of North America: Small Animal Practice 36(2): 385-396.
Shaw JR, Adams CL, et al. (2004). "What can veterinarians learn from studies of physician-patient communication about veterinarian-client-patient communication?" J Am Vet Med Assoc 224(5): 676-684.
Shin H. and Kominski R (2010). Language Use in the United States: 2007. American Community Survey Reports. Washington DC, US Census Bureau.
Sleath B (2002). "Pharmacists' experiences and perceptions toward serving Spanish-speaking patients in North Carolina community pharmacies." J Pharm Teach 9(4): 77-91.
Sleath B, Blalock SJ, et al. (2009). "Latinos' sources of medication and medication information in the United States and their home countries." Patient Educ Couns 75(2): 279-282.
Sleath B, Blalock SJ, et al. (2009). "Latino patients' preferences for medication information and pharmacy services." Journal of the American Pharmacists Association : JAPhA 49(5): 632-636.
Sleath B and Wallace J (2002). "Providing Pharmaceutical care to Spanish-speaking patients." J Am Pharm Assoc (Wash) 42(5): 799-800.
Social Science Research Solutions (2012). "Previous survey found 38% of Hispanics are pet owners".
232
The White House (2000). Executive Order 13166 of August 11, 2000. Washington DC, Federal Register. 65: 50121-50122.
Tremayne J (2013). "Women in Veterinary Medicine." Vet Prac News Oct 2013.
US Census (2013). "State & County QuickFacts." Retrieved July 25, 2013, from http://quickfacts.census.gov/qfd/states/00000.html.
US Census Bureau (2010). "S1601 Language Spoken at Home." Retrieved July 14 2013, from http://factfinder2.census.gov/faces/tableservices/jsf/pages/productview.xhtml?src=bkmk.
US Census Bureau (2011). "Hispanic Americans: Census Facts." Retrieved July 20 2013, from http://www.infoplease.com/spot/hhmcensus1.html.
US Census Bureau (2012, September 12, 2012). "Poverty." Retrieved May 7, 2013, from http://www.census.gov/hhes/www/poverty/data/threshld/.
US Department of Housing and Urban Development (2005). "Community development block grant-Colonias." Retrieved Retrieved June 25, 2013, from http://www.sos.state.tx.us/border/colonias/what_colonia.shtml.
United States Medical Licensing Examination (2013). "2103 Bulletin of Information." Retrieved July 10 2013, from www.usmle.org.
Van Kempen A (2007). "Legal risks of ineffective communication." Virtual Mentor: American Medical Association Journal of Ethics 9(8): 555-558.
VanTyle WK, Kennedy G, et al. (2011). "A Spanish language and culture initiative for a doctor of pharmacy curriculum." American journal of pharmaceutical education 75(1): 4.
Westberg SM and Sorensen TD (2005). "Pharmacy-related health disparities experienced by non-English-speaking patients: impact of pharmaceutical care." J Am Pharm Assoc 45(1): 48-54.
Williams MV, Baker DW, et al. (1998). "Inadequate literacy is a barrier to asthma knowledge and self-care." Chest. 114(4): 1008-1015.
Willis NG, Monroe FA, et al. (2007). "Envisioning the future of veterinary medical education: the Association of American Veterinary Medical Colleges Foresight Project, Final Report." AAVMC 34(1): 1-41.
Wilson E, Chen AH, et al. (2005). "Effects of limited English proficiency and physician language on health care comprehension." J Gen Intern Med 20(9): 800-806.
233
Wolf CA, Lloyd JW, et al. (2008). "An examination of US consumer pet-related and veterinary service expenditures, 1980-2005." J Am Vet Med Assoc 233(3): 404-413.
Wu S, Ridgely MS, et al. (2007). "Language access services for Latinos with limited English proficiency: lessons learned from Hablamos Juntos." J Gen Intern Med 22 Suppl 2: 350-355.
Xu KT and Rojas-Fernandez CH (2003). "Ancillary community pharmacy services provided to older people in a largely rural and ethnically diverse region: a survey of consumers in West Texas." J Rural Health 19(1): 79-86.
Yawman D, McIntosh S, et al. (2006). "The Use of Spanish by Medical Students and Residents at One University Hospital." Academic Medicine 81(5): 468-473 410.1097/1001.ACM.0000222280.0000205953.0000222219.
Yin HS, Dreyer BP, et al. (2008). "Randomized controlled trial of a pictogram-based intervention to reduce liquid medication dosing errors and improve adherence among caregivers of young children." Arch Pediatr Adolesc Med 162(9): 814-822.
Youmans SL and Schillinger D (2003). "Functional Health Literacy and Medication Use: the Pharmacist's Role." The Annals of Pharmacotherapy 37(11): 1726-1729.

234
APPENDICES
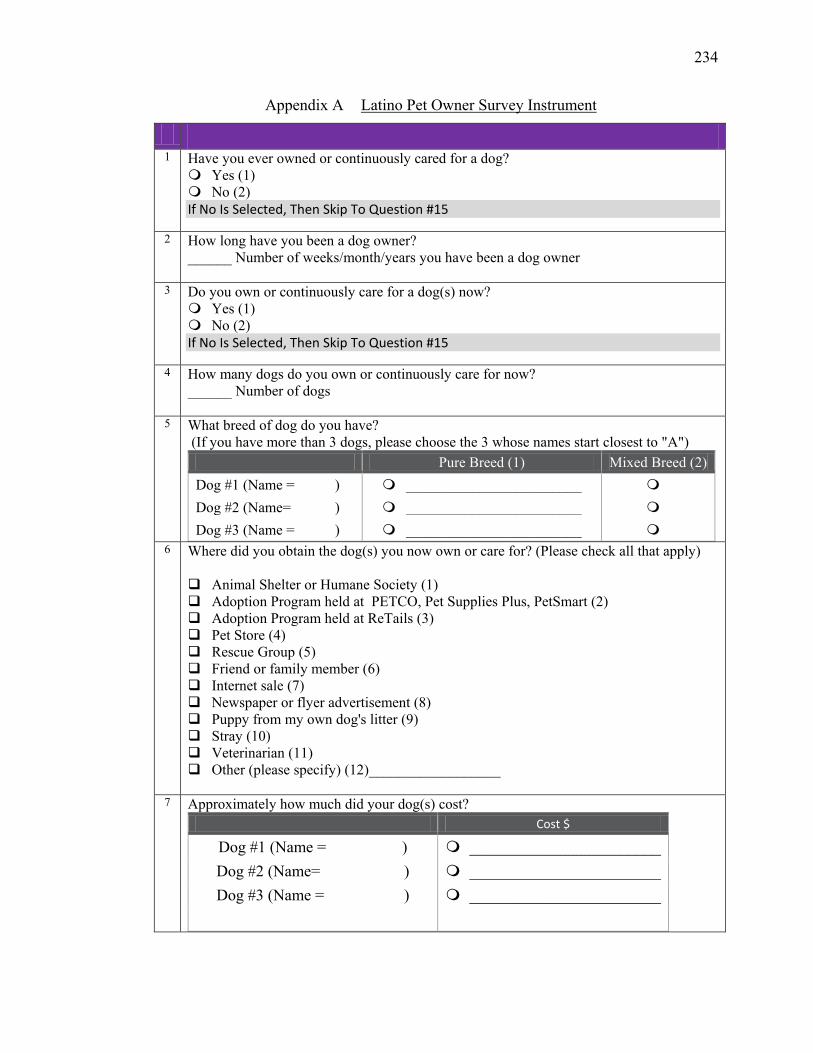
234
Appendix A Latino Pet Owner Survey Instrument
1 Have you ever owned or continuously cared for a dog? Yes (1) No (2) If No Is Selected, Then Skip To Question #15
2 How long have you been a dog owner? ______ Number of weeks/month/years you have been a dog owner
3 Do you own or continuously care for a dog(s) now? Yes (1) No (2) If No Is Selected, Then Skip To Question #15
4 How many dogs do you own or continuously care for now? ______ Number of dogs
5 What breed of dog do you have? (If you have more than 3 dogs, please choose the 3 whose names start closest to "A")
Pure Breed (1) Mixed Breed (2) Dog #1 (Name = ) ________________________ Dog #2 (Name= ) ________________________ Dog #3 (Name = ) ________________________
6 Where did you obtain the dog(s) you now own or care for? (Please check all that apply) Animal Shelter or Humane Society (1) Adoption Program held at PETCO, Pet Supplies Plus, PetSmart (2) Adoption Program held at ReTails (3) Pet Store (4) Rescue Group (5) Friend or family member (6) Internet sale (7) Newspaper or flyer advertisement (8) Puppy from my own dog's litter (9) Stray (10) Veterinarian (11) Other (please specify) (12)__________________
7 Approximately how much did your dog(s) cost?
Cost $
Dog #1 (Name = ) ________________________ Dog #2 (Name= ) ________________________ Dog #3 (Name = ) ________________________
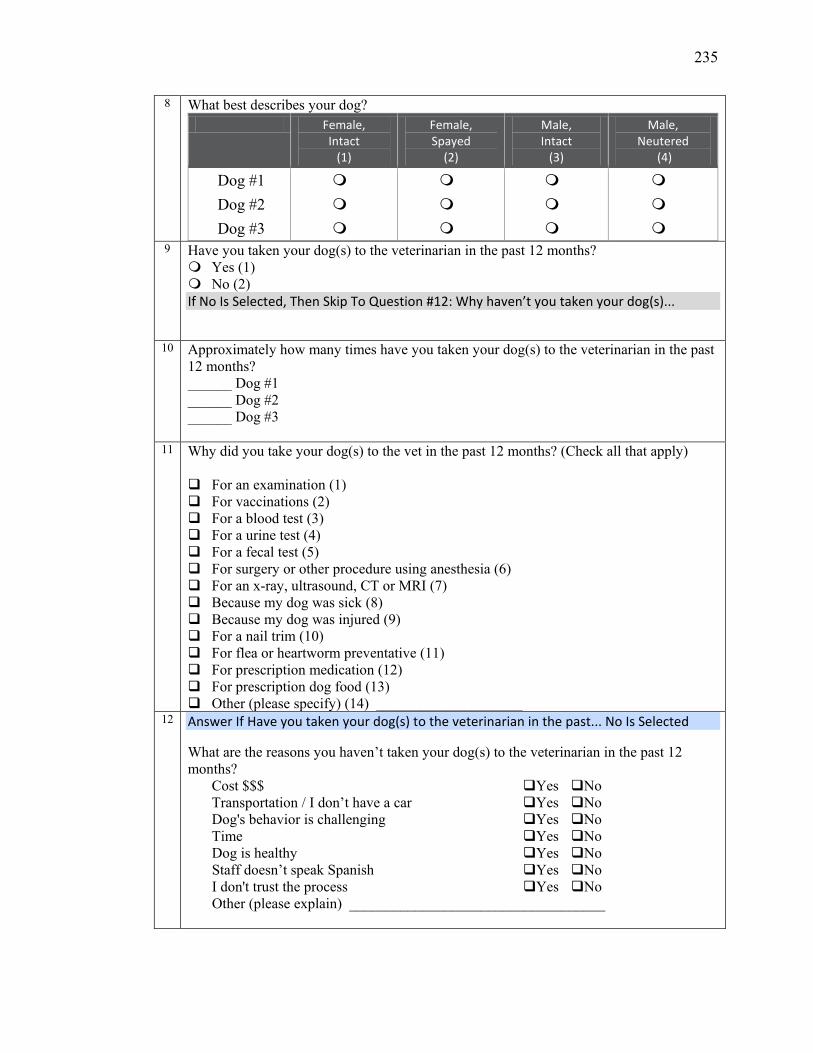
235
8 What best describes your dog? Female,
Intact (1)
Female, Spayed
(2)
Male, Intact
(3)
Male, Neutered
(4)
Dog #1 Dog #2 Dog #3
9 Have you taken your dog(s) to the veterinarian in the past 12 months? Yes (1) No (2) If No Is Selected, Then Skip To Question #12: Why haven’t you taken your dog(s)...
10 Approximately how many times have you taken your dog(s) to the veterinarian in the past
12 months? ______ Dog #1 ______ Dog #2 ______ Dog #3
11 Why did you take your dog(s) to the vet in the past 12 months? (Check all that apply)
For an examination (1) For vaccinations (2) For a blood test (3) For a urine test (4) For a fecal test (5) For surgery or other procedure using anesthesia (6) For an x-ray, ultrasound, CT or MRI (7) Because my dog was sick (8) Because my dog was injured (9) For a nail trim (10) For flea or heartworm preventative (11) For prescription medication (12) For prescription dog food (13) Other (please specify) (14) ____________________
12 Answer If Have you taken your dog(s) to the veterinarian in the past... No Is Selected
What are the reasons you haven’t taken your dog(s) to the veterinarian in the past 12 months?
Cost $$$ Yes No Transportation / I don’t have a car Yes No Dog's behavior is challenging Yes No Time Yes No Dog is healthy Yes No Staff doesn’t speak Spanish Yes No I don't trust the process Yes No Other (please explain) ___________________________________
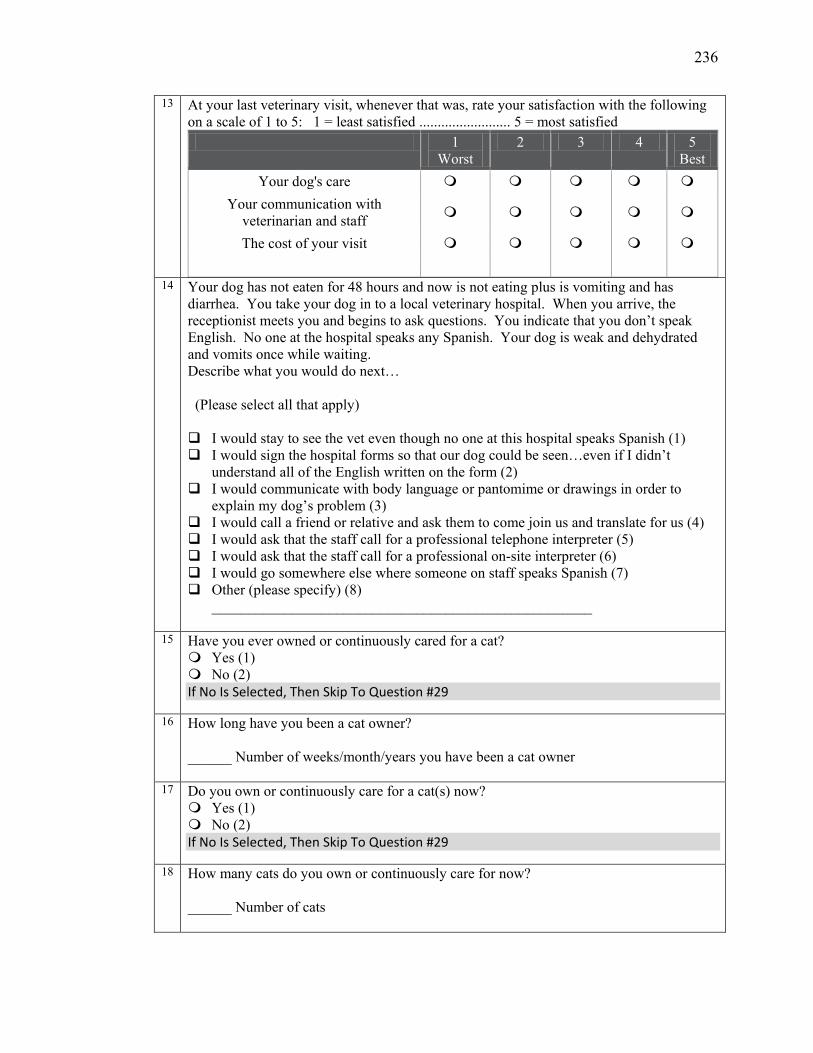
236
13 At your last veterinary visit, whenever that was, rate your satisfaction with the following on a scale of 1 to 5: 1 = least satisfied ......................... 5 = most satisfied
1 Worst
2 3 4 5 Best
Your dog's care Your communication with
veterinarian and staff
The cost of your visit
14 Your dog has not eaten for 48 hours and now is not eating plus is vomiting and has diarrhea. You take your dog in to a local veterinary hospital. When you arrive, the receptionist meets you and begins to ask questions. You indicate that you don’t speak English. No one at the hospital speaks any Spanish. Your dog is weak and dehydrated and vomits once while waiting. Describe what you would do next… (Please select all that apply) I would stay to see the vet even though no one at this hospital speaks Spanish (1) I would sign the hospital forms so that our dog could be seen…even if I didn’t
understand all of the English written on the form (2) I would communicate with body language or pantomime or drawings in order to
explain my dog’s problem (3) I would call a friend or relative and ask them to come join us and translate for us (4) I would ask that the staff call for a professional telephone interpreter (5) I would ask that the staff call for a professional on-site interpreter (6) I would go somewhere else where someone on staff speaks Spanish (7) Other (please specify) (8)
____________________________________________________
15 Have you ever owned or continuously cared for a cat? Yes (1) No (2) If No Is Selected, Then Skip To Question #29
16 How long have you been a cat owner? ______ Number of weeks/month/years you have been a cat owner
17 Do you own or continuously care for a cat(s) now? Yes (1) No (2) If No Is Selected, Then Skip To Question #29
18 How many cats do you own or continuously care for now? ______ Number of cats
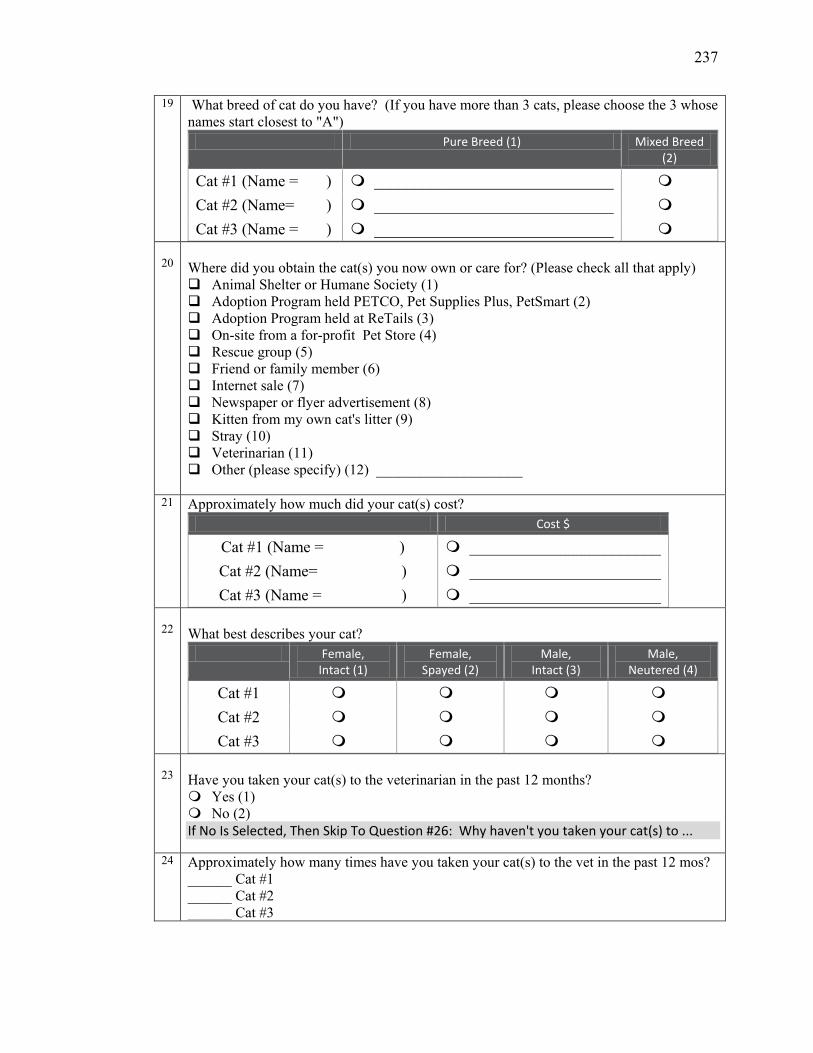
237
19 What breed of cat do you have? (If you have more than 3 cats, please choose the 3 whose names start closest to "A")
Pure Breed (1) Mixed Breed (2)
Cat #1 (Name = ) ______________________________ Cat #2 (Name= ) ______________________________ Cat #3 (Name = ) ______________________________
20
Where did you obtain the cat(s) you now own or care for? (Please check all that apply) Animal Shelter or Humane Society (1) Adoption Program held PETCO, Pet Supplies Plus, PetSmart (2) Adoption Program held at ReTails (3) On-site from a for-profit Pet Store (4) Rescue group (5) Friend or family member (6) Internet sale (7) Newspaper or flyer advertisement (8) Kitten from my own cat's litter (9) Stray (10) Veterinarian (11) Other (please specify) (12) ____________________
21 Approximately how much did your cat(s) cost? Cost $
Cat #1 (Name = ) ________________________ Cat #2 (Name= ) ________________________ Cat #3 (Name = ) ________________________
22
What best describes your cat?
Female, Intact (1)
Female, Spayed (2)
Male, Intact (3)
Male, Neutered (4)
Cat #1 Cat #2 Cat #3
23
Have you taken your cat(s) to the veterinarian in the past 12 months? Yes (1) No (2) If No Is Selected, Then Skip To Question #26: Why haven't you taken your cat(s) to ...
24 Approximately how many times have you taken your cat(s) to the vet in the past 12 mos? ______ Cat #1 ______ Cat #2 ______ Cat #3
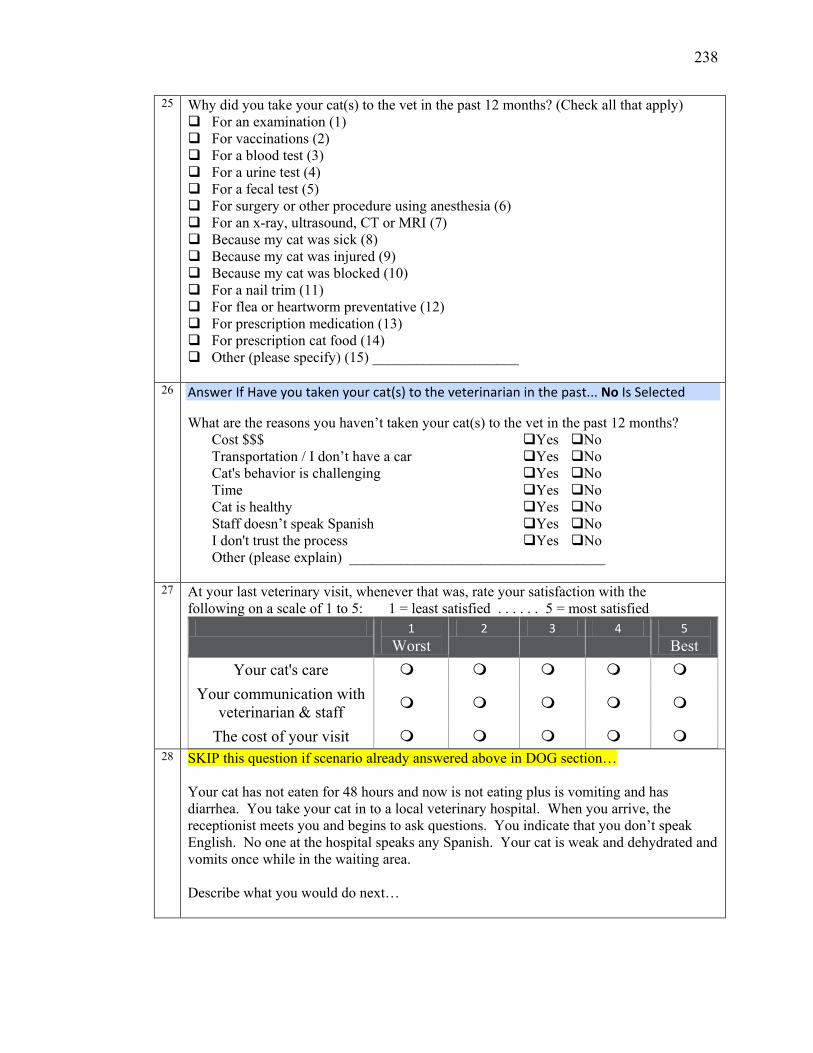
238
25 Why did you take your cat(s) to the vet in the past 12 months? (Check all that apply) For an examination (1) For vaccinations (2) For a blood test (3) For a urine test (4) For a fecal test (5) For surgery or other procedure using anesthesia (6) For an x-ray, ultrasound, CT or MRI (7) Because my cat was sick (8) Because my cat was injured (9) Because my cat was blocked (10) For a nail trim (11) For flea or heartworm preventative (12) For prescription medication (13) For prescription cat food (14) Other (please specify) (15) ____________________
26 Answer If Have you taken your cat(s) to the veterinarian in the past... No Is Selected
What are the reasons you haven’t taken your cat(s) to the vet in the past 12 months? Cost $$$ Yes No Transportation / I don’t have a car Yes No Cat's behavior is challenging Yes No Time Yes No Cat is healthy Yes No Staff doesn’t speak Spanish Yes No I don't trust the process Yes No Other (please explain) ___________________________________
27 At your last veterinary visit, whenever that was, rate your satisfaction with the
following on a scale of 1 to 5: 1 = least satisfied . . . . . . 5 = most satisfied 1
Worst 2 3 4 5
Best Your cat's care
Your communication with veterinarian & staff
The cost of your visit
28 SKIP this question if scenario already answered above in DOG section… Your cat has not eaten for 48 hours and now is not eating plus is vomiting and has diarrhea. You take your cat in to a local veterinary hospital. When you arrive, the receptionist meets you and begins to ask questions. You indicate that you don’t speak English. No one at the hospital speaks any Spanish. Your cat is weak and dehydrated and vomits once while in the waiting area. Describe what you would do next…
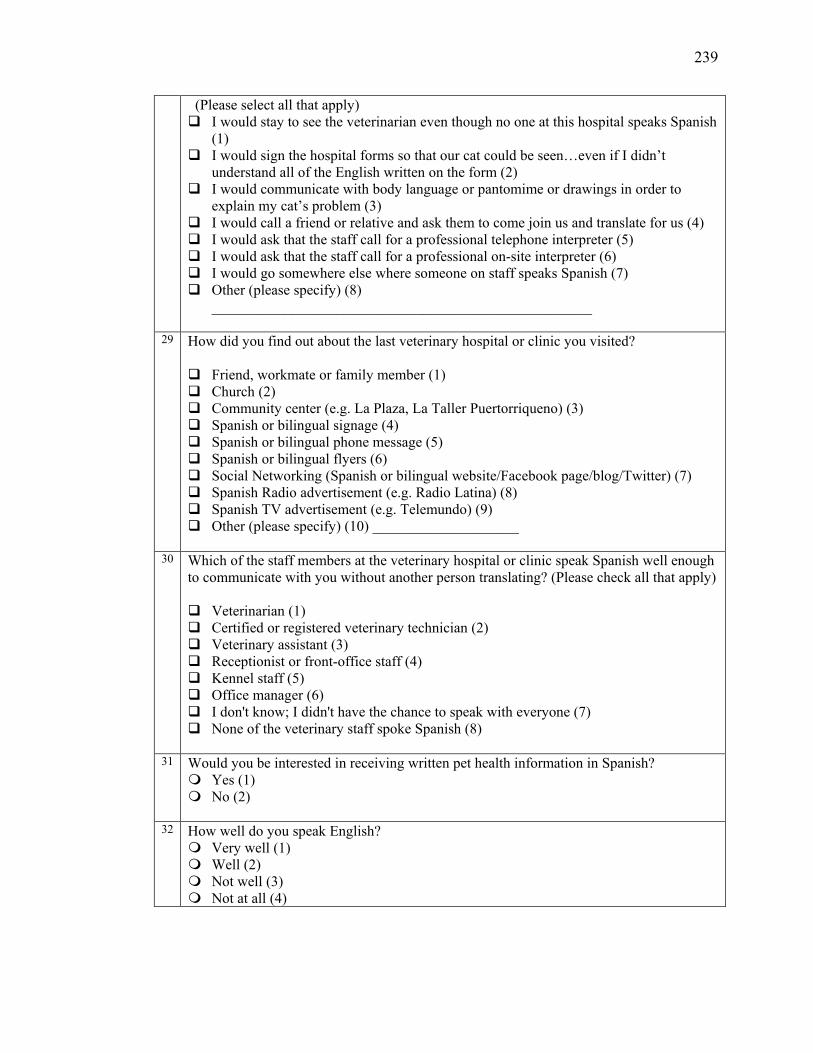
239
(Please select all that apply) I would stay to see the veterinarian even though no one at this hospital speaks Spanish
(1) I would sign the hospital forms so that our cat could be seen…even if I didn’t
understand all of the English written on the form (2) I would communicate with body language or pantomime or drawings in order to
explain my cat’s problem (3) I would call a friend or relative and ask them to come join us and translate for us (4) I would ask that the staff call for a professional telephone interpreter (5) I would ask that the staff call for a professional on-site interpreter (6) I would go somewhere else where someone on staff speaks Spanish (7) Other (please specify) (8)
____________________________________________________
29 How did you find out about the last veterinary hospital or clinic you visited? Friend, workmate or family member (1) Church (2) Community center (e.g. La Plaza, La Taller Puertorriqueno) (3) Spanish or bilingual signage (4) Spanish or bilingual phone message (5) Spanish or bilingual flyers (6) Social Networking (Spanish or bilingual website/Facebook page/blog/Twitter) (7) Spanish Radio advertisement (e.g. Radio Latina) (8) Spanish TV advertisement (e.g. Telemundo) (9) Other (please specify) (10) ____________________
30 Which of the staff members at the veterinary hospital or clinic speak Spanish well enough to communicate with you without another person translating? (Please check all that apply) Veterinarian (1) Certified or registered veterinary technician (2) Veterinary assistant (3) Receptionist or front-office staff (4) Kennel staff (5) Office manager (6) I don't know; I didn't have the chance to speak with everyone (7) None of the veterinary staff spoke Spanish (8)
31 Would you be interested in receiving written pet health information in Spanish? Yes (1) No (2)
32 How well do you speak English?
Very well (1) Well (2) Not well (3) Not at all (4)
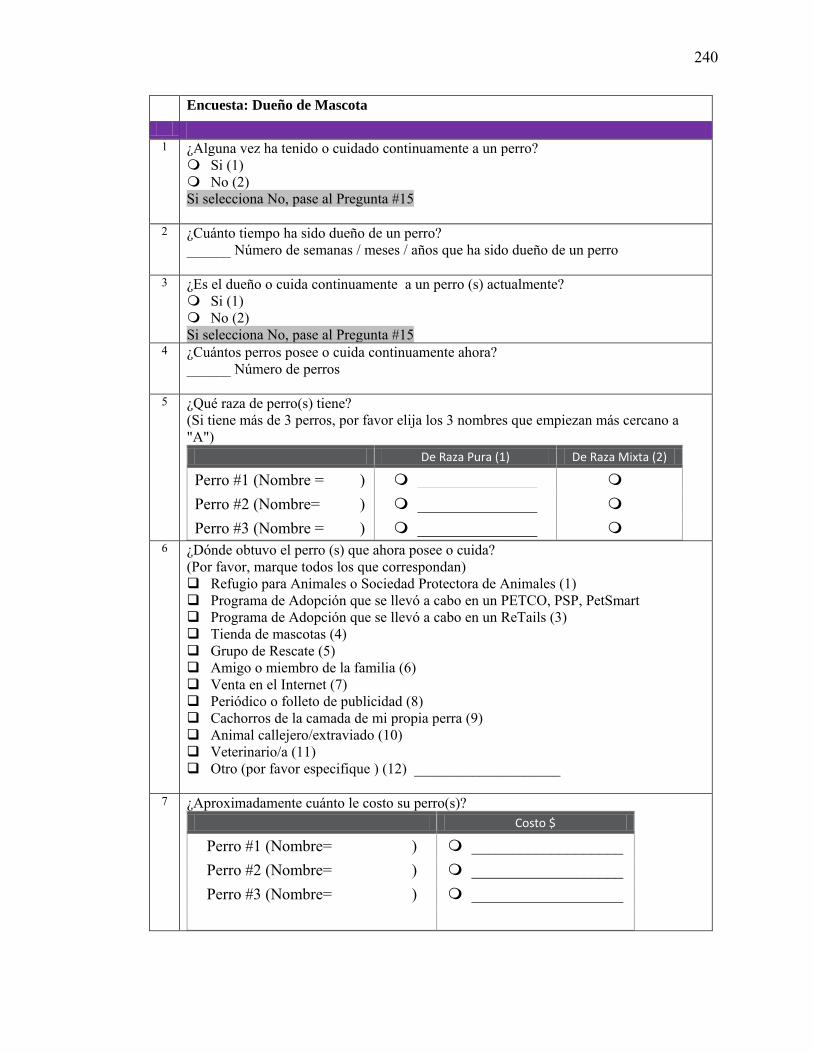
240
Encuesta: Dueño de Mascota 1 ¿Alguna vez ha tenido o cuidado continuamente a un perro? Si (1) No (2) Si selecciona No, pase al Pregunta #15
2 ¿Cuánto tiempo ha sido dueño de un perro? ______ Número de semanas / meses / años que ha sido dueño de un perro
3 ¿Es el dueño o cuida continuamente a un perro (s) actualmente? Si (1) No (2) Si selecciona No, pase al Pregunta #15
4 ¿Cuántos perros posee o cuida continuamente ahora? ______ Número de perros
5 ¿Qué raza de perro(s) tiene? (Si tiene más de 3 perros, por favor elija los 3 nombres que empiezan más cercano a "A")
De Raza Pura (1) De Raza Mixta (2)
Perro #1 (Nombre = ) _______________ Perro #2 (Nombre= ) _______________ Perro #3 (Nombre = ) _______________
6 ¿Dónde obtuvo el perro (s) que ahora posee o cuida? (Por favor, marque todos los que correspondan) Refugio para Animales o Sociedad Protectora de Animales (1) Programa de Adopción que se llevó a cabo en un PETCO, PSP, PetSmart Programa de Adopción que se llevó a cabo en un ReTails (3) Tienda de mascotas (4) Grupo de Rescate (5) Amigo o miembro de la familia (6) Venta en el Internet (7) Periódico o folleto de publicidad (8) Cachorros de la camada de mi propia perra (9) Animal callejero/extraviado (10) Veterinario/a (11) Otro (por favor especifique ) (12) ____________________
7 ¿Aproximadamente cuánto le costo su perro(s)? Costo $
Perro #1 (Nombre= ) ___________________ Perro #2 (Nombre= ) ___________________ Perro #3 (Nombre= ) ___________________
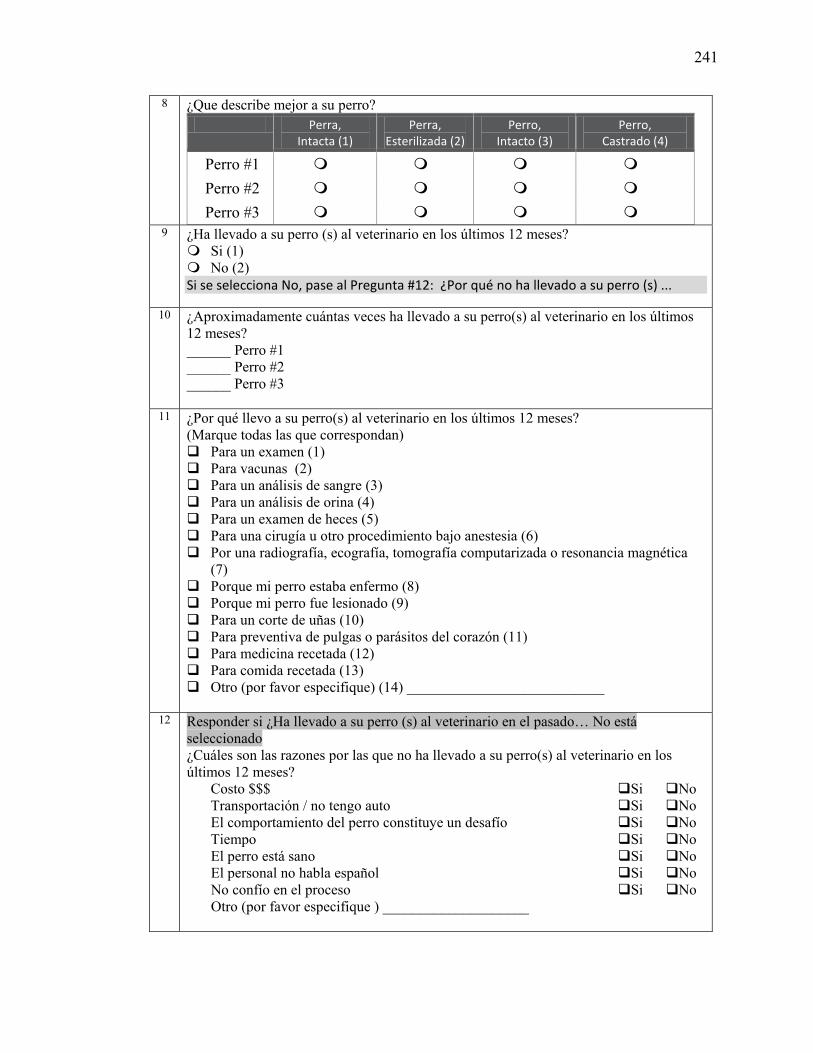
241
8 ¿Que describe mejor a su perro? Perra,
Intacta (1) Perra,
Esterilizada (2) Perro,
Intacto (3) Perro,
Castrado (4)
Perro #1 Perro #2 Perro #3
9 ¿Ha llevado a su perro (s) al veterinario en los últimos 12 meses? Si (1) No (2) Si se selecciona No, pase al Pregunta #12: ¿Por qué no ha llevado a su perro (s) ...
10 ¿Aproximadamente cuántas veces ha llevado a su perro(s) al veterinario en los últimos 12 meses? ______ Perro #1 ______ Perro #2 ______ Perro #3
11 ¿Por qué llevo a su perro(s) al veterinario en los últimos 12 meses? (Marque todas las que correspondan) Para un examen (1) Para vacunas (2) Para un análisis de sangre (3) Para un análisis de orina (4) Para un examen de heces (5) Para una cirugía u otro procedimiento bajo anestesia (6) Por una radiografía, ecografía, tomografía computarizada o resonancia magnética
(7) Porque mi perro estaba enfermo (8) Porque mi perro fue lesionado (9) Para un corte de uñas (10) Para preventiva de pulgas o parásitos del corazón (11) Para medicina recetada (12) Para comida recetada (13) Otro (por favor especifique) (14) ___________________________
12 Responder si ¿Ha llevado a su perro (s) al veterinario en el pasado… No está seleccionado ¿Cuáles son las razones por las que no ha llevado a su perro(s) al veterinario en los últimos 12 meses?
Costo $$$ Si No Transportación / no tengo auto Si No El comportamiento del perro constituye un desafío Si No Tiempo Si No El perro está sano Si No El personal no habla español Si No No confío en el proceso Si No Otro (por favor especifique ) ____________________
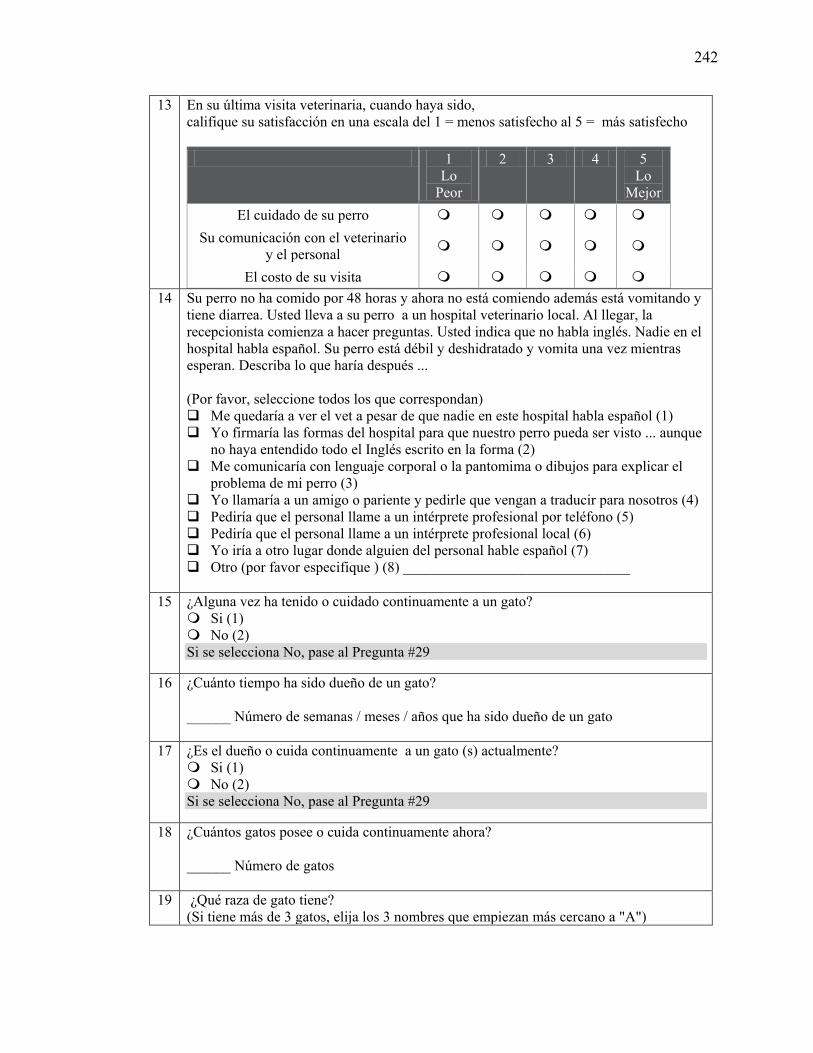
242
13 En su última visita veterinaria, cuando haya sido, califique su satisfacción en una escala del 1 = menos satisfecho al 5 = más satisfecho
1 Lo
Peor
2 3 4 5 Lo
Mejor El cuidado de su perro
Su comunicación con el veterinario y el personal
El costo de su visita
14 Su perro no ha comido por 48 horas y ahora no está comiendo además está vomitando y tiene diarrea. Usted lleva a su perro a un hospital veterinario local. Al llegar, la recepcionista comienza a hacer preguntas. Usted indica que no habla inglés. Nadie en el hospital habla español. Su perro está débil y deshidratado y vomita una vez mientras esperan. Describa lo que haría después ... (Por favor, seleccione todos los que correspondan) Me quedaría a ver el vet a pesar de que nadie en este hospital habla español (1) Yo firmaría las formas del hospital para que nuestro perro pueda ser visto ... aunque
no haya entendido todo el Inglés escrito en la forma (2) Me comunicaría con lenguaje corporal o la pantomima o dibujos para explicar el
problema de mi perro (3) Yo llamaría a un amigo o pariente y pedirle que vengan a traducir para nosotros (4) Pediría que el personal llame a un intérprete profesional por teléfono (5) Pediría que el personal llame a un intérprete profesional local (6) Yo iría a otro lugar donde alguien del personal hable español (7) Otro (por favor especifique ) (8) _______________________________
15 ¿Alguna vez ha tenido o cuidado continuamente a un gato?
Si (1) No (2) Si se selecciona No, pase al Pregunta #29
16 ¿Cuánto tiempo ha sido dueño de un gato? ______ Número de semanas / meses / años que ha sido dueño de un gato
17 ¿Es el dueño o cuida continuamente a un gato (s) actualmente? Si (1) No (2) Si se selecciona No, pase al Pregunta #29
18 ¿Cuántos gatos posee o cuida continuamente ahora? ______ Número de gatos
19 ¿Qué raza de gato tiene? (Si tiene más de 3 gatos, elija los 3 nombres que empiezan más cercano a "A")
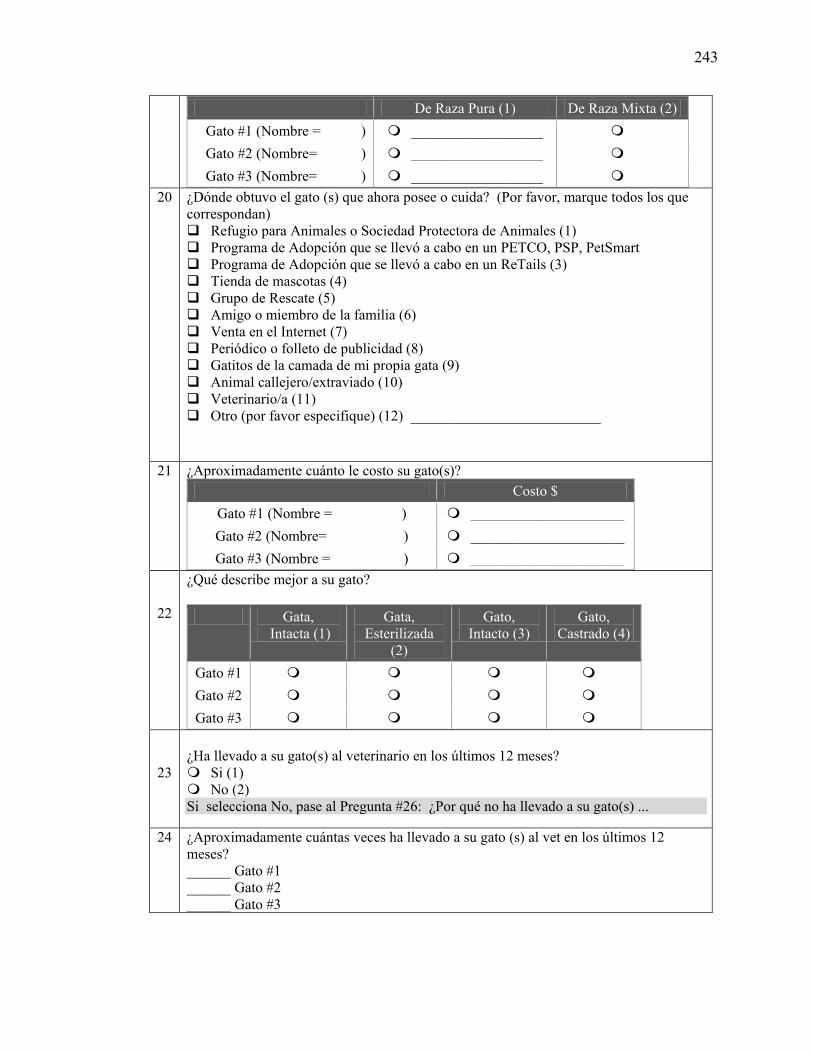
243
De Raza Pura (1) De Raza Mixta (2) Gato #1 (Nombre = ) __________________ Gato #2 (Nombre= ) __________________ Gato #3 (Nombre= ) __________________
20 ¿Dónde obtuvo el gato (s) que ahora posee o cuida? (Por favor, marque todos los que correspondan) Refugio para Animales o Sociedad Protectora de Animales (1) Programa de Adopción que se llevó a cabo en un PETCO, PSP, PetSmart Programa de Adopción que se llevó a cabo en un ReTails (3) Tienda de mascotas (4) Grupo de Rescate (5) Amigo o miembro de la familia (6) Venta en el Internet (7) Periódico o folleto de publicidad (8) Gatitos de la camada de mi propia gata (9) Animal callejero/extraviado (10) Veterinario/a (11) Otro (por favor especifique) (12) __________________________
21 ¿Aproximadamente cuánto le costo su gato(s)? Costo $
Gato #1 (Nombre = ) _____________________ Gato #2 (Nombre= ) _____________________ Gato #3 (Nombre = ) _____________________
22
¿Qué describe mejor a su gato?
Gata, Intacta (1)
Gata, Esterilizada
(2)
Gato, Intacto (3)
Gato, Castrado (4)
Gato #1 Gato #2 Gato #3
23
¿Ha llevado a su gato(s) al veterinario en los últimos 12 meses? Si (1) No (2) Si selecciona No, pase al Pregunta #26: ¿Por qué no ha llevado a su gato(s) ...
24 ¿Aproximadamente cuántas veces ha llevado a su gato (s) al vet en los últimos 12 meses? ______ Gato #1 ______ Gato #2 ______ Gato #3
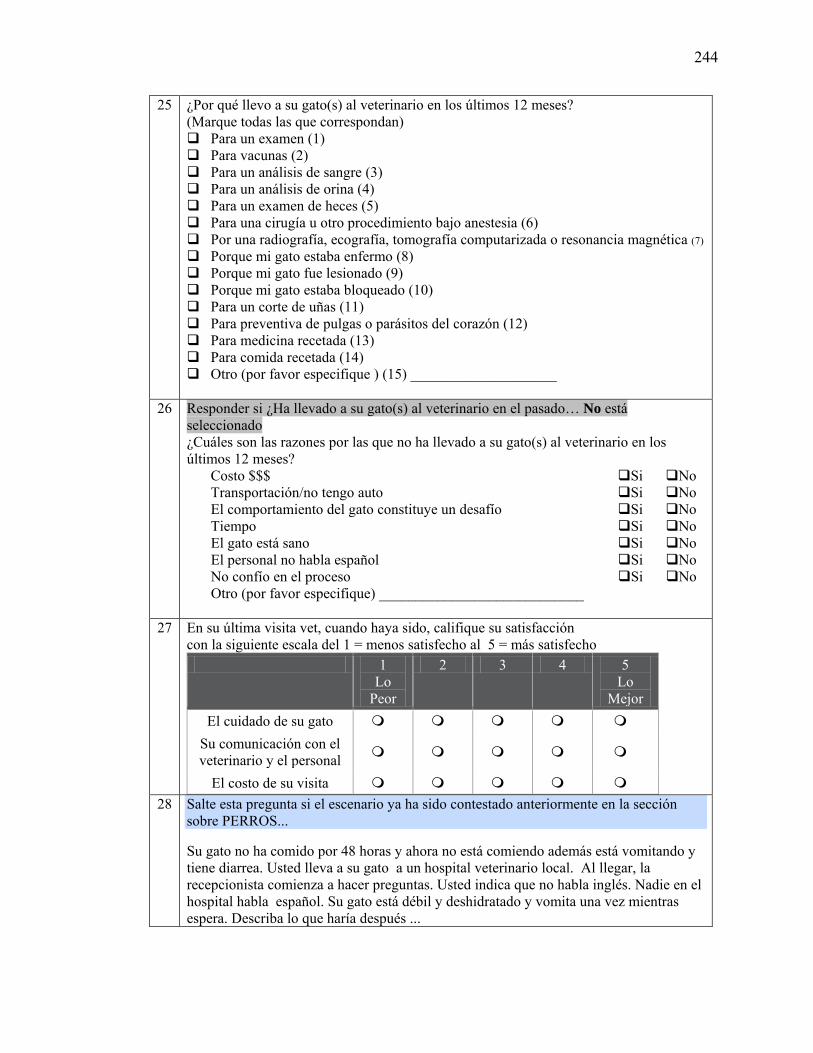
244
25 ¿Por qué llevo a su gato(s) al veterinario en los últimos 12 meses? (Marque todas las que correspondan) Para un examen (1) Para vacunas (2) Para un análisis de sangre (3) Para un análisis de orina (4) Para un examen de heces (5) Para una cirugía u otro procedimiento bajo anestesia (6) Por una radiografía, ecografía, tomografía computarizada o resonancia magnética (7) Porque mi gato estaba enfermo (8) Porque mi gato fue lesionado (9) Porque mi gato estaba bloqueado (10) Para un corte de uñas (11) Para preventiva de pulgas o parásitos del corazón (12) Para medicina recetada (13) Para comida recetada (14) Otro (por favor especifique ) (15) ____________________
26 Responder si ¿Ha llevado a su gato(s) al veterinario en el pasado… No está
seleccionado ¿Cuáles son las razones por las que no ha llevado a su gato(s) al veterinario en los últimos 12 meses?
Costo $$$ Si No Transportación/no tengo auto Si No El comportamiento del gato constituye un desafío Si No Tiempo Si No El gato está sano Si No El personal no habla español Si No No confío en el proceso Si No Otro (por favor especifique) ____________________________
27 En su última visita vet, cuando haya sido, califique su satisfacción con la siguiente escala del 1 = menos satisfecho al 5 = más satisfecho
1 Lo
Peor
2 3 4 5 Lo
Mejor El cuidado de su gato
Su comunicación con el veterinario y el personal
El costo de su visita
28 Salte esta pregunta si el escenario ya ha sido contestado anteriormente en la sección sobre PERROS...
Su gato no ha comido por 48 horas y ahora no está comiendo además está vomitando y tiene diarrea. Usted lleva a su gato a un hospital veterinario local. Al llegar, la recepcionista comienza a hacer preguntas. Usted indica que no habla inglés. Nadie en el hospital habla español. Su gato está débil y deshidratado y vomita una vez mientras espera. Describa lo que haría después ...
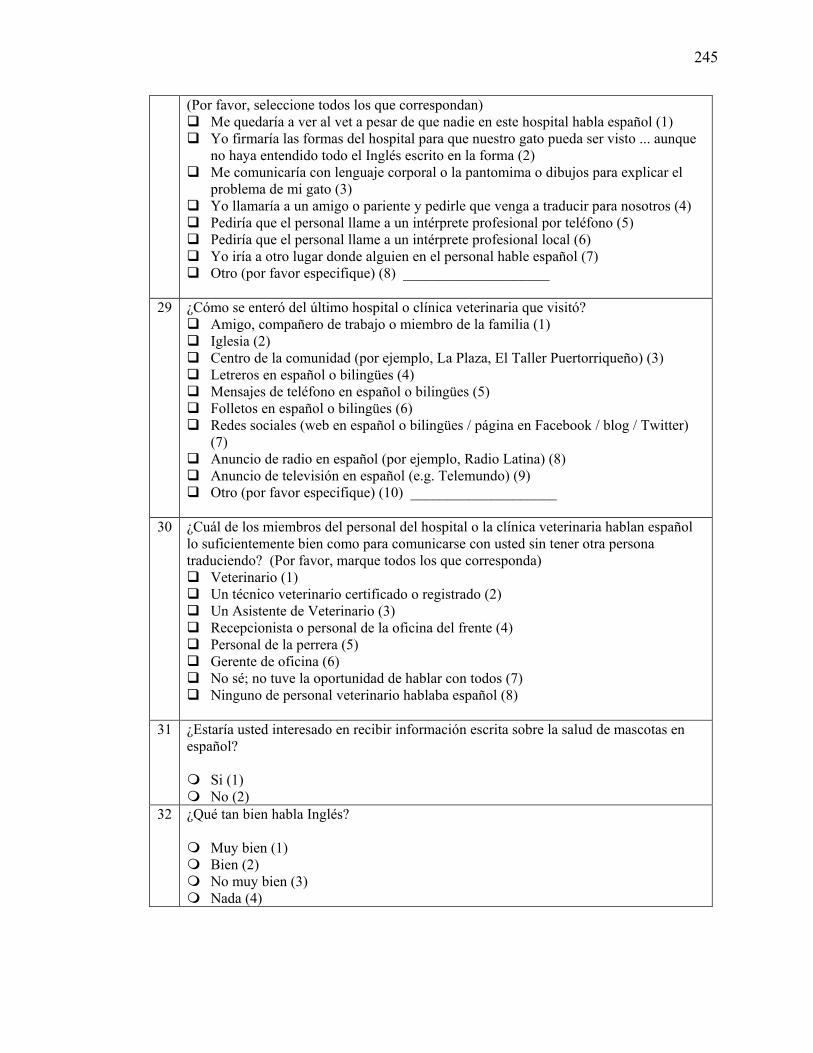
245
(Por favor, seleccione todos los que correspondan) Me quedaría a ver al vet a pesar de que nadie en este hospital habla español (1) Yo firmaría las formas del hospital para que nuestro gato pueda ser visto ... aunque
no haya entendido todo el Inglés escrito en la forma (2) Me comunicaría con lenguaje corporal o la pantomima o dibujos para explicar el
problema de mi gato (3) Yo llamaría a un amigo o pariente y pedirle que venga a traducir para nosotros (4) Pediría que el personal llame a un intérprete profesional por teléfono (5) Pediría que el personal llame a un intérprete profesional local (6) Yo iría a otro lugar donde alguien en el personal hable español (7) Otro (por favor especifique) (8) ____________________
29 ¿Cómo se enteró del último hospital o clínica veterinaria que visitó? Amigo, compañero de trabajo o miembro de la familia (1) Iglesia (2) Centro de la comunidad (por ejemplo, La Plaza, El Taller Puertorriqueño) (3) Letreros en español o bilingües (4) Mensajes de teléfono en español o bilingües (5) Folletos en español o bilingües (6) Redes sociales (web en español o bilingües / página en Facebook / blog / Twitter)
(7) Anuncio de radio en español (por ejemplo, Radio Latina) (8) Anuncio de televisión en español (e.g. Telemundo) (9) Otro (por favor especifique) (10) ____________________
30 ¿Cuál de los miembros del personal del hospital o la clínica veterinaria hablan español lo suficientemente bien como para comunicarse con usted sin tener otra persona traduciendo? (Por favor, marque todos los que corresponda) Veterinario (1) Un técnico veterinario certificado o registrado (2) Un Asistente de Veterinario (3) Recepcionista o personal de la oficina del frente (4) Personal de la perrera (5) Gerente de oficina (6) No sé; no tuve la oportunidad de hablar con todos (7) Ninguno de personal veterinario hablaba español (8)
31 ¿Estaría usted interesado en recibir información escrita sobre la salud de mascotas en
español? Si (1) No (2)
32 ¿Qué tan bien habla Inglés? Muy bien (1) Bien (2) No muy bien (3) Nada (4)
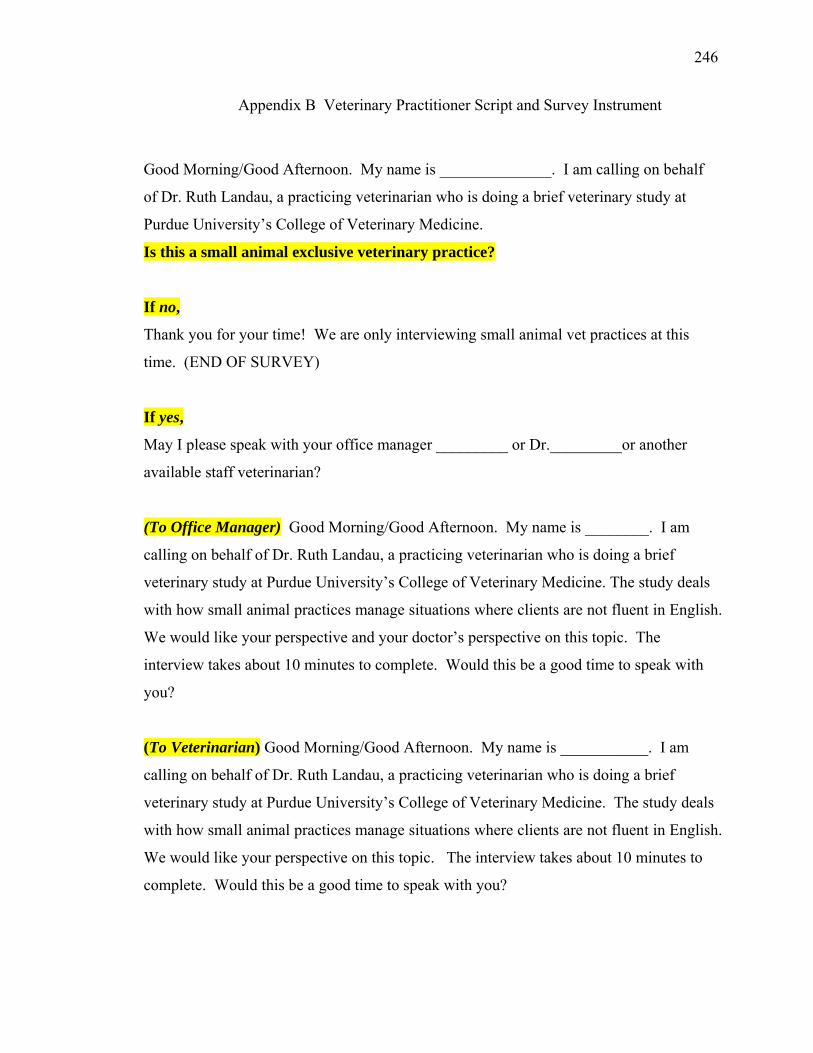
246
Appendix B Veterinary Practitioner Script and Survey Instrument
Good Morning/Good Afternoon. My name is ______________. I am calling on behalf
of Dr. Ruth Landau, a practicing veterinarian who is doing a brief veterinary study at
Purdue University’s College of Veterinary Medicine.
Is this a small animal exclusive veterinary practice?
If no,
Thank you for your time! We are only interviewing small animal vet practices at this
time. (END OF SURVEY)
If yes,
May I please speak with your office manager _________ or Dr._________or another
available staff veterinarian?
(To Office Manager) Good Morning/Good Afternoon. My name is ________. I am
calling on behalf of Dr. Ruth Landau, a practicing veterinarian who is doing a brief
veterinary study at Purdue University’s College of Veterinary Medicine. The study deals
with how small animal practices manage situations where clients are not fluent in English.
We would like your perspective and your doctor’s perspective on this topic. The
interview takes about 10 minutes to complete. Would this be a good time to speak with
you?
(To Veterinarian) Good Morning/Good Afternoon. My name is ___________. I am
calling on behalf of Dr. Ruth Landau, a practicing veterinarian who is doing a brief
veterinary study at Purdue University’s College of Veterinary Medicine. The study deals
with how small animal practices manage situations where clients are not fluent in English.
We would like your perspective on this topic. The interview takes about 10 minutes to
complete. Would this be a good time to speak with you?
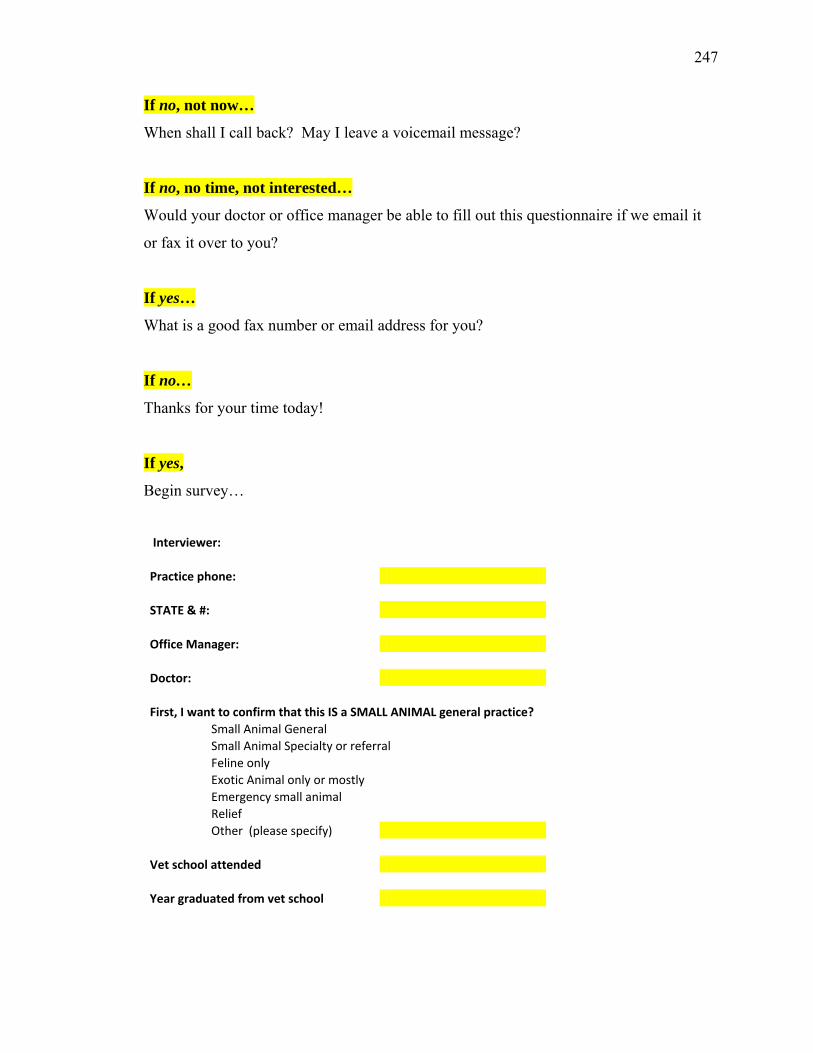
247
If no, not now…
When shall I call back? May I leave a voicemail message?
If no, no time, not interested…
Would your doctor or office manager be able to fill out this questionnaire if we email it
or fax it over to you?
If yes…
What is a good fax number or email address for you?
If no…
Thanks for your time today!
If yes,
Begin survey…
Interviewer:
Practice phone:
STATE & #:
Office Manager:
Doctor:
First, I want to confirm that this IS a SMALL ANIMAL general practice?
Small Animal General
Small Animal Specialty or referral
Feline only
Exotic Animal only or mostly
Emergency small animal
Relief
Other (please specify)
Vet school attended
Year graduated from vet school
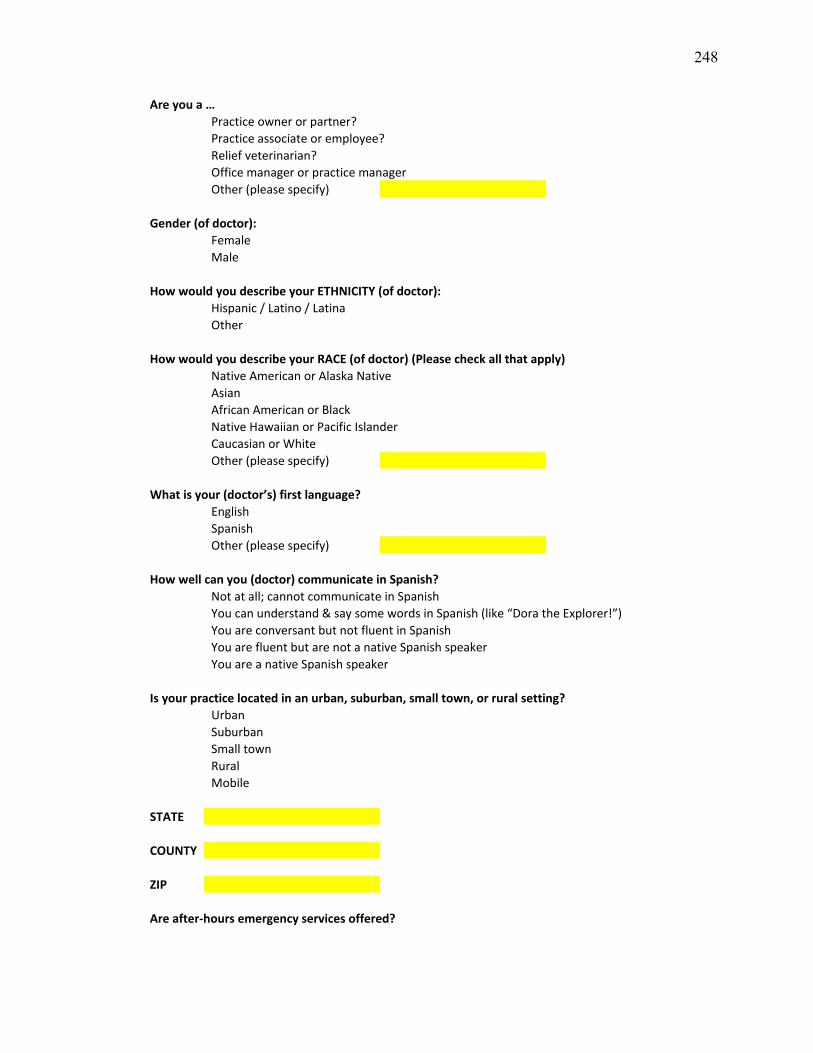
248
Are you a …
Practice owner or partner?
Practice associate or employee?
Relief veterinarian?
Office manager or practice manager
Other (please specify)
Gender (of doctor):
Female
Male
How would you describe your ETHNICITY (of doctor):
Hispanic / Latino / Latina
Other
How would you describe your RACE (of doctor) (Please check all that apply)
Native American or Alaska Native
Asian
African American or Black
Native Hawaiian or Pacific Islander
Caucasian or White
Other (please specify)
What is your (doctor’s) first language?
English
Spanish
Other (please specify)
How well can you (doctor) communicate in Spanish?
Not at all; cannot communicate in Spanish
You can understand & say some words in Spanish (like “Dora the Explorer!”)
You are conversant but not fluent in Spanish
You are fluent but are not a native Spanish speaker
You are a native Spanish speaker
Is your practice located in an urban, suburban, small town, or rural setting?
Urban
Suburban
Small town
Rural
Mobile
STATE
COUNTY
ZIP
Are after-hours emergency services offered?
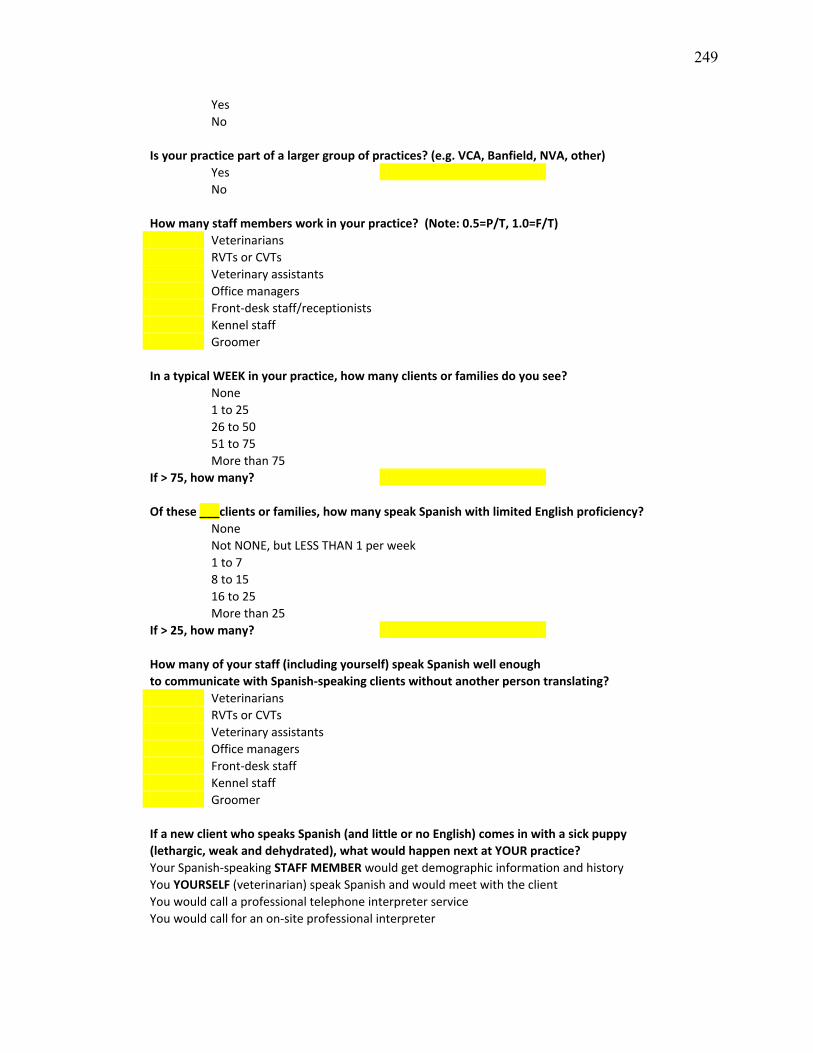
249
Yes
No
Is your practice part of a larger group of practices? (e.g. VCA, Banfield, NVA, other)
Yes
No
How many staff members work in your practice? (Note: 0.5=P/T, 1.0=F/T) Veterinarians
RVTs or CVTs Veterinary assistants Office managers Front-desk staff/receptionists Kennel staff Groomer
In a typical WEEK in your practice, how many clients or families do you see?
None
1 to 25
26 to 50
51 to 75
More than 75
If > 75, how many?
Of these ___clients or families, how many speak Spanish with limited English proficiency?
None
Not NONE, but LESS THAN 1 per week
1 to 7
8 to 15
16 to 25
More than 25 If > 25, how many?
How many of your staff (including yourself) speak Spanish well enough
to communicate with Spanish-speaking clients without another person translating? Veterinarians
RVTs or CVTs Veterinary assistants Office managers Front-desk staff Kennel staff Groomer
If a new client who speaks Spanish (and little or no English) comes in with a sick puppy (lethargic, weak and dehydrated), what would happen next at YOUR practice?
Your Spanish-speaking STAFF MEMBER would get demographic information and history You YOURSELF (veterinarian) speak Spanish and would meet with the client
You would call a professional telephone interpreter service You would call for an on-site professional interpreter
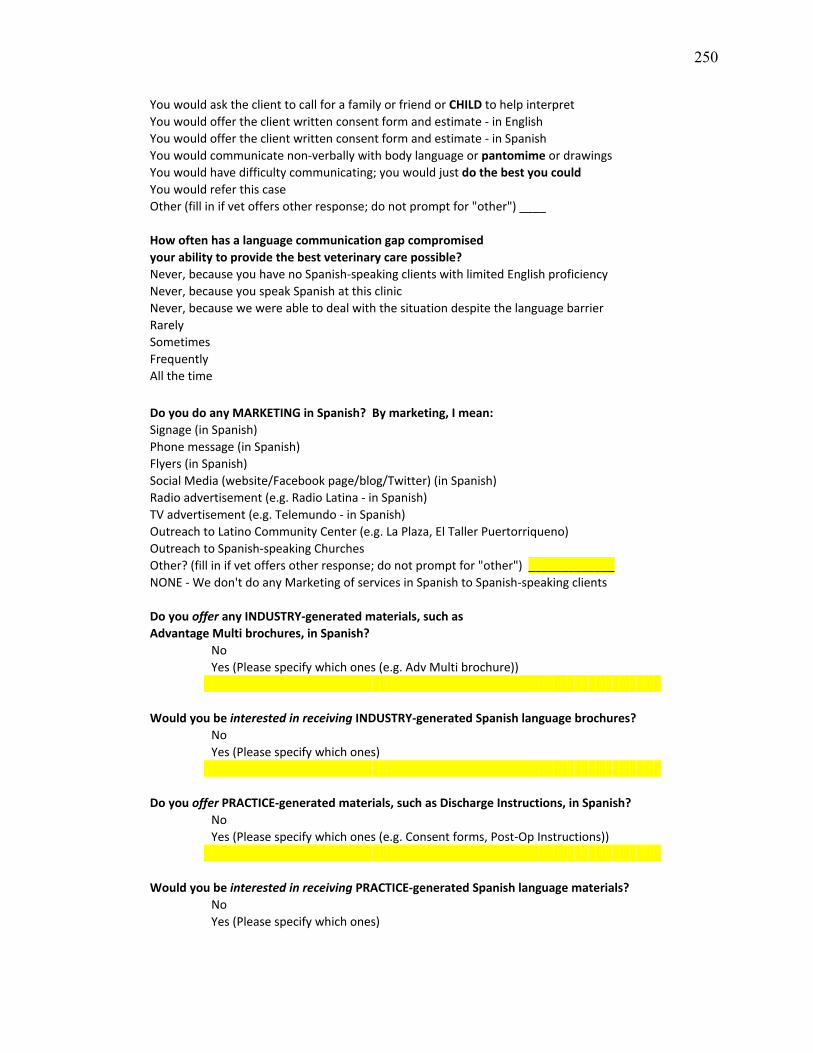
250
You would ask the client to call for a family or friend or CHILD to help interpret You would offer the client written consent form and estimate - in English
You would offer the client written consent form and estimate - in Spanish You would communicate non-verbally with body language or pantomime or drawings
You would have difficulty communicating; you would just do the best you could You would refer this case
Other (fill in if vet offers other response; do not prompt for "other") ____
How often has a language communication gap compromised your ability to provide the best veterinary care possible? Never, because you have no Spanish-speaking clients with limited English proficiency
Never, because you speak Spanish at this clinic Never, because we were able to deal with the situation despite the language barrier
Rarely Sometimes
Frequently All the time
Do you do any MARKETING in Spanish? By marketing, I mean: Signage (in Spanish)
Phone message (in Spanish) Flyers (in Spanish) Social Media (website/Facebook page/blog/Twitter) (in Spanish)
Radio advertisement (e.g. Radio Latina - in Spanish) TV advertisement (e.g. Telemundo - in Spanish) Outreach to Latino Community Center (e.g. La Plaza, El Taller Puertorriqueno)
Outreach to Spanish-speaking Churches Other? (fill in if vet offers other response; do not prompt for "other") _____________
NONE - We don't do any Marketing of services in Spanish to Spanish-speaking clients
Do you offer any INDUSTRY-generated materials, such as Advantage Multi brochures, in Spanish?
No
Yes (Please specify which ones (e.g. Adv Multi brochure))
Would you be interested in receiving INDUSTRY-generated Spanish language brochures?
No
Yes (Please specify which ones)
Do you offer PRACTICE-generated materials, such as Discharge Instructions, in Spanish?
No
Yes (Please specify which ones (e.g. Consent forms, Post-Op Instructions))
Would you be interested in receiving PRACTICE-generated Spanish language materials?
No
Yes (Please specify which ones)
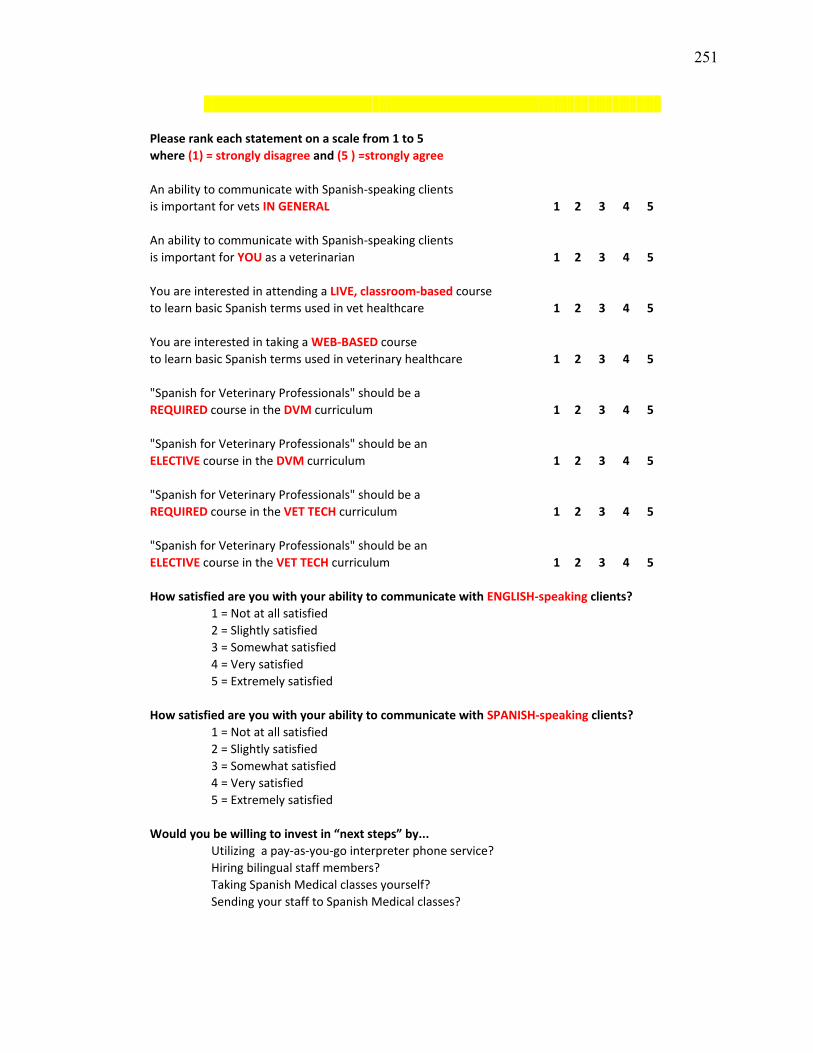
251
Please rank each statement on a scale from 1 to 5 where (1) = strongly disagree and (5 ) =strongly agree
An ability to communicate with Spanish-speaking clients is important for vets IN GENERAL
1 2 3 4 5
An ability to communicate with Spanish-speaking clients is important for YOU as a veterinarian 1 2 3 4 5
You are interested in attending a LIVE, classroom-based course to learn basic Spanish terms used in vet healthcare 1 2 3 4 5
You are interested in taking a WEB-BASED course to learn basic Spanish terms used in veterinary healthcare 1 2 3 4 5
"Spanish for Veterinary Professionals" should be a REQUIRED course in the DVM curriculum 1 2 3 4 5
"Spanish for Veterinary Professionals" should be an ELECTIVE course in the DVM curriculum 1 2 3 4 5
"Spanish for Veterinary Professionals" should be a REQUIRED course in the VET TECH curriculum 1 2 3 4 5
"Spanish for Veterinary Professionals" should be an ELECTIVE course in the VET TECH curriculum 1 2 3 4 5
How satisfied are you with your ability to communicate with ENGLISH-speaking clients?
1 = Not at all satisfied
2 = Slightly satisfied
3 = Somewhat satisfied
4 = Very satisfied
5 = Extremely satisfied
How satisfied are you with your ability to communicate with SPANISH-speaking clients?
1 = Not at all satisfied
2 = Slightly satisfied
3 = Somewhat satisfied
4 = Very satisfied
5 = Extremely satisfied
Would you be willing to invest in “next steps” by...
Utilizing a pay-as-you-go interpreter phone service?
Hiring bilingual staff members?
Taking Spanish Medical classes yourself?
Sending your staff to Spanish Medical classes?
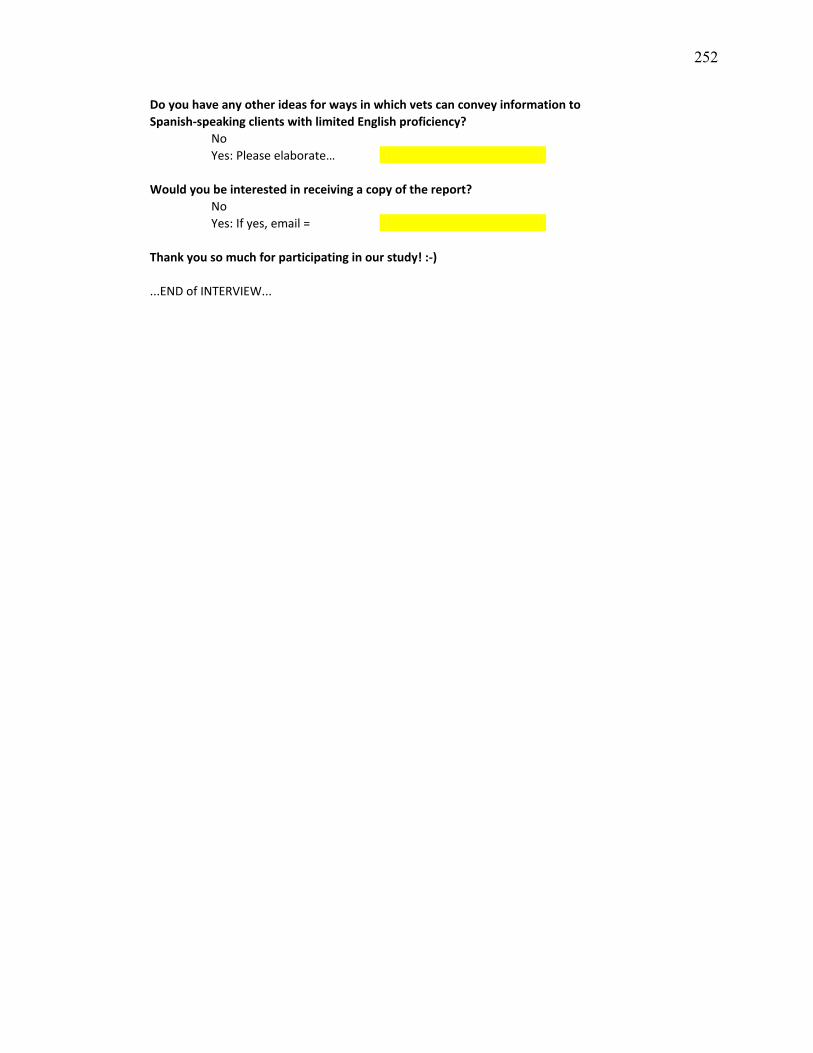
252
Do you have any other ideas for ways in which vets can convey information to Spanish-speaking clients with limited English proficiency?
No
Yes: Please elaborate…
Would you be interested in receiving a copy of the report?
No
Yes: If yes, email =
Thank you so much for participating in our study! :-)
...END of INTERVIEW...
253
Appendix C Veterinary Student Survey & Supporting Documentation
AAVMC Study Approval Request - Revised 30oct2012
Ruth Landau, DVM, MSEd, PhD Candidate College of Veterinary Medicine Purdue University 725 Harrison Street West Lafayette, IN 47907-2027 October 30, 2012
Lisa Greenhill, MPA Associate Executive Director for Institutional Research and Diversity Association of American Veterinary Medical Colleges 1101 Vermont Avenue NW, Suite 301 Washington, DC 20005-3536
Dear Lisa:
I want to thank you and your committee for your thoughtful review of my original AAVMC Study Approval Request. I appreciate the time and comments of your review committee, and am now resubmitting my request for AAVMC approval of the revised National Veterinary Student survey.
Who is conducting the study, title, organization/company, contact information: Principal Investigator: Dr. Annette Litster Assistant Professor, Small Animal Internal Medicine Department of Veterinary Clinical Sciences Purdue University, College of Veterinary Medicine 725 Harrison Street West Lafayette, IN 47907-2027 [email protected] / 765-496-3938 Co-Investigator: Ruth Landau, DVM, MSEd PhD Candidate, Epidemiology and Public Health Department of Comparative Pathobiology Purdue University, College of Veterinary Medicine 725 Harrison Street West Lafayette, IN 47907-2027 [email protected] / 317-440-9423
A brief description of the purpose/objectives of the study: The National Veterinary Student survey is one leg of a three-pronged PhD project whose overall objective is to assess the preparedness of the veterinary profession to provide high-quality veterinary health care to Spanish-speaking pet owners with limited English proficiency (LEP). Please see attached Project Summary for study details.
254
AAVMC Study Approval Request - Revised 30oct2012 (continued)
What audience or population is targeted for completion of the study? Our target audience is first-, second-, and third-year veterinary students at all 28 US veterinary schools and colleges. Which AAVMC member institutions do you wish to survey? We want to survey all 28 US veterinary schools and colleges. Proposed Study Instrument Attached please find a revised version of the on-line Qualtrics® National Veterinary Student survey, along with:
• Email 1 to Academic Deans: Introduction of project and survey (new) • Email 2 to Academic Deans: Please forward survey to veterinary students (new) • Email to Veterinary Students: Invitation to participate in survey (revised) • Survey instrument (revised) • Email to Veterinary Students: Thank you for participating in survey (revised) • Email to SAVMA delegates: Please help distribute gift cards to winners (new) • Email to SAVMA delegates: Thank you for distributing gift cards to winners (new)
Estimated time to complete the survey We estimate 3 weeks to complete the survey: First, we will introduce the project and survey via email to the Associate Dean of Academic Affairs of each veterinary school or college. Next, we will send a follow-up email asking the Associate Deans to forward our email to their 1st-, 2nd-, and 3rd-year veterinary students. The email invitation to participate will contain a link to the National Veterinary Student survey itself. An automatic thank you email will be sent to each student who participates in the survey. Separately, an email will be sent to the senior SAVMA delegate at each veterinary school or college, asking if they would distribute one or two gift cards to the winners of the drawing at the close of the survey. Finally, fifty $25 iTunes gift cards will be mailed to individual SAVMA delegates for distribution, along with a $10 Starbucks gift card of appreciation for the SAVMA delegates’ time and assistance. How will results be used and shared? Is there intent to publish your research findings? Results of the National Veterinary Student survey will be used, in conjunction with results from our national Pet Owner survey and national Veterinary Practitioner survey, to help further our understanding of the opportunities for and barriers to veterinary health care for Spanish-speaking pet owners with limited English proficiency. It will help us estimate how many veterinarians and veterinary students there are in the US who speak Spanish well enough to communicate social and medical content with Spanish-speaking pet owners without a translator, and will help us gauge the need to develop a future “Spanish for Veterinary Healthcare Professionals” elective course nationwide. We intend to publish our research results in JAVMA and JVME and would be delighted to share the results of the study with the AAVMC. A statement of intentions regarding the confidentiality of those responding, and if identities will be confidential, how will that confidentiality be achieved. The identities of survey respondents will be kept confidential. The on-line survey instrument itself will be distributed through the Associate Dean of Academic Affairs of each veterinary school or college, so that we will not have email addresses for the individual students. The completed surveys will be returned electronically via Qualtrics®. The incentive for student participation will be a drawing for one of fifty $25 iTunes gift cards. If a student respondent chooses to participate in the gift card drawing, s/he submits her/his email address for the drawing. The email address will be stripped out of the data prior to data
255
AAVMC Study Approval Request - Revised 30oct2012 (continued)
analysis. Following the drawing, gift cards will be mailed to the senior SAVMA delegate at each veterinary school/college for distribution to the drawing winners.
I thank you for reviewing this revised version of the survey instrument and supporting documentation. Sincerely,
Ruth Landau
Ruth Landau, DVM, MSEd PhD Candidate, Epidemiology and Public Health, College of Veterinary Medicine, Purdue University
256
Letter 1 to Academic Deans: Introduction of project and survey AAVMC-approved veterinary student study - REQUEST – School / Contact
Dear Dr. __________________,
On Tuesday, 1/8/13, I will be requesting the participation of your first-, second-, and third-year veterinary
students in an AAVMC-approved and Purdue University IRB-approved on-line Qualtrics® survey. The 5-
minute survey asks veterinary students throughout the US about their previous experience working with
clients who have limited English proficiency. It asks students to rate their own proficiency in spoken
Spanish and describe whether or not they have any level of experience translating in a medical setting.
The results of this national Veterinary Student survey, coupled with results from our national Pet Owner
survey and national Veterinary Practitioner survey, will help describe the level of preparedness of the
veterinary profession to communicate with the growing number of Spanish-speaking pet owners with
limited English proficiency in the US today.
Veterinary students who choose to participate in this brief survey will be entered to win one of fifty $25
iTunes gift card for their time and participation. SAVMA delegates will be asked to deliver the gift cards to
the winners at their school or college, and will be sent a $10 Starbucks gift card as a thank you for their
assistance.
This study has been reviewed and approved by the AAVMC Survey Committee as of November 9, 2012.
Confirmation of this approval may be sought by contacting Lisa Greenhill at [email protected].
On Tuesday, January 8, 2013, when you receive an email of the student invitation to participate in the
study, it will contain a live link to this survey. WOULD YOU PLEASE FORWARD TUESDAY'S EMAIL to your
veterinary medical students in the Classes of 2014, 2015, and 2016?
I thank you for your consideration and help with this data-collection effort,
Ruth Landau, DVM, MSEd 317-440-9423
PhD Candidate, Epidemiology and Public Health, Purdue University College of Veterinary Medicine
P.S. I am attaching a Microsoft Word version of the AAVMC-approved National Veterinary Student Survey.
Please do NOT forward this version of the survey to your students as it does not contain a live link for data
collection. Thank you!
257
Letter 2 to Academic Deans: Please forward survey to veterinary students
Dear Associate Dean for Academic Affairs:
Would you please forward this email to your veterinary medical students in the Classes of 2014, 2015,
and 2016? Thank you!
Ruth Landau, DVM, MSEd
PhD Candidate, Epidemiology and Public Health, Purdue University College of Veterinary Medicine
Veterinary Students: Invitation to participate in survey TO: Veterinary Medicine Classes of 2014, 2015 and 2016
FROM: Ruth Landau, DVM, MSEd, PhD Candidate in Epidemiology and Public Health
Purdue University College of Veterinary Medicine
RE: Invitation to participate in National Veterinary Student Survey
Greetings! As you participate in your veterinary training, we want to understand the degree to which
you feel prepared to work with Spanish-speaking clients who have limited English proficiency.
INFORMATIONAL INFORMED CONSENT:
This research is being conducted by Dr. Ruth Landau at Purdue University College of Veterinary Medicine.
We thank you in advance for contributing valuable information that will benefit future veterinary students
and the veterinary profession. Your participation is strictly voluntary. You will not be individually
identifiable through this survey. The survey should take less than 5 minutes to
complete. Participants who complete this survey will be eligible to enter a drawing to win one of fifty
$25 iTunes gift cards.
By advancing to the next screen, you are giving your consent to participate in this brief survey.
Click on the link below (or paste into browser) to participate in this National Veterinary Student Survey:
https://purdue.qualtrics.com/SE/?SID=SV_3f2d7OOQ2l8Q3Gd Thank you in advance for your participation! Ruth Landau, DVM, Purdue Class of 2000
PhD Candidate, Epidemiology and Public Health, Purdue University College of Veterinary Medicine
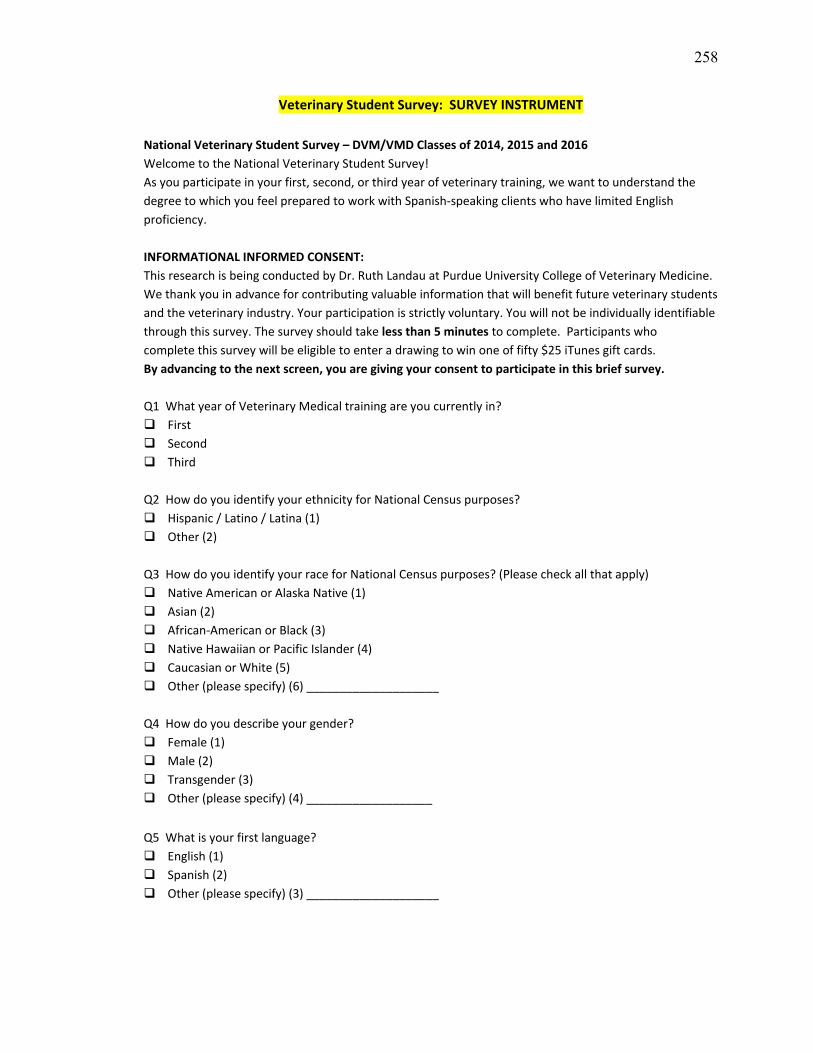
258
Veterinary Student Survey: SURVEY INSTRUMENT
National Veterinary Student Survey – DVM/VMD Classes of 2014, 2015 and 2016 Welcome to the National Veterinary Student Survey! As you participate in your first, second, or third year of veterinary training, we want to understand the degree to which you feel prepared to work with Spanish-speaking clients who have limited English proficiency. INFORMATIONAL INFORMED CONSENT: This research is being conducted by Dr. Ruth Landau at Purdue University College of Veterinary Medicine. We thank you in advance for contributing valuable information that will benefit future veterinary students and the veterinary industry. Your participation is strictly voluntary. You will not be individually identifiable through this survey. The survey should take less than 5 minutes to complete. Participants who complete this survey will be eligible to enter a drawing to win one of fifty $25 iTunes gift cards. By advancing to the next screen, you are giving your consent to participate in this brief survey. Q1 What year of Veterinary Medical training are you currently in? First Second Third
Q2 How do you identify your ethnicity for National Census purposes? Hispanic / Latino / Latina (1) Other (2) Q3 How do you identify your race for National Census purposes? (Please check all that apply) Native American or Alaska Native (1) Asian (2) African-American or Black (3) Native Hawaiian or Pacific Islander (4) Caucasian or White (5) Other (please specify) (6) ____________________ Q4 How do you describe your gender? Female (1) Male (2) Transgender (3) Other (please specify) (4) ___________________
Q5 What is your first language? English (1) Spanish (2) Other (please specify) (3) ____________________
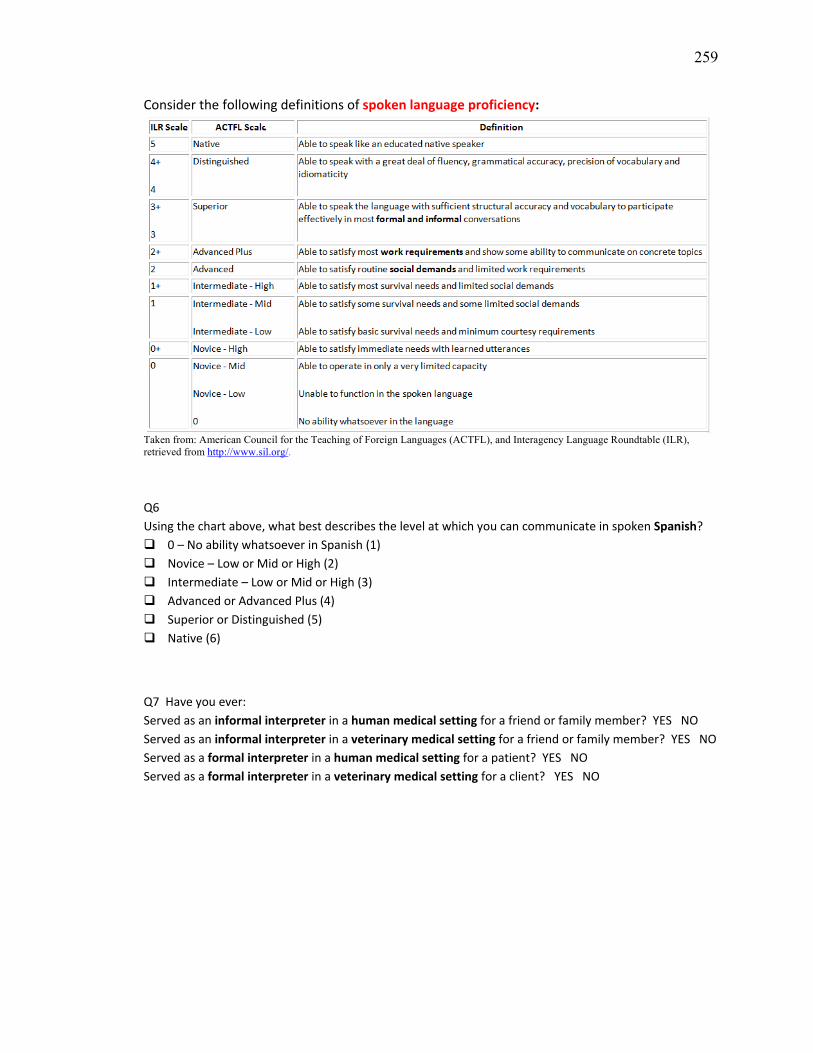
259
Consider the following definitions of spoken language proficiency:
Taken from: American Council for the Teaching of Foreign Languages (ACTFL), and Interagency Language Roundtable (ILR), retrieved from http://www.sil.org/.
Q6 Using the chart above, what best describes the level at which you can communicate in spoken Spanish? 0 – No ability whatsoever in Spanish (1) Novice – Low or Mid or High (2) Intermediate – Low or Mid or High (3) Advanced or Advanced Plus (4) Superior or Distinguished (5) Native (6)
Q7 Have you ever: Served as an informal interpreter in a human medical setting for a friend or family member? YES NO Served as an informal interpreter in a veterinary medical setting for a friend or family member? YES NO Served as a formal interpreter in a human medical setting for a patient? YES NO Served as a formal interpreter in a veterinary medical setting for a client? YES NO
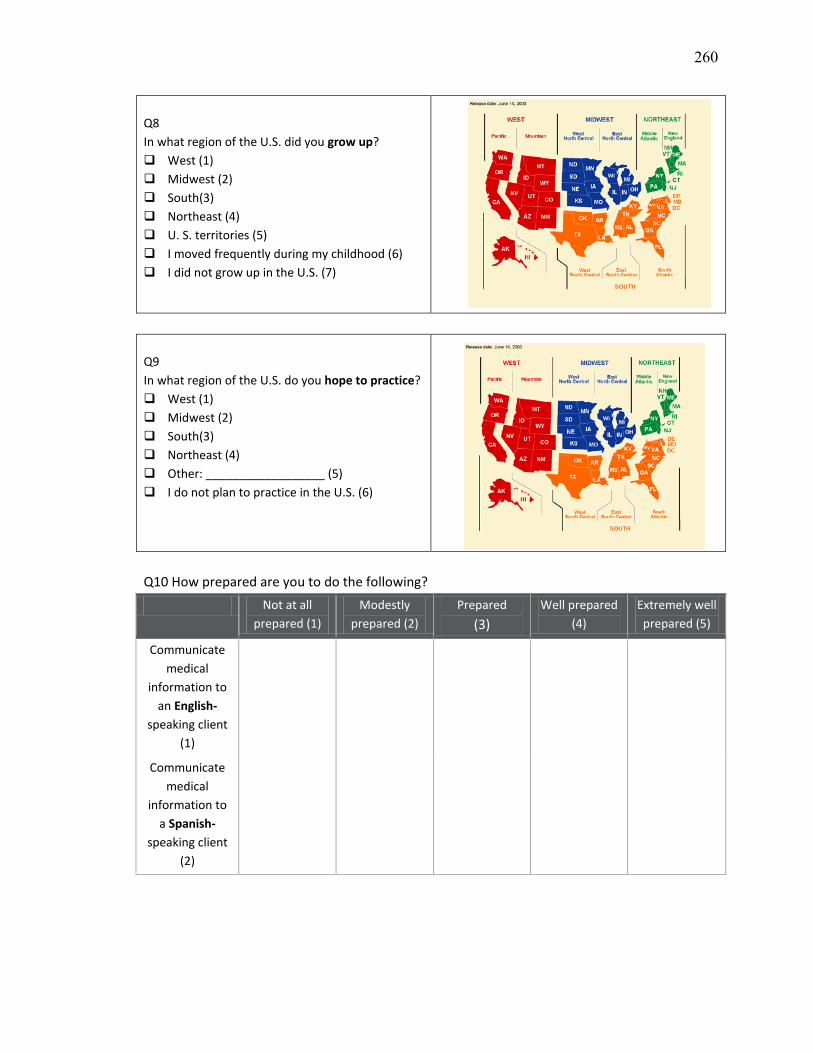
260
Q8 In what region of the U.S. did you grow up? West (1) Midwest (2) South(3) Northeast (4) U. S. territories (5) I moved frequently during my childhood (6) I did not grow up in the U.S. (7)
Q9 In what region of the U.S. do you hope to practice? West (1) Midwest (2) South(3) Northeast (4) Other: __________________ (5) I do not plan to practice in the U.S. (6)
Q10 How prepared are you to do the following?
Not at all prepared (1)
Modestly prepared (2)
Prepared (3)
Well prepared (4)
Extremely well prepared (5)
Communicate medical
information to an English-
speaking client (1)
Communicate medical
information to a Spanish-
speaking client (2)
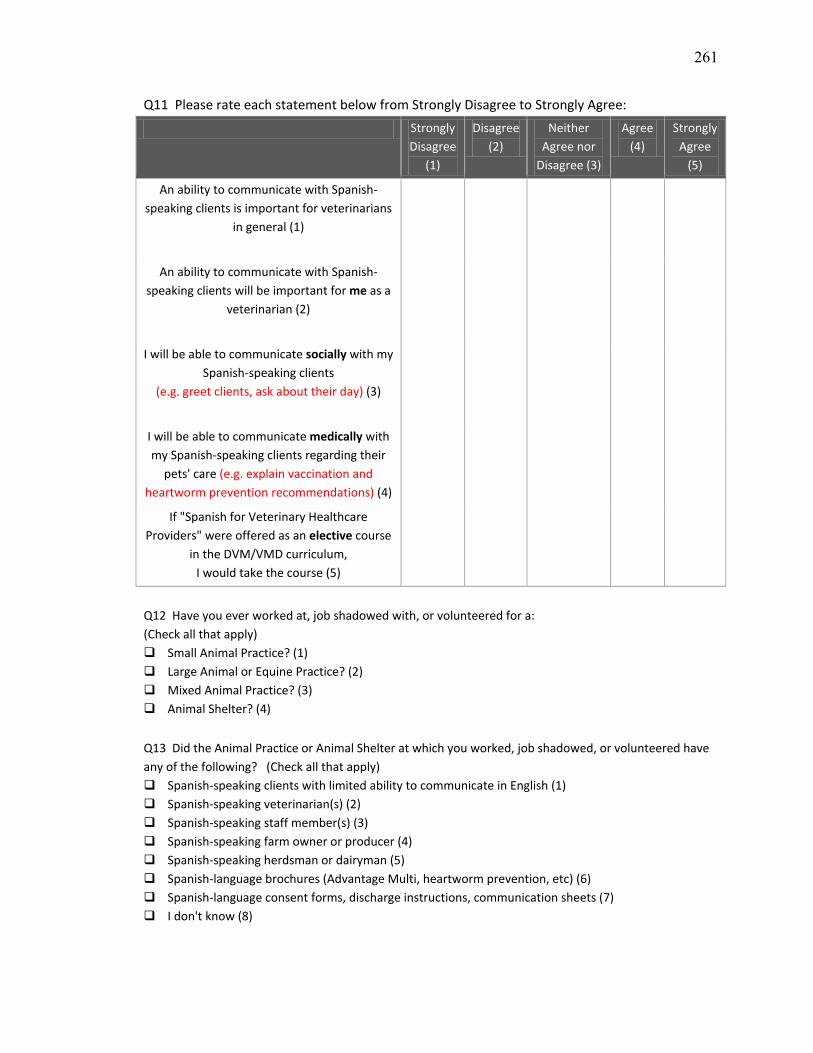
261
Q11 Please rate each statement below from Strongly Disagree to Strongly Agree:
Strongly Disagree
(1)
Disagree (2)
Neither Agree nor
Disagree (3)
Agree (4)
Strongly Agree
(5)
An ability to communicate with Spanish-speaking clients is important for veterinarians
in general (1)
An ability to communicate with Spanish-speaking clients will be important for me as a
veterinarian (2)
I will be able to communicate socially with my Spanish-speaking clients
(e.g. greet clients, ask about their day) (3)
I will be able to communicate medically with my Spanish-speaking clients regarding their
pets' care (e.g. explain vaccination and heartworm prevention recommendations) (4)
If "Spanish for Veterinary Healthcare Providers" were offered as an elective course
in the DVM/VMD curriculum, I would take the course (5)
Q12 Have you ever worked at, job shadowed with, or volunteered for a: (Check all that apply) Small Animal Practice? (1) Large Animal or Equine Practice? (2) Mixed Animal Practice? (3) Animal Shelter? (4)
Q13 Did the Animal Practice or Animal Shelter at which you worked, job shadowed, or volunteered have any of the following? (Check all that apply) Spanish-speaking clients with limited ability to communicate in English (1) Spanish-speaking veterinarian(s) (2) Spanish-speaking staff member(s) (3) Spanish-speaking farm owner or producer (4) Spanish-speaking herdsman or dairyman (5) Spanish-language brochures (Advantage Multi, heartworm prevention, etc) (6) Spanish-language consent forms, discharge instructions, communication sheets (7) I don't know (8)
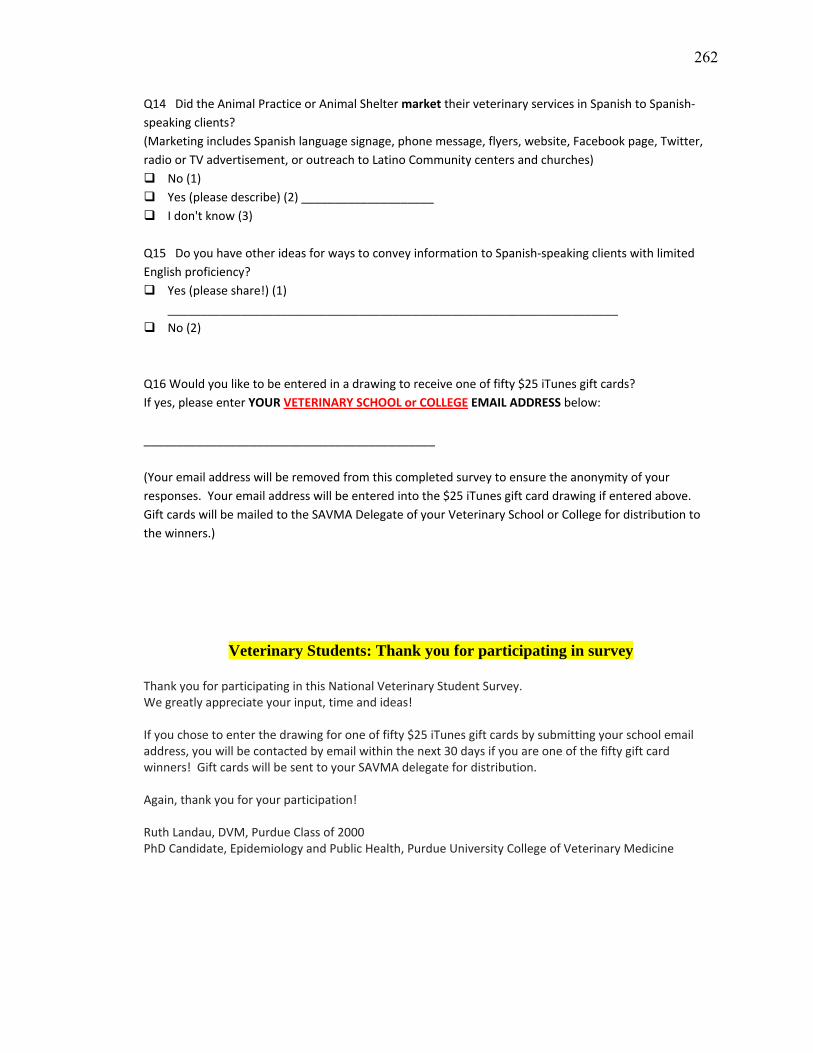
262
Q14 Did the Animal Practice or Animal Shelter market their veterinary services in Spanish to Spanish-speaking clients? (Marketing includes Spanish language signage, phone message, flyers, website, Facebook page, Twitter, radio or TV advertisement, or outreach to Latino Community centers and churches) No (1) Yes (please describe) (2) ____________________ I don't know (3) Q15 Do you have other ideas for ways to convey information to Spanish-speaking clients with limited English proficiency? Yes (please share!) (1)
____________________________________________________________________ No (2)
Q16 Would you like to be entered in a drawing to receive one of fifty $25 iTunes gift cards? If yes, please enter YOUR VETERINARY SCHOOL or COLLEGE EMAIL ADDRESS below: ____________________________________________ (Your email address will be removed from this completed survey to ensure the anonymity of your responses. Your email address will be entered into the $25 iTunes gift card drawing if entered above. Gift cards will be mailed to the SAVMA Delegate of your Veterinary School or College for distribution to the winners.)
Veterinary Students: Thank you for participating in survey
Thank you for participating in this National Veterinary Student Survey. We greatly appreciate your input, time and ideas! If you chose to enter the drawing for one of fifty $25 iTunes gift cards by submitting your school email address, you will be contacted by email within the next 30 days if you are one of the fifty gift card winners! Gift cards will be sent to your SAVMA delegate for distribution. Again, thank you for your participation! Ruth Landau, DVM, Purdue Class of 2000 PhD Candidate, Epidemiology and Public Health, Purdue University College of Veterinary Medicine
263
SAVMA Delegates: Please help distribute gift cards to winners
Dear NAME, COLLEGE SAVMA Senior Delegate:
I am requesting your help with the distribution of # iTunes gift cards to fellow veterinary students at
CVM, who were winners in a drawing that took place yesterday at the close of the National Veterinary
Student Survey.
Recently, all first-, second-, and third-year veterinary students in the US were invited to participate in an
on-line Qualtrics® survey. The survey asked veterinary students throughout the US about their previous
experience working with Spanish-speaking clients who have limited English proficiency.
Veterinary students who chose to participate in this 5-minute survey were entered to win one of fifty $25
iTunes gift card for their time and participation. The e-mail addresses of 50 student survey respondents
were randomly selected at the close of the survey yesterday. Two of those email addresses belong to
students at your veterinary college:
Although we have email addresses, for the purpose of confidentiality, we do not know who this student is!
In your role as SAVMA delegate, would you kindly distribute the prize to your fellow student? The mailing
address we have for you, obtained from the SAVMA delegate list, is:
NAME / STREET / CITY, ST / ZIP
Please let me know if you are willing to serve as the gift card prize delivery person!
Once we hear back from you via email that you are willing to distribute the gift cards, we will notify each
student that they have won this prize and ask that they find you at school to pick up their prize.
I thank you for your consideration and help with this prize-delivery effort!
Ruth Landau Ruth Landau, DVM, MSEd
PhD Candidate, Epidemiology and Public Health, Purdue University College of Veterinary Medicine
264
SAVMA Delegates: Thank you for distributing gift cards to winners
Dear , College of Medicine SAVMA Senior Delegate:
Thank you for your willingness to serve as the gift card prize delivery person next week!
I will be mailing you 2 iTunes gift cards to be delivered to the following students:
I will mail the cards to you at the address listed below, unless you prefer that I use a different address:
NAME / STREET ADDRESS / CITY, ST / ZIP
When you receive the envelope, please keep the enclosed Starbucks gift card for yourself as a thank you
for your help with this prize-delivery effort!
Ruth Landau
Ruth Landau, DVM, MSEd
PhD Candidate, Epidemiology and Public Health, Purdue University College of Veterinary Medicine

265
VITA
265
VITA
Dr. Landau’s love of languages and communication has been life long, starting
with her father’s Yiddish singing and storytelling at the dinner table while growing up.
Hebrew, French, American Sign Language and Spanish have woven their way into her
world, impacting her views about the international language of connectedness. After
spending time in Europe, Israel and Argentina, she completed a Bachelor of Arts degree
in the Biological Basis of Behavior and a Master of Science degree in Education from the
University of Pennsylvania, followed by a post-Master’s certification in Family Therapy
and Systems Consultation from the Philadelphia Child Guidance Center. At the
prompting of her mentor, Dr. Leo Bustad, she entered her veterinary medical training at
Purdue University in 1996. After 9 years in small animal private practice, she received a
fellowship from Maddie’s Shelter Medicine Fund and returned to Purdue in 2009 to
pursue her PhD in epidemiology and public health. She enjoys life on the farm with her
partner and their dogs, cats and horses, and enjoys time in the veterinary clinics
connecting with owners and their pets. Her love of languages, especially Spanish, has
been of great benefit when communicating with LEP pet owners!