assessing the efficiency of public education and pensions
TRANSCRIPT
J Popul Econ (2009) 22:285–309DOI 10.1007/s00148-007-0178-z
ORIGINAL PAPER
Assessing the efficiency of public educationand pensions
Michele Boldrin · Ana Montes
Received: 21 October 2005 / Accepted: 22 October 2007 /Published online: 14 March 2008© Springer-Verlag 2007
Abstract Theory says that, in an overlapping-generations context, intergen-erational transfer agreements are efficient if they induce equality betweencertain implicit rates of return. We apply this theory to the case of publiceducation and pensions, where public education is interpreted as a loan frommiddle age to young, and pensions are the repayment of this loan, plus interest,from middle age to old. We use micro- and macrodata from Spain to estimatehow far actual arrangements are from the normative goal. When demographicstationarity is assumed, efficiency appears reachable. When demographicchange is accounted for, efficiency is far from being achieved. Nevertheless,and contrary to earlier predictions in the generational accounting literature,our findings suggest that future generations may not necessarily be worse offthan current ones.
Keywords Public education · Public pensions · Demographic shocks
JEL Classification H52 · H55 · J11
Responsible editor: Alessandro Cigno
M. BoldrinDepartment of Economics, Washington University in St. Louis,Campus Box 1208 St. Louis, MO 63130-4899, USAe-mail: [email protected]
M. BoldrinFEDEA, Madrid, Spain
M. BoldrinCEPR, London, UK
A. Montes (B)Departamento de Fundamentos del Análisis Económico,Universidad de Murcia, 30100, Murcia, Spaine-mail: [email protected]
286 M. Boldrin, A. Montes
1 Introduction
Moral hazard problems have long prevented and still prevent the developmentof credit markets to finance individual investment in human capital. It isoften alleged that this is the main reason for the existence of public-educationfinancing. The argument is intuitively convincing: to the extent that humancapital accumulation is both necessary for growth and a gateway to a moreefficient allocation of resources, government intervention can ameliorate sucha far-reaching and widespread market failure. In Boldrin and Montes (1999,2005) we cast this argument in the context of a life-cycle model of savingand human capital accumulation and reach the following conclusion: publiceducation per se, even if provided in the “efficient” amount, is not enoughto restore efficiency when credit markets to finance human capital accumula-tion are missing. This is because, when a general equilibrium perspective isadopted, one is lead to recognize that financing the accumulation of humancapital is just a part of the general life-cycle saving and consumption problem.During their working years, individuals invest in various assets to providefor retirement consumption; if financial markets were complete, the humancapital of future generations would be a component of the optimal retirementportfolio. The optimal retirement portfolio allows you to invest in the humancapital of the future generations and, later on, also to draw a return fromsuch investment. Public education achieves the first objective, i.e., it allows theworking generation to invest in the human capital of the future generations,but not the second, i.e., it does not allow the former investors to collect themarket return from their beneficiaries. This, we have shown, will generallylead to an inefficiency: investment in physical capital is too high and there isless intergenerational consumption smoothing than under the first best.
Our proposed solution is to link public financing of education and publicpensions. This leads to a completely different design of PAYGO pensionsystems from the one advocated in Diamond (1965). In a life-cycle model,through the public financing of education, the young borrow from the middleaged to invest in human capital. When middle-aged and employed, they payback their debt via a social security tax, the proceedings of which financepension payments to the now elderly lenders. In this setting, public financingof education and public pensions are parts of a “social contrivance” betweengenerations: if pension payments are appropriately linked to earlier investmentin human capital, the complete market allocation can be achieved and, shouldthe latter be implemented, a certain equality among (risk-adjusted) rates ofreturn should be observed.
In Section 2, we illustrate this point by means of an example, which extendsthe model developed in Boldrin and Montes (2005) to take into considerationthe optimal welfare policy response to demographic shocks. In the rest of thepaper, we take the normative prescriptions of our model to the data. By doingso, we are not pretending to test the model, as the latter has only normativeimplications; we are instead pretending to test the efficiency of a specificpublic education and pension system, the Spanish one, and, more importantly,
Assessing the efficiency of public education and pensions 287
to begin quantitatively assessing its ability to handle demographic shocks.We use data from Spain to get a quantitative assessment of how far currentarrangements are from the theoretical optimum and how the foreseeabledemographic evolution of the next 50 years will impact generational welfareand the system’s efficiency.
The results are surprising along more than one dimension. On the onehand, under the assumption of demographic stationarity, current arrangementscome extremely close to satisfying the predicted equality of rates of return.According to our criterion, this means both that the efficient allocation is beingapproximated and that a negligible amount of intergenerational redistributionis taking place. To test the robustness of this finding, we also simulate anumber of reasonable future demographic and policy scenarios. Things changedramatically. We find that, should current rules be maintained, the combinedSpanish education and pension system will grossly violate the desired rate ofreturn equality and, therefore, become both inefficient and highly redistribu-tive across generations. In other words, the existing Spanish welfare system –likewise, we suspect, those of most advanced countries – would do decently,in terms of aggregate efficiency, in a stationary world, but it performs terriblyand unpredictably in front of demographic change.
While not theoretically surprising (the intellectual foundations of the systemassume complete stationarity along every dimension) this is most relevant fromthe point of view of practical policy. Our welfare systems need to be redesignedand reformed not just in their parameters (a few more years before retirement,a little bit of additional education fees, a less generous replacement ratio) butin their inner structure and basic assumptions. The computed rates of returnare far enough from efficiency to suggest that reforming the two systems bymaking the linkage between education and pensions explicit could improvesocial welfare substantially. Similar, or even stronger, conclusions are likelyto hold for other European countries. This is our contribution to the ongoingpolicy debate on reforming the welfare state.
Further, in the applied literature on contribution-based social securitysystems, the issue of actuarial fairness between contributions paid and pensionsreceived is an actively debated topic. Our model suggests that one shouldlook for actuarial fairness somewhere else, that is between contributions paidand amount of public funding for education received on the one hand andbetween taxes devoted to human capital accumulation and pension paymentson the other. This observation is not irrelevant for the debate about the“sustainability” of public pension systems in the USA and Europe alike.
The spirit of the empirical exercise is affine, but not identical, to thatof the literature on generational accounting (see, for example, Auerbachet al. 2000, and references to earlier work therein), which asks how far awayfrom intergenerational balance current fiscal policies are. Instead, we askhow far away from the normative optimum current public education andpension systems are. Further, they calculate the present value of the amounta typical member of each generation can expect to pay in taxes net of transferpayment received. In our simulations, instead, we assume that the education
288 M. Boldrin, A. Montes
and pension budgets are balanced yearly and compute the (implicit) rates ofinterest and of return for the typical member of each generation. In this sense,given the demographic predictions, we compute which policies would keep theoverall system close to the normative optimum and which would lead it farastray, which would redistribute in favor of some generations and which wouldsustain intergenerational neutrality. Traditionally, works in the GA traditionhave treated education as government consumption, leaving aside its role as aninvestment/transfer favoring the young generations. More recent works havemodified this assumption and started treating public education as a transfertoward the young. This modification is, in our view, quite appropriate and haslead to empirical findings that go in a direction similar to ours, i.e., a lowerburden of taxation on the young and future generations.
Our approach is, therefore, complementary and not alternative to genera-tional accounting, and it may lead to a clearer theoretical understanding of theempirical estimations obtained with that methodology. When looking at thewhole collection of public policies and associated taxes, though, it remains adaunting task to model appropriately the “missing markets” these policies aresupposed to take care of. The case for education and pensions is, in our view,much clearer and more well defined than that for most other welfare policies.
2 Normative theory
To illustrate our argument, consider an economy of overlapping generationswhere three generations are present in each period t = 0, 1, 2, · · ·. The aggre-gate physical capital, Kt, and the aggregate human capital, Ht, are owned,respectively, by the old and the middle-aged individuals. Aggregate outputof the homogenous commodity is Yt = AKα
t H1−αt , with A ≥ 1 and α ∈ (0, 1).
At the beginning of each period t, a new generation of young agents is born(called generation t), which is of size Nt = Nt−1 (1 + nt). Each member ofgeneration t is endowed with a stock hy
t of basic knowledge that can be usedto produce human capital. If she spends time and money at school, her humancapital becomes ht+1 = Bdβ
t
(hy
t
)1−β , with B ≥ 1 and β ∈ (0, 1), when middle-aged. Here, dt is the amount of homogenous good invested in the educationalprocess. During the second period of their life, individuals work and carry outconsumption–saving decisions. When old, they consume the total return ontheir savings before dying.
We assume agents draw utility from consumption when middle-aged andold (cm
t and cot+1) according to the utility function log(cm
t ) + δlog(cot+1). Neither
leisure nor the welfare of their descendants affect utility.Let the homogenous commodity be the numeraire. In each period t =
0, 1, 2, · · ·, aggregate output Yt is allocated to three purposes: aggregateconsumption (Ct = cm
t Nt−1 + cot Nt−2), accumulation of next period’s physical
capital (Kt+1), and aggregate investment in education (Dt = dt Nt). Human andphysical capital are hired by firms at competitive prices equal, respectively,to wt = A(1 − α)Kα
t H−αt , and 1 + rt = A αKα−1
t H1−αt . Aggregate saving
Assessing the efficiency of public education and pensions 289
(St = st Nt−1) is allocated, through competitive credit markets, to finance phys-ical and human capital accumulation (St = Kt+1 + Dt), accruing a total returnequal to (1 + rt+1)St = Rt+1St.
Assume financial markets for both kinds of capital are available. In thesecircumstances, the life-cycle optimization problem for an agent born in periodt − 1 is
Ut−1 = maxdt−1,st
{log(cm
t ) + δ log(cot+1)
}(1)
subject to:
0 ≤ dt−1 ≤ wtht
Rt
cmt + st + Rtdt−1 ≤ wtht
cot+1 ≤ Rt+1st
ht = Bdβ
t−1
(hy
t−1
)1−β.
The first-order conditions give
st = δ
1 + δ
[wtht − (1 + rt)dt−1
],
dt−1 = βwtht
(1 + rt).
Competitive firms maximize profits given factor prices, using their first-order conditions:
st = δ
1 + δ(1 − α) (1 − β)
AKαt H1−α
t
Nt−1
dt−1 = β(1 − α)
α
Kt
Nt−1
Setting β (1 − α) /α = γ and using the market-clearing condition for savingand investment gives
st Nt−1 = (1 + γ ) Kt+1
and
dt−1 = γ
(1 + γ )
st−1
(1 + nt−1).
Aggregate saving is therefore equal to
St =[
Aδ(1 − α)(1 − β)
1 + δ
]Kα
t H1−αt ,
and aggregate education is
Dt−1 = γ
(1 + γ )
[A
δ(1 − α)(1 − β)
1 + δ
]Kα
t−1 H1−αt−1

290 M. Boldrin, A. Montes
which implies
Kt+1 = AηKαt H1−α
t (2)
Ht+1 = B(hyt Nt)
1−β[γ AηKα
t H1−αt
]β(3)
where 0 < η = δ(1+δ)
(1−α)(1−β)
(1+γ )< 1.
Set hyt = Ht/Nt so that an autonomous system can be derived. The only rest
point of (2) and (3) is the origin. The ray
X∗ = Kt
Ht=
[Aη
B (Aγ η)β
] 11−α(1−β)
in the (Ht, Kt) plane defines a balanced growth path. Straightforward algebrashows that for all initial conditions (H0, K0) ∈ �2+ , iteration of (2) and (3) leads(Ht, Kt) to the ray X∗. Along the balanced growth path, the two stocks ofcapital expand (or contract) at the factor
1 + g∗ = Aη
[B(Aγ η)β
Aη
] 1−α1−α(1−β)
which is larger than one (i.e., there is unbounded growth) when
η >1
A·[
1
B1/βγ
](1−α)
.
A sufficient condition for the equilibrium path to be dynamically efficient isthat the gross rate of return on capital should be larger than or equal toone plus the growth rate of output. With linearly homogeneous productionfunctions, the rate of return on capital is determined by the factor intensityratio. Hence, we need (1 + g∗) < αA (X∗)−(1−α). The latter reduces to α > η,which is equivalent to
(1 − α)(1 − β)
α + β(1 − α)<
1 + δ
δ.
For reasonable values of α and β, the latter is satisfied, as long as δ > 0.Next, consider a situation in which markets for financing education are
altogether absent. Then, dt = 0 and st Nt−1 = Kt+1 for all t. The competitiveequilibrium is not efficient. Introduce the intergenerational welfare state. Ineach period t, two taxes are levied upon the middle-aged generation to provideresources for two simultaneous transfers. The proceedings from the first tax(T p
t ) are used to pay out a pension (Pt) to the elderly. The proceedings fromthe second tax (Te
t ) are used to finance investments in the education (Et) ofthe young generation. We assume balanced budget period by period, i.e.,
et Nt︸︷︷︸Et
= tet Nt−1︸ ︷︷ ︸
Tet
and tpt Nt−1︸ ︷︷ ︸
T pt
= pt Nt−2︸ ︷︷ ︸Pt
,
Assessing the efficiency of public education and pensions 291
where et denotes the per-young benefit from the education system, tet and
tpt are the per capita contributions to the education and the pension system,
respectively, and pt denotes the per capita benefit from the pension system.The budget constraints for the representative member of a generation born
in period t − 1 become
0 ≤ dt−1 ≤ et−1 (4)
cmt + st ≤ wtht − tp
t − tet (5)
cot+1 ≤ Rt+1st + pt+1. (6)
Comparing Eqs. 4, 5, and 6 to the budget restrictions of problem (1) showsthat, if the aggregate lump-sum amounts satisfy
Et = D∗t and Pt = D∗
t−1 R∗t , (7)
the competitive equilibrium under the new policy achieves the completemarket allocation (CMA; starred symbols, from now onward, refer to theCMA). In other words, a benevolent planner can restore efficiency, improvelong-run growth rates, and preserve intergenerational fairness by establishingpublicly financed education and PAYGO pensions simultaneously, and bylinking the two flows of payments via the market interest rate.
Only this arrangement can implement the efficient CMA. Note first thatneither retirement pensions financed by the investment in physical capital nor aPAYGO system with a rate of return equal to the growth rate of the populationcan achieve the CMA. Second, a system of pure public school financing cannotlead to the CMA either. Only a combined public education and pension systemsatisfying Eq. 7 can restore the CMA. This scheme is also intergenerationally“fair” in the sense that it provides each generation with a market-driven returnfrom its investment in human capital. In particular, we have
Et(1+i∗t+1
)=T pt+1, Te
t
(1+π∗
t+1
)= Pt+1 and i∗t+1 =π∗t+1 =r∗
t+1. (8)
Note that, contrary to what seems to have become the norm in many Europeanreforms (e.g., Italy and Sweden), the internal rate of return of an efficientPAYGO pension system should not be determined by the growth rate of GDPbut, instead, by the rate of return on human capital investment.
Note also that balanced budgets in each system imply
et Nt = tet Nt−1 = D∗
t and tpt Nt−1 = pt Nt−2 = D∗
t−1 R∗t .
The optimal welfare policy must take changes in cohorts size into account tomaintain efficiency and intergenerational fairness. This is clarified in the nextsubsection.
2.1 Fertility shocks
Assume that in period t there is a temporary negative fertility shock, reflectinga baby bust in period t. To simplify, we assume the shock has no effects on thesize of the population born in t + 1. This can be expressed as nt+ j = n ∀ j �= 0, 1,
292 M. Boldrin, A. Montes
nt = nt < n and 1 + nt+1 = (1 + n)2 / (1 + nt). We ask what the optimal policyresponse is. The demographic shock is fully predictable at the beginning ofperiod t.
If we keep per capita investment in education constant, then Et =d∗
t (1 + nt) Nt−1 < D∗t = d∗
t (1 + n) Nt−1. When Et < D∗t , the solution to the
consumer problem violates the social optimum (CMA) first-order condition,as F2(Ht+1, Kt+1) = Rt+1 < wt+1h1(d∗
t , hyt ) holds instead. Too much is invested
in the physical capital stock, the K/H ratio is too high, and the rate of returnon capital is too low with respect to the efficient one. To restore efficiencywe need to increase the amount invested in each young individual until itreaches dt = d∗
t (1 + n) / (1 + nt). By doing this the planner reaches Et = D∗t
and R∗t+1 = wt+1h1(dt, hy
t ).Next, we notice that this is not enough to restore efficiency at t + 1 for two
reasons. First, if each member of generation t pays the same social securitycontributions as before, t p
t+1 = d∗t R∗
t+1 < dt R∗t+1 holds. This means that the net
labor income in period t + 1 is too much and the capital income in t + 1, st Rt+1,
is too little relative to the efficient ones. This leads to “too much” investmentand “too little” consumption for individuals that are old during t + 1. In otherwords, parents of the generation born in t face it+1 < r∗
t+1 and πt+1 < r∗t+1 and
are therefore “subsidizing” their children relative to the social optimum. Torestore efficiency, the members of the baby-bust generation must pay backtheir debt in full. This holds when t p
t+1 = (1 + n) / (1 + nt) d∗t R∗
t+1 > d∗t R∗
t+1 =tp∗t+1, yielding i∗
t+1= π∗
t+1 = r∗t+1.
Second, if the demographic shock hits only in period t, the optimal invest-ment in education in period t + 1
(D∗
t+1
)requires te
t+1 = (1 + n) / (1 + nt) te∗t+1.
This, in turns, affects the optimal pension payment in period t + 2, which mustequal pt+2 = (1 + n) / (1 + nt) te∗
t+1 R∗t+1. Again, this yields i∗
t+2= π∗
t+2 = r∗t+2, and
the efficient allocation is restored. Note that the optimal policy response to atemporary baby bust in t lasts until period t + 2 even under the assumption thatfertility moves back to its stationary level after just one period.
Similarly, we can compute the optimal policy response to a baby boomin period t . This requires reducing per capita taxes
(tpt+1, te
t+1
)and transfers
(et, pt+2) by the factor (1 + n) / (1 + nt). In both cases, the optimal policy mustcompensate for demographic shocks; when this is not done, both aggregateinefficiency and redistribution arise.
2.2 Assessing the distance from the normative optimum
It follows from this discussion that, if all the implicit rates of return can beestimated, their deviations from the market rate of return on investments witha degree of risk comparable to education would provide a reasonable measureof the distance from the social optimum.
These considerations lead us to entertain, albeit briefly, a positive readingof our model. In the real world, benevolent planners are probably harder to
Assessing the efficiency of public education and pensions 293
come across than credit instruments for financing education. A priori, thereare very few reasons to expect that existing public education and pensionsystems should strive to replicate the CMA and achieve the efficiency gainswe have outlined here. As a matter of fact, in none of the countries weare aware of is the welfare state legislation explicitly organized around theprinciples advocated in this paper. In general, social security contributionsare levied as a percentage of labor income and bear no clear relation to theprevious use of public education. Pension benefits received are related, inone form or another, to past social security contributions but never to somemeasure of lifetime contributions to aggregate human capital accumulation.Still, there are intuitive reasons to believe that intergenerational transfersthat are either grossly inefficient or openly unfair (in the sense that somegenerations collect rates of return systematically higher than those of othergenerations) would be subject to strong public pressure to be either dismantledor improved upon. Further, in a recursive environment in which the middle-aged generation decides whether and how to implement an intergenerationalwelfare system, an equilibrium satisfying Eq. 8 may arise. In Boldrin andMontes (1999), we present a dynamic game of generational voting, along thelines of Boldrin and Rustichini (2000), which possesses a subgame perfectequilibrium implementing the CMA. We refer the interested reader to Boldrinand Montes (2006a) for this result, a discussion of the circumstances underwhich the political equilibrium implementing the CMA is the unique subgameperfect and, finally, for extensions to other notions of recursive equilibrium,and to more general overlapping-generation environments. Results along thesame lines have been derived independently by Rangel (2003) and, to a smallerdegree, by Bellettini and Berti-Cerroni (1999), while Cigno (2006) containsa fairly complete survey of theoretical results on efficient intergenerationaltransfers, especially in their connection to fertility choice. All of this conjuresto make an examination of the data worthy of our time. This we do, usingSpanish data, in the next section.
3 The Spanish intergenerational welfare state
In this section, we use Spanish data to compute the values of i and π implied bythe rules in place and the taxes and transfers implemented between 1990–1991and 1998–1999. To carry out our computations, the stationarity assumptionsmade in the model are first taken verbatim and then relaxed. We proceedin two stages. In the first, we abstract from demographic change and assumeconstant growth, the latter being a reasonable approximation given availableevidence. In the second stage, we incorporate the forecasted demographicevolution for the period 1998–2089 and consider how a number of policyscenarios fare in this context.
294 M. Boldrin, A. Montes
More specifically, in our empirical exercise we assume that the rules of theSpanish public education and public pension systems will not be changed forthe very long future and that all individuals currently alive have also livedunder those same rules in the past. This is obviously false, because botheducation and pension systems underwent large and frequent changes in theperiod 1960–1985. In 1985, the pension system was reformed once more, andsince then, it has kept its basic rules almost unchanged. The same goes for thepublic education system, which achieved its current structure in the early 1980sand has not changed much since. Hence, while our assumption of stationarityis only an approximation to reality, it is a good approximation for the last20 years, and it appears to be a reasonable one for the foreseeable future.
In the first stage, we assume that the aggregate burden of taxation and itsage distribution have not varied and will not vary over the lifetime of theindividuals alive during 1990–1999. In both cases we let age-specific per capitaincome grow at a constant rate and adjust aggregate taxation accordingly,under the assumption of a constant age distribution of taxes and transfers.Notice that, if it were not for the changing demographic structure, this wouldimply constant tax and transfer rates for each age group and function. Finally,in all of our simulations, we make the assumption that the education andpension yearly budgets are balanced.
We abstract from deficit financing and the generational burden of publicdebt for a variety of reasons. First, the Spanish public sector deficit has varieda lot during the last 15 years and has decreased to values very near zero since1998. The same is true for the social security administration budget, which wasrepeatedly manipulated by changes in accounting criteria and has generated asurplus since 1997. Secondly, there is no reliable method to allocate the debtburden over different cohorts, either for the past or for the future. Third, noear-marking of debt is available; hence, any attribution of part of the currentor future debt to either education or pensions would be completely arbitrary.The intergenerational distribution of the debt burden remains, nevertheless,an important issue to be addressed. It requires an explicit model of optimalfiscal policy in a life cycle model with changing demographic structure. A firststep in this direction is taken in Boldrin and Montes (2006b).
Ours are, indeed, relatively strong assumptions. Stationarity and balancedgrowth assumptions are often made in most empirical applications of dynamicmodels, and our case makes no exception. Given the available micro data, wefind our approach to be a reasonable starting point.
3.1 The base case under demographic stationarity
Consider an individual living for a maximum of A periods, and let pa denotethe (conditional) probability of survival between age a and a + 1. Denote withi the interest rate at which young people “borrow” through public educationand with π the rate of return the elderly receive from their “investment” inpublic education. For a given sequence of taxes and transfers, the rates i and

Assessing the efficiency of public education and pensions 295
π (time invariant, because of the stationarity assumptions) are definedimplicitly by
A∑
a=1
�aj=1 pj · (1 + i)A−a [
Ea − T pa
] = 0 (9)
A∑
a=1
�aj=1 pj · (1 + π)A−a [
Tea − Pa
] = 0. (10)
Equations 9 and 10 are the extensions of the equations in Eq. 8 to the case ofan individual that lives for A periods. To compute the stationary values of i andπ , we use several kinds of micro- and macrodata.1 The choice of the referenceyears for the baseline case is dictated by the availability of data, especially forwhat is concerned with the allocation of time along the life cycle. Currently,there is only one reliable data source, the Encuesta de Presupuestos Familiares,Household Budget Survey or EPF from now on, which is furthermore availableonly for 1980–1981 and 1990–1991. We have used the 1990–1991 EPF becausethe Spanish public pension system underwent a major reform in 1985 andbecause the 1980–1981 EPF contains only a severely limited subset of theinformation we need.
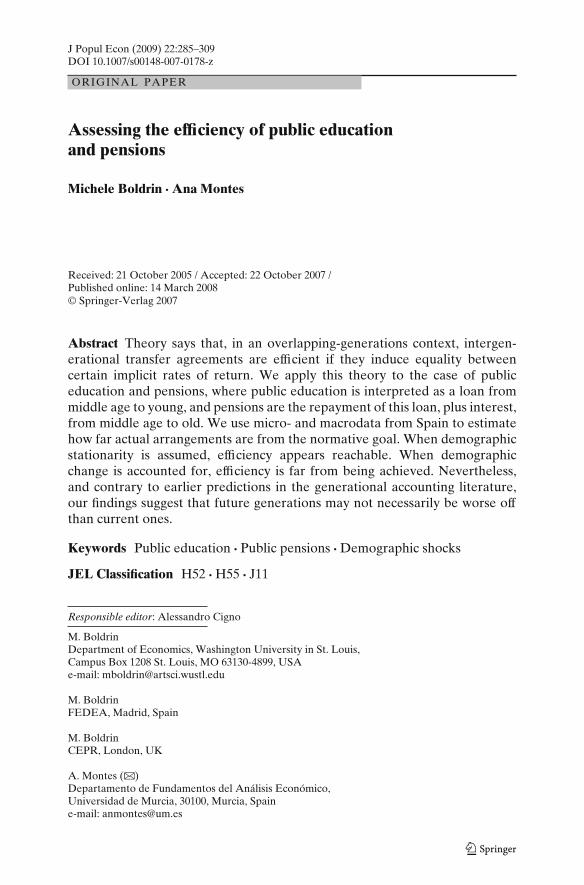
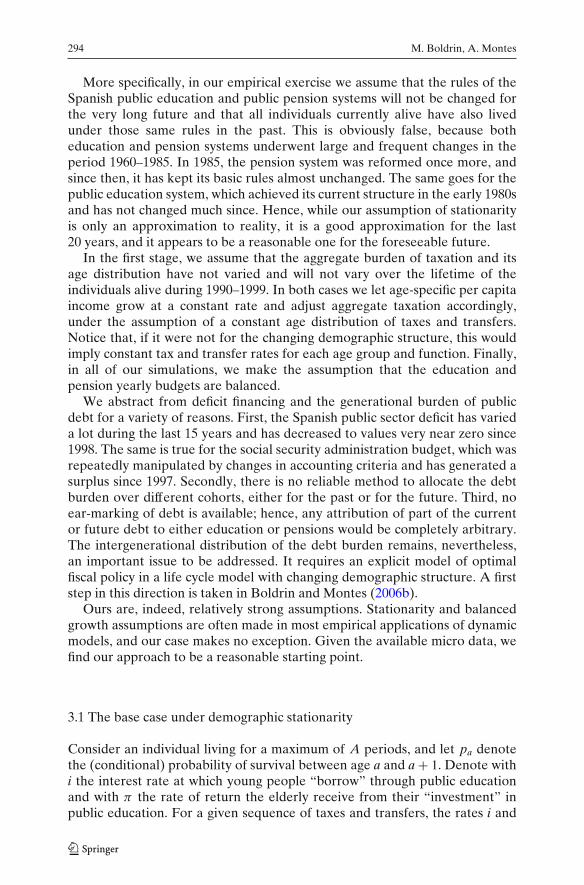
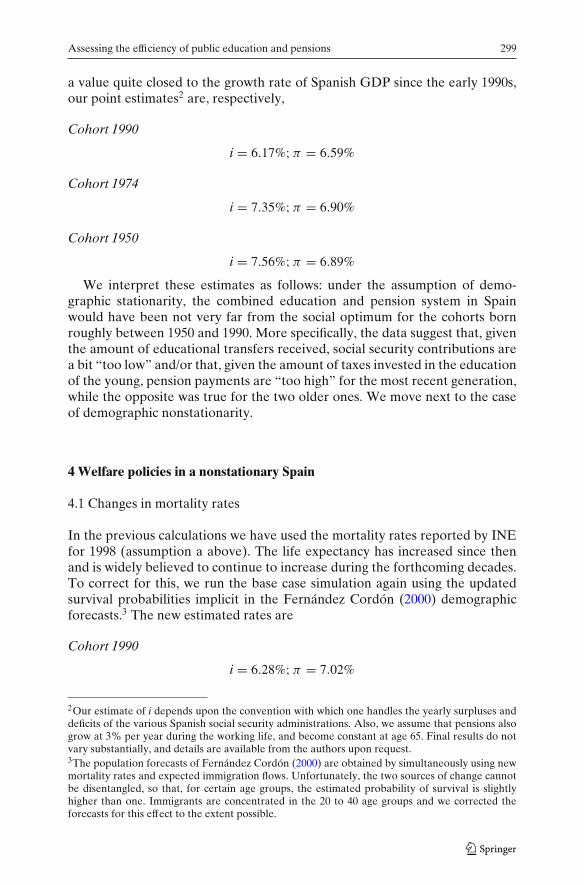
For each individual in the sample, conditional upon age and occupationalstatus, the information in the EPF allows for the estimation of (1) the valueof the school services received and which were directly or indirectly financedby the state, (2) the value of direct and indirect taxes paid, (3) the amount ofpension contributions paid, and (4) the amount of public contributive pensionsreceived. The information in the EPF also affords the computation of the shareof the population which, at each age, is studying, working, unemployed, orretired. Such lifetime distribution of activities is reported for 1990–1991, inpercentages of each age group, in Fig. 1.
The representative agent for our base case related to years 1990/1991 isdefined by the following assumptions:
(a) At age a = 1, . . . , 99, the probability pa of being alive at age a + 1 is theone reported by the Instituto Nacional de Estadistica for that age group in1998. The EPF does not contain individuals older than 99.
(b) At each age a = 1, . . . , 99, the representative individual is working, study-ing, unemployed, or retired with a probability equal to the frequency ofthat activity in the EPF sample of people of age a.
(c) At each age a = 1, . . . , 99, an individual receives or pays transfer andtaxes equal to the average, in the EPF, for those individuals that, at age a,were in the same occupational status.
Assumptions a–c can be used to extract from the EPF the amounts Ea, Pa, Tea ,
and T pa that an individual of age a would pay or receive. Such estimation
1Further details about the data sets we use are in the Appendix and in Montes (2000).
296 M. Boldrin, A. Montes
Fig. 1 Lifetime distributionamong activities. E student,W worker, U unemployed, Rretired; inactive, not reported
age
E W U R
0 10 20 30 40 50 60 70 80 90 99
0
.2
.4
.6
.8
1
uses the age- and status-specific information contained in the EPF, accordingto assumptions b and c. Let X be a stand-in for any of the four quantities.For each a = 1, 2, . . . , 99, we use population data to compute the amounts Xa
attributable to the representative agent of that age. Let La be the numberof individuals of age a in the Spanish population in the year 1990 (InstitutoNacional de Estadística (INE 1991)). A four-tuple of weights xa can becomputed by setting
xa = Xa∑A
a=1 Xa La
.
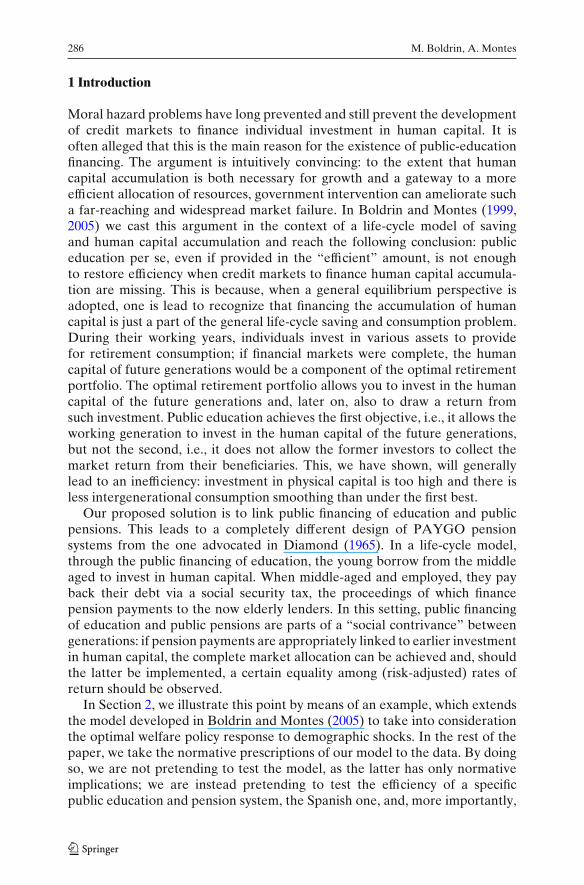
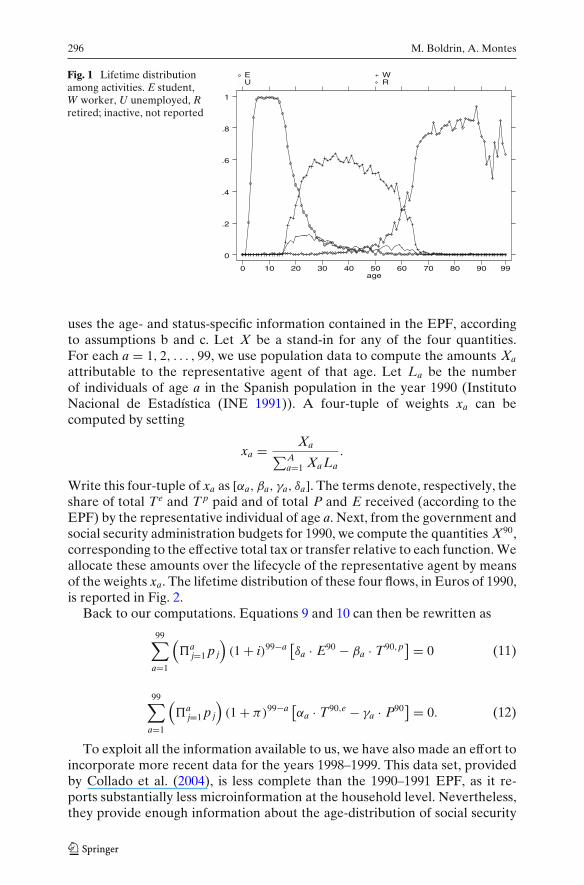
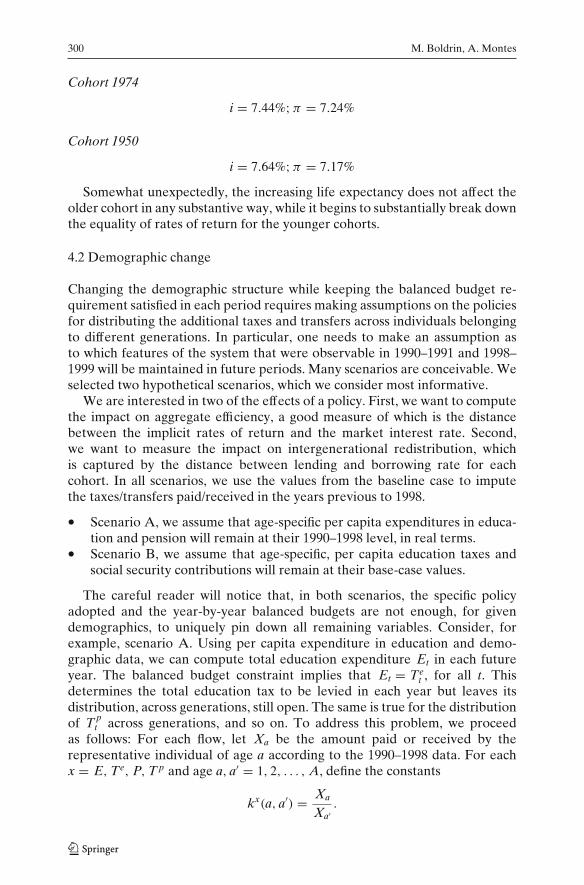
Write this four-tuple of xa as [αa, βa, γa, δa]. The terms denote, respectively, theshare of total Te and T p paid and of total P and E received (according to theEPF) by the representative individual of age a. Next, from the government andsocial security administration budgets for 1990, we compute the quantities X90,corresponding to the effective total tax or transfer relative to each function. Weallocate these amounts over the lifecycle of the representative agent by meansof the weights xa. The lifetime distribution of these four flows, in Euros of 1990,is reported in Fig. 2.
Back to our computations. Equations 9 and 10 can then be rewritten as
99∑
a=1
(�a
j=1 pj
)(1 + i)99−a [
δa · E90 − βa · T90,p] = 0 (11)
99∑
a=1
(�a
j=1 pj
)(1 + π)99−a [
αa · T90,e − γa · P90] = 0. (12)
To exploit all the information available to us, we have also made an effort toincorporate more recent data for the years 1998–1999. This data set, providedby Collado et al. (2004), is less complete than the 1990–1991 EPF, as it re-ports substantially less microinformation at the household level. Nevertheless,they provide enough information about the age-distribution of social security
Assessing the efficiency of public education and pensions 297
Fig. 2 Lifetime distributionof tax and transfer flows(1990)
age
E P Te Tp
0 10 20 30 40 50 60 70 80 90 99
0
1000
2000
3000
4000
contributions, total taxation, education transfers, and pensions payments dur-ing 1998–1999 to make our approach implementable. For what is concernedwith pension payments and direct taxation, the new data are basically extractedfrom the 1998 wave of the European Community Household Panel Survey,while, to derive education profile, they combine per capita expenditure by levelof education (from the Spanish Ministry of Education) with enrollment rates(provided by the Organisation for Economic Co-operation and Development).To obtain indirect taxes at the individual level, they use the EPF data from1990–1991, as we do.
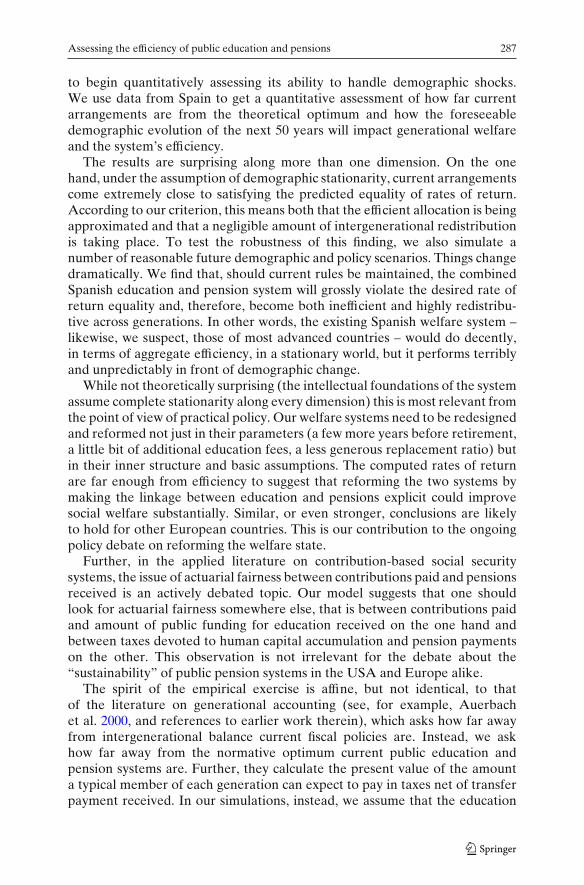
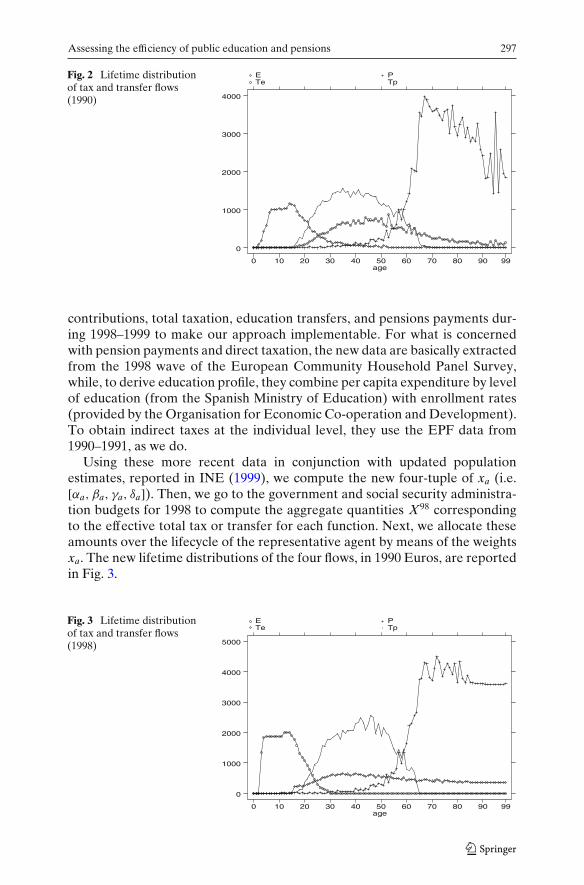
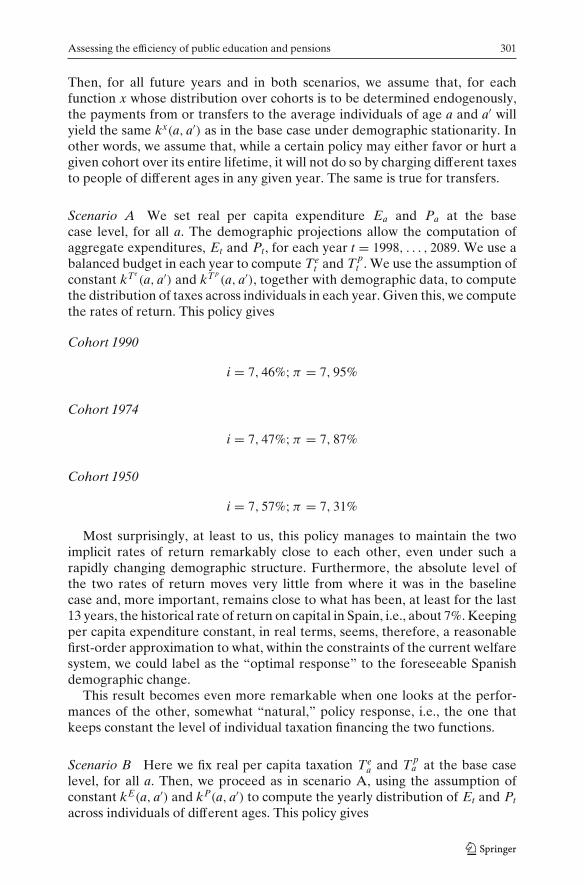
Using these more recent data in conjunction with updated populationestimates, reported in INE (1999), we compute the new four-tuple of xa (i.e.[αa, βa, γa, δa]). Then, we go to the government and social security administra-tion budgets for 1998 to compute the aggregate quantities X98 correspondingto the effective total tax or transfer for each function. Next, we allocate theseamounts over the lifecycle of the representative agent by means of the weightsxa. The new lifetime distributions of the four flows, in 1990 Euros, are reportedin Fig. 3.
Fig. 3 Lifetime distributionof tax and transfer flows(1998)
age
E P Te Tp
0 10 20 30 40 50 60 70 80 90 99
0
1000
2000
3000
4000
5000
298 M. Boldrin, A. Montes
A comparison with Fig. 2 shows the substantial increase in the amount ofpublic education transfers, which have literally doubled in real value at almostall age groups between 6 and 25. This is due to both strong enrollment growthand an increase in per capita expenditure. Pension expenditure has remainedroughly unchanged while the increase in employment rate has brought abouta visible increase in social security contributions.
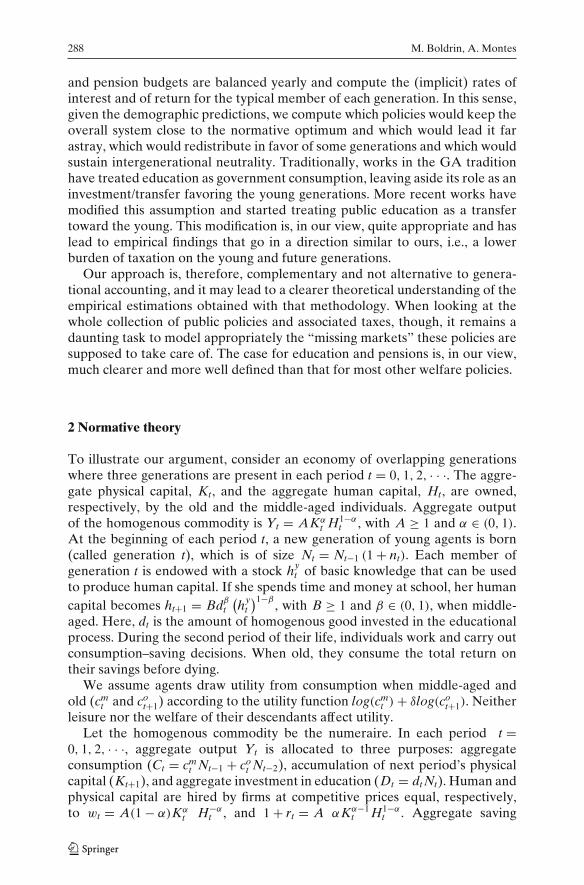
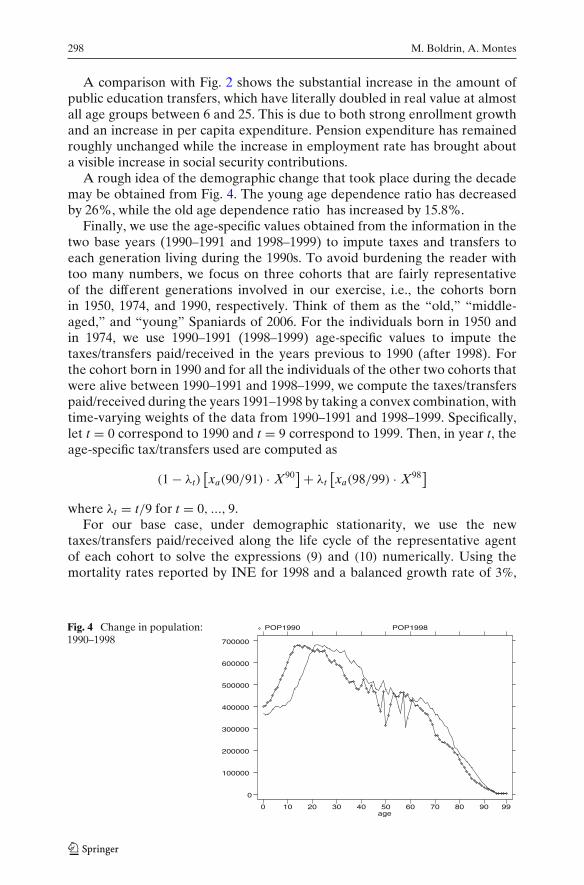
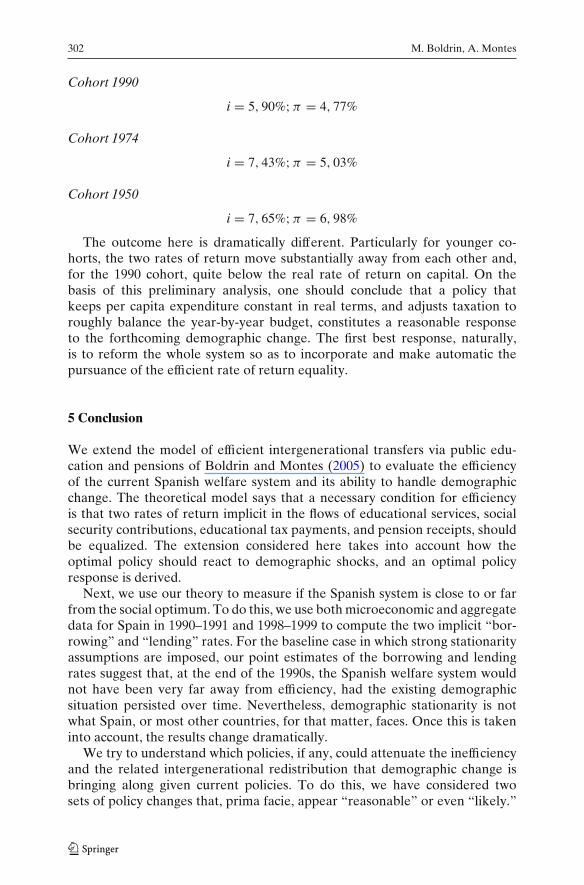
A rough idea of the demographic change that took place during the decademay be obtained from Fig. 4. The young age dependence ratio has decreasedby 26%, while the old age dependence ratio has increased by 15.8%.
Finally, we use the age-specific values obtained from the information in thetwo base years (1990–1991 and 1998–1999) to impute taxes and transfers toeach generation living during the 1990s. To avoid burdening the reader withtoo many numbers, we focus on three cohorts that are fairly representativeof the different generations involved in our exercise, i.e., the cohorts bornin 1950, 1974, and 1990, respectively. Think of them as the “old,” “middle-aged,” and “young” Spaniards of 2006. For the individuals born in 1950 andin 1974, we use 1990–1991 (1998–1999) age-specific values to impute thetaxes/transfers paid/received in the years previous to 1990 (after 1998). Forthe cohort born in 1990 and for all the individuals of the other two cohorts thatwere alive between 1990–1991 and 1998–1999, we compute the taxes/transferspaid/received during the years 1991–1998 by taking a convex combination, withtime-varying weights of the data from 1990–1991 and 1998–1999. Specifically,let t = 0 correspond to 1990 and t = 9 correspond to 1999. Then, in year t, theage-specific tax/transfers used are computed as
(1 − λt)[xa(90/91) · X90
] + λt[xa(98/99) · X98
]
where λt = t/9 for t = 0, ..., 9.For our base case, under demographic stationarity, we use the new
taxes/transfers paid/received along the life cycle of the representative agentof each cohort to solve the expressions (9) and (10) numerically. Using themortality rates reported by INE for 1998 and a balanced growth rate of 3%,
Fig. 4 Change in population:1990–1998
age
POP1990 POP1998
0 10 20 30 40 50 60 70 80 90 99
0
100000
200000
300000
400000
500000
600000
700000
Assessing the efficiency of public education and pensions 299
a value quite closed to the growth rate of Spanish GDP since the early 1990s,our point estimates2 are, respectively,
Cohort 1990
i = 6.17%; π = 6.59%
Cohort 1974
i = 7.35%; π = 6.90%
Cohort 1950
i = 7.56%; π = 6.89%
We interpret these estimates as follows: under the assumption of demo-graphic stationarity, the combined education and pension system in Spainwould have been not very far from the social optimum for the cohorts bornroughly between 1950 and 1990. More specifically, the data suggest that, giventhe amount of educational transfers received, social security contributions area bit “too low” and/or that, given the amount of taxes invested in the educationof the young, pension payments are “too high” for the most recent generation,while the opposite was true for the two older ones. We move next to the caseof demographic nonstationarity.
4 Welfare policies in a nonstationary Spain
4.1 Changes in mortality rates
In the previous calculations we have used the mortality rates reported by INEfor 1998 (assumption a above). The life expectancy has increased since thenand is widely believed to continue to increase during the forthcoming decades.To correct for this, we run the base case simulation again using the updatedsurvival probabilities implicit in the Fernández Cordón (2000) demographicforecasts.3 The new estimated rates are
Cohort 1990
i = 6.28%; π = 7.02%
2Our estimate of i depends upon the convention with which one handles the yearly surpluses anddeficits of the various Spanish social security administrations. Also, we assume that pensions alsogrow at 3% per year during the working life, and become constant at age 65. Final results do notvary substantially, and details are available from the authors upon request.3The population forecasts of Fernández Cordón (2000) are obtained by simultaneously using newmortality rates and expected immigration flows. Unfortunately, the two sources of change cannotbe disentangled, so that, for certain age groups, the estimated probability of survival is slightlyhigher than one. Immigrants are concentrated in the 20 to 40 age groups and we corrected theforecasts for this effect to the extent possible.
300 M. Boldrin, A. Montes
Cohort 1974
i = 7.44%; π = 7.24%
Cohort 1950
i = 7.64%; π = 7.17%
Somewhat unexpectedly, the increasing life expectancy does not affect theolder cohort in any substantive way, while it begins to substantially break downthe equality of rates of return for the younger cohorts.
4.2 Demographic change
Changing the demographic structure while keeping the balanced budget re-quirement satisfied in each period requires making assumptions on the policiesfor distributing the additional taxes and transfers across individuals belongingto different generations. In particular, one needs to make an assumption asto which features of the system that were observable in 1990–1991 and 1998–1999 will be maintained in future periods. Many scenarios are conceivable. Weselected two hypothetical scenarios, which we consider most informative.
We are interested in two of the effects of a policy. First, we want to computethe impact on aggregate efficiency, a good measure of which is the distancebetween the implicit rates of return and the market interest rate. Second,we want to measure the impact on intergenerational redistribution, whichis captured by the distance between lending and borrowing rate for eachcohort. In all scenarios, we use the values from the baseline case to imputethe taxes/transfers paid/received in the years previous to 1998.
• Scenario A, we assume that age-specific per capita expenditures in educa-tion and pension will remain at their 1990–1998 level, in real terms.
• Scenario B, we assume that age-specific, per capita education taxes andsocial security contributions will remain at their base-case values.
The careful reader will notice that, in both scenarios, the specific policyadopted and the year-by-year balanced budgets are not enough, for givendemographics, to uniquely pin down all remaining variables. Consider, forexample, scenario A. Using per capita expenditure in education and demo-graphic data, we can compute total education expenditure Et in each futureyear. The balanced budget constraint implies that Et = Te
t , for all t. Thisdetermines the total education tax to be levied in each year but leaves itsdistribution, across generations, still open. The same is true for the distributionof T p
t across generations, and so on. To address this problem, we proceedas follows: For each flow, let Xa be the amount paid or received by therepresentative individual of age a according to the 1990–1998 data. For eachx = E, Te, P, T p and age a, a′ = 1, 2, . . . , A, define the constants
kx(a, a′) = Xa
Xa′.
Assessing the efficiency of public education and pensions 301
Then, for all future years and in both scenarios, we assume that, for eachfunction x whose distribution over cohorts is to be determined endogenously,the payments from or transfers to the average individuals of age a and a′ willyield the same kx(a, a′) as in the base case under demographic stationarity. Inother words, we assume that, while a certain policy may either favor or hurt agiven cohort over its entire lifetime, it will not do so by charging different taxesto people of different ages in any given year. The same is true for transfers.
Scenario A We set real per capita expenditure Ea and Pa at the basecase level, for all a. The demographic projections allow the computation ofaggregate expenditures, Et and Pt, for each year t = 1998, . . . , 2089. We use abalanced budget in each year to compute Te
t and T pt . We use the assumption of
constant kTe(a, a′) and kT p
(a, a′), together with demographic data, to computethe distribution of taxes across individuals in each year. Given this, we computethe rates of return. This policy gives
Cohort 1990
i = 7, 46%; π = 7, 95%
Cohort 1974
i = 7, 47%; π = 7, 87%
Cohort 1950
i = 7, 57%; π = 7, 31%
Most surprisingly, at least to us, this policy manages to maintain the twoimplicit rates of return remarkably close to each other, even under such arapidly changing demographic structure. Furthermore, the absolute level ofthe two rates of return moves very little from where it was in the baselinecase and, more important, remains close to what has been, at least for the last13 years, the historical rate of return on capital in Spain, i.e., about 7%. Keepingper capita expenditure constant, in real terms, seems, therefore, a reasonablefirst-order approximation to what, within the constraints of the current welfaresystem, we could label as the “optimal response” to the foreseeable Spanishdemographic change.
This result becomes even more remarkable when one looks at the perfor-mances of the other, somewhat “natural,” policy response, i.e., the one thatkeeps constant the level of individual taxation financing the two functions.
Scenario B Here we fix real per capita taxation Tea and T p
a at the base caselevel, for all a. Then, we proceed as in scenario A, using the assumption ofconstant kE(a, a′) and kP(a, a′) to compute the yearly distribution of Et and Pt
across individuals of different ages. This policy gives
302 M. Boldrin, A. Montes
Cohort 1990
i = 5, 90%; π = 4, 77%
Cohort 1974
i = 7, 43%; π = 5, 03%
Cohort 1950
i = 7, 65%; π = 6, 98%
The outcome here is dramatically different. Particularly for younger co-horts, the two rates of return move substantially away from each other and,for the 1990 cohort, quite below the real rate of return on capital. On thebasis of this preliminary analysis, one should conclude that a policy thatkeeps per capita expenditure constant in real terms, and adjusts taxation toroughly balance the year-by-year budget, constitutes a reasonable responseto the forthcoming demographic change. The first best response, naturally,is to reform the whole system so as to incorporate and make automatic thepursuance of the efficient rate of return equality.
5 Conclusion
We extend the model of efficient intergenerational transfers via public edu-cation and pensions of Boldrin and Montes (2005) to evaluate the efficiencyof the current Spanish welfare system and its ability to handle demographicchange. The theoretical model says that a necessary condition for efficiencyis that two rates of return implicit in the flows of educational services, socialsecurity contributions, educational tax payments, and pension receipts, shouldbe equalized. The extension considered here takes into account how theoptimal policy should react to demographic shocks, and an optimal policyresponse is derived.
Next, we use our theory to measure if the Spanish system is close to or farfrom the social optimum. To do this, we use both microeconomic and aggregatedata for Spain in 1990–1991 and 1998–1999 to compute the two implicit “bor-rowing” and “lending” rates. For the baseline case in which strong stationarityassumptions are imposed, our point estimates of the borrowing and lendingrates suggest that, at the end of the 1990s, the Spanish welfare system wouldnot have been very far away from efficiency, had the existing demographicsituation persisted over time. Nevertheless, demographic stationarity is notwhat Spain, or most other countries, for that matter, faces. Once this is takeninto account, the results change dramatically.
We try to understand which policies, if any, could attenuate the inefficiencyand the related intergenerational redistribution that demographic change isbringing along given current policies. To do this, we have considered twosets of policy changes that, prima facie, appear “reasonable” or even “likely.”
Assessing the efficiency of public education and pensions 303
In the first case, we assume that per capita expenditures (transfers) are keptconstant at the 1998–1999 level, while taxes adjust to balance the educationand pension budgets every year. In the second, we do the reverse, hold percapita taxes and contributions at the old level and let expenditures/transfersadjust to balance the budget.
Much to our surprise, the two policies perform quite differently under themost realistic demographic scenario one can envisage on the basis of currentlyavailable information. The policy that keeps per capita expenditure constantdoes very well, i.e., it keeps the two rates of return almost unchanged andclose to each other. The policy that keeps constant per capita taxation doespoorly, signalling a dramatic increase in intergenerational redistribution and amovement away from the efficient allocation. In particular, pensions tend toyield a rate of return (on the previous education investment) lower than therate of interest the working cohorts are expected to pay (via social securitycontributions) on the education services they received. In other words, shouldthe Spanish Government keep taxing its citizens at the current rates for thepurpose of financing pensions and education, and then spend in the twosystems so as to balance the yearly budget, both pensions and educationalexpenditures would be too low, and pensions especially so. This is a surprisingresult, but only partially so in retrospect. The public sector data we use toextrapolate future policies come from a sequence of years in which the burdenof taxation was particularly high in Spain, and both the public sector budgetand the social security budget were heading toward substantial surpluses,which they have in fact been running for a number of consecutive years now.
Another relevant empirical finding is the following: Contrary to a wide-spread presumption, the movements away from efficiency and intergener-ational fairness are monotone in the direction opposite to what is usuallyexpected. In particular, they do not seem to favor the older relative to theyounger generations. While the latter are predicted to receive a much smallerrate of return, through pension payments, on their educational investments,they are also predicted to have to pay a much lower rate of interest onthe educational transfers they received during their youth. If one measures“distributions” by taking the difference between i (what people pay) and π
(what people receive) for each generation, it is the intermediate generation(the one born in 1974 in our case) that gets the worst deal. The oldest (1950)receives the best treatment and the youngest (1990) falls in between. In otherwords, rebus sic stantibus, the expected demographic evolution should notnecessarily lead to a huge redistribution of resources away from the youngeror not-yet-born generations and toward people that are now approachingretirement age. It is the generation now approaching its middle age thatappears to be the loser in the Spanish intergenerational redistribution game.Most previous findings, based on the generational accounting methodologypioneered by Auerbach and Kotlikoff (see, for example, Auerbach et al.2000), have instead shown that the interaction between demographic changeand current fiscal policies (in particular, current welfare policies) is likely toengender a large intergenerational redistribution in favor of the older cohorts.

304 M. Boldrin, A. Montes
While our findings cannot rule out this conclusion and, in fact, support it undercertain policy scenarios, we believe our estimates have independent value andshould shed some additional light on the intricacies of intergenerational publicpolicy.
Appendix: data sources and treatment
Data sources
Our sources of data are the following: We obtained the aggregate expendi-ture on public education from the Estadística del Gasto Público en Educación(EGPE 1995, in Ministerio de Educación y Ciencia 1995) and the Encuestasobre Financiación y Gasto de la Enseñanza Privada [EFGEP 1990-91, in INE(1992b)]. The first database contains public expenditure for each schoolinglevel; the second reports the amount of public funding going to private schools(centros concertados). Aggregate tax revenues are obtained from the Cuentasde las Administraciones Públicas (IGAE 1991b). From this we extract the shareof total tax revenues allocated to financing public expenditure on education,excluding the fraction covered with public debt. We assume that the fractionof public expenditure covered by debt financing is equal to the average shareof public expenditure financed by debt during 1990–1991. Aggregate flows ofpublic pension payments are obtained from the Cuentas de las Administra-ciones Públicas (IGAE 1991b) and Actuación Económica y Financiera de lasAdministraciones Públicas (IGAE 1991a).
The conditional survival probabilities at each age are equal to those ob-tained by the latest mortality tables published by the National StatisticalInstitute [INE (1999)] with reference to the year 1998. The aggregate data donot allow the study of individual lifecycle behavior. To do this, we use a Spanishhousehold budget survey (EPF) carried out by INE (1992a), in 1990–1991. Thissurvey contains data on individual income, expenditure, personal characteris-tics, and demographic composition for 21,155 households and 72,123 Spanishcitizens. This survey is representative of the entire Spanish population and iscalibrated on the Spanish Census data.
Treatment of the data
Lifetime distributions
We now detail how, using the data in the EPF, we calculated the lifetime distri-bution of the four flows associated to the two public systems. The informationin the EPF allows the estimation of the contributions and payments associatedto the two public systems for each individual in the sample. These contributionsand payments depend upon the labor market condition of the individual.
Assessing the efficiency of public education and pensions 305
Thus, we have considered five states in which each individual can be. Foreach state, we compute contributions and payments the individual receives ormakes. These five states are the following:
(E) Student. The individual is enrolled in a school or university receivingpublic funds. The individual is then receiving a transfer
(Ei
a
)of an amount
equal to the average cost of a pupil of his/her age attending a school of thekind he/she specifies, during the fiscal year 1990–1991. The same individualcontributes toward financing of public education through a portion of his/herdirect and indirect taxes,
(Ti
a
).
(W) Worker. This class includes all employed individuals. Such individualspay direct or indirect taxes to support public education,
(Ti
a
), and also pay
social security contributions,(
T pia
).
(R) Retired. We consider as retired only those individuals receiving acontributive pension
(Pi
a
). Retired individuals are also financing the public
education system with a portion of their taxes(Ti
a
).
(U) Unemployed. If an individual receives unemployment benefits, he/she isfinancing the public pension system through the social security contributions
paid(
T pia
). Again, the unemployed are also financing the public education
system with a portion of their taxes(Ti
a
).
(I) Inactive. Here we include all the individuals that are not in any ofthe previous four states. If these individuals pay some income taxes, this isrecorded in the EPF. Otherwise, we attribute to them a share of the indirecttaxes based on their reported expenditure. The total gives
(Ti
a
).
These five states are mutually exclusive. For the very rare cases in whichthe same individual in the EPF reports to be in two or more of them,we create two or more “artificial” individuals and increase the sample sizecorrespondingly. We define the universe of states to be S = {E,W,P,U, I}.The total population at each age a = 1, . . . , A is
∑s∈S La(s), with La(s) equal
to the number of individuals of age a that are in state s. Denote the share of thepopulation of age a in state s as μa(s) = La(s)/
∑s∈S La(s), with
∑s∈Sμa(s) = 1.
For each a and s ∈ S, μa(s) is the probability that an individual is in state s atage a.
Public education system
In Spain, public financing of education is allocated in part to public schoolsand in part to a special kind of private schools, centros concertados, by meansof school vouchers to students. At the compulsory school level (up to age 14in 1990; 16 in the current legislation) schooling is completely free. After that,students attending public institutions pay only a small fraction of the totalcost, the rest being born by general tax revenues. Students attending privateinstitutions bear the full cost.

306 M. Boldrin, A. Montes
Cost of public schooling
For each educational level (primary, secondary, higher, and other), we havecomputed the real per-pupil public expenditure on education for various typesof schools (public and concertados) and for the public universities. The EPFreports if an individual is enrolled in school, the type of school (public orprivate), and the level he/she is attending. This information is enough tocompute the total number of students in each level, type of school, and agegroup. The criterion we followed to compute the cost of schooling for each“kind” of student (age a, level j, type k of school) is the following: Fromthe EGPE and the EFGEP, we obtain the actual total amount of publicexpenditures for each kind (kj) of school. We divide these amounts by thetotal number of pupils attending each. This gives us the effective per-studentcost for each kind kj of school, E jk. From the EPF, we compute how manystudents of age a are attending a school of kind kj. Using this, we estimatepublic school expenditure on the representative individual at each age a as
Ea = μa (E)∑
k∈TC
∑
j∈NE
μa(E jk) E jk
a = μa (E) Ea
where μa (E) denotes the fraction of the population of age a attending school,NE is the universe of educational levels, and TC is the universe of types ofschools. Finally, μa
(E jk
)is the portion of students of age a enrolled in the
educational level j in a school of type k.The age distribution of public education “borrowing” is
δa = Ea∑A
a=1 Ea La
.
Hence, δa is the share of (lifetime total) education-related transfers the repre-sentative individual receives at age a.
Financing of the public education system
On the financing side, we need to compute the amount of education-relatedtaxes paid by the representative individual at age a. The taxes we consider arethe following: personal income tax (Impuesto sobre la Renta de las PersonasFísicas, or IRPF), value added tax (VAT), special, and other local taxes.
The EPF provides detailed information about the income flow of eachindividual and the wealth and consumption baskets of each household. Thisallows a detailed reconstruction of the various taxes paid by an individual,which we then aggregate in a total burden of taxation
(Ti
a
)for individual i
of age a. We calculate the average tax paid by a person of age a as
Ta =∑
s∈Sμa (s)
∑i∈s Ti
a
La (s)=
∑
s∈Sμa (s) T
sa
where Tsa is the average tax paid by an individual in state s at age a.
Assessing the efficiency of public education and pensions 307
Given the values Ta for a = 1, · · · , A, the computation of the lifetimedistribution of the total investment in public education is straightforward:
αa = Ta∑A
a=1 Ta La
.
Hence, αa represents the relative burden of taxation charged to the represen-tative individual at age a, for a = 1, · · · , A, call this the age distribution of thetotal tax burden.
To impute the flow of real expenditures in education to the various years ofone’s life, we need to scale the coefficients αa by the actual public expenditureon education. We retrieve this from IGAE (1991b); call it Te
90. Then wecompute Te∗
a = αa · Te90 for a = 1, · · · , A, the investment in public education
for the representative agent.
Public pensions
Public contributory pensions are provided by the following programs. TheGeneral Social Security Regime (Régimen General de la Seguridad Social,or RGSS) is the main one and covers most private-sector employees plus a(small but growing) number of public employees. The five plans included inthe Special Social Security Regimes (Regímenes Especiales de la SeguridadSocial, or RESS) are for the self-employed (Régimen Especial de TrabajadoresAutónomos, or RETA), the agricultural workers and small farmers (RégimenEspecial Agrario, or REA), the domestic employees (Régimen Especial de Em-pleados de Hogar, or REEH), the sailors (Régimen Especial de Trabajadoresde Mar, or RETM), and the coal miners (Régimen Especial de la Minería delCarbón, or REMC). Finally, there exists a seventh, special pension system forthe public employees (Ré gimen de Clases Pasivas, or RCP).
Financing the public contributive pension system
All seven pension regimes are of the pay-as-you-go type and, presumably, areself-financing. To estimate the lifetime distribution of social security payments,we identified all individuals in the EPF paying social security contributionsand split them among the seven plans. For each individual, we have enoughinformation, either from the EPF or from current legislation (for example, forpublic employees), to compute the fictitious income (bases de cotización andhaberes reguladores) upon which pension contributions are being charged. Toeach of the fictitious incomes we apply the social security contribution rate,as specified by the 1990–1991 legislation, for the pension regime in which theindividual was enrolled. Aggregating these amounts over all the individualsof age a, we obtain, for each a = 1, . . . , A, the amount of social securitycontributions paid by individuals in state W (TW
a ) and state U (TUa ). The social
security contribution paid by the representative agent at age a is then
T pa = μa (W) · TW
a + μa (U) · TUa .
308 M. Boldrin, A. Montes
Also in this case, we compute weights by setting
βa = T pa
∑Aa=1 T p
s La
Finally, from IGAE (1991a, b), we obtain the total amount of social securitycontributions paid to the seven plans during the year 1990, T p
90. In oursimulation, we use
T p∗a = βa · T p
90.
Benefits of the public pension system
The Spanish social security system provides five types of contributive pensions:old age, disability, widowers, orphans, and other relatives. We have notconsidered payments of noncontributive pensions as part of our scheme, asthey are not financed by means of social security contributions.
In the EPF, we are told if an individual is a pension recipient and what kindof pension he or she receives and in what amount. The average contributivepension received at each age a is, therefore, easily computed as
Pa = μa (P) ·∑
k∈T P
μa(Pk) ·∑
i∈k Pia
La(Pk
) = μa (P) Pa
where μa (P) is the fraction of the population of age a receiving a contributivepension, T P is the universe of kinds of contributive public pensions, μa(Pk)
is the portion of pensioners at age a receiving a pension of type k, Pia is the
actual pension received by individual i of age a, and La(Pk
)is the number of
individuals of age a receiving a pension of type k.As in the previous cases, the lifetime weights are computed as
γa = Pa∑A
a=1 Pa La
.
Finally, from IGAE (1991a, b), we obtain the total contributive pensionpayments effectively made, by the seven regimes, during the year 1990, P90.The amounts used in our calculations are, therefore, P∗
a = γa · P90.
Acknowledgements We thank two anonymous referees for their valuable comments. Financialsupport from the NSF, the BBVA, the DGES (BEC2002-04294-C02-01), the Spanish Ministry ofEducation and Science – PNICDI cofinanced by the FEDER – (SEJ2005-07200 and SEC2003-089889), and the Fundación Seneca (05710/PHCS/07) is gratefully acknowledged.
References
Auerbach AJ, Kotlikoff LJ, Leibfritz W (1999) Generational accounting around the world.University of Chicago Press, Chicago
Bellettini G, Berti-Cerroni C (1999) Is social security bad for growth? Rev Econ Dyn 2:249–275Boldrin M, Montes A (1999) Intergenerational transfer institutions: public education and public
pensions. Working Paper Series 99–36, Universidad Carlos III de Madrid
Assessing the efficiency of public education and pensions 309
Boldrin M, Montes A (2005) The intergenerational state: education and pensions. Rev Econ Stud72:651–664
Boldrin M, Montes A (2006a) Games generations play. Mimeo, University of Minnesota andUniversidad de Murcia
Boldrin M, Montes A (2006b) Optimal intergenerational debt. Mimeo, University of Minnesotaand Universidad de Murcia
Boldrin M, Rustichini A (2000) Political equilibria with social security. Rev Econ Dyn 3:41–7Cigno A (2006) The political economy of intergenerational cooperation. In: Kolm SC, Mercier
Ythier J (eds) Handbook of giving, reciprocity and altruism handbooks in economics (seriesedited by K.J. Arrow and M.D. Intriligator), vol 2. North-Holland, Amsterdam
Collado D, Iturbe-Ormaetxe I, Valera G (2004) Quantifying the impact of immigration on theSpanish welfare state. Int Tax Public Financ 11(3):335–353
Diamond P (1965) National debt in a neoclassical growth model. Am Econ Rev 55:1126–1150Fernández Cordón JA (2000) Proyecciones de la población española, 1998-2050. FEDEA,
(http://www.fedea.es/hojas/proyecciones.html)Instituto Nacional de Estadística (INE) (1991) Tablas de Mortalidad de la Población Española con
Referencia a los A ños 1990-91. Instituto Nacional de Estadística, MadridInstituto Nacional de Estadística (INE) (1992a) Encuesta de Presupuestos Familiares 1990-91.
Metodología Instituto Nacional de Estadística, MadridInstituto Nacional de Estadística (INE) (1992b) Encuesta sobre Financiación y Gasto de la
Enseñanza en España. Instituto Nacional de Estadística, MadridInstituto Nacional de Estadística (INE) (1999) Tablas de Mortalidad de la Población Española con
Referencia a los A ños 1998–99. Instituto Nacional de Estadística, MadridIntervención General de la Administración del Estado (IGAE) (1991a) Actuación Económico
Financiera de las Administraciones Públicas 1990. Ministerio de Economía y Hacienda,Madrid
Intervención General de la Administración del Estado (IGAE) (1991b) Cuentas de las Adminis-traciones Públicas 1990. Ministerio de Economía y Hacienda, Madrid
Ministerio de Educación y Ciencia (1995), Estadí stica del Gasto Público en Educación. Ministeriode Educación y Ciencia, Madrid
Montes A (2000) Profundizando en los Mecanismos del Estado del Bienestar: Educación yPensiones Públicas. Doctoral Dissertation, Universidad Carlos III de Madrid
Montes A (2002) Educación para los Jóvenes y Pensiones para los Mayores: ‘? Existe algunarelación? Evidencia para España. Investigaciones Económicas XXVI:145–185
Rangel A (2003) Forward and backward intergenerational goods: why is social security good forthe environment? Am Econ Rev 93:813–34