assessing diet of the non-indigenous predatory cladoceran cercopagis pengoi using stable isotopes
TRANSCRIPT
Assessing diet of the non-indigenouspredatory cladoceran Cercopagis pengoiusing stable isotopes
PER B. HOLLILAND*, TOWE HOLMBORN† AND ELENA GOROKHOVA‡
DEPARTMENT OF SYSTEMS ECOLOGY, STOCKHOLM UNIVERSITY, SE-106 91 STOCKHOLM, SWEDEN
†PRESENT ADDRESS: CALLUNA AB, STORA NYGATAN 45, SE-111 27 STOCKHOLM, SWEDEN
‡PRESENT ADDRESS: DEPARTMENT OF APPLIED ENVIRONMENTAL SCIENCE, STOCKHOLM UNIVERSITY, SE-106 91 STOCKHOLM, SWEDEN
*CORRESPONDING AUTHOR: [email protected]
Received July 29, 2011; accepted in principle January 25, 2012; accepted for publication January 31, 2012
Corresponding editor: Mark J. Gibbons
In the Baltic Sea, the predatory cladoceran Cercopagis pengoi is a non-indigenousspecies that has potential to compete for mesozooplankton with pelagic zooplank-tivorous fish. To understand the extent of diet overlap with these fishes in a coastalarea of the northern Baltic proper, we studied the feeding of C. pengoi using stable13C and 15N isotope signatures of the predator and possible prey. Feasible combi-nations of sources were estimated in two ways: (i) with the IsoSource mixingmodel, and (ii) temporal-tracking analysis. Further, contribution of different preywas related to ambient zooplankton composition to gauge selectivity. The model-ling results indicate that C. pengoi is an opportunistic generalist predator with apositive selection towards older copepodites (CIV–VI) of Acartia spp. andEurytemora affinis, which also have the greatest contribution to its diet. Positive selec-tion towards podonid Cladocera is also likely. In contrast, evidence for extensivefeeding on microzooplankton was inconclusive, and bosminids were not found tobe an important prey in the zooplankton assemblages studied. As the derived dietof C. pengoi overlaps greatly with that of zooplanktivorous fish, food competitionbetween these zooplanktivores is possible.
KEYWORDS: mixing models; temporal-tracking analysis; selectivity; food webinteractions; zooplankton
I N T RO D U C T I O N
Non-indigenous species can have detrimental effectsupon the biodiversity and food web functioning ininvaded ecosystems (Noonburg and Byers, 2005;Beardsley, 2006). In some cases, the impact on the recipi-ent community has been catastrophic, as in the case withthe invasion of the ctenophore Mnemiopsis leidyi into theBlack and Caspian seas (e.g. Kideys, 2002; Roohi et al.,2008). In other cases, however, no measurable impact(Gozlan, 2008) or even positive effects have beenobserved as, for example, with another ctenophore Beroe
ovata that is able to control populations of the earlierintroduced M. leidyi by predation (Shiganova et al., 2001).In general, to predict and evaluate the potential preda-
tory impact of the newly introduced species, one must
know the pre-existing trophic linkages in the food web as
well as those that the invader establishes and to quantify
its dietary composition and requirements.Cercopagis pengoi, a predatory cladoceran originating
from the Ponto-Caspian region (Rivier, 1998), was firstrecorded in 1992 in the Gulfs of Riga and Finland(Ojaveer and Lumberg, 1995; Krylov et al., 1999). Later,
doi:10.1093/plankt/fbs008, available online at www.plankt.oxfordjournals.org
# The Author 2012. Published by Oxford University Press. All rights reserved. For permissions, please email: [email protected]
JOURNAL OF PLANKTON RESEARCH j VOLUME 0 j NUMBER 0 j PAGES 1–12 j 2012 JPR Advance Access published February 27, 2012 by guest on February 11, 2016
http://plankt.oxfordjournals.org/D
ownloaded from
it spread to other parts of the Baltic Sea (Gorokhovaet al., 2000) and colonized the North American GreatLakes (Leppakoski and Olenin, 2000; Therriault et al.,2002). Cercopagis pengoi is a voracious predator that canreach high densities during summer (Baltic Sea: up to1800 ind m23, Uitto et al., 1999; Lake Ontario: up to2600 ind m23, Ojaveer et al., 2001; Lake Michigan:700 ind m23, Witt and Caceres, 2004) and has a poten-tial to alter native zooplankton populations (Ojaveeret al., 2004; Kotta et al., 2006). In pelagic food webs, itacts as both predator and prey and is recognized as aspecies with a large potential to affect food webs andfish feeding conditions in the invaded ecosystems(Leppakoski et al., 2002; Vanderploeg et al., 2002).
Before the introduction of C. pengoi into the BalticSea, the diet of Baltic zooplanktivorous fish, such asherring (Clupea harengus) and sprat (Sprattus sprattus), waslargely composed of copepods (Acartia spp. andEurytemora affinis) and cladocerans (podonids andBosmina maritima), with a preference for the copepods(Rudstam et al., 1992; Mehner and Heerkloss, 1994;Arrhenius, 1996; Antsulevich and Valipakka, 2000).Cercopagis is a voracious predator, with a very peculiarfeeding mode; it punctures the carapace and ingests softtissues discarding the exoskeleton (Rivier, 1998). Thisfeeding mode enables feeding on a broad size spectrumof prey from an order of magnitude below its own bodymass (Pichlova-Ptacnıkova and Vanderploeg, 2009).Previous field and experimental studies in the Baltic Sea(Simm et al., 2006; Lehtiniemi and Gorokhova, 2008)and the Laurentian Great Lakes (Laxson et al., 2003;Pichlova-Ptacnıkova and Vanderploeg, 2009) haveshown that C. pengoi feeds on copepods and cladocerans,and hence, it might compete with zooplanktivorous fishfeeding on the same kind of prey. Evidence is, however,accumulating that C. pengoi can prey upon zooplanktonthat is too small for the adult fish to utilize efficiently,such as large ciliates, rotifers and small meroplanktoniclarvae (Gorokhova et al., 2005; Simm et al., 2006;Lehtiniemi and Linden, 2006). Because C. pengoi is alsoa prey for various Baltic fish, such as herring and sprat(Ojaveer and Lumberg, 1995; Antsulevich andValipakka, 2000; Gorokhova et al., 2004), it may channelenergy from previously underutilized biomass producedat lower trophic levels to fish. Therefore, if microzoo-plankton contributes substantially to the diet ofCercopagis, the invasion may have a positive effect on fishfeeding conditions in the Baltic Sea, particularly inAugust–September, when mesozooplankton decline(Johansson et al., 1993; Adrian et al., 1999) during theconsumption peak by young-of-the-year fish (Rudstamet al., 1992; Arrhenius and Hansson, 1993). During thisperiod, the microzooplankton contribution to the total
zooplankton biomass increases and, simultaneously,C. pengoi reaches its abundance peak and may becomean important food source for adult herring and sprat,but also contributes to the diets of the young-of-the-yearfish (Gorokhova et al., 2004).
The aim of this study was to determine temporalchanges in diet composition of C. pengoi in the north-ern Baltic proper. In particular, our objectives were toinvestigate (i) to what extent C. pengoi utilizes micro-zooplankton and (ii) if C. pengoi has a preference forcopepods, i.e. preferred planktivorous fish prey. Usingstable C and N isotope signatures of potential zoo-plankton prey and C. pengoi, feasible ranges of differ-ent prey contributions to C. pengoi nutrition wereestimated using IsoSource mixing models (Phillips andGregg, 2003). Stable isotope analysis (SIA) has beenproved useful in determining trophic interactions inaquatic ecosystems (Zanden and Rasmussen, 2001;Post, 2002). This method enables diet analysis whentraditional methods are not applicable; as when thestudy organisms, feeding habits make gut contentanalysis impossible. Such feeding habits include fluidfeeding, as is the case with C. pengoi. Further, werelated IsoSource-based estimates to ambient zoo-plankton community composition to derive prey pre-ferences. In addition, we analysed relationshipsbetween the consumer and its potential prey on dif-ferent sampling occasions and used significant positiverelationships as an indication of strong trophiclinkage, following a probabilistic approach proposedby Melville and Connolly (Melville and Connolly,2003); the results were compared with the IsoSourcemodelling results. This allowed us to evaluate the se-lectivity of C. pengoi for various zooplankton preyorganisms and their contribution to its diet.
M E T H O D
Study site and sampling
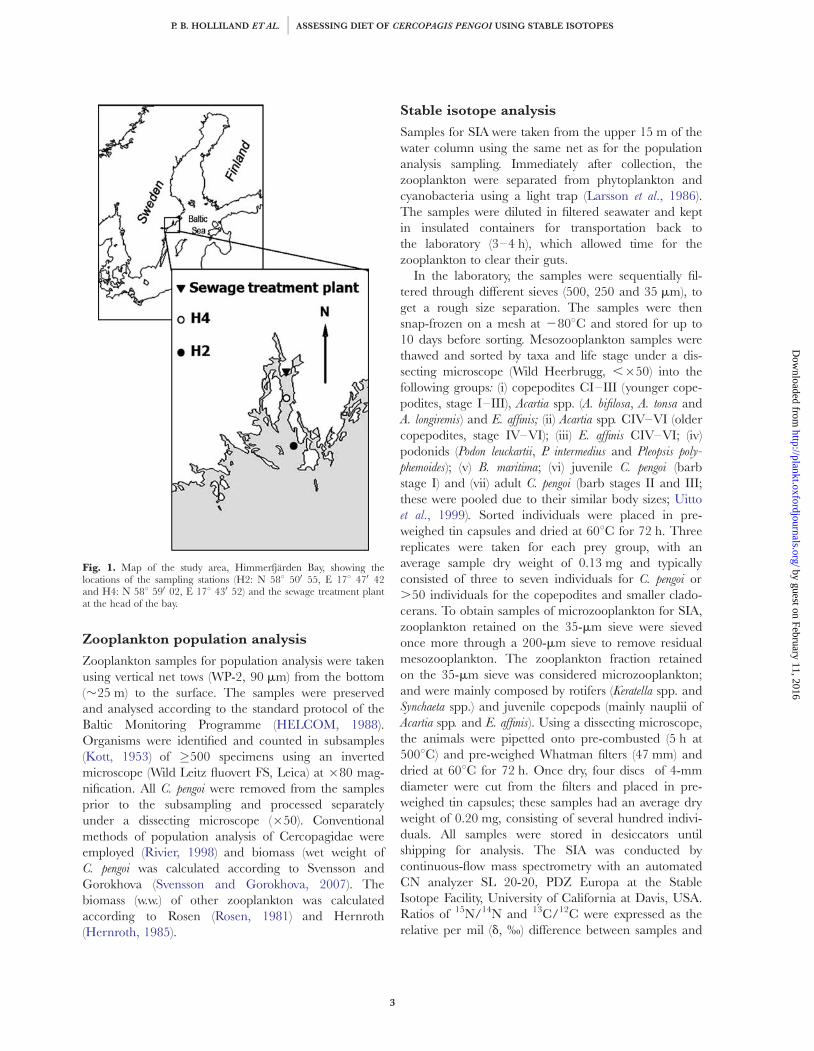
Himmerfjarden Bay is situated in the southern archi-pelago of Stockholm, north-western Baltic proper. Itis �30-km long, has a mean salinity of 6 (PSU) anda mean depth of 17 m. It receives discharge waterfrom a municipal water treatment plant located atthe bay-head. Zooplankton for SIA and populationanalysis were sampled at two stations inHimmerfjarden Bay on a fortnightly basis in June–September 2007. The sampling stations, H2 and H4(Fig. 1), are situated at the mouth of the bay (H2)and half-way up the bay, closer to the water treat-ment plant (H4).
JOURNAL OF PLANKTON RESEARCH j VOLUME 0 j NUMBER 0 j PAGES 1–12 j 2012
2
by guest on February 11, 2016http://plankt.oxfordjournals.org/
Dow
nloaded from
Zooplankton population analysis
Zooplankton samples for population analysis were takenusing vertical net tows (WP-2, 90 mm) from the bottom(�25 m) to the surface. The samples were preservedand analysed according to the standard protocol of theBaltic Monitoring Programme (HELCOM, 1988).Organisms were identified and counted in subsamples(Kott, 1953) of �500 specimens using an invertedmicroscope (Wild Leitz fluovert FS, Leica) at �80 mag-nification. All C. pengoi were removed from the samplesprior to the subsampling and processed separatelyunder a dissecting microscope (�50). Conventionalmethods of population analysis of Cercopagidae wereemployed (Rivier, 1998) and biomass (wet weight ofC. pengoi was calculated according to Svensson andGorokhova (Svensson and Gorokhova, 2007). Thebiomass (w.w.) of other zooplankton was calculatedaccording to Rosen (Rosen, 1981) and Hernroth(Hernroth, 1985).
Stable isotope analysis
Samples for SIA were taken from the upper 15 m of thewater column using the same net as for the populationanalysis sampling. Immediately after collection, thezooplankton were separated from phytoplankton andcyanobacteria using a light trap (Larsson et al., 1986).The samples were diluted in filtered seawater and keptin insulated containers for transportation back tothe laboratory (3–4 h), which allowed time for thezooplankton to clear their guts.
In the laboratory, the samples were sequentially fil-tered through different sieves (500, 250 and 35 mm), toget a rough size separation. The samples were thensnap-frozen on a mesh at 2808C and stored for up to10 days before sorting. Mesozooplankton samples werethawed and sorted by taxa and life stage under a dis-secting microscope (Wild Heerbrugg, ,�50) into thefollowing groups: (i) copepodites CI–III (younger cope-podites, stage I–III), Acartia spp. (A. bifilosa, A. tonsa andA. longiremis) and E. affinis; (ii) Acartia spp. CIV–VI (oldercopepodites, stage IV–VI); (iii) E. affinis CIV–VI; (iv)podonids (Podon leuckartii, P. intermedius and Pleopsis poly-
phemoides); (v) B. maritima; (vi) juvenile C. pengoi (barbstage I) and (vii) adult C. pengoi (barb stages II and III;these were pooled due to their similar body sizes; Uittoet al., 1999). Sorted individuals were placed in pre-weighed tin capsules and dried at 608C for 72 h. Threereplicates were taken for each prey group, with anaverage sample dry weight of 0.13 mg and typicallyconsisted of three to seven individuals for C. pengoi or.50 individuals for the copepodites and smaller clado-cerans. To obtain samples of microzooplankton for SIA,zooplankton retained on the 35-mm sieve were sievedonce more through a 200-mm sieve to remove residualmesozooplankton. The zooplankton fraction retainedon the 35-mm sieve was considered microzooplankton;and were mainly composed by rotifers (Keratella spp. andSynchaeta spp.) and juvenile copepods (mainly nauplii ofAcartia spp. and E. affinis). Using a dissecting microscope,the animals were pipetted onto pre-combusted (5 h at5008C) and pre-weighed Whatman filters (47 mm) anddried at 608C for 72 h. Once dry, four discs of 4-mmdiameter were cut from the filters and placed in pre-weighed tin capsules; these samples had an average dryweight of 0.20 mg, consisting of several hundred indivi-duals. All samples were stored in desiccators untilshipping for analysis. The SIA was conducted bycontinuous-flow mass spectrometry with an automatedCN analyzer SL 20-20, PDZ Europa at the StableIsotope Facility, University of California at Davis, USA.Ratios of 15N/14N and 13C/12C were expressed as therelative per mil (d, ‰) difference between samples and
Fig. 1. Map of the study area, Himmerfjarden Bay, showing thelocations of the sampling stations (H2: N 588 500 55, E 178 470 42and H4: N 588 590 02, E 178 430 52) and the sewage treatment plantat the head of the bay.
P. B. HOLLILAND ET AL. j ASSESSING DIET OF CERCOPAGIS PENGOI USING STABLE ISOTOPES
3
by guest on February 11, 2016http://plankt.oxfordjournals.org/
Dow
nloaded from
conventional standards (Vienna Pee Dee belemnite forC and atmospheric N2 for N).
Effects of freezing on d15N values
Snap freezing has been reported to increase d15Nvalues in cyclopoid copepods and cladocerans(Feuchtmayr and Grey, 2003). Therefore, the effect offreezing on d15N values in our zooplankton sampleswas tested by taking an additional five replicate samplesof Acartia spp. CIV–VI that were processed directly aftersampling, rather than freezing them. The results fromthese samples were then compared with five replicatesof frozen samples from the same sampling occasionusing an unpaired t-test. As no significant difference ind15N values was found between the frozen and freshsamples (unpaired t-test: t8¼ 0.88, P . 0.4), the freezingwas considered an adequate storage method allowingthe sampling schedule to be followed and all samples tobe processed uniformly.
Mixing models
To determine the source contributions to the diet ofC. pengoi, we estimated the relative contribution of eachprey with the IsoSource mixing model (Phillips andGregg, 2003) implemented in the SISUS platform (http://statacumen.com/sisus/). Only d15N values of poten-tial prey and predators were used because relative uni-formity of d13C values among the prey and predatorslimited the utility of these data. The model examinesall possible combinations of each prey potentialcontribution (0–100%) in small increments (here 1%).Combinations that summed to within 0.01‰ of C.
pengoi signature were considered feasible solutions. Theresults are presented as histograms to demonstrate thefrequency distribution of dietary biomass contributions(%). In the Baltic Sea, C. pengoi has a generation time of14–17 days (Svensson and Gorokhova, 2007), andhence, its isotopic signature should reflect the dietduring that period. Therefore, to obtain prey isotopiccomposition, which is representative of the consumersignature, food sources were averaged for a 2-weekperiod, i.e. between the neighbouring sampling occa-sions. To be used in the mixing model, food sources arerequired to be significantly different from each other;they were compared pairwise prior to being used asend-members in SISUS with an unpaired t-test (P ,
0.05 in all cases). Two 15N fractionation factors weretested for the model calculations: 2.4‰ (calculatedusing the model for invertebrates suggested by Cautet al. (Caut et al., 2009) and data for H2 as the leastaffected by the sewage effluents) and 3.4‰ (the average
fractionation factor for d15N recommended by Post,2002). As the latter fractionation factor resulted in non-converging models (in 13 out of 37 cases, data notshown), whereas all models using the fractionationfactor 2.4‰ converged, the results presented here arebased on models using the 2.4‰ fractionation factor.All statistical analyses were performed using GraphPadPrism 4.01 (GraphPad Software, USA); significance wasaccepted when P , 0.05.
Temporal-tracking analysis
To determine whether temporal-tracking occurred,mean d13C and d15N values for C. pengoi and potentialprey on each sampling occasion and station were usedas Cartesian coordinates, and Euclidean distances werecalculated between the value for C. pengoi and a prey onall dates when they both occurred. These distanceswere averaged (D0) to produce a measure of correlationin a two-dimensional space (tracking). To obtain a distri-bution of predator/potential prey distances, samplingdate labels of prey groups were changed and Euclideandistances were recalculated. The observed D0 of thepredator/prey combination was then compared withthis distribution of possible D values, giving a probabil-istic significance test (Melville and Connolly, 2003). Ifthe D0 value was small relative to the distribution ofpossible values, then C. pengoi was said to be trackingthat particular prey. This was done for all possible com-binations of prey against the observed C. pengoi data.
R E S U LT S
Seasonal dynamics of zooplanktoncommunities
The total biomass of zooplankton communities variedat both stations over the season, with �2-fold highervalues at H4 than at H2 (Fig. 2). At both stations, twobiomass peaks occurred, one at the end of July (940and 560 mg m23 at H4 and H2, respectively) and theother in September (690 and 270 mg m23 at H4 andH2, respectively). The zooplankton community struc-ture differed between the two sites: Acartia spp., E. affinis
and microzooplankton contributed most to the zoo-plankton stocks at station H2, while B. maritima and E.
affinis dominated at station H4. Throughout the season,C. pengoi biomass was relatively low at both stations, con-tributing up to 2 and 5% to the total zooplanktonbiomass, at H2 and H4, respectively, and with a 10-folddifference between the sites (�5 and �46 mg m3 at H2and H4, respectively; Fig. 2).
JOURNAL OF PLANKTON RESEARCH j VOLUME 0 j NUMBER 0 j PAGES 1–12 j 2012
4
by guest on February 11, 2016http://plankt.oxfordjournals.org/
Dow
nloaded from
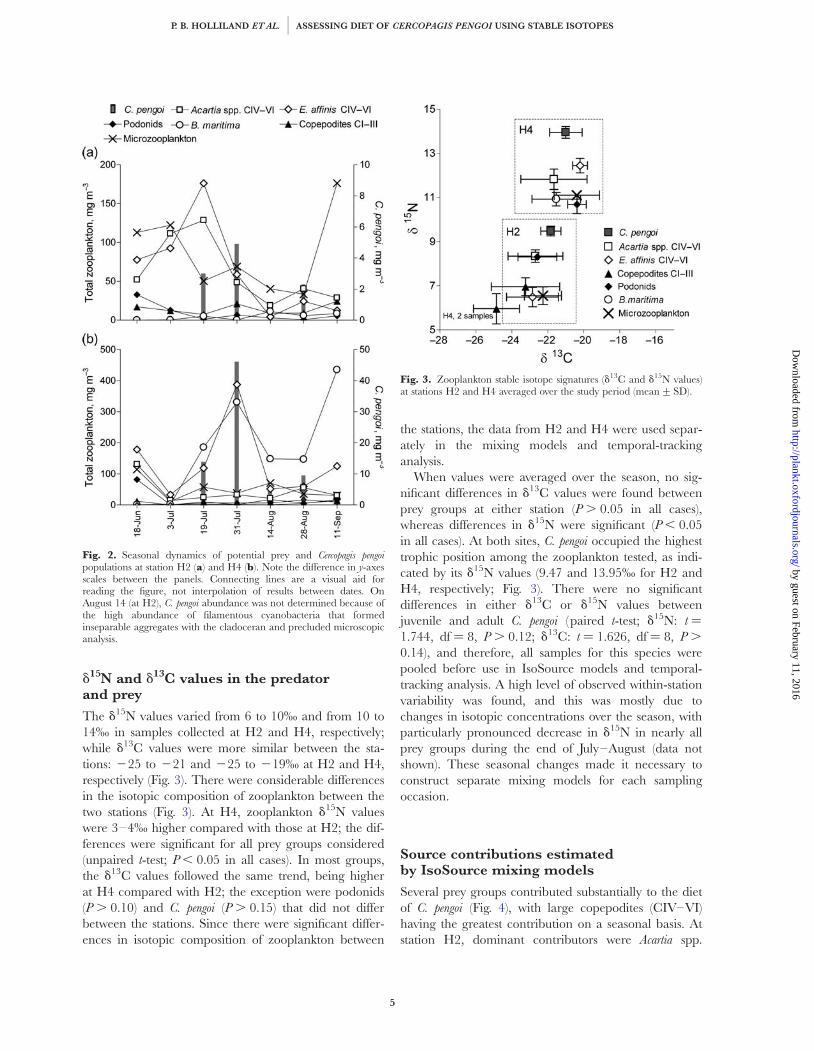
d15N and d13C values in the predatorand prey
The d15N values varied from 6 to 10‰ and from 10 to14‰ in samples collected at H2 and H4, respectively;while d13C values were more similar between the sta-tions: 225 to 221 and 225 to 219‰ at H2 and H4,respectively (Fig. 3). There were considerable differencesin the isotopic composition of zooplankton between thetwo stations (Fig. 3). At H4, zooplankton d15N valueswere 3–4‰ higher compared with those at H2; the dif-ferences were significant for all prey groups considered(unpaired t-test; P , 0.05 in all cases). In most groups,the d13C values followed the same trend, being higherat H4 compared with H2; the exception were podonids(P . 0.10) and C. pengoi (P . 0.15) that did not differbetween the stations. Since there were significant differ-ences in isotopic composition of zooplankton between
the stations, the data from H2 and H4 were used separ-ately in the mixing models and temporal-trackinganalysis.
When values were averaged over the season, no sig-nificant differences in d13C values were found betweenprey groups at either station (P . 0.05 in all cases),whereas differences in d15N were significant (P , 0.05in all cases). At both sites, C. pengoi occupied the highesttrophic position among the zooplankton tested, as indi-cated by its d15N values (9.47 and 13.95‰ for H2 andH4, respectively; Fig. 3). There were no significantdifferences in either d13C or d15N values betweenjuvenile and adult C. pengoi (paired t-test; d15N: t ¼
1.744, df ¼ 8, P . 0.12; d13C: t ¼ 1.626, df ¼ 8, P .
0.14), and therefore, all samples for this species werepooled before use in IsoSource models and temporal-tracking analysis. A high level of observed within-stationvariability was found, and this was mostly due tochanges in isotopic concentrations over the season, withparticularly pronounced decrease in d15N in nearly allprey groups during the end of July–August (data notshown). These seasonal changes made it necessary toconstruct separate mixing models for each samplingoccasion.
Source contributions estimatedby IsoSource mixing models
Several prey groups contributed substantially to the dietof C. pengoi (Fig. 4), with large copepodites (CIV–VI)having the greatest contribution on a seasonal basis. Atstation H2, dominant contributors were Acartia spp.
Fig. 2. Seasonal dynamics of potential prey and Cercopagis pengoipopulations at station H2 (a) and H4 (b). Note the difference in y-axesscales between the panels. Connecting lines are a visual aid forreading the figure, not interpolation of results between dates. OnAugust 14 (at H2), C. pengoi abundance was not determined because ofthe high abundance of filamentous cyanobacteria that formedinseparable aggregates with the cladoceran and precluded microscopicanalysis.
Fig. 3. Zooplankton stable isotope signatures (d13C and d15N values)at stations H2 and H4 averaged over the study period (mean+SD).
P. B. HOLLILAND ET AL. j ASSESSING DIET OF CERCOPAGIS PENGOI USING STABLE ISOTOPES
5
by guest on February 11, 2016http://plankt.oxfordjournals.org/
Dow
nloaded from

CIV–VI (8–71%), followed by microzooplankton (5–47%), E. affinis CIV–VI (8–35%), podonids (12–22%)and copepodites CI–III (13–20%). At station H4,B. maritima (8–85%) and E. affinis CIV–VI (4–69%)dominated, whereas Acartia CIV–VI (4–29%) andmicrozooplankton (8–20%) contributed less. During theperiod when C. pengoi was present in the water column,abundances of B. maritima and podonids at station H2and of podonids and copepodites CI–III at station H4were very low (Fig. 2). As a result, it was not always pos-sible to collect enough sample material for SIA of thesegroups and hence they were not included in models forall sampling occasions/stations (Fig. 4).
Prey-tracking analysis
Those prey that were more closely tracked by C. pengoi
(P , 0.05) were well separated from those less closelytracked (Table I). Old copepodites (CIV–VI), particular-ly E. affinis, were most closely tracked, while B. maritima
and microzooplankton were not. Tracking of podonidswas not possible to evaluate, due to the fact that thisprey nearly disappeared from the water column whenthe C. pengoi population started to increase.
Prey selectivity
A positive selection by C. pengoi was assumed tooccur, if the average contribution of a prey species in
the diet, estimated with the IsoSource mixing model,exceeded its contribution to the ambient zooplanktoncommunity. At station H2 (Fig. 5), this occurred forpodonids prior to their abundance dropping to verylow levels, and occasionally for the older copepodites(CIV–VI) of Acartia spp. and E. affinis. At H4(Fig. 5), the old copepodites were the preferredgroups; positive selection was also shown towards B.
maritima on one occasion in July. At both stations(Fig. 5), positive or neutral selection was alsoobserved for microzooplankton on several samplingoccasions.
Table I: Temporal tracking of prey byCercopagis pengoi at stations H2 and H4
Potential prey group
H2 H4
P% P-value P% P-value
Copepodites CI–III 0 0.02430.0243 nd —Acartia spp. CIV–VI 0 0.02180.0218 67 0.4767E. affinis CIV–VI 0 0.02200.0220 0 0.02350.0235Podonids 50 na nd —B. maritima nd — 0 0.1386Microzooplankton 0 0.1184 33 0.4864
P%, the percentage of possible D values smaller than observed D0, andcorresponding P-values (one-sample t-test) are shown. Low valuesindicate tracking in time of prey isotope signatures by the predator; na,prey occurred at insufficient occasions (n , 4) when the consumer waspresent; nd, no stable isotope data available. Significant values (P , 0.05)are in bold face.
Fig. 4. Dietary biomass contributions (%) of different prey for Cercopagis pengoi on different sampling occasions at stations H2 and H4 estimatedby the IsoSource mixing model using d 15N values of the consumer and its potential prey: Acartia spp. CIV–VI, copepodites CI–III, Eurytemoraaffinis CIV–VI, podonids, Bosmina maritima and microzooplankton. The contributions are calculated for all model iterations and expressed as thepercent frequency of all possible solutions. Owing to lack of material for samples, no stable isotope data were available for copepodites CI–IIIon the 4/7 at H2 and any occasion at H4, podonids on the 30/7, 15/8 and 27/8 at H2 and any occasion at H4 and bosminids for anyoccasion at H2.
JOURNAL OF PLANKTON RESEARCH j VOLUME 0 j NUMBER 0 j PAGES 1–12 j 2012
6
by guest on February 11, 2016http://plankt.oxfordjournals.org/
Dow
nloaded from
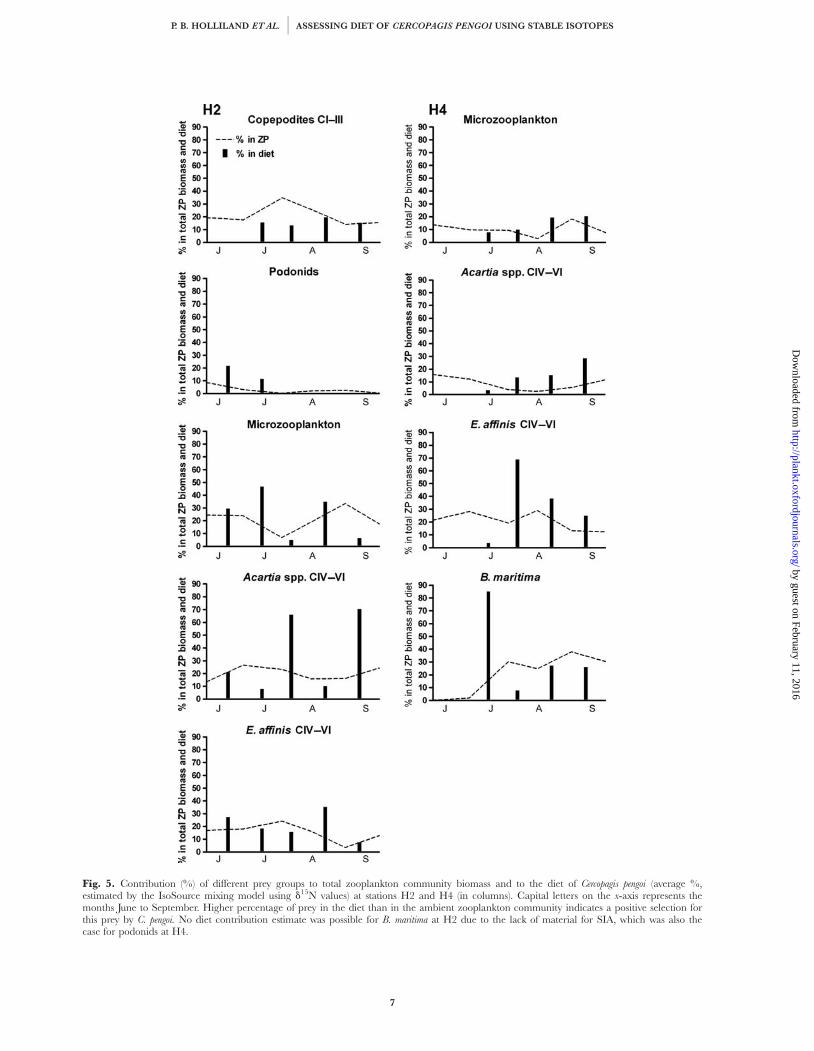
Fig. 5. Contribution (%) of different prey groups to total zooplankton community biomass and to the diet of Cercopagis pengoi (average %,estimated by the IsoSource mixing model using d15N values) at stations H2 and H4 (in columns). Capital letters on the x-axis represents themonths June to September. Higher percentage of prey in the diet than in the ambient zooplankton community indicates a positive selection forthis prey by C. pengoi. No diet contribution estimate was possible for B. maritima at H2 due to the lack of material for SIA, which was also thecase for podonids at H4.
P. B. HOLLILAND ET AL. j ASSESSING DIET OF CERCOPAGIS PENGOI USING STABLE ISOTOPES
7
by guest on February 11, 2016http://plankt.oxfordjournals.org/
Dow
nloaded from
D I S C U S S I O N
According to the IsoSource model outputs, relative con-tributions of different prey vary during the season andat different stations, consistent with the view thatC. pengoi is a generalist predator (Pichlova-Ptacnıkovaand Vanderploeg, 2009). Both methods employed (i.e.IsoSource mixing model and temporal tracking of prey)indicated older copepodites as both the dominant andthe preferred prey of C. pengoi. This agrees with experi-mental studies showing that C. pengoi feed on copepods,a prey with relatively fast escape abilities(Pichlova-Ptacnıkova and Vanderploeg, 2009), includingE. affinis (Simm et al., 2006; Lehtiniemi and Gorokhova,2008). Moreover, if individual body weight are takeninto account to ensure a more direct comparison withthe isotopic representation, the consumption ratesobserved by Simm et al. (Simm et al., 2006) for copepo-dites of E. affinis would be .2-fold higher comparedwith those for B. maritima and copepod nauplii. Also, ascopepods dominated the zooplankton community, ourstudy is in line with earlier studies both from the BalticSea (Simm et al., 2006) and The Laurentian GreatLakes (Laxson et al., 2003) that suggested that zooplank-ton groups dominating the ambient community tend tocontribute more to the diet of Cercopagis; this being indi-cative of opportunistic feeding. Evidence for the import-ance of microzooplankton, however, is inconclusive.While this prey had a low to high likelihood of contri-bution based on the IsoSource modelling (maximalvalues 16–90%) and in most cases was found to bepositively selected for (Fig. 5), no evidence for the asso-ciation between this source and C. pengoi nutrition wasfound in the temporal-tracking analysis. This is consid-ered as a more robust analysis, as it does not involveany assumptions regarding trophic shift values (Melvilleand Connolly, 2003). As this fraction was taxonomicallyheterogeneous consisting of different species of rotifers,copepods and barnacle nauplii, it is likely that there wasa differential predation on these taxa. This might haveresulted in varying estimates of the dietary contribution,depending on the proportion of different taxa in theambient plankton as was indeed indicated by theIsoSource mixing model results (Table I). Another ex-planation for the difference between the IsoSourceoutput and temporal-tracking analysis could be relatedto the fact that the 90-mm mesh of the WP2 net haslower sampling efficiency for microzooplankton(Johansson, 1992). This may result in underestimationof the standing stocks and therefore possible overesti-mation of selectivity. Experimental studies have shownthat C. pengoi can feed on these small zooplankters(Lehtiniemi and Linden, 2006; Pichlova-Ptacnıkova and
Vanderploeg, 2009), but to what extent this occurs innature is not clear. We also expected that youngC. pengoi would have lower d15N values due to a highercontribution of microzooplankton in their diet com-pared with adults. However, the isotopic differencesbetween the age groups were not significant, most prob-ably due to the high variability in body size of Instar II(see Table I in Grigorovich et al., 2000 and Fig. 6 inUitto et al., 1999) that comprised 58–90% of theC. pengoi population during the study period and, there-fore, was most probably overrepresented in the stableisotope samples of adults. This high natural variabilityin instar body size precluded evaluating diet differencesrelated to age. On the other hand, the lack of isotopicdifference between ages may reflect overlapping diets insimilarly sized C. pengoi regardless of their developmen-tal stage, which is the most plausible explanation.Overall, the discrepancy between the IsoSource modeloutput and temporal prey-tracking analysis indicatesthat different microzooplankton species should betreated separately and that size-, rather than, instar-specific differences in C. pengoi should be considered tofind out what microzooplankton prey, and when, is ac-tually consumed by C. pengoi. However, it is also likelythat rotifers and nauplii would have similar isotopic sig-natures, as they feed on similar prey (mostly nanoplank-ton), and this may hamper their use as separate prey
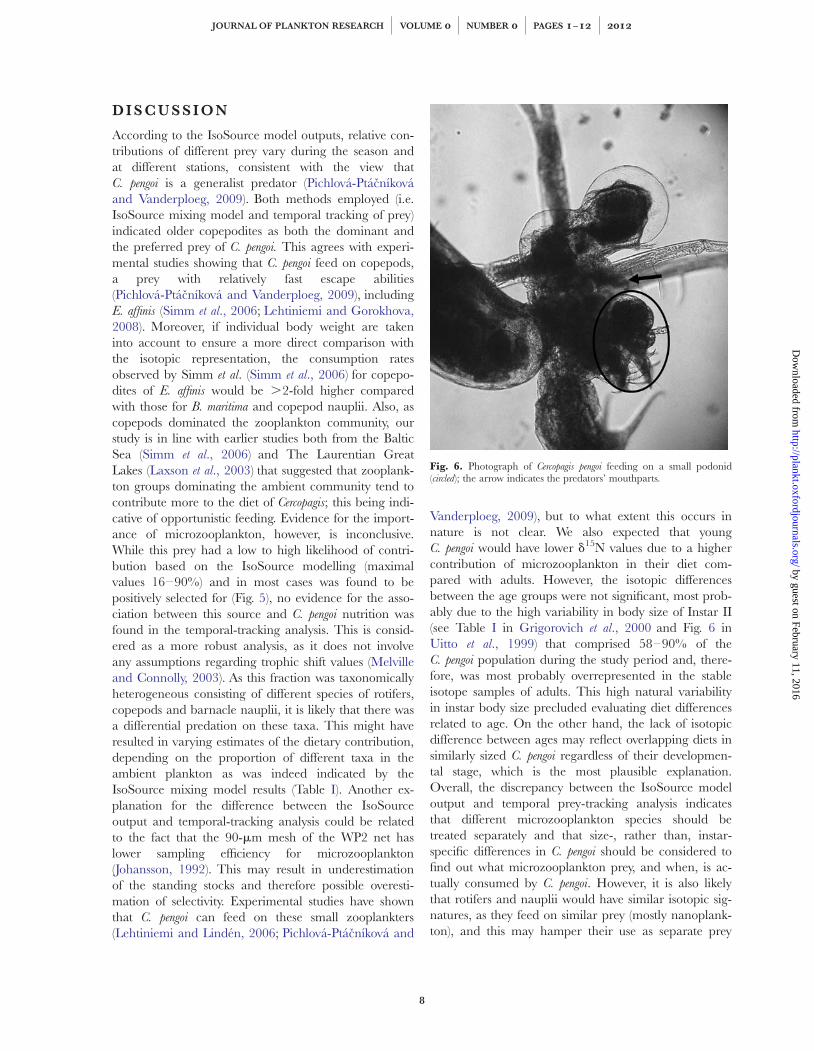
Fig. 6. Photograph of Cercopagis pengoi feeding on a small podonid(circled); the arrow indicates the predators’ mouthparts.
JOURNAL OF PLANKTON RESEARCH j VOLUME 0 j NUMBER 0 j PAGES 1–12 j 2012
8
by guest on February 11, 2016http://plankt.oxfordjournals.org/
Dow
nloaded from
groups in mixing models. IsoSource results indicatedthat cladocerans had low to medium (podonids, stationH2 only) and low to high (B. maritima, station H4 only)contribution to the diet of C. pengoi. When these esti-mates were compared with the proportions of theseprey groups in the ambient zooplankton communities,it became apparent that C. pengoi showed a positive se-lection towards podonids on every occasion SIAsamples were available. However, podonids were onlyfound in the water column until the beginning of July,comprising not .10% of the total zooplankton biomass(Fig. 2), resulting in the fact that there were only twosampling occasions when SIA samples for both C. pengoi
and podonids could be collected. This precludedtemporal-tracking analysis for this prey. However, tan-gible evidence for C. pengoi feeding on podonids wasfound while sorting samples for SIA (Fig. 6). IsoSourcemodelling results for the other cladoceran prey, B. mari-
tima, suggest highest contribution to the diet and posi-tive selection only at the beginning of the summer,when its share in the total zooplankton biomass was ex-tremely low (,1%). This low abundance of B. maritima
makes it highly unlikely that it could have been an im-portant prey during this time. Consistent with this, thetemporal-tracking analysis results do not indicate a sig-nificant association of this prey with C. pengoi. Fieldobservations support this conclusion: a positive correl-ation between abundances of B. maritima and C. pengoi
has been observed in the Gulf of Finland and was sug-gested to be a result of C. pengoi preying on other speciesthat compete with B. maritima, such as Pleopsis polyphe-
moides and Evadne nordmannii (Pollumae and Kotta,2007). Also, to meet the energy requirements ofC. pengoi, feeding rates on bosminids were not sufficient,whereas those on larger prey were (Laxson et al., 2003).However, considering the high diet contribution rangeof B. maritima during the period when this prey wasabundant (Table 1) and the evidence from predationexperiments suggesting this cladoceran is a readily con-sumed prey (Laxson et al., 2003; Simm et al., 2006;Pichlova-Ptacnıkova and Vanderploeg, 2009), it is pos-sible that C. pengoi preys actively on bosminids whenthey dominate zooplankton (Laxson et al., 2003). In thestudied area, the prey that contribute most to the diet ofC. pengoi are the dominant copepodites of Acartia spp.and E. affinis, while the contribution of other prey is lesspronounced (podonids and microzooplankton) or notimportant (B. maritima).
When using the IsoSource mixing model, the dietcomposition and prey preference estimates differedbetween the two sites, with relative contributions ofAcartia spp. and E. affinis differing between the stations(Acartia spp.: 35+ 27 and 15+ 9%; E. affinis: 21+ 9
and 34+ 4%; grand mean values+SD for the contri-butions to the diet at stations H2 and H4, respectively).These differences can be explained by (i) the differencesin community composition and prey abundances(Fig. 2; note the higher abundance and proportion ofAcartia spp. and E. affinis at stations H2 and H4, respect-ively) presenting the predator with different foodchoices, and (ii) the lack of SIA samples for certain prey,which might have resulted in errors in mixing modelcalculations. Indeed, the low abundance of young cope-podites (CI–III) and podonids at H4 and of B. maritima
and podonids at H2 made it impossible to get estimatesfor these prey groups and, consequently, the estimatedproportions of other prey may be biased.
The observed differences in isotopic compositionbetween the two sites could depend on several factors,none of which is mutually exclusive. Seston at H4 is iso-topically heavier than at H2 due to the greater terres-trial influence and the closer proximity to the watertreatment plant (Hoglander, 2005). Savage (Savage,2005) found the strongest influence of the 15N-enrichedeffluent to be within 10 km of the outfall, which encom-passes H4 but not H2, a concentration gradient thatmay also be strengthened by the limited water exchangein the bay (Savage, 2005). In addition, the concentrationof 15N at H2 may be reduced due to the greater contri-bution of isotopically light diazotrophic cyanobacteriain the outer part of the bay (pers. com. Dr S. Hajdu,Systems Ecology, Stockholm University). Understandingcauses of variability in isotopic composition and pro-cesses of isotope fractionation is important for interpret-ation of stable isotope data when using SIA for studyingfood web structure and functioning. Experimentalstudies show that fractionation is governed by manyvariables, such as temperature and feeding activity(Barnes et al., 2007), type of food (Crawley et al., 2007),diet isotopic ratios (Caut et al., 2008), C:N ratio of theprimary food source and availability of N (Adams andSterner, 2000), making fractionation factors vary bothgeographically and temporally. Strictly speaking, thepercentages of the prey contributions in the diet shouldalways be treated with caution as exact diet- andtemperature-specific fractionation factors are rarelyknown, particularly for omnivores living in fluctuatingenvironments and/or nutrient gradients, such as theHimmerfjarden Bay exposed to sewage discharge. Thisis why it is important to use an independent line of evi-dence, such as temporal-tracking analysis of differencesbetween sampling occasions, which does not rely ondiet fractionation (Melville and Connolly, 2003). Insightsinto diet composition obtained with other methods,such as feeding experiments, biochemical tracers (e.g.fatty acids), DNA-based and compound-specific isotopic
P. B. HOLLILAND ET AL. j ASSESSING DIET OF CERCOPAGIS PENGOI USING STABLE ISOTOPES
9
by guest on February 11, 2016http://plankt.oxfordjournals.org/
Dow
nloaded from
analysis, could further facilitate interpretation and in-crease the reliability of SIA for feeding and food webstudies (Ben-David and Schell, 2001; Gorokhova andLehtiniemi, 2007).
With larger copepodites (CIV–VI) making up themain part of the C. pengoi diet (Fig. 4), there is a signifi-cant diet overlap with zooplanktivorous fish in theBaltic Sea (Rudstam et al., 1992; Mehner and Heerkloss,1994; Arrhenius, 1996). This should not present aproblem as long as the copepod populations remainhigh and zooplanktivores are therefore not food limited.However, prior to the invasion of Cercopagis, young-of-the-year herring in areas close to Himmerfjarden weresuggested to be food limited (Arrhenius and Hansson,1996), indicating conditions of a possible food competi-tion. On the other hand, since C. pengoi has been foundto contribute substantially to the diet of Baltic Sea zoo-planktivorous fish (Ojaveer and Lumberg, 1995;Antsulevich and Valipakka, 2000; Gorokhova et al.,2004, 2005; Lankov et al., 2010), the risk of competitionmay be reduced, particularly if adult herring are abun-dant. Moreover, given the low stocks of C. pengoi
observed in our study (,5% of the total zooplanktonbiomass), it is unlikely to exert a heavy predation pres-sure on the rest of the zooplankton community.Nevertheless, C. pengoi does add an additional predationpressure on copepods and therefore might promoteincreased competition among zooplanktivores, particu-larly when abundant (Uitto et al., 1999). In LakeOntario, an increased predation on juvenile copepodshas been implicated in causing a decline in thecopepod populations (Benoit et al., 2002). This may alsooccur in the Baltic Sea as suggested by decreasedE. affinis stocks following C. pengoi invasion in the Gulfof Finland (Lehtiniemi and Gorokhova, 2008). With areduction in copepod stocks, food availability for fishwould decrease leading to a possible reduction in fishstocks. On the other hand, post-larval fish are not veryefficient in preying upon microzooplankton thatC. pengoi is able to feed upon (Lehtiniemi and Linden,2006; Pichlova-Ptacnıkova and Vanderploeg, 2009); tosome extent this feeding was also supported by theIsoSource model outputs (Fig. 4). Therefore, as C. pengoi
is preyed upon by zooplanktivorous fish (Gorokhovaet al., 2004; Lankov et al., 2010), the energy from micro-zooplankton, channelled through C. pengoi, may give fisha better access to previously underutilized energy.However, limited dependence of C. pengoi on microzoo-plankton (Table I) together with differences in foodquality between the copepods and microzooplanktonmakes it unlikely that the consumption of the microzoo-plankton compensates for the possible competition withfish for copepods. Furthermore, C. pengoi may not
represent a beneficial food source, as the indigestibletails occupy space in fish stomachs preventing moreprey from being ingested (Lankov et al., 2010).
To conclude, using SIA for in situ diet assessment, wefound that C. pengoi behaves as an opportunistic general-ist predator, with the main prey being copepods thatdominated the zooplankton community in the studyarea. These characteristics of the predator agree withpreviously reported laboratory observations forCercopagis-fed zooplankton typical for freshwaters(Pichlova-Ptacnıkova and Vanderploeg, 2009). BothIsoSource modelling and temporal-tracking analysis in-dicate that older copepodites of Acartia spp. and E. affinis
are the dominant prey of C. pengoi. Additionally,IsoSource results implicate this prey as consistently pre-ferred by Cercopagis. In contrast, evidence for rotifers(Keratella spp. and Synchaeta spp.) and nauplii (Acartia sub-stantially to Cercopagis nutrition was inconclusive. Tounderstand patterns of C. pengoi impacts on the foodwebs in the invaded ecosystems, cross-system compara-tive studies applying an array of methods are needed.In particular, studies investigating mechanisms by whichopportunistic feeding is manifest in Cercopagis popula-tions, the vulnerability of specific zooplankton commu-nities and the effects this predator has on the trophicdynamics within and across ecosystems will be particu-larly important in light of increasing invasions.
AC K N OW L E D G E M E N T S
We thank S. Svensson, B. Abrahamsson andL. Lundgren (Systems Ecology, Stockholm University,Sweden) for help in collecting zooplankton samples.
F U N D I N G
This research was supported by the Swedish NationalMonitoring program and grants from The SwedishResearch Council for Environment, AgriculturalSciences, and Spatial Planning (Formas), the SwedishEnvironmental Protection Agency (Naturvardsverket)and the foundation Baltic Sea 2020.
R E F E R E N C E S
Adams, T. S. and Sterner, R. W. (2000) The effect of dietary nitrogencontent on trophic level 15N enrichment. Limnol. Oceanogr., 45,601–607.
Adrian, R., Hansson, S., Soderlund, B. et al. (1999) Effects of foodavailability and predation on a marine zooplankton community—a
JOURNAL OF PLANKTON RESEARCH j VOLUME 0 j NUMBER 0 j PAGES 1–12 j 2012
10
by guest on February 11, 2016http://plankt.oxfordjournals.org/
Dow
nloaded from
study on copepods in the Baltic Sea. Int. Rev. Hydrobiol., 84,609–626.
Antsulevich, A. and Valipakka, P. (2000) Cercopagis pengoi—New import-ant food object of the Baltic herring in the Gulf of Finland. Int. Rev.
Hydrobiol., 85, 609–619.
Arrhenius, F. (1996) Diet composition and food selectivity of 0-groupherring (Clupea harengus L.) and sprat (Sprattus sprattus (L.)) in thenorthern Baltic Sea. ICES J. Mar. Sci., 53, 701–712.
Arrhenius, F. and Hansson, S. (1993) Food consumption of larval,young and adult herring and sprat in the Baltic Sea. Mar. Ecol. Prog.
Ser., 96, 125–137.
Arrhenius, F. and Hansson, S. (1996) Growth and seasonal changes inenergy content of young Baltic Sea herring (Clupea harengus L.). ICES
J. Mar. Sci., 53, 792–801.
Barnes, C., Sweeting, C. J., Jennings, S. et al. (2007) Effect of tempera-ture and ration size on carbon and nitrogen stable isotope trophicfractionation. Funct. Ecol., 21, 356–362.
Beardsley, T. M. (2006) Predicting aquatic threats. BioScience, 56,459–461.
Ben-David, M. and Schell, D. M. (2001) Mixing models in analyses ofdiet using multiple stable isotopes: a response. Oecologia, 127,180–184.
Benoit, H. P., Johannsson, O. E., Warner, D. M. et al. (2002) Assessingthe impact of a recent predatory invader: the population dynamics,vertical distribution, and potential prey of Cercopagis pengoi in LakeOntario. Limnol. Oceanogr., 47, 626–635.
Caut, S., Angulo, E. and Courchamp, F. (2008) Discrimination factors(15N and 13C) in an omnivorous consumer: effect of diet isotopicratio. Funct. Ecol., 22, 255–263.
Caut, S., Angulo, E. and Courchamp, F. (2009) Variation in discrimin-ation factors (delta 15N and delta 13C): the effect of diet isotopicvalues and applications for diet reconstruction. J. Appl. Ecol., 46,443–453.
Crawley, K. R., Hyndes, G. A. and Vanderklift, M. A. (2007)Variation among diets in discrimination of d13C and d15N in theamphipod Allorchestes compressa. J. Exp. Mar. Biol. Ecol., 349,370–377.
Feuchtmayr, H. and Grey, J. (2003) Effect of preparation and preserva-tion procedures on carbon and nitrogen stable isotope determina-tions from zooplankton. Rapid Commun. Mass Spectrom., 17,2605–2610.
Gorokhova, E., Aladin, N. and Dumont, H. (2000) Further expansionof the genus Cercopagis (Crustacea, Branchiopoda, Onychopoda) inthe Baltic Sea, with notes on the taxa present and their ecology.Hydrobiologia, 429, 207–218.
Gorokhova, E., Fagerberg, T. and Hansson, S. (2004) Predation byherring (Clupea harengus) and sprat (Sprattus sprattus) on Cercopagis pengoi
in a western Baltic Sea bay. ICES J. Mar. Sci., 61, 959–965.
Gorokhova, E., Hansson, S., Hoglander, H. et al. (2005) Stable iso-topes show food web changes after invasion by the predatory cla-doceran Cercopagis pengoi in a Baltic Sea bay. Oecologia, 143,251–259.
Gorokhova, E. and Lehtiniemi, M. (2007) A combined approach tounderstand trophic interactions between Cercopagis pengoi (Cladocera:Onychopoda) and mysids in the Gulf of Finland. Limnol. Oceanogr.,52, 685–695.
Gozlan, R. E. (2008) Introduction of non-native freshwater fish: is itall bad? Fish Fish., 9, 106–115.
Grigorovich, I. A., MacIsaac, H. J., Rivier, I. K. et al. (2000)Comparative biology of the predatory cladoceran Cercopagispengoi from Lake Ontario, Baltic Sea and Caspian Sea. Arch.
Hydrobiol., 149, 23–50.
HELCOM. (1988) Guidelines for the Baltic Monitoring Programmefor the third stage. Baltic Sea Environ. Proc., 27 D, 161.
Hernroth, L. (1985) Recommendations on methods for marine bio-logical studies in the Baltic Sea. Mesozooplankton biomass assess-ment. The Baltic Marine Biologists, 10, 32.
Hoglander, H. (2005) Studies of Baltic Sea plankton—spatial and tem-poral patterns. Doctoral Thesis, Stockholm University, Sweden
Johansson, S. (1992) Regulating factors for coastal zooplankton com-munity structure in the northern Baltic proper. Doctoral Thesis,Stockholm University, Sweden
Johansson, S., Hansson, S. and Araya-Nunez, O. (1993) Temporaland spatial variation of coastal zooplankton in the Baltic Sea.Ecography, 16, 167–173.
Kideys, A. E. (2002) Fall and rise of the Black Sea ecosystem. Science,297, 1482–1484.
Kott, P. (1953) Modified whirling apparatus for the subsampling ofplankton. Aust. J. Mar. Freshw. Res., 4, 387–393.
Kotta, J., Kotta, I., Simm, M. et al. (2006) Ecological consequences ofBiol. Invasions: three invertebrate case studies in the north-easternBaltic Sea. Helgol. Mar. Res., 60, 106–112.
Krylov, P. I., Bychenkov, D. E., Panov, V. E. et al. (1999) Distributionand Seasonal dynamic of the Ponto-Caspian invader Cercopagis pengoi
(Crustacea, Cladocera) in the Neva Estuary (Gulf of Finland).Hydrobiologia, 393, 227–232.
Lankov, A., Ojaveer, H., Simm, M. et al. (2010) Feeding ecology ofpelagic fish species in the Gulf of Riga (Baltic Sea): the importanceof changes in the zooplankton community. J. Fish. Biol., 77,2268–2284.
Larsson, U., Blomqqvist, S. and Abrahamsson, B. (1986) A new sedi-ment trap system. Mar. Ecol. Prog. Ser., 31, 205–207.
Laxson, C. L., McPhedran, K. N., Makarewicz, J. C. et al. (2003)Effects of the non-indigenous cladoceran Cercopagis pengoi on thelower food web of Lake Ontario. Freshwat. Biol., 48, 2094–2106.
Lehtiniemi, M. and Gorokhova, E. (2008) Predation of the introducedcladoceran Cercopagis pengoi on the native copepod Eurytemora affinis
in the northern Baltic Sea. Mar. Ecol. Prog. Ser., 362, 193–200.
Lehtiniemi, M. and Linden, E. (2006) Cercopagis pengoi and Mysis spp.alter their feeding rate and prey selection under predation risk ofherring (Clupea harengus membras). Mar. Biol., 4, 1432–1793.
Leppakoski, E., Gollasch, S., Gruszka, P. et al. (2002) The Baltic—asea of invaders. Can. J. Fish. Aquat. Sci., 59, 1175–1188.
Leppakoski, E. and Olenin, S. (2000) Non-native species and rates ofspread: lessons from the brackish Baltic Sea. Biol. Invasions, 2,151–163.
Mehner, T. and Heerkloss, R. (1994) Direct estimation of food con-sumption of juvenile fish in a shallow inlet of the southern Baltic.Int. Rev. Hydrobiol., 79, 295–304.
Melville, A. J. and Connolly, R. M. (2003) Spatial analysis of stableisotope data to determine primary sources of nutrition for fish.Oecologia, 136, 499–507.
Noonburg, E. G. and Byers, J. E. (2005) More harm than good: wheninvader vulnerability to predators enhances impact on nativespecies. Ecology, 86, 2555–2560.
P. B. HOLLILAND ET AL. j ASSESSING DIET OF CERCOPAGIS PENGOI USING STABLE ISOTOPES
11
by guest on February 11, 2016http://plankt.oxfordjournals.org/
Dow
nloaded from
Ojaveer, H., Kuhns, L. A., Barbiero, R. P. et al. (2001) Distributionand population charateristics of Cercopagis pengoi in Lake Ontario. J.Gt. Lakes Res., 27, 10–18.
Ojaveer, H. and Lumberg, A. (1995) On the role of Cercopagis
(Cercopagis) pengoi Ostroumov) in Parnu Bay and the NE part of theGulf of Riga ecosystem. Proc. Est. Ac. Sci. Biol. Ecol., 5, 20–25.
Ojaveer, H., Simm, M. and Lankov, A. (2004) Population dynamicsand ecological impact of the non-indigenous Cercopagis pengoi in theGulf of Riga (Baltic Sea). Hydrobiologia, 522, 261–269.
Phillips, D. L. and Gregg, J. W. (2003) Source partitioning using stableisotopes: coping with too many sources. Oecologia, 136, 261–269.
Pichlova-Ptacnıkova, R. and Vanderploeg, H. A. (2009) The invasivecladoceran Cercopagis pengoi is a generalist predator capable offeeding on a variety of prey species of different sizes and escapeabilities. Fundam. Appl. Limnol., 173, 267–279.
Pollumae, A. and Kotta, J. (2007) Factors affecting the distribution ofthe zooplankton community in the Gulf of Finland in the contextof interactions between native and introduced predatory cladocer-ans. Oceanologia, 49, 277–290.
Post, D. M. (2002) Using stable isotopes to estimate trophic position:models, methods, and assumptions. Ecology, 83, 703–718.
Rivier, I. K. (1998) The Predatory Cladocera (Onychopoda:Podonidae, Polyphemidae, Cercopagidae) and Leptodorida of theworld. Guides to the Identification of the Micro-invertebrates of the Continental
Waters of the World. Vol. 13. Backhuys Publishing, Leiden, pp. 1–213.
Roohi, A., Yasin, Z., Kideys, A. E. et al. (2008) Impact of a new inva-sive ctenophore (Mnemiopsis leidyi) on the zooplankton community ofthe Southern Caspian sea. Mar. Ecol., 29, 421–434.
Rosen, R. A. (1981) Length—dry weight relationships of some fresh-water zooplankton. J. Freshwater Ecol., 1, 225–229.
Rudstam, L. G., Hansson, S., Johansson, S. et al. (1992) Dynamics ofplanktivory in a coastal area of the northern Baltic Sea. Mar. Ecol.
Prog. Ser., 80, 159–173.
Savage, C. (2005) Tracing the influence of sewage nitrogen in acoastal ecosystem using stable nitrogen isotopes. AMBIO, 34,145–150.
Shiganova, T. A., Bulgakova, Y. V., Volovik, S. P. et al. (2001) The newinvader Beroe ovata Mayer 1912 and its effect on the ecosystem inthe northeastern Black Sea. Hydrobiologia, 451, 187–197.
Simm, M., Lankov, A., Pollupuu, M. et al. (2006) Estimation of con-sumption rates of the predatory cladoceran Cercopagis pengoi in la-boratory conditions. In: Ojaveer, H. and Kotta, J. (eds), Alien Invasive
Species in the North-Eastern Baltic Sea: Population Dynamics and Ecological
Impacts. Estonian Marine Institute Report Series, 14. Estonian MarineInstitute, Tallinn, pp. 1–66.
Svensson, S. and Gorokhova, E. (2007) Embryonic development timeof parthenogenically reproducing Cercopagis pengoi (Cladocera,Onychopoda) in the northern Baltic proper. Fundam. Appl. Limnol.,170, 257–261.
Therriault, T. W., Grigorovich, I. A., Kane, D. D. et al. (2002) Rangeexpansion of the exotic zooplankter Cercopagis pengoi (Ostroumov)into western Lake Erie and Muskegon Lake. J. Great Lakes Res., 28,698–701.
Uitto, A., Gorokhova, E. and Valipakka, P. (1999) Distribution of thenon-indigenous Cercopagis pengoi in the coastal waters of the easternGulf of Finland. ICES J. Mar. Sci., 56, 49–57.
Vanderploeg, H. A., Nalepa, T. F., Jude, D. J. et al. (2002) Dispersaland emerging ecological impacts of Ponto-Caspian species in theLaurentian Great Lakes. Can. J. Fish. Aquat. Sci., 59, 1209–1228.
Witt, A. M. and Caceres, C. E. (2004) Determining interactions ofnon-native predators in their new environment: Bythotrephes longima-
nus and Cercopagis pengoi in southwestern Lake Michigan. J. Gt. Lakes
Res., 30, 519–527.
Zanden, M. J. V. and Rasmussen, J. B. (2001) Variation in d15N andd13C trophic fractionation: implications for aquatic food webstudies. Limnol. Oceanogr., 46, 2061–2066.
JOURNAL OF PLANKTON RESEARCH j VOLUME 0 j NUMBER 0 j PAGES 1–12 j 2012
12
by guest on February 11, 2016http://plankt.oxfordjournals.org/
Dow
nloaded from