assessing applicant "fit" within the selection process
TRANSCRIPT

Louisiana State University Louisiana State University
LSU Digital Commons LSU Digital Commons
LSU Historical Dissertations and Theses Graduate School
1998
Assessing Applicant "Fit" Within the Selection Process: Which Assessing Applicant "Fit" Within the Selection Process: Which
Interviewer Perceptions Matter? Interviewer Perceptions Matter?
Dawn Ebe Haptonstahl Louisiana State University and Agricultural & Mechanical College
Follow this and additional works at: https://digitalcommons.lsu.edu/gradschool_disstheses
Recommended Citation Recommended Citation Haptonstahl, Dawn Ebe, "Assessing Applicant "Fit" Within the Selection Process: Which Interviewer Perceptions Matter?" (1998). LSU Historical Dissertations and Theses. 6626. https://digitalcommons.lsu.edu/gradschool_disstheses/6626
This Dissertation is brought to you for free and open access by the Graduate School at LSU Digital Commons. It has been accepted for inclusion in LSU Historical Dissertations and Theses by an authorized administrator of LSU Digital Commons. For more information, please contact [email protected].

INFORMATION TO USERS
This manuscript has been reproduced from the microfilm master. UMI
films the text directly from the original or copy submitted. Thus, some
thesis and dissertation copies are in typewriter face, while others may be
from any type of computer printer.
The quality of this reproduction is dependent upon the quality o f the
copy submitted. Broken or indistinct print, colored or poor quality
illustrations and photographs, print bleedthrough, substandard margins,
and improper alignment can adversely afreet reproduction.
In the unlikely event that the author did not send UMI a complete
manuscript and there are missing pages, these will be noted. Also, if
unauthorized copyright material had to be removed, a note will indicate
the deletion.
Oversize materials (e.g., maps, drawings, charts) are reproduced by
sectioning the original, beginning at the upper left-hand comer and
continuing from left to right in equal sections with small overlaps. Each
original is also photographed in one exposure and is included in reduced
form at the back o f the book.
Photographs included in the original manuscript have been reproduced
xerographically in this copy. Higher quality 6” x 9” black and white
photographic prints are available for any photographs or illustrations
appearing in this copy for an additional charge. Contact UM I directly to
order.
UMIA Bell & Howell Information Company
300 North Zeeb Road, Ann Arbor MI 48106-1346 USA 313/761-4700 800/521-0600
Reproduced with permission of the copyright owner. Further reproduction prohibited without permission.

Reproduced with permission of the copyright owner. Further reproduction prohibited without permission.

ASSESSING APPLICANT “FIT’ WITHIN THE SELECTION PROCESS WHICH INTERVIEWER PERCEPTIONS MATTER?
A Dissertation
Submitted to the Graduate Faculty of the Louisiana State University and
Agricultural and Mechanical College in partial fulfillment of the
requirements for the degree of Doctor of Philosophy
in
The Department of Psychology
byDawn Ebe Haptonstahl
B.A., The Ohio State University, 1991 M.A., Louisiana State University, 1993
May, 1998
Reproduced with permission of the copyright owner. Further reproduction prohibited without permission.

UMI Number: 9824483
UMI Microform 9824483 Copyright 1998, by UMI Company. All rights reserved.
This microform edition is protected against unauthorized copying under Title 17, United States Code.
UMI300 North Zeeb Road Ann Arbor, MI 48103
Reproduced with permission of the copyright owner. Further reproduction prohibited without permission.

Dedication
I dedicate this dissertation to my family and friends who have encouraged me in
my relentless pursuit of the Doctor of Philosophy degree, and especially to my husband,
whose unwavering confidence in me has endured the test of time.
ii
Reproduced with permission of the copyright owner. Further reproduction prohibited without permission.

Acknowledgments
I thank Dr. Frank Carney and the staff at Louisiana State University’s Career
Services for allowing me to collect data at their facility.
Special thanks to Tim Buckley for taking on the challenge of being the chairman
of my dissertation committee and for guiding me through this educational journey from
research idea to finished product.
Much appreciation also goes to Stephen R. Haptonstahl for his invaluable
assistance with my complex data computations and analyses.
iii
Reproduced with permission of the copyright owner. Further reproduction prohibited without permission.

Table of Contents
Dedication................................................................................................................................ ii
Acknowledgments..................................................................................................................iii
List of Tables...........................................................................................................................vi
List of Figures....................................................................................................................... vii
Abstract................................................................................................................................. viii
Introduction.............................................................................................................................. 1
Review o f Literature................................................................................................................4Fit: Definitions and Outcomes.................................................................................... 4Fit: Operationalization in the Present Study.............................................................15Role of Fit Within Selection Interviews....................................................................18Test of a Model: The Role of Different Types of Fit within the
Selection Interview........................................................................................21
Method....................................................................................................................................26Participants................................................................................................................26Procedure................................................................................................................... 26Measures.................................................................................................................... 27Congruence Analyses................................................................................................29
Results....................................................................................................................................32
Discussion..............................................................................................................................56
References..............................................................................................................................72
Appendix A: Survey Questions for Interviewers..................................................................77
Appendix B: Survey Questions Regarding Job Requirementsand Applicant Qualifications.................................................................................... 78
Appendix C: Validity and Reliability of Work Values Measures.......................................79
Appendix D: Behavioral Statements on CES and Likert Scales..........................................89
Appendix E: Mathematical Rationale for the Use of Edwards’Polynomial Regression Procedure............................................................................91
iv
Reproduced with permission of the copyright owner. Further reproduction prohibited without permission.

Appendix F: Categories of Recruiter-Specified Job Qualifications....................................93
Vita......................................................................................................................................... 94
v
Reproduced with permission of the copyright owner. Further reproduction prohibited without permission.

List of Tables
1. Means, Standard Deviations, and Correlations Among Recruiter Perceptionsof Applicant, Group, and Organization Values, Person-Organization (P-O), Person-Group (P-G), and Person-Job (P-J) Fit, Qualifications, and Selection Decisions................................................................................ 33
2. Predictions of Person-Organization (P-O) and Person-Group (P-G) Fit fromRecruiter Perceptions of Applicant, Group, and Organization Values - Achievement................................................................................................. 36
3. Predictions of Person-Organization (P-O) and Person-Group (P-G) Fit fromRecruiter Perceptions of Applicant, Group, and Organization Values - Fairness.......................................................................................................... 37
4. Predictions of Person-Organization (P-O) and Person-Group (P-G) Fit fromRecruiter Perceptions of Applicant, Group, and Organization Values - Honesty.......................................................................................................... 38
5. Predictions of Person-Organization (P-O) and Person-Group (P-G) Fit fromRecruiter Perceptions of Applicant, Group, and Organization Values - Concern.......................................................................................................... 39
6. Comparisons of Incremental Variance in Person-Organization (P-O) andPerson-Group (P-G) Fit Contributed by Work Values............................... 40
7. Predictions of Recruiter Selection Decisions from Person-Job (P-J), Person-Group (P-G), and Person-Organization (P-O) F it.......................................52
8. Comparisons of Incremental Validity in Predictions of Recruiter SelectionDecisions from Person-Job (P-J), Person-Group (P-G), and Person- Organization (P-O) Fit.................................................................................. 53
9. Comparisons of Incremental Validity in Predictions of Recruiter SelectionDecisions from Person-Group (P-G) and Person-Organization (P-O)Fit: Group Members Only.............................................................................55
10. Correlations Among Recruiter Perceptions of Person-Organization (P-O),Person-Group (P-G), and Person-Job (P-J) Fit and Composite Qualifications, KS A and O Ratings..............................................................62
11. Descriptive Statistics and Reliabilities of Likert Value Scales................................83
12. Factor Loadings for Likert Value Scales: Pilot Study 2, Time 2............................. 86
13. Intercorrelations Between Likert Scale Value Factors: Pilot Study 2, Time 2........88
vi
Reproduced with permission of the copyright owner. Further reproduction prohibited without permission.

List of Figures
1. Exploratory Model of Roles of Different Types of FitWithin the Selection Interview.......................................................................3
2. Person-Organization Fit: Achievement................................................................... 42
3. Person-Organization Fit: Honesty............................................................................ 43
4. Person-Organization Fit: Fairness............................................................................ 45
5. Person-Organization Fit: Concern...........................................................................46
6. Person-Group Fit: Achievement.............................................................................. 47
7. Person-Group Fit: Honesty....................................................................................... 48
8. Person-Group Fit: Fairness.......................................................................................49
9. Person-Group Fit: Concern....................................................................................... 50
vii
Reproduced with permission of the copyright owner. Further reproduction prohibited without permission.

Abstract
The research literature has noted that organizations are moving beyond simply
hiring individuals with the necessary knowledge, sk ills , and abilities (KS As) that fulfill
the requirements of the job - employers are also looking for people who can fit in with a
particular work group or even an entire organization. This study tested an exploratory
model that predicted recruiter selection decisions from their evaluations of applicants’
person-job (P-J), person-group (P-G), and person-organization (P-O) fit. The model also
postulated that P-G and P-O fit would be predicted by the perceived congruence
(similarity) of work values between applicants and groups/organizations. Hypotheses
were field-tested with 64 recruiters from 44 companies who conducted 262 initial
interviews with job applicants. As expected, the combination of P-J, P-G, and P-O fit
explained a significant amount of variance in recruiter selection decisions, such as the
likelihood that applicants would be invited for a second interview or would be
recommended for hiring. All three types of fit contributed to the recruiter selection
decisions, but ceiling effects and high multicollinearity among the fit ratings complicated
interpretation of their individual contributions. Applicant qualification match with job
requirements strongly predicted P-J fit. Perceived similarity in the work values of
achievement, fairness, honesty, and concern for others between applicants and
organizations significantly predicted P-O fit. Value congruence between applicants and
groups likewise predicted P-G fit. Among the study’s strengths was the use of Edwards’
polynomial regression and three-dimensional response surface techniques, which allowed
for both the relaxation of traditional constraints on equations and the interpretation of the
complex relationships between applicant values, organization/group values, and
viii
Reproduced with permission of the copyright owner. Further reproduction prohibited without permission.

perceptions of fit. Future research should move beyond the recruiting interview and
attend to the importance of values and P-O and P-G fit in later stages of the selection
process. Additional questions should focus on the impact of fit on criteria after
applicants have accepted employment, such as performance, tenure, and rate of
socialization.
ix
Reproduced with permission of the copyright owner. Further reproduction prohibited without permission.

Introduction
The main focus of selection processes has typically been on hiring individuals with
the necessary knowledge, skills, and abilities (KSAs) to fit well within the requirements of
the job. Research on matching people with jobs (P-J fit) has examined such outcomes as
job satisfaction, motivation, and performance (Edwards, 1991). A more recent trend in
the literature recommends hiring individuals who fit with the whole company, choosing
people whose values, needs, and interests are congruent with the organization (Bowen,
Ledford & Nathan, 1991). Person-organization (P-O) fit has been linked positively to
such outcomes as satisfaction and organizational commitment and negatively to turnover
(Bretz & Judge, 1994; Meglino, Ravlin & Adkins, 1989; O’Reilly, Chatman & Caldwell,
1991).
Finding compatibility between individuals and work groups, or person-group
(P-G) fit, is also of interest to organizations. Teams are being used more widely in the
corporate world (Hoerr, 1989) in handling production, customer service, strategy, and
professional/technical decision-making (Klimoski & Jones, 1995). The composition of
teams or other work groups contributes to group effectiveness. Special attention needs to
be paid not only to individual KSAs but to characteristics that facilitate team functioning,
such as risk taking and tolerance for stress. The selection of appropriate group members
is hypothesized to lead to task accomplishment, quality, satisfaction, and tenure (Klimoski
& Jones, 1995).
1
Reproduced with permission of the copyright owner. Further reproduction prohibited without permission.

The existence of these three types of fit, person-job, person-organization, and
person-group, and their contributions to various outcomes leads to some interesting
questions. For example, what is the comparative importance of each type of fit within a
selection setting? Because P-J, P-G, and P-O fit have been investigated individually to
varying degrees in the literature, but have not yet been considered simultaneously, it is
unknown which, if any, assessment of fit has the most influence in selection decisions.
This research aims to examine the importance of each type of fit within a selection
interview context. A related question involves the factors that contribute to these
assessments of fit - does matching applicants with groups or organizations make a
difference? This study will investigate the usefulness of work values in predicting fit.
Finally, selection situations may differ on variables such as the interviewer’s main role
either as traditional organizational recruiter or group leader (e.g. department
manager/supervisor). The present study centers on the development and testing of an
exploratory model that investigates factors which may influence recruiter perceptions
within a selection interview context.
This proposal first addresses the definitions of person-job, person-organization,
and person-group fit, in addition to the outcomes associated with each type of fit. The
focus then turns to a discussion of research on fit within the selection process. The
hypotheses for the study are included within a description of the exploratory model
(Figure 1).
Reproduced with permission of the copyright owner. Further reproduction prohibited without permission.

Reproduced
with perm
ission of the
copyright ow
ner. Further
reproduction prohibited
without
permission.
interviewer perception of
organization values
H2 interviewer perception of applicant values
u>
interviewer perception of job
requirements
HI
interviewer perception of applicant
qualifications
*
uiterviewer perception of group values
interviewer perception of applicant-
organization fit
(P-O fit)
interviewer perception of
applicant-job fit
(P-J fit)
mterviewer perception of
applicant-group fit
(P-G fit)
H3
H5
H4mterviewer
decision making process
\ H6
interviewer’s main role in organization
mterviewer perception of applicant values
interviewer selection judgments regarding applicant
Figure I. Exploratory Model of Roles of Different Types of Fit Within the Selection Interview

Review of Literature
Fit: Definitions and Outcomes
The idea that “individual level outcomes result from the relationship between
individual and environmental characteristics, rather than either one of the two separately”
is the premise for the global term of person-environment (P-E) fit (Kristof-Brown &
Stevens, 1996). Such fit can exist in a number of different forms so individuals may have
different degrees of fit with their jobs, work groups, and organizations. No matter what
the form, however, there exist multiple perspectives on the different kinds of fit that
should be carefully noted.
One line of thought follows the work of Muchinsky and Monahan (1987), who
defined two types of matches between people and the environment. Supplementary
models of person-environment fit propose that a person fits into an environment because
“he or she supplements, embellishes, or possesses characteristics which are similar to other
individuals in the environment” (p. 269). Complementary models, on the other hand,
describe fit as a situation where an individual’s characteristics “make whole” the
environment’s characteristics (p. 271). Here, the environment is seen as “requiring a
certain type of person in order to be effective” and the individual’s strengths compensate
for the environment’s weaknesses (p. 271). The difference between the two types of
congruence lies in the definition of the environment. In the supplementary model, the
environment is described in terms of the people within, whereas the environment in the
complementary model is described in terms of its demands and requirements (Muchinsky
& Monahan, 1987).
4
Reproduced with permission of the copyright owner. Further reproduction prohibited without permission.

A second perspective on fit, the needs-supplies and demands-abilities distinction,
applies itself well to complementary fit models. In discussions of congruence, needs-
supplies fit may occur when the environment satisfies what a person needs, desires, or
prefers. In a work context example, employees may ask themselves what they can get out
of their jobs, such as task-related and interpersonal opportunities, and the employer may
provide those opportunities in order to keep the employees (Kristof, 1996). In contrast,
demands-abilities fit may occur when a person possesses the KSAs, effort, and
commitment required by the environment (Kristof, 1996). In other words, the employer
considers what is required of the employees, and the employees determine what they have
to do to keep their jobs (Caplan, 1987).
An additional complication in the definition of fit is the need to distinguish between
actual and perceived fit. If the construct in question is conceptualized as a judgment that
a person fits well with an environment, then fit is subjectively perceived. By comparison,
actual fit is indirectly and objectively measured via separately rated person and
environment characteristics (French, Rogers, & Cobb, 1974).
The concept of fit can cover a range of facets, so it behooves researchers to be
precise in their definitions. Multiple conceptualizations and operationalizations can cause
confusion among researchers and lead to misinterpretation of results and ambiguous
conclusions. Before specifying how fit will be investigated in the present study, however,
it is necessary first to examine three separate areas of fit that will be explored: person-job,
person-organization, and person-group fit. Previous researchers have approached these
types of fit in different ways, and the various studies provide some direction for the
construction of the exploratory model to be examined in this project. Although it seems
5
Reproduced with permission of the copyright owner. Further reproduction prohibited without permission.

logical to discuss the topics in order of increasing level of analysis, from individual to
group to organization, the majority of research has been conducted on fit between people
and jobs or organizations, so P-J fit will be discussed first, followed by P-O and then P-G
fit. The idea of matching individuals and groups is a relatively new and interesting twist
and has not been extensively investigated; many of the ideas that will be touched upon in
P-O fit will be applied to the group context.
Person-iob fit. Edwards (1991) described that the essence of P-J fit “implies that
the person and the job operate as joint determinants of individual and organizational
outcomes” (p. 283). The fields of Industrial/Organizational Psychology and Organizational
Behavior have emphasized the congruence, matching, or fit between individuals and jobs;
P-J fit investigations can be considered a specific form of congruence research that is
characterized by the commensurate measurement of person and job constructs (Edwards,
1991). In commensurate measures, the individual and the job are expressed in terms of
the same content dimensions (e.g., on the same scale). Commensurate measurement
allows for direct assessment of discrepancies between person and environment; using
other instruments could result in a conservative estimate of the roles of person and
environment (Caplan, 1987). Edwards’ (1991) description of the domain of P-J fit
research (coming primarily from studies on job satisfaction, motivation, and job stress)
includes both person and job factors that may jointly influence various outcomes. One
broad class of corresponding constructs includes employee desires (Le., needs, goals,
values, interests, and preferences) and the job supplies that are available to meet those
desires (Le., occupational characteristics, organizational attributes, and job attributes like
pay and participation in decision making). These needs-supplies relationships are
6
Reproduced with permission of the copyright owner. Further reproduction prohibited without permission.

instrumental in P-J fit theories of satisfaction, stress, and motivation. A second class of
constructs encompasses job demands (Le., workload, performance requirements, and
instrumental activities) and the employee abilities needed to meet those demands (Le.
aptitudes, experience, and education). Demands-abilities correspondence is evident in P-J
fit theories of job stress.
Job satisfaction is the outcome most commonly considered in P-J fit research.
Mount and Muchinsky (1978), for example, examined Holland’s (1973) theory of
satisfaction as a function of personal and environmental characteristics. The authors
confirmed the assumptions that people were likely to be satisfied with many aspects of
their jobs, such as pay, supervision, promotions, co-workers, and the work itself, when
they were in an occupation that was congruent with what they liked to do. Cherrington
and England (1980) found employees with enriched jobs had greater satisfaction and
higher performance ratings; this was especially true for individuals who desired enriched
jobs. Rice, McFarlin, and Bennett (1989) confirmed that small discrepancies between
what employees want from their jobs and what they currently get from their jobs are
associated with higher levels of facet satisfaction. Job characteristics in this study included
pay, promotional opportunities, customer/client contact, learning opportunities, and
decision making, among others. Other outcomes of P-J fit include psychological and
physical health, coping and adaptation, motivation, performance, absenteeism, and
turnover (Edwards, 1991).
The exploratory model in the present study will approach P-J fit within a
complementary context. The demands-abilities distinction is central to traditional
selection models, which rely heavily on identifying critical job tasks through job analysis
7
Reproduced with permission of the copyright owner. Further reproduction prohibited without permission.

and specifying the requisite applicant KSAs to fulfill those job needs (Cascio, 1991).
During interviews, interviewers look for evidence that applicants have the necessary
education and experience, intelligence, and communication skills to meet job requirements
(Bretz et aL, 1993). Fit between applicant competencies and job duties and
responsibilities is theorized as important for later employee job performance and
satisfaction (Caldwell & O’Reilly, 1990). Given the apparent success of this
conceptualization, the present study will continue to consider person-job fit in a
complementary manner.
Person-organization fit. In moving beyond the individual level of analysis (P-J fit),
the model looks at additional characteristics o f applicants, the “other” characteristics
included in the term “KS AOs.” Such attributes include personality traits, values, goals,
and attitudes. Similarly, organizations can be described in terms beyond that of their
composition or structure; culture, climate, values, goals, and norms are variables often
under scrutiny. The inclusion of these characteristics is reflected in Kristof s (1996)
comprehensive review of the literature on P-O fit, which she broadly defined as the
“compatibility between individuals and organizations,” (p. 3). She efficiently organized
the multiple conceptualizations of P-O fit by incorporating the different perspectives of
congruence mentioned earlier into one modeL She represented supplementary fit as the
relationship between the fundamental characteristics of individuals and organizations. As
already mentioned, individuals can be described in terms of their values, goals, personality,
and attitudes, and organizations by their culture, climate, goals, and norms.
Supplementary fit exists when, for example, the person’s goals are similar to the goals of
the organization. The underlying characteristics of both the person and the organization
8
Reproduced with permission of the copyright owner. Further reproduction prohibited without permission.

are likely to influence what each of them demands and supplies in employment
agreements. Organizations can supply financial, physical, and psychological opportunities
that employees want, and employees bring their knowledge, skills, and abilities (KSAs),
time, effort, commitment, and experience that the organization desires. Complementary fit
exists when the demands of one entity are satisfied by the supplies of the other. Kristof
(1996) ultimately defined P-O fit as “the compatibility between people and organizations
that occurs when: (a) at least one entity provides what the other needs, or (b) they share
similar fundamental characteristics, or both” (p. 4-5).
Researchers have theorized on and empirically investigated the outcomes of P-O
fit, specifically work attitudes such as satisfaction and commitment and behaviors such as
turnover. Whereas studies differ in their operationalizations of person-organization fit -
Kristof (1996) named four different ones within her review of the literature — the
researchers’ conclusions appear to be similar: the more the fit, the more positive the
outcome. One operationalization follows a strict needs-supplies perspective in defining fit
as the congruence between individual needs and organizational systems. For example,
Cable and Judge (1994) specifically examined fit between individual personality traits (e.g.
locus of control, risk aversion, materialism, individualism/collectivism) and compensation
system characteristics (e.g. high vs. low pay, flexible vs. rigid benefits, fixed vs. contingent
pay). The authors found individuals have pay preferences, are attracted to systems with
certain characteristics, and congruence between individual traits and system characteristics
strengthened the effects. Additionally, Bretz and Judge (1994) focused specifically on the
theory of work adjustment, which states that “’successful’ work relations are the result of
adjustments intended to create a state of correspondence between individual and
9
Reproduced with permission of the copyright owner. Further reproduction prohibited without permission.

environmental characteristics” (p.32). The authors discovered that P-O fit accounted for
significant variance in tenure (11%), and even more in satisfaction (32%), after accounting
for demographics, human capital characteristics, and job and organization characteristics.
Following a second operationalization, other researchers define P-O fit as the
match between organizational climate and individual personality. Bowen, Ledford, and
Nathan (1991) hypothesized that P-O fit encompasses two types of fit: between the KSAs
of the individual and the task demands of the job, and between the personality of the
individual and the climate or culture of the organization. The authors surmised that
potential benefits from hiring for person-organization fit include: favorable employee
attitudes such as satisfaction, commitment, and team spirit, desirable behaviors like better
job performance and lower absenteeism and turnover, and reinforcement of organizational
design through support for work design and desired organizational culture.
Individual goal congruence with organizational leaders and peers is a third
operationalization of P-O fit. This is based on Schneider’s (1987) attraction-selection-
attrition (ASA) framework, which proposes organizations use recruitment and selection
practices to choose applicants with common personal attributes. Organizational goals are
operationalized in behaviors, which yield structures and processes, which in turn
“determine the kinds of people who are attracted to, are selected by, and stay with a
particular organization” (Schneider, 1987; p. 445). Vancouver and Schmitt (1991)
studied P-O fit in terms of supervisor-subordinate goal congruence and member-
constituency goal congruence, defined as the “agreement between an individual and all the
other individuals within a single constituency regarding the importance of various goals”
(p. 336). Both types of goal congruence were significantly related to satisfaction,
10
Reproduced with permission of the copyright owner. Further reproduction prohibited without permission.

commitment, and intent to quit, with member-constituency congruence having a greater
impact.
A fourth operationalization of the fit between the characteristics of people and
organizations, is value congruence (Kristof, 1996). Specifically, Chatman (1989) defined
P-O fit as “the congruence between the norms and values of organizations and the values
of persons” (p. 339), based on the assumptions that values are enduring, facilitate
adaptation to an environment, and have implications for behavior, and that value systems
and norms provide cues for appropriate member behaviors. This concept is also consistent
with the ASA framework (Schneider, Goldstein & Smith, 1995). Boxx, Odom, and Dunn
(1991) focused on the relationship between employees’ perceptions of their organization’s
values and the employees’ desired value orientation for their organization. Congruence
between these two assessments were positively related to satisfaction, commitment, and
perceptions of group cohesion. O’Reilly and Chatman (1986) looked at P-O fit as an
element of commitment. One of the methods by which individuals become attached to an
organization is through the internalization or adoption of characteristics or perspectives of
the organization, where internalization is based on the congruence of values between the
individual and the organization. The authors noted that commitment based on value
congruence positively predicted intra-role prescribed behaviors, extra-role prosocial
behaviors, and the intent to remain with the organization, and negatively predicted
turnover. The relationships between P-O fit and motivation, commitment, and teamwork
appears not to be moderated by demographic variables such as age, gender, ethnicity, and
functional area (Posner, 1992).
11
Reproduced with permission of the copyright owner. Further reproduction prohibited without permission.

Some studies focused on the effects of P-O fit over an extended period of time,
using a predictive rather than concurrent design. Chatman (1991) found that high
employee P-O fit at entry into an organization was positively related to employee
satisfaction one year later and negatively related to intent to leave the organization.
O’Reilly et aL (1991) attempted to predict outcomes such as commitment, satisfaction,
intent to leave, and turnover from new accountants’ data regarding their own preferences
concerning organizational culture. After one year, P-O fit significantly predicted
commitment, satisfaction, and intent to leave. After two years, individuals with low P-O
fit were more likely to leave the organization than high P-O scorers. Both studies looked
at P-O fit in terms of congruence between the value profiles of individuals and
organizations.
As can be seen in this discussion, many P-O fit studies have used a supplementary
approach to fit, and the present model will maintain this consistency. Searching for
complementary fit between applicants and organizations would be a difficult task for
interviewers; they would likely need to be very familiar with multiple organizational
desires in order to structure a complex mental model of what qualities an acceptable
applicant would have to possess. Even more challenging would be finding a solid way of
assessing an interviewer’s thought process of determining if good fit exists between an
organization and an applicant. Congruence of attributes such as values and goals
(supplementary fit) has been shown in previous studies to contribute to desired outcomes
and is predicted to do so in the exploratory model as welL
Person-group fit. The conceptualizations of fit in the person-organization
framework lend themselves well to that of person-group; after all, an organization is itself
12
Reproduced with permission of the copyright owner. Further reproduction prohibited without permission.

a group. However, for purposes of this setting, group is considered a level between
individual and organization. Unfortunately, there is comparatively little research focusing
specifically on P-G fit. Research on the related field of group composition, especially that
of teams, may shed some light on the topic, as long as one keeps in mind that the two
concepts are different in that P-G fit is an individual-level variable, while composition is
discussed in terms of group level Attention to a group’s composition should have a great
deal of impact on the group’s effectiveness; in fact, Haythom (1968) stated that “the
behavior, compatibility, and effectiveness of a group is dependent on the particular
combination of individuals with their unique configurations of personality, demographic,
and skill characteristics” (p. 98). Individuals put together in the right combination are
encouraged to get along well with each other, communicate with each other, and use their
skills to assist each other in attaining the group’s goals. Similarly, individual KSAs,
values, needs, and demographic variables are relevant to composition as an input factor of
team effectiveness. Team staffing requires attention to getting the right mix of individuals
based on their abilities, values/personalities, and politics (Klimoski & Jones, 1995).
Effective staffing or group composition is generally evaluated in terms of performance
variables, which are of most interest to researchers and organizational members, and
attitudes such as satisfaction, commitment, and turnover behaviors (Klimoski & Jones,
1995).
The question of which type of fit is best — supplementary or complementary - is
echoed throughout the group and team composition literature as that of homogeneity
versus heterogeneity, or “the degree to which members of a team as a whole are
similar...or dissimilar...with respect to individual level attributes” (Jackson, May &
13
Reproduced with permission of the copyright owner. Further reproduction prohibited without permission.

Whitney, 1995). Such attributes include KSAs, attitudes, values, goals, and personality,
and demographics like gender, age, race, and ethnicity. How similar or varied should
group members be for group effectiveness? Some authors propose that diversity within
teams is beneficial and even necessary in an increasingly global environment (Jackson et
a l 1995). Selection of group members with a mix of abilities or personality may be useful
depending on the tasks at hand, when skills of one individual complement those of another
or certain traits affect effort or performance (Klimoski & Jones, 1995; Shaw, 1981).
However, there is an argument for having a degree of similarity between individuals;
differences in personal objectives can generate conflict, which could drain energy away
from the group objectives, and personality clashes can result in failure to attain group
goals (Haythom, 1968). Shared attitudes can promote group cohesiveness, which
influences group maintenance, the quality and quantity of member interaction, social
influence of the group on its members, achievement of accepted goals, and member
satisfaction (Shaw, 1981).
Although the idea of choosing an applicant for a job position within a certain
group based on how well he/she compensates for deficiencies in that group is a fascinating
one, it is outside the scope of this project. The same concerns with studying
complementary P-O fit apply here; an interviewer would have to keep the numerous
differences between group members in mind when evaluating applicants, which is a
cognitively challenging task. In addition, every group and its members are distinctly
different, which severely reduces the generalizability of results. Supplementary fit
assessment should work as well for P-G fit as it would for P-0 fit, and will provide
consistency within the exploratory model
14
Reproduced with permission of the copyright owner. Further reproduction prohibited without permission.

Fit: Operationalisation in the Present Study
Kristof s (1996) review categorized various operationalizations of P-O fit
Attention has been paid thus far to how different kinds of fit would be conceptualized,
whether supplementary or complementary. It is just as important to identify how fit will
be measured. The usefulness of values was mentioned within the context of both P-G and
P-O fit. Researchers have been successful in operationalizing value congruence as a
predictor of various fit outcomes. A value is defined as “an enduring belief that a specific
mode of conduct-..is personally preferable to an opposite or converse mode of conduct”
and a value system is “an enduring organization of beliefs concerning preferable modes of
conduct” (Rokeach, 1973; p. 5).
Values are individual characteristics that can allow for prediction of compatibility
between a person and a group. Haythom (1968) suggested that keeping shared values in
mind when composing groups might reduce the energy necessary to gain shared group
norms and result in more compatibility and greater effectiveness. Their review of the
group composition literature concluded that “there is a tendency for individuals
fiomogeneous with regard to fundamental value systems relevant to the nature of their
interaction to be more compatible than groups heterogeneous with regard to such values”
(Haythom, 1968, p. 124). Value affinity could lead to greater group effectiveness;
Klimoski and Jones (1995) stated that “in general, team members who are similar in
attitudes, values, and preferences are likely to get along well together” (p. 304-305).
Most recently, Kristof-Brown and Stevens (1996) investigated the effects of person-group
value congruence on group-members’ satisfaction and contributions to the group. They
found that as congruence for the value of concern for others increased, so did satisfaction
15
Reproduced with permission of the copyright owner. Further reproduction prohibited without permission.

with the group project. Such results provide some additional support for the choice of
using supplementary, rather than complementary, fit in the exploratory model
As described before, work value congruence is a commonly used
operationalization of P-O fit. Attitudes and behaviors can be predicted by the value fit an
individual has with an organization; people are more satisfied and are likely to be
committed to organizations that have similar values and priorities to their own. Chatman
(1991) investigated the role of P-O fit in selection and socialization of new employees and
discovered that a match between the values of new recruits and their organizations was a
significant predictor of satisfaction and turnover over an extended period of time.
Meglino, Ravlin, and Adkins’ (1989) found employees would have greater satisfaction and
commitment and exhibit higher performance the closer their own work values were to the
values of their supervisor and the organization’s management. Posner, Kouzes, and
Schmidt (1985) examined data based on self-report measures o f value congruence. They
found high individual-organizational congruence was significantly related to feelings of
personal success, organizational commitment, participation in ethical behavior, lower
levels of job and personal stress, perceived importance of organizational goals, and
perceived importance of organizational stakeholders, such as customers. Again,
supplementary fit was examined in these studies with positive results.
Other operationalizations of fit have been explored in research, specifically in P-O
fit, so why choose values? First, values lend themselves to commensurate measurement, a
practice strongly advocated for clear interpretation of results (Edwards, 1991). Although
climate has sometimes been called an organizational “personality,” it has also been argued
that climate is not conceptually equivalent to individual personality (Glick, 1985) and so
16
Reproduced with permission of the copyright owner. Further reproduction prohibited without permission.
cannot be measured on the same terms. Similarly, fit between individual preferences and
organizational structure is often measured using different terminology (Cable & Judge,
1994). Second, values apply broadly to various groups and organizations; in their
development of a work values instrument, Ravlin and Meglino (1987) used work value
data collected from a wide variety of employees in different occupations in different
organizations and found that many people believed strongly in a particular set of values.
This is not to imply that every group or organization has the same preference for values,
but they do appear to draw from a common welL Goals, on the other hand, can be much
more specific in nature than values, which leads to difficulty in generalizing measures.
Finally, past studies on work values and established measures for those values have
provided a foundation upon which the present model can be solidly built, whereas the
other operationalizations of fit are on shakier ground.
The exploratory model in this study draws from the research areas discussed in the
preceding sections. In keeping with traditional concepts, person-job fit will be evaluated
from a complementary standpoint by assessing how well the abilities of the individual
fulfill the demands of the job. This will be measured via job requirements and applicant
KS As. The literature on person-organization fit suggests a supplementary fit perspective
that has been successfully operationalized in terms of work value congruence — this will
also be incorporated into the modeL Finally, in light of the lack of foundational studies on
person-group fit, the model will apply the same supplementary fit of work values
perspective. The next section provides a context for the model by focusing on how fit is
assessed within a particular selection method: the interview.
17
Reproduced with permission of the copyright owner. Further reproduction prohibited without permission.

Role of Fit Within Selection Interviews
Issues regarding employee selection processes have been, and remain, focal points
for researchers in Industrial/Organizational Psychology. There are volumes of information
written on such topics as job analysis, predictors, and instruments that are useful in the
effort to select applicants for jobs. One of the most widely-used methods for selection is
the employment interview. Although there have been concerns about the validity and
reliability of the interview, employers are reluctant to hire individuals whom they have
never seen (Cascio, 1991). Interviews provide opportunities to assess interpersonally
exhibited attributes, such as personal values and personality traits, and so are commonly
used to assess applicant fit (Rynes & Gerhart, 1990). They allow interviewers a chance to
form impressions about the applicants and their likelihood to fit with others in the group
or organization (Cascio, 1991).
For the most part, selection theories have centered on choosing individuals based
on their knowledge, skills, and abilities that fulfill the requirements for the job (P-J fit).
Recently, there has been increased attention paid to the idea of selecting applicants based
on their fit with the organization or a particular team or other group in mind.
Unfortunately, there are very few empirical studies on the selection of group members (P-
G fit). While some authors have strongly urged keeping members’ personalities in mind
when forming different task groups (Driskell, Hogan, & Salas, 1987) and others have
called for keeping values in mind to increase the chances of group compatibility (Klimoski
& Jones, 1995), these points remain for the most part scientifically untested. Person-
organization fit, however, has been examined in the context of interviews in a few studies.
18
Reproduced with permission of the copyright owner. Further reproduction prohibited without permission.

Rynes and Gerhart (1990) conducted the primary research concerning P-O fit in a
selection context, investigating the difference between interviewers’ assessments of
applicants’ general employability versus fit with an organization. Their findings were
consistent with the idea that P-O fit is evaluated above and beyond assessment of applicant
qualifications. The authors found assessments of fit were related to interpersonal
characteristics (listening, warmth, verbal skills, appearance), future plans and goals,
accomplishments and demonstrated leadership of applicants. Objective characteristics
such as applicant grade point average, gender, and business experience seemed to
contribute little to interviewer ratings of fit.
Bretz, Rynes, and Gerhart (1993) used data from structured interviews with
recruiters in an attempt to determine what recruiters considered to be important in
determining applicant fit with the recruiters’ organizations. Among recruiters, job-related
course work and experience and general desirable personal characteristics, such as
appearance and communication skills, were mentioned most often as factors contributing
to P-O fit. These applicant attributes seem to refer more to P-J than P-O fit, leading the
reader to wonder if P-O fit is actually considered at alL It is reasonable that recruiters
would concentrate first on job qualifications when asked about which applicants are best
for their organization — these are the most salient points for the recruiters to consider. In
fact, Rynes and Gerhart (1990) suggested assessments of P-O fit become most important
after applicants are considered adequately qualified for the position in question. It is
possible that more factors regarding P-O fit would have been mentioned by recruiters if
they had been asked the same structured interview questions as Bretz et aL (1993) used
considering only those applicants who were already deemed qualified for the job. Unless
19
Reproduced with permission of the copyright owner. Further reproduction prohibited without permission.

the condition of having an adequate match between the applicant and the job is satisfied, it
may be the case that recruiters would not expend effort concentrating on the finer points
of fit between the applicant and the organization. Such a case would imply that P-J fit is
most important to interviewers, with P-O fit as a secondary consideration.
Adkins, Russell, and Werbel (1994) extended previous work by looking at the
results of P-O fit assessments made by interviewers and the elements that contributed to
those fit assessments. The authors considered value congruence to be one element of
input into recruiter judgments of applicant P-O fit. They calculated applicant-
organizational value congruence from recruiters’ evaluations of the organizations’ work
values and applicants’ self-reported work values. They also calculated applicant-recruiter
value congruence based on applicants’ and recruiters’ self-reported values. Applicant P-O
fit was assessed via two items answered by the recruiter. Applicant-recruiter value
congruence contributed significantly to P-O fit ratings but applicant-organization value
congruence did not. Additionally, applicant-organization value congruence did not predict
invitations for a second interview (Adkins et aL, 1994).
The latter results raised concerns about the role of P-O fit in the selection
interview. It appeared that value congruence between the applicant and the interviewer
contributed to the likelihood of a second interview, but value congruence between the
applicant and the organization did not. One interpretation of such results could be that P-
O fit does not play a significant role in hiring decisions. However, a study by Cable and
Judge (1995) provided another explanation. The researchers investigated the different
effects of perceived and actual value congruence (a distinction raised earlier) on recruiters’
recommendations to hire using data from applicants and recruiters from various
20
Reproduced with permission of the copyright owner. Further reproduction prohibited without permission.

organizations. Cable and Judge (1995) found that actual value congruence (based on
interviewers’ reports of their own organizations and applicants’ reports of their own
values) was not predictive of interviewers’ P-O fit evaluations. Perceived values
congruence (based on the interviewers’ perceptions of both the applicants’ and the
organizations’ values) was a significant predictor of P-O fit assessments. The results
obtained by Adkins et aL (1994) could have been due to their looking at two different sets
of perceptions: the interviewer and the applicant. The interviewer is most likely to make
P-O fit evaluations based on the available information, which is his or her perception of
the applicant values. It makes intuitive sense that perceived values congruence would
have a stronger relationship to interviewer judgments of P-O fit than would applicant self-
reported values.
The research on P-O fit in the selection interview contributes to the present study
in three major ways. First, there is a foundation of studies that have examined work
values in measuring fit that lends support to the choice of investigating work value
congruence here as well Second, there is reason to believe that interviewers place a
heavier significance on P-J fit than P-O fit, and likewise, P-G fit. Third, it is necessary to
be explicit in the use of either actual or perceived values congruence; given the evidence
so far, it seems more appropriate to measure perceived congruence, because actual value
congruence has not served as a strong predictor of interview outcome measures. These
important issues are considered in the following exploratory model
Test of a Model: The Role of Different Types of Fit within the Selection Interview
The proposed model (see Figure 1) incorporates multiple elements from the
preceding discussions. First, person-job fit is evaluated in a demands-abilities
21
Reproduced with permission of the copyright owner. Further reproduction prohibited without permission.

complementary context: applicant KSAs are assessed for their match with job
requirements. Person-group and person-organization fit is examined from a
supplementary standpoint, where matching through similarity is the focus. Second,
individuals, groups, and organizations are compared according to their characteristic work
values. Value congruence is predicted to be a significant contributor to P-G and P-O fit.
Note that “group” in the model refers to the department or functional area in which the
job opening exists. Third, the model relies heavily on perceptions; research has indicated
that perceived congruence may be more predictive of outcomes than actual congruence
(Adkins et aL, 1994). The judgments of the interviewer are of greatest interest, because it
is the interviewer, not the applicant, who makes selection decisions on the part of the
organization. Thus, it is hypothesized:
HI: Congruence between the interviewer’s perception of the job requirements and
the interviewer’s perception of the applicant’s qualifications will predict the
interviewer’s assessment of the fit between the applicant and the job (P-J fit).
H2: Congruence between the interviewer’s perception of the organization’s values
and the interviewer’s perception of the applicant’s values will predict the
interviewer’s perception of fit between the applicant and the organization (P-O fit).
H3: Congruence between the interviewer’s perception of the group’s values and
the interviewer’s perception of the applicant’s values will predict the interviewer’s
perception of fit between the applicant and the group (P-G fit).
Determinations of P-O fit may contribute directly to selection interview outcomes
such as invitations for second interviews and recommendations to hire (Adkins et aL,
1994; Cable & Judge, 1995). However, in this modeL there are three distinct types of fit
22
Reproduced with permission of the copyright owner. Further reproduction prohibited without permission.

that the interviewer may consider before making final decisions, rather than just P-O fit.
The different forms of fit are likely to be evaluated and compared against each other in
some form of preferential decision process. There are a number of strategies that
interviewers can use to make decisions about applicants: a common one is the weighted
additive model, which allows for tradeoffs among attributes (Payne, Bettman, & Johnson,
1993). Applying this idea, an interviewer might consider an applicant as having low P-J fit
but relatively high P-G and P-O fit, leading to a positive selection decision. However,
with complex decision tasks, interviewers may adopt simplifying strategies that often are
noncompensatory in nature (Payne et aL, 1993). In this situation, high fit of one kind (P-
O or P-G) does not compensate for low fit of another kind (P-J).
It is likely that the latter form of strategy is used in the present model because
interviews are conducted with the main goal of determining if the applicant is qualified and
capable of performing the job. P-J fit is the primary focus, especially in initial interviews,
and takes precedence over both other types of fit (Bretz et aL, 1993). In fact, in their
summary of the literature on P-O fit, Rynes and Gerhart (1990) speculated that
assessments of P-O fit become most important after applicants are considered adequately
qualified for the position in question. That principle can similarly be applied to the
importance of P-G fit. A recruiter, for example, is not likely to hire a psychology graduate
over a business student for a marketing position, ignoring important KS As in favor of a
better value fit with the department. Following this argument, then,
H4(a): The interviewer’s perceptions of P-J, P-G, and P-O fit will enter into the
interviewer’s decision making process.
23
Reproduced with permission of the copyright owner. Further reproduction prohibited without permission.

H4(b) Of the three types of fit, P-J fit will have the greatest influence in the
interviewer’s decision making process.
Once the interviewer has considered the relative contributions of each type of fit, they can
make selection decisions about the applicants.
H5: The outcome of the interviewer’s decision process will predict the
interviewer’s selection decisions regarding the applicant.
An addition to the model, and an extension to previous research, is the proposed
influence of the interviewer’s role within the organization. Individuals responsible for
college recruiting, for example, may be human resource professionals within their
companies, but a substantial portion are line managers (Rynes & Boudreau, 1986). These
employees may have technical or functional expertise, such as engineering or finance,
which make them particularly useful as recruiters. Depending on their role and position
within a company, interviewers may have a greater or lesser knowledge of the position to
be filled. In a survey of college recruiting practices, Rynes and Boudreau (1986) noted
that applicant qualification levels are set by line managers, with guidance from HR, in
approximately two thirds of the companies questioned. Just as interviewers have served
as sources of information regarding organizational values, they may also have some
knowledge or familiarity with the values of particular groups or teams for which applicants
are being selected.
Because employees typically have more contact and work more closely with
members of a particular department, team, or other work group rather than organizational
members at large, fit between the individual and that group is predicted to be more
important than P-O fit. If the interviewer is a department head, team leader, or otherwise
24
Reproduced with permission of the copyright owner. Further reproduction prohibited without permission.

close enough to the group to know its values, P-G fit should receive more attention than
P-O fit in the selection interview. The role of the interviewer, then, serves as a moderating
variable in the interviewer decision making process.
H6 : The interviewer’s main role within the organization will be a significant
determinant for which type of fit (P-O or P-G) receives greater emphasis in the
interviewer’s decision process such that:
(a) an organizational recruiter will place more emphasis on P-O fit, whereas
(b) a department head will place more emphasis on P-G fit.
The exploratory model and related hypotheses were tested in a field study of
recruiters conducting job interviews at a college career placement center. The use of
actual interviews and recruiters adds to the external generalizability of the predictions.
25
Reproduced with permission of the copyright owner. Further reproduction prohibited without permission.

Method
Participants
Participants for the study consisted of recruiters interviewing through the job
placement center of a large southern state university. Recruiters were contacted either on
interview day or up to three months prior to their campus visits to solicit their
participation in the study. Sixty-four recruiters from 44 organizations returned usable pre-
interview and post-interview surveys. Their tenure with the organization ranged from .25
to 28 years (M = 9.55), and tenure in current position ranged from zero to 16 years (M =
3.24). Most recruiters volunteered to serve in their positions (55.4%) as compared to
those who were given that responsibility by others (44.6%), and they had a wide range of
experience in recruiting, from zero to 20 years (M = 5.73). Most recruiters indicated that
they used some sort of interview form (78.5%). Many different types of industries were
represented in the sample, including oil and gas, utilities, banking and other financial
services, and manufacturing. Consistent with previous studies (Adkins et aL, 1994; Rynes
& Gerhart, 1990), recruiters rated multiple applicants and applicants had multiple
interviews; therefore, the interview served as the unit of analysis. Recruiters provided
data on an average of 3.60 interviews each (range 1 to 7, mode = 5) for a total of 262
interviews.
Procedure
Prior to the interviews, recruiters completed two work values instruments, one
tapping into their perception of their organization’s values, the other addressing their
perception of the group/department/functional area in which the open position is located.
In addition, the recruiters answered a brief questionnaire regarding their primary position
26
Reproduced with permission of the copyright owner. Further reproduction prohibited without permission.

or job within the organization, their influence in applicant selection decisions, and the
capacity of the company to extend job offers. The survey also assessed recruiters’
familiarity with the open position, the department in which it was located, and the
organization in general (please see Appendix A for a complete list of recruiter
questionnaire items). Immediately after interviewing applicants, recruiters completed a
third work values instrument based on their perceptions of the applicants’ values, and
answered several items measuring job requirements and applicant qualifications (please
refer to Appendix B), applicant fit and interview outcomes. Recruiters were told that all
information gathered was confidential and that they would be provided with a report of
the results of the study.
Measures
Work Values. Several different instruments have been used in the literature to
assess work values. Two pilot studies were conducted to determine which of the
measures demonstrated sufficient construct validity and reliability for further use in this
project. Details of the scales, procedure, and results are available in Appendix C. Based
on this information, work values were measured in the present study via a modified
version of the Comparative Emphasis Scale (CES) constructed by Ravlin and Meglino
(1987). The scale contains 48 different behavioral statements, 12 each for the four values
of achievement, helping and concern for others, fairness, and honesty (please see
Appendix D for a complete list of behavioral statements). Respondents were asked to
answer a question such as “How frequently does your organization (group, the applicant)
think employees ought to behave in the following ways?” Each item of the Likert version
was rated on a 7-point scale with the same frequency anchors as used by Kristof-Brown
27
Reproduced with permission of the copyright owner. Further reproduction prohibited without permission.

and Stevens (1996): 1 = not often, 2 = now and then, 3 = sometimes, 4 = rather
frequently, 5 = very often, 6 = continually, and 7 = always. The gradation of the measure
was designed so that respondents could discriminate more finely at the upper end of the
scale, because of possible social desirability response problems raised by Ravlin and
Meglino (1987). Cronbach’s alphas for the behavior statements were acceptable:
achievement (a = .87 to .97), fairness (a = .90 to .96), honesty (a = .82 to .95), and
concern (a = .93 to .97). Item responses within each value scale were averaged to yield
overall composite scores for each value.
Applicant qualifications- Recruiters were asked to indicate the top five (5)
qualifications (e.g. competencies, skills, abilities, etc.) that were essential to the job, and
then rate how well they thought the candidate fulfilled each requirement ( / = poor match;
7 = good match). The five responses were averaged to yield overall composite scores
with a Cronbach’s alpha of .89.
Fit. Person-organization fit was assessed via three items. The first two items were
based on those used by Adkins et aL (1994) to gain recruiter impressions of applicant P-O
fit: “Given your overall impression of this candidate, how good a ‘fit’ do you think there is
between the candidate and your organizationT’ and “Do you think other people in your
organization will think this candidate fits well in the organizationT’ The items were
scored on a 7-point response scale (1 = poor fir, 7 = good fit). The last item was adapted
from one used by Cable and Judge (1995): “To what degree does this applicant match or
fit your organization and the current employees in your organizationT’ (1 = not at all, 1 =
completely). Item responses were averaged to yield an overall P-O fit score; a = .98.
28
Reproduced with permission of the copyright owner. Further reproduction prohibited without permission.

Person-group fit was assessed via three items similar to the ones listed above with
the word “group" substituted for “organization.” Item responses were averaged to yield
an overall P-G fit score. This combination of items yielded a Cronbach’s alpha of .98.
Perceptions of person-job fit were collected using the first two questions with the
term “job” instead of “organization” One additional item was included: ‘To what extent
does this applicant have the necessary qualifications that the job requires?” (/ = not at all,
7 = completely). Item responses were averaged to yield an overall P-J fit score; a = .95.
Interviewer selection decisions. Interview outcomes were measured via a
composite of four items. The first two were modifications from questions used by Cable
and Judge (1995). Interviewers were asked to “Please rate the likelihood that you will
recommend this applicant for hire” (1 = very unlikely, 7 = very likely), and “Please give
your overall evaluation of this candidate” (1 = very negative, 7 = very positive). In
addition, recruiters were asked “How comfortable are you in recommending further
consideration of this candidate?” (1 = very uncomfortable, 7 = very comfortable) and
“What are the chances that this applicant will be invited for a second interview?” (1 = low
probability, 7 = high probability). The high intercorrelations among the four items (Rs
ranged from .914 to .954, p<.001) indicated that only one construct was measured, so
they were averaged to yield a composite selection decision outcome score; a = .98.
Congruence Analyses
Value congruence, or the similarity between recruiter perceptions of
organizational/group values and applicant values, was analyzed with polynomial regression
procedures recommended by Edwards (1993). Traditional difference score and other
profile similarity index analyses suffer from conceptual ambiguity and various
29
Reproduced with permission of the copyright owner. Further reproduction prohibited without permission.

methodological problems including the discarding of information and the imposition of
constraints which are rarely tested (refer to Appendix E; see also Edwards, 1993; 1994 for
additional information on rationale and mathematical explanations). Edwards’ procedure
is based on the principles that (a) the relationship between two entities (Le. organization
values and applicant values) and an outcome (Le., P-O fit) should be considered in three
dimensions, (b) this relationship should be viewed as a three-dimensional response surface,
and (c) the constraints should not be imposed, but tested as hypotheses that would lend
credence to the conceptual model (Edwards, 1994).
The first step in Edwards’ procedure is scale-centering the predictor variables.
This transformation involves subtracting the midpoints of the scales from the scores,
which in this case, the midpoint on all of the 7-point scales is 4, thereby transforming the
scores from a range of 1 to 7 to a range of -3 to +3. This transformation of scores serves
to reduce multicollinearity in regression analyses and provides for more meaningful
interpretations of individual value coefficients when higher-order terms are included
(Edwards & Van Harrison, 1993; Neter, Wasserman, & Kutner, 1989). The second step
requires the specification of the functional form of the conceptual model that is expected
to best underlie the data. In this study, a U-shaped relationship between perceptions of fit
and value congruence was suggested, such that P-O fit should be strongest when
perceptions of applicant values correspond to perceptions of organizational values. A
similar U-shaped relationship was expected for P-G fit. These expected relationships were
based on past literature (Kristof-Brown & Stevens, 1996).
The third step in Edwards’ procedure calls for identification of constrained and
unconstrained regression equations that correspond to the hypotheses. For this study,
30
Reproduced with permission of the copyright owner. Further reproduction prohibited without permission.

four pairs of equations were identified, one set for each of the four work values of
achievement, honesty, fairness, and helping and concern for others. An example of an
equation pair is illustrated below: (Z = P-O fit, P = person/applicant, O = organization,
ach = achievement value)
Constrained Z = bo + fyPach2 - 2biPaChOaCh + biO**2 + e
Unconstrained Z = bo + tyP** + bjOach + fcbPach 2 + b4PachOach + bsOach 2 + e
To determine whether the restrictions in the constrained equation should be rejected,
Edwards (1993) suggests testing the increment in R2 of the unconstrained equation over
the constrained one.
If the unconstrained equation predicts significantly better than the constrained
equation, interpretation of the regression coefficients through the use of three-dimensional
response surfaces is the fourth and final step. The beta weights from the unconstrained
regression equation were used to calculate the values for the surfaces with the predictors,
such as applicant values and organization values, comprising the X and Y axes and the
criterion, P-O fit, represented on the Z axis. A three-dimensional depiction o f the
relationship between three variables, such as the joint prediction of P-O fit from perceived
organizational and applicant values, allows researchers to see curvature and inflections
that are lost in a two-dimensional figure.
31
Reproduced with permission of the copyright owner. Further reproduction prohibited without permission.

Results
Means, standard deviations, and correlations for recruiter perceptions of
organization, group, and applicant values, recruiter perceptions of applicant qualifications,
P-J, P-G, and P-O fit, and the recruiter selection decision composite scores are reported in
Table 1.
Hypothesis 1 stated that congruence between the recruiter’s perceptions of job
requirements and applicants’ qualifications would predict P-J fit. This was tested by
regressing the composite P-J fit score on the composite of applicant qualifications. The
hypothesis was supported, r = .87, £<.001.
Hypothesis 2 posited that congruence between the recruiter’s perceptions of
organization values and applicant values would predict P-O fit; this was tested in four
steps. First, the composite P-O fit score was regressed on five predictors: the recruiters’
perceptions of applicant and organization achievement, squared terms for each variable,
and an applicant X organization achievement interaction. The regression equation yielded
a significant R = .61, p<.001. Similar equations were constructed for the remaining three
work values and also produced significant regression coefficients; fairness R = .36,
£<.001; honesty R = .37, £<.001; and concern R = .37, £<.001.
To test H3, that congruence between the recruiter’s perceptions of group values
and applicant values would predict P-G fit, the composite P-G fit score was regressed on
the recruiters’ perceptions of applicant and group value, squared terms for both variables,
and the applicant X group value interaction. This process was repeated for each of the
four work values and resulted in significant regression coefficients: achievement R = .55,
32
Reproduced with permission of the copyright owner. Further reproduction prohibited without permission.

Reproduced
with perm
ission of the
copyright ow
ner. Further
reproduction prohibited
without
permission.
Table 1
Means. Standard Deviations, and Correlations Among Recruiter Perceptions of Applicant. Group, and Organization Values. Person- Organization (P-O’). Person-Group (P-G). and Person-Job (P-J) Fit. Qualifications, and Selection Decisions
Recruiter Perceptions Applicant Values_________________________ Group Values
M SD Ach FairApp Ach 5.483 1.042 -
App Fair 5.046 .939 .596 -
App Hon 5.231 .967 .731 .793App Con 4.917 .995 .478 .876Group Ach 5.888 .703 .318 .368Group Fair 5.679 .751 .129 .385Group Hon 5.799 .640 .296 .439Group Con 4.948 1.020 .190 .334Org Ach 5.728 .831 .223 .350Org Fair 5.430 1.065 .168 .433Org Hon 5.731 .942 .239 .458Org Con 4.651 1.081 .150 .376Qualifications 5.187 1.255 .629 .426P-J Fit 4.919 1.482 .584 .320P-G Fit 4.878 1.515 .526 .359P-O Fit 4.893 1.511 .563 .336SelectionDecision 4.720 1.892 .583 .360Composite
Hon Con Ach Fair Hon Con
.698
.384 .336 -
.271 .378 .342 -
.444 .416 .511 .672 -
.280 .397 .427 .750 .582 -
.398 .358 .680 .295 .465 .352
.359 .394 .185 .745 .512 .522
.466 .421 .336 .554 .684 .399
.296 .403 .382 .667 .486 .786
.460 .365 .040 .088 .098 -.014
.357 .252 -.004 .013 .026 -.041
.403 .305 .031 .068 .054 .014
.339 .296 .025 .081 .044 .017
.417 .275 .033 .029 .033 -.030
All correlations in bold are significant at p < .05. (table con’d)

Reproduced
with perm
ission of the
copyright ow
ner. Further
reproduction prohibited
without
permission.
u>
App Ach App Fair App Hon App Con Group Ach Group Fair Group Hon Group Con
Composite
Ach
Recruiter PerceptionsOrganization ValuesFair Hon Con
Qualifications
P-JFit
P-GFit
P-OFit
Org Ach -
Org Fair .355 -
Org Hon .542 .838 -
Org Con .403 .773 .661 -
Qualifications -.013 .087 .128 -.018 -
P-J Fit -.108 .005 .035 -.071 .876 -
P-G Fit -.025 .041 .064 -.025 .808 .891P-O Fit -.052 .047 .073 .016 .837 .906SelectionDecision -.039 .036 .084 -.031 .863 .910
.917
.883 .890
All correlations in bold are significant at p < .05.

£<.001; fairness R = .39, £<.001; honesty R = .43, £<001; and concern R = .36, £<001.
Results from all eight regression equations are reported in Tables 2 -5 .
Hierarchical regression equations were then constructed to determine which value,
if any, contributed most to recruiter assessments of fit. To test the incremental variance in
P-O fit offered by achievement, the five terms each for honesty, fairness, and concern were
entered together on the first step (for a total of 15 predictors), and the five terms for
achievement were entered in the second step, and all were regressed on P-O fit. The same
procedure was repeated with the terms for each value entered by themselves on the second
step and the remaining three values entered on the first step. Similar equations were
constructed with P-G fit as the criterion. Of all the values, achievement was the strongest
predictor of both P-O and P-G fit, contributing an R2A = .233, £<001 and R2A = .133,
£<001, respectively. Results are reported in Table 6 .
Edwards’ polynomial regression guidelines recommended testing the constraints
imposed on the traditional difference score equations. In this case, the constrained
equations included only three of the five predictor variables used above: both squared
terms and the interaction terms. If the R2 value from the unconstrained equation is
significantly larger than the R2 value from the constrained equation, the constraints are
unsupported and further investigation should be made using the unconstrained equations.
Comparisons between the constrained and unconstrained equations were made using an F
test eight times: once for each of the four values predicting P-O fit and once for each of
the four values predicting P-G fit. For achievement and P-O fit, the unconstrained
equation produced a significantly higher R2 (F(2,250) = 4.80, £<01), as it did for fairness
35
Reproduced with permission of the copyright owner. Further reproduction prohibited without permission.

Table 2
Predictions of Person-Organization fP-Q) and Person-Group (P-G) Fit from RecruiterPerceptions of Applicant. Group, and Organization Values - Achievement
PredictorP-O Fit
B ft _ BP-G Fit
a
AchievementAchievement2
Applicant (Person).510 ** .350 ** .768 **
1.217E-02 .021 -4.62E-03.523 **
-.008
AchievementAchievement2
Organization -.235 -.129 -.153 * -.255*
.171-.149
Group.079-.254
Achieve. Int.P-O Interaction
.231 * .363 *P-G Interaction
3.913E-02 .064
Multiple R Adjusted R2
E
.607
.356F(5,251) 29.269
.0 0 1
F(5,242)
.547
.28420.621
.0 0 1
Constrained Eq. Multiple R
Adjusted R2
B
.587
.336F(3,253) 44.259
.0 0 1
F(3, 244)
.521
.26230.267
.0 0 1
Difference in R2 4.8 ** 4.827 **
* £ < .05 * * £ < .0 1
36
Reproduced with permission of the copyright owner. Further reproduction prohibited without permission.

Table 3
Predictions of Person-Oreanization (P-O) and Person-Group fP-G) Fit from RecruiterPerceptions of Applicant. Group, and Organization Values - Fairness
PredictorP-O Fit
B 1P-G Fit
B
FairnessApplicant (Person)
.710 ** .441 ** .825 ** .509 **Fairness 2 -.110 -.139 -.151 -.188
FairnessOrganization
-.180 -.127Group
.636 .312Fairness2 -2.79E-02 -.050 -.238 -.408
P-O Interaction P-G InteractionFairness Int. 7.852E-02 .117 3.279E-02 .045
Multiple R .361 .389Adjusted Rl .113 .134
£F(5,251) 7.520
.0 0 1
F(5,242) 8.644 .0 0 1
Constrained Eq.Multiple R .289 .326
Adjusted R2 .072 .095
eF(3,253) 7.668
.0 0 1
F(5,244) 9.653 .0 0 1
Difference in R2 6.91 ** 6.57 **
* £ < .05 * * £ < .01
37
Reproduced with permission of the copyright owner. Further reproduction prohibited without permission.

Table 4
Predictions of Person-Oreanization (P-O) and Person-Group (P-G) Fit from RecruiterPerceptions of Applicant. Group, and Organization Values - Honesty
PredictorP-O Fit
B BP-G Fit
B
HonestyApplicant (Person)
.295 .189 .502 .320Honesty2 2.962E-02 .042 5.230E-02 .073
HonestyOrganization
-6.70E-02 -.042Group
5.801E-02 .024Honesty2 -.138 -.214 -.158 -.228
P-O Interaction P-G InteractionHonesty Int. .197 .277 8.368E-02 .117
Multiple R .372 .432Adjusted R2 .1 2 1 .170
RF(5,251) 8.043
.0 0 1
F(5,242) 11.112 .0 0 1
Constrained Eq.Multiple R .360 .420
Adjusted R2 .1 2 0 .166
RF(3,253) 12.597
.0 0 1
F(5,244) 17.381 .0 0 1
Difference in R2 1.33 1.67
* E < .05 * * £ < .0 1
38
Reproduced with permission of the copyright owner. Further reproduction prohibited without permission.

Table 5
Predictions of Person-Oreanization ( P-Q) and Person-Group (P-G) Fit from RecruiterPerceptions of Applicant. Group, and Organization Values - Concern
PredictorP-O Fit
B fi BP-G Fit
f i
ConcernConcern2
Applicant (Person) .795 ** .520 ** .734
-.234 ** -.303 ** -.204***
.479 ** -.257 *
Concern Concern 2
Organization -.349 * -.250 *
-9.74E-02 -.137
Group-3.39E-02
-.132- . 0 2 2
-.213
Concern Int.P-0 Interaction
.261 * .325 *P-G Interaction
.140 .178
Multiple R Adjusted R2
B
.374
.123F(5,251) 8.171
. 0 0 1
F(5,242)
.359
.1 1 1
7.151.0 0 1
Constrained Eq. Multiple R
Adjusted R2
B
.2 0 1
.029F(3,253) 3.537
.015F(5,244)
.245
.0485.190
.0 0 2
Difference in R2 16.67 ** 9.58 **
* P < .05** p < .01
39
Reproduced with permission of the copyright owner. Further reproduction prohibited without permission.

Table 6
ComDarisons of Incremental Variance in Person-Oreanization (P-O) and Person-Groun(P-G) Fit Contributed bv Work Values
Predictors AR2
P-0 FitA F
Step 2Achievement .233 ** 19.215 **
Fairness .006 .507Honesty .029* 2.420 *Concern . 0 2 2 1.812
R Adj. R2Whole Model(all 4 values) .653 ** .378 **
Predictors AR2
P-G FitA F
Step 2Achievement .133 ** 9.372 **
Fairness .0 2 1 1.459Honesty .028 1.944Concern .014 1.018
R Adj. r :Whole Model(all 4 values) .597 ** 2 9 9 **
* £ < .05 ** £ < .001A F(5,236) for Step 2 in P-0 fit equation. A F(5,227) for Step 2 in P-G fit equation.
40
Reproduced with permission of the copyright owner. Further reproduction prohibited without permission.

(F(2,250) = 6.91, £<.01) and concern for others (F(2,250) = 16.67, £<.01). There was no
difference in the R2 for honesty (F(2,250) = 1.33, ns) in predicting P-O fit. For the values
predicting P-G fit, the unconstrained equations produced significantly higher R2 for
achievement (F(2,247) = 4.827, £<.01), fairness (F(2,247) = 6.57, £ < 0 l), and concern for
others (F(2,247) = 9.58, £<.01), but again, not for honesty (F(2,247) = 1.67, ns). Again,
the significant increases in R2 indicated that the unconstrained equations provided better
approximations of the data and should be used in further examinations.
Interpretation of the polynomial regression equations was facilitated by the
construction of three-dimensional response surfaces. These figures depict the changes in
the criterion variable (P-O or P-G fit) based on the changes in and interactions of the
predictor variables (recruiter impressions of applicant, group, and organization variables)
and capture more of the relationships than two-dimensional graphs can represent. Eight
figures were produced corresponding to each of the eight regression equations. Figure 2
illustrates how recruiter perceptions of the applicant and organization achievement
predicted fit between the applicants and the organizations. P-O fit was highest when
recruiter perceptions of applicants were congruent (both high or both low), whereas P-O
fit was lowest when recruiter perceptions were incongruent (one high, the other low).
Figure 3 displays the fit predictions for the value of honesty. Again, high P-O fit was
indicated by congruence in recruiter perceptions of applicant and organization honesty,
and the lowest P-0 fit was found for incongruence between the applicants and
organizations. Both surfaces were consistent with the hypothesized relationship of high fit
with congruence and low fit with incongruence.
41
Reproduced with permission of the copyright owner. Further reproduction prohibited without permission.

f" VO <n CO CM o1 ii
CMii
VO to t}- c o1CM i io 1 CMi CO1
■ ■ ■ ■ ■ S ■ m m m
c © 2
06
42
Reproduced with permission of the copyright owner. Further reproduction prohibited without permission.
Figu
re
2. Pe
rson
-Org
aniz
atio
n Fi
t: A
chie
vem
ent

r-~ VO in m CN o1VO m en cs — O I■ ■ ■ ■ ■ ■ ■ m
43
Reproduced with permission of the copyright owner. Further reproduction prohibited without permission.
Figu
re
3. Pe
rson
-Org
aniz
atio
n Fi
t: H
ones
ty

In Figure 4, P-0 fit was generally high when the recruiter perceptions of applicant
fairness was moderate to high, regardless of perceptions of organization fairness. P-O fit
was somewhat lower when recruiter perceptions of applicants and organizations were
incongruent, but this effect was greatest when perceptions of the organization were high
and perceptions of the applicant were low. Figure 5 shows that higher P-O fit resulted
from moderate recruiter perceptions of applicants’ concern for others, regardless of the
perceptions of organizational concern for others. Again, low P-O fit was evidenced with
value incongruence, especially when perceptions of the organization were high and
perceptions of the applicant were low.
Figures 6 - 9 clarify the predictions of P-G fit from recruiter perceptions of
applicant and group values. Where achievement was concerned (Figure 6), P-G fit was
high when recruiter perceptions of applicants and groups were congruent and high. The
lowest P-G occurred when perceptions of the groups were high and the applicants were
low, but low fit was also indicated when applicants and groups were similarly low on
achievement. In Figure 7, the surface showed higher P-0 fit when recruiters considered
both applicants and groups as high on honesty, and lower P-0 fit with value incongruence.
In the depiction of fairness (Figure 8), high P-G fit was indicated when recruiter
perceptions for applicant and group honesty were congruent and moderately high. Low
P-G fit occurred for value incongruence, when recruiters perceived groups as high and
applicants as low on honesty, or vice versa. The lowest fit was seen when both applicants
and groups were perceived as low on honesty. Finally, regarding the concern for others
value in Figure 9, P-G fit was highest when recruiter perceptions of applicants and groups
were both moderately high, and was lowest when the perceptions were incongruent. Low
44
Reproduced with permission of the copyright owner. Further reproduction prohibited without permission.

r-~ VO <r> c sVO « n c n CN o■ ■ ■ ■ ■ ■ ■
I
45
Reproduced with permission of the copyright owner. Further reproduction prohibited without permission.
Figu
re
4. Pe
rson
-Org
aniz
atio
n Fi
t: Fa
irne
ss

r-~ VO m (N o1 11CNii
c niiN*ii
VO1
t o1
c n1
CN1
O 1 CNi c ni i mi■ ■ ■ ■ ■ ■ ■ ■ m E! □ □
46
Reproduced with permission of the copyright owner. Further reproduction prohibited without permission.
Figu
re
5. Pe
rson
-Org
aniz
atio
n Fi
t: C
once
rn

Reproduced with permission of the copyright owner. Further reproduction prohibited without permission.
Figu
re
6. Pe
rson
-Gro
up
Fit:
Ach
ieve
men
t

VO i n c n CNVO m c n N o■ ■ ■ ■ ■ ■ ■
48
Reproduced with permission of the copyright owner. Further reproduction prohibited without permission.
Figu
re
7. Pe
rson
-Gro
up
Fit:
Hon
esty

r - NO i n CN o iCN
ic n
iii
NO1
i ni
c ni
CNi I
o 1CN
ic n
i i
■ ■ ■ ■ ■ s ■ m M m □
Reproduced with permission of the copyright owner. Further reproduction prohibited without permission.
Figu
re
8. Pe
rson
-Gro
up
Fit:
Fair
ness

r- VO m CO <N o1 iiOlii■
VO1m Icn cn
1 o 1 Mi cni■ ■ ■ ■ ■ ■ ■ m m El
✓
50
Reproduced with permission of the copyright owner. Further reproduction prohibited without permission.
Figu
re
9. Pe
rson
-Gro
up
Fit:
Con
cern

P-G fit was also indicated when applicants and groups were perceived as similarly low on
concern for others. In general, the response surfaces indicated at least partial support for
the hypothesis that value congruence would result in high P-G fit and value incongruence
would result in low P-G fit.
Hypotheses 4(a) and 5 suggested that recruiters’ perceptions of P-J, P-G, and P-0
fit would enter into their decision making process, which would result in selection
decisions regarding the applicant. Hypothesis 4(b) posited that, of the three types of fit,
P-J fit would have the greatest influence on the recruiters’ decision making process.
The first hypotheses were confirmed by regressing the selection decision composite score
on P-J, P-G, and P-O fit scores together, which yielded a significant R = .928, £<.001
(refer to Table 7). To test Hypothesis 4(b) the selection decision composite score was
hierarchically regressed on P-0 and P-G fit entered together on step 1, and P-J fit entered
on step 2 (Equation I). Similar equations were tested using P-J and P-O fit on step 1 and
P-G fit entered on step 2 (Equation 2); finally, with P-J and P-G fit on step 1 and P-O on
step 2 (Equation 3). Significant incremental variance from P-J fit but not P-G or P-O fit
would indicate that P-J fit had the greatest inpact. As shown in Table 8, P-J fit provided
significant incremental variance to the regression equation (R2A = .039, £<.001). P-G and
P-0 fit each provided significant incremental variance as well (R2A = .005, £<.001; R2A =
.008, £<.001, respectively) but these amounts were very small.
Hypothesis 6 proposed that organizational recruiters would place more emphasis
on P-O fit than P-G fit after taking P-J fit into account, whereas department heads would
place more emphasis on P-G fit than P-O fit after taking P-J fit into account. A test of the
entire hypothesis as originally stated could not be performed due to a lack of individuals
51
Reproduced with permission of the copyright owner. Further reproduction prohibited without permission.

Table 7
and Person-Oreanization (P-O) Fit
PredictorSelection Decision Composite
B £P-J Fit .673 ** .517 **P-G Fit .245* .197 *P-O Fit .304 ** .241 **
Multiple R Adjusted R“
F(3, 246)
.928
.859508.676
.001* £ < .01 * * £ < .001
who identified themselves either as organizational recruiters or as human resource
representatives responsible for recruiting for the company as a whole. This small number
of such respondents was unexpected; previous studies indicated that nearly half of the
sample was composed of HR managers (Adkins et aL, 1994; Rynes & Boudreau, 1986).
In the current sample, only 10 (14.1%) recruiters indicated that they did not belong to the
group for which they were interviewing applicants; 59.2% were supervisors/managers and
18.3% considered themselves to be other members of the groups into which they were
recruiting (6 did not identify their positions).
The second part of the hypothesis was examined using the data from individuals
who were members of the group for which they were interviewing applicants. This subset
of recruiters included the self-identified supervisors/managers and other group members
(peers) in the analysis. The peers/other members were not specified in the original
hypothesis because their participation as recruiters was not anticipated. Their post hoc
inclusion in the analyses is appropriate for the same reason that supervisors/managers
52
Reproduced with permission of the copyright owner. Further reproduction prohibited without permission.
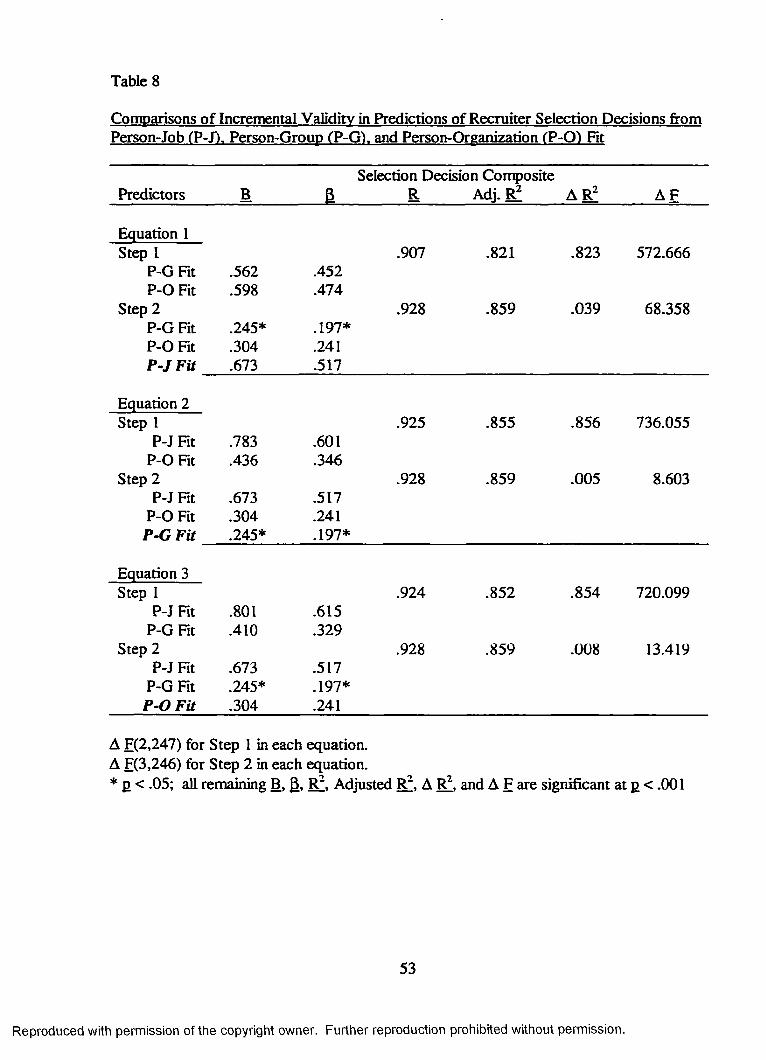
Table 8
Person-Job (P-J). Person-GrouD (P-G). and Person-Oreanization (P-O) Fit
Predictors BSelection Decision Composite
a R Adj. R2 A R 2 AF
Equation 1Step 1 .907 .821 .823 572.666
P-G Fit .562 .452P-O Fit .598 .474
Step 2 .928 .859 .039 68.358P-G Fit .245* .197*P-0 Fit .304 .241P-J Fit .673 .517
Equation 2Step I .925 .855 .856 736.055
P-J Fit .783 .601P-O Fit .436 .346
Step 2 .928 .859 .005 8.603P-J Fit .673 .517
P-O Fit .304 .241P-G Fit .245* .197*
Equation 3Step 1 .924 .852 .854 720.099
P-J Fit .801 .615P-G Fit .410 .329
Step 2 .928 .859 .008 13.419P-J Fit .673 .517
P-G Fit .245* .197*P-O Fit .304 .241
A F(2,247) for Step 1 in each equation.A F(3,246) for Step 2 in each equation.* E < .05; all remaining B, j3, Rl, Adjusted Rr, A R", and A F are significant at £> < .001
53
Reproduced with permission of the copyright owner. Further reproduction prohibited without permission.

were: their familiarity with and membership in the group should lead them to select
applicants more on their fit with the group than fit with the organization as a whole. The
selection decision composite score was regressed on P-J fit (step 1), P-O fit (step 2), and
P-G fit (step 3). The equation was repeated using P-J fit (step 1), then P-G fit (step 2),
and finally P-O fit (step 3). Incremental variance offered by P-G fit over that of P-O, with
none contributed by P-O over P-G, would suggest that departmental heads concentrate
more on fit between their own groups and the applicants rather than on fit between the
applicants and organizations. Contrary to predictions, P-G fit offered little incremental
variance beyond P-J and P-0 fit: R2A = .003, £<.001. P-0 fit provided significant, albeit
small, incremental variance to the selection decision composite beyond P-J and P-G fit:
R2A = .008, £<.001; thus, Hypothesis 6 was not supported. Results are provided in Table
9.
In summary, the results of this study partially support the exploratory model and
hypotheses put forward. As expected, congruence of recruiter perceptions of applicant
and group values (achievement, fairness, honesty, and concern for others) significantly
predicted P-G fit; likewise, congruence of recruiter perceptions of applicant and
organization values significantly predicted P-O fit. Recruiter perceptions of applicant
qualifications were strong predictors of P-J fit. The combination of person-job, person-
group, and person-organization fit significantly predicted recruiters’ selection decision
outcomes, with P-J fit as the strongest contributor of the three. Contrary to hypotheses,
department heads (group supervisors/managers) did not place more emphasis on P-G fit
than on P-O fit after taking P-J fit into account. The importance of P -0 fit specifically to
54
Reproduced with permission of the copyright owner. Further reproduction prohibited without permission.

organizational recruiters could not be examined due to their small number within the
sample.
Table 9
Comparisons o f Incremental Validity in Predictions of Recruiter Selection Decisions fromPerson-Grout) CP-G) and Person-Oreanization (P-O) Fit: Gtoud Members Onlv
Predictors B £Selection Decision Composite
R Adj. R2 AR2 A F
Equation 1Step 1 .910 .827 .828 995.872
P-J Fit 1.190 .910Step 2 .923 .850 .024 32.759
P-J Fit .764 .584P-0 Fit .449 .360
Step 3 .925 .853 .003* 4.526*P-J Fit .677 .518
P-0 Fit .323 .260P-G F it .216* .173*
Equation 2Step 1 .910 .827 .828 995.872
P-J Fit 1.190 .910Step 2 .920 .845 .019 25.624
P-J Fit .790 .604P-G Fit .418 .335
Step 3 .925 .853 .008 10.980P-J Fit .677 .518
P-G Fit .216* .173*P-O F it .323 .260
A F( 1,207) for Step 1 in both equations.A F(2,206) for Step 2 in both equations.A F(3,205) for Step 3 in both equations.
* j) < .05; all remaining B, J3, R ,̂ Adjusted R~, A R2, and A F are significant at p < .001
Reproduced with permission of the copyright owner. Further reproduction prohibited without permission.

Discussion
This research empirically tested a model incorporating work value congruence
between applicants and organizations and between applicants and groups. Consistent with
hypotheses, recruiter perceptions of applicant and organization work value congruence
significantly predicted person-organization fit; likewise, recruiter perceptions of applicant
and group value congruence significantly predicted person-group fit. The model also
included relationships among person-job, person-organization, and person-group fit and
their influence on recruiter selection decisions within a recruiting interview setting. As
expected, P-J, P-G, and P-O fit explained significant amounts of variance in recruiter
selection decisions, such as the likelihood that applicants would be invited for a second
interview or would be recommended for hiring. All three types of fit made contributions
to the recruiters’ selection decisions, although the incremental predictive abilities of P-G
and P-0 fit were statistically, but not practically, significant.
This study added to the growing body of literature exploring the usefulness of
work value congruence as a predictor of person-group and person-organization fit. As
hypothesized, congruence of recruiter perceptions of applicant and organization values
significantly predicted P-O fit, and congruence of recruiter perceptions of applicant and
group values significantly predicted P-G fit. The latter finding was especially interesting
because the inclusion of P-G fit into the model was unprecedented in the literature. This
effect was found for all four work values, achievement, fairness, honesty, and concern for
others. Additionally, this research employed polynomial regression and response surface
analyses to investigate the relationships between recruiter perceptions of applicant and
organization/group work values and assessments of P-0 and P-G fit. The techniques
56
Reproduced with permission of the copyright owner. Further reproduction prohibited without permission.

recommended by Edwards relaxed the constraints that are imposed by traditional
difference score statistics and allowed for the interpretation of complex relationships
within the data. In six of the eight cases the constraints were not supported, indicating the
need for the better-defined equations.
The four values varied in their contributions to P-O fit. All four equations that
included recruiter perceptions of applicant and organization values yielded significant
regression coefficients for P-O fit and generally followed the expected supplementary
model: fit increased as value congruence increased and decreased as congruence
decreased. For example, fit was highest when the recruiter perceived the applicant and the
organization as both high or both low on achievement; conversely, fit was lowest when the
applicant and organization were perceived as incongruent (one high, the other low). A
similar pattern was found for honesty and concern for others. The surface for fairness
displayed a slightly different shape. The highest P-0 fit was indicated when applicants
were perceived as moderate to high on fairness, almost regardless of the organizational
leveL The lowest fit was found when organizations were perceived as high and applicants
perceived as low on fairness. Overall, work value congruence significantly predicted P-O
fit and generally followed the shape specified by the supplementary fit model — recruiters
rated applicants who had values congruent with those of the organizations as likely to fit
in better with the organization than applicants whose values were not congruent with
those of the organizations.
Recruiter perceptions of applicant and group values also yielded significant
regression coefficients for P-G fit. In contrast to those mentioned above, the response
surfaces for P-G fit only partially supported the supplementary fit models. As expected,
57
Reproduced with permission of the copyright owner. Further reproduction prohibited without permission.

incongruence between applicants and groups for each of the values resulted in low levels
of P-G fit, especially when recruiters considered applicants as low and groups as high on
each of the values. Also consistent with the hypothesized supplementary model, high P-G
fit was associated with high perceptions of applicant and group value. However,
congruence when applicant and group values were both perceived as low was expected to
be associated with high P-G fit, but this was not the case. In feet, the lowest P-G fit
ratings regarding fairness occurred when recruiters perceived both applicants and groups
as low on fairness.
One conclusion that can be drawn from this value congruence exploration is that
values can be useful in predicting perceived fit with groups as well as with organizations in
a recruiting interview context. Studies regarding selection interviewing have examined
supplementary fit of work values, but only in terms of P-O fit (Adkins et aL, 1994; Cable
& Judge, 1995), and the results here are consistent with those findings. Only one study to
date (Kristof-Brown & Stevens, 1996) has looked specifically at P-G fit in terms of work
values, but that focus was outside the selection arena, so the present research contributes a
purposeful investigation into the prediction of P-G fit from work value similarity.
Additionally, of the four work values examined, achievement was the statistically strongest
contributor. Similarity between applicant and organization achievement explained 36% of
the variance in P-O fit, and achievement similarity between applicants and groups
explained 28% of P-G fit. The other values of foimess, honesty, and concern for others
explained less variance (ranging from 11% to 17%). Results such as these suggest some
practical significance in recruiters assessing applicant values to determine fit with groups
58
Reproduced with permission of the copyright owner. Further reproduction prohibited without permission.

or organizations; additional studies could compare the usefulness of values versus other
operationalizations of P-O fit such as goals.
Several questions arise at this point: a general desire for achievement showed itself
across the many organizations surveyed, but is there a pattern of value preferences that
varies by industry? By type of organization (service vs. manufacturing)? By type of
group within a company (engineering vs. audit)? Such questions, although outside the
scope of the present study, could be the focus of future research concentrating specifically
on work values. Attention should also be paid to an expanded list of work values to
reflect what organizations are currently searching for as part of their selection process.
The short list of achievement, fairness, honesty, and concern for others was useful and
applicable when the CES was developed a decade ago; however, recruiters reported that
they evaluated applicants for such characteristics as “drive” and “team orientation” and
“initiative.” A revival of interest into what values are of greatest importance to today’s
recruiters may prove fruitful for future research, especially if a new list includes values on
which organizations and groups vary widely. In the present study, recruiters’ perceptions
of applicant, group, and organization values showed ceiling effects (Ms ranged from 4.651
to 5.888 on a scale of 1 to 7 with SDs of .703 to 1.065) and significant correlation
coefficients as high as .876. A longer list of values that vary in their desirability to groups
and organizations might be helpful in detecting differences among those groups and
organizations and increase the amount of variance that value congruence could predict in
P-0 and P-G fit.
Regarding the latter half of the exploratory model and the corresponding
hypotheses, person-job, person-group, and person-organization fit jointly predicted a
59
Reproduced with permission of the copyright owner. Further reproduction prohibited without permission.

significant amount of variance (87%) in the composite of recruiter selection decisions, as
hypothesized. These decisions related to the likelihood of recommendation for further
consideration and for hire, the overall evaluation of applicant, and the probability of a
second interview invitation. Also as expected, P-J fit accounted for the greatest amount
of incremental variance in the selection decisions beyond that contributed by P-G or P-O
fit. This finding was a reasonable one — most of the applicants had been through a pre
selection process by the organizations based on their major areas of study, intended
graduation date, and resume information. This first screening determined the accessibility
to interview time slots and narrowed down the pool of individuals to be seen by the
recruiters. Applicants reported anecdotally that they were often questioned in depth
during the interviews about their relevant course work and past job experience. Assessing
applicant ability to supply the qualifications necessary to perform the job seemed to be
predominant among recruiter intentions, which is consistent with the results found by
Bretz et aL (1993). Beyond P-J fit, however, P-G and P-O fit each predicted statistically
significant, although small, incremental variance in the selection decisions. Recruiters
reported anecdotally that they inquired about applicants' work environment preferences
and outside activities and interests and were looking for the “right type” of potential
employee. The recruiters may have used this information to gauge the fit of these
applicants with other employees in the department, work group, functional area, or
organization as a whole.
The relatively small contributions from both P-G and P-0 fit on the recruiters’
selection decisions warranted closer investigation of all three fit variables and the
relationships among them. They were closely intercorrelated, with Rs ranging from .891
60
Reproduced with permission of the copyright owner. Further reproduction prohibited without permission.

to .917. Such high multicollinearity among these predictors is a concern, especially
because the exploratory model being tested treats them as separate variables. One
explanation for this finding could be contained in the items themselves - perhaps the
questions designed to tap into the different types of fit did not do so with sufficient
accuracy. Although the items used here to assess fit were gleaned from other studies
(Adkins et aL, 1994; Cable and Judge, 1995), the recruiters’ responses to the items did not
indicate much disparity among them. Another possibility was that the recruiters could not
make the distinction among the different types of fit; however, evidence from past
research does not support this supposition. For example, Adkins et aL (1994) found that
judgments of P-O fit accounted for variance independent of general employability ratings,
and Rynes and Gerhart’s (1990) findings were consistent with the idea that P-0 fit is
evaluated above and beyond assessment of applicant qualifications.
It seemed useful to investigate how the recruiters in this study reported their
thinking of job fit — perhaps they were including elements of P-0 or P-G fit rather than
maintaining a strict assessment of P-J fit. One element of the data collection required
recruiters to indicate the top five qualifications (e.g. competencies, skills, abilities, etc.)
that were essential to the job. This format allowed recruiters to specify, with little
structure, what they were looking for in applicants. Traditional theories in selection
research has differentiated knowledge, skills, and abilities (KSAs), which include the items
that are often treated in the literature as job-specific, from other characteristics (Os) which
frequently refer to the personality traits, attitudes, goals, and values that are considered
when assessing P-O fit. Therefore, the recruiter-specified qualifications were assigned by
the author to a KS A category or an O category using widely accepted definitions
61
Reproduced with permission of the copyright owner. Further reproduction prohibited without permission.

(Gatewood & Feild, 1994); a list of the categorized items is provided in Appendix F.
Recruiter perceptions of how well applicants met each of the KS A requirements were
averaged, as were the perceptions o f how well applicants met the O requirements. A
composite score including all KSAs and Os together (applicant qualification composite
score) had already been calculated and used in previous analyses. P-J, P-G, and P-O fit
were then correlated with composite qualifications, KSA, and O ratings; results are
reported in Table 10.
Table 10
Correlations Among Recruiter Perceptions of Person-Organization (P-O). Person-Group (P-Gl. and Person-Job (P-J) Fit and Composite Qualifications. KSA and O Ratings
KSAs________ Os________ Quals P-J Fit P-G FitOs .714Quals .820 .771P-J Fit .713 * .659aP-G Fit .645b .609aP-O Fit .668a .627
All correlations are significant at £ < .001 N range: 223 - 262Quals = Composite Qualification Rating a - Correlations in column are different at £<.05 b - Correlations in column are different at £<.001
If recruiters were indeed overlapping their perceptions of P-0 or P-G fit onto their
assessments of P-J fit, then separating the KSAs from the Os might result in different
correlation patterns. KSAs should be more highly correlated with P-J fit than P-O or P-G
fit, and Os should be more highly correlated with P-0 or P-G than with P-J fit; the
correlation coefficients were compared by a t-test between dependent rs (Cohen & Cohen,
1983). The overall composite qualifications ratings had consistently strong correlations
with all three types of fit. Separating the qualifications into KSA and O categories
62
.876ab
.808 * .891
.837a .906 .917
Reproduced with permission of the copyright owner. Further reproduction prohibited without permission.

significantly reduced the relationships between KSAs and Os and all three types of fit,
although they all remained strong (Rs ranged from .619 to .713). The relationship
between KSAs and P-J was significantly stronger than between KSAs and either P-G or P-
O fit, as was expected. However, when considering Os, the relationship with P-J fit was
again stronger than the correlation between O and P-G fit, and no other significant
differences were found. According to the results of this post-hoc analysis, the recruiters
apparently considered other characteristics in addition to KSAs when determining person-
job fit and did not look to those other characteristics when assessing person-group or
person-organization fit. These unexpected findings warrant special attention from
researchers who should closely examine their models, survey items, and response data to
determine if there is empirical evidence to support the assumption that recruiters can and
do distinguish among P-J, P-G, and P-0 fit.
The problems encountered with differentiating the three types of fit, along with the
small incremental variance offered by fit with the group and the organization, temper the
conclusions that can be drawn about certain elements of the modeL It was expected that
P-J, P-G, and P-O fit together and separately would make significant contributions to
recruiters’ selection decisions after the interview. Statistical significance is important for
research investigations, and the results of this study were complicated by the
multicollinearity of the fit variables. Practical significance, however, is necessary to make
persuasive arguments to the audiences most affected by the implications: organizations,
recruiters, and applicants. Given the results o f the present study, one could hardly make
an empirically-based case for recommending to organizations that they spend considerable
time or money on recruiting methods which concentrate specifically on identifying
63
Reproduced with permission of the copyright owner. Further reproduction prohibited without permission.

applicants whose values are most similar to their own. According to the current findings,
there is little justification for department heads, team leaders, and other group supervisors/
managers who serve as recruiters for their own groups to expend their energy in the initial
recruiting interview toward searching out those potential employees whose values are
congruent with the rest of the group. And for applicants looking for yet another edge in
the recruiting interview, the best advice is still to highlight any background and experience
relevant to the prospective job.
Although this study contributes little in the way of solid practical implications for
initial recruiting interviews, it does offer direction for research in related areas.
Specifically, new investigations should move beyond the initial interview and concentrate
on evaluations of value congruence and P-O and P-G fit within later stages of the selection
process, such as the round of second interviews often conducted during a site visit to the
company. One limitation of this study is that it captured only one snapshot of selection as
a whole, and the information was gathered early in the process. For this sample, following
the resume screening, the recruiting interview was the first opportunity for recruiters to
meet applicants face-to-face and attempt to determine if applicant qualifications satisfied
job requirements. Such interviews are intended to narrow down the field of applicants to
be considered for further review; very infrequently are job offers made after only one
interview. Even for positions for which one round of interviews was sufficient, thirty-
minute interactions may not have allowed sufficient time for recruiters to assess
applicants’ work values as well as their qualifications. Many organizations surveyed invite
a select group of applicants back to the company for site visits and additional interviews
before making job offers. It is possible that P-J fit is determined primarily from resume
64
Reproduced with permission of the copyright owner. Further reproduction prohibited without permission.

screening and the campus recruitment process and that P-G and P-O fit play a larger role
in the follow-up interviews, an idea also posited by Adkins et aL (1994). Future research
should address the perceptions of interviewers and other selection decision-makers closer
to the job-offer stage of the selection process.
Research on fit with groups and organizations in terms of value congruence should
not be limited to further investigation of the selection process only but also look at the
impact of fit on criteria after applicants have accepted employment. Variables such as
performance, tenure, extra-role behaviors, and rate of socialization within the group and
the organization should be examined as welL Chatman’s (1989) model of person-
organization fit, for example, predicted tenure and extra-role behaviors as possible
individual outcomes of P-O fit. New employees whose values are similar to the group or
organization may choose to remain employed there longer. Although Chatman’s (1991)
study did not find a significant relationship between employees’ initial P-O fit and
turnover, there was a significant correlation found between P-O fit at 10-12 months
employment with the company and departures up to 2.5 years later. Additionally, a new
employee’s rate of socialization into, or acceptance by, a group or organization may be
affected by others’ perceptions of the employee’s values. Socialization is an important
process during which a new employee becomes familiar with the norms, expected
behaviors, and social knowledge that allows him or her to participate as a member of the
group or organization.
Performance, on the individual, group, and organizational level, is probably the
variable of greatest interest to applied research and models should incorporate known,
measurable operationalizations of performance whenever it is feasible. There is some
65
Reproduced with permission of the copyright owner. Further reproduction prohibited without permission.

evidence that value congruence and endorsement of an organization’s core values predict
business unit performance. Shepherd’s (1997) organizational case study indicated that
congruence between individual and organization core values, as well as individual
endorsement of the core values, contribute significantly to unit performance in terms of
return on net assets, manufacturing quality, turnover, and sales growth. Future research
examining fit should develop and test models to predict performance outcomes that have
importance and implications in “real world” applications.
The outcomes of this research are supported by a number of strengths in the study
design. Data were collected at different time intervals, up to three months between
recruiters indicating their perceptions of group/organizational values and their assessment
of applicant values. Perceptions of applicant values, KS As, P-J, P-G, and P-O fit, and
recruiter selection decisions were assessed shortly after the interviews were completed.
External generalizability was provided by the use of 1) a wide variety of organizations,
industries, and job positions, 2) actual recruiters, with their range of experience, training,
and tenure with the companies, and 3) actual job applicants, with their range of
educational backgrounds and qualifications. The model also specified the use of recruiter
perceptions, rather than applicant self-assessments, following the suggestions by earlier
researchers (Cable & Judge, 1995) who found that perceived value congruence was a
better predictor of fit than actual value congruence.
Additionally, this study incorporated interview outcomes couched in perceptual
rather than objective terms, such as the number of actual second interviews or job offers.
Although practical application calls for more concrete, “countable” numbers, subjective
items were most appropriate in a study of this kind. First of all, as mentioned previously,
66
Reproduced with permission of the copyright owner. Further reproduction prohibited without permission.

this research focused solely on the first round of interviews. Several factors can inpact
final selection decisions, such as the economic capacity for the organizations to extend
invitations for site visits or make job offers (Le. hiring freezes). Fit at the initial stages of
recruiting is not expected to explain a large proportion of the variance in the final hiring
decision; the model investigated here was not designed longitudinally to include multiple
stages in the selection process. Secondly, perceptual data provide significant insight into
what information may be used to connect the initial interview stage to a second interview
stage. Recruiters in this sample perceived themselves as having a great deal of influence
on the final selection decisions (M = 6.19 on scale of 1 to 7), and past research has
indicated that recruiter perceptions of applicant employability have been shown to predict
actual invitations for second interviews (Adkins et aL, 1994).
Finally, this study successfully applied Edwards’ polynomial regression and
response surface techniques in the area of P-G and P-O fit. Edwards and his colleagues
have used empirical data to support this alternative approach to congruence indices
(Edwards, 1993, 1994; Edwards & Parry, 1993; Edwards & Van Harrison, 1993).
Kristof-Brown and Stevens (1996) employed similar methods in predicting satisfaction
and individual contributions from work value congruence. However, this is the first
application of higher-order terms in regression equations and their related three-
dimensional representations in the literature on fit and selection. The results provide
evidence that Edwards’ methods may be useful and valid in additional studies of
congruence.
This research is not without its limitations. In addition to the “snapshot” design
already addressed, a few methodological biases may have played a hand in affecting the
67
Reproduced with permission of the copyright owner. Further reproduction prohibited without permission.

results. Common method bias from collecting all of the data by survey format from a
single, though large, sample of individuals is one source of concern, and likely contributed
to the high multicollinearity among recruiter perceptions of applicant, group, and
organization values and among P-J, P-G, and P-O fit. However, the use of these self-
report measures was necessary to capture the recruiter perceptions with strong predictive
capacity. After all, the model is designed around what is believed to occur in practice: the
recruiter ratings play a major part in determining which, if any, applicants move along to
the next stage in the selection process. To reduce the effect of common method bias,
future studies should consider incorporating responses from multiple raters on a single
applicant and including more objective data as predictors and criteria. The use of these
different sources would be facilitated by research focusing on later stages of the selection
process or during actual employment, whereas this study centered solely on recruiter
perceptions.
Another issue is that of recruiter errors such as halo effect, order effect of
applicants seen, and rating biases. There was evidence of ceiling effects in recruiter
perceptions of applicant, group, and organization values decisions (Ms ranged from 4.651
to 5.888 on a scale of I to 7, with SDs of .640 to 1.065) as well as in perceptions of fit
and the selection decisions (Ms ranged from 4.720 to 4.919 on a scale of I to 7, with SDs
of 1.482 to 1.892). Such a small range of responses in predictor variables restricts the
amount of variance that can be explained in the criteria. Additionally, because recruiters
were given the questionnaires at the beginning of the recruiting day and allowed to
complete them on whichever applicants they preferred, it is possible that recruiters
responded differently about applicants seen later in the day by comparing them to
68
Reproduced with permission of the copyright owner. Further reproduction prohibited without permission.

applicants interviewed earlier. Although recruiters were encouraged to answer the items
as soon after seeing an applicant as possible and were requested to complete forms on a
range of good to poor applicants, such control within the study was not possible, and so
their effects could not be estimated. A third problem could have affected the results -
recruiter confirmatory behavior within the interviews. For the most part, recruiters
reported that they were highly involved in resume screening (M = 6.156, 7-point scale)
and had access to application information. Research has suggested that recruiters’
positive first impressions, based on application blank and test score information, leads to
showing positive regard for applicants, “selling” the company, and gathering less
information from applicants, as well as more confident and effective applicant behavior
(Dougherty, Turban & Callender, 1994). Favorable recruiter pre-interview impressions
are also related to favorable post-interview impressions of applicant qualifications and
better applicant performance in the interview (Macan & Dipboye, 1990). No data were
collected in the present study on the first impressions of the recruiters, so this possibility
could not be explored. Future research should consider these recruiter rating biases in
their design.
An additional point deserves special note: this exploratory model is based on
several assumptions, two of which are 1) the uni-directional relationships between value
congruence and P-O and P-G fit and 2) similarly uni-directional relationships of P-J, P-G,
and P-O fit ratings with recruiter selection decisions. Because the ratings of applicant
values and applicant fit were measured at the same time, it is possible that recruiters
perceived applicant values as congruent with the group or organization because they
responded with a high P-G or P-O fit rating — a relationship in the opposite direction than
69
Reproduced with permission of the copyright owner. Further reproduction prohibited without permission.

was predicted. However, this is unlikely because many of the recruiters ofFered their
perceptions of the group and organization at an earlier data collection time and probably
did not remember how they responded to a 48-item survey up to three months prior to the
interview. Regarding the second assumptions, recruiters could have made fit ratings as
justifications for their selection decisions. Although the decision items were listed last on
the questionnaire, all the fit ratings were measured at the same time and recruiters could
have answered the items out of order. Given the ceiling effects and multicollinearity
problems with all the variables involved, it would be difficult to tell if the relationship
between fit ratings and selection decisions was bi-directionaL
This model also ignores applicant involvement such as impression management in
the recruiting interview. Stevens and Kristof (1995) discovered that applicants used
techniques like self-promotion to control the images they presented to interviewers and
that such tactics predicted interviewer evaluations and site visits. It is possible that
applicants who are capable of detecting and reacting to recruiter cues about group or
organizational values effectively use impression management to affect recruiter value
assessments. The measurement of applicant behavior in the interview was outside the
scope of this project but would make for interesting future research.
In conclusion, the model presented in this study focused on recruiter perceptions in
the recruiting interview. Applicant qualification match with job requirements strongly
predicted person-job fit, which in turn predicted recruiter selection decisions. Person-
organization and person-group fit added statistical but little practical significance. Work
values of achievement, fairness, honesty, and concern for others proved useful in
predicting applicant fit with organizations and with specific groups such that value
70
Reproduced with permission of the copyright owner. Further reproduction prohibited without permission.

congruence between applicants and organizations significantly predicted P-O fit and value
congruence between applicants and groups likewise predicted P-G fit. Polynomial
regression analysis allowed for the relaxation of traditional constraints, and intensive
interpretation of the relationships between applicants, organizations/groups, and
perceptions of fit was facilitated by three-dimensional response surfaces. Future research
should move beyond the recruiting interview and attend to the importance of values and
P-O and P-G fit in later stages of the selection process and subsequent employment.
Studies in the area of fit should also take into account the possibility that there may
be fewer “true” organizational recruiters conducting campus interviews. As evidenced
here, the vast majority of applicants who were seeking employment participated in
interviews conducted by the supervisors/managers or other members of specific groups.
This difference from previous studies within the literature was unexpected — it could have
been idiosyncratic or the beginning of a trend. Researchers should take note of the
primary organizational roles of recruiters within their samples and carefully consider the
implications of those roles within research models.
71
Reproduced with permission of the copyright owner. Further reproduction prohibited without permission.

References
Adkins, C.L., Russell, C.J., & Werbel, J.D. (1994). Judgments of fit in the selection process: The role of work value congruence. Personnel Psychology. 47. 605- 623.
Bowen, D.E., Ledford, G.E., & Nathan, B.R. (1991). Hiring for the organization, not the job. Academy of Management Executive. 5. 35-51.
Boxx, W.R., Odom, R.Y., & Dunn, M.G. (1991). Organizational values and value congruency and their impact on satisfaction, commitment, and cohesion: An empirical examination within the public sector. Public Personnel Management. 20. 195-205.
Bretz, R.D., Jr., & Judge, T.A. (1994). Person-organization fit and the theory of work adjustment: Implications for satisfaction, tenure, and career success. Journal of Organizational Behavior. 44. 32-54.
Bretz, R.D., Jr., Rynes, S.L., & Gerhart, B. (1993). Recruiter perceptions of applicant fit: Implications for individual career preparation and job search behavior. Journal of Vocational Behavior. 43. 310-327.
Cable, D.M., & Judge, T.A. (1994). Pay preferences and job search decisions: A person-organization fit perspective. Personnel Psychology. 47. 317-348.
Cable, D.M., & Judge, T.A. (1995). The role of person-organization fit in organizational selection decisions. Paper presented at the Academy of Management Annual Meeting, Vancouver, Canada.
Caldwell, D.F., & O’Reilly, C.A. (1990). Measuring person-job fit with a profile comparison process. Journal of Applied Psychology. 75. 648-657.
Caplan, R.D. (1987). Person-environment fit theory and organizations: Commensurate dimensions, time perspectives, and mechanisms. Journal of Vocational Behavior. 31. 248-267.
Cascio, W.F. (1991). Applied psychology in personnel management (4th ed.).New Jersey: Prentice-Hall, Inc.
Chatman, J.A. (1989). Improving interactional organizational research: A model of person-organization fit. Academy of Management Review. 14. 333-349.
Chatman, J.A. (1991). Matching people and organizations: Selection and socialization in public accounting firms. Administrative Science Quarterly. 36. 459-484.
72
Reproduced with permission of the copyright owner. Further reproduction prohibited without permission.

Cleveland, J.N. (1991). Using hypothetical and actual applicants in assessing person-organization fit: A methodological note. Journal of Applied Social Psychology. 2 L 1004-1011.
Cherrington, D.J., & England, J.L. (1980). The desire of an enriched job as a moderator of the enrichment-satisfaction relationship. Organizational Behavior and Human Performance. 25. 139-159.
Cohen, J., & Cohen, P. (1983). Applied multiple regression/correlation analysis for the behavioral sciences (2nd ed.). New Jersey: Lawrence Erlbaum Associates.
Dougherty, T.W., Turban, D.B., & Callender, J.C. (1994). Confirming first impressions in the employment interview: A field study of interviewer behavior. Journal of Applied Psychology. 79. 659-665.
Driskell, J.E., Hogan, R., & Salas, E. (1987). Personality and group performance. In Hendrick, C. (Ed.), Review of personality and social psychology. (Vol. 9, pp. 91-112). Beverly Hills: Sage.
Edwards, J.R. (1991). Person-job fit: A conceptual integration, literature review, and methodological critique. International Review of Industrial and Organizational Psychology. 6. 283-357.
Edwards, J.R. (1993). Problems with the use of profile similarity indices in the study of congruence in organizational research. Personnel Psychology. 46. 641-665.
Edwards, J.R. (1994). The study of congruence in organizational behavior research: Critique and a proposed alternative. Organizational Behavior and Human Decision Processes. 58. 51-100.
Edwards, J.R., & Parry, M.E. (1993). On the use of polynomial regression equations as an alternative to difference scores in organizational research. Academy of Management Journal. 36. 1577-1613.
Edwards, J.R., & Van Harrison, R. (1993). Job demands and worker health: Three-dimensional reexamination of the relationship between person-environment fit and strain. Journal of Applied Psychology. 78. 628-648.
French, J.R.P. Jr., Rogers, W., & Cobb, S. (1974). Adjustment as person- environment fit. In Coelho, G.V.M. Hamburg, D.A., and Adams, J.E. (Eds.), Coping and adaptation, (pp. 316-333) New York: Basic Books.
Gatewood, R.D., & Feild, H.S. (1994). Incorporating job analysis results in selection measures. Human Resource Selection. 3rd Edition. Harcourt Brace College Publishers.
73
Reproduced with permission of the copyright owner. Further reproduction prohibited without permission.

Glick, W.H. (1985). Conceptualizing and measuring organizational and psychological climate: Pitfalls in multilevel research. Academy of Management Review. 10* 601-616.
Haythom, W.W. (1968). The composition of groups: A review of the literature. Acta Psvchologica. 28. 97-128.
Hicks, L.E. (1970). Some properties of ipsative, normative, and forced-choice normative measures. Psychological Bulletin. 74. 167-184.
Hoerr, J. (1989, July 10). The payoff from teamwork, Business Week. 56-62.
Holland, J.L. (1973). Making vocational choices: A theory of careers. Englewood Cliffs, NJ: Prentice-HalL
Jackson, S.E., May, K.E., & Whitney, K. (1995). Understanding the dynamics of diversity in decision-making teams. In Guzzo, R. and Salas, E. (Eds.), Team effectiveness and decision making in organizations (pp. 204-26 U. San Francisco: Jossey- Bass.
Klimoski, R., & Jones, R.G. (1995). Staffing for effective group decision making: Key issues in matching people and teams. In Guzzo, R. And Salas, E. (Eds.), Team effectiveness and decision making in organizations (pp. 291-332). San Francisco: Jossey- Bass.
Kristof, A.L. (1996). Person-organization fit: An integrative review of its conceptualizations, measurement, and implications. Personnel Psychology. 49. 1-49.
Kristof-Brown, A., & Stevens, C.K. (1996, April). Person-group fit: Effects on group members’ satisfaction and contributions to the group. Paper presented at the annual meeting of the Society for Industrial and Organizational Psychology, San Diego, California.
Macan, T.H., & Dipboye, R.L. (1990). The relationship of interviewers’ preinterview impressions to selection and recruitment outcomes. Personnel Psychology. 43* 745-768.
Meglino, B.M., Ravlin, E.C., & Adkins, C.L. (1989). A work values approach to corporate culture: A field test of the value congruence process and its relationship to individual outcomes. Journal of Applied Psychology. 74.424-432.
Mount, M.K., & Muchinsky, P.M. (1978). Person-environment congruence and employee job satisfaction: A test of Holland’s theory. Journal of Vocational Behavior. 13, 84-100.
74
Reproduced with permission of the copyright owner. Further reproduction prohibited without permission.

Muchinsky, P.M., & Monahan, C.J. (1987). What is person-environment congruence? Supplementary versus complementary models of fit. Journal of Vocational Behavior. 31. 268-277.
Navarick, D.J., & Fantino, E. (1974). Stochastic transitivity and unidimensional behavior theories. Psychological Review. 81. 426-441.
Neter, J., Wasserman, W., & Kutner, M.H. (1989). Applied linear regression models. Second Edition. Homewood, EL: Irwin.
O’Reilly, C.A., & Chatman, J. (1986). Organizational commitment and psychological attachment: The effects of compliance, identification, and internalization on prosocial behavior. Journal of Applied Psychology. 71.492-499.
O’Reilly, C.A., Chatman, J., & Caldwell, D.F. (1991). People and organizational culture: A profile comparison approach to assessing person-organization fit. Academy of Management Journal. 34. 487-516.
Payne, J.W., Bettman, J.R., & Johnson, E.J. (1993). The use of multiple strategies in judgment and choice. In Castellan Jr., N.J. (Ed.), Individual and group decision making (pp. 19-39). New Jersey: Lawrence Earlbaum Associates, Publishers.
Posner, B.Z. (1992). Person-organization values congruence: No support for individual differences as a moderating influence. Human Relations. 45. 351-361.
Posner, B.Z., Kouzes, J.M., & Schmidt, W.H. (1985). Shared values make a difference: An empirical test of corporate culture. Human Resource Management. 24. 293-309.
Ravlin, E.C., & Meglino, B.M. (1987). Effect of values on perception and decision making: A study of alternative work values measures. Journal of Applied Psychology. 72. 666-673.
Ravlin, E.C., & Meglino, B.M. (1987). Issues in work value measurement. Research in Corporate Social Performance and Policy. 9. 153-183.
Ravlin, E.C., & Meglino, B.M. (1989). The transitivity of work values: Hierarchical preference ordering of socially desirable stimuli Organizational Behavior and Human Decision Processes. 44. 494-508.
Rice, R.W., McFarlin, D.B., & Bennett, D.E. (1989). Standards of comparison and job satisfaction. Journal of Applied Psychology. 74 .591-598.
Rokeach, M. (1973). The nature of human values. Free Press: New York.
75
Reproduced with permission of the copyright owner. Further reproduction prohibited without permission.

Rynes, S.L., & Boudreau, J.W. (1986). College recruiting in large organizations: Practice, evaluation, and research implications. Personnel Psychology. 39. 729-757.
Rynes, S.L., & Gerhart, B. (1990). Interviewer assessments of applicant “fit”: An exploratory investigation. Personnel Psychology. 43. 13-35.
Schneider, B. (1987). The people make the place. Personnel Psychology. 40. 437-453.
Schneider, B., Goldstein, H.W., & Smith, D.B. (1995). The ASA framework: An update. Personnel Psychology. 48. 747-773.
Shaw, M. (1981). Group dynamics: The psychology of small group behavior. Third Ed. McGraw-Hill: New York.
Shepherd, W. (1997, April). Linking organizational values and measures of business unit performance. Paper presented at the annual meeting of the Society for Industrial and Organizational Psychology, Saint Louis, Missouri.
Stevens, C.K, & Kristof, A.L. (1995). Making the right impression: A field study of applicant impression management during job interviews. Journal of Applied Psychology. 80. 587-606.
Vancouver, J.B., & Schmitt, N.W. (1991). An exploratory examination of person- organization fit: Organizational goal congruence. Personnel Psychology. 44. 333-352.
76
Reproduced with permission of the copyright owner. Further reproduction prohibited without permission.

Appendix A
Survey Questions for Interviewers
1. What is your name?2. What is the name of your organization?3. In what type of industry is your organization involved (e.g. service, manufacturing,
etc.)?4. What is your job title?5. How long have you been employed with your present organization?6. How long have you been in your current job?7. How familiar are you with the requirements of the specific job for which you are
recruiting (Le. how well do you know what kinds of qualifications, competencies, skills, abilities are necessary for applicants to have)? (1 = not at all familiar, 7 = very familiar)
8. How familiar are you with the work values of the group in which the specific job is located (Le. how well do you know how much that particular team, department, location, etc. emphasizes work values such as achievement, fairness, honesty, and concern for others)? (I = not at all familiar, 7 = very familiar)
9. How familiar are you with the work values of your organization as a whole? (I = not at all familiar, 7 = very familiar)
10. Do you use any kind of interview form when interviewing candidates?11. Is your organization presently able to extend any job offers at this time?12. Was recruiting made part of your responsibilities by someone else, or did you
volunteer to serve as a recruiter?13. How long have you been recruiting/how much experience do you have as an
interviewer?14. To what extent are you involved in any pre-selection (e.g. resume screening) of
candidates to be interviewed? (I = not at all, 7 = great extent)15. How much influence do you have in the final selection decision? (1 = no
influence, 7 - great deal o f influence)
77
Reproduced with permission of the copyright owner. Further reproduction prohibited without permission.

Appendix B
Survey Questions Regarding Job Requirements and Applicant Qualifications
Please think o f the job fo r which you are interviewing this applicant. In the spaces provided below, please indicate the top five (5) qualifications (e.g. competencies, skills, abilities, etc.) that are essential to this job.
Job:__________________________________
Necessary qualifications:
1.
2.
3.
4.
Now, please rate how well you think the candidate fulfills these requirements. Please circle the number that best represents your opinion regarding the applicant.
How well does the applicant meet qualification #1 (listed above)?(I = poor match; 7 = good match)
How well does the applicant meet qualification #2 (listed above)?(I = poor match; 7 = good match)
How well does the applicant meet qualification #3 (listed above)?(I = poor match; 7 - good match)
How well does the applicant meet qualification #4 (listed above)?(I = poor match; 7 = good match)
How well does the applicant meet qualification #5 (listed above)?(I = poor match; 7 = good match)
78
Reproduced with permission of the copyright owner. Further reproduction prohibited without permission.

Appendix C
Validity and Reliability of Work Values Measures
Two pilot studies were conducted to compare several different work value
measures and to determine, by investigating reliability and construct validity, which of
them would be most appropriate for inclusion in the present research. The investigation
began with a focus on a commonly used work values measure, the Comparative Emphasis
Scale (CES). This measure assesses the relative importance of four work values:
achievement, fairness, honesty/integrity, and helping/concern for others (see Ravlin and
Meglino, 1987 for a more complete description of the scale development). Behavioral
statements representing each value are paired with statements from each of the other three
values a total of four times, so that each value is represented 12 times using different
behaviors. For each of the 24 pairs of statements, respondents are asked to choose the
behavior they think should receive the most emphasis (please see Appendix D for a
complete list of behavioral statements). By using this forced-choice technique, the CES
provides an ipsative rank ordering of the four values for each individual. This method is
consistent with the conceptualization of individual values as hierarchically organized
(Rokeach, 1973), and addresses the issue of social desirability of values by requiring
respondents to choose between equally desirable alternatives.
One aim of the first pilot study was to further investigate the idea that individuals
have a hierarchy of work values. This was accomplished using a test of logical preference
ordering. The transitivity postulate states that if Value A is selected as more important
than Value B, and Value B is selected as more important than Value C, then Value A must
also be selected as more important than Value C. Only if this pattern exists can it be
79
Reproduced with permission of the copyright owner. Further reproduction prohibited without permission.

claimed that an individual has value preferences in a logical hierarchy. However, over
multiple trials or choices, individuals may not show this pattern of complete consistency.
Therefore, the principle of weak stochastic transitivity is also considered: the probability
that Value A is selected over Value B > .5, the probability that Value B is selected over
Value C > .5, and the probability that Value A is selected over Value C > .5. Please refer
to Ravlin and Meglino (1987, 1989) and Navarick and Fantino (1974) for further
explanations of the transitivity concept.
A second aim of the first pilot study was to demonstrate construct validity for the
CES. Using a win-index (the number of times one value is chosen over another), the four
values can be placed in a ranked order. This order can then be compared to other
measures designed to obtain rankings, such as listing the four values and their definitions
and asking respondents to simply rank them or to distribute a fixed number of points
among them. Partial evidence of construct validity for the CES would be shown by strong
relationships between the value rankings obtained through the CES and the value rankings
obtained through the other two scales; such strong relationships would be indicative of
convergent validity.
Pilot Study 1
This was a partial replication of a validation study conducted by Ravlin and
Meglino (1987) during the construction of the CES. Fifty-seven undergraduate students
in a psychology measurement course participated in the study. They completed the CES,
the point assignment scale, and the simple ranking scale. In analyzing the CES data for
transitivity, we found that fifty-two individuals (91.2%) demonstrated at least weak
stochastic transitivity, but only six individuals (10.5%) were totally transitive. These
80
Reproduced with permission of the copyright owner. Further reproduction prohibited without permission.

results are fairly consistent with those found by Ravlin and Meglino (1987); however, they
are not sufficiently convincing in support of the notion of hierarchical work value
ordering.
In looking at the validity of the CES data, intrasubject rank-order correlations
were calculated between the CES value ranking, the simple ranking, and the ranking
derived from the point assignment measure. Each correlation was coded for strength
(strong £ .6, weak s .2) and expected (positive) versus opposite (negative) direction. As
expected, 88% of the correlations between the simple ranking and point assignments were
strong and in the expected direction. However, only 41% of the correlations between the
CES ranks and the simple ranking were strong and positive. (The same result was found
for comparisons between the CES and point assignments.)
The results of the first pilot study indicated evidence of some logical preference of
values but were not encouraging in terms of construct validity. Due to many problems
associated with scales that are ipsative in nature (Edwards, 1993), a Likert version of the
forced-choice CES was developed (Ravlin & Meglino, 1987). The revised scale contains
the 48 behavioral statements representing achievement, helping and concern for others,
fairness, and honesty. Re-gradation of the anchors allow respondents to discriminate
more finely at the upper end of the scale, addressing the possibility of socially desirable
responses in the Likert format. Each item of the Likert version is rated on a 7-point scale
with the following anchors: 1 = not often, 2 = now and then, 3 = sometimes, 4 = rather
frequently, 5 = very often, 6 = continually, and 7 = always (Kristof-Brown & Stevens,
1996). Pilot study 2 was designed to compare scores from the CES, simple ranking, and
the Likert version of the CES to investigate construct validity and establish reliability.
81
Reproduced with permission of the copyright owner. Further reproduction prohibited without permission.

Pilot Study 2
Undergraduate students in a psychology measurement course (different students
and course from Study 1) completed the CES, simple ranking, and Likert scales. All
measures were given on two separate occasions three weeks apart to provide evidence for
test-retest reliability; these are indicated as Time 1 and Time 2. Again, win-indices were
used to set up value rank orders for the CES data. For the Likert scale, responses for the
12 relevant behavioral statements were averaged to provide a single score for each value;
the scores were then rank ordered.
Data from 58 students were available at Time 1, the first data collection,
providing Cronbach’s alphas for the Likert scale values that were satisfactory and very
comparable to Kristof-Brown and Stevens’ (1996) results: honesty (a = .84),
helping/concern for others (a = .92), achievement (a = .85), and fairness (a = .94).
Please refer to Table 11 for a summary of Likert scale reliabilities for Time 1 and Time 2.
Using the earlier coding procedure for the intrasubject rank-order correlations, we
found that 53% of the correlations between the CES and simple ranked data were strong
and in the positive direction; this number rose to 78% when correlations of moderate
strength (between .2 and .6) were included. Between the Likert and simple ranking scale,
52% were positive and strong, 71% including moderate correlations. For the CES and
Likert measures, 57% of the correlations were strong and positive, elevating to 79% when
including the moderate strength correlations.
At Time 2,47 students completed the same measures as before. Cronbach’s
alphas for the Likert scale values were again strong: honesty (a = .91), helping/concern
for others (a = .93), achievement (a = .91), and fairness (a = .96). In examining the
82
Reproduced with permission of the copyright owner. Further reproduction prohibited without permission.

Table 11
Descriptive Statistics and Reliabilities of Likert Value Scales
Value Mean SDCronbach’s
AlphaTest-RetestReliability
Fairness Time 1 5.61 1.06 .94
.84
Time 2 5.51 .95 .96
Honesty Time 1 5.78 .79 .84
.86
Time 2 5.77 .85 .91
Helping/ Concern
Time 1 4.90 .93 .92
.85
Time 2 4.93 1.02 .93
Achievement Time 1 5.66 .77 .85
.79
Time 2 5.62 .78 .91
intrasubject rank-order correlations, we found that 34% of the correlations between the
CES and simple ranked data were strong and in the positive direction; this number rose to
64% when correlations of moderate strength (between .2 and .6) were included. Between
the Likert and CES, 50% were positive and strong, 62% including moderate correlations.
For the CES and simple ranking scales, 74% of the correlations were strong and positive,
elevating to 87% when including the moderate strength correlations.
Given this set of results, we surmised that the Likert version of the CES produced
rankings of values most closely resembling those obtained by the simple ranking
procedures. Therefore, we performed additional analyses to provide further support for
its use, rather than the original CES, in the current research. Based on data from the 39
students who participated in both data collection times, test-retest reliabilities for each of
83
Reproduced with permission of the copyright owner. Further reproduction prohibited without permission.

the four value scales were high: fairness = .84, honesty = .86, helping/concern for others =
.85, and achievement = .79. To confirm that the Likert version of the CES was assessing
four values, we conducted principal components factor analyses, forcing the four factors
we believed would represent the work values, with oblique rotation to allow the factors to
be correlated. At both Time 1 and Time 2, the 48 behavioral statements loaded on the
factors as expected. The factors were not highly intercorrelated at either time of data
collection. Please refer to Tables 12 and 13 for results obtained at Time 2; Time 1 results
are comparable.
An important question remains with the choice to use the Likert measure rather
than the forced-choice CES: what about social desirability bias? The ipsative measure was
originally developed to reduce the possibility of individuals responding that all the values
were similarly important by forcing them to choose between equally desirable behavioral
statements. However, even this design may not completely eliminate the bias.
Considering the evidence that many individuals are not totally transitive in their value
preferences, this allows for values to be “tied” for the same rank. If an individual responds
to the CES in such a way that two values have the same win-indices, placing them at the
same rank, we have no way of knowing if that individual either has no preference for one
value over another or places the same importance on both of the values. And, since the
CES only allows for ordinal data, there is no way to tell if the values are similarly very
important or not important at all Hicks (1970) concluded that “ipsative tests should be
used only in situations where it has been demonstrated th a t... an ipsative format
successfully diminishes bias and increases validity to a greater extent than do non-ipsative
controls for bias” (p. 181). It does not appear that the CES satisfies that condition, and
84
Reproduced with permission of the copyright owner. Further reproduction prohibited without permission.

given the evidence in support of the Likert version, the latter measure was chosen for use
in the present study.
A final note: after reviewing the results from the two pilot studies, the reader might
conclude that the simple ranking measure should be used. Indeed, it was the standard by
which the CES and Likert were compared to show evidence of convergent validity. It is
short, easy to complete, and takes little time. However, with ordinal data, there is a
significant loss of information that is critical to congruence research. Ranking of values
fails to reflect the magnitude of the difference between the values, and so are not ideal
measures in the evaluation of fit (Edwards, 1993).
85
Reproduced with permission of the copyright owner. Further reproduction prohibited without permission.

Table 12
Factor Loadings for Likert Value Scales: Pilot Study 2. Time 2
Item Fairness Achievement Honesty Helping/Concern
Fair 22 .88207 .28679 .27812 .50543Fair 43 .87256 .23874 .27389 .49357Fair 42 .86911 .22398 .43479 .40986Fair 26 .86752 .27039 .24885 .41439Fair 31 .86623 .24120 .23845 .44614Fair 34 .86393 .33872 .27471 .34768Fair 47 .86119 .21786 .33500 .48964Fair 15 .85040 .15942 .29628 .43553Fair 23 .81100 .37293 .15467 .28494Fair 9 .78153 .11472 .14354 .36391Fair 2 .76566 .17502 .23593 .43594Hon 18 .57926 .40337 .51599 .17184Fair 6 .57524 .14549 .20887 .38163Con 45 .32303 .11969 .22011 .18868
Ach 28 .22500 .85737 .21731 .22177Ach 40 .31138 .81827 .18531 .37060Ach 44 .09268 .80252 -.16264 .05730Ach 20 .04998 .78489 -.17991 -.05957Ach 29 .10838 .78209 .12784 .03485Ach 37 .34238 .77324 .22585 .20434Ach 24 .33531 .77256 .21008 .17648Ach 17 .08503 .72910 -.01396 .04096Ach 1 .31778 .57977 .29306 -.02203Ach 8 .38320 .56278 .09362 .25360Ach 11 .28282 .54184 .34260 .14287
(table con’d)
86
Reproduced with permission of the copyright owner. Further reproduction prohibited without permission.
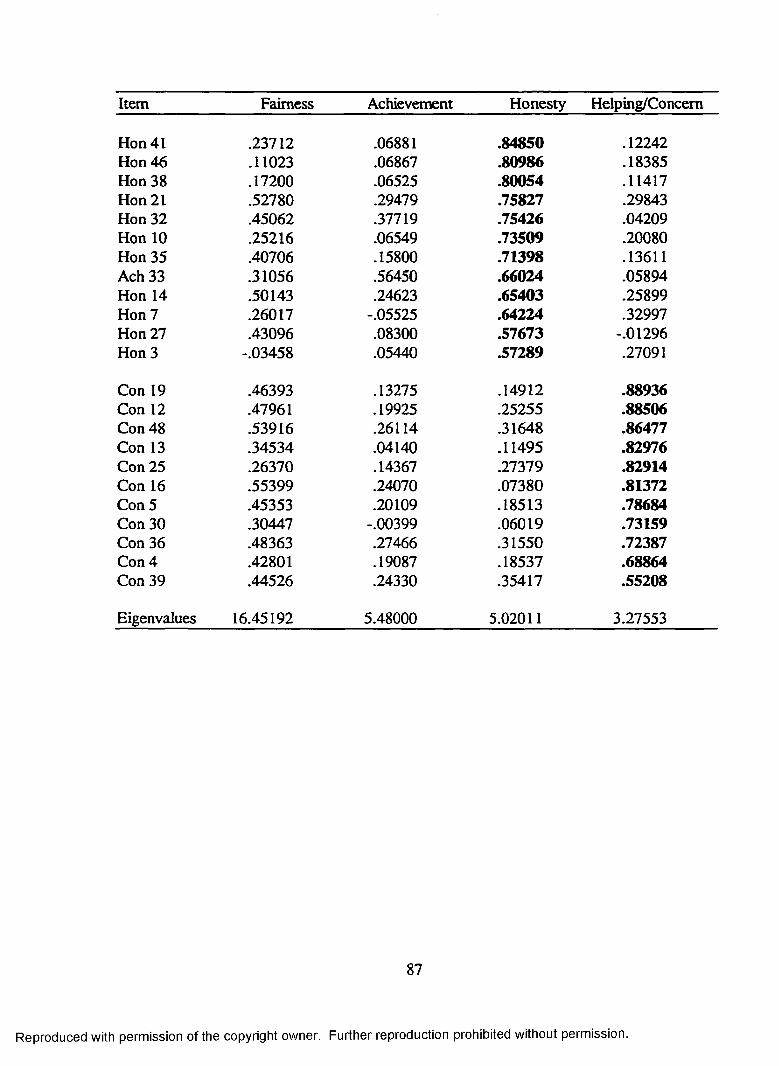
Item Fairness Achievement Honesty Helping/Concern
Hon 41 .23712 .06881 .84850 .12242Hon 46 .11023 .06867 .80986 .18385Hon 38 .17200 .06525 .80054 .11417Hon 21 .52780 .29479 .75827 .29843Hon 32 .45062 .37719 .75426 .04209Hon 10 .25216 .06549 .73509 .20080Hon 35 .40706 .15800 .71398 .13611Ach 33 .31056 .56450 .66024 .05894Hon 14 .50143 .24623 .65403 .25899Hon 7 .26017 -.05525 .64224 .32997Hon 27 .43096 .08300 .57673 -.01296Hon 3 -.03458 .05440 .57289 .27091
Con 19 .46393 .13275 .14912 .88936Con 12 .47961 .19925 .25255 .88506Con 48 .53916 .26114 .31648 .86477Con 13 .34534 .04140 .11495 .82976Con 25 .26370 .14367 .27379 .82914Con 16 .55399 .24070 .07380 .81372Con 5 .45353 .20109 .18513 .78684Con 30 .30447 -.00399 .06019 .73159Con 36 .48363 .27466 .31550 .72387Con 4 .42801 .19087 .18537 .68864Con 39 .44526 .24330 .35417 .55208
Eigenvalues 16.45192 5.48000 5.02011 3.27553
87
Reproduced with permission of the copyright owner. Further reproduction prohibited without permission.

Table 13
Intercorrelations Between Likert Scale Value Factors: Pilot Study 2. Time 2
Fairness Achievement Honesty
Achievement .27 — —
Honesty .30 .14 --
Helping/Concern .39 .12 .18
88
Reproduced with permission of the copyright owner. Further reproduction prohibited without permission.

Appendix D
Behavioral Statements on CES and Likert Scales
1. Taking care of all loose ends on an assignment or project2. Being impartial in dealing with others3. Taking actions which represent your true feelings4. Trying to avoid hurting other people5. Encouraging someone who is having a difficult day6. Considering different points of view before taking action7. Speaking your mind even when your views may not be popular8. Working to meet work requirements even when your personal schedule must be
rearranged9. Making decisions which are fair to all concerned10. Expressing your true opinions when asked11. Continuing to work on a problem until it is resolved12. Trying to help a fellow worker through a difficult time13. Trying to reduce a friend’s burden14. Admitting an error and accepting the consequences15. Being impartial in judging disagreements16. Helping others on difficult projects or assignments17. Taking on additional tasks to get ahead or gain recognition18. Admitting to making a mistake rather than covering it up19. Offering help to others when they are having a tough time20. Doing whatever work is required to advance in your career21. Always being truthful in dealing with others22. Taking steps to be sure that everyone has an equal opportunity at work23. Judging people fairly based on their abilities rather than only on their personalities24. Seeking out all opportunities to learn new skills25. Trying to be helpful to a friend26. Being sure that work assignments are fair to everyone27. Refusing to take credit for ideas of others28. Maintaining the highest standard for your performance29. Being determined to be the best at your work30. Trying not to hurt a friend’s feelings31. Trying to bring about a fair solution to a dispute32. Admitting responsibility for errors made33. Finishing each job you start even when others do not34. Making sure that rewards or credit are given in the fairest possible way35. Refusing to tell a lie to make yourself look good36. Helping those who are worried about things at work37. Trying as hard as you can to learn as much as possible about your job38. Taking a stand for what you believe in39. Sharing information and ideas which others need to do their work
89
Reproduced with permission of the copyright owner. Further reproduction prohibited without permission.

40. Always setting high performance goals for yourself41. Refusing to do something you think is wrong42. Providing fair treatment for everyone43. Allowing each employee to have an equal chance to get rewards44. Taking on more responsibility to get ahead in your career45. Correcting others’ errors without embarrassing them46. Holding true to your convictions47. Providing fair treatment for each person48. Lending a helpful hand to someone having difficulty
90
Reproduced with permission of the copyright owner. Further reproduction prohibited without permission.

Appendix E
Mathematical Rationale for the Use of Edwards’ Polynomial Regression Procedure
Using profile similarity indices (PSIs) as predictors impose a highly restrictive set
of constraints on the coefficients relating the measures to the outcome. This is
demonstrated through examination of the following regression equations:
(1) Z = b0 + bl ( X - Y ) + e
This equation represents the algebraic difference where X,Y are component measures, Z is
outcome measure, and e is a random disturbance term. The positive sign on bi indicates
that difference between X and Y is positively related to Z.
(2) Z = bo + b,X - bt Y + e
The expansion of equation 1 implies a positive relationship between X and Z and a
positive relationship between Y and Z. It is constrained by coefficients on X and Y that
are equal in magnitude but opposite in sign.
(3) Z = b0 + blX + b2Y + e
This equation relaxes the constraints on equation 2, allowing the coefficients on X and Y
to take whatever values maximize prediction of Z.
(4) Z = bo + bi (X - Y)2 + e
This represents the squared difference; the positive sign on bi indicates that Z increases as
the difference between X and Y increases in either direction.
(5) Z = bo + b,X2 - 2btXY + btY2 + e
The expansion of equation 4 implies positive coefficients that are equal in magnitude for
X2 and Y2 and a negative coefficient that is twice as large for XY. It also shows that
91
Reproduced with permission of the copyright owner. Further reproduction prohibited without permission.

equation 4 contains curvilinear and interactive terms without appropriate lower-order
terms.
(6) Z = bo + biX + bjY + bjX2 + b4XY + b5Y2 + e
This equation is an expansion of the previous one and adds lower-order terms. It relaxes
the constraints imposed by the squared difference: that the coefficient of X is 0, the
coefficient of Y is 0, the coefficients on X2 and Y2 are equal, and the coefficients on X2,
XY, and Y2 sum to 0.
92
Reproduced with permission of the copyright owner. Further reproduction prohibited without permission.

Appendix F
Categories of Recruiter-Specified Job Qualifications
Knowledge/Skill/AhilitvAnalysisAnalyticalApply SkillsAptitudeAttention to Detail Citizenship Communication Skills Competence CreativityDecision Making SkillsDegree (Le. B.S., M.S.)Diplomacy SkillsEducationEfficiencyExperienceFlexibilityFocusGPAHands-onHuman Resources Skills Ingenuity Intelligence Interpersonal Skills Job FitLeadership Skills Management Skills Mechanical Aptitude Methodical Approach Multitasking Skills Negotiation Skills Objectivity Organization Skills Planning Skills Practical Learning Presentation Skills Problem Solving Quick Learner Recruiting Skills Resourceful
Sales Skills Schedule Flexibility Soft Skills Stress Management SkillsTechnical Knowledge Time Management Skills
Other CharacteristicsAction-orientedAggressiveAmbitiousAppearanceAssertiveAttitudeCommitmentCompetitiveConfidentCustomer FocusDedicatedDeterminationDiligenceDriveEnergeticEnthusiasmEthicsFairGoal-orientedHonestyInitiativeInquisitiveIntegrityMotivationOwnershipResponsibilityPersistencePersonalityProactiveQualityRespect DiversityResponsibleRewardRiskTeam-orientedTolerance for ChangeUrgencyValuesWork Ethic
93
Reproduced with permission of the copyright owner. Further reproduction prohibited without permission.

Vita
Dawn Ebe Haptonstahl earned her bachelor of arts degree from The Ohio State
University in June, 1991 and her master of arts degree in psychology from Louisiana
State University in December, 1993. During her graduate career, Ms. Haptonstahl
completed an internship with the Human Resource Development department for
Albemarle Corporation in Baton Rouge, Louisiana, where she evaluated and
implemented changes to a company-wide Performance Improvement Process, facilitated
workshop sessions, and designed and conducted training courses. In her work with SS A
Consultants, Inc., also in Baton Rouge, Ms. Haptonstahl assisted in the development and
administration of work-sample tests, the start-to-finish revision of an existing employee
evaluation system, and the compilation of information to be used in training seminars.
Ms. Haptonstahl has also enhanced her assessment skills through her evaluation of the
cognitive capabilities of young children, adolescents, and adults as part of her
employment with a clinical psychologist.
Ms. Haptonstahl currently resides in Baton Rouge with her husband. Stephen, and
their minilop rabbit, Adeline. Her degree of Doctor of Philosophy in psychology will be
conferred during the L.S.U. spring commencement in May, 1998.
94
Reproduced with permission of the copyright owner. Further reproduction prohibited without permission.

DOCTORAL EXAMINATION AND DISSERTATION REPORT
Candidate: Dawn Ebe Haptonstahl
Major Field: Psychology
Title of Dissertation: Assessing Applicant "Fit" Within the SelectionProcess: Which Interviewer Perceptions Matter?
Approved:
Maj feasor
Graduate SchoolDe<
EXAMINING COMMITTEE:
U M
7\
Date of Kxami nat- i on •
December 10. 1997
Reproduced with permission of the copyright owner. Further reproduction prohibited without permission.

IMAGE EVALUATIONTEST TARGET (Q A -3 )
150mm
IIWIGE. Inc1653 East Main Street Rochester, NY 14609 USA Phone: 716/482-0300 Fax: 716/288-5989
Reproduced with permission of the copyright owner. Further reproduction prohibited without permission.