(asce)0733-9410(1990)116 2(297)
TRANSCRIPT
EVALUATION OF IN SITU PERMEABILITY TESTING METHODS
By Neal Fernuik1 and Moir Haug2
ABSTRACT: A testing program was established to determine the accuracy and efficiency of in situ permeability testing equipment. The sealed single-ring infiltrom-eter, sealed double-ring infiltrometer, and air-entry permeameter were evaluated in this study. The theoretical basis for each of these tests was examined and their testing procedures outlined. The accuracy and ease of use of these devices was demonstrated by full-scale tests under controlled field and laboratory conditions. The field permeability tests were conducted on a residual soil-liner test pad installed at a site near Jamestown, California. The laboratory permeability tests were conducted on a prototype liner composed of uniform Ottawa sand and sodium ben-tonite. This material was mixed, moisture-conditioned, and compacted into reinforced wooden frames. The in situ permeability test results were verified with low-gradient, back-pressure saturated triaxial permeameter tests conducted on undisturbed 101.4 mm (4 in.) cored and remolded samples. This evaluation shows that good agreement can be obtained between in situ field and laboratory triaxial permeability tests results. In addition, changes in hydraulic conductivity of hydrating sand-bentonite with time observed in the in situ tests, closely approximated the results obtained in the triaxial permeability tests. This evaluation also demonstrated that considerable care was required setting up and conducting in situ permeability tests, in order to obtain reliable results.
INTRODUCTION
Regulations by some environmental agencies require in situ measurements of hydraulic conductivity to confirm the competency of soil liners. At present there are no universally recognized standards and little published information on the accuracy of in situ hydraulic conductivity measuring techniques. Day and Daniel (1985) reported considerable variation between field and laboratory hydraulic conductivity values. This conclusion was based on tests carried out on two prototype clay liners using single- and double-ring infiltrom-eters. The variations between the field and laboratory values were attributed primarily to lack of quality control. Daniel and Trautwein (1986) reported the successful measurement of in situ hydraulic conductivity on a compacted landfill cover using a sealed double-ring infiltrometer.
A testing program was established to compare in situ test results of the sealed single-ring infiltrometer (SSRI), the sealed double-ring infiltrometer (SDRI), and the air-entry permeameter (AEP). These infiltrometers and permeameter are used to measure infiltration rate and/or hydraulic conductivity of soils. Infiltration rate is defined by the measurement at which a given volume of water crosses the air-soil interface into a unit area of soil per unit time (Amerman 1983). Infiltration rate depends upon the physical condition of the soil and the hydraulics of water in the profile, both of which may change with time. Hydraulic conductivity k refers to the soil's intrinsic abil-
'Proj. Engr., Thurber Consultants Ltd., Edmonton, Alberta, Canada. 2Prof. and Head, Dept. of Civ. Engrg., Univ. of Saskatchewan, Saskatoon, Sas
katchewan, Canada S7N 0W0. Note. Discussion open until July 1, 1990. To extend the closing date one month,
a written request must be filed with the ASCE Manager of Journals. The manuscript for this paper was submitted for review and possible publication on August 15, 1987. This paper is part of the Journal of Geotechnicat Engineering, Vol. 116, No. 2, February, 1990. ©ASCE, ISSN 0733-9410/90/0002-0297/$1.00 + $.15 per page. Paper No. 24385.
297
J. Geotech. Engrg. 1990.116:297-311.
Dow
nloa
ded
from
asc
elib
rary
.org
by
UN
IVE
RSI
TI
TE
KN
OL
OG
I M
AL
AY
SIA
on
09/0
4/14
. Cop
yrig
ht A
SCE
. For
per
sona
l use
onl
y; a
ll ri
ghts
res
erve
d.
ity to transmit fluid. It is a function of the rate of infiltration, hydraulic gradient, and area, as expressed empirically by Darcy's law for one-dimensional saturated flow (Darcy 1956).
Q = kiA (1)
where Q = the flow rate (cm3/s); / = the hydraulic gradient (dimensionless); and A. = the area of soil being tested (cm2). Hydraulic conductivity can be determined using an infiltrometer or permeameter; however, the hydraulic gradient in Darcy's law must be known or approximated.
The SSRI, SDRI, and AEP were used to measure the in situ hydraulic conductivity of three prototype sand-bentonite liners and a field test pad liner composed of a residual sandy clay. The in situ tests were statistically analyzed and compared with triaxial tests performed in the laboratory on cored and remolded samples. The results of this test program showed that all of the devices evaluated were capable of providing results comparable with triaxial permeameter tests.
DESCRIPTION OF TESTING EQUIPMENT AND PROCEDURES
The primary function of in situ permeability testing is to provide a mechanism for monitoring the quality of liner construction in the field and assessing the design criteria. The objective of this testing is to determine the saturated hydraulic conductivity of soil liners during construction and prior to in-service saturation. Three principal testing devices are currently being used to varying degrees for this purpose and were evaluated in this study. These include the sealed single-ring infiltrometer (SSRI), the sealed double-ring infiltrometer (SDRI), and the air-entry permeameter (AEP). Each of these devices uses different testing procedures and assumptions to determine in situ hydraulic conductivity. The in situ value is then compared to the laboratory design values to provide a measure of quality control in the field.
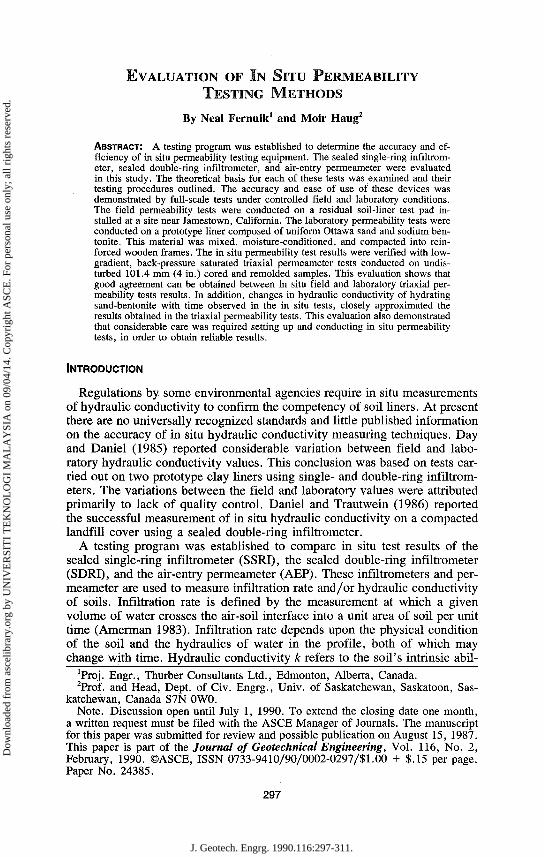
Sealed Single-Ring Infiltrometer The sealed single-ring infiltrometer (SSRI) is a device used to measure
the rate of infiltration (Fig. 1). It can also be used to determine hydraulic conductivity of a soil liner, if the head H and depth of infiltration Lf are known. In this calculation it is assumed that the entire wetted zone between the top of the liner and the wetting front is saturated and that soil suction at this front has no effect on gradient. The justification for this assumption is based on the belief that the influence of soil suction is relatively small in comparison with the pressure head.
Two SSRI's of 268-mm (10.25-in.) and 610-mm (24-in.) diameters, and 210-mm (8.25-in.) and 150-mm (6-in.) in height, respectively, were used in this study. The top of each ring was sealed with a clear removable plexiglass lid. This lid enabled the application of higher heads and visual monitoring of the test.
The SSRI is installed by smoothly jacking the steel ring into the soil or setting into a pre-excavated circular trench. The ring is placed approximately 100 mm (4 in.) into the liner. A narrow zone immediately adjacent to the inside of the ring is trimmed and filled with a bentonitic grout. This prevents escape of water down along the sides and under the ring. A steel plate and loose sand is placed over the test area to prevent erosion of the liner. The
298
J. Geotech. Engrg. 1990.116:297-311.
Dow
nloa
ded
from
asc
elib
rary
.org
by
UN
IVE
RSI
TI
TE
KN
OL
OG
I M
AL
AY
SIA
on
09/0
4/14
. Cop
yrig
ht A
SCE
. For
per
sona
l use
onl
y; a
ll ri
ghts
res
erve
d.
Graduated Cylinder -
Reservoir Supply
Steel Plate_
Bentonitic Grout
_ Loose sand - ^
mmmmmmL
3— Plexiglass lid
-Ring
Wetting Front Soil Liner
FIG. 1. Sealed Single-Ring Infiltrometer (SSRI)
plexiglass lid is bolted to the top of the ring to form a water-tight seal. Soil samples are taken to determine the density and moisture content of the liner. The SSRI is anchored to the liner during testing to maintain its position.
The test is initiated by rapidly filling the ring with water to a head of approximately 600-700 mm (24-28 in.). The quantity of water infiltrating the soil is measured from the graduated cylinder attached to the top of the plexiglass lid. The depth of infiltration Lf is calculated using the volume of permeant, porosity, dry density, degree of saturation, and area of soil (Fer-nuik 1987). The hydraulic gradient at this point is calculated from the following relationship:
(g + Lf) (2)
where H = the height of water in the infiltrometer. This equation is then substituted into Eq. 1 to calculate the hydraulic conductivity of the liner. Lf
cannot exceed the depth to which the ring is installed if one-dimensional flow conditions are to exist. This limits the thickness of liner tested in one setup.
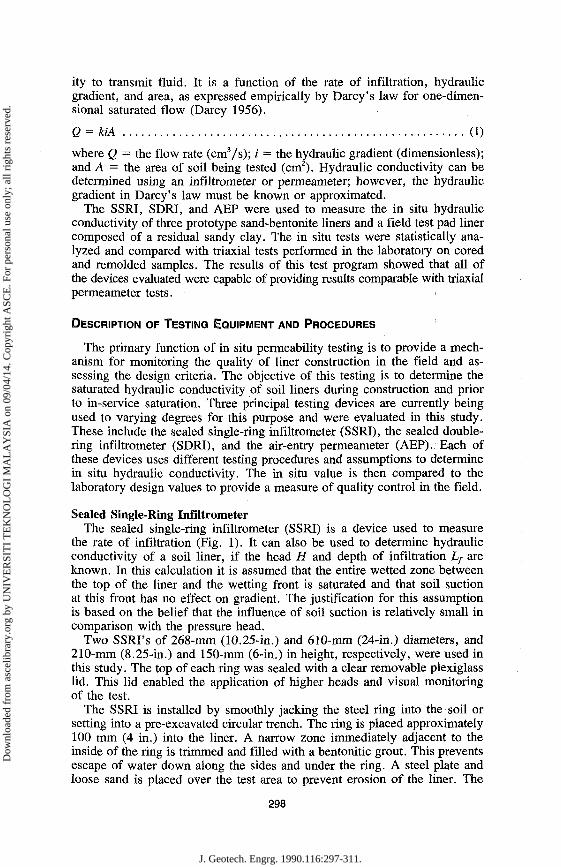
Sealed Double-Ring Infiltrometer Hydraulic conductivity calculations for the sealed double-ring infiltrometer
(SDRI) were based on full wetting front penetration of the liner (Fig. 2). The double ring enables measurement of k without piezometers or identification of the wetting front (Bouwer 1966). The double ring may also prevent lateral spreading of infiltrating permeant. Penetration is determined by physical observation of water exiting the base of the liner, or from calculations determining the porosity of the soil and volume of water required to penetrate the liner (Fernuik 1987). Full penetration of water through the liner eliminates sources of error associated with soil suction and unsaturated hydraulic conductivity in SSRI tests. The hydraulic gradient in this test is given by the following relationship:
299
J. Geotech. Engrg. 1990.116:297-311.
Dow
nloa
ded
from
asc
elib
rary
.org
by
UN
IVE
RSI
TI
TE
KN
OL
OG
I M
AL
AY
SIA
on
09/0
4/14
. Cop
yrig
ht A
SCE
. For
per
sona
l use
onl
y; a
ll ri
ghts
res
erve
d.
Outer Ring-
Inner Ring - n<k.
Bentonltlc Grout
;S;;w/:v Saturated m;
FIG. 2. Sealed Double-Ring Infiltrometer (SDRI)
(H + L) (3)
where L = the full thickness of the liner. This equation is then substituted into Eq. 1 to calculate hydraulic conductivity.
Two SDRIs were evaluated in this study. The primary apparatus commercially available at the time consisted of two square rings. The outer ring was constructed from aluminum and the inner ring fiberglass. The lengths of the sides of the inner and outer rings of the SDRI were 1,524 mm (72 in.) and 3,658 mm (144 in.), respectively. The height of the inner and outer rings were 150 mm (6 in.) and 950 mm (38 in.), respectively. A modified SDRI, in which the inner and outer circular rings were both sealed, was also used. This apparatus was used on the prototype liners. The outer and inner ring diameters were 268 mm (10.25 in.) and 134 mm (5.13 in.), respectively.
The large SDRI required considerable time and effort to install. This device also gave only one permeability measurement, and this measurement was compared with the other testing methods.
The setup of the SDRI is similar to the SSRI in most aspects; however, the SDRI has two rings. The outer ring of the commercial apparatus was installed by excavating a narrow trench approximately 450 mm (18 in.) deep along its proposed route. The area adjacent to this ring was also sealed with a bentonitic grout. The inner square ring was installed by excavating and sealing a similar trench to a depth of approximately 150 mm (6 in.).
The test was initiated by filling the inner and outer rings simultaneously to a height of approximately 300 mm (12 in.). A uniform water level was maintained during the test. The flow rate within the inner ring was determined by measuring the quantity of water from the flexible plastic bag.
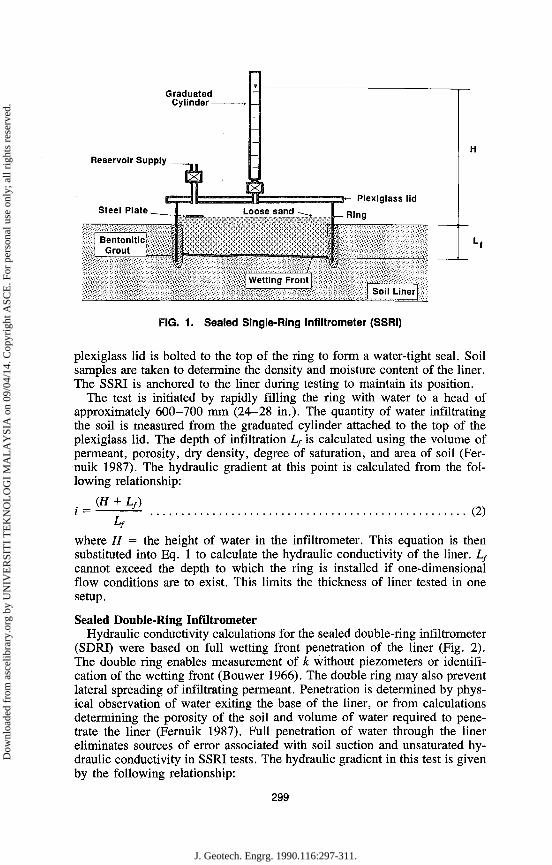
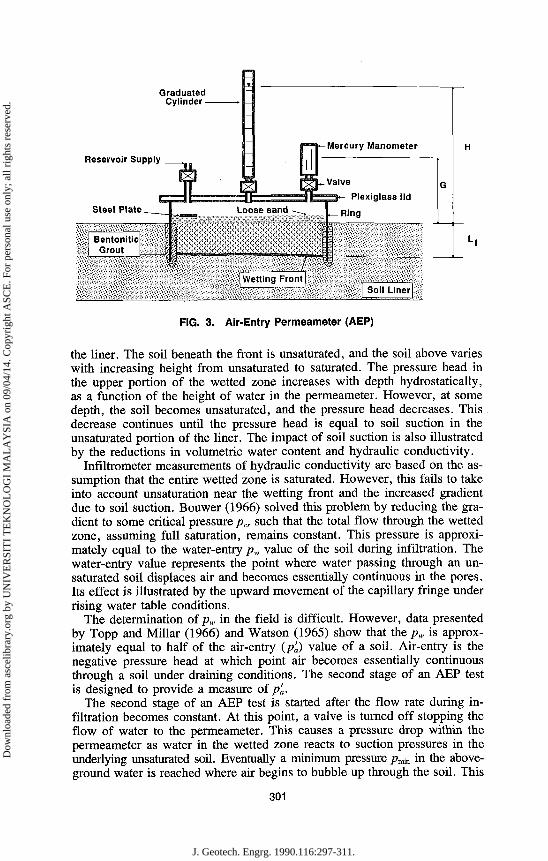
Air-Entry Permeameter The air-entry permeameter (AEP) is similar to the SSRI (Fig. 3). How
ever, the AEP is equipped with a mercury manometer to measure the influence of soil suction on infiltration. The AEP is performed in two stages. The installation and first stage in the operation of the AEP is similar to the SSRI. In this stage, the hydraulic conductivity of the soil is determined using the AEP as an infiltrometer.
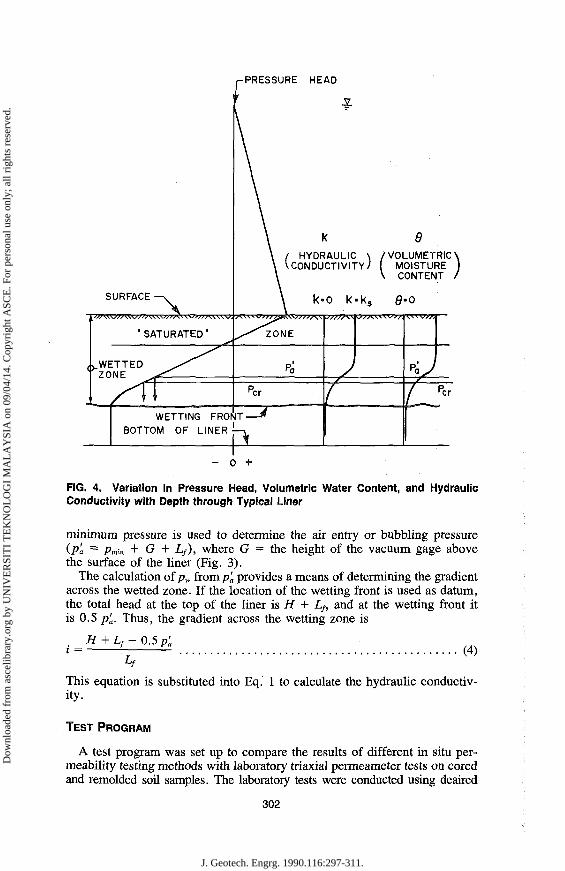
The variation in pressure head, volumetric water content, and hydraulic conductivity with depth through a typical liner during infiltration is shown in Fig. 4. The wetting front in this figure has advanced a distance Lf into
300
J. Geotech. Engrg. 1990.116:297-311.
Dow
nloa
ded
from
asc
elib
rary
.org
by
UN
IVE
RSI
TI
TE
KN
OL
OG
I M
AL
AY
SIA
on
09/0
4/14
. Cop
yrig
ht A
SCE
. For
per
sona
l use
onl
y; a
ll ri
ghts
res
erve
d.
Graduated Cylinder -
Reservoir Supply
Steel Plate.
Bentonitic Grout
^ g| j | _3E
-Mercury Manometer
Loose sand
Valve
|— Plexiglass lid
-Ring
f^mmmmm m
x^MMk!%)f!m>^i^^&. W f |
l ^ l i S ^ i ^ i i ^ ® S l i i S l l ^ ® i l i 3 Wetting Front ^^K&^MWM00M$$$^MIMMS%S^WS^MW^MM
$Wi8$$$§%W,
IMiflltts mmm Soil Liner
m. •••;•/, I
FIG. 3. Air-Entry Permeameter (AEP)
the liner. The soil beneath the front is unsaturated, and the soil above varies with increasing height from unsaturated to saturated. The pressure head in the upper portion of the wetted zone increases with depth hydrostatically, as a function of the height of water in the permeameter. However, at some depth, the soil becomes unsaturated, and the pressure head decreases. This decrease continues until the pressure head is equal to soil suction in the unsaturated portion of the liner. The impact of soil suction is also illustrated by the reductions in volumetric water content and hydraulic conductivity.
Infiltrometer measurements of hydraulic conductivity are based on the assumption that the entire wetted zone is saturated. However, this fails to take into account unsaturation near the wetting front and the increased gradient due to soil suction. Bouwer (1966) solved this problem by reducing the gradient to some critical pressure p„ such that the total flow through the wetted zone, assuming full saturation, remains constant. This pressure is approximately equal to the water-entry pw value of the soil during infiltration. The water-entry value represents the point where water passing through an unsaturated soil displaces air and becomes essentially continuous in the pores. Its effect is illustrated by the upward movement of the capillary fringe under rising water table conditions.
The determination of p„ in the field is difficult. However, data presented by Topp and Millar (1966) and Watson (1965) show that the pw is approximately equal to half of the air-entry (p'a) value of a soil. Air-entry is the negative pressure head at which point air becomes essentially continuous through a soil under draining conditions. The second stage of an AEP test is designed to provide a measure of p'a.
The second stage of an AEP test is started after the flow rate during infiltration becomes constant. At this point, a valve is turned off stopping the flow of water to the permeameter. This causes a pressure drop within the permeameter as water in the wetted zone reacts to suction pressures in the underlying unsaturated soil. Eventually a minimum pressure p^ in the above-ground water is reached where air begins to bubble up through the soil. This
301
J. Geotech. Engrg. 1990.116:297-311.
Dow
nloa
ded
from
asc
elib
rary
.org
by
UN
IVE
RSI
TI
TE
KN
OL
OG
I M
AL
AY
SIA
on
09/0
4/14
. Cop
yrig
ht A
SCE
. For
per
sona
l use
onl
y; a
ll ri
ghts
res
erve
d.
-PRESSURE HEAD
SURFACE
"SATURATED"
(.WETTED ^ZONE
k 9 I HYDRAULIC \ /VOLUMETRIC \ ^CONDUCTIVITY/ MOISTURE
\ CONTENT /
k-o k-kc Q'O
V: 7TWrW773J)*TO7777^
ZONE
ys/SS/V*S/A><\WJ/l\><.KV/S,
WETTING FRONT BOTTOM OF LINER —
- 0 +
FIG. 4. Variation in Pressure Head, Volumetric Water Content, and Hydraulic Conductivity with Depth through Typical Liner
minimum pressure is used to determine the air entry or bubbling pressure (Pa ~ Pmin + G + Lf), where G — the height of the vacuum gage above the surface of the liner (Fig. 3).
The calculation of pw fmmp'a provides a means of determining the gradient across the wetted zone. If the location of the wetting front is used as datum, the total head at the top of the liner is H + Lf, and at the wetting front it is 0.5 p'a. Thus, the gradient across the wetting zone is
H + Lf- Q.5p'a (4)
This equation is substituted into Eq. 1 to calculate the hydraulic conductivity.
TEST PROGRAM
A test program was set up to compare the results of different in situ permeability testing methods with laboratory triaxial permeameter tests on cored and remolded soil samples. The laboratory tests were conducted using deaired
302
J. Geotech. Engrg. 1990.116:297-311.
Dow
nloa
ded
from
asc
elib
rary
.org
by
UN
IVE
RSI
TI
TE
KN
OL
OG
I M
AL
AY
SIA
on
09/0
4/14
. Cop
yrig
ht A
SCE
. For
per
sona
l use
onl
y; a
ll ri
ghts
res
erve
d.
distilled water and employing 30 psi (210 kPa) backpressure and confining pressure of 2 psi (14 kPa). Vacuum and back-pressure were used to initially saturate the samples. The degree of saturation was checked with a pore-pressure reaction test prior to starting the permeability test. The test program was carried out on three different types of soil liners. Two of the liners were constructed from various percentages of sand and bentonite, while the third was constructed from residual sandy clay. In situ tests were performed in successive sequence on the sand-bentonite liners using distilled deaired water. This test involved the removal of the upper 20-50 mm (0.75-2.0 in.) of soil within the ring after completion of test and resealing the device at this lower level. All SSRI/AEP/SDRI tests performed on the field test pad liner were performed on the surface of the liner using potable water.
The sand-bentonite prototype liners were prepared in the laboratory in a rectangular 2,440-mm (100-in.) by 610-mm (24-in.) by 300-mm (12-in.) deep frame. The thickness of the liners was approximately 150 mm (6.0 in.). A subdrain system was installed beneath the liners consisting of a 50-mm (2-in.) layer of 25-mm (1-in.) aggregate. A plastic cover was installed over the liners to prevent drying.
The residual sand clay test pad liner was installed at a site near Jamestown, California. The liner was 30,480 mm (100 ft) by 9,140 mm (30 ft) by 610 mm (2 ft) in depth. A subdrain system was installed to collect seepage that exited the liner. This subdrain system was constructed from two layers of six-millimeter polyethylene, washed gravel, sand, and 200-mm (8-in.) PVC slotted/unslotted pipe. The base of the underdrain was sloped to direct the water to a collection sump. This liner was covered with 100-150 mm (4.0-5.0 in.) of clean gravel to prevent drying.
MATERIAL PROPERTIES
Uniform Ottawa silica sand and powdered sodium bentonite were used to construct the prototype liners. The sand conformed to ASTM-C109 specifications. The sand-bentonite liners were composed of 4.5% and 8.3% sodium bentonite by dry weight. Index properties of the two mixtures are shown in Table 1. Optimum dry density and moisture contents were based on standard Proctor tests (ASTM D-698, Method A).
The field test pad liner was constructed from residual soils of gabbro-diorite and serpentinite origin. Index properties of these materials is pre-
TABLE 1. Sand-Bentonite Liner Properties
Characteristic (1)
Na bentonite (%) Optimum dry density (kg/m3) Optimum moisture (%) Dry density (kg/m3) Moisture (%) Compaction (%) (standard Proctor)
1a (2)
4.5 1,770
15.2 1,730
16.3 98
Liner 1b (3)
4.5 1,770
15.2 1,730
16.2 98
2 (4)
8.3 1,780
15.3 1,780
16.3 100
303
J. Geotech. Engrg. 1990.116:297-311.
Dow
nloa
ded
from
asc
elib
rary
.org
by
UN
IVE
RSI
TI
TE
KN
OL
OG
I M
AL
AY
SIA
on
09/0
4/14
. Cop
yrig
ht A
SCE
. For
per
sona
l use
onl
y; a
ll ri
ghts
res
erve
d.
TABLE 2. Field Test Pad Liner Properties
Characteristic (1)
Number of tests Liquid limit (%) Plastic limit (%) Plasticity index Percent passing #200 sieve Optimum dry density (kg/m3) Optimum moisture content (%) Dry density (kg/m3) Moisture content (%) Compaction (%) (modified Proctor)
Field test pad liner (2)
10 34-37 22-24 11-14 30-41
2,100-2,000 9.1-11.8
1,900-2,000 9.7-12.5 94-97
sented in Table 2. Optimum dry density and moisture contents were based on modified Proctor.
LINER CONSTRUCTION
The sand-bentonite liners were prepared by mixing 270 kg (600 lb) of air-dried sand and sodium bentonite in a mortar mixer. Water was added to bring the mixture to 1.0% above optimum moisture content. After curing for two days, the sand-bentonite mixture was compacted in place with a vibratory plate compactor to a minimum dry density of 95% standard Proctor (Table 1).
The soil used to construct the field test pad liner was excavated and stockpiled in thin horizontal layers. Each layer was moisture-conditioned to approximately 1.0% above optimum moisture and allowed to cure for a minimum of two days. Scrapers cut perpendicular through the stockpile from the initial direction of placement to further mix the soil prior to placement on the test pad area. The test pad was constructed in three compacted 200-mm (8.0-in.) lifts to a thickness of 600-mm (2.0-ft) using a smooth drum vibrator roller (50,000 lb dynamic force at 1,800 cpm). The liner was compacted to a minimum dry density of 95% modified Proctor (Table 2). Each lift received two passes from an industrial disc pulled by a crawler tractor. The disc blended the soil and cut a minimum of 25 mm (1.0 in.) into the preceding lift to enhance bonding.
TEST RESULTS
A series of in situ hydraulic conductivity tests was performed at various depths through prototype liner 1. A summary of the test results from this liner is presented in Table 3. The duration of the in situ hydraulic conductivity tests performed on liner la ranged from 142-190 min, at SSRI gradients from 13-58. The measured air-entry values varied from - 7 to - 1 8 cm of water. The SSRI and AEP hydraulic conductivity values ranged from 1 to 19 X 10"7, and 0.9 to 17 x 10"7 cm/s, respectively. The duration of the tests carried out on liner lb ranged from 221-929 min at gradients between 9 and 22. The measured air-entry values varied from - 2 to -29 cm of water. The SSRI and AEP hydraulic conductivity values for the liner
304
J. Geotech. Engrg. 1990.116:297-311.
Dow
nloa
ded
from
asc
elib
rary
.org
by
UN
IVE
RSI
TI
TE
KN
OL
OG
I M
AL
AY
SIA
on
09/0
4/14
. Cop
yrig
ht A
SCE
. For
per
sona
l use
onl
y; a
ll ri
ghts
res
erve
d.
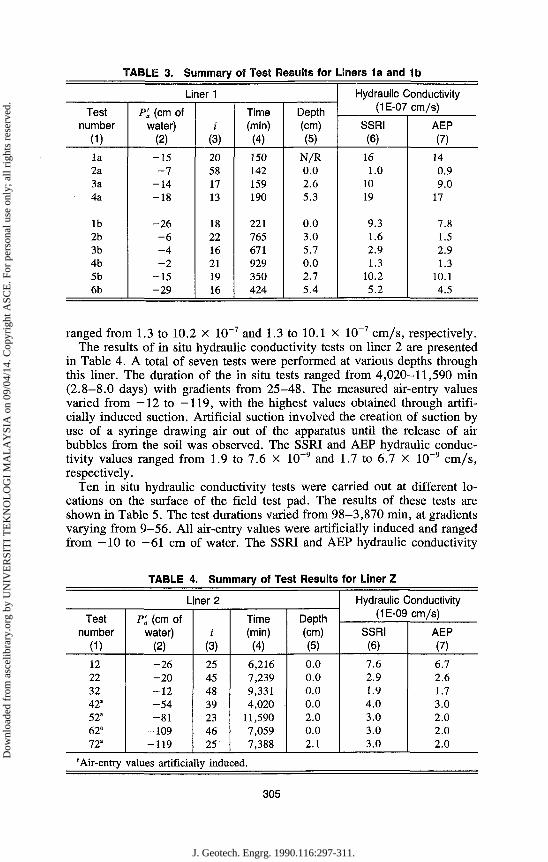
TABLE 3. Summary of Test Results for Liners 1a and 1b
Test number
(1) la 2a 3a 4a
lb 2b 3b 4b 5b 6b
Liner 1
K (cm of water)
(2)
-15 - 7
-14 -18
-26 - 6 - 4 - 2
-15 -29
i (3)
20 58 17 13
18 22 16 21 19 16
Time (min) (4)
150 142 159 190
221 765 671 929 350 424
Depth (cm) (5)
N/R 0.0 2.6 5.3
0.0 3.0 5.7 0.0 2.7 5.4
Hydraulic Conductivity (1E-07cm/s)
SSRI (6)
16 1.0
10 19
9.3 1.6 2.9 1.3
10.2 5.2
AEP (7)
14 0.9 9.0
17
7.8 1.5 2.9 1.3
10.1 4.5
ranged from 1.3 to 10.2 X 10~7 and 1.3 to 10.1 X 10"7 cm/s, respectively. The results of in situ hydraulic conductivity tests on liner 2 are presented
in Table 4. A total of seven tests were performed at various depths through this liner. The duration of the in situ tests ranged from 4,020-11,590 min (2.8-8.0 days) with gradients from 25-48. The measured air-entry values varied from —12 to —119, with the highest values obtained through artificially induced suction. Artificial suction involved the creation of suction by use of a syringe drawing air out of the apparatus until the release of air bubbles from the soil was observed. The SSRI and AEP hydraulic conductivity values ranged from 1.9 to 7.6 X 10⁻⁹ and 1.7 to 6.7 X 10"9 cm/s, respectively.
Ten in situ hydraulic conductivity tests were carried out at different locations on the surface of the field test pad. The results of these tests are shown in Table 5. The test durations varied from 98-3,870 min, at gradients varying from 9-56. All air-entry values were artificially induced and ranged from -10 to -61 cm of water. The SSRI and AEP hydraulic conductivity
TABLE 4. Summary of Test Results for Liner Z
Test number
(1) 12 22 32 42" 52" 62* 72*
Liner 2
P'a (cm of water)
(2)
-26 -20 -12 -54 -81
-109 -119
i (3)
25 45 48 39 23 46 25
Time (min) (4)
6,216 7,239 9,331 4,020
11,590 7,059 7,388
Depth (cm) (5)
0.0 0.0 0.0 0.0 2.0 0.0 2.1
Hydraulic Conductivity (1E-09cm/s)
SSRI (6)
7.6 2.9 1.9 4.0 3.0 3.0 3.0
AEP (7)
6.7 2.6 1.7 3.0 2.0 2.0 2.0
"Air-entry values artificially induced.
305
J. Geotech. Engrg. 1990.116:297-311.
Dow
nloa
ded
from
asc
elib
rary
.org
by
UN
IVE
RSI
TI
TE
KN
OL
OG
I M
AL
AY
SIA
on
09/0
4/14
. Cop
yrig
ht A
SCE
. For
per
sona
l use
onl
y; a
ll ri
ghts
res
erve
d.
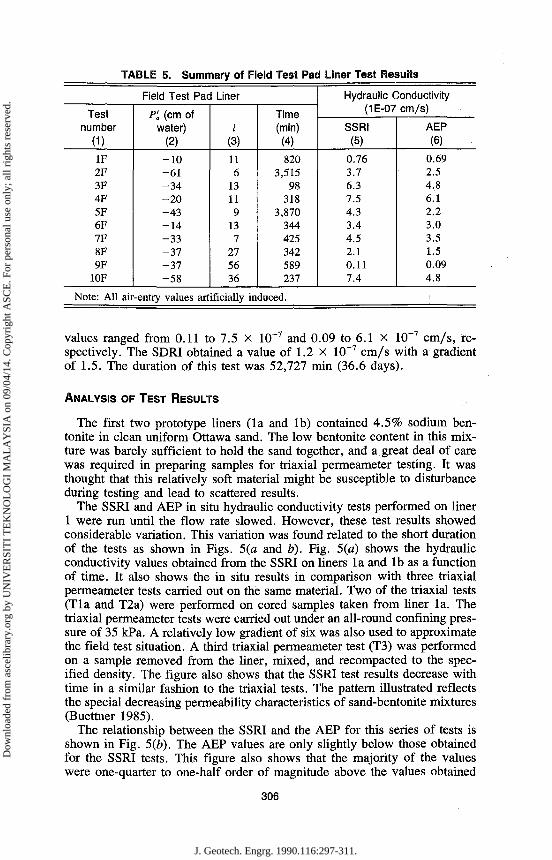
TABLE 5. Summary of Field Test Pad Liner Test Results
Test number
(D IF 2F 3F 4F 5F 6F 7F 8F 9F
10F
Field Test Pad Liner
P'„ (cm of water)
(2)
-10 -61 -34 -20 -43 -14 -33 -37 -37 -58
i (3)
11 6
13 11 9
13 7
27 56 36
Time (min) (4)
820 3,515
98 318
3,870 344 425 342 589 237
Hydraulic Conductivity (1E-07 cm/s)
SSRI (5)
0.76 3.7 6.3 7.5 4.3 3.4 4.5 2.1 0.11 7.4
AEP (6)
0.69 2.5 4.8 6.1 2.2 3.0 3.5 1.5 0.09 4.8
Note: All air-entry values artificially induced.
values ranged from 0.11 to 7.5 X 10~7 and 0.09 to 6.1 X 10~7 cm/s, respectively. The SDRI obtained a value of 1.2 X 10~7 cm/s with a gradient of 1.5. The duration of this test was 52,727 min (36.6 days).
ANALYSIS OF TEST RESULTS
The first two prototype liners (la and lb) contained 4.5% sodium ben-tonite in clean uniform Ottawa sand. The low bentonite content in this mixture was barely sufficient to hold the sand together, and a great deal of care was required in preparing samples for triaxial permeameter testing. It was thought that this relatively soft material might be susceptible to disturbance during testing and lead to scattered results.
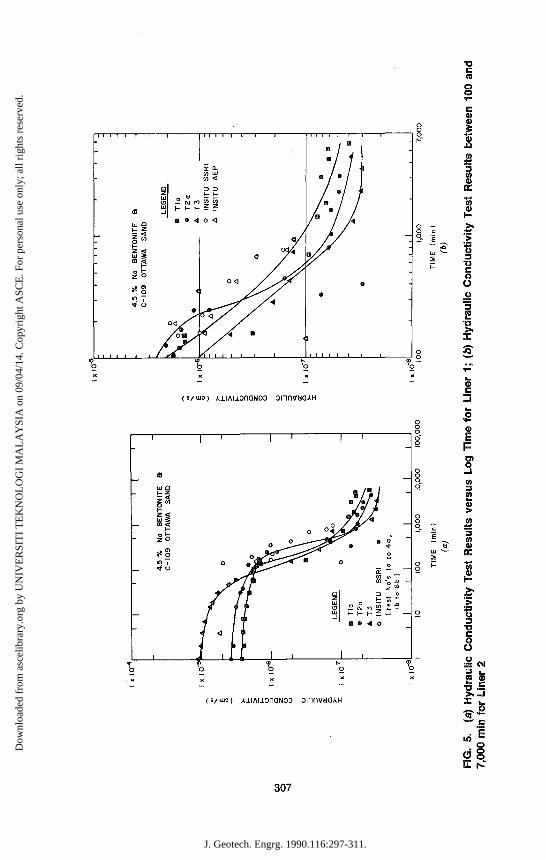
The SSRI and AEP in situ hydraulic conductivity tests performed on liner 1 were run until the flow rate slowed. However, these test results showed considerable variation. This variation was found related to the short duration of the tests as shown in Figs. 5(a and b). Fig. 5(a) shows the hydraulic conductivity values obtained from the SSRI on liners la and lb as a function of time. It also shows the in situ results in comparison with three triaxial permeameter tests carried out on the same material. Two of the triaxial tests (Tla and T2a) were performed on cored samples taken from liner la. The triaxial permeameter tests were carried out under an all-round confining pressure of 35 kPa. A relatively low gradient of six was also used to approximate the field test situation. A third triaxial permeameter test (T3) was performed on a sample removed from the liner, mixed, and recompacted to the specified density. The figure also shows that the SSRI test results decrease with time in a similar fashion to the triaxial tests. The pattern illustrated reflects the special decreasing permeability characteristics of sand-bentonite mixtures (Buettner 1985).
The relationship between the SSRI and the AEP for this series of tests is shown in Fig. 5(b). The AEP values are only slightly below those obtained for the SSRI tests. This figure also shows that the majority of the values were one-quarter to one-half order of magnitude above the values obtained
306
J. Geotech. Engrg. 1990.116:297-311.
Dow
nloa
ded
from
asc
elib
rary
.org
by
UN
IVE
RSI
TI
TE
KN
OL
OG
I M
AL
AY
SIA
on
09/0
4/14
. Cop
yrig
ht A
SCE
. For
per
sona
l use
onl
y; a
ll ri
ghts
res
erve
d.
03
O
^1
S/UJO ;
CONDUCTIVITY RAULIC >- X
I x
1 0
"5
1
x I0
"6
I x
id"7
-
1 i
A
^*
,
LE
GE
ND
s T
Ia
e
T2
a
A
T3
O
INS
ITU
( te
st
lb
to
1 1
1
1 '
1
i
4.5
%
N
a
BE
NT
ON
ITE
C
-10
9
OT
TA
WA
o "W
°
o
N^
BV
SS
RI
»
'
No
's
6b
)
1
la
to
4a
,
i i
i
SA
ND
"a. i
1 a 1
i
- - _ -
i
E
I X
I0
"6 : i i i - ~.
- - ~ _ 1 - "
oN
AS
.
B
4.5
%
N
a
BE
NT
ON
ITE
a
C-1
09
OT
TA
WA
S
AN
D
LE
GE
ND
O
^
O
TIa
\ •
T2
a
\ \
° IN
SIT
U
\\
A
INS
ITU
w
° \
NX
A
\ v
\ A
NX
ffl
V^
N.
^-
N^
«
^-̂-̂
>
. 1
- - -
SS
RI
;
AE
P
- - ~ „
B e
^-"-
——
-
~^—
#L.
• "
10
0
1,0
00
10
,00
0
10
0,0
00
TIM
E
(mln
)
1,0
00
TIM
E
(min
i
m
7,0
00
FIG
. 5.
(a
) H
ydra
ulic
Con
duct
ivity
Tes
t R
esul
ts v
ersu
s Lo
g T
ime
for
Line
r 1
; (b
) H
ydra
ulic
Con
duct
ivity
Tes
t R
esul
ts b
etw
een
100
and
7,
000
min
for
Line
r 2
J. Geotech. Engrg. 1990.116:297-311.
Dow
nloa
ded
from
asc
elib
rary
.org
by
UN
IVE
RSI
TI
TE
KN
OL
OG
I M
AL
AY
SIA
on
09/0
4/14
. Cop
yrig
ht A
SCE
. For
per
sona
l use
onl
y; a
ll ri
ghts
res
erve
d.
for the triaxial permeameter tests at any particular time. However, while reasonably good agreement was reached with the triaxial permeameter test, the in situ tests were not carried out for a sufficient length of time to allow full hydration of the bentonite. It may be possible, however, to perform shorter tests after correlating the field and laboratory values of a liner. No variation in hydraulic conductivity was observed between the two liners.
A number of problems were encountered in attempting to perform SDRI tests on liner 1. These primarily involved piping failures and loss of seal between the inner and outer rings. Tests performed with this apparatus were unsuccessful so its use was discontinued.
Liner 2 was constructed from 8.3% sodium bentonite and Ottawa sand. This mixture formed a more structurally stable liner than that obtained with 4.5% sodium bentonite. However, while the stability was markedly different, their optimum moisture contents and maximum dry densities were vh> tually identical.
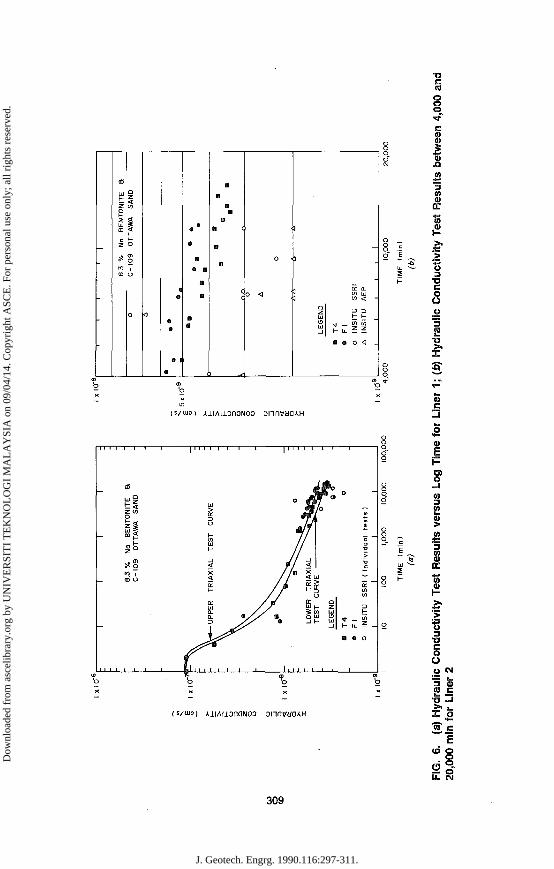
In situ hydraulic conductivity tests carried out on liner 2 were run for considerably longer periods of time than for liners la and lb. The relationship between hydraulic conductivity with time for the SSRI tests and the triaxial permeameter tests is shown in Fig. 6(a). The upper triaxial limit was obtained from a remolded and compacted sample using a back-pressured fixed wall permeameter, and the lower limit was obtained from the same material using a triaxial permeameter. This figure shows a variation of approximately one-quarter order of magnitude in the SSRI results, with the average near the lower permeameter value.
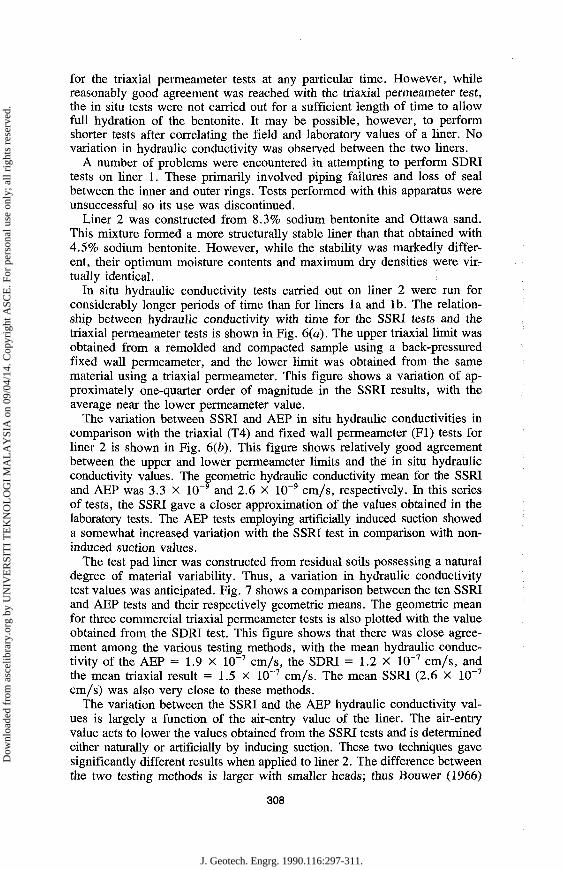
The variation between SSRI and AEP in situ hydraulic conductivities in comparison with the triaxial (T4) and fixed wall permeameter (Fl) tests for liner 2 is shown in Fig. 6(b). This figure shows relatively good agreement between the upper and lower permeameter limits and the in situ hydraulic conductivity values. The geometric hydraulic conductivity mean for the SSRI and AEP was 3.3 X 10"9 and 2.6 X 1(T9 cm/s, respectively. In this series of tests, the SSRI gave a closer approximation of the values obtained in the laboratory tests. The AEP tests employing artificially induced suction showed a somewhat increased variation with the SSRI test in comparison with non-induced suction values.
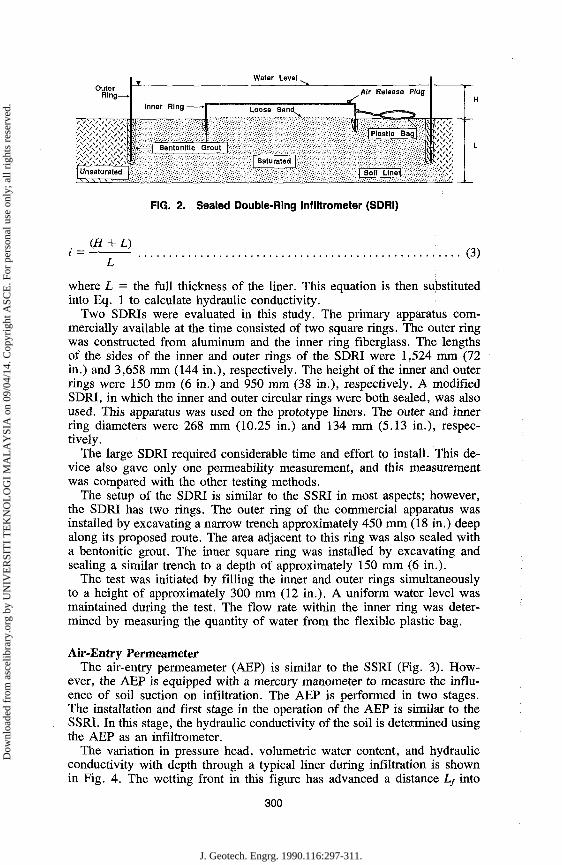
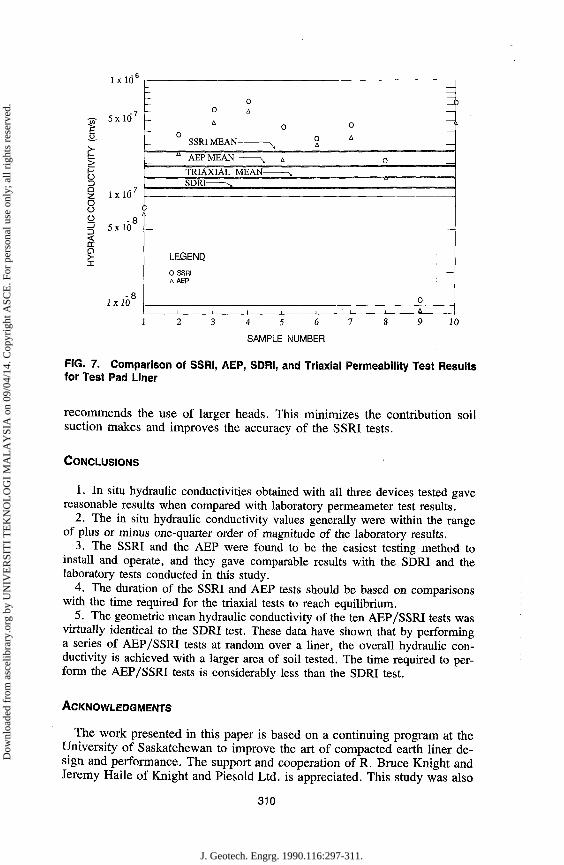
The test pad liner was constructed from residual soils possessing a natural degree of material variability. Thus, a variation in hydraulic conductivity test values was anticipated. Fig. 7 shows a comparison between the ten SSRI and AEP tests and their respectively geometric means. The geometric mean for three commercial triaxial permeameter tests is also plotted with the value obtained from the SDRI test. This figure shows that there was close agreement among the various testing methods, with the mean hydraulic conductivity of the AEP = 1.9 x 10"7 cm/s, the SDRI = 1.2 X 10~7 cm/s, and the mean triaxial result = 1.5 X 10~7 cm/s. The mean SSRI (2.6 X 10~7
cm/s) was also very close to these methods. The variation between the SSRI and the AEP hydraulic conductivity val
ues is largely a function of the air-entry value of the liner. The air-entry value acts to lower the values obtained from the SSRI tests and is determined either naturally or artificially by inducing suction. These two techniques gave significantly different results when applied to liner 2. The difference between the two testing methods is larger with smaller heads; thus Bouwer (1966)
308
J. Geotech. Engrg. 1990.116:297-311.
Dow
nloa
ded
from
asc
elib
rary
.org
by
UN
IVE
RSI
TI
TE
KN
OL
OG
I M
AL
AY
SIA
on
09/0
4/14
. Cop
yrig
ht A
SCE
. For
per
sona
l use
onl
y; a
ll ri
ghts
res
erve
d.
1 I
-
" _
-
BE
NTO
NIT
E
S
AW
A
SA
ND
*E
8.3
%
C
-10
9
0 <Q
t 9
9 9
9 1
©
0
9
a
0 S
a
a
a a
f
m
m
a a
a a
m
a
i
c
<
_* i —
0 *
3
1
LE
GE
ND
-™
i/> < -
T4
Fl
INS
ITU
IN
SIT
U
a © o < _
i <D
DC
to
e '•§ •a c o u
• g
is/mo) AiiAiionaNOD onrwacuH
CD e
—
(fi
lil Q
EN
TO
NIT
W
A
SA
CD
o Z
00
h-10 60
o
1 11 1 1 1
CU
RV
E
AL
TE
P
ER
T
RIA
o_
| l , . , . .
1
f a 9
1 a>
m i i i
AL
1°
X
WE
R
TR
IA
ST
C
UR
VE
O UJ
1
a
EN
D
«
,
O
<r
B «
tes
ts )
n
div
idu
T
U
SS
R!
(
1
INS
1
o
<n
(S/UJO) AiiAiionaNOO onrwacuH
CD
E
o
s a>
if • >
•5 3
•B c o o O CM
™ h . 3 0) ra e
i S
o o
U. CM
CO
309
J. Geotech. Engrg. 1990.116:297-311.
Dow
nloa
ded
from
asc
elib
rary
.org
by
UN
IVE
RSI
TI
TE
KN
OL
OG
I M
AL
AY
SIA
on
09/0
4/14
. Cop
yrig
ht A
SCE
. For
per
sona
l use
onl
y; a
ll ri
ghts
res
erve
d.
1x10
5 x 1 0
> O
1 I x l O 7
o o a -8 =| 5 x 10 —
1x10
--— -
)
0 0 A
0 0
" AEPMEAN v, A
SDRI ^
LEQENQ
OSSRI A AEP
0 A
,
0 A
- ,
0
1
0
*
— Zs — — i
-
4 5 6
SAMPLE NUMBER
10
FIG. 7. Comparison of SSRI, AEP, SDRI, and Trlaxial Permeability Test Results for Test Pad Liner
recommends the use of larger heads. This minimizes the contribution soil suction makes and improves the accuracy of the SSRI tests.
CONCLUSIONS
1. In situ hydraulic conductivities obtained with all three devices tested gave reasonable results when compared with laboratory permeameter test results.
2. The in situ hydraulic conductivity values generally were within the range of plus or minus one-quarter order of magnitude of the laboratory results.
3. The SSRI and the AEP were found to be the easiest testing method to install and operate, and they gave comparable results with the SDRI and the laboratory tests conducted in this study.
4. The duration of the SSRI and AEP tests should be based on comparisons with the time required for the triaxial tests to reach equilibrium.
5. The geometric mean hydraulic conductivity of the ten AEP/SSRI tests was virtually identical to the SDRI test. These data have shown that by performing a series of AEP/SSRI tests at random over a liner, me overall hydraulic conductivity is achieved with a larger area of soil tested. The time required to perform the AEP/SSRI tests is considerably less than the SDRI test.
ACKNOWLEDGMENTS
The work presented in this paper is based on a continuing program at the University of Saskatchewan to improve the art of compacted earth liner design and performance. The support and cooperation of R. Bruce Knight and Jeremy Haile of Knight and Piesold Ltd. is appreciated. This study was also
310
J. Geotech. Engrg. 1990.116:297-311.
Dow
nloa
ded
from
asc
elib
rary
.org
by
UN
IVE
RSI
TI
TE
KN
OL
OG
I M
AL
AY
SIA
on
09/0
4/14
. Cop
yrig
ht A
SCE
. For
per
sona
l use
onl
y; a
ll ri
ghts
res
erve
d.
funded in part by a grant from the National Sciences and Research Council of Canada and the Saskatchewan Research Council.
APPENDIX. REFERENCES
Amerman, C. R. (1983). "Advances in infiltration." Proc. Nat. Conf. on Advances in Infiltration, Chicago, 111., 201-214.
Bouwer, H. (1966). "Rapid field measurement of air-entry value and hydraulic conductivity of soil as significant parameters in flow system analysis." J. Water Re-sour. Res., 2(4), 729-732.
Buettner, W. G. (1985). "Permeability testing of soil liners with low hydraulic conductivity," thesis presented to the University of Saskatchewan, at Saskatoon, Canada, in partial fulfillment of the requirements for the degree of Master of Science.
Daniel, D. E., and Trautwein, S. J. (1986). "Field permeability test for earthern liners." Use of in situ tests in geotechnical engineering, ASCE, S. P. Clemence, ed., ASCE, New York, N.Y., 146-160.
Darcy, H. (1956). Les Fontaines plubliques de la ville de Dijon. Victor Dalmont, Paris, France.
Day, S. R., and Daniel, D. E. (1985). "Hydraulic conductivity of two prototype clay liners." / . Geotech. Engrg., ASCE, 111(8), 957-970.
Fernuik, N. (1987). "Insitu permeability testing of soil liners with low hydraulic conductivity," thesis presented to the University of Saskatchewan, at Saskatoon, Canada, in partial fulfillment of the requirements for the degree of Master of Science.
Topp, B. C , and Miller, E. E. (1966). "Hysteretic moisture characteristics and hydraulic conductivities for glass bead media." J. Soil Sci. Soc. Am., 30(2), 156-162.
Watson, K. K. (1965). "Non-continuous porous media flow." Report 84, Water Research Lab., University New South Wales, Manly Vale, N.S.W., Australia.
311
J. Geotech. Engrg. 1990.116:297-311.
Dow
nloa
ded
from
asc
elib
rary
.org
by
UN
IVE
RSI
TI
TE
KN
OL
OG
I M
AL
AY
SIA
on
09/0
4/14
. Cop
yrig
ht A
SCE
. For
per
sona
l use
onl
y; a
ll ri
ghts
res
erve
d.