artesunate dose escalation for the treatment of uncomplicated malaria in a region of reported...
TRANSCRIPT
Artesunate Dose Escalation for the Treatment ofUncomplicated Malaria in a Region of ReportedArtemisinin Resistance: A Randomized Clinical TrialDelia Bethell1*, Youry Se1, Chanthap Lon1, Stuart Tyner1, David Saunders1, Sabaithip Sriwichai1, Sea
Darapiseth2, Paktiya Teja-Isavadharm1, Phisit Khemawoot1, Kurt Schaecher1, Wiriya Ruttvisutinunt1,
Jessica Lin1, Worachet Kuntawungin1, Panita Gosi1, Ans Timmermans1, Bryan Smith1, Duong Socheat2,
Mark M. Fukuda1
1 Department of Immunology and Medicine, Armed Forces Research Institute of Medical Sciences (AFRIMS), Bangkok, Thailand, 2 Center for Parasitology, Entomology and
Malaria Control, Pnom Penh, Cambodia
Abstract
Background: The emergence of artemisinin resistance has raised concerns that the most potent antimalarial drug may beunder threat. The currently recommended daily dose of artesunate (AS) is 4 mg/kg, and is administered for 3 days togetherwith a partner antimalarial drug. This study investigated the impact of different AS doses on clinical and parasitologicalresponses in malaria patients from an area of known artemisinin resistance in western Cambodia.
Methods: Adult patients with uncomplicated P. falciparum malaria were randomized into one of three 7-day ASmonotherapy regimens: 2, 4 or 6 mg/kg/day (total dose 14, 28 and 42 mg/kg). Clinical, parasitological, pharmacokinetic andin vitro drug sensitivity data was collected over a 7-day inpatient period and during weekly follow-up to 42 days.
Results: 143 patients were enrolled (n = 75, 40 and 28 to receive AS 2, 4 and 6 mg/kg/day respectively). Cure rates were highin all treatment groups at 42 days despite almost half the patients remaining parasitemic on Day 3. There was no impact ofincreasing AS dose on median parasite clearance times, median parasite clearance rates or on the proportion of patientsremaining parasitemic on Day 3. However at the lowest dose used (2 mg/kg/d) patients with parasitemia .10,000/mL hadlonger median (IQR) parasite clearance times than those with parasitemia ,10,000/mL (63 (48–75) vs. 84 (66–96) hours,p,0.0001). 19% of patients in the high-dose arm developed neutropenia (absolute neutrophil count ,1.06109/L) by Day 14and resulted in the arm being halted early.
Conclusion: There is no pharmacodynamic benefit of increasing the daily dose of AS (4mg/kg) currently recommended forshort-course combination treatment of uncomplicated malaria, even in regions with emerging artemisinin resistance, aslong as the partner drug retains high efficacy.
Trial Registration: ClinicalTrials.gov NCT00722150.
Citation: Bethell D, Se Y, Lon C, Tyner S, Saunders D, et al. (2011) Artesunate Dose Escalation for the Treatment of Uncomplicated Malaria in a Region of ReportedArtemisinin Resistance: A Randomized Clinical Trial. PLoS ONE 6(5): e19283. doi:10.1371/journal.pone.0019283
Editor: Steffen Borrmann, Kenya Medical Research Institute - Wellcome Trust Research Programme, Kenya
Received December 18, 2010; Accepted March 25, 2011; Published May 13, 2011
Copyright: � 2011 Bethell et al. This is an open-access article distributed under the terms of the Creative Commons Attribution License, which permitsunrestricted use, distribution, and reproduction in any medium, provided the original author and source are credited.
Funding: This study was funded by a Bill and Melinda Gates Foundation Program Grant through the World Health Organization, and the U. S. Department ofDefense Global Emerging Infections System (GEIS) Program. The funders had no role in study design, data collection and analysis, decision to publish, orpreparation of the manuscript.
Competing Interests: The authors have declared that no competing interests exist.
* E-mail: [email protected]
Introduction
The emergence of artemisinin resistant malaria along the Thai-
Cambodian border has provoked global alarm that the most
valuable and effective antimalarial drug is in danger of being lost,
triggering a campaign to identify and eradicate resistant parasite
strains [1,2] [3]. Despite these concerns the artemisinin resistance
phenotype has been poorly characterized. Decreased parasite
sensitivity to the artemisinin drugs in standardized in vitro tests has
not been reported to date from clinical trials and a molecular
marker for artemisinin resistance remains elusive. The key features
of the phenotype appear to be prolonged parasite clearance times
and slower than expected parasite clearance rates in patients with
adequate plasma drug concentrations [4]. Recently a genetic basis
for this clinical phenotype has been proposed [5]. While cases of
slow parasitological responses can occur sporadically and at low
frequency in any malaria setting, more than 10% of patients in a
given population remaining parasitemic after 3 days of artemisinin
combination therapy (ACT) treatment has been suggested as a
figure to warrant further detailed investigation of parasitological
responses to treatment using AS monotherapy [6], [4].
Experimental seven-day AS monotherapy regimens, although
impractical and inadvisable for routine, unsupervised use, are
valuable research tools and have yielded important scientific
PLoS ONE | www.plosone.org 1 May 2011 | Volume 6 | Issue 5 | e19283
information about potentially resistant parasites without the
confounding influence of the partner drug and without compro-
mising antimalarial treatment efficacy; a daily dose of 4 mg/kg in
a 7-day AS monotherapy regimen was found to have 28-day
efficacy of 93% in a previous study conducted in 2007 in Tasanh,
western Cambodia [7].
This study formed part of the ARC3 (Artemisinin Resistance:
Confirmation, Characterization and planning for Containment)
Project, in which 4 sites (Tasanh and Pailin in western Cambodia,
Wang Pa in northern Thailand and Bandarban in Bangladesh)
were selected to evaluate 7-day artesunate (AS) monotherapy
regimens using harmonized protocols and common endpoints [4].
Data from Pailin and Wang Pa have already been published and
demonstrated for the first time that parasitological outcomes were
significantly different between malaria patients in Pailin and those
in Wang Pa, with slower parasite clearance times in western
Cambodia [8]. Although PCR-adjusted failure rates were higher
in Pailin than Wang Pa the difference was not statistically
significant. The principal objective of this study in Tasanh, an area
of known emerging artemisinin resistance, was to determine the
impact of AS dose on clinical and parasitological responses in
patients with uncomplicated falciparum malaria by employing 3
different AS monotherapy regimens and to test the hypothesis that
higher doses of AS than are currently recommended (.4 mg/kg)
might be effective in eliminating artemisinin resistant strains. An
additional objective was to identify and characterize resistant
malaria parasite populations and describe the clinical phenotype of
drug resistant malaria. Since safety data for this class of drug is
limited a further area of focus was to characterize the safety and
tolerability of higher cumulative doses of AS.
Methods
The protocol for this trial and supporting CONSORT checklist
are available as supporting information; see Checklist S1 and
Protocol S1.
DesignThis was a randomized, open-label comparison of 3 regimens of
AS monotherapy given as a single oral dose of 2, 4 or 6 mg/kg/
day (AS2, AS4 and AS6) for 7 days (total doses 14, 28 and 42 mg/
kg) in otherwise healthy adult patients with acute falciparum
malaria. AS2 was selected as the lower limit of what was
considered an effective dose to probe for clinical resistance. The
ratio of enrollment into the 3 groups was 2:1:2 into AS2, AS4 and
AS6 respectively; AS4 was intended to serve as a control and act as
a bridge to an earlier study performed at the same site in 2006/
2007 [7,9].
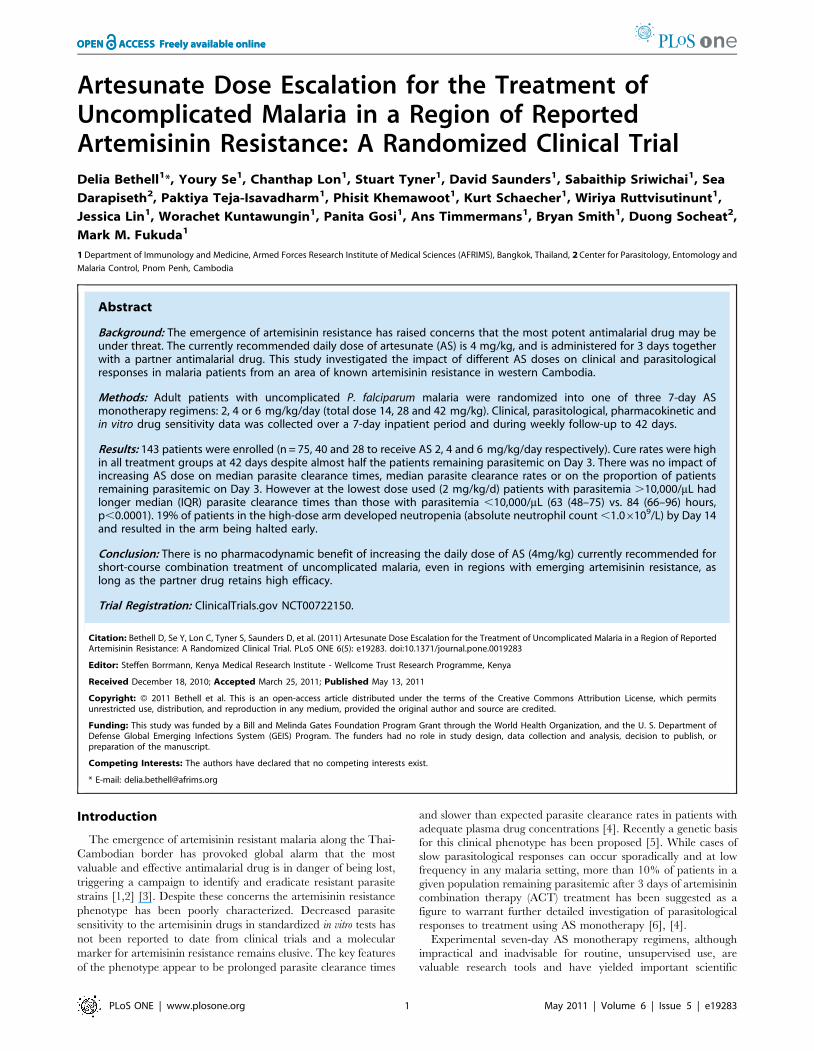
Study siteTasanh Health Center is located in Battambang Province in
western Cambodia, close to the Thailand border and due south of
Pailin (Figure 1); this is an area where reports of increasing rates of
ACT failure have emerged over recent years [1]; [8].
Entry criteriaConsecutive patients were recruited into the study if they
fulfilled the following criteria: (1) acute symptomatic P. falciparum
monoinfection as determined by microscopy with a parasite
density of 1000 to 200,000 asexual parasites/mL; (2) fever/history
of fever within 48 hours; (3) age 18–65 years; (4) gave written
informed consent to participate; (5) otherwise healthy outpatients.
Exclusion criteria included the following: (1) pregnancy or
unwillingness to use effective contraception if female and of
child-bearing age; (2) history of intolerance or hypersensitivity to
AS or other artemisinin derivatives; (3) history of any malaria drug
therapy within 30 days; (4) history of other significant illness; (5)
signs or symptoms indicating a requirement for parenteral
antimalarial therapy; (6) signs or symptoms of severe malaria [10].
Randomization and dosingRandomization was done by an independent statistician using
computer-allocated blocks of 10 and was not stratified; individual
treatment allocations were contained inside consecutively num-
bered sealed envelopes, which were opened sequentially by a study
investigator or clinical research coordinator (CRC) after the
decision to enroll a subject had been made by the study team. AS
doses (using 50 mg tablets, Guilin Pharmaceutical Co. Ltd.,
Guilin, China; quality-controlled and supplied by the World
Health Organization) were calculated individually based on the
patient’s weight at enrollment and the dose rounded up to the
nearest J tablet (12.5 mg). Doses were administered with water
and separated from other concomitant medications wherever
possible. All treatment was directly observed. The full dose was
repeated if vomiting occurred within 30 minutes, and half-dose
given if vomiting occurred within 30–60 minutes. Before the study
commenced 10 randomly selected tablets of study drug were
analyzed in-house for content and weight uniformity according to
standard guidelines [11][12]: the mean AS content was 45.9 mg
(range 41.3–50.2 mg), and dihydroartemisinin (DHA) impurity
was 1.31% (range 1.03–1.62%).
Figure 1. Study location.doi:10.1371/journal.pone.0019283.g001
Artesunate Dose Escalation in Malaria
PLoS ONE | www.plosone.org 2 May 2011 | Volume 6 | Issue 5 | e19283
Study proceduresSubjects remained as inpatients for the first 7 days then returned
for follow-up on days 14, 21, 28, 35 and 42. Before initiating AS
therapy blood was drawn to test for in vitro drug sensitivity,
molecular markers of drug resistance and to distinguish later
recrudescence from re-infection by parasite genotyping. Malaria
smears were prepared up to 8 times on Day 0, and then 4 times a
day until 2 consecutive smears were negative for asexual parasites,
then daily until discharge from the ward and then weekly on days
14, 21, 28, 35, and 42, and again if symptoms consistent with
malaria appeared during follow-up. Plasma samples for AS and
DHA concentrations were collected on Day 0 (pre-dose, 15, 30, 60
minutes and 2, 4, 6 and 8 h), and Day 6 (pre-dose, 2, 4 and 6 h)
doses of AS. Additional blood for parasite genotyping and culture
was drawn at the time of treatment failure.
EndpointsOutcomes at 28 and 42 days, including early treatment failure
(ETF), late treatment failure (LTF) and adequate clinical and
parasitological response (ACPR) were classified according to
standard definitions [13]. The parasite clearance time (PCT100)
was defined as the time from the start of treatment until the first
time the blood smear became negative for asexual parasites and
remained negative at 2 consecutive measurements. PCT90 and
PCT50 were times for the parasitemia to reduce to 90 and 50% of
baseline value. Parasite reduction ratios (PRR) were calculated as
100 minus percentage reduction from baseline level at 24, 48 and
72 hours. The slope of the log10 transformed parasite clearance
curves was used as a measure of parasite clearance rate and
calculated using TableCurve 2D (Systat Software, San Jose,
California). Fever clearance time (FCT) was defined as the time
from baseline until the start of the period in which the tympanic
temperature remained below 38uC for at least 24 hours.
SafetyBecause the highest dose arm (AS6) involved a total oral AS
dose of 42 mg/kg, which is higher than other previously published
studies, a number of safety features were built into the study design
(Table 1). These included development of specific individual and
cohort halting rules, the establishment of an independent
chartered Safety Monitoring Committee (SMC), daily assessment
of treatment emergent adverse events during the first 7 days, a
pause for safety review of AS6 after the first 5 patients had
completed treatment, and measurement of complete blood count
(CBC) and alanine aminotransferase (ALT) at baseline, before the
4th and 7th AS doses and on Day 14.
MicroscopyGiemsa-stained thick and thin blood smears were examined by
two microscopists blinded to each other’s results and to the
treatment status of the study subject. Parasite densities were
calculated based on a count of parasites per 200 WBCs (thick film)
or per 5000 RBCs (thin film). At least 200 oil immersion fields
were examined on the thick film before a blood smear was
considered negative. The final count was determined by taking the
geometric mean of the two microscopists counts. In case of a
difference in results (positive/negative; species diagnosis) between
the two microscopists, the blood smear was re-examined by a third
microscopist independent of the earlier findings and the third
reading accepted as the final result.
PharmacokineticsWhole blood was collected into chilled sodium heparin tubes,
centrifuged immediately, plasma separated and frozen at approx-
imately 220uC or below. Samples were transferred to Bangkok for
analysis by LC-MS [14]. Cmax and Tmax were estimated by
inspection of data. Pharmacokinetic (PK) parameters area under
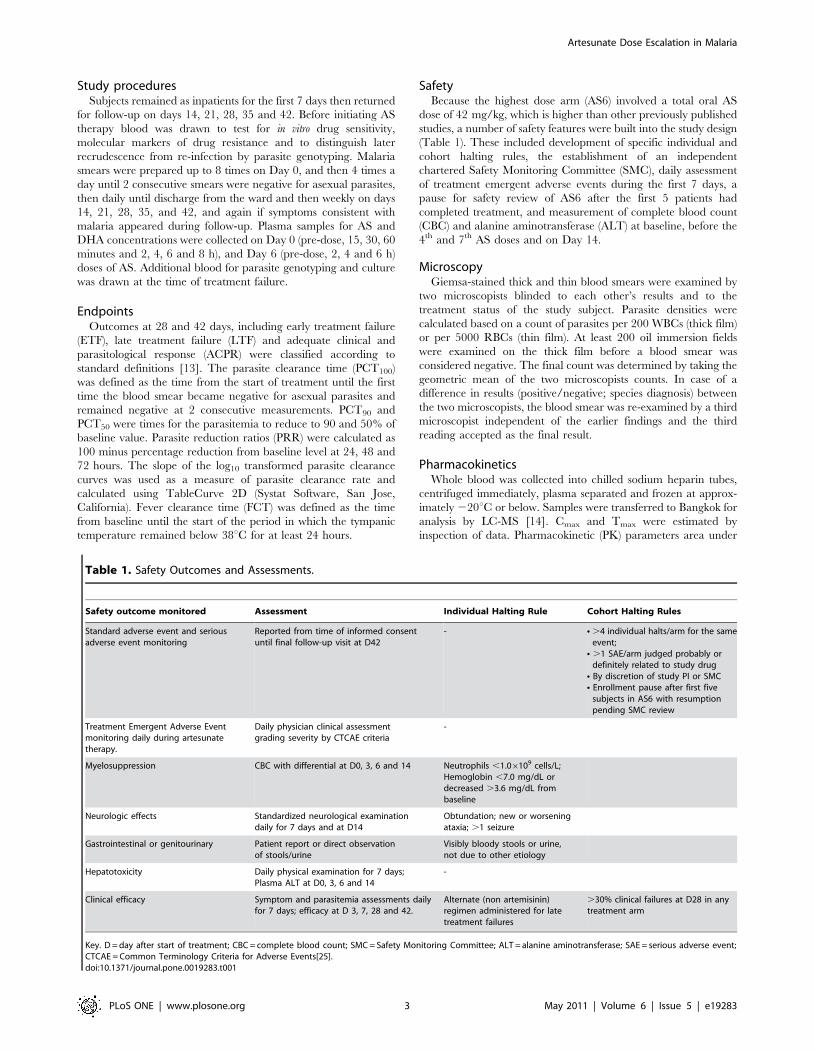
Table 1. Safety Outcomes and Assessments.
Safety outcome monitored Assessment Individual Halting Rule Cohort Halting Rules
Standard adverse event and seriousadverse event monitoring
Reported from time of informed consentuntil final follow-up visit at D42
- N .4 individual halts/arm for the sameevent;
N .1 SAE/arm judged probably ordefinitely related to study drug
N By discretion of study PI or SMCN Enrollment pause after first five
subjects in AS6 with resumptionpending SMC review
Treatment Emergent Adverse Eventmonitoring daily during artesunatetherapy.
Daily physician clinical assessmentgrading severity by CTCAE criteria
-
Myelosuppression CBC with differential at D0, 3, 6 and 14 Neutrophils ,1.06109 cells/L;Hemoglobin ,7.0 mg/dL ordecreased .3.6 mg/dL frombaseline
Neurologic effects Standardized neurological examinationdaily for 7 days and at D14
Obtundation; new or worseningataxia; .1 seizure
Gastrointestinal or genitourinary Patient report or direct observationof stools/urine
Visibly bloody stools or urine,not due to other etiology
Hepatotoxicity Daily physical examination for 7 days;Plasma ALT at D0, 3, 6 and 14
-
Clinical efficacy Symptom and parasitemia assessments dailyfor 7 days; efficacy at D 3, 7, 28 and 42.
Alternate (non artemisinin)regimen administered for latetreatment failures
.30% clinical failures at D28 in anytreatment arm
Key. D = day after start of treatment; CBC = complete blood count; SMC = Safety Monitoring Committee; ALT = alanine aminotransferase; SAE = serious adverse event;CTCAE = Common Terminology Criteria for Adverse Events[25].doi:10.1371/journal.pone.0019283.t001
Artesunate Dose Escalation in Malaria
PLoS ONE | www.plosone.org 3 May 2011 | Volume 6 | Issue 5 | e19283
the plasma concentration-time curve (AUC) and t1/2 were
calculated for AS and it’s major metabolite dihydroartemisinin
(DHA) by non-compartmental analysis using PK Solutions
Software (Summit Research Services).
BioassayPlasma samples from blood collected into sodium heparin were
frozen at 220uC and transported to AFRIMS for analysis.
Determination of antimalarial activity in DHA equivalents against
laboratory strains of P. falciparum (W2) indicating prior use of
antimalarial drugs was performed using a previously described ex
vivo bioassay method [15]; the cut-off value selected was 5 ng/ml
(18 nM).
Clinical labsCBC samples were collected into EDTA tubes and analyzed
using a Beckman CoulterH AcT5diff analyzer. Plasma ALT
samples were measured using a ReflotronH Plus analyzer (Roche
Diagnostics).
In vitroFresh samples, without prior freezing or pre-culturing, were
assayed in the histidine-rich protein 2 (HRP2) drug sensitivity ex
vivo assay for susceptibility to DHA, AS, mefloquine (MQ), quinine
(QN), chloroquine (CQ), and lumefantrine (LUM) [16]. Drug-
coated plates were stored at 4uC and used within 8 weeks of
coating. In order to avoid an innoculum effect, patient specimens
were diluted to a parasitemia between 0.2–0.5% before plating to
enable analysis of IC50 without the confounding effect of baseline
parasitemia. Parasite culture and drug sensitivity assays were
performed as previously described [17]. The CQ-resistant W2 P.
falciparum clone was used as a reference and for quality control of
drug-coated plates.
Parasite genotypingTo distinguish recrudescence from new infection polymor-
phisms in genes encoding the P. falciparum merozoite surface
proteins MSP-1 (National Center for Biotechnology Information
(NCBI) gene ID 813575) and MSP-2 (NCBI gene ID 812660), and
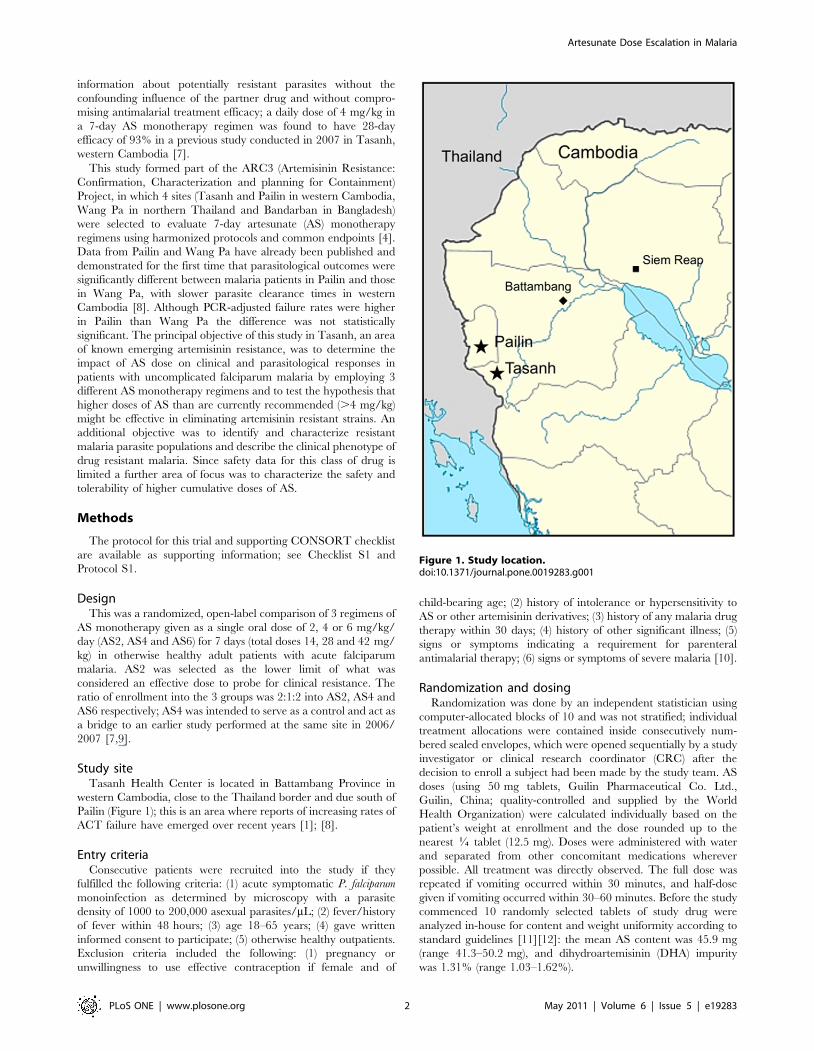
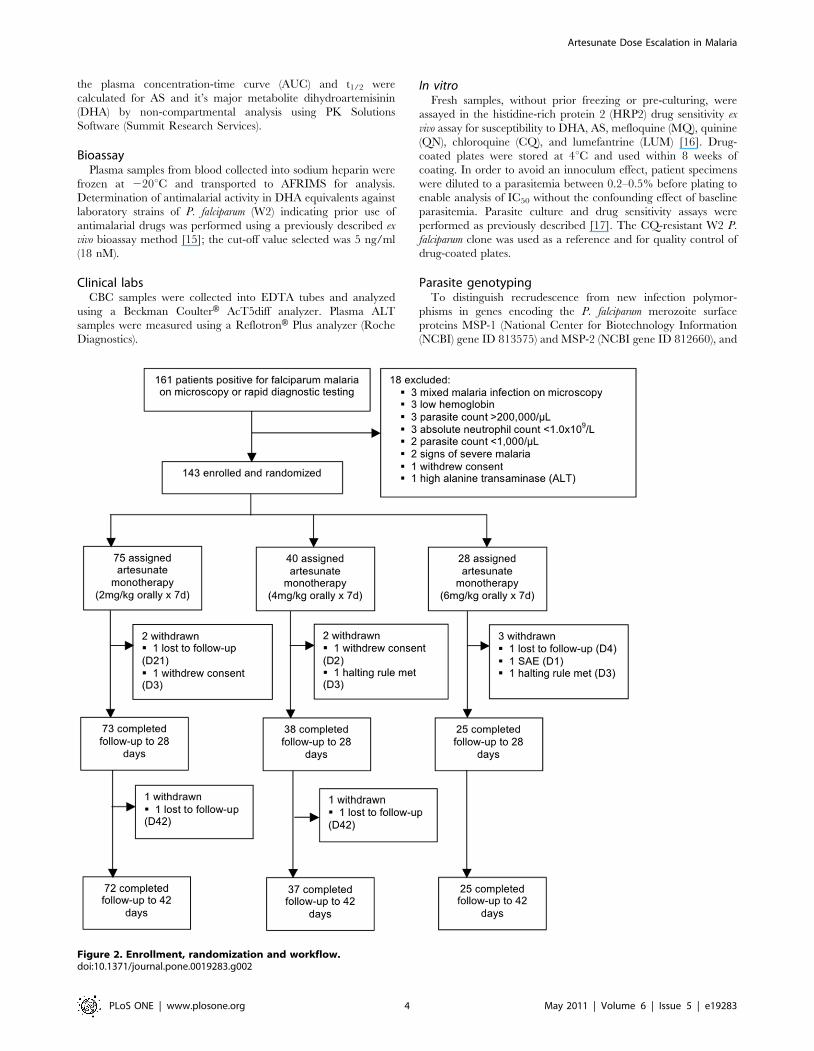
Figure 2. Enrollment, randomization and workflow.doi:10.1371/journal.pone.0019283.g002
Artesunate Dose Escalation in Malaria
PLoS ONE | www.plosone.org 4 May 2011 | Volume 6 | Issue 5 | e19283
the glutamate-rich surface protein (GLURP) (NCBI gene ID
810501) were compared in individual samples from baseline and
time of failure according to standard methodology [18][19]. The
polymorphic repetitive regions selected were block 2 of MSP-1
(allelic variants from the MAD20, K1 and RO33 families), block 3
of MSP-2 (allelic variants from the FC27 and the 3D7/IC families)
and RII block of GLURP.
Statistical analysisSample size estimation assumed a cure rate of 80% in AS2 and
95% in AS6 and was calculated as 60 patients in each of the two
arms with .80% chance of detecting a significant difference in
cure rate by uncorrected Chi-squared test at a two-sided 0.1
significance level. Proportions of patients, both adjusted and non-
adjusted for new infections and for P. vivax parasitemia during
follow-up, were compared between treatment groups using the
Chi-squared and Fishers exact tests. Values of normally distributed
data were expressed as means (95%CI) and non-normally
distributed data as geometric means (95% CI) or medians
(IQR), as appropriate. Means were compared using ANOVA;
otherwise the non-parametric Kruskall-Wallis test was used.
Comparison of failure rates between groups and the proportion
of patients remaining parasitemic over time, were assessed by
modified intention-to-treat (ITT) analysis using Kaplan-Meier
methods and differences between groups compared using the
Logrank test (WHO 2009). Data were analyzed using Stata 10.0
(College Station, Texas) and reported in accordance with
CONSORT methodology [20].
Results
From August 2008 until July 2009 161 patients were screened
and 143 enrolled into the study (Figure 2). Seventy-five, 40 and 28
subjects were randomized to AS2, 4 and 6 respectively. Seven
subjects were subsequently withdrawn; one (in AS6) deteriorated
clinically on Day 1 requiring withdrawal from the study and
transfer to another center for parenteral treatment; an additional 6
(2 in each arm) were either unwilling to continue study
participation or lost to follow-up. Baseline characteristics were
similar in the 3 treatment groups (Table 2). 136 patients completed
7 days of AS monotherapy and were followed to Day 28; 133
completed follow-up to Day 42 (Figure 2, Table 3). Median (range)
weight-adjusted doses were 2 (1.9–2.3) mg/kg, 4 (3.9–4.1) mg/kg
and 6 (5.9–6.1) mg/kg in the 3 groups respectively. Bioassay results
from baseline indicated that only 8/136 (6%) samples had non-
specific pre-existing antimalarial activity above the equivalent of
5 ng/mL DHA.
Eight months after the study started a Cohort Halting Rule was
triggered when a fifth subject in AS6 developed neutropenia;
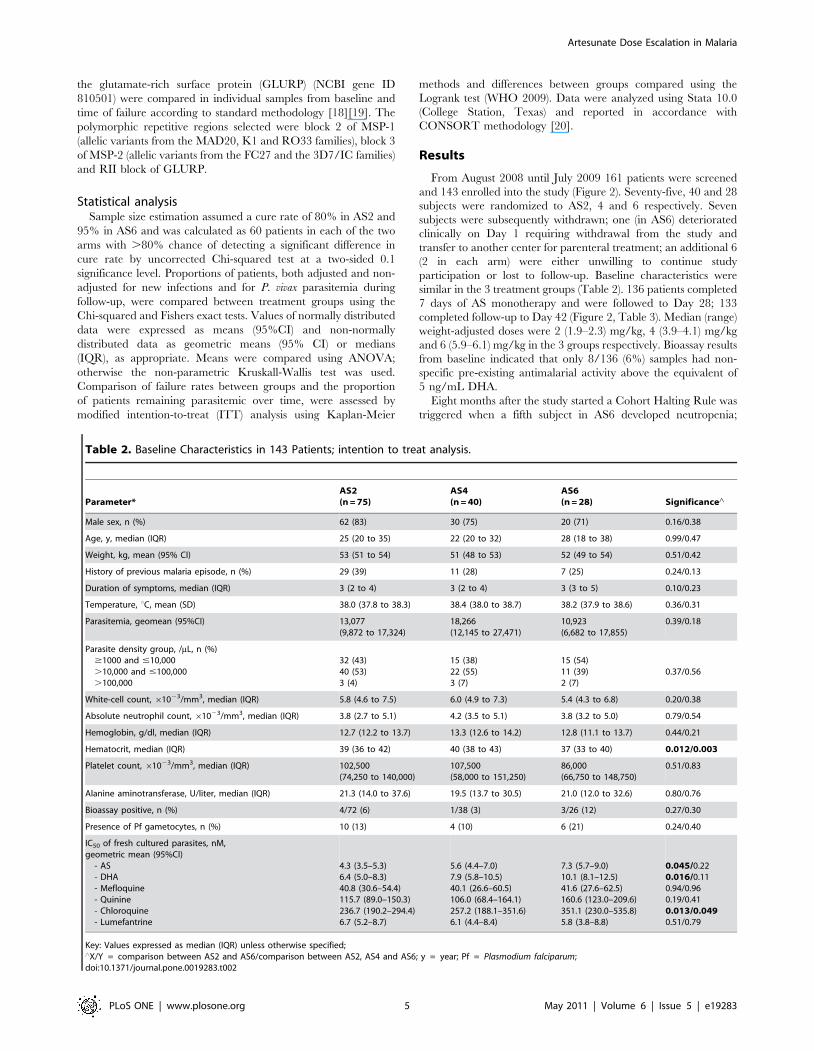
Table 2. Baseline Characteristics in 143 Patients; intention to treat analysis.
Parameter*AS2(n = 75)
AS4(n = 40)
AS6(n = 28) Significance‘
Male sex, n (%) 62 (83) 30 (75) 20 (71) 0.16/0.38
Age, y, median (IQR) 25 (20 to 35) 22 (20 to 32) 28 (18 to 38) 0.99/0.47
Weight, kg, mean (95% CI) 53 (51 to 54) 51 (48 to 53) 52 (49 to 54) 0.51/0.42
History of previous malaria episode, n (%) 29 (39) 11 (28) 7 (25) 0.24/0.13
Duration of symptoms, median (IQR) 3 (2 to 4) 3 (2 to 4) 3 (3 to 5) 0.10/0.23
Temperature, uC, mean (SD) 38.0 (37.8 to 38.3) 38.4 (38.0 to 38.7) 38.2 (37.9 to 38.6) 0.36/0.31
Parasitemia, geomean (95%CI) 13,077(9,872 to 17,324)
18,266(12,145 to 27,471)
10,923(6,682 to 17,855)
0.39/0.18
Parasite density group, /mL, n (%)$1000 and #10,000.10,000 and #100,000.100,000
32 (43)40 (53)3 (4)
15 (38)22 (55)3 (7)
15 (54)11 (39)2 (7)
0.37/0.56
White-cell count, 61023/mm3, median (IQR) 5.8 (4.6 to 7.5) 6.0 (4.9 to 7.3) 5.4 (4.3 to 6.8) 0.20/0.38
Absolute neutrophil count, 61023/mm3, median (IQR) 3.8 (2.7 to 5.1) 4.2 (3.5 to 5.1) 3.8 (3.2 to 5.0) 0.79/0.54
Hemoglobin, g/dl, median (IQR) 12.7 (12.2 to 13.7) 13.3 (12.6 to 14.2) 12.8 (11.1 to 13.7) 0.44/0.21
Hematocrit, median (IQR) 39 (36 to 42) 40 (38 to 43) 37 (33 to 40) 0.012/0.003
Platelet count, 61023/mm3, median (IQR) 102,500(74,250 to 140,000)
107,500(58,000 to 151,250)
86,000(66,750 to 148,750)
0.51/0.83
Alanine aminotransferase, U/liter, median (IQR) 21.3 (14.0 to 37.6) 19.5 (13.7 to 30.5) 21.0 (12.0 to 32.6) 0.80/0.76
Bioassay positive, n (%) 4/72 (6) 1/38 (3) 3/26 (12) 0.27/0.30
Presence of Pf gametocytes, n (%) 10 (13) 4 (10) 6 (21) 0.24/0.40
IC50 of fresh cultured parasites, nM,geometric mean (95%CI)
- AS- DHA- Mefloquine- Quinine- Chloroquine- Lumefantrine
4.3 (3.5–5.3)6.4 (5.0–8.3)40.8 (30.6–54.4)115.7 (89.0–150.3)236.7 (190.2–294.4)6.7 (5.2–8.7)
5.6 (4.4–7.0)7.9 (5.8–10.5)40.1 (26.6–60.5)106.0 (68.4–164.1)257.2 (188.1–351.6)6.1 (4.4–8.4)
7.3 (5.7–9.0)10.1 (8.1–12.5)41.6 (27.6–62.5)160.6 (123.0–209.6)351.1 (230.0–535.8)5.8 (3.8–8.8)
0.045/0.220.016/0.110.94/0.960.19/0.410.013/0.0490.51/0.79
Key: Values expressed as median (IQR) unless otherwise specified;‘X/Y = comparison between AS2 and AS6/comparison between AS2, AS4 and AS6; y = year; Pf = Plasmodium falciparum;doi:10.1371/journal.pone.0019283.t002
Artesunate Dose Escalation in Malaria
PLoS ONE | www.plosone.org 5 May 2011 | Volume 6 | Issue 5 | e19283
safety analysis demonstrated significantly lower geometric mean
absolute neutrophil counts (ANC) on Days 6 and 14 in patients in
AS6 and led to permanent suspension of the arm; this finding has
been reported in detail elsewhere [21]. Therefore fewer patients
were recruited into AS6 than AS2. There were no clinically
apparent adverse events associated with the neutropenia. Patients
in AS6 were significantly more likely to meet a halting rule
compared to the other 2 treatment arms (odds ratio 5.9 (95% CI
2.3–15.6, p = 0.0003).
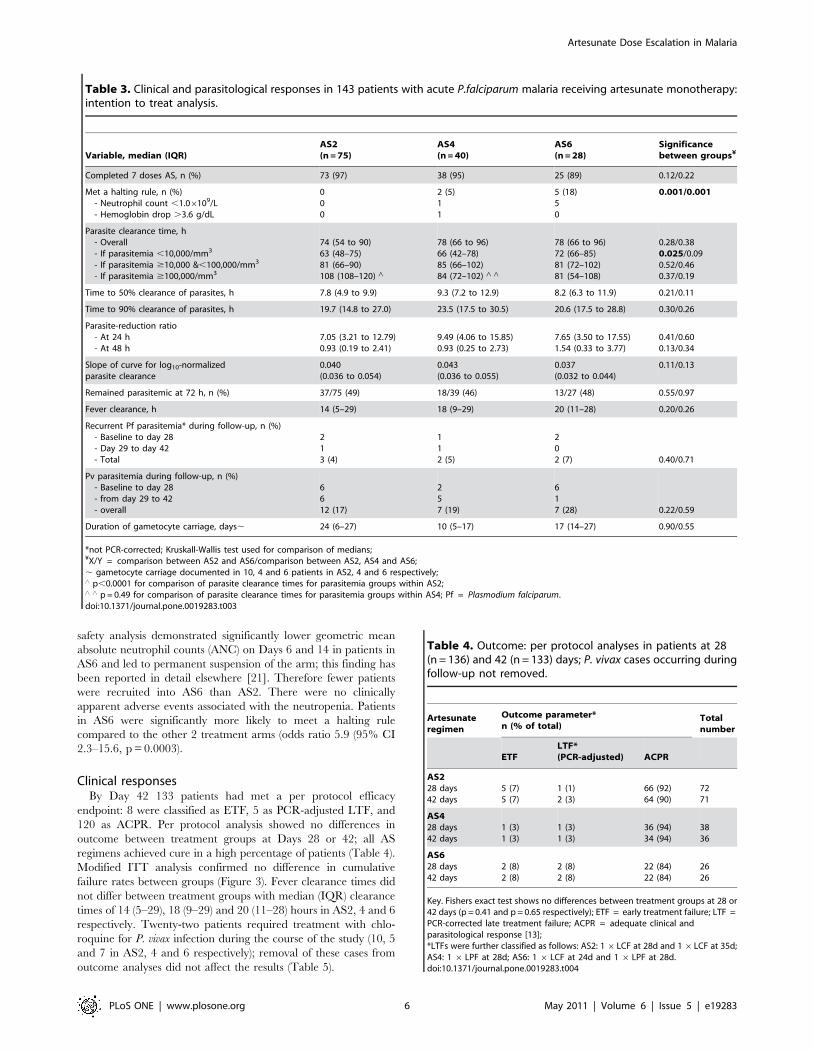
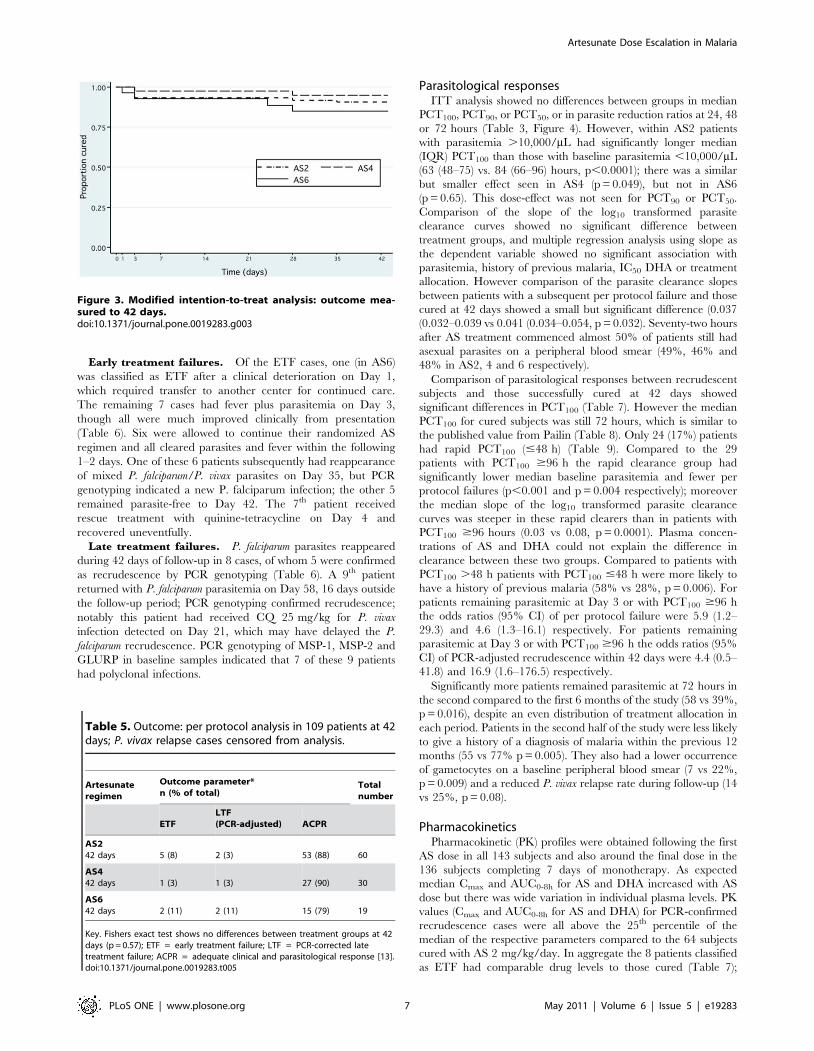
Clinical responsesBy Day 42 133 patients had met a per protocol efficacy
endpoint: 8 were classified as ETF, 5 as PCR-adjusted LTF, and
120 as ACPR. Per protocol analysis showed no differences in
outcome between treatment groups at Days 28 or 42; all AS
regimens achieved cure in a high percentage of patients (Table 4).
Modified ITT analysis confirmed no difference in cumulative
failure rates between groups (Figure 3). Fever clearance times did
not differ between treatment groups with median (IQR) clearance
times of 14 (5–29), 18 (9–29) and 20 (11–28) hours in AS2, 4 and 6
respectively. Twenty-two patients required treatment with chlo-
roquine for P. vivax infection during the course of the study (10, 5
and 7 in AS2, 4 and 6 respectively); removal of these cases from
outcome analyses did not affect the results (Table 5).
Table 3. Clinical and parasitological responses in 143 patients with acute P.falciparum malaria receiving artesunate monotherapy:intention to treat analysis.
Variable, median (IQR)AS2(n = 75)
AS4(n = 40)
AS6(n = 28)
Significancebetween groups¥
Completed 7 doses AS, n (%) 73 (97) 38 (95) 25 (89) 0.12/0.22
Met a halting rule, n (%)- Neutrophil count ,1.06109/L- Hemoglobin drop .3.6 g/dL
000
2 (5)11
5 (18)50
0.001/0.001
Parasite clearance time, h- Overall- If parasitemia ,10,000/mm3
- If parasitemia $10,000 &,100,000/mm3
- If parasitemia $100,000/mm3
74 (54 to 90)63 (48–75)81 (66–90)108 (108–120) ‘
78 (66 to 96)66 (42–78)85 (66–102)84 (72–102) ‘ ‘
78 (66 to 96)72 (66–85)81 (72–102)81 (54–108)
0.28/0.380.025/0.090.52/0.460.37/0.19
Time to 50% clearance of parasites, h 7.8 (4.9 to 9.9) 9.3 (7.2 to 12.9) 8.2 (6.3 to 11.9) 0.21/0.11
Time to 90% clearance of parasites, h 19.7 (14.8 to 27.0) 23.5 (17.5 to 30.5) 20.6 (17.5 to 28.8) 0.30/0.26
Parasite-reduction ratio- At 24 h- At 48 h
7.05 (3.21 to 12.79)0.93 (0.19 to 2.41)
9.49 (4.06 to 15.85)0.93 (0.25 to 2.73)
7.65 (3.50 to 17.55)1.54 (0.33 to 3.77)
0.41/0.600.13/0.34
Slope of curve for log10-normalizedparasite clearance
0.040(0.036 to 0.054)
0.043(0.036 to 0.055)
0.037(0.032 to 0.044)
0.11/0.13
Remained parasitemic at 72 h, n (%) 37/75 (49) 18/39 (46) 13/27 (48) 0.55/0.97
Fever clearance, h 14 (5–29) 18 (9–29) 20 (11–28) 0.20/0.26
Recurrent Pf parasitemia* during follow-up, n (%)- Baseline to day 28- Day 29 to day 42- Total
213 (4)
112 (5)
202 (7) 0.40/0.71
Pv parasitemia during follow-up, n (%)- Baseline to day 28- from day 29 to 42- overall
6612 (17)
257 (19)
617 (28) 0.22/0.59
Duration of gametocyte carriage, days, 24 (6–27) 10 (5–17) 17 (14–27) 0.90/0.55
*not PCR-corrected; Kruskall-Wallis test used for comparison of medians;¥X/Y = comparison between AS2 and AS6/comparison between AS2, AS4 and AS6;, gametocyte carriage documented in 10, 4 and 6 patients in AS2, 4 and 6 respectively;‘ p,0.0001 for comparison of parasite clearance times for parasitemia groups within AS2;‘ ‘ p = 0.49 for comparison of parasite clearance times for parasitemia groups within AS4; Pf = Plasmodium falciparum.doi:10.1371/journal.pone.0019283.t003
Table 4. Outcome: per protocol analyses in patients at 28(n = 136) and 42 (n = 133) days; P. vivax cases occurring duringfollow-up not removed.
Artesunateregimen
Outcome parameter*n (% of total)
Totalnumber
ETFLTF*(PCR-adjusted) ACPR
AS228 days42 days
5 (7)5 (7)
1 (1)2 (3)
66 (92)64 (90)
7271
AS428 days42 days
1 (3)1 (3)
1 (3)1 (3)
36 (94)34 (94)
3836
AS628 days42 days
2 (8)2 (8)
2 (8)2 (8)
22 (84)22 (84)
2626
Key. Fishers exact test shows no differences between treatment groups at 28 or42 days (p = 0.41 and p = 0.65 respectively); ETF = early treatment failure; LTF =PCR-corrected late treatment failure; ACPR = adequate clinical andparasitological response [13];*LTFs were further classified as follows: AS2: 16LCF at 28d and 16LCF at 35d;AS4: 1 6 LPF at 28d; AS6: 1 6 LCF at 24d and 1 6 LPF at 28d.doi:10.1371/journal.pone.0019283.t004
Artesunate Dose Escalation in Malaria
PLoS ONE | www.plosone.org 6 May 2011 | Volume 6 | Issue 5 | e19283
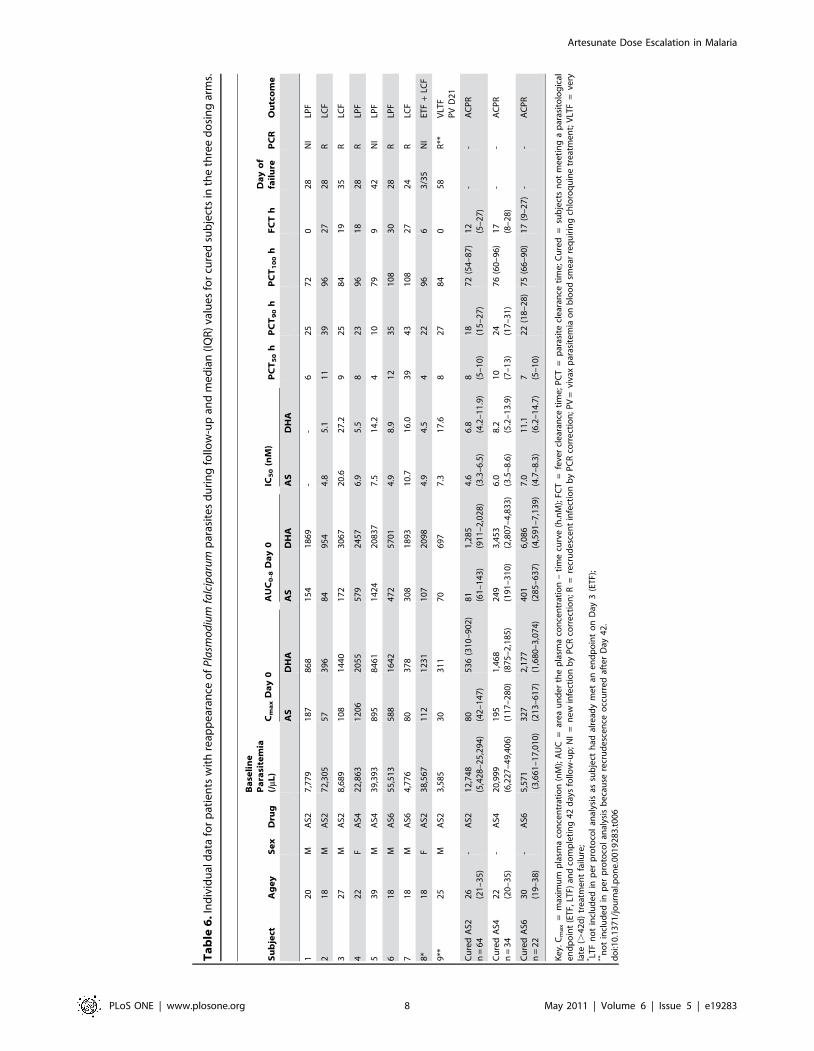
Early treatment failures. Of the ETF cases, one (in AS6)
was classified as ETF after a clinical deterioration on Day 1,
which required transfer to another center for continued care.
The remaining 7 cases had fever plus parasitemia on Day 3,
though all were much improved clinically from presentation
(Table 6). Six were allowed to continue their randomized AS
regimen and all cleared parasites and fever within the following
1–2 days. One of these 6 patients subsequently had reappearance
of mixed P. falciparum/P. vivax parasites on Day 35, but PCR
genotyping indicated a new P. falciparum infection; the other 5
remained parasite-free to Day 42. The 7th patient received
rescue treatment with quinine-tetracycline on Day 4 and
recovered uneventfully.
Late treatment failures. P. falciparum parasites reappeared
during 42 days of follow-up in 8 cases, of whom 5 were confirmed
as recrudescence by PCR genotyping (Table 6). A 9th patient
returned with P. falciparum parasitemia on Day 58, 16 days outside
the follow-up period; PCR genotyping confirmed recrudescence;
notably this patient had received CQ 25 mg/kg for P. vivax
infection detected on Day 21, which may have delayed the P.
falciparum recrudescence. PCR genotyping of MSP-1, MSP-2 and
GLURP in baseline samples indicated that 7 of these 9 patients
had polyclonal infections.
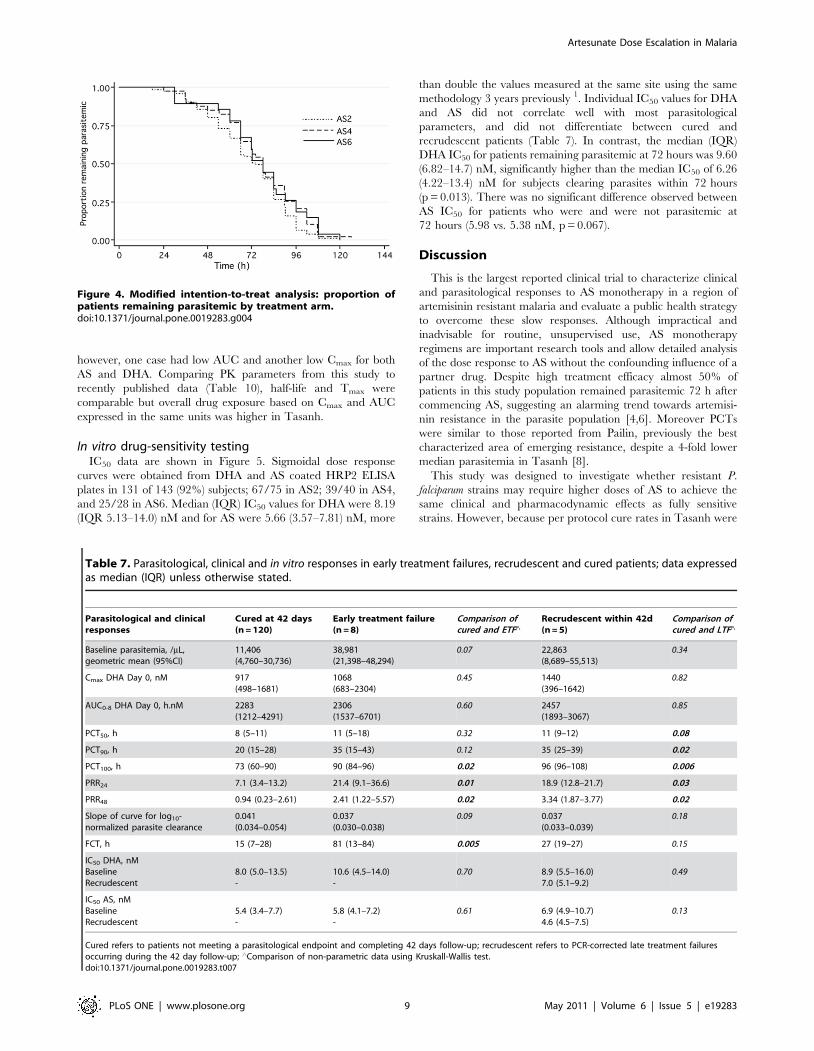
Parasitological responsesITT analysis showed no differences between groups in median
PCT100, PCT90, or PCT50, or in parasite reduction ratios at 24, 48
or 72 hours (Table 3, Figure 4). However, within AS2 patients
with parasitemia .10,000/mL had significantly longer median
(IQR) PCT100 than those with baseline parasitemia ,10,000/mL
(63 (48–75) vs. 84 (66–96) hours, p,0.0001); there was a similar
but smaller effect seen in AS4 (p = 0.049), but not in AS6
(p = 0.65). This dose-effect was not seen for PCT90 or PCT50.
Comparison of the slope of the log10 transformed parasite
clearance curves showed no significant difference between
treatment groups, and multiple regression analysis using slope as
the dependent variable showed no significant association with
parasitemia, history of previous malaria, IC50 DHA or treatment
allocation. However comparison of the parasite clearance slopes
between patients with a subsequent per protocol failure and those
cured at 42 days showed a small but significant difference (0.037
(0.032–0.039 vs 0.041 (0.034–0.054, p = 0.032). Seventy-two hours
after AS treatment commenced almost 50% of patients still had
asexual parasites on a peripheral blood smear (49%, 46% and
48% in AS2, 4 and 6 respectively).
Comparison of parasitological responses between recrudescent
subjects and those successfully cured at 42 days showed
significant differences in PCT100 (Table 7). However the median
PCT100 for cured subjects was still 72 hours, which is similar to
the published value from Pailin (Table 8). Only 24 (17%) patients
had rapid PCT100 (#48 h) (Table 9). Compared to the 29
patients with PCT100 $96 h the rapid clearance group had
significantly lower median baseline parasitemia and fewer per
protocol failures (p,0.001 and p = 0.004 respectively); moreover
the median slope of the log10 transformed parasite clearance
curves was steeper in these rapid clearers than in patients with
PCT100 $96 hours (0.03 vs 0.08, p = 0.0001). Plasma concen-
trations of AS and DHA could not explain the difference in
clearance between these two groups. Compared to patients with
PCT100 .48 h patients with PCT100 #48 h were more likely to
have a history of previous malaria (58% vs 28%, p = 0.006). For
patients remaining parasitemic at Day 3 or with PCT100 $96 h
the odds ratios (95% CI) of per protocol failure were 5.9 (1.2–
29.3) and 4.6 (1.3–16.1) respectively. For patients remaining
parasitemic at Day 3 or with PCT100 $96 h the odds ratios (95%
CI) of PCR-adjusted recrudescence within 42 days were 4.4 (0.5–
41.8) and 16.9 (1.6–176.5) respectively.
Significantly more patients remained parasitemic at 72 hours in
the second compared to the first 6 months of the study (58 vs 39%,
p = 0.016), despite an even distribution of treatment allocation in
each period. Patients in the second half of the study were less likely
to give a history of a diagnosis of malaria within the previous 12
months (55 vs 77% p = 0.005). They also had a lower occurrence
of gametocytes on a baseline peripheral blood smear (7 vs 22%,
p = 0.009) and a reduced P. vivax relapse rate during follow-up (14
vs 25%, p = 0.08).
PharmacokineticsPharmacokinetic (PK) profiles were obtained following the first
AS dose in all 143 subjects and also around the final dose in the
136 subjects completing 7 days of monotherapy. As expected
median Cmax and AUC0-8h for AS and DHA increased with AS
dose but there was wide variation in individual plasma levels. PK
values (Cmax and AUC0-8h for AS and DHA) for PCR-confirmed
recrudescence cases were all above the 25th percentile of the
median of the respective parameters compared to the 64 subjects
cured with AS 2 mg/kg/day. In aggregate the 8 patients classified
as ETF had comparable drug levels to those cured (Table 7);
Table 5. Outcome: per protocol analysis in 109 patients at 42days; P. vivax relapse cases censored from analysis.
Artesunateregimen
Outcome parameter*n (% of total)
Totalnumber
ETFLTF(PCR-adjusted) ACPR
AS242 days 5 (8) 2 (3) 53 (88) 60
AS442 days 1 (3) 1 (3) 27 (90) 30
AS642 days 2 (11) 2 (11) 15 (79) 19
Key. Fishers exact test shows no differences between treatment groups at 42days (p = 0.57); ETF = early treatment failure; LTF = PCR-corrected latetreatment failure; ACPR = adequate clinical and parasitological response [13].doi:10.1371/journal.pone.0019283.t005
Figure 3. Modified intention-to-treat analysis: outcome mea-sured to 42 days.doi:10.1371/journal.pone.0019283.g003
Artesunate Dose Escalation in Malaria
PLoS ONE | www.plosone.org 7 May 2011 | Volume 6 | Issue 5 | e19283
Ta
ble
6.
Ind
ivid
ual
dat
afo
rp
atie
nts
wit
hre
app
ear
ance
of
Pla
smo
diu
mfa
lcip
aru
mp
aras
ite
sd
uri
ng
follo
w-u
pan
dm
ed
ian
(IQ
R)
valu
es
for
cure
dsu
bje
cts
inth
eth
ree
do
sin
gar
ms.
Su
bje
ctA
ge
yS
ex
Dru
g
Ba
seli
ne
Pa
rasi
tem
ia(/
mL)
Cm
ax
Da
y0
AU
C0
-8D
ay
0IC
50
(nM
)P
CT
50
hP
CT
90
hP
CT
10
0h
FC
Th
Da
yo
ffa
ilu
reP
CR
Ou
tco
me
AS
DH
AA
SD
HA
AS
DH
A
12
0M
AS2
7,7
79
18
78
68
15
41
86
9-
-6
25
72
02
8N
ILP
F
21
8M
AS2
72
,30
55
73
96
84
95
44
.85
.11
13
99
62
72
8R
LCF
32
7M
AS2
8,6
89
10
81
44
01
72
30
67
20
.62
7.2
92
58
41
93
5R
LCF
42
2F
AS4
22
,86
31
20
62
05
55
79
24
57
6.9
5.5
82
39
61
82
8R
LPF
53
9M
AS4
39
,39
38
95
84
61
14
24
20
83
77
.51
4.2
41
07
99
42
NI
LPF
61
8M
AS6
55
,51
35
88
16
42
47
25
70
14
.98
.91
23
51
08
30
28
RLP
F
71
8M
AS6
4,7
76
80
37
83
08
18
93
10
.71
6.0
39
43
10
82
72
4R
LCF
8*
18
FA
S23
8,5
67
11
21
23
11
07
20
98
4.9
4.5
42
29
66
3/3
5N
IET
F+
LCF
9**
25
MA
S23
,58
53
03
11
70
69
77
.31
7.6
82
78
40
58
R**
VLT
FP
VD
21
Cu
red
AS2
n=
64
26
(21
–3
5)
-A
S21
2,7
48
(5,4
28
–2
5,2
94
)8
0(4
2–
14
7)
53
6(3
10
–9
02
)8
1(6
1–
14
3)
1,2
85
(91
1–
2,0
28
)4
.6(3
.3–
6.5
)6
.8(4
.2–
11
.9)
8 (5–
10
)1
8(1
5–
27
)7
2(5
4–
87
)1
2(5
–2
7)
--
AC
PR
Cu
red
AS4
n=
34
22
(20
–3
5)
-A
S42
0,9
99
(6,2
27
–4
9,4
06
)1
95
(11
7–
28
0)
1,4
68
(87
5–
2,1
85
)2
49
(19
1–
31
0)
3,4
53
(2,8
07
–4
,83
3)
6.0
(3.5
–8
.6)
8.2
(5.2
–1
3.9
)1
0(7
–1
3)
24
(17
–3
1)
76
(60
–9
6)
17
(8–
28
)-
-A
CP
R
Cu
red
AS6
n=
22
30
(19
–3
8)
-A
S65
,57
1(3
,66
1–
17
,01
0)
32
7(2
13
–6
17
)2
,17
7(1
,68
0–
3,0
74
)4
01
(28
5–
63
7)
6,0
86
(4,5
91
–7
,13
9)
7.0
(4.7
–8
.3)
11
.1(6
.2–
14
.7)
7 (5–
10
)2
2(1
8–
28
)7
5(6
6–
90
)1
7(9
–2
7)
--
AC
PR
Ke
y.C
ma
x=
max
imu
mp
lasm
aco
nce
ntr
atio
n(n
M);
AU
C=
are
au
nd
er
the
pla
sma
con
cen
trat
ion
–ti
me
curv
e(h
.nM
);FC
T=
feve
rcl
ear
ance
tim
e;
PC
T=
par
asit
ecl
ear
ance
tim
e;
Cu
red
=su
bje
cts
no
tm
ee
tin
ga
par
asit
olo
gic
ale
nd
po
int
(ET
F,LT
F)an
dco
mp
leti
ng
42
day
sfo
llow
-up
;NI
=n
ew
infe
ctio
nb
yP
CR
corr
ect
ion
;R=
recr
ud
esc
en
tin
fect
ion
by
PC
Rco
rre
ctio
n;P
V=
viva
xp
aras
ite
mia
on
blo
od
sme
arre
qu
irin
gch
loro
qu
ine
tre
atm
en
t;V
LTF
=ve
ryla
te(.
42
d)
tre
atm
en
tfa
ilure
;* LT
Fn
ot
incl
ud
ed
inp
er
pro
toco
lan
alys
isas
sub
ject
had
alre
ady
me
tan
en
dp
oin
to
nD
ay3
(ET
F);
**n
ot
incl
ud
ed
inp
er
pro
toco
lan
alys
isb
eca
use
recr
ud
esc
en
ceo
ccu
rre
daf
ter
Day
42
.d
oi:1
0.1
37
1/j
ou
rnal
.po
ne
.00
19
28
3.t
00
6
Artesunate Dose Escalation in Malaria
PLoS ONE | www.plosone.org 8 May 2011 | Volume 6 | Issue 5 | e19283
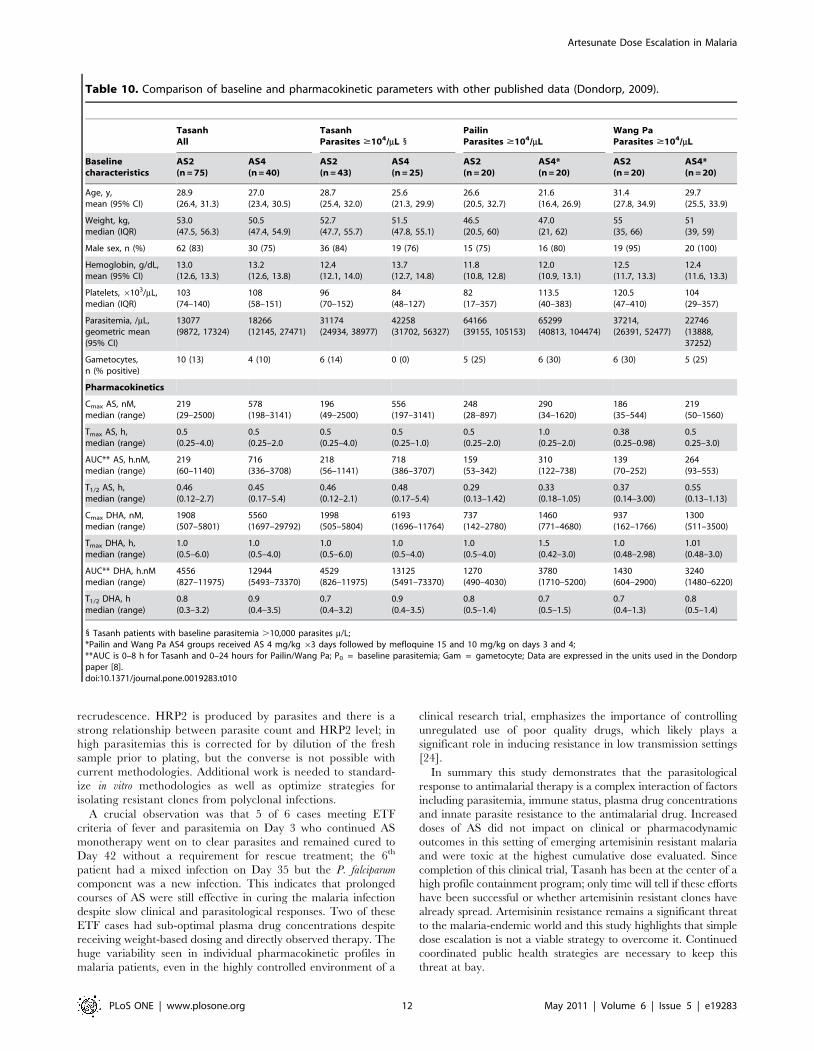
however, one case had low AUC and another low Cmax for both
AS and DHA. Comparing PK parameters from this study to
recently published data (Table 10), half-life and Tmax were
comparable but overall drug exposure based on Cmax and AUC
expressed in the same units was higher in Tasanh.
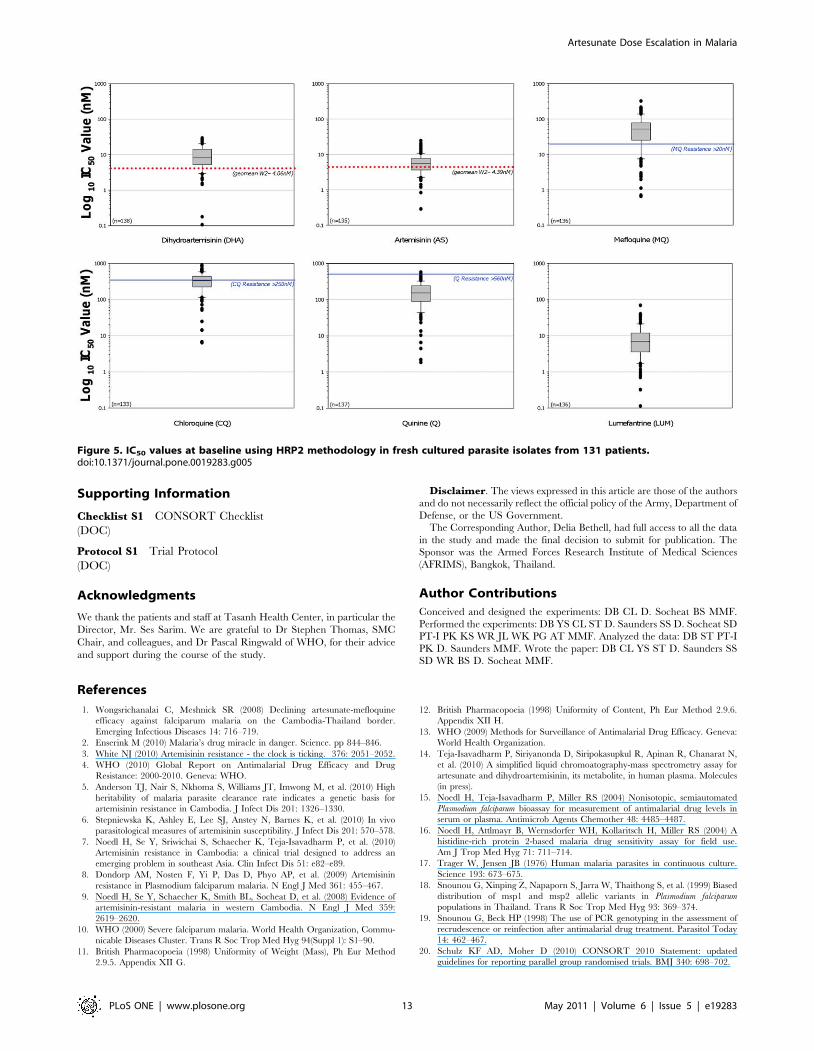
In vitro drug-sensitivity testingIC50 data are shown in Figure 5. Sigmoidal dose response
curves were obtained from DHA and AS coated HRP2 ELISA
plates in 131 of 143 (92%) subjects; 67/75 in AS2; 39/40 in AS4,
and 25/28 in AS6. Median (IQR) IC50 values for DHA were 8.19
(IQR 5.13–14.0) nM and for AS were 5.66 (3.57–7.81) nM, more
than double the values measured at the same site using the same
methodology 3 years previously 1. Individual IC50 values for DHA
and AS did not correlate well with most parasitological
parameters, and did not differentiate between cured and
recrudescent patients (Table 7). In contrast, the median (IQR)
DHA IC50 for patients remaining parasitemic at 72 hours was 9.60
(6.82–14.7) nM, significantly higher than the median IC50 of 6.26
(4.22–13.4) nM for subjects clearing parasites within 72 hours
(p = 0.013). There was no significant difference observed between
AS IC50 for patients who were and were not parasitemic at
72 hours (5.98 vs. 5.38 nM, p = 0.067).
Discussion
This is the largest reported clinical trial to characterize clinical
and parasitological responses to AS monotherapy in a region of
artemisinin resistant malaria and evaluate a public health strategy
to overcome these slow responses. Although impractical and
inadvisable for routine, unsupervised use, AS monotherapy
regimens are important research tools and allow detailed analysis
of the dose response to AS without the confounding influence of a
partner drug. Despite high treatment efficacy almost 50% of
patients in this study population remained parasitemic 72 h after
commencing AS, suggesting an alarming trend towards artemisi-
nin resistance in the parasite population [4,6]. Moreover PCTs
were similar to those reported from Pailin, previously the best
characterized area of emerging resistance, despite a 4-fold lower
median parasitemia in Tasanh [8].
This study was designed to investigate whether resistant P.
falciparum strains may require higher doses of AS to achieve the
same clinical and pharmacodynamic effects as fully sensitive
strains. However, because per protocol cure rates in Tasanh were
Figure 4. Modified intention-to-treat analysis: proportion ofpatients remaining parasitemic by treatment arm.doi:10.1371/journal.pone.0019283.g004
Table 7. Parasitological, clinical and in vitro responses in early treatment failures, recrudescent and cured patients; data expressedas median (IQR) unless otherwise stated.
Parasitological and clinicalresponses
Cured at 42 days(n = 120)
Early treatment failure(n = 8)
Comparison ofcured and ETF‘
Recrudescent within 42d(n = 5)
Comparison ofcured and LTF‘
Baseline parasitemia, /mL,geometric mean (95%CI)
11,406(4,760–30,736)
38,981(21,398–48,294)
0.07 22,863(8,689–55,513)
0.34
Cmax DHA Day 0, nM 917(498–1681)
1068(683–2304)
0.45 1440(396–1642)
0.82
AUC0-8 DHA Day 0, h.nM 2283(1212–4291)
2306(1537–6701)
0.60 2457(1893–3067)
0.85
PCT50, h 8 (5–11) 11 (5–18) 0.32 11 (9–12) 0.08
PCT90, h 20 (15–28) 35 (15–43) 0.12 35 (25–39) 0.02
PCT100, h 73 (60–90) 90 (84–96) 0.02 96 (96–108) 0.006
PRR24 7.1 (3.4–13.2) 21.4 (9.1–36.6) 0.01 18.9 (12.8–21.7) 0.03
PRR48 0.94 (0.23–2.61) 2.41 (1.22–5.57) 0.02 3.34 (1.87–3.77) 0.02
Slope of curve for log10-normalized parasite clearance
0.041(0.034–0.054)
0.037(0.030–0.038)
0.09 0.037(0.033–0.039)
0.18
FCT, h 15 (7–28) 81 (13–84) 0.005 27 (19–27) 0.15
IC50 DHA, nMBaselineRecrudescent
8.0 (5.0–13.5)-
10.6 (4.5–14.0)-
0.70 8.9 (5.5–16.0)7.0 (5.1–9.2)
0.49
IC50 AS, nMBaselineRecrudescent
5.4 (3.4–7.7)-
5.8 (4.1–7.2)-
0.61 6.9 (4.9–10.7)4.6 (4.5–7.5)
0.13
Cured refers to patients not meeting a parasitological endpoint and completing 42 days follow-up; recrudescent refers to PCR-corrected late treatment failuresoccurring during the 42 day follow-up; ‘Comparison of non-parametric data using Kruskall-Wallis test.doi:10.1371/journal.pone.0019283.t007
Artesunate Dose Escalation in Malaria
PLoS ONE | www.plosone.org 9 May 2011 | Volume 6 | Issue 5 | e19283
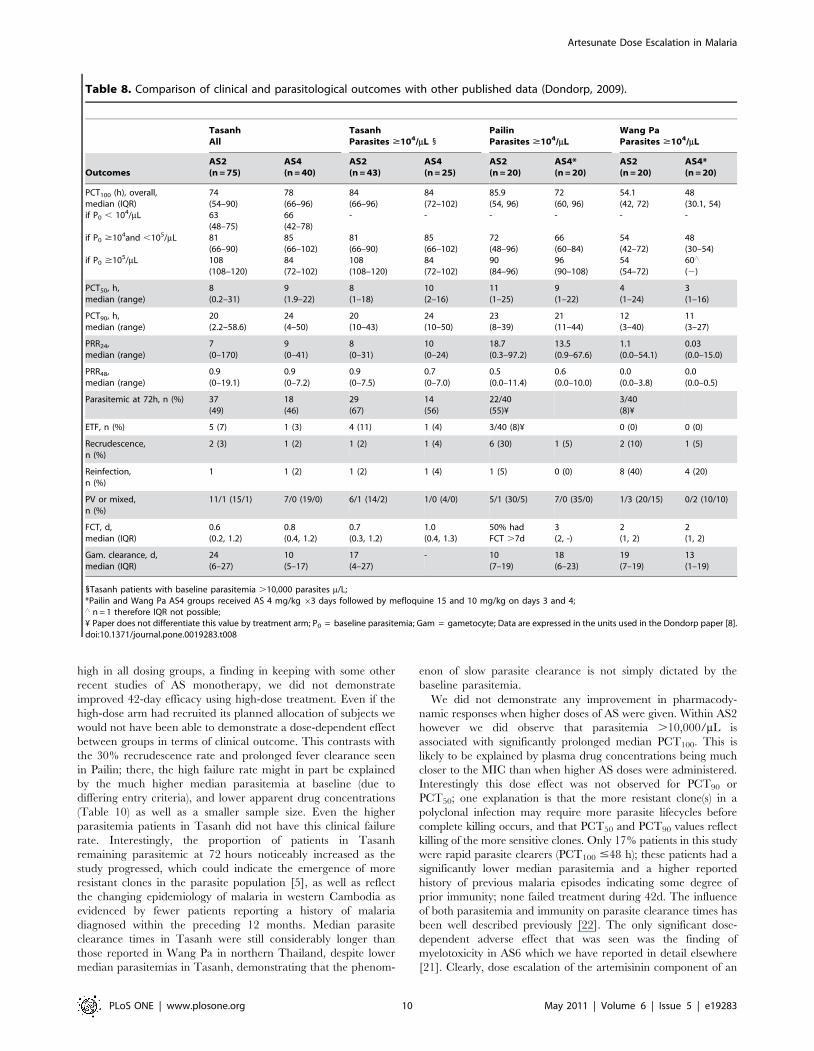
high in all dosing groups, a finding in keeping with some other
recent studies of AS monotherapy, we did not demonstrate
improved 42-day efficacy using high-dose treatment. Even if the
high-dose arm had recruited its planned allocation of subjects we
would not have been able to demonstrate a dose-dependent effect
between groups in terms of clinical outcome. This contrasts with
the 30% recrudescence rate and prolonged fever clearance seen
in Pailin; there, the high failure rate might in part be explained
by the much higher median parasitemia at baseline (due to
differing entry criteria), and lower apparent drug concentrations
(Table 10) as well as a smaller sample size. Even the higher
parasitemia patients in Tasanh did not have this clinical failure
rate. Interestingly, the proportion of patients in Tasanh
remaining parasitemic at 72 hours noticeably increased as the
study progressed, which could indicate the emergence of more
resistant clones in the parasite population [5], as well as reflect
the changing epidemiology of malaria in western Cambodia as
evidenced by fewer patients reporting a history of malaria
diagnosed within the preceding 12 months. Median parasite
clearance times in Tasanh were still considerably longer than
those reported in Wang Pa in northern Thailand, despite lower
median parasitemias in Tasanh, demonstrating that the phenom-
enon of slow parasite clearance is not simply dictated by the
baseline parasitemia.
We did not demonstrate any improvement in pharmacody-
namic responses when higher doses of AS were given. Within AS2
however we did observe that parasitemia .10,000/mL is
associated with significantly prolonged median PCT100. This is
likely to be explained by plasma drug concentrations being much
closer to the MIC than when higher AS doses were administered.
Interestingly this dose effect was not observed for PCT90 or
PCT50; one explanation is that the more resistant clone(s) in a
polyclonal infection may require more parasite lifecycles before
complete killing occurs, and that PCT50 and PCT90 values reflect
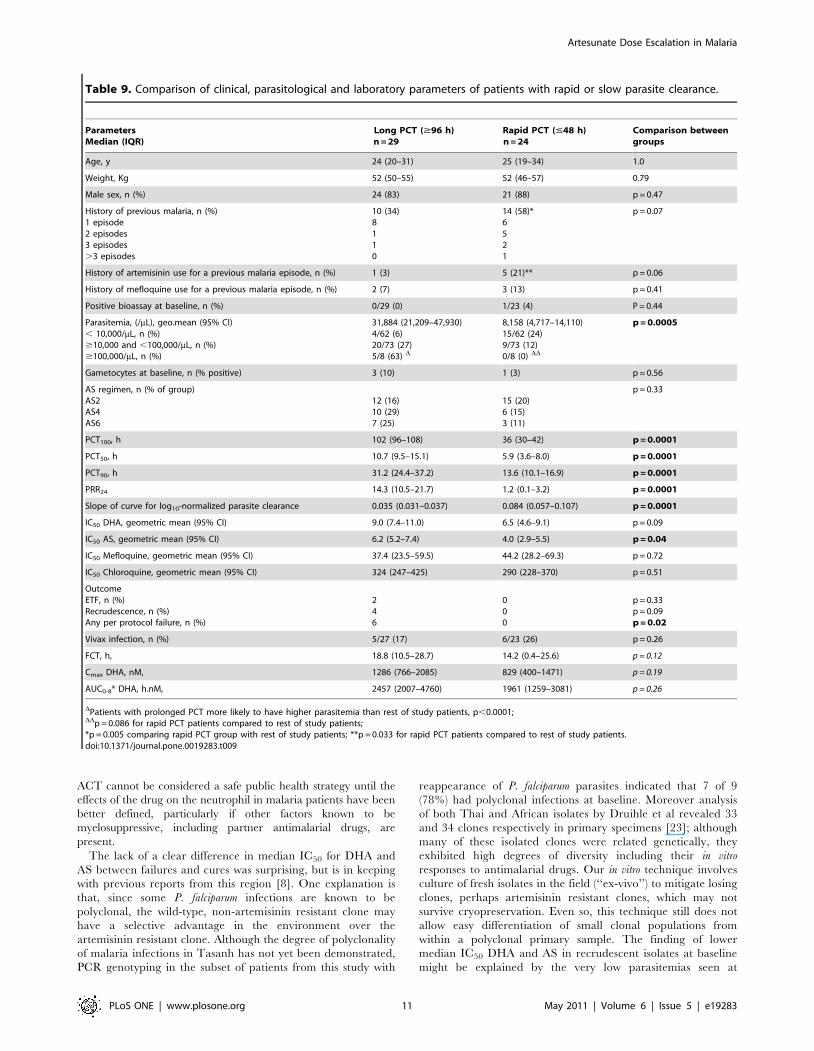
killing of the more sensitive clones. Only 17% patients in this study
were rapid parasite clearers (PCT100 #48 h); these patients had a
significantly lower median parasitemia and a higher reported
history of previous malaria episodes indicating some degree of
prior immunity; none failed treatment during 42d. The influence
of both parasitemia and immunity on parasite clearance times has
been well described previously [22]. The only significant dose-
dependent adverse effect that was seen was the finding of
myelotoxicity in AS6 which we have reported in detail elsewhere
[21]. Clearly, dose escalation of the artemisinin component of an
Table 8. Comparison of clinical and parasitological outcomes with other published data (Dondorp, 2009).
TasanhAll
TasanhParasites $104/mL 1
PailinParasites $104/mL
Wang PaParasites $104/mL
OutcomesAS2(n = 75)
AS4(n = 40)
AS2(n = 43)
AS4(n = 25)
AS2(n = 20)
AS4*(n = 20)
AS2(n = 20)
AS4*(n = 20)
PCT100 (h), overall,median (IQR)if P0 , 104/mL
if P0 $104and ,105/mL
if P0 $105/mL
74(54–90)63(48–75)81(66–90)108(108–120)
78(66–96)66(42–78)85(66–102)84(72–102)
84(66–96)-
81(66–90)108(108–120)
84(72–102)-
85(66–102)84(72–102)
85.9(54, 96)-
72(48–96)90(84–96)
72(60, 96)-
66(60–84)96(90–108)
54.1(42, 72)-
54(42–72)54(54–72)
48(30.1, 54)-
48(30–54)60‘
(2)
PCT50, h,median (range)
8(0.2–31)
9(1.9–22)
8(1–18)
10(2–16)
11(1–25)
9(1–22)
4(1–24)
3(1–16)
PCT90, h,median (range)
20(2.2–58.6)
24(4–50)
20(10–43)
24(10–50)
23(8–39)
21(11–44)
12(3–40)
11(3–27)
PRR24,median (range)
7(0–170)
9(0–41)
8(0–31)
10(0–24)
18.7(0.3–97.2)
13.5(0.9–67.6)
1.1(0.0–54.1)
0.03(0.0–15.0)
PRR48,median (range)
0.9(0–19.1)
0.9(0–7.2)
0.9(0–7.5)
0.7(0–7.0)
0.5(0.0–11.4)
0.6(0.0–10.0)
0.0(0.0–3.8)
0.0(0.0–0.5)
Parasitemic at 72h, n (%) 37(49)
18(46)
29(67)
14(56)
22/40(55)¥
3/40(8)¥
ETF, n (%) 5 (7) 1 (3) 4 (11) 1 (4) 3/40 (8)¥ 0 (0) 0 (0)
Recrudescence,n (%)
2 (3) 1 (2) 1 (2) 1 (4) 6 (30) 1 (5) 2 (10) 1 (5)
Reinfection,n (%)
1 1 (2) 1 (2) 1 (4) 1 (5) 0 (0) 8 (40) 4 (20)
PV or mixed,n (%)
11/1 (15/1) 7/0 (19/0) 6/1 (14/2) 1/0 (4/0) 5/1 (30/5) 7/0 (35/0) 1/3 (20/15) 0/2 (10/10)
FCT, d,median (IQR)
0.6(0.2, 1.2)
0.8(0.4, 1.2)
0.7(0.3, 1.2)
1.0(0.4, 1.3)
50% hadFCT .7d
3(2, -)
2(1, 2)
2(1, 2)
Gam. clearance, d,median (IQR)
24(6–27)
10(5–17)
17(4–27)
- 10(7–19)
18(6–23)
19(7–19)
13(1–19)
1Tasanh patients with baseline parasitemia .10,000 parasites m/L;*Pailin and Wang Pa AS4 groups received AS 4 mg/kg 63 days followed by mefloquine 15 and 10 mg/kg on days 3 and 4;‘ n = 1 therefore IQR not possible;¥ Paper does not differentiate this value by treatment arm; P0 = baseline parasitemia; Gam = gametocyte; Data are expressed in the units used in the Dondorp paper [8].doi:10.1371/journal.pone.0019283.t008
Artesunate Dose Escalation in Malaria
PLoS ONE | www.plosone.org 10 May 2011 | Volume 6 | Issue 5 | e19283
ACT cannot be considered a safe public health strategy until the
effects of the drug on the neutrophil in malaria patients have been
better defined, particularly if other factors known to be
myelosuppressive, including partner antimalarial drugs, are
present.
The lack of a clear difference in median IC50 for DHA and
AS between failures and cures was surprising, but is in keeping
with previous reports from this region [8]. One explanation is
that, since some P. falciparum infections are known to be
polyclonal, the wild-type, non-artemisinin resistant clone may
have a selective advantage in the environment over the
artemisinin resistant clone. Although the degree of polyclonality
of malaria infections in Tasanh has not yet been demonstrated,
PCR genotyping in the subset of patients from this study with
reappearance of P. falciparum parasites indicated that 7 of 9
(78%) had polyclonal infections at baseline. Moreover analysis
of both Thai and African isolates by Druihle et al revealed 33
and 34 clones respectively in primary specimens [23]; although
many of these isolated clones were related genetically, they
exhibited high degrees of diversity including their in vitro
responses to antimalarial drugs. Our in vitro technique involves
culture of fresh isolates in the field (‘‘ex-vivo’’) to mitigate losing
clones, perhaps artemisinin resistant clones, which may not
survive cryopreservation. Even so, this technique still does not
allow easy differentiation of small clonal populations from
within a polyclonal primary sample. The finding of lower
median IC50 DHA and AS in recrudescent isolates at baseline
might be explained by the very low parasitemias seen at
Table 9. Comparison of clinical, parasitological and laboratory parameters of patients with rapid or slow parasite clearance.
ParametersMedian (IQR)
Long PCT ($96 h)n = 29
Rapid PCT (#48 h)n = 24
Comparison betweengroups
Age, y 24 (20–31) 25 (19–34) 1.0
Weight, Kg 52 (50–55) 52 (46–57) 0.79
Male sex, n (%) 24 (83) 21 (88) p = 0.47
History of previous malaria, n (%)1 episode2 episodes3 episodes.3 episodes
10 (34)8110
14 (58)*6521
p = 0.07
History of artemisinin use for a previous malaria episode, n (%) 1 (3) 5 (21)** p = 0.06
History of mefloquine use for a previous malaria episode, n (%) 2 (7) 3 (13) p = 0.41
Positive bioassay at baseline, n (%) 0/29 (0) 1/23 (4) P = 0.44
Parasitemia, (/mL), geo.mean (95% CI), 10,000/mL, n (%)$10,000 and ,100,000/mL, n (%)$100,000/mL, n (%)
31,884 (21,209–47,930)4/62 (6)20/73 (27)5/8 (63) D
8,158 (4,717–14,110)15/62 (24)9/73 (12)0/8 (0) DD
p = 0.0005
Gametocytes at baseline, n (% positive) 3 (10) 1 (3) p = 0.56
AS regimen, n (% of group)AS2AS4AS6
12 (16)10 (29)7 (25)
15 (20)6 (15)3 (11)
p = 0.33
PCT100, h 102 (96–108) 36 (30–42) p = 0.0001
PCT50, h 10.7 (9.5–15.1) 5.9 (3.6–8.0) p = 0.0001
PCT90, h 31.2 (24.4–37.2) 13.6 (10.1–16.9) p = 0.0001
PRR24 14.3 (10.5–21.7) 1.2 (0.1–3.2) p = 0.0001
Slope of curve for log10-normalized parasite clearance 0.035 (0.031–0.037) 0.084 (0.057–0.107) p = 0.0001
IC50 DHA, geometric mean (95% CI) 9.0 (7.4–11.0) 6.5 (4.6–9.1) p = 0.09
IC50 AS, geometric mean (95% CI) 6.2 (5.2–7.4) 4.0 (2.9–5.5) p = 0.04
IC50 Mefloquine, geometric mean (95% CI) 37.4 (23.5–59.5) 44.2 (28.2–69.3) p = 0.72
IC50 Chloroquine, geometric mean (95% CI) 324 (247–425) 290 (228–370) p = 0.51
OutcomeETF, n (%)Recrudescence, n (%)Any per protocol failure, n (%)
246
000
p = 0.33p = 0.09p = 0.02
Vivax infection, n (%) 5/27 (17) 6/23 (26) p = 0.26
FCT, h, 18.8 (10.5–28.7) 14.2 (0.4–25.6) p = 0.12
Cmax DHA, nM, 1286 (766–2085) 829 (400–1471) p = 0.19
AUC0-8* DHA, h.nM, 2457 (2007–4760) 1961 (1259–3081) p = 0.26
DPatients with prolonged PCT more likely to have higher parasitemia than rest of study patients, p,0.0001;DDp = 0.086 for rapid PCT patients compared to rest of study patients;*p = 0.005 comparing rapid PCT group with rest of study patients; **p = 0.033 for rapid PCT patients compared to rest of study patients.doi:10.1371/journal.pone.0019283.t009
Artesunate Dose Escalation in Malaria
PLoS ONE | www.plosone.org 11 May 2011 | Volume 6 | Issue 5 | e19283
recrudescence. HRP2 is produced by parasites and there is a
strong relationship between parasite count and HRP2 level; in
high parasitemias this is corrected for by dilution of the fresh
sample prior to plating, but the converse is not possible with
current methodologies. Additional work is needed to standard-
ize in vitro methodologies as well as optimize strategies for
isolating resistant clones from polyclonal infections.
A crucial observation was that 5 of 6 cases meeting ETF
criteria of fever and parasitemia on Day 3 who continued AS
monotherapy went on to clear parasites and remained cured to
Day 42 without a requirement for rescue treatment; the 6th
patient had a mixed infection on Day 35 but the P. falciparum
component was a new infection. This indicates that prolonged
courses of AS were still effective in curing the malaria infection
despite slow clinical and parasitological responses. Two of these
ETF cases had sub-optimal plasma drug concentrations despite
receiving weight-based dosing and directly observed therapy. The
huge variability seen in individual pharmacokinetic profiles in
malaria patients, even in the highly controlled environment of a
clinical research trial, emphasizes the importance of controlling
unregulated use of poor quality drugs, which likely plays a
significant role in inducing resistance in low transmission settings
[24].
In summary this study demonstrates that the parasitological
response to antimalarial therapy is a complex interaction of factors
including parasitemia, immune status, plasma drug concentrations
and innate parasite resistance to the antimalarial drug. Increased
doses of AS did not impact on clinical or pharmacodynamic
outcomes in this setting of emerging artemisinin resistant malaria
and were toxic at the highest cumulative dose evaluated. Since
completion of this clinical trial, Tasanh has been at the center of a
high profile containment program; only time will tell if these efforts
have been successful or whether artemisinin resistant clones have
already spread. Artemisinin resistance remains a significant threat
to the malaria-endemic world and this study highlights that simple
dose escalation is not a viable strategy to overcome it. Continued
coordinated public health strategies are necessary to keep this
threat at bay.
Table 10. Comparison of baseline and pharmacokinetic parameters with other published data (Dondorp, 2009).
TasanhAll
TasanhParasites $104/mL 1
PailinParasites $104/mL
Wang PaParasites $104/mL
Baselinecharacteristics
AS2(n = 75)
AS4(n = 40)
AS2(n = 43)
AS4(n = 25)
AS2(n = 20)
AS4*(n = 20)
AS2(n = 20)
AS4*(n = 20)
Age, y,mean (95% CI)
28.9(26.4, 31.3)
27.0(23.4, 30.5)
28.7(25.4, 32.0)
25.6(21.3, 29.9)
26.6(20.5, 32.7)
21.6(16.4, 26.9)
31.4(27.8, 34.9)
29.7(25.5, 33.9)
Weight, kg,median (IQR)
53.0(47.5, 56.3)
50.5(47.4, 54.9)
52.7(47.7, 55.7)
51.5(47.8, 55.1)
46.5(20.5, 60)
47.0(21, 62)
55(35, 66)
51(39, 59)
Male sex, n (%) 62 (83) 30 (75) 36 (84) 19 (76) 15 (75) 16 (80) 19 (95) 20 (100)
Hemoglobin, g/dL,mean (95% CI)
13.0(12.6, 13.3)
13.2(12.6, 13.8)
12.4(12.1, 14.0)
13.7(12.7, 14.8)
11.8(10.8, 12.8)
12.0(10.9, 13.1)
12.5(11.7, 13.3)
12.4(11.6, 13.3)
Platelets, 6103/mL,median (IQR)
103(74–140)
108(58–151)
96(70–152)
84(48–127)
82(17–357)
113.5(40–383)
120.5(47–410)
104(29–357)
Parasitemia, /mL,geometric mean(95% CI)
13077(9872, 17324)
18266(12145, 27471)
31174(24934, 38977)
42258(31702, 56327)
64166(39155, 105153)
65299(40813, 104474)
37214,(26391, 52477)
22746(13888,37252)
Gametocytes,n (% positive)
10 (13) 4 (10) 6 (14) 0 (0) 5 (25) 6 (30) 6 (30) 5 (25)
Pharmacokinetics
Cmax AS, nM,median (range)
219(29–2500)
578(198–3141)
196(49–2500)
556(197–3141)
248(28–897)
290(34–1620)
186(35–544)
219(50–1560)
Tmax AS, h,median (range)
0.5(0.25–4.0)
0.5(0.25–2.0
0.5(0.25–4.0)
0.5(0.25–1.0)
0.5(0.25–2.0)
1.0(0.25–2.0)
0.38(0.25–0.98)
0.50.25–3.0)
AUC** AS, h.nM,median (range)
219(60–1140)
716(336–3708)
218(56–1141)
718(386–3707)
159(53–342)
310(122–738)
139(70–252)
264(93–553)
T1/2 AS, h,median (range)
0.46(0.12–2.7)
0.45(0.17–5.4)
0.46(0.12–2.1)
0.48(0.17–5.4)
0.29(0.13–1.42)
0.33(0.18–1.05)
0.37(0.14–3.00)
0.55(0.13–1.13)
Cmax DHA, nM,median (range)
1908(507–5801)
5560(1697–29792)
1998(505–5804)
6193(1696–11764)
737(142–2780)
1460(771–4680)
937(162–1766)
1300(511–3500)
Tmax DHA, h,median (range)
1.0(0.5–6.0)
1.0(0.5–4.0)
1.0(0.5–6.0)
1.0(0.5–4.0)
1.0(0.5–4.0)
1.5(0.42–3.0)
1.0(0.48–2.98)
1.01(0.48–3.0)
AUC** DHA, h.nMmedian (range)
4556(827–11975)
12944(5493–73370)
4529(826–11975)
13125(5491–73370)
1270(490–4030)
3780(1710–5200)
1430(604–2900)
3240(1480–6220)
T1/2 DHA, hmedian (range)
0.8(0.3–3.2)
0.9(0.4–3.5)
0.7(0.4–3.2)
0.9(0.4–3.5)
0.8(0.5–1.4)
0.7(0.5–1.5)
0.7(0.4–1.3)
0.8(0.5–1.4)
1 Tasanh patients with baseline parasitemia .10,000 parasites m/L;*Pailin and Wang Pa AS4 groups received AS 4 mg/kg 63 days followed by mefloquine 15 and 10 mg/kg on days 3 and 4;**AUC is 0–8 h for Tasanh and 0–24 hours for Pailin/Wang Pa; P0 = baseline parasitemia; Gam = gametocyte; Data are expressed in the units used in the Dondorppaper [8].doi:10.1371/journal.pone.0019283.t010
Artesunate Dose Escalation in Malaria
PLoS ONE | www.plosone.org 12 May 2011 | Volume 6 | Issue 5 | e19283
Supporting Information
Checklist S1 CONSORT Checklist
(DOC)
Protocol S1 Trial Protocol
(DOC)
Acknowledgments
We thank the patients and staff at Tasanh Health Center, in particular the
Director, Mr. Ses Sarim. We are grateful to Dr Stephen Thomas, SMC
Chair, and colleagues, and Dr Pascal Ringwald of WHO, for their advice
and support during the course of the study.
Disclaimer. The views expressed in this article are those of the authors
and do not necessarily reflect the official policy of the Army, Department of
Defense, or the US Government.
The Corresponding Author, Delia Bethell, had full access to all the data
in the study and made the final decision to submit for publication. The
Sponsor was the Armed Forces Research Institute of Medical Sciences
(AFRIMS), Bangkok, Thailand.
Author Contributions
Conceived and designed the experiments: DB CL D. Socheat BS MMF.
Performed the experiments: DB YS CL ST D. Saunders SS D. Socheat SD
PT-I PK KS WR JL WK PG AT MMF. Analyzed the data: DB ST PT-I
PK D. Saunders MMF. Wrote the paper: DB CL YS ST D. Saunders SS
SD WR BS D. Socheat MMF.
References
1. Wongsrichanalai C, Meshnick SR (2008) Declining artesunate-mefloquine
efficacy against falciparum malaria on the Cambodia-Thailand border.
Emerging Infectious Diseases 14: 716–719.
2. Enserink M (2010) Malaria’s drug miracle in danger. Science. pp 844–846.
3. White NJ (2010) Artemisinin resistance - the clock is ticking. 376: 2051–2052.
4. WHO (2010) Global Report on Antimalarial Drug Efficacy and Drug
Resistance: 2000-2010. Geneva: WHO.
5. Anderson TJ, Nair S, Nkhoma S, Williams JT, Imwong M, et al. (2010) High
heritability of malaria parasite clearance rate indicates a genetic basis for
artemisinin resistance in Cambodia. J Infect Dis 201: 1326–1330.
6. Stepniewska K, Ashley E, Lee SJ, Anstey N, Barnes K, et al. (2010) In vivo
parasitological measures of artemisinin susceptibility. J Infect Dis 201: 570–578.
7. Noedl H, Se Y, Sriwichai S, Schaecher K, Teja-Isavadharm P, et al. (2010)
Artemisinin resistance in Cambodia: a clinical trial designed to address an
emerging problem in southeast Asia. Clin Infect Dis 51: e82–e89.
8. Dondorp AM, Nosten F, Yi P, Das D, Phyo AP, et al. (2009) Artemisinin
resistance in Plasmodium falciparum malaria. N Engl J Med 361: 455–467.
9. Noedl H, Se Y, Schaecher K, Smith BL, Socheat D, et al. (2008) Evidence of
artemisinin-resistant malaria in western Cambodia. N Engl J Med 359:
2619–2620.
10. WHO (2000) Severe falciparum malaria. World Health Organization, Commu-
nicable Diseases Cluster. Trans R Soc Trop Med Hyg 94(Suppl 1): S1–90.
11. British Pharmacopoeia (1998) Uniformity of Weight (Mass), Ph Eur Method
2.9.5. Appendix XII G.
12. British Pharmacopoeia (1998) Uniformity of Content, Ph Eur Method 2.9.6.
Appendix XII H.
13. WHO (2009) Methods for Surveillance of Antimalarial Drug Efficacy. Geneva:
World Health Organization.
14. Teja-Isavadharm P, Siriyanonda D, Siripokasupkul R, Apinan R, Chanarat N,
et al. (2010) A simplified liquid chromoatography-mass spectrometry assay for
artesunate and dihydroartemisinin, its metabolite, in human plasma. Molecules
(in press).
15. Noedl H, Teja-Isavadharm P, Miller RS (2004) Nonisotopic, semiautomated
Plasmodium falciparum bioassay for measurement of antimalarial drug levels in
serum or plasma. Antimicrob Agents Chemother 48: 4485–4487.
16. Noedl H, Attlmayr B, Wernsdorfer WH, Kollaritsch H, Miller RS (2004) A
histidine-rich protein 2-based malaria drug sensitivity assay for field use.
Am J Trop Med Hyg 71: 711–714.
17. Trager W, Jensen JB (1976) Human malaria parasites in continuous culture.
Science 193: 673–675.
18. Snounou G, Xinping Z, Napaporn S, Jarra W, Thaithong S, et al. (1999) Biased
distribution of msp1 and msp2 allelic variants in Plasmodium falciparum
populations in Thailand. Trans R Soc Trop Med Hyg 93: 369–374.
19. Snounou G, Beck HP (1998) The use of PCR genotyping in the assessment of
recrudescence or reinfection after antimalarial drug treatment. Parasitol Today
14: 462–467.
20. Schulz KF AD, Moher D (2010) CONSORT 2010 Statement: updated
guidelines for reporting parallel group randomised trials. BMJ 340: 698–702.
Figure 5. IC50 values at baseline using HRP2 methodology in fresh cultured parasite isolates from 131 patients.doi:10.1371/journal.pone.0019283.g005
Artesunate Dose Escalation in Malaria
PLoS ONE | www.plosone.org 13 May 2011 | Volume 6 | Issue 5 | e19283
21. Bethell DB, Se Y, Lon C, Socheat D, Saunders D, et al. (2010) Dose-dependant
risk of neutropenia following 7-day courses of artesunate monotherapy in
Cambodian patients with acute P. falciparum malaria. Clin Infect Dis 51:
e105–e114.
22. Borrmann S, Matsiegui PB, Missinou MA, Kremsner PG (2008) Effects of
Plasmodium falciparum parasite population size and patient age on early and late
parasitological outcomes of antimalarial treatment in children. Antimicrob
Agents Chemother 52: 1799–1805.
23. Druihle P, Daubersies P, Patarapotikul J, Gentil C, Chene L, et al. (1998) A
primary malarial infection is composed of a very wide range of geneticallydiverse but related parasites. j Clin Invest 101: 2008–2016.
24. White NJ, Pongtavornpinyo W, Maude RJ, Saralamba S, Aguas R, et al. (2009)
Hyperparasitaemia and low dosing are an important source of anti-malarial drugresistance. Malar J 8: 253.
25. Trotti A, Colevas AD, Setser A, Rusch V, Jaques D, et al. (2003) CTCAE v3.0:development of a comprehensive grading system for the adverse effects of cancer
treatment. Semin Radiat Oncol 13: 176–181.
Artesunate Dose Escalation in Malaria
PLoS ONE | www.plosone.org 14 May 2011 | Volume 6 | Issue 5 | e19283