are governments in developing countries too big or too small?
TRANSCRIPT
University of Manchester
IDPM61091 Economic Analysis of the Public Sector
MSc International Development: Public Policy and Management
Author: Costanza Balboni Cestelli
Are governments in developing countries too big or too small?
1
Introduction Defining an optimum government share in the economy has become a crucial issue for improving
efficient policy strategies to stimulate economic growth and reduce poverty in developing
countries. However, empirical evidence in the public sector in lower – middle income countries,
in particular in Africa and Latin America, still show a persistent trend over time: the
government's tax base is limited and expenditure is often low, inefficient and mis-targeted.
(Alesina, 1998)
This paper aims to review the different issues related to the public sector in developing
countries, suggesting possible solutions to increase the tax revenue and improve the quality of
expenditure and consequentially, the size of the government. For this purpose the study is
organized in four sections. The first illustrates the context: what the role of government should
be in contemporary economies. It reviews the different methods of defining government size and
determines which is the most effective to assess the research. In addition, it explains why it is
possible to assume that public sector growth is positively correlated with economic
development, looking at the recent trend in OECD countries. The second part, discusses more
extensively the issue of taxation revenue in developing countries, looking at the case of the
Kenyan tax reform. The third section investigates the government expenditure in developing
countries in more depth and it explains which problems are associated with inefficient spending.
Furthermore, it reviews how a targeted composition of expenditure could represent an essential
tool to address better public sector performances. Finally, the last section draws effective and
critical conclusions on the issue.
2
1) Context and concepts The importance attached to defining the precise size of a public sector cannot be explained
without understanding what the government's role in the economy of every country is and its
relation with economic development. The government's activity should prevent market failure, it
should provide social safety nets avoiding excess market induced inequality and a good
allocation of resources to develop infrastructures of countries. All those actions increase the
national economic efficiency and as a result, economic growth. (Alesina, 1998; Stiglizt, 2010)
1.1 The role of government in the economy According to the distinction made by Musgrave (theory of public finance), the functions of the
public sector can be distinguished in three macro-categories: macroeconomic stabilization,
allocation of resources and redistribution of income.
The stabilization function is related to the abatement of the fluctuation of the national income
and the prevention of market failures. It could be realized, besides the monetary policy, through
the public balance sheet, in particular using operations of expenditures and revenues. The aim
should be to assure high employment and price stability, for these reasons, it is the government's
responsibility to provide regulation and subsidization of private production, especially for those
considered to be essential. (Stiglitz, 2010) The allocation of resources aims towards efficient
spending of the public budget. The government directly undertakes certain kinds of production,
like energy or printing money, and purchases goods and services, which are then supplied to the
population, for example providing national defence, education or fire protection. (Stiglitz 2010)
Finally, speaking about the redistribution of income, two main categories must be distinguished:
explicit redistribution which includes public assistance programs and social insurance programs,
3
and hidden redistribution which refers to the indirect effects of the tax system or other
government programs and also the spending in good services that can have redistributive
consequences, like road, public transport or education. (Stiglizt, 2010)
1.2 Measuring the size of the public sector: methodologies Before going further, it is necessary to agree upon how to measure the size of the public sector.
The most common measurements we can find in literature are the measurements in monetary
value on a per capita basis, by total employees or as a percentage of GDP. (Labonte, 2010; Berry
and Lowery, 1984) Each of the methods has its advantages, but some of them have more
weaknesses than others. The aim of the monetary value on a per capita basis is to determine the
resources at the disposal of the government, but the approach does not take into account an
important variable, inflation. Indeed, for example, in the case of US, a dollar of tax revenue in
1946 would be able to buy about 11$ of goods and services in 2009. (Labonte, 2010:2)
Furthermore this measurement does not incorporate the demographic change: again, because
spending per capita is more meaningful than the total government’s spending, $ 458.4 billion in
spending in 1946 amounted to $3,242 per person, but would only provide $1,492 per person in
2009. On the other hand, estimating the size of the government calculating the number of
employees is still misleading because the government, as is the case in the majority of the OECD
countries, can substitute capital for labour over time to realize the same task with fewer
employees or can pay workers in the private sector through contract and grants. (Ibid.) So,
considering a long-term effect, any level of government expenditure will seem irrelevant, unless
it is expressed as a fraction of gross domestic product (GDP), which includes both inflation and
population growth. (Ibid.) Because, this paper is looking for a long-term effect, it will use the
public sector consumption as a proportion of GDP as a measurement of government size.
4
ID:9241832
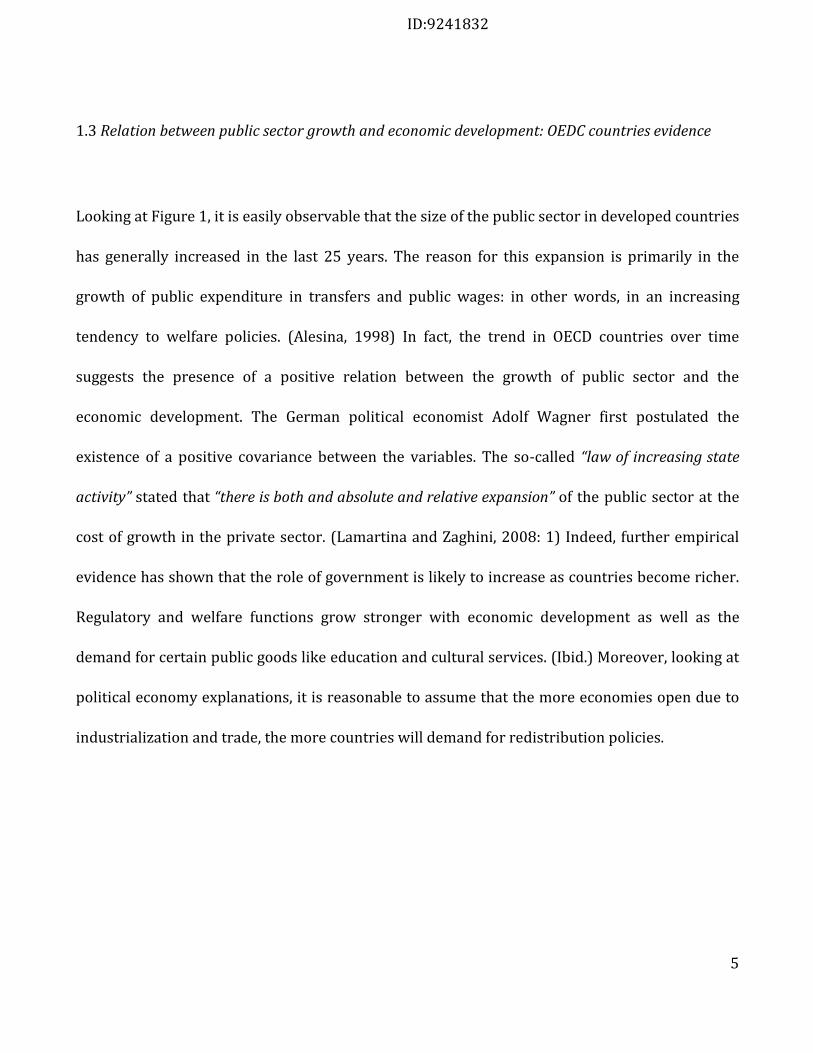
1.3 Relation between public sector growth and economic development: OEDC countries evidence Looking at Figure 1, it is easily observable that the size of the public sector in developed countries
has generally increased in the last 25 years. The reason for this expansion is primarily in the
growth of public expenditure in transfers and public wages: in other words, in an increasing
tendency to welfare policies. (Alesina, 1998) In fact, the trend in OECD countries over time
suggests the presence of a positive relation between the growth of public sector and the
economic development. The German political economist Adolf Wagner first postulated the
existence of a positive covariance between the variables. The so-called “law of increasing state
activity” stated that “there is both and absolute and relative expansion” of the public sector at the
cost of growth in the private sector. (Lamartina and Zaghini, 2008: 1) Indeed, further empirical
evidence has shown that the role of government is likely to increase as countries become richer.
Regulatory and welfare functions grow stronger with economic development as well as the
demand for certain public goods like education and cultural services. (Ibid.) Moreover, looking at
political economy explanations, it is reasonable to assume that the more economies open due to
industrialization and trade, the more countries will demand for redistribution policies.
5
ID:9241832
Figure 1: Expenditures and Revenues in OECD countries (Alesina, 1998:7)
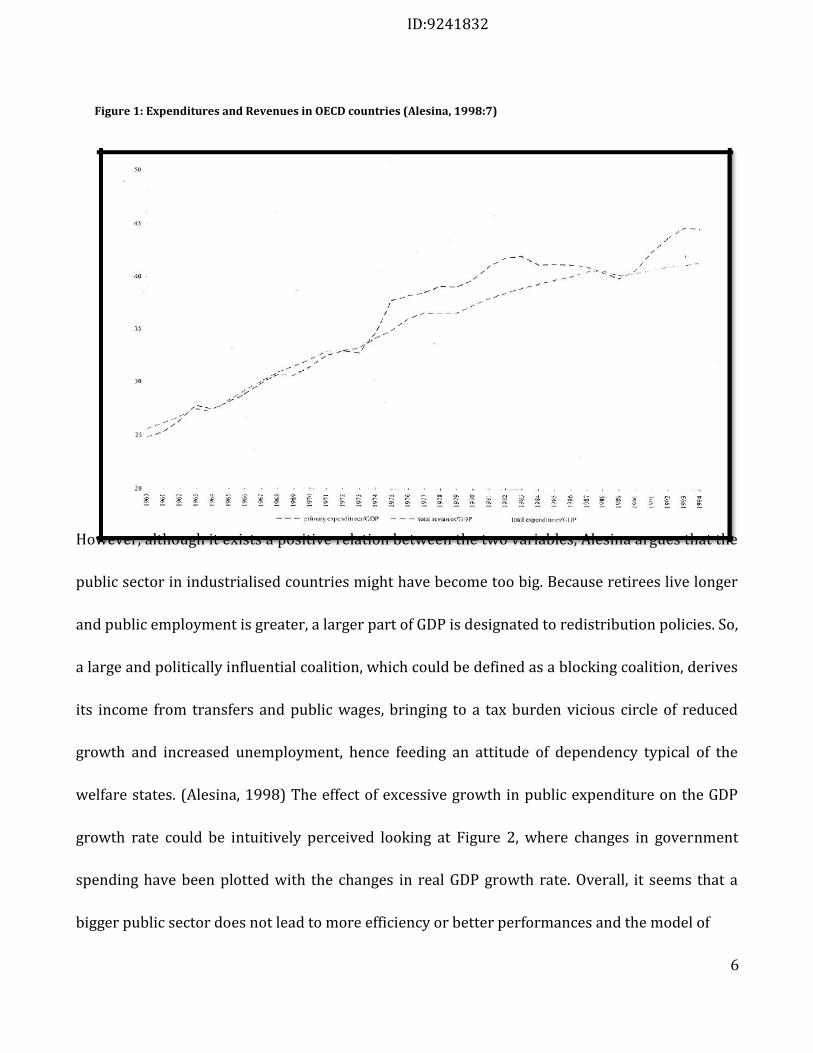
However, although it exists a positive relation between the two variables, Alesina argues that the
public sector in industrialised countries might have become too big. Because retirees live longer
and public employment is greater, a larger part of GDP is designated to redistribution policies. So,
a large and politically influential coalition, which could be defined as a blocking coalition, derives
its income from transfers and public wages, bringing to a tax burden vicious circle of reduced
growth and increased unemployment, hence feeding an attitude of dependency typical of the
welfare states. (Alesina, 1998) The effect of excessive growth in public expenditure on the GDP
growth rate could be intuitively perceived looking at Figure 2, where changes in government
spending have been plotted with the changes in real GDP growth rate. Overall, it seems that a
bigger public sector does not lead to more efficiency or better performances and the model of
6
ID:9241832
welfare state, emblematic of the developed countries, might not represent an optimum model for
developing countries.
Figure 2: Government spending slows growth in OECD countries (Data Source: IMF)
Government spending slows growth
0.00%
-2.00% 0.00% 2.00% 4.00% 6.00% 8.00% 10.00% 12.00% 14.00%
-5.00%
gro
wth
(%
) 2
00
8-2
00
9
Ch
an
ge
in
re
al
GD
P
fro
m 2
00
6-2
00
7 t
o
-10.00% -15.00%
-20.00%
-25.00%
-30.00%
-35.00%
-40.00%
y = -1.471x - 0.0382
R² = 0.50501
Change in government spending as % of
GDP from 2007 to 2009 7
ID:9241832
2) Taxation: raising resources to finance government expenditure. The Kenyan tax
reform. As stated in the introduction, it is possible to isolate two main reasons to explain the size and
inefficiency of developing countries public sector: an issue with the tax revenue and poor quality
of the public expenditure. (Alesina, 1998)
3.1 The taxation system in developing countries Theoretically, the taxation system has three main objectives: raising revenue to finance
government operations, assisting in the redistribution of income and encouraging or
discouraging certain activities through the use of tax provisions. (Karingi 2005)
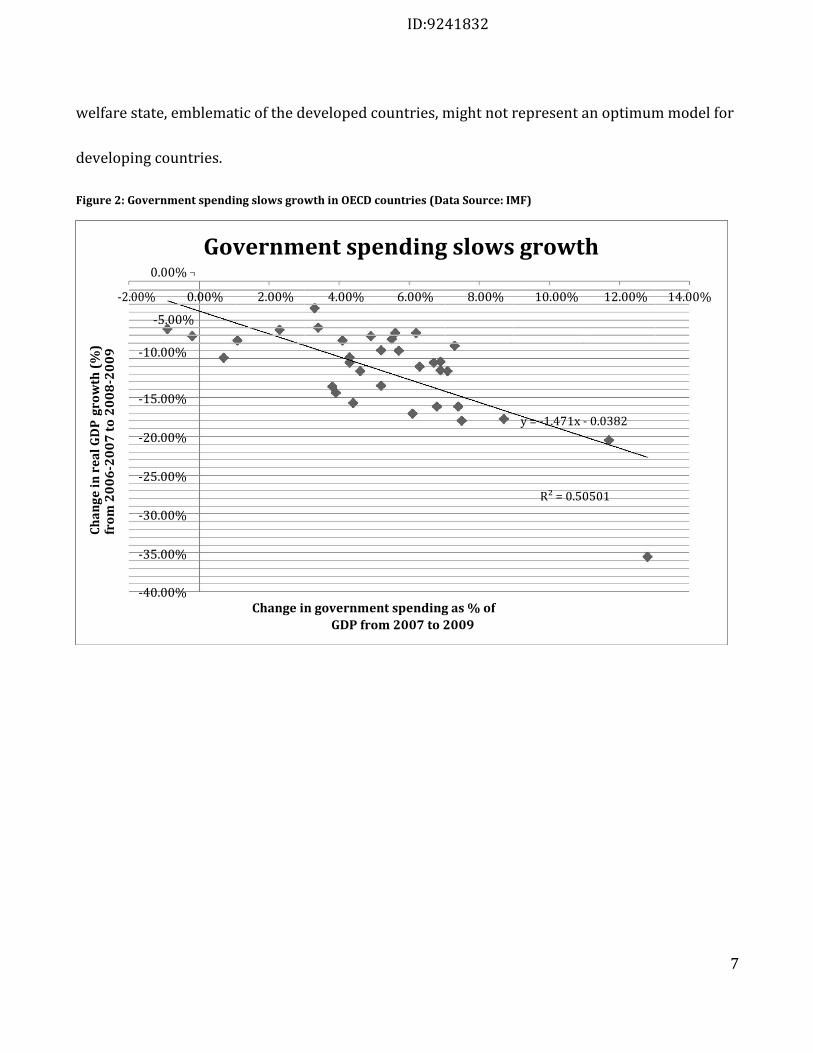
Looking at Figure 3, it seems that the primary objective of governments in developing countries
should be to improve the revenue. A bigger tax base, in fact, will mean a bigger public sector.
Figure 3: Tax Revenue as a % of GDP (2001-2011) (Data Source: World Bank)
18
16
14
12
10
8
6
4
2
2001 2002 2003 2004 2005 2006 2007 2008 2009 2010 2011
0
OECD countries Lower and middle income countries
8
ID:9241832
These economies generally live in a big black or grey area of informality to escape taxes and
regulations: the inefficiency of the public sector infrastructures leads to lower benefit entering
the formal sector. This system clearly leads to a vicious circle, where the bigger the informal
sector, the more difficult it is to collect more taxes and hence create a more efficient system of
services and infrastructures. Furthermore, regarding economic aspects, the informal sector is
generally less productive and specializes in low value added activities; this detail affects the
aggregate economic growth of countries, leading to an inefficient equilibrium in the internal
market. (Alesina, 1998)
It is interesting for these reasons as a result to investigate more how the expenditure is financed
in developing countries. Essentially there are four sources: government revenue, internal
borrowing, external borrowing and printing money. However, empirical evidence shows that
there are several negative effects related to borrowing: the first would be an increase in inflation
because government would have an incentive to default on part of the debt by unexpected
inflation. Furthermore, if debt is used excessively, there would come a time when it would no
longer be acceptable and the government would have to resort to monetizing the debt leading to
inflation. Another effect of debt that seems to cause inflation is the so-called “crowing out”. If the
government uses loans to substitute labour income, private consumption may rise and private
investments could be crowded out, particularly in an economy with full utilization of resources.
In the same way, the printing money financing may claim real resources from the population with
the effects of seignorage causing a high level of inflation: in Bolivia and Argentina seignorage
represented the 4.0 and 6.2 %of GDP respectively in 1980 and 1985. (Burgess and Stern,
1993:769) Hence it is clear that to assure positive effects in a long-term period there is no
alternative for less developed countries to taxation as main source of financing expenditures.
9
ID:9241832
More over, successful adjustment and macroeconomic stability rely on profound and permanent
fiscal corrections being made in the short and medium term, and apparently, structural changes
involving tax reform are at the heart of fiscal corrections. (Burgess and Stern, 1993)
Burden and Stern, using data from IMF of 82 developing countries, all having per-capita income
less than 6000$, found that the average ratio of total revenue to GDP is 18,1 %, (31,2% in
developed countries), and that developing countries derive most of their revenue from indirect
taxes, in particular domestic taxes on goods and services (5% of GDP and 30% on tax revenue),
foreign trade taxes (5% of GDP) and income taxes (6% of GDP, mainly on corporations). The
difference with industrialized countries is clear looking at the three main types of taxes from
where government revenue is collected: income taxes (11% of GDP and 36% of tax revenue,
mainly on individuals), domestic taxes on goods and services (9% of GDP and 29% of tax
revenue, mainly on sales) and social security contribution (9% of GDP). The reason why the
income taxes are so poorly developed is clear when thinking of the great area of informality in an
economic system ruled by agriculture and small-scale enterprises, hence income measurements
appear difficult, or often impossible, with the exception of employees of public sector and foreign
corporations. (Burgess and Stern, 1993:819) Indeed, in developing countries there seems to be a
successful gradual trend moving from trade taxes to domestic sales taxes, as domestic economies
develop, where tax tools can be tailored to tax domestic production and transactions, but very
few improvements have been made in terms of personal income taxes. (Ibid.)
3.2 Kenyan Tax Modernization Program
To have a deeper understanding on how the tax reforms are working in developing countries it is
useful to have a look at a country that seems to be a good model in terms of taxation reforms:
10
ID:9241832
Kenya. The Sub-Saharan country has reached a very good level of tax revenue becoming one of
the model countries for the entire continent. (ADB, 1998)
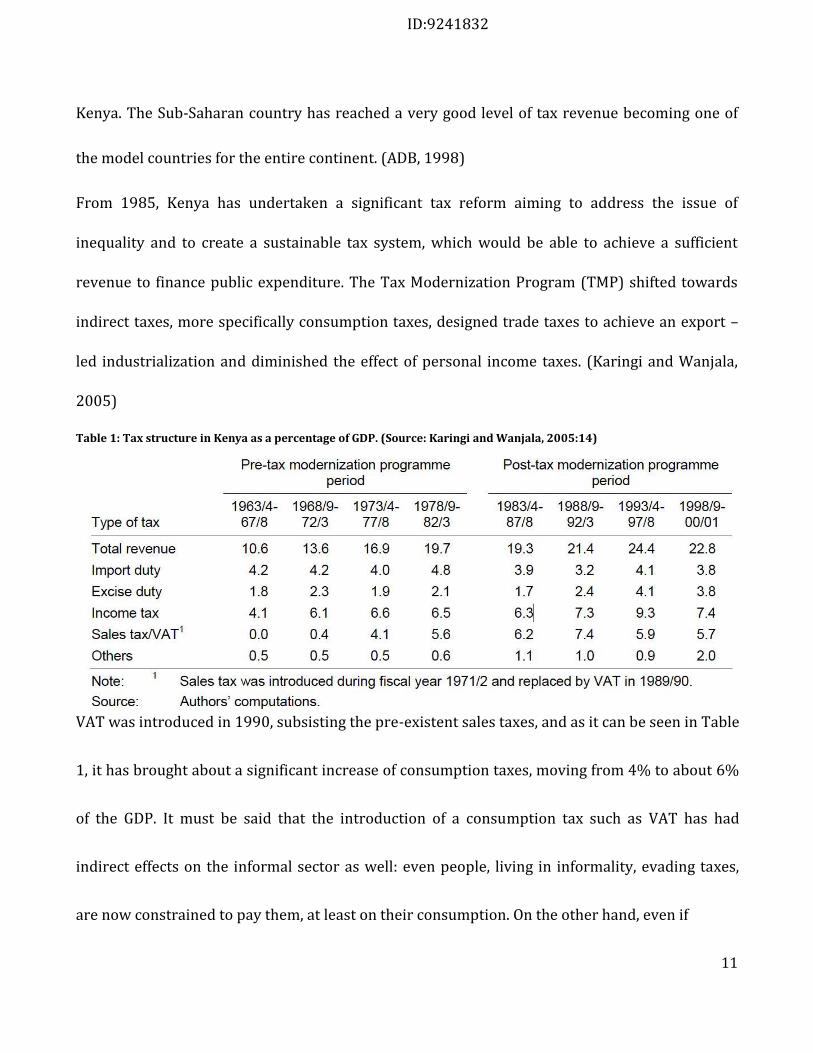
From 1985, Kenya has undertaken a significant tax reform aiming to address the issue of
inequality and to create a sustainable tax system, which would be able to achieve a sufficient
revenue to finance public expenditure. The Tax Modernization Program (TMP) shifted towards
indirect taxes, more specifically consumption taxes, designed trade taxes to achieve an export –
led industrialization and diminished the effect of personal income taxes. (Karingi and Wanjala,
2005)
Table 1: Tax structure in Kenya as a percentage of GDP. (Source: Karingi and Wanjala, 2005:14) VAT was introduced in 1990, subsisting the pre-existent sales taxes, and as it can be seen in Table
1, it has brought about a significant increase of consumption taxes, moving from 4% to about 6%
of the GDP. It must be said that the introduction of a consumption tax such as VAT has had
indirect effects on the informal sector as well: even people, living in informality, evading taxes,
are now constrained to pay them, at least on their consumption. On the other hand, even if
11
ID:9241832
remaining the main source of tax revenue, the role of income taxes has been reduced, and their
account is slightly over 7% of GDP. (Ibid.)
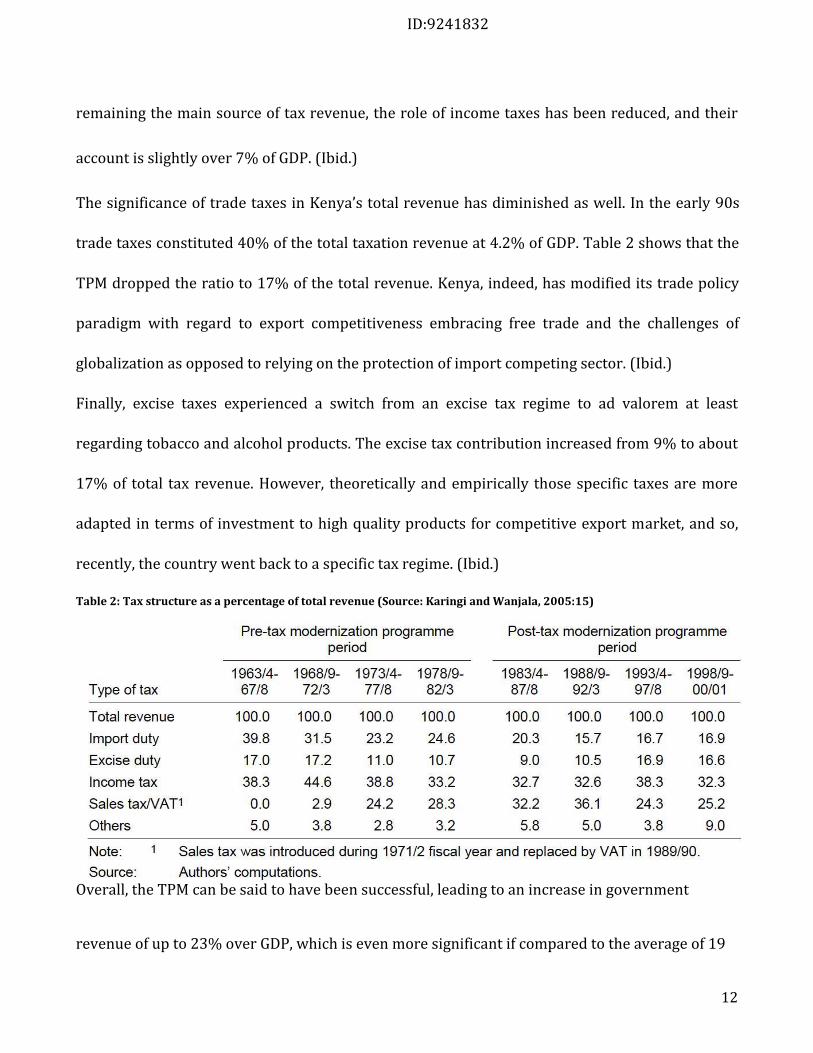
The significance of trade taxes in Kenya’s total revenue has diminished as well. In the early 90s
trade taxes constituted 40% of the total taxation revenue at 4.2% of GDP. Table 2 shows that the
TPM dropped the ratio to 17% of the total revenue. Kenya, indeed, has modified its trade policy
paradigm with regard to export competitiveness embracing free trade and the challenges of
globalization as opposed to relying on the protection of import competing sector. (Ibid.)
Finally, excise taxes experienced a switch from an excise tax regime to ad valorem at least
regarding tobacco and alcohol products. The excise tax contribution increased from 9% to about
17% of total tax revenue. However, theoretically and empirically those specific taxes are more
adapted in terms of investment to high quality products for competitive export market, and so,
recently, the country went back to a specific tax regime. (Ibid.)
Table 2: Tax structure as a percentage of total revenue (Source: Karingi and Wanjala, 2005:15)
Overall, the TPM can be said to have been successful, leading to an increase in government
revenue of up to 23% over GDP, which is even more significant if compared to the average of 19
12
ID:9241832
% in African countries. (ADB, 1998) It could also be observed that instead of changing the type of
taxes which were already in use, the reform addressed constraints in the existing tax structure
that could have deterred achieving this goal. In other words, the taxation policy aimed at
changing the significance on the total revenue of indirect consumption taxes which it achieved by
involving even the informal sector indirectly, and also diminishing trade and direct taxation, to
create a vibrant export oriented economy. It could be said, that the fiscal adjustment approach of
Kenya may represent a good starting point for the implementation of tax reforms in other African
countries.
3) Government’s size in developing countries: the good and bad expenditure As shown in Figure 3, with an average expenditure over GDP of about 18%, lower and middle-
income countries still have very small public sectors which are highly inefficient and unable to
provide the essential services to their populations, if compared with high-income countries
where the objectives of the expenditure are almost all focused on welfare policies.
13
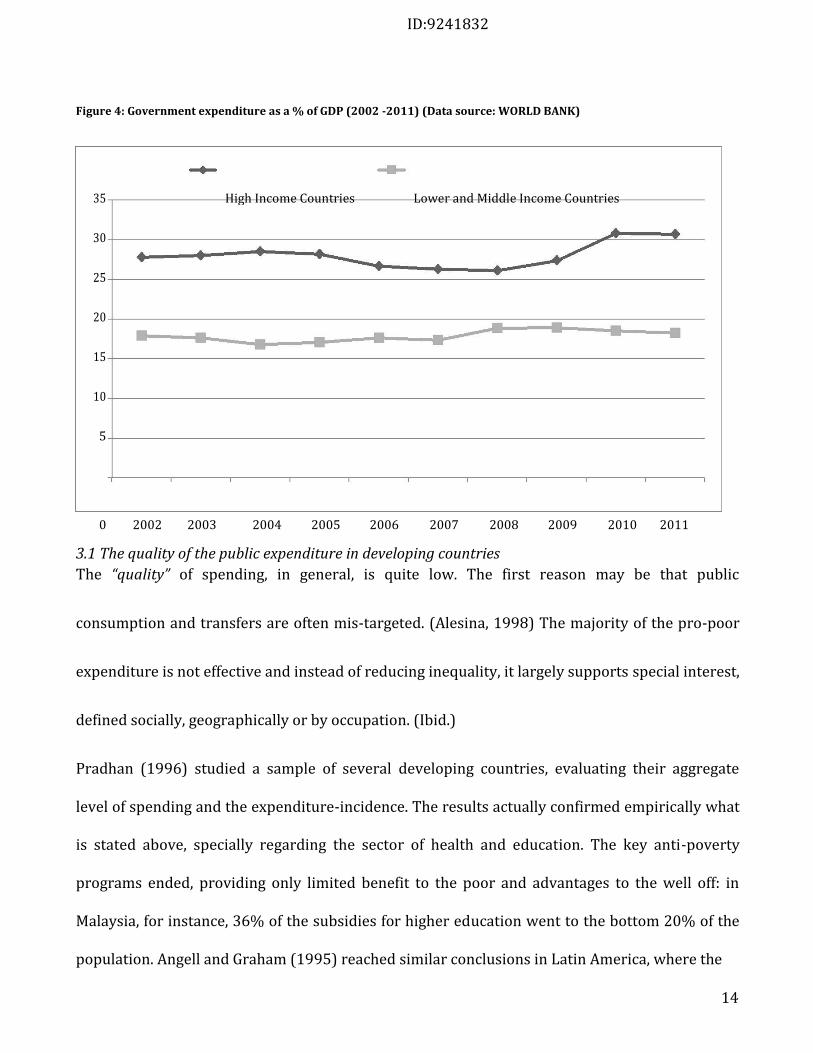
ID:9241832 Figure 4: Government expenditure as a % of GDP (2002 -2011) (Data source: WORLD BANK)
35 High Income Countries Lower and Middle Income Countries
30
25
20
15
10
5
2002 2003 2004 2005 2006 2007 2008 2009 2010 2011
0
3.1 The quality of the public expenditure in developing countries The “quality” of spending, in general, is quite low. The first reason may be that public
consumption and transfers are often mis-targeted. (Alesina, 1998) The majority of the pro-poor
expenditure is not effective and instead of reducing inequality, it largely supports special interest,
defined socially, geographically or by occupation. (Ibid.)
Pradhan (1996) studied a sample of several developing countries, evaluating their aggregate
level of spending and the expenditure-incidence. The results actually confirmed empirically what
is stated above, specially regarding the sector of health and education. The key anti-poverty
programs ended, providing only limited benefit to the poor and advantages to the well off: in
Malaysia, for instance, 36% of the subsidies for higher education went to the bottom 20% of the
population. Angell and Graham (1995) reached similar conclusions in Latin America, where the
14
ID:9241832
health system is generally dualistic. An expensive and restricted private sector and an unfunded
and poorly run public sector lead to an unequal distribution of resources. The importance of
curative medicine rather than preventive care supports the urban middle and upper class at the
expense of the poor. For instance, in Brazil in 1982, 78% of public health funds were spent on
high technology procedures for relatively small groups of urban patients, some of whom could
afford to buy these services out of public medical system in fee-charging hospitals. (Birdshall and
James, 1990)
Corruption and bureaucratic inefficiency represent another important obstacle in the quality of
government’s expenditure in developing countries. Indeed, corruption is inversely related to
growth and imposes significant economic costs. In addition, a high degree of corruption and tax
evasion bring to an inefficient equilibrium, which often increases the income inequality within a
country. (Alesina, 1998)
Mauro (1995) found that the negative association between corruption and investments, and,
consequentially, economic growth, is significant both in a statistical and an economic sense: for
example, if Bangladesh were to improve the integrity and efficiency of its bureaucracy to the level
of Uruguay, its investment rate would increase by almost 5% and its GDP yearly growth rate by
over half a percentage point. (Mauro, 1995:683) Furthermore, the research shows that a positive
and significant correlation exists between bureaucratic efficiency and political stability.
Therefore, corruption and instability could be associated in the sense that they may derive from
“the same coordination problem among members of the ruling elite”. (Mauro, 1995: 705). Further
evidences show that corruption may increase public investment in unproductive projects, and
reduce expenditure allocations for operation and maintenance, thereby lowering the productivity
of the public capital stock. (Tanzi and Davodi, 1997)
15
ID:9241832
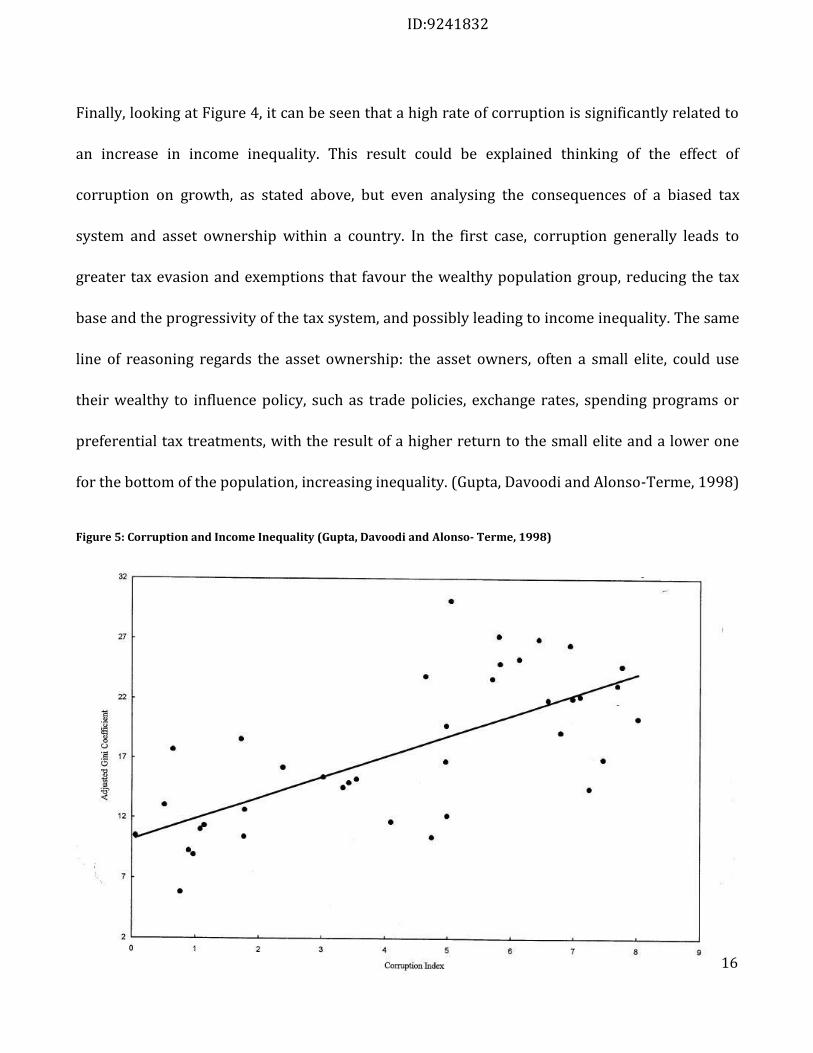
Finally, looking at Figure 4, it can be seen that a high rate of corruption is significantly related to
an increase in income inequality. This result could be explained thinking of the effect of
corruption on growth, as stated above, but even analysing the consequences of a biased tax
system and asset ownership within a country. In the first case, corruption generally leads to
greater tax evasion and exemptions that favour the wealthy population group, reducing the tax
base and the progressivity of the tax system, and possibly leading to income inequality. The same
line of reasoning regards the asset ownership: the asset owners, often a small elite, could use
their wealthy to influence policy, such as trade policies, exchange rates, spending programs or
preferential tax treatments, with the result of a higher return to the small elite and a lower one
for the bottom of the population, increasing inequality. (Gupta, Davoodi and Alonso-Terme, 1998)
Figure 5: Corruption and Income Inequality (Gupta, Davoodi and Alonso- Terme, 1998)
16
ID:9241832
3.1 The composition of public expenditure So, it is clear why a targeted and honest public expenditure is essential to overcome the problems
stated above and stimulate government efficiency and economic growth. The desirable
composition of public expenditure has been extensively discussed amongst economists over the
last decades. If there is an agreement about the positive and significant correlation between an
increase in public expenditure and economic growth being the most effective aggregate
composition of expenditure in developing countries the debate remains open.
The research of Fan and Rao (2003) investigated the impact of public spending in 43 developing
countries from 1980 to 1998 and the results showed that the total expenditure increased over
time and contributed to poverty reduction. Furthermore, it revealed that the performance of
public spending in economic growth is mixed within the studied countries: in Africa, government
spending in agriculture and health was particularly strong in promoting economic growth, in
Asia, agriculture, education and defence were key sectors, while in Latin America health spending
had a significant pro-growth effect. Overall, the cross-country evidence shows that agriculture,
education, and roads have been public investments that strongly contributed to growth. This
study could suggest several lessons. Firstly, various types of sectorial spending have a different
level of impact on the economic growth, implying a greater potential for governments to improve
efficiency through a reallocation of resources among sectors. Secondly, all regions should
increase their spending on agriculture, particularly on production-enhancing investments: this
type of spending not only leads to higher agricultural production returns, but also appears to
have a large impact on poverty reduction, considering that the majority of the poor lives and
works in rural areas and their main source of livelihood is agriculture. (Fan and Rao, 2003)
17
ID:9241832
On the other hand, Devarajan, Swaroop and Zou (1996) analysed whether the change in the
composition of expenditure brings to a higher steady-state growth. Using a sample of 43
developing countries over a period of 20 years, the study showed that a rise in the share of
current expenditure has a positive and statistically significant effect on growth. However, all the
typical candidates for productive expenditure, like capital, transport and communication, health
and education, had a negative or insignificant relationship on economic growth. The only broad
category, which was correlated with a higher economic growth, was current expenditure. These
results would not appear so surprising if it is considered that productive expenditure may be
unproductive if there is an excessive amount of it. Developing countries have been allocating
public expenditure in capital expenditure, caring less about the current one. In other words,
several components of current expenditure, such as operation and maintenance, may have a
higher rate of return than others and also, the common recommendation to increase public
investment’s share in developing countries could be misleading. (Devarajan, Swaroop and Zou,
1996)
Finally, the question about whether corruption can influence the composition of government
expenditure may have important associations. Mauro (1998) investigated the relationship
between corruption and the composition of expenditure. The results show that corruption is
negatively and significantly associated with government expenditure in education and health. A
possible interpretation of these observations is that government finds it easier to collect bribes
on some expenditure items than on others. Education seems a particularly unappealing target for
rent-seekers, probably because its provision does not require “ high-technology inputs to be
provided by oligopolistic suppliers”. (Mauro, 1998:278). A policy lesson could be assumed from
18
ID:9241832
this evidence: it would be desirable for governments to increase the expenditure in less
susceptible sectors, like the ones described above. (Ibid.)
Conclusions Overall, looking at the evidence shown on tax revenue and public expenditure it can be said that
governments in developing countries are too small. This phenomenon could be explained as a
persistent vicious cycle, which involves on one side a limited tax base, on the other a highly
inefficient and mis-targeted spending. Thus, governments should reverse this cycle increasing
government efficiency and at the same time reducing tax evasion and expanding the tax base.
As previously mentioned, to give long run results a tax reform is needed. In developing countries,
where the economy is generally based on a majority of informality, the tax policy has not only the
responsibility to numerically increase the tax base but also to find a strategy to involve the
informal sector in this process. The example of Kenya, indeed, showed that increasing the
significance of consumption taxes like VAT, instead of looking for methods to enforce the
efficiency of income taxes, might help to reach these goals. Taxing consumption goods will affect
all the population without distinction between the formal or informal sectors.
On the other hand, the improvement of spending has an equally essential role. The improvements
of services and infrastructures, besides having a direct and positive effect on economic growth,
represents an incentive to enter the formal sector and take advantage of the benefits offered.
However, the composition of expenditure remains an open debate: the sector which is better to
invest in may vary from country to country, but a general lesson is that agriculture seems to be a
significant sector to increase spending in, for all developing countries. In contrast, it has been
highlighted that instead of focusing all the expenditure policies on capital expenditure, greater
19
ID:9241832
investments should flow in current expenditure, which seems to have a stronger effect on
stimulating economic development.
Finally, as seen before, the issue of corruption, which represents one of the most difficult
obstacles to overcome in order to improve the quality of spending, could be tackled deciding to
focus and invest on targeted programs in specific sectors that appear less likely to be affected by
corruption.
20
ID:9241832
References
African Development Bank, 1998. KENYA - 2008-2012 Country Strategy Paper. IMF Working
Paper, Country and Regional Department - East A (OREA)
Alesina, A., (1998). Too Large or Too Small Governments. In Conference on Economic Policy
and Equity. Washington, D.C., June 8-9,1998 Harvard University.
Angell A. and Graham C., 1995. Can Social Reform Make Adjustment Sustainable and Equitable?
Lessons from Chile and Venezuela. Journal of Latina America Studies, Vol.27 N.1, 189-219.
Barro, R., 1991. Economic Growth in a Cross Section of Countries. The Quarterly Journal of
Economics, Vol.16, No.2, 407-443.
Berry W. and Lowery D., 1984. The Measurement of Government Size: Implication for the Study
of Government Growth. The Journal of Politics, Vol.46, 1193-1206.
Birdsall N. and James E., 1990. Efficiency and Equity in Social Spending: How and Why
Governments Misbehave. The World Bank, Working Paper WPS 274, 13.
Bose N., Haque M.E. and Osborn D., 2007. Public Expenditure and Economic Growth: A
disaggregate Analysis for Developing Countries. The Manchester School, Vol.75 No.5, 533-576.
Burgess R. and Stern N., 1993. Taxation and Development. Journal of Economic Literature,
Vol.31 N.2, 762-830.
21
ID:9241832
Devarajan S., Swaroop V. and Zou H., 1996. The Composition of Public Expenditure and
Economic Growth. Journal of Monetary Economics, Vol.37, 313-344.
Fan S. and Rao N., 2003. Public Spending in Developing Countries: Trends, Determination and
Impact. International Food Policy Research Institute, Environment and Production
Technology Division (EPTD) Discussion Paper No. 99
Kahn, J.A., 2011. Can We Determine the Optimal Size of Government? Development Policy
Briefing Paper, The Cato Institute
Kau J. and Rubin P., 1981. The Size of Government. Public Choiche, Vol.37 No.2, 261-274.
Karinji S. and Wanjala, B., 2005. The Tax Reform Experience in Kenya. World Institute for
Development Economics Research, Research Paper N. 2005/67, UNU-WIDER.
Labonte, M., 2010. The Size and Role of Government: Economic Issues. CRS Report for Congress,
Congressional Research Service.
Lamartina S. and Zaghini A., 2008. Increasing public expenditure: Wagner's law in OECD
countries. CFS Working Paper No. 2008/13, Center for Financial Studies (CFS ), Goethe
University Frankfurt.
Mauro, P., 1998. Corruption and the Composition of Government Expenditure. Journal of Public
Economics, Vol.69, 263-279.
Mauro P., 1995. Corruption and Growth. The Quarterly Journal of Economics, Vol.10 N.3, 681-
712.
22
ID:9241832
Pradhan , S., 1996. Evaluating Public Spending. World Bank Discussion Paper 323, 13, The
World Bank.
Tanzi V. and Schuknecht L., 1997. Reconsidering the Fiscal Role of Government: The
International Perspective. The America Economic Review, Vol.87 No.2, 164-168.
Tanzi V. and Davoodi, H., 1997. Corruption, Public Investment and Growth. IMF Working Paper,
WP 97/139, International Monetary Fund
Stiglitz, J.E., 2000. Economics of the Public Sector. 3rd ed. New York City: W W Norton &
Company Incorporated.
23