application of preparative capillary gas chromatography (pcgc), automated structure generation and...
TRANSCRIPT

RESEARCH ARTICLE
Application of preparative capillary gaschromatography (pcGC), automated structure generationand mutagenicity prediction to improve effect-directedanalysis of genotoxicants in a contaminated groundwater
Cornelia Meinert & Emma Schymanski &Eberhard Küster & Ralph Kühne & Gerrit Schüürmann &
Werner Brack
Received: 1 May 2009 /Accepted: 21 December 2009 /Published online: 30 January 2010# Springer-Verlag 2010
AbstractBackground, aim and scope The importance of groundwaterfor human life cannot be overemphasised. Besides fulfillingessential ecological functions, it is a major source of drinkingwater. However, in the industrial area of Bitterfeld, it iscontaminated with a multitude of harmful chemicals, includ-ing genotoxicants. Therefore, recently developed methodolo-gies including preparative capillary gas chromatography(pcGC), MOLGEN-MS structure generation and mutagenic-ity prediction were applied within effect-directed analysis(EDA) to reduce sample complexity and to identify candidatemutagens in the samples. A major focus was put on the addedvalue of these tools compared to conventional EDA combin-
ing reversed-phase liquid chromatography (RP-LC) followedby GC/MS analysis and MS library search.Materials and methods We combined genotoxicity testingwith umuC and RP-LC with pcGC fractionation to isolategenotoxic compounds from a contaminated groundwatersample. Spectral library information from the NIST05database was combined with a computer-based structuregeneration tool called MOLGEN-MS for structure elucidationof unknowns. Finally, we applied a computer model formutagenicity prediction (ChemProp) to identify candidatemutagens and genotoxicants.Results and discussion A total of 62 components weretentatively identified in genotoxic fractions. Ten of thesecomponents were predicted to be potentially mutagenic,whilst 2,4,6-trichlorophenol, 2,4-dichloro-6-methylphenoland 4-chlorobenzoic acid were confirmed as genotoxicants.Conclusions and perspectives The results suggest pcGC asa high-resolution fractionation tool and MOLGEN-MS toimprove structure elucidation, whilst mutagenicity predictionfailed in our study to predict identified genotoxicants.Genotoxicity, mutagenicity and carcinogenicity caused bychemicals are complex processes, and prediction fromchemical structure still appears to be quite difficult. Progressin this field would significantly support EDA and riskassessment of environmental mixtures.
Keywords EDA .MODELKEY.
Identification of unknowns . QSAR .UmuC
1 Background, aim and scope
Groundwater in industrial areas such as Bitterfeld, Germanyis often contaminated with a multitude of chemicals and
Responsible editor: Thomas Braunbeck
Electronic supplementary material The online version of this article(doi:10.1007/s11356-009-0286-2) contains supplementary material,which is available to authorized users.
C. Meinert (*) : E. Schymanski :W. BrackDepartment of Effect-Directed Analysis, UFZ,Helmholtz Centre for Environmental Research,Permoserstraße 15,04318 Leipzig, Germanye-mail: [email protected]
E. KüsterDepartment of Bioanalytical Ecotoxicology, UFZ,Helmholtz Centre for Environmental Research,Permoserstraße 15,04318 Leipzig, Germany
R. Kühne :G. SchüürmannDepartment of Ecological Chemistry, UFZ,Helmholtz Centre for Environmental Research,Permoserstraße 15,04318 Leipzig, Germany
Environ Sci Pollut Res (2010) 17:885–897DOI 10.1007/s11356-009-0286-2

may exhibit genotoxicity together with other adverse effectsto aquatic organisms but more importantly may also pose arisk to human health since groundwater is often used as asource of drinking water. One of the major requirements inthe characterisation of such complex mixtures is theidentification of those compounds causing the effect. It iscrucial to reduce the complexity of the mixture to a limitednumber of candidate compounds and finally to individualtoxicants. Effect-directed analysis (EDA), combining bio-testing, toxicity-based fractionation and chemical analysis,was shown to be a powerful tool to meet this requirement(Brack 2003).
In most cases, EDA of aqueous samples is based onreversed-phase high-performance liquid chromatography(RP-HPLC; Castillo and Barceló 1999; Brack 2003)followed by GC/MS analysis and MS library search. Incomplex samples, this procedure may result in fractions thatare still too complex, containing a multitude of chemicals.Many of them are not included in commonly used librariessuch as NIST, and analytical standards are not commer-cially available. Furthermore, effect data are missing for themajority of the suggested or identified compounds. Thisoften makes the identification and confirmation of, e.g.genotoxicants in contaminated waters a challenging task.
Thus, the present investigation aims to complement theclassical procedure with tools that promise high-resolutionfractionation, advanced structure elucidation and structure-dependent effect prediction. These tools include preparativecapillary gas chromatography (pcGC), structure generationwith the MOLGEN-MS software and qualitative structureactivity relationships (QSAR) for the identification ofpossible genotoxicants. The present study provides firstevidence as to whether these tools may be able to enhancethe probability to identify genotoxicants based on umuCtest (ISO/TC 147/SC5 1999) in contaminated groundwater.
The success of identifying unknown substances incomplex samples strongly depends on the resolution ofthe fractionation procedure prior to chemical analysis(Brack et al. 2008). Therefore, we established pcGC as anadditional fractionation approach in EDA to separate andharvest closely related substances and isomers. Initialstudies demonstrated high resolution, good recovery andexcellent reproducibility of pcGC (Eglinton et al. 1996;Holmstrand et al. 2006; Meinert et al. 2007; Mandalakis etal. 2008). These characteristics, together with the opportu-nity to exploit vapour pressure as additional compoundproperty for fractionation, make pcGC a promising com-plementary tool to HPLC-based separations (Meinert andBrack 2010).
Recently, a novel software for structure generation onthe basis of mass spectra called MOLGEN-MS has beendeveloped that may help to overcome the limitations oflibrary search-based toxicant identification (Benecke et al.
1997; Kerber et al. 2001; Schymanski et al. 2008). Today,the library of NIST covers 190,000 spectra, which is only asmall fraction of the chemicals that may be present in theenvironment. Isomers with similar mass spectra of whichonly some may be included in the library impede thepositive identification of chemicals if no standards areavailable. The hypothesis was that MOLGEN-MS based oneasily accessible information from electron impact massspectrometry such as molecular mass and substructureinformation from fragmentation patterns together withpredicted octanol–water partitioning coefficients (log Kow;Galassi and Benfenati 2000) and RP-HPLC retention couldfurther enhance the success of toxicity identification in thecontaminated groundwater.
Even after extensive fractionation and appropriatestructure elucidation, too many suggested structures maybe left in genotoxic fractions to initiate extensive standardprocurement or synthesis for confirmation purposes. Apromising approach to select candidate genotoxicants froma list of tentatively identified structures may be theapplication of genotoxicity or mutagenicity prediction onthe basis of substructures (toxicophores; Kazius et al.2005). It is believed that validated prediction models canbe suitable tools to allow for rapid screening of thetoxicological potential of chemicals and therefore for theprioritisation of toxicological confirmation (Zvinavashe etal. 2008). Since no QSAR for genotoxicity based on umuCwas available, an approach for mutagenicity predictionbased on the Ames test was used (Kazius et al. 2005).However, there is a good agreement between both testdesigns with a concordance of about 90% (Reifferscheidand Heil 1996). The modelling approach used here is basedon the finding that in a dataset of more than 4,000molecular structures, a set of 29 toxicophores could classifymutagenicity with a total classification error of 18%. In thepresent study, we applied that approach on a native mixtureisolated from contaminated groundwater and tried toconfirm the findings with a limited set of commerciallyavailable standards.
The study was performed in the industrial area ofBitterfeld, Germany which has been heavily polluted bymining, chemical industry and the uncontrolled disposal ofchemical waste over nearly 100 years. In total, over 4,000different products have been produced in Bitterfeld/Wolfenincluding chlorochemicals, dyes, pesticides and plastics(Chemie AG B-W 1993). The majority of the industriallandfills are in contact with the groundwater. Moreover, thecareless contaminant input in addition to a large variety ofcompounds with different chemical properties led to asignificant groundwater contamination in the Bitterfeldregion of about 25 km2 (Weiß et al. 2001; Wycisk et al.2003). Since volatile and semi-volatile compounds play animportant role in this groundwater, our study focused on
886 Environ Sci Pollut Res (2010) 17:885–897

GC-based methods, being aware that non-volatile polar andthermolabile compounds will not be detected by thisprocedure.
2 Materials and methods
2.1 Chemicals
HPLC-grade solvents n-hexane, dichloromethane (DCM),acetonitrile (ACN), acetone, dimethylsulfoxide (DMSO) andmethanol for sample extraction, cleanup, fractionation andanalysis were obtained from Merck (Darmstadt, Germany).
Supplier information of reference standards used forbiological confirmation in the umuC test as well as fortransformation of capacity factor k′ to log Kow values withinRP-LC fractionation are given in the supporting information.
2.2 Sampling and sample extraction
The groundwater sample was taken from a depth of 26 m(quaternary aquifer) from an area that has been polluteddirectly by seepage of spilled chemicals using a MP1groundwater pump (RK Carl Hamm GmbH, Essen,Germany). The sample was characterised by a pH valueof 3.65, an oxygen value of 0.55 mg L−1 and a conductivityof 808µS cm−1. A total of about 87 L was collected in three30-L barrels and stored in darkness at 4°C until furtherprocessing.
Organic contaminants were solid phase extracted usingpoly(styrene-divinylbenzene) (Bakerbond SDB, J.T. Baker,Deventer, the Netherlands). The groundwater was pumpedwith a stainless steel pump (SM 16617, Sartorius AG,Göttingen, Germany) through a cascade of two glasscolumns filled with 7 g of absorbent each to prevent abreakthrough of analytes. The groundwater was delivered ata flow rate of 65 mL min−1. Columns were dried under amoderate stream of nitrogen, eluted separately with 200 mlACN and concentrated for genotoxicity testing as well asfor RP-LC fractionation.
2.3 Genotoxicity analysis
The umuC test was applied due to its use as a standardisedtest method for the detection of the genotoxic potential ofwater and wastewater (ISO/TC 147/SC5 1999). Advantagesare its high sensitivity to a broad range of mutageniccompounds present in the low micrograms per litreconcentration range (Whong et al. 1986; Bobeldijk et al.2001). Furthermore, it can be easily applied and results arerapidly obtained within 8 h and measured on microtiterplates at the same time (Reifferscheid et al. 1991). Thebioassay was performed in 96-well microtiter plates with
Salmonella typhimurium with and without S9 metabolicactivation according to ISO/TC 147/SC5 (1999) with someminor modifications. The strain cultivation was donedirectly from the cryopreserves instead of an overnightculture. This simplification did not affect the growth rate orthe test results. The tester strain S. typhimurium TA1535/pSK1002 carries a fused umuC–lacZ gene, allowing for themonitoring of umuC expression by measuring cellular ß-galactosidase. The determination of the ß-galactosidaseactivity by the colorimetric method using 2-nitrophenyl-ß-D-galactopyranoside (ONPG, ICN Biomedicals GmbH,Eschwege, Germany) as a substrate was done at acultivation temperature of 37°C instead of 28°C. In orderto exclude errors due to the absorption of coloured samples,the growth factor was calculated from the increase of theoptical density.
The organic extracts of the samples were assayed in theumuC test in geometrical dilution series with a maximumtest concentration of 3% DMSO solution. All dilutionswere tested using three replicates with a maximumgroundwater concentration factor of 750:1. According toISO/TC 147/SC5 (1999), 2-aminoanthracene and 4-nitroquinolene-N-oxide were used as positive controls forthe tests with and without S9 activation, respectively.
The genotoxic activities were expressed in β-galactosidaseunits and in enzyme induction ratios. Induction ratios above1.5-fold are scored as positive results, estimated as minimalconcentrations of the samples required to produce significantincreases above background controls. The test was consideredvalid if the growth factor of exposed bacteria versus negativecontrol was above 0.5.
2.4 Fractionation procedure
Fractionation was based on RP-HPLC followed by pcGC.Fractions are marked as Fi.j, with i representing the fractionnumber in the primary HPLC fractionation step and j thefraction number in the pcGC step, respectively.
Reversed-phase liquid chromatography The first fraction-ation step was performed on reversed-phase HPLC using apreparative Nucleosil 100-5 C18 HD column (21×250 mm,Macherey-Nagel, Düren, Germany) at 20°C. The systemwas equipped with two high pressure pumps (KontronHPLC-pump 422, Biotek Instruments, Neufahrn, Germany), adual-mode UV–VIS detector (BIO-TEK HPLC 535, Milan,Italy) operated at 220 nm and a fraction collector (modelSF2120, Advantec MFS, Japan). Injection volumes of 2 mLwere delivered isocratically by ACN/phosphate buffer, pH3(20:80, v/v), at a flow rate of 14 mL min−1. In order to obtainenough material for further investigations, the fractionationwas performed three times. After separation, the collectedfractions were combined and transferred to DCM by triple
Environ Sci Pollut Res (2010) 17:885–897 887

liquid–liquid extraction after adding twice the volume ofhalf-saturated NaCl solution.
This fractionation step was designed to separate com-pounds according to their lipophilicity and was validated withstandard compounds with known log Kow values (Electronicsupplementary materials (ESM) Table S1). Thus, retentiontimes (tR) could be related to estimates of log Kow valuesfrom linear regression (see supporting information).
Preparative capillary gas chromatography The appliedinstrument used has been described by Meinert et al. (2007)and integrates an analytical GC system with mass selectivedetection (GC/MS; MSD 5973, Agilent Technologies, SantaClara, USA) and a preparative GC system connected via aspecial zero-dead volume effluent splitter to a flameionisation detector (FID) and two Gerstel preparative fractioncollectors (PFC). Both systems share the same oven (6890N,Agilent Technologies) and are each equipped with a cooledinjection system (CIS 4, Gerstel, Mühlheim, Germany).
The preparative separation was performed on a 5%phenylmethyl polysiloxane-fused silica capillary column(HP-5MS, 30 m×0.32 mm I.D., 0.5µm, Agilent Technolo-gies) using helium as carrier gas (2 mL min−1, constant flow).A 0.5-m deactivated FS-Phenyl-Sil capillary column(0.1 mm I.D., Agilent) was used for connecting the effluentsplitter with the FID, whilst two 0.87-m columns (0.32 mm I.D.) were used for interfacing the effluent splitter with thePFC devices. The column temperature was held at 50°C for1 min and then increased with a rate of 5°C min−1 to 300°Cand held for 10 min. The temperature of the PFC transferline as well as the PFC switch device was set to 300°C.
Volumes of 5µL were injected in solvent vent mode withan auto-sampler mps2 (Gerstel) and a speed of injection of100µL s−1. The vent flow was adjusted to 50 mL min−1 fora solvent vent time of 5 s. The split valve was then openedfor 1 min with a purge flow of 30 mL min−1. The injectorstarting temperature was 50°C, and the liner was flash-heated at 12°C s−1 to 300°C, which was held for 5 min.
After separation, the compounds were trapped in twelve100-µL glass tubes which were filled with DCM and cooled to−10°C with an external cooler (behrotest® UK 12/2000, behrLabor-Technik GmbH, Düsseldorf-Reisholz, Germany). Thetraps were then rinsed five times with 500µL of DCM andtransferred to 2-mL glass vials for GC/MS analysis.
2.5 Chemical analysis
Analysis was performed on a HP-5MS column (30 m×0.25 mm I.D., 0.25µm, Agilent Technologies) with helium ascarrier gas (1.1 mL min−1, constant flow). The GC oventemperatures were programmed from 50°C (hold time, 1 min)to 300°C (hold time, 10 min) at a rate of 5°C min−1. Aliquotsof 1µL DCM solution were injected in splitless mode. The
CIS 4 inlet was set at 50°C for 1 min and temperatureprogrammed to 300°C (hold time, 3 min) at a rate of 12°C s−1.
The transfer line, ion source and quadrupole of the massselective detector (MSD) were maintained at 280°C, 230°Cand 150°C, respectively. Electron ionisation was performedat 70-eV electron energy, and mass spectra were recorded infull-scan mode from m/z 50 to 500.
2.6 Structure elucidation
To identify known compounds, as well as for structureelucidation of unknown compounds, the mass spectra of allanalysed fractions were compared with the NIST05 massspectral database (NIST/EPA/NIH 2005). For identificationof compounds without a good NIST match and forconfirmation of compounds tentatively identified by librarysearch, the programme MOLGEN-MS (Schymanski et al.2008) was used to identify possible candidate structures.Mass spectral classifiers (Varmuza and Werther 1996) andexhaustive structure generation have been combined in theprogramme MOLGEN-MS (Kerber et al. 2001; Kerber etal. 2006) to generate all possible structures consistent witha given mass spectrum. The Automated Mass SpectralDeconvolution and Identification System (AMDIS; NIST2007) was used to deconvolute spectra prior to a librarysearch using the NIST05 database. Classifier information,molecular mass information and probabilities of thepresence/absence of Cl and Br were retrieved from NIST05following the library search. This information was com-bined with the calculation modules in MOLGEN-MS whichare described elsewhere (Schymanski et al. 2008). The finalstep of MOLGEN-MS calculates a theoretical spectrum foreach structure generated and compares this with theexperimental spectra to generate a ‘match value’. Structures,with rankings, were then exported for further processing usingprocedures written in MATLAB (The MathWorks 2006)incorporating OpenBabel (2007) conversions and calculationof octanol–water partition coefficients (log Kow) usingEPISuiteTM (US EPA 2007), preferring experimental valuesfor predictions if available. Comparison with log Kow valuescalculated from RP-HPLC retention times calibrated with aset of standards with increasing log Kow was used as afurther line of evidence for structure elucidation.
2.7 Mutagenicity prediction
The model of Kazius et al. (2005) was applied to predictmutagenicity. This model applies structural alerts in termsof molecular fragments (substructures) to identify chemicalssuspected to be mutagenic. From a dataset of Ames test resultsfor 4,337 compounds, 29 substructures (toxicophores) wereidentified by Kazius et al. (2005). A molecule is predicted tobe mutagenic when any of these substructures occurs, whilst
888 Environ Sci Pollut Res (2010) 17:885–897
non-mutagenicity is predicted in the absence of all of thesesubstructures. Due to the large heterogeneous dataset, theapplication of the method covers a broad range of organiccompound classes. The model has been run automatically asimplemented in the in-house software system ChemProp(Schüürmann et al. 1997, 2007).
3 Results
3.1 RP-LC fractionation and genotoxicity analysis
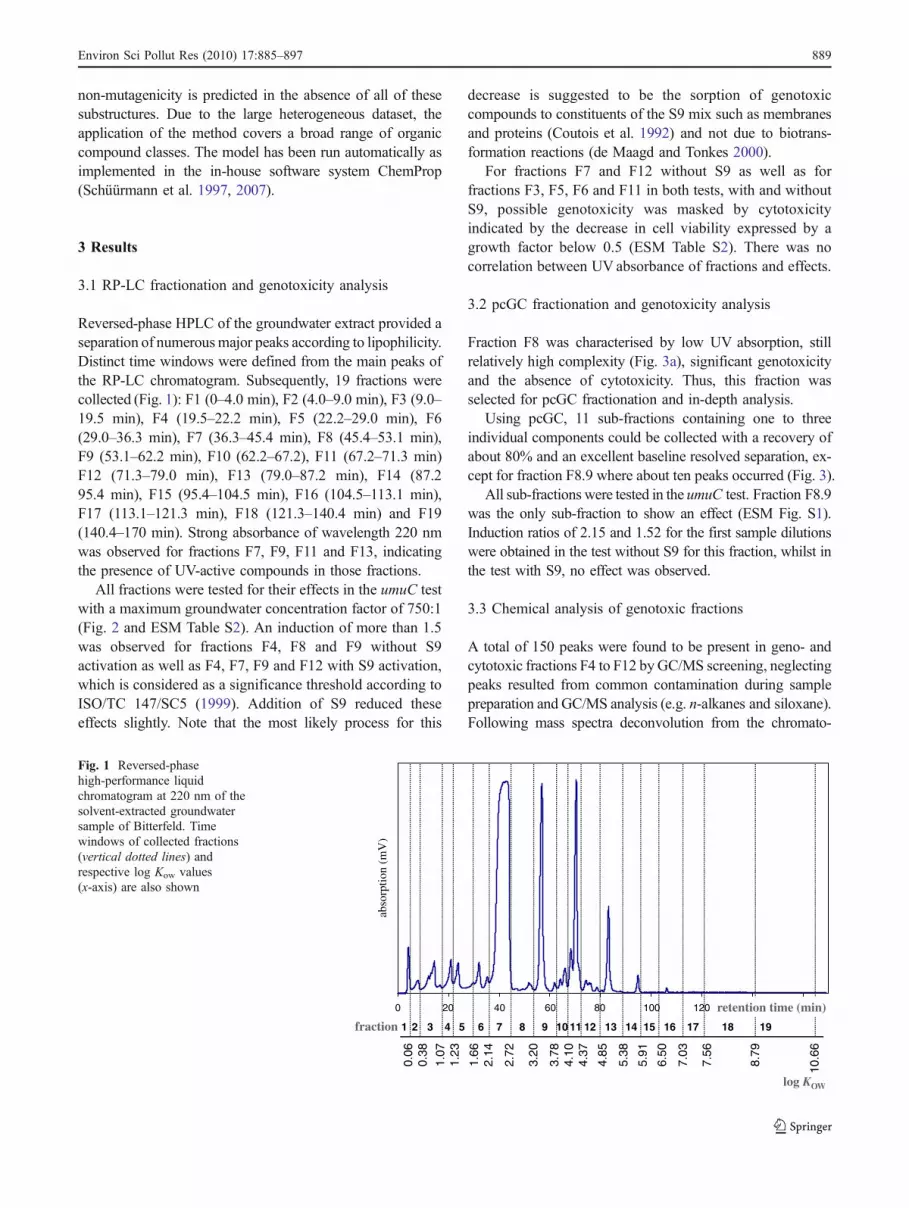
Reversed-phase HPLC of the groundwater extract provided aseparation of numerousmajor peaks according to lipophilicity.Distinct time windows were defined from the main peaks ofthe RP-LC chromatogram. Subsequently, 19 fractions werecollected (Fig. 1): F1 (0–4.0 min), F2 (4.0–9.0 min), F3 (9.0–19.5 min), F4 (19.5–22.2 min), F5 (22.2–29.0 min), F6(29.0–36.3 min), F7 (36.3–45.4 min), F8 (45.4–53.1 min),F9 (53.1–62.2 min), F10 (62.2–67.2), F11 (67.2–71.3 min)F12 (71.3–79.0 min), F13 (79.0–87.2 min), F14 (87.295.4 min), F15 (95.4–104.5 min), F16 (104.5–113.1 min),F17 (113.1–121.3 min), F18 (121.3–140.4 min) and F19(140.4–170 min). Strong absorbance of wavelength 220 nmwas observed for fractions F7, F9, F11 and F13, indicatingthe presence of UV-active compounds in those fractions.
All fractions were tested for their effects in the umuC testwith a maximum groundwater concentration factor of 750:1(Fig. 2 and ESM Table S2). An induction of more than 1.5was observed for fractions F4, F8 and F9 without S9activation as well as F4, F7, F9 and F12 with S9 activation,which is considered as a significance threshold according toISO/TC 147/SC5 (1999). Addition of S9 reduced theseeffects slightly. Note that the most likely process for this
decrease is suggested to be the sorption of genotoxiccompounds to constituents of the S9 mix such as membranesand proteins (Coutois et al. 1992) and not due to biotrans-formation reactions (de Maagd and Tonkes 2000).
For fractions F7 and F12 without S9 as well as forfractions F3, F5, F6 and F11 in both tests, with and withoutS9, possible genotoxicity was masked by cytotoxicityindicated by the decrease in cell viability expressed by agrowth factor below 0.5 (ESM Table S2). There was nocorrelation between UV absorbance of fractions and effects.
3.2 pcGC fractionation and genotoxicity analysis
Fraction F8 was characterised by low UV absorption, stillrelatively high complexity (Fig. 3a), significant genotoxicityand the absence of cytotoxicity. Thus, this fraction wasselected for pcGC fractionation and in-depth analysis.
Using pcGC, 11 sub-fractions containing one to threeindividual components could be collected with a recovery ofabout 80% and an excellent baseline resolved separation, ex-cept for fraction F8.9 where about ten peaks occurred (Fig. 3).
All sub-fractions were tested in the umuC test. Fraction F8.9was the only sub-fraction to show an effect (ESM Fig. S1).Induction ratios of 2.15 and 1.52 for the first sample dilutionswere obtained in the test without S9 for this fraction, whilst inthe test with S9, no effect was observed.
3.3 Chemical analysis of genotoxic fractions
A total of 150 peaks were found to be present in geno- andcytotoxic fractions F4 to F12 byGC/MS screening, neglectingpeaks resulted from common contamination during samplepreparation and GC/MS analysis (e.g. n-alkanes and siloxane).Following mass spectra deconvolution from the chromato-
0 20 40 60 80 100 120 140 160
abso
rptio
n (m
V)
fraction 1 2 4 5 6 7 8 9 10 11 12 13 14 15 16 17 18 193
0.06
0.38
1.07
1.23
1.66
2.14
2.72
3.20
3.78
4.10
4.37
4.85
5.38
5.91
6.50
7.03
7.56
8.79
10.6
6
log KOW
retention time (min)
Fig. 1 Reversed-phasehigh-performance liquidchromatogram at 220 nm of thesolvent-extracted groundwatersample of Bitterfeld. Timewindows of collected fractions(vertical dotted lines) andrespective log Kow values(x-axis) are also shown
Environ Sci Pollut Res (2010) 17:885–897 889

grams using AMDIS, the obtained spectra were compared toNIST05 mass spectral data base. In total, 28% of the spectra(42 structures) with a match value >65% (Table 1) couldtentatively be identified.
Both mass spectra without a reasonable NIST match andtentatively identified spectra were used for the generation ofall possible structures with MOLGEN-MS based on themolecular formula and a combination of mass spectralsubstructure classifiers derived from experimental massspectra (Schymanski et al. 2008). The number of possiblestructures for each spectrum ranged between 1 (for S8) and13,000 (for C18H35NO). Further reduction in structurenumbers was achieved by applying the log Kow informationgained from the fractionation technique and mass spectrummatch value (MV) for each structure. Structures with anestimated log Kow widely outside the experimental fractionrange were excluded, as were structures with spectrumMVs significantly lower than other structures. Estimatedlog Kow values±1.0 were considered close enough to thefraction range when considering the errors associated bothwith the correlation of capacity factor and log Kow in RP-LC fractionation and the prediction of log Kow fromstructures using EPISuiteTM (Schymanski et al. 2008). Incases where EPISuiteTM predicted obviously non-realisticvalues such as for dimethyl thrithiocarbonate (prediction,−0.49; Table 1), these predictions were cross-checked withthe SPARC online calculator (Hilal et al. 2004; prediction,1.8) and replaced. Acidic chromatographic conditions (pH3) were applied to ensure that all compounds were presentin their non-dissociated form based on SPARC pKa
estimates (Hilal et al. 1995). Using these methods, 32compounds identified by NIST could be confirmed, and for20 additional peaks, most probable matches were suggested(Table 1). In some cases, several isomers with similarspectra were possible (e.g. substituted aromatic com-
pounds), indicated by a number of MOLGEN matches >1.Hence, the combination of NIST and MOLGEN-MS wasable to provide sufficient information to tentatively identify42% of the compounds for confirmation studies.
The main part of contamination of the Bitterfeldgroundwater was found to be chlorinated and sulphuroushydrocarbons. In fractions with increasing ordinal numbers,the number of chlorinated compounds as well as theirdegree of chlorination increases, which basically confirmedthe RP-LC separation according to lipophilicity. Overall, thecomplex contaminated groundwater contained compoundswith log Kow values of −0.5 to 4.7.
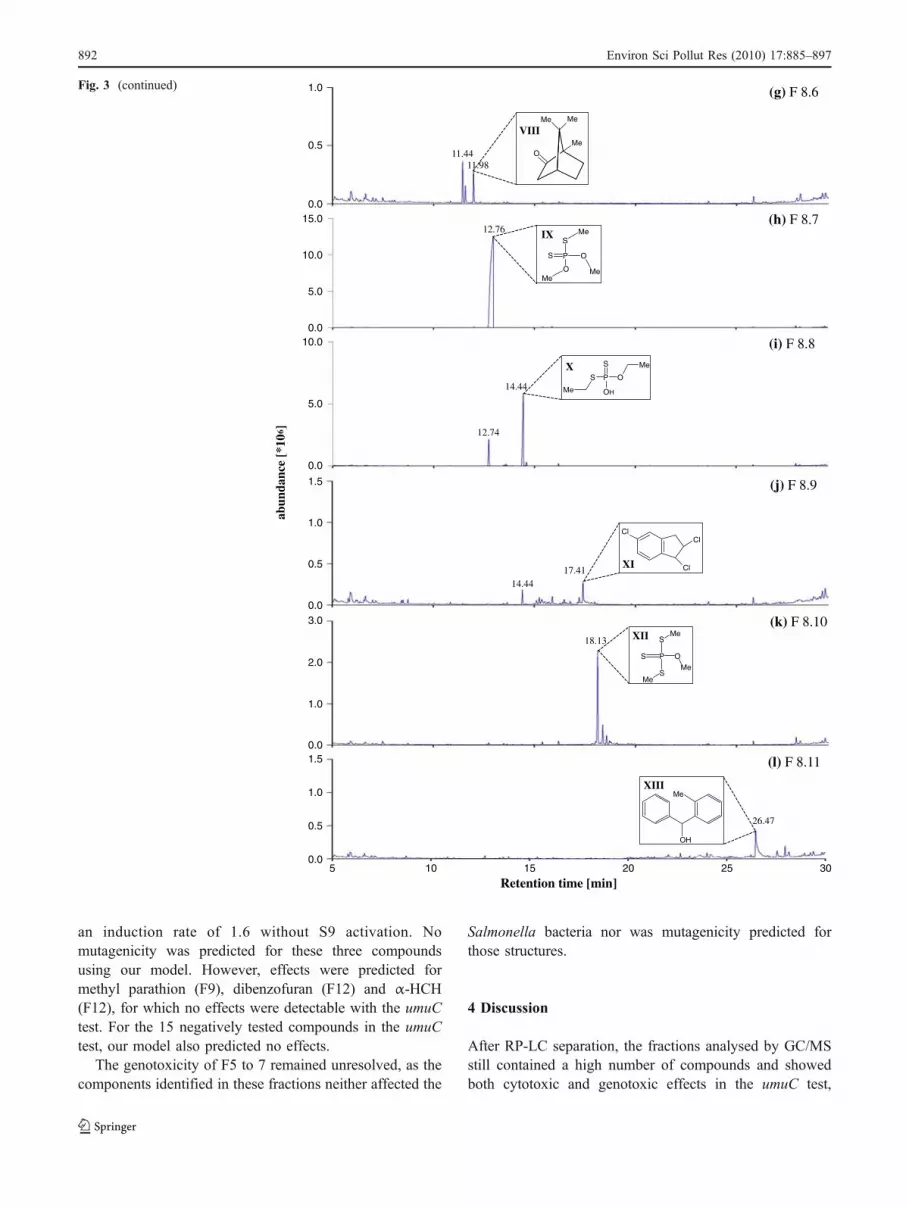
The one active fraction of the 11 pcGC fractions wassub-fraction F8.9 (Fig. 3j), which still contained severalcompounds. Apart from minor unidentified peaks, themajor peaks detected in F8.9 were tentatively identified.Thus, methyl chlorobenzoate (C8H7ClO2) could be identi-fied by characteristic ion trace patterns at m/z [50 75 111139 170] and partly confirmed by its matching log Kow
value of 2.47 to the fraction range of F8.9 (2.72–3.20).Three peaks were identified as isomers of dichloromethyl-phenol (C7H6Cl2O) by ion trace patterns at m/z [38 51 77111 141 176]. Moreover, the main peak in F8.9 at 17.41 mincould be tentatively identified as trichloroindane (C9H7Cl3)by m/z [61 89 123 149 185]. The compound at 14.44 minwas identified as O,S-diethyl hydrogen dithiophosphate,which corresponds to the main component of the previousfraction and could not be the reason for genotoxicity sincesub-fraction F8.8 showed no effect in the umuC test.
3.4 Genotoxicity prediction and confirmation
Since for many tentatively identified compounds neitherpure standards nor genotoxicity or mutagenicity data wereavailable, candidate genotoxicants were identified applying
F1 F2 F3 F4 F5 F6 F7 F8 F9 F10 F11 F12 F13 F14 F15 F16 F17 F18 F19
Ind
uct
ion
rat
e
0
0.5
1.0
1.5
2.0
with S9without S9cytotoxicty
Fig. 2 Induction of genotoxicityin the umuC test with and withoutS9 activation presented byRP-LC fractions (F1–F19) ofgroundwater from Bitterfeld atthe maximum tested concentra-tion factor of 750:1. The dottedline at 1.5 indicates the genotox-icity threshold according toISO/TC 147/SC5 (1999). For thefactions showing cytotoxicity(growth factor ≤0.5), noconclusion about genotoxicitycould be done, indicated by aninduction rate of 0
890 Environ Sci Pollut Res (2010) 17:885–897

software-based mutagenicity (Schüürmann et al. 1997). Tenstructures were predicted to be potentially mutagenic in thefractions 4 and 8 to 12, whilst 19 structures in all fractionswere predicted to be non-mutagenic (ESM Table S4).About 50% (29 compounds) from a total of 58 tentativelyidentified chemicals were found to be out of the applica-bility domain of the model.
Confirmation of the prediction power of our model wasdone for 21 commercially available standards. Different
dilutions of standards in a range of 1 mg L−1 up to1 mg mL−1 according to their water solubility were tested inthe umuC test in at least two independent replicates (ESMTable S3). An induction of more than 2.0 was obtained for2,4-dichloro-6-methylphenol and 2,4,6-trichlorophenolwithout S9 activation (ESM Table S4). Thus, part of thegenotoxicity observed in fraction F8.9 and F9, respectively,may be attributed to 2,4,6-trichlorophenol and 2,4-dichloro-6-methylphenol. 4-Chlorobenzoic acid found in F6 showed
Retention time [min]
abun
danc
e [*
106 ]
(a) Fraction 8
(b) F 8.1
(c) F 8.2
(d) F 8.3
(e) F 8.4
(f) F 8.5
Fraction 1 2 3 4 5 6 7 8 9 10 11
5.80
5.80
5.80
7.50
7.50
7.50
7.97
7.97
9.38
9.38
11.43
11.43
11.56
11.98
12.76
14.44
17.41
18.13
26.47
9.50
Cl
ClCl
Cl
P O
O
O
S
Me
MeMe
Br
Me Cl
Cl
I
II
III
Cl
Cl O
O
Me
Me
O
OMe
Cl
Cl
Cl
MeS S
SMe
MeO Cl
O Cl
IV
V
VI
VII
15.00
10.00
5.00
0.00
15.0
5.0
10.0
0.01.5
1.0
0.5
0.01.5
1.0
0.5
0.01.5
1.0
0.5
1.5
1.0
0.5
0.05 10 20 25 30
Fig. 3 GC/MS chromatogramsof fraction 8 (a) and pcGC subfractions 8.1 to 8.11 (b–l). I1,1,2,2-tetrachloroethane, II O,O,O-trimethylthiophosphate, III2-bromo-1,2-dichloropropane,IV 1,1-dichloro-2,2-diethoxy-ethane, V methyl trichloropro-penoate, VI methyl(methylthiomethyl) disulfide,VII methyl 3,3-dichloroprope-noate (continued), VIII 1,7,7-trimethyl-bicyclo[2.2.1]heptan-2-one, IX O,O,S-trimethyldithio-phosphate, X O,S-Diethylhydrogen dithiophosphate,XI 1,2,5-Trichloroindane, XII O,S,S′-trimethylphosphoro-trithioate, XIII 2-Methyl-α-phenyl-benzenemethanol
Environ Sci Pollut Res (2010) 17:885–897 891
an induction rate of 1.6 without S9 activation. Nomutagenicity was predicted for these three compoundsusing our model. However, effects were predicted formethyl parathion (F9), dibenzofuran (F12) and α-HCH(F12), for which no effects were detectable with the umuCtest. For the 15 negatively tested compounds in the umuCtest, our model also predicted no effects.
The genotoxicity of F5 to 7 remained unresolved, as thecomponents identified in these fractions neither affected the
Salmonella bacteria nor was mutagenicity predicted forthose structures.
4 Discussion
After RP-LC separation, the fractions analysed by GC/MSstill contained a high number of compounds and showedboth cytotoxic and genotoxic effects in the umuC test,
abun
danc
e [*
106 ]
VIII
11.44
12.76
12.74
14.44
11.98
14.4417.41
18.13
26.47
IX
X
XI
XII
(g) F 8.6
(h) F 8.7
(i) F 8.8
(j) F 8.9
(k) F 8.10
(l) F 8.11
XIII
MeO
Me Me
P O
Me
S
O
S
Me
Me
OH
Me
P
S
S
S
O
Me
Me
Me
Cl
ClCl
Retention time [min]
P O
S
OH
S
Me
Me
0.5
0.015.0
1.0
10.0
5.0
0.0
1.5
1.0
0.5
0.0
1.5
1.0
0.5
0.0
10.0
5.0
0.0
3.0
2.0
1.0
0.0
5 10 15 20 25 30
Fig. 3 (continued)
892 Environ Sci Pollut Res (2010) 17:885–897

Table 1 List of compounds identified in genotoxic fractions of Bitterfeld groundwater
Fraction NIST match[CAS no.]
NISTmatch
[%]log Kow
MOLGENMolecularFormula
MOLGEN match(CAS no.)
No. ofMOLGENmatches
MOLGENmatch
range [%]
MOLGENlog KOW
range [%]
4 O,S,S-Trimethyldithiophosphate [22608-53-3] (a) 97 0.68/2.64* C3H9O2PS2 O,S,S-Trimethyldithiophosphate [22608-53-3] 4 50-82 0.50-1.70unknown C3H6O2S3 (Methyltrisulfanyl)acetic acid [not available] (b) 1 72 1.13
(a)
3-Hydroxybenzaldehyde oxime [22241-18-5] (c)
(b)
90
(c)
1.39 C7H7NS 3-Hydroxybenzaldehyde oxime [22241-18-5] 6 44-46 1.00-1.50
5 2-Chloro benzenemethanol [17849-38-6] (a) 72 1.72 C7H7ClO o-, m- or p-Chloro benzenemethanol 3 15-45 1.72Dimethyltetrasulfide [5756-24-1] (b) 96 1.87 C2H6S4 Dimethyltetrasulfide [5756-24-1] 3 64-68 1.60-1.90unknown C7H7ClO o-, m- or p-Chloro benzenemethanol (p-) [873-76-7] (c) 3 18-19 1.72
(a)
Cyclic octaatomic sulfur [10544-50-0] (d)
(b)
99
(c)
0.23/0.42* S8 Cyclic octaatomic sulfur [10544-50-0]
(d)
1 11 0.23
6 Dimethyltrisulfide [3658-80-8] (a) 99 1.87/1.60* C2H6S3 Dimethyltrisulfide [3658-80-8] 8 49-67 1.50-2.00Dimethyltetrasulfide [5756-24-1] (b) 96 1.87/1.66* see Fraction 5 9 52-59 1.50-2.00unknown C7H5ClO2 2-, 3- or 4-Chlorobenzoic acid [74-11-3] (c) 3 73-75 2.52Dimethylpentasulfide [7330-31-6] (d) 79 1.87/1.72* C2H6S5 Dimethylpentasulfide [7330-31-6] 8 20-23 1.20-2.40
(a) (b) (c) (d)
7 O,O,S-Trimethyldithiophosphate [2953-29-9] (a) 98 1.81 C3H9O2PS2 O,O,S-Trimethylthiophosphate [2953-29-9] 6 43-50 1.50-3.00unknown C7H6Cl2O 3,5-Dichlorobenzene methanol [60211-57-6] (b) 6 40-42 2.36Formothion [2540-82-1] (c) 71 1.48/2.26* C6H12NO4PS2 O-(4-Mercaptobutyl) O,O-dimethyl thiophosphate [not available] 2 29 2.23-2.58
(a)
Bisphenol A [80-05-7] (d)
(b)
95
(c)
3.32 C15H16O24-(2-Hydroxypropan-2-yl)biphenyl-2-ol [not available]
(d)
37 74-87 2.70-3.60
8.01 1,1,2,2-Tetrachloroethane [79-34-5] 98 2.19 C2H2Cl4 1,1,2,2-Tetrachloroethane [79-34-5] 1 72 2.19
8.02 O,O,O-Trimethylthiophosphate [152-18-1] 95 1.16 C3H9O3PS (Mercaptooxy)(dimethoxy)methylenephosphorane [not available] 1 78 1.77
8.03 O,O,O-Trimethylthiophosphate [152-18-1] 95 1.16 see F8.02
OH N
OHP O
S
S
OMe
Me
Me
S
S
SS
S
S
S S
SS
SSCH3
CH3 Cl
OH
Cl
OH
Cl
OH
O
SS
SSCH3
SCH3
SS
SCH3CH3
P O
Me
S
O
S
Me
Me
Cl
Cl
OH
CH3
CH3
OHOHP
O
O
Me
Me
SS
N
O
Me
O
SS
SSCH3
CH3
SOH
O
SS
CH3
++
8.03 2-Bromo-1,2-dichloropropane [17759-88-5] 84 3.26 C3H5BrCl2 2-Bromo-1,2-dichloropropane [17759-88-5] 8 28-31 2.60-3.30
8.04 1,1-Dichloro-2,2-diethoxyethane [619-33-0] 95 1.64/2.29* C6H12Cl2O2 1,1-Dichloro-4-(ethylperoxy)butane [not available] 6 20-32 3.00-3.20
8.04 Methyl trichloropropenoate [17640-12-9] 98 2.07 C4H3Cl3O2 Methyl trichloropropenoate [17640-12-9] 1 46 2.07
8.05 Methyl (methylthio)methyl disulfide [42474-44-2] 98 1.96 C3H8S3 1-(Methylthio)ethane-1,2-dithiol [not available] 2 72-74 2.23 / 2.36
8.05 Methyl 3,3-dichloropropenoate [2257-46-7] 94 1.58/1.94* C5H8Cl2O2 4-Chloro-3-(chloromethyl) butanoic acid [not available] 1 78-80 2.00
8.06 Methyl (methylthio)methyl disulfide [42474-44-2] 98 1.96 see Fraction 8.05
8.06 Methyl 3,3-dichloropropenoate [2257-46-7] 97 1.58/1.94* see Fraction 8.05
8.06 unknown C10H16O 1,7,7-Trimethyl-(1S)-Bicyclo[2.2.1]heptan-2-one [not available] 98 60-70 2.50-3.50
8.07 O,O,S-Trimethyldithiophosphate [2953-29-9] 98 1.81 see Fraction 7
8.08 O,O,S-Trimethyldithiophosphate [2953-29-9] 98 1.81 see Fraction 7
8.08 unknown C4H11O2PS2 O,S-Diethyl hydrogen dithiophosphate [not available] 5 18-25 2.70-3.20
8.09 2,3-Bis(methylthio)bicyclo[2.2.1]hept-2-ene [not available] (a) 65 3.74 see F8.08 O,S-Diethyl hydrogen dithiophosphate [not available] (b) 5 18-25 2.70-3.20 unknown C10H16O 3-Isopropyl-6-methylcyclohex-2-en-1-one [not available] (c) 3 80-85 2.94 unknown C6H10OS2 3-Methyl-1,4-dithiepan-2-one [72018-97-4] (d) 4 50-58 2.60-2.90 unknown C8H7ClO2 Methyl o-, m- or p-chlorobenzoate (e) 3 77-78 2.47 unknown see Fraction 7 3,5-Dichlorobenzene methanol [60211-57-6] 6 40-42 2.36 2,4-Dichloro-6-methylphenol [1570-65-6] (f) 65 3.35 C7H6Cl2O Dichloromethylphenol or Chloro(chloromethyl)phenol 9 78-80 2.90-3.40 2,6-Dichloro-4-methylphenol [2432-12-4] (g) 65 3.35 C7H6Cl2O Dichloromethylphenol 9 78-79 2.90-3.40 2,6-Dichloro-4-methylphenol [2432-12-4] (g) 71 3.35 see Fraction 8.09 unknown C9H6Cl2O 2-Chloro-1-[(chloroethynyl)oxy]-3-methylbenzene [not available] 5 35-45 3.30 unknown C5H12S3 4-(Methyldisulfanyl)butane-1-thiol [not available] (h) 2 60-68 3.23 / 3.29 unknown C9H7Cl3 Trichloroindane (i) 6 45-60 4.47 / 4.94
(a)
(g)
(b)
(h)
(c)
(i)
(d) (e)
(f)
8.10 O,S,S'-Trimethylphosphorotrithioate [not available] 92 2.45 C3H9OPS3 O,S,S'-Trimethylphosphorotrithioate [not available] 7 57-68 2.30-2.90
8.11 2-Methyl- -phenyl-benzenemethanol [5472-13-9] 91 3.26 C14H14O 2-Methyl- -phenyl-benzenemethanol [5472-13-9] 20 10-35 3.00-3.50
S
SCH3
CH3
P O
S
S
OH
Me
MeS
S
CH3
OO
CH3
CH3
CH3
Cl
O
O
Me
OH
CH3
Cl
Cl
OH
ClCl
CH3Cl
ClCl
SS
CH3SH
Environ Sci Pollut Res (2010) 17:885–897 893

overlapping each other. Structure elucidation and thepurchase or synthesis of standard compounds for toxicantidentification and confirmation would be costly and time-consuming for such unresolved fractions. Thus, pcGC wastested for its potential within EDA studies to separatecomponents in the toxic RP-LC fraction F8. SubsequentGC/MS analysis revealed significantly reduced complexityof the sub-fractions F8.1–F8.11 compared with the parentfraction F8 (Fig. 3). Moreover, the combination of pcGC/FID with analytical GC/MSD in one column oven allowedfor a direct transfer of retention times and made compoundidentification possible. Isolation of pcGC fractions washighly reproducible with recoveries of about 80% forharvested compounds, facilitating structure elucidation andallowing for further genotoxicity testing. As toxicity wasonly recovered in pcGC fraction 8.9 from a total of 11 sub-fractions, this method is also advantageous in pinpointingthe toxicity.
A total of 42 compounds were identified in activefractions (Table 1) using classical NIST database search.The plausibility of the identified structures of compounds
was checked on the basis of MOLGEN-MS estimations andRP-LC retention times and thus log Kow values. On onehand, this method can indicate whether additional com-pounds need to be considered or whether the library matchis the only likely match. On the other hand, it could be usedas a supplement to library search especially for unknownswhere no clear library match is available. Thus, 30compounds identified with NIST could be confirmed andadditional 20 structures were suggested using MOLGEN-MS. Of these, some are well-known compounds that arealready recognised as environmental pollutants in waterbodies, e.g. the insecticide methyl parathion and theendocrine disrupter bisphenol A. Other compounds wereidentified that are not as well known. These could beidentified by comparison of existing GC/MS data and/or bygenerating structures using MOLGEN-MS.
Based on the knowledge of industrial processes inBitterfeld, the presence of chloroaromatic compounds wasexpected (Chemie AG B-W 1993). 1,4-Dichlorobenzene(F11), for instance, was used as pesticide and as anintermediate or precursor in the production of dyes,
Table 1 (continued)
Fraction NIST match [CAS no.]
NIST match
[%]log Kow
+
MOLGEN Molecular Formula
MOLGEN match [CAS no.]
No. of MOLGEN matches
MOLGEN match
range [%]
MOLGEN log KOW
+
range [%]
9 Dimethyl trithiocarbonate [2314-48-9] (a) 98 -0.49/1.8* C3H6S3 (3-Methyldithiiran-3-yl)methanethiol [not available] 2 73-74 2.79 2,4-Dichloro-6-methylphenol [1570-65-6] (b) 70 3.35 see Fraction 8.09 1,2,3,4-Tetrathiane [290-81-3] (c) 98 1.76 C2H4S4 1,2,3,4-Tetrathiane [290-81-3] 1 84 1.76 unknown C6H3Cl3O 2,4,6-Trichlorophenol [88-06-2] (d) 5 51-53 3.45 unknown C9H8Cl4 1-Chloromethyl-3-(1,1,2-trichloroethyl)benzene [not avail.] (e) 3 29-31 4.45 3,4,6-Trichloro-o-cresol [643-14-1] (f) 89 3.99 C7H5Cl3O 3,4,6-Trichloro-o-cresol [643-14-1] 20 35-46 3.60-4.00
(a)
Methyl parathion [298-00-0] (g)
(b) (c)
98 2.75
(d)
C8H10NO5PS o, m & p-isomers of Methylparathion
(e) (f)
3
(g)
0 2.75
11 unknown C6H4Cl2 Dichlorobenzene [106-46-7] (a) 3 72 3.28 unknown C4H3Cl5 Pentachlorobutene (b) 2 63-67 3.95 unknown C4H4Cl4 1,2-Dichloro-4-(dichloromethyl)benzene [56961-84-3] (c) 5 76-80 4.20-4.50 Benzylmethyldisulfide [699-10-5] (d) 85 3.58 C8H10S2 Benzylmethyldisulfide [699-10-5] 19 82-90 3.50-4.50
(a)
2-Cyclohexylidene cyclohexanone [1011-12-7] (e)
(b)
65
(c)
4.15 C12H18O 2-Cyclohexylidene cyclohexanone [1011-12-7]
(d) (e)
1 50 4.15
12 1,1,3,4-Tetrachloro-1,3-butadiene [42769-38-0] (a) 80 3.73 C4H2Cl4 Tetrachlorobutadiene 3 56-57 3.73 unknown C4H3Cl5 3,3,3-Trichloro-2-(dichloromethyl)prop-1-ene [not available] (b) 3 50-65 4.00-4.20 Acenaphthene [83-32-9] (c) 75 3.92 C12H10 Acenaphthene or 1-Ethylnaphthalene [1127-76-0] 2 60-64 3.90-4.20 Dibenzofuran [132-64-9] (d) 91 4.12 C12H8O Dibenzofuran [132-64-9] 1 65 4.12 1A,2E,3E,4E,5E-Pentachlorocyclohexane [22138-39-2] (e) 81 4.08 C6H7Cl5 1,1,2,2,3-Pentachlorocyclohexane [22138-39-2] 13 0.2 4.00-4.20 Fluorene [86-73-7] (f) 75 4.02 C13H10 Fluorene [86-73-7] 1 80-82 4.02 unknown C6H6Cl6 alpha- Hexachlorocyclohexane [319-84-6] (g) 1 0 4.26
(a)
Triphenylphosphate [115-86-6] (h)
(b) (c)
98 4.70
(d)
C18H15O4P Triphenylphosphate [115-86-6]
(e) (f) (g)
1
(h)
55 4.70
O
P
N
O
O
O
Me
S
OMe
S SS S
OHCl
Cl
Cl
S
S
S Me
Me
Cl OH
CH3
Cl
Cl
CH3
OH
Cl
Cl
Cl
Cl
Cl
H
Cl
ClCl
S S
CH3 O
Cl
Cl Cl
Cl
P O
O
OO
Cl
Cl
Cl
Cl
Cl
ClCl
Cl
Cl
Cl
Cl
Cl
Cl
Cl
Cl
Cl
Cl
Cl
Cl
Cl
CH2Cl
Cl
Cl
Cl
Cl
O
Structures are provided for identified compounds (x) using NIST05 database and MOLGEN-MS, respectively, as well as correspondingpartitioning coefficient (log Kow) values. In addition, the number of MOLGEN matches that fit to the match range (%) and to the log Kow fractionrange gained from applied fractionation protocol reducing candidate structures is given. Highlighted compounds were confirmed as genotoxicantsa US EPA 2007: EPI Suite v3.20b SPARC v4.2
894 Environ Sci Pollut Res (2010) 17:885–897

pesticides, pharmaceuticals and dichloroaniline. Similarly,2,4,6-trichlorophenol, identified in fraction F9, was used asintermediate in the production of chloroaniline, dyes,pentachlorophenol, pesticides and preservative agents(Chemie AG B-W 1993).
The added value of MOLGEN-MS for structure eluci-dation can be demonstrated using two examples. The firstexample shows the added value of MOLGEN-MS as anindependent confirmation tool for an obtained NIST match.In fraction F4, O,O,S-trimethyldithiophosphate was identi-fied with a match value of 97% using the NIST05 database(Table 1). On the basis of the empirical formula C3H9O2PS2and additional classifier information gained from massspectra, MOLGEN-MS suggested 116 structures with matchvalues >50% out of 264 candidate structures. Additionalestimates for log Kow from EPISuiteTM reduced the possiblestructures to four matches with log Kow values between 0.5and 1.7 (ESM Figs. S2–4). The estimated log Kow values areconsidered close enough to the fraction range (1.07–1.23)taking into account errors in estimation and calculation, asmentioned above. The log Kow as additional filteringcriterion limited the possible structures as most candidateshave log Kow that are below the accepted range.
Whilst two of the four matches were considered less likelydue to O–S or S–S bonds and a third due to clear differences inoverlaying its NIST spectrum with our unknown, MOLGEN-MS provided an independent line of evidence to confirmO,O,S-trimethyldithiophosphate as the compound detected infraction F4. In cases where no standards are available,structure confirmation relies on a weight of evidenceapproach (Brack et al. 2008), and MOLGEN-MS providesa helpful line of evidence to confirm the identity of anunknown compound.
The second example using the unknown found infraction F4 demonstrates how MOLGEN-MS can predictpossible structures in cases where library search does notprovide a well-fitting match (Table 1). The spectrum of thebest NIST match 1,2,4,6-tetrathiepane fits poorly with theunknown, indicated by a low match value (31%) due tomissing peaks in the NIST match compared with theexperimental spectrum (ESM Fig. S5). Thus, the peakobviously does not represent the suggested compound. Thiscompound was also calculated by MOLGEN-MS with amatch value of 28%. However, MOLGEN-MS generated(methyltrisulfanyl)acetic acid as a likely match with anestimated log Kow of 1.13 matching the fraction log Kow
range and MV higher than 70% from 831 total candidates(ESM Figs. S6 and S7). The estimated pKa value of 3.41(±0.01) using ACD/pKa DB 11.0 (ACD 2007) providessignificant supporting evidence to confirm this most likelymatch for the unknown compound, as the RP-LC fraction-ation was performed at pH3. Here, MOLGEN-MSincreases the chance to identify the unknown where no
clear library match was available. However, the effective-ness of this computer tool largely depends on the availablemass spectral “classifiers”, such as exact molecular masses,presence and absence of specific elements, isotope peaksand fragmentation pattern as well as additional sortingcriteria like fractions log Kow range gained from previousfractionation procedures (Schymanski et al. 2009).
Mutagenicity prediction was tested as a tool to selectcandidates for genotoxicity from tentatively identified struc-tures. Mutagenic activity could be predicted qualitatively forall compounds, whilst the model provides no predictions oneffect concentrations or effect intensities. About half of thetentatively identified structures were outside the applicationdomain of the model. For these compounds, no reliablepredictions were expected. Attempts were made to confirmthe model outcome for 21 compounds that were commerciallyavailable. None of the three compounds identified asgenotoxic experimentally was predicted to be mutagenic bythe model. Three other compounds that were predicted to bepotential mutagens could not be confirmed as genotoxicants inumuC experimentally. Although the presented data arelimited, they suggest that the power of the mutagenicityprediction model for the pre-selection of potential genotox-icants from environmental mixtures is still insufficient.Although umuC and Ames have been found to becomparable in sensitivity (Reifferscheid and Heil 1996), thediscrepancy may partly be due to the different endpointscovered by umuC genotoxicity assay and Ames test-basedmutagenicity.
The compounds that could be confirmed experimentallyas genotoxic in genotoxic fractions were chlorinatedphenols and 4-chlorobenzoic acid. 2,4,6-Trichlorophenoland other chlorophenols have been already identified asgenotoxic in the umuC test (Degirmenci et al. 2000). Othermajor components identified in genotoxic groundwaterfractions from Bitterfeld were phosphoric acid esters.However, O,O,O-trimethylthiophosphate, identified infractions F5 and F8, as well as O,O,S- (F7) and O,S,S-trimethyldithiophosphate (F4) have been described to benot mutagenic in S. typhimurium with or without activationby S9 liver homogenate (Imamura and Talcott 1985). Thiswas confirmed by our umuC test results for O,O,O-trimethylthiophosphate and O,S,S-trimethyldithiophosphate(ESM Table S4).
5 Conclusions and perspectives
Conventional EDA of contaminated groundwater, combiningbiological assays, RP-LC fractionation and GC/MS analysis,were supported with novel tools to further reduce thecomplexity of environmental mixtures and to enhance thepower of toxicant identification. Using genotoxicity identifi-
Environ Sci Pollut Res (2010) 17:885–897 895

cation in a contaminated groundwater as an example, pcGCfor high-resolution fractionation, MOLGEN-MS structuregeneration for improved structure elucidation and genotox-icity prediction for selecting candidate genotoxicants wereapplied. The present results suggest pcGC as a high-resolutiontool for separation of volatile and thermostable components inpre-fractionated environmental mixtures. MOLGEN-MSprovides a strong line of evidence in structure confirmationif no standards are available and also helps to suggeststructures if library search does not provide satisfying results.High-resolution MS with exact masses and spectral qualifiersmay significantly enhance the power of the model. Furtherprogress in structure prediction from mass spectra wouldimprove outcomes fromEDA further. Mutagenicity predictionfailed in our study to narrow down a list of tentativelyidentified compounds to candidate genotoxicants. Genotox-icity, mutagenicity and carcinogenicity caused by chemicalsare complex processes, and prediction from chemical structurestill appears to be quite difficult and limited to selectedcompound groups such as PAHs (Braga et al. 1999). Progressin this field would significantly support EDA and riskassessment of environmental mixtures.
However, we could confirm three genotoxic compoundsin our study. 2,4,6-Trichlorophenol, identified in fraction F9and produced in high amounts in Bitterfeld (Chemie AG B-W1993) was already described in the literature to be genotoxic.To the best of our knowledge, this is the first time that 2,4-dichloro-6-methylphenol and 4-chlorobenzoic acid werefound to be genotoxic in a contaminated groundwater sampleusing the umuC test.
Acknowledgements This study was supported by the EU fundedprojects MODELKEY (contract no. 511237-GOCE) and OSIRIS(contract no. 037017). We thank Ms. Aulhorn for technical assistance.
References
ACD (2007) ACD/pka DB, version 11.0. Advanced ChemistryDevelopment, Toronto, Canada
Benecke C, Grüner T, Kerber A, Laue R, Wieland T (1997) Molecularstructure generation with MOLGEN, new features and futuredevelopments. Fresenius’ J Anal Chem 359:23–32
Bobeldijk I, Brandt A, Wullings B, Noij ThHM (2001) High-performanceliquid chromatography-ToxPrint: chromatographic analysis with anovel (geno)toxicity detection. J Chromatogr A 918:277–291
Brack W (2003) Effect-directed analysis: a promising tool for theidentification of organic toxicants in complex mixtures. AnalBioanal Chem 377:397–407
Brack W, Schmitt-Jansen M, Machala M, Brix R, Barceló D,Schymanski E, Streck G, Schulze T (2008) How to confirmidentified toxicants in effect-directed analysis. Anal BioanalChem 390:1959–1973
Braga RS, Barone PMVB, Galvao DS (1999) Identifying carcinogenicactivity of methylated polycyclic aromatic hydrocarbons (PAHs).J Mol Struc-Theochem 464:257–266
Castillo M, Barceló D (1999) Identification of polar toxicants inindustrial wastewaters using toxicity-based fractionation withliquid chromatography/mass spectrometry. Anal Chem 71:3769–3776
Chemie AG B-W (1993) Bitterfelder Chronik. 100 Jahre Chemies-tandort Bitterfeld-Wolfen. Vorstand der Chemie AG Bitterfeld-Wolfen, Bitterfeld-Wolfen
Coutois YA, Pesle ML, Festy B (1992) Activation of pro-mutagens incomplex mixtures by rat liver S9 systems. Mutat Res 276:133–137
Degirmenci E, Ono Y, Kawara O, Utsumi H (2000) Genotoxicityanalysis and hazardousness priorization of a group of chemicals.Water Sci Technol 42:125–131
De Maagd PGJ, Tonkes M (2000) Selection of genotoxicity tests forrisk assessment of effluents. Environ Toxicol 15:81–90
Eglinton TI, Aluwihare LI, Bauer JE, Druffel ERM, McNichol AP(1996) Gas chromatographic isolation of individual compoundsfrom complex matrices for radiocarbon dating. Anal Chem68:904–912
Galassi S, Benfenati E (2000) Fractionation and toxicity evaluation ofwaste waters. J Chromatogr A 889:149–154
Hilal SH, Karickhoff SW, Carreira LA (1995) A rigorous test forSPARC’s chemical reactivity models: estimations of more than4300 ionisation pKa’s. Quant Struc Act Rel 14:348–355
Hilal SH, Karickhoff SW, Carreira LA (2004) Prediction of thesolubility, activity coefficient and liquid/liquid partition coeffi-cient of organic compounds. QSAR Comb Sci 23:709–720
Holmstrand H, Mandalakis M, Zencak Z, Gustafsson O, Andersson P(2006) Chlorine isotope fractionation of a semi-volatile organo-chlorine compound during preparative megabore-column capil-lary gas chromatography. J Chromatogr A 1103:133–138
Imamura T, Talcott R (1985) Mutagenic and alkylating properties oforganophosphorus impurities of commercial malathion. Mut Res155:1–6
ISO/TC 147/SC5 (1999) Water quality-determination of genotoxicityof water and wastewater using the umu-test. InternationalOrganization for Standardization, Geneva
Kazius J, McGuire R, Bursi R (2005) Derivation and validation oftoxicophores for mutagenicity prediction. J Med Chem 48:312–320
Kerber A, Laue R, Meringer M, Varmuza K (2001) MOLGEN-MS:evaluation of low resolution electron impact mass spectra withMS classification and exhaustive structure generation. Adv MassSpectrom 15:939–940
Kerber A,MeringerM, Rucker C (2006) CASE viaMS: ranking structurecandidates by mass spectra. Croat Chem Acta 79:449–464
Mandalakis M, Holmstrand H, Andersson P, Gustafsson Ö (2008)Compound-specific chlorine isotope analysis of polychlorinatedbiphenyls isolated from Aroclor and Clophen technical mixtures.Chemosphere 71:299–305
Meinert C, Brack W (2010) Optimisation of trapping parameters inpreparative capillary gas chromatography for the application ineffect-directed analysis. Chemosphere 78:416–422, http://dx.doi.org/10.1016/j.chemosphere.2009.10.061
Meinert C, Moeder M, Brack W (2007) Fractionation of technicalp-nonylphenol with preparative capillary gas chromatography.Chemosphere 70:215–223
NIST (2007) Automated Mass Spectral Deconvolution and Identifi-cation System (AMDIS). National Institute of Standards andTechnology, US Department of Defence, Washington DC, USA.http://chemdata.nist.gov/mass-spc/amdis/
NIST/EPA/NIH (2005) NIST mass spectral library, version 2.0.National Institute of Standards and Technology, US Departmentof Commerce, Washington
OpenBabel (2007) OpenBabel, version 2.0.1. http//openbabel.sourceforge.net
896 Environ Sci Pollut Res (2010) 17:885–897

Reifferscheid G, Heil J (1996) Validation of the SOS/umu test usingtest results of 486 chemicals and comparison with the Ames testand carcinogenicity data. Mut Res Toxicol 369:129–145
Reifferscheid G, Heil J, Oda Y, Zahn RK (1991) A microplate version ofthe SOS/umu-test for rapid detection of genotoxins and genotoxicpotentials of environmental samples. Mut Res 253:215–222
Schüürmann G, Kuehne R, Kleint F, Ebert RU, Rothenbacher C,Herth P (1997) A software system for automatic chemicalproperty estimation from molecular structure. In: Chen F,Schüürmann G (eds) Quantitative structure–activity relationshipsin environmental sciences. VII SETAC Press, Pensacola, pp 93–114
SchüürmannG, Ebert RU, NendzaM, Dearden JC, Paschke A, Kuehne R(2007) Prediction of fate-related compound properties. In: vanLeeuwen K, Vermeire T (eds) Risk assessment of chemicals. Anintroduction. Springer Science, Dordrecht, pp 375–426
Schymanski EL, Meinert C, Meringer M, Brack W (2008) The use ofMS classifiers and structure generation to assist in the identifi-cation of unknowns in effect-directed analysis. Anal Chim Acta615:136–147
Schymanski EL, Bataineh M, Brack W, Bataineh M, Goss KU (2009)Integrated analytical and computer tools for structure elucidation ineffect-directed analysis. TrAC Trends in Anal Chem 28:550–561
SPARC. Sparc performs automated reasoning in chemistry, version4.2. http://ibmlc2.chem.uga.edu/sparc/
The MathWorks (2006) MATLAB, version 7.2.0.232. The MathWorksInc, USA
US EPA (2007) Estimation Program Interface (EPI) Suite (TM), version3.20. United States Environmental Protection Agency, Washington
Varmuza K, Werther W (1996) Mass spectral classifiers for supportingsystematic structure elucidation. J Chem Inf Comput Sci 36:323–333
Weiß H, Teutsch G, Fritz P, Daus B, Dahmke A, Grathwohl P,Trabitzsch R, Feist B, Ruske R, Böhme O, Schirmer M (2001)Sanierungsforschung in regional kontaminierten Aquiferen(SAFIRA)—1. Information zum Forschungsschwerpunkt amStandort Bitterfeld. Grundwasser 6:113–122
WhongWZ,WenY, Steward J, Ong T (1986) Validation of the SOS/Umu-test with mutagenic complex mixtures. Mut Res 175:139–144
Wycisk P, Weiss H, Kaschl A, Heidrich S, Sommerwerk K (2003)Groundwater pollution and remediation options for multi-sourcecontaminated aquifers (Bitterfeld/Wolfen, Germany). ToxicolLett 140–141:343–351
Zvinavashe E, Murk AJ, Rietjens IMCM (2008) Promises and pitfalls ofquantitative structure–activity relationship approaches for predictingmetabolism and toxicity. Chem Res Toxicol 21:2229–2236
Environ Sci Pollut Res (2010) 17:885–897 897