application of electrical resistivity imaging technique and
TRANSCRIPT
APPLICATION OF ELECTRICAL RESISTIVITY IMAGING TECHNIQUE AND COLLOIDAL BOROSCOPE ON GROUNDWATER STUDY
AT BLOCK 33, MALAYSIAN NUCLEAR AGENCY
Mohd Muzamil Mohd Hashim, Mohd Abdul Wahab Yusof, Kamarudin Samuding, Nazran Harun, Nurul Fairuz Diyana Baharudin
Waste Technology and Environmental Division Malaysian Nuclear Agency
Bangi, 43000 Kajang, Selangor Email: [email protected]
Abstract
Electrical resistivity imaging is a geophysical surveying technique that used to obtain two
dimensional (2D) subsurface profile. Base on resistivity value, the potential zone that contained
groundwater has been identified. A borehole with 100m depth has been constructed on the
groundwater potential zone. Then, a Colloidal Boroscope is being used to get the groundwater
velocity and direction. From the resistivity profile, a groundwater zone identified at the north
and south area of the study site but the actual direction of groundwater system at that area
cannot be recognized so that, the colloidal boroscope data being used to clarify the actual flow
and direction. Combination from this two type of data produced a good result of groundwater
direction in this study area.
Keywords; Electrical resistivity imaging, Colloidal boroscope, groundwater
INTRODUCTION
The electrical resistivity imaging technique is a geophysical technique that often used for
determine the earth subsurface condition such as the subsurface thickness, rock structure,
groundwater flow and aquifer, groundwater salinity and mineral exploration (Reynolds 1997).
This technique can produce a 2D profile of subsurface condition base on the resistivity value of
subsurface materials. In this study, the focus is on the groundwater potential zone. The
groundwater existing in the earth was determined by the default value of freshwater resistivity
value (Table 1).

The resistivity profile only cannot give a factual data of groundwater flow because the profile is
in two dimensional only. To get the groundwater flow and velocity, a borehole must construct
at the potential zone of groundwater. Then, colloidal boroscope will measure the groundwater
flow and velocity. Colloidal boroscope is a equipment that can measure the direction and
velocity base on the movement of particles in the groundwater itself.
Data of groundwater potential zone, groundwater direction and velocity is very important data
that must have if there have any idea to build a radioactive waste repository facility. Before a
repository facility built in that area, the groundwater contamination study have to do in order
to get the groundwater contamination plumes direction and to indentify the groundwater
monitoring area.
LOCATION AND GEOLOGICAL BACKGROUND
Block 33 is a Nuclear Malaysia’s facility which is a Radioactive waste storage facility. It is located
on a hilly area named as Bukit Rupa. Bukit Rupa stands at about 110 metres above sea level. It
is a conical hill with four main spurs radiating towards the north, southsoutheast, south-
southwest and the west. Several streams drain northwards into Sungai Langat and several
others drain southwards and southwestwards into Sungai Semenyih.
Base on the geological report that produced by Mineral & Geoscience department, this site is
located on rocks of the Kajang Formation of Carboniferous to Permian age. The rocks consist
originally of thick shale, siltstones, sandstones and interbedded shale and sandstones that have
been metamorphosed into schists, phyllites and quartzites. There is no natural rock exposure
within this area.
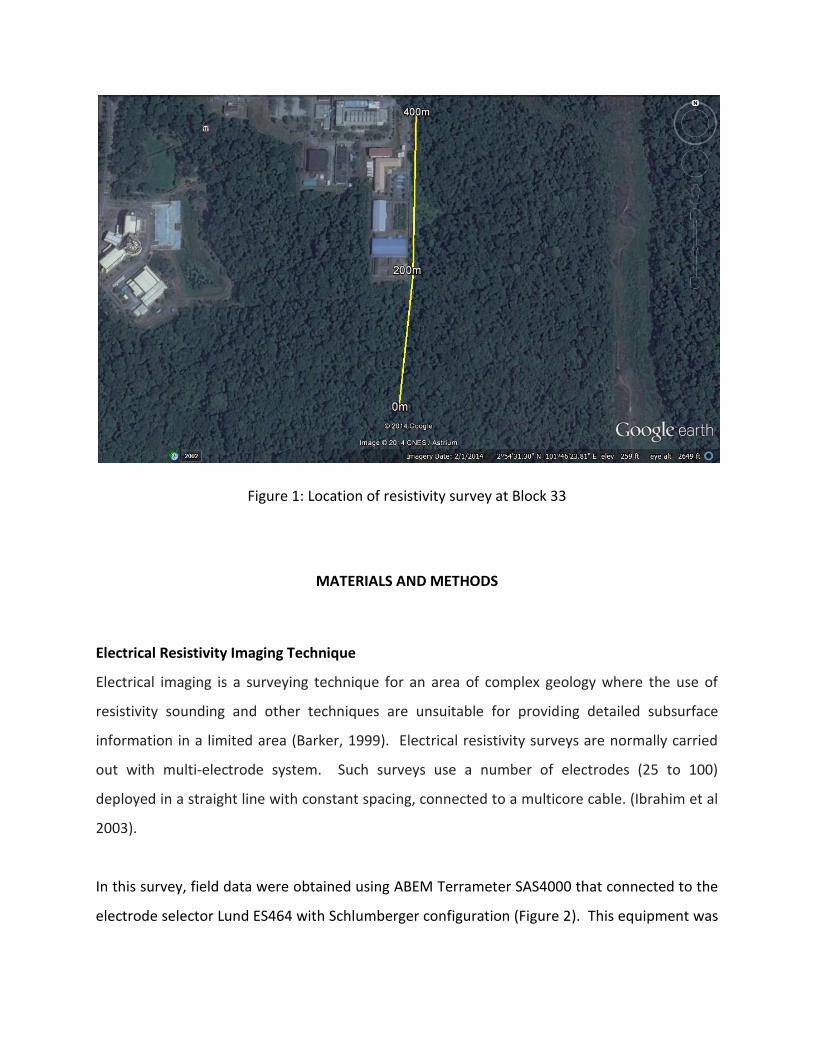
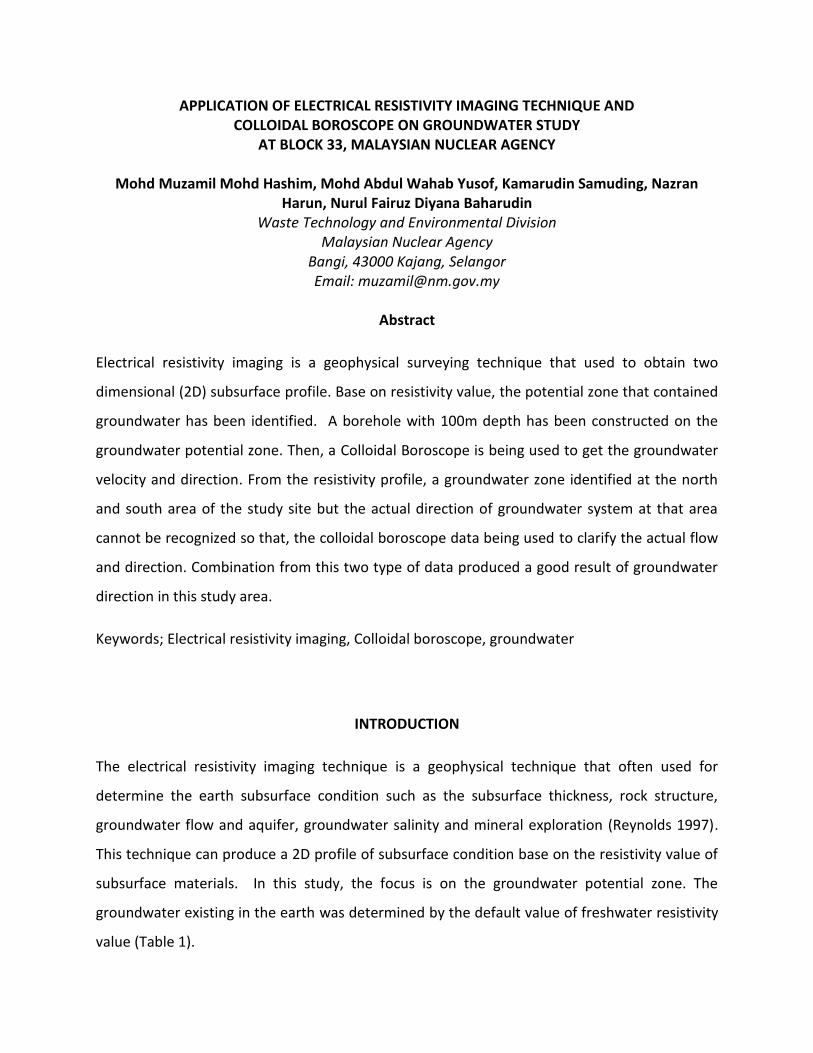
Figure 1: Location of resistivity survey at Block 33
MATERIALS AND METHODS
Electrical Resistivity Imaging Technique
Electrical imaging is a surveying technique for an area of complex geology where the use of
resistivity sounding and other techniques are unsuitable for providing detailed subsurface
information in a limited area (Barker, 1999). Electrical resistivity surveys are normally carried
out with multi-electrode system. Such surveys use a number of electrodes (25 to 100)
deployed in a straight line with constant spacing, connected to a multicore cable. (Ibrahim et al
2003).
In this survey, field data were obtained using ABEM Terrameter SAS4000 that connected to the
electrode selector Lund ES464 with Schlumberger configuration (Figure 2). This equipment was
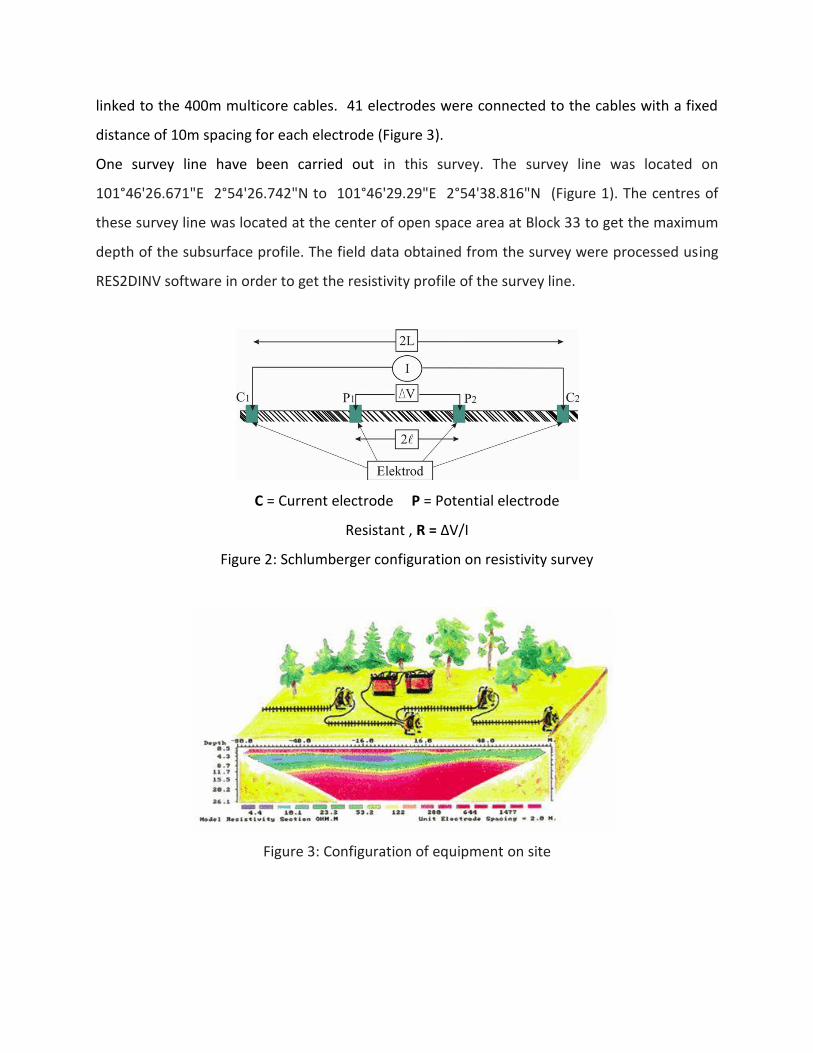
linked to the 400m multicore cables. 41 electrodes were connected to the cables with a fixed
distance of 10m spacing for each electrode (Figure 3).
One survey line have been carried out in this survey. The survey line was located on
101°46'26.671"E 2°54'26.742"N to 101°46'29.29"E 2°54'38.816"N (Figure 1). The centres of
these survey line was located at the center of open space area at Block 33 to get the maximum
depth of the subsurface profile. The field data obtained from the survey were processed using
RES2DINV software in order to get the resistivity profile of the survey line.
C = Current electrode P = Potential electrode
Resistant , R = ΔV/I
Figure 2: Schlumberger configuration on resistivity survey
Figure 3: Configuration of equipment on site

Colloidal Borescope System
Colloidal Borescope System consist Charged Couple Device (CCD) camera, a flux gate compass,
an optical magnification lens, an illumination source and a stainless steel housing (Figure 4).
Basically, this colloidal boroscope was used in the borehole or monitoring well that contained
groundwater. The measurement of velocity and direction are base on the particles movement
in the groundwater system. Upon the measurement in the well, an electronic image magnified
140x is transmitted to the surface, where it is viewed and analyze. The flux gate compass will
align the direction of boroscope in the well while the source of illumination is a source of
lighting for the lens to capture the movement of particles in the groundwater. All the particles
flow and direction that has been captured will transmitted to the video digitizer and analyzed
using a software.
The groundwater flow direction in this study area most possibly influence by geological
structures. So that, the measurement of groundwater direction must apply to shallow depth
until the deeper depth of the borehole to get the overall direction of groundwater in that area.
The initial groundwater measured at 22m below ground level. This first depth of measurement
is 30m and will continue at 10m interval until the deepest level 70m.
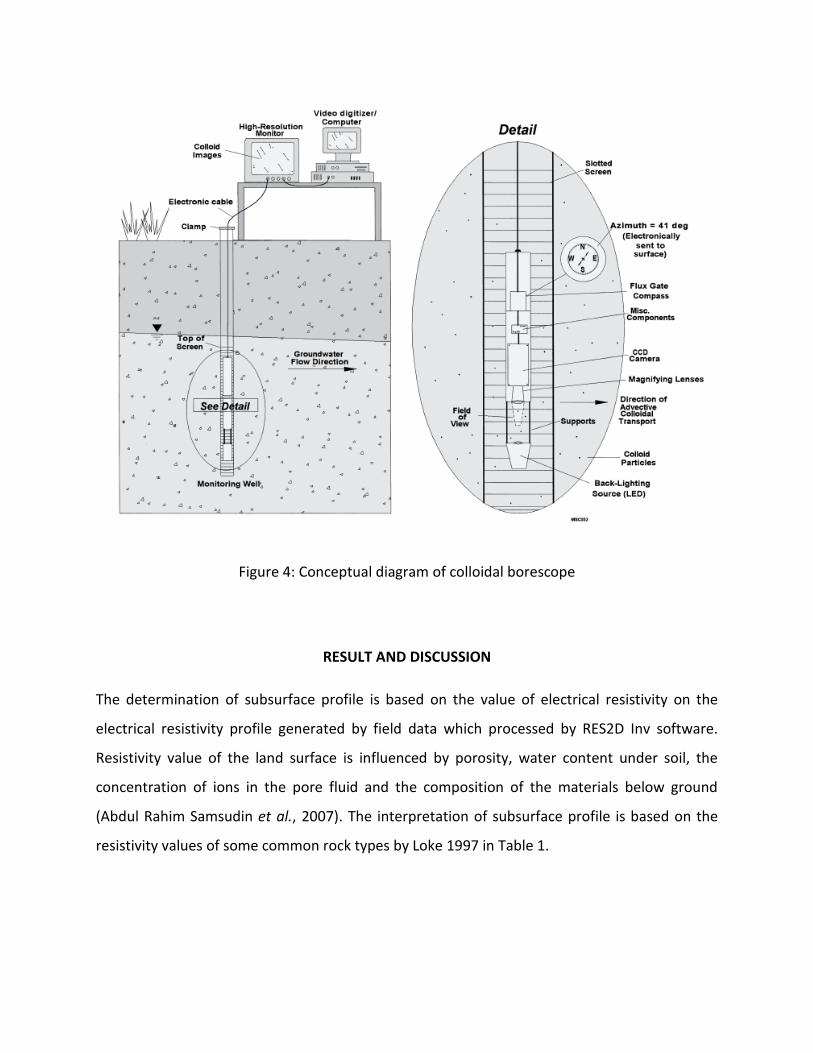
Figure 4: Conceptual diagram of colloidal borescope
RESULT AND DISCUSSION
The determination of subsurface profile is based on the value of electrical resistivity on the
electrical resistivity profile generated by field data which processed by RES2D Inv software.
Resistivity value of the land surface is influenced by porosity, water content under soil, the
concentration of ions in the pore fluid and the composition of the materials below ground
(Abdul Rahim Samsudin et al., 2007). The interpretation of subsurface profile is based on the
resistivity values of some common rock types by Loke 1997 in Table 1.

Table 1: Resistivities of some common rocks, minerals and chemicals (Loke, 1997).
Material Resistivity (Ωm) Conductivity (Siemen/m)
Igneous and Metamorphic
Rocks
Granite
Basalt
Slate
Marble
Quarzite
Sedimentary Rocks
Sandstone
Shale
Limestone
Soils and Waters
Clay
Alluvium
Groundwater (fresh)
Sea Water
Chemicals
Iron
0.01M Potassium chloride
0.01M Sodium chloride
0.01M Asetic acid
0.02 Xylene
5 x 10³ – 10
6
103-10
6
6x10²
– 4x10⁷
102 – 2.5 x 10
8
102 – x 10
8
8 – 4 x 10³
20 – 2 x 10³
50 – 4 x 10²
1 – 100
10 – 800
10 – 100
0.15
9.074 x 10⁻⁸
0.708
0.843
6.13
6.998 x 10⁶
10-6
– 2 x 10⁻⁶
10-6
– 10-3
2.5x10⁻⁸
– 1.7x10⁻³
4 x 10⁻⁹
– 10-2
5 x 10⁻⁹
– 10-2
2.5 x 10⁻⁴
– 0.125
5 x 10⁻⁴
– 0.05
2.5 x 10⁻³
– 0.02
0.01 – 1
1.25 x 10⁻³
– 0.1
0.01 – 0.1
6.7
1.102 x 10⁷
1.413
1.185
0.163
1.429 x 10⁻¹⁷
On the resistivity profile for line 1 (Figure 5), the 0m was located in South and the 400m located
in North. The maximum depth of subsurface profile is 80m. In this profile, the difference
between high resistivity zone (>500 Ωm), intermediate resistivity zone (75 Ωm - 200 Ωm) and
low resistivity zone (< 5 Ωm) were clearly shown. The occurrence of high resistivity zone
surrounds the intermediate resistivity zone more likely caused by the fractured zone.
Based on the resistivity profile, high resistivity zone (yellow to red colour) was interpreted as
hard rock. The intermediate resistivity zone is in green colour. The occurrence of this zone may
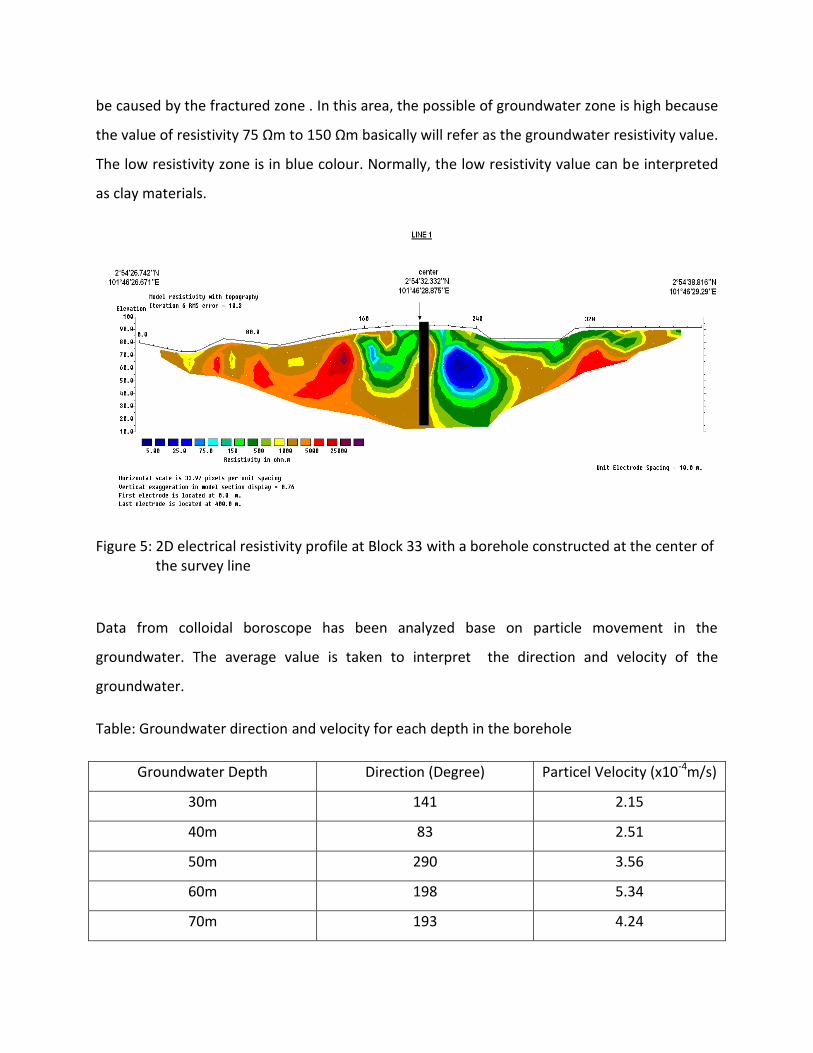
be caused by the fractured zone . In this area, the possible of groundwater zone is high because
the value of resistivity 75 Ωm to 150 Ωm basically will refer as the groundwater resistivity value.
The low resistivity zone is in blue colour. Normally, the low resistivity value can be interpreted
as clay materials.
Figure 5: 2D electrical resistivity profile at Block 33 with a borehole constructed at the center of the survey line
Data from colloidal boroscope has been analyzed base on particle movement in the
groundwater. The average value is taken to interpret the direction and velocity of the
groundwater.
Table: Groundwater direction and velocity for each depth in the borehole
Groundwater Depth Direction (Degree) Particel Velocity (x10-4m/s)
30m 141 2.15
40m 83 2.51
50m 290 3.56
60m 198 5.34
70m 193 4.24

Figure 6: Groundwater direction and velocity at 30m depth
Figure 7: Groundwater direction and velocity at 40m depth

Figure 8: Groundwater direction and velocity at 50m depth
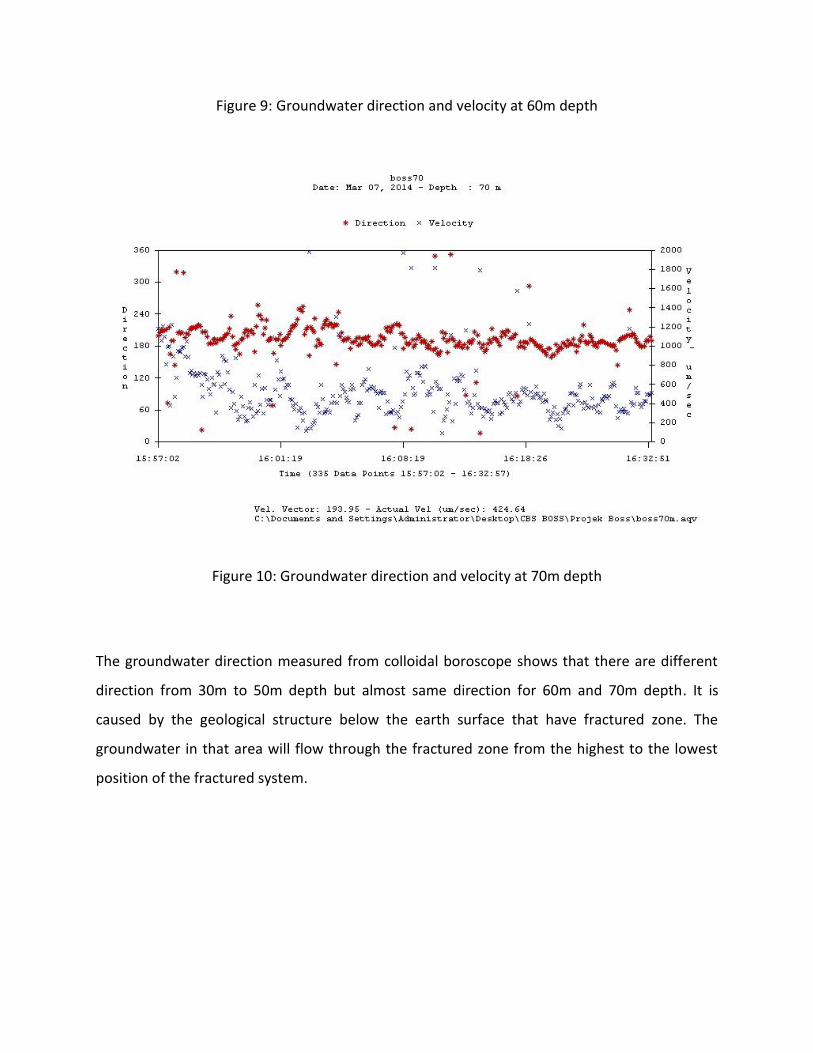
Figure 9: Groundwater direction and velocity at 60m depth
Figure 10: Groundwater direction and velocity at 70m depth
The groundwater direction measured from colloidal boroscope shows that there are different
direction from 30m to 50m depth but almost same direction for 60m and 70m depth. It is
caused by the geological structure below the earth surface that have fractured zone. The
groundwater in that area will flow through the fractured zone from the highest to the lowest
position of the fractured system.
CONCLUSION
Electrical resistivity imaging technique determined a groundwater potential zone at the south
area of study site and a little bit potential at north area. The colloidal boroscope data shows
that the groundwater direction is different for 30m to 50 depth because of geological structure
and almost same for 60m and 70m depth which is flow to south area.
The rely on electrical resistivity imaging technique alone for groundwater flow study is not
enough. It is must supported by colloidal boroscope because it can produce a factual data of
groundwater direction and velocity. Combination of these two types of data will produce a
good result for groundwater study.

REFERENCES
Abdul Rahim Samsudin, Bahaa-Eldin Elwali A.Rahim & Wan Zuhairi Wan Yaacob, 2007. Delineation of leachate plumes at two waste disposal sites, Selangor. Geological Society of Malaysia, Bulletin 53: 47–50
A.N. Ibrahim, Z.Z.T Harith & M.N.M Nawawi (2003). Resistivity Imaging And Borehole
Investigation Of The Banting Area Aquifer, Selangor, Malaysia. Journal of Environmental Hydrology Volume II Paper 10. http://hydroweb.com/jeh/jeh2003/ibrahim.pdf
Barker, R.D.; (1999). Surface and borehole geophysics. In Lloyd J. W. (ed) Water Resources
of Hard Rock Aquifers in Arid and Semi-Arid Zones. Studies and Reports in hydrology, 58, Paris, UNESCO, 287 pp.
C.S Hutchison (2009). Bentong-Raub Suture. Geology of Peninsular Malaysia. Geological Map of Peninsular Malaysia 1985. Department of Mineral and Geoscience Malaysia. Loke M.H., 1999. Electrical Imaging Surveys For Environmental And Engineering Studies.
http://www.georentals.co.uk/Lokenote.pdf