application and assessment of precision deep tillage
TRANSCRIPT
The authors are solely responsible for the content of this technical presentation. The technical presentation does not necessarily reflect the official position of the American Society of Agricultural Engineers (ASAE), and its printing and distribution does not constitute an endorsement of views which may be expressed. Technical presentations are not subject to the formal peer review process by ASAE editorial committees; therefore, they are not to be presented as refereed publications. Citation of this work should state that it is from an ASAE meeting paper. EXAMPLE: Author's Last Name, Initials. 2001. Title of Presentation. ASAE Meeting Paper No. xx-xxxx. St. Joseph, Mich.: ASAE. For information about securing permission to reprint or reproduce a technical presentation, please contact ASAE at [email protected] or 616-429-0300 (2950 Niles Road, St. Joseph, MI 49085-9659 USA).
Paper Number: 01-1032 An ASAE Meeting Presentation
Application and Assessment of Precision Deep Tillage
L.G. Wells, Professor
Biosystems and Agricultural Engineering, University of Kentucky ([email protected])
T.S. Stombaugh, Assistant Extension Professor
Biosystems and Agricultural Engineering, University of Kentucky
S.A. Shearer, Associate Professor
Biosystems and Agricultural Engineering, University of Kentucky
Written for presentation at the 2001 ASAE Annual International Meeting
Sponsored by ASAE Sacramento Convention Center
Sacramento, California, USA July 30-August 1, 2001
Abstract. Several fields have been identified in which detrimental soil compaction is suspected. The fields have been divided into 0.4 ha (1 ac) grid cells for the purpose of variable rate application and yield analysis. Multiple cone penetrometer readings have been collected and recorded in each cells to a depth of 700 mm. Precision deep tillage has been applied to depths up to 400mm in which CI is > 1.5 MPa. Crop yield data is compared with CI and NIR imagery to develop a preferred method of applying deep tillage in order to maximize net return.
Keywords. Deep tillage, Precision agriculture, Precision tillage
2
Introduction The utilization of large heavy equipment has resulted in excessive compaction of
soil that has been associated with decreased crop yield. It is relatively common for Kentucky growers to subsoil fields where compaction is suspected and/or heavy vehicles have operated. A major problem facing producers is reliable determination that such compaction exists and, if so, selecting the most advantageous means of dealing with the problem. The soil cone penetrometer has been used extensively to determine soil strength that indicates the likelihood of poor root growth and crop performance. This instrument provides a relatively rapid measurement of soil strength versus depth and, as such, can determine both the location and depth for which tillage is needed. However, cone index can vary considerably, and its reliability in assessing soil conditions requires acquiring and analyzing multiple readings in a typical field.
Crop yield maps can indicate areas of reduced yield that may be attributable to
excessive soil compaction. Since there are many causes of reduced crop yield, a means of confirming likely soil compaction is needed. Remote sensed images of soil surface moisture content might be helpful in identifying areas of poor drainage caused by excessive compaction.
The purpose of this study is to assess alternative methods of applying remedial tillage from the economic perspective of increasing net returns. The specific objectives of the proposed study were:
1. To measure and map the spatial distribution of soil compaction as indicated by cone penetrometer resistance, or soil cone index (CI), on multiple fields located in central Kentucky.
2. To acquire remote sensed images of NIR reflectance from these fields soon after one or more rainfall events of > 5 cm when no vegetation is present to indicate areas of soil saturation and poor drainage.
3. To compare various methods of applying remedial tillage in these field from the economic standpoint of net returns.
Background Compaction of soil by machine traffic often produces adverse changes in soil physical
properties that result in reduced crop yield. Soil cone index (ASAE, 2000a) is a measure of soil resistance to penetration by a small probe and is therefore indicative of both compactness and strength. Numerous researchers have reported reduced crop yields associated with high values of soil cone index (e.g. Taylor et al. (1964), Douglas and McKeyes (1983), Al-Adawi and Reed (1996)).
Tillage is the mechanical disturbance of soil with the intent of reducing strength and bulk density thereby alleviating compaction. Normal tillage operations do not disturb soil deeper than approximately 20-25 cm and, in the case of no-till crop production; there is generally no disturbance. When traffic compaction occurs below the normal depth of tillage, deep tillage or subsoiling is required.
3
Al-Awadi and Reed (1996) reported reduction in soil cone index from approximately 1.5 to 1.0 MPa at the 40-45 cm depth attributable to subsoiling in a silty clay loam soil. Chaudhary et al. (1985) found that subsoiling reduced penetration resistance and increased grain yield in a loamy sand soil. Blancher et al. (1978) reported that root growth decreased as cone index increased above 1 MPa and virtually stopped at 2 MPa. Foshee et al. (1998) also suggested a cone index value of 2 MPa to characterize severe compaction.
Raper et al. (1998) reported that annual in-row subsoiling could circumvent the detrimental effects of traffic in cotton production, allowing roots to reach moisture in deep zones. A similar concept of “precision tillage” was described by Carter and Tavernetti (1968) wherein tillage depth was precisely specified to reach and disturb a compacted “pan”. As the concept of GPS-based precision agriculture has gained acceptance, the idea of precision tillage has evolved to include real-time control of a “smart” tillage tool (Scarlett et al. (1997)) and variable-depth deep tillage (Raper, 1999).
Precision deep tillage is attractive from the standpoint of eliminating unnecessary tillage. Evans et al. (1996) reported no improvement of corn yield resulting from subsoiling and suggested that it be used only when compaction is evident. Threadgill (1982) showed that the loosening effect of subsoiling was temporary, suggesting that regular deep tillage would be required to achieve beneficial results as indicated by Raper et al. (1998).
In order to apply site-specific deep tillage cost-effectively, a method is needed to minimize costs associated with identifying compacted zones in fields. Soil cone index is perhaps the most easily acquired measurement of soil strength and density. However, the collection, recording and analysis of 10, 15 or more cone penetrometer readings per 0.4 ha (1-acre) field grid cell using equipment such as described by Raper et al. (1999) would involve substantial effort and expense. The use of supplementary information, such as remotely sensed images, in conjunction with yield maps and farmers’ knowledge of fields could lead to more efficient and cost-effective implementation of precision tillage.
Remote sensing by satellites is recognized as the only practical method for gathering spatially distributed data for watershed analysis (Engman, 1995). Schmugge (1983) described the use of microwave reflectance to sense soil moisture near the surface. Synthetic aperture radar (SAR) provides a remote sensing tool to measure soil moisture that is not compromised by cloud cover.
LANDSAT satellite images are one common source for multi-spectral remote sensed data from farm fields. Unfortunately, image availability is severely limited by time interval between satellite passes and the occurrence of cloud cover (Wells et al., 2000). Senay et al. (1998) described acquisition of remote sensed imagery for use in precision agriculture using aircraft. Everitt et al. (1989) described the use of multispectral imagery for determining soil surface conditions, including moisture content.
Even though remote sensing methods are generally imprecise in quantifying absolute soil moisture content, they may be useful in identifying areas of poor drainage that may indicate compacted soil. When this information is combined with crop yield maps and known field traffic patterns, areas of suspected soil compaction can be identified and, if necessary, verified by a cone penetrometer before applying precision deep tillage.
4
Material and Methods
Compacted Fields
The fields chosen for this study are part of Worth and Dee Ellis Farms located near Shelbyville, Kentucky and the University of Kentucky College of Agriculture Animal Research Center (ARC) located near Versailles, Kentucky. Four fields were identified as having reduced crop yields attributable to excessive soil compaction. Previous cropping methods and associated equipment traffic were the suspected suggested as causes of soil compaction.
Ellis Field 31 consists of approximately 36.7 ha (90 ac) in a no-till crop rotation of corn-soybeans-wheat/soybeans. The soil type is predominantly Lowell silt loam. Corn was grown in 1999 and wheat/soybeans were grown in 2000 under no-till practices. The field had been planted in alfalfa for several years prior to 1999 that involved traffic of high-axle-load forage wagons. Reduced crop yield in both 1999 and 2000 strongly suggested the occurrence of excessive soil compaction.
Field numbers 145 (18.0 ha, 44 ac) and 146 (27.3 ha, 67 ac) of the Van Stockum Farm were leased by Worth and Dee Ellis Farms in 1999. The soil type is predominantly Shelbyville silt loam. These fields were subjected to a similar history of forage production and heavy equipment traffic. Corn was grown in 2000 under no-till practices, and reduced yield in some locations indicated possible excessive soil compaction.
ARC Field K has been in no-till small grain production since 1996. The soil type is predominantly Maury silt loam, generally well drained and approximately 1-2 m deep, except for approximately 2-3 acres with outcropping of limestone. The crops grown during 1996 through 2000 were corn, corn, soybeans, corn and soybeans. Yields were generally low in many areas of the field. Excessive soil compaction associated with previous disk harrowing of soil at high water content was suspected. Prior to 1996, the field had been planted in burley tobacco and was used as a pasture.
Yield Mapping
All fields used in this study have been subdivided into 0.4 ha (1 ac) cells for yield mapping and implementation of variable rate application of fertilizer, herbicides, etc. Differentially corrected global position system (DGPS) receivers were used to locate position in the fields to an accuracy of approximately + 1 m.
Soil Cone Penetrometer Measurements
A multi-probe soil cone penetrometer system was used to measure soil compaction in the fields. The system consisted of five (5) penetrometers mounted 30.5 cm apart and pushed into the soil via a hydraulic cylinder. Fluid was metered to achieve a vertical penetration rate of 183 cm/min (ASAE, 2000). Each penetrometer was mounted on a 4.1 kN load cell. Load cell output was recorded using a multi-channel Campbell Scientific data logger. The penetrometer system was mounted on a tractor equipped with a DGPS system. Fifteen measurements of soil cone index were made in each field cell to a depth of approximately 700 mm. Soil cone index was recorded in MPa in depth increments of approximately 20 mm. Average and maximum CI was recorded for the entire soil profile and within the tillage zone (< 400 mm). Penetrometer measurements were acquired in Spring 2000 and 2001 when soil water content in the various fields was approximately at field capacity (ASAE, 2000).
5
Application of Precision Deep Tillage
A five-shank Case-New Holland Ecolo-Tiller 2500 with 76 cm tine spacing was used to apply precision deep tillage. The implement was capable of a maximum tillage depth of 400 mm. The 0.4 ha (1 ac) cells of each field were randomly assigned to four tillage treatments: tilled to maximum depth of 400 mm; tilled to the maximum depth for which cone Index (CI) was > 1.5 MPa; tilled to a depth of 230 mm, and; not tilled.
Precision tillage was applied to Ellis Field 31 and ARC Field K during the Fall 2000. Precision tillage was applied to one half of the cells of Van Stockum Fields 145 and 146. The remaining deep tillage treatments will be applied in those fields during Fall 2001.
Remote Imagery
Near-infrared (NIR) images of the fields were acquired in early April 2001. Approximately 1.5 cm of rainfall had occurred the day before the image was acquired. The fields were covered with residue from the previous year’s crop. A Nikon Coolpix 800 digital camera was used with a NIR filter. The pixel density was 1200 x 1600. Images were acquired in a small aircraft in which the rear seat was removed so that fields could be photographed directly from above via a hole in the underside of the airplane fuselage. Images were acquired at altitudes ranging from 550-650 m resulting in a pixel resolution of 1-2 m2.
NIR images were warped onto images of the fields mapped in state-plane coordinates using ArcView GIS 3.2. An ArcView script was written to calculate the mean value of NIR reflectance recorded in each field cell. The same script was also used to calculate mean crop yield in each cell from yield mapping data. Microsoft Excel was used to compute various CI measurements for each cell including: mean CI, maximum CI, mean CI in the tillage zone, and maximum CI in the tillage zone. The corresponding depths of maximum CI were recorded for each field cell.
Results
Ellis Field 31
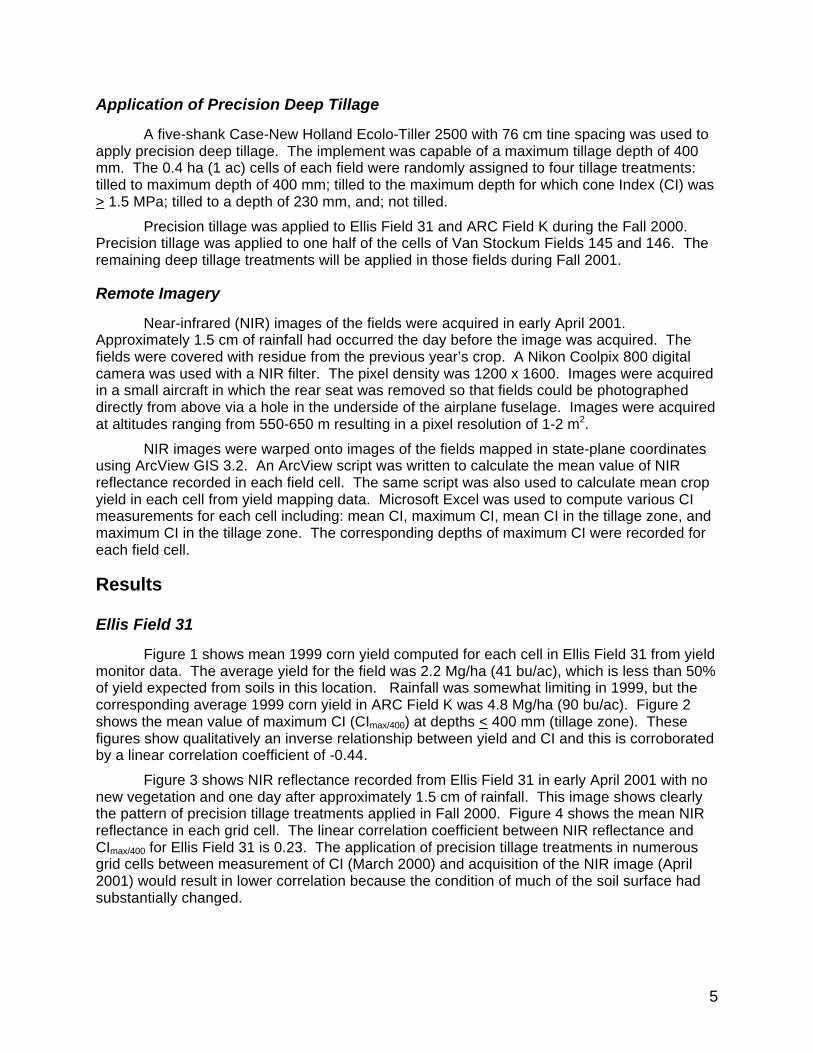
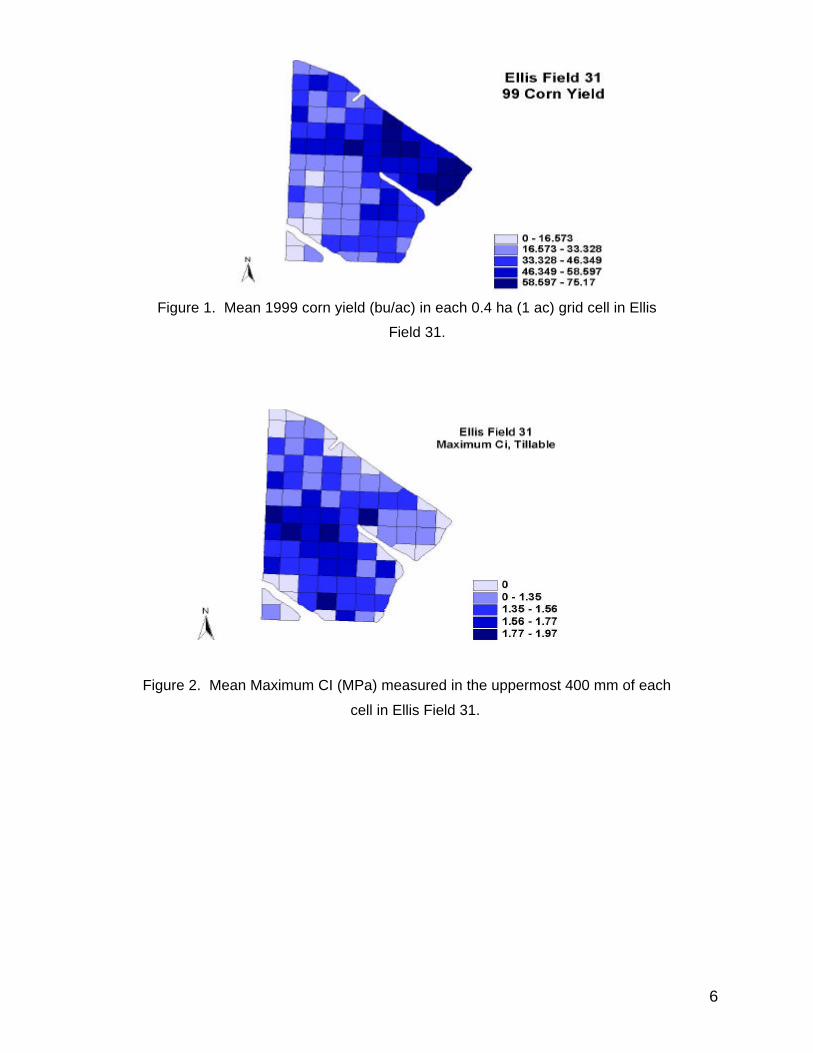
Figure 1 shows mean 1999 corn yield computed for each cell in Ellis Field 31 from yield monitor data. The average yield for the field was 2.2 Mg/ha (41 bu/ac), which is less than 50% of yield expected from soils in this location. Rainfall was somewhat limiting in 1999, but the corresponding average 1999 corn yield in ARC Field K was 4.8 Mg/ha (90 bu/ac). Figure 2 shows the mean value of maximum CI (CImax/400) at depths < 400 mm (tillage zone). These figures show qualitatively an inverse relationship between yield and CI and this is corroborated by a linear correlation coefficient of -0.44.
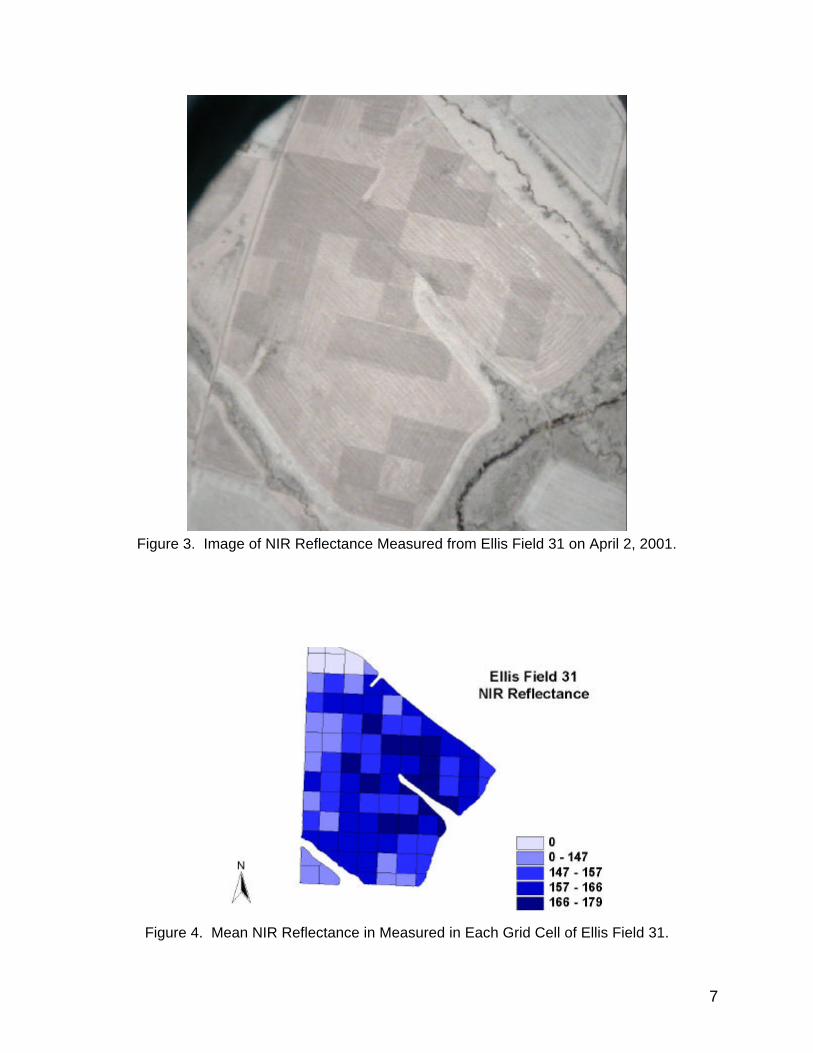
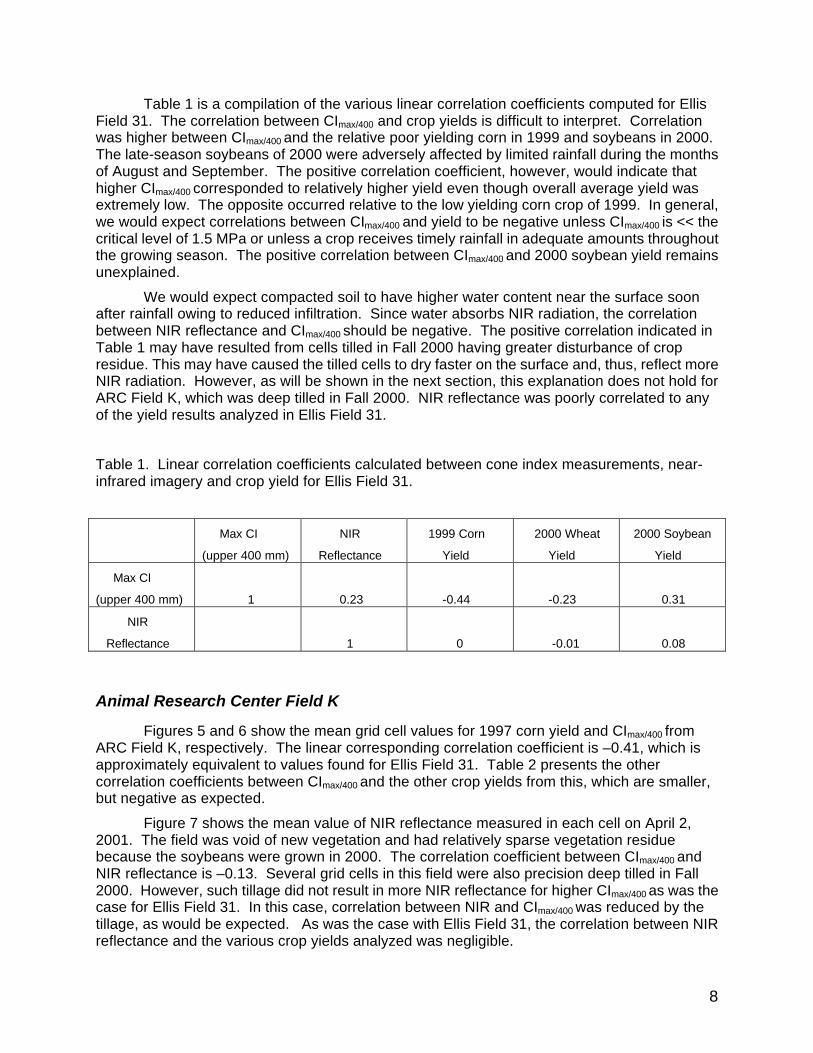
Figure 3 shows NIR reflectance recorded from Ellis Field 31 in early April 2001 with no new vegetation and one day after approximately 1.5 cm of rainfall. This image shows clearly the pattern of precision tillage treatments applied in Fall 2000. Figure 4 shows the mean NIR reflectance in each grid cell. The linear correlation coefficient between NIR reflectance and CImax/400 for Ellis Field 31 is 0.23. The application of precision tillage treatments in numerous grid cells between measurement of CI (March 2000) and acquisition of the NIR image (April 2001) would result in lower correlation because the condition of much of the soil surface had substantially changed.
6
Figure 1. Mean 1999 corn yield (bu/ac) in each 0.4 ha (1 ac) grid cell in Ellis
Field 31.
Figure 2. Mean Maximum CI (MPa) measured in the uppermost 400 mm of each
cell in Ellis Field 31.
7
Figure 3. Image of NIR Reflectance Measured from Ellis Field 31 on April 2, 2001.
Figure 4. Mean NIR Reflectance in Measured in Each Grid Cell of Ellis Field 31.
8
Table 1 is a compilation of the various linear correlation coefficients computed for Ellis Field 31. The correlation between CImax/400 and crop yields is difficult to interpret. Correlation was higher between CImax/400 and the relative poor yielding corn in 1999 and soybeans in 2000. The late-season soybeans of 2000 were adversely affected by limited rainfall during the months of August and September. The positive correlation coefficient, however, would indicate that higher CImax/400 corresponded to relatively higher yield even though overall average yield was extremely low. The opposite occurred relative to the low yielding corn crop of 1999. In general, we would expect correlations between CImax/400 and yield to be negative unless CImax/400 is << the critical level of 1.5 MPa or unless a crop receives timely rainfall in adequate amounts throughout the growing season. The positive correlation between CImax/400 and 2000 soybean yield remains unexplained.
We would expect compacted soil to have higher water content near the surface soon after rainfall owing to reduced infiltration. Since water absorbs NIR radiation, the correlation between NIR reflectance and CImax/400 should be negative. The positive correlation indicated in Table 1 may have resulted from cells tilled in Fall 2000 having greater disturbance of crop residue. This may have caused the tilled cells to dry faster on the surface and, thus, reflect more NIR radiation. However, as will be shown in the next section, this explanation does not hold for ARC Field K, which was deep tilled in Fall 2000. NIR reflectance was poorly correlated to any of the yield results analyzed in Ellis Field 31.
Table 1. Linear correlation coefficients calculated between cone index measurements, near-infrared imagery and crop yield for Ellis Field 31.
Max CI
(upper 400 mm)
NIR
Reflectance
1999 Corn
Yield
2000 Wheat
Yield
2000 Soybean
Yield
Max CI
(upper 400 mm)
1
0.23
-0.44
-0.23
0.31
NIR
Reflectance
1
0
-0.01
0.08
Animal Research Center Field K
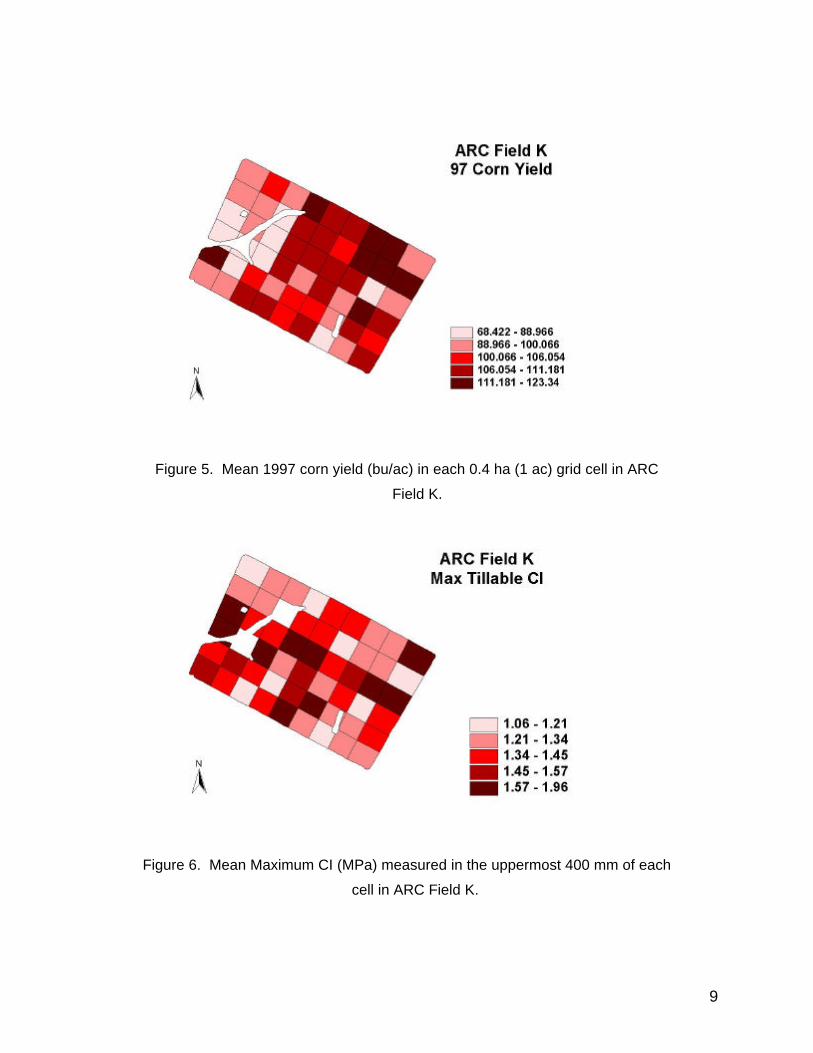
Figures 5 and 6 show the mean grid cell values for 1997 corn yield and CImax/400 from ARC Field K, respectively. The linear corresponding correlation coefficient is –0.41, which is approximately equivalent to values found for Ellis Field 31. Table 2 presents the other correlation coefficients between CImax/400 and the other crop yields from this, which are smaller, but negative as expected.
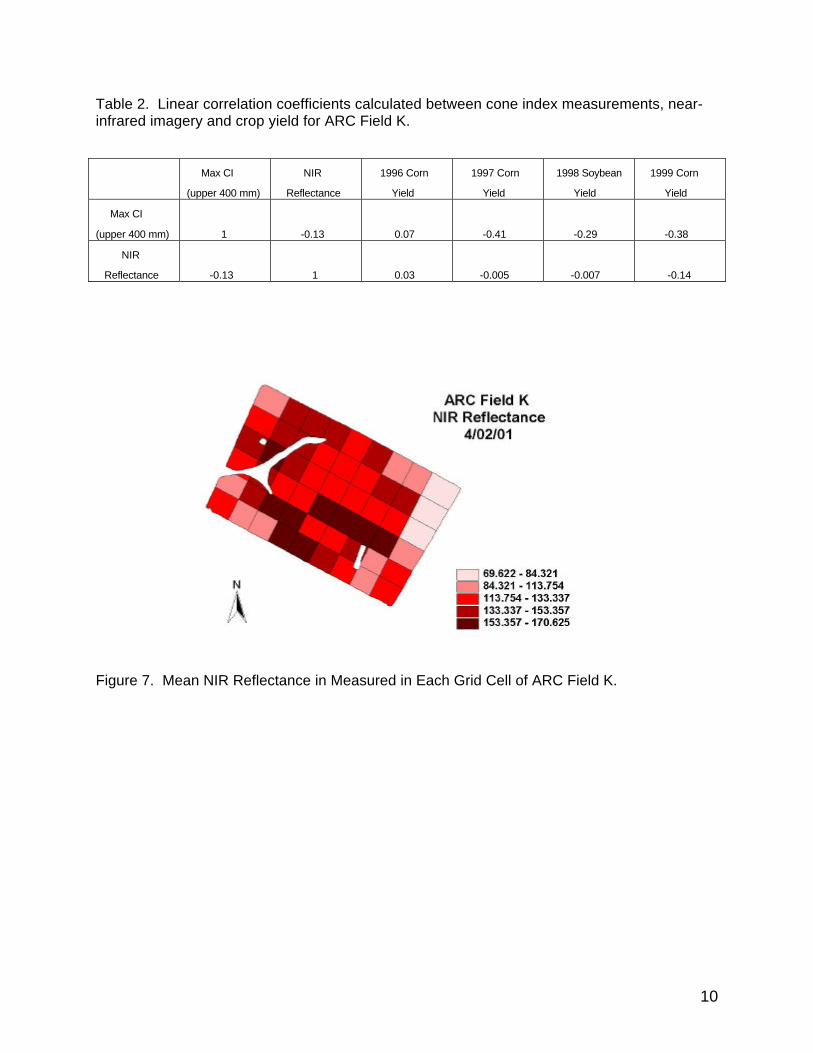
Figure 7 shows the mean value of NIR reflectance measured in each cell on April 2, 2001. The field was void of new vegetation and had relatively sparse vegetation residue because the soybeans were grown in 2000. The correlation coefficient between CImax/400 and NIR reflectance is –0.13. Several grid cells in this field were also precision deep tilled in Fall 2000. However, such tillage did not result in more NIR reflectance for higher CImax/400 as was the case for Ellis Field 31. In this case, correlation between NIR and CImax/400 was reduced by the tillage, as would be expected. As was the case with Ellis Field 31, the correlation between NIR reflectance and the various crop yields analyzed was negligible.
9
Figure 5. Mean 1997 corn yield (bu/ac) in each 0.4 ha (1 ac) grid cell in ARC
Field K.
Figure 6. Mean Maximum CI (MPa) measured in the uppermost 400 mm of each
cell in ARC Field K.
10
Table 2. Linear correlation coefficients calculated between cone index measurements, near-infrared imagery and crop yield for ARC Field K.
Max CI
(upper 400 mm)
NIR
Reflectance
1996 Corn
Yield
1997 Corn
Yield
1998 Soybean
Yield
1999 Corn
Yield
Max CI
(upper 400 mm)
1
-0.13
0.07
-0.41
-0.29
-0.38
NIR
Reflectance
-0.13
1
0.03
-0.005
-0.007
-0.14
Figure 7. Mean NIR Reflectance in Measured in Each Grid Cell of ARC Field K.
11
Van Stockum Fields 145 and 146
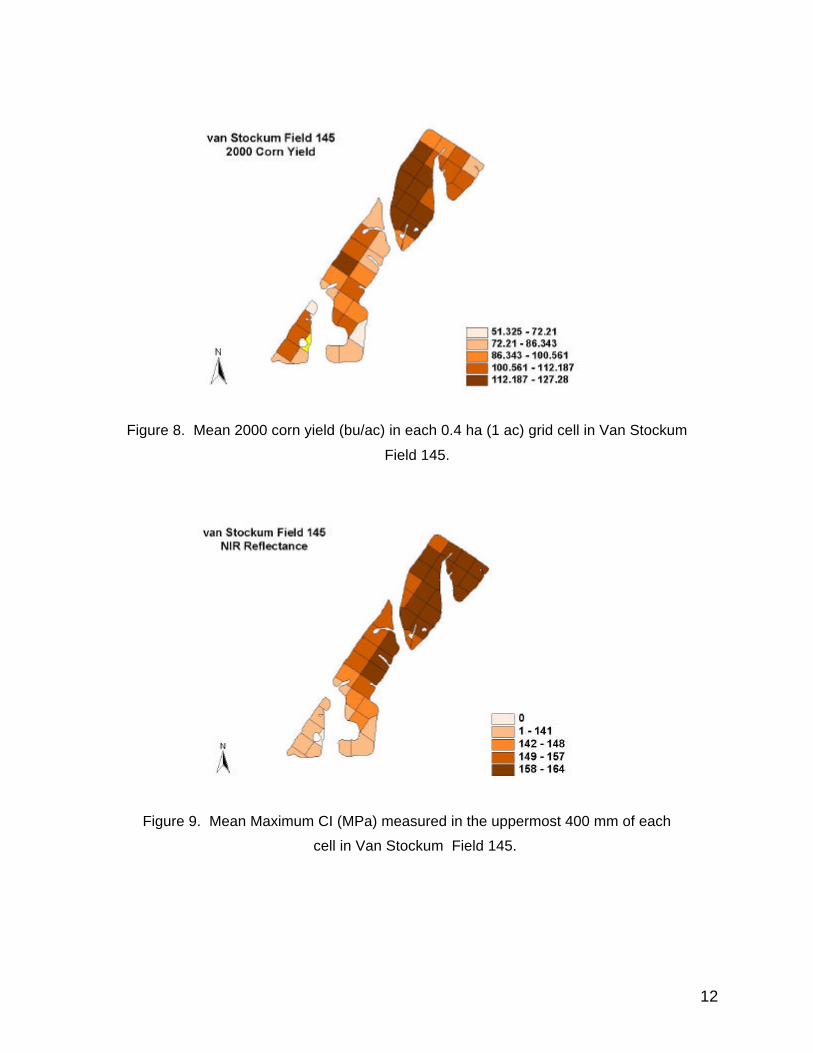
Examination of these results points to the difficulty of developing simple methods of assessing the complicated effects of soil physical conditions. Figures 8 and 9 show mean grid cell values of 2000 corn yield and CImax/400, respectively, for Van Stockum Field 145. The corresponding linear correlation coefficient is a relatively high –0.65, which would seem to indicate the expected strong adverse effect of high CI upon yield. However, the overall mean value of CImax/400 for this field was a relatively low 1.21 MPa while the mean yield was only 5.4 Mg/ha (101 bu/a). Mean CImax/400 exceeded 1.5 MPa in only 1 of 42 grid cells.
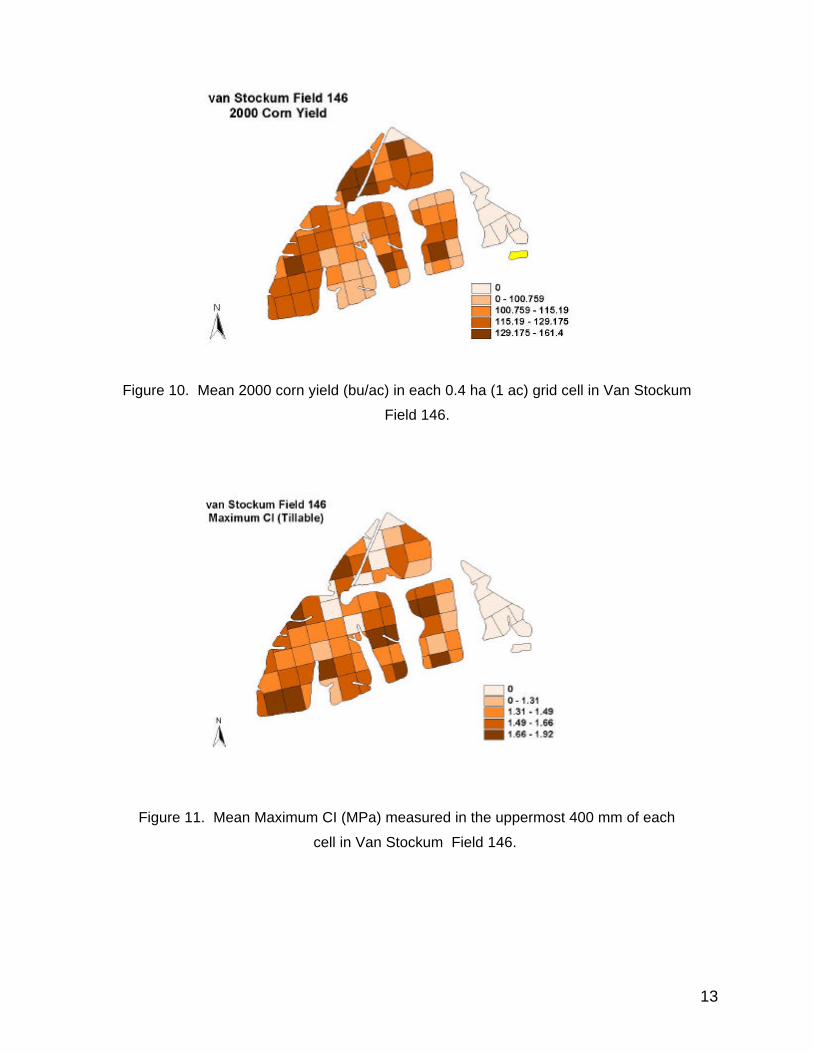
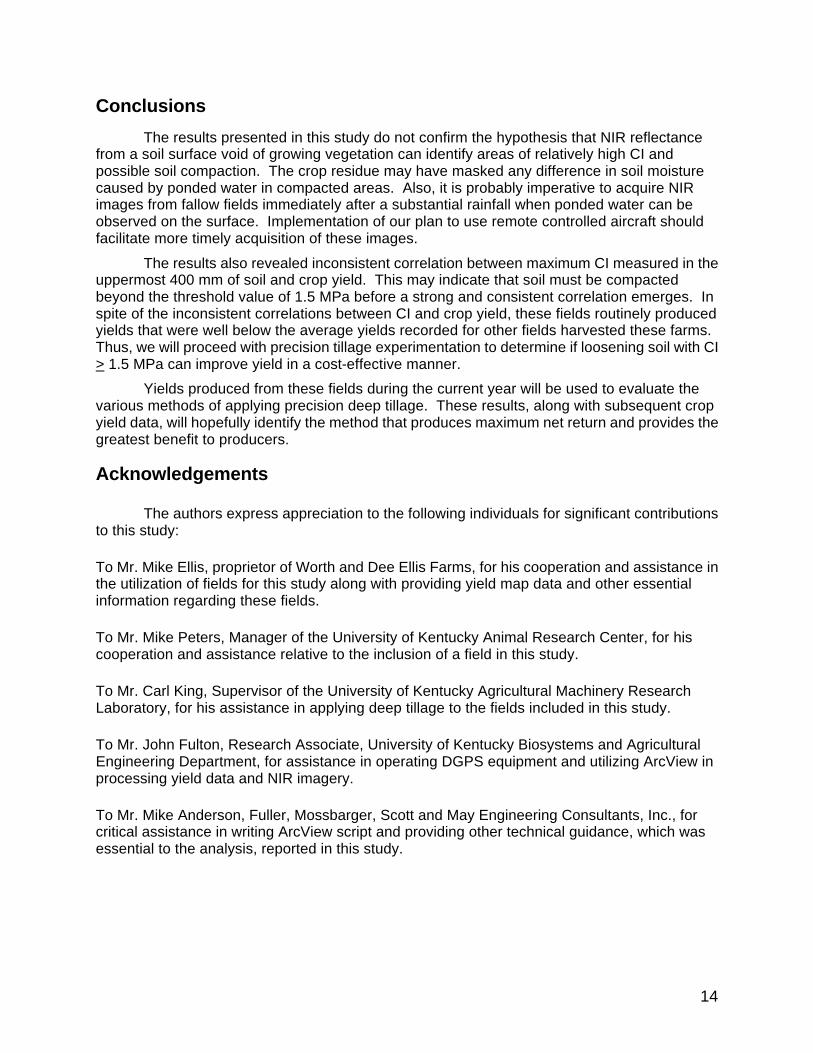
Figures 10 and 11 show mean grid cell values of 2000 corn yield and CImax/400,
respectively, for Van Stockum Field 146. In this field the mean yield was somewhat higher (6.1 Mg/ha, 114 bu/ac) while the mean value of CImax/400 was 1.35 MPa and in 9 of 60 grid cells, CImax/400 exceeded 1.5 MPa. The linear correlation coefficient between yield and CImax/400 was 0.09 and would suggest that yield was not adversely affected by increasing CImax/400. With these somewhat contradictory and confusing results, it remains for further research to determine if applying precision deep tillage to soil for which CImax/400 > 1.5 MPa will increase net crop return and whether or not such apparently reduced yields were caused by soil compaction.
The remaining linear correlation coefficients for these fields are presented in Table 3. NIR reflectance was strongly correlated with 2000 corn yield, but this is of no recognizable benefit with regard to application of precision tillage. Correlation between NIR reflectance and CImax/400, on the other hand, is important and these results are also somewhat contradictory and difficult to explain. Correlation between NIR reflectance and CImax/400 for field 145 was –0.69. This strong correlation occurred in spite of the relatively low mean value of CImax/400 = 1.21 MPa. The corresponding value for field 146 was 0.35, indicating that grid cells with higher CImax/400
reflected more NIR radiation. This may be explained by greater reflectance from grid cells with higher CImax/400, which would have more crop residue as a result of greater corn yield in 2000.
Table 3. Linear correlation coefficients calculated between cone index measurements, near-infrared imagery and crop yield for Van Stockum Fields 145 and 146.
Field 145 Field 146
Max CI
(upper 400 mm)
NIR
Reflectance
1996 Corn
Yield
Max CI
(upper 400 mm)
NIR
Reflectance
1996 Corn
Yield
Max CI
(upper 400 mm) 1 -0.69 -0.65 1 0.35 0.09
NIR
Reflectance -0.69 1 0.55 0.36 1 0.34
12
Figure 8. Mean 2000 corn yield (bu/ac) in each 0.4 ha (1 ac) grid cell in Van Stockum
Field 145.
Figure 9. Mean Maximum CI (MPa) measured in the uppermost 400 mm of each
cell in Van Stockum Field 145.
13
Figure 10. Mean 2000 corn yield (bu/ac) in each 0.4 ha (1 ac) grid cell in Van Stockum
Field 146.
Figure 11. Mean Maximum CI (MPa) measured in the uppermost 400 mm of each
cell in Van Stockum Field 146.
14
Conclusions
The results presented in this study do not confirm the hypothesis that NIR reflectance from a soil surface void of growing vegetation can identify areas of relatively high CI and possible soil compaction. The crop residue may have masked any difference in soil moisture caused by ponded water in compacted areas. Also, it is probably imperative to acquire NIR images from fallow fields immediately after a substantial rainfall when ponded water can be observed on the surface. Implementation of our plan to use remote controlled aircraft should facilitate more timely acquisition of these images.
The results also revealed inconsistent correlation between maximum CI measured in the uppermost 400 mm of soil and crop yield. This may indicate that soil must be compacted beyond the threshold value of 1.5 MPa before a strong and consistent correlation emerges. In spite of the inconsistent correlations between CI and crop yield, these fields routinely produced yields that were well below the average yields recorded for other fields harvested these farms. Thus, we will proceed with precision tillage experimentation to determine if loosening soil with CI > 1.5 MPa can improve yield in a cost-effective manner.
Yields produced from these fields during the current year will be used to evaluate the various methods of applying precision deep tillage. These results, along with subsequent crop yield data, will hopefully identify the method that produces maximum net return and provides the greatest benefit to producers.
Acknowledgements
The authors express appreciation to the following individuals for significant contributions to this study:
To Mr. Mike Ellis, proprietor of Worth and Dee Ellis Farms, for his cooperation and assistance in the utilization of fields for this study along with providing yield map data and other essential information regarding these fields.
To Mr. Mike Peters, Manager of the University of Kentucky Animal Research Center, for his cooperation and assistance relative to the inclusion of a field in this study.
To Mr. Carl King, Supervisor of the University of Kentucky Agricultural Machinery Research Laboratory, for his assistance in applying deep tillage to the fields included in this study.
To Mr. John Fulton, Research Associate, University of Kentucky Biosystems and Agricultural Engineering Department, for assistance in operating DGPS equipment and utilizing ArcView in processing yield data and NIR imagery.
To Mr. Mike Anderson, Fuller, Mossbarger, Scott and May Engineering Consultants, Inc., for critical assistance in writing ArcView script and providing other technical guidance, which was essential to the analysis, reported in this study.
15
References
1. Al-Adawi, S.S. and R.C. Reed. 1996. Compaction and subsoiling effects on corn and soybean yields and soil physical properties. Trans. of ASAE 39(5): 1641-1649.
2. ASAE . 2000a. ASAE S313.3: Soil Cone Penetrometer. St. Joseph, MI.
3. ASAE . 2000b. ASAE EP496.2: Agricultural Machinery Management. St. Joseph, MI.
4. ASAE . 2000c. ASAE D497.2: Agricultural Machinery Management Data. St. Joseph, MI.
5. Blancher, R.W., C.R. Edmonds and J.M. Bradford. 1978. Root growth in cores formed from fragipan and B2 horizons of Hobson soil. Soil Sci. Soc. Amer. J. 42:437-440.
6. Carter, L.M. and J.R. Tavernetti. 1968. Influence of precision tillage and soil compaction on cotton yields. Trans. of ASAE 11: 65-67,73.
7. Chaudhary, M.R., P.R. Gajri, S.S. Prihar and R. Khera. 1985. Effect of deep tillage on soil physical properties and maize yields on coarse textured soils. Soil Tillage Res. 6:31-44.
8. Douglas, E. and E. McKyes. 1983. Tillage practices related to limiting plant growth factors and crop yields. Canadian Agr. Eng. 25 (1):47-55.
9. Duncan, D.B. 1975. t-Tests and intervals for comparisons suggested by data. Biometrics 31:339-359.
10. Engman, E.T. 1995. The use of remote sensing data in watershed research. J. Soil and Water Conservation 50(5): 438-441.
11. Evans, S.D., M.J. Lindstrom, W.B. Voorhees, J.F. Moncrief and G.A. Nelson. 1996. Effect of subsoiling and subsequent tillage on soil bulk density, soil moisture, and corn yield. Soil Tillage Research 38: 35-46.
12. Everitt, L.H., D.E. Escobar, M.A. Alaniz and M.R. Davis. 1989. Using multispectral video imagery for detecting soil surface conditions. Photogrammetric Engineering and Remote Sensing, 55(4): 467-471.
13. Foshee, W.G., R.L.Raper, W.D. Goff and M.G. Patterson. 1997. Orchard floor practices affect soil compaction around young pecan trees. Amer. Soc. Hort. Sci. 32(5): 871-873.
14. Raper, R.L. 1999. Subsoiling considerations for site-specific tillage. ASAE paper no.991058, St. Joseph, MI.
15. Raper, R.L., D.W. Reeves and E.C. Burt. 1998. Using in-row subsoiling to minimize compaction caused by traffic. J. Cotton Sci. (The Cotton Foundation) 2(3):130-135.
16. Raper, R.L., B.H. Washington and J.D. Jarrell. 2000. A tractor-mounted multiple-probe soil cone penetrometer. Applied Engrg. in Agr. In Press.
17. Scarlett, A.J., J.C. Lowe and D.A. Semple. 1997. Precision tillage: in-field real-time control of seedbed quality. Procs. of 1st European Conf. on Precision Agr. Pp 503-510. 18. Schmugge, T.J. 1983. Remote sensing of soil moisture: recent advances. IEEE Trans.
on Geosci. And Remote Sensing GE-21:336-344.
19. Senay, G.B., A.D. Ward, J.G. Lyon, N.R. Fausey and S.E. Nokes. 1998. Manipulationof high spatial resolution data for use in site-specific farming. Trans. of ASAE 41(2): 489-495.
20. Taylor, H.M., L.F. Locke and J.E. Box, Jr. 1964. Pans in Southern Great Plains soils.

16
III. Their effect on yield of cotton and grain sorghum. Agron. J. 56:542-545.
21. Threadgill, E.D. 1982. Residual tillage effects as determined by cone index. Trans. of ASAE 25(4): 859- 863.
22. Wells, L.G., S.A. Shearer, J.P. Fulton and L.W. Murdock. 2000. Assessment of remote sensing for implementation of precision tillage. Amer. Soc. Agr. Engineers paper no. 001097, St. Joseph, MI.