antiviral drugs zanamivir and oseltamivir found in wastewater and surface water in osaka, japan
TRANSCRIPT
Journal of Water and Environment Technology, Vol. 10, No.1, 2012
Address correspondence to Ryohei Takanami, New Industrial R & D Center, Osaka Sangyo University, Email: [email protected] Received October 23, 2011, Accepted December 20, 2011.
- 57 -
Antiviral Drugs Zanamivir and Oseltamivir Found in Wastewater and Surface Water in Osaka, Japan Ryohei TAKANAMI*, Hiroaki OZAKI**, Rabindra Raj GIRI*, Shogo TANIGUCHI*, Shintaro HAYASHI**
*New Industrial R & D Center, Osaka Sangyo University, 3-1-1 Nakagaito, Daito City, Osaka
574-8530, Japan **Department of Civil Engineering, Osaka Sangyo University, 3-1-1 Nakagaito, Daito City,
Osaka 574-8630, Japan Abstract Oseltamivir and zanamivir are the two most prescribed antiviral drugs against influenza in Japan. Oseltamivir and its metabolite are frequently detected in surface water bodies in Japan during the last few years particularly in seasonal influenza period posing a potential threat of emergence of drug-resistant genes in human pathogens. Despite the second largest use of zanamivir as an antiviral drug in Japan, its presence and fate in environmental waters is unknown until now. Accurate assessment on the presence and fates of these drugs in environmental waters is the very first step in countering the potential negative impact on human health. We have recently developed a novel solid-phase extraction (SPE) method for simultaneous recovery of oseltamivir and zanamivir in environmental waters. These antiviral drugs were quantified in Neya River water and a nearby conventional sewage treatment plant (STP) during the 2010/2011 seasonal influenza using the SPE method in this investigation. Oseltamivir and zanamivir concentrations in the river water and STP water samples are discussed and compared with those of the 2009/2010 pandemic influenza in this article. This successful simultaneous quantitation of zanamivir in wastewater and river water with high recovery ratios paves the way for its monitoring in environmental waters. Keywords: Influenza, oseltamivir, river water, sewage treatment plant, simultaneous
quantification, zanamivir
INTRODUCTION Widespread detection of antiviral drugs in wastewaters and surface waters particularly during seasonal and pandemic influenza cases (Bartels and Tumpling, 2008; Soderstrom et al., 2009; Prasse et al., 2010; Ghosh et al., 2010a and b; Takanami et al., 2010a), and their potential negative consequences to aquatic ecology and humans (Taylor et al., 2008; Straub, 2009) has recently attracted considerable attention from scientific communities. After administration, the drugs and their metabolites are excreted, carried away in sewers, passed through treatment facilities (Fick et al., 2007; Accinelli et al., 2007, 2010a, and 2010b; Slater et al., 2011) and reached water bodies. The primary concern in this regard, is the potential emergence of drug resistant genes in human pathogens if the drugs remain in large concentrations in aquatic ecosystem for considerable periods (Fick et al., 2007; Singer et al., 2007; Accinelli et al., 2010a; Ghosh et al., 2010a and 2010b). Oseltamivir (also known as Tamiflu) and zanamivir (also known as Relenza) are the two mostly prescribed antiviral drugs during seasonal and pandemic influenza in Japan. Moreover, Japan is at the top in per capita consumption of oseltamivir (Soderstrom et al., 2009). Detection of oseltamivir carboxylate (OC) in considerable concentrations in
Journal of Water and Environment Technology, Vol. 10, No.1, 2012
- 58 -
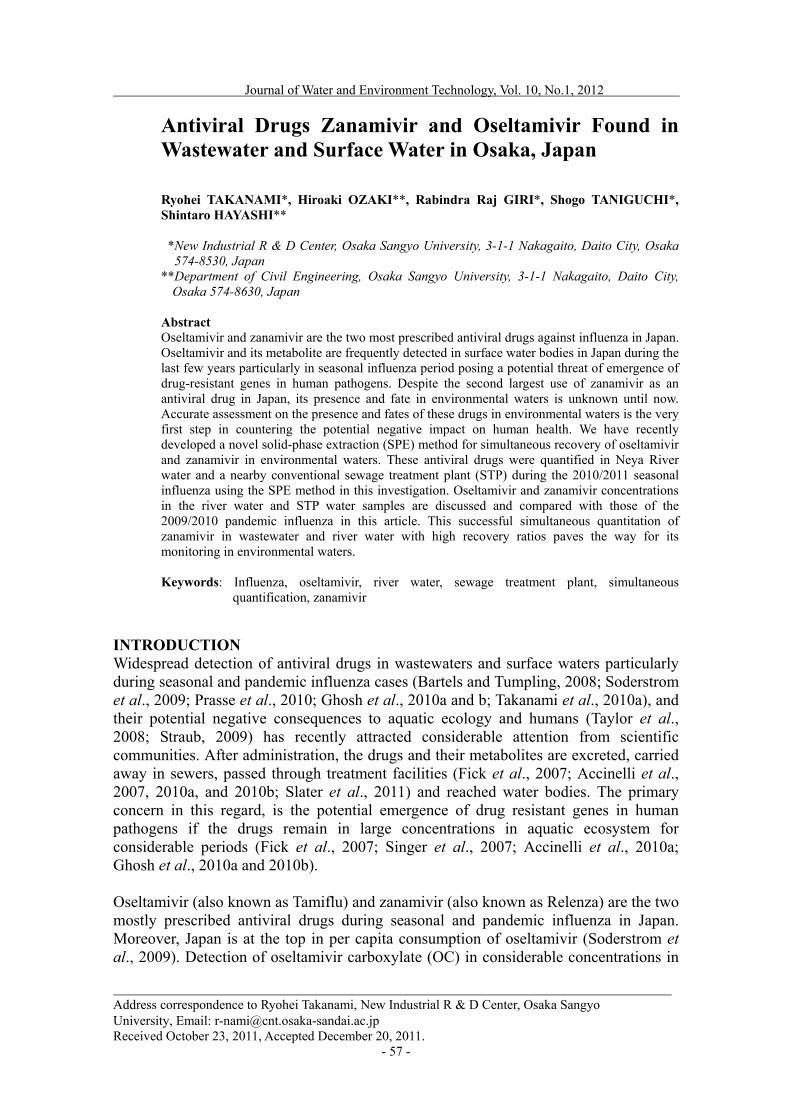
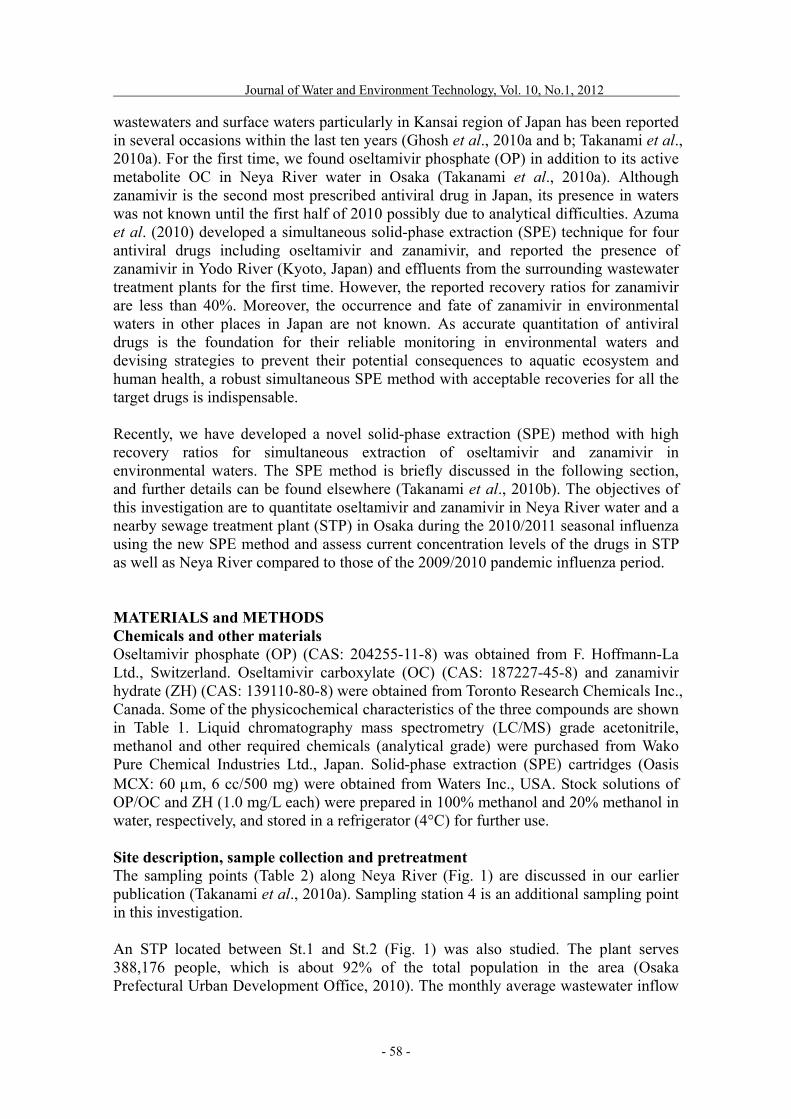
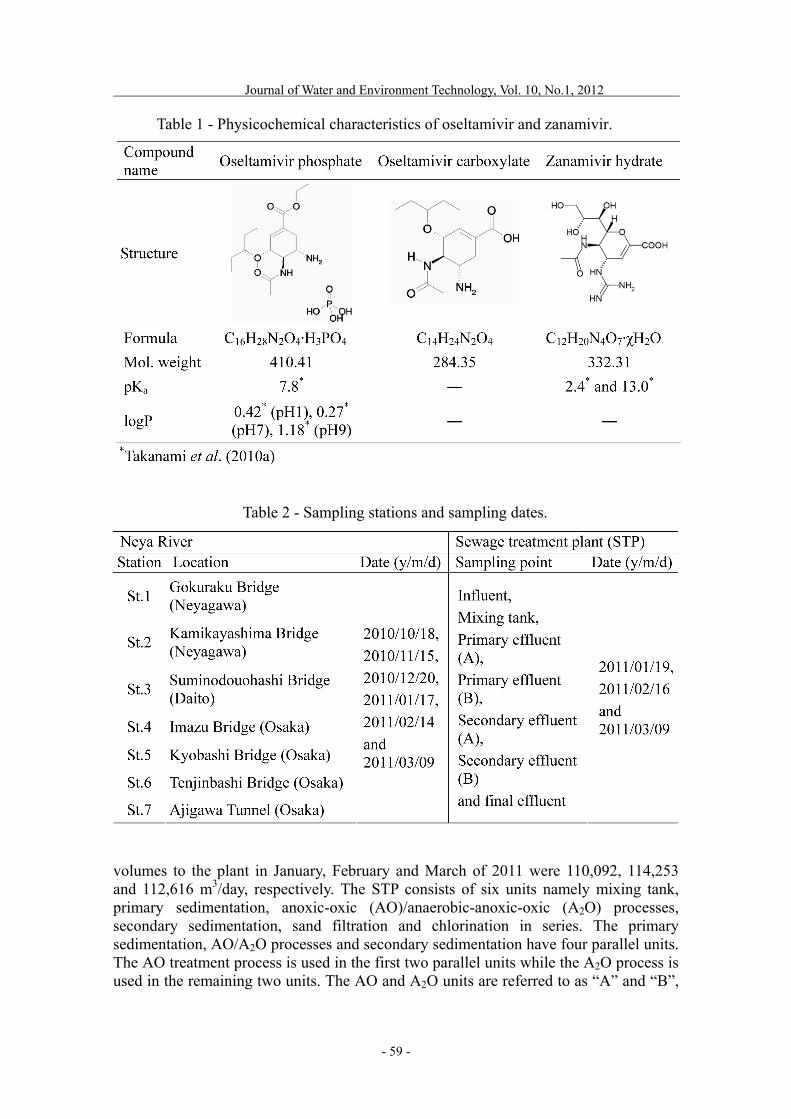
wastewaters and surface waters particularly in Kansai region of Japan has been reported in several occasions within the last ten years (Ghosh et al., 2010a and b; Takanami et al., 2010a). For the first time, we found oseltamivir phosphate (OP) in addition to its active metabolite OC in Neya River water in Osaka (Takanami et al., 2010a). Although zanamivir is the second most prescribed antiviral drug in Japan, its presence in waters was not known until the first half of 2010 possibly due to analytical difficulties. Azuma et al. (2010) developed a simultaneous solid-phase extraction (SPE) technique for four antiviral drugs including oseltamivir and zanamivir, and reported the presence of zanamivir in Yodo River (Kyoto, Japan) and effluents from the surrounding wastewater treatment plants for the first time. However, the reported recovery ratios for zanamivir are less than 40%. Moreover, the occurrence and fate of zanamivir in environmental waters in other places in Japan are not known. As accurate quantitation of antiviral drugs is the foundation for their reliable monitoring in environmental waters and devising strategies to prevent their potential consequences to aquatic ecosystem and human health, a robust simultaneous SPE method with acceptable recoveries for all the target drugs is indispensable. Recently, we have developed a novel solid-phase extraction (SPE) method with high recovery ratios for simultaneous extraction of oseltamivir and zanamivir in environmental waters. The SPE method is briefly discussed in the following section, and further details can be found elsewhere (Takanami et al., 2010b). The objectives of this investigation are to quantitate oseltamivir and zanamivir in Neya River water and a nearby sewage treatment plant (STP) in Osaka during the 2010/2011 seasonal influenza using the new SPE method and assess current concentration levels of the drugs in STP as well as Neya River compared to those of the 2009/2010 pandemic influenza period. MATERIALS and METHODS Chemicals and other materials Oseltamivir phosphate (OP) (CAS: 204255-11-8) was obtained from F. Hoffmann-La Ltd., Switzerland. Oseltamivir carboxylate (OC) (CAS: 187227-45-8) and zanamivir hydrate (ZH) (CAS: 139110-80-8) were obtained from Toronto Research Chemicals Inc., Canada. Some of the physicochemical characteristics of the three compounds are shown in Table 1. Liquid chromatography mass spectrometry (LC/MS) grade acetonitrile, methanol and other required chemicals (analytical grade) were purchased from Wako Pure Chemical Industries Ltd., Japan. Solid-phase extraction (SPE) cartridges (Oasis MCX: 60 m, 6 cc/500 mg) were obtained from Waters Inc., USA. Stock solutions of OP/OC and ZH (1.0 mg/L each) were prepared in 100% methanol and 20% methanol in water, respectively, and stored in a refrigerator (4°C) for further use. Site description, sample collection and pretreatment The sampling points (Table 2) along Neya River (Fig. 1) are discussed in our earlier publication (Takanami et al., 2010a). Sampling station 4 is an additional sampling point in this investigation. An STP located between St.1 and St.2 (Fig. 1) was also studied. The plant serves 388,176 people, which is about 92% of the total population in the area (Osaka Prefectural Urban Development Office, 2010). The monthly average wastewater inflow
Journal of Water and Environment Technology, Vol. 10, No.1, 2012
- 59 -
volumes to the plant in January, February and March of 2011 were 110,092, 114,253 and 112,616 m3/day, respectively. The STP consists of six units namely mixing tank, primary sedimentation, anoxic-oxic (AO)/anaerobic-anoxic-oxic (A2O) processes, secondary sedimentation, sand filtration and chlorination in series. The primary sedimentation, AO/A2O processes and secondary sedimentation have four parallel units. The AO treatment process is used in the first two parallel units while the A2O process is used in the remaining two units. The AO and A2O units are referred to as “A” and “B”,
Table 1 - Physicochemical characteristics of oseltamivir and zanamivir.
Table 2 - Sampling stations and sampling dates.
Journal of Water and Environment Technology, Vol. 10, No.1, 2012
- 60 -
respectively, in this article. The liquid generated from sludge dewatering is fed to the mixing tank. Sampling points within the STP and sampling dates are given in Table 2. The final effluent sample was taken after sand filtration. Grab water samples were taken from seven sampling stations along the Neya River on six different dates and seven sampling points in the STP on three different dates during the 2010/2011 seasonal influenza (Table 2). The samples were collected in clean plastic containers, immediately transported to the laboratory and stored in refrigerators (4°C). The stored samples were used within a few days after collection. Three separate subsamples (100 mL each) from a grab water sample after addition of 0, 50 and 100 ng of OC, OP and ZH, respectively, were filtered through glass microfiber (Whatman GF/F, pore size: 0.7 m) filters. The filter paper containing the residue was placed on a cleaned watch glass, then methanol was poured slowly over it and sonicated for 5 min to dissolve any undissolved portion of the target compounds. After sonication, methanol was slowly poured to the filtrate without disturbing the residue on filter paper. This process of dissolving the residue was repeated three times to ensure complete dissolution. Simultaneous solid-phase extraction Although the novel SPE method for simultaneous extraction of OP, OC and ZH in environmental waters with high recovery ratios has been already discussed in detail (Takanami et al., 2010b), the method is briefly discussed here. Sample pH was adjusted
Fig. 1 - Locations of sampling site and stations.
Journal of Water and Environment Technology, Vol. 10, No.1, 2012
- 61 -
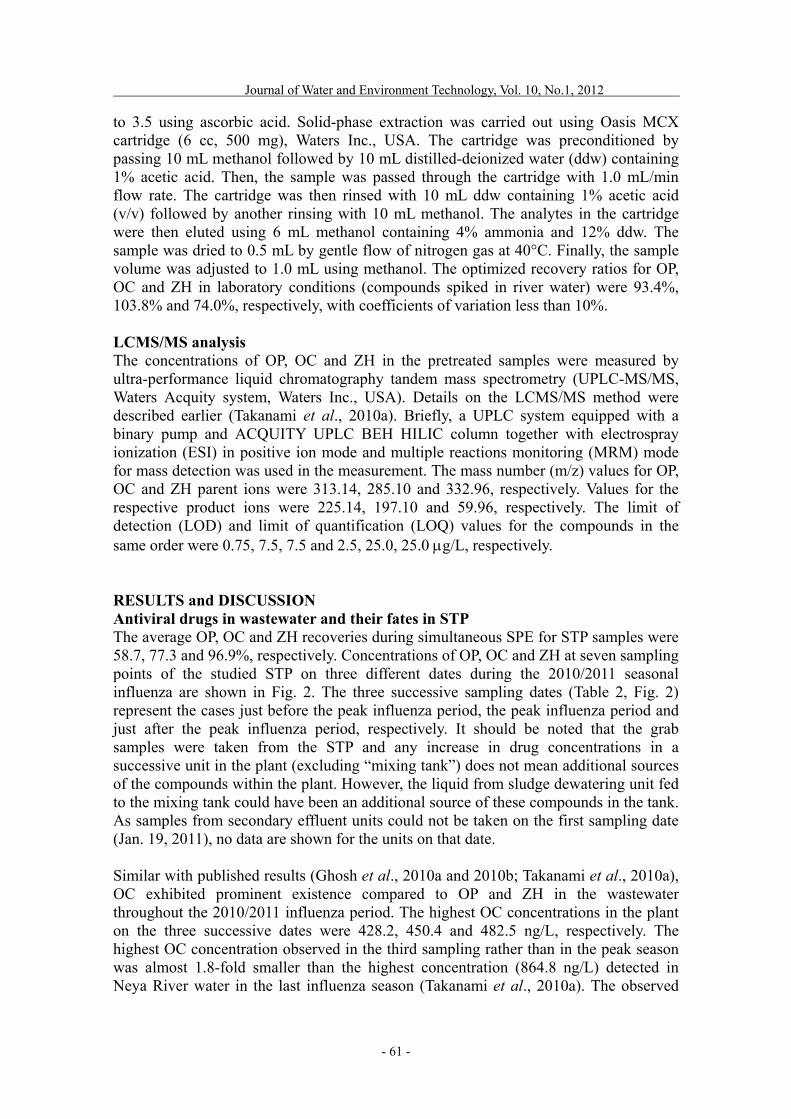
to 3.5 using ascorbic acid. Solid-phase extraction was carried out using Oasis MCX cartridge (6 cc, 500 mg), Waters Inc., USA. The cartridge was preconditioned by passing 10 mL methanol followed by 10 mL distilled-deionized water (ddw) containing 1% acetic acid. Then, the sample was passed through the cartridge with 1.0 mL/min flow rate. The cartridge was then rinsed with 10 mL ddw containing 1% acetic acid (v/v) followed by another rinsing with 10 mL methanol. The analytes in the cartridge were then eluted using 6 mL methanol containing 4% ammonia and 12% ddw. The sample was dried to 0.5 mL by gentle flow of nitrogen gas at 40°C. Finally, the sample volume was adjusted to 1.0 mL using methanol. The optimized recovery ratios for OP, OC and ZH in laboratory conditions (compounds spiked in river water) were 93.4%, 103.8% and 74.0%, respectively, with coefficients of variation less than 10%. LCMS/MS analysis The concentrations of OP, OC and ZH in the pretreated samples were measured by ultra-performance liquid chromatography tandem mass spectrometry (UPLC-MS/MS, Waters Acquity system, Waters Inc., USA). Details on the LCMS/MS method were described earlier (Takanami et al., 2010a). Briefly, a UPLC system equipped with a binary pump and ACQUITY UPLC BEH HILIC column together with electrospray ionization (ESI) in positive ion mode and multiple reactions monitoring (MRM) mode for mass detection was used in the measurement. The mass number (m/z) values for OP, OC and ZH parent ions were 313.14, 285.10 and 332.96, respectively. Values for the respective product ions were 225.14, 197.10 and 59.96, respectively. The limit of detection (LOD) and limit of quantification (LOQ) values for the compounds in the same order were 0.75, 7.5, 7.5 and 2.5, 25.0, 25.0 g/L, respectively. RESULTS and DISCUSSION Antiviral drugs in wastewater and their fates in STP The average OP, OC and ZH recoveries during simultaneous SPE for STP samples were 58.7, 77.3 and 96.9%, respectively. Concentrations of OP, OC and ZH at seven sampling points of the studied STP on three different dates during the 2010/2011 seasonal influenza are shown in Fig. 2. The three successive sampling dates (Table 2, Fig. 2) represent the cases just before the peak influenza period, the peak influenza period and just after the peak influenza period, respectively. It should be noted that the grab samples were taken from the STP and any increase in drug concentrations in a successive unit in the plant (excluding “mixing tank”) does not mean additional sources of the compounds within the plant. However, the liquid from sludge dewatering unit fed to the mixing tank could have been an additional source of these compounds in the tank. As samples from secondary effluent units could not be taken on the first sampling date (Jan. 19, 2011), no data are shown for the units on that date. Similar with published results (Ghosh et al., 2010a and 2010b; Takanami et al., 2010a), OC exhibited prominent existence compared to OP and ZH in the wastewater throughout the 2010/2011 influenza period. The highest OC concentrations in the plant on the three successive dates were 428.2, 450.4 and 482.5 ng/L, respectively. The highest OC concentration observed in the third sampling rather than in the peak season was almost 1.8-fold smaller than the highest concentration (864.8 ng/L) detected in Neya River water in the last influenza season (Takanami et al., 2010a). The observed
Journal of Water and Environment Technology, Vol. 10, No.1, 2012
- 62 -
OC concentrations in the STP were very similar to those in three STPs in Kyoto during the 2008/2009 seasonal influenza (Ghosh et al., 2010a). However, the largest OC concentrations in the STP were about 10-fold larger than those reported for wastewater treatment plant influent (42.7 ng/L) in Germany (Prasse et al., 2010), while the concentrations were very small compared to the predicted values for River Lee catchment area (98.1 µg/L) in United Kingdom and western Europe (348.0 µg/L) for pandemic influenza scenario (Straub, 2009).
Fig. 2 - OP, OC and ZH concentrations in the STP.
0
100
200
300
400
500
62.3
0.0
109.
1
69.1 12
4.0
331.
8
187.
6
424.9 428.2
351.
0
16.3
0.0
72.4
50.7
46.5
Con
cent
rati
on (n
g/L
)OPOCZH
Jan. 19, 2011
0
100
200
300
400
500
114.
1
64.4
64.3
83.2
47.5 84
.0
159.
2
450.4
264.
2 345.
1
361.
5
264.
2
175.
2
421.
1
27.8 46.1 85
.4
95.2
0.0
0.0 36
.4
Con
cent
rati
on (n
g/L
) Feb. 16, 2011
0
100
200
300
400
500
0.0
114.
4
171.
7
87.6
65.5
45.9
57.012
0.3
278.
8
482.5
286.
2
105.
6
67.8
130.
1
0.0 38
.9
231.
7
241.
6
32.0
0.0
0.0
Con
cent
rati
on (n
g/L
) March 09, 2011
Journal of Water and Environment Technology, Vol. 10, No.1, 2012
- 63 -
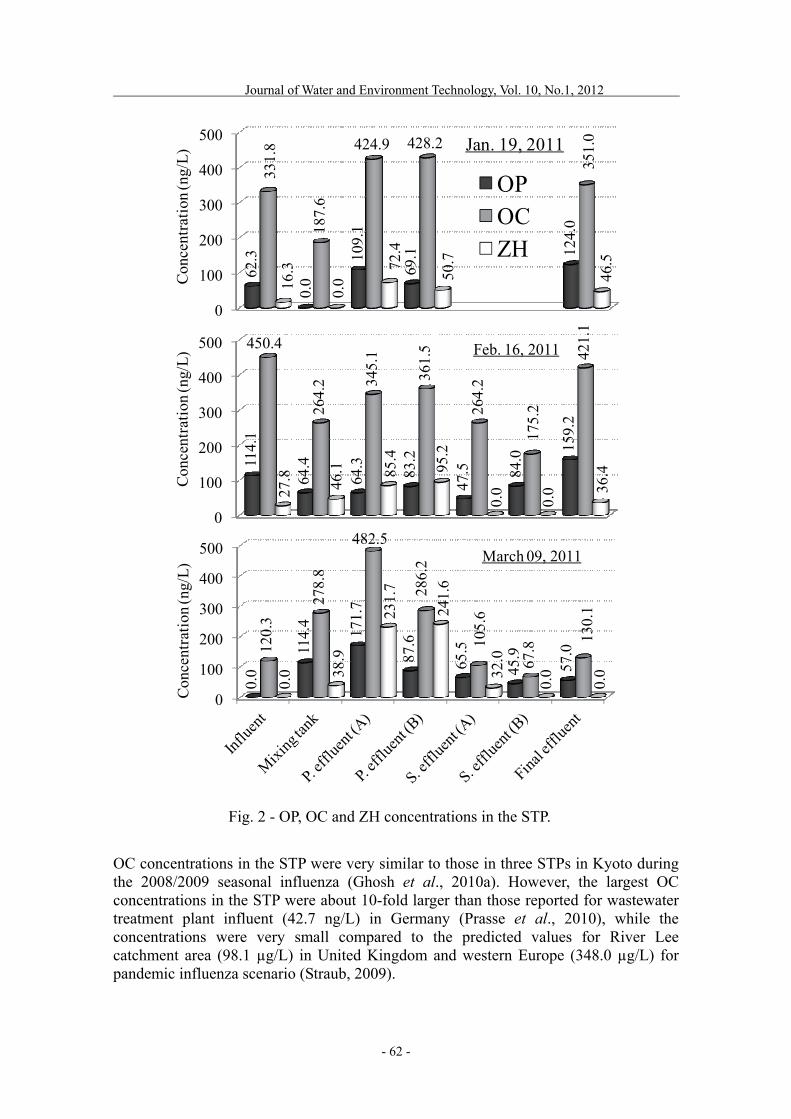
Oseltamivir phosphate in considerably large concentrations was detected in the STP (Fig. 2) for the first time in our knowledge. The highest OP concentrations in the STP were 10.0 to 14.0-fold larger than those reported for the wastewater treatment plant influent (11.9 ng/L) in Germany (Prasse et al., 2010). Furthermore, the concentrations in several STP samples in this investigation were considerably larger than those in Neya River water during the 2009/2010 pandemic influenza (Takanami et al., 2010a). For example, the highest OP concentration in the STP sample (171.7 ng/L) was significantly larger than the highest concentration in Neya River water (154.2 ng/L) during the 2009/2010 pandemic influenza. It therefore appears that OP exists in wastewaters and receiving waters not only in pandemic influenza, but also in seasonal influenza. However, no other published reports excluding one of our own (Takanami et al., 2010a) have mentioned the existence of OP in waters to date. Zanamivir, the second most prescribed antiviral drug in Japan, was detected for the first time in an STP in our knowledge, but the concentrations were very small compared to those of OP and OC (Fig. 2). The highest ZH concentration in the STP samples during the 2010/2011 influenza was 241.6 ng/L, which was 1.4-fold larger than the highest OP concentration, but almost 2-fold smaller than the highest OC concentration. It should be noted that the largest concentrations of the three compounds were observed in primary effluent (A) unit in the third sampling. Though OP and OC were observed in most of the units of the STP in all the three sampling dates in similar concentrations, ZH was detected more frequently at large concentrations in primary effluent units particularly in the third sampling. It is evident that high concentrations of OC and OP were found in wastewaters from the STP, while ZH was also present in water in significantly large concentrations. The very large ZH concentrations in the STP particularly in the third sampling indicated the possibility of sudden increase in the drug’s use after commencement of peak influenza of the season. Although drug concentrations in the grab samples from the STP do not accurately reflect their elimination efficiency, the considerably large concentrations of the drugs in final effluent suggested that they were not removed during the sewage treatment process, which is similar to earlier reports (Fick et al., 2007; Soderstrom et al., 2009; Prasse et al., 2010). The inefficiency of the plant may be attributed to the relatively simple treatment techniques (AO and A2O) employed in the plant and high concentrations of the drugs in wastewater resulting in inhibition of microbial activities (Slater et al., 2011). Antiviral drugs in river water The average OP, OC and ZH recoveries during simultaneous SPE for river water samples were 77.7, 86.7 and 83.2% respectively. Concentrations of OP, OC and ZH in Neya River water from seven sampling stations on three selected dates during the 2010/2011 seasonal influenza are shown in Fig. 3. As St.3 is an additional sampling station in this investigation, the designated station numbers from St.3 to St.7 (Fig. 3) differ from those used earlier (Takanami et al., 2010a). The three compounds were detected in river water way above their detection levels throughout the influenza period. Concentrations of the compounds were very large particularly from St.2 through St.4 along the river. Similar to earlier results (Takanami et al., 2010a), concentrations of OC among the three compounds were very large in Neya River water throughout the 2010/2011 influenza period. The largest concentration (556.9 ng/L) was observed at St.2
Journal of Water and Environment Technology, Vol. 10, No.1, 2012
- 64 -
during peak influenza period (Feb. 14, 2011), but the concentration was only 64% of the highest concentration at the station during the 2009/2010 pandemic influenza and 115% of the largest concentration observed in the STP discussed in the preceding section. Station 2 exhibited the highest OC concentrations on all the three sampling dates and the concentrations gradually decreased towards the river mouth. Oseltamivir phosphate exhibited the second largest concentrations in river water among the three compounds. The three sampling stations (St.2, St.3 and St.4) exhibited similar OP concentrations but unlike OC, the largest OP concentration (165.9 ng/L) was
0
120
240
360
480
600
0.0 70
.4
68.8
61.1
14.6
28.5
12.9
0.0
231.
6
218.
5
152.
8
52.7
58.2
0.0
0.0 31
.6
23.9
17.6
5.4 14
.4
0.0C
once
ntra
tion
(ng/
L) OP OC ZH Jan. 17, 2011
0
120
240
360
480
600
St.1 St.2 St.3 St.4 St.5 St.6 St.7
6.3 57
.0
49.2
52.9
50.2
13.6
5.8
0.0
117.
0
81.4
61.2
54.9
28.4
0.0
0.0 17
.4
19.5
17.2 17
.7
0.0
0.0
Con
cent
rati
on (n
g/L
)
Sampling stations
March 09, 2011
0
120
240
360
480
600
44.6
157.
8
165.
9
158.
8
42.1
48.7
38.751
.5
556.9
435.
3
358.
5
86.1 10
0.5
66.5
0.0 24
.7
58.8
6.0
0.0
0.0
0.0Con
cent
rati
on (n
g/L
)
Feb. 14, 2011
Fig. 3 - OP, OC and ZH concentrations in Neya River.
Journal of Water and Environment Technology, Vol. 10, No.1, 2012
- 65 -
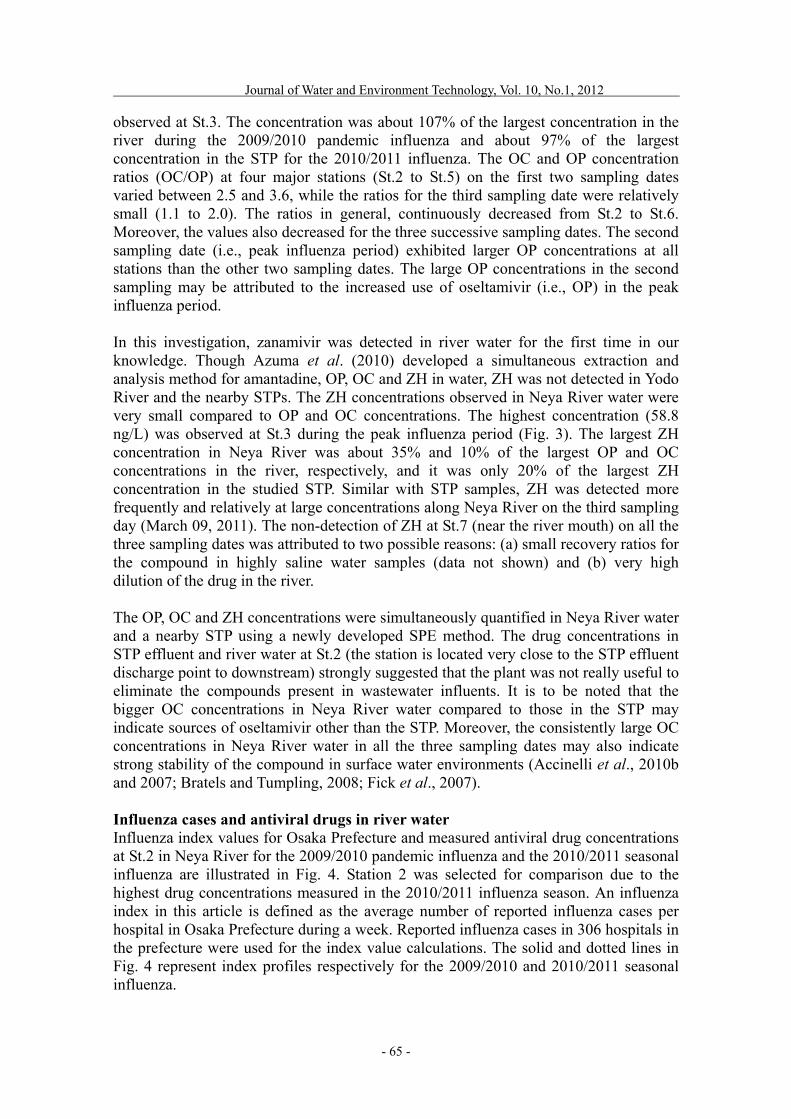
observed at St.3. The concentration was about 107% of the largest concentration in the river during the 2009/2010 pandemic influenza and about 97% of the largest concentration in the STP for the 2010/2011 influenza. The OC and OP concentration ratios (OC/OP) at four major stations (St.2 to St.5) on the first two sampling dates varied between 2.5 and 3.6, while the ratios for the third sampling date were relatively small (1.1 to 2.0). The ratios in general, continuously decreased from St.2 to St.6. Moreover, the values also decreased for the three successive sampling dates. The second sampling date (i.e., peak influenza period) exhibited larger OP concentrations at all stations than the other two sampling dates. The large OP concentrations in the second sampling may be attributed to the increased use of oseltamivir (i.e., OP) in the peak influenza period. In this investigation, zanamivir was detected in river water for the first time in our knowledge. Though Azuma et al. (2010) developed a simultaneous extraction and analysis method for amantadine, OP, OC and ZH in water, ZH was not detected in Yodo River and the nearby STPs. The ZH concentrations observed in Neya River water were very small compared to OP and OC concentrations. The highest concentration (58.8 ng/L) was observed at St.3 during the peak influenza period (Fig. 3). The largest ZH concentration in Neya River was about 35% and 10% of the largest OP and OC concentrations in the river, respectively, and it was only 20% of the largest ZH concentration in the studied STP. Similar with STP samples, ZH was detected more frequently and relatively at large concentrations along Neya River on the third sampling day (March 09, 2011). The non-detection of ZH at St.7 (near the river mouth) on all the three sampling dates was attributed to two possible reasons: (a) small recovery ratios for the compound in highly saline water samples (data not shown) and (b) very high dilution of the drug in the river. The OP, OC and ZH concentrations were simultaneously quantified in Neya River water and a nearby STP using a newly developed SPE method. The drug concentrations in STP effluent and river water at St.2 (the station is located very close to the STP effluent discharge point to downstream) strongly suggested that the plant was not really useful to eliminate the compounds present in wastewater influents. It is to be noted that the bigger OC concentrations in Neya River water compared to those in the STP may indicate sources of oseltamivir other than the STP. Moreover, the consistently large OC concentrations in Neya River water in all the three sampling dates may also indicate strong stability of the compound in surface water environments (Accinelli et al., 2010b and 2007; Bratels and Tumpling, 2008; Fick et al., 2007). Influenza cases and antiviral drugs in river water Influenza index values for Osaka Prefecture and measured antiviral drug concentrations at St.2 in Neya River for the 2009/2010 pandemic influenza and the 2010/2011 seasonal influenza are illustrated in Fig. 4. Station 2 was selected for comparison due to the highest drug concentrations measured in the 2010/2011 influenza season. An influenza index in this article is defined as the average number of reported influenza cases per hospital in Osaka Prefecture during a week. Reported influenza cases in 306 hospitals in the prefecture were used for the index value calculations. The solid and dotted lines in Fig. 4 represent index profiles respectively for the 2009/2010 and 2010/2011 seasonal influenza.
Journal of Water and Environment Technology, Vol. 10, No.1, 2012
- 66 -
The peak of influenza activity in the 2010/2011 season was delayed by about three months compared to the peak of influenza activity during the 2009/2010 season. For example, the highest index values for the two consecutive influenza seasons occurred on the 45th and 5th weeks , respectively. The value for the 2010/2011 season (20.3) was almost 1.5-fold smaller than the value for the 2009/2010 pandemic influenza. Moreover, the peak drug concentrations (particularly for OC) lagged behind the corresponding peak influenza index values in both seasons most probably due to regular use of the drug for five days after infection and the time required for the drugs to appear in wastewater streams after their oral ingestion. The influenza index values fairly matched with the drug concentrations at the station for both seasons. Furthermore, the correlation between the index values and drug concentrations was strong for OC, but weak in case of ZH. It is to be noted that the treated effluent from the STP contributed to about 80% of the river flow at St.2 (average values for the three sampling dates: treated effluent = 104,318 m3/day, river flow = 133,632 m3/day), and any possible impact of river flow rate on drug concentrations is not taken into account in this investigation. Results showed that accurately reported influenza data within the coverage of sewage collection and treatment facilities can be useful to roughly estimate levels of antiviral drugs in surface water bodies receiving the effluents. The three-week time gap between the highest index value and largest OP and OC concentrations at St.2 during the 2010/2011 seasonal influenza may be attributed to the regular use of oseltamivir for five days after infection and time gap between the drug’s administration and its appearance in wastewater streams as mentioned above. CONCLUSIONS Zanamivir (ZH) was quantified in Neya River water and wastewater from a nearby STP for the first time. However, the concentrations in both waters were up to 26-fold smaller
0
150
300
450
600
750
900
0
6
12
18
24
30
36
33 37 41 45 49 53 4 8 12
Con
cent
rati
on (n
g/L
)
Infl
uenz
a in
dex
nth week of year (2009 - 2010 / 2010 - 2011)
OP OCZH (2010-2011) Index (2009-2010)Index (2010-2011)
● 2009-2010 ★ 2010-2011
Fig. 4 - OP, OC and ZH concentrations at St.2 and influenza index values. The filled circles and stars respectively denote drug concentrations for the 2009/2010 and 2010/2011 seasonal influenza.
Journal of Water and Environment Technology, Vol. 10, No.1, 2012
- 67 -
than the corresponding oseltamivir (OP) concentrations. Very high OP concentrations in the STP (171.7 ng/L) and Neya River water (165.9 ng/L) compared to those in Neya River water during the 2009/2010 pandemic influenza strongly suggested that the drug in its original form does exist in wastewaters not only in pandemic influenza cases, but in normal influenza cases, too. The presented results suggested that the drugs simply passed through the treated effluents. The gradually decreased drug concentrations in river water towards the mouth may be attributed to the effect of dilution (increased river flow), although no quantitative analysis on the effect was carried out in this investigation. The OP and OC concentrations both in the STP and river water gradually increased with the start of the influenza season, reached to highest values at the peak of influenza activity and then decreased. However, more frequent detections of ZH in the STP in large concentrations at the final sampling suggested a possibly different pattern of drug use in the area. Acknowledgement This research was carried out under “Collaboration with Local Communities” project financially supported by the Ministry of Education, Culture, Sports, Science and Technology (MEXT), Japan. We are grateful to the personnel in sewage treatment plant for granting permission to collect samples from the plant. We are also grateful to Osaka Prefectural Institute of Public Health (Division of Infectious Diseases) for providing influenza data of Osaka Prefecture for the 2010/2011 season. REFERENCES Accinelli C., Caracciolo A. B. and Grenni P. (2007) Degradation of the antiviral drug
oseltamivir carboxylate in surface water samples. Int. J. Environ. Anal. Chem., 87, 579-587.
Accinelli C., Sacca M. L., Batisson I., Fick J., Mencarelli M. and Grabic R. (2010a) Removal of oseltamivir (Tamiflu) and other selected pharmaceuticals from wastewater using a granular bioplastic formulation entrapping propagules of Phanerochaete chrysosporium. Chemosphere, 81, 436-443.
Accinelli C., Sacca M. L., Fick J., Mencarelli M., Lindberg R. and Olsen B. (2010b) Dissipation and removal of oseltamivir (Tamiflu) in different aquatic environments. Chemosphere, 79, 891-897.
Azuma T., Nakada N., Yamashita N. and Tanaka H. (2010) Development of multiresidue analytical method for anti-influenza drugs by LC-MS/MS. Environ. Sanit. Eng. Res., 24(3), 82-89.
Bartels P. and Tumpling Jr. W. V. (2008) The environmental fate of the antiviral drug oseltamivir carboxylate in different waters. Sci. Tot. Environ., 405, 215-225.
Fick J., Lindberg R. H., Tysklind M., Haemig P. D., Waldenstrom J., Wallensten A. and Olsen B. (2007) Antiviral oseltamivir is not removed or degraded in normal sewage water treatment: Implications for development of resistance by influenza A virus. available at: www.plosone.org (accessed March 27, 2011).
Ghosh G. C., Nakada N., Yamashita N. and Tanaka H. (2010a) Occurrence and fate of oseltamivir carboxylate (Tamiflu) and amantadine in sewage treatment plants. Chemosphere, 81, 13-17.
Journal of Water and Environment Technology, Vol. 10, No.1, 2012
- 68 -
Ghosh G. C., Nakada N., Yamashita N. and Tanaka H. (2010b) Oseltamivir carboxylate, the active metabolite of oseltamivir phosphate (Tamiflu), detected in sewage discharge and river water in Japan. Environ. Health Perspect., 118(1), 103-106.
Osaka Prefectural Urban Development Office (2010) Osaka Prefecture Sewage Statistics. Report, Osaka, Japan. (in Japanese)
Prasse C., Schlusener M. P., Schulz R. and Ternes T. A. (2010) Antiviral drugs in wastewater and surface waters: a new pharmaceutical class of environmental relevance? Environ. Sci. Technol., 44, 1728-1735.
Singer A. C., Nunn M. A., Gould E. A. and Johnson A. C. (2007) Potential risks associated with the proposed widespread use of Tamiflu. Environ. Health Perspectives, 115, 102-106.
Slater F. R., Singer A. C., Turner S., Barr J. J. and Bond P. L. (2011) Pandemic pharmaceutical dosing effects on wastewater treatment: no adaptation of activated sludge bacteria to degrade the antiviral drug oseltamivir (Tamiflu) and loss of nutrient removal performance. FEMS Microbiol. Lett., 315, 17-22.
Soderstrom H., Jarhult J. D., Olsen B., Lindberg R. H., Tanaka H. and Fick J. (2009) Detection of the antiviral drug oseltamivir in aquatic environments. available at: www.plosone.org (accessed March 27, 2011).
Straub J. O. (2009) An environmental risk assessment for oseltamivir (Tamiflu®) for sewage works and surface waters under seasonal-influenza and pandemic-use conditions. Ecotoxicol. Environ. Saf., 72, 1625-1634.
Takanami R., Ozaki H., Giri R. R., Taniguchi S. and Hayashi S. (2010a) Detection of antiviral drugs oseltamivir phosphate and oseltamivir carboxylate in Neya River, Osaka, Japan. J. Water Environ. Technol., 8(4), 363-372.
Takanami R., Taniguchi S., Ozaki H., Hayashi S. and Hineno A. (2010b) A method for simultaneous analysis of anti-influenza virus drugs in environmental water. The 2nd Korea-Japan Symposium on Environmental Chemistry, Nov. 03-05, 85-88.
Taylor W. R. J., Thinh B. N., Anh G. T., Horby P., Wertheim H., Lindegardh N., Jong M. D., Stepniewska K., Hanh T. T., Hien N. D., Bien N. M., Chau N.Q ., Fox A., Ngoc N. M., Crusat M., Farrar J. J., White N. J., Ha N. H., Lien T. T., Trung N. V., Day N. and Binh N. G. (2008) Oseltamivir is adequately absorbed following nasogastric administration to adult patients with severe H5N1 influenza. available at: www.plosone.org (accessed March 27, 2011).