anti-mullerian hormone and insulin resistance in classic phenotype lean pcos
TRANSCRIPT

1 23
Archives of Gynecology andObstetrics ISSN 0932-0067 Arch Gynecol ObstetDOI 10.1007/s00404-013-2833-9
Anti-Mullerian hormone and insulinresistance in classic phenotype lean PCOS
Gamze Sinem Caglar, Inci Kahyaoglu,Recai Pabuccu, Selda Demirtas & RabiaSeker

1 23
Your article is protected by copyright and
all rights are held exclusively by Springer-
Verlag Berlin Heidelberg. This e-offprint is
for personal use only and shall not be self-
archived in electronic repositories. If you wish
to self-archive your article, please use the
accepted manuscript version for posting on
your own website. You may further deposit
the accepted manuscript version in any
repository, provided it is only made publicly
available 12 months after official publication
or later and provided acknowledgement is
given to the original source of publication
and a link is inserted to the published article
on Springer's website. The link must be
accompanied by the following text: "The final
publication is available at link.springer.com”.

REPRODUCTIVE MEDICINE
Anti-Mullerian hormone and insulin resistance in classicphenotype lean PCOS
Gamze Sinem Caglar • Inci Kahyaoglu •
Recai Pabuccu • Selda Demirtas • Rabia Seker
Received: 6 July 2012 / Accepted: 26 March 2013
� Springer-Verlag Berlin Heidelberg 2013
Abstract
Purpose This study is designed to explore the correlation
between AMH levels and IR in normal weight PCOS
women.
Materials and methods This prospective study was con-
ducted on 55 patients, who were admitted to obstetrics and
gynecology department of a university clinic. Study group
was consisted of 34 patients diagnosed as polycystic ovary
syndrome (PCOS) according to the Rotterdam Criteria,
whereas control group was consisted of 21 healthy volunteers
without any features of clinical or biochemical hyperandrog-
enism, who had regular menstrual cycles. BMI C 25 kg/m2
were considered overweight and obese and excluded. Blood
samples were obtained during days 2–3 after spontaneous
menses or progesterone-induced withdrawal bleeding after
overnight fasting for at least 12 h. The weight, height, hip and
waist circumferences of the patients were measured. Fasting
insulin and glucose (FPG) levels were used for calculating
different insulin resistance indexes (Homeostatic Model
Assessment (HOMA-IR), Quantitative Insulin Sensitivity
Check Index (QUICKI)).
Results No significant difference was found between
PCOS and control groups regarding the mean age, BMI,
waist to hip ratio (WHR), mean values of FPG, FPG/insulin
ratio and HOMA B (p [ 0.05). AMH values were signifi-
cantly higher in PCOS cases when compared with controls
(4.7 vs. 3.4 ng/mL) (p \ 0.05).The mean values of HOMA-
IR and QUICKI indexes were significantly higher among
PCOS cases when compared with controls. E2 levels were
significantly lower and Total-T were significantly higher in
PCOS patients. When PCOS cases are categorized according
to the existence of IR, no difference in Total-T and AMH
levels between both groups. Although not statistically sig-
nificant, a negative correlation of AMH with HOMA-IR and
a positive correlation with QUICKI index were found.
Among the hormone parameters, AMH was found to be
positively correlated with Total-T (r = 0.332, p = 0.013).
Conclusion Although the relation between AMH and
androgen production is supported by current evidence, the
mechanism underlying the relation between AMH and
insulin resistance is not clear yet.
Keywords Anti-Mullerian hormone � Polycystic ovary �Insulin resistance
Introduction
Polycystic ovary syndrome (PCOS) is the most common
endocrine disorder affecting 7–10 % of reproductive age
women. Metabolic aspects play important roles in both the
pathogenesis and the long-term sequelae of the condition.
Insulin resistance (IR) and hyperinsulinemia is highly
prevalent among PCOS women and affect 65–70 % of the
cases [1]. Moreover, in the majority of women with PCOS
(70–80 %), the presence of central obesity aggravates the
metabolic comorbidities. The biologic actions of insulin on
target tissues via binding to its own membrane associated
heterotetromeric glycoprotein receptor, initiates the auto-
phosphorylation of b-subunit on specific tyrosine residues
and increases the tyrosine kinase activity. The activation of
G. S. Caglar (&) � I. Kahyaoglu � R. Pabuccu
Department of Obstetrics and Gynecology Mevlana BulvarıBalgat, University of Ufuk Faculty of Medicine, Ankara 06520,
Turkey
e-mail: [email protected]
S. Demirtas � R. Seker
Department of Biochemistry, University of Ufuk Faculty of
Medicine, Ankara, Turkey
123
Arch Gynecol Obstet
DOI 10.1007/s00404-013-2833-9
Author's personal copy
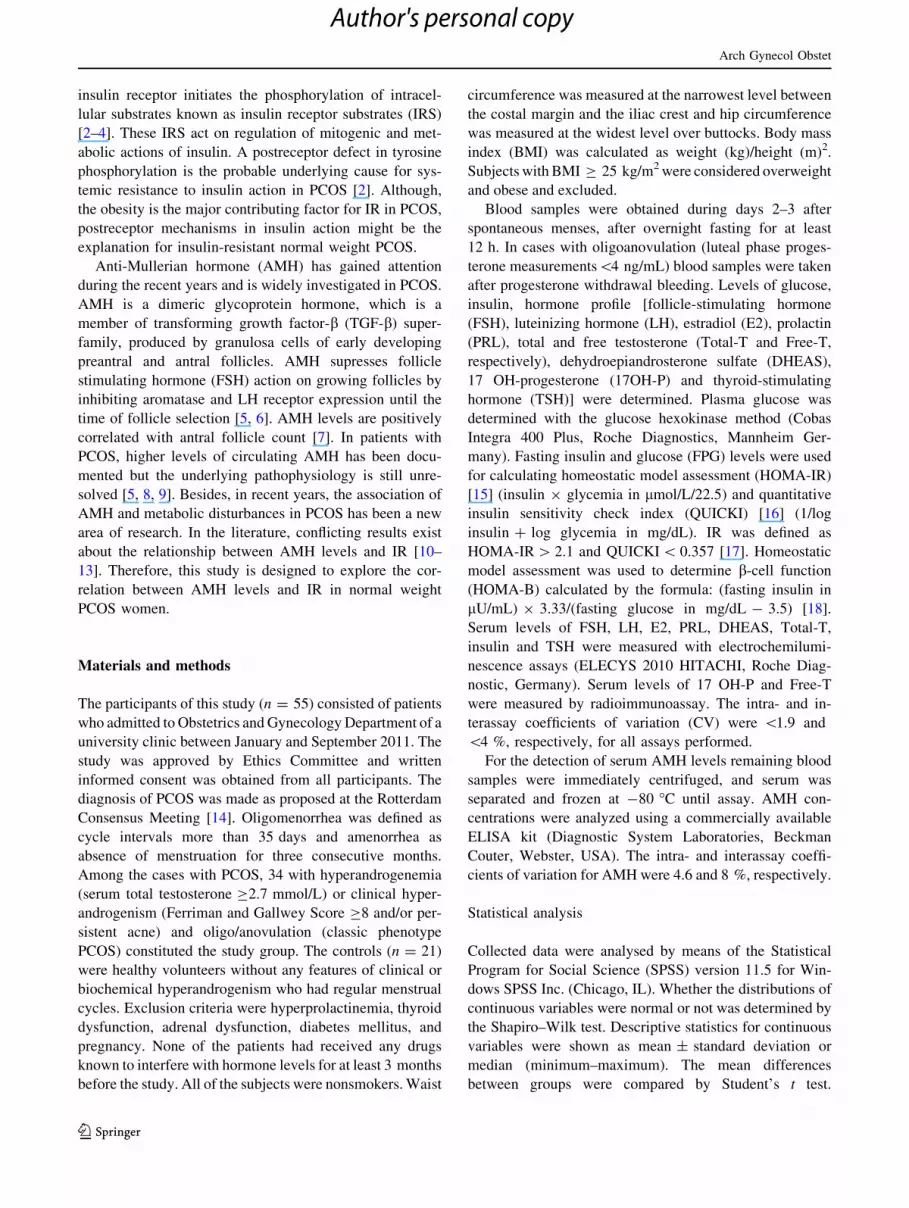
insulin receptor initiates the phosphorylation of intracel-
lular substrates known as insulin receptor substrates (IRS)
[2–4]. These IRS act on regulation of mitogenic and met-
abolic actions of insulin. A postreceptor defect in tyrosine
phosphorylation is the probable underlying cause for sys-
temic resistance to insulin action in PCOS [2]. Although,
the obesity is the major contributing factor for IR in PCOS,
postreceptor mechanisms in insulin action might be the
explanation for insulin-resistant normal weight PCOS.
Anti-Mullerian hormone (AMH) has gained attention
during the recent years and is widely investigated in PCOS.
AMH is a dimeric glycoprotein hormone, which is a
member of transforming growth factor-b (TGF-b) super-
family, produced by granulosa cells of early developing
preantral and antral follicles. AMH supresses follicle
stimulating hormone (FSH) action on growing follicles by
inhibiting aromatase and LH receptor expression until the
time of follicle selection [5, 6]. AMH levels are positively
correlated with antral follicle count [7]. In patients with
PCOS, higher levels of circulating AMH has been docu-
mented but the underlying pathophysiology is still unre-
solved [5, 8, 9]. Besides, in recent years, the association of
AMH and metabolic disturbances in PCOS has been a new
area of research. In the literature, conflicting results exist
about the relationship between AMH levels and IR [10–
13]. Therefore, this study is designed to explore the cor-
relation between AMH levels and IR in normal weight
PCOS women.
Materials and methods
The participants of this study (n = 55) consisted of patients
who admitted to Obstetrics and Gynecology Department of a
university clinic between January and September 2011. The
study was approved by Ethics Committee and written
informed consent was obtained from all participants. The
diagnosis of PCOS was made as proposed at the Rotterdam
Consensus Meeting [14]. Oligomenorrhea was defined as
cycle intervals more than 35 days and amenorrhea as
absence of menstruation for three consecutive months.
Among the cases with PCOS, 34 with hyperandrogenemia
(serum total testosterone C2.7 mmol/L) or clinical hyper-
androgenism (Ferriman and Gallwey Score C8 and/or per-
sistent acne) and oligo/anovulation (classic phenotype
PCOS) constituted the study group. The controls (n = 21)
were healthy volunteers without any features of clinical or
biochemical hyperandrogenism who had regular menstrual
cycles. Exclusion criteria were hyperprolactinemia, thyroid
dysfunction, adrenal dysfunction, diabetes mellitus, and
pregnancy. None of the patients had received any drugs
known to interfere with hormone levels for at least 3 months
before the study. All of the subjects were nonsmokers. Waist
circumference was measured at the narrowest level between
the costal margin and the iliac crest and hip circumference
was measured at the widest level over buttocks. Body mass
index (BMI) was calculated as weight (kg)/height (m)2.
Subjects with BMI C 25 kg/m2 were considered overweight
and obese and excluded.
Blood samples were obtained during days 2–3 after
spontaneous menses, after overnight fasting for at least
12 h. In cases with oligoanovulation (luteal phase proges-
terone measurements\4 ng/mL) blood samples were taken
after progesterone withdrawal bleeding. Levels of glucose,
insulin, hormone profile [follicle-stimulating hormone
(FSH), luteinizing hormone (LH), estradiol (E2), prolactin
(PRL), total and free testosterone (Total-T and Free-T,
respectively), dehydroepiandrosterone sulfate (DHEAS),
17 OH-progesterone (17OH-P) and thyroid-stimulating
hormone (TSH)] were determined. Plasma glucose was
determined with the glucose hexokinase method (Cobas
Integra 400 Plus, Roche Diagnostics, Mannheim Ger-
many). Fasting insulin and glucose (FPG) levels were used
for calculating homeostatic model assessment (HOMA-IR)
[15] (insulin 9 glycemia in lmol/L/22.5) and quantitative
insulin sensitivity check index (QUICKI) [16] (1/log
insulin ? log glycemia in mg/dL). IR was defined as
HOMA-IR [ 2.1 and QUICKI \ 0.357 [17]. Homeostatic
model assessment was used to determine b-cell function
(HOMA-B) calculated by the formula: (fasting insulin in
lU/mL) 9 3.33/(fasting glucose in mg/dL - 3.5) [18].
Serum levels of FSH, LH, E2, PRL, DHEAS, Total-T,
insulin and TSH were measured with electrochemilumi-
nescence assays (ELECYS 2010 HITACHI, Roche Diag-
nostic, Germany). Serum levels of 17 OH-P and Free-T
were measured by radioimmunoassay. The intra- and in-
terassay coefficients of variation (CV) were \1.9 and
\4 %, respectively, for all assays performed.
For the detection of serum AMH levels remaining blood
samples were immediately centrifuged, and serum was
separated and frozen at -80 �C until assay. AMH con-
centrations were analyzed using a commercially available
ELISA kit (Diagnostic System Laboratories, Beckman
Couter, Webster, USA). The intra- and interassay coeffi-
cients of variation for AMH were 4.6 and 8 %, respectively.
Statistical analysis
Collected data were analysed by means of the Statistical
Program for Social Science (SPSS) version 11.5 for Win-
dows SPSS Inc. (Chicago, IL). Whether the distributions of
continuous variables were normal or not was determined by
the Shapiro–Wilk test. Descriptive statistics for continuous
variables were shown as mean ± standard deviation or
median (minimum–maximum). The mean differences
between groups were compared by Student’s t test.
Arch Gynecol Obstet
123
Author's personal copy

Otherwise, Mann–Whitney U test was applied for the
comparisons of the median values. Nominal data were
analyzed by Pearson’s v2 where appropriate. The correla-
tion analysis was done using Pearson’s correlation test. A
p \ 0.05 was considered statistically significant.
Results
The mean age and BMI of the participants were 26 years
and 22 kg/m2, respectively. The demographic characteris-
tics of the cases and controls are shown in Table 1 and
Fig. 1. No significant difference was found between PCOS
and control groups regarding the mean age, BMI, waist to
hip ratio (WHR) (p [ 0.05). On admission, 82.4 % of the
PCOS cases had oligomenorrhea and/or anovulation.
Hirsutismus and acne was found in 44 and 38.2 % of the
PCOS cases, respectively.
Regarding the mean values of FPG, FPG/insulin ratio
and HOMA B, no significant difference was found between
PCOS and control groups (p [ 0.05) (Table 1). The mean
values of HOMA-IR and QUICKI indexes were signifi-
cantly different among PCOS cases when compared with
controls (Table 1). When PCOS patients were categorized
according to the existence of IR, 15 out of 34 PCOS cases
(44.1 %) were found to have IR (defined as HOMA-
IR [ 2.1). When IR is defined as QUICKI \ 0.357, 70 %
of PCOS women were found to have IR.
Among the hormone parameters (FSH, LH, E2, PRL,
Total-T, Free-T, 17OH-P, DHEAS), E2 levels were signifi-
cantly lower and Total-T were significantly higher in PCOS
patients when compared with controls (Table 2). In addition,
AMH values were significantly higher in PCOS cases when
compared with controls (4.7 vs. 3.4 ng/mL) (p \ 0.05).
When PCOS cases were categorized according to the exis-
tence of IR, no difference in Total-T and AMH levels were
found between HOMA-IR [ 2.1 and HOMA \ 2.1 groups
(0.5 vs. 0.6 nmol/L for Total-T and 5.4 vs. 4.4 ng/mL for
AMH in HOMA \ 2.1 and HOMA [ 2.1 groups, respec-
tively). According to QUICKI index, PCOS cases with or
without IR (QUICKI \ 0.357 and QUICKI [ 0.357 groups)
also had no significant difference in total Total-T and AMH
levels (0.5 vs. 0.6 nmol/L for Total-T and 4.9 vs. 4.4 ng/mL
for AMH in QUICKI \ 0.357 and QUICKI [ 0.357 groups,
respectively). According to Pearson’s correlation analysis,
the baseline characteristics (age, BMI, WHR) were not
correlated with AMH levels (p [ 0.05) (Table 3). Although
Table 1 Demographic characteristics and insulin resistance param-
eters of the participants
Parameter Controls
(n = 21)
PCOS group
(n = 34)
p values
Age (years) 26.0 ± 2.5 26.0 ± 2.8 0.981
Mean ± SD
BMI (kg/m2) 22.0 ± 1.1 22.1 ± 1.9 0.816
Mean ± SD
WHR 0.72 ± 0.06 0.74 ± 0.07 0.145
Mean ± SD
FPG (mg/dL) 85.8 ± 7.7 88.3 ± 6.2 0.188
Mean ± SD
Insulin (lm/mL) 7.9 (2.5–11.5) 9.3 (3.9–57.4) 0.052
Median (min–
max)
FPG/I 11.4 (7.5–35.2) 9.1 (1.7–22.3) 0.058
Median (min–
max)
HOMA B 123.5
(37.5–408.7)
142.9 (60.7–574.0) 0.239
Median (min–
max)
QUICKI 0.36 ± 0.03 0.34 ± 0.03 0.024*
Mean ± SD
HOMA-IR 1.8 (0.5–2.4) 2.0 (0.8–14.0) 0.025*
Median (min–
max)
BMI body mass index, WHR waist hip ratio, FPG fasting insulin and
glucose, FPG/I fasting plasma glucose/insulin, HOMA-B homeostatic
model assessment of steady state beta cell function, QUICKI quan-
titative insulin sensitivity check index, HOMA-IR homeostatic model
assessment of tissue insulin sensitivity
* Statistically significant
15
10
5
0
AM
H le
vels
(ng
/mL)
Control group PCOS group
Fig. 1 AMH values of control and PCOS cases
Arch Gynecol Obstet
123
Author's personal copy
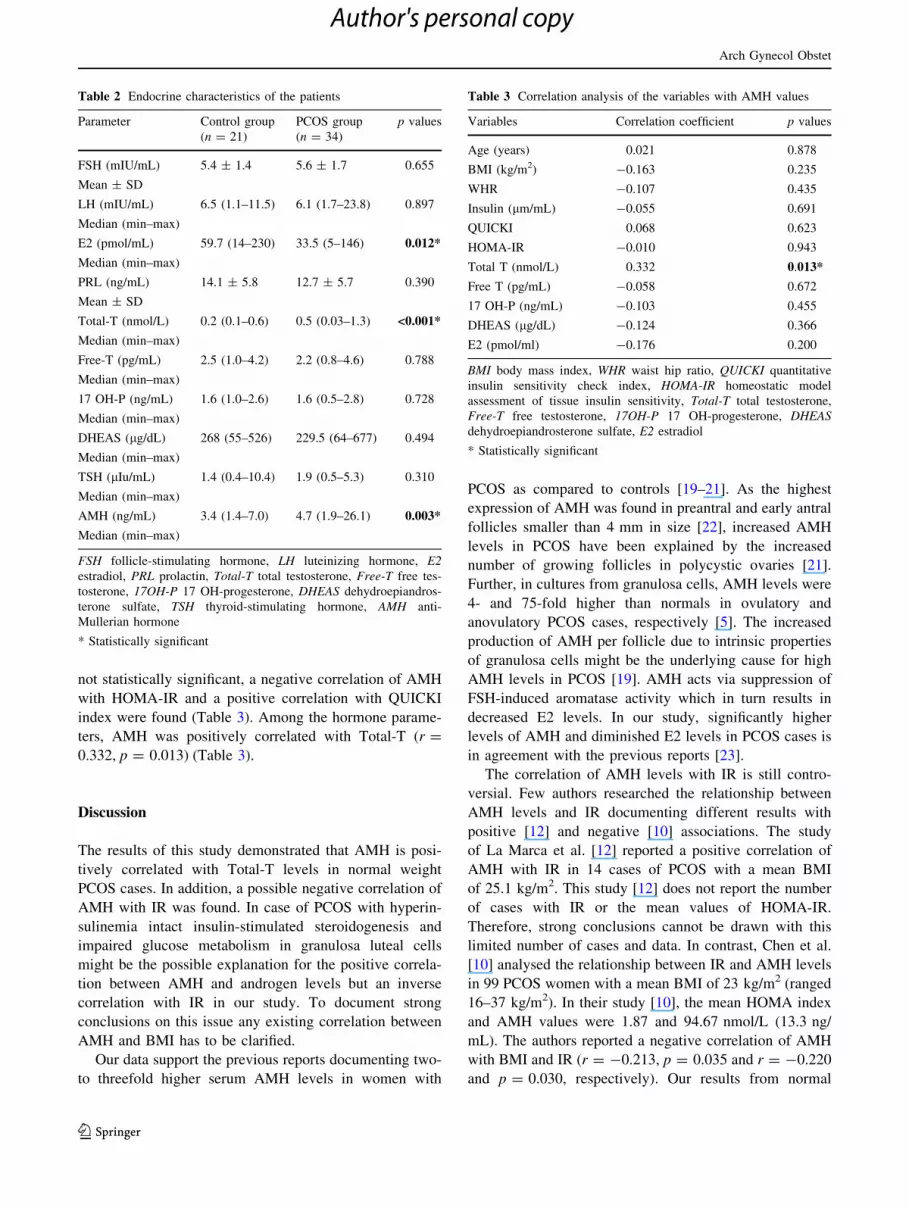
not statistically significant, a negative correlation of AMH
with HOMA-IR and a positive correlation with QUICKI
index were found (Table 3). Among the hormone parame-
ters, AMH was positively correlated with Total-T (r =
0.332, p = 0.013) (Table 3).
Discussion
The results of this study demonstrated that AMH is posi-
tively correlated with Total-T levels in normal weight
PCOS cases. In addition, a possible negative correlation of
AMH with IR was found. In case of PCOS with hyperin-
sulinemia intact insulin-stimulated steroidogenesis and
impaired glucose metabolism in granulosa luteal cells
might be the possible explanation for the positive correla-
tion between AMH and androgen levels but an inverse
correlation with IR in our study. To document strong
conclusions on this issue any existing correlation between
AMH and BMI has to be clarified.
Our data support the previous reports documenting two-
to threefold higher serum AMH levels in women with
PCOS as compared to controls [19–21]. As the highest
expression of AMH was found in preantral and early antral
follicles smaller than 4 mm in size [22], increased AMH
levels in PCOS have been explained by the increased
number of growing follicles in polycystic ovaries [21].
Further, in cultures from granulosa cells, AMH levels were
4- and 75-fold higher than normals in ovulatory and
anovulatory PCOS cases, respectively [5]. The increased
production of AMH per follicle due to intrinsic properties
of granulosa cells might be the underlying cause for high
AMH levels in PCOS [19]. AMH acts via suppression of
FSH-induced aromatase activity which in turn results in
decreased E2 levels. In our study, significantly higher
levels of AMH and diminished E2 levels in PCOS cases is
in agreement with the previous reports [23].
The correlation of AMH levels with IR is still contro-
versial. Few authors researched the relationship between
AMH levels and IR documenting different results with
positive [12] and negative [10] associations. The study
of La Marca et al. [12] reported a positive correlation of
AMH with IR in 14 cases of PCOS with a mean BMI
of 25.1 kg/m2. This study [12] does not report the number
of cases with IR or the mean values of HOMA-IR.
Therefore, strong conclusions cannot be drawn with this
limited number of cases and data. In contrast, Chen et al.
[10] analysed the relationship between IR and AMH levels
in 99 PCOS women with a mean BMI of 23 kg/m2 (ranged
16–37 kg/m2). In their study [10], the mean HOMA index
and AMH values were 1.87 and 94.67 nmol/L (13.3 ng/
mL). The authors reported a negative correlation of AMH
with BMI and IR (r = -0.213, p = 0.035 and r = -0.220
and p = 0.030, respectively). Our results from normal
Table 2 Endocrine characteristics of the patients
Parameter Control group
(n = 21)
PCOS group
(n = 34)
p values
FSH (mIU/mL) 5.4 ± 1.4 5.6 ± 1.7 0.655
Mean ± SD
LH (mIU/mL) 6.5 (1.1–11.5) 6.1 (1.7–23.8) 0.897
Median (min–max)
E2 (pmol/mL) 59.7 (14–230) 33.5 (5–146) 0.012*
Median (min–max)
PRL (ng/mL) 14.1 ± 5.8 12.7 ± 5.7 0.390
Mean ± SD
Total-T (nmol/L) 0.2 (0.1–0.6) 0.5 (0.03–1.3) <0.001*
Median (min–max)
Free-T (pg/mL) 2.5 (1.0–4.2) 2.2 (0.8–4.6) 0.788
Median (min–max)
17 OH-P (ng/mL) 1.6 (1.0–2.6) 1.6 (0.5–2.8) 0.728
Median (min–max)
DHEAS (lg/dL) 268 (55–526) 229.5 (64–677) 0.494
Median (min–max)
TSH (lIu/mL) 1.4 (0.4–10.4) 1.9 (0.5–5.3) 0.310
Median (min–max)
AMH (ng/mL) 3.4 (1.4–7.0) 4.7 (1.9–26.1) 0.003*
Median (min–max)
FSH follicle-stimulating hormone, LH luteinizing hormone, E2estradiol, PRL prolactin, Total-T total testosterone, Free-T free tes-
tosterone, 17OH-P 17 OH-progesterone, DHEAS dehydroepiandros-
terone sulfate, TSH thyroid-stimulating hormone, AMH anti-
Mullerian hormone
* Statistically significant
Table 3 Correlation analysis of the variables with AMH values
Variables Correlation coefficient p values
Age (years) 0.021 0.878
BMI (kg/m2) -0.163 0.235
WHR -0.107 0.435
Insulin (lm/mL) -0.055 0.691
QUICKI 0.068 0.623
HOMA-IR -0.010 0.943
Total T (nmol/L) 0.332 0.013*
Free T (pg/mL) -0.058 0.672
17 OH-P (ng/mL) -0.103 0.455
DHEAS (lg/dL) -0.124 0.366
E2 (pmol/ml) -0.176 0.200
BMI body mass index, WHR waist hip ratio, QUICKI quantitative
insulin sensitivity check index, HOMA-IR homeostatic model
assessment of tissue insulin sensitivity, Total-T total testosterone,
Free-T free testosterone, 17OH-P 17 OH-progesterone, DHEASdehydroepiandrosterone sulfate, E2 estradiol
* Statistically significant
Arch Gynecol Obstet
123
Author's personal copy

weight PCOS (BMI 22 kg/m2) patients is in accordance
with Chen et al. [10]. In addition, in our study, no differ-
ence was found between AMH levels of PCOS cases with
or without IR. Previously, an inverse relation of AMH and
IR was also detected in non-PCOS normal weight women
(BMI 22 kg/m2) [11]. The authors suggested that induced
oxidative injury on granulosa cells and perhaps vascular
injury causing suboptimal functioning of granulosa cells is
the reason for decreased AMH levels in IR [11].
The existing negative correlation between AMH levels
and IR seems to be related with BMI rather than PCOS per
se. However, the data in the literature are insufficient to
clarify any existing correlation between AMH and BMI.
Conflicting results from small population studies [10, 13, 24]
disable us from drawing strong conclusions. In a study by
Wetzka and colleaques, much higher levels of AMH were
found in normal weight PCOS women (BMI 21.8 kg/m2)
when compared with obese PCOS cases (BMI 30.7 kg/m2)
(15.6 vs. 11.6 ng/mL, respectively) [24]. In contrast others
report no correlation between AMH levels and BMI [13, 21,
24]. In our study, due to lack of different BMI groups, further
analysis could not be performed to evaluate the relationship
between AMH and BMI. Unfortunately, in the literature no
data exist about the correlation of IR with AMH levels in
different BMI PCOS groups.
Regarding the hypotheses that AMH levels might be
correlated with IR, few authors researched the change in
AMH values after treating PCOS for IR [26–29]. In a
prospective pilot study, short course of low-dose metfor-
min treatment did not alter the AMH levels despite a
decrease in antral follicle count and improvement in IR
after 1 week of metformin therapy (850 mg once daily)
[26]. Others [27] documented a decrease in AMH values
after at least 4 months use of metformin (500–850 mg
three times a day). The authors [27] suggested that met-
formin therapy can cause more normal follicles to enter the
following cohort by improving androgen level, IR and
ovulation. However, the significant weight loss during the
study period is not discussed by the authors as a possible
confounding factor. We suggest that the reported decrease
in AMH values in their study might be associated with this
decline in BMI.
Unlike the above-discussed correlation of AMH with IR,
the data in the literature about the correlation of AMH with
androgen levels is more clear. Many authors documented a
positive correlation between AMH and androgen levels
[13, 24, 29]. Androgen excess is one of the typical features
of PCOS. In PCOS, gonadotropin-independent follicular
growth in preantral and antral follicles with hyperandro-
genic intraovarian environment stimulates granulosa cell
proliferation and inhibits apoptosis. Accumulation of small
follicles and granulosa cell proliferation due to androgen
excess is the probable explanation for the association
between AMH (product of granulosa cells) and androgen
levels [30].
Hyperinsulinemia is also another determining factor for
hyperandrogenism. Insulin and LH act synergistically on
theca cells to enhance androgen production [31]. In the
presence of hyperinsulinemia in anovulatory PCOS, the
current evidence supports that insulin stimulated steroido-
genesis remains intact while glucose uptake and metabo-
lism is impaired in granulosa luteal cells [32]. This might
the possible explanation for the positive correlation
between AMH and androgen levels, but an inverse corre-
lation with IR in our study. Effects of insulin on granulosa
and theca cells are mediated through phosphorylation of
IRS proteins. Both cells have IRS isoforms, but concen-
trations and types of them are different. Insulin may have a
positive effect on androgen production via this augmented
IRS-1&2 isoforms in theca cells whereas the mechanism is
not so clear for granulosa cells [2]. Impaired phosphory-
lation of IRS proteins may result in activation of different
metabolic and steroidogenic signalling pathways in gran-
ulosa and theca cells. Further studies are needed to explore
the role of insulin on granulosa cell activity.
In conclusion, serum levels of AMH is higher in women
with PCOS as compared to controls. Although the current
evidence support the association between AMH and
androgen production, the relation between AMH and IR is
not so clear yet. The association of AMH and BMI needs to
be concluded in large population studies with or without
PCOS. Thereafter, the correlation of AMH with IR can be
resolved in PCOS.
Conflict of interest The authors declare that no actual or potential
conflict of interest in relation to this article exists.
References
1. Dunaif A (1997) Insulin resistance and the polycystic ovary
syndrome: mechanism and implications for pathogenesis. Endocr
Rev 8:774–800
2. Wu XK, Zhou SY, Liu JX, Pollanen P, Sallinen K, Makinen M,
Erkkola R (2003) Selective ovary resistance to insulin signaling in
women with polycystic ovary syndrome. Fertil Steril 80:954–965
3. Yen HW, Jakimiuk AJ, Munir I, Magoffin DA (2004) Selective
alterations in insulin receptor substrates-1, -2 and -4 in theca but
not granulosa cells from polycystic ovaries. Mol Hum Reprod
10:473–479
4. Nestler JE, Jakubowicz DJ, de Vargas AF, Brik C, Quintero N,
Medina F (1998) Insulin stimulates testosterone biosynthesis by
human thecal cells from women with polycystic ovary syndrome
by activating its own receptor and using inositolglycan mediators
as the signal transduction system. J Clin Endocrinol Metab
83:2001–2005
5. Pellatt L, Rice S, Mason HD (2010) Anti-Mullerian hormone and
polycystic ovary syndrome: a mountain too high? Reproduction
139:825–833
Arch Gynecol Obstet
123
Author's personal copy

6. Skałba P, Cygal A, Madej P, Dabkowska-Huc A, Sikora J,
Martirosian G, Romanik M, Olszanecka-Glinianowicz M (2011)
Is the plasma anti-Mullerian hormone (AMH) level associated
with body weight and metabolic, and hormonal disturbances in
women with and without polycystic ovary syndrome? Eur J
Obstet Gynecol Reprod Biol 158:254–259
7. Broer SL, Mol BW, Hendriks D, Broekmans FJ (2009) The role
of antimullerian hormone in prediction of outcome after IVF:
comparison with the antral follicle count. Fertil Steril 91:705–714
8. Lin Y, Fridstrom M, Hillensjo T (1997) Insulin stimulation of
lactate accumulation in isolated human granulosa-luteal cells: a
comparison between normal and polycystic ovaries. Hum Reprod
12:2469–2472
9. La Marca A, Broekmans FJ, Volpe A, Fauser BC, Macklon NS;
ESHRE Special Interest Group for Reproductive Endocrinol-
ogy—AMH Round Table (2009) Anti-Mullerian hormone
(AMH): what do we still need to know? Hum Reprod 24:
2264–2275
10. Chen MJ, Yang WS, Chen CL, Wu MY, Yang YS, Ho HN (2008)
The relationship between anti-Mullerian hormone, androgen and
insulin resistance on the number of antral follicles in women with
polycystic ovary syndrome. Hum Reprod 23:952–957
11. Park HT, Cho GJ, Ahn KH, Shin J, Kim YT, Hur JY, Kim SH,
Lee KW, Kim T (2010) Association of insulin resistance with
anti-Mullerian hormone levels in women without polycystic
ovary syndrome (PCOS). Clin Endocrinol (Oxf) 72:26–31
12. La Marca A, Orvieto R, Giulini S, Jasonni VM, Volpe A, De Leo
V (2004) Mullerian-inhibiting substance in women with poly-
cystic ovary syndrome: relationship with hormonal and metabolic
characteristics. Fertil Steril 82:970–972
13. Nardo LG, Yates AP, Roberts SA, Pemberton P, Laing I (2009)
The relationships between AMH, androgens, insulin resistance
and basal ovarian follicular status in non-obese subfertile women
with and without polycystic ovary syndrome. Hum Reprod
24:2917–2923
14. The Rotterdam ESHRE/ASRM-Sponsored PCOS Workshop
Group (2004) Revised 2003 consensus on diagnostic and long-
term health risks related to polycystic ovary syndrome. Fertil
Steril 81:19–25
15. Matthews DR, Hosker JP, Rudenski AS, Naylor BA, Treacher
DF, Turner RC (1985) Homeostasis model assessment: insulin
resistance and beta-cell function from fasting plasma glucose and
insulin concentrations in man. Diabetologia 28:412–419
16. Katz A, Nambi SS, Mather K, Baron AD, Follmann DA, Sullivan
G, Quon MJ (2000) Quantitative insulin sensitivity check index: a
simple, accurate method for assessing insulin sensitivity in
humans. J ClinEndocrinol Metab 85:2402–2410
17. Hedblad B, Nilsson P, Engstrom G, Berglund G, Janzon L (2002)
Insulin resistance in non-diabetic subjects is associated with
increased incidence of myocardial infarction and death. Diabet
Med 19:470–475
18. Muniyappa R, Lee S, Chen H, Quon MJ (2008) Current
approaches for assessing insulin sensitivity and resistance in vivo:
advantages, limitations, and appropriate usage. Am J Physiol
Endocrinol Metab 294:E15–E26
19. Fallat ME, Siow Y, Marra M, Cook C, Carrillo A (1997)
Mullerian-inhibiting substance in follicular fluid and serum: a
comparison of patients with tubal factor infertility, polycystic
ovary syndrome, and endometriosis. Fertil Steril 67:962–965
20. Cook CL, Siow Y, Brenner AG, Fallat ME (2002) Relationship
between serum mullerian-inhibiting substance and other repro-
ductive hormones in untreated women with polycystic ovary
syndrome and normal women. Fertil Steril 77:141–146
21. Pigny P, Jonard S, Robert Y, Dewailly D (2006) Serum anti-
Mullerian hormone as a surrogate for antral follicle count for
definition of the polycystic ovary syndrome. J Clin Endocrinol
Metab 91:941–945
22. Visser JA, de Jong FH, Laven JS, Themmen AP (2006) Anti-
Mullerian hormone: a new marker for ovarian function. Repro-
duction 131:1–9
23. Laven JS, Mulders AG, Visser JA, Themmen AP, De Jong FH,
Fauser BC (2004) Anti-Mullerian hormone serum concentrations
in normoovulatory and anovulatory women of reproductive age.
J Clin Endocrinol Metab 89:318–323
24. Wetzka B, Textor W, Ochsner A, Geisthovel F (2011) Anti-
Mullerian hormone confirms the novel classification of female
functional androgenization including polycystic ovary syndrome.
Eur J Endocrinol 165:323–330
25. Pietilainen KH, Kaprio J, Vaaralahti K, Rissanen A, Raivio T
(2012) Circulating anti-Mullerian hormone levels in adult men
are under a strong genetic influence. J Clin Endocrinol Metab
97:E161–E164
26. Bayrak A, Terbell H, Urwitz-Lane R, Mor E, Stanczyk FZ,
Paulson RJ (2007) Acute effects of metformin therapy include
improvement of insulin resistance and ovarian morphology. Fertil
Steril 87:870–875
27. Fleming R, Harborne L, MacLaughlin DT, Ling D, Norman J,
Sattar N, Seifer DB (2005) Metformin reduces serum mullerian-
inhibiting substance levels in women with polycystic ovary
syndrome after protracted treatment. Fertil Steril 83:130–136
28. Carlsen SM, Vanky E, Fleming R (2009) Anti-Mullerian hor-
mone concentrations in androgen-suppressed women with poly-
cystic ovary syndrome. Hum Reprod 24:1732–1738
29. Piltonen T, Morin-Papunen L, Koivunen R, Perheentupa A, Ru-
okonen A, Tapanainen JS (2005) Serum anti-Mullerian hormone
levels remain high until late reproductive age and decrease during
metformin therapy in women with polycystic ovary syndrome.
Hum Reprod 20:1820–1826
30. Vendola KA, Zhou J, Adesanya OO, Weil SJ, Bondy CA (1998)
Androgens stimulate early stages of follicular growth in the pri-
mate ovary. J Clin Invest 101:2622–2629
31. Franks S, Stark J, Hardy K (2008) Follicle dynamics and anov-
ulation in polycystic ovary syndrome. Hum Reprod Update
14:367–378
32. Rice S, Christoforidis N, Gadd C, Nikolaou D, Seyani L, Don-
aldson A, Margara R, Hardy K, Franks S (2005) Impaired insulin-
dependent glucose metabolism in granulosa-lutein cells from
anovulatory women with polycystic ovaries. Hum Reprod 20:
373–381
Arch Gynecol Obstet
123
Author's personal copy