antenna excitation of drift wave in a toroidal plasma
TRANSCRIPT

Antenna excitation of drift wave in a toroidal plasmaA. Diallo, P. Ricci, A. Fasoli, I. Furno, B. Labit, S. H. Müller, M. Podestà,F. M. Poli, and F. Skiffa�
Centre de Recherches en Physique des Plasmas Association Euratom-Confédération Suisse,École Polytechnique Fédérale de Lausanne (EPFL), Lausanne CH-1015, Switzerland
�Received 13 June 2007; accepted 23 August 2007; published online 10 October 2007�
In a magnetized toroidal plasma, an antenna tunable in vertical wave number is used to excitedensity perturbations. Coherent detection is performed by means of Langmuir probes to directlydetermine both the wave vector and the plasma response induced by the antenna. Comparisonbetween the theoretical density response predicted by the generalized Hasegawa-Wakatani model,and the experimentally determined density response enables us the identification of one peak of theplasma response as a drift wave. © 2007 American Institute of Physics. �DOI: 10.1063/1.2784464�
I. INTRODUCTION
In magnetically confined plasmas, drift wave turbulenceis generally believed to be responsible for anomalous cross-field energy and particle transport, reducing the energy con-finement. Improvements in such confinement, below thelevel determined purely by collisional transport, may beachieved through an active control of drift wave and furtherunderstanding of its dynamics.
Basic experimental investigations aimed at controllingdrift waves are performed in both high and low temperatureplasmas. These investigations started with modes suppres-sion in plasmas using Langmuir probes,1,2 and developedinto a more sophisticated approach based on the launching ofdrift waves using array antennas.3–8 Using the latter ap-proach, Schröder3 and co-workers have investigated the re-duction of the drift wave turbulence by driving preselectedmodes at the expense of the broadband density fluctuationsspectrum. The experiments were performed in a linearlymagnetized device using a large array antenna, whichcoupled nonlinearly to drift waves and strongly modified theplasma dynamics. Both experiment and simulations haveshown that the spatio-temporal driver signal has a stronginfluence on the dynamics of the pre-existing drift wave.Such influence tend to overshadow the underlying drift wavedynamics.
In this work, we report drift wave linear excitation in atoroidal plasma using an electrostatic antenna. Understand-ing the underlying physics in the linear properties of driftmode excitation is a necessary step into the investigation ofnonlinear phenomena �e.g., modulational instability, three-wave coupling�. Such understanding could open the way forpotential drift wave control scenarios. A necessary conditionfor the investigation in a linear regime of an antenna excita-tion is its minimal perturbation to both the background pro-file and the plasma dynamics. To the best of our knowledge,this regime has not been considered by any previous work.
Electrostatic antenna excitation in the plasma describedbelow is performed in the region of maximum density gra-
dient in the low B-field side �LFS� where both interchangeand drift modes coexist. A key feature of this antenna is itstunability in both frequency and vertical wave number kz.This feature enables excitation in the plasma frame by com-pensating for the E�B drift and by selecting the range ofvertical wave number proposed to the plasma dynamics. Us-ing an extensive coverage of Langmuir probes in the plasmacross section, direct measurements of both the wave vector kand the density response induced by the antenna excitationare obtained. Given these measured quantities, one can com-pare the predicted theoretical plasma response with the ob-served density response in the plasma frame. A model of thedriven system based on a generalized Hasegawa-Wakatani9
is used to identify the linearly excited modes.The remainder of this paper is organized as follows: Sec.
II briefly describes the experimental setup, introduces thetunable antenna as the exciter and the arrays of Langmuirprobes as the detectors. Section III presents the density fluc-tuation spectra with and without an antenna drive demon-strating the nonperturbative nature of the excitation. In addi-tion, an analysis of the spectral features of the densityfluctuations is shown. Section IV describes the coherent de-tection technique and the experimental results. In Sec. V, wesolve the linearized Hasegawa-Wakatani equations in thelimits strictly given by the experimental measurements. Thecomparison of the experimental results with the model and adiscussion are given in Sec. VI, followed by a summary inSec. VII.
II. EXPERIMENTAL APPARATUS
The experiments are performed on a magnetized plasmacontained in the toroidal device TORPEX.10 The major ra-dius is R=1 m; the minor radius is r=20 cm. Typically ar-gon, hydrogen, and helium plasma are produced using mi-crowaves at 2.45 GHz injected from the LFS.11 In thepresent experiment, hydrogen plasmas are produced under aneutral background pressure of 6�10−5 mbar with a micro-wave power of 400 W during 1200 ms, a vertical magneticfield of Bz=1.2 mT, and a toroidal magnetic field ofB�=76 mT on axis.12 The electron and ion temperatures are
a�Also at: Department of Physics and Astronomy, University of Iowa, IowaCity, Iowa 52242.
PHYSICS OF PLASMAS 14, 102101 �2007�
1070-664X/2007/14�10�/102101/8/$23.00 © 2007 American Institute of Physics14, 102101-1
Downloaded 11 Oct 2007 to 128.178.128.104. Redistribution subject to AIP license or copyright, see http://pop.aip.org/pop/copyright.jsp
4 eV and �0.1 eV, respectively, for electron density of theorder of 1016 m−3.
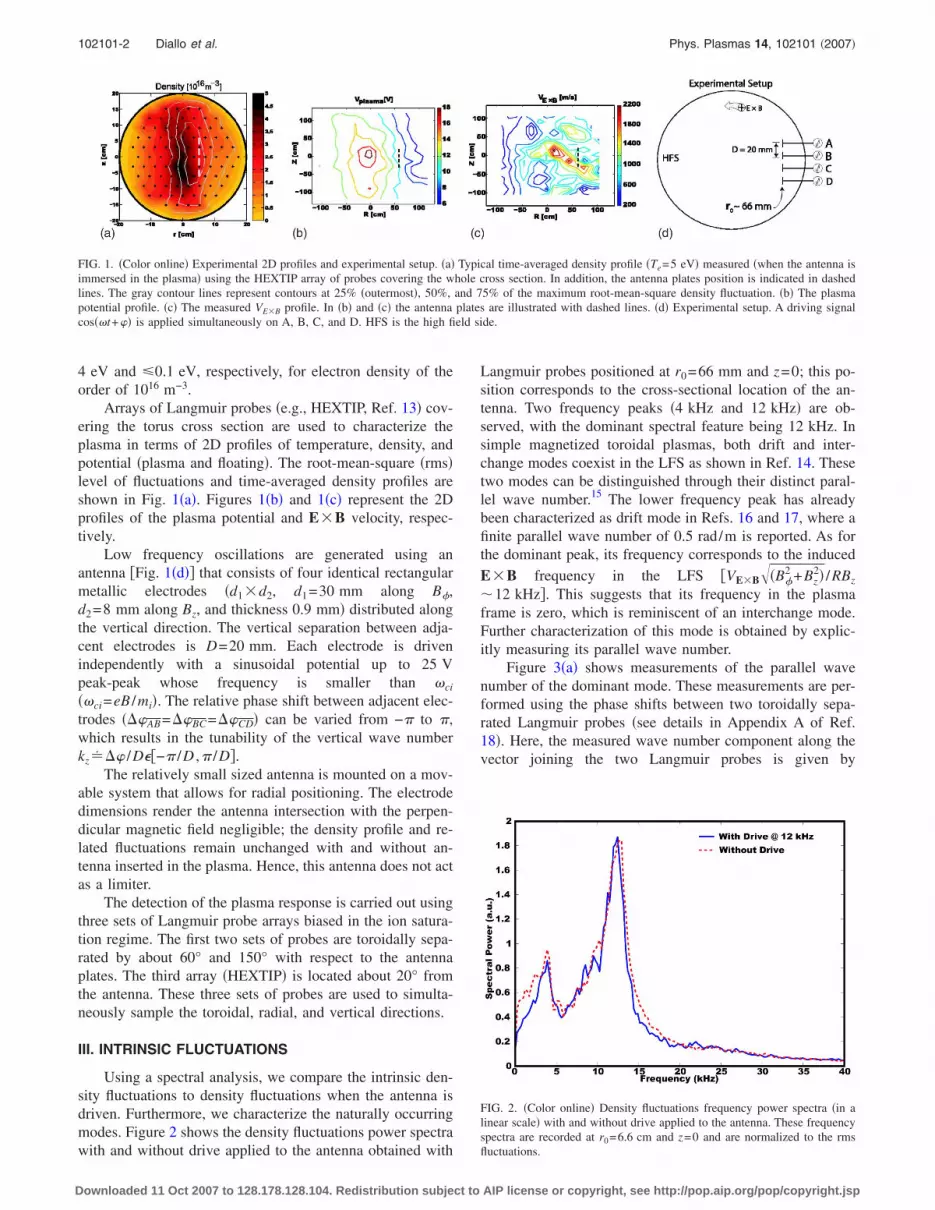
Arrays of Langmuir probes �e.g., HEXTIP, Ref. 13� cov-ering the torus cross section are used to characterize theplasma in terms of 2D profiles of temperature, density, andpotential �plasma and floating�. The root-mean-square �rms�level of fluctuations and time-averaged density profiles areshown in Fig. 1�a�. Figures 1�b� and 1�c� represent the 2Dprofiles of the plasma potential and E�B velocity, respec-tively.
Low frequency oscillations are generated using anantenna �Fig. 1�d�� that consists of four identical rectangularmetallic electrodes �d1�d2, d1=30 mm along B�,d2=8 mm along Bz, and thickness 0.9 mm� distributed alongthe vertical direction. The vertical separation between adja-cent electrodes is D=20 mm. Each electrode is drivenindependently with a sinusoidal potential up to 25 Vpeak-peak whose frequency is smaller than �ci
��ci=eB /mi�. The relative phase shift between adjacent elec-trodes ���AB=��BC=��CD� can be varied from −� to �,which results in the tunability of the vertical wave numberkz��� /D��−� /D ,� /D�.
The relatively small sized antenna is mounted on a mov-able system that allows for radial positioning. The electrodedimensions render the antenna intersection with the perpen-dicular magnetic field negligible; the density profile and re-lated fluctuations remain unchanged with and without an-tenna inserted in the plasma. Hence, this antenna does not actas a limiter.
The detection of the plasma response is carried out usingthree sets of Langmuir probe arrays biased in the ion satura-tion regime. The first two sets of probes are toroidally sepa-rated by about 60° and 150° with respect to the antennaplates. The third array �HEXTIP� is located about 20° fromthe antenna. These three sets of probes are used to simulta-neously sample the toroidal, radial, and vertical directions.
III. INTRINSIC FLUCTUATIONS
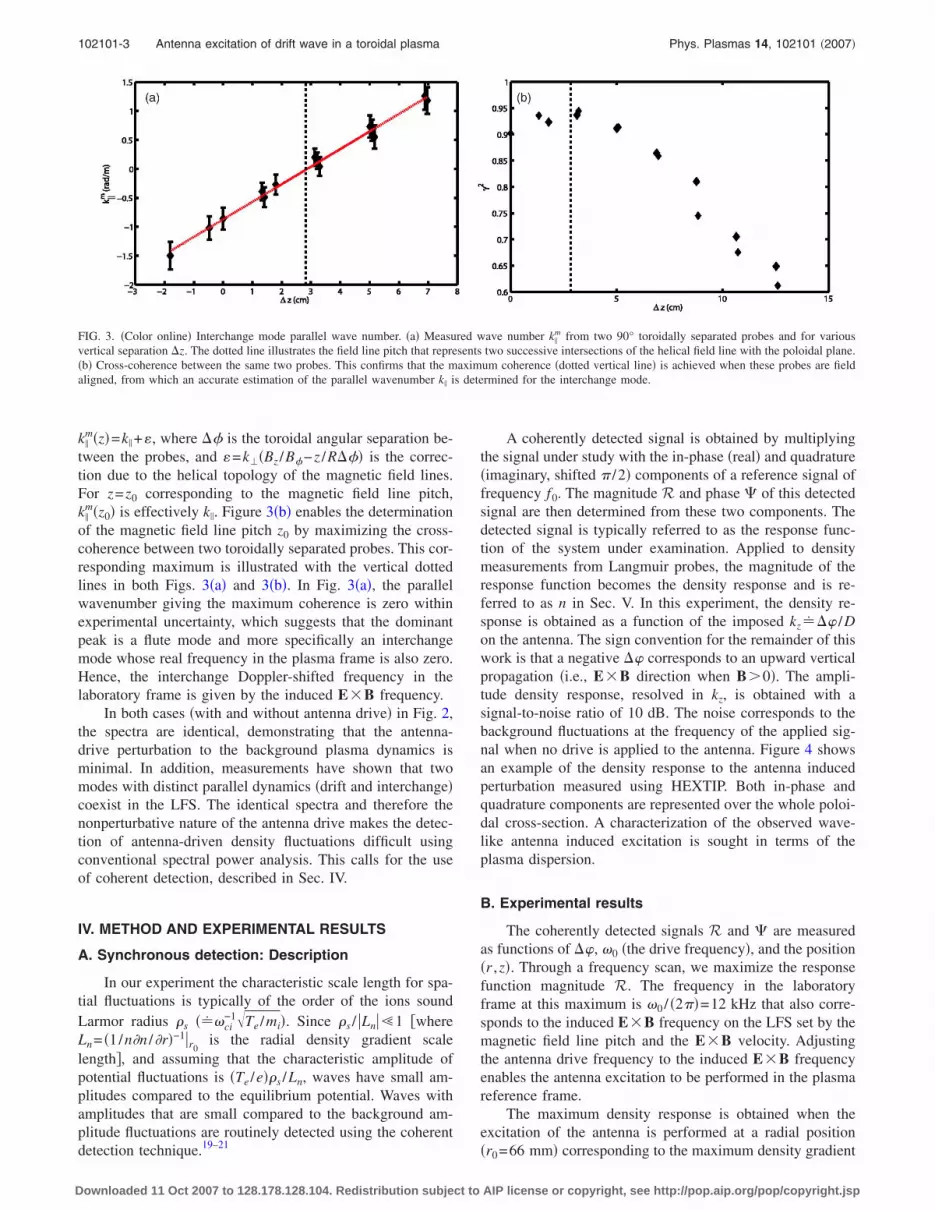
Using a spectral analysis, we compare the intrinsic den-sity fluctuations to density fluctuations when the antenna isdriven. Furthermore, we characterize the naturally occurringmodes. Figure 2 shows the density fluctuations power spectrawith and without drive applied to the antenna obtained with
Langmuir probes positioned at r0=66 mm and z=0; this po-sition corresponds to the cross-sectional location of the an-tenna. Two frequency peaks �4 kHz and 12 kHz� are ob-served, with the dominant spectral feature being 12 kHz. Insimple magnetized toroidal plasmas, both drift and inter-change modes coexist in the LFS as shown in Ref. 14. Thesetwo modes can be distinguished through their distinct paral-lel wave number.15 The lower frequency peak has alreadybeen characterized as drift mode in Refs. 16 and 17, where afinite parallel wave number of 0.5 rad/m is reported. As forthe dominant peak, its frequency corresponds to the inducedE�B frequency in the LFS �VE�B��B�
2 +Bz2� /RBz
�12 kHz�. This suggests that its frequency in the plasmaframe is zero, which is reminiscent of an interchange mode.Further characterization of this mode is obtained by explic-itly measuring its parallel wave number.
Figure 3�a� shows measurements of the parallel wavenumber of the dominant mode. These measurements are per-formed using the phase shifts between two toroidally sepa-rated Langmuir probes �see details in Appendix A of Ref.18�. Here, the measured wave number component along thevector joining the two Langmuir probes is given by
FIG. 1. �Color online� Experimental 2D profiles and experimental setup. �a� Typical time-averaged density profile �Te=5 eV� measured �when the antenna isimmersed in the plasma� using the HEXTIP array of probes covering the whole cross section. In addition, the antenna plates position is indicated in dashedlines. The gray contour lines represent contours at 25% �outermost�, 50%, and 75% of the maximum root-mean-square density fluctuation. �b� The plasmapotential profile. �c� The measured VE�B profile. In �b� and �c� the antenna plates are illustrated with dashed lines. �d� Experimental setup. A driving signalcos��t+�� is applied simultaneously on A, B, C, and D. HFS is the high field side.
FIG. 2. �Color online� Density fluctuations frequency power spectra �in alinear scale� with and without drive applied to the antenna. These frequencyspectra are recorded at r0=6.6 cm and z=0 and are normalized to the rmsfluctuations.
102101-2 Diallo et al. Phys. Plasmas 14, 102101 �2007�
Downloaded 11 Oct 2007 to 128.178.128.104. Redistribution subject to AIP license or copyright, see http://pop.aip.org/pop/copyright.jsp
k�m�z�=k� +, where �� is the toroidal angular separation be-
tween the probes, and =k��Bz /B�−z /R��� is the correc-tion due to the helical topology of the magnetic field lines.For z=z0 corresponding to the magnetic field line pitch,k�
m�z0� is effectively k�. Figure 3�b� enables the determinationof the magnetic field line pitch z0 by maximizing the cross-coherence between two toroidally separated probes. This cor-responding maximum is illustrated with the vertical dottedlines in both Figs. 3�a� and 3�b�. In Fig. 3�a�, the parallelwavenumber giving the maximum coherence is zero withinexperimental uncertainty, which suggests that the dominantpeak is a flute mode and more specifically an interchangemode whose real frequency in the plasma frame is also zero.Hence, the interchange Doppler-shifted frequency in thelaboratory frame is given by the induced E�B frequency.
In both cases �with and without antenna drive� in Fig. 2,the spectra are identical, demonstrating that the antenna-drive perturbation to the background plasma dynamics isminimal. In addition, measurements have shown that twomodes with distinct parallel dynamics �drift and interchange�coexist in the LFS. The identical spectra and therefore thenonperturbative nature of the antenna drive makes the detec-tion of antenna-driven density fluctuations difficult usingconventional spectral power analysis. This calls for the useof coherent detection, described in Sec. IV.
IV. METHOD AND EXPERIMENTAL RESULTS
A. Synchronous detection: Description
In our experiment the characteristic scale length for spa-tial fluctuations is typically of the order of the ions soundLarmor radius s ���ci
−1�Te /mi�. Since s / �Ln��1 �whereLn= �1/n�n /�r�−1�r0
is the radial density gradient scalelength�, and assuming that the characteristic amplitude ofpotential fluctuations is �Te /e�s /Ln, waves have small am-plitudes compared to the equilibrium potential. Waves withamplitudes that are small compared to the background am-plitude fluctuations are routinely detected using the coherentdetection technique.19–21
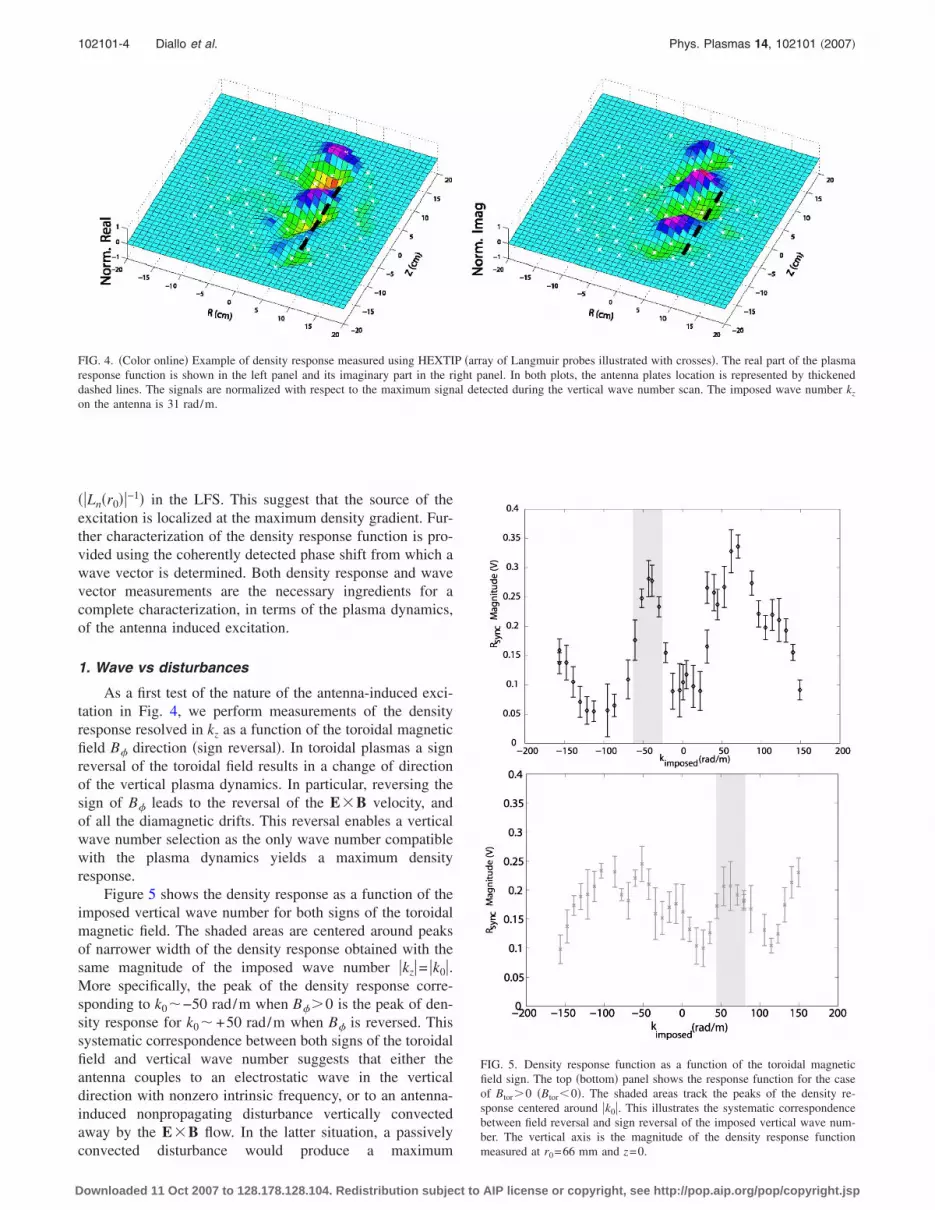
A coherently detected signal is obtained by multiplyingthe signal under study with the in-phase �real� and quadrature�imaginary, shifted � /2� components of a reference signal offrequency f0. The magnitude R and phase � of this detectedsignal are then determined from these two components. Thedetected signal is typically referred to as the response func-tion of the system under examination. Applied to densitymeasurements from Langmuir probes, the magnitude of theresponse function becomes the density response and is re-ferred to as n in Sec. V. In this experiment, the density re-sponse is obtained as a function of the imposed kz��� /Don the antenna. The sign convention for the remainder of thiswork is that a negative �� corresponds to an upward verticalpropagation �i.e., E�B direction when B 0�. The ampli-tude density response, resolved in kz, is obtained with asignal-to-noise ratio of 10 dB. The noise corresponds to thebackground fluctuations at the frequency of the applied sig-nal when no drive is applied to the antenna. Figure 4 showsan example of the density response to the antenna inducedperturbation measured using HEXTIP. Both in-phase andquadrature components are represented over the whole poloi-dal cross-section. A characterization of the observed wave-like antenna induced excitation is sought in terms of theplasma dispersion.
B. Experimental results
The coherently detected signals R and � are measuredas functions of ��, �0 �the drive frequency�, and the position�r ,z�. Through a frequency scan, we maximize the responsefunction magnitude R. The frequency in the laboratoryframe at this maximum is �0 / �2��=12 kHz that also corre-sponds to the induced E�B frequency on the LFS set by themagnetic field line pitch and the E�B velocity. Adjustingthe antenna drive frequency to the induced E�B frequencyenables the antenna excitation to be performed in the plasmareference frame.
The maximum density response is obtained when theexcitation of the antenna is performed at a radial position�r0=66 mm� corresponding to the maximum density gradient
FIG. 3. �Color online� Interchange mode parallel wave number. �a� Measured wave number k�m from two 90° toroidally separated probes and for various
vertical separation �z. The dotted line illustrates the field line pitch that represents two successive intersections of the helical field line with the poloidal plane.�b� Cross-coherence between the same two probes. This confirms that the maximum coherence �dotted vertical line� is achieved when these probes are fieldaligned, from which an accurate estimation of the parallel wavenumber k� is determined for the interchange mode.
102101-3 Antenna excitation of drift wave in a toroidal plasma Phys. Plasmas 14, 102101 �2007�
Downloaded 11 Oct 2007 to 128.178.128.104. Redistribution subject to AIP license or copyright, see http://pop.aip.org/pop/copyright.jsp
��Ln�r0��−1� in the LFS. This suggest that the source of theexcitation is localized at the maximum density gradient. Fur-ther characterization of the density response function is pro-vided using the coherently detected phase shift from which awave vector is determined. Both density response and wavevector measurements are the necessary ingredients for acomplete characterization, in terms of the plasma dynamics,of the antenna induced excitation.
1. Wave vs disturbances
As a first test of the nature of the antenna-induced exci-tation in Fig. 4, we perform measurements of the densityresponse resolved in kz as a function of the toroidal magneticfield B� direction �sign reversal�. In toroidal plasmas a signreversal of the toroidal field results in a change of directionof the vertical plasma dynamics. In particular, reversing thesign of B� leads to the reversal of the E�B velocity, andof all the diamagnetic drifts. This reversal enables a verticalwave number selection as the only wave number compatiblewith the plasma dynamics yields a maximum densityresponse.
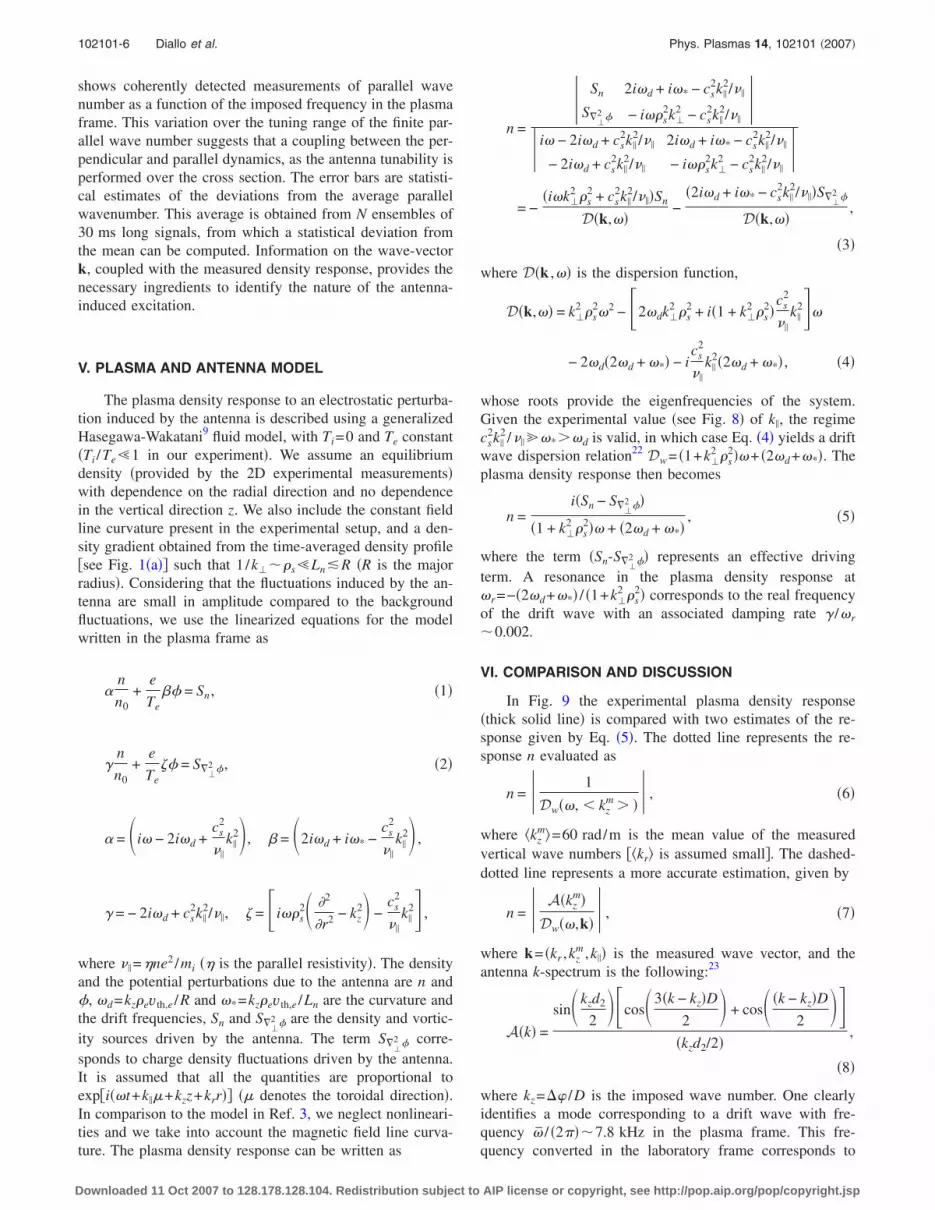
Figure 5 shows the density response as a function of theimposed vertical wave number for both signs of the toroidalmagnetic field. The shaded areas are centered around peaksof narrower width of the density response obtained with thesame magnitude of the imposed wave number �kz�= �k0�.More specifically, the peak of the density response corre-sponding to k0�−50 rad/m when B� 0 is the peak of den-sity response for k0� +50 rad/m when B� is reversed. Thissystematic correspondence between both signs of the toroidalfield and vertical wave number suggests that either theantenna couples to an electrostatic wave in the verticaldirection with nonzero intrinsic frequency, or to an antenna-induced nonpropagating disturbance vertically convectedaway by the E�B flow. In the latter situation, a passivelyconvected disturbance would produce a maximum
FIG. 4. �Color online� Example of density response measured using HEXTIP �array of Langmuir probes illustrated with crosses�. The real part of the plasmaresponse function is shown in the left panel and its imaginary part in the right panel. In both plots, the antenna plates location is represented by thickeneddashed lines. The signals are normalized with respect to the maximum signal detected during the vertical wave number scan. The imposed wave number kz
on the antenna is 31 rad/m.
FIG. 5. Density response function as a function of the toroidal magneticfield sign. The top �bottom� panel shows the response function for the caseof Btor 0 �Btor�0�. The shaded areas track the peaks of the density re-sponse centered around �k0�. This illustrates the systematic correspondencebetween field reversal and sign reversal of the imposed vertical wave num-ber. The vertical axis is the magnitude of the density response functionmeasured at r0=66 mm and z=0.
102101-4 Diallo et al. Phys. Plasmas 14, 102101 �2007�
Downloaded 11 Oct 2007 to 128.178.128.104. Redistribution subject to AIP license or copyright, see http://pop.aip.org/pop/copyright.jsp

density response corresponding to the zero frequency��0−VE�B
�B�2 +Bz
2 /RBz=0� in the plasma frame, and wouldnot be affected by any imposed vertical wave number. Sincethis density response did not result �as described in the Sec.V�, the latter characterization is ruled out. The sign reversalapproach is similar to the Ref. 3 co-rotating and counterrotating approach, except that in our experiment this testconfirms the toroidal field sign dependence in the couplingmechanism. The suggestion that the antenna couples to anelectrostatic wave leads to a second test which requires fur-ther analysis of the response function in terms of the disper-sion relation supported by the plasma dynamics.
2. Antenna excitation induced wave vector
The response function phase � is obtained using a lineararray of closely spaced �18 mm� Langmuir probes thatsample the vertical direction. Figure 6 shows an example ofthe phase shift measured at different vertically separated po-sitions, as well as the associated magnitude of the densityresponse. From these measured phase shifts, we determinethe vertical wave number which we refer to as kz
m. This wavenumber is selected by a combination of the plasma dynamicsand the antenna k-spectrum. We extend this technique to de-termine the other components of the excitation induced wavevector �radial wave number �kr� and the parallel wave num-ber �k��� using another set of Langmuir probes that samplesthe radial and the toroidal directions �see Sec. II for descrip-tion�. Figure 7 shows measurements of the radial and verticalwave numbers as a function of the imposed frequency in the
plasma frame from which we determine k�=��kzm�2+kr
2. Inthis figure one clearly sees that kr is much smaller than kz
m.The parallel wave number is obtained between two field-
aligned Langmuir probes �described in Sec. III� whose rela-tive toroidal separation is 90°. This field-alignment is veri-fied by determining the maximum coherence in the densityresponse measured between these two probes.18 Figure 8
FIG. 6. Example of phase measurements. Synchronously detected densityresponse �magnitude and phase� is obtained using a linear array of Langmuirprobes. This array samples a vertical strip in the E�B direction for the casewith �̄ / �2��= ��0-kzVE�B� / �2���28 kHz ��0 / �2�� is the drive frequencyand VE�B at the antenna position is �1.1 km/s, see Fig. 1�c��. The slope ofthe bottom plot is the vertical wave number.
FIG. 7. Perpendicular wave number measurements. The top panel shows themeasured radial wave number and the bottom panel the measured verticalwave number as a function of the Doppler-shifted frequency �̄ / �2��. Thevelocity E�B is determined from Fig. 1�c�.
FIG. 8. Coherently detected parallel wave number. This wave number isdetermined by using two toroidally field-aligned Langmuir probes.
102101-5 Antenna excitation of drift wave in a toroidal plasma Phys. Plasmas 14, 102101 �2007�
Downloaded 11 Oct 2007 to 128.178.128.104. Redistribution subject to AIP license or copyright, see http://pop.aip.org/pop/copyright.jsp
shows coherently detected measurements of parallel wavenumber as a function of the imposed frequency in the plasmaframe. This variation over the tuning range of the finite par-allel wave number suggests that a coupling between the per-pendicular and parallel dynamics, as the antenna tunability isperformed over the cross section. The error bars are statisti-cal estimates of the deviations from the average parallelwavenumber. This average is obtained from N ensembles of30 ms long signals, from which a statistical deviation fromthe mean can be computed. Information on the wave-vectork, coupled with the measured density response, provides thenecessary ingredients to identify the nature of the antenna-induced excitation.
V. PLASMA AND ANTENNA MODEL
The plasma density response to an electrostatic perturba-tion induced by the antenna is described using a generalizedHasegawa-Wakatani9 fluid model, with Ti=0 and Te constant�Ti /Te�1 in our experiment�. We assume an equilibriumdensity �provided by the 2D experimental measurements�with dependence on the radial direction and no dependencein the vertical direction z. We also include the constant fieldline curvature present in the experimental setup, and a den-sity gradient obtained from the time-averaged density profile�see Fig. 1�a�� such that 1 /k��s�Ln�R �R is the majorradius�. Considering that the fluctuations induced by the an-tenna are small in amplitude compared to the backgroundfluctuations, we use the linearized equations for the modelwritten in the plasma frame as
�n
n0+
e
Te�� = Sn, �1�
�n
n0+
e
Te�� = S�
�2 �, �2�
� = i� − 2i�d +cs
2
��
k�2, � = 2i�d + i�* −
cs2
��
k�2 ,
� = − 2i�d + cs2k�
2/��, � = �i�s2 �2
�r2 − kz2 −
cs2
��
k�2� ,
where �� =�ne2 /mi �� is the parallel resistivity�. The densityand the potential perturbations due to the antenna are n and�, �d=kzevth,e /R and �*=kzevth,e /Ln are the curvature andthe drift frequencies, Sn and S�
�2 � are the density and vortic-
ity sources driven by the antenna. The term S��2 � corre-
sponds to charge density fluctuations driven by the antenna.It is assumed that all the quantities are proportional toexp�i��t+k��+kzz+krr�� �� denotes the toroidal direction�.In comparison to the model in Ref. 3, we neglect nonlineari-ties and we take into account the magnetic field line curva-ture. The plasma density response can be written as
n =
Sn 2i�d + i�* − cs2k�
2/��
S��2 � − i�s
2k�2 − cs
2k�2/��
i� − 2i�d + cs
2k�2/�� 2i�d + i�* − cs
2k�2/��
− 2i�d + cs2k�
2/�� − i�s2k�
2 − cs2k�
2/��
= −
�i�k�2 s
2 + cs2k�
2/���Sn
D�k,��−
�2i�d + i�* − cs2k�
2/���S��2 �
D�k,��,
�3�
where D�k ,�� is the dispersion function,
D�k,�� = k�2 s
2�2 − �2�dk�2 s
2 + i�1 + k�2 s
2�cs
2
��
k�2��
− 2�d�2�d + �*� − ics
2
��
k�2�2�d + �*� , �4�
whose roots provide the eigenfrequencies of the system.Given the experimental value �see Fig. 8� of k�, the regimecs
2k�2 /�� ��* �d is valid, in which case Eq. �4� yields a drift
wave dispersion relation22 Dw= �1+k�2 s
2��+ �2�d+�*�. Theplasma density response then becomes
n =i�Sn − S�
�2 ��
�1 + k�2 s
2�� + �2�d + �*�, �5�
where the term �Sn-S��2 �� represents an effective driving
term. A resonance in the plasma density response at�r=−�2�d+�*� / �1+k�
2 s2� corresponds to the real frequency
of the drift wave with an associated damping rate � /�r
�0.002.
VI. COMPARISON AND DISCUSSION
In Fig. 9 the experimental plasma density response�thick solid line� is compared with two estimates of the re-sponse given by Eq. �5�. The dotted line represents the re-sponse n evaluated as
n = 1
Dw��, � kzm � , �6�
where �kzm�=60 rad/m is the mean value of the measured
vertical wave numbers ��kr� is assumed small�. The dashed-dotted line represents a more accurate estimation, given by
n = A�kzm�
Dw��,k� , �7�
where k= �kr ,kzm ,k�� is the measured wave vector, and the
antenna k-spectrum is the following:23
A�k� =
sin kzd2
2�cos3�k − kz�D
2 + cos �k − kz�D
2�
�kzd2/2�,
�8�
where kz=�� /D is the imposed wave number. One clearlyidentifies a mode corresponding to a drift wave with fre-quency �̄ / �2���7.8 kHz in the plasma frame. This fre-quency converted in the laboratory frame corresponds to
102101-6 Diallo et al. Phys. Plasmas 14, 102101 �2007�
Downloaded 11 Oct 2007 to 128.178.128.104. Redistribution subject to AIP license or copyright, see http://pop.aip.org/pop/copyright.jsp
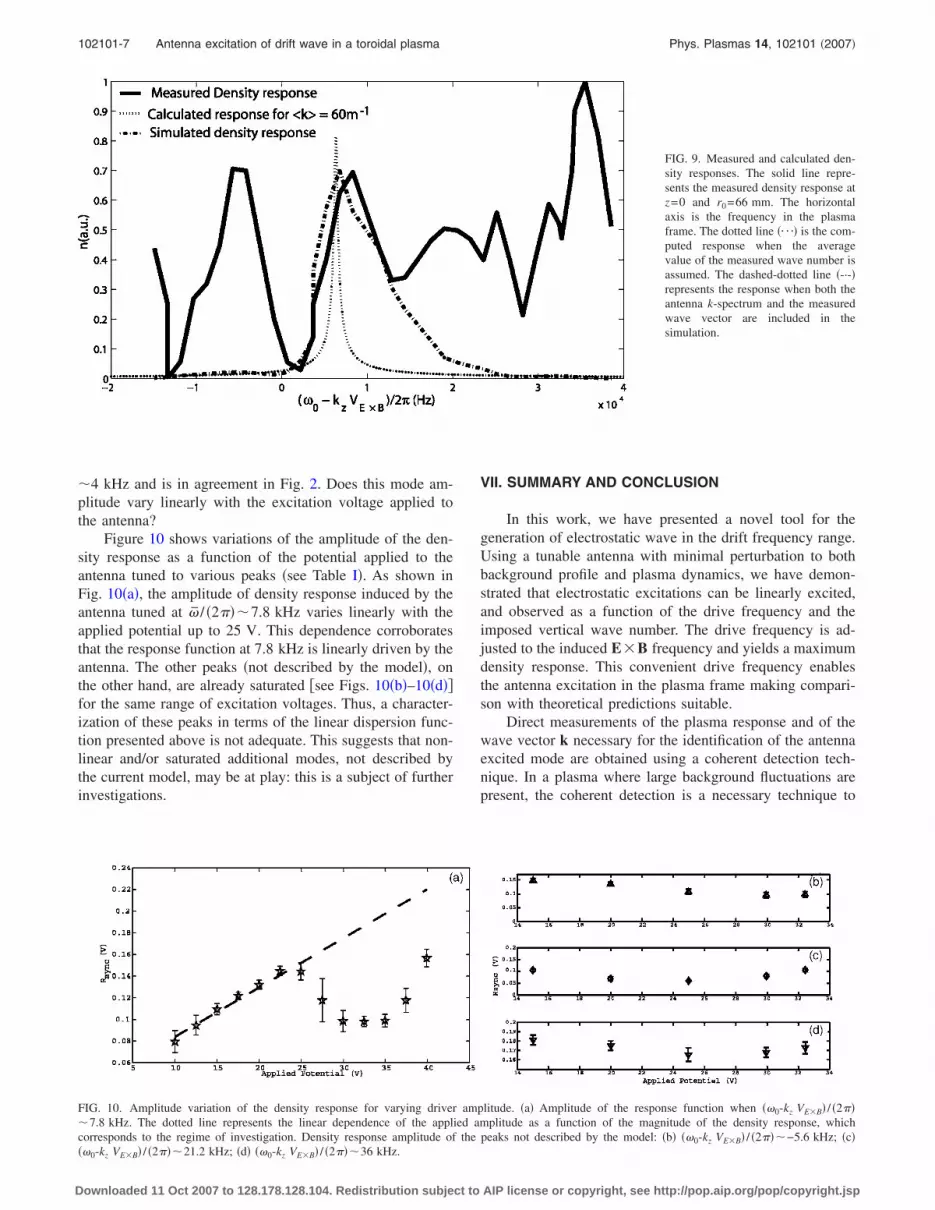
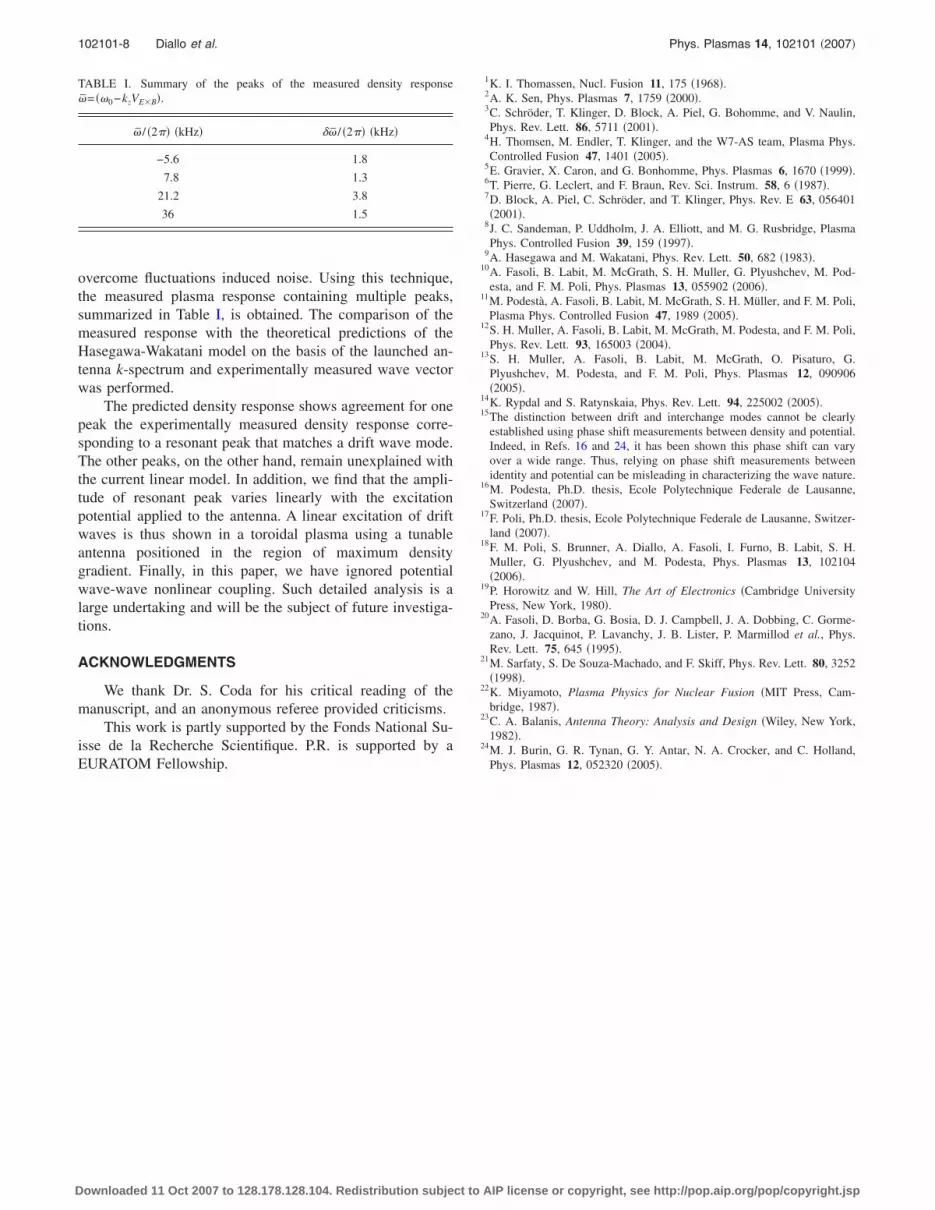
�4 kHz and is in agreement in Fig. 2. Does this mode am-plitude vary linearly with the excitation voltage applied tothe antenna?
Figure 10 shows variations of the amplitude of the den-sity response as a function of the potential applied to theantenna tuned to various peaks �see Table I�. As shown inFig. 10�a�, the amplitude of density response induced by theantenna tuned at �̄ / �2���7.8 kHz varies linearly with theapplied potential up to 25 V. This dependence corroboratesthat the response function at 7.8 kHz is linearly driven by theantenna. The other peaks �not described by the model�, onthe other hand, are already saturated �see Figs. 10�b�–10�d��for the same range of excitation voltages. Thus, a character-ization of these peaks in terms of the linear dispersion func-tion presented above is not adequate. This suggests that non-linear and/or saturated additional modes, not described bythe current model, may be at play: this is a subject of furtherinvestigations.
VII. SUMMARY AND CONCLUSION
In this work, we have presented a novel tool for thegeneration of electrostatic wave in the drift frequency range.Using a tunable antenna with minimal perturbation to bothbackground profile and plasma dynamics, we have demon-strated that electrostatic excitations can be linearly excited,and observed as a function of the drive frequency and theimposed vertical wave number. The drive frequency is ad-justed to the induced E�B frequency and yields a maximumdensity response. This convenient drive frequency enablesthe antenna excitation in the plasma frame making compari-son with theoretical predictions suitable.
Direct measurements of the plasma response and of thewave vector k necessary for the identification of the antennaexcited mode are obtained using a coherent detection tech-nique. In a plasma where large background fluctuations arepresent, the coherent detection is a necessary technique to
FIG. 9. Measured and calculated den-sity responses. The solid line repre-sents the measured density response atz=0 and r0=66 mm. The horizontalaxis is the frequency in the plasmaframe. The dotted line �¯� is the com-puted response when the averagevalue of the measured wave number isassumed. The dashed-dotted line �-·-�represents the response when both theantenna k-spectrum and the measuredwave vector are included in thesimulation.
FIG. 10. Amplitude variation of the density response for varying driver amplitude. �a� Amplitude of the response function when ��0-kz VE�B� / �2���7.8 kHz. The dotted line represents the linear dependence of the applied amplitude as a function of the magnitude of the density response, whichcorresponds to the regime of investigation. Density response amplitude of the peaks not described by the model: �b� ��0-kz VE�B� / �2���−5.6 kHz; �c���0-kz VE�B� / �2���21.2 kHz; �d� ��0-kz VE�B� / �2���36 kHz.
102101-7 Antenna excitation of drift wave in a toroidal plasma Phys. Plasmas 14, 102101 �2007�
Downloaded 11 Oct 2007 to 128.178.128.104. Redistribution subject to AIP license or copyright, see http://pop.aip.org/pop/copyright.jsp
overcome fluctuations induced noise. Using this technique,the measured plasma response containing multiple peaks,summarized in Table I, is obtained. The comparison of themeasured response with the theoretical predictions of theHasegawa-Wakatani model on the basis of the launched an-tenna k-spectrum and experimentally measured wave vectorwas performed.
The predicted density response shows agreement for onepeak the experimentally measured density response corre-sponding to a resonant peak that matches a drift wave mode.The other peaks, on the other hand, remain unexplained withthe current linear model. In addition, we find that the ampli-tude of resonant peak varies linearly with the excitationpotential applied to the antenna. A linear excitation of driftwaves is thus shown in a toroidal plasma using a tunableantenna positioned in the region of maximum densitygradient. Finally, in this paper, we have ignored potentialwave-wave nonlinear coupling. Such detailed analysis is alarge undertaking and will be the subject of future investiga-tions.
ACKNOWLEDGMENTS
We thank Dr. S. Coda for his critical reading of themanuscript, and an anonymous referee provided criticisms.
This work is partly supported by the Fonds National Su-isse de la Recherche Scientifique. P.R. is supported by aEURATOM Fellowship.
1K. I. Thomassen, Nucl. Fusion 11, 175 �1968�.2A. K. Sen, Phys. Plasmas 7, 1759 �2000�.3C. Schröder, T. Klinger, D. Block, A. Piel, G. Bohomme, and V. Naulin,Phys. Rev. Lett. 86, 5711 �2001�.
4H. Thomsen, M. Endler, T. Klinger, and the W7-AS team, Plasma Phys.Controlled Fusion 47, 1401 �2005�.
5E. Gravier, X. Caron, and G. Bonhomme, Phys. Plasmas 6, 1670 �1999�.6T. Pierre, G. Leclert, and F. Braun, Rev. Sci. Instrum. 58, 6 �1987�.7D. Block, A. Piel, C. Schröder, and T. Klinger, Phys. Rev. E 63, 056401�2001�.
8J. C. Sandeman, P. Uddholm, J. A. Elliott, and M. G. Rusbridge, PlasmaPhys. Controlled Fusion 39, 159 �1997�.
9A. Hasegawa and M. Wakatani, Phys. Rev. Lett. 50, 682 �1983�.10A. Fasoli, B. Labit, M. McGrath, S. H. Muller, G. Plyushchev, M. Pod-
esta, and F. M. Poli, Phys. Plasmas 13, 055902 �2006�.11M. Podestà, A. Fasoli, B. Labit, M. McGrath, S. H. Müller, and F. M. Poli,
Plasma Phys. Controlled Fusion 47, 1989 �2005�.12S. H. Muller, A. Fasoli, B. Labit, M. McGrath, M. Podesta, and F. M. Poli,
Phys. Rev. Lett. 93, 165003 �2004�.13S. H. Muller, A. Fasoli, B. Labit, M. McGrath, O. Pisaturo, G.
Plyushchev, M. Podesta, and F. M. Poli, Phys. Plasmas 12, 090906�2005�.
14K. Rypdal and S. Ratynskaia, Phys. Rev. Lett. 94, 225002 �2005�.15The distinction between drift and interchange modes cannot be clearly
established using phase shift measurements between density and potential.Indeed, in Refs. 16 and 24, it has been shown this phase shift can varyover a wide range. Thus, relying on phase shift measurements betweenidentity and potential can be misleading in characterizing the wave nature.
16M. Podesta, Ph.D. thesis, Ecole Polytechnique Federale de Lausanne,Switzerland �2007�.
17F. Poli, Ph.D. thesis, Ecole Polytechnique Federale de Lausanne, Switzer-land �2007�.
18F. M. Poli, S. Brunner, A. Diallo, A. Fasoli, I. Furno, B. Labit, S. H.Muller, G. Plyushchev, and M. Podesta, Phys. Plasmas 13, 102104�2006�.
19P. Horowitz and W. Hill, The Art of Electronics �Cambridge UniversityPress, New York, 1980�.
20A. Fasoli, D. Borba, G. Bosia, D. J. Campbell, J. A. Dobbing, C. Gorme-zano, J. Jacquinot, P. Lavanchy, J. B. Lister, P. Marmillod et al., Phys.Rev. Lett. 75, 645 �1995�.
21M. Sarfaty, S. De Souza-Machado, and F. Skiff, Phys. Rev. Lett. 80, 3252�1998�.
22K. Miyamoto, Plasma Physics for Nuclear Fusion �MIT Press, Cam-bridge, 1987�.
23C. A. Balanis, Antenna Theory: Analysis and Design �Wiley, New York,1982�.
24M. J. Burin, G. R. Tynan, G. Y. Antar, N. A. Crocker, and C. Holland,Phys. Plasmas 12, 052320 �2005�.
TABLE I. Summary of the peaks of the measured density response�̄= ��0−kzVE�B�.
�̄ / �2�� �kHz� ��̄ / �2�� �kHz�
−5.6 1.8
7.8 1.3
21.2 3.8
36 1.5
102101-8 Diallo et al. Phys. Plasmas 14, 102101 �2007�
Downloaded 11 Oct 2007 to 128.178.128.104. Redistribution subject to AIP license or copyright, see http://pop.aip.org/pop/copyright.jsp