anomalous motion illusion contributes to visual preference
TRANSCRIPT
ORIGINAL RESEARCH ARTICLEpublished: 29 November 2012
doi: 10.3389/fpsyg.2012.00528
Anomalous motion illusion contributes to visual preferenceJasmina Stevanov 1*, Branka Spehar 2, Hiroshi Ashida3 and Akiyoshi Kitaoka1
1 Faculty of Letters, Department of Psychology, Ritsumeikan University, Kyoto, Japan2 School of Psychology, University of New South Wales, Sydney, NSW, Australia3 Department of Psychology, Graduate School of Letters, Kyoto University, Kyoto, Japan
Edited by:Frans Verstraten, The University ofSydney, Australia
Reviewed by:Rob V. Lier, Donders Institute,NetherlandsMaarten Van Der Smagt, UtrechtUniversity, Netherlands
*Correspondence:Jasmina Stevanov , Faculty of Letters,Department of Psychology,Ritsumeikan University, 56-1 Toji-inKitamachi, Kita-ku, Kyoto 603-8577,Japan.e-mail: [email protected]
This study investigated the relationship between the magnitude of illusory motion in thevariants of the “Rotating Snakes” pattern and the visual preference among such patterns.In Experiment 1 we manipulated the outer contour and the internal geometrical structureof the figure to test for corresponding modulations in the perceived illusion magnitude.Thestrength of illusory motion was estimated by the method of adjustment where the speed ofa standard moving figure was matched to the speed of the perceived illusory motion in testfigures. We observed modulation of the perceived strength of illusory motion congruentwith our geometrical manipulations. In Experiment 2, we directly compared the magni-tude of the perceived illusory motion and the preference for these patterns by a methodof paired comparison. Images differing in illusion magnitude showed corresponding differ-ences in the reported preference for these patterns. In addition, further analysis revealedthat the geometry and lower level image characteristics also substantially contributed tothe observed preference ratings. Together these results support the idea that presence ofillusory effect and geometrical characteristics determine affective preference for images,as they may be regarded as more interesting, surprising, or fascinating.
Keywords: motion illusion, esthetic preference, illusion magnitude, geometry of patterns
INTRODUCTIONWhile the investigations of artworks and other estheticallydesigned objects have dominated the area of experimental esthet-ics, many other visual experiences can, in addition, be consideredas visually interesting, pleasant, and fascinating as well as emo-tionally evocative. Extending back over centuries, the intriguingproperties of visual illusions in particular have attracted attentionof ancient thinkers, philosophers, art impressionists, op artists, andcontemporary artistic illusionists (Wade, 2005). People are gener-ally fascinated or moved by various visual illusory effects, and itseems that such experiences are both perceptually and emotionallyrewarding.
There has been a considerable amount of conceptual confusionin empirical esthetics regarding a priori definitions of esthetic pref-erence, esthetic judgment, and esthetic experience. In the presentstudy, we will use the term“visual preference”interchangeably withthe term “esthetic preference.” McWhinnie’s (1968) definition ofesthetic preference, which is widely accepted among researchers,refers to the degree with which people like a particular visualstimulus, how they rate “its” beauty or how much they prefer itto another. Since the word “esthetic” sometimes denote “artistic”meaning and sometimes denote “pleasantness” or “attractiveness,”we opted for more neutral term “visual preference.”
Noguchi (2003) studied the visual preference of several geo-metrical illusions: Oppel–Kundt grid and concentric circles,Helmholtz radials, the Delboeuf illusion, the Morinaga–Noguchiillusion, the Ehrenstein figure, and the Kanizsa–Noguchi square.His study revealed a strong correlation between affective and per-ceptual judgments, i.e., strong affective preference occurred withstrong illusory effects.
In our recent study (Stevanov et al., 2012) we tried to cover awider range of illusory patterns and measure esthetic and affectivecontribution of illusion to the preference of such visual patterns.We used geometrical illusions (e.g., the Luckiesh pattern), light-ness illusions (e.g., the Anderson illusion, the enhanced Cornsweeteffect), motion illusion (the Rotating snakes illusion), as well asother related illusory phenomena, such as ambiguous figures (e.g.,the Necker cube, the Angel columns figure – ground reversiblefigure, the Frog-Horse figure) and impossible figures (e.g., Pen-rose’s triangle). Each of the illusory patterns was studied in itsintact version as well as in modified version that was intendedto produce a weakened strength of illusion (weak illusory vari-ant). Our results were consistent with the same general pattern asobserved by Noguchi: illusory patterns were esthetically preferredover their reduced-or-non-illusory counterparts. One exception tothis pattern was the Rotating Snakes illusion (Kitaoka, 2008a,b),where, surprisingly, changes in the magnitude of motion illusionwere unrelated to their esthetic preference. We speculated that theabundant richness and colorfulness of the figure pattern, present inboth the weak and strong illusory variants, might have masked thedifferences between the illusory and non-illusory counterparts,compared to, arguably, “less colorful” remaining experimentalstimuli. Another possible reason comes from certain limitationsof the method used. Changes in illusion magnitude were intro-duced in a binary fashion: observers compared two figures, one ofwhich had no illusory motion and the other which induced illu-sory motion. This method is particularly appropriate when only afew discrete interpretations exist, e.g., bi-stable ambiguous images,impossible figures, or figure-ground reversible images. In con-trast, anomalous motion illusions have arguably more continuous
www.frontiersin.org November 2012 | Volume 3 | Article 528 | 1

Stevanov et al. Motion illusion and esthetic preference
illusion strength and may require more sensitive measures ofreported esthetic preference.
Since anomalous motion illusions in general are relatively newas compared to others, it is worthwhile to look more closely howthese illusory patterns affect preference. Across two experiments,the present study focused on parametric changes in the perceivedmagnitude of the Rotating Snakes illusion, and how these changesmight be associated with the level of visual preference. To thisaim, we need precise quantification of the illusion magnitudesto ensure that the differences are significant and that the set ofstimuli reflects a certain gradient in perceived illusion strength.In Experiment 1, we introduced geometrical manipulations of theoriginal illusory pattern and measured the illusion strength by themethod of adjustment: the speed of the standard moving figurewas matched to the speed of the perceived illusory motion intest figures. The expected modulation of the illusion strength wasconfirmed as geometry was manipulated, and in Experiment 2, weprobed the relationship between the illusion magnitude and thevisual preference. Experiment 2 used a set of stimuli chosen fromthe previous experiment and utilized a method of paired compar-isons to establish concurrent and more comparable measures ofthe illusion magnitude and visual preference.
EXPERIMENT 1There are a variety of static images that induce illusory motion;some triggering illusory motion spontaneously while othersrequire movement of the retinal image (Kitaoka and Ashida, 2007).Fraser and Wilcox (1979) designed a motion illusion with repeatedsequences of a sawtooth luminance profile filling up the shape of aspiral. The“Rotating Snakes” illusion (Kitaoka, 2003), which couldbe considered an enhanced version of the Fraser–Wilcox illusion(Kitaoka and Ashida, 2003; Backus and Oruç, 2005; Kitaoka, 2007),enforces consistent direction of illusory motion, with subunitsof stepwise luminance changes (black-dark gray-white-light gray)placed along the circumference of multiple concentric circles.
The basic pattern used in the current study is a simplifiedversion of the “Rotating Snakes” and is classified as OptimizedFraser–Wilcox illusion type IIa (Kitaoka, 2006, 2007), which ishereinafter referred to as the “simplified Rotating Snakes” illu-sion. Previous studies identified many important properties thataffect illusion magnitude (for review see Backus and Oruç, 2005;Conway et al., 2005), among which it was shown that contrastchanges strongly affect perceived illusion strength. However, tofit the purpose of this study, we need simple manipulations thatcan modulate the illusion magnitude without changing the con-trast that could greatly affect preference judgments regardless ofillusion magnitude. Therefore, we changed the geometry of thepattern in the figures with minimum changes to the micropat-terns. There is anecdotal evidence that the illusion is strongerwhen the color patches are arranged circularly, or possibly radiallyorganized in comparison to the columnar and other arrange-ments (Fermüller et al., 2010). Thus the outer contour and theinner layout of micropatterns were independently deformed to bebetween square-columnar and circle-radial arrangement, and wetested whether a decrease in illusion magnitude is better predictedby internal area- or contour-related changes. In Experiment 1,we measured the magnitude of illusory motion by the method of
adjustment where the speed of the standard moving figure wasmatched to the speed of the perceived illusory motion in testfigures. Modulation of illusion magnitude was confirmed as thegeometry was manipulated.
MATERIALS AND METHODSParticipantsTwenty-nine students of psychology at the University of Bel-grade (aged between 19 and 22) participated in the experiment.All participants signed informed consent for voluntary participa-tion in exchange for the course credits. Participants had normalor corrected-to-normal vision. Before the experimental trials, wepresented participants with green-purple version of the “simpli-fied Rotating Snakes” illusion (Kitaoka, 2006, 2007) and all of theparticipants reported that they saw disks rotating in the expecteddirections.
StimuliWe used a“simplified Rotating Snakes”pattern that was introducedby Kitaoka (2006; 2007; Figure 1). Each subunit has areas of dif-ferent luminance levels; a thin area of black or white (the darkestor the lightest) is flanked by thicker areas of yellow and blue.
For convenience, we draw auxiliary radii lines along which thecolor segments are placed (Figure 1B). In this way the patterngeometry can be defined as a function of the circle radius.
If we move the center of the red auxiliary radii lines down(going from Figures 2A–I), the curvature of the bounding arcdecreases. When the center approaches infinity, the auxiliary linesas well as the bounding contour line become straight (Figure 2I).Each quadrant was separately deformed along these auxiliary radii.Using this principle, the outer contour and the inner layout of thecolored subunits were separately deformed to create test figures(Figures 3A–I). This allowed us to uncouple the contour fromthe enclosed area, and to test whether illusion magnitude couldbe better associated with changes in the appearance of the innerstructure or those in the contour curvature respectively. In totalthere were three types of the Contour (circle, circlesquare, square)and three types of the Inner layout (we will call them radial, elliptic,paraboloidal). With those conditions combined, we created ninefigures in total (Figure 3).
FIGURE 1 | (A) The basic pattern used in Experiment 1. This patternappears to rotate counterclockwise. (B) The auxiliary radii lines, shown inred in the top quadrant.
Frontiers in Psychology | Perception Science November 2012 | Volume 3 | Article 528 | 2

Stevanov et al. Motion illusion and esthetic preference
A B C
D E F
G H I
FIGURE 2 | Various Deformations of auxiliary radii lines. (A) circle-radial, (B) circlesquare-radial, (C) square-radial, (D) circle-elliptic, (E) circlesquare-elliptic,(F) square-elliptic, (G) circle-paraboloidal, (H) circlesquare-paraboloidal, (I) square-paraboloidal
ProcedureThe experiment was carried out in a dark room. Stimuli weregenerated with an Apple Mac Book Pro computer running Win-dows XP, and displayed on its 13′′ LCD display with the resolutionof 1280× 800 pixels, maximum luminance of 128 cd/m2, and therefresh rate of 60 Hz. Participants were seated 50 cm away from thedisplay. We used the method of adjustment to estimate the speedof perceived illusion in each test figure. The illusion is strongerwhen seen in peripheral vision (Hisakata and Murakami, 2008).Therefore, two test figures were presented to the left and right.The height (radius) of all test figures was constant of 330 pixels(subtending 6.3˚ of visual angle horizontally and vertically).
The distance between their centers was 835 pixels (16.5˚). Thecolor orders in the two test figures were arranged differently, sothat the left one appeared to rotate in counterclockwise directionand the right one appeared to rotate in clockwise direction.
A standard comparison figure was placed between the twotest figures. We used two types of standard comparison figures(Figure 4): (1) the full pattern of disk image whose pattern resem-bled the pattern of test figures, and (2) the semi-contour line
figure that consisted of four contour segments with four white dotsplaced along each segment. The full pattern always had a circle con-tour and radial layout, while the line segments in the semi-contourstimuli always had the same contour shape as the test figures. Thewhole image of the full pattern could be set in rotation, whileonly white dots of the semi-contour figure could be moved alongthe contour line. The reason for introducing the semi-contourfigure was that the disk-like full-pattern figure would not matchthe shape or the inner layout of all test stimuli, while it did not seemappropriate to have figures with circlesquare and square contoursrotating. Another reason for using the line segments was that sev-eral observers in our pilot study reported no or very weak illusorymotion around the corners and along the quadrants boundariesin some test figures. Furthermore, the comparison figure moved ata constant angular speed, which may not be an appropriate mea-sure of speed in circlesquare and square shaped test figures. Heresemi-contour line figures worked as a compromise solution. The-oretically, the angular velocity and linear velocity of points in thesecontour segments would not deviate much across semi-circle,semi-circlesquare, and semi-square contour figures (Figure 4).
www.frontiersin.org November 2012 | Volume 3 | Article 528 | 3
Stevanov et al. Motion illusion and esthetic preference
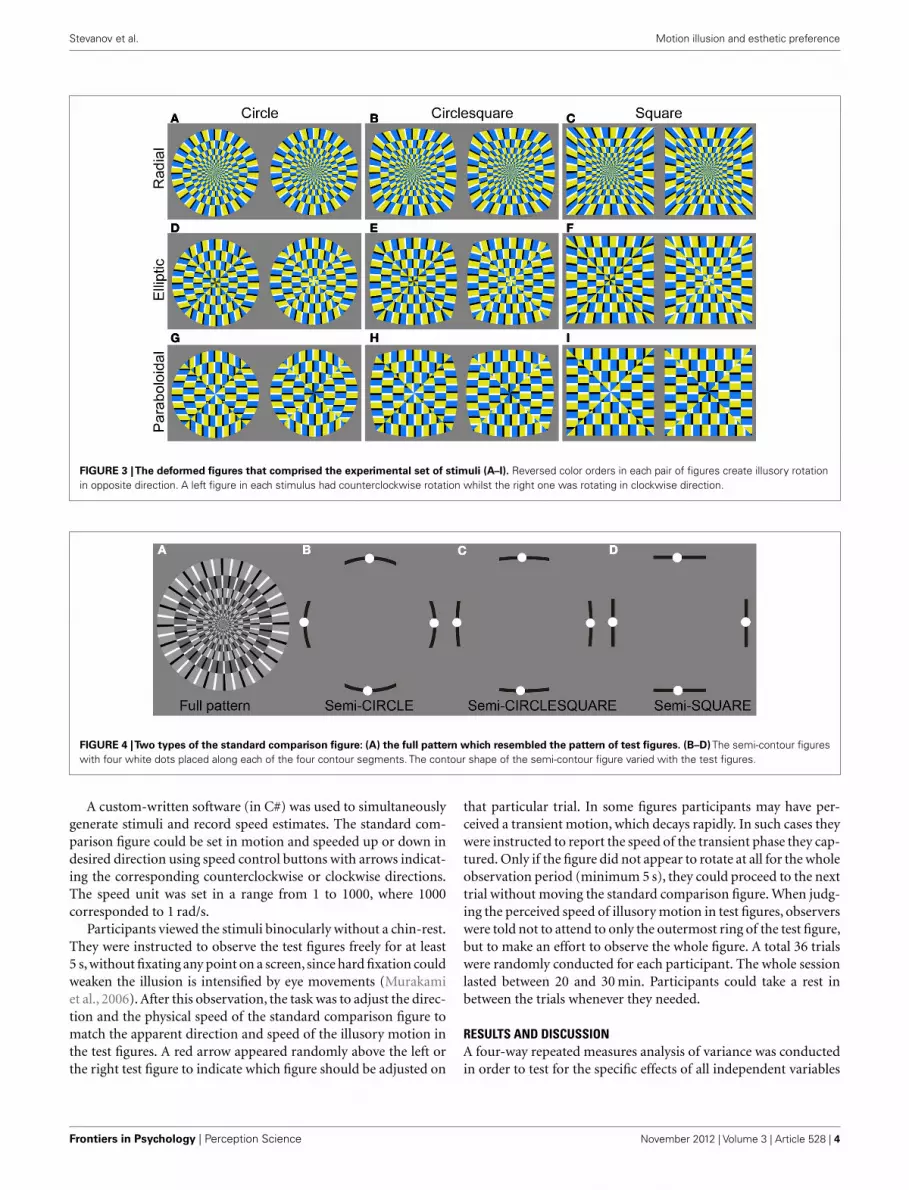
FIGURE 3 |The deformed figures that comprised the experimental set of stimuli (A–I). Reversed color orders in each pair of figures create illusory rotationin opposite direction. A left figure in each stimulus had counterclockwise rotation whilst the right one was rotating in clockwise direction.
FIGURE 4 |Two types of the standard comparison figure: (A) the full pattern which resembled the pattern of test figures. (B–D) The semi-contour figureswith four white dots placed along each of the four contour segments. The contour shape of the semi-contour figure varied with the test figures.
A custom-written software (in C#) was used to simultaneouslygenerate stimuli and record speed estimates. The standard com-parison figure could be set in motion and speeded up or down indesired direction using speed control buttons with arrows indicat-ing the corresponding counterclockwise or clockwise directions.The speed unit was set in a range from 1 to 1000, where 1000corresponded to 1 rad/s.
Participants viewed the stimuli binocularly without a chin-rest.They were instructed to observe the test figures freely for at least5 s, without fixating any point on a screen, since hard fixation couldweaken the illusion is intensified by eye movements (Murakamiet al., 2006). After this observation, the task was to adjust the direc-tion and the physical speed of the standard comparison figure tomatch the apparent direction and speed of the illusory motion inthe test figures. A red arrow appeared randomly above the left orthe right test figure to indicate which figure should be adjusted on
that particular trial. In some figures participants may have per-ceived a transient motion, which decays rapidly. In such cases theywere instructed to report the speed of the transient phase they cap-tured. Only if the figure did not appear to rotate at all for the wholeobservation period (minimum 5 s), they could proceed to the nexttrial without moving the standard comparison figure. When judg-ing the perceived speed of illusory motion in test figures, observerswere told not to attend to only the outermost ring of the test figure,but to make an effort to observe the whole figure. A total 36 trialswere randomly conducted for each participant. The whole sessionlasted between 20 and 30 min. Participants could take a rest inbetween the trials whenever they needed.
RESULTS AND DISCUSSIONA four-way repeated measures analysis of variance was conductedin order to test for the specific effects of all independent variables
Frontiers in Psychology | Perception Science November 2012 | Volume 3 | Article 528 | 4
Stevanov et al. Motion illusion and esthetic preference
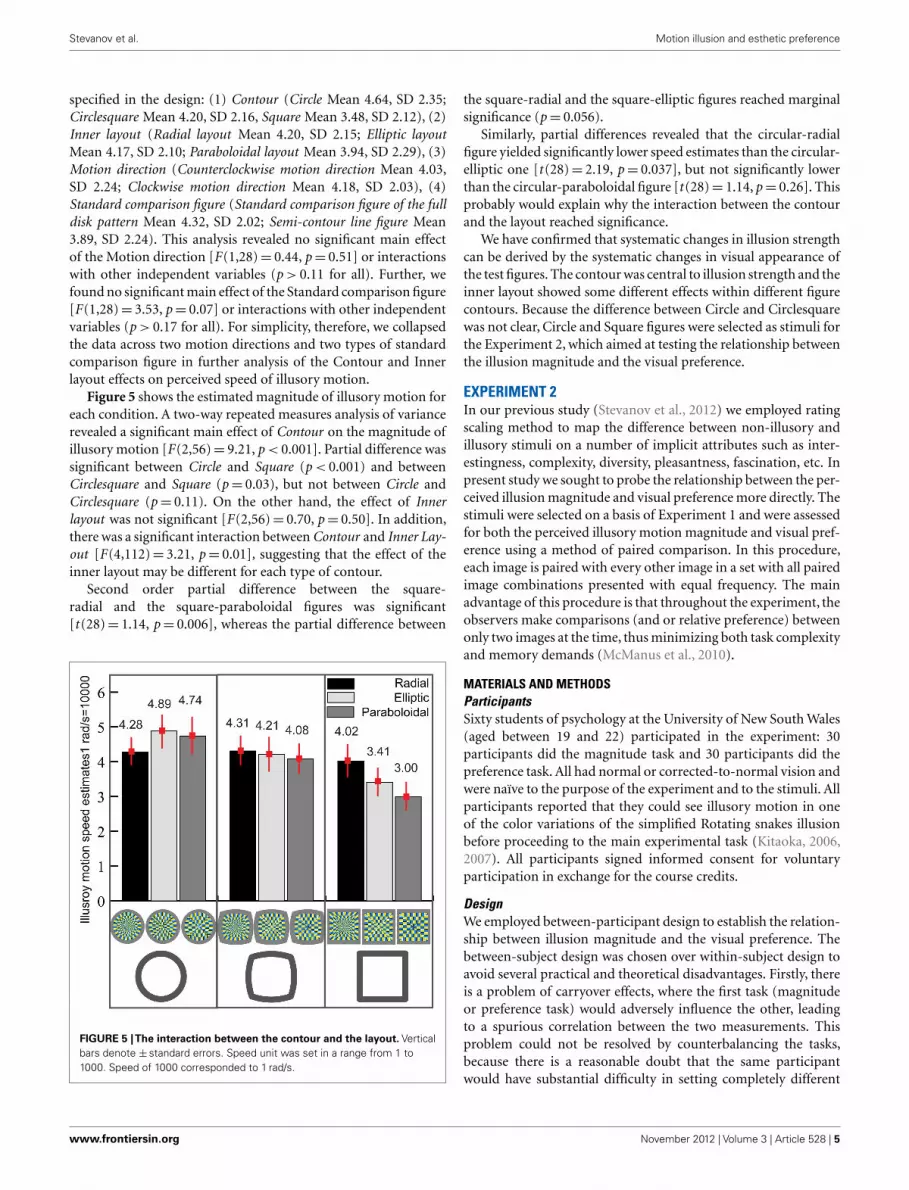
specified in the design: (1) Contour (Circle Mean 4.64, SD 2.35;Circlesquare Mean 4.20, SD 2.16, Square Mean 3.48, SD 2.12), (2)Inner layout (Radial layout Mean 4.20, SD 2.15; Elliptic layoutMean 4.17, SD 2.10; Paraboloidal layout Mean 3.94, SD 2.29), (3)Motion direction (Counterclockwise motion direction Mean 4.03,SD 2.24; Clockwise motion direction Mean 4.18, SD 2.03), (4)Standard comparison figure (Standard comparison figure of the fulldisk pattern Mean 4.32, SD 2.02; Semi-contour line figure Mean3.89, SD 2.24). This analysis revealed no significant main effectof the Motion direction [F(1,28)= 0.44, p= 0.51] or interactionswith other independent variables (p > 0.11 for all). Further, wefound no significant main effect of the Standard comparison figure[F(1,28)= 3.53, p= 0.07] or interactions with other independentvariables (p > 0.17 for all). For simplicity, therefore, we collapsedthe data across two motion directions and two types of standardcomparison figure in further analysis of the Contour and Innerlayout effects on perceived speed of illusory motion.
Figure 5 shows the estimated magnitude of illusory motion foreach condition. A two-way repeated measures analysis of variancerevealed a significant main effect of Contour on the magnitude ofillusory motion [F(2,56)= 9.21, p < 0.001]. Partial difference wassignificant between Circle and Square (p < 0.001) and betweenCirclesquare and Square (p= 0.03), but not between Circle andCirclesquare (p= 0.11). On the other hand, the effect of Innerlayout was not significant [F(2,56)= 0.70, p= 0.50]. In addition,there was a significant interaction between Contour and Inner Lay-out [F(4,112)= 3.21, p= 0.01], suggesting that the effect of theinner layout may be different for each type of contour.
Second order partial difference between the square-radial and the square-paraboloidal figures was significant[t (28)= 1.14, p= 0.006], whereas the partial difference between
FIGURE 5 |The interaction between the contour and the layout. Verticalbars denote ± standard errors. Speed unit was set in a range from 1 to1000. Speed of 1000 corresponded to 1 rad/s.
the square-radial and the square-elliptic figures reached marginalsignificance (p= 0.056).
Similarly, partial differences revealed that the circular-radialfigure yielded significantly lower speed estimates than the circular-elliptic one [t (28)= 2.19, p= 0.037], but not significantly lowerthan the circular-paraboloidal figure [t (28)= 1.14, p= 0.26]. Thisprobably would explain why the interaction between the contourand the layout reached significance.
We have confirmed that systematic changes in illusion strengthcan be derived by the systematic changes in visual appearance ofthe test figures. The contour was central to illusion strength and theinner layout showed some different effects within different figurecontours. Because the difference between Circle and Circlesquarewas not clear, Circle and Square figures were selected as stimuli forthe Experiment 2, which aimed at testing the relationship betweenthe illusion magnitude and the visual preference.
EXPERIMENT 2In our previous study (Stevanov et al., 2012) we employed ratingscaling method to map the difference between non-illusory andillusory stimuli on a number of implicit attributes such as inter-estingness, complexity, diversity, pleasantness, fascination, etc. Inpresent study we sought to probe the relationship between the per-ceived illusion magnitude and visual preference more directly. Thestimuli were selected on a basis of Experiment 1 and were assessedfor both the perceived illusory motion magnitude and visual pref-erence using a method of paired comparison. In this procedure,each image is paired with every other image in a set with all pairedimage combinations presented with equal frequency. The mainadvantage of this procedure is that throughout the experiment, theobservers make comparisons (and or relative preference) betweenonly two images at the time, thus minimizing both task complexityand memory demands (McManus et al., 2010).
MATERIALS AND METHODSParticipantsSixty students of psychology at the University of New South Wales(aged between 19 and 22) participated in the experiment: 30participants did the magnitude task and 30 participants did thepreference task. All had normal or corrected-to-normal vision andwere naïve to the purpose of the experiment and to the stimuli. Allparticipants reported that they could see illusory motion in oneof the color variations of the simplified Rotating snakes illusionbefore proceeding to the main experimental task (Kitaoka, 2006,2007). All participants signed informed consent for voluntaryparticipation in exchange for the course credits.
DesignWe employed between-participant design to establish the relation-ship between illusion magnitude and the visual preference. Thebetween-subject design was chosen over within-subject design toavoid several practical and theoretical disadvantages. Firstly, thereis a problem of carryover effects, where the first task (magnitudeor preference task) would adversely influence the other, leadingto a spurious correlation between the two measurements. Thisproblem could not be resolved by counterbalancing the tasks,because there is a reasonable doubt that the same participantwould have substantial difficulty in setting completely different
www.frontiersin.org November 2012 | Volume 3 | Article 528 | 5

Stevanov et al. Motion illusion and esthetic preference
response criteria for the judgments of the preference and theillusion strength. Another, more important, concern is that coun-terbalancing the tasks would also render a new confounding effectthat is better to be avoided: it is well documented that there is astrong relationship between the familiarity and the preference, sug-gesting that familiarity increases the preference (Tomkins, 1962;see Cupchik and Gebotys, 1990; Consedine et al., 2004; Silvia,2006; Sander and Scherer, 2009). Consequently, half of the par-ticipants would build up higher cumulative familiarity with thestimuli, leading to inequality of experimental conditions and offsetbetween the preference functions of the two groups of participants.
StimuliWe picked the circle- and square-contour test images from thefirst experiment, which significantly differed in illusion magni-tude. Each test image had two figures side by side, with reversedcolor orders, so that the left one appeared to rotate in counterclock-wise direction and the right one appeared to rotate in clockwisedirection. In addition to these weak-to-strong illusory images,we created non-illusory figures in which the order of colors inadjacent subunits was reversed so that the overall motion signalwas nulled. These non-illusory counterparts were introduced ascontrol stimuli. They were matched in features like contour andinner layout of subunits, but did not evoke global illusory motion(Figure 6). Although they may produce some jittering motion,Kuriki et al. (2008) examined fMRI responses in motion sensitiveareas of the human visual cortex (hMT+) and revealed signifi-cantly higher activity for the illusory figure in comparison withthe “non-illusory” one that was created in the same way. Non-illusory test images also had two figures side by side. The color ofthe thin area (black-white) flanked by blue or yellow was reversedin two adjacent figures.
ProcedureExperimental conditions were similar to the first experiment.Stimuli were shown on a computer screen (19′′ CRT displaywith the resolution of 1280× 800 pixels, maximum luminanceof 250 cd/m2 and refresh rate of 60 Hz) in a darkened room. Par-ticipants were seated 70 cm away from the display. The height(radius) of all test figures was 330 pixels (subtending 6.3˚ of
visual angle horizontally or vertically), as in the Experiment 1.Distance between the centers of the test figures was 400 pixels(7.4˚). Visual stimuli were shown using Matlab and custom-written code in Psychtoolbox (Brainard, 1997; Pelli, 1997) runningon Windows 98.
For the purpose of paired comparisons, 12 experimental stimuliwere each paired with every other yielding a total of 66 experi-mental pairs or choice sets. Each of the paired sets was presentedtwice with the order of stimulus presentations counterbalanced;i.e., each experimental stimulus appeared equally often as the firstas well as the second stimulus in a paired set. A two-interval vari-ant of the paired comparison procedure was used such that ineach paired choice set, experimental stimuli were shown one ata time and observers were requested to compare the stimuli pre-sented in successive temporal intervals. The observers were ableto go back and forth as many times as it was necessary for themto decide which one they preferred (preference task) or which oneseemed to have greater illusion (magnitude task). Each experi-mental stimulus was presented 22 times in total: 11 times in thefirst temporal interval and 11 times in the second interval. Intotal, each observer made 132 choices between paired experimentalstimuli.
In the magnitude task, observers were instructed to freelyobserve test figures without fixation so that the illusion wouldpersist for the whole observation period. We gave no furtherinstruction on how to base their judgments of the illusionmagnitude.
In the preference task, the instruction to the observers stressedthat there were “no right or wrong” answers, and that they shouldrely only on their subjective impressions. They were told to indi-cate which of the two images they prefer, i.e., which looks morepleasing or more attractive to them (McWhinnie, 1968; McManuset al., 2010). Observers were told to base their responses on theirfeeling about the images at that moment, without reflecting ontheir choices made on previous trials.
RESULTS AND DISCUSSIONCorrelation between illusion magnitude and preferenceThe visual preference and the illusion strength were quantified interms of the proportion of times each image was chosen. If there
FIGURE 6 |The whole set of stimulus images: (A) the upper panel shows illusory figures, while the lower one (B) shows their non-illusorycounterparts: they were matched in features like contour and inner layout, but were not supposed to evoke any illusory motion.
Frontiers in Psychology | Perception Science November 2012 | Volume 3 | Article 528 | 6

Stevanov et al. Motion illusion and esthetic preference
are no systematic differences among stimuli, the relative frequencywith which each image is chosen will not vary across images.
The illusion magnitude and preference data are plotted inFigure 7. The top panel shows that the circle-radial (left-most) and the square-radial (fourth from the left) figures wereranked the highest for illusion magnitude in the set, followedby circle-elliptic, circle-paraboloidal, and then by square-ellipticand square-paraboloidal figures. It is also evident that the circu-lar figures are ranked higher than the square figures, which agreeswith the results of Experiment 1, suggesting that the circle contourpromotes illusory motion. The non-illusory images were rankedthe lowest, and there were no systematic differences among thenon-illusory images. Similarly, the bottom panel depicts the pref-erence results whose pattern closely follows the changes in innerlayout, suggesting that the radial layout was better preferred overthe elliptic or the paraboloidal one.
We obtained a high positive correlation between the preferencejudgments and perceived illusion magnitude [Pearson’s correla-tion r(10)= 0.76, p= 0.004]. When we omit the non-illusorycounterparts, correlation between magnitude and preference forthe illusory images was even higher [r(4)= 0.97, p= 0.001]. Cen-tral feature of these results is a high degree of similarity in patternsof the preference and magnitude responses.
Individual differences and Q-mode factorial analysisAlthough the main purpose of this study was not todescribe individual differences, it is, however, useful to under-stand what aspects of images interact in expression oftheir preferences. The Pearson’s pairwise correlation betweenthe preference estimates of every pair of participants aver-aged 0.11 (SD= 0.48), whereas the pairwise correlations ofthe illusion magnitudes averaged 0.70 (SD= 0.23). Rela-tively low agreement across participants for preference judg-ments might imply that participants based their prefer-ence responses on different principles or aspects of theimages.
In order to investigate further what governed preference judg-ments of different participants, we applied the Q-mode factorialanalysis [a method proposed by McManus (1980) and McManuset al. (2010)]. For this analysis, we use correlations between thepreference estimates of every pair of participants, as opposed toconventional factor analysis that uses correlations between thestimuli. Therefore, this analysis extracts factors that can reveal theunderlying criteria which governed their preference judgments,and the factor loadings for each participant on extracted factorswill show how each participant puts more or less weight to eachcriterion.
FIGURE 7 | Visual preference for weak-to-strong illusory andnon-illusory images: average proportion by which the image waschosen among others as a function of illusion magnitude (A); visual
preference of weak-to-strong illusory and non-illusory imagesquantified in terms of the proportion of times each image waschosen (B).
www.frontiersin.org November 2012 | Volume 3 | Article 528 | 7

Stevanov et al. Motion illusion and esthetic preference
We applied factor analysis with PCA extraction method fol-lowed by a Varimax rotation to the 30× 30 correlation matrix. TheKaiser criterion suggested four factors with eigenvalues of 17.94,6.26, 3.4, and 1.3, whereas the scree-slope analysis revealed two fac-tors above the general “scree.” We therefore interpreted only thefirst two factors. The first factor accounted for 59.81% and the sec-ond factor for 20.88% of the total variance, summing up to 80.69%of the total variance explained by the first two extracted factors. Inorder to reify these two main factors, the participants’ preferencematrix was then multiplied by the factor loadings of each subjecton each of the two main factors. The resulting weighted matriceswere summed and the totals were standardized so that the absolutetotal was equal to 2 (McManus, 1980). These standardized totalswere then plotted against the stimulus set (Figure 8). This is aconvenient way to single out and a posteriori interpret the crite-ria upon which the preference judgments were made. Naturally,its explanatory power is not the same as of the a priori specifiedcriteria. It is, however, one of the possible statistical methods tounderpin the structure of the preference.
FIGURE 8 | Summary preference functions for (A) Factor 1 (radial,elliptic, and paraboloidal layout) and (B) Factor 2 (illusion). Thefunctions were calculated from the preference functions of all 30participants, weighted by their loadings on the Q-mode factors, and thenstandardized.
In order to see if either of the two factors could be associ-ated with the perceived illusion magnitude, we tested correlationsbetween these weighted totals and the standardized Magnituderesponses (derived from Figure 7). We obtained high positivecorrelation with the Preference responses weighted by the Factor2: r(10)= 0.92, p < 0.001, whilst the correlation with the Pref-erence responses weighted by the Factor 1 was not significant:r(10)= 0.55, p= 0.062, indicating that the Factor 2 mostly reflectsthe illusion magnitude. Since Preference responses weighted byFactor 1 and Factor 2 are correlated [r(10)= 0.70, p < 0.05), addi-tionally, we calculated partial correlations between the Magnituderesponses and the weighted preference responses alternately con-trolled for the effect of the Factor 1 or the Factor 2; high correlationbetween the Magnitude responses and the Preference responsesweighted by the Factor 2 (adjusted for the effect of Factor 1) wasconfirmed: r(9)= 0.89, t (9)= 5.99, p < 0.001, whereas correlationbetween the Magnitude responses and the Preference responsesweighted by the Factor 1 (adjusted for the effect of Factor 2) wasnot significant: r(9)=−0.31, t (9)=−0.99, p= 0.35, confirmingthat Factor 2 but not much of Factor 1 is related to the Magnituderesponses.
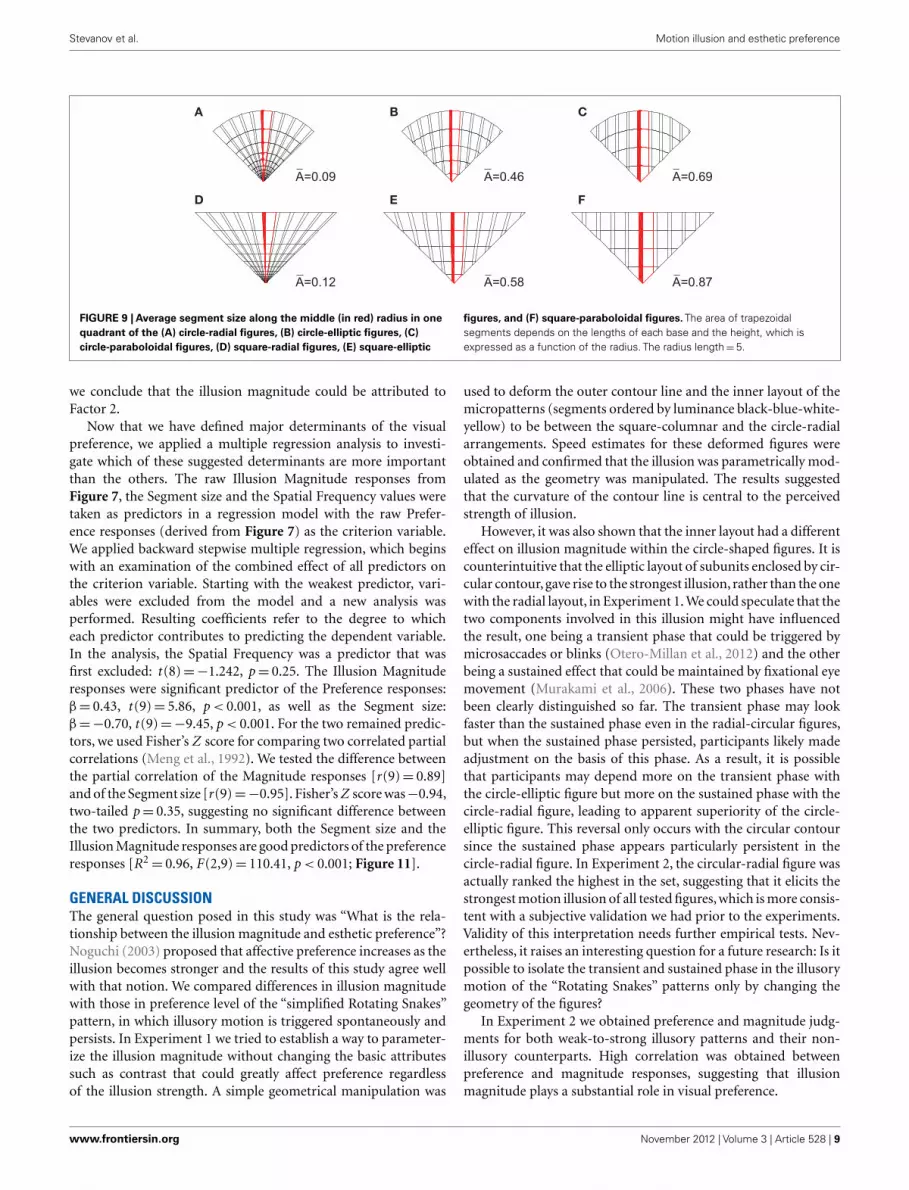
Interpretation of the Factor 1 is less straightforward. WhereasFactor 1 could be related to the inner layout and the shape of thefigures, as suggested in Figure 8A, it could also reflect the dif-ferences in image features such as spatial frequency components.As one of the measures that could reflect changes in geometry offigures, we took the average size of the yellow/blue color segments,which extend along the middle vertical or horizontal radius equalin all figures. The segment size is defined as a function of the totalarea and the number of segments, which differs across the radial,elliptic, and paraboloidal inner layout (Figure 9).
Partial correlations revealed that the Segment size highly corre-lates with the Preference responses weighted by the Factor 1 whenadjusted for the Factor 2: r(9)=−0.98, t (9)=−15.06, p < 0.000,whereas the Preference responses weighted by the Factor 2 do notcorrelate with the Segment size when adjusted for the Factor 1:r(9)= 0.37, t (9)= 1.21, p= 0.26.
Naturally, the size of the segments is related to the spatial fre-quency characteristics of these patterns. Relatively speaking, asthe size of the component segments decrease, there should bemore energy associated with high spatial frequency. Therefore, theslopes of the fitted linear functions to the log amplitude spec-tra for each of the stimuli (Figures 10A–C) were expected to becorrelated with the weighted Preference responses. As predicted,partial correlation of the slopes with the Preference responsesweighted by the Factor 1 (adjusted for the Factor 2) was high:r(9)= 0.92, t (9)= 6.86, p < 0.000, whereas the partial correlationwith the Preference responses weighted by the Factor 2 (adjustedfor the Factor 1) was not significant: r(9)=−0.158, t (9)=−0.48,p= 0.64.
These results suggest that the geometry changes of the stim-uli (described either in space or frequency domain) could explainthe nature of the Factor 1, while theoretically other unsubstan-tiated features of the figures may be involved as well. While theexplanation of the Factor 1 is not of our primary importance tothe purpose of this study, essential is that the geometry featuresof the stimuli are not much reflected in the Factor 2. Therefore,
Frontiers in Psychology | Perception Science November 2012 | Volume 3 | Article 528 | 8
Stevanov et al. Motion illusion and esthetic preference
A=0.09 A=0.46 A=0.69
A=0.12 A=0.58 A=0.87
A B C
D E F
FIGURE 9 | Average segment size along the middle (in red) radius in onequadrant of the (A) circle-radial figures, (B) circle-elliptic figures, (C)circle-paraboloidal figures, (D) square-radial figures, (E) square-elliptic
figures, and (F) square-paraboloidal figures. The area of trapezoidalsegments depends on the lengths of each base and the height, which isexpressed as a function of the radius. The radius length=5.
we conclude that the illusion magnitude could be attributed toFactor 2.
Now that we have defined major determinants of the visualpreference, we applied a multiple regression analysis to investi-gate which of these suggested determinants are more importantthan the others. The raw Illusion Magnitude responses fromFigure 7, the Segment size and the Spatial Frequency values weretaken as predictors in a regression model with the raw Prefer-ence responses (derived from Figure 7) as the criterion variable.We applied backward stepwise multiple regression, which beginswith an examination of the combined effect of all predictors onthe criterion variable. Starting with the weakest predictor, vari-ables were excluded from the model and a new analysis wasperformed. Resulting coefficients refer to the degree to whicheach predictor contributes to predicting the dependent variable.In the analysis, the Spatial Frequency was a predictor that wasfirst excluded: t (8)=−1.242, p= 0.25. The Illusion Magnituderesponses were significant predictor of the Preference responses:β= 0.43, t (9)= 5.86, p < 0.001, as well as the Segment size:β=−0.70, t (9)=−9.45, p < 0.001. For the two remained predic-tors, we used Fisher’s Z score for comparing two correlated partialcorrelations (Meng et al., 1992). We tested the difference betweenthe partial correlation of the Magnitude responses [r(9)= 0.89]and of the Segment size [r(9)=−0.95]. Fisher’s Z score was−0.94,two-tailed p= 0.35, suggesting no significant difference betweenthe two predictors. In summary, both the Segment size and theIllusion Magnitude responses are good predictors of the preferenceresponses [R2
= 0.96, F(2,9)= 110.41, p < 0.001; Figure 11].
GENERAL DISCUSSIONThe general question posed in this study was “What is the rela-tionship between the illusion magnitude and esthetic preference”?Noguchi (2003) proposed that affective preference increases as theillusion becomes stronger and the results of this study agree wellwith that notion. We compared differences in illusion magnitudewith those in preference level of the “simplified Rotating Snakes”pattern, in which illusory motion is triggered spontaneously andpersists. In Experiment 1 we tried to establish a way to parameter-ize the illusion magnitude without changing the basic attributessuch as contrast that could greatly affect preference regardlessof the illusion strength. A simple geometrical manipulation was
used to deform the outer contour line and the inner layout of themicropatterns (segments ordered by luminance black-blue-white-yellow) to be between the square-columnar and the circle-radialarrangements. Speed estimates for these deformed figures wereobtained and confirmed that the illusion was parametrically mod-ulated as the geometry was manipulated. The results suggestedthat the curvature of the contour line is central to the perceivedstrength of illusion.
However, it was also shown that the inner layout had a differenteffect on illusion magnitude within the circle-shaped figures. It iscounterintuitive that the elliptic layout of subunits enclosed by cir-cular contour, gave rise to the strongest illusion, rather than the onewith the radial layout, in Experiment 1. We could speculate that thetwo components involved in this illusion might have influencedthe result, one being a transient phase that could be triggered bymicrosaccades or blinks (Otero-Millan et al., 2012) and the otherbeing a sustained effect that could be maintained by fixational eyemovement (Murakami et al., 2006). These two phases have notbeen clearly distinguished so far. The transient phase may lookfaster than the sustained phase even in the radial-circular figures,but when the sustained phase persisted, participants likely madeadjustment on the basis of this phase. As a result, it is possiblethat participants may depend more on the transient phase withthe circle-elliptic figure but more on the sustained phase with thecircle-radial figure, leading to apparent superiority of the circle-elliptic figure. This reversal only occurs with the circular contoursince the sustained phase appears particularly persistent in thecircle-radial figure. In Experiment 2, the circular-radial figure wasactually ranked the highest in the set, suggesting that it elicits thestrongest motion illusion of all tested figures, which is more consis-tent with a subjective validation we had prior to the experiments.Validity of this interpretation needs further empirical tests. Nev-ertheless, it raises an interesting question for a future research: Is itpossible to isolate the transient and sustained phase in the illusorymotion of the “Rotating Snakes” patterns only by changing thegeometry of the figures?
In Experiment 2 we obtained preference and magnitude judg-ments for both weak-to-strong illusory patterns and their non-illusory counterparts. High correlation was obtained betweenpreference and magnitude responses, suggesting that illusionmagnitude plays a substantial role in visual preference.
www.frontiersin.org November 2012 | Volume 3 | Article 528 | 9

Stevanov et al. Motion illusion and esthetic preference
Am
plit
ude
IllusoryCircle-Radial
Circle-Elliptic
Circle-Paraboloidal
Square-Radial
Square-Elliptic
Square-Paraboloidal
Non-IllusoryCircle-Radial
Circle-Elliptic
Circle-Paraboloidal
Square-Radial
Square-Elliptic
Square-Paraboloidal
Spatial Frequency
A
Am
plit
ude
Spatial Frequency
Illusory Non-illusory
B
C
Am
plit
ude
Spatial Frequency
Radial Elliptic Paraboloidal
FIGURE 10 | Amplitude spectra of Spatial Frequency: (A) individualstimuli (B) averaged for the Illusory vs. Non-illusory stimuli (C)averaged for the three types of the Inner Layout.
Further, the Q-mode factor analysis on the participant-pairwise-correlations was utilized as explorative technique todefine underlying criteria of the individual’s preference judg-ments. Two major factors were extracted that account for 80%of the variance in participants’ responses. The first factor, whichhighly correlates with geometry changes in visual appearance ofthe figures and their spatial frequency distribution, explains 60%of the individual differences in preference judgments,whereas 20%of the variance could be assigned to illusion magnitude. Note thatthis does not mean that contribution of illusion magnitude in eachpreference judgment is only 20%. Instead, these results implicate
0.0 0.1 0.2 0.3 0.4 0.5 0.6 0.7 0.8 0.9
Segment Size
0.25
0.30
0.35
0.40
0.45
0.50
0.55
0.60
0.65
0.70
Pre
fere
nce
0.0 0.1 0.2 0.3 0.4 0.5 0.6 0.7 0.8 0.9 1.0
Illusion Magnitudes
0.25
0.30
0.35
0.40
0.45
0.50
0.55
0.60
0.65
0.70
Pre
fere
nce
A
B
FIGURE 11 | Scatterplots of the regression analysis: a criterion variablewas the Preference and predictors were (A) the Segment size and (B)the Illusion Magnitudes.
that the preference for visual appearance and spatial frequencyvaries more across participants than the preference for the strengthof the illusion, suggesting that preference for figures with strongerillusion is rather straightforward.
On the other hand, multiple regression analysis revealed thatthe geometry changes and the illusion magnitude are both goodpredictors of the preference responses, implying that they areboth important determinants of the visual preference. The Q-mode analysis is useful in suggesting a posteriori what are thedeterminants of the preference, without a priori criteria speci-fied by researchers. Joint efforts of the Q-mode factor analysisand multiple regression analysis imply that the geometry changesand illusion strength are the two major and equally importantdeterminants of the visual preference for the Rotating Snakesillusion.
Relying on Berlyne’s proposition (Berlyne, 1974) of collativevariables (i.e., novelty, complexity, surprisingness, incongruity),we could speculate that stronger illusion increases our judg-ments of novelty, surprisingness, or interestingness and thereforeit increases preference. There is also a possibility that increase inpreference could be due to increase in the speed of the perceivedmotion and not illusion itself. It is an open question, but given
Frontiers in Psychology | Perception Science November 2012 | Volume 3 | Article 528 | 10
Stevanov et al. Motion illusion and esthetic preference
that the illusory motion is processed at an early stage of motiondetection in V1 (e.g., Conway et al., 2005; Ashida et al., 2012), dis-tinction of real and illusory motion may not be crucial in terms ofpreference.
The implications of the current results could be important forfuture related research, where the same method of paired com-parisons could be used to assess the preference of other illusoryeffects which have continuous illusion strength like the anom-alous motion illusions. Our previous study (Stevanov et al., 2012)employed the rating scale method for assessing multidimensional“subjective evaluative meanings.” This method was suitable forthe purpose of the study, since we covered a wider range of dif-ferent illusory effects being assessed on numerous affective andcognitive dimensions interacting in esthetic experience. Never-theless, mapping a large number of stimuli on several dimensionsof subjective judgments may impose certain cognitive complexityand raises concern that participants may maintain separate map-pings to separate rating scales, whereas paired comparison doesnot require memory of previous stimuli, or anticipation of thesubsequent ones. Therefore paired comparison method may beuseful in comparing diverse stimuli when we aim to have them
mapped onto a single dimension (preference only), minimizingthe cognitive complexity of the task (McManus et al., 2010).
The limitation of the results is that they infer correlation andnot causality necessary for clarifying the underlying mechanismof the illusion-preference co-occurrence. However, there havebeen only few studies which addressed the correlation betweenthe illusion magnitude and the esthetic preference. This study isamong the first attempts to substantiate contribution of the illu-sion strength from the other determinants of the preference forillusion figures.
ACKNOWLEDGMENTSThis study was supported by the Japan Kokusaiteki Research Fund2011 (Research Fund for Promoting International Research Activ-ities in the Doctoral Degree Program), Grant-in-Aid for ScientificResearch (A; 22243044) Japan Society for the Promotion of Sci-ence and the Australian Research Council grant (DP120103659).We thank Srdjan Vukmirovic for software development and ZeljkoSesum for help with stimulus design. We thank Andrew Meso andMaiko Uesaki for helpful comments and suggestions and SophiaKwan and Dragan Jankovic for aiding in data collection.
REFERENCESAshida, H., Kuriki, I., Murakami, I.,
Hisakata, R., and Kitaoka, A. (2012).Direction-specific fMRI adaptationreveals the visual cortical networkunderlying the “Rotating Snakes”illusion. Neuroimage 61, 1143–1152.
Backus, B. T., and Oruç, I. (2005).Illusory motion from change overtime in the response to contrast andluminance. J. Vis. 5, 1055–1069.
Berlyne, D. E. (1974). “Novelty, com-plexity, and interestingness” in TheNew Experimental Aesthetics, ed.D. E. Berlyne (Washington, DC:Hemisphere Publishing Corpora-tion), 175–180.
Brainard, D. H. (1997). The psy-chophysics toolbox. Spat. Vis. 10,443–446.
Consedine, N. S., Magai, C., and King,A. (2004). Deconstructing positiveaffect in later life: a differential func-tionalist analysis of joy and inter-est. Int. J. Aging Hum. Dev. 58,49–68.
Conway, R. B., Kitaoka, A., Yazdan-bakhsh, A., Pack, C. C., and Living-stone, M. S. (2005). Neural basis fora powerful static motion illusion. J.Neurosci. 25, 5651–5656.
Cupchik, G. C., and Gebotys, R. J.(1990). Interest and pleasure asdimensions of aesthetic response.Empirical Stud. Arts 8, 1–14.
Fermüller, C., Ji, H., and Kitaoka,A. (2010). Illusory motion due tocausal time filtering. Vision Res. 50,315–329.
Fraser, A., and Wilcox, K. J. (1979).Perception of illusory movement.Nature 281, 565–566.
Hisakata, R., and Murakami, I. (2008).The effects of eccentricity and retinalilluminance on the illusory motionseen in a stationary luminance gra-dient. Vision Res. 48, 1940–1948.
Kitaoka, A. (2003). Rotating Snakes.Available at: http://www.ritsumei.ac.jp/~akitaoka/index-e.html
Kitaoka, A. (2006). Anomalous motionillusion and stereopsis. J. ThreeDimens. Images 20, 9–14.
Kitaoka, A. (2007). “Phenomenal clas-sification of the “optimized” Fraser-Wilcox illusion and the effect ofcolor,” in Poster presentation inDemoNight, VSS2007, GWiz, Sara-sota.
Kitaoka, A. (2008a). Trick Eyes Mecha-nism. Tokyo: Kanzen [in Japanese].
Kitaoka, A. (2008b). “OptimizedFraser-Wilcox illusions: a pic-torial classification by AkiyoshiKitaoka,” in Talk in a Workshop(WS005) in the 72nd AnnualConvention of the Japanese Psy-chological Association, HokkaidoUniversity, Sapporo. Availableat: http://www.psy.ritsumei.ac.jp/~akitaoka/nisshin2008ws.html
Kitaoka, A., and Ashida, H. (2003).Phenomenal characteristics of theperipheral drift illusion. Vision Res.15, 261–262.
Kitaoka, A., and Ashida, H. (2007). Avariant of the anomalous motionillusion based upon contrastand visual latency. Perception 36,1019–1035.
Kuriki, I., Ashida, H., Murakami, I.,and Kitaoka, A. (2008). Functionalbrain imaging of the Rotating Snakesillusion by fMRI. J. Vis. 8, 16, 1–10.
McManus, I. C. (1980). The aestheticsof simple figures. Br. J. Psychol. 71,505–524.
McManus, I. C., Cook, R., and Hunt, A.(2010). Beyond the golden sectionand normative aesthetics: why doindividuals differ so much in theiraesthetic preferences for rectan-gles? Psychol. Aesthet. Creat. Arts 4,113–126.
McWhinnie, H. J. (1968). A review ofresearch on aesthetic measure. ActaPsychol. (Amst.) 28, 363–375.
Meng, X., Rossenthal, R., and Rubin,D. B. (1992). Comparing corre-lated correlation coefficients. Psy-chol. Bull. 111, 172–175.
Murakami, I., Kitaoka, A., and Ashida,H. (2006). A positive correlationbetween fixation instability and thestrength of illusory motion in a staticdisplay. Vision Res. 46, 2421–2431.
Noguchi, K. (2003). The relationshipbetween visual illusion and aestheticpreference – an attempt to unifyexperimental phenomenology andempirical aesthetics. Axiomathes 13,261–281.
Otero-Millan, J., Macknik, S. L.,and Martinez-Conde, S. (2012).Microsaccades and blinks triggerillusory rotation in the ‘rotatingsnakes’ illusion. J. Neurosci. 32,6043–6051.
Pelli, D. G. (1997). The VideoToolboxsoftware for visual psychophysics:transforming numbers into movies.Spat. Vis. 10, 437–442.
Sander, D., and Scherer, K. R. (eds).(2009). The Oxford Companion toEmotion and the Affective Sciences.Oxford: Oxford University Press.
Silvia, P. J. (2006). Exploring the Psy-chology of Interest. New York: OxfordUniversity Press.
Stevanov, J., Markovic, S., and Kitaoka,A. (2012). Aesthetic valence of visualillusions. i-Perception 3, 112–140.
Tomkins, S. S. (1962). The PositiveAffects. Affect, Imagery, Conscious-ness, Vol. 1. NewYork: Springer.
Wade, N. J. (2005). Perception andIllusion: Historical Perspectives. NewYork: Springer.
Conflict of Interest Statement: Theauthors declare that the research wasconducted in the absence of any com-mercial or financial relationships thatcould be construed as a potential con-flict of interest.
Received: 07 August 2012; accepted: 07November 2012; published online: 29November 2012.Citation: Stevanov J, Spehar B, AshidaH and Kitaoka A (2012) Anomalousmotion illusion contributes to visual pref-erence. Front. Psychology 3:528. doi:10.3389/fpsyg.2012.00528This article was submitted to Frontiers inPerception Science, a specialty of Frontiersin Psychology.Copyright © 2012 Stevanov, Spehar,Ashida and Kitaoka. This is an open-access article distributed under the termsof the Creative Commons AttributionLicense, which permits use, distributionand reproduction in other forums, pro-vided the original authors and sourceare credited and subject to any copy-right notices concerning any third-partygraphics etc.
www.frontiersin.org November 2012 | Volume 3 | Article 528 | 11