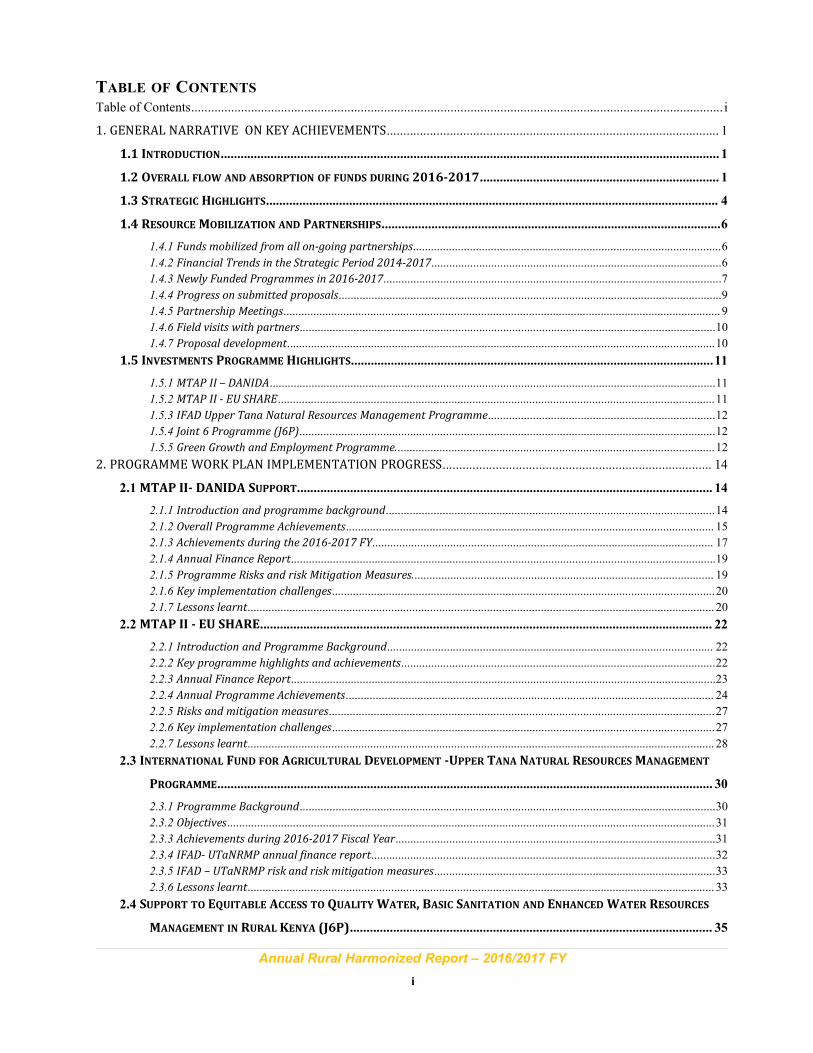
annual rural harmonised report fy 2016/2017
TRANSCRIPT
ANNUAL RURALHARMONISED REPORT
FY 2016/2017
October 2017
WATER SECTOR TRUST FUNDFinancial support for improved access to water and sanitation
Annual Rural Harmonized Report – 2016/2017 FY
i
TABLE OF CONTENTS
Table of Contents................................................................................................................................................................ i
1. GENERAL NARRATIVE ON KEY ACHIEVEMENTS.................................................................................................... 1
1.1 INTRODUCTION...................................................................................................................................................... 1
1.2 OVERALL FLOW AND ABSORPTION OF FUNDS DURING 2016-2017........................................................................ 1
1.3 STRATEGIC HIGHLIGHTS........................................................................................................................................ 4
1.4 RESOURCEMOBILIZATION AND PARTNERSHIPS......................................................................................................6
1.4.1 Funds mobilized from all on-going partnerships.......................................................................................................6
1.4.2 Financial Trends in the Strategic Period 2014-2017.................................................................................................6
1.4.3 Newly Funded Programmes in 2016-2017.................................................................................................................7
1.4.4 Progress on submitted proposals................................................................................................................................9
1.4.5 Partnership Meetings.................................................................................................................................................. 9
1.4.6 Field visits with partners...........................................................................................................................................10
1.4.7 Proposal development...............................................................................................................................................10
1.5 INVESTMENTS PROGRAMME HIGHLIGHTS.............................................................................................................11
1.5.1 MTAP II – DANIDA.....................................................................................................................................................11
1.5.2 MTAP II - EU SHARE..................................................................................................................................................11
1.5.3 IFAD Upper Tana Natural Resources Management Programme............................................................................12
1.5.4 Joint 6 Programme (J6P)...........................................................................................................................................12
1.5.5 Green Growth and Employment Programme...........................................................................................................12
2. PROGRAMME WORK PLAN IMPLEMENTATION PROGRESS................................................................................. 14
2.1 MTAP II- DANIDA SUPPORT............................................................................................................................. 14
2.1.1 Introduction and programme background..............................................................................................................14
2.1.2 Overall Programme Achievements........................................................................................................................... 15
2.1.3 Achievements during the 2016-2017 FY.................................................................................................................. 17
2.1.4 Annual Finance Report..............................................................................................................................................19
2.1.5 Programme Risks and risk Mitigation Measures..................................................................................................... 19
2.1.6 Key implementation challenges................................................................................................................................20
2.1.7 Lessons learnt............................................................................................................................................................ 20
2.2 MTAP II - EU SHARE........................................................................................................................................ 22
2.2.1 Introduction and Programme Background............................................................................................................. 22
2.2.2 Key programme highlights and achievements.........................................................................................................22
2.2.3 Annual Finance Report..............................................................................................................................................23
2.2.4 Annual Programme Achievements........................................................................................................................... 24
2.2.5 Risks and mitigation measures.................................................................................................................................27
2.2.6 Key implementation challenges................................................................................................................................27
2.2.7 Lessons learnt............................................................................................................................................................ 28
2.3 INTERNATIONAL FUND FOR AGRICULTURAL DEVELOPMENT -UPPER TANA NATURAL RESOURCESMANAGEMENT
PROGRAMME..................................................................................................................................................... 30
2.3.1 Programme Background...........................................................................................................................................30
2.3.2 Objectives...................................................................................................................................................................31
2.3.3 Achievements during 2016-2017 Fiscal Year...........................................................................................................31
2.3.4 IFAD- UTaNRMP annual finance report...................................................................................................................32
2.3.5 IFAD – UTaNRMP risk and risk mitigation measures..............................................................................................33
2.3.6 Lessons learnt............................................................................................................................................................ 33
2.4 SUPPORT TO EQUITABLE ACCESS TO QUALITYWATER, BASIC SANITATION AND ENHANCEDWATER RESOURCES
MANAGEMENT IN RURAL KENYA (J6P)............................................................................................................. 35
Annual Rural Harmonized Report – 2016/2017 FY
ii
2.4.1 Introduction and programme background..............................................................................................................35
2.4.2 Key programme highlights and achievements.........................................................................................................37
2.4.3 Annual Finance Report..............................................................................................................................................40
2.4.4 Programme achievements during the 2016-2017 FY..............................................................................................42
2.4.5 Analysis of Results..................................................................................................................................................... 46
2.4.6 Risks and risks mitigation measures – J6P...............................................................................................................47
2.4.7 Key implementation challenges................................................................................................................................ 48
2.4.8 Lessons learnt............................................................................................................................................................ 49
2.5 GREEN GROWTH AND EMPLOYMENT PROGRAMME (GGEP)................................................................................. 51
2.5.1 Introduction and programme background..............................................................................................................51
2.5.2 Key programme highlights and achievements.........................................................................................................52
2.5.3 Annual Finance Report..............................................................................................................................................53
2.5.4 Annual Programme Achievement.............................................................................................................................53
2.5.5 Analysis of Results..................................................................................................................................................... 54
2.5.6 Programme risks and mitigation measures.............................................................................................................55
2.5.7 Key implementation challenges................................................................................................................................55
2.5.8 Lessons learnt............................................................................................................................................................ 57
2.6 DROUGHT EMERGENCY RESPONSE PROGRAMME...................................................................................................57
2.6.1 Introduction and Programme Background............................................................................................................. 57
2.6.2 Key programme highlights and achievements.........................................................................................................57
2.6.3 Annual Finance Report- overall and absorption and FAS....................................................................................... 60
2.6.4 DERP Identified risks and mitigation measures...................................................................................................... 61
2.6.5 Implementation challenges.......................................................................................................................................61
2.6.6 Lessons learnt............................................................................................................................................................ 62
3. WSTF AUDIT AND RISK MANAGEMENT..................................................................................................................63
3.1 INTRODUCTION.....................................................................................................................................................63
3.2 INTERNAL CONTROLS........................................................................................................................................... 63
3.3 AUDIT AND RISKMANAGEMENT........................................................................................................................... 63
3.4 EXTERNAL AUDITS – HARMONIZED AUDIT FOR THE FY 2016-2017...................................................................65
3.5 SUMMARY OF QUESTIONED COSTS - HARMONIZED AUDIT FOR 2015/2016 FY.................................................. 65
3.6 STATUS OF QUESTIONED COSTS............................................................................................................................66
3.7 STATUTORY AUDITS.............................................................................................................................................66
3.8 RE-APPOINTMENT OF PRICEWATERHOUSECOOPERS (PWC)................................................................................. 67
4. MONITORING AND EVALUATION............................................................................................................................ 68
4.1 INTRODUCTION.....................................................................................................................................................68
4.2 MONITORING AND EVALUATION APPROACHES.......................................................................................................68
4.2.1 CRM engagement and alignment............................................................................................................................. 68
4.2.2 Use of Independent Consultants................................................................................................................................69
4.2.3 Routine Project Monitoring...................................................................................................................................... 70
4.3 PROGRESS IN THE FUNDSMONITORING AND EVALUATION....................................................................................71
4.3.1 Quality and Performance Management Systems..................................................................................................... 71
4.3.2 Addressing Low absorption of Funds....................................................................................................................... 72
4.3.3 Mapping of Water Utilities........................................................................................................................................73
4.3.4 Joint Annual Operations Monitoring of WSTF investments - 2016......................................................................... 75
4.3.5 Universal Result based Monitoring and Evaluation Framework............................................................................ 78
ANNEX 1:FUND ACCOUNTABILITY STATEMENTS...........................................................................................87
Annual Rural Harmonized Report – 2016/2017 FY
iii
87
ANNEX 2: STATUS OF THE IMPLEMENTATION OF THE ANNUALWORKPLAN- J6P.................................92
ANNEX 3: STATUS OF THE IMPLEMENTATION OF THE ANNUAL WORK PLAN- UTANRMP....................................99
ANNEX 4: STATUS OF THE IMPLEMENTATION OF THE ANNUAL WORK PLAN- EU SHARE....................................99
ANNEX 5 : STATUS OF THE IMPLEMENTATION OF THEWSTF RESULTS FRAMEWORK – JUNE, 2017....................... 100
ANNEX 6 : STATUS OF FUNDEDWATER PROJECTS- J6P AS AT 30TH JUNE, 2017.................................................... 107
ANNEX 7: STATUS OF FUNDED SANITATION PROJECTS- J6P AS AT 30TH JUNE, 2017................................................111
ANNEX 8: STATUS OF FUNDED WATER RESOURCES PROJECTS- J6P AS AT 30TH JUNE 2017.................................... 113
ANNEX 9: STATUS OF FUNDED PROJECTS- UTANRMP AS AT 30TH JUNE, 2017.................................................... 114
ANNEX 10: STATUS OFMTAP II PROJECTS AS AT 30TH JUNE, 2017.......................................................................120
ANNEX 11: COMPLETED SANITATION PROJECT UNDER EU SHARE.......................................................................... 124
ANNEX 12: MTAP II - WATER RESOURCES PROJECTS’ STATUS AS AT 30TH JUNE 2017......................................... 128
TABLE 13: KEY FINDINGS AND RECOMMENDATIONS OF THE JOINT OPERATIONSMONITORING 2016.......................131
Annual Rural Harmonized Report – 2016/2017 FY
iv
LIS OF TABLES
Table 1 : Funds absorption per programme in relation to total funds available in 2016/2017 FY..........................3
Table 2 : Funding by various Development Partners for 2016/2017..........................................................................6
Table 3 : Overall Achievements against Targets..........................................................................................................15
Table 4 : Risks and risks mitigation measures.............................................................................................................18
Table 5 : Challenges and adaptive measures................................................................................................................19
Table 6 : EU- SHARE programme achievements..........................................................................................................23
Table 7 : Identified Risks and Mitigation Measures.....................................................................................................26
Table 8 : Key implementation challenges and adaptive measures............................................................................ 26
Table 9 : Cumulative programme achievements per outcome...................................................................................30
Table 10 : Achievements against targets ..................................................................................................................... 30
Table 11 : Risks and mitigation measures ...................................................................................................................32
Table 12 : Budget utilization – FY 2016/2017.............................................................................................................39
Table 13 : 2016-2017 achievements against targets for J6P programme..................................................................40
Table 14 : Risk and mitigation measures......................................................................................................................45
Table 15 : Implementation challenges of J6P programme..........................................................................................46
Table 16 : FY 2016/17 GGEP achievements ............................................................................................................... 51
Table 17 : Identified risks and mitigation measures ................................................................................................. 52
Table 18 : Table showing implementation challenges - GGEP ..................................................................................52
Table 19 : Project implementation status – Tana River County as at 30th June, 2017.............................................54
Table 20 : Project implementation status for Garissa County as at 30th June, 2017................................................55
Table 21 : Project implementation status for Lamu County as at 30th June, 2017...................................................56
Table 22 : Summary of DERP Costs as at 30th, June, 2017...........................................................................................56
Table 23 : Identified risks and mitigation measures................................................................................................... 57
Table 24 : Implementation challenges and adaptive measures .................................................................................57
Table 25 : Summary of flagged projects as at 30th June, 2017.................................................................................... 61
Table 26 : Questioned costs by investment projects ................................................................................................. 63
Table 27 : Questioned costs by year..............................................................................................................................63
Table 28 : Questioned costs by investments................................................................................................................ 64
Table 29 : Summary of key monitoring issues and their mitigation measures.........................................................67
Table 30 : showing overall rating of the key result areas for FY 2016/2017............................................................75
Table 31 : Rural Investment projects currently flagged and their status as at 30th June, 2017............................. 77
Annual Rural Harmonized Report – 2016/2017 FY
v
LIST OF FIGURES
FIGURE 1 : FUNDS FLOW AND ABSORPTION FOR RURAL AND WATER RESOURCES INVESTMENT PROGRAMMES
BASED ON ACCRUALS..............................................................................................................................................2
FIGURE 2 FUNDS ABSORPTION PER PROGRAMME BASED ON AVAILABLE FUNDS ...................................................2
FIGURE 3 FUNDS ABSORPTION PER PROGRAMME BASED ON OVERALL AVAILABLE FUNDS FOR 2016-2017 FY...3
FIGURE 4 : A MAP SHOWING THE MTAP II COUNTIES................................................................................................ 14
FIGURE 5 : NO. OF MTAP II FUNDED WRUAS................................................................................................................15
FIGURE 6 : SUMMARY OF FUND UTILIZATION FOR THE MTAP II –DANIDA..............................................................18
FIGURE 7 : SUMMARY OF FUNDING UNDER MTAP II –EU SHARE ..............................................................................22
FIGURE 8 : SUMMARY OF FUND UTILIZATION FOR THE MTAP II –EU SHARE..........................................................23
FIGURE 9 : MAP OF THE IFAD UTANRMP TARGET COUNTIES....................................................................................29
FIGURE 10 : SUMMARY OF FUND UTILIZATION FOR THE IFAD –UTANRMP PROGRAMME 2016/20......................31
FIGURE 11 : COUNTIES COVERED BY THE J6P PROGRAMME............................................................................33
FIGURE 12 : SUMMARY OF FUND UTILIZATION FOR THE J6P PROGRAMME - 2016/2017.......................................39
FIGURE 13 : SUMMARY OF FUND UTILIZATION FOR THE GGEP PROGRAMME - 2016/2017...................................50
Annual Rural Harmonized Report – 2016/2017 FY
vi
ACRONYMS
ASALs : Arid and Semi-arid Lands
BOT : Board of Trustees
BP : Bridging Program
CBOs : Community Based Organizations
CRM : County Resident Monitor
CWG : County Working Group
CFA : Community Forest Associations
CTCN : Climate Technology Centre & Network
DP : Development Partner
DASAL : Department of Arid and Semi-Arid Lands
EU : European Union
FAS : Fund Accountability Statement
GETF : Global Environment & Technology Foundation
GOF : Government of Finland
GOS : Government of Sweden
GOK : Government of Kenya
IFAD : International Fund for Agricultural Development
JAOME : Joint Annual Operations Monitoring
KEWI : Kenya Water Institute
KWSP : Kenya Water and Sanitation Program
MOU : Memorandum of Understanding
MTAP : Medium Term ASAL Programme
MWI : Ministry of Water and Irrigation
OAG : Office of Auditor General
OBA : Output Based Aid
PC : Performance Contracting
PFMP : Participatory Forest Management Plans
RF : Results Framework
UNICEF : United Nations Children’s Fund
UTaNRMP : Upper Tana Natural Resource Management Programme
WASH : Water and Sanitation for Hygiene
WSTF : Water Sector Trust Fund
WDC : Water Resources Users Association Development Cycle
WRA : Water Resources Authority
WRUAs : Water Resources Users’ Associations
Annual Rural Harmonized Report – 2016/2017 FY
vii
PREFACE
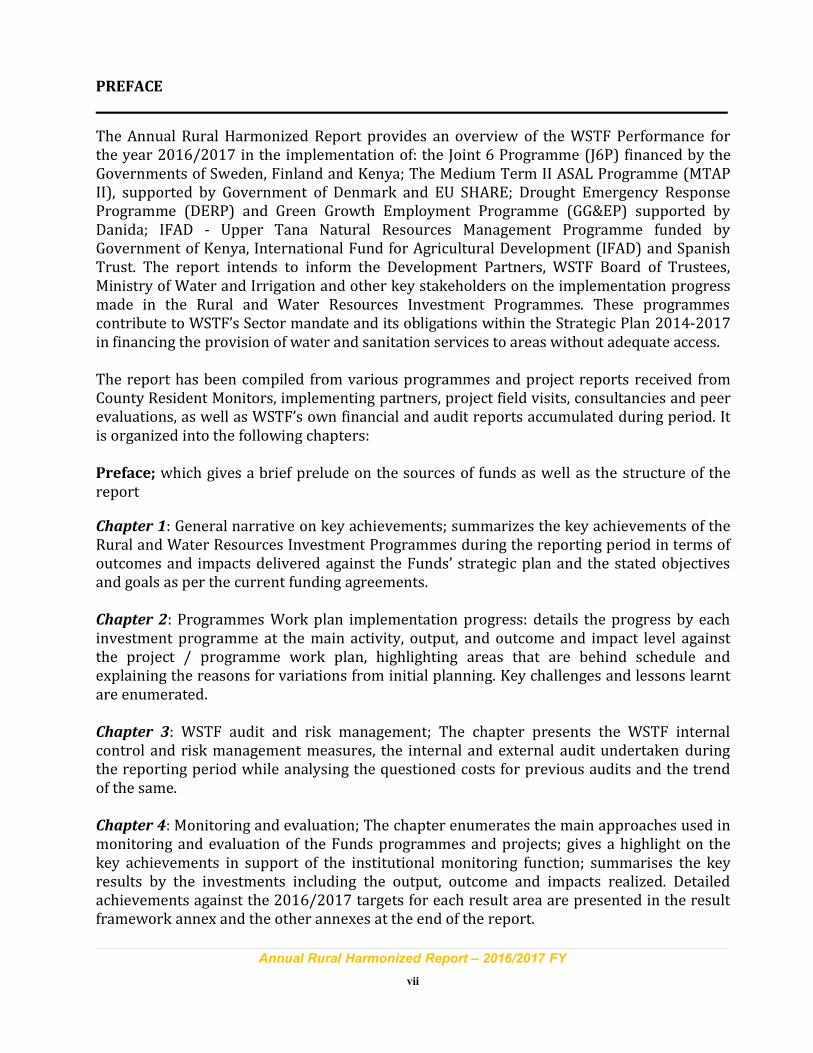
The Annual Rural Harmonized Report provides an overview of the WSTF Performance forthe year 2016/2017 in the implementation of: the Joint 6 Programme (J6P) financed by theGovernments of Sweden, Finland and Kenya; The Medium Term II ASAL Programme (MTAPII), supported by Government of Denmark and EU SHARE; Drought Emergency ResponseProgramme (DERP) and Green Growth Employment Programme (GG&EP) supported byDanida; IFAD - Upper Tana Natural Resources Management Programme funded byGovernment of Kenya, International Fund for Agricultural Development (IFAD) and SpanishTrust. The report intends to inform the Development Partners, WSTF Board of Trustees,Ministry of Water and Irrigation and other key stakeholders on the implementation progressmade in the Rural and Water Resources Investment Programmes. These programmescontribute to WSTF’s Sector mandate and its obligations within the Strategic Plan 2014-2017in financing the provision of water and sanitation services to areas without adequate access.
The report has been compiled from various programmes and project reports received fromCounty Resident Monitors, implementing partners, project field visits, consultancies and peerevaluations, as well as WSTF’s own financial and audit reports accumulated during period. Itis organized into the following chapters:
Preface; which gives a brief prelude on the sources of funds as well as the structure of thereport
Chapter 1: General narrative on key achievements; summarizes the key achievements of theRural and Water Resources Investment Programmes during the reporting period in terms ofoutcomes and impacts delivered against the Funds’ strategic plan and the stated objectivesand goals as per the current funding agreements.
Chapter 2: Programmes Work plan implementation progress: details the progress by eachinvestment programme at the main activity, output, and outcome and impact level againstthe project / programme work plan, highlighting areas that are behind schedule andexplaining the reasons for variations from initial planning. Key challenges and lessons learntare enumerated.
Chapter 3: WSTF audit and risk management; The chapter presents the WSTF internalcontrol and risk management measures, the internal and external audit undertaken duringthe reporting period while analysing the questioned costs for previous audits and the trendof the same.
Chapter 4: Monitoring and evaluation; The chapter enumerates the main approaches used inmonitoring and evaluation of the Funds programmes and projects; gives a highlight on thekey achievements in support of the institutional monitoring function; summarises the keyresults by the investments including the output, outcome and impacts realized. Detailedachievements against the 2016/2017 targets for each result area are presented in the resultframework annex and the other annexes at the end of the report.
Annual Rural Harmonized Report – 2016/2017 FY
1
1. GENERAL NARRATIVE ON KEY ACHIEVEMENTS
1.1Introduction
WSTF commenced its operations in March, 2005 and has realized tremendous growth in allperformance monitoring indicators ranging from investments, resources mobilized, andpartnerships as well as in the development of human resources capacity. The growth hasprovided an ideal environment for institutionalization of lessons learnt and best practices aswell as in the review of programming and financing procedures and systems.
This annual report provides an analysis of the achievements of Rural and Water ResourcesInvestment Programmes for the financial 2016-2017 Financial Year. The report is preparedfor the purpose of informing the Fund’s key stakeholders including the Ministry of Waterand Irrigation, Development Partners, Board of Trustees and Management on the progressrealized as at the end of the financial year 2016/2017.
This section provides a synopsis of the key achievements during the reporting period againstthe Funds strategic plan, its objectives and goals as per the current agreements between theFund and the Development Partners;
1.2Overall flow and absorption of funds during 2016-2017
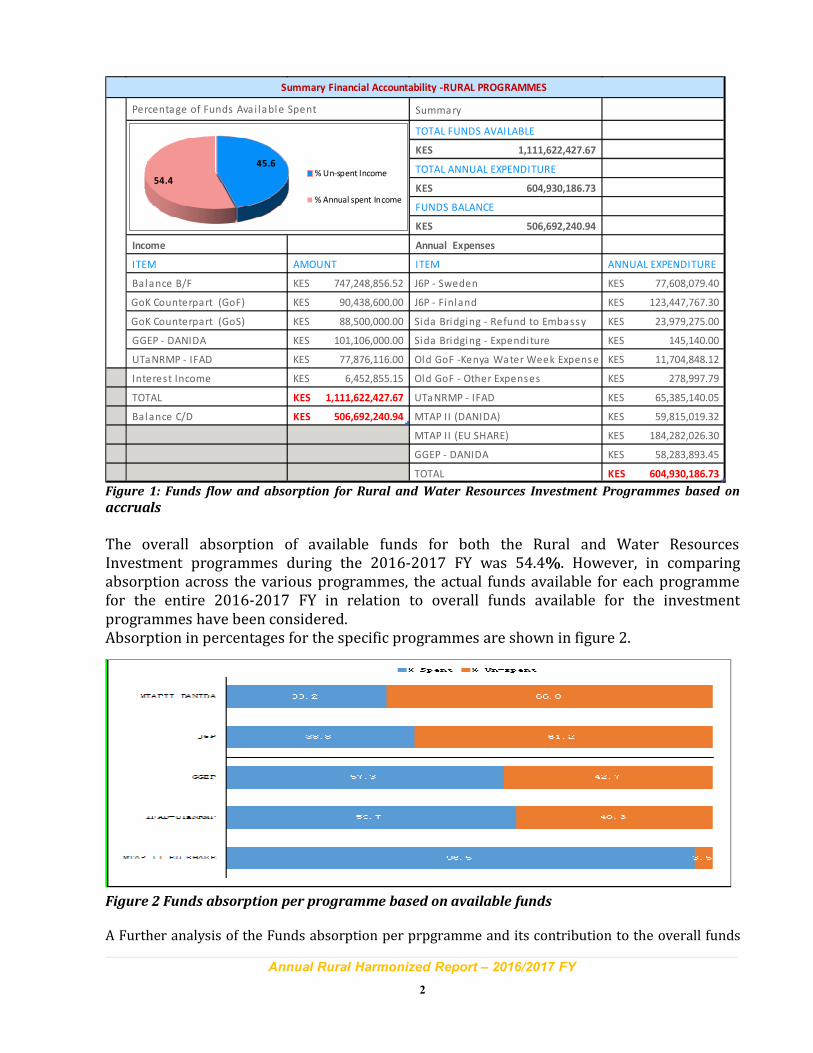
During the year under review, the Rural and Water Resources Investment Programmesreceived a total of Ksh 364,373,571.151 from GoK counterpart fund, Danida, EU SHARE,GGEP, CBO refunds, interest accruals and internal borrowings. The Fund had balancesbrought forward of Ksh 747,248,856.52 and hence a total of Ksh 1,111,622,427.67 wasavailable for utilization. The Fund expended Ksh 604,930,186.73 in the Rural InvestmentProgrammes effectively absorbing 54.4% of the available funds during the year.Figure 1 shows an overview of the Funds flow to the Rural Investments Programme duringthe year under review.Under the SIDA Bridging Programme, the balance of Ksh. 23,979,275.00 was refunded to theEmbassy during the year since the programme had ended. In addition, under the Old GoFProgramme, the balance was used to cater for Kenya Water Week expenses amounting toKsh. 11,704,848.12, which also marked the end of the programme.
1 Under the J6P programme supported by Finland and Sweden, a transfer of Ksh 164, 164,330.10 was made to the
National Treasury. However, there were delays in the subsequent disbursement to the WSTF accounts from the
National Treasury. This was attributed to erroneous entries made by the National Treasury reflecting the transfer as A-
in-A instead of revenue. The process of reverting the same took long hence occasioning the disbursement delay.
Annual Rural Harmonized Report – 2016/2017 FY
2
Summary
TOTAL FUNDS AVAILABLE
1,111,622,427.67KES
TOTAL ANNUAL EXPENDITURE
604,930,186.73KES
FUNDS BALANCE
506,692,240.94KES
Income Annual Expenses
ITEM AMOUNT ITEM ANNUAL EXPENDITURE
Bal ance B/F 747,248,856.52KES J6P - Sweden 77,608,079.40KES
GoK Counterpart (GoF) 90,438,600.00KES J6P - Finland 123,447,767.30KES
GoK Counterpart (GoS) 88,500,000.00KES Sida Bridging - Refund to Embassy 23,979,275.00KES
GGEP - DANIDA 101,106,000.00KES Sida Bridging - Expenditure 145,140.00KES
UTaNRMP - IFAD 77,876,116.00KES Old GoF -Kenya Water Week Expense 11,704,848.12KES
Interest Income 6,452,855.15KES Old GoF - Other Expenses 278,997.79KES
TOTAL 1,111,622,427.67KES UTaNRMP - IFAD 65,385,140.05KES
Bal ance C/D 506,692,240.94KES MTAP II (DANIDA) 59,815,019.32KES
MTAP II (EU SHARE) 184,282,026.30KES
GGEP - DANIDA 58,283,893.45KES
TOTAL 604,930,186.73KES
Summary Financial Accountability -RURAL PROGRAMMES
Percentage of Funds Ava i labl e Spent
45.6
54.4% Un-spent Income
% Annual spent Income
Figure 1: Funds flow and absorption for Rural and Water Resources Investment Programmes based on
accruals
The overall absorption of available funds for both the Rural and Water ResourcesInvestment programmes during the 2016-2017 FY was 54.4%. However, in comparingabsorption across the various programmes, the actual funds available for each programmefor the entire 2016-2017 FY in relation to overall funds available for the investmentprogrammes have been considered.Absorption in percentages for the specific programmes are shown in figure 2.
Figure 2 Funds absorption per programme based on available funds
A Further analysis of the Funds absorption per prpgramme and its contribution to the overall funds
Annual Rural Harmonized Report – 2016/2017 FY
3
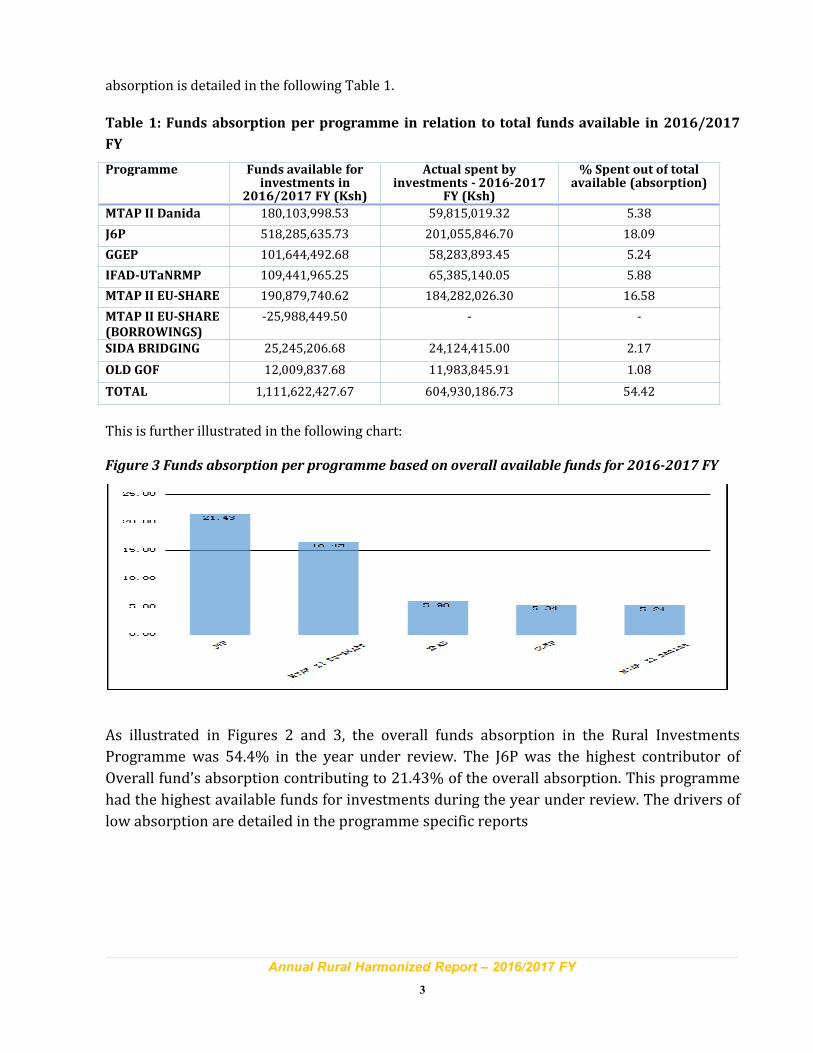
absorption is detailed in the following Table 1.
Table 1: Funds absorption per programme in relation to total funds available in 2016/2017
FY
Programme Funds available forinvestments in
2016/2017 FY (Ksh)
Actual spent byinvestments - 2016-2017
FY (Ksh)
% Spent out of totalavailable (absorption)
MTAP II Danida 180,103,998.53 59,815,019.32 5.38
J6P 518,285,635.73 201,055,846.70 18.09
GGEP 101,644,492.68 58,283,893.45 5.24
IFAD-UTaNRMP 109,441,965.25 65,385,140.05 5.88
MTAP II EU-SHARE 190,879,740.62 184,282,026.30 16.58
MTAP II EU-SHARE
(BORROWINGS)
-25,988,449.50 - -
SIDA BRIDGING 25,245,206.68 24,124,415.00 2.17
OLD GOF 12,009,837.68 11,983,845.91 1.08
TOTAL 1,111,622,427.67 604,930,186.73 54.42
This is further illustrated in the following chart:
Figure 3 Funds absorption per programme based on overall available funds for 2016-2017 FY
As illustrated in Figures 2 and 3, the overall funds absorption in the Rural Investments
Programme was 54.4% in the year under review. The J6P was the highest contributor of
Overall fund’s absorption contributing to 21.43% of the overall absorption. This programme
had the highest available funds for investments during the year under review. The drivers of
low absorption are detailed in the programme specific reports
Annual Rural Harmonized Report – 2016/2017 FY
4
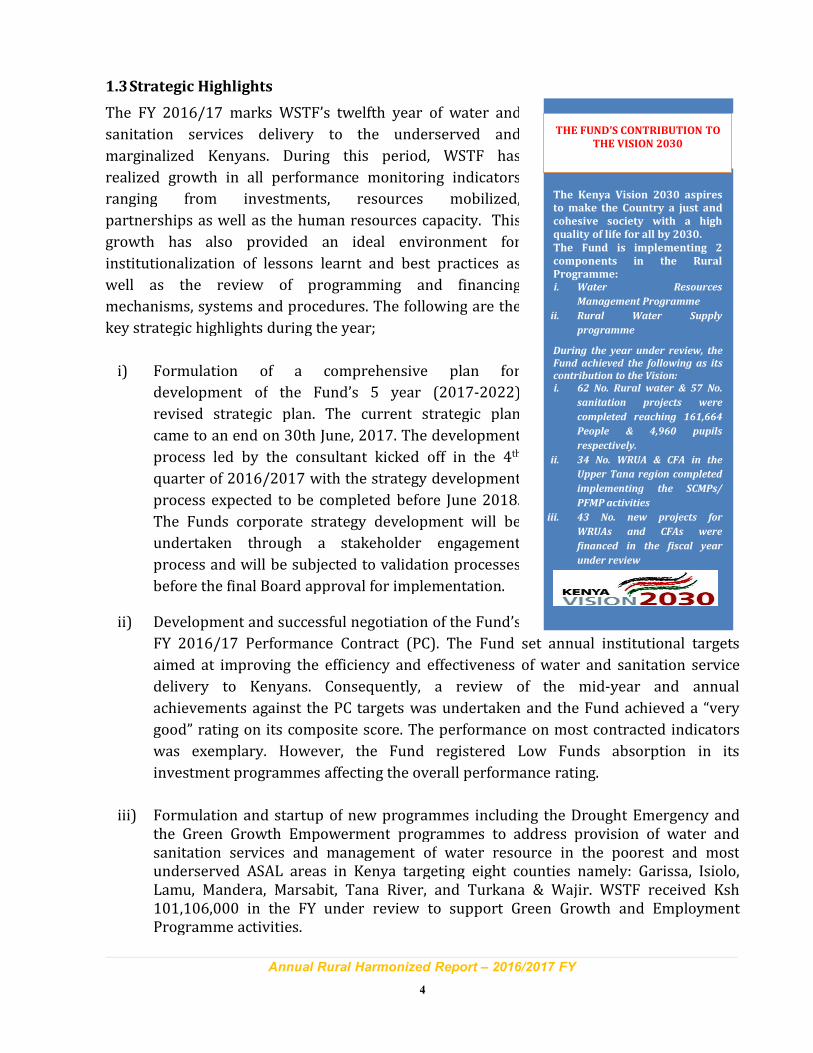
The Kenya Vision 2030 aspires
to make the Country a just and
cohesive society with a high
quality of life for all by 2030.
The Fund is implementing 2
components in the Rural
Programme:i. Water Resources
Management Programme
ii. Rural Water Supply
programme
During the year under review, the
Fund achieved the following as its
contribution to the Vision:
i. 62 No. Rural water & 57 No.
sanitation projects were
completed reaching 161,664
People & 4,960 pupils
respectively.
ii. 34 No. WRUA & CFA in the
Upper Tana region completed
implementing the SCMPs/
PFMP activities
iii. 43 No. new projects for
WRUAs and CFAs were
financed in the fiscal year
under review
THE FUND’S CONTRIBUTION TO
THE VISION 2030
1.3Strategic Highlights
The FY 2016/17 marks WSTF’s twelfth year of water and
sanitation services delivery to the underserved and
marginalized Kenyans. During this period, WSTF has
realized growth in all performance monitoring indicators
ranging from investments, resources mobilized,
partnerships as well as the human resources capacity. This
growth has also provided an ideal environment for
institutionalization of lessons learnt and best practices as
well as the review of programming and financing
mechanisms, systems and procedures. The following are the
key strategic highlights during the year;
i) Formulation of a comprehensive plan for
development of the Fund’s 5 year (2017-2022)
revised strategic plan. The current strategic plan
came to an end on 30th June, 2017. The development
process led by the consultant kicked off in the 4th
quarter of 2016/2017 with the strategy development
process expected to be completed before June 2018.
The Funds corporate strategy development will be
undertaken through a stakeholder engagement
process and will be subjected to validation processes
before the final Board approval for implementation.
ii) Development and successful negotiation of the Fund’s
FY 2016/17 Performance Contract (PC). The Fund set annual institutional targets
aimed at improving the efficiency and effectiveness of water and sanitation service
delivery to Kenyans. Consequently, a review of the mid-year and annual
achievements against the PC targets was undertaken and the Fund achieved a “very
good” rating on its composite score. The performance on most contracted indicators
was exemplary. However, the Fund registered Low Funds absorption in its
investment programmes affecting the overall performance rating.
iii) Formulation and startup of new programmes including the Drought Emergency andthe Green Growth Empowerment programmes to address provision of water andsanitation services and management of water resource in the poorest and mostunderserved ASAL areas in Kenya targeting eight counties namely: Garissa, Isiolo,Lamu, Mandera, Marsabit, Tana River, and Turkana & Wajir. WSTF received Ksh101,106,000 in the FY under review to support Green Growth and EmploymentProgramme activities.
Annual Rural Harmonized Report – 2016/2017 FY
5
iv) In order to enhance the overall Fund’s capacity, Technical Advisors were engaged tosupport monitoring and evaluation of the Fund’s investments, and support theimplementation of WSTF rural investment programmes. These TA’s included a ChiefTechnical Advisor and a Junior Professional engaged under the J6P programme andan M&E TA engaged under the Danida support. The enagement of the TAs hassupported the Fund in the development of various programme management tools andsystems, enhanced project monitoring and reporting and has contributed tosignificantly improving programme performance and efficient utilization of availableresources.
v) The Fund implemented a Human Resource Management Information System that is
expressly designed to automate the Human Resource processes and payroll
management to enhance compliance with statutory requirements. This system is
integrated with the existing SAP Business One Financial system. Implementation of
this system has enhanced transparency in leave management, payroll management
efficiencies, tax management and staff related financial management issues.
vi) The enactment of the Water Act, 2016 into law marked a new dawn for the Fund
converting it to a Water Sector Trust Fund. The Fund embarked on preparatory
activities to effect the transition initiatives. The key issues under consideration for
the transition plans include a rebranding strategy, county engagement strategy,
implementation of the Water Levy (and the subsidiary legislation), development of a
research framework, enhancement of the implementation of commercial financing
programmes, and progress towards realization of water as a right through
accelerating access to the underserved in Kenya.
vii) WSTF organized an Ambassadors field visit led by the Cabinet Secretary, Ministry of
Water & Irrigation, Hon Eugene Wamalwa with the Ambassadors of Denmark,
Finland & Sweden as well as the EU Deputy Head of delegation. The tour of the water
projects was undertaken in Mount Kenya region.
viii) The Fund received technical assistance from CTCN for a feasibility study on green
technologies and PPP models. This support was undertaken by UNEP – DTU and the
Green Technology Centre, Korea. A stakeholder workshop was held to disseminate
the findings of the reports.
ix) In partnership with the Kenya Markets Trust and SNV, the Fund developed service
delivery models participated in a workshop on the governance and sustainability in
rural water management in Isiolo County. WSTF CEO, Kenya Market Trust Director &
Dr. Joseph Sigi Langat, Chair of County executives for Water led 15 counties in making
the Isiolo Water Sector Declaration focusing on professionalizing rural water
management
Annual Rural Harmonized Report – 2016/2017 FY
6
1.4Resource Mobilization and Partnerships
The 2016/2017 financial year culminated in great initiatives and achievements for the Fund
including the undertaking of the Joint Annual Operations Monitoring (JAOME) for all WSTF
projects and investments financed from 2010, resulting in the first Maji Insight Report; the
first and successful Kenya Water Week and as a result, the first and successful Water Sector
Trust Fund Innovation Challenge (WICA 2016). As a result, WSTF has now fully trained and
paid the WICA 2016 winners.
1.4.1 Funds mobilized from all on-going partnerships
The Fund targeted to mobilize Ksh 1,743,514,400 in 2016/2017. However, it managed tomobilize a total of Ksh 1, 088,087,745 amounting to 62.4% of the annual target. Table 2gives the details of the resources mobilized in the year from ongoing partnershipsirrespective of the balances carried forward from the 2015/2016 FY.
Table 2: Funding by various Development Partners for 2016/2017
Development Partner Target (Ksh) Funds Disbursed (Ksh)
1. Government of Kenya 449,000,000 449,000,000
2. Government of Finland 106,714,400 0
3. Government of Sweden 40,000,000 0**
4. KfW III 531,000,000 390,979,102
5. DANIDA - GGEP 218,000,000 101,106,000
6. World Bank 117,500,000 69,126,527
7. IFAD 91,300,000 77,876,116
8. EU-Rural 190,000,000 0
Total 1,743,514,400 1,088,087,745
NB:
Ksh 208,702,138, Ksh 115,547,000, and Ksh 164,164,330.10 being disbursements from EU, Danida
Green Growth and GoS respectively was recorded as cash in transit having reached the Ministry of
Water and Irrigation but had not been transferred to WSTF.
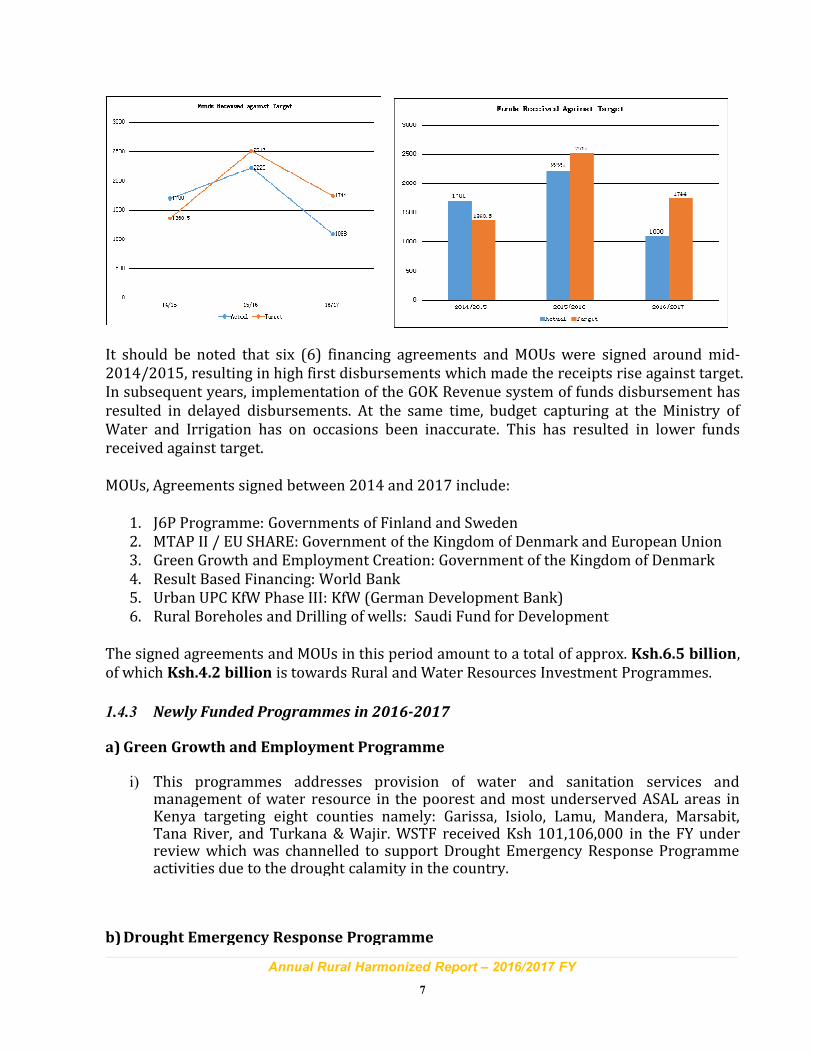
1.4.2 Financial Trends in the Strategic Period 2014-2017
During the Strategic period 2014 – 2017, WSTF received a total of Ksh.5.013 billion against atarget of Ksh.5.62 billion. The highest funds receipt against target was received in2014/2015 when Ksh.1.7 billion was realized against a target of Ksh.1360.5. In thesubsequent two financial years, the funds received were below target. The highest variancewas in 2016/2017, with Ksh.1.088 realized against a target of 1.744. This is demonstratedthrough the graph below
Annual Rural Harmonized Report – 2016/2017 FY
7
It should be noted that six (6) financing agreements and MOUs were signed around mid-2014/2015, resulting in high first disbursements which made the receipts rise against target.In subsequent years, implementation of the GOK Revenue system of funds disbursement hasresulted in delayed disbursements. At the same time, budget capturing at the Ministry ofWater and Irrigation has on occasions been inaccurate. This has resulted in lower fundsreceived against target.
MOUs, Agreements signed between 2014 and 2017 include:
1. J6P Programme: Governments of Finland and Sweden2. MTAP II / EU SHARE: Government of the Kingdom of Denmark and European Union3. Green Growth and Employment Creation: Government of the Kingdom of Denmark4. Result Based Financing: World Bank5. Urban UPC KfW Phase III: KfW (German Development Bank)6. Rural Boreholes and Drilling of wells: Saudi Fund for Development
The signed agreements and MOUs in this period amount to a total of approx. Ksh.6.5 billion,of which Ksh.4.2 billion is towards Rural andWater Resources Investment Programmes.
1.4.3 Newly Funded Programmes in 2016-2017
a) Green Growth and Employment Programme
i) This programmes addresses provision of water and sanitation services andmanagement of water resource in the poorest and most underserved ASAL areas inKenya targeting eight counties namely: Garissa, Isiolo, Lamu, Mandera, Marsabit,Tana River, and Turkana & Wajir. WSTF received Ksh 101,106,000 in the FY underreview which was channelled to support Drought Emergency Response Programmeactivities due to the drought calamity in the country.
b)Drought Emergency Response Programme
Annual Rural Harmonized Report – 2016/2017 FY
8
i) On 10th February, 2017 the Government of Kenya (GOK) declared the drought aNational disaster, with 23 of 47 counties affected. Water Sector Trust Fund (WSTF)upon analysis of the drought situation in the country and its positioning as a financinginstitution for improved water and sanitation access in underserved areas forged apartnership to be part of the solution to the drought disaster.
ii) A funding proposal for drought emergency response was submitted to the RoyalDanish Embassy (Danida) committed to fund the programme with Ksh 150 million.Monies were disbursed to target counties (Garissa, Tana River and Lamu) andimplementation of the identified projects is ongoing in three counties.
iii) The Government of Denmark has committed additional support to WSTF towardsdrought resilience to include utilization of the balance from the no-cost projectextension in the MTAP II water resources component, and allocation from a possibleDKK 100 million (about Ksh 1.5 billion) towards handling humanitarian (refugeeissues) and climate change.
iv)
c) Saudi Fund for DevelopmentWSTF submitted a proposal to the Saudi Fund for Development for support to drilling andequipping of 42 boreholes in selected ASAL Counties of Wajir, Mandera and Garissa. Theproposal has since been funded. A project Implementation Unit was formed at the Ministryof Water and Irrigation with WSTF represented by the Manager, Rural Investments.
d)Kenya Pooled Water Fund (KPWF) Reserve Funds
WSTF has received Ksh.250 million from the National Treasury as reserve funds under theKenya Pooled Water Fund programme. A further Ksh.250 million for the same is expected.The Reserve Fund will have the single exclusive purpose to provide temporary emergencyliquidity for the Kenya Pooled Water Fund to promptly pay its obligations to bondholders inthe unlikely event of a shortfall or late payment from one or more loans in the pool.
Background to the Kenya Pooled Water Fund:
The Kenya Pooled Water Fund (KPWF) aims to provide loans for water and sanitationinvestments to Kenyan Water Service Providers (WSPs) through a pooled bond, in supportof the Government of Kenya efforts to meet Vision 2030 and Sustainable Development Goal 6targets.
The objective of the KPWF is to help the GOK close the funding gap for Water and SanitationServices (WSS) through a financing facility that raises debt from the capital markets to
lend to creditworthy WSPs to build water and sanitation infrastructure. The KPWF
intends to raise a minimum of KES 3 billion in infrastructure bonds on an annual basis.The KPWF goal is to offer longer tenor, lower interest, local currency private financing to theWSS sector and puts special emphasis on contributing to poor areas, climate adaption, goodgovernance, implementation capacity and creditworthiness of the WSPs.
The work of KPWF further strengthens the commercial and business approach to waterfinancing which WSTF has already initiated through the Result Based Financing supportedby the World Bank with funding from the Government of Sweden.
e) Submission and Follow-up on Proposals
Annual Rural Harmonized Report – 2016/2017 FY
9
The process of signing the financing agreement for the European Union Climate Proofed
Infrastructure Programme is at an advanced stage and the signing is expected to take place
soon. The support is for Ksh 2 billion with SNV receiving Ksh 200 million out of this amount
towards enhancing capacity for project management and Private Sector Participation.
1.4.4 Progress on submitted proposals
i) WSTF met with representatives from the Global Environment and Technology
Foundation (GETF) to discuss progress of submitted proposals. GETF is expected to
fund Rainwater Harvesting as well as the Decentralized Treatment Facility value chain
process, focusing on economic re-use of treated waste.
ii) WSTF and the Gates Foundation are working on a proposal to African Development
Bank for construction of Faecal Sludge Management Treatment Facilities in 17 towns
in Kenya. This process is being undertaken in conjunction with the Ministry of Water
and Irrigation.
iii) Other proposals under negotiation include: Rainwater Harvesting Proposal to
Safaricom Foundation; Result Based Financing proposal to Safaricom MPESA
Foundation; Sanitation proposal to NIC bank.
iv) WSTF is in the process of developing and submitting a proposal to the Green Climate
Fund supported by the consultancy for the CTCN. Last year, CTCN supported the
consultancy for a study on green technologies and Public Private Partnerships, whose
results have been disseminated to WSTF and stakeholders. CTCN will mainly focus on
the following areas:
a) The WSTF aims to support infrastructure for climate resilient green
technologies in rural and peri-urban areas.
b) Scaling microfinance for climate resilient green technologies in rural and peri-
urban areas.
c) Improve climate resilience of water supply infrastructure in rural and peri-
urban areas.
d) Strengthen capacity of stakeholders and raise public awareness on climate
change and green technologies for effective Water Service delivery in Kenya.
1.4.5 Partnership MeetingsDuring the year, the Fund realized the following towards the management of new andexisting partnerships;i) Several steering and bilateral meetings were held during the period. Steering
meetings included three (3) Rural Steering committee meetings, one (1) JointSteering meeting and two (2) Joint six Programme (J6P) Steering Group meetings. Allthese meetings deliberated and sought to address pertinent issues such as
Annual Rural Harmonized Report – 2016/2017 FY
10
programmes progress, delayed co-funding by Counties, audit updates, financialreports and capacity development among others.
ii) Bilateral meetings included: High level Ministerial meeting between the Royal DanishEmbassy, Ministry of Water and Irrigation, WSTF and the Red Cross to discussDrought Emergency Response, meeting with the SIWI Director, meeting between J6PPartners, WSTF and MWI, IFAD and World Bank missions among others includingmeetings with Urban Partners such as KfW and the Gates Foundation. A sanitationstakeholder’s workshop was also carried out by WSTF and the Gates Foundation.
These meetings while specific to the relevant programmes, were all aimed at review ofprogrammes, addressing bilateral concerns or review of MOUs / agreements
1.4.6 Field visits with partnersSeveral field visits to monitor progress of funded projects or to familiarize with WSTFprogrammes, were carried out as follows:i) Joint Ambassadors Field Visit held in the Mount Kenya region as mentioned aboveii) Field Visit to Lamu by the Danish Ambassador and Deputy Ambassador for specific
project reviewsiii) Field Visit to the Machakos DTF and Safisan toilet facilities by the Director for Urban
Sanitation Markets, Water, Sanitation and Hygiene, Gates Foundation.iv) Field Visit to Limuru and Kikuyu for SIWI Director of Africa Regional Centre.
1.4.7 Proposal developmentThe Fund submitted three proposals to the Global Environment and Technology Foundation(GETF) on Rain Water Harvesting, Upscaling Basic Sanitation for the Urban Poor (UBSUP)and School WASH. GETF has expressed interest in the first two proposals and follow updiscussions have commenced.
Annual Rural Harmonized Report – 2016/2017 FY
11
1.5Investments Programme Highlights
WSTF strategically ties its investments around five key strategic components/ result areas
upon which resources are channeled to ensure efficiency and effectiveness in programme
delivery. These are:
i) County Capacity Development
ii) Improved Management of Water Resources
iii) Sustainable Access to Water Services
iv) Sustainable Access to Sanitation Services
v) WSTF Capacity Development
The achievements in these five result areas are continuously monitored and reported using
the Universal Result Based Monitoring and Evaluation Framework (Annex IV) to ensure the
desired results and outcomes are met. The following is a summary of the overall
achievement of the funded programmes under the two investments – Water Resources
Investments and Rural Investments:
1.5.1 MTAP II – DANIDA
The Danida funded Medium Term ASAL Programme (MTAP) Phase II activities ran from 1
July, 2014 to 30th June, 2016. This Ksh 250 million support to WRUAs in 6 ASAL counties
continued through a no-cost extension until December, 2017 for the completion of planned
activities. During the reporting period 20 WRUA management committees from Isiolo,
Marsabit, Garissa and Wajir Counties were trained on: financial, procurement procedures,
management, and monitoring and evaluation issues. 8 WRUAs were financed for 2nd Tranche
disbursements as at 30th June, 2017. Progress with implementation was less than expected
because of conflicting priorities between WSTF, WRA and county governments as well as the
devastating and prolonged drought that hit the six MTAP counties. Consequently Danida
agreed that the balance funds can be used for drought emergency activities up to December
2017. Further details appear in the section under GG&EP.
1.5.2 MTAP II - EU SHARE
This European Union initiative (Support to Horn of Africa Resilience – SHARE) provided
financial support of Ksh 690 million to WSTF channeled through Danida as a separate part of
MTAP. The support started in 2015 with 32 water projects financed by end of 30th June,
2017, with 12 water projects being completed during the reporting period, and 18
completed in 2015/16. The 2 pending projects are at various stages; Tana River County -
Kone project is stalled with works at 50%, Lamu County - Manda Maweni is awaiting closure
after submission of the final Funds Accountability Statement. Out of the 84 sanitation
projects financed under the programme, all (100%) were reported as complete by end of
June, 2017, with 18 completed during the year 2016/17. A further 24 water and sanitation
projects will be funded in the financial year 2017/18. The Project will close in June, 2018,
Annual Rural Harmonized Report – 2016/2017 FY
12
but a follow up Project on Climate Proofed Infrastructure in ASAL counties funded by EU is
expected to build on the experiences from EU SHARE.
1.5.3 IFAD Upper Tana Natural Resources Management Programme
This Ksh 600 million programme is focused on improving Natural Resource Management in
the crucial Upper Tana Basin. The programme runs from 2012 -20 and supports both
Community Forest Associations and Water Resources Users Associations with external funds
from IFAD and the Spanish Trust Fund. 34 projects (18 CFAs and 16 WRUAs) funded under
the 1st call for proposals in 2015/16 were reported as 100% complete. A further 43 projects
(31 WRUAs and 12 CFAs) were funded under the 2nd call after desk and field appraisals of 66
proposals. Ksh 75,086,828.05 was expended as at 30th June, 2017 to support both CFA and
WRUA projects. So far 9 springs have been protected and 306Ha of degraded land has been
rehabilitated in this critical water tower.
1.5.4 Joint 6 Programme (J6P)
This Ksh 2 billion programme is funded by the Governments of Kenya, Finland and Sweden.
It is planned to run from 2015-19 and is piloting new approaches to Water Infrastructure
investments in Migori, Nandi, Narok, Tharaka Nithi, Kwale and Laikipia through Water
Service Providers and Water Utilities. 31 water projects were financed in June, 2016 at a cost
of Ksh205, 619,350, targeting to reach 285,550 people. Implementation is ongoing for 28
projects but work on 3 water projects in Narok County has been suspended due to
procurement process irregularities. No project was reported as complete as at 30th June,
2017. J6P also supported drafting of a prototype County Water Bill, and Water Utility
Mapping to help improvement management of medium-sized Water Services Providers.
Based on experience from previous year, a further 12 water projects will be supported that
will be more comprehensive in scope in 2017/18. In addition there will be a focus on
improving knowledge management and streamlining and integrating reporting systems at
institutional level.
Based on lessons and experiences during implementation of the 1st phase of this programme,
there is a likelihood that the programme activities are not likely to be achieved within the
timelines provided for in the implementation programme document hence raising the
possibility for a no cost extension request in the next implementation period. This is as a
result of delays in the implementation of the programme and marshaling support from the
counties during the implementation of batch 1 activities. The implementation and closure
of bach one activities was delayed hence affecting the implementation timelines for the rest
of the activities.
1.5.5 Green Growth and Employment Programme.
The Danida funded Green Growth and Employment Programme is a 5 year, Ksh 975 million
programme focused in 8 ASAL counties, building on the experiences of MTAP. Following
Annual Rural Harmonized Report – 2016/2017 FY
13
some delays due to issues with budgets allocations and new funding modalities Ksh
101,106,000 was received at the end of February, 2017. At the same time the on-going
drought was declared as a national disaster. Consequently the focus of the programme
quickly and temporarily changed to allow reallocation of funds to Drought Emergency
Response. Emergency activities included assisting with water tracking and rehabilitation of
boreholes, djabias, shallow wells and water pans in critical areas to address the immediate
needs of ASAL communities. Ksh 99,334,385 was allocated to implement these emergency
projects. It is anticipated that the originally planned activities supporting improvements in
water infrastructure and water resources management through green technologies will take
off in 2017/18. Details of the support to the Drought Emergency Response are further given
in section 2.6.
Annual Rural Harmonized Report – 2016/2017 FY
14
2. PROGRAMME WORK PLAN IMPLEMENTATION PROGRESS
2.1 MTAP II- DANIDA Support
2.1.1 Introduction and programme background
The Government of Kenya signed an agreement with the Government of Denmark for theimplementation of the Natural Resource Management Programme (NRMP) in December,2009 under which the MTAP in the Ministry of Devolution and Planning was implemented.WSTF has been supported to achieve its mandate in providing financial assistance to theMTAP target counties by implementing MTAP Phase I and Phase II activities.
The Fund implemented the MTAP Phase I until December, 2014 followed withimplementation of MTAP phase II activities of which Danida support was to be completed byJune, 2016 and EU-SHARE support continued on until December, 2016 as per the addendumto the initial MTAP Phase II agreement.
The MTAP Phase II programme financed by DANIDA was to provide support to WSTF and itssub-grantees-Community Based Organizations (CBOs) and Water Resources UsersAssociations (WRUAs) within the 6 counties of Garissa, Isiolo, Lamu, Marsabit, Tana RiverandWajir.
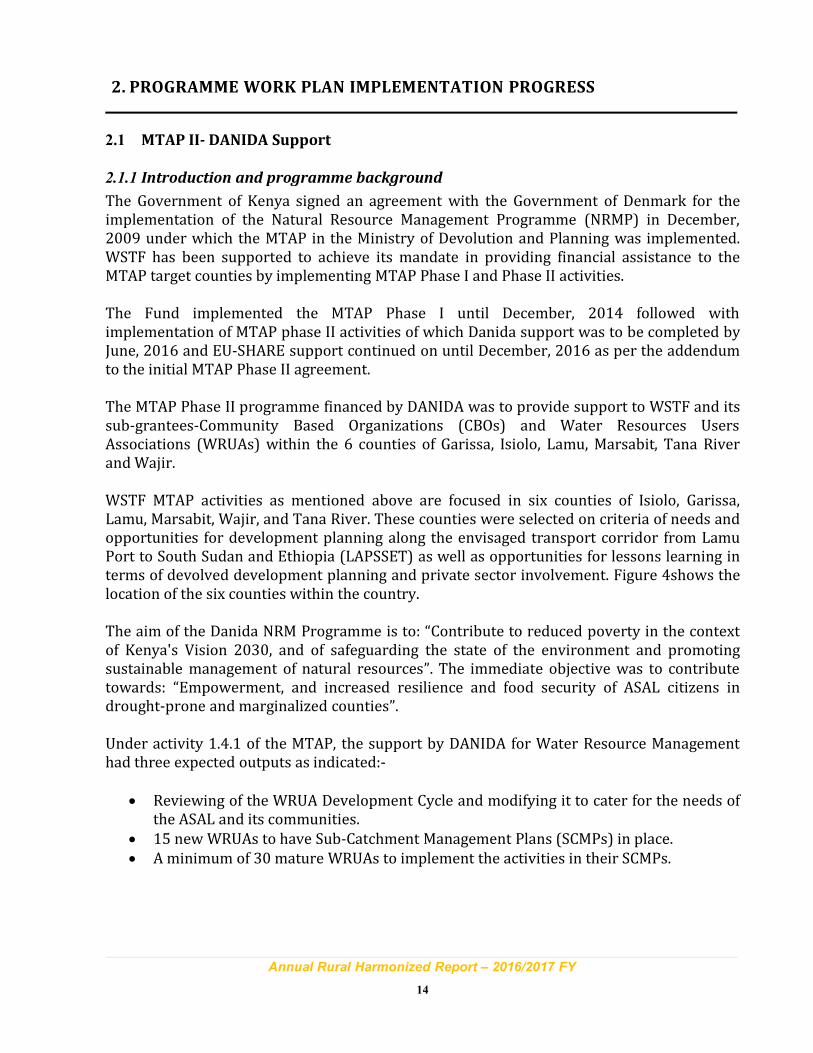
WSTF MTAP activities as mentioned above are focused in six counties of Isiolo, Garissa,Lamu, Marsabit, Wajir, and Tana River. These counties were selected on criteria of needs andopportunities for development planning along the envisaged transport corridor from LamuPort to South Sudan and Ethiopia (LAPSSET) as well as opportunities for lessons learning interms of devolved development planning and private sector involvement. Figure 4shows thelocation of the six counties within the country.
The aim of the Danida NRM Programme is to: “Contribute to reduced poverty in the contextof Kenya's Vision 2030, and of safeguarding the state of the environment and promotingsustainable management of natural resources”. The immediate objective was to contributetowards: “Empowerment, and increased resilience and food security of ASAL citizens indrought-prone and marginalized counties”.
Under activity 1.4.1 of the MTAP, the support by DANIDA for Water Resource Managementhad three expected outputs as indicated:-
• Reviewing of the WRUA Development Cycle and modifying it to cater for the needs ofthe ASAL and its communities.
• 15 new WRUAs to have Sub-Catchment Management Plans (SCMPs) in place.
• Aminimum of 30 mature WRUAs to implement the activities in their SCMPs.
Annual Rural Harmonized Report – 2016/2017 FY
15
Figure 4 : A Map showing the MTAP II Counties
2.1.2 Overall Programme Achievements
The programme supported Water Resources Users Associations (WRUAs) to develop and
implement the Sub-Catchment Management Plan (SCMP) activities. Normally, WRUAs work
in partnership with the Water Resources Authority (WRA), formerly WRMA, to develop
proposals and implement activities that lead to management of water resources within sub
catchments. WSTF received Kshs. 250 million for the support of WRUAs under the DANIDA
funding. To achieve the programme outputs, WSTF worked in collaboration with WRA, the
County Development Planners (CDPs) to ensure that WRUA proposals were prepared,
screened, financed, implemented and monitored.
Thirty five (35) WRUA projects were directly supported by the MTAP II programme within
the ASAL sub catchments of the six target counties out of which, Twenty seven (27) WRUAs
completed implementation of their activities in FY2015/2016 while Eight (8) completed
implementation of their activities in the Financial Year 2016/2017. The 8 WRUAs only
received their 2nd tranche disbursement under the “MTAP II No Cost extension” period. These
WRUAs did not receive their second tranche funding in 2015/2016 due to the limited
timeframe in regards to the programme deadline. The problem was brought about by
WRUAs failing to complete the implementation of tranche 1 activities owing to delayed
support fromWRA.
Annual Rural Harmonized Report – 2016/2017 FY
16
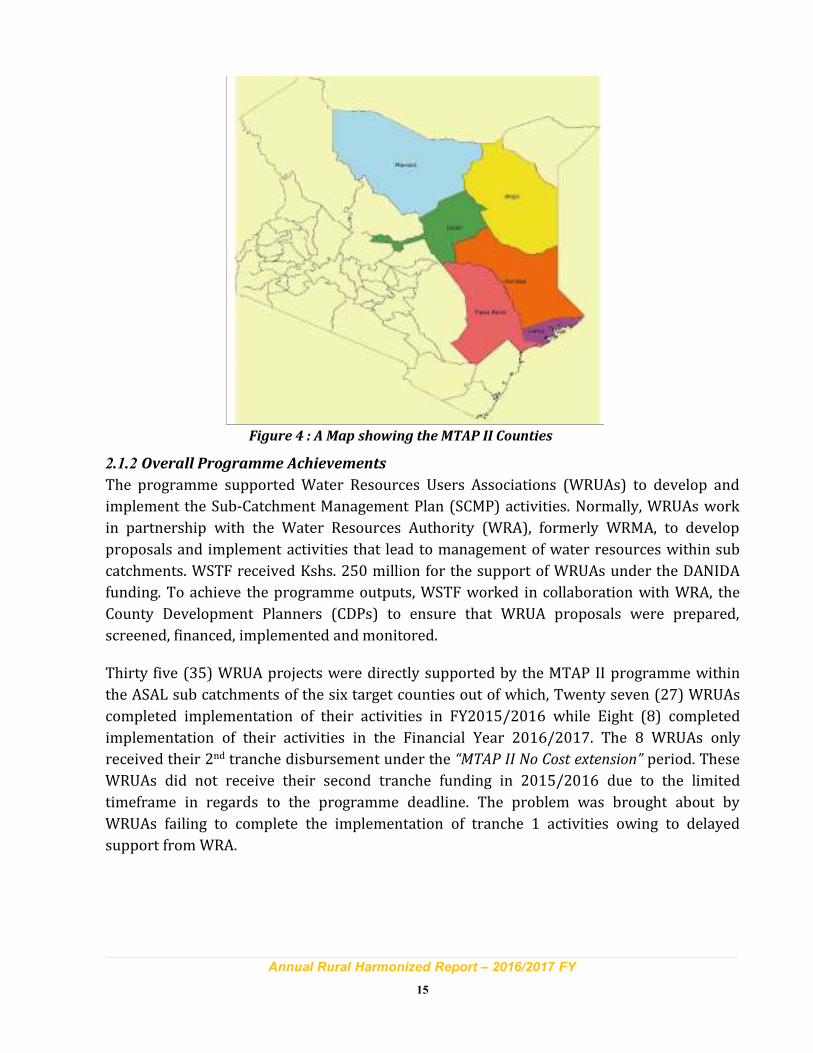
Figure 5: No. of MTAP II funded WRUAs
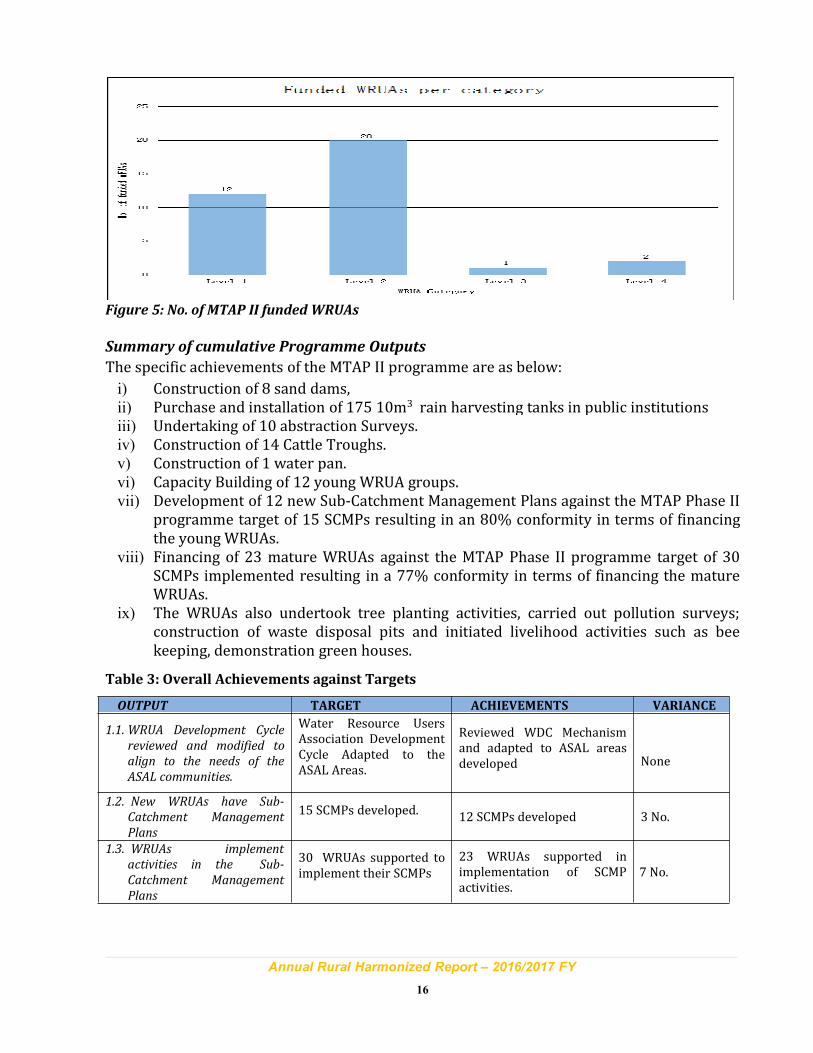
Summary of cumulative Programme Outputs
The specific achievements of the MTAP II programme are as below:
i) Construction of 8 sand dams,ii) Purchase and installation of 175 10m3 rain harvesting tanks in public institutionsiii) Undertaking of 10 abstraction Surveys.iv) Construction of 14 Cattle Troughs.v) Construction of 1 water pan.vi) Capacity Building of 12 young WRUA groups.vii) Development of 12 new Sub-Catchment Management Plans against the MTAP Phase II
programme target of 15 SCMPs resulting in an 80% conformity in terms of financingthe youngWRUAs.
viii) Financing of 23 mature WRUAs against the MTAP Phase II programme target of 30SCMPs implemented resulting in a 77% conformity in terms of financing the matureWRUAs.
ix) The WRUAs also undertook tree planting activities, carried out pollution surveys;construction of waste disposal pits and initiated livelihood activities such as beekeeping, demonstration green houses.
Table 3: Overall Achievements against Targets
OUTPUT TARGET ACHIEVEMENTS VARIANCE
1.1. WRUA Development Cycle
reviewed and modified to
align to the needs of the
ASAL communities.
Water Resource UsersAssociation DevelopmentCycle Adapted to theASAL Areas.
Reviewed WDC Mechanismand adapted to ASAL areasdeveloped None
1.2. New WRUAs have Sub-
Catchment Management
Plans
15 SCMPs developed.12 SCMPs developed 3 No.
1.3. WRUAs implement
activities in the Sub-
Catchment Management
Plans
30 WRUAs supported toimplement their SCMPs
23 WRUAs supported inimplementation of SCMPactivities.
7 No.
Annual Rural Harmonized Report – 2016/2017 FY
17
2.1.3 Achievements during the 2016-2017 FY
The “No cost” extension was granted to WSTF after the programme ended on June, 30th 2017.
This was to allow for the utilization of Kshs. 122 million which was not spent during the
programme implementation period. The achievements by the programme in the FY
2016/2017 against the work plan were:
(i) Funding of 8No. MTAP II WRUA Projects (Second disbursements amounting to Kshs.
17,481,000; A further Kshs. 2,622,150 representing 15% WRA fee) a 100%
achievement as projected in the work plan.
(ii) Capacity building of WRUAs officials for 20 MTAP II WRUAs in Isiolo, Marsabit,
Garissa and Wajir Counties on Financial Management , Procurement Procedures,
Monitoring and Evaluation skills.
(iii) In total Ksh 57.1million was expended under the programme in the FY under review
(with Kshs.4, 825,955.00 expended on capacity building, monitoring and WSTF
management fee.)
During the year under review, eight WRUAs were funded to implement the followingactivities:
i) Installation of 60 beehives,ii) Construction of 8 water troughs,iii) Establishment of 1 greenhouse,iv) Establishment of 1 tree nursery,v) Establishment of early warning system,vi) Construction of gabions,vii) Installation of 15 roof water harvesting tanks in public institutions,viii) Construction of 1 sand dam,ix) Rehabilitation of 1 Djabia,x) Construction of 2 Djabias,xi) Abstraction survey,xii) Baseline surveys,xiii) Monitoring and Reporting
Delay in starting implementation of these projects due to failure to have timely support fromWRA affected the expected date of completion. The physical implementation was completedby 30th June, 2017 but financial reporting spilled over to FY 2017/2018.
The following are the impacts projected to have been realized by the programme. These willbe validated in an end of programme impact assessment report.
(i) The funding of and installation of 60 No. bee hives is expected to improve the quality
economic status of the beneficiaries through enhanced income levels form the sale of
honey and related products. This is in addition to reported improved health benefits
associated with honey consumption. The demonstration bee hives are expected to
result in increased investments in beehives by the local communities hence reducing
Annual Rural Harmonized Report – 2016/2017 FY
18
overreliance on pastoralism, hence reducing the pressure on vegetative cover as a
result of overgrazing.
(ii) The construction of 8 No. water troughs has resulted in a separation of human and
livestock watering points. This effectively reduces water contamination at the points
hence reducing incidences of water borne diseases. The introduction of water troughs
also introduces a level of control and accountability on the livestock consuming from
the water sources, hence improving revenues from the source.
(iii) The establishment of a demonstration green house is expected to spur community
interest in green house farming as a more efficient method with higher returns on
investments. Investments in green houses are expected to result in enhanced
productivity per acreage resulting in food security in the targeted areas as well as
reduced demand for ecosystem services.
(iv) Reduction of water based conflicts through provision of appropriate watering points
such as the sand dams, water pans and the Rain Water Harvesting tanks.
(v) Reduced distance to water sources through installation of RWH tanks, construction of
water pans and sand dams. The time saved is spent on other productive activities.
(vi) Conservation of 2300km2 of land area by the mature WRUAs. The long term impact
will be improved water resources in the conserved areas. This can be measured
through indicators such as the yield from boreholes within the catchment and
possibly reduced surface runoff owing to improved infiltration of surface water,
(vii) Reduced prevalence of waterborne diseases through provision of portable water for
domestic use, proper disposal of waste in the constructed waste disposal pits &
construction of cattle troughs that eliminate animal defecation at the watering points.
(viii) Improved living standards for the WRUA groups through income generated from the
funded livelihood projects e.g. greenhouse farming and bee keeping.
(ix) Improved quality of water as a result of mitigation measures put in place to prevent
pollution from identified point and non – point sources through the pollution surveys.
(x) Positive attitude towards participation in Water Resource Management activities as
a result of capacity building of communities.
(xi) Improved governance of the WRUAs with a more participatory approach taken up by
the WRUA members and the committees especially in decision making and
implementation of activities. Most of the WRUA committees are now operational and
the different committees understand their roles.
(xii) The abstraction surveys are expected to result in enhanced accountability and control
on water resource use and hence efficiency in resource use. It is also expected to
result in equity in water resource use hence reducing water based community
conflicts.
(xiii) The early warning system will result in enhanced level of disaster preparedness and
allow for implementation of timely mitigation measures.
Annual Rural Harmonized Report – 2016/2017 FY
19
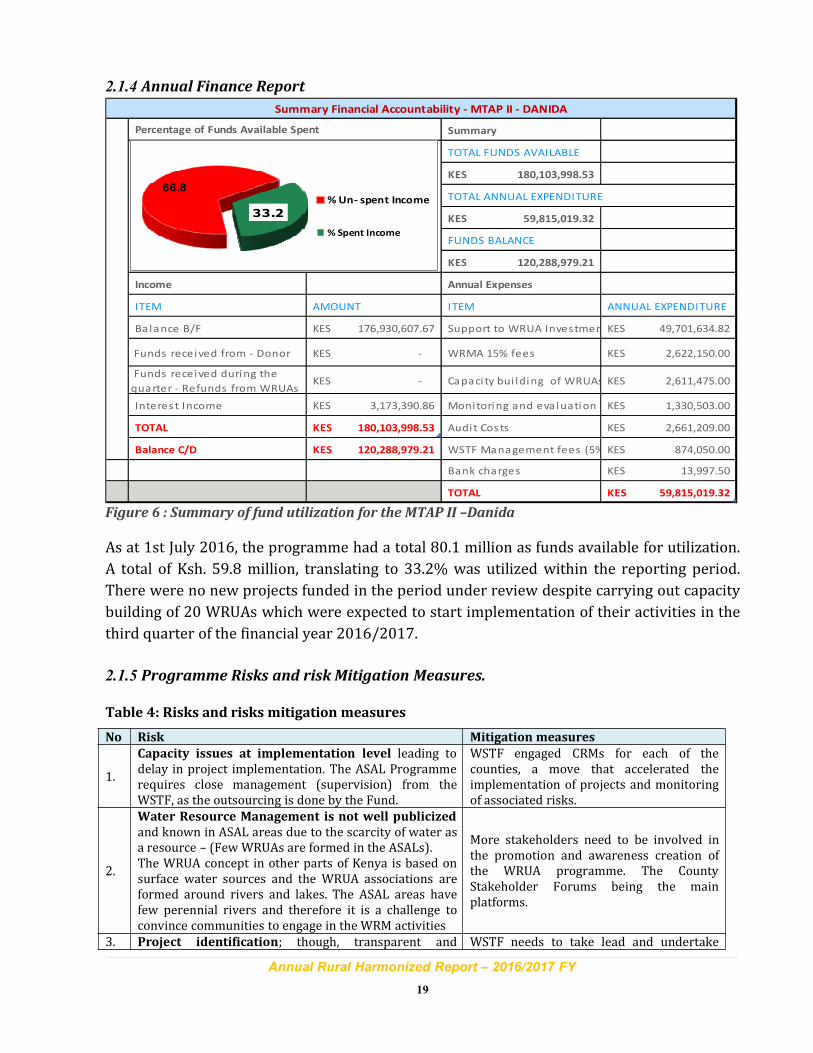
2.1.4 Annual Finance Report
Summary
TOTAL FUNDS AVAILABLE
180,103,998.53KES
TOTAL ANNUAL EXPENDITURE
59,815,019.32KES
FUNDS BALANCE
120,288,979.21KES
Income Annual Expenses
ITEM AMOUNT ITEM ANNUAL EXPENDITURE
Balance B/F 176,930,607.67KES Support to WRUA Investments 49,701,634.82KES
Funds received from - Donor -KES WRMA 15% fees 2,622,150.00KES
Funds received during the
quarter - Refunds from WRUAs -KES Capaci ty bui lding of WRUAs 2,611,475.00KES
Interes t Income 3,173,390.86KES Monitoring and eva luation 1,330,503.00KES
TOTAL 180,103,998.53KES Audit Cos ts 2,661,209.00KES
Balance C/D 120,288,979.21KES WSTF Management fees (5%) 874,050.00KES
Bank charges 13,997.50KES
TOTAL 59,815,019.32KES
Summary Financial Accountability - MTAP II - DANIDA
Percentage of Funds Available Spent
66.8
33.2
% Un- spent Income
% Spent Income
Figure 6 : Summary of fund utilization for the MTAP II –Danida
As at 1st July 2016, the programme had a total 80.1 million as funds available for utilization.
A total of Ksh. 59.8 million, translating to 33.2% was utilized within the reporting period.
There were no new projects funded in the period under review despite carrying out capacity
building of 20 WRUAs which were expected to start implementation of their activities in the
third quarter of the financial year 2016/2017.
2.1.5 Programme Risks and risk Mitigation Measures.
Table 4: Risks and risks mitigation measures
No Risk Mitigation measures
1.
Capacity issues at implementation level leading todelay in project implementation. The ASAL Programmerequires close management (supervision) from theWSTF, as the outsourcing is done by the Fund.
WSTF engaged CRMs for each of thecounties, a move that accelerated theimplementation of projects and monitoringof associated risks.
2.
Water Resource Management is not well publicized
and known in ASAL areas due to the scarcity of water asa resource – (Few WRUAs are formed in the ASALs).The WRUA concept in other parts of Kenya is based onsurface water sources and the WRUA associations areformed around rivers and lakes. The ASAL areas havefew perennial rivers and therefore it is a challenge toconvince communities to engage in the WRM activities
More stakeholders need to be involved inthe promotion and awareness creation ofthe WRUA programme. The CountyStakeholder Forums being the mainplatforms.
3. Project identification; though, transparent and WSTF needs to take lead and undertake
Annual Rural Harmonized Report – 2016/2017 FY
20
2.1.6 Key implementation challenges
The following were the main challenges during the 2016-2017 period.
Table 5: Challenges and adaptive measures
CHALLENGES ADAPTIVE MEASURES
1) Failure to agree in good time on WRUA financingcontract template between WRA andWSTF.
2) Low capacity of WRUAs to implement the plannedactivities.
3) Delayed support from WRA thus affectingcommencement of implementation of the plannedactivities.
4) Insecurity in some parts of the project areas alsoaffected implementation of the planned activities.
1) A harmonised WRUA financingcontract/agreement has been agreed uponbetween WSTF and WRA.
2) Capacity building of WRUAs on projectplanning, implementation, financialmanagement tracking to avoid unnecessarydelays during implementation.
3) Negotiate and fasttrack the release of the15% WRA fee to the WRA Sub-RegionalOffices.
4) Proper planning and use of local knowlege onsecurity issues and on ocassions hiring thesecurity officers
2.1.7 Lessons learnt
The implementation of projects brought about issues that are critical in any environment
and contract management. The challenges experienced at the implementation stage pointed
out serious omissions during project planning and preparation stages.
In regards to these experiences, the following were the lessons learnt:
equitable resource allocation, based on the principles ofpro-poor investment and environmental sustainabilityhas been the “selling point” of WSTF programmes; theresponsibility of project prioritization and selection isnow the mandate of the Counties. The Counties may nothave a reliable prioritization mechanism in place.
intensive capacity building of Counties /Basin Authorities. County Profiles to bewell publicized and put on theinternet/websites.
4.
Low Capacity of the Communities to undertake
projects: Communities in ASAL counties have lessexperience in undertaking community projects ascompared to communities in other parts of Kenya. Loweducational levels, nomadic lifestyle, cultural issues andscattered settlement patterns hinder the CommunityDevelopment.
Training of communities in projectmanagement and financial managementneeds to be enhanced.
5.Security issues in Northern Kenya: National (ethnic)and Cross Border Clashes made mobility and access tosome project areas difficult.
Project planning to take into considerationthe possible security risks and avoidtravelling in areas of clashes. Anassumption has been made that in thefuture the security situation will improve.
Annual Rural Harmonized Report – 2016/2017 FY
21
i) There is need to have a proper project plan to facilitate the development of
comprehensive and sound engineering designs, bills of quantities and tender
documents,
ii) Capacity building of WRUAs and other stakeholders on IWRM principles, particularly
for ASAL areas is key.
iii) Timely project supervision and support to WRUAs will always ensure proper project
implementation and accountability
iv) It is important to understand what works well for ASAL counties rather than the usual
tree planting which largely failed due to prevailing climatic and social environment
conditions in these areas.
v) Capacity of WRUAs needs to be enhanced to enable them manage and operate the
implemented works to ensure sustainability.
Annual Rural Harmonized Report – 2016/2017 FY
22
2.2 MTAP II - EU SHARE
2.2.1 Introduction and Programme Background
MTAP II-EU SHARE programme was a follow-up of the MTAP I Programme implementedthrough the Ministry of Devolution and Planning under the Natural ResourceManagement Programme (NRMP) signed between the Government of Kenya andDenmark. The MTAP I programme activities were completed in December 2014 and theMTAP II activities started in June 2015.
The objective of the Danida NRM Programme was to: “Contribute to reduced poverty inthe context of Kenya's Vision 2030, and of safeguarding the state of the environment andpromoting sustainable management of natural resources”. The immediate objective wasto contribute towards: “Empowerment, and increased resilience and food security ofASAL citizens in drought-prone and marginalised counties”. The NRM-MTAP programmetargeted 6 ASAL counties (Lamu, Tana River, Garissa, Wajir, Isiolo and Marsabit). Anaddendum to the MOU between Ministry of Devolution and WSTF was signed in June2015, to include the European Union support through the Supporting Horn of AfricaResilience Initiative for implementation of activity 1.5.2 to support to communityprioritized investments in water that are adapted to ASAL areas and improve productivity& resilience and linked to sustainable use of natural resources. The MTAP programme atthe Ministry of Devolution was due for closure by the end of 2016, thus WSTF took updirect implementation of the MTAP II EU-SHARE outputs under the oversight of Danida.
The MTAP-EU SHARE programme has a total funding of 6 million Euro, inclusive ofDanida overhead costs and anticipates to support at least 50 Water and SanitationProjects (Community, School and Health Institutions) within the six MTAP target Counties.The programme is expected to complete active implementation by June, 2018.
2.2.2 Key programme highlights and achievements
The EU SHARE Programme started active implementation in July, 2015 and receivedKshs.330 million to be utilized under Year 1 and Year 2 detailed budget for the MTAPfinancing programme. The Programme completed most of the year 1 and 2 activities byDecember, 2016 and realized some carry overs expected to be catered for with the year 3budget. The programme anticipates the last tranche of funding amounting to Kshs 272million to complete the year 3 and 4 activities of the programme. A funds request wasdone for year 3 funds and WSTF is waiting to receive Kshs 208 million for year 3 activities.
Cummulatively, 32 water projects benefitting a population of 100,252 and 87 sanitationprojects serving 6,950 pupils were funded in the FY 2015/2016. During the reportingperiod, only 2 projects (Kone water project-Tana River County & Manda Maweni-LamuCounty ) were no completed. Manda Maweni CBO had completed the implementation ofphysical infrastructre and was at the defects liability period period. Kone water project isunder audit review due to incomplete works and desertion of site by contractor. All 87sanitation facilities were completed with 18 having been completed within the reportingperiod. Project branding was undertaken for all the water projects through sign boardsand wall branding for sanitation facilities. The CRMs continued to monitor the projects
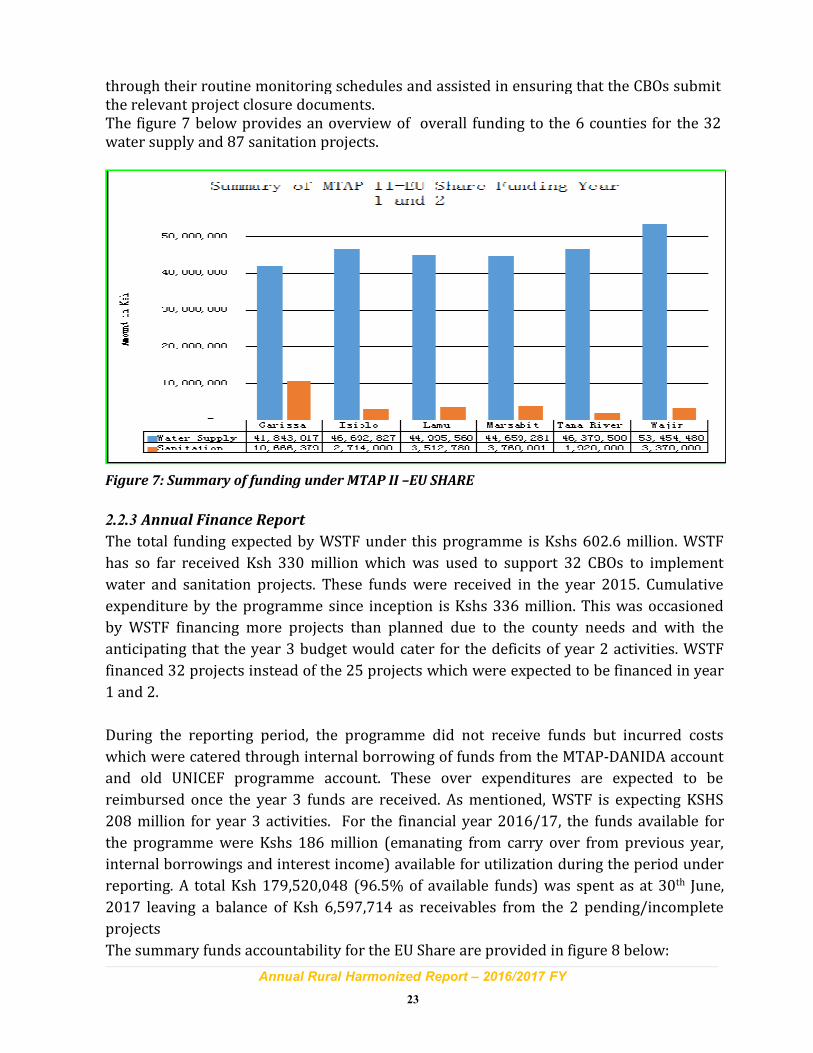
Annual Rural Harmonized Report – 2016/2017 FY
23
through their routine monitoring schedules and assisted in ensuring that the CBOs submitthe relevant project closure documents.The figure 7 below provides an overview of overall funding to the 6 counties for the 32water supply and 87 sanitation projects.
Figure 7: Summary of funding under MTAP II –EU SHARE
2.2.3 Annual Finance Report
The total funding expected by WSTF under this programme is Kshs 602.6 million. WSTF
has so far received Ksh 330 million which was used to support 32 CBOs to implement
water and sanitation projects. These funds were received in the year 2015. Cumulative
expenditure by the programme since inception is Kshs 336 million. This was occasioned
by WSTF financing more projects than planned due to the county needs and with the
anticipating that the year 3 budget would cater for the deficits of year 2 activities. WSTF
financed 32 projects instead of the 25 projects which were expected to be financed in year
1 and 2.
During the reporting period, the programme did not receive funds but incurred costs
which were catered through internal borrowing of funds from the MTAP-DANIDA account
and old UNICEF programme account. These over expenditures are expected to be
reimbursed once the year 3 funds are received. As mentioned, WSTF is expecting KSHS
208 million for year 3 activities. For the financial year 2016/17, the funds available for
the programme were Kshs 186 million (emanating from carry over from previous year,
internal borrowings and interest income) available for utilization during the period under
reporting. A total Ksh 179,520,048 (96.5% of available funds) was spent as at 30th June,
2017 leaving a balance of Ksh 6,597,714 as receivables from the 2 pending/incomplete
projects
The summary funds accountability for the EU Share are provided in figure 8 below:
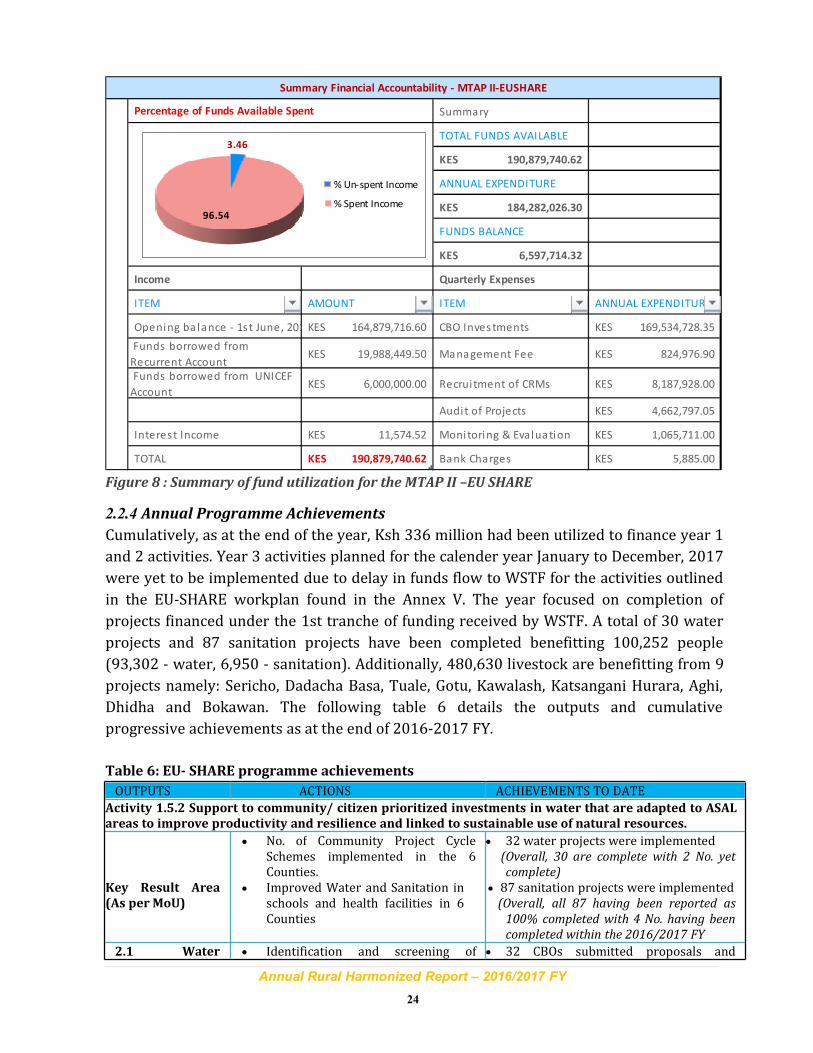
Annual Rural Harmonized Report – 2016/2017 FY
24
Summary
TOTAL FUNDS AVAILABLE
190,879,740.62KES
ANNUAL EXPENDITURE
184,282,026.30KES
FUNDS BALANCE
6,597,714.32KES
Income Quarterly Expenses
ITEM AMOUNT ITEM ANNUAL EXPENDITURE
Opening ba lance - 1s t June, 2016 164,879,716.60KES CBO Inves tments 169,534,728.35KES
Funds borrowed from
Recurrent Account 19,988,449.50KES Management Fee 824,976.90KES
Funds borrowed from UNICEF
Account 6,000,000.00KES Recrui tment of CRMs 8,187,928.00KES
Audit of Projects 4,662,797.05KES
Interest Income 11,574.52KES Monitoring & Evaluation 1,065,711.00KES
TOTAL 190,879,740.62KES Bank Charges 5,885.00KES
Summary Financial Accountability - MTAP II-EUSHARE
Percentage of Funds Available Spent
3.46
96.54
% Un-spent Income
% Spent Income
Figure 8 : Summary of fund utilization for the MTAP II –EU SHARE
2.2.4 Annual Programme Achievements
Cumulatively, as at the end of the year, Ksh 336 million had been utilized to finance year 1
and 2 activities. Year 3 activities planned for the calender year January to December, 2017
were yet to be implemented due to delay in funds flow to WSTF for the activities outlined
in the EU-SHARE workplan found in the Annex V. The year focused on completion of
projects financed under the 1st tranche of funding received by WSTF. A total of 30 water
projects and 87 sanitation projects have been completed benefitting 100,252 people
(93,302 - water, 6,950 - sanitation). Additionally, 480,630 livestock are benefitting from 9
projects namely: Sericho, Dadacha Basa, Tuale, Gotu, Kawalash, Katsangani Hurara, Aghi,
Dhidha and Bokawan. The following table 6 details the outputs and cumulative
progressive achievements as at the end of 2016-2017 FY.
Table 6: EU- SHARE programme achievements
OUTPUTS ACTIONS ACHIEVEMENTS TO DATE
Activity 1.5.2 Support to community/ citizen prioritized investments in water that are adapted to ASAL
areas to improve productivity and resilience and linked to sustainable use of natural resources.
Key Result Area
(As per MoU)
• No. of Community Project CycleSchemes implemented in the 6Counties.
• Improved Water and Sanitation inschools and health facilities in 6Counties
• 32 water projects were implemented(Overall, 30 are complete with 2 No. yet
complete)
• 87 sanitation projects were implemented(Overall, all 87 having been reported as
100% completed with 4 No. having been
completed within the 2016/2017 FY
2.1 Water • Identification and screening of • 32 CBOs submitted proposals and
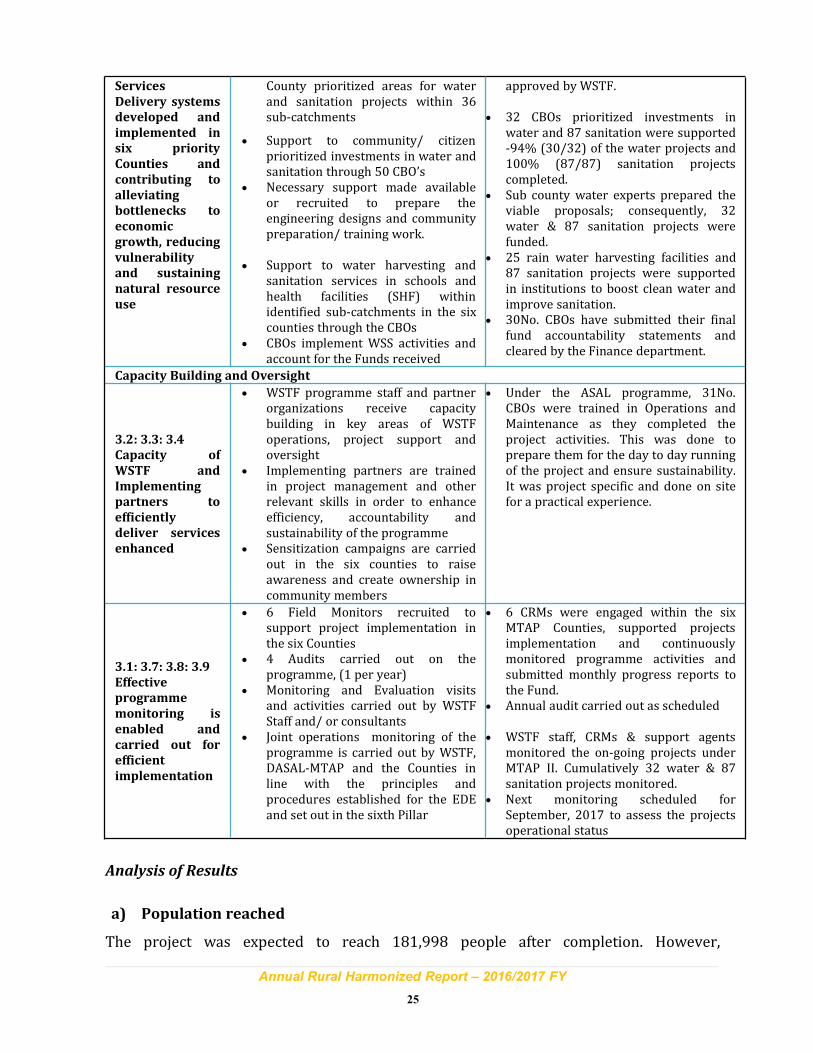
Annual Rural Harmonized Report – 2016/2017 FY
25
Services
Delivery systems
developed and
implemented in
six priority
Counties and
contributing to
alleviating
bottlenecks to
economic
growth, reducing
vulnerability
and sustaining
natural resource
use
County prioritized areas for waterand sanitation projects within 36sub-catchments
• Support to community/ citizenprioritized investments in water andsanitation through 50 CBO’s
• Necessary support made availableor recruited to prepare theengineering designs and communitypreparation/ training work.
• Support to water harvesting andsanitation services in schools andhealth facilities (SHF) withinidentified sub-catchments in the sixcounties through the CBOs
• CBOs implement WSS activities andaccount for the Funds received
approved by WSTF.
• 32 CBOs prioritized investments inwater and 87 sanitation were supported-94% (30/32) of the water projects and100% (87/87) sanitation projectscompleted.
• Sub county water experts prepared theviable proposals; consequently, 32water & 87 sanitation projects werefunded.
• 25 rain water harvesting facilities and87 sanitation projects were supportedin institutions to boost clean water andimprove sanitation.
• 30No. CBOs have submitted their finalfund accountability statements andcleared by the Finance department.
Capacity Building and Oversight
3.2: 3.3: 3.4
Capacity of
WSTF and
Implementing
partners to
efficiently
deliver services
enhanced
• WSTF programme staff and partnerorganizations receive capacitybuilding in key areas of WSTFoperations, project support andoversight
• Implementing partners are trainedin project management and otherrelevant skills in order to enhanceefficiency, accountability andsustainability of the programme
• Sensitization campaigns are carriedout in the six counties to raiseawareness and create ownership incommunity members
• Under the ASAL programme, 31No.CBOs were trained in Operations andMaintenance as they completed theproject activities. This was done toprepare them for the day to day runningof the project and ensure sustainability.It was project specific and done on sitefor a practical experience.
3.1: 3.7: 3.8: 3.9
Effective
programme
monitoring is
enabled and
carried out for
efficient
implementation
• 6 Field Monitors recruited tosupport project implementation inthe six Counties
• 4 Audits carried out on theprogramme, (1 per year)
• Monitoring and Evaluation visitsand activities carried out by WSTFStaff and/ or consultants
• Joint operations monitoring of theprogramme is carried out by WSTF,DASAL-MTAP and the Counties inline with the principles andprocedures established for the EDEand set out in the sixth Pillar
• 6 CRMs were engaged within the sixMTAP Counties, supported projectsimplementation and continuouslymonitored programme activities andsubmitted monthly progress reports tothe Fund.
• Annual audit carried out as scheduled
• WSTF staff, CRMs & support agentsmonitored the on-going projects underMTAP II. Cumulatively 32 water & 87sanitation projects monitored.
• Next monitoring scheduled forSeptember, 2017 to assess the projectsoperational status
Analysis of Results
a) Population reached
The project was expected to reach 181,998 people after completion. However,
Annual Rural Harmonized Report – 2016/2017 FY
26
implementation was delayed to various challenges during project implementation. 30CBO water projects benefitting 117,994 were completed to enable access to water forhousehold and livestock watering purpposes. 57 sanitation projects serving 4,960 pupilsand teachers were completed to enable access to improved sanitation facilities.Approximately 56,300 livestock have been reported to benefit from 4 supported projectsthat are already completed as follows:
Dhida - livestock population of 21,000,Aghi - livestock population of 22,500,Kawalash - 7800 livestockTuale - 5000 livestock.
b) Reduced distances in accessing water
Tuale CBO beneficiaries in Isiolo used to trek for 15 km to the nearest water source beforeintervention, but this distance has been reduced to 1-2km.Hurara/Katsangani CBO beneficiaries used to trek for 7km to the nearest water sourcebefore intervention, but this distance has been reduced to 200m at the water kiosks.For Balich CBO, the distance has been reduced from 8km to 500m after intervention.
Reduced open defecation through sanitation projects
A total number of 287 sanitation units were constructed in 87 schools and 187communities and this contributed to safe management and disposal of human wastewithin the settlements.
c) Increased availability of water all around the year
17 water pans were constructed under the MTAP II programme and this facilities willsupport existing schemes to enable complementarities with livestock production;21 rain water harvesting facilities were supported under the programme;
d) Reduced cost of buying water
The project has been a success by providing cheap, portable, clean and safe water close tothe community. The reduced price and time saved while fetching water will enable themto engage better in economic activities and improve their livelihoods.
e) Enhanced Management Capacity
The implementing CBOs received training on oprrations and maintenance which wasaimed to improve their capacity in managing the completed facilities, deciding on a waterfee and plan to cater for running costs. The CRMs supported the CBOs through closemonitoring of ongoing activities and ensure completed projects have submitted their finalcompletion reports which were inspected and certified by the sub county waterofficers.Project branding was supported to enhance the visibility of WSTF and its partners.
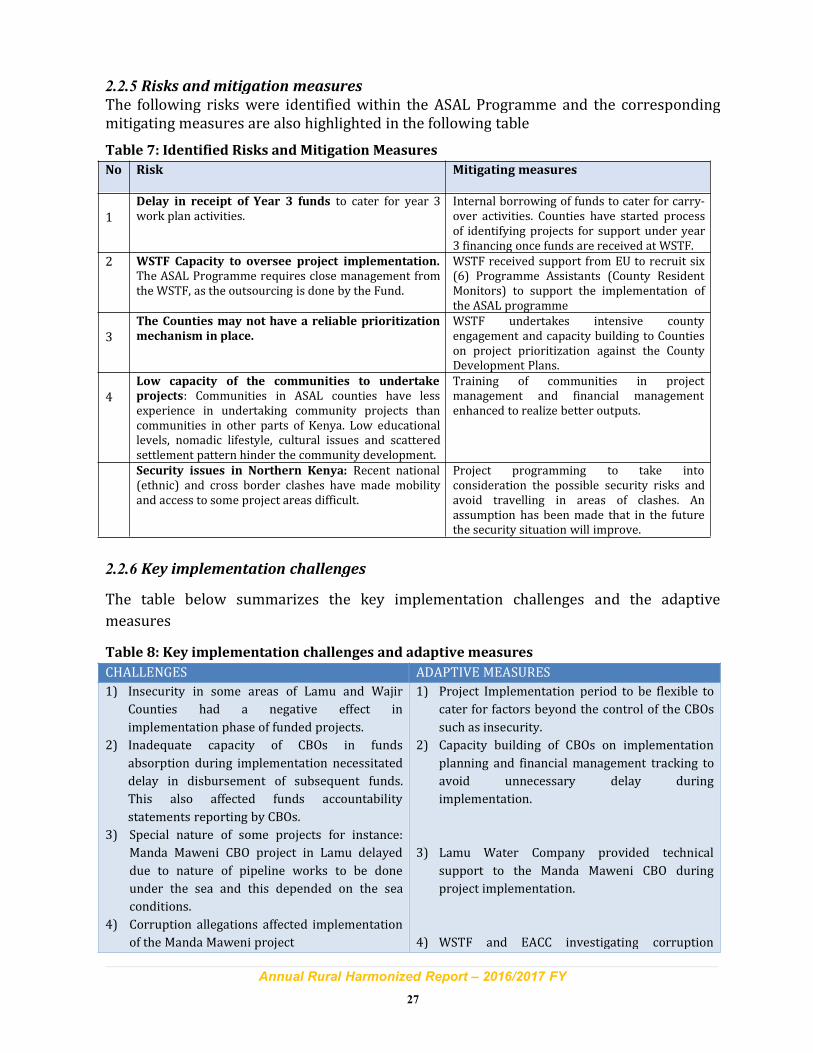
Annual Rural Harmonized Report – 2016/2017 FY
27
2.2.5 Risks and mitigation measures
The following risks were identified within the ASAL Programme and the correspondingmitigating measures are also highlighted in the following table
Table 7: Identified Risks and Mitigation Measures
No Risk Mitigating measures
1
Delay in receipt of Year 3 funds to cater for year 3work plan activities.
Internal borrowing of funds to cater for carry-over activities. Counties have started processof identifying projects for support under year3 financing once funds are received at WSTF.
2 WSTF Capacity to oversee project implementation.
The ASAL Programme requires close management fromthe WSTF, as the outsourcing is done by the Fund.
WSTF received support from EU to recruit six(6) Programme Assistants (County ResidentMonitors) to support the implementation ofthe ASAL programme
3
The Counties may not have a reliable prioritization
mechanism in place.
WSTF undertakes intensive countyengagement and capacity building to Countieson project prioritization against the CountyDevelopment Plans.
4
Low capacity of the communities to undertake
projects: Communities in ASAL counties have lessexperience in undertaking community projects thancommunities in other parts of Kenya. Low educationallevels, nomadic lifestyle, cultural issues and scatteredsettlement pattern hinder the community development.
Training of communities in projectmanagement and financial managementenhanced to realize better outputs.
Security issues in Northern Kenya: Recent national(ethnic) and cross border clashes have made mobilityand access to some project areas difficult.
Project programming to take intoconsideration the possible security risks andavoid travelling in areas of clashes. Anassumption has been made that in the futurethe security situation will improve.
2.2.6 Key implementation challenges
The table below summarizes the key implementation challenges and the adaptive
measures
Table 8: Key implementation challenges and adaptive measures
CHALLENGES ADAPTIVE MEASURES
1) Insecurity in some areas of Lamu and Wajir
Counties had a negative effect in
implementation phase of funded projects.
2) Inadequate capacity of CBOs in funds
absorption during implementation necessitated
delay in disbursement of subsequent funds.
This also affected funds accountability
statements reporting by CBOs.
3) Special nature of some projects for instance:
Manda Maweni CBO project in Lamu delayed
due to nature of pipeline works to be done
under the sea and this depended on the sea
conditions.
4) Corruption allegations affected implementation
of the Manda Maweni project
1) Project Implementation period to be flexible to
cater for factors beyond the control of the CBOs
such as insecurity.
2) Capacity building of CBOs on implementation
planning and financial management tracking to
avoid unnecessary delay during
implementation.
3) Lamu Water Company provided technical
support to the Manda Maweni CBO during
project implementation.
4) WSTF and EACC investigating corruption
Annual Rural Harmonized Report – 2016/2017 FY
28
5) Stalled implementation of Kone water project
due to poor project management by CBO and
dissertion from site by contractor.
allegations on the Manda Maweni project.
5) WSTF Internal Audit Department has made
follow-up with CBO on pending receivables. The
county government has been requested to assist
in following up this issue by compelling the
contractor to complete the works. WSTF
continues to follow up on this matter.
2.2.7 Lessons learnt
1)Working with Registered Water Utilities
The implementation of projects through CBOs has been seen as a risk venture especiallyby the fact that they are not legal entities that cannot be sued or sue in case of a litigation.To ensure sustainability of water schemes, professionalism of water committees needs tobe emphasized along with ensuring that CBOs advance to water users associations withgood legal standing. WSTF seeks to promote a business approach to water serviceprovision by ensuring that rural water sector investments are well managed.
2)Improving Financial Management
The programme outlined its clear standards in financial accounting from WSTF and itsproject implementers. Precise documentation and capacity building of implementersplayed a vital role, especially in case of controls. WSTF set standard of financial reportingwith concrete deadlines and specific eligibility rules eased the auditing of projects anderadicated financial doubt on the part of the investors. CRMs play a critical role in follow-up of FAS submissions to reduce on project receivables.
3)Change of Scope
Any change of scope from any project beneficiary has to be submitted to the fundingauthority for approval before any work on the same commenced. This enabled WSTF todetermine whether the request is sufficient and whether there was value for money in theproposed changes.4)Adherence to Procurement guidelines
Proper procurement procedures had to be followed to enable communities get value fortheir investments. The CBOs were initiated to Public Procurement Guidelines and theyworked towards comply with the guidelines as per the funding conditions. In the future, agreat deal of problems can be avoided by getting the right contractor at project inceptionand initiating the procurement process early enough.
5)Training on operation andmaintenance:
The benefits of the training on operations and maintenance can only be realized onceCBOs establish the right management structures, even though not elaborate, and engagingthe community members as part of the operations of the completed project. WSTF seeksto promote service delivery models to promote better management of water schemesespecially in ASAL areas by linking CBOs with registered Water Service providers fortechnical and operational support. The beneficiaries require training on installation,operation and maintenance of plant and machinery for any project. This would ensuresustainability of the projects as the community will be better equipped to manage theprojects.
Annual Rural Harmonized Report – 2016/2017 FY
29
6)Stakeholder involvement
Involvement of all stakeholders such as county governments during onset of programmeactivities is critical to ensure there is more support during project planning, design,implementation and operational phases.
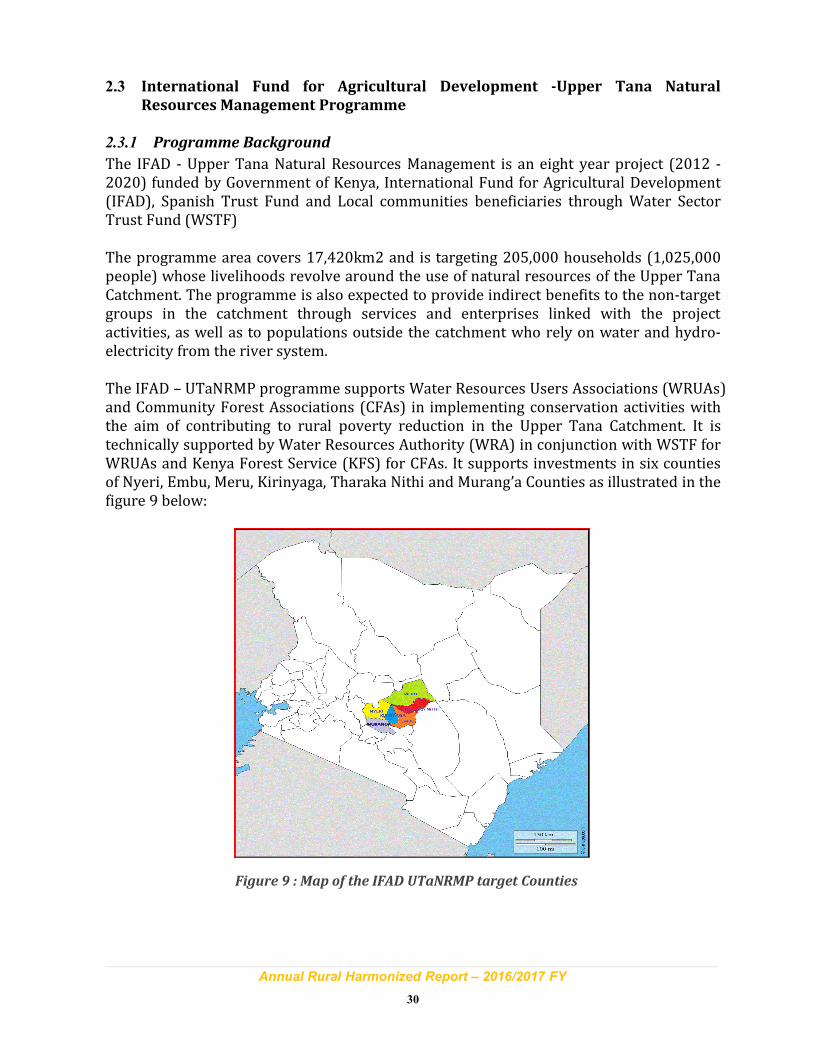
Annual Rural Harmonized Report – 2016/2017 FY
30
2.3 International Fund for Agricultural Development -Upper Tana Natural
Resources Management Programme
2.3.1 Programme Background
The IFAD - Upper Tana Natural Resources Management is an eight year project (2012 -2020) funded by Government of Kenya, International Fund for Agricultural Development(IFAD), Spanish Trust Fund and Local communities beneficiaries through Water SectorTrust Fund (WSTF)
The programme area covers 17,420km2 and is targeting 205,000 households (1,025,000people) whose livelihoods revolve around the use of natural resources of the Upper TanaCatchment. The programme is also expected to provide indirect benefits to the non-targetgroups in the catchment through services and enterprises linked with the projectactivities, as well as to populations outside the catchment who rely on water and hydro-electricity from the river system.
The IFAD – UTaNRMP programme supports Water Resources Users Associations (WRUAs)and Community Forest Associations (CFAs) in implementing conservation activities withthe aim of contributing to rural poverty reduction in the Upper Tana Catchment. It istechnically supported by Water Resources Authority (WRA) in conjunction with WSTF forWRUAs and Kenya Forest Service (KFS) for CFAs. It supports investments in six countiesof Nyeri, Embu, Meru, Kirinyaga, Tharaka Nithi and Murang’a Counties as illustrated in thefigure 9 below:
Figure 9 : Map of the IFAD UTaNRMP target Counties
Annual Rural Harmonized Report – 2016/2017 FY
31
2.3.2 Objectives
The Purpose of the IFAD- UTaNRMP programme is to enhance sustainable management of
water resources and natural resources through the financing of Water Resources Users
Associations and Community Forest Association activities. WRUAs are expected to
improve catchment conservation and water resources management through
implementation of the Sub Catchment Management Plans (SCMP) activities. On the other
hand, CFAs through the implementation of the PFMP activities enhance natural resource
management through rehabilitation of degraded forest reserves.
2.3.3 Achievements during 2016-2017 Fiscal Year
The WSTF has so far made two calls for proposals from the WRUAs and CFAs from the six
target counties. The first call was on 25th July, 2014 resulted in 34 proposals (16 WRUAs &
18 CFAs) being declared successful. As at 30th June, 2017, all the Call 1 WRUA and CFA
projects had been fully implemented and completed. The second call for proposals was
run in the print media of 6th May, 2016 with 43 projects (31 WRUAs and 12 CFAs) being
declared successful and receiving tranche 1 of their total funding in June, 2017. As a result
of the above, the following activities were achieved against the 2016-2017 work plan;
Table 9: Cumulative programme achievements per outcome
OUTCOME TARGET ACHIEVEMENTS VARIANCE
Outcome 1:
sustainable management of water
resources
Financing of 128WRUA contracts
37 No. WRUA Contractsfinanced.
91 No. WRUAContracts
Outcome 2:
Sustainable management of Forest
and agricultural ecosystems
Financing of 69CFA contracts
30 No. CFA contractsfinanced.
39 No. CFAcontracts.
Table 10: Achievements against targets
2016-2017 Targets Achieved Variance explanation
1)Undertake field appraisal for 36projects (WRUAs and CFAs)
Field appraisal undertaken for 43WRUAs and CFAs
Target achieved.
2) Financing of 37 WRUA contracts 46 WRUA contracts financed Target over achieved.
3) Finance 35 CFA Contracts 29 CFA contracts financed12 New Call 2 CFA contracts &17 Call CFA contracts financed.
4)Monitoring of 70 WRUA and CFAprojects
34 Projects (WRUA and CFAs)monitored
Only call 1 were legible formonitoring.
5)Hold 2 capacity buildingworkshops for WRUAs and CFAs
3 capacity building workshopsfor WRUAs and CFAs held
Target achieved
Annual Rural Harmonized Report – 2016/2017 FY
32
Analysis of results
The appraisal of 43 WRUAs and CFAs resulted in approval and financing on 43 WRUA and
CFA projects under the IFAD-UTaNRMP call 2. During the year 46 WRUA contracts were
financed with 15 contracts from call 1 as pending tranche 1 release of funds and 31
WRUAs under call 2. For CFAs out of the targeted 35 contracts, 29 contracts were
financed with the pending 14 contracts aimed to be funded during the IFAD-UTaNRMP
3rd call for proposals.
Under monitoring of CFA and WRUA projects, the target was 70 projects. Out of which 34
projects were monitored and the pending projects expected to be monitored as the 43
WRUA and CFA projects receive their funding. As a result of monitoring 34 projects
during the financial year, physical and financial reports were finalized and submitted to
WSTF. The projects are expected to qualify for consecutive call for project proposals
under the IFAD-UTaNRMP programme.
The programme outcomes have been achieved through the implementation of thefollowing activities:(i) Nineteen (19) capacity building fora on project management, integrated water
resources management, financial and institutional management, conflictmanagement and tree nursery establishment ( with 172 WRUA & CFA memberstrained on Financial Management & Procurement procedures while 500 CFAmembers were trained on tree nursery establishment.
(ii) Planting of approximately 350,000 seedlings and establishment of 12 treenurseries of approximately 420, 000 seedlings.
(iii) Protection of 10 water Springs(iv) Undertaking and reporting on 14 abstraction surveys(v) Undertaking and reporting on 4 pollution surveys(vi) Installation of 29 rain water harvesting tanks of various capacities (16m3 ; 10m3
& 5m3)(vii) Procurement, distribution and installation of 422 No. Energy Saving Jikos
alongside trainings in operation and maintenance.(viii) Reclamation and protection of 2 wetlands.
2.3.4 IFAD- UTaNRMP annual finance report
The total programme funding budget is Ksh 600 Million with the objective of financingWRUAs & CFAs in the six counties. During the 2016-2017 FY, a total of Ksh109,441,965.20 was available for supporting WRUAs and CFAs activities (including anopening balance of Ksh 31,557,595, a disbursement of Ksh 77,884,965.25 from IFAD andan interest of Ksh 8254.05). A total of Ksh 64,385,140.05 comprising of 59.7% wasutilized. Details of the expenditures are as detailed in figure 10 below.
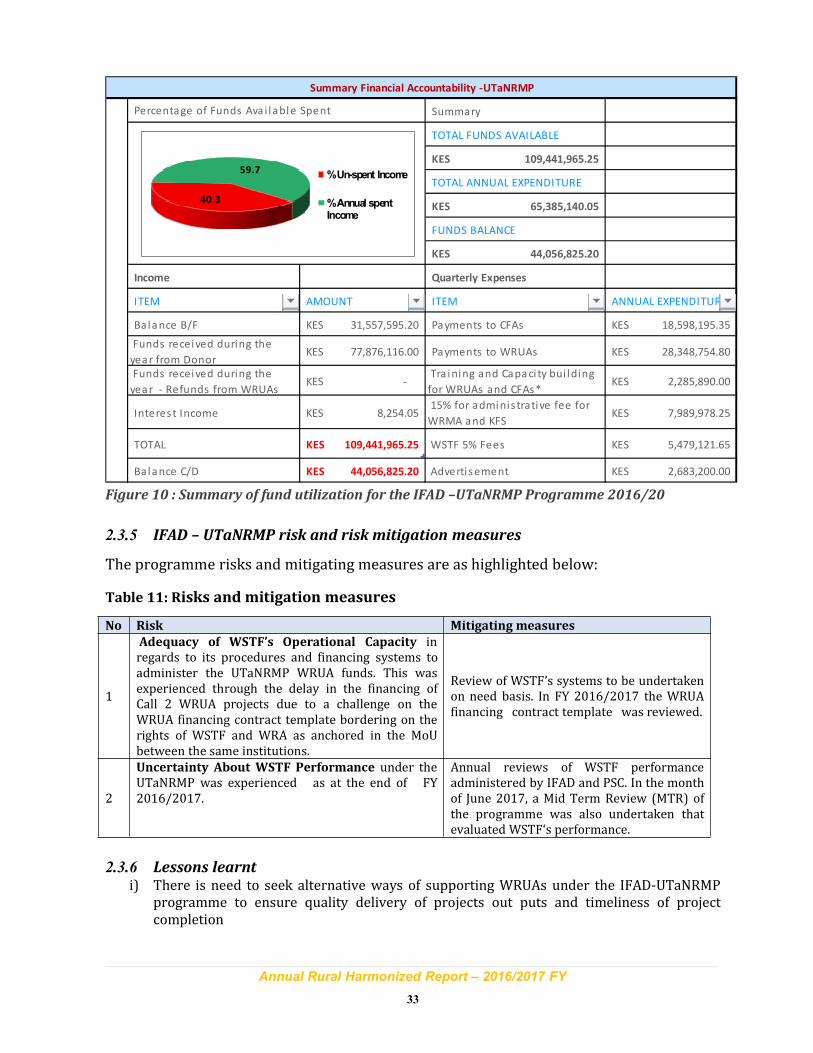
Annual Rural Harmonized Report – 2016/2017 FY
33
Summary
TOTAL FUNDS AVAILABLE
109,441,965.25KES
TOTAL ANNUAL EXPENDITURE
65,385,140.05KES
FUNDS BALANCE
44,056,825.20KES
Income Quarterly Expenses
ITEM AMOUNT ITEM ANNUAL EXPENDITURE
Balance B/F 31,557,595.20KES Payments to CFAs 18,598,195.35KES
Funds received during the
year from Donor 77,876,116.00KES Payments to WRUAs 28,348,754.80KES
Funds received during the
year - Refunds from WRUAs -KES
Tra ining and Capaci ty bui lding
for WRUAs and CFAs* 2,285,890.00KES
Interest Income 8,254.05KES 15% for adminis trative fee for
WRMA and KFS 7,989,978.25KES
TOTAL 109,441,965.25KES WSTF 5% Fees 5,479,121.65KES
Ba lance C/D 44,056,825.20KES Adverti sement 2,683,200.00KES
Summary Financial Accountability -UTaNRMP
Percentage of Funds Ava i lable Spent
40.3
59.7% Un-spent Income
% Annual spentIncome
Figure 10 : Summary of fund utilization for the IFAD –UTaNRMP Programme 2016/20
2.3.5 IFAD – UTaNRMP risk and risk mitigation measures
The programme risks and mitigating measures are as highlighted below:
Table 11: Risks and mitigation measures
No Risk Mitigating measures
1
Adequacy of WSTF’s Operational Capacity inregards to its procedures and financing systems toadminister the UTaNRMP WRUA funds. This wasexperienced through the delay in the financing ofCall 2 WRUA projects due to a challenge on theWRUA financing contract template bordering on therights of WSTF and WRA as anchored in the MoUbetween the same institutions.
Review of WSTF’s systems to be undertakenon need basis. In FY 2016/2017 the WRUAfinancing contract template was reviewed.
2
Uncertainty About WSTF Performance under theUTaNRMP was experienced as at the end of FY2016/2017.
Annual reviews of WSTF performanceadministered by IFAD and PSC. In the monthof June 2017, a Mid Term Review (MTR) ofthe programme was also undertaken thatevaluated WSTF‘s performance.
2.3.6 Lessons learnti) There is need to seek alternative ways of supporting WRUAs under the IFAD-UTaNRMP
programme to ensure quality delivery of projects out puts and timeliness of projectcompletion
Annual Rural Harmonized Report – 2016/2017 FY
34
ii) Quality and timely support accorded to the beneficiary communities (CFAs & WRUAs) iskey to their success. An evaluation of this programme indicates that CFAs have betterdeliverables as compared to WRUAs attributed to the quality technical support providedby KFS.
iii) Develop and adhere to a Monitoring Plan before project disbursements andimplementation to ensure effective monitoring for quality and timely deliverables by thebeneficiaries.
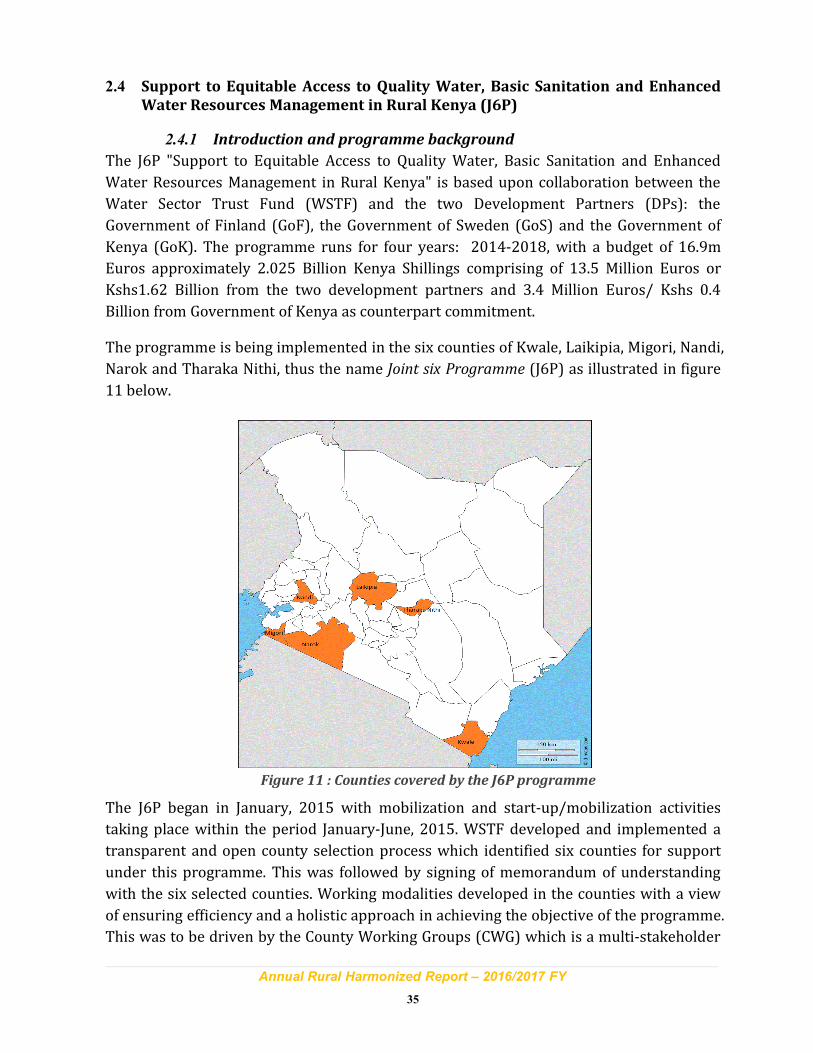
Annual Rural Harmonized Report – 2016/2017 FY
35
2.4 Support to Equitable Access to Quality Water, Basic Sanitation and Enhanced
Water Resources Management in Rural Kenya (J6P)
2.4.1 Introduction and programme background
The J6P "Support to Equitable Access to Quality Water, Basic Sanitation and Enhanced
Water Resources Management in Rural Kenya" is based upon collaboration between the
Water Sector Trust Fund (WSTF) and the two Development Partners (DPs): the
Government of Finland (GoF), the Government of Sweden (GoS) and the Government of
Kenya (GoK). The programme runs for four years: 2014-2018, with a budget of 16.9m
Euros approximately 2.025 Billion Kenya Shillings comprising of 13.5 Million Euros or
Kshs1.62 Billion from the two development partners and 3.4 Million Euros/ Kshs 0.4
Billion from Government of Kenya as counterpart commitment.
The programme is being implemented in the six counties of Kwale, Laikipia, Migori, Nandi,
Narok and Tharaka Nithi, thus the name Joint six Programme (J6P) as illustrated in figure
11 below.
Figure 11 : Counties covered by the J6P programme
The J6P began in January, 2015 with mobilization and start-up/mobilization activities
taking place within the period January-June, 2015. WSTF developed and implemented a
transparent and open county selection process which identified six counties for support
under this programme. This was followed by signing of memorandum of understanding
with the six selected counties. Working modalities developed in the counties with a view
of ensuring efficiency and a holistic approach in achieving the objective of the programme.
This was to be driven by the County Working Groups (CWG) which is a multi-stakeholder
Annual Rural Harmonized Report – 2016/2017 FY
36
forum that identifies and recommend projects to be funded in each of the programme
counties.
Rural water supply projects were implemented through Community Based Organizations
(CBOs). Overtime, programmes were implemented through these CBOs, though with
numerous challenges of capacity to implement, administration of contract and
sustainability of funded projects. It was against this backdrop that the nature and
approach of this programme required a well thought model, hence necessitating a
paradigm shift from CBOs to implementing through established Water Service Providers
(WSPs) and registered water utilities whose capacity can be developed to a level of WSPs.
This is because an established WSP has the capacity, both technical and financial, to
implement projects of whatever magnitude in a timely manner. Furthermore, WUs are
legal entities that can be sued or sue in case of breach of contract. This has been tried and
tested through the Urban Investment Programme and thus revitalizing the existing
utilities to a level of WSPs will in future be the gateway to successful implementation of
rural water programmes. It was at this point that baseline survey was conducted to
identify in order of priority, other than the service coverage, the requirements of the
Counties and identifying the most viable Water Utilities (WU) and WRUAs within the
vicinity of the viable water projects.
The selection of Water Resources Users Associations (WRUAs) was straight forward as
WUs were selected first. The source of water for the selected utility dictated the WRUA to
be supported with main aim of catchment conservation, an idea which contributes to
integrated water resource management (IWRM).
The implementation of projects in the six counties continued through the period under
review. However, as at the time of reporting, none of the projects was complete due to
failure by counties to support the programme. The 30% contribution from the counties
was not realized and this greatly contributed to the delay in implementation of the
projects.
Programme Components
The programme aims to achieve its purpose through five outcomes namely:
Outcome 1: County capacity enhanced, (County capacitated in fulfilling their
constitutional responsibilities in establishment of an enabling environment for the
provision and monitoring of WRM, Water and Sanitation services).
Outcome 2: Water resources management conflicts reduced, (WRM initiatives protecting
water resources and ensuring equity in water access thereby reducing water related
conflicts and environmental degradation).
Outcome 3: Increased water service access, (Water supply projects ensure improved
Annual Rural Harmonized Report – 2016/2017 FY
37
equitable access to water services).
Outcome 4: Increased sanitation service access, (Sanitation investments ensure improvedequitable access to sanitation).
Outcome 5: WSTF capacity enhanced, (The WSTF able to undertake its mandate throughstrengthened institutional capacity).2.4.2 Key programme highlights and achievements
The J6P began in January, 2015 with mobilization and start-up/mobilization activities
taking place within the period Jan-June 2015. Year 1 refers to the period July, 2015 to June,
2016. In the second year of implementation, implementation of components 2 to 4
activities were heighten with Water utilities and WRUAs focusing mainly on
infrastructure development and catchment conservation and protection respectively. The
overall programme achievements are listed per outcome area below.
Outcome 1: County capacity enhanced, (County capacitated in fulfilling their constitutional
responsibilities in establishment of an enabling environment for the provision and
monitoring of WRM, Water and Sanitation services).
Cumulative achievements by the programme includes:
i) WSTF developed and implemented a transparent and open county selection
process which identified six counties for support under this programme.
ii) WSTF signing Memorandum of Understanding with the six counties. This MOU
provided a framework for partnership between WSTF and the 6 county
governments stipulating the obligations of each party and modalities of
engagement.
iii) Counties established County Working Groups (CWGs) representing key
representative county stakeholders to oversee the J6 programme activities.
iv) WSTF engaged 6 County Resident Monitors (CRMs) in each of the J6P counties to
support linkages, cooperation and coordination of programme activities with the
county governments and the implementing partners at county level.
v) Baseline survey: Initiated matching the requirements of the Counties and
identifying the most viable Water Utilities (WU) and WRUAs within the vicinity of
the viable WU.
vi) Responding to a request from the Council of Governors through the Water and
Environment County Executive Committee, short term technical assistance has
been provided to develop a prototype county rural water and sanitation services
bill. The bill has now been drafted and is under review at MWI, prior to National
roll-out.
vii) Process of GESI guidelines initiated for WSTF and programme activities. Draft
guidelines available that require finalization through STTA support. These
guidelines when completed, will assist WSTF to mainstream GESI in its
programmes and projects.
Annual Rural Harmonized Report – 2016/2017 FY
38
viii) County engagement meetings held to enlist Political commitment on county
contribution.
ix) Development of Mapping software and initiating county level mapping of water
utilities. The mapping applications are developed to enable counties and their
water utilities to conduct self -mapping of their service areas and overally know
the extents of coverage to inform future investments.
x) Exchange visits for Water Utilities and County Water Officials. These visits
increased formal and informal exchange between technical and policy staff across
counties.
Outcome 2: Water resources management conflicts reduced, (WRM initiatives protecting
water resources and ensuring equity in water access thereby reducing water related
conflicts and environmental degradation).
Cumulative achievements by the programme includes:
i) Revision of appraisal and monitoring tools: These are tools used to appraise the
WRUA proposals, both desk and field appraisal before recommendation for
funding.
ii) Revision of WRUA Development Cycle Manual, in light of the new constitutional
responsibilities of stakeholders. The manual should guide how the WRM
stakeholders would work towards supporting WRUAs in their activities.
iii) Capacity building of the 10 WRUAs carried out - Capacity building on Governance,
Financial management and procurement before funding was conducted. This is a
prerequisite before the disbursement of funds to the projects, which has seen since
improvement in reporting of WSTF funds.
iv) 10 WRUA projects funded to implement their project activities expected to be
completed by 2017/18.
v) A financing mechanism for trans-boundary WRUAs was developed, to provide
modalities of financing WRUAs that share county boundaries.
vi) 5 Trans-boundary WRUA proposals were recommended for funding. The financing
of these WRUAs will ensure the implementation of the WRM activities aimed at
conserving and/or restoring watersheds.
Outcome 3: Increased water service access, (Water supply projects ensure improved
equitable access to water services).
Cumulative achievements by the programme includes:
i) Water utility mapping: Baseline maps were created for infrastructure and
household service levels for all the J6P funded project coverage areas. Also the
data for the creditworthiness of the funded utilities was collected in order to
assess the initial status of the utilities prior to the commissioning of the projects.
Narok County was excluded as there is no single water project/water utility that
Annual Rural Harmonized Report – 2016/2017 FY
39
was supported by the programme. This was occasioned by the suspension of
Narok County due to their failure to adhere to procurement rules and regulations.
ii) The J6P Project Cycle: The development of a coherent approach to water service
provision support in rural areas, where the Water Utility being identified as the
entry point and implementing partner. WSTF has engaged with the Counties and in
consensus clearly articulated the basis or screening and short listing of WUs,
whilst many projects have been suggested most focus on the construction of
infrastructure and generally would be improved if they included rudimentary
business plan, information on expected tariff and/or any other performance
related projections;
iii) WU screening criteria and performance assessment was developed and applied to
the identified implementing WUs in project counties
iv) Trainings done to enable the WUs develop water supply proposals. The trainings
enabled the WUs to submit proposals using a standard template that assisted them
define the project for support.
v) 23 Water utilities financed to implement 28 Water supply projects. This support is
expected to enable residents’ access water once the projects are completed.
vi) Implementation of project activities is on-going in Migori, Tharaka Nithi, Laikipia,
Nandi and Kwale at various stages.
vii) Development of Water Utilities design guidelines/protocol. This will guide WSTF
and WUs in making informed decisions on selection of standard designs and
costing to inform investments.
Outcome 4: Increased sanitation service access, (Sanitation investments ensure
improved equitable access to sanitation)
Cumulative implementation status by the programme includes:
i) Sanitation proposal template developed for use by the WUs. The proposal template
is provided as a standard tool for use by all to ensure that projects to be initiated
are well defined;
ii) Training of the WU on the proposal preparation. This training was done to enhance
their capacity in proposal preparation and familiarisation with the application tool;
iii) Public health departments at National and County level have been engaged to
provide direction on implementation of sanitation activities within the sector road
maps. This engagement assisted in identifying the training and support needs of
each county being targeted by the programme.
iv) Development of TOR for resource support for CLTS training of County Public
Health, Water Utilities and WSTF Staff has been done to build awareness on CLTS
approaches. This enabled the engagement of National Public Health staff to
provide training to the County teams.
Annual Rural Harmonized Report – 2016/2017 FY
40
v) Out of the 25 funded projects, 20 have commenced implementation and
construction of 44 VIP latrines is at various implementation levels.
vi) CLTS training was conducted for 5 counties and WUs & staff, CPHOs, CHVs
participated. The trainings have equipped the County Public Health teams to roll
out the CLTS approach based on the national roadmap.
vii) 22 CLTS proposals submitted for financing by the 5 counties. The proposals will
assist WSTF to identify the areas of support with the CLTS funding
Outcome 5: WSTF capacity enhanced, (The WSTF able to undertake its mandate through
strengthened institutional capacity).
Cumulative achievements includes:
i) Development of the M&E Framework to improve harmonization and alignment of
functions. The formulation of the Universal Results Based Framework(URBMF)
and familiarization by staff is expected to ensure that all programmes and
operations within WSTF, contribute towards the achievements of URBMF;
ii) Development and partial roll-out of the Project Management Information System
(PMIS).The PMIS is established as a system to assist WSTF to effectively and
efficiently report on projects along with produce programme specific reports for
analysis once it is fully operationalised.
iii) Recruitment of County Resident Monitors and their support to programme
implementation in their respective counties; Currently, WSTF is employing a total
of 17 CRMs covering a total of 39 Counties. The cost is usually shared between the
various programmes based on the specific inputs/support by the CRMs to the
specific programme activities.
iv) Review of various programme tools (monitoring, appraisal, reporting). The revised
tools, were utilised in the implementation of project activities as part of continuous
improvement of WSTF processes.
v) Purchase of two programme vehicles. These vehicles have improved the mobility
of WSTF staff to support programme activities. It has also improved the current
fleet of vehicles, several of which had been scheduled for disposal due to age of
service.
vi) WSTF monitoring and internal audit of programme activities to reduce fiduciary
risks and ensure project implementation.
vii) Support to Kenya Water Week activities that saw the participation of both state,
on-state, public and private sector players under the conference theme of “From
AID to Trade”.
2.4.3 Annual Finance Report
During the reporting period, the programme received Ksh 178.9 million as counterpart
funding from the government of Kenya. In the previous fiscal year, the balance brought
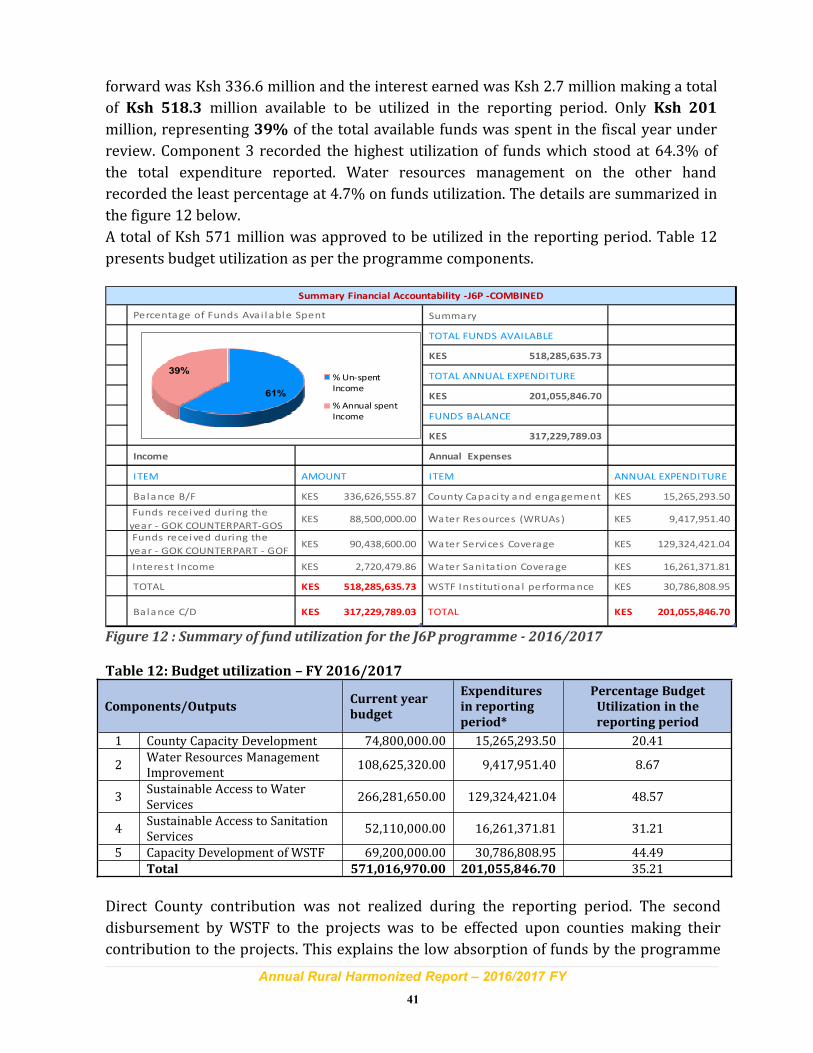
Annual Rural Harmonized Report – 2016/2017 FY
41
forward was Ksh 336.6 million and the interest earned was Ksh 2.7 million making a total
of Ksh 518.3 million available to be utilized in the reporting period. Only Ksh 201
million, representing 39% of the total available funds was spent in the fiscal year under
review. Component 3 recorded the highest utilization of funds which stood at 64.3% of
the total expenditure reported. Water resources management on the other hand
recorded the least percentage at 4.7% on funds utilization. The details are summarized in
the figure 12 below.
A total of Ksh 571 million was approved to be utilized in the reporting period. Table 12
presents budget utilization as per the programme components.
Summary
TOTAL FUNDS AVAILABLE
518,285,635.73KES
TOTAL ANNUAL EXPENDITURE
201,055,846.70KES
FUNDS BALANCE
317,229,789.03KES
Income Annual Expenses
ITEM AMOUNT ITEM ANNUAL EXPENDITURE
Bala nce B/F 336,626,555.87KES County Capaci ty a nd enga gement 15,265,293.50KES
Funds recei ved during the
year - GOK COUNTERPART-GOS 88,500,000.00KES Wa ter Res ources (WRUAs) 9,417,951.40KES
Funds recei ved during the
year - GOK COUNTERPART - GOF 90,438,600.00KES Wa ter Services Coverage 129,324,421.04KES
Interest Income 2,720,479.86KES Wa ter Sanitation Covera ge 16,261,371.81KES
TOTAL 518,285,635.73KES WSTF Insti tutiona l performa nce 30,786,808.95KES
Ba la nce C/D 317,229,789.03KES TOTAL 201,055,846.70KES
Summary Financial Accountability -J6P -COMBINED
Percenta ge of Funds Avai l able Spent
61%
39%% Un-spent
Income
% Annual spent
Income
Figure 12 : Summary of fund utilization for the J6P programme - 2016/2017
Table 12: Budget utilization – FY 2016/2017
Components/OutputsCurrent year
budget
Expenditures
in reporting
period*
Percentage Budget
Utilization in the
reporting period
1 County Capacity Development 74,800,000.00 15,265,293.50 20.41
2Water Resources ManagementImprovement
108,625,320.00 9,417,951.40 8.67
3Sustainable Access to WaterServices
266,281,650.00 129,324,421.04 48.57
4Sustainable Access to SanitationServices
52,110,000.00 16,261,371.81 31.21
5 Capacity Development of WSTF 69,200,000.00 30,786,808.95 44.49
Total 571,016,970.00 201,055,846.70 35.21
Direct County contribution was not realized during the reporting period. The second
disbursement by WSTF to the projects was to be effected upon counties making their
contribution to the projects. This explains the low absorption of funds by the programme
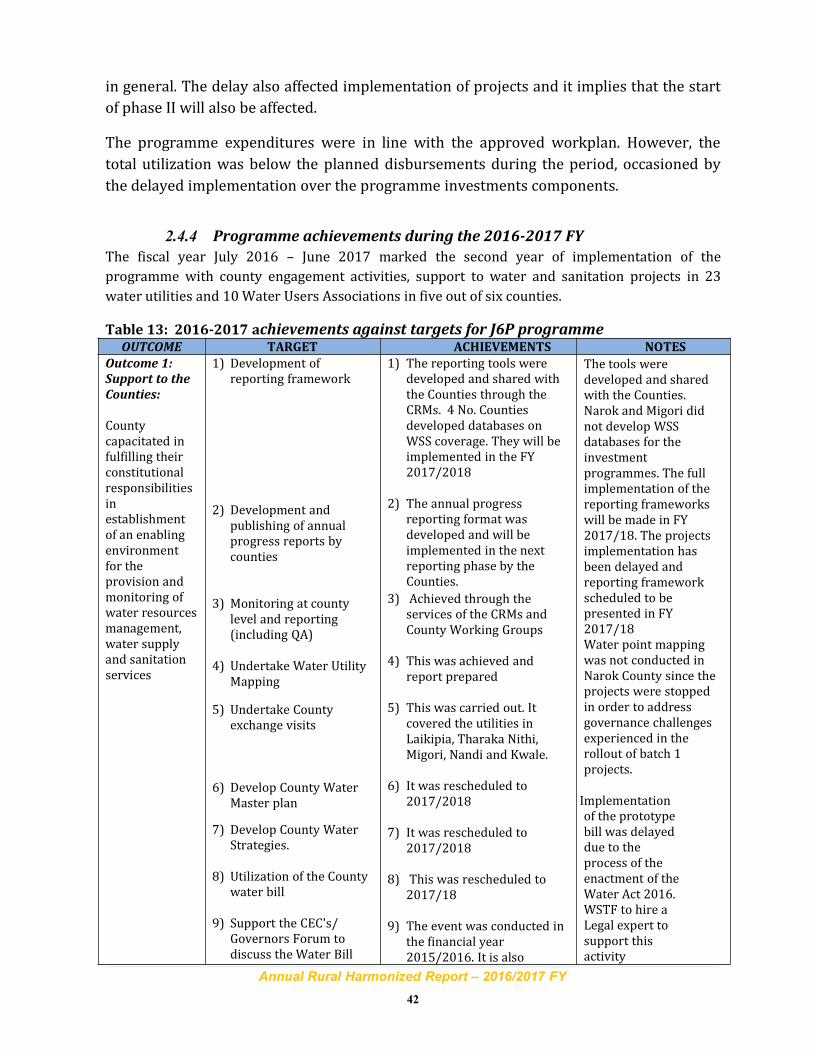
Annual Rural Harmonized Report – 2016/2017 FY
42
in general. The delay also affected implementation of projects and it implies that the start
of phase II will also be affected.
The programme expenditures were in line with the approved workplan. However, the
total utilization was below the planned disbursements during the period, occasioned by
the delayed implementation over the programme investments components.
2.4.4 Programme achievements during the 2016-2017 FY
The fiscal year July 2016 – June 2017 marked the second year of implementation of the
programme with county engagement activities, support to water and sanitation projects in 23
water utilities and 10Water Users Associations in five out of six counties.
Table 13: 2016-2017 achievements against targets for J6P programmeOUTCOME TARGET ACHIEVEMENTS NOTES
Outcome 1:
Support to the
Counties:
Countycapacitated infulfilling theirconstitutionalresponsibilitiesinestablishmentof an enablingenvironmentfor theprovision andmonitoring ofwater resourcesmanagement,water supplyand sanitationservices
1) Development ofreporting framework
2) Development andpublishing of annualprogress reports bycounties
3) Monitoring at countylevel and reporting(including QA)
4) Undertake Water UtilityMapping
5) Undertake Countyexchange visits
6) Develop County WaterMaster plan
7) Develop County WaterStrategies.
8) Utilization of the Countywater bill
9) Support the CEC's/Governors Forum todiscuss the Water Bill
1) The reporting tools weredeveloped and shared withthe Counties through theCRMs. 4 No. Countiesdeveloped databases onWSS coverage. They will beimplemented in the FY2017/2018
2) The annual progressreporting format wasdeveloped and will beimplemented in the nextreporting phase by theCounties.
3) Achieved through theservices of the CRMs andCounty Working Groups
4) This was achieved andreport prepared
5) This was carried out. Itcovered the utilities inLaikipia, Tharaka Nithi,Migori, Nandi and Kwale.
6) It was rescheduled to2017/2018
7) It was rescheduled to2017/2018
8) This was rescheduled to2017/18
9) The event was conducted inthe financial year2015/2016. It is also
The tools weredeveloped and sharedwith the Counties.Narok and Migori didnot develop WSSdatabases for theinvestmentprogrammes. The fullimplementation of thereporting frameworkswill be made in FY2017/18. The projectsimplementation hasbeen delayed andreporting frameworkscheduled to bepresented in FY2017/18Water point mappingwas not conducted inNarok County since theprojects were stoppedin order to addressgovernance challengesexperienced in therollout of batch 1projects.
Roll Implementationof the prototypebill was delayeddue to theprocess of theenactment of theWater Act 2016.WSTF to hire aLegal expert tosupport thisactivity
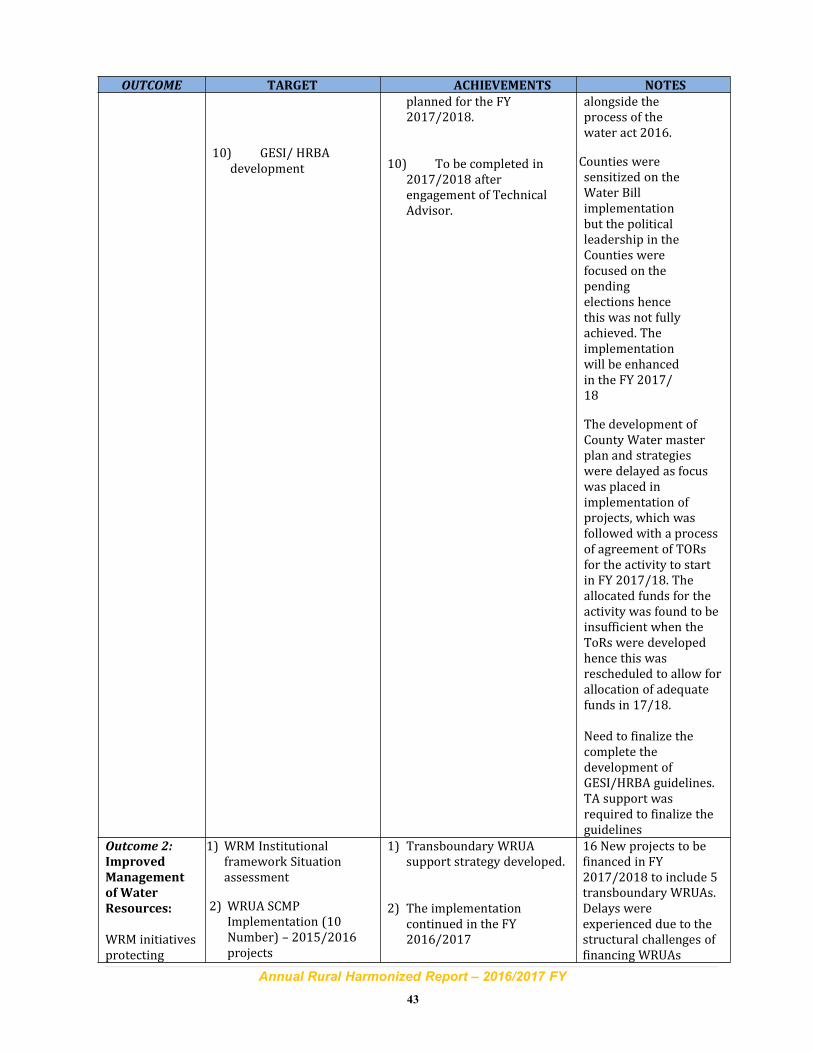
Annual Rural Harmonized Report – 2016/2017 FY
43
OUTCOME TARGET ACHIEVEMENTS NOTES
10) GESI/ HRBAdevelopment
planned for the FY2017/2018.
10) To be completed in2017/2018 afterengagement of TechnicalAdvisor.
alongside theprocess of thewater act 2016.
Counties weresensitized on theWater Billimplementationbut the politicalleadership in theCounties werefocused on thependingelections hencethis was not fullyachieved. Theimplementationwill be enhancedin the FY 2017/18
The development ofCounty Water masterplan and strategieswere delayed as focuswas placed inimplementation ofprojects, which wasfollowed with a processof agreement of TORsfor the activity to startin FY 2017/18. Theallocated funds for theactivity was found to beinsufficient when theToRs were developedhence this wasrescheduled to allow forallocation of adequatefunds in 17/18.
Need to finalize thecomplete thedevelopment ofGESI/HRBA guidelines.TA support wasrequired to finalize theguidelines
Outcome 2:
Improved
Management
of Water
Resources:
WRM initiativesprotecting
1) WRM Institutionalframework Situationassessment
2) WRUA SCMPImplementation (10Number) – 2015/2016projects
1) Transboundary WRUAsupport strategy developed.
2) The implementationcontinued in the FY2016/2017
16 New projects to befinanced in FY2017/2018 to include 5transboundary WRUAs.Delays wereexperienced due to thestructural challenges offinancing WRUAs
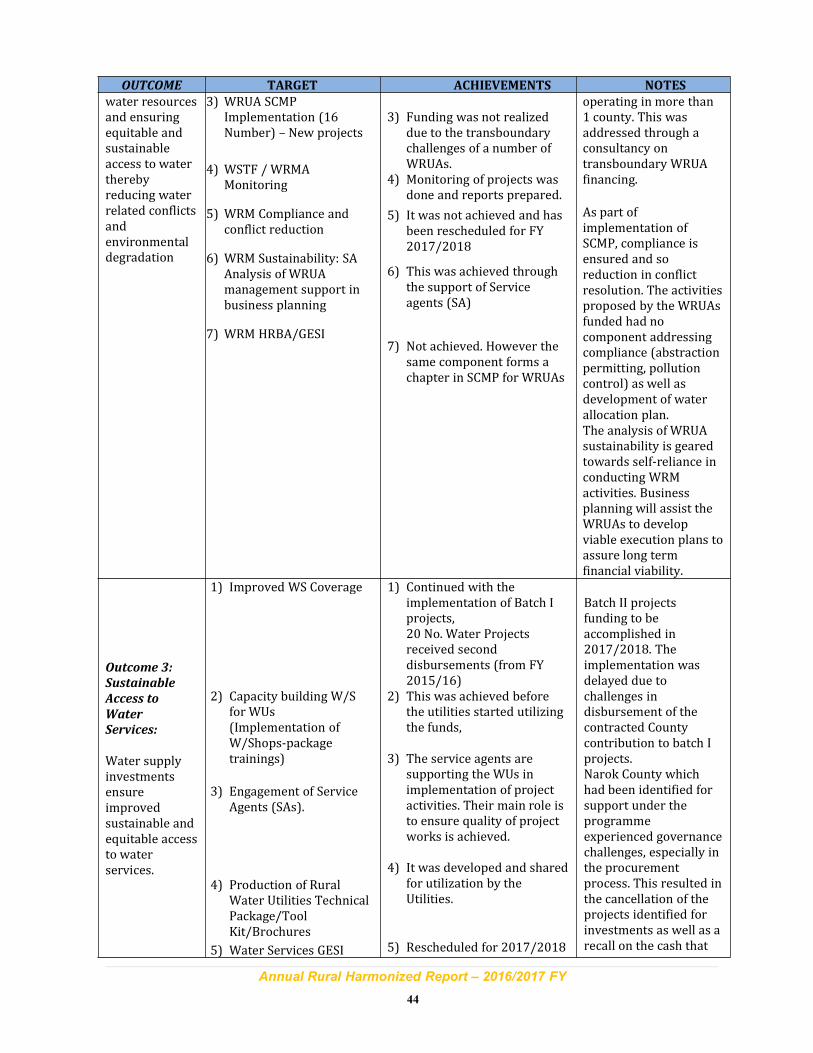
Annual Rural Harmonized Report – 2016/2017 FY
44
OUTCOME TARGET ACHIEVEMENTS NOTES
water resourcesand ensuringequitable andsustainableaccess to watertherebyreducing waterrelated conflictsandenvironmentaldegradation
3) WRUA SCMPImplementation (16Number) – New projects
4) WSTF / WRMAMonitoring
5) WRM Compliance andconflict reduction
6) WRM Sustainability: SAAnalysis of WRUAmanagement support inbusiness planning
7) WRM HRBA/GESI
3) Funding was not realizeddue to the transboundarychallenges of a number ofWRUAs.
4) Monitoring of projects wasdone and reports prepared.
5) It was not achieved and hasbeen rescheduled for FY2017/2018
6) This was achieved throughthe support of Serviceagents (SA)
7) Not achieved. However thesame component forms achapter in SCMP for WRUAs
operating in more than1 county. This wasaddressed through aconsultancy ontransboundary WRUAfinancing.
As part ofimplementation ofSCMP, compliance isensured and soreduction in conflictresolution. The activitiesproposed by the WRUAsfunded had nocomponent addressingcompliance (abstractionpermitting, pollutioncontrol) as well asdevelopment of waterallocation plan.The analysis of WRUAsustainability is gearedtowards self-reliance inconducting WRMactivities. Businessplanning will assist theWRUAs to developviable execution plans toassure long termfinancial viability.
Outcome 3:
Sustainable
Access to
Water
Services:
Water supplyinvestmentsensureimprovedsustainable andequitable accessto waterservices.
1) Improved WS Coverage
2) Capacity building W/Sfor WUs(Implementation ofW/Shops-packagetrainings)
3) Engagement of ServiceAgents (SAs).
4) Production of RuralWater Utilities TechnicalPackage/ToolKit/Brochures
5) Water Services GESI
1) Continued with theimplementation of Batch Iprojects,20 No. Water Projectsreceived seconddisbursements (from FY2015/16)
2) This was achieved beforethe utilities started utilizingthe funds,
3) The service agents aresupporting the WUs inimplementation of projectactivities. Their main role isto ensure quality of projectworks is achieved.
4) It was developed and sharedfor utilization by theUtilities.
5) Rescheduled for 2017/2018
Batch II projectsfunding to beaccomplished in2017/2018. Theimplementation wasdelayed due tochallenges indisbursement of thecontracted Countycontribution to batch Iprojects.Narok County whichhad been identified forsupport under theprogrammeexperienced governancechallenges, especially inthe procurementprocess. This resulted inthe cancellation of theprojects identified forinvestments as well as arecall on the cash that
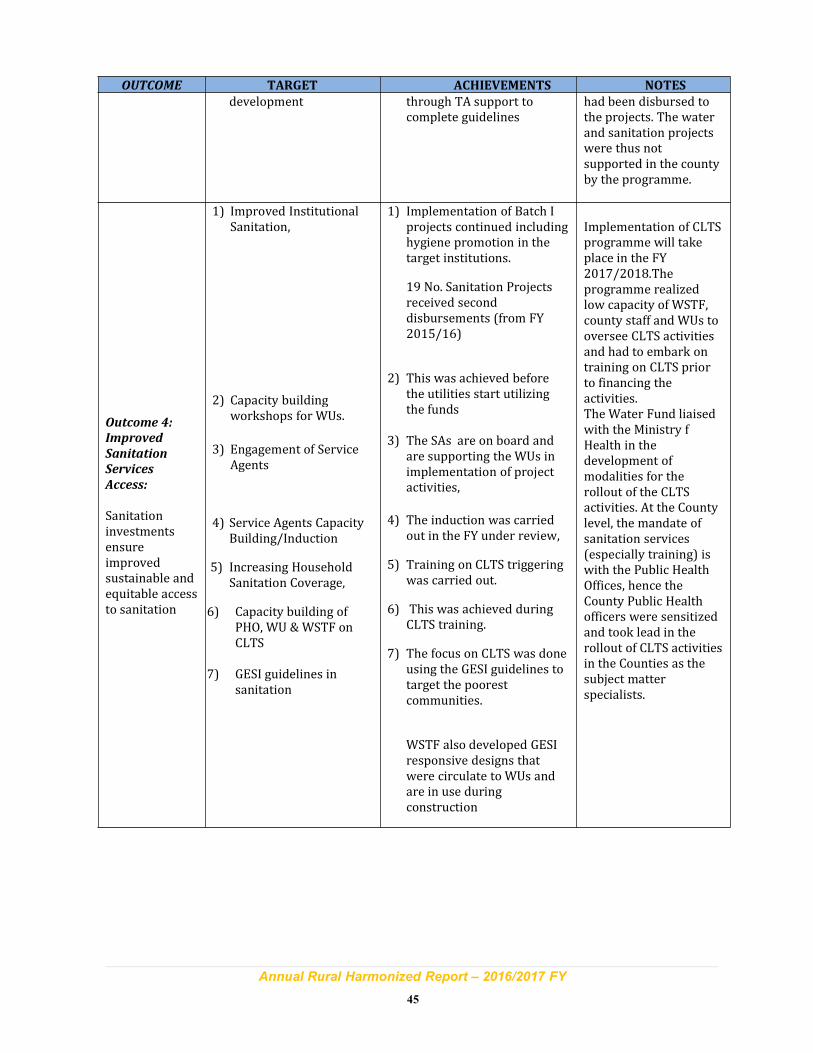
Annual Rural Harmonized Report – 2016/2017 FY
45
OUTCOME TARGET ACHIEVEMENTS NOTES
development through TA support tocomplete guidelines
had been disbursed tothe projects. The waterand sanitation projectswere thus notsupported in the countyby the programme.
Outcome 4:
Improved
Sanitation
Services
Access:
Sanitationinvestmentsensureimprovedsustainable andequitable accessto sanitation
1) Improved InstitutionalSanitation,
2) Capacity buildingworkshops for WUs.
3) Engagement of ServiceAgents
4) Service Agents CapacityBuilding/Induction
5) Increasing HouseholdSanitation Coverage,
6) Capacity building ofPHO, WU &WSTF onCLTS
7) GESI guidelines insanitation
1) Implementation of Batch Iprojects continued includinghygiene promotion in thetarget institutions.
19 No. Sanitation Projectsreceived seconddisbursements (from FY2015/16)
2) This was achieved beforethe utilities start utilizingthe funds
3) The SAs are on board andare supporting the WUs inimplementation of projectactivities,
4) The induction was carriedout in the FY under review,
5) Training on CLTS triggeringwas carried out.
6) This was achieved duringCLTS training.
7) The focus on CLTS was doneusing the GESI guidelines totarget the poorestcommunities.
WSTF also developed GESIresponsive designs thatwere circulate to WUs andare in use duringconstruction
Implementation of CLTSprogramme will takeplace in the FY2017/2018.Theprogramme realizedlow capacity of WSTF,county staff and WUs tooversee CLTS activitiesand had to embark ontraining on CLTS priorto financing theactivities.The Water Fund liaisedwith the Ministry fHealth in thedevelopment ofmodalities for therollout of the CLTSactivities. At the Countylevel, the mandate ofsanitation services(especially training) iswith the Public HealthOffices, hence theCounty Public Healthofficers were sensitizedand took lead in therollout of CLTS activitiesin the Counties as thesubject matterspecialists.
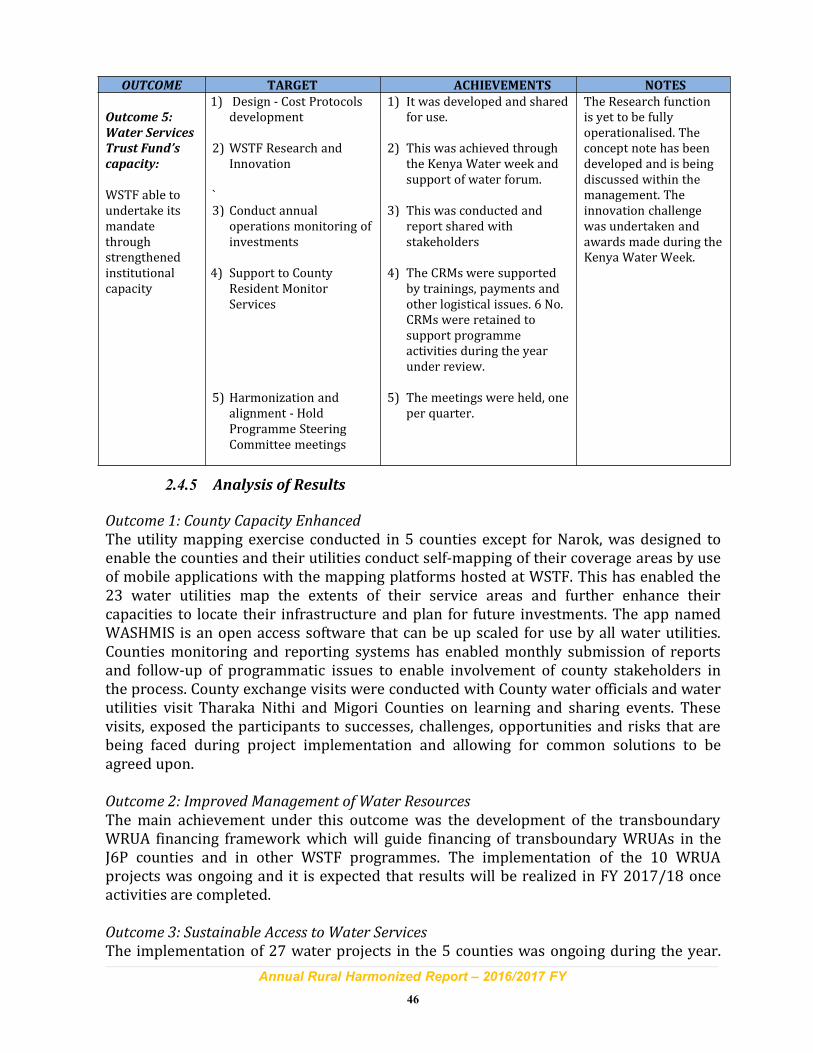
Annual Rural Harmonized Report – 2016/2017 FY
46
OUTCOME TARGET ACHIEVEMENTS NOTES
Outcome 5:
Water Services
Trust Fund’s
capacity:
WSTF able toundertake itsmandatethroughstrengthenedinstitutionalcapacity
1) Design - Cost Protocolsdevelopment
2) WSTF Research andInnovation
`3) Conduct annual
operations monitoring ofinvestments
4) Support to CountyResident MonitorServices
5) Harmonization andalignment - HoldProgramme SteeringCommittee meetings
1) It was developed and sharedfor use.
2) This was achieved throughthe Kenya Water week andsupport of water forum.
3) This was conducted andreport shared withstakeholders
4) The CRMs were supportedby trainings, payments andother logistical issues. 6 No.CRMs were retained tosupport programmeactivities during the yearunder review.
5) The meetings were held, oneper quarter.
The Research functionis yet to be fullyoperationalised. Theconcept note has beendeveloped and is beingdiscussed within themanagement. Theinnovation challengewas undertaken andawards made during theKenya Water Week.
2.4.5 Analysis of Results
Outcome 1: County Capacity Enhanced
The utility mapping exercise conducted in 5 counties except for Narok, was designed toenable the counties and their utilities conduct self-mapping of their coverage areas by useof mobile applications with the mapping platforms hosted at WSTF. This has enabled the23 water utilities map the extents of their service areas and further enhance theircapacities to locate their infrastructure and plan for future investments. The app namedWASHMIS is an open access software that can be up scaled for use by all water utilities.Counties monitoring and reporting systems has enabled monthly submission of reportsand follow-up of programmatic issues to enable involvement of county stakeholders inthe process. County exchange visits were conducted with County water officials and waterutilities visit Tharaka Nithi and Migori Counties on learning and sharing events. Thesevisits, exposed the participants to successes, challenges, opportunities and risks that arebeing faced during project implementation and allowing for common solutions to beagreed upon.
Outcome 2: Improved Management of Water Resources
The main achievement under this outcome was the development of the transboundaryWRUA financing framework which will guide financing of transboundary WRUAs in theJ6P counties and in other WSTF programmes. The implementation of the 10 WRUAprojects was ongoing and it is expected that results will be realized in FY 2017/18 onceactivities are completed.
Outcome 3: Sustainable Access to Water Services
The implementation of 27 water projects in the 5 counties was ongoing during the year.
Annual Rural Harmonized Report – 2016/2017 FY
47
Due to delays in county contribution, most projects were still ongoing by the end of thefinancial year. However, some projects, in Tharaka Nithi-Murugi Mugumango werealready reporting impacts from the consumer metering activity financed by theprogramme, which saw 800 connections and further increasing revenues for the waterutility. The support from Service Agents has assisted some water utilities enhance theircapacities in contract management and project implementation to ensure improvedworkmanship and review of designs in some cases.
Outcome 4: Improved Sanitation Services Access
Under this outcome, the implementation of sanitation facilities in different institutionsacross the 5 counties, was ongoing. It is expected that the completed facilities willimprove access to sanitation services and further reduce open defecation incidences inthe project areas. In addition, WSTF partnered with the Minister of Health-Public Healthdepartment to roll-out the CLTS approach in the 5 Counties. WSTF staff, County publichealth staff and water utilities were trained on CLTS, thereby enhancing their skills inimplementing the approach which will contribute to the National CLTS goal to end opendefecation in Kenya by 2018.
Outcome 5: Water Services Trust Fund’s capacity
The support for Kenya Water Week activities, allowed WSTF to effectively host aninternational forum that brought many national and stakeholders under the theme: Fromaid to Trade. This forum improved visibility for WSTF and its partners along with creatinglearning and sharing platforms for conferences and exhibitions. The programmecontinues to enhance WSTF presence in the counties by engaging County Residentsmonitors who oversee and monitor the project activities at county level. The Joint AnnualOperations monitoring exercise was conducted to review the sustainability of past WSTFinvestments and further inform WSTF’s development strategy. The exercise which wascompleted in November 2016, sampled 2692 projects (1616 Rural and 1031 Urban). 61%of rural projects implemented between 2011 and 2015 were found operational against83% for urban projects. Development of the design cost protocol has enhanced thecapacity of the investment teams in WSTF to make informed decisions on the cost ofinvestments. Programme steering group meetings have been every effective in providingprogramme updates and allow for decision making on pertinent issues by the developmentpartners.
2.4.6 Risks and risks mitigation measures – J6P
The table below shows the risks and mitigation measures that were experienced duringthe reporting period.
Table 14: Risk andmitigation measures
No Risk Mitigationmeasures
1. i) Vandalism of projects in some -Vandalism cases reported in Laikipia-Sirimon project and Kwale county-Taruproject that has caused additional costs.
i) Strengthen local level institutions(ownership) for management of the project,
ii) Sensitization of the public on the importanceof the project
iii)Measures put in place for communitiesworking with the utilities to safeguard the
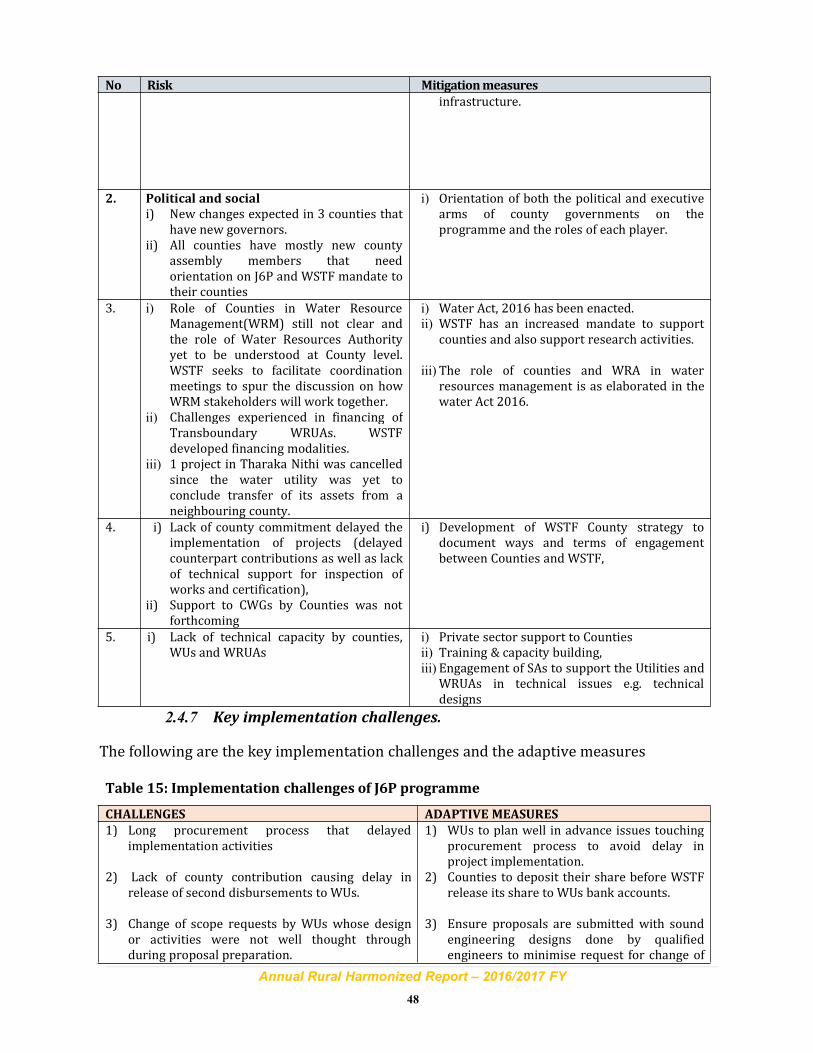
Annual Rural Harmonized Report – 2016/2017 FY
48
No Risk Mitigationmeasures
infrastructure.
2. Political and social
i) New changes expected in 3 counties thathave new governors.
ii) All counties have mostly new countyassembly members that needorientation on J6P and WSTF mandate totheir counties
i) Orientation of both the political and executivearms of county governments on theprogramme and the roles of each player.
3. i) Role of Counties in Water ResourceManagement(WRM) still not clear andthe role of Water Resources Authorityyet to be understood at County level.WSTF seeks to facilitate coordinationmeetings to spur the discussion on howWRM stakeholders will work together.
ii) Challenges experienced in financing ofTransboundary WRUAs. WSTFdeveloped financing modalities.
iii) 1 project in Tharaka Nithi was cancelledsince the water utility was yet toconclude transfer of its assets from aneighbouring county.
i) Water Act, 2016 has been enacted.ii) WSTF has an increased mandate to support
counties and also support research activities.
iii) The role of counties and WRA in waterresources management is as elaborated in thewater Act 2016.
4. i) Lack of county commitment delayed theimplementation of projects (delayedcounterpart contributions as well as lackof technical support for inspection ofworks and certification),
ii) Support to CWGs by Counties was notforthcoming
i) Development of WSTF County strategy todocument ways and terms of engagementbetween Counties and WSTF,
5. i) Lack of technical capacity by counties,WUs and WRUAs
i) Private sector support to Countiesii) Training & capacity building,iii) Engagement of SAs to support the Utilities and
WRUAs in technical issues e.g. technicaldesigns
2.4.7 Key implementation challenges.
The following are the key implementation challenges and the adaptive measures
Table 15: Implementation challenges of J6P programme
CHALLENGES ADAPTIVE MEASURES
1) Long procurement process that delayedimplementation activities
2) Lack of county contribution causing delay inrelease of second disbursements to WUs.
3) Change of scope requests by WUs whose designor activities were not well thought throughduring proposal preparation.
1) WUs to plan well in advance issues touchingprocurement process to avoid delay inproject implementation.
2) Counties to deposit their share before WSTFrelease its share to WUs bank accounts.
3) Ensure proposals are submitted with soundengineering designs done by qualifiedengineers to minimise request for change of
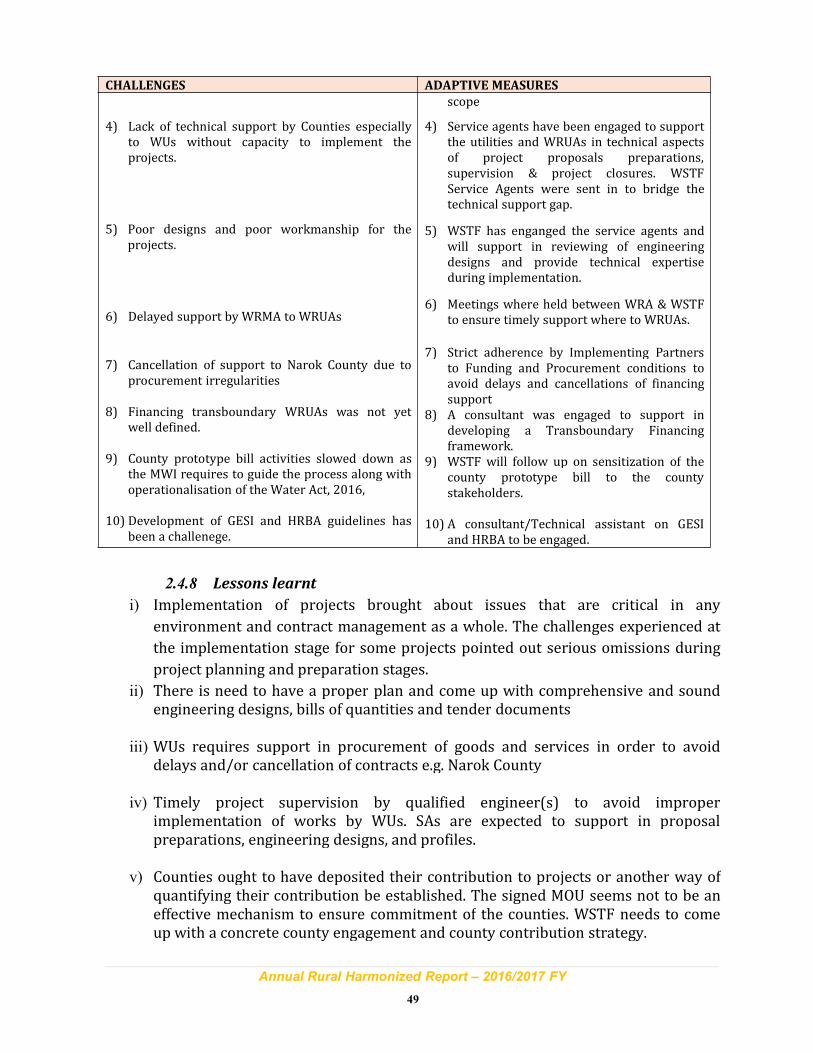
Annual Rural Harmonized Report – 2016/2017 FY
49
CHALLENGES ADAPTIVE MEASURES
4) Lack of technical support by Counties especiallyto WUs without capacity to implement theprojects.
5) Poor designs and poor workmanship for theprojects.
6) Delayed support by WRMA to WRUAs
7) Cancellation of support to Narok County due toprocurement irregularities
8) Financing transboundary WRUAs was not yetwell defined.
9) County prototype bill activities slowed down asthe MWI requires to guide the process along withoperationalisation of the Water Act, 2016,
10) Development of GESI and HRBA guidelines hasbeen a challenege.
scope
4) Service agents have been engaged to supportthe utilities and WRUAs in technical aspectsof project proposals preparations,supervision & project closures. WSTFService Agents were sent in to bridge thetechnical support gap.
5) WSTF has enganged the service agents andwill support in reviewing of engineeringdesigns and provide technical expertiseduring implementation.
6) Meetings where held between WRA & WSTFto ensure timely support where to WRUAs.
7) Strict adherence by Implementing Partnersto Funding and Procurement conditions toavoid delays and cancellations of financingsupport
8) A consultant was engaged to support indeveloping a Transboundary Financingframework.
9) WSTF will follow up on sensitization of thecounty prototype bill to the countystakeholders.
10) A consultant/Technical assistant on GESIand HRBA to be engaged.
2.4.8 Lessons learnt
i) Implementation of projects brought about issues that are critical in any
environment and contract management as a whole. The challenges experienced at
the implementation stage for some projects pointed out serious omissions during
project planning and preparation stages.
ii) There is need to have a proper plan and come up with comprehensive and soundengineering designs, bills of quantities and tender documents
iii) WUs requires support in procurement of goods and services in order to avoiddelays and/or cancellation of contracts e.g. Narok County
iv) Timely project supervision by qualified engineer(s) to avoid improperimplementation of works by WUs. SAs are expected to support in proposalpreparations, engineering designs, and profiles.
v) Counties ought to have deposited their contribution to projects or another way ofquantifying their contribution be established. The signed MOU seems not to be aneffective mechanism to ensure commitment of the counties. WSTF needs to comeup with a concrete county engagement and county contribution strategy.
Annual Rural Harmonized Report – 2016/2017 FY
50
vi) WRUAs need be supported closely by service agents and not rely entirely on WRAoffice.
vii)Capacity of both WUs and WRUAs need to be enhanced to enable them manage andoperate the completed works to ensure sustainability.
Annual Rural Harmonized Report – 2016/2017 FY
51
2.5 Green Growth and Employment Programme (GGEP)
2.5.1 Introduction and programme background
Water Sector Trust Fund, under the kind support of the Governments of Kenya andDenmark is implementing the Green Growth and Employment Programme - Access to andmanagement of water resources in the Arid and Semi-Arid Lands. The operatingframework of its implementation is detailed in the bilateral agreement between theDanish Ministry of Foreign Affairs and the Water Sector Trust Fund in a developmentengagement which entered into force on 1st July 2016. The overall vision for thepartnership is to support the Government and people of Kenya in implementing theirVision 2030 to create ‘a globally competitive and prosperous country with a high qualityof life by 2030’. The thematic Green Growth and Employment Programme’s Objective is tocontribute to inclusive green growth and employment in Kenya.
Programme Components
The programme aims to achieve its purpose through six outcomes namely:
Output 1: ASAL counties capacity and engagement in water related planning improved,
(WSTF will collaborate with eight ASAL counties to identify priority needs with focus on
the CIDPs for water and sanitation infrastructure and interventions).
Output 2: Water and sanitation access and deficit in the ASAL addressed, (Support 56
new and county prioritized water and sanitation services delivery systems, each
consisting of several investment schemes of varying size, will be developed and
implemented in eight counties. The water investments will be climate-proofed, and use
green technologies as appropriate with a view of contribution to green growth).
Output 3: Sustainable and community based management of water resources improved,
(Support 56 WRUAs focused on the eights ASAL counties to carry out activities in the Sub-
Catchment Management Plans in order to improve water quality and quantity and
promote sustainable and community-based management of the land and natural
resources in the sub-catchment area.)
Output 4: Improved capacity of and engagement by implementing agents (WRUAs, CBOs,
and Water Services Providers) for planning and efficient water service delivery, (Support
the training of implementing agents in the eight target ASAL counties involved in water
resources management and service provision in subjects relevant for improving their
capacity for delivering on catchment management and water and sanitation services.)
Output 5: Enhanced experience for promoting public private partnerships in water
provision in the ASALs, (This output will seek to pilot models for collaboration between
public sector and private sector actors in provision of water services and water resource
management in the ASALs).
Annual Rural Harmonized Report – 2016/2017 FY
52
Output 6: Strengthened institutional performance of WSTF, (To strengthen the
institutional performance of WSTF to deliver better on the WSTF mandate in the
counties).
2.5.2 Key programme highlights and achievements
During this financial year, the programme has not registered substantial progress across
all the 6 outputs highlighted in the preceding table. WSTF prepared a 6 month work plan
for the GEEP which was approved by Danida. The approved work plan and budget
facilitated the release of funds to the start off GGEP activities. WSTF received Ksh 101
million for the GGEP in the 3rd quarter of the year.
In February 2017, President Uhuru Kenyatta declared the ongoing drought situation as a
national disaster and as such the monies were reallocated to Drought Emergency
Response Programme to assist in water tracking and rehabilitation of boreholes, djabias,
shallow wells and water pans to address the immediate need of ASAL communities in
Lamu, Tana River and Garissa counties. An update of the DERP activities is provided in the
following section within this report.
The GGEP programme was able to achieve the following activities under three out of the
six outputs are as follows;
Output 1: ASAL counties capacity and engagement in water related planning
improved.
County engagement meeting of CEC’s at a cost of Ksh 725,552.60. The meeting sensitized
county officials on the new programme in preparation for start-up activities. TORs for
County Baselines were developed and consultants expected to start off baseline activities
in the 1st quarter of 2017/18.
Output 2: Water and sanitation access and deficit in the ASAL addressed
The Programme funds were reallocated to the Drought Emergency Response Programme
(DERP) to support development of emergency relief water sources in 3 counties. By the
end of the financial year, Ksh 50,205,730 had been transferred from the GGEP account to
the Lamu, Tana River and Garissa Water Service providers for implementation of the
drought response activities.
Output 6: Strengthened institutional performance of WSTF
In the year, Ksh 7,344,992 was utilized for some of the activities indicated below:
i) Sensitization of 2 programme Investments staff on Green Growth Programme
Concept.
ii) Capacity building of 4 No. staff in the following areas: Climate change, Greening the
growth and Results based monitoring courses
iii) Support to Kenya Water Week activities-WICA innovation challenge awards.
iv) Project monitoring of DERP activities
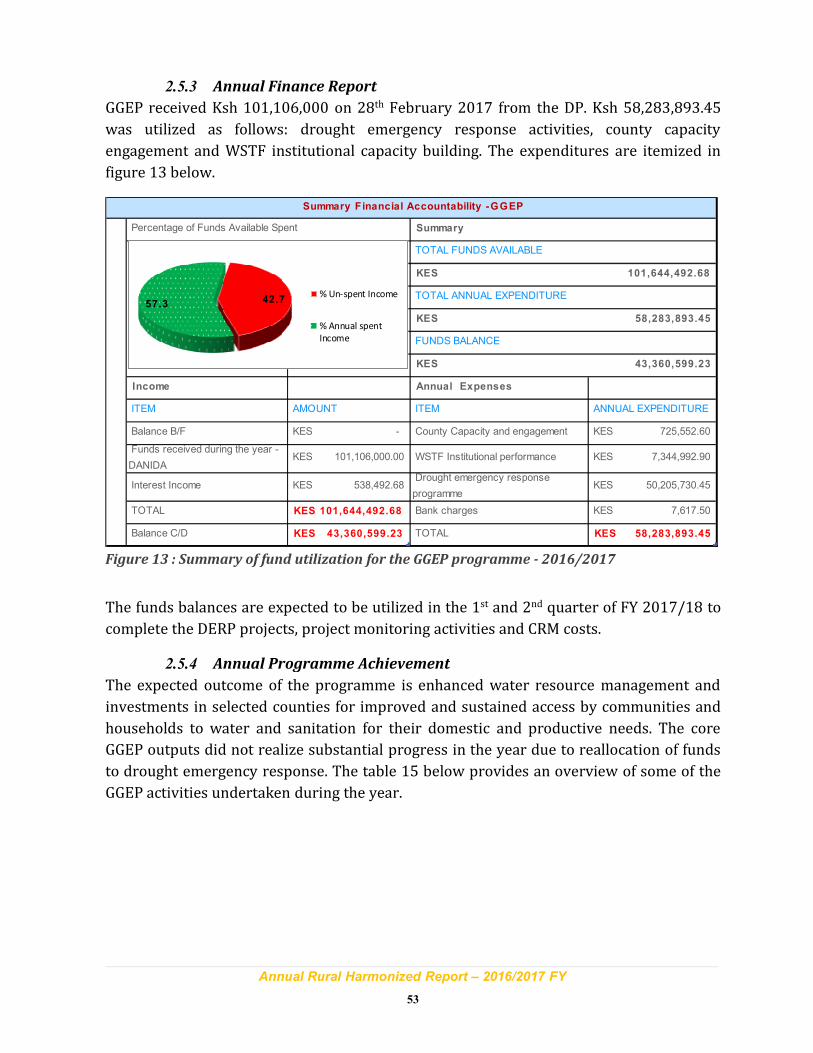
Annual Rural Harmonized Report – 2016/2017 FY
53
2.5.3 Annual Finance Report
GGEP received Ksh 101,106,000 on 28th February 2017 from the DP. Ksh 58,283,893.45
was utilized as follows: drought emergency response activities, county capacity
engagement and WSTF institutional capacity building. The expenditures are itemized in
figure 13 below.
Income Annual Expenses
ITEM AMOUNT ITEM ANNUAL EXPENDITURE
Balance B/F KES - County Capacity and engagement KES 725,552.60
Funds received during the year -
DANIDA KES 101,106,000.00 WSTF Institutional performance KES 7,344,992.90
Interest Income KES 538,492.68 Drought emergency response
programme KES 50,205,730.45
TOTAL KES 101,644,492.68 Bank charges KES 7,617.50
Balance C/D KES 43,360,599.23 TOTAL KES 58,283,893.45
KES 101,644,492.68
TOTAL ANNUAL EXPENDITURE
KES 58,283,893.45
FUNDS BALANCE
KES 43,360,599.23
Summary Financial Accountability -GGEP
Percentage of Funds Available Spent Summary
TOTAL FUNDS AVAILABLE
42.757.3% Un-spent Income
% Annual spent
Income
Figure 13 : Summary of fund utilization for the GGEP programme - 2016/2017
The funds balances are expected to be utilized in the 1st and 2nd quarter of FY 2017/18 to
complete the DERP projects, project monitoring activities and CRM costs.
2.5.4 Annual Programme Achievement
The expected outcome of the programme is enhanced water resource management and
investments in selected counties for improved and sustained access by communities and
households to water and sanitation for their domestic and productive needs. The core
GGEP outputs did not realize substantial progress in the year due to reallocation of funds
to drought emergency response. The table 15 below provides an overview of some of the
GGEP activities undertaken during the year.
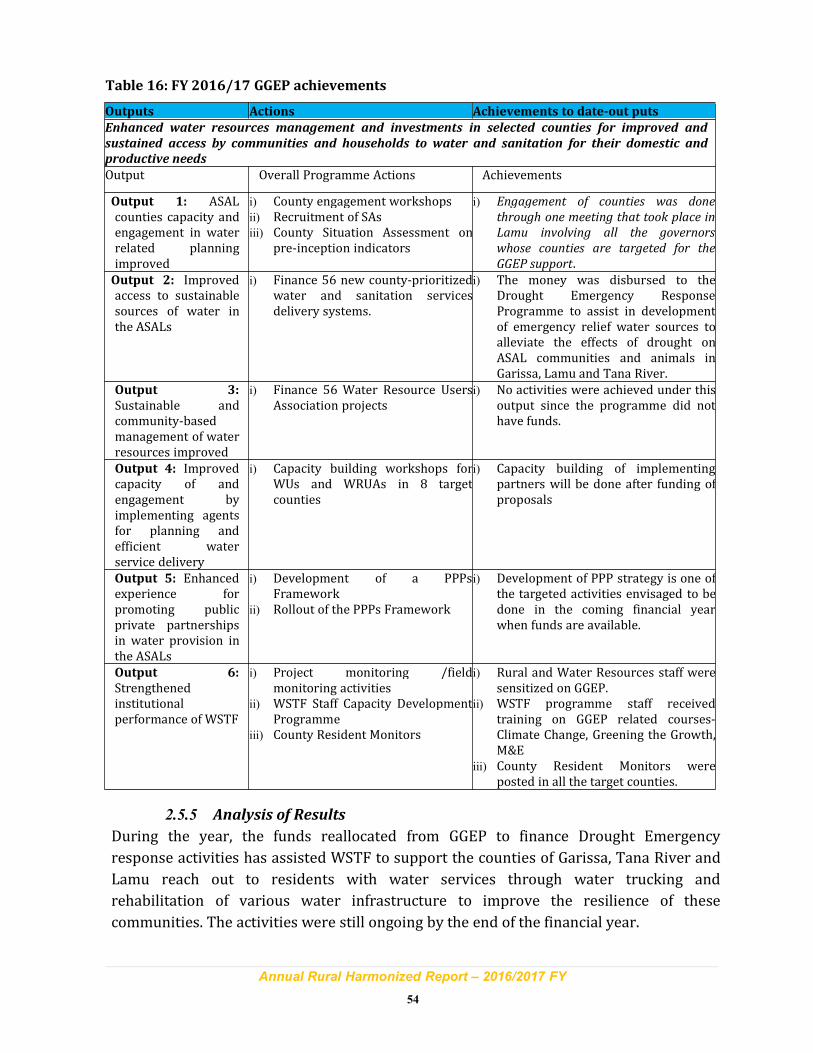
Annual Rural Harmonized Report – 2016/2017 FY
54
Table 16: FY 2016/17 GGEP achievements
Outputs Actions Achievements to date-out puts
Enhanced water resources management and investments in selected counties for improved and
sustained access by communities and households to water and sanitation for their domestic and
productive needs
Output Overall Programme Actions Achievements
Output 1: ASALcounties capacity andengagement in waterrelated planningimproved
i) County engagement workshopsii) Recruitment of SAsiii) County Situation Assessment on
pre-inception indicators
i) Engagement of counties was done
through one meeting that took place in
Lamu involving all the governors
whose counties are targeted for the
GGEP support.
Output 2: Improvedaccess to sustainablesources of water inthe ASALs
i) Finance 56 new county-prioritizedwater and sanitation servicesdelivery systems.
i) The money was disbursed to theDrought Emergency ResponseProgramme to assist in developmentof emergency relief water sources toalleviate the effects of drought onASAL communities and animals inGarissa, Lamu and Tana River.
Output 3:
Sustainable andcommunity-basedmanagement of waterresources improved
i) Finance 56 Water Resource UsersAssociation projects
i) No activities were achieved under thisoutput since the programme did nothave funds.
Output 4: Improvedcapacity of andengagement byimplementing agentsfor planning andefficient waterservice delivery
i) Capacity building workshops forWUs and WRUAs in 8 targetcounties
i) Capacity building of implementingpartners will be done after funding ofproposals
Output 5: Enhancedexperience forpromoting publicprivate partnershipsin water provision inthe ASALs
i) Development of a PPPsFramework
ii) Rollout of the PPPs Framework
i) Development of PPP strategy is one ofthe targeted activities envisaged to bedone in the coming financial yearwhen funds are available.
Output 6:
Strengthenedinstitutionalperformance of WSTF
i) Project monitoring /fieldmonitoring activities
ii) WSTF Staff Capacity DevelopmentProgramme
iii) County Resident Monitors
i) Rural and Water Resources staff weresensitized on GGEP.
ii) WSTF programme staff receivedtraining on GGEP related courses-Climate Change, Greening the Growth,M&E
iii) County Resident Monitors wereposted in all the target counties.
2.5.5 Analysis of Results
During the year, the funds reallocated from GGEP to finance Drought Emergency
response activities has assisted WSTF to support the counties of Garissa, Tana River and
Lamu reach out to residents with water services through water trucking and
rehabilitation of various water infrastructure to improve the resilience of these
communities. The activities were still ongoing by the end of the financial year.
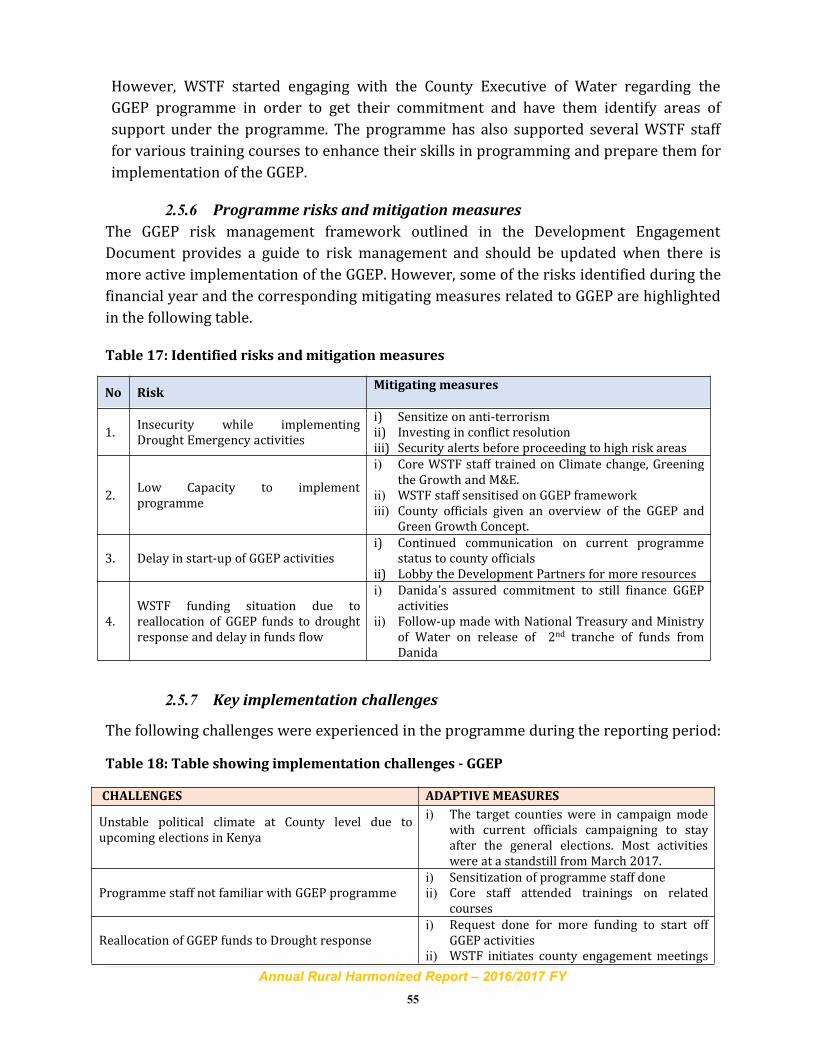
Annual Rural Harmonized Report – 2016/2017 FY
55
However, WSTF started engaging with the County Executive of Water regarding the
GGEP programme in order to get their commitment and have them identify areas of
support under the programme. The programme has also supported several WSTF staff
for various training courses to enhance their skills in programming and prepare them for
implementation of the GGEP.
2.5.6 Programme risks and mitigation measures
The GGEP risk management framework outlined in the Development Engagement
Document provides a guide to risk management and should be updated when there is
more active implementation of the GGEP. However, some of the risks identified during the
financial year and the corresponding mitigating measures related to GGEP are highlighted
in the following table.
Table 17: Identified risks andmitigation measures
No RiskMitigating measures
1.Insecurity while implementingDrought Emergency activities
i) Sensitize on anti-terrorismii) Investing in conflict resolutioniii) Security alerts before proceeding to high risk areas
2.Low Capacity to implementprogramme
i) Core WSTF staff trained on Climate change, Greeningthe Growth and M&E.
ii) WSTF staff sensitised on GGEP frameworkiii) County officials given an overview of the GGEP and
Green Growth Concept.
3. Delay in start-up of GGEP activitiesi) Continued communication on current programme
status to county officialsii) Lobby the Development Partners for more resources
4.WSTF funding situation due toreallocation of GGEP funds to droughtresponse and delay in funds flow
i) Danida’s assured commitment to still finance GGEPactivities
ii) Follow-up made with National Treasury and Ministryof Water on release of 2nd tranche of funds fromDanida
2.5.7 Key implementation challenges
The following challenges were experienced in the programme during the reporting period:
Table 18: Table showing implementation challenges - GGEP
CHALLENGES ADAPTIVE MEASURES
Unstable political climate at County level due toupcoming elections in Kenya
i) The target counties were in campaign modewith current officials campaigning to stayafter the general elections. Most activitieswere at a standstill from March 2017.
Programme staff not familiar with GGEP programmei) Sensitization of programme staff doneii) Core staff attended trainings on related
courses
Reallocation of GGEP funds to Drought responsei) Request done for more funding to start off
GGEP activitiesii) WSTF initiates county engagement meetings
Annual Rural Harmonized Report – 2016/2017 FY
56
CHALLENGES ADAPTIVE MEASURES
alongside other activities being undertakenand targeting the GGEP counties
Annual Rural Harmonized Report – 2016/2017 FY
57
2.5.8 Lessons learnt
The following lessons were learnt during the financial year:
i) Early engagement (March 2017) in general election campaigning by key county
officials results in planning of county engagement to be difficult.
ii) The county current officials were not willing to commit to the programme at this
time.
iii) The work plan will also be update to reflect the current funding expectation since
the previous one was not utilized as planned.
iv) There is need to improve the capacity of programme staff to implement the GGEP
since Green Growth are fairly new concepts within the Water sector both at
National and County level.
v) There was need to develop Green Growth and PPP strategies as one of the first
activities before rollout of this programme.
2.6 Drought Emergency Response Programme
2.6.1 Introduction and Programme Background
Following the declaration of drought as a National disaster by the Kenya Government on
10th February, 2017 with 23 out of 47 counties affected, the Water Sector Trust Fund
(WSTF) was appointed by MWI as one of the financing partners in the Drought
Emergency Water Response Programme. A funding proposal for drought emergency
response was submitted to DANIDA and the Royal Danish Embassy committed to fund the
programme to a tune of Ksh 150 million. The Drought Emergency Response Programme
(DERP) was initiated in Lamu, Garissa and Tana River counties in March, 2017 with WSTF
committing Kshs. 99 Million for three financing contracts to: Garissa Water Company;
Tana Water Company; and Lamu Water Company for diverse water infrastructure
including rehabilitation and water trucking activities. Implementation activities under the
1st DERP funding have been on-going with most activities reported to be over 80%
completion status. The implementation period was initially scheduled to be 3 months but
the WSPs later requested for contract extensions due to emerging challenges of project
siting and sudden rainfall affecting project sites. With the completion of the funded
projects, about 40,000 people will have benefitted with potable water. The CRMs continue
to monitor and support the DERP projects through routine monitoring schedules,
submitting weekly sitreps and ensuring that implementing agencies submit monthly
progress reports to WSTF for review.
2.6.2 Key programme highlights and achievements
The following are the drought emergency response programme key achievements during
the 2016-2017 period;
i) Rehabilitation and desilting of 12 water pans in the 3 counties
ii) Water trucking for 5 Sub Counties in the 3 targeted counties.
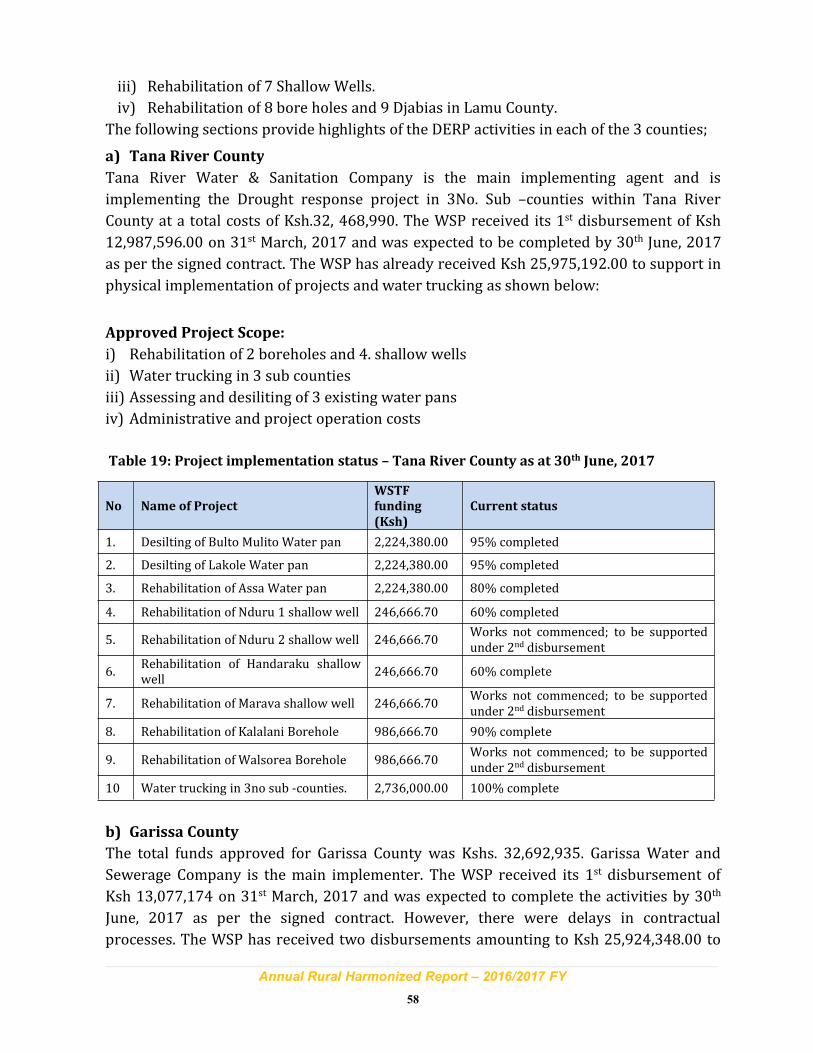
Annual Rural Harmonized Report – 2016/2017 FY
58
iii) Rehabilitation of 7 Shallow Wells.
iv) Rehabilitation of 8 bore holes and 9 Djabias in Lamu County.
The following sections provide highlights of the DERP activities in each of the 3 counties;
a) Tana River County
Tana River Water & Sanitation Company is the main implementing agent and is
implementing the Drought response project in 3No. Sub –counties within Tana River
County at a total costs of Ksh.32, 468,990. The WSP received its 1st disbursement of Ksh
12,987,596.00 on 31st March, 2017 and was expected to be completed by 30th June, 2017
as per the signed contract. The WSP has already received Ksh 25,975,192.00 to support in
physical implementation of projects and water trucking as shown below:
Approved Project Scope:
i) Rehabilitation of 2 boreholes and 4. shallow wells
ii) Water trucking in 3 sub counties
iii) Assessing and desiliting of 3 existing water pans
iv) Administrative and project operation costs
Table 19: Project implementation status – Tana River County as at 30th June, 2017
No Name of Project
WSTF
funding
(Ksh)
Current status
1. Desilting of Bulto Mulito Water pan 2,224,380.00 95% completed
2. Desilting of Lakole Water pan 2,224,380.00 95% completed
3. Rehabilitation of Assa Water pan 2,224,380.00 80% completed
4. Rehabilitation of Nduru 1 shallow well 246,666.70 60% completed
5. Rehabilitation of Nduru 2 shallow well 246,666.70Works not commenced; to be supportedunder 2nd disbursement
6.Rehabilitation of Handaraku shallowwell
246,666.70 60% complete
7. Rehabilitation of Marava shallow well 246,666.70Works not commenced; to be supportedunder 2nd disbursement
8. Rehabilitation of Kalalani Borehole 986,666.70 90% complete
9. Rehabilitation of Walsorea Borehole 986,666.70Works not commenced; to be supportedunder 2nd disbursement
10 Water trucking in 3no sub -counties. 2,736,000.00 100% complete
b) Garissa County
The total funds approved for Garissa County was Kshs. 32,692,935. Garissa Water and
Sewerage Company is the main implementer. The WSP received its 1st disbursement of
Ksh 13,077,174 on 31st March, 2017 and was expected to complete the activities by 30th
June, 2017 as per the signed contract. However, there were delays in contractual
processes. The WSP has received two disbursements amounting to Ksh 25,924,348.00 to
Annual Rural Harmonized Report – 2016/2017 FY
59
support in physical implementation of projects and water trucking as shown below.
Approved Project Scope:
i) Rehabilitation of 6 boreholesii) Water trucking in 2 sub countiesiii) Assessing and desiliting of 4 existing water pansiv) Administrative and project operation costs
Table 20: Project implementation status for Garissa County as at 30th June, 2017
N
oPROJECT NAME
SUB
COUNTY
FUNDS
DISBURSEDCOMPLETION STATUS
1. Afwein water pan Lagdera 4,900,00095% Completed; pending installation ofSignpost
2. Auliya water pan Balambala 6,300,00095% Completed; pending installation ofSignpost
3. Tinas water pan Dadaab 2,800,00095% Completed; pending installation ofSignpost – This pan was replaced withGubakibir
4. Ijara water pan Ijara 4,200,00095% Completed; pending installation ofSignpost
5.Amuma boreholerehabilitation
Fafi 300,00095% Completed; pending installation ofSignpost
6.Abdisamet boreholerehabilitation
Balambala 1,500,00095% Completed; pending installation ofSignpost
7.Dujis boreholerehabilitation
Balambala 300,00095% Completed; pending installation ofSignpost
8.Skanska boreholerehabilitation
Lagdera 500,00095% Completed; pending installation ofSignpost
9.Baraki boreholerehabilitation
Lagdera 2,500,000Not started – Community resistanceexperienced. A new site to be identified.
10.Bahuri B/Hrehabilitation
Dadaab 400,00095% Completed; pending installation ofSignpost
11. Hulugho water trucking Hulugho 7,364,700 100% Completed
c) Lamu County
Lamu Water and Sewerage Company (LAWASCO) as the main implementer signed a contractof Kshs. 34,172,460. The project received its 1st disbursement of Ksh 13,668,984 on 31st
March, 2017 and was expected to be completed by 30th June, 2017 as per the signed contract.The WSP has received a total of Ksh 27,337,968 to support in physical implementation ofprojects and water trucking as shown below:-.
Approved Project Scope:
i) Rehabilitation of 9No. Djabiasii) Rehabilitation of 4 No. shallow wellsiii) Water trucking in 3 wardsiv) Assessing and desiliting of 5No. existing water pansv) Administrative and project operation costs
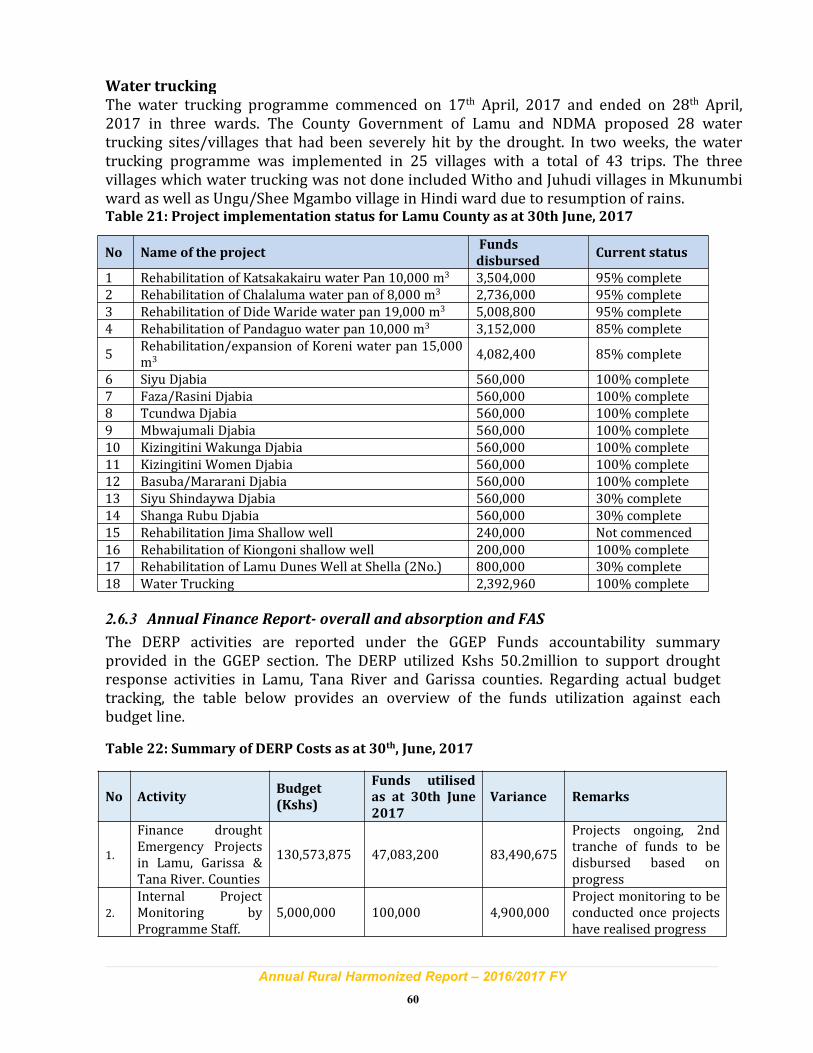
Annual Rural Harmonized Report – 2016/2017 FY
60
Water trucking
The water trucking programme commenced on 17th April, 2017 and ended on 28th April,2017 in three wards. The County Government of Lamu and NDMA proposed 28 watertrucking sites/villages that had been severely hit by the drought. In two weeks, the watertrucking programme was implemented in 25 villages with a total of 43 trips. The threevillages which water trucking was not done included Witho and Juhudi villages in Mkunumbiward as well as Ungu/Shee Mgambo village in Hindi ward due to resumption of rains.Table 21: Project implementation status for Lamu County as at 30th June, 2017
No Name of the projectFunds
disbursedCurrent status
1 Rehabilitation of Katsakakairu water Pan 10,000 m3 3,504,000 95% complete
2 Rehabilitation of Chalaluma water pan of 8,000 m3 2,736,000 95% complete
3 Rehabilitation of Dide Waride water pan 19,000 m3 5,008,800 95% complete
4 Rehabilitation of Pandaguo water pan 10,000 m3 3,152,000 85% complete
5Rehabilitation/expansion of Koreni water pan 15,000m3 4,082,400 85% complete
6 Siyu Djabia 560,000 100% complete
7 Faza/Rasini Djabia 560,000 100% complete
8 Tcundwa Djabia 560,000 100% complete
9 Mbwajumali Djabia 560,000 100% complete
10 Kizingitini Wakunga Djabia 560,000 100% complete
11 Kizingitini Women Djabia 560,000 100% complete
12 Basuba/Mararani Djabia 560,000 100% complete
13 Siyu Shindaywa Djabia 560,000 30% complete
14 Shanga Rubu Djabia 560,000 30% complete
15 Rehabilitation Jima Shallow well 240,000 Not commenced
16 Rehabilitation of Kiongoni shallow well 200,000 100% complete
17 Rehabilitation of Lamu Dunes Well at Shella (2No.) 800,000 30% complete
18 Water Trucking 2,392,960 100% complete
2.6.3 Annual Finance Report- overall and absorption and FAS
The DERP activities are reported under the GGEP Funds accountability summaryprovided in the GGEP section. The DERP utilized Kshs 50.2million to support droughtresponse activities in Lamu, Tana River and Garissa counties. Regarding actual budgettracking, the table below provides an overview of the funds utilization against eachbudget line.
Table 22: Summary of DERP Costs as at 30th, June, 2017
No ActivityBudget
(Kshs)
Funds utilised
as at 30th June
2017
Variance Remarks
1.
Finance droughtEmergency Projectsin Lamu, Garissa &Tana River. Counties
130,573,875 47,083,200 83,490,675
Projects ongoing, 2ndtranche of funds to bedisbursed based onprogress
2.
Internal ProjectMonitoring byProgramme Staff.
5,000,000 100,000 4,900,000Project monitoring to beconducted once projectshave realised progress
Annual Rural Harmonized Report – 2016/2017 FY
61
3.Project Monitoringby CRMs
4,897,431 1,129,745 3,767,686 CRM support is ongoing.
4.Project audits byexternal auditors
3,000,000 0 3,000,000Project audit scheduledfor next cycles
5.WSTF ManagementFee (5% Fee)
6,528,694 1,892,785 4,635,909WSTF fee to be drawnbased on progress ofdisbursements
Total 150,000,000 50,205,730
WSTF intends to seek Danida’s approval to utilize the MTAP-No-Cost extension funds
balance to finance additional drought response activities and to cater for current budget
deficits.
2.6.4 DERP Identified risks and mitigation measures
The table below indicates the risks and mitigation measures experienced.
Table 23: Identified risks andmitigation measures
No Risk Mitigating measures
1.A shift in donor policies & priorities withregards to ASAL development and droughtresilience.
Continuous Government commitment asexpressed in the priorities communicated todonors, will facilitate continued alignmentagainst Ending Drought Emergency priorities.
2.
Security issues in Northern Kenya &
target counties: Recent national (ethnic)and cross border clashes have made mobilityand access to some project areas difficult.
Key institutions focusing on the EDE-6th pillarfor example the Pastoralists ParliamentaryGroup can contribute to upholding peace andstability in the affected areas.
Project planning to take into account thepossible security risks and lay downmeasures to address the issue.
3.
Low capacity of communities to
undertake projects: Communities in ASALcounties have less experience in undertakingcommunity projects than communities inother parts of Kenya. Low educational levels,nomadic lifestyle, cultural issues andscattered settlement pattern hinder thecommunity development.
Water Service providers were engaged toimplement these projects and ensure thatcommunities are engaged all through theproject cycle.
2.6.5 Implementation challenges
The table below summarises the key implementation challenges
Table 24: Implementation challenges and adaptive measures
Challenges Adaptive measures
1. High demand for services - The bitingdrought resulted in high demand for thewater services among the local communities.Although the program targeted the mostvulnerable persons with water trucking,there were other people affected by thedrought in other sub counties.
2. Vastness of the program area posed
1) The county government had to ensure thatthe affected communities in other subcounties were supplied with water throughtrucking under county support.
2) The CRMs of the targeted counties providedadditional support in monitoring of theprojects. However, in future, programmemonitoring should be well coordinated
Annual Rural Harmonized Report – 2016/2017 FY
62
Challenges Adaptive measures
difficulty in monitoring of all the projectswithin the limited/short contract period.
3. Short timeframes within which to implementthe projects due to their emergency nature.
4. Failure to involve the communities from theonset of the projects hindered the smoothimplementation of the projects as thesecommunities were not consulted duringproject identifications.
5. Change of originally proposed sites due tovarious reasons for instance communal
conflicts or the targeted water pans having
been filled with rain water as the 1st
disbursement was released during rainy
season. This made it impossible for thedesilting to be done and thus a replacementwater pan sites to new ones.
through partnerships with CountyGovernment and the existing County DroughtResponse mechanisms.
3) Request for direct procurement provided dueto Drought being declared as a nationaldisaster to fast track activities.
4) Involvement of communities in the targetproject sites is vital during all stages ofproject cycles for Ownership andSustainability.
5) Proper project siting and timelydisbursement of funds is key in realizingsuccessful projects with value for money.
2.6.6 Lessons learnt
The lessons learnt in this program are as indicated below:
i) Contingency planning (Emergency Response) is a necessity - These
programs are triggered due to “nature challenges”. Usually they are to be
implemented within short timeframes in most instances when the affected
community capacities are over stretched in terms of coping with the challenges.
Organizations are required to put in place “contingency plans” to be applied
under such circumstances.
ii) Institutionalise an Emergency Response Programme– ASAL Counties
always experience low rainfall and dry spells annually. This weakens
Community Coping Mechanisms. WSTF should works towards
institutionalizing “special” resources (Programs; Staff and Funds) to support
ASAL communities in such emergencies.
iii) Develop a Clear Monitoring Schedule – Vastness of the program area poses
difficulty in monitoring of all the projects within the limited/short contract
period. This will ensure that these activities are effectively monitored within
the limited timeframe. A tool kit including the weekly Sitreps should also be
developed for ease of monitoring and reporting.
iv) Partnering with County Drought Response Teams/Structures is important
to have a coordinated response plan and identify the implementers to be
engaged in emergency response activities. This will help in effective
identification; design; implementation; close supervision and effective
monitoring of the programmes.
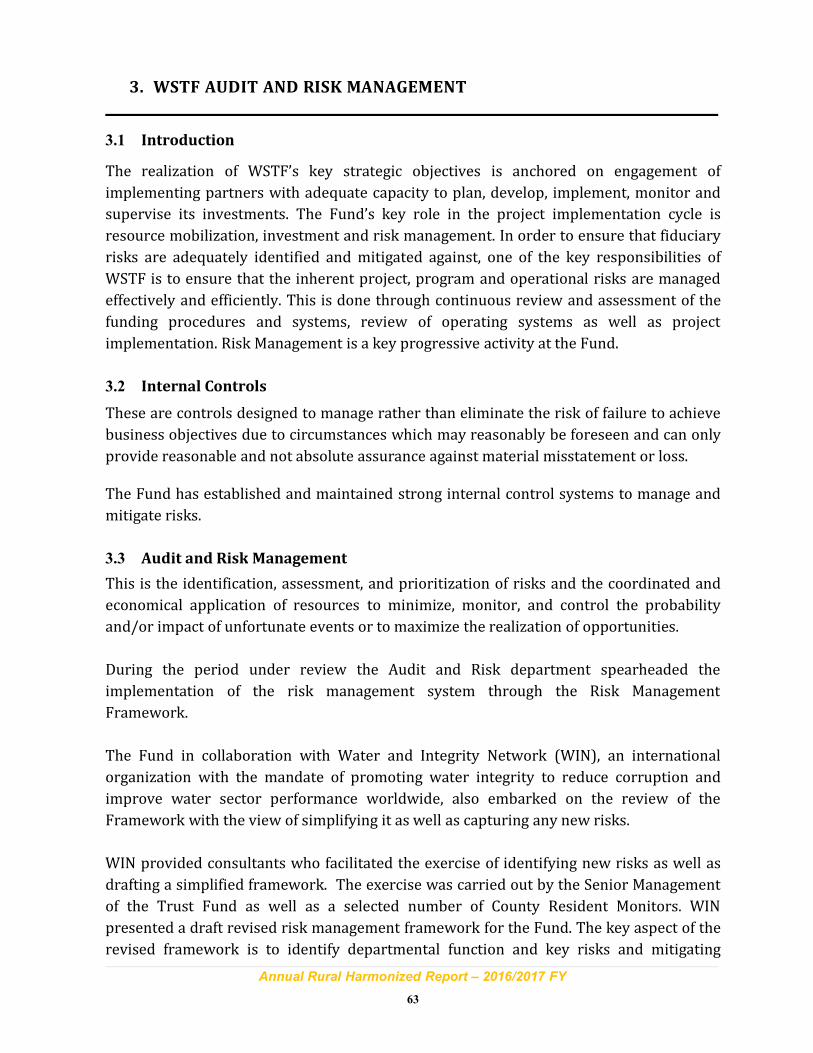
Annual Rural Harmonized Report – 2016/2017 FY
63
3. WSTF AUDIT AND RISK MANAGEMENT
3.1 Introduction
The realization of WSTF’s key strategic objectives is anchored on engagement of
implementing partners with adequate capacity to plan, develop, implement, monitor and
supervise its investments. The Fund’s key role in the project implementation cycle is
resource mobilization, investment and risk management. In order to ensure that fiduciary
risks are adequately identified and mitigated against, one of the key responsibilities of
WSTF is to ensure that the inherent project, program and operational risks are managed
effectively and efficiently. This is done through continuous review and assessment of the
funding procedures and systems, review of operating systems as well as project
implementation. Risk Management is a key progressive activity at the Fund.
3.2 Internal Controls
These are controls designed to manage rather than eliminate the risk of failure to achieve
business objectives due to circumstances which may reasonably be foreseen and can only
provide reasonable and not absolute assurance against material misstatement or loss.
The Fund has established and maintained strong internal control systems to manage and
mitigate risks.
3.3 Audit and Risk Management
This is the identification, assessment, and prioritization of risks and the coordinated and
economical application of resources to minimize, monitor, and control the probability
and/or impact of unfortunate events or to maximize the realization of opportunities.
During the period under review the Audit and Risk department spearheaded the
implementation of the risk management system through the Risk Management
Framework.
The Fund in collaboration with Water and Integrity Network (WIN), an international
organization with the mandate of promoting water integrity to reduce corruption and
improve water sector performance worldwide, also embarked on the review of the
Framework with the view of simplifying it as well as capturing any new risks.
WIN provided consultants who facilitated the exercise of identifying new risks as well as
drafting a simplified framework. The exercise was carried out by the Senior Management
of the Trust Fund as well as a selected number of County Resident Monitors. WIN
presented a draft revised risk management framework for the Fund. The key aspect of the
revised framework is to identify departmental function and key risks and mitigating
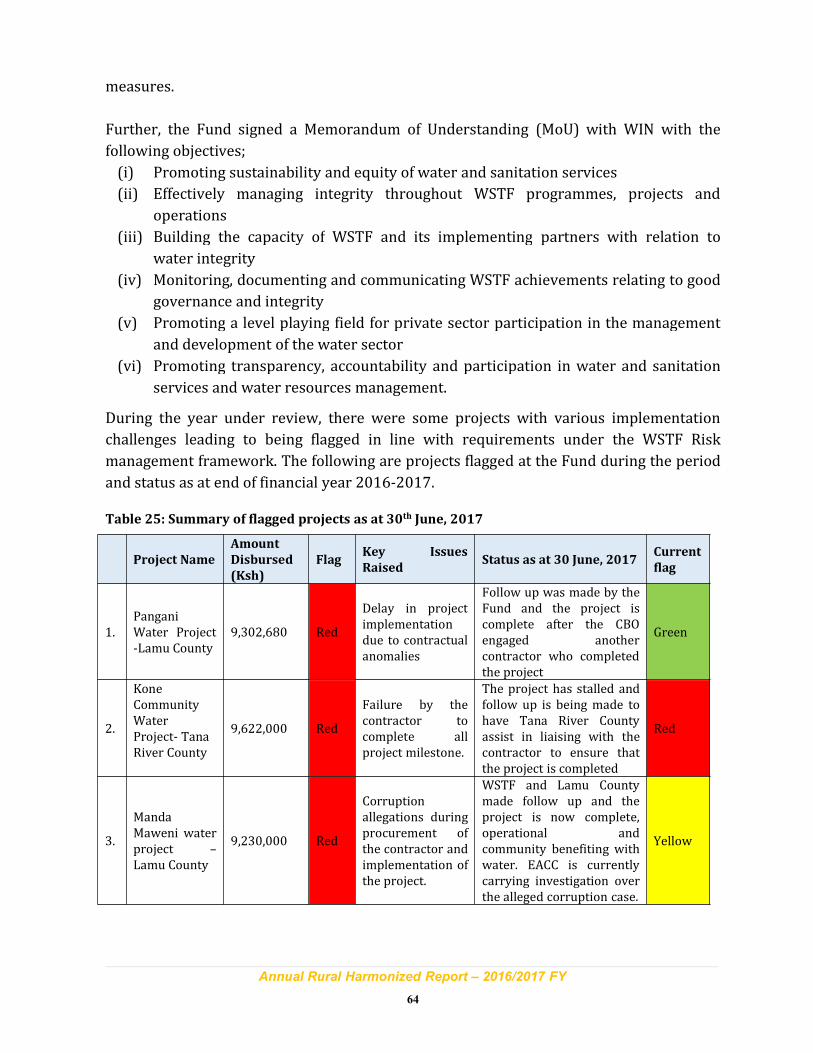
Annual Rural Harmonized Report – 2016/2017 FY
64
measures.
Further, the Fund signed a Memorandum of Understanding (MoU) with WIN with the
following objectives;
(i) Promoting sustainability and equity of water and sanitation services
(ii) Effectively managing integrity throughout WSTF programmes, projects and
operations
(iii) Building the capacity of WSTF and its implementing partners with relation to
water integrity
(iv) Monitoring, documenting and communicating WSTF achievements relating to good
governance and integrity
(v) Promoting a level playing field for private sector participation in the management
and development of the water sector
(vi) Promoting transparency, accountability and participation in water and sanitation
services and water resources management.
During the year under review, there were some projects with various implementation
challenges leading to being flagged in line with requirements under the WSTF Risk
management framework. The following are projects flagged at the Fund during the period
and status as at end of financial year 2016-2017.
Table 25: Summary of flagged projects as at 30th June, 2017
Project Name
Amount
Disbursed
(Ksh)
FlagKey Issues
RaisedStatus as at 30 June, 2017
Current
flag
1.
Pangani
Water Project
-Lamu County
9,302,680 Red
Delay in project
implementation
due to contractual
anomalies
Follow up was made by the
Fund and the project is
complete after the CBO
engaged another
contractor who completed
the project
Green
2.
Kone
Community
Water
Project- Tana
River County
9,622,000 Red
Failure by the
contractor to
complete all
project milestone.
The project has stalled and
follow up is being made to
have Tana River County
assist in liaising with the
contractor to ensure that
the project is completed
Red
3.
Manda
Maweni water
project –
Lamu County
9,230,000 Red
Corruption
allegations during
procurement of
the contractor and
implementation of
the project.
WSTF and Lamu County
made follow up and the
project is now complete,
operational and
community benefiting with
water. EACC is currently
carrying investigation over
the alleged corruption case.
Yellow
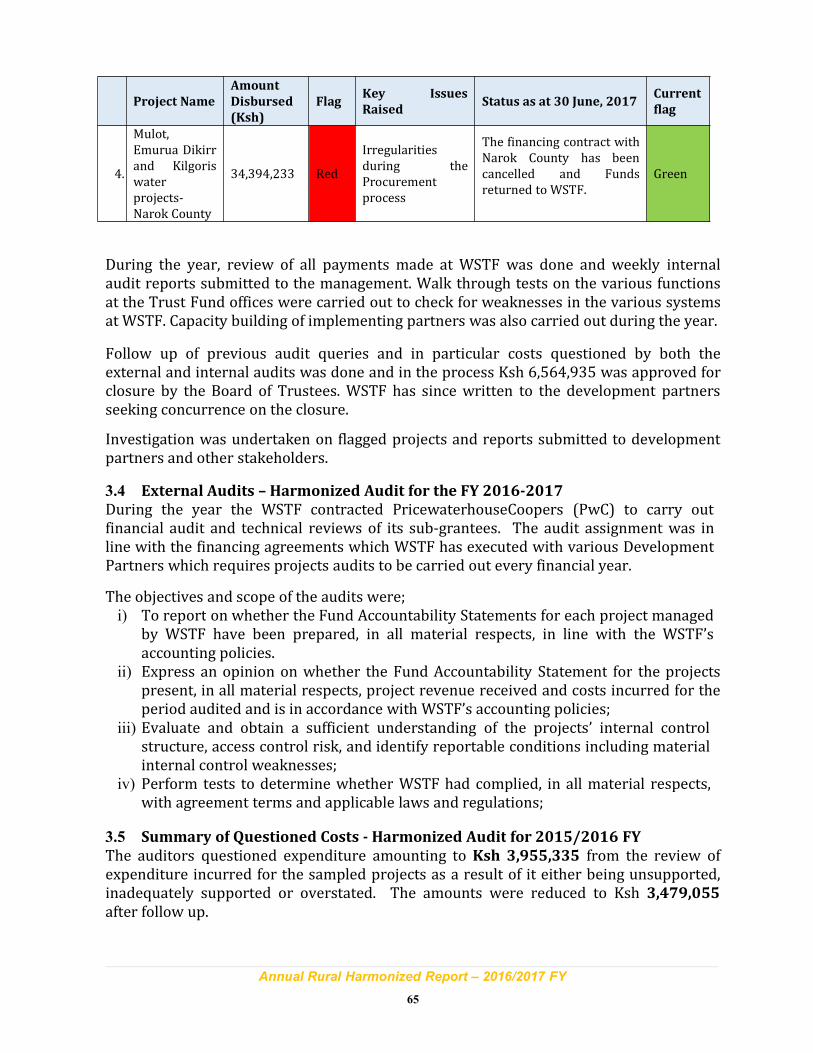
Annual Rural Harmonized Report – 2016/2017 FY
65
Project Name
Amount
Disbursed
(Ksh)
FlagKey Issues
RaisedStatus as at 30 June, 2017
Current
flag
4.
Mulot,
Emurua Dikirr
and Kilgoris
water
projects-
Narok County
34,394,233 Red
Irregularities
during the
Procurement
process
The financing contract with
Narok County has been
cancelled and Funds
returned to WSTF.
Green
During the year, review of all payments made at WSTF was done and weekly internalaudit reports submitted to the management. Walk through tests on the various functionsat the Trust Fund offices were carried out to check for weaknesses in the various systemsat WSTF. Capacity building of implementing partners was also carried out during the year.
Follow up of previous audit queries and in particular costs questioned by both theexternal and internal audits was done and in the process Ksh 6,564,935 was approved forclosure by the Board of Trustees. WSTF has since written to the development partnersseeking concurrence on the closure.
Investigation was undertaken on flagged projects and reports submitted to developmentpartners and other stakeholders.
3.4 External Audits – Harmonized Audit for the FY 2016-2017
During the year the WSTF contracted PricewaterhouseCoopers (PwC) to carry outfinancial audit and technical reviews of its sub-grantees. The audit assignment was inline with the financing agreements which WSTF has executed with various DevelopmentPartners which requires projects audits to be carried out every financial year.
The objectives and scope of the audits were;i) To report on whether the Fund Accountability Statements for each project managed
by WSTF have been prepared, in all material respects, in line with the WSTF’saccounting policies.
ii) Express an opinion on whether the Fund Accountability Statement for the projectspresent, in all material respects, project revenue received and costs incurred for theperiod audited and is in accordance with WSTF’s accounting policies;
iii) Evaluate and obtain a sufficient understanding of the projects’ internal controlstructure, access control risk, and identify reportable conditions including materialinternal control weaknesses;
iv) Perform tests to determine whether WSTF had complied, in all material respects,with agreement terms and applicable laws and regulations;
3.5 Summary of Questioned Costs - Harmonized Audit for 2015/2016 FY
The auditors questioned expenditure amounting to Ksh 3,955,335 from the review ofexpenditure incurred for the sampled projects as a result of it either being unsupported,inadequately supported or overstated. The amounts were reduced to Ksh 3,479,055after follow up.
Annual Rural Harmonized Report – 2016/2017 FY
66
Table 26: Questioned costs by investment projects
Project DonorTotal expenditure
incurred and verified
Questione
d cost
(Ksh)
Status at 30
June 2017
Witu WUA MTAP –EU Share 3,974,454 350,000 Closed
AMUWRUA MTAP – DANIDA 2,503,073 50,000 Closed
Ijara Community BasedEnvironmental Group
MTAP –EU Share3,884,000
76,280 Closed
Kone Community MTAP –EU Share - 3,479,055
Open, externalauditor willfollow up inthe next auditcycle
Total 10,361,527 3,955,335 3,479,055
3.6 Status of Questioned Costs
Table 27: Questioned costs by year
Financial Year
Original Questioned
costs (Ksh)
Open Questioned
costs (Ksh) Dec
2016
Open Questioned
costs (Ksh) June 2017
2010/11 9,872,132 - -
2011/12 17,337,047 16,318,922 15,751,790
2012/13 21,020,446 8,883,799 6,764,905
2013/14 17,772,684 2,578,362 2,578,362
2014/15 4,049,388 3,644,524 3,644,524
2015/16 3,955,055 3,955,055 3,479,055
Total 74,006,752 35,380,662 32,218,636
Fund has been following up on the outstanding costs by making visits to the affected
projects as well as engaging the external auditors’ technical team to assess whether the
projects have met their objectives.
The Fund has also engaged the Ethics and Anti-Corruption Commission (EACC) to assist in
the follow up of corruption related matters. The EACC made a visit to some of the projects
reported to them during the year andWSTF is waiting report submission from them.
3.7 Statutory Audits
During period, the Office of the Auditor General (OAG), released the statutory audit report
of the Fund in which he had issued a qualified opinion on the financial statements of
WSTF. The opinion was based on the following reasons;
(i) Outstanding ex-staff debtors
(ii) Long outstanding advances
(iii) Un-updated fixed assets register
(iv) Lack of bank reconciliations for one of WSTF’s bank accounts
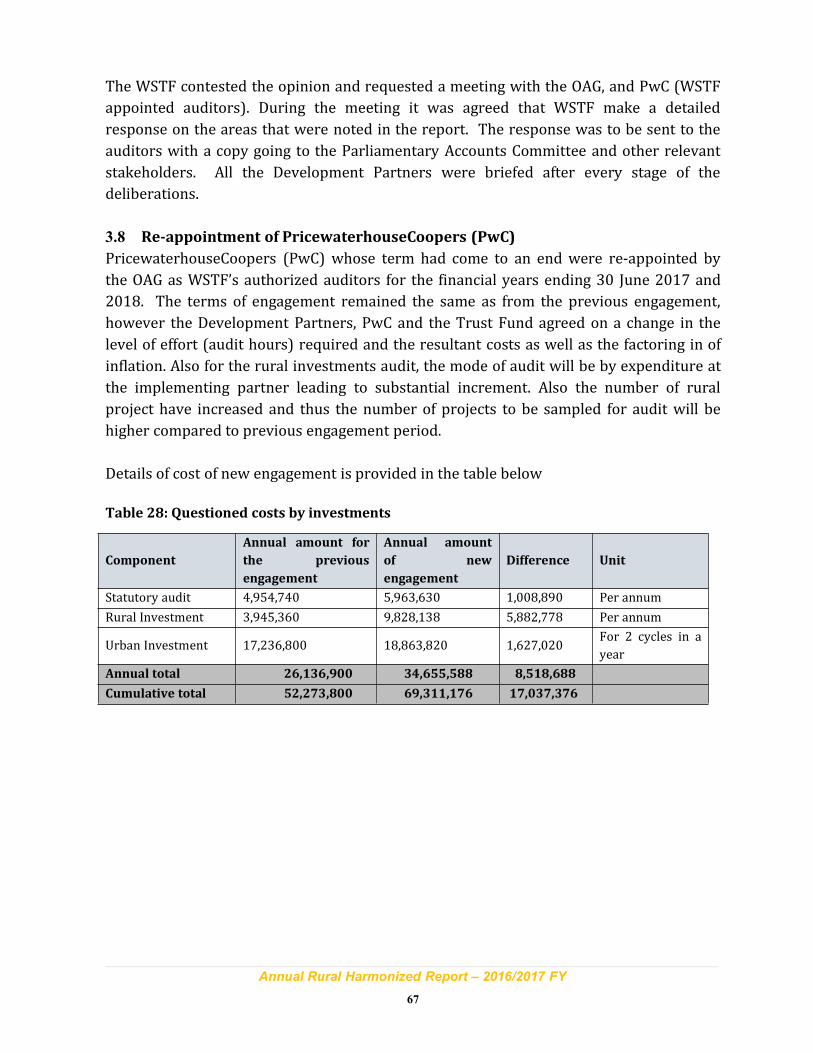
Annual Rural Harmonized Report – 2016/2017 FY
67
The WSTF contested the opinion and requested a meeting with the OAG, and PwC (WSTF
appointed auditors). During the meeting it was agreed that WSTF make a detailed
response on the areas that were noted in the report. The response was to be sent to the
auditors with a copy going to the Parliamentary Accounts Committee and other relevant
stakeholders. All the Development Partners were briefed after every stage of the
deliberations.
3.8 Re-appointment of PricewaterhouseCoopers (PwC)
PricewaterhouseCoopers (PwC) whose term had come to an end were re-appointed by
the OAG as WSTF’s authorized auditors for the financial years ending 30 June 2017 and
2018. The terms of engagement remained the same as from the previous engagement,
however the Development Partners, PwC and the Trust Fund agreed on a change in the
level of effort (audit hours) required and the resultant costs as well as the factoring in of
inflation. Also for the rural investments audit, the mode of audit will be by expenditure at
the implementing partner leading to substantial increment. Also the number of rural
project have increased and thus the number of projects to be sampled for audit will be
higher compared to previous engagement period.
Details of cost of new engagement is provided in the table below
Table 28: Questioned costs by investments
Component
Annual amount for
the previous
engagement
Annual amount
of new
engagement
Difference Unit
Statutory audit 4,954,740 5,963,630 1,008,890 Per annum
Rural Investment 3,945,360 9,828,138 5,882,778 Per annum
Urban Investment 17,236,800 18,863,820 1,627,020For 2 cycles in a
year
Annual total 26,136,900 34,655,588 8,518,688
Cumulative total 52,273,800 69,311,176 17,037,376
Annual Rural Harmonized Report – 2016/2017 FY
68
4. MONITORING AND EVALUATION
4.1 Introduction
The realization of WSTF’s key strategic objectives is anchored on engagement of
implementing partners with adequate capacity to plan, develop, implement, monitor and
supervise its investments. The Fund’s key role in the project implementation cycle is
resource mobilization, investment and risk management. In order to ensure that fiduciary
risks are adequately identified and mitigated against, one of the key responsibilities of
WSTF is to monitor the implementation of programme activities as well as evaluate the
achievement of specified objectives. The Fund saw a strategic shift in its Monitoring and
Evaluation approach with improved focus on tracking project implementation and
outputs and the systematic measurement of the achievement of component objectives,
programmes completion, timeliness and effectiveness. This shift has seen improved
provision of strategic information to inform planning, design and implementation of
projects. This chapter details the approaches taken in the monitoring and evaluation of
the Funds’ Investments as well as the key outcomes in the results framework.
4.2 Monitoring and Evaluation approaches
The fund continued to undertake monitoring and evaluation functions through County
Resident Monitors, Use of independent consultants and through planned routine
monitoring. The Fund undertakes monitoring and evaluation functions through the
following approaches;
4.2.1 CRM engagement and alignment
During the year, the Fund maintained a total of 28 CRMs who are based at the respective
counties and responsible for undertaking monitoring and support functions at County
level. The CRMs continued with their support to the Fund in addressing, technical, social
and financial issues related to all WSTF investments while working closely with the
Fund’s implementing partners. The monitors furnished the Fund with specific project
implementation reports and monthly reports covering status of all on-going investments
in their counties. In addition, the CRMs were actively involved in the Joint Annual
Operations Monitoring exercise.
One of the key challenge experienced by the Fund in its bid to maintain the 28 CRMs in the
respective counties was inadequate financing. The Urban Investment (KfW) Phase III
which has been supporting 50% of the monthly remuneration costs for CRMs is coming to
a close. Effectively, the Fund instituted the following changes:
i) Downscaling on the engagement of the CRMs in the affected counties from 29 No. to
16 No. CRMs effectively reducing the monthly remuneration from Kshs. 5.5 to 3.5
Annual Rural Harmonized Report – 2016/2017 FY
69
Million. Additional CRMs will be engaged on an need to engage basis to assure
efficient resource use.
ii) A review of the County Clustering and allocation for optimal use of available
resources within the budgetary constraints.
iii) Restructuring of the reporting framework to accelerate project implementation and
closure under the functional supervision of the team leader
4.2.2 Use of Independent Consultants
The Fund engages Framework consultants to support it in routine short term
consultancies. The consultants are expected to cover technical support to implementing
partners, capacity building services, spot check monitoring, technical audit support,
provision of support agency services and investigation and assessment services.
Specifically, consultants gave the following support;
i) Support to Implementing Partners in development of proposals, technical designs
to ensure that funds for activities are utilized for the purpose intended.
ii) Verification of proposals from a social perspective to ensure social aspects,
including conflict resolution, health and sanitation are in conformity with the
intended objectives.
iii) Technical support from a financial perspective to check compliance in order to
ensure that the project financial management procedures and arrangements
results in funds being properly accounted for, utilized for the purpose intended
and result in value for money
iv) Provision of technical progress monitoring reports on the projects’ achievement
and associated challenges.
During the year under review, the Fund continued to work with the consultants to
support the Investments Programmes in the aforementioned areas;
• Supporting registration, planning and proposal development,
• Offering quality assurance for J6P projects and advice on quality control systems to
water utilities,
• Provision of mentoring support to water utilities and CRMs on technical areas
such as procurement, contract designs/supervision, and other related utility
systems,
• Capacity Building/Training including; supporting the development of operationsand maintenance plans; development of Commercial Operations & AccountingProcedures Manual; and training the WU in adopting business planning as integralpart of the operating process;
• Supporting water utilities to develop and review their business plans in order to
ensure profitability and enhanced creditworthiness of the water utilities,
• Offering strategic guidance to related programme outcomes including: interactions
with County Governments; linkages with WRUAs and compliance to WRA
requirements; collaboration with public health
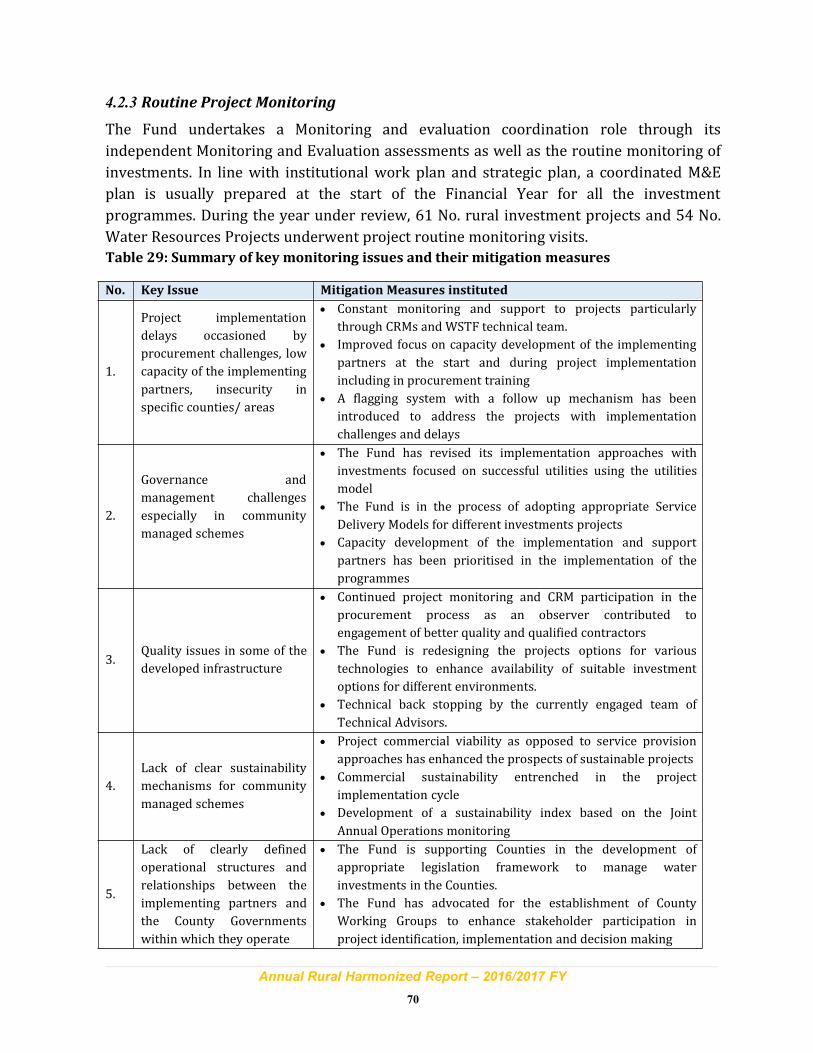
Annual Rural Harmonized Report – 2016/2017 FY
70
4.2.3 Routine Project Monitoring
The Fund undertakes a Monitoring and evaluation coordination role through its
independent Monitoring and Evaluation assessments as well as the routine monitoring of
investments. In line with institutional work plan and strategic plan, a coordinated M&E
plan is usually prepared at the start of the Financial Year for all the investment
programmes. During the year under review, 61 No. rural investment projects and 54 No.
Water Resources Projects underwent project routine monitoring visits.
Table 29: Summary of key monitoring issues and their mitigation measures
No. Key Issue Mitigation Measures instituted
1.
Project implementation
delays occasioned by
procurement challenges, low
capacity of the implementing
partners, insecurity in
specific counties/ areas
• Constant monitoring and support to projects particularly
through CRMs and WSTF technical team.
• Improved focus on capacity development of the implementing
partners at the start and during project implementation
including in procurement training
• A flagging system with a follow up mechanism has been
introduced to address the projects with implementation
challenges and delays
2.
Governance and
management challenges
especially in community
managed schemes
• The Fund has revised its implementation approaches with
investments focused on successful utilities using the utilities
model
• The Fund is in the process of adopting appropriate Service
Delivery Models for different investments projects
• Capacity development of the implementation and support
partners has been prioritised in the implementation of the
programmes
3.Quality issues in some of the
developed infrastructure
• Continued project monitoring and CRM participation in the
procurement process as an observer contributed to
engagement of better quality and qualified contractors
• The Fund is redesigning the projects options for various
technologies to enhance availability of suitable investment
options for different environments.
• Technical back stopping by the currently engaged team of
Technical Advisors.
4.
Lack of clear sustainability
mechanisms for community
managed schemes
• Project commercial viability as opposed to service provision
approaches has enhanced the prospects of sustainable projects
• Commercial sustainability entrenched in the project
implementation cycle
• Development of a sustainability index based on the Joint
Annual Operations monitoring
5.
Lack of clearly defined
operational structures and
relationships between the
implementing partners and
the County Governments
within which they operate
• The Fund is supporting Counties in the development of
appropriate legislation framework to manage water
investments in the Counties.
• The Fund has advocated for the establishment of County
Working Groups to enhance stakeholder participation in
project identification, implementation and decision making
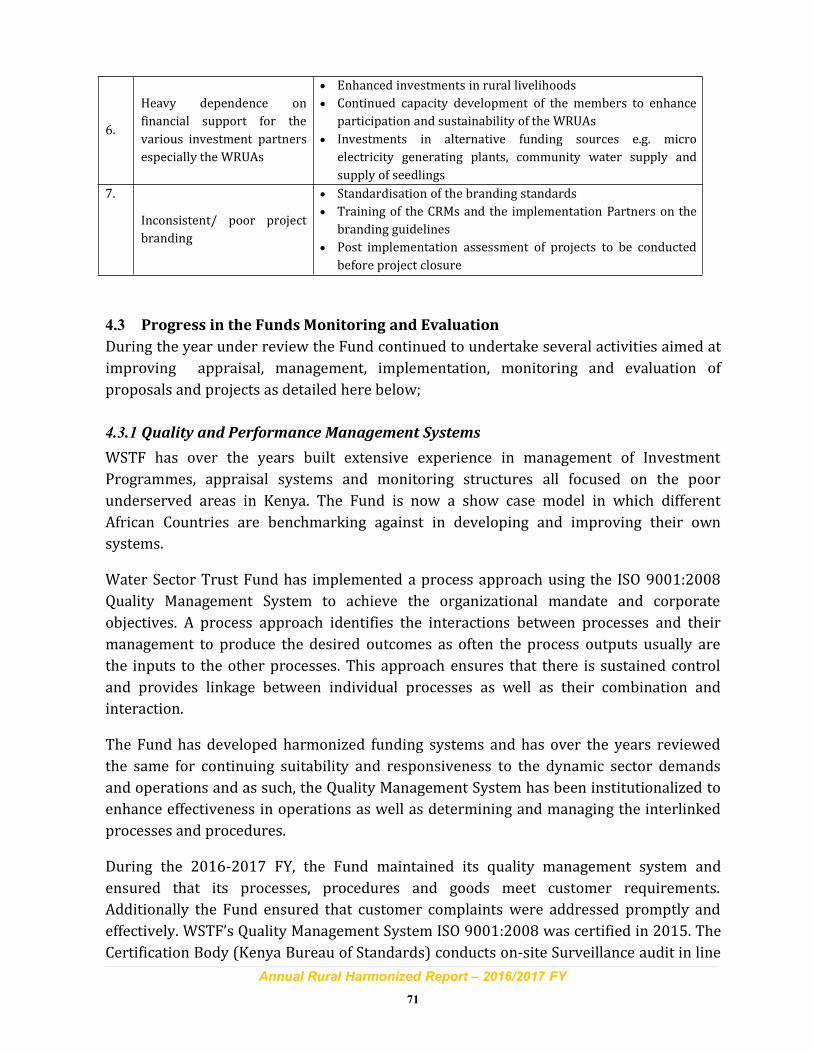
Annual Rural Harmonized Report – 2016/2017 FY
71
6.
Heavy dependence on
financial support for the
various investment partners
especially the WRUAs
• Enhanced investments in rural livelihoods
• Continued capacity development of the members to enhance
participation and sustainability of the WRUAs
• Investments in alternative funding sources e.g. micro
electricity generating plants, community water supply and
supply of seedlings
7.
Inconsistent/ poor project
branding
• Standardisation of the branding standards
• Training of the CRMs and the implementation Partners on the
branding guidelines
• Post implementation assessment of projects to be conducted
before project closure
4.3 Progress in the Funds Monitoring and Evaluation
During the year under review the Fund continued to undertake several activities aimed at
improving appraisal, management, implementation, monitoring and evaluation of
proposals and projects as detailed here below;
4.3.1 Quality and Performance Management Systems
WSTF has over the years built extensive experience in management of Investment
Programmes, appraisal systems and monitoring structures all focused on the poor
underserved areas in Kenya. The Fund is now a show case model in which different
African Countries are benchmarking against in developing and improving their own
systems.
Water Sector Trust Fund has implemented a process approach using the ISO 9001:2008
Quality Management System to achieve the organizational mandate and corporate
objectives. A process approach identifies the interactions between processes and their
management to produce the desired outcomes as often the process outputs usually are
the inputs to the other processes. This approach ensures that there is sustained control
and provides linkage between individual processes as well as their combination and
interaction.
The Fund has developed harmonized funding systems and has over the years reviewed
the same for continuing suitability and responsiveness to the dynamic sector demands
and operations and as such, the Quality Management System has been institutionalized to
enhance effectiveness in operations as well as determining and managing the interlinked
processes and procedures.
During the 2016-2017 FY, the Fund maintained its quality management system and
ensured that its processes, procedures and goods meet customer requirements.
Additionally the Fund ensured that customer complaints were addressed promptly and
effectively. WSTF’s Quality Management System ISO 9001:2008 was certified in 2015. The
Certification Body (Kenya Bureau of Standards) conducts on-site Surveillance audit in line
Annual Rural Harmonized Report – 2016/2017 FY
72
with the certification contract. The independent QMS Auditor (KeBS) scheduled and
undertook the third and fourth external Compliance Quality Audits on 29th June, 2017 at
the WSTF premises to assess continued QMS implementation for continued certification
recommendation with the following objectives;
i) To establish continued conformity of the Quality Management System (QMS) to ISO
9001:2008
ii) To evaluate effectiveness and continued improvement of the Quality Management
System
iii) To evaluate the ability to meet the applicable statutory, regulatory and Contractual
requirements for the purpose of continued certification
iv) To evaluate the effectiveness of correction and corrective actions from previous
audit.
The Audit was conducted as scheduled and 1 No. minor non-conformance raised on
efficient and effective document management.
The Auditors recommended continued Certification of the Fund as per the requirements of
ISO 9001:2008 Quality Management Systems.
However, owing to the central role of efficient and effective document management
systems in the realization of institutional objectives, the Fund is implementing measures
to ensure that adequate measures are instituted to improve such systems in the Fund.
4.3.2 Addressing Low absorption of Funds
The Fund as a financing and grant making institution is entrusted with the mandate of
improving access to water services and water resources management through provision
of timely financial support to underserved areas in Kenya. In line with this, absorption of
funds has been determined as a core performance Indicator. Assessments and reviews
have shown declining absorptive capacity of the Fund from 86% in 2011, 49% in 2015
and 18% in 2016. The Board of Trustees constituted a committee to analyze the drivers of
low absorption and make recommendations on sustainable measures to improve
absorption and overall Fund performance.
The various stakeholders and development partners made pertinent contributions on
how to enhance the absorption capacity of the allocated funds. The taskforce prepared a
report that was presented and adopted by the WSTF Board of Trustees for
implementation.
Following a review of the key factors influencing fund absorption by the Fund, the WSTF
management prepared a comprehensive plan to ensure implementation of the
recommendations. The plan is being followed through to ensure implementation of the
recommendations as summarized in Annex 13.
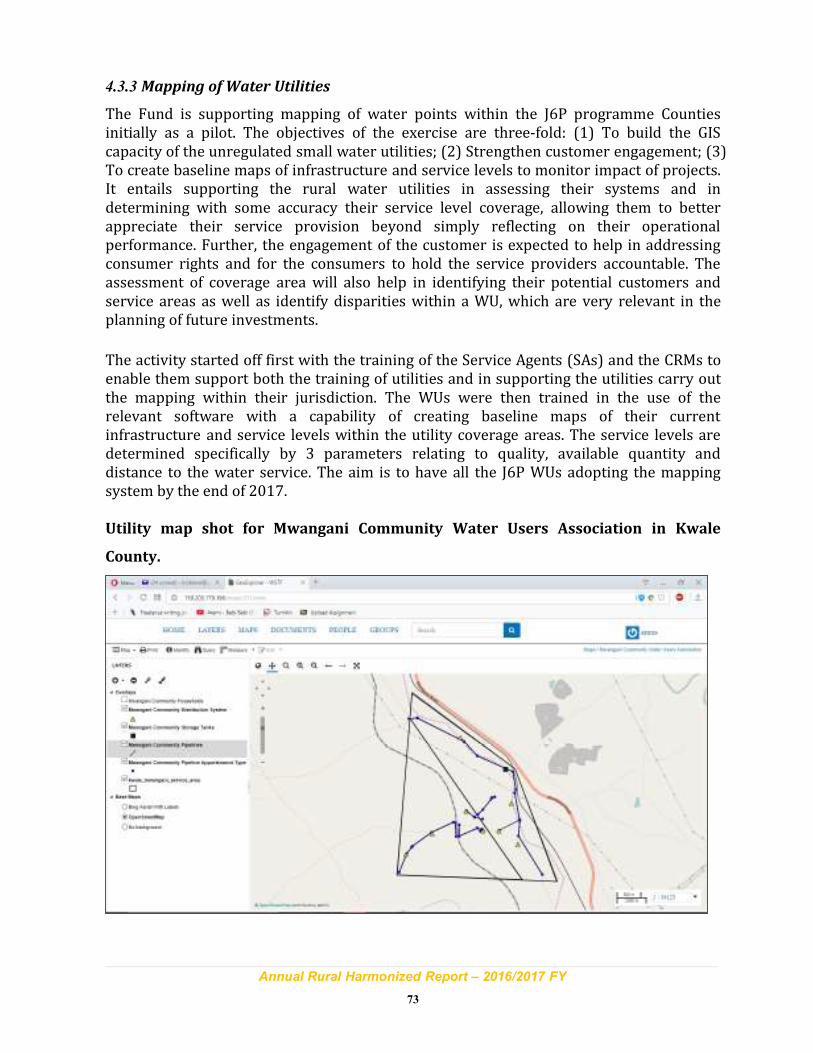
Annual Rural Harmonized Report – 2016/2017 FY
73
4.3.3 Mapping of Water Utilities
The Fund is supporting mapping of water points within the J6P programme Countiesinitially as a pilot. The objectives of the exercise are three-fold: (1) To build the GIScapacity of the unregulated small water utilities; (2) Strengthen customer engagement; (3)To create baseline maps of infrastructure and service levels to monitor impact of projects.It entails supporting the rural water utilities in assessing their systems and indetermining with some accuracy their service level coverage, allowing them to betterappreciate their service provision beyond simply reflecting on their operationalperformance. Further, the engagement of the customer is expected to help in addressingconsumer rights and for the consumers to hold the service providers accountable. Theassessment of coverage area will also help in identifying their potential customers andservice areas as well as identify disparities within a WU, which are very relevant in theplanning of future investments.
The activity started off first with the training of the Service Agents (SAs) and the CRMs toenable them support both the training of utilities and in supporting the utilities carry outthe mapping within their jurisdiction. The WUs were then trained in the use of therelevant software with a capability of creating baseline maps of their currentinfrastructure and service levels within the utility coverage areas. The service levels aredetermined specifically by 3 parameters relating to quality, available quantity anddistance to the water service. The aim is to have all the J6P WUs adopting the mappingsystem by the end of 2017.
Utility map shot for Mwangani Community Water Users Association in Kwale
County.
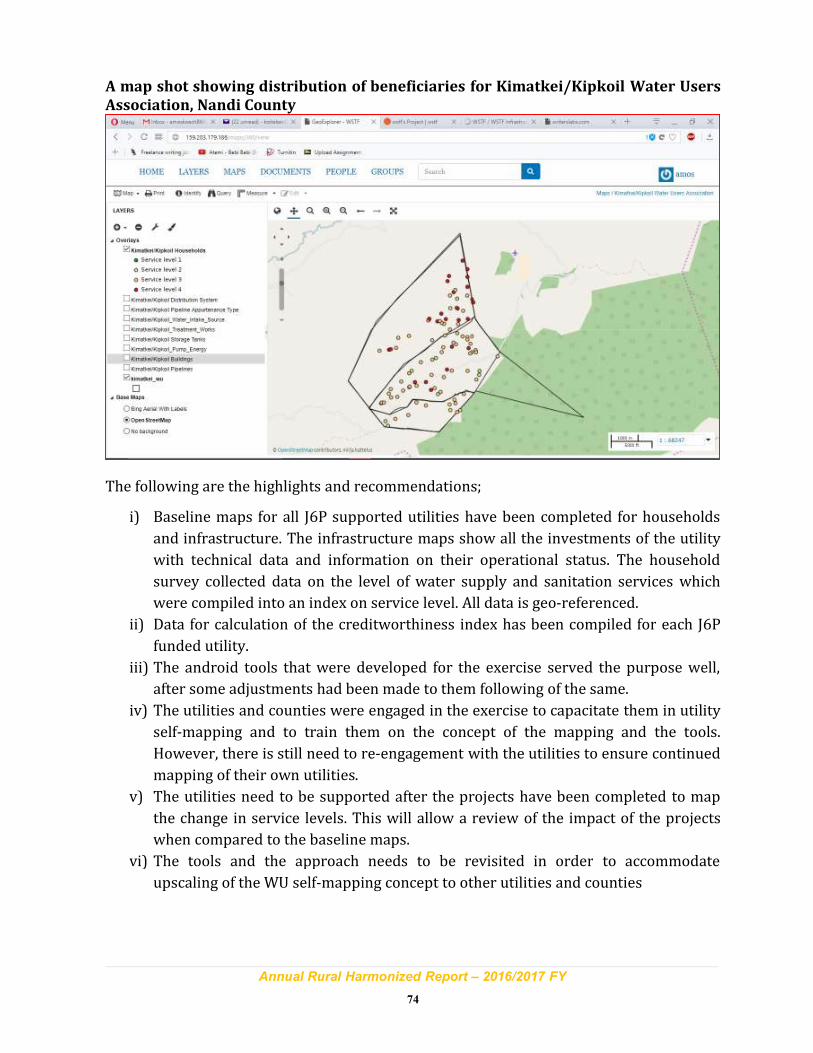
Annual Rural Harmonized Report – 2016/2017 FY
74
A map shot showing distribution of beneficiaries for Kimatkei/Kipkoil Water Users
Association, Nandi County
The following are the highlights and recommendations;
i) Baseline maps for all J6P supported utilities have been completed for households
and infrastructure. The infrastructure maps show all the investments of the utility
with technical data and information on their operational status. The household
survey collected data on the level of water supply and sanitation services which
were compiled into an index on service level. All data is geo-referenced.
ii) Data for calculation of the creditworthiness index has been compiled for each J6P
funded utility.
iii) The android tools that were developed for the exercise served the purpose well,
after some adjustments had been made to them following of the same.
iv) The utilities and counties were engaged in the exercise to capacitate them in utility
self-mapping and to train them on the concept of the mapping and the tools.
However, there is still need to re-engagement with the utilities to ensure continued
mapping of their own utilities.
v) The utilities need to be supported after the projects have been completed to map
the change in service levels. This will allow a review of the impact of the projects
when compared to the baseline maps.
vi) The tools and the approach needs to be revisited in order to accommodate
upscaling of the WU self-mapping concept to other utilities and counties
Annual Rural Harmonized Report – 2016/2017 FY
75
4.3.4 Joint Annual Operations Monitoring of WSTF investments - 2016
The Fund conducted an operations monitoring exercise in October/November, 2016
assessing the functionality, performance and sustainability of all WSTF-funded
infrastructure and investments that were implemented during the period 2011-2016.
Through establishing the operational status of the WSTF-funded infrastructure, the Joint
Annual Operations Monitoring Exercise (JAOME) supports long term planning and robust
monitoring through identifying supply and service gaps, highlighting underserved areas
and ensuring better controls for future funding based on performance. It also supports
learning lessons on what kind of investments work and why, thereby informing future
investment planning and priorities. Finally it allows key stakeholders to monitor coverage
and access, ensuring accountability for the past investments.
The geo-referenced data on the investments was collected by WSTF Staff, County Resident
Monitors (CRMs) and student interns from the Kenya Water Institute. The data was
collected using a mobile application and published on a dashboard including geo-
referenced maps and graphics on key parameters. In order to enhance transparency,
accountability and sustainability, this data is to be made publically available by
embedding the dashboard in the WSTF website.
The JAOME (2016) established that of the investments funded during 2011-2016, 95% of
rural water supply investments, 98% of rural sanitation investments and 94% of water
resources investments had been completed, whereas 87% of urban water supply
investments and 90% of urban sanitation investments had been completed. Of rural water
supply investments, 61% were still operational, while the corresponding figure for urban
was 82%. The sanitation investments showed a slightly higher success rate in terms of
operational status as 91% of rural sanitation projects and 95% of urban sanitation
projects were found to be operational. 70% of the water resources projects were
determined to be operational.
A sustainability index (SI) was developed as a key performance metric to facilitate
assessment and monitoring of sustainability of investments in the Counties. The results
show that the rural water supply and sanitation investments scored 45% for
sustainability and water resources scored 36%. Urban investments reached a higher
success rate of SI score of 77%. The performance difference between urban and rural
projects is largely related to revenue collection, which is higher for urban investments.
Involvement of women in operations responsibility seemed to generally improve the
sustainability index in all cases. Location of the investments, completion status for
individual investments and the operational status are shown below;
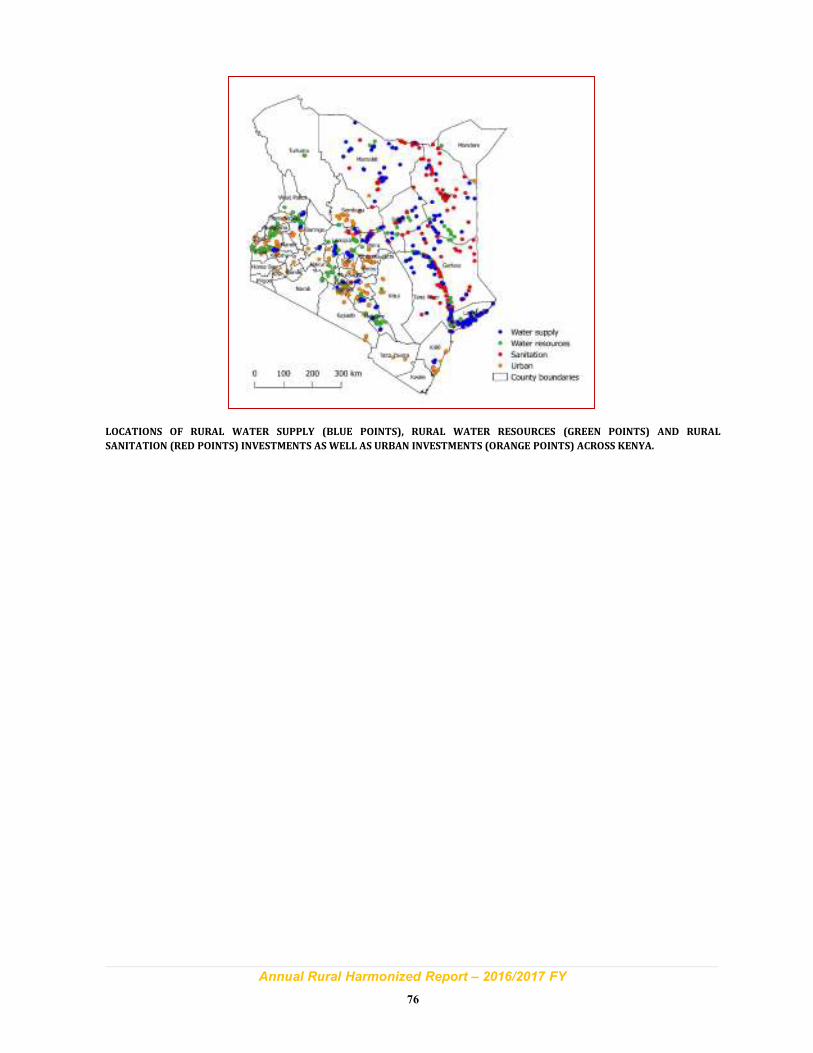
Annual Rural Harmonized Report – 2016/2017 FY
76
LOCATIONS OF RURAL WATER SUPPLY (BLUE POINTS), RURAL WATER RESOURCES (GREEN POINTS) AND RURAL
SANITATION (RED POINTS) INVESTMENTS ASWELL AS URBAN INVESTMENTS (ORANGE POINTS) ACROSS KENYA.
Annual Rural Harmonized Report – 2016/2017 FY
77
Key recommendations based on the lessons learned regarding how JAOME 2016 was
carried out, what kind of updates the technical components requires and how the
data quality verification should be done in the future are summarized in appendix 13
at the end of the report.
Annual Rural Harmonized Report – 2016/2017 FY
78
4.3.5 Universal Result based Monitoring and Evaluation Framework
During the year under review, the Fund used the results framework as a corporate tool
designed to monitor progress in the realization of the Fund’s objectives and enhance
corporate consistency through consolidation and streamlining of the various reporting
frameworks and harmonization across the various financing mechanisms and investment
programmes.
The results measurement framework has enhanced a results culture across all levels of
the Fund. This has focused on the key strategic priorities: programme progress review,
performance management, investment effectiveness, and identification performance
improvement areas. The framework entails continual measurement and assessment of
both qualitative and quantitative indicators within the national, sector and the Funds
frameworks.
The detailed results framework is presented in the annexes in this report.
The key results areas as detailed in the results framework in the Fund are:
i) Enhance capacity of the Implementing and support partners to implement projects
ii) Improved water resources management
iii) Improved access to water services
iv) Improved access to sanitation services
v) Enhanced capacity of WSTF to support project
The table below presents the overall rating of the key result areas in the Fund during the
year under review:
Table 30: showing overall rating of the key result areas for FY 2016/2017
Key Result area Rating Remarks
Results area 1: Enhance capacity ofthe Implementing and supportpartners to implement projects;
There were shortcomings in the
achievement of some of the planned
intermediate result for the current
Period, such as GESI interventions,
formulation of the county reporting
framework and annual progress
report
5
4
3
2
1
These activities have beenrescheduled to 2017-2018Financial Year
Annual Rural Harmonized Report – 2016/2017 FY
79
Results area 2: Improved waterresources management
There were shortcomings in the
achievement of some of the planned
intermediate result for the current
part of which the Fund will address in
the 2017-2018 FY.
5
4
3
2
1
Achievement of targets underIFAD- UTNRMP wasrecommendable – Closure of34 WRUAs/CFAs under 1st
call, funding of 43WRUAS/CFAS under 2nd calland fund absorption of 91%.Performance under J6P wasbelow average.
Results area 3: Improved access towater services
There were shortcomings in the
achievement of some of the planned
intermediate result for the current
reporting period.
5
4
3
2
1
The Fund has engagedservice agents to offertechnical support in projectsimplementation andoversight roles.There has been a delay inprocurement processes bythe water utilities as a resultof low capacity ofimplementing agents.
Results area 4: Improved access tosanitation services
There were shortcomings in the
achievement of some of the planned
intermediate result for the current
reporting period particularly
Household sanitation, ODF and CLTS
interventions.
5
4
3
2
1
There has been a delay inprocurement processes bythe water utilities as a resultof low capacity ofimplementing agents.
Results area 5: Enhanced capacity ofWSTF to support projects
Most of the activities were
preparatory in nature hence achieved.
5
4
3
2
1
Most activities under thisresult area were achieved.
4.4 Flagging of Projects
Summary of flagged rural investment projects
Out of the 7 classified as flagged by the end of 3rd Quarter, (including Manda Maweni,Pangani, Mkunumbi, Kone, Mulot, Emurua Dikirr and Kilgoris) only Kone project had notresolved the issues. The project (currently at 50%) has significant challenges and isunlikely to implement the remaining activities. The Audit department should evaluate thepossibility of having the project closed after due consideration of the necessary auditclosure process.
Annual Rural Harmonized Report – 2016/2017 FY
80
Table 31: Rural Investment projects currently flagged and their status as at 30th June, 2017
N
o
Project
name
Amount
disburse
d Kshs
Key issues raised
Action/
recommendations
by WSTF
Status as at
30.6.2017Flag
1.
KoneCommunity WaterProject inTanaRiverCounty
9,622,000
The contractordemobilized fromthe site beforecompletion ofcontracted works.Also, the project wassampled for audit bythe external auditorwho reported failureby the CBO to availdocuments for auditdespite having beennotified
A visit was made bythe Internal Audit inJanuary 2017 andproject has not beencompleted.A letter was writtento the Governor TanaRiver County toassist in follow up tohave the projectcompleted.
Incomplete at50% .Remainingactivities; 1)Expansion of waterpan to requiredcapacity. 2) Highunaccountedbalances, 3) O/Mtraining 4) Finalcompletion reportand certificatepending
2.NyaduongWaterProject
14,534,264
Inadequatedocumentation(3.8M),Comingling ofFunds (1.9M),ineligible expenses(240K)
M&E raised a red flag
on this project and
shared
recommendations
with key manager for
follow up with
following
recommendations;1) CRM to support
the WU andensurecompleteness ofsupportingdocuments.
2) Further capacitybuilding beforethey aresubjected to aPWC audit, afurther financialmonitoring andreview isrequired.
3) WSTF to make adecision onineligible costs
Issue has beenresolved partlysince the DPs gavean approval for useof WSTF funds tocater for theineligible costswhich wereincurred for countyfunded activities.The other issues ofcomingling of fundshas NOT beenaddressed asfunding to WUA hasbeen suspendeduntil properfinancial measuresare put
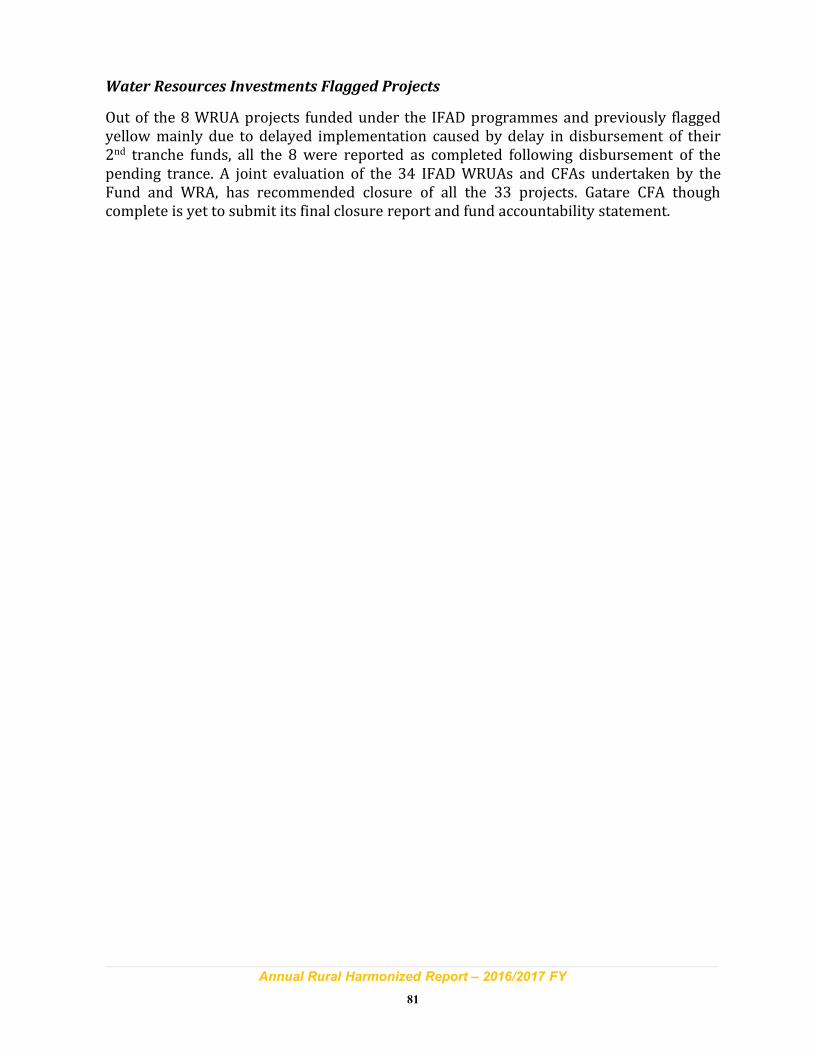
Annual Rural Harmonized Report – 2016/2017 FY
81
Water Resources Investments Flagged Projects
Out of the 8 WRUA projects funded under the IFAD programmes and previously flaggedyellow mainly due to delayed implementation caused by delay in disbursement of their2nd tranche funds, all the 8 were reported as completed following disbursement of thepending trance. A joint evaluation of the 34 IFAD WRUAs and CFAs undertaken by theFund and WRA, has recommended closure of all the 33 projects. Gatare CFA thoughcomplete is yet to submit its final closure report and fund accountability statement.
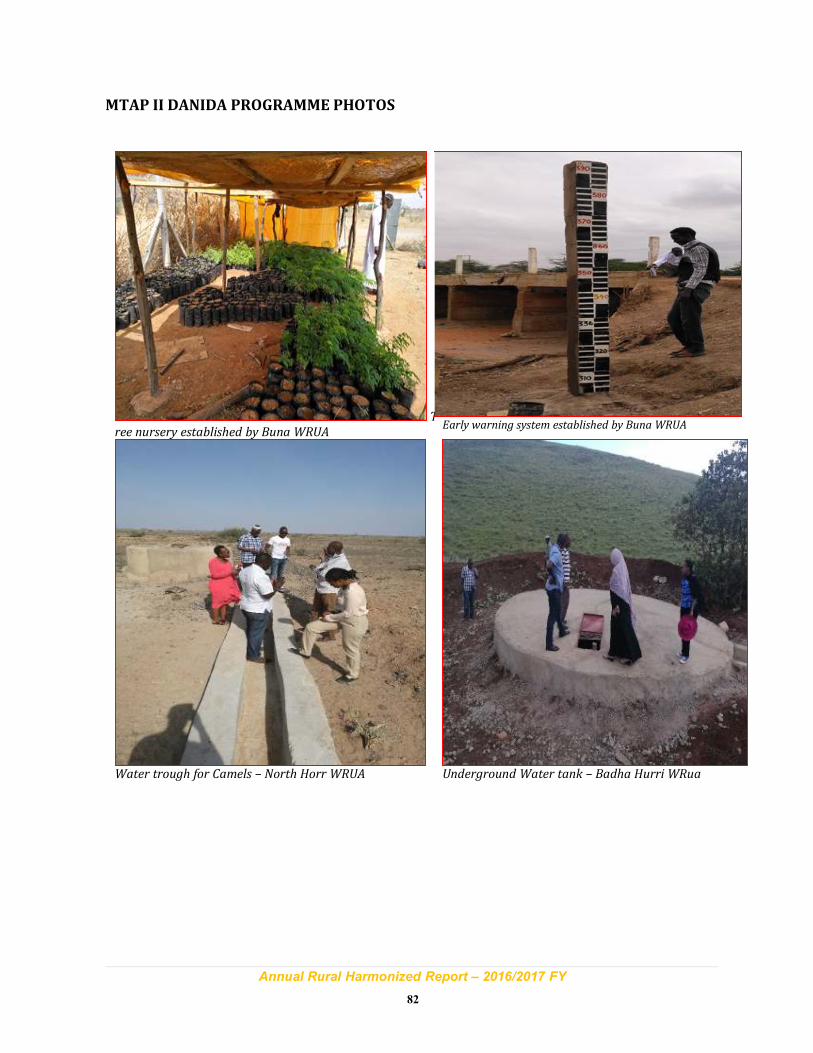
Annual Rural Harmonized Report – 2016/2017 FY
82
MTAP II DANIDA PROGRAMME PHOTOS
T
ree nursery established by Buna WRUAEarly warning system established by Buna WRUA
Water trough for Camels – North Horr WRUA Underground Water tank – Badha Hurri WRua
Annual Rural Harmonized Report – 2016/2017 FY
83
IFAD-UTaNRMP PHOTOS
Established Tree nursery by Zaina CFA Established Tree nursery by Kiandogoro CFA
Pine Plantation established by Kiandogoro CFA
J6P PHOTOS
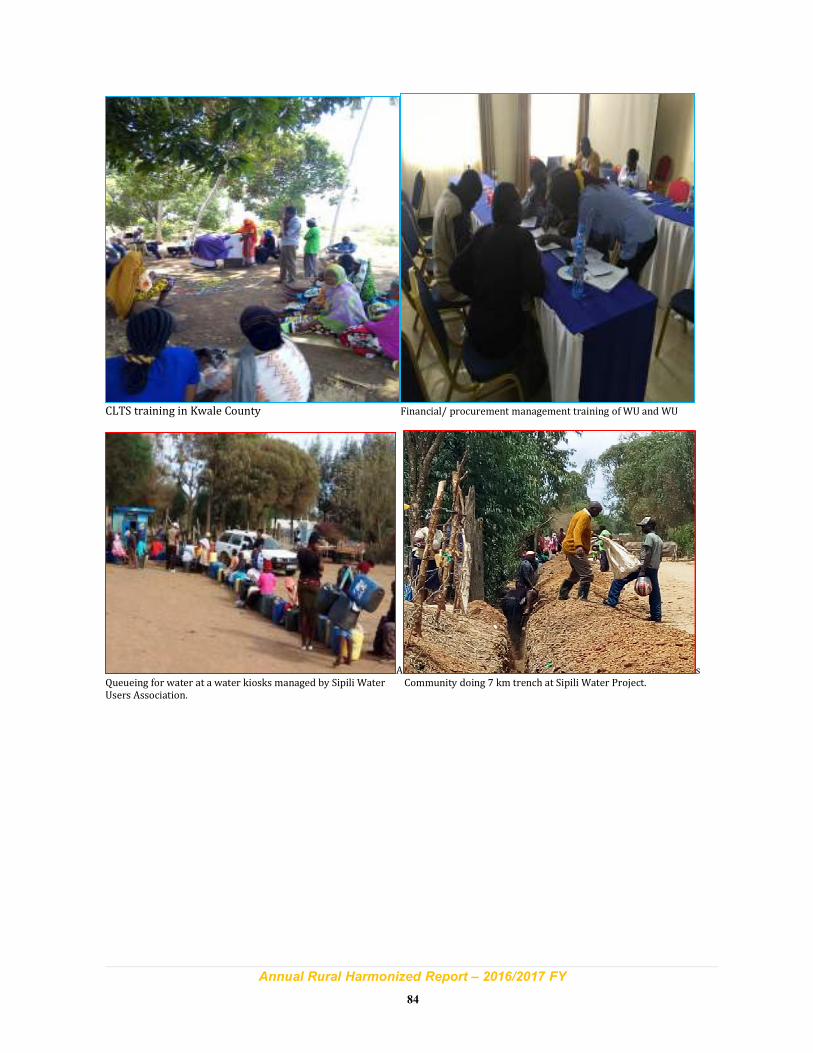
Annual Rural Harmonized Report – 2016/2017 FY
84
CLTS training in Kwale County Financial/ procurement management training of WU and WU
A sQueueing for water at a water kiosks managed by Sipili Water Community doing 7 km trench at Sipili Water Project.Users Association.
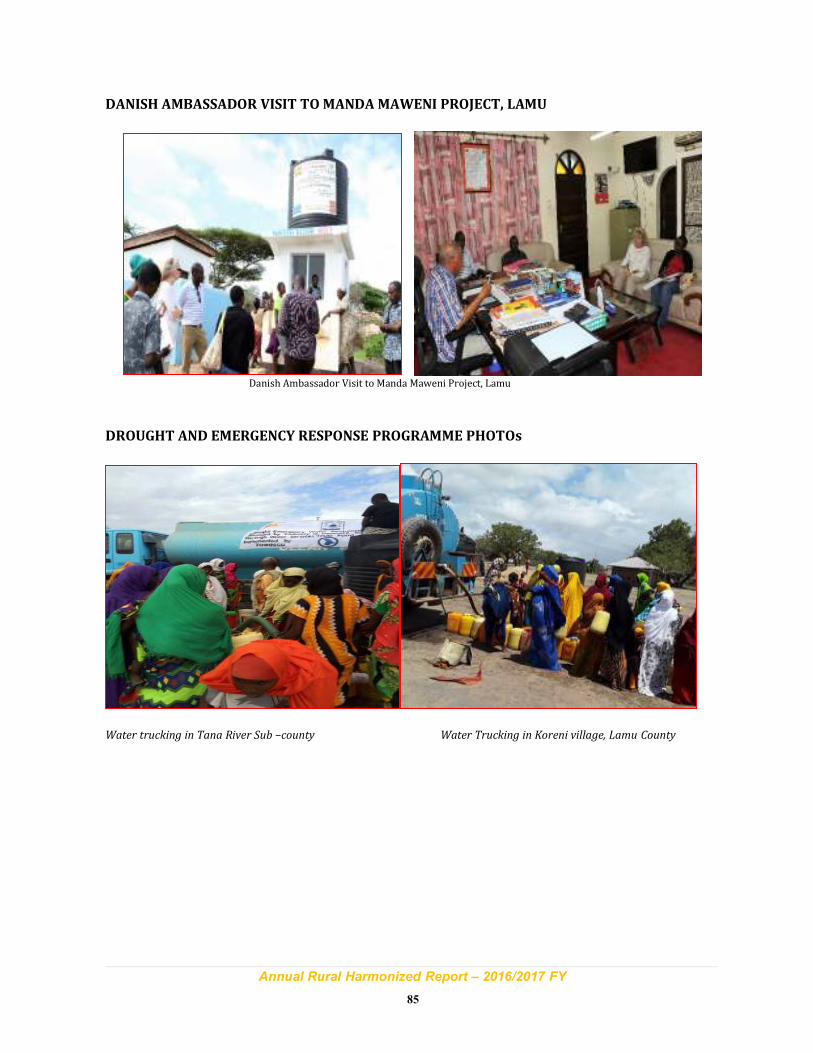
Annual Rural Harmonized Report – 2016/2017 FY
85
DANISH AMBASSADOR VISIT TOMANDAMAWENI PROJECT, LAMU
Danish Ambassador Visit to Manda Maweni Project, Lamu
DROUGHT AND EMERGENCY RESPONSE PROGRAMME PHOTOs
Water trucking in Tana River Sub –county Water Trucking in Koreni village, Lamu County
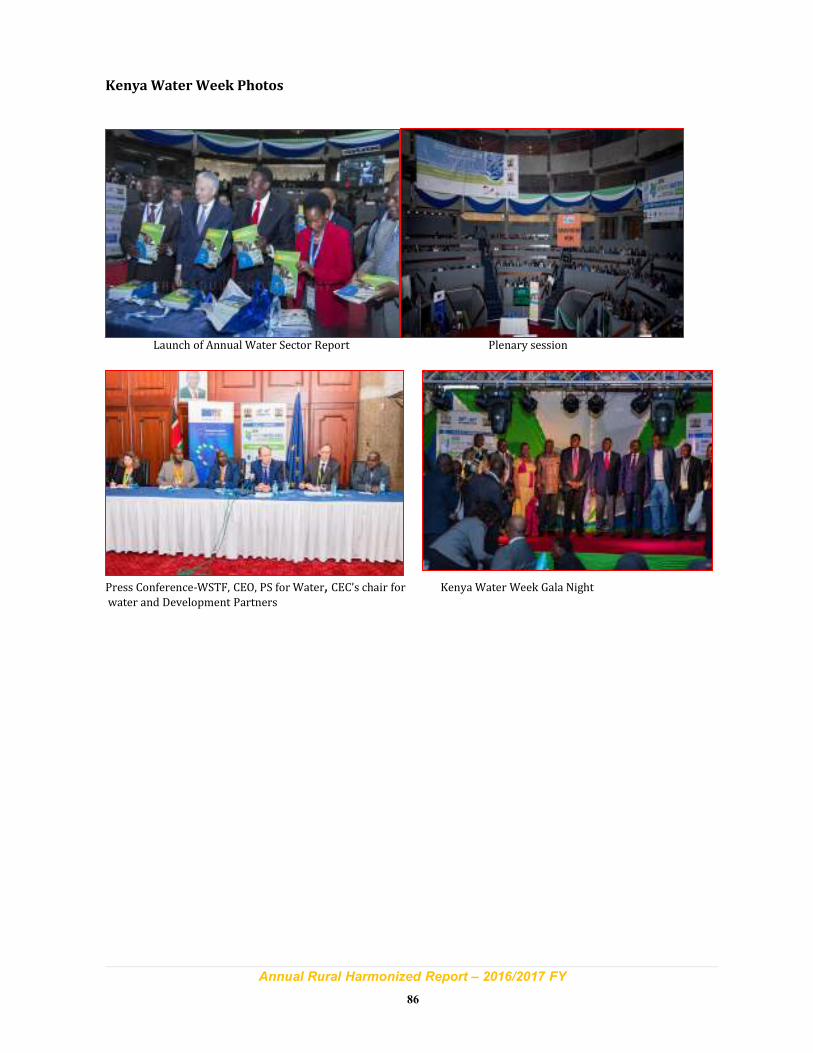
Annual Rural Harmonized Report – 2016/2017 FY
86
KenyaWater Week Photos
Launch of Annual Water Sector Report Plenary session
Press Conference-WSTF, CEO, PS for Water, CEC’s chair for Kenya Water Week Gala Night
water and Development Partners
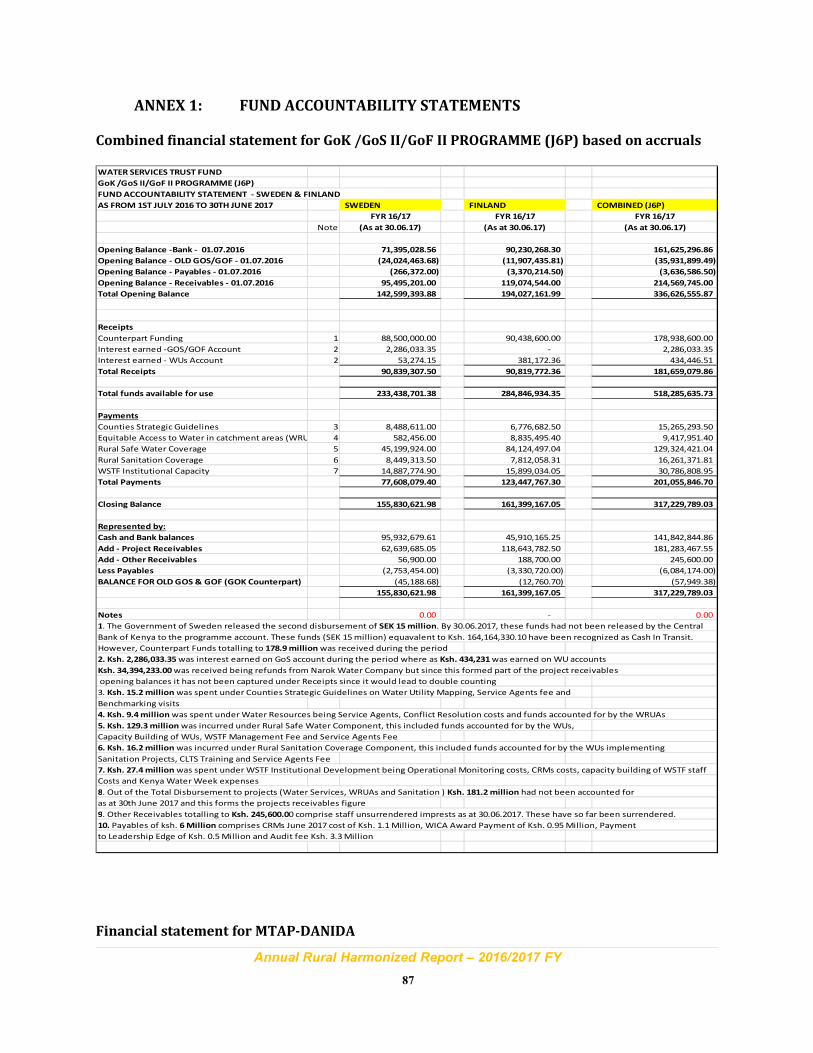
Annual Rural Harmonized Report – 2016/2017 FY
87
ANNEX 1: FUND ACCOUNTABILITY STATEMENTS
Combined financial statement for GoK /GoS II/GoF II PROGRAMME (J6P) based on accruals
WATER SERVICES TRUST FUND
GoK /GoS II/GoF II PROGRAMME (J6P)
FUND ACCOUNTABILITY STATEMENT - SWEDEN & FINLAND
AS FROM 1ST JULY 2016 TO 30TH JUNE 2017 SWEDEN FINLAND COMBINED (J6P)
FYR 16/17 FYR 16/17 FYR 16/17
Note (As at 30.06.17) (As at 30.06.17) (As at 30.06.17)
Opening Balance -Bank - 01.07.2016 71,395,028.56 90,230,268.30 161,625,296.86
Opening Balance - OLD GOS/GOF - 01.07.2016 (24,024,463.68) (11,907,435.81) (35,931,899.49)
Opening Balance - Payables - 01.07.2016 (266,372.00) (3,370,214.50) (3,636,586.50)
Opening Balance - Receivables - 01.07.2016 95,495,201.00 119,074,544.00 214,569,745.00
Total Opening Balance 142,599,393.88 194,027,161.99 336,626,555.87
Receipts
Counterpart Funding 1 88,500,000.00 90,438,600.00 178,938,600.00
Interest earned -GOS/GOF Account 2 2,286,033.35 - 2,286,033.35
Interest earned - WUs Account 2 53,274.15 381,172.36 434,446.51
Total Receipts 90,839,307.50 90,819,772.36 181,659,079.86
Total funds available for use 233,438,701.38 284,846,934.35 518,285,635.73
Payments
Counties Strategic Guidelines 3 8,488,611.00 6,776,682.50 15,265,293.50
Equitable Access to Water in catchment areas (WRUAs) 4 582,456.00 8,835,495.40 9,417,951.40
Rural Safe Water Coverage 5 45,199,924.00 84,124,497.04 129,324,421.04
Rural Sanitation Coverage 6 8,449,313.50 7,812,058.31 16,261,371.81
WSTF Institutional Capacity 7 14,887,774.90 15,899,034.05 30,786,808.95
Total Payments 77,608,079.40 123,447,767.30 201,055,846.70
Closing Balance 155,830,621.98 161,399,167.05 317,229,789.03
Represented by:
Cash and Bank balances 95,932,679.61 45,910,165.25 141,842,844.86
Add - Project Receivables 62,639,685.05 118,643,782.50 181,283,467.55
Add - Other Receivables 56,900.00 188,700.00 245,600.00
Less Payables (2,753,454.00) (3,330,720.00) (6,084,174.00)
BALANCE FOR OLD GOS & GOF (GOK Counterpart) (45,188.68) (12,760.70) (57,949.38)
155,830,621.98 161,399,167.05 317,229,789.03
Notes 0.00 - 0.00
1. The Government of Sweden released the second disbursement of SEK 15 million. By 30.06.2017, these funds had not been released by the Central
Bank of Kenya to the programme account. These funds (SEK 15 million) equavalent to Ksh. 164,164,330.10 have been recognized as Cash In Transit.
However, Counterpart Funds totalling to 178.9 million was received during the period
2. Ksh. 2,286,033.35 was interest earned on GoS account during the period where as Ksh. 434,231 was earned on WU accounts
Ksh. 34,394,233.00 was received being refunds from Narok Water Company but since this formed part of the project receivables
opening balances it has not been captured under Receipts since it would lead to double counting
3. Ksh. 15.2 million was spent under Counties Strategic Guidelines on Water Utility Mapping, Service Agents fee and
Benchmarking visits
4. Ksh. 9.4 million was spent under Water Resources being Service Agents, Conflict Resolution costs and funds accounted for by the WRUAs
5. Ksh. 129.3 million was incurred under Rural Safe Water Component, this included funds accounted for by the WUs,
Capacity Building of WUs, WSTF Management Fee and Service Agents Fee
6. Ksh. 16.2 million was incurred under Rural Sanitation Coverage Component, this included funds accounted for by the WUs implementing
Sanitation Projects, CLTS Training and Service Agents Fee
7. Ksh. 27.4 million was spent under WSTF Institutional Development being Operational Monitoring costs, CRMs costs, capacity building of WSTF staff
Costs and Kenya Water Week expenses
8. Out of the Total Disbursement to projects (Water Services, WRUAs and Sanitation ) Ksh. 181.2 million had not been accounted for
as at 30th June 2017 and this forms the projects receivables figure
9. Other Receivables totalling to Ksh. 245,600.00 comprise staff unsurrendered imprests as at 30.06.2017. These have so far been surrendered.
10. Payables of ksh. 6 Million comprises CRMs June 2017 cost of Ksh. 1.1 Million, WICA Award Payment of Ksh. 0.95 Million, Payment
to Leadership Edge of Ksh. 0.5 Million and Audit fee Ksh. 3.3 Million
Financial statement for MTAP-DANIDA
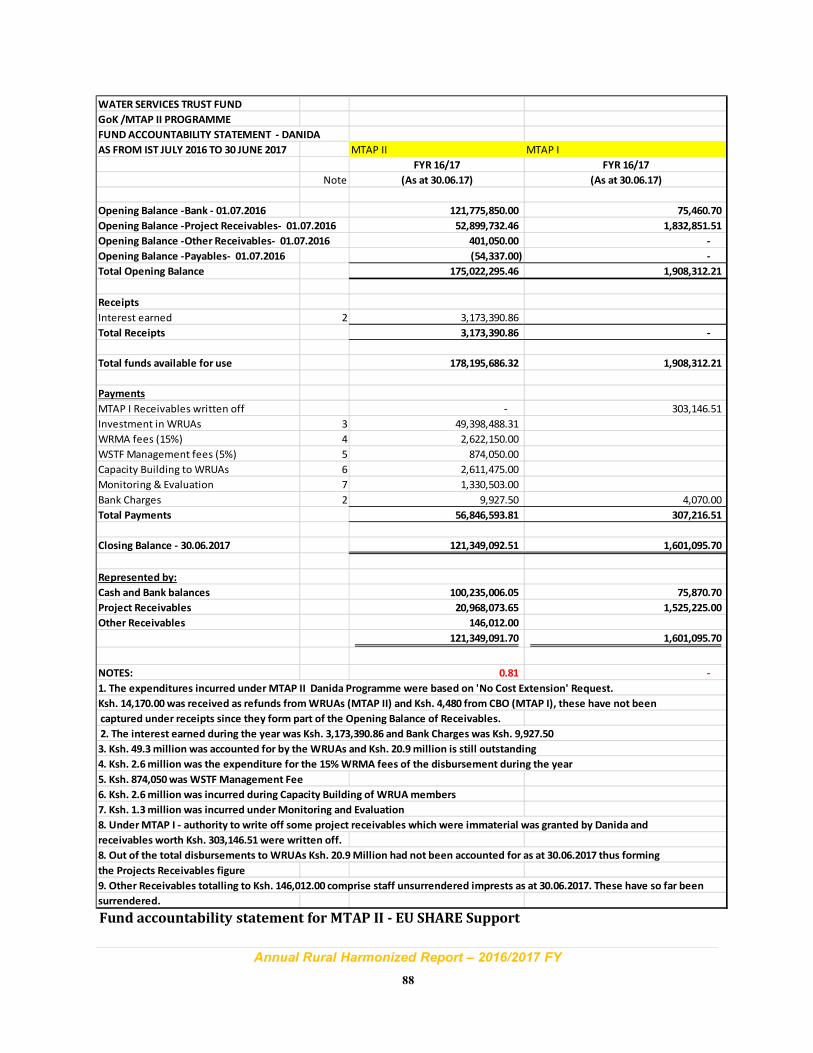
Annual Rural Harmonized Report – 2016/2017 FY
88
WATER SERVICES TRUST FUND
GoK /MTAP II PROGRAMME
FUND ACCOUNTABILITY STATEMENT - DANIDA
AS FROM IST JULY 2016 TO 30 JUNE 2017 MTAP II MTAP I
FYR 16/17 FYR 16/17
Note (As at 30.06.17) (As at 30.06.17)
Opening Balance -Bank - 01.07.2016 121,775,850.00 75,460.70
Opening Balance -Project Receivables- 01.07.2016 52,899,732.46 1,832,851.51
Opening Balance -Other Receivables- 01.07.2016 401,050.00 -
Opening Balance -Payables- 01.07.2016 (54,337.00) -
Total Opening Balance 175,022,295.46 1,908,312.21
Receipts
Interest earned 2 3,173,390.86
Total Receipts 3,173,390.86 -
Total funds available for use 178,195,686.32 1,908,312.21
Payments
MTAP I Receivables written off - 303,146.51
Investment in WRUAs 3 49,398,488.31
WRMA fees (15%) 4 2,622,150.00
WSTF Management fees (5%) 5 874,050.00
Capacity Building to WRUAs 6 2,611,475.00
Monitoring & Evaluation 7 1,330,503.00
Bank Charges 2 9,927.50 4,070.00
Total Payments 56,846,593.81 307,216.51
Closing Balance - 30.06.2017 121,349,092.51 1,601,095.70
Represented by:
Cash and Bank balances 100,235,006.05 75,870.70
Project Receivables 20,968,073.65 1,525,225.00
Other Receivables 146,012.00
121,349,091.70 1,601,095.70
NOTES: 0.81 -
1. The expenditures incurred under MTAP II Danida Programme were based on 'No Cost Extension' Request.
Ksh. 14,170.00 was received as refunds from WRUAs (MTAP II) and Ksh. 4,480 from CBO (MTAP I), these have not been
captured under receipts since they form part of the Opening Balance of Receivables.
2. The interest earned during the year was Ksh. 3,173,390.86 and Bank Charges was Ksh. 9,927.50
3. Ksh. 49.3 million was accounted for by the WRUAs and Ksh. 20.9 million is still outstanding
4. Ksh. 2.6 million was the expenditure for the 15% WRMA fees of the disbursement during the year
5. Ksh. 874,050 was WSTF Management Fee
6. Ksh. 2.6 million was incurred during Capacity Building of WRUA members
7. Ksh. 1.3 million was incurred under Monitoring and Evaluation
8. Under MTAP I - authority to write off some project receivables which were immaterial was granted by Danida and
receivables worth Ksh. 303,146.51 were written off.
8. Out of the total disbursements to WRUAs Ksh. 20.9 Million had not been accounted for as at 30.06.2017 thus forming
the Projects Receivables figure
9. Other Receivables totalling to Ksh. 146,012.00 comprise staff unsurrendered imprests as at 30.06.2017. These have so far been
surrendered.
Fund accountability statement for MTAP II - EU SHARE Support
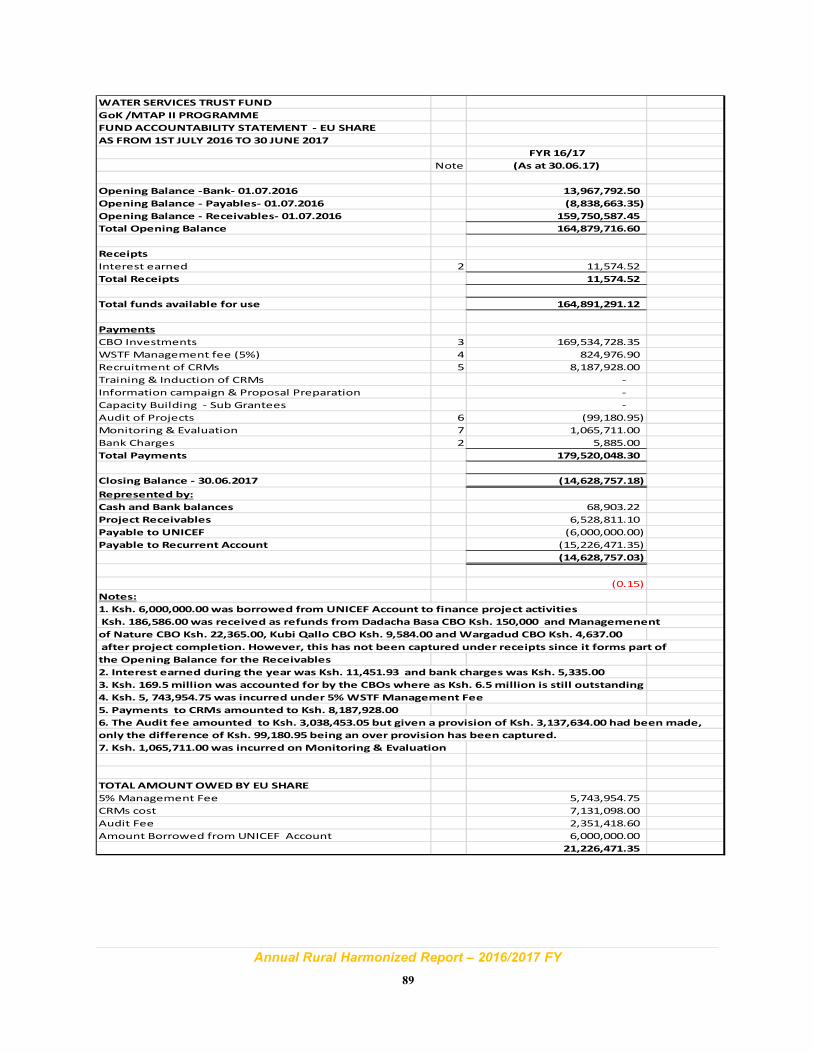
Annual Rural Harmonized Report – 2016/2017 FY
89
WATER SERVICES TRUST FUND
GoK /MTAP II PROGRAMME
FUND ACCOUNTABILITY STATEMENT - EU SHARE
AS FROM 1ST JULY 2016 TO 30 JUNE 2017
FYR 16/17
Note (As at 30.06.17)
Opening Balance -Bank- 01.07.2016 13,967,792.50
Opening Balance - Payables- 01.07.2016 (8,838,663.35)
Opening Balance - Receivables- 01.07.2016 159,750,587.45
Total Opening Balance 164,879,716.60
Receipts
Interest earned 2 11,574.52
Total Receipts 11,574.52
Total funds available for use 164,891,291.12
Payments
CBO Investments 3 169,534,728.35
WSTF Management fee (5%) 4 824,976.90
Recruitment of CRMs 5 8,187,928.00
Training & Induction of CRMs -
Information campaign & Proposal Preparation -
Capacity Building - Sub Grantees -
Audit of Projects 6 (99,180.95)
Monitoring & Evaluation 7 1,065,711.00
Bank Charges 2 5,885.00
Total Payments 179,520,048.30
Closing Balance - 30.06.2017 (14,628,757.18)
Represented by:
Cash and Bank balances 68,903.22
Project Receivables 6,528,811.10
Payable to UNICEF (6,000,000.00)
Payable to Recurrent Account (15,226,471.35)
(14,628,757.03)
(0.15)
Notes:
1. Ksh. 6,000,000.00 was borrowed from UNICEF Account to finance project activities
Ksh. 186,586.00 was received as refunds from Dadacha Basa CBO Ksh. 150,000 and Managemenent
of Nature CBO Ksh. 22,365.00, Kubi Qallo CBO Ksh. 9,584.00 and Wargadud CBO Ksh. 4,637.00
after project completion. However, this has not been captured under receipts since it forms part of
the Opening Balance for the Receivables
2. Interest earned during the year was Ksh. 11,451.93 and bank charges was Ksh. 5,335.00
3. Ksh. 169.5 million was accounted for by the CBOs where as Ksh. 6.5 million is still outstanding
4. Ksh. 5, 743,954.75 was incurred under 5% WSTF Management Fee
5. Payments to CRMs amounted to Ksh. 8,187,928.00
6. The Audit fee amounted to Ksh. 3,038,453.05 but given a provision of Ksh. 3,137,634.00 had been made,
only the difference of Ksh. 99,180.95 being an over provision has been captured.
7. Ksh. 1,065,711.00 was incurred on Monitoring & Evaluation
TOTAL AMOUNT OWED BY EU SHARE
5% Management Fee 5,743,954.75
CRMs cost 7,131,098.00
Audit Fee 2,351,418.60
Amount Borrowed from UNICEF Account 6,000,000.00
21,226,471.35
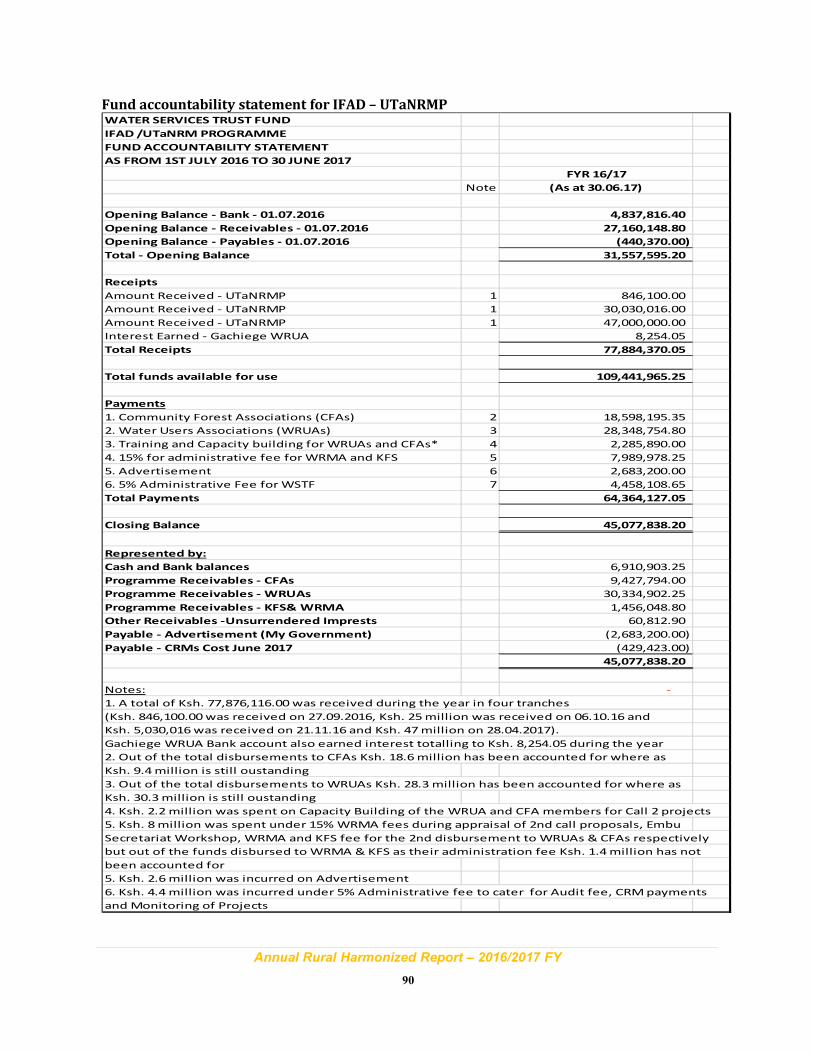
Annual Rural Harmonized Report – 2016/2017 FY
90
Fund accountability statement for IFAD – UTaNRMPWATER SERVICES TRUST FUND
IFAD /UTaNRM PROGRAMME
FUND ACCOUNTABILITY STATEMENT
AS FROM 1ST JULY 2016 TO 30 JUNE 2017
FYR 16/17
Note (As at 30.06.17)
Opening Balance - Bank - 01.07.2016 4,837,816.40
Opening Balance - Receivables - 01.07.2016 27,160,148.80
Opening Balance - Payables - 01.07.2016 (440,370.00)
Total - Opening Balance 31,557,595.20
Receipts
Amount Received - UTaNRMP 1 846,100.00
Amount Received - UTaNRMP 1 30,030,016.00
Amount Received - UTaNRMP 1 47,000,000.00
Interest Earned - Gachiege WRUA 8,254.05
Total Receipts 77,884,370.05
Total funds available for use 109,441,965.25
Payments
1. Community Forest Associations (CFAs) 2 18,598,195.35
2. Water Users Associations (WRUAs) 3 28,348,754.80
3. Training and Capacity building for WRUAs and CFAs* 4 2,285,890.00
4. 15% for administrative fee for WRMA and KFS 5 7,989,978.25
5. Advertisement 6 2,683,200.00
6. 5% Administrative Fee for WSTF 7 4,458,108.65
Total Payments 64,364,127.05
Closing Balance 45,077,838.20
Represented by:
Cash and Bank balances 6,910,903.25
Programme Receivables - CFAs 9,427,794.00
Programme Receivables - WRUAs 30,334,902.25
Programme Receivables - KFS& WRMA 1,456,048.80
Other Receivables -Unsurrendered Imprests 60,812.90
Payable - Advertisement (My Government) (2,683,200.00)
Payable - CRMs Cost June 2017 (429,423.00)
45,077,838.20
Notes: -
1. A total of Ksh. 77,876,116.00 was received during the year in four tranches
(Ksh. 846,100.00 was received on 27.09.2016, Ksh. 25 million was received on 06.10.16 and
Ksh. 5,030,016 was received on 21.11.16 and Ksh. 47 million on 28.04.2017).
Gachiege WRUA Bank account also earned interest totalling to Ksh. 8,254.05 during the year
2. Out of the total disbursements to CFAs Ksh. 18.6 million has been accounted for where as
Ksh. 9.4 million is still oustanding
3. Out of the total disbursements to WRUAs Ksh. 28.3 million has been accounted for where as
Ksh. 30.3 million is still oustanding
4. Ksh. 2.2 million was spent on Capacity Building of the WRUA and CFA members for Call 2 projects
5. Ksh. 8 million was spent under 15% WRMA fees during appraisal of 2nd call proposals, Embu
Secretariat Workshop, WRMA and KFS fee for the 2nd disbursement to WRUAs & CFAs respectively
but out of the funds disbursed to WRMA & KFS as their administration fee Ksh. 1.4 million has not
been accounted for
5. Ksh. 2.6 million was incurred on Advertisement
6. Ksh. 4.4 million was incurred under 5% Administrative fee to cater for Audit fee, CRM payments
and Monitoring of Projects
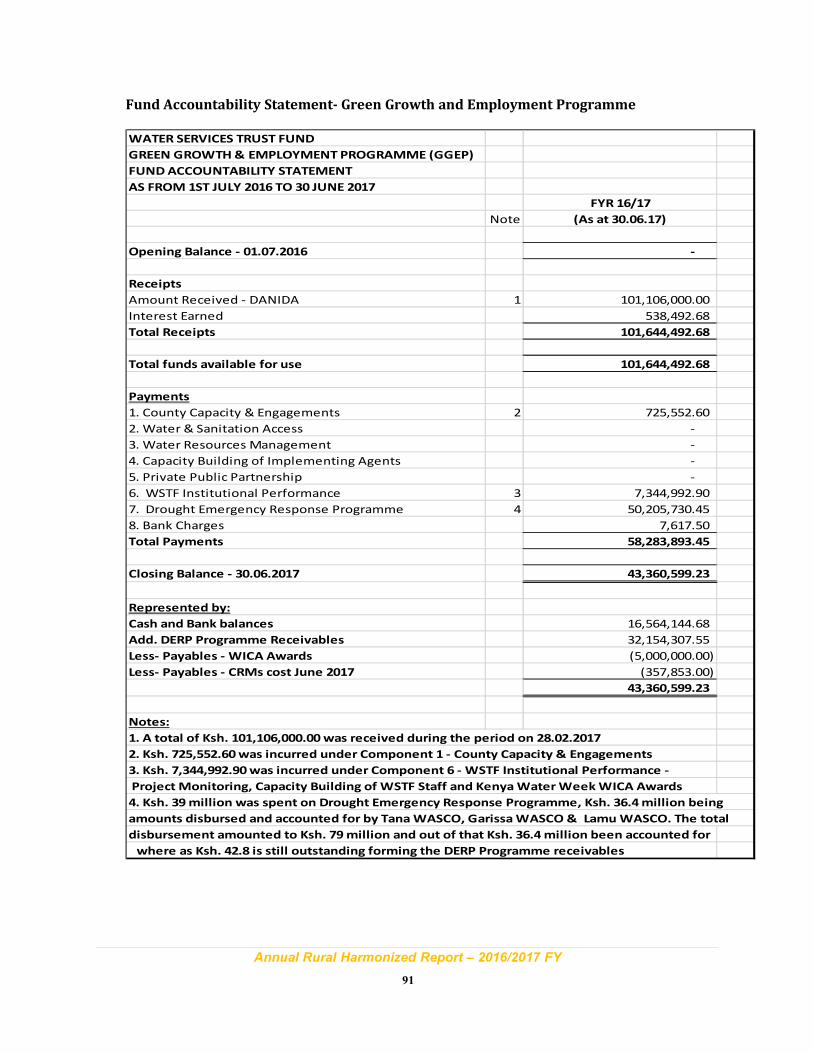
Annual Rural Harmonized Report – 2016/2017 FY
91
Fund Accountability Statement- Green Growth and Employment Programme
WATER SERVICES TRUST FUND
GREEN GROWTH & EMPLOYMENT PROGRAMME (GGEP)
FUND ACCOUNTABILITY STATEMENT
AS FROM 1ST JULY 2016 TO 30 JUNE 2017
FYR 16/17
Note (As at 30.06.17)
Opening Balance - 01.07.2016 -
Receipts
Amount Received - DANIDA 1 101,106,000.00
Interest Earned 538,492.68
Total Receipts 101,644,492.68
Total funds available for use 101,644,492.68
Payments
1. County Capacity & Engagements 2 725,552.60
2. Water & Sanitation Access -
3. Water Resources Management -
4. Capacity Building of Implementing Agents -
5. Private Public Partnership -
6. WSTF Institutional Performance 3 7,344,992.90
7. Drought Emergency Response Programme 4 50,205,730.45
8. Bank Charges 7,617.50
Total Payments 58,283,893.45
Closing Balance - 30.06.2017 43,360,599.23
Represented by:
Cash and Bank balances 16,564,144.68
Add. DERP Programme Receivables 32,154,307.55
Less- Payables - WICA Awards (5,000,000.00)
Less- Payables - CRMs cost June 2017 (357,853.00)
43,360,599.23
Notes:
1. A total of Ksh. 101,106,000.00 was received during the period on 28.02.2017
2. Ksh. 725,552.60 was incurred under Component 1 - County Capacity & Engagements
3. Ksh. 7,344,992.90 was incurred under Component 6 - WSTF Institutional Performance -
Project Monitoring, Capacity Building of WSTF Staff and Kenya Water Week WICA Awards
4. Ksh. 39 million was spent on Drought Emergency Response Programme, Ksh. 36.4 million being
amounts disbursed and accounted for by Tana WASCO, Garissa WASCO & Lamu WASCO. The total
disbursement amounted to Ksh. 79 million and out of that Ksh. 36.4 million been accounted for
where as Ksh. 42.8 is still outstanding forming the DERP Programme receivables
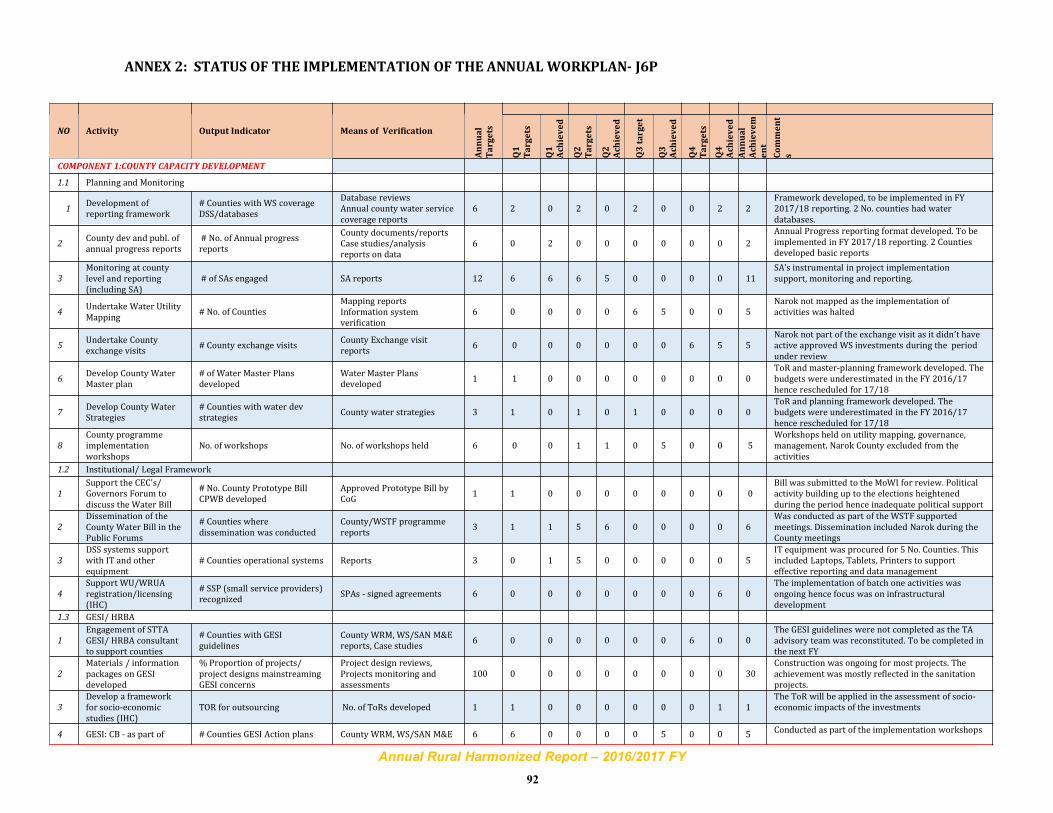
Annual Rural Harmonized Report – 2016/2017 FY
92
ANNEX 2: STATUS OF THE IMPLEMENTATION OF THE ANNUALWORKPLAN- J6P
NO Activity Output Indicator Means of Verification
Annual
Targets
Q1
Targets
Q1
Achieved
Q2
Targets
Q2
Achieved
Q3target
Q3
Achieved
Q4
Targets
Q4
Achieved
Annual
Achievem
ent
Comment
s
COMPONENT 1:COUNTY CAPACITY DEVELOPMENT
1.1 Planning and Monitoring
1Development ofreporting framework
# Counties with WS coverageDSS/databases
Database reviewsAnnual county water servicecoverage reports
6 2 0 2 0 2 0 0 2 2Framework developed, to be implemented in FY2017/18 reporting. 2 No. counties had waterdatabases.
2County dev and publ. ofannual progress reports
# No. of Annual progressreports
County documents/reportsCase studies/analysisreports on data
6 0 2 0 0 0 0 0 0 2
Annual Progress reporting format developed. To beimplemented in FY 2017/18 reporting. 2 Countiesdeveloped basic reports
3
Monitoring at countylevel and reporting(including SA)
# of SAs engaged SA reports 12 6 6 6 5 0 0 0 0 11SA’s instrumental in project implementationsupport, monitoring and reporting.
4Undertake Water UtilityMapping
# No. of CountiesMapping reportsInformation systemverification
6 0 0 0 0 6 5 0 0 5Narok not mapped as the implementation ofactivities was halted
5Undertake Countyexchange visits
# County exchange visitsCounty Exchange visitreports
6 0 0 0 0 0 0 6 5 5Narok not part of the exchange visit as it didn’t haveactive approved WS investments during the periodunder review
6Develop County WaterMaster plan
# of Water Master Plansdeveloped
Water Master Plansdeveloped
1 1 0 0 0 0 0 0 0 0ToR and master-planning framework developed. Thebudgets were underestimated in the FY 2016/17hence rescheduled for 17/18
7Develop County WaterStrategies
# Counties with water devstrategies
County water strategies 3 1 0 1 0 1 0 0 0 0ToR and planning framework developed. Thebudgets were underestimated in the FY 2016/17hence rescheduled for 17/18
8
County programmeimplementationworkshops
No. of workshops No. of workshops held 6 0 0 1 1 0 5 0 0 5Workshops held on utility mapping, governance,management. Narok County excluded from theactivities
1.2 Institutional/ Legal Framework
1
Support the CEC's/Governors Forum todiscuss the Water Bill
# No. County Prototype BillCPWB developed
Approved Prototype Bill byCoG
1 1 0 0 0 0 0 0 0 0Bill was submitted to the MoWI for review. Politicalactivity building up to the elections heightenedduring the period hence inadequate political support
2
Dissemination of theCounty Water Bill in thePublic Forums
# Counties wheredissemination was conducted
County/WSTF programmereports
3 1 1 5 6 0 0 0 0 6Was conducted as part of the WSTF supportedmeetings. Dissemination included Narok during theCounty meetings
3
DSS systems supportwith IT and otherequipment
# Counties operational systems Reports 3 0 1 5 0 0 0 0 0 5IT equipment was procured for 5 No. Counties. Thisincluded Laptops, Tablets, Printers to supporteffective reporting and data management
4
Support WU/WRUAregistration/licensing(IHC)
# SSP (small service providers)recognized
SPAs - signed agreements 6 0 0 0 0 0 0 0 6 0The implementation of batch one activities wasongoing hence focus was on infrastructuraldevelopment
1.3 GESI/ HRBA
1
Engagement of STTAGESI/ HRBA consultantto support counties
# Counties with GESIguidelines
County WRM, WS/SAN M&Ereports, Case studies
6 0 0 0 0 0 0 6 0 0The GESI guidelines were not completed as the TAadvisory team was reconstituted. To be completed inthe next FY
2
Materials / informationpackages on GESIdeveloped
% Proportion of projects/project designs mainstreamingGESI concerns
Project design reviews,Projects monitoring andassessments
100 0 0 0 0 0 0 0 0 30Construction was ongoing for most projects. Theachievement was mostly reflected in the sanitationprojects.
3
Develop a frameworkfor socio-economicstudies (IHC)
TOR for outsourcing No. of ToRs developed 1 1 0 0 0 0 0 0 1 1The ToR will be applied in the assessment of socio-economic impacts of the investments
4 GESI: CB - as part of # Counties GESI Action plans County WRM, WS/SAN M&E 6 6 0 0 0 0 5 0 0 5Conducted as part of the implementation workshops
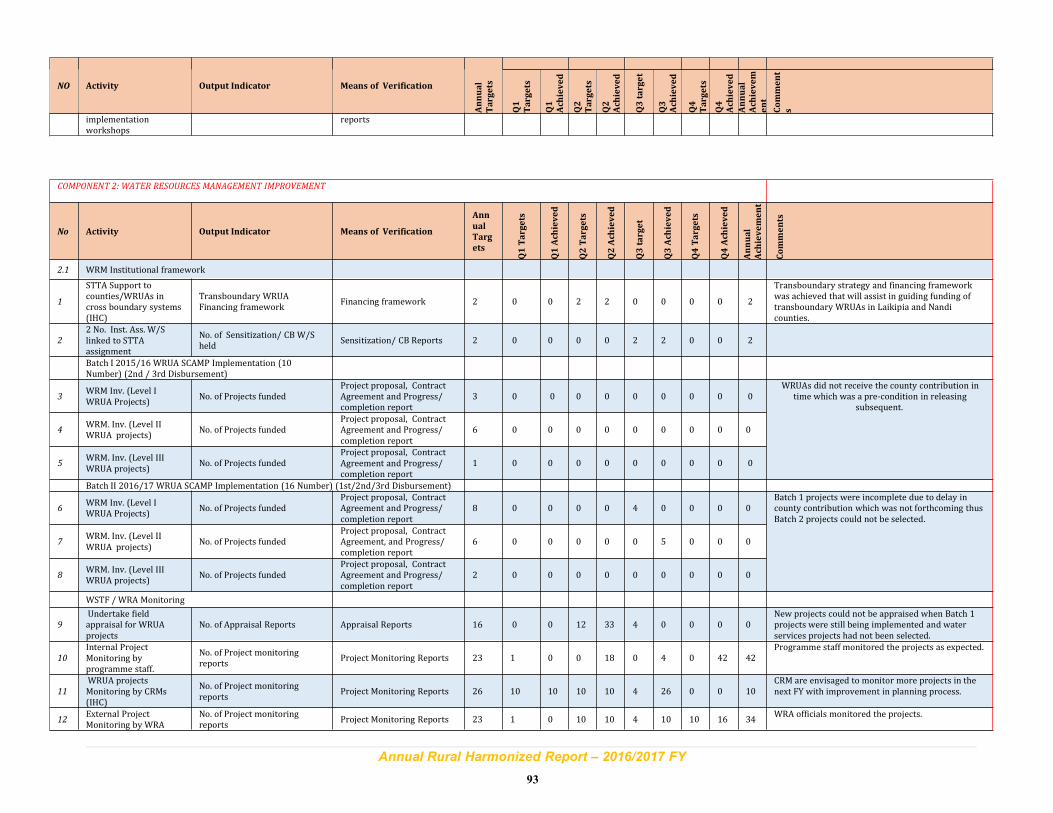
Annual Rural Harmonized Report – 2016/2017 FY
93
NO Activity Output Indicator Means of Verification
Annual
Targets
Q1
Targets
Q1
Achieved
Q2
Targets
Q2
Achieved
Q3target
Q3
Achieved
Q4
Targets
Q4
Achieved
Annual
Achievem
ent
Comment
s
implementationworkshops
reports
COMPONENT 2: WATER RESOURCES MANAGEMENT IMPROVEMENT
No Activity Output Indicator Means of Verification
Ann
ual
Targ
ets
Q1Targets
Q1Achieved
Q2Targets
Q2Achieved
Q3target
Q3Achieved
Q4Targets
Q4Achieved
Annual
Achievement
Comments
2.1 WRM Institutional framework
1
STTA Support tocounties/WRUAs incross boundary systems(IHC)
Transboundary WRUAFinancing framework
Financing framework 2 0 0 2 2 0 0 0 0 2
Transboundary strategy and financing frameworkwas achieved that will assist in guiding funding oftransboundary WRUAs in Laikipia and Nandicounties.
2
2 No. Inst. Ass. W/Slinked to STTAassignment
No. of Sensitization/ CB W/Sheld
Sensitization/ CB Reports 2 0 0 0 0 2 2 0 0 2
Batch I 2015/16 WRUA SCAMP Implementation (10Number) (2nd / 3rd Disbursement)
3WRM Inv. (Level IWRUA Projects)
No. of Projects fundedProject proposal, ContractAgreement and Progress/completion report
3 0 0 0 0 0 0 0 0 0WRUAs did not receive the county contribution in
time which was a pre-condition in releasingsubsequent.
4WRM. Inv. (Level IIWRUA projects)
No. of Projects fundedProject proposal, ContractAgreement and Progress/completion report
6 0 0 0 0 0 0 0 0 0
5WRM. Inv. (Level IIIWRUA projects)
No. of Projects fundedProject proposal, ContractAgreement and Progress/completion report
1 0 0 0 0 0 0 0 0 0
Batch II 2016/17 WRUA SCAMP Implementation (16 Number) (1st/2nd/3rd Disbursement)
6WRM Inv. (Level IWRUA Projects)
No. of Projects fundedProject proposal, ContractAgreement and Progress/completion report
8 0 0 0 0 4 0 0 0 0Batch 1 projects were incomplete due to delay incounty contribution which was not forthcoming thusBatch 2 projects could not be selected.
7WRM. Inv. (Level IIWRUA projects)
No. of Projects fundedProject proposal, ContractAgreement, and Progress/completion report
6 0 0 0 0 0 5 0 0 0
8WRM. Inv. (Level IIIWRUA projects)
No. of Projects fundedProject proposal, ContractAgreement and Progress/completion report
2 0 0 0 0 0 0 0 0 0
WSTF /WRA Monitoring
9
Undertake fieldappraisal for WRUAprojects
No. of Appraisal Reports Appraisal Reports 16 0 0 12 33 4 0 0 0 0New projects could not be appraised when Batch 1projects were still being implemented and waterservices projects had not been selected.
10
Internal ProjectMonitoring byprogramme staff.
No. of Project monitoringreports
Project Monitoring Reports 23 1 0 0 18 0 4 0 42 42Programme staff monitored the projects as expected.
11
WRUA projectsMonitoring by CRMs(IHC)
No. of Project monitoringreports
Project Monitoring Reports 26 10 10 10 10 4 26 0 0 10CRM are envisaged to monitor more projects in thenext FY with improvement in planning process.
12External ProjectMonitoring by WRA
No. of Project monitoringreports
Project Monitoring Reports 23 1 0 10 10 4 10 10 16 34WRA officials monitored the projects.

Annual Rural Harmonized Report – 2016/2017 FY
94
13
Engagement of ServiceAgents average10d/QTR
No. of Service Agents engagedSigned Contracts average20d/QTR
6 6 5 6 6 5 5 5 5 5SAs were engaged to provide technical support toWRUAs and Wus.
14
5%WSTF ManagementFee Water ResourcesProjects
0 0 0 0 0 0 0 0 0 0
2.2 WRM Compliance and conflict reduction
2
WRUA Capacity needsassessment (Rotationalco-ord. meetings)
1 No. Inventory of Capacityneeds dev
Report on capacity needsassessment
6 0 0 0 0 0 0 0 0 0This was not achieved since WRUAs were busycatching up with implementation activities whilefollowing up the county contribution.
2.3 WRM Catchment conservation
All activities budgetedunder result area 2.1
2.4 WRM Sustainability
1
Hold 11 No. CB/BusPlanning W/Ss ServiceAgents &WRUAs
No. of Sens/ CB/WSsSensitization/ CapacityBuilding Reports
11 9 9 9 9 0 19 0 0 18Reports were submitted and exceeded the set target.
2
STTA Analysis and STTAWRUA mgt support inbusiness planning
3
Organize 2 WRUAexchange program(centres of excellence)
No. of WRUA exchange progReports of WRUA exchangeprograms held
2 0 0 0 0 2 0 0 0 0The political climate made it difficult to travel to thebest performing WRUAs for a bench marking tour.
2.5 WRM HR/GESI
1
Activities linked /budgeted in relation toWDC investments
0 0 0 0 0 0 0 0 0 0
COMPONENT 3:SUSTAINABLE ACCESS TO WATER SERVICES
No Activity Output Indicator Means of Verification
Q1
Target
s Q1
Achiev
edQ2
Target
s Q2
Achiev
ed
Q3
target
Q3
Achiev
ed
Q4
Target
sQ4
Achiev
edAnnua
l Achiev
ement
Comm
ents
3.1 Improved WS Coverage
1
Batch 1 (2015/16contracted WUs (2nddisbursement :Phase Iprojects )
# of Water Utilities projectssupported
Contracts signed,disbursement memos
31 0 0 0 0 3 1 25 17 20
11 projects are set to receive subsequentdisbursement in the next financial year aftercompleting the outstanding works. This was also dueto delays in county contribution.
2
Batch 2 (2016/17contracted WusProposal Prep/ProjectAppraisal
# of Water Utilities projectssupported
Project Proposals andAppraisal reports
6 0 3 0 0 0 0 0
0
0
WSTF awaits completion of Batch 1 projects toembark on Batch 2 to reduce the risks and also dueto delay by counties in providing their contribution.
3
Batch 2 (2016/17Contracted WusInvestment (6projects*15M*50%)
# of Water Utilities projectssupported
Contracts signed,disbursement memos
6 0 0 0 0 0 0 0
0
0
WSTF awaits completion of Batch 1 projects toembark on Batch 2 to reduce the risks.
4
Monitorimplementation of RuralWater Supply projects
# of people gaining access Monitoring reports 37 0 0 31 31 12 12 20 16 28WSTF will envisage to visit all the projects underconstruction to ensure quality of works is up tostandard
55%WSTF ManagementFee Water projects
3.2 WU Service Quality/ Operational Efficiency
1
Cap. building W/S forWUs(Impl of W/Shops-package trainings)
#WUs supported inimpl./operational impr.
Workshop reports 12 6 6 0 0 0 0 66
12Financial, procurement and CLTS training was done.
2Engagement of ServiceAgents
#WUs supported inimpl./operational impr.
Service Agents Contractssigned
6 1 1 5 5 5 5 55
5SAs are on ground providing technical support toWus.
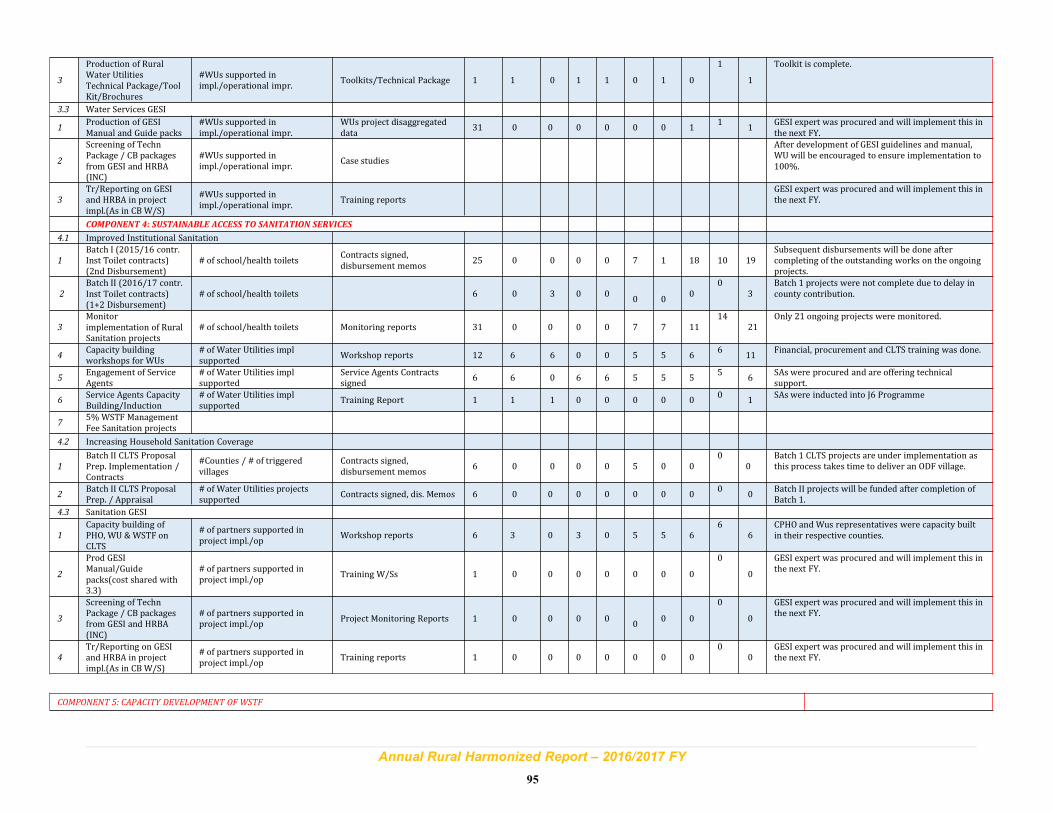
Annual Rural Harmonized Report – 2016/2017 FY
95
3
Production of RuralWater UtilitiesTechnical Package/ToolKit/Brochures
#WUs supported inimpl./operational impr.
Toolkits/Technical Package 1 1 0 1 1 0 1 0
1
1
Toolkit is complete.
3.3 Water Services GESI
1Production of GESIManual and Guide packs
#WUs supported inimpl./operational impr.
WUs project disaggregateddata
31 0 0 0 0 0 0 11
1GESI expert was procured and will implement this inthe next FY.
2
Screening of TechnPackage / CB packagesfrom GESI and HRBA(INC)
#WUs supported inimpl./operational impr.
Case studies
After development of GESI guidelines and manual,WU will be encouraged to ensure implementation to100%.
3
Tr/Reporting on GESIand HRBA in projectimpl.(As in CBW/S)
#WUs supported inimpl./operational impr.
Training reportsGESI expert was procured and will implement this inthe next FY.
COMPONENT 4: SUSTAINABLE ACCESS TO SANITATION SERVICES
4.1 Improved Institutional Sanitation
1
Batch I (2015/16 contr.Inst Toilet contracts)(2nd Disbursement)
# of school/health toiletsContracts signed,disbursement memos
25 0 0 0 0 7 1 18 10 19Subsequent disbursements will be done aftercompleting of the outstanding works on the ongoingprojects.
2
Batch II (2016/17 contr.Inst Toilet contracts)(1+2 Disbursement)
# of school/health toilets 6 0 3 0 00 0
00
3Batch 1 projects were not complete due to delay incounty contribution.
3
Monitorimplementation of RuralSanitation projects
# of school/health toilets Monitoring reports 31 0 0 0 0 7 7 1114
21Only 21 ongoing projects were monitored.
4Capacity buildingworkshops for WUs
# of Water Utilities implsupported
Workshop reports 12 6 6 0 0 5 5 66
11Financial, procurement and CLTS training was done.
5Engagement of ServiceAgents
# of Water Utilities implsupported
Service Agents Contractssigned
6 6 0 6 6 5 5 55
6SAs were procured and are offering technicalsupport.
6Service Agents CapacityBuilding/Induction
# of Water Utilities implsupported
Training Report 1 1 1 0 0 0 0 00
1SAs were inducted into J6 Programme
75%WSTF ManagementFee Sanitation projects
4.2 Increasing Household Sanitation Coverage
1
Batch II CLTS ProposalPrep. Implementation /Contracts
#Counties / # of triggeredvillages
Contracts signed,disbursement memos
6 0 0 0 0 5 0 00
0Batch 1 CLTS projects are under implementation asthis process takes time to deliver an ODF village.
2Batch II CLTS ProposalPrep. / Appraisal
# of Water Utilities projectssupported
Contracts signed, dis. Memos 6 0 0 0 0 0 0 00
0Batch II projects will be funded after completion ofBatch 1.
4.3 Sanitation GESI
1
Capacity building ofPHO, WU &WSTF onCLTS
# of partners supported inproject impl./op
Workshop reports 6 3 0 3 0 5 5 66
6CPHO and Wus representatives were capacity builtin their respective counties.
2
Prod GESIManual/Guidepacks(cost shared with3.3)
# of partners supported inproject impl./op
Training W/Ss 1 0 0 0 0 0 0 0
0
0
GESI expert was procured and will implement this inthe next FY.
3
Screening of TechnPackage / CB packagesfrom GESI and HRBA(INC)
# of partners supported inproject impl./op
Project Monitoring Reports 1 0 0 0 00
0 0
0
0
GESI expert was procured and will implement this inthe next FY.
4
Tr/Reporting on GESIand HRBA in projectimpl.(As in CBW/S)
# of partners supported inproject impl./op
Training reports 1 0 0 0 0 0 0 00
0GESI expert was procured and will implement this inthe next FY.
COMPONENT 5: CAPACITY DEVELOPMENT OF WSTF
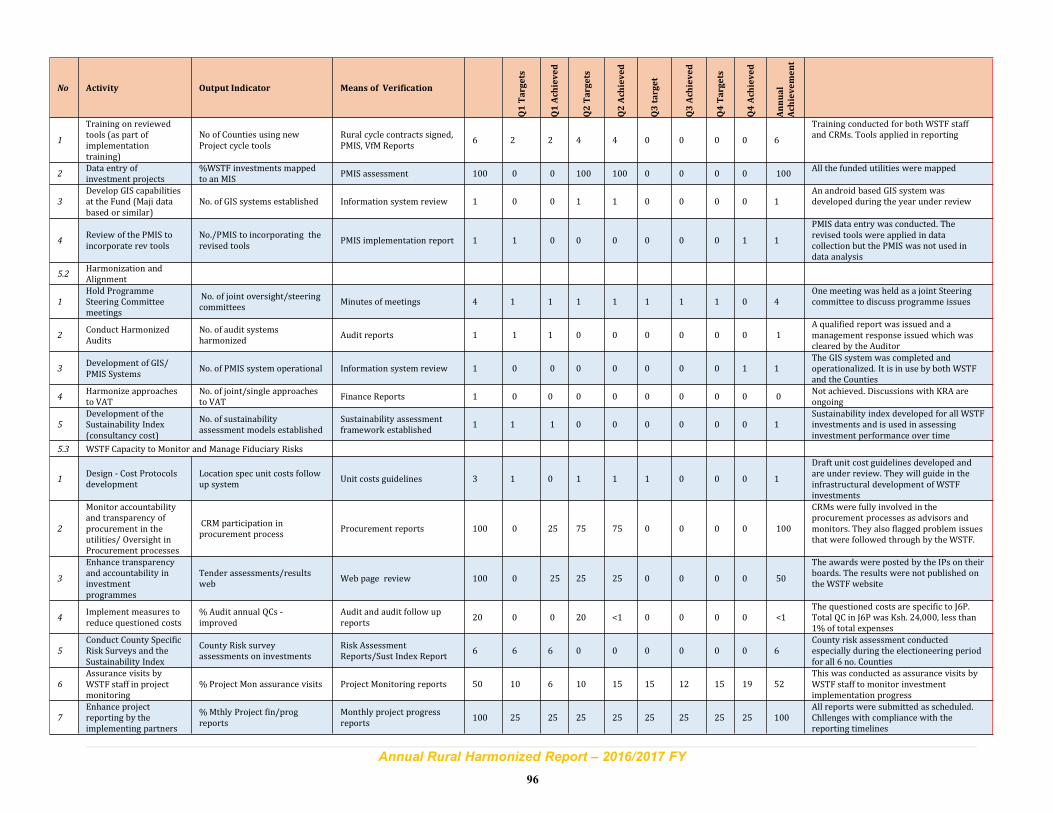
Annual Rural Harmonized Report – 2016/2017 FY
96
No Activity Output Indicator Means of Verification
Q1Targets
Q1Achieved
Q2Targets
Q2Achieved
Q3target
Q3Achieved
Q4Targets
Q4Achieved
Annual
Achievement
1
Training on reviewedtools (as part ofimplementationtraining)
No of Counties using newProject cycle tools
Rural cycle contracts signed,PMIS, VfM Reports
6 2 2 4 4 0 0 0 0 6
Training conducted for both WSTF staffand CRMs. Tools applied in reporting
2Data entry ofinvestment projects
%WSTF investments mappedto an MIS
PMIS assessment 100 0 0 100 100 0 0 0 0 100All the funded utilities were mapped
3
Develop GIS capabilitiesat the Fund (Maji databased or similar)
No. of GIS systems established Information system review 1 0 0 1 1 0 0 0 0 1An android based GIS system wasdeveloped during the year under review
4Review of the PMIS toincorporate rev tools
No./PMIS to incorporating therevised tools
PMIS implementation report 1 1 0 0 0 0 0 0 1 1
PMIS data entry was conducted. Therevised tools were applied in datacollection but the PMIS was not used indata analysis
5.2Harmonization andAlignment
1
Hold ProgrammeSteering Committeemeetings
No. of joint oversight/steeringcommittees
Minutes of meetings 4 1 1 1 1 1 1 1 0 4One meeting was held as a joint Steeringcommittee to discuss programme issues
2Conduct HarmonizedAudits
No. of audit systemsharmonized
Audit reports 1 1 1 0 0 0 0 0 0 1A qualified report was issued and amanagement response issued which wascleared by the Auditor
3Development of GIS/PMIS Systems
No. of PMIS system operational Information system review 1 0 0 0 0 0 0 0 1 1The GIS system was completed andoperationalized. It is in use by both WSTFand the Counties
4Harmonize approachesto VAT
No. of joint/single approachesto VAT
Finance Reports 1 0 0 0 0 0 0 0 0 0Not achieved. Discussions with KRA areongoing
5
Development of theSustainability Index(consultancy cost)
No. of sustainabilityassessment models established
Sustainability assessmentframework established
1 1 1 0 0 0 0 0 0 1Sustainability index developed for all WSTFinvestments and is used in assessinginvestment performance over time
5.3 WSTF Capacity to Monitor and Manage Fiduciary Risks
1Design - Cost Protocolsdevelopment
Location spec unit costs followup system
Unit costs guidelines 3 1 0 1 1 1 0 0 0 1
Draft unit cost guidelines developed andare under review. They will guide in theinfrastructural development of WSTFinvestments
2
Monitor accountabilityand transparency ofprocurement in theutilities/ Oversight inProcurement processes
CRM participation inprocurement process
Procurement reports 100 0 25 75 75 0 0 0 0 100
CRMs were fully involved in theprocurement processes as advisors andmonitors. They also flagged problem issuesthat were followed through by the WSTF.
3
Enhance transparencyand accountability ininvestmentprogrammes
Tender assessments/resultsweb
Web page review 100 0 25 25 25 0 0 0 0 50
The awards were posted by the IPs on theirboards. The results were not published onthe WSTF website
4Implement measures toreduce questioned costs
% Audit annual QCs -improved
Audit and audit follow upreports
20 0 0 20 <1 0 0 0 0 <1The questioned costs are specific to J6P.Total QC in J6P was Ksh. 24,000, less than1% of total expenses
5
Conduct County SpecificRisk Surveys and theSustainability Index
County Risk surveyassessments on investments
Risk AssessmentReports/Sust Index Report
6 6 6 0 0 0 0 0 0 6County risk assessment conductedespecially during the electioneering periodfor all 6 no. Counties
6
Assurance visits byWSTF staff in projectmonitoring
% Project Mon assurance visits Project Monitoring reports 50 10 6 10 15 15 12 15 19 52This was conducted as assurance visits byWSTF staff to monitor investmentimplementation progress
7
Enhance projectreporting by theimplementing partners
%Mthly Project fin/progreports
Monthly project progressreports
100 25 25 25 25 25 25 25 25 100All reports were submitted as scheduled.Chllenges with compliance with thereporting timelines
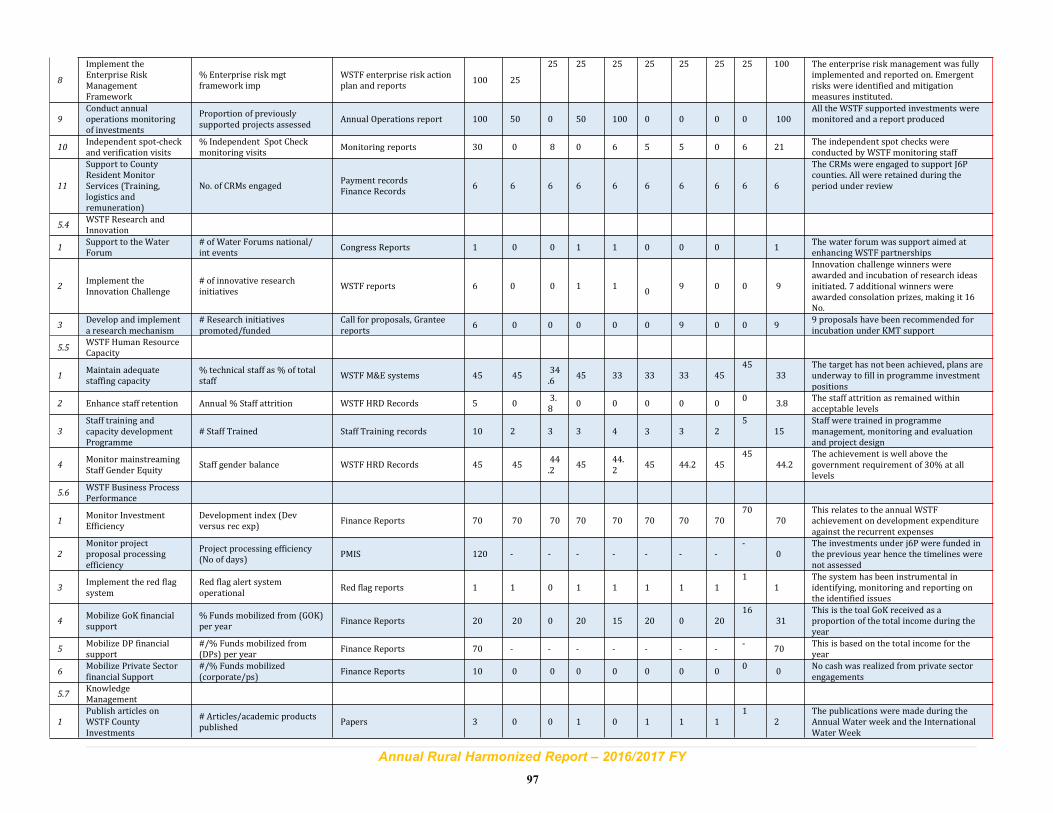
Annual Rural Harmonized Report – 2016/2017 FY
97
8
Implement theEnterprise RiskManagementFramework
% Enterprise risk mgtframework imp
WSTF enterprise risk actionplan and reports
100 25
25 25 25 25 25 25 25 100 The enterprise risk management was fullyimplemented and reported on. Emergentrisks were identified and mitigationmeasures instituted.
9
Conduct annualoperations monitoringof investments
Proportion of previouslysupported projects assessed
Annual Operations report 100 50 0 50 100 0 0 0 0 100All the WSTF supported investments weremonitored and a report produced
10Independent spot-checkand verification visits
% Independent Spot Checkmonitoring visits
Monitoring reports 30 0 8 0 6 5 5 0 6 21The independent spot checks wereconducted by WSTF monitoring staff
11
Support to CountyResident MonitorServices (Training,logistics andremuneration)
No. of CRMs engagedPayment recordsFinance Records
6 6 6 6 6 6 6 6 6 6
The CRMs were engaged to support J6Pcounties. All were retained during theperiod under review
5.4WSTF Research andInnovation
1Support to the WaterForum
# of Water Forums national/int events
Congress Reports 1 0 0 1 1 0 0 0 1The water forum was support aimed atenhancing WSTF partnerships
2Implement theInnovation Challenge
# of innovative researchinitiatives
WSTF reports 6 0 0 1 10
9 0 0 9
Innovation challenge winners wereawarded and incubation of research ideasinitiated. 7 additional winners wereawarded consolation prizes, making it 16No.
3Develop and implementa research mechanism
# Research initiativespromoted/funded
Call for proposals, Granteereports
6 0 0 0 0 0 9 0 0 99 proposals have been recommended forincubation under KMT support
5.5WSTF Human ResourceCapacity
1Maintain adequatestaffing capacity
% technical staff as % of totalstaff
WSTF M&E systems 45 4534.6
45 33 33 33 4545
33The target has not been achieved, plans areunderway to fill in programme investmentpositions
2 Enhance staff retention Annual % Staff attrition WSTF HRD Records 5 03.8
0 0 0 0 00
3.8The staff attrition as remained withinacceptable levels
3
Staff training andcapacity developmentProgramme
# Staff Trained Staff Training records 10 2 3 3 4 3 3 25
15Staff were trained in programmemanagement, monitoring and evaluationand project design
4Monitor mainstreamingStaff Gender Equity
Staff gender balance WSTF HRD Records 45 4544.2
4544.2
45 44.2 4545
44.2The achievement is well above thegovernment requirement of 30% at alllevels
5.6WSTF Business ProcessPerformance
1Monitor InvestmentEfficiency
Development index (Devversus rec exp)
Finance Reports 70 70 70 70 70 70 70 7070
70This relates to the annual WSTFachievement on development expenditureagainst the recurrent expenses
2
Monitor projectproposal processingefficiency
Project processing efficiency(No of days)
PMIS 120 - - - - - - --
0The investments under j6P were funded inthe previous year hence the timelines werenot assessed
3Implement the red flagsystem
Red flag alert systemoperational
Red flag reports 1 1 0 1 1 1 1 11
1The system has been instrumental inidentifying, monitoring and reporting onthe identified issues
4Mobilize GoK financialsupport
% Funds mobilized from (GOK)per year
Finance Reports 20 20 0 20 15 20 0 2016
31This is the toal GoK received as aproportion of the total income during theyear
5Mobilize DP financialsupport
#/% Funds mobilized from(DPs) per year
Finance Reports 70 - - - - - - --
70This is based on the total income for theyear
6Mobilize Private Sectorfinancial Support
#/% Funds mobilized(corporate/ps)
Finance Reports 10 0 0 0 0 0 0 00
0No cash was realized from private sectorengagements
5.7KnowledgeManagement
1
Publish articles onWSTF CountyInvestments
# Articles/academic productspublished
Papers 3 0 0 1 0 1 1 11
2The publications were made during theAnnual Water week and the InternationalWater Week
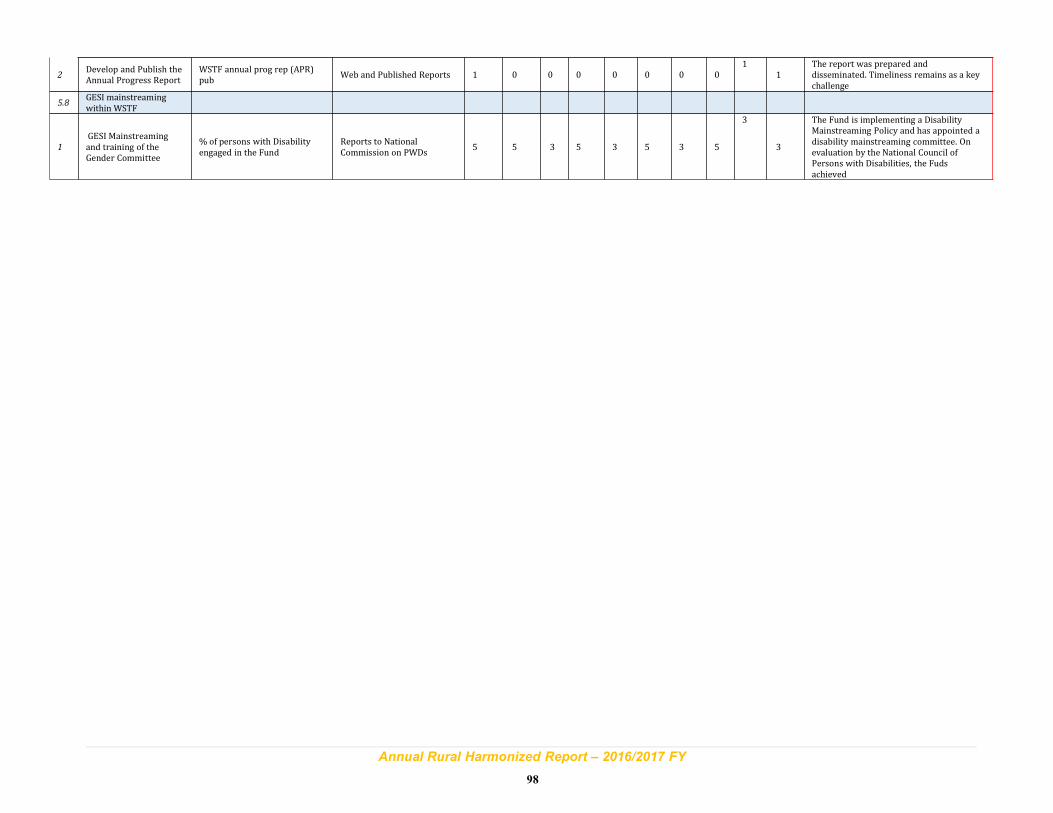
Annual Rural Harmonized Report – 2016/2017 FY
98
2Develop and Publish theAnnual Progress Report
WSTF annual prog rep (APR)pub
Web and Published Reports 1 0 0 0 0 0 0 01
1The report was prepared anddisseminated. Timeliness remains as a keychallenge
5.8GESI mainstreamingwithin WSTF
1
GESI Mainstreamingand training of theGender Committee
% of persons with Disabilityengaged in the Fund
Reports to NationalCommission on PWDs
5 5 3 5 3 5 3 5
3
3
The Fund is implementing a DisabilityMainstreaming Policy and has appointed adisability mainstreaming committee. Onevaluation by the National Council ofPersons with Disabilities, the Fudsachieved
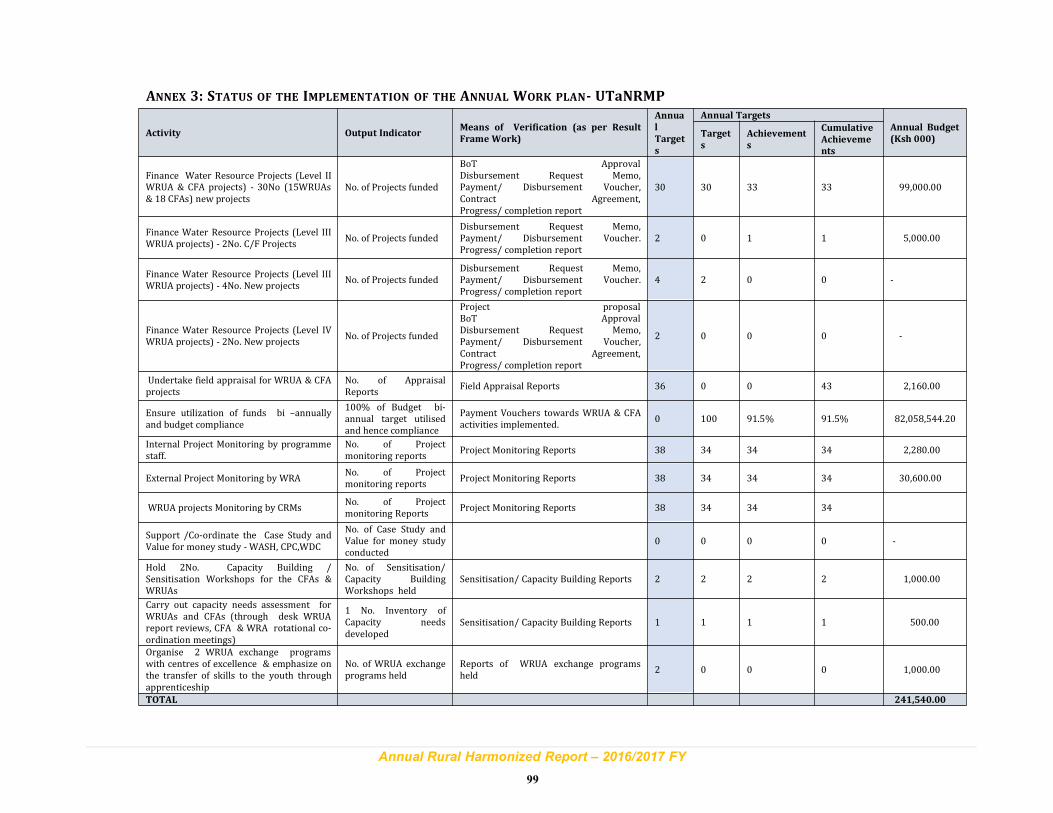
Annual Rural Harmonized Report – 2016/2017 FY
99
ANNEX 3: STATUS OF THE IMPLEMENTATION OF THE ANNUAL WORK PLAN- UTaNRMP
Activity Output IndicatorMeans of Verification (as per Result
Frame Work)
Annua
l
Target
s
Annual Targets
Annual Budget
(Ksh 000)Target
s
Achievement
s
Cumulative
Achieveme
nts
Finance Water Resource Projects (Level IIWRUA & CFA projects) - 30No (15WRUAs& 18 CFAs) new projects
No. of Projects funded
BoT ApprovalDisbursement Request Memo,Payment/ Disbursement Voucher,Contract Agreement,Progress/ completion report
30 30 33 33 99,000.00
Finance Water Resource Projects (Level IIIWRUA projects) - 2No. C/F Projects
No. of Projects fundedDisbursement Request Memo,Payment/ Disbursement Voucher.Progress/ completion report
2 0 1 1 5,000.00
Finance Water Resource Projects (Level IIIWRUA projects) - 4No. New projects
No. of Projects fundedDisbursement Request Memo,Payment/ Disbursement Voucher.Progress/ completion report
4 2 0 0 -
Finance Water Resource Projects (Level IVWRUA projects) - 2No. New projects
No. of Projects funded
Project proposalBoT ApprovalDisbursement Request Memo,Payment/ Disbursement Voucher,Contract Agreement,Progress/ completion report
2 0 0 0 -
Undertake field appraisal for WRUA & CFAprojects
No. of AppraisalReports
Field Appraisal Reports 36 0 0 43 2,160.00
Ensure utilization of funds bi –annuallyand budget compliance
100% of Budget bi-annual target utilisedand hence compliance
Payment Vouchers towards WRUA & CFAactivities implemented.
0 100 91.5% 91.5% 82,058,544.20
Internal Project Monitoring by programmestaff.
No. of Projectmonitoring reports
Project Monitoring Reports 38 34 34 34 2,280.00
External Project Monitoring by WRANo. of Projectmonitoring reports
Project Monitoring Reports 38 34 34 34 30,600.00
WRUA projects Monitoring by CRMsNo. of Projectmonitoring Reports
Project Monitoring Reports 38 34 34 34
Support /Co-ordinate the Case Study andValue for money study - WASH, CPC,WDC
No. of Case Study andValue for money studyconducted
0 0 0 0 -
Hold 2No. Capacity Building /Sensitisation Workshops for the CFAs &WRUAs
No. of Sensitisation/Capacity BuildingWorkshops held
Sensitisation/ Capacity Building Reports 2 2 2 2 1,000.00
Carry out capacity needs assessment forWRUAs and CFAs (through desk WRUAreport reviews, CFA & WRA rotational co-ordination meetings)
1 No. Inventory ofCapacity needsdeveloped
Sensitisation/ Capacity Building Reports 1 1 1 1 500.00
Organise 2 WRUA exchange programswith centres of excellence & emphasize onthe transfer of skills to the youth throughapprenticeship
No. of WRUA exchangeprograms held
Reports of WRUA exchange programsheld
2 0 0 0 1,000.00
TOTAL 241,540.00
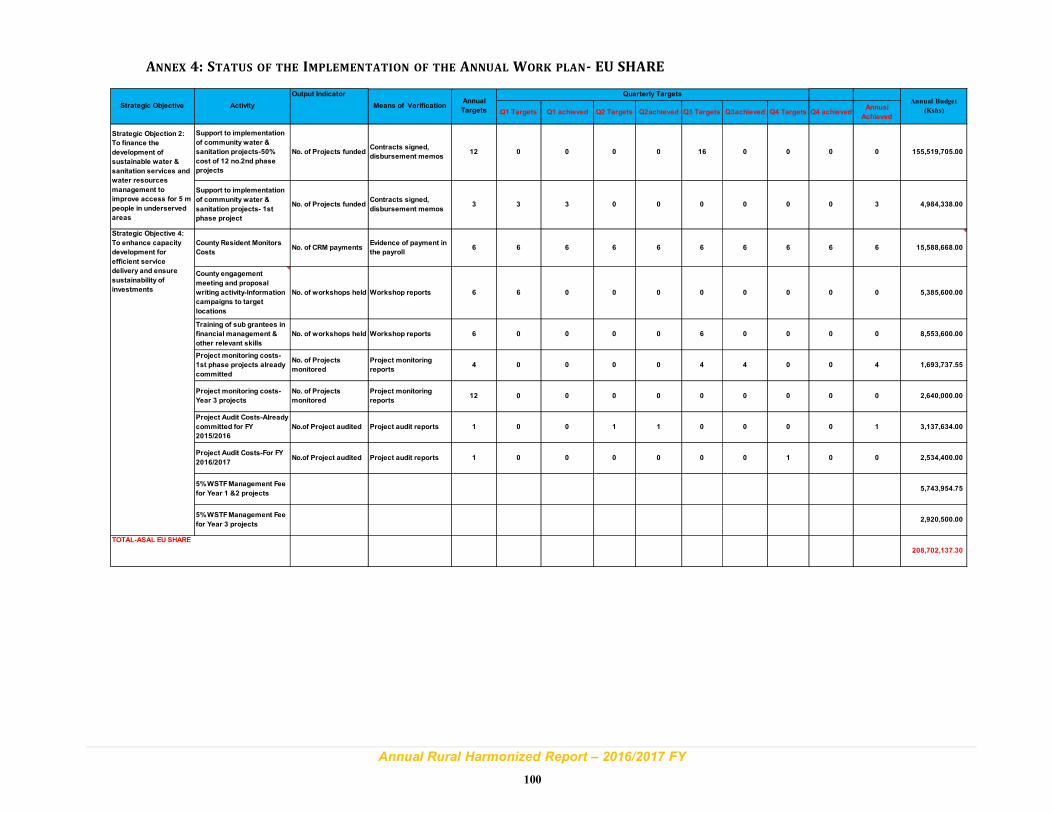
Annual Rural Harmonized Report – 2016/2017 FY
100
ANNEX 4: STATUS OF THE IMPLEMENTATION OF THE ANNUAL WORK PLAN- EU SHARE
Output Indicator
Q1 Targets Q1 achieved Q2 Targets Q2achieved Q3 Targets Q3achieved Q4 Targets Q4 achievedAnnual
Achieved
Support to implementation
of community water &
sanitation projects-50%
cost of 12 no.2nd phase
projects
No. of Projects fundedContracts signed,
disbursement memos12 0 0 0 0 16 0 0 0 0 155,519,705.00
Support to implementation
of community water &
sanitation projects- 1st
phase project
No. of Projects fundedContracts signed,
disbursement memos3 3 3 0 0 0 0 0 0 3 4,984,338.00
County Resident Monitors
CostsNo. of CRM payments
Evidence of payment in
the payroll6 6 6 6 6 6 6 6 6 6 15,588,668.00
County engagement
meeting and proposal
writing activity-Information
campaigns to target
locations
No. of workshops held Workshop reports 6 6 0 0 0 0 0 0 0 0 5,385,600.00
Training of sub grantees in
financial management &
other relevant skills
No. of workshops held Workshop reports 6 0 0 0 0 6 0 0 0 0 8,553,600.00
Project monitoring costs-
1st phase projects already
committed
No. of Projects
monitored
Project monitoring
reports4 0 0 0 0 4 4 0 0 4 1,693,737.55
Project monitoring costs-
Year 3 projects
No. of Projects
monitored
Project monitoring
reports12 0 0 0 0 0 0 0 0 0 2,640,000.00
Project Audit Costs-Already
committed for FY
2015/2016
No.of Project audited Project audit reports 1 0 0 1 1 0 0 0 0 1 3,137,634.00
Project Audit Costs-For FY
2016/2017No.of Project audited Project audit reports 1 0 0 0 0 0 0 1 0 0 2,534,400.00
5% WSTF Management Fee
for Year 1 &2 projects5,743,954.75
5% WSTF Management Fee
for Year 3 projects2,920,500.00
208,702,137.30
Strategic Objective 4:
To enhance capacity
development for
efficient service
delivery and ensure
sustainability of
investments
TOTAL-ASAL EU SHARE
Annual Budget
(Kshs)
Strategic Objection 2:
To finance the
development of
sustainable water &
sanitation services and
water resources
management to
improve access for 5 m
people in underserved
areas
Strategic ObjectiveAnnual
Targets
Quarterly Targets
Activity Means of Verification
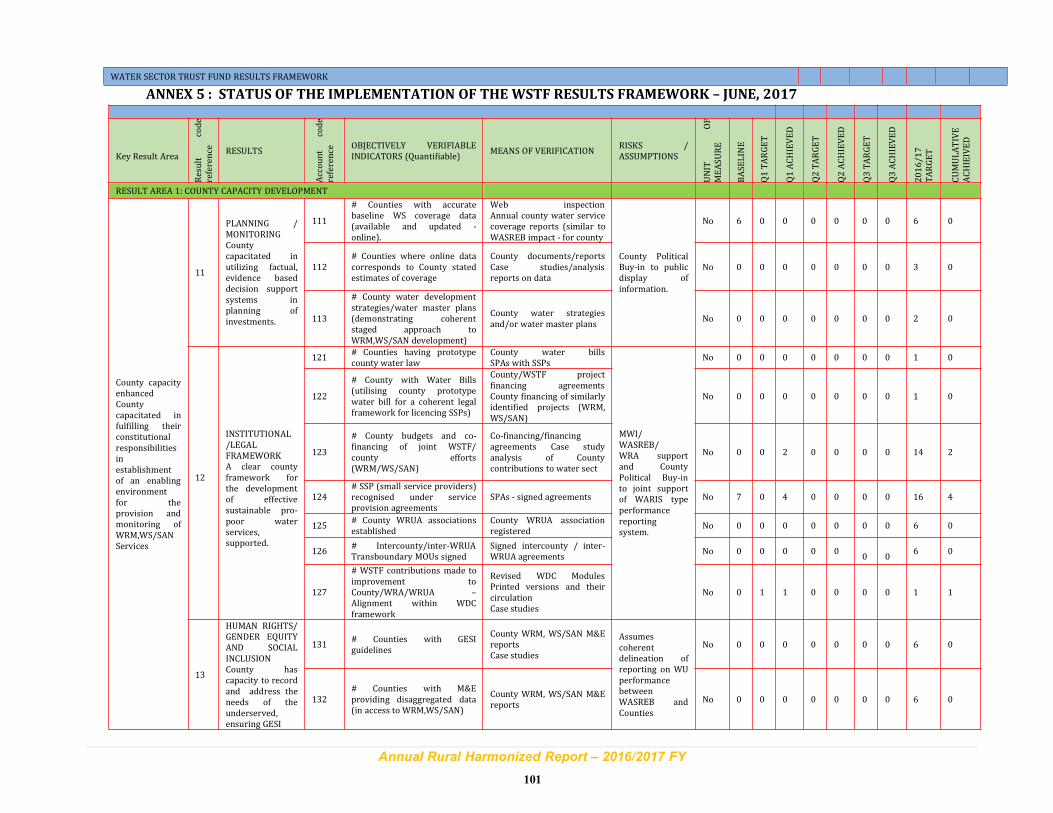
Annual Rural Harmonized Report – 2016/2017 FY
101
ANNEX 5 : STATUS OF THE IMPLEMENTATION OF THEWSTF RESULTS FRAMEWORK – JUNE, 2017
Key Result Area
Result
code
reference RESULTS
Account
code
reference
OBJECTIVELY VERIFIABLEINDICATORS (Quantifiable)
MEANS OF VERIFICATIONRISKS /ASSUMPTIONS
UNIT
OF
MEASURE
BASELINE
Q1TARGET
Q1ACHIEVED
Q2TARGET
Q2ACHIEVED
Q3TARGET
Q3ACHIEVED
2016/17
TARGET
CUMULATIVE
ACHIEIVED
RESULT AREA 1: COUNTY CAPACITY DEVELOPMENT
County capacityenhancedCountycapacitated infulfilling theirconstitutionalresponsibilitiesinestablishmentof an enablingenvironmentfor theprovision andmonitoring ofWRM,WS/SANServices
11
PLANNING /MONITORINGCountycapacitated inutilizing factual,evidence baseddecision supportsystems inplanning ofinvestments.
111
# Counties with accuratebaseline WS coverage data(available and updated -online).
Web inspectionAnnual county water servicecoverage reports (similar toWASREB impact - for county
County PoliticalBuy-in to publicdisplay ofinformation.
No 6 0 0 0 0 0 0 6 0
112# Counties where online datacorresponds to County statedestimates of coverage
County documents/reportsCase studies/analysisreports on data
No 0 0 0 0 0 0 0 3 0
113
# County water developmentstrategies/water master plans(demonstrating coherentstaged approach toWRM,WS/SAN development)
County water strategiesand/or water master plans
No 0 0 0 0 0 0 0 2 0
12
INSTITUTIONAL/LEGALFRAMEWORKA clear countyframework forthe developmentof effectivesustainable pro-poor waterservices,supported.
121# Counties having prototypecounty water law
County water billsSPAs with SSPs
MWI/WASREB/WRA supportand CountyPolitical Buy-into joint supportof WARIS typeperformancereportingsystem.
No 0 0 0 0 0 0 0 1 0
122
# County with Water Bills(utilising county prototypewater bill for a coherent legalframework for licencing SSPs)
County/WSTF projectfinancing agreementsCounty financing of similarlyidentified projects (WRM,WS/SAN)
No 0 0 0 0 0 0 0 1 0
123
# County budgets and co-financing of joint WSTF/county efforts(WRM/WS/SAN)
Co-financing/financingagreements Case studyanalysis of Countycontributions to water sect
No 0 0 2 0 0 0 0 14 2
124# SSP (small service providers)recognised under serviceprovision agreements
SPAs - signed agreements No 7 0 4 0 0 0 0 16 4
125# County WRUA associationsestablished
County WRUA associationregistered
No 0 0 0 0 0 0 0 6 0
126# Intercounty/inter-WRUATransboundary MOUs signed
Signed intercounty / inter-WRUA agreements
No 0 0 0 0 00 0
6 0
127
# WSTF contributions made toimprovement toCounty/WRA/WRUA –Alignment within WDCframework
Revised WDC ModulesPrinted versions and theircirculationCase studies
No 0 1 1 0 0 0 0 1 1
13
HUMAN RIGHTS/GENDER EQUITYAND SOCIALINCLUSIONCounty hascapacity to recordand address theneeds of theunderserved,ensuring GESI
131# Counties with GESIguidelines
County WRM, WS/SAN M&EreportsCase studies
Assumescoherentdelineation ofreporting on WUperformancebetweenWASREB andCounties
No 0 0 0 0 0 0 0 6 0
132# Counties with M&Eproviding disaggregated data(in access to WRM,WS/SAN)
County WRM, WS/SAN M&Ereports
No 0 0 0 0 0 0 0 6 0
WATER SECTOR TRUST FUND RESULTS FRAMEWORK
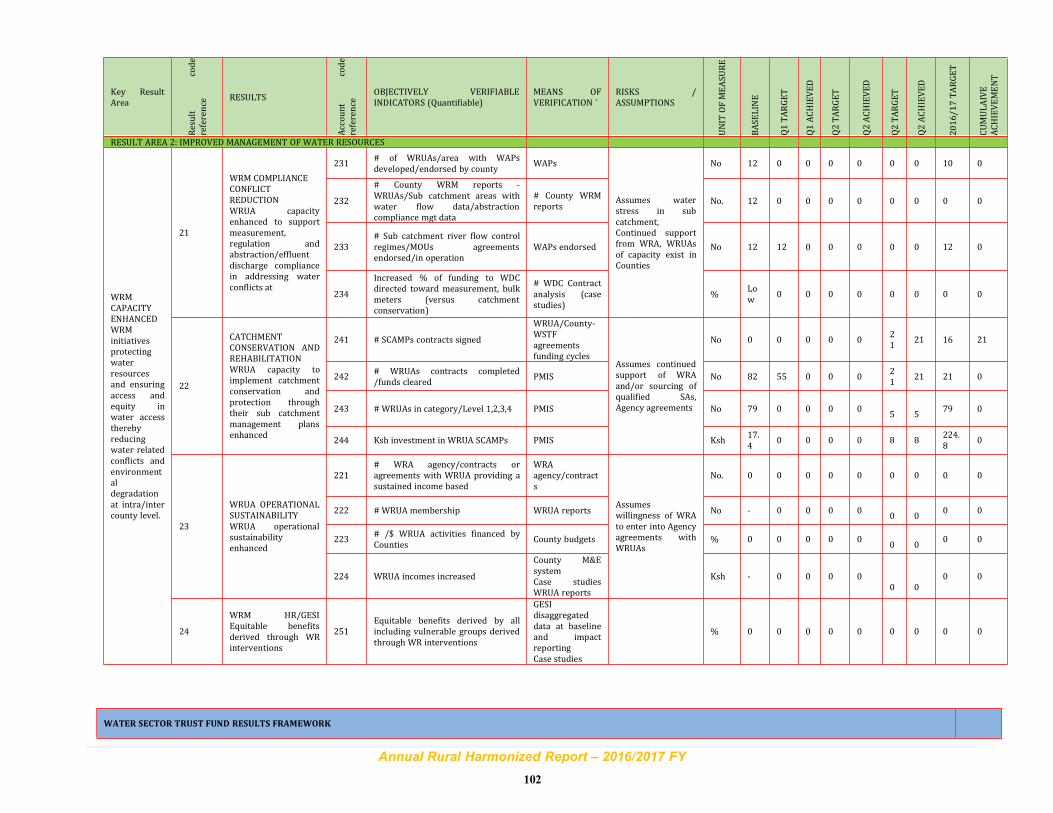
Annual Rural Harmonized Report – 2016/2017 FY
102
WATER SECTOR TRUST FUND RESULTS FRAMEWORK
Key ResultArea
Result
code
reference
RESULTS
Account
code
reference
OBJECTIVELY VERIFIABLEINDICATORS (Quantifiable)
MEANS OFVERIFICATION `
RISKS /ASSUMPTIONS
UNIT
OFMEASURE
BASELINE
Q1TARGET
Q1ACHIEVED
Q2TARGET
Q2ACHIEVED
Q2TARGET
Q2ACHIEVED
2016/17TARGET
CUMULAIVE
ACHIEVEMENT
RESULT AREA 2: IMPROVED MANAGEMENT OFWATER RESOURCES
WRMCAPACITYENHANCEDWRMinitiativesprotectingwaterresourcesand ensuringaccess andequity inwater accesstherebyreducingwater relatedconflicts andenvironmentaldegradationat intra/intercounty level.
21
WRM COMPLIANCECONFLICTREDUCTIONWRUA capacityenhanced to supportmeasurement,regulation andabstraction/effluentdischarge compliancein addressing waterconflicts at
231# of WRUAs/area with WAPsdeveloped/endorsed by county
WAPs
Assumes waterstress in subcatchment,Continued supportfrom WRA, WRUAsof capacity exist inCounties
No 12 0 0 0 0 0 0 10 0
232
# County WRM reports -WRUAs/Sub catchment areas withwater flow data/abstractioncompliance mgt data
# County WRMreports
No. 12 0 0 0 0 0 0 0 0
233# Sub catchment river flow controlregimes/MOUs agreementsendorsed/in operation
WAPs endorsed No 12 12 0 0 0 0 0 12 0
234
Increased % of funding to WDCdirected toward measurement, bulkmeters (versus catchmentconservation)
# WDC Contractanalysis (casestudies)
%Low
0 0 0 0 0 0 0 0
22
CATCHMENTCONSERVATION ANDREHABILITATIONWRUA capacity toimplement catchmentconservation andprotection throughtheir sub catchmentmanagement plansenhanced
241 # SCAMPs contracts signed
WRUA/County-WSTFagreementsfunding cycles
Assumes continuedsupport of WRAand/or sourcing ofqualified SAs,Agency agreements
No 0 0 0 0 021
21 16 21
242# WRUAs contracts completed/funds cleared
PMIS No 82 55 0 0 021
21 21 0
243 # WRUAs in category/Level 1,2,3,4 PMIS No 79 0 0 0 05 5
79 0
244 Ksh investment in WRUA SCAMPs PMIS Ksh17.4
0 0 0 0 8 8224.8
0
23
WRUA OPERATIONALSUSTAINABILITYWRUA operationalsustainabilityenhanced
221# WRA agency/contracts oragreements with WRUA providing asustained income based
WRAagency/contracts
Assumeswillingness of WRAto enter into Agencyagreements withWRUAs
No. 0 0 0 0 0 0 0 0 0
222 # WRUA membership WRUA reports No - 0 0 0 00 0
0 0
223# /$ WRUA activities financed byCounties
County budgets % 0 0 0 0 00 0
0 0
224 WRUA incomes increased
County M&EsystemCase studiesWRUA reports
Ksh - 0 0 0 00 0
0 0
24
WRM HR/GESIEquitable benefitsderived through WRinterventions
251Equitable benefits derived by allincluding vulnerable groups derivedthrough WR interventions
GESIdisaggregateddata at baselineand impactreportingCase studies
% 0 0 0 0 0 0 0 0 0
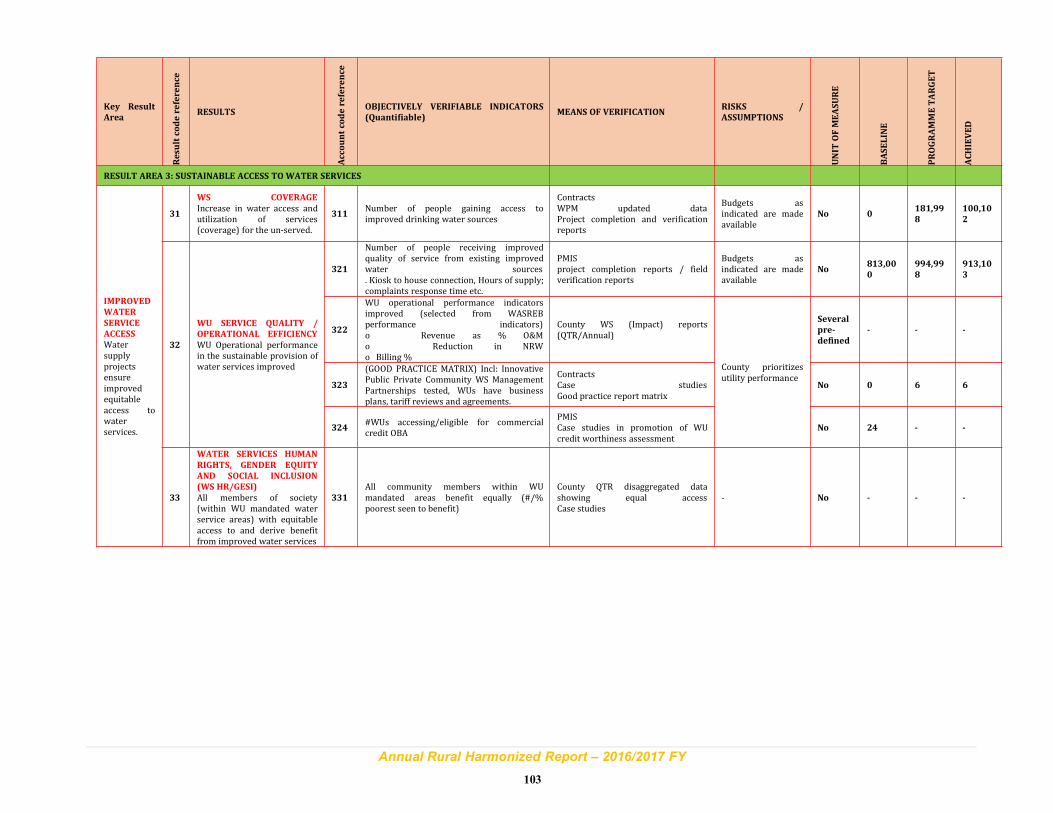
Annual Rural Harmonized Report – 2016/2017 FY
103
Key Result
Area
Resultcodereference
RESULTS
Accountcodereference
OBJECTIVELY VERIFIABLE INDICATORS
(Quantifiable)MEANS OF VERIFICATION
RISKS /
ASSUMPTIONS
UNITOFMEASURE
BASELINE
PROGRAMMETARGET
ACHIEVED
RESULT AREA 3: SUSTAINABLE ACCESS TOWATER SERVICES
IMPROVED
WATER
SERVICE
ACCESS
Watersupplyprojectsensureimprovedequitableaccess towaterservices.
31
WS COVERAGE
Increase in water access andutilization of services(coverage) for the un-served.
311Number of people gaining access toimproved drinking water sources
ContractsWPM updated dataProject completion and verificationreports
Budgets asindicated are madeavailable
No 0181,99
8
100,10
2
32
WU SERVICE QUALITY /
OPERATIONAL EFFICIENCY
WU Operational performancein the sustainable provision ofwater services improved
321
Number of people receiving improvedquality of service from existing improvedwater sources. Kiosk to house connection, Hours of supply;complaints response time etc.
PMISproject completion reports / fieldverification reports
Budgets asindicated are madeavailable
No813,00
0
994,99
8
913,10
3
322
WU operational performance indicatorsimproved (selected from WASREBperformance indicators)o Revenue as % O&Mo Reduction in NRWo Billing %
County WS (Impact) reports(QTR/Annual)
County prioritizesutility performance
Several
pre-
defined
- - -
323
(GOOD PRACTICE MATRIX) Incl: InnovativePublic Private Community WS ManagementPartnerships tested, WUs have businessplans, tariff reviews and agreements.
ContractsCase studiesGood practice report matrix
No 0 6 6
324#WUs accessing/eligible for commercialcredit OBA
PMISCase studies in promotion of WUcredit worthiness assessment
No 24 - -
33
WATER SERVICES HUMAN
RIGHTS, GENDER EQUITY
AND SOCIAL INCLUSION
(WS HR/GESI)
All members of society(within WU mandated waterservice areas) with equitableaccess to and derive benefitfrom improved water services
331
All community members within WUmandated areas benefit equally (#/%poorest seen to benefit)
County QTR disaggregated datashowing equal accessCase studies
- No - - -
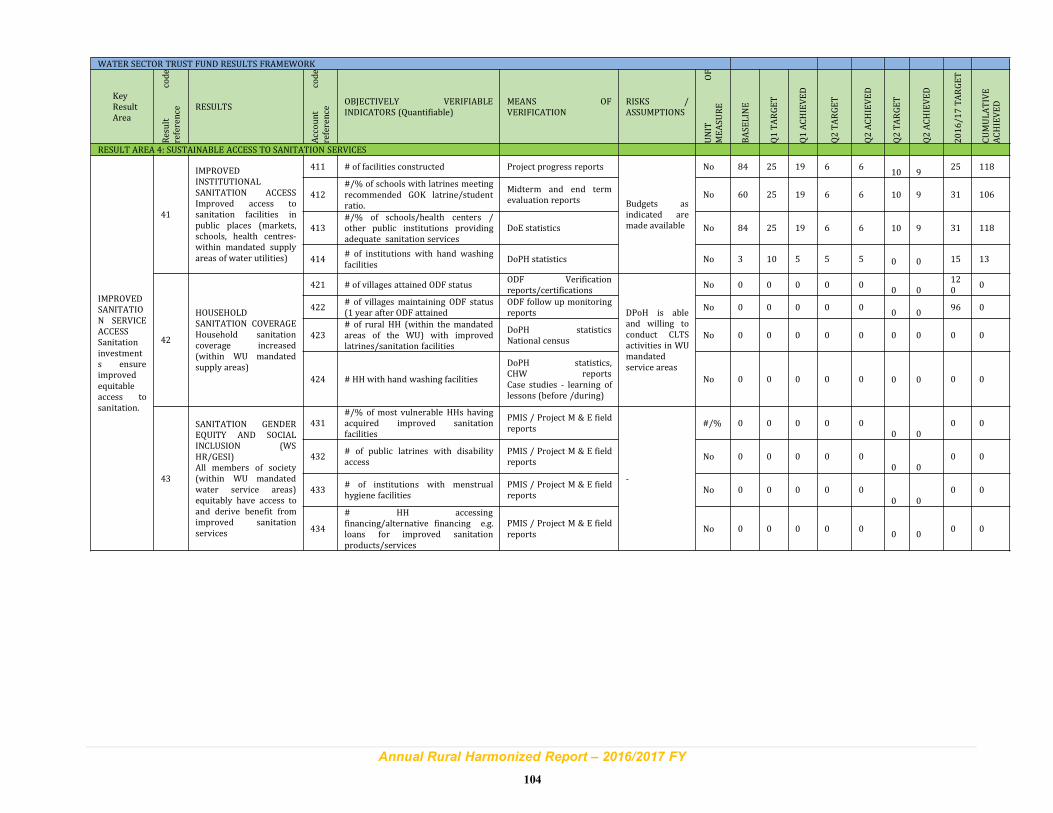
Annual Rural Harmonized Report – 2016/2017 FY
104
WATER SECTOR TRUST FUND RESULTS FRAMEWORK
KeyResultArea
Result
code
reference
RESULTS
Account
code
reference
OBJECTIVELY VERIFIABLEINDICATORS (Quantifiable)
MEANS OFVERIFICATION
RISKS /ASSUMPTIONS
UNIT
OF
MEASURE
BASELINE
Q1TARGET
Q1ACHIEVED
Q2TARGET
Q2ACHIEVED
Q2TARGET
Q2ACHIEVED
2016/17TARGET
CUMULATIVE
ACHIEVED
RESULT AREA 4: SUSTAINABLE ACCESS TO SANITATION SERVICES
IMPROVEDSANITATION SERVICEACCESSSanitationinvestments ensureimprovedequitableaccess tosanitation.
41
IMPROVEDINSTITUTIONALSANITATION ACCESSImproved access tosanitation facilities inpublic places (markets,schools, health centres-within mandated supplyareas of water utilities)
411 # of facilities constructed Project progress reports
Budgets asindicated aremade available
No 84 25 19 6 610 9
25 118
412#/% of schools with latrines meetingrecommended GOK latrine/studentratio.
Midterm and end termevaluation reports
No 60 25 19 6 6 10 9 31 106
413#/% of schools/health centers /other public institutions providingadequate sanitation services
DoE statistics No 84 25 19 6 6 10 9 31 118
414# of institutions with hand washingfacilities
DoPH statistics No 3 10 5 5 5 0 0 15 13
42
HOUSEHOLDSANITATION COVERAGEHousehold sanitationcoverage increased(within WU mandatedsupply areas)
421 # of villages attained ODF statusODF Verificationreports/certifications
DPoH is ableand willing toconduct CLTSactivities in WUmandatedservice areas
No 0 0 0 0 00 0
120
0
422# of villages maintaining ODF status(1 year after ODF attained
ODF follow up monitoringreports
No 0 0 0 0 00 0
96 0
423# of rural HH (within the mandatedareas of the WU) with improvedlatrines/sanitation facilities
DoPH statisticsNational census
No 0 0 0 0 0 0 0 0 0
424 # HH with hand washing facilities
DoPH statistics,CHW reportsCase studies - learning oflessons (before /during)
No 0 0 0 0 0 0 0 0 0
43
SANITATION GENDEREQUITY AND SOCIALINCLUSION (WSHR/GESI)All members of society(within WU mandatedwater service areas)equitably have access toand derive benefit fromimproved sanitationservices
431#/% of most vulnerable HHs havingacquired improved sanitationfacilities
PMIS / Project M & E fieldreports
-
#/% 0 0 0 0 00 0
0 0
432# of public latrines with disabilityaccess
PMIS / Project M & E fieldreports
No 0 0 0 0 00 0
0 0
433# of institutions with menstrualhygiene facilities
PMIS / Project M & E fieldreports
No 0 0 0 0 00 0
0 0
434
# HH accessingfinancing/alternative financing e.g.loans for improved sanitationproducts/services
PMIS / Project M & E fieldreports
No 0 0 0 0 00 0
0 0
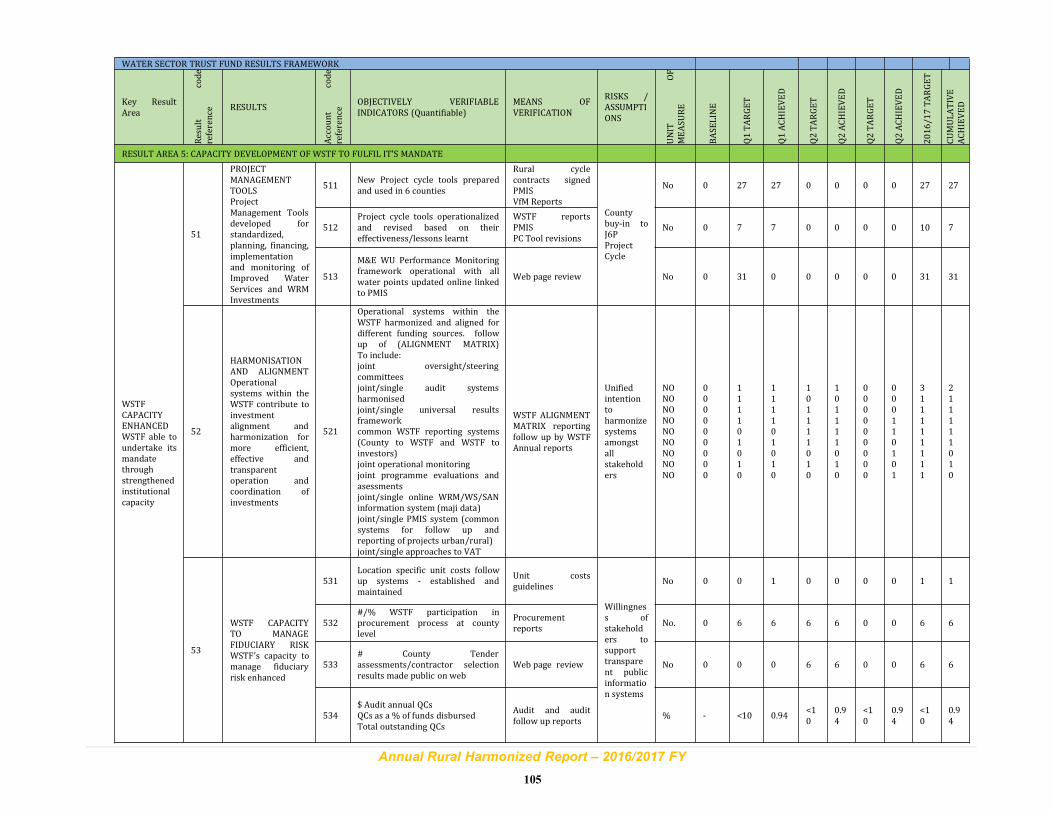
Annual Rural Harmonized Report – 2016/2017 FY
105
WATER SECTOR TRUST FUND RESULTS FRAMEWORK
Key ResultArea
Result
code
reference
RESULTS
Account
code
reference
OBJECTIVELY VERIFIABLEINDICATORS (Quantifiable)
MEANS OFVERIFICATION
RISKS /ASSUMPTIONS
UNIT
OF
MEASURE
BASELINE
Q1TARGET
Q1ACHIEVED
Q2TARGET
Q2ACHIEVED
Q2TARGET
Q2ACHIEVED
2016/17TARGET
CUMULATIVE
ACHIEVED
RESULT AREA 5: CAPACITY DEVELOPMENT OFWSTF TO FULFIL IT'S MANDATE
WSTFCAPACITYENHANCEDWSTF able toundertake itsmandatethroughstrengthenedinstitutionalcapacity
51
PROJECTMANAGEMENTTOOLSProjectManagement Toolsdeveloped forstandardized,planning, financing,implementationand monitoring ofImproved WaterServices and WRMInvestments
511New Project cycle tools preparedand used in 6 counties
Rural cyclecontracts signedPMISVfM Reports
Countybuy-in toJ6PProjectCycle
No 0 27 27 0 0 0 0 27 27
512Project cycle tools operationalizedand revised based on theireffectiveness/lessons learnt
WSTF reportsPMISPC Tool revisions
No 0 7 7 0 0 0 0 10 7
513
M&E WU Performance Monitoringframework operational with allwater points updated online linkedto PMIS
Web page review No 0 31 0 0 0 0 0 31 31
52
HARMONISATIONAND ALIGNMENTOperationalsystems within theWSTF contribute toinvestmentalignment andharmonization formore efficient,effective andtransparentoperation andcoordination ofinvestments
521
Operational systems within theWSTF harmonized and aligned fordifferent funding sources. followup of (ALIGNMENT MATRIX)To include:joint oversight/steeringcommitteesjoint/single audit systemsharmonisedjoint/single universal resultsframeworkcommon WSTF reporting systems(County to WSTF and WSTF toinvestors)joint operational monitoringjoint programme evaluations andasessmentsjoint/single online WRM/WS/SANinformation system (maji data)joint/single PMIS system (commonsystems for follow up andreporting of projects urban/rural)joint/single approaches to VAT
WSTF ALIGNMENTMATRIX reportingfollow up by WSTFAnnual reports
Unifiedintentiontoharmonizesystemsamongstallstakeholders
NONONONONONONONONO
000000000
111101010
111101010
101111010
101111010
000000000
000110101
311111111
211111010
53
WSTF CAPACITYTO MANAGEFIDUCIARY RISKWSTF’s capacity tomanage fiduciaryrisk enhanced
531Location specific unit costs followup systems - established andmaintained
Unit costsguidelines
Willingness ofstakeholders tosupporttransparent publicinformation systems
No 0 0 1 0 0 0 0 1 1
532#/% WSTF participation inprocurement process at countylevel
Procurementreports
No. 0 6 6 6 6 0 0 6 6
533# County Tenderassessments/contractor selectionresults made public on web
Web page review No 0 0 0 6 6 0 0 6 6
534$ Audit annual QCsQCs as a % of funds disbursedTotal outstanding QCs
Audit and auditfollow up reports
% - <10 0.94<10
0.94
<10
0.94
<10
0.94
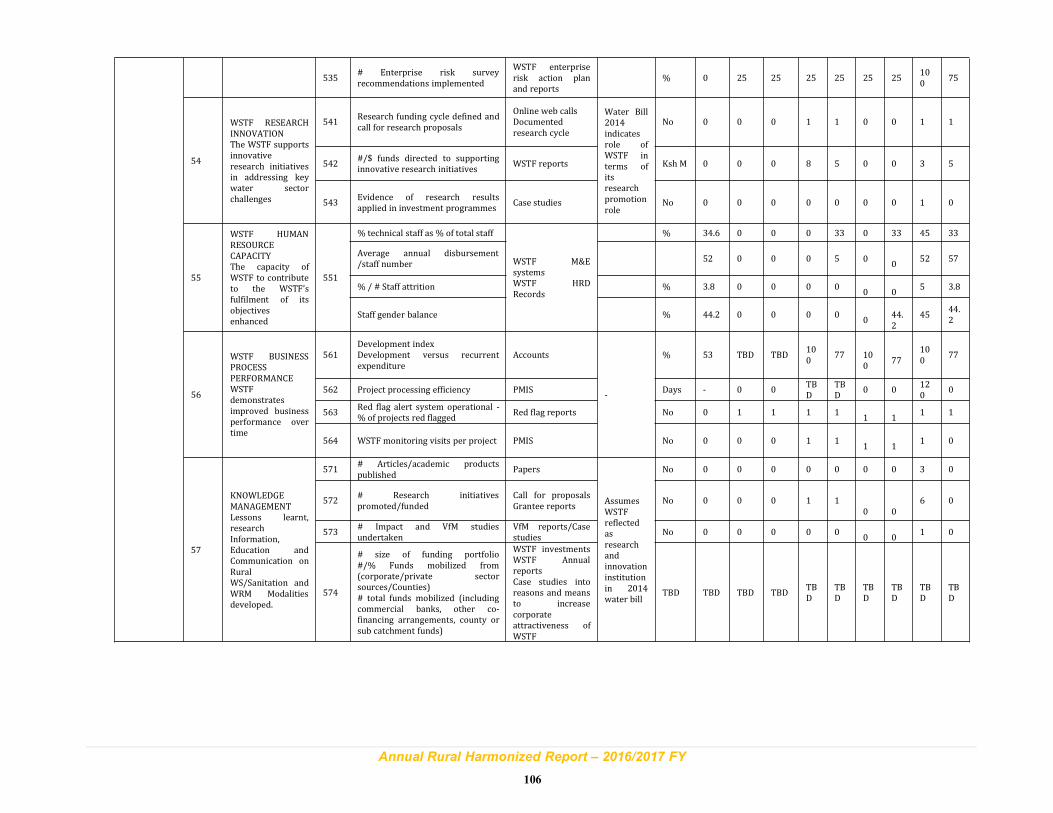
Annual Rural Harmonized Report – 2016/2017 FY
106
535# Enterprise risk surveyrecommendations implemented
WSTF enterpriserisk action planand reports
% 0 25 25 25 25 25 25100
75
54
WSTF RESEARCHINNOVATIONThe WSTF supportsinnovativeresearch initiativesin addressing keywater sectorchallenges
541Research funding cycle defined andcall for research proposals
Online web callsDocumentedresearch cycle
Water Bill2014indicatesrole ofWSTF interms ofitsresearchpromotionrole
No 0 0 0 1 1 0 0 1 1
542#/$ funds directed to supportinginnovative research initiatives
WSTF reports Ksh M 0 0 0 8 5 0 0 3 5
543Evidence of research resultsapplied in investment programmes
Case studies No 0 0 0 0 0 0 0 1 0
55
WSTF HUMANRESOURCECAPACITYThe capacity ofWSTF to contributeto the WSTF’sfulfilment of itsobjectivesenhanced
551
% technical staff as % of total staff
WSTF M&EsystemsWSTF HRDRecords
% 34.6 0 0 0 33 0 33 45 33
Average annual disbursement/staff number
52 0 0 0 5 00
52 57
% / # Staff attrition % 3.8 0 0 0 00 0
5 3.8
Staff gender balance % 44.2 0 0 0 00
44.2
4544.2
56
WSTF BUSINESSPROCESSPERFORMANCEWSTFdemonstratesimproved businessperformance overtime
561Development indexDevelopment versus recurrentexpenditure
Accounts
-
% 53 TBD TBD100
77 100
77100
77
562 Project processing efficiency PMIS Days - 0 0TBD
TBD
0 0120
0
563Red flag alert system operational -% of projects red flagged
Red flag reports No 0 1 1 1 11 1
1 1
564 WSTF monitoring visits per project PMIS No 0 0 0 1 11 1
1 0
57
KNOWLEDGEMANAGEMENTLessons learnt,researchInformation,Education andCommunication onRuralWS/Sanitation andWRM Modalitiesdeveloped.
571# Articles/academic productspublished
Papers
AssumesWSTFreflectedasresearchandinnovationinstitutionin 2014water bill
No 0 0 0 0 0 0 0 3 0
572# Research initiativespromoted/funded
Call for proposalsGrantee reports
No 0 0 0 1 10 0
6 0
573# Impact and VfM studiesundertaken
VfM reports/Casestudies
No 0 0 0 0 00 0
1 0
574
# size of funding portfolio#/% Funds mobilized from(corporate/private sectorsources/Counties)# total funds mobilized (includingcommercial banks, other co-financing arrangements, county orsub catchment funds)
WSTF investmentsWSTF AnnualreportsCase studies intoreasons and meansto increasecorporateattractiveness ofWSTF
TBD TBD TBD TBDTBD
TBD
TBD
TBD
TBD
TBD
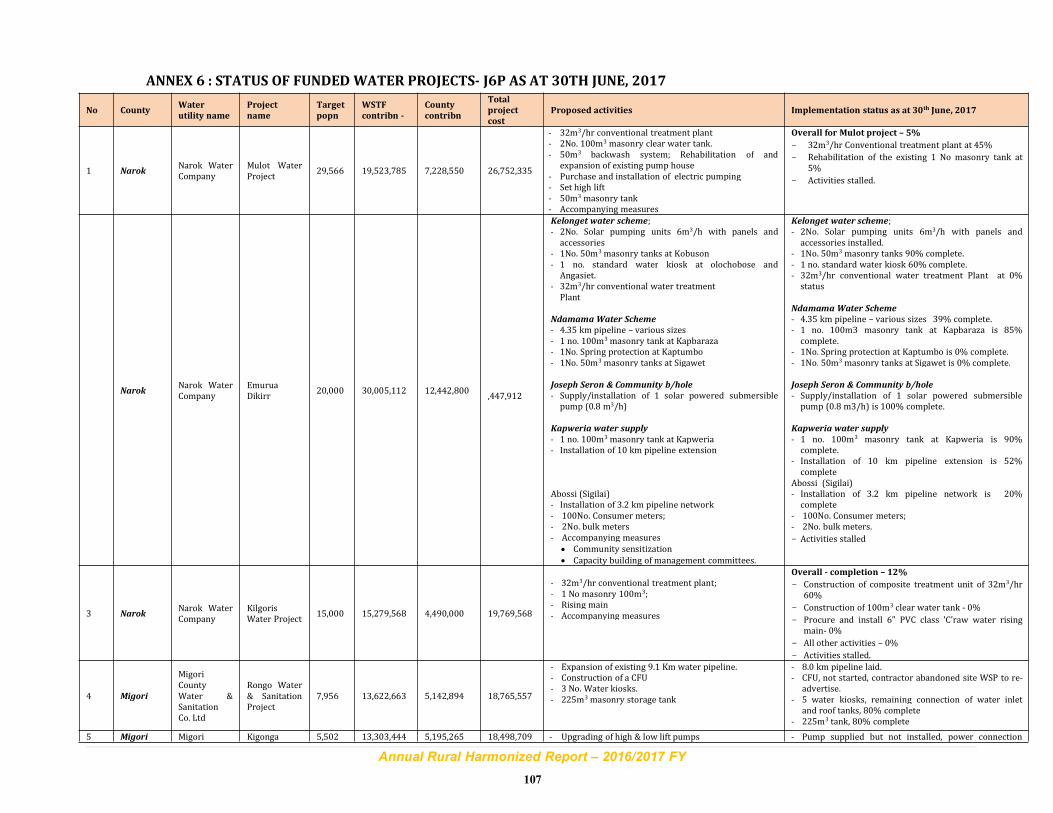
Annual Rural Harmonized Report – 2016/2017 FY
107
ANNEX 6 : STATUS OF FUNDEDWATER PROJECTS- J6P AS AT 30TH JUNE, 2017
No CountyWater
utility name
Project
name
Target
popn
WSTF
contribn -
County
contribn
Total
project
cost
Proposed activities Implementation status as at 30th June, 2017
1 NarokNarok WaterCompany
Mulot WaterProject
29,566 19,523,785 7,228,550 26,752,335
- 32m3/hr conventional treatment plant- 2No. 100m3 masonry clear water tank.- 50m3 backwash system; Rehabilitation of and
expansion of existing pump house- Purchase and installation of electric pumping- Set high lift- 50m3 masonry tank- Accompanying measures
Overall for Mulot project – 5%
- 32m3/hr Conventional treatment plant at 45%
- Rehabilitation of the existing 1 No masonry tank at5%
- Activities stalled.
NarokNarok WaterCompany
EmuruaDikirr
20,000 30,005,112 12,442,800,447,912
Kelonget water scheme;- 2No. Solar pumping units 6m3/h with panels andaccessories
- 1No. 50m3masonry tanks at Kobuson- 1 no. standard water kiosk at olochobose andAngasiet.
- 32m3/hr conventional water treatmentPlant
Ndamama Water Scheme
- 4.35 km pipeline – various sizes- 1 no. 100m3masonry tank at Kapbaraza- 1No. Spring protection at Kaptumbo- 1No. 50m3masonry tanks at Sigawet
Joseph Seron & Community b/hole
- Supply/installation of 1 solar powered submersiblepump (0.8 m3/h)
Kapweria water supply
- 1 no. 100m3masonry tank at Kapweria- Installation of 10 km pipeline extension
Abossi (Sigilai)- Installation of 3.2 km pipeline network- 100No. Consumer meters;- 2No. bulk meters- Accompanying measures
• Community sensitization
• Capacity building of management committees.
Kelonget water scheme;- 2No. Solar pumping units 6m3/h with panels andaccessories installed.
- 1No. 50m3 masonry tanks 90% complete.- 1 no. standard water kiosk 60% complete.- 32m3/hr conventional water treatment Plant at 0%status
Ndamama Water Scheme
- 4.35 km pipeline – various sizes 39% complete.- 1 no. 100m3 masonry tank at Kapbaraza is 85%complete.
- 1No. Spring protection at Kaptumbo is 0% complete.- 1No. 50m3 masonry tanks at Sigawet is 0% complete.
Joseph Seron & Community b/hole
- Supply/installation of 1 solar powered submersiblepump (0.8 m3/h) is 100% complete.
Kapweria water supply
- 1 no. 100m3 masonry tank at Kapweria is 90%complete.
- Installation of 10 km pipeline extension is 52%complete
Abossi (Sigilai)- Installation of 3.2 km pipeline network is 20%complete
- 100No. Consumer meters;- 2No. bulk meters.
- Activities stalled
3 NarokNarok WaterCompany
KilgorisWater Project
15,000 15,279,568 4,490,000 19,769,568
- 32m3/hr conventional treatment plant;- 1 No masonry 100m3;- Rising main- Accompanying measures
Overall - completion – 12%
- Construction of composite treatment unit of 32m3/hr60%
- Construction of 100m3 clear water tank - 0%
- Procure and install 6" PVC class 'C'raw water risingmain- 0%
- All other activities – 0%
- Activities stalled.
4 Migori
MigoriCountyWater &SanitationCo. Ltd
Rongo Water& SanitationProject
7,956 13,622,663 5,142,894 18,765,557
- Expansion of existing 9.1 Km water pipeline.- Construction of a CFU- 3 No. Water kiosks.- 225m3masonry storage tank
- 8.0 km pipeline laid.- CFU, not started, contractor abandoned site WSP to re-
advertise.- 5 water kiosks, remaining connection of water inlet
and roof tanks, 80% complete- 225m3 tank, 80% complete
5 Migori Migori Kigonga 5,502 13,303,444 5,195,265 18,498,709 - Upgrading of high & low lift pumps - Pump supplied but not installed, power connection
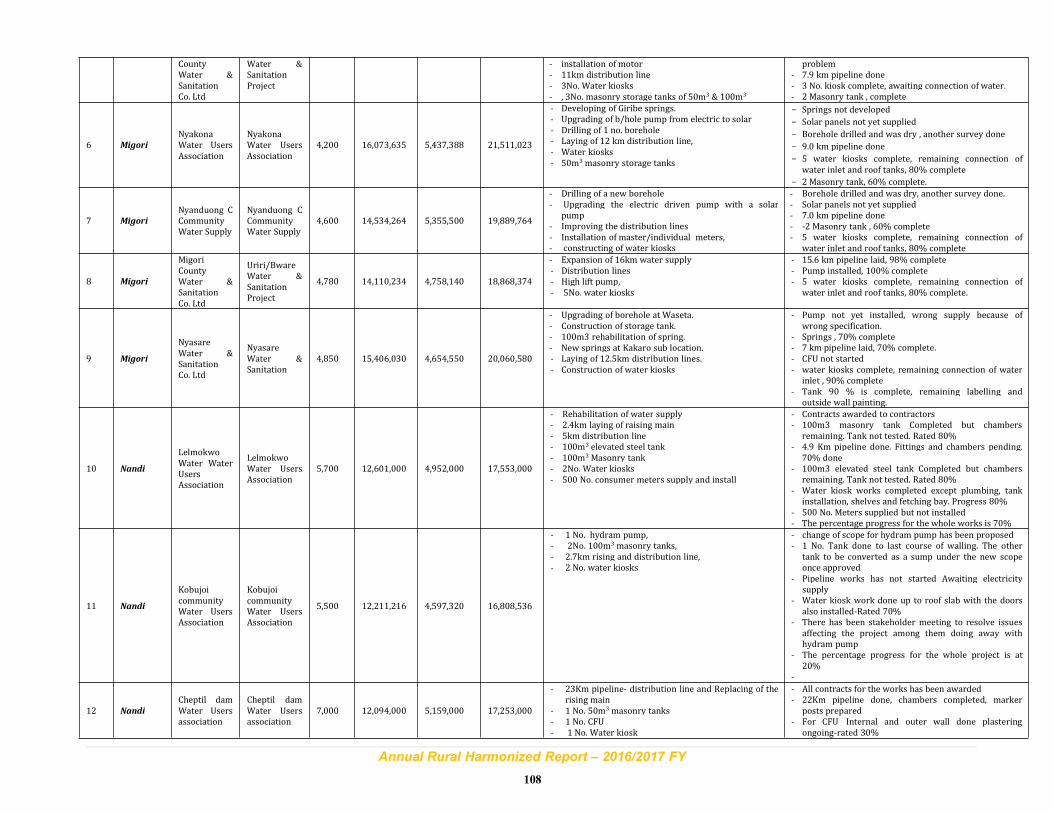
Annual Rural Harmonized Report – 2016/2017 FY
108
CountyWater &SanitationCo. Ltd
Water &SanitationProject
- installation of motor- 11km distribution line- 3No. Water kiosks- , 3No. masonry storage tanks of 50m3 & 100m3
problem- 7.9 km pipeline done- 3 No. kiosk complete, awaiting connection of water.- 2 Masonry tank , complete
6 Migori
NyakonaWater UsersAssociation
NyakonaWater UsersAssociation
4,200 16,073,635 5,437,388 21,511,023
- Developing of Giribe springs.- Upgrading of b/hole pump from electric to solar- Drilling of 1 no. borehole- Laying of 12 km distribution line,- Water kiosks- 50m3 masonry storage tanks
- Springs not developed
- Solar panels not yet supplied
- Borehole drilled and was dry , another survey done
- 9.0 km pipeline done
- 5 water kiosks complete, remaining connection ofwater inlet and roof tanks, 80% complete
- 2 Masonry tank, 60% complete.
7 Migori
Nyanduong CCommunityWater Supply
Nyanduong CCommunityWater Supply
4,600 14,534,264 5,355,500 19,889,764
- Drilling of a new borehole- Upgrading the electric driven pump with a solar
pump- Improving the distribution lines- Installation of master/individual meters,- constructing of water kiosks
- Borehole drilled and was dry, another survey done.- Solar panels not yet supplied- 7.0 km pipeline done- -2 Masonry tank , 60% complete- 5 water kiosks complete, remaining connection of
water inlet and roof tanks, 80% complete
8 Migori
MigoriCountyWater &SanitationCo. Ltd
Uriri/BwareWater &SanitationProject
4,780 14,110,234 4,758,140 18,868,374
- Expansion of 16km water supply- Distribution lines- High lift pump,- 5No. water kiosks
- 15.6 km pipeline laid, 98% complete- Pump installed, 100% complete- 5 water kiosks complete, remaining connection of
water inlet and roof tanks, 80% complete.
9 Migori
NyasareWater &SanitationCo. Ltd
NyasareWater &Sanitation
4,850 15,406,030 4,654,550 20,060,580
- Upgrading of borehole at Waseta.- Construction of storage tank.- 100m3 rehabilitation of spring.- New springs at Kakaro sub location.- Laying of 12.5km distribution lines.- Construction of water kiosks
- Pump not yet installed, wrong supply because ofwrong specification.
- Springs , 70% complete- 7 km pipeline laid, 70% complete.- CFU not started- water kiosks complete, remaining connection of water
inlet , 90% complete- Tank 90 % is complete, remaining labelling and
outside wall painting.
10 Nandi
LelmokwoWater WaterUsersAssociation
LelmokwoWater UsersAssociation
5,700 12,601,000 4,952,000 17,553,000
- Rehabilitation of water supply- 2.4km laying of raising main- 5km distribution line- 100m3 elevated steel tank- 100m3Masonry tank- 2No. Water kiosks- 500 No. consumer meters supply and install
- Contracts awarded to contractors- 100m3 masonry tank Completed but chambers
remaining. Tank not tested. Rated 80%- 4.9 Km pipeline done. Fittings and chambers pending.
70% done- 100m3 elevated steel tank Completed but chambers
remaining. Tank not tested. Rated 80%- Water kiosk works completed except plumbing, tank
installation, shelves and fetching bay. Progress 80%- 500 No. Meters supplied but not installed- The percentage progress for the whole works is 70%
11 Nandi
KobujoicommunityWater UsersAssociation
KobujoicommunityWater UsersAssociation
5,500 12,211,216 4,597,320 16,808,536
- 1 No. hydram pump,- 2No. 100m3 masonry tanks,- 2.7km rising and distribution line,- 2 No. water kiosks
- change of scope for hydram pump has been proposed- 1 No. Tank done to last course of walling. The other
tank to be converted as a sump under the new scopeonce approved
- Pipeline works has not started Awaiting electricitysupply
- Water kiosk work done up to roof slab with the doorsalso installed-Rated 70%
- There has been stakeholder meeting to resolve issuesaffecting the project among them doing away withhydram pump
- The percentage progress for the whole project is at20%
-
12 Nandi
Cheptil damWater Usersassociation
Cheptil damWater Usersassociation
7,000 12,094,000 5,159,000 17,253,000
- 23Km pipeline- distribution line and Replacing of therising main
- 1 No. 50m3 masonry tanks- 1 No. CFU- 1 No. Water kiosk
- All contracts for the works has been awarded- 22Km pipeline done, chambers completed, marker
posts prepared- For CFU Internal and outer wall done plastering
ongoing-rated 30%
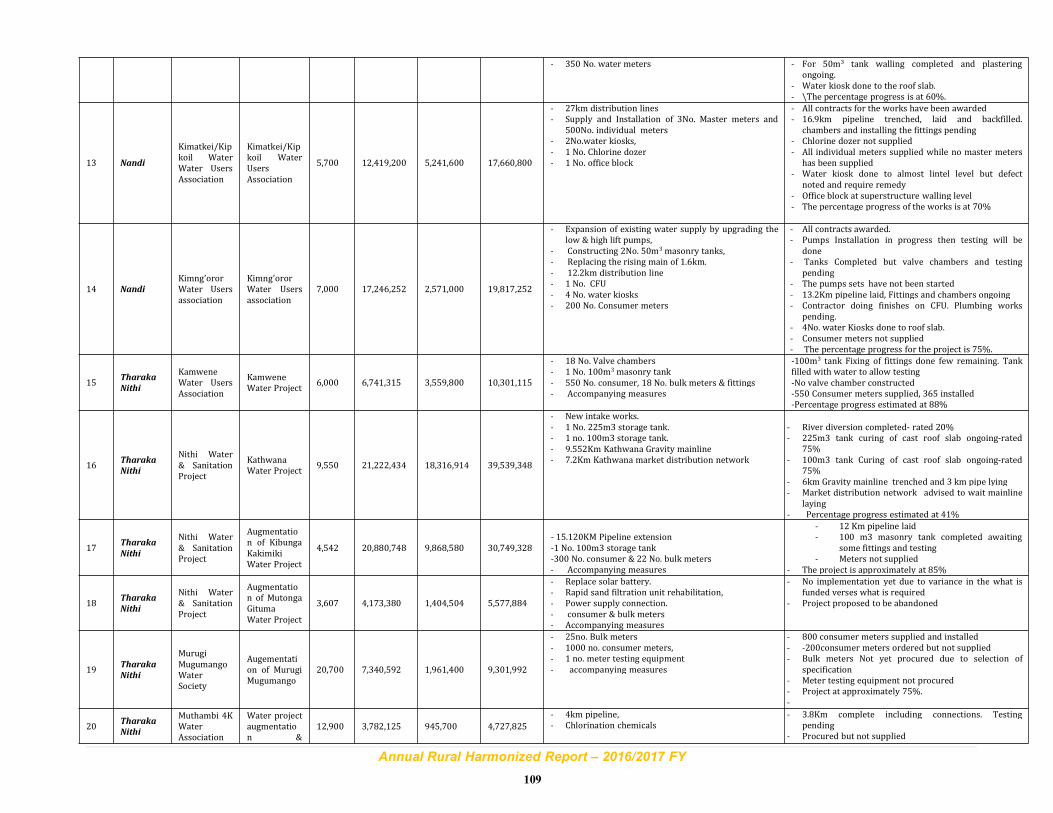
Annual Rural Harmonized Report – 2016/2017 FY
109
- 350 No. water meters - For 50m3 tank walling completed and plasteringongoing.
- Water kiosk done to the roof slab.- \The percentage progress is at 60%.
13 Nandi
Kimatkei/Kipkoil WaterWater UsersAssociation
Kimatkei/Kipkoil WaterUsersAssociation
5,700 12,419,200 5,241,600 17,660,800
- 27km distribution lines- Supply and Installation of 3No. Master meters and
500No. individual meters- 2No.water kiosks,- 1 No. Chlorine dozer- 1 No. office block
- All contracts for the works have been awarded- 16.9km pipeline trenched, laid and backfilled.
chambers and installing the fittings pending- Chlorine dozer not supplied- All individual meters supplied while no master meters
has been supplied- Water kiosk done to almost lintel level but defect
noted and require remedy- Office block at superstructure walling level- The percentage progress of the works is at 70%
14 Nandi
Kimng’ororWater Usersassociation
Kimng’ororWater Usersassociation
7,000 17,246,252 2,571,000 19,817,252
- Expansion of existing water supply by upgrading thelow & high lift pumps,
- Constructing 2No. 50m3masonry tanks,- Replacing the rising main of 1.6km.- 12.2km distribution line- 1 No. CFU- 4 No. water kiosks- 200 No. Consumer meters
- All contracts awarded.- Pumps Installation in progress then testing will be
done- Tanks Completed but valve chambers and testing
pending- The pumps sets have not been started- 13.2Km pipeline laid, Fittings and chambers ongoing- Contractor doing finishes on CFU. Plumbing works
pending.- 4No. water Kiosks done to roof slab.- Consumer meters not supplied- The percentage progress for the project is 75%.
15Tharaka
Nithi
KamweneWater UsersAssociation
KamweneWater Project
6,000 6,741,315 3,559,800 10,301,115
- 18 No. Valve chambers- 1 No. 100m3 masonry tank- 550 No. consumer, 18 No. bulk meters & fittings- Accompanying measures
-100m3 tank Fixing of fittings done few remaining. Tankfilled with water to allow testing-No valve chamber constructed-550 Consumer meters supplied, 365 installed-Percentage progress estimated at 88%
16Tharaka
Nithi
Nithi Water& SanitationProject
KathwanaWater Project
9,550 21,222,434 18,316,914 39,539,348
- New intake works.- 1 No. 225m3 storage tank.- 1 no. 100m3 storage tank.- 9.552Km Kathwana Gravity mainline- 7.2Km Kathwana market distribution network
- River diversion completed- rated 20%- 225m3 tank curing of cast roof slab ongoing-rated
75%- 100m3 tank Curing of cast roof slab ongoing-rated
75%- 6km Gravity mainline trenched and 3 km pipe lying- Market distribution network advised to wait mainline
laying- Percentage progress estimated at 41%
17Tharaka
Nithi
Nithi Water& SanitationProject
Augmentation of KibungaKakimikiWater Project
4,542 20,880,748 9,868,580 30,749,328- 15.120KM Pipeline extension-1 No. 100m3 storage tank-300 No. consumer & 22 No. bulk meters- Accompanying measures
- 12 Km pipeline laid- 100 m3 masonry tank completed awaiting
some fittings and testing- Meters not supplied
- The project is approximately at 85%
18Tharaka
Nithi
Nithi Water& SanitationProject
Augmentation of MutongaGitumaWater Project
3,607 4,173,380 1,404,504 5,577,884
- Replace solar battery.- Rapid sand filtration unit rehabilitation,- Power supply connection.- consumer & bulk meters- Accompanying measures
- No implementation yet due to variance in the what isfunded verses what is required
- Project proposed to be abandoned
19Tharaka
Nithi
MurugiMugumangoWaterSociety
Augementation of MurugiMugumango
20,700 7,340,592 1,961,400 9,301,992
- 25no. Bulk meters- 1000 no. consumer meters,- 1 no. meter testing equipment- accompanying measures
- 800 consumer meters supplied and installed- -200consumer meters ordered but not supplied- Bulk meters Not yet procured due to selection of
specification- Meter testing equipment not procured- Project at approximately 75%.-
20Tharaka
Nithi
Muthambi 4KWaterAssociation
Water projectaugmentation &
12,900 3,782,125 945,700 4,727,825
- 4km pipeline,- Chlorination chemicals
- 3.8Km complete including connections. Testingpending
- Procured but not supplied
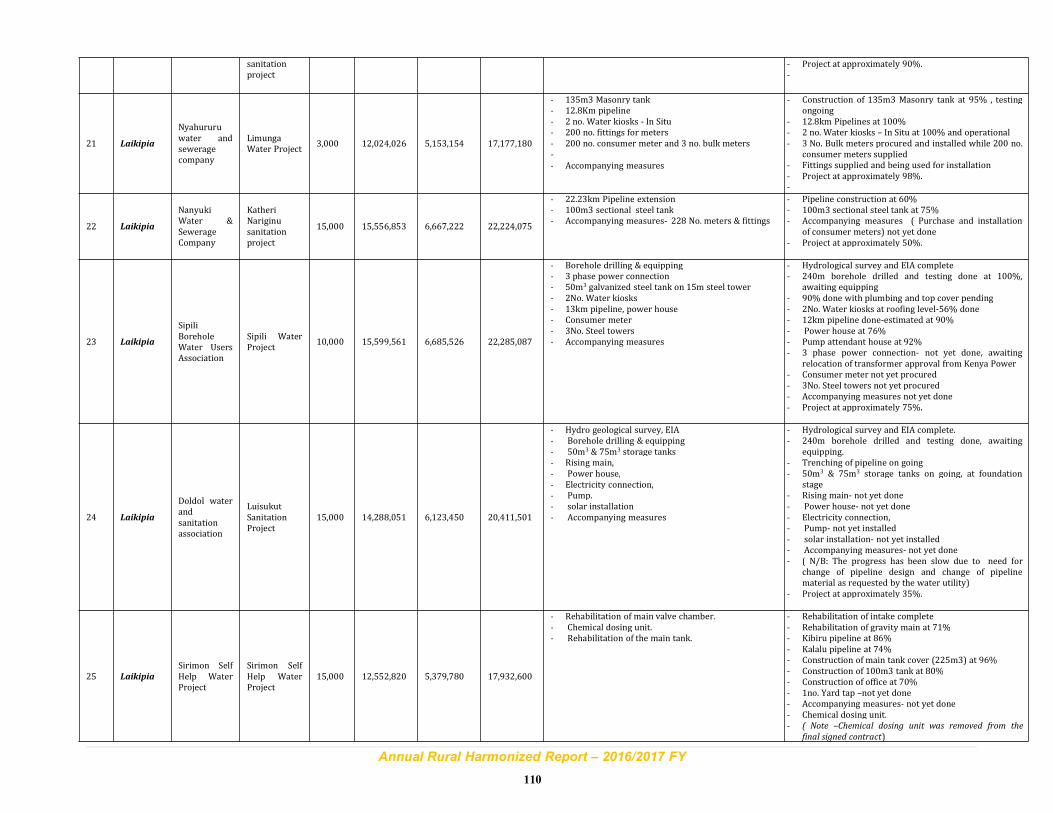
Annual Rural Harmonized Report – 2016/2017 FY
110
sanitationproject
- Project at approximately 90%.-
21 Laikipia
Nyahururuwater andseweragecompany
LimungaWater Project
3,000 12,024,026 5,153,154 17,177,180
- 135m3 Masonry tank- 12.8Km pipeline- 2 no. Water kiosks - In Situ- 200 no. fittings for meters- 200 no. consumer meter and 3 no. bulk meters-
- Accompanying measures
- Construction of 135m3 Masonry tank at 95% , testingongoing
- 12.8km Pipelines at 100%- 2 no. Water kiosks – In Situ at 100% and operational- 3 No. Bulk meters procured and installed while 200 no.
consumer meters supplied- Fittings supplied and being used for installation- Project at approximately 98%.-
22 Laikipia
NanyukiWater &SewerageCompany
KatheriNariginusanitationproject
15,000 15,556,853 6,667,222 22,224,075
- 22.23km Pipeline extension- 100m3 sectional steel tank- Accompanying measures- 228 No. meters & fittings
- Pipeline construction at 60%- 100m3 sectional steel tank at 75%- Accompanying measures ( Purchase and installation
of consumer meters) not yet done- Project at approximately 50%.
23 Laikipia
SipiliBoreholeWater UsersAssociation
Sipili WaterProject
10,000 15,599,561 6,685,526 22,285,087
- Borehole drilling & equipping- 3 phase power connection- 50m3 galvanized steel tank on 15m steel tower- 2No. Water kiosks- 13km pipeline, power house- Consumer meter- 3No. Steel towers- Accompanying measures
- Hydrological survey and EIA complete- 240m borehole drilled and testing done at 100%,
awaiting equipping- 90% done with plumbing and top cover pending- 2No. Water kiosks at roofing level-56% done- 12km pipeline done-estimated at 90%- Power house at 76%- Pump attendant house at 92%- 3 phase power connection- not yet done, awaiting
relocation of transformer approval from Kenya Power- Consumer meter not yet procured- 3No. Steel towers not yet procured- Accompanying measures not yet done- Project at approximately 75%.
24 Laikipia
Doldol waterandsanitationassociation
LuisukutSanitationProject
15,000 14,288,051 6,123,450 20,411,501
- Hydro geological survey, EIA- Borehole drilling & equipping- 50m3 & 75m3 storage tanks- Rising main,- Power house,- Electricity connection,- Pump.- solar installation- Accompanying measures
- Hydrological survey and EIA complete.- 240m borehole drilled and testing done, awaiting
equipping.- Trenching of pipeline on going- 50m3 & 75m3 storage tanks on going, at foundation
stage- Rising main- not yet done- Power house- not yet done- Electricity connection,- Pump- not yet installed- solar installation- not yet installed- Accompanying measures- not yet done- ( N/B: The progress has been slow due to need for
change of pipeline design and change of pipelinematerial as requested by the water utility)
- Project at approximately 35%.
25 Laikipia
Sirimon SelfHelp WaterProject
Sirimon SelfHelp WaterProject
15,000 12,552,820 5,379,780 17,932,600
- Rehabilitation of main valve chamber.- Chemical dosing unit.- Rehabilitation of the main tank.
- Rehabilitation of intake complete- Rehabilitation of gravity main at 71%- Kibiru pipeline at 86%- Kalalu pipeline at 74%- Construction of main tank cover (225m3) at 96%- Construction of 100m3 tank at 80%- Construction of office at 70%- 1no. Yard tap –not yet done- Accompanying measures- not yet done- Chemical dosing unit.- ( Note –Chemical dosing unit was removed from the
final signed contract)
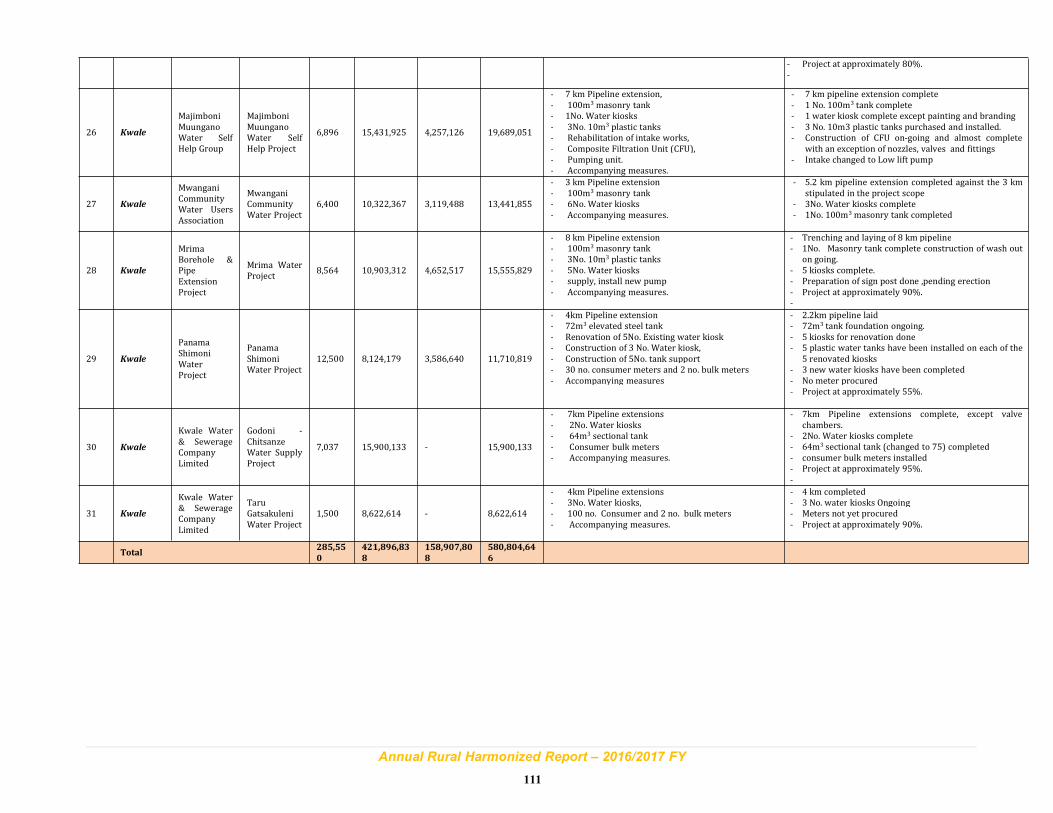
Annual Rural Harmonized Report – 2016/2017 FY
111
- Project at approximately 80%.-
26 Kwale
MajimboniMuunganoWater SelfHelp Group
MajimboniMuunganoWater SelfHelp Project
6,896 15,431,925 4,257,126 19,689,051
- 7 km Pipeline extension,- 100m3 masonry tank- 1No. Water kiosks- 3No. 10m3 plastic tanks- Rehabilitation of intake works,- Composite Filtration Unit (CFU),- Pumping unit.- Accompanying measures.
- 7 km pipeline extension complete- 1 No. 100m3 tank complete- 1 water kiosk complete except painting and branding- 3 No. 10m3 plastic tanks purchased and installed.- Construction of CFU on-going and almost complete
with an exception of nozzles, valves and fittings- Intake changed to Low lift pump
27 Kwale
MwanganiCommunityWater UsersAssociation
MwanganiCommunityWater Project
6,400 10,322,367 3,119,488 13,441,855
- 3 km Pipeline extension- 100m3 masonry tank- 6No. Water kiosks- Accompanying measures.
- 5.2 km pipeline extension completed against the 3 kmstipulated in the project scope
- 3No. Water kiosks complete- 1No. 100m3masonry tank completed
28 Kwale
MrimaBorehole &PipeExtensionProject
Mrima WaterProject
8,564 10,903,312 4,652,517 15,555,829
- 8 km Pipeline extension- 100m3 masonry tank- 3No. 10m3 plastic tanks- 5No. Water kiosks- supply, install new pump- Accompanying measures.
- Trenching and laying of 8 km pipeline- 1No. Masonry tank complete construction of wash out
on going.- 5 kiosks complete.- Preparation of sign post done ,pending erection- Project at approximately 90%.-
29 Kwale
PanamaShimoniWaterProject
PanamaShimoniWater Project
12,500 8,124,179 3,586,640 11,710,819
- 4km Pipeline extension- 72m3 elevated steel tank- Renovation of 5No. Existing water kiosk- Construction of 3 No. Water kiosk,- Construction of 5No. tank support- 30 no. consumer meters and 2 no. bulk meters- Accompanying measures
- 2.2km pipeline laid- 72m3 tank foundation ongoing.- 5 kiosks for renovation done- 5 plastic water tanks have been installed on each of the
5 renovated kiosks- 3 new water kiosks have been completed- No meter procured- Project at approximately 55%.
30 Kwale
Kwale Water& SewerageCompanyLimited
Godoni -ChitsanzeWater SupplyProject
7,037 15,900,133 - 15,900,133
- 7km Pipeline extensions- 2No. Water kiosks- 64m3 sectional tank- Consumer bulk meters- Accompanying measures.
- 7km Pipeline extensions complete, except valvechambers.
- 2No. Water kiosks complete- 64m3 sectional tank (changed to 75) completed- consumer bulk meters installed- Project at approximately 95%.-
31 Kwale
Kwale Water& SewerageCompanyLimited
TaruGatsakuleniWater Project
1,500 8,622,614 - 8,622,614
- 4km Pipeline extensions- 3No. Water kiosks,- 100 no. Consumer and 2 no. bulk meters- Accompanying measures.
- 4 km completed- 3 No. water kiosks Ongoing- Meters not yet procured- Project at approximately 90%.
Total285,55
0
421,896,83
8
158,907,80
8
580,804,64
6
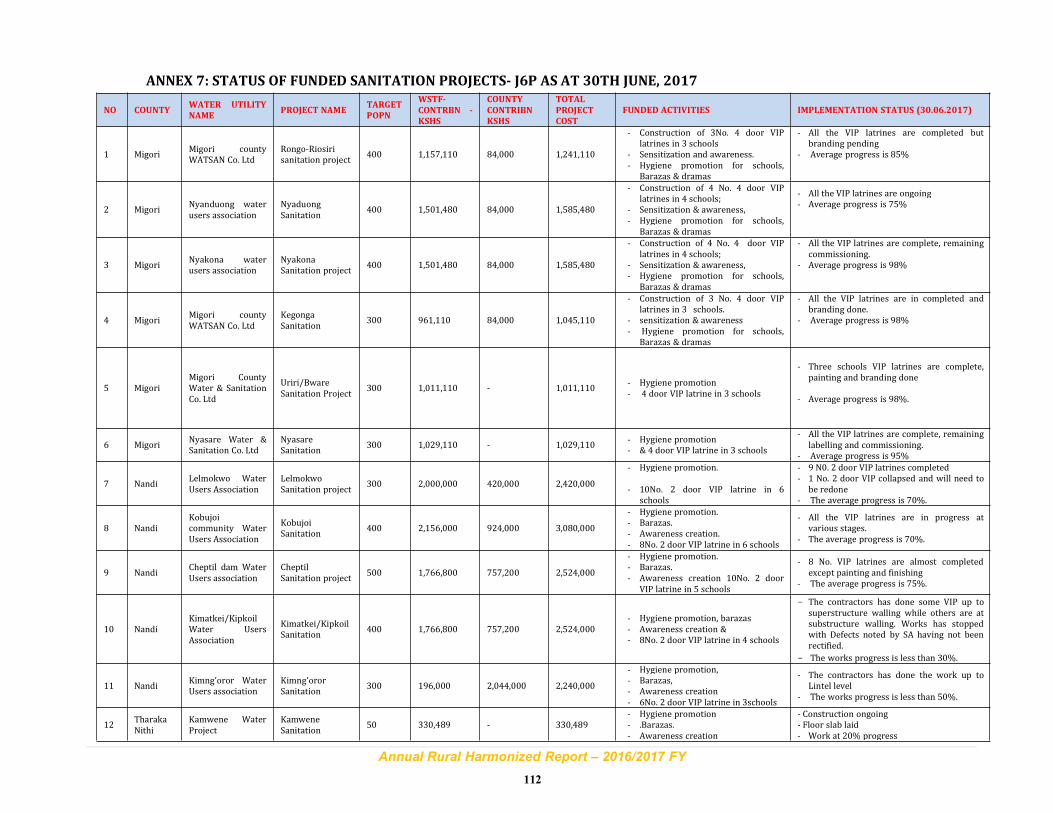
Annual Rural Harmonized Report – 2016/2017 FY
112
ANNEX 7: STATUS OF FUNDED SANITATION PROJECTS- J6P AS AT 30TH JUNE, 2017
NO COUNTYWATER UTILITY
NAMEPROJECT NAME
TARGET
POPN
WSTF-
CONTRBN -
KSHS
COUNTY
CONTRIBN
KSHS
TOTAL
PROJECT
COST
FUNDED ACTIVITIES IMPLEMENTATION STATUS (30.06.2017)
1 MigoriMigori countyWATSAN Co. Ltd
Rongo-Riosirisanitation project
400 1,157,110 84,000 1,241,110
- Construction of 3No. 4 door VIPlatrines in 3 schools
- Sensitization and awareness.- Hygiene promotion for schools,
Barazas & dramas
- All the VIP latrines are completed butbranding pending
- Average progress is 85%
2 MigoriNyanduong waterusers association
NyaduongSanitation
400 1,501,480 84,000 1,585,480
- Construction of 4 No. 4 door VIPlatrines in 4 schools;
- Sensitization & awareness,- Hygiene promotion for schools,
Barazas & dramas
- All the VIP latrines are ongoing- Average progress is 75%
3 MigoriNyakona waterusers association
NyakonaSanitation project
400 1,501,480 84,000 1,585,480
- Construction of 4 No. 4 door VIPlatrines in 4 schools;
- Sensitization & awareness,- Hygiene promotion for schools,
Barazas & dramas
- All the VIP latrines are complete, remainingcommissioning.
- Average progress is 98%
4 MigoriMigori countyWATSAN Co. Ltd
KegongaSanitation
300 961,110 84,000 1,045,110
- Construction of 3 No. 4 door VIPlatrines in 3 schools.
- sensitization & awareness- Hygiene promotion for schools,
Barazas & dramas
- All the VIP latrines are in completed andbranding done.
- Average progress is 98%
5 MigoriMigori CountyWater & SanitationCo. Ltd
Uriri/BwareSanitation Project
300 1,011,110 - 1,011,110- Hygiene promotion- 4 door VIP latrine in 3 schools
- Three schools VIP latrines are complete,painting and branding done
- Average progress is 98%.
6 MigoriNyasare Water &Sanitation Co. Ltd
NyasareSanitation
300 1,029,110 - 1,029,110- Hygiene promotion- & 4 door VIP latrine in 3 schools
- All the VIP latrines are complete, remaininglabelling and commissioning.
- Average progress is 95%
7 NandiLelmokwo WaterUsers Association
LelmokwoSanitation project
300 2,000,000 420,000 2,420,000
- Hygiene promotion.
- 10No. 2 door VIP latrine in 6schools
- 9 N0. 2 door VIP latrines completed- 1 No. 2 door VIP collapsed and will need to
be redone- The average progress is 70%.
8 NandiKobujoicommunity WaterUsers Association
KobujoiSanitation
400 2,156,000 924,000 3,080,000
- Hygiene promotion.- Barazas.- Awareness creation.- 8No. 2 door VIP latrine in 6 schools
- All the VIP latrines are in progress atvarious stages.
- The average progress is 70%.
9 NandiCheptil dam WaterUsers association
CheptilSanitation project
500 1,766,800 757,200 2,524,000
- Hygiene promotion.- Barazas.- Awareness creation 10No. 2 door
VIP latrine in 5 schools
- 8 No. VIP latrines are almost completedexcept painting and finishing
- The average progress is 75%.
10 NandiKimatkei/KipkoilWater UsersAssociation
Kimatkei/KipkoilSanitation
400 1,766,800 757,200 2,524,000- Hygiene promotion, barazas- Awareness creation &- 8No. 2 door VIP latrine in 4 schools
- The contractors has done some VIP up tosuperstructure walling while others are atsubstructure walling. Works has stoppedwith Defects noted by SA having not beenrectified.
- The works progress is less than 30%.
11 NandiKimng’oror WaterUsers association
Kimng’ororSanitation
300 196,000 2,044,000 2,240,000
- Hygiene promotion,- Barazas,- Awareness creation- 6No. 2 door VIP latrine in 3schools
- The contractors has done the work up toLintel level
- The works progress is less than 50%.
12TharakaNithi
Kamwene WaterProject
KamweneSanitation
50 330,489 - 330,489- Hygiene promotion- .Barazas.- Awareness creation
- Construction ongoing- Floor slab laid- Work at 20% progress
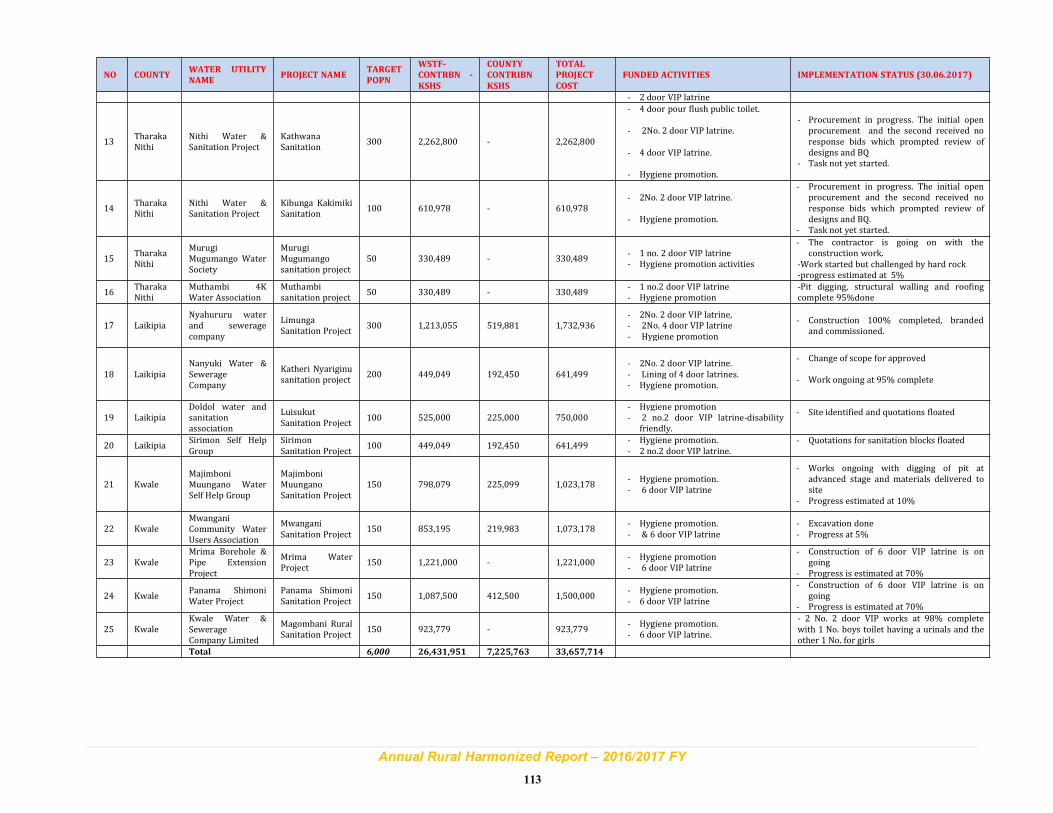
Annual Rural Harmonized Report – 2016/2017 FY
113
NO COUNTYWATER UTILITY
NAMEPROJECT NAME
TARGET
POPN
WSTF-
CONTRBN -
KSHS
COUNTY
CONTRIBN
KSHS
TOTAL
PROJECT
COST
FUNDED ACTIVITIES IMPLEMENTATION STATUS (30.06.2017)
- 2 door VIP latrine
13TharakaNithi
Nithi Water &Sanitation Project
KathwanaSanitation
300 2,262,800 - 2,262,800
- 4 door pour flush public toilet.
- 2No. 2 door VIP latrine.
- 4 door VIP latrine.
- Hygiene promotion.
- Procurement in progress. The initial openprocurement and the second received noresponse bids which prompted review ofdesigns and BQ
- Task not yet started.
14TharakaNithi
Nithi Water &Sanitation Project
Kibunga KakimikiSanitation
100 610,978 - 610,978- 2No. 2 door VIP latrine.
- Hygiene promotion.
- Procurement in progress. The initial openprocurement and the second received noresponse bids which prompted review ofdesigns and BQ.
- Task not yet started.
15TharakaNithi
MurugiMugumango WaterSociety
MurugiMugumangosanitation project
50 330,489 - 330,489- 1 no. 2 door VIP latrine- Hygiene promotion activities
- The contractor is going on with theconstruction work.
-Work started but challenged by hard rock-progress estimated at 5%
16TharakaNithi
Muthambi 4KWater Association
Muthambisanitation project
50 330,489 - 330,489- 1 no.2 door VIP latrine- Hygiene promotion
-Pit digging, structural walling and roofingcomplete 95%done
17 LaikipiaNyahururu waterand seweragecompany
LimungaSanitation Project
300 1,213,055 519,881 1,732,936- 2No. 2 door VIP latrine,- 2No. 4 door VIP latrine- Hygiene promotion
- Construction 100% completed, brandedand commissioned.
18 LaikipiaNanyuki Water &SewerageCompany
Katheri Nyariginusanitation project
200 449,049 192,450 641,499- 2No. 2 door VIP latrine.- Lining of 4 door latrines.- Hygiene promotion.
- Change of scope for approved
- Work ongoing at 95% complete
19 LaikipiaDoldol water andsanitationassociation
LuisukutSanitation Project
100 525,000 225,000 750,000- Hygiene promotion- 2 no.2 door VIP latrine-disability
friendly.
- Site identified and quotations floated
20 LaikipiaSirimon Self HelpGroup
SirimonSanitation Project
100 449,049 192,450 641,499- Hygiene promotion.- 2 no.2 door VIP latrine.
- Quotations for sanitation blocks floated
21 KwaleMajimboniMuungano WaterSelf Help Group
MajimboniMuunganoSanitation Project
150 798,079 225,099 1,023,178- Hygiene promotion.- 6 door VIP latrine
- Works ongoing with digging of pit atadvanced stage and materials delivered tosite
- Progress estimated at 10%
22 KwaleMwanganiCommunity WaterUsers Association
MwanganiSanitation Project
150 853,195 219,983 1,073,178- Hygiene promotion.- & 6 door VIP latrine
- Excavation done- Progress at 5%
23 KwaleMrima Borehole &Pipe ExtensionProject
Mrima WaterProject
150 1,221,000 - 1,221,000- Hygiene promotion- 6 door VIP latrine
- Construction of 6 door VIP latrine is ongoing
- Progress is estimated at 70%
24 KwalePanama ShimoniWater Project
Panama ShimoniSanitation Project
150 1,087,500 412,500 1,500,000- Hygiene promotion.- 6 door VIP latrine
- Construction of 6 door VIP latrine is ongoing
- Progress is estimated at 70%
25 KwaleKwale Water &SewerageCompany Limited
Magombani RuralSanitation Project
150 923,779 - 923,779- Hygiene promotion.- 6 door VIP latrine.
- 2 No. 2 door VIP works at 98% completewith 1 No. boys toilet having a urinals and theother 1 No. for girls
Total 6,000 26,431,951 7,225,763 33,657,714
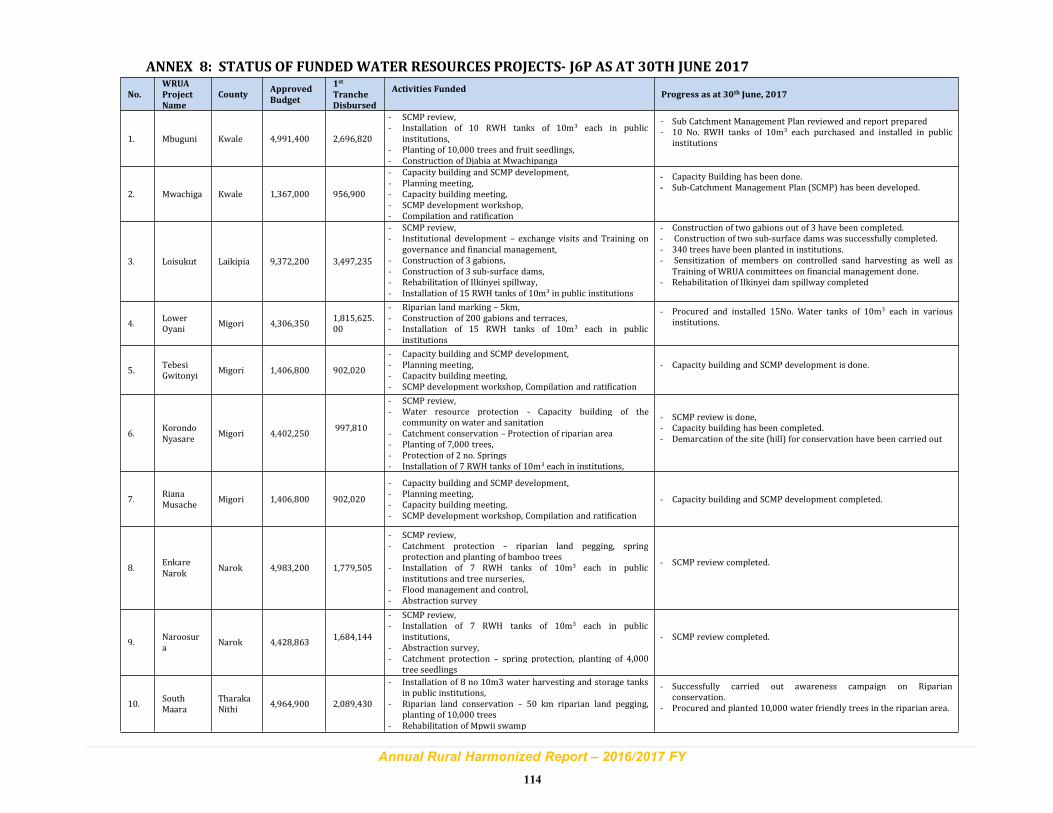
Annual Rural Harmonized Report – 2016/2017 FY
114
ANNEX 8: STATUS OF FUNDEDWATER RESOURCES PROJECTS- J6P AS AT 30TH JUNE 2017
No.
WRUA
Project
Name
CountyApproved
Budget
1st
Tranche
Disbursed
Activities FundedProgress as at 30th June, 2017
1. Mbuguni Kwale 4,991,400 2,696,820
- SCMP review,- Installation of 10 RWH tanks of 10m3 each in public
institutions,- Planting of 10,000 trees and fruit seedlings,- Construction of Djabia at Mwachipanga
- Sub Catchment Management Plan reviewed and report prepared- 10 No. RWH tanks of 10m3 each purchased and installed in public
institutions
2. Mwachiga Kwale 1,367,000 956,900
- Capacity building and SCMP development,- Planning meeting,- Capacity building meeting,- SCMP development workshop,- Compilation and ratification
- Capacity Building has been done.- Sub-Catchment Management Plan (SCMP) has been developed.
3. Loisukut Laikipia 9,372,200 3,497,235
- SCMP review,- Institutional development – exchange visits and Training on
governance and financial management,- Construction of 3 gabions,- Construction of 3 sub-surface dams,- Rehabilitation of Ilkinyei spillway,- Installation of 15 RWH tanks of 10m3 in public institutions
- Construction of two gabions out of 3 have been completed.- Construction of two sub-surface dams was successfully completed.- 340 trees have been planted in institutions.- Sensitization of members on controlled sand harvesting as well as
Training of WRUA committees on financial management done.- Rehabilitation of Ilkinyei dam spillway completed
4.LowerOyani
Migori 4,306,3501,815,625.00
- Riparian land marking – 5km,- Construction of 200 gabions and terraces,- Installation of 15 RWH tanks of 10m3 each in public
institutions
- Procured and installed 15No. Water tanks of 10m3 each in variousinstitutions.
5.TebesiGwitonyi
Migori 1,406,800 902,020
- Capacity building and SCMP development,- Planning meeting,- Capacity building meeting,- SCMP development workshop, Compilation and ratification
- Capacity building and SCMP development is done.
6.KorondoNyasare
Migori 4,402,250997,810
- SCMP review,- Water resource protection - Capacity building of the
community on water and sanitation- Catchment conservation – Protection of riparian area- Planting of 7,000 trees,- Protection of 2 no. Springs- Installation of 7 RWH tanks of 10m3 each in institutions,
- SCMP review is done,- Capacity building has been completed.- Demarcation of the site (hill) for conservation have been carried out
7.RianaMusache
Migori 1,406,800 902,020
- Capacity building and SCMP development,- Planning meeting,- Capacity building meeting,- SCMP development workshop, Compilation and ratification
- Capacity building and SCMP development completed.
8.EnkareNarok
Narok 4,983,200 1,779,505
- SCMP review,- Catchment protection – riparian land pegging, spring
protection and planting of bamboo trees- Installation of 7 RWH tanks of 10m3 each in public
institutions and tree nurseries,- Flood management and control,- Abstraction survey
- SCMP review completed.
9.Naroosura
Narok 4,428,8631,684,144
- SCMP review,- Installation of 7 RWH tanks of 10m3 each in public
institutions,- Abstraction survey,- Catchment protection – spring protection, planting of 4,000
tree seedlings
- SCMP review completed.
10.SouthMaara
TharakaNithi
4,964,900 2,089,430
- Installation of 8 no 10m3 water harvesting and storage tanksin public institutions,
- Riparian land conservation – 50 km riparian land pegging,planting of 10,000 trees
- Rehabilitation of Mpwii swamp
- Successfully carried out awareness campaign on Riparianconservation.
- Procured and planted 10,000 water friendly trees in the riparian area.
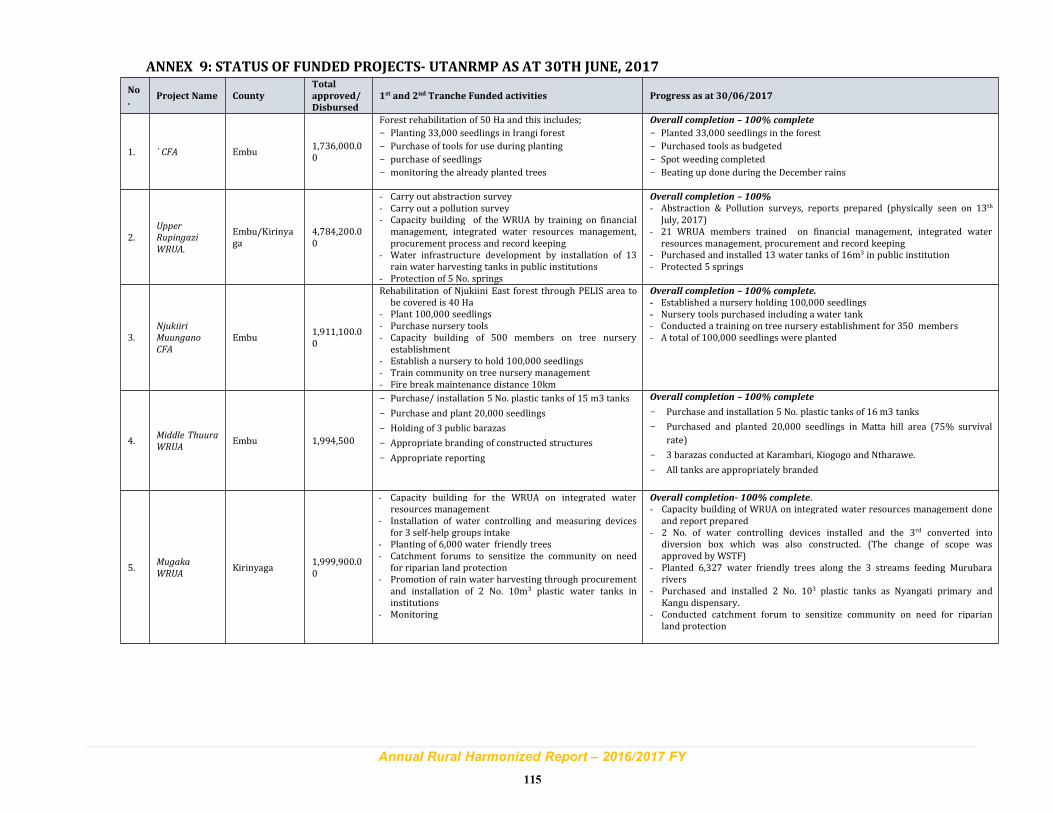
Annual Rural Harmonized Report – 2016/2017 FY
115
ANNEX 9: STATUS OF FUNDED PROJECTS- UTANRMP AS AT 30TH JUNE, 2017
No
.Project Name County
Total
approved/
Disbursed
1st and 2nd Tranche Funded activities Progress as at 30/06/2017
1. ` CFA Embu1,736,000.00
Forest rehabilitation of 50 Ha and this includes;
- Planting 33,000 seedlings in Irangi forest
- Purchase of tools for use during planting
- purchase of seedlings
- monitoring the already planted trees
Overall completion – 100% complete
- Planted 33,000 seedlings in the forest
- Purchased tools as budgeted
- Spot weeding completed
- Beating up done during the December rains
2.Upper
Rupingazi
WRUA.
Embu/Kirinyaga
4,784,200.00
- Carry out abstraction survey- Carry out a pollution survey- Capacity building of the WRUA by training on financial
management, integrated water resources management,procurement process and record keeping
- Water infrastructure development by installation of 13rain water harvesting tanks in public institutions
- Protection of 5 No. springs
Overall completion – 100%
- Abstraction & Pollution surveys, reports prepared (physically seen on 13th
July, 2017)- 21 WRUA members trained on financial management, integrated water
resources management, procurement and record keeping- Purchased and installed 13 water tanks of 16m3 in public institution- Protected 5 springs
3.Njukiiri
Muungano
CFA
Embu1,911,100.00
Rehabilitation of Njukiini East forest through PELIS area tobe covered is 40 Ha
- Plant 100,000 seedlings- Purchase nursery tools- Capacity building of 500 members on tree nursery
establishment- Establish a nursery to hold 100,000 seedlings- Train community on tree nursery management- Fire break maintenance distance 10km
Overall completion – 100% complete.
- Established a nursery holding 100,000 seedlings- Nursery tools purchased including a water tank- Conducted a training on tree nursery establishment for 350 members- A total of 100,000 seedlings were planted
4.Middle Thuura
WRUAEmbu 1,994,500
- Purchase/ installation 5 No. plastic tanks of 15 m3 tanks
- Purchase and plant 20,000 seedlings
- Holding of 3 public barazas
- Appropriate branding of constructed structures
- Appropriate reporting
Overall completion – 100% complete
- Purchase and installation 5 No. plastic tanks of 16 m3 tanks
- Purchased and planted 20,000 seedlings in Matta hill area (75% survival
rate)
- 3 barazas conducted at Karambari, Kiogogo and Ntharawe.
- All tanks are appropriately branded
5.Mugaka
WRUAKirinyaga
1,999,900.00
- Capacity building for the WRUA on integrated waterresources management
- Installation of water controlling and measuring devicesfor 3 self-help groups intake
- Planting of 6,000 water friendly trees- Catchment forums to sensitize the community on need
for riparian land protection- Promotion of rain water harvesting through procurement
and installation of 2 No. 10m3 plastic water tanks ininstitutions
- Monitoring
Overall completion- 100% complete.- Capacity building of WRUA on integrated water resources management done
and report prepared- 2 No. of water controlling devices installed and the 3rd converted into
diversion box which was also constructed. (The change of scope wasapproved by WSTF)
- Planted 6,327 water friendly trees along the 3 streams feeding Murubararivers
- Purchased and installed 2 No. 103 plastic tanks as Nyangati primary andKangu dispensary.
- Conducted catchment forum to sensitize community on need for riparianland protection
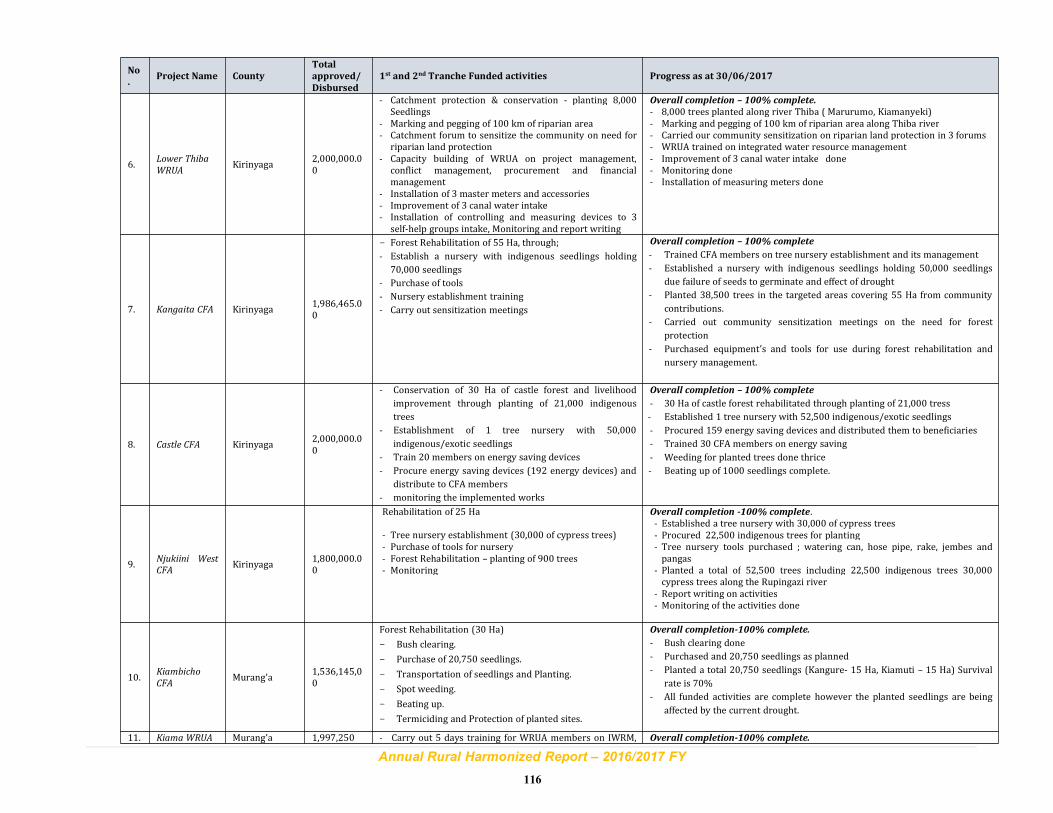
Annual Rural Harmonized Report – 2016/2017 FY
116
No
.Project Name County
Total
approved/
Disbursed
1st and 2nd Tranche Funded activities Progress as at 30/06/2017
6.Lower Thiba
WRUAKirinyaga
2,000,000.00
- Catchment protection & conservation - planting 8,000Seedlings
- Marking and pegging of 100 km of riparian area- Catchment forum to sensitize the community on need for
riparian land protection- Capacity building of WRUA on project management,
conflict management, procurement and financialmanagement
- Installation of 3 master meters and accessories- Improvement of 3 canal water intake- Installation of controlling and measuring devices to 3
self-help groups intake, Monitoring and report writing
Overall completion – 100% complete.
- 8,000 trees planted along river Thiba ( Marurumo, Kiamanyeki)- Marking and pegging of 100 km of riparian area along Thiba river- Carried our community sensitization on riparian land protection in 3 forums- WRUA trained on integrated water resource management- Improvement of 3 canal water intake done- Monitoring done- Installation of measuring meters done
7. Kangaita CFA Kirinyaga1,986,465.00
- Forest Rehabilitation of 55 Ha, through;
- Establish a nursery with indigenous seedlings holding
70,000 seedlings
- Purchase of tools
- Nursery establishment training
- Carry out sensitization meetings
Overall completion – 100% complete
- Trained CFA members on tree nursery establishment and its management
- Established a nursery with indigenous seedlings holding 50,000 seedlings
due failure of seeds to germinate and effect of drought
- Planted 38,500 trees in the targeted areas covering 55 Ha from community
contributions.
- Carried out community sensitization meetings on the need for forest
protection
- Purchased equipment’s and tools for use during forest rehabilitation and
nursery management.
8. Castle CFA Kirinyaga2,000,000.00
- Conservation of 30 Ha of castle forest and livelihood
improvement through planting of 21,000 indigenous
trees
- Establishment of 1 tree nursery with 50,000
indigenous/exotic seedlings
- Train 20 members on energy saving devices
- Procure energy saving devices (192 energy devices) and
distribute to CFA members
- monitoring the implemented works
Overall completion – 100% complete
- 30 Ha of castle forest rehabilitated through planting of 21,000 tress
- Established 1 tree nursery with 52,500 indigenous/exotic seedlings
- Procured 159 energy saving devices and distributed them to beneficiaries
- Trained 30 CFA members on energy saving
- Weeding for planted trees done thrice
- Beating up of 1000 seedlings complete.
9.Njukiini West
CFAKirinyaga
1,800,000.00
Rehabilitation of 25 Ha
- Tree nursery establishment (30,000 of cypress trees)- Purchase of tools for nursery- Forest Rehabilitation – planting of 900 trees- Monitoring
Overall completion -100% complete.- Established a tree nursery with 30,000 of cypress trees- Procured 22,500 indigenous trees for planting- Tree nursery tools purchased ; watering can, hose pipe, rake, jembes andpangas
- Planted a total of 52,500 trees including 22,500 indigenous trees 30,000cypress trees along the Rupingazi river
- Report writing on activities- Monitoring of the activities done
10.Kiambicho
CFAMurang’a
1,536,145,00
Forest Rehabilitation (30 Ha)
- Bush clearing.
- Purchase of 20,750 seedlings.
- Transportation of seedlings and Planting.
- Spot weeding.
- Beating up.
- Termiciding and Protection of planted sites.
Overall completion-100% complete.
- Bush clearing done
- Purchased and 20,750 seedlings as planned
- Planted a total 20,750 seedlings (Kangure- 15 Ha, Kiamuti – 15 Ha) Survival
rate is 70%
- All funded activities are complete however the planted seedlings are being
affected by the current drought.
11. Kiama WRUA Murang’a 1,997,250 - Carry out 5 days training for WRUA members on IWRM, Overall completion-100% complete.
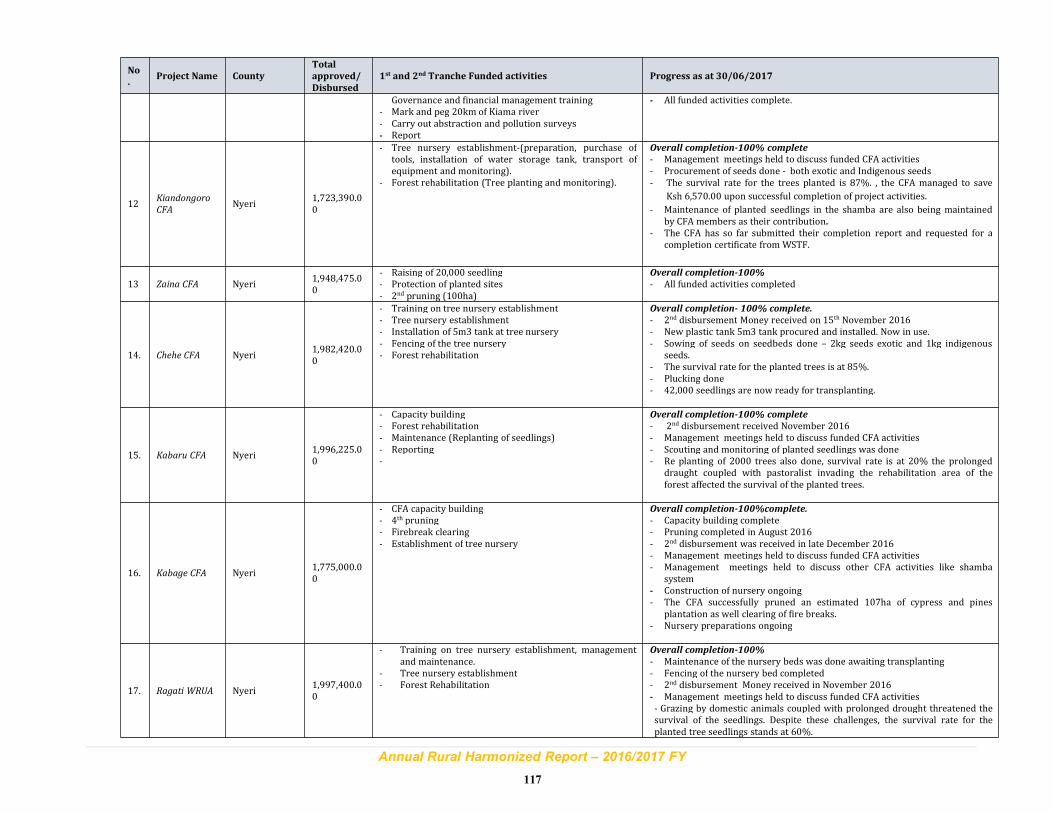
Annual Rural Harmonized Report – 2016/2017 FY
117
No
.Project Name County
Total
approved/
Disbursed
1st and 2nd Tranche Funded activities Progress as at 30/06/2017
Governance and financial management training- Mark and peg 20km of Kiama river- Carry out abstraction and pollution surveys- Report
- All funded activities complete.
12Kiandongoro
CFANyeri
1,723,390.00
- Tree nursery establishment-(preparation, purchase oftools, installation of water storage tank, transport ofequipment and monitoring).
- Forest rehabilitation (Tree planting and monitoring).
Overall completion-100% complete
- Management meetings held to discuss funded CFA activities- Procurement of seeds done - both exotic and Indigenous seeds- The survival rate for the trees planted is 87%. , the CFA managed to save
Ksh 6,570.00 upon successful completion of project activities.
- Maintenance of planted seedlings in the shamba are also being maintainedby CFA members as their contribution.
- The CFA has so far submitted their completion report and requested for acompletion certificate from WSTF.
13 Zaina CFA Nyeri1,948,475.00
- Raising of 20,000 seedling- Protection of planted sites- 2nd pruning (100ha)
Overall completion-100%
- All funded activities completed
14. Chehe CFA Nyeri1,982,420.00
- Training on tree nursery establishment- Tree nursery establishment- Installation of 5m3 tank at tree nursery- Fencing of the tree nursery- Forest rehabilitation
Overall completion- 100% complete.
- 2nd disbursement Money received on 15th November 2016- New plastic tank 5m3 tank procured and installed. Now in use.- Sowing of seeds on seedbeds done – 2kg seeds exotic and 1kg indigenous
seeds.- The survival rate for the planted trees is at 85%.- Plucking done- 42,000 seedlings are now ready for transplanting.
15. Kabaru CFA Nyeri1,996,225.00
- Capacity building- Forest rehabilitation- Maintenance (Replanting of seedlings)- Reporting-
Overall completion-100% complete
- 2nd disbursement received November 2016- Management meetings held to discuss funded CFA activities- Scouting and monitoring of planted seedlings was done- Re planting of 2000 trees also done, survival rate is at 20% the prolonged
draught coupled with pastoralist invading the rehabilitation area of theforest affected the survival of the planted trees.
16. Kabage CFA Nyeri1,775,000.00
- CFA capacity building- 4th pruning- Firebreak clearing- Establishment of tree nursery
Overall completion-100%complete.
- Capacity building complete- Pruning completed in August 2016- 2nd disbursement was received in late December 2016- Management meetings held to discuss funded CFA activities- Management meetings held to discuss other CFA activities like shamba
system- Construction of nursery ongoing- The CFA successfully pruned an estimated 107ha of cypress and pines
plantation as well clearing of fire breaks.- Nursery preparations ongoing
17. Ragati WRUA Nyeri1,997,400.00
- Training on tree nursery establishment, managementand maintenance.
- Tree nursery establishment- Forest Rehabilitation
Overall completion-100%
- Maintenance of the nursery beds was done awaiting transplanting- Fencing of the nursery bed completed- 2nd disbursement Money received in November 2016- Management meetings held to discuss funded CFA activities- Grazing by domestic animals coupled with prolonged drought threatened thesurvival of the seedlings. Despite these challenges, the survival rate for theplanted tree seedlings stands at 60%.
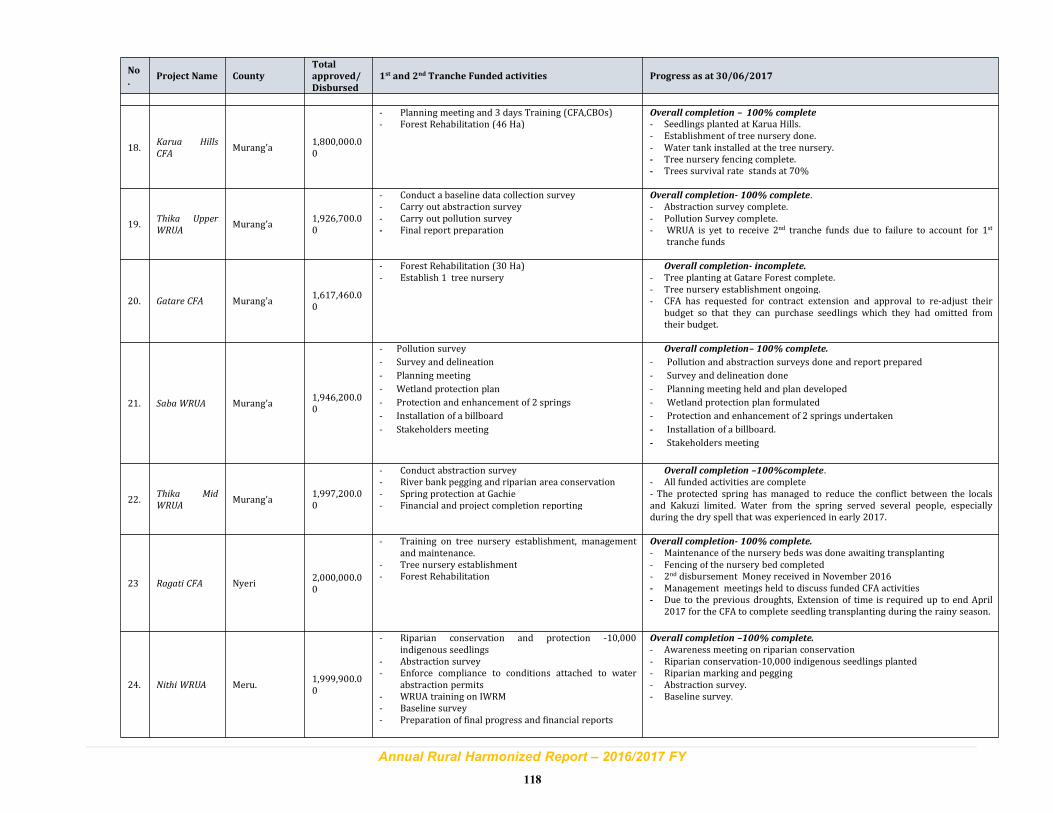
Annual Rural Harmonized Report – 2016/2017 FY
118
No
.Project Name County
Total
approved/
Disbursed
1st and 2nd Tranche Funded activities Progress as at 30/06/2017
18.Karua Hills
CFAMurang’a
1,800,000.00
- Planning meeting and 3 days Training (CFA,CBOs)- Forest Rehabilitation (46 Ha)
Overall completion – 100% complete
- Seedlings planted at Karua Hills.- Establishment of tree nursery done.- Water tank installed at the tree nursery.- Tree nursery fencing complete.- Trees survival rate stands at 70%
19.Thika Upper
WRUAMurang’a
1,926,700.00
- Conduct a baseline data collection survey- Carry out abstraction survey- Carry out pollution survey- Final report preparation
Overall completion- 100% complete.- Abstraction survey complete.- Pollution Survey complete.- WRUA is yet to receive 2nd tranche funds due to failure to account for 1st
tranche funds
20. Gatare CFA Murang’a1,617,460.00
- Forest Rehabilitation (30 Ha)- Establish 1 tree nursery
Overall completion- incomplete.
- Tree planting at Gatare Forest complete.- Tree nursery establishment ongoing.- CFA has requested for contract extension and approval to re-adjust their
budget so that they can purchase seedlings which they had omitted fromtheir budget.
21. Saba WRUA Murang’a1,946,200.00
- Pollution survey
- Survey and delineation
- Planning meeting
- Wetland protection plan
- Protection and enhancement of 2 springs
- Installation of a billboard
- Stakeholders meeting
Overall completion– 100% complete.
- Pollution and abstraction surveys done and report prepared
- Survey and delineation done
- Planning meeting held and plan developed
- Wetland protection plan formulated
- Protection and enhancement of 2 springs undertaken
- Installation of a billboard.
- Stakeholders meeting
22.Thika Mid
WRUAMurang’a
1,997,200.00
- Conduct abstraction survey- River bank pegging and riparian area conservation- Spring protection at Gachie- Financial and project completion reporting
Overall completion –100%complete.- All funded activities are complete- The protected spring has managed to reduce the conflict between the localsand Kakuzi limited. Water from the spring served several people, especiallyduring the dry spell that was experienced in early 2017.
23 Ragati CFA Nyeri2,000,000.00
- Training on tree nursery establishment, managementand maintenance.
- Tree nursery establishment- Forest Rehabilitation
Overall completion- 100% complete.
- Maintenance of the nursery beds was done awaiting transplanting- Fencing of the nursery bed completed- 2nd disbursement Money received in November 2016- Management meetings held to discuss funded CFA activities- Due to the previous droughts, Extension of time is required up to end April
2017 for the CFA to complete seedling transplanting during the rainy season.
24. Nithi WRUA Meru.1,999,900.00
- Riparian conservation and protection -10,000indigenous seedlings
- Abstraction survey- Enforce compliance to conditions attached to water
abstraction permits- WRUA training on IWRM- Baseline survey- Preparation of final progress and financial reports
Overall completion –100% complete.
- Awareness meeting on riparian conservation- Riparian conservation-10,000 indigenous seedlings planted- Riparian marking and pegging- Abstraction survey.- Baseline survey.
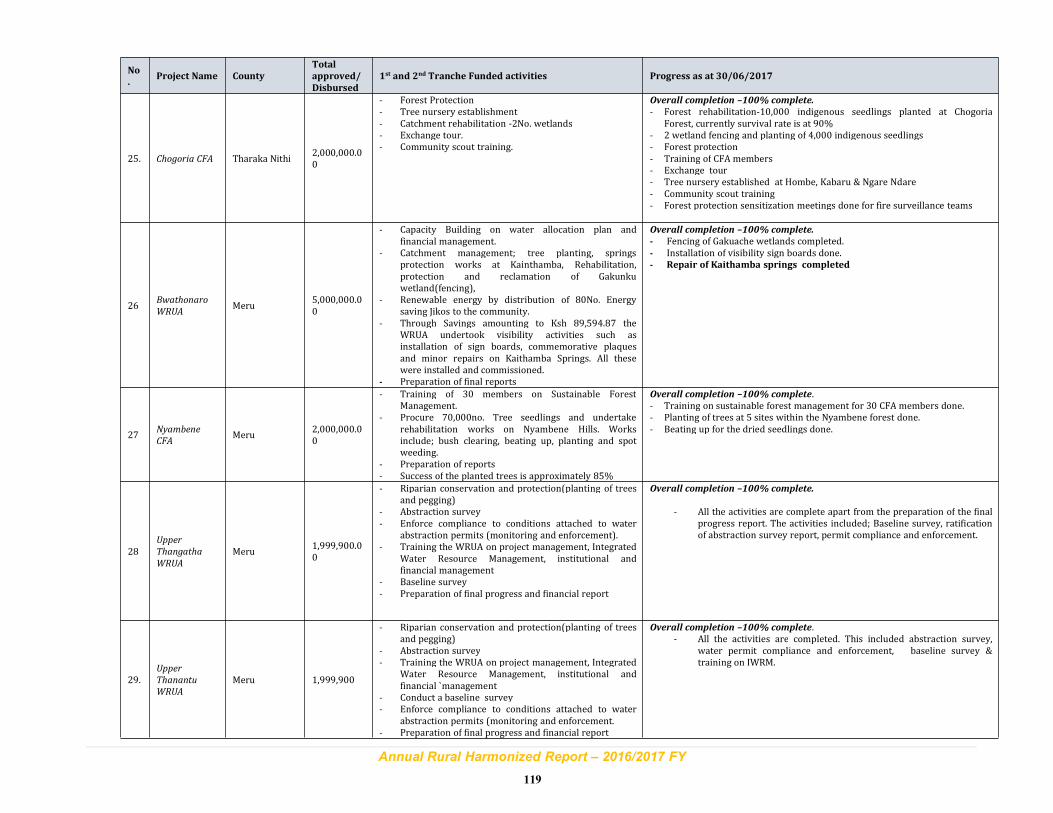
Annual Rural Harmonized Report – 2016/2017 FY
119
No
.Project Name County
Total
approved/
Disbursed
1st and 2nd Tranche Funded activities Progress as at 30/06/2017
25. Chogoria CFA Tharaka Nithi2,000,000.00
- Forest Protection- Tree nursery establishment- Catchment rehabilitation -2No. wetlands- Exchange tour.- Community scout training.
Overall completion –100% complete.
- Forest rehabilitation-10,000 indigenous seedlings planted at ChogoriaForest, currently survival rate is at 90%
- 2 wetland fencing and planting of 4,000 indigenous seedlings- Forest protection- Training of CFA members- Exchange tour- Tree nursery established at Hombe, Kabaru & Ngare Ndare- Community scout training- Forest protection sensitization meetings done for fire surveillance teams
26Bwathonaro
WRUAMeru
5,000,000.00
- Capacity Building on water allocation plan andfinancial management.
- Catchment management; tree planting, springsprotection works at Kainthamba, Rehabilitation,protection and reclamation of Gakunkuwetland(fencing),
- Renewable energy by distribution of 80No. Energysaving Jikos to the community.
- Through Savings amounting to Ksh 89,594.87 theWRUA undertook visibility activities such asinstallation of sign boards, commemorative plaquesand minor repairs on Kaithamba Springs. All thesewere installed and commissioned.
- Preparation of final reports
Overall completion –100% complete.
- Fencing of Gakuache wetlands completed.- Installation of visibility sign boards done.- Repair of Kaithamba springs completed
27Nyambene
CFAMeru
2,000,000.00
- Training of 30 members on Sustainable ForestManagement.
- Procure 70,000no. Tree seedlings and undertakerehabilitation works on Nyambene Hills. Worksinclude; bush clearing, beating up, planting and spotweeding.
- Preparation of reports- Success of the planted trees is approximately 85%
Overall completion –100% complete.- Training on sustainable forest management for 30 CFA members done.- Planting of trees at 5 sites within the Nyambene forest done.- Beating up for the dried seedlings done.
28Upper
Thangatha
WRUA
Meru1,999,900.00
- Riparian conservation and protection(planting of treesand pegging)
- Abstraction survey- Enforce compliance to conditions attached to water
abstraction permits (monitoring and enforcement).- Training the WRUA on project management, Integrated
Water Resource Management, institutional andfinancial management
- Baseline survey- Preparation of final progress and financial report
Overall completion –100% complete.
- All the activities are complete apart from the preparation of the finalprogress report. The activities included; Baseline survey, ratificationof abstraction survey report, permit compliance and enforcement.
29.Upper
Thanantu
WRUA
Meru 1,999,900
- Riparian conservation and protection(planting of treesand pegging)
- Abstraction survey- Training the WRUA on project management, Integrated
Water Resource Management, institutional andfinancial `management
- Conduct a baseline survey- Enforce compliance to conditions attached to water
abstraction permits (monitoring and enforcement.- Preparation of final progress and financial report
Overall completion –100% complete.- All the activities are completed. This included abstraction survey,
water permit compliance and enforcement, baseline survey &training on IWRM.
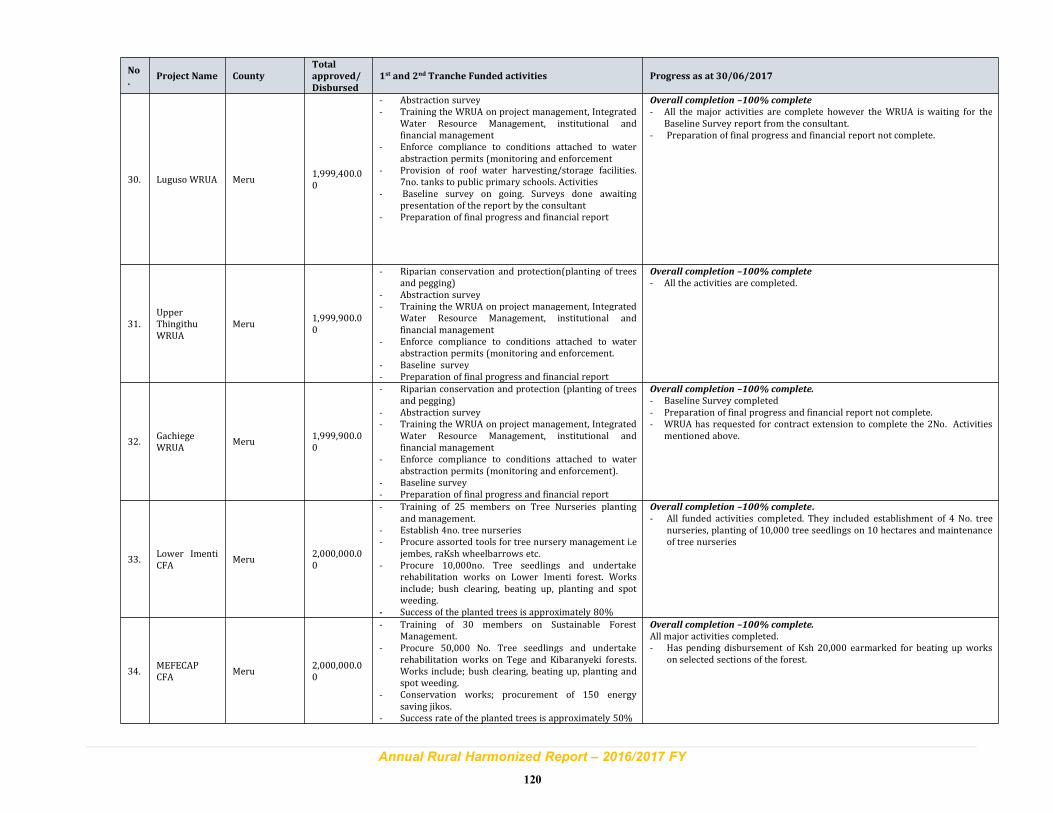
Annual Rural Harmonized Report – 2016/2017 FY
120
No
.Project Name County
Total
approved/
Disbursed
1st and 2nd Tranche Funded activities Progress as at 30/06/2017
30. Luguso WRUA Meru1,999,400.00
- Abstraction survey- Training the WRUA on project management, Integrated
Water Resource Management, institutional andfinancial management
- Enforce compliance to conditions attached to waterabstraction permits (monitoring and enforcement
- Provision of roof water harvesting/storage facilities.7no. tanks to public primary schools. Activities
- Baseline survey on going. Surveys done awaitingpresentation of the report by the consultant
- Preparation of final progress and financial report
Overall completion –100% complete
- All the major activities are complete however the WRUA is waiting for theBaseline Survey report from the consultant.
- Preparation of final progress and financial report not complete.
31.UpperThingithuWRUA
Meru1,999,900.00
- Riparian conservation and protection(planting of treesand pegging)
- Abstraction survey- Training the WRUA on project management, Integrated
Water Resource Management, institutional andfinancial management
- Enforce compliance to conditions attached to waterabstraction permits (monitoring and enforcement.
- Baseline survey- Preparation of final progress and financial report
Overall completion –100% complete
- All the activities are completed.
32.GachiegeWRUA
Meru1,999,900.00
- Riparian conservation and protection (planting of treesand pegging)
- Abstraction survey- Training the WRUA on project management, Integrated
Water Resource Management, institutional andfinancial management
- Enforce compliance to conditions attached to waterabstraction permits (monitoring and enforcement).
- Baseline survey- Preparation of final progress and financial report
Overall completion –100% complete.
- Baseline Survey completed- Preparation of final progress and financial report not complete.- WRUA has requested for contract extension to complete the 2No. Activities
mentioned above.
33.Lower ImentiCFA
Meru2,000,000.00
- Training of 25 members on Tree Nurseries plantingand management.
- Establish 4no. tree nurseries- Procure assorted tools for tree nursery management i.e
jembes, raKsh wheelbarrows etc.- Procure 10,000no. Tree seedlings and undertake
rehabilitation works on Lower Imenti forest. Worksinclude; bush clearing, beating up, planting and spotweeding.
- Success of the planted trees is approximately 80%
Overall completion –100% complete.
- All funded activities completed. They included establishment of 4 No. treenurseries, planting of 10,000 tree seedlings on 10 hectares and maintenanceof tree nurseries
34.MEFECAPCFA
Meru2,000,000.00
- Training of 30 members on Sustainable ForestManagement.
- Procure 50,000 No. Tree seedlings and undertakerehabilitation works on Tege and Kibaranyeki forests.Works include; bush clearing, beating up, planting andspot weeding.
- Conservation works; procurement of 150 energysaving jikos.
- Success rate of the planted trees is approximately 50%
Overall completion –100% complete.
All major activities completed.- Has pending disbursement of Ksh 20,000 earmarked for beating up works
on selected sections of the forest.
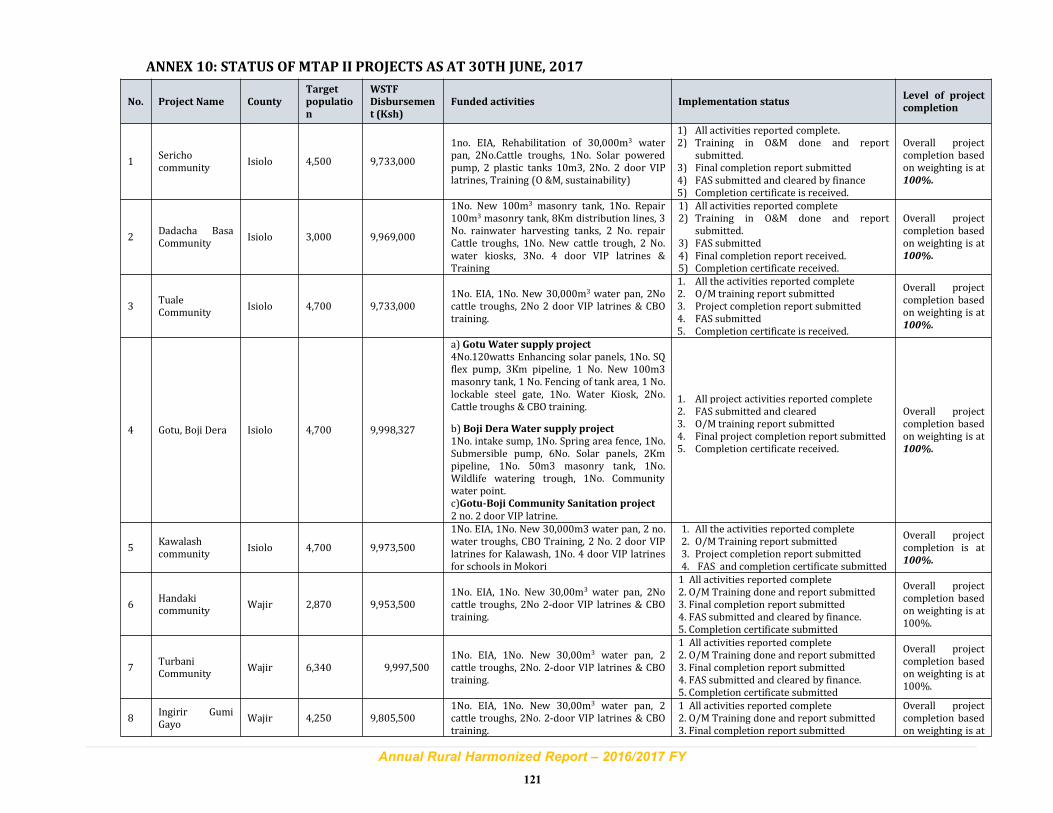
Annual Rural Harmonized Report – 2016/2017 FY
121
ANNEX 10: STATUS OF MTAP II PROJECTS AS AT 30TH JUNE, 2017
No. Project Name County
Target
populatio
n
WSTF
Disbursemen
t (Ksh)
Funded activities Implementation statusLevel of project
completion
1Serichocommunity
Isiolo 4,500 9,733,000
1no. EIA, Rehabilitation of 30,000m3 waterpan, 2No.Cattle troughs, 1No. Solar poweredpump, 2 plastic tanks 10m3, 2No. 2 door VIPlatrines, Training (O &M, sustainability)
1) All activities reported complete.2) Training in O&M done and report
submitted.3) Final completion report submitted4) FAS submitted and cleared by finance5) Completion certificate is received.
Overall projectcompletion basedon weighting is at100%.
2Dadacha BasaCommunity
Isiolo 3,000 9,969,000
1No. New 100m3 masonry tank, 1No. Repair100m3 masonry tank, 8Km distribution lines, 3No. rainwater harvesting tanks, 2 No. repairCattle troughs, 1No. New cattle trough, 2 No.water kiosks, 3No. 4 door VIP latrines &Training
1) All activities reported complete2) Training in O&M done and report
submitted.3) FAS submitted4) Final completion report received.5) Completion certificate received.
Overall projectcompletion basedon weighting is at100%.
3TualeCommunity
Isiolo 4,700 9,733,0001No. EIA, 1No. New 30,000m3 water pan, 2Nocattle troughs, 2No 2 door VIP latrines & CBOtraining.
1. All the activities reported complete2. O/M training report submitted3. Project completion report submitted4. FAS submitted5. Completion certificate is received.
Overall projectcompletion basedon weighting is at100%.
4 Gotu, Boji Dera Isiolo 4,700 9,998,327
a) GotuWater supply project4No.120watts Enhancing solar panels, 1No. SQflex pump, 3Km pipeline, 1 No. New 100m3masonry tank, 1 No. Fencing of tank area, 1 No.lockable steel gate, 1No. Water Kiosk, 2No.Cattle troughs & CBO training.
b) Boji DeraWater supply project1No. intake sump, 1No. Spring area fence, 1No.Submersible pump, 6No. Solar panels, 2Kmpipeline, 1No. 50m3 masonry tank, 1No.Wildlife watering trough, 1No. Communitywater point.c)Gotu-Boji Community Sanitation project2 no. 2 door VIP latrine.
1. All project activities reported complete2. FAS submitted and cleared3. O/M training report submitted4. Final project completion report submitted5. Completion certificate received.
Overall projectcompletion basedon weighting is at100%.
5Kawalashcommunity
Isiolo 4,700 9,973,500
1No. EIA, 1No. New 30,000m3 water pan, 2 no.water troughs, CBO Training, 2 No. 2 door VIPlatrines for Kalawash, 1No. 4 door VIP latrinesfor schools in Mokori
1. All the activities reported complete2. O/M Training report submitted3. Project completion report submitted4. FAS and completion certificate submitted
Overall projectcompletion is at100%.
6Handakicommunity
Wajir 2,870 9,953,5001No. EIA, 1No. New 30,00m3 water pan, 2Nocattle troughs, 2No 2-door VIP latrines & CBOtraining.
1 All activities reported complete2. O/M Training done and report submitted3. Final completion report submitted4. FAS submitted and cleared by finance.5. Completion certificate submitted
Overall projectcompletion basedon weighting is at100%.
7TurbaniCommunity
Wajir 6,340 9,997,5001No. EIA, 1No. New 30,00m3 water pan, 2cattle troughs, 2No. 2-door VIP latrines & CBOtraining.
1 All activities reported complete2. O/M Training done and report submitted3. Final completion report submitted4. FAS submitted and cleared by finance.5. Completion certificate submitted
Overall projectcompletion basedon weighting is at100%.
8Ingirir GumiGayo
Wajir 4,250 9,805,5001No. EIA, 1No. New 30,00m3 water pan, 2cattle troughs, 2No. 2-door VIP latrines & CBOtraining.
1 All activities reported complete2. O/M Training done and report submitted3. Final completion report submitted
Overall projectcompletion basedon weighting is at
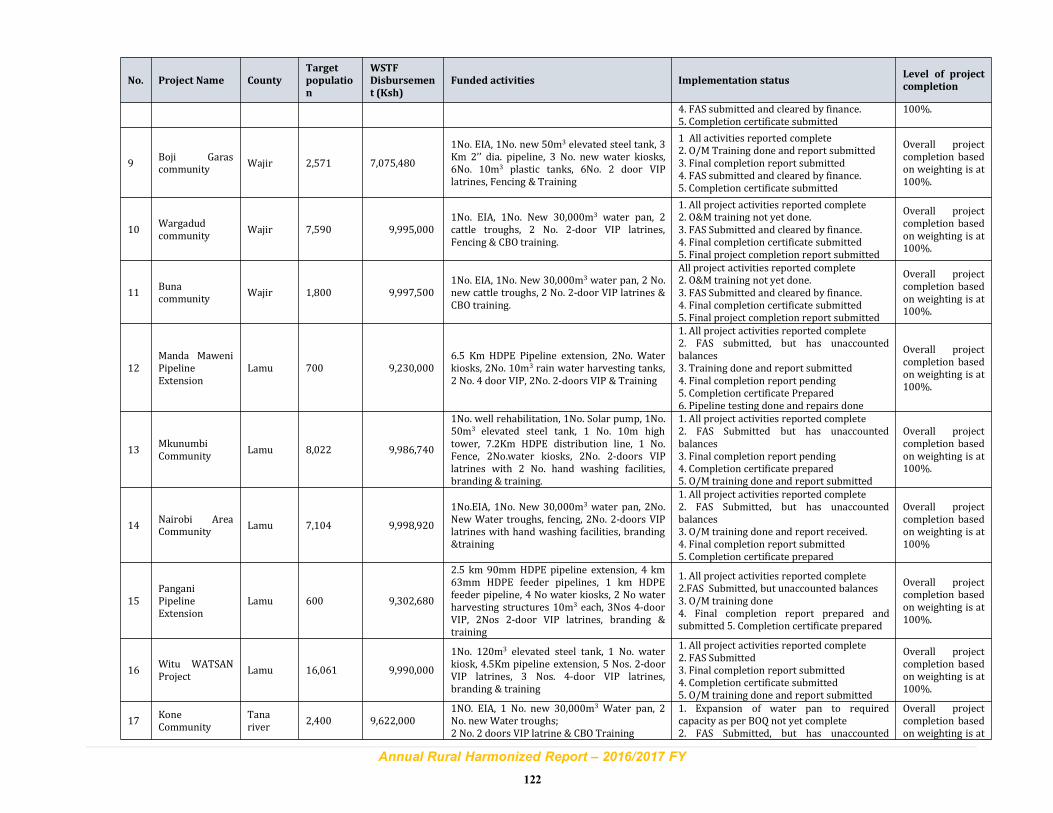
Annual Rural Harmonized Report – 2016/2017 FY
122
No. Project Name County
Target
populatio
n
WSTF
Disbursemen
t (Ksh)
Funded activities Implementation statusLevel of project
completion
4. FAS submitted and cleared by finance.5. Completion certificate submitted
100%.
9Boji Garascommunity
Wajir 2,571 7,075,480
1No. EIA, 1No. new 50m3 elevated steel tank, 3Km 2’’ dia. pipeline, 3 No. new water kiosks,6No. 10m3 plastic tanks, 6No. 2 door VIPlatrines, Fencing & Training
1 All activities reported complete2. O/M Training done and report submitted3. Final completion report submitted4. FAS submitted and cleared by finance.5. Completion certificate submitted
Overall projectcompletion basedon weighting is at100%.
10Wargadudcommunity
Wajir 7,590 9,995,0001No. EIA, 1No. New 30,000m3 water pan, 2cattle troughs, 2 No. 2-door VIP latrines,Fencing & CBO training.
1. All project activities reported complete2. O&M training not yet done.3. FAS Submitted and cleared by finance.4. Final completion certificate submitted5. Final project completion report submitted
Overall projectcompletion basedon weighting is at100%.
11Bunacommunity
Wajir 1,800 9,997,5001No. EIA, 1No. New 30,000m3 water pan, 2 No.new cattle troughs, 2 No. 2-door VIP latrines &CBO training.
All project activities reported complete2. O&M training not yet done.3. FAS Submitted and cleared by finance.4. Final completion certificate submitted5. Final project completion report submitted
Overall projectcompletion basedon weighting is at100%.
12Manda MaweniPipelineExtension
Lamu 700 9,230,0006.5 Km HDPE Pipeline extension, 2No. Waterkiosks, 2No. 10m3 rain water harvesting tanks,2 No. 4 door VIP, 2No. 2-doors VIP & Training
1. All project activities reported complete2. FAS submitted, but has unaccountedbalances3. Training done and report submitted4. Final completion report pending5. Completion certificate Prepared6. Pipeline testing done and repairs done
Overall projectcompletion basedon weighting is at100%.
13MkunumbiCommunity
Lamu 8,022 9,986,740
1No. well rehabilitation, 1No. Solar pump, 1No.50m3 elevated steel tank, 1 No. 10m hightower, 7.2Km HDPE distribution line, 1 No.Fence, 2No.water kiosks, 2No. 2-doors VIPlatrines with 2 No. hand washing facilities,branding & training.
1. All project activities reported complete2. FAS Submitted but has unaccountedbalances3. Final completion report pending4. Completion certificate prepared5. O/M training done and report submitted
Overall projectcompletion basedon weighting is at100%.
14Nairobi AreaCommunity
Lamu 7,104 9,998,920
1No.EIA, 1No. New 30,000m3 water pan, 2No.New Water troughs, fencing, 2No. 2-doors VIPlatrines with hand washing facilities, branding&training
1. All project activities reported complete2. FAS Submitted, but has unaccountedbalances3. O/M training done and report received.4. Final completion report submitted5. Completion certificate prepared
Overall projectcompletion basedon weighting is at100%
15PanganiPipelineExtension
Lamu 600 9,302,680
2.5 km 90mm HDPE pipeline extension, 4 km63mm HDPE feeder pipelines, 1 km HDPEfeeder pipeline, 4 No water kiosks, 2 No waterharvesting structures 10m3 each, 3Nos 4-doorVIP, 2Nos 2-door VIP latrines, branding &training
1. All project activities reported complete2.FAS Submitted, but unaccounted balances3. O/M training done4. Final completion report prepared andsubmitted 5. Completion certificate prepared
Overall projectcompletion basedon weighting is at100%.
16Witu WATSANProject
Lamu 16,061 9,990,000
1No. 120m3 elevated steel tank, 1 No. waterkiosk, 4.5Km pipeline extension, 5 Nos. 2-doorVIP latrines, 3 Nos. 4-door VIP latrines,branding & training
1. All project activities reported complete2. FAS Submitted3. Final completion report submitted4. Completion certificate submitted5. O/M training done and report submitted
Overall projectcompletion basedon weighting is at100%.
17KoneCommunity
Tanariver
2,400 9,622,0001NO. EIA, 1 No. new 30,000m3 Water pan, 2No. newWater troughs;2 No. 2 doors VIP latrine & CBO Training
1. Expansion of water pan to requiredcapacity as per BOQ not yet complete2. FAS Submitted, but has unaccounted
Overall projectcompletion basedon weighting is at
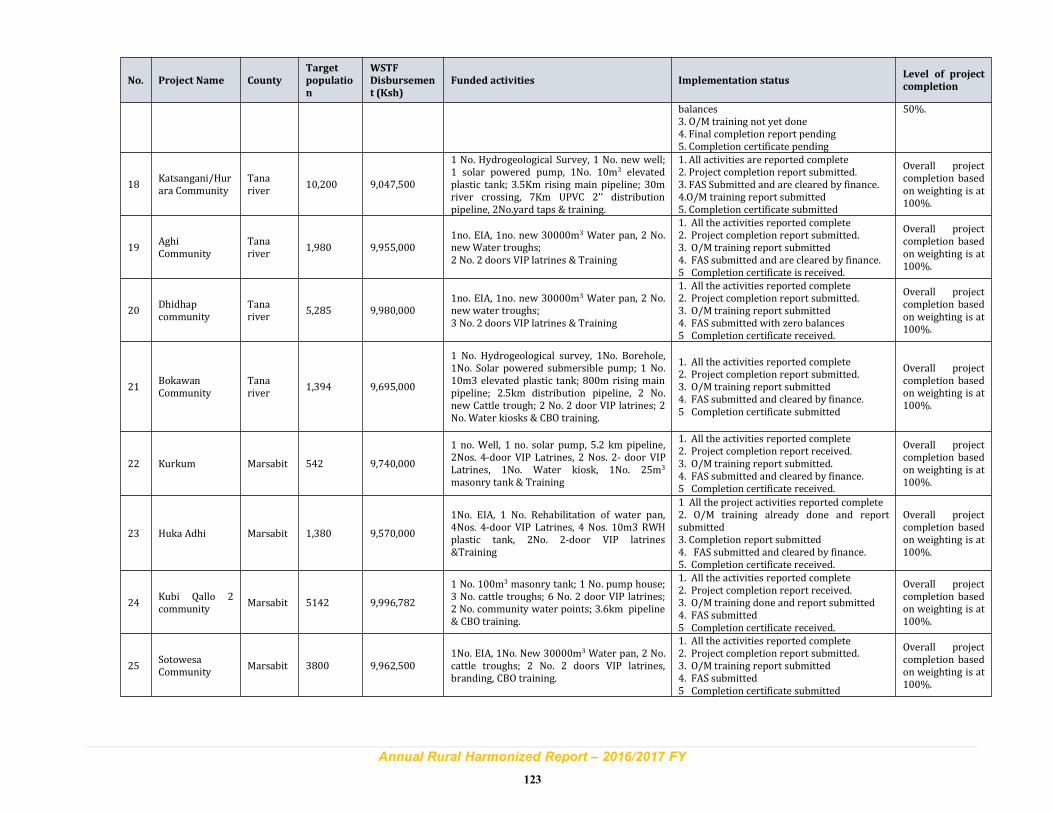
Annual Rural Harmonized Report – 2016/2017 FY
123
No. Project Name County
Target
populatio
n
WSTF
Disbursemen
t (Ksh)
Funded activities Implementation statusLevel of project
completion
balances3. O/M training not yet done4. Final completion report pending5. Completion certificate pending
50%.
18Katsangani/Hurara Community
Tanariver
10,200 9,047,500
1 No. Hydrogeological Survey, 1 No. new well;1 solar powered pump, 1No. 10m3 elevatedplastic tank; 3.5Km rising main pipeline; 30mriver crossing, 7Km UPVC 2’’ distributionpipeline, 2No.yard taps & training.
1. All activities are reported complete2. Project completion report submitted.3. FAS Submitted and are cleared by finance.4.O/M training report submitted5. Completion certificate submitted
Overall projectcompletion basedon weighting is at100%.
19AghiCommunity
Tanariver
1,980 9,955,0001no. EIA, 1no. new 30000m3 Water pan, 2 No.newWater troughs;2 No. 2 doors VIP latrines & Training
1. All the activities reported complete2. Project completion report submitted.3. O/M training report submitted4. FAS submitted and are cleared by finance.5 Completion certificate is received.
Overall projectcompletion basedon weighting is at100%.
20Dhidhapcommunity
Tanariver
5,285 9,980,0001no. EIA, 1no. new 30000m3 Water pan, 2 No.newwater troughs;3 No. 2 doors VIP latrines & Training
1. All the activities reported complete2. Project completion report submitted.3. O/M training report submitted4. FAS submitted with zero balances5 Completion certificate received.
Overall projectcompletion basedon weighting is at100%.
21BokawanCommunity
Tanariver
1,394 9,695,000
1 No. Hydrogeological survey, 1No. Borehole,1No. Solar powered submersible pump; 1 No.10m3 elevated plastic tank; 800m rising mainpipeline; 2.5km distribution pipeline, 2 No.new Cattle trough; 2 No. 2 door VIP latrines; 2No. Water kiosks & CBO training.
1. All the activities reported complete2. Project completion report submitted.3. O/M training report submitted4. FAS submitted and cleared by finance.5 Completion certificate submitted
Overall projectcompletion basedon weighting is at100%.
22 Kurkum Marsabit 542 9,740,000
1 no. Well, 1 no. solar pump, 5.2 km pipeline,2Nos. 4-door VIP Latrines, 2 Nos. 2- door VIPLatrines, 1No. Water kiosk, 1No. 25m3
masonry tank & Training
1. All the activities reported complete2. Project completion report received.3. O/M training report submitted.4. FAS submitted and cleared by finance.5 Completion certificate received.
Overall projectcompletion basedon weighting is at100%.
23 Huka Adhi Marsabit 1,380 9,570,000
1No. EIA, 1 No. Rehabilitation of water pan,4Nos. 4-door VIP Latrines, 4 Nos. 10m3 RWHplastic tank, 2No. 2-door VIP latrines&Training
1 All the project activities reported complete2. O/M training already done and reportsubmitted3. Completion report submitted4. FAS submitted and cleared by finance.5. Completion certificate received.
Overall projectcompletion basedon weighting is at100%.
24Kubi Qallo 2community
Marsabit 5142 9,996,782
1 No. 100m3 masonry tank; 1 No. pump house;3 No. cattle troughs; 6 No. 2 door VIP latrines;2 No. community water points; 3.6km pipeline& CBO training.
1. All the activities reported complete2. Project completion report received.3. O/M training done and report submitted4. FAS submitted5 Completion certificate received.
Overall projectcompletion basedon weighting is at100%.
25SotowesaCommunity
Marsabit 3800 9,962,5001No. EIA, 1No. New 30000m3 Water pan, 2 No.cattle troughs; 2 No. 2 doors VIP latrines,branding, CBO training.
1. All the activities reported complete2. Project completion report submitted.3. O/M training report submitted4. FAS submitted5 Completion certificate submitted
Overall projectcompletion basedon weighting is at100%.
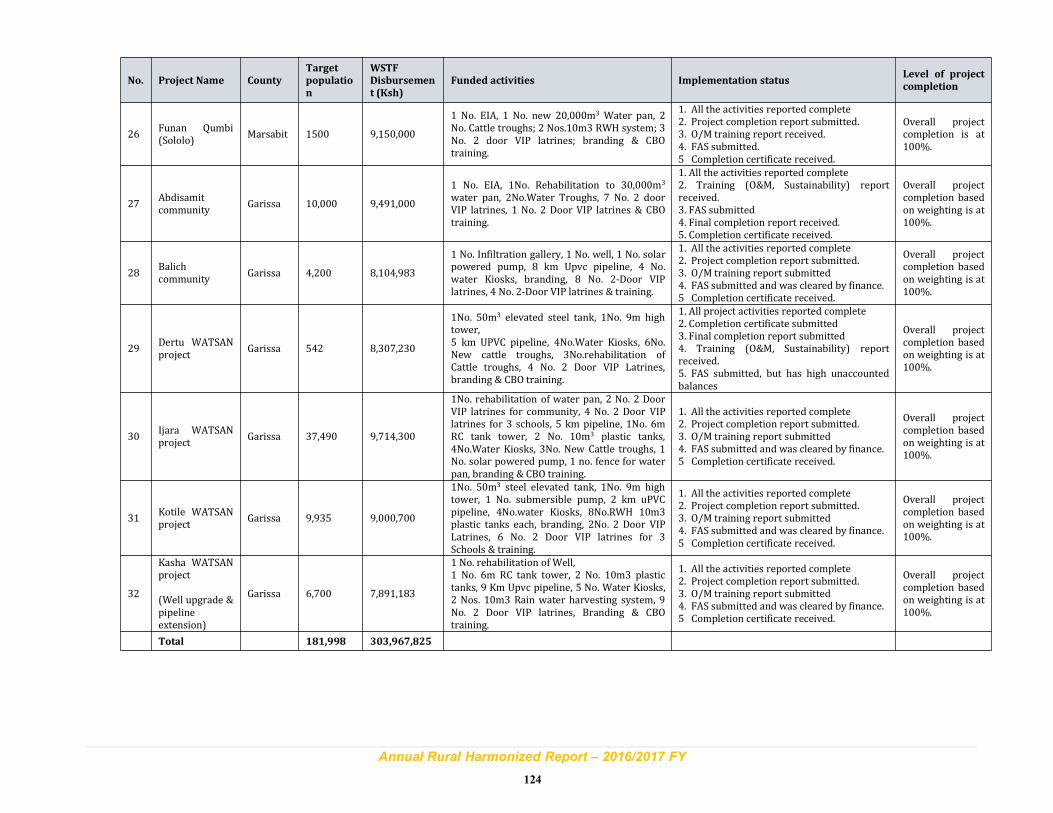
Annual Rural Harmonized Report – 2016/2017 FY
124
No. Project Name County
Target
populatio
n
WSTF
Disbursemen
t (Ksh)
Funded activities Implementation statusLevel of project
completion
26Funan Qumbi(Sololo)
Marsabit 1500 9,150,000
1 No. EIA, 1 No. new 20,000m3 Water pan, 2No. Cattle troughs; 2 Nos.10m3 RWH system; 3No. 2 door VIP latrines; branding & CBOtraining.
1. All the activities reported complete2. Project completion report submitted.3. O/M training report received.4. FAS submitted.5 Completion certificate received.
Overall projectcompletion is at100%.
27Abdisamitcommunity
Garissa 10,000 9,491,000
1 No. EIA, 1No. Rehabilitation to 30,000m3
water pan, 2No.Water Troughs, 7 No. 2 doorVIP latrines, 1 No. 2 Door VIP latrines & CBOtraining.
1. All the activities reported complete2. Training (O&M, Sustainability) reportreceived.3. FAS submitted4. Final completion report received.5. Completion certificate received.
Overall projectcompletion basedon weighting is at100%.
28Balichcommunity
Garissa 4,200 8,104,983
1 No. Infiltration gallery, 1 No. well, 1 No. solarpowered pump, 8 km Upvc pipeline, 4 No.water Kiosks, branding, 8 No. 2-Door VIPlatrines, 4 No. 2-Door VIP latrines & training.
1. All the activities reported complete2. Project completion report submitted.3. O/M training report submitted4. FAS submitted and was cleared by finance.5 Completion certificate received.
Overall projectcompletion basedon weighting is at100%.
29Dertu WATSANproject
Garissa 542 8,307,230
1No. 50m3 elevated steel tank, 1No. 9m hightower,5 km UPVC pipeline, 4No.Water Kiosks, 6No.New cattle troughs, 3No.rehabilitation ofCattle troughs, 4 No. 2 Door VIP Latrines,branding & CBO training.
1. All project activities reported complete2. Completion certificate submitted3. Final completion report submitted4. Training (O&M, Sustainability) reportreceived.5. FAS submitted, but has high unaccountedbalances
Overall projectcompletion basedon weighting is at100%.
30Ijara WATSANproject
Garissa 37,490 9,714,300
1No. rehabilitation of water pan, 2 No. 2 DoorVIP latrines for community, 4 No. 2 Door VIPlatrines for 3 schools, 5 km pipeline, 1No. 6mRC tank tower, 2 No. 10m3 plastic tanks,4No.Water Kiosks, 3No. New Cattle troughs, 1No. solar powered pump, 1 no. fence for waterpan, branding & CBO training.
1. All the activities reported complete2. Project completion report submitted.3. O/M training report submitted4. FAS submitted and was cleared by finance.5 Completion certificate received.
Overall projectcompletion basedon weighting is at100%.
31Kotile WATSANproject
Garissa 9,935 9,000,700
1No. 50m3 steel elevated tank, 1No. 9m hightower, 1 No. submersible pump, 2 km uPVCpipeline, 4No.water Kiosks, 8No.RWH 10m3plastic tanks each, branding, 2No. 2 Door VIPLatrines, 6 No. 2 Door VIP latrines for 3Schools & training.
1. All the activities reported complete2. Project completion report submitted.3. O/M training report submitted4. FAS submitted and was cleared by finance.5 Completion certificate received.
Overall projectcompletion basedon weighting is at100%.
32
Kasha WATSANproject
(Well upgrade &pipelineextension)
Garissa 6,700 7,891,183
1 No. rehabilitation of Well,1 No. 6m RC tank tower, 2 No. 10m3 plastictanks, 9 Km Upvc pipeline, 5 No. Water Kiosks,2 Nos. 10m3 Rain water harvesting system, 9No. 2 Door VIP latrines, Branding & CBOtraining.
1. All the activities reported complete2. Project completion report submitted.3. O/M training report submitted4. FAS submitted and was cleared by finance.5 Completion certificate received.
Overall projectcompletion basedon weighting is at100%.
Total 181,998 303,967,825
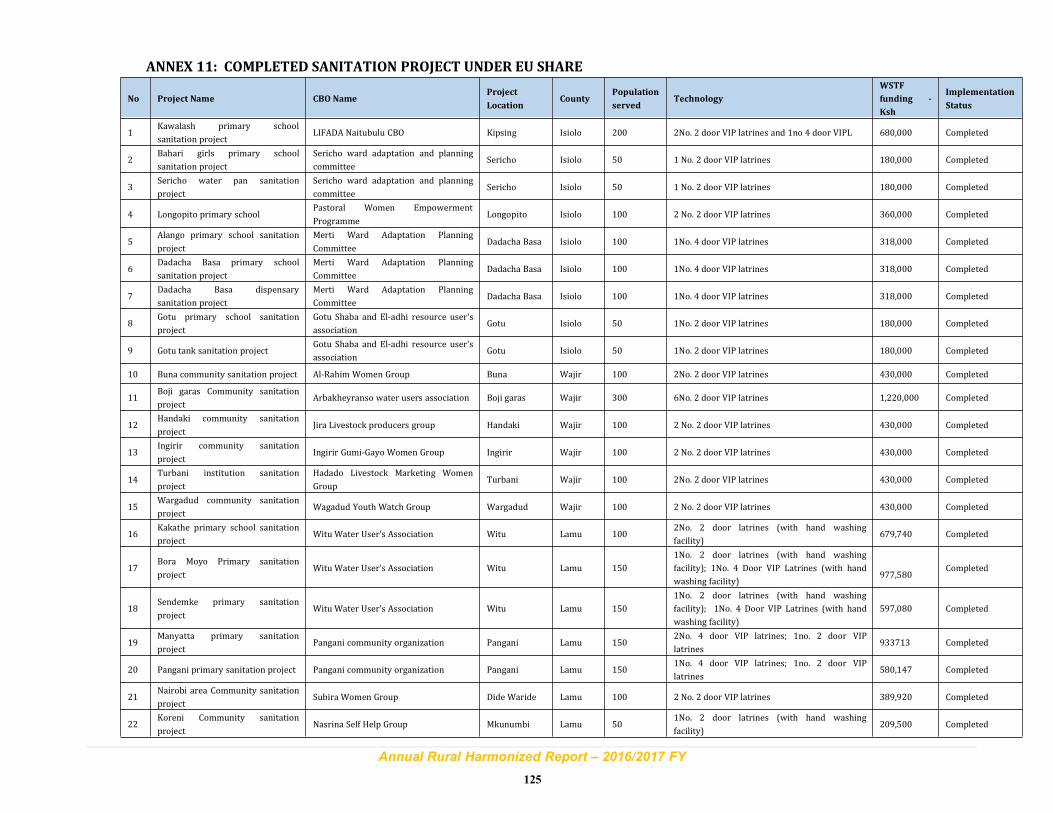
Annual Rural Harmonized Report – 2016/2017 FY
125
ANNEX 11: COMPLETED SANITATION PROJECT UNDER EU SHARE
No Project Name CBO NameProject
LocationCounty
Population
servedTechnology
WSTF
funding -
Ksh
Implementation
Status
1Kawalash primary school
sanitation projectLIFADA Naitubulu CBO Kipsing Isiolo 200 2No. 2 door VIP latrines and 1no 4 door VIPL 680,000 Completed
2Bahari girls primary school
sanitation project
Sericho ward adaptation and planning
committeeSericho Isiolo 50 1 No. 2 door VIP latrines 180,000 Completed
3Sericho water pan sanitation
project
Sericho ward adaptation and planning
committeeSericho Isiolo 50 1 No. 2 door VIP latrines 180,000 Completed
4 Longopito primary schoolPastoral Women Empowerment
ProgrammeLongopito Isiolo 100 2 No. 2 door VIP latrines 360,000 Completed
5Alango primary school sanitation
project
Merti Ward Adaptation Planning
CommitteeDadacha Basa Isiolo 100 1No. 4 door VIP latrines 318,000 Completed
6Dadacha Basa primary school
sanitation project
Merti Ward Adaptation Planning
CommitteeDadacha Basa Isiolo 100 1No. 4 door VIP latrines 318,000 Completed
7Dadacha Basa dispensary
sanitation project
Merti Ward Adaptation Planning
CommitteeDadacha Basa Isiolo 100 1No. 4 door VIP latrines 318,000 Completed
8Gotu primary school sanitation
project
Gotu Shaba and El-adhi resource user's
associationGotu Isiolo 50 1No. 2 door VIP latrines 180,000 Completed
9 Gotu tank sanitation projectGotu Shaba and El-adhi resource user's
associationGotu Isiolo 50 1No. 2 door VIP latrines 180,000 Completed
10 Buna community sanitation project Al-Rahim Women Group Buna Wajir 100 2No. 2 door VIP latrines 430,000 Completed
11Boji garas Community sanitation
projectArbakheyranso water users association Boji garas Wajir 300 6No. 2 door VIP latrines 1,220,000 Completed
12Handaki community sanitation
projectJira Livestock producers group Handaki Wajir 100 2 No. 2 door VIP latrines 430,000 Completed
13Ingirir community sanitation
projectIngirir Gumi-Gayo Women Group Ingirir Wajir 100 2 No. 2 door VIP latrines 430,000 Completed
14Turbani institution sanitation
project
Hadado Livestock Marketing Women
GroupTurbani Wajir 100 2No. 2 door VIP latrines 430,000 Completed
15Wargadud community sanitation
projectWagadud Youth Watch Group Wargadud Wajir 100 2 No. 2 door VIP latrines 430,000 Completed
16Kakathe primary school sanitation
projectWitu Water User's Association Witu Lamu 100
2No. 2 door latrines (with hand washing
facility)679,740 Completed
17Bora Moyo Primary sanitation
projectWitu Water User's Association Witu Lamu 150
1No. 2 door latrines (with hand washing
facility); 1No. 4 Door VIP Latrines (with hand
washing facility)977,580
Completed
18Sendemke primary sanitation
projectWitu Water User's Association Witu Lamu 150
1No. 2 door latrines (with hand washing
facility); 1No. 4 Door VIP Latrines (with hand
washing facility)
597,080 Completed
19Manyatta primary sanitation
projectPangani community organization Pangani Lamu 150
2No. 4 door VIP latrines; 1no. 2 door VIP
latrines933713 Completed
20 Pangani primary sanitation project Pangani community organization Pangani Lamu 1501No. 4 door VIP latrines; 1no. 2 door VIP
latrines580,147 Completed
21Nairobi area Community sanitation
projectSubira Women Group Dide Waride Lamu 100 2 No. 2 door VIP latrines 389,920 Completed
22Koreni Community sanitation
projectNasrina Self Help Group Mkunumbi Lamu 50
1No. 2 door latrines (with hand washing
facility)209,500 Completed
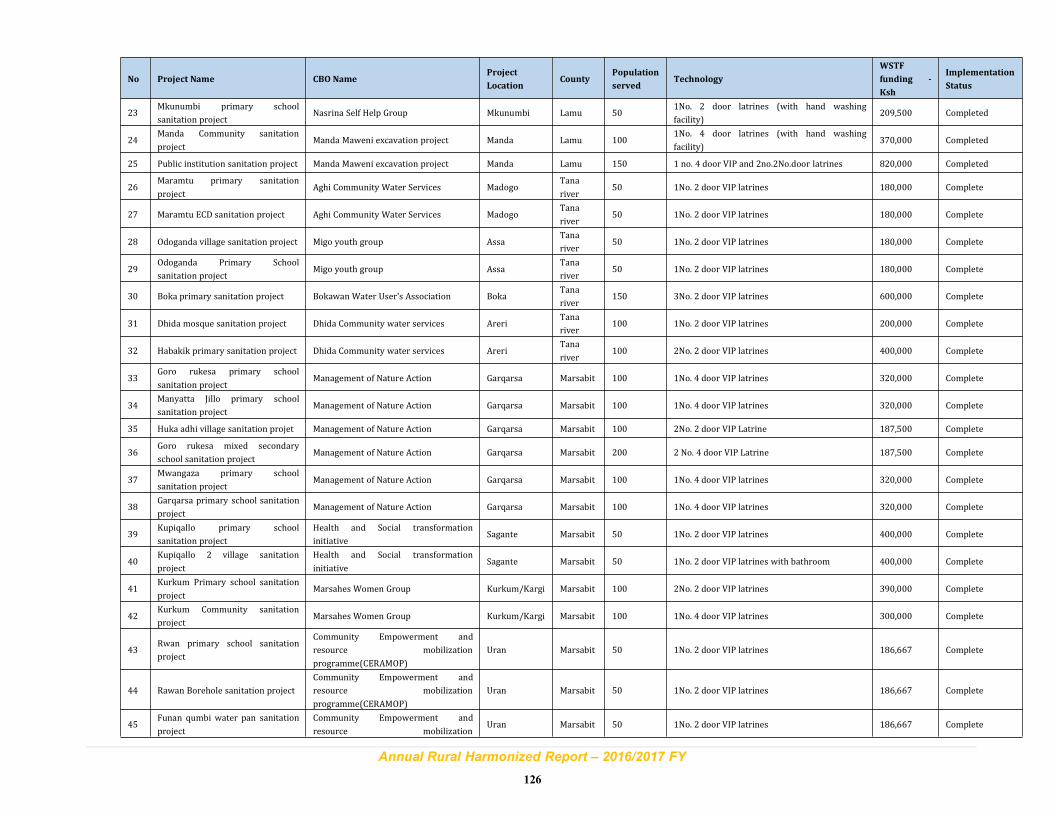
Annual Rural Harmonized Report – 2016/2017 FY
126
No Project Name CBO NameProject
LocationCounty
Population
servedTechnology
WSTF
funding -
Ksh
Implementation
Status
23Mkunumbi primary school
sanitation projectNasrina Self Help Group Mkunumbi Lamu 50
1No. 2 door latrines (with hand washing
facility)209,500 Completed
24Manda Community sanitation
projectManda Maweni excavation project Manda Lamu 100
1No. 4 door latrines (with hand washing
facility)370,000 Completed
25 Public institution sanitation project Manda Maweni excavation project Manda Lamu 150 1 no. 4 door VIP and 2no.2No.door latrines 820,000 Completed
26Maramtu primary sanitation
projectAghi Community Water Services Madogo
Tana
river50 1No. 2 door VIP latrines 180,000 Complete
27 Maramtu ECD sanitation project Aghi Community Water Services MadogoTana
river50 1No. 2 door VIP latrines 180,000 Complete
28 Odoganda village sanitation project Migo youth group AssaTana
river50 1No. 2 door VIP latrines 180,000 Complete
29Odoganda Primary School
sanitation projectMigo youth group Assa
Tana
river50 1No. 2 door VIP latrines 180,000 Complete
30 Boka primary sanitation project Bokawan Water User's Association BokaTana
river150 3No. 2 door VIP latrines 600,000 Complete
31 Dhida mosque sanitation project Dhida Community water services AreriTana
river100 1No. 2 door VIP latrines 200,000 Complete
32 Habakik primary sanitation project Dhida Community water services AreriTana
river100 2No. 2 door VIP latrines 400,000 Complete
33Goro rukesa primary school
sanitation projectManagement of Nature Action Garqarsa Marsabit 100 1No. 4 door VIP latrines 320,000 Complete
34Manyatta Jillo primary school
sanitation projectManagement of Nature Action Garqarsa Marsabit 100 1No. 4 door VIP latrines 320,000 Complete
35 Huka adhi village sanitation projet Management of Nature Action Garqarsa Marsabit 100 2No. 2 door VIP Latrine 187,500 Complete
36Goro rukesa mixed secondary
school sanitation projectManagement of Nature Action Garqarsa Marsabit 200 2 No. 4 door VIP Latrine 187,500 Complete
37Mwangaza primary school
sanitation projectManagement of Nature Action Garqarsa Marsabit 100 1No. 4 door VIP latrines 320,000 Complete
38Garqarsa primary school sanitation
projectManagement of Nature Action Garqarsa Marsabit 100 1No. 4 door VIP latrines 320,000 Complete
39Kupiqallo primary school
sanitation project
Health and Social transformation
initiativeSagante Marsabit 50 1No. 2 door VIP latrines 400,000 Complete
40Kupiqallo 2 village sanitation
project
Health and Social transformation
initiativeSagante Marsabit 50 1No. 2 door VIP latrines with bathroom 400,000 Complete
41Kurkum Primary school sanitation
projectMarsahes Women Group Kurkum/Kargi Marsabit 100 2No. 2 door VIP latrines 390,000 Complete
42Kurkum Community sanitation
projectMarsahes Women Group Kurkum/Kargi Marsabit 100 1No. 4 door VIP latrines 300,000 Complete
43Rwan primary school sanitation
project
Community Empowerment and
resource mobilization
programme(CERAMOP)
Uran Marsabit 50 1No. 2 door VIP latrines 186,667 Complete
44 Rawan Borehole sanitation project
Community Empowerment and
resource mobilization
programme(CERAMOP)
Uran Marsabit 50 1No. 2 door VIP latrines 186,667 Complete
45Funan qumbi water pan sanitation
project
Community Empowerment and
resource mobilizationUran Marsabit 50 1No. 2 door VIP latrines 186,667 Complete
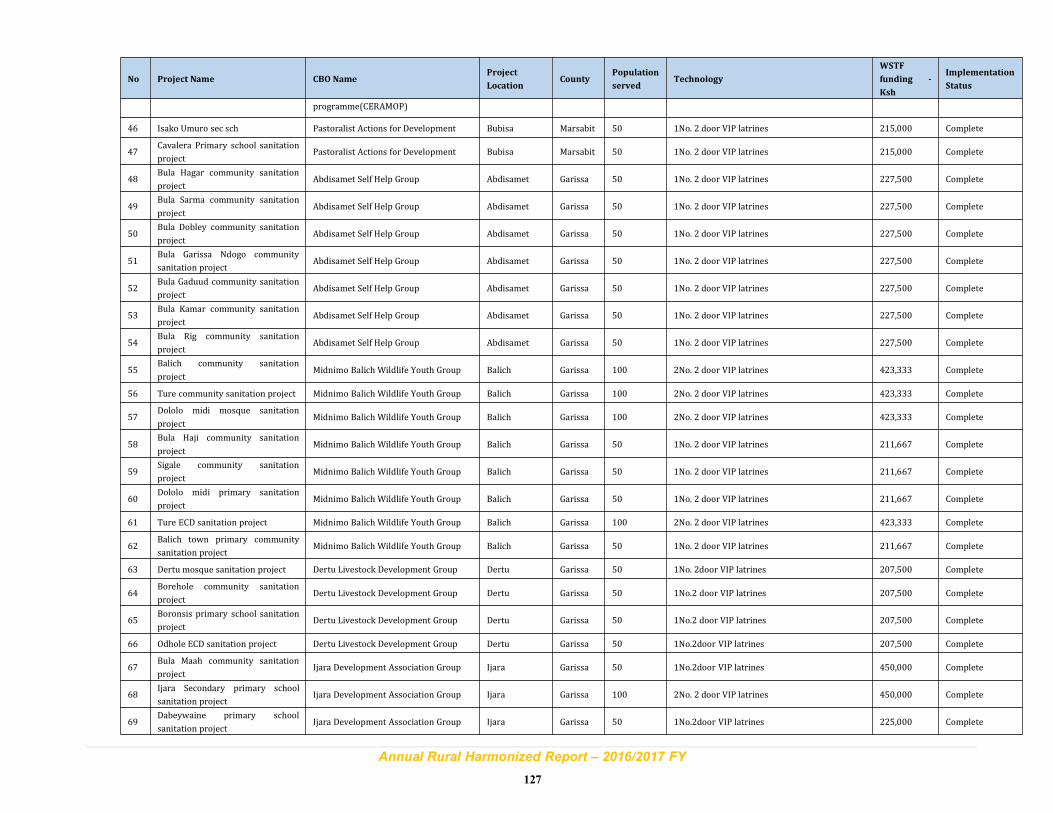
Annual Rural Harmonized Report – 2016/2017 FY
127
No Project Name CBO NameProject
LocationCounty
Population
servedTechnology
WSTF
funding -
Ksh
Implementation
Status
programme(CERAMOP)
46 Isako Umuro sec sch Pastoralist Actions for Development Bubisa Marsabit 50 1No. 2 door VIP latrines 215,000 Complete
47Cavalera Primary school sanitation
projectPastoralist Actions for Development Bubisa Marsabit 50 1No. 2 door VIP latrines 215,000 Complete
48Bula Hagar community sanitation
projectAbdisamet Self Help Group Abdisamet Garissa 50 1No. 2 door VIP latrines 227,500 Complete
49Bula Sarma community sanitation
projectAbdisamet Self Help Group Abdisamet Garissa 50 1No. 2 door VIP latrines 227,500 Complete
50Bula Dobley community sanitation
projectAbdisamet Self Help Group Abdisamet Garissa 50 1No. 2 door VIP latrines 227,500 Complete
51Bula Garissa Ndogo community
sanitation projectAbdisamet Self Help Group Abdisamet Garissa 50 1No. 2 door VIP latrines 227,500 Complete
52Bula Gaduud community sanitation
projectAbdisamet Self Help Group Abdisamet Garissa 50 1No. 2 door VIP latrines 227,500 Complete
53Bula Kamar community sanitation
projectAbdisamet Self Help Group Abdisamet Garissa 50 1No. 2 door VIP latrines 227,500 Complete
54Bula Rig community sanitation
projectAbdisamet Self Help Group Abdisamet Garissa 50 1No. 2 door VIP latrines 227,500 Complete
55Balich community sanitation
projectMidnimo Balich Wildlife Youth Group Balich Garissa 100 2No. 2 door VIP latrines 423,333 Complete
56 Ture community sanitation project Midnimo Balich Wildlife Youth Group Balich Garissa 100 2No. 2 door VIP latrines 423,333 Complete
57Dololo midi mosque sanitation
projectMidnimo Balich Wildlife Youth Group Balich Garissa 100 2No. 2 door VIP latrines 423,333 Complete
58Bula Haji community sanitation
projectMidnimo Balich Wildlife Youth Group Balich Garissa 50 1No. 2 door VIP latrines 211,667 Complete
59Sigale community sanitation
projectMidnimo Balich Wildlife Youth Group Balich Garissa 50 1No. 2 door VIP latrines 211,667 Complete
60Dololo midi primary sanitation
projectMidnimo Balich Wildlife Youth Group Balich Garissa 50 1No. 2 door VIP latrines 211,667 Complete
61 Ture ECD sanitation project Midnimo Balich Wildlife Youth Group Balich Garissa 100 2No. 2 door VIP latrines 423,333 Complete
62Balich town primary community
sanitation projectMidnimo Balich Wildlife Youth Group Balich Garissa 50 1No. 2 door VIP latrines 211,667 Complete
63 Dertu mosque sanitation project Dertu Livestock Development Group Dertu Garissa 50 1No. 2door VIP latrines 207,500 Complete
64Borehole community sanitation
projectDertu Livestock Development Group Dertu Garissa 50 1No.2 door VIP latrines 207,500 Complete
65Boronsis primary school sanitation
projectDertu Livestock Development Group Dertu Garissa 50 1No.2 door VIP latrines 207,500 Complete
66 Odhole ECD sanitation project Dertu Livestock Development Group Dertu Garissa 50 1No.2door VIP latrines 207,500 Complete
67Bula Maah community sanitation
projectIjara Development Association Group Ijara Garissa 50 1No.2door VIP latrines 450,000 Complete
68Ijara Secondary primary school
sanitation projectIjara Development Association Group Ijara Garissa 100 2No. 2 door VIP latrines 450,000 Complete
69Dabeywaine primary school
sanitation projectIjara Development Association Group Ijara Garissa 50 1No.2door VIP latrines 225,000 Complete
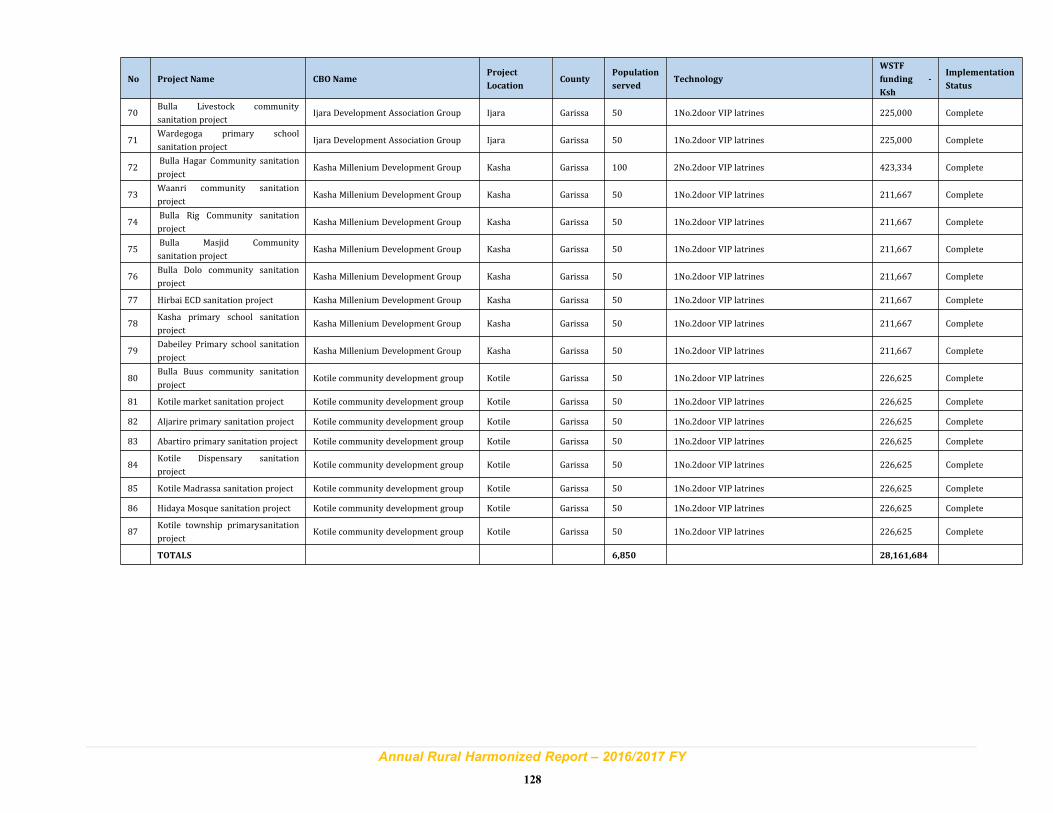
Annual Rural Harmonized Report – 2016/2017 FY
128
No Project Name CBO NameProject
LocationCounty
Population
servedTechnology
WSTF
funding -
Ksh
Implementation
Status
70Bulla Livestock community
sanitation projectIjara Development Association Group Ijara Garissa 50 1No.2door VIP latrines 225,000 Complete
71Wardegoga primary school
sanitation projectIjara Development Association Group Ijara Garissa 50 1No.2door VIP latrines 225,000 Complete
72Bulla Hagar Community sanitation
projectKasha Millenium Development Group Kasha Garissa 100 2No.2door VIP latrines 423,334 Complete
73Waanri community sanitation
projectKasha Millenium Development Group Kasha Garissa 50 1No.2door VIP latrines 211,667 Complete
74Bulla Rig Community sanitation
projectKasha Millenium Development Group Kasha Garissa 50 1No.2door VIP latrines 211,667 Complete
75Bulla Masjid Community
sanitation projectKasha Millenium Development Group Kasha Garissa 50 1No.2door VIP latrines 211,667 Complete
76Bulla Dolo community sanitation
projectKasha Millenium Development Group Kasha Garissa 50 1No.2door VIP latrines 211,667 Complete
77 Hirbai ECD sanitation project Kasha Millenium Development Group Kasha Garissa 50 1No.2door VIP latrines 211,667 Complete
78Kasha primary school sanitation
projectKasha Millenium Development Group Kasha Garissa 50 1No.2door VIP latrines 211,667 Complete
79Dabeiley Primary school sanitation
projectKasha Millenium Development Group Kasha Garissa 50 1No.2door VIP latrines 211,667 Complete
80Bulla Buus community sanitation
projectKotile community development group Kotile Garissa 50 1No.2door VIP latrines 226,625 Complete
81 Kotile market sanitation project Kotile community development group Kotile Garissa 50 1No.2door VIP latrines 226,625 Complete
82 Aljarire primary sanitation project Kotile community development group Kotile Garissa 50 1No.2door VIP latrines 226,625 Complete
83 Abartiro primary sanitation project Kotile community development group Kotile Garissa 50 1No.2door VIP latrines 226,625 Complete
84Kotile Dispensary sanitation
projectKotile community development group Kotile Garissa 50 1No.2door VIP latrines 226,625 Complete
85 Kotile Madrassa sanitation project Kotile community development group Kotile Garissa 50 1No.2door VIP latrines 226,625 Complete
86 Hidaya Mosque sanitation project Kotile community development group Kotile Garissa 50 1No.2door VIP latrines 226,625 Complete
87Kotile township primarysanitation
projectKotile community development group Kotile Garissa 50 1No.2door VIP latrines 226,625 Complete
TOTALS 6,850 28,161,684
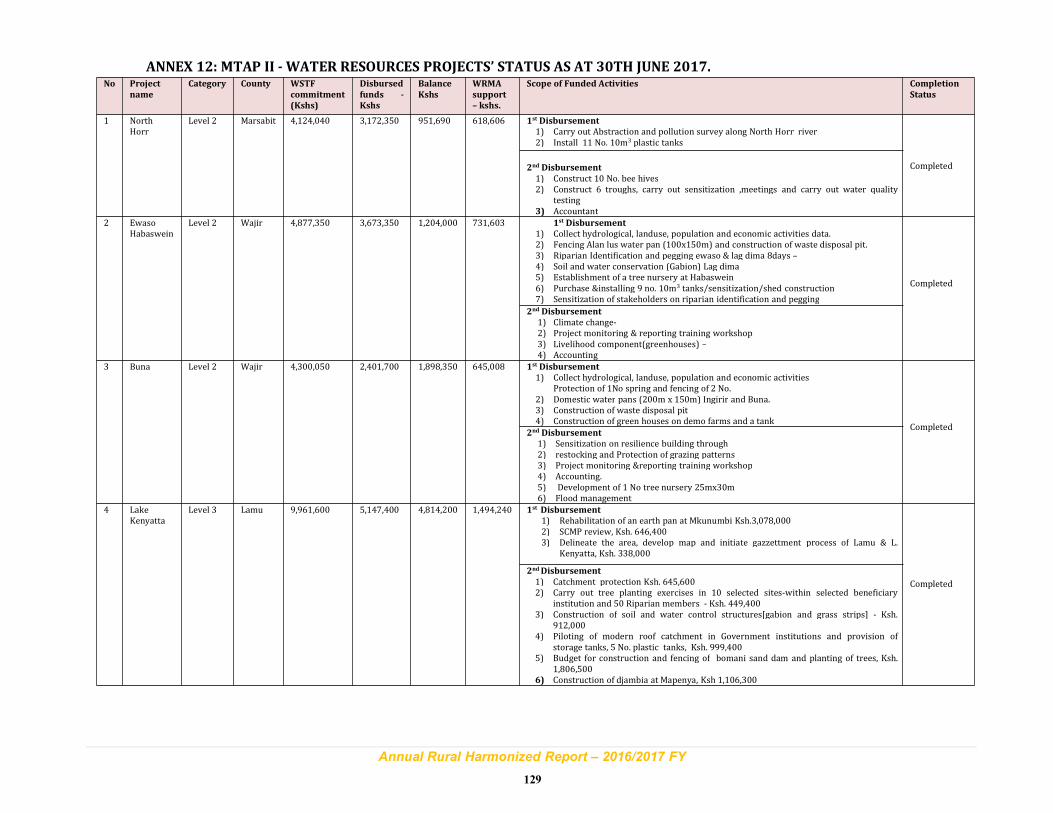
Annual Rural Harmonized Report – 2016/2017 FY
129
ANNEX 12: MTAP II - WATER RESOURCES PROJECTS’ STATUS AS AT 30TH JUNE 2017.No Project
name
Category County WSTF
commitment
(Kshs)
Disbursed
funds -
Kshs
Balance
Kshs
WRMA
support
– kshs.
Scope of Funded Activities Completion
Status
1 NorthHorr
Level 2 Marsabit 4,124,040 3,172,350 951,690 618,606 1st Disbursement
1) Carry out Abstraction and pollution survey along North Horr river2) Install 11 No. 10m3 plastic tanks
Completed2nd Disbursement
1) Construct 10 No. bee hives2) Construct 6 troughs, carry out sensitization ,meetings and carry out water quality
testing3) Accountant
2 EwasoHabaswein
Level 2 Wajir 4,877,350 3,673,350 1,204,000 731,603 1st Disbursement
1) Collect hydrological, landuse, population and economic activities data.2) Fencing Alan lus water pan (100x150m) and construction of waste disposal pit.3) Riparian Identification and pegging ewaso & lag dima 8days –4) Soil and water conservation (Gabion) Lag dima5) Establishment of a tree nursery at Habaswein6) Purchase &installing 9 no. 10m3 tanks/sensitization/shed construction7) Sensitization of stakeholders on riparian identification and pegging
Completed
2nd Disbursement
1) Climate change-2) Project monitoring & reporting training workshop3) Livelihood component(greenhouses) –4) Accounting
3 Buna Level 2 Wajir 4,300,050 2,401,700 1,898,350 645,008 1st Disbursement
1) Collect hydrological, landuse, population and economic activitiesProtection of 1No spring and fencing of 2 No.
2) Domestic water pans (200m x 150m) Ingirir and Buna.3) Construction of waste disposal pit4) Construction of green houses on demo farms and a tank
Completed2nd Disbursement
1) Sensitization on resilience building through2) restocking and Protection of grazing patterns3) Project monitoring &reporting training workshop4) Accounting.5) Development of 1 No tree nursery 25mx30m6) Flood management
4 LakeKenyatta
Level 3 Lamu 9,961,600 5,147,400 4,814,200 1,494,240 1st Disbursement
1) Rehabilitation of an earth pan at Mkunumbi Ksh.3,078,0002) SCMP review, Ksh. 646,4003) Delineate the area, develop map and initiate gazzettment process of Lamu & L.
Kenyatta, Ksh. 338,000
Completed
2ndDisbursement
1) Catchment protection Ksh. 645,6002) Carry out tree planting exercises in 10 selected sites-within selected beneficiary
institution and 50 Riparian members - Ksh. 449,4003) Construction of soil and water control structures[gabion and grass strips] - Ksh.
912,0004) Piloting of modern roof catchment in Government institutions and provision of
storage tanks, 5 No. plastic tanks, Ksh. 999,4005) Budget for construction and fencing of bomani sand dam and planting of trees, Ksh.
1,806,5006) Construction of djambia at Mapenya, Ksh 1,106,300
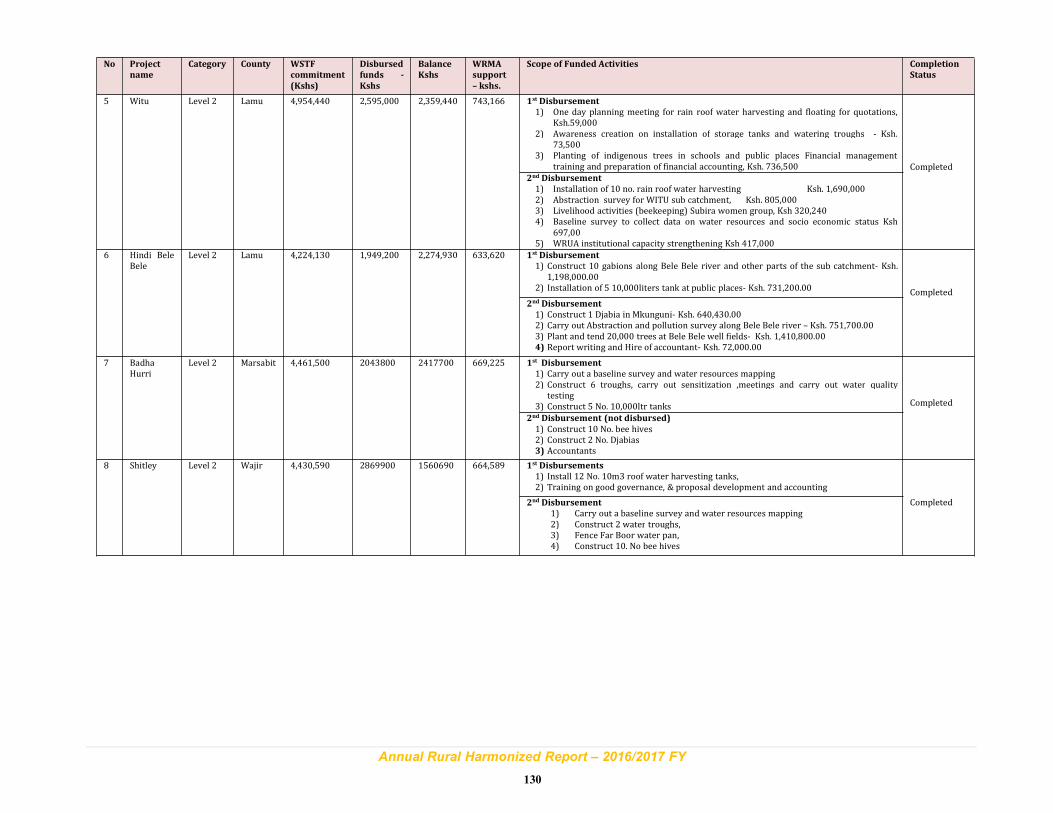
Annual Rural Harmonized Report – 2016/2017 FY
130
No Project
name
Category County WSTF
commitment
(Kshs)
Disbursed
funds -
Kshs
Balance
Kshs
WRMA
support
– kshs.
Scope of Funded Activities Completion
Status
5 Witu Level 2 Lamu 4,954,440 2,595,000 2,359,440 743,166 1st Disbursement
1) One day planning meeting for rain roof water harvesting and floating for quotations,Ksh.59,000
2) Awareness creation on installation of storage tanks and watering troughs - Ksh.73,500
3) Planting of indigenous trees in schools and public places Financial managementtraining and preparation of financial accounting, Ksh. 736,500 Completed
2nd Disbursement
1) Installation of 10 no. rain roof water harvesting Ksh. 1,690,0002) Abstraction survey for WITU sub catchment, Ksh. 805,0003) Livelihood activities (beekeeping) Subira women group, Ksh 320,2404) Baseline survey to collect data on water resources and socio economic status Ksh
697,005) WRUA institutional capacity strengthening Ksh 417,000
6 Hindi BeleBele
Level 2 Lamu 4,224,130 1,949,200 2,274,930 633,620 1st Disbursement
1) Construct 10 gabions along Bele Bele river and other parts of the sub catchment- Ksh.1,198,000.00
2) Installation of 5 10,000liters tank at public places- Ksh. 731,200.00Completed
2nd Disbursement
1) Construct 1 Djabia in Mkunguni- Ksh. 640,430.002) Carry out Abstraction and pollution survey along Bele Bele river – Ksh. 751,700.003) Plant and tend 20,000 trees at Bele Bele well fields- Ksh. 1,410,800.004) Report writing and Hire of accountant- Ksh. 72,000.00
7 BadhaHurri
Level 2 Marsabit 4,461,500 2043800 2417700 669,225 1st Disbursement
1) Carry out a baseline survey and water resources mapping2) Construct 6 troughs, carry out sensitization ,meetings and carry out water quality
testing3) Construct 5 No. 10,000ltr tanks Completed
2nd Disbursement (not disbursed)
1) Construct 10 No. bee hives2) Construct 2 No. Djabias3) Accountants
8 Shitley Level 2 Wajir 4,430,590 2869900 1560690 664,589 1st Disbursements
1) Install 12 No. 10m3 roof water harvesting tanks,2) Training on good governance, & proposal development and accounting
Completed2nd Disbursement
1) Carry out a baseline survey and water resources mapping2) Construct 2 water troughs,3) Fence Far Boor water pan,4) Construct 10. No bee hives
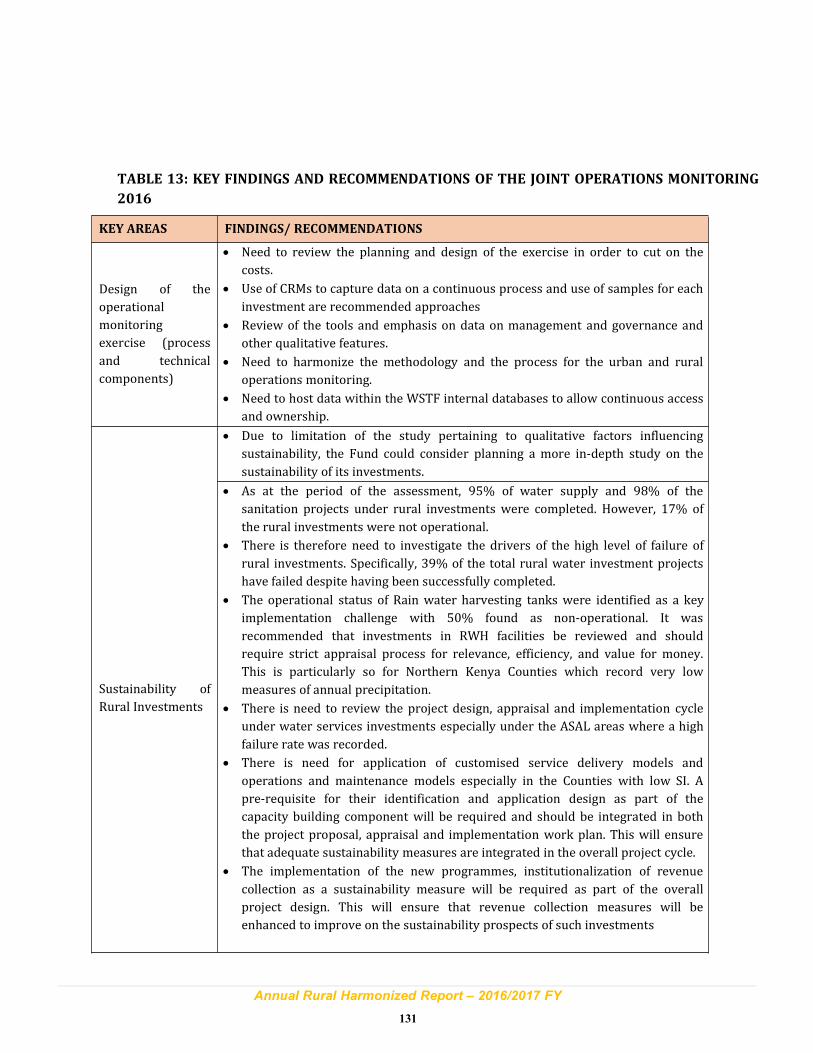
Annual Rural Harmonized Report – 2016/2017 FY
131
TABLE 13: KEY FINDINGS AND RECOMMENDATIONS OF THE JOINT OPERATIONS MONITORING
2016
KEY AREAS FINDINGS/ RECOMMENDATIONS
Design of the
operational
monitoring
exercise (process
and technical
components)
• Need to review the planning and design of the exercise in order to cut on the
costs.
• Use of CRMs to capture data on a continuous process and use of samples for each
investment are recommended approaches
• Review of the tools and emphasis on data on management and governance and
other qualitative features.
• Need to harmonize the methodology and the process for the urban and rural
operations monitoring.
• Need to host data within the WSTF internal databases to allow continuous access
and ownership.
Sustainability of
Rural Investments
• Due to limitation of the study pertaining to qualitative factors influencing
sustainability, the Fund could consider planning a more in-depth study on the
sustainability of its investments.
• As at the period of the assessment, 95% of water supply and 98% of the
sanitation projects under rural investments were completed. However, 17% of
the rural investments were not operational.
• There is therefore need to investigate the drivers of the high level of failure of
rural investments. Specifically, 39% of the total rural water investment projects
have failed despite having been successfully completed.
• The operational status of Rain water harvesting tanks were identified as a key
implementation challenge with 50% found as non-operational. It was
recommended that investments in RWH facilities be reviewed and should
require strict appraisal process for relevance, efficiency, and value for money.
This is particularly so for Northern Kenya Counties which record very low
measures of annual precipitation.
• There is need to review the project design, appraisal and implementation cycle
under water services investments especially under the ASAL areas where a high
failure rate was recorded.
• There is need for application of customised service delivery models and
operations and maintenance models especially in the Counties with low SI. A
pre-requisite for their identification and application design as part of the
capacity building component will be required and should be integrated in both
the project proposal, appraisal and implementation work plan. This will ensure
that adequate sustainability measures are integrated in the overall project cycle.
• The implementation of the new programmes, institutionalization of revenue
collection as a sustainability measure will be required as part of the overall
project design. This will ensure that revenue collection measures will be
enhanced to improve on the sustainability prospects of such investments
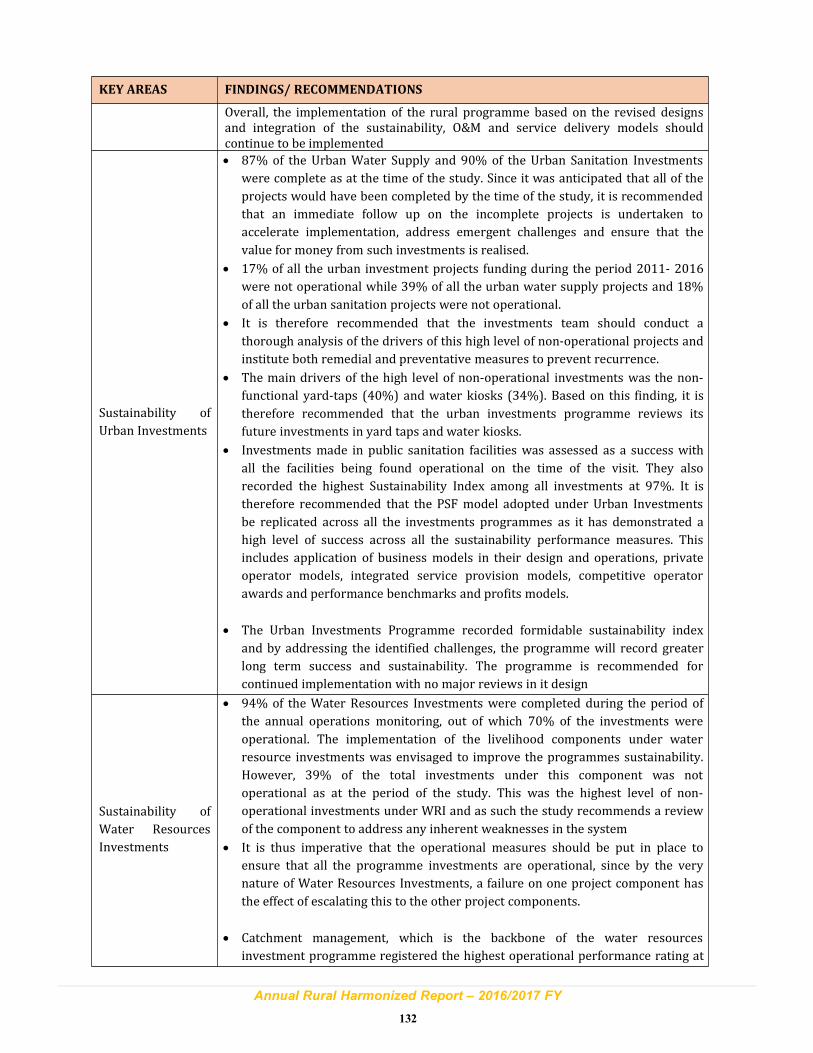
Annual Rural Harmonized Report – 2016/2017 FY
132
KEY AREAS FINDINGS/ RECOMMENDATIONS
Overall, the implementation of the rural programme based on the revised designsand integration of the sustainability, O&M and service delivery models shouldcontinue to be implemented
Sustainability of
Urban Investments
• 87% of the Urban Water Supply and 90% of the Urban Sanitation Investments
were complete as at the time of the study. Since it was anticipated that all of the
projects would have been completed by the time of the study, it is recommended
that an immediate follow up on the incomplete projects is undertaken to
accelerate implementation, address emergent challenges and ensure that the
value for money from such investments is realised.
• 17% of all the urban investment projects funding during the period 2011- 2016
were not operational while 39% of all the urban water supply projects and 18%
of all the urban sanitation projects were not operational.
• It is therefore recommended that the investments team should conduct a
thorough analysis of the drivers of this high level of non-operational projects and
institute both remedial and preventative measures to prevent recurrence.
• The main drivers of the high level of non-operational investments was the non-
functional yard-taps (40%) and water kiosks (34%). Based on this finding, it is
therefore recommended that the urban investments programme reviews its
future investments in yard taps and water kiosks.
• Investments made in public sanitation facilities was assessed as a success with
all the facilities being found operational on the time of the visit. They also
recorded the highest Sustainability Index among all investments at 97%. It is
therefore recommended that the PSF model adopted under Urban Investments
be replicated across all the investments programmes as it has demonstrated a
high level of success across all the sustainability performance measures. This
includes application of business models in their design and operations, private
operator models, integrated service provision models, competitive operator
awards and performance benchmarks and profits models.
• The Urban Investments Programme recorded formidable sustainability index
and by addressing the identified challenges, the programme will record greater
long term success and sustainability. The programme is recommended for
continued implementation with no major reviews in it design
Sustainability of
Water Resources
Investments
• 94% of the Water Resources Investments were completed during the period of
the annual operations monitoring, out of which 70% of the investments were
operational. The implementation of the livelihood components under water
resource investments was envisaged to improve the programmes sustainability.
However, 39% of the total investments under this component was not
operational as at the period of the study. This was the highest level of non-
operational investments under WRI and as such the study recommends a review
of the component to address any inherent weaknesses in the system
• It is thus imperative that the operational measures should be put in place to
ensure that all the programme investments are operational, since by the very
nature of Water Resources Investments, a failure on one project component has
the effect of escalating this to the other project components.
• Catchment management, which is the backbone of the water resources
investment programme registered the highest operational performance rating at
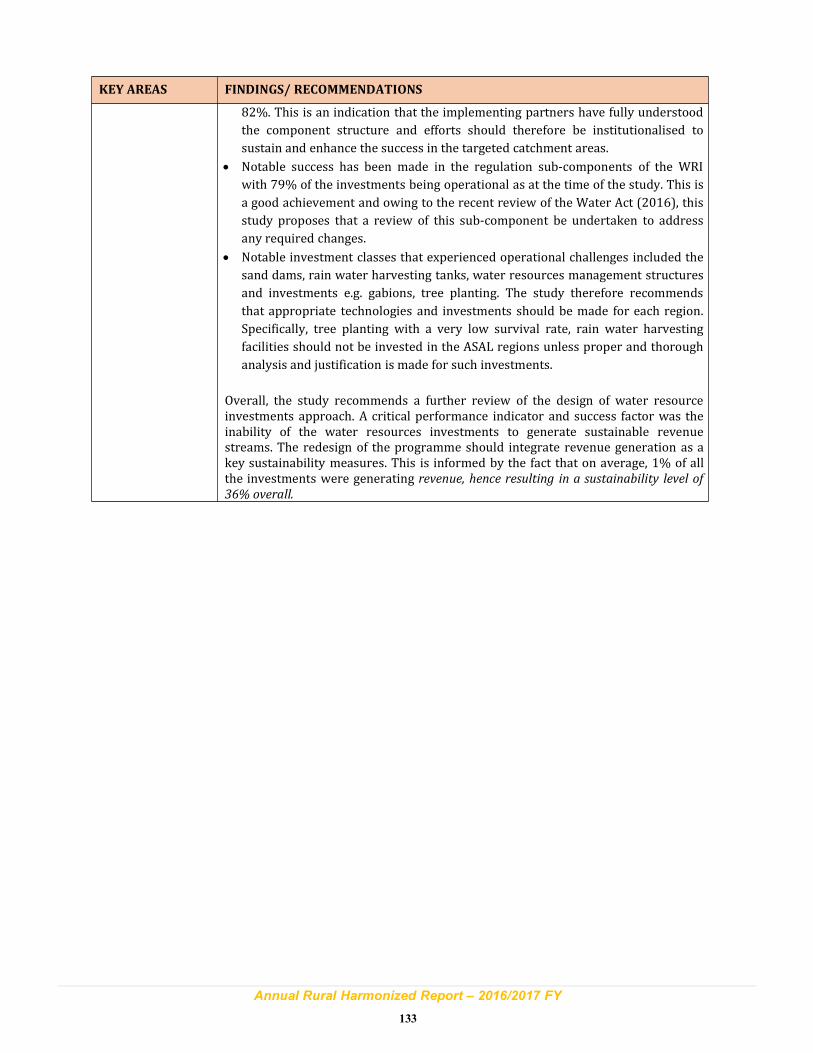
Annual Rural Harmonized Report – 2016/2017 FY
133
KEY AREAS FINDINGS/ RECOMMENDATIONS
82%. This is an indication that the implementing partners have fully understood
the component structure and efforts should therefore be institutionalised to
sustain and enhance the success in the targeted catchment areas.
• Notable success has been made in the regulation sub-components of the WRI
with 79% of the investments being operational as at the time of the study. This is
a good achievement and owing to the recent review of the Water Act (2016), this
study proposes that a review of this sub-component be undertaken to address
any required changes.
• Notable investment classes that experienced operational challenges included the
sand dams, rain water harvesting tanks, water resources management structures
and investments e.g. gabions, tree planting. The study therefore recommends
that appropriate technologies and investments should be made for each region.
Specifically, tree planting with a very low survival rate, rain water harvesting
facilities should not be invested in the ASAL regions unless proper and thorough
analysis and justification is made for such investments.
Overall, the study recommends a further review of the design of water resourceinvestments approach. A critical performance indicator and success factor was theinability of the water resources investments to generate sustainable revenuestreams. The redesign of the programme should integrate revenue generation as akey sustainability measures. This is informed by the fact that on average, 1% of allthe investments were generating revenue, hence resulting in a sustainability level of
36% overall.