annual report - fundsquare
TRANSCRIPT
Multiflex SICAV Société d'Investissement à Capital Variable
Annual Report As at 30 June 2017 (audited)
Subscriptions are carried out solely on the basis of the current prospectus or the key investor information, in conjunction with the latest annual report and the latest semi-annual report if published thereafter. The Articles of Association, the valid prospectus and the key investor information, the annual and semi-annual reports, as well as information based on the Guidelines on transparency with regard to management fees of the Swiss Funds & Asset Management Association [SFAMA], may be obtained free of charge from the representative in Switzerland and/or from the respective paying agent. In case of differences between the English version and the translation, the English version shall be the authentic text. AN INVESTMENT FUND UNDER LUXEMBOURG LAW
Paying agent in Luxembourg: State Street Bank Luxembourg S.C.A., 49, Avenue J.F. Kennedy, L - 1855 Luxembourg Representative in Switzerland: GAM Investment Management (Switzerland) AG, Hardstraße 201, Postfach, CH - 8037 Zurich Paying agent in Switzerland: State Street Bank International GmbH, Munich, Zurich Branch, Beethovenstrasse 19, CH - 8027 Zurich Paying agent in Germany: DekaBank Deutsche Girozentrale, Mainzer Landstraße 16, D - 60325 Frankfurt / Main Information agent in Germany: GAM (Deutschland) GmbH, Taunusanlage 15, D - 60325 Frankfurt / Main Representative and paying agent in Liechtenstein: LGT Bank AG, Herrengasse 12, FL - 9490 Vaduz Register number: R.C.S. Luxemburg B130982
Contents
*see Appendix I.
Page
Organisation and Management 3
Audit Report 5
Report of the Board of Directors 9
Notes to the Annual Report 10
Multiflex SICAV (Umbrella fund) 18
Multiflex SICAV - CARNOT EFFICIENT ENERGY FUND 20
Multiflex SICAV - DYNAMIC LONG-TERM MULTI-ASSET FUND* 27
Multiflex SICAV - DYNAMIC MULTI-ASSET FUND* 32
Multiflex SICAV - GLOBAL MULTI-ASSET INCOME FUND 69
Multiflex SICAV - GLOBAL OPTIMAL MULTI-ASSET FUND* 92
Multiflex SICAV - LONG-TERM OPTIMAL MULTI-ASSET FUND* 115
Multiflex SICAV - STRATEGIC INSURANCE DISTRIBUTION FUND* 127
Multiflex SICAV - SWISS ASSET PARTNERS EQUITY FUND 161
Appendix I – Launches, liquidations, mergers and name changes of sub-funds and share classes 166
Appendix II – Securities Financing Transactions (unaudited) 167
Appendix III – Additional Information for Shareholders in Switzerland (unaudited) 168
Appendix IV – Information on risk management (unaudited) 170
Addresses 171
Organisation and Management
The registered office of the Company is: Elmar Zumbühl (since 21 October 2016) 25, Grand-Rue Group Chief Risk Officer L - 1661 Luxembourg GAM Holding AG Zurich, Switzerland Board of Directors of the Company Managing Directors of the Management Company Chairman: Martin Jufer Ewald Hamlescher (until 17 March 2017) Member of the Group Management Board, GAM Group Managing Director Region Head Continental Europe GAM (Luxemburg) S.A. GAM Investment Management (Switzerland) AG Luxembourg, Grand Duchy of Luxembourg Zurich, Switzerland Steve Kieffer Members: Managing Director Me Freddy Brausch GAM (Luxemburg) S.A. Partner Luxembourg, Grand Duchy of Luxembourg Linklaters LLP Luxembourg, Grand Duchy of Luxembourg Nils Kruse (since 17 March 2017) Managing Director Andrew Hanges GAM (Luxemburg) S.A. Region Head UK Luxembourg, Grand Duchy of Luxembourg GAM (UK) Ltd. London, Great Britain Depositary, Central Administrator and Principal Paying Agent as well as Registrar and Transfer Agent Jean-Michel Loehr Independent Director State Street Bank Luxemburg S.C.A. Frisange, Grand Duchy of Luxembourg 49, Avenue J.F. Kennedy L - 1855 Luxembourg Dirk Spiegel Group General Counsel Investment Manager GAM Investment Management (Switzerland) AG Zurich, Switzerland For Multiflex SICAV - CARNOT EFFICIENT ENERGY FUND: Carnot Capital AG Management Company and Domiciliary Agent Schaffhauserstraße 418 CH - 8050 Zurich GAM (Luxembourg) S.A. Switzerland 25, Grand-Rue L - 1661 Luxembourg For the Sub-funds: Multiflex SICAV - DYNAMIC LONG-TERM MULTI-ASSET FUND* Board of Directors of the Management Company and Multiflex SICAV - DYNAMIC MULTI-ASSET FUND*: MORGAN STANLEY INVESTMENT MANAGEMENT LIMITED Chairman: 25 Cabot Square, Canary Wharf Martin Jufer London E14 4QA Member of the Group Management Board, GAM Group Great Britain Region Head Continental Europe GAM Investment Management (Switzerland) AG For Multiflex SICAV - GLOBAL MULTI-ASSET INCOME FUND: Zurich, Switzerland PIMCO EUROPE LIMITED 11 Baker Street Members: London W1U 3AH Andrew Hanges Great Britain Region Head UK GAM (UK) Ltd. For the Sub-funds: London, Great Britain Multiflex SICAV - GLOBAL OPTIMAL MULTI-ASSET FUND* and Multiflex SICAV - LONG-TERM OPTIMAL MULTI-ASSET FUND*: Yvon Lauret AXA INVESTMENT MANAGERS PARIS Independent Director Tour Majunga - La Défense 9, 6, place de la Pyramide Luxembourg, Grand Duchy of Luxembourg FR - 92800 Puteaux France William Norris (since 21 October 2016) Head of Operations and IT For Multiflex SICAV - STRATEGIC INSURANCE DISTRIBUTION FUND*: GAM (UK) Ltd. J.P. MORGAN ASSET MANAGEMENT (UK) LIMITED London, Great Britain 60 Victoria Embankment
London EC4Y 0JP Great Britain
3
Organisation and Management
For Multiflex SICAV - SWISS ASSET PARTNERS EQUITY FUND: Paying agent in Switzerland: Swiss Asset Partners Vermögensverwaltungs AG State Street Bank International GmbH, Munich Beethovenstraße 1 Zurich Branch CH - 8002 Zurich Beethovenstrasse 19 Switzerland CH - 8027 Zurich Each investment manager may hire the support of investment Paying agent in Germany: advisers for individual sub-funds. DekaBank Deutsche Girozentrale Mainzer Landstraße 16 Distributors D - 60325 Frankfurt / Main The Company and/or the Management Company has appointed and Information agent in Germany: may appoint further distributors to sell the shares in one or more GAM (Deutschland) GmbH jurisdictions. Taunusanlage 15 D - 60325 Frankfurt / Main Auditor Liechtenstein: PricewaterhouseCoopers, Société coopérative LGT Bank AG 2, rue Gerhard Mercator Herrengasse 12L - 2182 Luxembourg FL - 9490 Vaduz Legal Adviser Sweden: MFEX Mutual Funds Exchange AB Linklaters LLP Grev Turegatan 19 35, Avenue J.F. Kennedy SE - 114 38 Stockholm L - 1855 Luxembourg Local Representatives Switzerland: GAM Investment Management (Switzerland) AG Hardstrasse 201 P.O. Box CH - 8037 Zurich
*see Appendix I.
4
p
Audit report
To the Shareholders ofMultifl exSICAV
Our opi72i<>n
In our opinion, the accompanying financial statements give a true and fair View of the financialposition of Multifl exSICAV and of each of its sub—f11nds (the “Fund”) as at 30 June 2017, and of theresults of their operations and changes in their net assets for the year then ended in accordance withLuxembourg legal and regulatory requirements relating to the preparation and presentation of thefinancial statements.
I/Vhat we have audited
The Fund’s financial statements comprise:
the statement of net assets as at 30 June 2017;the securities portfolio as at 30 June 2017;the profit and loss account for the year then ended;the statement of changes in net assets for the year then ended; andthe notes to the financial statements, which include a summary of significant accounting policies.
Basisfor opinion
We conducted our audit in accordance with the Law of 23 July 2016 on the audit profession (Law of23 July 2016) and with International Standards on Auditing (ISAs) as adopted for Luxembourg by the“Commission de Surveillance du Secteur Financier” (CSSF). Our responsibilities under those Law and ’standards are further described in the “Responsibilities of the “Réviseur d’entreprises agree” for theaudit of the financial statements” section of our report.
We believe that the audit evidence we have obtained is sufficient and appropriate to provide a basis forour opinion.
PricewaterhouseCoopers, Société coopérative, 2 rue GerhardMercator, B.P. 1443, L—1014 LuxembourgT: +352 494848 1, F : +352 494848 2900, www.pwc.Iu
Cabinet de révision agréé. Expert—comptable (autorisation gouvernementale n°10o28256)R.C.S. Luxembourg B 65 477 - TVA LU25482518
5
pc
Independence
We are independent of the Fund in accordance with the International Ethics Standards Board forAccountants’ Code of Ethics for Professional Accountants (IESBA Code) as adopted for Luxembourg bythe CSSF together with the ethical requirements that are relevant to our audit of the financial statements.We have fulfilled our other ethical responsibilities under those ethical requirements.
Other informcztion
The Board of Directors of the Company is responsible for the other information. The other informationcomprises the information included in the annual report but does not include the financial statementsand our audit report thereon.
Our opinion on the financial statements does not cover the other information and we do not expressany form of assurance conclusion thereon.
In connection with our audit of the financial statements, our responsibility is to read the otherinformation identified above and, in doing so, consider whether the other information is materiallyinconsistent with the financial statements or our knowledge obtained in the audit, or otherwiseappears to be materially misstated. If, based on the work we have performed, we conclude that there isa material misstatement of this other information, we are required to report that fact. We have nothingto report in this regard.
Responsibilities ofthe Board ofDirectors of the Company and those charged w2'th governancefor thefinancial statemc-*ni's
The Board of Directors of the Company is responsible for the preparation and fair presentation of thefinancial statements in accordance with Luxembourg legal and regulatory requirements relating to thepreparation and presentation of the financial statements, and for such internal control as the Board ofDirectors of the Company determines is necessary to enable the preparation offinancial statements that arefree from material misstatement, whether due to fraud or error.
In preparing the financial statements, the Board of Directors of the Company is responsible forassessing the Fund’s ability to continue as a going concern, disclosing, as applicable, matters related togoing concern and using the going concern basis of accounting unless the Board of Directors of theCompany either intends to liquidate the Fund or to cease operations, or has no realistic alternative butto do so.
Those charged with governance are responsible for overseeing the Fund’s financial reporting process.
pc
Responsibilities of the “Réuiseur d’entreprises agréé”for the audit ofthefinancial statements
The objectives of our audit are to obtain reasonable assurance about whether the financial statementsas a whole are free from material misstatement, whether due to fraud or error, and to issue an auditreport that includes our opinion. Reasonable assurance is a high level of assurance, but is not aguarantee that an audit conducted in accordance with the Law of 23 July 2016 and with ISAs asadopted for Luxembourg by the CSSF will always detect a material misstatement when it exists.Misstatements can arise from fraud or error and are considered material if, individually or in theaggregate, they could reasonably be expected to influence the economic decisions of users taken on thebasis of these financial statements.
As part of an audit in accordance with the Law of 23 July 2016 and with ISAs as adopted for Luxembourgby the CSSF, we exercise professional judgment and maintain professional scepticism throughout theaudit.
We also:
0 identify and assess the risks of material misstatement of the financial statements, whether due tofraud or error, design and perform audit procedures responsive to those risks, and obtain auditevidence that is sufficient and appropriate to provide a basis for our opinion. The risk of notdetecting a material misstatement resulting from fraud is higher than for one resulting from error,as fraud may involve collusion, forgery, intentional omissions, misrepresentations, or the overrideof internal control;
0 obtain an understanding of internal control relevant to the audit in order to design auditprocedures that are appropriate in the circumstances, but not for the purpose of expressing anopinion on the effectiveness of the Fund’s internal control;
- evaluate the appropriateness of accounting policies used and the reasonableness of accountingestimates and related disclosures made by the Board ofDirectors of the Company;
0 conclude on the appropriateness of the Board of Directors of the Company use of the going concernbasis of accounting and, based on the audit evidence obtained, whether a material uncertaintyexists related to events or conditions that may cast significant doubt on the Fund’s ability tocontinue as a going concern. If we conclude that a material uncertainty exists, we are required todraw attention in our audit report to the related disclosures in the financial statements or, if suchdisclosures are inadequate, to modify our opinion. Our conclusions are based on the audit evidenceobtained up to the date of our audit report. However, future events or conditions may cause theFund to cease to continue as a going concern;
0 evaluate the overall presentation, structure and content of the financial statements, including thedisclosures, and whether the financial statements represent the underlying transactions and eventsin a manner that achieves fair presentation.
1)
We communicate with those charged with governance regarding, among other matters, the plannedscope and timing of the audit and significant audit findings, including any significant deficiencies ininternal control that we identify during our audit.
Pricewaterhousecoopers, Société coopérative Luxembourg, 10 October 2017Re
\
Marc Schernberg
Report of the Board of Directors
Dear Investor, We are pleased to enclose the Annual Report of the Multiflex SICAV. This includes the Fund Management Report produced on behalf of the Board of Directors for the active sub-funds. The Annual Report also includes the statement of net assets, the profit and loss account, the statement of changes in net assets, the comparative statement, as well as the respective portfolios of the sub-funds. The Board of Directors confirms that the Company adhered to the rules of the ALFI Code of Conduct for Luxembourg investment funds in all significant aspects during the accounting period and at the end of the financial year 30 June 2017. Further information on the SICAV and the sub-funds, including prospectuses and semi-annual reports, may be obtained free of charge from the Management Company of the SICAV or its paying agent upon request and may also be viewed online at www.funds.gam.com. Luxembourg, in October 2017 On behalf of the Board of Directors of the Multiflex SICAV
Martin Jufer Andrew Hanges Chairman of the Board of Directors Member of the Board of Directors
9
Notes to the Annual Report
Legal information Multiflex SICAV (the “Company”) was incorporated on 17 August 2007 for an indefinite period. It is organised as a Société d’Investissement à Capital Variable (open-ended investment company – SICAV) under the law of 10 August 1915 of the Grand Duchy of Luxembourg, as amended. It has been registered under Part I of the amended law of 17 December 2010 as an undertaking for collective investment in tranferable securities (UCITS). The Company is registered under number B130982 in the Register of Commerce in Luxembourg. The Company has its registered office at 25, Grand-Rue, L - 1661 Luxembourg. Share categories The following share classes are issued at present: - A shares: Shares with distribution of income and/or capital gains. - B shares: Shares without distribution of income and/or capital gains. - C shares (for determined investors as defined in the Prospectus): Shares without distribution of income and/or capital gains. - Cm shares (for determined investors as defined in the Prospectus): Shares with a monthly distribution of income and/or capital gains. - D shares (for determined investors as defined in the Prospectus): Shares without distribution of income and/or capital gains. B shares may also bear the additional "h" (currency-hedged share categories). Additional information on hedged share classes is detailed in the prospectus. Dividend distribution
In relation to the distributing Cm shares, a regular interim dividend shall be paid, in principle, on a monthly basis in the currency of the respective sub-fund or in the currency of the respective share category. Accounting principles Presentation of the annual report The annual report of the Company has been prepared in compliance with the legal requirements for investment funds in Luxembourg. The present report has been prepared on the basis of the last net asset value (“NAV”) calculation at the end of the accounting year (in the following NAV = Net Asset Value). Aggregation
Each sub-fund of the Company prepares accounts relating to its operating result in its denominated currency. The accounts of the Company (umbrella fund) are prepared in Swiss francs by aggregating the assets and liabilities of the individual sub-funds using the exchange rates applicable on the last day of the financial year. Accounting The annual report of the Company was prepared in accordance with the regulations relating to undertakings for collective investment in transferable securities (UCITS) applicable in Luxembourg. The accrual principle is applied in the preparation of the annual report. The accounting principles are applied consistently.
10
Notes to the Annual Report
Valuation of assets and liabilities Assets and liabilities are valued at their Nominal value, with the following exceptions. Foreign currencies
Transactions effected in currencies other than the currency of the particular sub-fund are converted using the exchange rate on the date of the transaction. Assets and liabilities denominated in currencies other than the currency of the particular sub-fund are converted using the exchange rate on the balance sheet date. Foreign exchange profits and losses are included in the profit and loss account for the current financial year. Foreign exchange differences
Foreign exchange differences are attributable to the fluctuation in exchange rates over the course of the financial year. The "foreign exchange difference" is as a result of consolidating the sub-fund currencies into the Fund currency. Securities portfolio
Securities listed on a stock exchange or any other regulated market open to the public are valued at the last available price of the financial year. Unlisted securities are identified as such. Their value shall be based on a probable realisation value, determined with due care and in good faith. The realised profit / loss from the sale of securities is determined using the average historical acquisition costs. Securities in currencies other than the currency of the particular sub-fund will be converted using the exchange rate on the balance sheet date or the date of sale, whichever is applicable. All foreign exchange profits and losses are shown in the profit and loss account, together with net realised profit / loss from securities. Dividends are recorded on the ex-dividend date. Income from securities is shown net of withholding taxes. The portfolio of the Fund may contain securities which are difficult to price (i.e. stale price, limited pricing sources). In those instances, the concerned securities are regularly monitored through a detailed analysis which is carried out at least monthly. A more general analysis is carried out every quarter. The monitoring is performed according to the principles and criteria defined by the Board of Directors. Securities lending
Income from securities lending is shown separately in the profit and loss account. There were no outstanding securities lending positions as at 30 June 2017. Repurchase agreement
Income from the repurchase agreement for securities is shown separately in the profit and loss account. There are no repurchase agreements at the end of the financial year. Income from zero-coupon bonds
For zero coupon bonds, the "notional" interest portion is calculated as interest income and reclassified in the profit and loss account under the caption "Income from securities" instead of the item "Net change in unrealised appreciation/depreciation on securities". Commercial papers Commercial papers are arithmetically discounted until their maturity.
11
Notes to the Annual Report
Insurance Linked Securities (ILS) Insurance Linked Securities (ILS), including catastrophe bonds (CAT Bonds), are securities where the risk of natural hazard is transferred from the issuer to the investor. The valuation of ILS is based on at least three up to nine broker quotes (in the first six months after the issuance date a single broker quote is deemed sufficient). The income derived from ILS is disclosed under the caption “Income on investments” and includes both the regular part of the coupon and the premium part of the coupon. Options
A purchaser of a put option has the right, but not the obligation, to sell an underlying instrument (“underlying”) at an agreed upon price (“strike price”) to the option seller. A purchaser of a call option has the right, but not the obligation, to purchase the underlying instrument at the strike price from the option seller. Purchased Options: Premiums paid by the sub-fund for purchased options are included in the statement of net assets as acquisition costs of the investments. The valuation of the options is adjusted daily to reflect the current market value of the option. The change is recorded as “net change in unrealised appreciation / depreciation” in the profit and loss account. If the option expires without being executed, the sub-fund loses the paid premium and a realised loss of corresponding value is booked. If a purchased option is exercised or closed, the paid premium with the sales proceeds of the underlying asset is settled or added to the cost price of the underlying asset to determine the realised profit / loss as well as the costs of the underlying asset. Written Options: Premiums received by the sub-fund for written options are included in the statement of net assets as negative acquisition cost of an investment. The valuation of the option is adjusted daily to reflect the current market value of the option. The change is recorded as net change in unrealised appreciation / depreciation in the profit and loss account. Premiums received from written options that expire without being executed are treated as realised profits of corresponding value. The sub-fund records a realised profit or loss on written options based on whether the cost of the closing transaction exceeds the premium received. If a call option is exercised by the option buyer, the premium received by the sub-fund is added to the proceeds from the sale of the underlying and compared to the cost of the closing transaction to determine whether there has been a realised profit or loss. If a put option is exercised by an option buyer, the premium received by the option buyer reduces the cost basis of purchased security. Written uncovered call options expose the sub-fund to an unlimited risk of loss. For written covered call options the potential for profit is limited to the strike price. Written put options expose the sub-fund to a risk of loss if the value of the underlying declines below the strike price minus the premium. The sub-fund is not subject to any credit risk on written options as the counterparty has already performed its obligation by paying the premium at the inception of the contract. Outstanding options traded on a regulated market are valued based on the closing price or the last available market price of the underlying security. OTC options are marked to market based upon prices obtained from third party pricing agents and verified against the value from the counterparty. The market value of options is included in the statement of net assets under the heading “Derivative instruments - Options”. The realised profits / losses and unrealised profits / losses on options are disclosed in the profit and loss account under the headings “Realised profit/loss on options” and “Net change in unrealised appreciation/depreciation on options.” Options, warrants and rights are recorded in numbers in the securities portfolio. For a future-style option contract the buyer does not prepay the premium. Buyers and sellers post margins as in a future contract, and the option premium is marked to market daily. Valuation differs from traditional futures options primarily in the analysis of the timing of cash flows associated with the buyer's non-payment of an upfront premium. The unrealised profit / loss of future-style options is recorded in the Statement of Net Assets under “Derivative instruments - Options”.
12
Notes to the Annual Report
Futures contracts (Futures)
The contractual parties of a future agree on the delivery of the underlying instrument at a fixed price or for a cash amount based on the change in the value of the underlying instrument at a specific date in the future. Upon entering into a futures contract, the sub-fund is required to deposit with the broker, cash or securities in an amount equal to a certain percentage of the contract amount, a so called initial margin. Subsequent payments, referred to as variation margin, are made or received by the sub-fund periodically and are based on changes in the market value of open futures contracts. The unrealised profit / loss on future contracts is disclosed in the statement of net assets under “Derivative instruments - Futures”. Changes in the market value of open futures contracts are recorded as unrealised profit / loss in the profit and loss account under “Net change in unrealised appreciation/depreciation on futures”. Realised profits or losses, representing the difference between the value of the contract at the time it was opened and the value at the time it was closed, are reported at the closing or expiration of futures contracts in the profit and loss account under “Realised profit/loss on futures”. Securities deposited as initial margin are designated in the securities portfolio and cash deposited is recorded in the statement of net assets. A receivable and/or a payable to brokers for the daily variation margin is also recorded in the statement of net assets. Forward foreign exchange contracts
Forward foreign exchange contracts represent obligations to purchase or sell foreign currency on a specified future date at a price fixed at the time the contracts are entered into. Non-deliverable forward foreign exchange contracts are settled with the counterparty in cash without the delivery of foreign currency. The values of the forward foreign exchange contracts are adjusted daily based on the applicable exchange rate of the underlying currency. Changes in the value of these contracts are recorded as unrealised appreciation or depreciation until the contract settlement date. When the forward contract is closed, the sub-fund records a realised profit or loss equal to the difference between the value at the time the contract was opened and the value at the time it was closed. The unrealised profit / loss on forward foreign exchange contracts is disclosed in the statement of net assets under “Derivative instruments - Forward foreign exchange contracts”. Realised profits/losses and change in unrealised profit / loss resulting there from are included in the profit and loss account respectively under “Realised profit/loss on forward foreign exchange contracts” and “Net change in unrealised appreciation/depreciation on forward foreign exchange contracts”. The forward foreign exchange contracts detailed in the overview of derivative instruments are grouped by traded currency and by maturity date. Contracts for differences (CFD)
Contracts for differences are contracts entered into between a broker and the sub-fund under which the parties agree to make payments to each other so as to replicate the economic consequences of holding a long or short position in the underlying security. Contracts for differences also mirror any corporate actions that take place. Contracts for differences are valued based on the closing market price of the underlying security, less any financing charges attributable to each contract. Upon entering into contracts for differences, the sub-fund may be required to pledge to the broker an amount of cash and/or other assets equal to a certain percentage of the contract amount (“initial margin”). Subsequently, payments known as “variation margin” are made or received by the sub-fund periodically, depending on fluctuations in the value of the underlying security. The unrealised profit / loss is disclosed in the statement of net assets under “Derivative instruments - Swaps”. Realised profits /losses and changes in unrealised profit / loss as a result thereof are included in the profit and loss account under “Realised profit / loss on swaps” and “Net change in unrealised appreciation/depreciation on swaps”. Interest Rate Swaps (IRS)
An interest rate swap is a bilateral agreement in which each party agrees to exchange a series of interest payments for another series of interest payments (usually fixed vs. floating) based on a notional amount that serves as a computation basis which is usually not exchanged. During the life of the swap, each party pays interest (in the currency of the principal received) to the other. Interest rate swaps are marked to market at each NAV calculation date. The market value is based on the valuation elements laid down in the contracts, and is obtained from independent third party pricing agents, market makers or internal models. The unrealised profit / loss is disclosed in the statement of net assets under “Derivative instruments - Swaps”. Realised profits / losses and changes in unrealised profit / loss as a result thereof are included in the profit and loss account under “Realised profit/loss on swaps” and “Net change in unrealised appreciation/depreciation on swaps”. Credit Default Swaps (CDS)
A credit default swap is a credit derivative transaction in which two parties enter into an agreement, whereby one party (the protection buyer) pays the other (the protection seller) a fixed periodic coupon for the specified life of the agreement in return for a payment contingent on a credit event related to the underlying reference obligation. If a credit event occurs, the protection seller would be obligated to make a payment, which may be either: (i) a net cash settlement equal to the notional amount of the swap less the auction value of the reference obligation or (ii) the notional amount of the swap in exchange for the delivery of the reference obligation. Selling protection effectively adds leverage to a sub-fund’s portfolio up to the notional amount of swap agreements. The notional amount represents the maximum potential liability under a contract and is not reflected in the statement of net assets. Potential liabilities under these contracts may be reduced by: the auction rates of the underlying reference obligations; upfront payments received at the inception of a swap; and net amounts received from credit default swaps purchased with the identical reference obligation.
13
Notes to the Annual Report
Credit default swaps are marked to market at each NAV calculation date. The market value is based on the valuation elements laid down in the contracts, and is obtained from independent third party pricing agents, market makers or internal models. The unrealised profit / loss is disclosed in the statement of net assets under “Derivative instruments - Swaps”. Realised profits / losses and change in unrealised profit / loss as a result thereof are included in the profit and loss account under the heading “Realised profit / loss on swaps” and “Net change in unrealised appreciation/depreciation on swaps”. Total Return Swaps (TRS)
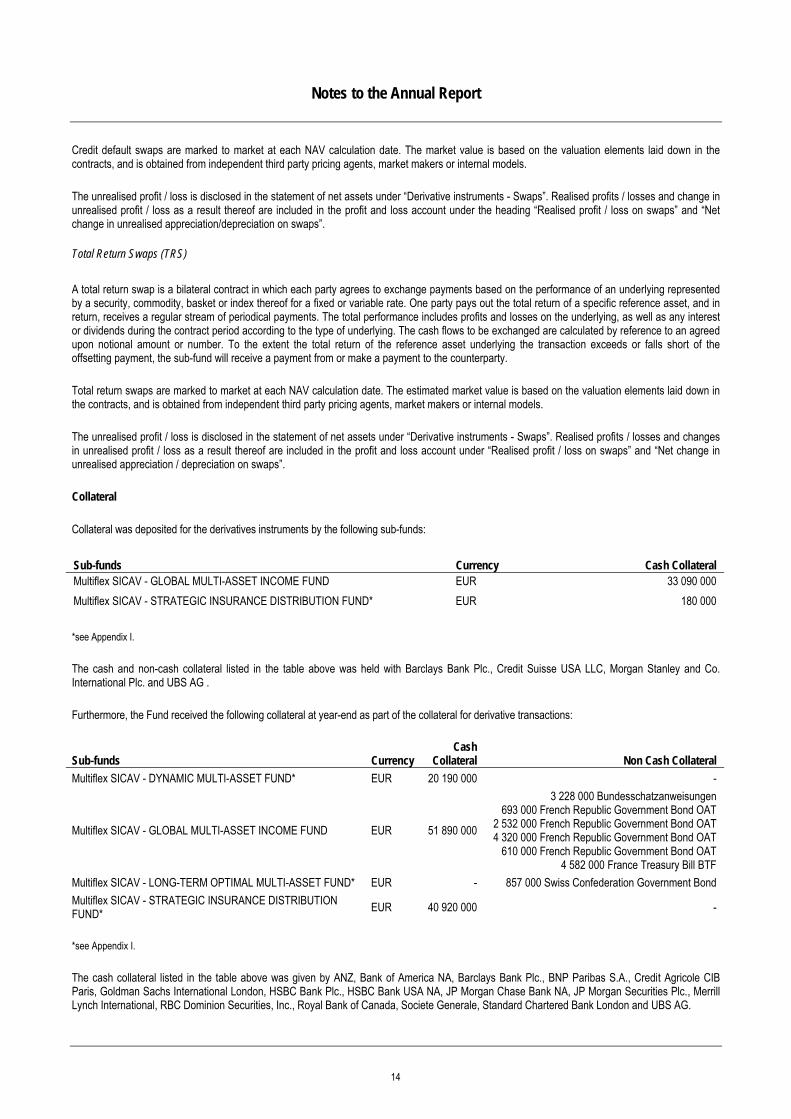
A total return swap is a bilateral contract in which each party agrees to exchange payments based on the performance of an underlying represented by a security, commodity, basket or index thereof for a fixed or variable rate. One party pays out the total return of a specific reference asset, and in return, receives a regular stream of periodical payments. The total performance includes profits and losses on the underlying, as well as any interest or dividends during the contract period according to the type of underlying. The cash flows to be exchanged are calculated by reference to an agreed upon notional amount or number. To the extent the total return of the reference asset underlying the transaction exceeds or falls short of the offsetting payment, the sub-fund will receive a payment from or make a payment to the counterparty. Total return swaps are marked to market at each NAV calculation date. The estimated market value is based on the valuation elements laid down in the contracts, and is obtained from independent third party pricing agents, market makers or internal models. The unrealised profit / loss is disclosed in the statement of net assets under “Derivative instruments - Swaps”. Realised profits / losses and changes in unrealised profit / loss as a result thereof are included in the profit and loss account under “Realised profit / loss on swaps” and “Net change in unrealised appreciation / depreciation on swaps”. Collateral Collateral was deposited for the derivatives instruments by the following sub-funds: Sub-funds Currency Cash Collateral Multiflex SICAV - GLOBAL MULTI-ASSET INCOME FUND EUR 33 090 000 Multiflex SICAV - STRATEGIC INSURANCE DISTRIBUTION FUND* EUR 180 000 *see Appendix I. The cash and non-cash collateral listed in the table above was held with Barclays Bank Plc., Credit Suisse USA LLC, Morgan Stanley and Co. International Plc. and UBS AG . Furthermore, the Fund received the following collateral at year-end as part of the collateral for derivative transactions:
Sub-funds Currency Cash
Collateral Non Cash Collateral
Multiflex SICAV - DYNAMIC MULTI-ASSET FUND* EUR 20 190 000 -
Multiflex SICAV - GLOBAL MULTI-ASSET INCOME FUND EUR 51 890 000
3 228 000 Bundesschatzanweisungen 693 000 French Republic Government Bond OAT
2 532 000 French Republic Government Bond OAT 4 320 000 French Republic Government Bond OAT
610 000 French Republic Government Bond OAT 4 582 000 France Treasury Bill BTF
Multiflex SICAV - LONG-TERM OPTIMAL MULTI-ASSET FUND* EUR - 857 000 Swiss Confederation Government Bond Multiflex SICAV - STRATEGIC INSURANCE DISTRIBUTION FUND* EUR 40 920 000 -
*see Appendix I. The cash collateral listed in the table above was given by ANZ, Bank of America NA, Barclays Bank Plc., BNP Paribas S.A., Credit Agricole CIB Paris, Goldman Sachs International London, HSBC Bank Plc., HSBC Bank USA NA, JP Morgan Chase Bank NA, JP Morgan Securities Plc., Merrill Lynch International, RBC Dominion Securities, Inc., Royal Bank of Canada, Societe Generale, Standard Chartered Bank London and UBS AG.
14
Notes to the Annual Report
Taxation
In accordance with current legal practice in the European Union, the Company may apply to local EU tax authorities for a refund of the withholding tax levied on dividend payments by a number of EU member-states. In the case that a reimbursement request of withholding taxes is filed, any receivables are neither recorded nor reported in the sub-fund, since the outcome of the refund applications is uncertain and the estimated likelihood of success may change over the course of a refund procedure. Only upon receipt of the withholding tax refund are the amounts recorded in the sub-funds in question and reported accordingly. Any costs in connection with the submission of the refund applications were/are charged to the concerned sub-funds. Any reimbursements of withholding taxes are included in the profit and loss account under the item “Other income”. Taxes In accordance with Luxembourg law, the Company is not subject to any Luxembourg income tax. Dividends paid by the Company are currently not subject to withholding tax in Luxembourg. The Company is, however, charged with an annual tax of 0.05% of the net assets (“taxe d’abonnement”). A reduced taxe d’abonnement of 0.01% will be applied on the net assets applicable to the share classes for institutional investors. This classification is based on the Company’s understanding of the current legal situation. This legal situation is liable to be changed, even with retroactive effect, which may result in the tax rate of 0.05% being applied retroactively. The tax is payable quarterly in arrears on the basis of the respective net assets at the end of each quarter. Costs and fees Management fees
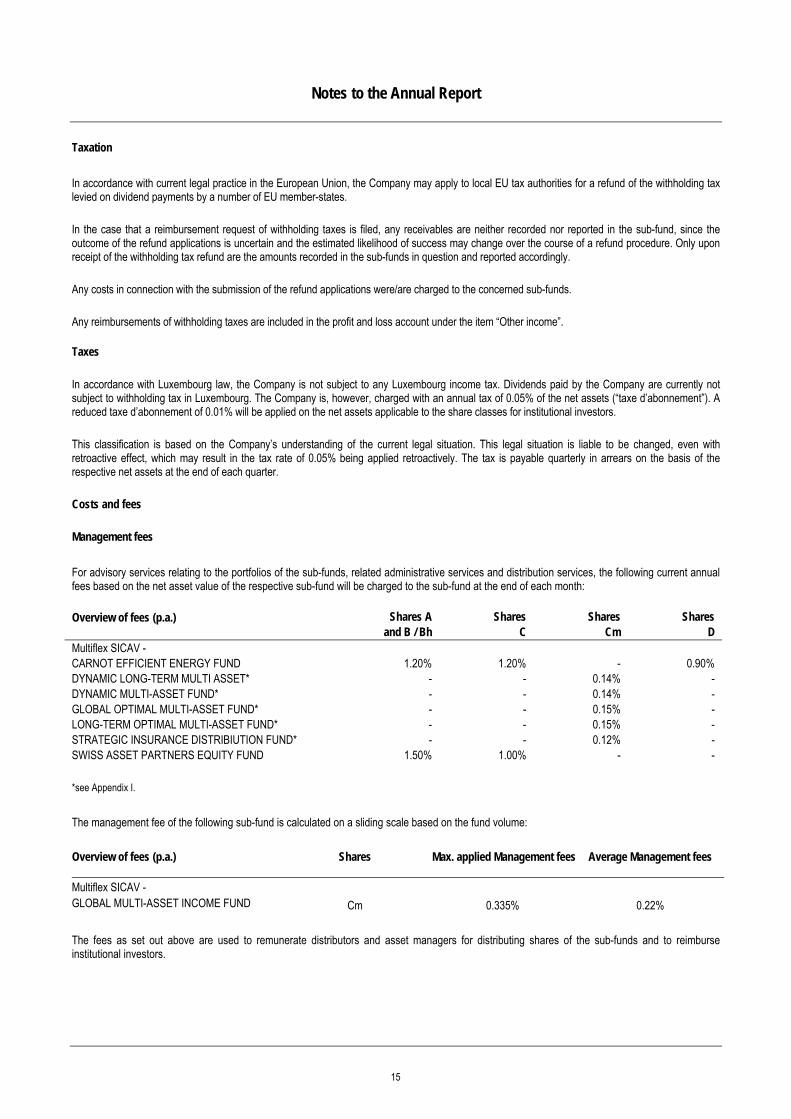
For advisory services relating to the portfolios of the sub-funds, related administrative services and distribution services, the following current annual fees based on the net asset value of the respective sub-fund will be charged to the sub-fund at the end of each month: Overview of fees (p.a.) Shares A Shares Shares Shares
and B / Bh C Cm D Multiflex SICAV - CARNOT EFFICIENT ENERGY FUND 1.20% 1.20% - 0.90% DYNAMIC LONG-TERM MULTI ASSET* - - 0.14% - DYNAMIC MULTI-ASSET FUND* - - 0.14% - GLOBAL OPTIMAL MULTI-ASSET FUND* - - 0.15% - LONG-TERM OPTIMAL MULTI-ASSET FUND* - - 0.15% - STRATEGIC INSURANCE DISTRIBIUTION FUND* - - 0.12% - SWISS ASSET PARTNERS EQUITY FUND 1.50% 1.00% - - *see Appendix I. The management fee of the following sub-fund is calculated on a sliding scale based on the fund volume: Overview of fees (p.a.) Shares Max. applied Management fees Average Management fees
Multiflex SICAV - GLOBAL MULTI-ASSET INCOME FUND Cm 0.335% 0.22% The fees as set out above are used to remunerate distributors and asset managers for distributing shares of the sub-funds and to reimburse institutional investors.
15
Notes to the Annual Report
Performance Fee Multiflex SICAV - CARNOT EFFICIENT ENERGY FUND In addition to the Management Fee above, the Investment Manager is entitled to receive a performance-related annual fee (“Performance Fee”) as set out below on the appreciation in the net asset value per relevant Share Category and currency. The Performance Fee will be calculated on each Valuation Day and is to be paid annually in arrears at the end of the financial year. The Performance Fee with respect to the sub-fund will be governed by a “High Water Mark” and a “Hurdle Rate”. The Investment Manager is only entitled to receive a Performance Fee provided the net asset value per Share on a Crystallisation Date (as defined below) is above the High Water Mark (as defined below) and the Hurdle Rate of 5% p.a. (before deduction of the Performance Fee). The Performance Fee is equal to 10% of the daily outperformance of the net asset value per Share over the higher of the High Water Mark and the Hurdle Rate. The Performance Fee is recalculated on each Valuation Day subject to the aforementioned conditions and an accrual is formed in the sub-fund’s accounts. The accrual is adjusted (up or down) on the basis of the difference between the newly calculated amount and the amount previously set aside. A Crystallisation Date is either (i) the last Valuation Day of each financial year or (ii) the Valuation Day relating to the Dealing Day, for which redemptions representing more than 5% of the sub-fund’s net assets have been received and accepted by the Company. In the case of (ii), the Performance Fee will be crystallised and set aside in proportion to the number of Shares redeemed however it will not be paid to the Investment Manager until the end of the financial year. The initial High Water Mark of each Share Category corresponds to the Issue Price at launch of the relevant Share Category. If the net asset value per Share exceeds the High Water Mark and the Hurdle Rate on the last Valuation Day of a subsequent financial year, then the High Water Mark will be set at the net asset value on such last Valuation Day of the relevant financial year, after deduction of the Performance Fee per Share. In all other cases the High Water Mark remains unchanged. Service Load Service Load means the costs incurred in connection with the operation of the Company. These costs include the following – unless already otherwise separately stated or included: Costs of operational management and supervision of the Company’s business; tax advisory, legal and auditing services; purchase and sale of securities and duties; convening the Annual General Meeting; issue of share acknowledgements; preparation of financial statements and prospectuses; sales support; issue and redemption of shares; the payment of dividends, paying agents and representatives, State Street Bank Luxembourg S.C.A. as administrator and principal paying agent, registrar and transfer agent; registration for sale; reporting to supervisory authorities in the various countries of distribution; fees and expenses of the Board of Directors of the Company; insurance premiums; interest; stock exchange admission fees and broker fees; reimbursement of expenses to the custodian and all other contracting parties of the Company; calculation and publication of the net asset value per share and the share prices as well as licence fees. Where such expenses and costs apply to all sub-funds equally, each sub-fund is charged pro rata the costs corresponding to its share of the volume of the Company’s total assets. Where expenses and costs only apply to one or some of the sub-funds, the costs are charged in full to the sub-fund or sub-funds in question. Marketing and advertising expenditure may only be charged in individual cases following a resolution of the Board of Directors. Formation expenses
Capitalised formation expenses of new sub-funds can be written off in those sub-funds over a period of five years in equal amounts.
16
Notes to the Annual Report
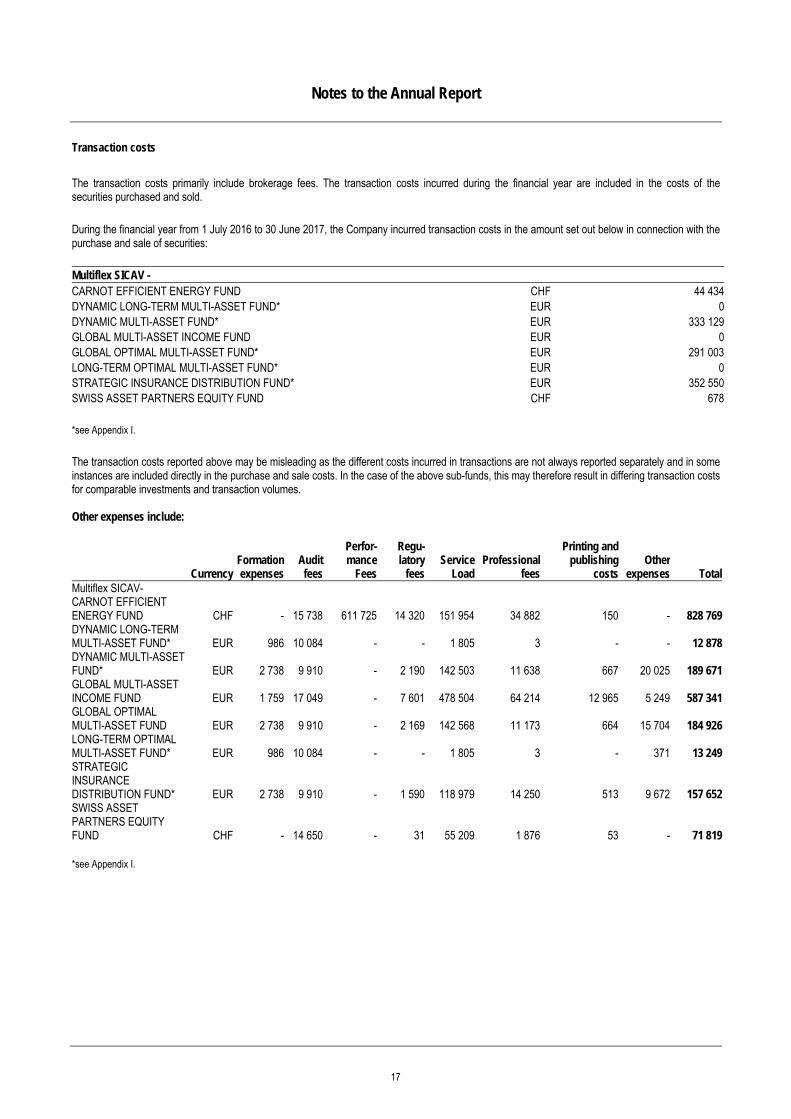
Transaction costs
The transaction costs primarily include brokerage fees. The transaction costs incurred during the financial year are included in the costs of the securities purchased and sold. During the financial year from 1 July 2016 to 30 June 2017, the Company incurred transaction costs in the amount set out below in connection with the purchase and sale of securities: Multiflex SICAV - CARNOT EFFICIENT ENERGY FUND CHF 44 434DYNAMIC LONG-TERM MULTI-ASSET FUND* EUR 0DYNAMIC MULTI-ASSET FUND* EUR 333 129GLOBAL MULTI-ASSET INCOME FUND EUR 0GLOBAL OPTIMAL MULTI-ASSET FUND* EUR 291 003LONG-TERM OPTIMAL MULTI-ASSET FUND* EUR 0STRATEGIC INSURANCE DISTRIBUTION FUND* EUR 352 550SWISS ASSET PARTNERS EQUITY FUND CHF 678 *see Appendix I. The transaction costs reported above may be misleading as the different costs incurred in transactions are not always reported separately and in some instances are included directly in the purchase and sale costs. In the case of the above sub-funds, this may therefore result in differing transaction costs for comparable investments and transaction volumes. Other expenses include:
CurrencyFormationexpenses
Audit fees
Perfor-mance
Fees
Regu-latory
feesService
LoadProfessional
fees
Printing and publishing
costsOther
expenses TotalMultiflex SICAV- CARNOT EFFICIENT ENERGY FUND CHF - 15 738 611 725 14 320 151 954 34 882 150 - 828 769DYNAMIC LONG-TERM MULTI-ASSET FUND* EUR 986 10 084 - - 1 805 3 - - 12 878DYNAMIC MULTI-ASSET FUND* EUR 2 738 9 910 - 2 190 142 503 11 638 667 20 025 189 671GLOBAL MULTI-ASSET INCOME FUND EUR 1 759 17 049 - 7 601 478 504 64 214 12 965 5 249 587 341GLOBAL OPTIMAL MULTI-ASSET FUND EUR 2 738 9 910 - 2 169 142 568 11 173 664 15 704 184 926LONG-TERM OPTIMAL MULTI-ASSET FUND* EUR 986 10 084 - - 1 805 3 - 371 13 249STRATEGIC INSURANCE DISTRIBUTION FUND* EUR 2 738 9 910 - 1 590 118 979 14 250 513 9 672 157 652SWISS ASSET PARTNERS EQUITY FUND CHF - 14 650 - 31 55 209 1 876 53 - 71 819 *see Appendix I.
17
Multiflex SICAV
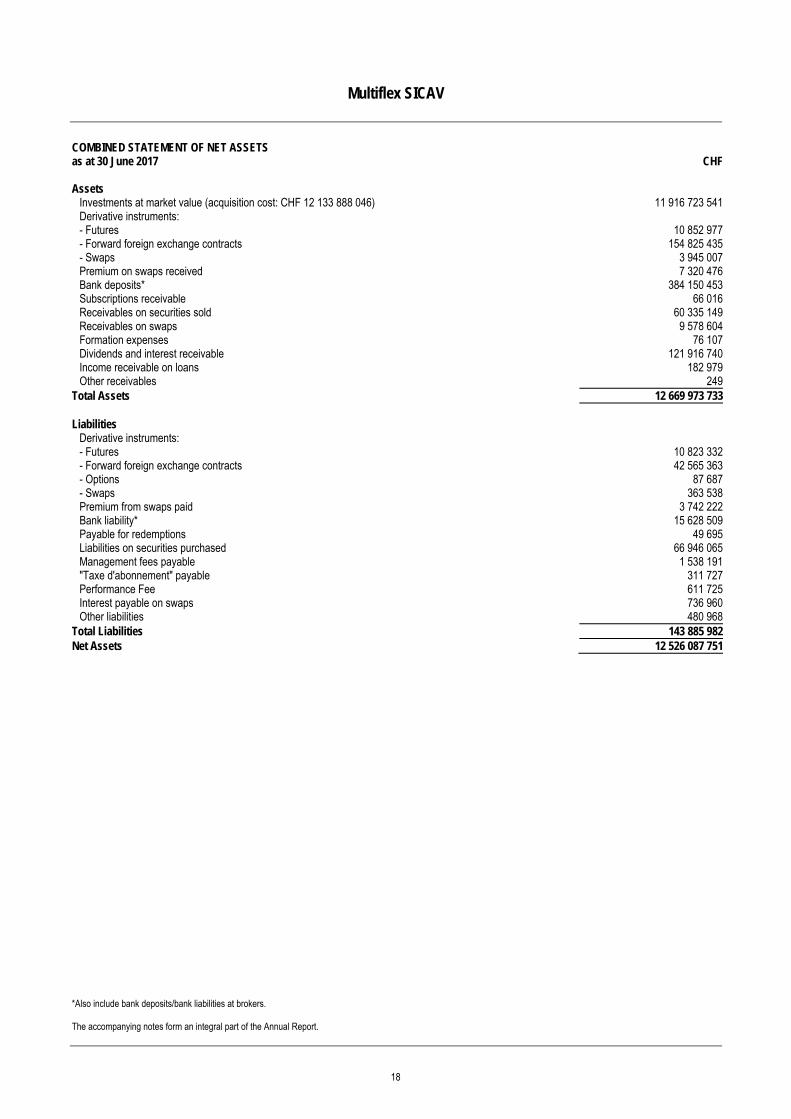
*Also include bank deposits/bank liabilities at brokers. The accompanying notes form an integral part of the Annual Report.
COMBINED STATEMENT OF NET ASSETS as at 30 June 2017 CHF Assets
Investments at market value (acquisition cost: CHF 12 133 888 046) 11 916 723 541Derivative instruments: - Futures 10 852 977- Forward foreign exchange contracts 154 825 435- Swaps 3 945 007Premium on swaps received 7 320 476Bank deposits* 384 150 453Subscriptions receivable 66 016Receivables on securities sold 60 335 149Receivables on swaps 9 578 604Formation expenses 76 107Dividends and interest receivable 121 916 740Income receivable on loans 182 979Other receivables 249
Total Assets 12 669 973 733 Liabilities
Derivative instruments: - Futures 10 823 332- Forward foreign exchange contracts 42 565 363- Options 87 687- Swaps 363 538Premium from swaps paid 3 742 222Bank liability* 15 628 509Payable for redemptions 49 695Liabilities on securities purchased 66 946 065Management fees payable 1 538 191"Taxe d'abonnement" payable 311 727Performance Fee 611 725Interest payable on swaps 736 960Other liabilities 480 968
Total Liabilities 143 885 982Net Assets 12 526 087 751
18
Multiflex SICAV
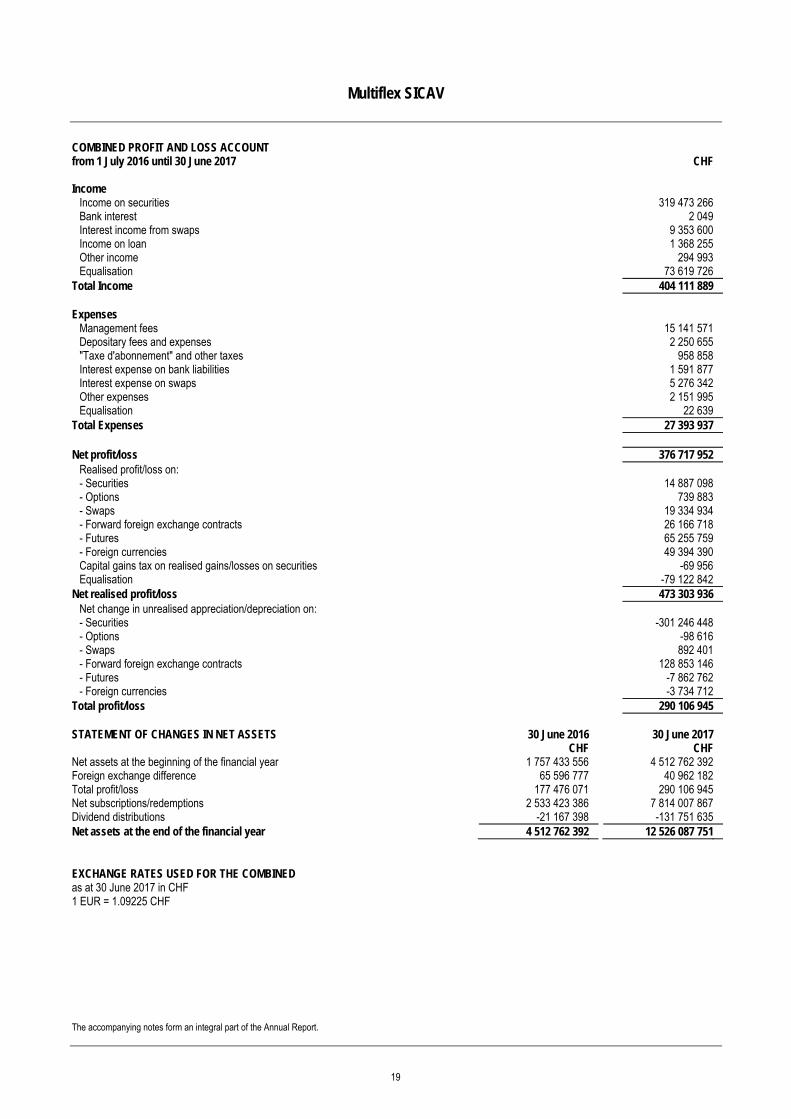
The accompanying notes form an integral part of the Annual Report.
COMBINED PROFIT AND LOSS ACCOUNT from 1 July 2016 until 30 June 2017 CHF Income
Income on securities 319 473 266 Bank interest 2 049 Interest income from swaps 9 353 600 Income on loan 1 368 255 Other income 294 993 Equalisation 73 619 726
Total Income 404 111 889 Expenses
Management fees 15 141 571 Depositary fees and expenses 2 250 655 "Taxe d'abonnement" and other taxes 958 858 Interest expense on bank liabilities 1 591 877 Interest expense on swaps 5 276 342 Other expenses 2 151 995 Equalisation 22 639
Total Expenses 27 393 937 Net profit/loss 376 717 952
Realised profit/loss on: - Securities 14 887 098 - Options 739 883 - Swaps 19 334 934 - Forward foreign exchange contracts 26 166 718 - Futures 65 255 759 - Foreign currencies 49 394 390 Capital gains tax on realised gains/losses on securities -69 956 Equalisation -79 122 842
Net realised profit/loss 473 303 936 Net change in unrealised appreciation/depreciation on: - Securities -301 246 448 - Options -98 616 - Swaps 892 401 - Forward foreign exchange contracts 128 853 146 - Futures -7 862 762 - Foreign currencies -3 734 712
Total profit/loss 290 106 945 STATEMENT OF CHANGES IN NET ASSETS 30 June 2016 30 June 2017 CHF CHF Net assets at the beginning of the financial year 1 757 433 556 4 512 762 392 Foreign exchange difference 65 596 777 40 962 182 Total profit/loss 177 476 071 290 106 945 Net subscriptions/redemptions 2 533 423 386 7 814 007 867 Dividend distributions -21 167 398 -131 751 635 Net assets at the end of the financial year 4 512 762 392 12 526 087 751 EXCHANGE RATES USED FOR THE COMBINED as at 30 June 2017 in CHF 1 EUR = 1.09225 CHF
19
Multiflex SICAV - CARNOT EFFICIENT ENERGY FUND
The information in this report is based on historical data and is no indication of future performance.
Fund Management Report Investment Policy The investment objective of Multiflex SICAV - CARNOT EFFICIENT ENERGY FUND is long-term capital growth. To this end, it invests in companies with products and technologies that enable a more efficient use of energy. The sub-fund pursues a fundamental investment strategy based on a value approach. It invests in listed equities and equity-like securities. Financial futures and options may be used for hedging purposes. Geographically, the investment focus is on Switzerland and Europe. Market review and portfolio Over the past 12 months, the global equity markets have developed in an extremely positive manner. With an increase of around 30%, the NIKKEI occupies the leading positions among the larger equity markets, followed by the DAX with an increase of over 25%. The European indexes posted increases of 20% (STOXX 50) and 15% (STOXX 600). The improved outlook for the global economy was the driver behind the boom in share prices. The US and China are experiencing stable growth rates, and Europe’s economy is back on a growth path after years of stagnation. We still consider the political risks to be considerable. With a performance of +26% in EUR and +28% in CHF, the Multiflex SICAV - CARNOT EFFICIENT ENERGY FUND still outstripped the relevant indexes. Several factors are responsible for the pleasing performance: We regard the slight recovery of the European construction industry and the growing importance of energy efficiency in the economic and energy policy as particularly important. In addition, the excellent securities selection has undoubtedly helped. Above all, the sector for medium-sized and smaller securities is looking very positive indeed. Some companies have even enjoyed growth of over 40%: Walter Meier, Belimo, LEM, Ems, Valmet, Concentric, Systemair and Centrotec are in this category. The portfolio composition has not changed very much at all. We have reduced our direct exposure to the oil price by selling equities relating to suppliers in the oil and gas industry. On the other hand, we have built up new positions in the building suppliers and automation sectors. Following the sharp increase witnessed last year, we have again improved the level of quality (good balance sheet and high cash flow) in our portfolio.
20
Multiflex SICAV - CARNOT EFFICIENT ENERGY FUND
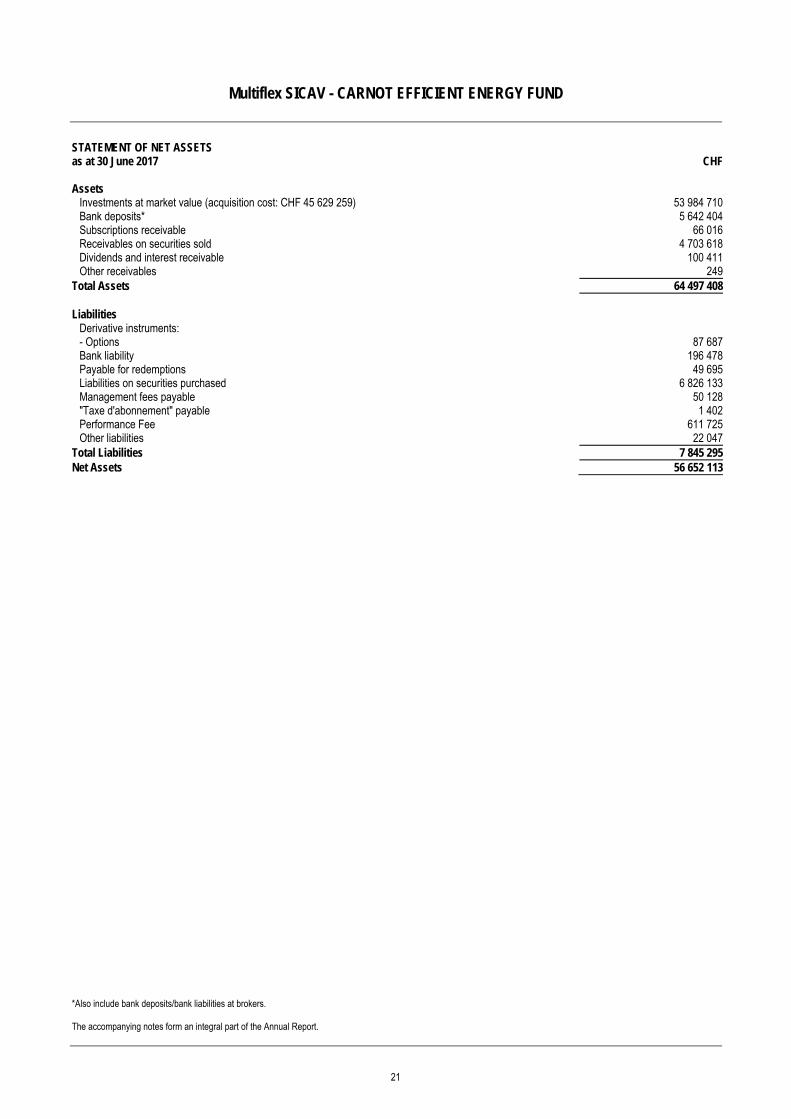
*Also include bank deposits/bank liabilities at brokers. The accompanying notes form an integral part of the Annual Report.
STATEMENT OF NET ASSETS as at 30 June 2017 CHF Assets
Investments at market value (acquisition cost: CHF 45 629 259) 53 984 710Bank deposits* 5 642 404Subscriptions receivable 66 016Receivables on securities sold 4 703 618Dividends and interest receivable 100 411Other receivables 249
Total Assets 64 497 408 Liabilities
Derivative instruments: - Options 87 687Bank liability 196 478Payable for redemptions 49 695Liabilities on securities purchased 6 826 133Management fees payable 50 128"Taxe d'abonnement" payable 1 402Performance Fee 611 725Other liabilities 22 047
Total Liabilities 7 845 295Net Assets 56 652 113
21
Multiflex SICAV - CARNOT EFFICIENT ENERGY FUND
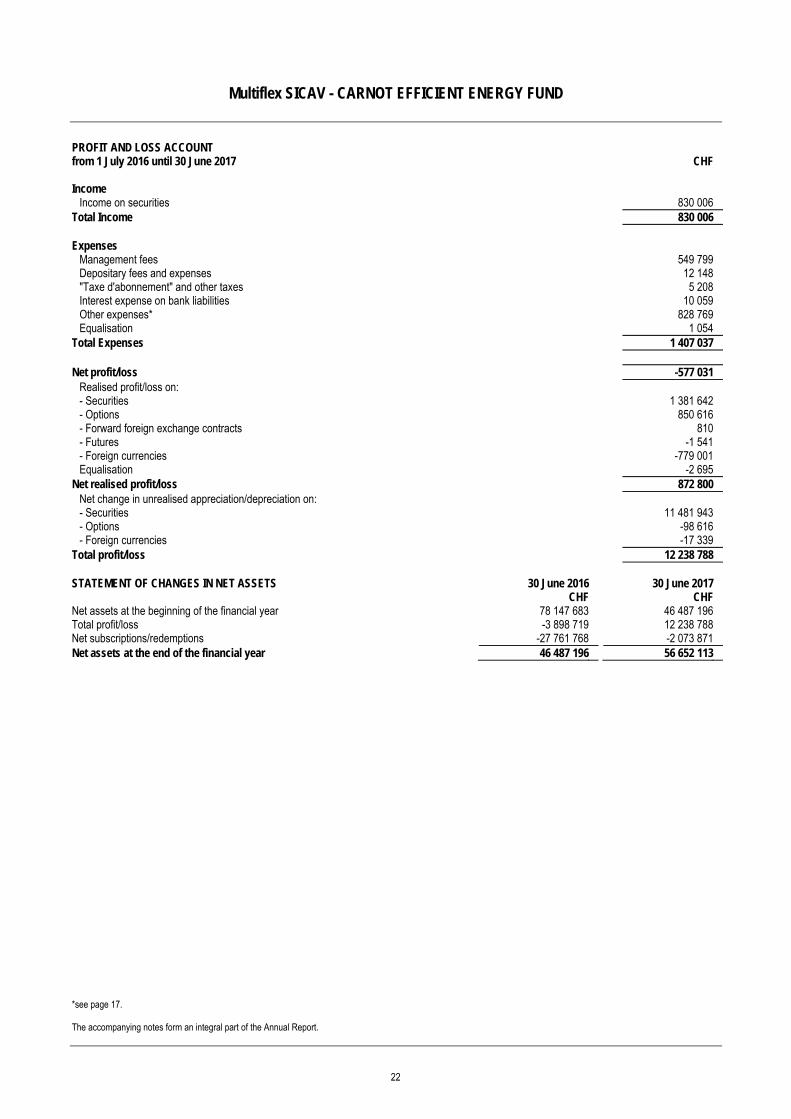
*see page 17. The accompanying notes form an integral part of the Annual Report.
PROFIT AND LOSS ACCOUNT from 1 July 2016 until 30 June 2017 CHF Income
Income on securities 830 006 Total Income 830 006 Expenses
Management fees 549 799 Depositary fees and expenses 12 148 "Taxe d'abonnement" and other taxes 5 208 Interest expense on bank liabilities 10 059 Other expenses* 828 769 Equalisation 1 054
Total Expenses 1 407 037 Net profit/loss -577 031
Realised profit/loss on: - Securities 1 381 642 - Options 850 616 - Forward foreign exchange contracts 810 - Futures -1 541 - Foreign currencies -779 001 Equalisation -2 695
Net realised profit/loss 872 800 Net change in unrealised appreciation/depreciation on: - Securities 11 481 943 - Options -98 616 - Foreign currencies -17 339
Total profit/loss 12 238 788 STATEMENT OF CHANGES IN NET ASSETS 30 June 2016 30 June 2017 CHF CHF Net assets at the beginning of the financial year 78 147 683 46 487 196 Total profit/loss -3 898 719 12 238 788 Net subscriptions/redemptions -27 761 768 -2 073 871 Net assets at the end of the financial year 46 487 196 56 652 113
22
Multiflex SICAV - CARNOT EFFICIENT ENERGY FUND
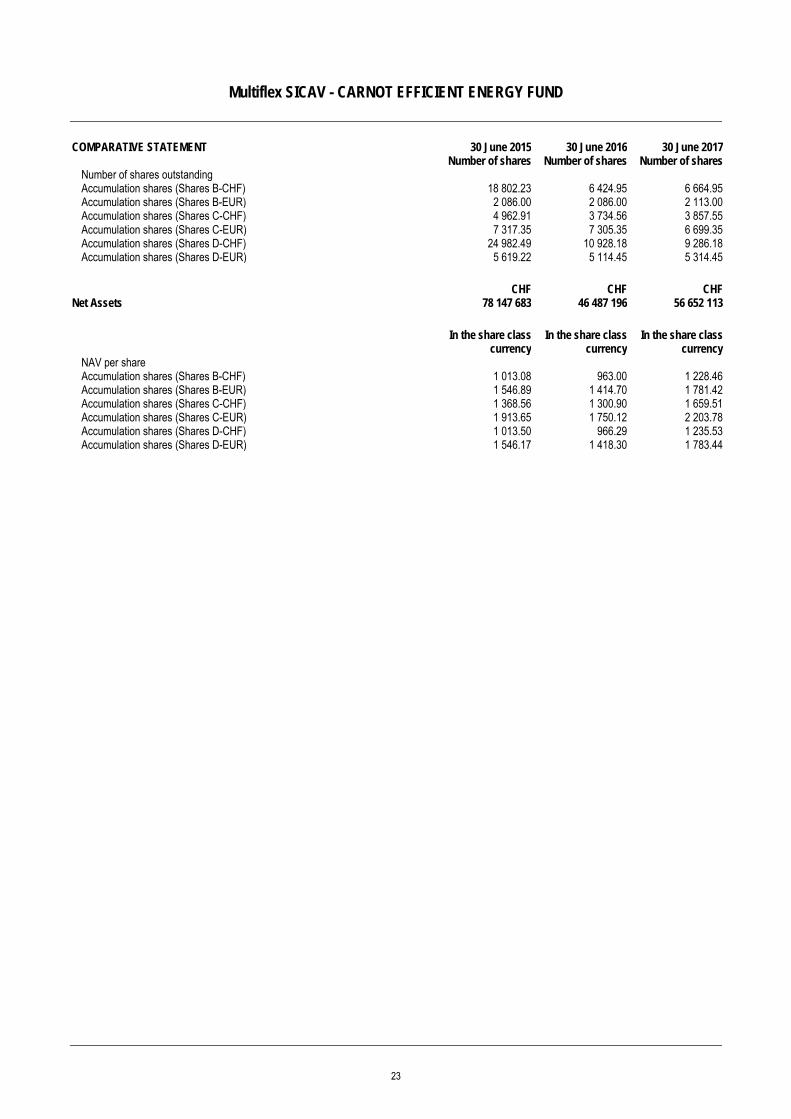
COMPARATIVE STATEMENT 30 June 2015 30 June 2016 30 June 2017 Number of shares Number of shares Number of shares
Number of shares outstanding Accumulation shares (Shares B-CHF) 18 802.23 6 424.95 6 664.95 Accumulation shares (Shares B-EUR) 2 086.00 2 086.00 2 113.00 Accumulation shares (Shares C-CHF) 4 962.91 3 734.56 3 857.55 Accumulation shares (Shares C-EUR) 7 317.35 7 305.35 6 699.35 Accumulation shares (Shares D-CHF) 24 982.49 10 928.18 9 286.18 Accumulation shares (Shares D-EUR) 5 619.22 5 114.45 5 314.45
CHF CHF CHF Net Assets 78 147 683 46 487 196 56 652 113
In the share class
currency In the share class
currency In the share class
currency NAV per share Accumulation shares (Shares B-CHF) 1 013.08 963.00 1 228.46 Accumulation shares (Shares B-EUR) 1 546.89 1 414.70 1 781.42 Accumulation shares (Shares C-CHF) 1 368.56 1 300.90 1 659.51 Accumulation shares (Shares C-EUR) 1 913.65 1 750.12 2 203.78 Accumulation shares (Shares D-CHF) 1 013.50 966.29 1 235.53 Accumulation shares (Shares D-EUR) 1 546.17 1 418.30 1 783.44
23
Multiflex SICAV - CARNOT EFFICIENT ENERGY FUND
SECURITIES PORTFOLIO AS AT 30 JUNE 2017
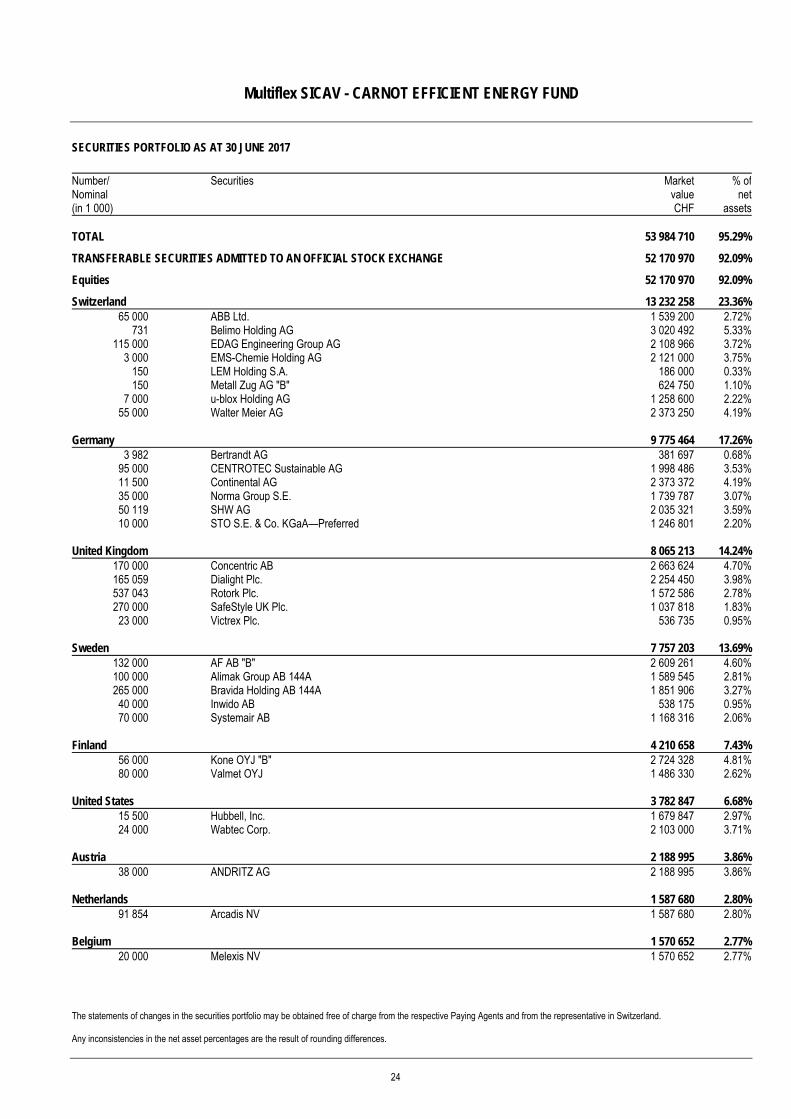
The statements of changes in the securities portfolio may be obtained free of charge from the respective Paying Agents and from the representative in Switzerland. Any inconsistencies in the net asset percentages are the result of rounding differences.
Number/ Nominal (in 1 000)
Securities MarketvalueCHF
% ofnet
assets TOTAL 53 984 710 95.29%
TRANSFERABLE SECURITIES ADMITTED TO AN OFFICIAL STOCK EXCHANGE 52 170 970 92.09%
Equities 52 170 970 92.09%
Switzerland 13 232 258 23.36%65 000 ABB Ltd. 1 539 200 2.72%
731 Belimo Holding AG 3 020 492 5.33%115 000 EDAG Engineering Group AG 2 108 966 3.72%
3 000 EMS-Chemie Holding AG 2 121 000 3.75%150 LEM Holding S.A. 186 000 0.33%150 Metall Zug AG "B" 624 750 1.10%
7 000 u-blox Holding AG 1 258 600 2.22%55 000 Walter Meier AG 2 373 250 4.19%
Germany 9 775 464 17.26%3 982 Bertrandt AG 381 697 0.68%
95 000 CENTROTEC Sustainable AG 1 998 486 3.53%11 500 Continental AG 2 373 372 4.19%35 000 Norma Group S.E. 1 739 787 3.07%50 119 SHW AG 2 035 321 3.59%10 000 STO S.E. & Co. KGaA—Preferred 1 246 801 2.20%
United Kingdom 8 065 213 14.24%170 000 Concentric AB 2 663 624 4.70%165 059 Dialight Plc. 2 254 450 3.98%537 043 Rotork Plc. 1 572 586 2.78%270 000 SafeStyle UK Plc. 1 037 818 1.83%
23 000 Victrex Plc. 536 735 0.95%
Sweden 7 757 203 13.69%132 000 AF AB "B" 2 609 261 4.60%100 000 Alimak Group AB 144A 1 589 545 2.81%265 000 Bravida Holding AB 144A 1 851 906 3.27%
40 000 Inwido AB 538 175 0.95%70 000 Systemair AB 1 168 316 2.06%
Finland 4 210 658 7.43%56 000 Kone OYJ "B" 2 724 328 4.81%80 000 Valmet OYJ 1 486 330 2.62%
United States 3 782 847 6.68%15 500 Hubbell, Inc. 1 679 847 2.97%24 000 Wabtec Corp. 2 103 000 3.71%
Austria 2 188 995 3.86%38 000 ANDRITZ AG 2 188 995 3.86%
Netherlands 1 587 680 2.80%91 854 Arcadis NV 1 587 680 2.80%
Belgium 1 570 652 2.77%20 000 Melexis NV 1 570 652 2.77%
24
Multiflex SICAV - CARNOT EFFICIENT ENERGY FUND
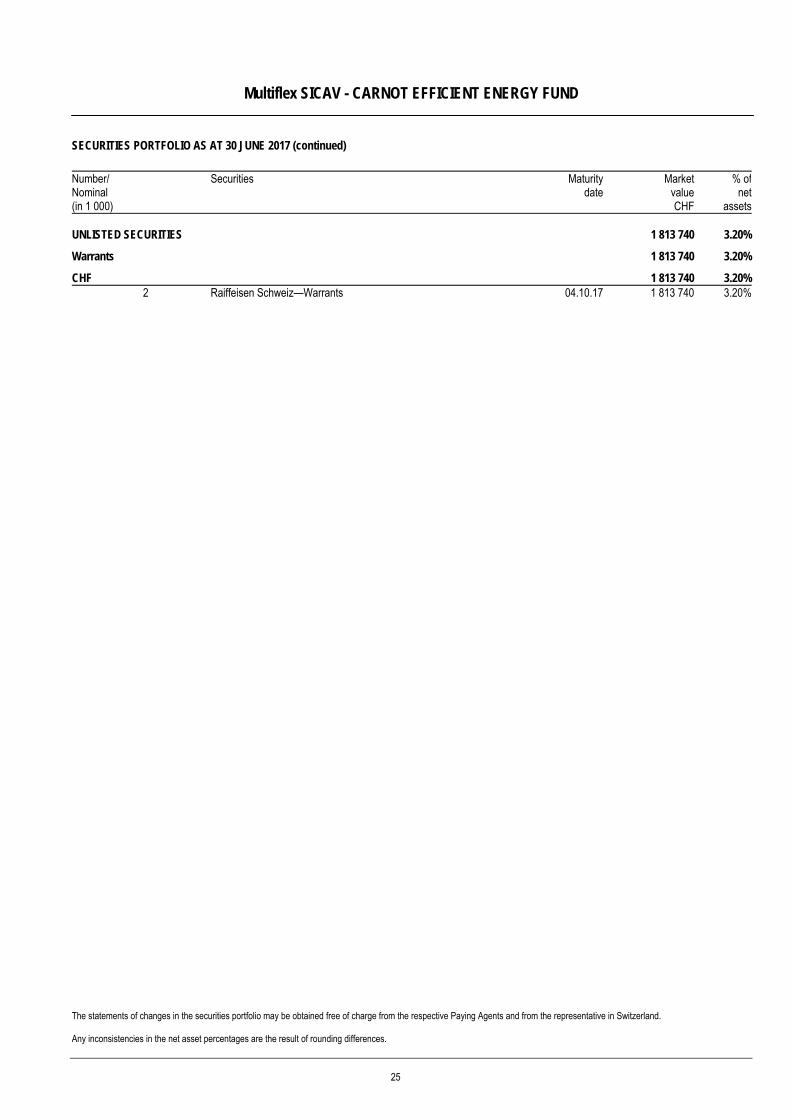
SECURITIES PORTFOLIO AS AT 30 JUNE 2017 (continued)
The statements of changes in the securities portfolio may be obtained free of charge from the respective Paying Agents and from the representative in Switzerland. Any inconsistencies in the net asset percentages are the result of rounding differences.
Number/ Nominal (in 1 000)
Securities Maturitydate
MarketvalueCHF
% ofnet
assets UNLISTED SECURITIES 1 813 740 3.20%
Warrants 1 813 740 3.20%
CHF 1 813 740 3.20%2 Raiffeisen Schweiz—Warrants 04.10.17 1 813 740 3.20%
25
Multiflex SICAV - CARNOT EFFICIENT ENERGY FUND
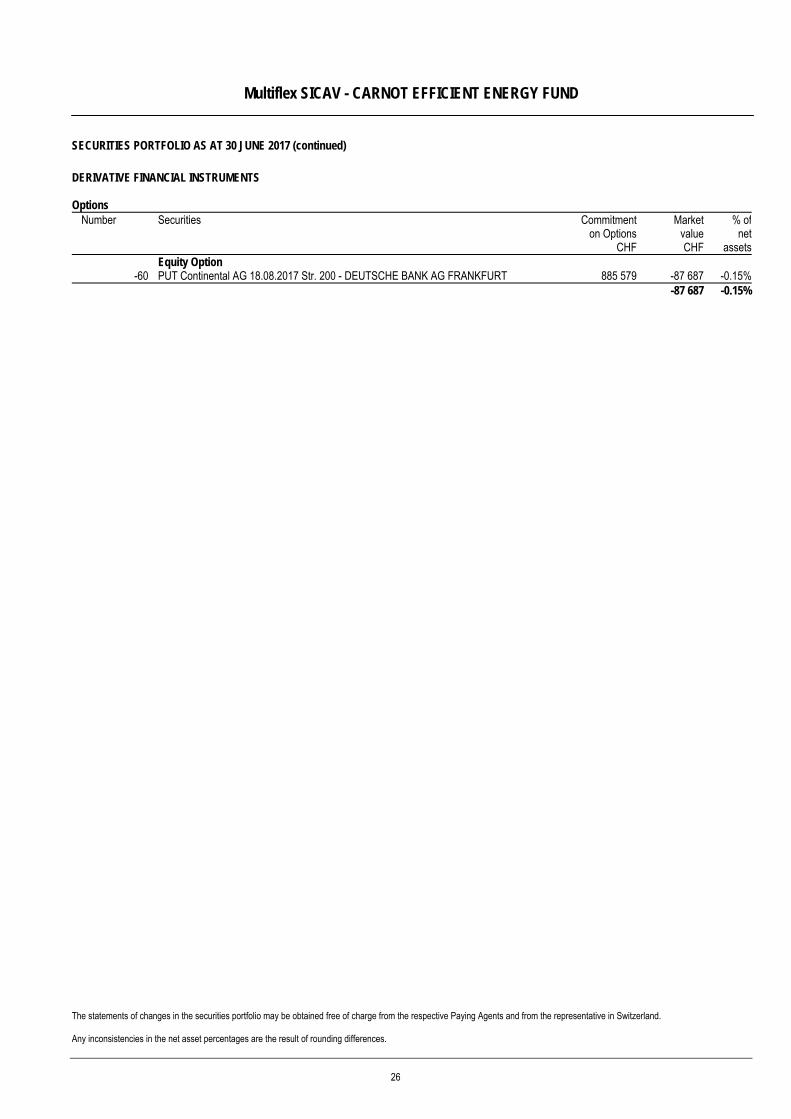
SECURITIES PORTFOLIO AS AT 30 JUNE 2017 (continued)
The statements of changes in the securities portfolio may be obtained free of charge from the respective Paying Agents and from the representative in Switzerland. Any inconsistencies in the net asset percentages are the result of rounding differences.
DERIVATIVE FINANCIAL INSTRUMENTS Options
Number
Securities Commitmenton Options
CHF
MarketvalueCHF
% ofnet
assets Equity Option
-60 PUT Continental AG 18.08.2017 Str. 200 - DEUTSCHE BANK AG FRANKFURT 885 579 -87 687 -0.15% -87 687 -0.15%
26
Multiflex SICAV - DYNAMIC LONG-TERM MULTI-ASSET FUND*
*see Appendix I. The information in this report is based on historical data and is no indication of future performance.
Fund Management Report Investment Policy The Multiflex SICAV - DYNAMIC LONG-TERM MULTI-ASSET FUND* invests across a range of asset classes, within the broad areas of fixed income and equity. Within fixed income, these would include high quality government bonds, investment grade bonds, high yield bonds, securitised and emerging market debt. Within equities, the sub-fund invests both in developed equity regions and in emerging markets. The aim is to build a well-diversified portfolio to enhance yield while limiting volatility. Market review and portfolio Global ecomonic growth continues to remain positive as economic data suggests solid growth momentum. In the US, business investments picked up in Q1 2017, which has been of some concern in the past and consumer confidence also remains strong providing optimism for the future. Economic data from Europe was largely postive with robust PMI numbers in major European countries indicating broader growth in the region. In fixed income, yields continue to remain low relative to history, with high-yield corporate bonds near all-time lows. We were fully invested in Italian Government bonds in Q2 2017. We maintained a relatively low duration exposure in the portfolio, as we believe rates may rise further in developed markets. Since inception, the Multiflex SICAV - DYNAMIC LONG-TERM MULTI-ASSET FUND returned 0.47% net of fees.
27
Multiflex SICAV - DYNAMIC LONG-TERM MULTI-ASSET FUND*
*see Appendix I. The accompanying notes form an integral part of the Annual Report.
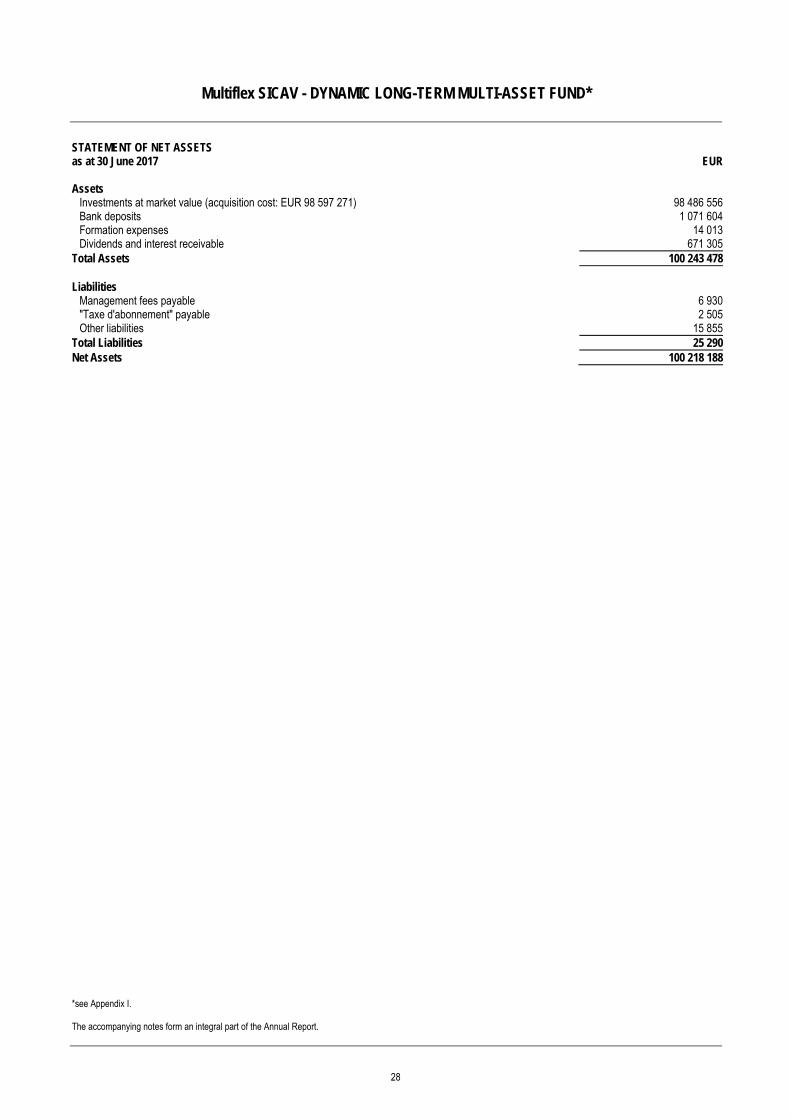
STATEMENT OF NET ASSETS as at 30 June 2017 EUR Assets
Investments at market value (acquisition cost: EUR 98 597 271) 98 486 556Bank deposits 1 071 604Formation expenses 14 013Dividends and interest receivable 671 305
Total Assets 100 243 478 Liabilities
Management fees payable 6 930"Taxe d'abonnement" payable 2 505Other liabilities 15 855
Total Liabilities 25 290Net Assets 100 218 188
28
Multiflex SICAV - DYNAMIC LONG-TERM MULTI-ASSET FUND*
*see Appendix I. **see page 17. The accompanying notes form an integral part of the Annual Report.
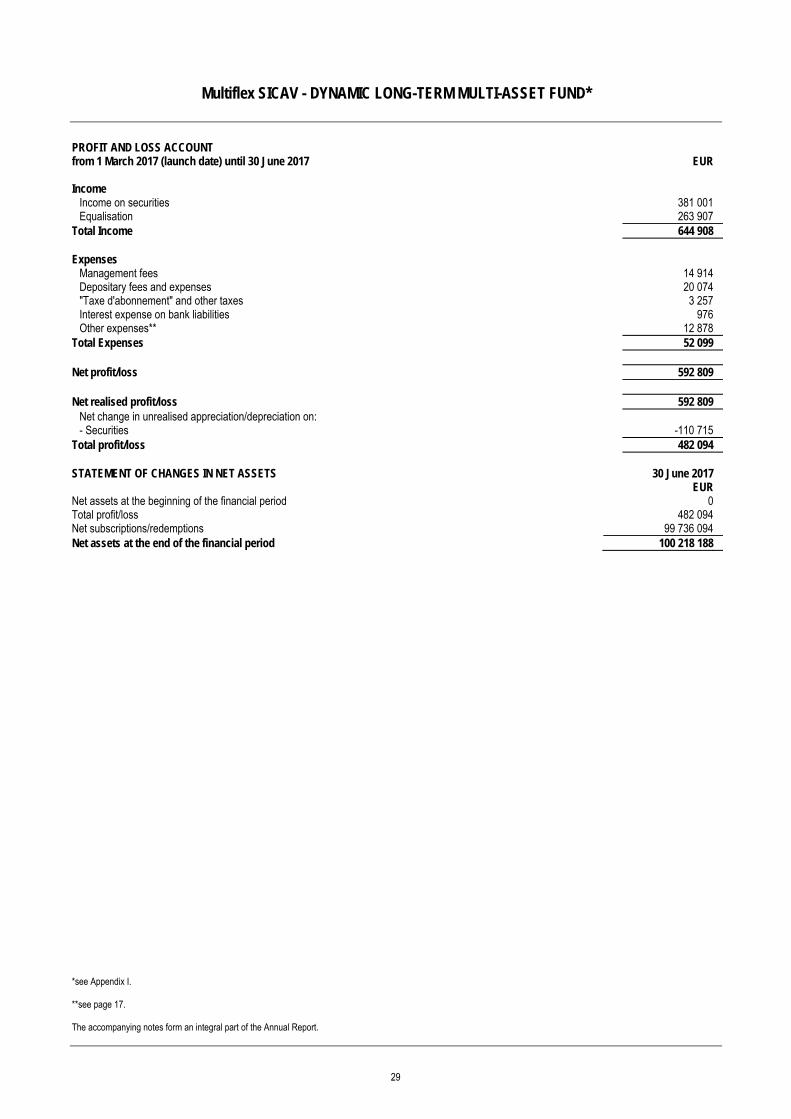
PROFIT AND LOSS ACCOUNT from 1 March 2017 (launch date) until 30 June 2017 EUR Income
Income on securities 381 001 Equalisation 263 907
Total Income 644 908 Expenses
Management fees 14 914 Depositary fees and expenses 20 074 "Taxe d'abonnement" and other taxes 3 257 Interest expense on bank liabilities 976 Other expenses** 12 878
Total Expenses 52 099 Net profit/loss 592 809
Net realised profit/loss 592 809
Net change in unrealised appreciation/depreciation on: - Securities -110 715
Total profit/loss 482 094 STATEMENT OF CHANGES IN NET ASSETS 30 June 2017 EUR Net assets at the beginning of the financial period 0 Total profit/loss 482 094 Net subscriptions/redemptions 99 736 094 Net assets at the end of the financial period 100 218 188
29

Multiflex SICAV - DYNAMIC LONG-TERM MULTI-ASSET FUND*
*see Appendix I.
COMPARATIVE STATEMENT 30 June 2017 Number of shares
Number of shares outstanding Distribution shares (Shares Cm-EUR) 997 499.63
EUR Net Assets 100 218 188
In the share class
currency NAV per share Distribution shares (Shares Cm-EUR) 100.47
30
Multiflex SICAV - DYNAMIC LONG-TERM MULTI-ASSET FUND*
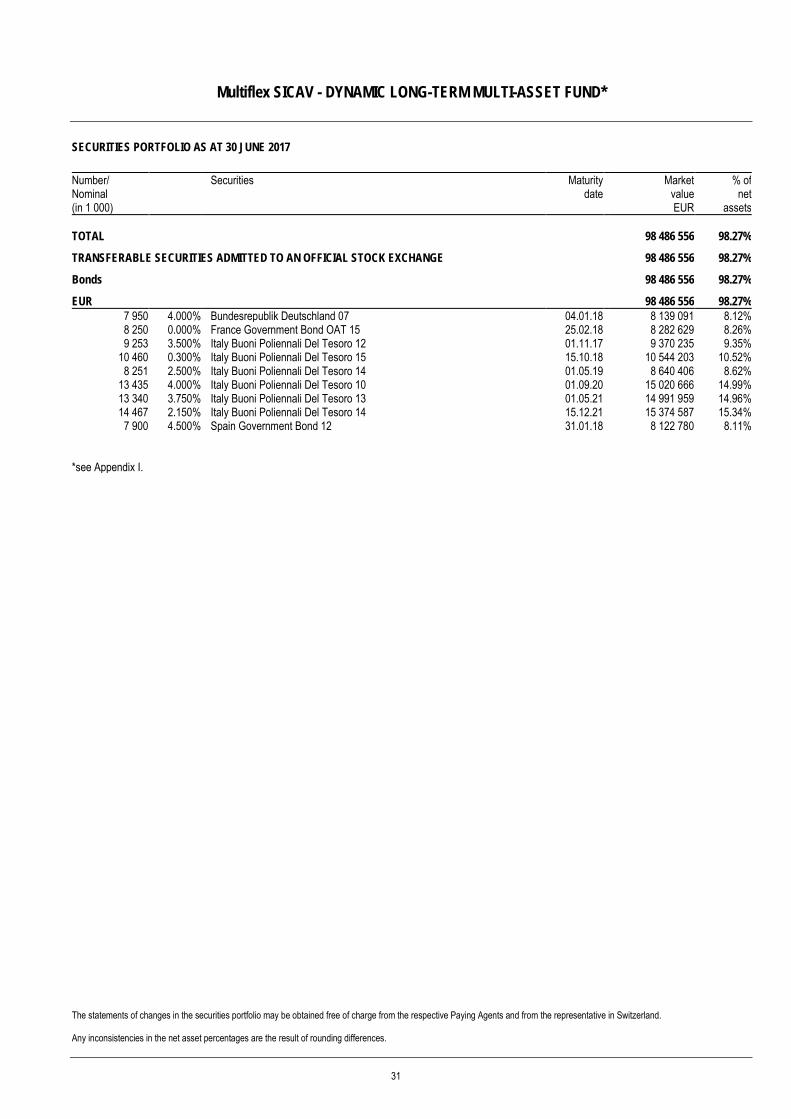
SECURITIES PORTFOLIO AS AT 30 JUNE 2017
The statements of changes in the securities portfolio may be obtained free of charge from the respective Paying Agents and from the representative in Switzerland. Any inconsistencies in the net asset percentages are the result of rounding differences.
Number/ Nominal (in 1 000)
Securities Maturity date
Market value EUR
% of net
assets TOTAL 98 486 556 98.27%
TRANSFERABLE SECURITIES ADMITTED TO AN OFFICIAL STOCK EXCHANGE 98 486 556 98.27%
Bonds 98 486 556 98.27%
EUR 98 486 556 98.27% 7 950 4.000% Bundesrepublik Deutschland 07 04.01.18 8 139 091 8.12% 8 250 0.000% France Government Bond OAT 15 25.02.18 8 282 629 8.26% 9 253 3.500% Italy Buoni Poliennali Del Tesoro 12 01.11.17 9 370 235 9.35%
10 460 0.300% Italy Buoni Poliennali Del Tesoro 15 15.10.18 10 544 203 10.52% 8 251 2.500% Italy Buoni Poliennali Del Tesoro 14 01.05.19 8 640 406 8.62%
13 435 4.000% Italy Buoni Poliennali Del Tesoro 10 01.09.20 15 020 666 14.99% 13 340 3.750% Italy Buoni Poliennali Del Tesoro 13 01.05.21 14 991 959 14.96% 14 467 2.150% Italy Buoni Poliennali Del Tesoro 14 15.12.21 15 374 587 15.34% 7 900 4.500% Spain Government Bond 12 31.01.18 8 122 780 8.11%
*see Appendix I.
31
Multiflex SICAV - DYNAMIC MULTI-ASSET FUND*
*see Appendix I. The information in this report is based on historical data and is no indication of future performance.
Fund Management Report Investment Policy The Multiflex SICAV - DYNAMIC MULTI-ASSET FUND* invests across a range of asset classes, within the broad areas of fixed income and equity. Within fixed income, these would include high quality government bonds, investment grade bonds, high yield bonds, securitised and emerging market debt. Within equities, the sub-fund invests both in developed equity regions and in emerging markets. The aim is to build a well-diversified portfolio to enhance yield while limiting volatility. Market review and portfolio Global stock markets started 2017 strong, extending their post US presidential election rally. Global ecomonic growth continues to remain positive as economic data suggests solid growth momentum. In the US, business investments picked up in Q1 2017, which has been of some concern in the past and consumer confidence also remains strong providing optimism for the future. Economic data from Europe was largely postive with robust PMI numbers in major European countries indicating broader growth in the region. In fixed income, yields continue to remain low relative to history, with high-yield corporate bonds near all-time lows. We were conservatively positioned at the beginning of November 2016 due to the uncertainty over US election and our concern over a possible sharp rise in government bond yields. However, we gradually increased equity allocations post-election, as we felt that market fear had subsided and the post-election sell-off represented a buying opportunity. Investor focus shifted quickly to the potential expansionary policies from the incoming administration. In 2017, we continued to target the higher end of the volatility range as VIX index remained at record low levels suggesting that investors perceived downside risks to be low. We favoured Emerging Markets equities on positive economic data and easing fears about US trade protectionism. In fixed income, we maintained low duration in the portfolio and favoured Emerging Market local currency debt due to its attractive yields. Since inception, the Multiflex SICAV - DYNAMIC MULTI-ASSET FUND returned 2.29%. Our allocation to Global Equities was the strongest perfroming asset class which contributed 2.29% while the main detractor of performance was Global Treasury bonds which returned -0.23%.
32
Multiflex SICAV - DYNAMIC MULTI-ASSET FUND*
*see Appendix I. **Also include bank deposits/bank liabilities at brokers. The accompanying notes form an integral part of the Annual Report.
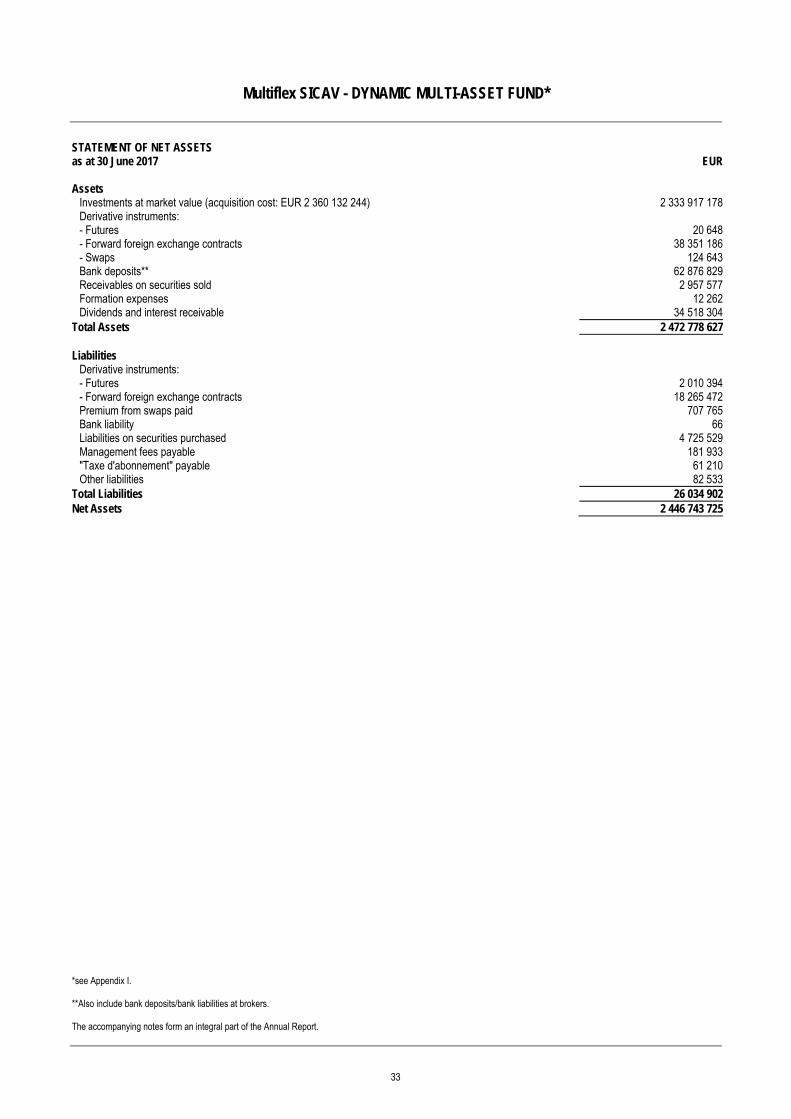
STATEMENT OF NET ASSETS as at 30 June 2017 EUR Assets
Investments at market value (acquisition cost: EUR 2 360 132 244) 2 333 917 178Derivative instruments: - Futures 20 648- Forward foreign exchange contracts 38 351 186- Swaps 124 643Bank deposits** 62 876 829Receivables on securities sold 2 957 577Formation expenses 12 262Dividends and interest receivable 34 518 304
Total Assets 2 472 778 627 Liabilities
Derivative instruments: - Futures 2 010 394- Forward foreign exchange contracts 18 265 472Premium from swaps paid 707 765Bank liability 66Liabilities on securities purchased 4 725 529Management fees payable 181 933"Taxe d'abonnement" payable 61 210Other liabilities 82 533
Total Liabilities 26 034 902Net Assets 2 446 743 725
33
Multiflex SICAV - DYNAMIC MULTI-ASSET FUND*
*see Appendix I. **see page 17. The accompanying notes form an integral part of the Annual Report.
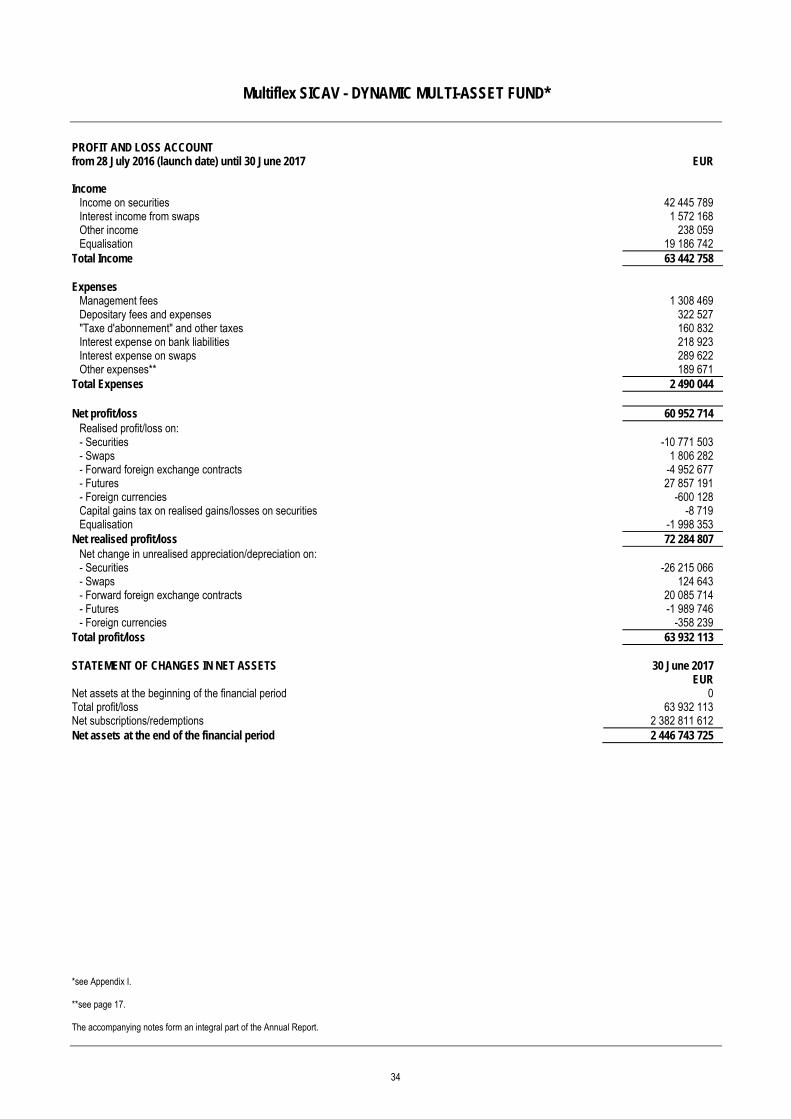
PROFIT AND LOSS ACCOUNT from 28 July 2016 (launch date) until 30 June 2017 EUR Income
Income on securities 42 445 789 Interest income from swaps 1 572 168 Other income 238 059 Equalisation 19 186 742
Total Income 63 442 758 Expenses
Management fees 1 308 469 Depositary fees and expenses 322 527 "Taxe d'abonnement" and other taxes 160 832 Interest expense on bank liabilities 218 923 Interest expense on swaps 289 622 Other expenses** 189 671
Total Expenses 2 490 044 Net profit/loss 60 952 714
Realised profit/loss on: - Securities -10 771 503 - Swaps 1 806 282 - Forward foreign exchange contracts -4 952 677 - Futures 27 857 191 - Foreign currencies -600 128 Capital gains tax on realised gains/losses on securities -8 719 Equalisation -1 998 353
Net realised profit/loss 72 284 807 Net change in unrealised appreciation/depreciation on: - Securities -26 215 066 - Swaps 124 643 - Forward foreign exchange contracts 20 085 714 - Futures -1 989 746 - Foreign currencies -358 239
Total profit/loss 63 932 113 STATEMENT OF CHANGES IN NET ASSETS 30 June 2017 EUR Net assets at the beginning of the financial period 0 Total profit/loss 63 932 113 Net subscriptions/redemptions 2 382 811 612 Net assets at the end of the financial period 2 446 743 725
34

Multiflex SICAV - DYNAMIC MULTI-ASSET FUND*
*see Appendix I.
COMPARATIVE STATEMENT 30 June 2017 Number of shares
Number of shares outstanding Distribution shares (Shares Cm-EUR) 23 919 145.13
EUR Net Assets 2 446 743 725
In the share class
currency NAV per share Distribution shares (Shares Cm-EUR) 102.29
35
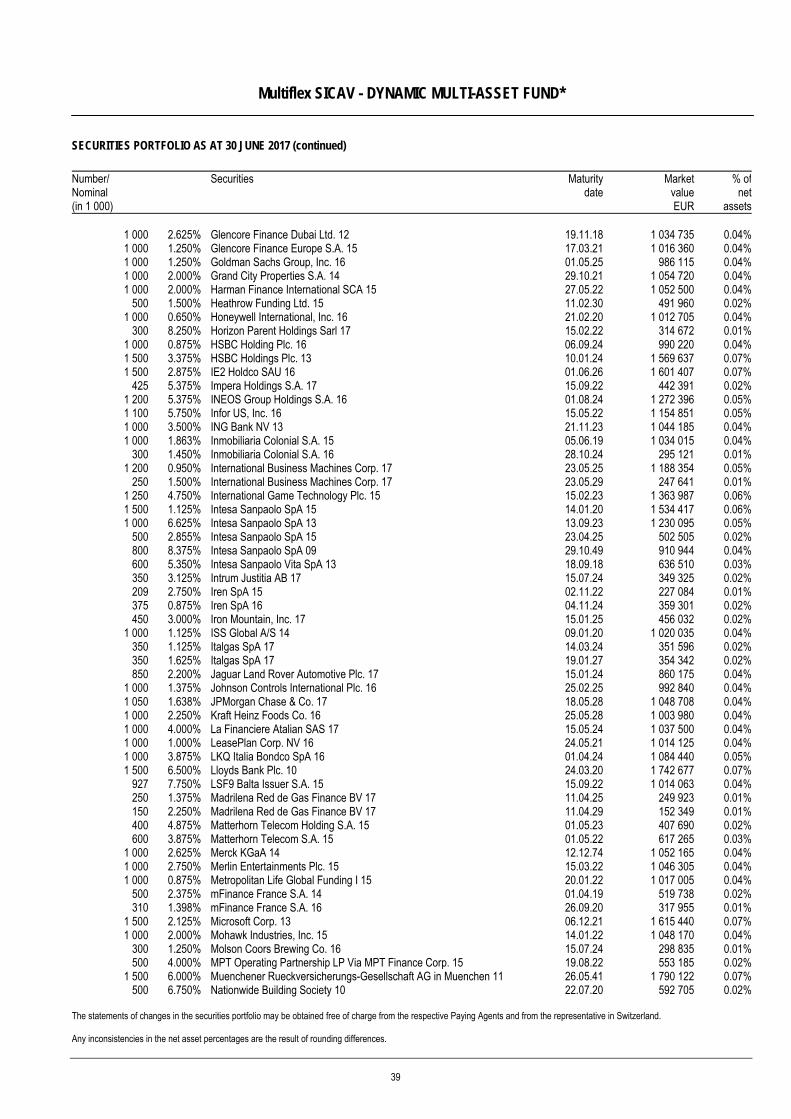
Multiflex SICAV - DYNAMIC MULTI-ASSET FUND*
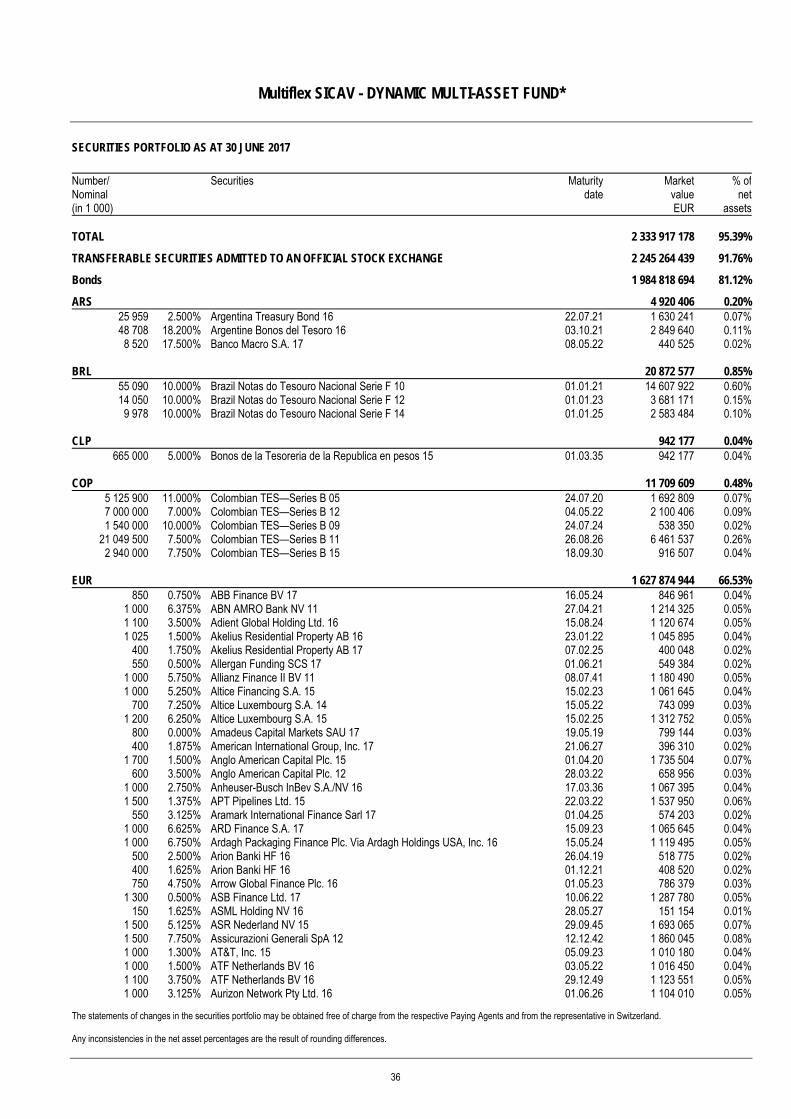
SECURITIES PORTFOLIO AS AT 30 JUNE 2017
The statements of changes in the securities portfolio may be obtained free of charge from the respective Paying Agents and from the representative in Switzerland. Any inconsistencies in the net asset percentages are the result of rounding differences.
Number/ Nominal (in 1 000)
Securities Maturitydate
MarketvalueEUR
% ofnet
assets TOTAL 2 333 917 178 95.39%
TRANSFERABLE SECURITIES ADMITTED TO AN OFFICIAL STOCK EXCHANGE 2 245 264 439 91.76%
Bonds 1 984 818 694 81.12%
ARS 4 920 406 0.20%25 959 2.500% Argentina Treasury Bond 16 22.07.21 1 630 241 0.07%48 708 18.200% Argentine Bonos del Tesoro 16 03.10.21 2 849 640 0.11%8 520 17.500% Banco Macro S.A. 17 08.05.22 440 525 0.02%
BRL 20 872 577 0.85%55 090 10.000% Brazil Notas do Tesouro Nacional Serie F 10 01.01.21 14 607 922 0.60%14 050 10.000% Brazil Notas do Tesouro Nacional Serie F 12 01.01.23 3 681 171 0.15%9 978 10.000% Brazil Notas do Tesouro Nacional Serie F 14 01.01.25 2 583 484 0.10%
CLP 942 177 0.04%665 000 5.000% Bonos de la Tesoreria de la Republica en pesos 15 01.03.35 942 177 0.04%
COP 11 709 609 0.48%5 125 900 11.000% Colombian TES—Series B 05 24.07.20 1 692 809 0.07%7 000 000 7.000% Colombian TES—Series B 12 04.05.22 2 100 406 0.09%1 540 000 10.000% Colombian TES—Series B 09 24.07.24 538 350 0.02%
21 049 500 7.500% Colombian TES—Series B 11 26.08.26 6 461 537 0.26%2 940 000 7.750% Colombian TES—Series B 15 18.09.30 916 507 0.04%
EUR 1 627 874 944 66.53%850 0.750% ABB Finance BV 17 16.05.24 846 961 0.04%
1 000 6.375% ABN AMRO Bank NV 11 27.04.21 1 214 325 0.05%1 100 3.500% Adient Global Holding Ltd. 16 15.08.24 1 120 674 0.05%1 025 1.500% Akelius Residential Property AB 16 23.01.22 1 045 895 0.04%
400 1.750% Akelius Residential Property AB 17 07.02.25 400 048 0.02%550 0.500% Allergan Funding SCS 17 01.06.21 549 384 0.02%
1 000 5.750% Allianz Finance II BV 11 08.07.41 1 180 490 0.05%1 000 5.250% Altice Financing S.A. 15 15.02.23 1 061 645 0.04%
700 7.250% Altice Luxembourg S.A. 14 15.05.22 743 099 0.03%1 200 6.250% Altice Luxembourg S.A. 15 15.02.25 1 312 752 0.05%
800 0.000% Amadeus Capital Markets SAU 17 19.05.19 799 144 0.03%400 1.875% American International Group, Inc. 17 21.06.27 396 310 0.02%
1 700 1.500% Anglo American Capital Plc. 15 01.04.20 1 735 504 0.07%600 3.500% Anglo American Capital Plc. 12 28.03.22 658 956 0.03%
1 000 2.750% Anheuser-Busch InBev S.A./NV 16 17.03.36 1 067 395 0.04%1 500 1.375% APT Pipelines Ltd. 15 22.03.22 1 537 950 0.06%
550 3.125% Aramark International Finance Sarl 17 01.04.25 574 203 0.02%1 000 6.625% ARD Finance S.A. 17 15.09.23 1 065 645 0.04%1 000 6.750% Ardagh Packaging Finance Plc. Via Ardagh Holdings USA, Inc. 16 15.05.24 1 119 495 0.05%
500 2.500% Arion Banki HF 16 26.04.19 518 775 0.02%400 1.625% Arion Banki HF 16 01.12.21 408 520 0.02%750 4.750% Arrow Global Finance Plc. 16 01.05.23 786 379 0.03%
1 300 0.500% ASB Finance Ltd. 17 10.06.22 1 287 780 0.05%150 1.625% ASML Holding NV 16 28.05.27 151 154 0.01%
1 500 5.125% ASR Nederland NV 15 29.09.45 1 693 065 0.07%1 500 7.750% Assicurazioni Generali SpA 12 12.12.42 1 860 045 0.08%1 000 1.300% AT&T, Inc. 15 05.09.23 1 010 180 0.04%1 000 1.500% ATF Netherlands BV 16 03.05.22 1 016 450 0.04%1 100 3.750% ATF Netherlands BV 16 29.12.49 1 123 551 0.05%1 000 3.125% Aurizon Network Pty Ltd. 16 01.06.26 1 104 010 0.05%
36
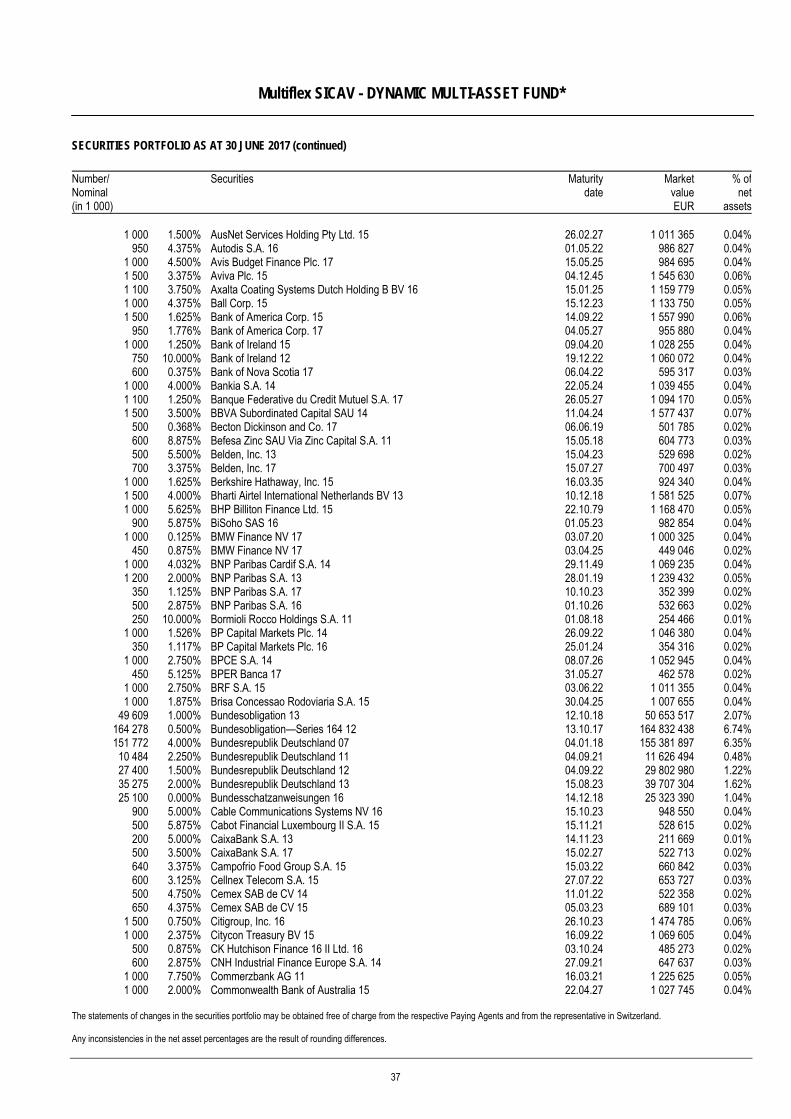
Multiflex SICAV - DYNAMIC MULTI-ASSET FUND*
SECURITIES PORTFOLIO AS AT 30 JUNE 2017 (continued)
The statements of changes in the securities portfolio may be obtained free of charge from the respective Paying Agents and from the representative in Switzerland. Any inconsistencies in the net asset percentages are the result of rounding differences.
Number/ Nominal (in 1 000)
Securities Maturitydate
MarketvalueEUR
% ofnet
assets
1 000 1.500% AusNet Services Holding Pty Ltd. 15 26.02.27 1 011 365 0.04%950 4.375% Autodis S.A. 16 01.05.22 986 827 0.04%
1 000 4.500% Avis Budget Finance Plc. 17 15.05.25 984 695 0.04%1 500 3.375% Aviva Plc. 15 04.12.45 1 545 630 0.06%1 100 3.750% Axalta Coating Systems Dutch Holding B BV 16 15.01.25 1 159 779 0.05%1 000 4.375% Ball Corp. 15 15.12.23 1 133 750 0.05%1 500 1.625% Bank of America Corp. 15 14.09.22 1 557 990 0.06%
950 1.776% Bank of America Corp. 17 04.05.27 955 880 0.04%1 000 1.250% Bank of Ireland 15 09.04.20 1 028 255 0.04%
750 10.000% Bank of Ireland 12 19.12.22 1 060 072 0.04%600 0.375% Bank of Nova Scotia 17 06.04.22 595 317 0.03%
1 000 4.000% Bankia S.A. 14 22.05.24 1 039 455 0.04%1 100 1.250% Banque Federative du Credit Mutuel S.A. 17 26.05.27 1 094 170 0.05%1 500 3.500% BBVA Subordinated Capital SAU 14 11.04.24 1 577 437 0.07%
500 0.368% Becton Dickinson and Co. 17 06.06.19 501 785 0.02%600 8.875% Befesa Zinc SAU Via Zinc Capital S.A. 11 15.05.18 604 773 0.03%500 5.500% Belden, Inc. 13 15.04.23 529 698 0.02%700 3.375% Belden, Inc. 17 15.07.27 700 497 0.03%
1 000 1.625% Berkshire Hathaway, Inc. 15 16.03.35 924 340 0.04%1 500 4.000% Bharti Airtel International Netherlands BV 13 10.12.18 1 581 525 0.07%1 000 5.625% BHP Billiton Finance Ltd. 15 22.10.79 1 168 470 0.05%
900 5.875% BiSoho SAS 16 01.05.23 982 854 0.04%1 000 0.125% BMW Finance NV 17 03.07.20 1 000 325 0.04%
450 0.875% BMW Finance NV 17 03.04.25 449 046 0.02%1 000 4.032% BNP Paribas Cardif S.A. 14 29.11.49 1 069 235 0.04%1 200 2.000% BNP Paribas S.A. 13 28.01.19 1 239 432 0.05%
350 1.125% BNP Paribas S.A. 17 10.10.23 352 399 0.02%500 2.875% BNP Paribas S.A. 16 01.10.26 532 663 0.02%250 10.000% Bormioli Rocco Holdings S.A. 11 01.08.18 254 466 0.01%
1 000 1.526% BP Capital Markets Plc. 14 26.09.22 1 046 380 0.04%350 1.117% BP Capital Markets Plc. 16 25.01.24 354 316 0.02%
1 000 2.750% BPCE S.A. 14 08.07.26 1 052 945 0.04%450 5.125% BPER Banca 17 31.05.27 462 578 0.02%
1 000 2.750% BRF S.A. 15 03.06.22 1 011 355 0.04%1 000 1.875% Brisa Concessao Rodoviaria S.A. 15 30.04.25 1 007 655 0.04%
49 609 1.000% Bundesobligation 13 12.10.18 50 653 517 2.07%164 278 0.500% Bundesobligation—Series 164 12 13.10.17 164 832 438 6.74%151 772 4.000% Bundesrepublik Deutschland 07 04.01.18 155 381 897 6.35%
10 484 2.250% Bundesrepublik Deutschland 11 04.09.21 11 626 494 0.48%27 400 1.500% Bundesrepublik Deutschland 12 04.09.22 29 802 980 1.22%35 275 2.000% Bundesrepublik Deutschland 13 15.08.23 39 707 304 1.62%25 100 0.000% Bundesschatzanweisungen 16 14.12.18 25 323 390 1.04%
900 5.000% Cable Communications Systems NV 16 15.10.23 948 550 0.04%500 5.875% Cabot Financial Luxembourg II S.A. 15 15.11.21 528 615 0.02%200 5.000% CaixaBank S.A. 13 14.11.23 211 669 0.01%500 3.500% CaixaBank S.A. 17 15.02.27 522 713 0.02%640 3.375% Campofrio Food Group S.A. 15 15.03.22 660 842 0.03%600 3.125% Cellnex Telecom S.A. 15 27.07.22 653 727 0.03%500 4.750% Cemex SAB de CV 14 11.01.22 522 358 0.02%650 4.375% Cemex SAB de CV 15 05.03.23 689 101 0.03%
1 500 0.750% Citigroup, Inc. 16 26.10.23 1 474 785 0.06%1 000 2.375% Citycon Treasury BV 15 16.09.22 1 069 605 0.04%
500 0.875% CK Hutchison Finance 16 II Ltd. 16 03.10.24 485 273 0.02%600 2.875% CNH Industrial Finance Europe S.A. 14 27.09.21 647 637 0.03%
1 000 7.750% Commerzbank AG 11 16.03.21 1 225 625 0.05%1 000 2.000% Commonwealth Bank of Australia 15 22.04.27 1 027 745 0.04%
37
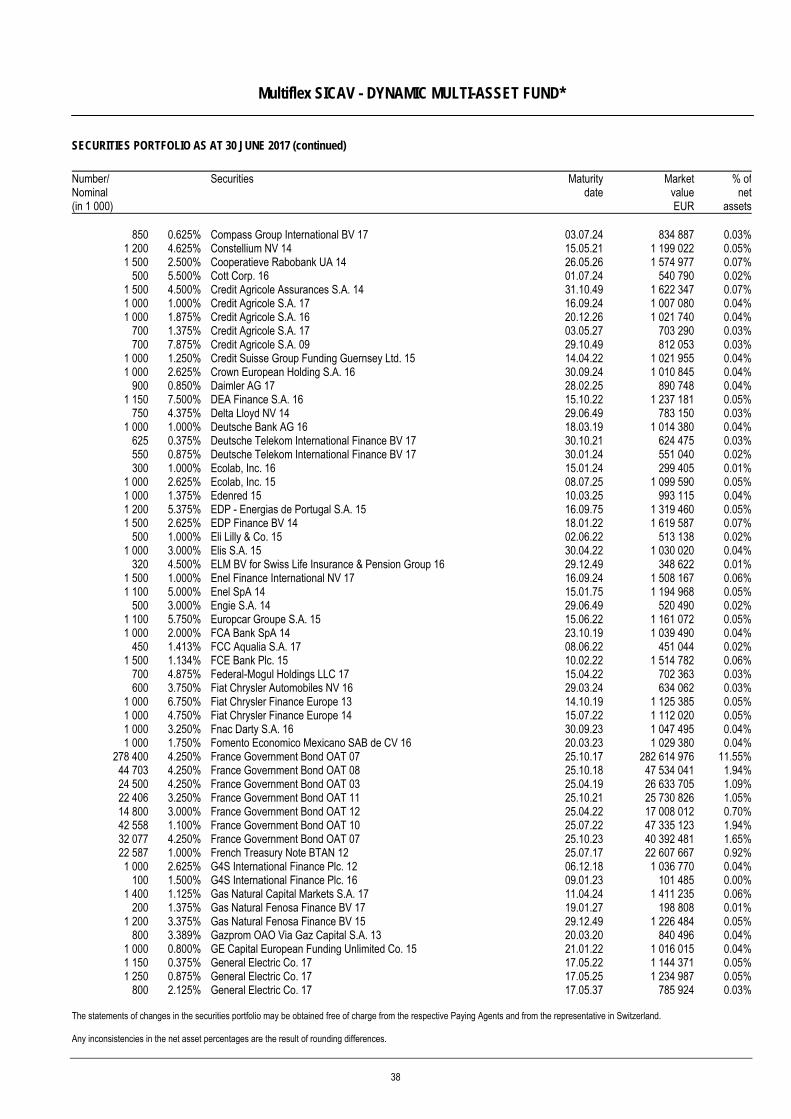
Multiflex SICAV - DYNAMIC MULTI-ASSET FUND*
SECURITIES PORTFOLIO AS AT 30 JUNE 2017 (continued)
The statements of changes in the securities portfolio may be obtained free of charge from the respective Paying Agents and from the representative in Switzerland. Any inconsistencies in the net asset percentages are the result of rounding differences.
Number/ Nominal (in 1 000)
Securities Maturitydate
MarketvalueEUR
% ofnet
assets
850 0.625% Compass Group International BV 17 03.07.24 834 887 0.03%1 200 4.625% Constellium NV 14 15.05.21 1 199 022 0.05%1 500 2.500% Cooperatieve Rabobank UA 14 26.05.26 1 574 977 0.07%
500 5.500% Cott Corp. 16 01.07.24 540 790 0.02%1 500 4.500% Credit Agricole Assurances S.A. 14 31.10.49 1 622 347 0.07%1 000 1.000% Credit Agricole S.A. 17 16.09.24 1 007 080 0.04%1 000 1.875% Credit Agricole S.A. 16 20.12.26 1 021 740 0.04%
700 1.375% Credit Agricole S.A. 17 03.05.27 703 290 0.03%700 7.875% Credit Agricole S.A. 09 29.10.49 812 053 0.03%
1 000 1.250% Credit Suisse Group Funding Guernsey Ltd. 15 14.04.22 1 021 955 0.04%1 000 2.625% Crown European Holding S.A. 16 30.09.24 1 010 845 0.04%
900 0.850% Daimler AG 17 28.02.25 890 748 0.04%1 150 7.500% DEA Finance S.A. 16 15.10.22 1 237 181 0.05%
750 4.375% Delta Lloyd NV 14 29.06.49 783 150 0.03%1 000 1.000% Deutsche Bank AG 16 18.03.19 1 014 380 0.04%
625 0.375% Deutsche Telekom International Finance BV 17 30.10.21 624 475 0.03%550 0.875% Deutsche Telekom International Finance BV 17 30.01.24 551 040 0.02%300 1.000% Ecolab, Inc. 16 15.01.24 299 405 0.01%
1 000 2.625% Ecolab, Inc. 15 08.07.25 1 099 590 0.05%1 000 1.375% Edenred 15 10.03.25 993 115 0.04%1 200 5.375% EDP - Energias de Portugal S.A. 15 16.09.75 1 319 460 0.05%1 500 2.625% EDP Finance BV 14 18.01.22 1 619 587 0.07%
500 1.000% Eli Lilly & Co. 15 02.06.22 513 138 0.02%1 000 3.000% Elis S.A. 15 30.04.22 1 030 020 0.04%
320 4.500% ELM BV for Swiss Life Insurance & Pension Group 16 29.12.49 348 622 0.01%1 500 1.000% Enel Finance International NV 17 16.09.24 1 508 167 0.06%1 100 5.000% Enel SpA 14 15.01.75 1 194 968 0.05%
500 3.000% Engie S.A. 14 29.06.49 520 490 0.02%1 100 5.750% Europcar Groupe S.A. 15 15.06.22 1 161 072 0.05%1 000 2.000% FCA Bank SpA 14 23.10.19 1 039 490 0.04%
450 1.413% FCC Aqualia S.A. 17 08.06.22 451 044 0.02%1 500 1.134% FCE Bank Plc. 15 10.02.22 1 514 782 0.06%
700 4.875% Federal-Mogul Holdings LLC 17 15.04.22 702 363 0.03%600 3.750% Fiat Chrysler Automobiles NV 16 29.03.24 634 062 0.03%
1 000 6.750% Fiat Chrysler Finance Europe 13 14.10.19 1 125 385 0.05%1 000 4.750% Fiat Chrysler Finance Europe 14 15.07.22 1 112 020 0.05%1 000 3.250% Fnac Darty S.A. 16 30.09.23 1 047 495 0.04%1 000 1.750% Fomento Economico Mexicano SAB de CV 16 20.03.23 1 029 380 0.04%
278 400 4.250% France Government Bond OAT 07 25.10.17 282 614 976 11.55%44 703 4.250% France Government Bond OAT 08 25.10.18 47 534 041 1.94%24 500 4.250% France Government Bond OAT 03 25.04.19 26 633 705 1.09%22 406 3.250% France Government Bond OAT 11 25.10.21 25 730 826 1.05%14 800 3.000% France Government Bond OAT 12 25.04.22 17 008 012 0.70%42 558 1.100% France Government Bond OAT 10 25.07.22 47 335 123 1.94%32 077 4.250% France Government Bond OAT 07 25.10.23 40 392 481 1.65%22 587 1.000% French Treasury Note BTAN 12 25.07.17 22 607 667 0.92%1 000 2.625% G4S International Finance Plc. 12 06.12.18 1 036 770 0.04%
100 1.500% G4S International Finance Plc. 16 09.01.23 101 485 0.00%1 400 1.125% Gas Natural Capital Markets S.A. 17 11.04.24 1 411 235 0.06%
200 1.375% Gas Natural Fenosa Finance BV 17 19.01.27 198 808 0.01%1 200 3.375% Gas Natural Fenosa Finance BV 15 29.12.49 1 226 484 0.05%
800 3.389% Gazprom OAO Via Gaz Capital S.A. 13 20.03.20 840 496 0.04%1 000 0.800% GE Capital European Funding Unlimited Co. 15 21.01.22 1 016 015 0.04%1 150 0.375% General Electric Co. 17 17.05.22 1 144 371 0.05%1 250 0.875% General Electric Co. 17 17.05.25 1 234 987 0.05%
800 2.125% General Electric Co. 17 17.05.37 785 924 0.03%
38
Multiflex SICAV - DYNAMIC MULTI-ASSET FUND*
SECURITIES PORTFOLIO AS AT 30 JUNE 2017 (continued)
The statements of changes in the securities portfolio may be obtained free of charge from the respective Paying Agents and from the representative in Switzerland. Any inconsistencies in the net asset percentages are the result of rounding differences.
Number/ Nominal (in 1 000)
Securities Maturitydate
MarketvalueEUR
% ofnet
assets
1 000 2.625% Glencore Finance Dubai Ltd. 12 19.11.18 1 034 735 0.04%1 000 1.250% Glencore Finance Europe S.A. 15 17.03.21 1 016 360 0.04%1 000 1.250% Goldman Sachs Group, Inc. 16 01.05.25 986 115 0.04%1 000 2.000% Grand City Properties S.A. 14 29.10.21 1 054 720 0.04%1 000 2.000% Harman Finance International SCA 15 27.05.22 1 052 500 0.04%
500 1.500% Heathrow Funding Ltd. 15 11.02.30 491 960 0.02%1 000 0.650% Honeywell International, Inc. 16 21.02.20 1 012 705 0.04%
300 8.250% Horizon Parent Holdings Sarl 17 15.02.22 314 672 0.01%1 000 0.875% HSBC Holding Plc. 16 06.09.24 990 220 0.04%1 500 3.375% HSBC Holdings Plc. 13 10.01.24 1 569 637 0.07%1 500 2.875% IE2 Holdco SAU 16 01.06.26 1 601 407 0.07%
425 5.375% Impera Holdings S.A. 17 15.09.22 442 391 0.02%1 200 5.375% INEOS Group Holdings S.A. 16 01.08.24 1 272 396 0.05%1 100 5.750% Infor US, Inc. 16 15.05.22 1 154 851 0.05%1 000 3.500% ING Bank NV 13 21.11.23 1 044 185 0.04%1 000 1.863% Inmobiliaria Colonial S.A. 15 05.06.19 1 034 015 0.04%
300 1.450% Inmobiliaria Colonial S.A. 16 28.10.24 295 121 0.01%1 200 0.950% International Business Machines Corp. 17 23.05.25 1 188 354 0.05%
250 1.500% International Business Machines Corp. 17 23.05.29 247 641 0.01%1 250 4.750% International Game Technology Plc. 15 15.02.23 1 363 987 0.06%1 500 1.125% Intesa Sanpaolo SpA 15 14.01.20 1 534 417 0.06%1 000 6.625% Intesa Sanpaolo SpA 13 13.09.23 1 230 095 0.05%
500 2.855% Intesa Sanpaolo SpA 15 23.04.25 502 505 0.02%800 8.375% Intesa Sanpaolo SpA 09 29.10.49 910 944 0.04%600 5.350% Intesa Sanpaolo Vita SpA 13 18.09.18 636 510 0.03%350 3.125% Intrum Justitia AB 17 15.07.24 349 325 0.02%209 2.750% Iren SpA 15 02.11.22 227 084 0.01%375 0.875% Iren SpA 16 04.11.24 359 301 0.02%450 3.000% Iron Mountain, Inc. 17 15.01.25 456 032 0.02%
1 000 1.125% ISS Global A/S 14 09.01.20 1 020 035 0.04%350 1.125% Italgas SpA 17 14.03.24 351 596 0.02%350 1.625% Italgas SpA 17 19.01.27 354 342 0.02%850 2.200% Jaguar Land Rover Automotive Plc. 17 15.01.24 860 175 0.04%
1 000 1.375% Johnson Controls International Plc. 16 25.02.25 992 840 0.04%1 050 1.638% JPMorgan Chase & Co. 17 18.05.28 1 048 708 0.04%1 000 2.250% Kraft Heinz Foods Co. 16 25.05.28 1 003 980 0.04%1 000 4.000% La Financiere Atalian SAS 17 15.05.24 1 037 500 0.04%1 000 1.000% LeasePlan Corp. NV 16 24.05.21 1 014 125 0.04%1 000 3.875% LKQ Italia Bondco SpA 16 01.04.24 1 084 440 0.05%1 500 6.500% Lloyds Bank Plc. 10 24.03.20 1 742 677 0.07%
927 7.750% LSF9 Balta Issuer S.A. 15 15.09.22 1 014 063 0.04%250 1.375% Madrilena Red de Gas Finance BV 17 11.04.25 249 923 0.01%150 2.250% Madrilena Red de Gas Finance BV 17 11.04.29 152 349 0.01%400 4.875% Matterhorn Telecom Holding S.A. 15 01.05.23 407 690 0.02%600 3.875% Matterhorn Telecom S.A. 15 01.05.22 617 265 0.03%
1 000 2.625% Merck KGaA 14 12.12.74 1 052 165 0.04%1 000 2.750% Merlin Entertainments Plc. 15 15.03.22 1 046 305 0.04%1 000 0.875% Metropolitan Life Global Funding I 15 20.01.22 1 017 005 0.04%
500 2.375% mFinance France S.A. 14 01.04.19 519 738 0.02%310 1.398% mFinance France S.A. 16 26.09.20 317 955 0.01%
1 500 2.125% Microsoft Corp. 13 06.12.21 1 615 440 0.07%1 000 2.000% Mohawk Industries, Inc. 15 14.01.22 1 048 170 0.04%
300 1.250% Molson Coors Brewing Co. 16 15.07.24 298 835 0.01%500 4.000% MPT Operating Partnership LP Via MPT Finance Corp. 15 19.08.22 553 185 0.02%
1 500 6.000% Muenchener Rueckversicherungs-Gesellschaft AG in Muenchen 11 26.05.41 1 790 122 0.07%500 6.750% Nationwide Building Society 10 22.07.20 592 705 0.02%
39
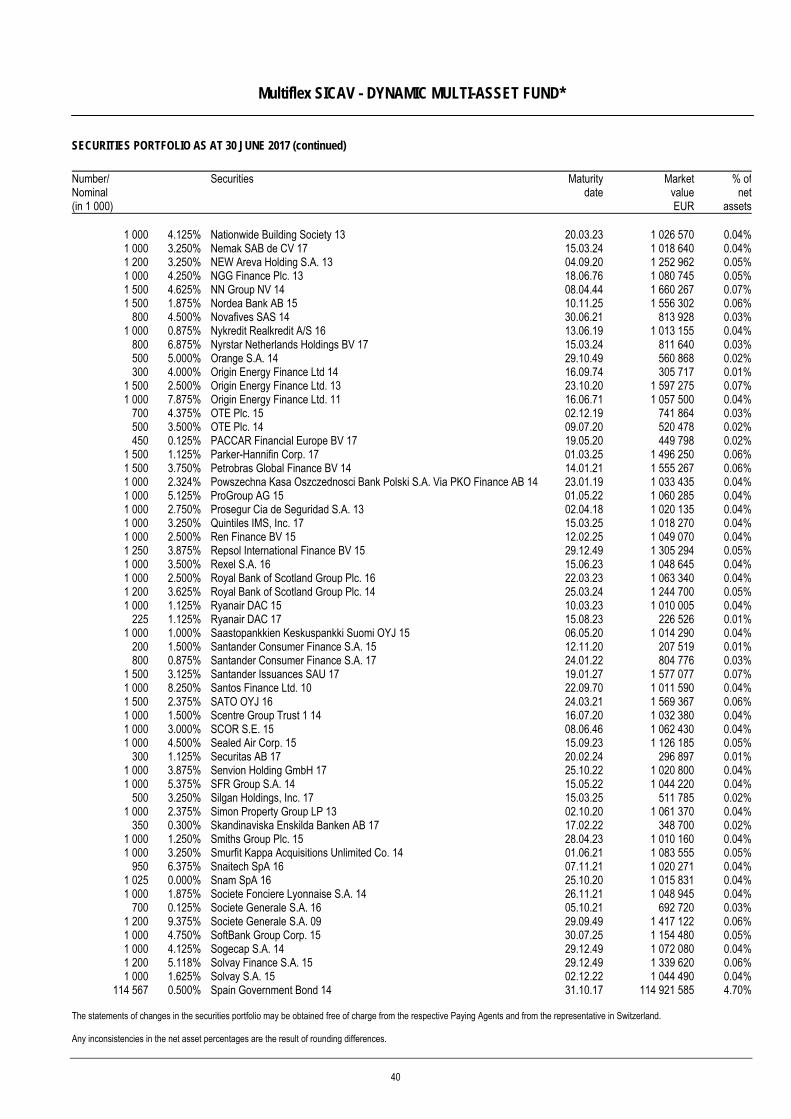
Multiflex SICAV - DYNAMIC MULTI-ASSET FUND*
SECURITIES PORTFOLIO AS AT 30 JUNE 2017 (continued)
The statements of changes in the securities portfolio may be obtained free of charge from the respective Paying Agents and from the representative in Switzerland. Any inconsistencies in the net asset percentages are the result of rounding differences.
Number/ Nominal (in 1 000)
Securities Maturitydate
MarketvalueEUR
% ofnet
assets
1 000 4.125% Nationwide Building Society 13 20.03.23 1 026 570 0.04%1 000 3.250% Nemak SAB de CV 17 15.03.24 1 018 640 0.04%1 200 3.250% NEW Areva Holding S.A. 13 04.09.20 1 252 962 0.05%1 000 4.250% NGG Finance Plc. 13 18.06.76 1 080 745 0.05%1 500 4.625% NN Group NV 14 08.04.44 1 660 267 0.07%1 500 1.875% Nordea Bank AB 15 10.11.25 1 556 302 0.06%
800 4.500% Novafives SAS 14 30.06.21 813 928 0.03%1 000 0.875% Nykredit Realkredit A/S 16 13.06.19 1 013 155 0.04%
800 6.875% Nyrstar Netherlands Holdings BV 17 15.03.24 811 640 0.03%500 5.000% Orange S.A. 14 29.10.49 560 868 0.02%300 4.000% Origin Energy Finance Ltd 14 16.09.74 305 717 0.01%
1 500 2.500% Origin Energy Finance Ltd. 13 23.10.20 1 597 275 0.07%1 000 7.875% Origin Energy Finance Ltd. 11 16.06.71 1 057 500 0.04%
700 4.375% OTE Plc. 15 02.12.19 741 864 0.03%500 3.500% OTE Plc. 14 09.07.20 520 478 0.02%450 0.125% PACCAR Financial Europe BV 17 19.05.20 449 798 0.02%
1 500 1.125% Parker-Hannifin Corp. 17 01.03.25 1 496 250 0.06%1 500 3.750% Petrobras Global Finance BV 14 14.01.21 1 555 267 0.06%1 000 2.324% Powszechna Kasa Oszczednosci Bank Polski S.A. Via PKO Finance AB 14 23.01.19 1 033 435 0.04%1 000 5.125% ProGroup AG 15 01.05.22 1 060 285 0.04%1 000 2.750% Prosegur Cia de Seguridad S.A. 13 02.04.18 1 020 135 0.04%1 000 3.250% Quintiles IMS, Inc. 17 15.03.25 1 018 270 0.04%1 000 2.500% Ren Finance BV 15 12.02.25 1 049 070 0.04%1 250 3.875% Repsol International Finance BV 15 29.12.49 1 305 294 0.05%1 000 3.500% Rexel S.A. 16 15.06.23 1 048 645 0.04%1 000 2.500% Royal Bank of Scotland Group Plc. 16 22.03.23 1 063 340 0.04%1 200 3.625% Royal Bank of Scotland Group Plc. 14 25.03.24 1 244 700 0.05%1 000 1.125% Ryanair DAC 15 10.03.23 1 010 005 0.04%
225 1.125% Ryanair DAC 17 15.08.23 226 526 0.01%1 000 1.000% Saastopankkien Keskuspankki Suomi OYJ 15 06.05.20 1 014 290 0.04%
200 1.500% Santander Consumer Finance S.A. 15 12.11.20 207 519 0.01%800 0.875% Santander Consumer Finance S.A. 17 24.01.22 804 776 0.03%
1 500 3.125% Santander Issuances SAU 17 19.01.27 1 577 077 0.07%1 000 8.250% Santos Finance Ltd. 10 22.09.70 1 011 590 0.04%1 500 2.375% SATO OYJ 16 24.03.21 1 569 367 0.06%1 000 1.500% Scentre Group Trust 1 14 16.07.20 1 032 380 0.04%1 000 3.000% SCOR S.E. 15 08.06.46 1 062 430 0.04%1 000 4.500% Sealed Air Corp. 15 15.09.23 1 126 185 0.05%
300 1.125% Securitas AB 17 20.02.24 296 897 0.01%1 000 3.875% Senvion Holding GmbH 17 25.10.22 1 020 800 0.04%1 000 5.375% SFR Group S.A. 14 15.05.22 1 044 220 0.04%
500 3.250% Silgan Holdings, Inc. 17 15.03.25 511 785 0.02%1 000 2.375% Simon Property Group LP 13 02.10.20 1 061 370 0.04%
350 0.300% Skandinaviska Enskilda Banken AB 17 17.02.22 348 700 0.02%1 000 1.250% Smiths Group Plc. 15 28.04.23 1 010 160 0.04%1 000 3.250% Smurfit Kappa Acquisitions Unlimited Co. 14 01.06.21 1 083 555 0.05%
950 6.375% Snaitech SpA 16 07.11.21 1 020 271 0.04%1 025 0.000% Snam SpA 16 25.10.20 1 015 831 0.04%1 000 1.875% Societe Fonciere Lyonnaise S.A. 14 26.11.21 1 048 945 0.04%
700 0.125% Societe Generale S.A. 16 05.10.21 692 720 0.03%1 200 9.375% Societe Generale S.A. 09 29.09.49 1 417 122 0.06%1 000 4.750% SoftBank Group Corp. 15 30.07.25 1 154 480 0.05%1 000 4.125% Sogecap S.A. 14 29.12.49 1 072 080 0.04%1 200 5.118% Solvay Finance S.A. 15 29.12.49 1 339 620 0.06%1 000 1.625% Solvay S.A. 15 02.12.22 1 044 490 0.04%
114 567 0.500% Spain Government Bond 14 31.10.17 114 921 585 4.70%
40
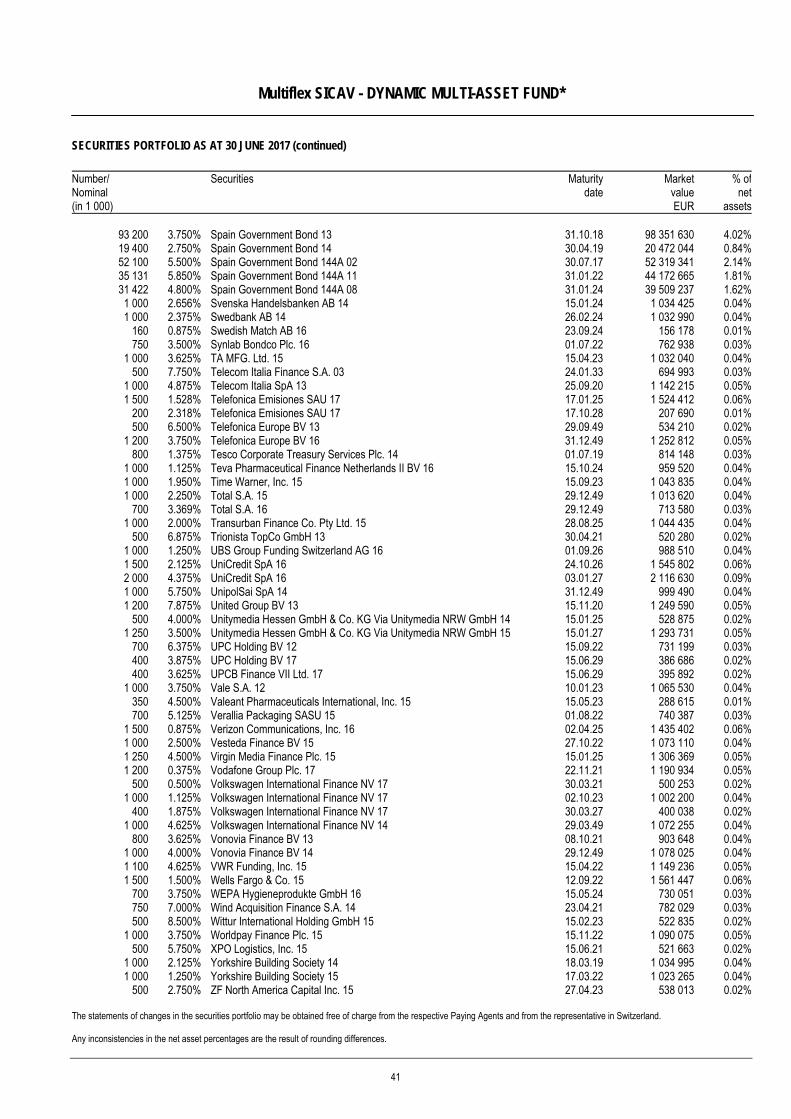
Multiflex SICAV - DYNAMIC MULTI-ASSET FUND*
SECURITIES PORTFOLIO AS AT 30 JUNE 2017 (continued)
The statements of changes in the securities portfolio may be obtained free of charge from the respective Paying Agents and from the representative in Switzerland. Any inconsistencies in the net asset percentages are the result of rounding differences.
Number/ Nominal (in 1 000)
Securities Maturitydate
MarketvalueEUR
% ofnet
assets
93 200 3.750% Spain Government Bond 13 31.10.18 98 351 630 4.02%19 400 2.750% Spain Government Bond 14 30.04.19 20 472 044 0.84%52 100 5.500% Spain Government Bond 144A 02 30.07.17 52 319 341 2.14%35 131 5.850% Spain Government Bond 144A 11 31.01.22 44 172 665 1.81%31 422 4.800% Spain Government Bond 144A 08 31.01.24 39 509 237 1.62%1 000 2.656% Svenska Handelsbanken AB 14 15.01.24 1 034 425 0.04%1 000 2.375% Swedbank AB 14 26.02.24 1 032 990 0.04%
160 0.875% Swedish Match AB 16 23.09.24 156 178 0.01%750 3.500% Synlab Bondco Plc. 16 01.07.22 762 938 0.03%
1 000 3.625% TA MFG. Ltd. 15 15.04.23 1 032 040 0.04%500 7.750% Telecom Italia Finance S.A. 03 24.01.33 694 993 0.03%
1 000 4.875% Telecom Italia SpA 13 25.09.20 1 142 215 0.05%1 500 1.528% Telefonica Emisiones SAU 17 17.01.25 1 524 412 0.06%
200 2.318% Telefonica Emisiones SAU 17 17.10.28 207 690 0.01%500 6.500% Telefonica Europe BV 13 29.09.49 534 210 0.02%
1 200 3.750% Telefonica Europe BV 16 31.12.49 1 252 812 0.05%800 1.375% Tesco Corporate Treasury Services Plc. 14 01.07.19 814 148 0.03%
1 000 1.125% Teva Pharmaceutical Finance Netherlands II BV 16 15.10.24 959 520 0.04%1 000 1.950% Time Warner, Inc. 15 15.09.23 1 043 835 0.04%1 000 2.250% Total S.A. 15 29.12.49 1 013 620 0.04%
700 3.369% Total S.A. 16 29.12.49 713 580 0.03%1 000 2.000% Transurban Finance Co. Pty Ltd. 15 28.08.25 1 044 435 0.04%
500 6.875% Trionista TopCo GmbH 13 30.04.21 520 280 0.02%1 000 1.250% UBS Group Funding Switzerland AG 16 01.09.26 988 510 0.04%1 500 2.125% UniCredit SpA 16 24.10.26 1 545 802 0.06%2 000 4.375% UniCredit SpA 16 03.01.27 2 116 630 0.09%1 000 5.750% UnipolSai SpA 14 31.12.49 999 490 0.04%1 200 7.875% United Group BV 13 15.11.20 1 249 590 0.05%
500 4.000% Unitymedia Hessen GmbH & Co. KG Via Unitymedia NRW GmbH 14 15.01.25 528 875 0.02%1 250 3.500% Unitymedia Hessen GmbH & Co. KG Via Unitymedia NRW GmbH 15 15.01.27 1 293 731 0.05%
700 6.375% UPC Holding BV 12 15.09.22 731 199 0.03%400 3.875% UPC Holding BV 17 15.06.29 386 686 0.02%400 3.625% UPCB Finance VII Ltd. 17 15.06.29 395 892 0.02%
1 000 3.750% Vale S.A. 12 10.01.23 1 065 530 0.04%350 4.500% Valeant Pharmaceuticals International, Inc. 15 15.05.23 288 615 0.01%700 5.125% Verallia Packaging SASU 15 01.08.22 740 387 0.03%
1 500 0.875% Verizon Communications, Inc. 16 02.04.25 1 435 402 0.06%1 000 2.500% Vesteda Finance BV 15 27.10.22 1 073 110 0.04%1 250 4.500% Virgin Media Finance Plc. 15 15.01.25 1 306 369 0.05%1 200 0.375% Vodafone Group Plc. 17 22.11.21 1 190 934 0.05%
500 0.500% Volkswagen International Finance NV 17 30.03.21 500 253 0.02%1 000 1.125% Volkswagen International Finance NV 17 02.10.23 1 002 200 0.04%
400 1.875% Volkswagen International Finance NV 17 30.03.27 400 038 0.02%1 000 4.625% Volkswagen International Finance NV 14 29.03.49 1 072 255 0.04%
800 3.625% Vonovia Finance BV 13 08.10.21 903 648 0.04%1 000 4.000% Vonovia Finance BV 14 29.12.49 1 078 025 0.04%1 100 4.625% VWR Funding, Inc. 15 15.04.22 1 149 236 0.05%1 500 1.500% Wells Fargo & Co. 15 12.09.22 1 561 447 0.06%
700 3.750% WEPA Hygieneprodukte GmbH 16 15.05.24 730 051 0.03%750 7.000% Wind Acquisition Finance S.A. 14 23.04.21 782 029 0.03%500 8.500% Wittur International Holding GmbH 15 15.02.23 522 835 0.02%
1 000 3.750% Worldpay Finance Plc. 15 15.11.22 1 090 075 0.05%500 5.750% XPO Logistics, Inc. 15 15.06.21 521 663 0.02%
1 000 2.125% Yorkshire Building Society 14 18.03.19 1 034 995 0.04%1 000 1.250% Yorkshire Building Society 15 17.03.22 1 023 265 0.04%
500 2.750% ZF North America Capital Inc. 15 27.04.23 538 013 0.02%
41
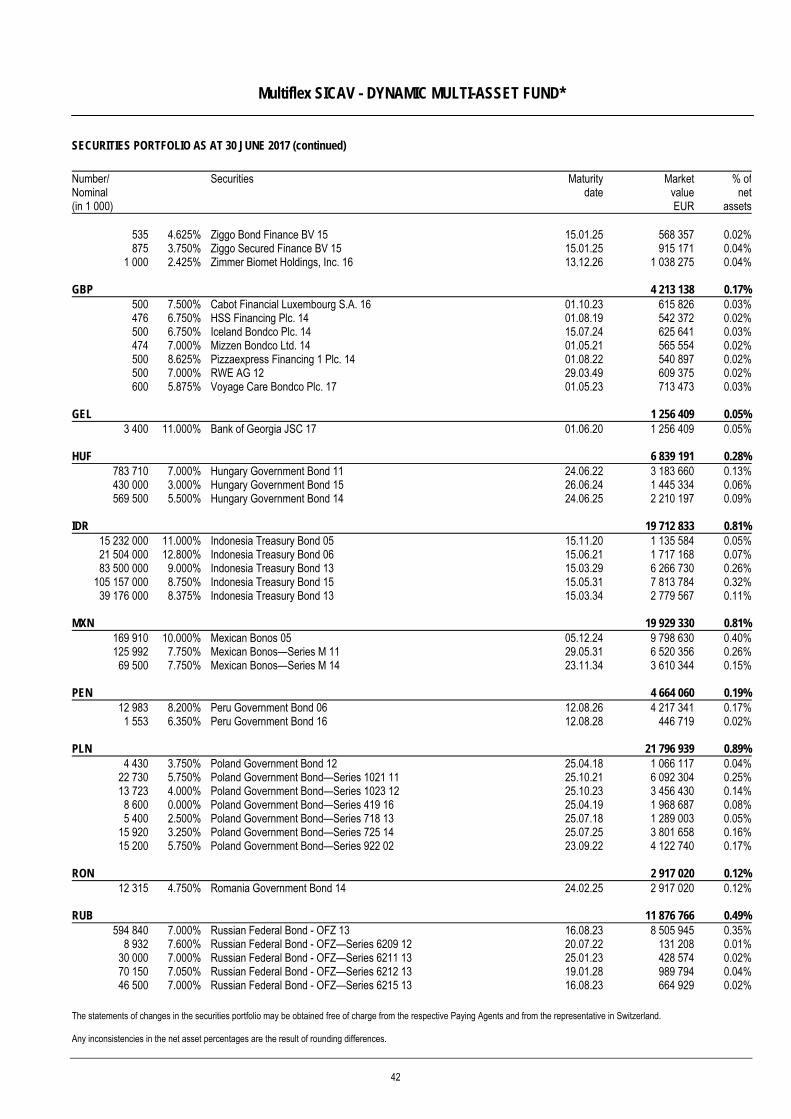
Multiflex SICAV - DYNAMIC MULTI-ASSET FUND*
SECURITIES PORTFOLIO AS AT 30 JUNE 2017 (continued)
The statements of changes in the securities portfolio may be obtained free of charge from the respective Paying Agents and from the representative in Switzerland. Any inconsistencies in the net asset percentages are the result of rounding differences.
Number/ Nominal (in 1 000)
Securities Maturitydate
MarketvalueEUR
% ofnet
assets
535 4.625% Ziggo Bond Finance BV 15 15.01.25 568 357 0.02%875 3.750% Ziggo Secured Finance BV 15 15.01.25 915 171 0.04%
1 000 2.425% Zimmer Biomet Holdings, Inc. 16 13.12.26 1 038 275 0.04%
GBP 4 213 138 0.17%500 7.500% Cabot Financial Luxembourg S.A. 16 01.10.23 615 826 0.03%476 6.750% HSS Financing Plc. 14 01.08.19 542 372 0.02%500 6.750% Iceland Bondco Plc. 14 15.07.24 625 641 0.03%474 7.000% Mizzen Bondco Ltd. 14 01.05.21 565 554 0.02%500 8.625% Pizzaexpress Financing 1 Plc. 14 01.08.22 540 897 0.02%500 7.000% RWE AG 12 29.03.49 609 375 0.02%600 5.875% Voyage Care Bondco Plc. 17 01.05.23 713 473 0.03%
GEL 1 256 409 0.05%3 400 11.000% Bank of Georgia JSC 17 01.06.20 1 256 409 0.05%
HUF 6 839 191 0.28%783 710 7.000% Hungary Government Bond 11 24.06.22 3 183 660 0.13%430 000 3.000% Hungary Government Bond 15 26.06.24 1 445 334 0.06%569 500 5.500% Hungary Government Bond 14 24.06.25 2 210 197 0.09%
IDR 19 712 833 0.81%15 232 000 11.000% Indonesia Treasury Bond 05 15.11.20 1 135 584 0.05%21 504 000 12.800% Indonesia Treasury Bond 06 15.06.21 1 717 168 0.07%83 500 000 9.000% Indonesia Treasury Bond 13 15.03.29 6 266 730 0.26%
105 157 000 8.750% Indonesia Treasury Bond 15 15.05.31 7 813 784 0.32%39 176 000 8.375% Indonesia Treasury Bond 13 15.03.34 2 779 567 0.11%
MXN 19 929 330 0.81%169 910 10.000% Mexican Bonos 05 05.12.24 9 798 630 0.40%125 992 7.750% Mexican Bonos—Series M 11 29.05.31 6 520 356 0.26%
69 500 7.750% Mexican Bonos—Series M 14 23.11.34 3 610 344 0.15%
PEN 4 664 060 0.19%12 983 8.200% Peru Government Bond 06 12.08.26 4 217 341 0.17%1 553 6.350% Peru Government Bond 16 12.08.28 446 719 0.02%
PLN 21 796 939 0.89%4 430 3.750% Poland Government Bond 12 25.04.18 1 066 117 0.04%
22 730 5.750% Poland Government Bond—Series 1021 11 25.10.21 6 092 304 0.25%13 723 4.000% Poland Government Bond—Series 1023 12 25.10.23 3 456 430 0.14%8 600 0.000% Poland Government Bond—Series 419 16 25.04.19 1 968 687 0.08%5 400 2.500% Poland Government Bond—Series 718 13 25.07.18 1 289 003 0.05%
15 920 3.250% Poland Government Bond—Series 725 14 25.07.25 3 801 658 0.16%15 200 5.750% Poland Government Bond—Series 922 02 23.09.22 4 122 740 0.17%
RON 2 917 020 0.12%12 315 4.750% Romania Government Bond 14 24.02.25 2 917 020 0.12%
RUB 11 876 766 0.49%594 840 7.000% Russian Federal Bond - OFZ 13 16.08.23 8 505 945 0.35%
8 932 7.600% Russian Federal Bond - OFZ—Series 6209 12 20.07.22 131 208 0.01%30 000 7.000% Russian Federal Bond - OFZ—Series 6211 13 25.01.23 428 574 0.02%70 150 7.050% Russian Federal Bond - OFZ—Series 6212 13 19.01.28 989 794 0.04%46 500 7.000% Russian Federal Bond - OFZ—Series 6215 13 16.08.23 664 929 0.02%
42
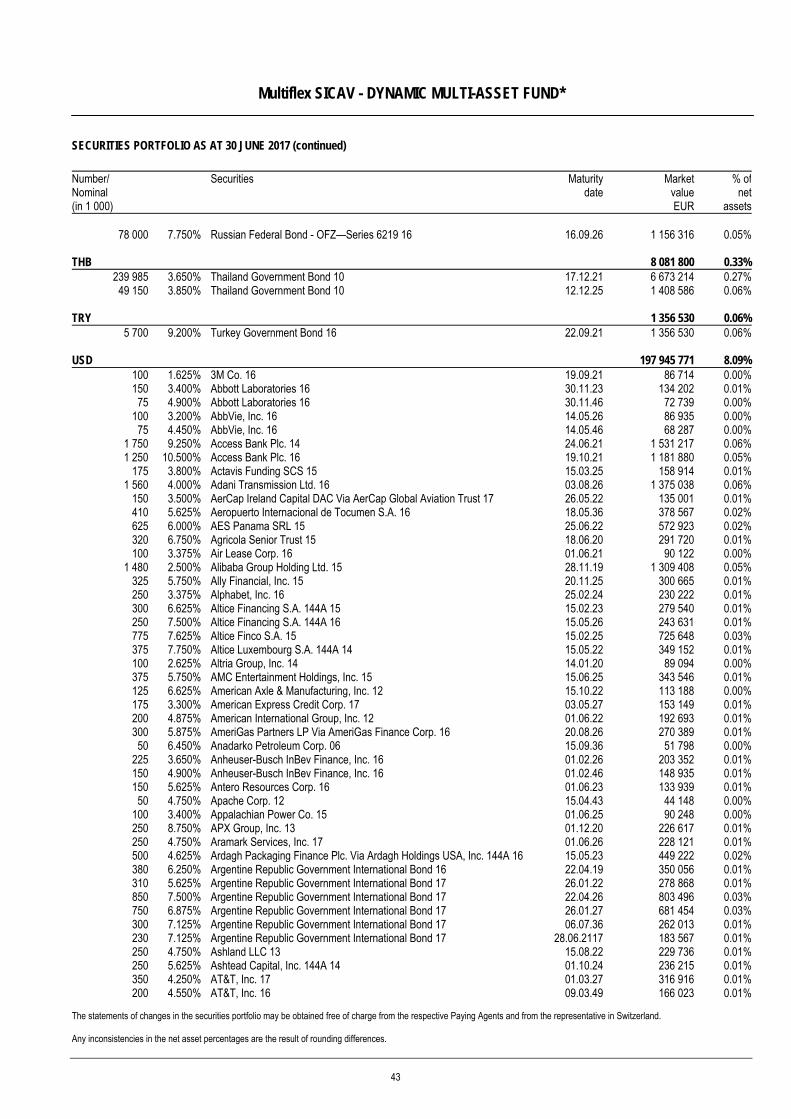
Multiflex SICAV - DYNAMIC MULTI-ASSET FUND*
SECURITIES PORTFOLIO AS AT 30 JUNE 2017 (continued)
The statements of changes in the securities portfolio may be obtained free of charge from the respective Paying Agents and from the representative in Switzerland. Any inconsistencies in the net asset percentages are the result of rounding differences.
Number/ Nominal (in 1 000)
Securities Maturitydate
MarketvalueEUR
% ofnet
assets
78 000 7.750% Russian Federal Bond - OFZ—Series 6219 16 16.09.26 1 156 316 0.05%
THB 8 081 800 0.33%239 985 3.650% Thailand Government Bond 10 17.12.21 6 673 214 0.27%
49 150 3.850% Thailand Government Bond 10 12.12.25 1 408 586 0.06%
TRY 1 356 530 0.06%5 700 9.200% Turkey Government Bond 16 22.09.21 1 356 530 0.06%
USD 197 945 771 8.09%100 1.625% 3M Co. 16 19.09.21 86 714 0.00%150 3.400% Abbott Laboratories 16 30.11.23 134 202 0.01%75 4.900% Abbott Laboratories 16 30.11.46 72 739 0.00%
100 3.200% AbbVie, Inc. 16 14.05.26 86 935 0.00%75 4.450% AbbVie, Inc. 16 14.05.46 68 287 0.00%
1 750 9.250% Access Bank Plc. 14 24.06.21 1 531 217 0.06%1 250 10.500% Access Bank Plc. 16 19.10.21 1 181 880 0.05%
175 3.800% Actavis Funding SCS 15 15.03.25 158 914 0.01%1 560 4.000% Adani Transmission Ltd. 16 03.08.26 1 375 038 0.06%
150 3.500% AerCap Ireland Capital DAC Via AerCap Global Aviation Trust 17 26.05.22 135 001 0.01%410 5.625% Aeropuerto Internacional de Tocumen S.A. 16 18.05.36 378 567 0.02%625 6.000% AES Panama SRL 15 25.06.22 572 923 0.02%320 6.750% Agricola Senior Trust 15 18.06.20 291 720 0.01%100 3.375% Air Lease Corp. 16 01.06.21 90 122 0.00%
1 480 2.500% Alibaba Group Holding Ltd. 15 28.11.19 1 309 408 0.05%325 5.750% Ally Financial, Inc. 15 20.11.25 300 665 0.01%250 3.375% Alphabet, Inc. 16 25.02.24 230 222 0.01%300 6.625% Altice Financing S.A. 144A 15 15.02.23 279 540 0.01%250 7.500% Altice Financing S.A. 144A 16 15.05.26 243 631 0.01%775 7.625% Altice Finco S.A. 15 15.02.25 725 648 0.03%375 7.750% Altice Luxembourg S.A. 144A 14 15.05.22 349 152 0.01%100 2.625% Altria Group, Inc. 14 14.01.20 89 094 0.00%375 5.750% AMC Entertainment Holdings, Inc. 15 15.06.25 343 546 0.01%125 6.625% American Axle & Manufacturing, Inc. 12 15.10.22 113 188 0.00%175 3.300% American Express Credit Corp. 17 03.05.27 153 149 0.01%200 4.875% American International Group, Inc. 12 01.06.22 192 693 0.01%300 5.875% AmeriGas Partners LP Via AmeriGas Finance Corp. 16 20.08.26 270 389 0.01%50 6.450% Anadarko Petroleum Corp. 06 15.09.36 51 798 0.00%
225 3.650% Anheuser-Busch InBev Finance, Inc. 16 01.02.26 203 352 0.01%150 4.900% Anheuser-Busch InBev Finance, Inc. 16 01.02.46 148 935 0.01%150 5.625% Antero Resources Corp. 16 01.06.23 133 939 0.01%50 4.750% Apache Corp. 12 15.04.43 44 148 0.00%
100 3.400% Appalachian Power Co. 15 01.06.25 90 248 0.00%250 8.750% APX Group, Inc. 13 01.12.20 226 617 0.01%250 4.750% Aramark Services, Inc. 17 01.06.26 228 121 0.01%500 4.625% Ardagh Packaging Finance Plc. Via Ardagh Holdings USA, Inc. 144A 16 15.05.23 449 222 0.02%380 6.250% Argentine Republic Government International Bond 16 22.04.19 350 056 0.01%310 5.625% Argentine Republic Government International Bond 17 26.01.22 278 868 0.01%850 7.500% Argentine Republic Government International Bond 17 22.04.26 803 496 0.03%750 6.875% Argentine Republic Government International Bond 17 26.01.27 681 454 0.03%300 7.125% Argentine Republic Government International Bond 17 06.07.36 262 013 0.01%230 7.125% Argentine Republic Government International Bond 17 28.06.2117 183 567 0.01%250 4.750% Ashland LLC 13 15.08.22 229 736 0.01%250 5.625% Ashtead Capital, Inc. 144A 14 01.10.24 236 215 0.01%350 4.250% AT&T, Inc. 17 01.03.27 316 916 0.01%200 4.550% AT&T, Inc. 16 09.03.49 166 023 0.01%
43
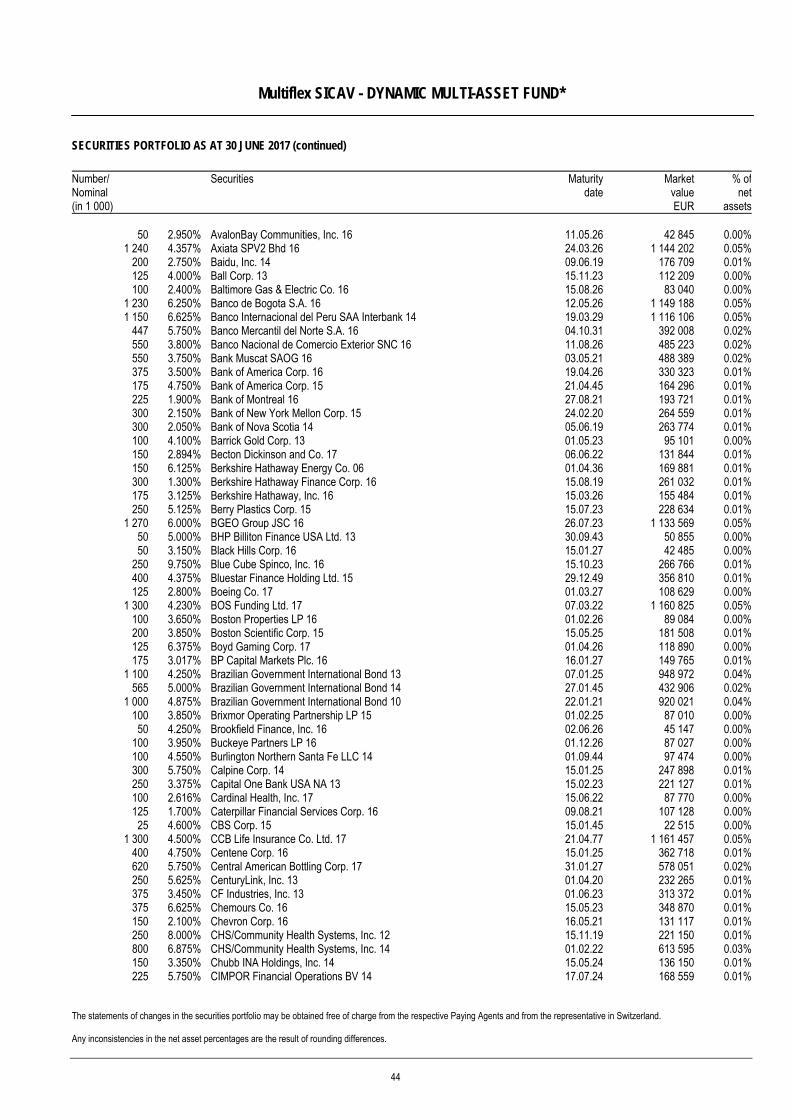
Multiflex SICAV - DYNAMIC MULTI-ASSET FUND*
SECURITIES PORTFOLIO AS AT 30 JUNE 2017 (continued)
The statements of changes in the securities portfolio may be obtained free of charge from the respective Paying Agents and from the representative in Switzerland. Any inconsistencies in the net asset percentages are the result of rounding differences.
Number/ Nominal (in 1 000)
Securities Maturitydate
MarketvalueEUR
% ofnet
assets
50 2.950% AvalonBay Communities, Inc. 16 11.05.26 42 845 0.00%1 240 4.357% Axiata SPV2 Bhd 16 24.03.26 1 144 202 0.05%
200 2.750% Baidu, Inc. 14 09.06.19 176 709 0.01%125 4.000% Ball Corp. 13 15.11.23 112 209 0.00%100 2.400% Baltimore Gas & Electric Co. 16 15.08.26 83 040 0.00%
1 230 6.250% Banco de Bogota S.A. 16 12.05.26 1 149 188 0.05%1 150 6.625% Banco Internacional del Peru SAA Interbank 14 19.03.29 1 116 106 0.05%
447 5.750% Banco Mercantil del Norte S.A. 16 04.10.31 392 008 0.02%550 3.800% Banco Nacional de Comercio Exterior SNC 16 11.08.26 485 223 0.02%550 3.750% Bank Muscat SAOG 16 03.05.21 488 389 0.02%375 3.500% Bank of America Corp. 16 19.04.26 330 323 0.01%175 4.750% Bank of America Corp. 15 21.04.45 164 296 0.01%225 1.900% Bank of Montreal 16 27.08.21 193 721 0.01%300 2.150% Bank of New York Mellon Corp. 15 24.02.20 264 559 0.01%300 2.050% Bank of Nova Scotia 14 05.06.19 263 774 0.01%100 4.100% Barrick Gold Corp. 13 01.05.23 95 101 0.00%150 2.894% Becton Dickinson and Co. 17 06.06.22 131 844 0.01%150 6.125% Berkshire Hathaway Energy Co. 06 01.04.36 169 881 0.01%300 1.300% Berkshire Hathaway Finance Corp. 16 15.08.19 261 032 0.01%175 3.125% Berkshire Hathaway, Inc. 16 15.03.26 155 484 0.01%250 5.125% Berry Plastics Corp. 15 15.07.23 228 634 0.01%
1 270 6.000% BGEO Group JSC 16 26.07.23 1 133 569 0.05%50 5.000% BHP Billiton Finance USA Ltd. 13 30.09.43 50 855 0.00%50 3.150% Black Hills Corp. 16 15.01.27 42 485 0.00%
250 9.750% Blue Cube Spinco, Inc. 16 15.10.23 266 766 0.01%400 4.375% Bluestar Finance Holding Ltd. 15 29.12.49 356 810 0.01%125 2.800% Boeing Co. 17 01.03.27 108 629 0.00%
1 300 4.230% BOS Funding Ltd. 17 07.03.22 1 160 825 0.05%100 3.650% Boston Properties LP 16 01.02.26 89 084 0.00%200 3.850% Boston Scientific Corp. 15 15.05.25 181 508 0.01%125 6.375% Boyd Gaming Corp. 17 01.04.26 118 890 0.00%175 3.017% BP Capital Markets Plc. 16 16.01.27 149 765 0.01%
1 100 4.250% Brazilian Government International Bond 13 07.01.25 948 972 0.04%565 5.000% Brazilian Government International Bond 14 27.01.45 432 906 0.02%
1 000 4.875% Brazilian Government International Bond 10 22.01.21 920 021 0.04%100 3.850% Brixmor Operating Partnership LP 15 01.02.25 87 010 0.00%50 4.250% Brookfield Finance, Inc. 16 02.06.26 45 147 0.00%
100 3.950% Buckeye Partners LP 16 01.12.26 87 027 0.00%100 4.550% Burlington Northern Santa Fe LLC 14 01.09.44 97 474 0.00%300 5.750% Calpine Corp. 14 15.01.25 247 898 0.01%250 3.375% Capital One Bank USA NA 13 15.02.23 221 127 0.01%100 2.616% Cardinal Health, Inc. 17 15.06.22 87 770 0.00%125 1.700% Caterpillar Financial Services Corp. 16 09.08.21 107 128 0.00%25 4.600% CBS Corp. 15 15.01.45 22 515 0.00%
1 300 4.500% CCB Life Insurance Co. Ltd. 17 21.04.77 1 161 457 0.05%400 4.750% Centene Corp. 16 15.01.25 362 718 0.01%620 5.750% Central American Bottling Corp. 17 31.01.27 578 051 0.02%250 5.625% CenturyLink, Inc. 13 01.04.20 232 265 0.01%375 3.450% CF Industries, Inc. 13 01.06.23 313 372 0.01%375 6.625% Chemours Co. 16 15.05.23 348 870 0.01%150 2.100% Chevron Corp. 16 16.05.21 131 117 0.01%250 8.000% CHS/Community Health Systems, Inc. 12 15.11.19 221 150 0.01%800 6.875% CHS/Community Health Systems, Inc. 14 01.02.22 613 595 0.03%150 3.350% Chubb INA Holdings, Inc. 14 15.05.24 136 150 0.01%225 5.750% CIMPOR Financial Operations BV 14 17.07.24 168 559 0.01%
44
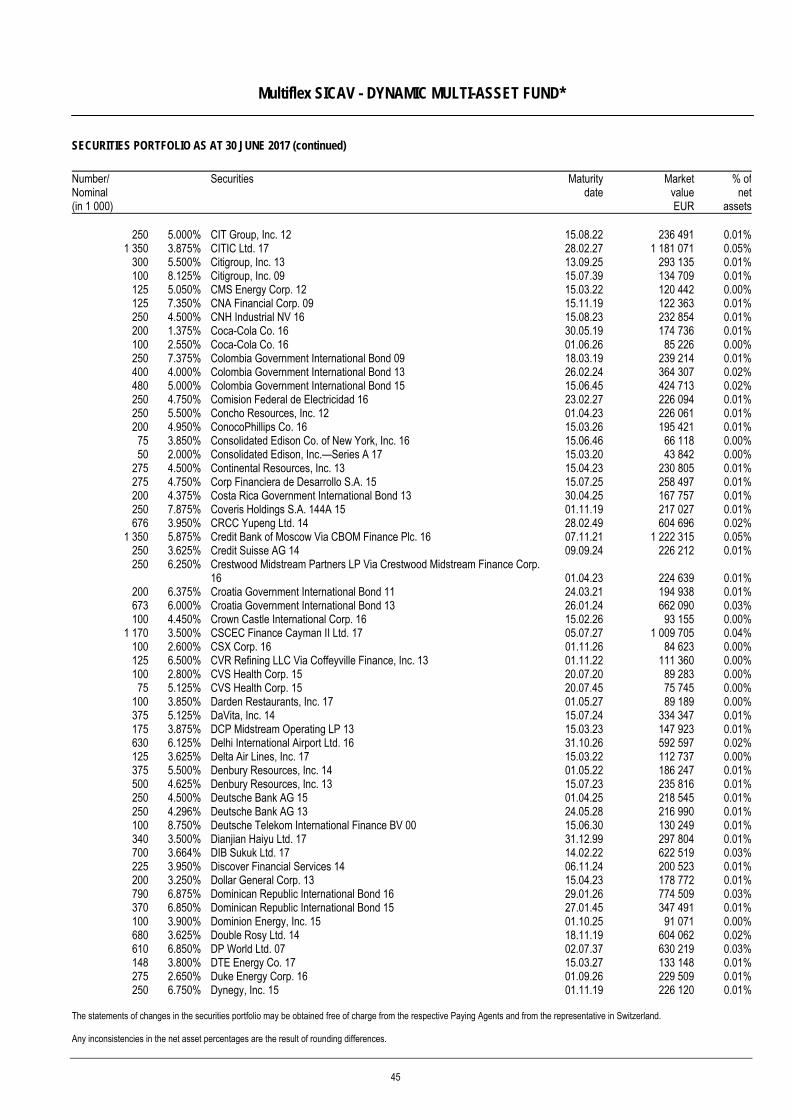
Multiflex SICAV - DYNAMIC MULTI-ASSET FUND*
SECURITIES PORTFOLIO AS AT 30 JUNE 2017 (continued)
The statements of changes in the securities portfolio may be obtained free of charge from the respective Paying Agents and from the representative in Switzerland. Any inconsistencies in the net asset percentages are the result of rounding differences.
Number/ Nominal (in 1 000)
Securities Maturitydate
MarketvalueEUR
% ofnet
assets
250 5.000% CIT Group, Inc. 12 15.08.22 236 491 0.01%1 350 3.875% CITIC Ltd. 17 28.02.27 1 181 071 0.05%
300 5.500% Citigroup, Inc. 13 13.09.25 293 135 0.01%100 8.125% Citigroup, Inc. 09 15.07.39 134 709 0.01%125 5.050% CMS Energy Corp. 12 15.03.22 120 442 0.00%125 7.350% CNA Financial Corp. 09 15.11.19 122 363 0.01%250 4.500% CNH Industrial NV 16 15.08.23 232 854 0.01%200 1.375% Coca-Cola Co. 16 30.05.19 174 736 0.01%100 2.550% Coca-Cola Co. 16 01.06.26 85 226 0.00%250 7.375% Colombia Government International Bond 09 18.03.19 239 214 0.01%400 4.000% Colombia Government International Bond 13 26.02.24 364 307 0.02%480 5.000% Colombia Government International Bond 15 15.06.45 424 713 0.02%250 4.750% Comision Federal de Electricidad 16 23.02.27 226 094 0.01%250 5.500% Concho Resources, Inc. 12 01.04.23 226 061 0.01%200 4.950% ConocoPhillips Co. 16 15.03.26 195 421 0.01%75 3.850% Consolidated Edison Co. of New York, Inc. 16 15.06.46 66 118 0.00%50 2.000% Consolidated Edison, Inc.—Series A 17 15.03.20 43 842 0.00%
275 4.500% Continental Resources, Inc. 13 15.04.23 230 805 0.01%275 4.750% Corp Financiera de Desarrollo S.A. 15 15.07.25 258 497 0.01%200 4.375% Costa Rica Government International Bond 13 30.04.25 167 757 0.01%250 7.875% Coveris Holdings S.A. 144A 15 01.11.19 217 027 0.01%676 3.950% CRCC Yupeng Ltd. 14 28.02.49 604 696 0.02%
1 350 5.875% Credit Bank of Moscow Via CBOM Finance Plc. 16 07.11.21 1 222 315 0.05%250 3.625% Credit Suisse AG 14 09.09.24 226 212 0.01%250 6.250% Crestwood Midstream Partners LP Via Crestwood Midstream Finance Corp.
16 01.04.23 224 639 0.01%200 6.375% Croatia Government International Bond 11 24.03.21 194 938 0.01%673 6.000% Croatia Government International Bond 13 26.01.24 662 090 0.03%100 4.450% Crown Castle International Corp. 16 15.02.26 93 155 0.00%
1 170 3.500% CSCEC Finance Cayman II Ltd. 17 05.07.27 1 009 705 0.04%100 2.600% CSX Corp. 16 01.11.26 84 623 0.00%125 6.500% CVR Refining LLC Via Coffeyville Finance, Inc. 13 01.11.22 111 360 0.00%100 2.800% CVS Health Corp. 15 20.07.20 89 283 0.00%75 5.125% CVS Health Corp. 15 20.07.45 75 745 0.00%
100 3.850% Darden Restaurants, Inc. 17 01.05.27 89 189 0.00%375 5.125% DaVita, Inc. 14 15.07.24 334 347 0.01%175 3.875% DCP Midstream Operating LP 13 15.03.23 147 923 0.01%630 6.125% Delhi International Airport Ltd. 16 31.10.26 592 597 0.02%125 3.625% Delta Air Lines, Inc. 17 15.03.22 112 737 0.00%375 5.500% Denbury Resources, Inc. 14 01.05.22 186 247 0.01%500 4.625% Denbury Resources, Inc. 13 15.07.23 235 816 0.01%250 4.500% Deutsche Bank AG 15 01.04.25 218 545 0.01%250 4.296% Deutsche Bank AG 13 24.05.28 216 990 0.01%100 8.750% Deutsche Telekom International Finance BV 00 15.06.30 130 249 0.01%340 3.500% Dianjian Haiyu Ltd. 17 31.12.99 297 804 0.01%700 3.664% DIB Sukuk Ltd. 17 14.02.22 622 519 0.03%225 3.950% Discover Financial Services 14 06.11.24 200 523 0.01%200 3.250% Dollar General Corp. 13 15.04.23 178 772 0.01%790 6.875% Dominican Republic International Bond 16 29.01.26 774 509 0.03%370 6.850% Dominican Republic International Bond 15 27.01.45 347 491 0.01%100 3.900% Dominion Energy, Inc. 15 01.10.25 91 071 0.00%680 3.625% Double Rosy Ltd. 14 18.11.19 604 062 0.02%610 6.850% DP World Ltd. 07 02.07.37 630 219 0.03%148 3.800% DTE Energy Co. 17 15.03.27 133 148 0.01%275 2.650% Duke Energy Corp. 16 01.09.26 229 509 0.01%250 6.750% Dynegy, Inc. 15 01.11.19 226 120 0.01%
45
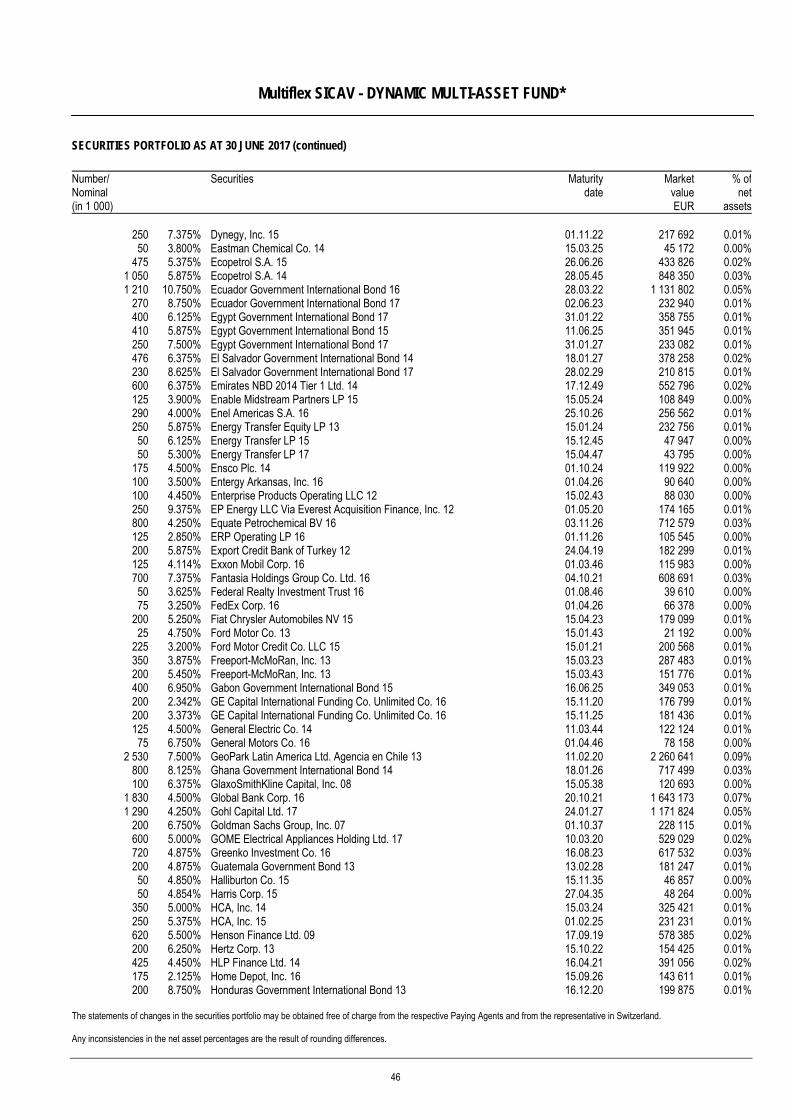
Multiflex SICAV - DYNAMIC MULTI-ASSET FUND*
SECURITIES PORTFOLIO AS AT 30 JUNE 2017 (continued)
The statements of changes in the securities portfolio may be obtained free of charge from the respective Paying Agents and from the representative in Switzerland. Any inconsistencies in the net asset percentages are the result of rounding differences.
Number/ Nominal (in 1 000)
Securities Maturitydate
MarketvalueEUR
% ofnet
assets
250 7.375% Dynegy, Inc. 15 01.11.22 217 692 0.01%50 3.800% Eastman Chemical Co. 14 15.03.25 45 172 0.00%
475 5.375% Ecopetrol S.A. 15 26.06.26 433 826 0.02%1 050 5.875% Ecopetrol S.A. 14 28.05.45 848 350 0.03%1 210 10.750% Ecuador Government International Bond 16 28.03.22 1 131 802 0.05%
270 8.750% Ecuador Government International Bond 17 02.06.23 232 940 0.01%400 6.125% Egypt Government International Bond 17 31.01.22 358 755 0.01%410 5.875% Egypt Government International Bond 15 11.06.25 351 945 0.01%250 7.500% Egypt Government International Bond 17 31.01.27 233 082 0.01%476 6.375% El Salvador Government International Bond 14 18.01.27 378 258 0.02%230 8.625% El Salvador Government International Bond 17 28.02.29 210 815 0.01%600 6.375% Emirates NBD 2014 Tier 1 Ltd. 14 17.12.49 552 796 0.02%125 3.900% Enable Midstream Partners LP 15 15.05.24 108 849 0.00%290 4.000% Enel Americas S.A. 16 25.10.26 256 562 0.01%250 5.875% Energy Transfer Equity LP 13 15.01.24 232 756 0.01%50 6.125% Energy Transfer LP 15 15.12.45 47 947 0.00%50 5.300% Energy Transfer LP 17 15.04.47 43 795 0.00%
175 4.500% Ensco Plc. 14 01.10.24 119 922 0.00%100 3.500% Entergy Arkansas, Inc. 16 01.04.26 90 640 0.00%100 4.450% Enterprise Products Operating LLC 12 15.02.43 88 030 0.00%250 9.375% EP Energy LLC Via Everest Acquisition Finance, Inc. 12 01.05.20 174 165 0.01%800 4.250% Equate Petrochemical BV 16 03.11.26 712 579 0.03%125 2.850% ERP Operating LP 16 01.11.26 105 545 0.00%200 5.875% Export Credit Bank of Turkey 12 24.04.19 182 299 0.01%125 4.114% Exxon Mobil Corp. 16 01.03.46 115 983 0.00%700 7.375% Fantasia Holdings Group Co. Ltd. 16 04.10.21 608 691 0.03%50 3.625% Federal Realty Investment Trust 16 01.08.46 39 610 0.00%75 3.250% FedEx Corp. 16 01.04.26 66 378 0.00%
200 5.250% Fiat Chrysler Automobiles NV 15 15.04.23 179 099 0.01%25 4.750% Ford Motor Co. 13 15.01.43 21 192 0.00%
225 3.200% Ford Motor Credit Co. LLC 15 15.01.21 200 568 0.01%350 3.875% Freeport-McMoRan, Inc. 13 15.03.23 287 483 0.01%200 5.450% Freeport-McMoRan, Inc. 13 15.03.43 151 776 0.01%400 6.950% Gabon Government International Bond 15 16.06.25 349 053 0.01%200 2.342% GE Capital International Funding Co. Unlimited Co. 16 15.11.20 176 799 0.01%200 3.373% GE Capital International Funding Co. Unlimited Co. 16 15.11.25 181 436 0.01%125 4.500% General Electric Co. 14 11.03.44 122 124 0.01%75 6.750% General Motors Co. 16 01.04.46 78 158 0.00%
2 530 7.500% GeoPark Latin America Ltd. Agencia en Chile 13 11.02.20 2 260 641 0.09%800 8.125% Ghana Government International Bond 14 18.01.26 717 499 0.03%100 6.375% GlaxoSmithKline Capital, Inc. 08 15.05.38 120 693 0.00%
1 830 4.500% Global Bank Corp. 16 20.10.21 1 643 173 0.07%1 290 4.250% Gohl Capital Ltd. 17 24.01.27 1 171 824 0.05%
200 6.750% Goldman Sachs Group, Inc. 07 01.10.37 228 115 0.01%600 5.000% GOME Electrical Appliances Holding Ltd. 17 10.03.20 529 029 0.02%720 4.875% Greenko Investment Co. 16 16.08.23 617 532 0.03%200 4.875% Guatemala Government Bond 13 13.02.28 181 247 0.01%50 4.850% Halliburton Co. 15 15.11.35 46 857 0.00%50 4.854% Harris Corp. 15 27.04.35 48 264 0.00%
350 5.000% HCA, Inc. 14 15.03.24 325 421 0.01%250 5.375% HCA, Inc. 15 01.02.25 231 231 0.01%620 5.500% Henson Finance Ltd. 09 17.09.19 578 385 0.02%200 6.250% Hertz Corp. 13 15.10.22 154 425 0.01%425 4.450% HLP Finance Ltd. 14 16.04.21 391 056 0.02%175 2.125% Home Depot, Inc. 16 15.09.26 143 611 0.01%200 8.750% Honduras Government International Bond 13 16.12.20 199 875 0.01%
46
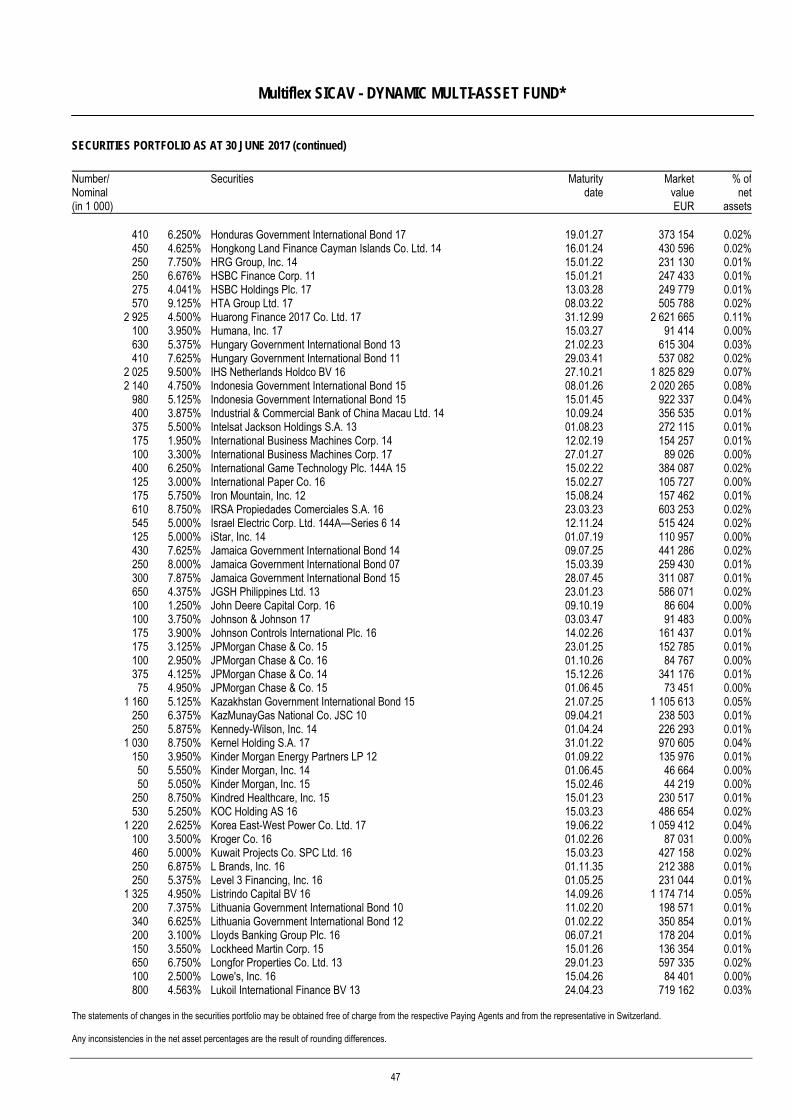
Multiflex SICAV - DYNAMIC MULTI-ASSET FUND*
SECURITIES PORTFOLIO AS AT 30 JUNE 2017 (continued)
The statements of changes in the securities portfolio may be obtained free of charge from the respective Paying Agents and from the representative in Switzerland. Any inconsistencies in the net asset percentages are the result of rounding differences.
Number/ Nominal (in 1 000)
Securities Maturitydate
MarketvalueEUR
% ofnet
assets
410 6.250% Honduras Government International Bond 17 19.01.27 373 154 0.02%450 4.625% Hongkong Land Finance Cayman Islands Co. Ltd. 14 16.01.24 430 596 0.02%250 7.750% HRG Group, Inc. 14 15.01.22 231 130 0.01%250 6.676% HSBC Finance Corp. 11 15.01.21 247 433 0.01%275 4.041% HSBC Holdings Plc. 17 13.03.28 249 779 0.01%570 9.125% HTA Group Ltd. 17 08.03.22 505 788 0.02%
2 925 4.500% Huarong Finance 2017 Co. Ltd. 17 31.12.99 2 621 665 0.11%100 3.950% Humana, Inc. 17 15.03.27 91 414 0.00%630 5.375% Hungary Government International Bond 13 21.02.23 615 304 0.03%410 7.625% Hungary Government International Bond 11 29.03.41 537 082 0.02%
2 025 9.500% IHS Netherlands Holdco BV 16 27.10.21 1 825 829 0.07%2 140 4.750% Indonesia Government International Bond 15 08.01.26 2 020 265 0.08%
980 5.125% Indonesia Government International Bond 15 15.01.45 922 337 0.04%400 3.875% Industrial & Commercial Bank of China Macau Ltd. 14 10.09.24 356 535 0.01%375 5.500% Intelsat Jackson Holdings S.A. 13 01.08.23 272 115 0.01%175 1.950% International Business Machines Corp. 14 12.02.19 154 257 0.01%100 3.300% International Business Machines Corp. 17 27.01.27 89 026 0.00%400 6.250% International Game Technology Plc. 144A 15 15.02.22 384 087 0.02%125 3.000% International Paper Co. 16 15.02.27 105 727 0.00%175 5.750% Iron Mountain, Inc. 12 15.08.24 157 462 0.01%610 8.750% IRSA Propiedades Comerciales S.A. 16 23.03.23 603 253 0.02%545 5.000% Israel Electric Corp. Ltd. 144A—Series 6 14 12.11.24 515 424 0.02%125 5.000% iStar, Inc. 14 01.07.19 110 957 0.00%430 7.625% Jamaica Government International Bond 14 09.07.25 441 286 0.02%250 8.000% Jamaica Government International Bond 07 15.03.39 259 430 0.01%300 7.875% Jamaica Government International Bond 15 28.07.45 311 087 0.01%650 4.375% JGSH Philippines Ltd. 13 23.01.23 586 071 0.02%100 1.250% John Deere Capital Corp. 16 09.10.19 86 604 0.00%100 3.750% Johnson & Johnson 17 03.03.47 91 483 0.00%175 3.900% Johnson Controls International Plc. 16 14.02.26 161 437 0.01%175 3.125% JPMorgan Chase & Co. 15 23.01.25 152 785 0.01%100 2.950% JPMorgan Chase & Co. 16 01.10.26 84 767 0.00%375 4.125% JPMorgan Chase & Co. 14 15.12.26 341 176 0.01%75 4.950% JPMorgan Chase & Co. 15 01.06.45 73 451 0.00%
1 160 5.125% Kazakhstan Government International Bond 15 21.07.25 1 105 613 0.05%250 6.375% KazMunayGas National Co. JSC 10 09.04.21 238 503 0.01%250 5.875% Kennedy-Wilson, Inc. 14 01.04.24 226 293 0.01%
1 030 8.750% Kernel Holding S.A. 17 31.01.22 970 605 0.04%150 3.950% Kinder Morgan Energy Partners LP 12 01.09.22 135 976 0.01%50 5.550% Kinder Morgan, Inc. 14 01.06.45 46 664 0.00%50 5.050% Kinder Morgan, Inc. 15 15.02.46 44 219 0.00%
250 8.750% Kindred Healthcare, Inc. 15 15.01.23 230 517 0.01%530 5.250% KOC Holding AS 16 15.03.23 486 654 0.02%
1 220 2.625% Korea East-West Power Co. Ltd. 17 19.06.22 1 059 412 0.04%100 3.500% Kroger Co. 16 01.02.26 87 031 0.00%460 5.000% Kuwait Projects Co. SPC Ltd. 16 15.03.23 427 158 0.02%250 6.875% L Brands, Inc. 16 01.11.35 212 388 0.01%250 5.375% Level 3 Financing, Inc. 16 01.05.25 231 044 0.01%
1 325 4.950% Listrindo Capital BV 16 14.09.26 1 174 714 0.05%200 7.375% Lithuania Government International Bond 10 11.02.20 198 571 0.01%340 6.625% Lithuania Government International Bond 12 01.02.22 350 854 0.01%200 3.100% Lloyds Banking Group Plc. 16 06.07.21 178 204 0.01%150 3.550% Lockheed Martin Corp. 15 15.01.26 136 354 0.01%650 6.750% Longfor Properties Co. Ltd. 13 29.01.23 597 335 0.02%100 2.500% Lowe's, Inc. 16 15.04.26 84 401 0.00%800 4.563% Lukoil International Finance BV 13 24.04.23 719 162 0.03%
47
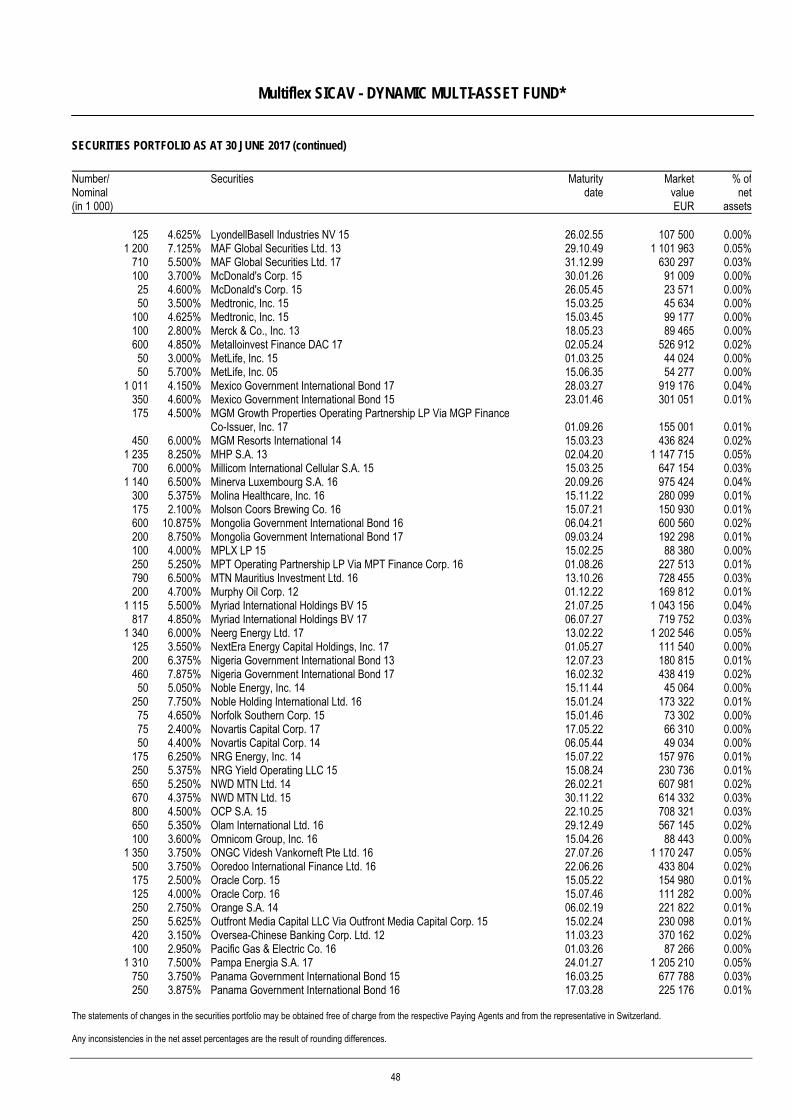
Multiflex SICAV - DYNAMIC MULTI-ASSET FUND*
SECURITIES PORTFOLIO AS AT 30 JUNE 2017 (continued)
The statements of changes in the securities portfolio may be obtained free of charge from the respective Paying Agents and from the representative in Switzerland. Any inconsistencies in the net asset percentages are the result of rounding differences.
Number/ Nominal (in 1 000)
Securities Maturitydate
MarketvalueEUR
% ofnet
assets
125 4.625% LyondellBasell Industries NV 15 26.02.55 107 500 0.00%1 200 7.125% MAF Global Securities Ltd. 13 29.10.49 1 101 963 0.05%
710 5.500% MAF Global Securities Ltd. 17 31.12.99 630 297 0.03%100 3.700% McDonald's Corp. 15 30.01.26 91 009 0.00%25 4.600% McDonald's Corp. 15 26.05.45 23 571 0.00%50 3.500% Medtronic, Inc. 15 15.03.25 45 634 0.00%
100 4.625% Medtronic, Inc. 15 15.03.45 99 177 0.00%100 2.800% Merck & Co., Inc. 13 18.05.23 89 465 0.00%600 4.850% Metalloinvest Finance DAC 17 02.05.24 526 912 0.02%50 3.000% MetLife, Inc. 15 01.03.25 44 024 0.00%50 5.700% MetLife, Inc. 05 15.06.35 54 277 0.00%
1 011 4.150% Mexico Government International Bond 17 28.03.27 919 176 0.04%350 4.600% Mexico Government International Bond 15 23.01.46 301 051 0.01%175 4.500% MGM Growth Properties Operating Partnership LP Via MGP Finance
Co-Issuer, Inc. 17 01.09.26 155 001 0.01%450 6.000% MGM Resorts International 14 15.03.23 436 824 0.02%
1 235 8.250% MHP S.A. 13 02.04.20 1 147 715 0.05%700 6.000% Millicom International Cellular S.A. 15 15.03.25 647 154 0.03%
1 140 6.500% Minerva Luxembourg S.A. 16 20.09.26 975 424 0.04%300 5.375% Molina Healthcare, Inc. 16 15.11.22 280 099 0.01%175 2.100% Molson Coors Brewing Co. 16 15.07.21 150 930 0.01%600 10.875% Mongolia Government International Bond 16 06.04.21 600 560 0.02%200 8.750% Mongolia Government International Bond 17 09.03.24 192 298 0.01%100 4.000% MPLX LP 15 15.02.25 88 380 0.00%250 5.250% MPT Operating Partnership LP Via MPT Finance Corp. 16 01.08.26 227 513 0.01%790 6.500% MTN Mauritius Investment Ltd. 16 13.10.26 728 455 0.03%200 4.700% Murphy Oil Corp. 12 01.12.22 169 812 0.01%
1 115 5.500% Myriad International Holdings BV 15 21.07.25 1 043 156 0.04%817 4.850% Myriad International Holdings BV 17 06.07.27 719 752 0.03%
1 340 6.000% Neerg Energy Ltd. 17 13.02.22 1 202 546 0.05%125 3.550% NextEra Energy Capital Holdings, Inc. 17 01.05.27 111 540 0.00%200 6.375% Nigeria Government International Bond 13 12.07.23 180 815 0.01%460 7.875% Nigeria Government International Bond 17 16.02.32 438 419 0.02%50 5.050% Noble Energy, Inc. 14 15.11.44 45 064 0.00%
250 7.750% Noble Holding International Ltd. 16 15.01.24 173 322 0.01%75 4.650% Norfolk Southern Corp. 15 15.01.46 73 302 0.00%75 2.400% Novartis Capital Corp. 17 17.05.22 66 310 0.00%50 4.400% Novartis Capital Corp. 14 06.05.44 49 034 0.00%
175 6.250% NRG Energy, Inc. 14 15.07.22 157 976 0.01%250 5.375% NRG Yield Operating LLC 15 15.08.24 230 736 0.01%650 5.250% NWD MTN Ltd. 14 26.02.21 607 981 0.02%670 4.375% NWD MTN Ltd. 15 30.11.22 614 332 0.03%800 4.500% OCP S.A. 15 22.10.25 708 321 0.03%650 5.350% Olam International Ltd. 16 29.12.49 567 145 0.02%100 3.600% Omnicom Group, Inc. 16 15.04.26 88 443 0.00%
1 350 3.750% ONGC Videsh Vankorneft Pte Ltd. 16 27.07.26 1 170 247 0.05%500 3.750% Ooredoo International Finance Ltd. 16 22.06.26 433 804 0.02%175 2.500% Oracle Corp. 15 15.05.22 154 980 0.01%125 4.000% Oracle Corp. 16 15.07.46 111 282 0.00%250 2.750% Orange S.A. 14 06.02.19 221 822 0.01%250 5.625% Outfront Media Capital LLC Via Outfront Media Capital Corp. 15 15.02.24 230 098 0.01%420 3.150% Oversea-Chinese Banking Corp. Ltd. 12 11.03.23 370 162 0.02%100 2.950% Pacific Gas & Electric Co. 16 01.03.26 87 266 0.00%
1 310 7.500% Pampa Energia S.A. 17 24.01.27 1 205 210 0.05%750 3.750% Panama Government International Bond 15 16.03.25 677 788 0.03%250 3.875% Panama Government International Bond 16 17.03.28 225 176 0.01%
48
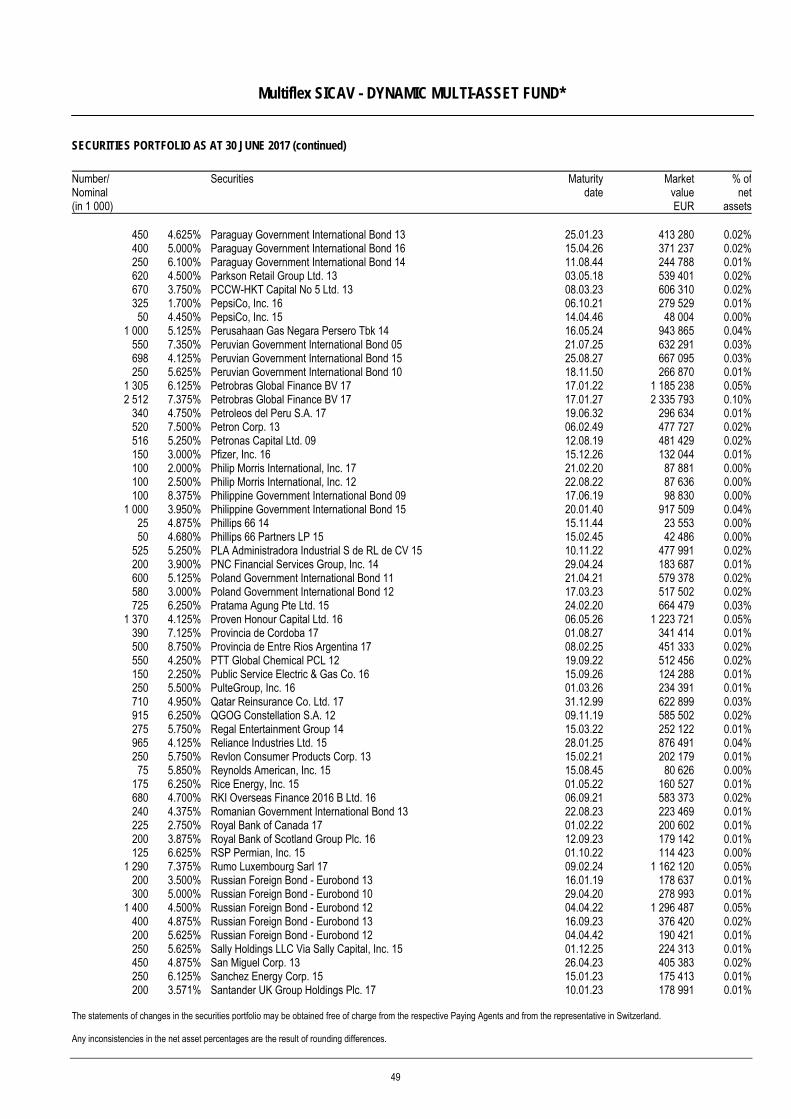
Multiflex SICAV - DYNAMIC MULTI-ASSET FUND*
SECURITIES PORTFOLIO AS AT 30 JUNE 2017 (continued)
The statements of changes in the securities portfolio may be obtained free of charge from the respective Paying Agents and from the representative in Switzerland. Any inconsistencies in the net asset percentages are the result of rounding differences.
Number/ Nominal (in 1 000)
Securities Maturitydate
MarketvalueEUR
% ofnet
assets
450 4.625% Paraguay Government International Bond 13 25.01.23 413 280 0.02%400 5.000% Paraguay Government International Bond 16 15.04.26 371 237 0.02%250 6.100% Paraguay Government International Bond 14 11.08.44 244 788 0.01%620 4.500% Parkson Retail Group Ltd. 13 03.05.18 539 401 0.02%670 3.750% PCCW-HKT Capital No 5 Ltd. 13 08.03.23 606 310 0.02%325 1.700% PepsiCo, Inc. 16 06.10.21 279 529 0.01%50 4.450% PepsiCo, Inc. 15 14.04.46 48 004 0.00%
1 000 5.125% Perusahaan Gas Negara Persero Tbk 14 16.05.24 943 865 0.04%550 7.350% Peruvian Government International Bond 05 21.07.25 632 291 0.03%698 4.125% Peruvian Government International Bond 15 25.08.27 667 095 0.03%250 5.625% Peruvian Government International Bond 10 18.11.50 266 870 0.01%
1 305 6.125% Petrobras Global Finance BV 17 17.01.22 1 185 238 0.05%2 512 7.375% Petrobras Global Finance BV 17 17.01.27 2 335 793 0.10%
340 4.750% Petroleos del Peru S.A. 17 19.06.32 296 634 0.01%520 7.500% Petron Corp. 13 06.02.49 477 727 0.02%516 5.250% Petronas Capital Ltd. 09 12.08.19 481 429 0.02%150 3.000% Pfizer, Inc. 16 15.12.26 132 044 0.01%100 2.000% Philip Morris International, Inc. 17 21.02.20 87 881 0.00%100 2.500% Philip Morris International, Inc. 12 22.08.22 87 636 0.00%100 8.375% Philippine Government International Bond 09 17.06.19 98 830 0.00%
1 000 3.950% Philippine Government International Bond 15 20.01.40 917 509 0.04%25 4.875% Phillips 66 14 15.11.44 23 553 0.00%50 4.680% Phillips 66 Partners LP 15 15.02.45 42 486 0.00%
525 5.250% PLA Administradora Industrial S de RL de CV 15 10.11.22 477 991 0.02%200 3.900% PNC Financial Services Group, Inc. 14 29.04.24 183 687 0.01%600 5.125% Poland Government International Bond 11 21.04.21 579 378 0.02%580 3.000% Poland Government International Bond 12 17.03.23 517 502 0.02%725 6.250% Pratama Agung Pte Ltd. 15 24.02.20 664 479 0.03%
1 370 4.125% Proven Honour Capital Ltd. 16 06.05.26 1 223 721 0.05%390 7.125% Provincia de Cordoba 17 01.08.27 341 414 0.01%500 8.750% Provincia de Entre Rios Argentina 17 08.02.25 451 333 0.02%550 4.250% PTT Global Chemical PCL 12 19.09.22 512 456 0.02%150 2.250% Public Service Electric & Gas Co. 16 15.09.26 124 288 0.01%250 5.500% PulteGroup, Inc. 16 01.03.26 234 391 0.01%710 4.950% Qatar Reinsurance Co. Ltd. 17 31.12.99 622 899 0.03%915 6.250% QGOG Constellation S.A. 12 09.11.19 585 502 0.02%275 5.750% Regal Entertainment Group 14 15.03.22 252 122 0.01%965 4.125% Reliance Industries Ltd. 15 28.01.25 876 491 0.04%250 5.750% Revlon Consumer Products Corp. 13 15.02.21 202 179 0.01%75 5.850% Reynolds American, Inc. 15 15.08.45 80 626 0.00%
175 6.250% Rice Energy, Inc. 15 01.05.22 160 527 0.01%680 4.700% RKI Overseas Finance 2016 B Ltd. 16 06.09.21 583 373 0.02%240 4.375% Romanian Government International Bond 13 22.08.23 223 469 0.01%225 2.750% Royal Bank of Canada 17 01.02.22 200 602 0.01%200 3.875% Royal Bank of Scotland Group Plc. 16 12.09.23 179 142 0.01%125 6.625% RSP Permian, Inc. 15 01.10.22 114 423 0.00%
1 290 7.375% Rumo Luxembourg Sarl 17 09.02.24 1 162 120 0.05%200 3.500% Russian Foreign Bond - Eurobond 13 16.01.19 178 637 0.01%300 5.000% Russian Foreign Bond - Eurobond 10 29.04.20 278 993 0.01%
1 400 4.500% Russian Foreign Bond - Eurobond 12 04.04.22 1 296 487 0.05%400 4.875% Russian Foreign Bond - Eurobond 13 16.09.23 376 420 0.02%200 5.625% Russian Foreign Bond - Eurobond 12 04.04.42 190 421 0.01%250 5.625% Sally Holdings LLC Via Sally Capital, Inc. 15 01.12.25 224 313 0.01%450 4.875% San Miguel Corp. 13 26.04.23 405 383 0.02%250 6.125% Sanchez Energy Corp. 15 15.01.23 175 413 0.01%200 3.571% Santander UK Group Holdings Plc. 17 10.01.23 178 991 0.01%
49
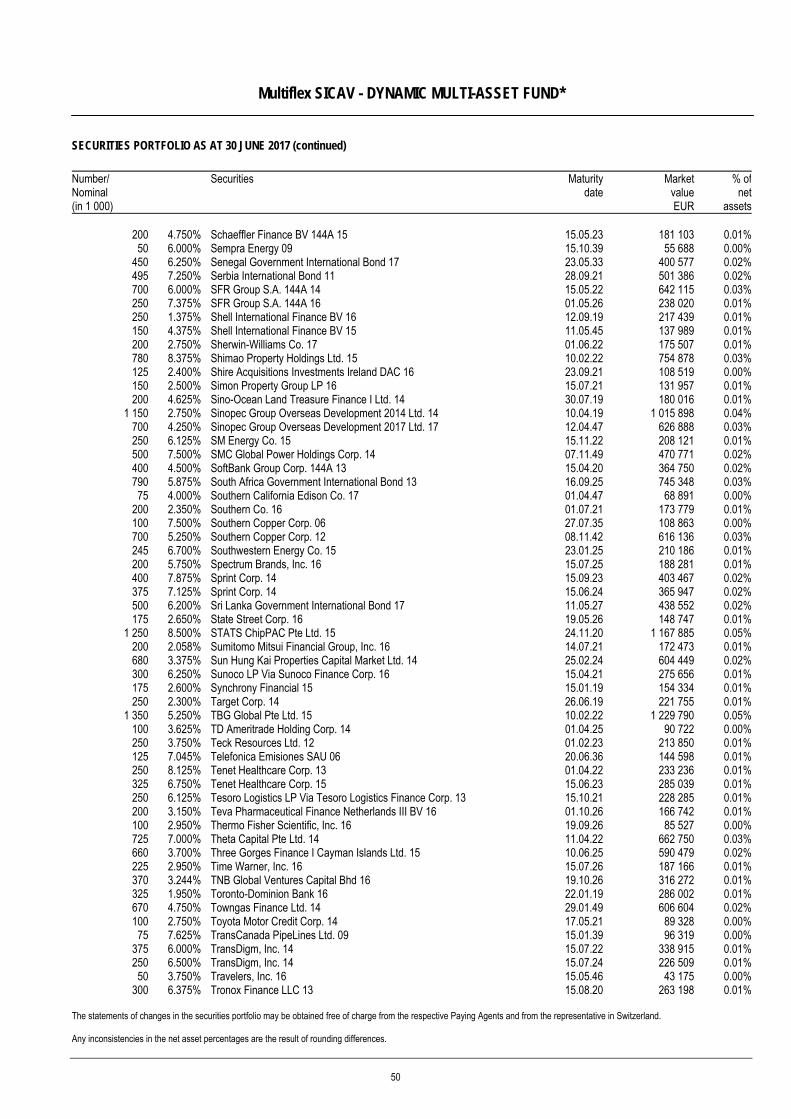
Multiflex SICAV - DYNAMIC MULTI-ASSET FUND*
SECURITIES PORTFOLIO AS AT 30 JUNE 2017 (continued)
The statements of changes in the securities portfolio may be obtained free of charge from the respective Paying Agents and from the representative in Switzerland. Any inconsistencies in the net asset percentages are the result of rounding differences.
Number/ Nominal (in 1 000)
Securities Maturitydate
MarketvalueEUR
% ofnet
assets
200 4.750% Schaeffler Finance BV 144A 15 15.05.23 181 103 0.01%50 6.000% Sempra Energy 09 15.10.39 55 688 0.00%
450 6.250% Senegal Government International Bond 17 23.05.33 400 577 0.02%495 7.250% Serbia International Bond 11 28.09.21 501 386 0.02%700 6.000% SFR Group S.A. 144A 14 15.05.22 642 115 0.03%250 7.375% SFR Group S.A. 144A 16 01.05.26 238 020 0.01%250 1.375% Shell International Finance BV 16 12.09.19 217 439 0.01%150 4.375% Shell International Finance BV 15 11.05.45 137 989 0.01%200 2.750% Sherwin-Williams Co. 17 01.06.22 175 507 0.01%780 8.375% Shimao Property Holdings Ltd. 15 10.02.22 754 878 0.03%125 2.400% Shire Acquisitions Investments Ireland DAC 16 23.09.21 108 519 0.00%150 2.500% Simon Property Group LP 16 15.07.21 131 957 0.01%200 4.625% Sino-Ocean Land Treasure Finance I Ltd. 14 30.07.19 180 016 0.01%
1 150 2.750% Sinopec Group Overseas Development 2014 Ltd. 14 10.04.19 1 015 898 0.04%700 4.250% Sinopec Group Overseas Development 2017 Ltd. 17 12.04.47 626 888 0.03%250 6.125% SM Energy Co. 15 15.11.22 208 121 0.01%500 7.500% SMC Global Power Holdings Corp. 14 07.11.49 470 771 0.02%400 4.500% SoftBank Group Corp. 144A 13 15.04.20 364 750 0.02%790 5.875% South Africa Government International Bond 13 16.09.25 745 348 0.03%75 4.000% Southern California Edison Co. 17 01.04.47 68 891 0.00%
200 2.350% Southern Co. 16 01.07.21 173 779 0.01%100 7.500% Southern Copper Corp. 06 27.07.35 108 863 0.00%700 5.250% Southern Copper Corp. 12 08.11.42 616 136 0.03%245 6.700% Southwestern Energy Co. 15 23.01.25 210 186 0.01%200 5.750% Spectrum Brands, Inc. 16 15.07.25 188 281 0.01%400 7.875% Sprint Corp. 14 15.09.23 403 467 0.02%375 7.125% Sprint Corp. 14 15.06.24 365 947 0.02%500 6.200% Sri Lanka Government International Bond 17 11.05.27 438 552 0.02%175 2.650% State Street Corp. 16 19.05.26 148 747 0.01%
1 250 8.500% STATS ChipPAC Pte Ltd. 15 24.11.20 1 167 885 0.05%200 2.058% Sumitomo Mitsui Financial Group, Inc. 16 14.07.21 172 473 0.01%680 3.375% Sun Hung Kai Properties Capital Market Ltd. 14 25.02.24 604 449 0.02%300 6.250% Sunoco LP Via Sunoco Finance Corp. 16 15.04.21 275 656 0.01%175 2.600% Synchrony Financial 15 15.01.19 154 334 0.01%250 2.300% Target Corp. 14 26.06.19 221 755 0.01%
1 350 5.250% TBG Global Pte Ltd. 15 10.02.22 1 229 790 0.05%100 3.625% TD Ameritrade Holding Corp. 14 01.04.25 90 722 0.00%250 3.750% Teck Resources Ltd. 12 01.02.23 213 850 0.01%125 7.045% Telefonica Emisiones SAU 06 20.06.36 144 598 0.01%250 8.125% Tenet Healthcare Corp. 13 01.04.22 233 236 0.01%325 6.750% Tenet Healthcare Corp. 15 15.06.23 285 039 0.01%250 6.125% Tesoro Logistics LP Via Tesoro Logistics Finance Corp. 13 15.10.21 228 285 0.01%200 3.150% Teva Pharmaceutical Finance Netherlands III BV 16 01.10.26 166 742 0.01%100 2.950% Thermo Fisher Scientific, Inc. 16 19.09.26 85 527 0.00%725 7.000% Theta Capital Pte Ltd. 14 11.04.22 662 750 0.03%660 3.700% Three Gorges Finance I Cayman Islands Ltd. 15 10.06.25 590 479 0.02%225 2.950% Time Warner, Inc. 16 15.07.26 187 166 0.01%370 3.244% TNB Global Ventures Capital Bhd 16 19.10.26 316 272 0.01%325 1.950% Toronto-Dominion Bank 16 22.01.19 286 002 0.01%670 4.750% Towngas Finance Ltd. 14 29.01.49 606 604 0.02%100 2.750% Toyota Motor Credit Corp. 14 17.05.21 89 328 0.00%75 7.625% TransCanada PipeLines Ltd. 09 15.01.39 96 319 0.00%
375 6.000% TransDigm, Inc. 14 15.07.22 338 915 0.01%250 6.500% TransDigm, Inc. 14 15.07.24 226 509 0.01%50 3.750% Travelers, Inc. 16 15.05.46 43 175 0.00%
300 6.375% Tronox Finance LLC 13 15.08.20 263 198 0.01%
50
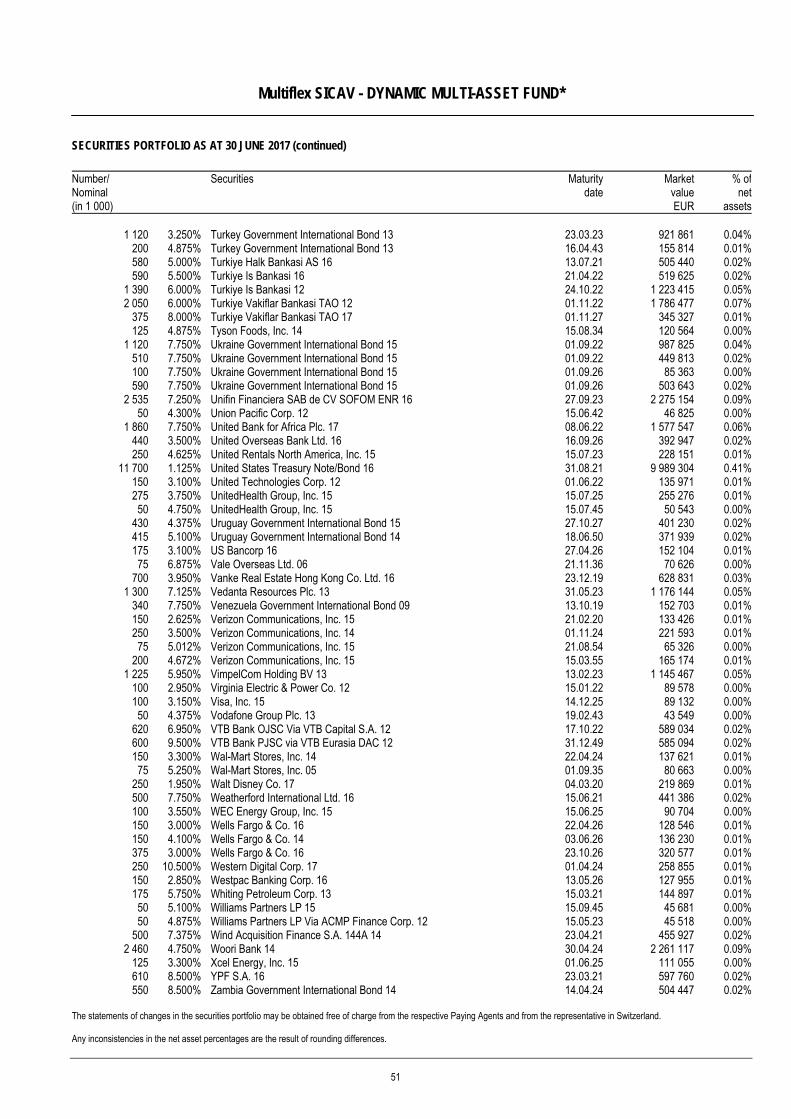
Multiflex SICAV - DYNAMIC MULTI-ASSET FUND*
SECURITIES PORTFOLIO AS AT 30 JUNE 2017 (continued)
The statements of changes in the securities portfolio may be obtained free of charge from the respective Paying Agents and from the representative in Switzerland. Any inconsistencies in the net asset percentages are the result of rounding differences.
Number/ Nominal (in 1 000)
Securities Maturitydate
MarketvalueEUR
% ofnet
assets
1 120 3.250% Turkey Government International Bond 13 23.03.23 921 861 0.04%200 4.875% Turkey Government International Bond 13 16.04.43 155 814 0.01%580 5.000% Turkiye Halk Bankasi AS 16 13.07.21 505 440 0.02%590 5.500% Turkiye Is Bankasi 16 21.04.22 519 625 0.02%
1 390 6.000% Turkiye Is Bankasi 12 24.10.22 1 223 415 0.05%2 050 6.000% Turkiye Vakiflar Bankasi TAO 12 01.11.22 1 786 477 0.07%
375 8.000% Turkiye Vakiflar Bankasi TAO 17 01.11.27 345 327 0.01%125 4.875% Tyson Foods, Inc. 14 15.08.34 120 564 0.00%
1 120 7.750% Ukraine Government International Bond 15 01.09.22 987 825 0.04%510 7.750% Ukraine Government International Bond 15 01.09.22 449 813 0.02%100 7.750% Ukraine Government International Bond 15 01.09.26 85 363 0.00%590 7.750% Ukraine Government International Bond 15 01.09.26 503 643 0.02%
2 535 7.250% Unifin Financiera SAB de CV SOFOM ENR 16 27.09.23 2 275 154 0.09%50 4.300% Union Pacific Corp. 12 15.06.42 46 825 0.00%
1 860 7.750% United Bank for Africa Plc. 17 08.06.22 1 577 547 0.06%440 3.500% United Overseas Bank Ltd. 16 16.09.26 392 947 0.02%250 4.625% United Rentals North America, Inc. 15 15.07.23 228 151 0.01%
11 700 1.125% United States Treasury Note/Bond 16 31.08.21 9 989 304 0.41%150 3.100% United Technologies Corp. 12 01.06.22 135 971 0.01%275 3.750% UnitedHealth Group, Inc. 15 15.07.25 255 276 0.01%50 4.750% UnitedHealth Group, Inc. 15 15.07.45 50 543 0.00%
430 4.375% Uruguay Government International Bond 15 27.10.27 401 230 0.02%415 5.100% Uruguay Government International Bond 14 18.06.50 371 939 0.02%175 3.100% US Bancorp 16 27.04.26 152 104 0.01%75 6.875% Vale Overseas Ltd. 06 21.11.36 70 626 0.00%
700 3.950% Vanke Real Estate Hong Kong Co. Ltd. 16 23.12.19 628 831 0.03%1 300 7.125% Vedanta Resources Plc. 13 31.05.23 1 176 144 0.05%
340 7.750% Venezuela Government International Bond 09 13.10.19 152 703 0.01%150 2.625% Verizon Communications, Inc. 15 21.02.20 133 426 0.01%250 3.500% Verizon Communications, Inc. 14 01.11.24 221 593 0.01%75 5.012% Verizon Communications, Inc. 15 21.08.54 65 326 0.00%
200 4.672% Verizon Communications, Inc. 15 15.03.55 165 174 0.01%1 225 5.950% VimpelCom Holding BV 13 13.02.23 1 145 467 0.05%
100 2.950% Virginia Electric & Power Co. 12 15.01.22 89 578 0.00%100 3.150% Visa, Inc. 15 14.12.25 89 132 0.00%50 4.375% Vodafone Group Plc. 13 19.02.43 43 549 0.00%
620 6.950% VTB Bank OJSC Via VTB Capital S.A. 12 17.10.22 589 034 0.02%600 9.500% VTB Bank PJSC via VTB Eurasia DAC 12 31.12.49 585 094 0.02%150 3.300% Wal-Mart Stores, Inc. 14 22.04.24 137 621 0.01%75 5.250% Wal-Mart Stores, Inc. 05 01.09.35 80 663 0.00%
250 1.950% Walt Disney Co. 17 04.03.20 219 869 0.01%500 7.750% Weatherford International Ltd. 16 15.06.21 441 386 0.02%100 3.550% WEC Energy Group, Inc. 15 15.06.25 90 704 0.00%150 3.000% Wells Fargo & Co. 16 22.04.26 128 546 0.01%150 4.100% Wells Fargo & Co. 14 03.06.26 136 230 0.01%375 3.000% Wells Fargo & Co. 16 23.10.26 320 577 0.01%250 10.500% Western Digital Corp. 17 01.04.24 258 855 0.01%150 2.850% Westpac Banking Corp. 16 13.05.26 127 955 0.01%175 5.750% Whiting Petroleum Corp. 13 15.03.21 144 897 0.01%50 5.100% Williams Partners LP 15 15.09.45 45 681 0.00%50 4.875% Williams Partners LP Via ACMP Finance Corp. 12 15.05.23 45 518 0.00%
500 7.375% Wind Acquisition Finance S.A. 144A 14 23.04.21 455 927 0.02%2 460 4.750% Woori Bank 14 30.04.24 2 261 117 0.09%
125 3.300% Xcel Energy, Inc. 15 01.06.25 111 055 0.00%610 8.500% YPF S.A. 16 23.03.21 597 760 0.02%550 8.500% Zambia Government International Bond 14 14.04.24 504 447 0.02%
51
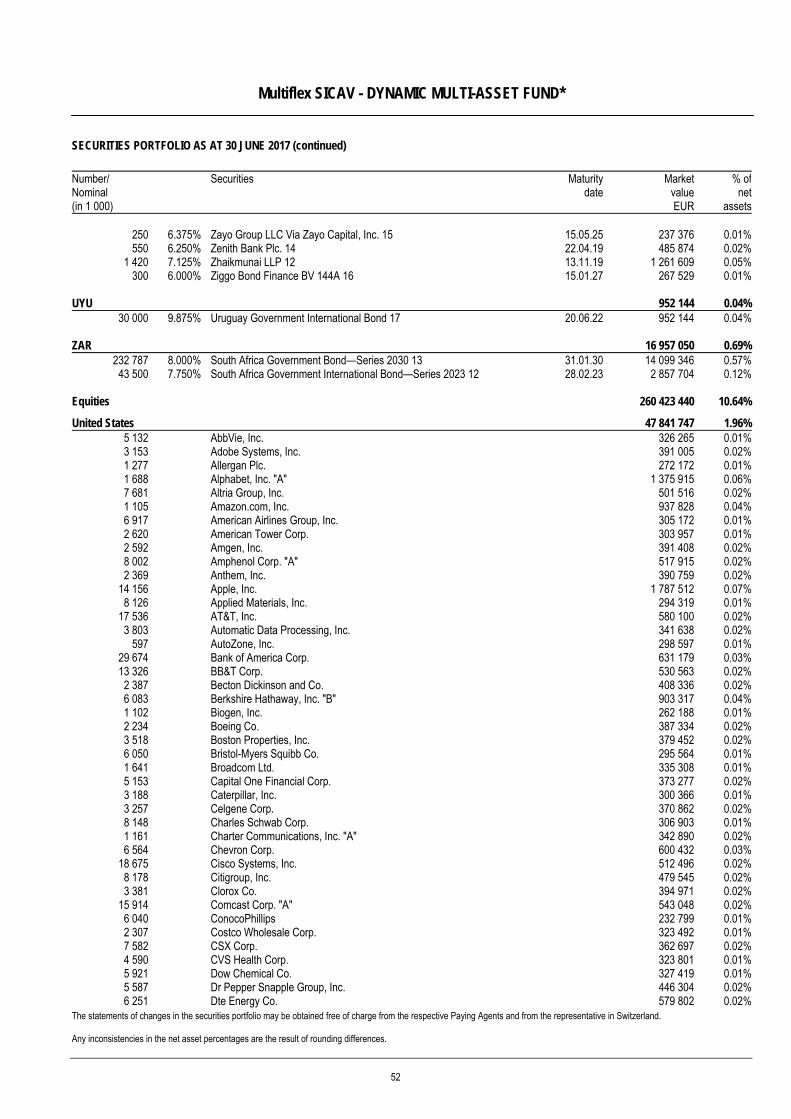
Multiflex SICAV - DYNAMIC MULTI-ASSET FUND*
SECURITIES PORTFOLIO AS AT 30 JUNE 2017 (continued)
The statements of changes in the securities portfolio may be obtained free of charge from the respective Paying Agents and from the representative in Switzerland. Any inconsistencies in the net asset percentages are the result of rounding differences.
Number/ Nominal (in 1 000)
Securities Maturitydate
MarketvalueEUR
% ofnet
assets
250 6.375% Zayo Group LLC Via Zayo Capital, Inc. 15 15.05.25 237 376 0.01%550 6.250% Zenith Bank Plc. 14 22.04.19 485 874 0.02%
1 420 7.125% Zhaikmunai LLP 12 13.11.19 1 261 609 0.05%300 6.000% Ziggo Bond Finance BV 144A 16 15.01.27 267 529 0.01%
UYU 952 144 0.04%30 000 9.875% Uruguay Government International Bond 17 20.06.22 952 144 0.04%
ZAR 16 957 050 0.69%232 787 8.000% South Africa Government Bond—Series 2030 13 31.01.30 14 099 346 0.57%
43 500 7.750% South Africa Government International Bond—Series 2023 12 28.02.23 2 857 704 0.12%
Equities 260 423 440 10.64%
United States 47 841 747 1.96%5 132 AbbVie, Inc. 326 265 0.01%3 153 Adobe Systems, Inc. 391 005 0.02%1 277 Allergan Plc. 272 172 0.01%1 688 Alphabet, Inc. "A" 1 375 915 0.06%7 681 Altria Group, Inc. 501 516 0.02%1 105 Amazon.com, Inc. 937 828 0.04%6 917 American Airlines Group, Inc. 305 172 0.01%2 620 American Tower Corp. 303 957 0.01%2 592 Amgen, Inc. 391 408 0.02%8 002 Amphenol Corp. "A" 517 915 0.02%2 369 Anthem, Inc. 390 759 0.02%
14 156 Apple, Inc. 1 787 512 0.07%8 126 Applied Materials, Inc. 294 319 0.01%
17 536 AT&T, Inc. 580 100 0.02%3 803 Automatic Data Processing, Inc. 341 638 0.02%
597 AutoZone, Inc. 298 597 0.01%29 674 Bank of America Corp. 631 179 0.03%13 326 BB&T Corp. 530 563 0.02%2 387 Becton Dickinson and Co. 408 336 0.02%6 083 Berkshire Hathaway, Inc. "B" 903 317 0.04%1 102 Biogen, Inc. 262 188 0.01%2 234 Boeing Co. 387 334 0.02%3 518 Boston Properties, Inc. 379 452 0.02%6 050 Bristol-Myers Squibb Co. 295 564 0.01%1 641 Broadcom Ltd. 335 308 0.01%5 153 Capital One Financial Corp. 373 277 0.02%3 188 Caterpillar, Inc. 300 366 0.01%3 257 Celgene Corp. 370 862 0.02%8 148 Charles Schwab Corp. 306 903 0.01%1 161 Charter Communications, Inc. "A" 342 890 0.02%6 564 Chevron Corp. 600 432 0.03%
18 675 Cisco Systems, Inc. 512 496 0.02%8 178 Citigroup, Inc. 479 545 0.02%3 381 Clorox Co. 394 971 0.02%
15 914 Comcast Corp. "A" 543 048 0.02%6 040 ConocoPhillips 232 799 0.01%2 307 Costco Wholesale Corp. 323 492 0.01%7 582 CSX Corp. 362 697 0.02%4 590 CVS Health Corp. 323 801 0.01%5 921 Dow Chemical Co. 327 419 0.01%5 587 Dr Pepper Snapple Group, Inc. 446 304 0.02%6 251 Dte Energy Co. 579 802 0.02%
52
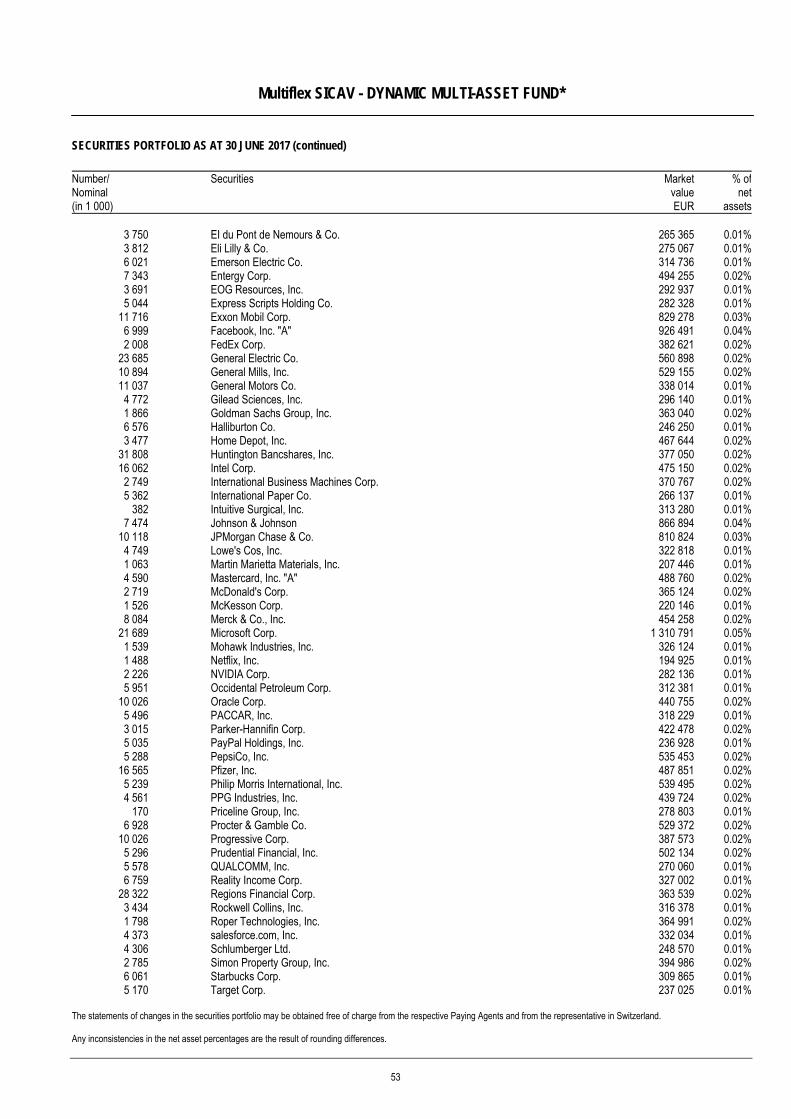
Multiflex SICAV - DYNAMIC MULTI-ASSET FUND*
SECURITIES PORTFOLIO AS AT 30 JUNE 2017 (continued)
The statements of changes in the securities portfolio may be obtained free of charge from the respective Paying Agents and from the representative in Switzerland. Any inconsistencies in the net asset percentages are the result of rounding differences.
Number/ Nominal (in 1 000)
Securities MarketvalueEUR
% ofnet
assets
3 750 EI du Pont de Nemours & Co. 265 365 0.01%3 812 Eli Lilly & Co. 275 067 0.01%6 021 Emerson Electric Co. 314 736 0.01%7 343 Entergy Corp. 494 255 0.02%3 691 EOG Resources, Inc. 292 937 0.01%5 044 Express Scripts Holding Co. 282 328 0.01%
11 716 Exxon Mobil Corp. 829 278 0.03%6 999 Facebook, Inc. "A" 926 491 0.04%2 008 FedEx Corp. 382 621 0.02%
23 685 General Electric Co. 560 898 0.02%10 894 General Mills, Inc. 529 155 0.02%11 037 General Motors Co. 338 014 0.01%4 772 Gilead Sciences, Inc. 296 140 0.01%1 866 Goldman Sachs Group, Inc. 363 040 0.02%6 576 Halliburton Co. 246 250 0.01%3 477 Home Depot, Inc. 467 644 0.02%
31 808 Huntington Bancshares, Inc. 377 050 0.02%16 062 Intel Corp. 475 150 0.02%2 749 International Business Machines Corp. 370 767 0.02%5 362 International Paper Co. 266 137 0.01%
382 Intuitive Surgical, Inc. 313 280 0.01%7 474 Johnson & Johnson 866 894 0.04%
10 118 JPMorgan Chase & Co. 810 824 0.03%4 749 Lowe's Cos, Inc. 322 818 0.01%1 063 Martin Marietta Materials, Inc. 207 446 0.01%4 590 Mastercard, Inc. "A" 488 760 0.02%2 719 McDonald's Corp. 365 124 0.02%1 526 McKesson Corp. 220 146 0.01%8 084 Merck & Co., Inc. 454 258 0.02%
21 689 Microsoft Corp. 1 310 791 0.05%1 539 Mohawk Industries, Inc. 326 124 0.01%1 488 Netflix, Inc. 194 925 0.01%2 226 NVIDIA Corp. 282 136 0.01%5 951 Occidental Petroleum Corp. 312 381 0.01%
10 026 Oracle Corp. 440 755 0.02%5 496 PACCAR, Inc. 318 229 0.01%3 015 Parker-Hannifin Corp. 422 478 0.02%5 035 PayPal Holdings, Inc. 236 928 0.01%5 288 PepsiCo, Inc. 535 453 0.02%
16 565 Pfizer, Inc. 487 851 0.02%5 239 Philip Morris International, Inc. 539 495 0.02%4 561 PPG Industries, Inc. 439 724 0.02%
170 Priceline Group, Inc. 278 803 0.01%6 928 Procter & Gamble Co. 529 372 0.02%
10 026 Progressive Corp. 387 573 0.02%5 296 Prudential Financial, Inc. 502 134 0.02%5 578 QUALCOMM, Inc. 270 060 0.01%6 759 Reality Income Corp. 327 002 0.01%
28 322 Regions Financial Corp. 363 539 0.02%3 434 Rockwell Collins, Inc. 316 378 0.01%1 798 Roper Technologies, Inc. 364 991 0.02%4 373 salesforce.com, Inc. 332 034 0.01%4 306 Schlumberger Ltd. 248 570 0.01%2 785 Simon Property Group, Inc. 394 986 0.02%6 061 Starbucks Corp. 309 865 0.01%5 170 Target Corp. 237 025 0.01%
53
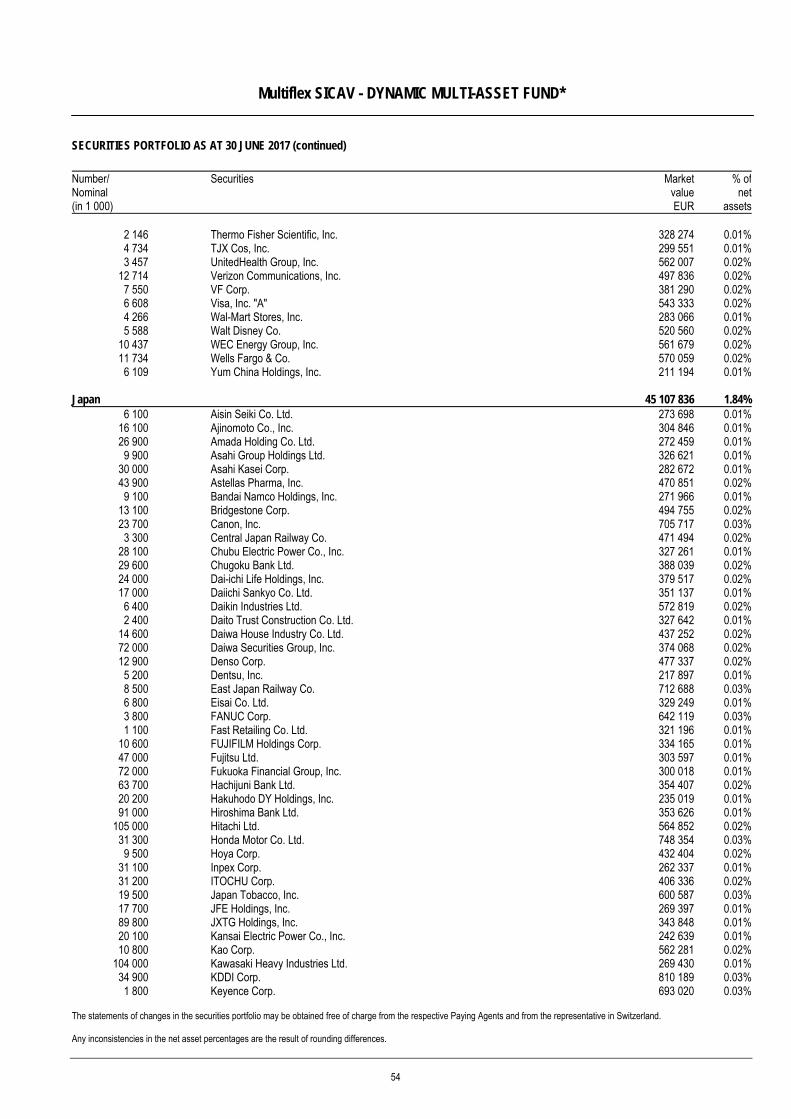
Multiflex SICAV - DYNAMIC MULTI-ASSET FUND*
SECURITIES PORTFOLIO AS AT 30 JUNE 2017 (continued)
The statements of changes in the securities portfolio may be obtained free of charge from the respective Paying Agents and from the representative in Switzerland. Any inconsistencies in the net asset percentages are the result of rounding differences.
Number/ Nominal (in 1 000)
Securities MarketvalueEUR
% ofnet
assets
2 146 Thermo Fisher Scientific, Inc. 328 274 0.01%4 734 TJX Cos, Inc. 299 551 0.01%3 457 UnitedHealth Group, Inc. 562 007 0.02%
12 714 Verizon Communications, Inc. 497 836 0.02%7 550 VF Corp. 381 290 0.02%6 608 Visa, Inc. "A" 543 333 0.02%4 266 Wal-Mart Stores, Inc. 283 066 0.01%5 588 Walt Disney Co. 520 560 0.02%
10 437 WEC Energy Group, Inc. 561 679 0.02%11 734 Wells Fargo & Co. 570 059 0.02%6 109 Yum China Holdings, Inc. 211 194 0.01%
Japan 45 107 836 1.84%6 100 Aisin Seiki Co. Ltd. 273 698 0.01%
16 100 Ajinomoto Co., Inc. 304 846 0.01%26 900 Amada Holding Co. Ltd. 272 459 0.01%9 900 Asahi Group Holdings Ltd. 326 621 0.01%
30 000 Asahi Kasei Corp. 282 672 0.01%43 900 Astellas Pharma, Inc. 470 851 0.02%9 100 Bandai Namco Holdings, Inc. 271 966 0.01%
13 100 Bridgestone Corp. 494 755 0.02%23 700 Canon, Inc. 705 717 0.03%3 300 Central Japan Railway Co. 471 494 0.02%
28 100 Chubu Electric Power Co., Inc. 327 261 0.01%29 600 Chugoku Bank Ltd. 388 039 0.02%24 000 Dai-ichi Life Holdings, Inc. 379 517 0.02%17 000 Daiichi Sankyo Co. Ltd. 351 137 0.01%6 400 Daikin Industries Ltd. 572 819 0.02%2 400 Daito Trust Construction Co. Ltd. 327 642 0.01%
14 600 Daiwa House Industry Co. Ltd. 437 252 0.02%72 000 Daiwa Securities Group, Inc. 374 068 0.02%12 900 Denso Corp. 477 337 0.02%5 200 Dentsu, Inc. 217 897 0.01%8 500 East Japan Railway Co. 712 688 0.03%6 800 Eisai Co. Ltd. 329 249 0.01%3 800 FANUC Corp. 642 119 0.03%1 100 Fast Retailing Co. Ltd. 321 196 0.01%
10 600 FUJIFILM Holdings Corp. 334 165 0.01%47 000 Fujitsu Ltd. 303 597 0.01%72 000 Fukuoka Financial Group, Inc. 300 018 0.01%63 700 Hachijuni Bank Ltd. 354 407 0.02%20 200 Hakuhodo DY Holdings, Inc. 235 019 0.01%91 000 Hiroshima Bank Ltd. 353 626 0.01%
105 000 Hitachi Ltd. 564 852 0.02%31 300 Honda Motor Co. Ltd. 748 354 0.03%9 500 Hoya Corp. 432 404 0.02%
31 100 Inpex Corp. 262 337 0.01%31 200 ITOCHU Corp. 406 336 0.02%19 500 Japan Tobacco, Inc. 600 587 0.03%17 700 JFE Holdings, Inc. 269 397 0.01%89 800 JXTG Holdings, Inc. 343 848 0.01%20 100 Kansai Electric Power Co., Inc. 242 639 0.01%10 800 Kao Corp. 562 281 0.02%
104 000 Kawasaki Heavy Industries Ltd. 269 430 0.01%34 900 KDDI Corp. 810 189 0.03%1 800 Keyence Corp. 693 020 0.03%
54
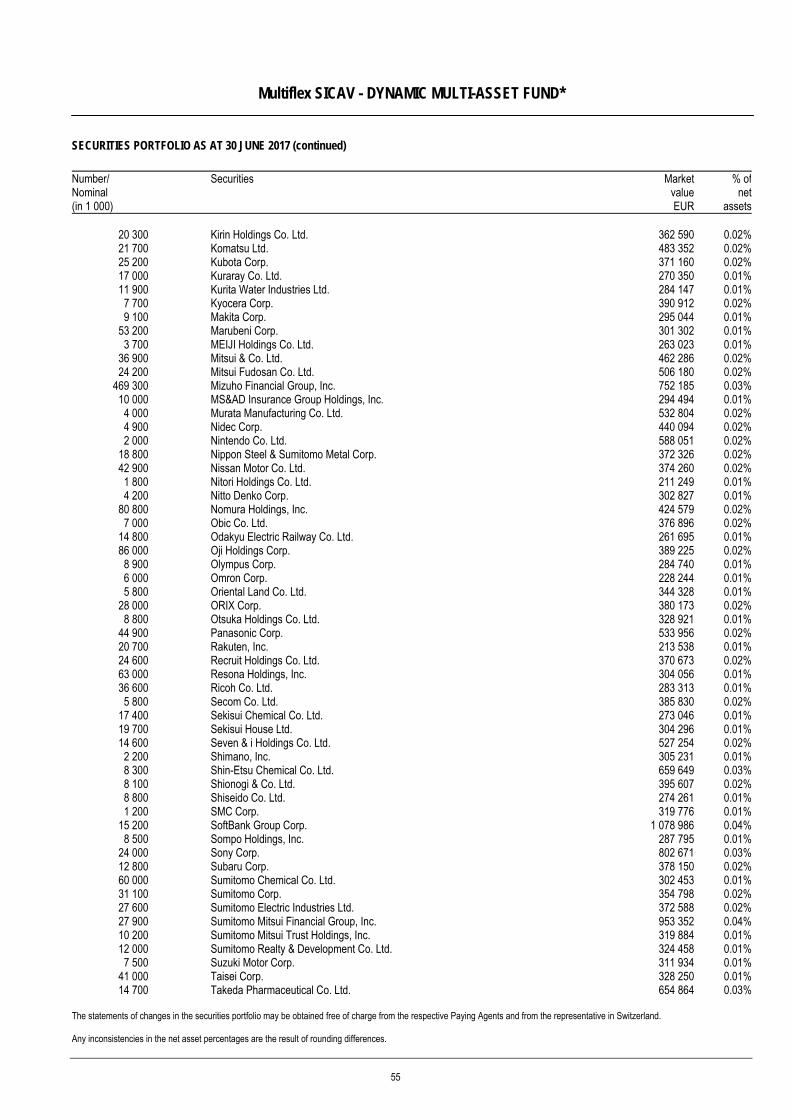
Multiflex SICAV - DYNAMIC MULTI-ASSET FUND*
SECURITIES PORTFOLIO AS AT 30 JUNE 2017 (continued)
The statements of changes in the securities portfolio may be obtained free of charge from the respective Paying Agents and from the representative in Switzerland. Any inconsistencies in the net asset percentages are the result of rounding differences.
Number/ Nominal (in 1 000)
Securities MarketvalueEUR
% ofnet
assets
20 300 Kirin Holdings Co. Ltd. 362 590 0.02%21 700 Komatsu Ltd. 483 352 0.02%25 200 Kubota Corp. 371 160 0.02%17 000 Kuraray Co. Ltd. 270 350 0.01%11 900 Kurita Water Industries Ltd. 284 147 0.01%7 700 Kyocera Corp. 390 912 0.02%9 100 Makita Corp. 295 044 0.01%
53 200 Marubeni Corp. 301 302 0.01%3 700 MEIJI Holdings Co. Ltd. 263 023 0.01%
36 900 Mitsui & Co. Ltd. 462 286 0.02%24 200 Mitsui Fudosan Co. Ltd. 506 180 0.02%
469 300 Mizuho Financial Group, Inc. 752 185 0.03%10 000 MS&AD Insurance Group Holdings, Inc. 294 494 0.01%4 000 Murata Manufacturing Co. Ltd. 532 804 0.02%4 900 Nidec Corp. 440 094 0.02%2 000 Nintendo Co. Ltd. 588 051 0.02%
18 800 Nippon Steel & Sumitomo Metal Corp. 372 326 0.02%42 900 Nissan Motor Co. Ltd. 374 260 0.02%1 800 Nitori Holdings Co. Ltd. 211 249 0.01%4 200 Nitto Denko Corp. 302 827 0.01%
80 800 Nomura Holdings, Inc. 424 579 0.02%7 000 Obic Co. Ltd. 376 896 0.02%
14 800 Odakyu Electric Railway Co. Ltd. 261 695 0.01%86 000 Oji Holdings Corp. 389 225 0.02%8 900 Olympus Corp. 284 740 0.01%6 000 Omron Corp. 228 244 0.01%5 800 Oriental Land Co. Ltd. 344 328 0.01%
28 000 ORIX Corp. 380 173 0.02%8 800 Otsuka Holdings Co. Ltd. 328 921 0.01%
44 900 Panasonic Corp. 533 956 0.02%20 700 Rakuten, Inc. 213 538 0.01%24 600 Recruit Holdings Co. Ltd. 370 673 0.02%63 000 Resona Holdings, Inc. 304 056 0.01%36 600 Ricoh Co. Ltd. 283 313 0.01%5 800 Secom Co. Ltd. 385 830 0.02%
17 400 Sekisui Chemical Co. Ltd. 273 046 0.01%19 700 Sekisui House Ltd. 304 296 0.01%14 600 Seven & i Holdings Co. Ltd. 527 254 0.02%2 200 Shimano, Inc. 305 231 0.01%8 300 Shin-Etsu Chemical Co. Ltd. 659 649 0.03%8 100 Shionogi & Co. Ltd. 395 607 0.02%8 800 Shiseido Co. Ltd. 274 261 0.01%1 200 SMC Corp. 319 776 0.01%
15 200 SoftBank Group Corp. 1 078 986 0.04%8 500 Sompo Holdings, Inc. 287 795 0.01%
24 000 Sony Corp. 802 671 0.03%12 800 Subaru Corp. 378 150 0.02%60 000 Sumitomo Chemical Co. Ltd. 302 453 0.01%31 100 Sumitomo Corp. 354 798 0.02%27 600 Sumitomo Electric Industries Ltd. 372 588 0.02%27 900 Sumitomo Mitsui Financial Group, Inc. 953 352 0.04%10 200 Sumitomo Mitsui Trust Holdings, Inc. 319 884 0.01%12 000 Sumitomo Realty & Development Co. Ltd. 324 458 0.01%7 500 Suzuki Motor Corp. 311 934 0.01%
41 000 Taisei Corp. 328 250 0.01%14 700 Takeda Pharmaceutical Co. Ltd. 654 864 0.03%
55
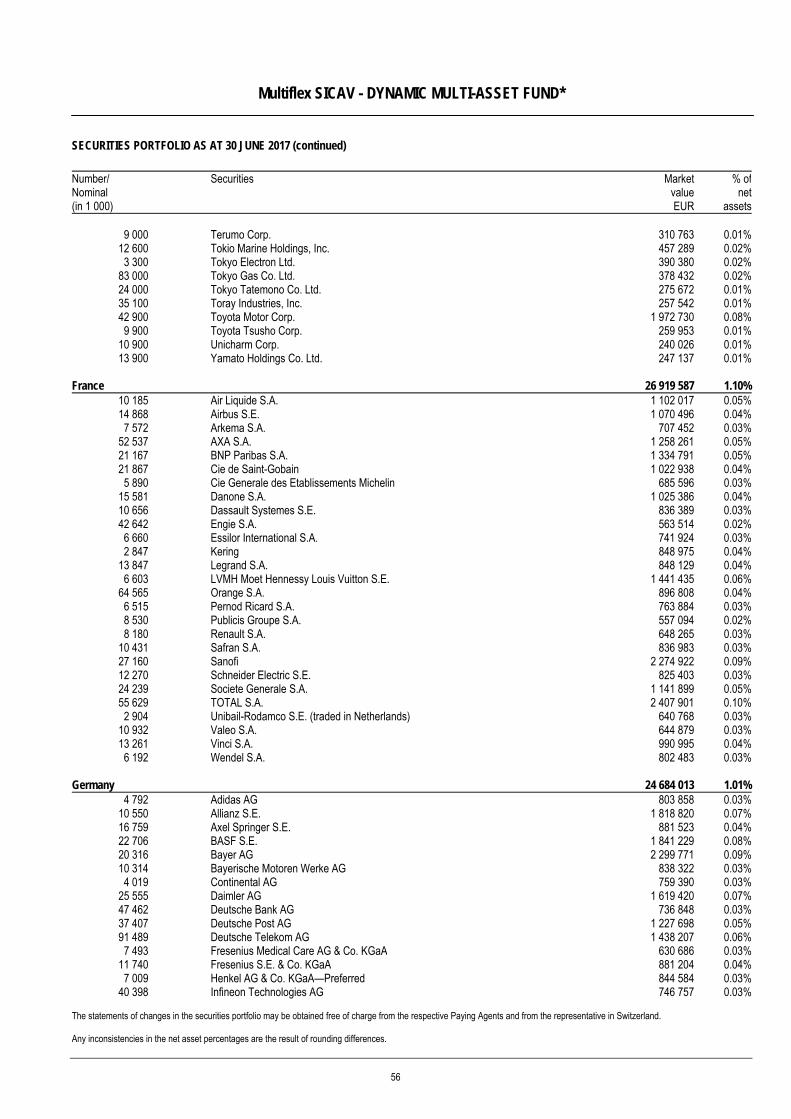
Multiflex SICAV - DYNAMIC MULTI-ASSET FUND*
SECURITIES PORTFOLIO AS AT 30 JUNE 2017 (continued)
The statements of changes in the securities portfolio may be obtained free of charge from the respective Paying Agents and from the representative in Switzerland. Any inconsistencies in the net asset percentages are the result of rounding differences.
Number/ Nominal (in 1 000)
Securities MarketvalueEUR
% ofnet
assets
9 000 Terumo Corp. 310 763 0.01%12 600 Tokio Marine Holdings, Inc. 457 289 0.02%3 300 Tokyo Electron Ltd. 390 380 0.02%
83 000 Tokyo Gas Co. Ltd. 378 432 0.02%24 000 Tokyo Tatemono Co. Ltd. 275 672 0.01%35 100 Toray Industries, Inc. 257 542 0.01%42 900 Toyota Motor Corp. 1 972 730 0.08%9 900 Toyota Tsusho Corp. 259 953 0.01%
10 900 Unicharm Corp. 240 026 0.01%13 900 Yamato Holdings Co. Ltd. 247 137 0.01%
France 26 919 587 1.10%10 185 Air Liquide S.A. 1 102 017 0.05%14 868 Airbus S.E. 1 070 496 0.04%7 572 Arkema S.A. 707 452 0.03%
52 537 AXA S.A. 1 258 261 0.05%21 167 BNP Paribas S.A. 1 334 791 0.05%21 867 Cie de Saint-Gobain 1 022 938 0.04%5 890 Cie Generale des Etablissements Michelin 685 596 0.03%
15 581 Danone S.A. 1 025 386 0.04%10 656 Dassault Systemes S.E. 836 389 0.03%42 642 Engie S.A. 563 514 0.02%6 660 Essilor International S.A. 741 924 0.03%2 847 Kering 848 975 0.04%
13 847 Legrand S.A. 848 129 0.04%6 603 LVMH Moet Hennessy Louis Vuitton S.E. 1 441 435 0.06%
64 565 Orange S.A. 896 808 0.04%6 515 Pernod Ricard S.A. 763 884 0.03%8 530 Publicis Groupe S.A. 557 094 0.02%8 180 Renault S.A. 648 265 0.03%
10 431 Safran S.A. 836 983 0.03%27 160 Sanofi 2 274 922 0.09%12 270 Schneider Electric S.E. 825 403 0.03%24 239 Societe Generale S.A. 1 141 899 0.05%55 629 TOTAL S.A. 2 407 901 0.10%2 904 Unibail-Rodamco S.E. (traded in Netherlands) 640 768 0.03%
10 932 Valeo S.A. 644 879 0.03%13 261 Vinci S.A. 990 995 0.04%6 192 Wendel S.A. 802 483 0.03%
Germany 24 684 013 1.01%4 792 Adidas AG 803 858 0.03%
10 550 Allianz S.E. 1 818 820 0.07%16 759 Axel Springer S.E. 881 523 0.04%22 706 BASF S.E. 1 841 229 0.08%20 316 Bayer AG 2 299 771 0.09%10 314 Bayerische Motoren Werke AG 838 322 0.03%4 019 Continental AG 759 390 0.03%
25 555 Daimler AG 1 619 420 0.07%47 462 Deutsche Bank AG 736 848 0.03%37 407 Deutsche Post AG 1 227 698 0.05%91 489 Deutsche Telekom AG 1 438 207 0.06%7 493 Fresenius Medical Care AG & Co. KGaA 630 686 0.03%
11 740 Fresenius S.E. & Co. KGaA 881 204 0.04%7 009 Henkel AG & Co. KGaA—Preferred 844 584 0.03%
40 398 Infineon Technologies AG 746 757 0.03%
56
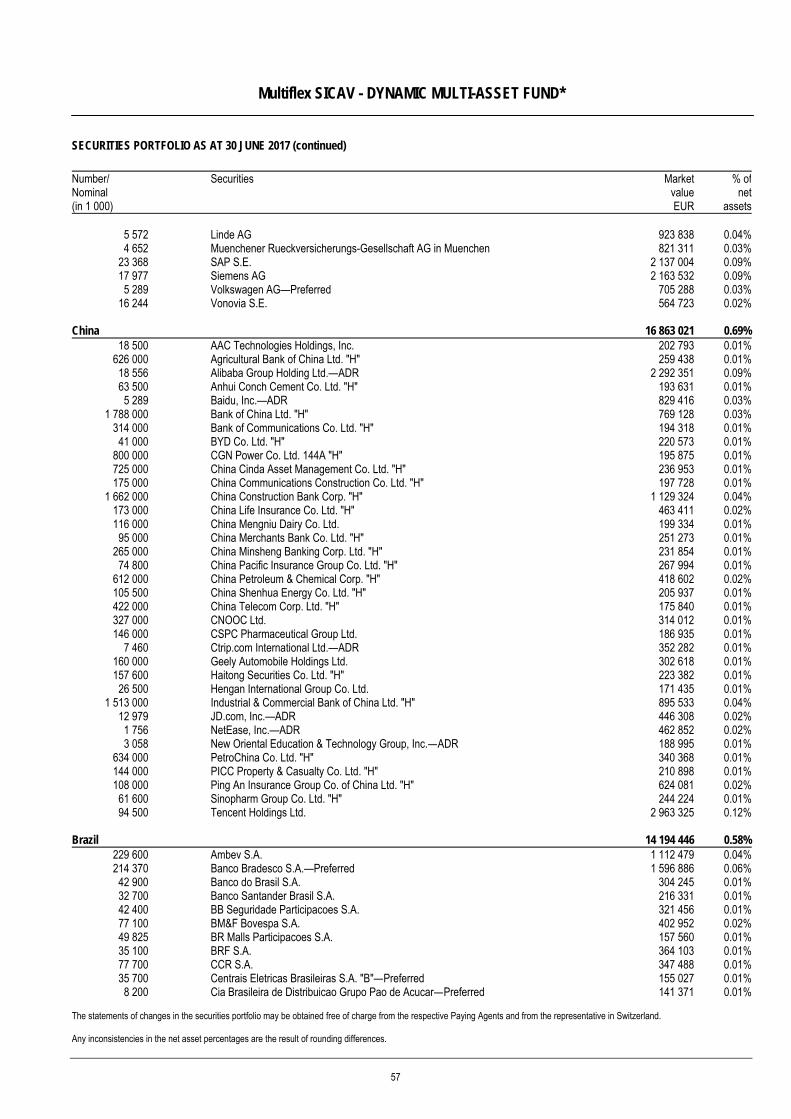
Multiflex SICAV - DYNAMIC MULTI-ASSET FUND*
SECURITIES PORTFOLIO AS AT 30 JUNE 2017 (continued)
The statements of changes in the securities portfolio may be obtained free of charge from the respective Paying Agents and from the representative in Switzerland. Any inconsistencies in the net asset percentages are the result of rounding differences.
Number/ Nominal (in 1 000)
Securities MarketvalueEUR
% ofnet
assets
5 572 Linde AG 923 838 0.04%4 652 Muenchener Rueckversicherungs-Gesellschaft AG in Muenchen 821 311 0.03%
23 368 SAP S.E. 2 137 004 0.09%17 977 Siemens AG 2 163 532 0.09%5 289 Volkswagen AG—Preferred 705 288 0.03%
16 244 Vonovia S.E. 564 723 0.02%
China 16 863 021 0.69%18 500 AAC Technologies Holdings, Inc. 202 793 0.01%
626 000 Agricultural Bank of China Ltd. "H" 259 438 0.01%18 556 Alibaba Group Holding Ltd.—ADR 2 292 351 0.09%63 500 Anhui Conch Cement Co. Ltd. "H" 193 631 0.01%5 289 Baidu, Inc.—ADR 829 416 0.03%
1 788 000 Bank of China Ltd. "H" 769 128 0.03%314 000 Bank of Communications Co. Ltd. "H" 194 318 0.01%
41 000 BYD Co. Ltd. "H" 220 573 0.01%800 000 CGN Power Co. Ltd. 144A "H" 195 875 0.01%725 000 China Cinda Asset Management Co. Ltd. "H" 236 953 0.01%175 000 China Communications Construction Co. Ltd. "H" 197 728 0.01%
1 662 000 China Construction Bank Corp. "H" 1 129 324 0.04%173 000 China Life Insurance Co. Ltd. "H" 463 411 0.02%116 000 China Mengniu Dairy Co. Ltd. 199 334 0.01%
95 000 China Merchants Bank Co. Ltd. "H" 251 273 0.01%265 000 China Minsheng Banking Corp. Ltd. "H" 231 854 0.01%
74 800 China Pacific Insurance Group Co. Ltd. "H" 267 994 0.01%612 000 China Petroleum & Chemical Corp. "H" 418 602 0.02%105 500 China Shenhua Energy Co. Ltd. "H" 205 937 0.01%422 000 China Telecom Corp. Ltd. "H" 175 840 0.01%327 000 CNOOC Ltd. 314 012 0.01%146 000 CSPC Pharmaceutical Group Ltd. 186 935 0.01%
7 460 Ctrip.com International Ltd.—ADR 352 282 0.01%160 000 Geely Automobile Holdings Ltd. 302 618 0.01%157 600 Haitong Securities Co. Ltd. "H" 223 382 0.01%
26 500 Hengan International Group Co. Ltd. 171 435 0.01%1 513 000 Industrial & Commercial Bank of China Ltd. "H" 895 533 0.04%
12 979 JD.com, Inc.—ADR 446 308 0.02%1 756 NetEase, Inc.—ADR 462 852 0.02%3 058 New Oriental Education & Technology Group, Inc.—ADR 188 995 0.01%
634 000 PetroChina Co. Ltd. "H" 340 368 0.01%144 000 PICC Property & Casualty Co. Ltd. "H" 210 898 0.01%108 000 Ping An Insurance Group Co. of China Ltd. "H" 624 081 0.02%
61 600 Sinopharm Group Co. Ltd. "H" 244 224 0.01%94 500 Tencent Holdings Ltd. 2 963 325 0.12%
Brazil 14 194 446 0.58%229 600 Ambev S.A. 1 112 479 0.04%214 370 Banco Bradesco S.A.—Preferred 1 596 886 0.06%
42 900 Banco do Brasil S.A. 304 245 0.01%32 700 Banco Santander Brasil S.A. 216 331 0.01%42 400 BB Seguridade Participacoes S.A. 321 456 0.01%77 100 BM&F Bovespa S.A. 402 952 0.02%49 825 BR Malls Participacoes S.A. 157 560 0.01%35 100 BRF S.A. 364 103 0.01%77 700 CCR S.A. 347 488 0.01%35 700 Centrais Eletricas Brasileiras S.A. "B"—Preferred 155 027 0.01%8 200 Cia Brasileira de Distribuicao Grupo Pao de Acucar—Preferred 141 371 0.01%
57
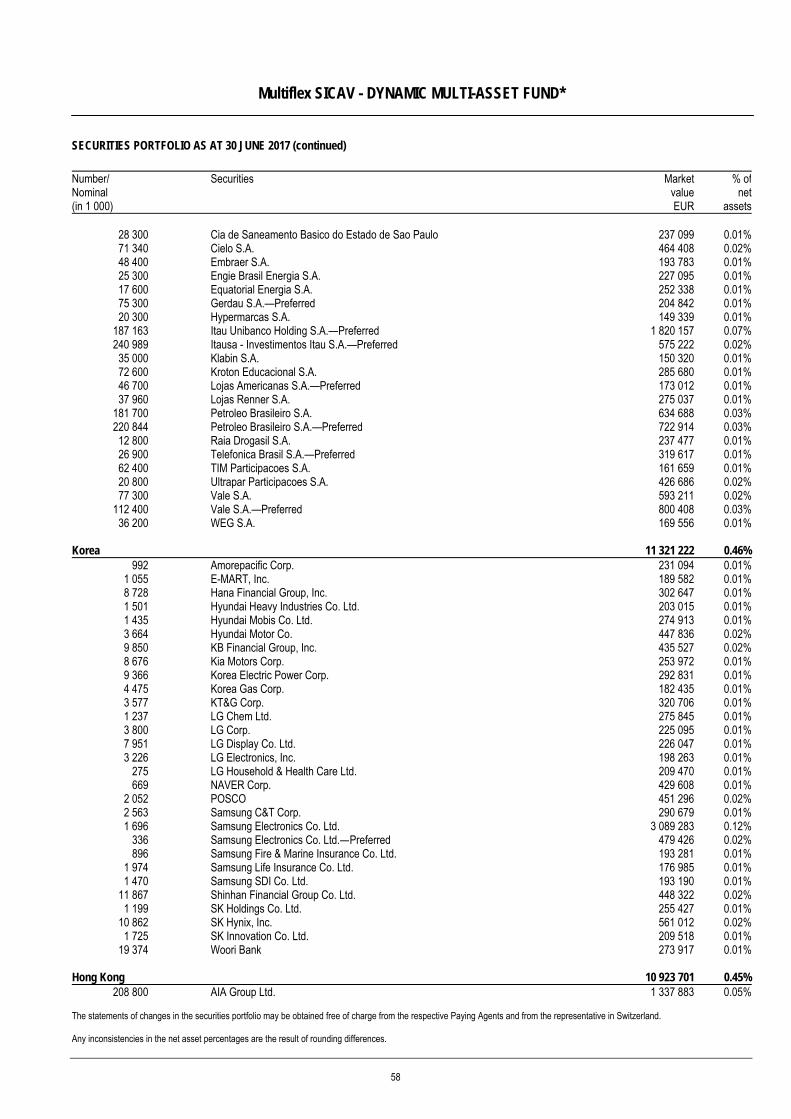
Multiflex SICAV - DYNAMIC MULTI-ASSET FUND*
SECURITIES PORTFOLIO AS AT 30 JUNE 2017 (continued)
The statements of changes in the securities portfolio may be obtained free of charge from the respective Paying Agents and from the representative in Switzerland. Any inconsistencies in the net asset percentages are the result of rounding differences.
Number/ Nominal (in 1 000)
Securities MarketvalueEUR
% ofnet
assets
28 300 Cia de Saneamento Basico do Estado de Sao Paulo 237 099 0.01%71 340 Cielo S.A. 464 408 0.02%48 400 Embraer S.A. 193 783 0.01%25 300 Engie Brasil Energia S.A. 227 095 0.01%17 600 Equatorial Energia S.A. 252 338 0.01%75 300 Gerdau S.A.—Preferred 204 842 0.01%20 300 Hypermarcas S.A. 149 339 0.01%
187 163 Itau Unibanco Holding S.A.—Preferred 1 820 157 0.07%240 989 Itausa - Investimentos Itau S.A.—Preferred 575 222 0.02%
35 000 Klabin S.A. 150 320 0.01%72 600 Kroton Educacional S.A. 285 680 0.01%46 700 Lojas Americanas S.A.—Preferred 173 012 0.01%37 960 Lojas Renner S.A. 275 037 0.01%
181 700 Petroleo Brasileiro S.A. 634 688 0.03%220 844 Petroleo Brasileiro S.A.—Preferred 722 914 0.03%
12 800 Raia Drogasil S.A. 237 477 0.01%26 900 Telefonica Brasil S.A.—Preferred 319 617 0.01%62 400 TIM Participacoes S.A. 161 659 0.01%20 800 Ultrapar Participacoes S.A. 426 686 0.02%77 300 Vale S.A. 593 211 0.02%
112 400 Vale S.A.—Preferred 800 408 0.03%36 200 WEG S.A. 169 556 0.01%
Korea 11 321 222 0.46%992 Amorepacific Corp. 231 094 0.01%
1 055 E-MART, Inc. 189 582 0.01%8 728 Hana Financial Group, Inc. 302 647 0.01%1 501 Hyundai Heavy Industries Co. Ltd. 203 015 0.01%1 435 Hyundai Mobis Co. Ltd. 274 913 0.01%3 664 Hyundai Motor Co. 447 836 0.02%9 850 KB Financial Group, Inc. 435 527 0.02%8 676 Kia Motors Corp. 253 972 0.01%9 366 Korea Electric Power Corp. 292 831 0.01%4 475 Korea Gas Corp. 182 435 0.01%3 577 KT&G Corp. 320 706 0.01%1 237 LG Chem Ltd. 275 845 0.01%3 800 LG Corp. 225 095 0.01%7 951 LG Display Co. Ltd. 226 047 0.01%3 226 LG Electronics, Inc. 198 263 0.01%
275 LG Household & Health Care Ltd. 209 470 0.01%669 NAVER Corp. 429 608 0.01%
2 052 POSCO 451 296 0.02%2 563 Samsung C&T Corp. 290 679 0.01%1 696 Samsung Electronics Co. Ltd. 3 089 283 0.12%
336 Samsung Electronics Co. Ltd.—Preferred 479 426 0.02%896 Samsung Fire & Marine Insurance Co. Ltd. 193 281 0.01%
1 974 Samsung Life Insurance Co. Ltd. 176 985 0.01%1 470 Samsung SDI Co. Ltd. 193 190 0.01%
11 867 Shinhan Financial Group Co. Ltd. 448 322 0.02%1 199 SK Holdings Co. Ltd. 255 427 0.01%
10 862 SK Hynix, Inc. 561 012 0.02%1 725 SK Innovation Co. Ltd. 209 518 0.01%
19 374 Woori Bank 273 917 0.01%
Hong Kong 10 923 701 0.45%208 800 AIA Group Ltd. 1 337 883 0.05%
58
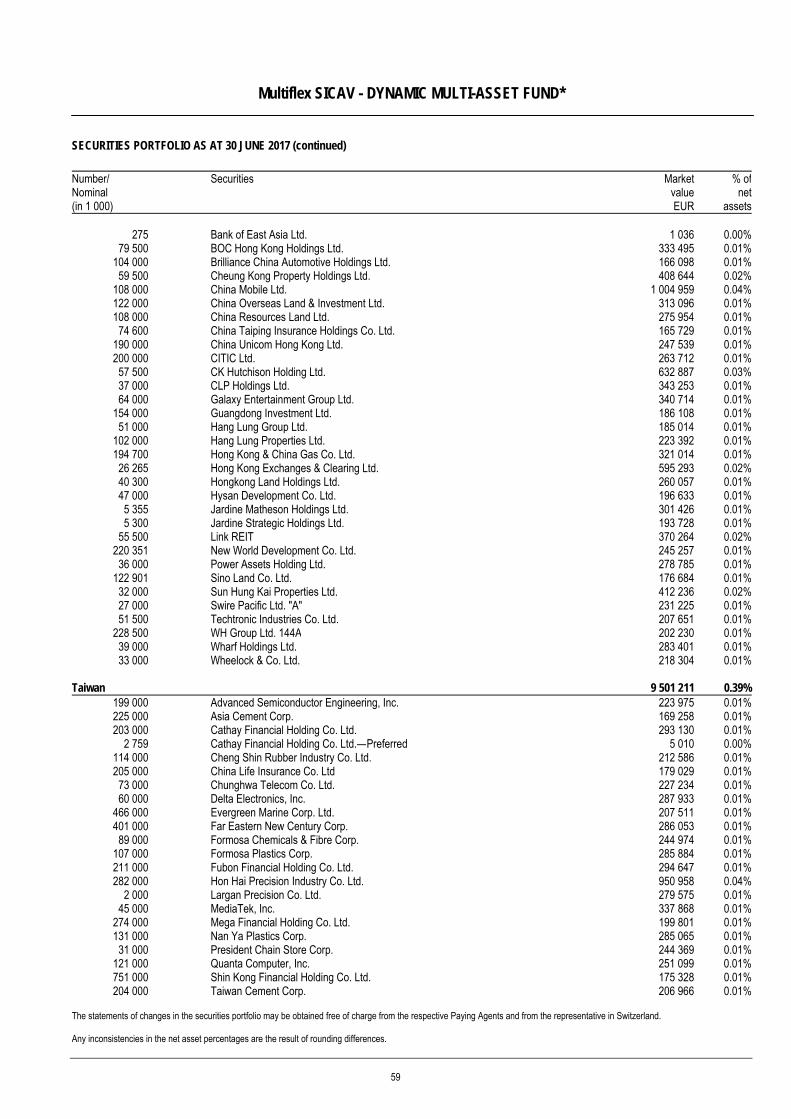
Multiflex SICAV - DYNAMIC MULTI-ASSET FUND*
SECURITIES PORTFOLIO AS AT 30 JUNE 2017 (continued)
The statements of changes in the securities portfolio may be obtained free of charge from the respective Paying Agents and from the representative in Switzerland. Any inconsistencies in the net asset percentages are the result of rounding differences.
Number/ Nominal (in 1 000)
Securities MarketvalueEUR
% ofnet
assets
275 Bank of East Asia Ltd. 1 036 0.00%79 500 BOC Hong Kong Holdings Ltd. 333 495 0.01%
104 000 Brilliance China Automotive Holdings Ltd. 166 098 0.01%59 500 Cheung Kong Property Holdings Ltd. 408 644 0.02%
108 000 China Mobile Ltd. 1 004 959 0.04%122 000 China Overseas Land & Investment Ltd. 313 096 0.01%108 000 China Resources Land Ltd. 275 954 0.01%
74 600 China Taiping Insurance Holdings Co. Ltd. 165 729 0.01%190 000 China Unicom Hong Kong Ltd. 247 539 0.01%200 000 CITIC Ltd. 263 712 0.01%
57 500 CK Hutchison Holding Ltd. 632 887 0.03%37 000 CLP Holdings Ltd. 343 253 0.01%64 000 Galaxy Entertainment Group Ltd. 340 714 0.01%
154 000 Guangdong Investment Ltd. 186 108 0.01%51 000 Hang Lung Group Ltd. 185 014 0.01%
102 000 Hang Lung Properties Ltd. 223 392 0.01%194 700 Hong Kong & China Gas Co. Ltd. 321 014 0.01%
26 265 Hong Kong Exchanges & Clearing Ltd. 595 293 0.02%40 300 Hongkong Land Holdings Ltd. 260 057 0.01%47 000 Hysan Development Co. Ltd. 196 633 0.01%5 355 Jardine Matheson Holdings Ltd. 301 426 0.01%5 300 Jardine Strategic Holdings Ltd. 193 728 0.01%
55 500 Link REIT 370 264 0.02%220 351 New World Development Co. Ltd. 245 257 0.01%
36 000 Power Assets Holding Ltd. 278 785 0.01%122 901 Sino Land Co. Ltd. 176 684 0.01%
32 000 Sun Hung Kai Properties Ltd. 412 236 0.02%27 000 Swire Pacific Ltd. "A" 231 225 0.01%51 500 Techtronic Industries Co. Ltd. 207 651 0.01%
228 500 WH Group Ltd. 144A 202 230 0.01%39 000 Wharf Holdings Ltd. 283 401 0.01%33 000 Wheelock & Co. Ltd. 218 304 0.01%
Taiwan 9 501 211 0.39%199 000 Advanced Semiconductor Engineering, Inc. 223 975 0.01%225 000 Asia Cement Corp. 169 258 0.01%203 000 Cathay Financial Holding Co. Ltd. 293 130 0.01%
2 759 Cathay Financial Holding Co. Ltd.—Preferred 5 010 0.00%114 000 Cheng Shin Rubber Industry Co. Ltd. 212 586 0.01%205 000 China Life Insurance Co. Ltd 179 029 0.01%
73 000 Chunghwa Telecom Co. Ltd. 227 234 0.01%60 000 Delta Electronics, Inc. 287 933 0.01%
466 000 Evergreen Marine Corp. Ltd. 207 511 0.01%401 000 Far Eastern New Century Corp. 286 053 0.01%
89 000 Formosa Chemicals & Fibre Corp. 244 974 0.01%107 000 Formosa Plastics Corp. 285 884 0.01%211 000 Fubon Financial Holding Co. Ltd. 294 647 0.01%282 000 Hon Hai Precision Industry Co. Ltd. 950 958 0.04%
2 000 Largan Precision Co. Ltd. 279 575 0.01%45 000 MediaTek, Inc. 337 868 0.01%
274 000 Mega Financial Holding Co. Ltd. 199 801 0.01%131 000 Nan Ya Plastics Corp. 285 065 0.01%
31 000 President Chain Store Corp. 244 369 0.01%121 000 Quanta Computer, Inc. 251 099 0.01%751 000 Shin Kong Financial Holding Co. Ltd. 175 328 0.01%204 000 Taiwan Cement Corp. 206 966 0.01%
59
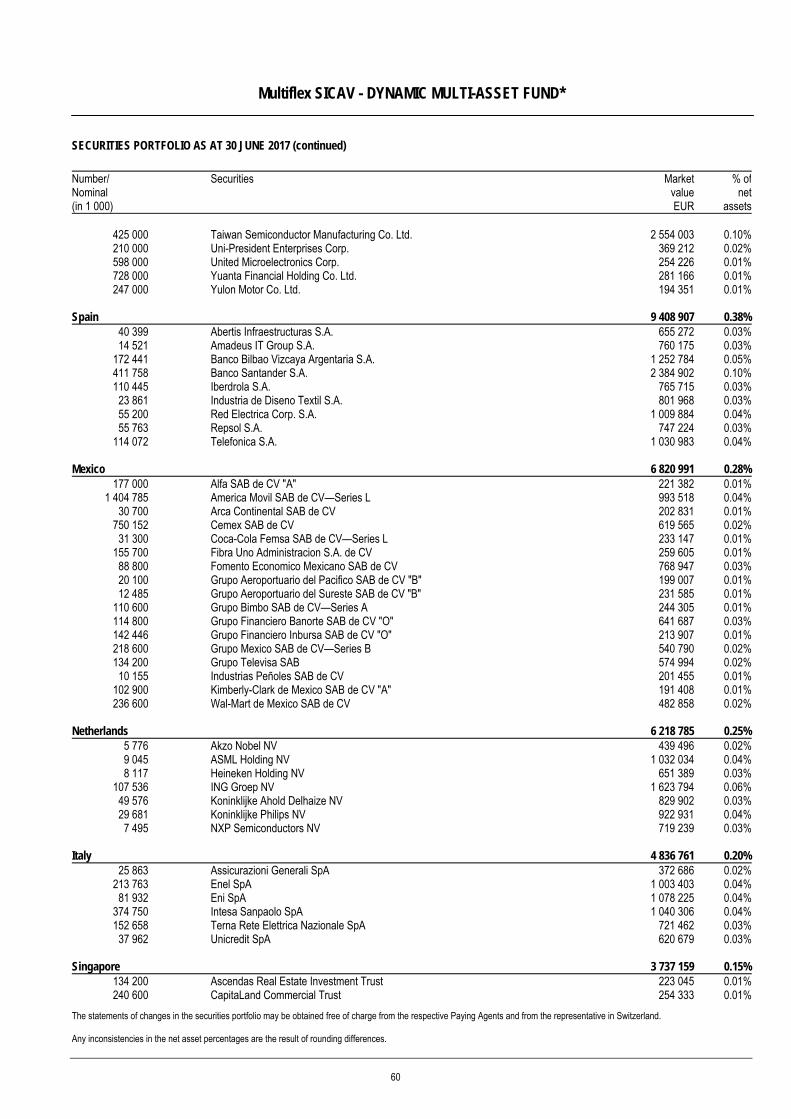
Multiflex SICAV - DYNAMIC MULTI-ASSET FUND*
SECURITIES PORTFOLIO AS AT 30 JUNE 2017 (continued)
The statements of changes in the securities portfolio may be obtained free of charge from the respective Paying Agents and from the representative in Switzerland. Any inconsistencies in the net asset percentages are the result of rounding differences.
Number/ Nominal (in 1 000)
Securities MarketvalueEUR
% ofnet
assets
425 000 Taiwan Semiconductor Manufacturing Co. Ltd. 2 554 003 0.10%210 000 Uni-President Enterprises Corp. 369 212 0.02%598 000 United Microelectronics Corp. 254 226 0.01%728 000 Yuanta Financial Holding Co. Ltd. 281 166 0.01%247 000 Yulon Motor Co. Ltd. 194 351 0.01%
Spain 9 408 907 0.38%40 399 Abertis Infraestructuras S.A. 655 272 0.03%14 521 Amadeus IT Group S.A. 760 175 0.03%
172 441 Banco Bilbao Vizcaya Argentaria S.A. 1 252 784 0.05%411 758 Banco Santander S.A. 2 384 902 0.10%110 445 Iberdrola S.A. 765 715 0.03%
23 861 Industria de Diseno Textil S.A. 801 968 0.03%55 200 Red Electrica Corp. S.A. 1 009 884 0.04%55 763 Repsol S.A. 747 224 0.03%
114 072 Telefonica S.A. 1 030 983 0.04%
Mexico 6 820 991 0.28%177 000 Alfa SAB de CV "A" 221 382 0.01%
1 404 785 America Movil SAB de CV—Series L 993 518 0.04%30 700 Arca Continental SAB de CV 202 831 0.01%
750 152 Cemex SAB de CV 619 565 0.02%31 300 Coca-Cola Femsa SAB de CV—Series L 233 147 0.01%
155 700 Fibra Uno Administracion S.A. de CV 259 605 0.01%88 800 Fomento Economico Mexicano SAB de CV 768 947 0.03%20 100 Grupo Aeroportuario del Pacifico SAB de CV "B" 199 007 0.01%12 485 Grupo Aeroportuario del Sureste SAB de CV "B" 231 585 0.01%
110 600 Grupo Bimbo SAB de CV—Series A 244 305 0.01%114 800 Grupo Financiero Banorte SAB de CV "O" 641 687 0.03%142 446 Grupo Financiero Inbursa SAB de CV "O" 213 907 0.01%218 600 Grupo Mexico SAB de CV—Series B 540 790 0.02%134 200 Grupo Televisa SAB 574 994 0.02%
10 155 Industrias Peñoles SAB de CV 201 455 0.01%102 900 Kimberly-Clark de Mexico SAB de CV "A" 191 408 0.01%236 600 Wal-Mart de Mexico SAB de CV 482 858 0.02%
Netherlands 6 218 785 0.25%5 776 Akzo Nobel NV 439 496 0.02%9 045 ASML Holding NV 1 032 034 0.04%8 117 Heineken Holding NV 651 389 0.03%
107 536 ING Groep NV 1 623 794 0.06%49 576 Koninklijke Ahold Delhaize NV 829 902 0.03%29 681 Koninklijke Philips NV 922 931 0.04%7 495 NXP Semiconductors NV 719 239 0.03%
Italy 4 836 761 0.20%25 863 Assicurazioni Generali SpA 372 686 0.02%
213 763 Enel SpA 1 003 403 0.04%81 932 Eni SpA 1 078 225 0.04%
374 750 Intesa Sanpaolo SpA 1 040 306 0.04%152 658 Terna Rete Elettrica Nazionale SpA 721 462 0.03%
37 962 Unicredit SpA 620 679 0.03%
Singapore 3 737 159 0.15%134 200 Ascendas Real Estate Investment Trust 223 045 0.01%240 600 CapitaLand Commercial Trust 254 333 0.01%
60
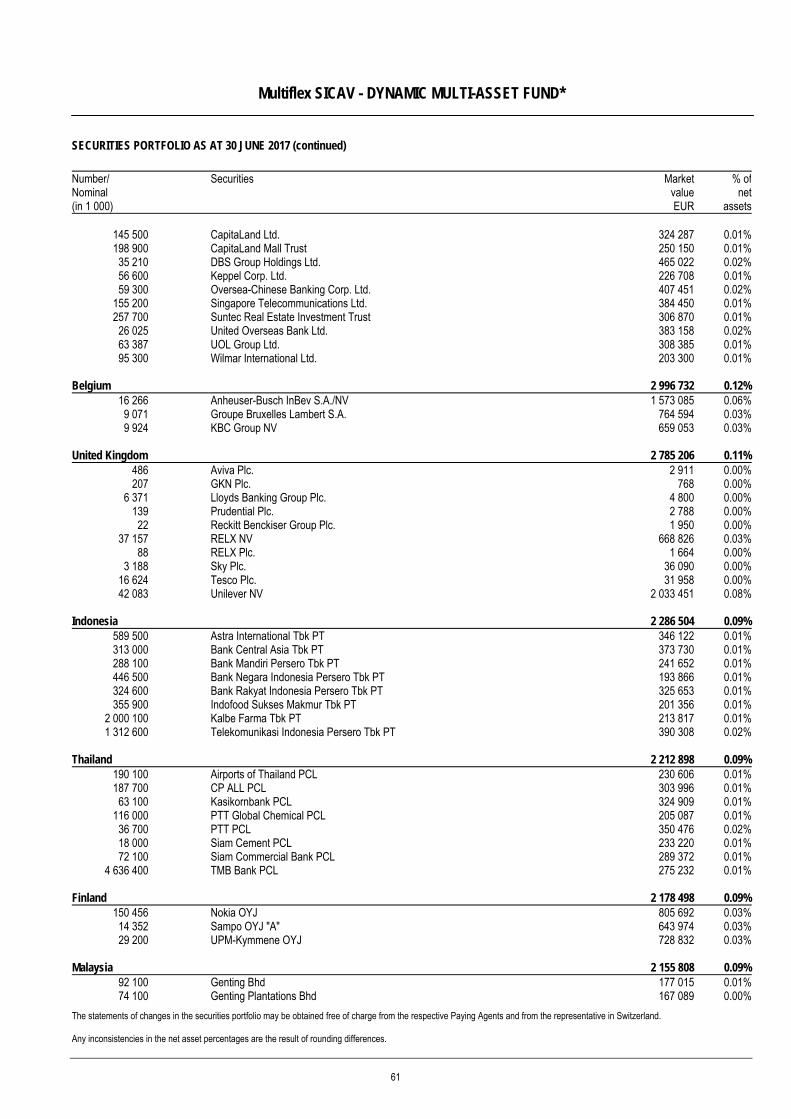
Multiflex SICAV - DYNAMIC MULTI-ASSET FUND*
SECURITIES PORTFOLIO AS AT 30 JUNE 2017 (continued)
The statements of changes in the securities portfolio may be obtained free of charge from the respective Paying Agents and from the representative in Switzerland. Any inconsistencies in the net asset percentages are the result of rounding differences.
Number/ Nominal (in 1 000)
Securities MarketvalueEUR
% ofnet
assets
145 500 CapitaLand Ltd. 324 287 0.01%198 900 CapitaLand Mall Trust 250 150 0.01%
35 210 DBS Group Holdings Ltd. 465 022 0.02%56 600 Keppel Corp. Ltd. 226 708 0.01%59 300 Oversea-Chinese Banking Corp. Ltd. 407 451 0.02%
155 200 Singapore Telecommunications Ltd. 384 450 0.01%257 700 Suntec Real Estate Investment Trust 306 870 0.01%
26 025 United Overseas Bank Ltd. 383 158 0.02%63 387 UOL Group Ltd. 308 385 0.01%95 300 Wilmar International Ltd. 203 300 0.01%
Belgium 2 996 732 0.12%16 266 Anheuser-Busch InBev S.A./NV 1 573 085 0.06%9 071 Groupe Bruxelles Lambert S.A. 764 594 0.03%9 924 KBC Group NV 659 053 0.03%
United Kingdom 2 785 206 0.11%486 Aviva Plc. 2 911 0.00%207 GKN Plc. 768 0.00%
6 371 Lloyds Banking Group Plc. 4 800 0.00%139 Prudential Plc. 2 788 0.00%22 Reckitt Benckiser Group Plc. 1 950 0.00%
37 157 RELX NV 668 826 0.03%88 RELX Plc. 1 664 0.00%
3 188 Sky Plc. 36 090 0.00%16 624 Tesco Plc. 31 958 0.00%42 083 Unilever NV 2 033 451 0.08%
Indonesia 2 286 504 0.09%589 500 Astra International Tbk PT 346 122 0.01%313 000 Bank Central Asia Tbk PT 373 730 0.01%288 100 Bank Mandiri Persero Tbk PT 241 652 0.01%446 500 Bank Negara Indonesia Persero Tbk PT 193 866 0.01%324 600 Bank Rakyat Indonesia Persero Tbk PT 325 653 0.01%355 900 Indofood Sukses Makmur Tbk PT 201 356 0.01%
2 000 100 Kalbe Farma Tbk PT 213 817 0.01%1 312 600 Telekomunikasi Indonesia Persero Tbk PT 390 308 0.02%
Thailand 2 212 898 0.09%190 100 Airports of Thailand PCL 230 606 0.01%187 700 CP ALL PCL 303 996 0.01%
63 100 Kasikornbank PCL 324 909 0.01%116 000 PTT Global Chemical PCL 205 087 0.01%
36 700 PTT PCL 350 476 0.02%18 000 Siam Cement PCL 233 220 0.01%72 100 Siam Commercial Bank PCL 289 372 0.01%
4 636 400 TMB Bank PCL 275 232 0.01%
Finland 2 178 498 0.09%150 456 Nokia OYJ 805 692 0.03%
14 352 Sampo OYJ "A" 643 974 0.03%29 200 UPM-Kymmene OYJ 728 832 0.03%
Malaysia 2 155 808 0.09%92 100 Genting Bhd 177 015 0.01%74 100 Genting Plantations Bhd 167 089 0.00%
61
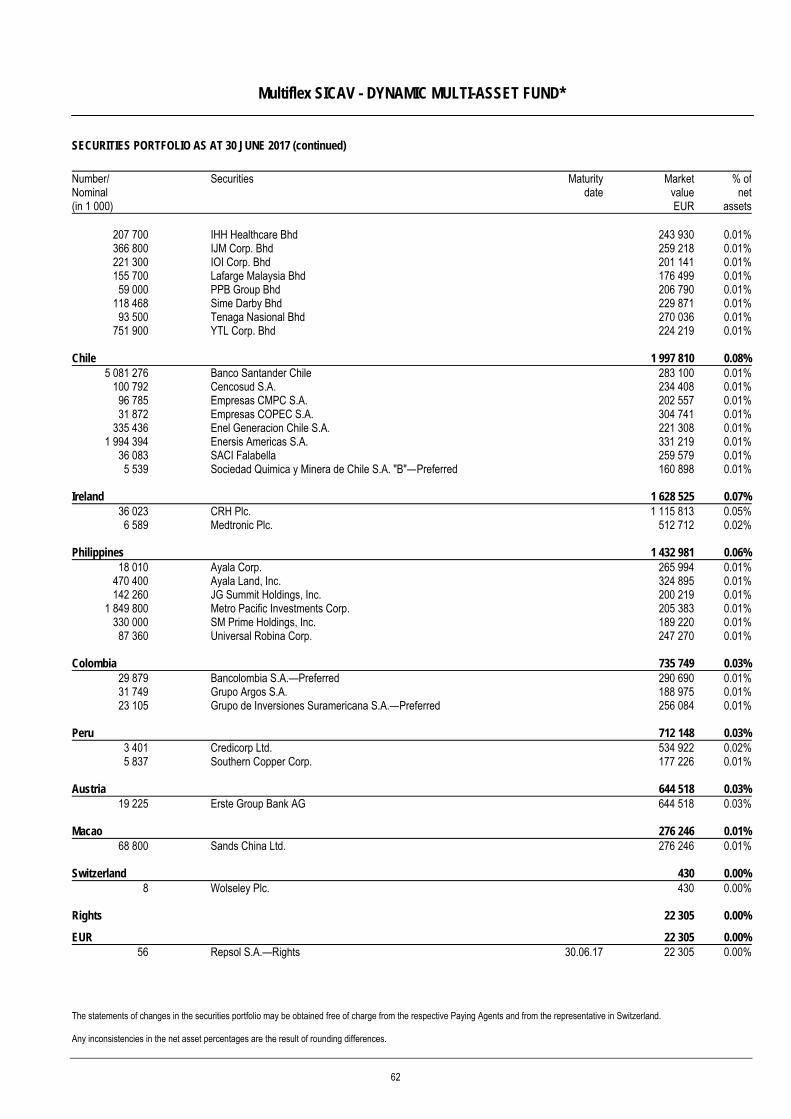
Multiflex SICAV - DYNAMIC MULTI-ASSET FUND*
SECURITIES PORTFOLIO AS AT 30 JUNE 2017 (continued)
The statements of changes in the securities portfolio may be obtained free of charge from the respective Paying Agents and from the representative in Switzerland. Any inconsistencies in the net asset percentages are the result of rounding differences.
Number/ Nominal (in 1 000)
Securities Maturitydate
MarketvalueEUR
% ofnet
assets
207 700 IHH Healthcare Bhd 243 930 0.01%366 800 IJM Corp. Bhd 259 218 0.01%221 300 IOI Corp. Bhd 201 141 0.01%155 700 Lafarge Malaysia Bhd 176 499 0.01%
59 000 PPB Group Bhd 206 790 0.01%118 468 Sime Darby Bhd 229 871 0.01%
93 500 Tenaga Nasional Bhd 270 036 0.01%751 900 YTL Corp. Bhd 224 219 0.01%
Chile 1 997 810 0.08%5 081 276 Banco Santander Chile 283 100 0.01%
100 792 Cencosud S.A. 234 408 0.01%96 785 Empresas CMPC S.A. 202 557 0.01%31 872 Empresas COPEC S.A. 304 741 0.01%
335 436 Enel Generacion Chile S.A. 221 308 0.01%1 994 394 Enersis Americas S.A. 331 219 0.01%
36 083 SACI Falabella 259 579 0.01%5 539 Sociedad Quimica y Minera de Chile S.A. "B"—Preferred 160 898 0.01%
Ireland 1 628 525 0.07%36 023 CRH Plc. 1 115 813 0.05%6 589 Medtronic Plc. 512 712 0.02%
Philippines 1 432 981 0.06%18 010 Ayala Corp. 265 994 0.01%
470 400 Ayala Land, Inc. 324 895 0.01%142 260 JG Summit Holdings, Inc. 200 219 0.01%
1 849 800 Metro Pacific Investments Corp. 205 383 0.01%330 000 SM Prime Holdings, Inc. 189 220 0.01%
87 360 Universal Robina Corp. 247 270 0.01%
Colombia 735 749 0.03%29 879 Bancolombia S.A.—Preferred 290 690 0.01%31 749 Grupo Argos S.A. 188 975 0.01%23 105 Grupo de Inversiones Suramericana S.A.—Preferred 256 084 0.01%
Peru 712 148 0.03%3 401 Credicorp Ltd. 534 922 0.02%5 837 Southern Copper Corp. 177 226 0.01%
Austria 644 518 0.03%19 225 Erste Group Bank AG 644 518 0.03%
Macao 276 246 0.01%68 800 Sands China Ltd. 276 246 0.01%
Switzerland 430 0.00%8 Wolseley Plc. 430 0.00%
Rights 22 305 0.00%
EUR 22 305 0.00%56 Repsol S.A.—Rights 30.06.17 22 305 0.00%
62
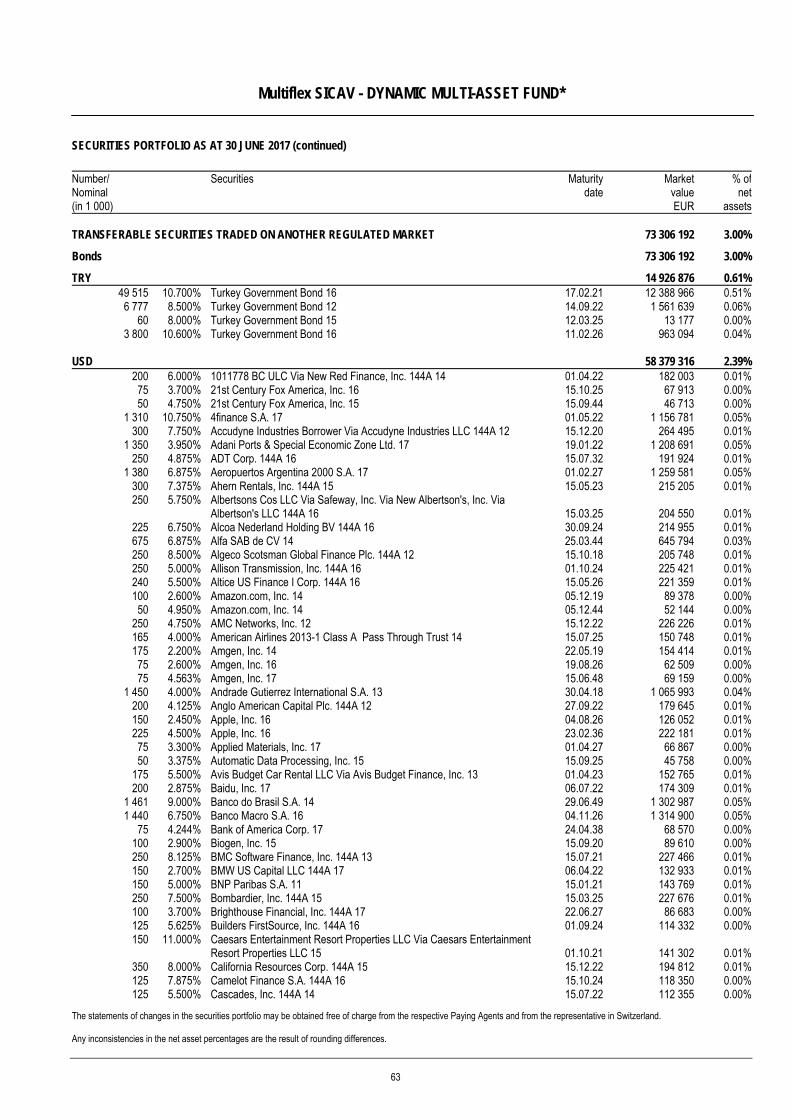
Multiflex SICAV - DYNAMIC MULTI-ASSET FUND*
SECURITIES PORTFOLIO AS AT 30 JUNE 2017 (continued)
The statements of changes in the securities portfolio may be obtained free of charge from the respective Paying Agents and from the representative in Switzerland. Any inconsistencies in the net asset percentages are the result of rounding differences.
Number/ Nominal (in 1 000)
Securities Maturitydate
MarketvalueEUR
% ofnet
assets TRANSFERABLE SECURITIES TRADED ON ANOTHER REGULATED MARKET 73 306 192 3.00%
Bonds 73 306 192 3.00%
TRY 14 926 876 0.61%49 515 10.700% Turkey Government Bond 16 17.02.21 12 388 966 0.51%6 777 8.500% Turkey Government Bond 12 14.09.22 1 561 639 0.06%
60 8.000% Turkey Government Bond 15 12.03.25 13 177 0.00%3 800 10.600% Turkey Government Bond 16 11.02.26 963 094 0.04%
USD 58 379 316 2.39%200 6.000% 1011778 BC ULC Via New Red Finance, Inc. 144A 14 01.04.22 182 003 0.01%75 3.700% 21st Century Fox America, Inc. 16 15.10.25 67 913 0.00%50 4.750% 21st Century Fox America, Inc. 15 15.09.44 46 713 0.00%
1 310 10.750% 4finance S.A. 17 01.05.22 1 156 781 0.05%300 7.750% Accudyne Industries Borrower Via Accudyne Industries LLC 144A 12 15.12.20 264 495 0.01%
1 350 3.950% Adani Ports & Special Economic Zone Ltd. 17 19.01.22 1 208 691 0.05%250 4.875% ADT Corp. 144A 16 15.07.32 191 924 0.01%
1 380 6.875% Aeropuertos Argentina 2000 S.A. 17 01.02.27 1 259 581 0.05%300 7.375% Ahern Rentals, Inc. 144A 15 15.05.23 215 205 0.01%250 5.750% Albertsons Cos LLC Via Safeway, Inc. Via New Albertson's, Inc. Via
Albertson's LLC 144A 16 15.03.25 204 550 0.01%225 6.750% Alcoa Nederland Holding BV 144A 16 30.09.24 214 955 0.01%675 6.875% Alfa SAB de CV 14 25.03.44 645 794 0.03%250 8.500% Algeco Scotsman Global Finance Plc. 144A 12 15.10.18 205 748 0.01%250 5.000% Allison Transmission, Inc. 144A 16 01.10.24 225 421 0.01%240 5.500% Altice US Finance I Corp. 144A 16 15.05.26 221 359 0.01%100 2.600% Amazon.com, Inc. 14 05.12.19 89 378 0.00%50 4.950% Amazon.com, Inc. 14 05.12.44 52 144 0.00%
250 4.750% AMC Networks, Inc. 12 15.12.22 226 226 0.01%165 4.000% American Airlines 2013-1 Class A Pass Through Trust 14 15.07.25 150 748 0.01%175 2.200% Amgen, Inc. 14 22.05.19 154 414 0.01%75 2.600% Amgen, Inc. 16 19.08.26 62 509 0.00%75 4.563% Amgen, Inc. 17 15.06.48 69 159 0.00%
1 450 4.000% Andrade Gutierrez International S.A. 13 30.04.18 1 065 993 0.04%200 4.125% Anglo American Capital Plc. 144A 12 27.09.22 179 645 0.01%150 2.450% Apple, Inc. 16 04.08.26 126 052 0.01%225 4.500% Apple, Inc. 16 23.02.36 222 181 0.01%75 3.300% Applied Materials, Inc. 17 01.04.27 66 867 0.00%50 3.375% Automatic Data Processing, Inc. 15 15.09.25 45 758 0.00%
175 5.500% Avis Budget Car Rental LLC Via Avis Budget Finance, Inc. 13 01.04.23 152 765 0.01%200 2.875% Baidu, Inc. 17 06.07.22 174 309 0.01%
1 461 9.000% Banco do Brasil S.A. 14 29.06.49 1 302 987 0.05%1 440 6.750% Banco Macro S.A. 16 04.11.26 1 314 900 0.05%
75 4.244% Bank of America Corp. 17 24.04.38 68 570 0.00%100 2.900% Biogen, Inc. 15 15.09.20 89 610 0.00%250 8.125% BMC Software Finance, Inc. 144A 13 15.07.21 227 466 0.01%150 2.700% BMW US Capital LLC 144A 17 06.04.22 132 933 0.01%150 5.000% BNP Paribas S.A. 11 15.01.21 143 769 0.01%250 7.500% Bombardier, Inc. 144A 15 15.03.25 227 676 0.01%100 3.700% Brighthouse Financial, Inc. 144A 17 22.06.27 86 683 0.00%125 5.625% Builders FirstSource, Inc. 144A 16 01.09.24 114 332 0.00%150 11.000% Caesars Entertainment Resort Properties LLC Via Caesars Entertainment
Resort Properties LLC 15 01.10.21 141 302 0.01%350 8.000% California Resources Corp. 144A 15 15.12.22 194 812 0.01%125 7.875% Camelot Finance S.A. 144A 16 15.10.24 118 350 0.00%125 5.500% Cascades, Inc. 144A 14 15.07.22 112 355 0.00%
63
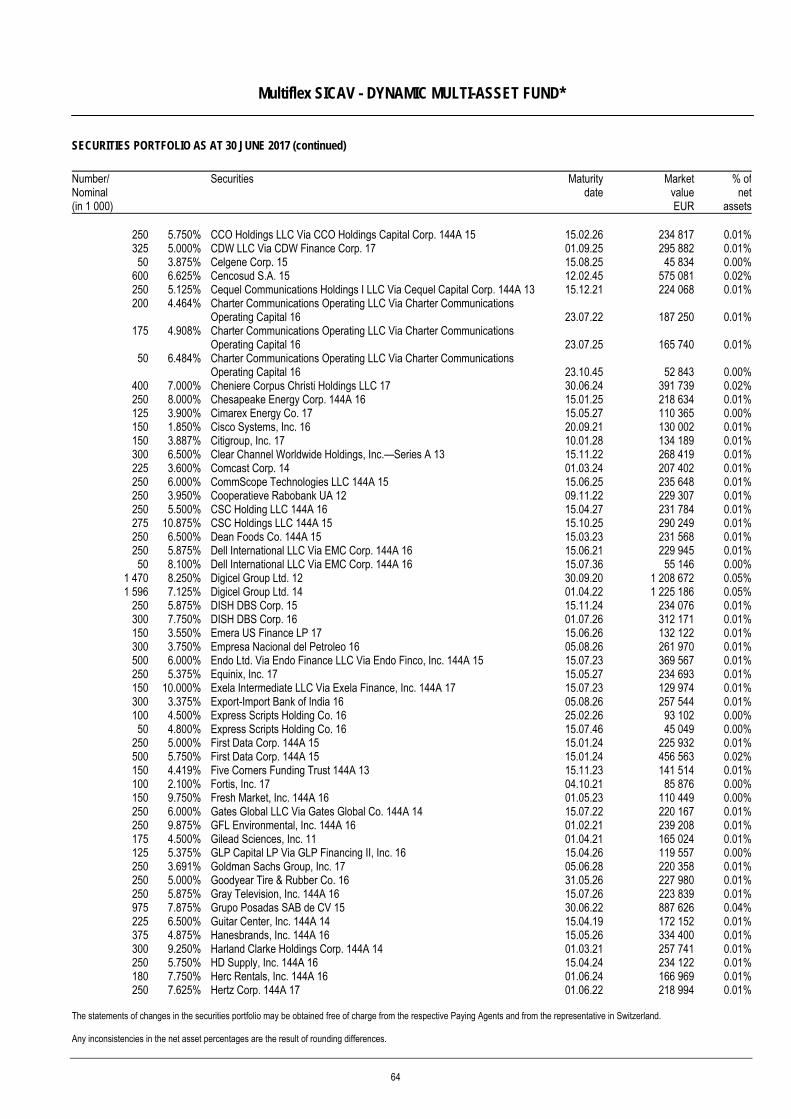
Multiflex SICAV - DYNAMIC MULTI-ASSET FUND*
SECURITIES PORTFOLIO AS AT 30 JUNE 2017 (continued)
The statements of changes in the securities portfolio may be obtained free of charge from the respective Paying Agents and from the representative in Switzerland. Any inconsistencies in the net asset percentages are the result of rounding differences.
Number/ Nominal (in 1 000)
Securities Maturitydate
MarketvalueEUR
% ofnet
assets
250 5.750% CCO Holdings LLC Via CCO Holdings Capital Corp. 144A 15 15.02.26 234 817 0.01%325 5.000% CDW LLC Via CDW Finance Corp. 17 01.09.25 295 882 0.01%50 3.875% Celgene Corp. 15 15.08.25 45 834 0.00%
600 6.625% Cencosud S.A. 15 12.02.45 575 081 0.02%250 5.125% Cequel Communications Holdings I LLC Via Cequel Capital Corp. 144A 13 15.12.21 224 068 0.01%200 4.464% Charter Communications Operating LLC Via Charter Communications
Operating Capital 16 23.07.22 187 250 0.01%175 4.908% Charter Communications Operating LLC Via Charter Communications
Operating Capital 16 23.07.25 165 740 0.01%50 6.484% Charter Communications Operating LLC Via Charter Communications
Operating Capital 16 23.10.45 52 843 0.00%400 7.000% Cheniere Corpus Christi Holdings LLC 17 30.06.24 391 739 0.02%250 8.000% Chesapeake Energy Corp. 144A 16 15.01.25 218 634 0.01%125 3.900% Cimarex Energy Co. 17 15.05.27 110 365 0.00%150 1.850% Cisco Systems, Inc. 16 20.09.21 130 002 0.01%150 3.887% Citigroup, Inc. 17 10.01.28 134 189 0.01%300 6.500% Clear Channel Worldwide Holdings, Inc.—Series A 13 15.11.22 268 419 0.01%225 3.600% Comcast Corp. 14 01.03.24 207 402 0.01%250 6.000% CommScope Technologies LLC 144A 15 15.06.25 235 648 0.01%250 3.950% Cooperatieve Rabobank UA 12 09.11.22 229 307 0.01%250 5.500% CSC Holding LLC 144A 16 15.04.27 231 784 0.01%275 10.875% CSC Holdings LLC 144A 15 15.10.25 290 249 0.01%250 6.500% Dean Foods Co. 144A 15 15.03.23 231 568 0.01%250 5.875% Dell International LLC Via EMC Corp. 144A 16 15.06.21 229 945 0.01%50 8.100% Dell International LLC Via EMC Corp. 144A 16 15.07.36 55 146 0.00%
1 470 8.250% Digicel Group Ltd. 12 30.09.20 1 208 672 0.05%1 596 7.125% Digicel Group Ltd. 14 01.04.22 1 225 186 0.05%
250 5.875% DISH DBS Corp. 15 15.11.24 234 076 0.01%300 7.750% DISH DBS Corp. 16 01.07.26 312 171 0.01%150 3.550% Emera US Finance LP 17 15.06.26 132 122 0.01%300 3.750% Empresa Nacional del Petroleo 16 05.08.26 261 970 0.01%500 6.000% Endo Ltd. Via Endo Finance LLC Via Endo Finco, Inc. 144A 15 15.07.23 369 567 0.01%250 5.375% Equinix, Inc. 17 15.05.27 234 693 0.01%150 10.000% Exela Intermediate LLC Via Exela Finance, Inc. 144A 17 15.07.23 129 974 0.01%300 3.375% Export-Import Bank of India 16 05.08.26 257 544 0.01%100 4.500% Express Scripts Holding Co. 16 25.02.26 93 102 0.00%50 4.800% Express Scripts Holding Co. 16 15.07.46 45 049 0.00%
250 5.000% First Data Corp. 144A 15 15.01.24 225 932 0.01%500 5.750% First Data Corp. 144A 15 15.01.24 456 563 0.02%150 4.419% Five Corners Funding Trust 144A 13 15.11.23 141 514 0.01%100 2.100% Fortis, Inc. 17 04.10.21 85 876 0.00%150 9.750% Fresh Market, Inc. 144A 16 01.05.23 110 449 0.00%250 6.000% Gates Global LLC Via Gates Global Co. 144A 14 15.07.22 220 167 0.01%250 9.875% GFL Environmental, Inc. 144A 16 01.02.21 239 208 0.01%175 4.500% Gilead Sciences, Inc. 11 01.04.21 165 024 0.01%125 5.375% GLP Capital LP Via GLP Financing II, Inc. 16 15.04.26 119 557 0.00%250 3.691% Goldman Sachs Group, Inc. 17 05.06.28 220 358 0.01%250 5.000% Goodyear Tire & Rubber Co. 16 31.05.26 227 980 0.01%250 5.875% Gray Television, Inc. 144A 16 15.07.26 223 839 0.01%975 7.875% Grupo Posadas SAB de CV 15 30.06.22 887 626 0.04%225 6.500% Guitar Center, Inc. 144A 14 15.04.19 172 152 0.01%375 4.875% Hanesbrands, Inc. 144A 16 15.05.26 334 400 0.01%300 9.250% Harland Clarke Holdings Corp. 144A 14 01.03.21 257 741 0.01%250 5.750% HD Supply, Inc. 144A 16 15.04.24 234 122 0.01%180 7.750% Herc Rentals, Inc. 144A 16 01.06.24 166 969 0.01%250 7.625% Hertz Corp. 144A 17 01.06.22 218 994 0.01%
64
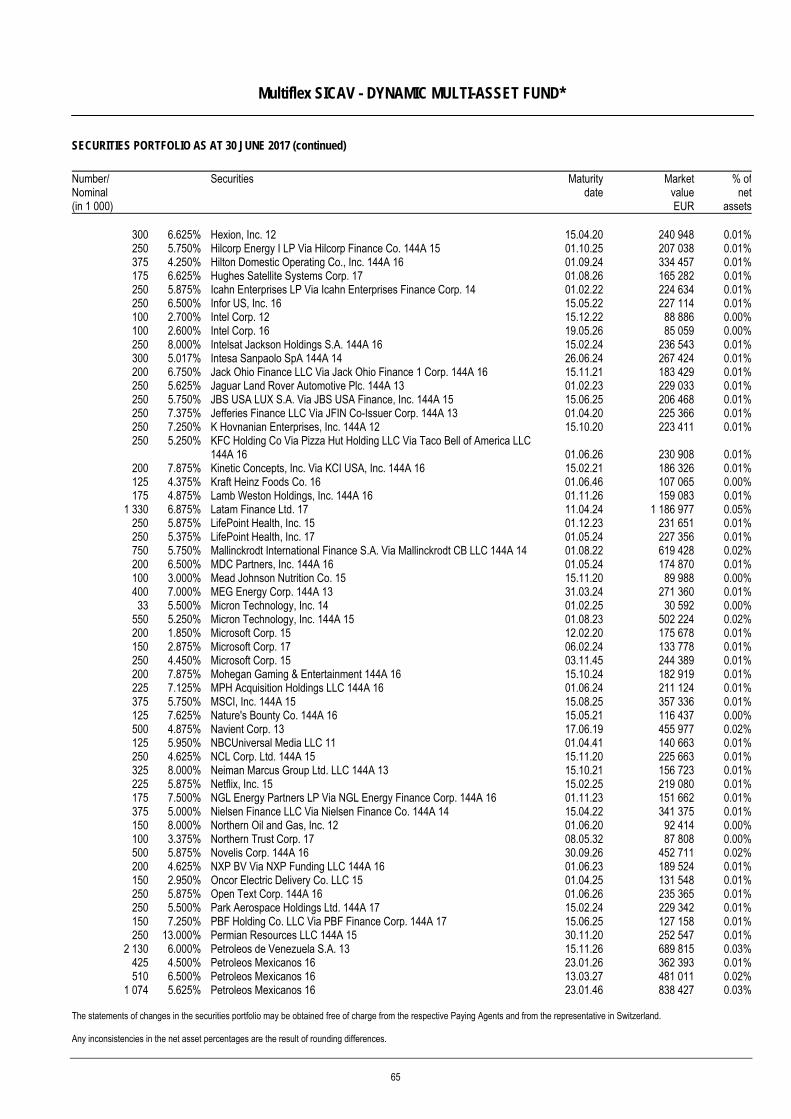
Multiflex SICAV - DYNAMIC MULTI-ASSET FUND*
SECURITIES PORTFOLIO AS AT 30 JUNE 2017 (continued)
The statements of changes in the securities portfolio may be obtained free of charge from the respective Paying Agents and from the representative in Switzerland. Any inconsistencies in the net asset percentages are the result of rounding differences.
Number/ Nominal (in 1 000)
Securities Maturitydate
MarketvalueEUR
% ofnet
assets
300 6.625% Hexion, Inc. 12 15.04.20 240 948 0.01%250 5.750% Hilcorp Energy I LP Via Hilcorp Finance Co. 144A 15 01.10.25 207 038 0.01%375 4.250% Hilton Domestic Operating Co., Inc. 144A 16 01.09.24 334 457 0.01%175 6.625% Hughes Satellite Systems Corp. 17 01.08.26 165 282 0.01%250 5.875% Icahn Enterprises LP Via Icahn Enterprises Finance Corp. 14 01.02.22 224 634 0.01%250 6.500% Infor US, Inc. 16 15.05.22 227 114 0.01%100 2.700% Intel Corp. 12 15.12.22 88 886 0.00%100 2.600% Intel Corp. 16 19.05.26 85 059 0.00%250 8.000% Intelsat Jackson Holdings S.A. 144A 16 15.02.24 236 543 0.01%300 5.017% Intesa Sanpaolo SpA 144A 14 26.06.24 267 424 0.01%200 6.750% Jack Ohio Finance LLC Via Jack Ohio Finance 1 Corp. 144A 16 15.11.21 183 429 0.01%250 5.625% Jaguar Land Rover Automotive Plc. 144A 13 01.02.23 229 033 0.01%250 5.750% JBS USA LUX S.A. Via JBS USA Finance, Inc. 144A 15 15.06.25 206 468 0.01%250 7.375% Jefferies Finance LLC Via JFIN Co-Issuer Corp. 144A 13 01.04.20 225 366 0.01%250 7.250% K Hovnanian Enterprises, Inc. 144A 12 15.10.20 223 411 0.01%250 5.250% KFC Holding Co Via Pizza Hut Holding LLC Via Taco Bell of America LLC
144A 16 01.06.26 230 908 0.01%200 7.875% Kinetic Concepts, Inc. Via KCI USA, Inc. 144A 16 15.02.21 186 326 0.01%125 4.375% Kraft Heinz Foods Co. 16 01.06.46 107 065 0.00%175 4.875% Lamb Weston Holdings, Inc. 144A 16 01.11.26 159 083 0.01%
1 330 6.875% Latam Finance Ltd. 17 11.04.24 1 186 977 0.05%250 5.875% LifePoint Health, Inc. 15 01.12.23 231 651 0.01%250 5.375% LifePoint Health, Inc. 17 01.05.24 227 356 0.01%750 5.750% Mallinckrodt International Finance S.A. Via Mallinckrodt CB LLC 144A 14 01.08.22 619 428 0.02%200 6.500% MDC Partners, Inc. 144A 16 01.05.24 174 870 0.01%100 3.000% Mead Johnson Nutrition Co. 15 15.11.20 89 988 0.00%400 7.000% MEG Energy Corp. 144A 13 31.03.24 271 360 0.01%33 5.500% Micron Technology, Inc. 14 01.02.25 30 592 0.00%
550 5.250% Micron Technology, Inc. 144A 15 01.08.23 502 224 0.02%200 1.850% Microsoft Corp. 15 12.02.20 175 678 0.01%150 2.875% Microsoft Corp. 17 06.02.24 133 778 0.01%250 4.450% Microsoft Corp. 15 03.11.45 244 389 0.01%200 7.875% Mohegan Gaming & Entertainment 144A 16 15.10.24 182 919 0.01%225 7.125% MPH Acquisition Holdings LLC 144A 16 01.06.24 211 124 0.01%375 5.750% MSCI, Inc. 144A 15 15.08.25 357 336 0.01%125 7.625% Nature's Bounty Co. 144A 16 15.05.21 116 437 0.00%500 4.875% Navient Corp. 13 17.06.19 455 977 0.02%125 5.950% NBCUniversal Media LLC 11 01.04.41 140 663 0.01%250 4.625% NCL Corp. Ltd. 144A 15 15.11.20 225 663 0.01%325 8.000% Neiman Marcus Group Ltd. LLC 144A 13 15.10.21 156 723 0.01%225 5.875% Netflix, Inc. 15 15.02.25 219 080 0.01%175 7.500% NGL Energy Partners LP Via NGL Energy Finance Corp. 144A 16 01.11.23 151 662 0.01%375 5.000% Nielsen Finance LLC Via Nielsen Finance Co. 144A 14 15.04.22 341 375 0.01%150 8.000% Northern Oil and Gas, Inc. 12 01.06.20 92 414 0.00%100 3.375% Northern Trust Corp. 17 08.05.32 87 808 0.00%500 5.875% Novelis Corp. 144A 16 30.09.26 452 711 0.02%200 4.625% NXP BV Via NXP Funding LLC 144A 16 01.06.23 189 524 0.01%150 2.950% Oncor Electric Delivery Co. LLC 15 01.04.25 131 548 0.01%250 5.875% Open Text Corp. 144A 16 01.06.26 235 365 0.01%250 5.500% Park Aerospace Holdings Ltd. 144A 17 15.02.24 229 342 0.01%150 7.250% PBF Holding Co. LLC Via PBF Finance Corp. 144A 17 15.06.25 127 158 0.01%250 13.000% Permian Resources LLC 144A 15 30.11.20 252 547 0.01%
2 130 6.000% Petroleos de Venezuela S.A. 13 15.11.26 689 815 0.03%425 4.500% Petroleos Mexicanos 16 23.01.26 362 393 0.01%510 6.500% Petroleos Mexicanos 16 13.03.27 481 011 0.02%
1 074 5.625% Petroleos Mexicanos 16 23.01.46 838 427 0.03%
65
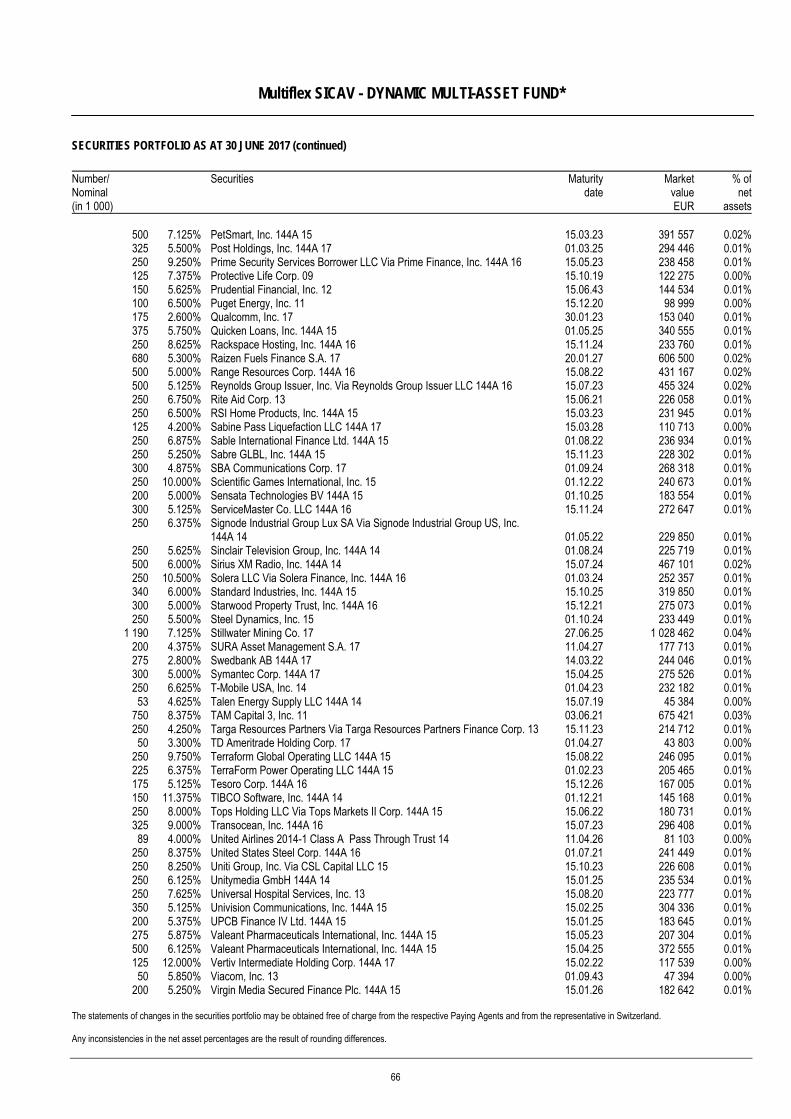
Multiflex SICAV - DYNAMIC MULTI-ASSET FUND*
SECURITIES PORTFOLIO AS AT 30 JUNE 2017 (continued)
The statements of changes in the securities portfolio may be obtained free of charge from the respective Paying Agents and from the representative in Switzerland. Any inconsistencies in the net asset percentages are the result of rounding differences.
Number/ Nominal (in 1 000)
Securities Maturitydate
MarketvalueEUR
% ofnet
assets
500 7.125% PetSmart, Inc. 144A 15 15.03.23 391 557 0.02%325 5.500% Post Holdings, Inc. 144A 17 01.03.25 294 446 0.01%250 9.250% Prime Security Services Borrower LLC Via Prime Finance, Inc. 144A 16 15.05.23 238 458 0.01%125 7.375% Protective Life Corp. 09 15.10.19 122 275 0.00%150 5.625% Prudential Financial, Inc. 12 15.06.43 144 534 0.01%100 6.500% Puget Energy, Inc. 11 15.12.20 98 999 0.00%175 2.600% Qualcomm, Inc. 17 30.01.23 153 040 0.01%375 5.750% Quicken Loans, Inc. 144A 15 01.05.25 340 555 0.01%250 8.625% Rackspace Hosting, Inc. 144A 16 15.11.24 233 760 0.01%680 5.300% Raizen Fuels Finance S.A. 17 20.01.27 606 500 0.02%500 5.000% Range Resources Corp. 144A 16 15.08.22 431 167 0.02%500 5.125% Reynolds Group Issuer, Inc. Via Reynolds Group Issuer LLC 144A 16 15.07.23 455 324 0.02%250 6.750% Rite Aid Corp. 13 15.06.21 226 058 0.01%250 6.500% RSI Home Products, Inc. 144A 15 15.03.23 231 945 0.01%125 4.200% Sabine Pass Liquefaction LLC 144A 17 15.03.28 110 713 0.00%250 6.875% Sable International Finance Ltd. 144A 15 01.08.22 236 934 0.01%250 5.250% Sabre GLBL, Inc. 144A 15 15.11.23 228 302 0.01%300 4.875% SBA Communications Corp. 17 01.09.24 268 318 0.01%250 10.000% Scientific Games International, Inc. 15 01.12.22 240 673 0.01%200 5.000% Sensata Technologies BV 144A 15 01.10.25 183 554 0.01%300 5.125% ServiceMaster Co. LLC 144A 16 15.11.24 272 647 0.01%250 6.375% Signode Industrial Group Lux SA Via Signode Industrial Group US, Inc.
144A 14 01.05.22 229 850 0.01%250 5.625% Sinclair Television Group, Inc. 144A 14 01.08.24 225 719 0.01%500 6.000% Sirius XM Radio, Inc. 144A 14 15.07.24 467 101 0.02%250 10.500% Solera LLC Via Solera Finance, Inc. 144A 16 01.03.24 252 357 0.01%340 6.000% Standard Industries, Inc. 144A 15 15.10.25 319 850 0.01%300 5.000% Starwood Property Trust, Inc. 144A 16 15.12.21 275 073 0.01%250 5.500% Steel Dynamics, Inc. 15 01.10.24 233 449 0.01%
1 190 7.125% Stillwater Mining Co. 17 27.06.25 1 028 462 0.04%200 4.375% SURA Asset Management S.A. 17 11.04.27 177 713 0.01%275 2.800% Swedbank AB 144A 17 14.03.22 244 046 0.01%300 5.000% Symantec Corp. 144A 17 15.04.25 275 526 0.01%250 6.625% T-Mobile USA, Inc. 14 01.04.23 232 182 0.01%53 4.625% Talen Energy Supply LLC 144A 14 15.07.19 45 384 0.00%
750 8.375% TAM Capital 3, Inc. 11 03.06.21 675 421 0.03%250 4.250% Targa Resources Partners Via Targa Resources Partners Finance Corp. 13 15.11.23 214 712 0.01%50 3.300% TD Ameritrade Holding Corp. 17 01.04.27 43 803 0.00%
250 9.750% Terraform Global Operating LLC 144A 15 15.08.22 246 095 0.01%225 6.375% TerraForm Power Operating LLC 144A 15 01.02.23 205 465 0.01%175 5.125% Tesoro Corp. 144A 16 15.12.26 167 005 0.01%150 11.375% TIBCO Software, Inc. 144A 14 01.12.21 145 168 0.01%250 8.000% Tops Holding LLC Via Tops Markets II Corp. 144A 15 15.06.22 180 731 0.01%325 9.000% Transocean, Inc. 144A 16 15.07.23 296 408 0.01%89 4.000% United Airlines 2014-1 Class A Pass Through Trust 14 11.04.26 81 103 0.00%
250 8.375% United States Steel Corp. 144A 16 01.07.21 241 449 0.01%250 8.250% Uniti Group, Inc. Via CSL Capital LLC 15 15.10.23 226 608 0.01%250 6.125% Unitymedia GmbH 144A 14 15.01.25 235 534 0.01%250 7.625% Universal Hospital Services, Inc. 13 15.08.20 223 777 0.01%350 5.125% Univision Communications, Inc. 144A 15 15.02.25 304 336 0.01%200 5.375% UPCB Finance IV Ltd. 144A 15 15.01.25 183 645 0.01%275 5.875% Valeant Pharmaceuticals International, Inc. 144A 15 15.05.23 207 304 0.01%500 6.125% Valeant Pharmaceuticals International, Inc. 144A 15 15.04.25 372 555 0.01%125 12.000% Vertiv Intermediate Holding Corp. 144A 17 15.02.22 117 539 0.00%50 5.850% Viacom, Inc. 13 01.09.43 47 394 0.00%
200 5.250% Virgin Media Secured Finance Plc. 144A 15 15.01.26 182 642 0.01%
66
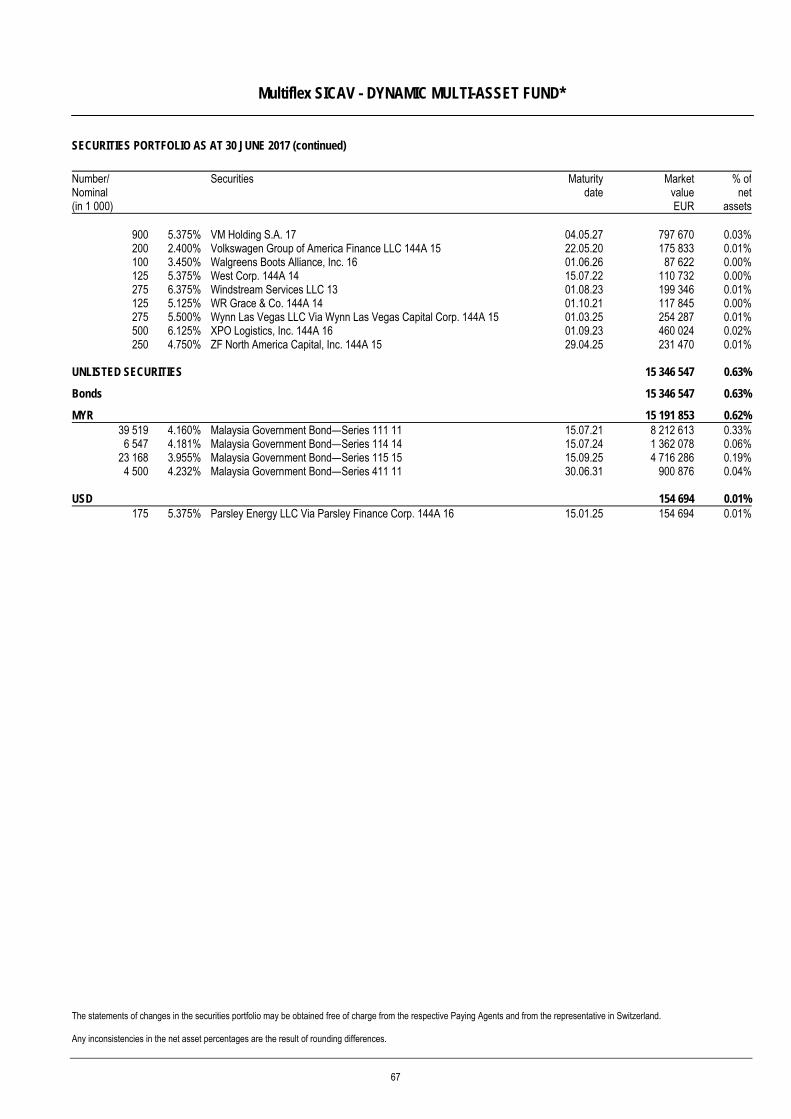
Multiflex SICAV - DYNAMIC MULTI-ASSET FUND*
SECURITIES PORTFOLIO AS AT 30 JUNE 2017 (continued)
The statements of changes in the securities portfolio may be obtained free of charge from the respective Paying Agents and from the representative in Switzerland. Any inconsistencies in the net asset percentages are the result of rounding differences.
Number/ Nominal (in 1 000)
Securities Maturitydate
MarketvalueEUR
% ofnet
assets
900 5.375% VM Holding S.A. 17 04.05.27 797 670 0.03%200 2.400% Volkswagen Group of America Finance LLC 144A 15 22.05.20 175 833 0.01%100 3.450% Walgreens Boots Alliance, Inc. 16 01.06.26 87 622 0.00%125 5.375% West Corp. 144A 14 15.07.22 110 732 0.00%275 6.375% Windstream Services LLC 13 01.08.23 199 346 0.01%125 5.125% WR Grace & Co. 144A 14 01.10.21 117 845 0.00%275 5.500% Wynn Las Vegas LLC Via Wynn Las Vegas Capital Corp. 144A 15 01.03.25 254 287 0.01%500 6.125% XPO Logistics, Inc. 144A 16 01.09.23 460 024 0.02%250 4.750% ZF North America Capital, Inc. 144A 15 29.04.25 231 470 0.01%
UNLISTED SECURITIES 15 346 547 0.63%
Bonds 15 346 547 0.63%
MYR 15 191 853 0.62%39 519 4.160% Malaysia Government Bond—Series 111 11 15.07.21 8 212 613 0.33%6 547 4.181% Malaysia Government Bond—Series 114 14 15.07.24 1 362 078 0.06%
23 168 3.955% Malaysia Government Bond—Series 115 15 15.09.25 4 716 286 0.19%4 500 4.232% Malaysia Government Bond—Series 411 11 30.06.31 900 876 0.04%
USD 154 694 0.01%175 5.375% Parsley Energy LLC Via Parsley Finance Corp. 144A 16 15.01.25 154 694 0.01%
67
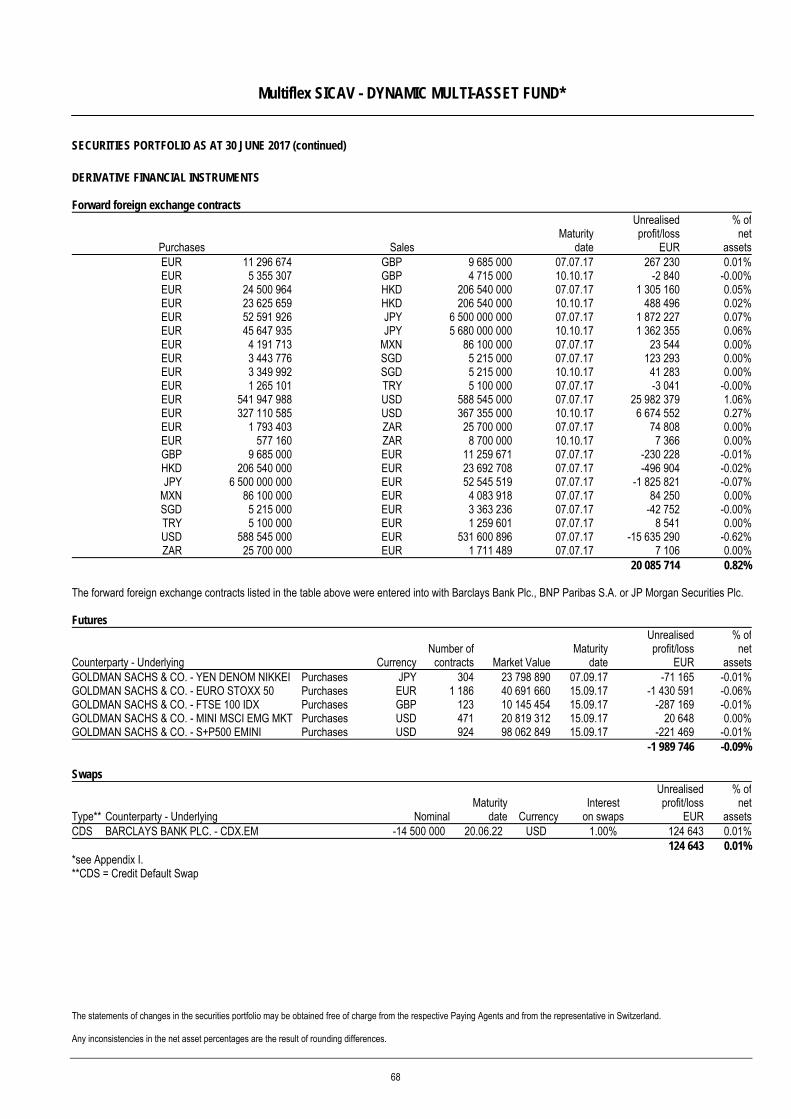
Multiflex SICAV - DYNAMIC MULTI-ASSET FUND*
SECURITIES PORTFOLIO AS AT 30 JUNE 2017 (continued)
The statements of changes in the securities portfolio may be obtained free of charge from the respective Paying Agents and from the representative in Switzerland. Any inconsistencies in the net asset percentages are the result of rounding differences.
DERIVATIVE FINANCIAL INSTRUMENTS Forward foreign exchange contracts
Purchases Sales Maturity
date
Unrealisedprofit/loss
EUR
% ofnet
assetsEUR 11 296 674 GBP 9 685 000 07.07.17 267 230 0.01%EUR 5 355 307 GBP 4 715 000 10.10.17 -2 840 -0.00%EUR 24 500 964 HKD 206 540 000 07.07.17 1 305 160 0.05%EUR 23 625 659 HKD 206 540 000 10.10.17 488 496 0.02%EUR 52 591 926 JPY 6 500 000 000 07.07.17 1 872 227 0.07%EUR 45 647 935 JPY 5 680 000 000 10.10.17 1 362 355 0.06%EUR 4 191 713 MXN 86 100 000 07.07.17 23 544 0.00%EUR 3 443 776 SGD 5 215 000 07.07.17 123 293 0.00%EUR 3 349 992 SGD 5 215 000 10.10.17 41 283 0.00%EUR 1 265 101 TRY 5 100 000 07.07.17 -3 041 -0.00%EUR 541 947 988 USD 588 545 000 07.07.17 25 982 379 1.06%EUR 327 110 585 USD 367 355 000 10.10.17 6 674 552 0.27%EUR 1 793 403 ZAR 25 700 000 07.07.17 74 808 0.00%EUR 577 160 ZAR 8 700 000 10.10.17 7 366 0.00%GBP 9 685 000 EUR 11 259 671 07.07.17 -230 228 -0.01%HKD 206 540 000 EUR 23 692 708 07.07.17 -496 904 -0.02%JPY 6 500 000 000 EUR 52 545 519 07.07.17 -1 825 821 -0.07%
MXN 86 100 000 EUR 4 083 918 07.07.17 84 250 0.00%SGD 5 215 000 EUR 3 363 236 07.07.17 -42 752 -0.00%TRY 5 100 000 EUR 1 259 601 07.07.17 8 541 0.00%USD 588 545 000 EUR 531 600 896 07.07.17 -15 635 290 -0.62%ZAR 25 700 000 EUR 1 711 489 07.07.17 7 106 0.00%
20 085 714 0.82% The forward foreign exchange contracts listed in the table above were entered into with Barclays Bank Plc., BNP Paribas S.A. or JP Morgan Securities Plc. Futures
Counterparty - Underlying CurrencyNumber of
contracts Market ValueMaturity
date
Unrealisedprofit/loss
EUR
% ofnet
assetsGOLDMAN SACHS & CO. - YEN DENOM NIKKEI Purchases JPY 304 23 798 890 07.09.17 -71 165 -0.01%GOLDMAN SACHS & CO. - EURO STOXX 50 Purchases EUR 1 186 40 691 660 15.09.17 -1 430 591 -0.06%GOLDMAN SACHS & CO. - FTSE 100 IDX Purchases GBP 123 10 145 454 15.09.17 -287 169 -0.01%GOLDMAN SACHS & CO. - MINI MSCI EMG MKT Purchases USD 471 20 819 312 15.09.17 20 648 0.00%GOLDMAN SACHS & CO. - S+P500 EMINI Purchases USD 924 98 062 849 15.09.17 -221 469 -0.01% -1 989 746 -0.09% Swaps
Type** Counterparty - Underlying NominalMaturity
date Currency Interest
on swaps
Unrealisedprofit/loss
EUR
% ofnet
assetsCDS BARCLAYS BANK PLC. - CDX.EM -14 500 000 20.06.22 USD 1.00% 124 643 0.01% 124 643 0.01%*see Appendix I. **CDS = Credit Default Swap
68
Multiflex SICAV - GLOBAL MULTI-ASSET INCOME FUND
The information in this report is based on historical data and is no indication of future performance.
Fund Management Report Investment Policy The investment objectives of the Multiflex SICAV - GLOBAL MULTI-ASSET INCOME FUND are (i) to maintain a diversified exposure across asset classes according to the geographical and concentration limits (ii) to maximise current income measured as distributable fund dividends; (iii) to generate attractive long-term total returns over a full market cycle (typically 3-5 years) through investment primarily in fixed income and related securities (iv) to target an annualised expected market return stable over the years, which has been initially set at 4% and will be subject to annual review. Market review and portfolio We believe global government bonds have priced in The New Neutral and we see levels as broadly fair given expectations for low policy rates sustained over the next three to five years. We are underweight government related bonds, while favoring high quality Danish and Swedish covered bonds. Within credit, the portfolio has an overweight to banks as they continue to de-lever and improve their capital structure. We are slightly underweight Emerging Markets (EM) in hard currency and continue to favor higher-yielding non-sovereign debt in countries that have low debt ratios, high FX reserves or positive reform momentum. The main contributions came from the underweight to sovereign bonds and the overweight and selection in Investment Grade Credit. In quarter four the alpha was 9 bps; the main contributor was selection in EM external while the largest detractor was the underweight to High Yield. From the beginning of 2017 till 27 February 2017 the main contributor was the selection in High Yield. In this period the alpha was of 28bps.The mandate was in performance holiday from COB 27 February 2017 to COB 9 May 2017, as the mandate was subject to a change in guidelines and in the strategic benchmark. We adjusted the asset allocation by increasing the exposure to equities and decreasing the allocation to High Yield. In the final period, concluding on 30 June 2017, the portfolio generated 7bps of alpha. The main contributor was the underweight to sovereign while the positioning in equity detracted.
69
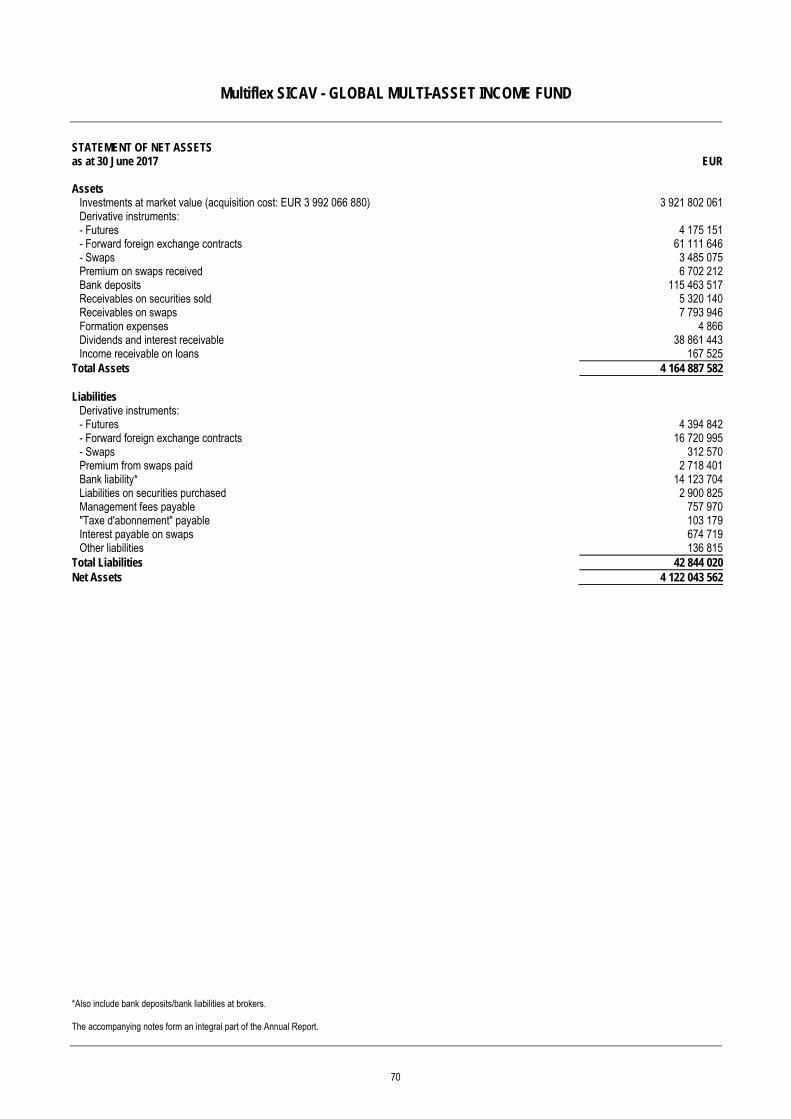
Multiflex SICAV - GLOBAL MULTI-ASSET INCOME FUND
*Also include bank deposits/bank liabilities at brokers. The accompanying notes form an integral part of the Annual Report.
STATEMENT OF NET ASSETS as at 30 June 2017 EUR Assets
Investments at market value (acquisition cost: EUR 3 992 066 880) 3 921 802 061Derivative instruments: - Futures 4 175 151- Forward foreign exchange contracts 61 111 646- Swaps 3 485 075Premium on swaps received 6 702 212Bank deposits 115 463 517Receivables on securities sold 5 320 140Receivables on swaps 7 793 946Formation expenses 4 866Dividends and interest receivable 38 861 443Income receivable on loans 167 525
Total Assets 4 164 887 582 Liabilities
Derivative instruments: - Futures 4 394 842- Forward foreign exchange contracts 16 720 995- Swaps 312 570Premium from swaps paid 2 718 401Bank liability* 14 123 704Liabilities on securities purchased 2 900 825Management fees payable 757 970"Taxe d'abonnement" payable 103 179Interest payable on swaps 674 719Other liabilities 136 815
Total Liabilities 42 844 020Net Assets 4 122 043 562
70
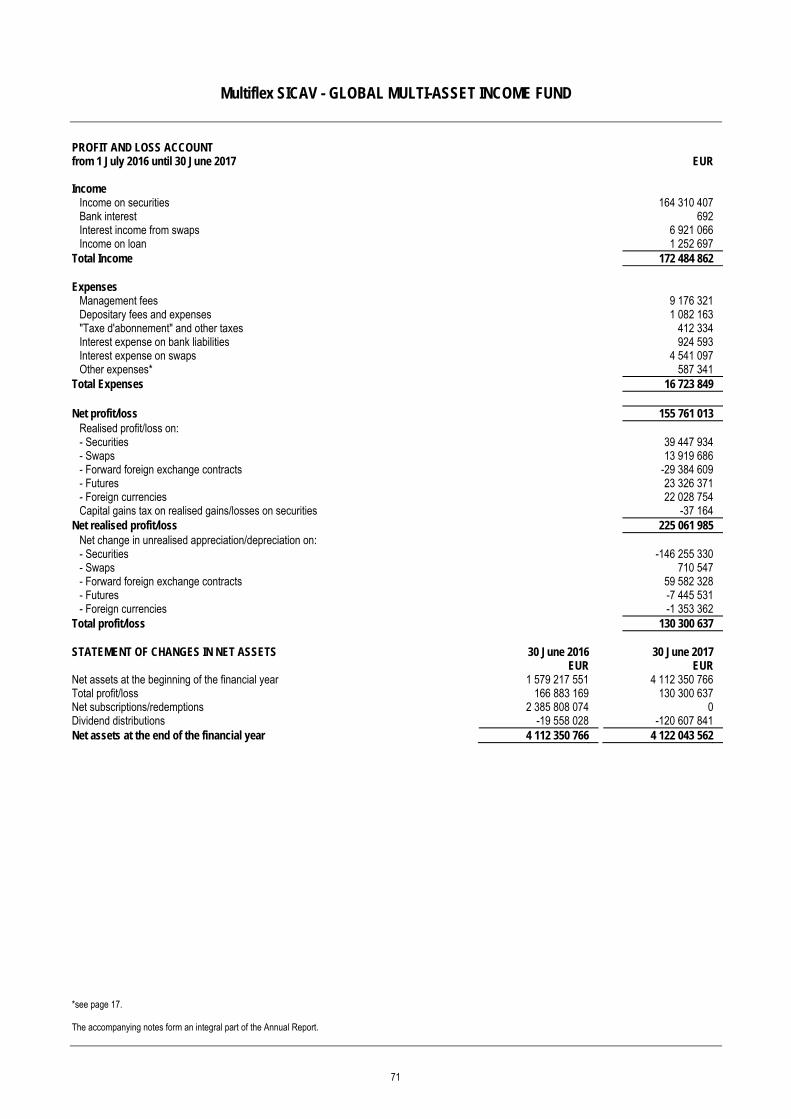
Multiflex SICAV - GLOBAL MULTI-ASSET INCOME FUND
*see page 17. The accompanying notes form an integral part of the Annual Report.
PROFIT AND LOSS ACCOUNT from 1 July 2016 until 30 June 2017 EUR Income
Income on securities 164 310 407 Bank interest 692 Interest income from swaps 6 921 066 Income on loan 1 252 697
Total Income 172 484 862 Expenses
Management fees 9 176 321 Depositary fees and expenses 1 082 163 "Taxe d'abonnement" and other taxes 412 334 Interest expense on bank liabilities 924 593 Interest expense on swaps 4 541 097 Other expenses* 587 341
Total Expenses 16 723 849 Net profit/loss 155 761 013
Realised profit/loss on: - Securities 39 447 934 - Swaps 13 919 686 - Forward foreign exchange contracts -29 384 609 - Futures 23 326 371 - Foreign currencies 22 028 754 Capital gains tax on realised gains/losses on securities -37 164
Net realised profit/loss 225 061 985 Net change in unrealised appreciation/depreciation on: - Securities -146 255 330 - Swaps 710 547 - Forward foreign exchange contracts 59 582 328 - Futures -7 445 531 - Foreign currencies -1 353 362
Total profit/loss 130 300 637 STATEMENT OF CHANGES IN NET ASSETS 30 June 2016 30 June 2017 EUR EUR Net assets at the beginning of the financial year 1 579 217 551 4 112 350 766 Total profit/loss 166 883 169 130 300 637 Net subscriptions/redemptions 2 385 808 074 0 Dividend distributions -19 558 028 -120 607 841 Net assets at the end of the financial year 4 112 350 766 4 122 043 562
71
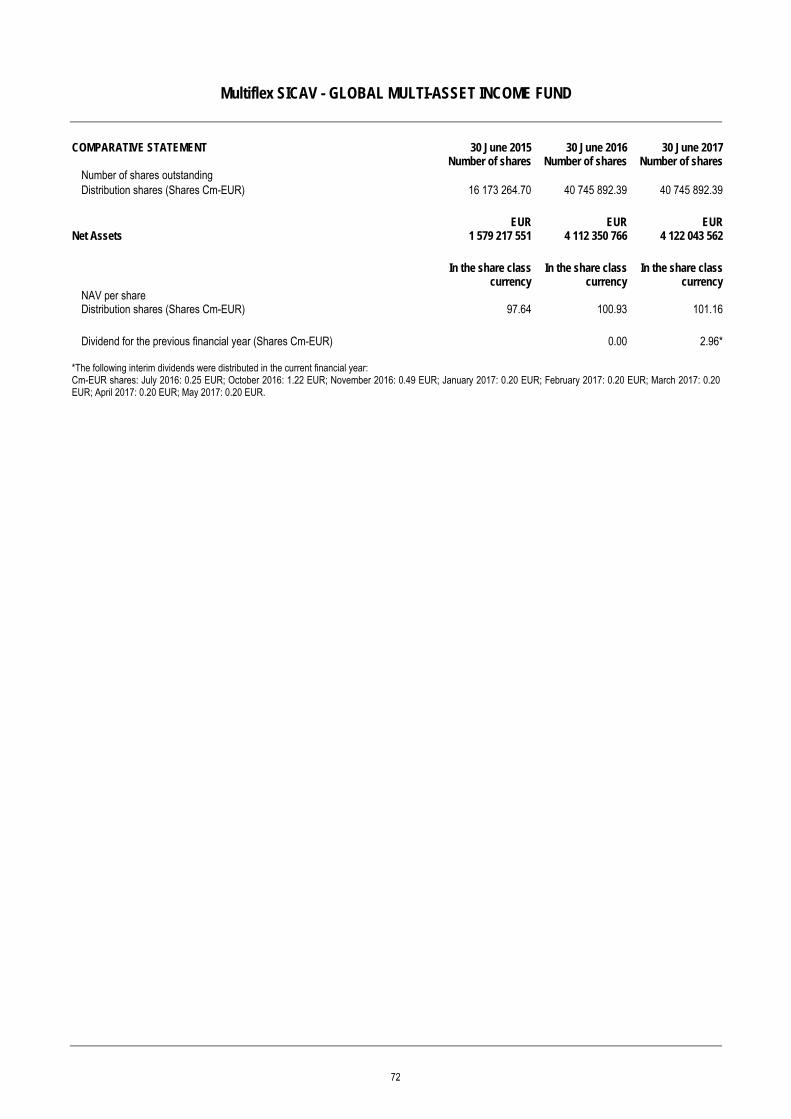
Multiflex SICAV - GLOBAL MULTI-ASSET INCOME FUND
COMPARATIVE STATEMENT 30 June 2015 30 June 2016 30 June 2017 Number of shares Number of shares Number of shares
Number of shares outstanding Distribution shares (Shares Cm-EUR) 16 173 264.70 40 745 892.39 40 745 892.39
EUR EUR EURNet Assets 1 579 217 551 4 112 350 766 4 122 043 562
In the share class
currencyIn the share class
currencyIn the share class
currencyNAV per share Distribution shares (Shares Cm-EUR) 97.64 100.93 101.16
Dividend for the previous financial year (Shares Cm-EUR) 0.00 2.96*
*The following interim dividends were distributed in the current financial year: Cm-EUR shares: July 2016: 0.25 EUR; October 2016: 1.22 EUR; November 2016: 0.49 EUR; January 2017: 0.20 EUR; February 2017: 0.20 EUR; March 2017: 0.20 EUR; April 2017: 0.20 EUR; May 2017: 0.20 EUR.
72
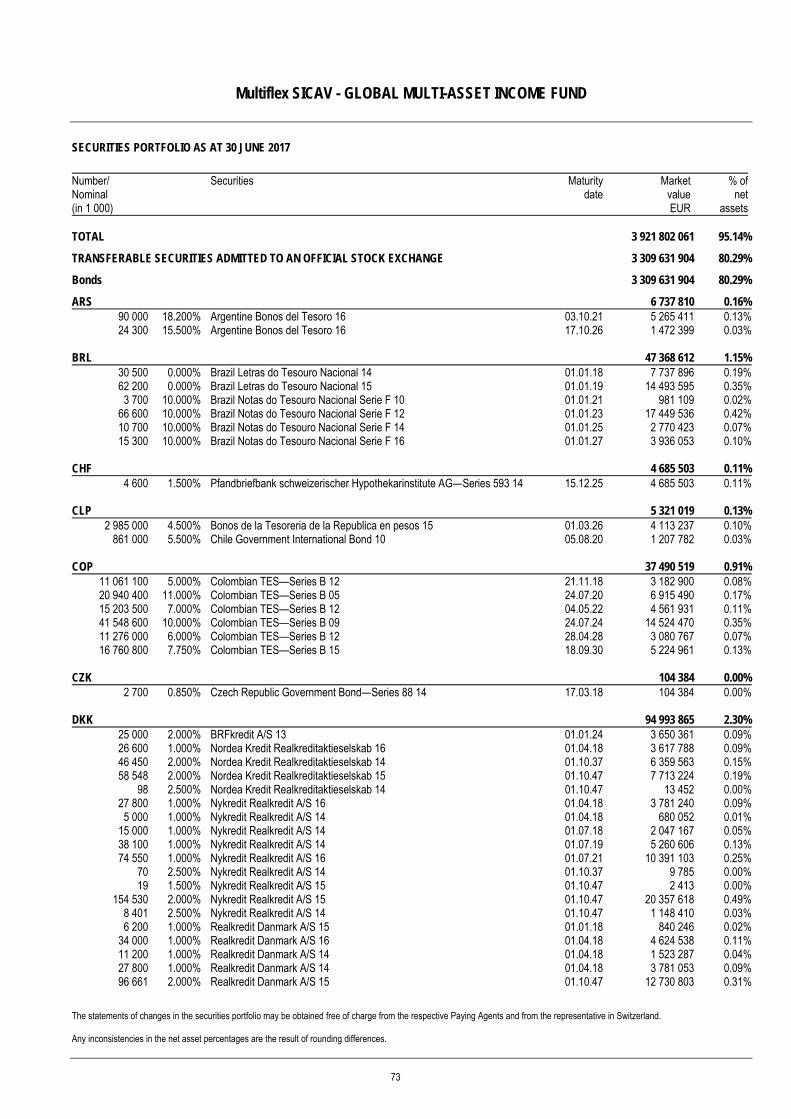
Multiflex SICAV - GLOBAL MULTI-ASSET INCOME FUND
SECURITIES PORTFOLIO AS AT 30 JUNE 2017
The statements of changes in the securities portfolio may be obtained free of charge from the respective Paying Agents and from the representative in Switzerland. Any inconsistencies in the net asset percentages are the result of rounding differences.
Number/ Nominal (in 1 000)
Securities Maturitydate
MarketvalueEUR
% ofnet
assets TOTAL 3 921 802 061 95.14%
TRANSFERABLE SECURITIES ADMITTED TO AN OFFICIAL STOCK EXCHANGE 3 309 631 904 80.29%
Bonds 3 309 631 904 80.29%
ARS 6 737 810 0.16%90 000 18.200% Argentine Bonos del Tesoro 16 03.10.21 5 265 411 0.13%24 300 15.500% Argentine Bonos del Tesoro 16 17.10.26 1 472 399 0.03%
BRL 47 368 612 1.15%30 500 0.000% Brazil Letras do Tesouro Nacional 14 01.01.18 7 737 896 0.19%62 200 0.000% Brazil Letras do Tesouro Nacional 15 01.01.19 14 493 595 0.35%3 700 10.000% Brazil Notas do Tesouro Nacional Serie F 10 01.01.21 981 109 0.02%
66 600 10.000% Brazil Notas do Tesouro Nacional Serie F 12 01.01.23 17 449 536 0.42%10 700 10.000% Brazil Notas do Tesouro Nacional Serie F 14 01.01.25 2 770 423 0.07%15 300 10.000% Brazil Notas do Tesouro Nacional Serie F 16 01.01.27 3 936 053 0.10%
CHF 4 685 503 0.11%4 600 1.500% Pfandbriefbank schweizerischer Hypothekarinstitute AG—Series 593 14 15.12.25 4 685 503 0.11%
CLP 5 321 019 0.13%2 985 000 4.500% Bonos de la Tesoreria de la Republica en pesos 15 01.03.26 4 113 237 0.10%
861 000 5.500% Chile Government International Bond 10 05.08.20 1 207 782 0.03%
COP 37 490 519 0.91%11 061 100 5.000% Colombian TES—Series B 12 21.11.18 3 182 900 0.08%20 940 400 11.000% Colombian TES—Series B 05 24.07.20 6 915 490 0.17%15 203 500 7.000% Colombian TES—Series B 12 04.05.22 4 561 931 0.11%41 548 600 10.000% Colombian TES—Series B 09 24.07.24 14 524 470 0.35%11 276 000 6.000% Colombian TES—Series B 12 28.04.28 3 080 767 0.07%16 760 800 7.750% Colombian TES—Series B 15 18.09.30 5 224 961 0.13%
CZK 104 384 0.00%2 700 0.850% Czech Republic Government Bond—Series 88 14 17.03.18 104 384 0.00%
DKK 94 993 865 2.30%25 000 2.000% BRFkredit A/S 13 01.01.24 3 650 361 0.09%26 600 1.000% Nordea Kredit Realkreditaktieselskab 16 01.04.18 3 617 788 0.09%46 450 2.000% Nordea Kredit Realkreditaktieselskab 14 01.10.37 6 359 563 0.15%58 548 2.000% Nordea Kredit Realkreditaktieselskab 15 01.10.47 7 713 224 0.19%
98 2.500% Nordea Kredit Realkreditaktieselskab 14 01.10.47 13 452 0.00%27 800 1.000% Nykredit Realkredit A/S 16 01.04.18 3 781 240 0.09%5 000 1.000% Nykredit Realkredit A/S 14 01.04.18 680 052 0.01%
15 000 1.000% Nykredit Realkredit A/S 14 01.07.18 2 047 167 0.05%38 100 1.000% Nykredit Realkredit A/S 14 01.07.19 5 260 606 0.13%74 550 1.000% Nykredit Realkredit A/S 16 01.07.21 10 391 103 0.25%
70 2.500% Nykredit Realkredit A/S 14 01.10.37 9 785 0.00%19 1.500% Nykredit Realkredit A/S 15 01.10.47 2 413 0.00%
154 530 2.000% Nykredit Realkredit A/S 15 01.10.47 20 357 618 0.49%8 401 2.500% Nykredit Realkredit A/S 14 01.10.47 1 148 410 0.03%6 200 1.000% Realkredit Danmark A/S 15 01.01.18 840 246 0.02%
34 000 1.000% Realkredit Danmark A/S 16 01.04.18 4 624 538 0.11%11 200 1.000% Realkredit Danmark A/S 14 01.04.18 1 523 287 0.04%27 800 1.000% Realkredit Danmark A/S 14 01.04.18 3 781 053 0.09%96 661 2.000% Realkredit Danmark A/S 15 01.10.47 12 730 803 0.31%
73
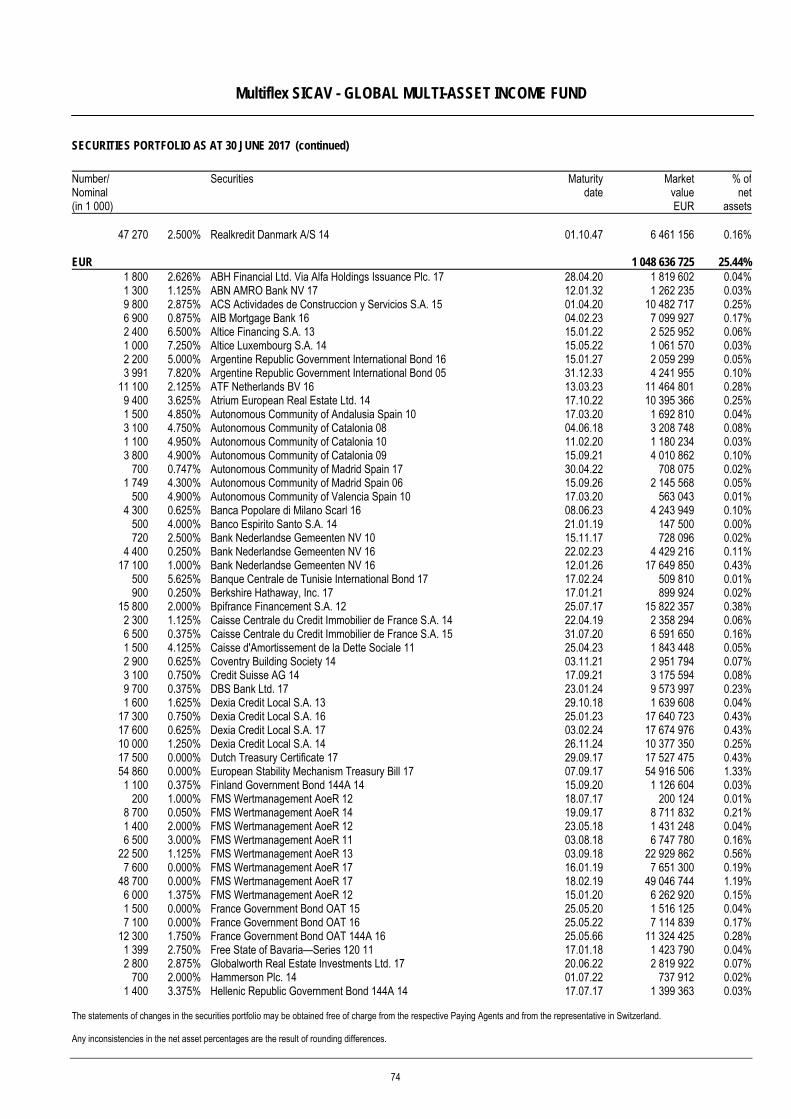
Multiflex SICAV - GLOBAL MULTI-ASSET INCOME FUND
SECURITIES PORTFOLIO AS AT 30 JUNE 2017 (continued)
The statements of changes in the securities portfolio may be obtained free of charge from the respective Paying Agents and from the representative in Switzerland. Any inconsistencies in the net asset percentages are the result of rounding differences.
Number/ Nominal (in 1 000)
Securities Maturitydate
MarketvalueEUR
% ofnet
assets
47 270 2.500% Realkredit Danmark A/S 14 01.10.47 6 461 156 0.16%
EUR 1 048 636 725 25.44%1 800 2.626% ABH Financial Ltd. Via Alfa Holdings Issuance Plc. 17 28.04.20 1 819 602 0.04%1 300 1.125% ABN AMRO Bank NV 17 12.01.32 1 262 235 0.03%9 800 2.875% ACS Actividades de Construccion y Servicios S.A. 15 01.04.20 10 482 717 0.25%6 900 0.875% AIB Mortgage Bank 16 04.02.23 7 099 927 0.17%2 400 6.500% Altice Financing S.A. 13 15.01.22 2 525 952 0.06%1 000 7.250% Altice Luxembourg S.A. 14 15.05.22 1 061 570 0.03%2 200 5.000% Argentine Republic Government International Bond 16 15.01.27 2 059 299 0.05%3 991 7.820% Argentine Republic Government International Bond 05 31.12.33 4 241 955 0.10%
11 100 2.125% ATF Netherlands BV 16 13.03.23 11 464 801 0.28%9 400 3.625% Atrium European Real Estate Ltd. 14 17.10.22 10 395 366 0.25%1 500 4.850% Autonomous Community of Andalusia Spain 10 17.03.20 1 692 810 0.04%3 100 4.750% Autonomous Community of Catalonia 08 04.06.18 3 208 748 0.08%1 100 4.950% Autonomous Community of Catalonia 10 11.02.20 1 180 234 0.03%3 800 4.900% Autonomous Community of Catalonia 09 15.09.21 4 010 862 0.10%
700 0.747% Autonomous Community of Madrid Spain 17 30.04.22 708 075 0.02%1 749 4.300% Autonomous Community of Madrid Spain 06 15.09.26 2 145 568 0.05%
500 4.900% Autonomous Community of Valencia Spain 10 17.03.20 563 043 0.01%4 300 0.625% Banca Popolare di Milano Scarl 16 08.06.23 4 243 949 0.10%
500 4.000% Banco Espirito Santo S.A. 14 21.01.19 147 500 0.00%720 2.500% Bank Nederlandse Gemeenten NV 10 15.11.17 728 096 0.02%
4 400 0.250% Bank Nederlandse Gemeenten NV 16 22.02.23 4 429 216 0.11%17 100 1.000% Bank Nederlandse Gemeenten NV 16 12.01.26 17 649 850 0.43%
500 5.625% Banque Centrale de Tunisie International Bond 17 17.02.24 509 810 0.01%900 0.250% Berkshire Hathaway, Inc. 17 17.01.21 899 924 0.02%
15 800 2.000% Bpifrance Financement S.A. 12 25.07.17 15 822 357 0.38%2 300 1.125% Caisse Centrale du Credit Immobilier de France S.A. 14 22.04.19 2 358 294 0.06%6 500 0.375% Caisse Centrale du Credit Immobilier de France S.A. 15 31.07.20 6 591 650 0.16%1 500 4.125% Caisse d'Amortissement de la Dette Sociale 11 25.04.23 1 843 448 0.05%2 900 0.625% Coventry Building Society 14 03.11.21 2 951 794 0.07%3 100 0.750% Credit Suisse AG 14 17.09.21 3 175 594 0.08%9 700 0.375% DBS Bank Ltd. 17 23.01.24 9 573 997 0.23%1 600 1.625% Dexia Credit Local S.A. 13 29.10.18 1 639 608 0.04%
17 300 0.750% Dexia Credit Local S.A. 16 25.01.23 17 640 723 0.43%17 600 0.625% Dexia Credit Local S.A. 17 03.02.24 17 674 976 0.43%10 000 1.250% Dexia Credit Local S.A. 14 26.11.24 10 377 350 0.25%17 500 0.000% Dutch Treasury Certificate 17 29.09.17 17 527 475 0.43%54 860 0.000% European Stability Mechanism Treasury Bill 17 07.09.17 54 916 506 1.33%1 100 0.375% Finland Government Bond 144A 14 15.09.20 1 126 604 0.03%
200 1.000% FMS Wertmanagement AoeR 12 18.07.17 200 124 0.01%8 700 0.050% FMS Wertmanagement AoeR 14 19.09.17 8 711 832 0.21%1 400 2.000% FMS Wertmanagement AoeR 12 23.05.18 1 431 248 0.04%6 500 3.000% FMS Wertmanagement AoeR 11 03.08.18 6 747 780 0.16%
22 500 1.125% FMS Wertmanagement AoeR 13 03.09.18 22 929 862 0.56%7 600 0.000% FMS Wertmanagement AoeR 17 16.01.19 7 651 300 0.19%
48 700 0.000% FMS Wertmanagement AoeR 17 18.02.19 49 046 744 1.19%6 000 1.375% FMS Wertmanagement AoeR 12 15.01.20 6 262 920 0.15%1 500 0.000% France Government Bond OAT 15 25.05.20 1 516 125 0.04%7 100 0.000% France Government Bond OAT 16 25.05.22 7 114 839 0.17%
12 300 1.750% France Government Bond OAT 144A 16 25.05.66 11 324 425 0.28%1 399 2.750% Free State of Bavaria—Series 120 11 17.01.18 1 423 790 0.04%2 800 2.875% Globalworth Real Estate Investments Ltd. 17 20.06.22 2 819 922 0.07%
700 2.000% Hammerson Plc. 14 01.07.22 737 912 0.02%1 400 3.375% Hellenic Republic Government Bond 144A 14 17.07.17 1 399 363 0.03%
74
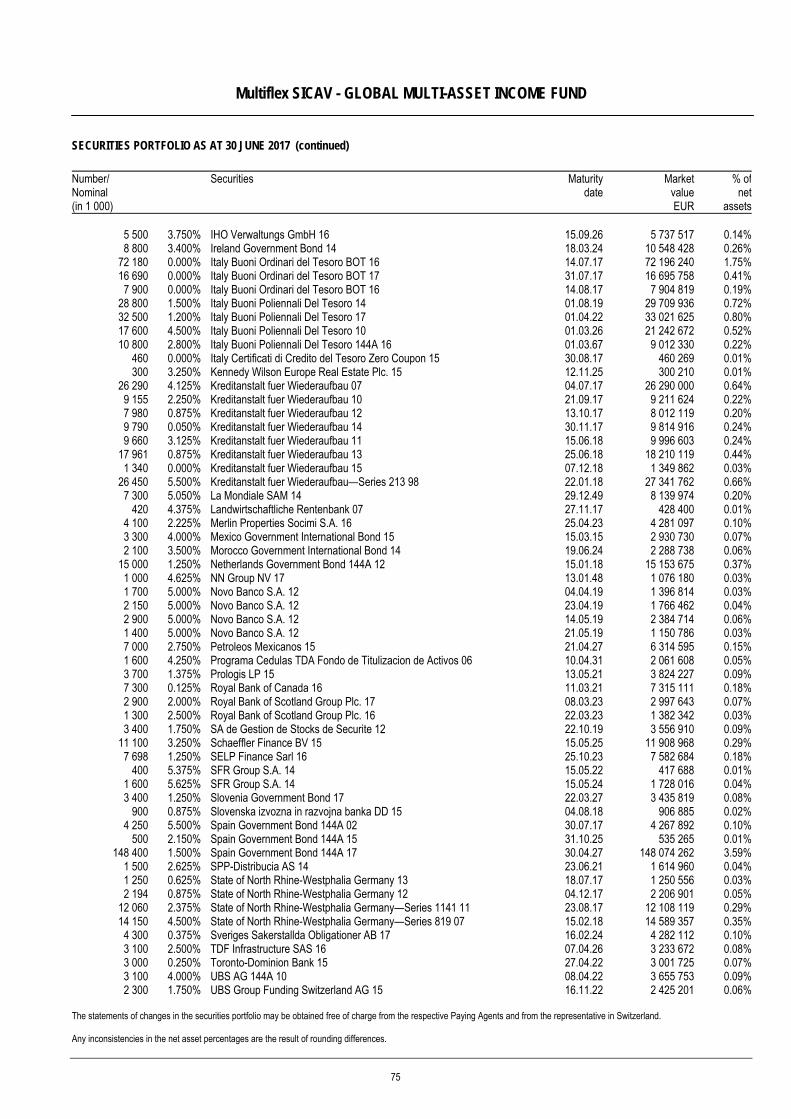
Multiflex SICAV - GLOBAL MULTI-ASSET INCOME FUND
SECURITIES PORTFOLIO AS AT 30 JUNE 2017 (continued)
The statements of changes in the securities portfolio may be obtained free of charge from the respective Paying Agents and from the representative in Switzerland. Any inconsistencies in the net asset percentages are the result of rounding differences.
Number/ Nominal (in 1 000)
Securities Maturitydate
MarketvalueEUR
% ofnet
assets
5 500 3.750% IHO Verwaltungs GmbH 16 15.09.26 5 737 517 0.14%8 800 3.400% Ireland Government Bond 14 18.03.24 10 548 428 0.26%
72 180 0.000% Italy Buoni Ordinari del Tesoro BOT 16 14.07.17 72 196 240 1.75%16 690 0.000% Italy Buoni Ordinari del Tesoro BOT 17 31.07.17 16 695 758 0.41%7 900 0.000% Italy Buoni Ordinari del Tesoro BOT 16 14.08.17 7 904 819 0.19%
28 800 1.500% Italy Buoni Poliennali Del Tesoro 14 01.08.19 29 709 936 0.72%32 500 1.200% Italy Buoni Poliennali Del Tesoro 17 01.04.22 33 021 625 0.80%17 600 4.500% Italy Buoni Poliennali Del Tesoro 10 01.03.26 21 242 672 0.52%10 800 2.800% Italy Buoni Poliennali Del Tesoro 144A 16 01.03.67 9 012 330 0.22%
460 0.000% Italy Certificati di Credito del Tesoro Zero Coupon 15 30.08.17 460 269 0.01%300 3.250% Kennedy Wilson Europe Real Estate Plc. 15 12.11.25 300 210 0.01%
26 290 4.125% Kreditanstalt fuer Wiederaufbau 07 04.07.17 26 290 000 0.64%9 155 2.250% Kreditanstalt fuer Wiederaufbau 10 21.09.17 9 211 624 0.22%7 980 0.875% Kreditanstalt fuer Wiederaufbau 12 13.10.17 8 012 119 0.20%9 790 0.050% Kreditanstalt fuer Wiederaufbau 14 30.11.17 9 814 916 0.24%9 660 3.125% Kreditanstalt fuer Wiederaufbau 11 15.06.18 9 996 603 0.24%
17 961 0.875% Kreditanstalt fuer Wiederaufbau 13 25.06.18 18 210 119 0.44%1 340 0.000% Kreditanstalt fuer Wiederaufbau 15 07.12.18 1 349 862 0.03%
26 450 5.500% Kreditanstalt fuer Wiederaufbau—Series 213 98 22.01.18 27 341 762 0.66%7 300 5.050% La Mondiale SAM 14 29.12.49 8 139 974 0.20%
420 4.375% Landwirtschaftliche Rentenbank 07 27.11.17 428 400 0.01%4 100 2.225% Merlin Properties Socimi S.A. 16 25.04.23 4 281 097 0.10%3 300 4.000% Mexico Government International Bond 15 15.03.15 2 930 730 0.07%2 100 3.500% Morocco Government International Bond 14 19.06.24 2 288 738 0.06%
15 000 1.250% Netherlands Government Bond 144A 12 15.01.18 15 153 675 0.37%1 000 4.625% NN Group NV 17 13.01.48 1 076 180 0.03%1 700 5.000% Novo Banco S.A. 12 04.04.19 1 396 814 0.03%2 150 5.000% Novo Banco S.A. 12 23.04.19 1 766 462 0.04%2 900 5.000% Novo Banco S.A. 12 14.05.19 2 384 714 0.06%1 400 5.000% Novo Banco S.A. 12 21.05.19 1 150 786 0.03%7 000 2.750% Petroleos Mexicanos 15 21.04.27 6 314 595 0.15%1 600 4.250% Programa Cedulas TDA Fondo de Titulizacion de Activos 06 10.04.31 2 061 608 0.05%3 700 1.375% Prologis LP 15 13.05.21 3 824 227 0.09%7 300 0.125% Royal Bank of Canada 16 11.03.21 7 315 111 0.18%2 900 2.000% Royal Bank of Scotland Group Plc. 17 08.03.23 2 997 643 0.07%1 300 2.500% Royal Bank of Scotland Group Plc. 16 22.03.23 1 382 342 0.03%3 400 1.750% SA de Gestion de Stocks de Securite 12 22.10.19 3 556 910 0.09%
11 100 3.250% Schaeffler Finance BV 15 15.05.25 11 908 968 0.29%7 698 1.250% SELP Finance Sarl 16 25.10.23 7 582 684 0.18%
400 5.375% SFR Group S.A. 14 15.05.22 417 688 0.01%1 600 5.625% SFR Group S.A. 14 15.05.24 1 728 016 0.04%3 400 1.250% Slovenia Government Bond 17 22.03.27 3 435 819 0.08%
900 0.875% Slovenska izvozna in razvojna banka DD 15 04.08.18 906 885 0.02%4 250 5.500% Spain Government Bond 144A 02 30.07.17 4 267 892 0.10%
500 2.150% Spain Government Bond 144A 15 31.10.25 535 265 0.01%148 400 1.500% Spain Government Bond 144A 17 30.04.27 148 074 262 3.59%
1 500 2.625% SPP-Distribucia AS 14 23.06.21 1 614 960 0.04%1 250 0.625% State of North Rhine-Westphalia Germany 13 18.07.17 1 250 556 0.03%2 194 0.875% State of North Rhine-Westphalia Germany 12 04.12.17 2 206 901 0.05%
12 060 2.375% State of North Rhine-Westphalia Germany—Series 1141 11 23.08.17 12 108 119 0.29%14 150 4.500% State of North Rhine-Westphalia Germany—Series 819 07 15.02.18 14 589 357 0.35%4 300 0.375% Sveriges Sakerstallda Obligationer AB 17 16.02.24 4 282 112 0.10%3 100 2.500% TDF Infrastructure SAS 16 07.04.26 3 233 672 0.08%3 000 0.250% Toronto-Dominion Bank 15 27.04.22 3 001 725 0.07%3 100 4.000% UBS AG 144A 10 08.04.22 3 655 753 0.09%2 300 1.750% UBS Group Funding Switzerland AG 15 16.11.22 2 425 201 0.06%
75
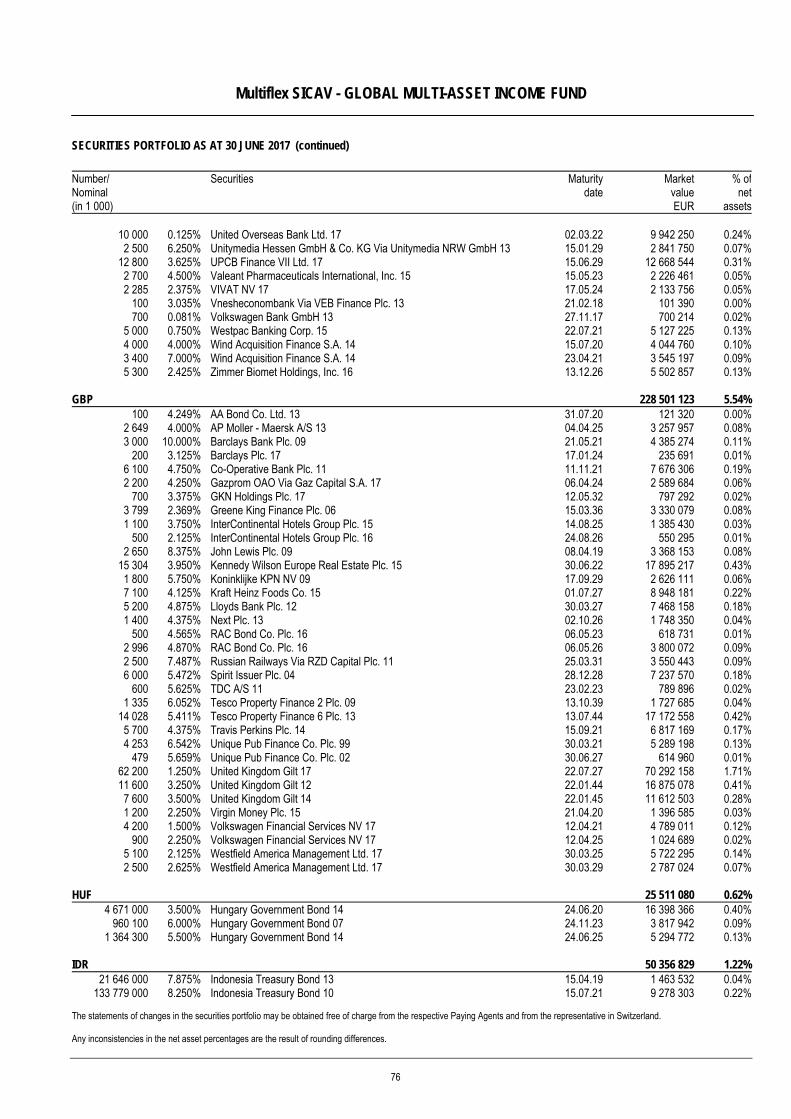
Multiflex SICAV - GLOBAL MULTI-ASSET INCOME FUND
SECURITIES PORTFOLIO AS AT 30 JUNE 2017 (continued)
The statements of changes in the securities portfolio may be obtained free of charge from the respective Paying Agents and from the representative in Switzerland. Any inconsistencies in the net asset percentages are the result of rounding differences.
Number/ Nominal (in 1 000)
Securities Maturitydate
MarketvalueEUR
% ofnet
assets
10 000 0.125% United Overseas Bank Ltd. 17 02.03.22 9 942 250 0.24%2 500 6.250% Unitymedia Hessen GmbH & Co. KG Via Unitymedia NRW GmbH 13 15.01.29 2 841 750 0.07%
12 800 3.625% UPCB Finance VII Ltd. 17 15.06.29 12 668 544 0.31%2 700 4.500% Valeant Pharmaceuticals International, Inc. 15 15.05.23 2 226 461 0.05%2 285 2.375% VIVAT NV 17 17.05.24 2 133 756 0.05%
100 3.035% Vnesheconombank Via VEB Finance Plc. 13 21.02.18 101 390 0.00%700 0.081% Volkswagen Bank GmbH 13 27.11.17 700 214 0.02%
5 000 0.750% Westpac Banking Corp. 15 22.07.21 5 127 225 0.13%4 000 4.000% Wind Acquisition Finance S.A. 14 15.07.20 4 044 760 0.10%3 400 7.000% Wind Acquisition Finance S.A. 14 23.04.21 3 545 197 0.09%5 300 2.425% Zimmer Biomet Holdings, Inc. 16 13.12.26 5 502 857 0.13%
GBP 228 501 123 5.54%100 4.249% AA Bond Co. Ltd. 13 31.07.20 121 320 0.00%
2 649 4.000% AP Moller - Maersk A/S 13 04.04.25 3 257 957 0.08%3 000 10.000% Barclays Bank Plc. 09 21.05.21 4 385 274 0.11%
200 3.125% Barclays Plc. 17 17.01.24 235 691 0.01%6 100 4.750% Co-Operative Bank Plc. 11 11.11.21 7 676 306 0.19%2 200 4.250% Gazprom OAO Via Gaz Capital S.A. 17 06.04.24 2 589 684 0.06%
700 3.375% GKN Holdings Plc. 17 12.05.32 797 292 0.02%3 799 2.369% Greene King Finance Plc. 06 15.03.36 3 330 079 0.08%1 100 3.750% InterContinental Hotels Group Plc. 15 14.08.25 1 385 430 0.03%
500 2.125% InterContinental Hotels Group Plc. 16 24.08.26 550 295 0.01%2 650 8.375% John Lewis Plc. 09 08.04.19 3 368 153 0.08%
15 304 3.950% Kennedy Wilson Europe Real Estate Plc. 15 30.06.22 17 895 217 0.43%1 800 5.750% Koninklijke KPN NV 09 17.09.29 2 626 111 0.06%7 100 4.125% Kraft Heinz Foods Co. 15 01.07.27 8 948 181 0.22%5 200 4.875% Lloyds Bank Plc. 12 30.03.27 7 468 158 0.18%1 400 4.375% Next Plc. 13 02.10.26 1 748 350 0.04%
500 4.565% RAC Bond Co. Plc. 16 06.05.23 618 731 0.01%2 996 4.870% RAC Bond Co. Plc. 16 06.05.26 3 800 072 0.09%2 500 7.487% Russian Railways Via RZD Capital Plc. 11 25.03.31 3 550 443 0.09%6 000 5.472% Spirit Issuer Plc. 04 28.12.28 7 237 570 0.18%
600 5.625% TDC A/S 11 23.02.23 789 896 0.02%1 335 6.052% Tesco Property Finance 2 Plc. 09 13.10.39 1 727 685 0.04%
14 028 5.411% Tesco Property Finance 6 Plc. 13 13.07.44 17 172 558 0.42%5 700 4.375% Travis Perkins Plc. 14 15.09.21 6 817 169 0.17%4 253 6.542% Unique Pub Finance Co. Plc. 99 30.03.21 5 289 198 0.13%
479 5.659% Unique Pub Finance Co. Plc. 02 30.06.27 614 960 0.01%62 200 1.250% United Kingdom Gilt 17 22.07.27 70 292 158 1.71%11 600 3.250% United Kingdom Gilt 12 22.01.44 16 875 078 0.41%7 600 3.500% United Kingdom Gilt 14 22.01.45 11 612 503 0.28%1 200 2.250% Virgin Money Plc. 15 21.04.20 1 396 585 0.03%4 200 1.500% Volkswagen Financial Services NV 17 12.04.21 4 789 011 0.12%
900 2.250% Volkswagen Financial Services NV 17 12.04.25 1 024 689 0.02%5 100 2.125% Westfield America Management Ltd. 17 30.03.25 5 722 295 0.14%2 500 2.625% Westfield America Management Ltd. 17 30.03.29 2 787 024 0.07%
HUF 25 511 080 0.62%4 671 000 3.500% Hungary Government Bond 14 24.06.20 16 398 366 0.40%
960 100 6.000% Hungary Government Bond 07 24.11.23 3 817 942 0.09%1 364 300 5.500% Hungary Government Bond 14 24.06.25 5 294 772 0.13%
IDR 50 356 829 1.22%21 646 000 7.875% Indonesia Treasury Bond 13 15.04.19 1 463 532 0.04%
133 779 000 8.250% Indonesia Treasury Bond 10 15.07.21 9 278 303 0.22%
76
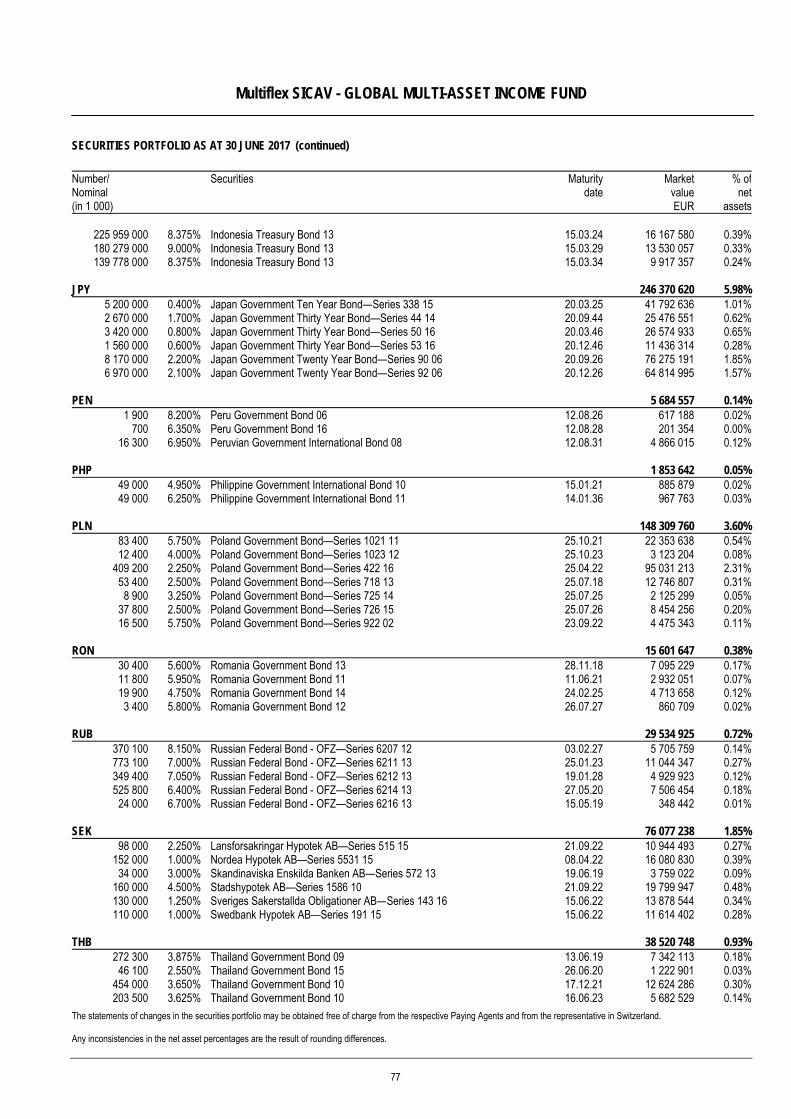
Multiflex SICAV - GLOBAL MULTI-ASSET INCOME FUND
SECURITIES PORTFOLIO AS AT 30 JUNE 2017 (continued)
The statements of changes in the securities portfolio may be obtained free of charge from the respective Paying Agents and from the representative in Switzerland. Any inconsistencies in the net asset percentages are the result of rounding differences.
Number/ Nominal (in 1 000)
Securities Maturitydate
MarketvalueEUR
% ofnet
assets
225 959 000 8.375% Indonesia Treasury Bond 13 15.03.24 16 167 580 0.39%180 279 000 9.000% Indonesia Treasury Bond 13 15.03.29 13 530 057 0.33%139 778 000 8.375% Indonesia Treasury Bond 13 15.03.34 9 917 357 0.24%
JPY 246 370 620 5.98%5 200 000 0.400% Japan Government Ten Year Bond—Series 338 15 20.03.25 41 792 636 1.01%2 670 000 1.700% Japan Government Thirty Year Bond—Series 44 14 20.09.44 25 476 551 0.62%3 420 000 0.800% Japan Government Thirty Year Bond—Series 50 16 20.03.46 26 574 933 0.65%1 560 000 0.600% Japan Government Thirty Year Bond—Series 53 16 20.12.46 11 436 314 0.28%8 170 000 2.200% Japan Government Twenty Year Bond—Series 90 06 20.09.26 76 275 191 1.85%6 970 000 2.100% Japan Government Twenty Year Bond—Series 92 06 20.12.26 64 814 995 1.57%
PEN 5 684 557 0.14%1 900 8.200% Peru Government Bond 06 12.08.26 617 188 0.02%
700 6.350% Peru Government Bond 16 12.08.28 201 354 0.00%16 300 6.950% Peruvian Government International Bond 08 12.08.31 4 866 015 0.12%
PHP 1 853 642 0.05%49 000 4.950% Philippine Government International Bond 10 15.01.21 885 879 0.02%49 000 6.250% Philippine Government International Bond 11 14.01.36 967 763 0.03%
PLN 148 309 760 3.60%83 400 5.750% Poland Government Bond—Series 1021 11 25.10.21 22 353 638 0.54%12 400 4.000% Poland Government Bond—Series 1023 12 25.10.23 3 123 204 0.08%
409 200 2.250% Poland Government Bond—Series 422 16 25.04.22 95 031 213 2.31%53 400 2.500% Poland Government Bond—Series 718 13 25.07.18 12 746 807 0.31%8 900 3.250% Poland Government Bond—Series 725 14 25.07.25 2 125 299 0.05%
37 800 2.500% Poland Government Bond—Series 726 15 25.07.26 8 454 256 0.20%16 500 5.750% Poland Government Bond—Series 922 02 23.09.22 4 475 343 0.11%
RON 15 601 647 0.38%30 400 5.600% Romania Government Bond 13 28.11.18 7 095 229 0.17%11 800 5.950% Romania Government Bond 11 11.06.21 2 932 051 0.07%19 900 4.750% Romania Government Bond 14 24.02.25 4 713 658 0.12%3 400 5.800% Romania Government Bond 12 26.07.27 860 709 0.02%
RUB 29 534 925 0.72%370 100 8.150% Russian Federal Bond - OFZ—Series 6207 12 03.02.27 5 705 759 0.14%773 100 7.000% Russian Federal Bond - OFZ—Series 6211 13 25.01.23 11 044 347 0.27%349 400 7.050% Russian Federal Bond - OFZ—Series 6212 13 19.01.28 4 929 923 0.12%525 800 6.400% Russian Federal Bond - OFZ—Series 6214 13 27.05.20 7 506 454 0.18%
24 000 6.700% Russian Federal Bond - OFZ—Series 6216 13 15.05.19 348 442 0.01%
SEK 76 077 238 1.85%98 000 2.250% Lansforsakringar Hypotek AB—Series 515 15 21.09.22 10 944 493 0.27%
152 000 1.000% Nordea Hypotek AB—Series 5531 15 08.04.22 16 080 830 0.39%34 000 3.000% Skandinaviska Enskilda Banken AB—Series 572 13 19.06.19 3 759 022 0.09%
160 000 4.500% Stadshypotek AB—Series 1586 10 21.09.22 19 799 947 0.48%130 000 1.250% Sveriges Sakerstallda Obligationer AB—Series 143 16 15.06.22 13 878 544 0.34%110 000 1.000% Swedbank Hypotek AB—Series 191 15 15.06.22 11 614 402 0.28%
THB 38 520 748 0.93%272 300 3.875% Thailand Government Bond 09 13.06.19 7 342 113 0.18%
46 100 2.550% Thailand Government Bond 15 26.06.20 1 222 901 0.03%454 000 3.650% Thailand Government Bond 10 17.12.21 12 624 286 0.30%203 500 3.625% Thailand Government Bond 10 16.06.23 5 682 529 0.14%
77
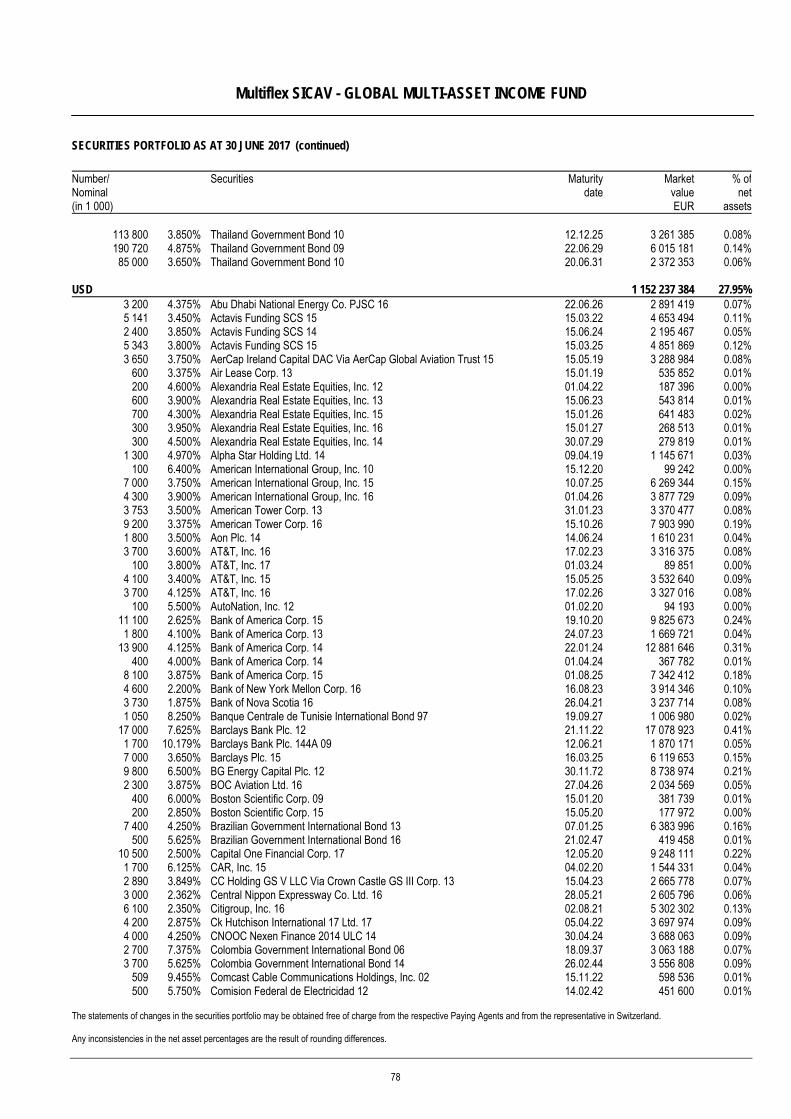
Multiflex SICAV - GLOBAL MULTI-ASSET INCOME FUND
SECURITIES PORTFOLIO AS AT 30 JUNE 2017 (continued)
The statements of changes in the securities portfolio may be obtained free of charge from the respective Paying Agents and from the representative in Switzerland. Any inconsistencies in the net asset percentages are the result of rounding differences.
Number/ Nominal (in 1 000)
Securities Maturitydate
MarketvalueEUR
% ofnet
assets
113 800 3.850% Thailand Government Bond 10 12.12.25 3 261 385 0.08%190 720 4.875% Thailand Government Bond 09 22.06.29 6 015 181 0.14%
85 000 3.650% Thailand Government Bond 10 20.06.31 2 372 353 0.06%
USD 1 152 237 384 27.95%3 200 4.375% Abu Dhabi National Energy Co. PJSC 16 22.06.26 2 891 419 0.07%5 141 3.450% Actavis Funding SCS 15 15.03.22 4 653 494 0.11%2 400 3.850% Actavis Funding SCS 14 15.06.24 2 195 467 0.05%5 343 3.800% Actavis Funding SCS 15 15.03.25 4 851 869 0.12%3 650 3.750% AerCap Ireland Capital DAC Via AerCap Global Aviation Trust 15 15.05.19 3 288 984 0.08%
600 3.375% Air Lease Corp. 13 15.01.19 535 852 0.01%200 4.600% Alexandria Real Estate Equities, Inc. 12 01.04.22 187 396 0.00%600 3.900% Alexandria Real Estate Equities, Inc. 13 15.06.23 543 814 0.01%700 4.300% Alexandria Real Estate Equities, Inc. 15 15.01.26 641 483 0.02%300 3.950% Alexandria Real Estate Equities, Inc. 16 15.01.27 268 513 0.01%300 4.500% Alexandria Real Estate Equities, Inc. 14 30.07.29 279 819 0.01%
1 300 4.970% Alpha Star Holding Ltd. 14 09.04.19 1 145 671 0.03%100 6.400% American International Group, Inc. 10 15.12.20 99 242 0.00%
7 000 3.750% American International Group, Inc. 15 10.07.25 6 269 344 0.15%4 300 3.900% American International Group, Inc. 16 01.04.26 3 877 729 0.09%3 753 3.500% American Tower Corp. 13 31.01.23 3 370 477 0.08%9 200 3.375% American Tower Corp. 16 15.10.26 7 903 990 0.19%1 800 3.500% Aon Plc. 14 14.06.24 1 610 231 0.04%3 700 3.600% AT&T, Inc. 16 17.02.23 3 316 375 0.08%
100 3.800% AT&T, Inc. 17 01.03.24 89 851 0.00%4 100 3.400% AT&T, Inc. 15 15.05.25 3 532 640 0.09%3 700 4.125% AT&T, Inc. 16 17.02.26 3 327 016 0.08%
100 5.500% AutoNation, Inc. 12 01.02.20 94 193 0.00%11 100 2.625% Bank of America Corp. 15 19.10.20 9 825 673 0.24%1 800 4.100% Bank of America Corp. 13 24.07.23 1 669 721 0.04%
13 900 4.125% Bank of America Corp. 14 22.01.24 12 881 646 0.31%400 4.000% Bank of America Corp. 14 01.04.24 367 782 0.01%
8 100 3.875% Bank of America Corp. 15 01.08.25 7 342 412 0.18%4 600 2.200% Bank of New York Mellon Corp. 16 16.08.23 3 914 346 0.10%3 730 1.875% Bank of Nova Scotia 16 26.04.21 3 237 714 0.08%1 050 8.250% Banque Centrale de Tunisie International Bond 97 19.09.27 1 006 980 0.02%
17 000 7.625% Barclays Bank Plc. 12 21.11.22 17 078 923 0.41%1 700 10.179% Barclays Bank Plc. 144A 09 12.06.21 1 870 171 0.05%7 000 3.650% Barclays Plc. 15 16.03.25 6 119 653 0.15%9 800 6.500% BG Energy Capital Plc. 12 30.11.72 8 738 974 0.21%2 300 3.875% BOC Aviation Ltd. 16 27.04.26 2 034 569 0.05%
400 6.000% Boston Scientific Corp. 09 15.01.20 381 739 0.01%200 2.850% Boston Scientific Corp. 15 15.05.20 177 972 0.00%
7 400 4.250% Brazilian Government International Bond 13 07.01.25 6 383 996 0.16%500 5.625% Brazilian Government International Bond 16 21.02.47 419 458 0.01%
10 500 2.500% Capital One Financial Corp. 17 12.05.20 9 248 111 0.22%1 700 6.125% CAR, Inc. 15 04.02.20 1 544 331 0.04%2 890 3.849% CC Holding GS V LLC Via Crown Castle GS III Corp. 13 15.04.23 2 665 778 0.07%3 000 2.362% Central Nippon Expressway Co. Ltd. 16 28.05.21 2 605 796 0.06%6 100 2.350% Citigroup, Inc. 16 02.08.21 5 302 302 0.13%4 200 2.875% Ck Hutchison International 17 Ltd. 17 05.04.22 3 697 974 0.09%4 000 4.250% CNOOC Nexen Finance 2014 ULC 14 30.04.24 3 688 063 0.09%2 700 7.375% Colombia Government International Bond 06 18.09.37 3 063 188 0.07%3 700 5.625% Colombia Government International Bond 14 26.02.44 3 556 808 0.09%
509 9.455% Comcast Cable Communications Holdings, Inc. 02 15.11.22 598 536 0.01%500 5.750% Comision Federal de Electricidad 12 14.02.42 451 600 0.01%
78
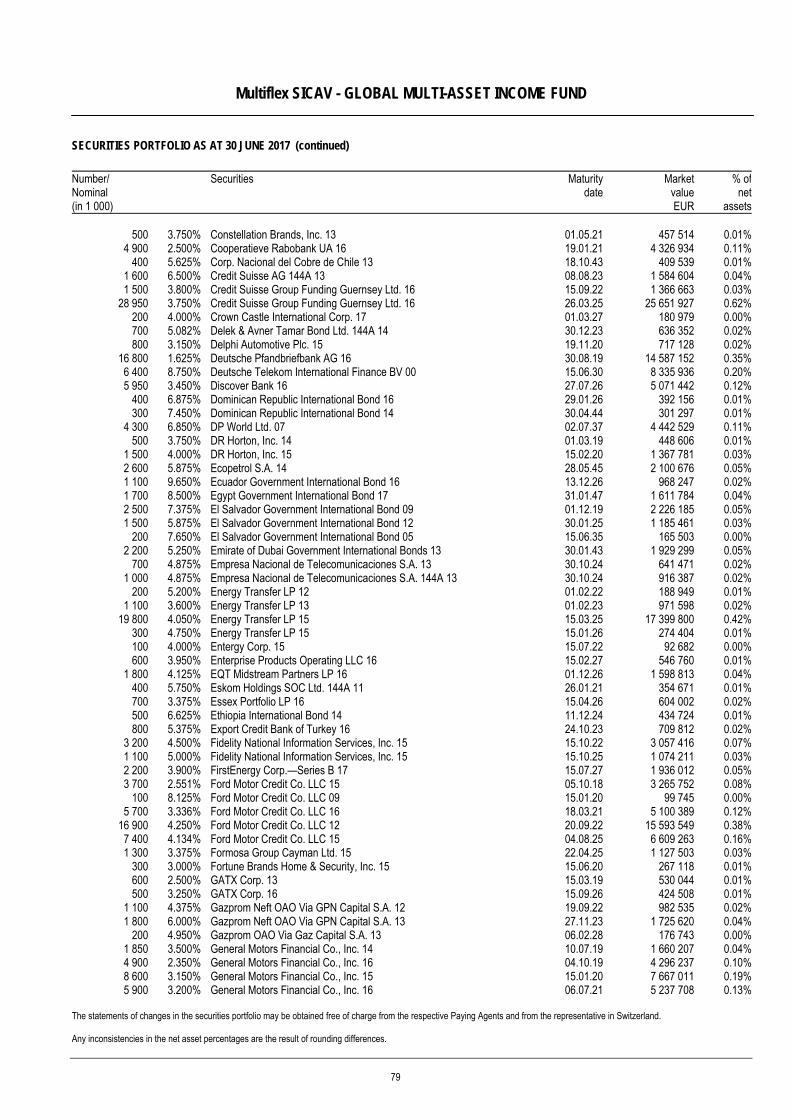
Multiflex SICAV - GLOBAL MULTI-ASSET INCOME FUND
SECURITIES PORTFOLIO AS AT 30 JUNE 2017 (continued)
The statements of changes in the securities portfolio may be obtained free of charge from the respective Paying Agents and from the representative in Switzerland. Any inconsistencies in the net asset percentages are the result of rounding differences.
Number/ Nominal (in 1 000)
Securities Maturitydate
MarketvalueEUR
% ofnet
assets
500 3.750% Constellation Brands, Inc. 13 01.05.21 457 514 0.01%4 900 2.500% Cooperatieve Rabobank UA 16 19.01.21 4 326 934 0.11%
400 5.625% Corp. Nacional del Cobre de Chile 13 18.10.43 409 539 0.01%1 600 6.500% Credit Suisse AG 144A 13 08.08.23 1 584 604 0.04%1 500 3.800% Credit Suisse Group Funding Guernsey Ltd. 16 15.09.22 1 366 663 0.03%
28 950 3.750% Credit Suisse Group Funding Guernsey Ltd. 16 26.03.25 25 651 927 0.62%200 4.000% Crown Castle International Corp. 17 01.03.27 180 979 0.00%700 5.082% Delek & Avner Tamar Bond Ltd. 144A 14 30.12.23 636 352 0.02%800 3.150% Delphi Automotive Plc. 15 19.11.20 717 128 0.02%
16 800 1.625% Deutsche Pfandbriefbank AG 16 30.08.19 14 587 152 0.35%6 400 8.750% Deutsche Telekom International Finance BV 00 15.06.30 8 335 936 0.20%5 950 3.450% Discover Bank 16 27.07.26 5 071 442 0.12%
400 6.875% Dominican Republic International Bond 16 29.01.26 392 156 0.01%300 7.450% Dominican Republic International Bond 14 30.04.44 301 297 0.01%
4 300 6.850% DP World Ltd. 07 02.07.37 4 442 529 0.11%500 3.750% DR Horton, Inc. 14 01.03.19 448 606 0.01%
1 500 4.000% DR Horton, Inc. 15 15.02.20 1 367 781 0.03%2 600 5.875% Ecopetrol S.A. 14 28.05.45 2 100 676 0.05%1 100 9.650% Ecuador Government International Bond 16 13.12.26 968 247 0.02%1 700 8.500% Egypt Government International Bond 17 31.01.47 1 611 784 0.04%2 500 7.375% El Salvador Government International Bond 09 01.12.19 2 226 185 0.05%1 500 5.875% El Salvador Government International Bond 12 30.01.25 1 185 461 0.03%
200 7.650% El Salvador Government International Bond 05 15.06.35 165 503 0.00%2 200 5.250% Emirate of Dubai Government International Bonds 13 30.01.43 1 929 299 0.05%
700 4.875% Empresa Nacional de Telecomunicaciones S.A. 13 30.10.24 641 471 0.02%1 000 4.875% Empresa Nacional de Telecomunicaciones S.A. 144A 13 30.10.24 916 387 0.02%
200 5.200% Energy Transfer LP 12 01.02.22 188 949 0.01%1 100 3.600% Energy Transfer LP 13 01.02.23 971 598 0.02%
19 800 4.050% Energy Transfer LP 15 15.03.25 17 399 800 0.42%300 4.750% Energy Transfer LP 15 15.01.26 274 404 0.01%100 4.000% Entergy Corp. 15 15.07.22 92 682 0.00%600 3.950% Enterprise Products Operating LLC 16 15.02.27 546 760 0.01%
1 800 4.125% EQT Midstream Partners LP 16 01.12.26 1 598 813 0.04%400 5.750% Eskom Holdings SOC Ltd. 144A 11 26.01.21 354 671 0.01%700 3.375% Essex Portfolio LP 16 15.04.26 604 002 0.02%500 6.625% Ethiopia International Bond 14 11.12.24 434 724 0.01%800 5.375% Export Credit Bank of Turkey 16 24.10.23 709 812 0.02%
3 200 4.500% Fidelity National Information Services, Inc. 15 15.10.22 3 057 416 0.07%1 100 5.000% Fidelity National Information Services, Inc. 15 15.10.25 1 074 211 0.03%2 200 3.900% FirstEnergy Corp.—Series B 17 15.07.27 1 936 012 0.05%3 700 2.551% Ford Motor Credit Co. LLC 15 05.10.18 3 265 752 0.08%
100 8.125% Ford Motor Credit Co. LLC 09 15.01.20 99 745 0.00%5 700 3.336% Ford Motor Credit Co. LLC 16 18.03.21 5 100 389 0.12%
16 900 4.250% Ford Motor Credit Co. LLC 12 20.09.22 15 593 549 0.38%7 400 4.134% Ford Motor Credit Co. LLC 15 04.08.25 6 609 263 0.16%1 300 3.375% Formosa Group Cayman Ltd. 15 22.04.25 1 127 503 0.03%
300 3.000% Fortune Brands Home & Security, Inc. 15 15.06.20 267 118 0.01%600 2.500% GATX Corp. 13 15.03.19 530 044 0.01%500 3.250% GATX Corp. 16 15.09.26 424 508 0.01%
1 100 4.375% Gazprom Neft OAO Via GPN Capital S.A. 12 19.09.22 982 535 0.02%1 800 6.000% Gazprom Neft OAO Via GPN Capital S.A. 13 27.11.23 1 725 620 0.04%
200 4.950% Gazprom OAO Via Gaz Capital S.A. 13 06.02.28 176 743 0.00%1 850 3.500% General Motors Financial Co., Inc. 14 10.07.19 1 660 207 0.04%4 900 2.350% General Motors Financial Co., Inc. 16 04.10.19 4 296 237 0.10%8 600 3.150% General Motors Financial Co., Inc. 15 15.01.20 7 667 011 0.19%5 900 3.200% General Motors Financial Co., Inc. 16 06.07.21 5 237 708 0.13%
79
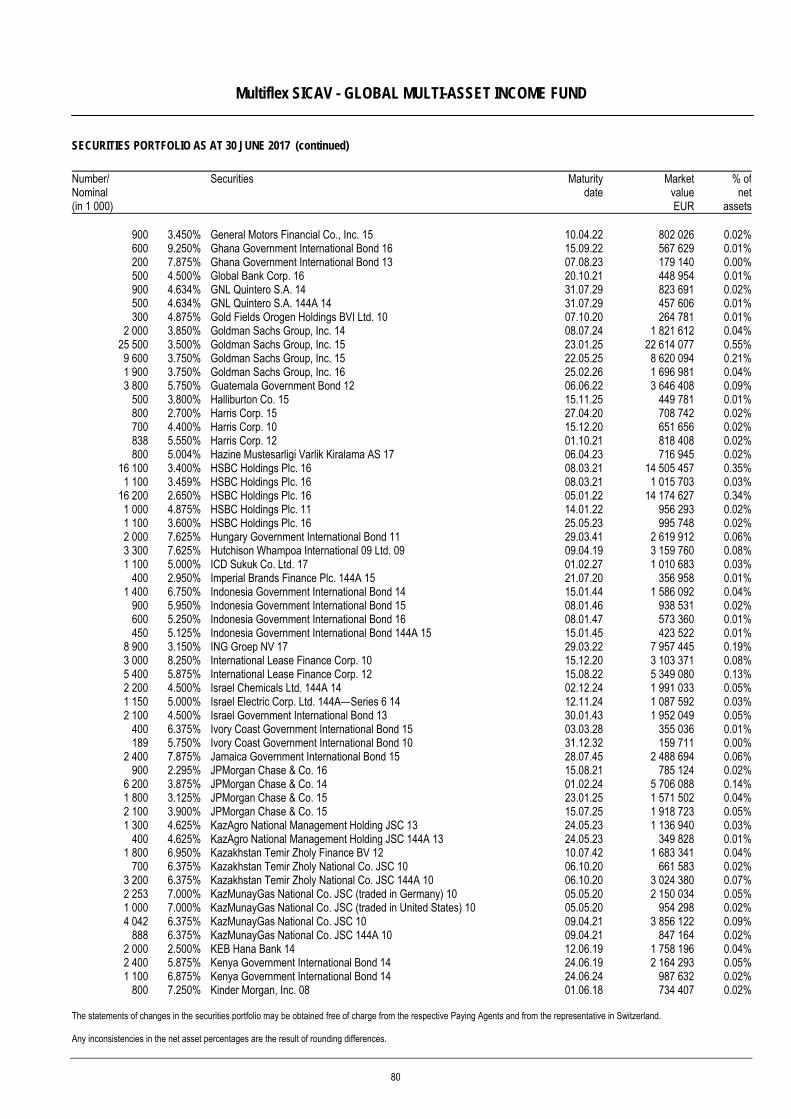
Multiflex SICAV - GLOBAL MULTI-ASSET INCOME FUND
SECURITIES PORTFOLIO AS AT 30 JUNE 2017 (continued)
The statements of changes in the securities portfolio may be obtained free of charge from the respective Paying Agents and from the representative in Switzerland. Any inconsistencies in the net asset percentages are the result of rounding differences.
Number/ Nominal (in 1 000)
Securities Maturitydate
MarketvalueEUR
% ofnet
assets
900 3.450% General Motors Financial Co., Inc. 15 10.04.22 802 026 0.02%600 9.250% Ghana Government International Bond 16 15.09.22 567 629 0.01%200 7.875% Ghana Government International Bond 13 07.08.23 179 140 0.00%500 4.500% Global Bank Corp. 16 20.10.21 448 954 0.01%900 4.634% GNL Quintero S.A. 14 31.07.29 823 691 0.02%500 4.634% GNL Quintero S.A. 144A 14 31.07.29 457 606 0.01%300 4.875% Gold Fields Orogen Holdings BVI Ltd. 10 07.10.20 264 781 0.01%
2 000 3.850% Goldman Sachs Group, Inc. 14 08.07.24 1 821 612 0.04%25 500 3.500% Goldman Sachs Group, Inc. 15 23.01.25 22 614 077 0.55%9 600 3.750% Goldman Sachs Group, Inc. 15 22.05.25 8 620 094 0.21%1 900 3.750% Goldman Sachs Group, Inc. 16 25.02.26 1 696 981 0.04%3 800 5.750% Guatemala Government Bond 12 06.06.22 3 646 408 0.09%
500 3.800% Halliburton Co. 15 15.11.25 449 781 0.01%800 2.700% Harris Corp. 15 27.04.20 708 742 0.02%700 4.400% Harris Corp. 10 15.12.20 651 656 0.02%838 5.550% Harris Corp. 12 01.10.21 818 408 0.02%800 5.004% Hazine Mustesarligi Varlik Kiralama AS 17 06.04.23 716 945 0.02%
16 100 3.400% HSBC Holdings Plc. 16 08.03.21 14 505 457 0.35%1 100 3.459% HSBC Holdings Plc. 16 08.03.21 1 015 703 0.03%
16 200 2.650% HSBC Holdings Plc. 16 05.01.22 14 174 627 0.34%1 000 4.875% HSBC Holdings Plc. 11 14.01.22 956 293 0.02%1 100 3.600% HSBC Holdings Plc. 16 25.05.23 995 748 0.02%2 000 7.625% Hungary Government International Bond 11 29.03.41 2 619 912 0.06%3 300 7.625% Hutchison Whampoa International 09 Ltd. 09 09.04.19 3 159 760 0.08%1 100 5.000% ICD Sukuk Co. Ltd. 17 01.02.27 1 010 683 0.03%
400 2.950% Imperial Brands Finance Plc. 144A 15 21.07.20 356 958 0.01%1 400 6.750% Indonesia Government International Bond 14 15.01.44 1 586 092 0.04%
900 5.950% Indonesia Government International Bond 15 08.01.46 938 531 0.02%600 5.250% Indonesia Government International Bond 16 08.01.47 573 360 0.01%450 5.125% Indonesia Government International Bond 144A 15 15.01.45 423 522 0.01%
8 900 3.150% ING Groep NV 17 29.03.22 7 957 445 0.19%3 000 8.250% International Lease Finance Corp. 10 15.12.20 3 103 371 0.08%5 400 5.875% International Lease Finance Corp. 12 15.08.22 5 349 080 0.13%2 200 4.500% Israel Chemicals Ltd. 144A 14 02.12.24 1 991 033 0.05%1 150 5.000% Israel Electric Corp. Ltd. 144A—Series 6 14 12.11.24 1 087 592 0.03%2 100 4.500% Israel Government International Bond 13 30.01.43 1 952 049 0.05%
400 6.375% Ivory Coast Government International Bond 15 03.03.28 355 036 0.01%189 5.750% Ivory Coast Government International Bond 10 31.12.32 159 711 0.00%
2 400 7.875% Jamaica Government International Bond 15 28.07.45 2 488 694 0.06%900 2.295% JPMorgan Chase & Co. 16 15.08.21 785 124 0.02%
6 200 3.875% JPMorgan Chase & Co. 14 01.02.24 5 706 088 0.14%1 800 3.125% JPMorgan Chase & Co. 15 23.01.25 1 571 502 0.04%2 100 3.900% JPMorgan Chase & Co. 15 15.07.25 1 918 723 0.05%1 300 4.625% KazAgro National Management Holding JSC 13 24.05.23 1 136 940 0.03%
400 4.625% KazAgro National Management Holding JSC 144A 13 24.05.23 349 828 0.01%1 800 6.950% Kazakhstan Temir Zholy Finance BV 12 10.07.42 1 683 341 0.04%
700 6.375% Kazakhstan Temir Zholy National Co. JSC 10 06.10.20 661 583 0.02%3 200 6.375% Kazakhstan Temir Zholy National Co. JSC 144A 10 06.10.20 3 024 380 0.07%2 253 7.000% KazMunayGas National Co. JSC (traded in Germany) 10 05.05.20 2 150 034 0.05%1 000 7.000% KazMunayGas National Co. JSC (traded in United States) 10 05.05.20 954 298 0.02%4 042 6.375% KazMunayGas National Co. JSC 10 09.04.21 3 856 122 0.09%
888 6.375% KazMunayGas National Co. JSC 144A 10 09.04.21 847 164 0.02%2 000 2.500% KEB Hana Bank 14 12.06.19 1 758 196 0.04%2 400 5.875% Kenya Government International Bond 14 24.06.19 2 164 293 0.05%1 100 6.875% Kenya Government International Bond 14 24.06.24 987 632 0.02%
800 7.250% Kinder Morgan, Inc. 08 01.06.18 734 407 0.02%
80
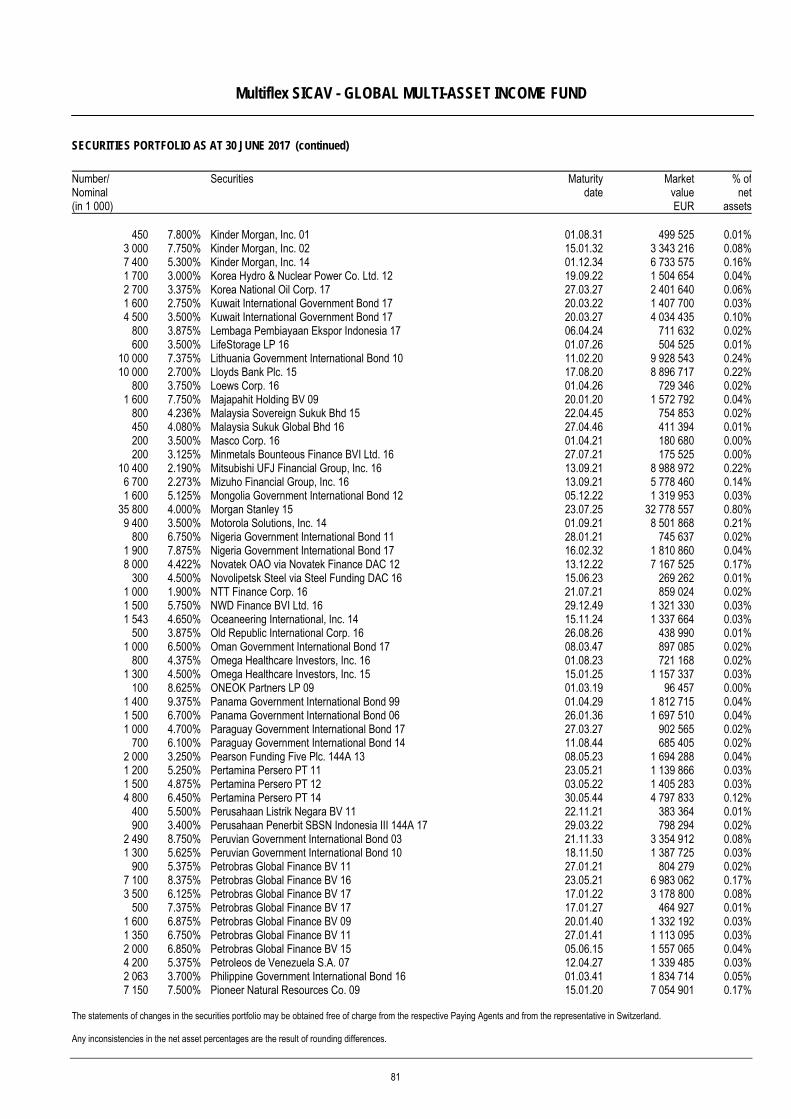
Multiflex SICAV - GLOBAL MULTI-ASSET INCOME FUND
SECURITIES PORTFOLIO AS AT 30 JUNE 2017 (continued)
The statements of changes in the securities portfolio may be obtained free of charge from the respective Paying Agents and from the representative in Switzerland. Any inconsistencies in the net asset percentages are the result of rounding differences.
Number/ Nominal (in 1 000)
Securities Maturitydate
MarketvalueEUR
% ofnet
assets
450 7.800% Kinder Morgan, Inc. 01 01.08.31 499 525 0.01%3 000 7.750% Kinder Morgan, Inc. 02 15.01.32 3 343 216 0.08%7 400 5.300% Kinder Morgan, Inc. 14 01.12.34 6 733 575 0.16%1 700 3.000% Korea Hydro & Nuclear Power Co. Ltd. 12 19.09.22 1 504 654 0.04%2 700 3.375% Korea National Oil Corp. 17 27.03.27 2 401 640 0.06%1 600 2.750% Kuwait International Government Bond 17 20.03.22 1 407 700 0.03%4 500 3.500% Kuwait International Government Bond 17 20.03.27 4 034 435 0.10%
800 3.875% Lembaga Pembiayaan Ekspor Indonesia 17 06.04.24 711 632 0.02%600 3.500% LifeStorage LP 16 01.07.26 504 525 0.01%
10 000 7.375% Lithuania Government International Bond 10 11.02.20 9 928 543 0.24%10 000 2.700% Lloyds Bank Plc. 15 17.08.20 8 896 717 0.22%
800 3.750% Loews Corp. 16 01.04.26 729 346 0.02%1 600 7.750% Majapahit Holding BV 09 20.01.20 1 572 792 0.04%
800 4.236% Malaysia Sovereign Sukuk Bhd 15 22.04.45 754 853 0.02%450 4.080% Malaysia Sukuk Global Bhd 16 27.04.46 411 394 0.01%200 3.500% Masco Corp. 16 01.04.21 180 680 0.00%200 3.125% Minmetals Bounteous Finance BVI Ltd. 16 27.07.21 175 525 0.00%
10 400 2.190% Mitsubishi UFJ Financial Group, Inc. 16 13.09.21 8 988 972 0.22%6 700 2.273% Mizuho Financial Group, Inc. 16 13.09.21 5 778 460 0.14%1 600 5.125% Mongolia Government International Bond 12 05.12.22 1 319 953 0.03%
35 800 4.000% Morgan Stanley 15 23.07.25 32 778 557 0.80%9 400 3.500% Motorola Solutions, Inc. 14 01.09.21 8 501 868 0.21%
800 6.750% Nigeria Government International Bond 11 28.01.21 745 637 0.02%1 900 7.875% Nigeria Government International Bond 17 16.02.32 1 810 860 0.04%8 000 4.422% Novatek OAO via Novatek Finance DAC 12 13.12.22 7 167 525 0.17%
300 4.500% Novolipetsk Steel via Steel Funding DAC 16 15.06.23 269 262 0.01%1 000 1.900% NTT Finance Corp. 16 21.07.21 859 024 0.02%1 500 5.750% NWD Finance BVI Ltd. 16 29.12.49 1 321 330 0.03%1 543 4.650% Oceaneering International, Inc. 14 15.11.24 1 337 664 0.03%
500 3.875% Old Republic International Corp. 16 26.08.26 438 990 0.01%1 000 6.500% Oman Government International Bond 17 08.03.47 897 085 0.02%
800 4.375% Omega Healthcare Investors, Inc. 16 01.08.23 721 168 0.02%1 300 4.500% Omega Healthcare Investors, Inc. 15 15.01.25 1 157 337 0.03%
100 8.625% ONEOK Partners LP 09 01.03.19 96 457 0.00%1 400 9.375% Panama Government International Bond 99 01.04.29 1 812 715 0.04%1 500 6.700% Panama Government International Bond 06 26.01.36 1 697 510 0.04%1 000 4.700% Paraguay Government International Bond 17 27.03.27 902 565 0.02%
700 6.100% Paraguay Government International Bond 14 11.08.44 685 405 0.02%2 000 3.250% Pearson Funding Five Plc. 144A 13 08.05.23 1 694 288 0.04%1 200 5.250% Pertamina Persero PT 11 23.05.21 1 139 866 0.03%1 500 4.875% Pertamina Persero PT 12 03.05.22 1 405 283 0.03%4 800 6.450% Pertamina Persero PT 14 30.05.44 4 797 833 0.12%
400 5.500% Perusahaan Listrik Negara BV 11 22.11.21 383 364 0.01%900 3.400% Perusahaan Penerbit SBSN Indonesia III 144A 17 29.03.22 798 294 0.02%
2 490 8.750% Peruvian Government International Bond 03 21.11.33 3 354 912 0.08%1 300 5.625% Peruvian Government International Bond 10 18.11.50 1 387 725 0.03%
900 5.375% Petrobras Global Finance BV 11 27.01.21 804 279 0.02%7 100 8.375% Petrobras Global Finance BV 16 23.05.21 6 983 062 0.17%3 500 6.125% Petrobras Global Finance BV 17 17.01.22 3 178 800 0.08%
500 7.375% Petrobras Global Finance BV 17 17.01.27 464 927 0.01%1 600 6.875% Petrobras Global Finance BV 09 20.01.40 1 332 192 0.03%1 350 6.750% Petrobras Global Finance BV 11 27.01.41 1 113 095 0.03%2 000 6.850% Petrobras Global Finance BV 15 05.06.15 1 557 065 0.04%4 200 5.375% Petroleos de Venezuela S.A. 07 12.04.27 1 339 485 0.03%2 063 3.700% Philippine Government International Bond 16 01.03.41 1 834 714 0.05%7 150 7.500% Pioneer Natural Resources Co. 09 15.01.20 7 054 901 0.17%
81
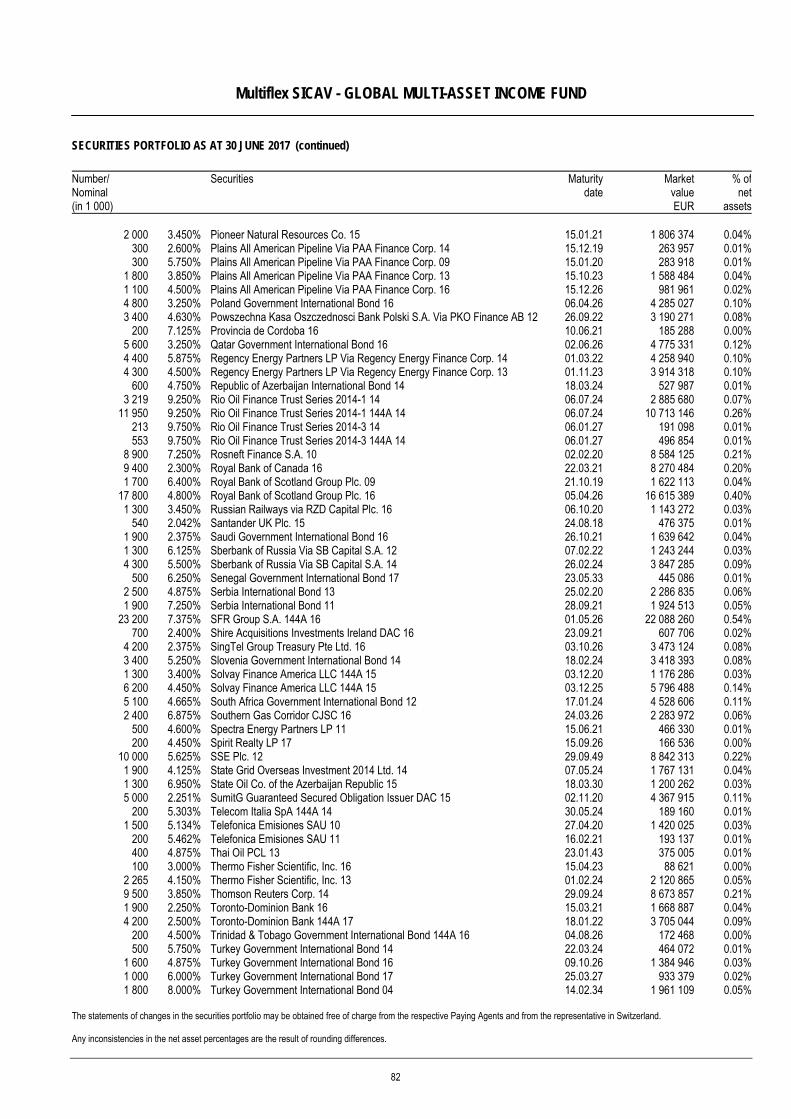
Multiflex SICAV - GLOBAL MULTI-ASSET INCOME FUND
SECURITIES PORTFOLIO AS AT 30 JUNE 2017 (continued)
The statements of changes in the securities portfolio may be obtained free of charge from the respective Paying Agents and from the representative in Switzerland. Any inconsistencies in the net asset percentages are the result of rounding differences.
Number/ Nominal (in 1 000)
Securities Maturitydate
MarketvalueEUR
% ofnet
assets
2 000 3.450% Pioneer Natural Resources Co. 15 15.01.21 1 806 374 0.04%300 2.600% Plains All American Pipeline Via PAA Finance Corp. 14 15.12.19 263 957 0.01%300 5.750% Plains All American Pipeline Via PAA Finance Corp. 09 15.01.20 283 918 0.01%
1 800 3.850% Plains All American Pipeline Via PAA Finance Corp. 13 15.10.23 1 588 484 0.04%1 100 4.500% Plains All American Pipeline Via PAA Finance Corp. 16 15.12.26 981 961 0.02%4 800 3.250% Poland Government International Bond 16 06.04.26 4 285 027 0.10%3 400 4.630% Powszechna Kasa Oszczednosci Bank Polski S.A. Via PKO Finance AB 12 26.09.22 3 190 271 0.08%
200 7.125% Provincia de Cordoba 16 10.06.21 185 288 0.00%5 600 3.250% Qatar Government International Bond 16 02.06.26 4 775 331 0.12%4 400 5.875% Regency Energy Partners LP Via Regency Energy Finance Corp. 14 01.03.22 4 258 940 0.10%4 300 4.500% Regency Energy Partners LP Via Regency Energy Finance Corp. 13 01.11.23 3 914 318 0.10%
600 4.750% Republic of Azerbaijan International Bond 14 18.03.24 527 987 0.01%3 219 9.250% Rio Oil Finance Trust Series 2014-1 14 06.07.24 2 885 680 0.07%
11 950 9.250% Rio Oil Finance Trust Series 2014-1 144A 14 06.07.24 10 713 146 0.26%213 9.750% Rio Oil Finance Trust Series 2014-3 14 06.01.27 191 098 0.01%553 9.750% Rio Oil Finance Trust Series 2014-3 144A 14 06.01.27 496 854 0.01%
8 900 7.250% Rosneft Finance S.A. 10 02.02.20 8 584 125 0.21%9 400 2.300% Royal Bank of Canada 16 22.03.21 8 270 484 0.20%1 700 6.400% Royal Bank of Scotland Group Plc. 09 21.10.19 1 622 113 0.04%
17 800 4.800% Royal Bank of Scotland Group Plc. 16 05.04.26 16 615 389 0.40%1 300 3.450% Russian Railways via RZD Capital Plc. 16 06.10.20 1 143 272 0.03%
540 2.042% Santander UK Plc. 15 24.08.18 476 375 0.01%1 900 2.375% Saudi Government International Bond 16 26.10.21 1 639 642 0.04%1 300 6.125% Sberbank of Russia Via SB Capital S.A. 12 07.02.22 1 243 244 0.03%4 300 5.500% Sberbank of Russia Via SB Capital S.A. 14 26.02.24 3 847 285 0.09%
500 6.250% Senegal Government International Bond 17 23.05.33 445 086 0.01%2 500 4.875% Serbia International Bond 13 25.02.20 2 286 835 0.06%1 900 7.250% Serbia International Bond 11 28.09.21 1 924 513 0.05%
23 200 7.375% SFR Group S.A. 144A 16 01.05.26 22 088 260 0.54%700 2.400% Shire Acquisitions Investments Ireland DAC 16 23.09.21 607 706 0.02%
4 200 2.375% SingTel Group Treasury Pte Ltd. 16 03.10.26 3 473 124 0.08%3 400 5.250% Slovenia Government International Bond 14 18.02.24 3 418 393 0.08%1 300 3.400% Solvay Finance America LLC 144A 15 03.12.20 1 176 286 0.03%6 200 4.450% Solvay Finance America LLC 144A 15 03.12.25 5 796 488 0.14%5 100 4.665% South Africa Government International Bond 12 17.01.24 4 528 606 0.11%2 400 6.875% Southern Gas Corridor CJSC 16 24.03.26 2 283 972 0.06%
500 4.600% Spectra Energy Partners LP 11 15.06.21 466 330 0.01%200 4.450% Spirit Realty LP 17 15.09.26 166 536 0.00%
10 000 5.625% SSE Plc. 12 29.09.49 8 842 313 0.22%1 900 4.125% State Grid Overseas Investment 2014 Ltd. 14 07.05.24 1 767 131 0.04%1 300 6.950% State Oil Co. of the Azerbaijan Republic 15 18.03.30 1 200 262 0.03%5 000 2.251% SumitG Guaranteed Secured Obligation Issuer DAC 15 02.11.20 4 367 915 0.11%
200 5.303% Telecom Italia SpA 144A 14 30.05.24 189 160 0.01%1 500 5.134% Telefonica Emisiones SAU 10 27.04.20 1 420 025 0.03%
200 5.462% Telefonica Emisiones SAU 11 16.02.21 193 137 0.01%400 4.875% Thai Oil PCL 13 23.01.43 375 005 0.01%100 3.000% Thermo Fisher Scientific, Inc. 16 15.04.23 88 621 0.00%
2 265 4.150% Thermo Fisher Scientific, Inc. 13 01.02.24 2 120 865 0.05%9 500 3.850% Thomson Reuters Corp. 14 29.09.24 8 673 857 0.21%1 900 2.250% Toronto-Dominion Bank 16 15.03.21 1 668 887 0.04%4 200 2.500% Toronto-Dominion Bank 144A 17 18.01.22 3 705 044 0.09%
200 4.500% Trinidad & Tobago Government International Bond 144A 16 04.08.26 172 468 0.00%500 5.750% Turkey Government International Bond 14 22.03.24 464 072 0.01%
1 600 4.875% Turkey Government International Bond 16 09.10.26 1 384 946 0.03%1 000 6.000% Turkey Government International Bond 17 25.03.27 933 379 0.02%1 800 8.000% Turkey Government International Bond 04 14.02.34 1 961 109 0.05%
82
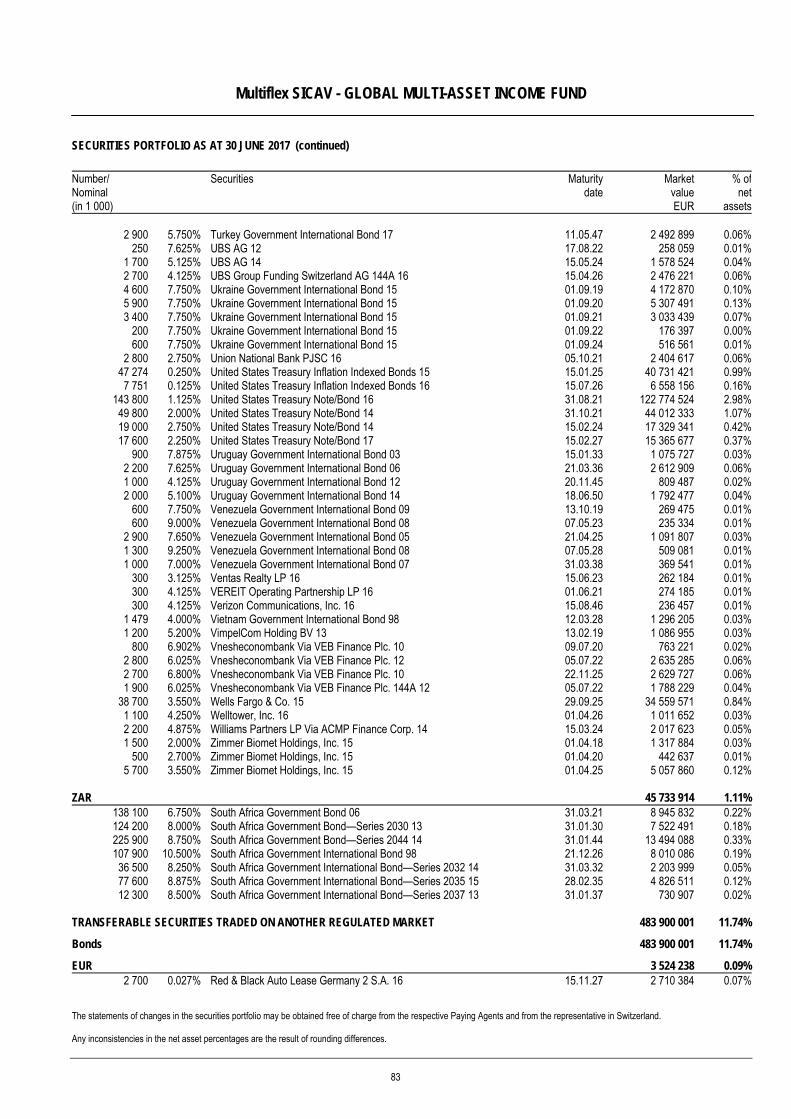
Multiflex SICAV - GLOBAL MULTI-ASSET INCOME FUND
SECURITIES PORTFOLIO AS AT 30 JUNE 2017 (continued)
The statements of changes in the securities portfolio may be obtained free of charge from the respective Paying Agents and from the representative in Switzerland. Any inconsistencies in the net asset percentages are the result of rounding differences.
Number/ Nominal (in 1 000)
Securities Maturitydate
MarketvalueEUR
% ofnet
assets
2 900 5.750% Turkey Government International Bond 17 11.05.47 2 492 899 0.06%250 7.625% UBS AG 12 17.08.22 258 059 0.01%
1 700 5.125% UBS AG 14 15.05.24 1 578 524 0.04%2 700 4.125% UBS Group Funding Switzerland AG 144A 16 15.04.26 2 476 221 0.06%4 600 7.750% Ukraine Government International Bond 15 01.09.19 4 172 870 0.10%5 900 7.750% Ukraine Government International Bond 15 01.09.20 5 307 491 0.13%3 400 7.750% Ukraine Government International Bond 15 01.09.21 3 033 439 0.07%
200 7.750% Ukraine Government International Bond 15 01.09.22 176 397 0.00%600 7.750% Ukraine Government International Bond 15 01.09.24 516 561 0.01%
2 800 2.750% Union National Bank PJSC 16 05.10.21 2 404 617 0.06%47 274 0.250% United States Treasury Inflation Indexed Bonds 15 15.01.25 40 731 421 0.99%7 751 0.125% United States Treasury Inflation Indexed Bonds 16 15.07.26 6 558 156 0.16%
143 800 1.125% United States Treasury Note/Bond 16 31.08.21 122 774 524 2.98%49 800 2.000% United States Treasury Note/Bond 14 31.10.21 44 012 333 1.07%19 000 2.750% United States Treasury Note/Bond 14 15.02.24 17 329 341 0.42%17 600 2.250% United States Treasury Note/Bond 17 15.02.27 15 365 677 0.37%
900 7.875% Uruguay Government International Bond 03 15.01.33 1 075 727 0.03%2 200 7.625% Uruguay Government International Bond 06 21.03.36 2 612 909 0.06%1 000 4.125% Uruguay Government International Bond 12 20.11.45 809 487 0.02%2 000 5.100% Uruguay Government International Bond 14 18.06.50 1 792 477 0.04%
600 7.750% Venezuela Government International Bond 09 13.10.19 269 475 0.01%600 9.000% Venezuela Government International Bond 08 07.05.23 235 334 0.01%
2 900 7.650% Venezuela Government International Bond 05 21.04.25 1 091 807 0.03%1 300 9.250% Venezuela Government International Bond 08 07.05.28 509 081 0.01%1 000 7.000% Venezuela Government International Bond 07 31.03.38 369 541 0.01%
300 3.125% Ventas Realty LP 16 15.06.23 262 184 0.01%300 4.125% VEREIT Operating Partnership LP 16 01.06.21 274 185 0.01%300 4.125% Verizon Communications, Inc. 16 15.08.46 236 457 0.01%
1 479 4.000% Vietnam Government International Bond 98 12.03.28 1 296 205 0.03%1 200 5.200% VimpelCom Holding BV 13 13.02.19 1 086 955 0.03%
800 6.902% Vnesheconombank Via VEB Finance Plc. 10 09.07.20 763 221 0.02%2 800 6.025% Vnesheconombank Via VEB Finance Plc. 12 05.07.22 2 635 285 0.06%2 700 6.800% Vnesheconombank Via VEB Finance Plc. 10 22.11.25 2 629 727 0.06%1 900 6.025% Vnesheconombank Via VEB Finance Plc. 144A 12 05.07.22 1 788 229 0.04%
38 700 3.550% Wells Fargo & Co. 15 29.09.25 34 559 571 0.84%1 100 4.250% Welltower, Inc. 16 01.04.26 1 011 652 0.03%2 200 4.875% Williams Partners LP Via ACMP Finance Corp. 14 15.03.24 2 017 623 0.05%1 500 2.000% Zimmer Biomet Holdings, Inc. 15 01.04.18 1 317 884 0.03%
500 2.700% Zimmer Biomet Holdings, Inc. 15 01.04.20 442 637 0.01%5 700 3.550% Zimmer Biomet Holdings, Inc. 15 01.04.25 5 057 860 0.12%
ZAR 45 733 914 1.11%138 100 6.750% South Africa Government Bond 06 31.03.21 8 945 832 0.22%124 200 8.000% South Africa Government Bond—Series 2030 13 31.01.30 7 522 491 0.18%225 900 8.750% South Africa Government Bond—Series 2044 14 31.01.44 13 494 088 0.33%107 900 10.500% South Africa Government International Bond 98 21.12.26 8 010 086 0.19%
36 500 8.250% South Africa Government International Bond—Series 2032 14 31.03.32 2 203 999 0.05%77 600 8.875% South Africa Government International Bond—Series 2035 15 28.02.35 4 826 511 0.12%12 300 8.500% South Africa Government International Bond—Series 2037 13 31.01.37 730 907 0.02%
TRANSFERABLE SECURITIES TRADED ON ANOTHER REGULATED MARKET 483 900 001 11.74%
Bonds 483 900 001 11.74%
EUR 3 524 238 0.09%2 700 0.027% Red & Black Auto Lease Germany 2 S.A. 16 15.11.27 2 710 384 0.07%
83
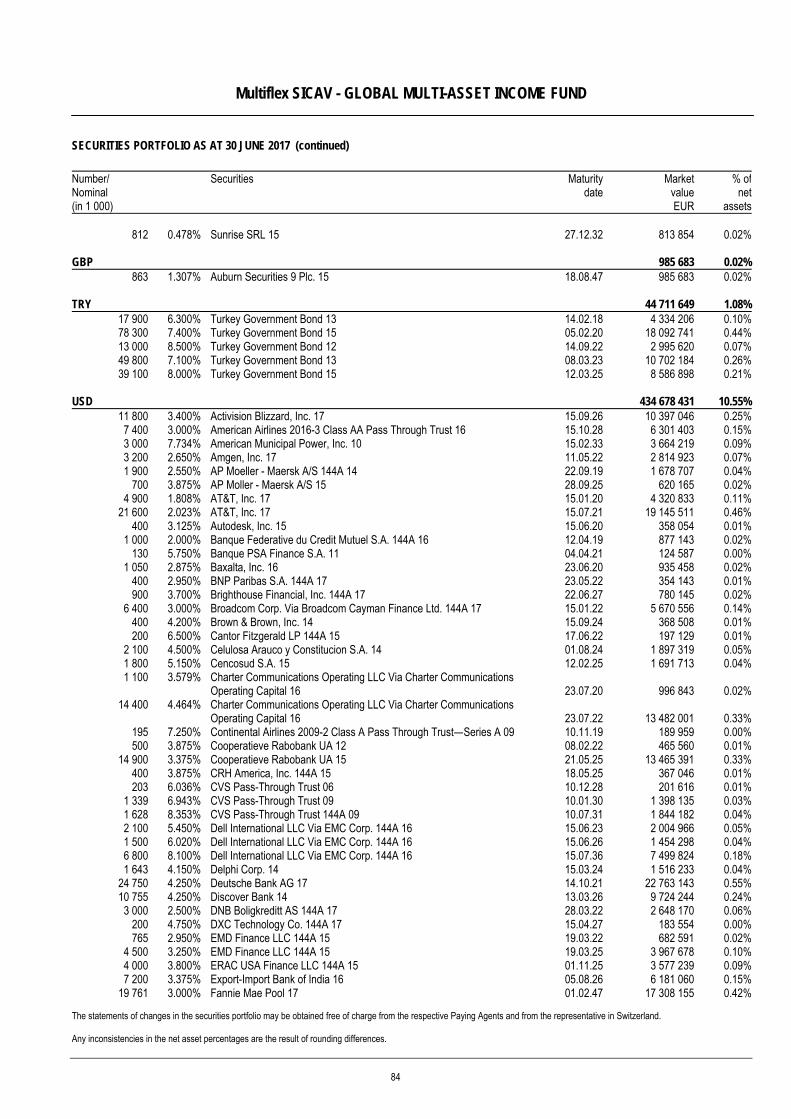
Multiflex SICAV - GLOBAL MULTI-ASSET INCOME FUND
SECURITIES PORTFOLIO AS AT 30 JUNE 2017 (continued)
The statements of changes in the securities portfolio may be obtained free of charge from the respective Paying Agents and from the representative in Switzerland. Any inconsistencies in the net asset percentages are the result of rounding differences.
Number/ Nominal (in 1 000)
Securities Maturitydate
MarketvalueEUR
% ofnet
assets
812 0.478% Sunrise SRL 15 27.12.32 813 854 0.02%
GBP 985 683 0.02%863 1.307% Auburn Securities 9 Plc. 15 18.08.47 985 683 0.02%
TRY 44 711 649 1.08%17 900 6.300% Turkey Government Bond 13 14.02.18 4 334 206 0.10%78 300 7.400% Turkey Government Bond 15 05.02.20 18 092 741 0.44%13 000 8.500% Turkey Government Bond 12 14.09.22 2 995 620 0.07%49 800 7.100% Turkey Government Bond 13 08.03.23 10 702 184 0.26%39 100 8.000% Turkey Government Bond 15 12.03.25 8 586 898 0.21%
USD 434 678 431 10.55%11 800 3.400% Activision Blizzard, Inc. 17 15.09.26 10 397 046 0.25%7 400 3.000% American Airlines 2016-3 Class AA Pass Through Trust 16 15.10.28 6 301 403 0.15%3 000 7.734% American Municipal Power, Inc. 10 15.02.33 3 664 219 0.09%3 200 2.650% Amgen, Inc. 17 11.05.22 2 814 923 0.07%1 900 2.550% AP Moeller - Maersk A/S 144A 14 22.09.19 1 678 707 0.04%
700 3.875% AP Moller - Maersk A/S 15 28.09.25 620 165 0.02%4 900 1.808% AT&T, Inc. 17 15.01.20 4 320 833 0.11%
21 600 2.023% AT&T, Inc. 17 15.07.21 19 145 511 0.46%400 3.125% Autodesk, Inc. 15 15.06.20 358 054 0.01%
1 000 2.000% Banque Federative du Credit Mutuel S.A. 144A 16 12.04.19 877 143 0.02%130 5.750% Banque PSA Finance S.A. 11 04.04.21 124 587 0.00%
1 050 2.875% Baxalta, Inc. 16 23.06.20 935 458 0.02%400 2.950% BNP Paribas S.A. 144A 17 23.05.22 354 143 0.01%900 3.700% Brighthouse Financial, Inc. 144A 17 22.06.27 780 145 0.02%
6 400 3.000% Broadcom Corp. Via Broadcom Cayman Finance Ltd. 144A 17 15.01.22 5 670 556 0.14%400 4.200% Brown & Brown, Inc. 14 15.09.24 368 508 0.01%200 6.500% Cantor Fitzgerald LP 144A 15 17.06.22 197 129 0.01%
2 100 4.500% Celulosa Arauco y Constitucion S.A. 14 01.08.24 1 897 319 0.05%1 800 5.150% Cencosud S.A. 15 12.02.25 1 691 713 0.04%1 100 3.579% Charter Communications Operating LLC Via Charter Communications
Operating Capital 16 23.07.20 996 843 0.02%14 400 4.464% Charter Communications Operating LLC Via Charter Communications
Operating Capital 16 23.07.22 13 482 001 0.33%195 7.250% Continental Airlines 2009-2 Class A Pass Through Trust—Series A 09 10.11.19 189 959 0.00%500 3.875% Cooperatieve Rabobank UA 12 08.02.22 465 560 0.01%
14 900 3.375% Cooperatieve Rabobank UA 15 21.05.25 13 465 391 0.33%400 3.875% CRH America, Inc. 144A 15 18.05.25 367 046 0.01%203 6.036% CVS Pass-Through Trust 06 10.12.28 201 616 0.01%
1 339 6.943% CVS Pass-Through Trust 09 10.01.30 1 398 135 0.03%1 628 8.353% CVS Pass-Through Trust 144A 09 10.07.31 1 844 182 0.04%2 100 5.450% Dell International LLC Via EMC Corp. 144A 16 15.06.23 2 004 966 0.05%1 500 6.020% Dell International LLC Via EMC Corp. 144A 16 15.06.26 1 454 298 0.04%6 800 8.100% Dell International LLC Via EMC Corp. 144A 16 15.07.36 7 499 824 0.18%1 643 4.150% Delphi Corp. 14 15.03.24 1 516 233 0.04%
24 750 4.250% Deutsche Bank AG 17 14.10.21 22 763 143 0.55%10 755 4.250% Discover Bank 14 13.03.26 9 724 244 0.24%3 000 2.500% DNB Boligkreditt AS 144A 17 28.03.22 2 648 170 0.06%
200 4.750% DXC Technology Co. 144A 17 15.04.27 183 554 0.00%765 2.950% EMD Finance LLC 144A 15 19.03.22 682 591 0.02%
4 500 3.250% EMD Finance LLC 144A 15 19.03.25 3 967 678 0.10%4 000 3.800% ERAC USA Finance LLC 144A 15 01.11.25 3 577 239 0.09%7 200 3.375% Export-Import Bank of India 16 05.08.26 6 181 060 0.15%
19 761 3.000% Fannie Mae Pool 17 01.02.47 17 308 155 0.42%
84
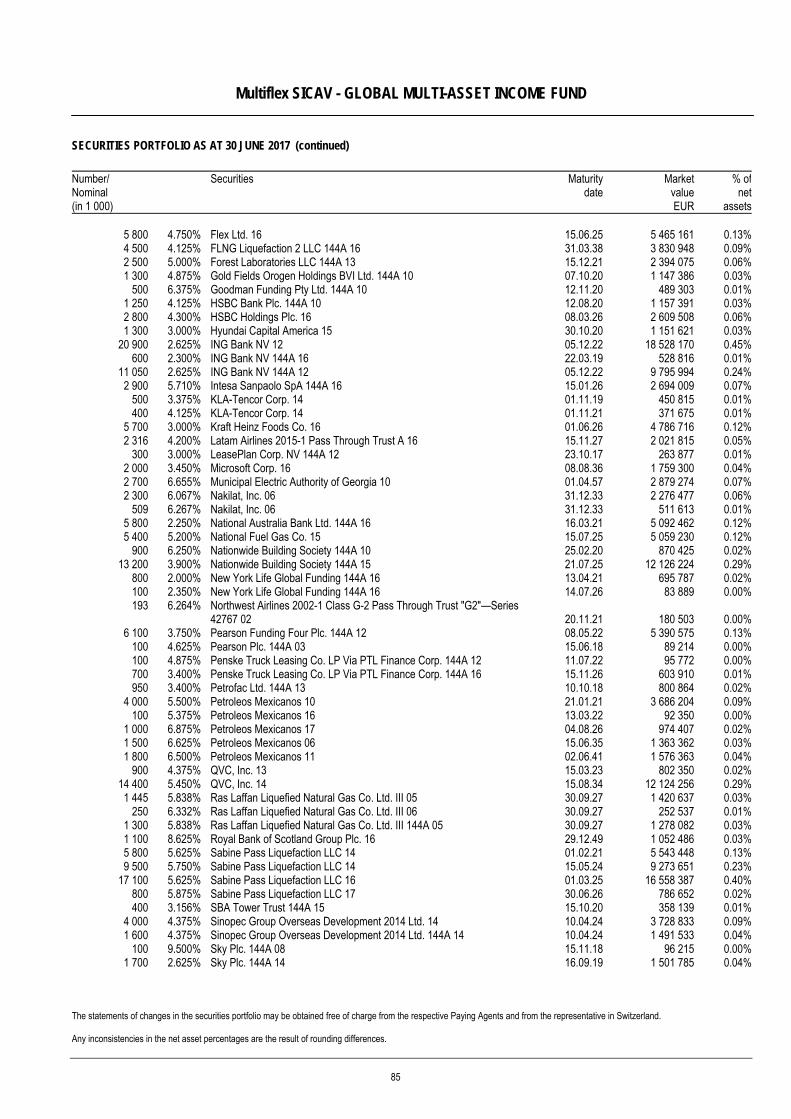
Multiflex SICAV - GLOBAL MULTI-ASSET INCOME FUND
SECURITIES PORTFOLIO AS AT 30 JUNE 2017 (continued)
The statements of changes in the securities portfolio may be obtained free of charge from the respective Paying Agents and from the representative in Switzerland. Any inconsistencies in the net asset percentages are the result of rounding differences.
Number/ Nominal (in 1 000)
Securities Maturitydate
MarketvalueEUR
% ofnet
assets
5 800 4.750% Flex Ltd. 16 15.06.25 5 465 161 0.13%4 500 4.125% FLNG Liquefaction 2 LLC 144A 16 31.03.38 3 830 948 0.09%2 500 5.000% Forest Laboratories LLC 144A 13 15.12.21 2 394 075 0.06%1 300 4.875% Gold Fields Orogen Holdings BVI Ltd. 144A 10 07.10.20 1 147 386 0.03%
500 6.375% Goodman Funding Pty Ltd. 144A 10 12.11.20 489 303 0.01%1 250 4.125% HSBC Bank Plc. 144A 10 12.08.20 1 157 391 0.03%2 800 4.300% HSBC Holdings Plc. 16 08.03.26 2 609 508 0.06%1 300 3.000% Hyundai Capital America 15 30.10.20 1 151 621 0.03%
20 900 2.625% ING Bank NV 12 05.12.22 18 528 170 0.45%600 2.300% ING Bank NV 144A 16 22.03.19 528 816 0.01%
11 050 2.625% ING Bank NV 144A 12 05.12.22 9 795 994 0.24%2 900 5.710% Intesa Sanpaolo SpA 144A 16 15.01.26 2 694 009 0.07%
500 3.375% KLA-Tencor Corp. 14 01.11.19 450 815 0.01%400 4.125% KLA-Tencor Corp. 14 01.11.21 371 675 0.01%
5 700 3.000% Kraft Heinz Foods Co. 16 01.06.26 4 786 716 0.12%2 316 4.200% Latam Airlines 2015-1 Pass Through Trust A 16 15.11.27 2 021 815 0.05%
300 3.000% LeasePlan Corp. NV 144A 12 23.10.17 263 877 0.01%2 000 3.450% Microsoft Corp. 16 08.08.36 1 759 300 0.04%2 700 6.655% Municipal Electric Authority of Georgia 10 01.04.57 2 879 274 0.07%2 300 6.067% Nakilat, Inc. 06 31.12.33 2 276 477 0.06%
509 6.267% Nakilat, Inc. 06 31.12.33 511 613 0.01%5 800 2.250% National Australia Bank Ltd. 144A 16 16.03.21 5 092 462 0.12%5 400 5.200% National Fuel Gas Co. 15 15.07.25 5 059 230 0.12%
900 6.250% Nationwide Building Society 144A 10 25.02.20 870 425 0.02%13 200 3.900% Nationwide Building Society 144A 15 21.07.25 12 126 224 0.29%
800 2.000% New York Life Global Funding 144A 16 13.04.21 695 787 0.02%100 2.350% New York Life Global Funding 144A 16 14.07.26 83 889 0.00%193 6.264% Northwest Airlines 2002-1 Class G-2 Pass Through Trust "G2"—Series
42767 02 20.11.21 180 503 0.00%6 100 3.750% Pearson Funding Four Plc. 144A 12 08.05.22 5 390 575 0.13%
100 4.625% Pearson Plc. 144A 03 15.06.18 89 214 0.00%100 4.875% Penske Truck Leasing Co. LP Via PTL Finance Corp. 144A 12 11.07.22 95 772 0.00%700 3.400% Penske Truck Leasing Co. LP Via PTL Finance Corp. 144A 16 15.11.26 603 910 0.01%950 3.400% Petrofac Ltd. 144A 13 10.10.18 800 864 0.02%
4 000 5.500% Petroleos Mexicanos 10 21.01.21 3 686 204 0.09%100 5.375% Petroleos Mexicanos 16 13.03.22 92 350 0.00%
1 000 6.875% Petroleos Mexicanos 17 04.08.26 974 407 0.02%1 500 6.625% Petroleos Mexicanos 06 15.06.35 1 363 362 0.03%1 800 6.500% Petroleos Mexicanos 11 02.06.41 1 576 363 0.04%
900 4.375% QVC, Inc. 13 15.03.23 802 350 0.02%14 400 5.450% QVC, Inc. 14 15.08.34 12 124 256 0.29%1 445 5.838% Ras Laffan Liquefied Natural Gas Co. Ltd. III 05 30.09.27 1 420 637 0.03%
250 6.332% Ras Laffan Liquefied Natural Gas Co. Ltd. III 06 30.09.27 252 537 0.01%1 300 5.838% Ras Laffan Liquefied Natural Gas Co. Ltd. III 144A 05 30.09.27 1 278 082 0.03%1 100 8.625% Royal Bank of Scotland Group Plc. 16 29.12.49 1 052 486 0.03%5 800 5.625% Sabine Pass Liquefaction LLC 14 01.02.21 5 543 448 0.13%9 500 5.750% Sabine Pass Liquefaction LLC 14 15.05.24 9 273 651 0.23%
17 100 5.625% Sabine Pass Liquefaction LLC 16 01.03.25 16 558 387 0.40%800 5.875% Sabine Pass Liquefaction LLC 17 30.06.26 786 652 0.02%400 3.156% SBA Tower Trust 144A 15 15.10.20 358 139 0.01%
4 000 4.375% Sinopec Group Overseas Development 2014 Ltd. 14 10.04.24 3 728 833 0.09%1 600 4.375% Sinopec Group Overseas Development 2014 Ltd. 144A 14 10.04.24 1 491 533 0.04%
100 9.500% Sky Plc. 144A 08 15.11.18 96 215 0.00%1 700 2.625% Sky Plc. 144A 14 16.09.19 1 501 785 0.04%
85
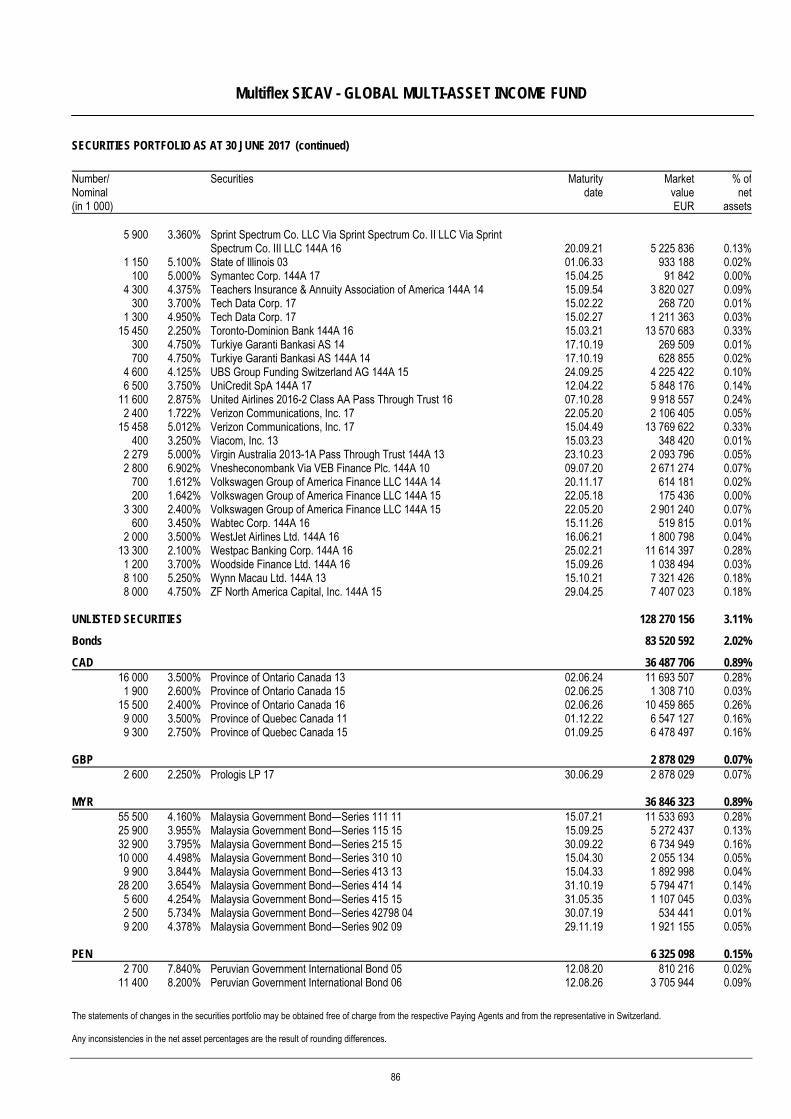
Multiflex SICAV - GLOBAL MULTI-ASSET INCOME FUND
SECURITIES PORTFOLIO AS AT 30 JUNE 2017 (continued)
The statements of changes in the securities portfolio may be obtained free of charge from the respective Paying Agents and from the representative in Switzerland. Any inconsistencies in the net asset percentages are the result of rounding differences.
Number/ Nominal (in 1 000)
Securities Maturitydate
MarketvalueEUR
% ofnet
assets
5 900 3.360% Sprint Spectrum Co. LLC Via Sprint Spectrum Co. II LLC Via Sprint Spectrum Co. III LLC 144A 16 20.09.21 5 225 836 0.13%
1 150 5.100% State of Illinois 03 01.06.33 933 188 0.02%100 5.000% Symantec Corp. 144A 17 15.04.25 91 842 0.00%
4 300 4.375% Teachers Insurance & Annuity Association of America 144A 14 15.09.54 3 820 027 0.09%300 3.700% Tech Data Corp. 17 15.02.22 268 720 0.01%
1 300 4.950% Tech Data Corp. 17 15.02.27 1 211 363 0.03%15 450 2.250% Toronto-Dominion Bank 144A 16 15.03.21 13 570 683 0.33%
300 4.750% Turkiye Garanti Bankasi AS 14 17.10.19 269 509 0.01%700 4.750% Turkiye Garanti Bankasi AS 144A 14 17.10.19 628 855 0.02%
4 600 4.125% UBS Group Funding Switzerland AG 144A 15 24.09.25 4 225 422 0.10%6 500 3.750% UniCredit SpA 144A 17 12.04.22 5 848 176 0.14%
11 600 2.875% United Airlines 2016-2 Class AA Pass Through Trust 16 07.10.28 9 918 557 0.24%2 400 1.722% Verizon Communications, Inc. 17 22.05.20 2 106 405 0.05%
15 458 5.012% Verizon Communications, Inc. 17 15.04.49 13 769 622 0.33%400 3.250% Viacom, Inc. 13 15.03.23 348 420 0.01%
2 279 5.000% Virgin Australia 2013-1A Pass Through Trust 144A 13 23.10.23 2 093 796 0.05%2 800 6.902% Vnesheconombank Via VEB Finance Plc. 144A 10 09.07.20 2 671 274 0.07%
700 1.612% Volkswagen Group of America Finance LLC 144A 14 20.11.17 614 181 0.02%200 1.642% Volkswagen Group of America Finance LLC 144A 15 22.05.18 175 436 0.00%
3 300 2.400% Volkswagen Group of America Finance LLC 144A 15 22.05.20 2 901 240 0.07%600 3.450% Wabtec Corp. 144A 16 15.11.26 519 815 0.01%
2 000 3.500% WestJet Airlines Ltd. 144A 16 16.06.21 1 800 798 0.04%13 300 2.100% Westpac Banking Corp. 144A 16 25.02.21 11 614 397 0.28%1 200 3.700% Woodside Finance Ltd. 144A 16 15.09.26 1 038 494 0.03%8 100 5.250% Wynn Macau Ltd. 144A 13 15.10.21 7 321 426 0.18%8 000 4.750% ZF North America Capital, Inc. 144A 15 29.04.25 7 407 023 0.18%
UNLISTED SECURITIES 128 270 156 3.11%
Bonds 83 520 592 2.02%
CAD 36 487 706 0.89%16 000 3.500% Province of Ontario Canada 13 02.06.24 11 693 507 0.28%1 900 2.600% Province of Ontario Canada 15 02.06.25 1 308 710 0.03%
15 500 2.400% Province of Ontario Canada 16 02.06.26 10 459 865 0.26%9 000 3.500% Province of Quebec Canada 11 01.12.22 6 547 127 0.16%9 300 2.750% Province of Quebec Canada 15 01.09.25 6 478 497 0.16%
GBP 2 878 029 0.07%2 600 2.250% Prologis LP 17 30.06.29 2 878 029 0.07%
MYR 36 846 323 0.89%55 500 4.160% Malaysia Government Bond—Series 111 11 15.07.21 11 533 693 0.28%25 900 3.955% Malaysia Government Bond—Series 115 15 15.09.25 5 272 437 0.13%32 900 3.795% Malaysia Government Bond—Series 215 15 30.09.22 6 734 949 0.16%10 000 4.498% Malaysia Government Bond—Series 310 10 15.04.30 2 055 134 0.05%9 900 3.844% Malaysia Government Bond—Series 413 13 15.04.33 1 892 998 0.04%
28 200 3.654% Malaysia Government Bond—Series 414 14 31.10.19 5 794 471 0.14%5 600 4.254% Malaysia Government Bond—Series 415 15 31.05.35 1 107 045 0.03%2 500 5.734% Malaysia Government Bond—Series 42798 04 30.07.19 534 441 0.01%9 200 4.378% Malaysia Government Bond—Series 902 09 29.11.19 1 921 155 0.05%
PEN 6 325 098 0.15%2 700 7.840% Peruvian Government International Bond 05 12.08.20 810 216 0.02%
11 400 8.200% Peruvian Government International Bond 06 12.08.26 3 705 944 0.09%
86
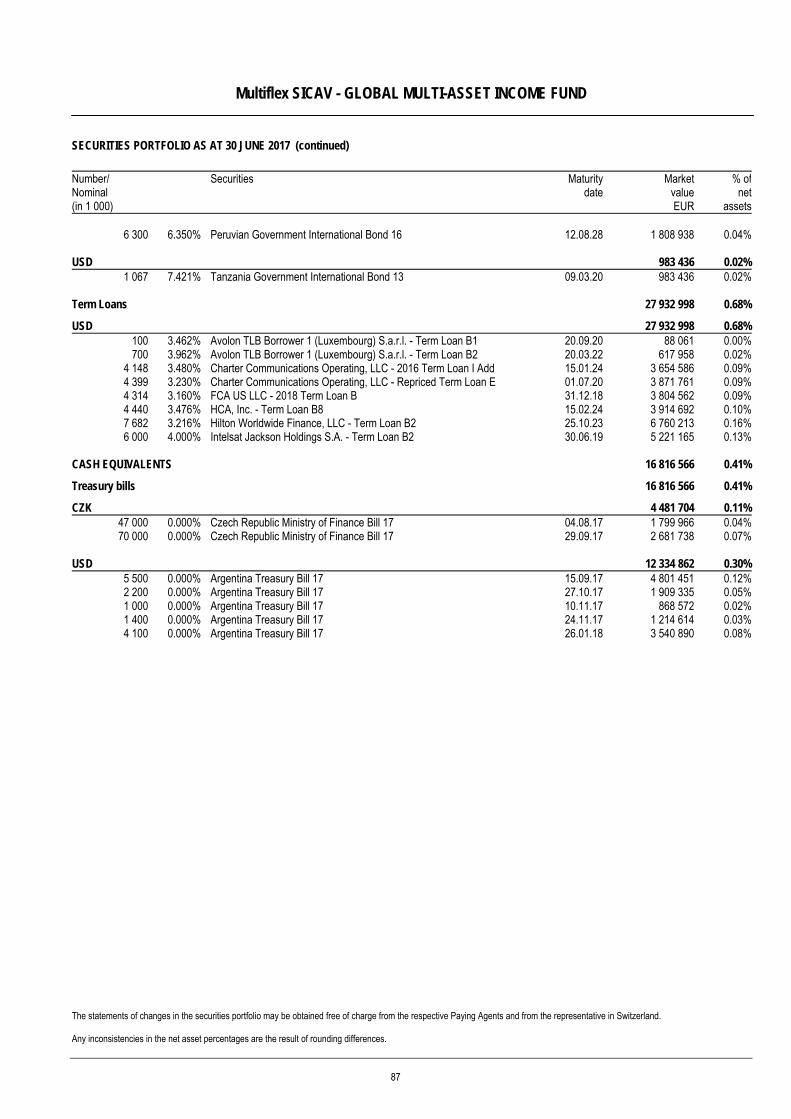
Multiflex SICAV - GLOBAL MULTI-ASSET INCOME FUND
SECURITIES PORTFOLIO AS AT 30 JUNE 2017 (continued)
The statements of changes in the securities portfolio may be obtained free of charge from the respective Paying Agents and from the representative in Switzerland. Any inconsistencies in the net asset percentages are the result of rounding differences.
Number/ Nominal (in 1 000)
Securities Maturitydate
MarketvalueEUR
% ofnet
assets
6 300 6.350% Peruvian Government International Bond 16 12.08.28 1 808 938 0.04%
USD 983 436 0.02%1 067 7.421% Tanzania Government International Bond 13 09.03.20 983 436 0.02%
Term Loans 27 932 998 0.68%
USD 27 932 998 0.68%100 3.462% Avolon TLB Borrower 1 (Luxembourg) S.a.r.l. - Term Loan B1 20.09.20 88 061 0.00%700 3.962% Avolon TLB Borrower 1 (Luxembourg) S.a.r.l. - Term Loan B2 20.03.22 617 958 0.02%
4 148 3.480% Charter Communications Operating, LLC - 2016 Term Loan I Add 15.01.24 3 654 586 0.09%4 399 3.230% Charter Communications Operating, LLC - Repriced Term Loan E 01.07.20 3 871 761 0.09%4 314 3.160% FCA US LLC - 2018 Term Loan B 31.12.18 3 804 562 0.09%4 440 3.476% HCA, Inc. - Term Loan B8 15.02.24 3 914 692 0.10%7 682 3.216% Hilton Worldwide Finance, LLC - Term Loan B2 25.10.23 6 760 213 0.16%6 000 4.000% Intelsat Jackson Holdings S.A. - Term Loan B2 30.06.19 5 221 165 0.13%
CASH EQUIVALENTS 16 816 566 0.41%
Treasury bills 16 816 566 0.41%
CZK 4 481 704 0.11%47 000 0.000% Czech Republic Ministry of Finance Bill 17 04.08.17 1 799 966 0.04%70 000 0.000% Czech Republic Ministry of Finance Bill 17 29.09.17 2 681 738 0.07%
USD 12 334 862 0.30%
5 500 0.000% Argentina Treasury Bill 17 15.09.17 4 801 451 0.12%2 200 0.000% Argentina Treasury Bill 17 27.10.17 1 909 335 0.05%1 000 0.000% Argentina Treasury Bill 17 10.11.17 868 572 0.02%1 400 0.000% Argentina Treasury Bill 17 24.11.17 1 214 614 0.03%4 100 0.000% Argentina Treasury Bill 17 26.01.18 3 540 890 0.08%
87
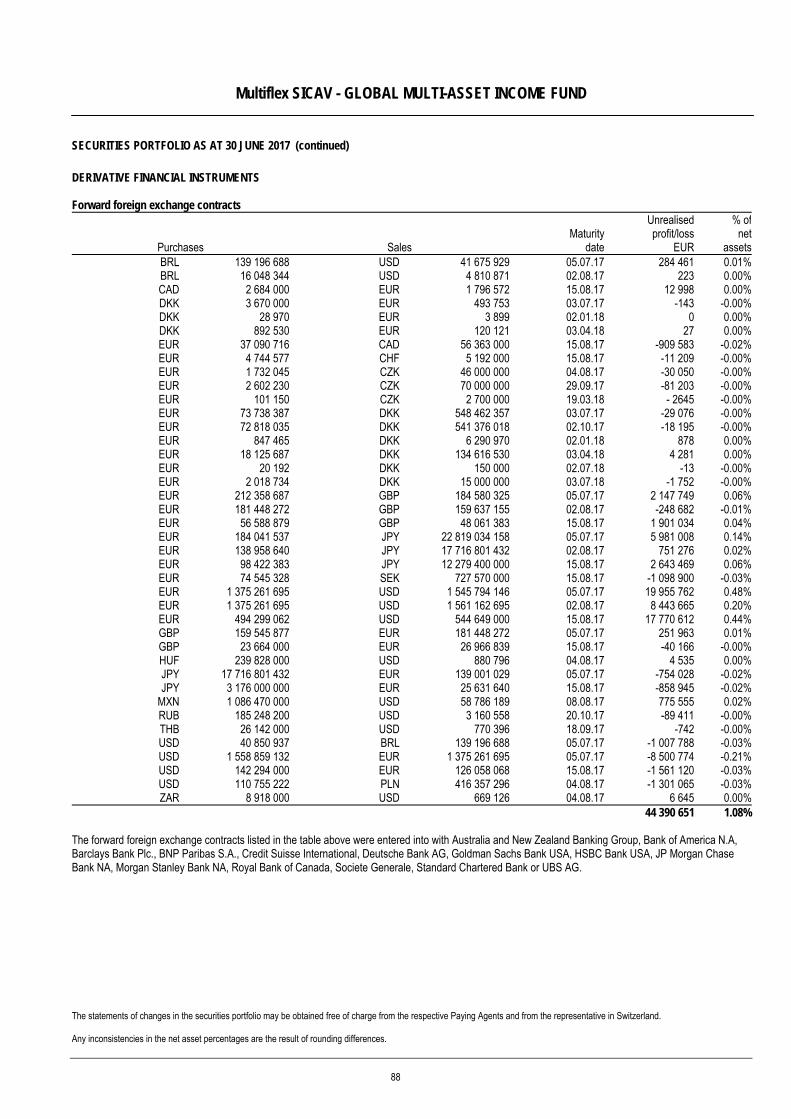
Multiflex SICAV - GLOBAL MULTI-ASSET INCOME FUND
SECURITIES PORTFOLIO AS AT 30 JUNE 2017 (continued)
The statements of changes in the securities portfolio may be obtained free of charge from the respective Paying Agents and from the representative in Switzerland. Any inconsistencies in the net asset percentages are the result of rounding differences.
DERIVATIVE FINANCIAL INSTRUMENTS Forward foreign exchange contracts
Purchases Sales Maturity
date
Unrealisedprofit/loss
EUR
% ofnet
assetsBRL 139 196 688 USD 41 675 929 05.07.17 284 461 0.01%BRL 16 048 344 USD 4 810 871 02.08.17 223 0.00%CAD 2 684 000 EUR 1 796 572 15.08.17 12 998 0.00%DKK 3 670 000 EUR 493 753 03.07.17 -143 -0.00%DKK 28 970 EUR 3 899 02.01.18 0 0.00%DKK 892 530 EUR 120 121 03.04.18 27 0.00%EUR 37 090 716 CAD 56 363 000 15.08.17 -909 583 -0.02%EUR 4 744 577 CHF 5 192 000 15.08.17 -11 209 -0.00%EUR 1 732 045 CZK 46 000 000 04.08.17 -30 050 -0.00%EUR 2 602 230 CZK 70 000 000 29.09.17 -81 203 -0.00%EUR 101 150 CZK 2 700 000 19.03.18 - 2645 -0.00%EUR 73 738 387 DKK 548 462 357 03.07.17 -29 076 -0.00%EUR 72 818 035 DKK 541 376 018 02.10.17 -18 195 -0.00%EUR 847 465 DKK 6 290 970 02.01.18 878 0.00%EUR 18 125 687 DKK 134 616 530 03.04.18 4 281 0.00%EUR 20 192 DKK 150 000 02.07.18 -13 -0.00%EUR 2 018 734 DKK 15 000 000 03.07.18 -1 752 -0.00%EUR 212 358 687 GBP 184 580 325 05.07.17 2 147 749 0.06%EUR 181 448 272 GBP 159 637 155 02.08.17 -248 682 -0.01%EUR 56 588 879 GBP 48 061 383 15.08.17 1 901 034 0.04%EUR 184 041 537 JPY 22 819 034 158 05.07.17 5 981 008 0.14%EUR 138 958 640 JPY 17 716 801 432 02.08.17 751 276 0.02%EUR 98 422 383 JPY 12 279 400 000 15.08.17 2 643 469 0.06%EUR 74 545 328 SEK 727 570 000 15.08.17 -1 098 900 -0.03%EUR 1 375 261 695 USD 1 545 794 146 05.07.17 19 955 762 0.48%EUR 1 375 261 695 USD 1 561 162 695 02.08.17 8 443 665 0.20%EUR 494 299 062 USD 544 649 000 15.08.17 17 770 612 0.44%GBP 159 545 877 EUR 181 448 272 05.07.17 251 963 0.01%GBP 23 664 000 EUR 26 966 839 15.08.17 -40 166 -0.00%HUF 239 828 000 USD 880 796 04.08.17 4 535 0.00%JPY 17 716 801 432 EUR 139 001 029 05.07.17 -754 028 -0.02%JPY 3 176 000 000 EUR 25 631 640 15.08.17 -858 945 -0.02%
MXN 1 086 470 000 USD 58 786 189 08.08.17 775 555 0.02%RUB 185 248 200 USD 3 160 558 20.10.17 -89 411 -0.00%THB 26 142 000 USD 770 396 18.09.17 -742 -0.00%USD 40 850 937 BRL 139 196 688 05.07.17 -1 007 788 -0.03%USD 1 558 859 132 EUR 1 375 261 695 05.07.17 -8 500 774 -0.21%USD 142 294 000 EUR 126 058 068 15.08.17 -1 561 120 -0.03%USD 110 755 222 PLN 416 357 296 04.08.17 -1 301 065 -0.03%ZAR 8 918 000 USD 669 126 04.08.17 6 645 0.00%
44 390 651 1.08% The forward foreign exchange contracts listed in the table above were entered into with Australia and New Zealand Banking Group, Bank of America N.A, Barclays Bank Plc., BNP Paribas S.A., Credit Suisse International, Deutsche Bank AG, Goldman Sachs Bank USA, HSBC Bank USA, JP Morgan Chase Bank NA, Morgan Stanley Bank NA, Royal Bank of Canada, Societe Generale, Standard Chartered Bank or UBS AG.
88
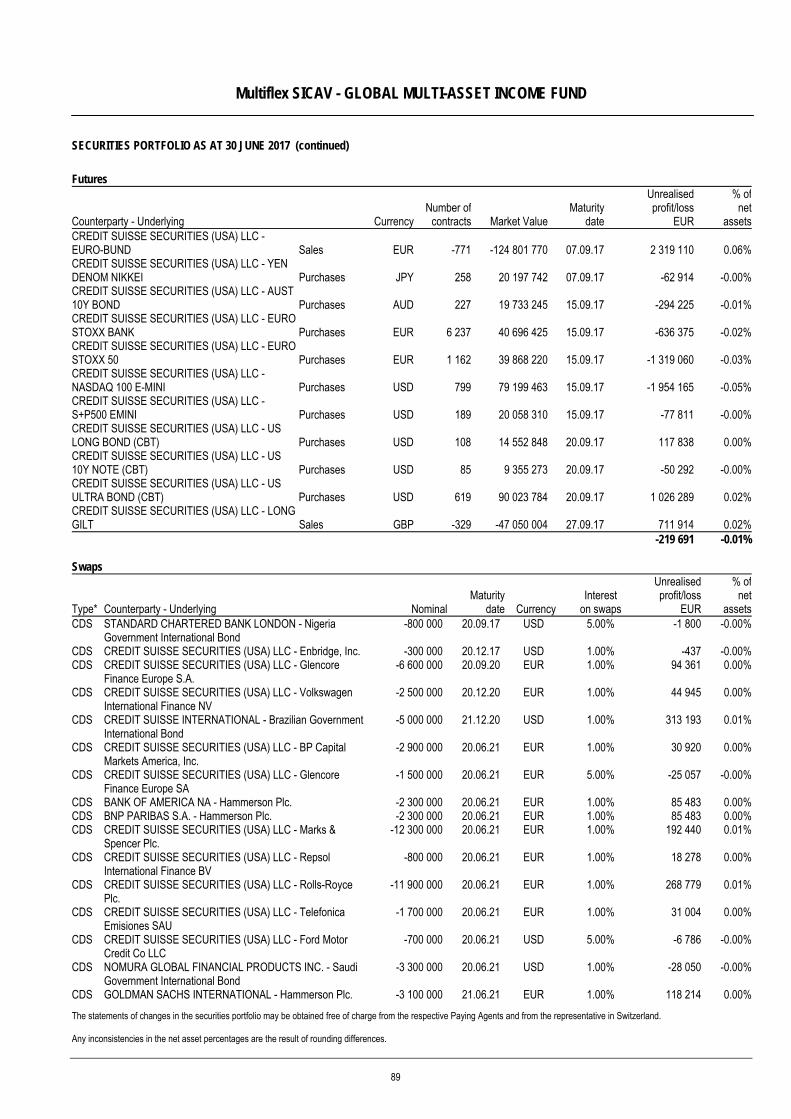
Multiflex SICAV - GLOBAL MULTI-ASSET INCOME FUND
SECURITIES PORTFOLIO AS AT 30 JUNE 2017 (continued)
The statements of changes in the securities portfolio may be obtained free of charge from the respective Paying Agents and from the representative in Switzerland. Any inconsistencies in the net asset percentages are the result of rounding differences.
Futures
Counterparty - Underlying CurrencyNumber of
contracts Market ValueMaturity
date
Unrealisedprofit/loss
EUR
% ofnet
assetsCREDIT SUISSE SECURITIES (USA) LLC - EURO-BUND Sales EUR -771 -124 801 770 07.09.17 2 319 110 0.06%CREDIT SUISSE SECURITIES (USA) LLC - YEN DENOM NIKKEI Purchases JPY 258 20 197 742 07.09.17 -62 914 -0.00%CREDIT SUISSE SECURITIES (USA) LLC - AUST 10Y BOND Purchases AUD 227 19 733 245 15.09.17 -294 225 -0.01%CREDIT SUISSE SECURITIES (USA) LLC - EURO STOXX BANK Purchases EUR 6 237 40 696 425 15.09.17 -636 375 -0.02%CREDIT SUISSE SECURITIES (USA) LLC - EURO STOXX 50 Purchases EUR 1 162 39 868 220 15.09.17 -1 319 060 -0.03%CREDIT SUISSE SECURITIES (USA) LLC - NASDAQ 100 E-MINI Purchases USD 799 79 199 463 15.09.17 -1 954 165 -0.05%CREDIT SUISSE SECURITIES (USA) LLC - S+P500 EMINI Purchases USD 189 20 058 310 15.09.17 -77 811 -0.00%CREDIT SUISSE SECURITIES (USA) LLC - US LONG BOND (CBT) Purchases USD 108 14 552 848 20.09.17 117 838 0.00%CREDIT SUISSE SECURITIES (USA) LLC - US 10Y NOTE (CBT) Purchases USD 85 9 355 273 20.09.17 -50 292 -0.00%CREDIT SUISSE SECURITIES (USA) LLC - US ULTRA BOND (CBT) Purchases USD 619 90 023 784 20.09.17 1 026 289 0.02%CREDIT SUISSE SECURITIES (USA) LLC - LONG GILT Sales GBP -329 -47 050 004 27.09.17 711 914 0.02% -219 691 -0.01% Swaps
Type* Counterparty - Underlying NominalMaturity
date Currency Interest
on swaps
Unrealisedprofit/loss
EUR
% ofnet
assetsCDS STANDARD CHARTERED BANK LONDON - Nigeria
Government International Bond -800 000 20.09.17 USD 5.00% -1 800 -0.00%
CDS CREDIT SUISSE SECURITIES (USA) LLC - Enbridge, Inc. -300 000 20.12.17 USD 1.00% -437 -0.00%CDS CREDIT SUISSE SECURITIES (USA) LLC - Glencore
Finance Europe S.A. -6 600 000 20.09.20 EUR 1.00% 94 361 0.00%
CDS CREDIT SUISSE SECURITIES (USA) LLC - Volkswagen International Finance NV
-2 500 000 20.12.20 EUR 1.00% 44 945 0.00%
CDS CREDIT SUISSE INTERNATIONAL - Brazilian Government International Bond
-5 000 000 21.12.20 USD 1.00% 313 193 0.01%
CDS CREDIT SUISSE SECURITIES (USA) LLC - BP Capital Markets America, Inc.
-2 900 000 20.06.21 EUR 1.00% 30 920 0.00%
CDS CREDIT SUISSE SECURITIES (USA) LLC - Glencore Finance Europe SA
-1 500 000 20.06.21 EUR 5.00% -25 057 -0.00%
CDS BANK OF AMERICA NA - Hammerson Plc. -2 300 000 20.06.21 EUR 1.00% 85 483 0.00%CDS BNP PARIBAS S.A. - Hammerson Plc. -2 300 000 20.06.21 EUR 1.00% 85 483 0.00%CDS CREDIT SUISSE SECURITIES (USA) LLC - Marks &
Spencer Plc. -12 300 000 20.06.21 EUR 1.00% 192 440 0.01%
CDS CREDIT SUISSE SECURITIES (USA) LLC - Repsol International Finance BV
-800 000 20.06.21 EUR 1.00% 18 278 0.00%
CDS CREDIT SUISSE SECURITIES (USA) LLC - Rolls-Royce Plc.
-11 900 000 20.06.21 EUR 1.00% 268 779 0.01%
CDS CREDIT SUISSE SECURITIES (USA) LLC - Telefonica Emisiones SAU
-1 700 000 20.06.21 EUR 1.00% 31 004 0.00%
CDS CREDIT SUISSE SECURITIES (USA) LLC - Ford Motor Credit Co LLC
-700 000 20.06.21 USD 5.00% -6 786 -0.00%
CDS NOMURA GLOBAL FINANCIAL PRODUCTS INC. - Saudi Government International Bond
-3 300 000 20.06.21 USD 1.00% -28 050 -0.00%
CDS GOLDMAN SACHS INTERNATIONAL - Hammerson Plc. -3 100 000 21.06.21 EUR 1.00% 118 214 0.00%
89
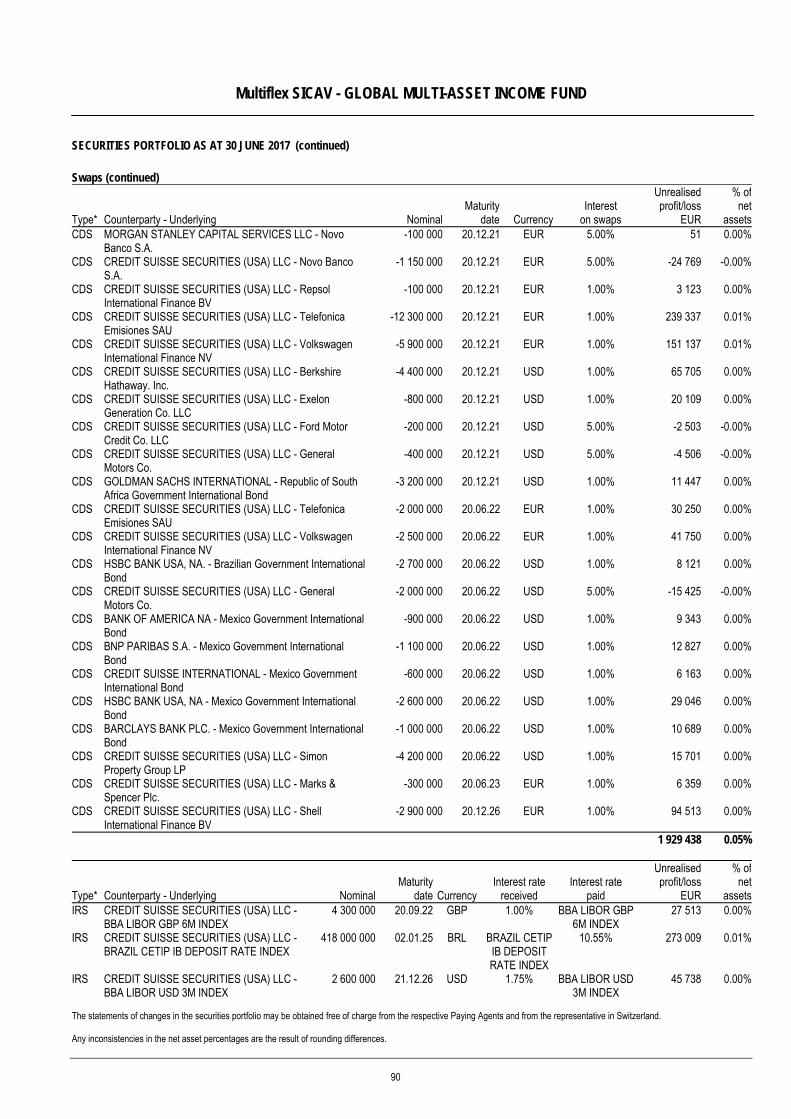
Multiflex SICAV - GLOBAL MULTI-ASSET INCOME FUND
SECURITIES PORTFOLIO AS AT 30 JUNE 2017 (continued)
The statements of changes in the securities portfolio may be obtained free of charge from the respective Paying Agents and from the representative in Switzerland. Any inconsistencies in the net asset percentages are the result of rounding differences.
Swaps (continued)
Type* Counterparty - Underlying NominalMaturity
date Currency Interest
on swaps
Unrealisedprofit/loss
EUR
% ofnet
assetsCDS MORGAN STANLEY CAPITAL SERVICES LLC - Novo
Banco S.A. -100 000 20.12.21 EUR 5.00% 51 0.00%
CDS CREDIT SUISSE SECURITIES (USA) LLC - Novo Banco S.A.
-1 150 000 20.12.21 EUR 5.00% -24 769 -0.00%
CDS CREDIT SUISSE SECURITIES (USA) LLC - Repsol International Finance BV
-100 000 20.12.21 EUR 1.00% 3 123 0.00%
CDS CREDIT SUISSE SECURITIES (USA) LLC - Telefonica Emisiones SAU
-12 300 000 20.12.21 EUR 1.00% 239 337 0.01%
CDS CREDIT SUISSE SECURITIES (USA) LLC - Volkswagen International Finance NV
-5 900 000 20.12.21 EUR 1.00% 151 137 0.01%
CDS CREDIT SUISSE SECURITIES (USA) LLC - Berkshire Hathaway. Inc.
-4 400 000 20.12.21 USD 1.00% 65 705 0.00%
CDS CREDIT SUISSE SECURITIES (USA) LLC - Exelon Generation Co. LLC
-800 000 20.12.21 USD 1.00% 20 109 0.00%
CDS CREDIT SUISSE SECURITIES (USA) LLC - Ford Motor Credit Co. LLC
-200 000 20.12.21 USD 5.00% -2 503 -0.00%
CDS CREDIT SUISSE SECURITIES (USA) LLC - General Motors Co.
-400 000 20.12.21 USD 5.00% -4 506 -0.00%
CDS GOLDMAN SACHS INTERNATIONAL - Republic of South Africa Government International Bond
-3 200 000 20.12.21 USD 1.00% 11 447 0.00%
CDS CREDIT SUISSE SECURITIES (USA) LLC - Telefonica Emisiones SAU
-2 000 000 20.06.22 EUR 1.00% 30 250 0.00%
CDS CREDIT SUISSE SECURITIES (USA) LLC - Volkswagen International Finance NV
-2 500 000 20.06.22 EUR 1.00% 41 750 0.00%
CDS HSBC BANK USA, NA. - Brazilian Government International Bond
-2 700 000 20.06.22 USD 1.00% 8 121 0.00%
CDS CREDIT SUISSE SECURITIES (USA) LLC - General Motors Co.
-2 000 000 20.06.22 USD 5.00% -15 425 -0.00%
CDS BANK OF AMERICA NA - Mexico Government International Bond
-900 000 20.06.22 USD 1.00% 9 343 0.00%
CDS BNP PARIBAS S.A. - Mexico Government International Bond
-1 100 000 20.06.22 USD 1.00% 12 827 0.00%
CDS CREDIT SUISSE INTERNATIONAL - Mexico Government International Bond
-600 000 20.06.22 USD 1.00% 6 163 0.00%
CDS HSBC BANK USA, NA - Mexico Government International Bond
-2 600 000 20.06.22 USD 1.00% 29 046 0.00%
CDS BARCLAYS BANK PLC. - Mexico Government International Bond
-1 000 000 20.06.22 USD 1.00% 10 689 0.00%
CDS CREDIT SUISSE SECURITIES (USA) LLC - Simon Property Group LP
-4 200 000 20.06.22 USD 1.00% 15 701 0.00%
CDS CREDIT SUISSE SECURITIES (USA) LLC - Marks & Spencer Plc.
-300 000 20.06.23 EUR 1.00% 6 359 0.00%
CDS CREDIT SUISSE SECURITIES (USA) LLC - Shell International Finance BV
-2 900 000 20.12.26 EUR 1.00% 94 513 0.00%
1 929 438 0.05%
Type* Counterparty - Underlying NominalMaturity
date Currency Interest rate
received Interest rate
paid
Unrealisedprofit/loss
EUR
% ofnet
assetsIRS CREDIT SUISSE SECURITIES (USA) LLC -
BBA LIBOR GBP 6M INDEX 4 300 000 20.09.22 GBP 1.00% BBA LIBOR GBP
6M INDEX 27 513 0.00%
IRS CREDIT SUISSE SECURITIES (USA) LLC - BRAZIL CETIP IB DEPOSIT RATE INDEX
418 000 000 02.01.25 BRL BRAZIL CETIP IB DEPOSIT RATE INDEX
10.55% 273 009 0.01%
IRS CREDIT SUISSE SECURITIES (USA) LLC - BBA LIBOR USD 3M INDEX
2 600 000 21.12.26 USD 1.75% BBA LIBOR USD 3M INDEX
45 738 0.00%
90
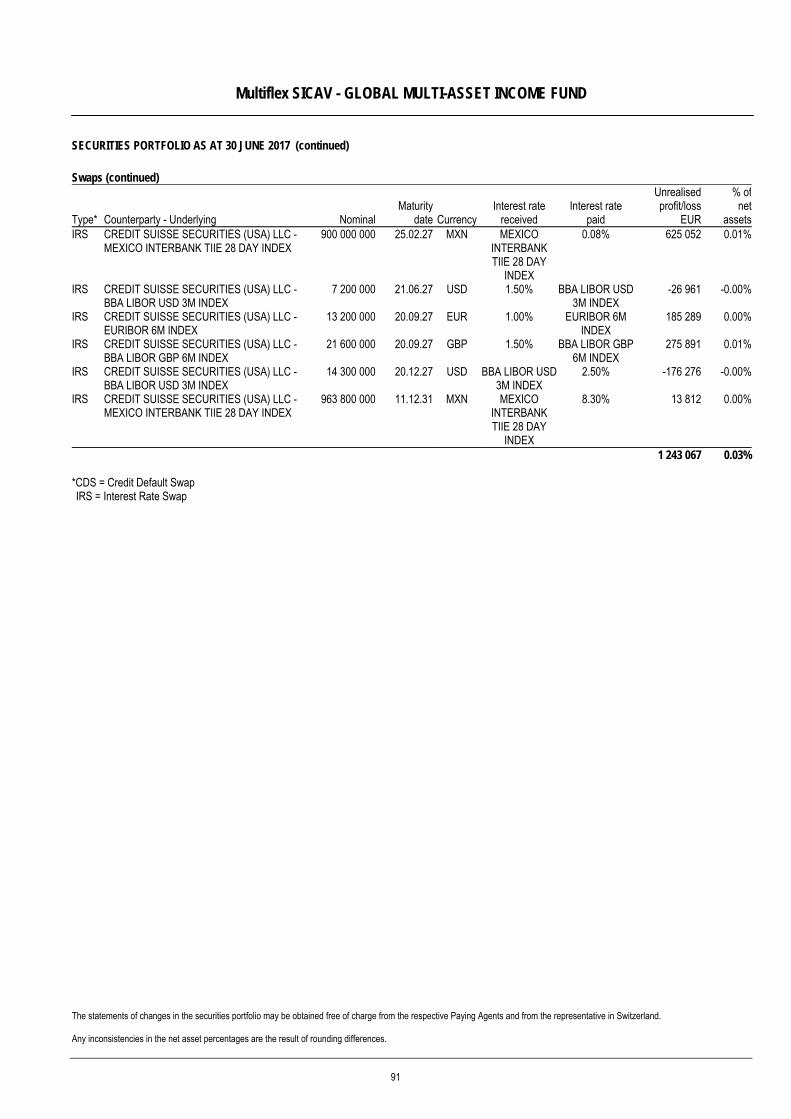
Multiflex SICAV - GLOBAL MULTI-ASSET INCOME FUND
SECURITIES PORTFOLIO AS AT 30 JUNE 2017 (continued)
The statements of changes in the securities portfolio may be obtained free of charge from the respective Paying Agents and from the representative in Switzerland. Any inconsistencies in the net asset percentages are the result of rounding differences.
Swaps (continued)
Type* Counterparty - Underlying NominalMaturity
date Currency Interest rate
received Interest rate
paid
Unrealisedprofit/loss
EUR
% ofnet
assetsIRS CREDIT SUISSE SECURITIES (USA) LLC -
MEXICO INTERBANK TIIE 28 DAY INDEX 900 000 000 25.02.27 MXN MEXICO
INTERBANK TIIE 28 DAY
INDEX
0.08% 625 052 0.01%
IRS CREDIT SUISSE SECURITIES (USA) LLC - BBA LIBOR USD 3M INDEX
7 200 000 21.06.27 USD 1.50% BBA LIBOR USD 3M INDEX
-26 961 -0.00%
IRS CREDIT SUISSE SECURITIES (USA) LLC - EURIBOR 6M INDEX
13 200 000 20.09.27 EUR 1.00% EURIBOR 6M INDEX
185 289 0.00%
IRS CREDIT SUISSE SECURITIES (USA) LLC - BBA LIBOR GBP 6M INDEX
21 600 000 20.09.27 GBP 1.50% BBA LIBOR GBP 6M INDEX
275 891 0.01%
IRS CREDIT SUISSE SECURITIES (USA) LLC - BBA LIBOR USD 3M INDEX
14 300 000 20.12.27 USD BBA LIBOR USD 3M INDEX
2.50% -176 276 -0.00%
IRS CREDIT SUISSE SECURITIES (USA) LLC - MEXICO INTERBANK TIIE 28 DAY INDEX
963 800 000 11.12.31 MXN MEXICO INTERBANK TIIE 28 DAY
INDEX
8.30% 13 812 0.00%
1 243 067 0.03% *CDS = Credit Default Swap IRS = Interest Rate Swap
91
Multiflex SICAV - GLOBAL OPTIMAL MULTI-ASSET FUND*
*see Appendix I. The information in this report is based on historical data and is no indication of future performance.
Fund Management Report Investment Policy The Multiflex SICAV - GLOBAL OPTIMAL MULTI-ASSET FUND* follows a multi-asset solution strategy with a total return approach with a focus on the full spectrum of fixed income assets combined with equity. This approach is instrumental to enhance yield while limiting volatility and market risk. Market review and portfolio Since July 2016, markets were attentive to political events: the Brexit vote, the election of Donald Trump to the presidency of the United States, the rejection by referendum of the constitutional reform in Italy, and lastly to the election of Emmanuel Macron to the presidency of France. The normalisation of monetary policy began in the United States (two interest rates hike), while the European Central Bank, the Bank of Japan, and the Bank of England continued to expand their policy of quantitative easing. Growth and Inflation have been modest over the period and the global growth as well as the Eurozone growth improved The Multiflex SICAV - GLOBAL OPTIMAL MULTI-ASSET FUND* has been launched in July 2016. The sub-fund is invested in several asset classes focusing mainly in the fixed income spectrum and is mainly exposed to US investment grade bonds (in average 18.52%), US high yield bonds (in average 8.90%), Emerging markets bonds (in average 22.61%) and in equities (in average 10.76%) over the period. The remaining portfolio assets are investing in cash, government bonds and otherwise in derivatives linked to tactical asset allocation strategies. Since launch of the sub-fund, net performance is positive at 1.58%. Allocation into high returns asset classes as high yield bonds and equities have been the main drivers of such performance. Tactical overlay as Long european and french equities positionned before french elections are also participating to such positive performance.
92
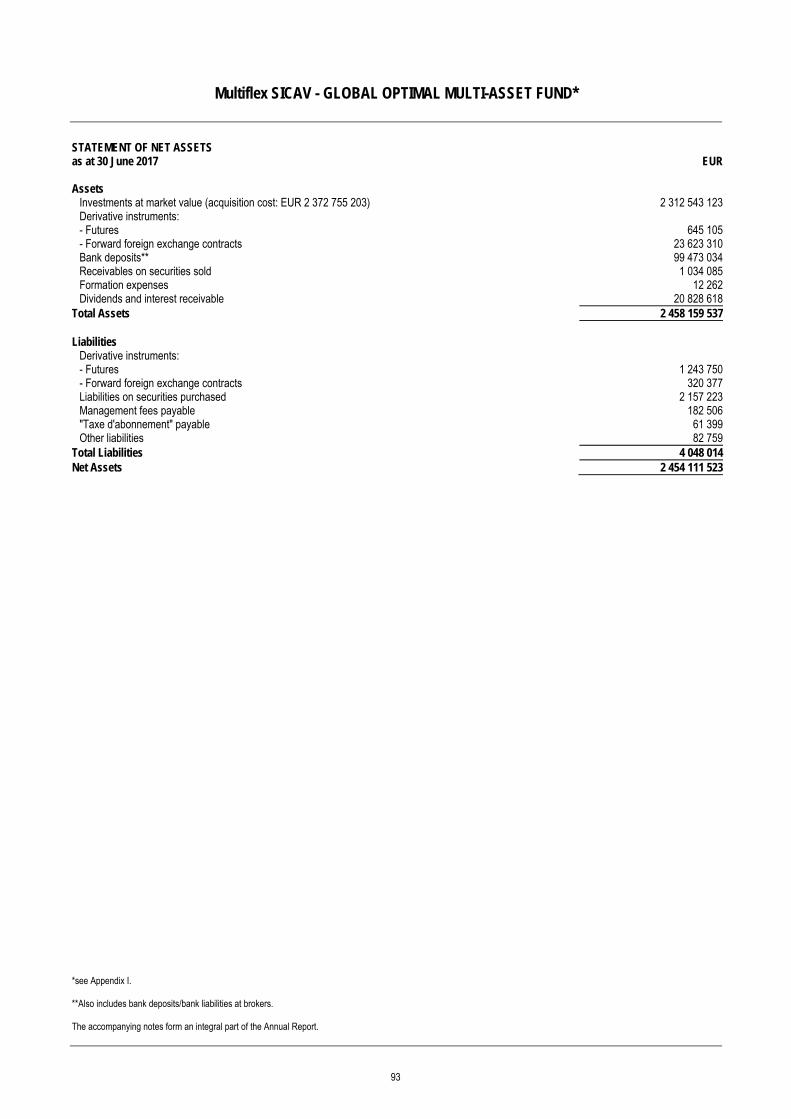
Multiflex SICAV - GLOBAL OPTIMAL MULTI-ASSET FUND*
*see Appendix I. **Also includes bank deposits/bank liabilities at brokers. The accompanying notes form an integral part of the Annual Report.
STATEMENT OF NET ASSETS as at 30 June 2017 EUR Assets
Investments at market value (acquisition cost: EUR 2 372 755 203) 2 312 543 123Derivative instruments: - Futures 645 105- Forward foreign exchange contracts 23 623 310Bank deposits** 99 473 034Receivables on securities sold 1 034 085Formation expenses 12 262Dividends and interest receivable 20 828 618
Total Assets 2 458 159 537 Liabilities
Derivative instruments: - Futures 1 243 750- Forward foreign exchange contracts 320 377Liabilities on securities purchased 2 157 223Management fees payable 182 506"Taxe d'abonnement" payable 61 399Other liabilities 82 759
Total Liabilities 4 048 014Net Assets 2 454 111 523
93
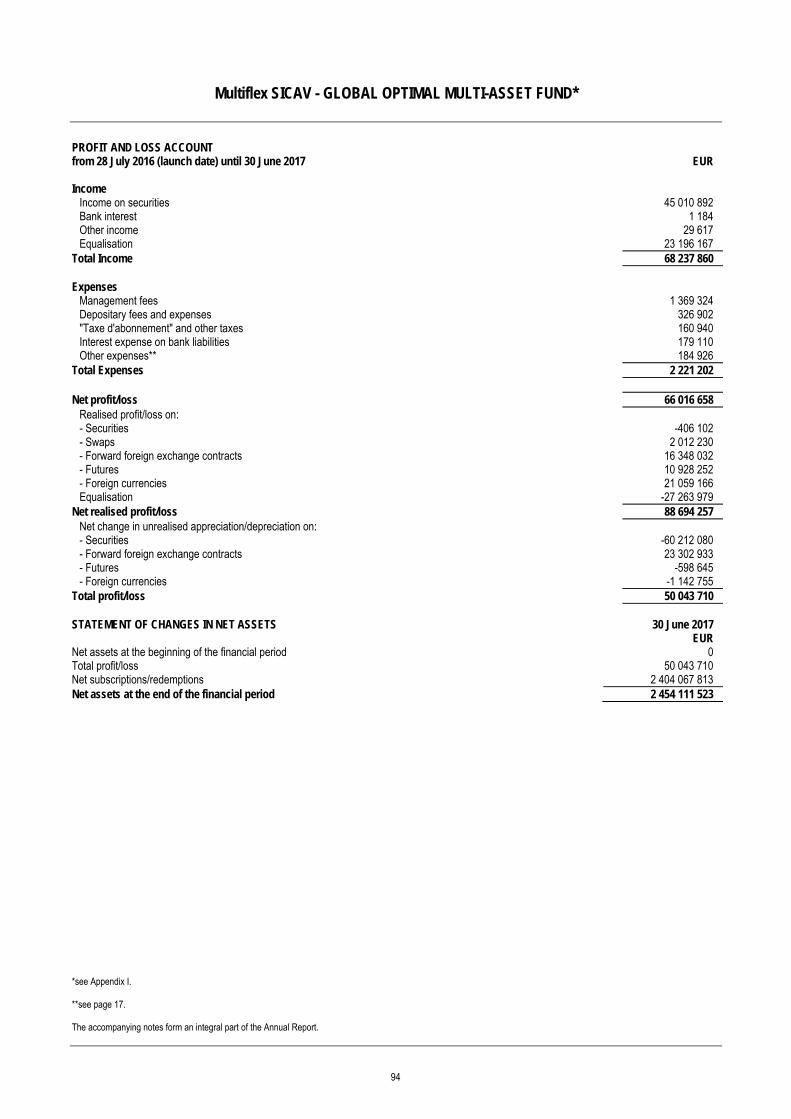
Multiflex SICAV - GLOBAL OPTIMAL MULTI-ASSET FUND*
*see Appendix I. **see page 17. The accompanying notes form an integral part of the Annual Report.
PROFIT AND LOSS ACCOUNT from 28 July 2016 (launch date) until 30 June 2017 EUR Income
Income on securities 45 010 892 Bank interest 1 184 Other income 29 617 Equalisation 23 196 167
Total Income 68 237 860 Expenses
Management fees 1 369 324 Depositary fees and expenses 326 902 "Taxe d'abonnement" and other taxes 160 940 Interest expense on bank liabilities 179 110 Other expenses** 184 926
Total Expenses 2 221 202 Net profit/loss 66 016 658
Realised profit/loss on: - Securities -406 102 - Swaps 2 012 230 - Forward foreign exchange contracts 16 348 032 - Futures 10 928 252 - Foreign currencies 21 059 166 Equalisation -27 263 979
Net realised profit/loss 88 694 257 Net change in unrealised appreciation/depreciation on: - Securities -60 212 080 - Forward foreign exchange contracts 23 302 933 - Futures -598 645 - Foreign currencies -1 142 755
Total profit/loss 50 043 710 STATEMENT OF CHANGES IN NET ASSETS 30 June 2017 EUR Net assets at the beginning of the financial period 0 Total profit/loss 50 043 710 Net subscriptions/redemptions 2 404 067 813 Net assets at the end of the financial period 2 454 111 523
94

Multiflex SICAV - GLOBAL OPTIMAL MULTI-ASSET FUND*
*see Appendix I.
COMPARATIVE STATEMENT 30 June 2017 Number of shares
Number of shares outstanding Distribution shares (Shares Cm-EUR) 24 160 251.22
EUR Net Assets 2 454 111 523
In the share class
currency NAV per share Distribution shares (Shares Cm-EUR) 101.58
95
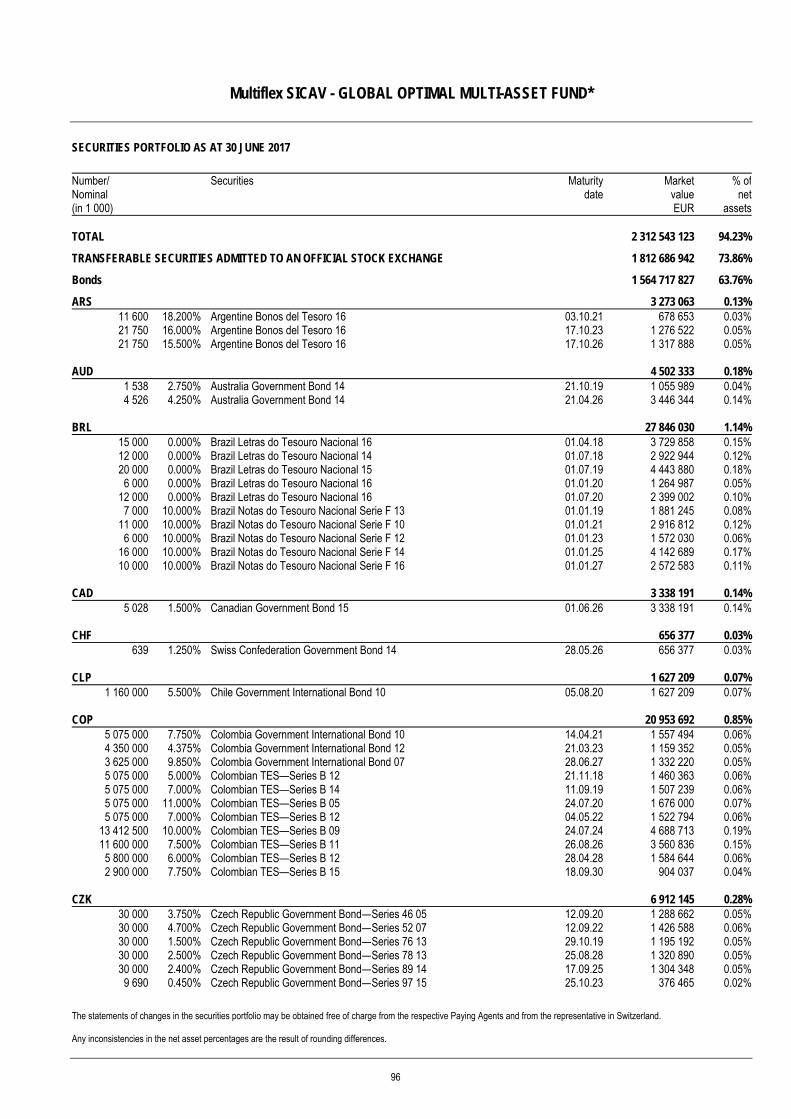
Multiflex SICAV - GLOBAL OPTIMAL MULTI-ASSET FUND*
SECURITIES PORTFOLIO AS AT 30 JUNE 2017
The statements of changes in the securities portfolio may be obtained free of charge from the respective Paying Agents and from the representative in Switzerland. Any inconsistencies in the net asset percentages are the result of rounding differences.
Number/ Nominal (in 1 000)
Securities Maturitydate
MarketvalueEUR
% ofnet
assets TOTAL 2 312 543 123 94.23%
TRANSFERABLE SECURITIES ADMITTED TO AN OFFICIAL STOCK EXCHANGE 1 812 686 942 73.86%
Bonds 1 564 717 827 63.76%
ARS 3 273 063 0.13%11 600 18.200% Argentine Bonos del Tesoro 16 03.10.21 678 653 0.03%21 750 16.000% Argentine Bonos del Tesoro 16 17.10.23 1 276 522 0.05%21 750 15.500% Argentine Bonos del Tesoro 16 17.10.26 1 317 888 0.05%
AUD 4 502 333 0.18%1 538 2.750% Australia Government Bond 14 21.10.19 1 055 989 0.04%4 526 4.250% Australia Government Bond 14 21.04.26 3 446 344 0.14%
BRL 27 846 030 1.14%15 000 0.000% Brazil Letras do Tesouro Nacional 16 01.04.18 3 729 858 0.15%12 000 0.000% Brazil Letras do Tesouro Nacional 14 01.07.18 2 922 944 0.12%20 000 0.000% Brazil Letras do Tesouro Nacional 15 01.07.19 4 443 880 0.18%6 000 0.000% Brazil Letras do Tesouro Nacional 16 01.01.20 1 264 987 0.05%
12 000 0.000% Brazil Letras do Tesouro Nacional 16 01.07.20 2 399 002 0.10%7 000 10.000% Brazil Notas do Tesouro Nacional Serie F 13 01.01.19 1 881 245 0.08%
11 000 10.000% Brazil Notas do Tesouro Nacional Serie F 10 01.01.21 2 916 812 0.12%6 000 10.000% Brazil Notas do Tesouro Nacional Serie F 12 01.01.23 1 572 030 0.06%
16 000 10.000% Brazil Notas do Tesouro Nacional Serie F 14 01.01.25 4 142 689 0.17%10 000 10.000% Brazil Notas do Tesouro Nacional Serie F 16 01.01.27 2 572 583 0.11%
CAD 3 338 191 0.14%5 028 1.500% Canadian Government Bond 15 01.06.26 3 338 191 0.14%
CHF 656 377 0.03%639 1.250% Swiss Confederation Government Bond 14 28.05.26 656 377 0.03%
CLP 1 627 209 0.07%1 160 000 5.500% Chile Government International Bond 10 05.08.20 1 627 209 0.07%
COP 20 953 692 0.85%5 075 000 7.750% Colombia Government International Bond 10 14.04.21 1 557 494 0.06%4 350 000 4.375% Colombia Government International Bond 12 21.03.23 1 159 352 0.05%3 625 000 9.850% Colombia Government International Bond 07 28.06.27 1 332 220 0.05%5 075 000 5.000% Colombian TES—Series B 12 21.11.18 1 460 363 0.06%5 075 000 7.000% Colombian TES—Series B 14 11.09.19 1 507 239 0.06%5 075 000 11.000% Colombian TES—Series B 05 24.07.20 1 676 000 0.07%5 075 000 7.000% Colombian TES—Series B 12 04.05.22 1 522 794 0.06%
13 412 500 10.000% Colombian TES—Series B 09 24.07.24 4 688 713 0.19%11 600 000 7.500% Colombian TES—Series B 11 26.08.26 3 560 836 0.15%
5 800 000 6.000% Colombian TES—Series B 12 28.04.28 1 584 644 0.06%2 900 000 7.750% Colombian TES—Series B 15 18.09.30 904 037 0.04%
CZK 6 912 145 0.28%30 000 3.750% Czech Republic Government Bond—Series 46 05 12.09.20 1 288 662 0.05%30 000 4.700% Czech Republic Government Bond—Series 52 07 12.09.22 1 426 588 0.06%30 000 1.500% Czech Republic Government Bond—Series 76 13 29.10.19 1 195 192 0.05%30 000 2.500% Czech Republic Government Bond—Series 78 13 25.08.28 1 320 890 0.05%30 000 2.400% Czech Republic Government Bond—Series 89 14 17.09.25 1 304 348 0.05%9 690 0.450% Czech Republic Government Bond—Series 97 15 25.10.23 376 465 0.02%
96
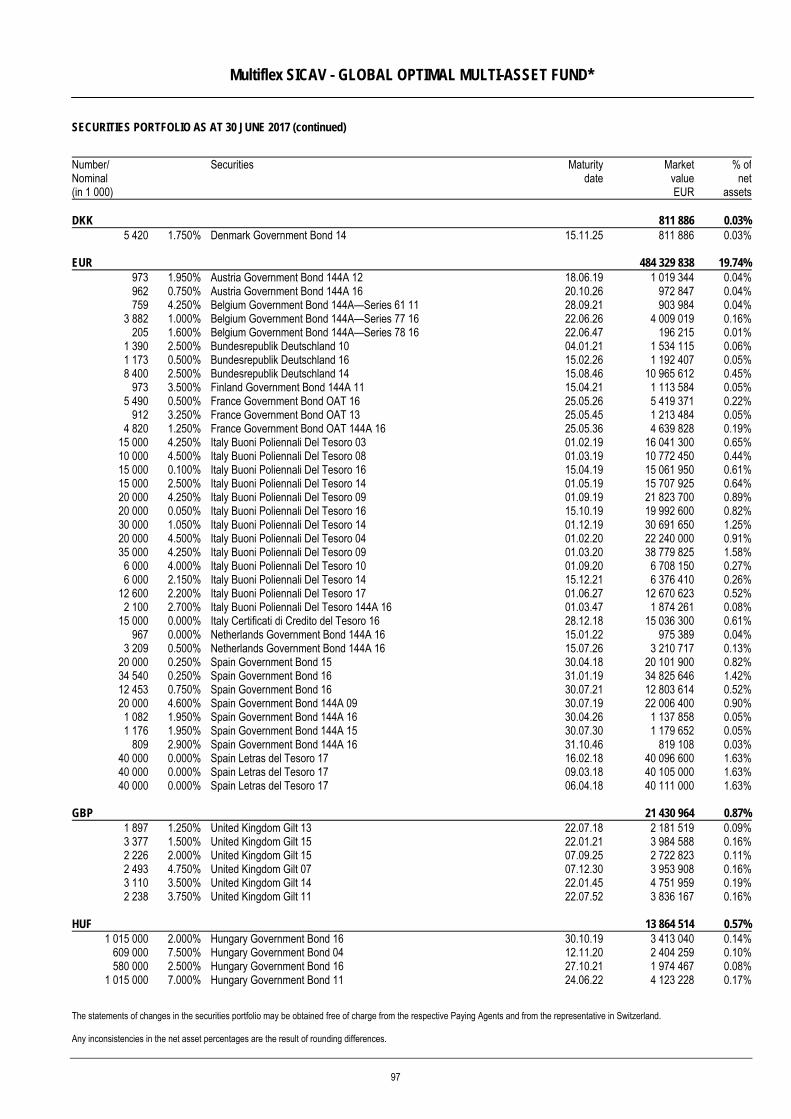
Multiflex SICAV - GLOBAL OPTIMAL MULTI-ASSET FUND*
SECURITIES PORTFOLIO AS AT 30 JUNE 2017 (continued)
The statements of changes in the securities portfolio may be obtained free of charge from the respective Paying Agents and from the representative in Switzerland. Any inconsistencies in the net asset percentages are the result of rounding differences.
Number/ Nominal (in 1 000)
Securities Maturitydate
MarketvalueEUR
% ofnet
assets DKK 811 886 0.03%
5 420 1.750% Denmark Government Bond 14 15.11.25 811 886 0.03%
EUR 484 329 838 19.74%973 1.950% Austria Government Bond 144A 12 18.06.19 1 019 344 0.04%962 0.750% Austria Government Bond 144A 16 20.10.26 972 847 0.04%759 4.250% Belgium Government Bond 144A—Series 61 11 28.09.21 903 984 0.04%
3 882 1.000% Belgium Government Bond 144A—Series 77 16 22.06.26 4 009 019 0.16%205 1.600% Belgium Government Bond 144A—Series 78 16 22.06.47 196 215 0.01%
1 390 2.500% Bundesrepublik Deutschland 10 04.01.21 1 534 115 0.06%1 173 0.500% Bundesrepublik Deutschland 16 15.02.26 1 192 407 0.05%8 400 2.500% Bundesrepublik Deutschland 14 15.08.46 10 965 612 0.45%
973 3.500% Finland Government Bond 144A 11 15.04.21 1 113 584 0.05%5 490 0.500% France Government Bond OAT 16 25.05.26 5 419 371 0.22%
912 3.250% France Government Bond OAT 13 25.05.45 1 213 484 0.05%4 820 1.250% France Government Bond OAT 144A 16 25.05.36 4 639 828 0.19%
15 000 4.250% Italy Buoni Poliennali Del Tesoro 03 01.02.19 16 041 300 0.65%10 000 4.500% Italy Buoni Poliennali Del Tesoro 08 01.03.19 10 772 450 0.44%15 000 0.100% Italy Buoni Poliennali Del Tesoro 16 15.04.19 15 061 950 0.61%15 000 2.500% Italy Buoni Poliennali Del Tesoro 14 01.05.19 15 707 925 0.64%20 000 4.250% Italy Buoni Poliennali Del Tesoro 09 01.09.19 21 823 700 0.89%20 000 0.050% Italy Buoni Poliennali Del Tesoro 16 15.10.19 19 992 600 0.82%30 000 1.050% Italy Buoni Poliennali Del Tesoro 14 01.12.19 30 691 650 1.25%20 000 4.500% Italy Buoni Poliennali Del Tesoro 04 01.02.20 22 240 000 0.91%35 000 4.250% Italy Buoni Poliennali Del Tesoro 09 01.03.20 38 779 825 1.58%6 000 4.000% Italy Buoni Poliennali Del Tesoro 10 01.09.20 6 708 150 0.27%6 000 2.150% Italy Buoni Poliennali Del Tesoro 14 15.12.21 6 376 410 0.26%
12 600 2.200% Italy Buoni Poliennali Del Tesoro 17 01.06.27 12 670 623 0.52%2 100 2.700% Italy Buoni Poliennali Del Tesoro 144A 16 01.03.47 1 874 261 0.08%
15 000 0.000% Italy Certificati di Credito del Tesoro 16 28.12.18 15 036 300 0.61%967 0.000% Netherlands Government Bond 144A 16 15.01.22 975 389 0.04%
3 209 0.500% Netherlands Government Bond 144A 16 15.07.26 3 210 717 0.13%20 000 0.250% Spain Government Bond 15 30.04.18 20 101 900 0.82%34 540 0.250% Spain Government Bond 16 31.01.19 34 825 646 1.42%12 453 0.750% Spain Government Bond 16 30.07.21 12 803 614 0.52%20 000 4.600% Spain Government Bond 144A 09 30.07.19 22 006 400 0.90%1 082 1.950% Spain Government Bond 144A 16 30.04.26 1 137 858 0.05%1 176 1.950% Spain Government Bond 144A 15 30.07.30 1 179 652 0.05%
809 2.900% Spain Government Bond 144A 16 31.10.46 819 108 0.03%40 000 0.000% Spain Letras del Tesoro 17 16.02.18 40 096 600 1.63%40 000 0.000% Spain Letras del Tesoro 17 09.03.18 40 105 000 1.63%40 000 0.000% Spain Letras del Tesoro 17 06.04.18 40 111 000 1.63%
GBP 21 430 964 0.87%1 897 1.250% United Kingdom Gilt 13 22.07.18 2 181 519 0.09%3 377 1.500% United Kingdom Gilt 15 22.01.21 3 984 588 0.16%2 226 2.000% United Kingdom Gilt 15 07.09.25 2 722 823 0.11%2 493 4.750% United Kingdom Gilt 07 07.12.30 3 953 908 0.16%3 110 3.500% United Kingdom Gilt 14 22.01.45 4 751 959 0.19%2 238 3.750% United Kingdom Gilt 11 22.07.52 3 836 167 0.16%
HUF 13 864 514 0.57%1 015 000 2.000% Hungary Government Bond 16 30.10.19 3 413 040 0.14%
609 000 7.500% Hungary Government Bond 04 12.11.20 2 404 259 0.10%580 000 2.500% Hungary Government Bond 16 27.10.21 1 974 467 0.08%
1 015 000 7.000% Hungary Government Bond 11 24.06.22 4 123 228 0.17%
97
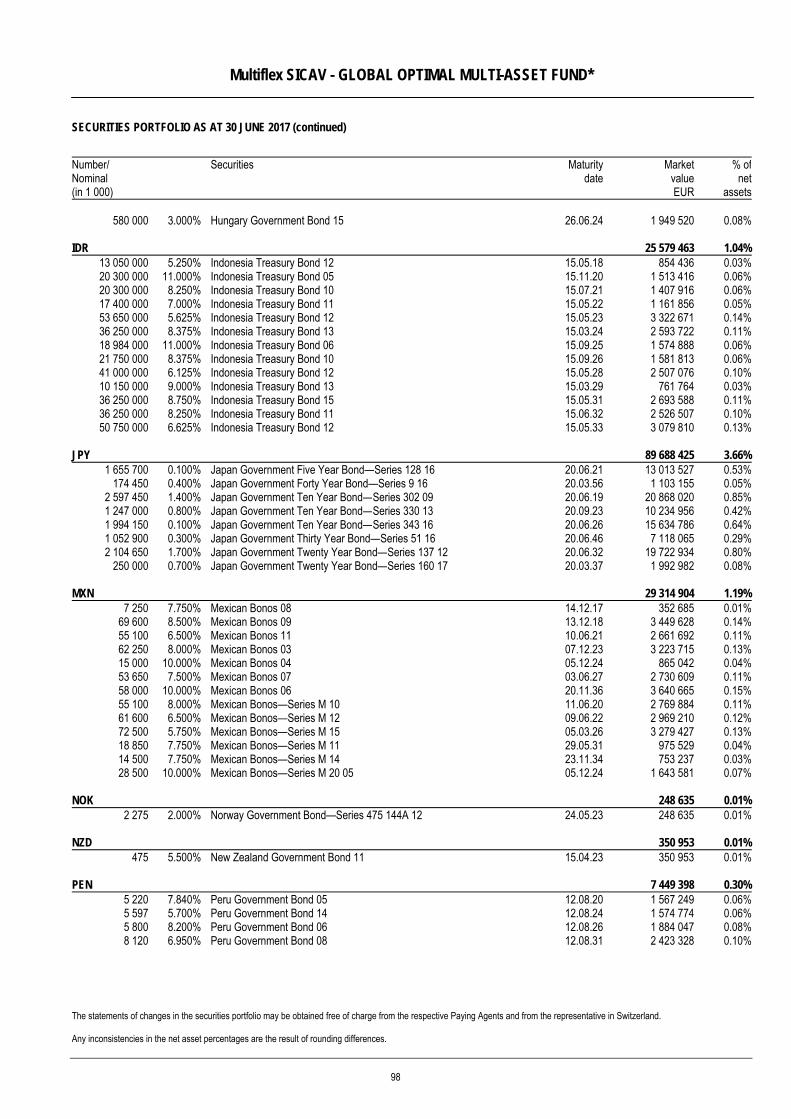
Multiflex SICAV - GLOBAL OPTIMAL MULTI-ASSET FUND*
SECURITIES PORTFOLIO AS AT 30 JUNE 2017 (continued)
The statements of changes in the securities portfolio may be obtained free of charge from the respective Paying Agents and from the representative in Switzerland. Any inconsistencies in the net asset percentages are the result of rounding differences.
Number/ Nominal (in 1 000)
Securities Maturitydate
MarketvalueEUR
% ofnet
assets
580 000 3.000% Hungary Government Bond 15 26.06.24 1 949 520 0.08%
IDR 25 579 463 1.04%13 050 000 5.250% Indonesia Treasury Bond 12 15.05.18 854 436 0.03%20 300 000 11.000% Indonesia Treasury Bond 05 15.11.20 1 513 416 0.06%20 300 000 8.250% Indonesia Treasury Bond 10 15.07.21 1 407 916 0.06%17 400 000 7.000% Indonesia Treasury Bond 11 15.05.22 1 161 856 0.05%53 650 000 5.625% Indonesia Treasury Bond 12 15.05.23 3 322 671 0.14%36 250 000 8.375% Indonesia Treasury Bond 13 15.03.24 2 593 722 0.11%18 984 000 11.000% Indonesia Treasury Bond 06 15.09.25 1 574 888 0.06%21 750 000 8.375% Indonesia Treasury Bond 10 15.09.26 1 581 813 0.06%41 000 000 6.125% Indonesia Treasury Bond 12 15.05.28 2 507 076 0.10%10 150 000 9.000% Indonesia Treasury Bond 13 15.03.29 761 764 0.03%36 250 000 8.750% Indonesia Treasury Bond 15 15.05.31 2 693 588 0.11%36 250 000 8.250% Indonesia Treasury Bond 11 15.06.32 2 526 507 0.10%50 750 000 6.625% Indonesia Treasury Bond 12 15.05.33 3 079 810 0.13%
JPY 89 688 425 3.66%1 655 700 0.100% Japan Government Five Year Bond—Series 128 16 20.06.21 13 013 527 0.53%
174 450 0.400% Japan Government Forty Year Bond—Series 9 16 20.03.56 1 103 155 0.05%2 597 450 1.400% Japan Government Ten Year Bond—Series 302 09 20.06.19 20 868 020 0.85%1 247 000 0.800% Japan Government Ten Year Bond—Series 330 13 20.09.23 10 234 956 0.42%1 994 150 0.100% Japan Government Ten Year Bond—Series 343 16 20.06.26 15 634 786 0.64%1 052 900 0.300% Japan Government Thirty Year Bond—Series 51 16 20.06.46 7 118 065 0.29%2 104 650 1.700% Japan Government Twenty Year Bond—Series 137 12 20.06.32 19 722 934 0.80%
250 000 0.700% Japan Government Twenty Year Bond—Series 160 17 20.03.37 1 992 982 0.08%
MXN 29 314 904 1.19%7 250 7.750% Mexican Bonos 08 14.12.17 352 685 0.01%
69 600 8.500% Mexican Bonos 09 13.12.18 3 449 628 0.14%55 100 6.500% Mexican Bonos 11 10.06.21 2 661 692 0.11%62 250 8.000% Mexican Bonos 03 07.12.23 3 223 715 0.13%15 000 10.000% Mexican Bonos 04 05.12.24 865 042 0.04%53 650 7.500% Mexican Bonos 07 03.06.27 2 730 609 0.11%58 000 10.000% Mexican Bonos 06 20.11.36 3 640 665 0.15%55 100 8.000% Mexican Bonos—Series M 10 11.06.20 2 769 884 0.11%61 600 6.500% Mexican Bonos—Series M 12 09.06.22 2 969 210 0.12%72 500 5.750% Mexican Bonos—Series M 15 05.03.26 3 279 427 0.13%18 850 7.750% Mexican Bonos—Series M 11 29.05.31 975 529 0.04%14 500 7.750% Mexican Bonos—Series M 14 23.11.34 753 237 0.03%28 500 10.000% Mexican Bonos—Series M 20 05 05.12.24 1 643 581 0.07%
NOK 248 635 0.01%2 275 2.000% Norway Government Bond—Series 475 144A 12 24.05.23 248 635 0.01%
NZD 350 953 0.01%475 5.500% New Zealand Government Bond 11 15.04.23 350 953 0.01%
PEN 7 449 398 0.30%5 220 7.840% Peru Government Bond 05 12.08.20 1 567 249 0.06%5 597 5.700% Peru Government Bond 14 12.08.24 1 574 774 0.06%5 800 8.200% Peru Government Bond 06 12.08.26 1 884 047 0.08%8 120 6.950% Peru Government Bond 08 12.08.31 2 423 328 0.10%
98
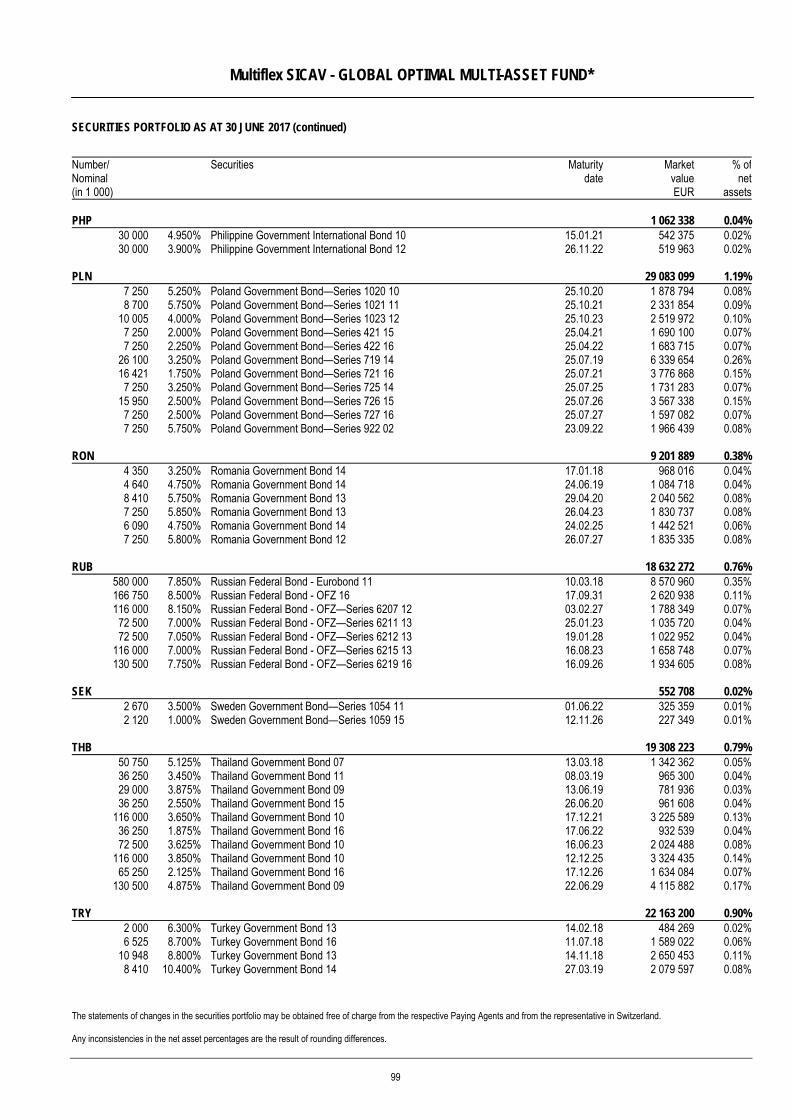
Multiflex SICAV - GLOBAL OPTIMAL MULTI-ASSET FUND*
SECURITIES PORTFOLIO AS AT 30 JUNE 2017 (continued)
The statements of changes in the securities portfolio may be obtained free of charge from the respective Paying Agents and from the representative in Switzerland. Any inconsistencies in the net asset percentages are the result of rounding differences.
Number/ Nominal (in 1 000)
Securities Maturitydate
MarketvalueEUR
% ofnet
assets PHP 1 062 338 0.04%
30 000 4.950% Philippine Government International Bond 10 15.01.21 542 375 0.02%30 000 3.900% Philippine Government International Bond 12 26.11.22 519 963 0.02%
PLN 29 083 099 1.19%7 250 5.250% Poland Government Bond—Series 1020 10 25.10.20 1 878 794 0.08%8 700 5.750% Poland Government Bond—Series 1021 11 25.10.21 2 331 854 0.09%
10 005 4.000% Poland Government Bond—Series 1023 12 25.10.23 2 519 972 0.10%7 250 2.000% Poland Government Bond—Series 421 15 25.04.21 1 690 100 0.07%7 250 2.250% Poland Government Bond—Series 422 16 25.04.22 1 683 715 0.07%
26 100 3.250% Poland Government Bond—Series 719 14 25.07.19 6 339 654 0.26%16 421 1.750% Poland Government Bond—Series 721 16 25.07.21 3 776 868 0.15%7 250 3.250% Poland Government Bond—Series 725 14 25.07.25 1 731 283 0.07%
15 950 2.500% Poland Government Bond—Series 726 15 25.07.26 3 567 338 0.15%7 250 2.500% Poland Government Bond—Series 727 16 25.07.27 1 597 082 0.07%7 250 5.750% Poland Government Bond—Series 922 02 23.09.22 1 966 439 0.08%
RON 9 201 889 0.38%4 350 3.250% Romania Government Bond 14 17.01.18 968 016 0.04%4 640 4.750% Romania Government Bond 14 24.06.19 1 084 718 0.04%8 410 5.750% Romania Government Bond 13 29.04.20 2 040 562 0.08%7 250 5.850% Romania Government Bond 13 26.04.23 1 830 737 0.08%6 090 4.750% Romania Government Bond 14 24.02.25 1 442 521 0.06%7 250 5.800% Romania Government Bond 12 26.07.27 1 835 335 0.08%
RUB 18 632 272 0.76%580 000 7.850% Russian Federal Bond - Eurobond 11 10.03.18 8 570 960 0.35%166 750 8.500% Russian Federal Bond - OFZ 16 17.09.31 2 620 938 0.11%116 000 8.150% Russian Federal Bond - OFZ—Series 6207 12 03.02.27 1 788 349 0.07%
72 500 7.000% Russian Federal Bond - OFZ—Series 6211 13 25.01.23 1 035 720 0.04%72 500 7.050% Russian Federal Bond - OFZ—Series 6212 13 19.01.28 1 022 952 0.04%
116 000 7.000% Russian Federal Bond - OFZ—Series 6215 13 16.08.23 1 658 748 0.07%130 500 7.750% Russian Federal Bond - OFZ—Series 6219 16 16.09.26 1 934 605 0.08%
SEK 552 708 0.02%2 670 3.500% Sweden Government Bond—Series 1054 11 01.06.22 325 359 0.01%2 120 1.000% Sweden Government Bond—Series 1059 15 12.11.26 227 349 0.01%
THB 19 308 223 0.79%50 750 5.125% Thailand Government Bond 07 13.03.18 1 342 362 0.05%36 250 3.450% Thailand Government Bond 11 08.03.19 965 300 0.04%29 000 3.875% Thailand Government Bond 09 13.06.19 781 936 0.03%36 250 2.550% Thailand Government Bond 15 26.06.20 961 608 0.04%
116 000 3.650% Thailand Government Bond 10 17.12.21 3 225 589 0.13%36 250 1.875% Thailand Government Bond 16 17.06.22 932 539 0.04%72 500 3.625% Thailand Government Bond 10 16.06.23 2 024 488 0.08%
116 000 3.850% Thailand Government Bond 10 12.12.25 3 324 435 0.14%65 250 2.125% Thailand Government Bond 16 17.12.26 1 634 084 0.07%
130 500 4.875% Thailand Government Bond 09 22.06.29 4 115 882 0.17%
TRY 22 163 200 0.90%2 000 6.300% Turkey Government Bond 13 14.02.18 484 269 0.02%6 525 8.700% Turkey Government Bond 16 11.07.18 1 589 022 0.06%
10 948 8.800% Turkey Government Bond 13 14.11.18 2 650 453 0.11%8 410 10.400% Turkey Government Bond 14 27.03.19 2 079 597 0.08%
99
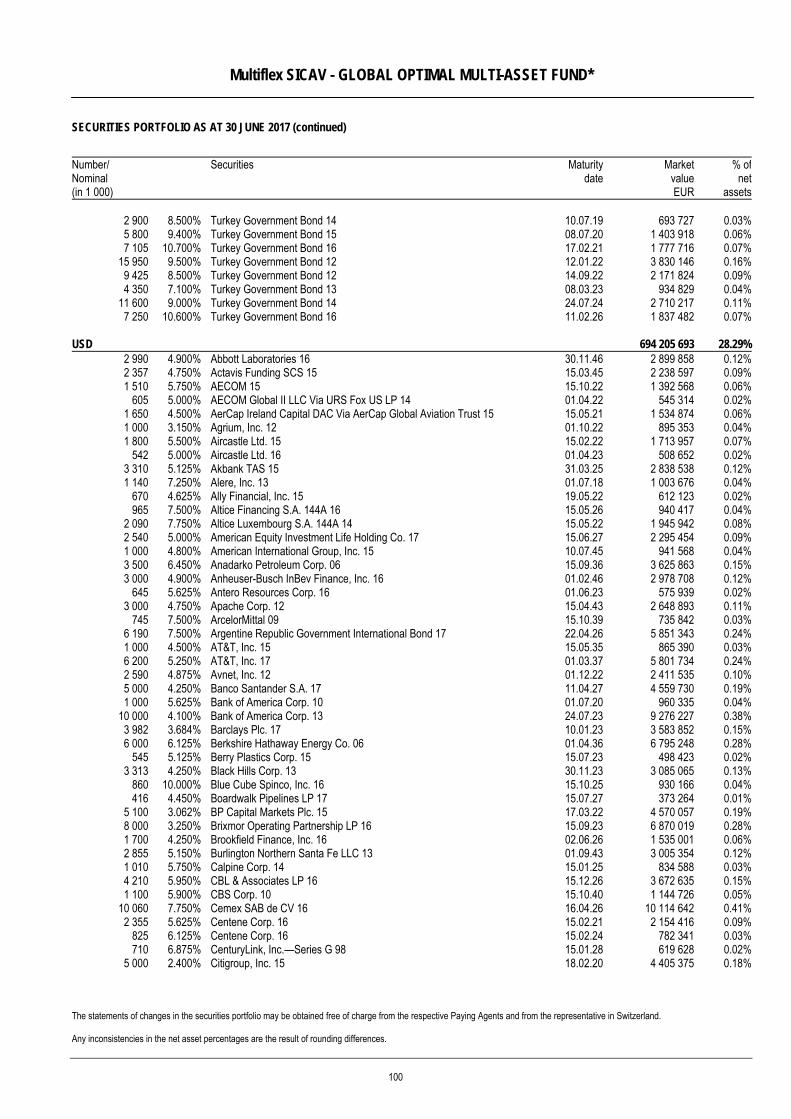
Multiflex SICAV - GLOBAL OPTIMAL MULTI-ASSET FUND*
SECURITIES PORTFOLIO AS AT 30 JUNE 2017 (continued)
The statements of changes in the securities portfolio may be obtained free of charge from the respective Paying Agents and from the representative in Switzerland. Any inconsistencies in the net asset percentages are the result of rounding differences.
Number/ Nominal (in 1 000)
Securities Maturitydate
MarketvalueEUR
% ofnet
assets
2 900 8.500% Turkey Government Bond 14 10.07.19 693 727 0.03%5 800 9.400% Turkey Government Bond 15 08.07.20 1 403 918 0.06%7 105 10.700% Turkey Government Bond 16 17.02.21 1 777 716 0.07%
15 950 9.500% Turkey Government Bond 12 12.01.22 3 830 146 0.16%9 425 8.500% Turkey Government Bond 12 14.09.22 2 171 824 0.09%4 350 7.100% Turkey Government Bond 13 08.03.23 934 829 0.04%
11 600 9.000% Turkey Government Bond 14 24.07.24 2 710 217 0.11%7 250 10.600% Turkey Government Bond 16 11.02.26 1 837 482 0.07%
USD 694 205 693 28.29%2 990 4.900% Abbott Laboratories 16 30.11.46 2 899 858 0.12%2 357 4.750% Actavis Funding SCS 15 15.03.45 2 238 597 0.09%1 510 5.750% AECOM 15 15.10.22 1 392 568 0.06%
605 5.000% AECOM Global II LLC Via URS Fox US LP 14 01.04.22 545 314 0.02%1 650 4.500% AerCap Ireland Capital DAC Via AerCap Global Aviation Trust 15 15.05.21 1 534 874 0.06%1 000 3.150% Agrium, Inc. 12 01.10.22 895 353 0.04%1 800 5.500% Aircastle Ltd. 15 15.02.22 1 713 957 0.07%
542 5.000% Aircastle Ltd. 16 01.04.23 508 652 0.02%3 310 5.125% Akbank TAS 15 31.03.25 2 838 538 0.12%1 140 7.250% Alere, Inc. 13 01.07.18 1 003 676 0.04%
670 4.625% Ally Financial, Inc. 15 19.05.22 612 123 0.02%965 7.500% Altice Financing S.A. 144A 16 15.05.26 940 417 0.04%
2 090 7.750% Altice Luxembourg S.A. 144A 14 15.05.22 1 945 942 0.08%2 540 5.000% American Equity Investment Life Holding Co. 17 15.06.27 2 295 454 0.09%1 000 4.800% American International Group, Inc. 15 10.07.45 941 568 0.04%3 500 6.450% Anadarko Petroleum Corp. 06 15.09.36 3 625 863 0.15%3 000 4.900% Anheuser-Busch InBev Finance, Inc. 16 01.02.46 2 978 708 0.12%
645 5.625% Antero Resources Corp. 16 01.06.23 575 939 0.02%3 000 4.750% Apache Corp. 12 15.04.43 2 648 893 0.11%
745 7.500% ArcelorMittal 09 15.10.39 735 842 0.03%6 190 7.500% Argentine Republic Government International Bond 17 22.04.26 5 851 343 0.24%1 000 4.500% AT&T, Inc. 15 15.05.35 865 390 0.03%6 200 5.250% AT&T, Inc. 17 01.03.37 5 801 734 0.24%2 590 4.875% Avnet, Inc. 12 01.12.22 2 411 535 0.10%5 000 4.250% Banco Santander S.A. 17 11.04.27 4 559 730 0.19%1 000 5.625% Bank of America Corp. 10 01.07.20 960 335 0.04%
10 000 4.100% Bank of America Corp. 13 24.07.23 9 276 227 0.38%3 982 3.684% Barclays Plc. 17 10.01.23 3 583 852 0.15%6 000 6.125% Berkshire Hathaway Energy Co. 06 01.04.36 6 795 248 0.28%
545 5.125% Berry Plastics Corp. 15 15.07.23 498 423 0.02%3 313 4.250% Black Hills Corp. 13 30.11.23 3 085 065 0.13%
860 10.000% Blue Cube Spinco, Inc. 16 15.10.25 930 166 0.04%416 4.450% Boardwalk Pipelines LP 17 15.07.27 373 264 0.01%
5 100 3.062% BP Capital Markets Plc. 15 17.03.22 4 570 057 0.19%8 000 3.250% Brixmor Operating Partnership LP 16 15.09.23 6 870 019 0.28%1 700 4.250% Brookfield Finance, Inc. 16 02.06.26 1 535 001 0.06%2 855 5.150% Burlington Northern Santa Fe LLC 13 01.09.43 3 005 354 0.12%1 010 5.750% Calpine Corp. 14 15.01.25 834 588 0.03%4 210 5.950% CBL & Associates LP 16 15.12.26 3 672 635 0.15%1 100 5.900% CBS Corp. 10 15.10.40 1 144 726 0.05%
10 060 7.750% Cemex SAB de CV 16 16.04.26 10 114 642 0.41%2 355 5.625% Centene Corp. 16 15.02.21 2 154 416 0.09%
825 6.125% Centene Corp. 16 15.02.24 782 341 0.03%710 6.875% CenturyLink, Inc.—Series G 98 15.01.28 619 628 0.02%
5 000 2.400% Citigroup, Inc. 15 18.02.20 4 405 375 0.18%
100
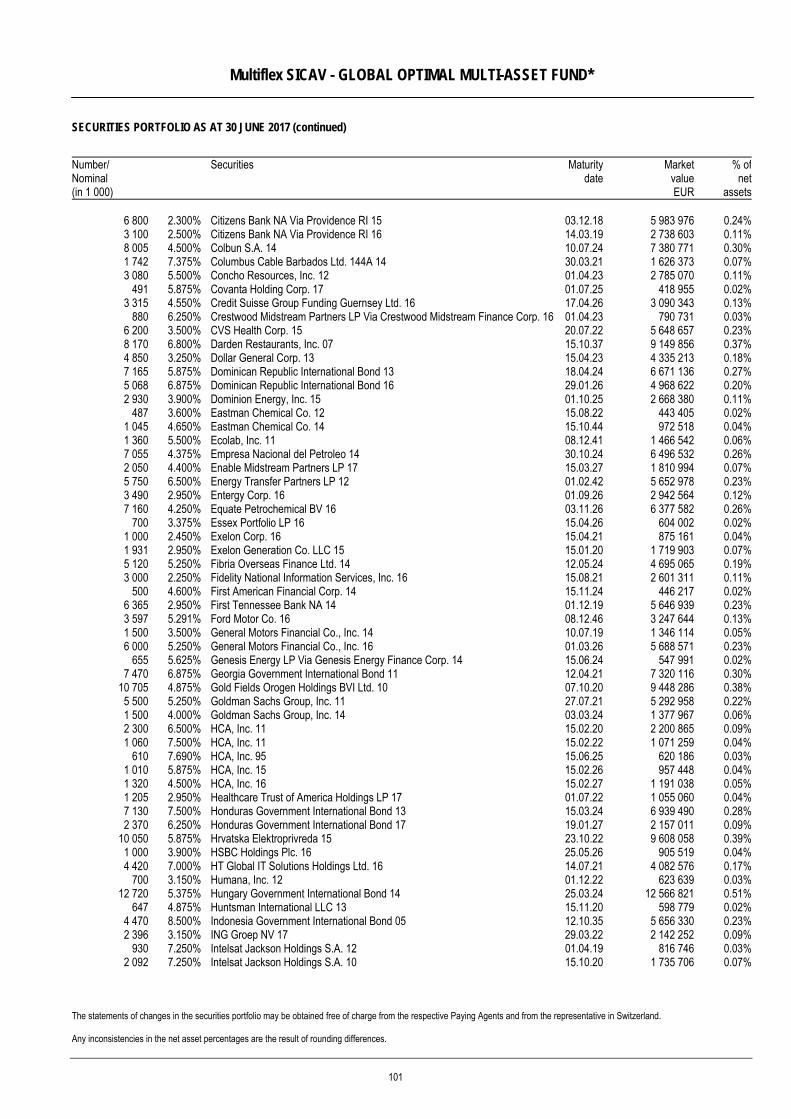
Multiflex SICAV - GLOBAL OPTIMAL MULTI-ASSET FUND*
SECURITIES PORTFOLIO AS AT 30 JUNE 2017 (continued)
The statements of changes in the securities portfolio may be obtained free of charge from the respective Paying Agents and from the representative in Switzerland. Any inconsistencies in the net asset percentages are the result of rounding differences.
Number/ Nominal (in 1 000)
Securities Maturitydate
MarketvalueEUR
% ofnet
assets
6 800 2.300% Citizens Bank NA Via Providence RI 15 03.12.18 5 983 976 0.24%3 100 2.500% Citizens Bank NA Via Providence RI 16 14.03.19 2 738 603 0.11%8 005 4.500% Colbun S.A. 14 10.07.24 7 380 771 0.30%1 742 7.375% Columbus Cable Barbados Ltd. 144A 14 30.03.21 1 626 373 0.07%3 080 5.500% Concho Resources, Inc. 12 01.04.23 2 785 070 0.11%
491 5.875% Covanta Holding Corp. 17 01.07.25 418 955 0.02%3 315 4.550% Credit Suisse Group Funding Guernsey Ltd. 16 17.04.26 3 090 343 0.13%
880 6.250% Crestwood Midstream Partners LP Via Crestwood Midstream Finance Corp. 16 01.04.23 790 731 0.03%6 200 3.500% CVS Health Corp. 15 20.07.22 5 648 657 0.23%8 170 6.800% Darden Restaurants, Inc. 07 15.10.37 9 149 856 0.37%4 850 3.250% Dollar General Corp. 13 15.04.23 4 335 213 0.18%7 165 5.875% Dominican Republic International Bond 13 18.04.24 6 671 136 0.27%5 068 6.875% Dominican Republic International Bond 16 29.01.26 4 968 622 0.20%2 930 3.900% Dominion Energy, Inc. 15 01.10.25 2 668 380 0.11%
487 3.600% Eastman Chemical Co. 12 15.08.22 443 405 0.02%1 045 4.650% Eastman Chemical Co. 14 15.10.44 972 518 0.04%1 360 5.500% Ecolab, Inc. 11 08.12.41 1 466 542 0.06%7 055 4.375% Empresa Nacional del Petroleo 14 30.10.24 6 496 532 0.26%2 050 4.400% Enable Midstream Partners LP 17 15.03.27 1 810 994 0.07%5 750 6.500% Energy Transfer Partners LP 12 01.02.42 5 652 978 0.23%3 490 2.950% Entergy Corp. 16 01.09.26 2 942 564 0.12%7 160 4.250% Equate Petrochemical BV 16 03.11.26 6 377 582 0.26%
700 3.375% Essex Portfolio LP 16 15.04.26 604 002 0.02%1 000 2.450% Exelon Corp. 16 15.04.21 875 161 0.04%1 931 2.950% Exelon Generation Co. LLC 15 15.01.20 1 719 903 0.07%5 120 5.250% Fibria Overseas Finance Ltd. 14 12.05.24 4 695 065 0.19%3 000 2.250% Fidelity National Information Services, Inc. 16 15.08.21 2 601 311 0.11%
500 4.600% First American Financial Corp. 14 15.11.24 446 217 0.02%6 365 2.950% First Tennessee Bank NA 14 01.12.19 5 646 939 0.23%3 597 5.291% Ford Motor Co. 16 08.12.46 3 247 644 0.13%1 500 3.500% General Motors Financial Co., Inc. 14 10.07.19 1 346 114 0.05%6 000 5.250% General Motors Financial Co., Inc. 16 01.03.26 5 688 571 0.23%
655 5.625% Genesis Energy LP Via Genesis Energy Finance Corp. 14 15.06.24 547 991 0.02%7 470 6.875% Georgia Government International Bond 11 12.04.21 7 320 116 0.30%
10 705 4.875% Gold Fields Orogen Holdings BVI Ltd. 10 07.10.20 9 448 286 0.38%5 500 5.250% Goldman Sachs Group, Inc. 11 27.07.21 5 292 958 0.22%1 500 4.000% Goldman Sachs Group, Inc. 14 03.03.24 1 377 967 0.06%2 300 6.500% HCA, Inc. 11 15.02.20 2 200 865 0.09%1 060 7.500% HCA, Inc. 11 15.02.22 1 071 259 0.04%
610 7.690% HCA, Inc. 95 15.06.25 620 186 0.03%1 010 5.875% HCA, Inc. 15 15.02.26 957 448 0.04%1 320 4.500% HCA, Inc. 16 15.02.27 1 191 038 0.05%1 205 2.950% Healthcare Trust of America Holdings LP 17 01.07.22 1 055 060 0.04%7 130 7.500% Honduras Government International Bond 13 15.03.24 6 939 490 0.28%2 370 6.250% Honduras Government International Bond 17 19.01.27 2 157 011 0.09%
10 050 5.875% Hrvatska Elektroprivreda 15 23.10.22 9 608 058 0.39%1 000 3.900% HSBC Holdings Plc. 16 25.05.26 905 519 0.04%4 420 7.000% HT Global IT Solutions Holdings Ltd. 16 14.07.21 4 082 576 0.17%
700 3.150% Humana, Inc. 12 01.12.22 623 639 0.03%12 720 5.375% Hungary Government International Bond 14 25.03.24 12 566 821 0.51%
647 4.875% Huntsman International LLC 13 15.11.20 598 779 0.02%4 470 8.500% Indonesia Government International Bond 05 12.10.35 5 656 330 0.23%2 396 3.150% ING Groep NV 17 29.03.22 2 142 252 0.09%
930 7.250% Intelsat Jackson Holdings S.A. 12 01.04.19 816 746 0.03%2 092 7.250% Intelsat Jackson Holdings S.A. 10 15.10.20 1 735 706 0.07%
101
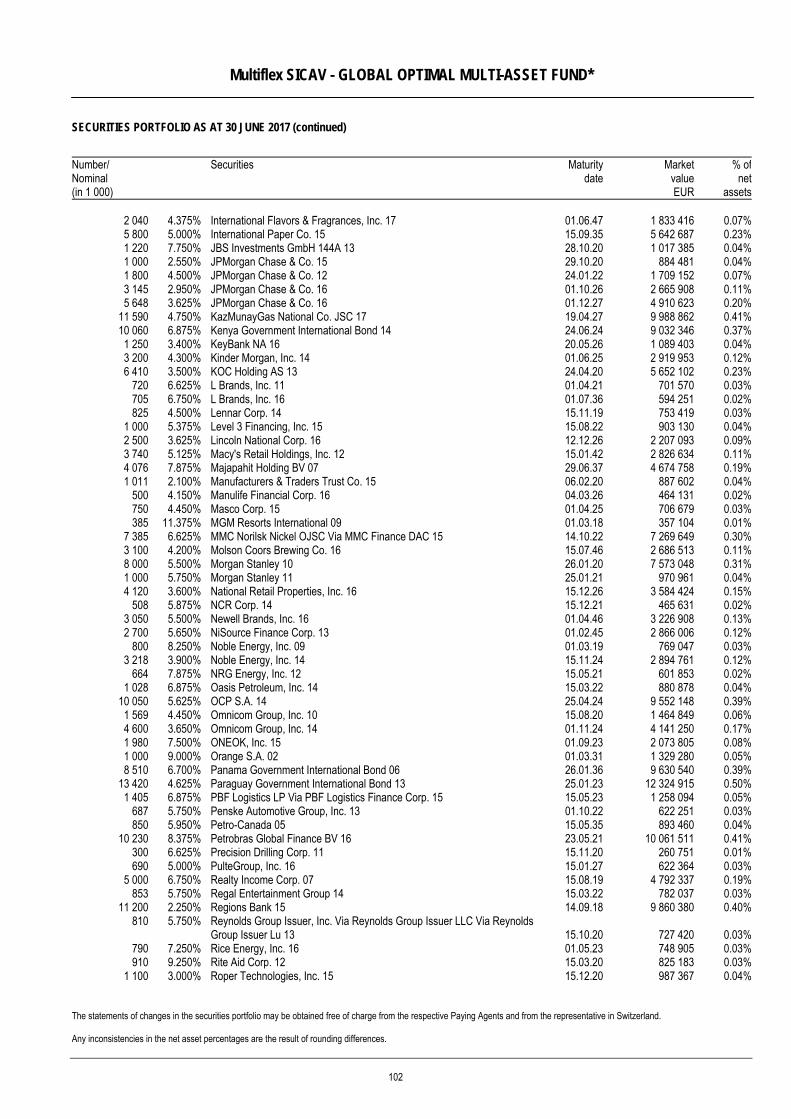
Multiflex SICAV - GLOBAL OPTIMAL MULTI-ASSET FUND*
SECURITIES PORTFOLIO AS AT 30 JUNE 2017 (continued)
The statements of changes in the securities portfolio may be obtained free of charge from the respective Paying Agents and from the representative in Switzerland. Any inconsistencies in the net asset percentages are the result of rounding differences.
Number/ Nominal (in 1 000)
Securities Maturitydate
MarketvalueEUR
% ofnet
assets
2 040 4.375% International Flavors & Fragrances, Inc. 17 01.06.47 1 833 416 0.07%5 800 5.000% International Paper Co. 15 15.09.35 5 642 687 0.23%1 220 7.750% JBS Investments GmbH 144A 13 28.10.20 1 017 385 0.04%1 000 2.550% JPMorgan Chase & Co. 15 29.10.20 884 481 0.04%1 800 4.500% JPMorgan Chase & Co. 12 24.01.22 1 709 152 0.07%3 145 2.950% JPMorgan Chase & Co. 16 01.10.26 2 665 908 0.11%5 648 3.625% JPMorgan Chase & Co. 16 01.12.27 4 910 623 0.20%
11 590 4.750% KazMunayGas National Co. JSC 17 19.04.27 9 988 862 0.41%10 060 6.875% Kenya Government International Bond 14 24.06.24 9 032 346 0.37%1 250 3.400% KeyBank NA 16 20.05.26 1 089 403 0.04%3 200 4.300% Kinder Morgan, Inc. 14 01.06.25 2 919 953 0.12%6 410 3.500% KOC Holding AS 13 24.04.20 5 652 102 0.23%
720 6.625% L Brands, Inc. 11 01.04.21 701 570 0.03%705 6.750% L Brands, Inc. 16 01.07.36 594 251 0.02%825 4.500% Lennar Corp. 14 15.11.19 753 419 0.03%
1 000 5.375% Level 3 Financing, Inc. 15 15.08.22 903 130 0.04%2 500 3.625% Lincoln National Corp. 16 12.12.26 2 207 093 0.09%3 740 5.125% Macy's Retail Holdings, Inc. 12 15.01.42 2 826 634 0.11%4 076 7.875% Majapahit Holding BV 07 29.06.37 4 674 758 0.19%1 011 2.100% Manufacturers & Traders Trust Co. 15 06.02.20 887 602 0.04%
500 4.150% Manulife Financial Corp. 16 04.03.26 464 131 0.02%750 4.450% Masco Corp. 15 01.04.25 706 679 0.03%385 11.375% MGM Resorts International 09 01.03.18 357 104 0.01%
7 385 6.625% MMC Norilsk Nickel OJSC Via MMC Finance DAC 15 14.10.22 7 269 649 0.30%3 100 4.200% Molson Coors Brewing Co. 16 15.07.46 2 686 513 0.11%8 000 5.500% Morgan Stanley 10 26.01.20 7 573 048 0.31%1 000 5.750% Morgan Stanley 11 25.01.21 970 961 0.04%4 120 3.600% National Retail Properties, Inc. 16 15.12.26 3 584 424 0.15%
508 5.875% NCR Corp. 14 15.12.21 465 631 0.02%3 050 5.500% Newell Brands, Inc. 16 01.04.46 3 226 908 0.13%2 700 5.650% NiSource Finance Corp. 13 01.02.45 2 866 006 0.12%
800 8.250% Noble Energy, Inc. 09 01.03.19 769 047 0.03%3 218 3.900% Noble Energy, Inc. 14 15.11.24 2 894 761 0.12%
664 7.875% NRG Energy, Inc. 12 15.05.21 601 853 0.02%1 028 6.875% Oasis Petroleum, Inc. 14 15.03.22 880 878 0.04%
10 050 5.625% OCP S.A. 14 25.04.24 9 552 148 0.39%1 569 4.450% Omnicom Group, Inc. 10 15.08.20 1 464 849 0.06%4 600 3.650% Omnicom Group, Inc. 14 01.11.24 4 141 250 0.17%1 980 7.500% ONEOK, Inc. 15 01.09.23 2 073 805 0.08%1 000 9.000% Orange S.A. 02 01.03.31 1 329 280 0.05%8 510 6.700% Panama Government International Bond 06 26.01.36 9 630 540 0.39%
13 420 4.625% Paraguay Government International Bond 13 25.01.23 12 324 915 0.50%1 405 6.875% PBF Logistics LP Via PBF Logistics Finance Corp. 15 15.05.23 1 258 094 0.05%
687 5.750% Penske Automotive Group, Inc. 13 01.10.22 622 251 0.03%850 5.950% Petro-Canada 05 15.05.35 893 460 0.04%
10 230 8.375% Petrobras Global Finance BV 16 23.05.21 10 061 511 0.41%300 6.625% Precision Drilling Corp. 11 15.11.20 260 751 0.01%690 5.000% PulteGroup, Inc. 16 15.01.27 622 364 0.03%
5 000 6.750% Realty Income Corp. 07 15.08.19 4 792 337 0.19%853 5.750% Regal Entertainment Group 14 15.03.22 782 037 0.03%
11 200 2.250% Regions Bank 15 14.09.18 9 860 380 0.40%810 5.750% Reynolds Group Issuer, Inc. Via Reynolds Group Issuer LLC Via Reynolds
Group Issuer Lu 13 15.10.20 727 420 0.03%790 7.250% Rice Energy, Inc. 16 01.05.23 748 905 0.03%910 9.250% Rite Aid Corp. 12 15.03.20 825 183 0.03%
1 100 3.000% Roper Technologies, Inc. 15 15.12.20 987 367 0.04%
102
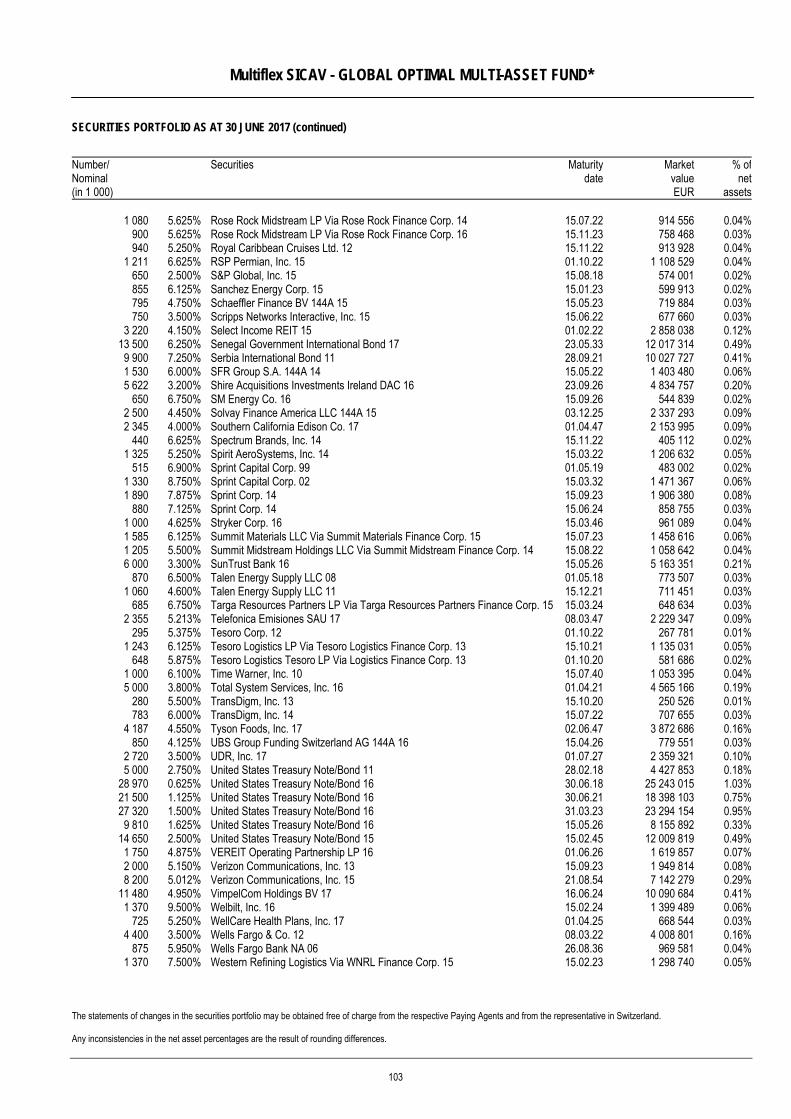
Multiflex SICAV - GLOBAL OPTIMAL MULTI-ASSET FUND*
SECURITIES PORTFOLIO AS AT 30 JUNE 2017 (continued)
The statements of changes in the securities portfolio may be obtained free of charge from the respective Paying Agents and from the representative in Switzerland. Any inconsistencies in the net asset percentages are the result of rounding differences.
Number/ Nominal (in 1 000)
Securities Maturitydate
MarketvalueEUR
% ofnet
assets
1 080 5.625% Rose Rock Midstream LP Via Rose Rock Finance Corp. 14 15.07.22 914 556 0.04%900 5.625% Rose Rock Midstream LP Via Rose Rock Finance Corp. 16 15.11.23 758 468 0.03%940 5.250% Royal Caribbean Cruises Ltd. 12 15.11.22 913 928 0.04%
1 211 6.625% RSP Permian, Inc. 15 01.10.22 1 108 529 0.04%650 2.500% S&P Global, Inc. 15 15.08.18 574 001 0.02%855 6.125% Sanchez Energy Corp. 15 15.01.23 599 913 0.02%795 4.750% Schaeffler Finance BV 144A 15 15.05.23 719 884 0.03%750 3.500% Scripps Networks Interactive, Inc. 15 15.06.22 677 660 0.03%
3 220 4.150% Select Income REIT 15 01.02.22 2 858 038 0.12%13 500 6.250% Senegal Government International Bond 17 23.05.33 12 017 314 0.49%9 900 7.250% Serbia International Bond 11 28.09.21 10 027 727 0.41%1 530 6.000% SFR Group S.A. 144A 14 15.05.22 1 403 480 0.06%5 622 3.200% Shire Acquisitions Investments Ireland DAC 16 23.09.26 4 834 757 0.20%
650 6.750% SM Energy Co. 16 15.09.26 544 839 0.02%2 500 4.450% Solvay Finance America LLC 144A 15 03.12.25 2 337 293 0.09%2 345 4.000% Southern California Edison Co. 17 01.04.47 2 153 995 0.09%
440 6.625% Spectrum Brands, Inc. 14 15.11.22 405 112 0.02%1 325 5.250% Spirit AeroSystems, Inc. 14 15.03.22 1 206 632 0.05%
515 6.900% Sprint Capital Corp. 99 01.05.19 483 002 0.02%1 330 8.750% Sprint Capital Corp. 02 15.03.32 1 471 367 0.06%1 890 7.875% Sprint Corp. 14 15.09.23 1 906 380 0.08%
880 7.125% Sprint Corp. 14 15.06.24 858 755 0.03%1 000 4.625% Stryker Corp. 16 15.03.46 961 089 0.04%1 585 6.125% Summit Materials LLC Via Summit Materials Finance Corp. 15 15.07.23 1 458 616 0.06%1 205 5.500% Summit Midstream Holdings LLC Via Summit Midstream Finance Corp. 14 15.08.22 1 058 642 0.04%6 000 3.300% SunTrust Bank 16 15.05.26 5 163 351 0.21%
870 6.500% Talen Energy Supply LLC 08 01.05.18 773 507 0.03%1 060 4.600% Talen Energy Supply LLC 11 15.12.21 711 451 0.03%
685 6.750% Targa Resources Partners LP Via Targa Resources Partners Finance Corp. 15 15.03.24 648 634 0.03%2 355 5.213% Telefonica Emisiones SAU 17 08.03.47 2 229 347 0.09%
295 5.375% Tesoro Corp. 12 01.10.22 267 781 0.01%1 243 6.125% Tesoro Logistics LP Via Tesoro Logistics Finance Corp. 13 15.10.21 1 135 031 0.05%
648 5.875% Tesoro Logistics Tesoro LP Via Logistics Finance Corp. 13 01.10.20 581 686 0.02%1 000 6.100% Time Warner, Inc. 10 15.07.40 1 053 395 0.04%5 000 3.800% Total System Services, Inc. 16 01.04.21 4 565 166 0.19%
280 5.500% TransDigm, Inc. 13 15.10.20 250 526 0.01%783 6.000% TransDigm, Inc. 14 15.07.22 707 655 0.03%
4 187 4.550% Tyson Foods, Inc. 17 02.06.47 3 872 686 0.16%850 4.125% UBS Group Funding Switzerland AG 144A 16 15.04.26 779 551 0.03%
2 720 3.500% UDR, Inc. 17 01.07.27 2 359 321 0.10%5 000 2.750% United States Treasury Note/Bond 11 28.02.18 4 427 853 0.18%
28 970 0.625% United States Treasury Note/Bond 16 30.06.18 25 243 015 1.03%21 500 1.125% United States Treasury Note/Bond 16 30.06.21 18 398 103 0.75%27 320 1.500% United States Treasury Note/Bond 16 31.03.23 23 294 154 0.95%9 810 1.625% United States Treasury Note/Bond 16 15.05.26 8 155 892 0.33%
14 650 2.500% United States Treasury Note/Bond 15 15.02.45 12 009 819 0.49%1 750 4.875% VEREIT Operating Partnership LP 16 01.06.26 1 619 857 0.07%2 000 5.150% Verizon Communications, Inc. 13 15.09.23 1 949 814 0.08%8 200 5.012% Verizon Communications, Inc. 15 21.08.54 7 142 279 0.29%
11 480 4.950% VimpelCom Holdings BV 17 16.06.24 10 090 684 0.41%1 370 9.500% Welbilt, Inc. 16 15.02.24 1 399 489 0.06%
725 5.250% WellCare Health Plans, Inc. 17 01.04.25 668 544 0.03%4 400 3.500% Wells Fargo & Co. 12 08.03.22 4 008 801 0.16%
875 5.950% Wells Fargo Bank NA 06 26.08.36 969 581 0.04%1 370 7.500% Western Refining Logistics Via WNRL Finance Corp. 15 15.02.23 1 298 740 0.05%
103
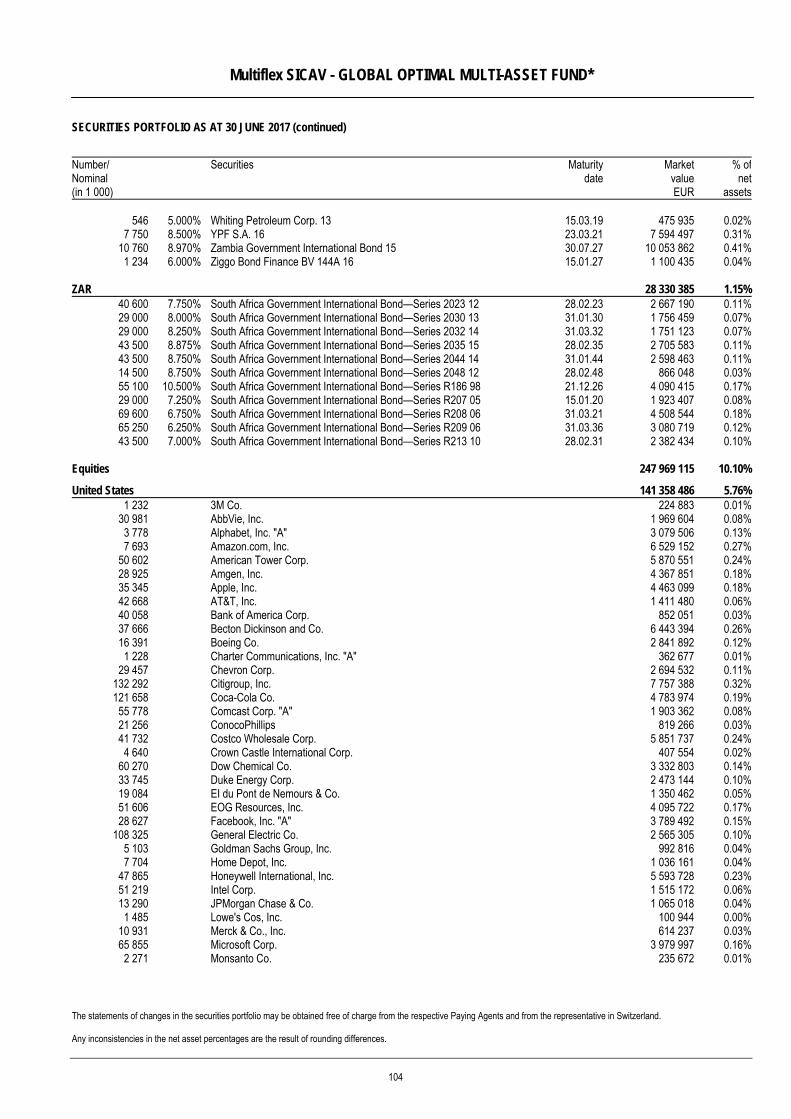
Multiflex SICAV - GLOBAL OPTIMAL MULTI-ASSET FUND*
SECURITIES PORTFOLIO AS AT 30 JUNE 2017 (continued)
The statements of changes in the securities portfolio may be obtained free of charge from the respective Paying Agents and from the representative in Switzerland. Any inconsistencies in the net asset percentages are the result of rounding differences.
Number/ Nominal (in 1 000)
Securities Maturitydate
MarketvalueEUR
% ofnet
assets
546 5.000% Whiting Petroleum Corp. 13 15.03.19 475 935 0.02%7 750 8.500% YPF S.A. 16 23.03.21 7 594 497 0.31%
10 760 8.970% Zambia Government International Bond 15 30.07.27 10 053 862 0.41%1 234 6.000% Ziggo Bond Finance BV 144A 16 15.01.27 1 100 435 0.04%
ZAR 28 330 385 1.15%40 600 7.750% South Africa Government International Bond—Series 2023 12 28.02.23 2 667 190 0.11%29 000 8.000% South Africa Government International Bond—Series 2030 13 31.01.30 1 756 459 0.07%29 000 8.250% South Africa Government International Bond—Series 2032 14 31.03.32 1 751 123 0.07%43 500 8.875% South Africa Government International Bond—Series 2035 15 28.02.35 2 705 583 0.11%43 500 8.750% South Africa Government International Bond—Series 2044 14 31.01.44 2 598 463 0.11%14 500 8.750% South Africa Government International Bond—Series 2048 12 28.02.48 866 048 0.03%55 100 10.500% South Africa Government International Bond—Series R186 98 21.12.26 4 090 415 0.17%29 000 7.250% South Africa Government International Bond—Series R207 05 15.01.20 1 923 407 0.08%69 600 6.750% South Africa Government International Bond—Series R208 06 31.03.21 4 508 544 0.18%65 250 6.250% South Africa Government International Bond—Series R209 06 31.03.36 3 080 719 0.12%43 500 7.000% South Africa Government International Bond—Series R213 10 28.02.31 2 382 434 0.10%
Equities 247 969 115 10.10%
United States 141 358 486 5.76%1 232 3M Co. 224 883 0.01%
30 981 AbbVie, Inc. 1 969 604 0.08%3 778 Alphabet, Inc. "A" 3 079 506 0.13%7 693 Amazon.com, Inc. 6 529 152 0.27%
50 602 American Tower Corp. 5 870 551 0.24%28 925 Amgen, Inc. 4 367 851 0.18%35 345 Apple, Inc. 4 463 099 0.18%42 668 AT&T, Inc. 1 411 480 0.06%40 058 Bank of America Corp. 852 051 0.03%37 666 Becton Dickinson and Co. 6 443 394 0.26%16 391 Boeing Co. 2 841 892 0.12%1 228 Charter Communications, Inc. "A" 362 677 0.01%
29 457 Chevron Corp. 2 694 532 0.11%132 292 Citigroup, Inc. 7 757 388 0.32%121 658 Coca-Cola Co. 4 783 974 0.19%
55 778 Comcast Corp. "A" 1 903 362 0.08%21 256 ConocoPhillips 819 266 0.03%41 732 Costco Wholesale Corp. 5 851 737 0.24%4 640 Crown Castle International Corp. 407 554 0.02%
60 270 Dow Chemical Co. 3 332 803 0.14%33 745 Duke Energy Corp. 2 473 144 0.10%19 084 EI du Pont de Nemours & Co. 1 350 462 0.05%51 606 EOG Resources, Inc. 4 095 722 0.17%28 627 Facebook, Inc. "A" 3 789 492 0.15%
108 325 General Electric Co. 2 565 305 0.10%5 103 Goldman Sachs Group, Inc. 992 816 0.04%7 704 Home Depot, Inc. 1 036 161 0.04%
47 865 Honeywell International, Inc. 5 593 728 0.23%51 219 Intel Corp. 1 515 172 0.06%13 290 JPMorgan Chase & Co. 1 065 018 0.04%1 485 Lowe's Cos, Inc. 100 944 0.00%
10 931 Merck & Co., Inc. 614 237 0.03%65 855 Microsoft Corp. 3 979 997 0.16%2 271 Monsanto Co. 235 672 0.01%
104
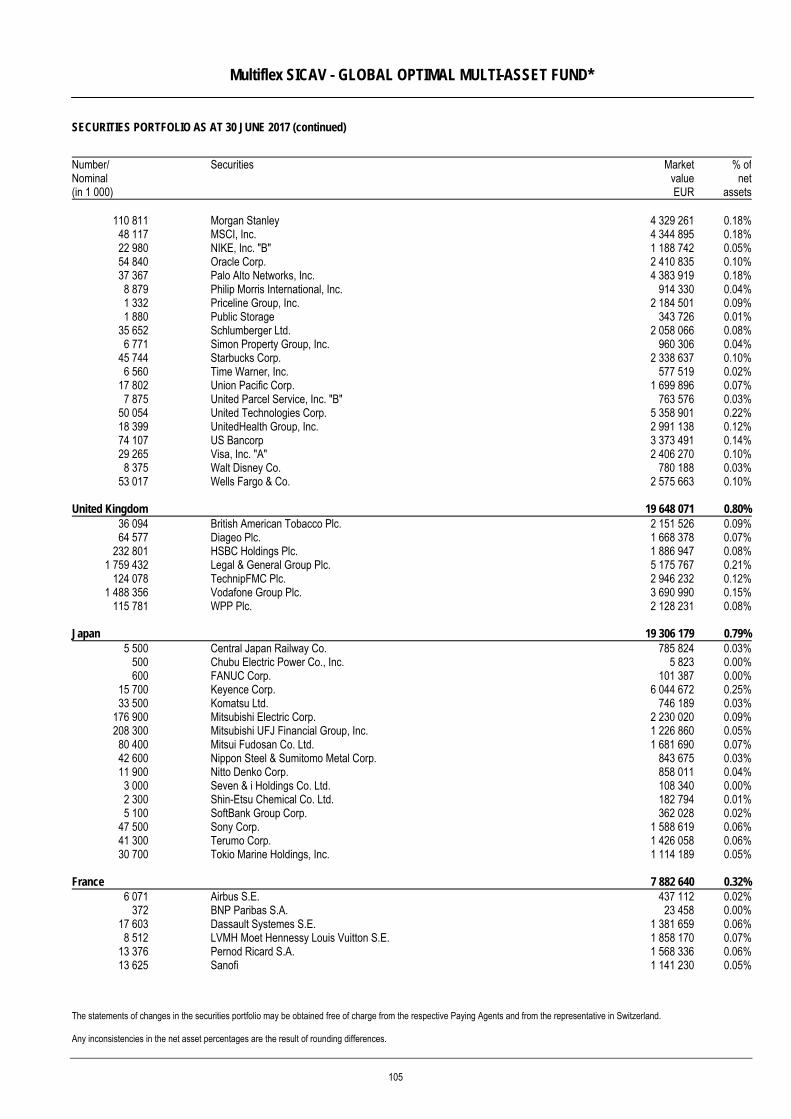
Multiflex SICAV - GLOBAL OPTIMAL MULTI-ASSET FUND*
SECURITIES PORTFOLIO AS AT 30 JUNE 2017 (continued)
The statements of changes in the securities portfolio may be obtained free of charge from the respective Paying Agents and from the representative in Switzerland. Any inconsistencies in the net asset percentages are the result of rounding differences.
Number/ Nominal (in 1 000)
Securities MarketvalueEUR
% ofnet
assets
110 811 Morgan Stanley 4 329 261 0.18%48 117 MSCI, Inc. 4 344 895 0.18%22 980 NIKE, Inc. "B" 1 188 742 0.05%54 840 Oracle Corp. 2 410 835 0.10%37 367 Palo Alto Networks, Inc. 4 383 919 0.18%8 879 Philip Morris International, Inc. 914 330 0.04%1 332 Priceline Group, Inc. 2 184 501 0.09%1 880 Public Storage 343 726 0.01%
35 652 Schlumberger Ltd. 2 058 066 0.08%6 771 Simon Property Group, Inc. 960 306 0.04%
45 744 Starbucks Corp. 2 338 637 0.10%6 560 Time Warner, Inc. 577 519 0.02%
17 802 Union Pacific Corp. 1 699 896 0.07%7 875 United Parcel Service, Inc. "B" 763 576 0.03%
50 054 United Technologies Corp. 5 358 901 0.22%18 399 UnitedHealth Group, Inc. 2 991 138 0.12%74 107 US Bancorp 3 373 491 0.14%29 265 Visa, Inc. "A" 2 406 270 0.10%8 375 Walt Disney Co. 780 188 0.03%
53 017 Wells Fargo & Co. 2 575 663 0.10%
United Kingdom 19 648 071 0.80%36 094 British American Tobacco Plc. 2 151 526 0.09%64 577 Diageo Plc. 1 668 378 0.07%
232 801 HSBC Holdings Plc. 1 886 947 0.08%1 759 432 Legal & General Group Plc. 5 175 767 0.21%
124 078 TechnipFMC Plc. 2 946 232 0.12%1 488 356 Vodafone Group Plc. 3 690 990 0.15%
115 781 WPP Plc. 2 128 231 0.08%
Japan 19 306 179 0.79%5 500 Central Japan Railway Co. 785 824 0.03%
500 Chubu Electric Power Co., Inc. 5 823 0.00%600 FANUC Corp. 101 387 0.00%
15 700 Keyence Corp. 6 044 672 0.25%33 500 Komatsu Ltd. 746 189 0.03%
176 900 Mitsubishi Electric Corp. 2 230 020 0.09%208 300 Mitsubishi UFJ Financial Group, Inc. 1 226 860 0.05%
80 400 Mitsui Fudosan Co. Ltd. 1 681 690 0.07%42 600 Nippon Steel & Sumitomo Metal Corp. 843 675 0.03%11 900 Nitto Denko Corp. 858 011 0.04%3 000 Seven & i Holdings Co. Ltd. 108 340 0.00%2 300 Shin-Etsu Chemical Co. Ltd. 182 794 0.01%5 100 SoftBank Group Corp. 362 028 0.02%
47 500 Sony Corp. 1 588 619 0.06%41 300 Terumo Corp. 1 426 058 0.06%30 700 Tokio Marine Holdings, Inc. 1 114 189 0.05%
France 7 882 640 0.32%6 071 Airbus S.E. 437 112 0.02%
372 BNP Paribas S.A. 23 458 0.00%17 603 Dassault Systemes S.E. 1 381 659 0.06%8 512 LVMH Moet Hennessy Louis Vuitton S.E. 1 858 170 0.07%
13 376 Pernod Ricard S.A. 1 568 336 0.06%13 625 Sanofi 1 141 230 0.05%
105
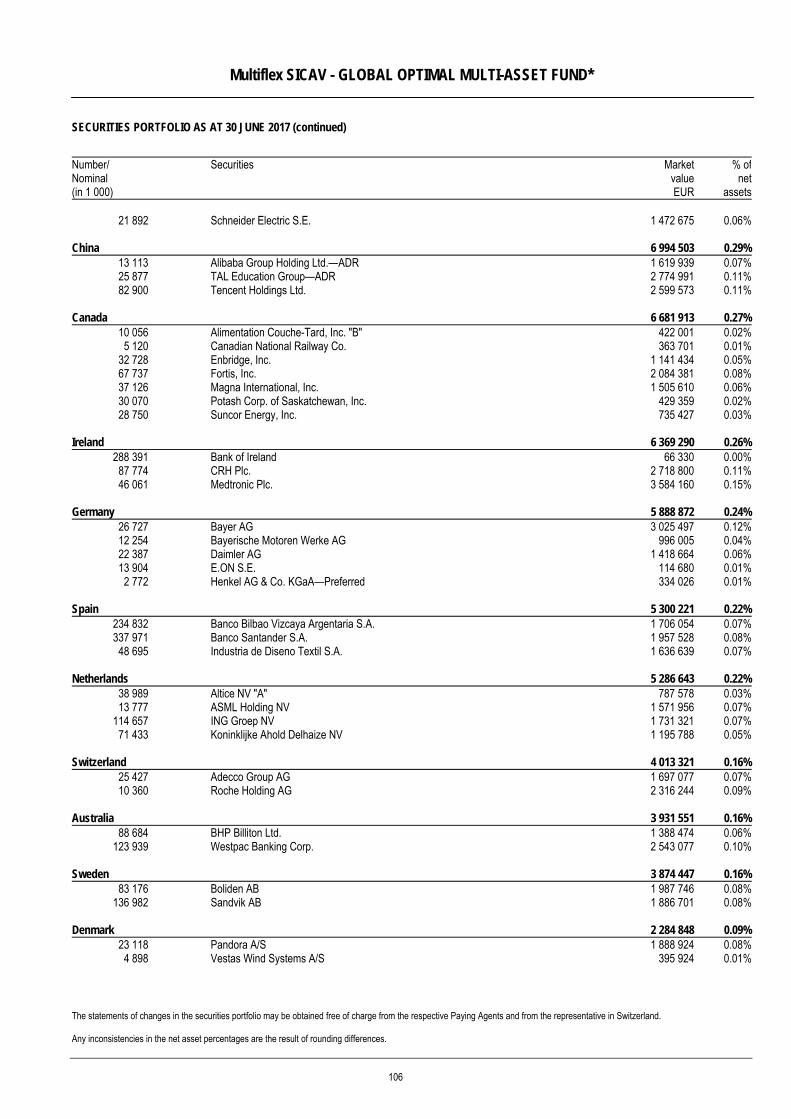
Multiflex SICAV - GLOBAL OPTIMAL MULTI-ASSET FUND*
SECURITIES PORTFOLIO AS AT 30 JUNE 2017 (continued)
The statements of changes in the securities portfolio may be obtained free of charge from the respective Paying Agents and from the representative in Switzerland. Any inconsistencies in the net asset percentages are the result of rounding differences.
Number/ Nominal (in 1 000)
Securities MarketvalueEUR
% ofnet
assets
21 892 Schneider Electric S.E. 1 472 675 0.06%
China 6 994 503 0.29%13 113 Alibaba Group Holding Ltd.—ADR 1 619 939 0.07%25 877 TAL Education Group—ADR 2 774 991 0.11%82 900 Tencent Holdings Ltd. 2 599 573 0.11%
Canada 6 681 913 0.27%10 056 Alimentation Couche-Tard, Inc. "B" 422 001 0.02%5 120 Canadian National Railway Co. 363 701 0.01%
32 728 Enbridge, Inc. 1 141 434 0.05%67 737 Fortis, Inc. 2 084 381 0.08%37 126 Magna International, Inc. 1 505 610 0.06%30 070 Potash Corp. of Saskatchewan, Inc. 429 359 0.02%28 750 Suncor Energy, Inc. 735 427 0.03%
Ireland 6 369 290 0.26%288 391 Bank of Ireland 66 330 0.00%
87 774 CRH Plc. 2 718 800 0.11%46 061 Medtronic Plc. 3 584 160 0.15%
Germany 5 888 872 0.24%26 727 Bayer AG 3 025 497 0.12%12 254 Bayerische Motoren Werke AG 996 005 0.04%22 387 Daimler AG 1 418 664 0.06%13 904 E.ON S.E. 114 680 0.01%2 772 Henkel AG & Co. KGaA—Preferred 334 026 0.01%
Spain 5 300 221 0.22%234 832 Banco Bilbao Vizcaya Argentaria S.A. 1 706 054 0.07%337 971 Banco Santander S.A. 1 957 528 0.08%
48 695 Industria de Diseno Textil S.A. 1 636 639 0.07%
Netherlands 5 286 643 0.22%38 989 Altice NV "A" 787 578 0.03%13 777 ASML Holding NV 1 571 956 0.07%
114 657 ING Groep NV 1 731 321 0.07%71 433 Koninklijke Ahold Delhaize NV 1 195 788 0.05%
Switzerland 4 013 321 0.16%25 427 Adecco Group AG 1 697 077 0.07%10 360 Roche Holding AG 2 316 244 0.09%
Australia 3 931 551 0.16%88 684 BHP Billiton Ltd. 1 388 474 0.06%
123 939 Westpac Banking Corp. 2 543 077 0.10%
Sweden 3 874 447 0.16%83 176 Boliden AB 1 987 746 0.08%
136 982 Sandvik AB 1 886 701 0.08%
Denmark 2 284 848 0.09%23 118 Pandora A/S 1 888 924 0.08%4 898 Vestas Wind Systems A/S 395 924 0.01%
106
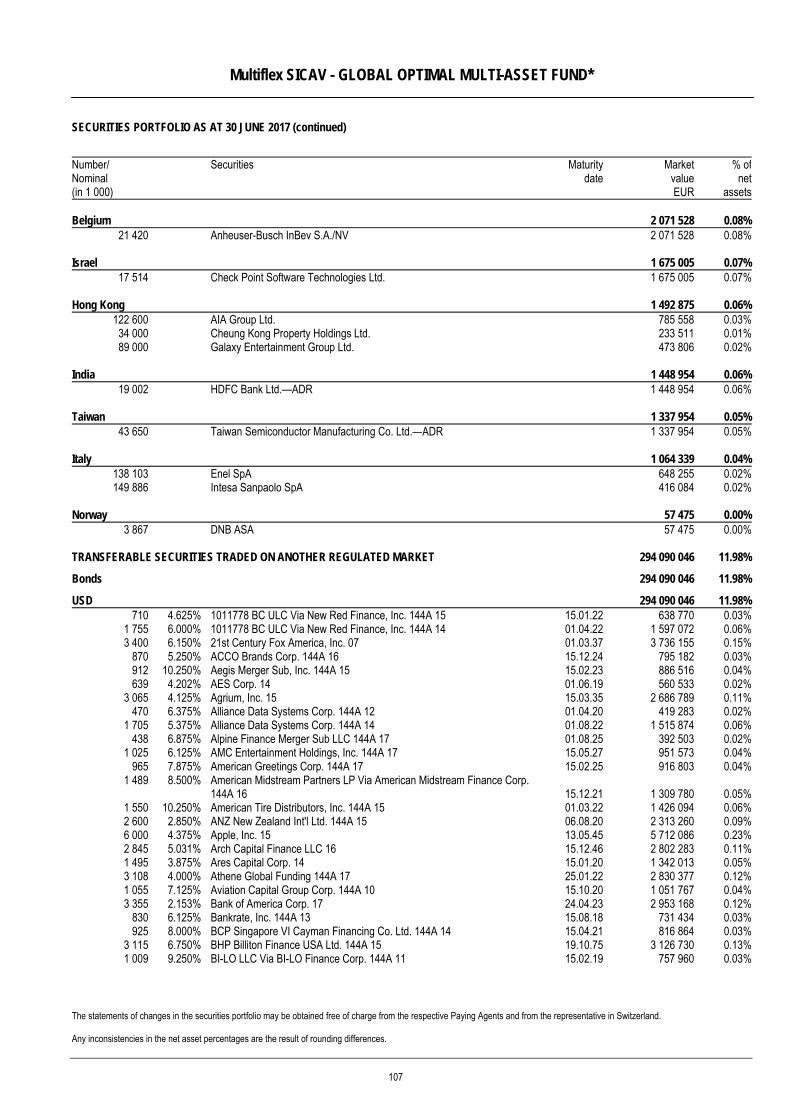
Multiflex SICAV - GLOBAL OPTIMAL MULTI-ASSET FUND*
SECURITIES PORTFOLIO AS AT 30 JUNE 2017 (continued)
The statements of changes in the securities portfolio may be obtained free of charge from the respective Paying Agents and from the representative in Switzerland. Any inconsistencies in the net asset percentages are the result of rounding differences.
Number/ Nominal (in 1 000)
Securities Maturitydate
MarketvalueEUR
% ofnet
assets Belgium 2 071 528 0.08%
21 420 Anheuser-Busch InBev S.A./NV 2 071 528 0.08%
Israel 1 675 005 0.07%17 514 Check Point Software Technologies Ltd. 1 675 005 0.07%
Hong Kong 1 492 875 0.06%122 600 AIA Group Ltd. 785 558 0.03%
34 000 Cheung Kong Property Holdings Ltd. 233 511 0.01%89 000 Galaxy Entertainment Group Ltd. 473 806 0.02%
India 1 448 954 0.06%19 002 HDFC Bank Ltd.—ADR 1 448 954 0.06%
Taiwan 1 337 954 0.05%43 650 Taiwan Semiconductor Manufacturing Co. Ltd.—ADR 1 337 954 0.05%
Italy 1 064 339 0.04%138 103 Enel SpA 648 255 0.02%149 886 Intesa Sanpaolo SpA 416 084 0.02%
Norway 57 475 0.00%3 867 DNB ASA 57 475 0.00%
TRANSFERABLE SECURITIES TRADED ON ANOTHER REGULATED MARKET 294 090 046 11.98%
Bonds 294 090 046 11.98%
USD 294 090 046 11.98%710 4.625% 1011778 BC ULC Via New Red Finance, Inc. 144A 15 15.01.22 638 770 0.03%
1 755 6.000% 1011778 BC ULC Via New Red Finance, Inc. 144A 14 01.04.22 1 597 072 0.06%3 400 6.150% 21st Century Fox America, Inc. 07 01.03.37 3 736 155 0.15%
870 5.250% ACCO Brands Corp. 144A 16 15.12.24 795 182 0.03%912 10.250% Aegis Merger Sub, Inc. 144A 15 15.02.23 886 516 0.04%639 4.202% AES Corp. 14 01.06.19 560 533 0.02%
3 065 4.125% Agrium, Inc. 15 15.03.35 2 686 789 0.11%470 6.375% Alliance Data Systems Corp. 144A 12 01.04.20 419 283 0.02%
1 705 5.375% Alliance Data Systems Corp. 144A 14 01.08.22 1 515 874 0.06%438 6.875% Alpine Finance Merger Sub LLC 144A 17 01.08.25 392 503 0.02%
1 025 6.125% AMC Entertainment Holdings, Inc. 144A 17 15.05.27 951 573 0.04%965 7.875% American Greetings Corp. 144A 17 15.02.25 916 803 0.04%
1 489 8.500% American Midstream Partners LP Via American Midstream Finance Corp. 144A 16 15.12.21 1 309 780 0.05%
1 550 10.250% American Tire Distributors, Inc. 144A 15 01.03.22 1 426 094 0.06%2 600 2.850% ANZ New Zealand Int'l Ltd. 144A 15 06.08.20 2 313 260 0.09%6 000 4.375% Apple, Inc. 15 13.05.45 5 712 086 0.23%2 845 5.031% Arch Capital Finance LLC 16 15.12.46 2 802 283 0.11%1 495 3.875% Ares Capital Corp. 14 15.01.20 1 342 013 0.05%3 108 4.000% Athene Global Funding 144A 17 25.01.22 2 830 377 0.12%1 055 7.125% Aviation Capital Group Corp. 144A 10 15.10.20 1 051 767 0.04%3 355 2.153% Bank of America Corp. 17 24.04.23 2 953 168 0.12%
830 6.125% Bankrate, Inc. 144A 13 15.08.18 731 434 0.03%925 8.000% BCP Singapore VI Cayman Financing Co. Ltd. 144A 14 15.04.21 816 864 0.03%
3 115 6.750% BHP Billiton Finance USA Ltd. 144A 15 19.10.75 3 126 730 0.13%1 009 9.250% BI-LO LLC Via BI-LO Finance Corp. 144A 11 15.02.19 757 960 0.03%
107
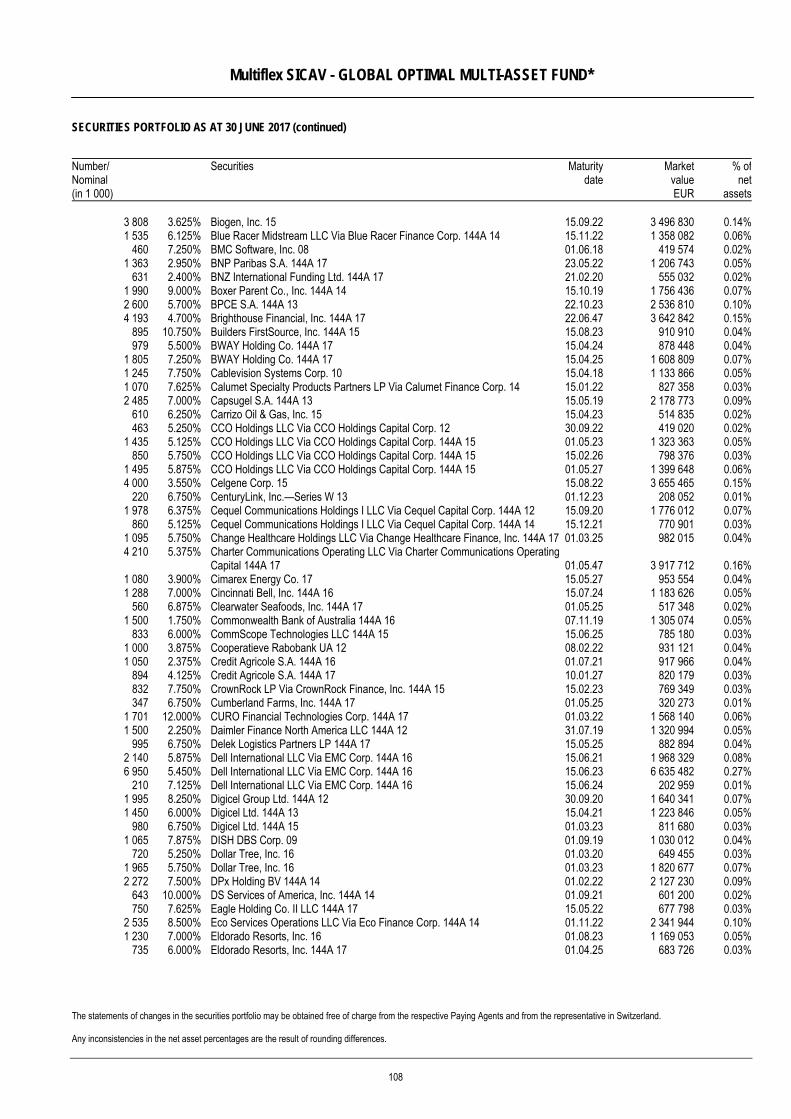
Multiflex SICAV - GLOBAL OPTIMAL MULTI-ASSET FUND*
SECURITIES PORTFOLIO AS AT 30 JUNE 2017 (continued)
The statements of changes in the securities portfolio may be obtained free of charge from the respective Paying Agents and from the representative in Switzerland. Any inconsistencies in the net asset percentages are the result of rounding differences.
Number/ Nominal (in 1 000)
Securities Maturitydate
MarketvalueEUR
% ofnet
assets
3 808 3.625% Biogen, Inc. 15 15.09.22 3 496 830 0.14%1 535 6.125% Blue Racer Midstream LLC Via Blue Racer Finance Corp. 144A 14 15.11.22 1 358 082 0.06%
460 7.250% BMC Software, Inc. 08 01.06.18 419 574 0.02%1 363 2.950% BNP Paribas S.A. 144A 17 23.05.22 1 206 743 0.05%
631 2.400% BNZ International Funding Ltd. 144A 17 21.02.20 555 032 0.02%1 990 9.000% Boxer Parent Co., Inc. 144A 14 15.10.19 1 756 436 0.07%2 600 5.700% BPCE S.A. 144A 13 22.10.23 2 536 810 0.10%4 193 4.700% Brighthouse Financial, Inc. 144A 17 22.06.47 3 642 842 0.15%
895 10.750% Builders FirstSource, Inc. 144A 15 15.08.23 910 910 0.04%979 5.500% BWAY Holding Co. 144A 17 15.04.24 878 448 0.04%
1 805 7.250% BWAY Holding Co. 144A 17 15.04.25 1 608 809 0.07%1 245 7.750% Cablevision Systems Corp. 10 15.04.18 1 133 866 0.05%1 070 7.625% Calumet Specialty Products Partners LP Via Calumet Finance Corp. 14 15.01.22 827 358 0.03%2 485 7.000% Capsugel S.A. 144A 13 15.05.19 2 178 773 0.09%
610 6.250% Carrizo Oil & Gas, Inc. 15 15.04.23 514 835 0.02%463 5.250% CCO Holdings LLC Via CCO Holdings Capital Corp. 12 30.09.22 419 020 0.02%
1 435 5.125% CCO Holdings LLC Via CCO Holdings Capital Corp. 144A 15 01.05.23 1 323 363 0.05%850 5.750% CCO Holdings LLC Via CCO Holdings Capital Corp. 144A 15 15.02.26 798 376 0.03%
1 495 5.875% CCO Holdings LLC Via CCO Holdings Capital Corp. 144A 15 01.05.27 1 399 648 0.06%4 000 3.550% Celgene Corp. 15 15.08.22 3 655 465 0.15%
220 6.750% CenturyLink, Inc.—Series W 13 01.12.23 208 052 0.01%1 978 6.375% Cequel Communications Holdings I LLC Via Cequel Capital Corp. 144A 12 15.09.20 1 776 012 0.07%
860 5.125% Cequel Communications Holdings I LLC Via Cequel Capital Corp. 144A 14 15.12.21 770 901 0.03%1 095 5.750% Change Healthcare Holdings LLC Via Change Healthcare Finance, Inc. 144A 17 01.03.25 982 015 0.04%4 210 5.375% Charter Communications Operating LLC Via Charter Communications Operating
Capital 144A 17 01.05.47 3 917 712 0.16%1 080 3.900% Cimarex Energy Co. 17 15.05.27 953 554 0.04%1 288 7.000% Cincinnati Bell, Inc. 144A 16 15.07.24 1 183 626 0.05%
560 6.875% Clearwater Seafoods, Inc. 144A 17 01.05.25 517 348 0.02%1 500 1.750% Commonwealth Bank of Australia 144A 16 07.11.19 1 305 074 0.05%
833 6.000% CommScope Technologies LLC 144A 15 15.06.25 785 180 0.03%1 000 3.875% Cooperatieve Rabobank UA 12 08.02.22 931 121 0.04%1 050 2.375% Credit Agricole S.A. 144A 16 01.07.21 917 966 0.04%
894 4.125% Credit Agricole S.A. 144A 17 10.01.27 820 179 0.03%832 7.750% CrownRock LP Via CrownRock Finance, Inc. 144A 15 15.02.23 769 349 0.03%347 6.750% Cumberland Farms, Inc. 144A 17 01.05.25 320 273 0.01%
1 701 12.000% CURO Financial Technologies Corp. 144A 17 01.03.22 1 568 140 0.06%1 500 2.250% Daimler Finance North America LLC 144A 12 31.07.19 1 320 994 0.05%
995 6.750% Delek Logistics Partners LP 144A 17 15.05.25 882 894 0.04%2 140 5.875% Dell International LLC Via EMC Corp. 144A 16 15.06.21 1 968 329 0.08%6 950 5.450% Dell International LLC Via EMC Corp. 144A 16 15.06.23 6 635 482 0.27%
210 7.125% Dell International LLC Via EMC Corp. 144A 16 15.06.24 202 959 0.01%1 995 8.250% Digicel Group Ltd. 144A 12 30.09.20 1 640 341 0.07%1 450 6.000% Digicel Ltd. 144A 13 15.04.21 1 223 846 0.05%
980 6.750% Digicel Ltd. 144A 15 01.03.23 811 680 0.03%1 065 7.875% DISH DBS Corp. 09 01.09.19 1 030 012 0.04%
720 5.250% Dollar Tree, Inc. 16 01.03.20 649 455 0.03%1 965 5.750% Dollar Tree, Inc. 16 01.03.23 1 820 677 0.07%2 272 7.500% DPx Holding BV 144A 14 01.02.22 2 127 230 0.09%
643 10.000% DS Services of America, Inc. 144A 14 01.09.21 601 200 0.02%750 7.625% Eagle Holding Co. II LLC 144A 17 15.05.22 677 798 0.03%
2 535 8.500% Eco Services Operations LLC Via Eco Finance Corp. 144A 14 01.11.22 2 341 944 0.10%1 230 7.000% Eldorado Resorts, Inc. 16 01.08.23 1 169 053 0.05%
735 6.000% Eldorado Resorts, Inc. 144A 17 01.04.25 683 726 0.03%
108
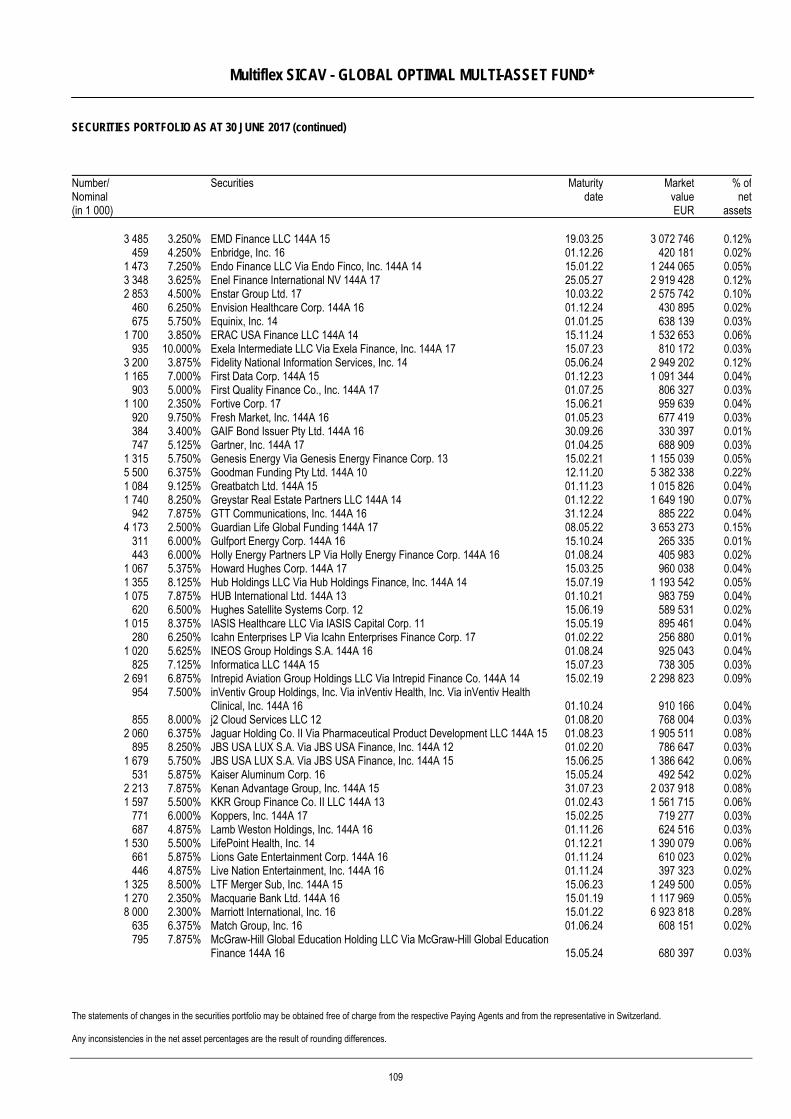
Multiflex SICAV - GLOBAL OPTIMAL MULTI-ASSET FUND*
SECURITIES PORTFOLIO AS AT 30 JUNE 2017 (continued)
The statements of changes in the securities portfolio may be obtained free of charge from the respective Paying Agents and from the representative in Switzerland. Any inconsistencies in the net asset percentages are the result of rounding differences.
Number/ Nominal (in 1 000)
Securities Maturitydate
MarketvalueEUR
% ofnet
assets
3 485 3.250% EMD Finance LLC 144A 15 19.03.25 3 072 746 0.12%459 4.250% Enbridge, Inc. 16 01.12.26 420 181 0.02%
1 473 7.250% Endo Finance LLC Via Endo Finco, Inc. 144A 14 15.01.22 1 244 065 0.05%3 348 3.625% Enel Finance International NV 144A 17 25.05.27 2 919 428 0.12%2 853 4.500% Enstar Group Ltd. 17 10.03.22 2 575 742 0.10%
460 6.250% Envision Healthcare Corp. 144A 16 01.12.24 430 895 0.02%675 5.750% Equinix, Inc. 14 01.01.25 638 139 0.03%
1 700 3.850% ERAC USA Finance LLC 144A 14 15.11.24 1 532 653 0.06%935 10.000% Exela Intermediate LLC Via Exela Finance, Inc. 144A 17 15.07.23 810 172 0.03%
3 200 3.875% Fidelity National Information Services, Inc. 14 05.06.24 2 949 202 0.12%1 165 7.000% First Data Corp. 144A 15 01.12.23 1 091 344 0.04%
903 5.000% First Quality Finance Co., Inc. 144A 17 01.07.25 806 327 0.03%1 100 2.350% Fortive Corp. 17 15.06.21 959 639 0.04%
920 9.750% Fresh Market, Inc. 144A 16 01.05.23 677 419 0.03%384 3.400% GAIF Bond Issuer Pty Ltd. 144A 16 30.09.26 330 397 0.01%747 5.125% Gartner, Inc. 144A 17 01.04.25 688 909 0.03%
1 315 5.750% Genesis Energy Via Genesis Energy Finance Corp. 13 15.02.21 1 155 039 0.05%5 500 6.375% Goodman Funding Pty Ltd. 144A 10 12.11.20 5 382 338 0.22%1 084 9.125% Greatbatch Ltd. 144A 15 01.11.23 1 015 826 0.04%1 740 8.250% Greystar Real Estate Partners LLC 144A 14 01.12.22 1 649 190 0.07%
942 7.875% GTT Communications, Inc. 144A 16 31.12.24 885 222 0.04%4 173 2.500% Guardian Life Global Funding 144A 17 08.05.22 3 653 273 0.15%
311 6.000% Gulfport Energy Corp. 144A 16 15.10.24 265 335 0.01%443 6.000% Holly Energy Partners LP Via Holly Energy Finance Corp. 144A 16 01.08.24 405 983 0.02%
1 067 5.375% Howard Hughes Corp. 144A 17 15.03.25 960 038 0.04%1 355 8.125% Hub Holdings LLC Via Hub Holdings Finance, Inc. 144A 14 15.07.19 1 193 542 0.05%1 075 7.875% HUB International Ltd. 144A 13 01.10.21 983 759 0.04%
620 6.500% Hughes Satellite Systems Corp. 12 15.06.19 589 531 0.02%1 015 8.375% IASIS Healthcare LLC Via IASIS Capital Corp. 11 15.05.19 895 461 0.04%
280 6.250% Icahn Enterprises LP Via Icahn Enterprises Finance Corp. 17 01.02.22 256 880 0.01%1 020 5.625% INEOS Group Holdings S.A. 144A 16 01.08.24 925 043 0.04%
825 7.125% Informatica LLC 144A 15 15.07.23 738 305 0.03%2 691 6.875% Intrepid Aviation Group Holdings LLC Via Intrepid Finance Co. 144A 14 15.02.19 2 298 823 0.09%
954 7.500% inVentiv Group Holdings, Inc. Via inVentiv Health, Inc. Via inVentiv Health Clinical, Inc. 144A 16 01.10.24 910 166 0.04%
855 8.000% j2 Cloud Services LLC 12 01.08.20 768 004 0.03%2 060 6.375% Jaguar Holding Co. II Via Pharmaceutical Product Development LLC 144A 15 01.08.23 1 905 511 0.08%
895 8.250% JBS USA LUX S.A. Via JBS USA Finance, Inc. 144A 12 01.02.20 786 647 0.03%1 679 5.750% JBS USA LUX S.A. Via JBS USA Finance, Inc. 144A 15 15.06.25 1 386 642 0.06%
531 5.875% Kaiser Aluminum Corp. 16 15.05.24 492 542 0.02%2 213 7.875% Kenan Advantage Group, Inc. 144A 15 31.07.23 2 037 918 0.08%1 597 5.500% KKR Group Finance Co. II LLC 144A 13 01.02.43 1 561 715 0.06%
771 6.000% Koppers, Inc. 144A 17 15.02.25 719 277 0.03%687 4.875% Lamb Weston Holdings, Inc. 144A 16 01.11.26 624 516 0.03%
1 530 5.500% LifePoint Health, Inc. 14 01.12.21 1 390 079 0.06%661 5.875% Lions Gate Entertainment Corp. 144A 16 01.11.24 610 023 0.02%446 4.875% Live Nation Entertainment, Inc. 144A 16 01.11.24 397 323 0.02%
1 325 8.500% LTF Merger Sub, Inc. 144A 15 15.06.23 1 249 500 0.05%1 270 2.350% Macquarie Bank Ltd. 144A 16 15.01.19 1 117 969 0.05%8 000 2.300% Marriott International, Inc. 16 15.01.22 6 923 818 0.28%
635 6.375% Match Group, Inc. 16 01.06.24 608 151 0.02%795 7.875% McGraw-Hill Global Education Holding LLC Via McGraw-Hill Global Education
Finance 144A 16 15.05.24 680 397 0.03%
109
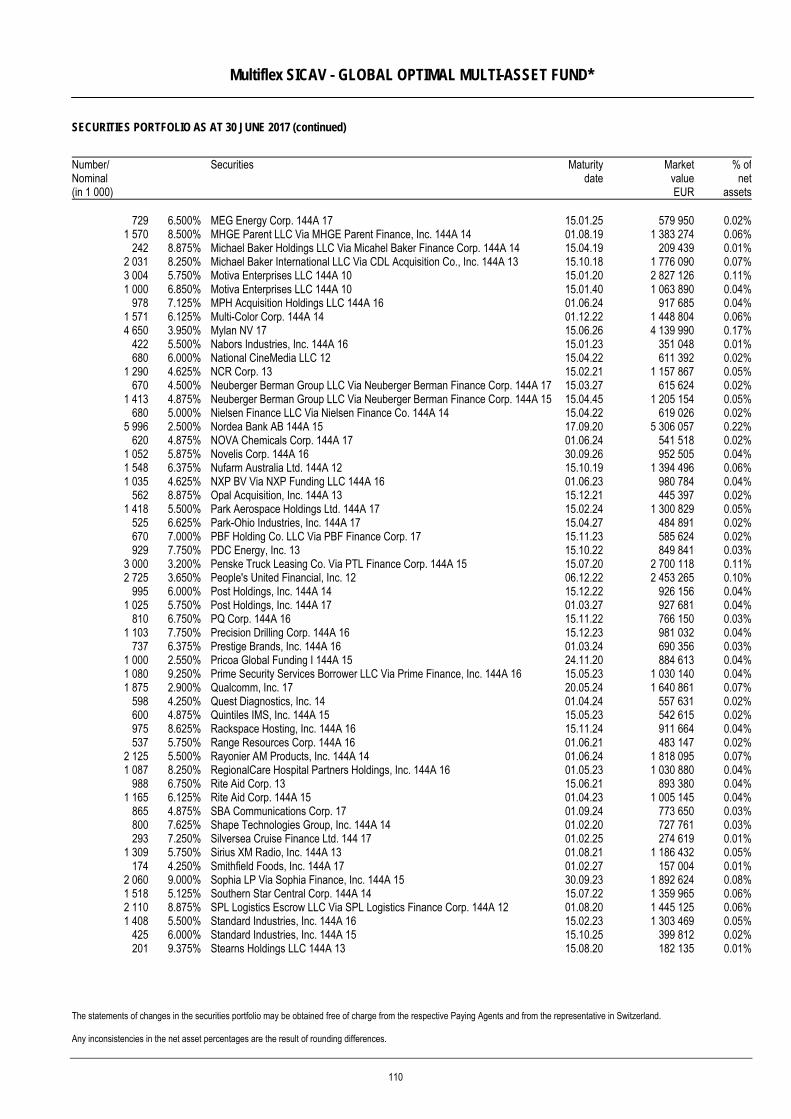
Multiflex SICAV - GLOBAL OPTIMAL MULTI-ASSET FUND*
SECURITIES PORTFOLIO AS AT 30 JUNE 2017 (continued)
The statements of changes in the securities portfolio may be obtained free of charge from the respective Paying Agents and from the representative in Switzerland. Any inconsistencies in the net asset percentages are the result of rounding differences.
Number/ Nominal (in 1 000)
Securities Maturitydate
MarketvalueEUR
% ofnet
assets
729 6.500% MEG Energy Corp. 144A 17 15.01.25 579 950 0.02%1 570 8.500% MHGE Parent LLC Via MHGE Parent Finance, Inc. 144A 14 01.08.19 1 383 274 0.06%
242 8.875% Michael Baker Holdings LLC Via Micahel Baker Finance Corp. 144A 14 15.04.19 209 439 0.01%2 031 8.250% Michael Baker International LLC Via CDL Acquisition Co., Inc. 144A 13 15.10.18 1 776 090 0.07%3 004 5.750% Motiva Enterprises LLC 144A 10 15.01.20 2 827 126 0.11%1 000 6.850% Motiva Enterprises LLC 144A 10 15.01.40 1 063 890 0.04%
978 7.125% MPH Acquisition Holdings LLC 144A 16 01.06.24 917 685 0.04%1 571 6.125% Multi-Color Corp. 144A 14 01.12.22 1 448 804 0.06%4 650 3.950% Mylan NV 17 15.06.26 4 139 990 0.17%
422 5.500% Nabors Industries, Inc. 144A 16 15.01.23 351 048 0.01%680 6.000% National CineMedia LLC 12 15.04.22 611 392 0.02%
1 290 4.625% NCR Corp. 13 15.02.21 1 157 867 0.05%670 4.500% Neuberger Berman Group LLC Via Neuberger Berman Finance Corp. 144A 17 15.03.27 615 624 0.02%
1 413 4.875% Neuberger Berman Group LLC Via Neuberger Berman Finance Corp. 144A 15 15.04.45 1 205 154 0.05%680 5.000% Nielsen Finance LLC Via Nielsen Finance Co. 144A 14 15.04.22 619 026 0.02%
5 996 2.500% Nordea Bank AB 144A 15 17.09.20 5 306 057 0.22%620 4.875% NOVA Chemicals Corp. 144A 17 01.06.24 541 518 0.02%
1 052 5.875% Novelis Corp. 144A 16 30.09.26 952 505 0.04%1 548 6.375% Nufarm Australia Ltd. 144A 12 15.10.19 1 394 496 0.06%1 035 4.625% NXP BV Via NXP Funding LLC 144A 16 01.06.23 980 784 0.04%
562 8.875% Opal Acquisition, Inc. 144A 13 15.12.21 445 397 0.02%1 418 5.500% Park Aerospace Holdings Ltd. 144A 17 15.02.24 1 300 829 0.05%
525 6.625% Park-Ohio Industries, Inc. 144A 17 15.04.27 484 891 0.02%670 7.000% PBF Holding Co. LLC Via PBF Finance Corp. 17 15.11.23 585 624 0.02%929 7.750% PDC Energy, Inc. 13 15.10.22 849 841 0.03%
3 000 3.200% Penske Truck Leasing Co. Via PTL Finance Corp. 144A 15 15.07.20 2 700 118 0.11%2 725 3.650% People's United Financial, Inc. 12 06.12.22 2 453 265 0.10%
995 6.000% Post Holdings, Inc. 144A 14 15.12.22 926 156 0.04%1 025 5.750% Post Holdings, Inc. 144A 17 01.03.27 927 681 0.04%
810 6.750% PQ Corp. 144A 16 15.11.22 766 150 0.03%1 103 7.750% Precision Drilling Corp. 144A 16 15.12.23 981 032 0.04%
737 6.375% Prestige Brands, Inc. 144A 16 01.03.24 690 356 0.03%1 000 2.550% Pricoa Global Funding I 144A 15 24.11.20 884 613 0.04%1 080 9.250% Prime Security Services Borrower LLC Via Prime Finance, Inc. 144A 16 15.05.23 1 030 140 0.04%1 875 2.900% Qualcomm, Inc. 17 20.05.24 1 640 861 0.07%
598 4.250% Quest Diagnostics, Inc. 14 01.04.24 557 631 0.02%600 4.875% Quintiles IMS, Inc. 144A 15 15.05.23 542 615 0.02%975 8.625% Rackspace Hosting, Inc. 144A 16 15.11.24 911 664 0.04%537 5.750% Range Resources Corp. 144A 16 01.06.21 483 147 0.02%
2 125 5.500% Rayonier AM Products, Inc. 144A 14 01.06.24 1 818 095 0.07%1 087 8.250% RegionalCare Hospital Partners Holdings, Inc. 144A 16 01.05.23 1 030 880 0.04%
988 6.750% Rite Aid Corp. 13 15.06.21 893 380 0.04%1 165 6.125% Rite Aid Corp. 144A 15 01.04.23 1 005 145 0.04%
865 4.875% SBA Communications Corp. 17 01.09.24 773 650 0.03%800 7.625% Shape Technologies Group, Inc. 144A 14 01.02.20 727 761 0.03%293 7.250% Silversea Cruise Finance Ltd. 144 17 01.02.25 274 619 0.01%
1 309 5.750% Sirius XM Radio, Inc. 144A 13 01.08.21 1 186 432 0.05%174 4.250% Smithfield Foods, Inc. 144A 17 01.02.27 157 004 0.01%
2 060 9.000% Sophia LP Via Sophia Finance, Inc. 144A 15 30.09.23 1 892 624 0.08%1 518 5.125% Southern Star Central Corp. 144A 14 15.07.22 1 359 965 0.06%2 110 8.875% SPL Logistics Escrow LLC Via SPL Logistics Finance Corp. 144A 12 01.08.20 1 445 125 0.06%1 408 5.500% Standard Industries, Inc. 144A 16 15.02.23 1 303 469 0.05%
425 6.000% Standard Industries, Inc. 144A 15 15.10.25 399 812 0.02%201 9.375% Stearns Holdings LLC 144A 13 15.08.20 182 135 0.01%
110
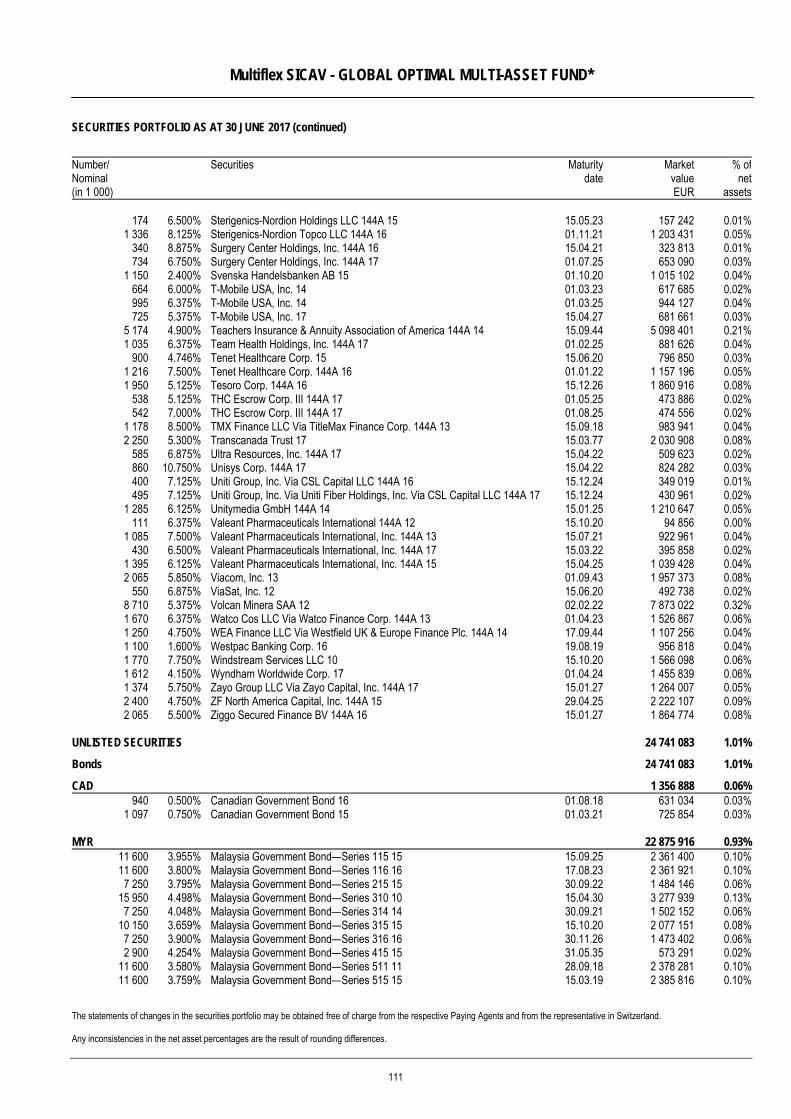
Multiflex SICAV - GLOBAL OPTIMAL MULTI-ASSET FUND*
SECURITIES PORTFOLIO AS AT 30 JUNE 2017 (continued)
The statements of changes in the securities portfolio may be obtained free of charge from the respective Paying Agents and from the representative in Switzerland. Any inconsistencies in the net asset percentages are the result of rounding differences.
Number/ Nominal (in 1 000)
Securities Maturitydate
MarketvalueEUR
% ofnet
assets
174 6.500% Sterigenics-Nordion Holdings LLC 144A 15 15.05.23 157 242 0.01%1 336 8.125% Sterigenics-Nordion Topco LLC 144A 16 01.11.21 1 203 431 0.05%
340 8.875% Surgery Center Holdings, Inc. 144A 16 15.04.21 323 813 0.01%734 6.750% Surgery Center Holdings, Inc. 144A 17 01.07.25 653 090 0.03%
1 150 2.400% Svenska Handelsbanken AB 15 01.10.20 1 015 102 0.04%664 6.000% T-Mobile USA, Inc. 14 01.03.23 617 685 0.02%995 6.375% T-Mobile USA, Inc. 14 01.03.25 944 127 0.04%725 5.375% T-Mobile USA, Inc. 17 15.04.27 681 661 0.03%
5 174 4.900% Teachers Insurance & Annuity Association of America 144A 14 15.09.44 5 098 401 0.21%1 035 6.375% Team Health Holdings, Inc. 144A 17 01.02.25 881 626 0.04%
900 4.746% Tenet Healthcare Corp. 15 15.06.20 796 850 0.03%1 216 7.500% Tenet Healthcare Corp. 144A 16 01.01.22 1 157 196 0.05%1 950 5.125% Tesoro Corp. 144A 16 15.12.26 1 860 916 0.08%
538 5.125% THC Escrow Corp. III 144A 17 01.05.25 473 886 0.02%542 7.000% THC Escrow Corp. III 144A 17 01.08.25 474 556 0.02%
1 178 8.500% TMX Finance LLC Via TitleMax Finance Corp. 144A 13 15.09.18 983 941 0.04%2 250 5.300% Transcanada Trust 17 15.03.77 2 030 908 0.08%
585 6.875% Ultra Resources, Inc. 144A 17 15.04.22 509 623 0.02%860 10.750% Unisys Corp. 144A 17 15.04.22 824 282 0.03%400 7.125% Uniti Group, Inc. Via CSL Capital LLC 144A 16 15.12.24 349 019 0.01%495 7.125% Uniti Group, Inc. Via Uniti Fiber Holdings, Inc. Via CSL Capital LLC 144A 17 15.12.24 430 961 0.02%
1 285 6.125% Unitymedia GmbH 144A 14 15.01.25 1 210 647 0.05%111 6.375% Valeant Pharmaceuticals International 144A 12 15.10.20 94 856 0.00%
1 085 7.500% Valeant Pharmaceuticals International, Inc. 144A 13 15.07.21 922 961 0.04%430 6.500% Valeant Pharmaceuticals International, Inc. 144A 17 15.03.22 395 858 0.02%
1 395 6.125% Valeant Pharmaceuticals International, Inc. 144A 15 15.04.25 1 039 428 0.04%2 065 5.850% Viacom, Inc. 13 01.09.43 1 957 373 0.08%
550 6.875% ViaSat, Inc. 12 15.06.20 492 738 0.02%8 710 5.375% Volcan Minera SAA 12 02.02.22 7 873 022 0.32%1 670 6.375% Watco Cos LLC Via Watco Finance Corp. 144A 13 01.04.23 1 526 867 0.06%1 250 4.750% WEA Finance LLC Via Westfield UK & Europe Finance Plc. 144A 14 17.09.44 1 107 256 0.04%1 100 1.600% Westpac Banking Corp. 16 19.08.19 956 818 0.04%1 770 7.750% Windstream Services LLC 10 15.10.20 1 566 098 0.06%1 612 4.150% Wyndham Worldwide Corp. 17 01.04.24 1 455 839 0.06%1 374 5.750% Zayo Group LLC Via Zayo Capital, Inc. 144A 17 15.01.27 1 264 007 0.05%2 400 4.750% ZF North America Capital, Inc. 144A 15 29.04.25 2 222 107 0.09%2 065 5.500% Ziggo Secured Finance BV 144A 16 15.01.27 1 864 774 0.08%
UNLISTED SECURITIES 24 741 083 1.01%
Bonds 24 741 083 1.01%
CAD 1 356 888 0.06%940 0.500% Canadian Government Bond 16 01.08.18 631 034 0.03%
1 097 0.750% Canadian Government Bond 15 01.03.21 725 854 0.03%
MYR 22 875 916 0.93%11 600 3.955% Malaysia Government Bond—Series 115 15 15.09.25 2 361 400 0.10%11 600 3.800% Malaysia Government Bond—Series 116 16 17.08.23 2 361 921 0.10%7 250 3.795% Malaysia Government Bond—Series 215 15 30.09.22 1 484 146 0.06%
15 950 4.498% Malaysia Government Bond—Series 310 10 15.04.30 3 277 939 0.13%7 250 4.048% Malaysia Government Bond—Series 314 14 30.09.21 1 502 152 0.06%
10 150 3.659% Malaysia Government Bond—Series 315 15 15.10.20 2 077 151 0.08%7 250 3.900% Malaysia Government Bond—Series 316 16 30.11.26 1 473 402 0.06%2 900 4.254% Malaysia Government Bond—Series 415 15 31.05.35 573 291 0.02%
11 600 3.580% Malaysia Government Bond—Series 511 11 28.09.18 2 378 281 0.10%11 600 3.759% Malaysia Government Bond—Series 515 15 15.03.19 2 385 816 0.10%
111
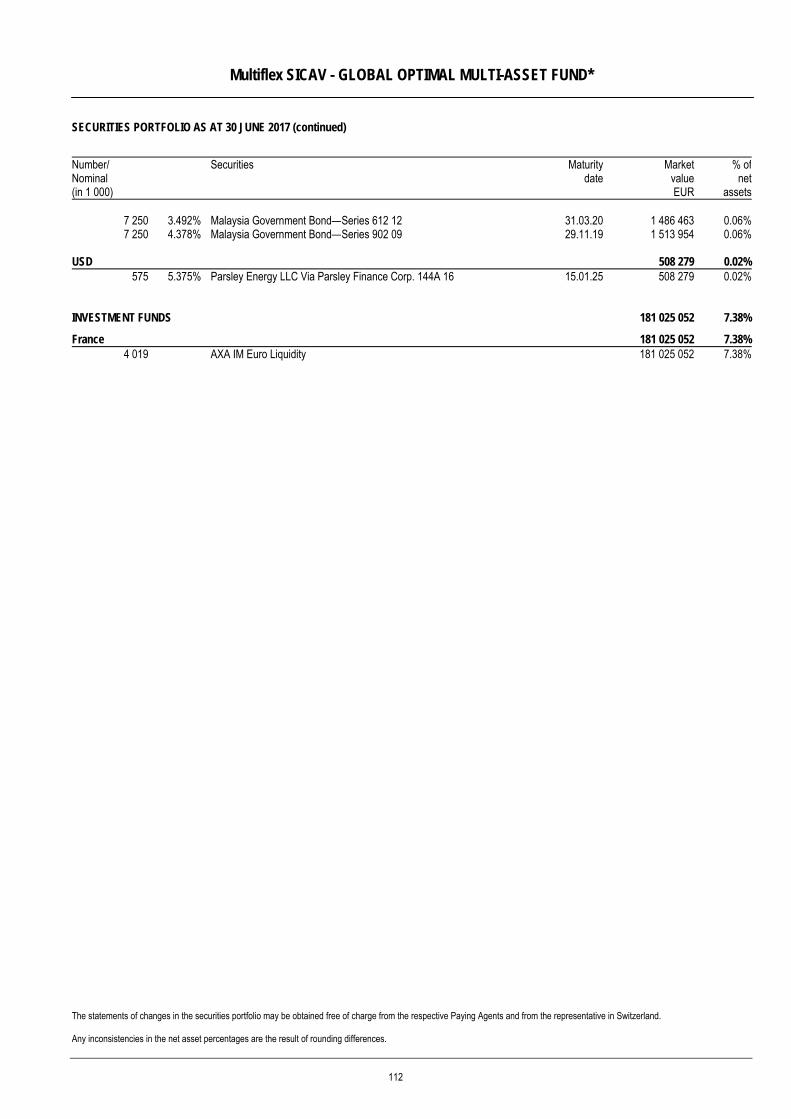
Multiflex SICAV - GLOBAL OPTIMAL MULTI-ASSET FUND*
SECURITIES PORTFOLIO AS AT 30 JUNE 2017 (continued)
The statements of changes in the securities portfolio may be obtained free of charge from the respective Paying Agents and from the representative in Switzerland. Any inconsistencies in the net asset percentages are the result of rounding differences.
Number/ Nominal (in 1 000)
Securities Maturitydate
MarketvalueEUR
% ofnet
assets
7 250 3.492% Malaysia Government Bond—Series 612 12 31.03.20 1 486 463 0.06%7 250 4.378% Malaysia Government Bond—Series 902 09 29.11.19 1 513 954 0.06%
USD 508 279 0.02%575 5.375% Parsley Energy LLC Via Parsley Finance Corp. 144A 16 15.01.25 508 279 0.02%
INVESTMENT FUNDS 181 025 052 7.38%
France 181 025 052 7.38%4 019 AXA IM Euro Liquidity 181 025 052 7.38%
112
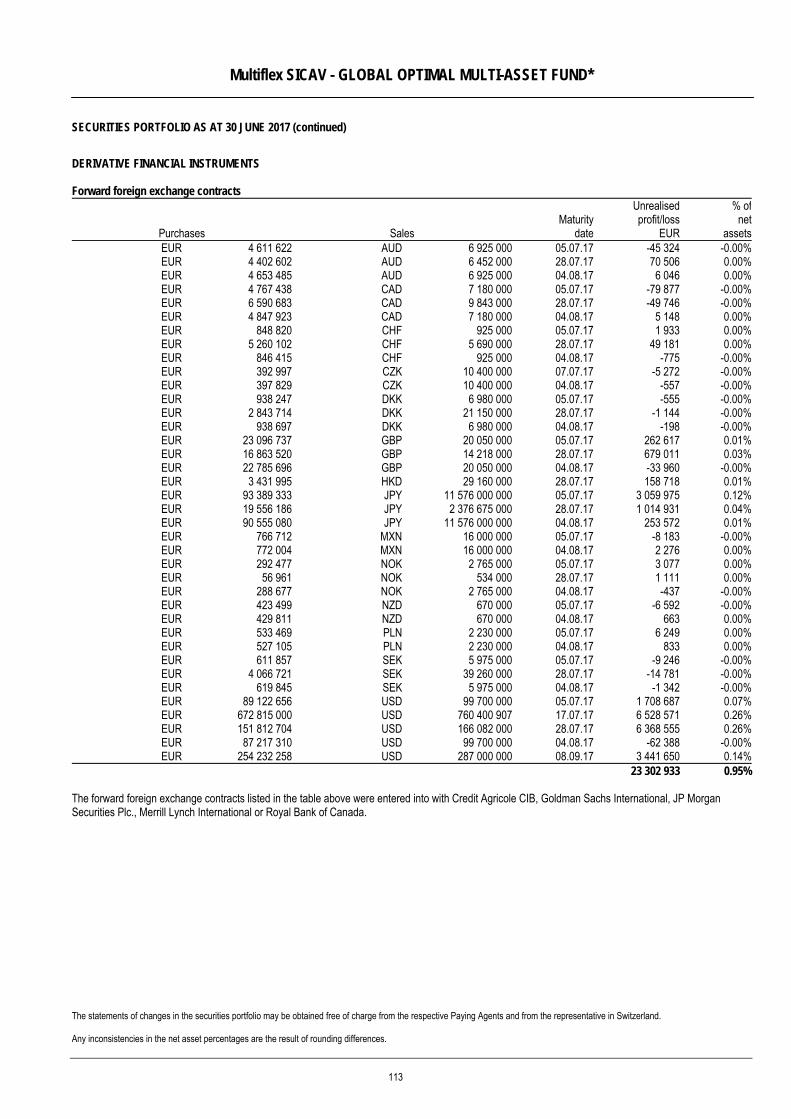
Multiflex SICAV - GLOBAL OPTIMAL MULTI-ASSET FUND*
SECURITIES PORTFOLIO AS AT 30 JUNE 2017 (continued)
The statements of changes in the securities portfolio may be obtained free of charge from the respective Paying Agents and from the representative in Switzerland. Any inconsistencies in the net asset percentages are the result of rounding differences.
DERIVATIVE FINANCIAL INSTRUMENTS Forward foreign exchange contracts
Purchases Sales Maturity
date
Unrealisedprofit/loss
EUR
% ofnet
assetsEUR 4 611 622 AUD 6 925 000 05.07.17 -45 324 -0.00%EUR 4 402 602 AUD 6 452 000 28.07.17 70 506 0.00%EUR 4 653 485 AUD 6 925 000 04.08.17 6 046 0.00%EUR 4 767 438 CAD 7 180 000 05.07.17 -79 877 -0.00%EUR 6 590 683 CAD 9 843 000 28.07.17 -49 746 -0.00%EUR 4 847 923 CAD 7 180 000 04.08.17 5 148 0.00%EUR 848 820 CHF 925 000 05.07.17 1 933 0.00%EUR 5 260 102 CHF 5 690 000 28.07.17 49 181 0.00%EUR 846 415 CHF 925 000 04.08.17 -775 -0.00%EUR 392 997 CZK 10 400 000 07.07.17 -5 272 -0.00%EUR 397 829 CZK 10 400 000 04.08.17 -557 -0.00%EUR 938 247 DKK 6 980 000 05.07.17 -555 -0.00%EUR 2 843 714 DKK 21 150 000 28.07.17 -1 144 -0.00%EUR 938 697 DKK 6 980 000 04.08.17 -198 -0.00%EUR 23 096 737 GBP 20 050 000 05.07.17 262 617 0.01%EUR 16 863 520 GBP 14 218 000 28.07.17 679 011 0.03%EUR 22 785 696 GBP 20 050 000 04.08.17 -33 960 -0.00%EUR 3 431 995 HKD 29 160 000 28.07.17 158 718 0.01%EUR 93 389 333 JPY 11 576 000 000 05.07.17 3 059 975 0.12%EUR 19 556 186 JPY 2 376 675 000 28.07.17 1 014 931 0.04%EUR 90 555 080 JPY 11 576 000 000 04.08.17 253 572 0.01%EUR 766 712 MXN 16 000 000 05.07.17 -8 183 -0.00%EUR 772 004 MXN 16 000 000 04.08.17 2 276 0.00%EUR 292 477 NOK 2 765 000 05.07.17 3 077 0.00%EUR 56 961 NOK 534 000 28.07.17 1 111 0.00%EUR 288 677 NOK 2 765 000 04.08.17 -437 -0.00%EUR 423 499 NZD 670 000 05.07.17 -6 592 -0.00%EUR 429 811 NZD 670 000 04.08.17 663 0.00%EUR 533 469 PLN 2 230 000 05.07.17 6 249 0.00%EUR 527 105 PLN 2 230 000 04.08.17 833 0.00%EUR 611 857 SEK 5 975 000 05.07.17 -9 246 -0.00%EUR 4 066 721 SEK 39 260 000 28.07.17 -14 781 -0.00%EUR 619 845 SEK 5 975 000 04.08.17 -1 342 -0.00%EUR 89 122 656 USD 99 700 000 05.07.17 1 708 687 0.07%EUR 672 815 000 USD 760 400 907 17.07.17 6 528 571 0.26%EUR 151 812 704 USD 166 082 000 28.07.17 6 368 555 0.26%EUR 87 217 310 USD 99 700 000 04.08.17 -62 388 -0.00%EUR 254 232 258 USD 287 000 000 08.09.17 3 441 650 0.14%
23 302 933 0.95% The forward foreign exchange contracts listed in the table above were entered into with Credit Agricole CIB, Goldman Sachs International, JP Morgan Securities Plc., Merrill Lynch International or Royal Bank of Canada.
113
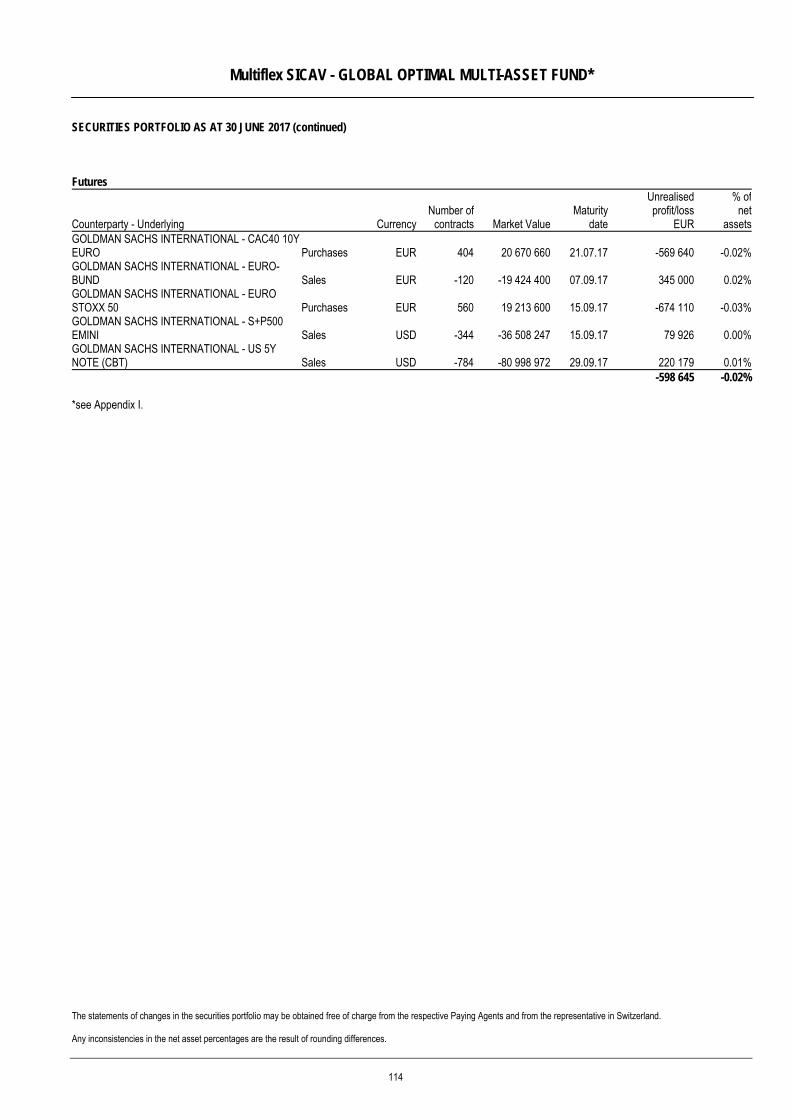
Multiflex SICAV - GLOBAL OPTIMAL MULTI-ASSET FUND*
SECURITIES PORTFOLIO AS AT 30 JUNE 2017 (continued)
The statements of changes in the securities portfolio may be obtained free of charge from the respective Paying Agents and from the representative in Switzerland. Any inconsistencies in the net asset percentages are the result of rounding differences.
Futures
Counterparty - Underlying CurrencyNumber of
contracts Market ValueMaturity
date
Unrealisedprofit/loss
EUR
% ofnet
assetsGOLDMAN SACHS INTERNATIONAL - CAC40 10Y EURO Purchases EUR 404 20 670 660 21.07.17 -569 640 -0.02%GOLDMAN SACHS INTERNATIONAL - EURO-BUND Sales EUR -120 -19 424 400 07.09.17 345 000 0.02%GOLDMAN SACHS INTERNATIONAL - EURO STOXX 50 Purchases EUR 560 19 213 600 15.09.17 -674 110 -0.03%GOLDMAN SACHS INTERNATIONAL - S+P500 EMINI Sales USD -344 -36 508 247 15.09.17 79 926 0.00%GOLDMAN SACHS INTERNATIONAL - US 5Y NOTE (CBT) Sales USD -784 -80 998 972 29.09.17 220 179 0.01% -598 645 -0.02% *see Appendix I.
114
Multiflex SICAV - LONG-TERM OPTIMAL MULTI-ASSET FUND*
*see Appendix I. The information in this report is based on historical data and is no indication of future performance.
Fund Management Report Investment Policy The Multiflex SICAV - LONG-TERM OPTIMAL MULTI-ASSET FUND* follows a multi-asset solution strategy with a total return approach with a focus on the full spectrum of fixed income assets combined with equity. This approach is instrumental to enhance yield while limiting volatility and market risk. Market review and portfolio Since end of June 2016, markets were attentive to political events: the Brexit vote, the election of Donald Trump to the presidency of the United States, the rejection by referendum of the constitutional reform in Italy, and lastly to the election of Emmanuel Macron to the presidency of France. The normalisation of monetary policy began in the United States (two interest rates hike), while the European Central Bank, the Bank of Japan, and the Bank of England continued to expand their policy of quantitative easing. Growth and Inflation have been modest over the period and the global growth as well as the Eurozone growth improved Multiflex SICAV - LONG-TERM OPTIMAL MULTI-ASSET FUND* has been launched in March 2017. The sub-fund is invested in several asset classes focusing mainly in the fixed income spectrum and is mainly exposed to US investment grade bonds (in average 7%), US high yield bonds (in average 15%) through a mutual fund, Emerging markets bonds (in average 36%) and in equities (in average 15%) through derivativees over the period. The remaining portfolio assets are investing in cash, government bonds, and otherwise in other derivatives linked to tactical asset allocation strategies. Since launch of the sub-fund, net performance is negative at -0.15%.
115
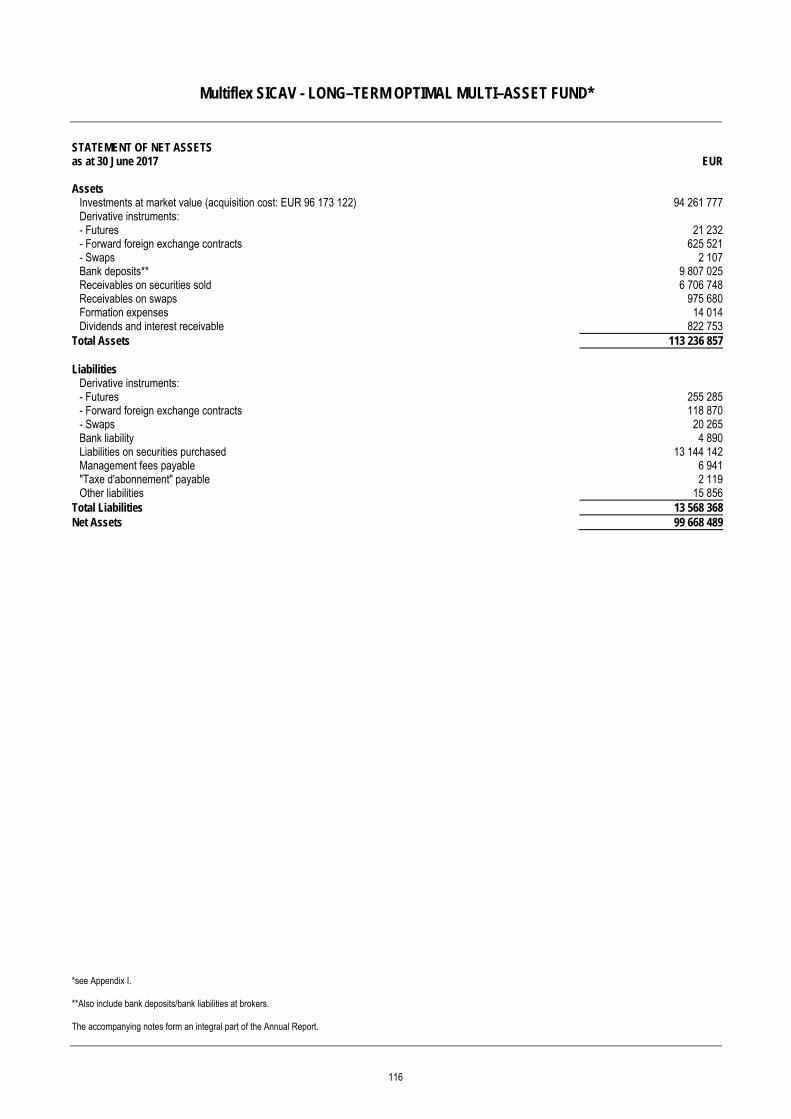
Multiflex SICAV - LONG–TERM OPTIMAL MULTI–ASSET FUND*
*see Appendix I. **Also include bank deposits/bank liabilities at brokers. The accompanying notes form an integral part of the Annual Report.
STATEMENT OF NET ASSETS as at 30 June 2017 EUR Assets
Investments at market value (acquisition cost: EUR 96 173 122) 94 261 777Derivative instruments: - Futures 21 232- Forward foreign exchange contracts 625 521- Swaps 2 107Bank deposits** 9 807 025Receivables on securities sold 6 706 748Receivables on swaps 975 680Formation expenses 14 014Dividends and interest receivable 822 753
Total Assets 113 236 857 Liabilities
Derivative instruments: - Futures 255 285- Forward foreign exchange contracts 118 870- Swaps 20 265Bank liability 4 890Liabilities on securities purchased 13 144 142Management fees payable 6 941"Taxe d'abonnement" payable 2 119Other liabilities 15 856
Total Liabilities 13 568 368Net Assets 99 668 489
116
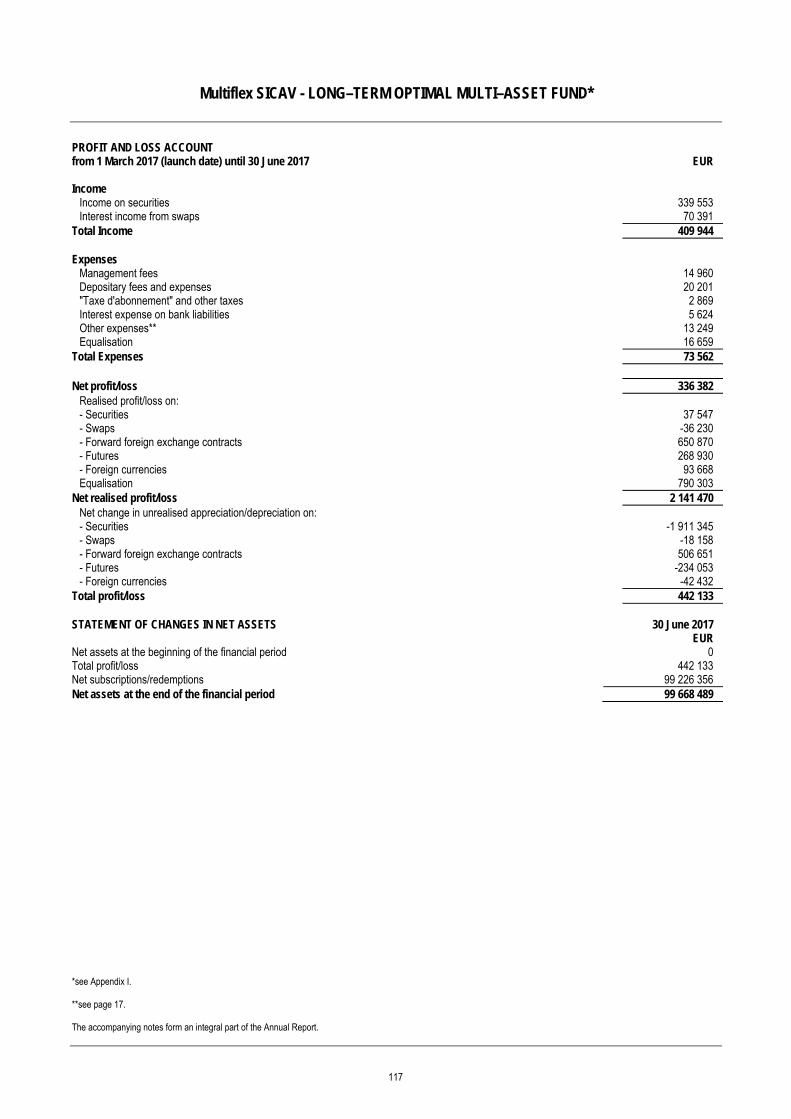
Multiflex SICAV - LONG–TERM OPTIMAL MULTI–ASSET FUND*
*see Appendix I. **see page 17. The accompanying notes form an integral part of the Annual Report.
PROFIT AND LOSS ACCOUNT from 1 March 2017 (launch date) until 30 June 2017 EUR Income
Income on securities 339 553 Interest income from swaps 70 391
Total Income 409 944 Expenses
Management fees 14 960 Depositary fees and expenses 20 201 "Taxe d'abonnement" and other taxes 2 869 Interest expense on bank liabilities 5 624 Other expenses** 13 249 Equalisation 16 659
Total Expenses 73 562 Net profit/loss 336 382
Realised profit/loss on: - Securities 37 547 - Swaps -36 230 - Forward foreign exchange contracts 650 870 - Futures 268 930 - Foreign currencies 93 668 Equalisation 790 303
Net realised profit/loss 2 141 470 Net change in unrealised appreciation/depreciation on: - Securities -1 911 345 - Swaps -18 158 - Forward foreign exchange contracts 506 651 - Futures -234 053 - Foreign currencies -42 432
Total profit/loss 442 133 STATEMENT OF CHANGES IN NET ASSETS 30 June 2017 EUR Net assets at the beginning of the financial period 0 Total profit/loss 442 133 Net subscriptions/redemptions 99 226 356 Net assets at the end of the financial period 99 668 489
117
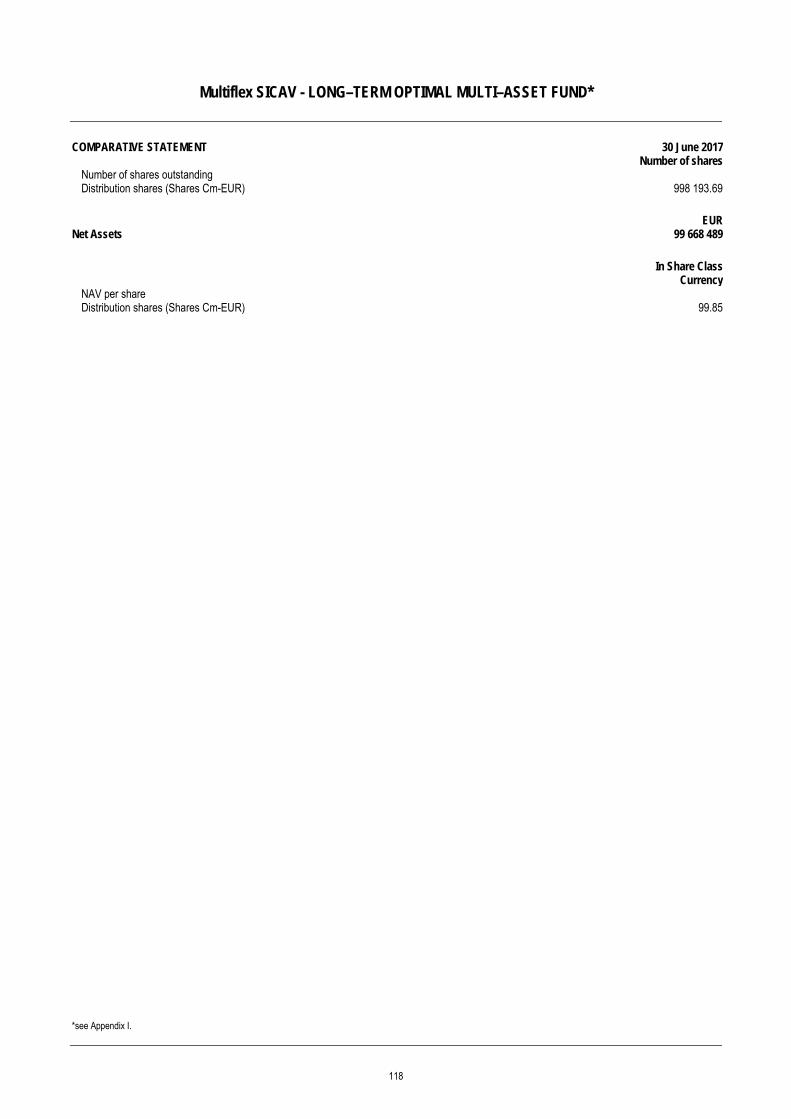
Multiflex SICAV - LONG–TERM OPTIMAL MULTI–ASSET FUND*
*see Appendix I.
COMPARATIVE STATEMENT 30 June 2017 Number of shares
Number of shares outstanding Distribution shares (Shares Cm-EUR) 998 193.69
EUR Net Assets 99 668 489
In Share Class
Currency NAV per share Distribution shares (Shares Cm-EUR) 99.85
118
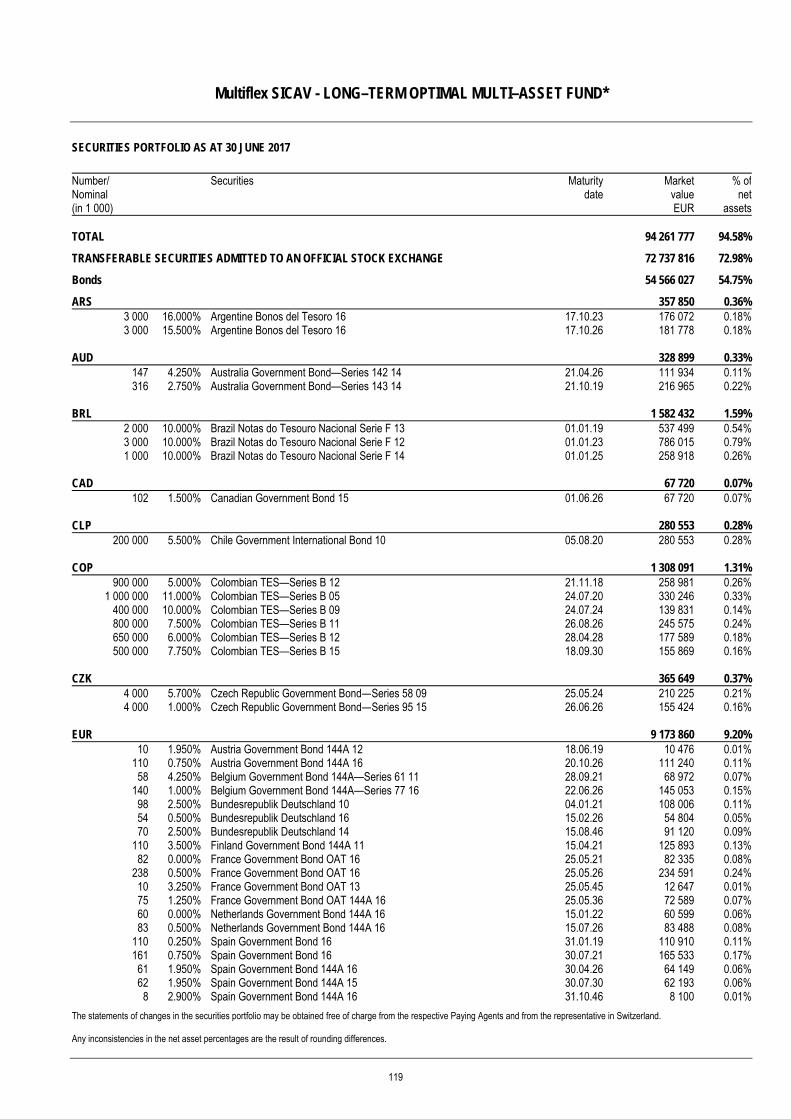
Multiflex SICAV - LONG–TERM OPTIMAL MULTI–ASSET FUND*
SECURITIES PORTFOLIO AS AT 30 JUNE 2017
The statements of changes in the securities portfolio may be obtained free of charge from the respective Paying Agents and from the representative in Switzerland. Any inconsistencies in the net asset percentages are the result of rounding differences.
Number/ Nominal (in 1 000)
Securities Maturitydate
MarketvalueEUR
% ofnet
assets TOTAL 94 261 777 94.58%
TRANSFERABLE SECURITIES ADMITTED TO AN OFFICIAL STOCK EXCHANGE 72 737 816 72.98%
Bonds 54 566 027 54.75%
ARS 357 850 0.36%3 000 16.000% Argentine Bonos del Tesoro 16 17.10.23 176 072 0.18%3 000 15.500% Argentine Bonos del Tesoro 16 17.10.26 181 778 0.18%
AUD 328 899 0.33%147 4.250% Australia Government Bond—Series 142 14 21.04.26 111 934 0.11%316 2.750% Australia Government Bond—Series 143 14 21.10.19 216 965 0.22%
BRL 1 582 432 1.59%2 000 10.000% Brazil Notas do Tesouro Nacional Serie F 13 01.01.19 537 499 0.54%3 000 10.000% Brazil Notas do Tesouro Nacional Serie F 12 01.01.23 786 015 0.79%1 000 10.000% Brazil Notas do Tesouro Nacional Serie F 14 01.01.25 258 918 0.26%
CAD 67 720 0.07%102 1.500% Canadian Government Bond 15 01.06.26 67 720 0.07%
CLP 280 553 0.28%200 000 5.500% Chile Government International Bond 10 05.08.20 280 553 0.28%
COP 1 308 091 1.31%900 000 5.000% Colombian TES—Series B 12 21.11.18 258 981 0.26%
1 000 000 11.000% Colombian TES—Series B 05 24.07.20 330 246 0.33%400 000 10.000% Colombian TES—Series B 09 24.07.24 139 831 0.14%800 000 7.500% Colombian TES—Series B 11 26.08.26 245 575 0.24%650 000 6.000% Colombian TES—Series B 12 28.04.28 177 589 0.18%500 000 7.750% Colombian TES—Series B 15 18.09.30 155 869 0.16%
CZK 365 649 0.37%4 000 5.700% Czech Republic Government Bond—Series 58 09 25.05.24 210 225 0.21%4 000 1.000% Czech Republic Government Bond—Series 95 15 26.06.26 155 424 0.16%
EUR 9 173 860 9.20%10 1.950% Austria Government Bond 144A 12 18.06.19 10 476 0.01%
110 0.750% Austria Government Bond 144A 16 20.10.26 111 240 0.11%58 4.250% Belgium Government Bond 144A—Series 61 11 28.09.21 68 972 0.07%
140 1.000% Belgium Government Bond 144A—Series 77 16 22.06.26 145 053 0.15%98 2.500% Bundesrepublik Deutschland 10 04.01.21 108 006 0.11%54 0.500% Bundesrepublik Deutschland 16 15.02.26 54 804 0.05%70 2.500% Bundesrepublik Deutschland 14 15.08.46 91 120 0.09%
110 3.500% Finland Government Bond 144A 11 15.04.21 125 893 0.13%82 0.000% France Government Bond OAT 16 25.05.21 82 335 0.08%
238 0.500% France Government Bond OAT 16 25.05.26 234 591 0.24%10 3.250% France Government Bond OAT 13 25.05.45 12 647 0.01%75 1.250% France Government Bond OAT 144A 16 25.05.36 72 589 0.07%60 0.000% Netherlands Government Bond 144A 16 15.01.22 60 599 0.06%83 0.500% Netherlands Government Bond 144A 16 15.07.26 83 488 0.08%
110 0.250% Spain Government Bond 16 31.01.19 110 910 0.11%161 0.750% Spain Government Bond 16 30.07.21 165 533 0.17%61 1.950% Spain Government Bond 144A 16 30.04.26 64 149 0.06%62 1.950% Spain Government Bond 144A 15 30.07.30 62 193 0.06%
8 2.900% Spain Government Bond 144A 16 31.10.46 8 100 0.01%
119
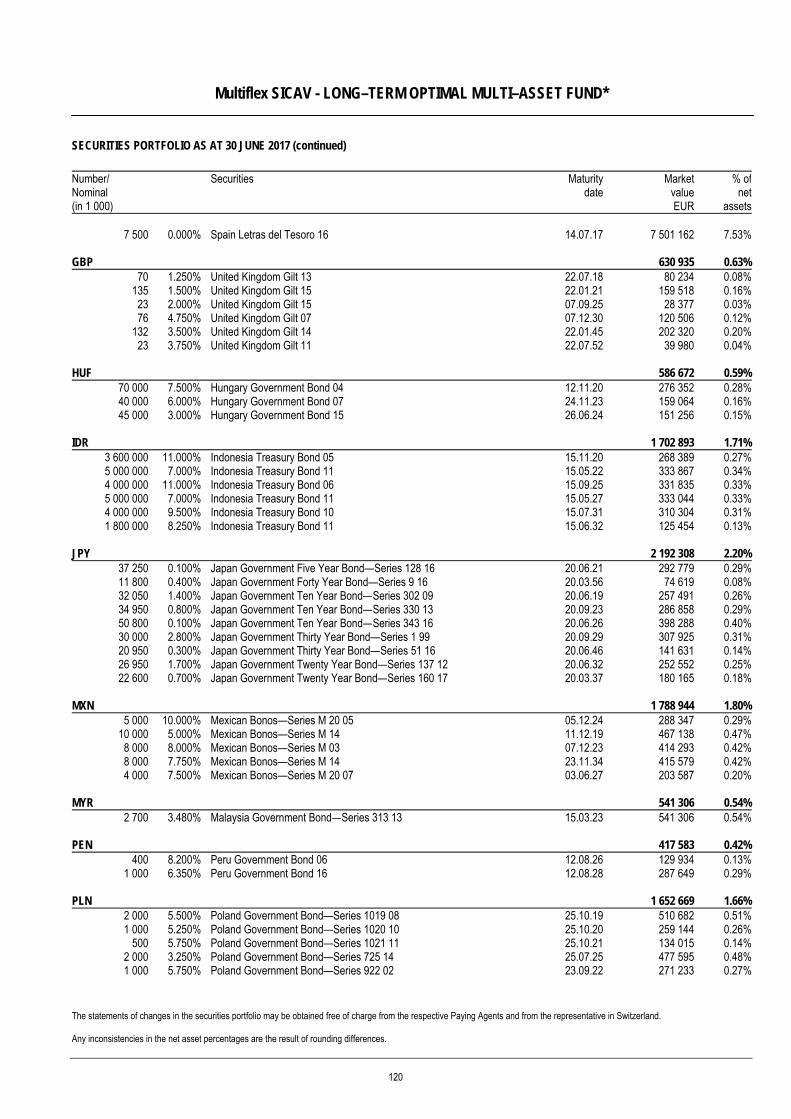
Multiflex SICAV - LONG–TERM OPTIMAL MULTI–ASSET FUND*
SECURITIES PORTFOLIO AS AT 30 JUNE 2017 (continued)
The statements of changes in the securities portfolio may be obtained free of charge from the respective Paying Agents and from the representative in Switzerland. Any inconsistencies in the net asset percentages are the result of rounding differences.
Number/ Nominal (in 1 000)
Securities Maturitydate
MarketvalueEUR
% ofnet
assets
7 500 0.000% Spain Letras del Tesoro 16 14.07.17 7 501 162 7.53%
GBP 630 935 0.63%70 1.250% United Kingdom Gilt 13 22.07.18 80 234 0.08%
135 1.500% United Kingdom Gilt 15 22.01.21 159 518 0.16%23 2.000% United Kingdom Gilt 15 07.09.25 28 377 0.03%76 4.750% United Kingdom Gilt 07 07.12.30 120 506 0.12%
132 3.500% United Kingdom Gilt 14 22.01.45 202 320 0.20%23 3.750% United Kingdom Gilt 11 22.07.52 39 980 0.04%
HUF 586 672 0.59%70 000 7.500% Hungary Government Bond 04 12.11.20 276 352 0.28%40 000 6.000% Hungary Government Bond 07 24.11.23 159 064 0.16%45 000 3.000% Hungary Government Bond 15 26.06.24 151 256 0.15%
IDR 1 702 893 1.71%3 600 000 11.000% Indonesia Treasury Bond 05 15.11.20 268 389 0.27%5 000 000 7.000% Indonesia Treasury Bond 11 15.05.22 333 867 0.34%4 000 000 11.000% Indonesia Treasury Bond 06 15.09.25 331 835 0.33%5 000 000 7.000% Indonesia Treasury Bond 11 15.05.27 333 044 0.33%4 000 000 9.500% Indonesia Treasury Bond 10 15.07.31 310 304 0.31%1 800 000 8.250% Indonesia Treasury Bond 11 15.06.32 125 454 0.13%
JPY 2 192 308 2.20%37 250 0.100% Japan Government Five Year Bond—Series 128 16 20.06.21 292 779 0.29%11 800 0.400% Japan Government Forty Year Bond—Series 9 16 20.03.56 74 619 0.08%32 050 1.400% Japan Government Ten Year Bond—Series 302 09 20.06.19 257 491 0.26%34 950 0.800% Japan Government Ten Year Bond—Series 330 13 20.09.23 286 858 0.29%50 800 0.100% Japan Government Ten Year Bond—Series 343 16 20.06.26 398 288 0.40%30 000 2.800% Japan Government Thirty Year Bond—Series 1 99 20.09.29 307 925 0.31%20 950 0.300% Japan Government Thirty Year Bond—Series 51 16 20.06.46 141 631 0.14%26 950 1.700% Japan Government Twenty Year Bond—Series 137 12 20.06.32 252 552 0.25%22 600 0.700% Japan Government Twenty Year Bond—Series 160 17 20.03.37 180 165 0.18%
MXN 1 788 944 1.80%5 000 10.000% Mexican Bonos—Series M 20 05 05.12.24 288 347 0.29%
10 000 5.000% Mexican Bonos—Series M 14 11.12.19 467 138 0.47%8 000 8.000% Mexican Bonos—Series M 03 07.12.23 414 293 0.42%8 000 7.750% Mexican Bonos—Series M 14 23.11.34 415 579 0.42%4 000 7.500% Mexican Bonos—Series M 20 07 03.06.27 203 587 0.20%
MYR 541 306 0.54%2 700 3.480% Malaysia Government Bond—Series 313 13 15.03.23 541 306 0.54%
PEN 417 583 0.42%400 8.200% Peru Government Bond 06 12.08.26 129 934 0.13%
1 000 6.350% Peru Government Bond 16 12.08.28 287 649 0.29%
PLN 1 652 669 1.66%2 000 5.500% Poland Government Bond—Series 1019 08 25.10.19 510 682 0.51%1 000 5.250% Poland Government Bond—Series 1020 10 25.10.20 259 144 0.26%
500 5.750% Poland Government Bond—Series 1021 11 25.10.21 134 015 0.14%2 000 3.250% Poland Government Bond—Series 725 14 25.07.25 477 595 0.48%1 000 5.750% Poland Government Bond—Series 922 02 23.09.22 271 233 0.27%
120
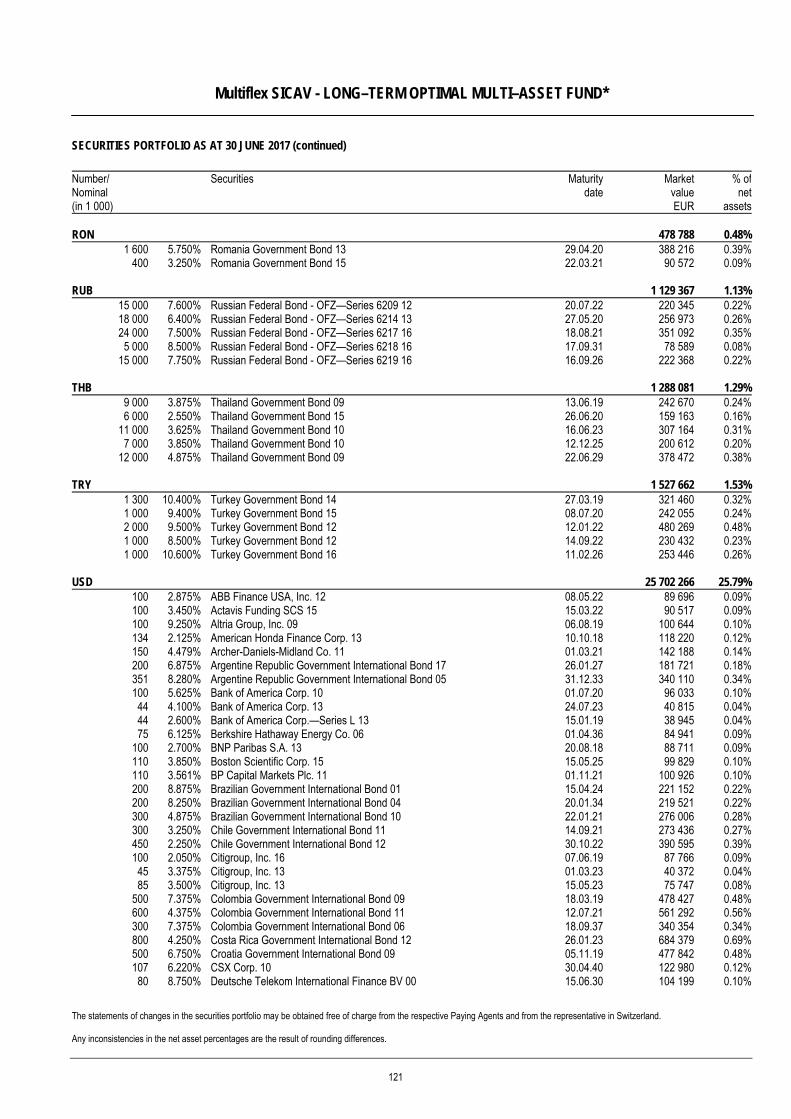
Multiflex SICAV - LONG–TERM OPTIMAL MULTI–ASSET FUND*
SECURITIES PORTFOLIO AS AT 30 JUNE 2017 (continued)
The statements of changes in the securities portfolio may be obtained free of charge from the respective Paying Agents and from the representative in Switzerland. Any inconsistencies in the net asset percentages are the result of rounding differences.
Number/ Nominal (in 1 000)
Securities Maturitydate
MarketvalueEUR
% ofnet
assets RON 478 788 0.48%
1 600 5.750% Romania Government Bond 13 29.04.20 388 216 0.39%400 3.250% Romania Government Bond 15 22.03.21 90 572 0.09%
RUB 1 129 367 1.13%15 000 7.600% Russian Federal Bond - OFZ—Series 6209 12 20.07.22 220 345 0.22%18 000 6.400% Russian Federal Bond - OFZ—Series 6214 13 27.05.20 256 973 0.26%24 000 7.500% Russian Federal Bond - OFZ—Series 6217 16 18.08.21 351 092 0.35%5 000 8.500% Russian Federal Bond - OFZ—Series 6218 16 17.09.31 78 589 0.08%
15 000 7.750% Russian Federal Bond - OFZ—Series 6219 16 16.09.26 222 368 0.22%
THB 1 288 081 1.29%9 000 3.875% Thailand Government Bond 09 13.06.19 242 670 0.24%6 000 2.550% Thailand Government Bond 15 26.06.20 159 163 0.16%
11 000 3.625% Thailand Government Bond 10 16.06.23 307 164 0.31%7 000 3.850% Thailand Government Bond 10 12.12.25 200 612 0.20%
12 000 4.875% Thailand Government Bond 09 22.06.29 378 472 0.38%
TRY 1 527 662 1.53%1 300 10.400% Turkey Government Bond 14 27.03.19 321 460 0.32%1 000 9.400% Turkey Government Bond 15 08.07.20 242 055 0.24%2 000 9.500% Turkey Government Bond 12 12.01.22 480 269 0.48%1 000 8.500% Turkey Government Bond 12 14.09.22 230 432 0.23%1 000 10.600% Turkey Government Bond 16 11.02.26 253 446 0.26%
USD 25 702 266 25.79%100 2.875% ABB Finance USA, Inc. 12 08.05.22 89 696 0.09%100 3.450% Actavis Funding SCS 15 15.03.22 90 517 0.09%100 9.250% Altria Group, Inc. 09 06.08.19 100 644 0.10%134 2.125% American Honda Finance Corp. 13 10.10.18 118 220 0.12%150 4.479% Archer-Daniels-Midland Co. 11 01.03.21 142 188 0.14%200 6.875% Argentine Republic Government International Bond 17 26.01.27 181 721 0.18%351 8.280% Argentine Republic Government International Bond 05 31.12.33 340 110 0.34%100 5.625% Bank of America Corp. 10 01.07.20 96 033 0.10%44 4.100% Bank of America Corp. 13 24.07.23 40 815 0.04%44 2.600% Bank of America Corp.—Series L 13 15.01.19 38 945 0.04%75 6.125% Berkshire Hathaway Energy Co. 06 01.04.36 84 941 0.09%
100 2.700% BNP Paribas S.A. 13 20.08.18 88 711 0.09%110 3.850% Boston Scientific Corp. 15 15.05.25 99 829 0.10%110 3.561% BP Capital Markets Plc. 11 01.11.21 100 926 0.10%200 8.875% Brazilian Government International Bond 01 15.04.24 221 152 0.22%200 8.250% Brazilian Government International Bond 04 20.01.34 219 521 0.22%300 4.875% Brazilian Government International Bond 10 22.01.21 276 006 0.28%300 3.250% Chile Government International Bond 11 14.09.21 273 436 0.27%450 2.250% Chile Government International Bond 12 30.10.22 390 595 0.39%100 2.050% Citigroup, Inc. 16 07.06.19 87 766 0.09%45 3.375% Citigroup, Inc. 13 01.03.23 40 372 0.04%85 3.500% Citigroup, Inc. 13 15.05.23 75 747 0.08%
500 7.375% Colombia Government International Bond 09 18.03.19 478 427 0.48%600 4.375% Colombia Government International Bond 11 12.07.21 561 292 0.56%300 7.375% Colombia Government International Bond 06 18.09.37 340 354 0.34%800 4.250% Costa Rica Government International Bond 12 26.01.23 684 379 0.69%500 6.750% Croatia Government International Bond 09 05.11.19 477 842 0.48%107 6.220% CSX Corp. 10 30.04.40 122 980 0.12%80 8.750% Deutsche Telekom International Finance BV 00 15.06.30 104 199 0.10%
121
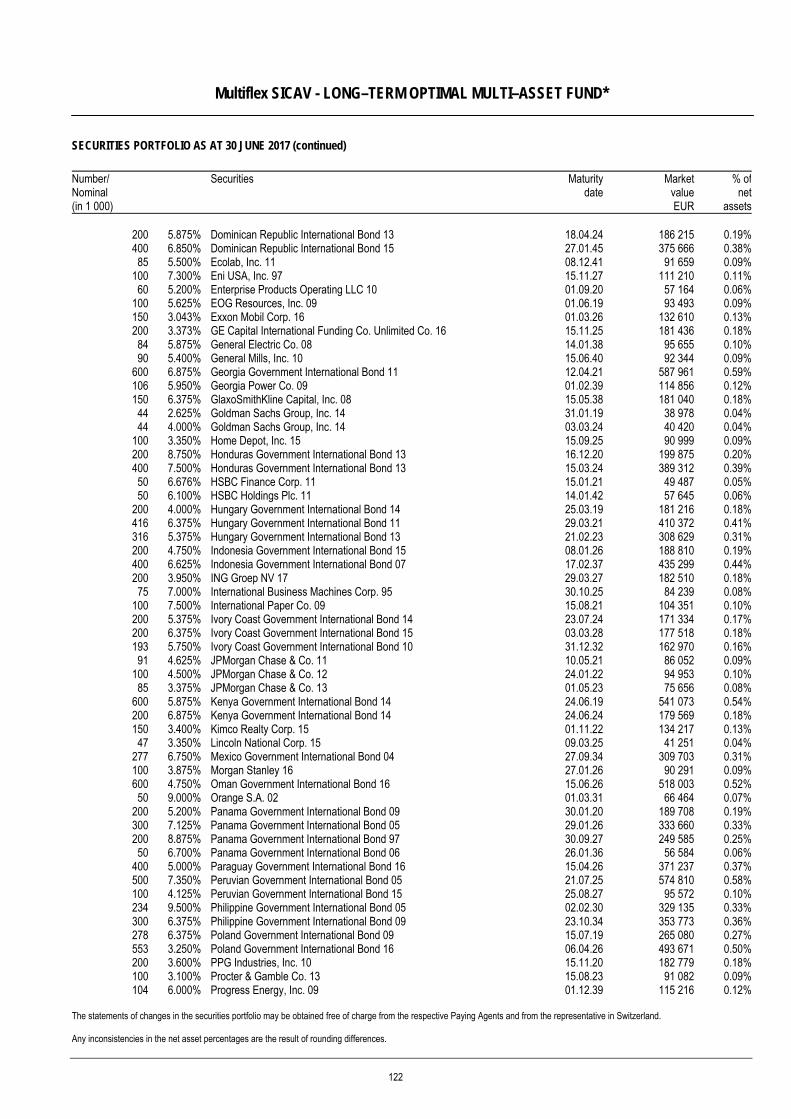
Multiflex SICAV - LONG–TERM OPTIMAL MULTI–ASSET FUND*
SECURITIES PORTFOLIO AS AT 30 JUNE 2017 (continued)
The statements of changes in the securities portfolio may be obtained free of charge from the respective Paying Agents and from the representative in Switzerland. Any inconsistencies in the net asset percentages are the result of rounding differences.
Number/ Nominal (in 1 000)
Securities Maturitydate
MarketvalueEUR
% ofnet
assets
200 5.875% Dominican Republic International Bond 13 18.04.24 186 215 0.19%400 6.850% Dominican Republic International Bond 15 27.01.45 375 666 0.38%85 5.500% Ecolab, Inc. 11 08.12.41 91 659 0.09%
100 7.300% Eni USA, Inc. 97 15.11.27 111 210 0.11%60 5.200% Enterprise Products Operating LLC 10 01.09.20 57 164 0.06%
100 5.625% EOG Resources, Inc. 09 01.06.19 93 493 0.09%150 3.043% Exxon Mobil Corp. 16 01.03.26 132 610 0.13%200 3.373% GE Capital International Funding Co. Unlimited Co. 16 15.11.25 181 436 0.18%84 5.875% General Electric Co. 08 14.01.38 95 655 0.10%90 5.400% General Mills, Inc. 10 15.06.40 92 344 0.09%
600 6.875% Georgia Government International Bond 11 12.04.21 587 961 0.59%106 5.950% Georgia Power Co. 09 01.02.39 114 856 0.12%150 6.375% GlaxoSmithKline Capital, Inc. 08 15.05.38 181 040 0.18%44 2.625% Goldman Sachs Group, Inc. 14 31.01.19 38 978 0.04%44 4.000% Goldman Sachs Group, Inc. 14 03.03.24 40 420 0.04%
100 3.350% Home Depot, Inc. 15 15.09.25 90 999 0.09%200 8.750% Honduras Government International Bond 13 16.12.20 199 875 0.20%400 7.500% Honduras Government International Bond 13 15.03.24 389 312 0.39%50 6.676% HSBC Finance Corp. 11 15.01.21 49 487 0.05%50 6.100% HSBC Holdings Plc. 11 14.01.42 57 645 0.06%
200 4.000% Hungary Government International Bond 14 25.03.19 181 216 0.18%416 6.375% Hungary Government International Bond 11 29.03.21 410 372 0.41%316 5.375% Hungary Government International Bond 13 21.02.23 308 629 0.31%200 4.750% Indonesia Government International Bond 15 08.01.26 188 810 0.19%400 6.625% Indonesia Government International Bond 07 17.02.37 435 299 0.44%200 3.950% ING Groep NV 17 29.03.27 182 510 0.18%75 7.000% International Business Machines Corp. 95 30.10.25 84 239 0.08%
100 7.500% International Paper Co. 09 15.08.21 104 351 0.10%200 5.375% Ivory Coast Government International Bond 14 23.07.24 171 334 0.17%200 6.375% Ivory Coast Government International Bond 15 03.03.28 177 518 0.18%193 5.750% Ivory Coast Government International Bond 10 31.12.32 162 970 0.16%91 4.625% JPMorgan Chase & Co. 11 10.05.21 86 052 0.09%
100 4.500% JPMorgan Chase & Co. 12 24.01.22 94 953 0.10%85 3.375% JPMorgan Chase & Co. 13 01.05.23 75 656 0.08%
600 5.875% Kenya Government International Bond 14 24.06.19 541 073 0.54%200 6.875% Kenya Government International Bond 14 24.06.24 179 569 0.18%150 3.400% Kimco Realty Corp. 15 01.11.22 134 217 0.13%47 3.350% Lincoln National Corp. 15 09.03.25 41 251 0.04%
277 6.750% Mexico Government International Bond 04 27.09.34 309 703 0.31%100 3.875% Morgan Stanley 16 27.01.26 90 291 0.09%600 4.750% Oman Government International Bond 16 15.06.26 518 003 0.52%50 9.000% Orange S.A. 02 01.03.31 66 464 0.07%
200 5.200% Panama Government International Bond 09 30.01.20 189 708 0.19%300 7.125% Panama Government International Bond 05 29.01.26 333 660 0.33%200 8.875% Panama Government International Bond 97 30.09.27 249 585 0.25%50 6.700% Panama Government International Bond 06 26.01.36 56 584 0.06%
400 5.000% Paraguay Government International Bond 16 15.04.26 371 237 0.37%500 7.350% Peruvian Government International Bond 05 21.07.25 574 810 0.58%100 4.125% Peruvian Government International Bond 15 25.08.27 95 572 0.10%234 9.500% Philippine Government International Bond 05 02.02.30 329 135 0.33%300 6.375% Philippine Government International Bond 09 23.10.34 353 773 0.36%278 6.375% Poland Government International Bond 09 15.07.19 265 080 0.27%553 3.250% Poland Government International Bond 16 06.04.26 493 671 0.50%200 3.600% PPG Industries, Inc. 10 15.11.20 182 779 0.18%100 3.100% Procter & Gamble Co. 13 15.08.23 91 082 0.09%104 6.000% Progress Energy, Inc. 09 01.12.39 115 216 0.12%
122
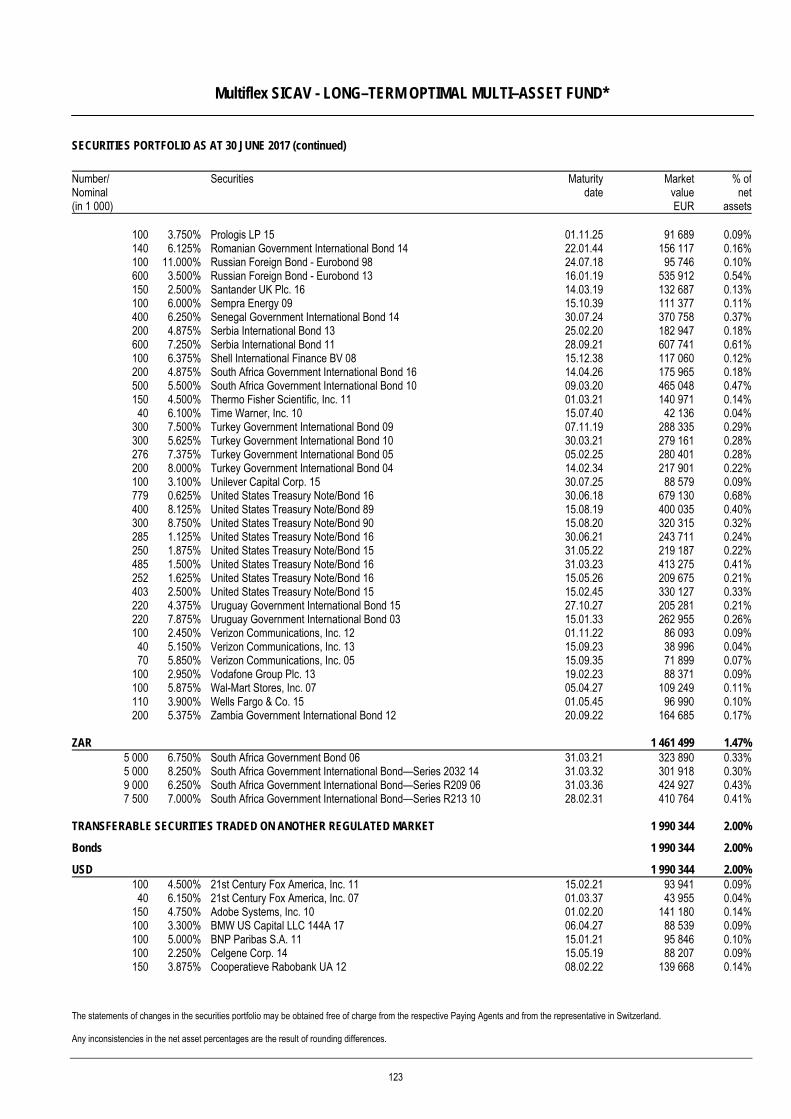
Multiflex SICAV - LONG–TERM OPTIMAL MULTI–ASSET FUND*
SECURITIES PORTFOLIO AS AT 30 JUNE 2017 (continued)
The statements of changes in the securities portfolio may be obtained free of charge from the respective Paying Agents and from the representative in Switzerland. Any inconsistencies in the net asset percentages are the result of rounding differences.
Number/ Nominal (in 1 000)
Securities Maturitydate
MarketvalueEUR
% ofnet
assets
100 3.750% Prologis LP 15 01.11.25 91 689 0.09%140 6.125% Romanian Government International Bond 14 22.01.44 156 117 0.16%100 11.000% Russian Foreign Bond - Eurobond 98 24.07.18 95 746 0.10%600 3.500% Russian Foreign Bond - Eurobond 13 16.01.19 535 912 0.54%150 2.500% Santander UK Plc. 16 14.03.19 132 687 0.13%100 6.000% Sempra Energy 09 15.10.39 111 377 0.11%400 6.250% Senegal Government International Bond 14 30.07.24 370 758 0.37%200 4.875% Serbia International Bond 13 25.02.20 182 947 0.18%600 7.250% Serbia International Bond 11 28.09.21 607 741 0.61%100 6.375% Shell International Finance BV 08 15.12.38 117 060 0.12%200 4.875% South Africa Government International Bond 16 14.04.26 175 965 0.18%500 5.500% South Africa Government International Bond 10 09.03.20 465 048 0.47%150 4.500% Thermo Fisher Scientific, Inc. 11 01.03.21 140 971 0.14%40 6.100% Time Warner, Inc. 10 15.07.40 42 136 0.04%
300 7.500% Turkey Government International Bond 09 07.11.19 288 335 0.29%300 5.625% Turkey Government International Bond 10 30.03.21 279 161 0.28%276 7.375% Turkey Government International Bond 05 05.02.25 280 401 0.28%200 8.000% Turkey Government International Bond 04 14.02.34 217 901 0.22%100 3.100% Unilever Capital Corp. 15 30.07.25 88 579 0.09%779 0.625% United States Treasury Note/Bond 16 30.06.18 679 130 0.68%400 8.125% United States Treasury Note/Bond 89 15.08.19 400 035 0.40%300 8.750% United States Treasury Note/Bond 90 15.08.20 320 315 0.32%285 1.125% United States Treasury Note/Bond 16 30.06.21 243 711 0.24%250 1.875% United States Treasury Note/Bond 15 31.05.22 219 187 0.22%485 1.500% United States Treasury Note/Bond 16 31.03.23 413 275 0.41%252 1.625% United States Treasury Note/Bond 16 15.05.26 209 675 0.21%403 2.500% United States Treasury Note/Bond 15 15.02.45 330 127 0.33%220 4.375% Uruguay Government International Bond 15 27.10.27 205 281 0.21%220 7.875% Uruguay Government International Bond 03 15.01.33 262 955 0.26%100 2.450% Verizon Communications, Inc. 12 01.11.22 86 093 0.09%40 5.150% Verizon Communications, Inc. 13 15.09.23 38 996 0.04%70 5.850% Verizon Communications, Inc. 05 15.09.35 71 899 0.07%
100 2.950% Vodafone Group Plc. 13 19.02.23 88 371 0.09%100 5.875% Wal-Mart Stores, Inc. 07 05.04.27 109 249 0.11%110 3.900% Wells Fargo & Co. 15 01.05.45 96 990 0.10%200 5.375% Zambia Government International Bond 12 20.09.22 164 685 0.17%
ZAR 1 461 499 1.47%5 000 6.750% South Africa Government Bond 06 31.03.21 323 890 0.33%5 000 8.250% South Africa Government International Bond—Series 2032 14 31.03.32 301 918 0.30%9 000 6.250% South Africa Government International Bond—Series R209 06 31.03.36 424 927 0.43%7 500 7.000% South Africa Government International Bond—Series R213 10 28.02.31 410 764 0.41%
TRANSFERABLE SECURITIES TRADED ON ANOTHER REGULATED MARKET 1 990 344 2.00%
Bonds 1 990 344 2.00%
USD 1 990 344 2.00%100 4.500% 21st Century Fox America, Inc. 11 15.02.21 93 941 0.09%40 6.150% 21st Century Fox America, Inc. 07 01.03.37 43 955 0.04%
150 4.750% Adobe Systems, Inc. 10 01.02.20 141 180 0.14%100 3.300% BMW US Capital LLC 144A 17 06.04.27 88 539 0.09%100 5.000% BNP Paribas S.A. 11 15.01.21 95 846 0.10%100 2.250% Celgene Corp. 14 15.05.19 88 207 0.09%150 3.875% Cooperatieve Rabobank UA 12 08.02.22 139 668 0.14%
123
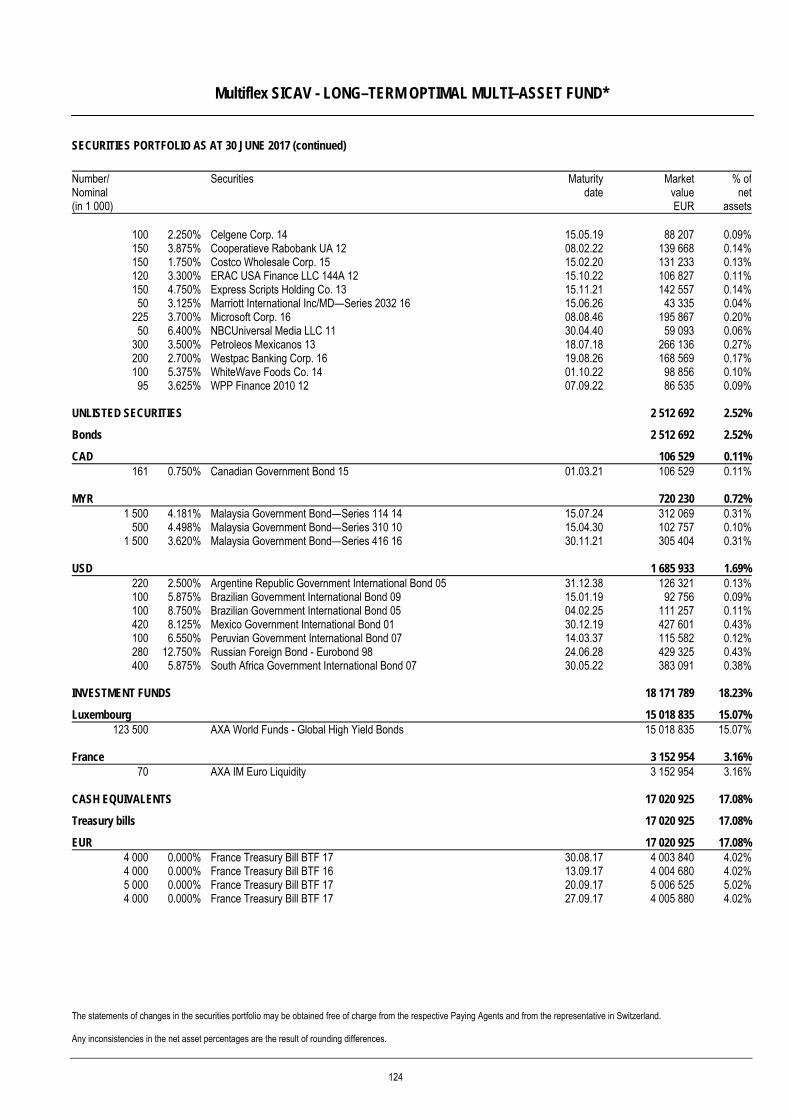
Multiflex SICAV - LONG–TERM OPTIMAL MULTI–ASSET FUND*
SECURITIES PORTFOLIO AS AT 30 JUNE 2017 (continued)
The statements of changes in the securities portfolio may be obtained free of charge from the respective Paying Agents and from the representative in Switzerland. Any inconsistencies in the net asset percentages are the result of rounding differences.
Number/ Nominal (in 1 000)
Securities Maturitydate
MarketvalueEUR
% ofnet
assets
100 2.250% Celgene Corp. 14 15.05.19 88 207 0.09%150 3.875% Cooperatieve Rabobank UA 12 08.02.22 139 668 0.14%150 1.750% Costco Wholesale Corp. 15 15.02.20 131 233 0.13%120 3.300% ERAC USA Finance LLC 144A 12 15.10.22 106 827 0.11%150 4.750% Express Scripts Holding Co. 13 15.11.21 142 557 0.14%50 3.125% Marriott International Inc/MD—Series 2032 16 15.06.26 43 335 0.04%
225 3.700% Microsoft Corp. 16 08.08.46 195 867 0.20%50 6.400% NBCUniversal Media LLC 11 30.04.40 59 093 0.06%
300 3.500% Petroleos Mexicanos 13 18.07.18 266 136 0.27%200 2.700% Westpac Banking Corp. 16 19.08.26 168 569 0.17%100 5.375% WhiteWave Foods Co. 14 01.10.22 98 856 0.10%95 3.625% WPP Finance 2010 12 07.09.22 86 535 0.09%
UNLISTED SECURITIES 2 512 692 2.52%
Bonds 2 512 692 2.52%
CAD 106 529 0.11%161 0.750% Canadian Government Bond 15 01.03.21 106 529 0.11%
MYR 720 230 0.72%1 500 4.181% Malaysia Government Bond—Series 114 14 15.07.24 312 069 0.31%
500 4.498% Malaysia Government Bond—Series 310 10 15.04.30 102 757 0.10%1 500 3.620% Malaysia Government Bond—Series 416 16 30.11.21 305 404 0.31%
USD 1 685 933 1.69%220 2.500% Argentine Republic Government International Bond 05 31.12.38 126 321 0.13%100 5.875% Brazilian Government International Bond 09 15.01.19 92 756 0.09%100 8.750% Brazilian Government International Bond 05 04.02.25 111 257 0.11%420 8.125% Mexico Government International Bond 01 30.12.19 427 601 0.43%100 6.550% Peruvian Government International Bond 07 14.03.37 115 582 0.12%280 12.750% Russian Foreign Bond - Eurobond 98 24.06.28 429 325 0.43%400 5.875% South Africa Government International Bond 07 30.05.22 383 091 0.38%
INVESTMENT FUNDS 18 171 789 18.23%
Luxembourg 15 018 835 15.07%123 500 AXA World Funds - Global High Yield Bonds 15 018 835 15.07%
France 3 152 954 3.16%70 AXA IM Euro Liquidity 3 152 954 3.16%
CASH EQUIVALENTS 17 020 925 17.08%
Treasury bills 17 020 925 17.08%
EUR 17 020 925 17.08%4 000 0.000% France Treasury Bill BTF 17 30.08.17 4 003 840 4.02%4 000 0.000% France Treasury Bill BTF 16 13.09.17 4 004 680 4.02%5 000 0.000% France Treasury Bill BTF 17 20.09.17 5 006 525 5.02%4 000 0.000% France Treasury Bill BTF 17 27.09.17 4 005 880 4.02%
124
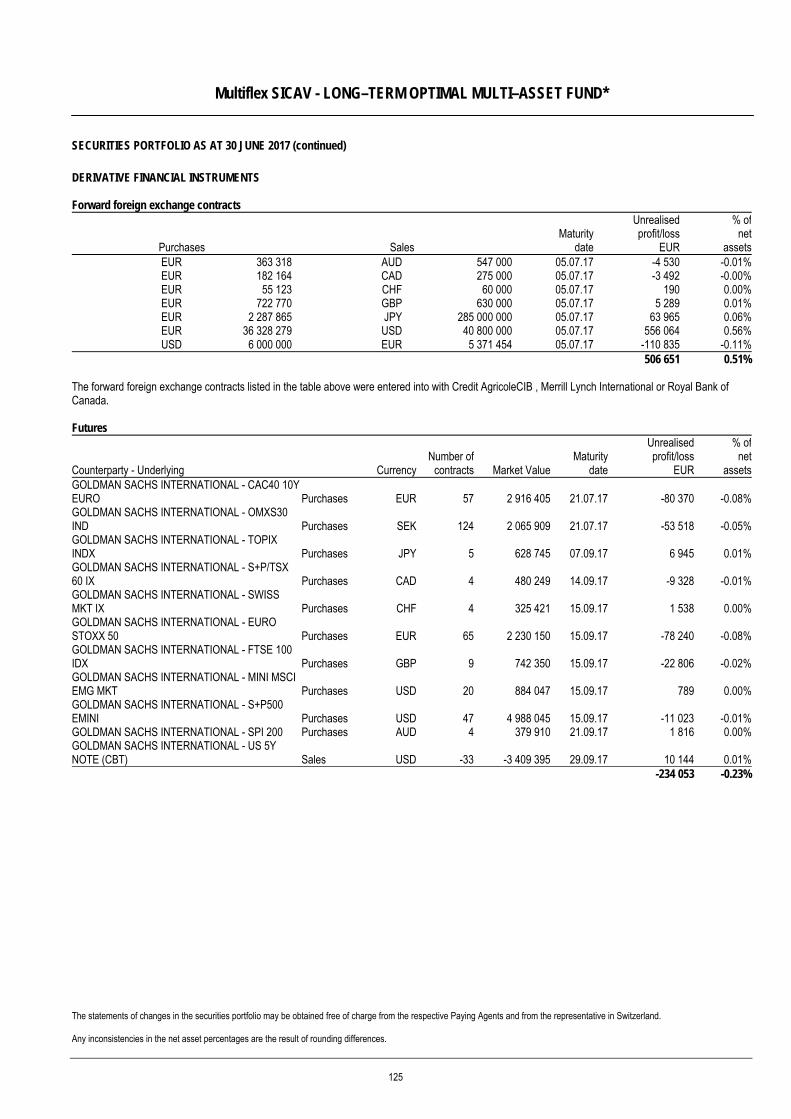
Multiflex SICAV - LONG–TERM OPTIMAL MULTI–ASSET FUND*
SECURITIES PORTFOLIO AS AT 30 JUNE 2017 (continued)
The statements of changes in the securities portfolio may be obtained free of charge from the respective Paying Agents and from the representative in Switzerland. Any inconsistencies in the net asset percentages are the result of rounding differences.
DERIVATIVE FINANCIAL INSTRUMENTS Forward foreign exchange contracts
Purchases Sales Maturity
date
Unrealisedprofit/loss
EUR
% ofnet
assetsEUR 363 318 AUD 547 000 05.07.17 -4 530 -0.01%EUR 182 164 CAD 275 000 05.07.17 -3 492 -0.00%EUR 55 123 CHF 60 000 05.07.17 190 0.00%EUR 722 770 GBP 630 000 05.07.17 5 289 0.01%EUR 2 287 865 JPY 285 000 000 05.07.17 63 965 0.06%EUR 36 328 279 USD 40 800 000 05.07.17 556 064 0.56%USD 6 000 000 EUR 5 371 454 05.07.17 -110 835 -0.11%
506 651 0.51% The forward foreign exchange contracts listed in the table above were entered into with Credit AgricoleCIB , Merrill Lynch International or Royal Bank of Canada. Futures
Counterparty - Underlying CurrencyNumber of
contracts Market ValueMaturity
date
Unrealisedprofit/loss
EUR
% ofnet
assetsGOLDMAN SACHS INTERNATIONAL - CAC40 10Y EURO Purchases EUR 57 2 916 405 21.07.17 -80 370 -0.08%GOLDMAN SACHS INTERNATIONAL - OMXS30 IND Purchases SEK 124 2 065 909 21.07.17 -53 518 -0.05%GOLDMAN SACHS INTERNATIONAL - TOPIX INDX Purchases JPY 5 628 745 07.09.17 6 945 0.01%GOLDMAN SACHS INTERNATIONAL - S+P/TSX 60 IX Purchases CAD 4 480 249 14.09.17 -9 328 -0.01%GOLDMAN SACHS INTERNATIONAL - SWISS MKT IX Purchases CHF 4 325 421 15.09.17 1 538 0.00%GOLDMAN SACHS INTERNATIONAL - EURO STOXX 50 Purchases EUR 65 2 230 150 15.09.17 -78 240 -0.08%GOLDMAN SACHS INTERNATIONAL - FTSE 100 IDX Purchases GBP 9 742 350 15.09.17 -22 806 -0.02%GOLDMAN SACHS INTERNATIONAL - MINI MSCI EMG MKT Purchases USD 20 884 047 15.09.17 789 0.00%GOLDMAN SACHS INTERNATIONAL - S+P500 EMINI Purchases USD 47 4 988 045 15.09.17 -11 023 -0.01%GOLDMAN SACHS INTERNATIONAL - SPI 200 Purchases AUD 4 379 910 21.09.17 1 816 0.00%GOLDMAN SACHS INTERNATIONAL - US 5Y NOTE (CBT) Sales USD -33 -3 409 395 29.09.17 10 144 0.01% -234 053 -0.23%
125
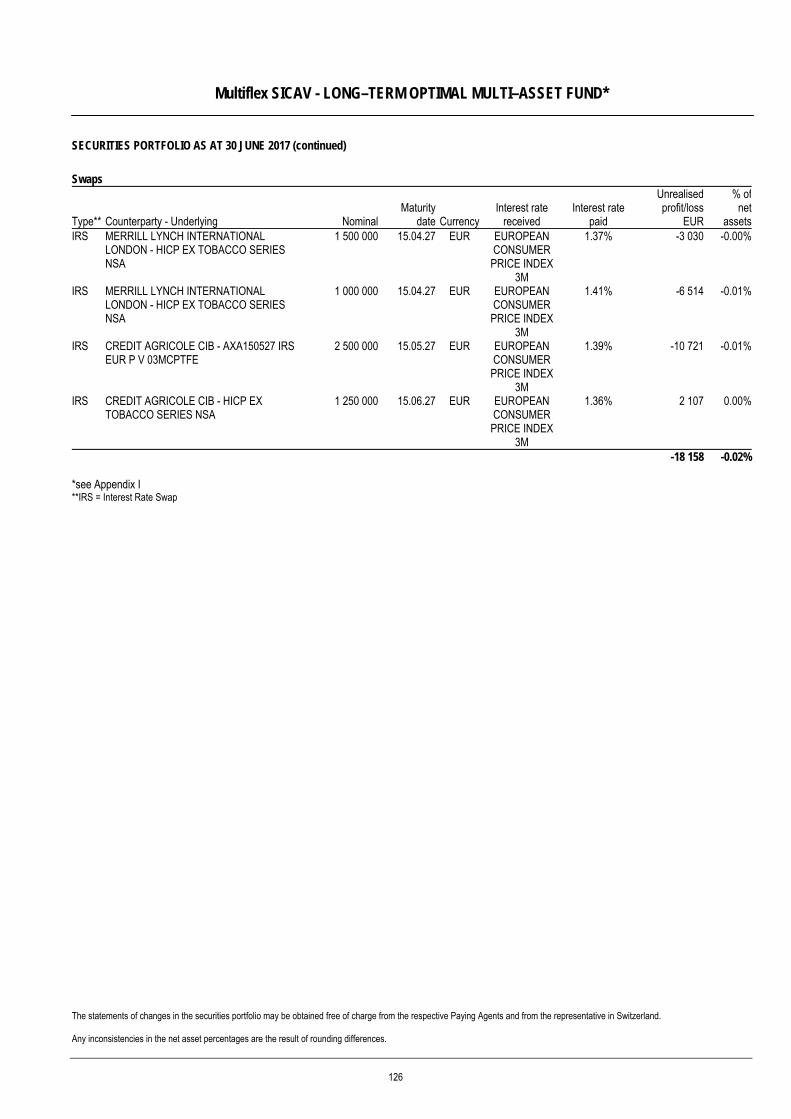
Multiflex SICAV - LONG–TERM OPTIMAL MULTI–ASSET FUND*
SECURITIES PORTFOLIO AS AT 30 JUNE 2017 (continued)
The statements of changes in the securities portfolio may be obtained free of charge from the respective Paying Agents and from the representative in Switzerland. Any inconsistencies in the net asset percentages are the result of rounding differences.
Swaps
Type** Counterparty - Underlying NominalMaturity
date Currency Interest rate
received Interest rate
paid
Unrealisedprofit/loss
EUR
% ofnet
assetsIRS MERRILL LYNCH INTERNATIONAL
LONDON - HICP EX TOBACCO SERIES NSA
1 500 000 15.04.27 EUR EUROPEAN CONSUMER PRICE INDEX
3M
1.37% -3 030 -0.00%
IRS MERRILL LYNCH INTERNATIONAL LONDON - HICP EX TOBACCO SERIES NSA
1 000 000 15.04.27 EUR EUROPEAN CONSUMER PRICE INDEX
3M
1.41% -6 514 -0.01%
IRS CREDIT AGRICOLE CIB - AXA150527 IRS EUR P V 03MCPTFE
2 500 000 15.05.27 EUR EUROPEAN CONSUMER PRICE INDEX
3M
1.39% -10 721 -0.01%
IRS CREDIT AGRICOLE CIB - HICP EX TOBACCO SERIES NSA
1 250 000 15.06.27 EUR EUROPEAN CONSUMER PRICE INDEX
3M
1.36% 2 107 0.00%
-18 158 -0.02% *see Appendix I **IRS = Interest Rate Swap
126
Multiflex SICAV - STRATEGIC INSURANCE DISTRIBUTION FUND*
*see Appendix I. The information in this report is based on historical data and is no indication of future performance.
Fund Management Report Investment Policy The Multiflex SICAV - STRATEGIC INSURANCE DISTRIBUTION FUND* follows a multi-asset solution strategy which aims to provide an attractive level of total return with a flexible approach to the different asset classes. The sub-fund invests the majority of its assets in fixed and floating rate debt securities issued in developed and emerging markets. Market review and portfolio Since inception the portfolio has returned -0.24% (share class Cm-EUR). In Q4 2016, Global fixed income sold off sharply against a backdrop of rising inflation expectations, as well as concerns about the potential for less dovish central bank policy. Our fixed income allocation detracted from absolute performance. We have increased the global equity allocation as we remain constructive on risk assets, and this contributed to overall sub-fund performance as equities posted positive returns. In March 2017 our portfolio positioning was driven by the Solvency Capital Ratio (SCR) reduction exercise. The main rotation occurred between developed market corporate credit and government bonds. Further inflows were mainly invested into very low or zero SCR securities in order to add back Equity exposure while retaining as much yield/credit risk as possible. In June 2017, we maintained our favourable view of risk assets while maintaining an underweight to duration, reflecting our view of rising global rates as central banks begin to remove extraordinary accommodation.
127
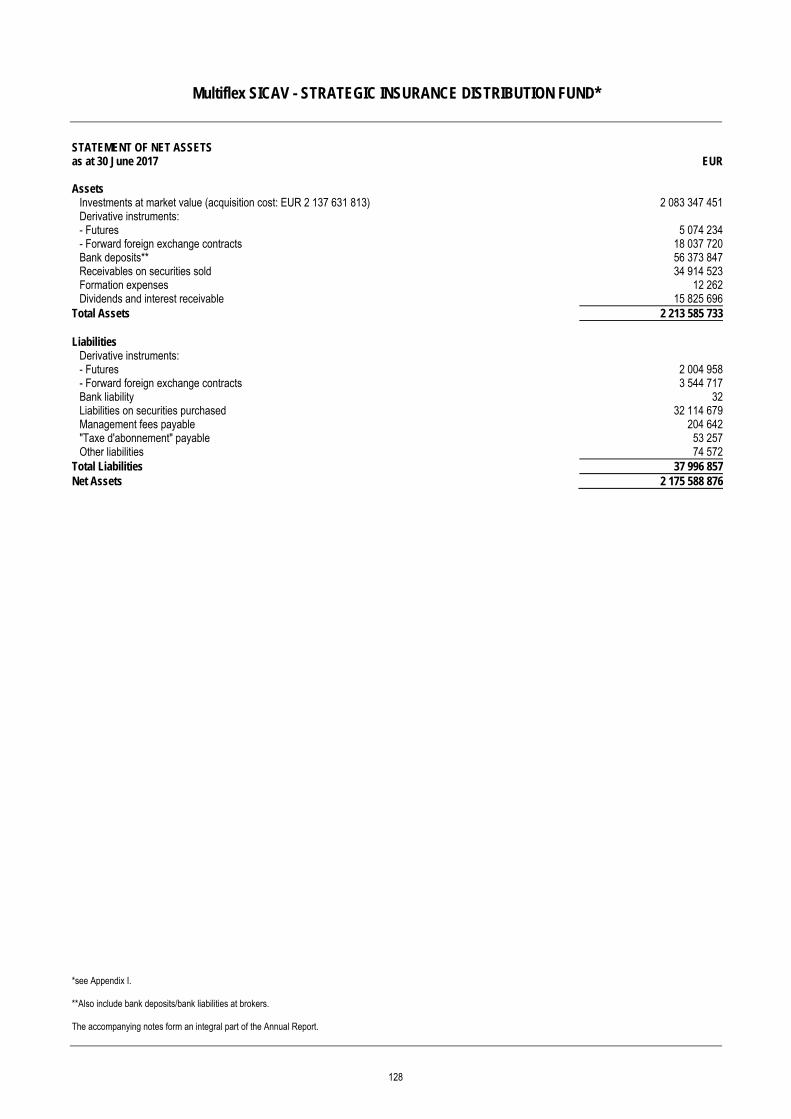
Multiflex SICAV - STRATEGIC INSURANCE DISTRIBUTION FUND*
*see Appendix I. **Also include bank deposits/bank liabilities at brokers. The accompanying notes form an integral part of the Annual Report.
STATEMENT OF NET ASSETS as at 30 June 2017 EUR Assets
Investments at market value (acquisition cost: EUR 2 137 631 813) 2 083 347 451Derivative instruments: - Futures 5 074 234- Forward foreign exchange contracts 18 037 720Bank deposits** 56 373 847Receivables on securities sold 34 914 523Formation expenses 12 262Dividends and interest receivable 15 825 696
Total Assets 2 213 585 733 Liabilities
Derivative instruments: - Futures 2 004 958- Forward foreign exchange contracts 3 544 717Bank liability 32Liabilities on securities purchased 32 114 679Management fees payable 204 642"Taxe d'abonnement" payable 53 257Other liabilities 74 572
Total Liabilities 37 996 857Net Assets 2 175 588 876
128
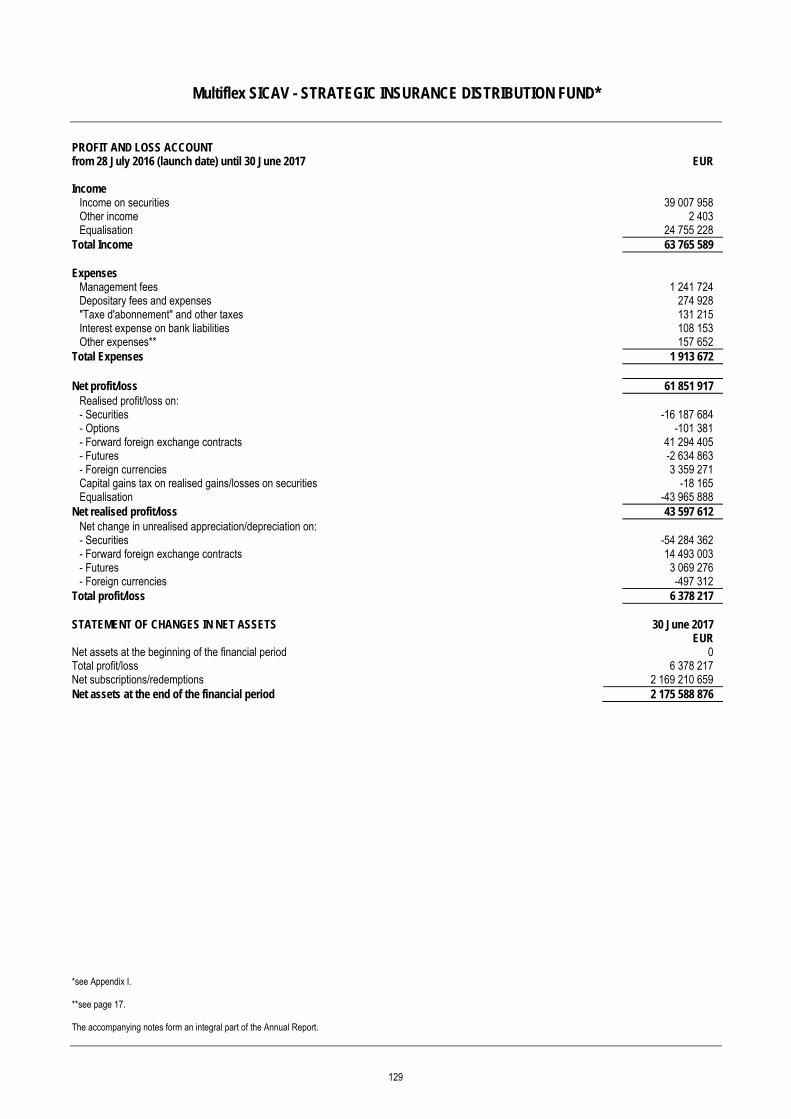
Multiflex SICAV - STRATEGIC INSURANCE DISTRIBUTION FUND*
*see Appendix I. **see page 17. The accompanying notes form an integral part of the Annual Report.
PROFIT AND LOSS ACCOUNT from 28 July 2016 (launch date) until 30 June 2017 EUR Income
Income on securities 39 007 958 Other income 2 403 Equalisation 24 755 228
Total Income 63 765 589 Expenses
Management fees 1 241 724 Depositary fees and expenses 274 928 "Taxe d'abonnement" and other taxes 131 215 Interest expense on bank liabilities 108 153 Other expenses** 157 652
Total Expenses 1 913 672 Net profit/loss 61 851 917
Realised profit/loss on: - Securities -16 187 684 - Options -101 381 - Forward foreign exchange contracts 41 294 405 - Futures -2 634 863 - Foreign currencies 3 359 271 Capital gains tax on realised gains/losses on securities -18 165 Equalisation -43 965 888
Net realised profit/loss 43 597 612 Net change in unrealised appreciation/depreciation on: - Securities -54 284 362 - Forward foreign exchange contracts 14 493 003 - Futures 3 069 276 - Foreign currencies -497 312
Total profit/loss 6 378 217 STATEMENT OF CHANGES IN NET ASSETS 30 June 2017 EUR Net assets at the beginning of the financial period 0 Total profit/loss 6 378 217 Net subscriptions/redemptions 2 169 210 659 Net assets at the end of the financial period 2 175 588 876
129
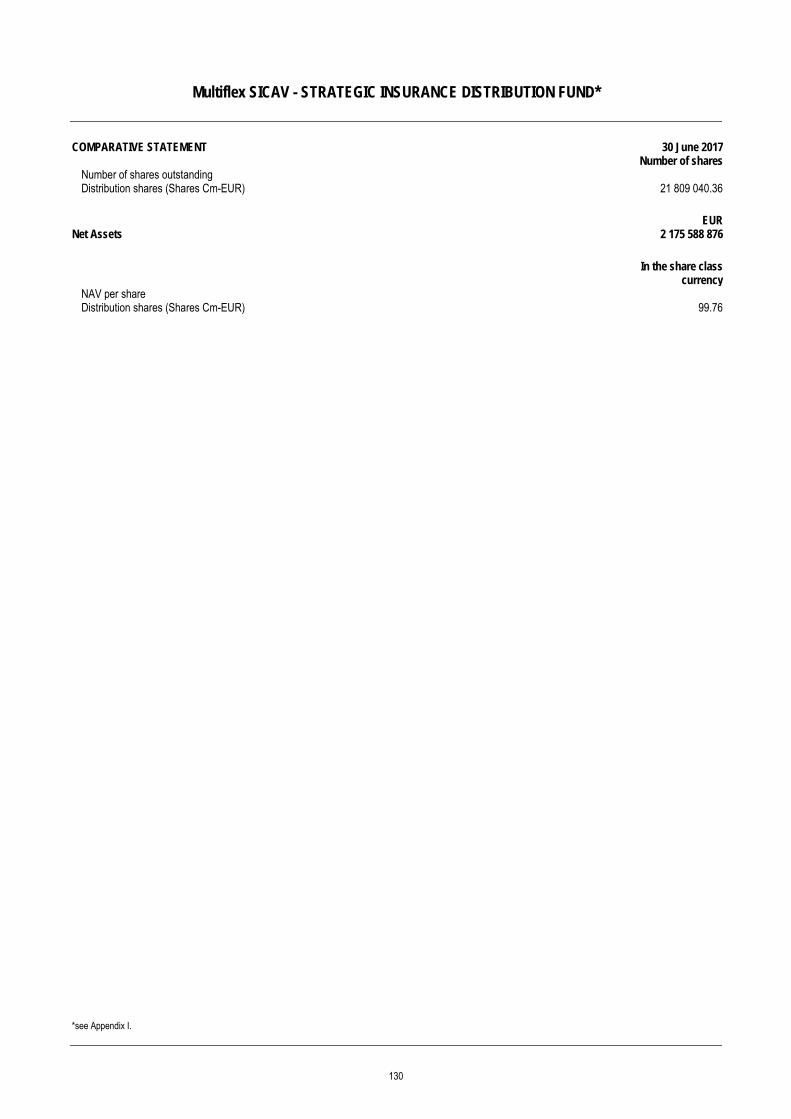
Multiflex SICAV - STRATEGIC INSURANCE DISTRIBUTION FUND*
*see Appendix I.
COMPARATIVE STATEMENT 30 June 2017 Number of shares
Number of shares outstanding Distribution shares (Shares Cm-EUR) 21 809 040.36
EUR Net Assets 2 175 588 876
In the share class
currency NAV per share Distribution shares (Shares Cm-EUR) 99.76
130
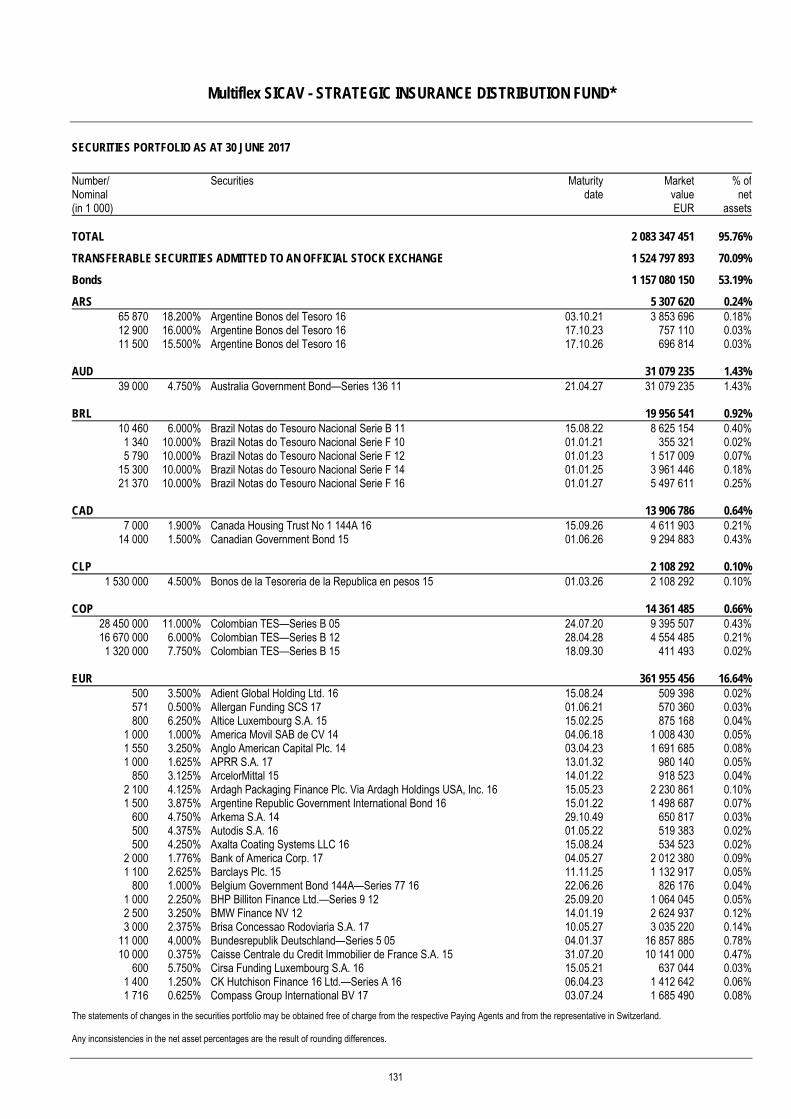
Multiflex SICAV - STRATEGIC INSURANCE DISTRIBUTION FUND*
SECURITIES PORTFOLIO AS AT 30 JUNE 2017
The statements of changes in the securities portfolio may be obtained free of charge from the respective Paying Agents and from the representative in Switzerland. Any inconsistencies in the net asset percentages are the result of rounding differences.
Number/ Nominal (in 1 000)
Securities Maturitydate
MarketvalueEUR
% ofnet
assets TOTAL 2 083 347 451 95.76%
TRANSFERABLE SECURITIES ADMITTED TO AN OFFICIAL STOCK EXCHANGE 1 524 797 893 70.09%
Bonds 1 157 080 150 53.19%
ARS 5 307 620 0.24%65 870 18.200% Argentine Bonos del Tesoro 16 03.10.21 3 853 696 0.18%12 900 16.000% Argentine Bonos del Tesoro 16 17.10.23 757 110 0.03%11 500 15.500% Argentine Bonos del Tesoro 16 17.10.26 696 814 0.03%
AUD 31 079 235 1.43%39 000 4.750% Australia Government Bond—Series 136 11 21.04.27 31 079 235 1.43%
BRL 19 956 541 0.92%10 460 6.000% Brazil Notas do Tesouro Nacional Serie B 11 15.08.22 8 625 154 0.40%1 340 10.000% Brazil Notas do Tesouro Nacional Serie F 10 01.01.21 355 321 0.02%5 790 10.000% Brazil Notas do Tesouro Nacional Serie F 12 01.01.23 1 517 009 0.07%
15 300 10.000% Brazil Notas do Tesouro Nacional Serie F 14 01.01.25 3 961 446 0.18%21 370 10.000% Brazil Notas do Tesouro Nacional Serie F 16 01.01.27 5 497 611 0.25%
CAD 13 906 786 0.64%7 000 1.900% Canada Housing Trust No 1 144A 16 15.09.26 4 611 903 0.21%
14 000 1.500% Canadian Government Bond 15 01.06.26 9 294 883 0.43%
CLP 2 108 292 0.10%1 530 000 4.500% Bonos de la Tesoreria de la Republica en pesos 15 01.03.26 2 108 292 0.10%
COP 14 361 485 0.66%28 450 000 11.000% Colombian TES—Series B 05 24.07.20 9 395 507 0.43%16 670 000 6.000% Colombian TES—Series B 12 28.04.28 4 554 485 0.21%
1 320 000 7.750% Colombian TES—Series B 15 18.09.30 411 493 0.02%
EUR 361 955 456 16.64%500 3.500% Adient Global Holding Ltd. 16 15.08.24 509 398 0.02%571 0.500% Allergan Funding SCS 17 01.06.21 570 360 0.03%800 6.250% Altice Luxembourg S.A. 15 15.02.25 875 168 0.04%
1 000 1.000% America Movil SAB de CV 14 04.06.18 1 008 430 0.05%1 550 3.250% Anglo American Capital Plc. 14 03.04.23 1 691 685 0.08%1 000 1.625% APRR S.A. 17 13.01.32 980 140 0.05%
850 3.125% ArcelorMittal 15 14.01.22 918 523 0.04%2 100 4.125% Ardagh Packaging Finance Plc. Via Ardagh Holdings USA, Inc. 16 15.05.23 2 230 861 0.10%1 500 3.875% Argentine Republic Government International Bond 16 15.01.22 1 498 687 0.07%
600 4.750% Arkema S.A. 14 29.10.49 650 817 0.03%500 4.375% Autodis S.A. 16 01.05.22 519 383 0.02%500 4.250% Axalta Coating Systems LLC 16 15.08.24 534 523 0.02%
2 000 1.776% Bank of America Corp. 17 04.05.27 2 012 380 0.09%1 100 2.625% Barclays Plc. 15 11.11.25 1 132 917 0.05%
800 1.000% Belgium Government Bond 144A—Series 77 16 22.06.26 826 176 0.04%1 000 2.250% BHP Billiton Finance Ltd.—Series 9 12 25.09.20 1 064 045 0.05%2 500 3.250% BMW Finance NV 12 14.01.19 2 624 937 0.12%3 000 2.375% Brisa Concessao Rodoviaria S.A. 17 10.05.27 3 035 220 0.14%
11 000 4.000% Bundesrepublik Deutschland—Series 5 05 04.01.37 16 857 885 0.78%10 000 0.375% Caisse Centrale du Credit Immobilier de France S.A. 15 31.07.20 10 141 000 0.47%
600 5.750% Cirsa Funding Luxembourg S.A. 16 15.05.21 637 044 0.03%1 400 1.250% CK Hutchison Finance 16 Ltd.—Series A 16 06.04.23 1 412 642 0.06%1 716 0.625% Compass Group International BV 17 03.07.24 1 685 490 0.08%
131
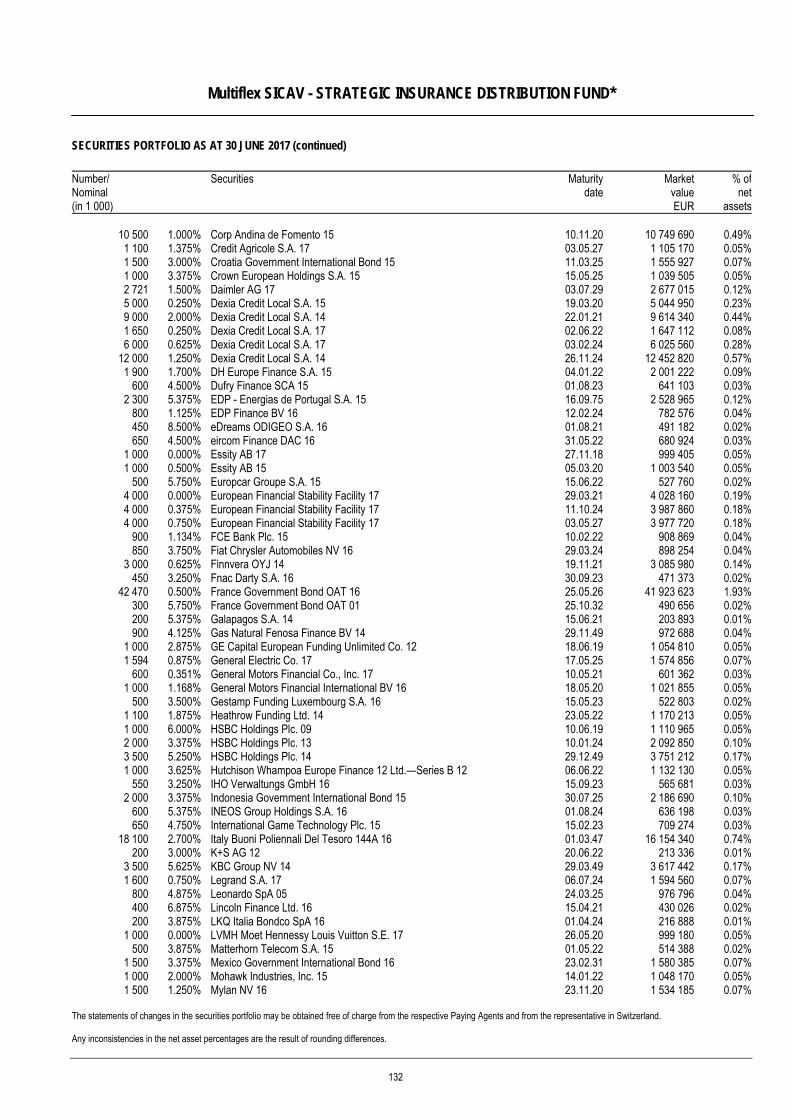
Multiflex SICAV - STRATEGIC INSURANCE DISTRIBUTION FUND*
SECURITIES PORTFOLIO AS AT 30 JUNE 2017 (continued)
The statements of changes in the securities portfolio may be obtained free of charge from the respective Paying Agents and from the representative in Switzerland. Any inconsistencies in the net asset percentages are the result of rounding differences.
Number/ Nominal (in 1 000)
Securities Maturitydate
MarketvalueEUR
% ofnet
assets
10 500 1.000% Corp Andina de Fomento 15 10.11.20 10 749 690 0.49%1 100 1.375% Credit Agricole S.A. 17 03.05.27 1 105 170 0.05%1 500 3.000% Croatia Government International Bond 15 11.03.25 1 555 927 0.07%1 000 3.375% Crown European Holdings S.A. 15 15.05.25 1 039 505 0.05%2 721 1.500% Daimler AG 17 03.07.29 2 677 015 0.12%5 000 0.250% Dexia Credit Local S.A. 15 19.03.20 5 044 950 0.23%9 000 2.000% Dexia Credit Local S.A. 14 22.01.21 9 614 340 0.44%1 650 0.250% Dexia Credit Local S.A. 17 02.06.22 1 647 112 0.08%6 000 0.625% Dexia Credit Local S.A. 17 03.02.24 6 025 560 0.28%
12 000 1.250% Dexia Credit Local S.A. 14 26.11.24 12 452 820 0.57%1 900 1.700% DH Europe Finance S.A. 15 04.01.22 2 001 222 0.09%
600 4.500% Dufry Finance SCA 15 01.08.23 641 103 0.03%2 300 5.375% EDP - Energias de Portugal S.A. 15 16.09.75 2 528 965 0.12%
800 1.125% EDP Finance BV 16 12.02.24 782 576 0.04%450 8.500% eDreams ODIGEO S.A. 16 01.08.21 491 182 0.02%650 4.500% eircom Finance DAC 16 31.05.22 680 924 0.03%
1 000 0.000% Essity AB 17 27.11.18 999 405 0.05%1 000 0.500% Essity AB 15 05.03.20 1 003 540 0.05%
500 5.750% Europcar Groupe S.A. 15 15.06.22 527 760 0.02%4 000 0.000% European Financial Stability Facility 17 29.03.21 4 028 160 0.19%4 000 0.375% European Financial Stability Facility 17 11.10.24 3 987 860 0.18%4 000 0.750% European Financial Stability Facility 17 03.05.27 3 977 720 0.18%
900 1.134% FCE Bank Plc. 15 10.02.22 908 869 0.04%850 3.750% Fiat Chrysler Automobiles NV 16 29.03.24 898 254 0.04%
3 000 0.625% Finnvera OYJ 14 19.11.21 3 085 980 0.14%450 3.250% Fnac Darty S.A. 16 30.09.23 471 373 0.02%
42 470 0.500% France Government Bond OAT 16 25.05.26 41 923 623 1.93%300 5.750% France Government Bond OAT 01 25.10.32 490 656 0.02%200 5.375% Galapagos S.A. 14 15.06.21 203 893 0.01%900 4.125% Gas Natural Fenosa Finance BV 14 29.11.49 972 688 0.04%
1 000 2.875% GE Capital European Funding Unlimited Co. 12 18.06.19 1 054 810 0.05%1 594 0.875% General Electric Co. 17 17.05.25 1 574 856 0.07%
600 0.351% General Motors Financial Co., Inc. 17 10.05.21 601 362 0.03%1 000 1.168% General Motors Financial International BV 16 18.05.20 1 021 855 0.05%
500 3.500% Gestamp Funding Luxembourg S.A. 16 15.05.23 522 803 0.02%1 100 1.875% Heathrow Funding Ltd. 14 23.05.22 1 170 213 0.05%1 000 6.000% HSBC Holdings Plc. 09 10.06.19 1 110 965 0.05%2 000 3.375% HSBC Holdings Plc. 13 10.01.24 2 092 850 0.10%3 500 5.250% HSBC Holdings Plc. 14 29.12.49 3 751 212 0.17%1 000 3.625% Hutchison Whampoa Europe Finance 12 Ltd.—Series B 12 06.06.22 1 132 130 0.05%
550 3.250% IHO Verwaltungs GmbH 16 15.09.23 565 681 0.03%2 000 3.375% Indonesia Government International Bond 15 30.07.25 2 186 690 0.10%
600 5.375% INEOS Group Holdings S.A. 16 01.08.24 636 198 0.03%650 4.750% International Game Technology Plc. 15 15.02.23 709 274 0.03%
18 100 2.700% Italy Buoni Poliennali Del Tesoro 144A 16 01.03.47 16 154 340 0.74%200 3.000% K+S AG 12 20.06.22 213 336 0.01%
3 500 5.625% KBC Group NV 14 29.03.49 3 617 442 0.17%1 600 0.750% Legrand S.A. 17 06.07.24 1 594 560 0.07%
800 4.875% Leonardo SpA 05 24.03.25 976 796 0.04%400 6.875% Lincoln Finance Ltd. 16 15.04.21 430 026 0.02%200 3.875% LKQ Italia Bondco SpA 16 01.04.24 216 888 0.01%
1 000 0.000% LVMH Moet Hennessy Louis Vuitton S.E. 17 26.05.20 999 180 0.05%500 3.875% Matterhorn Telecom S.A. 15 01.05.22 514 388 0.02%
1 500 3.375% Mexico Government International Bond 16 23.02.31 1 580 385 0.07%1 000 2.000% Mohawk Industries, Inc. 15 14.01.22 1 048 170 0.05%1 500 1.250% Mylan NV 16 23.11.20 1 534 185 0.07%
132
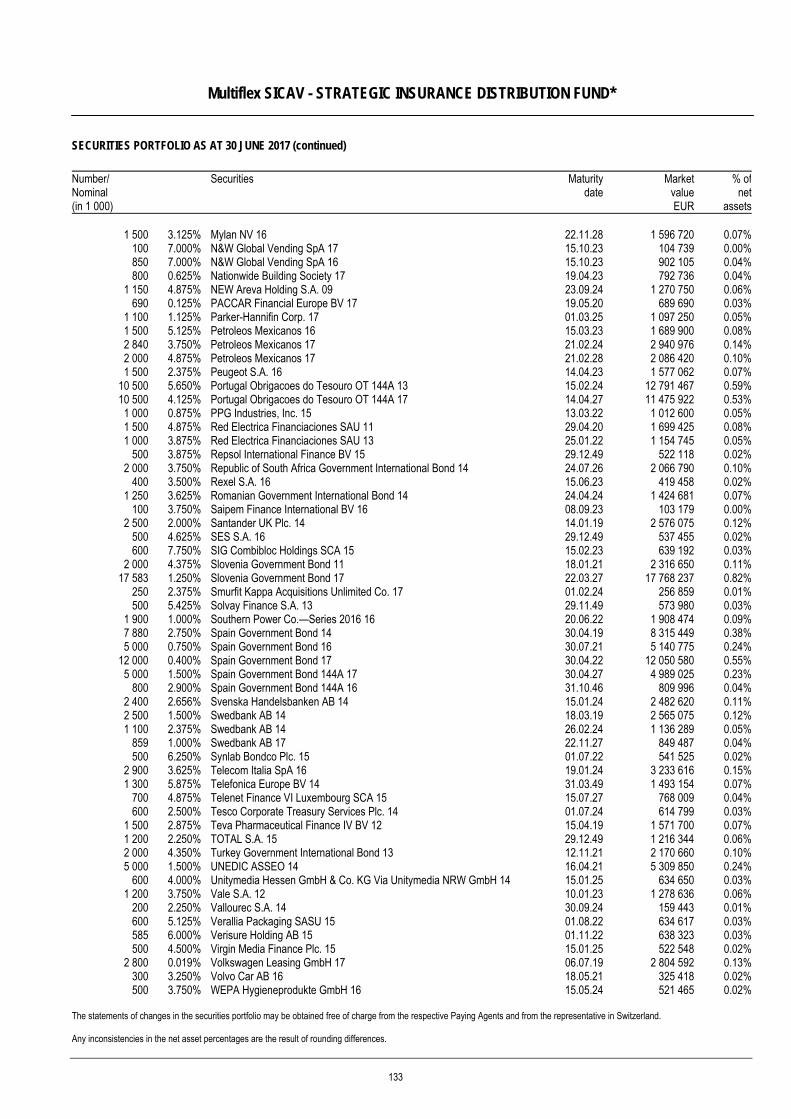
Multiflex SICAV - STRATEGIC INSURANCE DISTRIBUTION FUND*
SECURITIES PORTFOLIO AS AT 30 JUNE 2017 (continued)
The statements of changes in the securities portfolio may be obtained free of charge from the respective Paying Agents and from the representative in Switzerland. Any inconsistencies in the net asset percentages are the result of rounding differences.
Number/ Nominal (in 1 000)
Securities Maturitydate
MarketvalueEUR
% ofnet
assets
1 500 3.125% Mylan NV 16 22.11.28 1 596 720 0.07%100 7.000% N&W Global Vending SpA 17 15.10.23 104 739 0.00%850 7.000% N&W Global Vending SpA 16 15.10.23 902 105 0.04%800 0.625% Nationwide Building Society 17 19.04.23 792 736 0.04%
1 150 4.875% NEW Areva Holding S.A. 09 23.09.24 1 270 750 0.06%690 0.125% PACCAR Financial Europe BV 17 19.05.20 689 690 0.03%
1 100 1.125% Parker-Hannifin Corp. 17 01.03.25 1 097 250 0.05%1 500 5.125% Petroleos Mexicanos 16 15.03.23 1 689 900 0.08%2 840 3.750% Petroleos Mexicanos 17 21.02.24 2 940 976 0.14%2 000 4.875% Petroleos Mexicanos 17 21.02.28 2 086 420 0.10%1 500 2.375% Peugeot S.A. 16 14.04.23 1 577 062 0.07%
10 500 5.650% Portugal Obrigacoes do Tesouro OT 144A 13 15.02.24 12 791 467 0.59%10 500 4.125% Portugal Obrigacoes do Tesouro OT 144A 17 14.04.27 11 475 922 0.53%1 000 0.875% PPG Industries, Inc. 15 13.03.22 1 012 600 0.05%1 500 4.875% Red Electrica Financiaciones SAU 11 29.04.20 1 699 425 0.08%1 000 3.875% Red Electrica Financiaciones SAU 13 25.01.22 1 154 745 0.05%
500 3.875% Repsol International Finance BV 15 29.12.49 522 118 0.02%2 000 3.750% Republic of South Africa Government International Bond 14 24.07.26 2 066 790 0.10%
400 3.500% Rexel S.A. 16 15.06.23 419 458 0.02%1 250 3.625% Romanian Government International Bond 14 24.04.24 1 424 681 0.07%
100 3.750% Saipem Finance International BV 16 08.09.23 103 179 0.00%2 500 2.000% Santander UK Plc. 14 14.01.19 2 576 075 0.12%
500 4.625% SES S.A. 16 29.12.49 537 455 0.02%600 7.750% SIG Combibloc Holdings SCA 15 15.02.23 639 192 0.03%
2 000 4.375% Slovenia Government Bond 11 18.01.21 2 316 650 0.11%17 583 1.250% Slovenia Government Bond 17 22.03.27 17 768 237 0.82%
250 2.375% Smurfit Kappa Acquisitions Unlimited Co. 17 01.02.24 256 859 0.01%500 5.425% Solvay Finance S.A. 13 29.11.49 573 980 0.03%
1 900 1.000% Southern Power Co.—Series 2016 16 20.06.22 1 908 474 0.09%7 880 2.750% Spain Government Bond 14 30.04.19 8 315 449 0.38%5 000 0.750% Spain Government Bond 16 30.07.21 5 140 775 0.24%
12 000 0.400% Spain Government Bond 17 30.04.22 12 050 580 0.55%5 000 1.500% Spain Government Bond 144A 17 30.04.27 4 989 025 0.23%
800 2.900% Spain Government Bond 144A 16 31.10.46 809 996 0.04%2 400 2.656% Svenska Handelsbanken AB 14 15.01.24 2 482 620 0.11%2 500 1.500% Swedbank AB 14 18.03.19 2 565 075 0.12%1 100 2.375% Swedbank AB 14 26.02.24 1 136 289 0.05%
859 1.000% Swedbank AB 17 22.11.27 849 487 0.04%500 6.250% Synlab Bondco Plc. 15 01.07.22 541 525 0.02%
2 900 3.625% Telecom Italia SpA 16 19.01.24 3 233 616 0.15%1 300 5.875% Telefonica Europe BV 14 31.03.49 1 493 154 0.07%
700 4.875% Telenet Finance VI Luxembourg SCA 15 15.07.27 768 009 0.04%600 2.500% Tesco Corporate Treasury Services Plc. 14 01.07.24 614 799 0.03%
1 500 2.875% Teva Pharmaceutical Finance IV BV 12 15.04.19 1 571 700 0.07%1 200 2.250% TOTAL S.A. 15 29.12.49 1 216 344 0.06%2 000 4.350% Turkey Government International Bond 13 12.11.21 2 170 660 0.10%5 000 1.500% UNEDIC ASSEO 14 16.04.21 5 309 850 0.24%
600 4.000% Unitymedia Hessen GmbH & Co. KG Via Unitymedia NRW GmbH 14 15.01.25 634 650 0.03%1 200 3.750% Vale S.A. 12 10.01.23 1 278 636 0.06%
200 2.250% Vallourec S.A. 14 30.09.24 159 443 0.01%600 5.125% Verallia Packaging SASU 15 01.08.22 634 617 0.03%585 6.000% Verisure Holding AB 15 01.11.22 638 323 0.03%500 4.500% Virgin Media Finance Plc. 15 15.01.25 522 548 0.02%
2 800 0.019% Volkswagen Leasing GmbH 17 06.07.19 2 804 592 0.13%300 3.250% Volvo Car AB 16 18.05.21 325 418 0.02%500 3.750% WEPA Hygieneprodukte GmbH 16 15.05.24 521 465 0.02%
133
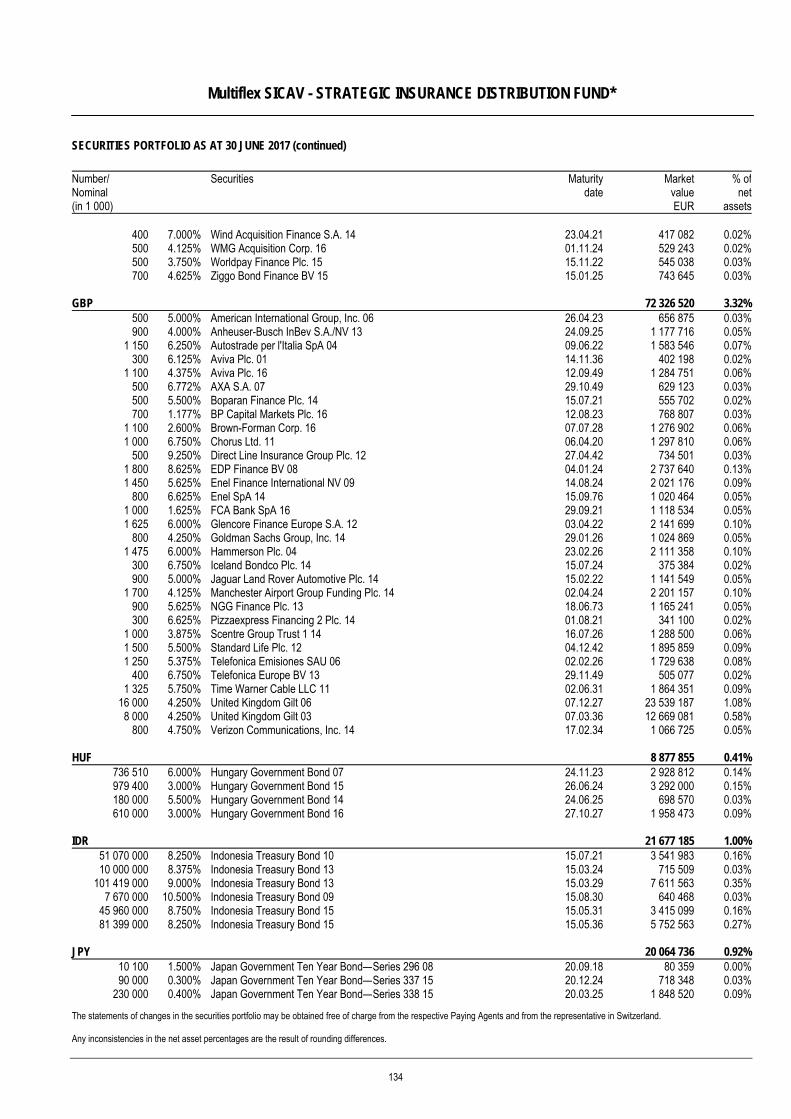
Multiflex SICAV - STRATEGIC INSURANCE DISTRIBUTION FUND*
SECURITIES PORTFOLIO AS AT 30 JUNE 2017 (continued)
The statements of changes in the securities portfolio may be obtained free of charge from the respective Paying Agents and from the representative in Switzerland. Any inconsistencies in the net asset percentages are the result of rounding differences.
Number/ Nominal (in 1 000)
Securities Maturitydate
MarketvalueEUR
% ofnet
assets
400 7.000% Wind Acquisition Finance S.A. 14 23.04.21 417 082 0.02%500 4.125% WMG Acquisition Corp. 16 01.11.24 529 243 0.02%500 3.750% Worldpay Finance Plc. 15 15.11.22 545 038 0.03%700 4.625% Ziggo Bond Finance BV 15 15.01.25 743 645 0.03%
GBP 72 326 520 3.32%500 5.000% American International Group, Inc. 06 26.04.23 656 875 0.03%900 4.000% Anheuser-Busch InBev S.A./NV 13 24.09.25 1 177 716 0.05%
1 150 6.250% Autostrade per l'Italia SpA 04 09.06.22 1 583 546 0.07%300 6.125% Aviva Plc. 01 14.11.36 402 198 0.02%
1 100 4.375% Aviva Plc. 16 12.09.49 1 284 751 0.06%500 6.772% AXA S.A. 07 29.10.49 629 123 0.03%500 5.500% Boparan Finance Plc. 14 15.07.21 555 702 0.02%700 1.177% BP Capital Markets Plc. 16 12.08.23 768 807 0.03%
1 100 2.600% Brown-Forman Corp. 16 07.07.28 1 276 902 0.06%1 000 6.750% Chorus Ltd. 11 06.04.20 1 297 810 0.06%
500 9.250% Direct Line Insurance Group Plc. 12 27.04.42 734 501 0.03%1 800 8.625% EDP Finance BV 08 04.01.24 2 737 640 0.13%1 450 5.625% Enel Finance International NV 09 14.08.24 2 021 176 0.09%
800 6.625% Enel SpA 14 15.09.76 1 020 464 0.05%1 000 1.625% FCA Bank SpA 16 29.09.21 1 118 534 0.05%1 625 6.000% Glencore Finance Europe S.A. 12 03.04.22 2 141 699 0.10%
800 4.250% Goldman Sachs Group, Inc. 14 29.01.26 1 024 869 0.05%1 475 6.000% Hammerson Plc. 04 23.02.26 2 111 358 0.10%
300 6.750% Iceland Bondco Plc. 14 15.07.24 375 384 0.02%900 5.000% Jaguar Land Rover Automotive Plc. 14 15.02.22 1 141 549 0.05%
1 700 4.125% Manchester Airport Group Funding Plc. 14 02.04.24 2 201 157 0.10%900 5.625% NGG Finance Plc. 13 18.06.73 1 165 241 0.05%300 6.625% Pizzaexpress Financing 2 Plc. 14 01.08.21 341 100 0.02%
1 000 3.875% Scentre Group Trust 1 14 16.07.26 1 288 500 0.06%1 500 5.500% Standard Life Plc. 12 04.12.42 1 895 859 0.09%1 250 5.375% Telefonica Emisiones SAU 06 02.02.26 1 729 638 0.08%
400 6.750% Telefonica Europe BV 13 29.11.49 505 077 0.02%1 325 5.750% Time Warner Cable LLC 11 02.06.31 1 864 351 0.09%
16 000 4.250% United Kingdom Gilt 06 07.12.27 23 539 187 1.08%8 000 4.250% United Kingdom Gilt 03 07.03.36 12 669 081 0.58%
800 4.750% Verizon Communications, Inc. 14 17.02.34 1 066 725 0.05%
HUF 8 877 855 0.41%736 510 6.000% Hungary Government Bond 07 24.11.23 2 928 812 0.14%979 400 3.000% Hungary Government Bond 15 26.06.24 3 292 000 0.15%180 000 5.500% Hungary Government Bond 14 24.06.25 698 570 0.03%610 000 3.000% Hungary Government Bond 16 27.10.27 1 958 473 0.09%
IDR 21 677 185 1.00%51 070 000 8.250% Indonesia Treasury Bond 10 15.07.21 3 541 983 0.16%10 000 000 8.375% Indonesia Treasury Bond 13 15.03.24 715 509 0.03%
101 419 000 9.000% Indonesia Treasury Bond 13 15.03.29 7 611 563 0.35%7 670 000 10.500% Indonesia Treasury Bond 09 15.08.30 640 468 0.03%
45 960 000 8.750% Indonesia Treasury Bond 15 15.05.31 3 415 099 0.16%81 399 000 8.250% Indonesia Treasury Bond 15 15.05.36 5 752 563 0.27%
JPY 20 064 736 0.92%10 100 1.500% Japan Government Ten Year Bond—Series 296 08 20.09.18 80 359 0.00%90 000 0.300% Japan Government Ten Year Bond—Series 337 15 20.12.24 718 348 0.03%
230 000 0.400% Japan Government Ten Year Bond—Series 338 15 20.03.25 1 848 520 0.09%
134
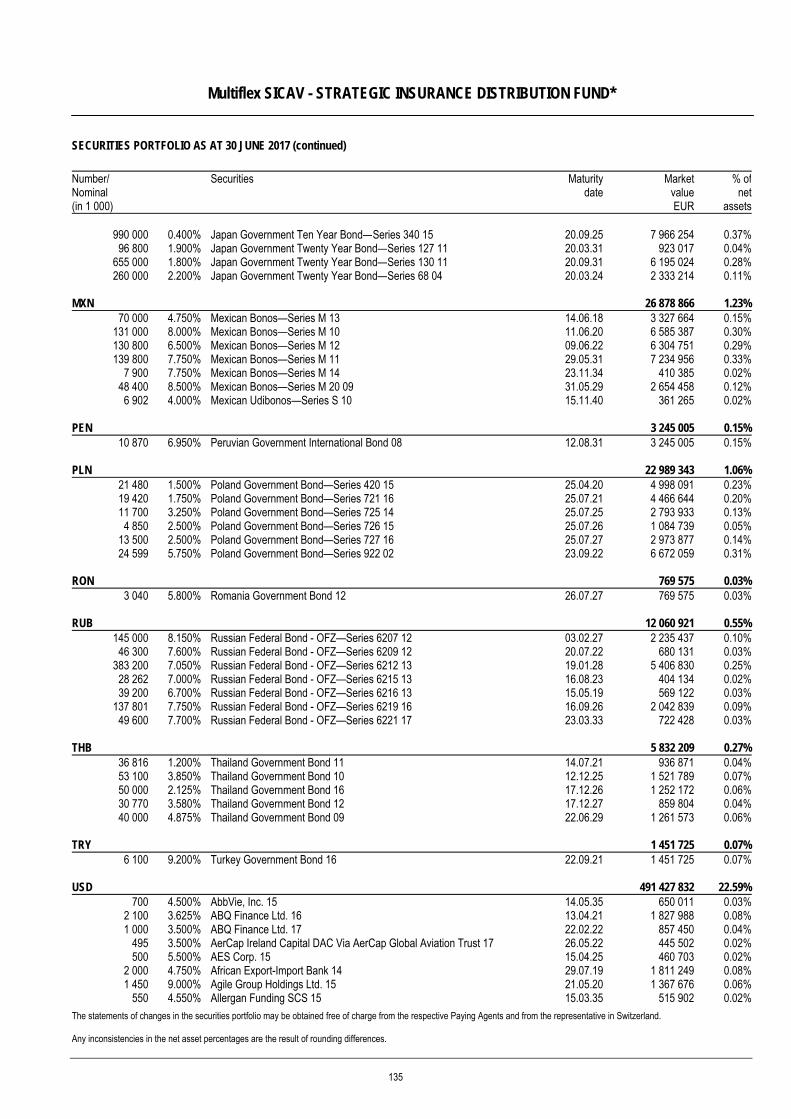
Multiflex SICAV - STRATEGIC INSURANCE DISTRIBUTION FUND*
SECURITIES PORTFOLIO AS AT 30 JUNE 2017 (continued)
The statements of changes in the securities portfolio may be obtained free of charge from the respective Paying Agents and from the representative in Switzerland. Any inconsistencies in the net asset percentages are the result of rounding differences.
Number/ Nominal (in 1 000)
Securities Maturitydate
MarketvalueEUR
% ofnet
assets
990 000 0.400% Japan Government Ten Year Bond—Series 340 15 20.09.25 7 966 254 0.37%96 800 1.900% Japan Government Twenty Year Bond—Series 127 11 20.03.31 923 017 0.04%
655 000 1.800% Japan Government Twenty Year Bond—Series 130 11 20.09.31 6 195 024 0.28%260 000 2.200% Japan Government Twenty Year Bond—Series 68 04 20.03.24 2 333 214 0.11%
MXN 26 878 866 1.23%70 000 4.750% Mexican Bonos—Series M 13 14.06.18 3 327 664 0.15%
131 000 8.000% Mexican Bonos—Series M 10 11.06.20 6 585 387 0.30%130 800 6.500% Mexican Bonos—Series M 12 09.06.22 6 304 751 0.29%139 800 7.750% Mexican Bonos—Series M 11 29.05.31 7 234 956 0.33%
7 900 7.750% Mexican Bonos—Series M 14 23.11.34 410 385 0.02%48 400 8.500% Mexican Bonos—Series M 20 09 31.05.29 2 654 458 0.12%6 902 4.000% Mexican Udibonos—Series S 10 15.11.40 361 265 0.02%
PEN 3 245 005 0.15%10 870 6.950% Peruvian Government International Bond 08 12.08.31 3 245 005 0.15%
PLN 22 989 343 1.06%21 480 1.500% Poland Government Bond—Series 420 15 25.04.20 4 998 091 0.23%19 420 1.750% Poland Government Bond—Series 721 16 25.07.21 4 466 644 0.20%11 700 3.250% Poland Government Bond—Series 725 14 25.07.25 2 793 933 0.13%4 850 2.500% Poland Government Bond—Series 726 15 25.07.26 1 084 739 0.05%
13 500 2.500% Poland Government Bond—Series 727 16 25.07.27 2 973 877 0.14%24 599 5.750% Poland Government Bond—Series 922 02 23.09.22 6 672 059 0.31%
RON 769 575 0.03%3 040 5.800% Romania Government Bond 12 26.07.27 769 575 0.03%
RUB 12 060 921 0.55%145 000 8.150% Russian Federal Bond - OFZ—Series 6207 12 03.02.27 2 235 437 0.10%
46 300 7.600% Russian Federal Bond - OFZ—Series 6209 12 20.07.22 680 131 0.03%383 200 7.050% Russian Federal Bond - OFZ—Series 6212 13 19.01.28 5 406 830 0.25%
28 262 7.000% Russian Federal Bond - OFZ—Series 6215 13 16.08.23 404 134 0.02%39 200 6.700% Russian Federal Bond - OFZ—Series 6216 13 15.05.19 569 122 0.03%
137 801 7.750% Russian Federal Bond - OFZ—Series 6219 16 16.09.26 2 042 839 0.09%49 600 7.700% Russian Federal Bond - OFZ—Series 6221 17 23.03.33 722 428 0.03%
THB 5 832 209 0.27%36 816 1.200% Thailand Government Bond 11 14.07.21 936 871 0.04%53 100 3.850% Thailand Government Bond 10 12.12.25 1 521 789 0.07%50 000 2.125% Thailand Government Bond 16 17.12.26 1 252 172 0.06%30 770 3.580% Thailand Government Bond 12 17.12.27 859 804 0.04%40 000 4.875% Thailand Government Bond 09 22.06.29 1 261 573 0.06%
TRY 1 451 725 0.07%6 100 9.200% Turkey Government Bond 16 22.09.21 1 451 725 0.07%
USD 491 427 832 22.59%700 4.500% AbbVie, Inc. 15 14.05.35 650 011 0.03%
2 100 3.625% ABQ Finance Ltd. 16 13.04.21 1 827 988 0.08%1 000 3.500% ABQ Finance Ltd. 17 22.02.22 857 450 0.04%
495 3.500% AerCap Ireland Capital DAC Via AerCap Global Aviation Trust 17 26.05.22 445 502 0.02%500 5.500% AES Corp. 15 15.04.25 460 703 0.02%
2 000 4.750% African Export-Import Bank 14 29.07.19 1 811 249 0.08%1 450 9.000% Agile Group Holdings Ltd. 15 21.05.20 1 367 676 0.06%
550 4.550% Allergan Funding SCS 15 15.03.35 515 902 0.02%
135
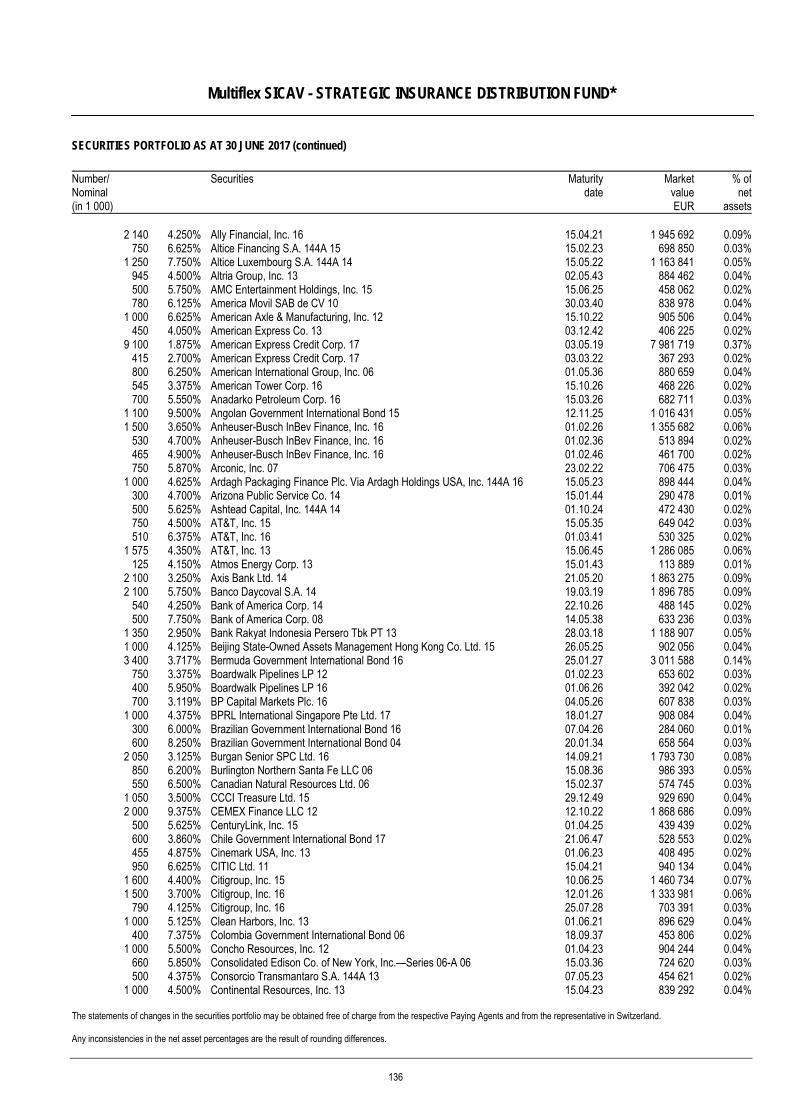
Multiflex SICAV - STRATEGIC INSURANCE DISTRIBUTION FUND*
SECURITIES PORTFOLIO AS AT 30 JUNE 2017 (continued)
The statements of changes in the securities portfolio may be obtained free of charge from the respective Paying Agents and from the representative in Switzerland. Any inconsistencies in the net asset percentages are the result of rounding differences.
Number/ Nominal (in 1 000)
Securities Maturitydate
MarketvalueEUR
% ofnet
assets
2 140 4.250% Ally Financial, Inc. 16 15.04.21 1 945 692 0.09%750 6.625% Altice Financing S.A. 144A 15 15.02.23 698 850 0.03%
1 250 7.750% Altice Luxembourg S.A. 144A 14 15.05.22 1 163 841 0.05%945 4.500% Altria Group, Inc. 13 02.05.43 884 462 0.04%500 5.750% AMC Entertainment Holdings, Inc. 15 15.06.25 458 062 0.02%780 6.125% America Movil SAB de CV 10 30.03.40 838 978 0.04%
1 000 6.625% American Axle & Manufacturing, Inc. 12 15.10.22 905 506 0.04%450 4.050% American Express Co. 13 03.12.42 406 225 0.02%
9 100 1.875% American Express Credit Corp. 17 03.05.19 7 981 719 0.37%415 2.700% American Express Credit Corp. 17 03.03.22 367 293 0.02%800 6.250% American International Group, Inc. 06 01.05.36 880 659 0.04%545 3.375% American Tower Corp. 16 15.10.26 468 226 0.02%700 5.550% Anadarko Petroleum Corp. 16 15.03.26 682 711 0.03%
1 100 9.500% Angolan Government International Bond 15 12.11.25 1 016 431 0.05%1 500 3.650% Anheuser-Busch InBev Finance, Inc. 16 01.02.26 1 355 682 0.06%
530 4.700% Anheuser-Busch InBev Finance, Inc. 16 01.02.36 513 894 0.02%465 4.900% Anheuser-Busch InBev Finance, Inc. 16 01.02.46 461 700 0.02%750 5.870% Arconic, Inc. 07 23.02.22 706 475 0.03%
1 000 4.625% Ardagh Packaging Finance Plc. Via Ardagh Holdings USA, Inc. 144A 16 15.05.23 898 444 0.04%300 4.700% Arizona Public Service Co. 14 15.01.44 290 478 0.01%500 5.625% Ashtead Capital, Inc. 144A 14 01.10.24 472 430 0.02%750 4.500% AT&T, Inc. 15 15.05.35 649 042 0.03%510 6.375% AT&T, Inc. 16 01.03.41 530 325 0.02%
1 575 4.350% AT&T, Inc. 13 15.06.45 1 286 085 0.06%125 4.150% Atmos Energy Corp. 13 15.01.43 113 889 0.01%
2 100 3.250% Axis Bank Ltd. 14 21.05.20 1 863 275 0.09%2 100 5.750% Banco Daycoval S.A. 14 19.03.19 1 896 785 0.09%
540 4.250% Bank of America Corp. 14 22.10.26 488 145 0.02%500 7.750% Bank of America Corp. 08 14.05.38 633 236 0.03%
1 350 2.950% Bank Rakyat Indonesia Persero Tbk PT 13 28.03.18 1 188 907 0.05%1 000 4.125% Beijing State-Owned Assets Management Hong Kong Co. Ltd. 15 26.05.25 902 056 0.04%3 400 3.717% Bermuda Government International Bond 16 25.01.27 3 011 588 0.14%
750 3.375% Boardwalk Pipelines LP 12 01.02.23 653 602 0.03%400 5.950% Boardwalk Pipelines LP 16 01.06.26 392 042 0.02%700 3.119% BP Capital Markets Plc. 16 04.05.26 607 838 0.03%
1 000 4.375% BPRL International Singapore Pte Ltd. 17 18.01.27 908 084 0.04%300 6.000% Brazilian Government International Bond 16 07.04.26 284 060 0.01%600 8.250% Brazilian Government International Bond 04 20.01.34 658 564 0.03%
2 050 3.125% Burgan Senior SPC Ltd. 16 14.09.21 1 793 730 0.08%850 6.200% Burlington Northern Santa Fe LLC 06 15.08.36 986 393 0.05%550 6.500% Canadian Natural Resources Ltd. 06 15.02.37 574 745 0.03%
1 050 3.500% CCCI Treasure Ltd. 15 29.12.49 929 690 0.04%2 000 9.375% CEMEX Finance LLC 12 12.10.22 1 868 686 0.09%
500 5.625% CenturyLink, Inc. 15 01.04.25 439 439 0.02%600 3.860% Chile Government International Bond 17 21.06.47 528 553 0.02%455 4.875% Cinemark USA, Inc. 13 01.06.23 408 495 0.02%950 6.625% CITIC Ltd. 11 15.04.21 940 134 0.04%
1 600 4.400% Citigroup, Inc. 15 10.06.25 1 460 734 0.07%1 500 3.700% Citigroup, Inc. 16 12.01.26 1 333 981 0.06%
790 4.125% Citigroup, Inc. 16 25.07.28 703 391 0.03%1 000 5.125% Clean Harbors, Inc. 13 01.06.21 896 629 0.04%
400 7.375% Colombia Government International Bond 06 18.09.37 453 806 0.02%1 000 5.500% Concho Resources, Inc. 12 01.04.23 904 244 0.04%
660 5.850% Consolidated Edison Co. of New York, Inc.—Series 06-A 06 15.03.36 724 620 0.03%500 4.375% Consorcio Transmantaro S.A. 144A 13 07.05.23 454 621 0.02%
1 000 4.500% Continental Resources, Inc. 13 15.04.23 839 292 0.04%
136
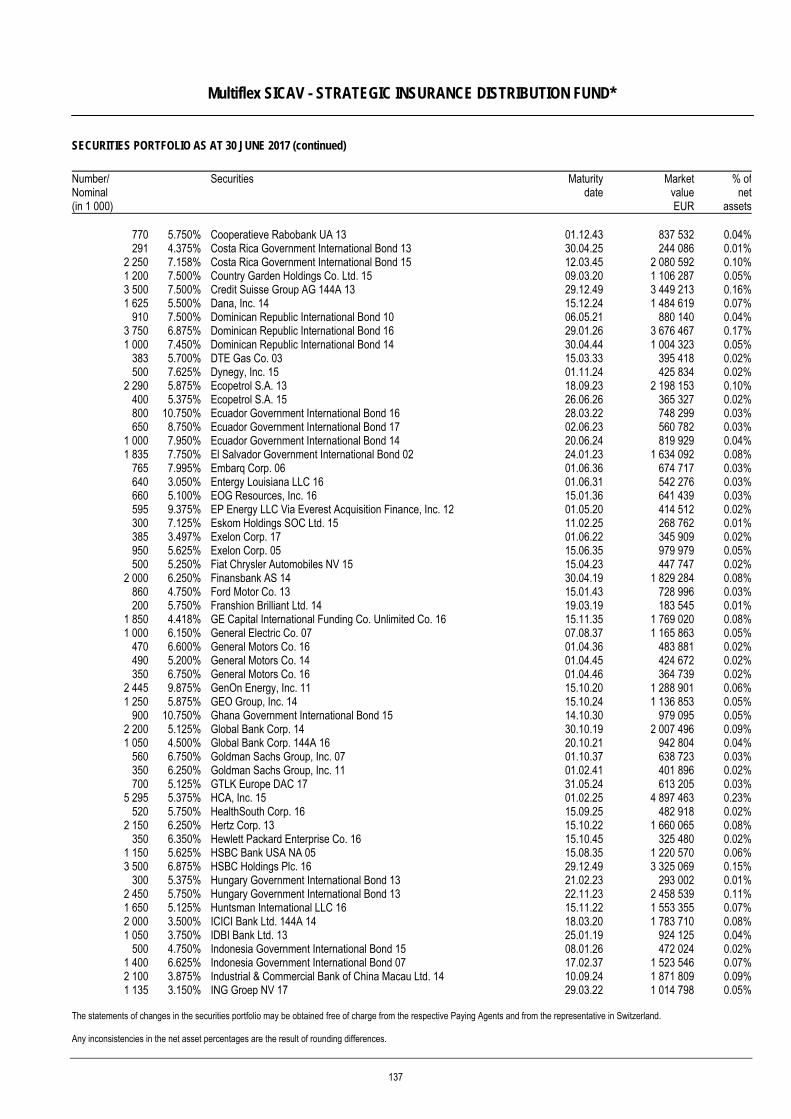
Multiflex SICAV - STRATEGIC INSURANCE DISTRIBUTION FUND*
SECURITIES PORTFOLIO AS AT 30 JUNE 2017 (continued)
The statements of changes in the securities portfolio may be obtained free of charge from the respective Paying Agents and from the representative in Switzerland. Any inconsistencies in the net asset percentages are the result of rounding differences.
Number/ Nominal (in 1 000)
Securities Maturitydate
MarketvalueEUR
% ofnet
assets
770 5.750% Cooperatieve Rabobank UA 13 01.12.43 837 532 0.04%291 4.375% Costa Rica Government International Bond 13 30.04.25 244 086 0.01%
2 250 7.158% Costa Rica Government International Bond 15 12.03.45 2 080 592 0.10%1 200 7.500% Country Garden Holdings Co. Ltd. 15 09.03.20 1 106 287 0.05%3 500 7.500% Credit Suisse Group AG 144A 13 29.12.49 3 449 213 0.16%1 625 5.500% Dana, Inc. 14 15.12.24 1 484 619 0.07%
910 7.500% Dominican Republic International Bond 10 06.05.21 880 140 0.04%3 750 6.875% Dominican Republic International Bond 16 29.01.26 3 676 467 0.17%1 000 7.450% Dominican Republic International Bond 14 30.04.44 1 004 323 0.05%
383 5.700% DTE Gas Co. 03 15.03.33 395 418 0.02%500 7.625% Dynegy, Inc. 15 01.11.24 425 834 0.02%
2 290 5.875% Ecopetrol S.A. 13 18.09.23 2 198 153 0.10%400 5.375% Ecopetrol S.A. 15 26.06.26 365 327 0.02%800 10.750% Ecuador Government International Bond 16 28.03.22 748 299 0.03%650 8.750% Ecuador Government International Bond 17 02.06.23 560 782 0.03%
1 000 7.950% Ecuador Government International Bond 14 20.06.24 819 929 0.04%1 835 7.750% El Salvador Government International Bond 02 24.01.23 1 634 092 0.08%
765 7.995% Embarq Corp. 06 01.06.36 674 717 0.03%640 3.050% Entergy Louisiana LLC 16 01.06.31 542 276 0.03%660 5.100% EOG Resources, Inc. 16 15.01.36 641 439 0.03%595 9.375% EP Energy LLC Via Everest Acquisition Finance, Inc. 12 01.05.20 414 512 0.02%300 7.125% Eskom Holdings SOC Ltd. 15 11.02.25 268 762 0.01%385 3.497% Exelon Corp. 17 01.06.22 345 909 0.02%950 5.625% Exelon Corp. 05 15.06.35 979 979 0.05%500 5.250% Fiat Chrysler Automobiles NV 15 15.04.23 447 747 0.02%
2 000 6.250% Finansbank AS 14 30.04.19 1 829 284 0.08%860 4.750% Ford Motor Co. 13 15.01.43 728 996 0.03%200 5.750% Franshion Brilliant Ltd. 14 19.03.19 183 545 0.01%
1 850 4.418% GE Capital International Funding Co. Unlimited Co. 16 15.11.35 1 769 020 0.08%1 000 6.150% General Electric Co. 07 07.08.37 1 165 863 0.05%
470 6.600% General Motors Co. 16 01.04.36 483 881 0.02%490 5.200% General Motors Co. 14 01.04.45 424 672 0.02%350 6.750% General Motors Co. 16 01.04.46 364 739 0.02%
2 445 9.875% GenOn Energy, Inc. 11 15.10.20 1 288 901 0.06%1 250 5.875% GEO Group, Inc. 14 15.10.24 1 136 853 0.05%
900 10.750% Ghana Government International Bond 15 14.10.30 979 095 0.05%2 200 5.125% Global Bank Corp. 14 30.10.19 2 007 496 0.09%1 050 4.500% Global Bank Corp. 144A 16 20.10.21 942 804 0.04%
560 6.750% Goldman Sachs Group, Inc. 07 01.10.37 638 723 0.03%350 6.250% Goldman Sachs Group, Inc. 11 01.02.41 401 896 0.02%700 5.125% GTLK Europe DAC 17 31.05.24 613 205 0.03%
5 295 5.375% HCA, Inc. 15 01.02.25 4 897 463 0.23%520 5.750% HealthSouth Corp. 16 15.09.25 482 918 0.02%
2 150 6.250% Hertz Corp. 13 15.10.22 1 660 065 0.08%350 6.350% Hewlett Packard Enterprise Co. 16 15.10.45 325 480 0.02%
1 150 5.625% HSBC Bank USA NA 05 15.08.35 1 220 570 0.06%3 500 6.875% HSBC Holdings Plc. 16 29.12.49 3 325 069 0.15%
300 5.375% Hungary Government International Bond 13 21.02.23 293 002 0.01%2 450 5.750% Hungary Government International Bond 13 22.11.23 2 458 539 0.11%1 650 5.125% Huntsman International LLC 16 15.11.22 1 553 355 0.07%2 000 3.500% ICICI Bank Ltd. 144A 14 18.03.20 1 783 710 0.08%1 050 3.750% IDBI Bank Ltd. 13 25.01.19 924 125 0.04%
500 4.750% Indonesia Government International Bond 15 08.01.26 472 024 0.02%1 400 6.625% Indonesia Government International Bond 07 17.02.37 1 523 546 0.07%2 100 3.875% Industrial & Commercial Bank of China Macau Ltd. 14 10.09.24 1 871 809 0.09%1 135 3.150% ING Groep NV 17 29.03.22 1 014 798 0.05%
137
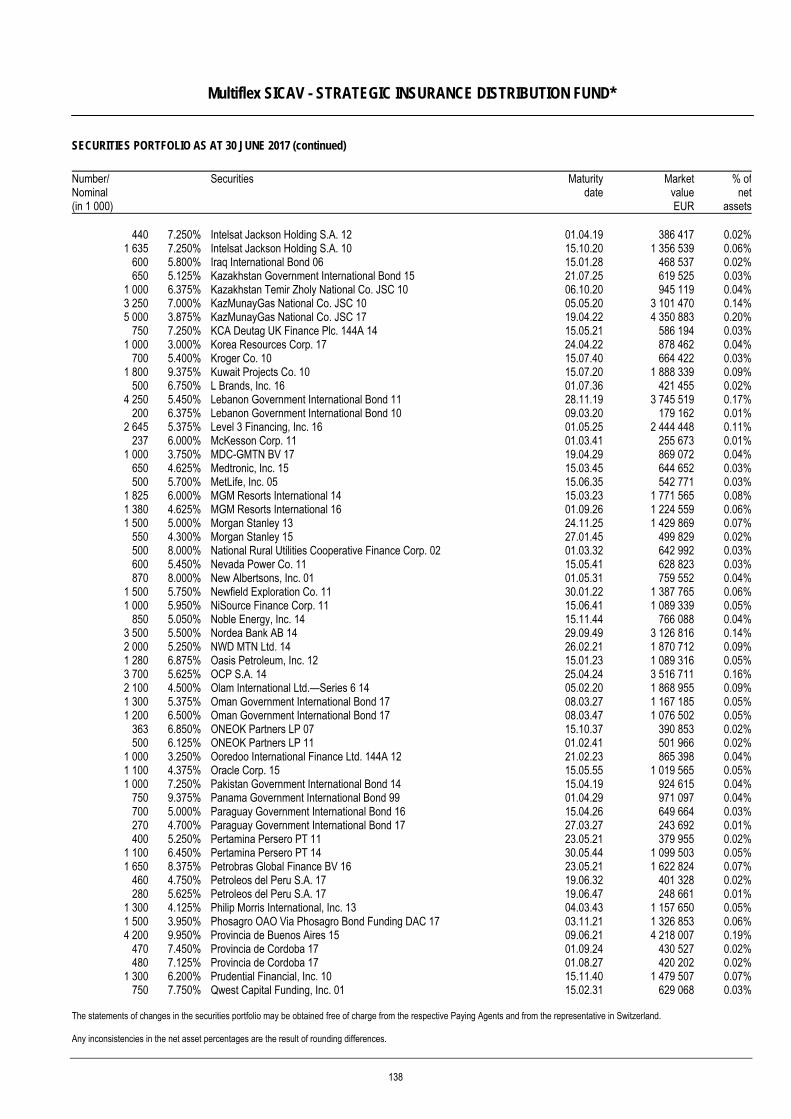
Multiflex SICAV - STRATEGIC INSURANCE DISTRIBUTION FUND*
SECURITIES PORTFOLIO AS AT 30 JUNE 2017 (continued)
The statements of changes in the securities portfolio may be obtained free of charge from the respective Paying Agents and from the representative in Switzerland. Any inconsistencies in the net asset percentages are the result of rounding differences.
Number/ Nominal (in 1 000)
Securities Maturitydate
MarketvalueEUR
% ofnet
assets
440 7.250% Intelsat Jackson Holding S.A. 12 01.04.19 386 417 0.02%1 635 7.250% Intelsat Jackson Holding S.A. 10 15.10.20 1 356 539 0.06%
600 5.800% Iraq International Bond 06 15.01.28 468 537 0.02%650 5.125% Kazakhstan Government International Bond 15 21.07.25 619 525 0.03%
1 000 6.375% Kazakhstan Temir Zholy National Co. JSC 10 06.10.20 945 119 0.04%3 250 7.000% KazMunayGas National Co. JSC 10 05.05.20 3 101 470 0.14%5 000 3.875% KazMunayGas National Co. JSC 17 19.04.22 4 350 883 0.20%
750 7.250% KCA Deutag UK Finance Plc. 144A 14 15.05.21 586 194 0.03%1 000 3.000% Korea Resources Corp. 17 24.04.22 878 462 0.04%
700 5.400% Kroger Co. 10 15.07.40 664 422 0.03%1 800 9.375% Kuwait Projects Co. 10 15.07.20 1 888 339 0.09%
500 6.750% L Brands, Inc. 16 01.07.36 421 455 0.02%4 250 5.450% Lebanon Government International Bond 11 28.11.19 3 745 519 0.17%
200 6.375% Lebanon Government International Bond 10 09.03.20 179 162 0.01%2 645 5.375% Level 3 Financing, Inc. 16 01.05.25 2 444 448 0.11%
237 6.000% McKesson Corp. 11 01.03.41 255 673 0.01%1 000 3.750% MDC-GMTN BV 17 19.04.29 869 072 0.04%
650 4.625% Medtronic, Inc. 15 15.03.45 644 652 0.03%500 5.700% MetLife, Inc. 05 15.06.35 542 771 0.03%
1 825 6.000% MGM Resorts International 14 15.03.23 1 771 565 0.08%1 380 4.625% MGM Resorts International 16 01.09.26 1 224 559 0.06%1 500 5.000% Morgan Stanley 13 24.11.25 1 429 869 0.07%
550 4.300% Morgan Stanley 15 27.01.45 499 829 0.02%500 8.000% National Rural Utilities Cooperative Finance Corp. 02 01.03.32 642 992 0.03%600 5.450% Nevada Power Co. 11 15.05.41 628 823 0.03%870 8.000% New Albertsons, Inc. 01 01.05.31 759 552 0.04%
1 500 5.750% Newfield Exploration Co. 11 30.01.22 1 387 765 0.06%1 000 5.950% NiSource Finance Corp. 11 15.06.41 1 089 339 0.05%
850 5.050% Noble Energy, Inc. 14 15.11.44 766 088 0.04%3 500 5.500% Nordea Bank AB 14 29.09.49 3 126 816 0.14%2 000 5.250% NWD MTN Ltd. 14 26.02.21 1 870 712 0.09%1 280 6.875% Oasis Petroleum, Inc. 12 15.01.23 1 089 316 0.05%3 700 5.625% OCP S.A. 14 25.04.24 3 516 711 0.16%2 100 4.500% Olam International Ltd.—Series 6 14 05.02.20 1 868 955 0.09%1 300 5.375% Oman Government International Bond 17 08.03.27 1 167 185 0.05%1 200 6.500% Oman Government International Bond 17 08.03.47 1 076 502 0.05%
363 6.850% ONEOK Partners LP 07 15.10.37 390 853 0.02%500 6.125% ONEOK Partners LP 11 01.02.41 501 966 0.02%
1 000 3.250% Ooredoo International Finance Ltd. 144A 12 21.02.23 865 398 0.04%1 100 4.375% Oracle Corp. 15 15.05.55 1 019 565 0.05%1 000 7.250% Pakistan Government International Bond 14 15.04.19 924 615 0.04%
750 9.375% Panama Government International Bond 99 01.04.29 971 097 0.04%700 5.000% Paraguay Government International Bond 16 15.04.26 649 664 0.03%270 4.700% Paraguay Government International Bond 17 27.03.27 243 692 0.01%400 5.250% Pertamina Persero PT 11 23.05.21 379 955 0.02%
1 100 6.450% Pertamina Persero PT 14 30.05.44 1 099 503 0.05%1 650 8.375% Petrobras Global Finance BV 16 23.05.21 1 622 824 0.07%
460 4.750% Petroleos del Peru S.A. 17 19.06.32 401 328 0.02%280 5.625% Petroleos del Peru S.A. 17 19.06.47 248 661 0.01%
1 300 4.125% Philip Morris International, Inc. 13 04.03.43 1 157 650 0.05%1 500 3.950% Phosagro OAO Via Phosagro Bond Funding DAC 17 03.11.21 1 326 853 0.06%4 200 9.950% Provincia de Buenos Aires 15 09.06.21 4 218 007 0.19%
470 7.450% Provincia de Cordoba 17 01.09.24 430 527 0.02%480 7.125% Provincia de Cordoba 17 01.08.27 420 202 0.02%
1 300 6.200% Prudential Financial, Inc. 10 15.11.40 1 479 507 0.07%750 7.750% Qwest Capital Funding, Inc. 01 15.02.31 629 068 0.03%
138
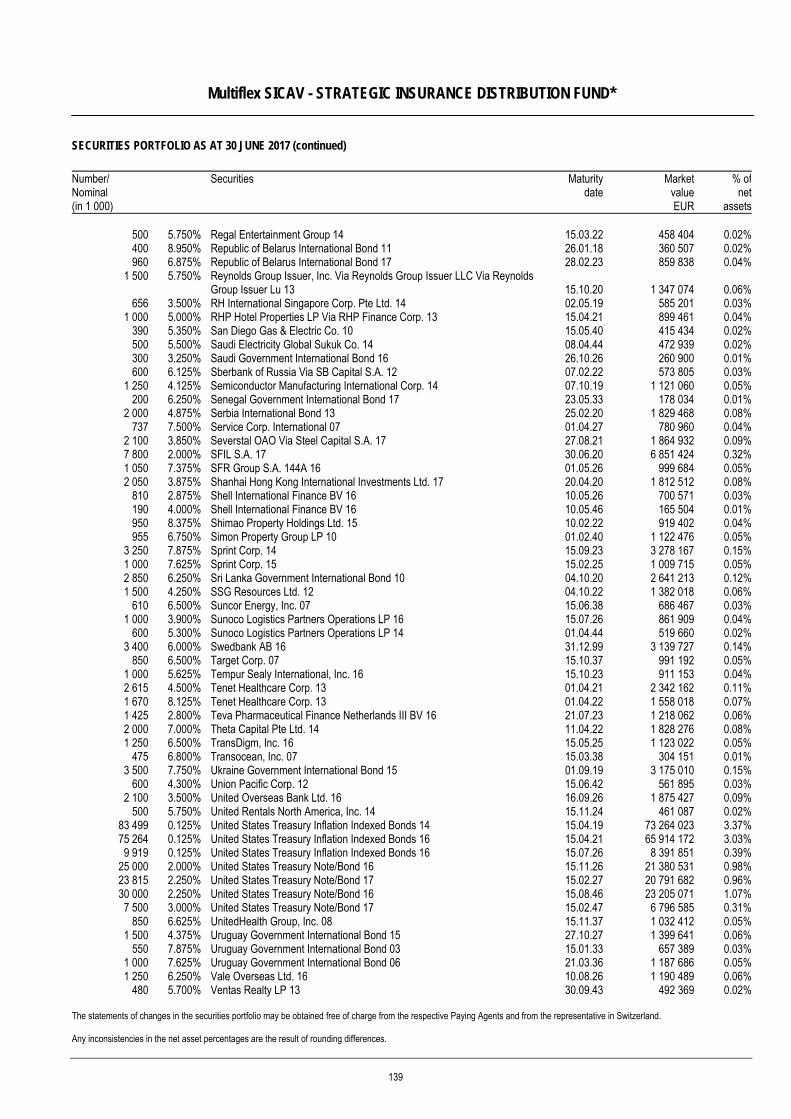
Multiflex SICAV - STRATEGIC INSURANCE DISTRIBUTION FUND*
SECURITIES PORTFOLIO AS AT 30 JUNE 2017 (continued)
The statements of changes in the securities portfolio may be obtained free of charge from the respective Paying Agents and from the representative in Switzerland. Any inconsistencies in the net asset percentages are the result of rounding differences.
Number/ Nominal (in 1 000)
Securities Maturitydate
MarketvalueEUR
% ofnet
assets
500 5.750% Regal Entertainment Group 14 15.03.22 458 404 0.02%400 8.950% Republic of Belarus International Bond 11 26.01.18 360 507 0.02%960 6.875% Republic of Belarus International Bond 17 28.02.23 859 838 0.04%
1 500 5.750% Reynolds Group Issuer, Inc. Via Reynolds Group Issuer LLC Via Reynolds Group Issuer Lu 13 15.10.20 1 347 074 0.06%
656 3.500% RH International Singapore Corp. Pte Ltd. 14 02.05.19 585 201 0.03%1 000 5.000% RHP Hotel Properties LP Via RHP Finance Corp. 13 15.04.21 899 461 0.04%
390 5.350% San Diego Gas & Electric Co. 10 15.05.40 415 434 0.02%500 5.500% Saudi Electricity Global Sukuk Co. 14 08.04.44 472 939 0.02%300 3.250% Saudi Government International Bond 16 26.10.26 260 900 0.01%600 6.125% Sberbank of Russia Via SB Capital S.A. 12 07.02.22 573 805 0.03%
1 250 4.125% Semiconductor Manufacturing International Corp. 14 07.10.19 1 121 060 0.05%200 6.250% Senegal Government International Bond 17 23.05.33 178 034 0.01%
2 000 4.875% Serbia International Bond 13 25.02.20 1 829 468 0.08%737 7.500% Service Corp. International 07 01.04.27 780 960 0.04%
2 100 3.850% Severstal OAO Via Steel Capital S.A. 17 27.08.21 1 864 932 0.09%7 800 2.000% SFIL S.A. 17 30.06.20 6 851 424 0.32%1 050 7.375% SFR Group S.A. 144A 16 01.05.26 999 684 0.05%2 050 3.875% Shanhai Hong Kong International Investments Ltd. 17 20.04.20 1 812 512 0.08%
810 2.875% Shell International Finance BV 16 10.05.26 700 571 0.03%190 4.000% Shell International Finance BV 16 10.05.46 165 504 0.01%950 8.375% Shimao Property Holdings Ltd. 15 10.02.22 919 402 0.04%955 6.750% Simon Property Group LP 10 01.02.40 1 122 476 0.05%
3 250 7.875% Sprint Corp. 14 15.09.23 3 278 167 0.15%1 000 7.625% Sprint Corp. 15 15.02.25 1 009 715 0.05%2 850 6.250% Sri Lanka Government International Bond 10 04.10.20 2 641 213 0.12%1 500 4.250% SSG Resources Ltd. 12 04.10.22 1 382 018 0.06%
610 6.500% Suncor Energy, Inc. 07 15.06.38 686 467 0.03%1 000 3.900% Sunoco Logistics Partners Operations LP 16 15.07.26 861 909 0.04%
600 5.300% Sunoco Logistics Partners Operations LP 14 01.04.44 519 660 0.02%3 400 6.000% Swedbank AB 16 31.12.99 3 139 727 0.14%
850 6.500% Target Corp. 07 15.10.37 991 192 0.05%1 000 5.625% Tempur Sealy International, Inc. 16 15.10.23 911 153 0.04%2 615 4.500% Tenet Healthcare Corp. 13 01.04.21 2 342 162 0.11%1 670 8.125% Tenet Healthcare Corp. 13 01.04.22 1 558 018 0.07%1 425 2.800% Teva Pharmaceutical Finance Netherlands III BV 16 21.07.23 1 218 062 0.06%2 000 7.000% Theta Capital Pte Ltd. 14 11.04.22 1 828 276 0.08%1 250 6.500% TransDigm, Inc. 16 15.05.25 1 123 022 0.05%
475 6.800% Transocean, Inc. 07 15.03.38 304 151 0.01%3 500 7.750% Ukraine Government International Bond 15 01.09.19 3 175 010 0.15%
600 4.300% Union Pacific Corp. 12 15.06.42 561 895 0.03%2 100 3.500% United Overseas Bank Ltd. 16 16.09.26 1 875 427 0.09%
500 5.750% United Rentals North America, Inc. 14 15.11.24 461 087 0.02%83 499 0.125% United States Treasury Inflation Indexed Bonds 14 15.04.19 73 264 023 3.37%75 264 0.125% United States Treasury Inflation Indexed Bonds 16 15.04.21 65 914 172 3.03%9 919 0.125% United States Treasury Inflation Indexed Bonds 16 15.07.26 8 391 851 0.39%
25 000 2.000% United States Treasury Note/Bond 16 15.11.26 21 380 531 0.98%23 815 2.250% United States Treasury Note/Bond 17 15.02.27 20 791 682 0.96%30 000 2.250% United States Treasury Note/Bond 16 15.08.46 23 205 071 1.07%7 500 3.000% United States Treasury Note/Bond 17 15.02.47 6 796 585 0.31%
850 6.625% UnitedHealth Group, Inc. 08 15.11.37 1 032 412 0.05%1 500 4.375% Uruguay Government International Bond 15 27.10.27 1 399 641 0.06%
550 7.875% Uruguay Government International Bond 03 15.01.33 657 389 0.03%1 000 7.625% Uruguay Government International Bond 06 21.03.36 1 187 686 0.05%1 250 6.250% Vale Overseas Ltd. 16 10.08.26 1 190 489 0.06%
480 5.700% Ventas Realty LP 13 30.09.43 492 369 0.02%
139
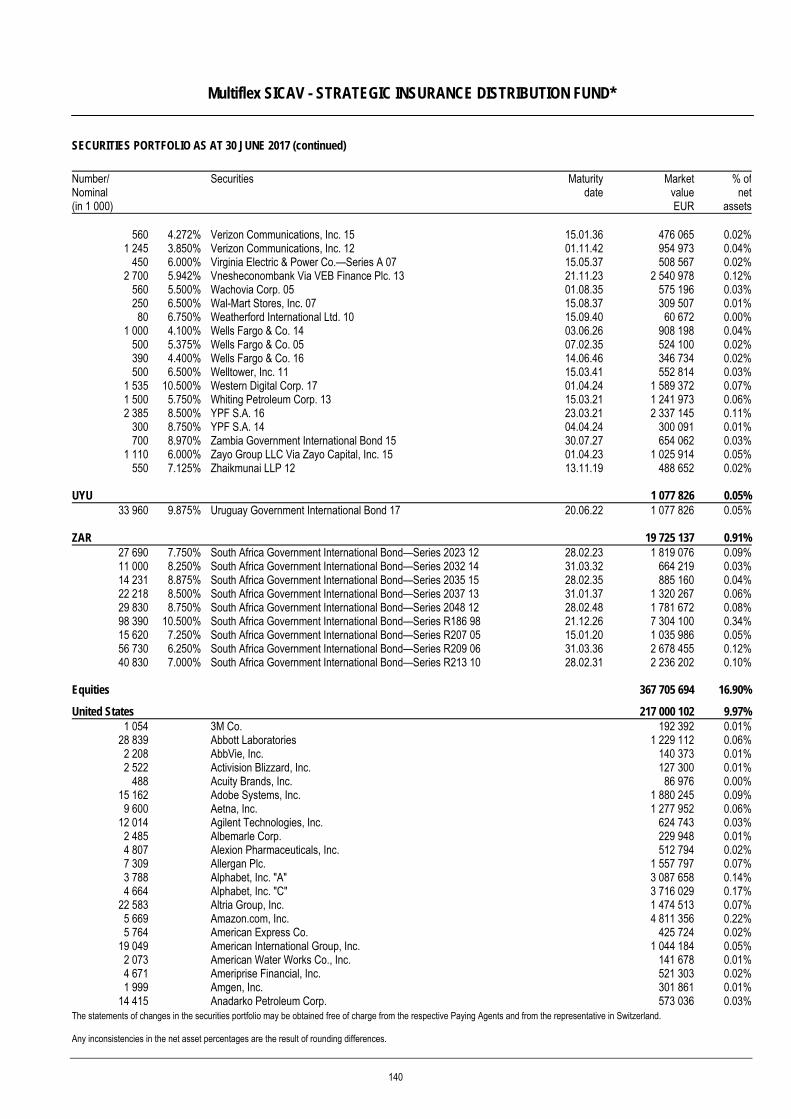
Multiflex SICAV - STRATEGIC INSURANCE DISTRIBUTION FUND*
SECURITIES PORTFOLIO AS AT 30 JUNE 2017 (continued)
The statements of changes in the securities portfolio may be obtained free of charge from the respective Paying Agents and from the representative in Switzerland. Any inconsistencies in the net asset percentages are the result of rounding differences.
Number/ Nominal (in 1 000)
Securities Maturitydate
MarketvalueEUR
% ofnet
assets
560 4.272% Verizon Communications, Inc. 15 15.01.36 476 065 0.02%1 245 3.850% Verizon Communications, Inc. 12 01.11.42 954 973 0.04%
450 6.000% Virginia Electric & Power Co.—Series A 07 15.05.37 508 567 0.02%2 700 5.942% Vnesheconombank Via VEB Finance Plc. 13 21.11.23 2 540 978 0.12%
560 5.500% Wachovia Corp. 05 01.08.35 575 196 0.03%250 6.500% Wal-Mart Stores, Inc. 07 15.08.37 309 507 0.01%80 6.750% Weatherford International Ltd. 10 15.09.40 60 672 0.00%
1 000 4.100% Wells Fargo & Co. 14 03.06.26 908 198 0.04%500 5.375% Wells Fargo & Co. 05 07.02.35 524 100 0.02%390 4.400% Wells Fargo & Co. 16 14.06.46 346 734 0.02%500 6.500% Welltower, Inc. 11 15.03.41 552 814 0.03%
1 535 10.500% Western Digital Corp. 17 01.04.24 1 589 372 0.07%1 500 5.750% Whiting Petroleum Corp. 13 15.03.21 1 241 973 0.06%2 385 8.500% YPF S.A. 16 23.03.21 2 337 145 0.11%
300 8.750% YPF S.A. 14 04.04.24 300 091 0.01%700 8.970% Zambia Government International Bond 15 30.07.27 654 062 0.03%
1 110 6.000% Zayo Group LLC Via Zayo Capital, Inc. 15 01.04.23 1 025 914 0.05%550 7.125% Zhaikmunai LLP 12 13.11.19 488 652 0.02%
UYU 1 077 826 0.05%33 960 9.875% Uruguay Government International Bond 17 20.06.22 1 077 826 0.05%
ZAR 19 725 137 0.91%27 690 7.750% South Africa Government International Bond—Series 2023 12 28.02.23 1 819 076 0.09%11 000 8.250% South Africa Government International Bond—Series 2032 14 31.03.32 664 219 0.03%14 231 8.875% South Africa Government International Bond—Series 2035 15 28.02.35 885 160 0.04%22 218 8.500% South Africa Government International Bond—Series 2037 13 31.01.37 1 320 267 0.06%29 830 8.750% South Africa Government International Bond—Series 2048 12 28.02.48 1 781 672 0.08%98 390 10.500% South Africa Government International Bond—Series R186 98 21.12.26 7 304 100 0.34%15 620 7.250% South Africa Government International Bond—Series R207 05 15.01.20 1 035 986 0.05%56 730 6.250% South Africa Government International Bond—Series R209 06 31.03.36 2 678 455 0.12%40 830 7.000% South Africa Government International Bond—Series R213 10 28.02.31 2 236 202 0.10%
Equities 367 705 694 16.90%
United States 217 000 102 9.97%1 054 3M Co. 192 392 0.01%
28 839 Abbott Laboratories 1 229 112 0.06%2 208 AbbVie, Inc. 140 373 0.01%2 522 Activision Blizzard, Inc. 127 300 0.01%
488 Acuity Brands, Inc. 86 976 0.00%15 162 Adobe Systems, Inc. 1 880 245 0.09%9 600 Aetna, Inc. 1 277 952 0.06%
12 014 Agilent Technologies, Inc. 624 743 0.03%2 485 Albemarle Corp. 229 948 0.01%4 807 Alexion Pharmaceuticals, Inc. 512 794 0.02%7 309 Allergan Plc. 1 557 797 0.07%3 788 Alphabet, Inc. "A" 3 087 658 0.14%4 664 Alphabet, Inc. "C" 3 716 029 0.17%
22 583 Altria Group, Inc. 1 474 513 0.07%5 669 Amazon.com, Inc. 4 811 356 0.22%5 764 American Express Co. 425 724 0.02%
19 049 American International Group, Inc. 1 044 184 0.05%2 073 American Water Works Co., Inc. 141 678 0.01%4 671 Ameriprise Financial, Inc. 521 303 0.02%1 999 Amgen, Inc. 301 861 0.01%
14 415 Anadarko Petroleum Corp. 573 036 0.03%
140
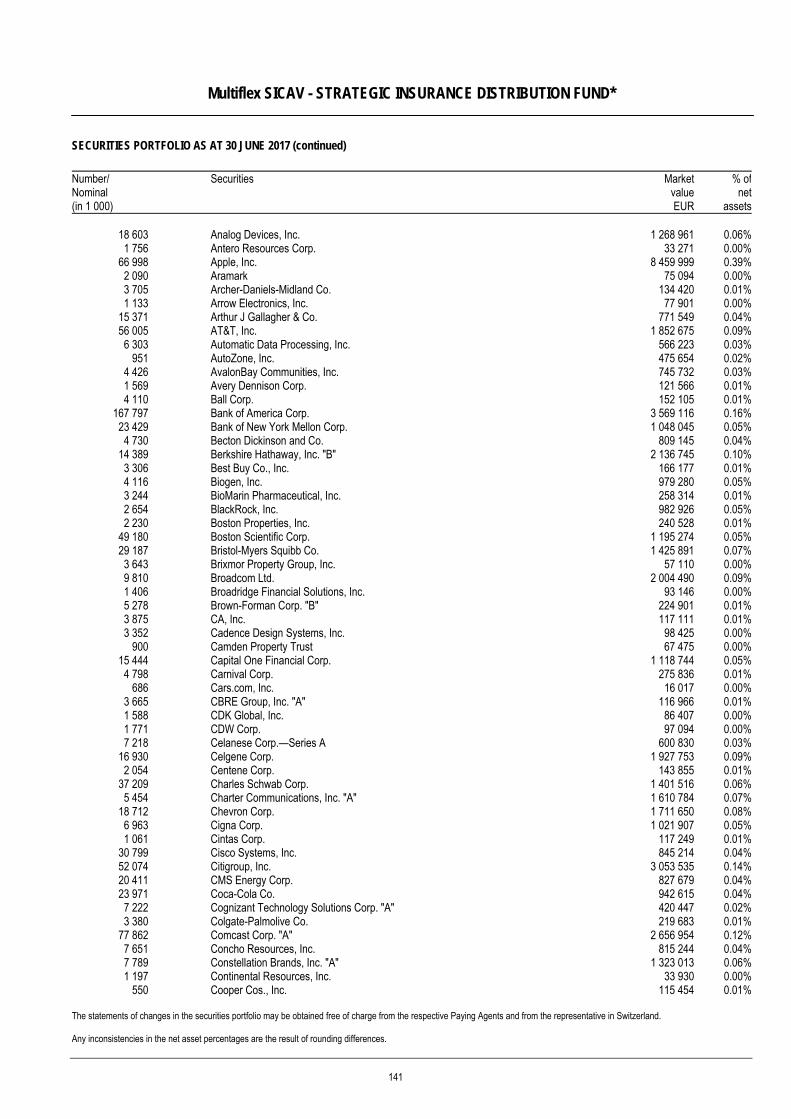
Multiflex SICAV - STRATEGIC INSURANCE DISTRIBUTION FUND*
SECURITIES PORTFOLIO AS AT 30 JUNE 2017 (continued)
The statements of changes in the securities portfolio may be obtained free of charge from the respective Paying Agents and from the representative in Switzerland. Any inconsistencies in the net asset percentages are the result of rounding differences.
Number/ Nominal (in 1 000)
Securities MarketvalueEUR
% ofnet
assets
18 603 Analog Devices, Inc. 1 268 961 0.06%1 756 Antero Resources Corp. 33 271 0.00%
66 998 Apple, Inc. 8 459 999 0.39%2 090 Aramark 75 094 0.00%3 705 Archer-Daniels-Midland Co. 134 420 0.01%1 133 Arrow Electronics, Inc. 77 901 0.00%
15 371 Arthur J Gallagher & Co. 771 549 0.04%56 005 AT&T, Inc. 1 852 675 0.09%6 303 Automatic Data Processing, Inc. 566 223 0.03%
951 AutoZone, Inc. 475 654 0.02%4 426 AvalonBay Communities, Inc. 745 732 0.03%1 569 Avery Dennison Corp. 121 566 0.01%4 110 Ball Corp. 152 105 0.01%
167 797 Bank of America Corp. 3 569 116 0.16%23 429 Bank of New York Mellon Corp. 1 048 045 0.05%4 730 Becton Dickinson and Co. 809 145 0.04%
14 389 Berkshire Hathaway, Inc. "B" 2 136 745 0.10%3 306 Best Buy Co., Inc. 166 177 0.01%4 116 Biogen, Inc. 979 280 0.05%3 244 BioMarin Pharmaceutical, Inc. 258 314 0.01%2 654 BlackRock, Inc. 982 926 0.05%2 230 Boston Properties, Inc. 240 528 0.01%
49 180 Boston Scientific Corp. 1 195 274 0.05%29 187 Bristol-Myers Squibb Co. 1 425 891 0.07%3 643 Brixmor Property Group, Inc. 57 110 0.00%9 810 Broadcom Ltd. 2 004 490 0.09%1 406 Broadridge Financial Solutions, Inc. 93 146 0.00%5 278 Brown-Forman Corp. "B" 224 901 0.01%3 875 CA, Inc. 117 111 0.01%3 352 Cadence Design Systems, Inc. 98 425 0.00%
900 Camden Property Trust 67 475 0.00%15 444 Capital One Financial Corp. 1 118 744 0.05%4 798 Carnival Corp. 275 836 0.01%
686 Cars.com, Inc. 16 017 0.00%3 665 CBRE Group, Inc. "A" 116 966 0.01%1 588 CDK Global, Inc. 86 407 0.00%1 771 CDW Corp. 97 094 0.00%7 218 Celanese Corp.—Series A 600 830 0.03%
16 930 Celgene Corp. 1 927 753 0.09%2 054 Centene Corp. 143 855 0.01%
37 209 Charles Schwab Corp. 1 401 516 0.06%5 454 Charter Communications, Inc. "A" 1 610 784 0.07%
18 712 Chevron Corp. 1 711 650 0.08%6 963 Cigna Corp. 1 021 907 0.05%1 061 Cintas Corp. 117 249 0.01%
30 799 Cisco Systems, Inc. 845 214 0.04%52 074 Citigroup, Inc. 3 053 535 0.14%20 411 CMS Energy Corp. 827 679 0.04%23 971 Coca-Cola Co. 942 615 0.04%7 222 Cognizant Technology Solutions Corp. "A" 420 447 0.02%3 380 Colgate-Palmolive Co. 219 683 0.01%
77 862 Comcast Corp. "A" 2 656 954 0.12%7 651 Concho Resources, Inc. 815 244 0.04%7 789 Constellation Brands, Inc. "A" 1 323 013 0.06%1 197 Continental Resources, Inc. 33 930 0.00%
550 Cooper Cos., Inc. 115 454 0.01%
141
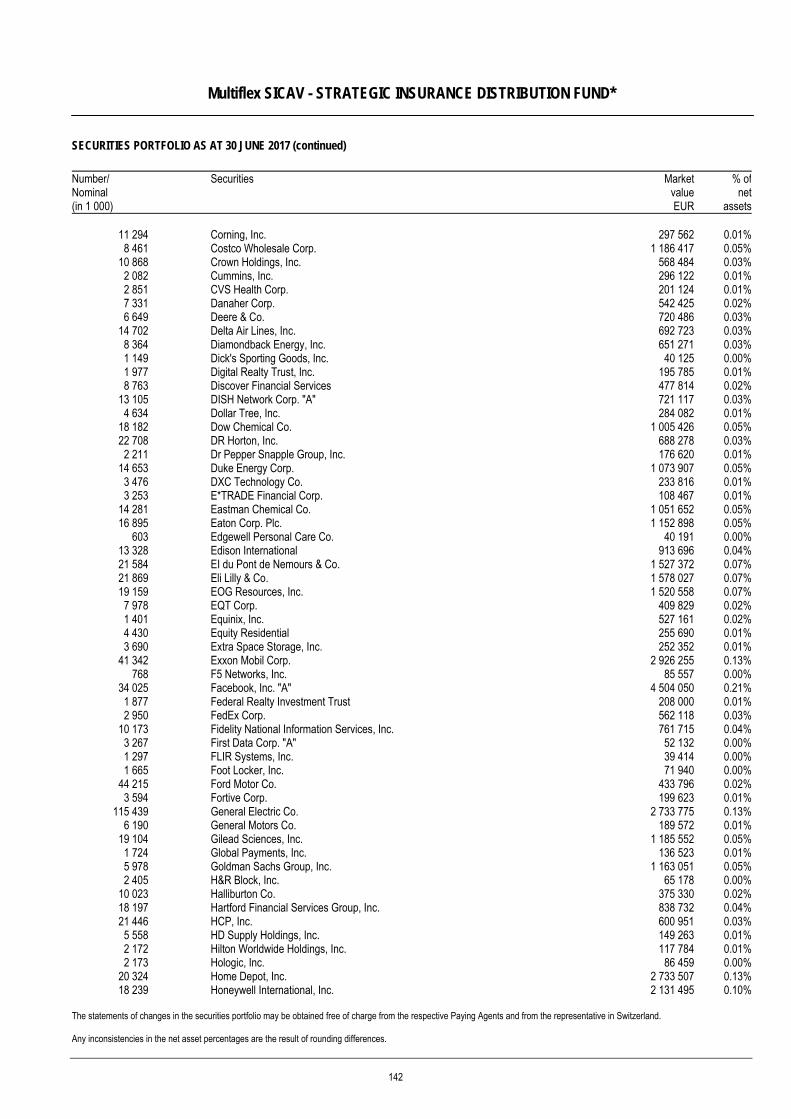
Multiflex SICAV - STRATEGIC INSURANCE DISTRIBUTION FUND*
SECURITIES PORTFOLIO AS AT 30 JUNE 2017 (continued)
The statements of changes in the securities portfolio may be obtained free of charge from the respective Paying Agents and from the representative in Switzerland. Any inconsistencies in the net asset percentages are the result of rounding differences.
Number/ Nominal (in 1 000)
Securities MarketvalueEUR
% ofnet
assets
11 294 Corning, Inc. 297 562 0.01%8 461 Costco Wholesale Corp. 1 186 417 0.05%
10 868 Crown Holdings, Inc. 568 484 0.03%2 082 Cummins, Inc. 296 122 0.01%2 851 CVS Health Corp. 201 124 0.01%7 331 Danaher Corp. 542 425 0.02%6 649 Deere & Co. 720 486 0.03%
14 702 Delta Air Lines, Inc. 692 723 0.03%8 364 Diamondback Energy, Inc. 651 271 0.03%1 149 Dick's Sporting Goods, Inc. 40 125 0.00%1 977 Digital Realty Trust, Inc. 195 785 0.01%8 763 Discover Financial Services 477 814 0.02%
13 105 DISH Network Corp. "A" 721 117 0.03%4 634 Dollar Tree, Inc. 284 082 0.01%
18 182 Dow Chemical Co. 1 005 426 0.05%22 708 DR Horton, Inc. 688 278 0.03%2 211 Dr Pepper Snapple Group, Inc. 176 620 0.01%
14 653 Duke Energy Corp. 1 073 907 0.05%3 476 DXC Technology Co. 233 816 0.01%3 253 E*TRADE Financial Corp. 108 467 0.01%
14 281 Eastman Chemical Co. 1 051 652 0.05%16 895 Eaton Corp. Plc. 1 152 898 0.05%
603 Edgewell Personal Care Co. 40 191 0.00%13 328 Edison International 913 696 0.04%21 584 EI du Pont de Nemours & Co. 1 527 372 0.07%21 869 Eli Lilly & Co. 1 578 027 0.07%19 159 EOG Resources, Inc. 1 520 558 0.07%7 978 EQT Corp. 409 829 0.02%1 401 Equinix, Inc. 527 161 0.02%4 430 Equity Residential 255 690 0.01%3 690 Extra Space Storage, Inc. 252 352 0.01%
41 342 Exxon Mobil Corp. 2 926 255 0.13%768 F5 Networks, Inc. 85 557 0.00%
34 025 Facebook, Inc. "A" 4 504 050 0.21%1 877 Federal Realty Investment Trust 208 000 0.01%2 950 FedEx Corp. 562 118 0.03%
10 173 Fidelity National Information Services, Inc. 761 715 0.04%3 267 First Data Corp. "A" 52 132 0.00%1 297 FLIR Systems, Inc. 39 414 0.00%1 665 Foot Locker, Inc. 71 940 0.00%
44 215 Ford Motor Co. 433 796 0.02%3 594 Fortive Corp. 199 623 0.01%
115 439 General Electric Co. 2 733 775 0.13%6 190 General Motors Co. 189 572 0.01%
19 104 Gilead Sciences, Inc. 1 185 552 0.05%1 724 Global Payments, Inc. 136 523 0.01%5 978 Goldman Sachs Group, Inc. 1 163 051 0.05%2 405 H&R Block, Inc. 65 178 0.00%
10 023 Halliburton Co. 375 330 0.02%18 197 Hartford Financial Services Group, Inc. 838 732 0.04%21 446 HCP, Inc. 600 951 0.03%5 558 HD Supply Holdings, Inc. 149 263 0.01%2 172 Hilton Worldwide Holdings, Inc. 117 784 0.01%2 173 Hologic, Inc. 86 459 0.00%
20 324 Home Depot, Inc. 2 733 507 0.13%18 239 Honeywell International, Inc. 2 131 495 0.10%
142
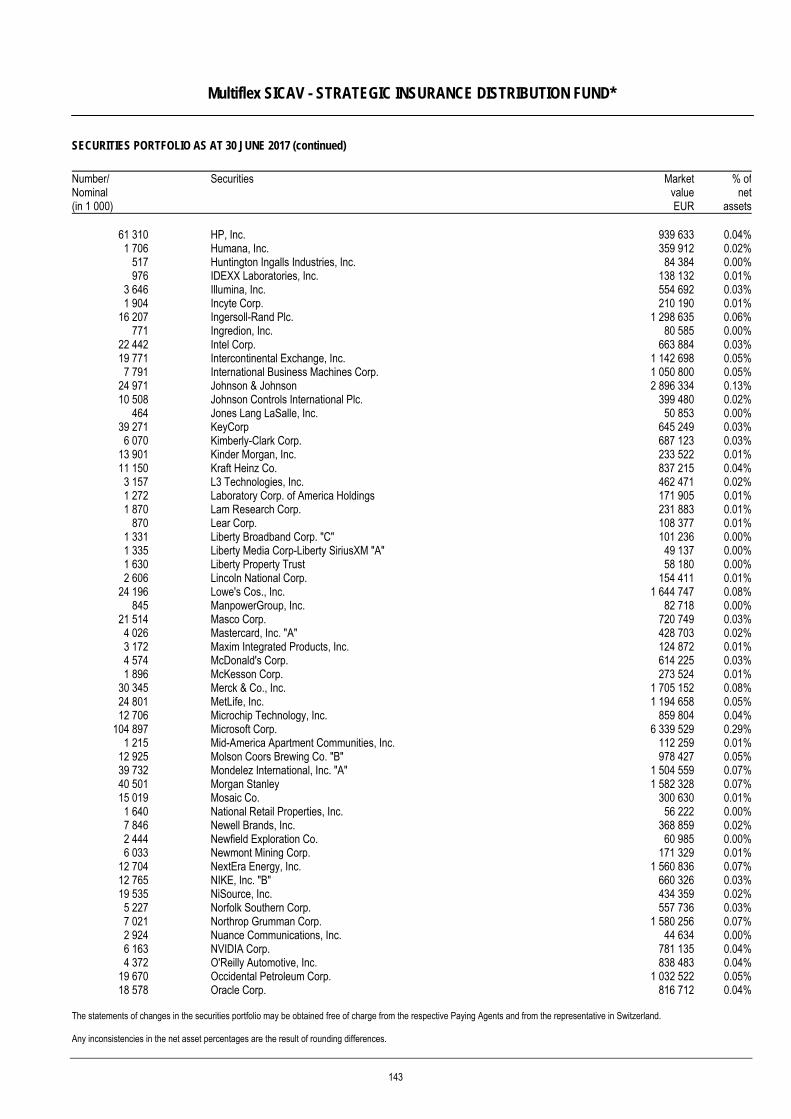
Multiflex SICAV - STRATEGIC INSURANCE DISTRIBUTION FUND*
SECURITIES PORTFOLIO AS AT 30 JUNE 2017 (continued)
The statements of changes in the securities portfolio may be obtained free of charge from the respective Paying Agents and from the representative in Switzerland. Any inconsistencies in the net asset percentages are the result of rounding differences.
Number/ Nominal (in 1 000)
Securities MarketvalueEUR
% ofnet
assets
61 310 HP, Inc. 939 633 0.04%1 706 Humana, Inc. 359 912 0.02%
517 Huntington Ingalls Industries, Inc. 84 384 0.00%976 IDEXX Laboratories, Inc. 138 132 0.01%
3 646 Illumina, Inc. 554 692 0.03%1 904 Incyte Corp. 210 190 0.01%
16 207 Ingersoll-Rand Plc. 1 298 635 0.06%771 Ingredion, Inc. 80 585 0.00%
22 442 Intel Corp. 663 884 0.03%19 771 Intercontinental Exchange, Inc. 1 142 698 0.05%7 791 International Business Machines Corp. 1 050 800 0.05%
24 971 Johnson & Johnson 2 896 334 0.13%10 508 Johnson Controls International Plc. 399 480 0.02%
464 Jones Lang LaSalle, Inc. 50 853 0.00%39 271 KeyCorp 645 249 0.03%6 070 Kimberly-Clark Corp. 687 123 0.03%
13 901 Kinder Morgan, Inc. 233 522 0.01%11 150 Kraft Heinz Co. 837 215 0.04%3 157 L3 Technologies, Inc. 462 471 0.02%1 272 Laboratory Corp. of America Holdings 171 905 0.01%1 870 Lam Research Corp. 231 883 0.01%
870 Lear Corp. 108 377 0.01%1 331 Liberty Broadband Corp. "C" 101 236 0.00%1 335 Liberty Media Corp-Liberty SiriusXM "A" 49 137 0.00%1 630 Liberty Property Trust 58 180 0.00%2 606 Lincoln National Corp. 154 411 0.01%
24 196 Lowe's Cos., Inc. 1 644 747 0.08%845 ManpowerGroup, Inc. 82 718 0.00%
21 514 Masco Corp. 720 749 0.03%4 026 Mastercard, Inc. "A" 428 703 0.02%3 172 Maxim Integrated Products, Inc. 124 872 0.01%4 574 McDonald's Corp. 614 225 0.03%1 896 McKesson Corp. 273 524 0.01%
30 345 Merck & Co., Inc. 1 705 152 0.08%24 801 MetLife, Inc. 1 194 658 0.05%12 706 Microchip Technology, Inc. 859 804 0.04%
104 897 Microsoft Corp. 6 339 529 0.29%1 215 Mid-America Apartment Communities, Inc. 112 259 0.01%
12 925 Molson Coors Brewing Co. "B" 978 427 0.05%39 732 Mondelez International, Inc. "A" 1 504 559 0.07%40 501 Morgan Stanley 1 582 328 0.07%15 019 Mosaic Co. 300 630 0.01%1 640 National Retail Properties, Inc. 56 222 0.00%7 846 Newell Brands, Inc. 368 859 0.02%2 444 Newfield Exploration Co. 60 985 0.00%6 033 Newmont Mining Corp. 171 329 0.01%
12 704 NextEra Energy, Inc. 1 560 836 0.07%12 765 NIKE, Inc. "B" 660 326 0.03%19 535 NiSource, Inc. 434 359 0.02%5 227 Norfolk Southern Corp. 557 736 0.03%7 021 Northrop Grumman Corp. 1 580 256 0.07%2 924 Nuance Communications, Inc. 44 634 0.00%6 163 NVIDIA Corp. 781 135 0.04%4 372 O'Reilly Automotive, Inc. 838 483 0.04%
19 670 Occidental Petroleum Corp. 1 032 522 0.05%18 578 Oracle Corp. 816 712 0.04%
143
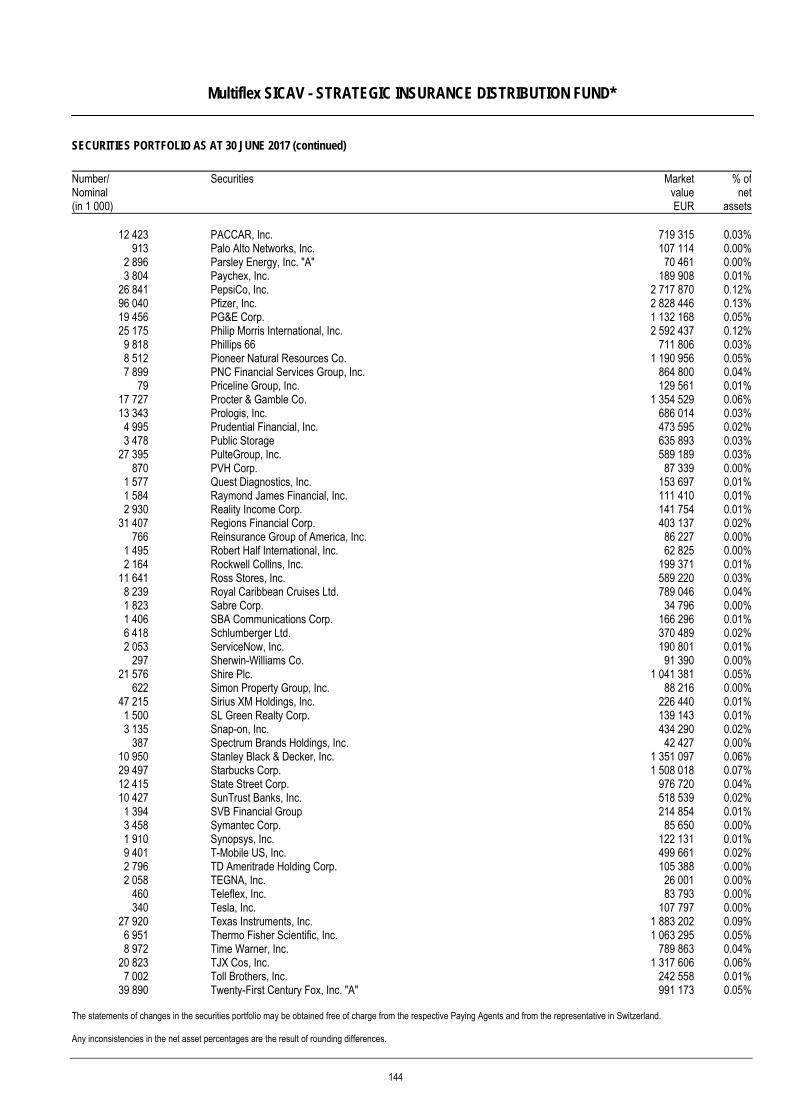
Multiflex SICAV - STRATEGIC INSURANCE DISTRIBUTION FUND*
SECURITIES PORTFOLIO AS AT 30 JUNE 2017 (continued)
The statements of changes in the securities portfolio may be obtained free of charge from the respective Paying Agents and from the representative in Switzerland. Any inconsistencies in the net asset percentages are the result of rounding differences.
Number/ Nominal (in 1 000)
Securities MarketvalueEUR
% ofnet
assets
12 423 PACCAR, Inc. 719 315 0.03%913 Palo Alto Networks, Inc. 107 114 0.00%
2 896 Parsley Energy, Inc. "A" 70 461 0.00%3 804 Paychex, Inc. 189 908 0.01%
26 841 PepsiCo, Inc. 2 717 870 0.12%96 040 Pfizer, Inc. 2 828 446 0.13%19 456 PG&E Corp. 1 132 168 0.05%25 175 Philip Morris International, Inc. 2 592 437 0.12%9 818 Phillips 66 711 806 0.03%8 512 Pioneer Natural Resources Co. 1 190 956 0.05%7 899 PNC Financial Services Group, Inc. 864 800 0.04%
79 Priceline Group, Inc. 129 561 0.01%17 727 Procter & Gamble Co. 1 354 529 0.06%13 343 Prologis, Inc. 686 014 0.03%4 995 Prudential Financial, Inc. 473 595 0.02%3 478 Public Storage 635 893 0.03%
27 395 PulteGroup, Inc. 589 189 0.03%870 PVH Corp. 87 339 0.00%
1 577 Quest Diagnostics, Inc. 153 697 0.01%1 584 Raymond James Financial, Inc. 111 410 0.01%2 930 Reality Income Corp. 141 754 0.01%
31 407 Regions Financial Corp. 403 137 0.02%766 Reinsurance Group of America, Inc. 86 227 0.00%
1 495 Robert Half International, Inc. 62 825 0.00%2 164 Rockwell Collins, Inc. 199 371 0.01%
11 641 Ross Stores, Inc. 589 220 0.03%8 239 Royal Caribbean Cruises Ltd. 789 046 0.04%1 823 Sabre Corp. 34 796 0.00%1 406 SBA Communications Corp. 166 296 0.01%6 418 Schlumberger Ltd. 370 489 0.02%2 053 ServiceNow, Inc. 190 801 0.01%
297 Sherwin-Williams Co. 91 390 0.00%21 576 Shire Plc. 1 041 381 0.05%
622 Simon Property Group, Inc. 88 216 0.00%47 215 Sirius XM Holdings, Inc. 226 440 0.01%1 500 SL Green Realty Corp. 139 143 0.01%3 135 Snap-on, Inc. 434 290 0.02%
387 Spectrum Brands Holdings, Inc. 42 427 0.00%10 950 Stanley Black & Decker, Inc. 1 351 097 0.06%29 497 Starbucks Corp. 1 508 018 0.07%12 415 State Street Corp. 976 720 0.04%10 427 SunTrust Banks, Inc. 518 539 0.02%1 394 SVB Financial Group 214 854 0.01%3 458 Symantec Corp. 85 650 0.00%1 910 Synopsys, Inc. 122 131 0.01%9 401 T-Mobile US, Inc. 499 661 0.02%2 796 TD Ameritrade Holding Corp. 105 388 0.00%2 058 TEGNA, Inc. 26 001 0.00%
460 Teleflex, Inc. 83 793 0.00%340 Tesla, Inc. 107 797 0.00%
27 920 Texas Instruments, Inc. 1 883 202 0.09%6 951 Thermo Fisher Scientific, Inc. 1 063 295 0.05%8 972 Time Warner, Inc. 789 863 0.04%
20 823 TJX Cos, Inc. 1 317 606 0.06%7 002 Toll Brothers, Inc. 242 558 0.01%
39 890 Twenty-First Century Fox, Inc. "A" 991 173 0.05%
144
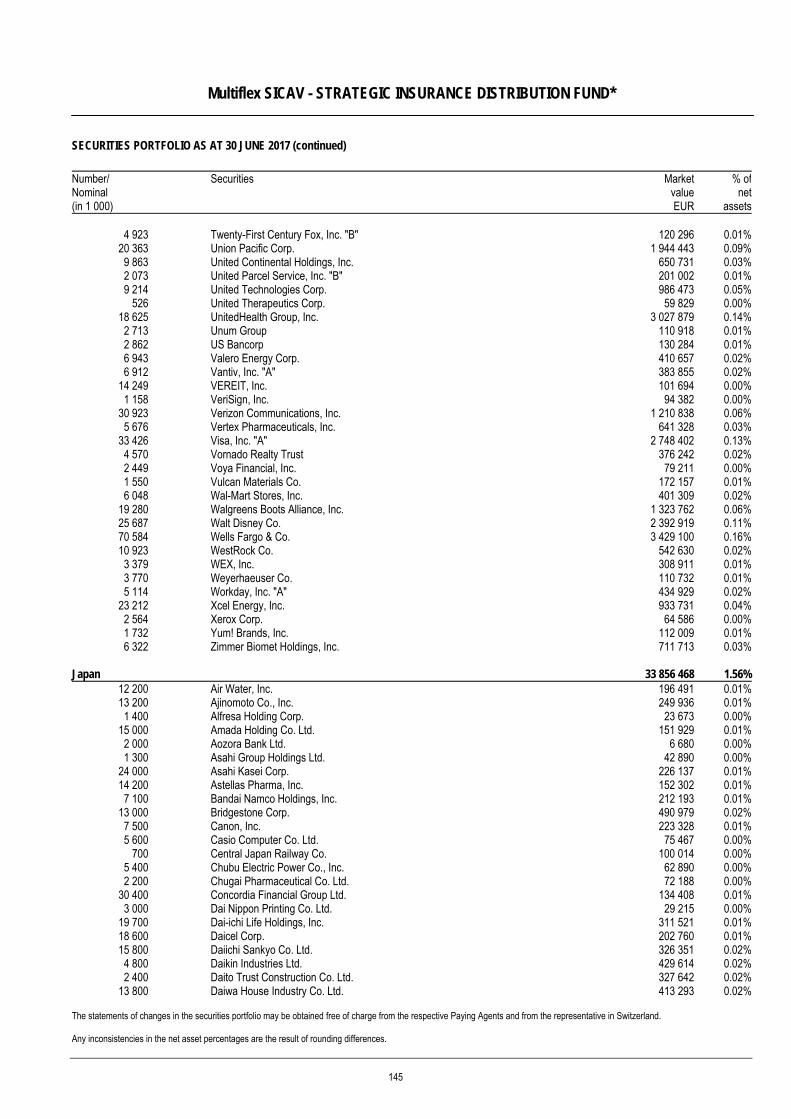
Multiflex SICAV - STRATEGIC INSURANCE DISTRIBUTION FUND*
SECURITIES PORTFOLIO AS AT 30 JUNE 2017 (continued)
The statements of changes in the securities portfolio may be obtained free of charge from the respective Paying Agents and from the representative in Switzerland. Any inconsistencies in the net asset percentages are the result of rounding differences.
Number/ Nominal (in 1 000)
Securities MarketvalueEUR
% ofnet
assets
4 923 Twenty-First Century Fox, Inc. "B" 120 296 0.01%20 363 Union Pacific Corp. 1 944 443 0.09%9 863 United Continental Holdings, Inc. 650 731 0.03%2 073 United Parcel Service, Inc. "B" 201 002 0.01%9 214 United Technologies Corp. 986 473 0.05%
526 United Therapeutics Corp. 59 829 0.00%18 625 UnitedHealth Group, Inc. 3 027 879 0.14%2 713 Unum Group 110 918 0.01%2 862 US Bancorp 130 284 0.01%6 943 Valero Energy Corp. 410 657 0.02%6 912 Vantiv, Inc. "A" 383 855 0.02%
14 249 VEREIT, Inc. 101 694 0.00%1 158 VeriSign, Inc. 94 382 0.00%
30 923 Verizon Communications, Inc. 1 210 838 0.06%5 676 Vertex Pharmaceuticals, Inc. 641 328 0.03%
33 426 Visa, Inc. "A" 2 748 402 0.13%4 570 Vornado Realty Trust 376 242 0.02%2 449 Voya Financial, Inc. 79 211 0.00%1 550 Vulcan Materials Co. 172 157 0.01%6 048 Wal-Mart Stores, Inc. 401 309 0.02%
19 280 Walgreens Boots Alliance, Inc. 1 323 762 0.06%25 687 Walt Disney Co. 2 392 919 0.11%70 584 Wells Fargo & Co. 3 429 100 0.16%10 923 WestRock Co. 542 630 0.02%3 379 WEX, Inc. 308 911 0.01%3 770 Weyerhaeuser Co. 110 732 0.01%5 114 Workday, Inc. "A" 434 929 0.02%
23 212 Xcel Energy, Inc. 933 731 0.04%2 564 Xerox Corp. 64 586 0.00%1 732 Yum! Brands, Inc. 112 009 0.01%6 322 Zimmer Biomet Holdings, Inc. 711 713 0.03%
Japan 33 856 468 1.56%12 200 Air Water, Inc. 196 491 0.01%13 200 Ajinomoto Co., Inc. 249 936 0.01%1 400 Alfresa Holding Corp. 23 673 0.00%
15 000 Amada Holding Co. Ltd. 151 929 0.01%2 000 Aozora Bank Ltd. 6 680 0.00%1 300 Asahi Group Holdings Ltd. 42 890 0.00%
24 000 Asahi Kasei Corp. 226 137 0.01%14 200 Astellas Pharma, Inc. 152 302 0.01%7 100 Bandai Namco Holdings, Inc. 212 193 0.01%
13 000 Bridgestone Corp. 490 979 0.02%7 500 Canon, Inc. 223 328 0.01%5 600 Casio Computer Co. Ltd. 75 467 0.00%
700 Central Japan Railway Co. 100 014 0.00%5 400 Chubu Electric Power Co., Inc. 62 890 0.00%2 200 Chugai Pharmaceutical Co. Ltd. 72 188 0.00%
30 400 Concordia Financial Group Ltd. 134 408 0.01%3 000 Dai Nippon Printing Co. Ltd. 29 215 0.00%
19 700 Dai-ichi Life Holdings, Inc. 311 521 0.01%18 600 Daicel Corp. 202 760 0.01%15 800 Daiichi Sankyo Co. Ltd. 326 351 0.02%4 800 Daikin Industries Ltd. 429 614 0.02%2 400 Daito Trust Construction Co. Ltd. 327 642 0.02%
13 800 Daiwa House Industry Co. Ltd. 413 293 0.02%
145
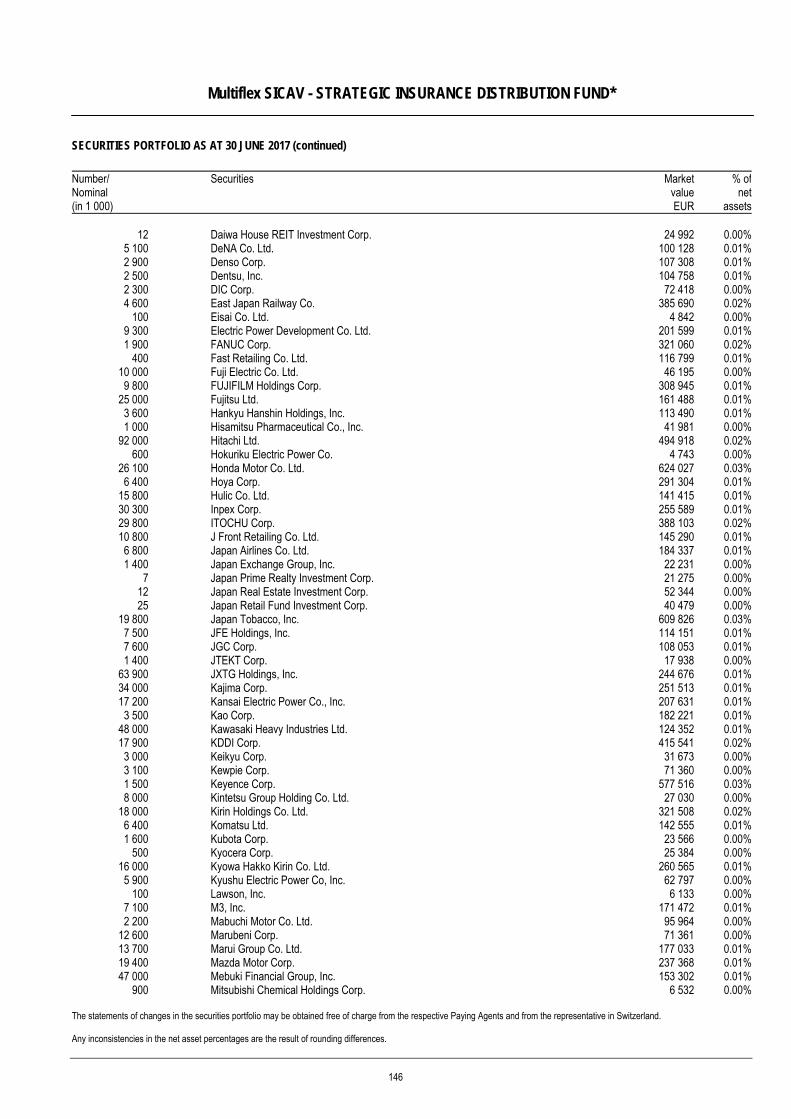
Multiflex SICAV - STRATEGIC INSURANCE DISTRIBUTION FUND*
SECURITIES PORTFOLIO AS AT 30 JUNE 2017 (continued)
The statements of changes in the securities portfolio may be obtained free of charge from the respective Paying Agents and from the representative in Switzerland. Any inconsistencies in the net asset percentages are the result of rounding differences.
Number/ Nominal (in 1 000)
Securities MarketvalueEUR
% ofnet
assets
12 Daiwa House REIT Investment Corp. 24 992 0.00%5 100 DeNA Co. Ltd. 100 128 0.01%2 900 Denso Corp. 107 308 0.01%2 500 Dentsu, Inc. 104 758 0.01%2 300 DIC Corp. 72 418 0.00%4 600 East Japan Railway Co. 385 690 0.02%
100 Eisai Co. Ltd. 4 842 0.00%9 300 Electric Power Development Co. Ltd. 201 599 0.01%1 900 FANUC Corp. 321 060 0.02%
400 Fast Retailing Co. Ltd. 116 799 0.01%10 000 Fuji Electric Co. Ltd. 46 195 0.00%9 800 FUJIFILM Holdings Corp. 308 945 0.01%
25 000 Fujitsu Ltd. 161 488 0.01%3 600 Hankyu Hanshin Holdings, Inc. 113 490 0.01%1 000 Hisamitsu Pharmaceutical Co., Inc. 41 981 0.00%
92 000 Hitachi Ltd. 494 918 0.02%600 Hokuriku Electric Power Co. 4 743 0.00%
26 100 Honda Motor Co. Ltd. 624 027 0.03%6 400 Hoya Corp. 291 304 0.01%
15 800 Hulic Co. Ltd. 141 415 0.01%30 300 Inpex Corp. 255 589 0.01%29 800 ITOCHU Corp. 388 103 0.02%10 800 J Front Retailing Co. Ltd. 145 290 0.01%6 800 Japan Airlines Co. Ltd. 184 337 0.01%1 400 Japan Exchange Group, Inc. 22 231 0.00%
7 Japan Prime Realty Investment Corp. 21 275 0.00%12 Japan Real Estate Investment Corp. 52 344 0.00%25 Japan Retail Fund Investment Corp. 40 479 0.00%
19 800 Japan Tobacco, Inc. 609 826 0.03%7 500 JFE Holdings, Inc. 114 151 0.01%7 600 JGC Corp. 108 053 0.01%1 400 JTEKT Corp. 17 938 0.00%
63 900 JXTG Holdings, Inc. 244 676 0.01%34 000 Kajima Corp. 251 513 0.01%17 200 Kansai Electric Power Co., Inc. 207 631 0.01%3 500 Kao Corp. 182 221 0.01%
48 000 Kawasaki Heavy Industries Ltd. 124 352 0.01%17 900 KDDI Corp. 415 541 0.02%3 000 Keikyu Corp. 31 673 0.00%3 100 Kewpie Corp. 71 360 0.00%1 500 Keyence Corp. 577 516 0.03%8 000 Kintetsu Group Holding Co. Ltd. 27 030 0.00%
18 000 Kirin Holdings Co. Ltd. 321 508 0.02%6 400 Komatsu Ltd. 142 555 0.01%1 600 Kubota Corp. 23 566 0.00%
500 Kyocera Corp. 25 384 0.00%16 000 Kyowa Hakko Kirin Co. Ltd. 260 565 0.01%5 900 Kyushu Electric Power Co, Inc. 62 797 0.00%
100 Lawson, Inc. 6 133 0.00%7 100 M3, Inc. 171 472 0.01%2 200 Mabuchi Motor Co. Ltd. 95 964 0.00%
12 600 Marubeni Corp. 71 361 0.00%13 700 Marui Group Co. Ltd. 177 033 0.01%19 400 Mazda Motor Corp. 237 368 0.01%47 000 Mebuki Financial Group, Inc. 153 302 0.01%
900 Mitsubishi Chemical Holdings Corp. 6 532 0.00%
146
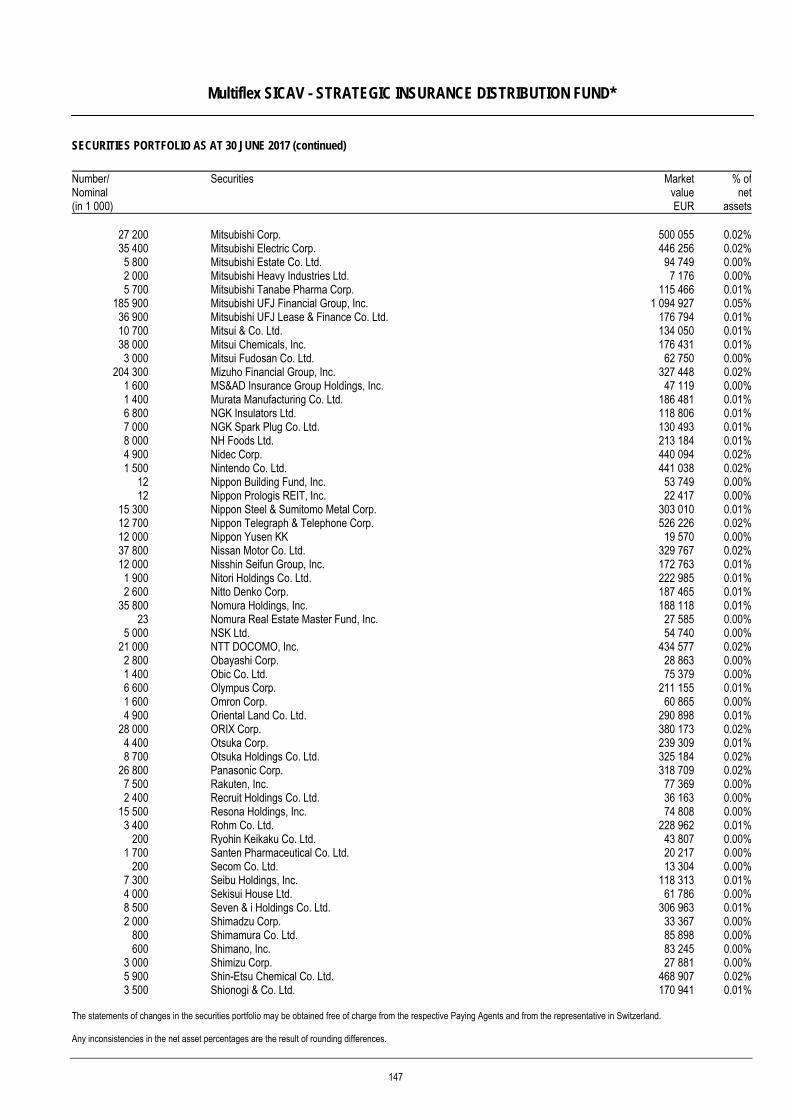
Multiflex SICAV - STRATEGIC INSURANCE DISTRIBUTION FUND*
SECURITIES PORTFOLIO AS AT 30 JUNE 2017 (continued)
The statements of changes in the securities portfolio may be obtained free of charge from the respective Paying Agents and from the representative in Switzerland. Any inconsistencies in the net asset percentages are the result of rounding differences.
Number/ Nominal (in 1 000)
Securities MarketvalueEUR
% ofnet
assets
27 200 Mitsubishi Corp. 500 055 0.02%35 400 Mitsubishi Electric Corp. 446 256 0.02%5 800 Mitsubishi Estate Co. Ltd. 94 749 0.00%2 000 Mitsubishi Heavy Industries Ltd. 7 176 0.00%5 700 Mitsubishi Tanabe Pharma Corp. 115 466 0.01%
185 900 Mitsubishi UFJ Financial Group, Inc. 1 094 927 0.05%36 900 Mitsubishi UFJ Lease & Finance Co. Ltd. 176 794 0.01%10 700 Mitsui & Co. Ltd. 134 050 0.01%38 000 Mitsui Chemicals, Inc. 176 431 0.01%3 000 Mitsui Fudosan Co. Ltd. 62 750 0.00%
204 300 Mizuho Financial Group, Inc. 327 448 0.02%1 600 MS&AD Insurance Group Holdings, Inc. 47 119 0.00%1 400 Murata Manufacturing Co. Ltd. 186 481 0.01%6 800 NGK Insulators Ltd. 118 806 0.01%7 000 NGK Spark Plug Co. Ltd. 130 493 0.01%8 000 NH Foods Ltd. 213 184 0.01%4 900 Nidec Corp. 440 094 0.02%1 500 Nintendo Co. Ltd. 441 038 0.02%
12 Nippon Building Fund, Inc. 53 749 0.00%12 Nippon Prologis REIT, Inc. 22 417 0.00%
15 300 Nippon Steel & Sumitomo Metal Corp. 303 010 0.01%12 700 Nippon Telegraph & Telephone Corp. 526 226 0.02%12 000 Nippon Yusen KK 19 570 0.00%37 800 Nissan Motor Co. Ltd. 329 767 0.02%12 000 Nisshin Seifun Group, Inc. 172 763 0.01%
1 900 Nitori Holdings Co. Ltd. 222 985 0.01%2 600 Nitto Denko Corp. 187 465 0.01%
35 800 Nomura Holdings, Inc. 188 118 0.01%23 Nomura Real Estate Master Fund, Inc. 27 585 0.00%
5 000 NSK Ltd. 54 740 0.00%21 000 NTT DOCOMO, Inc. 434 577 0.02%2 800 Obayashi Corp. 28 863 0.00%1 400 Obic Co. Ltd. 75 379 0.00%6 600 Olympus Corp. 211 155 0.01%1 600 Omron Corp. 60 865 0.00%4 900 Oriental Land Co. Ltd. 290 898 0.01%
28 000 ORIX Corp. 380 173 0.02%4 400 Otsuka Corp. 239 309 0.01%8 700 Otsuka Holdings Co. Ltd. 325 184 0.02%
26 800 Panasonic Corp. 318 709 0.02%7 500 Rakuten, Inc. 77 369 0.00%2 400 Recruit Holdings Co. Ltd. 36 163 0.00%
15 500 Resona Holdings, Inc. 74 808 0.00%3 400 Rohm Co. Ltd. 228 962 0.01%
200 Ryohin Keikaku Co. Ltd. 43 807 0.00%1 700 Santen Pharmaceutical Co. Ltd. 20 217 0.00%
200 Secom Co. Ltd. 13 304 0.00%7 300 Seibu Holdings, Inc. 118 313 0.01%4 000 Sekisui House Ltd. 61 786 0.00%8 500 Seven & i Holdings Co. Ltd. 306 963 0.01%2 000 Shimadzu Corp. 33 367 0.00%
800 Shimamura Co. Ltd. 85 898 0.00%600 Shimano, Inc. 83 245 0.00%
3 000 Shimizu Corp. 27 881 0.00%5 900 Shin-Etsu Chemical Co. Ltd. 468 907 0.02%3 500 Shionogi & Co. Ltd. 170 941 0.01%
147
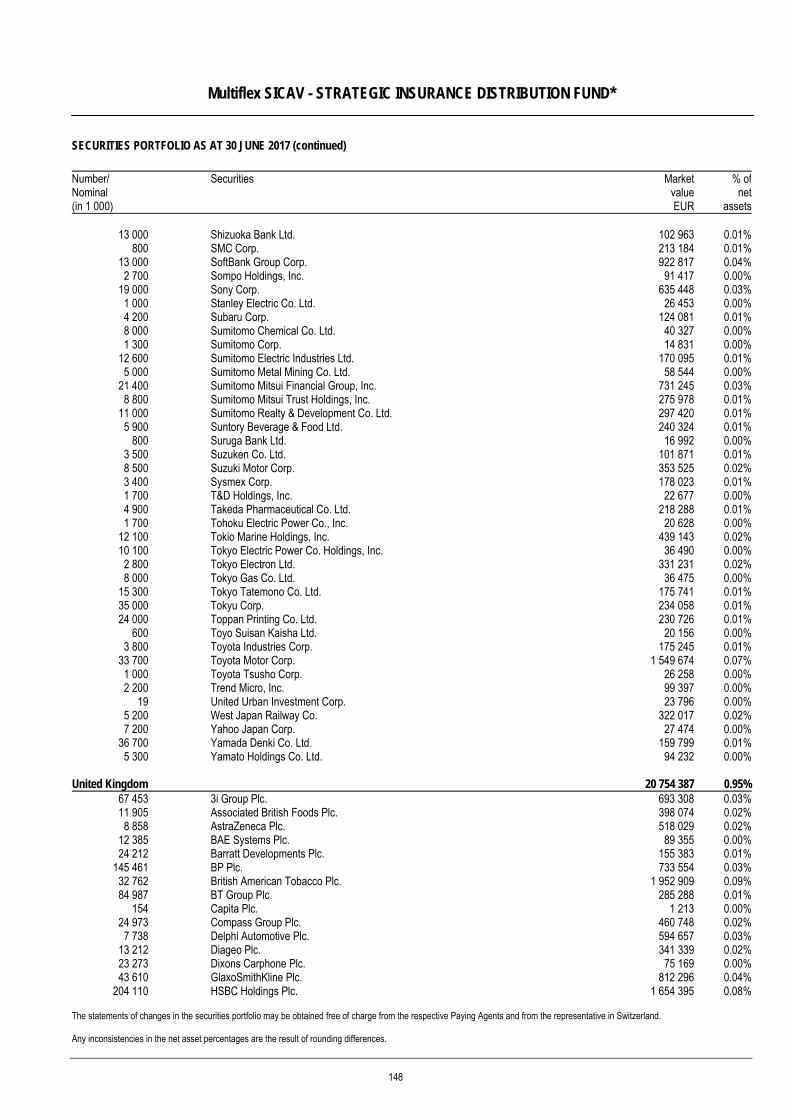
Multiflex SICAV - STRATEGIC INSURANCE DISTRIBUTION FUND*
SECURITIES PORTFOLIO AS AT 30 JUNE 2017 (continued)
The statements of changes in the securities portfolio may be obtained free of charge from the respective Paying Agents and from the representative in Switzerland. Any inconsistencies in the net asset percentages are the result of rounding differences.
Number/ Nominal (in 1 000)
Securities MarketvalueEUR
% ofnet
assets
13 000 Shizuoka Bank Ltd. 102 963 0.01%800 SMC Corp. 213 184 0.01%
13 000 SoftBank Group Corp. 922 817 0.04%2 700 Sompo Holdings, Inc. 91 417 0.00%
19 000 Sony Corp. 635 448 0.03%1 000 Stanley Electric Co. Ltd. 26 453 0.00%4 200 Subaru Corp. 124 081 0.01%8 000 Sumitomo Chemical Co. Ltd. 40 327 0.00%1 300 Sumitomo Corp. 14 831 0.00%
12 600 Sumitomo Electric Industries Ltd. 170 095 0.01%5 000 Sumitomo Metal Mining Co. Ltd. 58 544 0.00%
21 400 Sumitomo Mitsui Financial Group, Inc. 731 245 0.03%8 800 Sumitomo Mitsui Trust Holdings, Inc. 275 978 0.01%
11 000 Sumitomo Realty & Development Co. Ltd. 297 420 0.01%5 900 Suntory Beverage & Food Ltd. 240 324 0.01%
800 Suruga Bank Ltd. 16 992 0.00%3 500 Suzuken Co. Ltd. 101 871 0.01%8 500 Suzuki Motor Corp. 353 525 0.02%3 400 Sysmex Corp. 178 023 0.01%1 700 T&D Holdings, Inc. 22 677 0.00%4 900 Takeda Pharmaceutical Co. Ltd. 218 288 0.01%1 700 Tohoku Electric Power Co., Inc. 20 628 0.00%
12 100 Tokio Marine Holdings, Inc. 439 143 0.02%10 100 Tokyo Electric Power Co. Holdings, Inc. 36 490 0.00%2 800 Tokyo Electron Ltd. 331 231 0.02%8 000 Tokyo Gas Co. Ltd. 36 475 0.00%
15 300 Tokyo Tatemono Co. Ltd. 175 741 0.01%35 000 Tokyu Corp. 234 058 0.01%24 000 Toppan Printing Co. Ltd. 230 726 0.01%
600 Toyo Suisan Kaisha Ltd. 20 156 0.00%3 800 Toyota Industries Corp. 175 245 0.01%
33 700 Toyota Motor Corp. 1 549 674 0.07%1 000 Toyota Tsusho Corp. 26 258 0.00%2 200 Trend Micro, Inc. 99 397 0.00%
19 United Urban Investment Corp. 23 796 0.00%5 200 West Japan Railway Co. 322 017 0.02%7 200 Yahoo Japan Corp. 27 474 0.00%
36 700 Yamada Denki Co. Ltd. 159 799 0.01%5 300 Yamato Holdings Co. Ltd. 94 232 0.00%
United Kingdom 20 754 387 0.95%67 453 3i Group Plc. 693 308 0.03%11 905 Associated British Foods Plc. 398 074 0.02%8 858 AstraZeneca Plc. 518 029 0.02%
12 385 BAE Systems Plc. 89 355 0.00%24 212 Barratt Developments Plc. 155 383 0.01%
145 461 BP Plc. 733 554 0.03%32 762 British American Tobacco Plc. 1 952 909 0.09%84 987 BT Group Plc. 285 288 0.01%
154 Capita Plc. 1 213 0.00%24 973 Compass Group Plc. 460 748 0.02%7 738 Delphi Automotive Plc. 594 657 0.03%
13 212 Diageo Plc. 341 339 0.02%23 273 Dixons Carphone Plc. 75 169 0.00%43 610 GlaxoSmithKline Plc. 812 296 0.04%
204 110 HSBC Holdings Plc. 1 654 395 0.08%
148
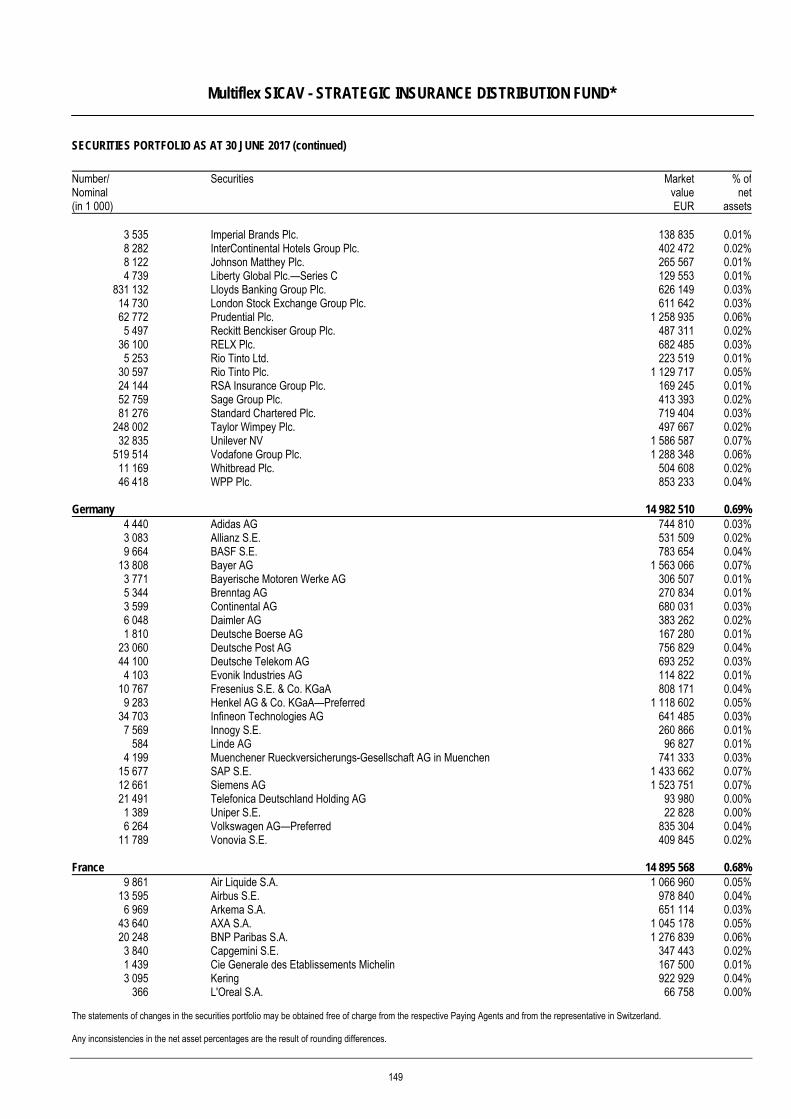
Multiflex SICAV - STRATEGIC INSURANCE DISTRIBUTION FUND*
SECURITIES PORTFOLIO AS AT 30 JUNE 2017 (continued)
The statements of changes in the securities portfolio may be obtained free of charge from the respective Paying Agents and from the representative in Switzerland. Any inconsistencies in the net asset percentages are the result of rounding differences.
Number/ Nominal (in 1 000)
Securities MarketvalueEUR
% ofnet
assets
3 535 Imperial Brands Plc. 138 835 0.01%8 282 InterContinental Hotels Group Plc. 402 472 0.02%8 122 Johnson Matthey Plc. 265 567 0.01%4 739 Liberty Global Plc.—Series C 129 553 0.01%
831 132 Lloyds Banking Group Plc. 626 149 0.03%14 730 London Stock Exchange Group Plc. 611 642 0.03%62 772 Prudential Plc. 1 258 935 0.06%5 497 Reckitt Benckiser Group Plc. 487 311 0.02%
36 100 RELX Plc. 682 485 0.03%5 253 Rio Tinto Ltd. 223 519 0.01%
30 597 Rio Tinto Plc. 1 129 717 0.05%24 144 RSA Insurance Group Plc. 169 245 0.01%52 759 Sage Group Plc. 413 393 0.02%81 276 Standard Chartered Plc. 719 404 0.03%
248 002 Taylor Wimpey Plc. 497 667 0.02%32 835 Unilever NV 1 586 587 0.07%
519 514 Vodafone Group Plc. 1 288 348 0.06%11 169 Whitbread Plc. 504 608 0.02%46 418 WPP Plc. 853 233 0.04%
Germany 14 982 510 0.69%4 440 Adidas AG 744 810 0.03%3 083 Allianz S.E. 531 509 0.02%9 664 BASF S.E. 783 654 0.04%
13 808 Bayer AG 1 563 066 0.07%3 771 Bayerische Motoren Werke AG 306 507 0.01%5 344 Brenntag AG 270 834 0.01%3 599 Continental AG 680 031 0.03%6 048 Daimler AG 383 262 0.02%1 810 Deutsche Boerse AG 167 280 0.01%
23 060 Deutsche Post AG 756 829 0.04%44 100 Deutsche Telekom AG 693 252 0.03%4 103 Evonik Industries AG 114 822 0.01%
10 767 Fresenius S.E. & Co. KGaA 808 171 0.04%9 283 Henkel AG & Co. KGaA—Preferred 1 118 602 0.05%
34 703 Infineon Technologies AG 641 485 0.03%7 569 Innogy S.E. 260 866 0.01%
584 Linde AG 96 827 0.01%4 199 Muenchener Rueckversicherungs-Gesellschaft AG in Muenchen 741 333 0.03%
15 677 SAP S.E. 1 433 662 0.07%12 661 Siemens AG 1 523 751 0.07%21 491 Telefonica Deutschland Holding AG 93 980 0.00%1 389 Uniper S.E. 22 828 0.00%6 264 Volkswagen AG—Preferred 835 304 0.04%
11 789 Vonovia S.E. 409 845 0.02%
France 14 895 568 0.68%9 861 Air Liquide S.A. 1 066 960 0.05%
13 595 Airbus S.E. 978 840 0.04%6 969 Arkema S.A. 651 114 0.03%
43 640 AXA S.A. 1 045 178 0.05%20 248 BNP Paribas S.A. 1 276 839 0.06%3 840 Capgemini S.E. 347 443 0.02%1 439 Cie Generale des Etablissements Michelin 167 500 0.01%3 095 Kering 922 929 0.04%
366 L'Oreal S.A. 66 758 0.00%
149
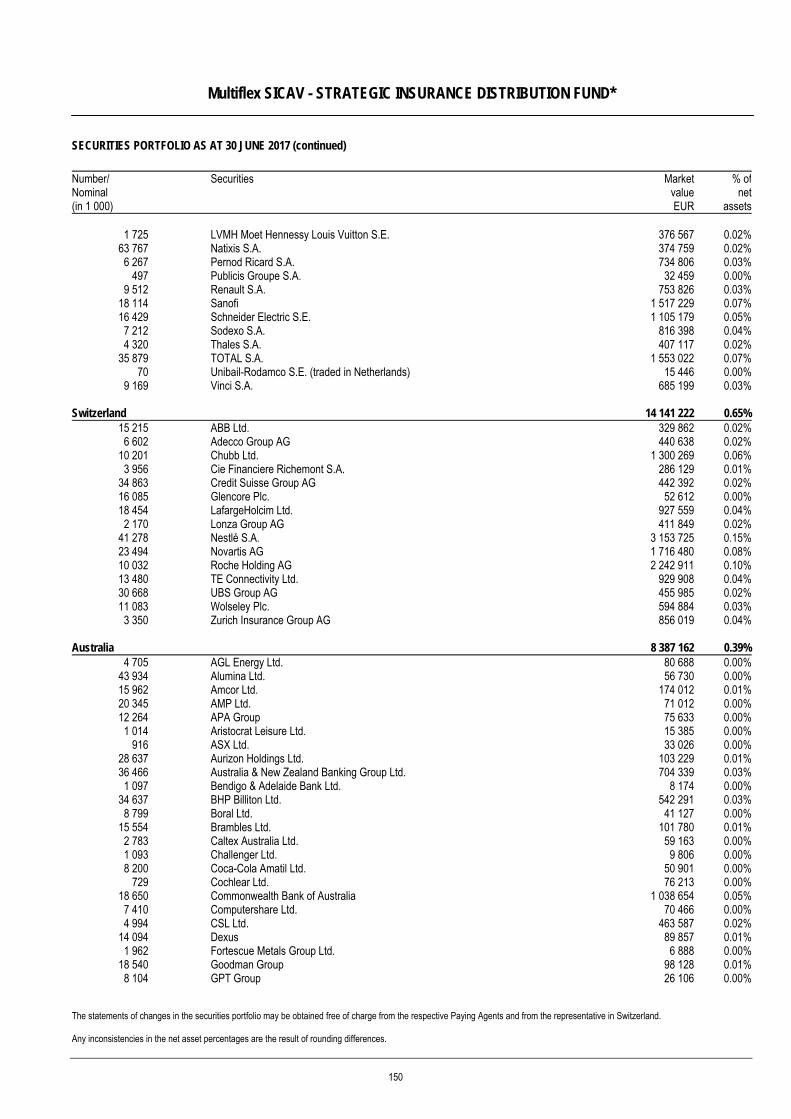
Multiflex SICAV - STRATEGIC INSURANCE DISTRIBUTION FUND*
SECURITIES PORTFOLIO AS AT 30 JUNE 2017 (continued)
The statements of changes in the securities portfolio may be obtained free of charge from the respective Paying Agents and from the representative in Switzerland. Any inconsistencies in the net asset percentages are the result of rounding differences.
Number/ Nominal (in 1 000)
Securities MarketvalueEUR
% ofnet
assets
1 725 LVMH Moet Hennessy Louis Vuitton S.E. 376 567 0.02%63 767 Natixis S.A. 374 759 0.02%6 267 Pernod Ricard S.A. 734 806 0.03%
497 Publicis Groupe S.A. 32 459 0.00%9 512 Renault S.A. 753 826 0.03%
18 114 Sanofi 1 517 229 0.07%16 429 Schneider Electric S.E. 1 105 179 0.05%7 212 Sodexo S.A. 816 398 0.04%4 320 Thales S.A. 407 117 0.02%
35 879 TOTAL S.A. 1 553 022 0.07%70 Unibail-Rodamco S.E. (traded in Netherlands) 15 446 0.00%
9 169 Vinci S.A. 685 199 0.03%
Switzerland 14 141 222 0.65%15 215 ABB Ltd. 329 862 0.02%6 602 Adecco Group AG 440 638 0.02%
10 201 Chubb Ltd. 1 300 269 0.06%3 956 Cie Financiere Richemont S.A. 286 129 0.01%
34 863 Credit Suisse Group AG 442 392 0.02%16 085 Glencore Plc. 52 612 0.00%18 454 LafargeHolcim Ltd. 927 559 0.04%2 170 Lonza Group AG 411 849 0.02%
41 278 Nestlé S.A. 3 153 725 0.15%23 494 Novartis AG 1 716 480 0.08%10 032 Roche Holding AG 2 242 911 0.10%13 480 TE Connectivity Ltd. 929 908 0.04%30 668 UBS Group AG 455 985 0.02%11 083 Wolseley Plc. 594 884 0.03%3 350 Zurich Insurance Group AG 856 019 0.04%
Australia 8 387 162 0.39%4 705 AGL Energy Ltd. 80 688 0.00%
43 934 Alumina Ltd. 56 730 0.00%15 962 Amcor Ltd. 174 012 0.01%20 345 AMP Ltd. 71 012 0.00%12 264 APA Group 75 633 0.00%1 014 Aristocrat Leisure Ltd. 15 385 0.00%
916 ASX Ltd. 33 026 0.00%28 637 Aurizon Holdings Ltd. 103 229 0.01%36 466 Australia & New Zealand Banking Group Ltd. 704 339 0.03%1 097 Bendigo & Adelaide Bank Ltd. 8 174 0.00%
34 637 BHP Billiton Ltd. 542 291 0.03%8 799 Boral Ltd. 41 127 0.00%
15 554 Brambles Ltd. 101 780 0.01%2 783 Caltex Australia Ltd. 59 163 0.00%1 093 Challenger Ltd. 9 806 0.00%8 200 Coca-Cola Amatil Ltd. 50 901 0.00%
729 Cochlear Ltd. 76 213 0.00%18 650 Commonwealth Bank of Australia 1 038 654 0.05%7 410 Computershare Ltd. 70 466 0.00%4 994 CSL Ltd. 463 587 0.02%
14 094 Dexus 89 857 0.01%1 962 Fortescue Metals Group Ltd. 6 888 0.00%
18 540 Goodman Group 98 128 0.01%8 104 GPT Group 26 106 0.00%
150
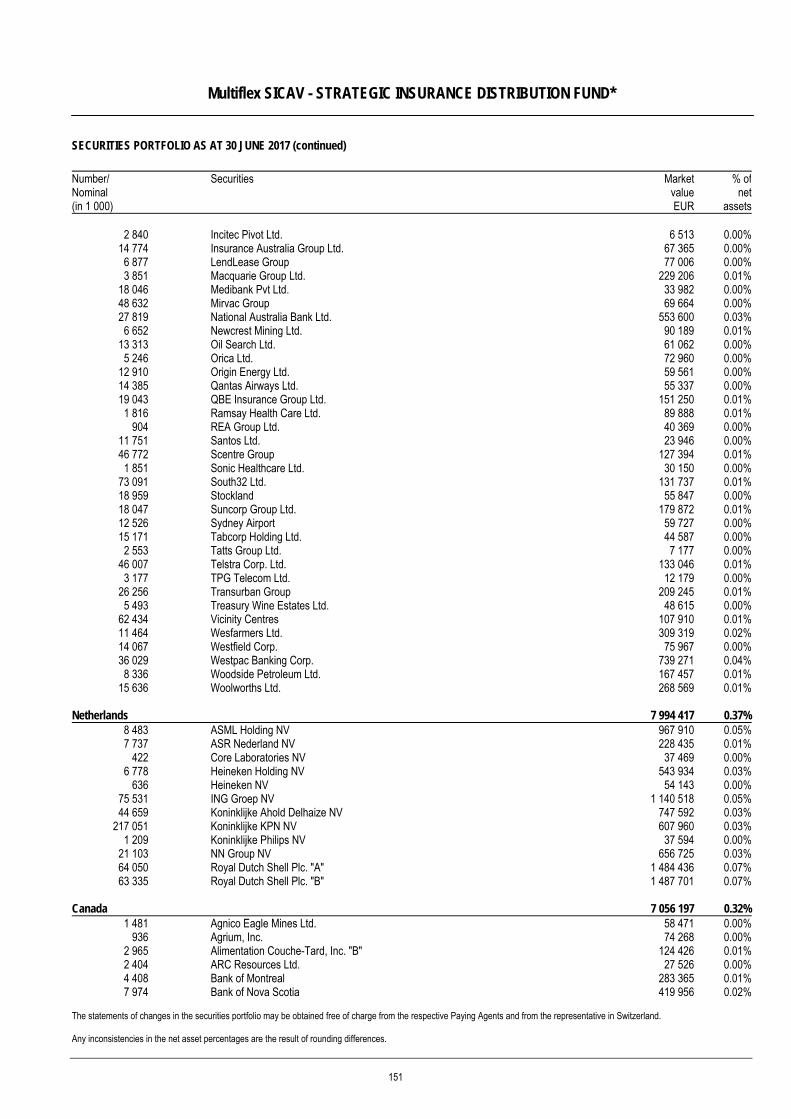
Multiflex SICAV - STRATEGIC INSURANCE DISTRIBUTION FUND*
SECURITIES PORTFOLIO AS AT 30 JUNE 2017 (continued)
The statements of changes in the securities portfolio may be obtained free of charge from the respective Paying Agents and from the representative in Switzerland. Any inconsistencies in the net asset percentages are the result of rounding differences.
Number/ Nominal (in 1 000)
Securities MarketvalueEUR
% ofnet
assets
2 840 Incitec Pivot Ltd. 6 513 0.00%14 774 Insurance Australia Group Ltd. 67 365 0.00%6 877 LendLease Group 77 006 0.00%3 851 Macquarie Group Ltd. 229 206 0.01%
18 046 Medibank Pvt Ltd. 33 982 0.00%48 632 Mirvac Group 69 664 0.00%27 819 National Australia Bank Ltd. 553 600 0.03%6 652 Newcrest Mining Ltd. 90 189 0.01%
13 313 Oil Search Ltd. 61 062 0.00%5 246 Orica Ltd. 72 960 0.00%
12 910 Origin Energy Ltd. 59 561 0.00%14 385 Qantas Airways Ltd. 55 337 0.00%19 043 QBE Insurance Group Ltd. 151 250 0.01%1 816 Ramsay Health Care Ltd. 89 888 0.01%
904 REA Group Ltd. 40 369 0.00%11 751 Santos Ltd. 23 946 0.00%46 772 Scentre Group 127 394 0.01%1 851 Sonic Healthcare Ltd. 30 150 0.00%
73 091 South32 Ltd. 131 737 0.01%18 959 Stockland 55 847 0.00%18 047 Suncorp Group Ltd. 179 872 0.01%12 526 Sydney Airport 59 727 0.00%15 171 Tabcorp Holding Ltd. 44 587 0.00%2 553 Tatts Group Ltd. 7 177 0.00%
46 007 Telstra Corp. Ltd. 133 046 0.01%3 177 TPG Telecom Ltd. 12 179 0.00%
26 256 Transurban Group 209 245 0.01%5 493 Treasury Wine Estates Ltd. 48 615 0.00%
62 434 Vicinity Centres 107 910 0.01%11 464 Wesfarmers Ltd. 309 319 0.02%14 067 Westfield Corp. 75 967 0.00%36 029 Westpac Banking Corp. 739 271 0.04%8 336 Woodside Petroleum Ltd. 167 457 0.01%
15 636 Woolworths Ltd. 268 569 0.01%
Netherlands 7 994 417 0.37%8 483 ASML Holding NV 967 910 0.05%7 737 ASR Nederland NV 228 435 0.01%
422 Core Laboratories NV 37 469 0.00%6 778 Heineken Holding NV 543 934 0.03%
636 Heineken NV 54 143 0.00%75 531 ING Groep NV 1 140 518 0.05%44 659 Koninklijke Ahold Delhaize NV 747 592 0.03%
217 051 Koninklijke KPN NV 607 960 0.03%1 209 Koninklijke Philips NV 37 594 0.00%
21 103 NN Group NV 656 725 0.03%64 050 Royal Dutch Shell Plc. "A" 1 484 436 0.07%63 335 Royal Dutch Shell Plc. "B" 1 487 701 0.07%
Canada 7 056 197 0.32%1 481 Agnico Eagle Mines Ltd. 58 471 0.00%
936 Agrium, Inc. 74 268 0.00%2 965 Alimentation Couche-Tard, Inc. "B" 124 426 0.01%2 404 ARC Resources Ltd. 27 526 0.00%4 408 Bank of Montreal 283 365 0.01%7 974 Bank of Nova Scotia 419 956 0.02%
151
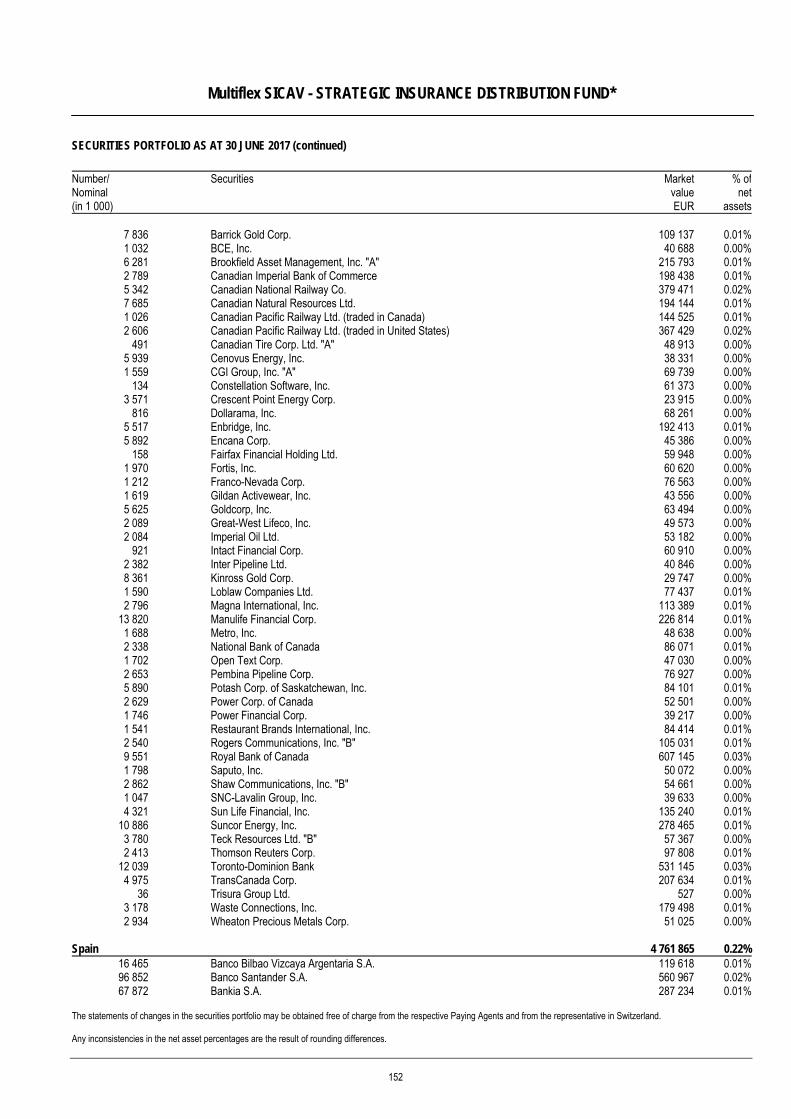
Multiflex SICAV - STRATEGIC INSURANCE DISTRIBUTION FUND*
SECURITIES PORTFOLIO AS AT 30 JUNE 2017 (continued)
The statements of changes in the securities portfolio may be obtained free of charge from the respective Paying Agents and from the representative in Switzerland. Any inconsistencies in the net asset percentages are the result of rounding differences.
Number/ Nominal (in 1 000)
Securities MarketvalueEUR
% ofnet
assets
7 836 Barrick Gold Corp. 109 137 0.01%1 032 BCE, Inc. 40 688 0.00%6 281 Brookfield Asset Management, Inc. "A" 215 793 0.01%2 789 Canadian Imperial Bank of Commerce 198 438 0.01%5 342 Canadian National Railway Co. 379 471 0.02%7 685 Canadian Natural Resources Ltd. 194 144 0.01%1 026 Canadian Pacific Railway Ltd. (traded in Canada) 144 525 0.01%2 606 Canadian Pacific Railway Ltd. (traded in United States) 367 429 0.02%
491 Canadian Tire Corp. Ltd. "A" 48 913 0.00%5 939 Cenovus Energy, Inc. 38 331 0.00%1 559 CGI Group, Inc. "A" 69 739 0.00%
134 Constellation Software, Inc. 61 373 0.00%3 571 Crescent Point Energy Corp. 23 915 0.00%
816 Dollarama, Inc. 68 261 0.00%5 517 Enbridge, Inc. 192 413 0.01%5 892 Encana Corp. 45 386 0.00%
158 Fairfax Financial Holding Ltd. 59 948 0.00%1 970 Fortis, Inc. 60 620 0.00%1 212 Franco-Nevada Corp. 76 563 0.00%1 619 Gildan Activewear, Inc. 43 556 0.00%5 625 Goldcorp, Inc. 63 494 0.00%2 089 Great-West Lifeco, Inc. 49 573 0.00%2 084 Imperial Oil Ltd. 53 182 0.00%
921 Intact Financial Corp. 60 910 0.00%2 382 Inter Pipeline Ltd. 40 846 0.00%8 361 Kinross Gold Corp. 29 747 0.00%1 590 Loblaw Companies Ltd. 77 437 0.01%2 796 Magna International, Inc. 113 389 0.01%
13 820 Manulife Financial Corp. 226 814 0.01%1 688 Metro, Inc. 48 638 0.00%2 338 National Bank of Canada 86 071 0.01%1 702 Open Text Corp. 47 030 0.00%2 653 Pembina Pipeline Corp. 76 927 0.00%5 890 Potash Corp. of Saskatchewan, Inc. 84 101 0.01%2 629 Power Corp. of Canada 52 501 0.00%1 746 Power Financial Corp. 39 217 0.00%1 541 Restaurant Brands International, Inc. 84 414 0.01%2 540 Rogers Communications, Inc. "B" 105 031 0.01%9 551 Royal Bank of Canada 607 145 0.03%1 798 Saputo, Inc. 50 072 0.00%2 862 Shaw Communications, Inc. "B" 54 661 0.00%1 047 SNC-Lavalin Group, Inc. 39 633 0.00%4 321 Sun Life Financial, Inc. 135 240 0.01%
10 886 Suncor Energy, Inc. 278 465 0.01%3 780 Teck Resources Ltd. "B" 57 367 0.00%2 413 Thomson Reuters Corp. 97 808 0.01%
12 039 Toronto-Dominion Bank 531 145 0.03%4 975 TransCanada Corp. 207 634 0.01%
36 Trisura Group Ltd. 527 0.00%3 178 Waste Connections, Inc. 179 498 0.01%2 934 Wheaton Precious Metals Corp. 51 025 0.00%
Spain 4 761 865 0.22%16 465 Banco Bilbao Vizcaya Argentaria S.A. 119 618 0.01%96 852 Banco Santander S.A. 560 967 0.02%67 872 Bankia S.A. 287 234 0.01%
152
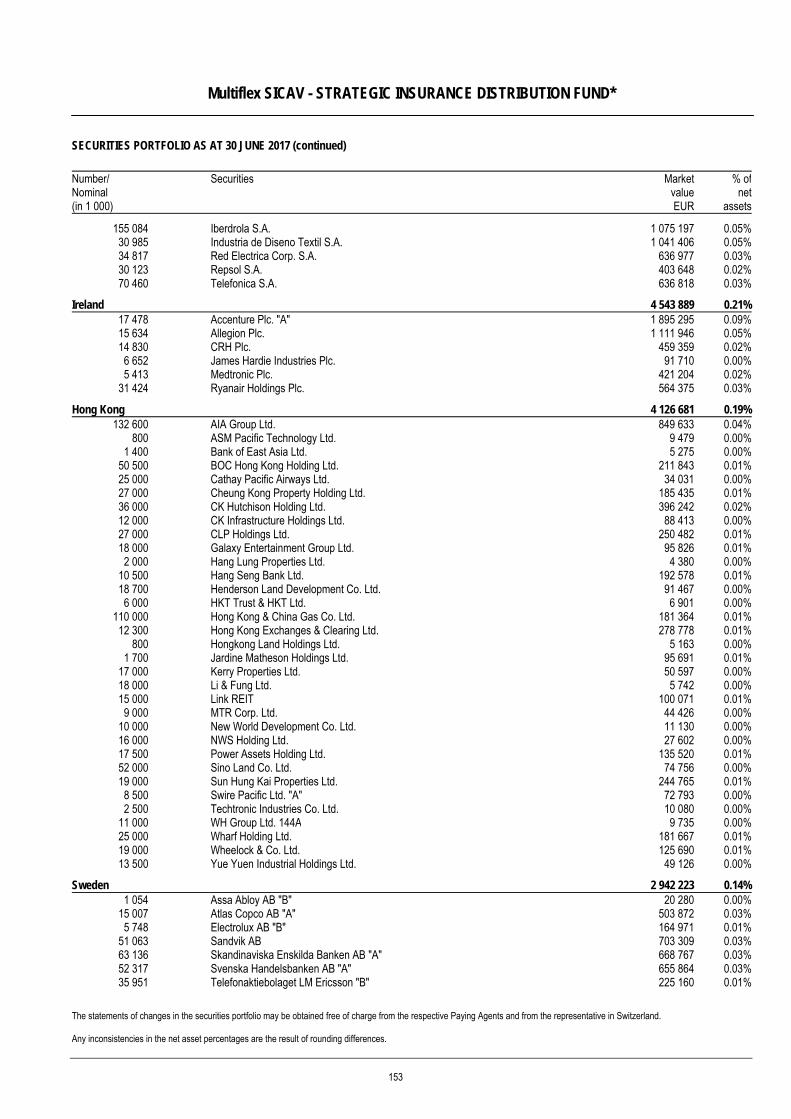
Multiflex SICAV - STRATEGIC INSURANCE DISTRIBUTION FUND*
SECURITIES PORTFOLIO AS AT 30 JUNE 2017 (continued)
The statements of changes in the securities portfolio may be obtained free of charge from the respective Paying Agents and from the representative in Switzerland. Any inconsistencies in the net asset percentages are the result of rounding differences.
Number/ Nominal (in 1 000)
Securities MarketvalueEUR
% ofnet
assets
155 084 Iberdrola S.A. 1 075 197 0.05%30 985 Industria de Diseno Textil S.A. 1 041 406 0.05%34 817 Red Electrica Corp. S.A. 636 977 0.03%30 123 Repsol S.A. 403 648 0.02%70 460 Telefonica S.A. 636 818 0.03%
Ireland 4 543 889 0.21%17 478 Accenture Plc. "A" 1 895 295 0.09%15 634 Allegion Plc. 1 111 946 0.05%14 830 CRH Plc. 459 359 0.02%6 652 James Hardie Industries Plc. 91 710 0.00%5 413 Medtronic Plc. 421 204 0.02%
31 424 Ryanair Holdings Plc. 564 375 0.03%
Hong Kong 4 126 681 0.19%132 600 AIA Group Ltd. 849 633 0.04%
800 ASM Pacific Technology Ltd. 9 479 0.00%1 400 Bank of East Asia Ltd. 5 275 0.00%
50 500 BOC Hong Kong Holding Ltd. 211 843 0.01%25 000 Cathay Pacific Airways Ltd. 34 031 0.00%27 000 Cheung Kong Property Holding Ltd. 185 435 0.01%36 000 CK Hutchison Holding Ltd. 396 242 0.02%12 000 CK Infrastructure Holdings Ltd. 88 413 0.00%27 000 CLP Holdings Ltd. 250 482 0.01%18 000 Galaxy Entertainment Group Ltd. 95 826 0.01%2 000 Hang Lung Properties Ltd. 4 380 0.00%
10 500 Hang Seng Bank Ltd. 192 578 0.01%18 700 Henderson Land Development Co. Ltd. 91 467 0.00%6 000 HKT Trust & HKT Ltd. 6 901 0.00%
110 000 Hong Kong & China Gas Co. Ltd. 181 364 0.01%12 300 Hong Kong Exchanges & Clearing Ltd. 278 778 0.01%
800 Hongkong Land Holdings Ltd. 5 163 0.00%1 700 Jardine Matheson Holdings Ltd. 95 691 0.01%
17 000 Kerry Properties Ltd. 50 597 0.00%18 000 Li & Fung Ltd. 5 742 0.00%15 000 Link REIT 100 071 0.01%9 000 MTR Corp. Ltd. 44 426 0.00%
10 000 New World Development Co. Ltd. 11 130 0.00%16 000 NWS Holding Ltd. 27 602 0.00%17 500 Power Assets Holding Ltd. 135 520 0.01%52 000 Sino Land Co. Ltd. 74 756 0.00%19 000 Sun Hung Kai Properties Ltd. 244 765 0.01%8 500 Swire Pacific Ltd. "A" 72 793 0.00%2 500 Techtronic Industries Co. Ltd. 10 080 0.00%
11 000 WH Group Ltd. 144A 9 735 0.00%25 000 Wharf Holding Ltd. 181 667 0.01%19 000 Wheelock & Co. Ltd. 125 690 0.01%13 500 Yue Yuen Industrial Holdings Ltd. 49 126 0.00%
Sweden 2 942 223 0.14%1 054 Assa Abloy AB "B" 20 280 0.00%
15 007 Atlas Copco AB "A" 503 872 0.03%5 748 Electrolux AB "B" 164 971 0.01%
51 063 Sandvik AB 703 309 0.03%63 136 Skandinaviska Enskilda Banken AB "A" 668 767 0.03%52 317 Svenska Handelsbanken AB "A" 655 864 0.03%35 951 Telefonaktiebolaget LM Ericsson "B" 225 160 0.01%
153
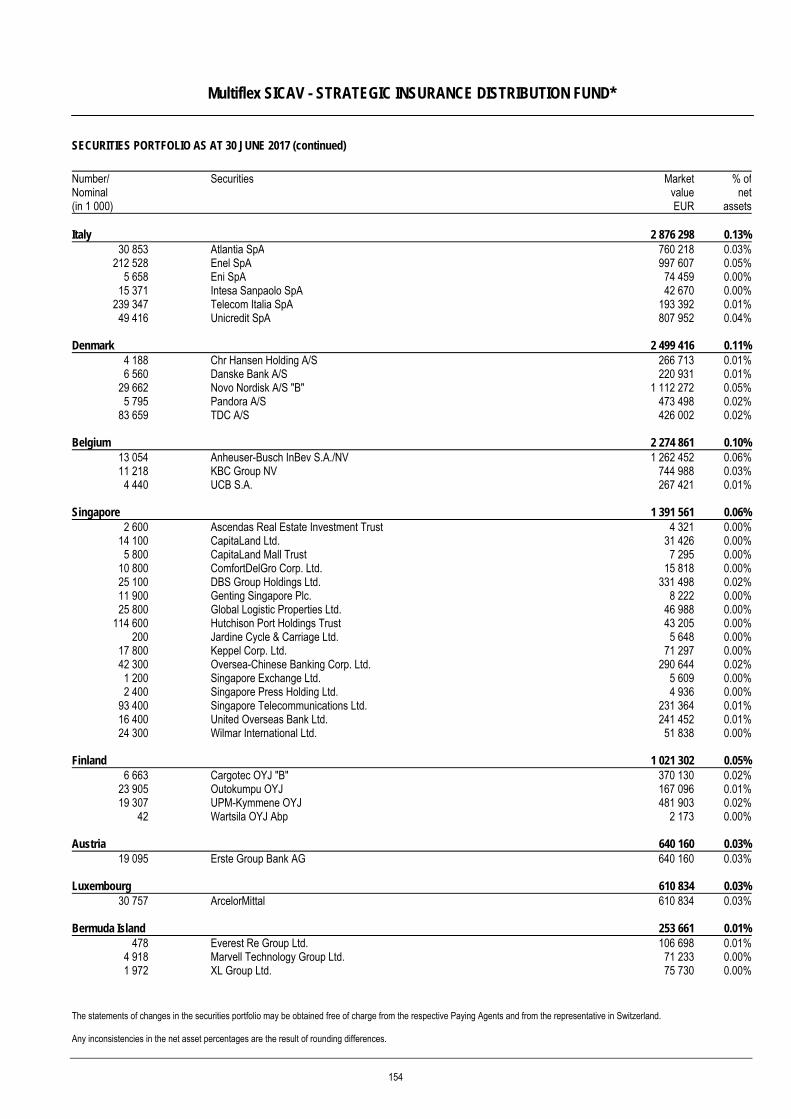
Multiflex SICAV - STRATEGIC INSURANCE DISTRIBUTION FUND*
SECURITIES PORTFOLIO AS AT 30 JUNE 2017 (continued)
The statements of changes in the securities portfolio may be obtained free of charge from the respective Paying Agents and from the representative in Switzerland. Any inconsistencies in the net asset percentages are the result of rounding differences.
Number/ Nominal (in 1 000)
Securities MarketvalueEUR
% ofnet
assets Italy 2 876 298 0.13%
30 853 Atlantia SpA 760 218 0.03%212 528 Enel SpA 997 607 0.05%
5 658 Eni SpA 74 459 0.00%15 371 Intesa Sanpaolo SpA 42 670 0.00%
239 347 Telecom Italia SpA 193 392 0.01%49 416 Unicredit SpA 807 952 0.04%
Denmark 2 499 416 0.11%4 188 Chr Hansen Holding A/S 266 713 0.01%6 560 Danske Bank A/S 220 931 0.01%
29 662 Novo Nordisk A/S "B" 1 112 272 0.05%5 795 Pandora A/S 473 498 0.02%
83 659 TDC A/S 426 002 0.02%
Belgium 2 274 861 0.10%13 054 Anheuser-Busch InBev S.A./NV 1 262 452 0.06%11 218 KBC Group NV 744 988 0.03%4 440 UCB S.A. 267 421 0.01%
Singapore 1 391 561 0.06%2 600 Ascendas Real Estate Investment Trust 4 321 0.00%
14 100 CapitaLand Ltd. 31 426 0.00%5 800 CapitaLand Mall Trust 7 295 0.00%
10 800 ComfortDelGro Corp. Ltd. 15 818 0.00%25 100 DBS Group Holdings Ltd. 331 498 0.02%11 900 Genting Singapore Plc. 8 222 0.00%25 800 Global Logistic Properties Ltd. 46 988 0.00%
114 600 Hutchison Port Holdings Trust 43 205 0.00%200 Jardine Cycle & Carriage Ltd. 5 648 0.00%
17 800 Keppel Corp. Ltd. 71 297 0.00%42 300 Oversea-Chinese Banking Corp. Ltd. 290 644 0.02%1 200 Singapore Exchange Ltd. 5 609 0.00%2 400 Singapore Press Holding Ltd. 4 936 0.00%
93 400 Singapore Telecommunications Ltd. 231 364 0.01%16 400 United Overseas Bank Ltd. 241 452 0.01%24 300 Wilmar International Ltd. 51 838 0.00%
Finland 1 021 302 0.05%6 663 Cargotec OYJ "B" 370 130 0.02%
23 905 Outokumpu OYJ 167 096 0.01%19 307 UPM-Kymmene OYJ 481 903 0.02%
42 Wartsila OYJ Abp 2 173 0.00%
Austria 640 160 0.03%19 095 Erste Group Bank AG 640 160 0.03%
Luxembourg 610 834 0.03%30 757 ArcelorMittal 610 834 0.03%
Bermuda Island 253 661 0.01%478 Everest Re Group Ltd. 106 698 0.01%
4 918 Marvell Technology Group Ltd. 71 233 0.00%1 972 XL Group Ltd. 75 730 0.00%
154
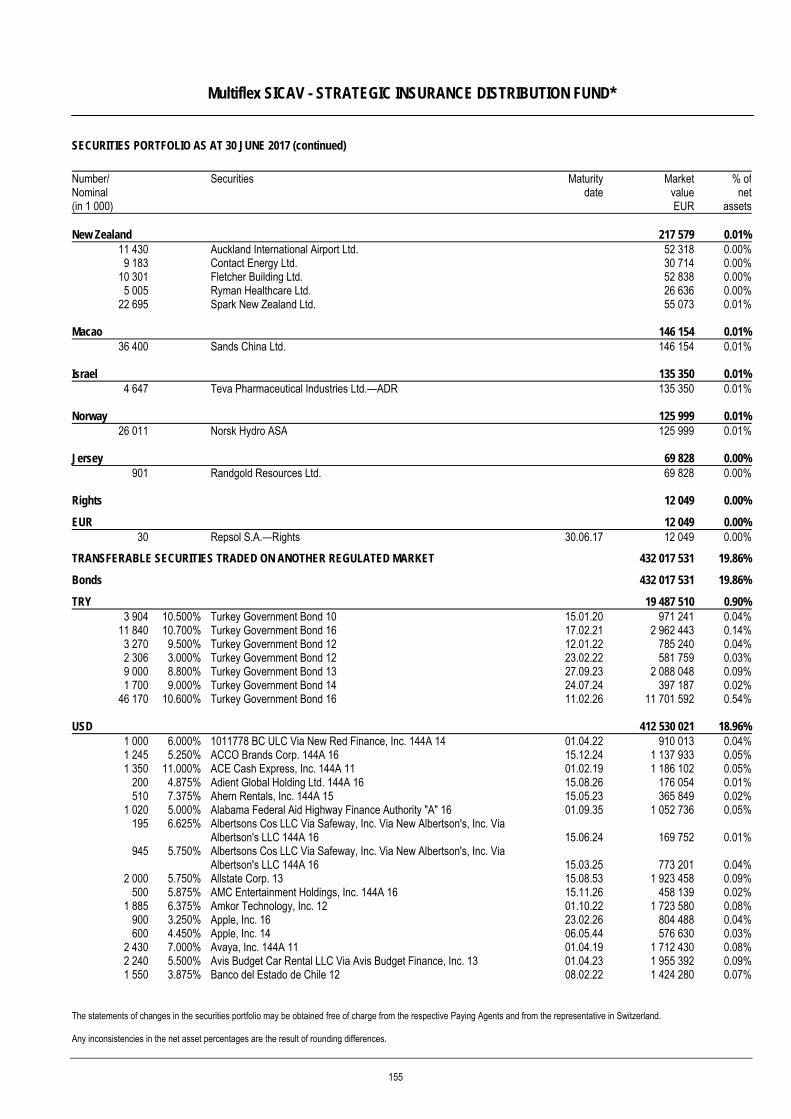
Multiflex SICAV - STRATEGIC INSURANCE DISTRIBUTION FUND*
SECURITIES PORTFOLIO AS AT 30 JUNE 2017 (continued)
The statements of changes in the securities portfolio may be obtained free of charge from the respective Paying Agents and from the representative in Switzerland. Any inconsistencies in the net asset percentages are the result of rounding differences.
Number/ Nominal (in 1 000)
Securities Maturitydate
MarketvalueEUR
% ofnet
assets New Zealand 217 579 0.01%
11 430 Auckland International Airport Ltd. 52 318 0.00%9 183 Contact Energy Ltd. 30 714 0.00%
10 301 Fletcher Building Ltd. 52 838 0.00%5 005 Ryman Healthcare Ltd. 26 636 0.00%
22 695 Spark New Zealand Ltd. 55 073 0.01%
Macao 146 154 0.01%36 400 Sands China Ltd. 146 154 0.01%
Israel 135 350 0.01%4 647 Teva Pharmaceutical Industries Ltd.—ADR 135 350 0.01%
Norway 125 999 0.01%26 011 Norsk Hydro ASA 125 999 0.01%
Jersey 69 828 0.00%901 Randgold Resources Ltd. 69 828 0.00%
Rights 12 049 0.00%
EUR 12 049 0.00%30 Repsol S.A.—Rights 30.06.17 12 049 0.00%
TRANSFERABLE SECURITIES TRADED ON ANOTHER REGULATED MARKET 432 017 531 19.86%
Bonds 432 017 531 19.86%
TRY 19 487 510 0.90%3 904 10.500% Turkey Government Bond 10 15.01.20 971 241 0.04%
11 840 10.700% Turkey Government Bond 16 17.02.21 2 962 443 0.14%3 270 9.500% Turkey Government Bond 12 12.01.22 785 240 0.04%2 306 3.000% Turkey Government Bond 12 23.02.22 581 759 0.03%9 000 8.800% Turkey Government Bond 13 27.09.23 2 088 048 0.09%1 700 9.000% Turkey Government Bond 14 24.07.24 397 187 0.02%
46 170 10.600% Turkey Government Bond 16 11.02.26 11 701 592 0.54%
USD 412 530 021 18.96%1 000 6.000% 1011778 BC ULC Via New Red Finance, Inc. 144A 14 01.04.22 910 013 0.04%1 245 5.250% ACCO Brands Corp. 144A 16 15.12.24 1 137 933 0.05%1 350 11.000% ACE Cash Express, Inc. 144A 11 01.02.19 1 186 102 0.05%
200 4.875% Adient Global Holding Ltd. 144A 16 15.08.26 176 054 0.01%510 7.375% Ahern Rentals, Inc. 144A 15 15.05.23 365 849 0.02%
1 020 5.000% Alabama Federal Aid Highway Finance Authority "A" 16 01.09.35 1 052 736 0.05%195 6.625% Albertsons Cos LLC Via Safeway, Inc. Via New Albertson's, Inc. Via
Albertson's LLC 144A 16 15.06.24 169 752 0.01%945 5.750% Albertsons Cos LLC Via Safeway, Inc. Via New Albertson's, Inc. Via
Albertson's LLC 144A 16 15.03.25 773 201 0.04%2 000 5.750% Allstate Corp. 13 15.08.53 1 923 458 0.09%
500 5.875% AMC Entertainment Holdings, Inc. 144A 16 15.11.26 458 139 0.02%1 885 6.375% Amkor Technology, Inc. 12 01.10.22 1 723 580 0.08%
900 3.250% Apple, Inc. 16 23.02.26 804 488 0.04%600 4.450% Apple, Inc. 14 06.05.44 576 630 0.03%
2 430 7.000% Avaya, Inc. 144A 11 01.04.19 1 712 430 0.08%2 240 5.500% Avis Budget Car Rental LLC Via Avis Budget Finance, Inc. 13 01.04.23 1 955 392 0.09%1 550 3.875% Banco del Estado de Chile 12 08.02.22 1 424 280 0.07%
155
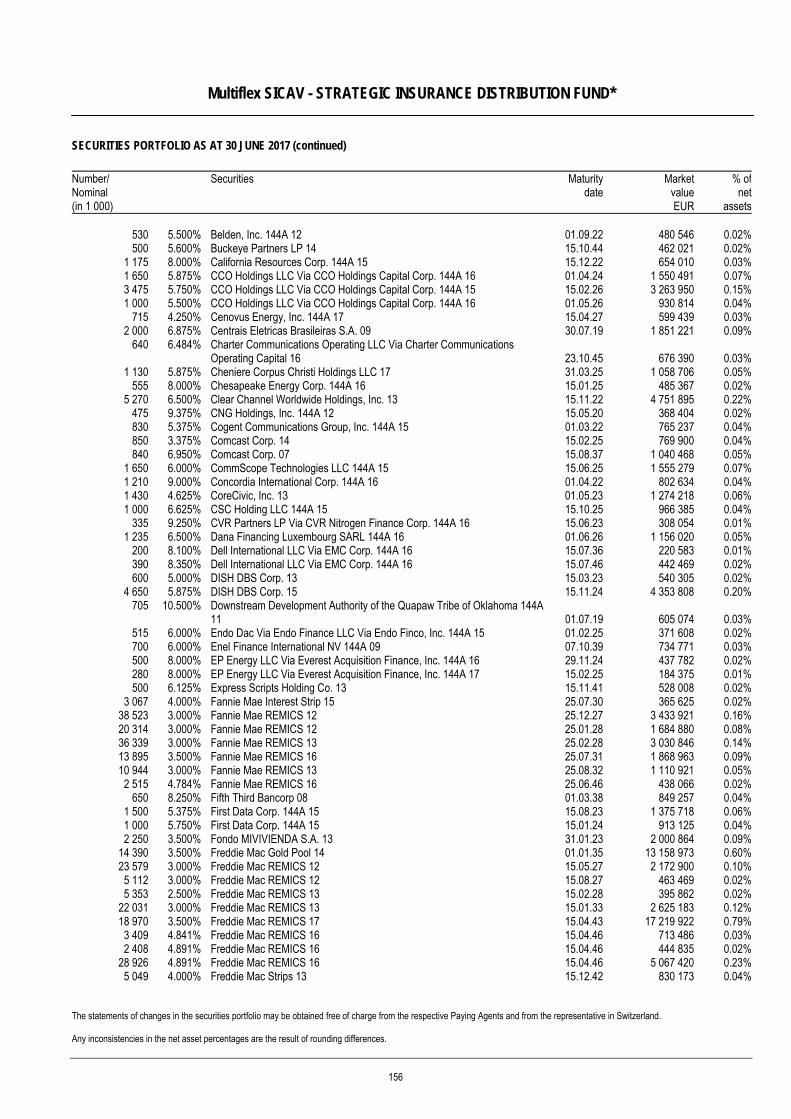
Multiflex SICAV - STRATEGIC INSURANCE DISTRIBUTION FUND*
SECURITIES PORTFOLIO AS AT 30 JUNE 2017 (continued)
The statements of changes in the securities portfolio may be obtained free of charge from the respective Paying Agents and from the representative in Switzerland. Any inconsistencies in the net asset percentages are the result of rounding differences.
Number/ Nominal (in 1 000)
Securities Maturitydate
MarketvalueEUR
% ofnet
assets
530 5.500% Belden, Inc. 144A 12 01.09.22 480 546 0.02%500 5.600% Buckeye Partners LP 14 15.10.44 462 021 0.02%
1 175 8.000% California Resources Corp. 144A 15 15.12.22 654 010 0.03%1 650 5.875% CCO Holdings LLC Via CCO Holdings Capital Corp. 144A 16 01.04.24 1 550 491 0.07%3 475 5.750% CCO Holdings LLC Via CCO Holdings Capital Corp. 144A 15 15.02.26 3 263 950 0.15%1 000 5.500% CCO Holdings LLC Via CCO Holdings Capital Corp. 144A 16 01.05.26 930 814 0.04%
715 4.250% Cenovus Energy, Inc. 144A 17 15.04.27 599 439 0.03%2 000 6.875% Centrais Eletricas Brasileiras S.A. 09 30.07.19 1 851 221 0.09%
640 6.484% Charter Communications Operating LLC Via Charter Communications Operating Capital 16 23.10.45 676 390 0.03%
1 130 5.875% Cheniere Corpus Christi Holdings LLC 17 31.03.25 1 058 706 0.05%555 8.000% Chesapeake Energy Corp. 144A 16 15.01.25 485 367 0.02%
5 270 6.500% Clear Channel Worldwide Holdings, Inc. 13 15.11.22 4 751 895 0.22%475 9.375% CNG Holdings, Inc. 144A 12 15.05.20 368 404 0.02%830 5.375% Cogent Communications Group, Inc. 144A 15 01.03.22 765 237 0.04%850 3.375% Comcast Corp. 14 15.02.25 769 900 0.04%840 6.950% Comcast Corp. 07 15.08.37 1 040 468 0.05%
1 650 6.000% CommScope Technologies LLC 144A 15 15.06.25 1 555 279 0.07%1 210 9.000% Concordia International Corp. 144A 16 01.04.22 802 634 0.04%1 430 4.625% CoreCivic, Inc. 13 01.05.23 1 274 218 0.06%1 000 6.625% CSC Holding LLC 144A 15 15.10.25 966 385 0.04%
335 9.250% CVR Partners LP Via CVR Nitrogen Finance Corp. 144A 16 15.06.23 308 054 0.01%1 235 6.500% Dana Financing Luxembourg SARL 144A 16 01.06.26 1 156 020 0.05%
200 8.100% Dell International LLC Via EMC Corp. 144A 16 15.07.36 220 583 0.01%390 8.350% Dell International LLC Via EMC Corp. 144A 16 15.07.46 442 469 0.02%600 5.000% DISH DBS Corp. 13 15.03.23 540 305 0.02%
4 650 5.875% DISH DBS Corp. 15 15.11.24 4 353 808 0.20%705 10.500% Downstream Development Authority of the Quapaw Tribe of Oklahoma 144A
11 01.07.19 605 074 0.03%515 6.000% Endo Dac Via Endo Finance LLC Via Endo Finco, Inc. 144A 15 01.02.25 371 608 0.02%700 6.000% Enel Finance International NV 144A 09 07.10.39 734 771 0.03%500 8.000% EP Energy LLC Via Everest Acquisition Finance, Inc. 144A 16 29.11.24 437 782 0.02%280 8.000% EP Energy LLC Via Everest Acquisition Finance, Inc. 144A 17 15.02.25 184 375 0.01%500 6.125% Express Scripts Holding Co. 13 15.11.41 528 008 0.02%
3 067 4.000% Fannie Mae Interest Strip 15 25.07.30 365 625 0.02%38 523 3.000% Fannie Mae REMICS 12 25.12.27 3 433 921 0.16%20 314 3.000% Fannie Mae REMICS 12 25.01.28 1 684 880 0.08%36 339 3.000% Fannie Mae REMICS 13 25.02.28 3 030 846 0.14%13 895 3.500% Fannie Mae REMICS 16 25.07.31 1 868 963 0.09%10 944 3.000% Fannie Mae REMICS 13 25.08.32 1 110 921 0.05%2 515 4.784% Fannie Mae REMICS 16 25.06.46 438 066 0.02%
650 8.250% Fifth Third Bancorp 08 01.03.38 849 257 0.04%1 500 5.375% First Data Corp. 144A 15 15.08.23 1 375 718 0.06%1 000 5.750% First Data Corp. 144A 15 15.01.24 913 125 0.04%2 250 3.500% Fondo MIVIVIENDA S.A. 13 31.01.23 2 000 864 0.09%
14 390 3.500% Freddie Mac Gold Pool 14 01.01.35 13 158 973 0.60%23 579 3.000% Freddie Mac REMICS 12 15.05.27 2 172 900 0.10%5 112 3.000% Freddie Mac REMICS 12 15.08.27 463 469 0.02%5 353 2.500% Freddie Mac REMICS 13 15.02.28 395 862 0.02%
22 031 3.000% Freddie Mac REMICS 13 15.01.33 2 625 183 0.12%18 970 3.500% Freddie Mac REMICS 17 15.04.43 17 219 922 0.79%3 409 4.841% Freddie Mac REMICS 16 15.04.46 713 486 0.03%2 408 4.891% Freddie Mac REMICS 16 15.04.46 444 835 0.02%
28 926 4.891% Freddie Mac REMICS 16 15.04.46 5 067 420 0.23%5 049 4.000% Freddie Mac Strips 13 15.12.42 830 173 0.04%
156
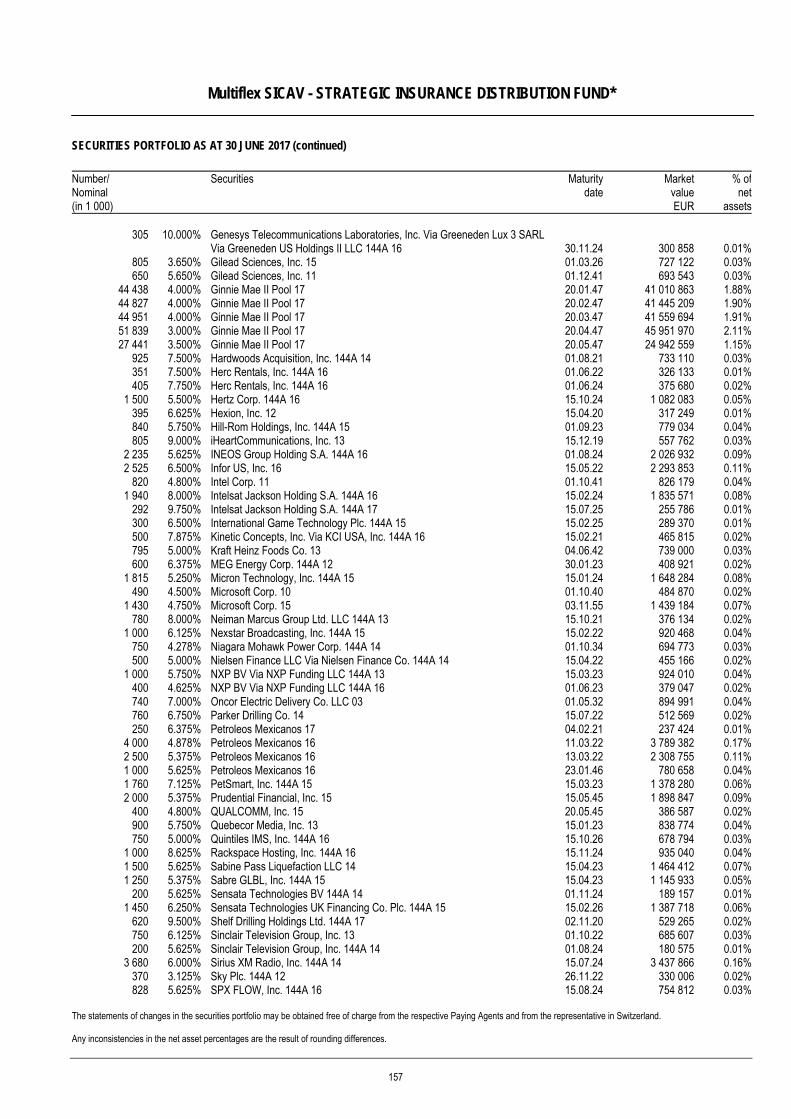
Multiflex SICAV - STRATEGIC INSURANCE DISTRIBUTION FUND*
SECURITIES PORTFOLIO AS AT 30 JUNE 2017 (continued)
The statements of changes in the securities portfolio may be obtained free of charge from the respective Paying Agents and from the representative in Switzerland. Any inconsistencies in the net asset percentages are the result of rounding differences.
Number/ Nominal (in 1 000)
Securities Maturitydate
MarketvalueEUR
% ofnet
assets
305 10.000% Genesys Telecommunications Laboratories, Inc. Via Greeneden Lux 3 SARL Via Greeneden US Holdings II LLC 144A 16 30.11.24 300 858 0.01%
805 3.650% Gilead Sciences, Inc. 15 01.03.26 727 122 0.03%650 5.650% Gilead Sciences, Inc. 11 01.12.41 693 543 0.03%
44 438 4.000% Ginnie Mae II Pool 17 20.01.47 41 010 863 1.88%44 827 4.000% Ginnie Mae II Pool 17 20.02.47 41 445 209 1.90%44 951 4.000% Ginnie Mae II Pool 17 20.03.47 41 559 694 1.91%51 839 3.000% Ginnie Mae II Pool 17 20.04.47 45 951 970 2.11%27 441 3.500% Ginnie Mae II Pool 17 20.05.47 24 942 559 1.15%
925 7.500% Hardwoods Acquisition, Inc. 144A 14 01.08.21 733 110 0.03%351 7.500% Herc Rentals, Inc. 144A 16 01.06.22 326 133 0.01%405 7.750% Herc Rentals, Inc. 144A 16 01.06.24 375 680 0.02%
1 500 5.500% Hertz Corp. 144A 16 15.10.24 1 082 083 0.05%395 6.625% Hexion, Inc. 12 15.04.20 317 249 0.01%840 5.750% Hill-Rom Holdings, Inc. 144A 15 01.09.23 779 034 0.04%805 9.000% iHeartCommunications, Inc. 13 15.12.19 557 762 0.03%
2 235 5.625% INEOS Group Holding S.A. 144A 16 01.08.24 2 026 932 0.09%2 525 6.500% Infor US, Inc. 16 15.05.22 2 293 853 0.11%
820 4.800% Intel Corp. 11 01.10.41 826 179 0.04%1 940 8.000% Intelsat Jackson Holding S.A. 144A 16 15.02.24 1 835 571 0.08%
292 9.750% Intelsat Jackson Holding S.A. 144A 17 15.07.25 255 786 0.01%300 6.500% International Game Technology Plc. 144A 15 15.02.25 289 370 0.01%500 7.875% Kinetic Concepts, Inc. Via KCI USA, Inc. 144A 16 15.02.21 465 815 0.02%795 5.000% Kraft Heinz Foods Co. 13 04.06.42 739 000 0.03%600 6.375% MEG Energy Corp. 144A 12 30.01.23 408 921 0.02%
1 815 5.250% Micron Technology, Inc. 144A 15 15.01.24 1 648 284 0.08%490 4.500% Microsoft Corp. 10 01.10.40 484 870 0.02%
1 430 4.750% Microsoft Corp. 15 03.11.55 1 439 184 0.07%780 8.000% Neiman Marcus Group Ltd. LLC 144A 13 15.10.21 376 134 0.02%
1 000 6.125% Nexstar Broadcasting, Inc. 144A 15 15.02.22 920 468 0.04%750 4.278% Niagara Mohawk Power Corp. 144A 14 01.10.34 694 773 0.03%500 5.000% Nielsen Finance LLC Via Nielsen Finance Co. 144A 14 15.04.22 455 166 0.02%
1 000 5.750% NXP BV Via NXP Funding LLC 144A 13 15.03.23 924 010 0.04%400 4.625% NXP BV Via NXP Funding LLC 144A 16 01.06.23 379 047 0.02%740 7.000% Oncor Electric Delivery Co. LLC 03 01.05.32 894 991 0.04%760 6.750% Parker Drilling Co. 14 15.07.22 512 569 0.02%250 6.375% Petroleos Mexicanos 17 04.02.21 237 424 0.01%
4 000 4.878% Petroleos Mexicanos 16 11.03.22 3 789 382 0.17%2 500 5.375% Petroleos Mexicanos 16 13.03.22 2 308 755 0.11%1 000 5.625% Petroleos Mexicanos 16 23.01.46 780 658 0.04%1 760 7.125% PetSmart, Inc. 144A 15 15.03.23 1 378 280 0.06%2 000 5.375% Prudential Financial, Inc. 15 15.05.45 1 898 847 0.09%
400 4.800% QUALCOMM, Inc. 15 20.05.45 386 587 0.02%900 5.750% Quebecor Media, Inc. 13 15.01.23 838 774 0.04%750 5.000% Quintiles IMS, Inc. 144A 16 15.10.26 678 794 0.03%
1 000 8.625% Rackspace Hosting, Inc. 144A 16 15.11.24 935 040 0.04%1 500 5.625% Sabine Pass Liquefaction LLC 14 15.04.23 1 464 412 0.07%1 250 5.375% Sabre GLBL, Inc. 144A 15 15.04.23 1 145 933 0.05%
200 5.625% Sensata Technologies BV 144A 14 01.11.24 189 157 0.01%1 450 6.250% Sensata Technologies UK Financing Co. Plc. 144A 15 15.02.26 1 387 718 0.06%
620 9.500% Shelf Drilling Holdings Ltd. 144A 17 02.11.20 529 265 0.02%750 6.125% Sinclair Television Group, Inc. 13 01.10.22 685 607 0.03%200 5.625% Sinclair Television Group, Inc. 144A 14 01.08.24 180 575 0.01%
3 680 6.000% Sirius XM Radio, Inc. 144A 14 15.07.24 3 437 866 0.16%370 3.125% Sky Plc. 144A 12 26.11.22 330 006 0.02%828 5.625% SPX FLOW, Inc. 144A 16 15.08.24 754 812 0.03%
157
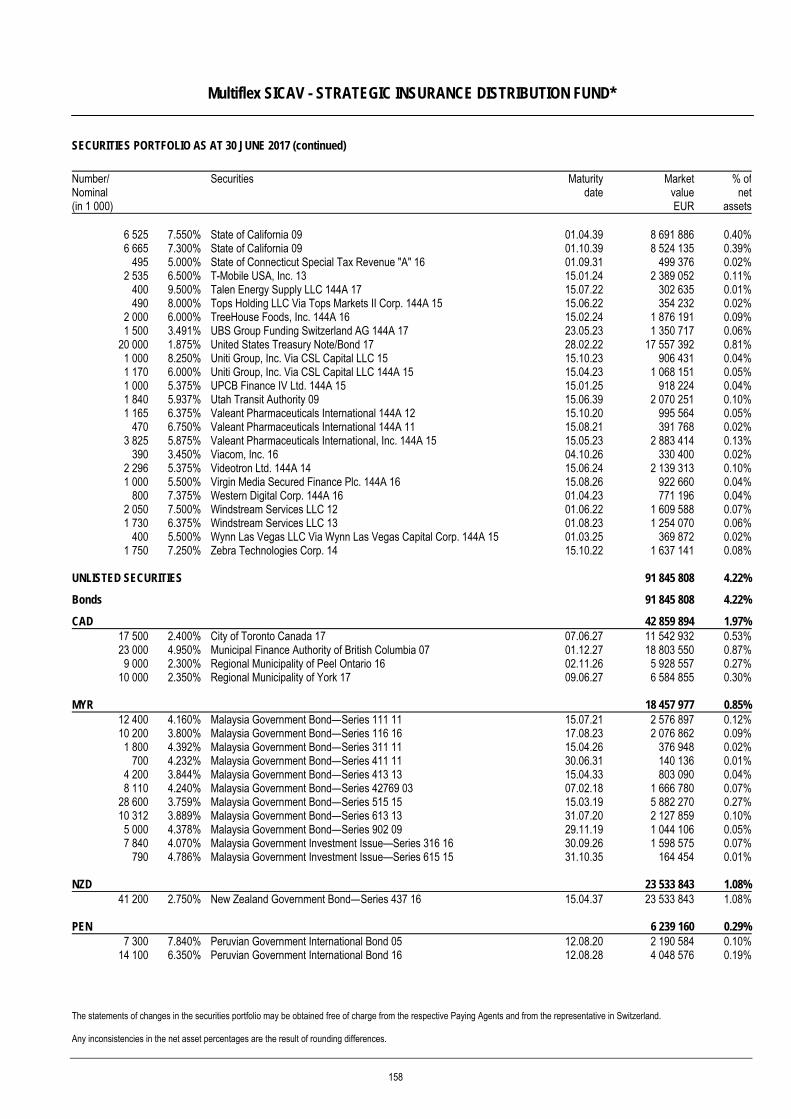
Multiflex SICAV - STRATEGIC INSURANCE DISTRIBUTION FUND*
SECURITIES PORTFOLIO AS AT 30 JUNE 2017 (continued)
The statements of changes in the securities portfolio may be obtained free of charge from the respective Paying Agents and from the representative in Switzerland. Any inconsistencies in the net asset percentages are the result of rounding differences.
Number/ Nominal (in 1 000)
Securities Maturitydate
MarketvalueEUR
% ofnet
assets
6 525 7.550% State of California 09 01.04.39 8 691 886 0.40%6 665 7.300% State of California 09 01.10.39 8 524 135 0.39%
495 5.000% State of Connecticut Special Tax Revenue "A" 16 01.09.31 499 376 0.02%2 535 6.500% T-Mobile USA, Inc. 13 15.01.24 2 389 052 0.11%
400 9.500% Talen Energy Supply LLC 144A 17 15.07.22 302 635 0.01%490 8.000% Tops Holding LLC Via Tops Markets II Corp. 144A 15 15.06.22 354 232 0.02%
2 000 6.000% TreeHouse Foods, Inc. 144A 16 15.02.24 1 876 191 0.09%1 500 3.491% UBS Group Funding Switzerland AG 144A 17 23.05.23 1 350 717 0.06%
20 000 1.875% United States Treasury Note/Bond 17 28.02.22 17 557 392 0.81%1 000 8.250% Uniti Group, Inc. Via CSL Capital LLC 15 15.10.23 906 431 0.04%1 170 6.000% Uniti Group, Inc. Via CSL Capital LLC 144A 15 15.04.23 1 068 151 0.05%1 000 5.375% UPCB Finance IV Ltd. 144A 15 15.01.25 918 224 0.04%1 840 5.937% Utah Transit Authority 09 15.06.39 2 070 251 0.10%1 165 6.375% Valeant Pharmaceuticals International 144A 12 15.10.20 995 564 0.05%
470 6.750% Valeant Pharmaceuticals International 144A 11 15.08.21 391 768 0.02%3 825 5.875% Valeant Pharmaceuticals International, Inc. 144A 15 15.05.23 2 883 414 0.13%
390 3.450% Viacom, Inc. 16 04.10.26 330 400 0.02%2 296 5.375% Videotron Ltd. 144A 14 15.06.24 2 139 313 0.10%1 000 5.500% Virgin Media Secured Finance Plc. 144A 16 15.08.26 922 660 0.04%
800 7.375% Western Digital Corp. 144A 16 01.04.23 771 196 0.04%2 050 7.500% Windstream Services LLC 12 01.06.22 1 609 588 0.07%1 730 6.375% Windstream Services LLC 13 01.08.23 1 254 070 0.06%
400 5.500% Wynn Las Vegas LLC Via Wynn Las Vegas Capital Corp. 144A 15 01.03.25 369 872 0.02%1 750 7.250% Zebra Technologies Corp. 14 15.10.22 1 637 141 0.08%
UNLISTED SECURITIES 91 845 808 4.22%
Bonds 91 845 808 4.22%
CAD 42 859 894 1.97%17 500 2.400% City of Toronto Canada 17 07.06.27 11 542 932 0.53%23 000 4.950% Municipal Finance Authority of British Columbia 07 01.12.27 18 803 550 0.87%9 000 2.300% Regional Municipality of Peel Ontario 16 02.11.26 5 928 557 0.27%
10 000 2.350% Regional Municipality of York 17 09.06.27 6 584 855 0.30%
MYR 18 457 977 0.85%12 400 4.160% Malaysia Government Bond—Series 111 11 15.07.21 2 576 897 0.12%10 200 3.800% Malaysia Government Bond—Series 116 16 17.08.23 2 076 862 0.09%1 800 4.392% Malaysia Government Bond—Series 311 11 15.04.26 376 948 0.02%
700 4.232% Malaysia Government Bond—Series 411 11 30.06.31 140 136 0.01%4 200 3.844% Malaysia Government Bond—Series 413 13 15.04.33 803 090 0.04%8 110 4.240% Malaysia Government Bond—Series 42769 03 07.02.18 1 666 780 0.07%
28 600 3.759% Malaysia Government Bond—Series 515 15 15.03.19 5 882 270 0.27%10 312 3.889% Malaysia Government Bond—Series 613 13 31.07.20 2 127 859 0.10%5 000 4.378% Malaysia Government Bond—Series 902 09 29.11.19 1 044 106 0.05%7 840 4.070% Malaysia Government Investment Issue—Series 316 16 30.09.26 1 598 575 0.07%
790 4.786% Malaysia Government Investment Issue—Series 615 15 31.10.35 164 454 0.01%
NZD 23 533 843 1.08%41 200 2.750% New Zealand Government Bond—Series 437 16 15.04.37 23 533 843 1.08%
PEN 6 239 160 0.29%7 300 7.840% Peruvian Government International Bond 05 12.08.20 2 190 584 0.10%
14 100 6.350% Peruvian Government International Bond 16 12.08.28 4 048 576 0.19%
158
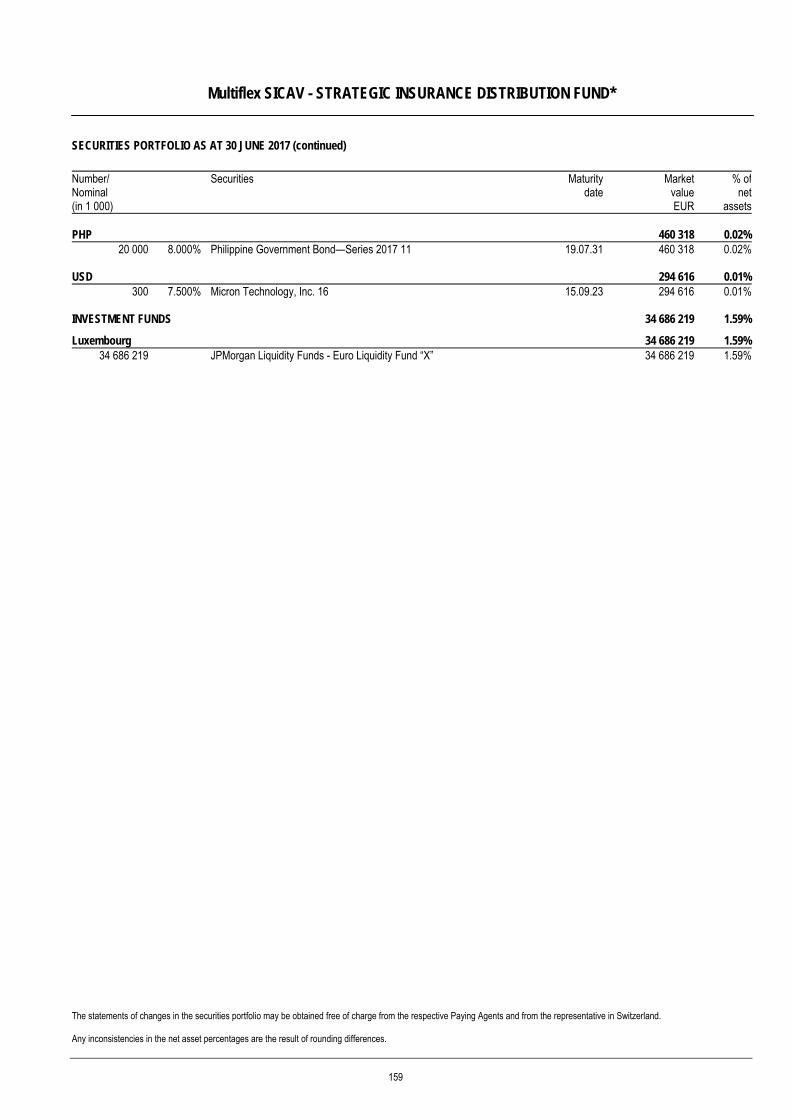
Multiflex SICAV - STRATEGIC INSURANCE DISTRIBUTION FUND*
SECURITIES PORTFOLIO AS AT 30 JUNE 2017 (continued)
The statements of changes in the securities portfolio may be obtained free of charge from the respective Paying Agents and from the representative in Switzerland. Any inconsistencies in the net asset percentages are the result of rounding differences.
Number/ Nominal (in 1 000)
Securities Maturitydate
MarketvalueEUR
% ofnet
assets PHP 460 318 0.02%
20 000 8.000% Philippine Government Bond—Series 2017 11 19.07.31 460 318 0.02%
USD 294 616 0.01%300 7.500% Micron Technology, Inc. 16 15.09.23 294 616 0.01%
INVESTMENT FUNDS 34 686 219 1.59%
Luxembourg 34 686 219 1.59%34 686 219 JPMorgan Liquidity Funds - Euro Liquidity Fund “X” 34 686 219 1.59%
159
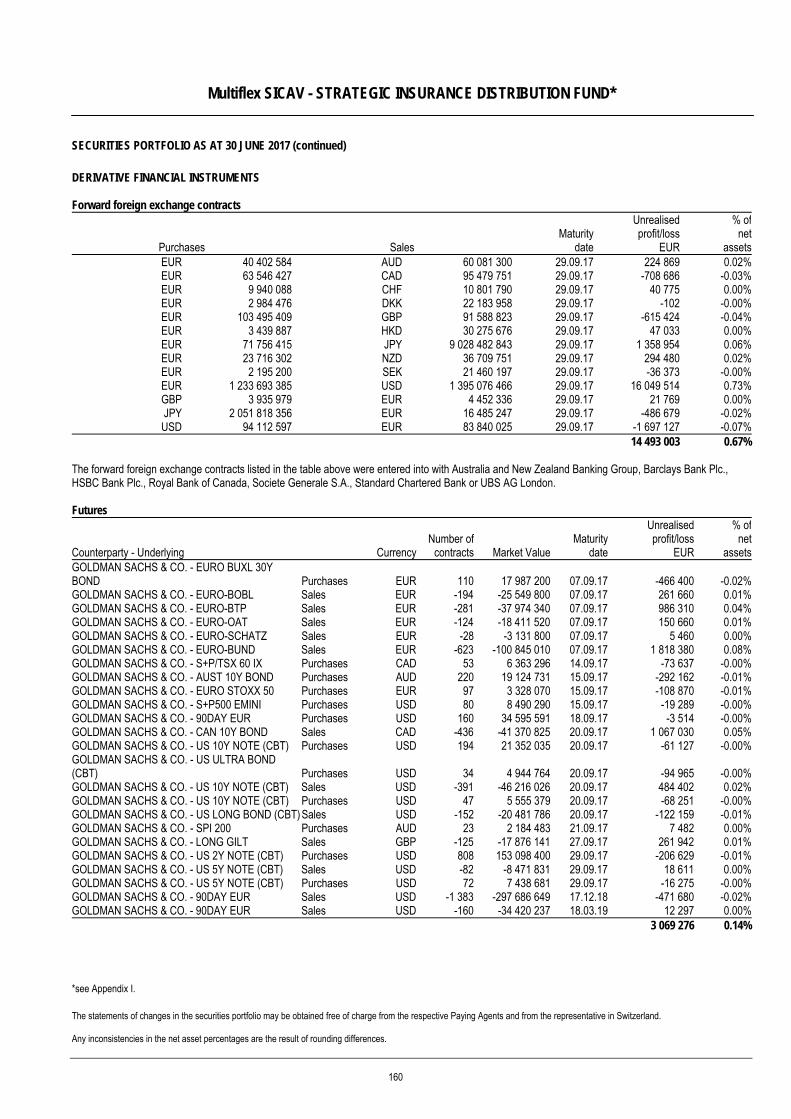
Multiflex SICAV - STRATEGIC INSURANCE DISTRIBUTION FUND*
SECURITIES PORTFOLIO AS AT 30 JUNE 2017 (continued)
The statements of changes in the securities portfolio may be obtained free of charge from the respective Paying Agents and from the representative in Switzerland. Any inconsistencies in the net asset percentages are the result of rounding differences.
DERIVATIVE FINANCIAL INSTRUMENTS Forward foreign exchange contracts
Purchases Sales Maturity
date
Unrealisedprofit/loss
EUR
% ofnet
assetsEUR 40 402 584 AUD 60 081 300 29.09.17 224 869 0.02%EUR 63 546 427 CAD 95 479 751 29.09.17 -708 686 -0.03%EUR 9 940 088 CHF 10 801 790 29.09.17 40 775 0.00%EUR 2 984 476 DKK 22 183 958 29.09.17 -102 -0.00%EUR 103 495 409 GBP 91 588 823 29.09.17 -615 424 -0.04%EUR 3 439 887 HKD 30 275 676 29.09.17 47 033 0.00%EUR 71 756 415 JPY 9 028 482 843 29.09.17 1 358 954 0.06%EUR 23 716 302 NZD 36 709 751 29.09.17 294 480 0.02%EUR 2 195 200 SEK 21 460 197 29.09.17 -36 373 -0.00%EUR 1 233 693 385 USD 1 395 076 466 29.09.17 16 049 514 0.73%GBP 3 935 979 EUR 4 452 336 29.09.17 21 769 0.00%JPY 2 051 818 356 EUR 16 485 247 29.09.17 -486 679 -0.02%USD 94 112 597 EUR 83 840 025 29.09.17 -1 697 127 -0.07%
14 493 003 0.67% The forward foreign exchange contracts listed in the table above were entered into with Australia and New Zealand Banking Group, Barclays Bank Plc., HSBC Bank Plc., Royal Bank of Canada, Societe Generale S.A., Standard Chartered Bank or UBS AG London. Futures
Counterparty - Underlying CurrencyNumber of
contracts Market ValueMaturity
date
Unrealisedprofit/loss
EUR
% ofnet
assetsGOLDMAN SACHS & CO. - EURO BUXL 30Y BOND Purchases EUR 110 17 987 200 07.09.17 -466 400 -0.02%GOLDMAN SACHS & CO. - EURO-BOBL Sales EUR -194 -25 549 800 07.09.17 261 660 0.01%GOLDMAN SACHS & CO. - EURO-BTP Sales EUR -281 -37 974 340 07.09.17 986 310 0.04%GOLDMAN SACHS & CO. - EURO-OAT Sales EUR -124 -18 411 520 07.09.17 150 660 0.01%GOLDMAN SACHS & CO. - EURO-SCHATZ Sales EUR -28 -3 131 800 07.09.17 5 460 0.00%GOLDMAN SACHS & CO. - EURO-BUND Sales EUR -623 -100 845 010 07.09.17 1 818 380 0.08%GOLDMAN SACHS & CO. - S+P/TSX 60 IX Purchases CAD 53 6 363 296 14.09.17 -73 637 -0.00%GOLDMAN SACHS & CO. - AUST 10Y BOND Purchases AUD 220 19 124 731 15.09.17 -292 162 -0.01%GOLDMAN SACHS & CO. - EURO STOXX 50 Purchases EUR 97 3 328 070 15.09.17 -108 870 -0.01%GOLDMAN SACHS & CO. - S+P500 EMINI Purchases USD 80 8 490 290 15.09.17 -19 289 -0.00%GOLDMAN SACHS & CO. - 90DAY EUR Purchases USD 160 34 595 591 18.09.17 -3 514 -0.00%GOLDMAN SACHS & CO. - CAN 10Y BOND Sales CAD -436 -41 370 825 20.09.17 1 067 030 0.05%GOLDMAN SACHS & CO. - US 10Y NOTE (CBT) Purchases USD 194 21 352 035 20.09.17 -61 127 -0.00%GOLDMAN SACHS & CO. - US ULTRA BOND (CBT) Purchases USD 34 4 944 764 20.09.17 -94 965 -0.00%GOLDMAN SACHS & CO. - US 10Y NOTE (CBT) Sales USD -391 -46 216 026 20.09.17 484 402 0.02%GOLDMAN SACHS & CO. - US 10Y NOTE (CBT) Purchases USD 47 5 555 379 20.09.17 -68 251 -0.00%GOLDMAN SACHS & CO. - US LONG BOND (CBT) Sales USD -152 -20 481 786 20.09.17 -122 159 -0.01%GOLDMAN SACHS & CO. - SPI 200 Purchases AUD 23 2 184 483 21.09.17 7 482 0.00%GOLDMAN SACHS & CO. - LONG GILT Sales GBP -125 -17 876 141 27.09.17 261 942 0.01%GOLDMAN SACHS & CO. - US 2Y NOTE (CBT) Purchases USD 808 153 098 400 29.09.17 -206 629 -0.01%GOLDMAN SACHS & CO. - US 5Y NOTE (CBT) Sales USD -82 -8 471 831 29.09.17 18 611 0.00%GOLDMAN SACHS & CO. - US 5Y NOTE (CBT) Purchases USD 72 7 438 681 29.09.17 -16 275 -0.00%GOLDMAN SACHS & CO. - 90DAY EUR Sales USD -1 383 -297 686 649 17.12.18 -471 680 -0.02%GOLDMAN SACHS & CO. - 90DAY EUR Sales USD -160 -34 420 237 18.03.19 12 297 0.00% 3 069 276 0.14% *see Appendix I.
160

Multiflex SICAV - SWISS ASSET PARTNERS EQUITY FUND
The information in this report is based on historical data and is no indication of future performance. In case of differences between the German version and the translation, the German version shall be the authentic text.
Fund Management Report Investment Policy The investment objective of Multiflex SICAV - SWISS ASSET PARTNERS EQUITY FUND is principally to achieve a long-term capital growth in the accounting currency by investing the sub-fund's assets in a portfolio of carefully selected shares, other equities and warrants on shares and equities. The sub-fund invests primarily in equities and similar instruments (shares, dividend-right certificates, participation certificates, etc.) of large and small and medium-sized companies which are domiciled in Switzerland, or which carry out the bulk of their business activities in Switzerland. Market review and portfolio Swiss shares were witnessing a positive trend at the end of June 2017. During the reporting period, the Swiss Leader Index (SLI) increased by 17.6%. The market was spurred on by a brighter economic environment, substantial corporate profits, continuing low interest rates, expansionary central bank policies as well as lower political risks (elections in US, Italy, Holland and France). The Multiflex SICAV - SWISS ASSET PARTNERS EQUITY FUND finished the reporting period on a high note. The SLI was beaten with a performance of 19.54% (share class C). This was done by adopting a defensive approach geared towards value, but with a cash quote. The key performance drivers were Sika, Ems-Chemie, Coltene and also Nestlé, which sprang a surprise with a number of positive strategic announcements. The sub-funds at banks remain considerably underweighted. Some new transactions were conducted. For instance, Forbo, U-Blox, Vifor Pharma as well as OC Oerlikon now form part of our portfolio. Syngenta was taken over by Chem China, and the shares were correspondingly charged off.
161
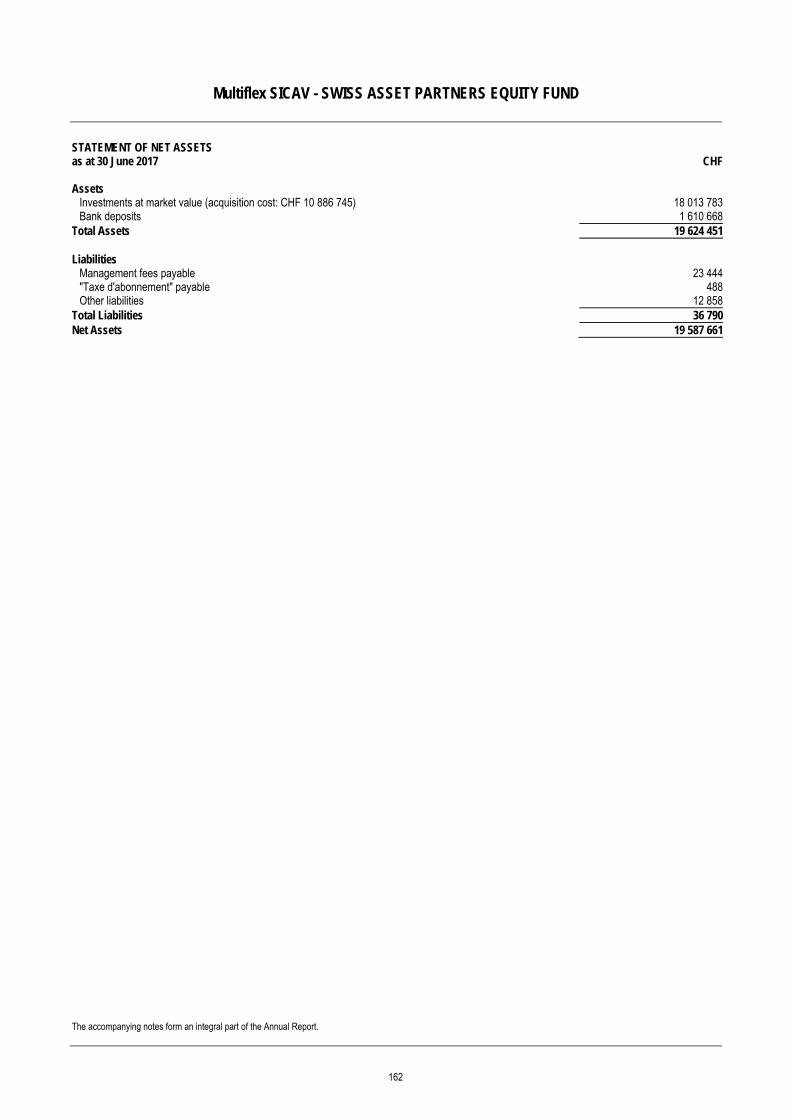
Multiflex SICAV - SWISS ASSET PARTNERS EQUITY FUND
The accompanying notes form an integral part of the Annual Report.
STATEMENT OF NET ASSETS as at 30 June 2017 CHF Assets
Investments at market value (acquisition cost: CHF 10 886 745) 18 013 783Bank deposits 1 610 668
Total Assets 19 624 451 Liabilities
Management fees payable 23 444"Taxe d'abonnement" payable 488Other liabilities 12 858
Total Liabilities 36 790Net Assets 19 587 661
162
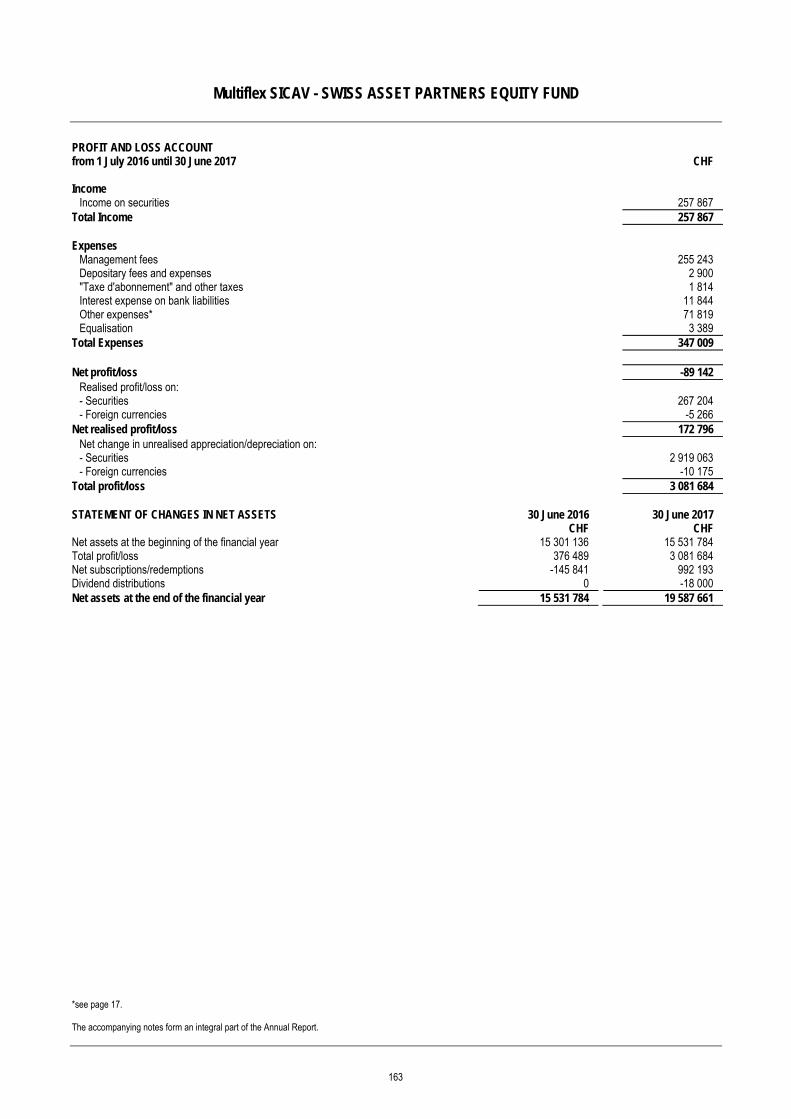
Multiflex SICAV - SWISS ASSET PARTNERS EQUITY FUND
*see page 17. The accompanying notes form an integral part of the Annual Report.
PROFIT AND LOSS ACCOUNT from 1 July 2016 until 30 June 2017 CHF Income
Income on securities 257 867 Total Income 257 867 Expenses
Management fees 255 243 Depositary fees and expenses 2 900 "Taxe d'abonnement" and other taxes 1 814 Interest expense on bank liabilities 11 844 Other expenses* 71 819 Equalisation 3 389
Total Expenses 347 009 Net profit/loss -89 142
Realised profit/loss on: - Securities 267 204 - Foreign currencies -5 266
Net realised profit/loss 172 796 Net change in unrealised appreciation/depreciation on: - Securities 2 919 063 - Foreign currencies -10 175
Total profit/loss 3 081 684 STATEMENT OF CHANGES IN NET ASSETS 30 June 2016 30 June 2017 CHF CHF Net assets at the beginning of the financial year 15 301 136 15 531 784 Total profit/loss 376 489 3 081 684 Net subscriptions/redemptions -145 841 992 193 Dividend distributions 0 -18 000 Net assets at the end of the financial year 15 531 784 19 587 661
163
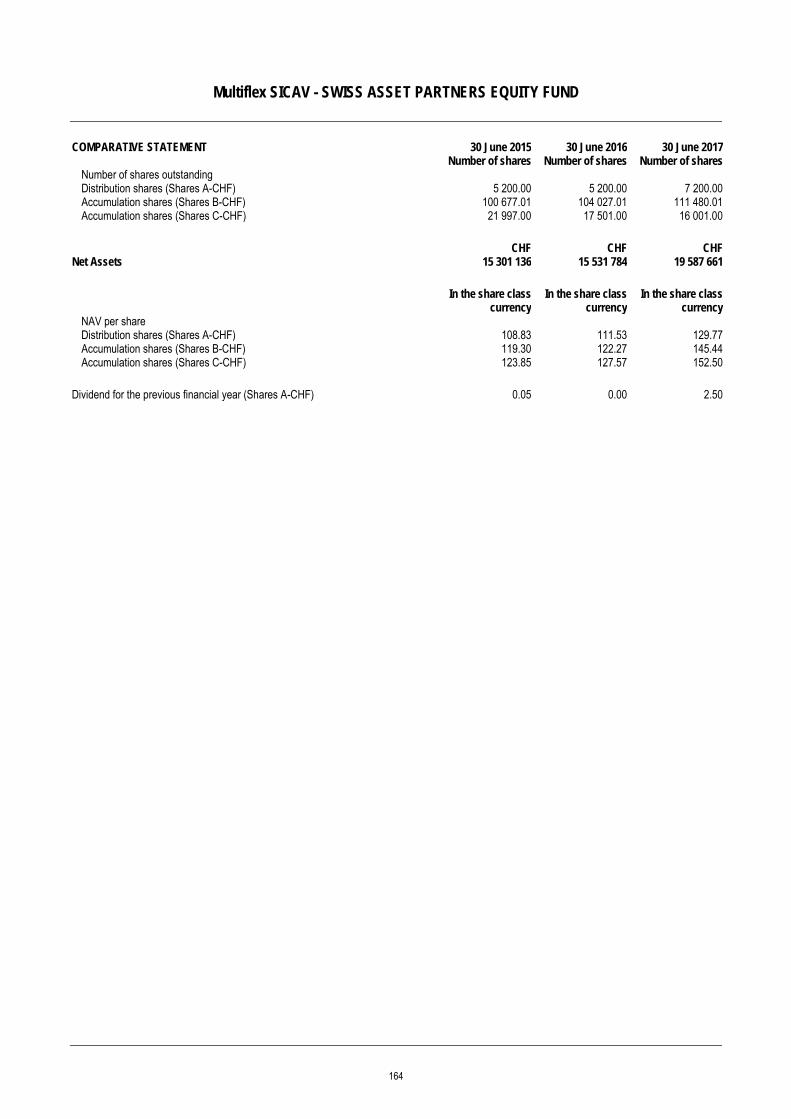
Multiflex SICAV - SWISS ASSET PARTNERS EQUITY FUND
COMPARATIVE STATEMENT 30 June 2015 30 June 2016 30 June 2017 Number of shares Number of shares Number of shares
Number of shares outstanding Distribution shares (Shares A-CHF) 5 200.00 5 200.00 7 200.00 Accumulation shares (Shares B-CHF) 100 677.01 104 027.01 111 480.01 Accumulation shares (Shares C-CHF) 21 997.00 17 501.00 16 001.00
CHF CHF CHF Net Assets 15 301 136 15 531 784 19 587 661
In the share class
currency In the share class
currency In the share class
currency NAV per share Distribution shares (Shares A-CHF) 108.83 111.53 129.77 Accumulation shares (Shares B-CHF) 119.30 122.27 145.44 Accumulation shares (Shares C-CHF) 123.85 127.57 152.50
Dividend for the previous financial year (Shares A-CHF) 0.05 0.00 2.50
164
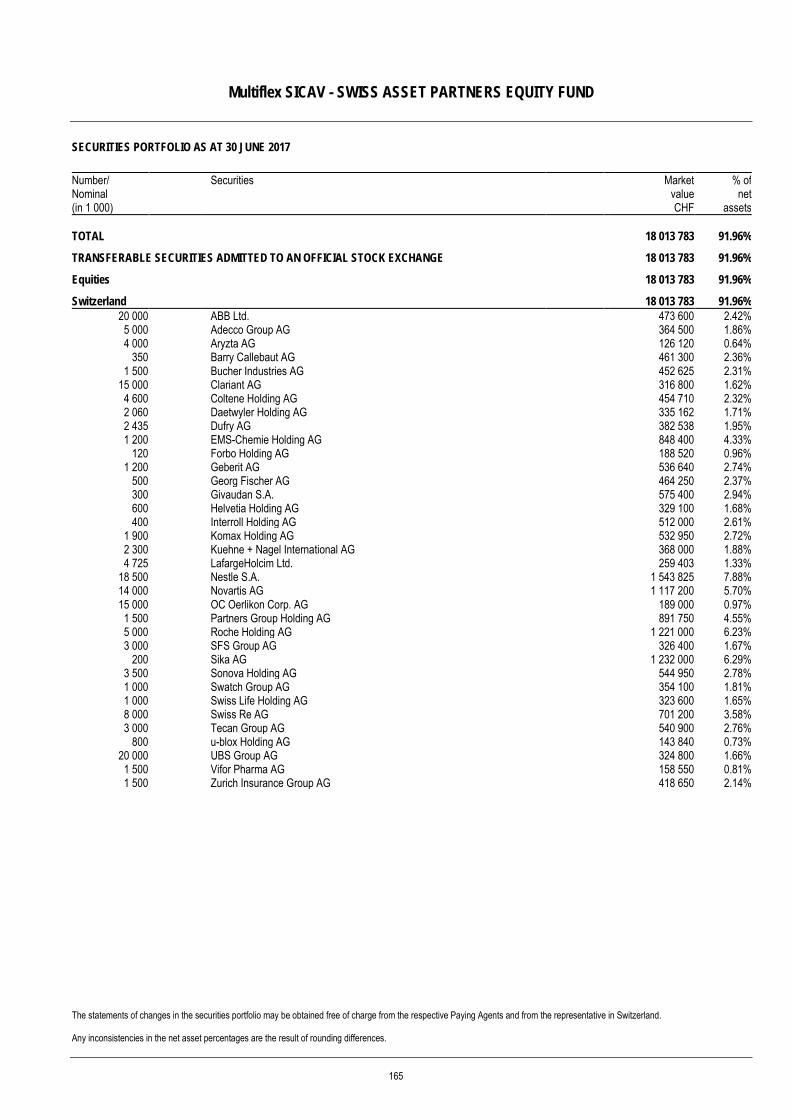
Multiflex SICAV - SWISS ASSET PARTNERS EQUITY FUND
SECURITIES PORTFOLIO AS AT 30 JUNE 2017
The statements of changes in the securities portfolio may be obtained free of charge from the respective Paying Agents and from the representative in Switzerland. Any inconsistencies in the net asset percentages are the result of rounding differences.
Number/ Nominal (in 1 000)
Securities
Market value CHF
% of net
assets TOTAL 18 013 783 91.96%
TRANSFERABLE SECURITIES ADMITTED TO AN OFFICIAL STOCK EXCHANGE 18 013 783 91.96%
Equities 18 013 783 91.96%
Switzerland 18 013 783 91.96% 20 000 ABB Ltd. 473 600 2.42% 5 000 Adecco Group AG 364 500 1.86% 4 000 Aryzta AG 126 120 0.64%
350 Barry Callebaut AG 461 300 2.36% 1 500 Bucher Industries AG 452 625 2.31%
15 000 Clariant AG 316 800 1.62% 4 600 Coltene Holding AG 454 710 2.32% 2 060 Daetwyler Holding AG 335 162 1.71% 2 435 Dufry AG 382 538 1.95% 1 200 EMS-Chemie Holding AG 848 400 4.33%
120 Forbo Holding AG 188 520 0.96% 1 200 Geberit AG 536 640 2.74%
500 Georg Fischer AG 464 250 2.37% 300 Givaudan S.A. 575 400 2.94% 600 Helvetia Holding AG 329 100 1.68% 400 Interroll Holding AG 512 000 2.61%
1 900 Komax Holding AG 532 950 2.72% 2 300 Kuehne + Nagel International AG 368 000 1.88% 4 725 LafargeHolcim Ltd. 259 403 1.33%
18 500 Nestle S.A. 1 543 825 7.88% 14 000 Novartis AG 1 117 200 5.70% 15 000 OC Oerlikon Corp. AG 189 000 0.97% 1 500 Partners Group Holding AG 891 750 4.55% 5 000 Roche Holding AG 1 221 000 6.23% 3 000 SFS Group AG 326 400 1.67%
200 Sika AG 1 232 000 6.29% 3 500 Sonova Holding AG 544 950 2.78% 1 000 Swatch Group AG 354 100 1.81% 1 000 Swiss Life Holding AG 323 600 1.65% 8 000 Swiss Re AG 701 200 3.58% 3 000 Tecan Group AG 540 900 2.76%
800 u-blox Holding AG 143 840 0.73% 20 000 UBS Group AG 324 800 1.66% 1 500 Vifor Pharma AG 158 550 0.81% 1 500 Zurich Insurance Group AG 418 650 2.14%
165
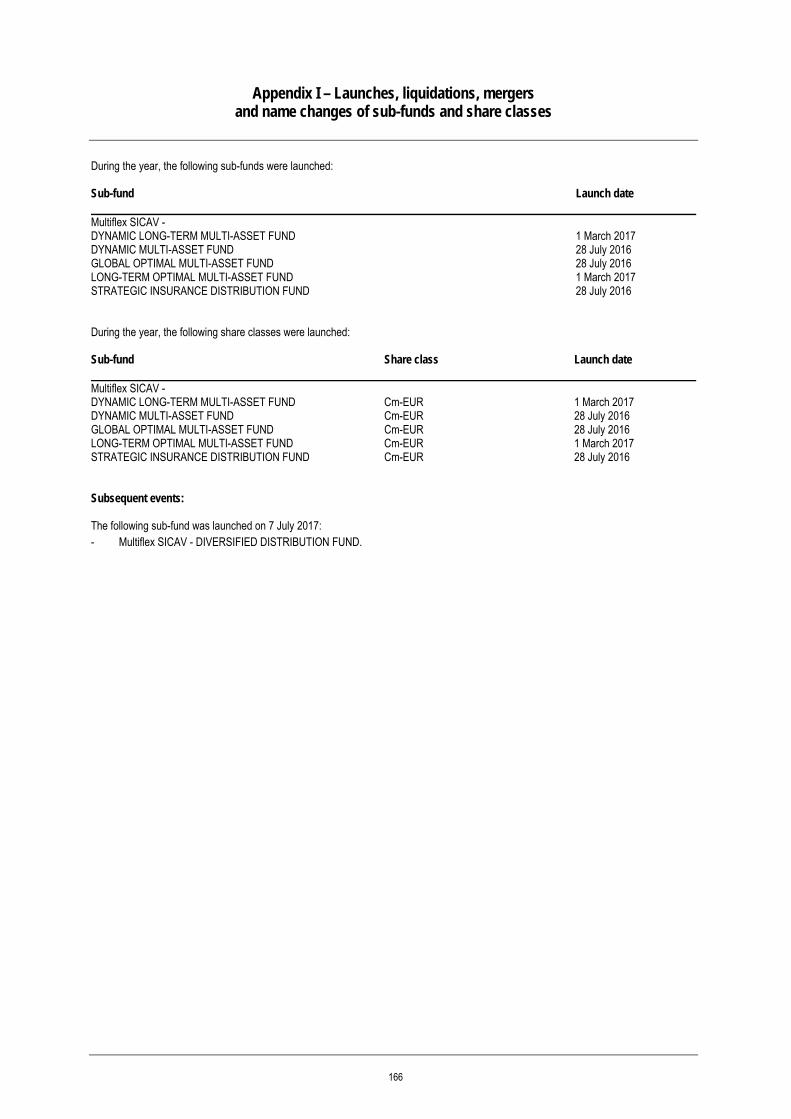
Appendix I – Launches, liquidations, mergers and name changes of sub-funds and share classes
During the year, the following sub-funds were launched: Sub-fund Launch date Multiflex SICAV - DYNAMIC LONG-TERM MULTI-ASSET FUND 1 March 2017 DYNAMIC MULTI-ASSET FUND 28 July 2016 GLOBAL OPTIMAL MULTI-ASSET FUND 28 July 2016 LONG-TERM OPTIMAL MULTI-ASSET FUND 1 March 2017 STRATEGIC INSURANCE DISTRIBUTION FUND 28 July 2016 During the year, the following share classes were launched: Sub-fund Share class Launch date Multiflex SICAV - DYNAMIC LONG-TERM MULTI-ASSET FUND Cm-EUR 1 March 2017 DYNAMIC MULTI-ASSET FUND Cm-EUR 28 July 2016 GLOBAL OPTIMAL MULTI-ASSET FUND Cm-EUR 28 July 2016 LONG-TERM OPTIMAL MULTI-ASSET FUND Cm-EUR 1 March 2017 STRATEGIC INSURANCE DISTRIBUTION FUND Cm-EUR 28 July 2016 Subsequent events: The following sub-fund was launched on 7 July 2017: - Multiflex SICAV - DIVERSIFIED DISTRIBUTION FUND.
166
Appendix II – Securities Financing Transactions (unaudited)
SFTR disclosures are not applicable to this Fund.
167
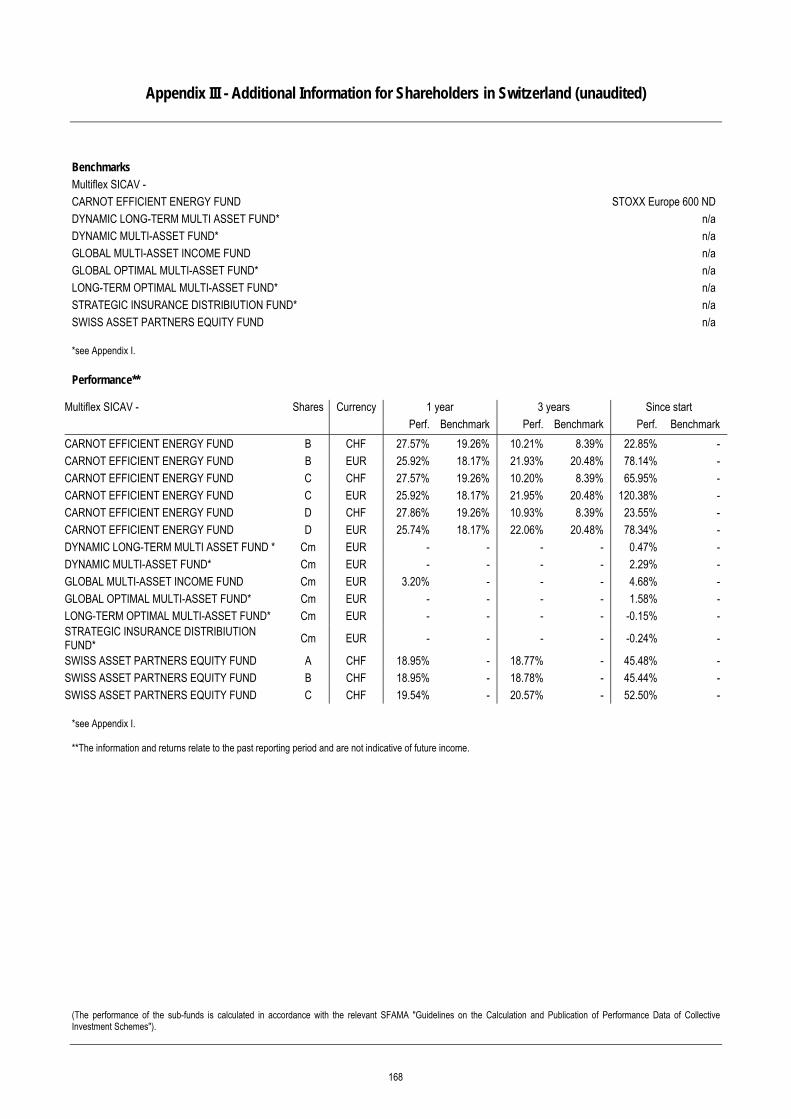
Appendix III - Additional Information for Shareholders in Switzerland (unaudited)
(The performance of the sub-funds is calculated in accordance with the relevant SFAMA "Guidelines on the Calculation and Publication of Performance Data of Collective Investment Schemes").
Benchmarks Multiflex SICAV - CARNOT EFFICIENT ENERGY FUND STOXX Europe 600 ND DYNAMIC LONG-TERM MULTI ASSET FUND* n/a DYNAMIC MULTI-ASSET FUND* n/a GLOBAL MULTI-ASSET INCOME FUND n/a GLOBAL OPTIMAL MULTI-ASSET FUND* n/a LONG-TERM OPTIMAL MULTI-ASSET FUND* n/a STRATEGIC INSURANCE DISTRIBIUTION FUND* n/a SWISS ASSET PARTNERS EQUITY FUND n/a *see Appendix I. Performance**
Multiflex SICAV - Shares Currency 1 year 3 years Since start Perf. Benchmark Perf. Benchmark Perf. Benchmark
CARNOT EFFICIENT ENERGY FUND B CHF 27.57% 19.26% 10.21% 8.39% 22.85% - CARNOT EFFICIENT ENERGY FUND B EUR 25.92% 18.17% 21.93% 20.48% 78.14% - CARNOT EFFICIENT ENERGY FUND C CHF 27.57% 19.26% 10.20% 8.39% 65.95% - CARNOT EFFICIENT ENERGY FUND C EUR 25.92% 18.17% 21.95% 20.48% 120.38% - CARNOT EFFICIENT ENERGY FUND D CHF 27.86% 19.26% 10.93% 8.39% 23.55% - CARNOT EFFICIENT ENERGY FUND D EUR 25.74% 18.17% 22.06% 20.48% 78.34% - DYNAMIC LONG-TERM MULTI ASSET FUND * Cm EUR - - - - 0.47% - DYNAMIC MULTI-ASSET FUND* Cm EUR - - - - 2.29% - GLOBAL MULTI-ASSET INCOME FUND Cm EUR 3.20% - - - 4.68% - GLOBAL OPTIMAL MULTI-ASSET FUND* Cm EUR - - - - 1.58% - LONG-TERM OPTIMAL MULTI-ASSET FUND* Cm EUR - - - - -0.15% - STRATEGIC INSURANCE DISTRIBIUTION FUND* Cm EUR - - - - -0.24% -
SWISS ASSET PARTNERS EQUITY FUND A CHF 18.95% - 18.77% - 45.48% - SWISS ASSET PARTNERS EQUITY FUND B CHF 18.95% - 18.78% - 45.44% - SWISS ASSET PARTNERS EQUITY FUND C CHF 19.54% - 20.57% - 52.50% -
*see Appendix I. **The information and returns relate to the past reporting period and are not indicative of future income.
168
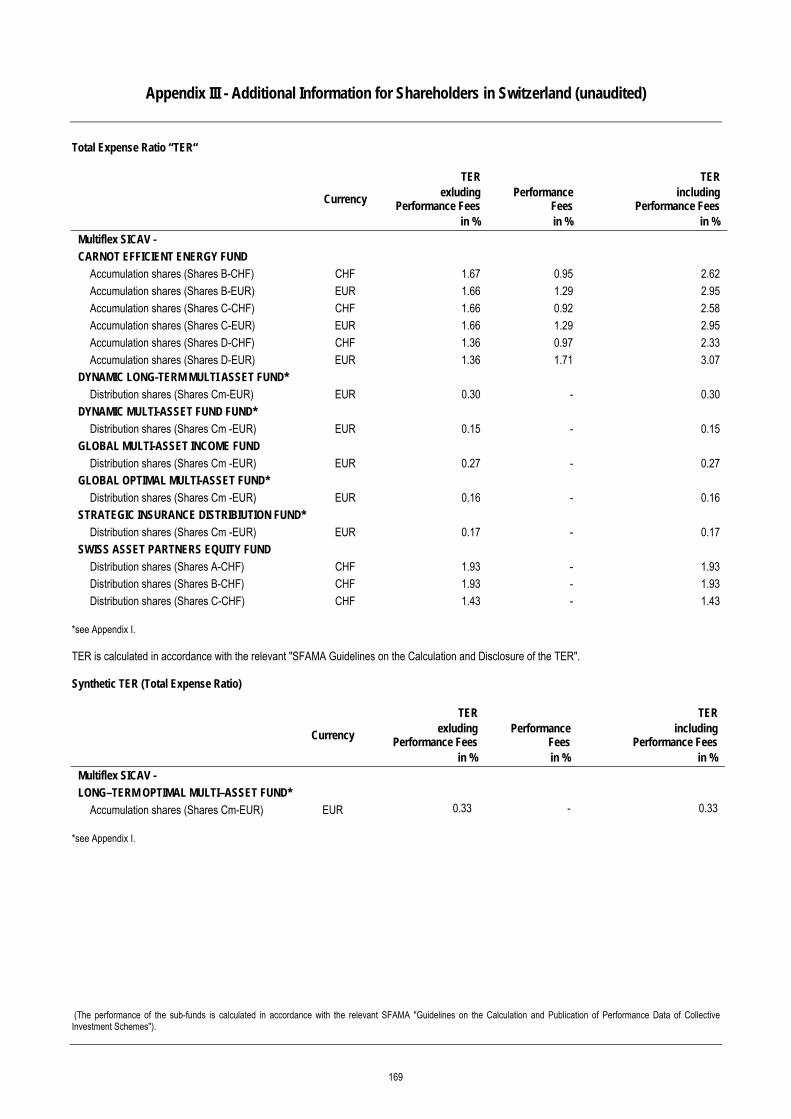
Appendix III - Additional Information for Shareholders in Switzerland (unaudited)
(The performance of the sub-funds is calculated in accordance with the relevant SFAMA "Guidelines on the Calculation and Publication of Performance Data of Collective Investment Schemes").
Total Expense Ratio “TER“
TER
TER
Currency exluding Performance Fees
Performance Fees
including Performance Fees
in % in % in %
Multiflex SICAV -
CARNOT EFFICIENT ENERGY FUND Accumulation shares (Shares B-CHF) CHF 1.67 0.95 2.62 Accumulation shares (Shares B-EUR) EUR 1.66 1.29 2.95 Accumulation shares (Shares C-CHF) CHF 1.66 0.92 2.58 Accumulation shares (Shares C-EUR) EUR 1.66 1.29 2.95 Accumulation shares (Shares D-CHF) CHF 1.36 0.97 2.33 Accumulation shares (Shares D-EUR) EUR 1.36 1.71 3.07
DYNAMIC LONG-TERM MULTI ASSET FUND*
Distribution shares (Shares Cm-EUR) EUR 0.30 - 0.30 DYNAMIC MULTI-ASSET FUND FUND*
Distribution shares (Shares Cm -EUR) EUR 0.15 - 0.15 GLOBAL MULTI-ASSET INCOME FUND
Distribution shares (Shares Cm -EUR) EUR 0.27 - 0.27 GLOBAL OPTIMAL MULTI-ASSET FUND*
Distribution shares (Shares Cm -EUR) EUR 0.16 - 0.16 STRATEGIC INSURANCE DISTRIBIUTION FUND*
Distribution shares (Shares Cm -EUR) EUR 0.17 - 0.17 SWISS ASSET PARTNERS EQUITY FUND
Distribution shares (Shares A-CHF) CHF 1.93 - 1.93 Distribution shares (Shares B-CHF) CHF 1.93 - 1.93 Distribution shares (Shares C-CHF) CHF 1.43 - 1.43
*see Appendix I. TER is calculated in accordance with the relevant "SFAMA Guidelines on the Calculation and Disclosure of the TER". Synthetic TER (Total Expense Ratio)
TER
TER
Currency exluding Performance Fees
Performance Fees
including Performance Fees
in % in % in %
Multiflex SICAV -
LONG–TERM OPTIMAL MULTI–ASSET FUND* Accumulation shares (Shares Cm-EUR) EUR 0.33 - 0.33
*see Appendix I.
169
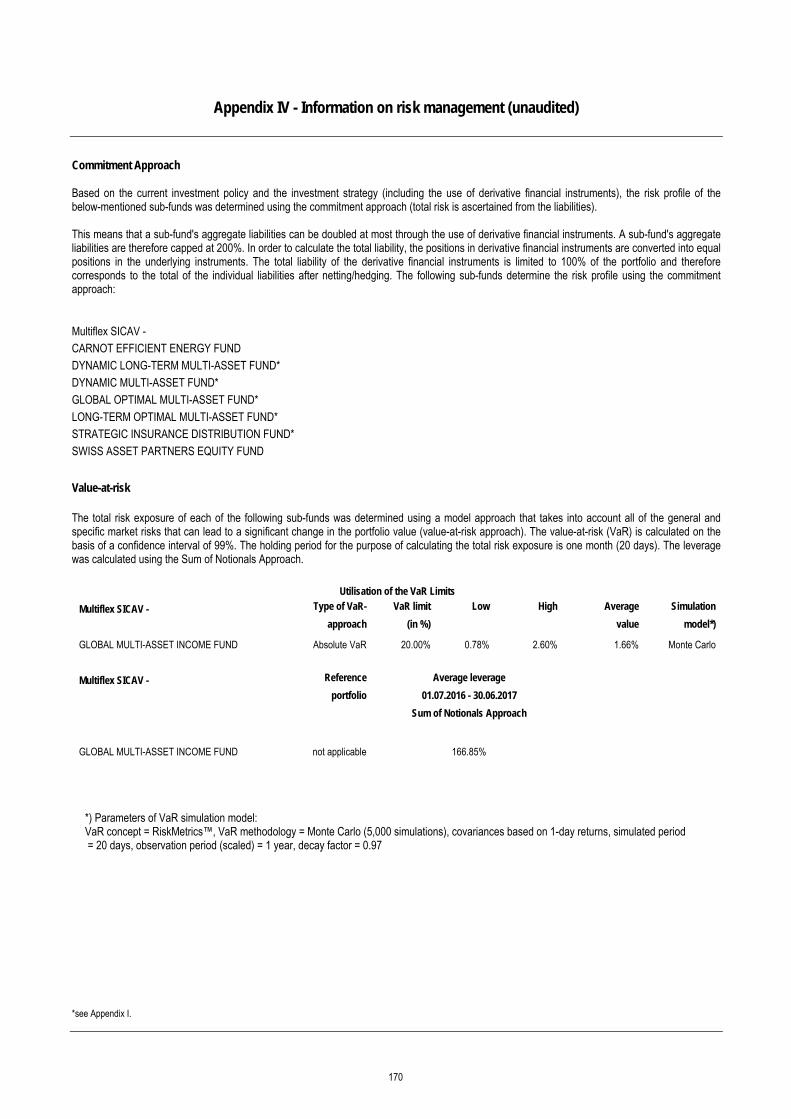
Appendix IV - Information on risk management (unaudited)
*see Appendix I.
Commitment Approach Based on the current investment policy and the investment strategy (including the use of derivative financial instruments), the risk profile of the below-mentioned sub-funds was determined using the commitment approach (total risk is ascertained from the liabilities). This means that a sub-fund's aggregate liabilities can be doubled at most through the use of derivative financial instruments. A sub-fund's aggregate liabilities are therefore capped at 200%. In order to calculate the total liability, the positions in derivative financial instruments are converted into equal positions in the underlying instruments. The total liability of the derivative financial instruments is limited to 100% of the portfolio and therefore corresponds to the total of the individual liabilities after netting/hedging. The following sub-funds determine the risk profile using the commitment approach: Multiflex SICAV - CARNOT EFFICIENT ENERGY FUND DYNAMIC LONG-TERM MULTI-ASSET FUND* DYNAMIC MULTI-ASSET FUND* GLOBAL OPTIMAL MULTI-ASSET FUND* LONG-TERM OPTIMAL MULTI-ASSET FUND* STRATEGIC INSURANCE DISTRIBUTION FUND* SWISS ASSET PARTNERS EQUITY FUND Value-at-risk The total risk exposure of each of the following sub-funds was determined using a model approach that takes into account all of the general and specific market risks that can lead to a significant change in the portfolio value (value-at-risk approach). The value-at-risk (VaR) is calculated on the basis of a confidence interval of 99%. The holding period for the purpose of calculating the total risk exposure is one month (20 days). The leverage was calculated using the Sum of Notionals Approach.
Utilisation of the VaR Limits
Multiflex SICAV - Type of VaR- VaR limit Low High Average Simulation
approach (in %) value model*)
GLOBAL MULTI-ASSET INCOME FUND Absolute VaR 20.00% 0.78% 2.60% 1.66% Monte Carlo
Multiflex SICAV - Reference Average leverage
portfolio 01.07.2016 - 30.06.2017
Sum of Notionals Approach
GLOBAL MULTI-ASSET INCOME FUND not applicable 166.85%
*) Parameters of VaR simulation model: VaR concept = RiskMetrics™, VaR methodology = Monte Carlo (5,000 simulations), covariances based on 1-day returns, simulated period = 20 days, observation period (scaled) = 1 year, decay factor = 0.97
170
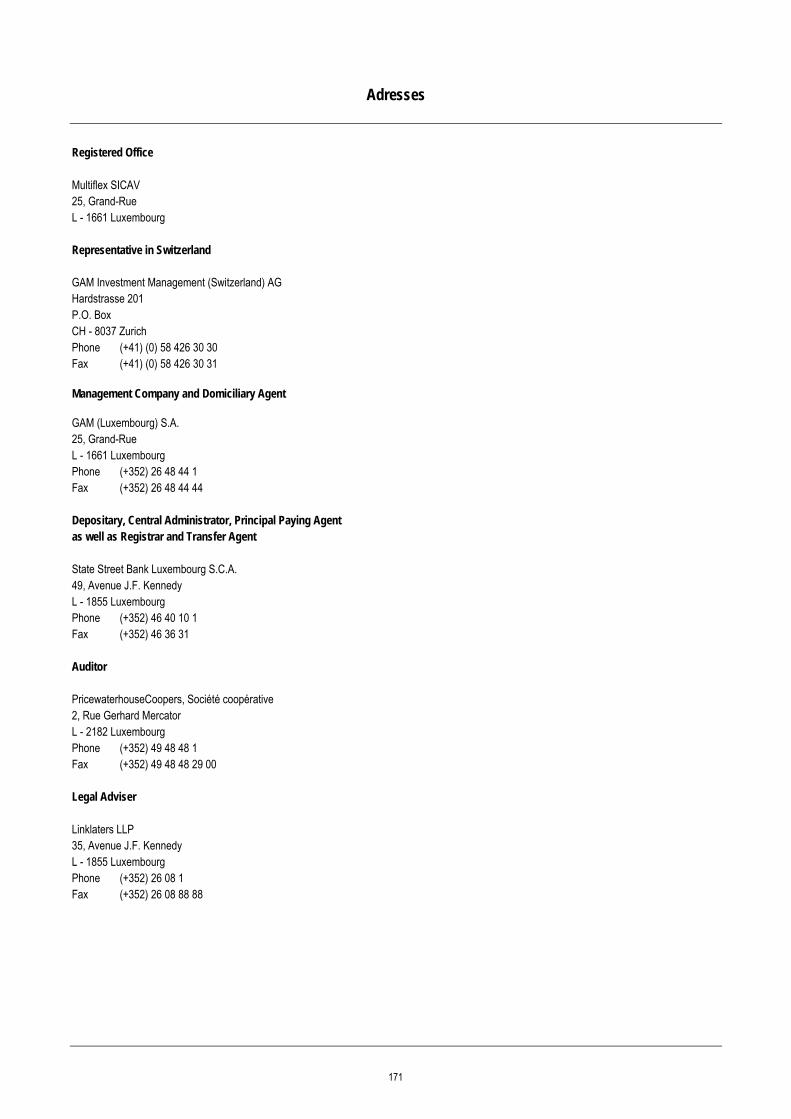
Adresses
Registered Office Multiflex SICAV 25, Grand-Rue L - 1661 Luxembourg Representative in Switzerland GAM Investment Management (Switzerland) AG Hardstrasse 201 P.O. Box CH - 8037 Zurich Phone (+41) (0) 58 426 30 30 Fax (+41) (0) 58 426 30 31 Management Company and Domiciliary Agent
GAM (Luxembourg) S.A. 25, Grand-Rue L - 1661 Luxembourg Phone (+352) 26 48 44 1 Fax (+352) 26 48 44 44 Depositary, Central Administrator, Principal Paying Agent as well as Registrar and Transfer Agent State Street Bank Luxembourg S.C.A. 49, Avenue J.F. Kennedy L - 1855 Luxembourg Phone (+352) 46 40 10 1 Fax (+352) 46 36 31 Auditor PricewaterhouseCoopers, Société coopérative 2, Rue Gerhard Mercator L - 2182 Luxembourg Phone (+352) 49 48 48 1 Fax (+352) 49 48 48 29 00 Legal Adviser Linklaters LLP 35, Avenue J.F. Kennedy L - 1855 Luxembourg Phone (+352) 26 08 1 Fax (+352) 26 08 88 88
171