annual report and accounts 2021 - pharos energy
TRANSCRIPT
Annual Reportand Accounts2021
Pharos Energy is an independent oil and gas exploration and production company with a focus on sustainable growth and returns to stakeholders.
With a registered office in London and listed on the London Stock Exchange, we have production, development and exploration interests in Egypt and Vietnam and exploration interests in Israel.
www.pharos.energy
STRATEGIC REPORT
Company overview 2
Pharos at a glance 3
Where we operate 4
Capital discipline 5
Growth opportunities 7
Diversity and inclusion 9
Sustainability 10
Chair’s statement 11
Market overview 13
CEO’s statement 15
Core strategic objectives 17
Business model 20
Key metrics 21
Operations review 26
s.172(1) 35
CFO’s statement 38
Risk management 43
Risks 49
Corporate Responsibility 58
FINANCIAL STATEMENTS
Independent Auditor’s Report 123
Consolidated Income Statement 132
Consolidated Statement of Comprehensive Income 132
Balance Sheets 133
Statements of Changes in Equity 134
Cash Flow Statements 135
Notes to the Consolidated Financial Statements 136
GOVERNANCE REPORT
Chair’s Introduction to Governance 79
Board of Directors 83
Corporate Governance Report 86
Environmental, Social & Governance (‘ESG’) Committee Report
92
Nominations Committee Report 95
Audit and Risk Committee Report 97
Directors’ Remuneration Report 102
Directors’ Report 117
ADDITIONAL INFORMATION
Non-IFRS Measures 163
Five Year Summary 165
Reserves Statistics 166
Report on Payments to Governments 167
Transparency Disclosure 2020 168
Glossary of Terms 169
Company Information 171

Pharos Energy Annual Report and Accounts 2021 2
Additional InformationGovernance Report Financial StatementsStrategic Report
JANN BROWNINCOMING CHIEF EXECUTIVE OFFICER
Capital discipline PAGE 5
Portfolio of low-cost growth opportunities PAGE 7
Diversity & Inclusion PAGE 9
Sustainability PAGE 10
Our distinctive portfolio in the energy regions of Asia and MENA, together with a robust and disciplined capital allocation framework, supports our strategy of delivering long-term, sustainable growth. We have a range of opportunities in the portfolio to position us for a positive future. Our purpose is to continue to provide energy for communities around the world and fuel their lives and businesses.
INVESTMENT CASE
Pharos Energy Annual Report and Accounts 20213
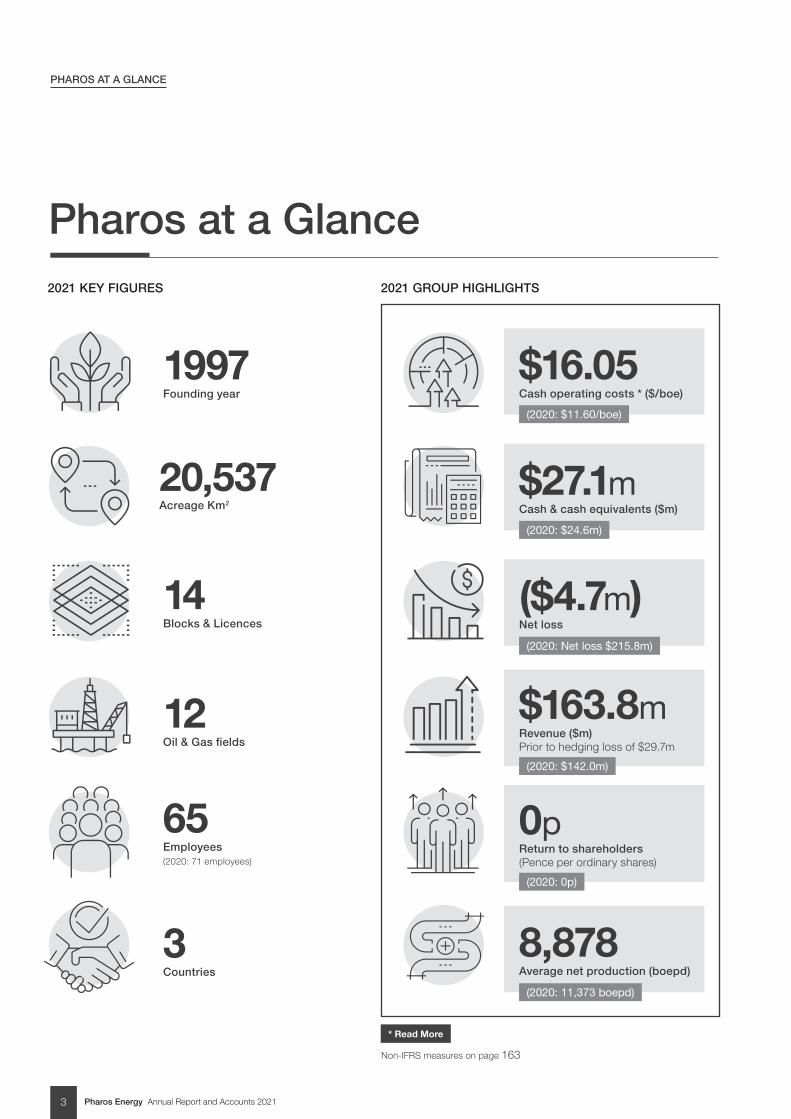
Pharos at a Glance2021 KEY FIGURES 2021 GROUP HIGHLIGHTS
1997Founding year
14Blocks & Licences
20,537Acreage Km2
12Oil & Gas fields
65Employees
3Countries
$16.05Cash operating costs * ($/boe)
$27.1mCash & cash equivalents ($m)
($4.7m)Net loss
0pReturn to shareholders (Pence per ordinary shares)
$163.8mRevenue ($m) Prior to hedging loss of $29.7m
8,878Average net production (boepd)
(2020: 71 employees)
(2020: $11.60/boe)
(2020: $24.6m)
(2020: Net loss $215.8m)
(2020: $142.0m)
(2020: 0p)
(2020: 11,373 boepd)
* Read More
Non-IFRS measures on page 163
PHAROS AT A GLANCE
Pharos Energy Annual Report and Accounts 2021 4
Additional InformationGovernance Report Financial StatementsStrategic Report
WHERE WE OPERATE
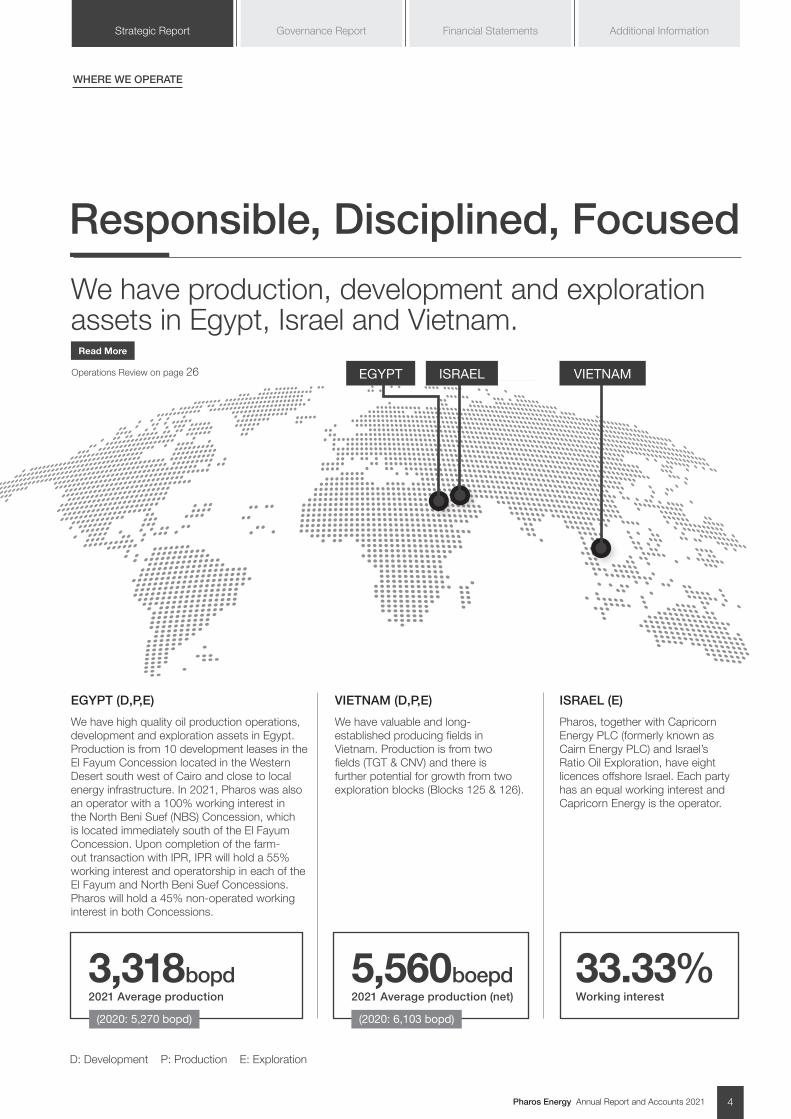
We have production, development and exploration assets in Egypt, Israel and Vietnam.
Read More
Operations Review on page 26 EGYPT ISRAEL VIETNAM
D: Development P: Production E: Exploration
EGYPT (D,P,E)
We have high quality oil production operations, development and exploration assets in Egypt. Production is from 10 development leases in the El Fayum Concession located in the Western Desert south west of Cairo and close to local energy infrastructure. In 2021, Pharos was also an operator with a 100% working interest in the North Beni Suef (NBS) Concession, which is located immediately south of the El Fayum Concession. Upon completion of the farm-out transaction with IPR, IPR will hold a 55% working interest and operatorship in each of the El Fayum and North Beni Suef Concessions. Pharos will hold a 45% non-operated working interest in both Concessions.
ISRAEL (E)
Pharos, together with Capricorn Energy PLC (formerly known as Cairn Energy PLC) and Israel’s Ratio Oil Exploration, have eight licences offshore Israel. Each party has an equal working interest and Capricorn Energy is the operator.
VIETNAM (D,P,E)
We have valuable and long-established producing fields in Vietnam. Production is from two fields (TGT & CNV) and there is further potential for growth from two exploration blocks (Blocks 125 & 126).
3,318bopd2021 Average production
5,560boepd2021 Average production (net)
33.33%Working interest
Responsible, Disciplined, Focused
(2020: 5,270 bopd) (2020: 6,103 bopd)
Pharos Energy Annual Report and Accounts 20215
1. Responsible management • Cost and balance sheet actively managed through continued uncertainty in the macroeconomic
environment
• Positive operational cash flow
• Active hedging programme
• Gearing remains modest (net debt to EDITDAX 1.00x)
Robust capital discipline in our DNA
We take great care with our investors’ money and use our expertise:
• To allocate capital to those assets which offer a combination of cash flow, growth and sustainability
• To focus on our cost base wherever we are
• To assess and develop high grade growth opportunities
• To provide cash returns to shareholders
2020 was a year of significant change for Pharos, with the impact of the COVID-19 pandemic and the associated low oil prices, and 2021 continued to see a sustained macroeconomic environment of uncertainty. A major priority for the Board and the Group in the period was the preservation of cash in order to protect balance sheet strength. Therefore, in addition to a series of financing activities such as the equity placing and refinancing of the RBL, the Board had to make a difficult decision to restructure the London office and continue to suspend dividend payments for the second year. A commitment to cash returns to shareholders remains a core element of our overall allocation framework. We are not complacent about the situation, and it is our intention to return to shareholders through the combination of annual dividends and capital growth as soon as appropriate.
Read More CFO’s statement page 38
2. Flexibility in allocation• Low level of commitments
• RBL facility in place
• IPR carry on farm-down Egyptian concessions
Capital allocation framework• Focus on shareholder returns over the long term
• High-grade investment opportunities using a number of metrics
• Focus on near-term cash flow positive development opportunities
As a business, our ability to deliver value is key to our investment case. Capital discipline and financial stability have always been key to the Company and continue to underpin the business.
INVESTMENT CASE – CAPITAL DISCIPLINE
Pharos Energy Annual Report and Accounts 2021 6
Additional InformationGovernance Report Financial StatementsStrategic Report
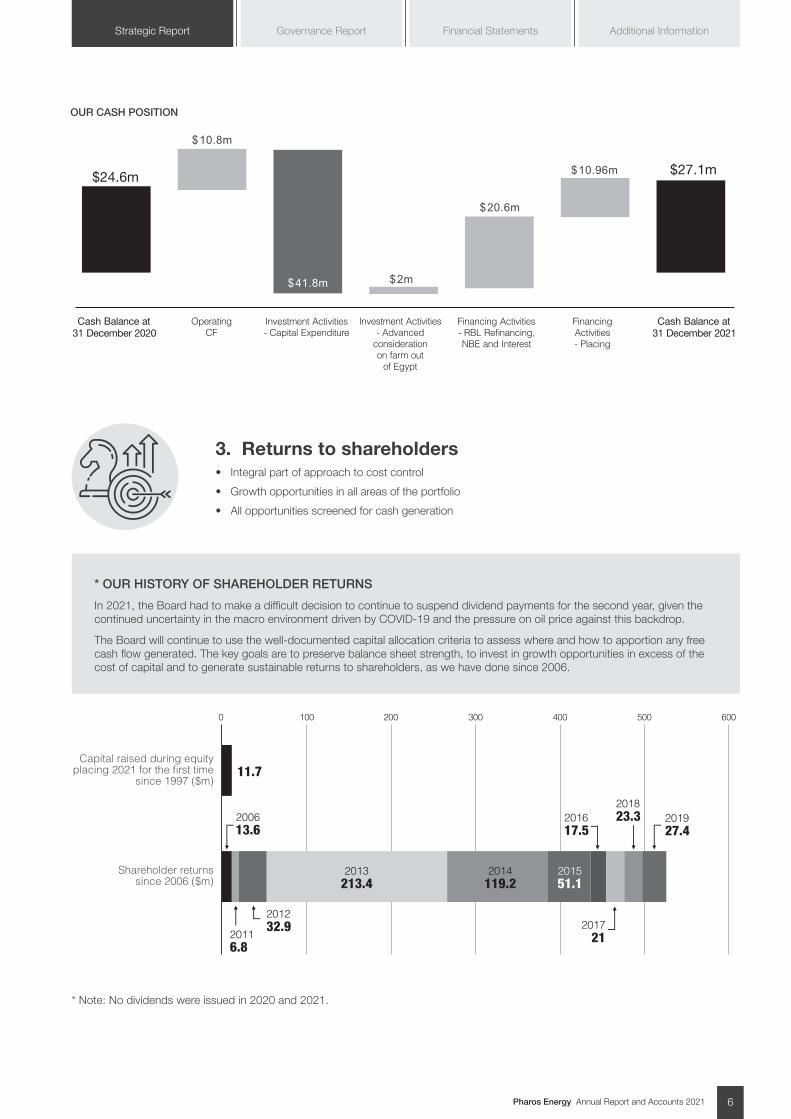
* Note: No dividends were issued in 2020 and 2021.
* OUR HISTORY OF SHAREHOLDER RETURNS
In 2021, the Board had to make a difficult decision to continue to suspend dividend payments for the second year, given the continued uncertainty in the macro environment driven by COVID-19 and the pressure on oil price against this backdrop.
The Board will continue to use the well-documented capital allocation criteria to assess where and how to apportion any free cash flow generated. The key goals are to preserve balance sheet strength, to invest in growth opportunities in excess of the cost of capital and to generate sustainable returns to shareholders, as we have done since 2006.
3. Returns to shareholders• Integral part of approach to cost control
• Growth opportunities in all areas of the portfolio
• All opportunities screened for cash generation
OUR CASH POSITION
$24.6m
$10.8m
Cash Balance at31 December 2020
Cash Balance at31 December 2021
Operating CF
Investment Activities- Capital Expenditure
Investment Activities- Advanced
consideration on farm out
of Egypt
Financing Activities- RBL Refinancing, NBE and Interest
Financing Activities- Placing
$27.1m
$41.8m $2m
$20.6m
$10.96m
0 100 200 300 400 500 600
200613.6
20116.8
2013213.4
201232.9
2014119.2
201551.1
11.7Capital raised during equity
placing 2021 for the first time since 1997 ($m)
Shareholder returns since 2006 ($m)
201617.5
201721
201823.3 2019
27.4
Pharos Energy Annual Report and Accounts 20217
Portfolio of low-cost growth opportunities to access free cash flowOver the past few years, we have created multiple growth opportunities in our diverse and complementary portfolio in Asia and MENA. We are always focused on value-adding activities that have potential to generate free cash flow.In Vietnam, our current growth opportunities include fully funded near-term development drilling programme in TGT and CNV, and seismic mapping on Block 125 & 126 to identify future prospects.
In Egypt, this includes the full deployment of the waterflood programme to provide reservoir pressure support and maintain production. Upon completion of the transaction with IPR and transfer of operatorship in Egypt, the first phase of the main multi-year and multi-well development drilling programme at El Fayum will commence in order to increase production in break-even price on the Concession.
EGYPTEgypt is a dynamic and growing economy, providing a stable business environment. In 2021, Pharos had a 100% working interest* in two concessions in Egypt - El Fayum and North Beni Suef. The El Fayum Concession is located in the Western Desert, about 80km south west of Cairo and close to local energy infrastructure. The El Fayum Concession covers an area of 1,722 km2 in Egypt’s low-cost and highly prolific Western Desert, and so benefits from extensive existing infrastructure and a well-developed service industry. Additionally, the El Fayum development area is 256 km2. The North Beni Suef Concession covers an area of 5,060 km2 in the Beni Suef basin, immediately south of the El Fayum Concession and close to existing Egyptian production in adjacent development leases. The existing dataset on the North Beni Suef Concession consists of 3,101 km 2D seismic, 1,625 km2 3D seismic and data from eight wells.
* In September 2021, Pharos announced the farm-out and sale of a 55% working interest and operatorship in each of the El Fayum and North Beni Suef Concessions to IPR Lake Qarun Petroleum Co, a wholly owned subsidiary of IPR Energy AG. Pharos and EGPC have finalised all necessary documents to be presented to the Minister of Petroleum and Natural Resources to approve the transaction with IPR and this approval is expected shortly.
Growth opportunities• Completion of the farm-out transaction and transfer of operatorship to IPR, which will
provide the investment needed to accelerate the first phase of the main multi-year and multi-well development drilling programme at El Fayum and increase production
• Waterflood programme in the El Fayum Concession provided reservoir pressure support and maintain production ahead of the main development programme
• El Fayum full field development investment case that identifies a path towards production of over 10,000 bbls/day. The 2022 and 2023 work programme and budget associated with the investment case have been agreed in principle by IPR under the El Fayum farm-out agreement.
• Potential for low-cost oil exploration in the North Beni Suef Concession, as well as possible extensions into the block of producing properties within separate development leases held by a third party JV
37.8MMBBL OF 2P RESERVES (2020: 40.8 mmbbl)
3,318 BOPD 2021 PRODUCTION FROM EL FAYUM (2020: 5,270 bopd)
10 OIL FIELDS AT THE EL FAYUM CONCESSION
7,038km2 ACREAGE (EL FAYUM AND NORTH BENI SUEF)
INVESTMENT CASE – PORTFOLIO OF LOW-COST GROWTH OPPORTUNITIES
Pharos Energy Annual Report and Accounts 2021 8
Additional InformationGovernance Report Financial StatementsStrategic Report
VIETNAMOur 25-year history with Vietnam has been a success story both for the company and the country. As at 2021, Pharos has invested c.$1.2 billion in the exploration, appraisal and development of oil and gas projects located offshore Vietnam since inception, of which $6.2 million was for training levy and charity donation projects, making Pharos one of the largest British investors in the country. The Group’s current producing interests, the Te Giac Trang (TGT) and Ca Ngu Vang (CNV) fields in the Cuu Long basin off the southern coast, together, are amongst Vietnam’s largest oil producers. We have further potential for growth from two deep-water exploration positions in Blocks 125 & 126 in the Phu Khanh basin off the eastern coast, where we expect to seek an industry partner to fund our commitments and develop the blocks before drilling. We continue to have an excellent safety record in Vietnam, and are careful to maintain this.
Growth opportunities• Two additional TGT wells planned to be drilled from cash flow in Q3 2022 as part of the
approved TGT Full Field Development Plan (FFDP), following completion of the initial four-well drilling programme in 2021
• One well on CNV planned to be drilled in Q4 2022 after completion of the drilling of the two TGT wells
• Submission of licence extension requests for both TGT & CNV
• Revised Full Field Development Plan for TGT & CNV by Q4 2022
• Final 3D seismic processed results on Block 125 expected in July 2022 and will proceed to seismic mapping to identify prospects and bring in an industry partner before drilling
5,560 BOEPD 2021 AVERAGE NET PRODUCTION FROM TGT & CNV (2020: 6,103 boepd)
15.2MMBOE OF 2P RESERVES (2020: 17.9 mmboe)
c.$1.2 BILLION INVESTMENT BY PHAROS IN OIL AND GAS PROJECTS OFFSHORE VIETNAM SINCE INCEPTION
11.4 MMBOE OF 2C RESERVES (2020: 12.2 mmboe)
Pharos Energy Annual Report and Accounts 20219
Diversity and Inclusion at the heart of the business Greater diversity and inclusivity brings greater understanding of people. Led by the Pharos Guiding Principles of ‘Openness and Integrity’ and ‘Empowerment and Capability’, we have demonstrated our commitment to maintaining and building a culture of diversity and inclusion in meaningful ways. approach to sustainability by engaging with and taking into account views of these stakeholders.
We believe in a workforce with a diversity of experience, nationalities, cultural backgrounds and gender, to support our business strategy of long-term sustainable growth. It is crucial to the success of our business that we retain and develop the diversity of our workforce and have diversity and inclusion at the heart of our recruitment, development and promotion processes.
Our Code of Business Conduct and Ethics, associated policies and the Pharos Guiding Principles commit us to providing a workplace free of discrimination where all employees can fulfil their potential based on merit and ability. They also commit us to providing a fully inclusive workplace, while providing the right development opportunities to ensure existing staff have rewarding careers.
Diversity in all formsThe spirit of diversity, inclusion and trust lies behind everything we do. In 2021, four of nine Pharos Board members were women, and we are proud that women accounted for nearly 60% of employees at our London head office. Our offices across the organisation recruit talents from diverse backgrounds, ethnicity and experience. Most notably, our London head office has 17 people from 10 different nationalities, which ensures that we cultivate a culture that recognises and promotes diversities in all forms, where every voice is heard.
Regional knowledge and experienceWe apply our expertise locally with operational teams in each region, working closely with joint operating companies. We encourage dialogue and co-operation between the different business assets to ensure new ideas and solutions are always being considered.
We are committed to providing meaningful opportunities for training and capacity building in host countries. We have maintained a gender-neutral recruitment process and, wherever possible, are ensuring that we first look to fill any vacancy internally with a local candidate in London, Vietnam and Egypt.
Further Board refreshmentIn 2021, various Directorate changes were made to the Board to ensure that Pharos is guided by a lean management team with diverse knowledge, deep experience and greater gender diversity. In March 2021, the Company announced the appointment of Sue Rivett to the Board as Chief Financial Officer (“CFO”) effective 1 July 2021. Additionally, upon completion of the transaction with IPR, Ed Story will step down from the Board as Chief Executive Officer (“CEO”) but will remain as President of the Vietnam business, and Jann Brown will assume the role of CEO as one of two Executive Directors alongside Sue. Mike Watts will also step down from the Board on completion, though Mike will be available to advise the Board for a period in relation to its ongoing interests as the Company may require. Finally, in support of the policy to slim down the Board and having served as Non-Executive Director, Senior Non-Executive Director and Deputy Chairman in his nearly 9 years on the Board, Rob Gray will not be putting his name forward for re-election as a Director at the 2022 AGM in May. The result of these changes is reduction in the size of the Board from nine Directors (four Executive Directors and five Non-Executive Directors) to six (two Executive Directors and four Non-Executive Directors), of which four out of six Directors are women.
The Company is committed to good governance and will continue to review the balance and effectiveness of the Board commensurate with our size and needs.
Read More
Corporate Governance Report page 86 - 91 and
Corporate Responsibility Report page 58 - 78.
INVESTMENT CASE – DIVERSITY AND INCLUSION
Pharos Energy Annual Report and Accounts 2021 10
Additional InformationGovernance Report Financial StatementsStrategic Report
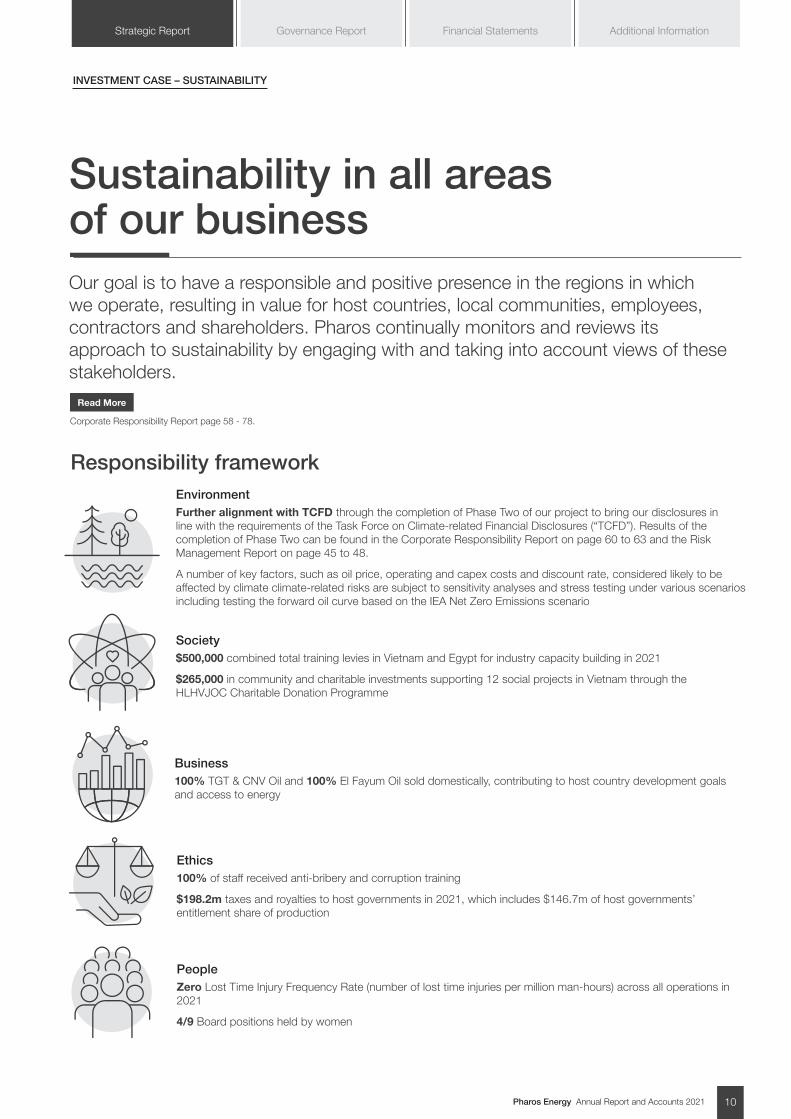
Sustainability in all areas of our business Our goal is to have a responsible and positive presence in the regions in which we operate, resulting in value for host countries, local communities, employees, contractors and shareholders. Pharos continually monitors and reviews its approach to sustainability by engaging with and taking into account views of these stakeholders.
Responsibility framework
PeopleZero Lost Time Injury Frequency Rate (number of lost time injuries per million man-hours) across all operations in 2021
4/9 Board positions held by women
Ethics100% of staff received anti-bribery and corruption training
$198.2m taxes and royalties to host governments in 2021, which includes $146.7m of host governments’ entitlement share of production
Business100% TGT & CNV Oil and 100% El Fayum Oil sold domestically, contributing to host country development goals and access to energy
Society$500,000 combined total training levies in Vietnam and Egypt for industry capacity building in 2021
$265,000 in community and charitable investments supporting 12 social projects in Vietnam through the HLHVJOC Charitable Donation Programme
EnvironmentFurther alignment with TCFD through the completion of Phase Two of our project to bring our disclosures in line with the requirements of the Task Force on Climate-related Financial Disclosures (“TCFD”). Results of the completion of Phase Two can be found in the Corporate Responsibility Report on page 60 to 63 and the Risk Management Report on page 45 to 48.
A number of key factors, such as oil price, operating and capex costs and discount rate, considered likely to be affected by climate climate-related risks are subject to sensitivity analyses and stress testing under various scenarios including testing the forward oil curve based on the IEA Net Zero Emissions scenario
Read More
Corporate Responsibility Report page 58 - 78.
INVESTMENT CASE – SUSTAINABILITY
Pharos Energy Annual Report and Accounts 202111
CHAIR’S STATEMENT
Chair’s Statement
JOHN MARTINNon-Executive Chair
Rebalanced and focused on valuesI am pleased to report that Pharos has successfully navigated another challenging year in 2021 whilst continuing to make the improvements necessary to rebalance our cost base, our capital structure and our assets. We start 2022 with a clear roadmap of how the company can drive value for all our stakeholders and we have the right team in place to deliver that.
The backdrop of the global pandemic persisted throughout 2021 and the ongoing climate of uncertainty remained the dominant challenge in planning, forecasting and managing capital. After the swift and decisive actions taken in 2020 to reduce costs and preserve liquidity, 2021 saw us take further vital steps to strengthen the capital structure of the business, which had been severely impacted by the loss of revenues as a result of the oil price crash. The $11.7 million equity placing, subscription and retail offering, completed in January 2021, was the first capital raised from the market since 1997 and the support we received is a testament to the strength of our existing shareholder base and the attraction of the company to new investors. I welcome these new investors and thank all our investors for their support. The refinancing of our RBL over the assets in Vietnam, completed in July 2021, provided additional liquidity while maintaining our leverage at a comfortable level. The approval of improved fiscal terms in Egypt reset the economics for the El Fayum Concession, bringing down the breakeven price and improving the overall returns. The farm-down of our Egyptian assets, a process that started in 2020, achieved a key milestone with the signature of conditional agreements with IPR in September. The transaction with IPR is a key step in the realignment of our asset base to match the levels of funding available to generate cash flow and value. We now have a clear path to cash generation and value creation in Vietnam, where our programme is self-funded, and in Egypt where we will be carried through the next phase of investment by IPR.
As part of our reshaping for the future we have driven down costs and created a new, leaner organisational structure in the UK and these efforts will continue in Egypt in 2022. This positions us well to thrive in a stronger oil price environment.
Board ChangesWe have long recognised that our board would need to be reshaped following the farm-down of our assets in Egypt to IPR and the associated transfer of operatorship. We announced the proposed changes in January of this year and Ed Story and Mike Watts will step down from the board once the farm-down transaction completed. Ed will remain as President of the Vietnam business, while Mike will be available to advise the Board during his notice period of one year. I would like to take this opportunity to thank Ed for his considerable contribution to Pharos over many years. We are delighted that he will stay with us to help the management of our relationships and activity in Vietnam. I would also like to thank Mike for his long-term dedication to the Company and for his important contributions during that time. Our Senior Non-Executive Director and Deputy Chair, Rob Gray, will also step down in May of this year at the 2022 AGM and again we thank him for his long and valued service.
The result of these changes will be to reduce the size of the Board from nine Directors to six, commensurate with the scale of the business, and we have all of the skills and experience required to provide the necessary governance and oversight of a Premium Listed Company. Pharos’ commitment to inclusion and diversity remains strong. Following the board changes described above, both of our executive directors will be female, with a total of four of the six directors being women, representing two thirds of the Board.
I am delighted Jann will be the CEO of Pharos and I look forward to working with her, Sue and the rest of my Board colleagues into this next phase.
SustainabilitySustainability is an increasing focus for our entire industry. We recognise that oil and gas will continue to play an essential role in the provision of energy security and the global energy mix for many years to come and that the importance of producing this energy in a safe, environmentally sustainable and socially responsible way will continue to grow amidst the wider energy transition. We stand ready to play our part in this transition and we
Pharos Energy Annual Report and Accounts 2021 12
Additional InformationGovernance Report Financial StatementsStrategic Report
can do that by providing transparent and comparable sustainability disclosures, embedding sustainability considerations in the way we operate and identifying where changes in our field practices could make a difference in our efforts to reduce our carbon footprint.
We have also continued to participate in various climate disclosures. Over the past four years, we have participated in the CDP Climate Change Questionnaire and have maintained our score (C), which is also the industry average. 2021 also marks the first year that the Company submitted their response to the CDP Water Security Questionnaire, which was completed at a basic level in 2021 and we plan to improve our level of transparency on water usage and protection by completing the full version in 2022. More recently, we commenced Phase 2 of the project to bring our disclosures in line with the requirements of the Task Force on Climate-related Financial Disclosures (“TCFD”) in accordance with LR 9.8.6.
Over the years, Pharos has embedded sustainability considerations throughout our operations. We set up an ESG Committee at Board level and an ESG Working Group to operationalise our approach. Climate change is now, following TCFD guidance, recognised as a principal risk for the Company and we engage our stakeholders regularly on all aspects of environmental, social and economic impacts. In 2021, the Remuneration Committee has increased the level of management incentives which attach to improvements in our sustainability performance in order to further encourage action on this agenda.
Following the COP26 summit in Glasgow in November 2021, we recognise and understand the growing need to accelerate business action on climate change. The Board welcomed the outcomes of the Glasgow Climate Pact and is now focused on reviewing what a possible pathway towards Net Zero entails. This will not be straightforward, for Pharos and for the wider industry, with a lot of solutions being currently tried and tested. But we commit to being transparent in what can and what cannot be delivered and to keeping stakeholders updated on the progress. During the net zero transition, we want to ensure we do not lose sight of the role our energy plays in driving economic development of those countries where it is produced.
Purpose and organisationOur purpose has been expanded to include our commitment to sustainability; to provide the energy to support the economic development and prosperity of the countries, communities and families wherever we work, in line with recognised socially and environmentally responsible practices.
Our organisation has proved itself to be resilient beyond expectations this year. We have had difficult decisions to make on reducing our staffing levels in the UK as part of our efforts to manage costs. We have lost many talented colleagues and I am delighted that so many of them have found new positions so quickly. The team who have stayed with us have all risen to the challenges of delivering what has been needed and I have every confidence that they will continue to do so.
The culture of the workforce is strong and is built on openness, safety and care, trust and respect for each other. Our workforce in the UK has indicated a clear preference for retaining flexibility in our way of working and, throughout the period of mandatory remote working, we have built well-established channels of communication and ways of working which can accommodate these preferences with minimal disruption and no adverse impact on delivery and efficiency.
Outlook Despite the turmoil we have all experienced in the global macro-economic environment, our strategy to deliver long-term, sustainable value for all our stakeholders remains unchanged. We have capital to allocate to exciting work programmes in 2022 and our commitment to returning cash to shareholders remains a core element of our overall allocation framework.
It is with great sadness that we note the terrible situation that is ongoing in Ukraine. Alongside the humanitarian issues, there are increased business risks due to the heightened volatility in commodity price and impact on inflation. We have no direct business in the region but we are carrying out due diligence checks and reviewing the supply chain implications in all parts of the business. No immediate impact has been identified but we will continue to keep this under close review and will devise mitigating actions if needed.
In Vietnam our status as a major investor in country plus our track record of managing operations stand us in good stead to deliver the next phase of value from our existing producing fields. In Egypt, we have a period of collecting revenues with all costs covered by the carry provided by IPR, our new partner. IPR has proven itself to be a technically proficient, effective and low-cost operator and are well capitalised
to fund the right work programme on both Concessions in Egypt to maximise long-term growth and cash flow. Their long-standing in-country presence and relationships with the Egyptian government and regulatory authorities will support the expansion of operational activity needed to develop the resource base. The Board firmly believes that IPR is the right partner for Pharos in Egypt, and we look forward to working with them in 2022 and beyond.
Thanks to the effort and hard work of all of our colleagues, the businesses is now in significantly better shape, with funding in place to make the investments needed to deliver value from the assets already in the portfolio. On behalf of the Board, I would like to thank our shareholders for their support through the year, as well as our staff, partners, suppliers and advisers all of whom have helped to provide stability through this period of uncertainty and volatility.
We enter 2022 with a more confident outlook. Pharos has a unique combination of complementary assets, a talented and diverse workforce and capital discipline in its DNA. Most importantly, it has a clear roadmap to cash generation and value creation for the coming year.
JOHN MARTINNon-Executive Chair
Pharos Energy Annual Report and Accounts 202113
MARKET OVERVIEW
Market overview While 2020 was characterised by the initial widespread shock brought about by the COVID-19 pandemic, 2021 will be remembered for the year where global vaccination programmes vastly changed how we lived and helped ease restrictions. Global growth was significant, albeit in an environment of caution, as virus mutations provided a reminder of how quickly circumstances can change. As well as volatile rates of COVID-19, there was significant volatility in the oil price. In 2021, we saw improved prices to an average Brent crude price of US$70.68 per barrel, a 68% increase from the previous year.
Economics and politicalUnsurprisingly the pandemic remained a significant force influencing global growth in 2021 as most economies began the year in the grip of restrictions stifling growth. However, as vaccination rates increased and restrictions were eased, the economy made significant headway and business practices returned to something similar to pre pandemic times, even if most economic metrics remained lower. Global monetary and fiscal policies during the crisis provided stimulus that has had a significant effect for a prolonged period across various economies, which, added to the reopening of many previously closed sectors, led to demand and prices increasing. In many countries this has meant inflationary pressures are now prominent in many governments’ economic thinking going forward.
From a market perspective, the S&P500 in the US finished the year just under 27% up while the MSCI World index finished up 31%, showing how global equity markets reacted to the favourable economic conditions. While in late 2021 the rapid spread of the Omicron strain of the COVID-19 virus provided a reminder of the fragility of the world’s markets, the outlook for 2022 is regarded as positive with levels of global vaccination and antibody count in the general population high enough that returning to a situation akin to the beginning of the pandemic is seen as unlikely.
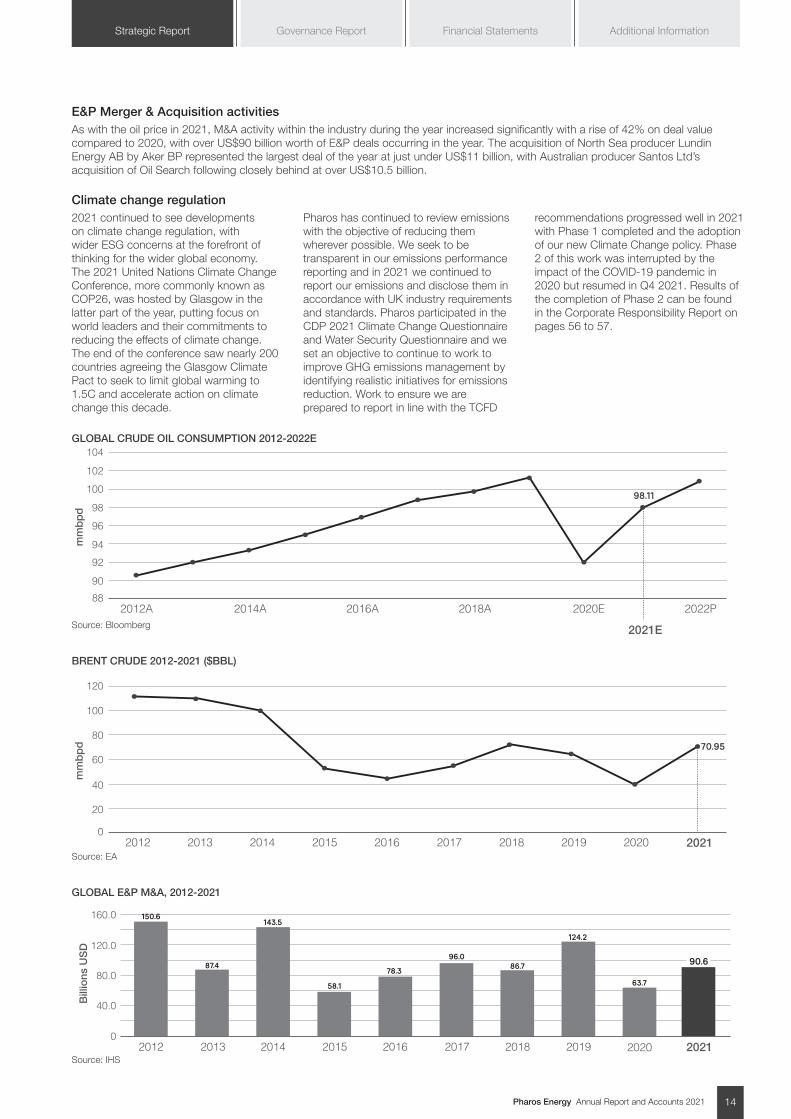
Oil priceWhile an average Brent crude price of US$70.68/bbl in 2021 was a significant 68% increase from the average price in 2020, the picture was one of a steady recovery throughout the year as demand for oil grew by 5.7mmbbls/d from the previous period. This increase in demand was primarily due to fiscal and monetary stimulus supporting a buoyant economy, with restrictions in movement easing throughout the year as vaccination programmes were deployed. This increase in demand significantly outpaced supply as OPEC+ retained its restrictive policies spanning from the depressed prices of 2020, and prolonged periods of restrained investment from other oil producing nations such as the US meant that supply capacity was constrained. As well as increased pricing for crude, the market saw significant inventory draws as nations attempted to meet demand as best as they could leading to the EIA estimating that global petroleum inventories dropped by 469 million barrels in the year.
The ongoing volatility in the oil price was still prevalent in 2021. Average realised oil price per barrel achieved for Vietnam was c.$73/bbl representing a premium of just under $2/bbl to Brent. For Egypt the average realised price was c.$65/bbl, representing a discount of c.$5/bbl to Brent.
The Board’s strategy to mitigate this principal risk of commodity price instability is set out on pages 49 to 57 in our discussion on principal risks. Pharos regularly evaluates whether the benefit of hedging its oil production is in the best
interest of shareholders by considering the balance between protecting the Group in low oil price scenarios, set against the opportunity cost of being unhedged. In addition, Pharos continues to manage its overall portfolio to target a low break-even oil price, regardless of actual oil prices. Our strong ethos of capital discipline ensures that cost efficiencies are maintained, even in higher oil price environments. Pharos ensures all operational decisions – including new country entry, production optimisation and acquisitions – are reviewed through the lens of full-cycle project economics in a range of oil price scenarios.
Commentary around the outlook for oil prices in 2022 is mostly positive with an estimated world GDP growth forecast of 4.2%, meaning a repetition of the strong demand seen in 2021. Tight supply is expected to remain as investment in upstream assets remains subdued while OPEC estimates global demand to rise by 4.15 million barrels a day in 2022. Looking forward, while interest rate increases ( likely to be used as a tool to supress rising inflation by many central banks) pose as a potential suppressant to the oil price, the crude market looks set to be well supported in the period.
For more information on the impact of climate change on the long-term oil prices and demand, please see pages 56 to 57 the Viability Statement.
Pharos Energy Annual Report and Accounts 2021 14
Additional InformationGovernance Report Financial StatementsStrategic Report
GLOBAL CRUDE OIL CONSUMPTION 2012-2022E104
102
100
98
96
94
92
90
88
mmbpd
98.11
2012A 2014A 2016A 2018A 2020E 2022P
2021E
BRENT CRUDE 2012-2021 ($BBL)
120
100
80
60
40
20
0
mmbpd 70.95
2012 2014 2016 2018 20212013 2015 2017 2019 2020
GLOBAL E&P M&A, 2012-2021
40.0
80.0
120.0
160.0
0
Bill
ion
s U
SD
2012 2013 2014 2015 2016 2017 2018 2019 2020
63.7
124.2
86.796.0
78.3
58.1
143.5
87.4
150.6
2021
90.6
E&P Merger & Acquisition activitiesAs with the oil price in 2021, M&A activity within the industry during the year increased significantly with a rise of 42% on deal value compared to 2020, with over US$90 billion worth of E&P deals occurring in the year. The acquisition of North Sea producer Lundin Energy AB by Aker BP represented the largest deal of the year at just under US$11 billion, with Australian producer Santos Ltd’s acquisition of Oil Search following closely behind at over US$10.5 billion.
Climate change regulation2021 continued to see developments on climate change regulation, with wider ESG concerns at the forefront of thinking for the wider global economy. The 2021 United Nations Climate Change Conference, more commonly known as COP26, was hosted by Glasgow in the latter part of the year, putting focus on world leaders and their commitments to reducing the effects of climate change. The end of the conference saw nearly 200 countries agreeing the Glasgow Climate Pact to seek to limit global warming to 1.5C and accelerate action on climate change this decade.
Pharos has continued to review emissions with the objective of reducing them wherever possible. We seek to be transparent in our emissions performance reporting and in 2021 we continued to report our emissions and disclose them in accordance with UK industry requirements and standards. Pharos participated in the CDP 2021 Climate Change Questionnaire and Water Security Questionnaire and we set an objective to continue to work to improve GHG emissions management by identifying realistic initiatives for emissions reduction. Work to ensure we are prepared to report in line with the TCFD
recommendations progressed well in 2021 with Phase 1 completed and the adoption of our new Climate Change policy. Phase 2 of this work was interrupted by the impact of the COVID-19 pandemic in 2020 but resumed in Q4 2021. Results of the completion of Phase 2 can be found in the Corporate Responsibility Report on pages 56 to 57.
Source: Bloomberg
Source: EA
Source: IHS
Pharos Energy Annual Report and Accounts 202115
CHIEF EXECUTIVE OFFICER’S STATEMENT
CEO’s Statement
JANN BROWNIncoming Chief Executive Officer
2021 was a critical year for Pharos and several key steps were taken which provide the foundations for the exciting programmes, focused on growth, cash flow generation and value, in 2022 and beyond.
• In January, we had strong support for an equity placing, subscription and retail offer, raising $11.7m in gross proceeds, with net proceeds invested in the El Fayum waterflood programme to support production levels.
• In March, we announced a reduction of our head office headcount of c.50%, significantly reducing our ongoing annual G&A cost. Many talented colleagues left the Company in this reorganisation and it is a testament to the team who have stayed with us that they have continued to deliver.
• In March we announced that we had reached agreement with EGPC, the industry regulator and state oil company in Egypt, to various amendments to the El Fayum Concession (known collectively as “The Third Amendment”) the most important effect of which was an improvement in the fiscal terms backdated to November 2020. The improved terms were subjected to parliamentary and presidential approval, which were obtained in January 2022. As a result of this Third Amendment, Contractor share of revenues increased by 20%, from c.42% to c50% whilst in full cost recovery mode. Signature of the Third Amendment was a key Condition Precedent for the transfer of a 55% participating interest (and operatorship) in the El Fayum and North Beni Suef Concessions to IPR.
• In July, we completed the refinancing of our Reserve Based Lending Facility (“RBL”) which provided access to a committed $100m with a further $50m available on an uncommitted “accordion” basis and has a four-year term that matures in July 2025. The revised RBL facility extends the tenor of the facility by 22 months, rephases the repayment schedule and has provided additional liquidity without taking gearing to unacceptable levels.
• In September, we announced the signature of agreements for the farm-down to IPR to of a 55% working interest in, and operatorship of, both of our concessions in Egypt, full details of which transaction are set out in the Financial Review. Pharos and EGPC have finalised all necessary documents to be presented to the Minister of Petroleum and Natural Resources to approve the transaction with IPR and this approval is expected shortly. The IPR Energy group has been present in Egypt for 40 years, currently has eight concessions pre-acquisition, five of which are operated, and has achieved significant growth in net production. We look forward to working with them to deliver the full potential of these fields.
These steps, alongside the operational activity set out below, have reset the Group’s potential. That potential was already there in the portfolio, but we now have the access to funding to exploit these to grow cash flow and increase shareholder value. We enter 2022 with a refreshed portfolio, cost base, and access to capital.
Consistent operational delivery amidst ongoing global uncertaintiesIn Vietnam, the Group had a busy operational year. Most notable was the commencement of the TGT well intervention and development drilling programme in July 2021, following the approval of the updated FFDP and the two year extension on both the TGT and CNV licences which was announced in 2020. Phase 1 of the campaign was successfully completed in November 2021, ahead of schedule and c.$20 million below the JV gross budget. In 2021, the crude produced from the fields in Vietnam commanded a premium to Brent of just under $2/bbl and the payback period for the wells drilled is estimated at below 12 months, making investment in these fields an attractive proposition.
Production for 2021 from the TGT and CNV fields net to the Group’s working interest averaged 5,560 boepd, in line with guidance, and guidance for 2022 is set at 5,000 to 6,000 boepd.
Pharos Energy Annual Report and Accounts 2021 16
Additional InformationGovernance Report Financial StatementsStrategic Report
In July 2021, the Company announced the completion of its 3D seismic acquisition programme on the western part of Block 125 in the Phu Khanh Basin, offshore Vietnam. The seismic processing work is ongoing, with the final processed results expected in mid-2022. In September 2021, Pharos received approval for a two-year extension of the initial exploration phase under the Block 125 & 126 PSC, which now runs until November 2023. There is a commitment to drill one well on these Blocks within the initial exploration phase and, following completion of the seismic processing, we will look to bring in an additional partner pre-drill.
In Egypt, after an operational hiatus in 2020, Phase 1B of the waterflood programme on El Fayum commenced, supported by the net proceeds of the equity placing, subscription and retail offer completed in January 2021. A three-well development drilling programme was started in November 2021 to provide reservoir pressure support and maintain production ahead of the multi-year, multi-well development programme planned following completion of the transaction with IPR. Pharos will be carried through the first part of this programme by IPR for its retained 45% working interest in El Fayum.
In June 2021, Pharos announced the modest discovery on the Batran-1X exploration commitment well, which reconfirmed the potential for additional oil on the El Fayum concession.
The Board believes that 2021 was a turning point year for Pharos, with key building blocks now in place to move forward into exciting programmes in both Vietnam and Egypt.
SustainabilitySustainability has been a challenge for our industry for many years and the focus on our activities on this front is increasing, and rightly so. Alongside our statutory obligations in the United Kingdom (where we are listed) and Egypt, Israel and Vietnam (where we operate), we recognise that the expectations of all stakeholders are growing in this respect. At Pharos, we have been diligently preparing to ensure that our disclosures are in line with the Task Force on Climate-related Financial Disclosures (“TCFD”) recommendations and can report that we are on track to do so, having completed Phase Two of our alignment project with TCFD’s reporting requirements. We also continue to meet our obligations under the Modern Slavery Act and anti-bribery legislation. As part of local agreements, we are focused on meeting legal environmental, social and economic obligations: that is why we provide $500,000 every year for local capability training in Vietnam and Egypt. I am proud that we continue to achieve a
zero on our Lost Time indicators. In 2021, we paid $198.2m in taxes and royalties to host governments, including their share of production entitlements. With 100% of production sold domestically in 2021, this has made a valuable contribution to the host countries’ socio-economic development, energy security and access to energy.
But we go beyond what’s legally required, noting the growing expectations of all our stakeholders. As we work predominantly through Joint Operating Companies (“JOCs”) we work collaboratively with our partners to identify what else we can do. This extends to all our community initiatives, where our financial contribution amounted to $265,000 in 2021 via HLHVJOC Charitable Donation Programme. We are investigating opportunities to reduce our carbon footprint by adopting different methods and processes to power our operations and other carbon reduction technologies in the longer term and will provide updates on our progress. We will not make commitments or set targets which are vague or which rely on new technologies or those being developed in the future, and which do not carry the support of our partners.
Outlook - Reaping our rewards in a new phase of growthOver the past five years, we have built a portfolio in Asia MENA with a combination of assets which offer resilience in difficult times, strong cash returns in better times plus valuable growth potential when investment capital is available.
In Vietnam, the economics are attractive on all fronts – premium commodity pricing, a low LOF Breakeven price, attractive netbacks and rapid payback periods on new development wells - with all planned activities funded from cash flows generated. Following the four wells drilled on TGT in 2021, two further TGT wells are planned for 2022 plus one on CNV. The JOC is now progressing work on submitting licence extension requests for both TGT & CNV, with a Revised Full Field Development Plan (“FFDP”) for both fields to be submitted by Q4 2022. This would take the licence terms out to 2031 (TGT) and 2032 (CNV) and would add two years of reserves to the production profiles and economics for these fields.
In Egypt, upon completion of the transaction with IPR and transfer of operatorship which is expected imminently], we will enter a new phase, and will benefit from IPR’s experience as an Operator plus the carry of our retained 45% working interest through the first part of the multi-year and multi-well development programme. With the field economics enhanced by the signing of the Third Amendment and the Group’s
own economics further improved by the carry, we consider that Egypt is now in an excellent position to deliver on its potential.
I would like to pay tribute to my colleagues leaving the board at this time. To Ed Story, as he ends his 25 year leadership of the company, having taken it through many different territories and phases, always with a focus on shareholder returns. He will be a key part of the team in Vietnam to deliver on his long held view of the potential there. Mike’s association with Pharos has also been formative and instrumental over the long term. Finally, Rob Gray will step down in May from his roles as both Deputy Chair and as Senior Non-Executive Director. All three have played an important role in putting the company where it is today and I thank each of them for their own unique contributions.
I would also like to thank our shareholders and wider stakeholders for their ongoing support.
Last but not least, I would also like to express my gratitude towards my colleagues for their efforts, continued hard work and commitment as we have navigated through challenges and uncertainties to build a business with a return to growth.
JANN BROWNIncoming Chief Executive Officer
Pharos Energy Annual Report and Accounts 202117
CORE STRATEGIC OBJECTIVES
Navigating through challenging times1. Responsible & Flexible stewards of capitalA culture of prudent financial management, capital allocation and capital return.
We exhibit capital discipline through a focus on cost management and control. Capital allocation decisions are taken to make investments where they will provide risk-adjusted full-cycle returns. It is this approach that has allowed us to return significant amounts of capital to shareholders. We have looked to add another strand to the story – capital growth – to underpin the sustainability of dividends over the longer term.
Activities in 2021• Disciplined capital investment and
flexible allocation through:
- Completion of the equity placing, subscription and retail offer in January 2021 to fund Phase 1B of the waterflood programme in El Fayum
- Refinancing of the Reserved Based Lending Facility (“RBL”) which provided access to a committed $100m with a further $50m available on an uncommitted “accordion” basis, thus allowing the Company more financial flexibility
• Responsible and decisive cost-cutting actions to preserve balance sheet strength through:
- Continued reviewing and reducing of all G&A costs across the Group, including voluntary salary reductions from staff and the Board
- Continuation of working from home (WFH), thus reducing pre-pandemic office rental cost
- Reorganisation and redundancy programmes within the London and Cairo offices
• Revenue stability through active hedging programme – approximately 59% of production hedged in 2021. With the ongoing volatility in the oil price still prevalent, Pharos used hedges judiciously to protect against the downside
• Maintained financial strength through bringing in an industry partner (IPR) to support the next stage of development in Egypt
• Modest gearing level – Net debt to EBITDAX 1.00x
Priorities in 2022• Continue to actively manage our cost
base, capital allocation and investments into growth opportunities already in the portfolio
• Manage a smooth transition of operatorship to IPR to accelerate investment into the Egyptian assets
• Complete the development drilling in TGT and CNV
• Complete the seismic processing and interpretation on 125 & 126 and initiate the process for seeking a further industry partner pre-drill
• Evaluate what we can do as a responsible operator and good corporate citizen to reduce our carbon footprint; and what commitments can be made towards our progress to Net Zero
Risks• Commodity price risk
• Carbon tax
• Insufficient funds to finance growth plans and maintain dividends
• Rising operational cost
• Composition of the new workforce and Board / HR management
• Regulatory risk; new regulations
• Climate related risk – transition and physical risk
• Partner alignment risk
Mitigation• Oil price hedging
• Close monitoring of business activities, financial position, cash flows
• Control over procurement costs/effective management of supply chains
• Capital discipline with focus on controlling and managing costs
• Stress testing scenarios and sensitivities to ensure a level of robustness to downside price, carbon tax, discount rates, and production sensitivities, and review of capital expenditure and operating cost
• Discretionary spend actively managed
• Cultivating and maintaining good relationships with lenders
Pharos Energy Annual Report and Accounts 2021 18
Additional InformationGovernance Report Financial StatementsStrategic Report
2. Focus on stakeholdersDialogue with shareholders, local communities, host governments, employees, contractors, and others in the supply chain.
We continue to consult and engage, through formal and informal processes, in an open dialogue with our stakeholders. These conversations consider matters that are important both to our stakeholders, and to the successful delivery of our corporate objectives.
Activities in 2021• Board refreshment to bring further
knowledge and deeper experience
• Active employee engagement by the Executive Directors with UK, Egypt and Vietnam employees during the entirety of lock-down via anonymous surveys, weekly Monday business meetings, and off-site away days
• A hybrid working model of working from home and working from physical offices after consultation with employees
• Open and active dialogue with shareholders throughout the year via analyst research feed, Investor Meet Company online meetings and Q&A, and Results roadshows
• Engagement across our supply chain to identify and address red-flag areas of concern
• Continued social engagement with local communities during the pandemic to ensure continuous investments in local projects with the most positive impact
• Transparent disclosure of ESG-related metrics. Maintained grade C in CDP Climate Change questionnaire, with first time participation in the CDP Water Security questionnaire. Completion of Phase Two of the implementation of Task Force on Climate-related Financial Disclosures (TCFD) recommendations
Priorities in 2022• Continue workforce and stakeholder
engagement, building on work in 2021
• Regular staff training and development
• Build on and improve new ways of working and communication to make the business base fit for the workforce going forward
• Further Board reductions to ensure a flatter organisational structure, shorter lines of management and more direct, accessible channels of communication with leadership
Risks • HSES reputational and operational risk
• Climate change –speed of the energy transition and physical risks from extreme weather events
• Human resource risk
• Political and regional risks
• Business conduct and bribery
• Partner alignment risk
Mitigation• Promoting a positive health and safety
culture
• Continuing the implementation of COVID-19 precautionary measures based on applicable law, regulation and public health guidance
• Emergency preparedness
• Embedding climate change scenarios and evaluate decisions on key business operations where we have control
• Complying with all legislative/regulatory frameworks and focus on a goal based approach to improve safety
• Adhering to the Group’s Code of Business Conduct and Ethics and associated policies
• Annual training and compliance certifications by all associated persons/whistleblowing facility in place
• Active participation in JOC management
• Engaging directly with the relevant authorities on a regular basis
Pharos Energy Annual Report and Accounts 202119
CORE STRATEGIC OBJECTIVES - CONTINUED
3. Enhanced growth potentialA portfolio of low-cost growth opportunities that is resilient in difficult times, and thrive when economic environment improves.
Building and enhancing growth opportunities in our current portfolio. Actively managing our portfolio through investments and divestments. Focusing on near-term development opportunities to create value for stakeholders whilst maintaining high operational and safety standards using local staff and suppliers.
Activities in 2021
Egypt
• Improved fiscal terms signed in January 2022 with revenue increases backdated to November 2020
• Commencement of Phase 1B of the waterflood programme in El Fayum
• Return to drilling with commencement of the El Fayum Phase 1B waterflood programme, three-well development drilling programme, and Batran-1X commitment well oil discovery
• Interpretation of the large pre-existing 3D seismic survey on the NBS Concession continues with several low risk drillable prospects already identified
• Commencement of the farm-out transaction with IPR to fund the capital programme on the Egyptian assets to increase production and fulfil the full potential of the concessions
Vietnam
• Successful completion of the first phase of the 2021 TGT well intervention and development drilling campaign, on schedule and below budget
• Approval for a two-year extension to the terms of Phase 1 of the Block 125 & 126 Exploration Period from the Ministry of Industry and Trade
• Completion of the 3D seismic acquisition programme on Block 125 in the Phu Khanh Basin, with processing of the new data underway
Priorities in 2022
Egypt
• Completion of the three-well development drilling programme
• Completion of the farm-out transaction with IPR and transfer of operatorship to support the next stage of development in Egypt
Vietnam
• Commencement of development drilling programme of two TGT wells in the FFDP in Q3 2022, and one CNV well
• Processing 3D seismic results on Block 125 in order to identify future prospects
• Progressing work on submitting licence extension requests for both TGT & CNV, and a revised Full Field Development Plan for both fields
Risks • Insufficient funds to meet commitments
• Commodity price volatility, volatility in production levels – sub-optimal well performance
• Partner alignment risk
Mitigation• Regular review of funding options
• Stress testing forecasts
• Down side protection through hedging
• Cultivating and maintaining good relationships with lenders
• Active participation in dialogue with JVs/ JOCs
Pharos Energy Annual Report and Accounts 2021 20
Additional InformationGovernance Report Financial StatementsStrategic Report
BUSINESS MODEL
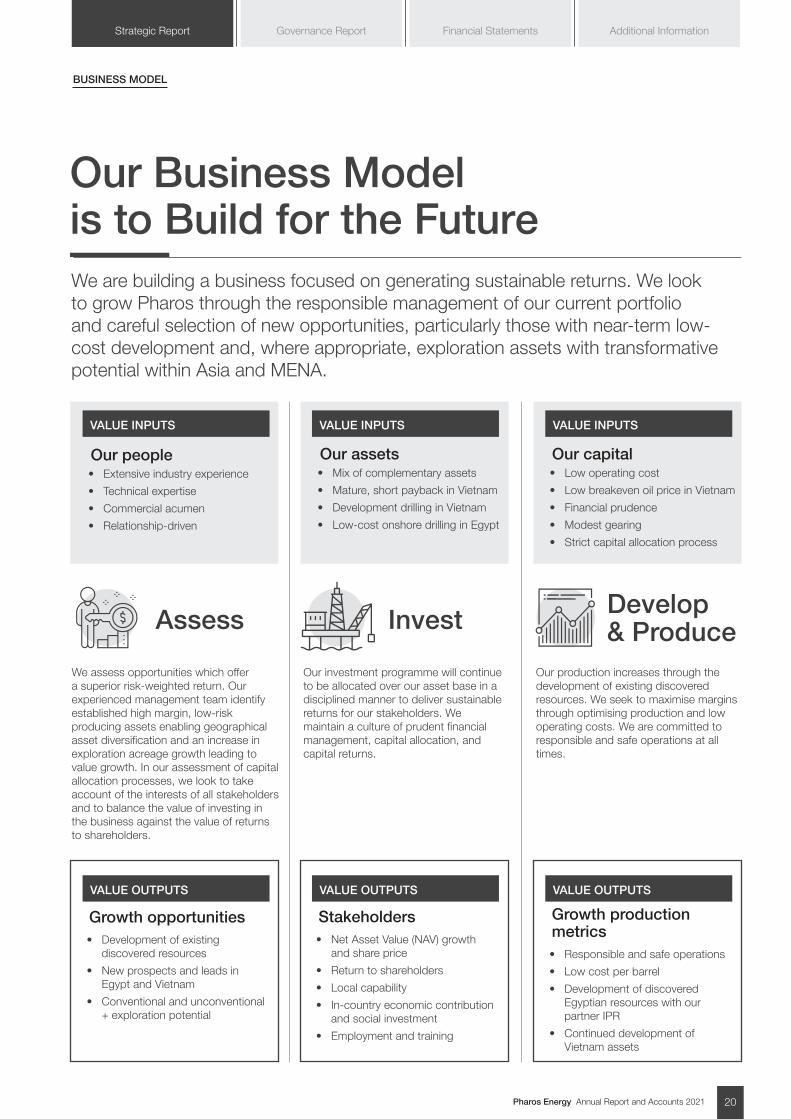
Our Business Model is to Build for the Future We are building a business focused on generating sustainable returns. We look to grow Pharos through the responsible management of our current portfolio and careful selection of new opportunities, particularly those with near-term low-cost development and, where appropriate, exploration assets with transformative potential within Asia and MENA.
Assess
VALUE INPUTS
VALUE OUTPUTS VALUE OUTPUTS VALUE OUTPUTS
VALUE INPUTS VALUE INPUTS
InvestDevelop & Produce
We assess opportunities which offer a superior risk-weighted return. Our experienced management team identify established high margin, low-risk producing assets enabling geographical asset diversification and an increase in exploration acreage growth leading to value growth. In our assessment of capital allocation processes, we look to take account of the interests of all stakeholders and to balance the value of investing in the business against the value of returns to shareholders.
Our investment programme will continue to be allocated over our asset base in a disciplined manner to deliver sustainable returns for our stakeholders. We maintain a culture of prudent financial management, capital allocation, and capital returns.
Our production increases through the development of existing discovered resources. We seek to maximise margins through optimising production and low operating costs. We are committed to responsible and safe operations at all times.
Our people• Extensive industry experience
• Technical expertise
• Commercial acumen
• Relationship-driven
Growth opportunities• Development of existing
discovered resources
• New prospects and leads in Egypt and Vietnam
• Conventional and unconventional + exploration potential
Stakeholders• Net Asset Value (NAV) growth
and share price
• Return to shareholders
• Local capability
• In-country economic contribution and social investment
• Employment and training
Growth production metrics• Responsible and safe operations
• Low cost per barrel
• Development of discovered Egyptian resources with our partner IPR
• Continued development of Vietnam assets
Our assets• Mix of complementary assets
• Mature, short payback in Vietnam
• Development drilling in Vietnam
• Low-cost onshore drilling in Egypt
Our capital• Low operating cost
• Low breakeven oil price in Vietnam
• Financial prudence
• Modest gearing
• Strict capital allocation process
Pharos Energy Annual Report and Accounts 202121
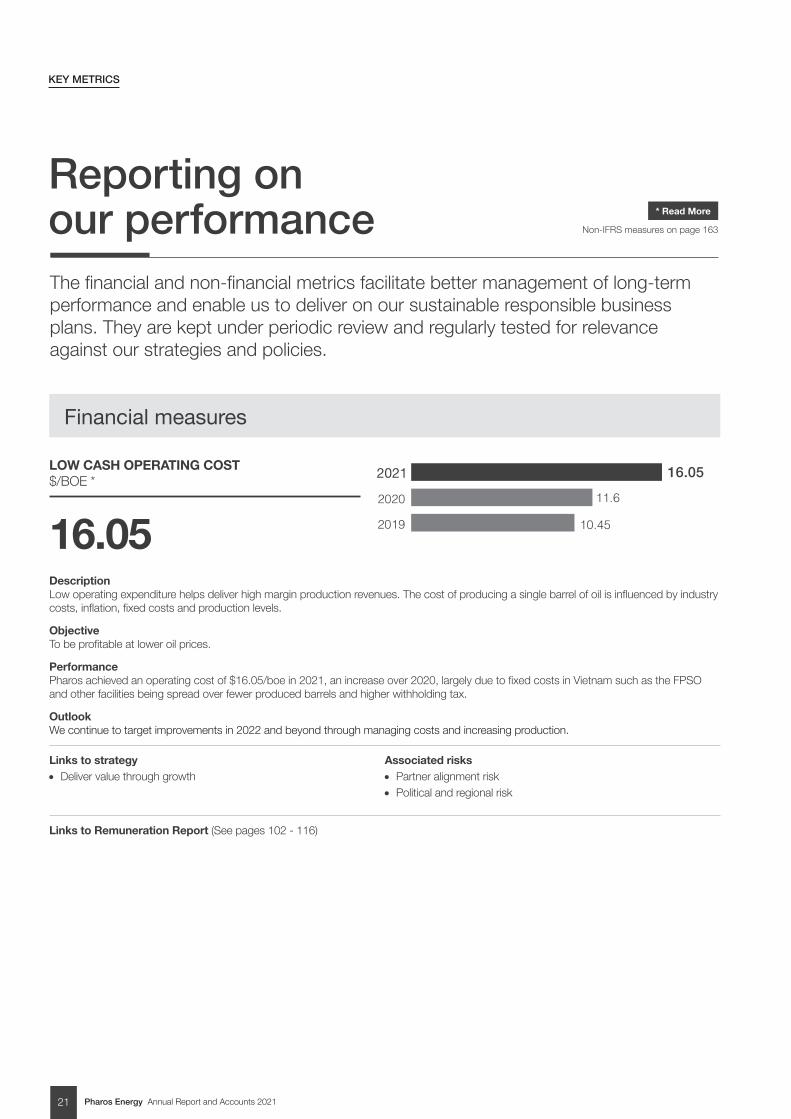
Reporting on our performance The financial and non-financial metrics facilitate better management of long-term performance and enable us to deliver on our sustainable responsible business plans. They are kept under periodic review and regularly tested for relevance against our strategies and policies.
LOW CASH OPERATING COST $/BOE *
16.05 DescriptionLow operating expenditure helps deliver high margin production revenues. The cost of producing a single barrel of oil is influenced by industry costs, inflation, fixed costs and production levels.
ObjectiveTo be profitable at lower oil prices.
PerformancePharos achieved an operating cost of $16.05/boe in 2021, an increase over 2020, largely due to fixed costs in Vietnam such as the FPSO and other facilities being spread over fewer produced barrels and higher withholding tax.
OutlookWe continue to target improvements in 2022 and beyond through managing costs and increasing production.
Links to strategy • Deliver value through growth
Associated risks• Partner alignment risk• Political and regional risk
Links to Remuneration Report (See pages 102 - 116)
Financial measures
2020
2019
2021 16.05
11.6
10.45
* Read More
Non-IFRS measures on page 163
KEY METRICS
Pharos Energy Annual Report and Accounts 2021 22
Additional InformationGovernance Report Financial StatementsStrategic Report
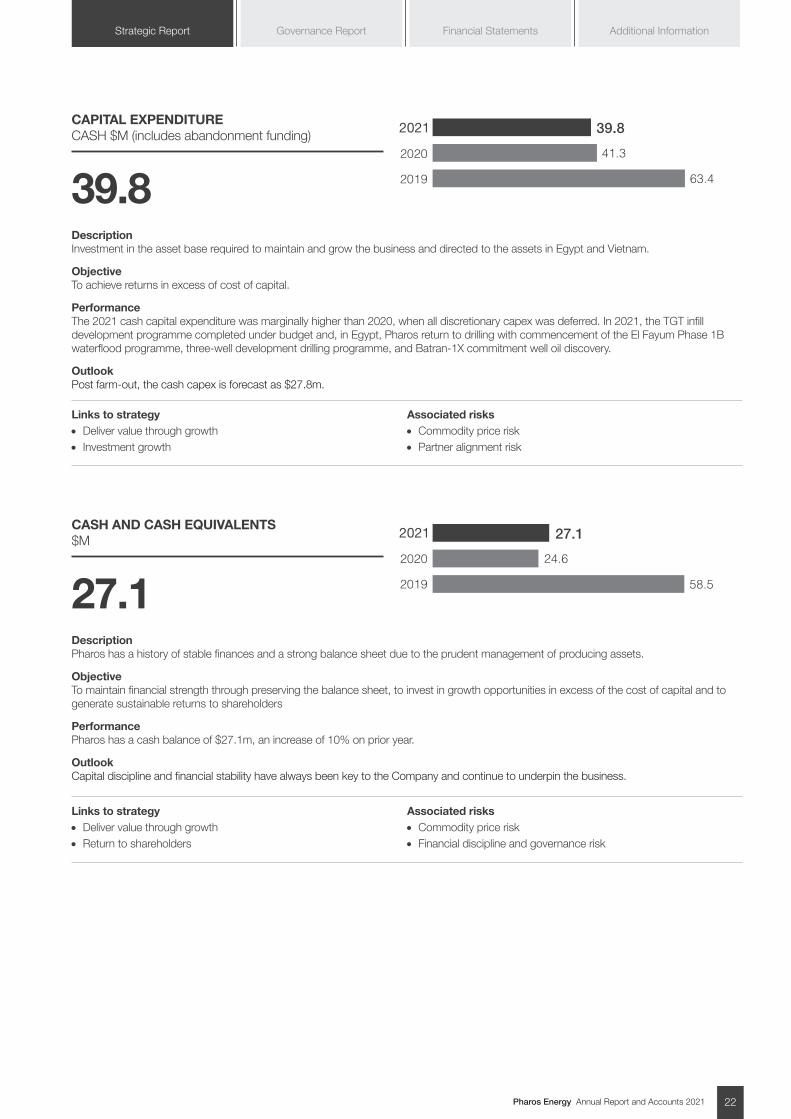
CAPITAL EXPENDITURE CASH $M (includes abandonment funding)
39.8 DescriptionInvestment in the asset base required to maintain and grow the business and directed to the assets in Egypt and Vietnam.
ObjectiveTo achieve returns in excess of cost of capital.
PerformanceThe 2021 cash capital expenditure was marginally higher than 2020, when all discretionary capex was deferred. In 2021, the TGT infill development programme completed under budget and, in Egypt, Pharos return to drilling with commencement of the El Fayum Phase 1B waterflood programme, three-well development drilling programme, and Batran-1X commitment well oil discovery.
OutlookPost farm-out, the cash capex is forecast as $27.8m.
Links to strategy • Deliver value through growth • Investment growth
Associated risks• Commodity price risk• Partner alignment risk
CASH AND CASH EQUIVALENTS $M
27.1 DescriptionPharos has a history of stable finances and a strong balance sheet due to the prudent management of producing assets.
ObjectiveTo maintain financial strength through preserving the balance sheet, to invest in growth opportunities in excess of the cost of capital and to generate sustainable returns to shareholders
PerformancePharos has a cash balance of $27.1m, an increase of 10% on prior year.
OutlookCapital discipline and financial stability have always been key to the Company and continue to underpin the business.
Links to strategy • Deliver value through growth• Return to shareholders
Associated risks• Commodity price risk• Financial discipline and governance risk
2020
2019
2021 39.8
41.3
63.4
2020
2019
2021
58.5
24.6
27.1
Pharos Energy Annual Report and Accounts 202123
KEY METRICS - CONTINUED
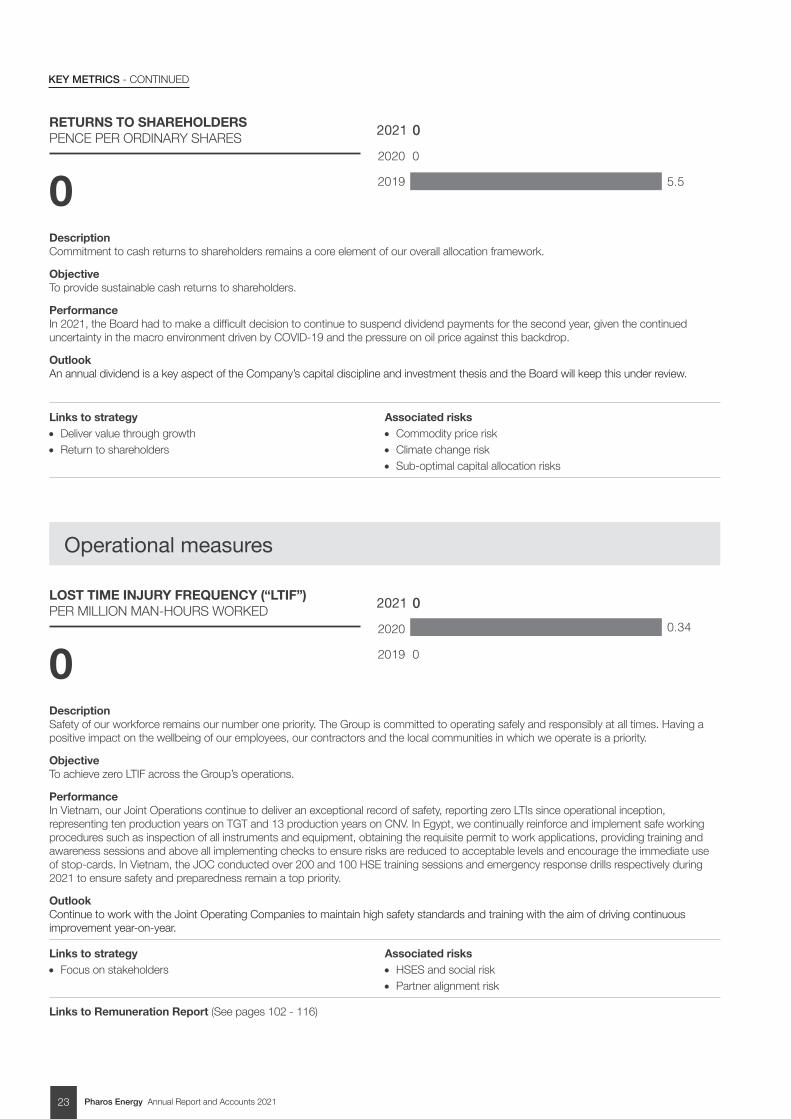
RETURNS TO SHAREHOLDERS PENCE PER ORDINARY SHARES
0 DescriptionCommitment to cash returns to shareholders remains a core element of our overall allocation framework.
ObjectiveTo provide sustainable cash returns to shareholders.
PerformanceIn 2021, the Board had to make a difficult decision to continue to suspend dividend payments for the second year, given the continued uncertainty in the macro environment driven by COVID-19 and the pressure on oil price against this backdrop.
OutlookAn annual dividend is a key aspect of the Company’s capital discipline and investment thesis and the Board will keep this under review.
Links to strategy • Deliver value through growth• Return to shareholders
Associated risks• Commodity price risk• Climate change risk• Sub-optimal capital allocation risks
LOST TIME INJURY FREQUENCY (“LTIF”) PER MILLION MAN-HOURS WORKED
0 DescriptionSafety of our workforce remains our number one priority. The Group is committed to operating safely and responsibly at all times. Having a positive impact on the wellbeing of our employees, our contractors and the local communities in which we operate is a priority.
ObjectiveTo achieve zero LTIF across the Group’s operations.
PerformanceIn Vietnam, our Joint Operations continue to deliver an exceptional record of safety, reporting zero LTIs since operational inception, representing ten production years on TGT and 13 production years on CNV. In Egypt, we continually reinforce and implement safe working procedures such as inspection of all instruments and equipment, obtaining the requisite permit to work applications, providing training and awareness sessions and above all implementing checks to ensure risks are reduced to acceptable levels and encourage the immediate use of stop-cards. In Vietnam, the JOC conducted over 200 and 100 HSE training sessions and emergency response drills respectively during 2021 to ensure safety and preparedness remain a top priority.
OutlookContinue to work with the Joint Operating Companies to maintain high safety standards and training with the aim of driving continuous improvement year-on-year.
Links to strategy • Focus on stakeholders
Associated risks• HSES and social risk• Partner alignment risk
Links to Remuneration Report (See pages 102 - 116)
2020
2019
2021
5.5
0
0
2020
2019
2021
0.34
0
0
Operational measures
Pharos Energy Annual Report and Accounts 2021 24
Additional InformationGovernance Report Financial StatementsStrategic Report
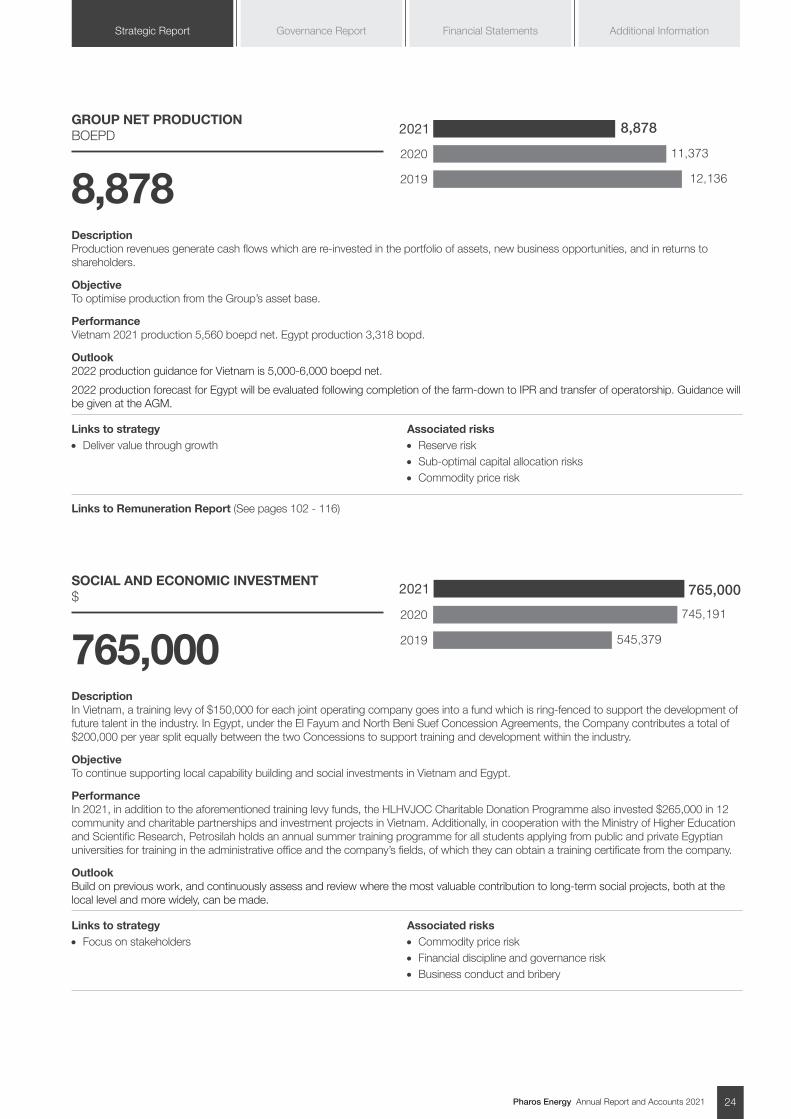
GROUP NET PRODUCTION BOEPD
8,878 DescriptionProduction revenues generate cash flows which are re-invested in the portfolio of assets, new business opportunities, and in returns to shareholders.
ObjectiveTo optimise production from the Group’s asset base.
PerformanceVietnam 2021 production 5,560 boepd net. Egypt production 3,318 bopd.
Outlook2022 production guidance for Vietnam is 5,000-6,000 boepd net.
2022 production forecast for Egypt will be evaluated following completion of the farm-down to IPR and transfer of operatorship. Guidance will be given at the AGM.
Links to strategy • Deliver value through growth
Associated risks• Reserve risk• Sub-optimal capital allocation risks• Commodity price risk
Links to Remuneration Report (See pages 102 - 116)
SOCIAL AND ECONOMIC INVESTMENT $
765,000 DescriptionIn Vietnam, a training levy of $150,000 for each joint operating company goes into a fund which is ring-fenced to support the development of future talent in the industry. In Egypt, under the El Fayum and North Beni Suef Concession Agreements, the Company contributes a total of $200,000 per year split equally between the two Concessions to support training and development within the industry.
ObjectiveTo continue supporting local capability building and social investments in Vietnam and Egypt.
PerformanceIn 2021, in addition to the aforementioned training levy funds, the HLHVJOC Charitable Donation Programme also invested $265,000 in 12 community and charitable partnerships and investment projects in Vietnam. Additionally, in cooperation with the Ministry of Higher Education and Scientific Research, Petrosilah holds an annual summer training programme for all students applying from public and private Egyptian universities for training in the administrative office and the company’s fields, of which they can obtain a training certificate from the company.
OutlookBuild on previous work, and continuously assess and review where the most valuable contribution to long-term social projects, both at the local level and more widely, can be made.
Links to strategy • Focus on stakeholders
Associated risks• Commodity price risk• Financial discipline and governance risk• Business conduct and bribery
2020
2019
2021
12,136
11,373
8,878
2020
2019
2021 765,000
745,191
545,379
Pharos Energy Annual Report and Accounts 202125
KEY METRICS - CONTINUED
EMPLOYEES UNDERTAKEN ANTI-BRIBERY AND CORRUPTION TRAINING %
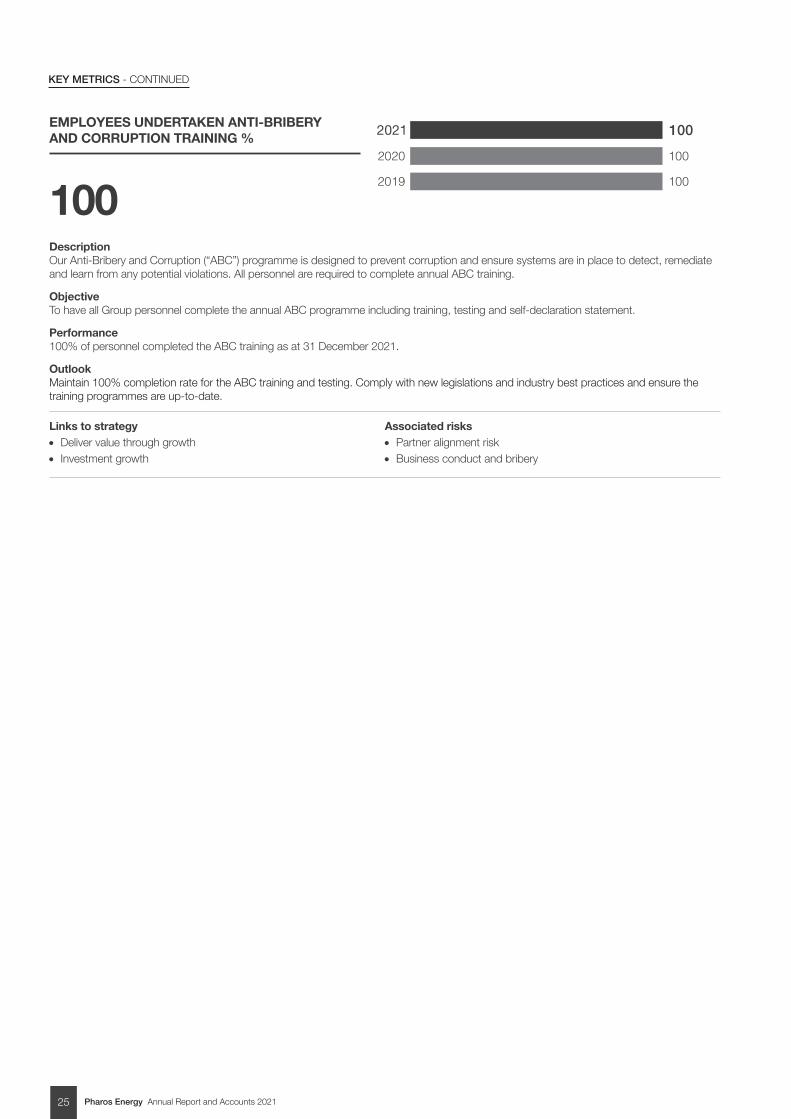
100 DescriptionOur Anti-Bribery and Corruption (“ABC”) programme is designed to prevent corruption and ensure systems are in place to detect, remediate and learn from any potential violations. All personnel are required to complete annual ABC training.
ObjectiveTo have all Group personnel complete the annual ABC programme including training, testing and self-declaration statement.
Performance100% of personnel completed the ABC training as at 31 December 2021.
OutlookMaintain 100% completion rate for the ABC training and testing. Comply with new legislations and industry best practices and ensure the training programmes are up-to-date.
Links to strategy • Deliver value through growth • Investment growth
Associated risks• Partner alignment risk • Business conduct and bribery
2020
2019
2021 100
100
100
Pharos Energy Annual Report and Accounts 2021 26
Additional InformationGovernance Report Financial StatementsStrategic Report
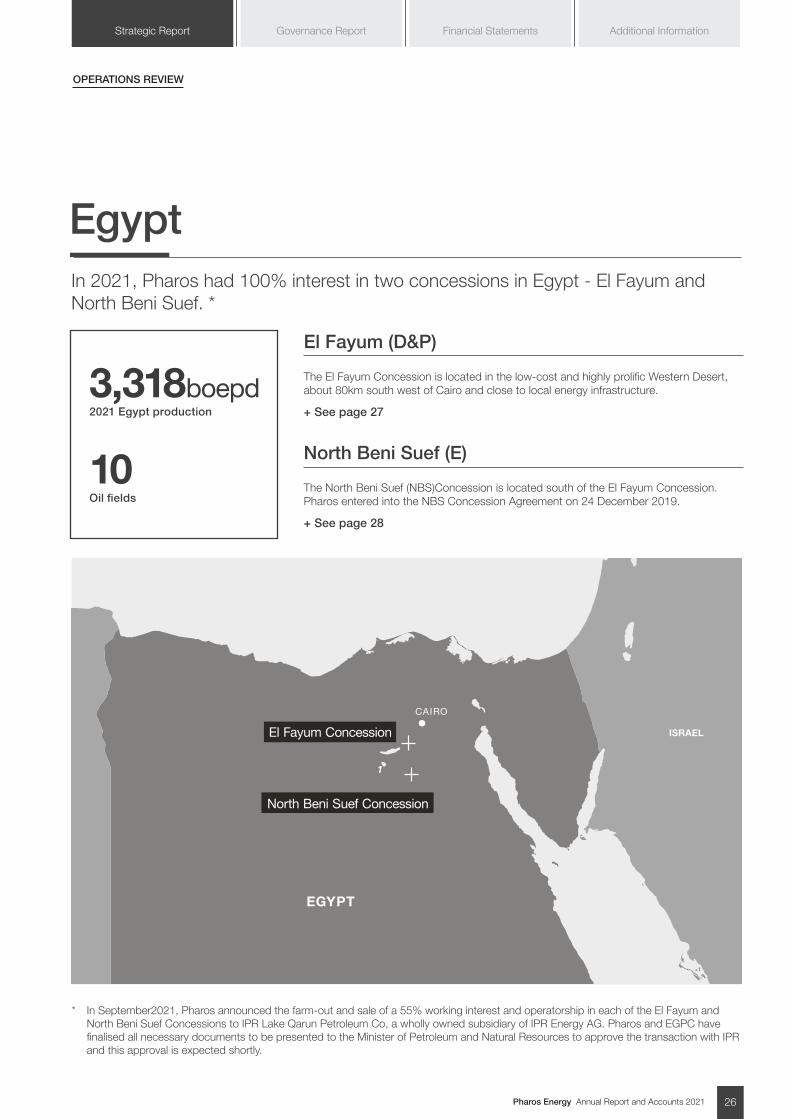
In 2021, Pharos had 100% interest in two concessions in Egypt - El Fayum and North Beni Suef. *
Egypt
OPERATIONS REVIEW
3,318boepd2021 Egypt production
10Oil fields
EGYPT
CAIRO
El Fayum Concession
North Beni Suef Concession
ISRAEL
El Fayum (D&P)
The El Fayum Concession is located in the low-cost and highly prolific Western Desert, about 80km south west of Cairo and close to local energy infrastructure.
+ See page 27
North Beni Suef (E)
The North Beni Suef (NBS)Concession is located south of the El Fayum Concession. Pharos entered into the NBS Concession Agreement on 24 December 2019.
+ See page 28
* In September2021, Pharos announced the farm-out and sale of a 55% working interest and operatorship in each of the El Fayum and North Beni Suef Concessions to IPR Lake Qarun Petroleum Co, a wholly owned subsidiary of IPR Energy AG. Pharos and EGPC have finalised all necessary documents to be presented to the Minister of Petroleum and Natural Resources to approve the transaction with IPR and this approval is expected shortly.
Pharos Energy Annual Report and Accounts 202127
OPERATIONS REVIEW - CONTINUED
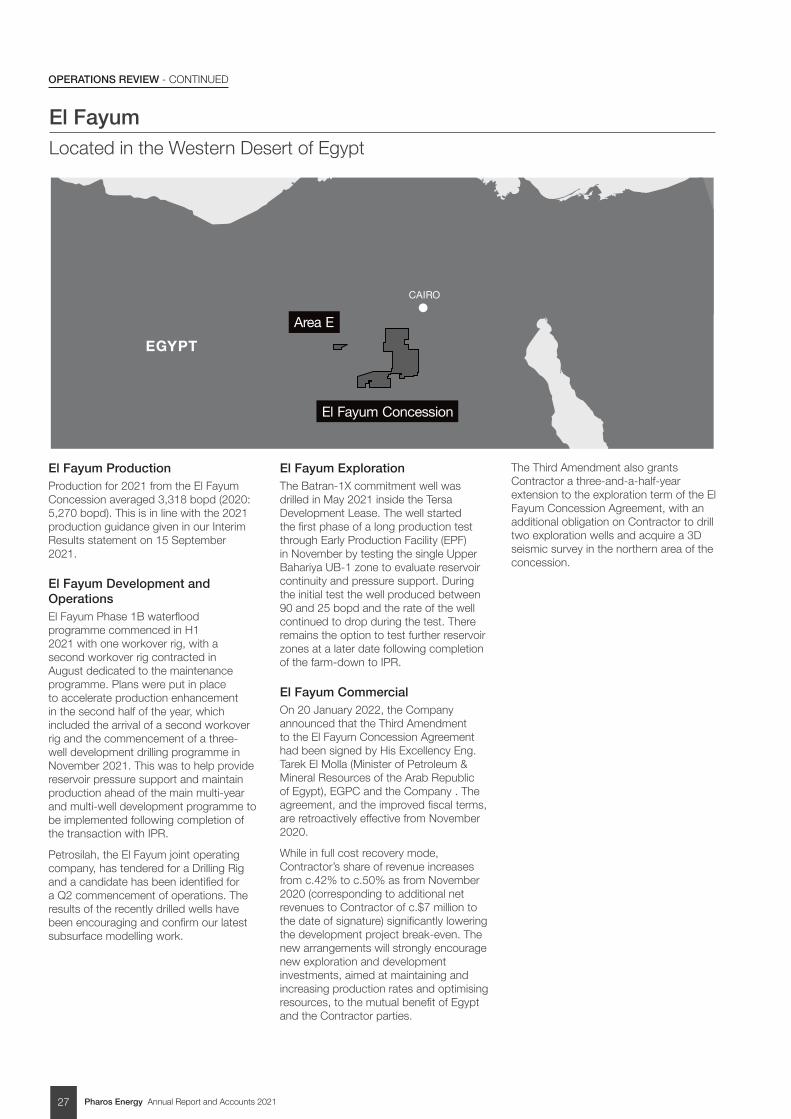
El Fayum Located in the Western Desert of Egypt
El Fayum ProductionProduction for 2021 from the El Fayum Concession averaged 3,318 bopd (2020: 5,270 bopd). This is in line with the 2021 production guidance given in our Interim Results statement on 15 September 2021.
El Fayum Development and OperationsEl Fayum Phase 1B waterflood programme commenced in H1 2021 with one workover rig, with a second workover rig contracted in August dedicated to the maintenance programme. Plans were put in place to accelerate production enhancement in the second half of the year, which included the arrival of a second workover rig and the commencement of a three-well development drilling programme in November 2021. This was to help provide reservoir pressure support and maintain production ahead of the main multi-year and multi-well development programme to be implemented following completion of the transaction with IPR.
Petrosilah, the El Fayum joint operating company, has tendered for a Drilling Rig and a candidate has been identified for a Q2 commencement of operations. The results of the recently drilled wells have been encouraging and confirm our latest subsurface modelling work.
El Fayum ExplorationThe Batran-1X commitment well was drilled in May 2021 inside the Tersa Development Lease. The well started the first phase of a long production test through Early Production Facility (EPF) in November by testing the single Upper Bahariya UB-1 zone to evaluate reservoir continuity and pressure support. During the initial test the well produced between 90 and 25 bopd and the rate of the well continued to drop during the test. There remains the option to test further reservoir zones at a later date following completion of the farm-down to IPR.
El Fayum Commercial On 20 January 2022, the Company announced that the Third Amendment to the El Fayum Concession Agreement had been signed by His Excellency Eng. Tarek El Molla (Minister of Petroleum & Mineral Resources of the Arab Republic of Egypt), EGPC and the Company . The agreement, and the improved fiscal terms, are retroactively effective from November 2020.
While in full cost recovery mode, Contractor’s share of revenue increases from c.42% to c.50% as from November 2020 (corresponding to additional net revenues to Contractor of c.$7 million to the date of signature) significantly lowering the development project break-even. The new arrangements will strongly encourage new exploration and development investments, aimed at maintaining and increasing production rates and optimising resources, to the mutual benefit of Egypt and the Contractor parties.
The Third Amendment also grants Contractor a three-and-a-half-year extension to the exploration term of the El Fayum Concession Agreement, with an additional obligation on Contractor to drill two exploration wells and acquire a 3D seismic survey in the northern area of the concession.
EGYPT
CAIRO
El Fayum Concession
Area E
Pharos Energy Annual Report and Accounts 2021 28
Additional InformationGovernance Report Financial StatementsStrategic Report
2022 Work ProgrammeThe three-well drilling programme, which commenced in November 2021, is ongoing. Two wells have been completed and are on production, with the third one due to spud soon.
Following award of the drilling rig contract by Petrosilah on behalf of the Joint Venture and upon completion of the transaction with IPR and transfer of operatorship, the Contractor parties expect to commence the main El Fayum multi-year and multi-well development programme in Q2 2022.
Production forecast for 2022 will be evaluated following completion of the farm-down to IPR and transfer of operatorship. Guidance will be given at the AGM.
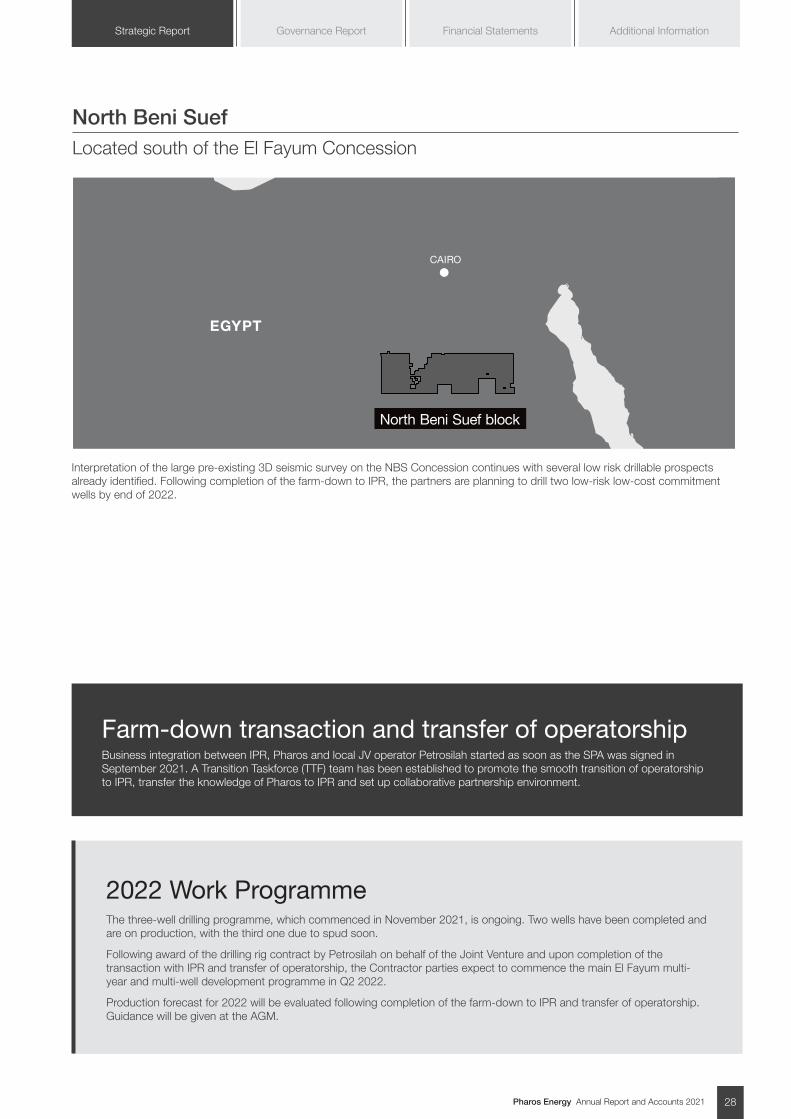
North Beni SuefLocated south of the El Fayum Concession
Interpretation of the large pre-existing 3D seismic survey on the NBS Concession continues with several low risk drillable prospects already identified. Following completion of the farm-down to IPR, the partners are planning to drill two low-risk low-cost commitment wells by end of 2022.
Farm-down transaction and transfer of operatorshipBusiness integration between IPR, Pharos and local JV operator Petrosilah started as soon as the SPA was signed in September 2021. A Transition Taskforce (TTF) team has been established to promote the smooth transition of operatorship to IPR, transfer the knowledge of Pharos to IPR and set up collaborative partnership environment.
North Beni Suef block
CAIRO
EGYPT
Pharos Energy Annual Report and Accounts 202129
Vietnam
OPERATIONS REVIEW - CONTINUED
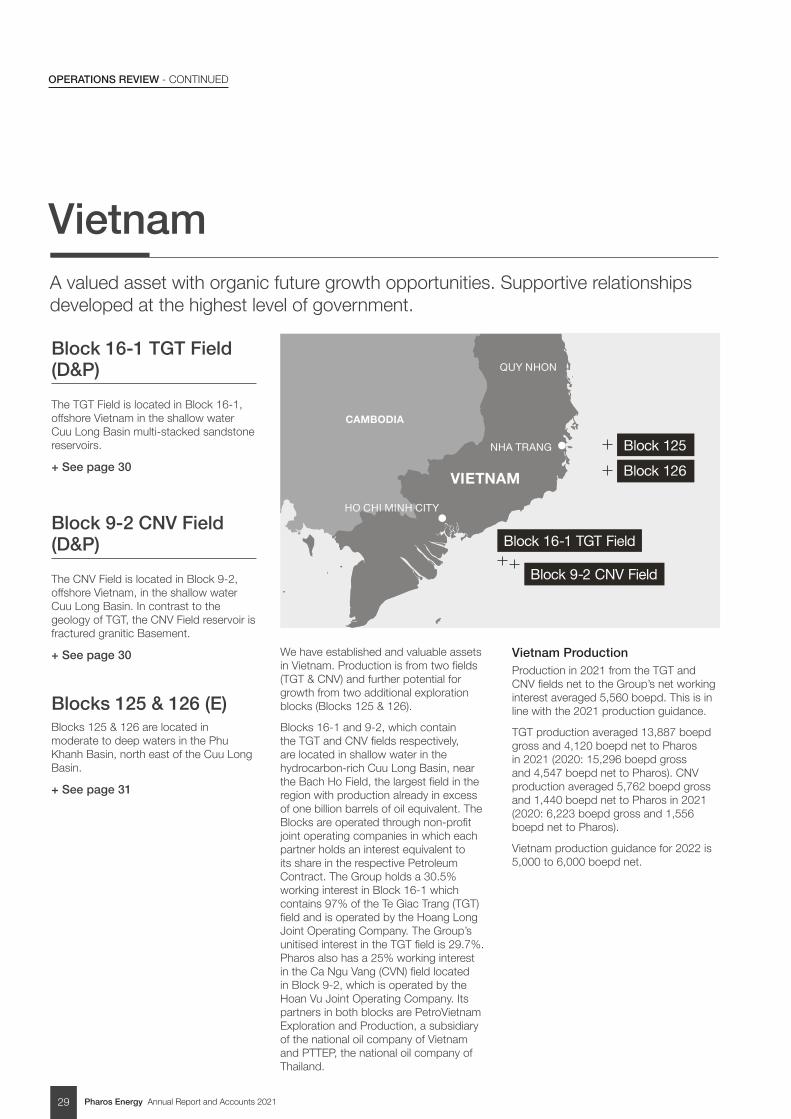
A valued asset with organic future growth opportunities. Supportive relationships developed at the highest level of government.
We have established and valuable assets in Vietnam. Production is from two fields (TGT & CNV) and further potential for growth from two additional exploration blocks (Blocks 125 & 126).
Blocks 16-1 and 9-2, which contain the TGT and CNV fields respectively, are located in shallow water in the hydrocarbon-rich Cuu Long Basin, near the Bach Ho Field, the largest field in the region with production already in excess of one billion barrels of oil equivalent. The Blocks are operated through non-profit joint operating companies in which each partner holds an interest equivalent to its share in the respective Petroleum Contract. The Group holds a 30.5% working interest in Block 16-1 which contains 97% of the Te Giac Trang (TGT) field and is operated by the Hoang Long Joint Operating Company. The Group’s unitised interest in the TGT field is 29.7%. Pharos also has a 25% working interest in the Ca Ngu Vang (CVN) field located in Block 9-2, which is operated by the Hoan Vu Joint Operating Company. Its partners in both blocks are PetroVietnam Exploration and Production, a subsidiary of the national oil company of Vietnam and PTTEP, the national oil company of Thailand.
Vietnam ProductionProduction in 2021 from the TGT and CNV fields net to the Group’s net working interest averaged 5,560 boepd. This is in line with the 2021 production guidance.
TGT production averaged 13,887 boepd gross and 4,120 boepd net to Pharos in 2021 (2020: 15,296 boepd gross and 4,547 boepd net to Pharos). CNV production averaged 5,762 boepd gross and 1,440 boepd net to Pharos in 2021 (2020: 6,223 boepd gross and 1,556 boepd net to Pharos).
Vietnam production guidance for 2022 is 5,000 to 6,000 boepd net.
HO CHI MINH CITY
VIETNAM
NHA TRANG
QUY NHON
Block 9-2 CNV Field
Block 16-1 TGT Field
Block 125
Block 126
CAMBODIA
Block 16-1 TGT Field (D&P)
The TGT Field is located in Block 16-1, offshore Vietnam in the shallow water Cuu Long Basin multi-stacked sandstone reservoirs.
+ See page 30
Block 9-2 CNV Field (D&P)
The CNV Field is located in Block 9-2, offshore Vietnam, in the shallow water Cuu Long Basin. In contrast to the geology of TGT, the CNV Field reservoir is fractured granitic Basement.
+ See page 30
Blocks 125 & 126 (E)Blocks 125 & 126 are located in moderate to deep waters in the Phu Khanh Basin, north east of the Cuu Long Basin.
+ See page 31
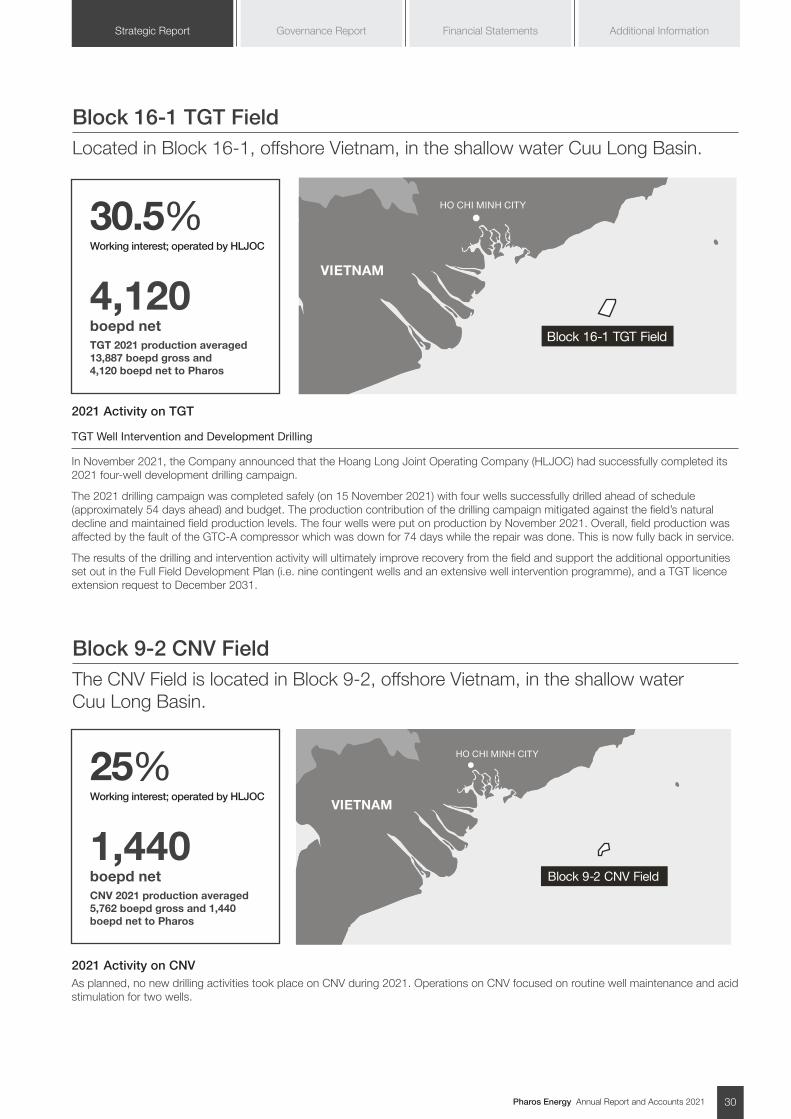
Pharos Energy Annual Report and Accounts 2021 30
Additional InformationGovernance Report Financial StatementsStrategic Report
Block 16-1 TGT FieldLocated in Block 16-1, offshore Vietnam, in the shallow water Cuu Long Basin.
Block 9-2 CNV FieldThe CNV Field is located in Block 9-2, offshore Vietnam, in the shallow water Cuu Long Basin.
2021 Activity on TGT
TGT Well Intervention and Development Drilling
In November 2021, the Company announced that the Hoang Long Joint Operating Company (HLJOC) had successfully completed its 2021 four-well development drilling campaign.
The 2021 drilling campaign was completed safely (on 15 November 2021) with four wells successfully drilled ahead of schedule (approximately 54 days ahead) and budget. The production contribution of the drilling campaign mitigated against the field’s natural decline and maintained field production levels. The four wells were put on production by November 2021. Overall, field production was affected by the fault of the GTC-A compressor which was down for 74 days while the repair was done. This is now fully back in service.
The results of the drilling and intervention activity will ultimately improve recovery from the field and support the additional opportunities set out in the Full Field Development Plan (i.e. nine contingent wells and an extensive well intervention programme), and a TGT licence extension request to December 2031.
2021 Activity on CNVAs planned, no new drilling activities took place on CNV during 2021. Operations on CNV focused on routine well maintenance and acid stimulation for two wells.
HO CHI MINH CITY
VIETNAM
Block 16-1 TGT Field
30.5%Working interest; operated by HLJOC
4,120boepd netTGT 2021 production averaged 13,887 boepd gross and 4,120 boepd net to Pharos
25%Working interest; operated by HLJOC
1,440boepd netCNV 2021 production averaged 5,762 boepd gross and 1,440 boepd net to Pharos
HO CHI MINH CITY
VIETNAM
Block 9-2 CNV Field
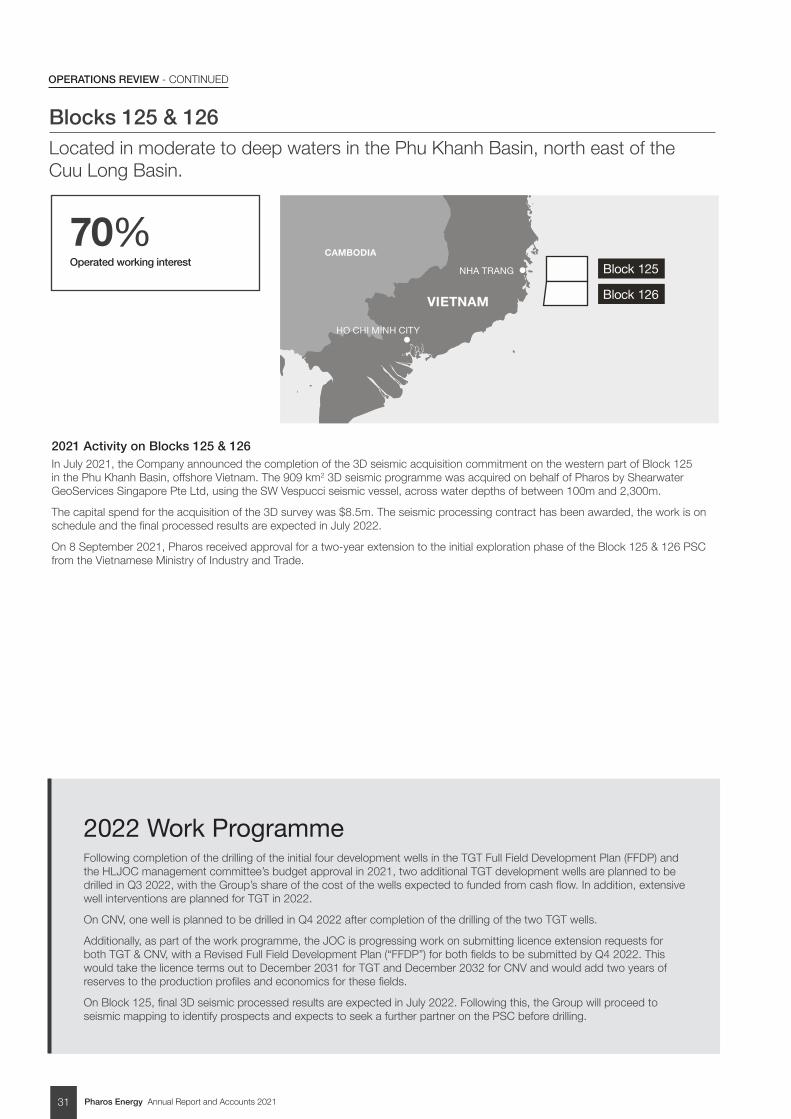
Pharos Energy Annual Report and Accounts 202131
OPERATIONS REVIEW - CONTINUED
2022 Work ProgrammeFollowing completion of the drilling of the initial four development wells in the TGT Full Field Development Plan (FFDP) and the HLJOC management committee’s budget approval in 2021, two additional TGT development wells are planned to be drilled in Q3 2022, with the Group’s share of the cost of the wells expected to funded from cash flow. In addition, extensive well interventions are planned for TGT in 2022.
On CNV, one well is planned to be drilled in Q4 2022 after completion of the drilling of the two TGT wells.
Additionally, as part of the work programme, the JOC is progressing work on submitting licence extension requests for both TGT & CNV, with a Revised Full Field Development Plan (“FFDP”) for both fields to be submitted by Q4 2022. This would take the licence terms out to December 2031 for TGT and December 2032 for CNV and would add two years of reserves to the production profiles and economics for these fields.
On Block 125, final 3D seismic processed results are expected in July 2022. Following this, the Group will proceed to seismic mapping to identify prospects and expects to seek a further partner on the PSC before drilling.
Blocks 125 & 126Located in moderate to deep waters in the Phu Khanh Basin, north east of the Cuu Long Basin.
2021 Activity on Blocks 125 & 126In July 2021, the Company announced the completion of the 3D seismic acquisition commitment on the western part of Block 125 in the Phu Khanh Basin, offshore Vietnam. The 909 km2 3D seismic programme was acquired on behalf of Pharos by Shearwater GeoServices Singapore Pte Ltd, using the SW Vespucci seismic vessel, across water depths of between 100m and 2,300m.
The capital spend for the acquisition of the 3D survey was $8.5m. The seismic processing contract has been awarded, the work is on schedule and the final processed results are expected in July 2022.
On 8 September 2021, Pharos received approval for a two-year extension to the initial exploration phase of the Block 125 & 126 PSC from the Vietnamese Ministry of Industry and Trade.
70%Operated working interest
NHA TRANG
VIETNAM
HO CHI MINH CITY
Block 125
Block 126
CAMBODIA
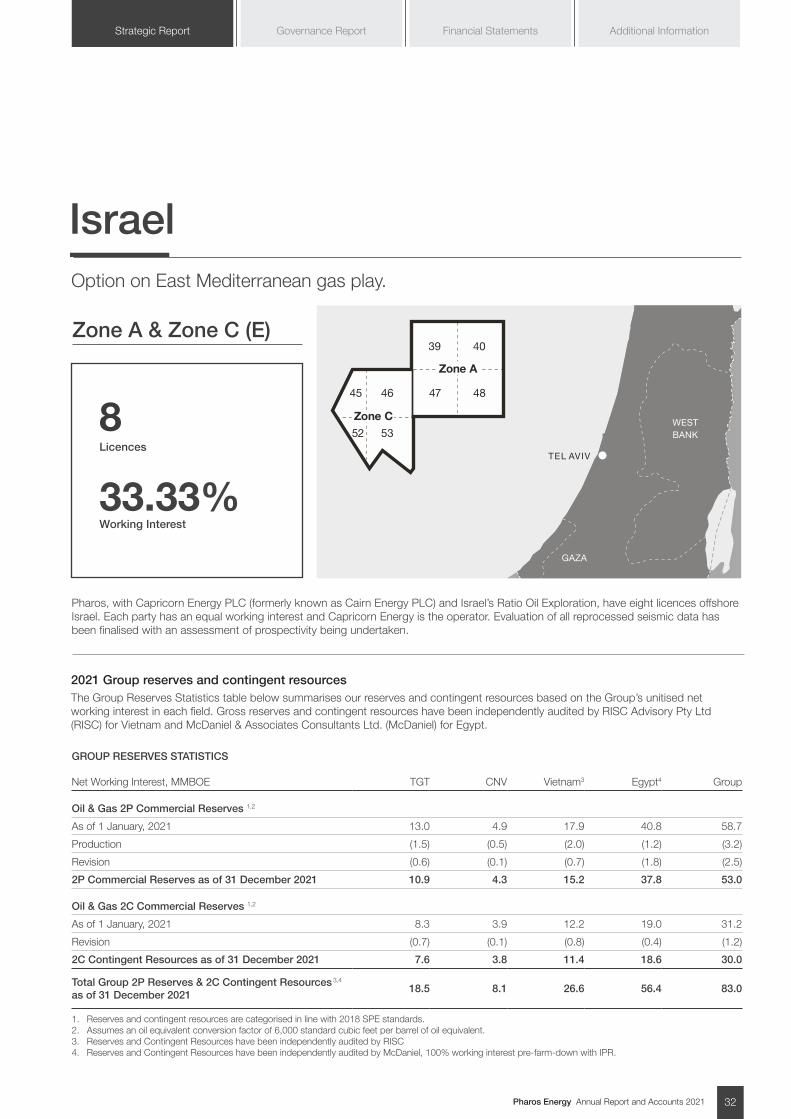
Pharos Energy Annual Report and Accounts 2021 32
Additional InformationGovernance Report Financial StatementsStrategic Report
Israel Option on East Mediterranean gas play.
Zone A & Zone C (E)
TEL AVIV
ISRAEL
WESTBANK
GAZA
4039
48
Zone A
474645
5352
Zone C
EGYPT
8Licences
33.33%Working Interest
Pharos, with Capricorn Energy PLC (formerly known as Cairn Energy PLC) and Israel’s Ratio Oil Exploration, have eight licences offshore Israel. Each party has an equal working interest and Capricorn Energy is the operator. Evaluation of all reprocessed seismic data has been finalised with an assessment of prospectivity being undertaken.
GROUP RESERVES STATISTICS
Net Working Interest, MMBOE TGT CNV Vietnam3 Egypt4 Group
Oil & Gas 2P Commercial Reserves 1,2
As of 1 January, 2021 13.0 4.9 17.9 40.8 58.7
Production (1.5) (0.5) (2.0) (1.2) (3.2)
Revision (0.6) (0.1) (0.7) (1.8) (2.5)
2P Commercial Reserves as of 31 December 2021 10.9 4.3 15.2 37.8 53.0
Oil & Gas 2C Commercial Reserves 1,2
As of 1 January, 2021 8.3 3.9 12.2 19.0 31.2
Revision (0.7) (0.1) (0.8) (0.4) (1.2)
2C Contingent Resources as of 31 December 2021 7.6 3.8 11.4 18.6 30.0
Total Group 2P Reserves & 2C Contingent Resources 3,4 as of 31 December 2021
18.5 8.1 26.6 56.4 83.0
1. Reserves and contingent resources are categorised in line with 2018 SPE standards. 2. Assumes an oil equivalent conversion factor of 6,000 standard cubic feet per barrel of oil equivalent. 3. Reserves and Contingent Resources have been independently audited by RISC4. Reserves and Contingent Resources have been independently audited by McDaniel, 100% working interest pre-farm-down with IPR.
2021 Group reserves and contingent resources The Group Reserves Statistics table below summarises our reserves and contingent resources based on the Group’s unitised net working interest in each field. Gross reserves and contingent resources have been independently audited by RISC Advisory Pty Ltd (RISC) for Vietnam and McDaniel & Associates Consultants Ltd. (McDaniel) for Egypt.
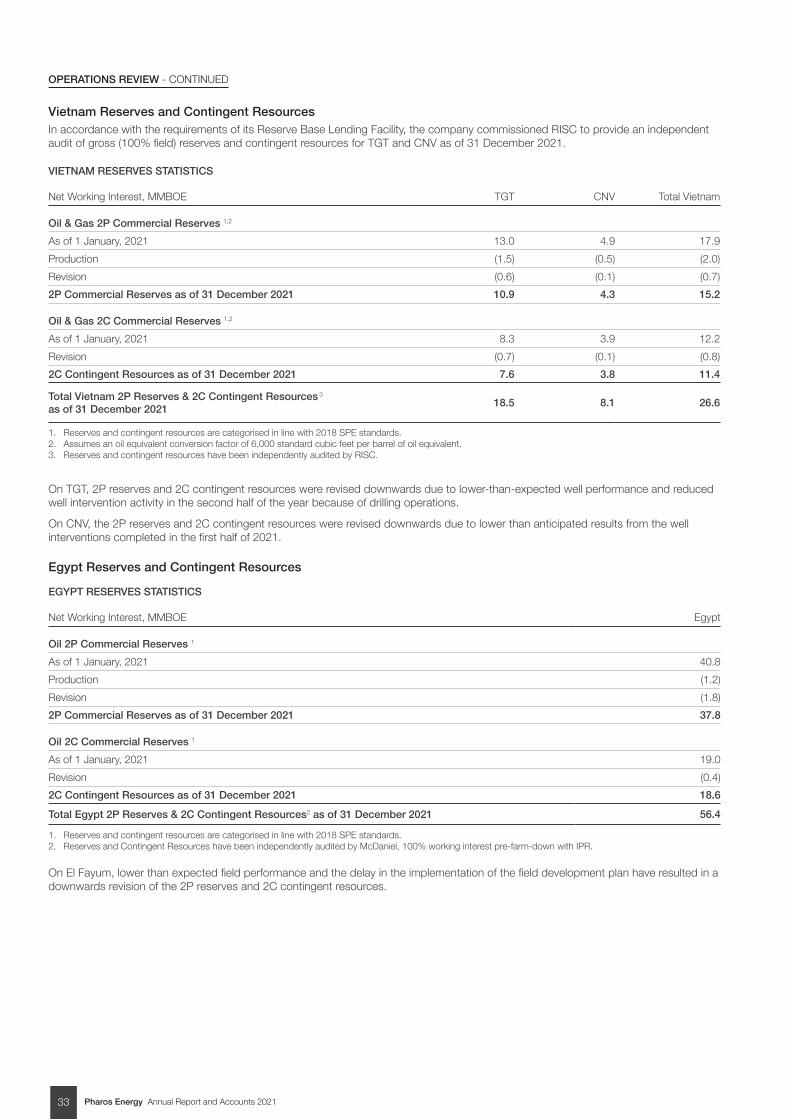
Pharos Energy Annual Report and Accounts 202133
OPERATIONS REVIEW - CONTINUED
Vietnam Reserves and Contingent ResourcesIn accordance with the requirements of its Reserve Base Lending Facility, the company commissioned RISC to provide an independent audit of gross (100% field) reserves and contingent resources for TGT and CNV as of 31 December 2021.
VIETNAM RESERVES STATISTICS
Net Working Interest, MMBOE TGT CNV Total Vietnam
Oil & Gas 2P Commercial Reserves 1,2
As of 1 January, 2021 13.0 4.9 17.9
Production (1.5) (0.5) (2.0)
Revision (0.6) (0.1) (0.7)
2P Commercial Reserves as of 31 December 2021 10.9 4.3 15.2
Oil & Gas 2C Commercial Reserves 1,2
As of 1 January, 2021 8.3 3.9 12.2
Revision (0.7) (0.1) (0.8)
2C Contingent Resources as of 31 December 2021 7.6 3.8 11.4
Total Vietnam 2P Reserves & 2C Contingent Resources 3 as of 31 December 2021
18.5 8.1 26.6
1. Reserves and contingent resources are categorised in line with 2018 SPE standards. 2. Assumes an oil equivalent conversion factor of 6,000 standard cubic feet per barrel of oil equivalent. 3. Reserves and contingent resources have been independently audited by RISC.
On TGT, 2P reserves and 2C contingent resources were revised downwards due to lower-than-expected well performance and reduced well intervention activity in the second half of the year because of drilling operations.
On CNV, the 2P reserves and 2C contingent resources were revised downwards due to lower than anticipated results from the well interventions completed in the first half of 2021.
Egypt Reserves and Contingent Resources
EGYPT RESERVES STATISTICS
Net Working Interest, MMBOE Egypt
Oil 2P Commercial Reserves 1
As of 1 January, 2021 40.8
Production (1.2)
Revision (1.8)
2P Commercial Reserves as of 31 December 2021 37.8
Oil 2C Commercial Reserves 1
As of 1 January, 2021 19.0
Revision (0.4)
2C Contingent Resources as of 31 December 2021 18.6
Total Egypt 2P Reserves & 2C Contingent Resources2 as of 31 December 2021 56.4
1. Reserves and contingent resources are categorised in line with 2018 SPE standards. 2. Reserves and Contingent Resources have been independently audited by McDaniel, 100% working interest pre-farm-down with IPR.
On El Fayum, lower than expected field performance and the delay in the implementation of the field development plan have resulted in a downwards revision of the 2P reserves and 2C contingent resources.
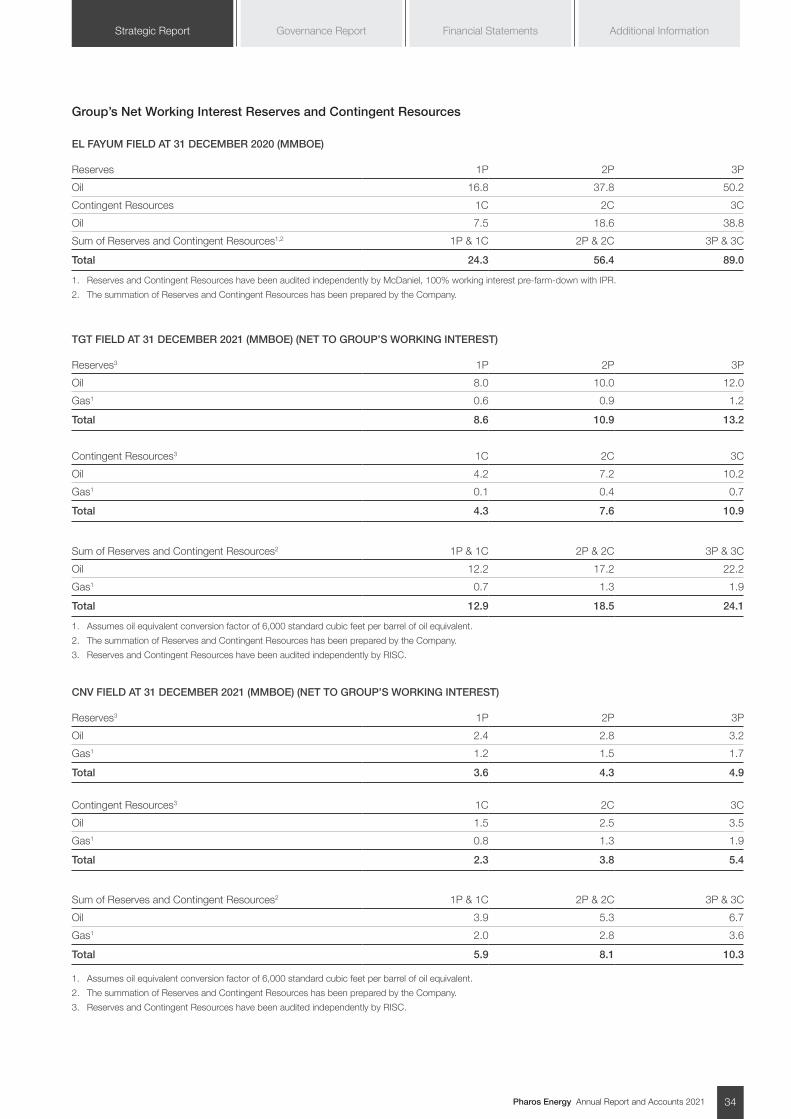
Pharos Energy Annual Report and Accounts 2021 34
Additional InformationGovernance Report Financial StatementsStrategic Report
Group’s Net Working Interest Reserves and Contingent Resources
EL FAYUM FIELD AT 31 DECEMBER 2020 (MMBOE)
Reserves 1P 2P 3P
Oil 16.8 37.8 50.2
Contingent Resources 1C 2C 3C
Oil 7.5 18.6 38.8
Sum of Reserves and Contingent Resources1,2 1P & 1C 2P & 2C 3P & 3C
TotalTotal 24.324.3 56.456.4 89.089.0
1. Reserves and Contingent Resources have been audited independently by McDaniel, 100% working interest pre-farm-down with IPR.
2. The summation of Reserves and Contingent Resources has been prepared by the Company.
TGT FIELD AT 31 DECEMBER 2021 (MMBOE) (NET TO GROUP’S WORKING INTEREST)
Reserves3 1P 2P 3P
Oil 8.0 10.0 12.0
Gas1 0.6 0.9 1.2
Total 8.6 10.9 13.2
Contingent Resources3 1C 2C 3C
Oil 4.2 7.2 10.2
Gas1 0.1 0.4 0.7
Total 4.3 7.6 10.9
Sum of Reserves and Contingent Resources2 1P & 1C 2P & 2C 3P & 3C
Oil 12.2 17.2 22.2
Gas1 0.7 1.3 1.9
Total 12.9 18.5 24.1
1. Assumes oil equivalent conversion factor of 6,000 standard cubic feet per barrel of oil equivalent.
2. The summation of Reserves and Contingent Resources has been prepared by the Company.
3. Reserves and Contingent Resources have been audited independently by RISC.
CNV FIELD AT 31 DECEMBER 2021 (MMBOE) (NET TO GROUP’S WORKING INTEREST)
Reserves3 1P 2P 3P
Oil 2.4 2.8 3.2
Gas1 1.2 1.5 1.7
Total 3.6 4.3 4.9
Contingent Resources3 1C 2C 3C
Oil 1.5 2.5 3.5
Gas1 0.8 1.3 1.9
Total 2.3 3.8 5.4
Sum of Reserves and Contingent Resources2 1P & 1C 2P & 2C 3P & 3C
Oil 3.9 5.3 6.7
Gas1 2.0 2.8 3.6
Total 5.9 8.1 10.3
1. Assumes oil equivalent conversion factor of 6,000 standard cubic feet per barrel of oil equivalent.
2. The summation of Reserves and Contingent Resources has been prepared by the Company.
3. Reserves and Contingent Resources have been audited independently by RISC.
Pharos Energy Annual Report and Accounts 202135
S.172(1) Companies Act 2006
In accordance with section 172(1) of the Companies Act 2006 (“s.172(1)”), the Directors of the Company have a statutory duty to promote the success of the Company. The Board at Pharos, as individuals and together, consider that they have acted in a way that would most likely promote the success of the Company, and deliver the goals and objectives for the benefit of it¬s members as a whole in relation to all stakeholders who may be affected by or engaging with the Company’s activities.
Board meetings and discussionsThe Board has always taken into account its s.172(1) obligations during the year in line with current reporting requirements. Their key decisions have been specifically confirmed at each Board meeting to take into account these matters. This has been supplemented by the roles of the individual directors giving due regard and consideration of each element of the s.172(1) requirements including:
a) The likely consequences of any decisions in the long-term;
b) The interests of the employees;
c) The requirements to foster business relationships with suppliers, customers, and others;
d) The impact on the community and environment of the Company’s operations;
e) The desirability of the Company maintaining a reputation for high standards of business conduct; and
f) The need to act fairly as between members of the company.
Illustration of how s.172(1) factors have been applied by the Board can be found throughout the strategic report.
a) The likely consequences of any decisions in the long-term
During its meetings and discussions, the Board considers decisions with keen regard to consequences in the long term for the business, for example, the decision to defer all discretionary spend in Egypt in order to preserve the group’s balance sheet and position it for the longer term. Board papers are drafted to promote discussion and provide options for the Board to hold an informed and balanced debate.
For more information on how the Board consider decisions with regards to the long-term consequences for the business, see pages 43 to 57 of the Risk Management report for all principal risk.
b) The interests of the employeesThe interests of the Company’s employees is a key element of the statutory duty under s. 172(1). Throughout the year, we have run a dedicated Monday weekly meeting to ensure all colleagues are continuously informed about important business developments in the Company and have channels through which they can ask questions and provide input. Additionally, there was increased use of video camera during virtual calls to maintain visibility and connection. The recent reorganisation of the Group has instituted a flatter organisational structure, allowing for shorter lines of management and more direct, accessible channels of communication with leadership.
The Executive Directors receive regular updates on colleague engagement to understand any complaints or troubles from the changing work environment. Following feedback from various anonymous staff surveys, the Executive Directors took on board feedbacks from the team and organised an off-site away day for the London team to better understand employees’ working preferences for working and to explore
any concerns arising from working from home in the past year. Ed Story, who was CEO at the time, could not travel to the UK due to COVID-19 travel restrictions, but joined the off-site meeting virtually via Microsoft Teams in order to participate in the sessions with the rest of the team. Ed also used the opportunity to communicate the Company’s long-term strategy going forward, which was an additional area of feedback from the anonymous surveys.
In another survey, colleagues gave views on future working patterns. Regardless of location, there was a clear preference for permanently blending office with home working in the future. This has informed the development of our balanced working programme and led to our rental of a WeWork office space in central London, which seeks to address UK employees’ working needs and provide greater flexibility in how and from where those employees work after removal or relaxation of travel and public gathering restrictions introduced in response to the COVID-19 pandemic.
For more information on the Board’s engagement with employees, see pages 86 to- 87 of our Corporate Governance report, pages 11 to 12 of our Chair’s Statement, and pages 59, 60, 65 to 68, 76, 77 of our Corporate Responsibility report.
c) The requirements to foster business relationships with suppliers, customers, and others
The Group’s business relationships with suppliers, customers and others are subject to regular review and consideration through vendor due diligence and active contracts management. Vendor due diligence is actively undertaken before a service provider of any size is engaged. Significant contracts, concessions and commitments are considered by the executive and the Board, supported by Board papers
The duty under section 172(1) of the Companies Act 2006 is applied in addition to the other duties of a Director. Each Director must discharge these duties in accordance with the duty of care, skill and diligence both objectively and to a subjective standard.
S.172(1) COMPANIES ACT 2006
Pharos Energy Annual Report and Accounts 2021 36
Additional InformationGovernance Report Financial StatementsStrategic Report
outlining impact and consequences of potential decisions. Our relationships with our joint venture partners are key in developing these strong foundations and will support our business in the future.
The Board regularly monitors the Group’s business activities, financial position, cash flows and liquidity through detailed forecasts. Scenarios and sensitivities are regularly presented to the Board, including changes in commodity prices and in production levels from the existing assets, plus other factors which could affect the Group’s future performance and position.
For more information on how the Company foster relationships with suppliers and business partners, see pages 59, 64 to 68, 75 to 77 of our Corporate Responsibility report. For more information on Board oversight on business activities and financial position, see pages 43 to 57 of the Risk Management report.
d) The impact on the community and environment of the Group’s operations
The organisation has provided robust evidence of its commitment to ESG in the sector through its ESG Committee and ESG Working Group. Over the past four years, we have participated in the CDP (Climate Disclosure Project) Climate Change Questionnaire and have maintained our score (C), which is also the industry average. 2021 also marks the first year that the Company submitted their response to the CDP Water Security Questionnaire, which was completed at a basic level in 2021 and we plan to improve our level of transparency on water usage and protection by completing the full version in 2022. More recently, we re-engaged with Verisk Maplecroft, a third party Task Force on Climate-related Financial Disclosures (“TCFD”) consultant, to commence Phase 2 of the project to bring our disclosures in line with the requirements of the TCFD. These efforts had been interrupted by the impact of the pandemic in 2020 but have resumed in Q4 2021. Results of the completion of Phase 2 can be found in the Corporate Responsibility report.
In addition to this, the Company has always remained committed to creating value in a sustainable manner for host countries and local communities as well as for staff. In recent years, we have structured our social investment programme to align more with the United Nations Sustainable Development Goals (UN SDGs). We’ve worked closely with our local partners and joint ventures in order to make sure that our social initiatives in the region continue to bring more positive impacts to the region. In 2021, a total of $765,000 was invested in long-term
community projects and ring-fenced funds for training to develop future talents in the industry.
For more information on the Board’s commitment to ESG and considerations on the community and the environment, see pages 92 to 94 for the ESG Committee report, pages 11 to 12 for the Chair’s Statement, and pages 58 to 78 for the Corporate Responsibility report.
e) The desirability of the Company maintaining a reputation for high standards of business conduct
Our Anti-Bribery and Corruption (‘ABC’) Policy and Code of Business Conduct and Ethics have been followed rigorously in 2021, ensuring that our engagements with government officials in all countries are recorded and monitored internally. This demonstrates that our Company understands its Code of Business Conduct and Ethics and places it at the forefront of our engagement with public officials. Our Whistleblowing Policy ensures that employees are protected from possible reprisals when raising concerns in good faith. In addition to internal reporting channels, we have a confidential ethics hotline supported by EthicsPoint with numbers displayed in local offices available 24 hours a day all year round.
The Board has an obligation and duty to ensure that we exercise our intention to behave responsibly. The management team is obliged to execute the business responsibly and to the highest standards. We communicate regularly with the Executive Directors and maintain open communication with the management team to ensure the two-way information flow is clear and open. Each Board member brings individual judgement and considerable experience to decision-making and carefully assesses the course of action which is most likely to promote the success of the Company. For example, in 2021, following anonymous feedback from the London office staff to the Board and Executive Directors, the Company introduced a hybrid working model of working from home and working from a physical office in central London, seeking to address UK employees’ working needs and provide greater flexibility in how and from where those employees work after removal or relaxation of travel and public gathering restrictions introduced in response to the COVID-19 pandemic. For more information on the Company’s commitment to maintaining high standards of business conduct, see pages 59, 60, 66, 76 of the Corporate Responsibility report and pages 11 to 12 of the Chair’s Statement.
f) The need to act fairly as between members of the company.
We believe in a workforce with a diversity of experience, nationalities, cultural backgrounds and gender, to support our business strategy of long-term sustainable growth. It is crucial to the success of our business that we retain and develop the diversity of our workforce and have diversity and inclusion at the heart of our recruitment, development and promotion processes.
Our Code of Business Conduct and Ethics, associated policies and the Pharos Guiding Principles commit us to providing a workplace free of discrimination where all employees can fulfil their potential based on merit and ability. We remain respectful and accepting in our relationships with current and future employees without discrimination or prejudice on grounds of age, disability, gender, marital status, sexual orientation, colour, race, religion or any other characteristic protected by applicable laws. They also commit us to providing a fully inclusive workplace, while providing the right development opportunities to ensure existing staff have rewarding careers.
For more information on our commitment to act fairly as between members of the company, see page 9 of the Investment Case, pages 67 to 68 of the Corporate Responsibility report, or visit our website at https://www.pharos.energy/responsibility/policy-statements/ for our Human Rights statement.
The Company is committed to good governance and will continue to review the balance and effectiveness of the Board with a view to maintaining the right skills, experience and diversity to align with the Group’s strategic goals.
We will act and make decisions responsibly in the interests of the Company, our shareholders and other stakeholders, delivering our plan and working closely to consider the best opportunities for the Company. Detailed Board and Committee papers are carefully prepared and analysed to ensure all scenarios and options are fully considered in a timely and consistent fashion in meetings.
In accordance with s. 172(1), the Board has also continued to consult with, and take account of, the views of our investors, employees, partners, governments, suppliers and other stakeholders throughout the year.
Pharos Energy Annual Report and Accounts 202137
Our initiatives on stakeholder engagement included, but not limited to:
• Robust process to refresh Board members and reduce Board size
• Agile and responsible response to continued COVID-19 work restrictions – protecting people, cutting costs and deferring capex
• Ensuring the health and safety of our workforce by adhering to the requisite precautionary procedures and vaccine recommendations, in line with the government directives in Egypt, Vietnam and the UK
• Re-engagement of Verisk Maplecroft to complete Phase 2 of the project to bring our disclosures in line with the requirements of the TCFD
• Submission of CDP Water Security Questionnaire, in addition to the Climate Change Questionnaire, for the first time in 2021 to ensure transparency on water usage and protection
• Open and active dialogue with its institutional private and retail shareholder via website, Twitter and LinkedIn, email communications, and online meeting with Q&A to allow the wider public a free platform to raise questions directly to the Executive Directors
• Rigorous assessment of all suppliers/potential suppliers/ partners and off-takers
• Frequent meetings between Executive Directors and in-country regulators and partners, reported to the Board
• A section of the agenda for each regularly scheduled meeting of the Board being dedicated to investor and stakeholder considerations.
• Reports from brokers and financial PR firm on feedback from investors and research analysts.
• Confidential ethics hotline supported by EthicsPoint with numbers displayed in local offices available 24 hours a day all year round
S.172(1) COMPANIES ACT 2006

Pharos Energy Annual Report and Accounts 2021 38
Additional InformationGovernance Report Financial StatementsStrategic Report
CFO’S Statement
CHIEF FINANCIAL OFFICER’S STATEMENT
SUE RIVETTChief Financial Officer
Finance strategyOur finance strategy continues to underpin the Group’s business model and goes hand in hand with our commitment to building shareholder value through capital growth and sustainable dividends. In 2021, we recommenced investment in Vietnam and with the additional liquidity offered by our farm-in partner in Egypt, we are on the path back to focusing on investing for cash flow generation and growth in 2022.
Operating performance
Revenues
Group revenues for the year totalled to $163.8m prior to hedging loss of $29.7m, representing a 38% increase over the prior year (2020: $118.3m plus hedging gain of $23.7m).
The revenue for Vietnam of $131.0m (2020: $87.7m) increased significantly year on year. The average realised crude oil price was $72.61/bbl (2020: $44.70/bbl), a 62% increase year on year, and the premium to Brent was just under $2/bbl (2020: just over $3/bbl). Production, however, declined from 6,103 boepd to 5,560 boepd primarily due to the GTC-A compressor fault on the TGT field in November 2021.
The revenue for Egypt of $32.8m (2020: $30.6m) increased largely as a result of the higher average realised crude oil price, up 76% to $65.12/bbl (2020: $37.08/bbl), offset by lower average production, of 3,318 boepd from 5,270 boepd . There are two discounts applied to the El Fayum crude production – a general Western Desert discount and one related specifically to El Fayum. Both are set by EGPC and combined stayed consistent at nearly $5/bbl over the year.
Operating costs
Group cash operating costs were $52.0m (2020: $48.3m). Vietnam increased by 17% from $26.5m to $31.0m in 2021, which equates to $15.28/bbl (2020: $11.86/bbl). The increase is due to higher costs relating to the FPSO as a result of (i) lower TLJOC production throughput which increased Pharos’ share of the costs and (ii) higher foreign contractor’s withholding tax, of which the CIT element impacts the FPSO costs included in operating costs, from 2% to 5% from 27 August 2018 to date, which was also spread over fewer produced barrels. Cash operating costs in Egypt were $21.0m in 2021 (2020: $21.8m), which equates to $17.34/bbl (2020: $11.30/bbl). The decrease in cash operating costs relates predominantly to a reduction in variable costs as a result of decreased production, partially offset by higher well workover costs, but spread over fewer produced barrels.
DD&A
Group DD&A associated with producing assets decreased to $51.0m (2020: $63.3m) due to the lower depreciating cost base following 2020 impairments taken on both Vietnam and Egypt, combined with lower production. DD&A per bbl is currently $21.19/boe for Vietnam (2020: $21.40/boe) and $6.61/boe in Egypt (2020: $8.04/boe).
Administrative Expenses
Administrative expenses in 2021 of $13.2m (2020: $14.7m) are lower than prior year, due to continuous efforts to reduce the head office costs. After adjusting for the non-cash items under IFRS 2 Share Based Payments of $2.2m (2020: $2.8m) and IFRS 16 Leases $nil (2020: $0.7m), the administrative expense is $11.0m (2020: $11.2m). Voluntary staff salary reductions at 20% continued from 2020 through to 1Q 2021. The executive directors, who had previously volunteered a 35% reduction in base salary in 2020 agreed to a further reduction from 1 April 2021 to 50% of base salary. The non-executive directors reduced their fees throughout most of 2020 and continued those reductions throughout the whole of 2021. The fees will revert to previous levels post completion of the transaction with IPR. A programme of phased redundancies took place at head office in London during 2021.
Operating Profit
Operating profit from continuing operations for the year was $6.3m (2020: $3.5m) excluding the net impairment reversal of $42.0m (2020: $234.8m impairment charge), reflecting the higher commodity price environment throughout the year, offset by lower production volumes.
Other/Restructuring Expenses
Other/restructuring expenses for the year totalled $3.3m (2020: $5.8m) and included restructuring costs for both the head office in London and the Egypt office in Cairo ($3.0m). In addition, there was $0.3m charge relating to the premium on the transfer of the lease on the London office.
Finance Costs
Finance costs increased to $6.4m (2020: $4.2m), mainly related to amortisation of capitalised borrowing costs of $2.4m (2020: $1.5m gain due to changes in future cash flows), interest expense payable and similar fees of $3.8m (2020: $4.8m) and unwinding of discount on provisions of $0.8m (2020: $0.8m).
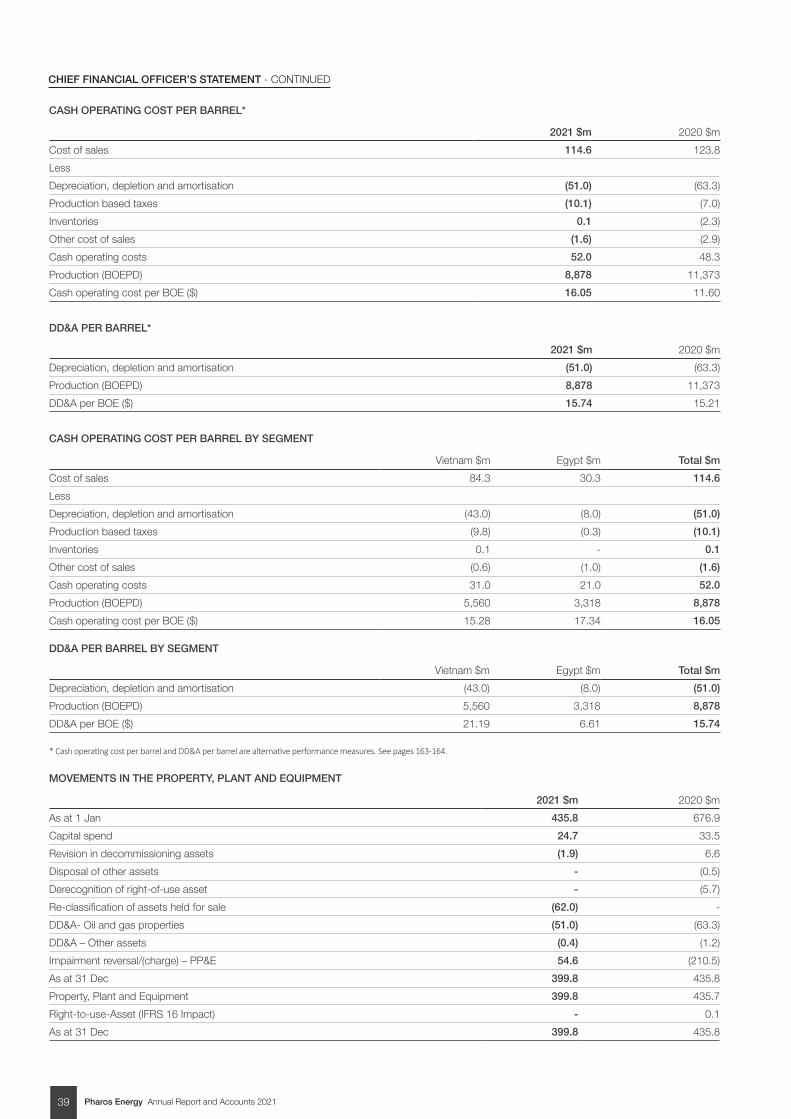
Pharos Energy Annual Report and Accounts 202139
CHIEF FINANCIAL OFFICER’S STATEMENT - CONTINUED
CASH OPERATING COST PER BARREL*
2021 $m 2020 $m
Cost of sales 114.6 123.8
Less
Depreciation, depletion and amortisation (51.0) (63.3)
Production based taxes (10.1) (7.0)
Inventories 0.1 (2.3)
Other cost of sales (1.6) (2.9)
Cash operating costs 52.0 48.3
Production (BOEPD) 8,878 11,373
Cash operating cost per BOE ($) 16.05 11.60
DD&A PER BARREL*
2021 $m 2020 $m
Depreciation, depletion and amortisation (51.0) (63.3)
Production (BOEPD) 8,878 11,373
DD&A per BOE ($) 15.74 15.21
CASH OPERATING COST PER BARREL BY SEGMENT
Vietnam $m Egypt $m Total $m
Cost of sales 84.3 30.3 114.6
Less
Depreciation, depletion and amortisation (43.0) (8.0) (51.0)
Production based taxes (9.8) (0.3) (10.1)
Inventories 0.1 - 0.1
Other cost of sales (0.6) (1.0) (1.6)
Cash operating costs 31.0 21.0 52.0
Production (BOEPD) 5,560 3,318 8,878
Cash operating cost per BOE ($) 15.28 17.34 16.05
DD&A PER BARREL BY SEGMENT
Vietnam $m Egypt $m Total $m
Depreciation, depletion and amortisation (43.0) (8.0) (51.0)
Production (BOEPD) 5,560 3,318 8,878
DD&A per BOE ($) 21.19 6.61 15.74
* Cash operating cost per barrel and DD&A per barrel are alternative performance measures. See pages 163-164.
MOVEMENTS IN THE PROPERTY, PLANT AND EQUIPMENT
2021 $m 2020 $m
As at 1 Jan 435.8 676.9
Capital spend 24.7 33.5
Revision in decommissioning assets (1.9) 6.6
Disposal of other assets - (0.5)
Derecognition of right-of-use asset - (5.7)
Re-classification of assets held for sale (62.0) -
DD&A- Oil and gas properties (51.0) (63.3)
DD&A – Other assets (0.4) (1.2)
Impairment reversal/(charge) – PP&E 54.6 (210.5)
As at 31 Dec 399.8 435.8
Property, Plant and Equipment 399.8 435.7
Right-to-use-Asset (IFRS 16 Impact) - 0.1
As at 31 Dec 399.8 435.8
Pharos Energy Annual Report and Accounts 2021 40
Additional InformationGovernance Report Financial StatementsStrategic Report
TaxationThe overall net tax charge of $43.3m (2020: $25.6m credit) relates to tax charges in Vietnam of $24.8m plus the deferred tax charge on impairment reversal of $18.5m (2020: Vietnam tax charges of $11.1m offset by a deferred tax credit on impairment of $36.7m).
The Group’s effective tax rate approximates to the statutory tax rate in Vietnam of 50%, after adjusting for non-deductible expenditure and tax losses not recognised.
The Egypt concessions are subject to corporate income tax at the standard rate of 40.55%, however responsibility for payment of corporate income taxes falls upon EGPC on behalf of Pharos El Fayum (PEF). The Group records a tax charge, with a corresponding increase in revenue, for the tax paid by EGPC on its behalf. Due to accumulated tax-deductible balances, there is no tax due on PEF this period.
One of the Group company entered into commodity swaps designated as cash flow hedges. In accordance with IAS 12, a deferred tax asset has not been recognised in relation to the hedging losses of $29.7m recorded in the year as it is unlikely that the UK tax group will generate sufficient taxable profit in the future, against which the deductible temporary differences can be utilised.
Loss post taxThe post tax loss for the year from continuing operations and prior to the impairment reversal of $42.0m, impairment tax charge of $18.5m and exceptional costs of $3.3m was $24.9m (2020: post tax loss for the year of $11.7m from continuing operations and prior to the impairment charge of $234.8m, impairment tax credit of $36.7m and exceptional costs of $5.8m). The overall loss for the year was $4.7m (2020: $215.8m).
Cash flowOperating cash flow (before movements in working capital) was $60.1m (2020: $70.8m), after tax charges of $39.9m (2020: $26.5m), restructuring expense $0.7m (2020: $2.7m) and working capital adjustments of $8.6m (2020: $14.7m), the cash generated from operations was $10.8m (2020: $56.4m).
Operating cash flow (before movements in working capital) adjusted for the impact of the hedging positions of $29.7m loss (2020: gain $23.7m) gives an underlying operational performance of $89.8m (2020: $47.1m), which is consistent with the improvement seen in commodity prices offset by the production decrease year on year.
The increase in receivables was $7.2m (2020: decrease in receivables of $19.6m). The movement is mainly commodity price driven, from YE20 the average oil price realised has increased from $44.70/bbl to $70.95/bbl, therefore increasing the receivables balance held at YE21.
Capital expenditure on continuing operations for the year was relatively flat at $41.8m (2020: $41.3m). All discretionary capex was deferred during 2020 following the oil price crash to preserve balance sheet strength and liquidity. During 2021, the TGT four well infill development was successfully carried out within schedule and under budget. Egypt capital expenditure included the drilling of commitment exploration well Batran-1X in May 2021 and a three-well back-to-back development drilling programme commenced in November 2021.
Net cash inflows from financing activities of $31.1m (2020: $48.5m outflow) included net inflow of the RBL totalling $20.9m following the refinancing in July 2021 ($21.8m further borrowing, offset by $0.9m settlement of the original RBL). The revised RBL has provided access of up to a committed $100m with a further $50m available on an uncommitted “accordion” basis and has a four year term that matures in July 2025. In 2020, the significant decrease in the oil price during H1 2020 led to a reduction in the borrowing base and principal repayments during the year on the RBL totalled $42.8m. In addition for 2021, the Group drew down on a new facility with National Bank of Egypt for a net amount of $6.5m ($18.1m principal facility, less $11.6m of repayments). The carrying amount of our trade receivables balance includes receivables in Egypt which are subject to an Uncommitted Revolving Credit Facility for Discounting (with Recourse) arrangement. This facility has been put in place to mitigate the risk of late payment of our debtors. Under this arrangement, Pharos is able to access cash from the facility using the El Fayum oil sales invoices as evidence to support its ability to repay the facility. The oil sales invoices remain due to Pharos and it retains the credit risk. The Group therefore continues to recognise the trade receivables in their entirety on the balance sheet.
In January 2021, also within financing activities, the Company announced the successful completion of the placing, subscription and retail offer resulting in the issue of 44,661,490 new ordinary shares. Through this transaction, Pharos raised additional capital of $10.9m (net of direct issue costs of $0.8m).
No final dividend was paid for the year (2020: $nil).
Tax strategy and total tax contributionTax is managed proactively and responsibly with the goal of ensuring that the Group is compliant in all countries in which it holds interests. Any tax planning undertaken is commercially driven and within the spirit as well as the letter of the law.
This approach forms an integral part of Pharos’ sustainable business model.
The Group’s Code of Business Conduct & Ethics seeks to build open, cooperative and constructive relationships with tax authorities and governmental bodies in all territories in which it operates. The Group supports greater transparency in tax reporting to build and maintain stakeholder trust. We have a number of overseas subsidiaries which were set up some time ago and the Group is now proactively planning to bring these into the UK tax net to ensure greater transparency and comparability. No additional taxes are expected to be due as a result of this exercise.
During 2021, the total payments to governments for the Group amounted to $198.2m (2020: $150.9m), of which $151.9m or 77% (2020: $104.9m or 70%) was related to the Vietnam producing licence areas, of which $102.6m (2020: $72.5m) was for indirect taxes based on production entitlement. In Egypt payments to government totalled $44.7m (2020: $42.2m), of which $44.1m (2020: $41.3m) related to indirect taxes based on production entitlement.
Balance sheetIntangible assets increased during the period to $12.4m (2020: $1.5m). Additions for the year related to Blocks 125 & 126 in Vietnam $10.6m (2020: $2.0m), Egypt $3.9m (2020: $1.1m) and $0.7m (2020: $1.2m) for the Israeli bid round licence fee. The Group has written off $2.2m relating to the Israel asset as no substantive expenditure has been identified under IFRS 6. In addition, $2.1m of intangible assets relating to the Egypt concessions has been re-classified as assets held for sale.
The movements in the Property, Plant and Equipment asset class are shown above.
ImpairmentAs a result of ongoing oil price volatility and movements in 2P reserves, we have tested each of our oil and gas producing properties for impairment and impairment reversals. The results of these impairment tests are summarised below. For Vietnam producing properties, the recoverable amount has been determined using the value in use method which constitutes a level 3 valuation within
Pharos Energy Annual Report and Accounts 202141
the fair value hierarchy. The recoverable amount is based on the fair value derived from a discounted cash flow valuation of the 2P production profile for each producing property. For Egypt producing property, the recoverable amount has been determined using the value-in-use method.
For CNV, a pre-tax impairment reversal of $3.8m (2020: impairment charge $23.3m) has been reflected in the income statement with an associated deferred tax charge of $1.4m (2020: deferred tax credit $8.7m). As at 31 December 2021, the carrying amount of the CNV oil and gas producing property, after additions of $0.3m, changes in decommissioning asset due to discount rate ($0.9m), DD&A ($10.2m) and the impairment reversal ($3.8m), is $84.2m (2020: the carrying amount of the CNV oil and gas producing property, after additions ($1.9m), DD&A ($11.5m) and the impairment charge ($23.3m) was $91.2m).
For TGT, a pre-tax impairment reversal of $49.1m (2020: impairment charge $81.8m) has been reflected in the income statement with an associated deferred tax charge of $17.1m (2020: deferred tax credit $28.0m). As at 31 December 2021, the carrying amount of the TGT oil and gas producing property, after additions of $11.4m, changes in decommissioning asset due to discount rate ($1.0m), DD&A ($32.8m) and the impairment reversal ($49.1m), is $266.0m (2020: the carrying amount of the TGT oil and gas producing property, after additions ($14.8m), DD&A ($36.3m) and the impairment charge ($21.9m) was $239.3m).
For Egypt, an impairment reversal (pre- and post-tax) in the amount of $1.7m (2020: impairment charge $105.4m) has been reflected in the income statement. As at 31 December 2021, the carrying amount of the Egypt oil and gas producing property, after additions ($12.9m), re-classification of PP&E to assets held for sale of ($1.4m), DD&A ($8.0m) and the impairment reversal ($1.7m), is $109.3m (2020: the carrying amount of the Egypt oil and gas producing property, after additions ($22.7m), DD&A ($15.2m) and the impairment charge ($105.4m) was $104.1m). After the reclassification to assets held for sale, the Egypt oil and gas producing property amounts to $49.2m.
The total non-cash, post tax impairment reversal amounts to $36.1m and the balance sheet carrying values of the oil and gas producing properties stands at $399.4m, after reclassification of assets held for sale in relation to Egypt of $61.6m (2020: the total non-cash, post tax impairment charge amounts to $173.8m and the balance sheet carrying values of the oil and gas producing properties stood at $434.6m). Further details of
these impairment charges and oil price scenario sensitivity testing, including key assumptions in relation to oil price, discount rate and 2P reserves in Vietnam, are provided in Note 16 of the financial statements.
The agreement post year end of the Third Amendment to the El Fayum Concession Agreement, with retroactive application of the improved fiscal terms from November 2020 and a three and a half year extension to the exploration period was not considered certain at 31 December 2021 and so has been treated as a non-adjusting post balance sheet event. An impairment reversal of $28.2m utilising the circumstances of 31 December 2021 as the basis has been calculated and will be factored into the impairment reviews going forward.
Balance sheet continued Cash is set aside into abandonment funds for both TGT and CNV. These abandonment funds are operated by PetroVietnam and, as the Group retains the legal rights to the funds pending commencement of abandonment operations, they are treated as other non-current assets in our financial statements.
Oil inventory was $5.9m at 31 December 2021 (2020: $5.6m), of which $5.4m related to Vietnam and $0.5m to Egypt. Trade and other receivables increased to $28.1m (2020: $22.9m) of which $18.2m (2020: $11.2m) relates to Vietnam and $8.5m (2020: $10.0m) to Egypt, driven mainly by the higher oil price and timing of crude oil cargos.
Cash and cash equivalents at the end of the year were $27.1m (2020: $24.6m) mainly due to the RBL refinancing in July and also the Placing in January 2021, offset by the reduction in net cash from operating activities as a result of the hedging losses during the year.
Trade and other payables were $30.6m (2020: $35.6m), of which $14.5m (2020: $23.3m) relates to the Egypt payables, $4.8m (2020: $1.7m) Vietnam payables and $6.5m (2020: $6.8m) net hedging liability. Tax payable decreased to $5.4m (2020: $6.7m), consistent with lower revenues.
Borrowings were $80.5m (2020: $53.7m), an increase of $26.8m and $20.3m related to the RBL refinancing in July, inclusive of capitalised borrowing costs. In April 2021, the Group drew down on the new facility with the National Bank of Egypt and the amount repayable under the agreement at 31 December 2021 was $6.5m (2020: $nil). Net debt was $57.5m (2020: $32.6m).
Long-term provisions comprise the Group’s decommissioning obligations and the royalty over the El Fayum asset. In Vietnam, the decommissioning provision decreased from $68.0m at 2020 year-end to $66.9m at 2021 mainly due to an increase in discount rate from 0.9% to 1.5% as a result of an increase in prevailing risk-free market rates, partially offset by the TGT infill well programme. The amounts set aside into the abandonment funds total $48.1m (2020: $45.9m). No decommissioning obligation exists in the El Fayum producing area under the terms of the Concession Agreement in Egypt.
The royalty provision relates to a historical arrangement granting a 3% royalty on Pharos’s share of profit oil and excess cost recovery from El Fayum in Egypt. At 31 December 2021, the provision was increased by $0.2m, giving a total of $5.6m ($3.4m of which is deemed to be repayable in 2022).
Own sharesThe Pharos EBT holds ordinary shares of the Company for the purposes of satisfying long-term incentive awards for senior management. At the end of 2021, the trust held 1,767,757 (2020: 2,181,655), representing 0.40% (2020: 0.54%) of the issued share capital.
In addition, as at 31 December 2021, the Company held 9,122,268 (2020: 9,122,268) treasury shares, representing 2.02% (2020: 2.24%) of the issued share capital.
Assets held for saleIn December 2021, the Company announced that shareholders had approved the farm-out of 55% of the Group’s operated interest in each of our Egyptian Concessions, El Fayum and North Beni Suef, to IPR, a group that has extensive experience in Egypt.
As part of the transaction, IPR will fund Pharos’s share of the costs to a maximum of $33.425m (to be adjusted for working capital and interim period adjustments from the effective economic date of 1 July 2020). This is in addition to the deposit at signing of the farm-out agreements of US$2 million and a further US$3 million payable on completion. This investment programme should result in an increase in production and also fulfil commitments under the concessions. In addition, the Group will be entitled to contingent consideration depending on the average Brent Price each year from 2022 to the end of 2025, capped at a maximum total payment of US$20 million.
CHIEF FINANCIAL OFFICER’S STATEMENT - CONTINUED
Pharos Energy Annual Report and Accounts 2021 42
Additional InformationGovernance Report Financial StatementsStrategic Report
An impairment of $10.4m was recognised to bring the value of the net assets classified as held for sale down to the fair value less costs to sell calculated as at 31 December 2021. The breakdown of assets held for sale at year end is as follows:
2021 $m
Intangible assets 2.1
Property, plant and equipment – oil and gas properties - NBV 61.6
Impairment charge – Assets classified as held for sale (10.4)
Property, plant and equipment – oil and gas properties – after impairment 51.2
Property, plant and equipment – other - NBV 0.4
Inventories 6.3
Trade and other receivables 2.0
Assets classified as held for sale 62.0
Trade and other payables (8.5)
Liabilities directly associated with assets classified as held for sale (8.5)
Net assets classified as held for sale 53.5
Going concern Pharos continuously monitors its business activities, financial position, cash flows and liquidity through detailed forecasts. Scenarios and sensitivities are also regularly presented to the Board, including changes in commodity prices and in production levels from the existing assets, plus other factors which could affect the Group’s future performance and position.
A base case forecast has been considered which uses an oil price of $76.9/bbl in 2022 and $70.2/bbl in 2023.The key assumptions and related sensitivities include a “Reasonable Worst Case” (RWC) sensitivity, where the Board has considered the risk of an oil price crash broadly similar to 2020 as a result of the global outbreak of the COVID-19 virus. This assumes the Brent oil price drops to 49.0/bbl in April 2022 and gradually recovers to base price in next 12 months, concurrent with reductions in Vietnam and Egypt production compared to our base case of 5% from March 2022. Both the base case and RWC take into consideration the hedging that has already been put in place for 2022 and 2023 which covers 24.6% of the Group’s forecast Q2 2022 to Q2 2023 entitlement volumes securing a minimum and maximum price for this hedged volume of $67.5 and $81.4 per barrel, respectively. Under the RWC scenario, we have identified appropriate mitigating actions, which could look to defer capital expenditure programme as required.
We have also developed a reverse stress test sensitivity, which shows the extent to which oil prices would need to fall before our financial headroom is breached, keeping all other variables unchanged.
In Egypt, the Base case assumes a full investment scenario and a farm-down.
Our business in Vietnam remains robust with a breakeven price of c.$25/bbl. We have limited capital expenditure outside
of the two TGT wells and one CNV well in Vietnam over the rest of the business with most falling outside 2022. Most of our debt is secured against the Vietnam assets under the RBL with just $6.5m drawn on an uncommitted revolving credit facility on the Egypt revenue invoices.
The forecasts outlined above show that the Group will have sufficient financial headroom for the 12 months from the date of approval of the 2021 Accounts. Based on this analysis, the Directors have a reasonable expectation that the Group has adequate resources to continue in operational existence for the foreseeable future. Therefore, they continue to use the going concern basis of accounting in preparing the annual Financial Statements.
Financial outlook Pharos’ financial strength is founded on our long-term approach to managing capital to provide risk adjusted full cycle returns, which has allowed us to return significant amounts of capital to shareholders in previous years. In a prevailing stronger oil price environment, our focus can turn again to returns to shareholders.
We continue to have the support of our strong RBL lending banks who approved the refinancing of the RBL during July, extending the tenor to July 2025. Additionally, we also signed an uncommitted revolving credit facility with National Bank of Egypt, which provides modest additional liquidity.
The improvement in the fiscal terms and the farm-down of our concessions in Egypt to IPR means that we will enjoy the benefit from completion in 2022 and into 2023 of the carry of our share of operating and capital costs. During the carry period we continue to receive our revenues with only Pharos 100% costs to cover.
The low breakevens and continuation of the TGT infield development plan in Vietnam with two additional wells and one well infield well in CNV will support the production profiles in a strong price environment.
The restructure of the London and Cairo offices will be fully completed following the transfer of operatorship of the Egypt concessions to IPR. The restructure resets the cost base for the Group moving forward.
The measures we have taken during this period have set us up to be able to reap the benefits of stable production from our assets, improved fiscal terms, low breakevens, improved liquidity from our lenders, a streamlined organisation against a background of improved long term prices.
SUE RIVETTChief Financial Officer
Pharos Energy Annual Report and Accounts 202143
Risk Management ReportRisk Management Framework at PharosPharos carried out regular and robust risk assessments to identify and manage its Principal and Emerging risks during 2021 and continues to monitor closely the evolving risk landscape during the COVID-19 pandemic and the global macroeconomic environment. Our management undertook a number of deep-dive exercises as the pandemic unfolded to gauge its risk appetite and recalibrate its risk tolerance to ensure the appropriate mitigating actions were implemented. The Board has closely considered the potential impact and probability of these risks and related events on its corporate strategy, objectives and stakeholders’ perspectives of the Group.
Control environmentThe Group’s control environment is based primarily on its Code of Business Conduct and Ethics, which carries a number of fundamental values, including openness and integrity, safety and care for the environment and respect for human rights. The control environment is also supported by a series of corporate policies, which form part of the Group’s Business Management System. These documents are distributed to all employees, followed up with training as required and are available on the Intranet. As part of the compliance programme, all employees have to do an anti-bribery and corruption training and assessment at least once a year.
Governance, authorities and accountabilityThe Board of Directors, supported by its various Committees, ensures that the internal control functions operate properly. The Audit and Risk Committee oversees the implementation by the Senior Management Team of the internal control and risk management procedures based on the risks identified to support the Group’s objectives.
Principal risks in 2021
• Further lockdowns dampening oil demand
• Insufficient funds to meet commitments
• Commodity Price volatility
• Volatility in Production levels
• Climate Change and speed of energy transition
• HSE & Social
• Unsuccessful Farm-out of Egypt assets
• Partner alignment
• Reserves downgrades
• Cyber security
• Human Resources
• Sub-optimal capital allocation
• Political and Regional
• Business Conduct and Bribery
Principal and Emerging risks in 2022
• Further lockdowns dampening oil demand
• Insufficient funds to meet commitments
• Commodity Price volatility
• Volatility in Production levels
• Rising operational costs
• Climate Change - transition and physical risks
• HSE & Public Health Risk – COVID-19 resurgence
• Partners’ alignment
• Reserves downgrades
• Cyber security
• Human Resources
• Sub-optimal capital allocation
• Political and Regional
• Business Conduct and Bribery
MANAGING OUR RISKS
RISK MANAGEMENT
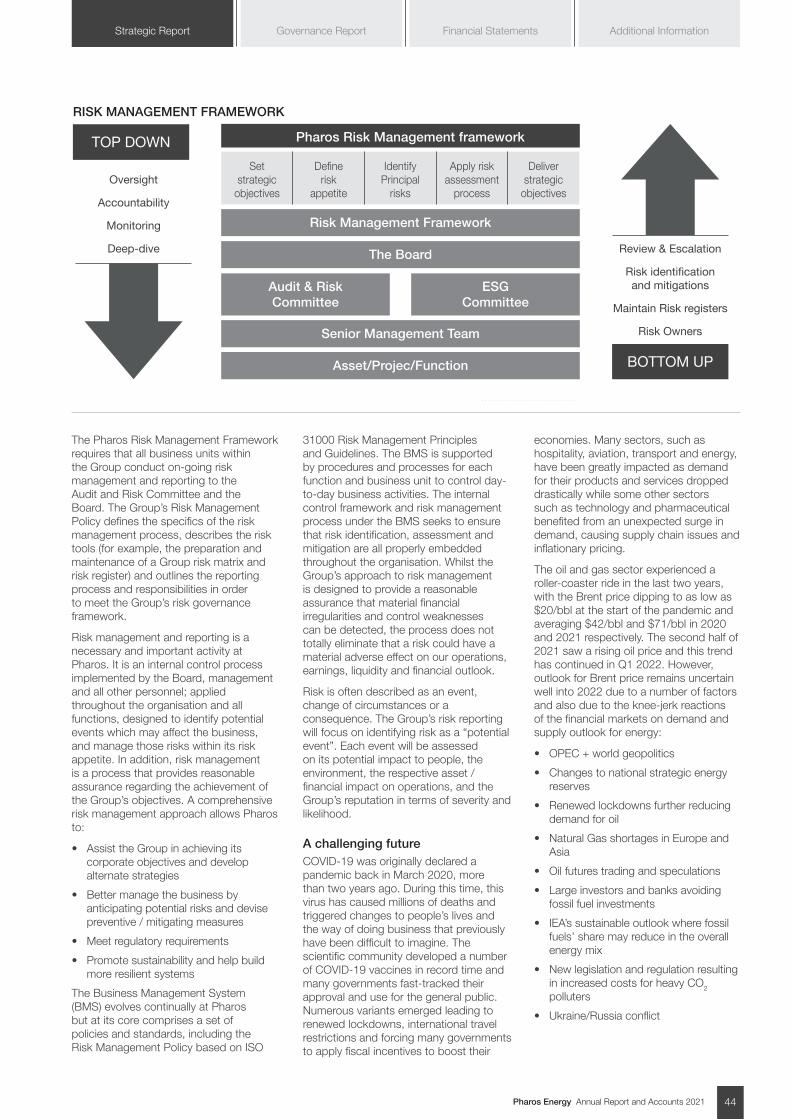
Pharos Energy Annual Report and Accounts 2021 44
Additional InformationGovernance Report Financial StatementsStrategic Report
The Pharos Risk Management Framework requires that all business units within the Group conduct on-going risk management and reporting to the Audit and Risk Committee and the Board. The Group’s Risk Management Policy defines the specifics of the risk management process, describes the risk tools (for example, the preparation and maintenance of a Group risk matrix and risk register) and outlines the reporting process and responsibilities in order to meet the Group’s risk governance framework.
Risk management and reporting is a necessary and important activity at Pharos. It is an internal control process implemented by the Board, management and all other personnel; applied throughout the organisation and all functions, designed to identify potential events which may affect the business, and manage those risks within its risk appetite. In addition, risk management is a process that provides reasonable assurance regarding the achievement of the Group’s objectives. A comprehensive risk management approach allows Pharos to:
• Assist the Group in achieving its corporate objectives and develop alternate strategies
• Better manage the business by anticipating potential risks and devise preventive / mitigating measures
• Meet regulatory requirements
• Promote sustainability and help build more resilient systems
The Business Management System (BMS) evolves continually at Pharos but at its core comprises a set of policies and standards, including the Risk Management Policy based on ISO
31000 Risk Management Principles and Guidelines. The BMS is supported by procedures and processes for each function and business unit to control day-to-day business activities. The internal control framework and risk management process under the BMS seeks to ensure that risk identification, assessment and mitigation are all properly embedded throughout the organisation. Whilst the Group’s approach to risk management is designed to provide a reasonable assurance that material financial irregularities and control weaknesses can be detected, the process does not totally eliminate that a risk could have a material adverse effect on our operations, earnings, liquidity and financial outlook.
Risk is often described as an event, change of circumstances or a consequence. The Group’s risk reporting will focus on identifying risk as a “potential event”. Each event will be assessed on its potential impact to people, the environment, the respective asset / financial impact on operations, and the Group’s reputation in terms of severity and likelihood.
A challenging futureCOVID-19 was originally declared a pandemic back in March 2020, more than two years ago. During this time, this virus has caused millions of deaths and triggered changes to people’s lives and the way of doing business that previously have been difficult to imagine. The scientific community developed a number of COVID-19 vaccines in record time and many governments fast-tracked their approval and use for the general public. Numerous variants emerged leading to renewed lockdowns, international travel restrictions and forcing many governments to apply fiscal incentives to boost their
economies. Many sectors, such as hospitality, aviation, transport and energy, have been greatly impacted as demand for their products and services dropped drastically while some other sectors such as technology and pharmaceutical benefited from an unexpected surge in demand, causing supply chain issues and inflationary pricing.
The oil and gas sector experienced a roller-coaster ride in the last two years, with the Brent price dipping to as low as $20/bbl at the start of the pandemic and averaging $42/bbl and $71/bbl in 2020 and 2021 respectively. The second half of 2021 saw a rising oil price and this trend has continued in Q1 2022. However, outlook for Brent price remains uncertain well into 2022 due to a number of factors and also due to the knee-jerk reactions of the financial markets on demand and supply outlook for energy:
• OPEC + world geopolitics
• Changes to national strategic energy reserves
• Renewed lockdowns further reducing demand for oil
• Natural Gas shortages in Europe and Asia
• Oil futures trading and speculations
• Large investors and banks avoiding fossil fuel investments
• IEA’s sustainable outlook where fossil fuels’ share may reduce in the overall energy mix
• New legislation and regulation resulting in increased costs for heavy CO2 polluters
• Ukraine/Russia conflict
Review & Escalation
Risk identification and mitigations
Maintain Risk registers
Risk Owners
Oversight
Accountability
Monitoring
Deep-dive
BOTTOM UP
TOP DOWN Pharos Risk Management framework
Risk Management Framework
The Board
Senior Management Team
Audit & Risk Committee
ESG Committee
Asset/Projec/Function
Set strategic
objectives
Define risk
appetite
Identify Principal
risks
Apply risk assessment
process
Deliver strategic
objectives
RISK MANAGEMENT FRAMEWORK
Pharos Energy Annual Report and Accounts 202145
RISK MANAGEMENT - CONTINUED
Public Health risk – COVID-19 and the future variantsThe rise and fall of the Omicron impact around the world is being closely watched by scientists and governments - precautionary measures such as the effectiveness of lockdowns to control any spread are dividing camps and may be risky in triggering another recession. The waning immunity of those vaccinated and the need for regular boosters can cause many logistical and equity issues. With very high levels of infection worldwide, further virus mutations are inevitable and so is the emergence of new variants of concern. With this landscape, 2022 will remain full of uncertainties and oil price is likely to see significant swings either way.
The health, safety and welfare of our staff, contractors and host communities across our business remains the highest priority on the Board agenda, especially during the pandemic. The Group adhered to the requisite precautionary procedures and restrictions, in line with the government directives in Egypt, Vietnam and the UK. In Egypt at Petrosilah and Pharos El Fayum, a vaccination campaign for all employees in the main offices and fields started in Q2 2021 and culminated to 97% (2 doses) of the workforce being vaccinated at the end of December 2021. In Vietnam, the HLHV JOC strict 5-7 days quarantine regulations are being applied for the workforce going offshore, in addition to rapid and PCR tests one day prior to offshore mobilisation - 100% of the workforce are vaccinated with at least two doses at the end of December 2021. For the office workforce at all locations, Pharos has continuously applied a hybrid-working mode and will do so until further notice.
The new mode of working under the pandemic has led to the culture of many organisations including Pharos to change overnight with more focus on flexibility and mutual trust. However, it is important that companies watch for any possible negative signs - can workers’ health and productivity suffer as a result of prolonged Working from Home (WFH)? How to ensure operational staff do not feel disadvantaged as they cannot WFH? An active and regular programme of engagement between management and the workforce is important so that any issues can be discussed and tackled early.
Climate Change risksDuring 2021 a number of trends peppered the energy sector; the energy price inflation crisis, the rise of the activist blaming companies on overpromising and under delivering on climate and the speed of recovery of oil price particularly in the second half of 2021 as the Omicron COVID-19 variant was still causing rising infections and uncertainty on the markets. In August 2021, a landmark report from IPCC* warned that global warming will hit 1.5C by 2040, thus potentially breaching the targets of the Paris Agreement. The report found that immediate, rapid and large-scale reductions in emissions were needed to avert a calamitous effect on the planet.
The COP26 summit in Glasgow in November 2021 culminated with the agreement of the Glasgow Climate Pact (GCP), where each participating country commits to their submitted nationally determined contributions (NDCs) but how the various governments will achieve their respective CO2 reduction commitments by passing legislation to tax heavy polluters or incentivise renewable investments remains uncharted territory. As the success or failure of COP26 is debated, a number of ESG topics have been elevated and will likely dominate 2022:
• Focus on reporting and reducing Scope 3 emissions
• How private capital can influence and assist the energy transition journey?
• Carbon markets - how to set a globally acceptable price and ensure carbon offsets are verifiable?
• The rise of sustainability accounting
• Focus on diversity, equity and inclusion
* UN Intergovernmental Panel on Climate change
Climate Risk and ResilienceClimate change risks, both arising from energy transition and the physical effects of changes in climate are identified and assessed as part of the Group’s integrated risk management approach and mitigated within the remit of a diverging set of key stakeholders’ aspirations and calibrated within the Group’s risk appetite and corporate strategy.
In January 2022, Pharos further advanced its alignment with the four TCFD pillars and disclosures on Governance, Strategy, Risk Management and Metrics and Targets. A detailed analysis was commissioned with the help of aa Climate Change and TCFD specialist consultancy which produced in-depth assessments of the transition and physical climate risks followed by a hi-grading risk exercise based on the Group internal risk matrix. These assessments were then discussed with the Senior Management Team and submitted to the ESG committee of the Board.
The physical risk assessment focused on screening our interests in Vietnam, Egypt and Israel using the consultant’s physical risks datasets and an attempt to quantify changes in key climate variables (e.g. drought, rainfall, wave height) over a 5 and 10 year timeframe under the three emissions scenarios – Representative Concentration Pathways (RCPs). The transition analysis focused on the potential impacts of different future scenarios on the key transition risks facing the Group and the oil and gas sector more broadly over the next 5-10 years. By undertaking these assessments, Pharos is in a better position to formulate strategies which will increase its resilience to climate related risks - and better cope with the uncertainty, speed and extent of the energy transition. The transition risk analysis conducted by an independent Climate Change and TCFD specialist consultant was assessed under the International Agency (IEA) Sustainable Development Scenario (SDS) and Stated Policies Scenario (STEPS) over a timeframe of 5 and 10 years. Additionally, Pharos has considered the risk that climate change pressures could reduce oil prices during the 3-year Viability Statement window under the recommended IEA’s Net Zero Emissions scenario. For more information, please see pages 56-57 for the Viability Statement.
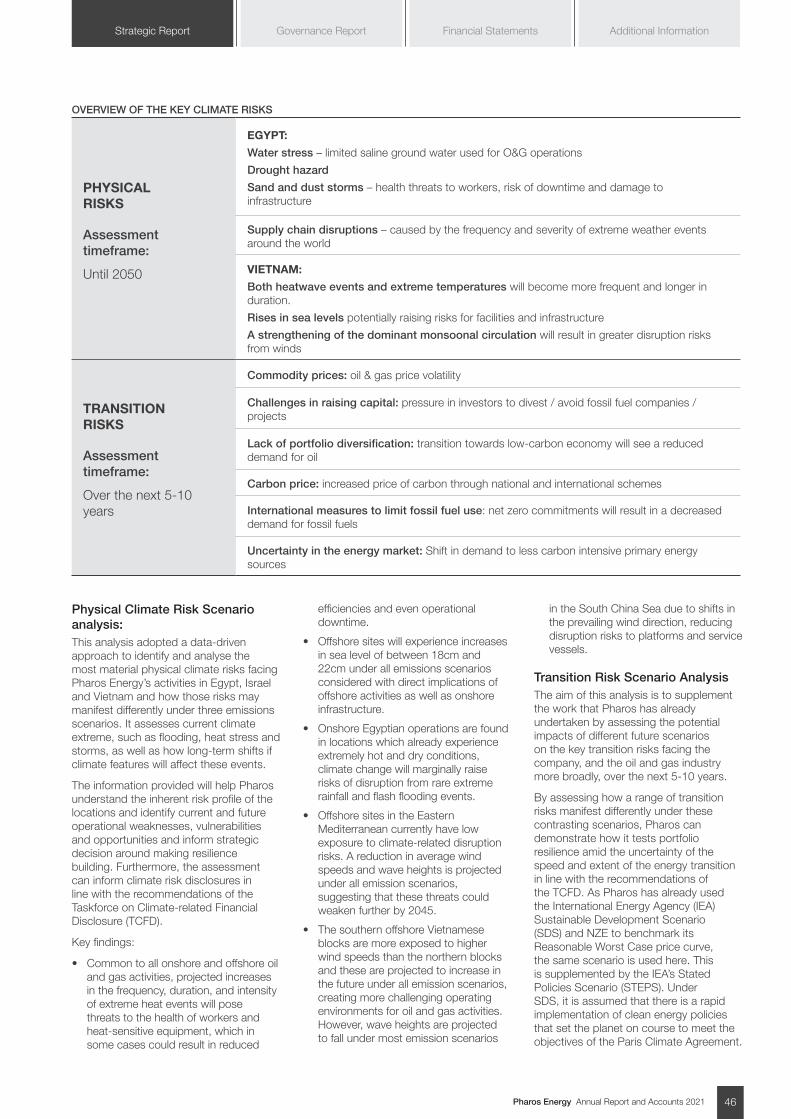
Pharos Energy Annual Report and Accounts 2021 46
Additional InformationGovernance Report Financial StatementsStrategic Report
OVERVIEW OF THE KEY CLIMATE RISKS
PHYSICAL RISKS
Assessment timeframe:
Until 2050
EGYPT:
Water stress – limited saline ground water used for O&G operations
Drought hazard
Sand and dust storms – health threats to workers, risk of downtime and damage to infrastructure
Supply chain disruptions – caused by the frequency and severity of extreme weather events around the world
VIETNAM:
Both heatwave events and extreme temperatures will become more frequent and longer in duration.
Rises in sea levels potentially raising risks for facilities and infrastructure
A strengthening of the dominant monsoonal circulation will result in greater disruption risks from winds
TRANSITION RISKS
Assessment timeframe:
Over the next 5-10 years
Commodity prices: oil & gas price volatility
Challenges in raising capital: pressure in investors to divest / avoid fossil fuel companies / projects
Lack of portfolio diversification: transition towards low-carbon economy will see a reduced demand for oil
Carbon price: increased price of carbon through national and international schemes
International measures to limit fossil fuel use: net zero commitments will result in a decreased demand for fossil fuels
Uncertainty in the energy market: Shift in demand to less carbon intensive primary energy sources
Physical Climate Risk Scenario analysis:This analysis adopted a data-driven approach to identify and analyse the most material physical climate risks facing Pharos Energy’s activities in Egypt, Israel and Vietnam and how those risks may manifest differently under three emissions scenarios. It assesses current climate extreme, such as flooding, heat stress and storms, as well as how long-term shifts if climate features will affect these events.
The information provided will help Pharos understand the inherent risk profile of the locations and identify current and future operational weaknesses, vulnerabilities and opportunities and inform strategic decision around making resilience building. Furthermore, the assessment can inform climate risk disclosures in line with the recommendations of the Taskforce on Climate-related Financial Disclosure (TCFD).
Key findings:
• Common to all onshore and offshore oil and gas activities, projected increases in the frequency, duration, and intensity of extreme heat events will pose threats to the health of workers and heat-sensitive equipment, which in some cases could result in reduced
efficiencies and even operational downtime.
• Offshore sites will experience increases in sea level of between 18cm and 22cm under all emissions scenarios considered with direct implications of offshore activities as well as onshore infrastructure.
• Onshore Egyptian operations are found in locations which already experience extremely hot and dry conditions, climate change will marginally raise risks of disruption from rare extreme rainfall and flash flooding events.
• Offshore sites in the Eastern Mediterranean currently have low exposure to climate-related disruption risks. A reduction in average wind speeds and wave heights is projected under all emission scenarios, suggesting that these threats could weaken further by 2045.
• The southern offshore Vietnamese blocks are more exposed to higher wind speeds than the northern blocks and these are projected to increase in the future under all emission scenarios, creating more challenging operating environments for oil and gas activities. However, wave heights are projected to fall under most emission scenarios
in the South China Sea due to shifts in the prevailing wind direction, reducing disruption risks to platforms and service vessels.
Transition Risk Scenario AnalysisThe aim of this analysis is to supplement the work that Pharos has already undertaken by assessing the potential impacts of different future scenarios on the key transition risks facing the company, and the oil and gas industry more broadly, over the next 5-10 years.
By assessing how a range of transition risks manifest differently under these contrasting scenarios, Pharos can demonstrate how it tests portfolio resilience amid the uncertainty of the speed and extent of the energy transition in line with the recommendations of the TCFD. As Pharos has already used the International Energy Agency (IEA) Sustainable Development Scenario (SDS) and NZE to benchmark its Reasonable Worst Case price curve, the same scenario is used here. This is supplemented by the IEA’s Stated Policies Scenario (STEPS). Under SDS, it is assumed that there is a rapid implementation of clean energy policies that set the planet on course to meet the objectives of the Paris Climate Agreement.
Pharos Energy Annual Report and Accounts 202147
RISK MANAGEMENT - CONTINUED
Meanwhile STEPS is a more conservative view of the future, in which only current and planned policies are enacted, and oil and gas play a greater role in the energy system for longer.
To tackle the climate and environmental challenges Pharos will continue to focus on the following:
• Measuring and assessing our environmental footprints
• Conducting climate scenario analysis
• Evaluating our alignment with market frameworks and regulations designed to support the transition to a low carbon, sustainable and equitable future
• Continuing on our TCFD commitments and alignment
• Exploring partnerships with effective CO2 reduction solutions
Identifying the costs of mitigating climate risksOne of the most important considerations in assessing climate risk is the cost of mitigation action and solutions. Given the uncertainties surrounding potential losses, and the need to generate reasonable returns in the near term, it is necessary to balance the protection afforded with any economic costs of such measures. These questions are debated at the Board and with senior management:
• What sort of action to take to mitigate climate change?
• Over what timeframe?
• And with what cost?
In Q4 2021, Pharos undertook a review of our Vietnamese operations and assets with the assistance of an independent energy consultant focusing on the potential application CO2 reduction technologies. Besides considering the application of simpler technologies like the installing solar panels and hydrogen storage batteries to power our operations thus reducing our own produced gas as fuel, a number of more advanced technologies such as the injector technology and gas to liquid process will be investigated further in 2022/23.
These feasibility studies will be progressed during 2022 to further assess their technical applicability on the existing infrastructure as there may be a number of logistical constraints on the existing infrastructure. Once the studies support that the technical hurdles can be overcome and potential CO2 reduction will ensue a more detailed cost/benefit analyses will be undertaken - when an investment case for a particular CO2 reduction technology shows it has potential for implementation into our
operations, Pharos will then try to get partners’ approval to support the CO2 reduction investment.
Commodity Price riskOne of the key uncertainties in the energy world in 2021 was the extent and timing of the recovery in demand for oil, natural gas and electricity from lows earlier in the pandemic. Then in Q4 2021, both Brent and WTI oil spot prices climbed inexorably causing geo-political and economic tensions among some governments forcing them to tap into their oil / gas strategic reserves and boost supplies to avoid excessive petrol rises at the pump and further inflationary pressures. Europe and Asia in the meantime faced a severe gas shortage causing gas prices to shoot up. Further energy shocks can be expected as a result of the recent Ukraine/Russia conflict.
A buoyant oil market and price is sometimes perceived as an unconditional positive for the oil and gas sector, but the costs of material and services in this capital intensive industry can lead to big changes to predicted returns and stifle cash flows.
Carbon Tracker, a London-based not-for-profit think tank researching the impact of climate change on financial markets, warned oil producers they should not let high prices today lure investments into pricey new projects that will lose money when the fever breaks and the energy transition cripples fossil fuel demand over coming years.
Commodity price uncertainty persists and is factored into all stages of the planning process. Please refer to the Viability Statement on pages 56 to 57 for more details of how the Group has stress tested its assets and projected cash flows against its principal risks.
Cyber risksWFH also creates an increased dependence on cloud-deployed services and thus opening more vulnerabilities to cyber-attacks. Pharos continues to its focus on the robustness of its business continuity and collaborate closely with its IT partners to minimise disruption to our business.
Insurance costs / pollution liabilityThe energy insurance premiums have increased more or less in line with inflation over the last twelve months. This year the energy insurance markets may be more difficult to tap into and significant premium increases can be expected – selective covers and reduced limits may have to be evaluated to avoid excessive premiums but this strategy can result in increased exposure in the event of a loss. Some other insurance markets have been badly affected by the havoc caused by extreme weather events across the globe and this can lead to a shrinkage in the insurance energy market capacity as climate change risks will be high on insurers’ radar for oil and gas assets. As ESG issues and disclosures continue to dominate how financial markets should operate, the energy insurers may have to recalibrate the portfolio and pricing to reflect the increased risks of liability claims.
The cost of directors’ and officers’ liability insurance (D&O) has increased dramatically over the last two years due to reduced D&O capacity being offered and an increase in liability claims during the COVID-19 pandemic. The D&O market is unlikely to ease off in 2022 as both businesses and insurers face increased uncertainty on many fronts.
Operational Cost riskRising operational costs may become a big risk because they are directly impacted by the other factors, particularly our ability to meet capex commitments. Generally speaking, the larger a project, the greater the legal and regulatory burden and associated costs. In addition, higher oil prices result in services companies increasing prices, creating further inflationary pressure. With the unpredictability of oil and other commodity prices and owing to global manufacturing beyond any one company’s control, there are genuine cost concerns.
Additionally many oil and gas firms struggle to find and keep skilled employees during boom periods. Thus payroll can rapidly grow to add another expense to the total picture. The cost of training employees in the oil and gas sector has increased, reducing the number of firms in the industry. As a result, oil and gas have become a very capital-intensive business with fewer participants each year. Out--sourcing is becoming more common in the industry, and while this offers flexibility to operators, it also results in greater exposure to increases in daily rates for essential services, such as drilling and well services, when the oil price rises.
Pharos Energy Annual Report and Accounts 2021 48
Additional InformationGovernance Report Financial StatementsStrategic Report
The long-term ramifications of COVID-19 on labour and business practices to ensure a safe working environment and workforce welfare will likely lead to further HSE regulations which can add to operational costs. With heightened scrutiny on environmental, social, and governance (ESG) transparency, there will be continuous and more onerous regulatory challenges which oil and gas companies must handle to sustain their growth and purpose.
There has been a major organisation re-structuring of the workforce through a managed redundancy programme at Head Office during 2021. In January 2022, Pharos announced directorate changes reducing the size of the Board from nine Directors to six (two Executive Directors and four Non-Executive Directors) upon completion of the farm-out transactions with IPR and the 2022 AGM. The headcount reduction at all levels will contribute to lower G&A costs.
Emerging RisksAs the pandemic persists into its second year, it acts as a catalyst for many changes and creates opportunities for businesses to re-assess their resilience. Other areas of emerging risks will be around regulatory changes, digital transformation, remote working, risks of social disorders and the role of the Board in crisis situations. The pandemic has highlighted further existing inequalities such as the disparity to access to digital information and the unequal vaccine rollout between high and low income countries.
ESG activism continues to grow – the COP26 summit in Glasgow in November 2021 highlighted that governments around the world must reassess and renew their commitments to the Paris Climate Agreement to avert catastrophic irreversible consequences. However, the path to decarbonisation must garner much more cohesive participation and collaboration from the highest CO2 emitting countries, as otherwise a disorderly climate transition will exacerbate inequalities and lead to significant economic and societal hardships. With so much uncertainty, severe short-term commodity shocks may manifest more regularly and will make business planning and cash flow forecasting increasingly difficult.
Similar to our principal risks, emerging risks are identified using our bottom up approach with the regular risk assessments with risk owners and reporting to and discussing the emerging trends at the quarterly management risk meetings and the Audit and Risk Committee meetings. Pharos is engaged with the industry with organisations such
as BRINDEX and assesses news alerts from such sources as Oil & Gas UK, FT, Refinitiv (Eikon and Worldcheckone) Bloomberg Green and World Economic Forum. Pharos also conducts internal benchmarking analyses with its industry peers to better understand emerging trends in the sector.
OpportunitiesFor the oil and gas sector the lack of liquidity and increased scrutiny from investors on fossil fuel producers to decarbonise may create investment opportunities for oil and gas independents with a lower cost base than the oil majors and which are more able to adapt to a rapidly changing risk landscape. In the short term, capital allocation and discipline will be rigorously maintained while at the same time exploring opportunities to reduce our carbon footprint by adopting different methods / processes to power our operations, including the possibilities of solar power, and other carbon reduction technologies in the longer term. Our asset base is operated by separate independent Joint Operating Companies, leaving our role in both Egypt and Vietnam one of joint, rather than unilateral, control.
Board ResponsibilityThe Board fulfils its role in risk oversight by developing policies and procedures around risk that are consistent with the organisation’s strategy and risk appetite, taking steps to foster risk awareness and encouraging a company culture of risk adjusting awareness throughout the Group. The Audit and Risk Committee reports back to the Board regarding the adequacy of risk management measures so that the Board has confidence that management can support them. The Board periodically reviews the principal and emerging risks facing the business, including an annual review of the effectiveness of the risk management process in identifying, assessing and mitigating any significant risks which may affect the Group’s business objectives.
Risk management and the principal financial risks and uncertainties facing the Group are discussed in Note 3 and Note 36 to the Financial Statements. The Group’s Risk Management Framework, Policy and associated procedures are further discussed in the Corporate Governance Report on pages 86 to 91 and in the Audit and Risk Committee Report on pages 97 to 101, where the significant issues related to the 2021 Financial Statements are also reported. The Group’s Business Management System, which includes the Health, Safety, Environmental and Social Responsibility (‘HSES’) Management System, which incorporates the Company’s internal
control mechanisms of policies, procedures and guidelines through which the Group assesses, manages and mitigates its HSES risks and impacts, is described more fully in the Corporate Responsibility Report on pages 58 to 78.
The Board has carried out a review of the uncertainties surrounding the Group’s principal and emerging risks and recognised that a potential adverse event can have a material impact on the Group’s future earnings and cash flows. The fluctuating prices of crude oil and gas remain a significant variable to monitor closely for the Group. Flash events are happening more frequently from international trade tensions, geopolitical tensions, sudden outbreak of diseases, speed of climate change transition and physical risks which may require changes to our corporate price assumptions and productions outlook which in turn may trigger impairment of assets.
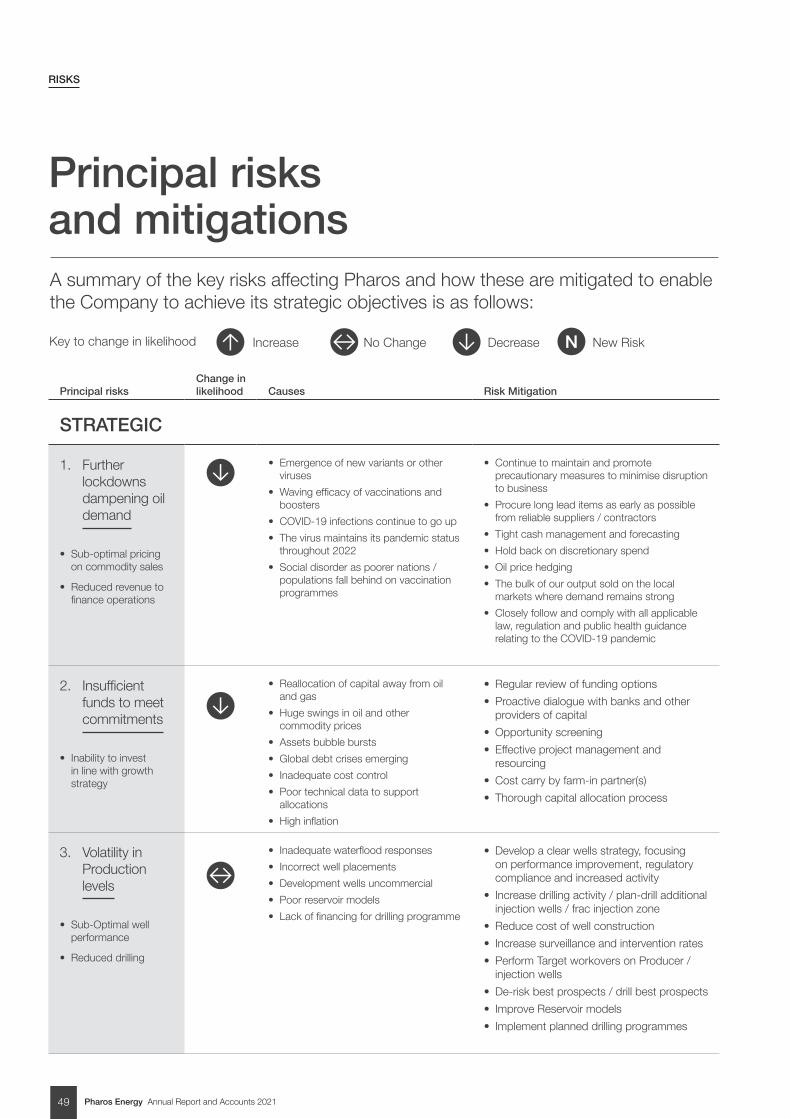
Pharos Energy Annual Report and Accounts 202149
Principal risksChange in likelihood Causes Risk Mitigation
STRATEGIC
1. Further lockdowns dampening oil demand
• Sub-optimal pricing on commodity sales
• Reduced revenue to finance operations
• Emergence of new variants or other viruses
• Waving efficacy of vaccinations and boosters
• COVID-19 infections continue to go up
• The virus maintains its pandemic status throughout 2022
• Social disorder as poorer nations / populations fall behind on vaccination programmes
• Continue to maintain and promote precautionary measures to minimise disruption to business
• Procure long lead items as early as possible from reliable suppliers / contractors
• Tight cash management and forecasting
• Hold back on discretionary spend
• Oil price hedging
• The bulk of our output sold on the local markets where demand remains strong
• Closely follow and comply with all applicable law, regulation and public health guidance relating to the COVID-19 pandemic
2. Insufficient funds to meet commitments
• Inability to invest in line with growth strategy
• Reallocation of capital away from oil and gas
• Huge swings in oil and other commodity prices
• Assets bubble bursts
• Global debt crises emerging
• Inadequate cost control
• Poor technical data to support allocations
• High inflation
• Regular review of funding options
• Proactive dialogue with banks and other providers of capital
• Opportunity screening
• Effective project management and resourcing
• Cost carry by farm-in partner(s)
• Thorough capital allocation process
3. Volatility in Production levels
• Sub-Optimal well performance
• Reduced drilling
• Inadequate waterflood responses
• Incorrect well placements
• Development wells uncommercial
• Poor reservoir models
• Lack of financing for drilling programme
• Develop a clear wells strategy, focusing on performance improvement, regulatory compliance and increased activity
• Increase drilling activity / plan-drill additional injection wells / frac injection zone
• Reduce cost of well construction
• Increase surveillance and intervention rates
• Perform Target workovers on Producer / injection wells
• De-risk best prospects / drill best prospects
• Improve Reservoir models
• Implement planned drilling programmes
Principal risks and mitigations
RISKS
Key to change in likelihood Increase No Change Decrease New Risk
A summary of the key risks affecting Pharos and how these are mitigated to enable the Company to achieve its strategic objectives is as follows:
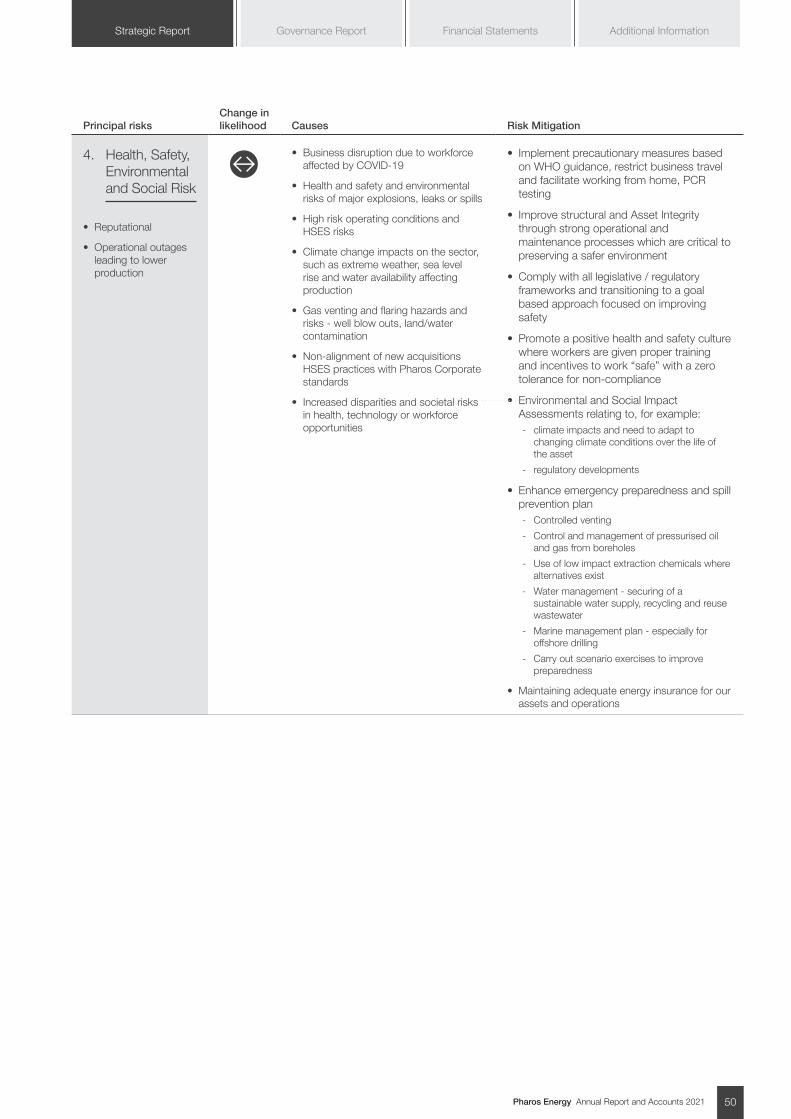
Pharos Energy Annual Report and Accounts 2021 50
Additional InformationGovernance Report Financial StatementsStrategic Report
Principal risksChange in likelihood Causes Risk Mitigation
4. Health, Safety, Environmental and Social Risk
• Reputational
• Operational outages leading to lower production
• Business disruption due to workforce affected by COVID-19
• Health and safety and environmental risks of major explosions, leaks or spills
• High risk operating conditions and HSES risks
• Climate change impacts on the sector, such as extreme weather, sea level rise and water availability affecting production
• Gas venting and flaring hazards and risks - well blow outs, land/water contamination
• Non-alignment of new acquisitions HSES practices with Pharos Corporate standards
• Increased disparities and societal risks in health, technology or workforce opportunities
• Implement precautionary measures based on WHO guidance, restrict business travel and facilitate working from home, PCR testing
• Improve structural and Asset Integrity through strong operational and maintenance processes which are critical to preserving a safer environment
• Comply with all legislative / regulatory frameworks and transitioning to a goal based approach focused on improving safety
• Promote a positive health and safety culture where workers are given proper training and incentives to work “safe” with a zero tolerance for non-compliance
• Environmental and Social Impact Assessments relating to, for example:
- climate impacts and need to adapt to changing climate conditions over the life of the asset
- regulatory developments
• Enhance emergency preparedness and spill prevention plan
- Controlled venting
- Control and management of pressurised oil and gas from boreholes
- Use of low impact extraction chemicals where alternatives exist
- Water management - securing of a sustainable water supply, recycling and reuse wastewater
- Marine management plan - especially for offshore drilling
- Carry out scenario exercises to improve preparedness
• Maintaining adequate energy insurance for our assets and operations
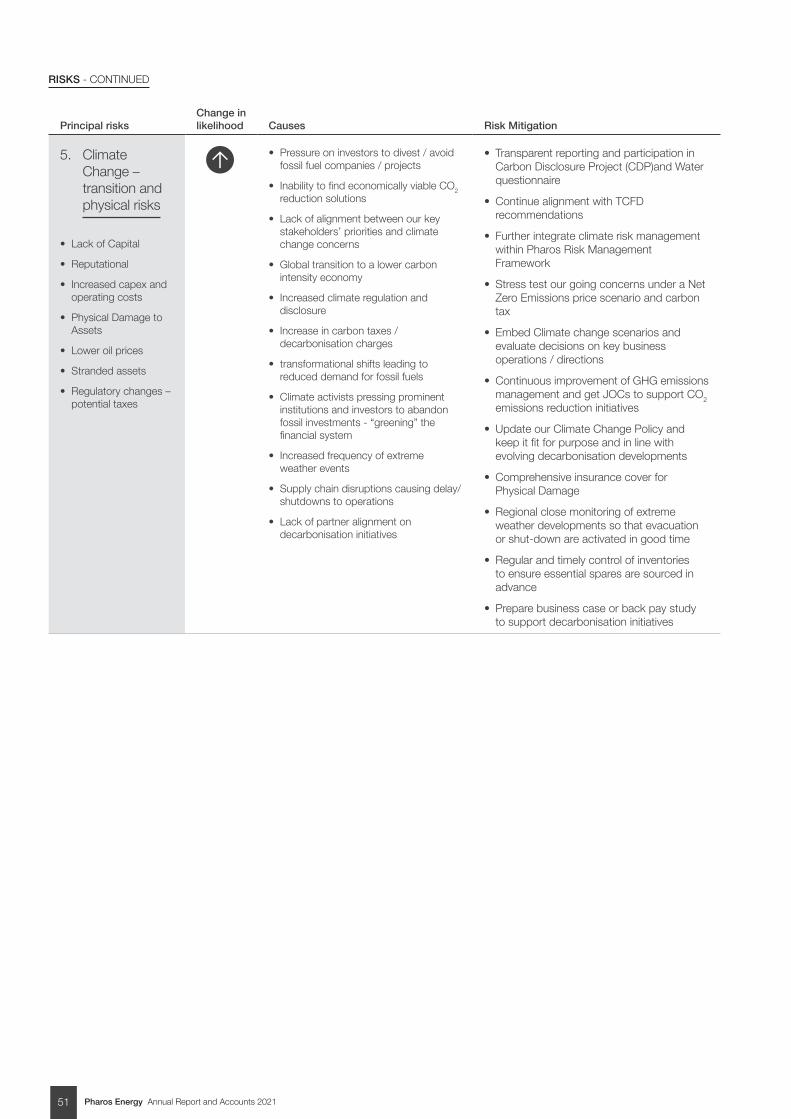
Pharos Energy Annual Report and Accounts 202151
RISKS - CONTINUED
Principal risksChange in likelihood Causes Risk Mitigation
5. Climate Change – transition and physical risks
• Lack of Capital
• Reputational
• Increased capex and operating costs
• Physical Damage to Assets
• Lower oil prices
• Stranded assets
• Regulatory changes – potential taxes
• Pressure on investors to divest / avoid fossil fuel companies / projects
• Inability to find economically viable CO2 reduction solutions
• Lack of alignment between our key stakeholders’ priorities and climate change concerns
• Global transition to a lower carbon intensity economy
• Increased climate regulation and disclosure
• Increase in carbon taxes / decarbonisation charges
• transformational shifts leading to reduced demand for fossil fuels
• Climate activists pressing prominent institutions and investors to abandon fossil investments - “greening” the financial system
• Increased frequency of extreme weather events
• Supply chain disruptions causing delay/shutdowns to operations
• Lack of partner alignment on decarbonisation initiatives
• Transparent reporting and participation in Carbon Disclosure Project (CDP)and Water questionnaire
• Continue alignment with TCFD recommendations
• Further integrate climate risk management within Pharos Risk Management Framework
• Stress test our going concerns under a Net Zero Emissions price scenario and carbon tax
• Embed Climate change scenarios and evaluate decisions on key business operations / directions
• Continuous improvement of GHG emissions management and get JOCs to support CO2 emissions reduction initiatives
• Update our Climate Change Policy and keep it fit for purpose and in line with evolving decarbonisation developments
• Comprehensive insurance cover for Physical Damage
• Regional close monitoring of extreme weather developments so that evacuation or shut-down are activated in good time
• Regular and timely control of inventories to ensure essential spares are sourced in advance
• Prepare business case or back pay study to support decarbonisation initiatives
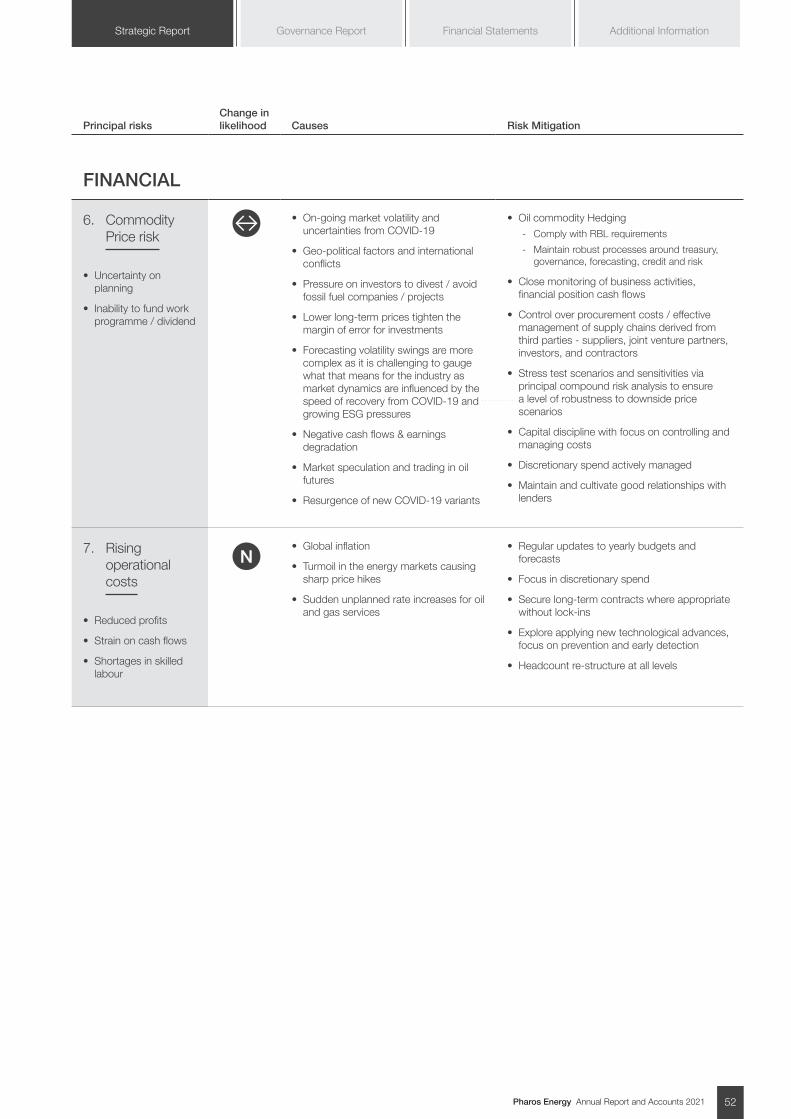
Pharos Energy Annual Report and Accounts 2021 52
Additional InformationGovernance Report Financial StatementsStrategic Report
Principal risksChange in likelihood Causes Risk Mitigation
FINANCIAL
6. Commodity Price risk
• Uncertainty on planning
• Inability to fund work programme / dividend
• On-going market volatility and uncertainties from COVID-19
• Geo-political factors and international conflicts
• Pressure on investors to divest / avoid fossil fuel companies / projects
• Lower long-term prices tighten the margin of error for investments
• Forecasting volatility swings are more complex as it is challenging to gauge what that means for the industry as market dynamics are influenced by the speed of recovery from COVID-19 and growing ESG pressures
• Negative cash flows & earnings degradation
• Market speculation and trading in oil futures
• Resurgence of new COVID-19 variants
• Oil commodity Hedging
- Comply with RBL requirements
- Maintain robust processes around treasury, governance, forecasting, credit and risk
• Close monitoring of business activities, financial position cash flows
• Control over procurement costs / effective management of supply chains derived from third parties - suppliers, joint venture partners, investors, and contractors
• Stress test scenarios and sensitivities via principal compound risk analysis to ensure a level of robustness to downside price scenarios
• Capital discipline with focus on controlling and managing costs
• Discretionary spend actively managed
• Maintain and cultivate good relationships with lenders
7. Rising operational costs
• Reduced profits
• Strain on cash flows
• Shortages in skilled labour
• Global inflation
• Turmoil in the energy markets causing sharp price hikes
• Sudden unplanned rate increases for oil and gas services
• Regular updates to yearly budgets and forecasts
• Focus in discretionary spend
• Secure long-term contracts where appropriate without lock-ins
• Explore applying new technological advances, focus on prevention and early detection
• Headcount re-structure at all levels
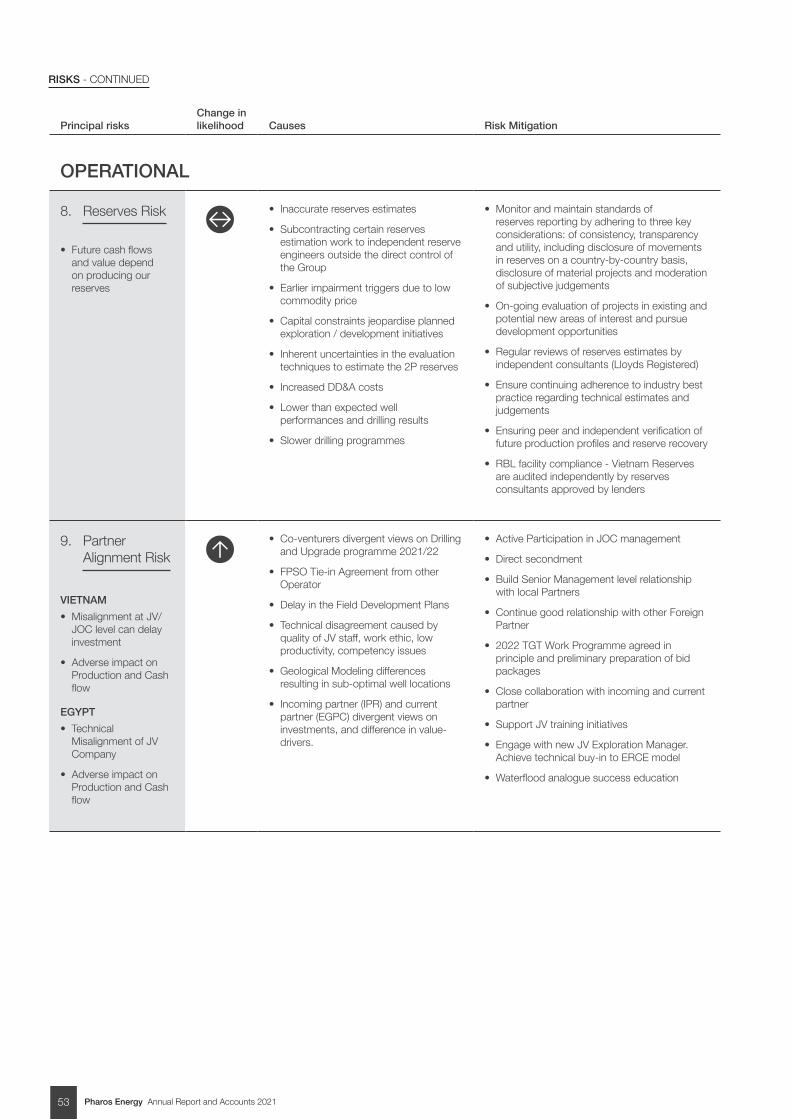
Pharos Energy Annual Report and Accounts 202153
RISKS - CONTINUED
Principal risksChange in likelihood Causes Risk Mitigation
OPERATIONAL
8. Reserves Risk
• Future cash flows and value depend on producing our reserves
• Inaccurate reserves estimates
• Subcontracting certain reserves estimation work to independent reserve engineers outside the direct control of the Group
• Earlier impairment triggers due to low commodity price
• Capital constraints jeopardise planned exploration / development initiatives
• Inherent uncertainties in the evaluation techniques to estimate the 2P reserves
• Increased DD&A costs
• Lower than expected well performances and drilling results
• Slower drilling programmes
• Monitor and maintain standards of reserves reporting by adhering to three key considerations: of consistency, transparency and utility, including disclosure of movements in reserves on a country-by-country basis, disclosure of material projects and moderation of subjective judgements
• On-going evaluation of projects in existing and potential new areas of interest and pursue development opportunities
• Regular reviews of reserves estimates by independent consultants (Lloyds Registered)
• Ensure continuing adherence to industry best practice regarding technical estimates and judgements
• Ensuring peer and independent verification of future production profiles and reserve recovery
• RBL facility compliance - Vietnam Reserves are audited independently by reserves consultants approved by lenders
9. Partner Alignment Risk
VIETNAM
• Misalignment at JV/JOC level can delay investment
• Adverse impact on Production and Cash flow
EGYPT
• Technical Misalignment of JV Company
• Adverse impact on Production and Cash flow
• Co-venturers divergent views on Drilling and Upgrade programme 2021/22
• FPSO Tie-in Agreement from other Operator
• Delay in the Field Development Plans
• Technical disagreement caused by quality of JV staff, work ethic, low productivity, competency issues
• Geological Modeling differences resulting in sub-optimal well locations
• Incoming partner (IPR) and current partner (EGPC) divergent views on investments, and difference in value-drivers.
• Active Participation in JOC management
• Direct secondment
• Build Senior Management level relationship with local Partners
• Continue good relationship with other Foreign Partner
• 2022 TGT Work Programme agreed in principle and preliminary preparation of bid packages
• Close collaboration with incoming and current partner
• Support JV training initiatives
• Engage with new JV Exploration Manager. Achieve technical buy-in to ERCE model
• Waterflood analogue success education
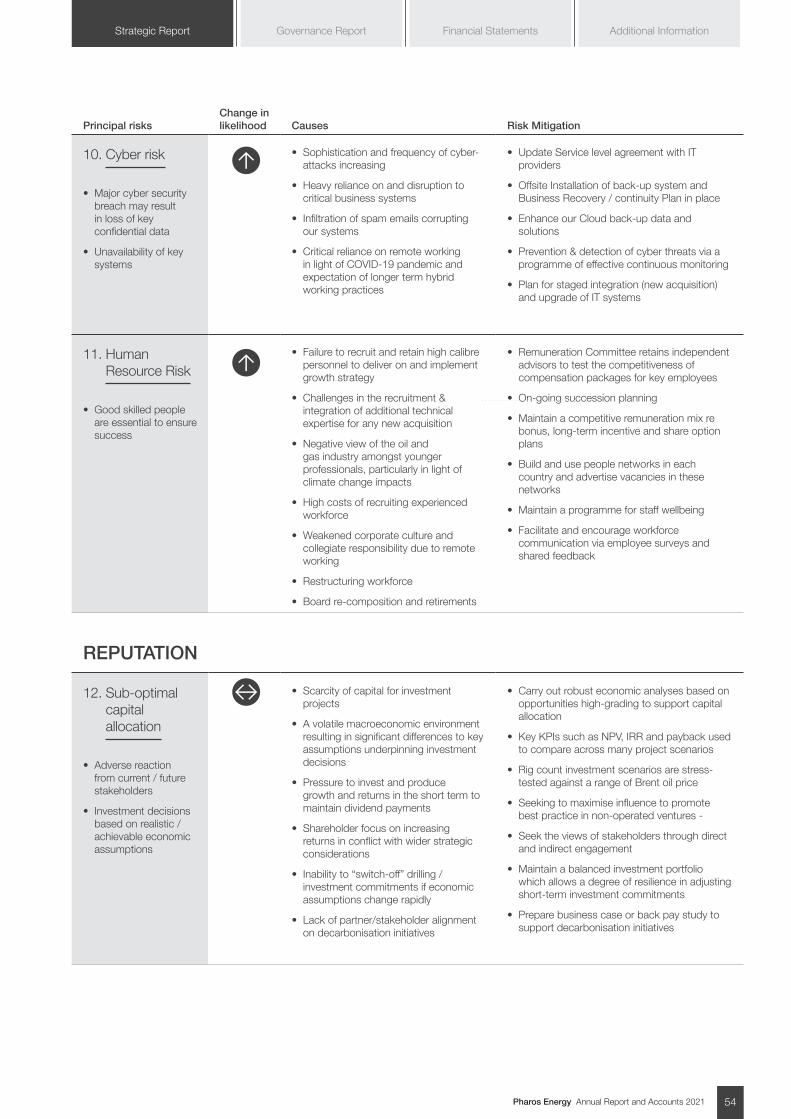
Pharos Energy Annual Report and Accounts 2021 54
Additional InformationGovernance Report Financial StatementsStrategic Report
Principal risksChange in likelihood Causes Risk Mitigation
10. Cyber risk
• Major cyber security breach may result in loss of key confidential data
• Unavailability of key systems
• Sophistication and frequency of cyber-attacks increasing
• Heavy reliance on and disruption to critical business systems
• Infiltration of spam emails corrupting our systems
• Critical reliance on remote working in light of COVID-19 pandemic and expectation of longer term hybrid working practices
• Update Service level agreement with IT providers
• Offsite Installation of back-up system and Business Recovery / continuity Plan in place
• Enhance our Cloud back-up data and solutions
• Prevention & detection of cyber threats via a programme of effective continuous monitoring
• Plan for staged integration (new acquisition) and upgrade of IT systems
11. Human Resource Risk
• Good skilled people are essential to ensure success
• Failure to recruit and retain high calibre personnel to deliver on and implement growth strategy
• Challenges in the recruitment & integration of additional technical expertise for any new acquisition
• Negative view of the oil and gas industry amongst younger professionals, particularly in light of climate change impacts
• High costs of recruiting experienced workforce
• Weakened corporate culture and collegiate responsibility due to remote working
• Restructuring workforce
• Board re-composition and retirements
• Remuneration Committee retains independent advisors to test the competitiveness of compensation packages for key employees
• On-going succession planning
• Maintain a competitive remuneration mix re bonus, long-term incentive and share option plans
• Build and use people networks in each country and advertise vacancies in these networks
• Maintain a programme for staff wellbeing
• Facilitate and encourage workforce communication via employee surveys and shared feedback
REPUTATION
12. Sub-optimal capital allocation
• Adverse reaction from current / future stakeholders
• Investment decisions based on realistic / achievable economic assumptions
• Scarcity of capital for investment projects
• A volatile macroeconomic environment resulting in significant differences to key assumptions underpinning investment decisions
• Pressure to invest and produce growth and returns in the short term to maintain dividend payments
• Shareholder focus on increasing returns in conflict with wider strategic considerations
• Inability to “switch-off” drilling / investment commitments if economic assumptions change rapidly
• Lack of partner/stakeholder alignment on decarbonisation initiatives
• Carry out robust economic analyses based on opportunities high-grading to support capital allocation
• Key KPIs such as NPV, IRR and payback used to compare across many project scenarios
• Rig count investment scenarios are stress-tested against a range of Brent oil price
• Seeking to maximise influence to promote best practice in non-operated ventures -
• Seek the views of stakeholders through direct and indirect engagement
• Maintain a balanced investment portfolio which allows a degree of resilience in adjusting short-term investment commitments
• Prepare business case or back pay study to support decarbonisation initiatives
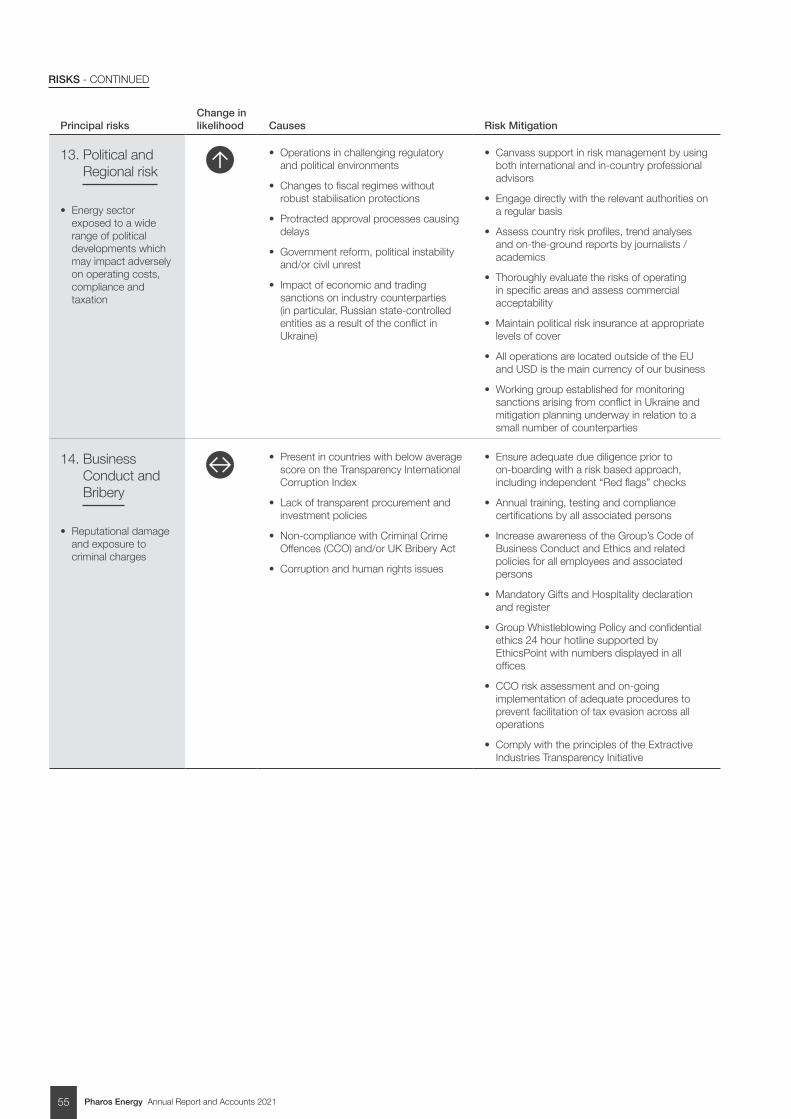
Pharos Energy Annual Report and Accounts 202155
RISKS - CONTINUED
Principal risksChange in likelihood Causes Risk Mitigation
13. Political and Regional risk
• Energy sector exposed to a wide range of political developments which may impact adversely on operating costs, compliance and taxation
• Operations in challenging regulatory and political environments
• Changes to fiscal regimes without robust stabilisation protections
• Protracted approval processes causing delays
• Government reform, political instability and/or civil unrest
• Impact of economic and trading sanctions on industry counterparties (in particular, Russian state-controlled entities as a result of the conflict in Ukraine)
• Canvass support in risk management by using both international and in-country professional advisors
• Engage directly with the relevant authorities on a regular basis
• Assess country risk profiles, trend analyses and on-the-ground reports by journalists / academics
• Thoroughly evaluate the risks of operating in specific areas and assess commercial acceptability
• Maintain political risk insurance at appropriate levels of cover
• All operations are located outside of the EU and USD is the main currency of our business
• Working group established for monitoring sanctions arising from conflict in Ukraine and mitigation planning underway in relation to a small number of counterparties
14. Business Conduct and Bribery
• Reputational damage and exposure to criminal charges
• Present in countries with below average score on the Transparency International Corruption Index
• Lack of transparent procurement and investment policies
• Non-compliance with Criminal Crime Offences (CCO) and/or UK Bribery Act
• Corruption and human rights issues
• Ensure adequate due diligence prior to on-boarding with a risk based approach, including independent “Red flags” checks
• Annual training, testing and compliance certifications by all associated persons
• Increase awareness of the Group’s Code of Business Conduct and Ethics and related policies for all employees and associated persons
• Mandatory Gifts and Hospitality declaration and register
• Group Whistleblowing Policy and confidential ethics 24 hour hotline supported by EthicsPoint with numbers displayed in all offices
• CCO risk assessment and on-going implementation of adequate procedures to prevent facilitation of tax evasion across all operations
• Comply with the principles of the Extractive Industries Transparency Initiative
Pharos Energy Annual Report and Accounts 2021 56
Additional InformationGovernance Report Financial StatementsStrategic Report
Viability Statement In accordance with the UK Corporate Governance code, the Board has assessed the prospects of the company over a period longer than the twelve months required to support the Going Concern Statement on page 42 of the CFO’s statement. The Audit & Risk Committee reapproved in December 2021 that the appropriate length which the Viability Statement (“VS”) should cover is 3 years. A significant factor in the Group’s forward cash position is the oil price assumption, and as most of the source data relates to a 3 year period this is considered the appropriate lookout period for the VS.
In undertaking this assessment, the Board has carried out a robust review of the principal and emerging risks facing the Group, including those that would threaten its business model, future performance, solvency or liquidity, giving particular attention to the principal and emerging risks.
Our strategy and associated principal and emerging risks underpin both the Group’s three year base forecast and scenario testing, plus our longer term prospects and position.
Group’s current position
• Production assets in Vietnam and Egypt with low operating cost base
• Carry in Egypt Concessions following completion of farm down to IPR
• Flexibility in the capital expenditure programme
• Operating cash flows in line with oil prices and supported by hedging programme
• Focus on capital discipline
• Excellent HSES standards
• Repayment of current RBL loan in the 3 year period of the VS
Strategy & business model
• Business model drawing on geoscience, engineering, financial and commercial talent
• Responsible and Flexible stewards of capital
• Focus on stakeholders
The principal and emerging risks, which are relevant to the assessment of the Group’s prospects, are the same as those used to stress test our viability over the three-year period.
How we assess our viability
Our forecast is built on an asset by asset basis using a bottom up model and is stress tested by compounding downward scenarios.
The three year period selected for testing covers the Group’s medium term capital plans and projections, in particular oil price projections, a fundamental driver of the groups operating cash flows, where market consensus data becomes less reliable for periods further ahead than three years.
Although individual assets are often modelled for periods longer than three years, to reflect the return on investments being considered over the life of field, the three year period has been selected by the Board as most appropriate for the group as a whole. It provides management and the Board with sufficient and realistic visibility of the future industry environment whilst capturing the Group’s future expenditure commitments on its licences, its near term drilling programmes and Full Field Development Plans (FFDPs).
In assessing the Group’s viability over the next three years, it is recognised that all future assessments are subject to a level of uncertainty which increases with time and that future outcomes cannot be guaranteed.
Key Assumptions
During the three year period the working assumption is that Group will be dependent on its two cash generating assets in Vietnam and the El Fayum concession in Egypt with the Farm down of 55% working interest in Egypt’s assets.
The underlying oil and gas reserves in both Vietnam and Egypt have been certified by Reserves Auditors, RISC (for Vietnam) and McDaniel (for Egypt). In our model, we have used management’s best estimate of future commodity prices, resulting in a base oil price prior to scenario testing of $73.9/bbl in 2022, $70.2/bbl in 2023 and $67.8/bbl in 2024. The base model also includes the Group’s latest life of field production models and expenditure forecasts.
The company has a Reserves Based Lending (RBL) facility of $125 million over its Vietnam producing assets taken out in September 2018. In July 2021, the Group completed the refinancing of its RBL that now matures in July 2025. The current borrowing levels and the repayment schedules in the model is based on the RBL’s economic and technical assumption as of the December 2021 redetermination. In the current VS period, the majority of the RBL loan is forecast to be repaid.
Pharos Energy Annual Report and Accounts 202157
RISKS - CONTINUED
Stress testing linked to Principal Risks
As well as the base model, the Group also considers other scenarios and has stress tested the forecast for a combination of a number of severe but plausible events (linked to the majority of the Group’s principal risks) that could impact its ability to fund planned activities and/or comply with the covenants and undertakings within its reserves based lending (RBL) facility agreement. These events include:
• A material reduction in the oil price putting pressure on the Group’s capital available for investment
• A material reduction in production
• An unfavourable event resulting in lost production and oil price shock
The oil price sensitivity reflects a level of price reductions broadly similar to 2020 as a result of the global outbreak of the COVID-19 virus, to reflect the similar risk of the oil price crash during the 3 year VS period.
Base Forecast flexed for combinations of the following scenarios
Link to Principal Risks and Uncertainties Level of Severity Tested Conclusion
Base Forecast flexed for combinations of the following scenarios
Link to Principal Risks and Uncertainties
Level of Severity Tested Conclusion
Sustained and sharp drop in oil price
1, 2, 5, 6
Sharp drop in the oil price, down by a third to $49/bbl rising gradually over a year till in line with base price
Company remains viable with mitigating actions
Reduction in production 2,3,4,8,9,12,13,75% drop in production over the period of testing
Company remains viable with mitigating actions
Unfavourable event leading to lost production and price shock
1,2,3,4, 5, 6,7 8,9,11, 12,13
Combination of tests aboveCompany remains viable with mitigating actions
Climate ChangeWe have also taken into consideration the risk that climate change pressures could reduce oil prices during the 3 year VS window. In doing so, we have considered the price curve as an output of a Net Zero Emissions by 2050 (NZE) based on IEA’s World Outlook 2021 report, which is consistent with achieving 1.5 °C stabilisation in global average temperatures and a net zero CO2 emission by 2050. The nominal Brent prices used in this scenario is similar to our base case oil price assumptions over the 3 year VS period. Nevertheless, we have concluded that the stress testing outlined above adequately takes into consideration the risk of any downside adjustments to our revenue base over the 3 year VS period due to climate change pressures.
To date there is no official carbon tax determined in both jurisdictions where our operations are i.e. Vietnam and Egypt. Furthermore, the imposition of carbon taxes would likely to uplift the Brent prices as some of the burden will be passed to the consumer.
As a sensitivity test, we have run the effect of carbon tax from 2024 on Base case without assuming any increment in Brent price and the Group remains viable over the 3 year VS period.
It should be noted that majority of the existing RBL facility is within the 3-year viability statement window, we currently have some protection from the risk that Climate Change concerns begin to restrict the availability of capital.
In all combinations tested, the Group had access to mitigating actions, including hedging and deferring non-committed capital expenditure beyond the 3-year window of the VS.
Directors have reviewed the realistic mitigating actions that could be taken to reduce the impact of the underlying risk. The forecast cash flows are regularly monitored and reviewed to provide early warnings of any issues and to give sufficient time to take any necessary mitigating actions.
The potential impact of each of the other principal risks on the viability of the group during the assessment period has also been considered. Such risks include the inability to attract and retain appropriately skilled people, Cyber risk and Business Conduct and Bribery risk. The Board has considered the risk mitigation strategy for each of these risks and believes that the mitigation strategies are sufficient to reduce the impact of each risk to make it unlikely to jeopardise the Group’s viability during the three-year period.
Based on all of these assessments, including the availability of actions which could be taken in the event of plausible negative scenarios occurring, the Directors confirm that they have a reasonable expectation that the Group will continue to operate and meet its liabilities as they fall due for the three year period to 31 December 2024.
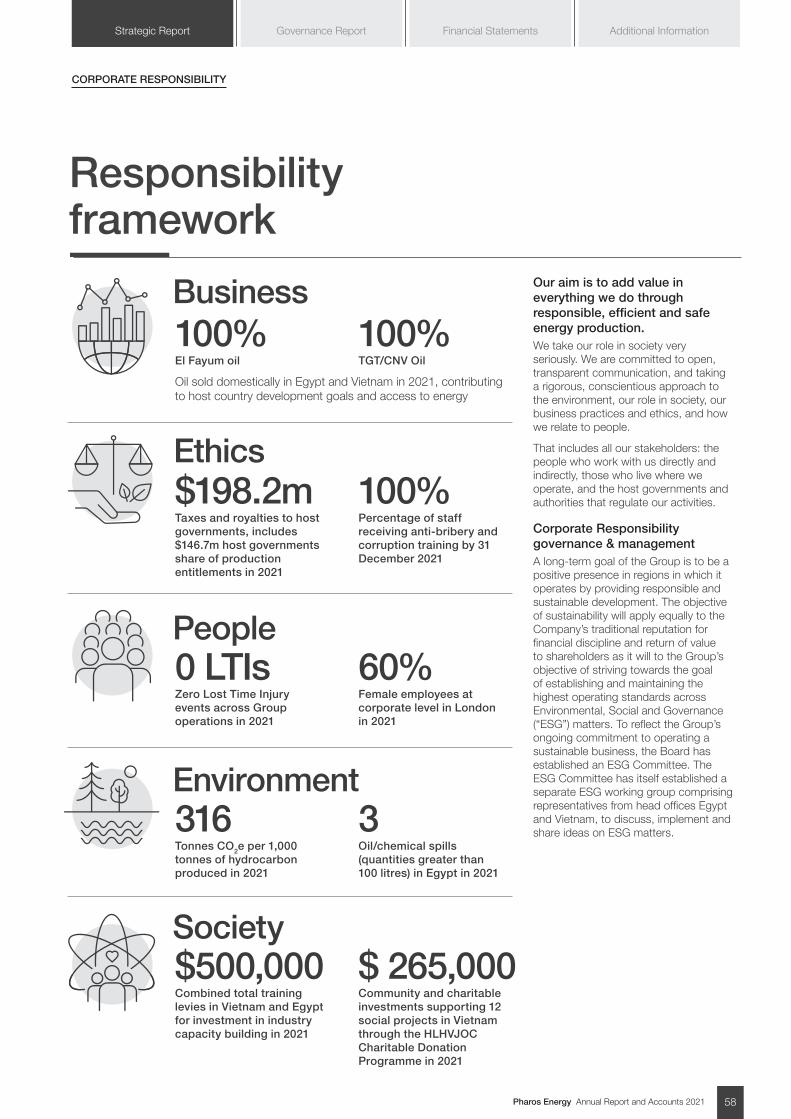
Pharos Energy Annual Report and Accounts 2021 58
Additional InformationGovernance Report Financial StatementsStrategic Report
Responsibility framework
Oil sold domestically in Egypt and Vietnam in 2021, contributing to host country development goals and access to energy
Business
People
Environment
Society
Ethics
100%El Fayum oil
0 LTIsZero Lost Time Injury events across Group operations in 2021
316Tonnes CO2e per 1,000 tonnes of hydrocarbon produced in 2021
$500,000Combined total training levies in Vietnam and Egypt for investment in industry capacity building in 2021
$198.2mTaxes and royalties to host governments, includes $146.7m host governments share of production entitlements in 2021
100%TGT/CNV Oil
60%Female employees at corporate level in London in 2021
3Oil/chemical spills (quantities greater than 100 litres) in Egypt in 2021
$ 265,000Community and charitable investments supporting 12 social projects in Vietnam through the HLHVJOC Charitable Donation Programme in 2021
100%Percentage of staff receiving anti-bribery and corruption training by 31 December 2021
CORPORATE RESPONSIBILITY
Our aim is to add value in everything we do through responsible, efficient and safe energy production.We take our role in society very seriously. We are committed to open, transparent communication, and taking a rigorous, conscientious approach to the environment, our role in society, our business practices and ethics, and how we relate to people.
That includes all our stakeholders: the people who work with us directly and indirectly, those who live where we operate, and the host governments and authorities that regulate our activities.
Corporate Responsibility governance & managementA long-term goal of the Group is to be a positive presence in regions in which it operates by providing responsible and sustainable development. The objective of sustainability will apply equally to the Company’s traditional reputation for financial discipline and return of value to shareholders as it will to the Group’s objective of striving towards the goal of establishing and maintaining the highest operating standards across Environmental, Social and Governance (“ESG”) matters. To reflect the Group’s ongoing commitment to operating a sustainable business, the Board has established an ESG Committee. The ESG Committee has itself established a separate ESG working group comprising representatives from head offices Egypt and Vietnam, to discuss, implement and share ideas on ESG matters.
Pharos Energy Annual Report and Accounts 202159
CORPORATE RESPONSIBILITY - CONTINUED
Climate change risksIn January 2022, Pharos further advanced its alignment with the four TCFD pillars and disclosures on Governance, Strategy, Risk Management and Metrics and Targets. A detailed analysis was commissioned with the help of an external climate expert consultancy which produced in-depth assessments of the transition and physical climate risks followed by a hi-grading risk exercise based on the Group internal risk matrix. These assessments were then discussed with the Senior Management Team and submitted to the ESG committee of the Board.
Structure of the Group’s Corporate Responsibility and HSES Management System
1. Code of Business Conduct and Ethics
2. Key CR/HSES policies supporting the Code
Human Rights Policy
Health, Safety and Environment Policy
Security Policy
Social Responsibility Policy
Biodiversity and Conservation Policy
Tax Strategy Statement
Prevention of Modern Slavery and Human Trafficking Policy
Climate Change Policy
3. Standards, procedures and guidance support the policies
See https://www.pharos.energy/responsibility/policy-statements/ for the full text of the current versions of each of these policies.
Stakeholder groups and corporate responsibility topics
Stakeholder groupHow we engage with them and understand any concerns
Key areas of concern for stakeholder groups
Local communities Environmental and social impact assessments and grievance mechanisms at project level
Community investment
Effluents and waste management
Biodiversity
Transparency
National and host governments
Regular dialogue Payments to governments
Local capability building
Environmental management
Health and safety
Employees and contractors
Promote adherence to WHO COVID-19 guidelines and respective governments’ guidelines
Regular dialogue and grievance mechanisms
Completed 2021 Employee Survey
Employee Focus Groups
Keep workforce safe during
COVID-19 pandemic
Local capacity building
Contractor management
Staff wellbeing
Shareholders Regular dialogue Climate risk/energy transition and other ESG risks
HSES Health and Safety
HSES Management System
Preventing corruption
International community
Responding to inquiries and media scanning
Climate risk/energy transition
GHG emissions
Preventing corruption
Human rights
Pharos Energy Annual Report and Accounts 2021 60
Additional InformationGovernance Report Financial StatementsStrategic Report
The Constitution and Terms of Reference of the ESG Committee sets the framework to:
• Assist the Board in defining the Pharos Group’s strategy relating to ESG matters;
• Assess the effectiveness of the Pharos Group’s policies, programmes, practices and systems for identifying, managing and mitigating or eliminating ESG risks in connection with the Pharos Group’s operations and corporate activity;
• Provide oversight of the Pharos Group’s management of ESG matters and compliance with legal and regulatory requirements, including applicable rules and principles of corporate governance, and applicable industry standards;
• Report on these matters to the Board and, where appropriate, make recommendations to the Board; and
• Report as required to shareholders of the Company on the activities and remit of the Committee.
The Board is also fully committed to effective compliance with the 2018 UK Corporate Governance Code, applicable to the current financial year of the Company ending 31 December 2021. The Board’s objective is to be recognised for meticulous governance, with a considerate and pragmatic approach to its business.
In terms of corporate responsibility and community engagement, the Board is committed to treating all stakeholders in every area of operations with honesty, fairness, openness, engagement and respect, and to conducting all business ethically and safely. The Group will only work with parties that share these values.
Our Code of Business Conduct and Ethics (“our Code”) sets out our expectations for how we do business, clarifying our commitments to ethical, social and environmental performance. Our Group CR and HSES policies described above support our Code.
Our corporate standards, procedures and guidelines support the policies. Project-specific operational plans, programmes and procedures set out the specific approach to CR and HSES issues and risks within each project.
The Pharos Health, Safety, Environmental and Social Responsibility Management System (“HSES MS”) describes the Group’s internal processes to manage risks and is consistent with the requirements of internationally recognised standards (ISO 14001, ISO 45001) and aligned with the World Bank’s International Finance Corporation (“IFC”) Environmental and Social Performance Standards.
The Chief Executive Officer is accountable to the Board for implementation of CR policies and HSES performance. The Board and the Audit and Risk Committee oversee the adequacy and effectiveness of our policies, standards and management system for HSES. The ESG Committee has responsibility, inter alia, for defining the Group’s strategy related to ESG matters, reviewing the Group’s ESG policies, programmes and initiatives and, more generally, has oversight of the Group’s management of ESG matters.
CR objectives are defined annually and reviewed quarterly in relation to: our business, our ethics, our people, environment and society.
Stakeholder engagementIn determining our CR strategy, we consider issues that are important to the successful delivery of our corporate objectives and the matters that are important to our stakeholders. We have developed communication and stakeholder guidance setting out the controls and arrangements for effective, timely and transparent processes. We receive feedback from stakeholders through a range of formal and informal processes. This takes place at a project and at a corporate level.
ESG materiality screeningFollowing an earlier screening of material ESG factors relevant to the oil and gas sector, in 2021 Pharos has been referring to the Sustainability Accounting Standards Board (SASB) materiality map for Oil & Gas - Exploration and Production, to ensure that the material issues of importance to its activities are appropriately managed and reported.
The Board will further reinforce the integration of climate considerations into its governance frameworks by implementing the principles stated in our Climate Change Policy. Further TCFD alignment started in Q4 2021 and culminated in early in January 2022 with a detailed climate change physical and transition risks analyses - the results of this work have been discussed internally and used to develop on-going programmes, recognise best practice and provide clear direction on our ESG strategy during 2022. For further details on our TCFD work, please refer to the Risk Management report on pages 45 to 48.
Our approach on environmental and social reporting in 2021 has taken into account the Voluntary Sustainability Reporting guidance (4th edition, published March 2020)” issued by IPIECA, the global not-for-profit oil and gas industry association for environmental and social issues, in partnership with the American Petroleum Institute and the International Association of Oil and Gas Producers. In 2022, Pharos will continue to review best practice to further guide our ESG reporting. We report on jointly operated companies in Egypt and Vietnam.
Pharos Energy Annual Report and Accounts 202161
BusinessOur objective is to provide responsible and sustainable development throughout our operations.
Climate risks and global energy transitionClimate change is considered a principal risk to the Group and its business over the medium and long term, and this is discussed in more detail in the Risk Management and risk report on pages 43 to 57.
Both transition and physical climate risks may further impact many of the Group’s principal risks including those associated with commodity price, access to capital, reserves, operations, political, stakeholders’ and reputational risks. We recognise that the global energy transition to a lower carbon intensity world in response to climate change could result in reduced demand for fossil fuels, lower oil prices and increased operating cost, increased capital cost, further regulation and carbon taxation which may significantly increase our operating costs and reduce our revenue. Our overall risk management framework integrates climate change and carbon related risks by stress-testing key a number of our principal risks on key variables for the Going Concern and Viability Testing. Established management processes include any physical risks associated with climate change and our energy insurance programmes cover to a large extent our asset portfolio against the risks of extreme weather events.
Pharos is cognisant of the potential diminished role of fossil fuels in the global energy mix as depicted in the IEA Sustainable Recovery Plan. However, at the same time, we also recognise that energy demand for oil and gas will continue to be an important component of the global energy mix for many decades to come.
In 2021, Vietnam remained one of the most dynamic emerging countries in East Asia region. Vietnam has become a net energy and oil and gas importer and most of the oil and gas produced in Vietnam is consumed domestically, with the HLHVJOCs continuing to contribute to this economic success story. Pharos will continue to develop its oil and gas resources responsibly to aid global economic development and deliver value for all our stakeholders. We believe that countries such as Egypt and Vietnam can continue to have economic and social benefits from the responsible development of their natural resources and we are committed to using our influence within JOCs to ensure this is undertaken in a sustainable way. We will also continue to support our host governments as they seek to use oil revenues to promote sustainable and inclusive economic development, and we will support the actions that they take to manage climate change. Egypt will host COP27 in November 2022 and Pharos will work closely with our partners to ensure climate change risks are evaluated in our processes and a decarbonisation plan is implemented for the medium and long term.
We report transparently and have participated in the CDP (formerly Climate Disclosure Project) Climate Change Questionnaire over the past four years. In 2021, we maintained our score of (C), originally awarded in 2019. 2021 also marks the first year that the Company submitted their response to the CDP Water Security Questionnaire. This Questionnaire completed at a basic level in 2021 and we plan to improve our level of transparency on water usage and protection by completing the full version in 2022. Our greenhouse gas emissions (“GHG”) are reported in the Environment section on page 69 to 75 and on page 78 of the Corporate Responsibility report.
On-going commitment to align with TCFD Pharos is committed to implementing the TCFD’s recommendations and a working group consisting of personnel from the London head office and the business units in Egypt and Vietnam is now set up to achieve this with the support of an outside consultant. The project is on-going and consists of two phases. Phase 1, which is now completed, consisted of a thorough peer benchmarking, internal document review and gap analysis and culminated in the development and approval by the Board of the Group Climate Change Policy in December 2020. As part of the Group’s continued alignment with the TCFD recommendations, Phase 2 started in 2H 2021 - an external climate consultancy expert worked with our internal team to draw up a long-list of climate-related risks facing the business. The risk identification process was undertaken in 2021 Q4 and considered both the company’s asset locations and primary markets, as well as macro-scale socio-economic, political and environmental trends. Specific operational risks were out of scope for this study but are still assessed, managed and reported taking into consideration climate related impact on our operations as part of the Group’s Risk Management Framework.
CORPORATE RESPONSIBILITY - CONTINUED
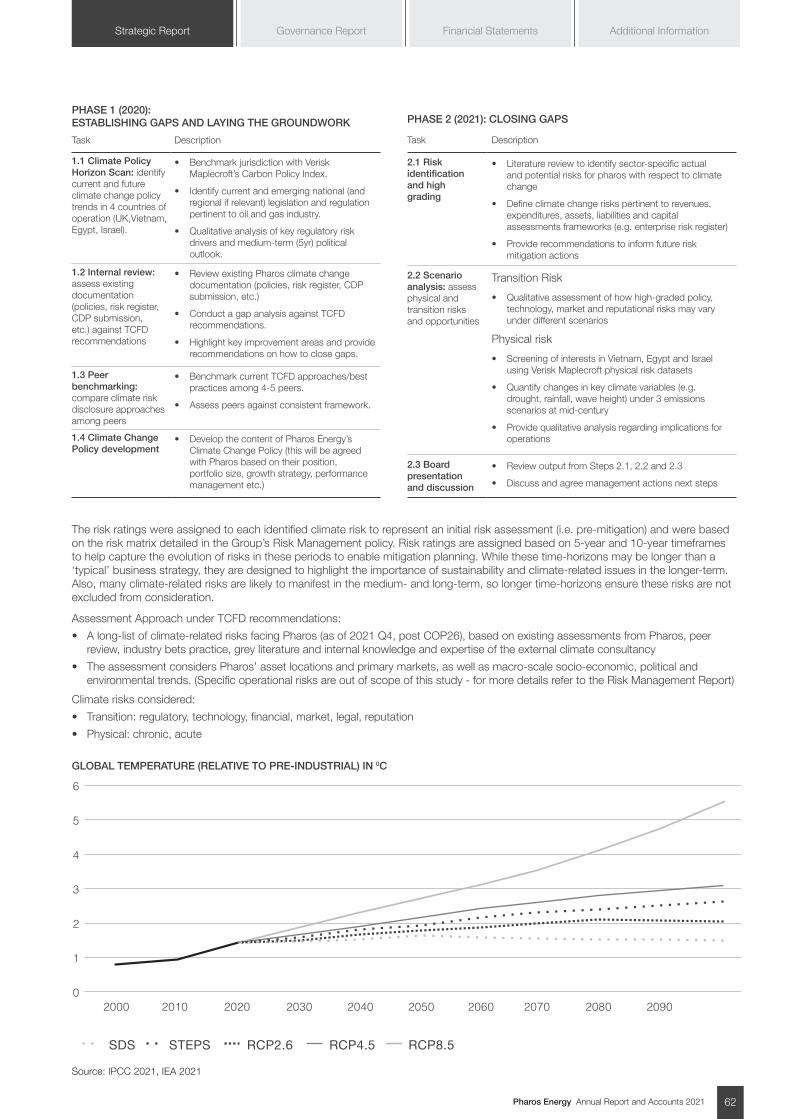
Pharos Energy Annual Report and Accounts 2021 62
Additional InformationGovernance Report Financial StatementsStrategic Report
The risk ratings were assigned to each identified climate risk to represent an initial risk assessment (i.e. pre-mitigation) and were based on the risk matrix detailed in the Group’s Risk Management policy. Risk ratings are assigned based on 5-year and 10-year timeframes to help capture the evolution of risks in these periods to enable mitigation planning. While these time-horizons may be longer than a ‘typical’ business strategy, they are designed to highlight the importance of sustainability and climate-related issues in the longer-term. Also, many climate-related risks are likely to manifest in the medium- and long-term, so longer time-horizons ensure these risks are not excluded from consideration.
Assessment Approach under TCFD recommendations:
• A long-list of climate-related risks facing Pharos (as of 2021 Q4, post COP26), based on existing assessments from Pharos, peer review, industry bets practice, grey literature and internal knowledge and expertise of the external climate consultancy
• The assessment considers Pharos’ asset locations and primary markets, as well as macro-scale socio-economic, political and environmental trends. (Specific operational risks are out of scope of this study - for more details refer to the Risk Management Report)
Climate risks considered:
• Transition: regulatory, technology, financial, market, legal, reputation
• Physical: chronic, acute
GLOBAL TEMPERATURE (RELATIVE TO PRE-INDUSTRIAL) IN 0C
6
5
4
3
2
1
0
2000 2010 2020 2030 2040 2050 2060 2070 2080 2090
SDS STEPS RCP2.6 RCP4.5 RCP8.5
Source: IPCC 2021, IEA 2021
PHASE 1 (2020): ESTABLISHING GAPS AND LAYING THE GROUNDWORK
Task Description
1.1 Climate Policy Horizon Scan: identify current and future climate change policy trends in 4 countries of operation (UK,Vietnam, Egypt, Israel).
• Benchmark jurisdiction with Verisk Maplecroft’s Carbon Policy Index.
• Identify current and emerging national (and regional if relevant) legislation and regulation pertinent to oil and gas industry.
• Qualitative analysis of key regulatory risk drivers and medium-term (5yr) political outlook.
1.2 Internal review: assess existing documentation (policies, risk register, CDP submission, etc.) against TCFD recommendations
• Review existing Pharos climate change documentation (policies, risk register, CDP submission, etc.)
• Conduct a gap analysis against TCFD recommendations.
• Highlight key improvement areas and provide recommendations on how to close gaps.
1.3 Peer benchmarking: compare climate risk disclosure approaches among peers
• Benchmark current TCFD approaches/best practices among 4-5 peers.
• Assess peers against consistent framework.
1.4 Climate Change Policy development
• Develop the content of Pharos Energy’s Climate Change Policy (this will be agreed with Pharos based on their position, portfolio size, growth strategy, performance management etc.)
PHASE 2 (2021): CLOSING GAPS
Task Description
2.1 Risk identification and high grading
• Literature review to identify sector-specific actual and potential risks for pharos with respect to climate change
• Define climate change risks pertinent to revenues, expenditures, assets, liabilities and capital assessments frameworks (e.g. enterprise risk register)
• Provide recommendations to inform future risk mitigation actions
2.2 Scenario analysis: assess physical and transition risks and opportunities
Transition Risk
• Qualitative assessment of how high-graded policy, technology, market and reputational risks may vary under different scenarios
Physical risk
• Screening of interests in Vietnam, Egypt and Israel using Verisk Maplecroft physical risk datasets
• Quantify changes in key climate variables (e.g. drought, rainfall, wave height) under 3 emissions scenarios at mid-century
• Provide qualitative analysis regarding implications for operations
2.3 Board presentation and discussion
• Review output from Steps 2.1, 2.2 and 2.3
• Discuss and agree management actions next steps
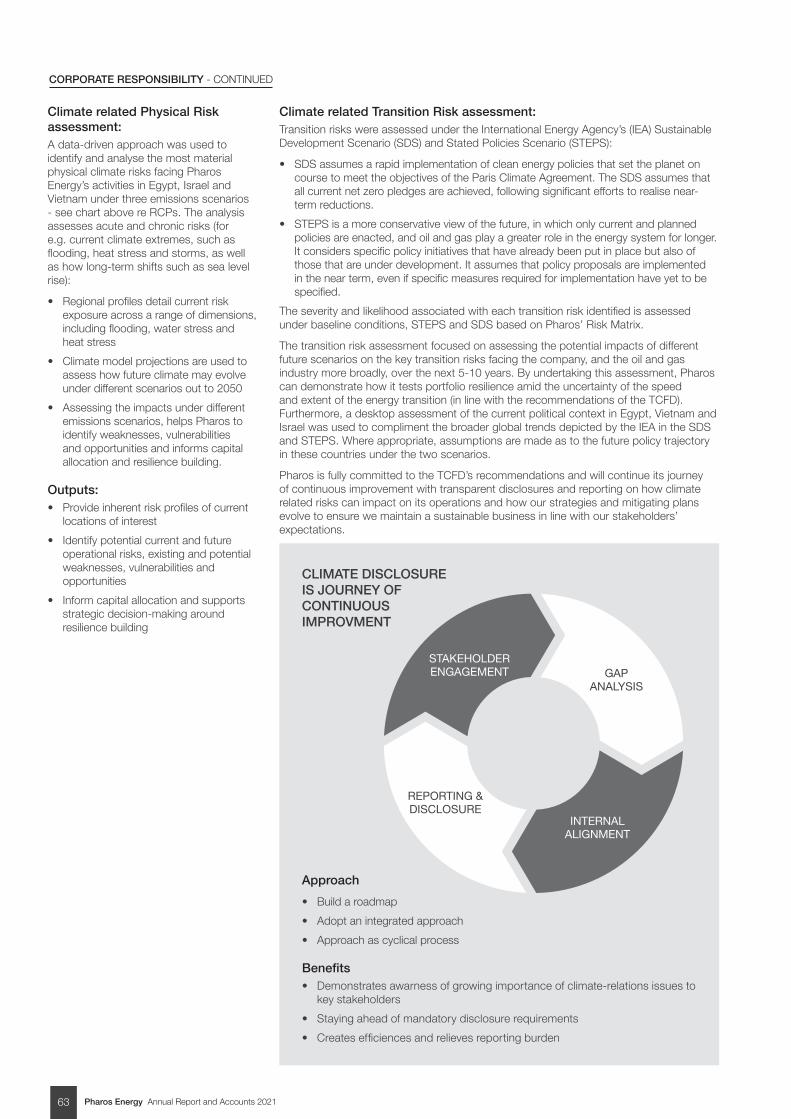
Pharos Energy Annual Report and Accounts 202163
CORPORATE RESPONSIBILITY - CONTINUED
Climate related Physical Risk assessment:A data-driven approach was used to identify and analyse the most material physical climate risks facing Pharos Energy’s activities in Egypt, Israel and Vietnam under three emissions scenarios - see chart above re RCPs. The analysis assesses acute and chronic risks (for e.g. current climate extremes, such as flooding, heat stress and storms, as well as how long-term shifts such as sea level rise):
• Regional profiles detail current risk exposure across a range of dimensions, including flooding, water stress and heat stress
• Climate model projections are used to assess how future climate may evolve under different scenarios out to 2050
• Assessing the impacts under different emissions scenarios, helps Pharos to identify weaknesses, vulnerabilities and opportunities and informs capital allocation and resilience building.
Outputs:• Provide inherent risk profiles of current
locations of interest
• Identify potential current and future operational risks, existing and potential weaknesses, vulnerabilities and opportunities
• Inform capital allocation and supports strategic decision-making around resilience building
Climate related Transition Risk assessment:Transition risks were assessed under the International Energy Agency’s (IEA) Sustainable Development Scenario (SDS) and Stated Policies Scenario (STEPS):
• SDS assumes a rapid implementation of clean energy policies that set the planet on course to meet the objectives of the Paris Climate Agreement. The SDS assumes that all current net zero pledges are achieved, following significant efforts to realise near-term reductions.
• STEPS is a more conservative view of the future, in which only current and planned policies are enacted, and oil and gas play a greater role in the energy system for longer. It considers specific policy initiatives that have already been put in place but also of those that are under development. It assumes that policy proposals are implemented in the near term, even if specific measures required for implementation have yet to be specified.
The severity and likelihood associated with each transition risk identified is assessed under baseline conditions, STEPS and SDS based on Pharos’ Risk Matrix.
The transition risk assessment focused on assessing the potential impacts of different future scenarios on the key transition risks facing the company, and the oil and gas industry more broadly, over the next 5-10 years. By undertaking this assessment, Pharos can demonstrate how it tests portfolio resilience amid the uncertainty of the speed and extent of the energy transition (in line with the recommendations of the TCFD). Furthermore, a desktop assessment of the current political context in Egypt, Vietnam and Israel was used to compliment the broader global trends depicted by the IEA in the SDS and STEPS. Where appropriate, assumptions are made as to the future policy trajectory in these countries under the two scenarios.
Pharos is fully committed to the TCFD’s recommendations and will continue its journey of continuous improvement with transparent disclosures and reporting on how climate related risks can impact on its operations and how our strategies and mitigating plans evolve to ensure we maintain a sustainable business in line with our stakeholders’ expectations.
CLIMATE DISCLOSURE IS JOURNEY OF CONTINUOUS IMPROVMENT
Approach
• Build a roadmap
• Adopt an integrated approach
• Approach as cyclical process
Benefits• Demonstrates awarness of growing importance of climate-relations issues to
key stakeholders
• Staying ahead of mandatory disclosure requirements
• Creates efficiences and relieves reporting burden
STAKEHOLDERENGAGEMENT GAP
ANALYSIS
INTERNAL ALIGNMENT
REPORTING &DISCLOSURE
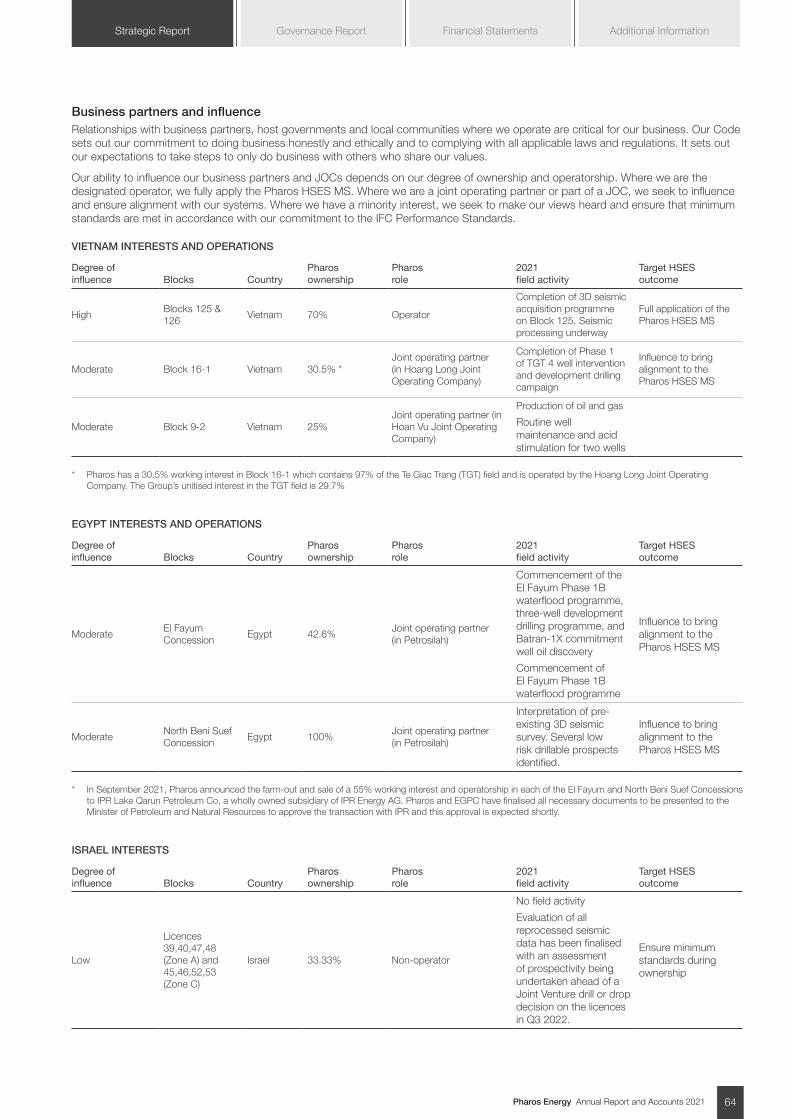
Pharos Energy Annual Report and Accounts 2021 64
Additional InformationGovernance Report Financial StatementsStrategic Report
Business partners and influenceRelationships with business partners, host governments and local communities where we operate are critical for our business. Our Code sets out our commitment to doing business honestly and ethically and to complying with all applicable laws and regulations. It sets out our expectations to take steps to only do business with others who share our values.
Our ability to influence our business partners and JOCs depends on our degree of ownership and operatorship. Where we are the designated operator, we fully apply the Pharos HSES MS. Where we are a joint operating partner or part of a JOC, we seek to influence and ensure alignment with our systems. Where we have a minority interest, we seek to make our views heard and ensure that minimum standards are met in accordance with our commitment to the IFC Performance Standards.
VIETNAM INTERESTS AND OPERATIONS
Degree of influence Blocks Country
Pharos ownership
Pharos role
2021 field activity
Target HSES outcome
High Blocks 125 & 126
Vietnam 70% Operator
Completion of 3D seismic acquisition programme on Block 125. Seismic processing underway
Full application of the Pharos HSES MS
Moderate Block 16-1 Vietnam 30.5% *Joint operating partner (in Hoang Long Joint Operating Company)
Completion of Phase 1 of TGT 4 well intervention and development drilling campaign
Influence to bring alignment to the Pharos HSES MS
Moderate Block 9-2 Vietnam 25%Joint operating partner (in Hoan Vu Joint Operating Company)
Production of oil and gas
Routine well maintenance and acid stimulation for two wells
* Pharos has a 30.5% working interest in Block 16-1 which contains 97% of the Te Giac Trang (TGT) field and is operated by the Hoang Long Joint Operating Company. The Group’s unitised interest in the TGT field is 29.7%
EGYPT INTERESTS AND OPERATIONS
Degree of influence Blocks Country
Pharos ownership
Pharos role
2021 field activity
Target HSES outcome
Moderate El Fayum Concession
Egypt 42.6% Joint operating partner (in Petrosilah)
Commencement of the El Fayum Phase 1B waterflood programme, three-well development drilling programme, and Batran-1X commitment well oil discovery
Commencement of El Fayum Phase 1B waterflood programme
Influence to bring alignment to the Pharos HSES MS
Moderate North Beni Suef Concession
Egypt 100% Joint operating partner (in Petrosilah)
Interpretation of pre-existing 3D seismic survey. Several low risk drillable prospects identified.
Influence to bring alignment to the Pharos HSES MS
* In September 2021, Pharos announced the farm-out and sale of a 55% working interest and operatorship in each of the El Fayum and North Beni Suef Concessions to IPR Lake Qarun Petroleum Co, a wholly owned subsidiary of IPR Energy AG. Pharos and EGPC have finalised all necessary documents to be presented to the Minister of Petroleum and Natural Resources to approve the transaction with IPR and this approval is expected shortly.
ISRAEL INTERESTS
Degree of influence Blocks Country
Pharos ownership
Pharos role
2021 field activity
Target HSES outcome
Low
Licences 39,40,47,48 (Zone A) and 45,46,52,53 (Zone C)
Israel 33.33% Non-operator
No field activity
Evaluation of all reprocessed seismic data has been finalised with an assessment of prospectivity being undertaken ahead of a Joint Venture drill or drop decision on the licences in Q3 2022.
Ensure minimum standards during ownership
Pharos Energy Annual Report and Accounts 202165
CORPORATE RESPONSIBILITY - CONTINUED
HSES Management System We undertake a range of activities to continuously improve our HSES MS to ensure that the Company’s policy commitments are applied. We may work in countries that have different standards and we review any potential gaps to ensure adherence to our policies in dialogue with our business partners. Routine monitoring is undertaken to assess and improve performance and periodic audits are conducted.
HSE trainings and exercises In Vietnam, the HLHVJOCs continued HSE induction to new staff, maintained its HSE Training Matrix such as travel safely by boat, firefighting and rescue, working at height and also conducted training for offshore production team such as Personal Protective Equipment training, refresh safety induction for contractors, behavioural safety and tank inspection procedure.
In Egypt, HSES training focused on lifesaving rules, permit to work, hot work hazards and safety requirements in confined space entry and working at heights. All five staff HSE engineers obtained Nebosh general certificates.
KEY PERFORMANCE INDICATORS
KPI Target 2021 2020 2019
HSES regulatory non-compliances
Zero 0 0 01
1. Although three regulatory non-compliances were reported in our Egyptian assets in 2019, these occurred in January, prior to the completion of our acquisition.
Contractor managementContractors are used throughout all aspects of our business. Our Contractor Management Procedure sets out requirements through all stages from selection through to management and service delivery.
In HSES critical activities, bridging documents are put in place to ensure Pharos and contractor alignment with our requirements.
Hours worked in Vietnam and Egypt assets
Percentage of total
Company staff: 779,216 25%
Contractors: 2,391,204 75%
Overall objectiveTo provide responsible and sustainable development
2021 Objectives 2021 Outcomes 2022 Objectives
Each asset to further enhance their own HSES training programme.
In Egypt, training is currently suspended on account of the COVID-19 pandemic. In Vietnam offshore staff complete regular HSE training; onshore staff training currently limited due to working from home.
Further alignment with Pharos HSES Management system
Confirm that outstanding recommendations from gap analysis of Merlon HSES MS against PHAROS Corporate HSES MS requirements have been closed
Findings are 98 percent closedWork closely with new partner HSES department to ensure a similar HSES approach is shared
Implement recommendations from gap analysis of Joint Operated Company (JOC) Management system in Vietnam against Pharos HSES MS requirements.
Completed Update Pharos HSES Management System
Further enhance in-country respective Emergency Response Teams interface with Head Office Crisis Management Response Team.
Pharos new Crisis Management Plan rolled out Pharos new Crisis Management Plan rolled out
Corporate Crisis Response team training conducted
Virtual Crisis Room setup
Pharos Energy to consider creating a single easily accessible online repository for accessing emergency response and relevant project documentation to ensure this can be readily sourced following an emergency.
Pharos Energy Annual Report and Accounts 2021 66
Additional InformationGovernance Report Financial StatementsStrategic Report
Preventing corruption Pharos currently operates in Vietnam, which is allocated a low score on Transparency International’s most recently published Corruption Perception Index (“CPI”), and is ranked number 87 (104 in 2020) out of 180 countries in the 2021 CPI. Egypt is ranked at 117 on the same CPI. Israel is ranked at 36 on the CPI, indicating a lower risk of corruption. We recognise that, with both areas of operation having a reputation for a lack of transparency and relatively high risk of corruption, it is vital that the Group’s policies, procedures and working practices are fit for purpose. Pharos maintains internal control systems to guide and ensure that our ethical business standards for relationships with others are achieved. The Audit and Risk Committee and the Board have carried out a review
of the effectiveness the Group’s risk management and internal control systems, see the Audit and Risk report pages 97 to 101. Bribery is prohibited throughout the organisation, both by our employees and by those performing work on our behalf. The Code of Business Conduct and Ethics supports all businesses that are conducted in an honest and ethical manner across the organisation. Our Anti-Bribery and Corruption (“ABC”) programme is designed to prevent corruption and ensure systems are in place to detect, remediate and learn from any potential violations. This includes due diligence on new vendors, annual training for all personnel, requisite compliance declarations from all associated persons, Gifts and Hospitality declaration and comprehensive ‘whistleblowing’ arrangements.
Our Whistleblowing Policy and Procedure ensures that employees are protected from possible reprisals when raising concerns in good faith. In addition to internal reporting channels, we have a confidential ethics hotlines supported by EthicsPoint with numbers displayed in local offices available 24 hours a day all year round. Zero calls were made to the EthicsPoint hotlines in 2021.
Payments to host governments Wealth generated by natural resources plays an important part in the growth and development of countries in which we operate. Revenues to governments become payable by the Group due to oil production entitlements, taxes, royalties, licence fees and infrastructure improvements.
During 2021, the total payments to governments for the Group amounted to $198.2m (2020: $150.9m), of which $151.9m or 77% (2020: $104.9m or 70%) was related to the Vietnam producing licence areas, of which $102.6m (2020: $72.5m) was for indirect taxes based on production entitlement. Egypt was paid a total of $44.7m (2020: $42.2m) of which $44.1m (2020: $41.3m) relates to indirect taxes based on production entitlement. The breakdown of other contributions, including payroll taxes and other taxes is contained within the additional information on pages 167 to 168. Our Code prohibits contributions to political parties, candidates or other political organisations.
Ethics
100%Employees and relevant contractors have undertaken anti-bribery and corruption training by 31 December 2021
Our objective is to conduct our business in an honest and ethical manner.
Overall objectiveTo conduct our business in an honest and ethical manner
2021 Objectives 2021 Outcomes 2022 Objectives
All personnel to complete the annual ABC programme including training, testing and self-declaration statement.
CompletedAll personnel to complete the annual ABC programme including training, testing and self-declaration statement
Continue to review ABC programme and update as required.
No updates requiredContinue to review ABC programme and update as required
Update and republish the Modern Slavery annual statement.
The annual statement on Modern Slavery has been published on the Pharos website.
Update and republish the Modern Slavery annual statement and all other corporate policy statements
Pharos Energy Annual Report and Accounts 202167
People
CORPORATE RESPONSIBILITY - CONTINUED
Our objective is to ensure the health, safety, security and welfare of our employees and those with whom we work and to ensure that we have a workforce that is performing at its best.
Our Health, Safety and Environment Policy and Code of Business Conduct and Ethics commit us to protecting the health and safety of our workforce, to providing a workplace free of discrimination where diversity is valued and to ensure that we consult and engage with our employees.
We value the contribution made by all employees and strive to ensure that we have training and development opportunities for everyone.
During 2021, the Group maintained its priority of keeping our workforce safe during the global pandemic.
On-going monitoring and precautionary / preventive measures under COVID-19The Group adhered to the requisite precautionary procedures and restrictions, in line with the government directives in Egypt, Vietnam and the UK. At Petrosilah and Pharos El Fayum, a vaccination campaign for all employees in the main offices and fields started in Q2 2021 and culminated to 97% (2 doses) of the workforce being vaccinated at the end of December 2021. In Vietnam, the HLHV JOC strict 5-7 days quarantine regulations are being applied for the workforce going offshore, in addition to rapid and PCR tests one day prior to offshore mobilisation
- 100% of the workforce are vaccinated with 2 doses at the end of December 2021. For the office workforce at all locations Pharos has continuously applied a hybrid-working mode and will do so until further notice.
Occupational health and safety Safety is the highest priority in our business and we are committed to operating safely and responsibly at all times and to providing a safe and healthy working environment for staff and contractors. Following from our Health, Safety and Environment Policy and Code of Business Conduct and Ethics, our HSES MS provides the framework for our approach and is implemented at each stage of a project supported by Occupational Health and Safety Guidance and Standard Operating Procedures. While Pharos had no field activity in 2021 in which we were the operator, we continued to work with our partners in Vietnam where the HLHVJOCs continued to maintain a high level of safety. We have worked to build and contribute to improvements in the safety culture in Vietnam and we are proud of that record of achievement. HSES training, drills, workshops and inspections are conducted on an annual basis to ensure that the zero target is maintained.
We are able to share our practices and lessons learned with others in the industry and are contributing to further capacity building.
In Egypt, we are pleased to report no recordable health and safety incident in 2021.
Safety of our workforce remains our number one priority and Pharos has reinforced the use of stop cards and safety training across all of the Group’s operations.
Critical Incident Risk ManagementPharos has emergency response plans in place for all projects and assets. The plans are communicated to the workforce and response personnel receive training to ensure they are competent to carry out their emergency roles. This is supplemented by periodic refresher training. Drills and training exercises are carried out. We ensure asset integrity and control operations in order to effectively manage all significant risks during all stages of the operations.
During 2021, there were no Process Safety Events classified Tier 1 or Tier 2 to be reported. All incidents were investigated and lessons learned as appropriate and actions to prevent recurrence were implemented.
SAFETY RECORD
2021 2020 2019
KPI Target rates Pharos IOGP4 Pharos IOGP Pharos IOGP
Fatal Accident Frequency Rate1 Zero 0 34 0.55 0 0.82
Lost Time Injury (“LTI”) Frequency Rate2 Zero 0 0.34 0.22 0 0.24
Total Recordable Injury Rate3 <0.34 0 0.34 0.70 0.42 0.92
Million-man hours worked 3.17 2.97 2,544 2.35 3,038 1 Fatal accident frequency rate: Number of fatal accidents per hundred million man-hours for both employees and contractors2 Lost time injury frequency rate: Number of lost time injuries per million man-hours for both employees and contractors3 Total Recordable Injury rate; Number of recordable injuries per million man-hours for both employees and contractors4 International Association of Oil and Gas Producers (“IOGP”) - Statistics not yet available for 2021
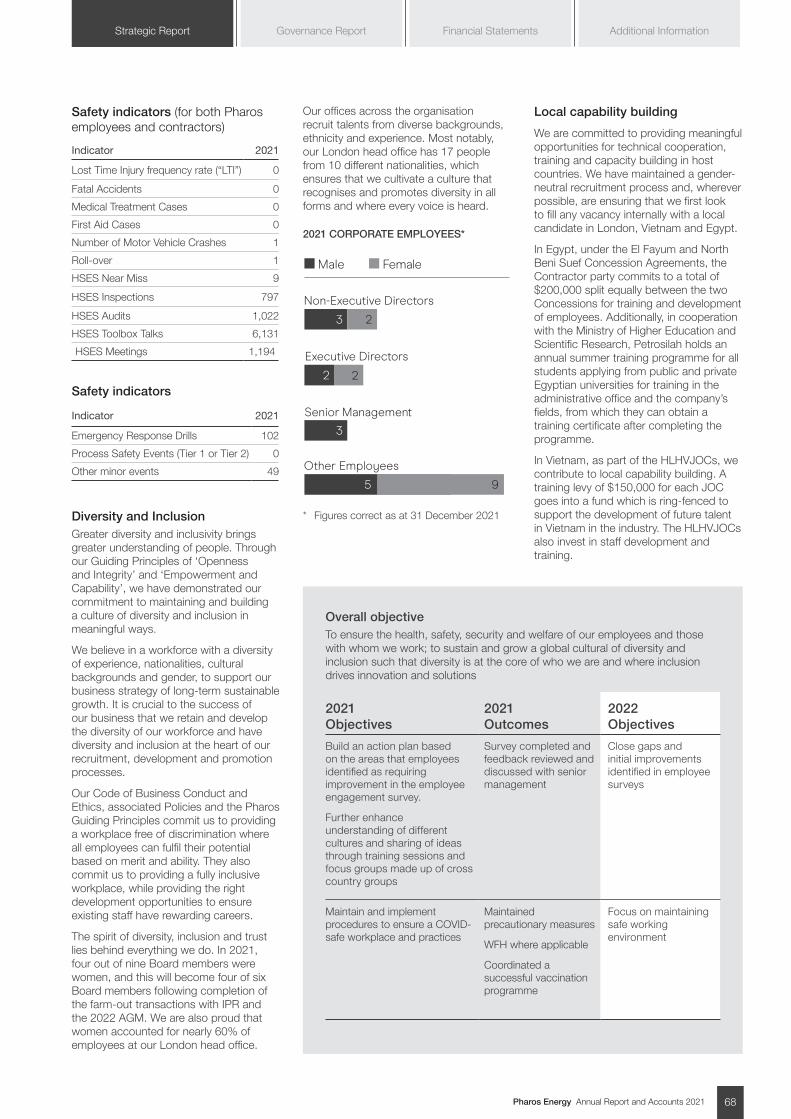
Pharos Energy Annual Report and Accounts 2021 68
Additional InformationGovernance Report Financial StatementsStrategic Report
Safety indicators (for both Pharos employees and contractors)
Indicator 2021
Lost Time Injury frequency rate (“LTI”) 0
Fatal Accidents 0
Medical Treatment Cases 0
First Aid Cases 0
Number of Motor Vehicle Crashes 1
Roll-over 1
HSES Near Miss 9
HSES Inspections 797
HSES Audits 1,022
HSES Toolbox Talks 6,131
HSES Meetings 1,194
Safety indicators
Indicator 2021
Emergency Response Drills 102
Process Safety Events (Tier 1 or Tier 2) 0
Other minor events 49
Diversity and Inclusion Greater diversity and inclusivity brings greater understanding of people. Through our Guiding Principles of ‘Openness and Integrity’ and ‘Empowerment and Capability’, we have demonstrated our commitment to maintaining and building a culture of diversity and inclusion in meaningful ways.
We believe in a workforce with a diversity of experience, nationalities, cultural backgrounds and gender, to support our business strategy of long-term sustainable growth. It is crucial to the success of our business that we retain and develop the diversity of our workforce and have diversity and inclusion at the heart of our recruitment, development and promotion processes.
Our Code of Business Conduct and Ethics, associated Policies and the Pharos Guiding Principles commit us to providing a workplace free of discrimination where all employees can fulfil their potential based on merit and ability. They also commit us to providing a fully inclusive workplace, while providing the right development opportunities to ensure existing staff have rewarding careers.
The spirit of diversity, inclusion and trust lies behind everything we do. In 2021, four out of nine Board members were women, and this will become four of six Board members following completion of the farm-out transactions with IPR and the 2022 AGM. We are also proud that women accounted for nearly 60% of employees at our London head office.
Our offices across the organisation recruit talents from diverse backgrounds, ethnicity and experience. Most notably, our London head office has 17 people from 10 different nationalities, which ensures that we cultivate a culture that recognises and promotes diversity in all forms and where every voice is heard.
2021 CORPORATE EMPLOYEES*
Non-Executive Directors
3 2
Executive Directors
2 2
Senior Management
Other Employees
5 9
Male Female
3
* Figures correct as at 31 December 2021
Local capability building
We are committed to providing meaningful opportunities for technical cooperation, training and capacity building in host countries. We have maintained a gender-neutral recruitment process and, wherever possible, are ensuring that we first look to fill any vacancy internally with a local candidate in London, Vietnam and Egypt.
In Egypt, under the El Fayum and North Beni Suef Concession Agreements, the Contractor party commits to a total of $200,000 split equally between the two Concessions for training and development of employees. Additionally, in cooperation with the Ministry of Higher Education and Scientific Research, Petrosilah holds an annual summer training programme for all students applying from public and private Egyptian universities for training in the administrative office and the company’s fields, from which they can obtain a training certificate after completing the programme.
In Vietnam, as part of the HLHVJOCs, we contribute to local capability building. A training levy of $150,000 for each JOC goes into a fund which is ring-fenced to support the development of future talent in Vietnam in the industry. The HLHVJOCs also invest in staff development and training.
Overall objectiveTo ensure the health, safety, security and welfare of our employees and those with whom we work; to sustain and grow a global cultural of diversity and inclusion such that diversity is at the core of who we are and where inclusion drives innovation and solutions
2021 Objectives
2021 Outcomes
2022 Objectives
Build an action plan based on the areas that employees identified as requiring improvement in the employee engagement survey.
Further enhance understanding of different cultures and sharing of ideas through training sessions and focus groups made up of cross country groups
Survey completed and feedback reviewed and discussed with senior management
Close gaps and initial improvements identified in employee surveys
Maintain and implement procedures to ensure a COVID-safe workplace and practices
Maintained precautionary measures
WFH where applicable
Coordinated a successful vaccination programme
Focus on maintaining safe working environment
Pharos Energy Annual Report and Accounts 202169
Environment
CORPORATE RESPONSIBILITY - CONTINUED
We recognise the potential impacts of our business on the environment. Our Health, Safety and Environment Policy sets out our commitment to conduct all business activities in a responsible manner. In setting the Group’s corporate responsibility priorities, our objective is to protect the environment and conserve biodiversity.
Greenhouse gas emissions (“GHG”)GHGs associated with energy use and with natural gas flaring and venting are a key issue for the Group.
In 2021, we continued to monitor our emissions and disclose them in accordance with industry requirements and standards, participated in the Carbon Disclosure Project (“CDP”), with further work completed in Q1 2022 on implementing the TCFD recommendations and alignment.
TCFD alignmentThe physical risk assessment focused on screening our interests in Vietnam, Egypt and Israel using the consultant’s physical risks datasets and an attempt to quantify changes in key climate variables (e.g. drought, rainfall, wave height) over a 5 and 10-year timeframe under the three emissions scenarios - Representative Concentration Pathways (RCPs). The transition analysis focused on the potential impacts of different future scenarios on the key transition risks facing the Group and the oil and gas sector more broadly over the next 5-10 years. By undertaking this assessment, Pharos demonstrated how it evaluated its portfolio resilience amid the uncertainty of the speed and extent of the energy transition. Transition risks were assessed by Pharos’ TCFD consultant under the International Agency (IEA) Sustainable Development Scenario (SDS) and Stated Policies Scenario (STEPS). Additionally, Pharos has considered the risk that climate change pressures could reduce oil prices during the 3 year Viability Statement window (please refer to the Viability Statement from pages 56-57 under the recommended IEA’s Net Zero Emissions scenario.
Pharos Energy plc has complied with the requirements of LR 9.8.6R by including climate-related financial disclosures consistent with the TCFD recommendations and recommended disclosures Pharos is compliant with 9 out of 11 of the TCFD recommended disclosure. The two exceptions are Strategy (b) and Metrics and Targets (c), details of which are noted below.
Strategy (b) Describe the impact of climate-related risks and opportunities on the organisation’s strategy and financial planning
To date Pharos has not yet formulated its decarbonisation plan as part of our corporate strategy as the physical and transition scenario risk analyses were completed in February 2022 and further assessments/discussions will take place during 2022 to consider adaptation strategies to mitigate the identified climate risks. Pharos has a comprehensive portfolio of climate related risks under multiple scenarios which will be regularly tracked, re-assessed and re-calibrated regularly to reflect the evolving climate landscape. Risk mitigation is already being considered in financial planning as part of our going concern and viability testing on oil future price curve based on the recommended IEA’s NZE scenario. Also, some stress testing has been carried out on a carbon tax impact on our future base cash balance and the impact was deemed not material. The risks and opportunities were assessed over a 5 and 10 year timeframe. A comprehensive decarbonisation/ climate mitigation plan will be formulated by our Senior Management by Q1 2023 to embed the mitigation plan into our medium and long-term corporate strategy.
Metrics and Targets (c) Describe the targets used by the organization to manage climate-related risks and opportunities and performance against targets
The baselines for GHG emissions for 2021 are disclosed in the Corporate Responsibility section under Environment (please refer to pages 69 to 75 and page 78 but no carbon reduction target has been set yet. During the course of 2022, Pharos will progress further feasibility studies on CO2 reduction technologies, improve our management of flaring and venting, explore where operational processes can be altered and evaluate the use of greener energy sources to replace the use of our own produced gas as fuel for our operations. By the end of 2022, Pharos will be in a better position to set a specific carbon footprint reduction targets against the 2021 GHG baselines.
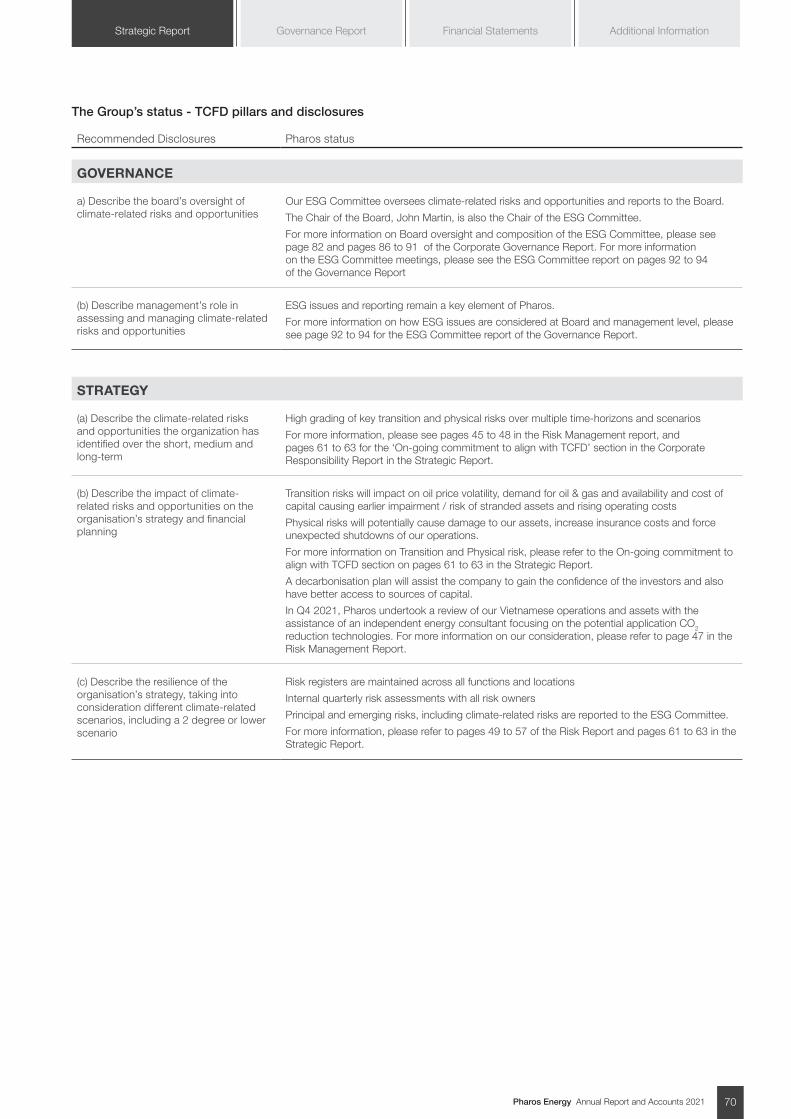
Pharos Energy Annual Report and Accounts 2021 70
Additional InformationGovernance Report Financial StatementsStrategic Report
The Group’s status - TCFD pillars and disclosures
Recommended Disclosures Pharos status
GOVERNANCE
a) Describe the board’s oversight of climate-related risks and opportunities
Our ESG Committee oversees climate-related risks and opportunities and reports to the Board.
The Chair of the Board, John Martin, is also the Chair of the ESG Committee.
For more information on Board oversight and composition of the ESG Committee, please see page 82 and pages 86 to 91 of the Corporate Governance Report. For more information on the ESG Committee meetings, please see the ESG Committee report on pages 92 to 94 of the Governance Report
(b) Describe management’s role in assessing and managing climate-related risks and opportunities
ESG issues and reporting remain a key element of Pharos.
For more information on how ESG issues are considered at Board and management level, please see page 92 to 94 for the ESG Committee report of the Governance Report.
STRATEGY
(a) Describe the climate-related risks and opportunities the organization has identified over the short, medium and long-term
High grading of key transition and physical risks over multiple time-horizons and scenarios
For more information, please see pages 45 to 48 in the Risk Management report, and pages 61 to 63 for the ‘On-going commitment to align with TCFD’ section in the Corporate Responsibility Report in the Strategic Report.
(b) Describe the impact of climate-related risks and opportunities on the organisation’s strategy and financial planning
Transition risks will impact on oil price volatility, demand for oil & gas and availability and cost of capital causing earlier impairment / risk of stranded assets and rising operating costs
Physical risks will potentially cause damage to our assets, increase insurance costs and force unexpected shutdowns of our operations.
For more information on Transition and Physical risk, please refer to the On-going commitment to align with TCFD section on pages 61 to 63 in the Strategic Report.
A decarbonisation plan will assist the company to gain the confidence of the investors and also have better access to sources of capital.
In Q4 2021, Pharos undertook a review of our Vietnamese operations and assets with the assistance of an independent energy consultant focusing on the potential application CO2 reduction technologies. For more information on our consideration, please refer to page 47 in the Risk Management Report.
(c) Describe the resilience of the organisation’s strategy, taking into consideration different climate-related scenarios, including a 2 degree or lower scenario
Risk registers are maintained across all functions and locations
Internal quarterly risk assessments with all risk owners
Principal and emerging risks, including climate-related risks are reported to the ESG Committee.
For more information, please refer to pages 49 to 57 of the Risk Report and pages 61 to 63 in the Strategic Report.
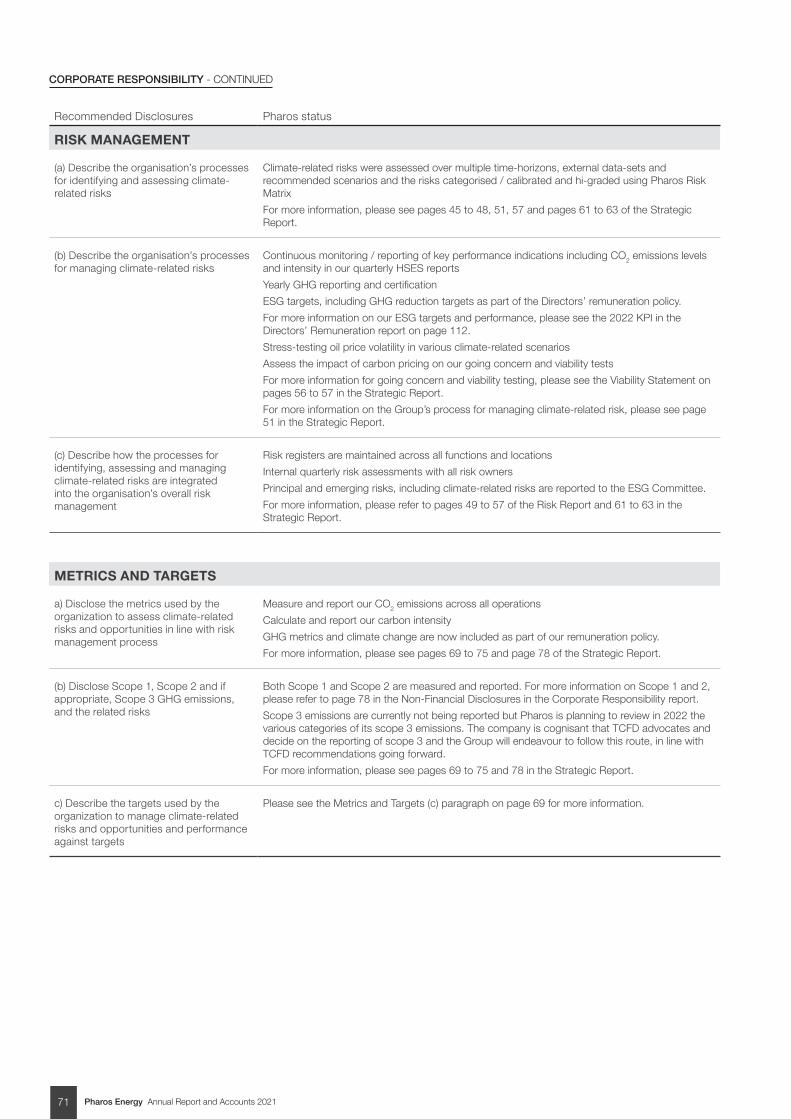
Pharos Energy Annual Report and Accounts 202171
CORPORATE RESPONSIBILITY - CONTINUED
Recommended Disclosures Pharos status
RISK MANAGEMENT
(a) Describe the organisation’s processes for identifying and assessing climate-related risks
Climate-related risks were assessed over multiple time-horizons, external data-sets and recommended scenarios and the risks categorised / calibrated and hi-graded using Pharos Risk Matrix
For more information, please see pages 45 to 48, 51, 57 and pages 61 to 63 of the Strategic Report.
(b) Describe the organisation’s processes for managing climate-related risks
Continuous monitoring / reporting of key performance indications including CO2 emissions levels and intensity in our quarterly HSES reports
Yearly GHG reporting and certification
ESG targets, including GHG reduction targets as part of the Directors’ remuneration policy.
For more information on our ESG targets and performance, please see the 2022 KPI in the Directors’ Remuneration report on page 112.
Stress-testing oil price volatility in various climate-related scenarios
Assess the impact of carbon pricing on our going concern and viability tests
For more information for going concern and viability testing, please see the Viability Statement on pages 56 to 57 in the Strategic Report.
For more information on the Group’s process for managing climate-related risk, please see page 51 in the Strategic Report.
(c) Describe how the processes for identifying, assessing and managing climate-related risks are integrated into the organisation’s overall risk management
Risk registers are maintained across all functions and locations
Internal quarterly risk assessments with all risk owners
Principal and emerging risks, including climate-related risks are reported to the ESG Committee.
For more information, please refer to pages 49 to 57 of the Risk Report and 61 to 63 in the Strategic Report.
METRICS AND TARGETS
a) Disclose the metrics used by the organization to assess climate-related risks and opportunities in line with risk management process
Measure and report our CO2 emissions across all operations
Calculate and report our carbon intensity
GHG metrics and climate change are now included as part of our remuneration policy.
For more information, please see pages 69 to 75 and page 78 of the Strategic Report.
(b) Disclose Scope 1, Scope 2 and if appropriate, Scope 3 GHG emissions, and the related risks
Both Scope 1 and Scope 2 are measured and reported. For more information on Scope 1 and 2, please refer to page 78 in the Non-Financial Disclosures in the Corporate Responsibility report.
Scope 3 emissions are currently not being reported but Pharos is planning to review in 2022 the various categories of its scope 3 emissions. The company is cognisant that TCFD advocates and decide on the reporting of scope 3 and the Group will endeavour to follow this route, in line with TCFD recommendations going forward.
For more information, please see pages 69 to 75 and 78 in the Strategic Report.
c) Describe the targets used by the organization to manage climate-related risks and opportunities and performance against targets
Please see the Metrics and Targets (c) paragraph on page 69 for more information.
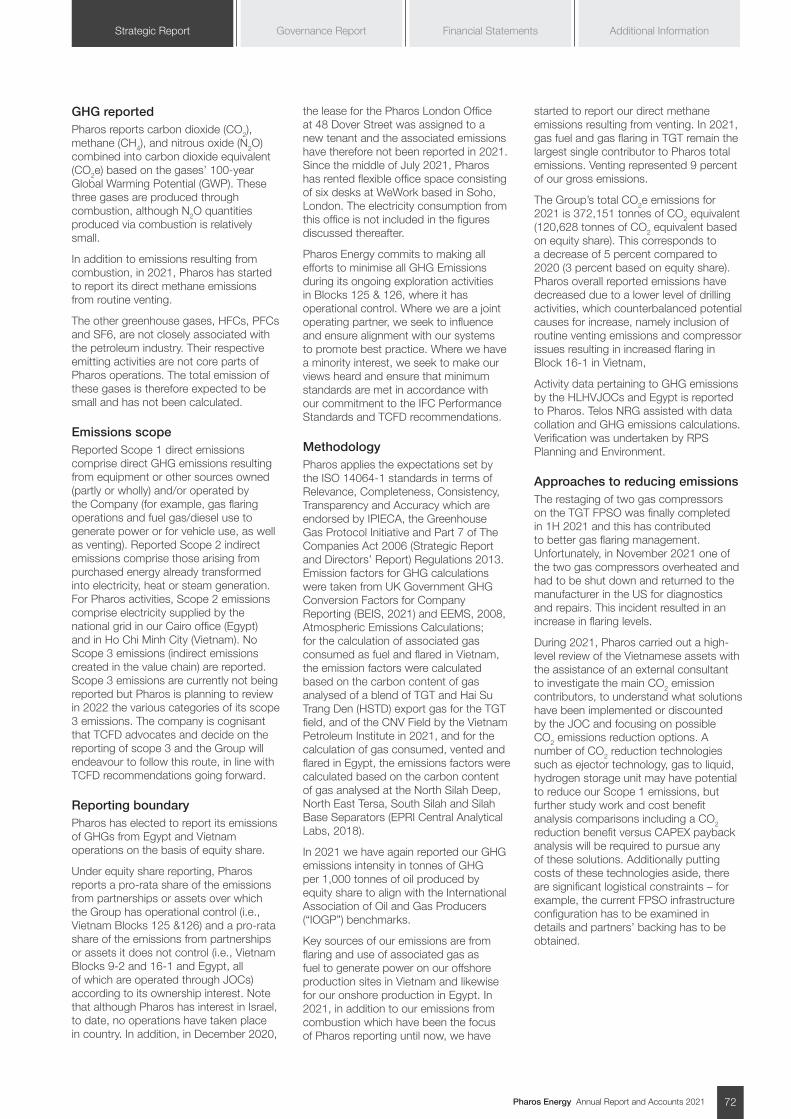
Pharos Energy Annual Report and Accounts 2021 72
Additional InformationGovernance Report Financial StatementsStrategic Report
GHG reportedPharos reports carbon dioxide (CO2), methane (CH4), and nitrous oxide (N2O) combined into carbon dioxide equivalent (CO2e) based on the gases’ 100-year Global Warming Potential (GWP). These three gases are produced through combustion, although N2O quantities produced via combustion is relatively small.
In addition to emissions resulting from combustion, in 2021, Pharos has started to report its direct methane emissions from routine venting.
The other greenhouse gases, HFCs, PFCs and SF6, are not closely associated with the petroleum industry. Their respective emitting activities are not core parts of Pharos operations. The total emission of these gases is therefore expected to be small and has not been calculated.
Emissions scopeReported Scope 1 direct emissions comprise direct GHG emissions resulting from equipment or other sources owned (partly or wholly) and/or operated by the Company (for example, gas flaring operations and fuel gas/diesel use to generate power or for vehicle use, as well as venting). Reported Scope 2 indirect emissions comprise those arising from purchased energy already transformed into electricity, heat or steam generation. For Pharos activities, Scope 2 emissions comprise electricity supplied by the national grid in our Cairo office (Egypt) and in Ho Chi Minh City (Vietnam). No Scope 3 emissions (indirect emissions created in the value chain) are reported. Scope 3 emissions are currently not being reported but Pharos is planning to review in 2022 the various categories of its scope 3 emissions. The company is cognisant that TCFD advocates and decide on the reporting of scope 3 and the Group will endeavour to follow this route, in line with TCFD recommendations going forward.
Reporting boundaryPharos has elected to report its emissions of GHGs from Egypt and Vietnam operations on the basis of equity share.
Under equity share reporting, Pharos reports a pro-rata share of the emissions from partnerships or assets over which the Group has operational control (i.e., Vietnam Blocks 125 &126) and a pro-rata share of the emissions from partnerships or assets it does not control (i.e., Vietnam Blocks 9-2 and 16-1 and Egypt, all of which are operated through JOCs) according to its ownership interest. Note that although Pharos has interest in Israel, to date, no operations have taken place in country. In addition, in December 2020,
the lease for the Pharos London Office at 48 Dover Street was assigned to a new tenant and the associated emissions have therefore not been reported in 2021. Since the middle of July 2021, Pharos has rented flexible office space consisting of six desks at WeWork based in Soho, London. The electricity consumption from this office is not included in the figures discussed thereafter.
Pharos Energy commits to making all efforts to minimise all GHG Emissions during its ongoing exploration activities in Blocks 125 & 126, where it has operational control. Where we are a joint operating partner, we seek to influence and ensure alignment with our systems to promote best practice. Where we have a minority interest, we seek to make our views heard and ensure that minimum standards are met in accordance with our commitment to the IFC Performance Standards and TCFD recommendations.
MethodologyPharos applies the expectations set by the ISO 14064-1 standards in terms of Relevance, Completeness, Consistency, Transparency and Accuracy which are endorsed by IPIECA, the Greenhouse Gas Protocol Initiative and Part 7 of The Companies Act 2006 (Strategic Report and Directors’ Report) Regulations 2013. Emission factors for GHG calculations were taken from UK Government GHG Conversion Factors for Company Reporting (BEIS, 2021) and EEMS, 2008, Atmospheric Emissions Calculations; for the calculation of associated gas consumed as fuel and flared in Vietnam, the emission factors were calculated based on the carbon content of gas analysed of a blend of TGT and Hai Su Trang Den (HSTD) export gas for the TGT field, and of the CNV Field by the Vietnam Petroleum Institute in 2021, and for the calculation of gas consumed, vented and flared in Egypt, the emissions factors were calculated based on the carbon content of gas analysed at the North Silah Deep, North East Tersa, South Silah and Silah Base Separators (EPRI Central Analytical Labs, 2018).
In 2021 we have again reported our GHG emissions intensity in tonnes of GHG per 1,000 tonnes of oil produced by equity share to align with the International Association of Oil and Gas Producers (“IOGP”) benchmarks.
Key sources of our emissions are from flaring and use of associated gas as fuel to generate power on our offshore production sites in Vietnam and likewise for our onshore production in Egypt. In 2021, in addition to our emissions from combustion which have been the focus of Pharos reporting until now, we have
started to report our direct methane emissions resulting from venting. In 2021, gas fuel and gas flaring in TGT remain the largest single contributor to Pharos total emissions. Venting represented 9 percent of our gross emissions.
The Group’s total CO2e emissions for 2021 is 372,151 tonnes of CO2 equivalent (120,628 tonnes of CO2 equivalent based on equity share). This corresponds to a decrease of 5 percent compared to 2020 (3 percent based on equity share). Pharos overall reported emissions have decreased due to a lower level of drilling activities, which counterbalanced potential causes for increase, namely inclusion of routine venting emissions and compressor issues resulting in increased flaring in Block 16-1 in Vietnam,
Activity data pertaining to GHG emissions by the HLHVJOCs and Egypt is reported to Pharos. Telos NRG assisted with data collation and GHG emissions calculations. Verification was undertaken by RPS Planning and Environment.
Approaches to reducing emissionsThe restaging of two gas compressors on the TGT FPSO was finally completed in 1H 2021 and this has contributed to better gas flaring management. Unfortunately, in November 2021 one of the two gas compressors overheated and had to be shut down and returned to the manufacturer in the US for diagnostics and repairs. This incident resulted in an increase in flaring levels.
During 2021, Pharos carried out a high-level review of the Vietnamese assets with the assistance of an external consultant to investigate the main CO2 emission contributors, to understand what solutions have been implemented or discounted by the JOC and focusing on possible CO2 emissions reduction options. A number of CO2 reduction technologies such as ejector technology, gas to liquid, hydrogen storage unit may have potential to reduce our Scope 1 emissions, but further study work and cost benefit analysis comparisons including a CO2 reduction benefit versus CAPEX payback analysis will be required to pursue any of these solutions. Additionally putting costs of these technologies aside, there are significant logistical constraints – for example, the current FPSO infrastructure configuration has to be examined in details and partners’ backing has to be obtained.
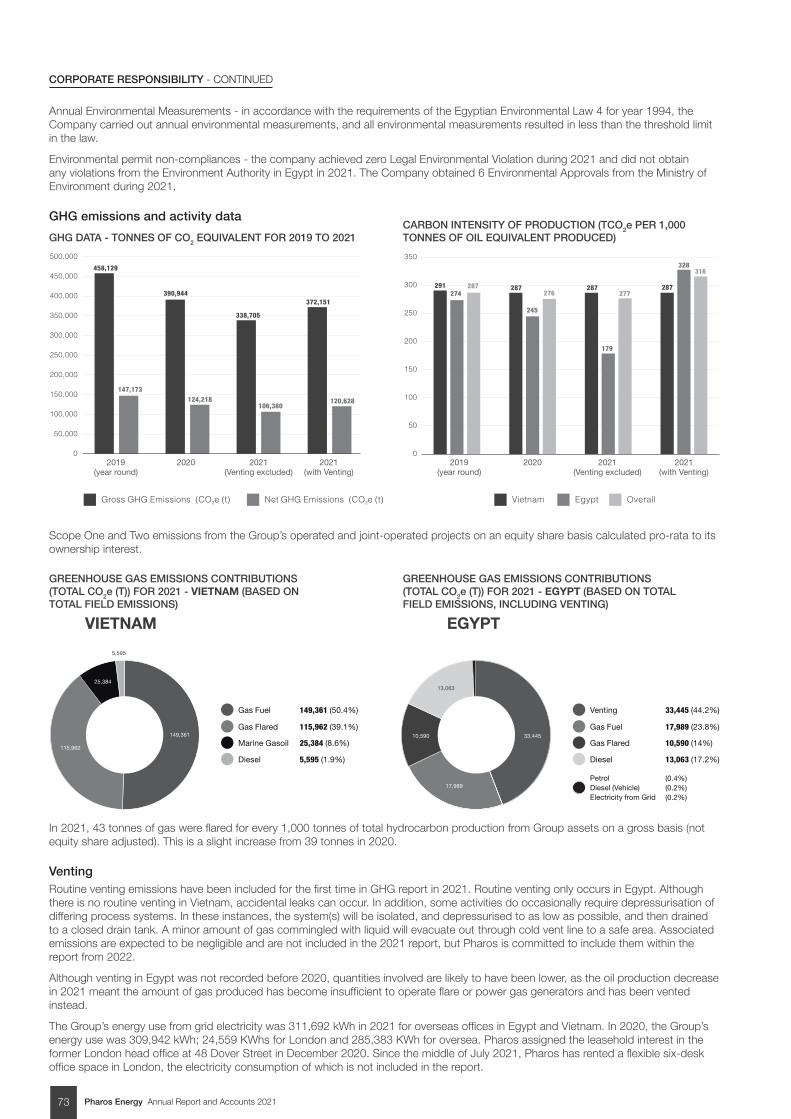
Pharos Energy Annual Report and Accounts 202173
CORPORATE RESPONSIBILITY - CONTINUED
Annual Environmental Measurements - in accordance with the requirements of the Egyptian Environmental Law 4 for year 1994, the Company carried out annual environmental measurements, and all environmental measurements resulted in less than the threshold limit in the law.
Environmental permit non-compliances - the company achieved zero Legal Environmental Violation during 2021 and did not obtain any violations from the Environment Authority in Egypt in 2021. The Company obtained 6 Environmental Approvals from the Ministry of Environment during 2021.
GHG emissions and activity data
Scope One and Two emissions from the Group’s operated and joint-operated projects on an equity share basis calculated pro-rata to its ownership interest.
In 2021, 43 tonnes of gas were flared for every 1,000 tonnes of total hydrocarbon production from Group assets on a gross basis (not equity share adjusted). This is a slight increase from 39 tonnes in 2020.
VentingRoutine venting emissions have been included for the first time in GHG report in 2021. Routine venting only occurs in Egypt. Although there is no routine venting in Vietnam, accidental leaks can occur. In addition, some activities do occasionally require depressurisation of differing process systems. In these instances, the system(s) will be isolated, and depressurised to as low as possible, and then drained to a closed drain tank. A minor amount of gas commingled with liquid will evacuate out through cold vent line to a safe area. Associated emissions are expected to be negligible and are not included in the 2021 report, but Pharos is committed to include them within the report from 2022.
Although venting in Egypt was not recorded before 2020, quantities involved are likely to have been lower, as the oil production decrease in 2021 meant the amount of gas produced has become insufficient to operate flare or power gas generators and has been vented instead.
The Group’s energy use from grid electricity was 311,692 kWh in 2021 for overseas offices in Egypt and Vietnam. In 2020, the Group’s energy use was 309,942 kWh; 24,559 KWhs for London and 285,383 KWh for oversea. Pharos assigned the leasehold interest in the former London head office at 48 Dover Street in December 2020. Since the middle of July 2021, Pharos has rented a flexible six-desk office space in London, the electricity consumption of which is not included in the report.
GHG DATA - TONNES OF CO2 EQUIVALENT FOR 2019 TO 2021CARBON INTENSITY OF PRODUCTION (TCO2e PER 1,000 TONNES OF OIL EQUIVALENT PRODUCED)
GREENHOUSE GAS EMISSIONS CONTRIBUTIONS (TOTAL CO2e (T)) FOR 2021 - VIETNAM (BASED ON TOTAL FIELD EMISSIONS)
GREENHOUSE GAS EMISSIONS CONTRIBUTIONS (TOTAL CO2e (T)) FOR 2021 - EGYPT (BASED ON TOTAL FIELD EMISSIONS, INCLUDING VENTING)
EGYPTVIETNAM
0
50,000
100,000
150,000
200,000
250,000
300,000
350,000
400,000
450,000
500,000
2019 (year round)
2020 2021(Venting excluded)
2021(with Venting)
0
50
100
150
200
250
300
350
2019 (year round)
2020 2021(Venting excluded)
2021(with Venting)
458,129
390,944
338,705
372,151
291 287 287 287
147,173
124,218106,380
120,628
274
245
179
328
287276 277
316
Gross GHG Emissions (CO e (t)2 Net GHG Emissions (CO e (t)2 Vietnam Egypt Overall
Gas Fuel
149,361 (50.4%)
Gas Flared
115,962 (39.1%)
Marine Gasoil
25,384 (8.6%)
Diesel
5,595 (1.9%)
149,361
115,962
5,595
25,384
Venting
33,445 (44.2%)
Gas Fuel
17,989 (23.8%)
Gas Flared
10,590 (14%)
Diesel
13,063 (17.2%)
33,445
17,989
13,063
PetrolDiesel (Vehicle)Electricity from Grid
10,590
(0.4%)(0.2%)(0.2%)
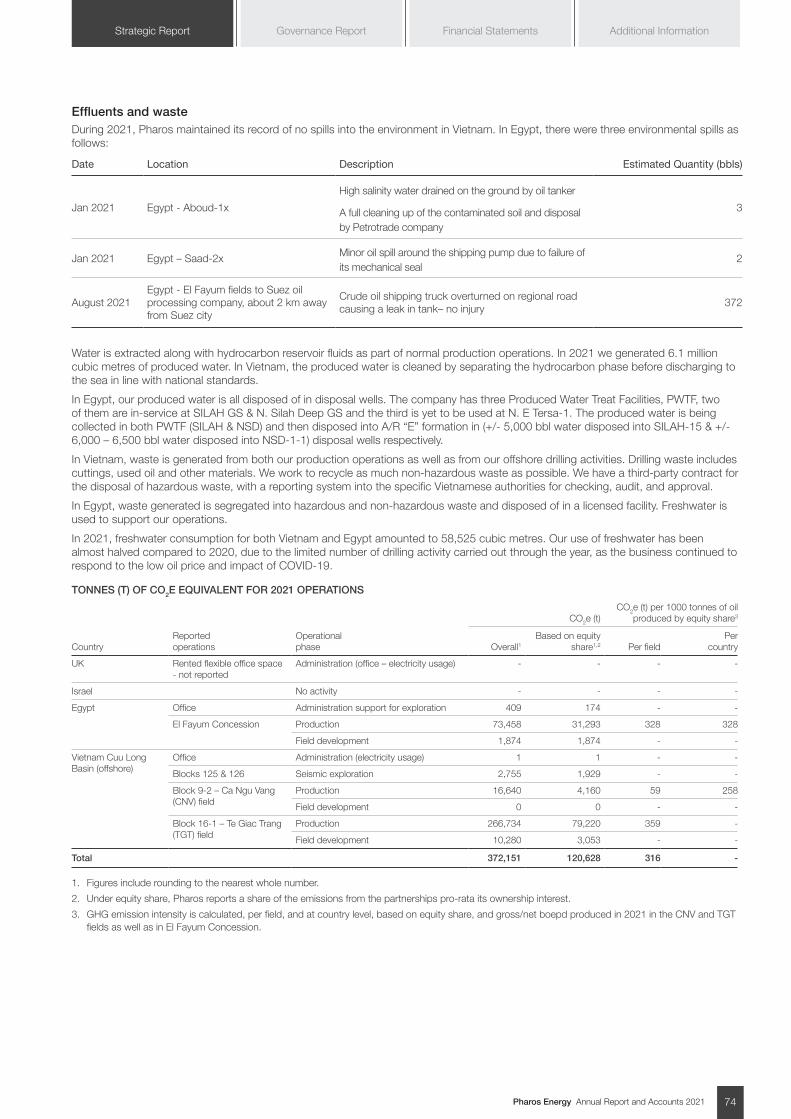
Pharos Energy Annual Report and Accounts 2021 74
Additional InformationGovernance Report Financial StatementsStrategic Report
Effluents and waste During 2021, Pharos maintained its record of no spills into the environment in Vietnam. In Egypt, there were three environmental spills as follows:
Date Location Description Estimated Quantity (bbls)
Jan 2021 Egypt - Aboud-1x
High salinity water drained on the ground by oil tanker
A full cleaning up of the contaminated soil and disposal by Petrotrade company
3
Jan 2021 Egypt – Saad-2x Minor oil spill around the shipping pump due to failure of its mechanical seal
2
August 2021Egypt - El Fayum fields to Suez oil processing company, about 2 km away from Suez city
Crude oil shipping truck overturned on regional road causing a leak in tank– no injury
372
Water is extracted along with hydrocarbon reservoir fluids as part of normal production operations. In 2021 we generated 6.1 million cubic metres of produced water. In Vietnam, the produced water is cleaned by separating the hydrocarbon phase before discharging to the sea in line with national standards.
In Egypt, our produced water is all disposed of in disposal wells. The company has three Produced Water Treat Facilities, PWTF, two of them are in-service at SILAH GS & N. Silah Deep GS and the third is yet to be used at N. E Tersa-1. The produced water is being collected in both PWTF (SILAH & NSD) and then disposed into A/R “E” formation in (+/- 5,000 bbl water disposed into SILAH-15 & +/-6,000 – 6,500 bbl water disposed into NSD-1-1) disposal wells respectively.
In Vietnam, waste is generated from both our production operations as well as from our offshore drilling activities. Drilling waste includes cuttings, used oil and other materials. We work to recycle as much non-hazardous waste as possible. We have a third-party contract for the disposal of hazardous waste, with a reporting system into the specific Vietnamese authorities for checking, audit, and approval.
In Egypt, waste generated is segregated into hazardous and non-hazardous waste and disposed of in a licensed facility. Freshwater is used to support our operations.
In 2021, freshwater consumption for both Vietnam and Egypt amounted to 58,525 cubic metres. Our use of freshwater has been almost halved compared to 2020, due to the limited number of drilling activity carried out through the year, as the business continued to respond to the low oil price and impact of COVID-19.
TONNES (T) OF CO2E EQUIVALENT FOR 2021 OPERATIONS
CO2e (t)CO2e (t) per 1000 tonnes of oil
produced by equity share3
CountryReported operations
Operational phase Overall1
Based on equity share1,2 Per field
Per country
UK Rented flexible office space - not reported
Administration (office – electricity usage) - - - -
Israel No activity - - - -
Egypt Office Administration support for exploration 409 174 - -
El Fayum Concession Production 73,458 31,293 328 328
Field development 1,874 1,874 - -
Vietnam Cuu Long Basin (offshore)
Office Administration (electricity usage) 1 1 - -
Blocks 125 & 126 Seismic exploration 2,755 1,929 - -
Block 9-2 – Ca Ngu Vang (CNV) field
Production 16,640 4,160 59 258
Field development 0 0 - -
Block 16-1 – Te Giac Trang (TGT) field
Production 266,734 79,220 359 -
Field development 10,280 3,053 - -
Total 372,151 120,628 316 -
1. Figures include rounding to the nearest whole number.
2. Under equity share, Pharos reports a share of the emissions from the partnerships pro-rata its ownership interest.
3. GHG emission intensity is calculated, per field, and at country level, based on equity share, and gross/net boepd produced in 2021 in the CNV and TGT fields as well as in El Fayum Concession.
Pharos Energy Annual Report and Accounts 202175
CORPORATE RESPONSIBILITY - CONTINUED
Biodiversity The Group’s Biodiversity and Conservation Policy commits us to meet the objectives of the Convention on Biological Diversity (1992). We identify whether a project is located in modified, natural or critical habitats, or a legally protected or internationally recognised area; and whether the project may potentially impact on, or be dependent on, ecosystems services over which Pharos has direct management control or significant influence. In Egypt, the El Fayum Concession borders the multiple-use management area and the natural protectorate area of Lake Qarun which includes important bird habitats. It is adjacent to the Wadi El Rayan protected area, which includes the Wadi Al-Hitan World Heritage Site. In Vietnam, Blocks 125 & 126 are approximately 50km offshore to the Nha Trang Bay Protected Area and the Thuy Trieu Marine Protected Area. Consistent with the Biodiversity and Conservation Policy, Pharos does not operate in any UNESCO designated World Heritage Site and ensures that activities in buffer zones around these sites do not jeopardise the Outstanding Universal Value (as defined by UNESCO) of these sites.
In Vietnam, safe practices were adhered to ensure the surrounding environment is protected at all times:
• The oil in water content of produced water were continuously monitored
• Hazardous wastes have been strictly managed, with hazardous wastes manifests completed and submitted to the relevant authorities
• All waste waters and sewage generated on the drilling rigs, supply vessels and FPSO have been treated before discharge
• All solid wastes were collected, segregated and transported to shore and sent to the appointed contractors who provided waste treatment system
In Egypt, similar safe practices were in place:
• For normal waste, handling and disposal was undertaken in compliance with applicable environmental law and regulatory requirements, involving contracting with local units.
• Handling, transportation and disposal of hazardous waste was undertaken as follows:
- solid hazardous waste to approved landfill
- liquid and solid hydrocarbon waste to approved landfill
- waste water to ULTRA EXTRACT treatment factory
- water-based mud cutting waste to the Fayum Governorate landfill.
An annual environmental monitoring was conducted over Petrosilah work locations by IMS Company to assess compliance with applicable environmental law and regulation.
We are committed to developing site-specific biodiversity action plans in the event that operational sites are within sensitive areas, incorporating country-specific strategies and action plans and working in association with external advisers to ensure that best practice conservation priorities are achieved.
NON-FINANCIAL KPIS (HSES) Target - 2022 2021 2020 2019
Spills to the environment* 0 3 4 2
*Number of spills reported.
Target 2021 2020 2019
Solid non-hazardous waste produced (tonnes) Set per project 111 94 104
Percentage of non-hazardous waste reused or recycled Set per project 24 25 15
Solid hazardous waste (tonnes) Set per project 48 41 3,112
Percentage of hazardous waste reused or recycled Set per project <1 4 <1
OVERALL OBJECTIVE To protect the environment and conserve biodiversity
2021 Objectives 2021 Outcomes 2022 Objectives
Commission all necessary EIAs before start of activities or projects
All environmental permits obtained prior to starting operational activities
Obtain all necessary environmental permits for all drilling programmes / seismic studies
Complete gap analysis and fully implement Pharos standards
Work in progressImprove methane emissions management and reporting
Implementation of the new country entry procedure prior to any acquisition.
There has been no new country entry in 2021
To be applied if there is a new country entry
Flaring in Vietnam is better managed with re-staged compressors
Partly achieved – one GTC was shut down in mid-Nov 21 this caused an increase in daily flaring levels
Carry out further feasibility studies / cost benefit analysis on a few CO2 reduction technologies
Look to resume at the appropriate time
Continue Phase 2 TCFD implementation
Project GOO - Greening our Operations
Phase 2 of TCFD implementation completed
Project GOO has been placed on hold due to lack of funding
Continue with TCFD alignment - disclosure & reporting
Map out Pharos decarbonisation plan
Pharos Energy Annual Report and Accounts 2021 76
Additional InformationGovernance Report Financial StatementsStrategic Report
SocietyOur Social Responsibility and Human Rights Policies set our requirements for social responsibility, community engagement and human rights.
Human rights The Group Human Rights Policy commits Pharos to conducting its business in accordance with the fundamental principles of human rights set out in the Universal Declaration of Human Rights and reflects the terms of both the OECD Guidelines for Multinational Enterprises and the United Nations Guiding Principles on Business and Human Rights. Together with our Social Responsibility Policy, it sets out our commitments to align with the Voluntary Principles on Security and Human Rights. We respect indigenous rights and cultures of the communities where we operate.
Our human rights due diligence includes processes to address, monitor and communicate actual or potential impacts.
For Egypt, all Group corporate policies including the Human Rights Policy and the Social Responsibility Policy, have been translated into Arabic for dissemination locally.
In accordance with the UK Modern Slavery Act, Pharos reports annually on the steps it has taken to mitigate the risk of modern slavery occurring in any part of its business. The Group’s Statement on Modern Slavery is available on the Company’s website at https://www.pharos.energy/modern-slavery-act/.
Community and social investment Pharos remains committed to creating value for host countries and local communities as well as for staff and shareholders. We understand that our success is reliant upon building strong relationships and being welcomed as a responsible partner in our host countries and communities. In recent years, we have structured our social investment programme to align more with the United Nations Sustainable Development Goals (UN SDGs).
In Vietnam, in 2021, we worked closely with the JOCs in order to make sure that our social initiatives in the region
continue to have positive impacts on the region. In addition to the training levy of $300,000 per year in a ring-fenced fund to support developing future Vietnamese expertise in the industry, a further $265,000 was invested in 12 community projects. The JOCs actively inquired and listened to locals to identify which areas of the country would need the greatest assistance in order to ensure that we were investing in local projects that would bring the most sustainable positive impact to the community. For instance, in Q1 2021, the Group provided financial support for autistic children at Anh Dao Specialised Educational Centre in Ha Tinh province, with additional donations towards providing therapy for children with disabilities at An Tue Social Assistance Centre, Thua Thien Hue province (UN SDG 3: Good health & wellbeing and UN SDG 4: Quality education). In Q2 2021, the Donation Programme helped fund the construction of a community culture house in Hop Hung commune, Vu Ban district, Nam Dinh province which, once finishes, will act as a communal education house for children in the area for years to come (UN SDG 4 Quality education and UN SDG 9: Industry, innovation and infrastructure).
As at 2021, Pharos has invested c.$1.2 billion in the exploration, appraisal and development of oil and gas projects located offshore Vietnam since inception, of which $6.2 million was for training levy and charity donation projects, making Pharos one of the largest British investors in the country.
In Egypt, under the El Fayum and North Beni Suef Concession Agreements, the Company contributes a total of $200,000 split equally between the two Concessions to support long-term training and development of talents within the industry (UN SDG 9: Industry, innovation and infrastructure). Additionally, in cooperation with the Ministry of Higher Education and Scientific Research, Petrosilah holds an annual summer training programme for all students applying from public and private
Egyptian universities for training in the administrative office and the company’s fields, of which they can obtain a training certificate from the company (UN SDG 4: Quality education).
Social projects like these have been part of Pharos since inception, and we have always sought to invest sustainably so that the initiatives that we helped set up, stay in place, and have lasting impacts for many generations.
Local capacityWe support local capacity building during the exploration or development phases of a project to ensure a positive imprint and legacy. All our licence agreements include a high degree of local content, which commits us to hire locally where possible and provide training to develop new skills. Our policy commits us to provide meaningful opportunities for technical co-operation, training and capacity building within any host country in which we operate.
Community projects in Vietnam 2021 via the HLHVJOC Donation ProgrammeWhile the yearly contributions from HLHVJOC Foreign Partners for community and social projects are set at $200,000, historically, HLHVJOC charitable donations have been in excess of this. The additional contributions were raised by staff through fundraising event and from various donations by expat members, anytime during the year when there are unforeseen typhoons or national disasters that cause widespread devastation, such as flooding and landslides destroying infrastructure, houses, livestock, and crops. Additionally, staff donations are matched by HLHVJOC and then added to the total budget.
We look to replicate this in the future with our community and social investment programmes in Egypt and London.
Pharos Energy Annual Report and Accounts 202177
CORPORATE RESPONSIBILITY - CONTINUED
UN SDG 1 – NO POVERTY
End poverty in all its forms everywhere
• Financial support for low-income households in Tran Hung Dao commune, Ha Nam province and Son Binh commune, Ha Tinh province in 2021 Lunar New Year
• Financial support for low-income households in Doan Ket commune, Bu Dang district, Binh Phuoc province on 2021 Lunar New Year
• Financial support the House of Grace Orphanage (Hông Ân House) in Thu Duc city, Ho Chi Minh city, Viet Nam
• Financial support to green summer volunteers to build roads for the low-income community in Dong Thap province
• Financial support towards children in areas hit hardest by the COVID-19 pandemic
• Financial support to Agent Orange victims in the central provinces in Quang Tri and Thai Binh province
UN SDG 3 – GOOD HEALTH & WELL-BEING
Ensure healthy lives and promote well-being for all at all ages
• Financial support for Tran Hai Nam, our Vietnamese employee, and his mother for cancer treatment
• Financial support the COVID-19 epidemic prevention fund through the HLHV JOCs Labor Union
• Funding to support the Government’s COVID-19 Vaccine Fund through PVEP
UN SDG 4 – QUALITY EDUCATION
Ensure inclusive and equitable quality education and promote lifelong learning opportunities for all
• Financial support to Autistic Children at Anh Dao Specialised Educational Center – Ha Tinh Province
• Financial support to therapy for children with disabilities at An Tue Social Assistance Center – Thua Thien Hue province.
• Financial support construction funding community education culture house in Hop Hung commune, Vu Ban district, Nam Dinh province
$265,000 Total
SOCIETY CASE STUDY
Engaging with host communities
VIETNAM
$30,400 Charitable donation from the HLHVJOCs to autistic children at Anh Dao Specialised Educational Centre in Ha Tinh province, with additional $30,400 donations towards providing therapy for children with disabilities at An Tue Social Assistance Centre, Thua Thien Hue province.
$100,000 Charitable donation to fund the construction of a community culture house in Hop Hung commune, Vu Ban district, Nam Dinh province which, once finishes, will act as a communal education house for children in the area for years to come.
$25,400 In financial support for the COVID-19 pandemic prevention fund through the HLHVJOCs’ Labour Union and the Government’s COVID-19 Vaccine Fund through PVEP.
EGYPT
In cooperation with the Ministry of Higher Education and Scientific Research, Petrosilah holds an annual summer training programme for all students applying from public and private Egyptian universities for training in the administrative office and the company’s fields, of which they can obtain a training certificate from the company.
Overall objectiveTo consult with and contribute into our host communities
2021 Objectives 2021 Outcomes 2022 Objectives
Country managers to implement recommendations from human right due diligence exercise prior to any operation
On targetContinuation of the social investment programme in Vietnam, with further alignment to UN SDGs
Honour social obligations under production sharing agreements.
On targetImprovement in social investment programmes in Egypt and London
Review and implement recommendation from human rights due diligence report for Israel
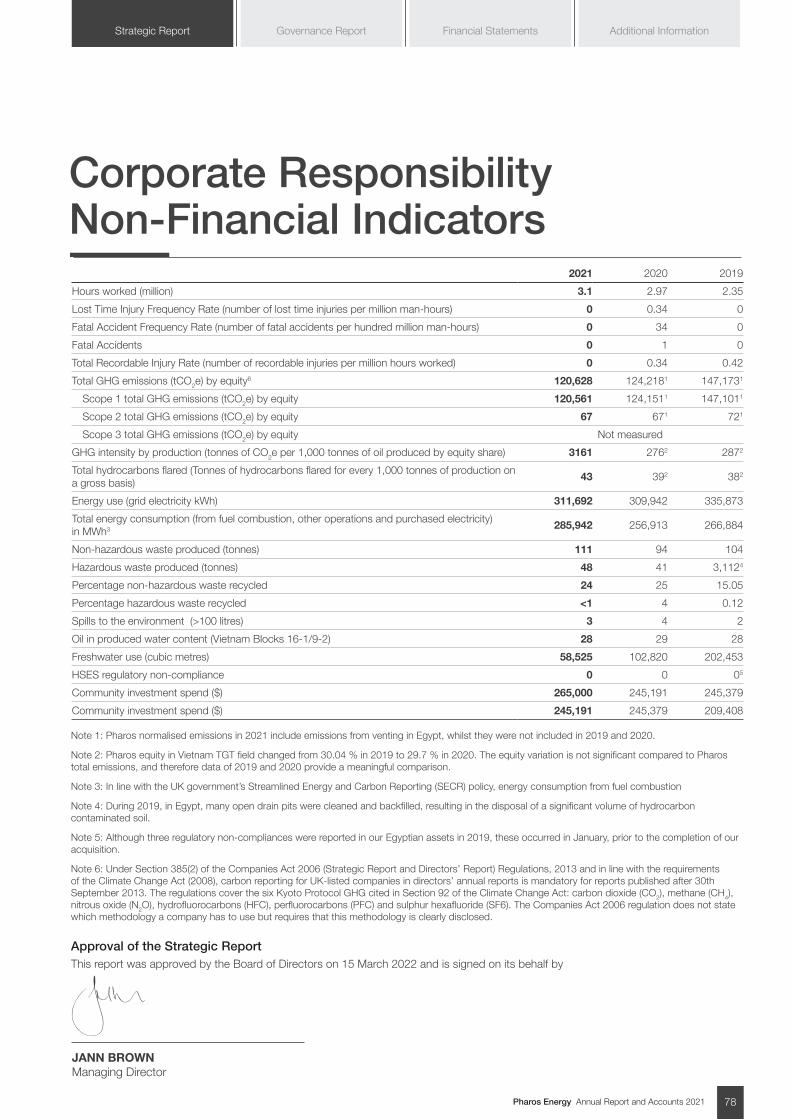
Pharos Energy Annual Report and Accounts 2021 78
Additional InformationGovernance Report Financial StatementsStrategic Report
Corporate ResponsibilityNon-Financial Indicators
2021 2020 2019
Hours worked (million) 3.1 2.97 2.35
Lost Time Injury Frequency Rate (number of lost time injuries per million man-hours) 0 0.34 0
Fatal Accident Frequency Rate (number of fatal accidents per hundred million man-hours) 0 34 0
Fatal Accidents 0 1 0
Total Recordable Injury Rate (number of recordable injuries per million hours worked) 0 0.34 0.42
Total GHG emissions (tCO2e) by equity6 120,628 124,2181 147,1731
Scope 1 total GHG emissions (tCO2e) by equity 120,561 124,1511 147,1011
Scope 2 total GHG emissions (tCO2e) by equity 67 671 721
Scope 3 total GHG emissions (tCO2e) by equity Not measured
GHG intensity by production (tonnes of CO2e per 1,000 tonnes of oil produced by equity share) 3161 2762 2872
Total hydrocarbons flared (Tonnes of hydrocarbons flared for every 1,000 tonnes of production on a gross basis)
43 392 382
Energy use (grid electricity kWh) 311,692 309,942 335,873
Total energy consumption (from fuel combustion, other operations and purchased electricity) in MWh3 285,942 256,913 266,884
Non-hazardous waste produced (tonnes) 111 94 104
Hazardous waste produced (tonnes) 48 41 3,1124
Percentage non-hazardous waste recycled 24 25 15.05
Percentage hazardous waste recycled <1 4 0.12
Spills to the environment (>100 litres) 3 4 2
Oil in produced water content (Vietnam Blocks 16-1/9-2) 28 29 28
Freshwater use (cubic metres) 58,525 102,820 202,453
HSES regulatory non-compliance 0 0 05
Community investment spend ($) 265,000 245,191 245,379
Community investment spend ($) 245,191 245,379 209,408
Note 1: Pharos normalised emissions in 2021 include emissions from venting in Egypt, whilst they were not included in 2019 and 2020.
Note 2: Pharos equity in Vietnam TGT field changed from 30.04 % in 2019 to 29.7 % in 2020. The equity variation is not significant compared to Pharos total emissions, and therefore data of 2019 and 2020 provide a meaningful comparison.
Note 3: In line with the UK government’s Streamlined Energy and Carbon Reporting (SECR) policy, energy consumption from fuel combustion
Note 4: During 2019, in Egypt, many open drain pits were cleaned and backfilled, resulting in the disposal of a significant volume of hydrocarbon contaminated soil.
Note 5: Although three regulatory non-compliances were reported in our Egyptian assets in 2019, these occurred in January, prior to the completion of our acquisition.
Note 6: Under Section 385(2) of the Companies Act 2006 (Strategic Report and Directors’ Report) Regulations, 2013 and in line with the requirements of the Climate Change Act (2008), carbon reporting for UK-listed companies in directors’ annual reports is mandatory for reports published after 30th September 2013. The regulations cover the six Kyoto Protocol GHG cited in Section 92 of the Climate Change Act: carbon dioxide (CO2), methane (CH4), nitrous oxide (N2O), hydrofluorocarbons (HFC), perfluorocarbons (PFC) and sulphur hexafluoride (SF6). The Companies Act 2006 regulation does not state which methodology a company has to use but requires that this methodology is clearly disclosed.
Approval of the Strategic ReportThis report was approved by the Board of Directors on 15 March 2022 and is signed on its behalf by
JANN BROWN Managing Director

Pharos Energy Annual Report and Accounts 202179
Focus on delivering full potential
CHAIR’S INTRODUCTION TO GOVERNANCE
JOHN MARTINNon-Executive Chair
Dear shareholders 2021 was a transformative year for Pharos Energy. In the first half of 2021 we completed the equity placing, subscription and retail offer to raise finance for the El Fayum waterflood programme, followed in the second half of the year by the restructuring of the organisation due to the industry downturn. This was a necessary action to reposition the business on a path to growth with careful cost reduction and capital allocation in the best interests of all stakeholders. The restructuring realised significant efficiencies and reductions in overheads, allowing the Group to meet future challenges with a leaner structure.
There has been significant progress this year in both Egypt and Vietnam; Pharos has successfully managed the impacts of the global COVID-19 pandemic and the resultant oil price crash and is creating the right opportunities to thrive in the future.
In particular, 2021 saw the successful conclusion of the process to seek a partner for our Egyptian assets. In December 2021, the Company announced that shareholders had approved the farm-out of 55% of the Group’s operated interest in each of our Egyptian Concessions, El Fayum and North Beni Suef, to IPR, an integrated energy services group with extensive experience in Egypt. Following completion of the farm-out and the transfer of operatorship, IPR is set to embark on a multi-year investment waterflood and drilling campaign on El Fayum. As part of the transaction, IPR will fund Pharos’s retained 45% share of the costs of the future work programme on the Egyptian assets to a maximum of $33.425m (to be adjusted for working capital and interim period adjustments from the effective economic date of 1 July 2020). This is in addition to the deposit at signing of the farm-out agreements of US$2 million and receipt of a further US$3 million in cash on completion. This investment programme should result in an increase in production on El Fayum and will also fulfil work commitments under the concessions.
In March 2021, the Company announced that we had reached agreement with EGPC, the industry regulator and state oil company in Egypt, to various amendments to the El Fayum Concession (known collectively as “The Third Amendment”) the most important effect of which was an improvement in the fiscal terms backdated to November 2020. The improved terms were subjected to parliamentary and presidential approval, which were obtained in January 2022. As a result of this Third Amendment, Contractor share of revenues increased by 20%, from c.42% to c50% whilst in full cost recovery mode.
In Vietnam, we were pleased to announce in July 2021 the completion of the 3D seismic programme on the western part of Block 125 in the Phu Khanh Basin, and in September 2021 the Government approval for a 2-year extension to the initial exploration period of the Block 125 & 126 PSC. There is a commitment to drill one well on these Blocks within this period and we will look to bring in a partner pre-drill following processing and interpretation of the newly acquires seismic data. The gathered 3D data will be critical to attracting an investment partner for any subsequent drilling phase, and exposure to acreage with such material potential will offer significant growth opportunity for the future. On TGT, the TGT four-well well intervention and development drilling programme commenced in July 2021. Phase 1 of the campaign was successfully completed in November 2021, ahead of schedule and c.$20 million below the JV gross budget. Two further TGT wells are planned to be drilled in 2022, plus one well on CNV. The JOC is now progressing work on submitting licence extension requests for both TGT & CNV, with a Revised Full Field Development Plan for both fields to be submitted by Q4 2022.
Pharos Energy Annual Report and Accounts 2021 80
Additional InformationGovernance Report Financial StatementsStrategic Report
The Board approved a restructure of the head office organisation, realising significant efficiencies and reductions in the overhead costs of the company and allowing the Company to meet future challenges with a leaner structure. In July 2021 we also completed the refinancing of the Group’s RBL facility secured by the producing assets in Vietnam, providing access to a committed $100m facility with a further $50m is available on an uncommitted accordion basis. The refinancing also extended the tenor of the facility by 22 months, providing useful funding flexibility.
Pharos continues to manage its operations carefully in light of the COVID-19 pandemic and associated legal and regulatory restrictions and public health guidance. The Group is adhering closely to applicable procedures, rules and requirements within all host countries.
Throughout the year, the Board devoted considerable time to supporting and challenging the executive team in assessing farm-down opportunities, portfolio management and capital allocation. The Board received regular detailed updates from the executive team and other key members of staff and time was allocated to strategic, operational, ESG and corporate matters. In pursuit of the best interests of shareholders, the Non-Executive Directors (“NEDs”) brought constructive challenge to the executives’ proposals and direction, offering direction and support. Key areas of focus for the NED’s discussions in 2021 were overseeing the reorganisation of the head office, farm out of Egypt, succession planning, ESG, effective implementation of Group strategy and oversight of operational, financial performance and KPIs.
Safety has remained a top priority for the Group. In 2021, we delivered an excellent performance from a health and safety perspective. There were zero Lost Time Injuries (LTIs) across all Group operations throughout the year.
The ESG Committee continues to focus on its stakeholders’ health and safety during the COVID-19 pandemic. The development of ESG KPIs including climate change and health and safety metrics demonstrate that the Group takes its responsibilities in this area very seriously. Further focus has been around approval and oversight of the work on Phase of 2 of TCFD, ongoing social project investments in Vietnam and a review and discussion on ESG practices across industry peers and CO2 reduction options for Pharos.
During 2021 the Nominations Committee (see the report on pages 95 to 96) focused on reviewing our Board composition, succession planning for key roles at Executive level, a review of annual Board evaluation, and annual Director re-appointments. The Board ensured full compliance with the 2018 Corporate Governance Code.
I am delighted that we were able to fill the position of Chief Financial Officer (“CFO”) with an internal candidate - Sue Rivett, who took on the role from 1 July 2021 and joined the Board at that time. Further changes to the Board were discussed towards the end of 2021, and these were finalised and announced on 13 January 2022 to take effect when the farm-out transaction with IPR is completed. On completion of that transaction, Jann Brown will assume the role of Chief Executive Officer (“CEO”) as one of two Executive Directors alongside CFO Sue Rivett. Jann has been a member of the Board since 2017 and was formerly Managing Director and CFO. Also on completion, Ed Story will step down from the Board as CEO, after leading the Company for over 20 years since its admission to the main market of the London Stock Exchange in 1997. Ed will remain as President of the Vietnam business, which provides both cash flow and growth potential to the Group. In addition, as part of the post transaction restructuring, Dr Mike Watts will step down from the Board on completion. Mike has been actively involved with the Company for over 25 years, since its pre-IPO inception, and has been instrumental in building its international portfolio during this period including its current projects in Vietnam and Egypt. I thank Mike for his strong contribution.
Finally, in support of the succession policy to slim down the Board and having served as Non-Executive Director, Senior Non-Executive Director and Deputy Chairman in his nearly 9 years on the Board, Rob Gray has indicated that he will not be putting his name forward for re-election as a Director at the AGM in May 2022. We thank Rob for all his commitment and support over the years.
Looking ahead to 2022 the result of these changes will be to reduce the size of the Board from nine Directors (four Executives and five NEDs) to six (two Executives and four NEDs), which will be more appropriate to the size and shape of the Company.
The Executive Directors at the start of the year continued to take a reduction of 35% of their salaries for the first quarter and then further reduced this by another 15% (to a total reduction of 50%) from 1 April 2021 for the Executive Directors in office at that date. These reductions were in place for the remainder of the year. The Chairman, who had reduced his fee by 25% on assuming the role in March 2020, also took an additional 25% reduction along with the other Non-Executive Directors as from 1 May 2020, which reductions continued throughout the full year 2021. The Executive Directors volunteered to reduce significantly their LTIP award for 2021, the second year of a reduced award. The policy limit is 200% of salary but existing Executive Directors received an award in 2021 equivalent to 29% of contractual entitlement, whilst Sue Rivett, as the new CFO, received an award of 35% of contractual entitlement. Additionally, the bonus award for 2021 was voluntarily reduced by 20% from 72.5% to 58% for the Executive Directors. As set out in the Directors’ Remuneration Report from pages 102 to 116, an updated Remuneration structure has been put in place effective upon completion of the transaction with IPR to reflect the scale of the business.
Finally, I look forward to continuing to work closely with the Board and senior management as we focus on delivering the full potential of the Company’s opportunities and a return to growth built on all of the work that has been done to refresh the Company, its governance and its Board. A priority for 2022 will be to ensure a smooth transition of operatorship in Egypt to IPR. Looking ahead, we intend to focus on the Company’s existing asset portfolio, and to continue to carefully manage the cost base and capital structure to balance the need for efficiency in the short term with the need for investment in the long term. I am excited about the prospects for Pharos Energy and look forward to the year ahead.
JOHN MARTINNon-Executive Chair
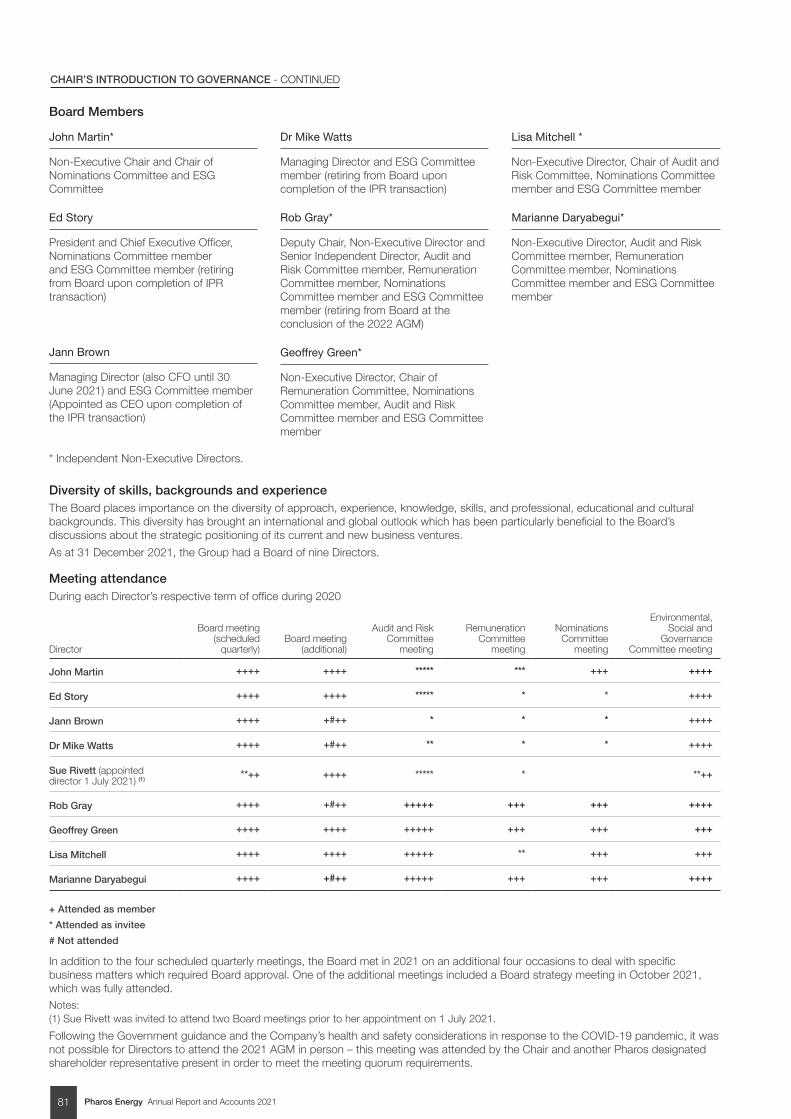
Pharos Energy Annual Report and Accounts 202181
CHAIR’S INTRODUCTION TO GOVERNANCE - CONTINUED
Board Members
John Martin*
Non-Executive Chair and Chair of Nominations Committee and ESG Committee
Ed Story
President and Chief Executive Officer, Nominations Committee member and ESG Committee member (retiring from Board upon completion of IPR transaction)
Jann Brown
Managing Director (also CFO until 30 June 2021) and ESG Committee member (Appointed as CEO upon completion of the IPR transaction)
Dr Mike Watts
Managing Director and ESG Committee member (retiring from Board upon completion of the IPR transaction)
Rob Gray*
Deputy Chair, Non-Executive Director and Senior Independent Director, Audit and Risk Committee member, Remuneration Committee member, Nominations Committee member and ESG Committee member (retiring from Board at the conclusion of the 2022 AGM)
Geoffrey Green*
Non-Executive Director, Chair of Remuneration Committee, Nominations Committee member, Audit and Risk Committee member and ESG Committee member
Lisa Mitchell *
Non-Executive Director, Chair of Audit and Risk Committee, Nominations Committee member and ESG Committee member
Marianne Daryabegui*
Non-Executive Director, Audit and Risk Committee member, Remuneration Committee member, Nominations Committee member and ESG Committee member
Diversity of skills, backgrounds and experienceThe Board places importance on the diversity of approach, experience, knowledge, skills, and professional, educational and cultural backgrounds. This diversity has brought an international and global outlook which has been particularly beneficial to the Board’s discussions about the strategic positioning of its current and new business ventures.
As at 31 December 2021, the Group had a Board of nine Directors.
Meeting attendanceDuring each Director’s respective term of office during 2020
Director
Board meeting (scheduled
quarterly)Board meeting
(additional)
Audit and Risk Committee
meeting
Remuneration Committee
meeting
Nominations Committee
meeting
Environmental, Social and
Governance Committee meeting
John Martin ++++ ++++ ***** *** +++ ++++
Ed Story ++++ ++++ ***** * * ++++
Jann Brown ++++ +#++ * * * ++++
Dr Mike Watts ++++ +#++ ** * * ++++
Sue Rivett (appointed director 1 July 2021) (1) **++ ++++ ***** * **++
Rob Gray ++++ +#++ +++++ +++ +++ ++++
Geoffrey Green ++++ ++++ +++++ +++ +++ +++
Lisa Mitchell ++++ ++++ +++++ ** +++ +++
Marianne Daryabegui ++++ +#++ +++++ +++ +++ ++++
+ Attended as member
* Attended as invitee
# Not attended
In addition to the four scheduled quarterly meetings, the Board met in 2021 on an additional four occasions to deal with specific business matters which required Board approval. One of the additional meetings included a Board strategy meeting in October 2021, which was fully attended. Notes: (1) Sue Rivett was invited to attend two Board meetings prior to her appointment on 1 July 2021.
Following the Government guidance and the Company’s health and safety considerations in response to the COVID-19 pandemic, it was not possible for Directors to attend the 2021 AGM in person – this meeting was attended by the Chair and another Pharos designated shareholder representative present in order to meet the meeting quorum requirements.
* Independent Non-Executive Directors.
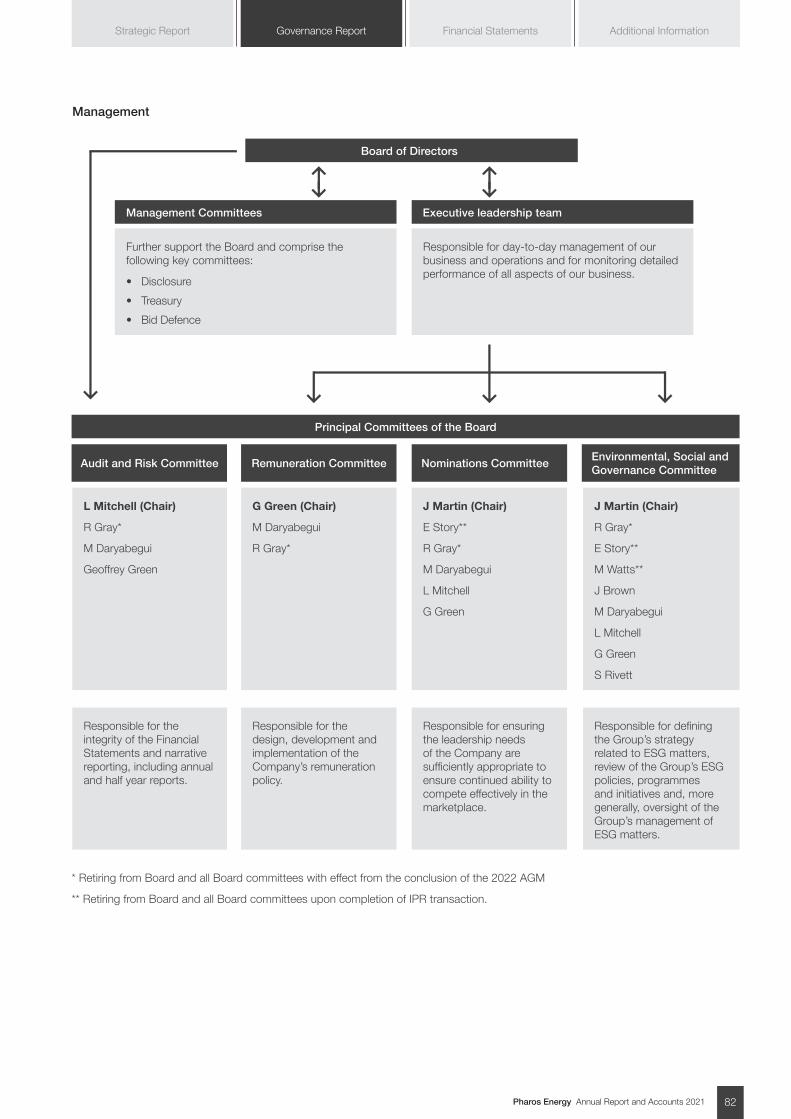
Pharos Energy Annual Report and Accounts 2021 82
Additional InformationGovernance Report Financial StatementsStrategic Report
* Retiring from Board and all Board committees with effect from the conclusion of the 2022 AGM
** Retiring from Board and all Board committees upon completion of IPR transaction.
Management
Board of Directors
Executive leadership teamManagement Committees
Audit and Risk Committee Remuneration Committee Nominations CommitteeEnvironmental, Social and Governance Committee
Principal Committees of the Board
Further support the Board and comprise the following key committees:
• Disclosure
• Treasury
• Bid Defence
Responsible for day-to-day management of our business and operations and for monitoring detailed performance of all aspects of our business.
L Mitchell (Chair)
R Gray*
M Daryabegui
Geoffrey Green
Responsible for the integrity of the Financial Statements and narrative reporting, including annual and half year reports.
G Green (Chair)
M Daryabegui
R Gray*
Responsible for the design, development and implementation of the Company’s remuneration policy.
J Martin (Chair)
E Story**
R Gray*
M Daryabegui
L Mitchell
G Green
Responsible for ensuring the leadership needs of the Company are sufficiently appropriate to ensure continued ability to compete effectively in the marketplace.
J Martin (Chair)
R Gray*
E Story**
M Watts**
J Brown
M Daryabegui
L Mitchell
G Green
S Rivett
Responsible for defining the Group’s strategy related to ESG matters, review of the Group’s ESG policies, programmes and initiatives and, more generally, oversight of the Group’s management of ESG matters.

Pharos Energy Annual Report and Accounts 202183
Experienced leaders guiding our future
BOARD OF DIRECTORS
1
4
7
2
5
8 9
3
6
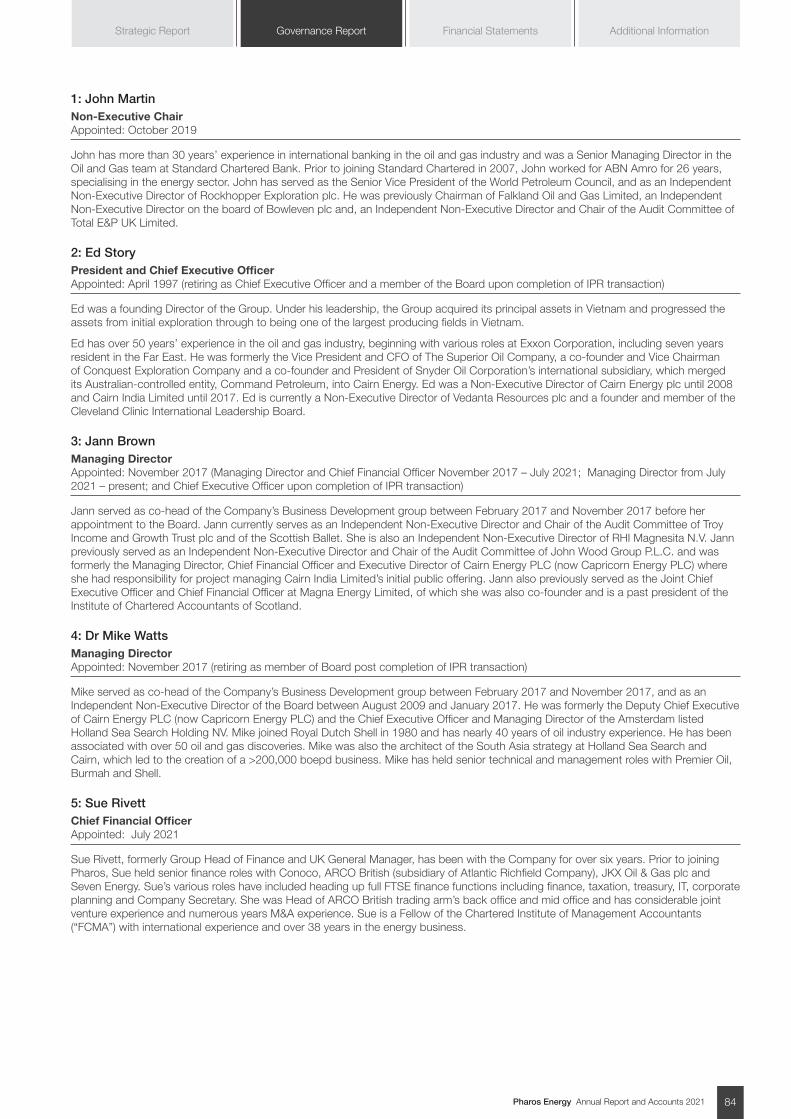
Pharos Energy Annual Report and Accounts 2021 84
Additional InformationGovernance Report Financial StatementsStrategic Report
1: John Martin Non-Executive ChairAppointed: October 2019
John has more than 30 years’ experience in international banking in the oil and gas industry and was a Senior Managing Director in the Oil and Gas team at Standard Chartered Bank. Prior to joining Standard Chartered in 2007, John worked for ABN Amro for 26 years, specialising in the energy sector. John has served as the Senior Vice President of the World Petroleum Council, and as an Independent Non-Executive Director of Rockhopper Exploration plc. He was previously Chairman of Falkland Oil and Gas Limited, an Independent Non-Executive Director on the board of Bowleven plc and, an Independent Non-Executive Director and Chair of the Audit Committee of Total E&P UK Limited.
2: Ed Story President and Chief Executive OfficerAppointed: April 1997 (retiring as Chief Executive Officer and a member of the Board upon completion of IPR transaction)
Ed was a founding Director of the Group. Under his leadership, the Group acquired its principal assets in Vietnam and progressed the assets from initial exploration through to being one of the largest producing fields in Vietnam.
Ed has over 50 years’ experience in the oil and gas industry, beginning with various roles at Exxon Corporation, including seven years resident in the Far East. He was formerly the Vice President and CFO of The Superior Oil Company, a co-founder and Vice Chairman of Conquest Exploration Company and a co-founder and President of Snyder Oil Corporation’s international subsidiary, which merged its Australian-controlled entity, Command Petroleum, into Cairn Energy. Ed was a Non-Executive Director of Cairn Energy plc until 2008 and Cairn India Limited until 2017. Ed is currently a Non-Executive Director of Vedanta Resources plc and a founder and member of the Cleveland Clinic International Leadership Board.
3: Jann Brown Managing DirectorAppointed: November 2017 (Managing Director and Chief Financial Officer November 2017 – July 2021; Managing Director from July 2021 – present; and Chief Executive Officer upon completion of IPR transaction)
Jann served as co-head of the Company’s Business Development group between February 2017 and November 2017 before her appointment to the Board. Jann currently serves as an Independent Non-Executive Director and Chair of the Audit Committee of Troy Income and Growth Trust plc and of the Scottish Ballet. She is also an Independent Non-Executive Director of RHI Magnesita N.V. Jann previously served as an Independent Non-Executive Director and Chair of the Audit Committee of John Wood Group P.L.C. and was formerly the Managing Director, Chief Financial Officer and Executive Director of Cairn Energy PLC (now Capricorn Energy PLC) where she had responsibility for project managing Cairn India Limited’s initial public offering. Jann also previously served as the Joint Chief Executive Officer and Chief Financial Officer at Magna Energy Limited, of which she was also co-founder and is a past president of the Institute of Chartered Accountants of Scotland.
4: Dr Mike WattsManaging DirectorAppointed: November 2017 (retiring as member of Board post completion of IPR transaction)
Mike served as co-head of the Company’s Business Development group between February 2017 and November 2017, and as an Independent Non-Executive Director of the Board between August 2009 and January 2017. He was formerly the Deputy Chief Executive of Cairn Energy PLC (now Capricorn Energy PLC) and the Chief Executive Officer and Managing Director of the Amsterdam listed Holland Sea Search Holding NV. Mike joined Royal Dutch Shell in 1980 and has nearly 40 years of oil industry experience. He has been associated with over 50 oil and gas discoveries. Mike was also the architect of the South Asia strategy at Holland Sea Search and Cairn, which led to the creation of a >200,000 boepd business. Mike has held senior technical and management roles with Premier Oil, Burmah and Shell.
5: Sue RivettChief Financial OfficerAppointed: July 2021
Sue Rivett, formerly Group Head of Finance and UK General Manager, has been with the Company for over six years. Prior to joining Pharos, Sue held senior finance roles with Conoco, ARCO British (subsidiary of Atlantic Richfield Company), JKX Oil & Gas plc and Seven Energy. Sue’s various roles have included heading up full FTSE finance functions including finance, taxation, treasury, IT, corporate planning and Company Secretary. She was Head of ARCO British trading arm’s back office and mid office and has considerable joint venture experience and numerous years M&A experience. Sue is a Fellow of the Chartered Institute of Management Accountants (“FCMA”) with international experience and over 38 years in the energy business.
Pharos Energy Annual Report and Accounts 202185
BOARD OF DIRECTORS - CONTINUED
6: Rob GrayDeputy Chair, Non-Executive Director and Senior Independent DirectorAppointed: December 2013 (retiring May 2022 on conclusion of the 2022 AGM)
Rob has been an adviser to the natural resources sector for more than 30 years. Rob qualified as a solicitor in 1981 at Allen & Overy and then went on to help establish James Capel & Co. Petroleum Services, a successful advisory and Mergers & Acquisitions practice. Rob’s experience includes 13 years at Deutsche Bank where he was latterly a Senior Advisor having been Chairman of UK Investment Banking for five years and formerly Global Head of Natural Resources. Rob was previously a Director and Head of the Natural Resource Group at Robert Fleming & Co. Ltd. for four years, a group which he established. Between 2000 and 2010, Rob was an Advisory Board Member for Heerema Marine Contractors. Rob was a co-founder of RegEnersys, a natural resources investment entity and is currently the principal of ReVysion LLP. In 2018 Rob was appointed an adviser to the T2 Energy Transition Fund of Tikehau Capital.
7: Marianne DaryabeguiNon-Executive DirectorAppointed: March 2019
Marianne is currently the Chief Financial Officer of Lithium de France, a renewable company focused on geothermal energy and lithium extraction. She was Head of Natural Resources at BNP Paribas and then Managing Director at Natixis in the Energy sector. She has extensive experience in corporate transactions and capital markets and has advised majors, independent E&Ps and national oil companies. Prior to leading the Oil and Gas Corporate Finance Team in 2006 at BNP Paribas, Marianne headed the Commodity Structure Finance team for the Middle East and Africa. Before joining the banking sector Marianne spent eight years at TOTAL. Marianne has a Master’s degree in Finance and Capital Markets from Sciences Po University, Paris and a Masters in Tax and Corporate Law.
8: Lisa Mitchell Non-Executive DirectorAppointed: April 2020
Lisa is currently the Chief Financial Officer of Orca Energy Group Inc. a TSX-V listed company, and also serves as a Non-Executive Director of Wiluna Mining Corporation Limited, a company listed on the Australian Securities Exchange (“ASX”). Lisa is an experienced CFO with over 25 years’ international experience, across the oil and gas, mining and the pharmaceutical industries. She was most recently CFO of San Leon Energy plc and was previously CFO and Executive Director of Lekoil Limited, the African-focused oil and gas exploration and production company with interests in Nigeria. Prior to this, Lisa was CFO and Executive Director at Ophir Energy plc, formerly a FTSE 250 company where she was responsible for contributing to the overall business strategy of Ophir; leading the finance function including all financial, taxation, treasury and funding requirements and investor relations. Lisa’s previous roles include CSL Limited, and Mobil Oil Australia. Lisa is a Certified Practicing Accountant (FCPA Australia) and holds a Bachelor of Economics (major in Accounting) from La Trobe University, Melbourne and a Graduate Diploma in Applied Corporate Governance from the Governance Institute of Australia.
9: Geoffrey GreenNon-Executive DirectorAppointed: May 2020
Geoffrey has many years of legal and commercial experience in advising UK listed companies on corporate governance, mergers and acquisitions and corporate finance. He retired as a partner of Ashurst LLP, a major international law firm, in 2013 after 30 years as a partner including 10 years of service as the firm’s elected senior partner and chair of its management board. He then served as head of Ashurst’s Asia practice from 2009 to 2013, based in Hong Kong, and was responsible for leading the firm’s strategy and business development throughout the Asia region. Until 31 December 2020 Geoffrey was the Non-Executive chair of the Financial Reporting Review Panel, one of the main subsidiary bodies of the Financial Reporting Council, and is currently a member of the FRC’s Conduct Committee. He is also a Non- Executive director of a Hong Kong based private equity fund and was until recently a Non-Executive director of Vedanta Resources plc, formerly a FTSE 250 natural resources company, where he was also chair of the Remuneration Committee. He has a degree in Law from Cambridge University and qualified as a solicitor at Ashurst LLP.and investor relations. Lisa’s previous roles include CSL Limited, and Mobil Oil Australia. Lisa is a Certified Practicing Accountant (FCPA Australia) and holds a Bachelor of Economics (major in Accounting) from La Trobe University, Melbourne and a Graduate Diploma in Applied Corporate Governance from the Governance Institute of Australia.
Pharos Energy Annual Report and Accounts 2021 86
Additional InformationGovernance Report Financial StatementsStrategic Report
Corporate governance report
CORPORATE GOVERNANCE REPORT
2021 statement of compliance with the 2018 Code We are committed to the highest standards of corporate governance and to compliance with the UK Corporate Governance Code 2018 which sets out the principles that emphasise the value of good corporate governance to long-term sustainable success. The Company was in full compliance with the provisions of the 2018 Code throughout the year.
The section below demonstrates our application of the Principles of the 2018 Code.
Board Leadership and Company Purpose
Purpose and Culture
It has been important to the Board to preserve and enhance a corporate culture of honesty, fairness, transparency, engagement and respect. The Board schedule format has been adjusted to give space for increased engagement amongst the NEDs, including the Senior Independent Director and the Chair, without the presence of the Executive Directors, and to provide further opportunity to raise and discuss concerns. Our purpose is to continue to provide energy for communities around the world and fuel their lives and businesses.
Stakeholder engagement
• Colleague engagement
The Board understand that the strategy and long-term success of the Group is dependent on a strong culture and set of values that is clear and guide everything we do. Our approach is driven by the strength, skills and imagination of our people, and our shared purpose to make a positive impact in everything we do. The way we work and do business is based on five guiding principles which we call the Pharos Way: Safety & Care, Energy & Challenge, Openness & Integrity, Empowerment & Accountability, and Pragmatism & Focus. They are reinforced by our Code of Conduct and Business Ethics. The Board has responsibility for assessing and
monitoring the culture of the Group and ensuring that the Group’s policies and practices are aligned with this. There are a number of ways in which the Board monitor and assess the culture, which is detailed in our colleague engagements below.
The Board placed great importance on the level of engagement with senior management and other colleagues. The Board remains passionate about workforce engagement and fostering a genuine dialogue between the Company and staff. Throughout the year, we ran a dedicated Monday weekly meeting to ensure all colleagues were continuously informed about important business developments in the Company and have channels through which they can ask questions and provide input. Additionally, there was increased use of video camera during virtual calls to maintain visibility and connection. The recent reorganisation of the Group has instituted a flatter organisational structure, allowing for shorter lines of management and more direct, accessible channels of communication with leadership. During the year, the designed Non-Executive Director responsible for workforce engagement carried out town hall meetings with staff in the UK, Egypt and Vietnam offices, during which everyone could share their feedback and views about the Company. Outcomes of these meetings were then communicated back to the Board.
The Executive Directors received regular updates on colleague engagement to understand any complaints or troubles from the changing work environment. Following feedback from various anonymous staff surveys, the Executive Directors organised an off-site away day for the London team to better understand employees’ working preferences and to explore any concerns arising from working from home in the past year. Ed Story, who was CEO at the time, could not travel to the UK due to COVID-19 travel restrictions, but joined the off-site meeting virtually via Microsoft Teams in order to participate in the session with the rest of the team. Ed also used the opportunity to communicate the
Company’s long-term strategy going forward, which was an additional area of feedback from the anonymous surveys.
In another survey, colleagues gave views on future working patterns. Regardless of location, there was a clear preference for permanently blending office with home working in the future. This has informed the development of our balanced working programme and led to our rental of a small serviced office space in central London, which seeks to address UK employees’ working needs and provide greater flexibility in how and from where those employees want to work after removal or relaxation of travel and public gathering restrictions introduced in response to the COVID-19 pandemic.
Additionally, there has been other forms of engagement including extending participation in the Company’s share schemes and other feedback channels, including through the Group’s Whistleblowing Policy and access to a dedicated, anonymous and confidential ethics hotline.
• Shareholder engagement
The Board as a whole has responsibility for ensuring that a satisfactory dialogue with shareholders takes place. The Executive Directors are responsible for ensuring that effective communication is maintained with key stakeholders and partners, including an appropriate level of contact with major shareholders and ensuring that their views are communicated to the Board. The Chief Financial Officer has management responsibility for investor relations.
To maintain a clear understanding of the views of shareholders, all Directors receive a quarterly investor relations report, which includes market updates, brokerage and communications reports, share register and share performance analysis and comments and notes from research analysts and proxy agencies.
Pharos had an open and active dialogue with its institutional, private and retail shareholders throughout the year. The Company uses its online
Pharos Energy Annual Report and Accounts 202187
CORPORATE GOVERNANCE REPORT - CONTINUED
presence to post and disseminate key information promptly to a wide audience. The Company’s website is regularly used by shareholders and stakeholders for email communication with management. The official Twitter and LinkedIn accounts of Pharos continue to be used actively. The Company uses a PR agency to provide assistance in the dissemination of information to shareholders and the general public and also to solicit active feedback as to the effectiveness of such efforts. Additionally, in 2021, for the first time ever, the Company embedded an analyst research feed on to its corporate website at https://www.pharos.energy/investors/analyst-research/. This was to allow a wider audience of private and retail shareholder free access to analyst research notes about the Company. Also in 2021, the Company engaged with an online platform Investor Meet Company to host an online meeting with a Q&A session in April to allow the wider public a free platform to raise questions directly to the Executive Directors. During the year, the Executive Directors and investor relations colleagues met and engaged with 29 different institutions and family offices in over 40 meetings.
The NEDs are each responsible for taking sufficient steps to understand shareholder views, including any issues or concerns. This includes being available to major institutional shareholders and responding to requests for additional communication with the Chair, Senior Independent Director or other NEDs. The delegated role of the Senior Independent Director includes being available to shareholders if they have concerns which cannot be fully or appropriately addressed by the Chair or the Executive Directors.
Additionally, both before and after the formal proceedings of each AGM, and subject to travel or public gathering restrictions in response to the COVID-19 pandemic, all Directors and senior management, including the Chairs of the Audit and Risk, Remuneration and Nominations Committees, make themselves available to answer shareholder questions and respond to any specific queries.
• Local communities, governments and employees
Our goal is to have a responsible and positive presence in the regions in which we operate, resulting in value for host countries, local communities, employees, contractors, suppliers and shareholders, and we engage with them on a regular basis. Additionally,
the requirements in the Modern Slavery Act are dealt with through our due diligence and on boarding processes with suppliers.
In Vietnam, commitment to local sourcing, employment, training and industry capacity building has continued with a training levy of $300,000 per year in a ring-fenced fund to support developing future Vietnamese expertise in the industry. In Egypt, under the El Fayum and North Beni Suef Concession Agreements, the Contractor contributes a total of $200,000 per year split equally between the two Concessions to support training and development in industry.
In recent years, we have structured our social investment programme to align more with the United Nations Sustainable Development Goals (UN SDGs). In Vietnam, in 2021, in addition to the training levy mentioned above, a further $265,000 was invested in 12 community projects. The JOCs actively inquired and listened to locals to find out which areas of the country would need the greatest assistance in order to ensure that we were investing in local projects that would bring the most sustainable positive impact to the community. For instance, in Q1 2021, the Group provided financial support for autistic children at Anh Dao Specialised Educational Centre in Ha Tinh province, with additional donations towards providing therapy for children with disabilities at An Tue Social Assistance Centre, Thua Thien Hue province (UN SDG 3: Good health & wellbeing and UN SDG 4: Quality education). In Q2 2021, the Donation Programme helped fund the construction of a community culture house in Hop Hung commune, Vu Ban district, Nam Dinh province which, once finishes, will act as a communal education house for children in the area for years to come (UN SDG 4 Quality education and UN SDG 9: Industry, innovation and infrastructure).
For full details of all the projects the JOCs have invested in 2021, please see our Corporate Responsibility report on pages 58 to 78.
• Conflicts of interests & Ethics hotline
Our Whistleblowing Policy and associated procedures ensure that employees are protected from possible reprisals when raising concerns in good faith. In addition to internal reporting channels, we have a dedicated, anonymous and confidential ethics hotline supported by EthicsPoint with numbers displayed in local offices available 24 hours a day all year round. Zero calls were made to the EthicsPoint hotline in 2021.
Division of Roles & Responsibilities
Responsibilities of the Board
The statutory duty of the Directors is to act in what they consider to be in the best interests of the Company and, as a unitary Board, they are responsible for the long-term success of the Company. The Board determines and develops the strategy for the business and provides it with the necessary entrepreneurial leadership. It ensures the Company is adequately resourced to meet its strategic objectives and can meet its obligations to its stakeholders. The Board sets the values, standards and controls necessary for risk to be effectively assessed and managed. Some of its responsibilities have been delegated to committees of the Board, including the Audit and Risk, Remuneration and Nominations Committees.
The roles of the Chair and Chief Executive Officer are separated and their responsibilities are clearly established, set out in writing and agreed by the Board. Both are collectively responsible for the leadership of the Company. The Chair chairs the Board meetings, leads the NEDs in the constructive challenge of the Executive Directors’ strategy and is accountable for the Board’s effectiveness. This includes encouraging an open and frank boardroom culture, setting the Board’s agenda, facilitating the NEDs’ contribution and ensuring sufficient time and information to promote effective and challenging discussions. The Chair has been in his current role since March 2020.
The CEO is responsible for the everyday management of the Company. The CEO leads the Executive Directors and management team in the implementation of the Board’s strategy and management’s performance in running the business.
The NEDs have a supervisory role that contributes to the development of the strategy through supportive and challenging inquiry. They scrutinise the Executive Directors’ performance in meeting their agreed goals and objectives, and play a key role in their appointment or removal.
The Company Secretary is appointed by the Board. He facilitates the communications and processes of the Board, the induction programme for new Directors and provides advice through the Chair as may be required in the ongoing discharge of the Directors’ duties. This includes ensuring that the Company provides the necessary resources for access to independent advice and any individual professional training and development needs agreed with each Director.
Pharos Energy Annual Report and Accounts 2021 88
Additional InformationGovernance Report Financial StatementsStrategic Report
The Board operates within a framework that distinguishes the types of decisions to be taken by the Board, including determination of strategy, setting the principal operating policies and standards of conduct, approval of overall financial budgets and financing agreements, approval for establishing key corporate relationships and approval of any actions or matters requiring the approval of shareholders.
Board composition
As at December 2021, the Board comprised of nine Directors including the Chair, made up of four Executive Directors and five Non-Executive Directors.
Tony Hunter was Company Secretary throughout the year and his appointment was approved by the Board as a whole.
Responsibilities & Composition of the Committees
There are four principal committees of the Board:
• The Audit and Risk Committee – responsible for the integrity of the Financial Statements and narrative reporting, including annual and half year reports
• The Environmental, Social and Governance (ESG) Committee - responsible for defining the Group’s strategy related to ESG matters.
• The Nominations Committee – responsible for ensuring the leadership needs of the Company are sufficiently appropriate to ensure continued ability to compete effectively in the marketplace
• The Remuneration Committee – responsible for the design, development and implementation of the Company’s remuneration policy
Each principal Board committee has a formal Terms of Reference (“TOR”), which sets out the Committee’s delegated role and authority and is approved by the Board. The TOR as well as the Committee members are available on the Company’s website at https://www.pharos.energy/about-us/governance/committees/.
Time commitment
The Board has four scheduled meetings a year although additional meetings are scheduled as required.
In 2021, in addition to the four scheduled quarterly meetings, the Board also met on an additional four occasions to deal with specific business matters which required Board approval. One of the additional meetings included a Board strategy meeting in October 2021, which was fully attended.
Only Committee members are entitled to attend their respective meetings. Other Directors were invited to attend, as determined appropriate or beneficial, and committee chairs provide an update at the full Board meeting. There was full attendance of committee members at the Audit and Risk, Remuneration and Nominations and ESG Committees in 2021.
Composition, succession and evaluation
Board composition and succession
The Nominations Committee ensures the leadership needs of the Company are met and maintained appropriately to allow it to compete effectively in the marketplace. Board appointments are made through a formal process led by the Nominations Committee. In relation to the recruitment and appointment of Non-Executive Directors, the Committee recognises the emphasis placed by the 2018 Code on the engagement of an external search consultancy or the open advertising of vacancies.
The Directors’ roles are established in writing and approved by the Board. Biographical details are provided on page 84 to 85.
Diversity and Inclusion
We believe in a workforce with a diversity of experience, nationalities, cultural backgrounds and gender, to support our business strategy of long-term sustainable growth. Our Code of Business Conduct and Ethics, associated policies and the Pharos Guiding Principles commit us to providing a workplace free of discrimination where all employees can fulfil their potential based on merit and ability. They also commit us to providing a fully inclusive workplace, while providing the right development opportunities to ensure existing staff have rewarding careers.
For more information on the gender balance of our corporate employees and senior management, please see page 68 of the Corporate Responsibility report.
Annual re-election of Directors
All Directors annually retire and seek re-election by shareholders at the Company’s AGM. The Nominations Committee makes its recommendation to the Board on each re-election resolution. Pending the Chair confirming his satisfaction that each Director continues to perform effectively and with the appropriate commitment to the role, the full Board then determines its own recommendation to shareholders in relation to those resolutions.
The Committee formed its recommendations regarding the re-election resolutions at the 2022 AGM following assessments of Board balance, composition and independence.
Board effectiveness and evaluation
The Nominations Committee assesses the Board’s balance of skills, experience, independence, diversity, tenure and knowledge of the Company and the industry on an annual basis. The assessment in 2021 included consideration of the Company’s leadership needs within the context of growth, portfolio diversification and long-term strategy. The discussions determined that the current balance remains appropriate and sufficient to effectively promote the long-term success of the Company and would be further enhanced through the process already underway to increase the number of Independent NEDs.
Remuneration
Remuneration principles
The Remuneration Committee is responsible for the design, development and implementation of the Company’s Remuneration Policy.
In determining the remuneration packages awarded to management, the Board and the Remuneration Committee have continued to aim at providing incentive schemes that reflect the characteristics of attractive rewards, fairness and restraint. Appropriate advice on best practice is taken from an independent advisor.
Remuneration Policy
Our overarching aim is to operate a Remuneration Policy which rewards senior management at an appropriate level for delivering against the Company’s annual and longer-term strategic objectives. The policy is intended to create strong alignment between Executive Directors and shareholders.
In line with the requirements of applicable law, requiring us to review our Directors’ remuneration policy every 3 years, the policy was reviewed and proposed at the 2020 AGM and will next be put to shareholders for approval at the 2023 AGM. Few changes were proposed to the policy, principally relating to developments in best practice guidelines including the introduction of post-cessation shareholder guidelines. The new policy was approved by 92.6% of our shareholders at the 2020 AGM.
Pharos Energy Annual Report and Accounts 202189
CORPORATE GOVERNANCE REPORT - CONTINUED
Pension and benefits
All eligible employees have the same access to the same pension contribution rate (15% of salary) and access to a similar level of benefits.
Directors’ shareholdings and share interests
The Board has a policy requiring Executive Directors to build a minimum shareholding of 200% of their annual salary. Additionally, LTIP awards require a two-year holding period following vesting. This is intended to emphasise a commitment to the alignment of Executive Directors with shareholders and a focus on long term stewardship.
Audit, Risk and Internal Control
Significant reporting and accounting matters
During the first half of 2021, the Group’s accounting policies, in accordance with best practice, were reviewed by management and the Audit and Risk Committee to ensure that they remained appropriate for the Group’s activities. Following this review, the Group’s accounting policies were judged to be fully up-to-date and no significant changes were recommended to the Board by the Audit and Risk Committee.
Fair, balanced and understandable
The Audit and Risk Committee advised the Board whether the annual report and accounts taken as a whole are fair, balanced and understandable and provide the range of information necessary for shareholders to assess the Group’s performance, business model and strategy. The Directors have confirmed this in their Responsibility Statement set out on page 121 of the Directors’ Report.
Viability statement and Going concern
Management completed their Going Concern assessment which was challenged and reviewed by the Audit and Risk Committee. The assessment included a “Base Case” for the Group, including cash flow estimates for both Egypt and Vietnam, as well as a “Reasonable Worst Case” scenario, giving particular regard to the commodity price volatility.
Under these scenarios, management has assessed, on a conservative basis, the risks around commodity pricing, operational risk and political and regional risks... The assessments also took into account the impact of potential discretionary reductions in capital expenditures, as well as the hedging of production volumes to mitigate against commodity price fluctuations.
Based on this detailed analysis, management has concluded that the Group will continue as a Going Concern for 12 months from the date of signing of the 2021 Financial Statements.
Following its review of management’s paper to the Audit and Risk Committee and in-depth walk through of assumptions, the Committee is satisfied that it is appropriate to prepare the Financial Statements on a Going Concern basis.
For more information, please see the Viability Statement in the Strategic Report on pages 56 to 57.
Internal controls and risk management systems
The Group’s internal control framework and risk management processes are designed to ensure that risk identification, assessment and mitigation is properly embedded throughout the organisation. The risk management approach is designed to provide the Audit and Risk Committee and the Board with reasonable assurance that financial irregularities and control weaknesses will be identified to mitigate risks that could potentially have a material adverse impact on the Group’s operations, earnings, liquidity and financial prospects.
The Board is primarily responsible for the effectiveness of the Group’s internal control systems which are monitored and improved on an ongoing basis. The Audit and Risk Committee has been delegated the responsibility to monitor and assess the effectiveness of the control systems operated by management. The external auditor, Deloitte, also provides feedback and recommendations on controls which are brought to the attention of the Audit and Risk Committee.
Internal controls and risk management issues are discussed in detail and reviewed for effectiveness at each Audit and Risk Committee meeting, with a report being provided to the Board for approval.
Internal audit
In previous years, based on the size and scale of the Group’s activities, an Internal Audit function could not be justified. However, following the acquisition of the Egyptian assets and the Group’s stated growth strategy in 2020, the Audit and Risk Committee had recommended and the Board approved the appointment of KPMG to carry out various internal audits. The Committee discussed and subsequently resolved that, following the curtailment of the Group’s growth plans in 2020 and 2021 as a result of the COVID-19 pandemic, the detailed internal audit plan should be rescheduled for 2022 start date. This internal audit plan will be
complementary but separate to the audit work undertaken by the Group’s external auditor, Deloitte.
In 2021, internal assurance has been handled by the Group management. The lack of an Internal Audit function in 2021 had no impact on the work of the external auditor.
The Board is responsible for maintaining a sound system of internal controls to safeguard shareholders’ investment and the assets of the Company. There is an effective internal control function within the Company which gives reasonable assurance against any material misstatement or loss. The Board and management will continue to review the effectiveness and the adequacy of the Company’s internal control systems and update such as may be necessary.
External auditor
Deloitte was appointed as external auditor in 2002 and no tender has been conducted since that date. In accordance with the Code’s guidance concerning external audit tendering and rotation, a competitive tender process is required at least once every 10 years typically. However, taking into account the transitional provisions of Statutory Auditors and Third Country Auditors Regulation 2016 the Group plans to conduct a competitive tender process during 2022.
The Committee assesses the performance of the auditor based on their experience, the quality of their written and oral communication and input from management, prior to making any recommendation as to the re-appointment of the auditor at the AGM. The Committee also assesses the independence of the external auditor once a year and the lead partner is required to be rotated every five years. On completion of David Paterson’s term Anthony Matthews succeeded him and is compliant with the rotation requirements. Other senior audit staff are also rotated every five to seven years.
Principal and emerging risks
On page 43, we set out our assessment of the principal risks facing the business. The Group Risk Management framework requires that all business units within the Group conduct on-going risk management and reporting to the Audit and Risk Committee and the Board. The Group Risk Management Policy defines the specifics of the risk management process, describes the risk tools (for example, the preparation and maintenance of a Group risk matrix and risk register) and outlines the reporting process and responsibilities in order to meet the Group’s risk governance framework.
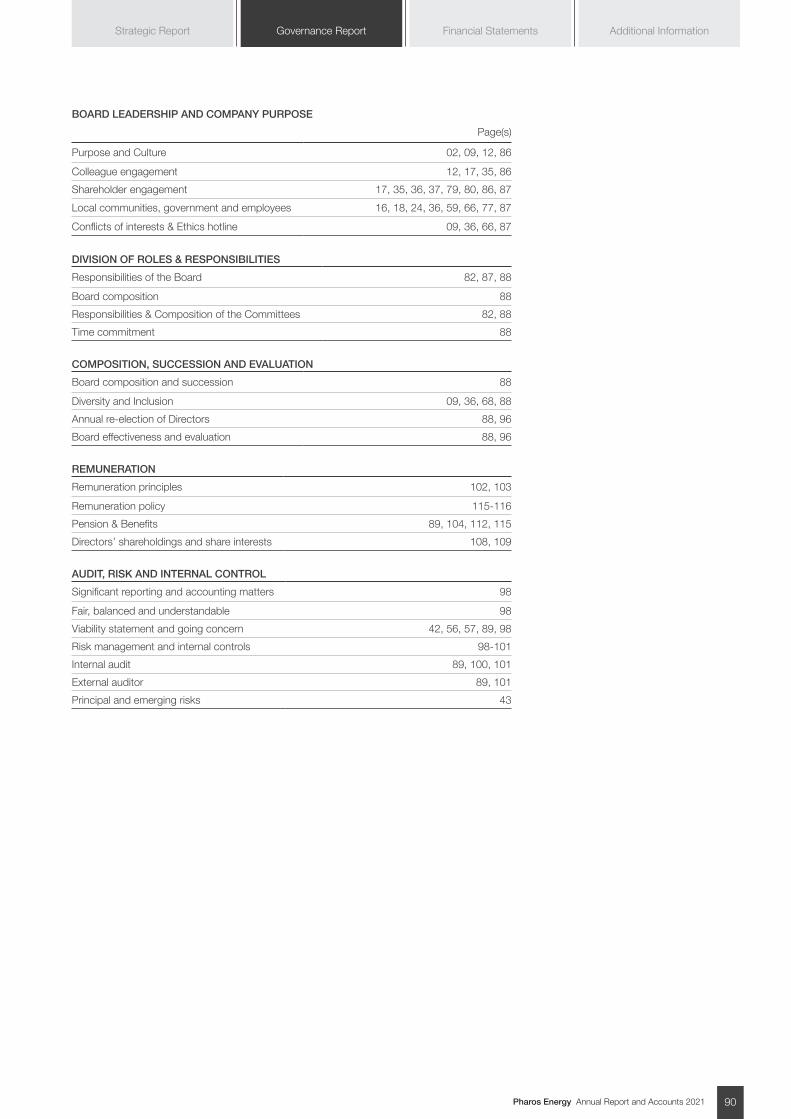
Pharos Energy Annual Report and Accounts 2021 90
Additional InformationGovernance Report Financial StatementsStrategic Report
BOARD LEADERSHIP AND COMPANY PURPOSE
Page(s)
Purpose and Culture 02, 09, 12, 86
Colleague engagement 12, 17, 35, 86
Shareholder engagement 17, 35, 36, 37, 79, 80, 86, 87
Local communities, government and employees 16, 18, 24, 36, 59, 66, 77, 87
Conflicts of interests & Ethics hotline 09, 36, 66, 87
DIVISION OF ROLES & RESPONSIBILITIES
Responsibilities of the Board 82, 87, 88
Board composition 88
Responsibilities & Composition of the Committees 82, 88
Time commitment 88
COMPOSITION, SUCCESSION AND EVALUATION
Board composition and succession 88
Diversity and Inclusion 09, 36, 68, 88
Annual re-election of Directors 88, 96
Board effectiveness and evaluation 88, 96
REMUNERATION
Remuneration principles 102, 103
Remuneration policy 115-116
Pension & Benefits 89, 104, 112, 115
Directors’ shareholdings and share interests 108, 109
AUDIT, RISK AND INTERNAL CONTROL
Significant reporting and accounting matters 98
Fair, balanced and understandable 98
Viability statement and going concern 42, 56, 57, 89, 98
Risk management and internal controls 98-101
Internal audit 89, 100, 101
External auditor 89, 101
Principal and emerging risks 43
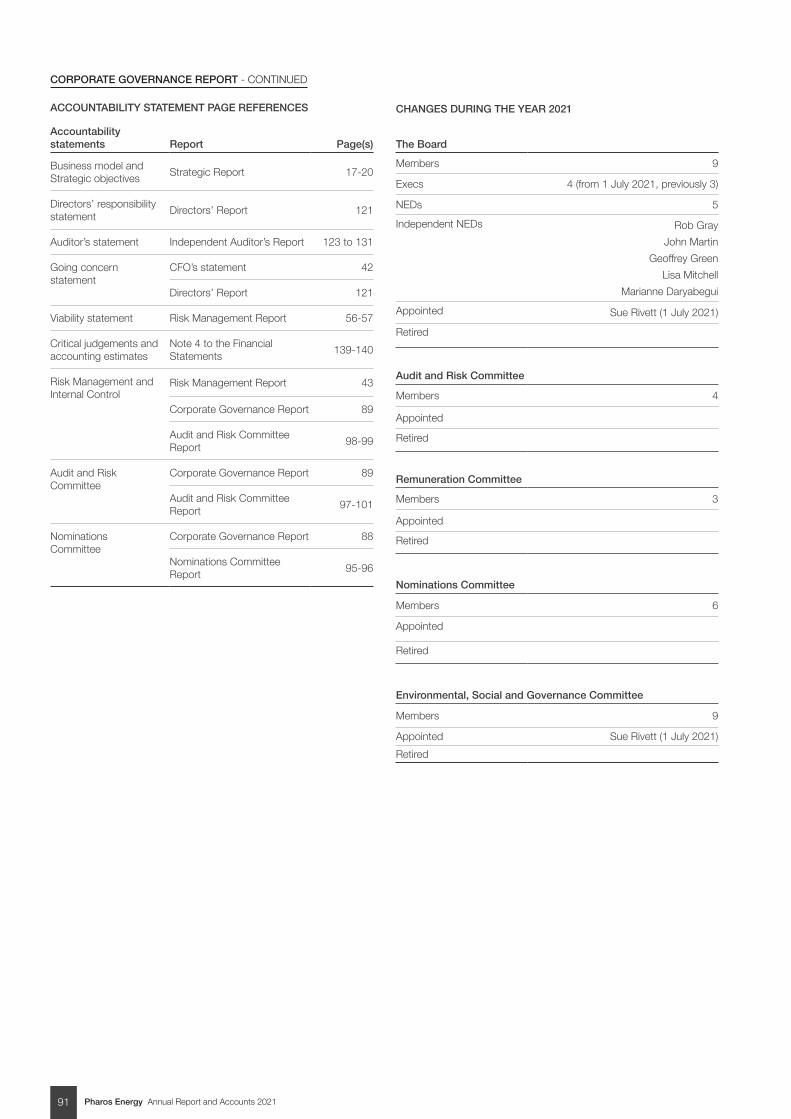
Pharos Energy Annual Report and Accounts 202191
CORPORATE GOVERNANCE REPORT - CONTINUED
ACCOUNTABILITY STATEMENT PAGE REFERENCES
Accountability statements Report Page(s)
Business model and Strategic objectives
Strategic Report 17-20
Directors’ responsibility statement
Directors’ Report 121
Auditor’s statement Independent Auditor’s Report 123 to 131
Going concern statement
CFO’s statement 42
Directors’ Report 121
Viability statement Risk Management Report 56-57
Critical judgements and accounting estimates
Note 4 to the Financial Statements
139-140
Risk Management and Internal Control
Risk Management Report 43
Corporate Governance Report 89
Audit and Risk Committee Report
98-99
Audit and Risk Committee
Corporate Governance Report 89
Audit and Risk Committee Report
97-101
Nominations Committee
Corporate Governance Report 88
Nominations Committee Report
95-96
CHANGES DURING THE YEAR 2021
The Board
Members 9
Execs 4 (from 1 July 2021, previously 3)
NEDs 5
Independent NEDs Rob Gray
John Martin
Geoffrey Green
Lisa Mitchell
Marianne Daryabegui
Appointed Sue Rivett (1 July 2021)
Retired
Audit and Risk Committee
Members 4
Appointed
Retired
Remuneration Committee
Members 3
Appointed
Retired
Nominations Committee
Members 6
Appointed
Retired
Environmental, Social and Governance Committee
Members 9
Appointed Sue Rivett (1 July 2021)
Retired
Pharos Energy Annual Report and Accounts 2021 92
Additional InformationGovernance Report Financial StatementsStrategic Report
Environmental, Social & Governance (‘ESG’) committee report
ENVIRONMENTAL, SOCIAL AND GOVERNANCE (‘ESG’) COMMITTEE REPORT
JOHN MARTINESG Committee Chair
MEETING ATTENDANCE
Committee member2021
attendance
John Martin (Chair) ++++
Rob Gray (Deputy Chair) ++++
Ed Story (President & CEO) ++++
Jann Brown (Managing Director & CFO)
++++
Mike Watts (Managing Director) ++++
Marianne Daryabegui * ++++
Lisa Mitchell * ++++
Geoffrey Green * ++++
Sue Rivett *1,2 ++
+ Attended.
* Independent NED.
1 Appointed as a Director 1 July 2021
2 Sue Rivett attended two additional meetings during the year as a non-committee member
DEAR SHAREHOLDERS,
Membership and responsibilitiesDuring 2021, the Environmental, Social and Governance (‘ESG’) Committee was comprised of myself as Chair, Rob Gray, Ed Story, Jann Brown, Mike Watts, Marianne Daryabegui, Lisa Mitchell and Geoffrey Green. I was delighted to welcome Sue Rivett to the Committee from her appointment to the Board on 1 July 2021. Rob, Marianne, Lisa, and Geoffrey are all Independent Non-Executive Directors each having recent and relevant financial and legal experience in the energy sector.
As Chair of the Committee, I convene meetings on a regular basis and report to the Board throughout the year.
The ESG Committee has a formal document outlining its responsibilities, which is reviewed and updated as appropriate by the Board on an annual basis.
The ESG Committee Terms of Reference are available on our website, https://www.pharos.energy/about-us/governance/committees/ .
Key responsibilitiesThe Committee is constituted by the Board to:
• Assist the Board in defining and implementing the Pharos Group’s strategy relating to ESG matters;
• Review the policies, programmes, practices and initiatives of the Pharos Group relating to ESG matters ensuring they remain effective and up to date;
• Oversee the Pharos Group’s management of ESG matters and compliance with legal and regulatory requirements, including applicable rules and principles of corporate governance, and applicable industry standards;
• Report on these matters to the Board and, where appropriate, make recommendations to the Board; and
• Report as required to shareholders of the Company on the activities and remit of the Committee, and in achieving ESG targets.
ESG Committee meetings in 2021The Committee met four times during 2021. These meetings were regularly scheduled Committee meetings held in March, May, September and December. The Committee examines and discusses at each meeting:
• Review of inventory of current ESG social projects in Vietnam, and proposed carbon-reduction investment projects in Egypt and Vietnam
• Review of HSES policies and procedures, CDP climate change reporting, annual Corporate Responsibility (“CR”) Report, Annual Health, Safety, and Environmental and Social (“HSES”) Plan
• Review of the development of ESG KPIs including climate change and health and safety metrics
• Review of ESG practices across the Group’s industry peers
• Review of the work on Phase 2 of TCFD alignment
In addition to members of the Committee, additional non-committee members, such as Risk Manager, Reservoir Engineer and Investor Relations Analyst were invited to attend Committee meetings. Internal ESG working group meetings were also held separately from ESG Committee meetings. There was noted to be buy-in on ESG matters across the Group.
Pharos Energy Annual Report and Accounts 202193
ENVIRONMENTAL, SOCIAL AND GOVERNANCE (‘ESG’) COMMITTEE REPORT - CONTINUED
During 2021, the following additional areas were discussed at meetings of the Committee:
MarchReview and discussion on:
• Progress for the ESG KPIs, noting these could not be finalised for Egypt until the farm-out terms had been agreed
• Ongoing work on the reduction of GHG emissions, noting these were likely to increase as the capital development work proceeded
• Draft ESG Committee report to be included in the Annual Report
• Ongoing work on TCFD
• Group’s GHG emissions reporting compared to peer groups
• Group’s Health, Safety, Environment and Social (HSES) matters performance to date, noting 2020’s sub-contractor fatality and four spills in Egypt and actions taken to prevent a recurrence. Major disruptions to operations from COVID-19 have been avoided, noting the precautions taken.
• Inventory of social projects to date
MayReview and discussion on:
• The new format of Annual Report, noting it had worked well and that ESG matters had been appropriately incorporated in this
• Ongoing work on TCFD
• Group’s HSES matters and performance, noting no H&S incidents to report in the period and one minor spill
• Peer and industry ESG reporting
• Submission of CDP Climate Change and Water Security questionnaires, noting its previous rating of ‘C’ and ways to improve this rating
SeptemberReview and discussion on:
• Group’s HSES matters and performance. GHG emissions were noted to be at par with last year despite reduced activities and ways in which emissions could be reduced were commented upon. Spills in Egypt were reviewed and discussed including whether another service company or better training could be used to improve matters, albeit this was dealt with at a JV level
• Update on social projects in Vietnam in H1 2021
• The alignment towards TCFD recommendations. The proposal from Verisk Maplecroft, an external TCFD consultant company, to review and develop a roadmap to carbon reductions, was approved
• Improvements in flaring both in Vietnam and in Egypt
• Future meeting on potential actions that could be taken in relation to climate change, taking account of input from consultants and examples in other companies
DecemberReview and discussion on:
• The development of corporate ESG targets for management incentives, to be reported to the Remuneration Committee
• Group’s HSES matters, noting the reparation of the faulty compressor in Vietnam, flaring would again be reduced, which would determine whether there would be an improvement on prior year performance
• KPIs for both safety and environmental matters
• CO2 reduction options, noting that cost benefit analysis of this would be looked at
• ESG practices across Pharos industry peers, noting more research to look into what Vietnam and Egypt had signed up to at COP26
During the year the Committee focused on the following matters:The Committee and its working group focused on its stakeholders’ health and safety during the COVID-19 pandemic; the development of ESG KPIs including climate change and health and safety metrics; approval and oversight of the work on Phase of 2 of TCFD; oversight and approval of the Group’s CDP Climate Change and Water Security Questionnaires; ongoing social project
investments in Vietnam; review and discussion on ESG practices across industry peers and CO2 reduction options for Pharos.
COVID-19 precautionary measuresThe health, safety and welfare of our staff, contractors and host communities across our business remains the highest priority on the Board agenda, especially during this global pandemic. The Group adhered to the requisite precautionary procedures and restrictions, in line with the government directives in Egypt, Vietnam and the UK. At Petrosilah and Pharos El Fayum, a vaccination campaign for all employees in the main offices and fields started in Q2 2021 and culminated to 97% of the workforce being double vaccinated at the end of December 2021. In Vietnam, the HLHVJOC strict 5-7 days quarantine regulations are being applied for the workforce going offshore, in addition to rapid and PCR tests one day prior to offshore mobilisation. 100% of our workforce in Vietnam are double vaccinated at the end of December 2021. For office staff at all locations, Pharos has implemented ongoing facilitation of Working From Home (WFH) measures where possible until further notice.
Health & SafetyIn 2021, the Company has delivered an excellent performance from a health and safety perspective. There were zero Lost Time Injuries (LTIs) across all our operations through-out the year. In Vietnam, the JOCs continue to deliver an exceptional record of safety, reporting zero LTIs since operational inception, representing ten production years on TGT and 13 production years on CNV. In Egypt, we continually reinforce and implement safe working procedures such as inspection of all instruments and equipment, obtaining the requisite permit to work applications, providing training and awareness sessions and above all implementing checks to ensure risks are reduced to acceptable levels and encourage the immediate use of stop-cards. In Vietnam, the JOCs conducted over 200 and 100 HSE training sessions and emergency response drills respectively during 2021 to ensure safety and preparedness remain a top priority.
HSES performance of the Group was reviewed and discussed at every ESG Committee meetings in 2021. All spillage incidents during the year were investigated and lessons learned as appropriate and actions to prevent recurrence were implemented.
Pharos Energy Annual Report and Accounts 2021 94
Additional InformationGovernance Report Financial StatementsStrategic Report
ESG KPIsThe Committee reviewed and discussed the progress of ESG KPIs. However, after careful consideration, the Committee agreed that these could not be finalised for Egypt until the farm-out terms had been agreed. ESG KPIs for Vietnam are noted in the 2022 KPI in the Remuneration Report on page 112.
TCFD The Company commenced Phase 2 of the project to bringing our disclosures in line with the requirements of the Task Force on Climate-Related Financial Disclosures (“TCFD”). These efforts had been interrupted by the impact of the pandemic in 2020 but Phase 2 of the project was approved in Q3 2021 and commenced in Q4 2021, after careful considerations and review from the ESG Committee and ESG working group. Results of the completion of Phase 2 can be found in the Corporate Responsibility Report on page 60 to 63.
CDP Over the past four years, the Company have participated in the CDP Climate Change Questionnaire. In 2021, we have maintained our score of (C), originally awarded in 2019 and which is also the industry average. Most notably, 2021 marks the first year that the Company submitted their response to the Water Security Questionnaire, in addition to and at the same time as the Climate Change Questionnaire. The Water Security Questionnaire was completed at a basic level in 2021, and we plan to improve our level of transparency on water usage and protection by completing the full version in 2022.
Both Questionnaires were completed through collaborative efforts across multiple disciplines and functions within the Group and after thorough discussions within the ESG working group, with oversight and approval from the ESG Committee before submission
ESG peer benchmarking and CO2 reduction optionsDuring the year, the Committee reviewed various CO2 reduction options, such as ejector technology and gas to liquid technology. There were inputs from HSE Country Managers, Reservoir Engineers and Risk Managers during the process. The Committee have taken this into consideration, noting that further cost benefit analysis would be looked at in further depth.
ESG best practices and reporting standards across the Group’s industry peers were also discussed in 2021. The Committee noted that more research would be done to understand what the Company could do, and to look into the commitments made by Vietnam and Egypt at COP26.
SocialIn recent years, we have structured our social investment programme to align more with the United Nations Sustainable Development Goals (UN SDGs).
In Vietnam, in 2021, we worked closely with the JOCs in order to make sure that our social initiatives in the region continue to bring more positive impacts to the region. In addition to the training levy of $300,000 per year in a ring-fenced fund to support developing future Vietnamese expertise in the industry, a further $265,000 was invested in 12 community projects. The JOCs actively inquired and listened to locals to find out which areas of the country would need the greatest assistance in order to ensure that we were investing in local projects that would bring the most sustainable positive impact to the community. For instance, in Q1 2021, the Group provided financial support for autistic children at Anh Dao Specialised Educational Centre in Ha Tinh province, with additional donations towards providing therapy for children with disabilities at An Tue Social Assistance Centre, Thua Thien Hue province (UN SDG 3: Good health & wellbeing and UN SDG 4: Quality education). In Q2 2021, the Donation Programme helped fund the construction of a community culture house in Hop Hung commune, Vu Ban district, Nam Dinh province which, once finishes, will act as a communal education house for children in the area for years to come (UN SDG 4 Quality education and UN SDG 9: Industry, innovation and infrastructure).
In Egypt, under the El Fayum and North Beni Suef Concession Agreements, the Contractor contributes a total of $200,000 split equally between the two Concessions to support long-term training and development of talents within the industry (UN SDG 9: Industry, innovation and
infrastructure). Additionally, in cooperation with the Ministry of Higher Education and Scientific Research, Petrosilah holds an annual summer training programme for all students applying from public and private Egyptian universities for training in the administrative office and the company’s fields, of which they can obtain a training certificate from the company (UN SDG 4: Quality education).
For full details of all the projects the JOCs have invested in 2021, please see our Corporate Responsibility report on pages 76 to 77.
Focus for 2022• Continue to work with JOC’s for
continued improvements and trainings with respect to GHG’s emissions reductions, initiative’s to reduced emissions and spillages
• Maintain current work programme through the JOC’s social project investment and review outcomes of local indicative’s that benefit local communities and host countries
• Proposal and review of ESG metrics in Remuneration and KPI
• Continue engagement and dialogue with the ESG working group as it progresses during 2022
JOHN MARTIN Environmental, Social and Governance (ESG) Committee Chair
Pharos Energy Annual Report and Accounts 202195
Nominations committee report
JOHN MARTINNominations Committee Chair
MEETING ATTENDANCE
Committee member2021
attendance
John Martin * (Chair) +++
Ed Story (President and CEO) +
Rob Gray * (Deputy Chair and Senior Independent Director)
+++
Marianne Daryabegui* +++
Lisa Mitchell * +++
Geoffrey Green* +++
+ Attended.
* Independent NED.
Jann Brown and Mike Watts attended as non-committee members for the first meeting of the year.
NOMINATIONS COMMITTEE REPORT
MembershipDuring the year, the Committee comprised John Martin as Chair, the Chief Executive Officer Ed Story and the four Independent Non-Executive Directors (‘NEDs’), Rob Gray, Marianne Daryabegui, Lisa Mitchell and Geoffrey Green.
The qualifications of each of the Chair and members are set out on pages 84 to 85.
MeetingsThe Committee conducted its duties through three meetings held during 2021. During the year the following areas were discussed at the Committee meetings:
Meeting Matter
Q1
Finalisation of Sue Rivett as a Director and CFO
Review and approval of Nominations Committee report for inclusion in the 2020 Annual Report and Accounts
Annual review of conflicts of interest register
Annual Director reappointment
Q2 No Meeting
Q3 Ongoing succession planning
Q4 Succession planning continued
As at 31 December 2021, the Board comprised four Executive Directors and five NEDs, including the Chair. All of those NEDs were considered independent for the purposes of the 2018 Code. John Martin remains Chair of the ESG Committee, and Chair of the Nominations Committee.
Board refreshment and succession planningBoard refreshment and succession planning continue as ongoing processes. In 2021, the priority was to maintain the independent component of the Board and to fully comply with the 2018 Code.
In March 2021 we announced the appointment of Sue Rivett to the Board as Chief Financial Officer (“CFO”) effective 1 July 2021. Jann Brown, who was Managing Director (“MD”) and CFO, remained as MD following Sue’s appointment, focused on delivering the next phase of the Group’s strategic plan.
Appointments processDuring 2021, the Committee assessed the suitability of Sue Rivett for appointment to the Board, taking into account her previous sector experience and work history, and concluded that her expertise and track record in oil and gas, would complement and enhance the skills and experience of the current Board.
IndependenceAll NEDs are independent in full compliance with the provisions of the 2018 Code.
Board balanceThe Committee assesses the Board’s balance of skills, experience, independence, diversity, tenure and knowledge of the Company and the industry on an annual basis. The assessment in 2021 included consideration of the Company’s leadership needs within the context of growth, portfolio diversification and long-term strategy. The discussions determined that following the recent changes in the business the current balance is appropriate and sufficient to effectively promote the long-term success of the Company.
The Board’s current balance and composition are shown on page 82.
Role of the CommitteeEnsuring the composition of the Company’s leadership remains effective and competitive
Leading the process for Board and committee appointments and making recommendations to the Board
Annually reviewing the Board balance, structure, composition, diversity and succession planning
Establishing an ongoing process for evaluating the Board’s performance and effectiveness
The Committee has continued to ensure that Board independence was evident during 2021 and will continue into 2022 taking into account the Board composition requirements of the 2018 UK Corporate Governance Code.
Pharos Energy Annual Report and Accounts 2021 96
Additional InformationGovernance Report Financial StatementsStrategic Report
DiversityOur approach to diversity and inclusiveness is embedded within the Group’s Human Rights Policy available on the Company’s website at https://www.pharos.energy/responsibility/policy-statements/. A key aim of the Policy is a workplace that is inclusive and free from discrimination.
In applying the Human Rights Policy to Board composition, the Committee pursues diversity of approach, experience, knowledge, skills, and professional, educational and cultural backgrounds. The international and global perspective achieved has enhanced the Board’s discussions on business development, M&A and operational and financial integration.
In its annual review of diversity, the Committee noted diversity of gender, age, demographics, skills, professional backgrounds, experience and education amongst the Board and senior management.
Board evaluation In early 2022, having delayed the process to ensure that this incorporated all the events of 2021, the Board carried out its annual evaluation of its own performance and effectiveness and that of its principal Committees, the Chair and the individual Directors. In doing so, the outcomes of last year’s review and recently agreed actions in connection with succession planning and Board changes were also considered. The Committee Chair led the process which was facilitated by the Company Secretary and followed a similar format to that of prior years. Directors completed confidential questionnaires covering the key areas as set out below. The questions were structured to encourage full, in-depth responses on each area of focus.
• Strategy and risk, including how the Board has handled risk and opportunities
• Shareholder and Stakeholder Relations
• The performance of the Chair
• Board effectiveness and operation
• The operation of the principal Board committees
• Board training and development needs
• Any other general matters Directors wished to raise
The results were reported on an unattributed basis and discussed by the Committee, led by the Committee Chair, then shared with the whole Board. The results of the Chair’s performance review were discussed with the other NEDs, led by the Deputy Chair and Senior Independent Director, and communicated
to the Chair. Following the evaluation process, a number of areas were identified for ongoing focus in 2022 including:
• Continued focus on strategy
• Maintaining review of key risks
• Ongoing communications to shareholders and other stakeholders
• Evolution of reporting in line with development of the Group
• Continued focus on Climate Change and ESG Agenda
Re-electionAll Directors annually retire and seek re-election by shareholders at the Company’s AGM. The Committee makes its recommendation to the Board on each re-election resolution. Pending the Chair confirming his satisfaction that each Director continues to perform effectively and with the appropriate commitment to the role, the full Board then determines its own recommendation to shareholders in relation to those resolutions.
The full Board retired and offered itself for re-election by shareholders at the Company’s AGM in June 2021. All Directors were duly re-elected at the 2021 AGM, each receiving more than 97% of the proxy votes submitted in advance of the meeting.
Ed Story and Dr Mike Watts will retire as Directors upon completion of the farm-out transaction with IPR. In addition, Rob Gray will not seek re-election as a Director at the 2022 AGM and will accordingly retire with effect from the close of that meeting. The remaining six Directors will retire and will offer themselves for re-election at the 2022 AGM.
The Committee is satisfied that each individual Director’s performance continues to be effective and demonstrates commitment to the role and, accordingly, has recommended to the Board that each such Director remains in office subject to re-election by shareholders at the AGM.
The Committee formed its recommendations regarding re-election following assessments of Board balance, composition and independence.
Workforce engagementIn November 2021, the Chair joined head office staff for the afternoon during an offsite staff meeting, at which staff members were able to discuss matters of interest. This engagement has proved an effective communication route for the employees and demonstrates the values of openness and integrity to which we are committed.
Board development, information and supportThroughout 2021, all Directors received ongoing access to resources for the update of their skills and knowledge; both on an individual and a full Board basis. Comments are solicited in the annual Board evaluation and discussed with the Chair.
Conflicts of interestThe Board has the power, subject to certain conditions, to authorise, where appropriate, a situation where a Director has, or can have, a direct or indirect interest that conflicts, or possibly may conflict, with the Company’s interests. Such authority is in accordance with section 175 of the Companies Act 2006 and the Company’s articles of association. Procedures are in place for ensuring that the Board’s powers to authorise conflicts are used effectively and appropriately. Directors are required to notify the Company of any conflicts of interest or potential conflicts of interest that may arise, before they arise, either in relation to the Director concerned or their connected persons. The decision to authorise each situation is considered separately on its particular facts.
Only Directors who have no interest in the matter are able to take the relevant decision to authorise a conflict and must act in a way they consider, in good faith, will be most likely to promote the Company’s success. The Directors will impose such limits or conditions as they deem appropriate when giving authorisation or when an actual conflict arises. These may include provisions relating to confidential information, attendance at Board meetings and availability of Board papers, along with other measures as determined appropriate.
Each Director has notified the Board of either the potential for or the absence of conflicts. The Board assesses every notification of a conflict on its own merits, including the implementation of appropriate limits and conditions, prior to giving authorisation for any specific conflict or potential conflict to exist.
The Board assesses its conflict authorisations on an ongoing basis throughout the year and additionally performs a scheduled review in December.
JOHN MARTIN Nominations Committee Chair
Pharos Energy Annual Report and Accounts 202197
Audit and risk committee report
AUDIT AND RISK COMMITTEE REPORT
LISA MITCHELL Audit and Risk Committee Chair
MEETING ATTENDANCE
Committee member2021
attendance
Lisa Mitchell * +++++
Rob Gray* +++++
Marianne Daryabegui* +++++
Geoffrey Green * +++++
+ Attended.
* Independent NED.
Ed Story, Jann Brown, Mike Watts, Sue Rivett and John Martin also attended most of the meetings as non-committee members/ guests
DEAR SHAREHOLDERS,
Membership and responsibilitiesDuring 2021, the Audit and Risk Committee comprised myself as Chair, Rob Gray, Marianne Daryabegui and Geoffrey Green. Marianne, Rob, Geoffrey and I are all Independent Non-Executive Directors each having recent and relevant financial experience in the energy sector.
As Chair of the Committee, I convene meetings on a regular basis and report to the Board throughout the year.
The Audit and Risk Committee has a formal document outlining its responsibilities, which is reviewed and updated as appropriate by the Board on an annual basis.
The Audit and Risk Committee Terms of Reference are available on our website, https://www.pharos.energy/about-us/governance/committees/.
Key responsibilitiesReviewing key financial, operational and corporate responsibility risk management processes with strong focus on Environmental, Social and Governance (“ESG”) issues
Reviewing and testing the integrity of the Group’s financial statements to ensure full compliance with international financial reporting standards and requirements
Overseeing the planning and execution of the ongoing external audit programme including a detailed review of audit quality and results
Reviewing the effectiveness of internal control processes and systems, including IT control platforms
Audit and Risk Committee meetings in 2021The Committee met five times during 2021. These meetings were the regularly scheduled Committee meetings held in March, May, September and December, with the March meeting split into 2, firstly to review the internal Committee papers and the second to review the final 2020 year-end release and the auditor’s paper. The Committee examines and discusses at each meeting:
Detailed review of internal controls and implementation of upgrades
Review of risk register and risk management reports
In addition to members of the Committee, all members of the Board, the finance management team, operational management and the Group’s external auditor, Deloitte, attended each of the Audit and Risk Committee meetings.
During 2021, the following additional areas were discussed at meetings of the Committee:
March (2 meetings)Update and review of Modern Slavery and Human Trafficking Statement, HSE Policy, Social Responsibility Policy, Biodiversity and Conservation Policy, Human Rights Policy and Code of Business Conduct and Ethics
Finance update including the Internal Controls Report, Reserves Update, Impairment Analysis, review of the IFRS 16 Lease paper, Royalty paper and Treasury review
Review and approval of 2020 financial statements, including reviews that they were fair, balanced and understandable, reviews of Going Concern and Viability Statements
Review of 2020 external audit status, including analyses of findings of the external audit and key judgemental areas
Review and update of the Audit and Risk Committee governance matters, with attention to internal controls processes and systems, and a detailed review of Risk management issues and mitigation
MayReview and update of Internal Controls Report including Financial review
Status update on Treasury activities including the RBL and hedging status
Review and assessment of Risks and mitigations
Pharos Energy Annual Report and Accounts 2021 98
Additional InformationGovernance Report Financial StatementsStrategic Report
SeptemberFinance update including the Internal Controls Report, Reserves Update, Impairment Analysis, review equity placing paper and insurance review
Review and Approval of 2021 Interim Accounts, including presentation by external auditor, Deloitte, and Audit and Risk Committee comments
Review and approval of the Going Concern Paper, including stress testing and mitigations
An update on financing, covenant compliance monitoring and commodity hedging
DecemberReview and update on Internal Controls and Risk Report including: Finance review and Treasury update
Review of the Group Budget and capital allocation
Annual Review and Approval of Terms of Reference of the Audit and Risk Committee
Review of 2021 year-end planning
Review and discussion of Significant Risks particularly around the impact of COVID-19 and Climate Change and the impact on Going Concern and Impairment of assets
Review and discussion on Section 172 of the Companies Act 2006
Review of external audit scope, review of audit quality and 2021 audit plan
Review of recent developments in relation to FRC requirements, proposed developments in relation to external auditors’ responsibilities, and other related regulatory and compliance matters
Financial reporting and significant accounting issuesDuring the first half of 2021, the Group’s accounting policies, in accordance with best practice, were reviewed by management and the Committee to ensure that they remained appropriate for the Group’s activities. Following this review, the Group’s accounting policies were judged to be fully up-to-date and no significant changes were recommended to the Board by the Committee.
Significant issues related to the 2021 Financial StatementsThe Committee met twice in March to go through the significant issues that should be taken into consideration in relation to the Financial Statements for the year ended 31 December 2021, being key issues which may be subject to heightened risk of material misstatement. These key issues are set out below.
Fair, balanced and understandableThe Committee advised the Board whether the annual report and accounts taken as a whole are fair, balanced and understandable and provide the range of information necessary for shareholders to assess the Group’s performance, business model and strategy. The Directors have confirmed this in their Responsibility Statement set out on page 121 of the Directors’ Report.
Going ConcernManagement completed their Going Concern assessment which was challenged and reviewed by the Committee. The assessment included a “Base Case” for the Group, including cash flow estimates for both Egypt and Vietnam, as well as a “Reasonable Worst Case” scenario, giving particular regard to the continuing impact of commodity price volatility. A further assessment was also undertaken to show the impact of a farm down of the Egyptian concessions.
Under these scenarios, management has assessed, on a conservative basis, the risks around commodity pricing, operational risk and political and regional risks, particularly in Egypt. The assessments also took into account the impact of potential discretionary reductions in capital expenditures, as well as the hedging of production volumes to mitigate against commodity price fluctuations.
Based on this detailed analysis, management has concluded that the Group will continue as a Going Concern for 12 months from the date of signing of the 2021 Financial Statements.
Following its review of management’s Committee paper and in-depth walk through of assumptions, the Committee are satisfied that it is appropriate to prepare the 2021 Financial Statements on a Going Concern basis.
Oil and gas reservesThe Group’s estimates of oil and gas reserves have a crucial impact on the Financial Statements, especially in relation to DD&A and impairment of PP&E assets. Oil and gas reserves, as discussed in the Viability Statement on pages 56 to 57 are calculated using best practice and industry evaluation techniques which have uncertainties in their application.
The Committee reviewed, in conjunction with management the results of independent third party assessments conducted by ERCe during 2021 for Vietnam assets TGT and CNV, and subsequently audited by the Group’s reserves auditor, RISC Advisory Pty Ltd (“RISC”) which are described in the review of operations on pages 32 to 34.
In addition, the Committee reviewed, in conjunction with management and Deloitte, the reserves assessment conducted by McDaniel for the El Fayum Concession in Egypt.
The various reserves estimates have been scrutinised by management, taking into account the status of each field’s development, to be satisfied that reserves estimates are appropriate, that DD&A calculations are correct and that rigorous impairment testing has been carried out. Management also reviewed its estimates of future costs (including decommissioning costs) associated with producing reserves. Reserve estimates are inherently uncertain, and are revised over the producing lives of oil and gas fields as new reserves estimates become available and economic conditions evolve.
Internal controls and risk management systemsThe Group’s internal control framework and risk management processes are designed to ensure that risk identification, assessment and mitigation is properly embedded throughout the organisation. The risk management approach is designed to provide the Committee and the Board with reasonable assurance that financial irregularities and control weaknesses will be identified to mitigate risks that could potentially have a material adverse impact on the Group’s operations, earnings, liquidity and financial prospects.
During 2021, the Group continued to carry out comprehensive reviews of the overall effectiveness of its internal controls framework and continued to work on improvements.
The Board is primarily responsible for the effectiveness of the Group’s internal control systems which are monitored and improved on an ongoing basis. The Committee has been delegated
Pharos Energy Annual Report and Accounts 202199
AUDIT AND RISK COMMITTEE REPORT - CONTINUED
the responsibility to monitor and assess the effectiveness of the control systems operated by management. The external auditor, Deloitte, also provides feedback and recommendations on controls which are brought to the attention of the Committee.
Internal controls and risk management issues are discussed in detail and reviewed for effectiveness at each Committee meeting, with a report being provided to the Board for approval.
Reserve Based Lending Facility (RBL)During 2021, the Group completed the refinancing of its RBL facility providing access to a committed $100m facility based solely on the Vietnam assets, of which $78.1m was drawn at December 2021. A further $50m is available on an uncommitted accordion basis. The refinanced facility has a four-year term that matures in July 2025. The refinancing extended the tenor of the facility by 22 months, allowing for a rephasing of the
repayment schedule and provision of additional funds available for general corporate purposes.
Under the revised RBL facility agreement, the Group is required to be compliant with certain debt covenants for each half year ending 30 June and 31 December, as set out on page 163.
The Committee has reviewed management’s assessments of debt covenant calculations and is satisfied that the Group is fully compliant.
Commodity hedging – treasury management During the year, the Group actively managed its exposure to commodity price risk by entering into an ongoing programme of hedging. The objectives of the hedging programme have been to protect the Group’s Reasonable Worst case and the Working Capital Test required for the farm down of its Egyptian concessions to any downward commodity price movements and to provide certainty
for cash flows, ensure compliance with the terms of the RBL Facility Agreement, and to help mitigate the redetermination risk implicit with any RBL.
A Treasury Committee, comprising the Chief Financial Officer as Chair and senior members of the Group’s finance team, convene on a regular basis to review the Group’s strategy and the open hedge positions to ensure that these are still fit for purpose in light of current market conditions. Over the course of 2021, the hedged positions were out of the money by $29.7m, the hedge position having been taken out to satisfy the 35% minimum Vietnam production hedge required under the RBL and hedges to mitigate the impact on Reasonable Worst Case for Going Concern and the Working Capital Test for the Egypt farm down.
In 2022, the Group seeks to extend this coverage further to protect budgetary cash flow and ensure compliance with and help mitigate redetermination risk on the RBL.
KEY JUDGEMENTS AND ESTIMATES IN FINANCIAL REPORTING
Key judgements and estimates in financial reporting
Audit and Risk Committee review Outcomes
Asset carrying values and impairment testing – including judgements on future oil pricing, discount rates, production profiles, reserves and cost estimates
Reviewed the Group’s oil price assumptionsThe Group’s short and long-term price assumptions were increased in line with the improvement in commodity prices
Upstream impairment charges were reviewed twice during the year
Impairment reversal of assets
Significant risks that could potentially impact on financial statements – including DD&A estimates, override management controls
Reviewed DD&A estimates, based on reserves reports, units of production and future development costs
Management’s assessments of DD&A judged to be reasonable based on prudent assumptions
Reviewed override of management controlsUnder ISA 240 management override of controls is presumed significant risk. No breaches were found
Oil reserves accounting – including management’s assumptions for future oil prices which have a direct impact on the estimate of the recoverability of asset values reported in the Financial Statements
Reviewed the Group’s guidelines and policy for compliance with oil reserves disclosure regulations; including governance and control
Reviewed exploration chargesCosts held in Vietnam pending future work programme and costs in Israel impaired due to no substantive future work programme
Reviewed at each Committee meeting an update on the status of all updated estimates
Updated third party estimates and independent audit completed, with results disclosed in the 2021 Financial Statements
Exploration and evaluation assets and impairment reviewThe Committee reviewed the Group’s intangible exploration and evaluation assets individually in Egypt, Israel and Vietnam for any indications of impairment, including the various indicators specified in paragraphs 18 to 20 as set out in IFRS 6 – “Exploration for and Evaluation of Mineral Resources”. Please refer to Note 4 (b) to the Financial Statements for more information on climate change and energy transition.
At both the half year and year end 2021, the Committee considered whether various indicators of impairment existed, and also whether there were issues arising from the results of impairment reviews by management. Such reviews are carried out in relation to both exploration and evaluation assets, with the role of the Committee being focused on challenging management’s underlying assumptions and estimates and to judge whether
they are realistic and justified. Following the impairment testing, the Committee recommended to the Board that following 3D seismic acquisition on Block 125 in Vietnam and the forward programme of work that no impairment had been triggered. The minor commitment programme of work in Israel will be completed in 1H 2022, but there being no major work budgeted or planned the Group have impaired the assets.
Pharos Energy Annual Report and Accounts 2021 100
Additional InformationGovernance Report Financial StatementsStrategic Report
Producing assets, property, plant and equipment (“PP&E”) and impairment reviewThe Committee reviewed individually the Group’s oil and gas producing assets classified as PP&E on the balance sheet for impairment with reference to IAS 36 – “Impairment of Assets”. During 2021, the Group’s PP&E oil and gas assets comprised its two Vietnam producing licences, TGT and CNV, as well as its El Fayum Concession in Egypt. These are described in the operations review on pages 32 to 34.
This review focused on an updated assessment of the recoverable amount of each asset compared to their carrying value in the accounts. If the recoverable amount dropped below the carrying value, there would have been an impairment charge to reduce the carrying value. The Committee considered the various assumptions underpinning the assessment of the recoverable amount, including underlying reserves, commodity prices, production rates and discount rates. Based on the Group’s approved economic assumptions, the Committee recommended to the Board that impairment reversals were made on the 2two Vietnam fields, and small impairment charge on the El Fayum Concession in Egypt.
On our CNV field in Vietnam, a pre-tax impairment reversal of $3.8m has been reflected in the Income Statement with an associated deferred tax charge of $1.4m. As at 31 December 2021, the carrying amount of the CNV oil and gas producing property is $84.2m.
On our TGT field in Vietnam, a pre-tax impairment reversal of $49.1m has been reflected in the Income Statement with an associated deferred tax charge of $17.1m. As at 31 December 2021, the carrying amount of the TGT oil and gas producing property is $266.0m.
For our El Fayum concession in Egypt, an impairment reversal of $1.7m, no tax applicable, is reflected in the Income Statement. As at 31 December 2021, the carrying amount of the El Fayum oil producing property is $109.3m, pre-reclassification to Assets held for sale. After the reclassification to assets held for sale, the Egypt oil and gas producing property amounts to $49.2m.
Asset Held for Sale (AHFS)In December 2021, it was announced that shareholders had approved the farm-out of 55% of the Group’s operated interest in each of our Egyptian Concessions, El Fayum and North Beni Suef, to IPR, a group that has extensive experience in Egypt.
As part of the transaction, IPR will fund Pharos’s share of the costs to a maximum of $33.425m (to be adjusted for working capital and interim period adjustments from the effective economic date of 1 July 2020). This is in addition to the deposit at signing of the farm-out agreements of US$2 million and a further US$3 million payable on completion. This investment programme should result in an increase in production and also fulfil commitments under the concessions. In addition, the Group will be entitled to contingent consideration depending on the average Brent Price each year from 2022 to the end of 2025, capped at a maximum total payment of US$20 million. We have calculated the contingent consideration using our Brent oil price curve as at 31 December 2021 (not recognised the full $20m).
$$53.5m net assets were reclassified as held for sale. Details on the calculation of the AHFS net assets are set out in Note 37 to the Financial Statements.
Concession Agreement Amendment El Fayum areaOn 19 January 2022, the Third Amendment to the El Fayum Concession Agreement was signed by His Excellency Eng. Tarek El Molla (Minister of Petroleum & Mineral Resources of the Arab Republic of Egypt), EGPC and the Company.
Signature of the Third Amendment was a key Condition Precedent for the transfer of a 55% participating interest (and operatorship) in the El Fayum and North Beni Suef Concessions to IPR Lake Qarun.
Under the terms, the cost recovery percentage will be increased from 30% to 40% allowing Pharos a significantly faster recovery of all its past and future investments. In return, Pharos has agreed to waive its rights to recover a portion of the past costs pool ($115 million) and reduce its share of Excess Cost Recovery Petroleum from 15% to 7.5%. While in full cost recovery mode, Contractor’s share of revenue increases from 42.6% to 50.8% as from November 2020 (corresponding to additional net revenues to Contractor of $7.0m to the date of signature).
The relevant final approvals from the Egyptian Government had not been obtained at 31 December 2021 and so this has been accounted as a non-adjusting balance sheet event, as per Note 38 to the Financial Statements.
Assuming conditions at 31 December 2021, the discounted cash flows from the remaining 45% share held and calculated for impairment purposes would increase from $49.2m to $77.4m.
Internal controls focus for 2021In previous years, based on the size and scale of the Group’s activities, an Internal Audit function could not be justified. However, following the acquisition of the Egyptian asset and the Group’s stated growth strategy in 2020, the Committee had recommended and the Board approved the appointment of KPMG to carry out various internal audits. The Committee discussed and subsequently approved that following the curtailment of the Group’s growth plans in 2020 and 2021 as a result of the COVID-19 pandemic that the detailed internal audit plan should be rescheduled for 2022. This internal audit plan will be complementary but separate to the audit work undertaken by the Group’s external auditor, Deloitte.
In 2021, internal assurance has been handled by the Group management. The lack of an Internal Audit function in 2021 had no impact on the work of the external auditor.
The Treasury Committee will continue to meet regularly to review the RBL covenants compliance and to review the Group’s liquidity, hedging requirements and investment strategy.
The Committee reviewed and approved the related compliance statements set out in the Risk Management Report. The Committee has also reviewed and approved the statements regarding compliance with the 2018 Code, in the Corporate Governance Report on page 86. The Committee reviewed and discussed with management and the external auditor the Company’s relevant financial information prior to recommendation for Board approval. This included the Financial Statements and other material information presented in the annual and half year reports. The Committee considered the significant financial reporting issues, accounting policies and judgements impacting the Financial Statements, and the clarity of disclosures. The Committee conducted a review of its Terms of Reference for best practice, which were approved by the Board in early 2021. These will be reviewed again during 2022.
The Audit and Risk Committee and the Board have carried out a review of the effectiveness of the Group’s risk management and internal control systems.
Overall, the control environment was considered to be operating effectively. We recognise the oil and gas industry faces many challenges ahead, including the technical, financial, environmental and political challenges of accessing an increasingly scarce resource base and at the same time coping with the opposing dual challenges of production growth but managing transition to a low carbon
Pharos Energy Annual Report and Accounts 2021101
AUDIT AND RISK COMMITTEE REPORT - CONTINUED
future. The pressure to move to a low carbon future have been brought to the forefront during the pandemic.
Our Strategic Framework takes into consideration the range of potential risks and the nature of their impact on the business. The strategic ambitions of the Group, achieving our financial and ESG objectives, maintaining operational effectiveness, ensuring our reputation to markets, partners, and stakeholders are all assessed in the context of our appetite for risk.
The Board is responsible for maintaining a sound system of internal controls to safeguard shareholders’ investment and the assets of the Company. There is an effective internal control function within the Company which gives reasonable assurance against any material misstatement or loss. The Board and management will continue to review the effectiveness and the adequacy of the Company’s internal control systems and update such as may be necessary.
Risk assessmentThe Committee carried out a detailed risk assessment in which it reviewed existing risks and identified new risks as appropriate. The likelihood and significance of each risk was evaluated along with proposed mitigating factors and was reported to the Board. All new risks or changes to existing risks were monitored throughout the year and discussed at each Committee meeting. The Committee maintains a comprehensive bribery risk assessment and mitigation procedure to ensure that the Group has procedures in place to eliminate bribery, and that all employees, agents, contractors, and other associated persons are made fully aware of the Group’s robust policies and procedures on a regular basis.
We recognise the sad situation ongoing in Ukraine. We have no direct business in the region but are taking steps and carrying out due diligence checks to assess if there are any parts of the business likely to be directly affected and will devise mitigating actions if needed.
External auditorDeloitte was appointed as external auditor in 2002 and no tender has been conducted since that date. In accordance with the 2018 Code’s guidance concerning external audit tendering and rotation, a competitive tender process is required at least once every 10 years typically. However, taking into account the transitional provisions of Statutory Auditors and Third Country Auditors Regulation 2016 the Group plans to conduct a competitive tender process during 2022.
The Committee assess the performance of the auditor based on their experience, the quality of their written and oral communication and input from management, prior to making any recommendations as to the re-appointment of the AGM. The committee also assesses the independence of the external auditor once a year and the lead partner is required to be rotated every five years. On completion of David Paterson’s term Anthony Matthews succeeded him and is compliant with the rotation requirements. Other senior audit staff are also rotated every five to seven years.
External auditor – non-audit servicesThe external auditor is appointed primarily to carry out the statutory audit and their continued independence and objectivity is crucial. In view of their knowledge of the business, there may be occasions when the external auditor is best placed to undertake other services on behalf of the Group. The Committee has a policy which sets out those non-audit services which the external auditor may provide and those which are prohibited. Within that policy, any non-audit service must be approved by the Committee.
Before approving a non-audit service, consideration is given to whether the nature of the service, materiality of the fees, or the level of reliance to be placed on it by the Group would create, or appear to create, a threat to independence. If it is determined that such a threat might arise, approval will not be granted unless the Committee is satisfied that appropriate safeguards are applied to ensure independence and that objectivity is not impaired. The auditor is prohibited from providing any services which might result in certain circumstances that have been deemed to present such a threat, including auditing their own work, taking management decisions for the Group or creating either a mutuality or conflict of interest. The Company has taken steps to develop resources and relationships in order to establish availability of alternate advisers for financial and other matters.
External audit feesTotal audit and non-audit fees in 2021 were $0.5m and $0.3m respectively. The Committee approved all non-audit services provided by the external auditor in 2021.The principal non-audit fees during 2021 were $0.1m for the interim review and $0.1m for reporting accountant services associated with the Class 1 Circular relating to the farm down of its Egyptian concessions.
The Committee reviews its non-audit services policy on an annual basis and current policy requires all non-audit services to be pre-approved by the Committee. It is noted that the Group’s policy sets out the permitted services and those that are prohibited.
Review of the effectiveness of the Audit and Risk Committee
During the year, the Committee has undergone a comprehensive review of its effectiveness and results were reported to the Board. The Committee was considered by the Board to be operating effectively and in compliance with the 2018 Code and associated guidance.
LISA MITCHELLAudit and Risk Committee Chair
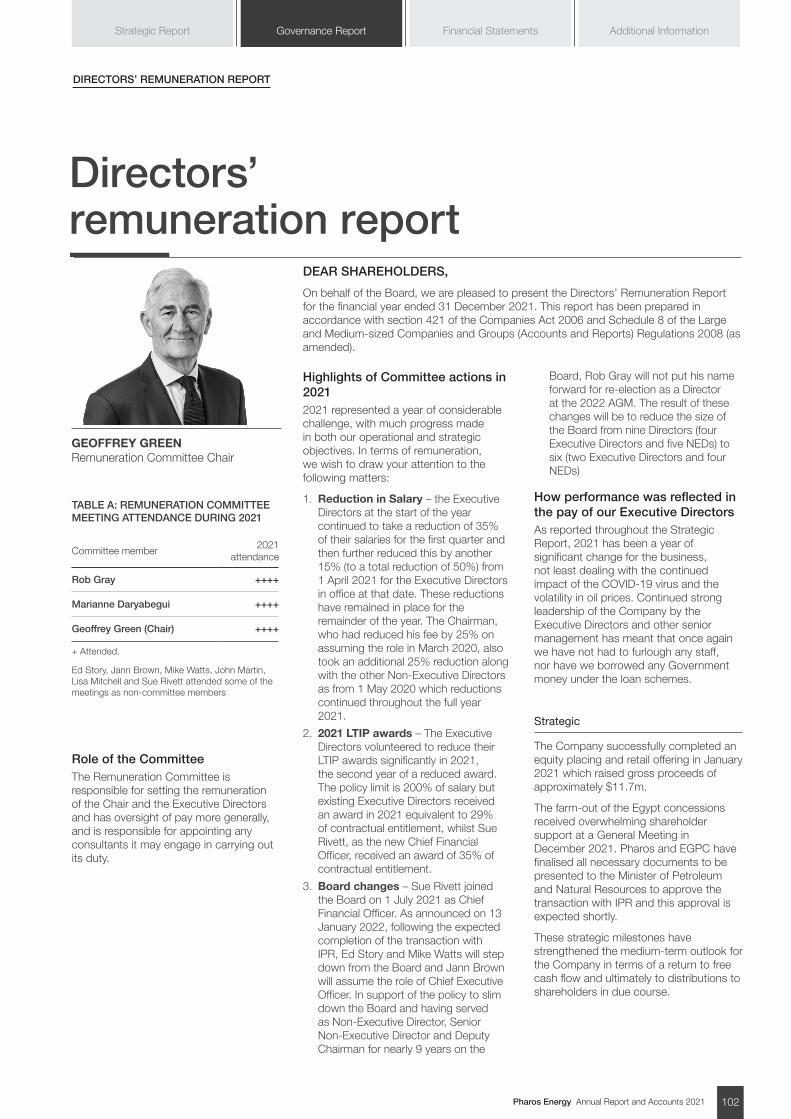
Pharos Energy Annual Report and Accounts 2021 102
Additional InformationGovernance Report Financial StatementsStrategic Report
Directors’ remuneration report
DIRECTORS’ REMUNERATION REPORT
GEOFFREY GREENRemuneration Committee Chair
TABLE A: REMUNERATION COMMITTEE MEETING ATTENDANCE DURING 2021
Committee member2021
attendance
Rob Gray ++++
Marianne Daryabegui ++++
Geoffrey Green (Chair) ++++
+ Attended.
Ed Story, Jann Brown, Mike Watts, John Martin, Lisa Mitchell and Sue Rivett attended some of the meetings as non-committee members
Role of the CommitteeThe Remuneration Committee is responsible for setting the remuneration of the Chair and the Executive Directors and has oversight of pay more generally, and is responsible for appointing any consultants it may engage in carrying out its duty.
DEAR SHAREHOLDERS,
On behalf of the Board, we are pleased to present the Directors’ Remuneration Report for the financial year ended 31 December 2021. This report has been prepared in accordance with section 421 of the Companies Act 2006 and Schedule 8 of the Large and Medium-sized Companies and Groups (Accounts and Reports) Regulations 2008 (as amended).
Highlights of Committee actions in 2021 2021 represented a year of considerable challenge, with much progress made in both our operational and strategic objectives. In terms of remuneration, we wish to draw your attention to the following matters:
1. Reduction in Salary – the Executive Directors at the start of the year continued to take a reduction of 35% of their salaries for the first quarter and then further reduced this by another 15% (to a total reduction of 50%) from 1 April 2021 for the Executive Directors in office at that date. These reductions have remained in place for the remainder of the year. The Chairman, who had reduced his fee by 25% on assuming the role in March 2020, also took an additional 25% reduction along with the other Non-Executive Directors as from 1 May 2020 which reductions continued throughout the full year 2021.
2. 2021 LTIP awards – The Executive Directors volunteered to reduce their LTIP awards significantly in 2021, the second year of a reduced award. The policy limit is 200% of salary but existing Executive Directors received an award in 2021 equivalent to 29% of contractual entitlement, whilst Sue Rivett, as the new Chief Financial Officer, received an award of 35% of contractual entitlement.
3. Board changes – Sue Rivett joined the Board on 1 July 2021 as Chief Financial Officer. As announced on 13 January 2022, following the expected completion of the transaction with IPR, Ed Story and Mike Watts will step down from the Board and Jann Brown will assume the role of Chief Executive Officer. In support of the policy to slim down the Board and having served as Non-Executive Director, Senior Non-Executive Director and Deputy Chairman for nearly 9 years on the
Board, Rob Gray will not put his name forward for re-election as a Director at the 2022 AGM. The result of these changes will be to reduce the size of the Board from nine Directors (four Executive Directors and five NEDs) to six (two Executive Directors and four NEDs)
How performance was reflected in the pay of our Executive DirectorsAs reported throughout the Strategic Report, 2021 has been a year of significant change for the business, not least dealing with the continued impact of the COVID-19 virus and the volatility in oil prices. Continued strong leadership of the Company by the Executive Directors and other senior management has meant that once again we have not had to furlough any staff, nor have we borrowed any Government money under the loan schemes.
Strategic
The Company successfully completed an equity placing and retail offering in January 2021 which raised gross proceeds of approximately $11.7m.
The farm-out of the Egypt concessions received overwhelming shareholder support at a General Meeting in December 2021. Pharos and EGPC have finalised all necessary documents to be presented to the Minister of Petroleum and Natural Resources to approve the transaction with IPR and this approval is expected shortly.
These strategic milestones have strengthened the medium-term outlook for the Company in terms of a return to free cash flow and ultimately to distributions to shareholders in due course.
Pharos Energy Annual Report and Accounts 2021103
Operational
On an operational basis, the Company performed well across a broad range of metrics. Production levels in Vietnam were in line with guidance, whilst maintaining strong safety and environment outcomes and retaining focused cost discipline across the business.
The strong performance despite challenging market conditions were reflected in the KPI assessment and pay out-turn for 2021, with no bonuses having been paid the previous year. Following a robust assessment of the performance criteria the Committee determined the formulaic outturn for bonuses at 72.5% of the maximum potential. However, given the wider stakeholder experience, the Committee decided it was appropriate to reduce the outcome by 20% to 58% of maximum. Bonus outcomes for the wider workforce also reflect corporate KPIs achieved as well as personal performance but were not subject to the discretionary reduction applied to the Executive Directors and therefore paid in full. The average bonus outturn across the workforce was 78.7% of maximum. The 2019 LTIP awards due to vest in March 2022 are expected to lapse through a failure to meet the required relative TSR performance conditions.
Outlook for 2022Upon completion of the farm-down of our Egypt concessions to IPR, the Executive Directors will be Jann Brown, Chief Executive Officer and Sue Rivett, Chief Financial Officer. Jann’s base salary will be £420,000, which represents a c.21% reduction on her previous salary as Managing Director and is intended to represent the new size of the business and her expanded role. Jann has also voluntarily proposed to invest a third of her after tax salary in Pharos shares, subject to share dealing restrictions. Sue’s base salary will be £280,000, a 7.7% increase, reflecting her responsibilities in the changed structure of the business since she joined the Board. Sue has volunteered to invest an amount equal to her after tax salary increase in Pharos shares, subject to the same share dealing restrictions.
It is intended that Non-Executive Director fees, having been reduced by 25% from 1 May 2020, will also return to their previously agreed level following completion of the Egypt farm-down to IPR.
Annual bonus potential and LTIP award levels permitted under the remuneration policy remain unchanged. The main elements of the 2021 bonus plan will be unchanged as regards structure, measures for performance (safety and environment, operational, financial, governance and licence to operate – albeit with a reduction the weighting for operational management and a corresponding increase in safety and environment weighting) and deferral requirements. The Committee intends to develop and update certain specific objective criteria during the course of the year, given the changing structure of the business.
The LTIP performance metrics will be a mixed weighting of TSR (40%) relative and (15%) absolute and 15% weighting to each of cash flow from operations, return to capital employed, and emission reduction targets. These changes reflect feedback from major shareholders in recent years that the LTIP should be subject to a balanced scorecard of performance measures.
ConclusionThe continued disruption of the COVID-19 pandemic has made the last financial year extremely difficult to navigate, but our progress is down to the exceptional efforts of all our employees. The Remuneration Committee feels that the remuneration outcomes for 2021 are a fair reflection of the context in which decisions had to be made.
We look forward to receiving your support at the upcoming AGM and to working with you face to face when circumstances allow.
GEOFFREY GREEN Remuneration Committee Chair
DIRECTORS’ REMUNERATION REPORT - CONTINUED
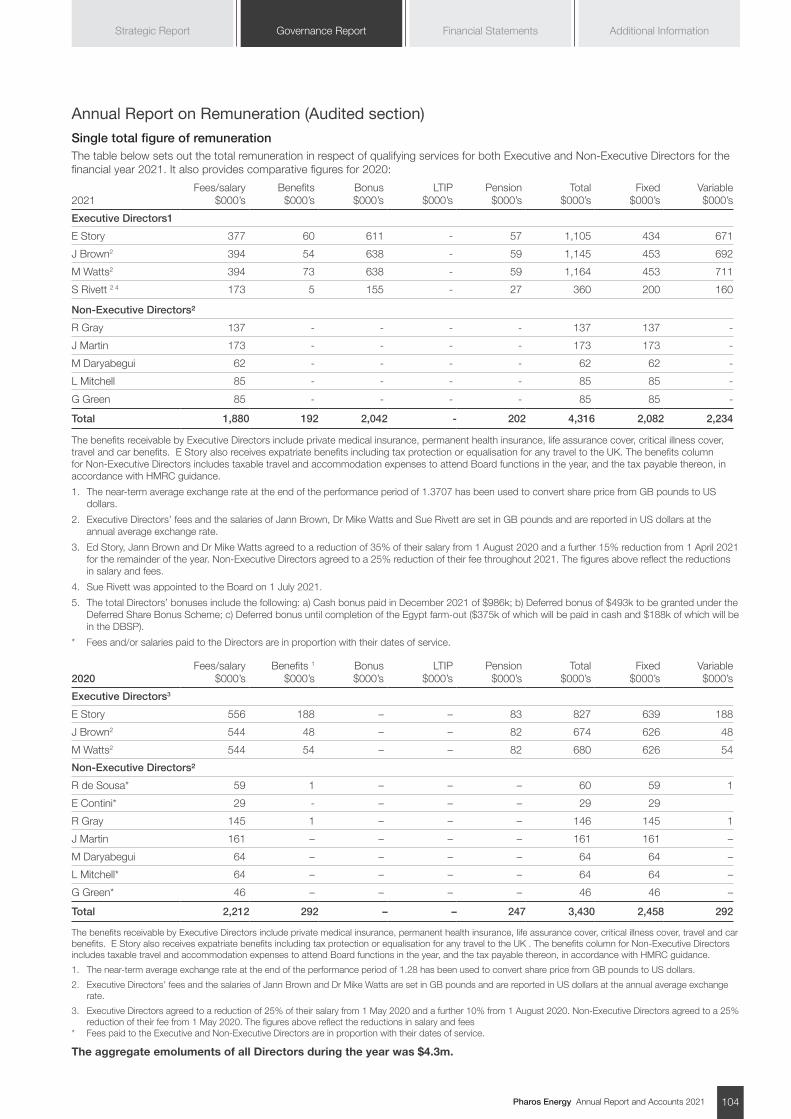
Pharos Energy Annual Report and Accounts 2021 104
Additional InformationGovernance Report Financial StatementsStrategic Report
Single total figure of remunerationThe table below sets out the total remuneration in respect of qualifying services for both Executive and Non-Executive Directors for the financial year 2021. It also provides comparative figures for 2020:
2021Fees/salary
$000’sBenefits
$000’sBonus $000’s
LTIP $000’s
Pension $000’s
Total $000’s
Fixed $000’s
Variable $000’s
Executive Directors1
E Story 377 60 611 - 57 1,105 434 671
J Brown2 394 54 638 - 59 1,145 453 692
M Watts2 394 73 638 - 59 1,164 453 711
S Rivett 2 4 173 5 155 - 27 360 200 160
Non-Executive Directors²
R Gray 137 - - - - 137 137 -
J Martin 173 - - - - 173 173 -
M Daryabegui 62 - - - - 62 62 -
L Mitchell 85 - - - - 85 85 -
G Green 85 - - - - 85 85 -
Total 1,880 192 2,042 - 202 4,316 2,082 2,234
The benefits receivable by Executive Directors include private medical insurance, permanent health insurance, life assurance cover, critical illness cover, travel and car benefits. E Story also receives expatriate benefits including tax protection or equalisation for any travel to the UK. The benefits column for Non-Executive Directors includes taxable travel and accommodation expenses to attend Board functions in the year, and the tax payable thereon, in accordance with HMRC guidance.
1. The near-term average exchange rate at the end of the performance period of 1.3707 has been used to convert share price from GB pounds to US dollars.
2. Executive Directors’ fees and the salaries of Jann Brown, Dr Mike Watts and Sue Rivett are set in GB pounds and are reported in US dollars at the annual average exchange rate.
3. Ed Story, Jann Brown and Dr Mike Watts agreed to a reduction of 35% of their salary from 1 August 2020 and a further 15% reduction from 1 April 2021 for the remainder of the year. Non-Executive Directors agreed to a 25% reduction of their fee throughout 2021. The figures above reflect the reductions in salary and fees.
4. Sue Rivett was appointed to the Board on 1 July 2021.
5. The total Directors’ bonuses include the following: a) Cash bonus paid in December 2021 of $986k; b) Deferred bonus of $493k to be granted under the Deferred Share Bonus Scheme; c) Deferred bonus until completion of the Egypt farm-out ($375k of which will be paid in cash and $188k of which will be in the DBSP).
* Fees and/or salaries paid to the Directors are in proportion with their dates of service.
2020Fees/salary
$000’sBenefits 1
$000’sBonus $000’s
LTIP $000’s
Pension $000’s
Total $000’s
Fixed $000’s
Variable $000’s
Executive Directors3
E Story 556 188 – – 83 827 639 188
J Brown2 544 48 – – 82 674 626 48
M Watts2 544 54 – – 82 680 626 54
Non-Executive Directors²
R de Sousa* 59 1 – – – 60 59 1
E Contini* 29 - – – – 29 29
R Gray 145 1 – – – 146 145 1
J Martin 161 – – – – 161 161 –
M Daryabegui 64 – – – – 64 64 –
L Mitchell* 64 – – – – 64 64 –
G Green* 46 – – – – 46 46 –
Total 2,212 292 – – 247 3,430 2,458 292
The benefits receivable by Executive Directors include private medical insurance, permanent health insurance, life assurance cover, critical illness cover, travel and car benefits. E Story also receives expatriate benefits including tax protection or equalisation for any travel to the UK . The benefits column for Non-Executive Directors includes taxable travel and accommodation expenses to attend Board functions in the year, and the tax payable thereon, in accordance with HMRC guidance.
1. The near-term average exchange rate at the end of the performance period of 1.28 has been used to convert share price from GB pounds to US dollars.
2. Executive Directors’ fees and the salaries of Jann Brown and Dr Mike Watts are set in GB pounds and are reported in US dollars at the annual average exchange rate.
3. Executive Directors agreed to a reduction of 25% of their salary from 1 May 2020 and a further 10% from 1 August 2020. Non-Executive Directors agreed to a 25% reduction of their fee from 1 May 2020. The figures above reflect the reductions in salary and fees
* Fees paid to the Executive and Non-Executive Directors are in proportion with their dates of service.
The aggregate emoluments of all Directors during the year was $4.3m.
Annual Report on Remuneration (Audited section)
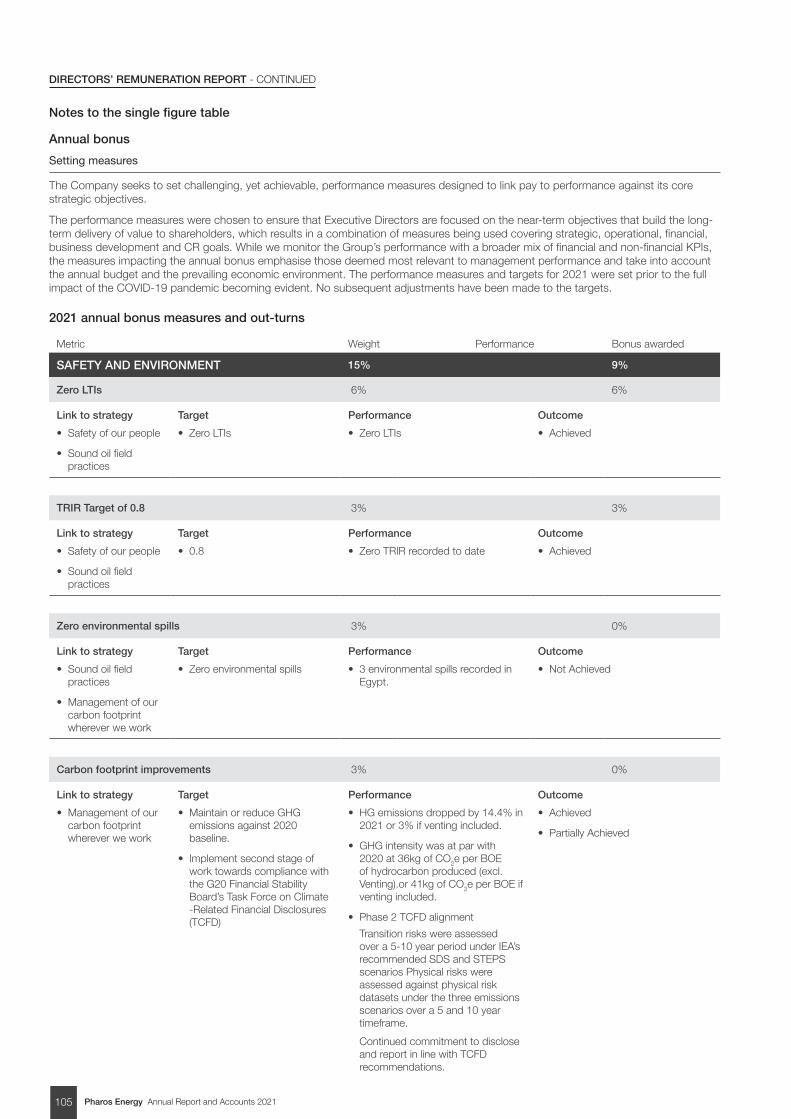
Pharos Energy Annual Report and Accounts 2021105
DIRECTORS’ REMUNERATION REPORT - CONTINUED
Notes to the single figure table
Annual bonus
Setting measures
The Company seeks to set challenging, yet achievable, performance measures designed to link pay to performance against its core strategic objectives.
The performance measures were chosen to ensure that Executive Directors are focused on the near-term objectives that build the long-term delivery of value to shareholders, which results in a combination of measures being used covering strategic, operational, financial, business development and CR goals. While we monitor the Group’s performance with a broader mix of financial and non-financial KPIs, the measures impacting the annual bonus emphasise those deemed most relevant to management performance and take into account the annual budget and the prevailing economic environment. The performance measures and targets for 2021 were set prior to the full impact of the COVID-19 pandemic becoming evident. No subsequent adjustments have been made to the targets.
2021 annual bonus measures and out-turns
Metric Weight Performance Bonus awarded
SAFETY AND ENVIRONMENT 15% 9%
Zero LTIs 6% 6%
Link to strategy
• Safety of our people
• Sound oil field practices
Target
• Zero LTIs
Performance
• Zero LTIs
Outcome
• Achieved
TRIR Target of 0.8 3% 3%
Link to strategy
• Safety of our people
• Sound oil field practices
Target
• 0.8
Performance
• Zero TRIR recorded to date
Outcome
• Achieved
Zero environmental spills 3% 0%
Link to strategy
• Sound oil field practices
• Management of our carbon footprint wherever we work
Target
• Zero environmental spills
Performance
• 3 environmental spills recorded in Egypt.
Outcome
• Not Achieved
Carbon footprint improvements 3% 0%
Link to strategy
• Management of our carbon footprint wherever we work
Target
• Maintain or reduce GHG emissions against 2020 baseline.
• Implement second stage of work towards compliance with the G20 Financial Stability Board’s Task Force on Climate -Related Financial Disclosures (TCFD)
Performance
• HG emissions dropped by 14.4% in 2021 or 3% if venting included.
• GHG intensity was at par with 2020 at 36kg of CO2e per BOE of hydrocarbon produced (excl. Venting).or 41kg of CO2e per BOE if venting included.
• Phase 2 TCFD alignment
Transition risks were assessed over a 5-10 year period under IEA’s recommended SDS and STEPS scenarios Physical risks were assessed against physical risk datasets under the three emissions scenarios over a 5 and 10 year timeframe.
Continued commitment to disclose and report in line with TCFD recommendations.
Outcome
• Achieved
• Partially Achieved
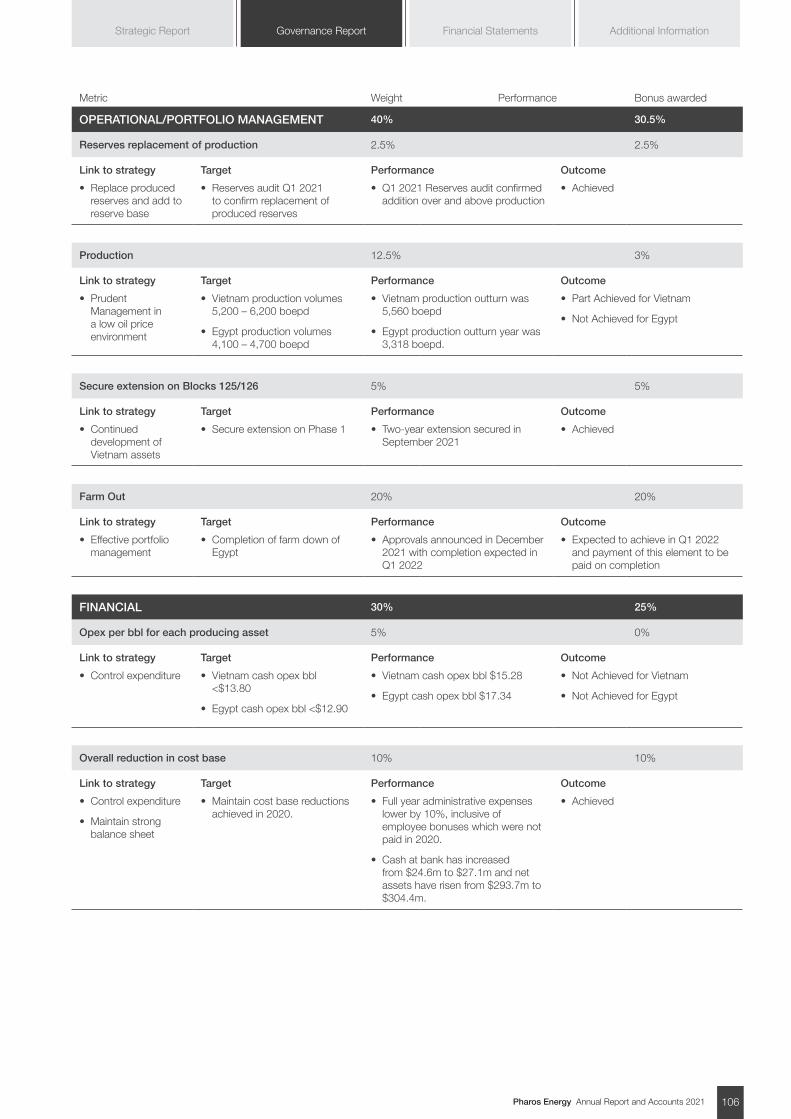
Pharos Energy Annual Report and Accounts 2021 106
Additional InformationGovernance Report Financial StatementsStrategic Report
Metric Weight Performance Bonus awarded
OPERATIONAL/PORTFOLIO MANAGEMENT 40% 30.5%
Reserves replacement of production 2.5% 2.5%
Link to strategy
• Replace produced reserves and add to reserve base
Target
• Reserves audit Q1 2021 to confirm replacement of produced reserves
Performance
• Q1 2021 Reserves audit confirmed addition over and above production
Outcome
• Achieved
Production 12.5% 3%
Link to strategy
• Prudent Management in a low oil price environment
Target
• Vietnam production volumes 5,200 – 6,200 boepd
• Egypt production volumes 4,100 – 4,700 boepd
Performance
• Vietnam production outturn was 5,560 boepd
• Egypt production outturn year was 3,318 boepd.
Outcome
• Part Achieved for Vietnam
• Not Achieved for Egypt
Secure extension on Blocks 125/126 5% 5%
Link to strategy
• Continued development of Vietnam assets
Target
• Secure extension on Phase 1
Performance
• Two-year extension secured in September 2021
Outcome
• Achieved
Farm Out 20% 20%
Link to strategy
• Effective portfolio management
Target
• Completion of farm down of Egypt
Performance
• Approvals announced in December 2021 with completion expected in Q1 2022
Outcome
• Expected to achieve in Q1 2022 and payment of this element to be paid on completion
FINANCIAL 30% 25%
Opex per bbl for each producing asset 5% 0%
Link to strategy
• Control expenditure
Target
• Vietnam cash opex bbl <$13.80
• Egypt cash opex bbl <$12.90
Performance
• Vietnam cash opex bbl $15.28
• Egypt cash opex bbl $17.34
Outcome
• Not Achieved for Vietnam
• Not Achieved for Egypt
Overall reduction in cost base 10% 10%
Link to strategy
• Control expenditure
• Maintain strong balance sheet
Target
• Maintain cost base reductions achieved in 2020.
Performance
• Full year administrative expenses lower by 10%, inclusive of employee bonuses which were not paid in 2020.
• Cash at bank has increased from $24.6m to $27.1m and net assets have risen from $293.7m to $304.4m.
Outcome
• Achieved
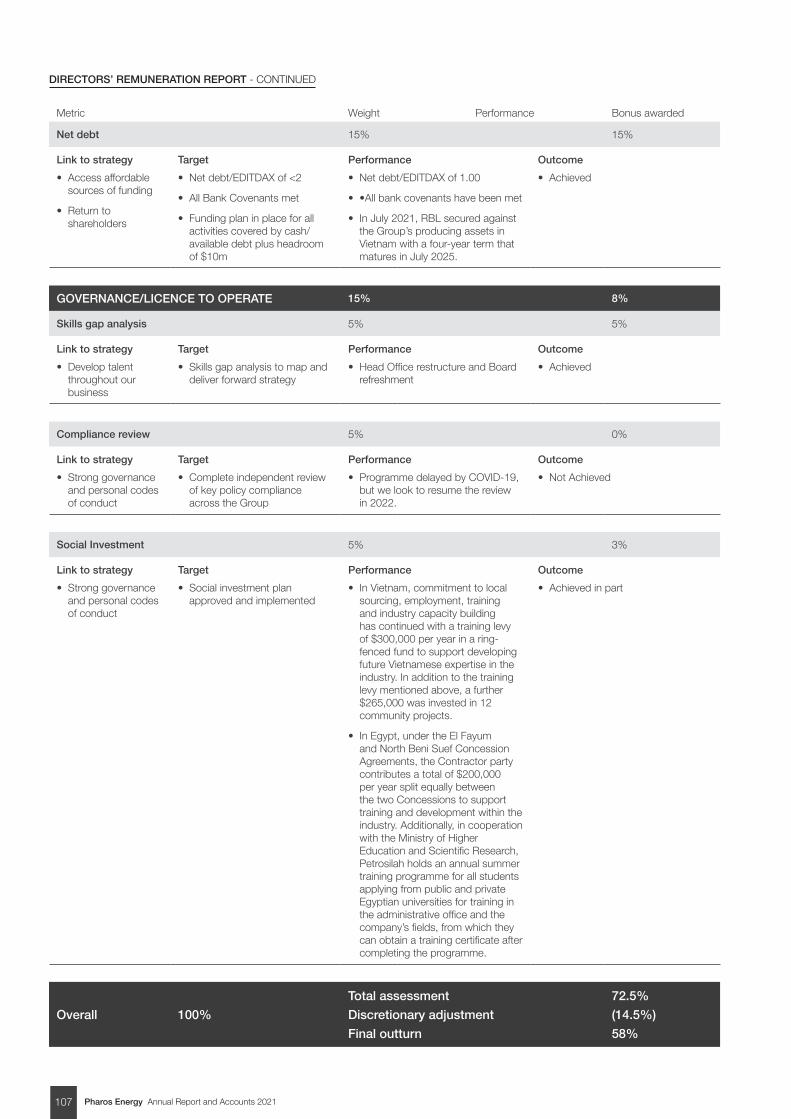
Pharos Energy Annual Report and Accounts 2021107
DIRECTORS’ REMUNERATION REPORT - CONTINUED
Metric Weight Performance Bonus awarded
Net debt 15% 15%
Link to strategy
• Access affordable sources of funding
• Return to shareholders
Target
• Net debt/EDITDAX of <2
• All Bank Covenants met
• Funding plan in place for all activities covered by cash/available debt plus headroom of $10m
Performance
• Net debt/EDITDAX of 1.00
• •All bank covenants have been met
• In July 2021, RBL secured against the Group’s producing assets in Vietnam with a four-year term that matures in July 2025.
Outcome
• Achieved
GOVERNANCE/LICENCE TO OPERATE 15% 8%
Skills gap analysis 5% 5%
Link to strategy
• Develop talent throughout our business
Target
• Skills gap analysis to map and deliver forward strategy
Performance
• Head Office restructure and Board refreshment
Outcome
• Achieved
Compliance review 5% 0%
Link to strategy
• Strong governance and personal codes of conduct
Target
• Complete independent review of key policy compliance across the Group
Performance
• Programme delayed by COVID-19, but we look to resume the review in 2022.
Outcome
• Not Achieved
Social Investment 5% 3%
Link to strategy
• Strong governance and personal codes of conduct
Target
• Social investment plan approved and implemented
Performance
• In Vietnam, commitment to local sourcing, employment, training and industry capacity building has continued with a training levy of $300,000 per year in a ring-fenced fund to support developing future Vietnamese expertise in the industry. In addition to the training levy mentioned above, a further $265,000 was invested in 12 community projects.
• In Egypt, under the El Fayum and North Beni Suef Concession Agreements, the Contractor party contributes a total of $200,000 per year split equally between the two Concessions to support training and development within the industry. Additionally, in cooperation with the Ministry of Higher Education and Scientific Research, Petrosilah holds an annual summer training programme for all students applying from public and private Egyptian universities for training in the administrative office and the company’s fields, from which they can obtain a training certificate after completing the programme.
Outcome
• Achieved in part
Overall 100%
Total assessment
Discretionary adjustment
Final outturn
72.5%
(14.5%)
58%
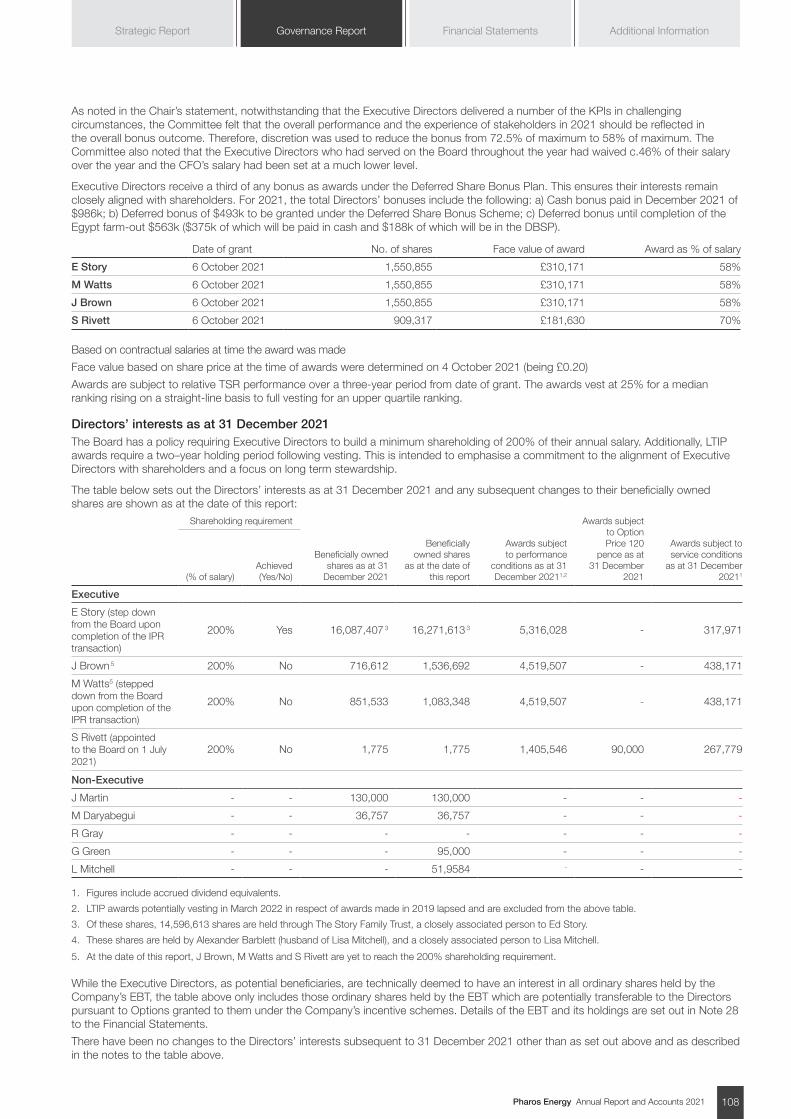
Pharos Energy Annual Report and Accounts 2021 108
Additional InformationGovernance Report Financial StatementsStrategic Report
As noted in the Chair’s statement, notwithstanding that the Executive Directors delivered a number of the KPIs in challenging circumstances, the Committee felt that the overall performance and the experience of stakeholders in 2021 should be reflected in the overall bonus outcome. Therefore, discretion was used to reduce the bonus from 72.5% of maximum to 58% of maximum. The Committee also noted that the Executive Directors who had served on the Board throughout the year had waived c.46% of their salary over the year and the CFO’s salary had been set at a much lower level.
Executive Directors receive a third of any bonus as awards under the Deferred Share Bonus Plan. This ensures their interests remain closely aligned with shareholders. For 2021, the total Directors’ bonuses include the following: a) Cash bonus paid in December 2021 of $986k; b) Deferred bonus of $493k to be granted under the Deferred Share Bonus Scheme; c) Deferred bonus until completion of the Egypt farm-out $563k ($375k of which will be paid in cash and $188k of which will be in the DBSP).
Date of grant No. of shares Face value of award Award as % of salary
E Story 6 October 2021 1,550,855 £310,171 58%
M Watts 6 October 2021 1,550,855 £310,171 58%
J Brown 6 October 2021 1,550,855 £310,171 58%
S Rivett 6 October 2021 909,317 £181,630 70% Based on contractual salaries at time the award was made
Face value based on share price at the time of awards were determined on 4 October 2021 (being £0.20)
Awards are subject to relative TSR performance over a three-year period from date of grant. The awards vest at 25% for a median ranking rising on a straight-line basis to full vesting for an upper quartile ranking.
Directors’ interests as at 31 December 2021The Board has a policy requiring Executive Directors to build a minimum shareholding of 200% of their annual salary. Additionally, LTIP awards require a two–year holding period following vesting. This is intended to emphasise a commitment to the alignment of Executive Directors with shareholders and a focus on long term stewardship.
The table below sets out the Directors’ interests as at 31 December 2021 and any subsequent changes to their beneficially owned shares are shown as at the date of this report:
Shareholding requirement
Beneficially owned shares as at 31
December 2021
Beneficially owned shares
as at the date of this report
Awards subject to performance
conditions as at 31 December 20211,2
Awards subject to Option Price 120
pence as at 31 December
2021
Awards subject to service conditions
as at 31 December 20211 (% of salary)
Achieved (Yes/No)
Executive
E Story (step down from the Board upon completion of the IPR transaction)
200% Yes 16,087,407 3 16,271,613 3 5,316,028 - 317,971
J Brown 5 200% No 716,612 1,536,692 4,519,507 - 438,171
M Watts5 (stepped down from the Board upon completion of the IPR transaction)
200% No 851,533 1,083,348 4,519,507 - 438,171
S Rivett (appointed to the Board on 1 July 2021)
200% No 1,775 1,775 1,405,546 90,000 267,779
Non-Executive
J Martin - - 130,000 130,000 - - -
M Daryabegui - - 36,757 36,757 - - -
R Gray - - - - - - -
G Green - - - 95,000 - - -
L Mitchell - - - 51,9584 - - -
1. Figures include accrued dividend equivalents.
2. LTIP awards potentially vesting in March 2022 in respect of awards made in 2019 lapsed and are excluded from the above table.
3. Of these shares, 14,596,613 shares are held through The Story Family Trust, a closely associated person to Ed Story.
4. These shares are held by Alexander Barblett (husband of Lisa Mitchell), and a closely associated person to Lisa Mitchell.
5. At the date of this report, J Brown, M Watts and S Rivett are yet to reach the 200% shareholding requirement. While the Executive Directors, as potential beneficiaries, are technically deemed to have an interest in all ordinary shares held by the Company’s EBT, the table above only includes those ordinary shares held by the EBT which are potentially transferable to the Directors pursuant to Options granted to them under the Company’s incentive schemes. Details of the EBT and its holdings are set out in Note 28 to the Financial Statements.
There have been no changes to the Directors’ interests subsequent to 31 December 2021 other than as set out above and as described in the notes to the table above.
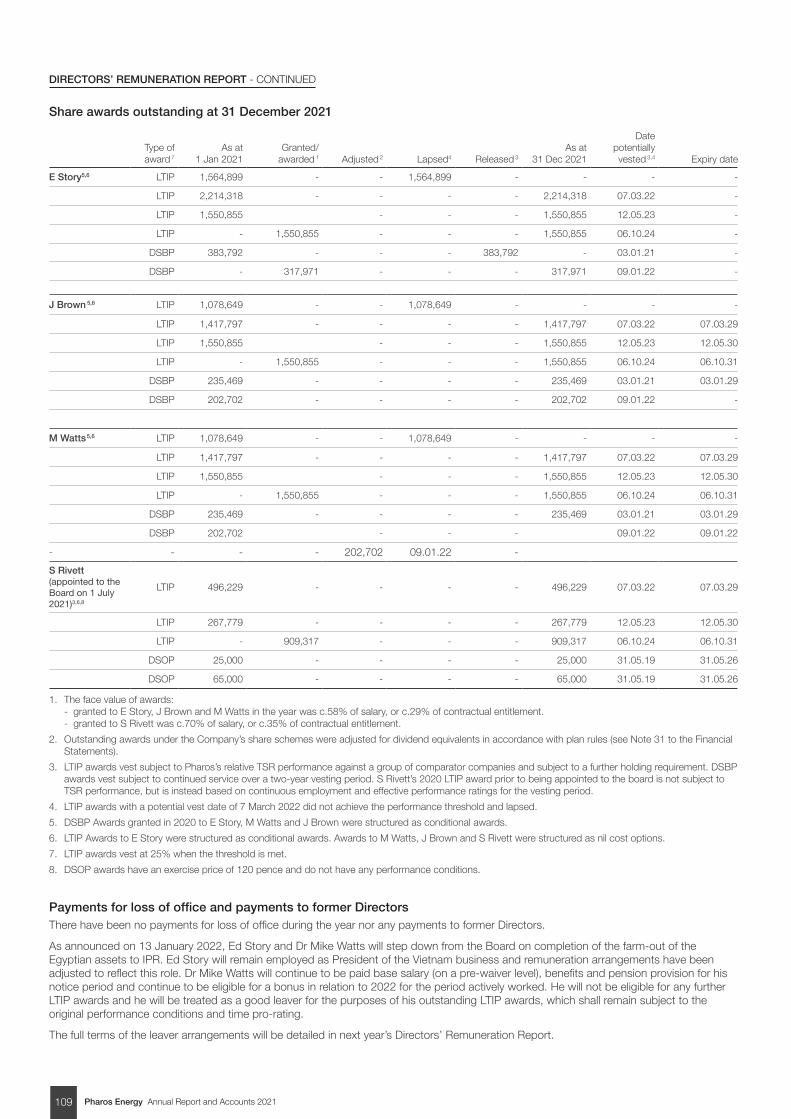
Pharos Energy Annual Report and Accounts 2021109
DIRECTORS’ REMUNERATION REPORT - CONTINUED
Share awards outstanding at 31 December 2021
Type of award 7
As at 1 Jan 2021
Granted/awarded 1 Adjusted 2 Lapsed4 Released 3
As at 31 Dec 2021
Date potentially vested 3,4 Expiry date
E Story5,6 LTIP 1,564,899 - - 1,564,899 - - - -
LTIP 2,214,318 - - - - 2,214,318 07.03.22 -
LTIP 1,550,855 - - - 1,550,855 12.05.23 -
LTIP - 1,550,855 - - - 1,550,855 06.10.24 -
DSBP 383,792 - - - 383,792 - 03.01.21 -
DSBP - 317,971 - - - 317,971 09.01.22 -
J Brown 5,6 LTIP 1,078,649 - - 1,078,649 - - - -
LTIP 1,417,797 - - - - 1,417,797 07.03.22 07.03.29
LTIP 1,550,855 - - - 1,550,855 12.05.23 12.05.30
LTIP - 1,550,855 - - - 1,550,855 06.10.24 06.10.31
DSBP 235,469 - - - - 235,469 03.01.21 03.01.29
DSBP 202,702 - - - - 202,702 09.01.22 -
M Watts 5,6 LTIP 1,078,649 - - 1,078,649 - - - -
LTIP 1,417,797 - - - - 1,417,797 07.03.22 07.03.29
LTIP 1,550,855 - - - 1,550,855 12.05.23 12.05.30
LTIP - 1,550,855 - - - 1,550,855 06.10.24 06.10.31
DSBP 235,469 - - - - 235,469 03.01.21 03.01.29
DSBP 202,702 - - - 09.01.22 09.01.22
- - - - 202,702 09.01.22 -
S Rivett (appointed to the Board on 1 July 2021)3,6,8
LTIP 496,229 - - - - 496,229 07.03.22 07.03.29
LTIP 267,779 - - - - 267,779 12.05.23 12.05.30
LTIP - 909,317 - - - 909,317 06.10.24 06.10.31
DSOP 25,000 - - - - 25,000 31.05.19 31.05.26
DSOP 65,000 - - - - 65,000 31.05.19 31.05.26
1. The face value of awards: - granted to E Story, J Brown and M Watts in the year was c.58% of salary, or c.29% of contractual entitlement. - granted to S Rivett was c.70% of salary, or c.35% of contractual entitlement.
2. Outstanding awards under the Company’s share schemes were adjusted for dividend equivalents in accordance with plan rules (see Note 31 to the Financial Statements).
3. LTIP awards vest subject to Pharos’s relative TSR performance against a group of comparator companies and subject to a further holding requirement. DSBP awards vest subject to continued service over a two-year vesting period. S Rivett’s 2020 LTIP award prior to being appointed to the board is not subject to TSR performance, but is instead based on continuous employment and effective performance ratings for the vesting period.
4. LTIP awards with a potential vest date of 7 March 2022 did not achieve the performance threshold and lapsed.
5. DSBP Awards granted in 2020 to E Story, M Watts and J Brown were structured as conditional awards.
6. LTIP Awards to E Story were structured as conditional awards. Awards to M Watts, J Brown and S Rivett were structured as nil cost options.
7. LTIP awards vest at 25% when the threshold is met.
8. DSOP awards have an exercise price of 120 pence and do not have any performance conditions.
Payments for loss of office and payments to former Directors There have been no payments for loss of office during the year nor any payments to former Directors.
As announced on 13 January 2022, Ed Story and Dr Mike Watts will step down from the Board on completion of the farm-out of the Egyptian assets to IPR. Ed Story will remain employed as President of the Vietnam business and remuneration arrangements have been adjusted to reflect this role. Dr Mike Watts will continue to be paid base salary (on a pre-waiver level), benefits and pension provision for his notice period and continue to be eligible for a bonus in relation to 2022 for the period actively worked. He will not be eligible for any further LTIP awards and he will be treated as a good leaver for the purposes of his outstanding LTIP awards, which shall remain subject to the original performance conditions and time pro-rating.
The full terms of the leaver arrangements will be detailed in next year’s Directors’ Remuneration Report.
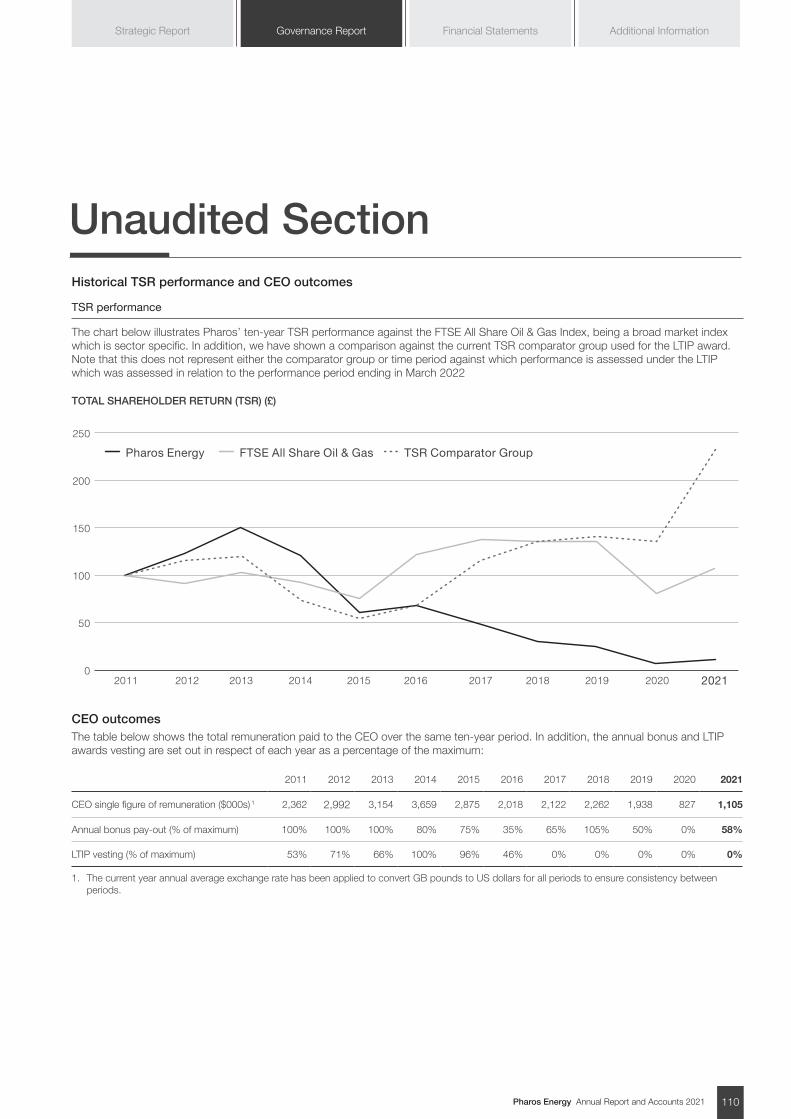
Pharos Energy Annual Report and Accounts 2021 110
Additional InformationGovernance Report Financial StatementsStrategic Report
Unaudited Section Historical TSR performance and CEO outcomes
TSR performance
The chart below illustrates Pharos’ ten-year TSR performance against the FTSE All Share Oil & Gas Index, being a broad market index which is sector specific. In addition, we have shown a comparison against the current TSR comparator group used for the LTIP award. Note that this does not represent either the comparator group or time period against which performance is assessed under the LTIP which was assessed in relation to the performance period ending in March 2022
TOTAL SHAREHOLDER RETURN (TSR) (£)
250
200
150
100
50
02011 2012 2013 2014 2015 2016 2017 2018 2019 2020 2021
Pharos Energy FTSE All Share Oil & Gas TSR Comparator Group
CEO outcomesThe table below shows the total remuneration paid to the CEO over the same ten-year period. In addition, the annual bonus and LTIP awards vesting are set out in respect of each year as a percentage of the maximum:
2011 2012 2013 2014 2015 2016 2017 2018 2019 2020 2021
CEO single figure of remuneration ($000s) 1 2,362 2,992 3,154 3,659 2,875 2,018 2,122 2,262 1,938 827 1,105
Annual bonus pay-out (% of maximum) 100% 100% 100% 80% 75% 35% 65% 105% 50% 0% 58%
LTIP vesting (% of maximum) 53% 71% 66% 100% 96% 46% 0% 0% 0% 0% 0%
1. The current year annual average exchange rate has been applied to convert GB pounds to US dollars for all periods to ensure consistency between periods.
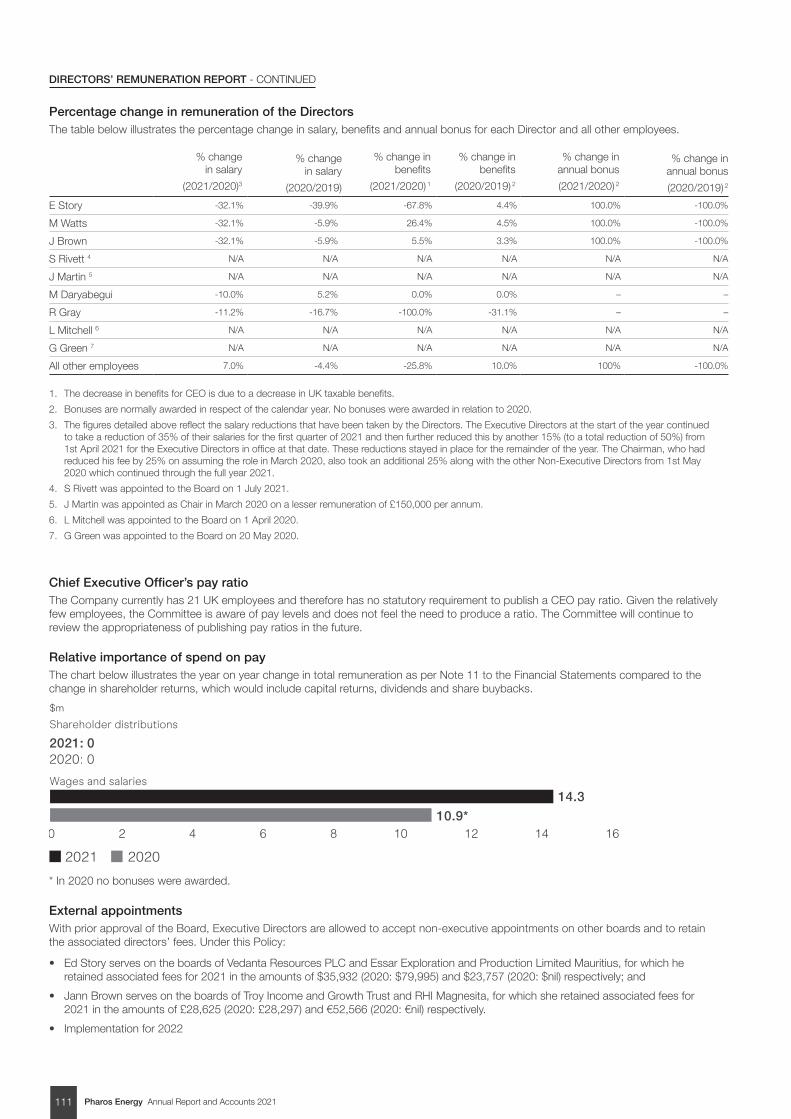
Pharos Energy Annual Report and Accounts 2021111
DIRECTORS’ REMUNERATION REPORT - CONTINUED
Percentage change in remuneration of the Directors The table below illustrates the percentage change in salary, benefits and annual bonus for each Director and all other employees.
% change in salary
(2021/2020)3
% change in salary
(2020/2019)
% change in benefits
(2021/2020) 1
% change in benefits
(2020/2019) 2
% change in annual bonus
(2021/2020) 2
% change in annual bonus
(2020/2019) 2
E Story -32.1% -39.9% -67.8% 4.4% 100.0% -100.0%
M Watts -32.1% -5.9% 26.4% 4.5% 100.0% -100.0%
J Brown -32.1% -5.9% 5.5% 3.3% 100.0% -100.0%
S Rivett 4 N/A N/A N/A N/A N/A N/A
J Martin 5 N/A N/A N/A N/A N/A N/A
M Daryabegui -10.0% 5.2% 0.0% 0.0% – –
R Gray -11.2% -16.7% -100.0% -31.1% – –
L Mitchell 6 N/A N/A N/A N/A N/A N/A
G Green 7 N/A N/A N/A N/A N/A N/A
All other employees 7.0% -4.4% -25.8% 10.0% 100% -100.0%
1. The decrease in benefits for CEO is due to a decrease in UK taxable benefits.
2. Bonuses are normally awarded in respect of the calendar year. No bonuses were awarded in relation to 2020.
3. The figures detailed above reflect the salary reductions that have been taken by the Directors. The Executive Directors at the start of the year continued to take a reduction of 35% of their salaries for the first quarter of 2021 and then further reduced this by another 15% (to a total reduction of 50%) from 1st April 2021 for the Executive Directors in office at that date. These reductions stayed in place for the remainder of the year. The Chairman, who had reduced his fee by 25% on assuming the role in March 2020, also took an additional 25% along with the other Non-Executive Directors from 1st May 2020 which continued through the full year 2021.
4. S Rivett was appointed to the Board on 1 July 2021.
5. J Martin was appointed as Chair in March 2020 on a lesser remuneration of £150,000 per annum.
6. L Mitchell was appointed to the Board on 1 April 2020.
7. G Green was appointed to the Board on 20 May 2020.
Chief Executive Officer’s pay ratio The Company currently has 21 UK employees and therefore has no statutory requirement to publish a CEO pay ratio. Given the relatively few employees, the Committee is aware of pay levels and does not feel the need to produce a ratio. The Committee will continue to review the appropriateness of publishing pay ratios in the future.
Relative importance of spend on pay The chart below illustrates the year on year change in total remuneration as per Note 11 to the Financial Statements compared to the change in shareholder returns, which would include capital returns, dividends and share buybacks.
2021 2020
2021: 0
14.3
10.9*
2020: 0
0 161412108642
* In 2020 no bonuses were awarded.
External appointmentsWith prior approval of the Board, Executive Directors are allowed to accept non-executive appointments on other boards and to retain the associated directors’ fees. Under this Policy:
• Ed Story serves on the boards of Vedanta Resources PLC and Essar Exploration and Production Limited Mauritius, for which he retained associated fees for 2021 in the amounts of $35,932 (2020: $79,995) and $23,757 (2020: $nil) respectively; and
• Jann Brown serves on the boards of Troy Income and Growth Trust and RHI Magnesita, for which she retained associated fees for 2021 in the amounts of £28,625 (2020: £28,297) and €52,566 (2020: €nil) respectively.
• Implementation for 2022
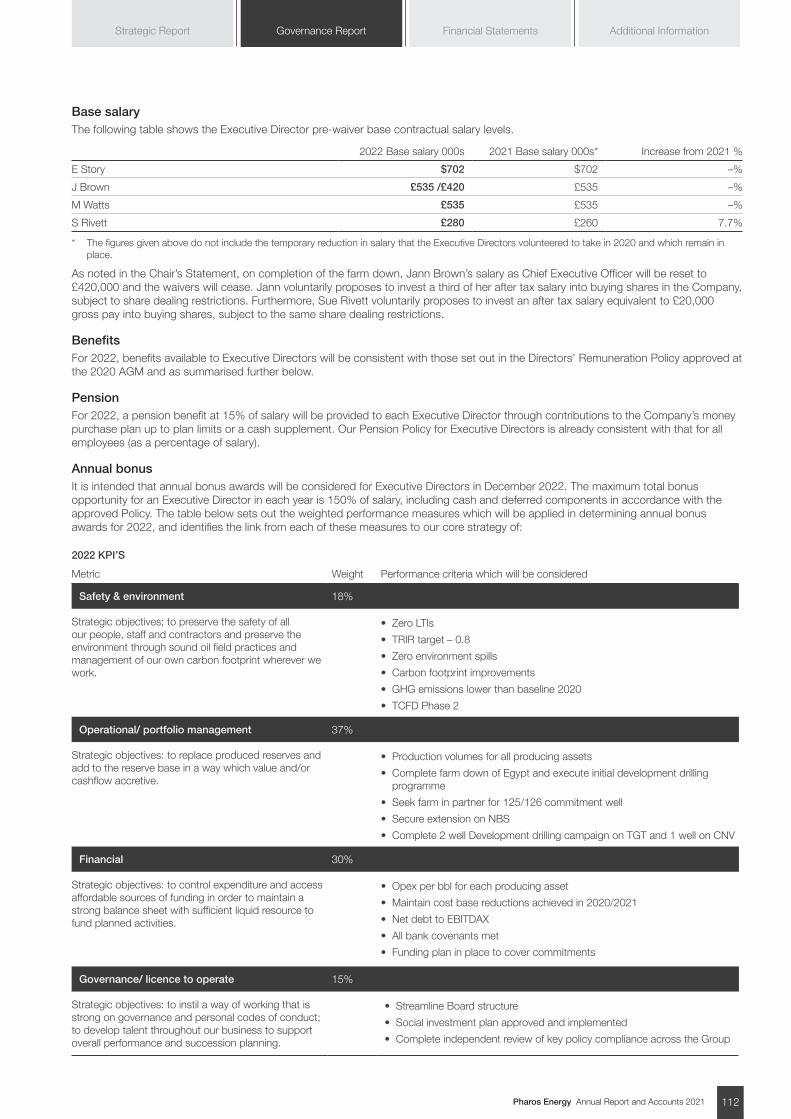
Pharos Energy Annual Report and Accounts 2021 112
Additional InformationGovernance Report Financial StatementsStrategic Report
Base salary The following table shows the Executive Director pre-waiver base contractual salary levels.
2022 Base salary 000s 2021 Base salary 000s* Increase from 2021 %
E Story $702 $702 –%
J Brown £535 /£420 £535 –%
M Watts £535 £535 –%
S Rivett £280 £260 7.7%
* The figures given above do not include the temporary reduction in salary that the Executive Directors volunteered to take in 2020 and which remain in place.
As noted in the Chair’s Statement, on completion of the farm down, Jann Brown’s salary as Chief Executive Officer will be reset to £420,000 and the waivers will cease. Jann voluntarily proposes to invest a third of her after tax salary into buying shares in the Company, subject to share dealing restrictions. Furthermore, Sue Rivett voluntarily proposes to invest an after tax salary equivalent to £20,000 gross pay into buying shares, subject to the same share dealing restrictions.
BenefitsFor 2022, benefits available to Executive Directors will be consistent with those set out in the Directors’ Remuneration Policy approved at the 2020 AGM and as summarised further below.
PensionFor 2022, a pension benefit at 15% of salary will be provided to each Executive Director through contributions to the Company’s money purchase plan up to plan limits or a cash supplement. Our Pension Policy for Executive Directors is already consistent with that for all employees (as a percentage of salary).
Annual bonusIt is intended that annual bonus awards will be considered for Executive Directors in December 2022. The maximum total bonus opportunity for an Executive Director in each year is 150% of salary, including cash and deferred components in accordance with the approved Policy. The table below sets out the weighted performance measures which will be applied in determining annual bonus awards for 2022, and identifies the link from each of these measures to our core strategy of:
2022 KPI’S
Metric Weight Performance criteria which will be considered
Safety & environment 18%
Strategic objectives; to preserve the safety of all our people, staff and contractors and preserve the environment through sound oil field practices and management of our own carbon footprint wherever we work.
• Zero LTIs
• TRIR target – 0.8
• Zero environment spills
• Carbon footprint improvements
• GHG emissions lower than baseline 2020
• TCFD Phase 2
Operational/ portfolio management 37%
Strategic objectives: to replace produced reserves and add to the reserve base in a way which value and/or cashflow accretive.
• Production volumes for all producing assets
• Complete farm down of Egypt and execute initial development drilling programme
• Seek farm in partner for 125/126 commitment well
• Secure extension on NBS
• Complete 2 well Development drilling campaign on TGT and 1 well on CNV
Financial 30%
Strategic objectives: to control expenditure and access affordable sources of funding in order to maintain a strong balance sheet with sufficient liquid resource to fund planned activities.
• Opex per bbl for each producing asset
• Maintain cost base reductions achieved in 2020/2021
• Net debt to EBITDAX
• All bank covenants met
• Funding plan in place to cover commitments
Governance/ licence to operate 15%
Strategic objectives: to instil a way of working that is strong on governance and personal codes of conduct; to develop talent throughout our business to support overall performance and succession planning.
• Streamline Board structure
• Social investment plan approved and implemented
• Complete independent review of key policy compliance across the Group
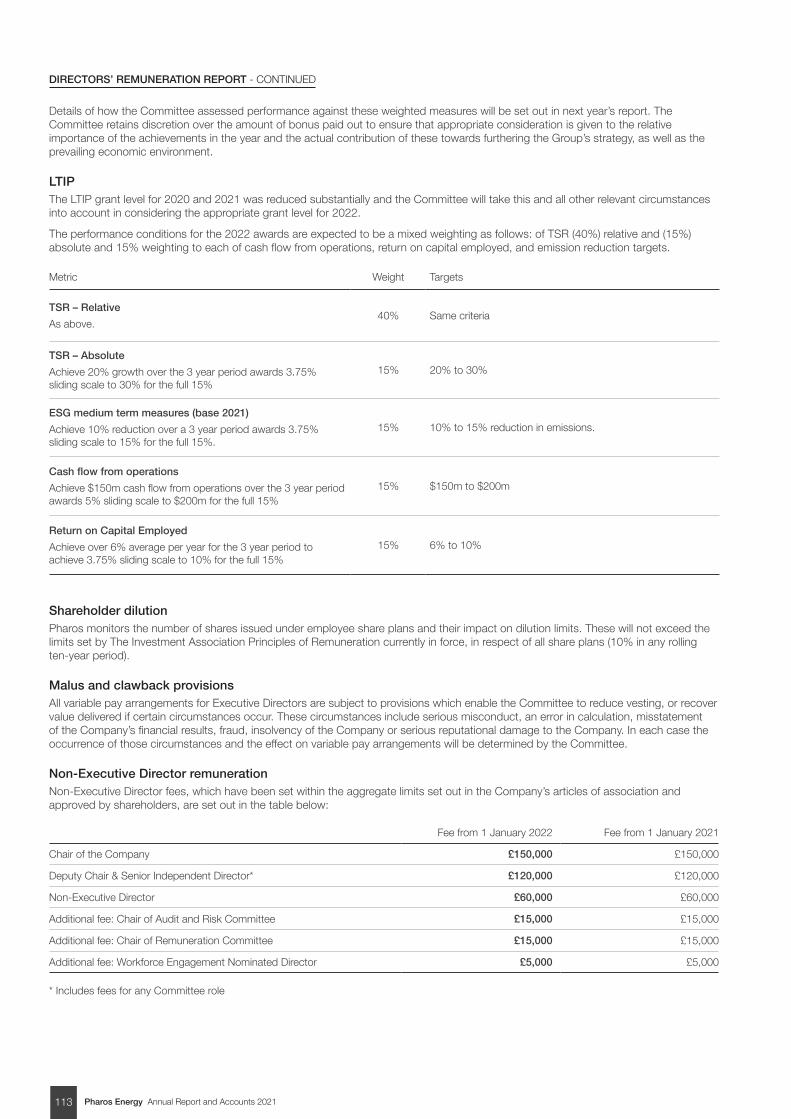
Pharos Energy Annual Report and Accounts 2021113
DIRECTORS’ REMUNERATION REPORT - CONTINUED
Details of how the Committee assessed performance against these weighted measures will be set out in next year’s report. The Committee retains discretion over the amount of bonus paid out to ensure that appropriate consideration is given to the relative importance of the achievements in the year and the actual contribution of these towards furthering the Group’s strategy, as well as the prevailing economic environment.
LTIPThe LTIP grant level for 2020 and 2021 was reduced substantially and the Committee will take this and all other relevant circumstances into account in considering the appropriate grant level for 2022.
The performance conditions for the 2022 awards are expected to be a mixed weighting as follows: of TSR (40%) relative and (15%) absolute and 15% weighting to each of cash flow from operations, return on capital employed, and emission reduction targets.
Metric Weight Targets
TSR – Relative
As above.40% Same criteria
TSR – Absolute
Achieve 20% growth over the 3 year period awards 3.75% sliding scale to 30% for the full 15%
15% 20% to 30%
ESG medium term measures (base 2021)
Achieve 10% reduction over a 3 year period awards 3.75% sliding scale to 15% for the full 15%.
15% 10% to 15% reduction in emissions.
Cash flow from operations
Achieve $150m cash flow from operations over the 3 year period awards 5% sliding scale to $200m for the full 15%
15% $150m to $200m
Return on Capital Employed
Achieve over 6% average per year for the 3 year period to achieve 3.75% sliding scale to 10% for the full 15%
15% 6% to 10%
Shareholder dilutionPharos monitors the number of shares issued under employee share plans and their impact on dilution limits. These will not exceed the limits set by The Investment Association Principles of Remuneration currently in force, in respect of all share plans (10% in any rolling ten-year period).
Malus and clawback provisionsAll variable pay arrangements for Executive Directors are subject to provisions which enable the Committee to reduce vesting, or recover value delivered if certain circumstances occur. These circumstances include serious misconduct, an error in calculation, misstatement of the Company’s financial results, fraud, insolvency of the Company or serious reputational damage to the Company. In each case the occurrence of those circumstances and the effect on variable pay arrangements will be determined by the Committee.
Non-Executive Director remuneration Non-Executive Director fees, which have been set within the aggregate limits set out in the Company’s articles of association and approved by shareholders, are set out in the table below:
Fee from 1 January 2022 Fee from 1 January 2021
Chair of the Company £150,000 £150,000
Deputy Chair & Senior Independent Director* £120,000 £120,000
Non-Executive Director £60,000 £60,000
Additional fee: Chair of Audit and Risk Committee £15,000 £15,000
Additional fee: Chair of Remuneration Committee £15,000 £15,000
Additional fee: Workforce Engagement Nominated Director £5,000 £5,000
* Includes fees for any Committee role
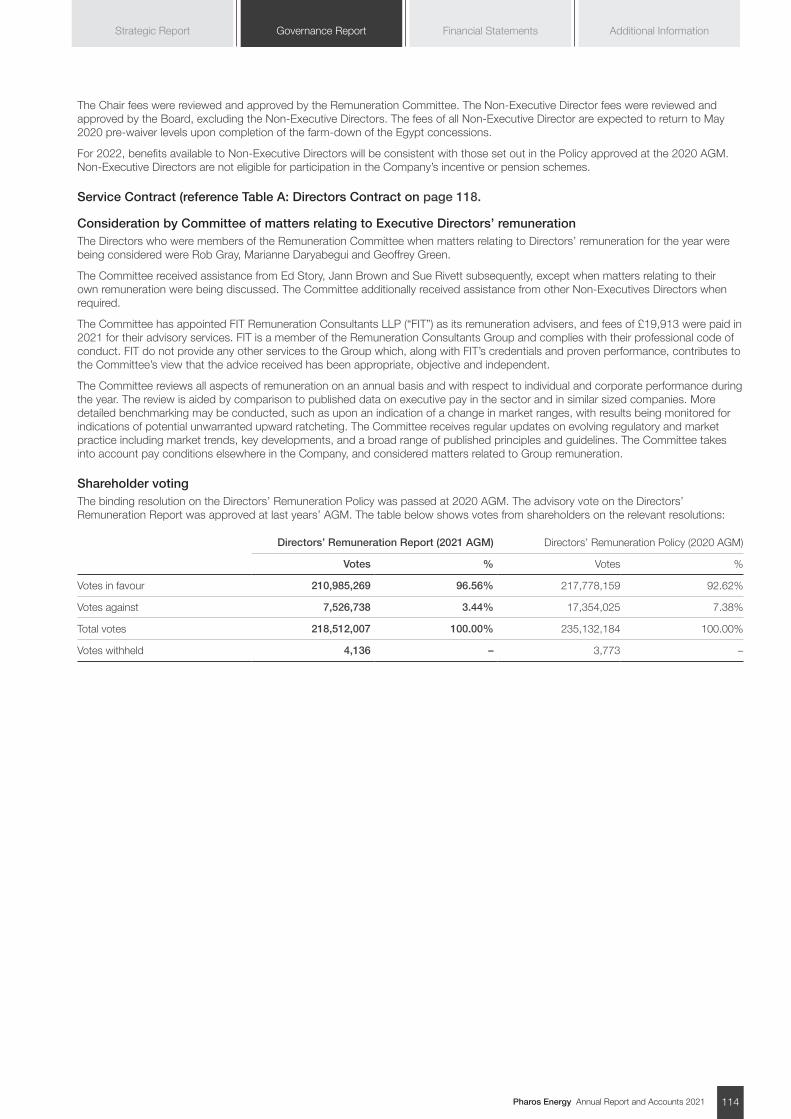
Pharos Energy Annual Report and Accounts 2021 114
Additional InformationGovernance Report Financial StatementsStrategic Report
The Chair fees were reviewed and approved by the Remuneration Committee. The Non-Executive Director fees were reviewed and approved by the Board, excluding the Non-Executive Directors. The fees of all Non-Executive Director are expected to return to May 2020 pre-waiver levels upon completion of the farm-down of the Egypt concessions.
For 2022, benefits available to Non-Executive Directors will be consistent with those set out in the Policy approved at the 2020 AGM. Non-Executive Directors are not eligible for participation in the Company’s incentive or pension schemes.
Service Contract (reference Table A: Directors Contract on page 118.
Consideration by Committee of matters relating to Executive Directors’ remuneration The Directors who were members of the Remuneration Committee when matters relating to Directors’ remuneration for the year were being considered were Rob Gray, Marianne Daryabegui and Geoffrey Green.
The Committee received assistance from Ed Story, Jann Brown and Sue Rivett subsequently, except when matters relating to their own remuneration were being discussed. The Committee additionally received assistance from other Non-Executives Directors when required.
The Committee has appointed FIT Remuneration Consultants LLP (“FIT”) as its remuneration advisers, and fees of £19,913 were paid in 2021 for their advisory services. FIT is a member of the Remuneration Consultants Group and complies with their professional code of conduct. FIT do not provide any other services to the Group which, along with FIT’s credentials and proven performance, contributes to the Committee’s view that the advice received has been appropriate, objective and independent.
The Committee reviews all aspects of remuneration on an annual basis and with respect to individual and corporate performance during the year. The review is aided by comparison to published data on executive pay in the sector and in similar sized companies. More detailed benchmarking may be conducted, such as upon an indication of a change in market ranges, with results being monitored for indications of potential unwarranted upward ratcheting. The Committee receives regular updates on evolving regulatory and market practice including market trends, key developments, and a broad range of published principles and guidelines. The Committee takes into account pay conditions elsewhere in the Company, and considered matters related to Group remuneration.
Shareholder votingThe binding resolution on the Directors’ Remuneration Policy was passed at 2020 AGM. The advisory vote on the Directors’ Remuneration Report was approved at last years’ AGM. The table below shows votes from shareholders on the relevant resolutions:
Directors’ Remuneration Report (2021 AGM) Directors’ Remuneration Policy (2020 AGM)
Votes % Votes %
Votes in favour 210,985,269 96.56% 217,778,159 92.62%
Votes against 7,526,738 3.44% 17,354,025 7.38%
Total votes 218,512,007 100.00% 235,132,184 100.00%
Votes withheld 4,136 – 3,773 –
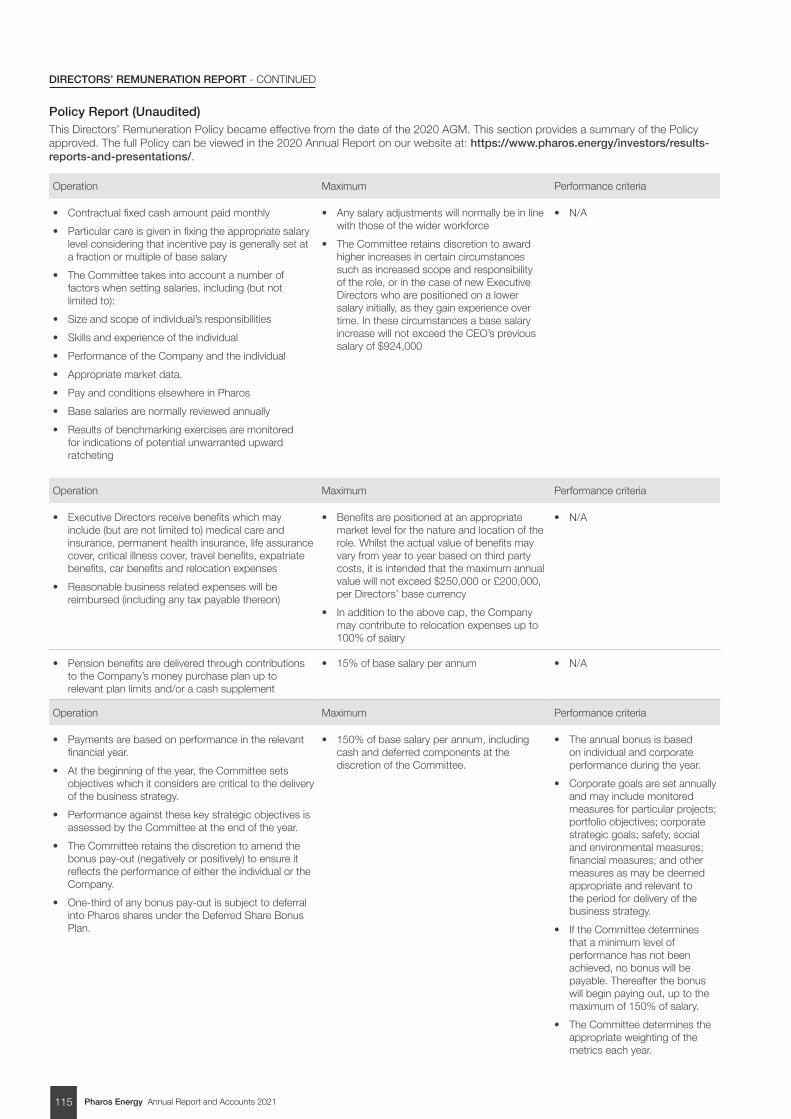
Pharos Energy Annual Report and Accounts 2021115
DIRECTORS’ REMUNERATION REPORT - CONTINUED
Policy Report (Unaudited)This Directors’ Remuneration Policy became effective from the date of the 2020 AGM. This section provides a summary of the Policy approved. The full Policy can be viewed in the 2020 Annual Report on our website at: https://www.pharos.energy/investors/results-reports-and-presentations/.
Operation Maximum Performance criteria
• Contractual fixed cash amount paid monthly
• Particular care is given in fixing the appropriate salary level considering that incentive pay is generally set at a fraction or multiple of base salary
• The Committee takes into account a number of factors when setting salaries, including (but not limited to):
• Size and scope of individual’s responsibilities
• Skills and experience of the individual
• Performance of the Company and the individual
• Appropriate market data.
• Pay and conditions elsewhere in Pharos
• Base salaries are normally reviewed annually
• Results of benchmarking exercises are monitored for indications of potential unwarranted upward ratcheting
• Any salary adjustments will normally be in line with those of the wider workforce
• The Committee retains discretion to award higher increases in certain circumstances such as increased scope and responsibility of the role, or in the case of new Executive Directors who are positioned on a lower salary initially, as they gain experience over time. In these circumstances a base salary increase will not exceed the CEO’s previous salary of $924,000
• N/A
Operation Maximum Performance criteria
• Executive Directors receive benefits which may include (but are not limited to) medical care and insurance, permanent health insurance, life assurance cover, critical illness cover, travel benefits, expatriate benefits, car benefits and relocation expenses
• Reasonable business related expenses will be reimbursed (including any tax payable thereon)
• Benefits are positioned at an appropriate market level for the nature and location of the role. Whilst the actual value of benefits may vary from year to year based on third party costs, it is intended that the maximum annual value will not exceed $250,000 or £200,000, per Directors’ base currency
• In addition to the above cap, the Company may contribute to relocation expenses up to 100% of salary
• N/A
• Pension benefits are delivered through contributions to the Company’s money purchase plan up to relevant plan limits and/or a cash supplement
• 15% of base salary per annum • N/A
Operation Maximum Performance criteria
• Payments are based on performance in the relevant financial year.
• At the beginning of the year, the Committee sets objectives which it considers are critical to the delivery of the business strategy.
• Performance against these key strategic objectives is assessed by the Committee at the end of the year.
• The Committee retains the discretion to amend the bonus pay-out (negatively or positively) to ensure it reflects the performance of either the individual or the Company.
• One-third of any bonus pay-out is subject to deferral into Pharos shares under the Deferred Share Bonus Plan.
• 150% of base salary per annum, including cash and deferred components at the discretion of the Committee.
• The annual bonus is based on individual and corporate performance during the year.
• Corporate goals are set annually and may include monitored measures for particular projects; portfolio objectives; corporate strategic goals; safety, social and environmental measures; financial measures; and other measures as may be deemed appropriate and relevant to the period for delivery of the business strategy.
• If the Committee determines that a minimum level of performance has not been achieved, no bonus will be payable. Thereafter the bonus will begin paying out, up to the maximum of 150% of salary.
• The Committee determines the appropriate weighting of the metrics each year.
Pharos Energy Annual Report and Accounts 2021 116
Additional InformationGovernance Report Financial StatementsStrategic Report
Operation Maximum Performance criteria
• Typically a conditional award of shares or a nil price option is made annually, normally in December, in the course of the annual review cycle
• Vesting of the awards is dependent on the achievement of performance targets, which are typically measured over a three-year performance period
• Awards (post of tax) will also be subject to a two-year post-vesting holding period during which they cannot be sold (except in exceptional circumstances and with the Committee’s prior approval)
• Usually 200% of base salary per annum
• In circumstances which the Committee determines to be exceptional, annual awards of up to 400% of base salary per annum may be made
• Awards vest based on performance against financial, operational and/or share price measures, as set by the Committee, which are aligned with the long-term strategic objectives of Pharos
• No less than 50% of the award will be based on share price measures. The remainder will be based on financial, operational measures
• For ‘threshold’ levels of performance, 25% of the award vests. 100% of the award will vest for maximum performance. Pro-rating applies between these points and between ranking positions
• The Committee may reduce LTIP vesting outcomes (including to zero), based on the result of testing the performance condition, if it considers the potential outcome to be inconsistent with the performance of the Company, business or individual during the performance period. Any use of such discretion would be detailed in the Annual Report on Remuneration
Operation Maximum Performance criteria
• The Board has a policy of requiring Executive Directors to build a minimum shareholding in Pharos shares equivalent to 200% of salary
• A post cessation shareholding guideline will operate from the approval of this Policy. Executive Directors will be expected to retain the lower of actual shares held and shares equal to 200% of salary for one year post-cessation and 100% of salary for up to two years post-cessation (unless the Committee exceptionally determines that it is appropriate to release this requirement). Pharos shares which vest from future deferred bonus and LTIP awards will be retained until a sufficient holding has been built up
• N/A • N/A
This report was approved by the Board of Directors and signed on its behalf by:
GEOFFREY GREENRemuneration Committee Chair 15 March 2022
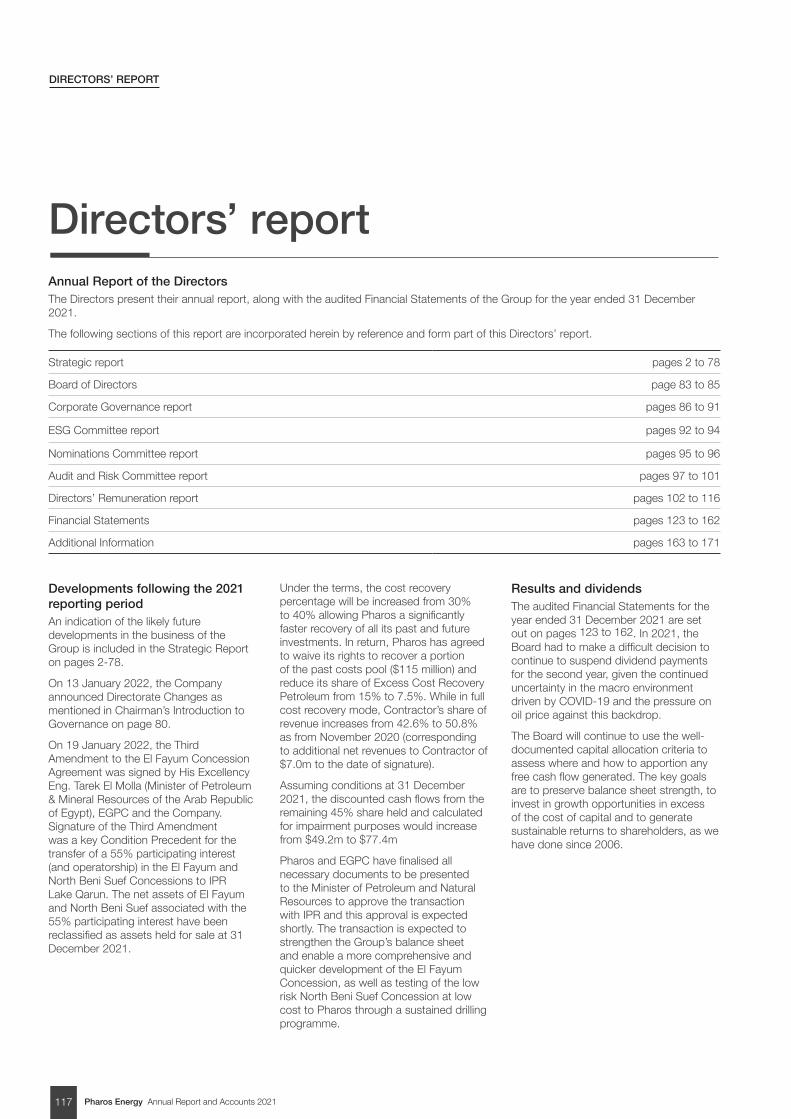
Pharos Energy Annual Report and Accounts 2021117
Directors’ report
DIRECTORS’ REPORT
Annual Report of the DirectorsThe Directors present their annual report, along with the audited Financial Statements of the Group for the year ended 31 December 2021.
The following sections of this report are incorporated herein by reference and form part of this Directors’ report.
Strategic report pages 2 to 78
Board of Directors page 83 to 85
Corporate Governance report pages 86 to 91
ESG Committee report pages 92 to 94
Nominations Committee report pages 95 to 96
Audit and Risk Committee report pages 97 to 101
Directors’ Remuneration report pages 102 to 116
Financial Statements pages 123 to 162
Additional Information pages 163 to 171
Developments following the 2021 reporting periodAn indication of the likely future developments in the business of the Group is included in the Strategic Report on pages 2-78.
On 13 January 2022, the Company announced Directorate Changes as mentioned in Chairman’s Introduction to Governance on page 80.
On 19 January 2022, the Third Amendment to the El Fayum Concession Agreement was signed by His Excellency Eng. Tarek El Molla (Minister of Petroleum & Mineral Resources of the Arab Republic of Egypt), EGPC and the Company. Signature of the Third Amendment was a key Condition Precedent for the transfer of a 55% participating interest (and operatorship) in the El Fayum and North Beni Suef Concessions to IPR Lake Qarun. The net assets of El Fayum and North Beni Suef associated with the 55% participating interest have been reclassified as assets held for sale at 31 December 2021.
Under the terms, the cost recovery percentage will be increased from 30% to 40% allowing Pharos a significantly faster recovery of all its past and future investments. In return, Pharos has agreed to waive its rights to recover a portion of the past costs pool ($115 million) and reduce its share of Excess Cost Recovery Petroleum from 15% to 7.5%. While in full cost recovery mode, Contractor’s share of revenue increases from 42.6% to 50.8% as from November 2020 (corresponding to additional net revenues to Contractor of $7.0m to the date of signature).
Assuming conditions at 31 December 2021, the discounted cash flows from the remaining 45% share held and calculated for impairment purposes would increase from $49.2m to $77.4m
Pharos and EGPC have finalised all necessary documents to be presented to the Minister of Petroleum and Natural Resources to approve the transaction with IPR and this approval is expected shortly. The transaction is expected to strengthen the Group’s balance sheet and enable a more comprehensive and quicker development of the El Fayum Concession, as well as testing of the low risk North Beni Suef Concession at low cost to Pharos through a sustained drilling programme.
Results and dividends The audited Financial Statements for the year ended 31 December 2021 are set out on pages 123 to 162. In 2021, the Board had to make a difficult decision to continue to suspend dividend payments for the second year, given the continued uncertainty in the macro environment driven by COVID-19 and the pressure on oil price against this backdrop.
The Board will continue to use the well-documented capital allocation criteria to assess where and how to apportion any free cash flow generated. The key goals are to preserve balance sheet strength, to invest in growth opportunities in excess of the cost of capital and to generate sustainable returns to shareholders, as we have done since 2006.
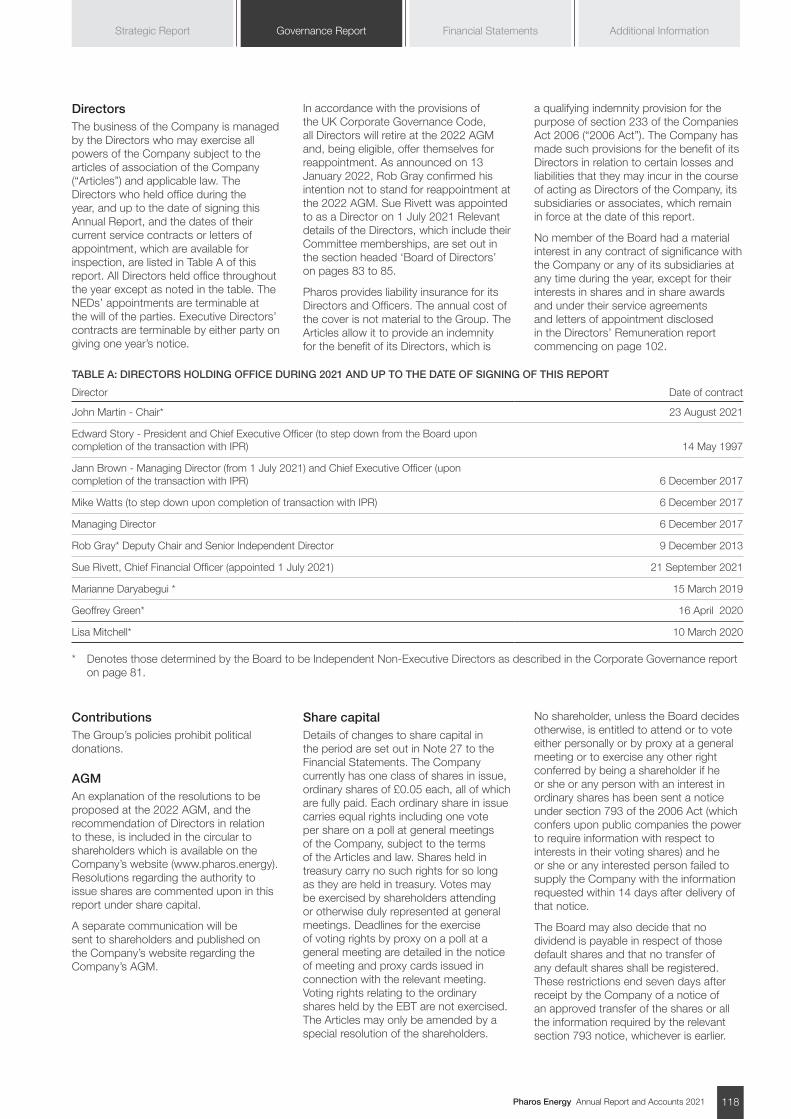
Pharos Energy Annual Report and Accounts 2021 118
Additional InformationGovernance Report Financial StatementsStrategic Report
DirectorsThe business of the Company is managed by the Directors who may exercise all powers of the Company subject to the articles of association of the Company (“Articles”) and applicable law. The Directors who held office during the year, and up to the date of signing this Annual Report, and the dates of their current service contracts or letters of appointment, which are available for inspection, are listed in Table A of this report. All Directors held office throughout the year except as noted in the table. The NEDs’ appointments are terminable at the will of the parties. Executive Directors’ contracts are terminable by either party on giving one year’s notice.
In accordance with the provisions of the UK Corporate Governance Code, all Directors will retire at the 2022 AGM and, being eligible, offer themselves for reappointment. As announced on 13 January 2022, Rob Gray confirmed his intention not to stand for reappointment at the 2022 AGM. Sue Rivett was appointed to as a Director on 1 July 2021 Relevant details of the Directors, which include their Committee memberships, are set out in the section headed ‘Board of Directors’ on pages 83 to 85.
Pharos provides liability insurance for its Directors and Officers. The annual cost of the cover is not material to the Group. The Articles allow it to provide an indemnity for the benefit of its Directors, which is
a qualifying indemnity provision for the purpose of section 233 of the Companies Act 2006 (“2006 Act”). The Company has made such provisions for the benefit of its Directors in relation to certain losses and liabilities that they may incur in the course of acting as Directors of the Company, its subsidiaries or associates, which remain in force at the date of this report.
No member of the Board had a material interest in any contract of significance with the Company or any of its subsidiaries at any time during the year, except for their interests in shares and in share awards and under their service agreements and letters of appointment disclosed in the Directors’ Remuneration report commencing on page 102.
TABLE A: DIRECTORS HOLDING OFFICE DURING 2021 AND UP TO THE DATE OF SIGNING OF THIS REPORT
Director Date of contract
John Martin - Chair* 23 August 2021
Edward Story - President and Chief Executive Officer (to step down from the Board upon completion of the transaction with IPR) 14 May 1997
Jann Brown - Managing Director (from 1 July 2021) and Chief Executive Officer (upon completion of the transaction with IPR) 6 December 2017
Mike Watts (to step down upon completion of transaction with IPR) 6 December 2017
Managing Director 6 December 2017
Rob Gray* Deputy Chair and Senior Independent Director 9 December 2013
Sue Rivett, Chief Financial Officer (appointed 1 July 2021) 21 September 2021
Marianne Daryabegui * 15 March 2019
Geoffrey Green* 16 April 2020
Lisa Mitchell* 10 March 2020
* Denotes those determined by the Board to be Independent Non-Executive Directors as described in the Corporate Governance report on page 81.
ContributionsThe Group’s policies prohibit political donations.
AGMAn explanation of the resolutions to be proposed at the 2022 AGM, and the recommendation of Directors in relation to these, is included in the circular to shareholders which is available on the Company’s website (www.pharos.energy). Resolutions regarding the authority to issue shares are commented upon in this report under share capital.
A separate communication will be sent to shareholders and published on the Company’s website regarding the Company’s AGM.
Share capital Details of changes to share capital in the period are set out in Note 27 to the Financial Statements. The Company currently has one class of shares in issue, ordinary shares of £0.05 each, all of which are fully paid. Each ordinary share in issue carries equal rights including one vote per share on a poll at general meetings of the Company, subject to the terms of the Articles and law. Shares held in treasury carry no such rights for so long as they are held in treasury. Votes may be exercised by shareholders attending or otherwise duly represented at general meetings. Deadlines for the exercise of voting rights by proxy on a poll at a general meeting are detailed in the notice of meeting and proxy cards issued in connection with the relevant meeting. Voting rights relating to the ordinary shares held by the EBT are not exercised. The Articles may only be amended by a special resolution of the shareholders.
No shareholder, unless the Board decides otherwise, is entitled to attend or to vote either personally or by proxy at a general meeting or to exercise any other right conferred by being a shareholder if he or she or any person with an interest in ordinary shares has been sent a notice under section 793 of the 2006 Act (which confers upon public companies the power to require information with respect to interests in their voting shares) and he or she or any interested person failed to supply the Company with the information requested within 14 days after delivery of that notice.
The Board may also decide that no dividend is payable in respect of those default shares and that no transfer of any default shares shall be registered. These restrictions end seven days after receipt by the Company of a notice of an approved transfer of the shares or all the information required by the relevant section 793 notice, whichever is earlier.

Pharos Energy Annual Report and Accounts 2021119
DIRECTORS’ REPORT - CONTINUED
The Directors may refuse to register any transfer of any share which is not a fully-paid share, although such discretion may not be exercised in a way which the Financial Conduct Authority regards as preventing dealings in shares of that class from taking place on an open or proper basis. The Directors may likewise refuse any transfer of a share in favour of more than four persons jointly.
The Company is not aware of any other restrictions on the transfer of ordinary shares in the Company other than certain restrictions that may from time to time be imposed by laws and regulations (for example, insider trading laws); and pursuant to the Listing Rules whereby certain employees of the Company require approval of the Company to deal in the Company’s shares.
The Company is not aware of any agreements between shareholders that may result in restrictions on the transfer of securities or voting rights. Resolutions will be proposed at the 2022 AGM, as is customary, to authorise the Directors to exercise all powers to allot shares and approve a limited disapplication of pre-emption rights. This authority will be sought in line with institutional shareholder guidance, and in particular with the Pre-Emption Group’s Statement of Principles (the “Pre-Emption Principles”), the authority sought for disapplication of pre-emption rights will be 10% on the basis that 5% of this is only intended to be used in accordance with the Pre-Emption Principles. Further information regarding these resolutions, which are based on template resolutions published by the Pre-Emption Group, is set out in the circular to shareholders. A resolution will also be proposed at the 2022 AGM, as is also customary, to renew the Directors’ existing authority to make market purchases of the Company’s Ordinary Share capital, and to limit such authority to purchases of up
to approximately 10% of the Company’s issued Ordinary Share capital. Shares purchased under this authority may either be cancelled or held as treasury shares.
AuditorA resolution to reappoint Deloitte LLP as the Company’s auditor will be proposed by the Directors at the 2022 AGM. Deloitte also provide non-audit services to the Group, and details of the non-audit services provided in the year to 31 December 2021 are set out in Note 10 to the Financial Statements. All non-audit services are approved by the Audit and Risk Committee. The Directors are currently satisfied, and will continue to ensure, that this range of services is delivered in compliance with the relevant ethical guidance of the accountancy profession and does not impair the judgement or independence of the auditor. Further details of the Group policy on non-audit services are set out in the Audit and Risk Committee Report on pages 97 to 101.
The Directors at the date of approval of this report confirm that, so far as they are each aware, there is no relevant audit information, being information needed by the auditor in connection with preparing its report, of which the auditor are unaware. Each Director has taken all steps that they ought to have taken as a Director, having made such enquiries of fellow Directors and the auditor and taken such other steps as are required under their duties as a Director, to make themselves aware of any relevant audit information and to establish that the auditor is aware of that information. This confirmation is given and should be interpreted in accordance with the provisions of section 418 of the 2006 Act.
Greenhouse gas emissions reportingReporting on emission sources, as required under the Companies Act 2006 (Strategic and Directors’ Reports) Regulations 2013 and the Energy and Carbon Report Regulations 2018, is included in the Corporate Responsibility report on pages 69 to 75 and 78.
Tax governanceThe Company is committed to high standards of tax governance and strives to meet its tax obligations. Tax contributions benefit the communities in which we operate by providing a framework within which the Company can grow. Pharos’ Tax Strategy Statement, which the Board has approved, defines the key tax objectives of the Group and is available on the Company’s website (www.pharos.energy).
Risk managementThe Directors carried out a robust review of the principal and emerging risks facing the Group that could threaten the Company’s business model, future performance, solvency and liquidity. The Risk Management and Risk report on pages 43 to 57 details how we manage and mitigate these risks.
Substantial shareholdingsAs at the date of this report, the Company had been notified, in accordance with Chapter 5 of the Disclosure and Transparency Rules, of the voting rights as a shareholder of the Company shown in Table B of this report.
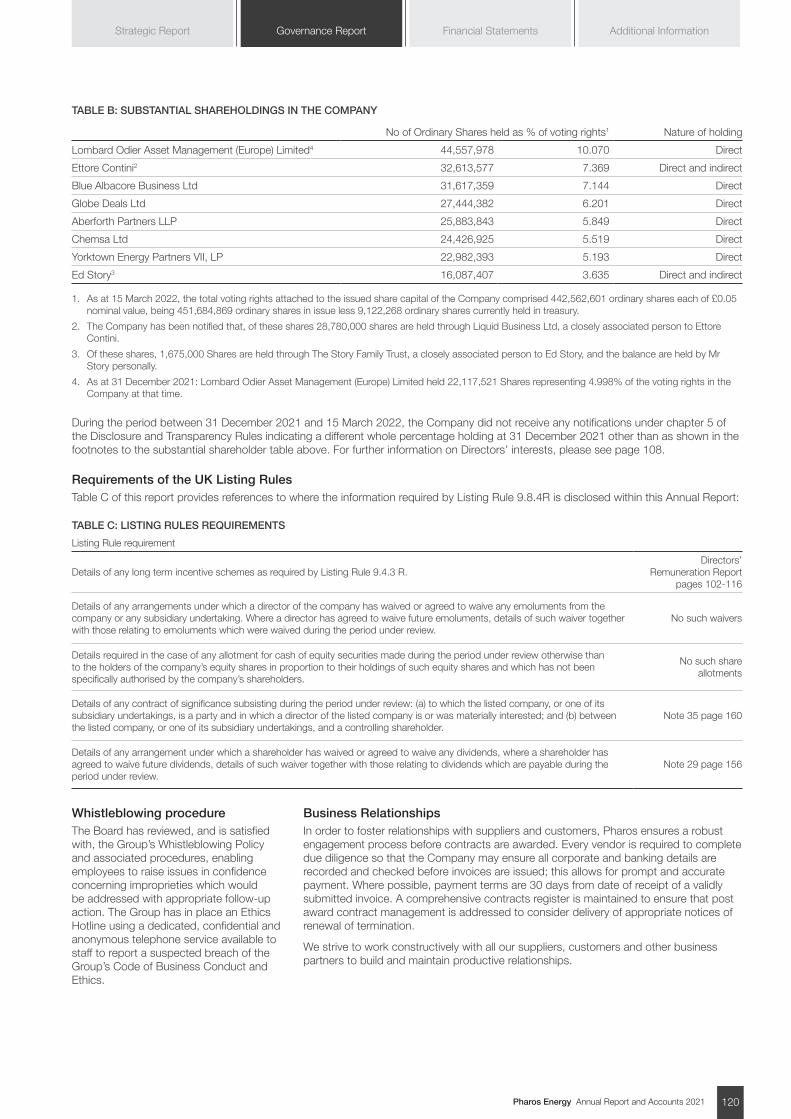
Pharos Energy Annual Report and Accounts 2021 120
Additional InformationGovernance Report Financial StatementsStrategic Report
TABLE B: SUBSTANTIAL SHAREHOLDINGS IN THE COMPANY
No of Ordinary Shares held as % of voting rights1 Nature of holding
Lombard Odier Asset Management (Europe) Limited4 44,557,978 10.070 Direct
Ettore Contini2 32,613,577 7.369 Direct and indirect
Blue Albacore Business Ltd 31,617,359 7.144 Direct
Globe Deals Ltd 27,444,382 6.201 Direct
Aberforth Partners LLP 25,883,843 5.849 Direct
Chemsa Ltd 24,426,925 5.519 Direct
Yorktown Energy Partners VII, LP 22,982,393 5.193 Direct
Ed Story3 16,087,407 3.635 Direct and indirect
1. As at 15 March 2022, the total voting rights attached to the issued share capital of the Company comprised 442,562,601 ordinary shares each of £0.05 nominal value, being 451,684,869 ordinary shares in issue less 9,122,268 ordinary shares currently held in treasury.
2. The Company has been notified that, of these shares 28,780,000 shares are held through Liquid Business Ltd, a closely associated person to Ettore Contini.
3. Of these shares, 1,675,000 Shares are held through The Story Family Trust, a closely associated person to Ed Story, and the balance are held by Mr Story personally.
4. As at 31 December 2021: Lombard Odier Asset Management (Europe) Limited held 22,117,521 Shares representing 4.998% of the voting rights in the Company at that time.
During the period between 31 December 2021 and 15 March 2022, the Company did not receive any notifications under chapter 5 of the Disclosure and Transparency Rules indicating a different whole percentage holding at 31 December 2021 other than as shown in the footnotes to the substantial shareholder table above. For further information on Directors’ interests, please see page 108.
Requirements of the UK Listing RulesTable C of this report provides references to where the information required by Listing Rule 9.8.4R is disclosed within this Annual Report:
TABLE C: LISTING RULES REQUIREMENTS
Listing Rule requirement
Details of any long term incentive schemes as required by Listing Rule 9.4.3 R. Directors’
Remuneration Report pages 102-116
Details of any arrangements under which a director of the company has waived or agreed to waive any emoluments from the company or any subsidiary undertaking. Where a director has agreed to waive future emoluments, details of such waiver together with those relating to emoluments which were waived during the period under review.
No such waivers
Details required in the case of any allotment for cash of equity securities made during the period under review otherwise than to the holders of the company’s equity shares in proportion to their holdings of such equity shares and which has not been specifically authorised by the company’s shareholders.
No such share allotments
Details of any contract of significance subsisting during the period under review: (a) to which the listed company, or one of its subsidiary undertakings, is a party and in which a director of the listed company is or was materially interested; and (b) between the listed company, or one of its subsidiary undertakings, and a controlling shareholder.
Note 35 page 160
Details of any arrangement under which a shareholder has waived or agreed to waive any dividends, where a shareholder has agreed to waive future dividends, details of such waiver together with those relating to dividends which are payable during the period under review.
Note 29 page 156
Whistleblowing procedureThe Board has reviewed, and is satisfied with, the Group’s Whistleblowing Policy and associated procedures, enabling employees to raise issues in confidence concerning improprieties which would be addressed with appropriate follow-up action. The Group has in place an Ethics Hotline using a dedicated, confidential and anonymous telephone service available to staff to report a suspected breach of the Group’s Code of Business Conduct and Ethics.
Business Relationships In order to foster relationships with suppliers and customers, Pharos ensures a robust engagement process before contracts are awarded. Every vendor is required to complete due diligence so that the Company may ensure all corporate and banking details are recorded and checked before invoices are issued; this allows for prompt and accurate payment. Where possible, payment terms are 30 days from date of receipt of a validly submitted invoice. A comprehensive contracts register is maintained to ensure that post award contract management is addressed to consider delivery of appropriate notices of renewal of termination.
We strive to work constructively with all our suppliers, customers and other business partners to build and maintain productive relationships.
Pharos Energy Annual Report and Accounts 2021121
DIRECTORS’ REPORT - CONTINUED
Going concernIt should be recognised that any consideration of the foreseeable future involves making a judgement, at a particular point in time, about future events which are inherently uncertain. Nevertheless, at the time of preparation of these accounts and after making enquiries, the Directors have a reasonable expectation that the Group has adequate resources to continue operating for the foreseeable future. For this reason, and taking into consideration the additional factors in the Strategic Report on pages 2 to 78 including the Going Concern section of the CFO’s statement on pages 38 to 42, they continue to adopt the going concern basis in preparing the accounts.
Directors’ responsibilities for the Financial StatementsThe Directors are responsible for preparing the annual report and the Financial Statements in accordance with international accounting standards in conformity with the requirements of the Companies Act 2006 and International Financial Reporting Standards adopted pursuant to Regulation (EC) No 1606/2002 as it applies in the European Union. The Financial Statements have also been prepared in accordance with International Financial Reporting Standards as issued by the IASB. The Directors are required to prepare Financial Statements for each financial year that give a true and fair view of the financial position of the Company and of the Group and the financial performance and cash flows of the Group for that period. In preparing those accounts the Directors are required to select suitable accounting policies and then apply them consistently; present information and accounting policies in a manner that provides relevant, reliable and comparable information; and state that the Company and the Group have complied with applicable accounting standards, subject to any material departures disclosed and explained in the accounts.
The Directors are responsible for keeping proper accounting records which disclose with reasonable accuracy at any time the financial position of the Company and the Group and enable them to ensure that the accounts comply with relevant legislation. They are also responsible for safeguarding the assets of the Company and the Group and hence for taking reasonable steps for the prevention and detection of fraud and other irregularities.
The Directors are responsible for the maintenance and integrity of the corporate and financial information included on the Company’s website. Information published on the internet is accessible in many countries with different legal requirements. Legislation in the United Kingdom governing the preparation and dissemination of Financial Statements may differ from legislation in other jurisdictions.
Directors’ responsibility statementThe Directors confirm that, to the best of each person’s knowledge:
a) the Financial Statements set out on pages 123 to 162, which have been prepared in accordance with international accounting standards in conformity with the requirements of the Companies Act 2006 and International Financial Reporting Standards adopted pursuant to Regulation (EC) No 1606/2002 as it applies in the European Union and in accordance with International Financial Reporting Standards as issued by the IASB, give a true and fair view of the assets, liabilities, financial position and loss of the Company and the Group taken as a whole;
b) this Directors’ Report along with the Strategic Report, including each of the management reports forming part of these reports, includes a fair review of the development and performance of the business and the position of the Company and the Group taken as a whole, together with a description of the principal risks and uncertainties that they face and how these are being managed and mitigated as set out in the Risk Management and Risk Report on pages 43 to 57; and
c) the annual report and the Financial Statements, taken as a whole, are fair, balanced and understandable and provide the information necessary for the shareholders to assess the Group’s position, performance, business model and strategy.
Approved by the Board and signed on its behalf.
SUE RIVETTChief Financial Officer 15 March 2022
Pharos Energy Annual Report and Accounts 2021 122
Additional InformationGovernance Report Financial StatementsStrategic Report
Independent Auditor’s Report 123
Consolidated Income Statement 132
Consolidated Statement of Comprehensive Income 132
Balance Sheets 133
Statements of Changes in Equity 134
Cash Flow Statements 135
Notes to the Consolidated Financial Statements 136
Financial Statements
Pharos Energy Annual Report and Accounts 2021123
INDEPENDENT AUDITOR’S REPORT
INDEPENDENT AUDITOR’S REPORT TO THE MEMBERS OF PHAROS ENERGY PLC
Report on the audit of the financial statements
1. Opinion
In our opinion:
• the financial statements of Pharos Energy plc (the ‘parent company’) and its subsidiaries (the ‘group’) give a true and fair view of the state of the group’s and of the parent company’s affairs as at 31 December 2021 and of the group’s loss for the year then ended;
• the group financial statements have been properly prepared in accordance with United Kingdom adopted international accounting standards and International Financial Reporting Standards (IFRSs) as issued by the International Accounting Standards Board (IASB);
• the parent company financial statements have been properly prepared in accordance with United Kingdom adopted international accounting standards and as applied in accordance with the provisions of the Companies Act 2006; and
• the financial statements have been prepared in accordance with the requirements of the Companies Act 2006.
We have audited the financial statements which comprise:
• the consolidated income statement;
• the consolidated statement of comprehensive income;
• the consolidated and parent company balance sheets;
• the consolidated and parent company statements of changes in equity;
• the consolidated cash flow statement; and
• the related notes 1 to 38.
The financial reporting framework that has been applied in their preparation is applicable law, United Kingdom adopted international accounting standards and IFRSs as issued by the IASB. The financial reporting framework that has been applied in the preparation of the parent company financial statements is applicable law and United Kingdom adopted international accounting standards and as applied in accordance with the provisions of the Companies Act 2006.
2. Basis for opinionWe conducted our audit in accordance with International Standards on Auditing (UK) (ISAs (UK)) and applicable law. Our responsibilities under those standards are further described in the auditor’s responsibilities for the audit of the financial statements section of our report.
We are independent of the group and the parent company in accordance with the ethical requirements that are relevant to our audit of the financial statements in the UK, including the Financial Reporting Council’s (the ‘FRC’s’) Ethical Standard as applied to listed public interest entities, and we have fulfilled our other ethical responsibilities in accordance with these requirements. The non-audit services provided to the group and parent company for the year are disclosed in note 10 to the financial statements. We confirm that we have not provided any non-audit services prohibited by the FRC’s Ethical Standard to the group or the parent company.
We believe that the audit evidence we have obtained is sufficient and appropriate to provide a basis for our opinion.
Pharos Energy Annual Report and Accounts 2021 124
Additional InformationGovernance Report Financial StatementsStrategic Report
3. Summary of our audit approach
Key audit matters The key audit matters that we identified in the current year were:
• Impairment of producing oil & gas assets
Within this report, key audit matters are identified as follows:
Newly identified
Increased level of risk
Similar level of risk
Decreased level of risk
Materiality
The materiality that we used for the group financial statements was $3.2 million which was determined on the basis of the 3-year average of earnings from continuing activities before interest, tax, DD&A, impairment of PP&E and intangibles, exploration other/expenditure and Other/restructuring expense “EBITDAX”. Management’s calculation of EBITDAX is provided on page 164 to the financial statements.
Scoping
We focused primarily on the group’s key business units, being Vietnam and Egypt, as well as the parent company which is based in London. These locations were all subject to full scope audit and account for 98% of the group’s total assets, 83% of the group’s revenue and 100% of the group’s loss before tax from loss making entities. Specified audit procedures were then performed on the remaining 2% of the group’s total assets, 17% of the group’s revenue and 100% of the group’s profit before tax from profit making entities.
Significant changes in our approach
The Going concern basis of accounting was included as a key audit matter in the prior year. As the business performance working capital and commodity prices have improved, this is not considered a key audit matter in the current year.
We have changed the materiality benchmark from Net assets and EBITDAX in 2020 to a 3-year average of EBITDAX in 2021. See section 6.1 below for details.
No other changes were noted to the key audit matters or our overall audit approach as compared to the prior year.
4. Conclusions relating to going concernIn auditing the financial statements, we have concluded that the directors’ use of the going concern basis of accounting in the preparation of the financial statements is appropriate.
Our evaluation of the directors’ assessment of the group’s and parent company’s ability to continue to adopt the going concern basis of accounting included:
• assessed that the forecasts incorporated in the base case model are consistent with the budget
• approved by the Board;
• compared the key assumptions in the base case forecast to those used in the impairment models for
• oil & gas producing assets and understood the basis for any differences;
• assessed the historical accuracy of budgets prepared by Management;
• compared the oil prices in the aggregated downside scenario with both the spot oil price and publicly available forward curves as of the date of approval of the financial statements;
• assessed and recalculated the impact of the aggregated downside scenario on the financial covenants included in the reserve based lending (RBL) during the going concern period;
• assessed the ability of management to execute the mitigating actions in its aggregated downside scenario, including the extent to which the adjustments made to capital expenditure are uncommitted as of the date of this report;
• assessed the results of the oil price reverse stress test, by comparing to currently prevailing prices;
• tested the going concern model for mechanical accuracy; and
• assessed whether the disclosures relating to going concern are appropriate.
Pharos Energy Annual Report and Accounts 2021125
INDEPENDENT AUDITOR’S REPORT - CONTINUED
Based on the work we have performed, we have not identified any material uncertainties relating to events or conditions that, individually or collectively, may cast significant doubt on the group’s and parent company’s ability to continue as a going concern for a period of at least twelve months from when the financial statements are authorised for issue.
In relation to the reporting on how the group has applied the UK Corporate Governance Code, we have nothing material to add or draw attention to in relation to the directors’ statement in the financial statements about whether the directors considered it appropriate to adopt the going concern basis of accounting.
Our responsibilities and the responsibilities of the directors with respect to going concern are described in the relevant sections of this report.
5. Key audit mattersKey audit matters are those matters that, in our professional judgement, were of most significance in our audit of the financial statements of the current period and include the most significant assessed risks of material misstatement (whether or not due to fraud) that we identified. These matters included those which had the greatest effect on: the overall audit strategy, the allocation of resources in the audit; and directing the efforts of the engagement team.
These matters were addressed in the context of our audit of the financial statements as a whole, and in forming our opinion thereon, and we do not provide a separate opinion on these matters.
5.1. Impairment of producing oil & gas assets
Key audit matter description
The value of property, plant and equipment relating to the group’s producing oil and gas assets as at 31 December 2021 was $399.7 million (2020: $434.6 million). Impairment of producing oil & gas assets is considered a key audit matter due to the significant judgements and estimates involved in assessing whether any impairment charges or reversals have arisen at year-end, and in quantifying any such impairment charges or reversals. In addition, we considered that there was a risk of impairment due to the potential impact of climate change on long term oil prices. Given the importance of producing oil & gas assets to the group and the judgemental nature of the inputs used in determining the recoverable amounts, we also considered there to be a potential for fraud in this area. We have assessed an increased risk in 2021 as compared to 2020 as a result of the increasing risk of reserves estimates coupled with the significant change in oil prices in 2022.
Management reviewed its two producing assets in Vietnam, being Te Giac Trang (‘TGT’) and Ca Ngu Vang (‘CNV’), and its one producing asset in Egypt, being El Fayum, for indicators of impairment. As a result of the steady growth of the oil prices in 2021 compared to the volatility in 2021, Management revised their oil price assumptions upwards during 2021 compared to the prior year assumptions, as set out in note 16 of the financial statements. Given the significance of the revision, together with changes to estimates of oil & gas reserves, Management concluded that there was an indicator of impairment reversals for all three of those fields. Management have estimated the recoverable amount of each field, being its Value-in-Use “VIU”, and compared this to its balance sheet carrying amount.
Management recorded pre-tax impairment reversal of $3.8 million on CNV (2020: pre-tax impairment charges of $23.3 million), pre-tax impairment reversal of $49.1 million on TGT (2020: pre-tax impairment charges of $81.8 million) and pre-tax impairment reversal of $1.2 million on El Fayum (2020: pre-tax impairment charges of $105.4 million).
Management’s recoverable amount estimates were based on key assumptions which included:
• oil price forecasts, being $73.9/bbl in 2022, $70.2/bbl in 2023, $67.8/bbl in 2024, $68/bbl in 2025 plus inflation of 2% thereafter;
• reserves estimates and production profiles; and,
• pre-tax nominal discount rates of 11.4% for TGT and CNV, and 14% for El Fayum
In relation to reserves estimates and production profiles, Management have engaged third party reservoir engineering experts to provide an independent report on the group’s reserves estimates using standard industry reserve estimation methods and definitions for each of the CNV, TGT and El Fayum fields. Management have explained the scope of work of the third party experts and their findings in the operations review, as well as highlighting oil and gas reserves as a key source of estimation uncertainty in note 4(b) to the financial statements.
As referenced in note 4(b) of the financial statements, the impairment of producing oil & gas assets is considered by management as a key source of estimation uncertainty.
Further details of the key assumptions used by management in their impairment evaluation are provided in note 16 of the financial statements and in the Report of the Audit & Risk Committee on pages 97-101. The disclosures in note 16 include the sensitivity of the impairment reversals to changes in key assumptions, including the impact of adopting an oil price from a third party forecaster described as being compliant with achieving the Paris agreement goal to limit temperature rises to well below 2°C (“Paris 2°C Goal”).
Pharos Energy Annual Report and Accounts 2021 126
Additional InformationGovernance Report Financial StatementsStrategic Report
How the scope of our audit responded to the key audit matter
For the TGT, CNV and El Fayum impairment assessments, we obtained an understanding of the management’s relevant key controls related to the valuation of each producing oil & gas asset. We evaluated management’s assessment of whether or not impairment reversals or charges indicators were present in respect of each producing oil & gas asset, and thus the completeness of management’s impairment tests. Where indicators were identified, we assessed the methods and models used for consistency with the requirements of IAS 36 “Impairment of Assets”. We evaluated the key assumptions made by management in the measurement of recoverable amounts by performing the following substantive procedures:
Oil prices:
We assessed group’s forecast oil price assumptions by:
• Independently developing a reasonable range of forecasts based on a variety of reputable external forecasts, peer information and market data, against which we compared the group’s future oil price assumptions in order to challenge whether they are reasonable;
• In developing our range we also considered a certain scenario that was described as meeting the Paris goals which aligns with the goals to limit temperature rises to well below 2°C. We also considered the impact of COVID on energy supply and demand and whether that had been appropriately taken into account.
• We assessed management’s current ‘best estimate’ of future oil prices including consideration of third party forecasts under scenarios that we interpreted to be consistent with this measurement objective.
Reserves estimates and production profiles:
Through working with our internal oil and gas reserve specialists, we:
• Understood the process used by management to derive their reserves estimates and associated production profiles and how they provide information to, and interact with, the external third party reserve experts;
• Assessed the competence, capability and objectivity of the company’s internal and external third party reserve experts, through obtaining their relevant professional qualifications and experience;
• Reviewed the external third party experts’ reports on Pharos’ reserves estimates as summarised in the operations review and evaluated whether these estimates were used consistently throughout the accounting calculations reflected in the financial statements;
• Communicated directly with the external third party reserves experts to discuss their scope of work and assess their methodologies used and outputs;
• Compared the production forecasts used in the impairment tests with management’s approved reserves and resources estimates;
• Assessed the cash flow forecasts to determine the significant assumptions to which the impairment outcome was most sensitive;
• Substantively tested the hydrocarbon production and cost forecasts used in the impairment tests, including challenging the significant assumptions;
• Compared the production and cost forecasts with similar forecasts from the prior year and challenged significant changes;
• Assessed the reasonableness of the production and cost forecasts relative to each other;
• Performed a retrospective review to check for indications of estimation bias over time; and
• Where relevant, assessed the company’s historical forecasting accuracy and whether the estimates had been determined and applied on a consistent basis.
Discount rates:
• We assessed the Group’s discount rates by working with our internal valuation specialists to develop independent estimates using independent third party information for TGT, CNV and El-Fayum and comparing those assumptions to management’s assumptions.
Other procedures:
• We assessed management’s other assumptions by reference to third party information, our knowledge of the group and industry and also budgeted and forecast performance.
• We assessed whether the Group’s impairment methodology was acceptable under IFRS and tested the integrity and mechanical accuracy of the impairment models.
• We assessed whether management’s presentation and disclosures relating to impairment and associated estimation uncertainty were adequate.
Pharos Energy Annual Report and Accounts 2021127
INDEPENDENT AUDITOR’S REPORT - CONTINUED
Key observations Oil prices:
For the purpose of Impairment of producing oil & gas assets, management is required under IAS 36 to apply its current “best estimate” of future oil prices.
We observed that in the short-term, the Group’s oil price assumptions sit comfortably within our range, albeit towards the lower end. For the long-term, the Group’s oil price assumptions sit comfortably within our range albeit towards the higher end. Accordingly, we found the Group’s oil price assumptions to be within our range, and therefore we determined that the Group’s “best estimate” oil price assumptions are reasonable.
We also observe that the forecast oil price assumptions aligned with the Paris goals to be generally lower than the Group’s oil price assumptions. The disclosures in note 16 to the financial statements includes the impact of adopting an oil price described as being compliant with achieving the Paris agreement goal to limit temperature rises to well below 2°C (“Paris 2°C Goal”).
Discount rates:
The Group’s discount rate used for impairment testing, was within our independent range and therefore considered reasonable.
Reserves estimates and production profiles:
We found that the reserves estimates and production profiles used in the impairment tests to have been appropriately prepared, and found the underlying assumptions we tested to be reasonable.
Other procedures:
We concluded that the impairment reversals recorded by management are appropriate. We are also satisfied that appropriate disclosures relating to Management’s impairment assessment and sensitivities have been provided in note 16.
6. Our application of materiality
6.1. MaterialityWe define materiality as the magnitude of misstatement in the financial statements that makes it probable that the economic decisions of a reasonably knowledgeable person would be changed or influenced. We use materiality both in planning the scope of our audit work and in evaluating the results of our work.
Based on our professional judgement, we determined materiality for the financial statements as a whole as follows:
Group financial statements Parent company financial statements
Materiality $3.2 million (2020: $3.0 million) $2.3 million (2020: $2.7 million)
Basis for determining materiality
4% of the 3-year average of EBITDAX (2020: 1% of net assets and 4.4% of EBITDAX)
Management’s calculation of EBITDAX is provided on page 164 to the financial statements.
Parent company materiality equates to 1.5% of net assets, which is capped at 90% of group materiality.(2020: 0.8% of net assets)
Rationale for the benchmark applied
In the prior year, materiality was based on net assets and EBITDAX. However, in the current year we concluded that a 3-year average of EBITDAX is the most relevant benchmark given the volatility in oil prices, the majority of the group’s oil & gas assets are now at the producing stage and the group is in its second full year of operations in Egypt. This reflects the group’s performance, noting that EBITDAX is also an input to one of the covenants under the group’s RBL facility. The net assets metric is still considered relevant as it is reflective of the long term value of the group through its portfolio of producing and exploration assets (in the current year, our determined materiality represents 1% of net assets).
Consistent with prior year, as the primary nature of this holding company is to hold investments in subsidiaries, we have concluded that net assets represents the most appropriate benchmark.
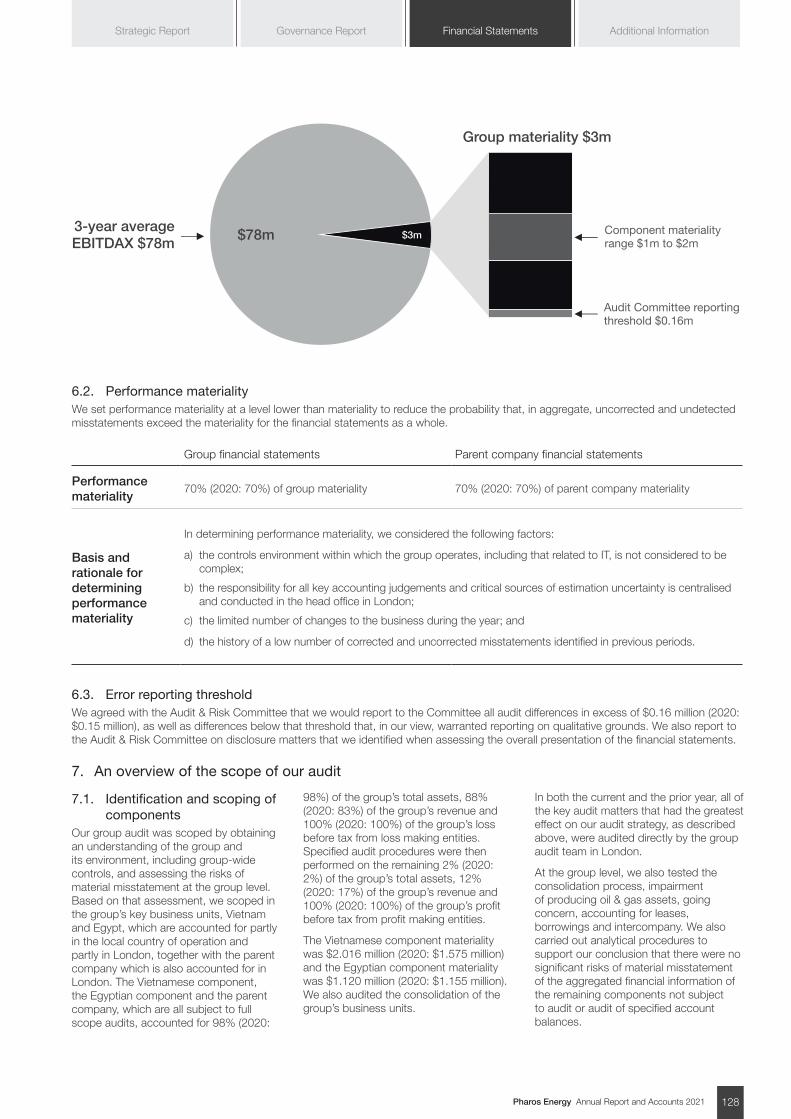
Pharos Energy Annual Report and Accounts 2021 128
Additional InformationGovernance Report Financial StatementsStrategic Report
Group materiality $3m
Component materiality range $1m to $2m
Audit Committee reportingthreshold $0.16m
3-year average EBITDAX $78m
$3m$78m
6.2. Performance materialityWe set performance materiality at a level lower than materiality to reduce the probability that, in aggregate, uncorrected and undetected misstatements exceed the materiality for the financial statements as a whole.
Group financial statements Parent company financial statements
Performance materiality
70% (2020: 70%) of group materiality 70% (2020: 70%) of parent company materiality
Basis and rationale for determining performance materiality
In determining performance materiality, we considered the following factors:
a) the controls environment within which the group operates, including that related to IT, is not considered to be complex;
b) the responsibility for all key accounting judgements and critical sources of estimation uncertainty is centralised and conducted in the head office in London;
c) the limited number of changes to the business during the year; and
d) the history of a low number of corrected and uncorrected misstatements identified in previous periods.
6.3. Error reporting thresholdWe agreed with the Audit & Risk Committee that we would report to the Committee all audit differences in excess of $0.16 million (2020: $0.15 million), as well as differences below that threshold that, in our view, warranted reporting on qualitative grounds. We also report to the Audit & Risk Committee on disclosure matters that we identified when assessing the overall presentation of the financial statements.
7. An overview of the scope of our audit
7.1. Identification and scoping of components
Our group audit was scoped by obtaining an understanding of the group and its environment, including group-wide controls, and assessing the risks of material misstatement at the group level. Based on that assessment, we scoped in the group’s key business units, Vietnam and Egypt, which are accounted for partly in the local country of operation and partly in London, together with the parent company which is also accounted for in London. The Vietnamese component, the Egyptian component and the parent company, which are all subject to full scope audits, accounted for 98% (2020:
98%) of the group’s total assets, 88% (2020: 83%) of the group’s revenue and 100% (2020: 100%) of the group’s loss before tax from loss making entities. Specified audit procedures were then performed on the remaining 2% (2020: 2%) of the group’s total assets, 12% (2020: 17%) of the group’s revenue and 100% (2020: 100%) of the group’s profit before tax from profit making entities.
The Vietnamese component materiality was $2.016 million (2020: $1.575 million) and the Egyptian component materiality was $1.120 million (2020: $1.155 million). We also audited the consolidation of the group’s business units.
In both the current and the prior year, all of the key audit matters that had the greatest effect on our audit strategy, as described above, were audited directly by the group audit team in London.
At the group level, we also tested the consolidation process, impairment of producing oil & gas assets, going concern, accounting for leases, borrowings and intercompany. We also carried out analytical procedures to support our conclusion that there were no significant risks of material misstatement of the aggregated financial information of the remaining components not subject to audit or audit of specified account balances.
Pharos Energy Annual Report and Accounts 2021129
INDEPENDENT AUDITOR’S REPORT - CONTINUED
7.2. Our consideration of climate-related risks
Climate change is considered a principal risk to the Group and its business over the medium and long term. Further details are disclosed in the Strategic report of the 2021 Annual Report pages 2 to 78.
Through working with our internal climate specialists, we:
• Obtained an understanding of management’s process for considering the impact of climate-related risks and relevant controls through enquiries performed with the Audit & Risk committee, enquiries and observations of relevant documentation with the ESG committee as well as regular meetings with management;
• To ensure the completeness and consistency of climate related risks identified by management with our understanding of the entity and risk assessment, we obtained and reviewed management’s assessment of climate related risks, read the minutes of meeting of the ESG committee and specifically inquired management of any climate-related litigations or claims involving the group.
As disclosed in note 4(b) to the financial statements, Management identified that the group’s producing oil & gas properties are short-term in nature and none are being depleted over a period that extends beyond 2036. Therefore, due to the relatively short-time frame, Management concluded that the impact of climate change on the group’s oil & gas properties depletion, economic useful lives and decommissioning not to be material. Management further identified that the impact of climate change on the group’s Exploration & Evaluation assets is similar to the group’s producing oil & gas properties, but the potential longevity of those assets has not yet been determined for further consideration. Accordingly, the related principal risks that we have identified for our audit is the forecast oil assumptions used in the fair value estimates of group’s producing oil & gas properties may not appropriately reflect changes in supply and demand due to climate change and the energy transition (see the key audit matter in section ‘5.1 Impairment of producing oil & gas assets’ above).
In order to address the risk identified, we performed the following procedures through working with our climate specialist:
• We read the climate change related disclosures presented in the Strategic Report to consider whether they are materially consistent with the financial statements and our knowledge obtained in the audit;
• We challenged management’s forecast oil price assumptions to assess whether they are reasonable and present management’s current ‘best estimate’ in accordance with IAS 36 (see the key audit matter in section ‘5.1 Impairment of producing oil & gas assets’ above); and
• We evaluated the accuracy and appropriateness of the disclosures addressing the impact of climate and energy transition on the financial statements in note 4(b) and the key assumptions and calculated sensitivities showing the impact on impairment of producing oil & gas assets included in note 16 of the financial statements.
7.3. Working with other auditorsThe group audit team assesses each year how best to be appropriately involved in the audit work undertaken in Vietnam and Egypt. In the current year, as a result of travel restrictions due to the Covid-19 pandemic, this was achieved by regular interaction and review through correspondence, telephone and other electronic media as well as performing a remote review of the underlying work of the component auditors in selected key areas by a senior member of the audit team.
In addition to our direct interactions, we sent detailed instructions to our component audit teams, and reviewed their audit working papers.
8. Other informationThe other information comprises the information included in the annual report, other than the financial statements and our auditor’s report thereon. The directors are responsible for the other information contained within the annual report.
Our opinion on the financial statements does not cover the other information and, except to the extent otherwise explicitly stated in our report, we do not express any form of assurance conclusion thereon.
Our responsibility is to read the other information and, in doing so, consider whether the other information is materially inconsistent with the financial statements or our knowledge obtained in the course of the audit, or otherwise appears to be materially misstated.
If we identify such material inconsistencies or apparent material misstatements, we are required to determine whether this gives rise to a material misstatement in the financial statements themselves. If, based on the work we have performed, we conclude that there is a material misstatement of this other information, we are required to report that fact.
We have nothing to report in this regard.
9. Responsibilities of directorsAs explained more fully in the directors’ responsibilities statement, the directors are responsible for the preparation of the financial statements and for being satisfied that they give a true and fair view, and for such internal control as the directors determine is necessary to enable the preparation of financial statements that are free from material misstatement, whether due to fraud or error.
In preparing the financial statements, the directors are responsible for assessing the group’s and the parent company’s ability to continue as a going concern, disclosing as applicable, matters related to going concern and using the going concern basis of accounting unless the directors either intend to liquidate the group or the parent company or to cease operations, or have no realistic alternative but to do so.
10. Auditor’s responsibilities for the audit of the financial statements
Our objectives are to obtain reasonable assurance about whether the financial statements as a whole are free from material misstatement, whether due to fraud or error, and to issue an auditor’s report that includes our opinion. Reasonable assurance is a high level of assurance, but is not a guarantee that an audit conducted in accordance with ISAs (UK) will always detect a material misstatement when it exists. Misstatements can arise from fraud or error and are considered material if, individually or in the aggregate, they could reasonably be expected to influence the economic decisions of users taken on the basis of these financial statements.
A further description of our responsibilities for the audit of the financial statements is located on the FRC’s website at: www.frc.org.uk/auditorsresponsibilities. This description forms part of our auditor’s report.
Pharos Energy Annual Report and Accounts 2021 130
Additional InformationGovernance Report Financial StatementsStrategic Report
11. Extent to which the audit was considered capable of detecting irregularities, including fraud
Irregularities, including fraud, are instances of non-compliance with laws and regulations. We design procedures in line with our responsibilities, outlined above, to detect material misstatements in respect of irregularities, including fraud. The extent to which our procedures are capable of detecting irregularities, including fraud is detailed below.
11.1. Identifying and assessing potential risks related to irregularities
In identifying and assessing risks of material misstatement in respect of irregularities, including fraud and non-compliance with laws and regulations, we considered the following:
• the nature of the industry and sector, control environment and business performance including the design of the group’s remuneration policies, key drivers for directors’ remuneration, bonus levels and performance targets;
• results of our enquiries of management and the audit committee about their own identification and assessment of the risks of irregularities;
• any matters we identified having obtained and reviewed the group’s documentation of their policies and procedures relating to:
- identifying, evaluating and complying with laws and regulations and whether they were aware of any instances of non-compliance;
- detecting and responding to the risks of fraud and whether they have knowledge of any actual, suspected or alleged fraud
- the internal controls established to mitigate risks of fraud or non-compliance with laws and regulations
• the matters discussed among the audit engagement team including significant component audit teams and relevant internal specialists, including tax, valuations and reserves specialists regarding how and where fraud might occur in the financial statements and any potential indicators of fraud.
As a result of these procedures, we considered the opportunities and incentives that may exist within the organisation for fraud and identified the greatest potential for fraud in management’s assessment of the impairment of producing oil & gas assets. In common with all audits under ISAs (UK), we are also required to perform specific procedures to respond to the risk of management override.
We also obtained an understanding of the legal and regulatory frameworks that the group operates in, focusing on provisions of those laws and regulations that had a direct effect on the determination of material amounts and disclosures in the financial statements. The key laws and regulations we considered in this context included the UK Companies Act, the Listing Rules, tax legislation in the UK, Vietnam and Egypt.
In addition, we considered provisions of other laws and regulations that do not have a direct effect on the financial statements but compliance with which may be fundamental to the group’s ability to operate or to avoid a material penalty. These included the group’s operating licences and environmental regulations.
11.2. Audit response to risks identified
As a result of performing the above, we identified impairment of producing oil & gas assets as a key audit matter related to the potential risk of fraud. The key audit matter section of our report (‘5.1 Impairment of producing oil & gas assets’ above) explains the matter in more detail and also describes the specific procedures we performed in response to that key audit matter.
In addition to the above, our procedures to respond to risks identified included the following:
• reviewing the financial statement disclosures and testing to supporting documentation to assess compliance with provisions of relevant laws and regulations described as having a direct effect on the financial statements;
• enquiring of management, the audit & risk committee and in-house and external legal counsel concerning actual and potential litigation and claims;
• performing analytical procedures to identify any unusual or unexpected relationships that may indicate risks of material misstatement due to fraud;
• reading minutes of meetings of those charged with governance; and
• in addressing the risk of fraud through management override of controls, testing the appropriateness of journal
entries and other adjustments; assessing whether the judgements made in making accounting estimates are indicative of a potential bias; and evaluating the business rationale of any significant transactions that are unusual or outside the normal course of business.
We also communicated relevant identified laws and regulations and potential fraud risks to all engagement team members including internal specialists and significant component audit teams, and remained alert to any indications of fraud or non-compliance with laws and regulations throughout the audit.
Report on other legal and regulatory requirements
12. Opinions on other matters prescribed by the Companies Act 2006
In our opinion the part of the directors’ remuneration report to be audited has been properly prepared in accordance with the Companies Act 2006.
In our opinion, based on the work undertaken in the course of the audit:
• the information given in the strategic report and the directors’ report for the financial year for which the financial statements are prepared is consistent with the financial statements; and
• the strategic report and the directors’ report have been prepared in accordance with applicable legal requirements.
In the light of the knowledge and understanding of the group and the parent company and their environment obtained in the course of the audit, we have not identified any material misstatements in the strategic report or the directors’ report.
Pharos Energy Annual Report and Accounts 2021131
INDEPENDENT AUDITOR’S REPORT - CONTINUED
13. Corporate Governance Statement
The Listing Rules require us to review the directors’ statement in relation to going concern, longer-term viability and that part of the Corporate Governance Statement relating to the group’s compliance with the provisions of the UK Corporate Governance Code specified for our review.
Based on the work undertaken as part of our audit, we have concluded that each of the following elements of the Corporate Governance Statement is materially consistent with the financial statements and our knowledge obtained during the audit:
• the directors’ statement with regards to the appropriateness of adopting the going concern basis of accounting and any material uncertainties identified (as set out on page 89);
• the directors’ explanation as to its assessment of the group’s prospects, the period this assessment covers and why the period is appropriate (as set out on page 89);
• the directors’ statement on fair, balanced and understandable (set out on page 121);
• the board’s confirmation that it has carried out a robust assessment of the emerging and principal risks (set out on page 89);
• the section of the annual report that describes the review of effectiveness of risk management and internal control systems (set out on page 89); and
• the section describing the work of the audit committee (set out on page 89).
14. Matters on which we are required to report by exception
14.1. Adequacy of explanations received and accounting records
Under the Companies Act 2006 we are required to report to you if, in our opinion:
• we have not received all the information and explanations we require for our audit; or
• adequate accounting records have not been kept by the parent company, or returns adequate for our audit have not been received from branches not visited by us; or
• the parent company financial statements are not in agreement with the accounting records and returns.
We have nothing to report in respect of these matters.
14.2. Directors’ remunerationUnder the Companies Act 2006 we are also required to report if in our opinion certain disclosures of directors’ remuneration have not been made or the part of the directors’ remuneration report to be audited is not in agreement with the accounting records and returns.
We have nothing to report in respect of these matters.
15. Other matters which we are required to address
15.1. Auditor tenureFollowing the recommendation of the audit committee, we were appointed by the directors on 1 August 2002 to audit the financial statements for the year ending 31 December 2002 and subsequent financial periods. The period of total uninterrupted engagement including previous renewals and reappointments of the firm is 20 years, covering the years ending 31 December 2002 to 31 December 2021.
15.2. Consistency of the audit report with the additional report to the audit committee
Our audit opinion is consistent with the additional report to the audit committee we are required to provide in accordance with ISAs (UK).
16. Use of our reportThis report is made solely to the company’s members, as a body, in accordance with Chapter 3 of Part 16 of the Companies Act 2006. Our audit work has been undertaken so that we might state to the company’s members those matters we are required to state to them in an auditor’s report and for no other purpose. To the fullest extent permitted by law, we do not accept or assume responsibility to anyone other than the company and the company’s members as a body, for our audit work, for this report, or for the opinions we have formed.
As required by the Financial Conduct Authority (FCA) Disclosure Guidance and Transparency Rule (DTR) 4.1.14R, these financial statements form part of the European Single Electronic Format (ESEF) prepared Annual Financial Report filed on the National Storage Mechanism of the UK FCA in accordance with the ESEF Regulatory Technical Standard ((‘ESEF RTS’). This auditor’s report provides no assurance over whether the annual financial report has been prepared using the single electronic format specified in the ESEF RTS.
ANTHONY MATTHEWS, FCA (SENIOR STATUTORY AUDITOR) For and on behalf of Deloitte LLPStatutory AuditorLondon, United Kingdom16 March 2022
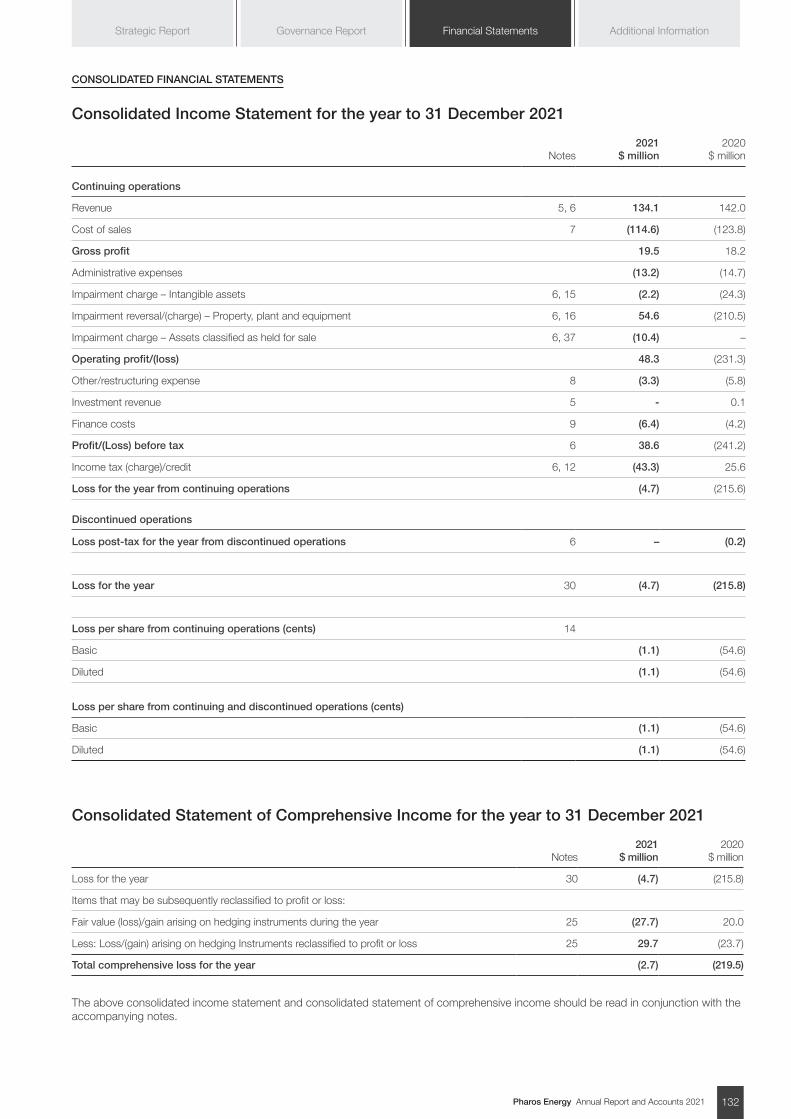
Pharos Energy Annual Report and Accounts 2021 132
Additional InformationGovernance Report Financial StatementsStrategic Report
CONSOLIDATED FINANCIAL STATEMENTS
Consolidated Income Statement for the year to 31 December 2021
Notes2021
$ million2020
$ million
Continuing operations
Revenue 5, 6 134.1 142.0
Cost of sales 7 (114.6) (123.8)
Gross profit 19.5 18.2
Administrative expenses (13.2) (14.7)
Impairment charge – Intangible assets 6, 15 (2.2) (24.3)
Impairment reversal/(charge) – Property, plant and equipment 6, 16 54.6 (210.5)
Impairment charge – Assets classified as held for sale 6, 37 (10.4) –
Operating profit/(loss) 48.3 (231.3)
Other/restructuring expense 8 (3.3) (5.8)
Investment revenue 5 - 0.1
Finance costs 9 (6.4) (4.2)
Profit/(Loss) before tax 6 38.6 (241.2)
Income tax (charge)/credit 6, 12 (43.3) 25.6
Loss for the year from continuing operations (4.7) (215.6)
Discontinued operations
Loss post-tax for the year from discontinued operations 6 – (0.2)
Loss for the year 30 (4.7) (215.8)
Loss per share from continuing operations (cents) 14
Basic (1.1) (54.6)
Diluted (1.1) (54.6)
Loss per share from continuing and discontinued operations (cents)
Basic (1.1) (54.6)
Diluted (1.1) (54.6)
Consolidated Statement of Comprehensive Income for the year to 31 December 2021
Notes2021
$ million 2020
$ million
Loss for the year 30 (4.7) (215.8)
Items that may be subsequently reclassified to profit or loss:
Fair value (loss)/gain arising on hedging instruments during the year 25 (27.7) 20.0
Less: Loss/(gain) arising on hedging Instruments reclassified to profit or loss 25 29.7 (23.7)
Total comprehensive loss for the year (2.7) (219.5)
The above consolidated income statement and consolidated statement of comprehensive income should be read in conjunction with the accompanying notes.
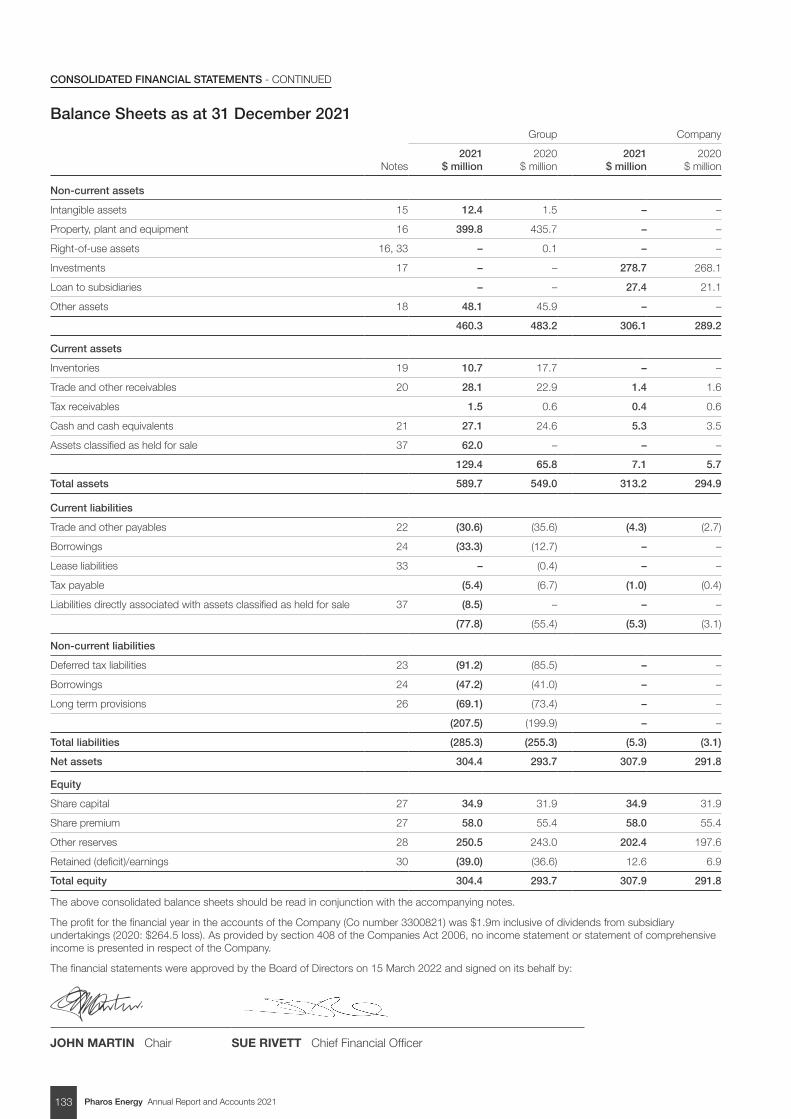
Pharos Energy Annual Report and Accounts 2021133
CONSOLIDATED FINANCIAL STATEMENTS - CONTINUED
Balance Sheets as at 31 December 2021Group Company
Notes2021
$ million2020
$ million2021
$ million2020
$ million
Non-current assets
Intangible assets 15 12.4 1.5 – –
Property, plant and equipment 16 399.8 435.7 – –
Right-of-use assets 16, 33 – 0.1 – –
Investments 17 – – 278.7 268.1
Loan to subsidiaries – – 27.4 21.1
Other assets 18 48.1 45.9 – –
460.3 483.2 306.1 289.2
Current assets
Inventories 19 10.7 17.7 – –
Trade and other receivables 20 28.1 22.9 1.4 1.6
Tax receivables 1.5 0.6 0.4 0.6
Cash and cash equivalents 21 27.1 24.6 5.3 3.5
Assets classified as held for sale 37 62.0 – – –
129.4 65.8 7.1 5.7
Total assets 589.7 549.0 313.2 294.9
Current liabilities
Trade and other payables 22 (30.6) (35.6) (4.3) (2.7)
Borrowings 24 (33.3) (12.7) – –
Lease liabilities 33 – (0.4) – –
Tax payable (5.4) (6.7) (1.0) (0.4)
Liabilities directly associated with assets classified as held for sale 37 (8.5) – – –
(77.8) (55.4) (5.3) (3.1)
Non-current liabilities
Deferred tax liabilities 23 (91.2) (85.5) – –
Borrowings 24 (47.2) (41.0) – –
Long term provisions 26 (69.1) (73.4) – –
(207.5) (199.9) – –
Total liabilities (285.3) (255.3) (5.3) (3.1)
Net assets 304.4 293.7 307.9 291.8
Equity
Share capital 27 34.9 31.9 34.9 31.9
Share premium 27 58.0 55.4 58.0 55.4
Other reserves 28 250.5 243.0 202.4 197.6
Retained (deficit)/earnings 30 (39.0) (36.6) 12.6 6.9
Total equity 304.4 293.7 307.9 291.8
The above consolidated balance sheets should be read in conjunction with the accompanying notes.
The profit for the financial year in the accounts of the Company (Co number 3300821) was $1.9m inclusive of dividends from subsidiary undertakings (2020: $264.5 loss). As provided by section 408 of the Companies Act 2006, no income statement or statement of comprehensive income is presented in respect of the Company.
The financial statements were approved by the Board of Directors on 15 March 2022 and signed on its behalf by:
JOHN MARTIN Chair SUE RIVETT Chief Financial Officer
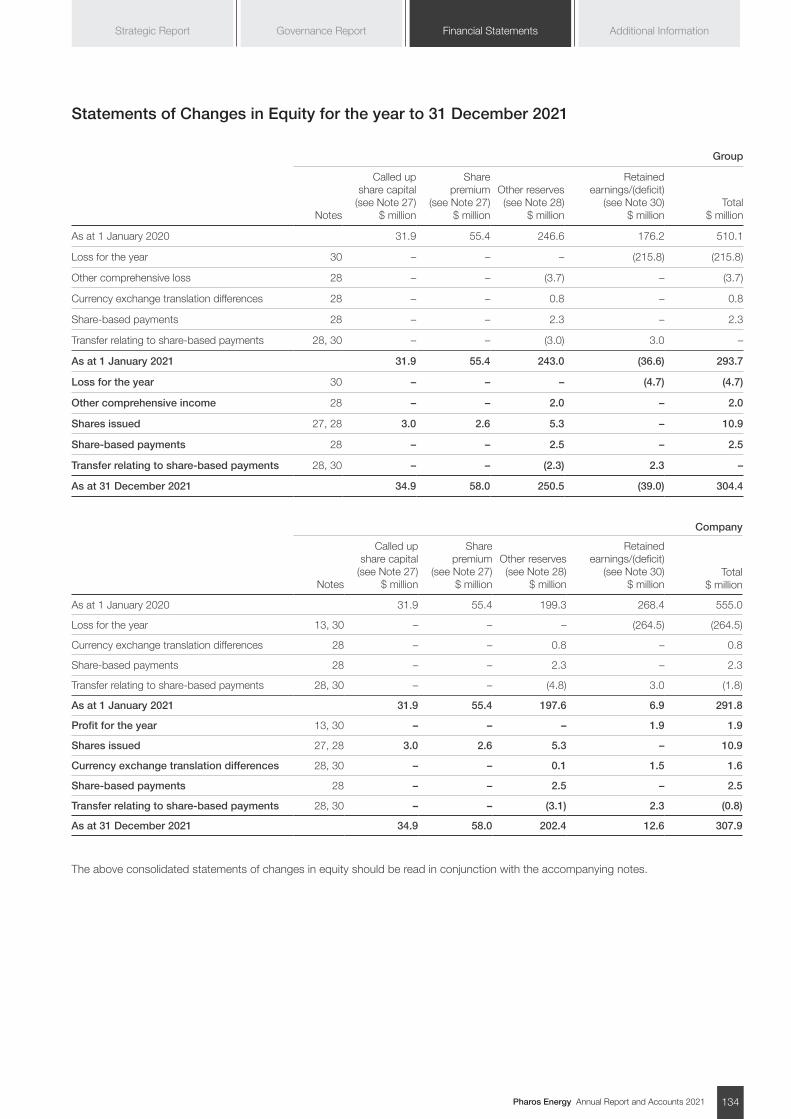
Pharos Energy Annual Report and Accounts 2021 134
Additional InformationGovernance Report Financial StatementsStrategic Report
Statements of Changes in Equity for the year to 31 December 2021
Group
Notes
Called up share capital
(see Note 27) $ million
Share premium
(see Note 27) $ million
Other reserves (see Note 28)
$ million
Retained earnings/(deficit)
(see Note 30) $ million
Total $ million
As at 1 January 2020 31.9 55.4 246.6 176.2 510.1
Loss for the year 30 – – – (215.8) (215.8)
Other comprehensive loss 28 – – (3.7) – (3.7)
Currency exchange translation differences 28 – – 0.8 – 0.8
Share-based payments 28 – – 2.3 – 2.3
Transfer relating to share-based payments 28, 30 – – (3.0) 3.0 –
As at 1 January 2021 31.9 55.4 243.0 (36.6) 293.7
Loss for the year 30 – – – (4.7) (4.7)
Other comprehensive income 28 – – 2.0 – 2.0
Shares issued 27, 28 3.0 2.6 5.3 – 10.9
Share-based payments 28 – – 2.5 – 2.5
Transfer relating to share-based payments 28, 30 – – (2.3) 2.3 –
As at 31 December 2021 34.9 58.0 250.5 (39.0) 304.4
Company
Notes
Called up share capital
(see Note 27) $ million
Share premium
(see Note 27) $ million
Other reserves (see Note 28)
$ million
Retained earnings/(deficit)
(see Note 30) $ million
Total $ million
As at 1 January 2020 31.9 55.4 199.3 268.4 555.0
Loss for the year 13, 30 – – – (264.5) (264.5)
Currency exchange translation differences 28 – – 0.8 – 0.8
Share-based payments 28 – – 2.3 – 2.3
Transfer relating to share-based payments 28, 30 – – (4.8) 3.0 (1.8)
As at 1 January 2021 31.9 55.4 197.6 6.9 291.8
Profit for the year 13, 30 – – – 1.9 1.9
Shares issued 27, 28 3.0 2.6 5.3 – 10.9
Currency exchange translation differences 28, 30 – – 0.1 1.5 1.6
Share-based payments 28 – – 2.5 – 2.5
Transfer relating to share-based payments 28, 30 – – (3.1) 2.3 (0.8)
As at 31 December 2021 34.9 58.0 202.4 12.6 307.9
The above consolidated statements of changes in equity should be read in conjunction with the accompanying notes.
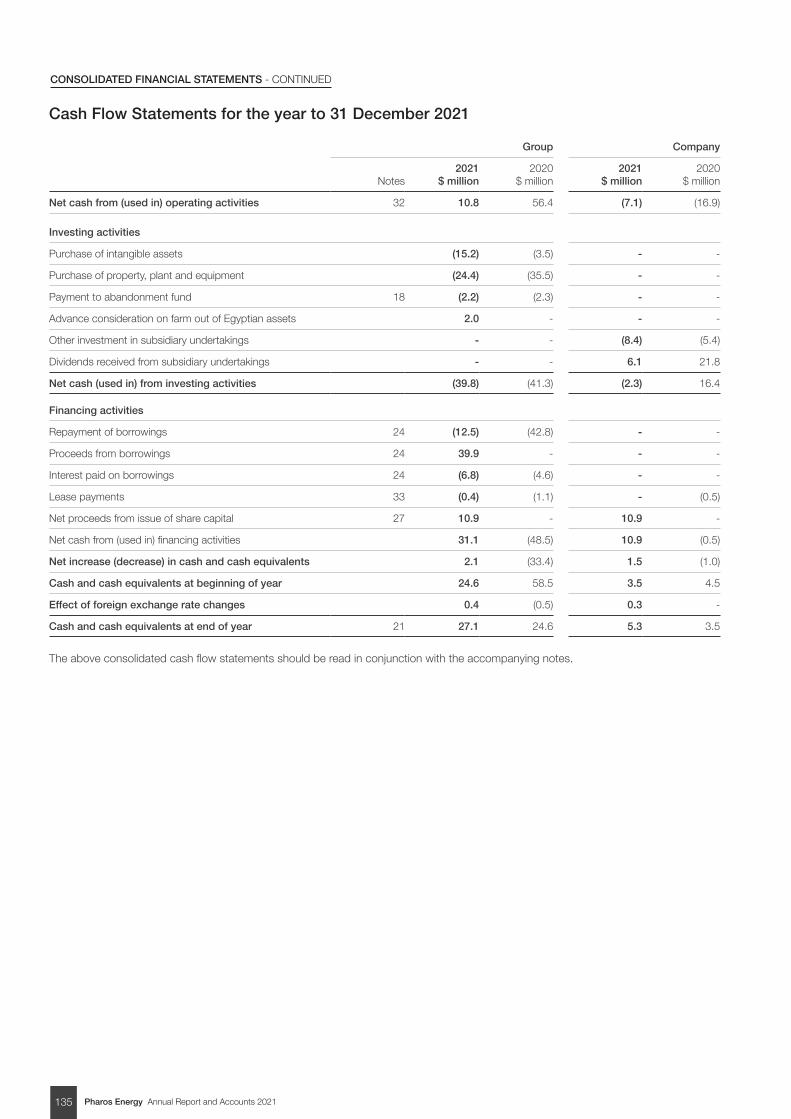
Pharos Energy Annual Report and Accounts 2021135
CONSOLIDATED FINANCIAL STATEMENTS - CONTINUED
Cash Flow Statements for the year to 31 December 2021
Group Company
Notes2021
$ million2020
$ million2021
$ million2020
$ million
Net cash from (used in) operating activities 32 10.8 56.4 (7.1) (16.9)
Investing activities
Purchase of intangible assets (15.2) (3.5) - -
Purchase of property, plant and equipment (24.4) (35.5) - -
Payment to abandonment fund 18 (2.2) (2.3) - -
Advance consideration on farm out of Egyptian assets 2.0 - - -
Other investment in subsidiary undertakings - - (8.4) (5.4)
Dividends received from subsidiary undertakings - - 6.1 21.8
Net cash (used in) from investing activities (39.8) (41.3) (2.3) 16.4
Financing activities
Repayment of borrowings 24 (12.5) (42.8) - -
Proceeds from borrowings 24 39.9 - - -
Interest paid on borrowings 24 (6.8) (4.6) - -
Lease payments 33 (0.4) (1.1) - (0.5)
Net proceeds from issue of share capital 27 10.9 - 10.9 -
Net cash from (used in) financing activities 31.1 (48.5) 10.9 (0.5)
Net increase (decrease) in cash and cash equivalents 2.1 (33.4) 1.5 (1.0)
Cash and cash equivalents at beginning of year 24.6 58.5 3.5 4.5
Effect of foreign exchange rate changes 0.4 (0.5) 0.3 -
Cash and cash equivalents at end of year 21 27.1 24.6 5.3 3.5
The above consolidated cash flow statements should be read in conjunction with the accompanying notes.
Pharos Energy Annual Report and Accounts 2021 136
Additional InformationGovernance Report Financial StatementsStrategic Report
NOTES TO THE CONSOLIDATED FINANCIAL STATEMENTS
1. General informationPharos Energy plc is a company limited by shares and incorporated in England and Wales under the Companies Act. The address of the registered office is given on the inside back cover. The nature of the Group’s operations and its principal activities are set out in Note 6, in the Operations Review and CFO’s statement on pages 26 to 37 and 38 to 42, respectively. Pharos Energy plc is the ultimate parent company of the Group and except where otherwise indicated the following accounting policies apply to both the Group and the Company.
2. Significant accounting policies
a) Basis of preparationThe financial statements have been prepared in accordance with international accounting standards in conformity with the requirements of the Companies Act 2006 and International Financial Reporting Standards as issued by the International Accounting Standard Board (IASB).
The Financial Statements have also been prepared on a going concern basis of accounting for the reasons set out in the Directors’ Report on page 121 and in the CFO’s statement on page 42.
The Financial Statements have been prepared under the historical cost basis, except for the valuation of hydrocarbon inventories and the revaluation of certain financial instruments. The Financial Statements are presented in US dollars as it is the functional currency of each of the Company’s subsidiary undertakings and is generally accepted practice in the oil and gas sector.
The principal accounting policies adopted are set out below.
b) New and amended standards adopted by the Group
A number of new or amended standards became applicable for the current reporting period. The group did not have to change its accounting policies or make retrospective adjustments as a result of adopting these standards.
• COVID-19-Related Rent Concessions – amendments to IFRS 16, and
• Interest Rate Benchmark Reform – Phase 2 – amendments to IFRS 9, IAS 39, IFRS 7, IFRS 4 and IFRS 16.
c) New standards and interpretations not yet adopted
Certain new accounting standards and interpretations have been published that are not mandatory for 31 December 2021 year end and have not been early adopted by the Group. These standards are not expected to have a material impact on the Group in the current or future reporting periods nor on foreseeable future transactions.
d) Basis of consolidationThe Group Financial Statements consolidate the accounts of Pharos Energy plc and entities controlled by the Company (its subsidiary undertakings) drawn up to the balance sheet date. Control is achieved where the investor is exposed or has rights to variable returns from its involvement with the investee and has the ability to affect those returns through its power over the investee. The Company reassesses whether or not it controls an investee if facts and circumstances indicate that there are changes to one or more of the elements of control. The results of subsidiaries acquired or sold are consolidated for the periods from or to the date on which control passed.
Where necessary, adjustments are made at the Group level to align the accounting policies of the subsidiaries to the Group’s accounting policies.
All intragroup assets and liabilities, equity, income, expenses and cash flows relating to transactions between the members of the Group are eliminated on consolidation
e) Assets held for saleNon-current assets are classified as held-for-sale if it is highly probable that they will be recovered primarily through sale rather than through continuing use. This condition is regarded as met only when the sale is highly probable and the asset is available for immediate sale in its present condition subject only to terms that are usual and customary for sales of such assets. Management must be committed to the sale, which should be expected to qualify for recognition as a completed sale within one year from the date of classification as held for sale, and actions required to complete the plan of sale should indicate that it is unlikely that significant changes to the plan will be made or that the plan will be withdrawn.
Such assets are measured at the lower of their carrying amount and fair value less costs to sell. Impairment losses on initial classification as held for sale and subsequent gains or losses on re-measurement are recognised in profit and loss.
Once classified as held for sale, intangible assets and property, plant and equipment are no longer amortised or depreciated.
f) InvestmentsNon-current investments in subsidiaries of the Company are shown at cost less provision for impairment. An impairment loss is recognised for the amount by which the asset’s carrying amount exceeds its recoverable amount. The recoverable amount is the higher of an asset’s fair value less costs of disposal and value in use. Liquid investments comprise short-term liquid investments of between three to six months maturity.
g) Interests in joint arrangementsA joint arrangement is an arrangement where two or more parties have joint control. Joint control is the contractually agreed sharing of control of an arrangement, which exists only when decisions about the relevant activities require the unanimous consent of the parties sharing control. Joint arrangements where the Group has the rights to assets and obligations for liabilities of the arrangement are classified as joint operations and are accounted for by recognising the Group’s share of assets, liabilities, income and expenses.
Joint arrangements where the Group has the rights to the net assets of the arrangement are classified as joint ventures and are accounted for using the equity method of accounting.
h) RevenueRevenue represents the fair value of the Group’s share of oil and gas sold during the year on a liftings basis and is recognised when the Group satisfies a performance obligation by transferring oil and gas to a customer. In accordance with the Group’s sales agreements for oil and gas, the title to oil and gas typically transfers to a customer at the same time as the customer takes physical possession of the oil or gas. Typically, at this point in time, the performance obligations of the Group are fully satisfied.
Investment revenue is accrued on a time basis, by reference to the principal outstanding and at the effective interest rate applicable.
Pharos Energy Annual Report and Accounts 2021137
CONSOLIDATED FINANCIAL STATEMENTS - CONTINUED
i) Other/restructuring itemsOther/restructuring items represent income and expenses that arise from events or transactions that are clearly distinct from the ordinary activities of the Group and, therefore, are not expected to recur frequently or regularly. Refer to Note 8 for further details.
j) Intangible and tangible non-current assets
Oil and gas exploration, evaluation and development expenditure
The Group adopts the successful efforts method of accounting for exploration and evaluation costs. Pre-licence costs are expensed in the period in which they are incurred. All licence acquisition, exploration and evaluation costs and direct administration costs are initially capitalised as intangible non-current assets in cost centres by well (most typically), field or exploration area, as appropriate. Interest payable is capitalised insofar as it relates to specific development activities.
These costs are then written off as exploration costs in the income statement unless commercial reserves have been established or the determination process has not been completed and there are no indicators of impairment.
All field development costs are capitalised as property, plant and equipment. Property, plant and equipment related to production activities is amortised in accordance with the Group’s depreciation, depletion and amortisation accounting policy.
Depreciation, depletion and amortisation
Depletion is provided on oil and gas assets in production using the unit of production method, based on proven and probable reserves, applied to the sum of the total capitalised exploration, evaluation and development costs, together with estimated future development costs at current prices. Oil and gas assets which have a similar economic life are aggregated for depreciation purposes.
Impairment of value
Where there has been a change in economic conditions or in the expected use of a tangible non-current asset that indicates a possible impairment of an asset, management tests the recoverability of the net book value of the asset by comparison with the estimated discounted future net cash flows based on management’s expectations of future oil prices and future costs. Any identified impairment is charged/credited to the income statement in the period in which it
is identified.
Intangible non-current assets are considered for impairment at least annually by reference to the indicators specified in paragraphs 18 to 20 of IFRS 6. The impairment indicators in IFRS 6 for each exploration asset are:
• The period for which the entity has the right to explore in the specific area has expired during the period or will expire in the near future, and is not expected to be renewed;
• Substantive expenditure on further exploration for and evaluation of mineral resources in the specific area is neither budgeted nor planned;
• Exploration for and evaluation of mineral resources in the specific area have not led to the discovery of commercially viable quantities of mineral resources and the entity has decided to discontinue such activities in the specific area; and
• Sufficient data exist to indicate that, although a development in the specific area is likely to proceed, the carrying amount of the exploration and evaluation asset is unlikely to be recovered in full from successful development or by sale.
Other tangible non-current assets
Other tangible non-current assets are stated at historical cost less accumulated depreciation. Depreciation is provided on a straight-line basis at rates calculated to write off the cost of those assets, less residual value, over their expected useful lives of three to seven years.
Decommissioning
The decommissioning provision is calculated as the net present value of the Group’s share of the expenditure which is expected to be incurred at the end of the producing life of each field in the removal and decommissioning of the production, storage and transportation facilities currently in place. The cost of recognising the decommissioning provision is included as part of the cost of the relevant property, plant and equipment and is thus charged to the income statement on a unit of production basis in accordance with the Group’s policy for depletion and depreciation of tangible non-current assets. Period charges for changes in the net present value of the decommissioning provision arising from discounting are included in finance costs.
k) Changes in estimatesThe effects of changes in estimates on the unit of production calculations are accounted for prospectively, from the date of adoption of the revised estimates, over the estimated remaining proven and probable reserves.
l) InventoriesInventories, except for inventories of hydrocarbons, are valued at the lower of cost and net realisable value. Cost is determined on a weighted average cost basis and comprises direct purchase costs. Net realisable value is determined by reference to prices existing at the balance sheet date.
Physical inventories of hydrocarbons are valued at net realisable value in line with well-established industry practice. Underlifts and overlifts are valued at market value and are included in accrued income and prepayments, and accruals and deferred income, respectively. Changes in hydrocarbon inventories, underlifts and overlifts are adjusted through cost of sales.
m) LeasesOn inception of a contract, the Group assesses whether the contract is, or contains, a lease. The contract is, or contains, a lease if it conveys the right to control the use of an identified asset for a period of time in exchange for consideration. To determine whether the contract conveys the right to control the use of an identified asset, the Group assesses whether the contract involves the use of an identified asset, the Group has the right to obtain substantially all of the economic benefits from the use of the asset throughout the period of use, and the Group has the right to direct the use of the asset.
For short-term leases (lease term less than 12 months) and leases for which the underlying asset is of low value assets, the Group has opted to recognise a lease expense on a straight-line basis.
Right-of-use assets are measured at the amount of the corresponding lease liability on the date of initial adoption (adjusted for any prepaid or accrued lease expenses).
Lease liabilities are measured at the present value of the remaining lease payments, discounted using the interest rate implicit in the lease (if available), or the incremental borrowing rate at start of the lease.
Pharos Energy Annual Report and Accounts 2021 138
Additional InformationGovernance Report Financial StatementsStrategic Report
n) Share-based paymentsEquity-settled awards under share-based incentive plans are measured at fair value at the date of grant. The fair value determined at the grant date of the equity-settled share-based payments is expensed on a straight- line basis over the vesting period, based on the Group’s estimate of the number of equity instruments that will eventually vest. At each reporting date, the Group revises its estimate of the number of equity instruments expected to vest as a result of the effect of non-market-based vesting conditions. The impact of the revision of the original estimates, if any, is recognised in profit or loss such that the cumulative expense reflects the revised estimate, with a corresponding adjustment to reserves.
For cash-settled share-based payments, a liability is recognised measured initially at fair value. At each balance sheet date until the liability is settled, and at the date of settlement, the fair value of the liability is measured, with any changes in fair value recognised in profit or loss for the year.
o) TaxationThe tax expense represents the sum of the tax currently payable and deferred tax.
The tax currently payable is based on taxable profit for the year. Taxable profit differs from net profit as reported in profit or loss because it excludes items of income or expense that are taxable or deductible in other years and it further excludes items that are never taxable or deductible. The Group’s liability for current tax is calculated using tax rates that have been enacted or substantively enacted by the balance sheet date.
Deferred tax is the tax expected to be payable or recoverable on differences between the carrying amounts of assets and liabilities in the financial statements and the corresponding tax bases, and is accounted for using the balance sheet liability method. Deferred tax liabilities are generally recognised for all taxable temporary differences and deferred tax assets are recognised to the extent that it is probable that sufficient taxable profits will be available to recover the asset. Deferred tax is not recognised where an asset or liability is acquired in a transaction which is not a business combination for an amount which differs from its tax value.
Deferred tax is calculated at the tax rates that are expected to be applied in the period when the liability is settled or the asset is realised based on tax rates that have been enacted or substantively enacted by the balance sheet date. Deferred tax is charged or credited in the income statement, except when it relates to items charged or credited directly to
equity, in which case the deferred tax is also dealt with in equity.
p) Financial instrumentsFinancial assets and financial liabilities are recognised on the Group’s balance sheet when the Group becomes a party to the contractual provisions of the instrument.
There are no material financial assets and liabilities for which differences between carrying amounts and fair values are required to be disclosed. The classification of financial instruments as required by IFRS 7 is disclosed in Notes 20, 21, 22, 24, 33 and 36.
Financial asset at fair value through profit or loss
Where a financial instrument is classified as a financial asset at fair value through profit or loss it is initially recognised at fair value. At each balance sheet date the fair value is reviewed and any gain or loss arising is recognised in the income statement. Changes in the net present value of the financial asset arising from discounting are included in other income and expense. As at 31 December 2021 and 2020 no financial assets were classified at fair value through profit or loss.
Trade receivables
Trade receivables are recognised initially at fair value and subsequently measured at amortised cost, less expected credit losses provision, when required.
Trade payables
Trade payables are generally stated at amortised cost using the effective interest rate.
Derivative and hedging instruments
Derivatives are initially recognised at fair value on the date that a derivative contract is entered into, and they are subsequently re-measured to their fair value at the end of each reporting period. The accounting for subsequent changes in fair value depends on whether the derivative is designated as a hedging instrument and, if so, the nature of the item being hedged.
At inception of the hedge relationship, the Group documents the economic relationship between hedging instruments and hedged items, including whether changes in the cash flows of the hedging instruments are expected to offset changes in the cash flows of hedged items. The Group documents its risk management objective and strategy for undertaking its hedge transactions.
Pharos entered into different commodity (swap) hedges to protect the Brent component of forecast oil sales and to ensure future compliance with its obligations under the RBL. Pharos has designated the swaps as cash flow hedges. For cash flow hedges, the portion of the gains and losses on the hedging instrument that is determined to be an effective hedge is taken to other comprehensive income and the ineffective portion is recognised in the income statement. The gains and losses taken to other comprehensive income are subsequently transferred to the income statement during the period in which the hedged transaction affects the income statement.
Borrowings
Interest-bearing bank loans are recorded at the proceeds received, net of direct issue costs. Finance charges, including any direct issue costs, are accounted for on an accrual basis in the income statement using the effective interest method and are added to the carrying amount of the instrument to the extent that they are not settled in the year in which they arise.
The effective interest method is a method of calculating the amortised cost of a financial liability and of allocating interest expense over the relevant period. The effective interest rate is the rate that exactly discounts estimated future cash payments (including all fees and transaction costs) through the expected life of the financial liability to the amortised cost of a financial liability.
The Group derecognises financial liabilities when, and only when, the Group’s obligations are discharged, cancelled or have expired. The difference between the carrying amount of the financial liability derecognised and the consideration paid and payable is recognised in profit or loss.
When the Group exchanges with the existing lender one debt instrument into another one with substantially different terms, such exchange is accounted for as an extinguishment of the original financial liability and the recognition of a new financial liability. Similarly, the Group accounts for substantial modification of terms of an existing liability or part of it as an extinguishment of the original financial liability and the recognition of a new liability. It is assumed that the terms are substantially different if the discounted present value of the cash flows under the new terms, including any fees paid net of any fees received and discounted using the original effective interest rate is at least 10 per cent different from the discounted present value of the remaining cash flows of the original
Pharos Energy Annual Report and Accounts 2021139
CONSOLIDATED FINANCIAL STATEMENTS - CONTINUED
financial liability. If the modification is not substantial, the difference between: (1) the carrying amount of the liability before the modification; and (2) the present value of the cash flows after modification is recognised in profit or loss as the modification gain or loss within other gains and losses.
Equity instruments
Equity instruments issued by the Company are recorded at the proceeds received, net of direct issue costs. Equity instruments repurchased are deducted from equity at cost.
q) Provisions A contingent liability is disclosed unless the possibility of an outflow of resources embodying economic benefits is remote or the amount of the liability cannot be measured with sufficient reliability.
Contingent liabilities may develop in a way not initially expected. Therefore, they are assessed continually to determine whether an outflow of resources embodying economic benefits has become probable. If it becomes probable that an outflow of future economic benefits will be required for an item previously dealt with as a contingent liability, a provision is recognised in the financial statements of the period in which the change in probability occurs.
Provisions are recognised when the Group has a present obligation (legal or constructive) as a result of a past event, it is probable that the Group will be required to settle that obligation and a reliable estimate can be made of the amount of the obligation.
The amount recognised as a provision is the best estimate of the consideration required to settle the present obligation at the reporting date, taking into account the risks and uncertainties surrounding the obligation. Where a provision is measured using the cash flows estimated to settle the present obligation, its carrying amount is the present value of those cash flows (when the effect of the time value of money is material).
When some or all of the economic benefits required to settle a provision are expected to be recovered from a third party, a receivable is recognised as an asset if it is virtually certain that reimbursement will be received and the amount of the receivable can be measured reliably.
Decommissioning provisions:
Provisions for the costs to decommission oil & gas properties are recognised when the Group has an obligation required by the terms and conditions of the agreements and when a reliable estimate can be made. The provision for the costs of decommissioning oil & gas properties at the end of their economic lives is estimated using existing technology, at future prices, depending on the expected timing of the activity, and discounted using the nominal discount rate. Estimates are regularly reviewed and adjusted as appropriate for new circumstances.
r) Foreign currenciesThe individual financial statements of each Group company are stated in the currency of the primary economic environment in which it operates (its functional currency). Transactions in currencies other than the entity’s functional currency (foreign currency) are recorded at the rate of exchange at the date of the transaction. Monetary assets and liabilities denominated in foreign currencies at the balance sheet date are recorded at the rates of exchange prevailing at that date, or if appropriate, at the forward contract rate. Any resulting gains and losses are included in net profit or loss for the period.
For the purpose of presenting consolidated financial statements the results of entities denominated in currencies other than US dollars are translated at the daily rate of exchange and their balance sheets at the rates ruling at the balance sheet date. Any resulting gains or losses are taken to other comprehensive income.
s) Pension costsThe contributions payable in the year in respect of pension costs for defined contribution schemes and other post-retirement benefits are charged to the income statement. Differences between contributions payable in the year and contributions actually paid are shown either as accruals or prepayments in the balance sheet.
3. Financial risk managementThe Board reviews and agrees policies for managing financial risks that may affect the Group. In certain cases the Board delegates responsibility for such reviews and policy setting to the Audit and Risk Committee. The principal financial risks affecting the Group are discussed in the Risk Management and Risk Report on pages 43 to 57.
4. Critical judgements and accounting estimates
a) Critical judgements in applying the Group’s accounting policies
In the process of applying the Group’s accounting policies described in Note 2, management has made judgements that may have a significant effect on the amounts recognised in the financial statements. These are discussed below:
Oil and gas assets
Note 2(j) describes the judgements necessary to implement the Group’s policy with respect to the carrying value of intangible exploration and evaluation assets.
Management considers these assets for impairment at least annually with reference to indicators in IFRS 6. Note 15 discloses the carrying value of intangible exploration and evaluation assets along with details of impairment charges that arose during the year. Further, Note 2(j) describes the Group’s policy regarding reclassification of intangible assets to tangible assets. Management considers the appropriateness of asset classification at least annually.
Going concern
The Financial Statements have been prepared on the going concern basis of accounting. A number of judgements were taken in concluding that this basis of preparation was appropriate and that there were no material uncertainties in this regard. These included applying appropriate estimates of future production and oil price together with ensuring that the forecasts included all expenditure that was either committed or expected to be incurred in relation to estimated production volumes. Consideration was also given to the potential ongoing impact of the COVID-19 pandemic. During 2020, the pandemic did not cause any interruptions to the group’s producing assets in Vietnam and Egypt and accordingly the primary impact to the group’s cash generating ability due to the pandemic in the next 12 months is considered to be the risk of further oil price reductions due to global supply
Pharos Energy Annual Report and Accounts 2021 140
Additional InformationGovernance Report Financial StatementsStrategic Report
and demand dislocations. This risk has been taken into consideration through downside oil price sensitivities, including the application of a reverse stress test. Further details in this area are provided in the Directors’ Report on page 121 and in the CFO’s Statement on pages 38 to 42.
Asset held for sale
There are certain criteria that should be actively considered in assessing whether that for the farm-down and sale of a 55% working interest and operatorship in the Egyptian concessions to IPR should be treated as an Asset held for sale. In particular that it should be highly probable and available for sale in its present condition subject to terms that are usual and customary for sales of such assets.
The sale was considered highly probable given the commitment to sell in place from the Board of Directors and that a buyer and price had been agreed with IPR. Shareholder approval had been obtained and the process of negotiation in obtaining regulatory approvals for the disposal were well advanced. Accordingly the key criteria were considered met in December 2021 and the relevant assets and liabilities were treated as held for sale.
Treatment of the Third Amendment to the El Fayum Concession Agreement
At 31 December 2021 it was not certain that the Third Amendment to the El Fayum Concession Agreement would be agreed. Whilst some preliminary approvals occurred in December 2020 the final approvals had not been received. Until these had arisen it was not considered appropriate to recognise these revised terms until these final approvals had been obtained reflecting the risks of political change or potential for subsequent change and renegotiation.
The agreement post year end of the Third Amendment to the El Fayum Concession Agreement, with retroactive application of the improved fiscal terms from November 2020 and a three and a half year extension to the exploration period, was accordingly treated as a non-adjusting post balance sheet event. An impairment reversal of $28.2m utilising the changed circumstances of 31 December 2021 as the basis has been calculated on the remaining 45% share held and will be factored into the impairment reviews going forward.
b) Key sources of estimation uncertainty
The key assumptions concerning the future, and other key sources of estimation uncertainty at the balance sheet date, other than those mentioned above, that may have a significant risk of causing a material adjustment to the carrying amounts of assets and liabilities within the next financial year are discussed below:
Oil and gas reserves and DD&A
Note 2(j) sets out the Group’s accounting policy on DD&A. Proven and probable reserves are estimated using standard recognised evaluation techniques and are disclosed on page 166. The estimate is reviewed at least twice a year and is audited by third party reservoir engineers at year end. Future development costs are estimated taking into account the level of development required to produce the reserves by reference to operators, where applicable, and internal engineers. As discussed in the Operations Review on pages 32 to 34, the Vietnam fields, TGT and CNV proved and probable reserves estimates have been revised based on ongoing work of ERCE and audited by our Reserves Auditors, RISC Advisory Pty Ltd. Egypt proved and probable reserves estimates have been revised based on ongoing work of ERCE and audited by McDaniels. Reserves estimates are inherently uncertain, especially in the early stages of a field’s life, and are routinely revised over the producing lives of oil and gas fields as new information becomes available and as economic conditions evolve. Such revisions may impact the Group’s future financial position and results, in particular, in relation to DD&A and impairment testing of oil and gas property, plant and equipment.
Impairment of producing oil and gas assets
If impairment indicators are identified in relation to a producing oil and gas field, management is required to compare the net carrying value of the assets and liabilities which represent the field cash generating unit (CGU) with the estimated recoverable amount of the field. Management generally determines the recoverable amount of the field by estimating its value in use, using a discounted cash flow method. Calculating the net present value of the discounted cash flows involves key assumptions which include commodity prices, 2P reserves estimates and discount rates. Other assumptions include production profiles, future operating and capital expenditures and the relevant fiscal terms.
Further information relating to the specific assumptions and uncertainties relevant to impairment tests performed in the year are discussed in Note 17.
Climate change and the energy transition
Climate change and the transition to a low carbon economy were considered in preparing the consolidated financial statements. In particular, the energy transition is likely to impact future oil and gas prices which in turn may affect the recoverable amount of the group’s property, plant and equipment (PP&E). Management’s best estimate of future oil prices was revised down significantly in 2020 but upwards in 2021, in part due to expectations of the impact of the energy transition. In developing these price assumptions, consideration was given to a range of third party forecasts, including a number that were described as being consistent with achieving the goal to reach net zero by 2050 and align with COP26 (the “Net Zero price scenario”). Management’s best estimate of oil prices, although higher, was within $5/bbl of the average of the Net Zero price scenario. Further details of the key assumptions in this area have been provided in Note 16, including sensitivity analysis outlining the impact on the impairment charges of using the average of the Paris compliant scenarios. In addition to impairment, climate change pressures could curtail the expected useful lives of the group’s oil and gas PP&E, thereby accelerating depreciation charges. However, the group’s producing fields are likely to be fully depreciated within 15 years, during which timeframe it is expected that global demand for oil will remain robust. Accordingly, the impact of climate change on expected useful lives is not considered to be a significant judgement or estimate.
In addition to PP&E, climate change could: (1) adversely impact the future development or viability of exploration and evaluation (E&E) prospects. However, the impact of the climate change will be taken into consideration when the field is transferred from exploration to development stage; (2) bring forward the date of decommissioning of the group’s producing oil and gas assets in Vietnam, thereby increasing the net present value of the associated provision. However, decommissioning is currently forecast to occur within the next 10-11 years and, due to the relatively short timeframe, it is not considered that any reasonably possible acceleration in the timing of decommissioning will have a material impact on the provision, assuming the underlying cost estimates remain unchanged.
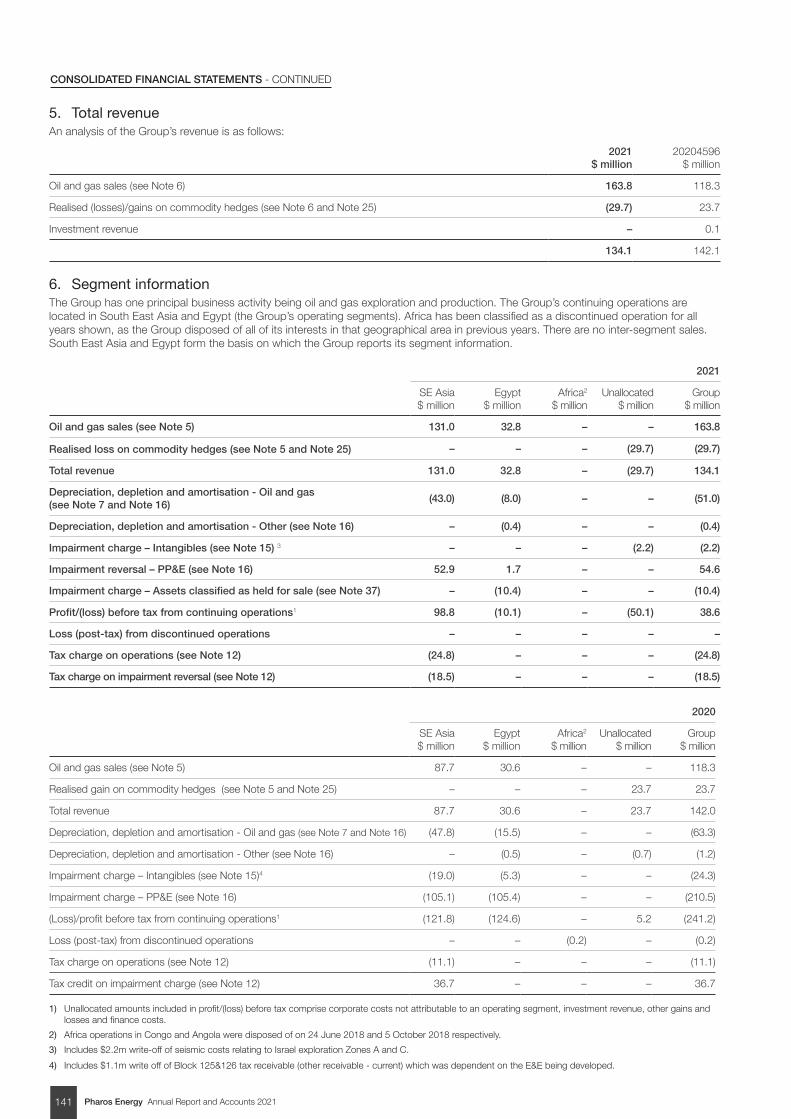
Pharos Energy Annual Report and Accounts 2021141
CONSOLIDATED FINANCIAL STATEMENTS - CONTINUED
5. Total revenueAn analysis of the Group’s revenue is as follows:
2021 $ million
20204596 $ million
Oil and gas sales (see Note 6) 163.8 118.3
Realised (losses)/gains on commodity hedges (see Note 6 and Note 25) (29.7) 23.7
Investment revenue – 0.1
134.1 142.1
6. Segment informationThe Group has one principal business activity being oil and gas exploration and production. The Group’s continuing operations are located in South East Asia and Egypt (the Group’s operating segments). Africa has been classified as a discontinued operation for all years shown, as the Group disposed of all of its interests in that geographical area in previous years. There are no inter-segment sales. South East Asia and Egypt form the basis on which the Group reports its segment information.
2021
SE Asia $ million
Egypt $ million
Africa2
$ millionUnallocated
$ millionGroup
$ million
Oil and gas sales (see Note 5) 131.0 32.8 – – 163.8
Realised loss on commodity hedges (see Note 5 and Note 25) – – – (29.7) (29.7)
Total revenue 131.0 32.8 – (29.7) 134.1
Depreciation, depletion and amortisation - Oil and gas (see Note 7 and Note 16)
(43.0) (8.0) – – (51.0)
Depreciation, depletion and amortisation - Other (see Note 16) – (0.4) – – (0.4)
Impairment charge – Intangibles (see Note 15) 3 – – – (2.2) (2.2)
Impairment reversal – PP&E (see Note 16) 52.9 1.7 – – 54.6
Impairment charge – Assets classified as held for sale (see Note 37) – (10.4) – – (10.4)
Profit/(loss) before tax from continuing operations1 98.8 (10.1) – (50.1) 38.6
Loss (post-tax) from discontinued operations – – – – –
Tax charge on operations (see Note 12) (24.8) – – – (24.8)
Tax charge on impairment reversal (see Note 12) (18.5) – – – (18.5)
2020
SE Asia $ million
Egypt $ million
Africa2
$ millionUnallocated
$ millionGroup
$ million
Oil and gas sales (see Note 5) 87.7 30.6 – – 118.3
Realised gain on commodity hedges (see Note 5 and Note 25) – – – 23.7 23.7
Total revenue 87.7 30.6 – 23.7 142.0
Depreciation, depletion and amortisation - Oil and gas (see Note 7 and Note 16) (47.8) (15.5) – – (63.3)
Depreciation, depletion and amortisation - Other (see Note 16) – (0.5) – (0.7) (1.2)
Impairment charge – Intangibles (see Note 15)4 (19.0) (5.3) – – (24.3)
Impairment charge – PP&E (see Note 16) (105.1) (105.4) – – (210.5)
(Loss)/profit before tax from continuing operations1 (121.8) (124.6) – 5.2 (241.2)
Loss (post-tax) from discontinued operations – – (0.2) – (0.2)
Tax charge on operations (see Note 12) (11.1) – – – (11.1)
Tax credit on impairment charge (see Note 12) 36.7 – – – 36.7
1) Unallocated amounts included in profit/(loss) before tax comprise corporate costs not attributable to an operating segment, investment revenue, other gains and losses and finance costs.
2) Africa operations in Congo and Angola were disposed of on 24 June 2018 and 5 October 2018 respectively.
3) Includes $2.2m write-off of seismic costs relating to Israel exploration Zones A and C.
4) Includes $1.1m write off of Block 125&126 tax receivable (other receivable - current) which was dependent on the E&E being developed.
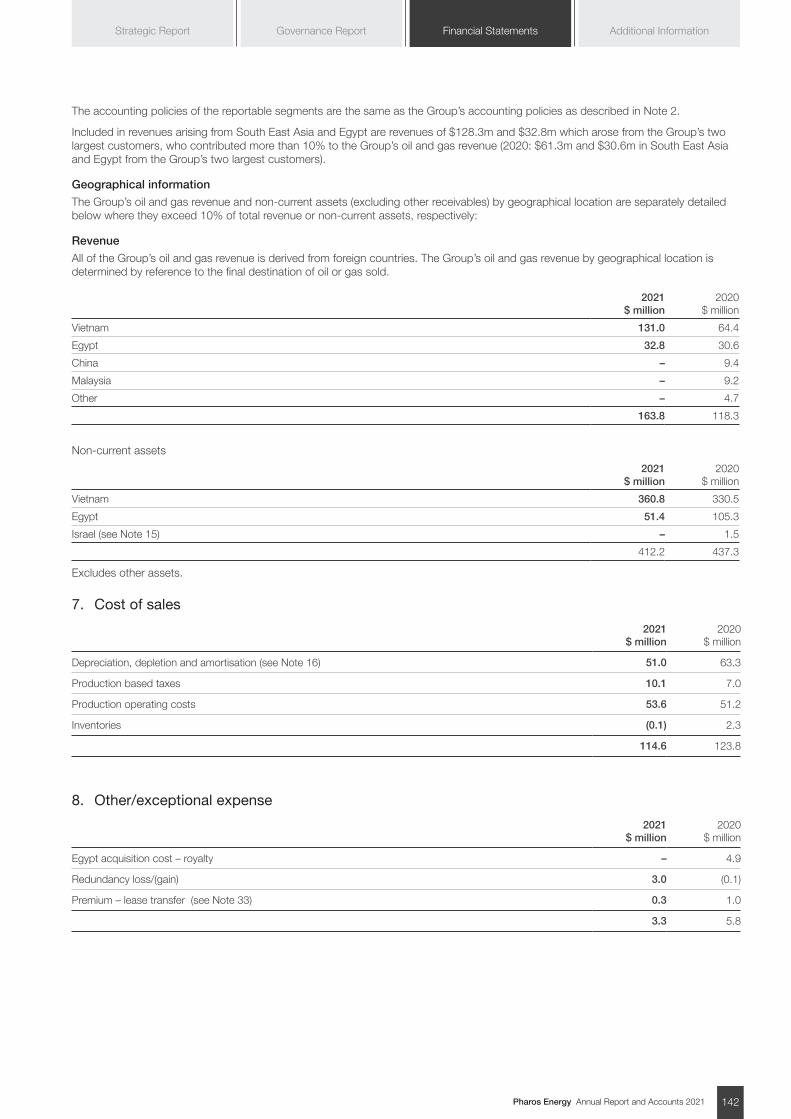
Pharos Energy Annual Report and Accounts 2021 142
Additional InformationGovernance Report Financial StatementsStrategic Report
The accounting policies of the reportable segments are the same as the Group’s accounting policies as described in Note 2.
Included in revenues arising from South East Asia and Egypt are revenues of $128.3m and $32.8m which arose from the Group’s two largest customers, who contributed more than 10% to the Group’s oil and gas revenue (2020: $61.3m and $30.6m in South East Asia and Egypt from the Group’s two largest customers).
Geographical information
The Group’s oil and gas revenue and non-current assets (excluding other receivables) by geographical location are separately detailed below where they exceed 10% of total revenue or non-current assets, respectively:
Revenue
All of the Group’s oil and gas revenue is derived from foreign countries. The Group’s oil and gas revenue by geographical location is determined by reference to the final destination of oil or gas sold.
2021 $ million
2020 $ million
Vietnam 131.0 64.4
Egypt 32.8 30.6
China – 9.4
Malaysia – 9.2
Other – 4.7
163.8 118.3
Non-current assets
2021 $ million
2020 $ million
Vietnam 360.8 330.5
Egypt 51.4 105.3
Israel (see Note 15) – 1.5
412.2 437.3
Excludes other assets.
7. Cost of sales
2021 $ million
2020 $ million
Depreciation, depletion and amortisation (see Note 16) 51.0 63.3
Production based taxes 10.1 7.0
Production operating costs 53.6 51.2
Inventories (0.1) 2.3
114.6 123.8
8. Other/exceptional expense
2021 $ million
2020 $ million
Egypt acquisition cost – royalty – 4.9
Redundancy loss/(gain) 3.0 (0.1)
Premium – lease transfer (see Note 33) 0.3 1.0
3.3 5.8
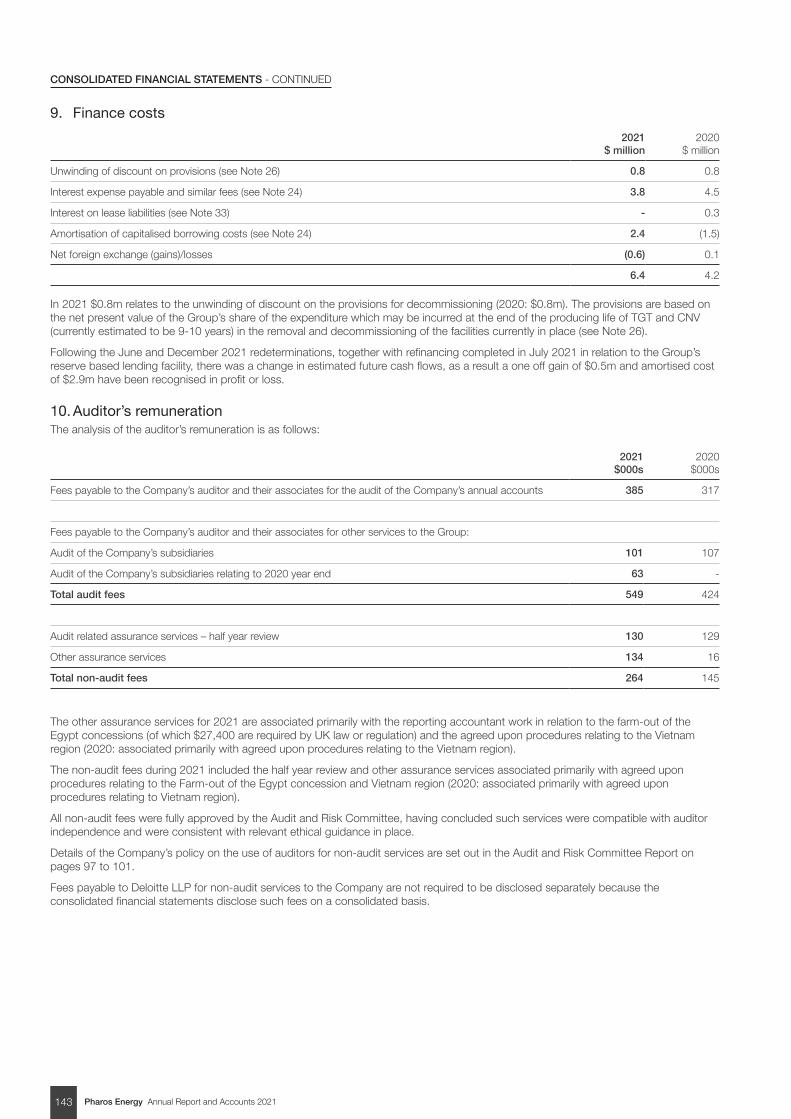
Pharos Energy Annual Report and Accounts 2021143
CONSOLIDATED FINANCIAL STATEMENTS - CONTINUED
9. Finance costs
2021 $ million
2020 $ million
Unwinding of discount on provisions (see Note 26) 0.8 0.8
Interest expense payable and similar fees (see Note 24) 3.8 4.5
Interest on lease liabilities (see Note 33) - 0.3
Amortisation of capitalised borrowing costs (see Note 24) 2.4 (1.5)
Net foreign exchange (gains)/losses (0.6) 0.1
6.4 4.2 In 2021 $0.8m relates to the unwinding of discount on the provisions for decommissioning (2020: $0.8m). The provisions are based on the net present value of the Group’s share of the expenditure which may be incurred at the end of the producing life of TGT and CNV (currently estimated to be 9-10 years) in the removal and decommissioning of the facilities currently in place (see Note 26).
Following the June and December 2021 redeterminations, together with refinancing completed in July 2021 in relation to the Group’s reserve based lending facility, there was a change in estimated future cash flows, as a result a one off gain of $0.5m and amortised cost of $2.9m have been recognised in profit or loss.
10. Auditor’s remunerationThe analysis of the auditor’s remuneration is as follows:
2021 $000s
2020 $000s
Fees payable to the Company’s auditor and their associates for the audit of the Company’s annual accounts 385 317
Fees payable to the Company’s auditor and their associates for other services to the Group:
Audit of the Company’s subsidiaries 101 107
Audit of the Company’s subsidiaries relating to 2020 year end 63 -
Total audit fees 549 424
Audit related assurance services – half year review 130 129
Other assurance services 134 16
Total non-audit fees 264 145
The other assurance services for 2021 are associated primarily with the reporting accountant work in relation to the farm-out of the Egypt concessions (of which $27,400 are required by UK law or regulation) and the agreed upon procedures relating to the Vietnam region (2020: associated primarily with agreed upon procedures relating to the Vietnam region).
The non-audit fees during 2021 included the half year review and other assurance services associated primarily with agreed upon procedures relating to the Farm-out of the Egypt concession and Vietnam region (2020: associated primarily with agreed upon procedures relating to Vietnam region).
All non-audit fees were fully approved by the Audit and Risk Committee, having concluded such services were compatible with auditor independence and were consistent with relevant ethical guidance in place.
Details of the Company’s policy on the use of auditors for non-audit services are set out in the Audit and Risk Committee Report on pages 97 to 101.
Fees payable to Deloitte LLP for non-audit services to the Company are not required to be disclosed separately because the consolidated financial statements disclose such fees on a consolidated basis.
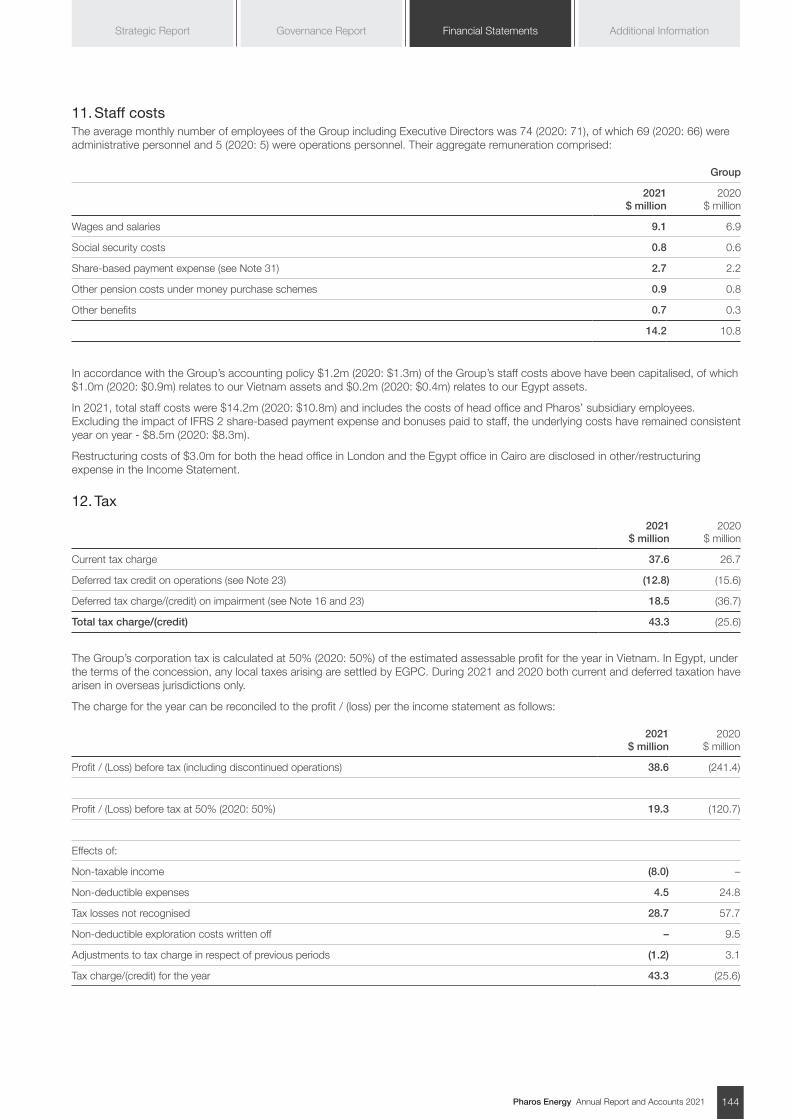
Pharos Energy Annual Report and Accounts 2021 144
Additional InformationGovernance Report Financial StatementsStrategic Report
11. Staff costs The average monthly number of employees of the Group including Executive Directors was 74 (2020: 71), of which 69 (2020: 66) were administrative personnel and 5 (2020: 5) were operations personnel. Their aggregate remuneration comprised:
Group
2021 $ million
2020 $ million
Wages and salaries 9.1 6.9
Social security costs 0.8 0.6
Share-based payment expense (see Note 31) 2.7 2.2
Other pension costs under money purchase schemes 0.9 0.8
Other benefits 0.7 0.3
14.2 10.8 In accordance with the Group’s accounting policy $1.2m (2020: $1.3m) of the Group’s staff costs above have been capitalised, of which $1.0m (2020: $0.9m) relates to our Vietnam assets and $0.2m (2020: $0.4m) relates to our Egypt assets.
In 2021, total staff costs were $14.2m (2020: $10.8m) and includes the costs of head office and Pharos’ subsidiary employees. Excluding the impact of IFRS 2 share-based payment expense and bonuses paid to staff, the underlying costs have remained consistent year on year - $8.5m (2020: $8.3m).
Restructuring costs of $3.0m for both the head office in London and the Egypt office in Cairo are disclosed in other/restructuring expense in the Income Statement.
12. Tax
2021 $ million
2020 $ million
Current tax charge 37.6 26.7
Deferred tax credit on operations (see Note 23) (12.8) (15.6)
Deferred tax charge/(credit) on impairment (see Note 16 and 23) 18.5 (36.7)
Total tax charge/(credit) 43.3 (25.6)
The Group’s corporation tax is calculated at 50% (2020: 50%) of the estimated assessable profit for the year in Vietnam. In Egypt, under the terms of the concession, any local taxes arising are settled by EGPC. During 2021 and 2020 both current and deferred taxation have arisen in overseas jurisdictions only.
The charge for the year can be reconciled to the profit / (loss) per the income statement as follows:
2021 $ million
2020 $ million
Profit / (Loss) before tax (including discontinued operations) 38.6 (241.4)
Profit / (Loss) before tax at 50% (2020: 50%) 19.3 (120.7)
Effects of:
Non-taxable income (8.0) –
Non-deductible expenses 4.5 24.8
Tax losses not recognised 28.7 57.7
Non-deductible exploration costs written off – 9.5
Adjustments to tax charge in respect of previous periods (1.2) 3.1
Tax charge/(credit) for the year 43.3 (25.6)
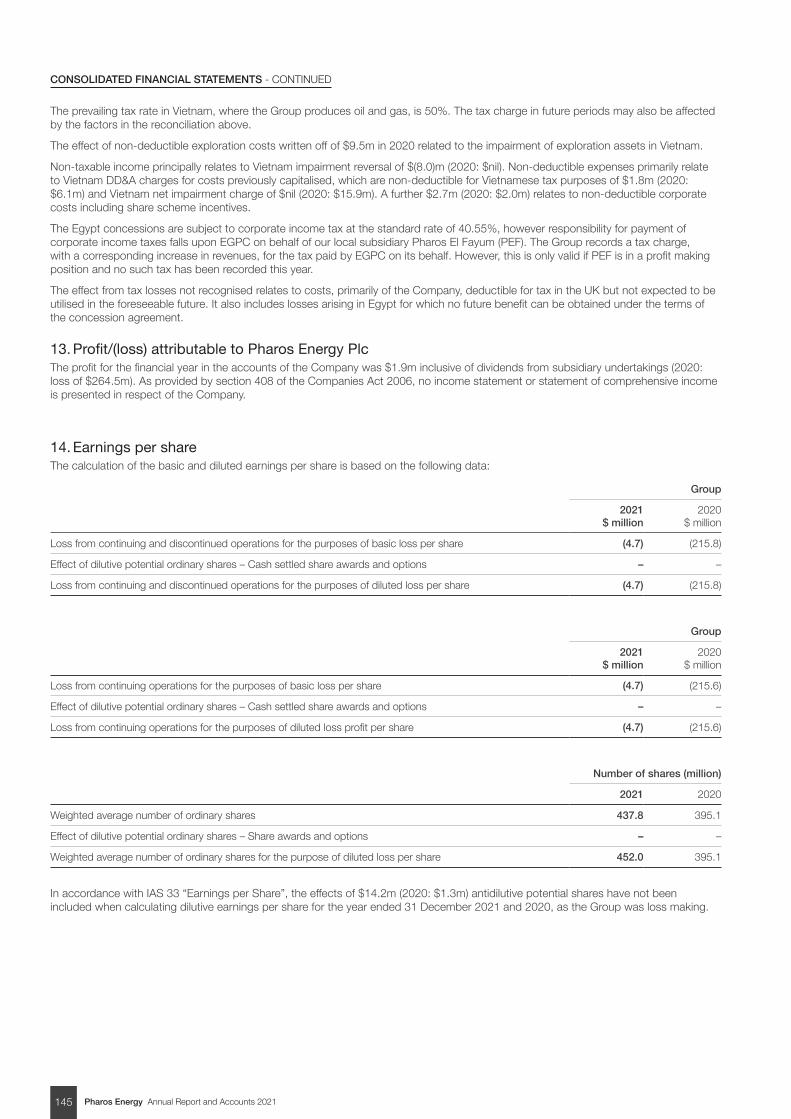
Pharos Energy Annual Report and Accounts 2021145
CONSOLIDATED FINANCIAL STATEMENTS - CONTINUED
The prevailing tax rate in Vietnam, where the Group produces oil and gas, is 50%. The tax charge in future periods may also be affected by the factors in the reconciliation above.
The effect of non-deductible exploration costs written off of $9.5m in 2020 related to the impairment of exploration assets in Vietnam.
Non-taxable income principally relates to Vietnam impairment reversal of $(8.0)m (2020: $nil). Non-deductible expenses primarily relate to Vietnam DD&A charges for costs previously capitalised, which are non-deductible for Vietnamese tax purposes of $1.8m (2020: $6.1m) and Vietnam net impairment charge of $nil (2020: $15.9m). A further $2.7m (2020: $2.0m) relates to non-deductible corporate costs including share scheme incentives.
The Egypt concessions are subject to corporate income tax at the standard rate of 40.55%, however responsibility for payment of corporate income taxes falls upon EGPC on behalf of our local subsidiary Pharos El Fayum (PEF). The Group records a tax charge, with a corresponding increase in revenues, for the tax paid by EGPC on its behalf. However, this is only valid if PEF is in a profit making position and no such tax has been recorded this year.
The effect from tax losses not recognised relates to costs, primarily of the Company, deductible for tax in the UK but not expected to be utilised in the foreseeable future. It also includes losses arising in Egypt for which no future benefit can be obtained under the terms of the concession agreement.
13. Profit/(loss) attributable to Pharos Energy Plc The profit for the financial year in the accounts of the Company was $1.9m inclusive of dividends from subsidiary undertakings (2020: loss of $264.5m). As provided by section 408 of the Companies Act 2006, no income statement or statement of comprehensive income is presented in respect of the Company.
14. Earnings per shareThe calculation of the basic and diluted earnings per share is based on the following data:
Group
2021 $ million
2020 $ million
Loss from continuing and discontinued operations for the purposes of basic loss per share (4.7) (215.8)
Effect of dilutive potential ordinary shares – Cash settled share awards and options – –
Loss from continuing and discontinued operations for the purposes of diluted loss per share (4.7) (215.8)
Group
2021 $ million
2020 $ million
Loss from continuing operations for the purposes of basic loss per share (4.7) (215.6)
Effect of dilutive potential ordinary shares – Cash settled share awards and options – –
Loss from continuing operations for the purposes of diluted loss profit per share (4.7) (215.6)
Number of shares (million)
2021 2020
Weighted average number of ordinary shares 437.8 395.1
Effect of dilutive potential ordinary shares – Share awards and options – –
Weighted average number of ordinary shares for the purpose of diluted loss per share 452.0 395.1
In accordance with IAS 33 “Earnings per Share”, the effects of $14.2m (2020: $1.3m) antidilutive potential shares have not been included when calculating dilutive earnings per share for the year ended 31 December 2021 and 2020, as the Group was loss making.
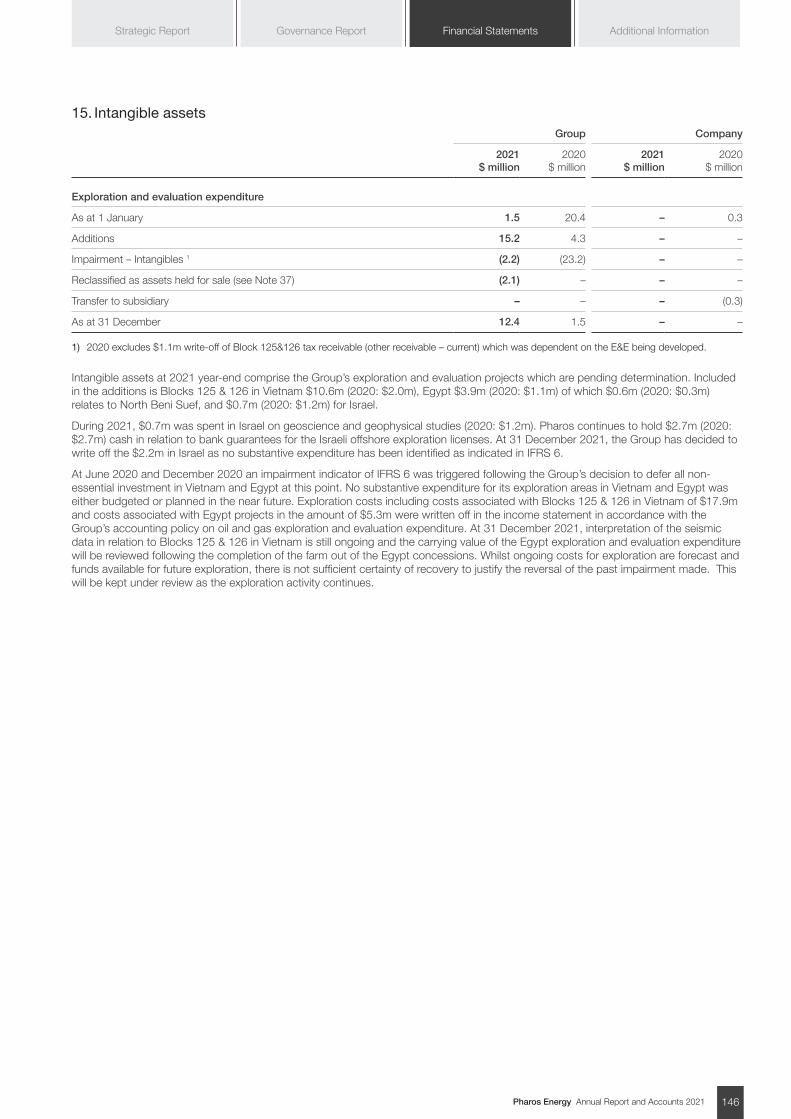
Pharos Energy Annual Report and Accounts 2021 146
Additional InformationGovernance Report Financial StatementsStrategic Report
15. Intangible assetsGroup Company
2021 $ million
2020 $ million
2021 $ million
2020 $ million
Exploration and evaluation expenditure
As at 1 January 1.5 20.4 – 0.3
Additions 15.2 4.3 – –
Impairment – Intangibles 1 (2.2) (23.2) – –
Reclassified as assets held for sale (see Note 37) (2.1) – – –
Transfer to subsidiary – – – (0.3)
As at 31 December 12.4 1.5 – –
1) 2020 excludes $1.1m write-off of Block 125&126 tax receivable (other receivable – current) which was dependent on the E&E being developed.
Intangible assets at 2021 year-end comprise the Group’s exploration and evaluation projects which are pending determination. Included in the additions is Blocks 125 & 126 in Vietnam $10.6m (2020: $2.0m), Egypt $3.9m (2020: $1.1m) of which $0.6m (2020: $0.3m) relates to North Beni Suef, and $0.7m (2020: $1.2m) for Israel.
During 2021, $0.7m was spent in Israel on geoscience and geophysical studies (2020: $1.2m). Pharos continues to hold $2.7m (2020: $2.7m) cash in relation to bank guarantees for the Israeli offshore exploration licenses. At 31 December 2021, the Group has decided to write off the $2.2m in Israel as no substantive expenditure has been identified as indicated in IFRS 6.
At June 2020 and December 2020 an impairment indicator of IFRS 6 was triggered following the Group’s decision to defer all non-essential investment in Vietnam and Egypt at this point. No substantive expenditure for its exploration areas in Vietnam and Egypt was either budgeted or planned in the near future. Exploration costs including costs associated with Blocks 125 & 126 in Vietnam of $17.9m and costs associated with Egypt projects in the amount of $5.3m were written off in the income statement in accordance with the Group’s accounting policy on oil and gas exploration and evaluation expenditure. At 31 December 2021, interpretation of the seismic data in relation to Blocks 125 & 126 in Vietnam is still ongoing and the carrying value of the Egypt exploration and evaluation expenditure will be reviewed following the completion of the farm out of the Egypt concessions. Whilst ongoing costs for exploration are forecast and funds available for future exploration, there is not sufficient certainty of recovery to justify the reversal of the past impairment made. This will be kept under review as the exploration activity continues.
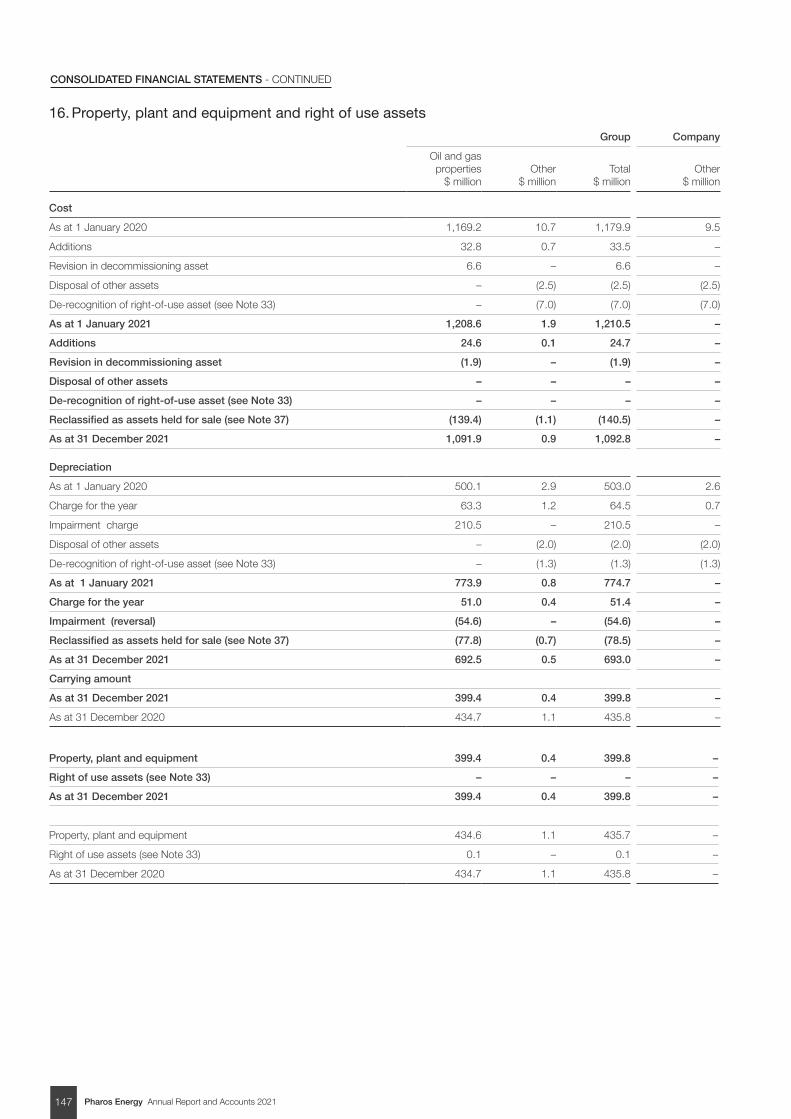
Pharos Energy Annual Report and Accounts 2021147
CONSOLIDATED FINANCIAL STATEMENTS - CONTINUED
16. Property, plant and equipment and right of use assets
Group Company
Oil and gas properties
$ millionOther
$ millionTotal
$ millionOther
$ million
Cost
As at 1 January 2020 1,169.2 10.7 1,179.9 9.5
Additions 32.8 0.7 33.5 –
Revision in decommissioning asset 6.6 – 6.6 –
Disposal of other assets – (2.5) (2.5) (2.5)
De-recognition of right-of-use asset (see Note 33) – (7.0) (7.0) (7.0)
As at 1 January 2021 1,208.6 1.9 1,210.5 –
Additions 24.6 0.1 24.7 –
Revision in decommissioning asset (1.9) – (1.9) –
Disposal of other assets – – – –
De-recognition of right-of-use asset (see Note 33) – – – –
Reclassified as assets held for sale (see Note 37) (139.4) (1.1) (140.5) –
As at 31 December 2021 1,091.9 0.9 1,092.8 –
Depreciation
As at 1 January 2020 500.1 2.9 503.0 2.6
Charge for the year 63.3 1.2 64.5 0.7
Impairment charge 210.5 – 210.5 –
Disposal of other assets – (2.0) (2.0) (2.0)
De-recognition of right-of-use asset (see Note 33) – (1.3) (1.3) (1.3)
As at 1 January 2021 773.9 0.8 774.7 –
Charge for the year 51.0 0.4 51.4 –
Impairment (reversal) (54.6) – (54.6) –
Reclassified as assets held for sale (see Note 37) (77.8) (0.7) (78.5) –
As at 31 December 2021 692.5 0.5 693.0 –
Carrying amount
As at 31 December 2021 399.4 0.4 399.8 –
As at 31 December 2020 434.7 1.1 435.8 –
Property, plant and equipment 399.4 0.4 399.8 –
Right of use assets (see Note 33) – – – –
As at 31 December 2021 399.4 0.4 399.8 –
Property, plant and equipment 434.6 1.1 435.7 –
Right of use assets (see Note 33) 0.1 – 0.1 –
As at 31 December 2020 434.7 1.1 435.8 –
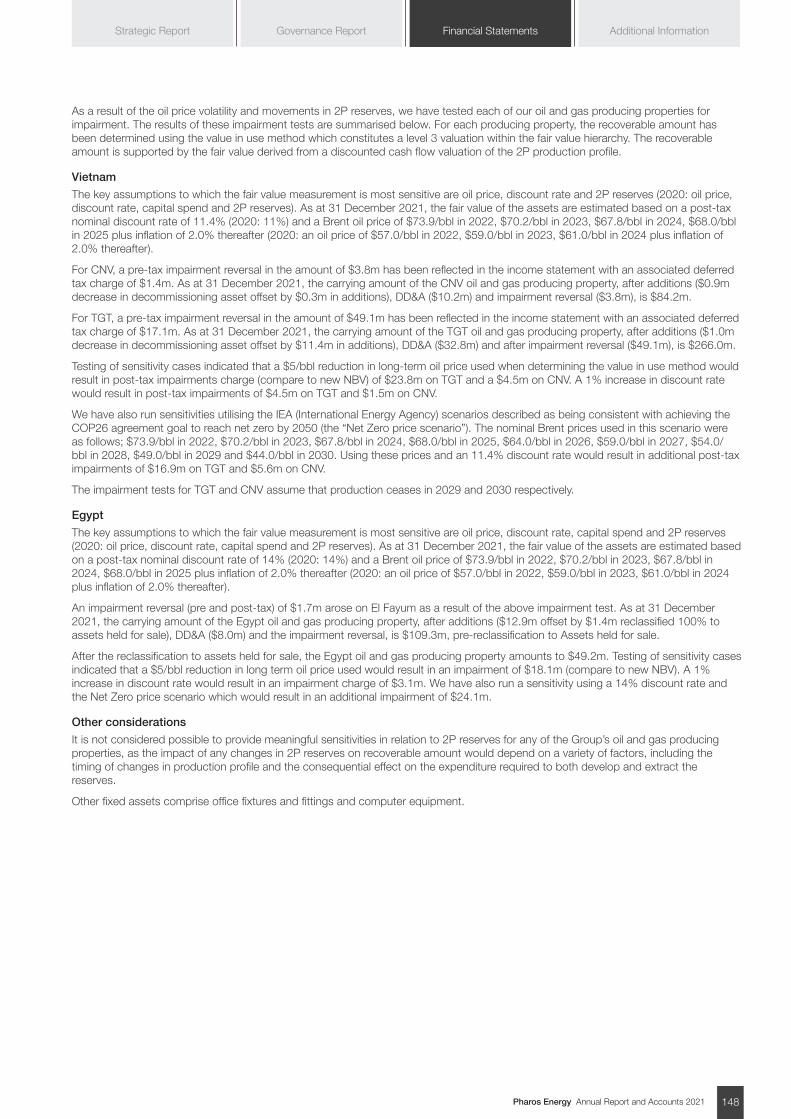
Pharos Energy Annual Report and Accounts 2021 148
Additional InformationGovernance Report Financial StatementsStrategic Report
As a result of the oil price volatility and movements in 2P reserves, we have tested each of our oil and gas producing properties for impairment. The results of these impairment tests are summarised below. For each producing property, the recoverable amount has been determined using the value in use method which constitutes a level 3 valuation within the fair value hierarchy. The recoverable amount is supported by the fair value derived from a discounted cash flow valuation of the 2P production profile.
Vietnam
The key assumptions to which the fair value measurement is most sensitive are oil price, discount rate and 2P reserves (2020: oil price, discount rate, capital spend and 2P reserves). As at 31 December 2021, the fair value of the assets are estimated based on a post-tax nominal discount rate of 11.4% (2020: 11%) and a Brent oil price of $73.9/bbl in 2022, $70.2/bbl in 2023, $67.8/bbl in 2024, $68.0/bbl in 2025 plus inflation of 2.0% thereafter (2020: an oil price of $57.0/bbl in 2022, $59.0/bbl in 2023, $61.0/bbl in 2024 plus inflation of 2.0% thereafter).
For CNV, a pre-tax impairment reversal in the amount of $3.8m has been reflected in the income statement with an associated deferred tax charge of $1.4m. As at 31 December 2021, the carrying amount of the CNV oil and gas producing property, after additions ($0.9m decrease in decommissioning asset offset by $0.3m in additions), DD&A ($10.2m) and impairment reversal ($3.8m), is $84.2m.
For TGT, a pre-tax impairment reversal in the amount of $49.1m has been reflected in the income statement with an associated deferred tax charge of $17.1m. As at 31 December 2021, the carrying amount of the TGT oil and gas producing property, after additions ($1.0m decrease in decommissioning asset offset by $11.4m in additions), DD&A ($32.8m) and after impairment reversal ($49.1m), is $266.0m.
Testing of sensitivity cases indicated that a $5/bbl reduction in long-term oil price used when determining the value in use method would result in post-tax impairments charge (compare to new NBV) of $23.8m on TGT and a $4.5m on CNV. A 1% increase in discount rate would result in post-tax impairments of $4.5m on TGT and $1.5m on CNV.
We have also run sensitivities utilising the IEA (International Energy Agency) scenarios described as being consistent with achieving the COP26 agreement goal to reach net zero by 2050 (the “Net Zero price scenario”). The nominal Brent prices used in this scenario were as follows; $73.9/bbl in 2022, $70.2/bbl in 2023, $67.8/bbl in 2024, $68.0/bbl in 2025, $64.0/bbl in 2026, $59.0/bbl in 2027, $54.0/bbl in 2028, $49.0/bbl in 2029 and $44.0/bbl in 2030. Using these prices and an 11.4% discount rate would result in additional post-tax impairments of $16.9m on TGT and $5.6m on CNV.
The impairment tests for TGT and CNV assume that production ceases in 2029 and 2030 respectively.
Egypt
The key assumptions to which the fair value measurement is most sensitive are oil price, discount rate, capital spend and 2P reserves (2020: oil price, discount rate, capital spend and 2P reserves). As at 31 December 2021, the fair value of the assets are estimated based on a post-tax nominal discount rate of 14% (2020: 14%) and a Brent oil price of $73.9/bbl in 2022, $70.2/bbl in 2023, $67.8/bbl in 2024, $68.0/bbl in 2025 plus inflation of 2.0% thereafter (2020: an oil price of $57.0/bbl in 2022, $59.0/bbl in 2023, $61.0/bbl in 2024 plus inflation of 2.0% thereafter).
An impairment reversal (pre and post-tax) of $1.7m arose on El Fayum as a result of the above impairment test. As at 31 December 2021, the carrying amount of the Egypt oil and gas producing property, after additions ($12.9m offset by $1.4m reclassified 100% to assets held for sale), DD&A ($8.0m) and the impairment reversal, is $109.3m, pre-reclassification to Assets held for sale.
After the reclassification to assets held for sale, the Egypt oil and gas producing property amounts to $49.2m. Testing of sensitivity cases indicated that a $5/bbl reduction in long term oil price used would result in an impairment of $18.1m (compare to new NBV). A 1% increase in discount rate would result in an impairment charge of $3.1m. We have also run a sensitivity using a 14% discount rate and the Net Zero price scenario which would result in an additional impairment of $24.1m.
Other considerations
It is not considered possible to provide meaningful sensitivities in relation to 2P reserves for any of the Group’s oil and gas producing properties, as the impact of any changes in 2P reserves on recoverable amount would depend on a variety of factors, including the timing of changes in production profile and the consequential effect on the expenditure required to both develop and extract the reserves.
Other fixed assets comprise office fixtures and fittings and computer equipment.
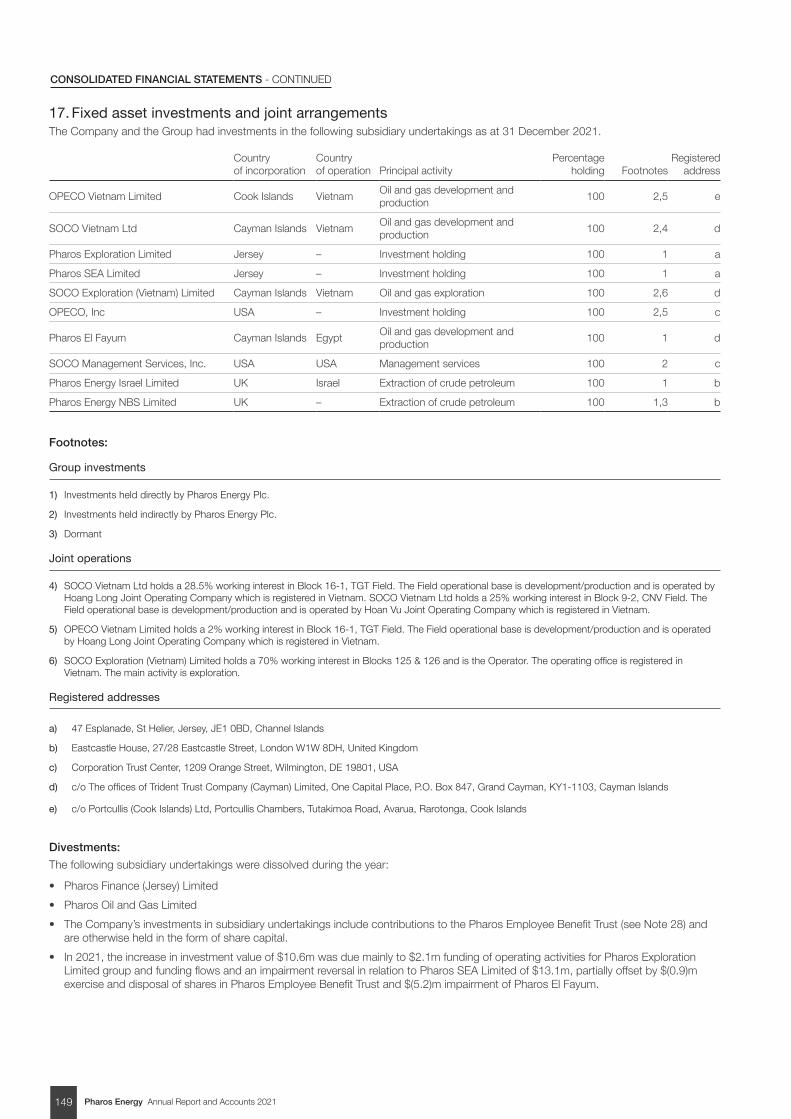
Pharos Energy Annual Report and Accounts 2021149
CONSOLIDATED FINANCIAL STATEMENTS - CONTINUED
17. Fixed asset investments and joint arrangementsThe Company and the Group had investments in the following subsidiary undertakings as at 31 December 2021.
Country of incorporation
Country of operation Principal activity
Percentage holding Footnotes
Registered address
OPECO Vietnam Limited Cook Islands VietnamOil and gas development and production
100 2,5 e
SOCO Vietnam Ltd Cayman Islands VietnamOil and gas development and production
100 2,4 d
Pharos Exploration Limited Jersey – Investment holding 100 1 a
Pharos SEA Limited Jersey – Investment holding 100 1 a
SOCO Exploration (Vietnam) Limited Cayman Islands Vietnam Oil and gas exploration 100 2,6 d
OPECO, Inc USA – Investment holding 100 2,5 c
Pharos El Fayum Cayman Islands EgyptOil and gas development and production
100 1 d
SOCO Management Services, Inc. USA USA Management services 100 2 c
Pharos Energy Israel Limited UK Israel Extraction of crude petroleum 100 1 b
Pharos Energy NBS Limited UK – Extraction of crude petroleum 100 1,3 b
Footnotes:
Group investments
1) Investments held directly by Pharos Energy Plc.
2) Investments held indirectly by Pharos Energy Plc.
3) Dormant
Joint operations
4) SOCO Vietnam Ltd holds a 28.5% working interest in Block 16-1, TGT Field. The Field operational base is development/production and is operated by Hoang Long Joint Operating Company which is registered in Vietnam. SOCO Vietnam Ltd holds a 25% working interest in Block 9-2, CNV Field. The Field operational base is development/production and is operated by Hoan Vu Joint Operating Company which is registered in Vietnam.
5) OPECO Vietnam Limited holds a 2% working interest in Block 16-1, TGT Field. The Field operational base is development/production and is operated by Hoang Long Joint Operating Company which is registered in Vietnam.
6) SOCO Exploration (Vietnam) Limited holds a 70% working interest in Blocks 125 & 126 and is the Operator. The operating office is registered in Vietnam. The main activity is exploration.
Registered addresses
a) 47 Esplanade, St Helier, Jersey, JE1 0BD, Channel Islands
b) Eastcastle House, 27/28 Eastcastle Street, London W1W 8DH, United Kingdom
c) Corporation Trust Center, 1209 Orange Street, Wilmington, DE 19801, USA
d) c/o The offices of Trident Trust Company (Cayman) Limited, One Capital Place, P.O. Box 847, Grand Cayman, KY1-1103, Cayman Islands
e) c/o Portcullis (Cook Islands) Ltd, Portcullis Chambers, Tutakimoa Road, Avarua, Rarotonga, Cook Islands
Divestments:
The following subsidiary undertakings were dissolved during the year:
• Pharos Finance (Jersey) Limited
• Pharos Oil and Gas Limited
• The Company’s investments in subsidiary undertakings include contributions to the Pharos Employee Benefit Trust (see Note 28) and are otherwise held in the form of share capital.
• In 2021, the increase in investment value of $10.6m was due mainly to $2.1m funding of operating activities for Pharos Exploration Limited group and funding flows and an impairment reversal in relation to Pharos SEA Limited of $13.1m, partially offset by $(0.9)m exercise and disposal of shares in Pharos Employee Benefit Trust and $(5.2)m impairment of Pharos El Fayum.
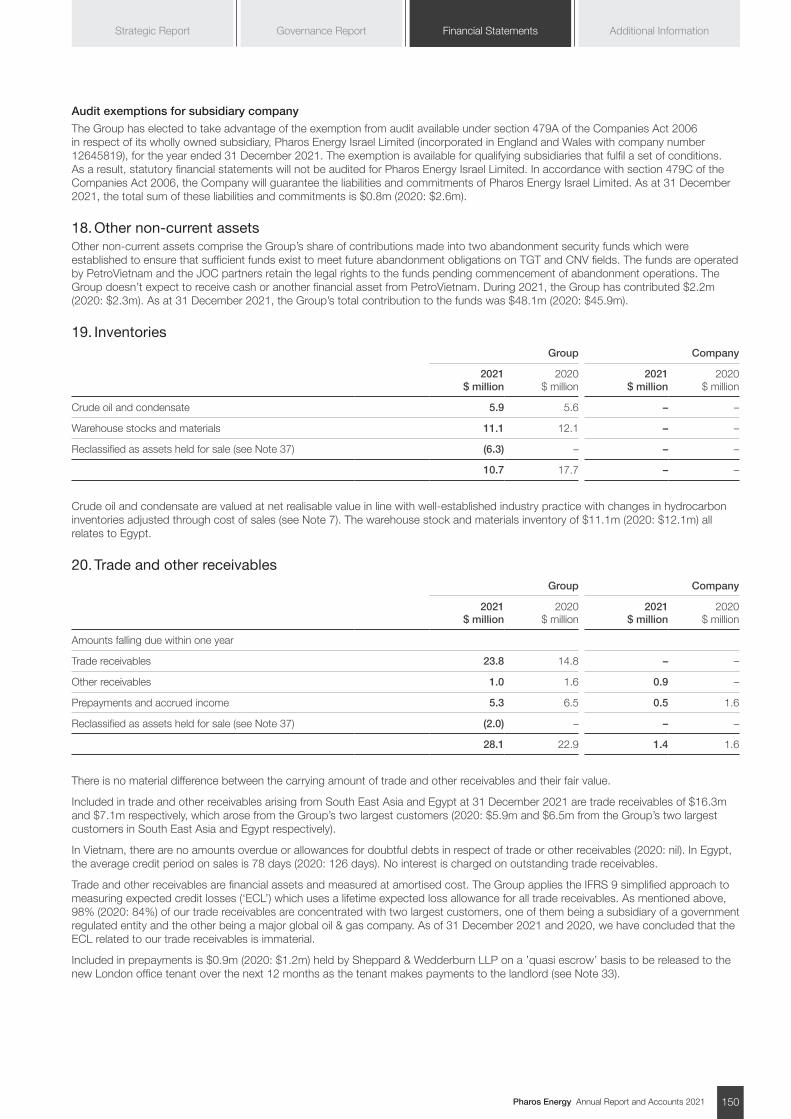
Pharos Energy Annual Report and Accounts 2021 150
Additional InformationGovernance Report Financial StatementsStrategic Report
Audit exemptions for subsidiary company
The Group has elected to take advantage of the exemption from audit available under section 479A of the Companies Act 2006 in respect of its wholly owned subsidiary, Pharos Energy Israel Limited (incorporated in England and Wales with company number 12645819), for the year ended 31 December 2021. The exemption is available for qualifying subsidiaries that fulfil a set of conditions. As a result, statutory financial statements will not be audited for Pharos Energy Israel Limited. In accordance with section 479C of the Companies Act 2006, the Company will guarantee the liabilities and commitments of Pharos Energy Israel Limited. As at 31 December 2021, the total sum of these liabilities and commitments is $0.8m (2020: $2.6m).
18. Other non-current assetsOther non-current assets comprise the Group’s share of contributions made into two abandonment security funds which were established to ensure that sufficient funds exist to meet future abandonment obligations on TGT and CNV fields. The funds are operated by PetroVietnam and the JOC partners retain the legal rights to the funds pending commencement of abandonment operations. The Group doesn’t expect to receive cash or another financial asset from PetroVietnam. During 2021, the Group has contributed $2.2m (2020: $2.3m). As at 31 December 2021, the Group’s total contribution to the funds was $48.1m (2020: $45.9m).
19. InventoriesGroup Company
2021 $ million
2020 $ million
2021 $ million
2020 $ million
Crude oil and condensate 5.9 5.6 – –
Warehouse stocks and materials 11.1 12.1 – –
Reclassified as assets held for sale (see Note 37) (6.3) – – –
10.7 17.7 – –
Crude oil and condensate are valued at net realisable value in line with well-established industry practice with changes in hydrocarbon inventories adjusted through cost of sales (see Note 7). The warehouse stock and materials inventory of $11.1m (2020: $12.1m) all relates to Egypt.
20. Trade and other receivablesGroup Company
2021 $ million
2020 $ million
2021 $ million
2020 $ million
Amounts falling due within one year
Trade receivables 23.8 14.8 – –
Other receivables 1.0 1.6 0.9 –
Prepayments and accrued income 5.3 6.5 0.5 1.6
Reclassified as assets held for sale (see Note 37) (2.0) – – –
28.1 22.9 1.4 1.6
There is no material difference between the carrying amount of trade and other receivables and their fair value.
Included in trade and other receivables arising from South East Asia and Egypt at 31 December 2021 are trade receivables of $16.3m and $7.1m respectively, which arose from the Group’s two largest customers (2020: $5.9m and $6.5m from the Group’s two largest customers in South East Asia and Egypt respectively).
In Vietnam, there are no amounts overdue or allowances for doubtful debts in respect of trade or other receivables (2020: nil). In Egypt, the average credit period on sales is 78 days (2020: 126 days). No interest is charged on outstanding trade receivables.
Trade and other receivables are financial assets and measured at amortised cost. The Group applies the IFRS 9 simplified approach to measuring expected credit losses (‘ECL’) which uses a lifetime expected loss allowance for all trade receivables. As mentioned above, 98% (2020: 84%) of our trade receivables are concentrated with two largest customers, one of them being a subsidiary of a government regulated entity and the other being a major global oil & gas company. As of 31 December 2021 and 2020, we have concluded that the ECL related to our trade receivables is immaterial.
Included in prepayments is $0.9m (2020: $1.2m) held by Sheppard & Wedderburn LLP on a ’quasi escrow’ basis to be released to the new London office tenant over the next 12 months as the tenant makes payments to the landlord (see Note 33).
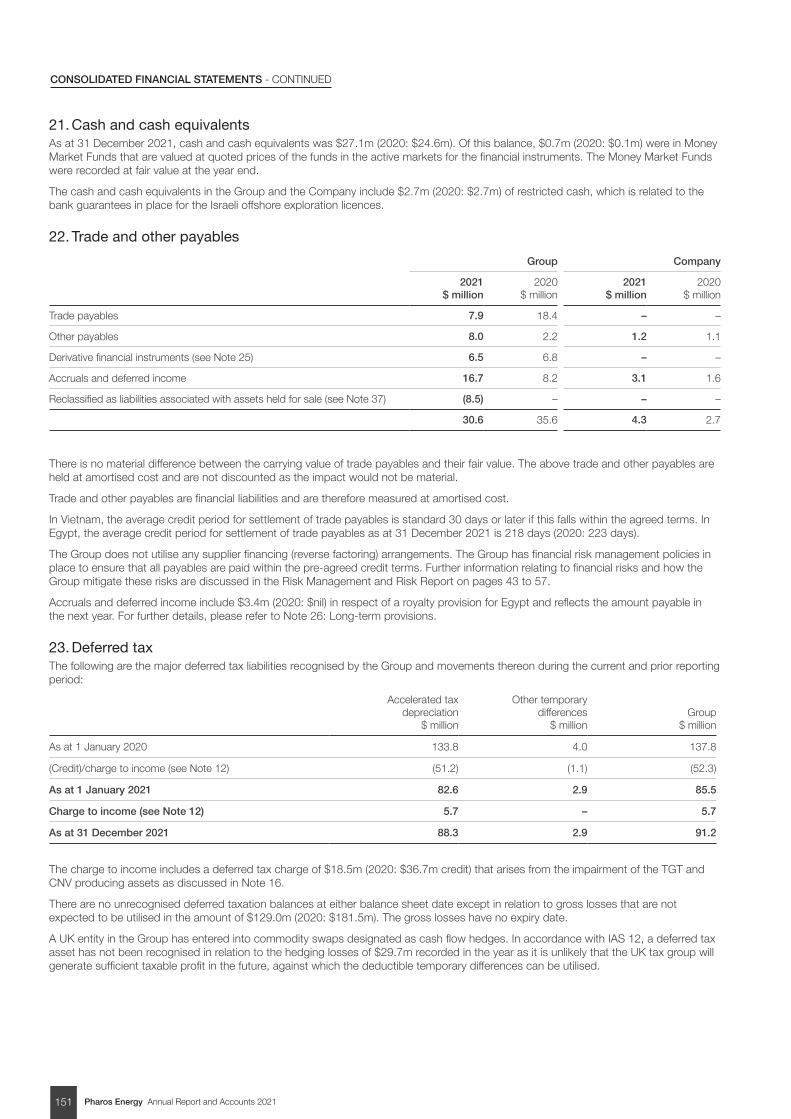
Pharos Energy Annual Report and Accounts 2021151
CONSOLIDATED FINANCIAL STATEMENTS - CONTINUED
21. Cash and cash equivalentsAs at 31 December 2021, cash and cash equivalents was $27.1m (2020: $24.6m). Of this balance, $0.7m (2020: $0.1m) were in Money Market Funds that are valued at quoted prices of the funds in the active markets for the financial instruments. The Money Market Funds were recorded at fair value at the year end.
The cash and cash equivalents in the Group and the Company include $2.7m (2020: $2.7m) of restricted cash, which is related to the bank guarantees in place for the Israeli offshore exploration licences.
22. Trade and other payables
Group Company
2021 $ million
2020 $ million
2021 $ million
2020 $ million
Trade payables 7.9 18.4 – –
Other payables 8.0 2.2 1.2 1.1
Derivative financial instruments (see Note 25) 6.5 6.8 – –
Accruals and deferred income 16.7 8.2 3.1 1.6
Reclassified as liabilities associated with assets held for sale (see Note 37) (8.5) – – –
30.6 35.6 4.3 2.7
There is no material difference between the carrying value of trade payables and their fair value. The above trade and other payables are held at amortised cost and are not discounted as the impact would not be material.
Trade and other payables are financial liabilities and are therefore measured at amortised cost.
In Vietnam, the average credit period for settlement of trade payables is standard 30 days or later if this falls within the agreed terms. In Egypt, the average credit period for settlement of trade payables as at 31 December 2021 is 218 days (2020: 223 days).
The Group does not utilise any supplier financing (reverse factoring) arrangements. The Group has financial risk management policies in place to ensure that all payables are paid within the pre-agreed credit terms. Further information relating to financial risks and how the Group mitigate these risks are discussed in the Risk Management and Risk Report on pages 43 to 57.
Accruals and deferred income include $3.4m (2020: $nil) in respect of a royalty provision for Egypt and reflects the amount payable in the next year. For further details, please refer to Note 26: Long-term provisions.
23. Deferred tax The following are the major deferred tax liabilities recognised by the Group and movements thereon during the current and prior reporting period:
Accelerated tax depreciation
$ million
Other temporary differences
$ millionGroup
$ million
As at 1 January 2020 133.8 4.0 137.8
(Credit)/charge to income (see Note 12) (51.2) (1.1) (52.3)
As at 1 January 2021 82.6 2.9 85.5
Charge to income (see Note 12) 5.7 – 5.7
As at 31 December 2021 88.3 2.9 91.2
The charge to income includes a deferred tax charge of $18.5m (2020: $36.7m credit) that arises from the impairment of the TGT and CNV producing assets as discussed in Note 16.
There are no unrecognised deferred taxation balances at either balance sheet date except in relation to gross losses that are not expected to be utilised in the amount of $129.0m (2020: $181.5m). The gross losses have no expiry date.
A UK entity in the Group has entered into commodity swaps designated as cash flow hedges. In accordance with IAS 12, a deferred tax asset has not been recognised in relation to the hedging losses of $29.7m recorded in the year as it is unlikely that the UK tax group will generate sufficient taxable profit in the future, against which the deductible temporary differences can be utilised.
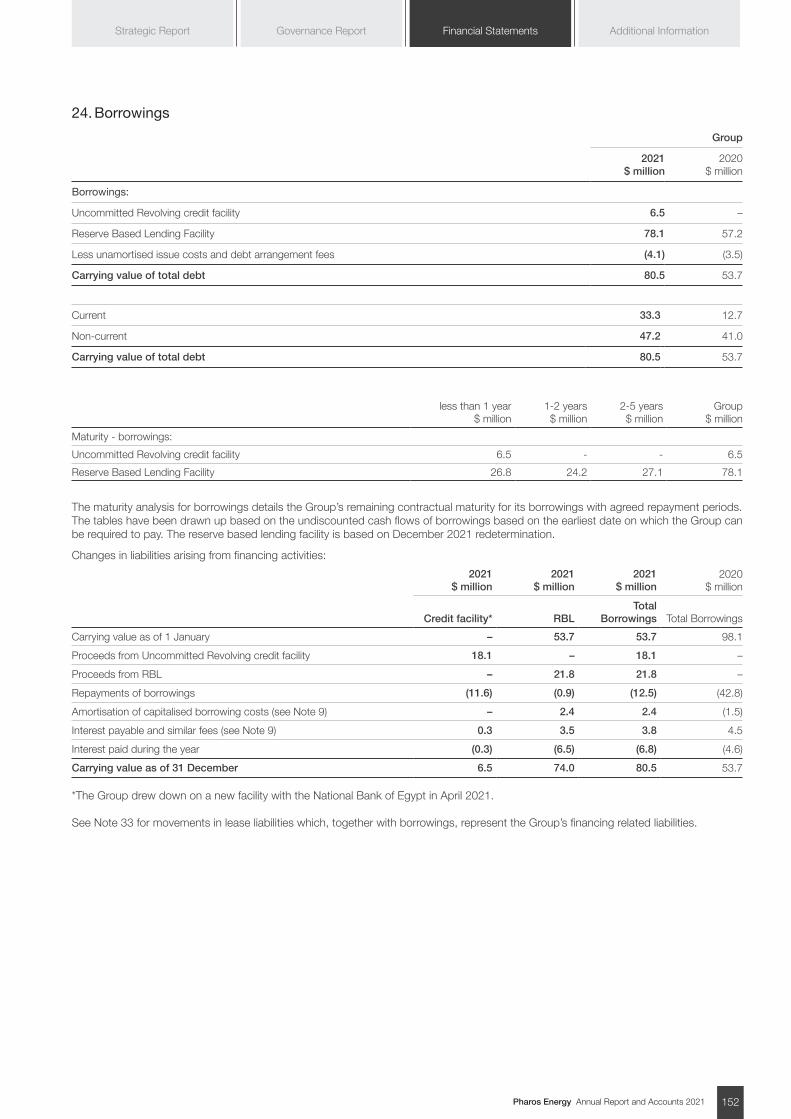
Pharos Energy Annual Report and Accounts 2021 152
Additional InformationGovernance Report Financial StatementsStrategic Report
24. Borrowings
Group
2021 $ million
2020 $ million
Borrowings:
Uncommitted Revolving credit facility 6.5 –
Reserve Based Lending Facility 78.1 57.2
Less unamortised issue costs and debt arrangement fees (4.1) (3.5)
Carrying value of total debt 80.5 53.7
Current 33.3 12.7
Non-current 47.2 41.0
Carrying value of total debt 80.5 53.7
less than 1 year $ million
1-2 years $ million
2-5 years $ million
Group $ million
Maturity - borrowings:
Uncommitted Revolving credit facility 6.5 - - 6.5
Reserve Based Lending Facility 26.8 24.2 27.1 78.1
The maturity analysis for borrowings details the Group’s remaining contractual maturity for its borrowings with agreed repayment periods. The tables have been drawn up based on the undiscounted cash flows of borrowings based on the earliest date on which the Group can be required to pay. The reserve based lending facility is based on December 2021 redetermination.
Changes in liabilities arising from financing activities:
2021 $ million
2021 $ million
2021 $ million
2020 $ million
Credit facility* RBLTotal
Borrowings Total Borrowings
Carrying value as of 1 January – 53.7 53.7 98.1
Proceeds from Uncommitted Revolving credit facility 18.1 – 18.1 –
Proceeds from RBL – 21.8 21.8 –
Repayments of borrowings (11.6) (0.9) (12.5) (42.8)
Amortisation of capitalised borrowing costs (see Note 9) – 2.4 2.4 (1.5)
Interest payable and similar fees (see Note 9) 0.3 3.5 3.8 4.5
Interest paid during the year (0.3) (6.5) (6.8) (4.6)
Carrying value as of 31 December 6.5 74.0 80.5 53.7 *The Group drew down on a new facility with the National Bank of Egypt in April 2021. See Note 33 for movements in lease liabilities which, together with borrowings, represent the Group’s financing related liabilities.
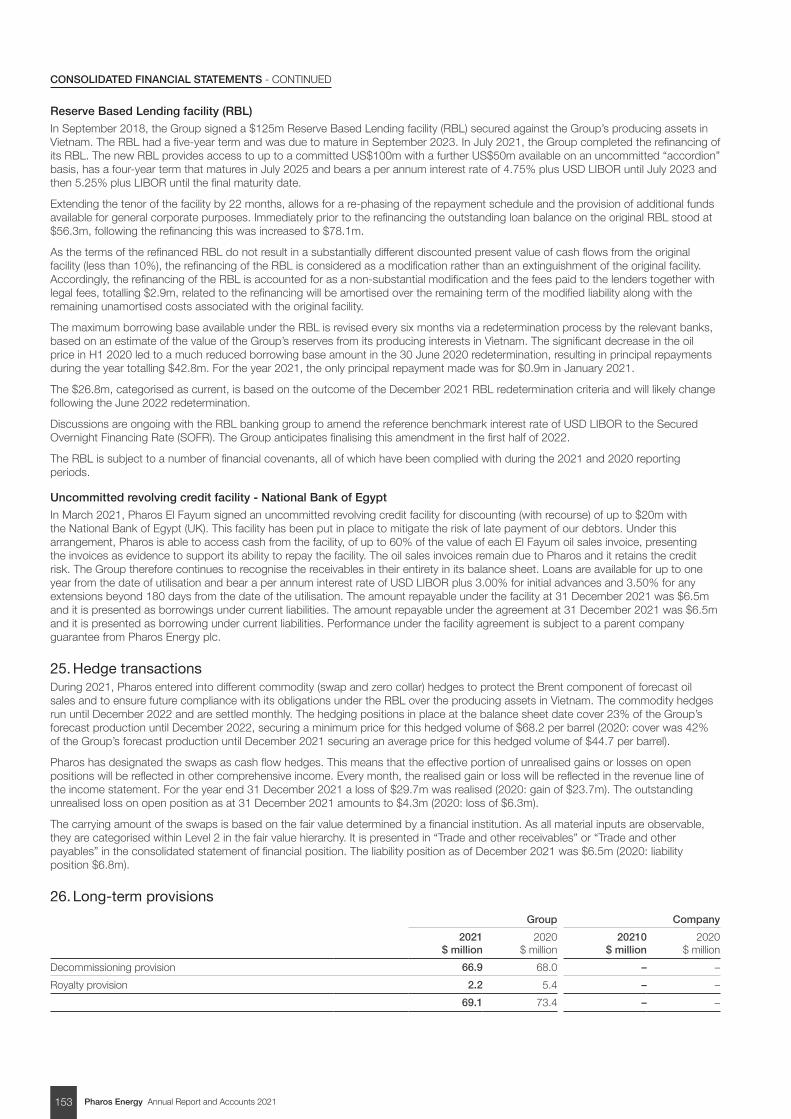
Pharos Energy Annual Report and Accounts 2021153
CONSOLIDATED FINANCIAL STATEMENTS - CONTINUED
Reserve Based Lending facility (RBL)
In September 2018, the Group signed a $125m Reserve Based Lending facility (RBL) secured against the Group’s producing assets in Vietnam. The RBL had a five-year term and was due to mature in September 2023. In July 2021, the Group completed the refinancing of its RBL. The new RBL provides access to up to a committed US$100m with a further US$50m available on an uncommitted “accordion” basis, has a four-year term that matures in July 2025 and bears a per annum interest rate of 4.75% plus USD LIBOR until July 2023 and then 5.25% plus LIBOR until the final maturity date.
Extending the tenor of the facility by 22 months, allows for a re-phasing of the repayment schedule and the provision of additional funds available for general corporate purposes. Immediately prior to the refinancing the outstanding loan balance on the original RBL stood at $56.3m, following the refinancing this was increased to $78.1m.
As the terms of the refinanced RBL do not result in a substantially different discounted present value of cash flows from the original facility (less than 10%), the refinancing of the RBL is considered as a modification rather than an extinguishment of the original facility. Accordingly, the refinancing of the RBL is accounted for as a non-substantial modification and the fees paid to the lenders together with legal fees, totalling $2.9m, related to the refinancing will be amortised over the remaining term of the modified liability along with the remaining unamortised costs associated with the original facility.
The maximum borrowing base available under the RBL is revised every six months via a redetermination process by the relevant banks, based on an estimate of the value of the Group’s reserves from its producing interests in Vietnam. The significant decrease in the oil price in H1 2020 led to a much reduced borrowing base amount in the 30 June 2020 redetermination, resulting in principal repayments during the year totalling $42.8m. For the year 2021, the only principal repayment made was for $0.9m in January 2021.
The $26.8m, categorised as current, is based on the outcome of the December 2021 RBL redetermination criteria and will likely change following the June 2022 redetermination.
Discussions are ongoing with the RBL banking group to amend the reference benchmark interest rate of USD LIBOR to the Secured Overnight Financing Rate (SOFR). The Group anticipates finalising this amendment in the first half of 2022.
The RBL is subject to a number of financial covenants, all of which have been complied with during the 2021 and 2020 reporting periods.
Uncommitted revolving credit facility - National Bank of Egypt
In March 2021, Pharos El Fayum signed an uncommitted revolving credit facility for discounting (with recourse) of up to $20m with the National Bank of Egypt (UK). This facility has been put in place to mitigate the risk of late payment of our debtors. Under this arrangement, Pharos is able to access cash from the facility, of up to 60% of the value of each El Fayum oil sales invoice, presenting the invoices as evidence to support its ability to repay the facility. The oil sales invoices remain due to Pharos and it retains the credit risk. The Group therefore continues to recognise the receivables in their entirety in its balance sheet. Loans are available for up to one year from the date of utilisation and bear a per annum interest rate of USD LIBOR plus 3.00% for initial advances and 3.50% for any extensions beyond 180 days from the date of the utilisation. The amount repayable under the facility at 31 December 2021 was $6.5m and it is presented as borrowings under current liabilities. The amount repayable under the agreement at 31 December 2021 was $6.5m and it is presented as borrowing under current liabilities. Performance under the facility agreement is subject to a parent company guarantee from Pharos Energy plc.
25. Hedge transactionsDuring 2021, Pharos entered into different commodity (swap and zero collar) hedges to protect the Brent component of forecast oil sales and to ensure future compliance with its obligations under the RBL over the producing assets in Vietnam. The commodity hedges run until December 2022 and are settled monthly. The hedging positions in place at the balance sheet date cover 23% of the Group’s forecast production until December 2022, securing a minimum price for this hedged volume of $68.2 per barrel (2020: cover was 42% of the Group’s forecast production until December 2021 securing an average price for this hedged volume of $44.7 per barrel).
Pharos has designated the swaps as cash flow hedges. This means that the effective portion of unrealised gains or losses on open positions will be reflected in other comprehensive income. Every month, the realised gain or loss will be reflected in the revenue line of the income statement. For the year end 31 December 2021 a loss of $29.7m was realised (2020: gain of $23.7m). The outstanding unrealised loss on open position as at 31 December 2021 amounts to $4.3m (2020: loss of $6.3m).
The carrying amount of the swaps is based on the fair value determined by a financial institution. As all material inputs are observable, they are categorised within Level 2 in the fair value hierarchy. It is presented in “Trade and other receivables” or “Trade and other payables” in the consolidated statement of financial position. The liability position as of December 2021 was $6.5m (2020: liability position $6.8m).
26. Long-term provisions
Group Company
2021 $ million
2020 $ million
20210 $ million
2020 $ million
Decommissioning provision 66.9 68.0 – –
Royalty provision 2.2 5.4 – –
69.1 73.4 – –
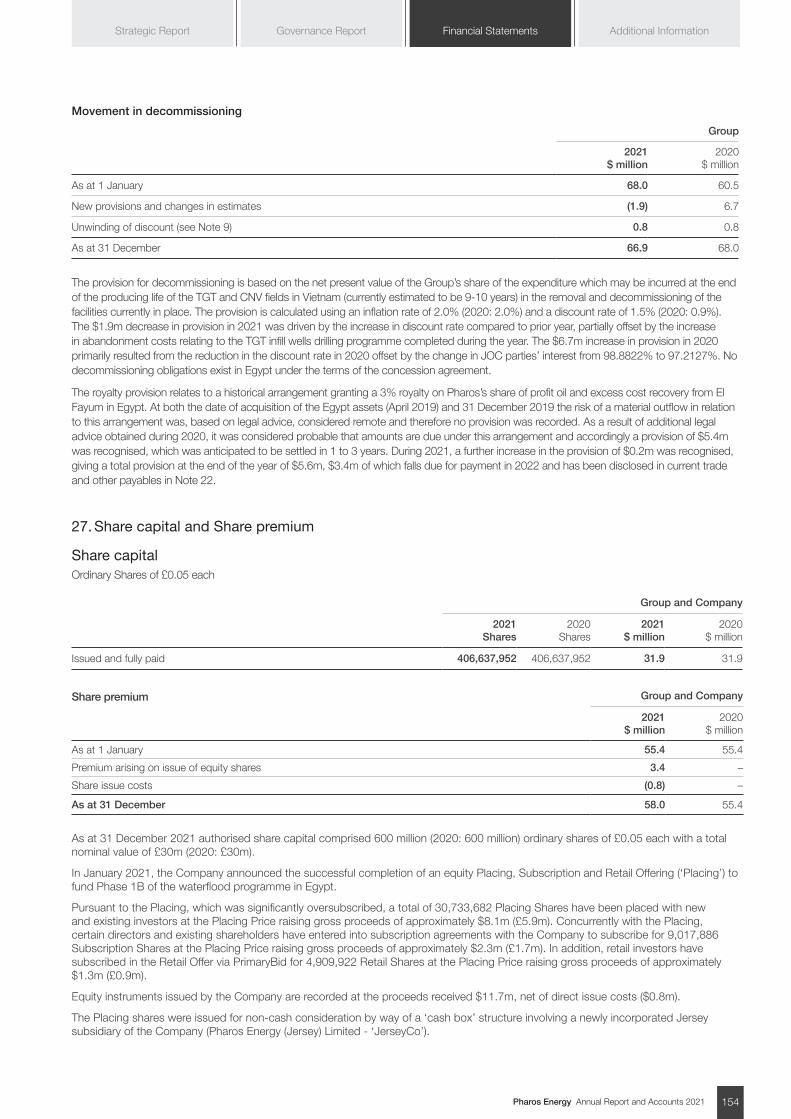
Pharos Energy Annual Report and Accounts 2021 154
Additional InformationGovernance Report Financial StatementsStrategic Report
Movement in decommissioning
Group
2021 $ million
2020 $ million
As at 1 January 68.0 60.5
New provisions and changes in estimates (1.9) 6.7
Unwinding of discount (see Note 9) 0.8 0.8
As at 31 December 66.9 68.0
The provision for decommissioning is based on the net present value of the Group’s share of the expenditure which may be incurred at the end of the producing life of the TGT and CNV fields in Vietnam (currently estimated to be 9-10 years) in the removal and decommissioning of the facilities currently in place. The provision is calculated using an inflation rate of 2.0% (2020: 2.0%) and a discount rate of 1.5% (2020: 0.9%). The $1.9m decrease in provision in 2021 was driven by the increase in discount rate compared to prior year, partially offset by the increase in abandonment costs relating to the TGT infill wells drilling programme completed during the year. The $6.7m increase in provision in 2020 primarily resulted from the reduction in the discount rate in 2020 offset by the change in JOC parties’ interest from 98.8822% to 97.2127%. No decommissioning obligations exist in Egypt under the terms of the concession agreement.
The royalty provision relates to a historical arrangement granting a 3% royalty on Pharos’s share of profit oil and excess cost recovery from El Fayum in Egypt. At both the date of acquisition of the Egypt assets (April 2019) and 31 December 2019 the risk of a material outflow in relation to this arrangement was, based on legal advice, considered remote and therefore no provision was recorded. As a result of additional legal advice obtained during 2020, it was considered probable that amounts are due under this arrangement and accordingly a provision of $5.4m was recognised, which was anticipated to be settled in 1 to 3 years. During 2021, a further increase in the provision of $0.2m was recognised, giving a total provision at the end of the year of $5.6m, $3.4m of which falls due for payment in 2022 and has been disclosed in current trade and other payables in Note 22.
27. Share capital and Share premium
Share capitalOrdinary Shares of £0.05 each
Group and Company
2021 Shares
2020 Shares
2021 $ million
2020 $ million
Issued and fully paid 406,637,952 406,637,952 31.9 31.9
Share premium Group and Company
2021 $ million
2020 $ million
As at 1 January 55.4 55.4
Premium arising on issue of equity shares 3.4 –
Share issue costs (0.8) –
As at 31 December 58.0 55.4
As at 31 December 2021 authorised share capital comprised 600 million (2020: 600 million) ordinary shares of £0.05 each with a total nominal value of £30m (2020: £30m).
In January 2021, the Company announced the successful completion of an equity Placing, Subscription and Retail Offering (‘Placing’) to fund Phase 1B of the waterflood programme in Egypt.
Pursuant to the Placing, which was significantly oversubscribed, a total of 30,733,682 Placing Shares have been placed with new and existing investors at the Placing Price raising gross proceeds of approximately $8.1m (£5.9m). Concurrently with the Placing, certain directors and existing shareholders have entered into subscription agreements with the Company to subscribe for 9,017,886 Subscription Shares at the Placing Price raising gross proceeds of approximately $2.3m (£1.7m). In addition, retail investors have subscribed in the Retail Offer via PrimaryBid for 4,909,922 Retail Shares at the Placing Price raising gross proceeds of approximately $1.3m (£0.9m).
Equity instruments issued by the Company are recorded at the proceeds received $11.7m, net of direct issue costs ($0.8m).
The Placing shares were issued for non-cash consideration by way of a ‘cash box’ structure involving a newly incorporated Jersey subsidiary of the Company (Pharos Energy (Jersey) Limited - ‘JerseyCo’).
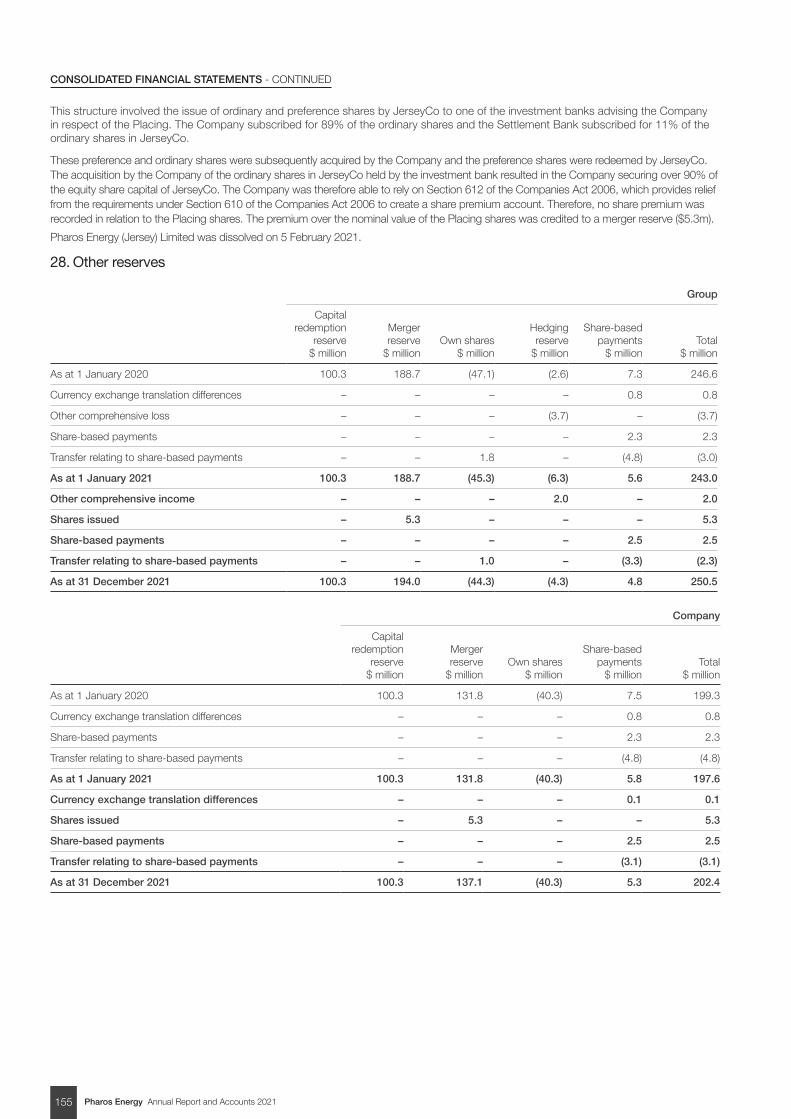
Pharos Energy Annual Report and Accounts 2021155
CONSOLIDATED FINANCIAL STATEMENTS - CONTINUED
This structure involved the issue of ordinary and preference shares by JerseyCo to one of the investment banks advising the Company in respect of the Placing. The Company subscribed for 89% of the ordinary shares and the Settlement Bank subscribed for 11% of the ordinary shares in JerseyCo.
These preference and ordinary shares were subsequently acquired by the Company and the preference shares were redeemed by JerseyCo. The acquisition by the Company of the ordinary shares in JerseyCo held by the investment bank resulted in the Company securing over 90% of the equity share capital of JerseyCo. The Company was therefore able to rely on Section 612 of the Companies Act 2006, which provides relief from the requirements under Section 610 of the Companies Act 2006 to create a share premium account. Therefore, no share premium was recorded in relation to the Placing shares. The premium over the nominal value of the Placing shares was credited to a merger reserve ($5.3m).
Pharos Energy (Jersey) Limited was dissolved on 5 February 2021.
28. Other reserves
Group
Capital redemption
reserve $ million
Merger reserve
$ millionOwn shares
$ million
Hedging reserve
$ million
Share-based payments
$ millionTotal
$ million
As at 1 January 2020 100.3 188.7 (47.1) (2.6) 7.3 246.6
Currency exchange translation differences – – – – 0.8 0.8
Other comprehensive loss – – – (3.7) – (3.7)
Share-based payments – – – – 2.3 2.3
Transfer relating to share-based payments – – 1.8 – (4.8) (3.0)
As at 1 January 2021 100.3 188.7 (45.3) (6.3) 5.6 243.0
Other comprehensive income – – – 2.0 – 2.0
Shares issued – 5.3 – – – 5.3
Share-based payments – – – – 2.5 2.5
Transfer relating to share-based payments – – 1.0 – (3.3) (2.3)
As at 31 December 2021 100.3 194.0 (44.3) (4.3) 4.8 250.5
Company
Capital redemption
reserve $ million
Merger reserve
$ millionOwn shares
$ million
Share-based payments
$ millionTotal
$ million
As at 1 January 2020 100.3 131.8 (40.3) 7.5 199.3
Currency exchange translation differences – – – 0.8 0.8
Share-based payments – – – 2.3 2.3
Transfer relating to share-based payments – – – (4.8) (4.8)
As at 1 January 2021 100.3 131.8 (40.3) 5.8 197.6
Currency exchange translation differences – – – 0.1 0.1
Shares issued – 5.3 – – 5.3
Share-based payments – – – 2.5 2.5
Transfer relating to share-based payments – – – (3.1) (3.1)
As at 31 December 2021 100.3 137.1 (40.3) 5.3 202.4
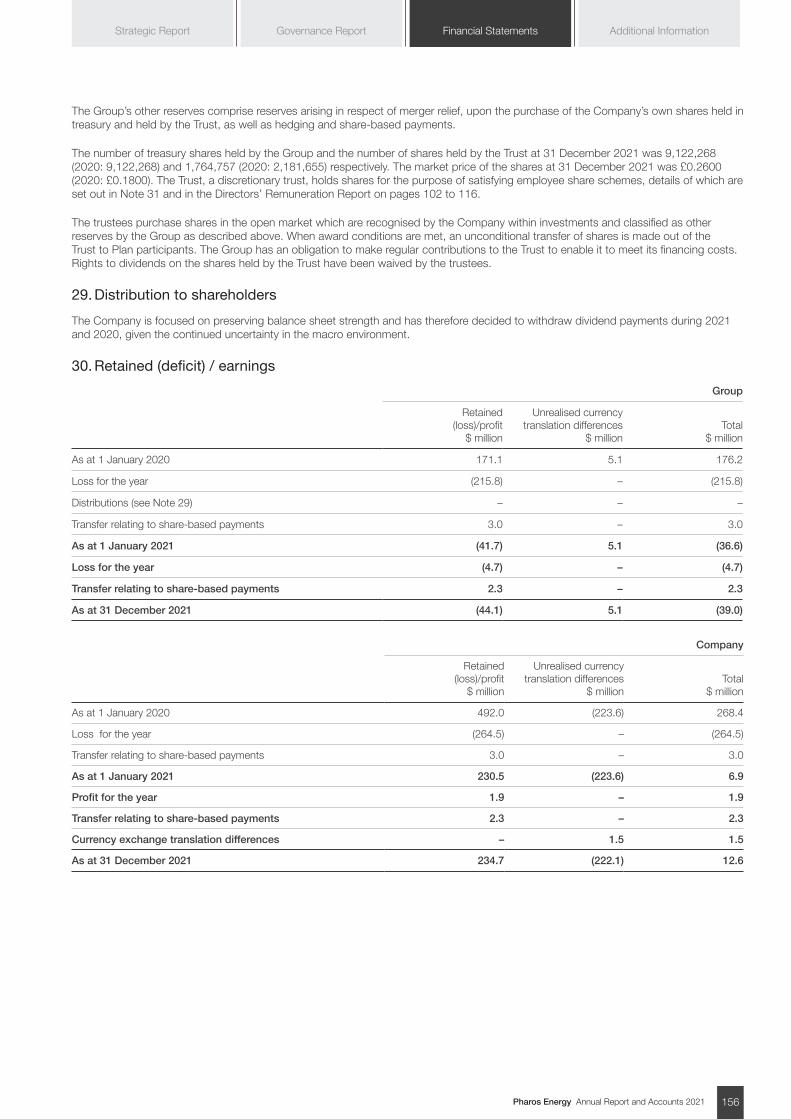
Pharos Energy Annual Report and Accounts 2021 156
Additional InformationGovernance Report Financial StatementsStrategic Report
The Group’s other reserves comprise reserves arising in respect of merger relief, upon the purchase of the Company’s own shares held in treasury and held by the Trust, as well as hedging and share-based payments.
The number of treasury shares held by the Group and the number of shares held by the Trust at 31 December 2021 was 9,122,268 (2020: 9,122,268) and 1,764,757 (2020: 2,181,655) respectively. The market price of the shares at 31 December 2021 was £0.2600 (2020: £0.1800). The Trust, a discretionary trust, holds shares for the purpose of satisfying employee share schemes, details of which are set out in Note 31 and in the Directors’ Remuneration Report on pages 102 to 116.
The trustees purchase shares in the open market which are recognised by the Company within investments and classified as other reserves by the Group as described above. When award conditions are met, an unconditional transfer of shares is made out of the Trust to Plan participants. The Group has an obligation to make regular contributions to the Trust to enable it to meet its financing costs. Rights to dividends on the shares held by the Trust have been waived by the trustees.
29. Distribution to shareholders
The Company is focused on preserving balance sheet strength and has therefore decided to withdraw dividend payments during 2021 and 2020, given the continued uncertainty in the macro environment.
30. Retained (deficit) / earnings
Group
Retained (loss)/profit
$ million
Unrealised currency translation differences
$ millionTotal
$ million
As at 1 January 2020 171.1 5.1 176.2
Loss for the year (215.8) – (215.8)
Distributions (see Note 29) – – –
Transfer relating to share-based payments 3.0 – 3.0
As at 1 January 2021 (41.7) 5.1 (36.6)
Loss for the year (4.7) – (4.7)
Transfer relating to share-based payments 2.3 – 2.3
As at 31 December 2021 (44.1) 5.1 (39.0)
Company
Retained (loss)/profit
$ million
Unrealised currency translation differences
$ millionTotal
$ million
As at 1 January 2020 492.0 (223.6) 268.4
Loss for the year (264.5) – (264.5)
Transfer relating to share-based payments 3.0 – 3.0
As at 1 January 2021 230.5 (223.6) 6.9
Profit for the year 1.9 – 1.9
Transfer relating to share-based payments 2.3 – 2.3
Currency exchange translation differences – 1.5 1.5
As at 31 December 2021 234.7 (222.1) 12.6
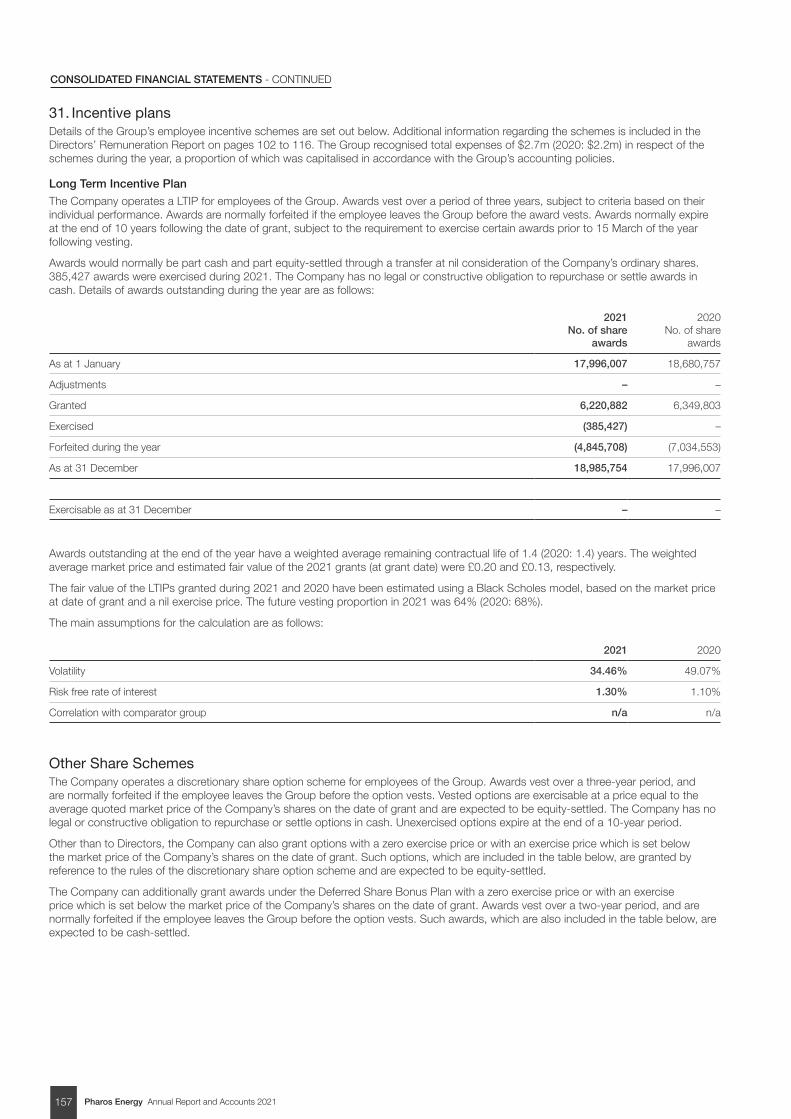
Pharos Energy Annual Report and Accounts 2021157
CONSOLIDATED FINANCIAL STATEMENTS - CONTINUED
31. Incentive plans Details of the Group’s employee incentive schemes are set out below. Additional information regarding the schemes is included in the Directors’ Remuneration Report on pages 102 to 116. The Group recognised total expenses of $2.7m (2020: $2.2m) in respect of the schemes during the year, a proportion of which was capitalised in accordance with the Group’s accounting policies.
Long Term Incentive Plan
The Company operates a LTIP for employees of the Group. Awards vest over a period of three years, subject to criteria based on their individual performance. Awards are normally forfeited if the employee leaves the Group before the award vests. Awards normally expire at the end of 10 years following the date of grant, subject to the requirement to exercise certain awards prior to 15 March of the year following vesting.
Awards would normally be part cash and part equity-settled through a transfer at nil consideration of the Company’s ordinary shares. 385,427 awards were exercised during 2021. The Company has no legal or constructive obligation to repurchase or settle awards in cash. Details of awards outstanding during the year are as follows:
2021 No. of share
awards
2020 No. of share
awards
As at 1 January 17,996,007 18,680,757
Adjustments – –
Granted 6,220,882 6,349,803
Exercised (385,427) –
Forfeited during the year (4,845,708) (7,034,553)
As at 31 December 18,985,754 17,996,007
Exercisable as at 31 December – –
Awards outstanding at the end of the year have a weighted average remaining contractual life of 1.4 (2020: 1.4) years. The weighted average market price and estimated fair value of the 2021 grants (at grant date) were £0.20 and £0.13, respectively.
The fair value of the LTIPs granted during 2021 and 2020 have been estimated using a Black Scholes model, based on the market price at date of grant and a nil exercise price. The future vesting proportion in 2021 was 64% (2020: 68%).
The main assumptions for the calculation are as follows:
2021 2020
Volatility 34.46% 49.07%
Risk free rate of interest 1.30% 1.10%
Correlation with comparator group n/a n/a
Other Share SchemesThe Company operates a discretionary share option scheme for employees of the Group. Awards vest over a three-year period, and are normally forfeited if the employee leaves the Group before the option vests. Vested options are exercisable at a price equal to the average quoted market price of the Company’s shares on the date of grant and are expected to be equity-settled. The Company has no legal or constructive obligation to repurchase or settle options in cash. Unexercised options expire at the end of a 10-year period.
Other than to Directors, the Company can also grant options with a zero exercise price or with an exercise price which is set below the market price of the Company’s shares on the date of grant. Such options, which are included in the table below, are granted by reference to the rules of the discretionary share option scheme and are expected to be equity-settled.
The Company can additionally grant awards under the Deferred Share Bonus Plan with a zero exercise price or with an exercise price which is set below the market price of the Company’s shares on the date of grant. Awards vest over a two-year period, and are normally forfeited if the employee leaves the Group before the option vests. Such awards, which are also included in the table below, are expected to be cash-settled.
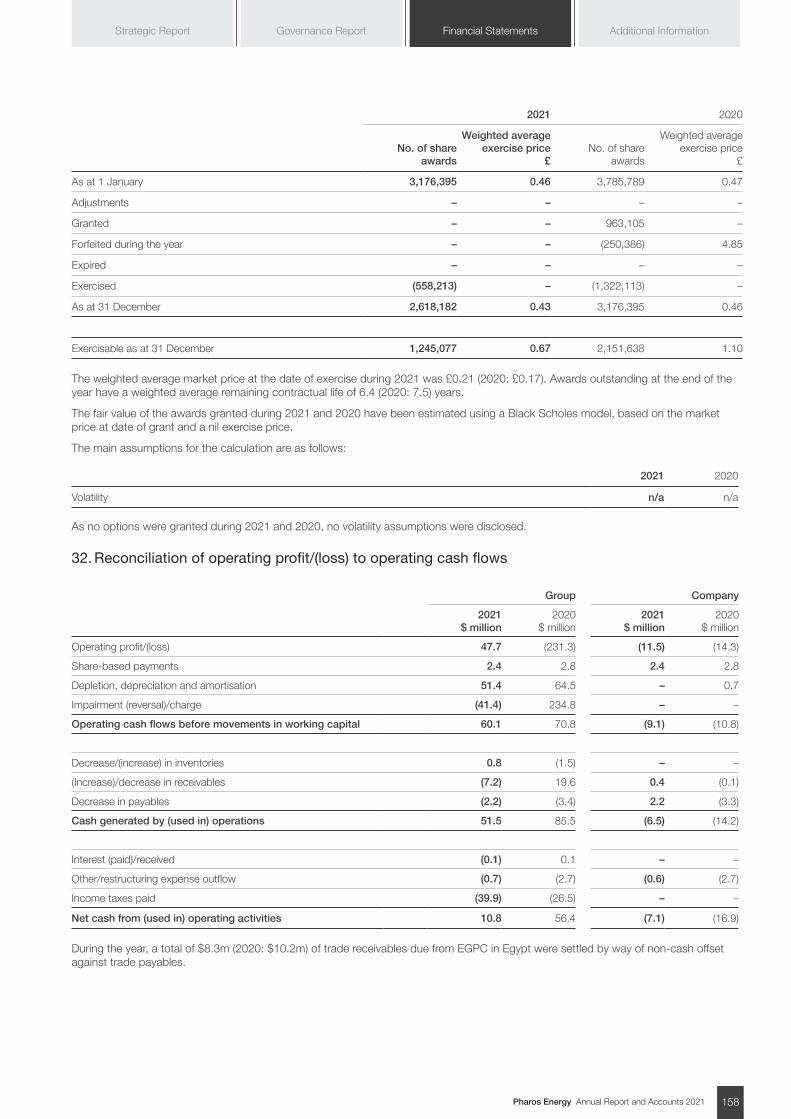
Pharos Energy Annual Report and Accounts 2021 158
Additional InformationGovernance Report Financial StatementsStrategic Report
2021 2020
No. of share awards
Weighted average exercise price
£No. of share
awards
Weighted average exercise price
£
As at 1 January 3,176,395 0.46 3,785,789 0.47
Adjustments – – – –
Granted – – 963,105 –
Forfeited during the year – – (250,386) 4.85
Expired – – – –
Exercised (558,213) – (1,322,113) –
As at 31 December 2,618,182 0.43 3,176,395 0.46
Exercisable as at 31 December 1,245,077 0.67 2,151,638 1.10
The weighted average market price at the date of exercise during 2021 was £0.21 (2020: £0.17). Awards outstanding at the end of the year have a weighted average remaining contractual life of 6.4 (2020: 7.5) years.
The fair value of the awards granted during 2021 and 2020 have been estimated using a Black Scholes model, based on the market price at date of grant and a nil exercise price.
The main assumptions for the calculation are as follows:
2021 2020
Volatility n/a n/a
As no options were granted during 2021 and 2020, no volatility assumptions were disclosed.
32. Reconciliation of operating profit/(loss) to operating cash flows
Group Company
2021 $ million
2020 $ million
2021 $ million
2020 $ million
Operating profit/(loss) 47.7 (231.3) (11.5) (14.3)
Share-based payments 2.4 2.8 2.4 2.8
Depletion, depreciation and amortisation 51.4 64.5 – 0.7
Impairment (reversal)/charge (41.4) 234.8 – –
Operating cash flows before movements in working capital 60.1 70.8 (9.1) (10.8)
Decrease/(increase) in inventories 0.8 (1.5) – –
(Increase)/decrease in receivables (7.2) 19.6 0.4 (0.1)
Decrease in payables (2.2) (3.4) 2.2 (3.3)
Cash generated by (used in) operations 51.5 85.5 (6.5) (14.2)
Interest (paid)/received (0.1) 0.1 – –
Other/restructuring expense outflow (0.7) (2.7) (0.6) (2.7)
Income taxes paid (39.9) (26.5) – –
Net cash from (used in) operating activities 10.8 56.4 (7.1) (16.9)
During the year, a total of $8.3m (2020: $10.2m) of trade receivables due from EGPC in Egypt were settled by way of non-cash offset against trade payables.
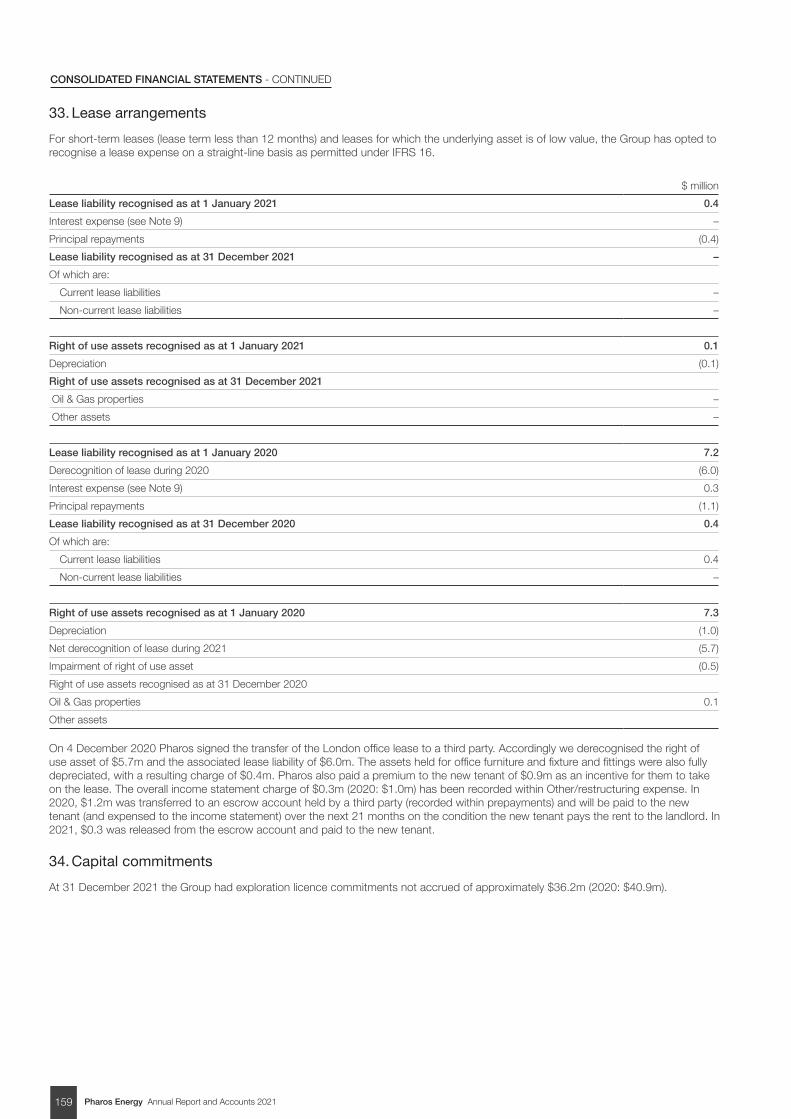
Pharos Energy Annual Report and Accounts 2021159
CONSOLIDATED FINANCIAL STATEMENTS - CONTINUED
33. Lease arrangements
For short-term leases (lease term less than 12 months) and leases for which the underlying asset is of low value, the Group has opted to recognise a lease expense on a straight-line basis as permitted under IFRS 16.
$ million
Lease liability recognised as at 1 January 2021 0.4
Interest expense (see Note 9) –
Principal repayments (0.4)
Lease liability recognised as at 31 December 2021 –
Of which are:
Current lease liabilities –
Non-current lease liabilities –
Right of use assets recognised as at 1 January 2021 0.1
Depreciation (0.1)
Right of use assets recognised as at 31 December 2021
Oil & Gas properties –
Other assets –
Lease liability recognised as at 1 January 2020 7.2
Derecognition of lease during 2020 (6.0)
Interest expense (see Note 9) 0.3
Principal repayments (1.1)
Lease liability recognised as at 31 December 2020 0.4
Of which are:
Current lease liabilities 0.4
Non-current lease liabilities –
Right of use assets recognised as at 1 January 2020 7.3
Depreciation (1.0)
Net derecognition of lease during 2021 (5.7)
Impairment of right of use asset (0.5)
Right of use assets recognised as at 31 December 2020
Oil & Gas properties 0.1
Other assets
On 4 December 2020 Pharos signed the transfer of the London office lease to a third party. Accordingly we derecognised the right of use asset of $5.7m and the associated lease liability of $6.0m. The assets held for office furniture and fixture and fittings were also fully depreciated, with a resulting charge of $0.4m. Pharos also paid a premium to the new tenant of $0.9m as an incentive for them to take on the lease. The overall income statement charge of $0.3m (2020: $1.0m) has been recorded within Other/restructuring expense. In 2020, $1.2m was transferred to an escrow account held by a third party (recorded within prepayments) and will be paid to the new tenant (and expensed to the income statement) over the next 21 months on the condition the new tenant pays the rent to the landlord. In 2021, $0.3 was released from the escrow account and paid to the new tenant.
34. Capital commitments
At 31 December 2021 the Group had exploration licence commitments not accrued of approximately $36.2m (2020: $40.9m).
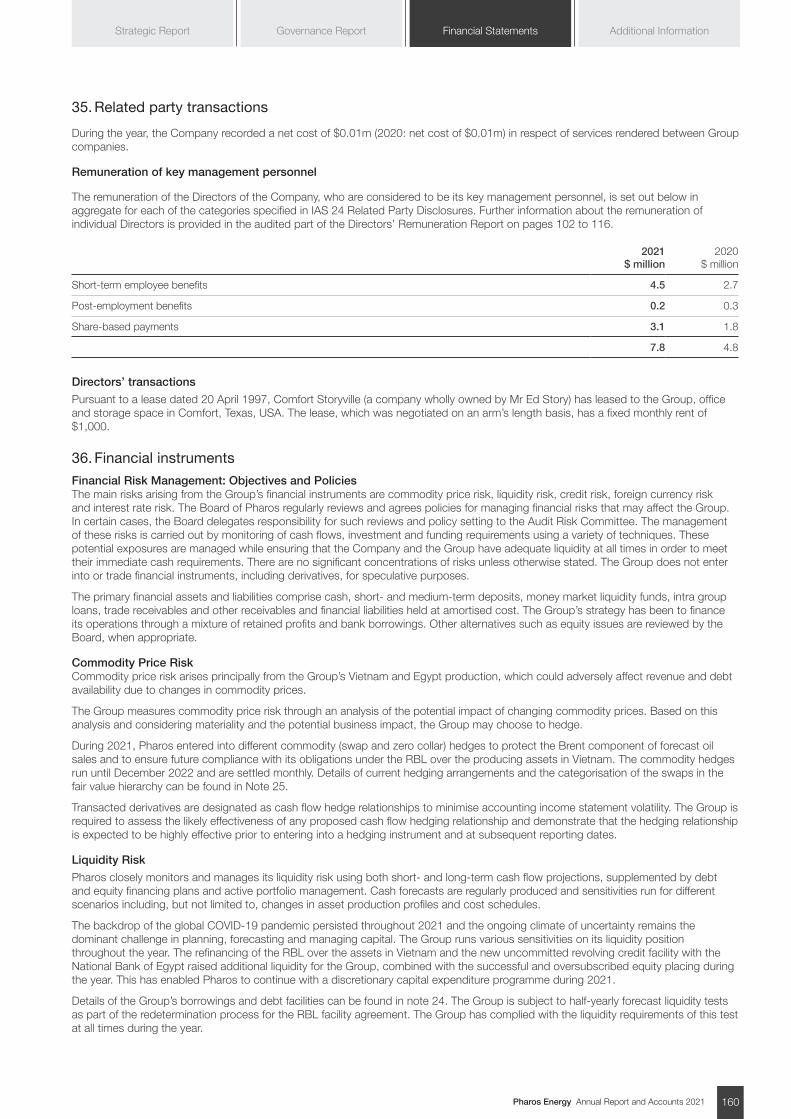
Pharos Energy Annual Report and Accounts 2021 160
Additional InformationGovernance Report Financial StatementsStrategic Report
35. Related party transactions
During the year, the Company recorded a net cost of $0.01m (2020: net cost of $0.01m) in respect of services rendered between Group companies.
Remuneration of key management personnel
The remuneration of the Directors of the Company, who are considered to be its key management personnel, is set out below in aggregate for each of the categories specified in IAS 24 Related Party Disclosures. Further information about the remuneration of individual Directors is provided in the audited part of the Directors’ Remuneration Report on pages 102 to 116.
2021 $ million
2020 $ million
Short-term employee benefits 4.5 2.7
Post-employment benefits 0.2 0.3
Share-based payments 3.1 1.8
7.8 4.8
Directors’ transactions
Pursuant to a lease dated 20 April 1997, Comfort Storyville (a company wholly owned by Mr Ed Story) has leased to the Group, office and storage space in Comfort, Texas, USA. The lease, which was negotiated on an arm’s length basis, has a fixed monthly rent of $1,000.
36. Financial instruments
Financial Risk Management: Objectives and Policies The main risks arising from the Group’s financial instruments are commodity price risk, liquidity risk, credit risk, foreign currency risk and interest rate risk. The Board of Pharos regularly reviews and agrees policies for managing financial risks that may affect the Group. In certain cases, the Board delegates responsibility for such reviews and policy setting to the Audit Risk Committee. The management of these risks is carried out by monitoring of cash flows, investment and funding requirements using a variety of techniques. These potential exposures are managed while ensuring that the Company and the Group have adequate liquidity at all times in order to meet their immediate cash requirements. There are no significant concentrations of risks unless otherwise stated. The Group does not enter into or trade financial instruments, including derivatives, for speculative purposes.
The primary financial assets and liabilities comprise cash, short- and medium-term deposits, money market liquidity funds, intra group loans, trade receivables and other receivables and financial liabilities held at amortised cost. The Group’s strategy has been to finance its operations through a mixture of retained profits and bank borrowings. Other alternatives such as equity issues are reviewed by the Board, when appropriate.
Commodity Price Risk Commodity price risk arises principally from the Group’s Vietnam and Egypt production, which could adversely affect revenue and debt availability due to changes in commodity prices.
The Group measures commodity price risk through an analysis of the potential impact of changing commodity prices. Based on this analysis and considering materiality and the potential business impact, the Group may choose to hedge.
During 2021, Pharos entered into different commodity (swap and zero collar) hedges to protect the Brent component of forecast oil sales and to ensure future compliance with its obligations under the RBL over the producing assets in Vietnam. The commodity hedges run until December 2022 and are settled monthly. Details of current hedging arrangements and the categorisation of the swaps in the fair value hierarchy can be found in Note 25.
Transacted derivatives are designated as cash flow hedge relationships to minimise accounting income statement volatility. The Group is required to assess the likely effectiveness of any proposed cash flow hedging relationship and demonstrate that the hedging relationship is expected to be highly effective prior to entering into a hedging instrument and at subsequent reporting dates.
Liquidity Risk
Pharos closely monitors and manages its liquidity risk using both short- and long-term cash flow projections, supplemented by debt and equity financing plans and active portfolio management. Cash forecasts are regularly produced and sensitivities run for different scenarios including, but not limited to, changes in asset production profiles and cost schedules.
The backdrop of the global COVID-19 pandemic persisted throughout 2021 and the ongoing climate of uncertainty remains the dominant challenge in planning, forecasting and managing capital. The Group runs various sensitivities on its liquidity position throughout the year. The refinancing of the RBL over the assets in Vietnam and the new uncommitted revolving credit facility with the National Bank of Egypt raised additional liquidity for the Group, combined with the successful and oversubscribed equity placing during the year. This has enabled Pharos to continue with a discretionary capital expenditure programme during 2021.
Details of the Group’s borrowings and debt facilities can be found in note 24. The Group is subject to half-yearly forecast liquidity tests as part of the redetermination process for the RBL facility agreement. The Group has complied with the liquidity requirements of this test at all times during the year.
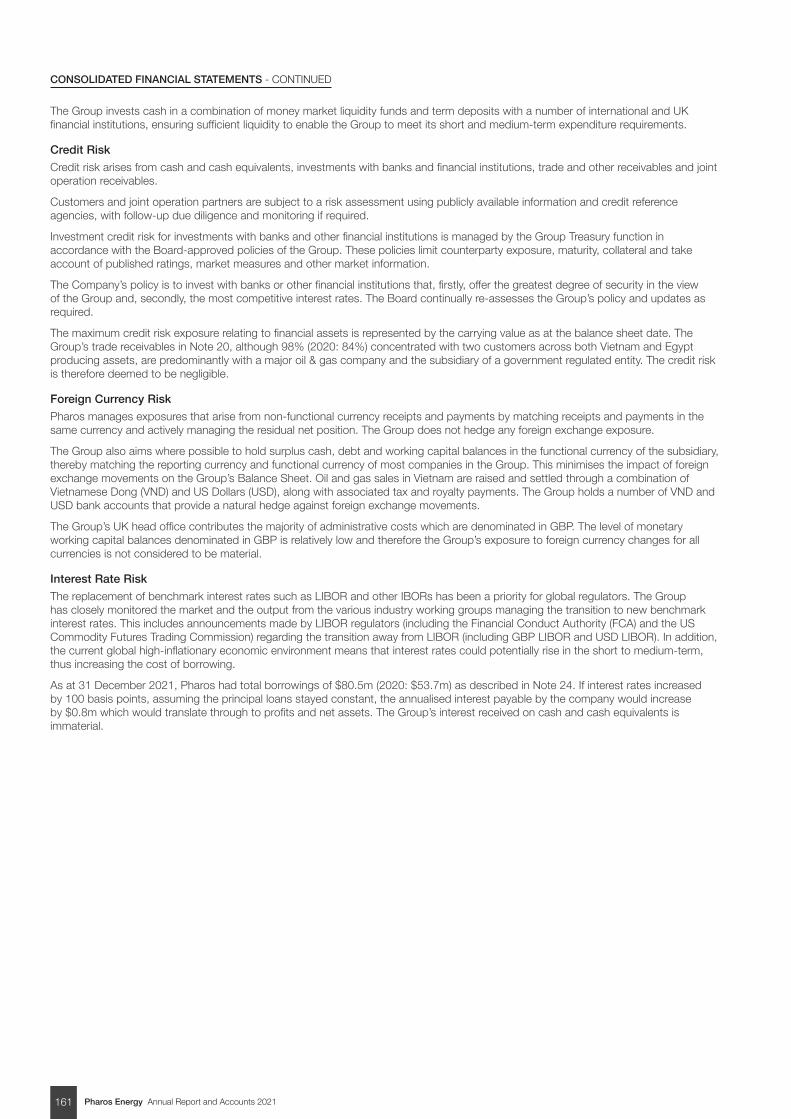
Pharos Energy Annual Report and Accounts 2021161
CONSOLIDATED FINANCIAL STATEMENTS - CONTINUED
The Group invests cash in a combination of money market liquidity funds and term deposits with a number of international and UK financial institutions, ensuring sufficient liquidity to enable the Group to meet its short and medium-term expenditure requirements.
Credit Risk
Credit risk arises from cash and cash equivalents, investments with banks and financial institutions, trade and other receivables and joint operation receivables.
Customers and joint operation partners are subject to a risk assessment using publicly available information and credit reference agencies, with follow-up due diligence and monitoring if required.
Investment credit risk for investments with banks and other financial institutions is managed by the Group Treasury function in accordance with the Board-approved policies of the Group. These policies limit counterparty exposure, maturity, collateral and take account of published ratings, market measures and other market information.
The Company’s policy is to invest with banks or other financial institutions that, firstly, offer the greatest degree of security in the view of the Group and, secondly, the most competitive interest rates. The Board continually re-assesses the Group’s policy and updates as required.
The maximum credit risk exposure relating to financial assets is represented by the carrying value as at the balance sheet date. The Group’s trade receivables in Note 20, although 98% (2020: 84%) concentrated with two customers across both Vietnam and Egypt producing assets, are predominantly with a major oil & gas company and the subsidiary of a government regulated entity. The credit risk is therefore deemed to be negligible.
Foreign Currency Risk
Pharos manages exposures that arise from non-functional currency receipts and payments by matching receipts and payments in the same currency and actively managing the residual net position. The Group does not hedge any foreign exchange exposure.
The Group also aims where possible to hold surplus cash, debt and working capital balances in the functional currency of the subsidiary, thereby matching the reporting currency and functional currency of most companies in the Group. This minimises the impact of foreign exchange movements on the Group’s Balance Sheet. Oil and gas sales in Vietnam are raised and settled through a combination of Vietnamese Dong (VND) and US Dollars (USD), along with associated tax and royalty payments. The Group holds a number of VND and USD bank accounts that provide a natural hedge against foreign exchange movements.
The Group’s UK head office contributes the majority of administrative costs which are denominated in GBP. The level of monetary working capital balances denominated in GBP is relatively low and therefore the Group’s exposure to foreign currency changes for all currencies is not considered to be material.
Interest Rate Risk
The replacement of benchmark interest rates such as LIBOR and other IBORs has been a priority for global regulators. The Group has closely monitored the market and the output from the various industry working groups managing the transition to new benchmark interest rates. This includes announcements made by LIBOR regulators (including the Financial Conduct Authority (FCA) and the US Commodity Futures Trading Commission) regarding the transition away from LIBOR (including GBP LIBOR and USD LIBOR). In addition, the current global high-inflationary economic environment means that interest rates could potentially rise in the short to medium-term, thus increasing the cost of borrowing.
As at 31 December 2021, Pharos had total borrowings of $80.5m (2020: $53.7m) as described in Note 24. If interest rates increased by 100 basis points, assuming the principal loans stayed constant, the annualised interest payable by the company would increase by $0.8m which would translate through to profits and net assets. The Group’s interest received on cash and cash equivalents is immaterial.
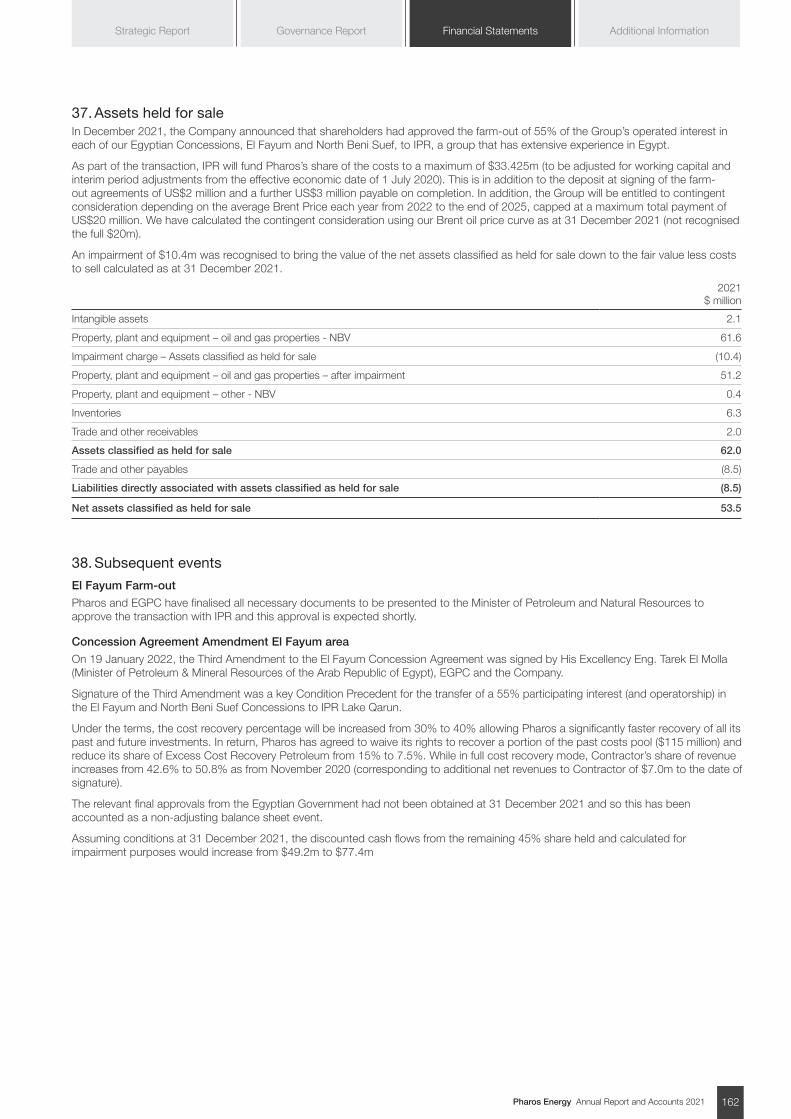
Pharos Energy Annual Report and Accounts 2021 162
Additional InformationGovernance Report Financial StatementsStrategic Report
37. Assets held for saleIn December 2021, the Company announced that shareholders had approved the farm-out of 55% of the Group’s operated interest in each of our Egyptian Concessions, El Fayum and North Beni Suef, to IPR, a group that has extensive experience in Egypt.
As part of the transaction, IPR will fund Pharos’s share of the costs to a maximum of $33.425m (to be adjusted for working capital and interim period adjustments from the effective economic date of 1 July 2020). This is in addition to the deposit at signing of the farm-out agreements of US$2 million and a further US$3 million payable on completion. In addition, the Group will be entitled to contingent consideration depending on the average Brent Price each year from 2022 to the end of 2025, capped at a maximum total payment of US$20 million. We have calculated the contingent consideration using our Brent oil price curve as at 31 December 2021 (not recognised the full $20m).
An impairment of $10.4m was recognised to bring the value of the net assets classified as held for sale down to the fair value less costs to sell calculated as at 31 December 2021.
2021 $ million
Intangible assets 2.1
Property, plant and equipment – oil and gas properties - NBV 61.6
Impairment charge – Assets classified as held for sale (10.4)
Property, plant and equipment – oil and gas properties – after impairment 51.2
Property, plant and equipment – other - NBV 0.4
Inventories 6.3
Trade and other receivables 2.0
Assets classified as held for sale 62.0
Trade and other payables (8.5)
Liabilities directly associated with assets classified as held for sale (8.5)
Net assets classified as held for sale 53.5
38. Subsequent events
El Fayum Farm-out
Pharos and EGPC have finalised all necessary documents to be presented to the Minister of Petroleum and Natural Resources to approve the transaction with IPR and this approval is expected shortly.
Concession Agreement Amendment El Fayum area
On 19 January 2022, the Third Amendment to the El Fayum Concession Agreement was signed by His Excellency Eng. Tarek El Molla (Minister of Petroleum & Mineral Resources of the Arab Republic of Egypt), EGPC and the Company.
Signature of the Third Amendment was a key Condition Precedent for the transfer of a 55% participating interest (and operatorship) in the El Fayum and North Beni Suef Concessions to IPR Lake Qarun.
Under the terms, the cost recovery percentage will be increased from 30% to 40% allowing Pharos a significantly faster recovery of all its past and future investments. In return, Pharos has agreed to waive its rights to recover a portion of the past costs pool ($115 million) and reduce its share of Excess Cost Recovery Petroleum from 15% to 7.5%. While in full cost recovery mode, Contractor’s share of revenue increases from 42.6% to 50.8% as from November 2020 (corresponding to additional net revenues to Contractor of $7.0m to the date of signature).
The relevant final approvals from the Egyptian Government had not been obtained at 31 December 2021 and so this has been accounted as a non-adjusting balance sheet event.
Assuming conditions at 31 December 2021, the discounted cash flows from the remaining 45% share held and calculated for impairment purposes would increase from $49.2m to $77.4m
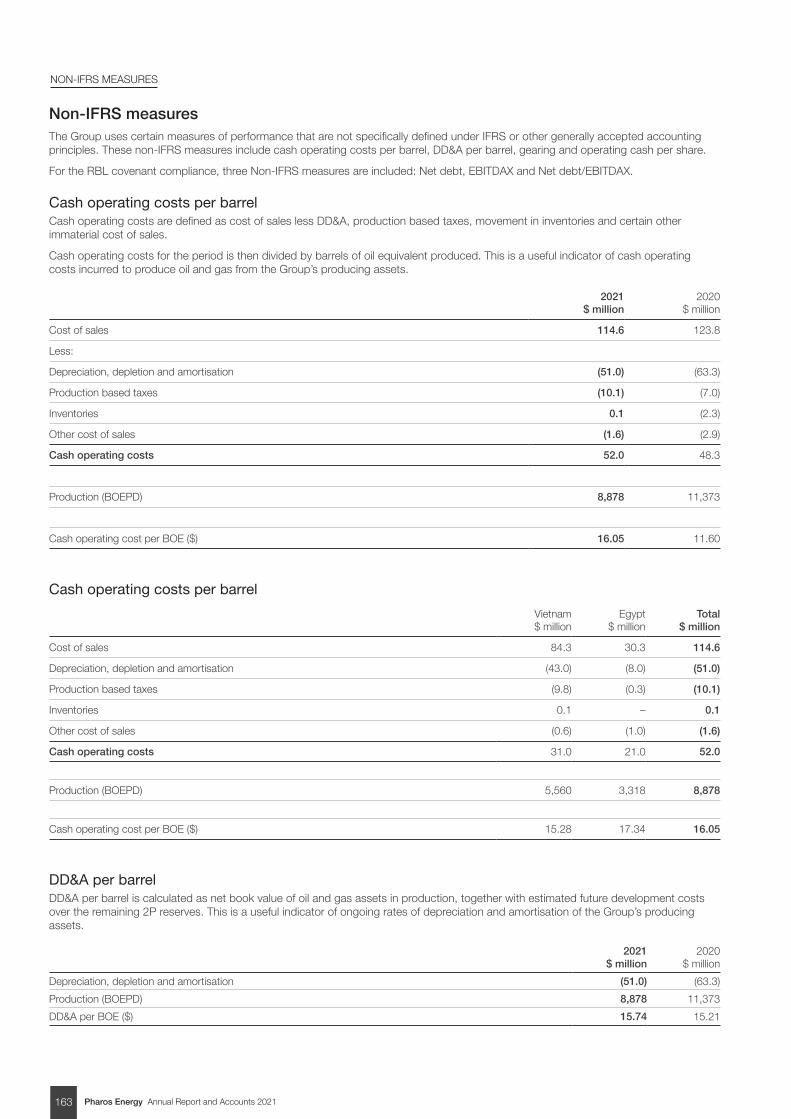
Pharos Energy Annual Report and Accounts 2021163
NON-IFRS MEASURES
Non-IFRS measuresThe Group uses certain measures of performance that are not specifically defined under IFRS or other generally accepted accounting principles. These non-IFRS measures include cash operating costs per barrel, DD&A per barrel, gearing and operating cash per share.
For the RBL covenant compliance, three Non-IFRS measures are included: Net debt, EBITDAX and Net debt/EBITDAX.
Cash operating costs per barrelCash operating costs are defined as cost of sales less DD&A, production based taxes, movement in inventories and certain other immaterial cost of sales.
Cash operating costs for the period is then divided by barrels of oil equivalent produced. This is a useful indicator of cash operating costs incurred to produce oil and gas from the Group’s producing assets.
2021 $ million
2020 $ million
Cost of sales 114.6 123.8
Less:
Depreciation, depletion and amortisation (51.0) (63.3)
Production based taxes (10.1) (7.0)
Inventories 0.1 (2.3)
Other cost of sales (1.6) (2.9)
Cash operating costs 52.0 48.3
Production (BOEPD) 8,878 11,373
Cash operating cost per BOE ($) 16.05 11.60
Cash operating costs per barrel
Vietnam $ million
Egypt $ million
Total $ million
Cost of sales 84.3 30.3 114.6
Depreciation, depletion and amortisation (43.0) (8.0) (51.0)
Production based taxes (9.8) (0.3) (10.1)
Inventories 0.1 – 0.1
Other cost of sales (0.6) (1.0) (1.6)
Cash operating costs 31.0 21.0 52.0
Production (BOEPD) 5,560 3,318 8,878
Cash operating cost per BOE ($) 15.28 17.34 16.05
DD&A per barrelDD&A per barrel is calculated as net book value of oil and gas assets in production, together with estimated future development costs over the remaining 2P reserves. This is a useful indicator of ongoing rates of depreciation and amortisation of the Group’s producing assets.
2021 $ million
2020 $ million
Depreciation, depletion and amortisation (51.0) (63.3)
Production (BOEPD) 8,878 11,373
DD&A per BOE ($) 15.74 15.21
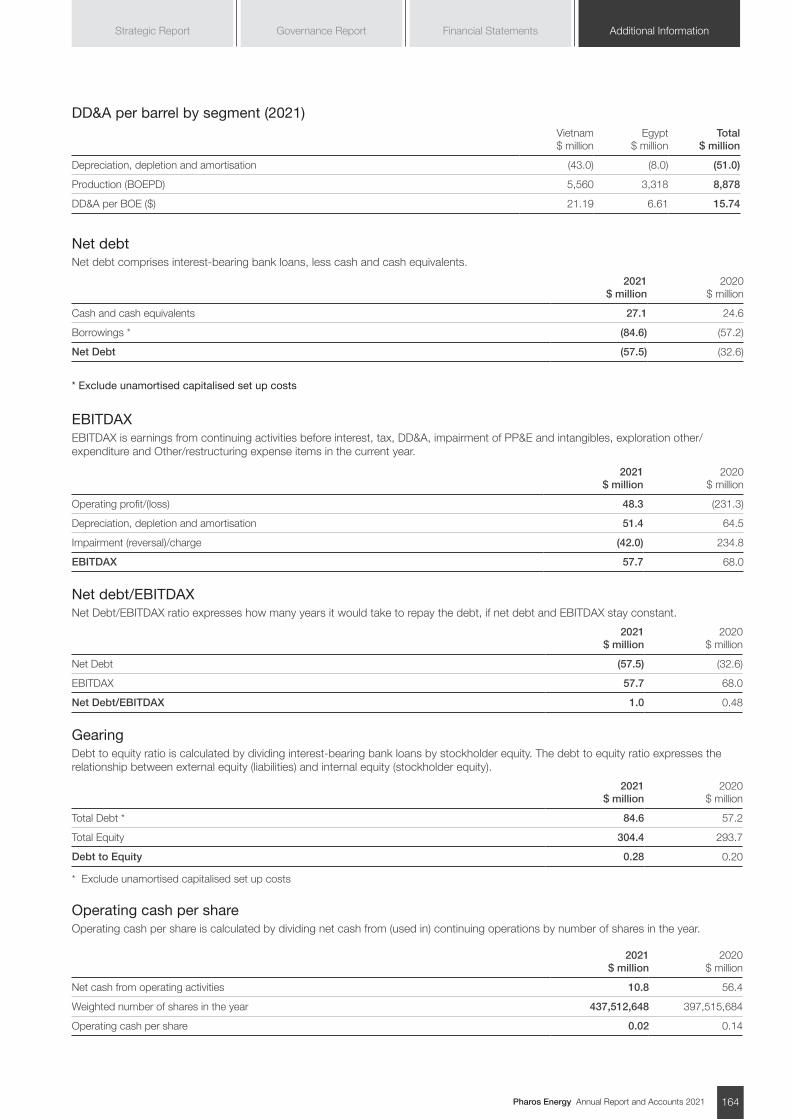
Pharos Energy Annual Report and Accounts 2021 164
Additional InformationGovernance Report Financial StatementsStrategic Report
DD&A per barrel by segment (2021)Vietnam $ million
Egypt $ million
Total $ million
Depreciation, depletion and amortisation (43.0) (8.0) (51.0)
Production (BOEPD) 5,560 3,318 8,878
DD&A per BOE ($) 21.19 6.61 15.74
Net debtNet debt comprises interest-bearing bank loans, less cash and cash equivalents.
2021 $ million
2020 $ million
Cash and cash equivalents 27.1 24.6
Borrowings * (84.6) (57.2)
Net Debt (57.5) (32.6)
* Exclude unamortised capitalised set up costs EBITDAXEBITDAX is earnings from continuing activities before interest, tax, DD&A, impairment of PP&E and intangibles, exploration other/expenditure and Other/restructuring expense items in the current year.
2021 $ million
2020 $ million
Operating profit/(loss) 48.3 (231.3)
Depreciation, depletion and amortisation 51.4 64.5
Impairment (reversal)/charge (42.0) 234.8
EBITDAX 57.7 68.0
Net debt/EBITDAXNet Debt/EBITDAX ratio expresses how many years it would take to repay the debt, if net debt and EBITDAX stay constant.
2021 $ million
2020 $ million
Net Debt (57.5) (32.6)
EBITDAX 57.7 68.0
Net Debt/EBITDAX 1.0 0.48
GearingDebt to equity ratio is calculated by dividing interest-bearing bank loans by stockholder equity. The debt to equity ratio expresses the relationship between external equity (liabilities) and internal equity (stockholder equity).
2021 $ million
2020 $ million
Total Debt * 84.6 57.2
Total Equity 304.4 293.7
Debt to Equity 0.28 0.20
* Exclude unamortised capitalised set up costs
Operating cash per shareOperating cash per share is calculated by dividing net cash from (used in) continuing operations by number of shares in the year.
2021 $ million
2020 $ million
Net cash from operating activities 10.8 56.4
Weighted number of shares in the year 437,512,648 397,515,684
Operating cash per share 0.02 0.14
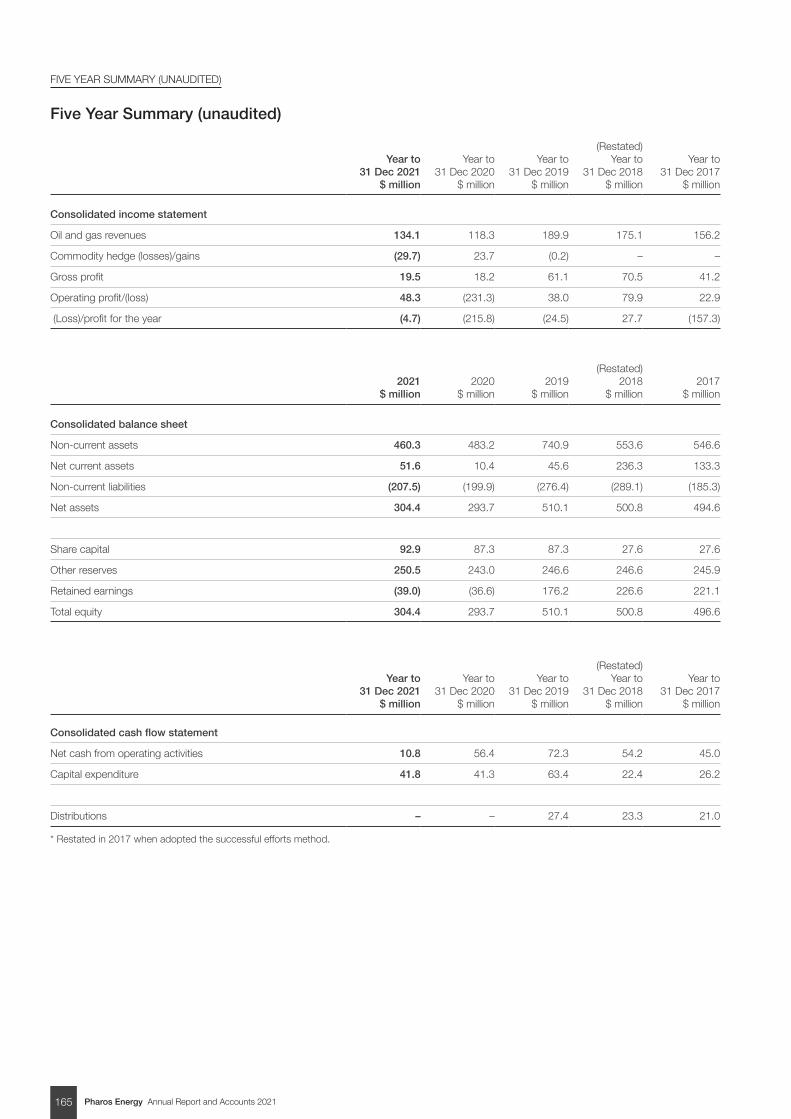
Pharos Energy Annual Report and Accounts 2021165
FIVE YEAR SUMMARY (UNAUDITED)
Five Year Summary (unaudited)
Year to 31 Dec 2021
$ million
Year to 31 Dec 2020
$ million
Year to 31 Dec 2019
$ million
(Restated) Year to
31 Dec 2018 $ million
Year to
31 Dec 2017 $ million
Consolidated income statement
Oil and gas revenues 134.1 118.3 189.9 175.1 156.2
Commodity hedge (losses)/gains (29.7) 23.7 (0.2) – –
Gross profit 19.5 18.2 61.1 70.5 41.2
Operating profit/(loss) 48.3 (231.3) 38.0 79.9 22.9
(Loss)/profit for the year (4.7) (215.8) (24.5) 27.7 (157.3)
2021 $ million
2020 $ million
2019
$ million
(Restated) 2018
$ million
2017
$ million
Consolidated balance sheet
Non-current assets 460.3 483.2 740.9 553.6 546.6
Net current assets 51.6 10.4 45.6 236.3 133.3
Non-current liabilities (207.5) (199.9) (276.4) (289.1) (185.3)
Net assets 304.4 293.7 510.1 500.8 494.6
Share capital 92.9 87.3 87.3 27.6 27.6
Other reserves 250.5 243.0 246.6 246.6 245.9
Retained earnings (39.0) (36.6) 176.2 226.6 221.1
Total equity 304.4 293.7 510.1 500.8 496.6
Year to 31 Dec 2021
$ million
Year to 31 Dec 2020
$ million
Year to 31 Dec 2019
$ million
(Restated) Year to
31 Dec 2018 $ million
Year to
31 Dec 2017 $ million
Consolidated cash flow statement
Net cash from operating activities 10.8 56.4 72.3 54.2 45.0
Capital expenditure 41.8 41.3 63.4 22.4 26.2
Distributions – – 27.4 23.3 21.0
* Restated in 2017 when adopted the successful efforts method.
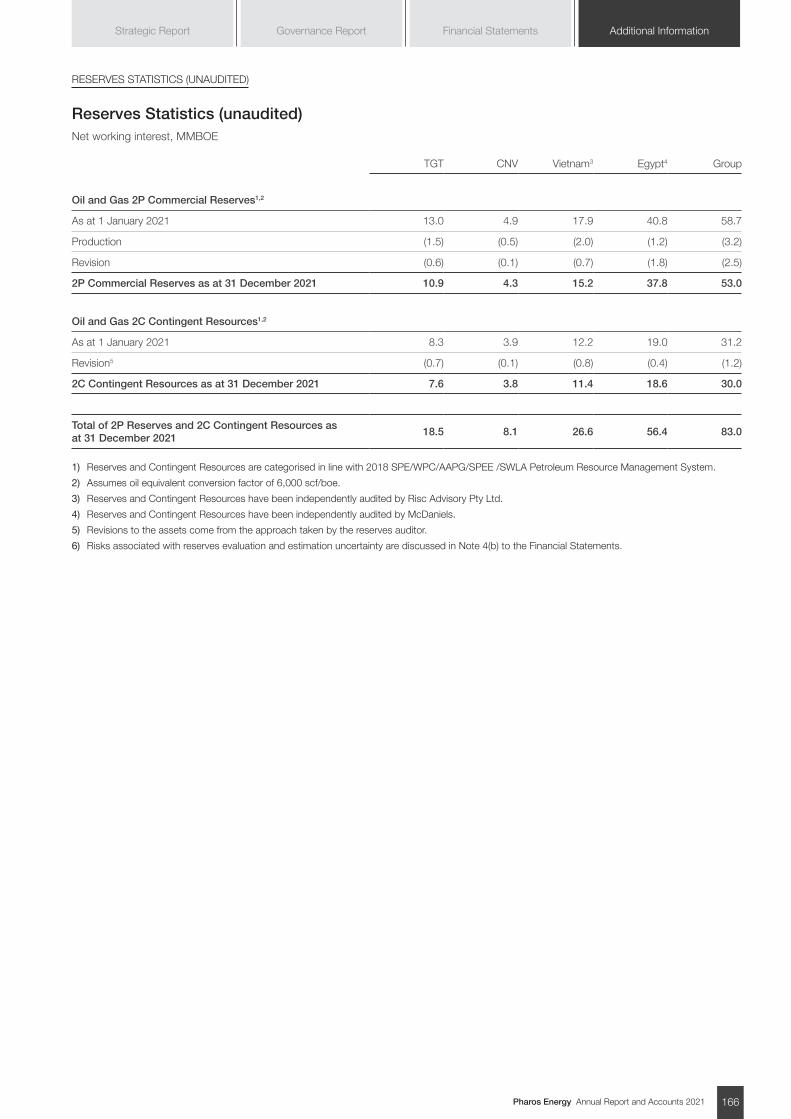
Pharos Energy Annual Report and Accounts 2021 166
Additional InformationGovernance Report Financial StatementsStrategic Report
RESERVES STATISTICS (UNAUDITED)
Reserves Statistics (unaudited)Net working interest, MMBOE
TGT CNV Vietnam3 Egypt4 Group
Oil and Gas 2P Commercial Reserves1,2
As at 1 January 2021 13.0 4.9 17.9 40.8 58.7
Production (1.5) (0.5) (2.0) (1.2) (3.2)
Revision (0.6) (0.1) (0.7) (1.8) (2.5)
2P Commercial Reserves as at 31 December 2021 10.9 4.3 15.2 37.8 53.0
Oil and Gas 2C Contingent Resources1,2
As at 1 January 2021 8.3 3.9 12.2 19.0 31.2
Revision5 (0.7) (0.1) (0.8) (0.4) (1.2)
2C Contingent Resources as at 31 December 2021 7.6 3.8 11.4 18.6 30.0
Total of 2P Reserves and 2C Contingent Resources as at 31 December 2021
18.5 8.1 26.6 56.4 83.0
1) Reserves and Contingent Resources are categorised in line with 2018 SPE/WPC/AAPG/SPEE /SWLA Petroleum Resource Management System.
2) Assumes oil equivalent conversion factor of 6,000 scf/boe.
3) Reserves and Contingent Resources have been independently audited by Risc Advisory Pty Ltd.
4) Reserves and Contingent Resources have been independently audited by McDaniels.
5) Revisions to the assets come from the approach taken by the reserves auditor.
6) Risks associated with reserves evaluation and estimation uncertainty are discussed in Note 4(b) to the Financial Statements.
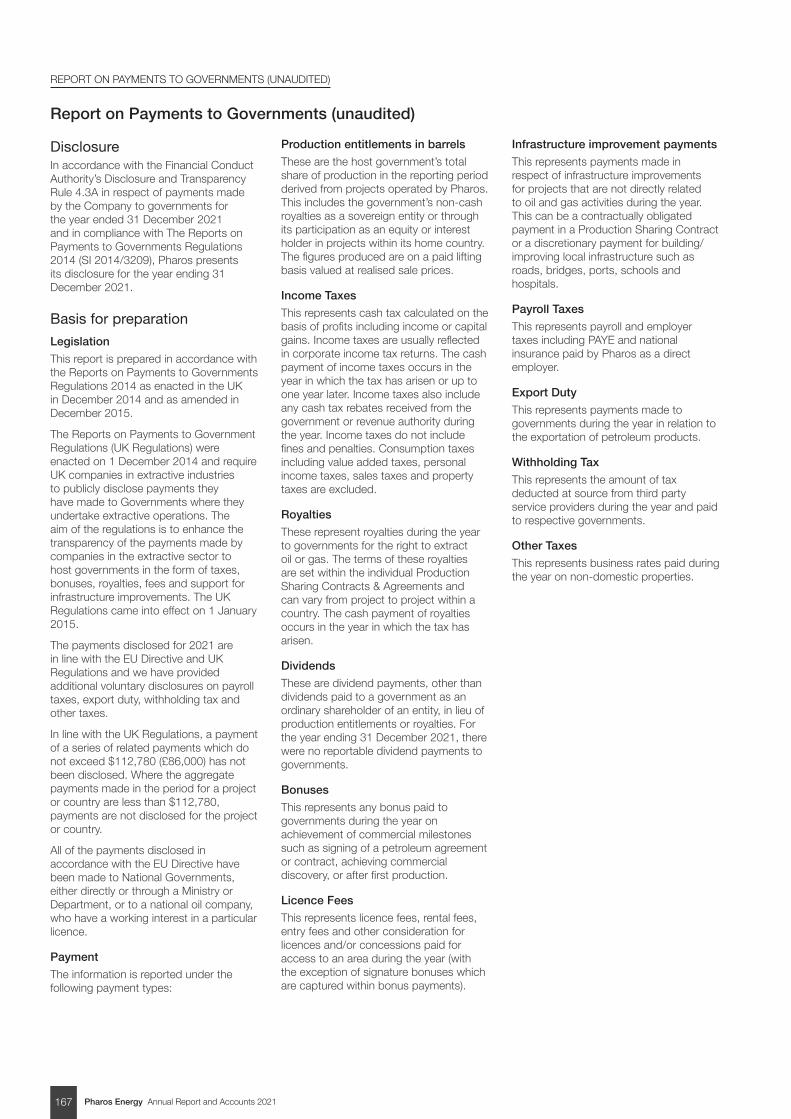
Pharos Energy Annual Report and Accounts 2021167
REPORT ON PAYMENTS TO GOVERNMENTS (UNAUDITED)
Report on Payments to Governments (unaudited)
DisclosureIn accordance with the Financial Conduct Authority’s Disclosure and Transparency Rule 4.3A in respect of payments made by the Company to governments for the year ended 31 December 2021 and in compliance with The Reports on Payments to Governments Regulations 2014 (SI 2014/3209), Pharos presents its disclosure for the year ending 31 December 2021.
Basis for preparation
Legislation
This report is prepared in accordance with the Reports on Payments to Governments Regulations 2014 as enacted in the UK in December 2014 and as amended in December 2015.
The Reports on Payments to Government Regulations (UK Regulations) were enacted on 1 December 2014 and require UK companies in extractive industries to publicly disclose payments they have made to Governments where they undertake extractive operations. The aim of the regulations is to enhance the transparency of the payments made by companies in the extractive sector to host governments in the form of taxes, bonuses, royalties, fees and support for infrastructure improvements. The UK Regulations came into effect on 1 January 2015.
The payments disclosed for 2021 are in line with the EU Directive and UK Regulations and we have provided additional voluntary disclosures on payroll taxes, export duty, withholding tax and other taxes.
In line with the UK Regulations, a payment of a series of related payments which do not exceed $112,780 (£86,000) has not been disclosed. Where the aggregate payments made in the period for a project or country are less than $112,780, payments are not disclosed for the project or country.
All of the payments disclosed in accordance with the EU Directive have been made to National Governments, either directly or through a Ministry or Department, or to a national oil company, who have a working interest in a particular licence.
Payment
The information is reported under the following payment types:
Production entitlements in barrels
These are the host government’s total share of production in the reporting period derived from projects operated by Pharos. This includes the government’s non-cash royalties as a sovereign entity or through its participation as an equity or interest holder in projects within its home country. The figures produced are on a paid lifting basis valued at realised sale prices.
Income Taxes
This represents cash tax calculated on the basis of profits including income or capital gains. Income taxes are usually reflected in corporate income tax returns. The cash payment of income taxes occurs in the year in which the tax has arisen or up to one year later. Income taxes also include any cash tax rebates received from the government or revenue authority during the year. Income taxes do not include fines and penalties. Consumption taxes including value added taxes, personal income taxes, sales taxes and property taxes are excluded.
Royalties
These represent royalties during the year to governments for the right to extract oil or gas. The terms of these royalties are set within the individual Production Sharing Contracts & Agreements and can vary from project to project within a country. The cash payment of royalties occurs in the year in which the tax has arisen.
Dividends
These are dividend payments, other than dividends paid to a government as an ordinary shareholder of an entity, in lieu of production entitlements or royalties. For the year ending 31 December 2021, there were no reportable dividend payments to governments.
Bonuses
This represents any bonus paid to governments during the year on achievement of commercial milestones such as signing of a petroleum agreement or contract, achieving commercial discovery, or after first production.
Licence Fees
This represents licence fees, rental fees, entry fees and other consideration for licences and/or concessions paid for access to an area during the year (with the exception of signature bonuses which are captured within bonus payments).
Infrastructure improvement payments
This represents payments made in respect of infrastructure improvements for projects that are not directly related to oil and gas activities during the year. This can be a contractually obligated payment in a Production Sharing Contract or a discretionary payment for building/improving local infrastructure such as roads, bridges, ports, schools and hospitals.
Payroll Taxes
This represents payroll and employer taxes including PAYE and national insurance paid by Pharos as a direct employer.
Export Duty
This represents payments made to governments during the year in relation to the exportation of petroleum products.
Withholding Tax
This represents the amount of tax deducted at source from third party service providers during the year and paid to respective governments.
Other Taxes
This represents business rates paid during the year on non-domestic properties.
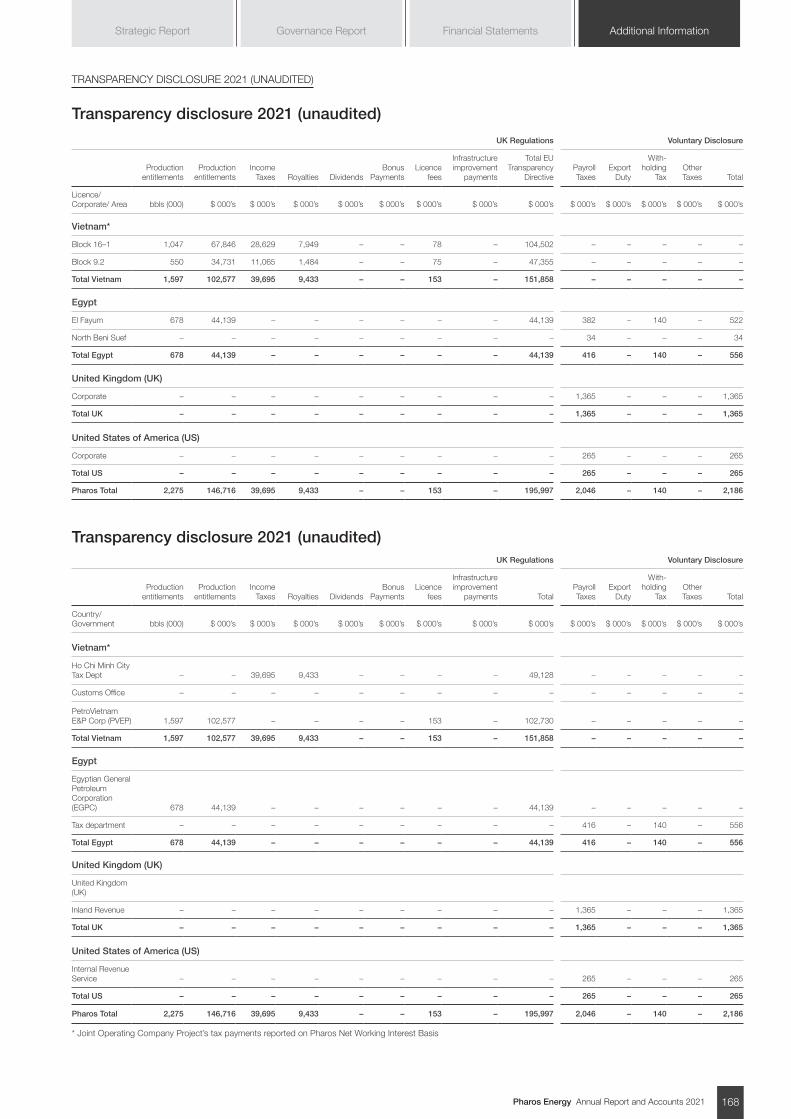
Pharos Energy Annual Report and Accounts 2021 168
Additional InformationGovernance Report Financial StatementsStrategic Report
TRANSPARENCY DISCLOSURE 2021 (UNAUDITED)
Transparency disclosure 2021 (unaudited)
UK Regulations Voluntary Disclosure
Production entitlements
Production entitlements
Income Taxes Royalties Dividends
Bonus Payments
Licence fees
Infrastructure improvement
payments
Total EU Transparency
DirectivePayroll Taxes
Export Duty
With- holding
TaxOther Taxes Total
Licence/ Corporate/ Area bbls (000) $ 000’s $ 000’s $ 000’s $ 000’s $ 000’s $ 000’s $ 000’s $ 000’s $ 000’s $ 000’s $ 000’s $ 000’s $ 000’s
Vietnam*
Block 16–1 1,047 67,846 28,629 7,949 – – 78 – 104,502 – – – – –
Block 9.2 550 34,731 11,065 1,484 – – 75 – 47,355 – – – – –
Total Vietnam 1,597 102,577 39,695 9,433 – – 153 – 151,858 – – – – –
Egypt
El Fayum 678 44,139 – – – – – – 44,139 382 – 140 – 522
North Beni Suef – – – – – – – – – 34 – – – 34
Total Egypt 678 44,139 – – – – – – 44,139 416 – 140 – 556
United Kingdom (UK)
Corporate – – – – – – – – – 1,365 – – – 1,365
Total UK – – – – – – – – – 1,365 – – – 1,365
United States of America (US)
Corporate – – – – – – – – – 265 – – – 265
Total US – – – – – – – – – 265 – – – 265
Pharos Total 2,275 146,716 39,695 9,433 – – 153 – 195,997 2,046 – 140 – 2,186
Transparency disclosure 2021 (unaudited)UK Regulations Voluntary Disclosure
Production entitlements
Production entitlements
Income Taxes Royalties Dividends
Bonus Payments
Licence fees
Infrastructure improvement
payments TotalPayroll Taxes
Export Duty
With- holding
TaxOther Taxes Total
Country/ Government bbls (000) $ 000’s $ 000’s $ 000’s $ 000’s $ 000’s $ 000’s $ 000’s $ 000’s $ 000’s $ 000’s $ 000’s $ 000’s $ 000’s
Vietnam*
Ho Chi Minh City Tax Dept – – 39,695 9,433 – – – – 49,128 – – – – –
Customs Office – – – – – – – – – – – – – –
PetroVietnam E&P Corp (PVEP) 1,597 102,577 – – – – 153 – 102,730 – – – – –
Total Vietnam 1,597 102,577 39,695 9,433 – – 153 – 151,858 – – – – –
Egypt
Egyptian General Petroleum Corporation (EGPC) 678 44,139 – – – – – – 44,139 – – – – –
Tax department – – – – – – – – – 416 – 140 – 556
Total Egypt 678 44,139 – – – – – – 44,139 416 – 140 – 556
United Kingdom (UK)
United Kingdom (UK)
Inland Revenue – – – – – – – – – 1,365 – – – 1,365
Total UK – – – – – – – – – 1,365 – – – 1,365
United States of America (US)
Internal Revenue Service – – – – – – – – – 265 – – – 265
Total US – – – – – – – – – 265 – – – 265
Pharos Total 2,275 146,716 39,695 9,433 – – 153 – 195,997 2,046 – 140 – 2,186
* Joint Operating Company Project’s tax payments reported on Pharos Net Working Interest Basis
Pharos Energy Annual Report and Accounts 2021169
GLOSSARY OF TERMS
AABCAnti-Bribery and Corruption
AGMAnnual General Meeting
BbblBarrel
blpdBarrels of liquids per day
BMSBusiness Management System
BnBillion
boeBarrels of oil equivalent
BHCPPBach Ho Central Processing Platform
boepdBarrels of oil equivalent per day
bopdBarrels of oil per day
bwpdBarrels of water per day
CCASH or cashCash, cash equivalent and liquid investments
CAPEX or capexCapital expenditure
CDP Formerly the Carbon Disclosure Project
CEOChief Executive Officer
CFOChief Financial Officer
CNVCa Ngu Vang field located in Block 9-2
CO2
Carbon Dioxide
CO2eCarbon Dioxide Equivalent
CompanyPharos Energy plc
Contingent ResourcesThose quantities of petroleum to be potentially recoverable from known accumulations by application of development projects but which are not currently considered to be commercially recoverable due to one or more contingencies
ContractorThe party or parties identified as being, or forming part of, the “CONTRACTOR” as defined in the El Fayum Concession or, as the case may be, the North Beni Suef Concession
CRCorporate Responsibility
DDD&ADepreciation, depletion and amortisation
EE&PExploration & Production
EBITDAXEarnings before interest, tax, DD&A, impairment of PP&E and intangibles, exploration expenditure and other/exceptional items in the current year
EBTEmployee benefit trust
E&EExploration and Evaluation
EGPEgyptian Pound
EGPCEgyptian General Petroleum Corporation
El Fayum or the El Fayum ConcessionThe concession agreement for petroleum exploration and exploitation entered into on 15 July 2004 between the Arab Republic of Egypt, EGPC and Pharos El Fayum in respect of the El Fayum area, Western Desert, as amended from time to time
EUEuropean Union
FFFDPFull Field Development Plan
FPSOFloating, Production, Storage and Offloading Vessel
FYFull year
G&AGeneral and administration
GHGGreenhouse gas
GroupPharos and its direct and indirect subsidiary undertakings
HH&SHealth and Safety
HLHVJOCHoang Long and Hoan Vu Joint Operating Companies
HLJOCHoang Long Joint Operating Company
HSESHealth, Safety, Environmental and Security
HVJOCHoan Vu Joint Operating Company
IIASBInternational Accounting Standards Board
IFRSInternational Financial Reporting Standards
IMFInternational Monetary Fund
IOGPThe International Association of Oil & Gas Producers
IPIECAThe global oil and gas industry association for environmental and social issues
IPR or IPR Energy GroupThe IPR Energy group of companies, including IPR Lake Qarun and IPR Energy AG, or such of them as the context may require
IPR Lake QarunIPR Lake Qarun Petroleum Co, an exempted company with limited liability organised and existing under the laws of the Cayman Islands (registration number 379306), a wholly owned subsidiary of IPR Energy AG
JJOCJoint Operating Company
JVJoint venture
Kkthousands
kbopdThousand barrels of oil per day
KmKilometre
km2
Square kilometre
Pharos Energy Annual Report and Accounts 2021 170
Additional InformationGovernance Report Financial StatementsStrategic Report
LListing RulesThe Listing Rules of the UK Financial Conduct Authority
LTILost Time Injury
LTIFLost Time Injury Frequency
LTIPLong Term Incentive Plan
Mmmillion
M&AMergers and Acquisitions
MENAMiddle East and North Africa region
mmbblMillion barrels
mmboeMillion barrels of oil equivalent
NNBS, North Beni Suef or the North Beni Suef ConcessionThe concession agreement for petroleum exploration and exploitation entered into on 24 December 2019 between the Arab Republic of Egypt, EGPC and Pharos El Fayum in respect of the North Beni Suef area, Nile Valley
NBVNet Book Value
NEDNon-Executive Director
NPVNet Present Value
OOOIPOriginal Oil in Place
OPECO VietnamOPECO Vietnam Limited
OpexOperational expenditure
PPEFPharos El Fayum, (formerly named Merlon Petroleum El Fayum Company), an exempted company with limited liability organised and existing under the laws of the Cayman Islands (registration number 78257), a member of the Group
PetrosilahAn Egyptian joint stock company held 50/50 between the Contractor parties (being the Pharos Group and IPR Lake Qarun following completion of the farm-out of the El Fayum concession) and the Egyptian General Petroleum Corporation
PSCProduction sharing contract or production sharing agreement
PetrovietnamVietnam Oil and Gas Group
PTTEPPTT Exploration and Production Public Company Limited
RReservesReserves are those quantities of petroleum anticipated to be commercially recoverable by application of development projects to known accumulations from a given date forward under defined conditions. Reserves must further satisfy four criteria: they must be discovered, recoverable, commercial and remaining based on the development projects applied
RBLReserve Based Lending facility
RISCRISC Advisory Pty Ltd
SSharesOrdinary Shares
STOIIPStock Tank Oil Initially In Place
TTORTerms of Reference
TCFDTask-Force for Climate-related Financial Disclosures
TGTTe Giac Trang field located in Block 16-1
TSRTotal shareholder return
TIATie-in Agreement
UUKUnited Kingdom
USUnited States of America
WWHPWellhead PlatformUnited States of America
YYTDYear-to-date
$United States Dollar
£UK Pound Sterling
1CLow estimate scenario of Contingent Resources
1HFirst half
1PEquivalent to Proved Reserves; denotes low estimate scenario of Reserves
2018 CodeThe 2018 UK Corporate Governance Code of the Financial Reporting Council
2CBest estimate scenario of Contingent Resources
2C Contingent ResourcesBest estimate scenario of Contingent Resources
2P ReservesEquivalent to the sum of Proved plus Probable Reserves; denotes best estimate scenario of Reserves. Also referred to as 2P Commercial Reserves
Pharos Energy Annual Report and Accounts 2021171
COMPANY INFORMATION
Registered office:
Pharos Energy
27/28 Eastcastle Street, London W1W 8DH, United Kingdom Registered in England T +44 (0)20 7747 2000 F +44 (0)20 7747 2001 Company No. 3300821 www.pharos.energy
Company Secretary
Tony Hunter
Financial Calendar
Group results for the year to 31 December are announced in March. The Annual General Meeting is held during the second quarter. Interim Results to 30 June are announced in September.
Advisers Auditor:
Deloitte LLP
London, United Kingdom
Bankers:
J.P. Morgan
125 London Wall London, EC2Y 5AY United Kingdom
HSBC UK Bank plc
60 Queen Victoria Street London EC4N 4TR United Kingdom
BNP Paribas – Singapore Branch
10 Collyer Quay #33-01 Ocean Financial Center 049315 Singapore
Financial Adviser and Corporate Brokers:
Jefferies
100 Bishopsgate London, EC2N 4JL United Kingdom
Peel Hunt
120 London Wall, London EC2Y 5ET United Kingdom
Capital Markets Advisor:
Auctus Advisors
Robsacks, Long Barn Road, Weald, Sevenoaks, Kent TN14 6NJ United Kingdom
Registrar:
RD:IR Limited
9 Bridewell Place, London EC4V 6AW United Kingdom
Solicitors:
Shepherd and Wedderburn LLP
1 Exchange Crescent, Conference Square, Edinburgh EH3 8UL United Kingdom
Designed and Produced by Presentation Graphics Design Ltd

Pharos Energy Annual Report and Accounts 2021 172
Pharos Energy (Head Office) Eastcastle House 27/28 Eastcastle Street London W1W 8DH United Kingdom
Registered in England Company No. 3300821
T +44 (0)20 7747 2000 F +44 (0)20 7747 2001
www.pharos.energy