annual report 2019-2020 online annexes
TRANSCRIPT
5-YEAR BOARD REPORT
ASIA PACIFIC FOUNDATION OF CANADA
1
2019-2020
ANNUAL REPORT
DIGITAL LEADERSHIP
ANNEXES
5-YEAR BOARD REPORT - ANNEXES
ASIA PACIFIC FOUNDATION OF CANADA
2
TABLE OF CONTENTS
Artificial Intelligence: Policies in East Asia
Canada as a 21st Century Pacific Power
Market Intelligence and Policy Research
The Mobile Payment Revolution in China
E-Commerce in South Korea: a Canadian Perspective
Guide for Doing Business in the Asia Pacific
Indigenous - Asia Pacific Business Relations Roundtable
Investment Monitor - 2019
Investment Monitor - 2020
National Opinion Poll - 2019
National Opinion Poll - 2020
China's Evolving Senior Care Sector
Navigating a Future of Tech Uncertainty
The CPTPP Tracker - 2019
3
43
112
149
197
265
349
389
470
551
586
625
672
683
ARTIFICIAL INTELLIGENCE POLICIES IN EAST ASIA :
AN OVERVIEW FROM THE CANADIAN PERSPECTIVE
TABLE OF CONTENTS
EXECUTIVE SUMMARY
INTRODUCTION
Structure and Methodology
Artificial Intelligence (AI) 101
Why an AI Policy?
Where is Canada in the AI Space?
Why East Asian AI?
CHINA
Government Policies
AI R&D and Talent
AI ELSI
Conclusion
JAPAN
Government Policies
AI R&D and Talent
AI ELSI
Conclusion
SOUTH KOREA
Government Policies
AI R&D and Talent
AI ELSI
Conclusion
ANALYSIS & POLICY RECOMMENDATIONS
Analysis
Policy Recommendations
ACKNOWLEDGEMENTS
ABOUT THE ASIA PACIFIC FOUNDATION OF CANADA
3
5
6
6
7
9
9
11
11
13
14
17
18
18
19
20
22
24
24
27
28
30
32
32
35
38
39
EXECUTIVE SUMMARY
Accelerated advances in computing and greater integration of the internet – along with the proliferation of big data – have enabled significant progress in the field of artificial intelligence (AI) during the past few years, raising the profile of a discipline long relegated to the fringes. Many, especially in Asia, point to the DeepMind AI AlphaGo’s victory over Lee Se-dol in the game of Go in 2016 as the watershed moment when the zeitgeist shifted. The possibilities – and therefore fears – tied to advances in AI have started to dominate the public discourse. Tangible progress in a field that blurs the line between science fiction and reality has helped fuel the furor and underscores the urgent need for intervention by policy-makers.
As AI is relatively new lay for people, it is challenging to talk about it, let alone create policies related to it. There are many unknowns and upcoming firsts in the regulation or governance of AI. In China, Japan, and South Korea, however, governments have begun creating AI policies in a comprehensive and committed manner. Thus East Asia provides excellent case studies for Canadian policy-makers as they begin to grapple with the development, deployment, and regulation of artificial intelligence.
Underpinning this report is the fact that all three East Asian nations regard AI as a key factor contributing to their international competitiveness, and that they have all taken nation-wide measures to enhance their AI capabilities. The scope of their national AI strategies is broad, with ambitious goals for everything from AI research and development (R&D) to integration of AI in specific economic sectors. This report provides a nuanced and detailed documentation of East Asia’s AI agenda. It is hoped that the report will provide useful case studies for the Government of Canada as it seeks innovative ideas for expanding its own governance of this disruptive technology.
More importantly, this report asserts that the Government of Canada must recognize AI as a space for geopolitical competition and act proactively and strategically. The examination of the AI policies in East Asia paints a familiar picture for Canadians: China is a major influencer in the space of AI, promising opportunities for Canadians, but engagement with China entails risks and difficulties arising from differing values. In a similar vein, Japan and South Korea remain reliable partners for co-operation for Canadians, with the potential for collaboration yet to be fully exploited. Canada punches above its weight in AI research, and China, Japan, and South Korea are looking to Canada to help boost their own talent and research capabilities. Today, AI is a space where Canada can exercise greater influence, with the potential to take a leadership role in shaping norms of international AI governance.
Canada should, therefore, leverage its strengths and engage with these three East Asian countries in a strategic manner. It should participate in discussions on AI ethics and governance to positively contribute to the shaping of international norms, while building partnerships of like-minded nations to gain leverage in promoting uses of AI that align with Canadian values. As the technological becomes intertwined with the political, the perception of China as a threat to the
3
liberal world order continues to gain traction in the AI space. Western liberal democracies have strengthened their rhetoric and policies to counter China’s approach to AI, highlighting liberal values in their ethics guidelines and policies. At the same time, China continues with its AI agenda and seeks to raise its international profile by becoming a norm-setter. Canada could play the role of the traditional “middle power” in facilitating constructive conversations, bridging the gap between China and the West. Meanwhile, Canada has the opportunity to form alliances with like-minded, relevant countries like Japan and South Korea to further increase its profile as a major player in international governance of AI.
As of July 2019, the trade war between China and the United States continues. This is accompanied by the United States’ attempts to check the rise of Chinese high-tech firms, as exemplified in the White House and Department of Commerce orders to limit Chinese company Huawei’s access to its U.S. vendors. The trade war underscores the greater role that technologies such as AI play in foreign policy today and brings attention to the need for the Canadian government to approach AI governance on the global stage in a strategic and comprehensive manner.
In this context, this report explores the national AI policies of these three East Asian countries to inform Canadian policy-makers and AI practitioners of the challenges and opportunities of a field that will soon intersect with every aspect of our lives. The report first establishes the relevance of AI and AI policies in East Asia for Canadian policy-makers. Then, three subsequent sections investigate AI policies in China, Japan, and South Korea, focusing on the policies, talent management, and ethical, legal, and social implications (ELSI) of the technology. Finally, the last section synthesizes the analysis of AI development in East Asia and concludes with four broad recommendations:
Recommendation 1: Increase Canada’s capacity to govern AI in a co-ordinated manner at different levels of government.
Recommendation 2: Leverage Canada’s AI talent more effectively as part of “Brand Canada.”
Recommendation 3: Proactively address emerging AI issues in trade and investment.
Recommendation 4: Identify Canada’s place in emerging AI geopolitics and engage strategically.
4
INTRODUCTION
It is an exciting time to be in the field of artificial intelligence (AI). Recent research breakthroughs and the transition toward a data-based society and economy have brought forth a golden age for AI. Every day, the media continues to circulate stories – often sensationalized ones – about AI and how it will revolutionize the way we live.
However, contrary to public expectations, AI will not dramatically change the world. Instead, it will make existing products and services faster and more efficient. AI does not exist on its own; as it is used today, AI is a program that is applied in existing hardware or services to maximize their efficiency – more similar to electricity than the T-800 from the film Terminator. But this means that AI, omnipresent like electricity, will influence – and already has influenced – most of what we do today, and this will have policy implications. AI presents the world with challenges and opportunities.
Particularly for Canada, this is a pivotal moment. During the late 1980s and early 1990s, at a time when AI was considered an interesting but impractical field, Canada invested in the field. Some of its institutions are now home to leading AI academics who are thriving in the field and attracting investments from tech giants like Amazon and Google. In the mid-2010s, the federal government invested C$125M on a national AI strategy to further support research and attract talent, which contributed to bringing Canada to the top of the list for investors and companies seeking to leverage AI. However, the upcoming transformations brought by AI pose new challenges to all stakeholders: government, industry, and civil society.
China, Japan, and South Korea’s approach to AI provides important insights at this critical juncture for Canadians. Their governments have committed to comprehensive AI strategies that stretch beyond supporting research and development (R&D). These strategies point to opportunities for Canada in both its bilateral relations with these countries and in multilateral settings where Canada could take a leading role in driving the discussion/agenda around AI governance. Further, their strategies underscore the permeability and potential impact of the technology, which prompts us to think about our own approach to AI.
The objective of this study is to provide an overview of Chinese, Japanese, and South Korean AI policies, demonstrating their degree of commitment to not only research, but also commercialization, deployment, and considerations of ethical, legal, and social implications (ELSI). This report also analyzes the differences between Canadian and East Asian policies, drawing out implications for Canada. In order to limit the scope of this study, policy discussions on privacy and data management laws are not included. This report represents an attempt to make sense of the new space and provide the foundation for more in-depth research in specific areas of AI governance.
This report adds to the existing literature by taking a more in-depth look at the national policies in the three countries, with the intent of finding Canadian implications. At the moment, there are
5
several reports that focus on domestic implications (e.g. future of work) within Canada, or non-Canadian reports that focus specifically on China and threats to security. This report considers the region as a whole and provides comparative overviews while developing a greater analytical perspective on Canada’s policy toward East Asia.
Structure and MethodologyThe report is based on qualitative analysis of policy documents, reports, and media coverage, supplemented by interviews with relevant academics, policy-makers, and other practitioners in Beijing, Seoul, and Tokyo. These interviews occurred primarily during the spring of 2018 and are complemented by additional conversations.
The first section explains the basics of AI policy. Case studies of China, Japan, and South Korea are then presented. Findings are analyzed in the final section, and policy recommendations are presented. Each case study features an analysis of the broader government policy on AI, the country’s attempts to address AI R&D and talent training, and its engagement with AI ELSI through government policy. Based on the analysis of the three cases in East Asia, four policy recommendations for Canada are presented at the end.
AI 101How do we define intelligence? Philosophers have dedicated substantial tomes to this task, but disagreement remains, which leads to even more questions about the nature of intelligence. The definition of artificial intelligence becomes even more challenging, particularly when the term is conflated with other closely associated technologies like robotics and 5G, although neither of these constitute an artificial intelligence.
There is no singular definition of AI. Even Stuart Russell and Peter Norvig’s leading textbook on AI, Artificial Intelligence: A Modern
Approach, eschews a singular definition, and instead lists four different definitions: thinking humanly, thinking rationally, acting humanly, and acting rationally.1 Russell and Norvig also note the interdisciplinary aspect of AI as a field, pointing to philosophy, mathematics, economics, neuroscience, psychology, computer engineering, control theory and cybernetics, and linguistics as the intellectual foundations of the technology, which underscores the point that defining AI could be tantamount to tackling the perennial questions in the discipline of philosophy.2 Ryan Calo states that AI is “an umbrella term, comprised by many different techniques,” and other policy documents on the subject take similar approaches.3
For the purposes of this report, AI is simply defined as simulation of human intelligence through computers, mainly referring to machine learning. Put simply, machine learning is a form of data
1 Russell, Stuart and Peter Norvig. 2010. Artificial intelligence: A modern approach. Upper Saddle River: Prentice Hall, p. 2.2 Ibid., p. 5-16.3 Calo, Ryan. 2017. Artificial intelligence policy: A primer and roadmap. U.C. Davis Law Review. 51(2): 5.
6

analysis in which systems identify patterns and make decisions based on data in an automated manner. The theory itself is not new, but it took off in recent years due to the availability of big data and computing hardware capable of running these systems.
It should also be noted that we are still very far from seeing an AI like the T-800 from the Terminator movie franchise or Andrew in Bicentennial Man because current AI programs are limited to performing specific tasks that they were designed for – that is, they are “narrow” AIs. For instance, consider an AI program designed to play chess. A human may not be able to beat this program in chess, but this program will not be able to perform other tasks that we perform daily, such as figuring out the best transit route to work or summarizing the contents of a newspaper article.
The opposite of narrow AI is artificial general intelligence, a system that is able to perform any task that a human being can. But experts in the field generally believe that this will not happen in the near future. Martin Ford, an author who has written on AI and robotics, asked 23 leading experts when we should expect to see the first artificial general intelligence, and the average timeline of the 18 who responded is 2099.4 As such, at least for the near future, the use of AI will mainly complement, not displace, humans or their intelligence.
This report focuses on the more immediate challenges emerging from greater integration of narrow AI into all aspects of our daily lives rather than issues surrounding artificial general intelligence.
Why an AI Policy?If we are not concerned about the rise of a self-aware robot army, then why should we worry about AI at the policy level? It is because AI is a disruptive technology that will significantly affect the way businesses operate, as well as the larger society. According to a 2017 PwC report, AI is expected to provide a US$15.7T boost to global gross domestic product (GDP) by 2030, which would be equivalent to adding approximately 10 Canadian economies to the global economy.5 Especially for high-income, developed countries with technical capabilities, AI promises an opportunity for increased productivity. Today, there is consensus around the world that policy-makers should support their respective AI research and industry to take advantage of the economic opportunity that AI presents.
However, this report argues that investment in AI policies is required not only for economic reasons, but also because of three broader challenges in the rapidly evolving field of AI.
First, most countries lack the necessary infrastructure to further their AI ambitions. There is a worldwide AI talent shortage, and major players in the private sector are racing to hire AI talent, from Silicon Valley to Beijing. According to a Tencent report, there are perhaps 300,000 individuals with AI expertise, while there is an immediate shortage of 800,000 specialists in this field.6 This challenge will require a government-level response in education and immigration policies. The problem of infrastructure also extends to data, the “fuel” of AI. The greater the amount of data available, the better AI can be engaged. Today, however, most countries have regulations that
4 Vincent, James. 2018. This is when AI’s top researchers think artificial general intelligence will be achieved. The Verge. https://www.theverge.com/2018/11/27/18114362/ai-artificial-general-intelligence-when-achieved-martin-ford-book; and Ford, M. 2018. Architects of intelligence: The truth about AI from the people building it. Birmingham: Packt Publishing.5 PricewaterhouseCoopers. 2017. Sizing the prize: What’s the real value of AI for your business and how can you capitalise? Boston: PricewaterhouseCoopers.6 Tencent Research Institute. 2017. 全球 人工智能人才 白皮书 (Global artificial intelligence talent white paper). Beijing: Tencent Research Institute.
7
restrict data flow due to privacy concerns. As such, there is a need to reform existing regulations to allow the use of data, while ensuring the privacy rights of individual citizens.
Just as governments needed to create highways and establish rules of the road with the advent of the mass-produced automobile, so too do citizens and industry require the involvement of government to set up the basic infrastructure for an AI-driven economy to take full advantage of the new technology.
Second, AI involves ethical, legal, and social implications that will permeate different sectors. The best publicized example is labour market disruption due to automation. According to McKinsey, as much as 30 percent of human labour could be displaced by AI by 2030.7 Further, AI involves potential threats to privacy rights, as well as the perpetuation and exacerbation of existing socio-economic biases. Economist Joseph Stiglitz warns that AI could further deepen the gap between the rich and the poor.8 Experts in the field have raised concerns about the abuse of AI for malicious uses, from new forms of scams to drone attacks.9 These concerns underscore the need for greater state involvement in proactively adjusting regulations to promote R&D and deployment, but also to prepare citizens for a society where AI is fully integrated.
Finally, AI raises potential challenges for state sovereignty. At the most basic level, integration of AI into weapons and weapon systems could change the nature of warfare. Russian President Vladimir Putin recently said that “whoever leads on AI will rule the world.” The policy debates surrounding the technology are now increasingly framed within the language of an AI race, which emphasizes the competition between nations for supremacy on AI technologies, akin to the arms race between the United States and the former Soviet Union during the Cold War.10 At a more subtle level, AI could also challenge the ability of states to govern effectively. AI, due to its decentralized nature, is a difficult technology to regulate. It has the potential to further undermine states through ELSI, such as mass unemployment or the dissemination of misinformation. As such, AI poses threats to a state’s sovereignty at different levels, which warrants a response from policy-makers.
7 McKinsey & Company. 2017. Jobs lost, jobs gained: What the future of work will mean for jobs, skills, and wages. New York City: McKinsey & Company. https://www.mckinsey.com/featured-insights/future-of-work/jobs-lost-jobs-gained-what-the-future-of-work-will-mean-for-jobs-skills-and-wages.8 Korinek, Anton, and Joseph E. Stiglitz. 2018. Artificial intelligence and its implications for income distribution and unemployment. NBER Working Paper No. 24174. Cambridge: National Bureau of Economic Research.9 Future of Humanity Institute. 2018. The malicious use of artificial intelligence: forecasting, prevention, and mitigation. Oxford: Future of Humanity Institute.10 Suder, Katrin. 2018. AI can change the balance of power. Berlin Policy Journal. https://berlinpolicyjournal.com/ai-can-change-the-balance-of-power/.
8
Policy-makers have become aware of the opportunities and challenges that come with AI, and governments around the world have started announcing their AI strategies.
Where is Canada in the AI Space?Canada was an early investor in AI research. During the so-called “AI winter,” a period during the 1980s and 1990s when decreased interest in AI led to a drop in research funding, Canadian funding agencies continued to support basic AI research, attracting scholars from all over the world. As a result, Canada today is home to world-leading researchers and their teams. At a time when AI talent is in high demand, Canada’s research capabilities allow it to punch above its weight.
To further leverage this advantage, the Government of Canada announced in 2017 that it would commit C$125M for the next five years to further Canada’s AI R&D and attract top-level talent in the country through the Pan-Canadian Artificial Intelligence Strategy, managed by the Canadian Institute for Advanced Research (CIFAR). The Strategy mainly addresses R&D and talent issues.
Further, there are various initiatives within the government that seek to address the advent of AI. Innovation, Science and Economic Development Canada (ISED) launched the National Digital and Data Consultations to understand the Canadian public perception of data issues. The Standards Council of Canada is working to develop a national standard for ethical uses of AI as well. The Treasury Board of Canada has also been active in the AI space. In February 2018, Canada joined the Digital Seven, a network of governments seeking to further integrate digital technologies in governance, and in July 2018 it created the first-ever Minister of Digital Government. In December 2018, the government also announced that it would collaborate with the French government on the International Panel on Artificial Intelligence, which will convene international AI initiatives.
Why East Asian AI?There are three key reasons why Canadians should pay attention to East Asia’s AI development.
First, China, Japan, and South Korea offer examples of comprehensive and forward-looking AI strategies that could provide lessons for Canadian policy-makers. The three East Asian governments have each formulated comprehensive national plans that promote AI R&D through facilitation of collaboration among policy-makers, academics, and industry stakeholders. Their plans also include strategic integration of AI into their economies and societies with a long-term view.
Second, understanding East Asian AI development is crucial for Canada’s future engagement in the region. Economically and politically, the three East Asian countries are important partners for Canada. China is Canada’s second largest trading partner. Japan and South Korea are also key trading partners (fifth and seventh largest, respectively). They are also regarded as vital partners in Canada’s multilateral dealings and share similar political values. The national policies in East Asian states demonstrate a clear commitment to transforming their economies and societies through AI, which gives rise to new challenges in trade and diplomacy. Canada’s continued engagement in Asia should be accompanied by a deeper understanding of the region’s AI development.
Third, East Asian AI development underscores the emergence of an AI race and the need for Canada to identify its appropriate role. An examination of AI development in East Asia suggests a global fracture in attitudes toward AI and the subsequent emergence of an AI race or AI geopolitics. The attitude toward AI in East Asia clearly demonstrates that AI development is regarded as a national-
9
level project with implications in multiple areas of society. China, Japan, and South Korea regard AI development as a continuation of national development.
Combined with the cultural, social, and political factors that contribute to AI development, the consideration of AI as a national endeavour strongly suggests the emergence of AI as a space in foreign policy that could deepen existing splits in contemporary geopolitics. For instance, competition for securing AI talent and infrastructure between China and the United States has already been described as a duopoly – a race between the two – especially as China’s use of AI for social surveillance and military application has alarmed liberal, Western states, led by the United States. Also, AI experts and practitioners in Japan and South Korea express concerns about their role “stuck between” China and the United States, sentiments that echo existing anxiety about China’s rise in the region.
Canada has research capacities that allow it to perform well in the space of AI. Early investment in basic research has produced world-leading researchers in AI based in institutes at the University of Alberta, University of Toronto, and Université de Montréal, and has drawn investment from global giants such as Google and Amazon to the country. The Government of Canada launched the Pan-Canadian Artificial Intelligence Strategy in 2017 to further develop its existing strengths in research and talent. As the technological becomes increasingly intertwined with the political, these strengths in research and talent provide Canada with a tool to broaden its options in foreign policy, which should be leveraged in a timely manner.
10
CHINA
Government PoliciesThe Chinese Communist Party has clearly articulated a concrete vision for the role of AI in its policy documents released since 2015. The latest Five Year Plan (2016-2020), which is China’s principal, large economic strategy, released in 2015, articulated China’s intent to invest and gain leadership in big data and “intelligent manufacturing.” Made in China 2025 consistently emphasized the need for China to upgrade its manufacturing sector by integrating emerging technologies (principally AI). As such, the Party had clearly identified the need to invest in AI for continued economic growth before the release of its AI-specific plans.
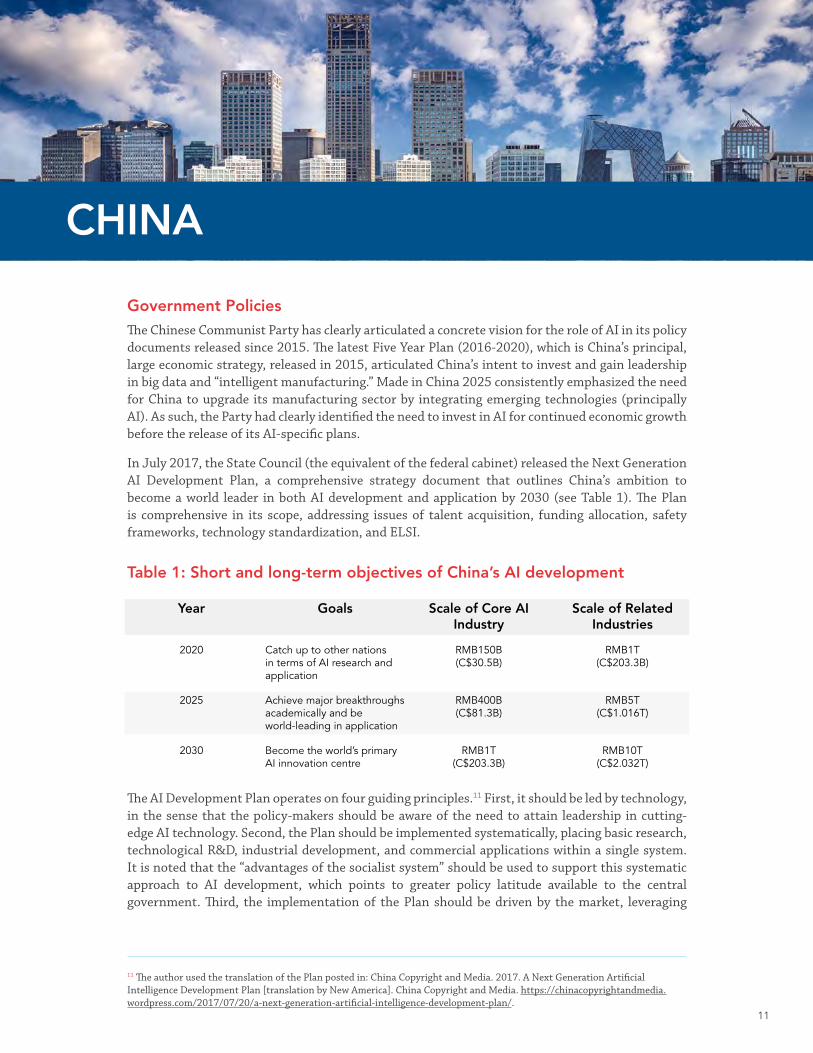
In July 2017, the State Council (the equivalent of the federal cabinet) released the Next Generation AI Development Plan, a comprehensive strategy document that outlines China’s ambition to become a world leader in both AI development and application by 2030 (see Table 1). The Plan is comprehensive in its scope, addressing issues of talent acquisition, funding allocation, safety frameworks, technology standardization, and ELSI.
Table 1: Short and long-term objectives of China’s AI development
The AI Development Plan operates on four guiding principles.11 First, it should be led by technology, in the sense that the policy-makers should be aware of the need to attain leadership in cutting-edge AI technology. Second, the Plan should be implemented systematically, placing basic research, technological R&D, industrial development, and commercial applications within a single system. It is noted that the “advantages of the socialist system” should be used to support this systematic approach to AI development, which points to greater policy latitude available to the central government. Third, the implementation of the Plan should be driven by the market, leveraging
Year
2020
2025
2030
Goals
Catch up to other nations in terms of AI research and application
Achieve major breakthroughs academically and be world-leading in application
Become the world’s primary AI innovation centre
Scale of Core AI Industry
RMB150B (C$30.5B)
RMB400B (C$81.3B)
RMB1T (C$203.3B)
Scale of Related Industries
RMB1T (C$203.3B)
RMB5T (C$1.016T)
RMB10T (C$2.032T)
11 The author used the translation of the Plan posted in: China Copyright and Media. 2017. A Next Generation Artificial Intelligence Development Plan [translation by New America]. China Copyright and Media. https://chinacopyrightandmedia.wordpress.com/2017/07/20/a-next-generation-artificial-intelligence-development-plan/.
11
the resources in the private sector. It highlights the need to fully delineate the responsibilities of the government and the private sector to maximize the government’s role in planning and guidance, policy support, security, regulation, environmental protection, and formulation of ethical guidelines. Finally, the Plan should follow the concept of open-source sharing and promote collaboration between industry, academia, research, and production units. It highlights the need to promote two-way conversion and application of AI technology for civil and military uses, and the need to continue participating in global research.
Following the release of the Next Generation AI Development Plan, the Ministry of Industry and Information Technology released the Three-Year Action Plan for Promoting Development of a New Generation Artificial Intelligence Industry (2018-2020), which outlines more immediate guidelines for industry, government, and other stakeholders until 2020. The Action Plan highlights the importance of supporting research and entrepreneurship in establishing a foundational AI industry, and specifies target AI products such as autonomous vehicles, medical imaging diagnostic systems, video and voice identification systems, smart home products, and intelligent translation systems. The Action Plan falls in line with and supports the Next Generation AI Development Plan within a narrower time frame.
It is necessary to approach these national policies in a nuanced manner that considers China’s unique form of governance. In the West, where there is emphasis on the rule of law, the text of a policy is of utmost importance, and any kind of adjustment in policy requires appropriate process (i.e. legislative procedures). However, this is slightly different in China. The text of a policy is important to some degree, but policies and regulations can be bent following mutual understanding between officials that such action is necessary to achieve greater goals. This can provide greater agility and flexibility in addressing emerging technologies such as AI (this advantage comes with the cost of lack of democratic accountability or predictability, of course).
In this case, the greatest impact of the Next Generation AI Development Plan is the Party’s explicit endorsement of the industry and the implicit understanding that it will be followed by policy support. Ultimately, the Plan functions not as a detailed blueprint whose success is measured by congruence to its details, but as a general “wish list,” according to Matt Sheehan of MacroPolo, a University of Chicago think tank that analyzes the Chinese economy. Sheehan writes that this wish list signals the relevant players – local government officials, private firms, academics – to deliver the items on it using their resources and ingenuity and promises the necessary policy support.12
Since the launch of the Next Generation AI Development Plan, China has made great strides in this area by leveraging its unique policy strengths. In China, these national plans offer an opportunity for ambitious local government officials to make a name for themselves by delivering the items on the wish list. Fifteen out of 34 local governments had announced their own AI strategies as of October 2018. The projected size of the AI industry from the combination of the 15 AI strategies amounts to RMB429B (C$80.17B) by 2020, almost three times the national goal of RMB150B (C$30.5B), which underscores the impact of the national directive upon local policies.13
The private sector has followed suit as well. The Chinese startup scene is notoriously competitive, and the nod from the government was quickly understood by ambitious entrepreneurs as an
12 Sheehan, Matt. 2018. How China’s massive AI plan actually works. MacroPolo. https://macropolo.org/chinas-massive-ai-plan-actually-works/.13 Ding, Jeffrey. 2018. Latest Policies for AI Industry [Data sourced from Qianzhan Chanye Institute]. https://docs.google.com/document/d/1NQ8kjeKso6mpaQtXyoFu7Tbl44UapdnNt7dOjGwhB8w/edit#.
12
opportunity to profit. Chinese startups received 48 percent of total global AI funding in 2017.14 SenseTime, a Beijing-based facial recognition firm, became the world’s most valuable startup at US$4.5B, and its success would not have been possible without the government policy support.15 Chinese AI research is gaining more influence in academia as well, with the number of papers from Chinese researchers accepted by the Association for the Advancement of Artificial Intelligence conferences (the most prestigious in the field) more than doubling – jumping from 10 percent of papers to 23 percent – between 2012 and 2017.16
The Party has also taken further measures to maximize the efficiency of the private sector by organizing a National AI Team. More specifically, the Ministry of Science and Technology has designated tech giants such as Baidu, Alibaba, Tencent, and iFlyTek to lead specific sectors of AI. For instance, Baidu is responsible for autonomous driving, Alibaba for smart cities, Tencent for health care, and iFlyTek for voice recognition. The expectation is that the members of the National AI Team develop “open innovation platforms” on these key areas and thereby set the standards for each industry.17 Further, this has the effect of minimizing competition among large tech firms, which have shown the tendency to compete until they have edged each other out of the market.
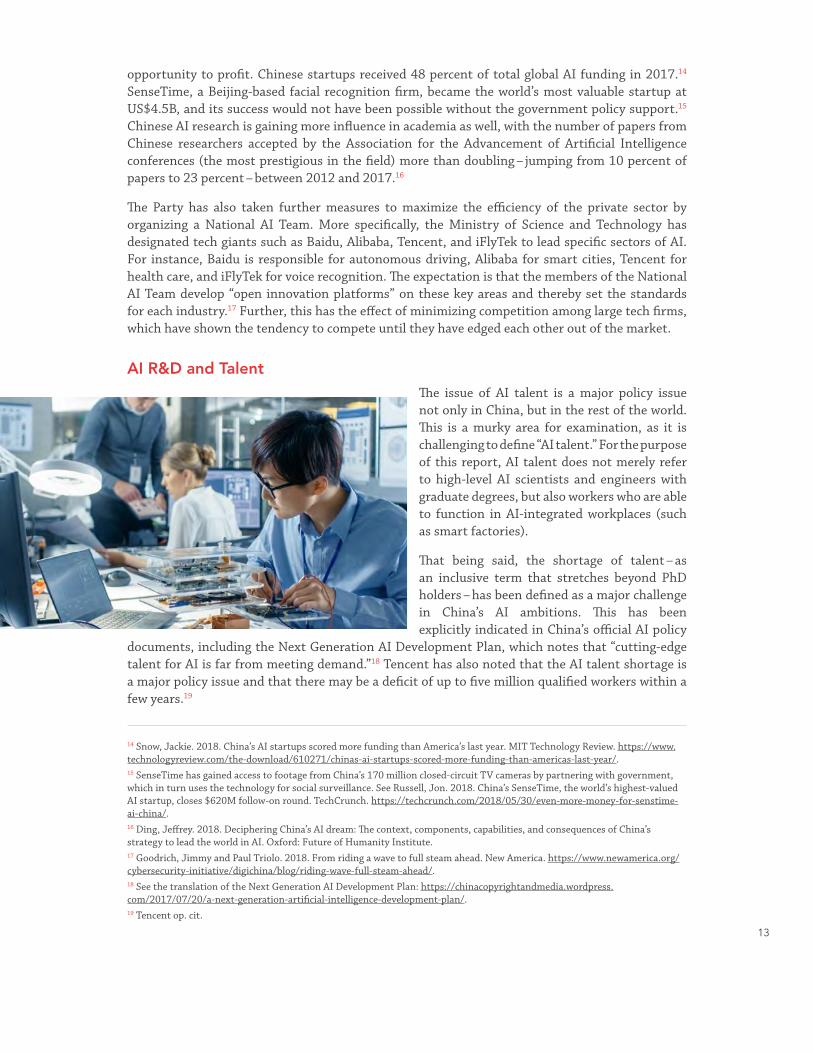
AI R&D and TalentThe issue of AI talent is a major policy issue not only in China, but in the rest of the world. This is a murky area for examination, as it is challenging to define “AI talent.” For the purpose of this report, AI talent does not merely refer to high-level AI scientists and engineers with graduate degrees, but also workers who are able to function in AI-integrated workplaces (such as smart factories).
That being said, the shortage of talent – as an inclusive term that stretches beyond PhD holders – has been defined as a major challenge in China’s AI ambitions. This has been explicitly indicated in China’s official AI policy
documents, including the Next Generation AI Development Plan, which notes that “cutting-edge talent for AI is far from meeting demand.”18 Tencent has also noted that the AI talent shortage is a major policy issue and that there may be a deficit of up to five million qualified workers within a few years.19
14 Snow, Jackie. 2018. China’s AI startups scored more funding than America’s last year. MIT Technology Review. https://www.technologyreview.com/the-download/610271/chinas-ai-startups-scored-more-funding-than-americas-last-year/.15 SenseTime has gained access to footage from China’s 170 million closed-circuit TV cameras by partnering with government, which in turn uses the technology for social surveillance. See Russell, Jon. 2018. China’s SenseTime, the world’s highest-valued AI startup, closes $620M follow-on round. TechCrunch. https://techcrunch.com/2018/05/30/even-more-money-for-senstime-ai-china/.16 Ding, Jeffrey. 2018. Deciphering China’s AI dream: The context, components, capabilities, and consequences of China’s strategy to lead the world in AI. Oxford: Future of Humanity Institute.17 Goodrich, Jimmy and Paul Triolo. 2018. From riding a wave to full steam ahead. New America. https://www.newamerica.org/cybersecurity-initiative/digichina/blog/riding-wave-full-steam-ahead/.18 See the translation of the Next Generation AI Development Plan: https://chinacopyrightandmedia.wordpress.com/2017/07/20/a-next-generation-artificial-intelligence-development-plan/.19 Tencent op. cit.
13
The Chinese government views addressing this talent shortage as a priority. Even before the launch of the AI Development Plan, the Chinese government had been proactive in recruiting international academic talent in science and engineering through the likes of the Thousand Talents Program, which focuses on repatriating Chinese researchers working abroad. Further, since the launch of the Plan, all relevant players involved in China’s AI development have been racing to attract talent. For instance, the municipality of Beijing introduced an incentive program for top AI talent in March 2018 that offered RMB1M (C$187,000) in cash prizes and a fast-tracked immigration process as perks.20
The private sector plays a key role in this space. Companies such as Baidu, Alibaba, and Tencent have been leveraging their financial resources to compete against other tech giants in the Silicon Valley and elsewhere to attract AI talent from around the world. Nick Zhang, president of the Wuzhen Institute, said experienced AI researchers are being offered a salary of US$1M or more by major companies.21 The combined efforts of the Chinese in this space seem to be yielding results. According to a Tencent report, the proportion of foreign AI talent in China increased from 5.2 percent to 7 percent between 2015 and 2017.22 In addition, these companies have also established AI labs outside China, such as Baidu’s driverless cars laboratory in the Silicon Valley or Tencent’s AI research lab in Seattle.
However, in the long run, China’s priority is to strengthen its own AI talent pool, and it has started investing in AI education at the national level. In April 2018, the Ministry of Education issued the AI Innovation Action Plan for Colleges and Universities, which seeks to make Chinese research and academic institutions the leaders of AI innovation and training by 2030, in line with the goals of the Next Generation AI Development Plan.23 Under this Action Plan, 100 AI specialization programs for specific domains (e.g. AI plus health care, AI plus transportation) would be created by 2020 through the development of 50 sets of world-class teaching materials, 50 national-level, high-quality online courses, and 50 AI institutes. By doing this, the Chinese government addresses the talent shortage in not only academic research, but also in lower-level, technical applications in different sectors that seek to integrate AI.
Further, under this initiative, AI expert and venture capitalist Kai-Fu Lee’s Sinovation Ventures, created in 2017 to offer AI talent in Beijing, partnered with the Ministry of Education and Peking University to develop a plan to educate at least 5,000 students and 500 teachers within the next five years. At the pre-university level, 40 high schools have teamed up with SenseTime for the AI high school program, and there are reports of elementary schools introducing basic AI curricula to their students as well.
AI ELSI For Canadians, China’s engagement with AI from the ELSI perspective is a major concern. As a liberal democracy, the use of AI for social surveillance and militarization – especially with the explicit emphasis on civil-military technology transfer in China’s official strategies – raises major
20 Lee, Amanda. 2018. Beijing offers 1 million yuan in cash incentives, long-term visas and ‘green card’ to attract global talent. South China Morning Post. https://www.scmp.com/tech/china-tech/article/2138630/beijing-offers-1m-yuan-cash-incentives-long-term-visas-and-green.21 Cyranoski, David. 2018. China enters the battle for AI talent. Nature. https://www.nature.com/articles/d41586-018-00604-6.22 Tencent op. cit.23 See the summary of the AI Innovation Action Plan for Colleges and Universities: https://medium.com/syncedreview/china-puts-education-focus-on-ai-plans-50-ai-research-centres-by-2020-5589c35ba701.
14
concerns. It also seemingly justifies the call to securitize Canada’s digital assets with regards to China, as the United States has done by limiting access to U.S. research institutes and funding. This is an especially difficult topic of discussion, as it is layered with cultural and political differences between the two countries, amplifying the sense of anxiety and fear that has characterized the world’s response to China’s rapid rise to power. In this light, it is important to consider the different ways in which China approaches AI ELSI and identify areas where constructive engagements could be pursued.
First, it is true that China uses AI for social surveillance and military applications. It regards such applications of AI as directly relating to the maintenance of stability (“social harmony”) and therefore is unlikely to yield to any compromise in this area. The government plays a clear role as a client in acquiring key AI technologies for social surveillance. Since 2015, the Chinese government has been rolling out the social credit system, which rates citizens based on their behaviours within society. Based on their rating, citizens could be either punished (e.g. banned from public transit, denied loans) or rewarded (e.g. discounts on public bicycle rental fees, access to government loans). The program is expected to be rolled out nationally by 2020, and international experts have expressed concerns about the added surveillance capacity of the Chinese government and the potential implications for democratic institutions abroad as well.24 In this light, it is difficult to imagine China being receptive to international AI ethics guidelines or standards that emphasize democratic values, such as the Montreal Declaration25 or the European Commission’s Ethics Guidelines for Trustworthy AI.26
It is also important to consider other approaches to AI ELSI in China. Indeed, the Party is using AI in a way that does not match the values of liberal democratic societies like Canada’s – such as developing tools of social surveillance and allowing companies to access private data and test out AI products and services in a way that may jeopardize citizens’ safety from the Canadian perspective. However, this does not mean that China is unaware of or indifferent to the potential dangers of AI, or that the Chinese people are passively accepting these illiberal uses by the Party. Arguably, the opposite is true.
24 Hoffman, Samantha. 2018. Social credit: Technology-enhanced authoritarian control with global consequences. Canberra: Australian Strategic Policy Institute.25 Link to Montréal Declaration: https://www.montrealdeclaration-responsibleai.com/.26 Link to Guidelines for Trustworthy AI: https://ec.europa.eu/futurium/en/ai-alliance-consultation.
15
At the public level, there are concerns about AI ELSI. Chinese citizens are aware of the potential dangers of AI, as shown in a March 2018 poll that indicated 76.3 percent of Chinese people saw AI as a threat to their privacy.27 Chinese consumers have been pushing back against misuse of private data by raising their concerns online, as well as initiating lawsuits. For the Chinese government, which greatly cares about its legitimacy, this is not an issue that it will merely disregard to meet the economic targets of the Next Generation AI Development Plan; in fact, it regards itself as the key player in protecting the collective well-being of its citizens. For instance, the Ministry of Industry and Information Technology issued warnings to Baidu, news platform Toutiao, and online payment platform Alipay for their misuse of personal data and ordered the companies to address the complaints from concerned citizens.28
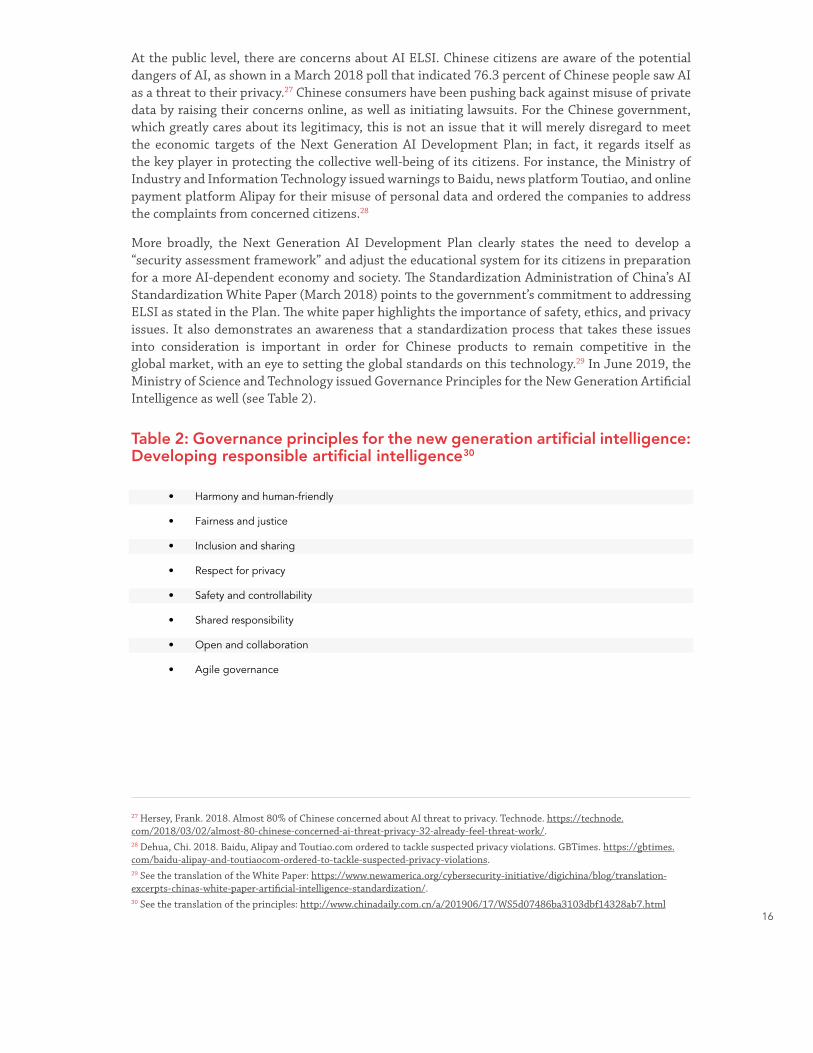
More broadly, the Next Generation AI Development Plan clearly states the need to develop a “security assessment framework” and adjust the educational system for its citizens in preparation for a more AI-dependent economy and society. The Standardization Administration of China’s AI Standardization White Paper (March 2018) points to the government’s commitment to addressing ELSI as stated in the Plan. The white paper highlights the importance of safety, ethics, and privacy issues. It also demonstrates an awareness that a standardization process that takes these issues into consideration is important in order for Chinese products to remain competitive in the global market, with an eye to setting the global standards on this technology.29 In June 2019, the Ministry of Science and Technology issued Governance Principles for the New Generation Artificial Intelligence as well (see Table 2).
Table 2: Governance principles for the new generation artificial intelligence: Developing responsible artificial intelligence 30
• Harmony and human-friendly
• Fairness and justice
• Inclusion and sharing
• Respect for privacy
• Safety and controllability
• Shared responsibility
• Open and collaboration
• Agile governance
27 Hersey, Frank. 2018. Almost 80% of Chinese concerned about AI threat to privacy. Technode. https://technode.com/2018/03/02/almost-80-chinese-concerned-ai-threat-privacy-32-already-feel-threat-work/.28 Dehua, Chi. 2018. Baidu, Alipay and Toutiao.com ordered to tackle suspected privacy violations. GBTimes. https://gbtimes.com/baidu-alipay-and-toutiaocom-ordered-to-tackle-suspected-privacy-violations.29 See the translation of the White Paper: https://www.newamerica.org/cybersecurity-initiative/digichina/blog/translation-excerpts-chinas-white-paper-artificial-intelligence-standardization/.30 See the translation of the principles: http://www.chinadaily.com.cn/a/201906/17/WS5d07486ba3103dbf14328ab7.html
16
ConclusionThe main takeaway of this section is that China regards AI as a key technology for its national competitiveness, and it has been investing substantial resources to achieve its goal of becoming the global leader in AI – in both research and application – by 2030. Regardless of the quality of China’s AI innovation, the government’s announcement of the Next Generation AI Development Plan has made quite a splash among the relevant stakeholders (private sector, academia, local governments) and also outside China. The perceived importance of AI for future national competitiveness, combined with the scale and speed of China’s AI agenda, has generated concern and anxiety from the rest of the world, especially regarding China’s seemingly illiberal application of the technology.
It is necessary to understand that China’s AI ambitions are pursued in a comprehensive manner, one that does not really operate with the same clear demarcation between public and private that Canadians are familiar with. As stated in the Next Generation AI Development Plan, the development of AI in China allows technology transfer between civil and military uses. While it would be imprudent to entirely securitize Canada’s research assets or businesses against China and cease engagement, it is necessary to critically approach Chinese investment in Canadian AI research institutes or commercial deals. As such, China’s whole-of-
the-nation approach must be taken into consideration and addressed commensurately in dealing with it on AI, whether it is on research collaboration or business engagement.
At the same time, the Government of Canada has an opportunity to positively influence China’s use of this technology through smart engagement. There are no widely embraced international standards on the R&D and use of AI, and China has the ambition of being a norm-setter in this area. The relationship between China and the United States continues to become more frigid, and the European Union has become increasingly vocal in integrating explicitly liberal values into its digital policies. In this context, there is an opportunity for Canada to play the role of a middle power in finding pragmatic areas of collaboration with China, such as in the development of ethics guidelines on data and AI technologies, eschewing more sensitive topics such as social surveillance or military applications, and addressing non-political yet critical aspects of AI regulation focused on safety. China’s recent softening stance on AI development and its call for international collaboration further suggests that there is such an opportunity for Canada.31
Overall, Canada must invest more resources in developing and implementing necessary measures to not only manage its domestic technology agenda, but also to manage its relations in the arena of foreign policy where technology and China are increasingly becoming more and more important.
31 Knight, Will. 2018. China’s leaders are softening their stance on AI. MIT Technology Review. https://www.technologyreview.com/s/612141/chinas-leaders-are-calling-for-international-collaboration-on-ai/.
17
JAPAN
Government PoliciesAI is embedded within Japan’s overall growth agenda, characterized by the vision of Society 5.0. Prime Minister Abe came to power in 2012 with an aggressive economic policy called Abenomics, characterized by measures designed to tackle economic stagnation, which had been identified as a long-term problem stemming from fundamental issues such as decreasing productivity and an aging population. Prime Minister Abe won by pledging to address these problems.
In this context, the Japanese government coined the concept of Society 5.0. This socio-economic vision aims to use emerging technologies – most notably, AI – to create “a human-centred society that balances economic advancement with the solution of social problems by a system that highly integrates cyberspace and physical space.”32 The concept was first introduced in 2016 through the Ministry of Education, Culture, Sports, Science, and Technology (MEXT) in its fifth Science and Technology Basic Plan, Japan’s five-year science and technology strategy.33 Society 5.0 was further integrated into Japan’s greater economic development strategy by the Council on Investments for the Future in June 2017, when it announced the new Growth Strategy that explicitly articulated the goal of realizing the visions of Society 5.0 and selected health care, mobility, distribution, smart cities, and financial technology as priority areas. Further, the Growth Strategy introduced the following objectives:
• Investment of government resources in strategic fields, leveraging Japan’s strength;
• Development of data platforms for inter-connected utilization of data across different fields and provision of public data for private sector needs;
• Support for individual-focused adult education and strengthening of IT skills of citizens;
• Introduction of a “regulatory sandbox system”34 to try out new ideas; and
• Linkage of the aforementioned measures to a wide range of regions, companies, and people.35
As part of realizing the visions of Society 5.0, the Cabinet created the Strategic Council for AI Technology to specifically address AI R&D and implementation. In this, the Strategic Council serves as a “control tower” for three main ministries relevant to AI: MEXT, the Ministry of Internal Affairs and Communications (MIC), and the Ministry of Economy, Trade, and Industry (METI).
32 Society 5.0. Cabinet Office. https://www8.cao.go.jp/cstp/english/society5_0/index.html.33 Ministry of Education, Culture, Sports, Science and Technology – Japan. Japan’s 5th Science and Technology Basic Plan. http://www.mext.go.jp/en/policy/science_technology/lawandplan/title01/detail01/1375311.htm.34 Regulatory sandboxes refer to testing grounds for new business models that are not protected by current regulation or supervised by regulatory institutions.35 2017. Council on Investments for the Future. Prime Minister of Japan and His Cabinet. https://japan.kantei.go.jp/97_abe/actions/201705/30article6.html.
18
The Strategic Council co-ordinates policies within these ministries and sometimes others, such as Ministry of Health or Ministry of Agriculture, when relevant. These ministries have also been responsible for national institutes that conduct relevant research on AI, such as the National Institute of Information and Communications Technology (NICT), the National Institute of Physical and Chemical Research (RIKEN), or the National Institute of Advanced Industrial Science and Technology (AIST), which further gives them the ability to facilitate the government-industry-academia collaboration on AI.
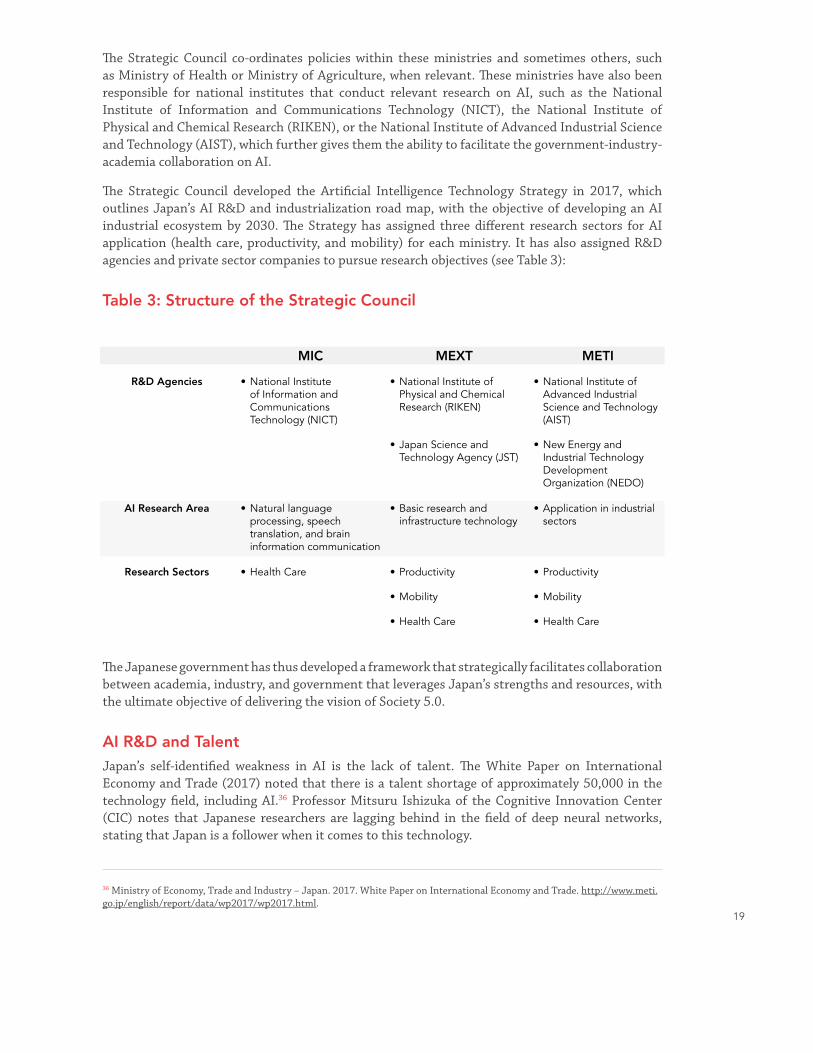
The Strategic Council developed the Artificial Intelligence Technology Strategy in 2017, which outlines Japan’s AI R&D and industrialization road map, with the objective of developing an AI industrial ecosystem by 2030. The Strategy has assigned three different research sectors for AI application (health care, productivity, and mobility) for each ministry. It has also assigned R&D agencies and private sector companies to pursue research objectives (see Table 3):
Table 3: Structure of the Strategic Council
R&D Agencies
AI Research Area
Research Sectors
MIC
• National Institute of Information and Communications Technology (NICT)
• Natural language processing, speech translation, and brain information communication
• Health Care
MEXT
• National Institute of Physical and Chemical Research (RIKEN)
• Japan Science and Technology Agency (JST)
• Basic research and infrastructure technology
• Productivity
• Mobility
• Health Care
METI
• National Institute of Advanced Industrial Science and Technology (AIST)
• New Energy and Industrial Technology Development Organization (NEDO)
• Application in industrial sectors
• Productivity
• Mobility
• Health Care
The Japanese government has thus developed a framework that strategically facilitates collaboration between academia, industry, and government that leverages Japan’s strengths and resources, with the ultimate objective of delivering the vision of Society 5.0.
AI R&D and TalentJapan’s self-identified weakness in AI is the lack of talent. The White Paper on International Economy and Trade (2017) noted that there is a talent shortage of approximately 50,000 in the technology field, including AI.36 Professor Mitsuru Ishizuka of the Cognitive Innovation Center (CIC) notes that Japanese researchers are lagging behind in the field of deep neural networks, stating that Japan is a follower when it comes to this technology.
36 Ministry of Economy, Trade and Industry – Japan. 2017. White Paper on International Economy and Trade. http://www.meti.go.jp/english/report/data/wp2017/wp2017.html.
19
Major corporations lead AI R&D and talent recruitment in Japan, as they have the financial resources to attract AI talent. According to a Canadian official in Tokyo, while Japanese companies have been reluctant to look outside Japan thus far, the lack of talent in AI has made them more willing to collaborate with international partners. The Perspectives on Artificial Intelligence/Robotics and Work/Employment report by Artificial Intelligence Research for Human (AIR) notes that corporations have started hiring foreign talent to address this gap.37 The official, however, notes that most Japanese companies are
looking for access to foreign AI talent through the purchase of startups abroad or on a consulting basis, as opposed to hiring and bringing them to Japan. The Japanese private sector’s interest in accessing Canadian AI talent is reflected in Fujitsu’s recent opening of its global AI headquarters in Vancouver, BC, in November 2018.
The government’s commitment to promoting AI has had a positive impact on AI education, spurring collaboration between private and public sector entities. MEXT and METI have together created AI-related university programs, convening a national consultative body with post-secondary institutions, the Japan Business Federation, and industry stakeholders to address talent shortages and weaknesses in research.38 Further, government ministries are collaborating closely with national research institutes and the private sector to advance research and application in the fields that they have been assigned. The Japan Deep Learning Association (JDLA) has launched an AI certificate program, in which engineers and managers go through short-term training on AI fundamentals. Lastly, Japan Science and Technology Agency also offers JPY150M to JPY500M (C$1.8M to C$6M) worth of funding in the area of AI and big data, and PRESTO for Young Researchers provides JPY30M to JPY40M (C$360,000 to C$480,000) for each three-year project for young, rising AI researchers.
AI ELSI Society 5.0 regards economic growth and solutions for social problems as inseparable. Thus, in addition to R&D and economic growth, Society 5.0 includes Japan’s approach to ELSI in relation to AI development. The Cabinet’s commitment to ELSI is most notable in the establishment of the Advisory Board on Artificial Intelligence and Human Society.39 The Advisory Board consists of 12 members from different academic backgrounds (humanities, social sciences, engineering, law, etc.) and is designed to advise the Cabinet on ELSI matters related to AI from an interdisciplinary perspective. The Board’s Report on Artificial Intelligence and Human Society (March 2017)
37 Ministry of Education, Culture, Sports, Science and Technology – Japan. Acceptable Intelligence with Responsibility, Perspectives on Artificial Intelligence/Robotics and Work/Employment. http://www.mext.go.jp/en/policy/science_technology/lawandplan/title01/detail01/1375311.htm.38 Harris, Paul. 2017. Research brief: Developments in artificial intelligence (AI) in Japan and implications for Australia. Department of Education and Training. https://internationaleducation.gov.au/International-network/japan/PolicyUpdates-Japan/Documents/AI%20in%20Japan%20research%20brief_07-2017.pdf.39 Ema, Arisa. 2017. EADv2 Regional Reports on A/IS Ethics: Japan. The IEEE Global Initiative on Ethics of Autonomous and Intelligent Systems. https://standards.ieee.org/content/dam/ieee-standards/standards/web/documents/other/eadv2_regional_report.pdf.
20
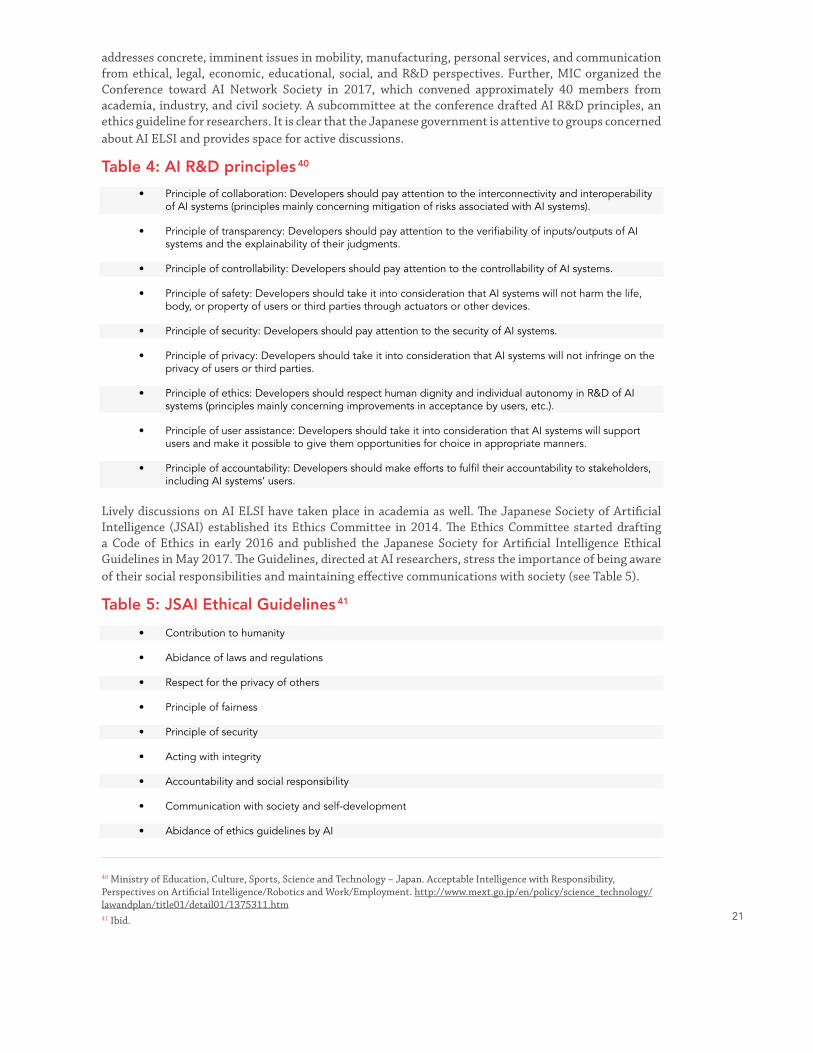
addresses concrete, imminent issues in mobility, manufacturing, personal services, and communication from ethical, legal, economic, educational, social, and R&D perspectives. Further, MIC organized the Conference toward AI Network Society in 2017, which convened approximately 40 members from academia, industry, and civil society. A subcommittee at the conference drafted AI R&D principles, an ethics guideline for researchers. It is clear that the Japanese government is attentive to groups concerned about AI ELSI and provides space for active discussions.
Table 4: AI R&D principles 40
Lively discussions on AI ELSI have taken place in academia as well. The Japanese Society of Artificial Intelligence (JSAI) established its Ethics Committee in 2014. The Ethics Committee started drafting a Code of Ethics in early 2016 and published the Japanese Society for Artificial Intelligence Ethical Guidelines in May 2017. The Guidelines, directed at AI researchers, stress the importance of being aware of their social responsibilities and maintaining effective communications with society (see Table 5).
Table 5: JSAI Ethical Guidelines 41
• Principle of collaboration: Developers should pay attention to the interconnectivity and interoperability of AI systems (principles mainly concerning mitigation of risks associated with AI systems).
• Principle of transparency: Developers should pay attention to the verifiability of inputs/outputs of AI systems and the explainability of their judgments.
• Principle of controllability: Developers should pay attention to the controllability of AI systems.
• Principle of safety: Developers should take it into consideration that AI systems will not harm the life, body, or property of users or third parties through actuators or other devices.
• Principle of security: Developers should pay attention to the security of AI systems.
• Principle of privacy: Developers should take it into consideration that AI systems will not infringe on the privacy of users or third parties.
• Principle of ethics: Developers should respect human dignity and individual autonomy in R&D of AI systems (principles mainly concerning improvements in acceptance by users, etc.).
• Principle of user assistance: Developers should take it into consideration that AI systems will support users and make it possible to give them opportunities for choice in appropriate manners.
• Principle of accountability: Developers should make efforts to fulfil their accountability to stakeholders, including AI systems’ users.
• Contribution to humanity
• Abidance of laws and regulations
• Respect for the privacy of others
• Principle of fairness
• Principle of security
• Acting with integrity
• Accountability and social responsibility
• Communication with society and self-development
• Abidance of ethics guidelines by AI
40 Ministry of Education, Culture, Sports, Science and Technology – Japan. Acceptable Intelligence with Responsibility, Perspectives on Artificial Intelligence/Robotics and Work/Employment. http://www.mext.go.jp/en/policy/science_technology/lawandplan/title01/detail01/1375311.htm41 Ibid. 21
There are also other groups, such as the JDLA and AIR. As such, there are forums in Japan for interdisciplinary scholars to raise AI ELSI matters to policy-makers as large-scale domestic policies are formulated. AI ELSI continues to raise concerns around the world. In this context, Japan, a country with a great AI ambition, the technological capability to deliver it, and similar political values as Canadians, stands out as a promising partner in the area of international governance in matters of AI ELSI.
Japan has started mobilizing its resources to play an active role in shaping the international governance of AI. During his policy speech delivered to the National Diet on January 28, 2019, Prime Minister Abe announced that Japan “will take the lead in establishing human-centred ethical principles for AI.”42 His administration has thus far followed through with this pledge. Japan has agreed to collaborate more closely with Canada and the European Union on AI during Prime Minister Abe’s trips in April and May, with an emphasis on promoting “human-centric” uses of the technology.
ConclusionStrong, centralized leadership by the government underscores Japan’s AI strategy. The policies that the Japanese government has rolled out thus far make it very clear that it regards increasing its R&D capacities and integrating AI into its economy – particularly the manufacturing sector – a key priority within the national economic agenda. The formation of the Strategic Council – the control tower – underscores the importance of the government support. The Council creates the space for key ministries – MEXT, METI, and MIC – to co-ordinate their AI policies, while also providing a forum for policy-makers, industry, and research to collaborate in creating the foundation for a new economy driven by emerging technologies such as AI.
The emphasis on AI within Japan’s greater economic policy has spilled over to the private sector in the area of talent. The government and the industry are keenly aware of Japan’s lag in basic AI research, and they are looking at Canada to fill the gap. Japanese companies, known for their conservative attitude toward foreign workers, are now realizing that they need to work with those abroad in order to complement their weakness in AI research. Japan’s capital and manufacturing capabilities could be effectively coupled with Canada’s strength in AI basic research.
Finally, the Japanese government’s proactive movement in AI ELSI again underscores the degree of importance that it has invested in AI. The fact that the government has invested in internal bodies such as the Advisory Board on Artificial Intelligence and Human Society highlights the Japanese government’s understanding that AI cannot be confined to the realm of science and technology policy, but that of the greater national development policy. Further, Japanese AI ELSI bodies have been active in producing early and widely distributed AI ethics guidelines, with an eye to the international governance of the technology.
42 Cabinet Public Relations Office. 2019. Policy Speech by Prime Minister Shinzo Abe to the 198th Session of the Diet. https://japan.kantei.go.jp/98_abe/statement/201801/_00003.html.
22

Overall, the review of Japan’s AI strategy demonstrates that Japan, like China, considers AI and its integration into the economy as a priority within its national economic agenda, and that it has been making use of its powerful government bureaucracy to spur the collaboration between policy-makers, industry, and academia. Japan’s strategy is comprehensive and co-ordinated, viewing AI as a key marker of global competitiveness for Japan in the world.
In this context, Japan stands as an attractive partner for collaboration in the space of AI. Canada’s strength in basic research complements Japan’s strength in manufacturing and application, as well as abundance of capital. Further, the alignment of values between Japan and Canada suggests that the two could also collaborate in the promotion of global AI governance. Being mindful of Japan’s substantial commitment to AI, the Government of Canada should look to Japan for a like-minded partner.
23
SOUTH KOREA
Government PoliciesIn 2017, the Ministry of Science, ICT, and Future Planning (now the Ministry of Science and ICT) launched the Mid-to-Long-Term Master Plan in Preparation for the Intelligent Information Society: Managing the Fourth Industrial Revolution. The policy document addresses R&D strategies and potential ELSI of greater use of AI and introduces a road map for achieving the following goals:
• Build a world-class technological foundation;
• Promote intelligent industry43; and
• Revise existing social policies and regulations.
The document provides a framework for collaboration between technology, industry, and civil society with a 30-year time frame. The Ministry of Science, ICT, and Future Planning was re-structured to the Ministry of Science and ICT with the change of power in May 2017, and the Mid-to-Long-Term Master Plan has become outdated. However, the Plan reflects the South Korean government’s basic approach to AI, which is re-articulated in more detail through the Presidential Committee on the Fourth Industrial Revolution (PCFIR).
Newly elected President Moon Jae-in established the PCFIR in November 2018. Operating under the motto “led by the private sector, supported by the government,” the PCFIR features a roster of private sector leaders and academics alongside five ministers from relevant departments and the science advisor to the President, totalling 25 members (see Table 6). Approximately 30 staff members from the Ministry of Science and ICT support the day-to-day operations of the PCFIR.
43 When South Korean documents refer to “intelligence” or “intelligent,” it often refers to AI in particular.24
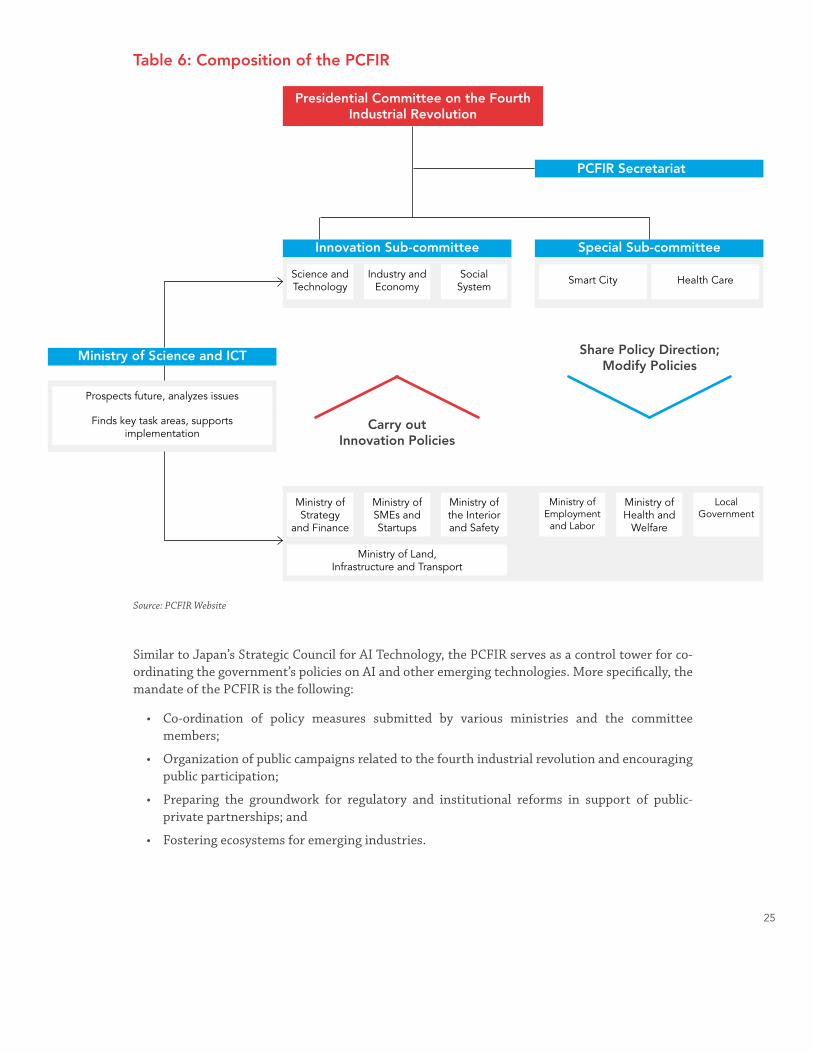
Table 6: Composition of the PCFIR
Similar to Japan’s Strategic Council for AI Technology, the PCFIR serves as a control tower for co-ordinating the government’s policies on AI and other emerging technologies. More specifically, the mandate of the PCFIR is the following:
• Co-ordination of policy measures submitted by various ministries and the committee members;
• Organization of public campaigns related to the fourth industrial revolution and encouraging public participation;
• Preparing the groundwork for regulatory and institutional reforms in support of public-private partnerships; and
• Fostering ecosystems for emerging industries.
Presidential Committee on the Fourth Industrial Revolution
PCFIR Secretariat
Special Sub-committeeInnovation Sub-committee
Carry out Innovation Policies
Share Policy Direction; Modify Policies
Ministry of Science and ICT
Smart City Health CareScience and Technology
Ministry of Strategy
and Finance
Ministry of Employment
and Labor
Ministry of SMEs and Startups
Ministry of Health and
Welfare
Ministry of Land, Infrastructure and Transport
Ministry of the Interior and Safety
Local Government
Prospects future, analyzes issues
Finds key task areas, supports implementation
Industry and Economy
Social System
Source: PCFIR Website
25
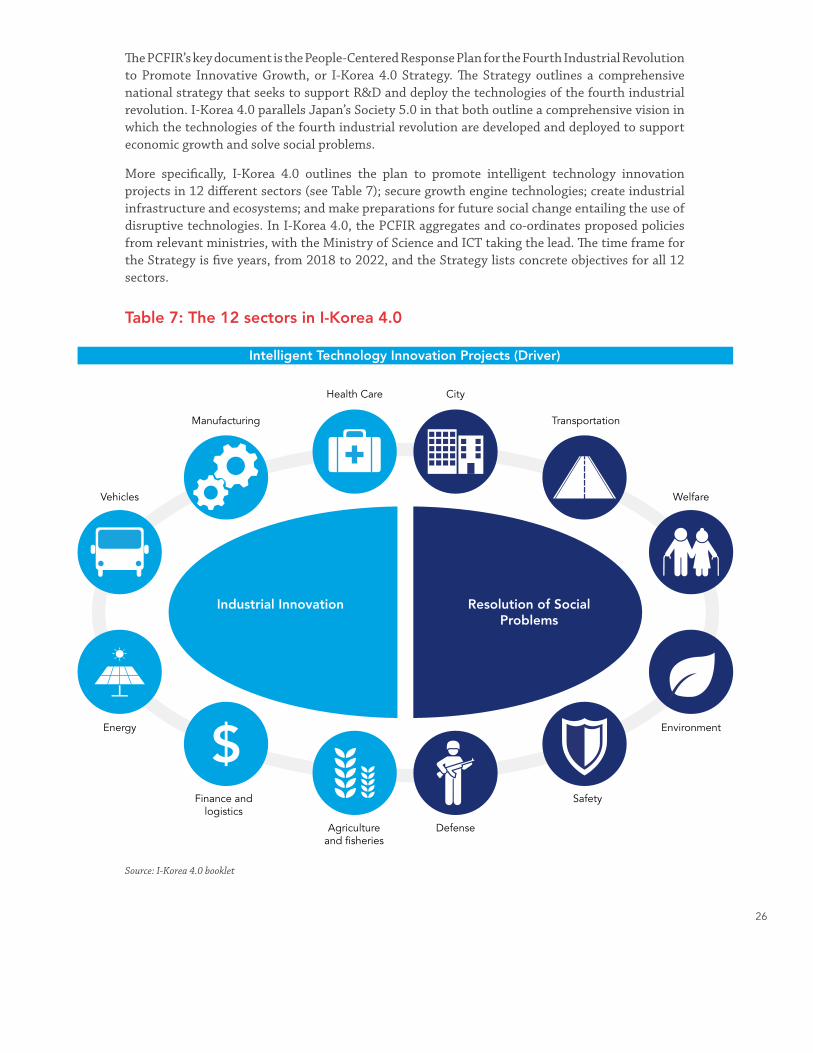
The PCFIR’s key document is the People-Centered Response Plan for the Fourth Industrial Revolution to Promote Innovative Growth, or I-Korea 4.0 Strategy. The Strategy outlines a comprehensive national strategy that seeks to support R&D and deploy the technologies of the fourth industrial revolution. I-Korea 4.0 parallels Japan’s Society 5.0 in that both outline a comprehensive vision in which the technologies of the fourth industrial revolution are developed and deployed to support economic growth and solve social problems.
More specifically, I-Korea 4.0 outlines the plan to promote intelligent technology innovation projects in 12 different sectors (see Table 7); secure growth engine technologies; create industrial infrastructure and ecosystems; and make preparations for future social change entailing the use of disruptive technologies. In I-Korea 4.0, the PCFIR aggregates and co-ordinates proposed policies from relevant ministries, with the Ministry of Science and ICT taking the lead. The time frame for the Strategy is five years, from 2018 to 2022, and the Strategy lists concrete objectives for all 12 sectors.
Table 7: The 12 sectors in I-Korea 4.0
Intelligent Technology Innovation Projects (Driver)
Source: I-Korea 4.0 booklet
26
Industrial Innovation Resolution of Social Problems
City
Transportation
Welfare
Environment
Safety
DefenseAgriculture and fisheries
Finance and logistics
Energy
Vehicles
Manufacturing
Health Care
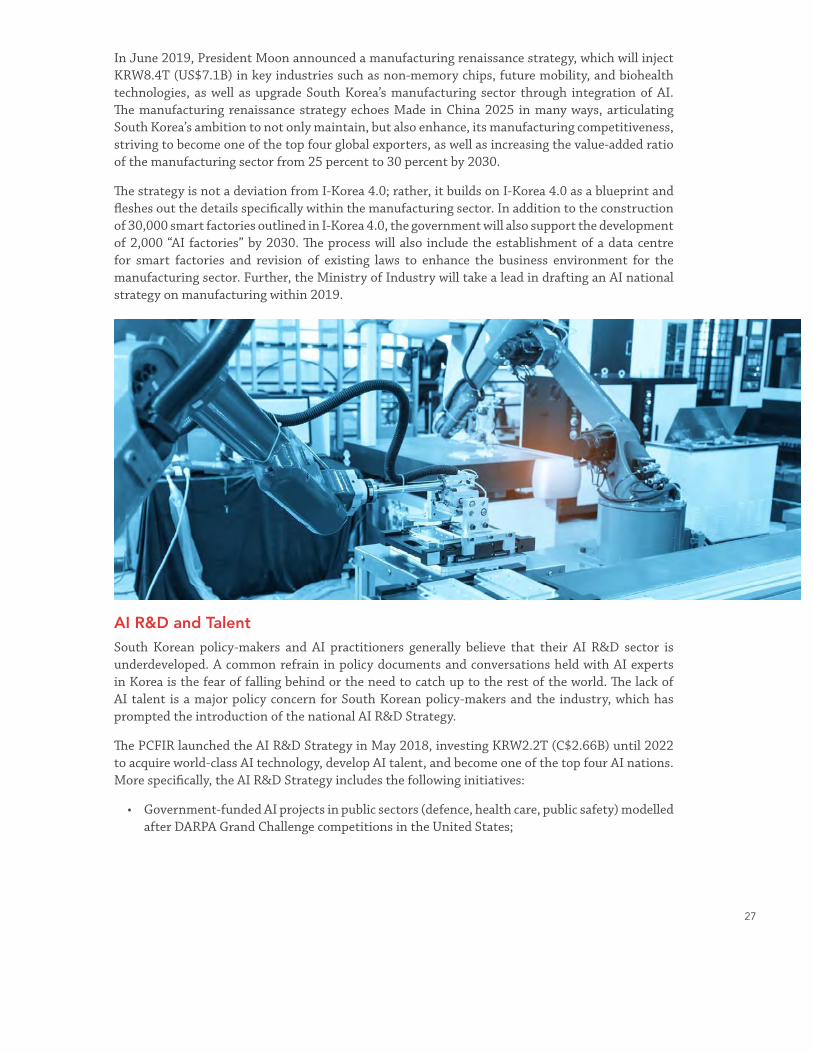
In June 2019, President Moon announced a manufacturing renaissance strategy, which will inject KRW8.4T (US$7.1B) in key industries such as non-memory chips, future mobility, and biohealth technologies, as well as upgrade South Korea’s manufacturing sector through integration of AI. The manufacturing renaissance strategy echoes Made in China 2025 in many ways, articulating South Korea’s ambition to not only maintain, but also enhance, its manufacturing competitiveness, striving to become one of the top four global exporters, as well as increasing the value-added ratio of the manufacturing sector from 25 percent to 30 percent by 2030.
The strategy is not a deviation from I-Korea 4.0; rather, it builds on I-Korea 4.0 as a blueprint and fleshes out the details specifically within the manufacturing sector. In addition to the construction of 30,000 smart factories outlined in I-Korea 4.0, the government will also support the development of 2,000 “AI factories” by 2030. The process will also include the establishment of a data centre for smart factories and revision of existing laws to enhance the business environment for the manufacturing sector. Further, the Ministry of Industry will take a lead in drafting an AI national strategy on manufacturing within 2019.
AI R&D and TalentSouth Korean policy-makers and AI practitioners generally believe that their AI R&D sector is underdeveloped. A common refrain in policy documents and conversations held with AI experts in Korea is the fear of falling behind or the need to catch up to the rest of the world. The lack of AI talent is a major policy concern for South Korean policy-makers and the industry, which has prompted the introduction of the national AI R&D Strategy.
The PCFIR launched the AI R&D Strategy in May 2018, investing KRW2.2T (C$2.66B) until 2022 to acquire world-class AI technology, develop AI talent, and become one of the top four AI nations. More specifically, the AI R&D Strategy includes the following initiatives:
• Government-funded AI projects in public sectors (defence, health care, public safety) modelled after DARPA Grand Challenge competitions in the United States;
27

• Creation of six additional AI graduate programs and five AI R&D institutes for training 5,000 new AI specialists by 2022;
• Promotion of AI application in promising industries (e.g. pharmaceutical research); and
• Creation of an AI hub to provide data relevant to local entrepreneurs and industries.
Adding to the challenge is the disparity in resources between the conglomerates and small and medium-sized enterprises (SMEs). Startups and SMEs currently compete against multinational conglomerates (e.g. Samsung, LG) that are not only acquiring talent from within, but also from the rest of the world.
Table 8: AI research centres of South Korean Multinational Corporations
South Korean conglomerates have started looking abroad to access top AI talent around the world. Naver (often referred to as South Korea’s Google) purchased XRCE in France to gain access to 80 top European AI experts. The conglomerates have also been active in Canada. Samsung opened its second North American AI Centre in Toronto in May 2018, following the launch of its AI lab in Montreal in partnership with the Université de Montréal’s MILA (one of the three AI clusters) in September 2017. LG also established a partnership with the University of Toronto – home to the Vector Institute, another AI cluster – to set up an AI research lab.
AI ELSI ELSI is integrated into South Korea’s blueprint for its fourth industrial revolution policies. The PCFIR’s objective of using cutting-edge technologies to boost economic growth and solve social problems makes it very clear that ELSI is a central concern for South Korea’s lawmakers. I-Korea 4.0 specifically points to policies of integrating AI into health care, welfare, the environment, and public safety. One of the PCFIR’s three subcommittees is the Social Institutions Subcommittee, which is tasked with innovation of employment and welfare policies, educational reforms to foster creativity, legal and policy reforms to solve real social problems, and international and community relations.
One of the four pillars of I-Korea 4.0 is to make preparations for future society. The PCFIR lists the following policy measures that fall within this pillar:
Corporate AI Research Labs
Naver Labs AI
SK Telecom AI
Samsung AI Center
LG AI Lab
SK T-Brain
Kakao Brain
Naver Clova
Samsung SDS AI
Hyundai Motors AI
Year of Establishment
2015
2016
2016
2017
2017
2017
2017
2017
2017
28
• Broadening of scope for employment insurance and strengthening of the social safety net for job retraining;
• Reflecting the changing nature of the work environment to ensure that workers in new industries are eligible for workers’ compensation;
• Creating an ethics guideline for AI;
• Creating measures to ensure that those negatively impacted by AI have a legal basis for proper compensation; and
• Continuing to hold multi-stakeholder discussions through the PCFIR to create “social consensus” on the government’s response to the fourth industrial revolution on labour, education, the social safety net, and ethics.
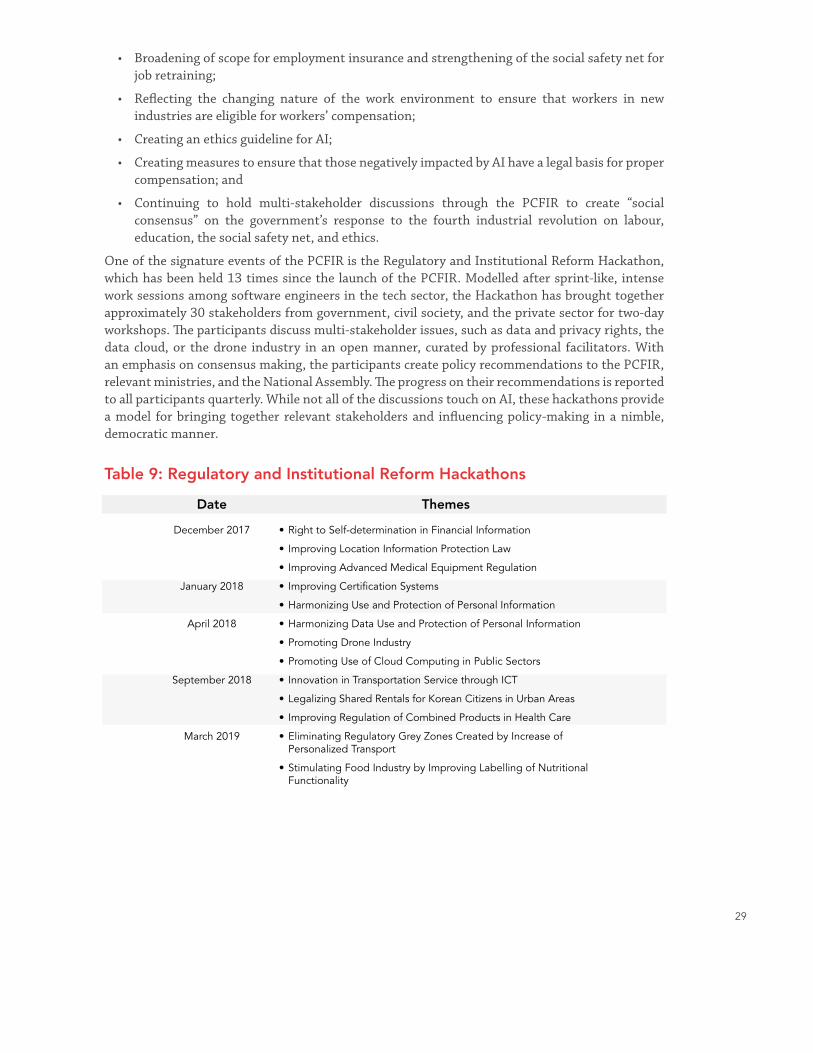
One of the signature events of the PCFIR is the Regulatory and Institutional Reform Hackathon, which has been held 13 times since the launch of the PCFIR. Modelled after sprint-like, intense work sessions among software engineers in the tech sector, the Hackathon has brought together approximately 30 stakeholders from government, civil society, and the private sector for two-day workshops. The participants discuss multi-stakeholder issues, such as data and privacy rights, the data cloud, or the drone industry in an open manner, curated by professional facilitators. With an emphasis on consensus making, the participants create policy recommendations to the PCFIR, relevant ministries, and the National Assembly. The progress on their recommendations is reported to all participants quarterly. While not all of the discussions touch on AI, these hackathons provide a model for bringing together relevant stakeholders and influencing policy-making in a nimble, democratic manner.
Table 9: Regulatory and Institutional Reform Hackathons
Date
December 2017
January 2018
April 2018
September 2018
March 2019
Themes
• Right to Self-determination in Financial Information
• Improving Location Information Protection Law
• Improving Advanced Medical Equipment Regulation
• Improving Certification Systems
• Harmonizing Use and Protection of Personal Information
• Harmonizing Data Use and Protection of Personal Information
• Promoting Drone Industry
• Promoting Use of Cloud Computing in Public Sectors
• Innovation in Transportation Service through ICT
• Legalizing Shared Rentals for Korean Citizens in Urban Areas
• Improving Regulation of Combined Products in Health Care
• Eliminating Regulatory Grey Zones Created by Increase of Personalized Transport
• Stimulating Food Industry by Improving Labelling of Nutritional Functionality
29

On the ethics front, the Ministry of ICT, in collaboration with the National Information Society Agency, released the Ethics Guideline for Intelligent Society in June 2018, as indicated by I-Korea 4.0. The Guideline builds on the principles of Seoul PACT (Publicness, Accountability, Controllability, and Transparency) (see Table 10).
Table 10: Seoul PACT
ConclusionSouth Korea’s rapid economic development following the ravages of the Korean War has been referred to as the Miracle on the Han River and became a benchmark for developing nations around the world. The miracle was made possible through economic policies in which the government and private sector entities collaborated closely with each other, taking a whole-of-the-nation approach to economic and social development. The catch-up mindset of the twentieth century is reflected in South Korea’s approach to AI and, more broadly, the fourth industrial revolution. Like China and Japan, South Korea regards AI as a key driver of the next generation economy and therefore a national project, closely tied to its global competitiveness. As such, the government has taken measures to ensure that South Korea does not fall behind the rest of the world, clearly articulated in its goal of becoming one of the top four AI nations by 2022. Canada’s C$125M investment in its national AI strategy pales in comparison to South Korea’s C$2.66B investment in its R&D strategy, and even more so considering other policy measures taken within the PCFIR’s greater agenda.
South Korea and Canada have strengths that complement each other. Experts have noted Canada’s strength in basic AI research, a product of a long-term investment in its scientists; meanwhile, South Korea excels in implementation and has hardware capacities through its strong manufacturing sector. South Korea’s emphasis on upgrading its manufacturing sector through integration of AI is consistent with the objectives of China and Japan, and also highlights the same opportunity for Canada: Canadian AI talent and the East Asian partner’s manufacturing capacity. The rush of South Korean conglomerates to Canada is a testament to this potential, and Canada should explore ways of harnessing this opportunity even further.
Publicness: Intelligent information technology should benefit as many people as possible, and the economic benefits produced by the technology should be shared widely for the prosperity of humanity.
Accountability: Clarify the distribution of liabilities entailed to intelligent information technology and related services, and ensure that the distribution of information on safety and protection of user rights and other related social duties is undertaken.
Controllability: Pre-emptively prepare responses to malfunctions of intelligent information technology and services, and ensure that user rights for choices be guaranteed as much as possible.
Transparency: R&D and design should strive to reflect opinions of users, consumers, and citizens; disclose potential dangers while in use; and ensure that personal information is processed appropriately.
30
Finally, the examination of South Korea’s approach to AI underscores the potential for collaboration between Canada and South Korea on the issues of AI ethics and broader politics of AI governance. The South Korean government is aware of – and has taken policy measures through the PCFIR to act upon – the potential ELSI of AI. When it comes to values, Canada and South Korea have more in common than not. Further, in light of the growing chasm between China and the United States, Canada and South Korea have the potential to collaborate closely on advocating for the ethical use of AI at the international level.
31
ANALYSIS & POLICY RECOMMENDATIONS
AnalysisThis review of AI policies in East Asia suggests that all three governments regard AI as a transformative technology that is critical to their economic and social development. They regard the state as a key actor in delivering this AI vision, and thus have created comprehensive strategies that stretch beyond R&D and talent development to consider AI’s integration into their economy and measures to address associated ELSI.
Accordingly, they have created AI-specific bodies, such as China’s AI Plan Promotion Office under the Ministry of Science and Technology; Japan’s Strategic Council for AI Technology; and South Korea’s Presidential Committee on the Fourth Industrial Revolution, to co-ordinate AI-related endeavours of different ministries and facilitate a coherent, long-term, national-scale plan of action.
These AI strategies create a framework in which a set of goals on AI development are outlined, and the private sector, with the policy support of the state, delivers them. More specifically, these strategies create a space where policy-makers, private enterprises, and academia can collaborate closely. South Korea’s strong bureaucracy and co-ordinated policy-making allow the state to play the role of facilitator among different stakeholders. Given that AI requires not only advances in R&D and capital, but also adjustment of existing policies and regulations at the government level, this comprehensive, national approach to AI will facilitate a favourable environment for the East Asian states to move forward in the AI space.
China, Japan, and South Korea believe that they are lagging behind in R&D and talent development, and therefore have prioritized these perceived deficiencies. They have enacted policies to address the shortage of AI talent, by both creating education programs and attracting foreign talent. Their private sectors are also aggressively recruiting and creating research centres abroad to access foreign AI talent. In this, they have shown considerable interest in gaining access to Canada’s AI ecosystem and talent.
Further, these government bodies and plans point to their awareness of ELSI resulting from increased deployment of AI. China’s Next Generation AI Development Plan and South Korea’s I-Korea 4.0 address the need to both adjust social and legal institutions in place and adequately prepare their citizens in the long run. Similarly, the Advisory Board in Japan has made recommendations on ELSI to the Cabinet through its Report on Artificial Intelligence and Human Society. All three East Asian governments display an awareness of the potential dangers of AI and a willingness to engage with the ELSI issues in both development and deployment with a long-term perspective.
AI development in each of the three states is considered a national project. The strategies of each country conform to the developmental state theory, which explains the past success of East Asian states in achieving rapid economic growth by appealing to the nationalist rhetoric that they
32
are falling behind the rest of the world and thereby justifying significant state involvement in economic planning.44 With the rise of AI geopolitics, therefore, it is important to understand that AI development is regarded as a national project, and Canada’s engagement in this space – whether the objectives are to promote trade or address national security concerns – requires a more comprehensive approach, especially with a technology like AI, which blurs previously set sectoral boundaries.
Finally, on values: it is important to understand that substantive discussion on AI ethics will have to go beyond broad statements featured in respective ethics guidelines. Table 11 demonstrates that ethics guidelines from the three East Asian states and Canada do not deviate much from each other. These guidelines share the idea that AI must be used for some sort of greater good, and that it must be used in a way that is safe, transparent, or responsible. From a broader point of view, the difference lies in the specific social, economic, political, and cultural context in which AI systems are deployed. This difference is an implicit premise of this report.
44 See Leftwich, Adrian. 1995. Bringing politics back in: Towards a model of developmental state. The Journal of Development Studies. 31(3).
33
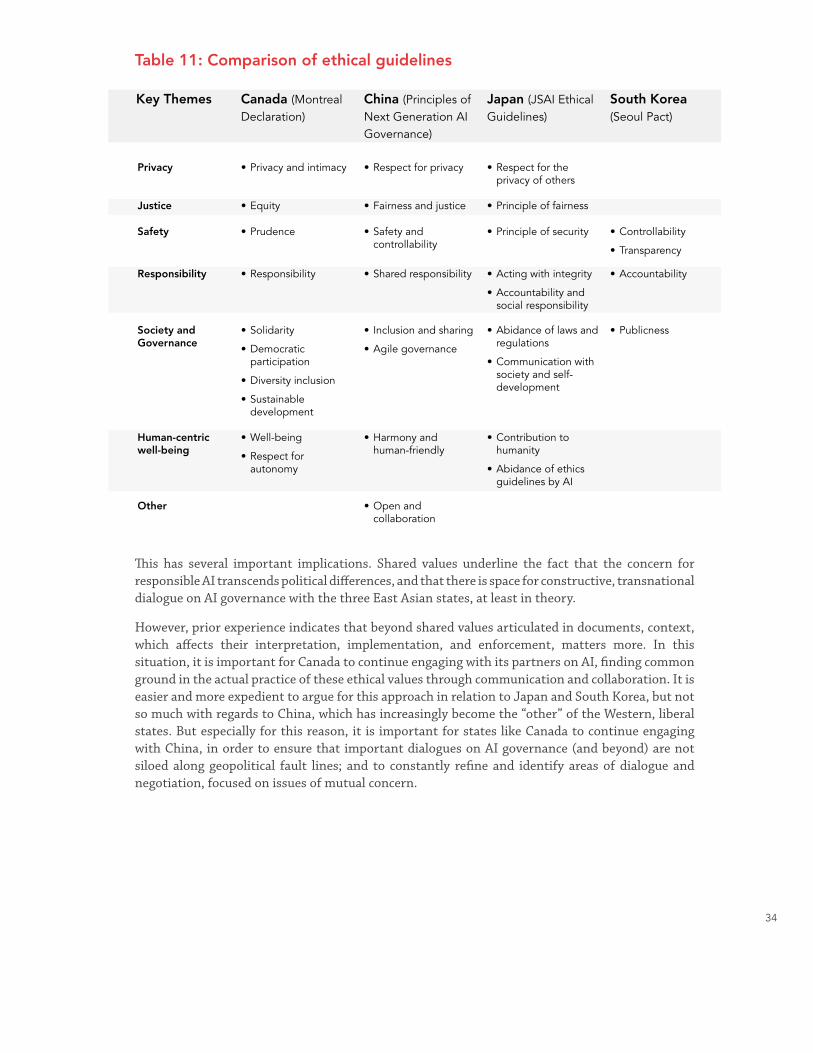
Table 11: Comparison of ethical guidelines
This has several important implications. Shared values underline the fact that the concern for responsible AI transcends political differences, and that there is space for constructive, transnational dialogue on AI governance with the three East Asian states, at least in theory.
However, prior experience indicates that beyond shared values articulated in documents, context, which affects their interpretation, implementation, and enforcement, matters more. In this situation, it is important for Canada to continue engaging with its partners on AI, finding common ground in the actual practice of these ethical values through communication and collaboration. It is easier and more expedient to argue for this approach in relation to Japan and South Korea, but not so much with regards to China, which has increasingly become the “other” of the Western, liberal states. But especially for this reason, it is important for states like Canada to continue engaging with China, in order to ensure that important dialogues on AI governance (and beyond) are not siloed along geopolitical fault lines; and to constantly refine and identify areas of dialogue and negotiation, focused on issues of mutual concern.
Key Themes
Privacy
Safety
Other
Responsibility
Society and Governance
Human-centric well-being
Justice
Canada (Montreal Declaration)
• Privacy and intimacy
• Prudence
• Responsibility
• Solidarity
• Democratic participation
• Diversity inclusion
• Sustainable development
• Well-being
• Respect for autonomy
• Equity
China (Principles of Next Generation AI Governance)
• Respect for privacy
• Safety and controllability
• Open and collaboration
• Shared responsibility
• Inclusion and sharing
• Agile governance
• Harmony and human-friendly
• Fairness and justice
Japan (JSAI Ethical Guidelines)
• Respect for the privacy of others
• Principle of security
• Acting with integrity
• Accountability and social responsibility
• Abidance of laws and regulations
• Communication with society and self-development
• Contribution to humanity
• Abidance of ethics guidelines by AI
• Principle of fairness
South Korea (Seoul Pact)
• Controllability
• Transparency
• Accountability
• Publicness
34
Policy RecommendationsRecommendation 1: Increase Canada’s capacity to govern AI in a co-ordinated manner at different levels of government.
Canada stands to benefit from the Government of Canada’s forward-looking investment in academic research in the field of AI. The C$125M investment in the Pan-Canadian Artificial Intelligence Strategy will further boost Canada’s excellence in research, striving to maintain its global competitiveness. However, this evaluation of East Asian AI strategies suggests that there is a need for a more comprehensive Canadian AI strategy that stretches beyond R&D and that would harness Canada’s capacity to adequately compete with better co-ordinated states in AI like China, Japan, or South Korea.
These countries have recognized that AI is a technology that is not limited within a single domain, and that engagement with it requires a cross-ministerial effort, which requires expertise to govern. Therefore, they have created bodies such as the AI Plan Promotion Office (China), Strategic Council (Japan), and the Presidential Committee on the Fourth Industrial Revolution (South Korea). In May 2019, the Government of Canada created the Advisory Council on Artificial Intelligence to “advise the Government of Canada on how best to build on Canada’s AI strengths, identify opportunities to create economic growth that benefits all Canadians and ensure that AI
advancements reflect Canadian values.”45 This is a new development and not much information is available, but it is definitely a step to the right direction.
Canada is different from East Asia and the developmental state approach would not be applicable in the context of Canada’s system of governance, especially considering different levels of government. It is challenging for the Canadian government to engage with better co-ordinated Asian states, because it does not have the same capacity to centralize its AI agenda as they do. This is a challenge that has no single answer, but the Government of Canada must lead and hold dialogues with lower-level governments to ensure that AI is deployed across the country and to formulate AI policies that balance the need for co-ordination while maintaining the respect for existing relations between different levels of government.
Increasing the state capacity to govern AI starts by creating a space and investing in talent that can facilitate agile discussions and policy implementations in co-ordination with different levels of government and non-governmental stakeholders. While it is difficult to imagine a centralized AI agency with the same capacities as the ones in East Asia, it might be reasonable to create an AI hub for federal and provincial AI R&D and deployment strategies in different sectors, as well as policy guidelines and public engagement.
45 Innovation, Science and Economic Development Canada. 2019. Government of Canada creates Advisory Council on Artificial Intelligence. News Wire Canada. https://www.newswire.ca/news-releases/government-of-canada-creates-advisory-council-on-artificial-intelligence-838598005.html.
35
There are great initiatives rolling out in different levels of government in addition to the Pan-Canadian Strategy, such as the federal government’s Innovation Superclusters Initiative or the Alberta government’s recent decision to invest C$100M to help AI sectors. Also, the federal government has worked with the Council of Chief Information Officers to set standards for use of AI and hosted National Data and Digital Consultations roundtables to address the ELSI issues. The creation of a central AI agency would allow the different levels of government to work together more effectively to maximize the potential of different AI-related programs, ensure that the diffusion and adoption of the technology across the country follow common norms and ethics, and provide the capacity for Canadian policy-makers to lead in AI governance at the international level.
Recommendation 2: Leverage Canada’s AI talent more effectively as part of “Brand Canada.”
Canada is home to world-class researchers strong in basic AI research. This is an asset particularly important at a time when the global AI talent shortage is the most common, pressing challenge for governments seeking to harness their AI potential. The Pan-Canadian AI Strategy recognizes this strength and seeks to maintain this competitive edge.
However, at least in East Asia, there is a need to highlight the association between these world-class researchers with the Canada brand. While many recognize the names of researchers, they do not necessarily associate them with Canada. Although major corporations from East Asia (e.g. Samsung, Baidu, Fujitsu) are rushing to establish research centres to gain access to Canada’s AI talent, more could be done to attract investment to Canada. Canadian governments and AI stakeholders should work together on branding Canadian AI to further stress the association with Canada, thereby creating opportunities for post-secondary universities and local economies that host these world-class researchers.
More specifically, it is necessary for Canada’s AI stakeholders – federal and provincial governments, academics, and practitioners – to identify what makes Canadian AI distinct from U.S., Chinese, or any other competitor’s AI. Initial conversations have suggested that Canada’s diversity and excellence in good governance are some of the qualities that should be stressed, and a policy that combines immigration – a specific policy area that reflects these Canadian values – with AI talent acquisition might be a productive way forward.
Finally, it is necessary to harness the economic benefit of Canadian AI beyond R&D and connect it to its application to different sectors of the Canadian economy. The Innovation Superclusters Initiative is a positive measure that enhances existing areas of strength in Canada’s diverse economy and showcases it to the rest of the world. In branding Canadian AI, it is necessary to integrate a broader picture that goes beyond highlighting excellence in R&D.
Recommendation 3: Proactively address emerging AI issues in trade and investment.
Due to the nature of the technology, advances in AI development and deployment will create new issues in trade and investment with China, Japan, and South Korea, which are Canada’s second, fifth, and seventh largest trading partners, respectively. As such, Canada’s different levels of government should consider emerging AI issues in trade and investment and prepare a future course of action.
Canadian AI entrepreneurs are aware of the market opportunity in China but are apprehensive about the issues of intellectual property regulations and potential transfer of their technology for social surveillance or AI weapons. This apprehension stems from the perception of different
36

approaches to AI ethics, a problem that will not necessarily be limited to China. Further, cross-border data regulation, which is tied to AI development and deployment, has already been identified as an emerging trade issue. In this context, different governments in Canada – especially the federal government – must harness the capacity to respond to issues related to AI and trade in an efficient and timely manner.
Canadian AI talent and research centres continue to attract investments from major East Asian companies. AI is a permeable technology and could pose threats in different social, economic, and political sectors. This does not mean that Canada should resort to isolationism driven by fear; on the contrary, it is necessary for policy-makers to fully assess the implications of foreign investments in the space of AI and create clear guidelines for all stakeholders.
Finally, it should be noted that when it comes to AI policy, there is no silver bullet that will adequately address all issues at once. The focus should be on creating a space for continuous discussions and devising policy responses in a nimble manner, instead of drafting heavy handed regulations that cannot keep pace with the technology.
Recommendation 4: Identify Canada’s place in emerging AI geopolitics and engage strategically.
China’s rapid rise in the field of AI has created a sense of anxiety around the world, coupled with the existing fears toward China. Conversations about AI in the Western world increasingly stress points such as democracy and civil rights, which read as a response to China’s use of AI for social surveillance. Key discussions on AI ethics and policy occur in forums such as the Organisation for Economic Co-operation and Development (OECD) or the G7, which exclude China. Consequently, a fracture seems to be emerging between China and the Western world, which may prevent constructive dialogue on AI ethics and global governance. This fracture seems to have deepened significantly and become more obvious since September 2018, when the first draft of this report was developed.
Japan and South Korea share apprehension about China’s AI leapfrogging, viewing it as a threat to their economic competitiveness. Politically, they are considered to be part of the liberal countries, but there are concerns about an overly Western imposition of AI ethical discussions, stemming from distinct cultural and intellectual traditions. For instance, even though both are liberal democracies, Japan and South Korea’s discussions of AI ethics avoid explicit use of liberal language, such as democracy or civil rights. Further, for states like Japan and South Korea, their proximity to and economic dependence on China will increasingly limit their full commitment to causes of the liberal countries.
In this context, Canada is in a position to play a positive role on the international stage as a mediator. It has strong AI researchers and institutions as an asset and the credibility that China, the United States, and European countries lack vis-à-vis each other. Regrettably, Canada’s relations with China have deteriorated significantly since the arrest of Huawei CFO Meng Wanzhou, but with the right pivoting in the long run, Canada could be the player that brings these parties to the table to facilitate dialogue on AI ethics and global governance.
In sum, the Government of Canada must embrace AI as a space of international competition among states, an amalgam of the geopolitical and technological. In addition to continuing to harness its AI capacity, it should also actively participate in AI ethics and governance moving forward.
37
ACKNOWLEDGEMENTS
I am grateful to everyone who agreed to share their knowledge and thoughts during this research. I would like to particularly note the following individuals and organizations for their help and valuable discussions during the field research in 2018:
• Beijing: Professor Roger Ames (University of Hawaii), the United States Information Technology Office, and the Embassy of Canada to China in Beijing.
• Tokyo: Professor Arisa Ema (University of Tokyo), Professor Mitsuru Ishizuka (University of Tokyo), and the Canadian Embassy in Japan.
• Seoul: The Office of Presidential Committee on the Fourth Industrial Revolution, the Artificial Intelligence Industrial Association, Professor Jung-won Lee (University of Seoul), and the Canadian Embassy in Seoul.
The research, including the fieldwork, was principally funded by the Asia Pacific Foundation of Canada’s Post-Graduate Research Fellowship. The completion of the project would have been impossible without the support of the Foundation. I would also like to particularly acknowledge the following individuals at the Foundation (in alphabetical order of their last names):
• Sanya Arora
• Eva Busza
• Justin Elavathil
• Scott Harrison
• Serena Ko
• Charles Labrecque
• Sebastian Murdoch-Gibson
• Michael Roberts
• Pauline Stern
• Kai Valdez-Bettcher
In addition, part of the material in this report was produced for the International Policy Ideas Challenge funded by Global Affairs Canada and Social Sciences and Humanities Research Council of Canada, Government of Canada.
38
ABOUT THE ASIA PACIFIC FOUNDATION OF CANADA
The Asia Pacific Foundation of Canada (APF Canada) is dedicated to strengthening ties between Canada and Asia with a focus on expanding economic relations through trade, investment, and innovation; promoting Canada’s expertise in offering solutions to Asia’s climate change, energy, food security, and natural resource management challenges; building Asia skills and competencies among Canadians, including young Canadians, and improving Canadians’ general understanding of Asia and its growing global influence.
Visit APF Canada at http://www.asiapacific.ca.
39

JANUARY 2020
TOWARD ‘BROAD DIVERSIFICATION’ IN ASIA
CANADA AS A 21ST CENTURY PACIFIC POWER
This policy brief is a part of the Asia Pacific
Foundation of Canada’s Strategic Asia series,
which examines security and geopolitical issues
in the Asia Pacific with reference to Canada’s
national security interests. The authors identify
what they agree are the region’s most pressing
geopolitical and geo-economic issues and outline
the parameters within which policy-makers
can act. The brief is non-partisan and, as such,
avoids prescribing specific policy measures.
Rather, the authors have provided regional
situational awareness for those in government to
craft informed policy in line with their
respective political mandates.
3CANADA AS A 21ST CENTURY PACIFIC POWER: TOWARD ‘BROAD DIVERSIFICATION’ IN ASIA
ASIA PACIFIC FOUNDATION OF CANADA
The Asia Pacific Foundation of Canada (APF
Canada) is a not-for-profit organization focused on
Canada’s relations with Asia. Our mission is to be
Canada’s catalyst for engagement with Asia and Asia’s bridge to
Canada. APF Canada is dedicated to strengthening ties between
Canada and Asia with a focus on seven thematic areas: trade
and investment, surveys and polling, regional security, digital
technologies, domestic networks, sustainable development,
and Asia Competency.
Our research provides high-quality, relevant, and timely
information, insights, and perspectives on Canada-Asia relations.
Providing policy considerations and business intelligence for
stakeholders across the Asia Pacific, our work includes Reports,
Policy Briefs, Case Studies, Dispatches, and a regular Asia Watch
newsletter that together support these thematic areas.
APF Canada also works with business, government, and academic
stakeholders to provide custom research, data, briefing and Asia
Competency training for Canadian organizations. This ‘micro-
consulting’ service is available by request and we would be pleased
to work with you to meet your business intelligence needs.
Visit APF Canada at www.asiapacific.ca.
ABOUT THE ASIA PACIFIC FOUNDATION OF CANADA
4CANADA AS A 21ST CENTURY PACIFIC POWER: TOWARD ‘BROAD DIVERSIFICATION’ IN ASIA
ASIA PACIFIC FOUNDATION OF CANADA
Canada must prioritize the advancement of its national interests
in the Asia Pacific when developing a regional grand strategy.
Specifically, Canada must develop an approach to Asia that allows
it to ensure its security, demonstrate its autonomy, continue its
economic development, and grow its stature and prestige.
Most immediately, Canada must develop a strategic approach to
manage its position between the United States and China as the
two superpowers’ relations are conflictual and Canada finds itself
under pressure to ‘choose sides.’
Central to this approach is the need to demonstrate to Asia Pacific
countries that Canada is an independent actor. Canada must
articulate its autonomy in Asia, particularly as regional countries
are increasingly concerned over the U.S.’s influence on regional
security and stability and tend to view Canada as aligned with
the U.S.
Canada needs to demonstrate strategic commitment to Asia
through bilateral engagement and multilateral dialogue. Canada,
in particular, must strengthen its non-economic links to Asia,
particularly those addressing strategic issues.
EXECUTIVE SUMMARY
5CANADA AS A 21ST CENTURY PACIFIC POWER: TOWARD ‘BROAD DIVERSIFICATION’ IN ASIA
ASIA PACIFIC FOUNDATION OF CANADA
Central to developing a strategy to achieve ‘broad diversification’
is greater understanding of the region’s institutions and trends.
Canadian policy-makers must invest in developing a domestic
capacity to monitor and respond to regional developments in
ways that demonstrate Canadian leadership and Canadian values.
Canada can also engage with other regional ‘middle powers,’ many
of which are looking to expand bilateral relations with other Asian
countries to balance against U.S. and Chinese influence. Australia,
Japan, New Zealand, and Singapore, in particular, are natural
partners.
Canada should particularly look to ASEAN and ASEAN
member states for opportunities for engagement with a clear
understanding that ASEAN is growing in regional centrality and
importance.
6CANADA AS A 21ST CENTURY PACIFIC POWER: TOWARD ‘BROAD DIVERSIFICATION’ IN ASIA
INTRODUCTION
In the three years since the Asia Pacific Foundation of Canada
(APF Canada) published its 2016 Building Blocks for a Canada-
Asia Strategy, the Asian region has grown in importance and
in complexity for Canada. Opportunities for diplomatic and
commercial engagement within the region have expanded, for
example, around areas including middle power diplomacy and
economic regionalism. Concurrently, uncertainty and instability
in the Asia Pacific – whether in the form of trade tensions
between the United States and China, a deterioration in bilateral
relations between Canada and China, or a creeping militarization
of issues ranging from the South China Sea to India-controlled
Kashmir – have grown and continue to expand.
‘An immediate priority of any Canadian
government must be the formulation and
implementation of a comprehensive Asian
strategy that draws on Canadian strengths
and values to demonstrate its strategic
commitment to the region.’
It is APF Canada’s position that an immediate priority of
any Canadian government must be the formulation and
implementation of a comprehensive Asian strategy that
draws on Canadian strengths and values to demonstrate its
strategic commitment to the region. While certain issue areas
INTRODUCTION
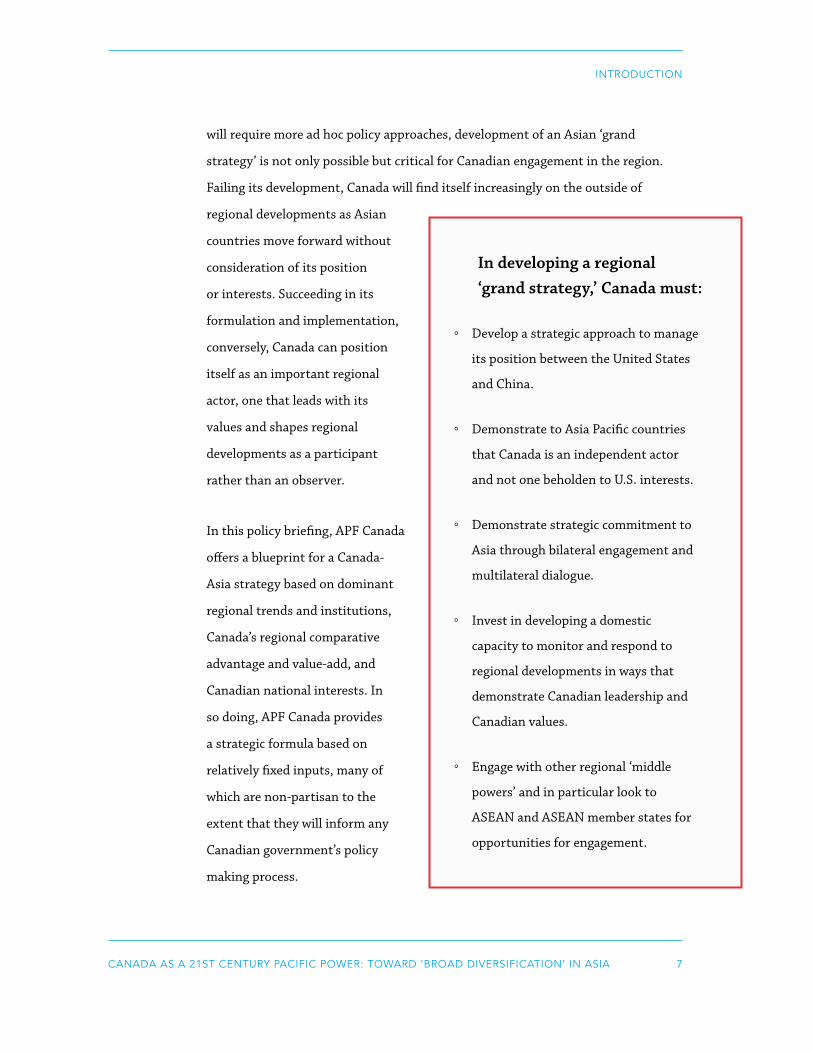
7CANADA AS A 21ST CENTURY PACIFIC POWER: TOWARD ‘BROAD DIVERSIFICATION’ IN ASIA
INTRODUCTION
will require more ad hoc policy approaches, development of an Asian ‘grand
strategy’ is not only possible but critical for Canadian engagement in the region.
Failing its development, Canada will find itself increasingly on the outside of
regional developments as Asian
countries move forward without
consideration of its position
or interests. Succeeding in its
formulation and implementation,
conversely, Canada can position
itself as an important regional
actor, one that leads with its
values and shapes regional
developments as a participant
rather than an observer.
In this policy briefing, APF Canada
offers a blueprint for a Canada-
Asia strategy based on dominant
regional trends and institutions,
Canada’s regional comparative
advantage and value-add, and
Canadian national interests. In
so doing, APF Canada provides
a strategic formula based on
relatively fixed inputs, many of
which are non-partisan to the
extent that they will inform any
Canadian government’s policy
making process.
In developing a regional ‘grand strategy,’ Canada must:
◦ Develop a strategic approach to manage
its position between the United States
and China.
◦ Demonstrate to Asia Pacific countries
that Canada is an independent actor
and not one beholden to U.S. interests.
◦ Demonstrate strategic commitment to
Asia through bilateral engagement and
multilateral dialogue.
◦ Invest in developing a domestic
capacity to monitor and respond to
regional developments in ways that
demonstrate Canadian leadership and
Canadian values.
◦ Engage with other regional ‘middle
powers’ and in particular look to
ASEAN and ASEAN member states for
opportunities for engagement.

9CANADA AS A 21ST CENTURY PACIFIC POWER: TOWARD ‘BROAD DIVERSIFICATION’ IN ASIA
CHAPTER 1 INSTITUTIONS AND TRENDS
11CANADA AS A 21ST CENTURY PACIFIC POWER: TOWARD ‘BROAD DIVERSIFICATION’ IN ASIA
INSTITUTIONS AND TRENDS
CHALLENGES
With regard to the Asia Pacific’s predominant
institutions – those most influential on regional
order and development – APF Canada believes
the following are the most relevant with respect to Canada’s
policy formulation. First and foremost are the ongoing tensions
between the United States and People’s Republic of China
(PRC), which suggest the Asia Pacific is moving toward a future
of increased competition (if not conflict) and bifurcation.
While ostensibly the result of trade disputes, such tensions are
increasingly structural, based on China’s growing economic
centrality in Asia, the interconnected nature of Asian trade,
investment, and finance, and the United States’ reliance on its
military to maintain regional ‘pre-eminence.’ As most forecasts
suggest China’s dominant position in Asia will grow with the PRC
potentially becoming the world’s largest economy in real gross
domestic product (GDP) terms by 2030 and as more Americans
come to view China’s growth as a ‘critical threat’ to U.S. interests,
it is highly unlikely that tensions between the two countries will
ameliorate with a trade agreement, even one seen as beneficial by
both governments.1 Rather, there is a likelihood that U.S.-China
tensions will extend beyond the Trump and Xi administrations
to infect the two countries’ next-generation leaders, regardless
of their political affiliations and/or proclivities. At the time of
writing, for instance, all the U.S. Democratic candidates for
president have expressed opposition to China’s development
model and criticism of its internal politics.
12CANADA AS A 21ST CENTURY PACIFIC POWER: TOWARD ‘BROAD DIVERSIFICATION’ IN ASIA
INSTITUTIONS AND TRENDS
‘There is a likelihood that U.S.-China
tensions will extend beyond the Trump
and Xi administrations to infect the two
countries’ next-generation leaders.’
As U.S.-China tensions deepen, there is an increased likelihood
that regional states, including Canada, will be forced to choose
which of the two countries is a priority partner. While Asian
countries have long sought to avoid this outcome, which they
universally agree would lead to increased strategic instability
and decreased economic development, any ‘decoupling’ between
the U.S. and China will result in parallel institutions within Asia
that would result in competing ‘spheres of influence.’ One of
the most prominent examples of this type of development is
already underway with regard to telecommunications and 5G,
with Asian countries such as Thailand, Malaysia, the Philippines,
Cambodia, Laos, and Myanmar all working with the Chinese
company Huawei while others, including Japan, Australia, and
Taiwan, limiting and/or restricting Huawei’s involvement in their
internal communication network systems. The division between
those countries that work with Huawei and those that do not is
not simply a choice between companies, but rather a choice with
implications that extend to competing rules, regulations, and
systems that are mutually exclusive.
Closely related to U.S.-China tensions is the increase in bellicosity
and unilateralism coming from both the United States and
China toward issues in the Asia Pacific. With regard to the
United States, the Trump administration’s ‘America First’ foreign
13CANADA AS A 21ST CENTURY PACIFIC POWER: TOWARD ‘BROAD DIVERSIFICATION’ IN ASIA
INSTITUTIONS AND TRENDS
policy approach is undermining the U.S.’ traditional alliance
relationships with South Korea and Japan while creating tension
within Asia over their relations with China. Senior Trump
administration officials including Vice President Pence and
Secretary of State Pompeo have repeatedly used international
and regional multilateral fora to demand that U.S. allies pay more
for U.S. ‘protection’ and to pressure Asian countries to reject
economic engagement with China, advancing the controversial
assertion that Beijing uses ‘debt trap diplomacy’ to undermine
Asian countries’ sovereignty. The Trump administration has also
shown a willingness to use economic coercion to shape Asian
countries’ foreign and trade policy, the most relevant example for
Canada being steel and aluminum tariffs and threats of further
trade control measures.
'The Trump administration’s ‘America First’
foreign policy approach is undermining
the U.S.’ traditional alliance relationships
with South Korea and Japan while creating
tension within Asia over their relations with
China.’
The Trump administration is also militarizing Asia through its
plans to deploy land-based, medium range ballistic missiles off
the Chinese mainland, its ‘fire and fury’ approach to North Korea,
its continued freedom of navigation operations (FONOPs) in the
South China Sea, and its drawdown of diplomats and increase in
military officials through the region. While the prioritization of
a U.S. ‘forward presence’ in Asia has been a staple in U.S. foreign

14CANADA AS A 21ST CENTURY PACIFIC POWER: TOWARD ‘BROAD DIVERSIFICATION’ IN ASIA
INSTITUTIONS AND TRENDS
policy going back decades, the Trump administration’s publication
of its Indo-Pacific Strategy Report marks a significant increase in
U.S. securitization of the Asian region with specific reference to
China as a near-peer adversary and an existential threat.2 Notably,
the Trump administration’s militarization of Asia is occurring in
parallel with broader U.S. disengagement from Asia, whether
in terms of its alliance networks or economic relations. These
concurrent developments suggest the U.S.’s future role in Asia
will be one predicated on security issues, not on the economic and
political concerns Asian states prioritize.
As for China, Beijing under the Xi Jinping administration has
shown an increased willingness to use coercion to advance its
foreign and security policy goals, whether in the form of hostage
diplomacy or informal economic sanctions. Canadians are well
aware, for example, that Beijing has detained foreign nationals
working in China to gain negotiating leverage or as a means to
punish countries it feels are working against it. The case of the
Canadian detainees is a stark example of this behaviour and a
clear sign of the pitfalls any country faces when working closely
with the PRC. Beijing has also demonstrated its willingness to
use economic tools such as import controls and/or phytosanitary
inspections to stop or to slow inbound exports from countries it
seeks to punish.
Chinese rhetoric around issues it describes as ‘core’ to its national
interests has become increasingly assertive, with particular
reference to China’s territorial claim over the South China Sea
and its sovereignty claim to Taiwan. While Beijing continues to
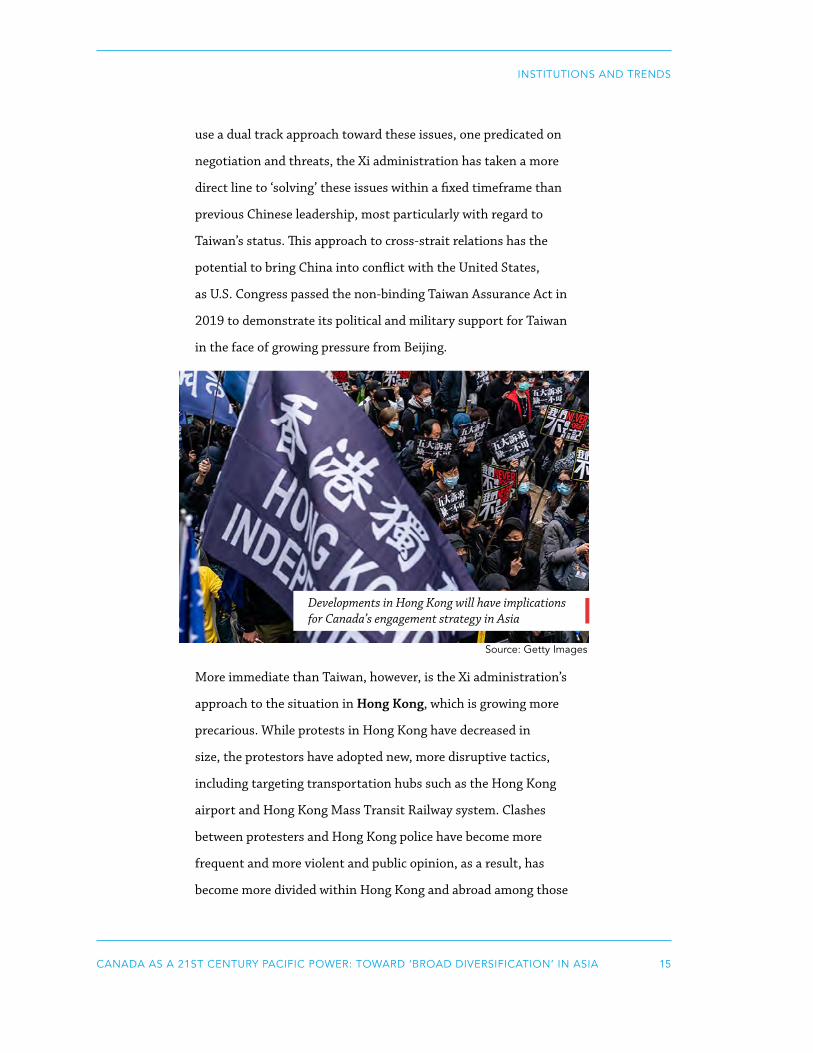
15CANADA AS A 21ST CENTURY PACIFIC POWER: TOWARD ‘BROAD DIVERSIFICATION’ IN ASIA
INSTITUTIONS AND TRENDS
use a dual track approach toward these issues, one predicated on
negotiation and threats, the Xi administration has taken a more
direct line to ‘solving’ these issues within a fixed timeframe than
previous Chinese leadership, most particularly with regard to
Taiwan’s status. This approach to cross-strait relations has the
potential to bring China into conflict with the United States,
as U.S. Congress passed the non-binding Taiwan Assurance Act in
2019 to demonstrate its political and military support for Taiwan
in the face of growing pressure from Beijing.
More immediate than Taiwan, however, is the Xi administration’s
approach to the situation in Hong Kong, which is growing more
precarious. While protests in Hong Kong have decreased in
size, the protestors have adopted new, more disruptive tactics,
including targeting transportation hubs such as the Hong Kong
airport and Hong Kong Mass Transit Railway system. Clashes
between protesters and Hong Kong police have become more
frequent and more violent and public opinion, as a result, has
become more divided within Hong Kong and abroad among those
Developments in Hong Kong will have implications for Canada’s engagement strategy in Asia
Source: Getty Images
16CANADA AS A 21ST CENTURY PACIFIC POWER: TOWARD ‘BROAD DIVERSIFICATION’ IN ASIA
INSTITUTIONS AND TRENDS
who support some protesters and those who support the local
government and Beijing.3 Some analysts argue Hong Kong is
the first ‘battleground’ in the emerging U.S.-China ‘Cold War,’
pointing to the clash of political and economic ideology within
the autonomous region and U.S. overt and (suspected) covert
activity in the area challenging Beijing’s sovereignty. Whether or
not this is an accurate portrayal, it is likely that developments in
Hong Kong will have wider regional implications for U.S.-China
relations and, consequently, for Canada’s engagement strategy in
Asia. Canada will find its relations with Hong Kong complicated,
for instance, if the United States revokes Hong Kong’s special
trading status as members of the U.S. Congress have threatened.
Beyond U.S.-China tensions and U.S. and Chinese behaviour,
there are many other significant institutions that constitute
Asian order and, thereby, shape Canada’s policy options toward
the region. One troubling development, for instance, is the
breakdown in state relations between South Korea and Japan,
two countries that have, despite a troubled history, developed
deep political, commercial, and people-to-people ties over the
past 50-plus years. While the precise nature of the downturn in
South Korean-Japanese relations is beyond this paper’s scope, it
is important to note the two countries’ deterioration in relations
is occurring during a time of diminished engagement by the U.S.
The Trump administration has repeatedly called the value of its
alliance relations with South Korea and Japan into question, has
left key State Department position is both countries unfilled for
extended periods of time (including the U.S. ambassador to South
Korea), has appointed non-career diplomats as ambassadors to

17CANADA AS A 21ST CENTURY PACIFIC POWER: TOWARD ‘BROAD DIVERSIFICATION’ IN ASIA
INSTITUTIONS AND TRENDS
both countries, and has marginalized both states from the U.S.
approach to security and trade in the region. The breakdown in
South Korea-Japan relations is also taking place as both countries
increase their diplomatic and economic ties to China and as China
becomes more militarily engaged with Russia in Northeast Asia.
The Democratic People’s Republic of Korea (DPRK) and its
ongoing nuclear program remain a critical part of Asian order
with the potential to introduce high levels of conflict, if not war,
to the Asian theatre. The current U.S. administration’s summit
approach to U.S.-DPRK relations has not addressed any of the
outstanding issues around the DPRK’s nuclear program, rather
it has provided time and space for its further development and
consolidation. While some may see the DPRK’s self-imposed
moratorium on long-range ballistic missile testing as a tactical
victory, that the current administration has chosen to disregard
it allies’ concerns over its short- and medium-range missiles is a
strategic win for Kim Jong-un. That the DPRK continues to test
and to refine its missile delivery systems is also indicative that the
situation on the Korean peninsula remains unstable.
Among the regional ‘hot spots,’ Kashmir remains one of the
hottest, with the current Indian government’s decision to revoke
Article 370 of India’s constitution and its subsequent stripping of
the region’s autonomy likely to contribute to further instability
in the area. India is also experiencing nationwide protests,
many of which have resulted in loss of life, the result of the
Modi government’s new citizenship law that restricts Muslim
immigration and relegates the country’s 200 million Muslims to
second-class status.4

18CANADA AS A 21ST CENTURY PACIFIC POWER: TOWARD ‘BROAD DIVERSIFICATION’ IN ASIA
INSTITUTIONS AND TRENDS
Relations among the Mekong River basin states are also
increasingly strained over issues related to water use and water
management. Late monsoon rains coupled with upstream
hydropower developments in China and Laos led to a drought
within Mekong riparian communities in 2019 with the river’s
water level falling to its lowest level in 100 years. Rice cultivation
in China, Myanmar, Thailand, Laos, Cambodia, and Vietnam – all
Mekong states –fell precipitously as a result, affecting continental
Southeast Asia’s overall food security. While the Mekong river
states continue to discuss terms for shared usage, China is
developing upstream hydropower projects, damming the river
close to its source waters. As the Mekong directly affects up to 300
million people across Southeast Asia, its remains an important
source of potential instability within the Asia Pacific.
‘While the Mekong river states continue
to discuss terms for shared usage, China
is developing upstream hydropower
projects, damming the river close to its
source waters.’
Closely related is the issue of climate change, an issue with deep
relevance in the Asia Pacific context. Changes in temperatures
and weather patterns have caused super typhoons in Southeast
and Northeast Asia, flooding in India, Japan, and Thailand,
and extreme weather in countries like China, Japan, and South
Korea in 2019. For Asian countries such as the Maldives, Fiji, and
Bangladesh, rising sea levels present existential challenges both in
terms of inundation and human security.
19CANADA AS A 21ST CENTURY PACIFIC POWER: TOWARD ‘BROAD DIVERSIFICATION’ IN ASIA
INSTITUTIONS AND TRENDS
OPPORTUNITIES
Within the past year, there has been a resurgence of
middle power diplomacy within the Asia Pacific,
particularly from the Association of Southeast
Asian Nation (ASEAN) member states as they work to navigate
U.S.-China tensions and to insulate themselves from outside
pressure. Most recently in June 2019, the ASEAN member
states agreed on an Outlook on the Indo-Pacific concept where
member states identified ASEAN centrality in regional affairs and
ASEAN-led institutions, such as the East Asian Summit (EAS),
as necessary conditions to regional stability. While a degree of
disunity persists among the ASEAN member states over certain
issue areas, whether with regard to the South China Sea or
the U.S.-China trade war, there is still a clear tendency among
these countries to collaborate on strategic issues, such as the
development of a Code of Conduct (CoC) for activity in the South
China Sea. While scholars have debated ASEAN’s relevancy since
its inception, the organization’s position as an alternative centre
of power in Asia is growing as its member states’ economies grow,
as ASEAN economic and political interconnectivity deepens, as
China increases its reliance on ASEAN to facilitate its approach to
Southeast Asia, and as the U.S. and EU empower the organization
to balance against China’s regional influence.
Middle power co-operation between countries including
Australia, Japan, New Zealand, and Singapore has also
deepened over recent years, both the result of these countries’
shared commitment to good governance and economic

20CANADA AS A 21ST CENTURY PACIFIC POWER: TOWARD ‘BROAD DIVERSIFICATION’ IN ASIA
INSTITUTIONS AND TRENDS
inclusivity and their shared visions of the Asia Pacific’s strategic
environment. Less formalized than ASEAN, co-operation between
these like-minded Asian middle powers has resulted in the
development of regional norms around concepts like the Indo-
Pacific and institutions like the Comprehensive and Progressive
Transpacific Partnership (CPTPP).5 Such middle power
engagement in Asia extends to Latin America, where middle
powers including Chile and Mexico have prioritized their Asian
engagement strategies and operationalized their engagement
through regional institutions like the CPTPP. For Canada,
opportunities with Asian middle powers include multilateral
engagement (outlined below) and bilateral dialogues, such as
Canadian-Australian, Canadian-Singaporean, and/or a Canadian-
Indonesian dialogue mechanisms, for example.
‘While scholars have debated ASEAN’s
relevancy since its inception, the
organization’s position as an alternative
centre of power in Asia is growing.’
Closely related to middle power activism is the continued
importance within the Asia Pacific of multilateralism and
multilateral institutions. While ASEAN is arguably Asia’s most
established and enduring multilateral institution – both as a
standalone institution and as a co-ordinating mechanism for
extra-regional states through its ASEAN+ formats – institutions
such as the Conference on Interaction and Confidence-Building
Measures in Asia (CICA), the Council for Security Cooperation

21CANADA AS A 21ST CENTURY PACIFIC POWER: TOWARD ‘BROAD DIVERSIFICATION’ IN ASIA
INSTITUTIONS AND TRENDS
in the Asia Pacific (CSCAP), Asia-Pacific Economic Cooperation
(APEC), the Lancang-Mekong Cooperation (LMC) Mechanism,
and the Shanghai Cooperation Organization (SCO) also provide
important platforms for regional states to engage in diplomacy
and dialogue around regional issues that, if left unaddressed,
could lead to conflict. Within the ASEAN+China forum, for
example, ASEAN member states and China are negotiating a
Code of Conduct (CoC) for the South China Sea that could – if
successfully agreed upon – help deescalate one of Asia’s main
flashpoints. Southeast Asian countries are also working with
China through the LMC mechanism to agree on water rights
and water usage around the Mekong river, relying on diplomacy
and dialogue to address what otherwise has the potential to be a
significant source of tension in Asia.
Parallel to Asian multilateralism is the growing number of
minilateral institutions, often formulated around a specific issue
area. The U.S.-led Quadrilateral Security Dialogue is ¬one such
example of a minilateral institution between the U.S., Japan,
Australia, and India, designed as a democratic bulwark against
China’s regional rise. China-Japan-ROK trilateralism and the
ASEAN-based ‘Our Eyes’ intelligence sharing mechanism are
other salient examples of Asian minilateralism, all with potential
to influence regional dynamics for broader regional stability.
For Canada, there are also significant opportunities to develop
minilateral ties around other issue areas in Asia. A strategic
Canadian minilateral approach to Asian landlocked countries
including Nepal, Mongolia, and Bhutan, for instance, would allow
22CANADA AS A 21ST CENTURY PACIFIC POWER: TOWARD ‘BROAD DIVERSIFICATION’ IN ASIA
INSTITUTIONS AND TRENDS
it to develop influence in otherwise isolated states where it has a
long tradition of good bilateral relations but lacks a contemporary
aid program to maintain relations. The demand-signals for
Canadian involvement within these landlocked countries are loud;
Canada need only allocate resources for engagement to advance
its interests.
While political engagement and dialogue are in part responsible
for ASEAN’s growing stature as a middle power institution, the
shift in the economic centre of gravity in Asia from China
toward Southeast Asia is also providing it with additional
relevance. ASEAN member states such as Vietnam, Thailand,
Malaysia, and Singapore are all benefiting from U.S.-China trade
tensions as investors relocate manufacturing hubs, reroute supply
chains, and look for alternative resource providers. This shift
provides a complementarity to the increased consolidation of
the ASEAN Economic Community (AEC) 2025 concept, which
ASEAN member states adopted in 2015 to facilitate a single
ASEAN common market, and some ASEAN member states’
adoption of the CPTPP agreement in late 2018/early 2019.
Building on these economic institutions, ASEAN member
states are in negotiation with other Asian countries – including
Australia, China, Japan, India, New Zealand, and South Korea –
to conclude the Regional Comprehensive Economic Partnership
(RCEP) agreement, which would further increase Asian economic
integration and ASEAN economic centrality.
23CANADA AS A 21ST CENTURY PACIFIC POWER: TOWARD ‘BROAD DIVERSIFICATION’ IN ASIA
INSTITUTIONS AND TRENDS
‘Vietnam, Thailand, Malaysia, and
Singapore are all benefiting from U.S.-
China trade tensions as investors relocate
manufacturing hubs, reroute supply
chains, and look for alternative resource
providers.’
In addition to ASEAN and ASEAN member states, Japan under
Prime Minister Abe has taken on a more active role in the Asia
Pacific and has, as a consequence, become a partner of choice
on economic and diplomatic affairs for many Asian countries.6
Tokyo was a driving force behind the CPTPP agreement and
remains the largest outside provider of foreign direct investment
(FDI) to Southeast Asia, investing primarily in the sub-region’s
underdeveloped infrastructure sector. Japan has also embraced
global and regional multilateralism, leading the charge to
reform the World Trade Organization (WTO), for example,
and reinforcing market openness through its role as G20 host.
Through this proactive approach, Tokyo has increased its regional
influence –or its ability to influence regional outcomes – to the
degree where the Lowy Institute identified it as the second most
powerful power in Asia in 2019, after China.7 Where the U.S. has
withdrawn from regional leadership, Japan has stepped forward
as the regional stalwart of the existing liberal order.
Japan has also been proactive in negotiations around the
Regional Comprehensive Economic Partnership (RCEP)
agreement, hosting the first non-ASEAN multilateral meeting
on the topic in Tokyo in 2019. RCEP would include all ASEAN
24CANADA AS A 21ST CENTURY PACIFIC POWER: TOWARD ‘BROAD DIVERSIFICATION’ IN ASIA
member states and ASEAN’s six free trade agreement (FTA)
partners, making it one of the largest free trade blocs in the world,
accounting for 45% of the world’s population, 40% of the world’s
trade, and 33% of its gross domestic product (GDP). In parallel
to RCEP, China has launched the largely regionally-focused Belt
and Road Initiative (BRI) which, while often decried in Western
media as a grand strategy to advance China’s global influence, also
brings much needed investment to the Asian region and enables
interconnectivity between China and the rest of Asia and between
Asian countries.
Like Japan, Indonesia is becoming an increasingly active middle
power state, both within ASEAN and Southeast Asia. Over the
past three years, Indonesia has maintained a growth rate of
around 5%, has experienced a rapid growth in mobile e-commerce,
and has introduced a Maritime Global Fulcrum (MGF) strategy
designed to turn the country into an Indo-Pacific hub. With 60%
of its population under 40 years of age and a population of 256
million, Indonesia will grow in importance in the near to medium
terms, particularly within the Asia theatre.
The Asia Pacific continues to lead the globe in state-led
investment in technology development and innovation, with
key countries like China, South Korea, Japan, and India leading
the charge.8 This state-centric push has led to breakthroughs in
big data and Artificial Intelligence with matching opportunities
for regional multilateral institution formation to take place
around data management and AI application. Regional technology
trends are also contributing to the growth of research and
25CANADA AS A 21ST CENTURY PACIFIC POWER: TOWARD ‘BROAD DIVERSIFICATION’ IN ASIA
development centres of excellence in Asian economies such as
Australia, China, Taiwan, Singapore, and Japan and accelerator
and incubator clusters in countries like Thailand, Malaysia, and
Vietnam.
27CANADA AS A 21ST CENTURY PACIFIC POWER: TOWARD ‘BROAD DIVERSIFICATION’ IN ASIA
CHAPTER 2 BUILDING A 2020 CANADA-ASIA STRATEGY
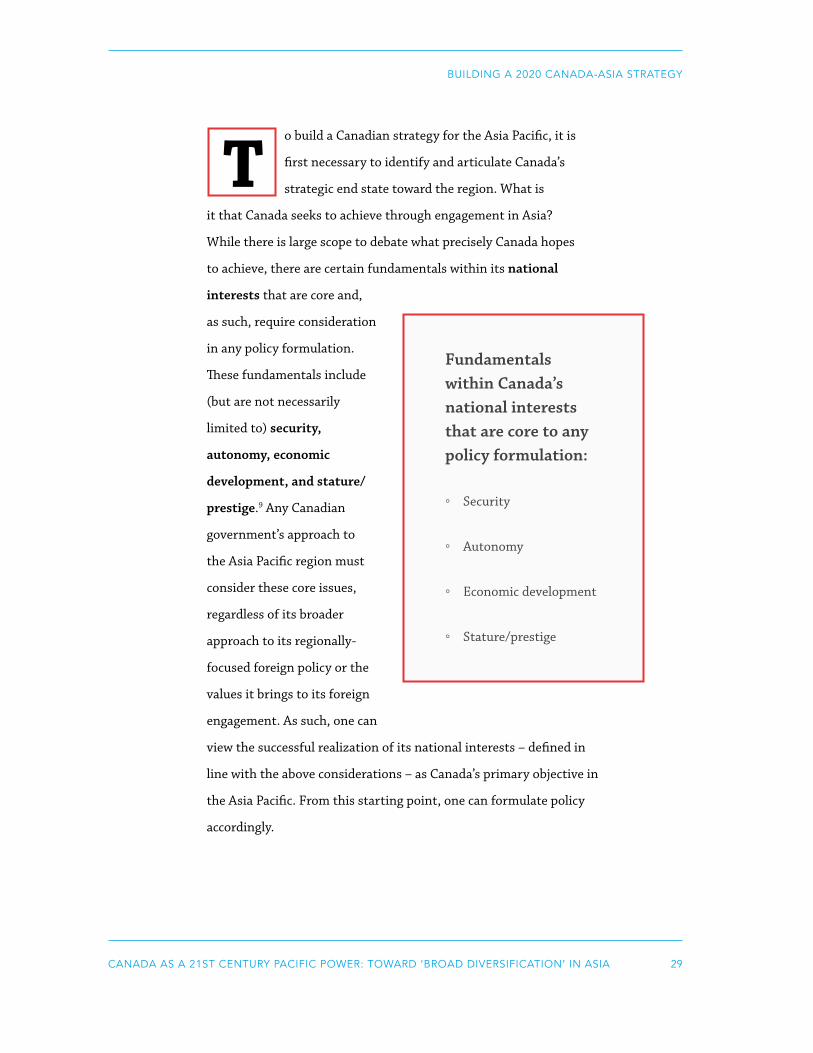
29CANADA AS A 21ST CENTURY PACIFIC POWER: TOWARD ‘BROAD DIVERSIFICATION’ IN ASIA
BUILDING A 2020 CANADA-ASIA STRATEGY
To build a Canadian strategy for the Asia Pacific, it is
first necessary to identify and articulate Canada’s
strategic end state toward the region. What is
it that Canada seeks to achieve through engagement in Asia?
While there is large scope to debate what precisely Canada hopes
to achieve, there are certain fundamentals within its national
interests that are core and,
as such, require consideration
in any policy formulation.
These fundamentals include
(but are not necessarily
limited to) security,
autonomy, economic
development, and stature/
prestige.9 Any Canadian
government’s approach to
the Asia Pacific region must
consider these core issues,
regardless of its broader
approach to its regionally-
focused foreign policy or the
values it brings to its foreign
engagement. As such, one can
view the successful realization of its national interests – defined in
line with the above considerations – as Canada’s primary objective in
the Asia Pacific. From this starting point, one can formulate policy
accordingly.
Fundamentals within Canada’s national interests that are core to any policy formulation:
◦ Security
◦ Autonomy
◦ Economic development
◦ Stature/prestige

30CANADA AS A 21ST CENTURY PACIFIC POWER: TOWARD ‘BROAD DIVERSIFICATION’ IN ASIA
BUILDING A 2020 CANADA-ASIA STRATEGY
SECURITY
With regard to security, the most pressing challenges Canada
faces in the Asia Pacific are 1) conflict between the U.S. and
China, 2) conflict in the South China Sea, 3) conflict on the
Korean Peninsula, 4) conflict between China and Taiwan, and
5) non-traditional security threats, including transnational
crime, terrorism, and climate change. While none of these
challenges – with the possible exception of terrorism – presents
a direct domestic challenge to Canada, each has the potential
to destabilize the Asian region (undermining Canada’s other
national interests, such as economic development and stature), to
split the region along opposing sides, and/or to draw Canada into
a conflict scenario where it has much to lose and little to gain.
No strategy can completely remove the threat of insecurity for
Canada. The best policy-makers can do is to develop an approach
that lessens Canada’s overall risk in the Asia Pacific through
engagement, dialogue, and partnership. Where, when, and how
a government chooses to undertake such policy can vary, but a
successful policy for the Asia Pacific must consider the following
structural conditions within the region around these issues.
First, many of the region’s outstanding disputes – whether
instability on the Korean Peninsula, territorial disputes between
China and Japan, or questions of sovereignty between the PRC
and Taiwan – are remnants of the Cold War in Asia and, as such,
carry deep ideological and historical undertones.10 Any attempt
to address these issues, or to participate through multilateralism

31CANADA AS A 21ST CENTURY PACIFIC POWER: TOWARD ‘BROAD DIVERSIFICATION’ IN ASIA
BUILDING A 2020 CANADA-ASIA STRATEGY
to address these issues, requires those involved to have a deep
understanding of historical issues as they influence contemporary
state relations. To ensure Canadian policy-makers have these
requisite skills, the Canadian government must invest in a
nationwide push to promote Asian literacy around language,
history, and culture. By way of example, under Prime Minister
Kevin Rudd, Australia committed AUS$68 million to develop
Asian literacy at the primacy, secondary, and tertiary levels
explicitly to strengthen Australia’s foreign and security policy
relation in Asia.11
Second, the Canadian government must be proactive rather than
reactive in engaging with Asian countries on issues of regional
security and stability. The most effective means to achieve
proactive security diplomacy is through engagement in Asia’s
predominant security-related multilateral fora, including the
ASEAN Defence Ministers Meeting-Plus (ADMM+), the East
Asia Summit (EAS), and the Track 1.5/2 Council for Security
Cooperation in the Asia Pacific (CSCAP), all of which lack a
Canada could invest in a nationwide push to boost knowledge around Asian literacy, language and culture
Source: Getty Images
32CANADA AS A 21ST CENTURY PACIFIC POWER: TOWARD ‘BROAD DIVERSIFICATION’ IN ASIA
BUILDING A 2020 CANADA-ASIA STRATEGY
sustained Canadian presence at the time of writing. While
Canada’s ultimate participation within these multilateral fora
is conditional on regional states’ approval (particularly the
ASEAN-led ADMM+ and EAS), the government can, and should,
energetically lobby for the chance to engage and contribute to
discussions on regional issues. Canada can, and also should, look
to engage bilaterally with Asian states on security diplomacy and
strategic dialogue, particularly with Asian middle powers such
as Australia, Japan, New Zealand, and Singapore, which share
Canadian values and strategic priorities toward the region.
Canada should also consider the possibility and desirability
of establishing rotational troop presences in certain key
Asia states, such as Singapore, Indonesia, or Malaysia, for
training and operational purposes, particularly around non-
kinetic activities such as humanitarian and disaster relief, and
maritime law enforcement activities. This is not to advocate for
Canadian overseas military bases, but rather for an increased
investment from the Department of National Defence (DND) in
military people-to-people exchanges to demonstrate Canadian’s
willingness to support regional strategic priorities and to show a
sustained, non-economic Canadian presence within the region.
‘The government can, and should,
energetically lobby for the chance to
engage and contribute to discussions on
regional issues.’
33CANADA AS A 21ST CENTURY PACIFIC POWER: TOWARD ‘BROAD DIVERSIFICATION’ IN ASIA
BUILDING A 2020 CANADA-ASIA STRATEGY
Third, and closely related, the Canadian government must
demonstrate sustained strategic resolve to its Asian partner
countries. There is an unfortunate sense from regional actors
that Canada’s interests in the Asia Pacific are purely economic
and that it would rather avoid the trickier issues around security
and stability and, as such, that it lacks a sustained commitment
to Asia outside its economic interests.12 This regional perception
means that Canada has less influence in the region, not because
Asian countries see Canada as not important, but rather that they
see Canada as largely absent from regional non-economic affairs.13
To address this, the Canadian government must do more than
simply open embassies in Asian countries or appoint an ASEAN
ambassador. Rather, it must invest in government and non-
government initiatives to ensure Canadian voices are consistently
and regularly heard throughout the region on security issues
and to demonstrate its long-term investment in regional peace
and stability.
‘There is an unfortunate sense from
regional actors that Canada’s interests
in the Asia Pacific are purely economic
and that it would rather avoid the trickier
issues.’
Fourth, the government must work within regional norms
and values to advance Canada’s national interests with regard
to security relations. Rather than framing its Asian engagement
through its own values and norms, many of which are not
widely shared throughout the region, Canada would do well to
34CANADA AS A 21ST CENTURY PACIFIC POWER: TOWARD ‘BROAD DIVERSIFICATION’ IN ASIA
BUILDING A 2020 CANADA-ASIA STRATEGY
understand the importance for Asian countries of concepts such
as ‘non-interference,’ ‘mutual respect,’ and freedom of ‘national
existence,’ which are codified in ASEAN principles and the Five
Principles of Peaceful Coexistence that inform regional state
relations.14 This is not to suggest that Canada should not pursue
its own values where and when it sees doing so as essential to its
national security interests. Rather, Canada should understand
that many Asian states view regional security as a value-less
structure requiring a pragmatic rather than a principled
approach. 15 As such, Canada should work to desegregate
its principled foreign policy from its security relations on
issues including China's internment of its Uighur population,
the Myanmar government's treatment of its ethnic Rohingya
population, and Philippine President Duterte's 'drug war' extra-
judicial killings. While such a realpolitik approach will be difficult
for many Canadians to support, it is essential for Canada to
operate within the strategic Asian environment as it exists, not as
Canada would prefer it.
‘Canada should understand that many
Asian states view regional security as a
value-less structure requiring a pragmatic
rather than a principled approach.’

35CANADA AS A 21ST CENTURY PACIFIC POWER: TOWARD ‘BROAD DIVERSIFICATION’ IN ASIA
BUILDING A 2020 CANADA-ASIA STRATEGY
AUTONOMY
In his keynote speech to the Shangri-La Dialogue in 2019,
Singaporean Prime Minister Lee Hsien Loong outlined a vision
of Asian order predicated on conflict between the U.S. and China
where small and middle powers lack agency to advance their
own national interests outside of multilateral institutions.16
PM Lee used his speech to call for greater unity among ASEAN
member states to maintain sovereign autonomy and to prevent
the development of regional spheres of influence around U.S.-
led and Chinese-led blocs. While PM Lee was speaking from a
Singaporean perspective, his comments echoed regional polling
results that suggest fear of autonomy and dissatisfaction over
great power conflict is widespread among Asian states.17
Canada faces, and will face, these same pressures operating in the
Asia Pacific. While there is no question about Canada’s domestic
sovereignty, its ability to operate within the Asia Pacific is limited
to the extent that it can affect change within the regional order.
As a quintessential middle power, Canada can influence outcomes
through traditional tools like diplomacy. Canada’s unilateral
ability to shape its operational environment in Asia is, however,
limited, as is its ability to maintain full autonomy of action.
‘The U.S. has looked to Canada as a natural
partner to advance its own foreign affairs,
even when the rationality of doing so is
not immediately clear for Canada.’

36CANADA AS A 21ST CENTURY PACIFIC POWER: TOWARD ‘BROAD DIVERSIFICATION’ IN ASIA
BUILDING A 2020 CANADA-ASIA STRATEGY
This is particularly the case with regard to the United States,
which sees Canada, and which Canada has long seen, as a
natural partner and ally in Asia. Indeed, while Canada has been a
leader in some cases toward Asian affairs (most notably with its
decision to normalize relations with the PRC before the U.S.), it
has traditionally looked to the U.S. (and EU) for policy direction
within the region.18 Concurrently, the U.S. has looked to Canada
as a natural partner to advance its own foreign affairs, even when
the rationality of doing so is not immediately clear for Canada.19
While Canada has benefited, and continues to benefit, from
its close relations with the U.S., the current administration’s
approach to U.S.-Canada relations and its increasingly bellicose
approach to Asian affairs both suggest that Canada must actively
work to develop strategic autonomy within the region outside
of the broader U.S.-driven approach. The need to demonstrate
autonomy from U.S. influence within the Asian region is
particularly important for the following reasons.
Demonstrating independence from the US would allow Canada to develop further autonomy
Source: Getty Images
37CANADA AS A 21ST CENTURY PACIFIC POWER: TOWARD ‘BROAD DIVERSIFICATION’ IN ASIA
BUILDING A 2020 CANADA-ASIA STRATEGY
First, the U.S. has clearly articulated an approach to the Asian
region – its 2019 Indo-Pacific Strategy – predicated on a
military-led strategy designed to counter China, which it portrays
as a ‘strategic threat.’ In adopting similar language around an
Indo-Pacific approach to Asia, Canada must make certain to
differentiate itself from the U.S.-formulated concept, particularly
with its focus on military competition and its inherently anti-
China language. This distinction is essential as other regional
states and institutions – Japan and ASEAN, for example – are
working to develop their own visions of the Indo-Pacific more
relevant to their strategic visions, geographic positions, and
multilateral relations.
Second, Canada must demonstrate its independence from
the U.S. in the Asia Pacific to address regional concerns over its
autonomy.20 While this is not to suggest that Canada purposefully
break with the U.S., or undermine its relations with Washington
for symbolism’s sake, clear opposition to a U.S. priority and/or
initiative within the region would ameliorate regional perceptions
that Canada only acts in ways that support U.S. priorities.
Importantly, Canada should only show opposition to U.S.-led
initiatives if doing so advances Canada’s national interests. Yet
the simple act of demonstrating Canada’s independence to a
somewhat sceptical region would allow Canada to develop further
its autonomy, and a national interest in and of itself.
Third, Canada should look to regional strategies such as
Indonesia’s ‘pragmatic equidistance’ to develop an approach to
great power relations where it maintains strategic distance from
China and the United States. This type of policy must include

38CANADA AS A 21ST CENTURY PACIFIC POWER: TOWARD ‘BROAD DIVERSIFICATION’ IN ASIA
BUILDING A 2020 CANADA-ASIA STRATEGY
diversification of Canada’s economy away from the United States,
deepening of bilateral relations with middle powers in Asia, such
as Japan, Taiwan, Australia, and Indonesia, and expanding its
presence in regional multilateral fora, including those multilateral
platforms such as the Belt and Road Initiative Forum that
Washington does not support. The demonstration of a distinct
Canadian ‘voice’ on regional strategic issues within regional
groupings like CSCAP is also a critical component of a strategic
distancing approach toward Asia, although the developing of such
a voice requires a sustained strategic commitment to the region.
Fourth, and lastly, Canada must restore positive ties with China
for the sake of regional balance of relations and for the value of
the overall bilateral relationship. Despite the difficulty in working
with China, it is in Canada’s broader national interest to maintain
good state relations. Importantly, Canada must approach its
bilateral relations with the understanding that good relations
require reciprocity and that Beijing must be willing to compromise
on issues such as the detainees to advance relations. Canada, too,
must compromise on issues of importance to China, even at the
cost of diminished relations with the United States. Canada could
follow the United Kingdom's example, for instance, and allow the
Chinese firm Huawei to have a role in Canadian 5G development.
Or Canada might co-operate with China under its Belt and Road
Initiative, including participation in China's annual Belt and
Road Initiative Forum, where doing so makes sense for Canada's
national interests. While such compromise may be impalpable to
some Canadians, poor relations with China do come with a heavy
cost, including greater dependence on the United States and the
corresponding loss of strategic autonomy in Asia.
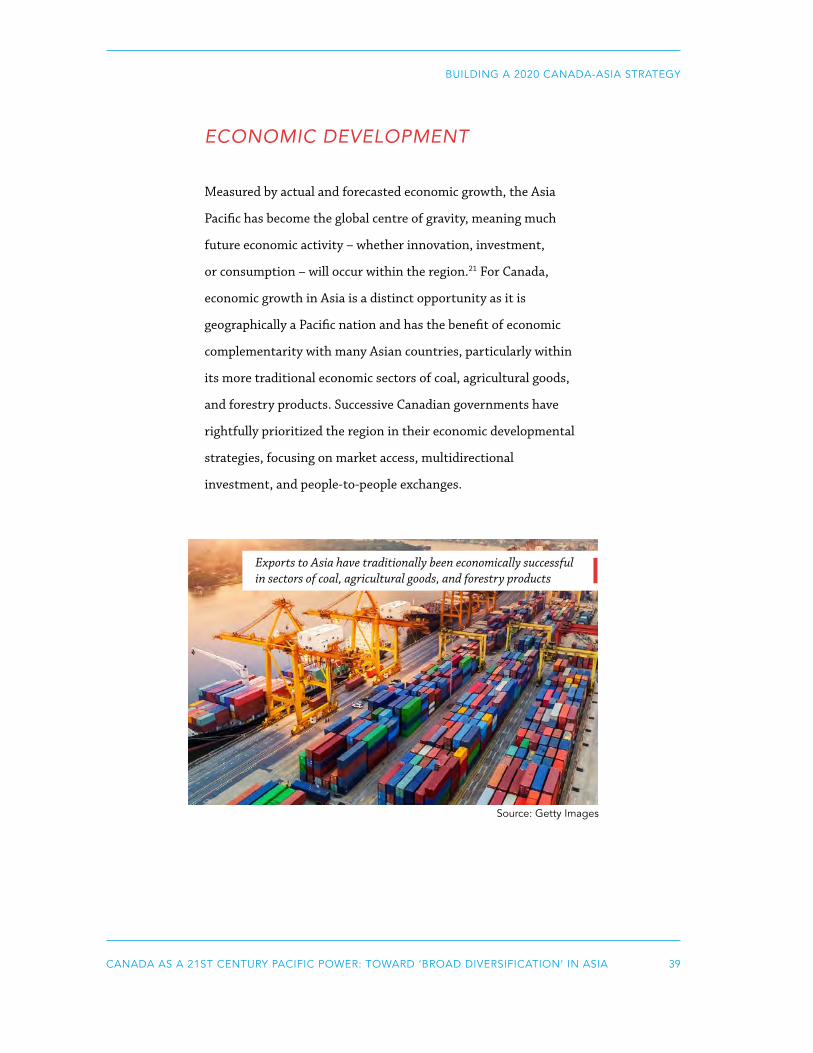
39CANADA AS A 21ST CENTURY PACIFIC POWER: TOWARD ‘BROAD DIVERSIFICATION’ IN ASIA
BUILDING A 2020 CANADA-ASIA STRATEGY
Exports to Asia have traditionally been economically successful in sectors of coal, agricultural goods, and forestry products
ECONOMIC DEVELOPMENT
Measured by actual and forecasted economic growth, the Asia
Pacific has become the global centre of gravity, meaning much
future economic activity – whether innovation, investment,
or consumption – will occur within the region.21 For Canada,
economic growth in Asia is a distinct opportunity as it is
geographically a Pacific nation and has the benefit of economic
complementarity with many Asian countries, particularly within
its more traditional economic sectors of coal, agricultural goods,
and forestry products. Successive Canadian governments have
rightfully prioritized the region in their economic developmental
strategies, focusing on market access, multidirectional
investment, and people-to-people exchanges.
Source: Getty Images

40CANADA AS A 21ST CENTURY PACIFIC POWER: TOWARD ‘BROAD DIVERSIFICATION’ IN ASIA
BUILDING A 2020 CANADA-ASIA STRATEGY
Yet Canada’s approach to economic engagement in Asia has, to
date, fallen short of its full potential, even within institutions such
as the CPTPP. Since late 2018/early 2019, for instance, Canada’s
overall trade with Japan, Mexico, Peru, and New Zealand – all
CPTPP states – has actually declined, despite the reduction and
removal of trade barriers such as tariffs.22
While this downturn in trade is in line with global trends, the
implications for Canada’s economic integration in the Asia Pacific
are nonetheless significant.
‘In a region where politics and economics
are intricately linked, Canada’s approach
has failed to reconcile the two.’
Neither has Canada successfully navigated the political dimensions
of economic co-operation, failing, for example, to separate the
political and economic components of its relations with China and/
or to demonstrate its strategic commitment to the Asia Pacific
outside its economic interests. In a region where politics and
economics are intricately linked, Canada’s approach has failed to
reconcile the two.
To ensure greater economic engagement in the Asia Pacific, both
within its existing institutions and with non-traditional partners,
the Canadian government can develop a strategy that achieves both
its economic and political aims. While the exact parameters will
differ with each government, such a strategy should be based on
the principle of ‘broad diversification,’ as outlined below.
41CANADA AS A 21ST CENTURY PACIFIC POWER: TOWARD ‘BROAD DIVERSIFICATION’ IN ASIA
BUILDING A 2020 CANADA-ASIA STRATEGY
ECONOMIC DIVERSIFICATION Central to a broad diversification approach is the deepening of
Canada’s economic relations with its traditional Asian partners,
the expansion of Canada’s regional economic partners, and the
broadening of its economic relations from traditional sectors –
those based on natural resource extraction – to technology driven
sectors, including clean technology and aerospace products,
among others.
With regard to deepening economic relations, Canada should
work with Asia’s developed economies – many of which are
already its most important regional economic partners – to
expand bilateral economic ties in both type and scope. With
Japan, for instance, Canada should increase its export of
liquefied natural gas (LNG) to the country to help Tokyo ensure
energy diversification and to expand Canada’s energy exports
to the region. Canada also has a unique opportunity through
the CPTPP to export more agri-food and seafood products to
Japan, particularly beef, which saw a tariff reduction of nearly
40% under the multilateral trade agreement. With Australia
and New Zealand, conversely, Canada should encourage further
public and private investment in key industries, building on the
already extensive bilateral investment relations it enjoys with
both countries. Canada’s pension funds, in particular, should
look to Australia and New Zealand as two of Asia’s most stable
investment destinations going forward, and Canada’s service
sector can leverage new rules under the CPTPP to expand
their activities in transportation, legal, manufacturing, and
environmental sectors.
42CANADA AS A 21ST CENTURY PACIFIC POWER: TOWARD ‘BROAD DIVERSIFICATION’ IN ASIA
BUILDING A 2020 CANADA-ASIA STRATEGY
With regard to partnership diversification, Canada can work
within its existing regionally-based institutions, such as the
Canada-Korea FTA, the CPTPP, and the Asian Infrastructure
Investment Bank (AIIB), to expand trade and investment ties
and to identify areas for development assistance that can provide
return on investment and advance its political interests. With
the Canada-Korea FTA, for instance, Canadian firms must move
beyond the export of coal, copper and iron ore, and raw aluminum
to include more value-added products such as precision
instruments and machines, both of which South Korea imports
from other sources.23
The Canadian government can support such expansion either
through direct negotiations with the South Korean government
(which enjoys a trade surplus with Canada) for greater market
access or by providing funding to Canadian small and medium
sized enterprises to pilot their products in the South Korean
market.
‘Central to a broad diversification
approach is the expansion of Canada’s
economic partners and the broadening
of its economic relations from traditional
sectors – those based on natural resource
extraction – to technology driven sectors.’
With CPTPP member states, Canada can support its private
enterprises to expand trade and investment with both its
traditional and non-traditional economic partners by providing
43CANADA AS A 21ST CENTURY PACIFIC POWER: TOWARD ‘BROAD DIVERSIFICATION’ IN ASIA
BUILDING A 2020 CANADA-ASIA STRATEGY
them with timely data so they can identify trends and
opportunities within the bloc. According to APF Canada’s 2019
CPTPP Tracker report, for instance, Canada currently sends 82%
of its exports within this bloc to Japan, Mexico, and Australia. Yet
Canadian exports are actually growing more quickly with smaller
CPTPP states such as Malaysia, Vietnam, and New Zealand.24
This is not to discount Canada’s trade relations with its largest
partners – although bilateral trade between Canada and Japan,
Mexico, and Australia did, indeed, decline in 2019. Rather, it is
to suggest Canada develop a comprehensive approach to CPTPP
developing states as a way to broaden its economic diversity in
Asia.
In parallel, Canada would benefit from building on its CPTPP
relations in Southeast Asia to develop a sub-regional approach
to expanding trade. Canada should predicate this approach on
expanding Canada’s FTAs with Singapore, Brunei, Malaysia, and
Vietnam (CPTPP member states) to all of ASEAN – an outcome
that would give Canada greater economic access to 648 million
consumers with a combined economy of US$2.8 trillion.25
Canada should also look to its outbound investment data in
the Asia Pacific to better understand where and how Canadian
firms are investing in Asia so to better position the Canadian
government to support broader engagement. According to APF
Canada’s Investment Monitor data for 2019, for instance, while
Canadian firms continue to invest primarily in the ‘traditional’
economies of Australia, China, India, Hong Kong, and Vietnam,
Canadian investment in Asia is becoming more diversified with
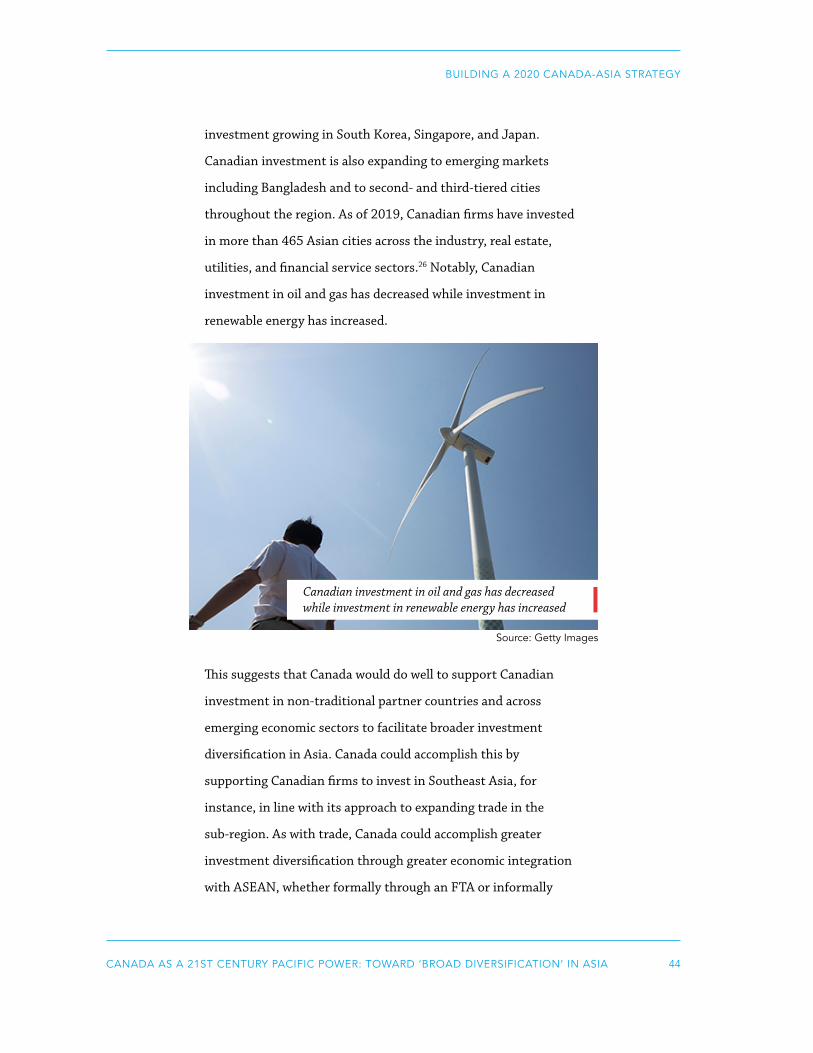
44CANADA AS A 21ST CENTURY PACIFIC POWER: TOWARD ‘BROAD DIVERSIFICATION’ IN ASIA
BUILDING A 2020 CANADA-ASIA STRATEGY
investment growing in South Korea, Singapore, and Japan.
Canadian investment is also expanding to emerging markets
including Bangladesh and to second- and third-tiered cities
throughout the region. As of 2019, Canadian firms have invested
in more than 465 Asian cities across the industry, real estate,
utilities, and financial service sectors.26 Notably, Canadian
investment in oil and gas has decreased while investment in
renewable energy has increased.
This suggests that Canada would do well to support Canadian
investment in non-traditional partner countries and across
emerging economic sectors to facilitate broader investment
diversification in Asia. Canada could accomplish this by
supporting Canadian firms to invest in Southeast Asia, for
instance, in line with its approach to expanding trade in the
sub-region. As with trade, Canada could accomplish greater
investment diversification through greater economic integration
with ASEAN, whether formally through an FTA or informally
Canadian investment in oil and gas has decreased while investment in renewable energy has increased
Source: Getty Images

45CANADA AS A 21ST CENTURY PACIFIC POWER: TOWARD ‘BROAD DIVERSIFICATION’ IN ASIA
BUILDING A 2020 CANADA-ASIA STRATEGY
through bilateral exchange, perhaps drawing on the CPTPP’s
investment chapter for a framework for bilateral and/or
multilateral investment co-operation.
Lastly, Canada can work to identify and to support regional
development priorities, particularly around infrastructure
interconnectivity and small and medium sized enterprise
development, both of which are development priorities
among regional states. Canada can accomplish this through
bilateral engagement, utilizing its development aid to help
countries achieve their millennium development goals, or
through multilateral channels, such as the Asian Infrastructure
Investment Bank or Asian Development Bank. Notably, while
some Canadian policy-makers are hesitant to engage with
the AIIB because of China’s central role in the organization’s
founding and development, regional perceptions of the AIIB are
largely positive and Canada’s current role as one of 12 rotational
directors of the AIIB’s Board of Directors (through 2021) gives it
a unique opportunity to ensure the institution’s regulations are in
line with Canadian norms and values.
46CANADA AS A 21ST CENTURY PACIFIC POWER: TOWARD ‘BROAD DIVERSIFICATION’ IN ASIA
BUILDING A 2020 CANADA-ASIA STRATEGY
DECREASE DEPENDANCY ON THE U.S.
Central to any diversification strategy for Canada is the need to
decrease its dependency on the United States economy for trade
and investment. The U.S. remains Canada’s most important
economic partner at present, with more than 73% of its exports
going to the U.S., more than 46% of its imports coming from
the U.S., and more than 46% of overall FDI into Canada coming
from the U.S.27 Long held as a position of economic advantage
for Canada, such dependency comes with opportunity cost,
particularly with regard to Canada’s economic relations in the
Asia Pacific. Whereas Australia – a country of similar population
and economic size – has successfully diversified its economy away
from dependency on the U.S. toward integration with Asia, with
its intra-Asian trade increasing by 85% over the past five years
alone, Canada remains an exclusively North American economy.28
There are three primary reasons Canada should earnestly pursue
a strategy of economic diversification away from the United
States: one economic, one political, and one security related.
Economically, dependence on the U.S. results in Canadian
underdevelopment, as it exports raw materials to the U.S.
(crude petroleum, aluminum, and agri-food) and imports
manufactured goods (such as electronics, cars and trucks, and
chemical products). This is not to suggest Canada’s economy
itself is underdeveloped, only that within its bilateral economic
relations with the U.S. it remains a provider of natural resources
and a consumer of value-added goods. Decreasing its reliance on
manufactured goods from the U.S. would allow Canada to develop
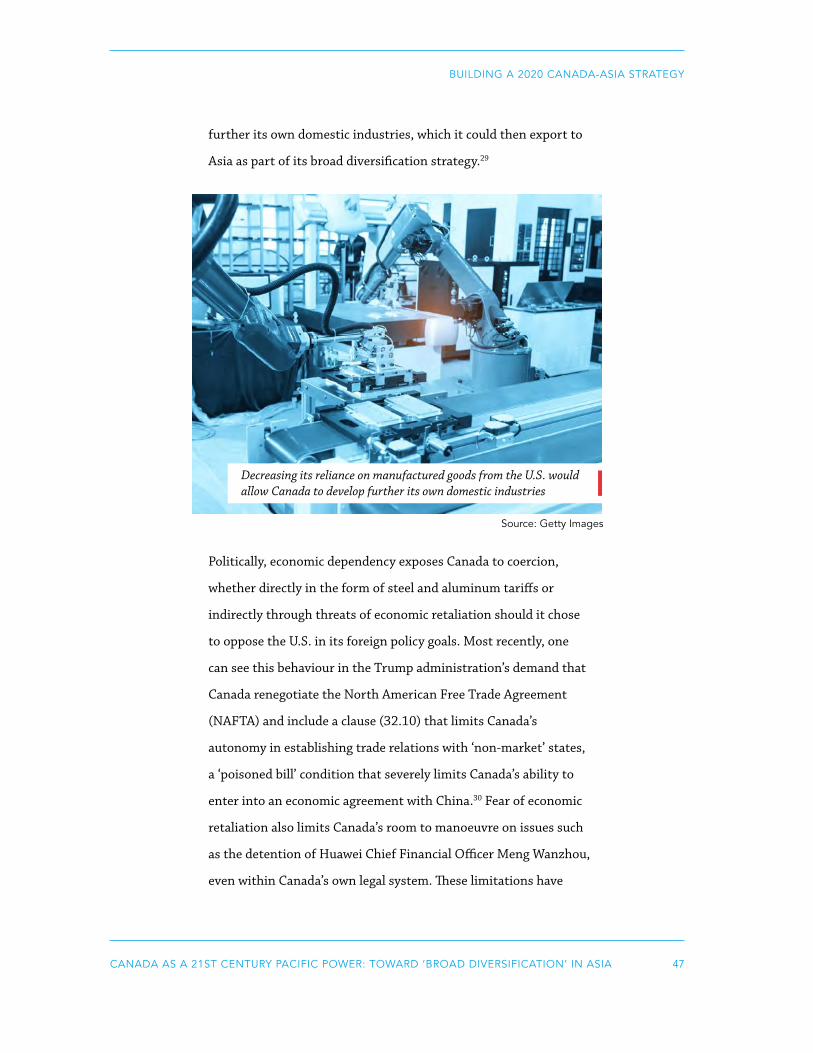
47CANADA AS A 21ST CENTURY PACIFIC POWER: TOWARD ‘BROAD DIVERSIFICATION’ IN ASIA
BUILDING A 2020 CANADA-ASIA STRATEGY
Decreasing its reliance on manufactured goods from the U.S. would allow Canada to develop further its own domestic industries
Source: Getty Images
further its own domestic industries, which it could then export to
Asia as part of its broad diversification strategy.29
Politically, economic dependency exposes Canada to coercion,
whether directly in the form of steel and aluminum tariffs or
indirectly through threats of economic retaliation should it chose
to oppose the U.S. in its foreign policy goals. Most recently, one
can see this behaviour in the Trump administration’s demand that
Canada renegotiate the North American Free Trade Agreement
(NAFTA) and include a clause (32.10) that limits Canada’s
autonomy in establishing trade relations with ‘non-market’ states,
a ‘poisoned bill’ condition that severely limits Canada’s ability to
enter into an economic agreement with China.30 Fear of economic
retaliation also limits Canada’s room to manoeuvre on issues such
as the detention of Huawei Chief Financial Officer Meng Wanzhou,
even within Canada’s own legal system. These limitations have
48CANADA AS A 21ST CENTURY PACIFIC POWER: TOWARD ‘BROAD DIVERSIFICATION’ IN ASIA
BUILDING A 2020 CANADA-ASIA STRATEGY
serious implications for Canada’s broader relations in the Asia
Pacific, particularly with China.
With regard to security, Canada’s economic dependency on the
U.S. undermines its autonomy and, as such, prevents it from
achieving its national interests. While a controversial point,
one can argue that Canada’s current downturn in relations with
China is the direct result of U.S. influence over aspects of its
domestic institutions, primarily with regard to law enforcement
and extradition. Prior to the decision by local customs and law
enforcement officers to detain Meng Wanzhou in Vancouver in
December 2018, Canada was actively pursuing deeper economic
ties with China, including a potential bilateral FTA. After
her detention, and China’s retaliation and arbitrary arrest of
two Canadians, Canada-China relations broke down, with an
enormous cost to Canada and an equally enormous benefit to
Washington. China now views Canada as a dependent actor,
accusing it of ‘singing a duet’ with Washington, a viewpoint that
places Canada clearly in China’s retaliatory ‘crosshairs’ with no
benefit for Canadian interests.31 Canadian perceptions of China
have also turned sharply negative, with only 29% of Canadians
holding positive views of China in 2019, down from 36% in
2017.32
49CANADA AS A 21ST CENTURY PACIFIC POWER: TOWARD ‘BROAD DIVERSIFICATION’ IN ASIA
BUILDING A 2020 CANADA-ASIA STRATEGY
MAINTAIN AND DEEPEN ECONOMIC TIES WITH CHINA
What less than a year ago was accepted wisdom has now become
a controversial point in need of new justification and defence.
To be certain, China’s detention of two Canadians on charges
of espionage and Beijing’s willingness to engage in hostage
diplomacy to ensure its own national interests does raise serious
concerns over Beijing’s foreign policy and its willingness to use
direct coercion. Indeed, Beijing’s past behaviour with economies
including South Korea, Japan, the Philippines, Norway, and
Taiwan suggests that any economy pursuing closer relations
with China must do so with the clear understanding that China’s
domestic institutions allow it to engage in behaviour other states
generally avoid. Any economy that engages with China must,
therefore, do so with clear-eyed realism, understanding that for
Beijing politics and economics are two sides of the same coin.
The realization that bilateral relations with China are challenging
should not, however, prevent the Canadian government from
engaging with Beijing. Nor should Canadian policy-makers
succumb to the ill-informed advice of commentators that China
is ‘too different’ to work with and that it should ‘double down’
on its relations with the U.S. to counter China. There is nothing
inherently ‘different’ about China that should prevent strong
Canada-China relations. Neither is China the only country to
use coercion against Canada for political ends. One need look
no further than the Trump administration’s steel and aluminum
tariffs for evidence of U.S. coercion, designed to achieve a political
rather than an economic outcome.
50CANADA AS A 21ST CENTURY PACIFIC POWER: TOWARD ‘BROAD DIVERSIFICATION’ IN ASIA
BUILDING A 2020 CANADA-ASIA STRATEGY
‘There is nothing inherently ‘different’
about China that should prevent strong
Canada-China relations. Neither is China
the only country to use coercion against
Canada for political ends.’
Canada’s own Export Development Canada (EDC) continues
to rate China as a ‘low risk’ country that is open for Canadian
businesses.33 Anecdotally, Canadian businesses largely report
that work in China is ‘business as usual,’ despite the relative
breakdown in state relations. People-to-people relations also
remain robust, with record numbers of Chinese students coming
to Canada for higher education and, according to APF Canada’s
public opinion polling, the majority of Canadians is still open to
high-skilled Chinese immigration to Canada.34
In line with these realizations, it is in Canada’s best interest to
continue developing deep economic ties when and where doing
so is in Canada’s national interest. Clearly, Canada can benefit
from trade, investment, and joint research and development with
China, so much so that the EDC believes China could become
Canada’s largest trade and investment partner by the end of the
2020s.35
51CANADA AS A 21ST CENTURY PACIFIC POWER: TOWARD ‘BROAD DIVERSIFICATION’ IN ASIA
BUILDING A 2020 CANADA-ASIA STRATEGY
NAVIGATING POLITICS AND ECONOMICS IN ASIA
For Canada to act on these basic elements of a ‘broad
diversification’ strategy, it must come to terms with the overlap
between economics and politics in the region. In line with the
global zeitgeist of anti-globalism, or economic nationalism, the
Canadian government must accept the unfortunate reality that its
political choices will influence its economic opportunities in Asia,
particularly with regard to its relations with the U.S. and China.
Leaders from the U.S. and China have both indicated, for example,
that they view their bilateral relations with Canada through the
lens of ongoing U.S.-China tensions to the extent that Canadian
political support for one will come with an opportunity cost for
the other.36
The Canadian government must allocate resources to better
understand its strategic and operational environment in order to
support its broader economic engagement. Ongoing participation
in regional strategic dialogue forums like CSCAP or the EAS, for
instance, would provide Canadian policy-makers and academics
access to regional strategic thinking with reference back to its
economic involvement in Asia. Canadian policy-makers can
then consider regional strategic views and perceptions when
formulating the country’s economic and political approach to
the Asia Pacific. At the same time, Canada can and should look to
countries like Japan and Taiwan for direction on how to manage a
‘hot economic, cold politic’ relationship with regional economies.
Tokyo and Taipei both have extensive experience maintaining
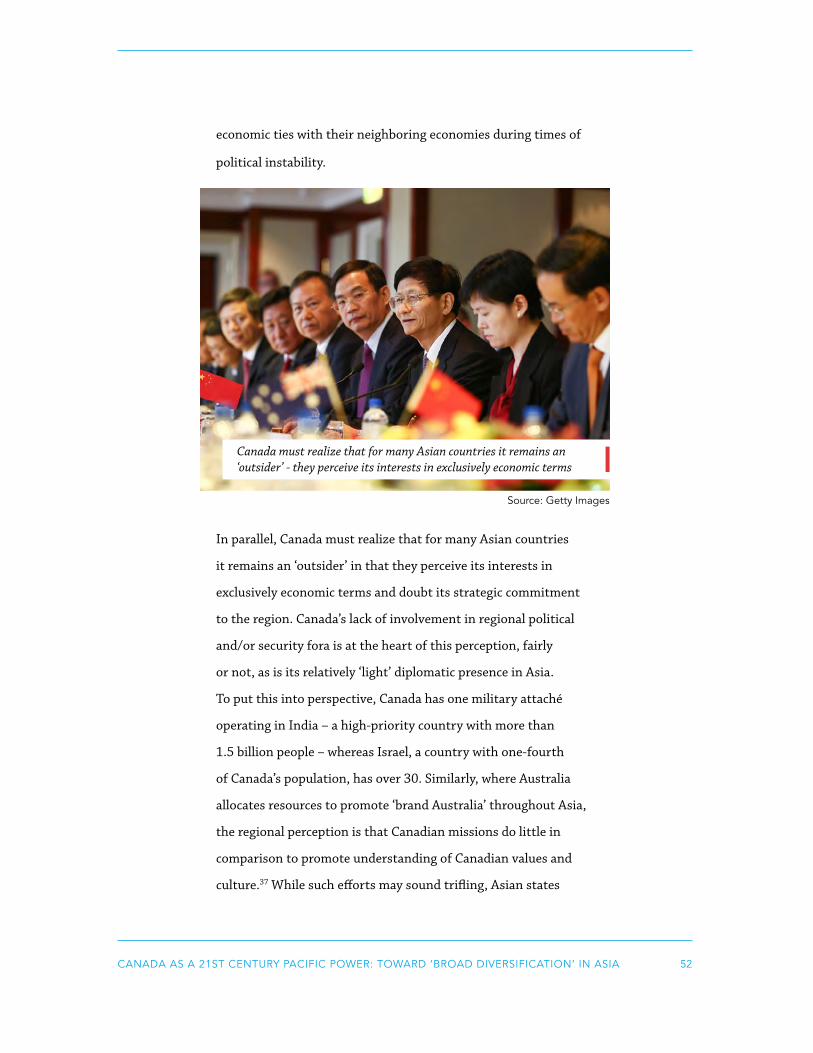
52CANADA AS A 21ST CENTURY PACIFIC POWER: TOWARD ‘BROAD DIVERSIFICATION’ IN ASIA
economic ties with their neighboring economies during times of
political instability.
In parallel, Canada must realize that for many Asian countries
it remains an ‘outsider’ in that they perceive its interests in
exclusively economic terms and doubt its strategic commitment
to the region. Canada’s lack of involvement in regional political
and/or security fora is at the heart of this perception, fairly
or not, as is its relatively ‘light’ diplomatic presence in Asia.
To put this into perspective, Canada has one military attaché
operating in India – a high-priority country with more than
1.5 billion people – whereas Israel, a country with one-fourth
of Canada’s population, has over 30. Similarly, where Australia
allocates resources to promote ‘brand Australia’ throughout Asia,
the regional perception is that Canadian missions do little in
comparison to promote understanding of Canadian values and
culture.37 While such efforts may sound trifling, Asian states
Canada must realize that for many Asian countries it remains an ‘outsider’ - they perceive its interests in exclusively economic terms
Source: Getty Images
53CANADA AS A 21ST CENTURY PACIFIC POWER: TOWARD ‘BROAD DIVERSIFICATION’ IN ASIA
place value on such engagement and Asian populations rely on such
activities to learn more about ‘Western’ states. Canada’s lack of
regional non-economic activity leaves the country relatively isolated,
to the degree that many institutions and/or think-tanks in the
region that study Asian state relations do not consider Canada an
‘Asian’ country.
To address these concerns, and to demonstrate a deeper regional
commitment than simple economic relations, the Canada
government should undertake the non-economic activities within
the region described above. These include participation in regional
dialogues, engagement with strategic initiatives, and, above all
else, establishing a permanent, noticeable presence within the
region's multilateral strategic forums, perhaps emulating the
Australia model.
55CANADA AS A 21ST CENTURY PACIFIC POWER: TOWARD ‘BROAD DIVERSIFICATION’ IN ASIA
CHAPTER 3 THE DOMESTIC CONTEXT
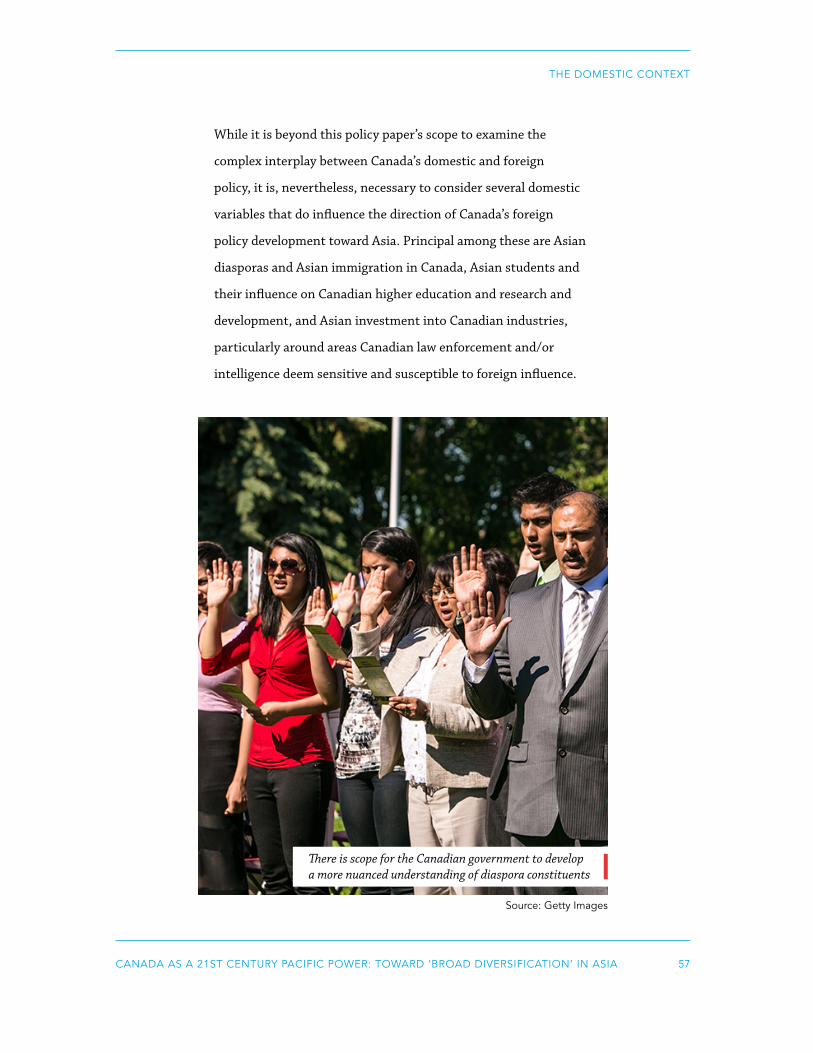
57CANADA AS A 21ST CENTURY PACIFIC POWER: TOWARD ‘BROAD DIVERSIFICATION’ IN ASIA
THE DOMESTIC CONTEXT
While it is beyond this policy paper’s scope to examine the
complex interplay between Canada’s domestic and foreign
policy, it is, nevertheless, necessary to consider several domestic
variables that do influence the direction of Canada’s foreign
policy development toward Asia. Principal among these are Asian
diasporas and Asian immigration in Canada, Asian students and
their influence on Canadian higher education and research and
development, and Asian investment into Canadian industries,
particularly around areas Canadian law enforcement and/or
intelligence deem sensitive and susceptible to foreign influence.
There is scope for the Canadian government to develop a more nuanced understanding of diaspora constituents
Source: Getty Images
58CANADA AS A 21ST CENTURY PACIFIC POWER: TOWARD ‘BROAD DIVERSIFICATION’ IN ASIA
THE DOMESTIC CONTEXT
DIASPORAS AND IMMIGRANTS
With regard to Asian diasporas, Canada should work closely
with key organizations and individuals to help facilitate greater
economic linkages with Asia, to encourage greater people-to-
people exchanges with various diasporas’ respective countries,
and to develop ‘Asia competence’ within the broader Canadian
population. Ottawa can, and should, develop a national strategy
for diaspora engagement that provides specific mechanisms for
information sharing (town halls, for example) and advocacy
designed to advance both the community’s and Canada’s shared
interests. Central to this approach is the government developing
a more nuanced understanding of diaspora constituents and
dynamics, as many diaspora communities are less homogenous
and far more complex in terms of group dynamics than they may
appear at first glance.38
‘Ottawa can, and should, develop a
national strategy for diaspora engagement
that provides specific mechanisms
for information sharing and advocacy
designed to advance both the community’s
and Canada’s shared interests.’
One caveat to this approach is the government’s need to better
understand diaspora politics and the diasporas’ relations back
to their countries of origin. While people-to-people ties are
invaluable in supporting Canada’s bilateral relations throughout
Asia, diasporas are not necessarily the only lens through which

59CANADA AS A 21ST CENTURY PACIFIC POWER: TOWARD ‘BROAD DIVERSIFICATION’ IN ASIA
THE DOMESTIC CONTEXT
Canada should view its bilateral relations or define its national
interests toward a partner country. Although important
contributors to the Canadian social fabric, Canada’s sizable
Sikh community does not represent the only voice in Canada-
India relations. India is a large and diverse country with many
languages, cultures, and regional ethnicities. Favouring the
interests of one diaspora within the Indo-Canadian community
over the others in the bilateral relationship has impacts
domestically but, also, on the foreign policy relationship with
India. The Canadian government must avoid letting domestic
diaspora politics spill over into bilateral foreign relations.
With regard to Asian immigration, the Canada government
should continue to support high-skilled individuals into Canada
to strengthen its people-to-people ties to Asia and to support its
economic development. According to a 2019 APF Canada public
opinion poll, the majority of Canadians support high-skilled
immigration from Asia – regardless of country of origin – as
they see it as essential to building Canada’s high-tech domestic
industries.39 The Canadian government should work to attract
this talent, particularly at a time when other countries, especially
the United States, are decreasing Asian immigration in line with
growing nationalist sentiments. Such measures could include
the continuation of a work visa/permanent resident scheme for
foreign students who complete courses in Canada and express
entry for those with advanced degrees and work experience.
60CANADA AS A 21ST CENTURY PACIFIC POWER: TOWARD ‘BROAD DIVERSIFICATION’ IN ASIA
THE DOMESTIC CONTEXT
FOREIGN STUDENTS AND HIGHER EDUCATION
More than 60% of foreign students studying in Canada come
from Asia, with students from China and India accounting
for 50% of total foreign students.40 As with the United States,
Australia, the United Kingdom, and New Zealand, Canada’s
domestic universities benefit largely from this foreign student
inflow, both in terms of revenue generated and talent acquired.
As of 2019, foreign students contributed more than C$21 billion
to the Canadian economy, resulting in more than 190,00 full-
time jobs.41 At the university level, the increase in revenue from
foreign students can result in more generous scholarships, greater
resources for research and development, and more diversity
within a broader student body.
To both support and to manage foreign students coming to
Canada from Asia, the government must consider the following
issues. First, there is a clear strategic need to diversify foreign
students away from China and India to include students from
alternative destinations in Asia including Vietnam, Thailand,
the Philippines, and Indonesia, among others. Overreliance on
Chinese students for revenue, in particular, is a strategic weakness
for Canada as the Chinese government has shown it is willing
to use government control to restrict Chinese citizens’ overseas
activities for strategic ends. A 2019 report on the subject noted
that three of Canada’s largest universities – University of Toronto,
the University of British Columbia, and McGill University – would
experience ‘catastrophic’ financial shortfalls in the event China
restricted its citizens from studying in Canada.42
61CANADA AS A 21ST CENTURY PACIFIC POWER: TOWARD ‘BROAD DIVERSIFICATION’ IN ASIA
THE DOMESTIC CONTEXT
‘There is a clear strategic need to diversify
foreign students away from China and
India to include students from alternative
destinations in Asia.’
To address this strategic vulnerability through student
diversification, the Canadian government has two choices.
Ottawa can impose limits on foreign students from any one
country to decrease their overall percentage of total foreign
students, or increase the number of students from alternative
source countries. As imposing ceilings on student visas based
on the applicant’s country of origin is a lose-lose scenario for
both universities and students, increasing students from less-
represented source countries is the preferable option.43 To this
end, the Trudeau administration took some initiative in 2019,
providing around C$30 million over five years for recruitment
activities in Asia (and Latin America) to attract more foreign
students.44 While certainly an important start, expanding
recruitment alone will not address the imbalance within Canada’s
overseas student population. Rather, Canada could learn from
New Zealand and provide direct merit-based scholarships to
students from Southeast Asia – many of whom cannot afford
to study in Canada – as well as support for the application
process through country-based outreach.45 Canada could also
provide scholarships and paths to citizenship for Asian doctoral
candidates, particularly those working in sectors where Canada
has high demand for employment. These types of approaches
could achieve Canada’s student diversification strategy, raise
its profile within Asia, and contribute to its domestic economic
growth through high-skilled immigration.
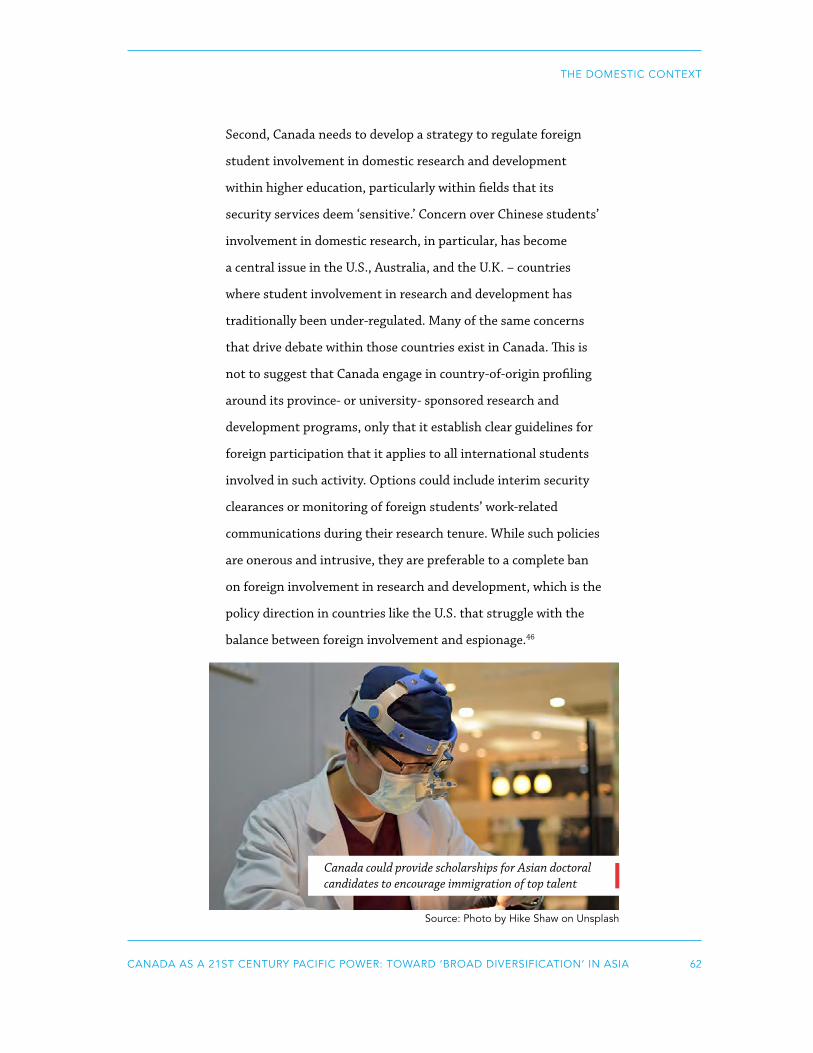
62CANADA AS A 21ST CENTURY PACIFIC POWER: TOWARD ‘BROAD DIVERSIFICATION’ IN ASIA
THE DOMESTIC CONTEXT
Second, Canada needs to develop a strategy to regulate foreign
student involvement in domestic research and development
within higher education, particularly within fields that its
security services deem ‘sensitive.’ Concern over Chinese students’
involvement in domestic research, in particular, has become
a central issue in the U.S., Australia, and the U.K. – countries
where student involvement in research and development has
traditionally been under-regulated. Many of the same concerns
that drive debate within those countries exist in Canada. This is
not to suggest that Canada engage in country-of-origin profiling
around its province- or university- sponsored research and
development programs, only that it establish clear guidelines for
foreign participation that it applies to all international students
involved in such activity. Options could include interim security
clearances or monitoring of foreign students’ work-related
communications during their research tenure. While such policies
are onerous and intrusive, they are preferable to a complete ban
on foreign involvement in research and development, which is the
policy direction in countries like the U.S. that struggle with the
balance between foreign involvement and espionage.46
Canada could provide scholarships for Asian doctoral candidates to encourage immigration of top talent
Source: Photo by Hike Shaw on Unsplash
63CANADA AS A 21ST CENTURY PACIFIC POWER: TOWARD ‘BROAD DIVERSIFICATION’ IN ASIA
THE DOMESTIC CONTEXT
FOREIGN INVESTMENT IN CANADA'S DOMESTIC INDUSTRIES
According to APF Canada’s 2019 poll on Asian investment in
Canada’s high-tech sector, Canadians are, by and large, receptive
to foreign brownfield and greenfield investment in Canada,
with the exception of Chinese investment in the country’s
telecommunication and resource sectors, particularly by state-
owned enterprises.47 Concern around China’s involvement in
telecommunications comes primarily from media reporting
on Huawei, as well as the Trump administration’s forceful
position that the U.S.’s allies and partners exclude Huawei from
their telecommunications industry or face the prospect of an
intelligence-sharing ban.48 The 2019 poll also shows a majority
of Canadians (54%) believe the federal government lacks the
ability to conduct risk-benefit analysis around Asian investment
and that decisions to ban foreign investment on the basis of
national security is too secretive and lacks transparency (81%).
This data suggests the challenge for Ottawa is not providing
greater oversight over Asian investment into Canada, but rather
demonstrating to the Canadian public that its deliberations
include risk analysis and are open to external scrutiny.
‘The challenge for Ottawa is not providing
greater oversight over Asian investment
into Canada, but rather demonstrating to
the Canadian public that its deliberations
include risk analysis and are open to
external scrutiny.’
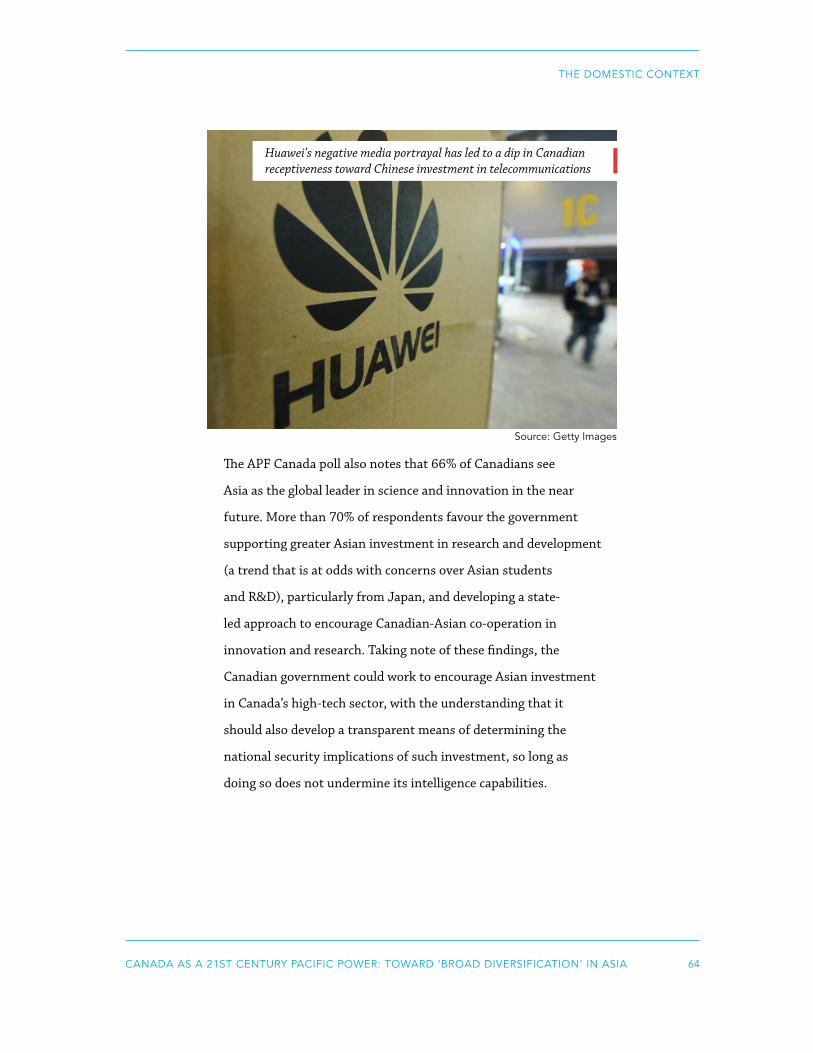
64CANADA AS A 21ST CENTURY PACIFIC POWER: TOWARD ‘BROAD DIVERSIFICATION’ IN ASIA
THE DOMESTIC CONTEXT
The APF Canada poll also notes that 66% of Canadians see
Asia as the global leader in science and innovation in the near
future. More than 70% of respondents favour the government
supporting greater Asian investment in research and development
(a trend that is at odds with concerns over Asian students
and R&D), particularly from Japan, and developing a state-
led approach to encourage Canadian-Asian co-operation in
innovation and research. Taking note of these findings, the
Canadian government could work to encourage Asian investment
in Canada’s high-tech sector, with the understanding that it
should also develop a transparent means of determining the
national security implications of such investment, so long as
doing so does not undermine its intelligence capabilities.
Huawei's negative media portrayal has led to a dip in Canadian receptiveness toward Chinese investment in telecommunications
Source: Getty Images
65CANADA AS A 21ST CENTURY PACIFIC POWER: TOWARD ‘BROAD DIVERSIFICATION’ IN ASIA
THE DOMESTIC CONTEXT
IGNORE THE SCAREMONGERING Within Canada, there is a vocal cohort of academics and analysts
who write on the deleterious effects of China’s influence on the
country’s domestic institutions. They argue that China’s activities
– both overt and covert – are challenging Canadian sovereignty
and undermining Canadian values. In contrast to the Australian
and New Zealand cases, where analysts have clearly documented
Chinese attempts to develop influence through political funding
and/or pressure campaigns, the evidence for such Chinese
activities in Canada is there – but to date, limited.
‘Ottawa should treat unsubstantiated,
anecdotal reporting on Chinese influence
operations in Canada as a call to develop
Asian literacy in the country rather than a
call to arms.’
Furthermore, Beijing’s ability to ‘buy’ political influence in Canada
is held in check by domestic laws that prohibit foreign campaign
funding and ensure transparency under the 2018 Elections
Modernization Act. Neither is there compelling evidence that
China or any other Asian country is working to influence election
outcomes through social media, although Ottawa should (and
is) monitoring sites including Facebook and Twitter for foreign
sponsored content.

66CANADA AS A 21ST CENTURY PACIFIC POWER: TOWARD ‘BROAD DIVERSIFICATION’ IN ASIA
THE DOMESTIC CONTEXT
Canada must not turn a blind eye to foreign activities within its
borders that could ultimately result in influence development;
indeed, Canada should maintain vigilance over this foreign
activity. But at present, China has not differentiated itself as
a particularly malign actor within Canada’s domestic context.
Ottawa should, therefore, treat unsubstantiated, anecdotal
reporting on Chinese influence operations in Canada as a call to
develop Asian literacy in the country rather than a call to arms
against one of the country’s most important partners.
Hong Kong-related protests in Canadian cities have been largely peaceful
Source: Chris Slupski | Unsplash

67CANADA AS A 21ST CENTURY PACIFIC POWER: TOWARD ‘BROAD DIVERSIFICATION’ IN ASIA
CHAPTER 4 CONCLUSION
69CANADA AS A 21ST CENTURY PACIFIC POWER: TOWARD ‘BROAD DIVERSIFICATION’ IN ASIA
CONCLUSION
There is no simple formula the Canadian
government can follow to develop a grand strategy
toward Asia. Canada’s interests within the region
are diverse and, in some instances, conflicting. Engagement with
China – long a government strategy for economic and political
diversification – requires an acceptance of the interplay between
politics and economics, something Ottawa has been loath
to do in the past. Engagement with countries like Myanmar,
Cambodia, Thailand, and Vietnam also requires a more realpolitik
mindset for Ottawa, as these countries all eschew democracy for
authoritarianism. Under U.S. pressure, demonstrating autonomy
in foreign policy toward Asia, particularly China, will carry certain
costs for Ottawa. As such, the best any Canadian government
can do is develop a comprehensive approach to Asia that balances
its interests and values and seeks to minimize costs while
maximizing gains.
While APF Canada believes there is no one clear approach to Asia
that is ‘correct,’ it does advocate informed policy making that
takes regional dynamics into account. This brief has identified
what APF Canada believes are the overarching conditions
within Asia that Canada must navigate when developing an Asia
strategy and has provided parameters around the policy decisions
it believes any government must consider. In defining these
parameters, APF Canada has used Canada’s national interests as
a guide, focusing on the core issues of security, sovereignty, and
economic growth which, it believes, all Canadian policy-makers
will support.
70CANADA AS A 21ST CENTURY PACIFIC POWER: TOWARD ‘BROAD DIVERSIFICATION’ IN ASIA
CONCLUSION
As such, policy-makers should treat this policy paper as a guide
upon which they can build a distinct strategy; one that accords
with their values and intentions. While it is beyond this brief’s
scope to spell out such specific policy directions, it provides
a starting point for informed discussion from which any
government will benefit.
Report prepared by:
Dr. Jeffrey Reeves,
Vice-President, Research,
Asia Pacific Foundation of Canada
For more information, contact:
:

1 Gallup, ‘Americans' Favorable Views of China Take 12-Point Hit,’ Gallup, 11 March 2019, available at: https://news.gallup.com/poll/247559/americans-favorable-views-china-point-hit.aspx.
2 United States Department of Defense, ‘Indo-Pacific Strategy Report,’ US Department of Defense, 1 July 2019, available at: https://media.defense.gov/2019/Jul/01/2002152311/-1/-1/1/DEPARTMENT-OF-DEFENSE-INDO-PACIFIC-STRATEGY-REPORT-2019.PDF
3 Max Fisher, ‘‘One Country, Two Nationalisms’: The Identity Crisis Behind Hong Kong’s Turmoil,’ New York Times, 27 September 2019, available at: https://www.nytimes.com/2019/09/27/world/asia/hong-kong-protests-identity.html
4 Nilanjana Roy, ‘Democracy in India is on the brink,’ Financial Times, 20 December 2019, available at: https://www.ft.com/content/50de5e78-225a-11ea-b8a1-584213ee7b2b
5 Bonnie Bley, ‘A Middle-Power Moment,’ Lowy Institute, 23 August 2019, available at: https://www.lowyinstitute.org/the-interpreter/middle-power-moment
6 Pew Research Center, ‘Countries’ views of Japan, Abe; Japanese views China,’ Pew Research Center, 12 November 2018, available at: https://www.pewresearch.org/global/2018/11/12/countries-views-of-japan-abe-japanese-views-of-china/
7 Lowy Institute, ‘Asia Power Index 2019: Key Findings,’ Lowy Institute, 28 May 2019, available at: https://power.lowyinstitute.org/downloads/Lowy-Institute-Asia-Power-Index-2019-Key-Findings.pdf
8 Asia Pacific Foundation of Canada, ‘Artificial Intelligence Policies in East Asia,’ Asia Pacific Foundation of Canada, 25 June 2019, available at: https://www.asiapacific.ca/sites/default/files/filefield/ai_report_2019.pdf.
9 Steven Kendall Holloway, Canadian Foreign Policy: Defining the National Interest (Toronto: University of Toronto Press, 2006), pg. 14.
10 Van Jackson, ‘A Region Primed for Peace or War? Historical Institutionalism and Debates in East Asian Security,’ Journal of Global Security Studies, Vol 2, Issue 3 (2017)
11 Christine Halse, Asia Literate Schooling in the Asian Century (London: Routledge, 2015)
12 Standing Senate Committee on Foreign Affairs and International Trade, ‘Security Canada’s Place in Asia Pacific: A Focus on Southeast Asia,’ Standing Senate Committee on Foreign Affairs and International Trade, June 2015, available at: https://sencanada.ca/Content/SEN/Committee/412/aefa/rep/rep12jun15-e.pdf, pg. 27
13 House of Commons, ‘Canada’s Engagement with East Asia,’ House of Commons, November 2018, available at: https://www.ourcommons.ca/Content/Committee/421/FAAE/Reports/RP10186949/faaerp20/faaerp20-e.pdf, pg. 18
14 ASEAN, ‘Overview,’ ASEAN, available at: https://asean.org/asean/about-asean/overview/
BIBLIOGRAPHY

15 David Capie, ‘A pragmatic approach to foreign policy,’ University of Wellington, 5 March 2018, available at: https://www.victoria.ac.nz/news/2018/03/a-pragmatic-approach-to-foreign-policy
16 Prime Minister’s Office, Singapore, ‘PM Lee Hsien Loong at the IISS Shangri-la Dialogue 2019,’ Prime Minister’s Office, Singapore, 31 May 2019, available at: https://www.channelnewsasia.com/news/singapore/lee-hsien-loong-speech-2019-shangri-la-dialogue-11585954
17 Tang Siew Mun, et al, ‘The State of Southeast Asia,’ ASEAN Studies Centre, 29 January 2019, available at: https://www.iseas.edu.sg/images/pdf/TheStateofSEASurveyReport_2019.pdf
18 Jonathan Paquin and Philippe Beauregard, ‘Shedding Light on Canada’s Foreign Policy Alignment,’ Canadian Journal of Political Science, Vol. 46, Vol. 3 (2013), pg. 617-643
19 David Carment and Christopher Sands, Canada-US Relations: Sovereignty or Shared Institutions? (New York, Springer, 2019)
20 Li Qingqing, ‘Canada’s diplomatic dilemma stems from lack of independence,’ Global Times, 5 June 2019, available at: http://www.globaltimes.cn/content/1148749.shtml
21 Lee Kuan Yew School of Public Policy, ‘Asia will soon be the world’s economic center—if it isn’t already,’ Quartz, 6 February 2017, available at: https://qz.com/902512/asia-will-soon-be-the-worlds-economic-center-if-it-isnt-already/
22 Grace Jaramillo, ‘The CPTPP Tracker 2019: The First Year,’ Asia Pacific Foundation of Canada, 10 December 2019, available at: https://www.asiapacific.ca/sites/default/files/publication-pdf/the_cptpp_tracker_report_final_0.pdf
23 Observatory of Economic Complexity, ‘South Korea,’ OEC, accessed 25 October 2019, available at: https://oec.world/en/profile/country/kor/
24 Grace Jaramillo, ‘The CPTPP Tracker 2019: The First Year,’ Asia Pacific Foundation of Canada, 10 December 2019, available at: https://www.asiapacific.ca/sites/default/files/publication-pdf/the_cptpp_tracker_report_final_0.pdf 25 Wayne Farmer, ‘Why a ASEAN-Canada Free-Trade Agreement is a winning strategy, EDC, 11 Feb. 2019, available at: https://www.edc.ca/en/blog/asean-canada-agreement.html
26 Grace Jaramillo and Kai Valdez Bettcher’ “Investment Monitor 2019: Report on City-Level Foreign Direct Investment Between Canada and the Asia Pacific” Asia Pacific Foundation of Canada, accessed 23 December 2019, available at: https://www.investmentmonitor.ca/insights-reports/investment-monitor-2019-report-city-level-foreign-direct-investment-between-canada
27 Observatory of Economic Complexity, ‘Canada,’ OEC, accessed 25 October 2019, available at: https://oec.world/en/profile/country/can/
28 Observatory of Economic Complexity, ‘Australia,’ OEC, accessed 25 October 2019, available at: https://oec.world/en/profile/country/aus/
29 Stephen Clarkson and Matto Mildenberger, Dependent America?: How Canada and Mexico Construct US Power (Toronto: University of Toronto Press, 2011)
30 Mike Blanchfield, ‘Beijing attacks USMCA clause seen as blocking efforts to expand trade with Canada, Mexico,’ The Canadian Press, 5 October 2018, available at: https://www.cbc.ca/news/politics/usmca-nafta-china-trade-1.4852269
31 Steven Chase, ‘China accuses Canada and U.S. of ‘singing a duet’ to confuse world over Meng and Canadian detainees,’ The Globe and Mail, 23 August 2019, available at: https://www.theglobeandmail.com/politics/article-china-accuses-canada-and-us-of-singing-a-duet-to-confuse-world/
32 Paul Evans and Li Xiaojun, “National Survey Results and Findings on Canadian Public Attitudes on China and Canada-China Relations,’ UBC School of Public Policy and Global Affairs, 1 November 2019, available at: https://sppga.ubc.ca/news/october-2019-national-survey-results-and-findings-on-canadian-public-attitudes-on-china-and-canada-china-relations/
33 EDC, ‘China,’ EDC, accessed 25 October 2019, available at: https://www.edc.ca/en/country-info/country/china.html
34 2019 National Opinion Poll: Canadian Views on Human Capital from Asia, https://www.asiapacific.ca/publication/2019-national-opinion-poll-canadian-views-human-capital-asia
35 Reference from trade diversification event
36 Kristin Huang, ‘Canada ‘will join US’ in speaking out for rules-based global order against China,’ South China Morning Post, 23 June 2019, available at: https://www.scmp.com/news/china/diplomacy/article/3015555/canada-will-join-us-speaking-out-rules-based-global-order; ‘China warns Canada not to be 'naive' in thinking allies can help fix dispute,’ CBC News, 3 July 2019, available at: https://www.cbc.ca/news/politics/china-canada-trump-naive-1.5198249
37 Ellen Huijgh and Caitlin Byrne, “Opening the Windows on Diplomacy: A Comparison of the Domestic Dimension of Public Diplomacy in Canada and Australia,” The Hague Journal of Diplomacy Vol. 7, No. 4 (2012)
38 APF Canada is currently working with National Geographic on a project to better understand and to advocate for Chinese language usage within Vancouver’s Chinese diaspora, particularly with regard to underrepresented China languages such as Cantonese and Hokkien. Through this type of work, the Canadian government can develop a better understanding of its domestic diasporas that will allow it to more effectively reach out to those communities when doing so can support its foreign policies
39 Sreyoshi Dey, ‘New Poll Finds Canadians Ready to Engage Asia to Fill Growing Gap in Skilled Labour,’ Asia Pacific Foundation of Canada, 21 November 2019, available at: https://www.asiapacific.ca/publication/new-poll-finds-canadians-ready-engage-asia-fill-growing-gap
40 Canadian Bureau for International Education, ‘International Students in Canada,’ Canadian Bureau for International Education, accessed 25 October 2019, available at: https://cbie.ca/infographic/
41 Joe Friesen, ‘Trudeau government outlines five-year, $148-million plan to attract more foreign students to Canadian universities,’ Globe and Mail, available at: https://www.theglobeandmail.com/politics/article-trudeau-government-outlines-five-year-148-million-plan-to-attract/
42 Canadian Press, ‘Credit agency warns big risk to Canadian schools if China pulls students,’ Toronto Star, 7 February 2019, available at: https://toronto.citynews.ca/2019/02/07/credit-agency-warns-big-risk-to-canadian-schools-if-china-pulls-students/
43 Alia Wong, ‘Colleges Face Growing International Student-Visa Issues,’ The Atlantic, 6 September 2019, available at: https://www.theatlantic.com/education/archive/2019/09/how-harvard-and-other-colleges-grapple-student-visa-problems/597409/
44 Joe Friesen, ‘Trudeau government outlines five-year, $148-million plan to attract more foreign students to Canadian universities,’ Globe and Mail, available at: https://www.theglobeandmail.com/politics/article-trudeau-government-outlines-five-year-148-million-plan-to-attract/
45 New Zealand Foreign Affairs and Trade, ‘New Zealand Scholarships for International Tertiary Students,’ New Zealand Foreign Affairs and Trade, accessed 25 October 2019, available at: https://www.mfat.govt.nz/en/aid-and-development/new-zealand-government-scholarships/new-
zealand-scholarships-for-international-tertiary-students/apply-online-for-a-new-zealand-scholarship/application-opening-and-closing-dates-for-your-country/
46 Meng Jing, ‘Why Trump’s clampdown on academia is forcing many Chinese researchers into a difficult corner,’ South China Morning Post, 13 June 2019, available at: https://www.scmp.com/tech/policy/article/3014185/why-trumps-clampdown-academia-forcing-many-chinese-researchers
47 Asia Pacific Foundation of Canada, ‘2019 National Opinion Poll: Canadian Views on High-tech Investment from Asia,’ Asia Pacific Foundation of Canada, 12 June 2019, available at: https://www.asiapacific.ca/surveys/national-opinion-polls/2019-national-opinion-poll-canadian-views-high-tech
48 Christopher Parsons, ‘Is Huawei a security threat to Canada? Risks could be closer to home, says columnist,’ CBC Radio, 27 May 2019, available at: https://www.cbc.ca/radio/thecurrent/the-current-for-may-27-2019-1.5148981/is-huawei-a-security-threat-to-canada-risks-could-be-closer-to-home-says-columnist-1.5149096


11
MARKET INTELLIGENCE AND POLICY RESEARCH
Cleantech Market Opportunities in China
2
TABLE OF CONTENTS
Executive Summary
Methodology
Introduction
Section I: Green Growth and Cleantech Market Opportunities in China
Section II: Canada’s Cleantech Industry: Doing Business in China
Section III: Environmental Performance of China’s 31 Provincial Capitals
Section IV: Identification of Priority Markets and Recommendations
Acknowledgement
About the Asia Pacific Foundation of Canada
3
4
5
6
14
20
29
35
36

3
EXECUTIVE SUMMARY
China has achieved remarkable economic growth in a few short decades, but at the cost of a deteriorating environment. In recent years, the Chinese government has embedded environmental protection and green development into its growth strategy in an attempt to mitigate this damage. China has made comprehensive plans and enacted new policies to deal with pollution and committed considerable resources to key regions and cities.
These commitments are contributing to the rapid growth of China’s cleantech market; investment in the environment sector has boomed in recent years and is expected to continue to grow in line with China’s strong GDP. There were more than 50,000 cleantech companies in China in 2016, and that number continues to rise. China now ranks globally as the top market for air, water, and soil remediation technologies. Sewage treatment, air pollution, and solid waste account for more than 95 per cent of China’s cleantech industry, while the remediation of contaminated soil is projected to soon be the fastest growing sector. Despite the rapid development of China’s cleantech sector, demand outpaces supply.
Canada, meanwhile, excels in the cleantech sector – particularly in water and wastewater treatment, solid waste management, soil remediation, and air pollution control. Canada is strong in the research and development stage of cleantech, but not so when it comes to commercializing the technology. When it comes to doing business with or in China, Canadian companies need to invest more in establishing a presence, deepening engagement with Chinese partners, and better understanding the Chinese regulatory and business environment.
Information on China’s environmental changes at the city level will help Canadian cleantech companies looking to invest in China. Opportunities are immense in major cities across China, but some cities lag behind in terms of their environmental protection performance, providing both challenges and opportunities to potential investors. Similarly, the national government has targeted key regions for pollution control, and local governments differ in their investment and efforts for environment protection, creating an uneven investment landscape for Canadian cleantech firms looking at markets in China.
This report identifies five provincial capitals in China as areas of focus and potential interest for export-ready Canadian clean tech firms. The five cities were identified based on the severity of their pollution problems, their historical environmental performance, and their ability and willingness to integrate local and national government policies. The cities of focus are: Shijiazhuang and Xi’an for air, Shanghai and Chongqing for water, and Kunming for solid waste.

4
METHODOLOGY
The research for this report was conducted from January to March 2019. It consisted of three sets of activities:
• The first consisted of reviewing publicly available information, documents, and analytical articles on China’s environmental policies and its cleantech market, and development of Canada’s cleantech industry;
• The second involved consultations with the Canadian cleantech community. Information solicited from roundtable discussions with representatives from industry, government, and experts in Vancouver, Montreal, Toronto, and Calgary provides Canadian perspectives on Chinese market opportunities; and
• The third was a quantitative assessment of China’s environmental protection performance. Environmental data from China’s 31 provincial capital cities were analyzed to assess changes in performance between 2013 and 2017. Different sets of indexes reflecting air and water quality and solid waste management were taken into consideration to determine where cleantech goods and services may be in demand.

5
INTRODUCTION
China today is at a historical juncture. After decades of high but unsustainable growth driven by polluting industries, the economy is dramatically transitioning toward a high-quality, innovation growth model that emphasizes green development. This transition underlines China’s desire to become an “ecological civilization” and a global player in addressing climate change.
As China has been steadily moving toward a greener future, Canada has been investing in and promoting clean technologies at home and for the international market. This has enabled Canadian cleantech companies to support Canada’s transition toward a low-carbon economy and cleaner environment, as well as to be better positioned in the global marketplace. China represents the largest international market for clean technologies. This presents Canadian firms with tremendous opportunities, as well as challenges to scale up and compete in this marketplace.
This report analyzes China’s transition and progress toward a green growth economy and the implications this has for Canada–China co-operation in clean technology. The aim of the research is to analyze China’s environmental protection performance and assess where the best opportunities for Canada’s cleantech exports and investment can be found.
Where to do business is a question Canadian small and medium-sized enterprises (SMEs) often ask when looking at the vast and immensely competitive market in China, in all its complexity. For the cleantech industry, this usually means going to where there is the most demand for the type of product or service being marketed. The research seeks to address this question. Using data from the China Eco-City Tracker project from the Asia Pacific Foundation of Canada (APF Canada), it identifies priority markets at the municipal level for clean technologies focused on air pollution, water quality, and solid waste management. Soil remediation is also discussed.
The report comprises the following sections:
• Green Growth and Cleantech Market Opportunities in China: an overview of China’s transition toward a green growth economy, policy restructuring, and cleantech market development;
• Canada’s Clean Technology Industry: a review of Canada’s cleantech industry, its presence in the cleantech market in China, and opportunities and challenges;
• Environmental Performance of China’s 31 Provincial Capitals: an assessment of environmental protection performance in China’s provincial capitals, and trends with respect to air, water, and solid waste management; and
• Identification of Priority Markets and Recommendations: priority market areas are identified for further study relating to air, water, and solid waste disposal technologies. Recommendations are made for facilitating Canadian cleantech business interests in China in these sectors.

6
SECTION I: GREEN GROWTH AND CLEANTECH MARKET OPPORTUNITIES IN CHINAChina’s rapid economic development over the past three decades has been remarkable. Today, China is the world’s second-largest economy and the largest producer of industrial goods. The economy accounts for over 19% of global GDP, surpassing that of the United States, and close to half of global manufacturing employment.1
China’s export-led growth model has yielded huge economic dividends, but to the detriment of the environment and human health. Inefficient resource consumption and a heavy reliance on coal to drive industry have made China the world’s largest polluter of air, water, and soil. The World Bank conservatively estimates the cost of environmental pollution to be in excess of 6% of its GDP.2
1. China’s Transition to Green Growth
China has not been oblivious to environmental concerns since its industrial transformation. The first Environmental Protection Law was passed by the National People’s Congress in 1979, and a National Environmental Protection Commission was established in 1984. However, during the early reform years, economic growth was given much higher priority than environmental protection. As a result, there were few incentives to take corrective action, and policy implementation proved weak.
Environmental protection began to show prominence in China’s 11th Five Year Plan (2006-2010), marking a turning point in environmental policy-making.3 The 12th Five Year Plan (2011-2015) took this further, with measures for shutting down heavily polluting industries and developing a series of action plans to tackle air, water, and soil pollution and waste disposal. Premier Li Keqiang’s declaration of a “war on pollution” at the annual meeting of the National People’s Congress in 2014 signalled an important change in the government’s approach to the environment, ushering in stringent protection measures and enforcement to tackle the three battles of air, water, and soil.
Today, the environmental agenda has moved to the forefront. In the 13th Five Year Plan (2016-2020), environmental protection and green development are embedded within China’s growth strategy. The plan prioritizes structural reform of the economy and states that the principle of an “ecological civilization” will guide China’s growth and development. It sets ambitious targets to control carbon emissions and eliminate polluting industries, improve water quality, address soil contamination, control waste, and develop green infrastructure. Furthermore, it lays the foundation for mainstreaming green growth across the economy via industrial policy, green finance, and market reforms to promote clean technologies as new economic drivers.
7
Environmental Protection Policies and Action Plans
Over the years, China has enacted a relatively comprehensive legal framework for environmental protection, beginning with the Environmental Protection Law. The legal regime pursued end of pipe cleanup approaches to dealing with pollution. It was not until the shift in economic thinking that China began to develop forward-looking action plans.
Air Pollution
Air pollution is the most prominent public concern in China. Geographically widespread, it affects all major cities, and especially those in the northeast industrial belt. The first Air Pollution Prevention and Control Action Plan was released in 2013. It embedded targets on air quality improvement into government officials’ performance, prompting local governments to pay close attention to implementation. The plan set nation-wide sub-goals with priority given to the urban conglomerates in the Yangtze River Delta, the Pearl River Delta, and the Beijing-Tianjin-Hebei (BTH) region.
In June 2018, the State Council released its successor, the Three-Year Action Plan for Winning the Blue Sky War, which set new targets for air quality by 2020.4 The plan expands the geographic scope to include 82 new cities and new regions where pollution is heavy, including the Fen-Wei Plains5 and areas adjacent to the BTH region, such as parts of Shanxi, Shandong, and Henan.
Water Pollution
Water pollution is widespread and particularly acute in cities. About two-thirds of China’s cities suffer from water shortages and severe contamination. China’s Water Pollution Prevention and Control Action Plan, issued in 2015, puts tight controls on polluting industries and includes strict supervision. For surface water, the focus is on improving water quality in seven major river systems: Yangtze, Yellow, Pearl, Songhua, Huai, Hai, and Liao. For groundwater, the focus is on treatment and control in all 31 provincial capitals and direct-administered municipalities.
Soil Contamination
Soil contamination, up until recently, has not received as much attention. However, soil pollution is very serious because of its complex interactions with groundwater and food production. A government survey in 2014 estimated that one-fifth of farmland is heavily polluted.6 In 2016, the State Council released its Soil Pollution Prevention and Control Action Plan; in 2018, the Soil Pollution Prevention and Control Law was enacted. The Action Plan sets two major targets – one for 2020 and the other for 2030 – to attain the safe utilization ratio of contaminated lands. A National Soil Pollution Survey is currently being undertaken; by next year, “an assessment of the distribution of all contaminated land by key polluting enterprises and their environmental risks will be complete.”7

8
Solid Waste Management
Solid waste has been expanding at a high rate, posing health and food safety concerns. Disposing of it has become a major challenge. Four solid wastes – municipal, industrial, hazardous, and agricultural – are disposed of largely by incineration or landfill. However, less than 60% of hazardous waste is safely disposed of, and more than 30% of cities do not have disposal facilities for medical waste.8 China does not have an action plan for solid waste, but there are multiple laws and regulations governing it, including the Solid Waste Pollution Prevention and Control Law (2015 revised). The adoption of resource use policies, such as the Circular Economy Promotion Law (2009), has increased the utilization rate of industrial and residential waste, but increasing volumes pose major challenges to municipal governments.
Municipal waste, including waste electrical and electronic equipment, is the fastest-growing waste stream in China. Waste collection and recycling is dominated by small-scale collections and informal recycling facilities. Throughout China, the government is introducing modern recycling plants, but the management system is in need of modernization. At present, most hazardous waste treatment facilities are small-scale enterprises with low capacity.
Ban on Foreign Waste
Up until very recently, China’s solid waste pollution was compounded by the importation of foreign garbage, where regulatory controls were lax. The government has now taken decisive action and implemented a complete ban on imported waste – Implementation Plan on Banning Entry of Foreign Garbage and Reforming the Administration System of Solid Waste Importation (2017) – effective as of 2018. This stops the importation of all waste (China was previously the world’s largest importer) and significantly reduces environmental damage caused by waste pollution.
Environmental Protection Tax
A market-based instrument introduced in 2018 to advance China’s green growth reforms is the Environmental Protection Tax Law. This is China’s first green tax specifically designed to shift the system of pollution discharge fees into a system of taxes, thereby incentivizing enterprises to not just control pollution, but to switch to cleaner alternatives. The tax is also designed to help shift China’s manufacturing industry toward technologically advanced and eco-friendly businesses.
Green Financing
Complementing fiscal levers, China is quickly developing green financing instruments. Green credit systems extending financing for environmental protection and green projects are shaping new market niches. The system is being developed to regulate access to finance in terms of compliance with environmental standards. Government is also promoting environmental liability insurance for companies to manage environmental risk. The People’s Bank of China recently launched green bonds into China’s financial system, with more than
9
90% of transactions being conducted by state-owned enterprises. This size and scope of China’s green financing system has made it the world leader.
Co-ordinated Regional and Urban Green Development Approach
Green growth is also encapsulated in China’s approach for co-ordinated regional development and urbanization.9 Priority is given to implementing co-ordinated green development in:
• The Beijing-Tianjin-Hebei region for the establishment of ecological corridors/zones;
• The Yangtze River Delta to protect water resources and control water and soil pollution;
• Clean energy transformation in city clusters in the Fen-Wei Plains; and
• Water remediation in the Pearl River Delta region.
Resources are also being committed for the greening of cities and new urbanization, including the development of:
• Smart cities to make full use of new technological drivers for green growth, the development of the internet of things to promote efficiencies and green development, and green infrastructure;
• Green eco-cities and forest cities projects incorporating green principles and practices in city planning and uses of resources; and
• Zero-waste cities projects that aim to minimize waste produces and strengthen recycling and urban solid waste management.
2. Market Opportunities in Cleantech
China’s commitment to green growth has made it the largest and fastest-growing market for clean technologies in the world. Investment in the environmental sector is reported to have reached a trillion dollars, an increase of 21% year on year,10 constituting over 2.5% of GDP. China’s investment in cleantech and renewable energy exceeds the combined investment of that of the United States and Europe, making it the global leader. In addition, China today dominates in the provision of smart technology, such as smart metering, and is poised to lead the global industrial internet of things, linking it to environmental services.11
China’s rapid expansion in the cleantech market is also seen in the growth of its companies, rising from around 3,000 in 2005 to over 50,000 in 2016,12 with that number being even higher today. Chinese companies top the list of the Clean 200 company roster, and the country ranks globally as the top market for air, water, and soil remediation technologies.13

10
Market Development
China’s market for clean technology is responsive to policy, and government investment aggressively drives the market. Green investment needs are estimated to be between US$450B and US$600B per year, and this is expected to grow in line with China’s GDP in the short term.14 However, public funding is not sufficient to meet more than a quarter of domestic demand. The development of green financing mechanisms and new instruments is helping to reduce this gap and to encourage greater marketization of green development as part of China’s new market reforms.
Market barriers have been a longstanding complaint of foreign investors of the Chinese economy. However, barriers are slowly eroding as China deepens its market reforms. The new Foreign Investment Law that takes effect on January 1, 2020, is a significant step toward protecting investors and strengthening the intellectual property (IP) regime. The Ministry of Commerce’s Industry Catalogue for the Guidance of Foreign Investment (2017) lists renewable energy and the cleantech sector as areas where foreign investors are permitted to establish wholly foreign-owned enterprises. And as inducements for Chinese companies, the State Council, in its 2016 Catalogue of Encouraged Imported Technology and Products, grants local companies import purchase discounts for a variety of cleantech products.
Despite these trends and the size of the market, the cleantech industry in China is still in a development stage. Industries have a relatively low degree of concentration compared with OECD countries, and many enterprises are still small in scale with no clear market leaders.15 For example, the Hong Kong Trade Development Council finds that “in the mainland market for urban domestic sewage treatment, the top 10 enterprises take up only 27% of the market share.” Chinese cleantech enterprises are keen to co-operate with international companies, not just for technology transfer and R&D, but to improve managerial capabilities, enhance co-operation in international markets, and to seek opportunities to capture supply chain niches.
Cleantech Sectors
The cleantech market in China is broad and complex, and each sector is unique and operates in a different way. However, sewage treatment, air pollution, and solid waste account for over 95% of the total output value of the industry.16 The remediation of contaminated soil, previously not given attention, is projected to soon be the fastest-growing sector.
Air Pollution
The scope for cleantech is wide, ranging from technologies to control industrial air pollution and motor vehicle emissions, to monitoring systems and equipment, to consumer products such as filters. And the market is large in all the industrial cities.
Coal is the single largest source of air pollutants in China, and the country relies on it to meet its energy demand. Reducing coal consumption is an overriding priority, but one that won’t happen overnight. Replacement by non-polluting renewable energy sources is the direction

11
the government is going, but until then, improved energy efficiency and cleantech solutions to emissions offer considerable market scope for the industry.
Over the past five years, the manufacturing of pollution treatment equipment and emission control technologies in China has grown by 15%, and the number of businesses by over 9%.17 Industry revenue reached US$3.3B for 2017. Companies holding the largest market share include Tianhao Group, China Datang Corporation, Fujian Longking Co., and Tsinghua Tongfang Environment Co. The market for environmental monitoring has also kept pace, growing at 17% over the same period and generating US$3.3B in revenue in 2017 alone.18
Water and Wastewater Treatment
The Clean Water Action Plan lays out targets to achieve water quality of Grade III (fit for consumption) in 70% of water in the major watersheds and over 93% of drinking water sources in all major cities.19 The plan establishes 26 detailed requirements and 238 measures to address industrial effluent, wastewater treatment, water reuse, and improved monitoring systems. The implementation of activities is valued at approximately US$920B.
There is also a requirement to upgrade existing plants and to introduce new chemical and biological methods. Key technologies in demand include advanced filtration and membrane systems, nitrification and biological denitrification, waste handling equipment, and the enhancement of management and monitoring systems.
The plan also sets targets for water efficiency and reuse to combat water scarcity, specifically in coal mining and in the metals, textiles, pulp and paper, chemical, and petroleum industries. These priorities provide particular inducement for cleantech solutions in membranes and advanced filtration, digital water control systems, and a range of monitoring and engineering consulting services. It is estimated that the membrane technology market will grow around 30% annually over the next five years in response to these policy drivers.20
China’s wastewater treatment market is currently valued at approximately US$50B, growing at a compound annual rate (CAGR) of 6.7%. As the management of water pollution strengthens across China, industry revenue is expected to grow even faster, as well as the number of businesses emerging in the sector (currently increasing at 6%). Companies holding the largest market share include Shanghai Foxin Aijian River Control, AquaMats Holdings, Chongqing Water Group, Beijing Capital, and Beijing Guohuan Tsinghua Environmental Engineering.
In the water resource management sector, revenue has also grown at approximately the same level, reaching over US$3B in 2018. Companies with the largest market share include Guangdong Investment Ltd., China Water Investment, General Water of China, Sound Group, Shanghai Municipal Raw Water, and Beijing Capital.21

12
Waste Management and Recycling
Solid waste disposal and repurposing or recycling constitutes a large but segmented market in China. Of the waste collected in urban municipalities, most of it is landfilled, incinerated, or composted. Recycling of household waste is relatively low, and within the sector varies greatly between industries and in how it is reported. Electronic scrap waste recycling is quickly growing but is dominated by small-scale collections and informal recycling facilities. Plans are underway to establish modern recycling plants across China, but this is still at an early development stage.22
With respect to hazardous industrial waste, over 60 million tons are generated annually, most of which is not treated properly.23 Hazardous waste treatment facilities are generally small enterprises with low capacity. Disposal capacity is estimated to be approximately one-third of waste collected. Funds have been allotted for the construction of 300 hazardous waste disposal facilities and to initiate brownfield remediation projects in China.24
The hazardous waste management industry in China has grown close to 9.5% over the past five years, generating revenue of around US$3B. The scope for accelerated growth is large given the small scale of the industry. Companies currently holding the largest market share include Dongjiang Environmental, China Everbright International, Sound Group, Shenzhen Green Eco-Manufacture High Tech, and Yonker Environmental Protection Group.25
Soil Remediation
Soil treatment is a growth area with large technology and finance gaps. Industrial pollution in brownfields and farmland contamination caused by polluting industries – alongside a lack of sanitary landfills – has made soil pollution the biggest but most neglected threat to China’s ecology and economy. The Soil Pollution Prevention and Control Action Plan proposes a number of remedial actions, including the construction of six national pilot zones, over 200 pilot projects of soil remediation, and the establishment of monitoring systems and a regulatory framework.
Market scale and size is growing rapidly thanks to preferential policies for soil remediation. The International Institute for Sustainable Development (IISD) reports “as of May 2017, there were more than 2,600 companies with soil-related businesses, making it one of the hottest areas in the environmental protection industry.”26 It is expected that the market will grow to over US$100B by 2020. Soil remediation, however, is complex and costly. The IISD cites estimates of around US$1T for remediation, but the government can only meet a fraction of that cost.
At present, there is a lack of comprehensive risk assessment and verification systems, as well as capacity in site investigations and remedial technologies. Various soil remediation technologies have been applied – such as soil leaching, in situ heating, and microbial chemical reduction – but more advanced interventions are needed that can be applied to the various contexts in China.

13
Many of the soil remediation companies are joint ventures with international co-operation. Companies holding the largest market share include Jiangsu DDBS Environmental Remediation, Junmei Materials, BCEG Environmental Remediation, Yonker Environmental Protection Group, and CECEP DADI Environmental Remediation.27
1 OECD. 2018. China’s Progress Towards Green Growth.
2 World Bank. 2007. Cost of Pollution in China.
3 China’s five-year plans (FYPs) serve as strategic blueprints for China’s economic planning. The 11th FYP introduced the concept of ecology and outlined some important environmental measures, including targets to reduce carbon emissions, treating wastewater, improving municipal solid waste, and providing access to safe drinking water.
4 The plan sets specific targets for reducing sulphur dioxide and nitrogen oxides by 15% compared with 2015 by 2020, and to reduce PM2.5 by 18%.
5 This includes Xi’an and other parts of Shaanxi province, Henan province, and Shanxi province. See: State Council, PRC, 2018: Three Year Action Plan for Winning the Blue Sky War.
6 Ministry of Environmental Protection (now Ministry of Ecology and Environment), and Ministry of Land and Resources (now Ministry of Natural Resources). 2014: The Report on the National General Survey of Soil Contamination.
7 Li, T., Y. Liu, et al. 2019. Soil Pollution Management in China, Sustainability 2019, 11,556.
8 Global Times. 2017. Laws needed to tackle solid waste disposal.
9 In President Xi Jinping’s report to the 19th National Congress of the Communist Party of China, new patterns of urbanization and regional development are to be guided by ecological considerations and drivers for green growth. http://english.gov.cn/19th cpccongress/.
10 Hong Kong Trade Development Council. 2018. China’s Environment Market.11 Institute for Energy Economics and Financial Analysis (IEEFA). 2018. China’s Global Renewable Energy Expansion.12 PWC. 2017. Chinese Cleantech Market Opportunities.13 International Trade Administration, USA Department of Commerce. 2017. 2016 Top Markets Report: Environmental Technologies, China; Institute for Energy Economics and Financial Analysis. 2018. China 2017 Review.14 Caixin. 2018. Opinion: China Sets Stage for Wave of Green Investment.15 Hong Kong Trade Development Council. 2018. China’s Environmental Market. https://hkmb.hktdc.com/en/1X002L45/hktdc-research/China%E2%80%99s-Environmental-Market. In OECD countries, environmental protection firms are more concentrated and vertically integrated, as for example the Veolia conglomerate (https://www.veolia.ca/en). 16 Hong Kong Trade Development Council. 2018. China’s Environmental Market.17 IBISWorld is an international industry report platform providing global, regional, and country reports on all industry sectors. In China, over 270 industry sector reports are available. See: IBISWorld: www.ibisworld.com/industry-trends/china-market-research-reports.18 For a full listing of companies in the air quality sector, see: https://www.environmental-expert.com/air-climate/companies/location-china. Environmental XPRT is a global environmental industry marketplace information platform. 19 China Water Risk. 2017. 2016 State of Environment Report Review.20 Ibid.21 https://www.ibisworld.com/industry-trends/international/china-market-research-reports/management-of-water-conservation-environment-public-facilities/water-pollution-control.html22 Zhou, B., C. Sun, H. Yi. 2017. Solid Waste Disposal in Chinese Cities: An Evaluation of Local Performance. Sustainability 2017. 9:2234.23 Global Times (August 15, 2017) reported that only 15% of China’s hazardous waste is treated properly, and most of the remaining waste is not treated properly (http://www.ecns.cn/2017/08-15/269325.shtml). 24 International Trade Administration, USA Department of Commerce. 2017. 2016 Top Markets Report: Environmental Technologies, China.25 https://www.ibisworld.com/industry-trends/international/china-market-research-reports/management-of-water-conservation-environment-public-facilities/hazardous-waste-management.html26 IISD. 2018. Financing Models for Soil Remediation in China.27 https://www.environmental-expert.com/companies/keyword-soil-remediation-1020/location-china
14
SECTION II: CANADA'S CLEANTECH INDUSTRY: DOING BUSINESS IN CHINAAs China progresses toward a green growth economy and its cleantech market expands quickly, Canada has been investing in and promoting its clean technologies. Canadian firms have expertise that is in demand in China. However, challenges exist in doing business with or in the Chinese market.
1. The Cleantech Industry in Canada
Canada is home to a variety of enterprises with competitive advantage in global value chains in the cleantech sector, including renewable energy, air pollution control, green transport, water and wastewater treatment, solid waste management, and soil remediation. There are around 850 cleantech firms, with total revenues exceeding C$13B. They employ more than 55,000 people, most of whom are young and highly skilled.1 Canada’s cleantech sector is dubbed as the “nation’s first new industry of the 21st Century” – a major growth sector with revenues growing annually at over 10% and contributing around 3% to GDP. With better financing and market support,2 the industry has the potential to contribute significantly more to the Canadian economy.
Canadian cleantech firms are internationally recognized as drivers of innovation. Ranked fourth overall in the Global Cleantech Innovation Index,3 the industry draws more than 50% of its revenue from exports. Twelve Canadian companies are listed in the 2019 Global Cleantech 100 list.4 The majority of Canada’s cleantech firms are, however, SMEs. As small firms in a large international market, they are challenged with many issues of scale relating to innovation commercialization, market entry, profitability, financing, and organizational development (retaining talent and building capacity).5
Sectors with Proven Capabilities
Given Canada’s small domestic market, cleantech enterprises are highly export driven. And consisting mostly of SMEs, the industry is fairly segmented, not well vertically integrated, and focused on specific market sectors. However, Canada has innovation potential, and increasing conversion rates of innovation into outputs, supported by late stage investments, are helping to move Canadian firms into key markets.
Areas where Canadian firms have proven expertise in sub-sectors with market opportunities in China include:6
• Water and wastewater treatment: desalination; grey water treatment; groundwater remediation; heavy water treatment; membrane and tertiary treatment; monitoring and information technologies; and systems management;

15
• Solid waste management: e-waste; industrial waste; municipal waste; hazardous waste;
• Soil remediation: pollutant identification; non-extractive remediation; extractive remediation; and
• Air: filtration systems; emissions detection and control; monitoring and information technologies; energy renewables.
In the water sector, there are a growing number of companies offering treatment and control management services using leading-edge technologies, such as UV systems, oxidation, wastewater recycling, and their components.7 Canadian expertise is strong in this sector, as exemplified by the depth of innovative products reaching the market, and the development of more vertically integrated industries, as can be seen with multinational companies in the sector (for example, Veolia and SUEZ).
In the soil remediation market, Canadian enterprises are pioneering in new technologies that are in demand in China. Some of the leading commercial remediation technologies are in thermal soil remediation, chemical absorbent technologies, and in situ remediation.8 Canadian firms also have proven international experience in sampling, monitoring, and filtration.
Canada’s expertise in the air pollution sector is varied and growing in response to international demand. Services range from emissions and process monitoring systems to filters, oxidizers, and other industrial pollution control technologies.
In the sector of solid waste management and recycling, Canadian firms have established international market presence in both product design and systems management. Cleantech firms are particularly active in research and innovation in bio-product technologies for recycling carbons into biofuels and chemicals, and municipal garbage into energy.
Challenges for Industry Growth
Canada’s cleantech sector performs well in the early stages of innovation and has a fairly strong research ecosystem. Between 2009 and 2015, the industry spent over US$7B in research and development, contributing to more than 3% of global cleantech research publications. However, the industry has not fared as well as other countries in commercializing innovation, as seen from its declining market share in exported goods – from 1.8% to 1.3%, a 40% decline.9 This contrasts sharply with the 53% increase of Chinese companies over the same period.
Canadian cleantech SMEs face two major challenges in developing market presence internationally: low adoption rates and, relatedly, the lack of market demand in Canada.

16
Canada’s domestic market is not large, and this in turn acts as a barrier to SMEs being able to penetrate international markets more deeply because of the lack of adoption, branding, and endorsement. Though developing, the industry as a whole is not yet deep enough or sufficiently financed to compete with larger, integrated commercial firms internationally. A more integrated market ecosystem involving cleantech SMEs in partnership with the government and large industry, with greater access to market and green financing mechanisms, would strengthen the industry.
Many Canadian cleantech SMEs tend to focus on “developing and delivering complete solutions based on intellectual property,” which tend to have higher cost margins, rather than supplying specific intermediate products in global supply chains that are lower cost options.10 This may partly explain the slow rate of adoption and scale-up in the industry. Other factors, such as the lack of alignment of the financial sector to support cleantech, asymmetric market information, and unco-ordinated public sector engagement, may also play a part. Government support at the R&D stage is important, but cleantech SMEs lack sufficient support for later stage asset building and roll out. Green financing mechanisms and blended financing could assist.
2. Doing Cleantech Business in China: Engaging the Chinese Market11
Canadian commercial presence in China ranges from mining, agri-food products, and energy services, to electronics, information technology, and cleantech. A 2015 survey of Canadian business presence in China12 looked at 31 Canadian cleantech firms. It notes more than a third are located in Hong Kong, followed by Shanghai and Beijing, Shenzhen, Guangzhou, and Nanjing. Only three are located in regional cities, with Dunhuang in Gansu province being the most remote.
Interestingly, firms in the smaller cities have larger projects, carried out in partnership with local governments and local firms, and are engaged in manufacturing and/or providing equipment. Most enterprises in the larger cities have representative offices largely for promotion of technology products and services. These tend to be concentrated in wastewater, air treatment services, and energy efficient products.
China’s cleantech market offers opportunities for Canadian businesses. There are, however, a few hurdles for SMEs when engaging China’s large, complex, and diverse market. Navigating the path for business co-operation involves more investment in establishing presence and deeper engagement with Chinese state-owned enterprises (SOEs) and SMEs, including understanding the local context within which Chinese businesses operate.
17
Market Entry, Collaboration, and Building Partnerships
Chinese cleantech firms actively look for international collaboration from the position of an investor. They are increasingly up to date on technological developments and international business strategies, and so are keen to collaborate with partners who, from their perspective, have demonstrated proven capabilities and endorsed products that are ready for the Chinese market, rather than potential ones. Brands, endorsements, and network capabilities are prerequisites, and because of the large number of international players looking to gain market entry in China, local firms are in a position to be cautious and picky about potential partners.
Building cultural understanding and relationships are critical for doing good business, and fundamental for sustainable business practices. Chinese firms think in the long term, and developing relationships takes time and investment. Yet within this context, their interest in engaging with “what specifically works” in the market necessitates mutual understanding and trust in a relationship.
Partnership building requires flexibility and patience, and an understanding of the social and political narratives in different market segments across different localities. Reputations and relationships are very important, requiring long-term commitment and an appreciation for the local organizational culture to better understand the complexities of decision-making in firms.
Technological Innovation and Knowledge Development
China is a global leader in technological innovations, the digital economy, and artificial intelligence applications. For cleantech firms, much attention is given to transaction models and piloting new initiatives on an experimental basis to demonstrate which technologies work for scaling up, and which don’t. The speed of change in the marketplace is enormous, driven by incremental innovation.
Firms in China are interested in prospective partners who can bring innovative proprietary technology along with management practices that are consistent with local cost structures. International partners also need to be able to adapt to local market specificities. Over the medium term, this can be developed and improved on, allowing for a “learning by doing” knowledge development model that can then be rolled out in progressively larger scale.
Competition
The cleantech market in China is starting to deepen as firms become vertically integrated through supply chains. The motivation to scale up can present a challenge to smaller Canadian firms not wishing to be subsumed.
18
Maintaining cost advantage is therefore important, driving firms to be constantly on the lookout for market niches within maturing supply chains. As shown in a McKinsey survey,13 Chinese firms commercialize innovation with lower cost to get into the market quickly, and then improve incrementally. Firms shift business strategies quickly. To keep up with market changes driven by policy directives, cost structures change often, and there are constant increases in new market players.
Regulatory Aspects and Intellectual Property
The demand to internalize technology, intellectual property, and technology appropriation dominate business strategies of firms in the cleantech sector. Chinese firms manage their IP regimes by pragmatically managing information flow with their partners along the supply chain.
China has been making improvements in its IP protection regime, as reflected in the recent Foreign Investment Law draft (2019). China’s IP regime has levels of litigation that are found internationally, but there have also been holes and weaknesses. This is now being addressed. Chinese firms have increased their capacity in dealing with IP rights as patent filings have skyrocketed and co-operation agreements have become increasingly sophisticated in order to protect reputations and prevent violations.
Building Networks and Showcasing
Exhibitions, trade fairs, and eco-tech conferences are important business platforms for networking and showcasing products. They are also major venues for engaging local officials and other stakeholder groups, serving as clearing houses for information and new ideas. Increasingly they are hosted in lower-tier cities in order to attract business and investment. The regional events tend to be directed to leading Chinese industry players, but they can also serve as important entry points for international firms. National events in the major cities are oriented to international participation.
China’s technology parks, innovation zones, and science parks are increasingly attracting large numbers of companies and technical research establishments. There are currently over 1,500 innovation parks in China.14 They receive substantial government funding and are the foundation for piloting new innovations and market applications. Being part of a technology park affords firms a learning and networking ground for market entry, partnership building, and building capacity both for the Chinese and international markets.
19
Where Are the Opportunities?
There are numerous Chinese cleantech companies spread throughout the major and lower-tier cities in China, as well as accelerators and consulting firms to assist partnership building and establishment of cleantech firms in China.15 The market for cleantech is growing in all sectors, and perhaps most notably in wastewater treatment, solid waste management, and soil remediation – sectors where Canadian firms have capabilities.
Similarly, the investment landscape in China has broadened significantly, facilitated by the growth of green financial instruments alongside investments from SOEs, corporate venture capital firms, and angel investors. Increasingly, there are opportunities for blended financing of projects, public-private partnerships, and third-party arrangements where Canadian SMEs can effectively engage.
A common theme from consultations with representatives of the Canadian cleantech industry was that the market is very competitive and very large for Canadian SMEs to navigate, especially for those with little exposure to China and its business culture. Representatives asked basic questions such as “Where are the opportunities?” and “How do we enter the market?” More detailed market information at the municipality level can be helpful when assessing the wide market landscape in China.
1 Analytica Advisors. 2017. Canadian Clean Technology Industry Report.
2 Challenges include getting better access to debt financing, market information, and reducing structural barriers to investments in innovation driving the industry. See Analytica Advisors 2017 report recommendations.
3 Cleantech Group. Global Cleantech Innovation Index 2017. https://www.cleantech.com/.
4 Cleantech Group: The index ranks independent cleantech companies in terms of their potential to make significant market impact.
5 OECD. 2017. The Future of Business Survey. https://eu.futureofbusinesssurvey.org/.
6 Analytica Advisors. 2017. Canadian Clean Technology Industry Report.
7 Some leading Canadian companies in this sector include: TrojanUV (Ont.), BlueInGreen (Ont.), and SUEZ Water Technologies (Que). See https://www.environmental-expert.com/ for lists of leading companies in different sectors.
8 For example, firms include Nelson Environmental Remediation (Alb.), Jentek Environmental (BC), and IRSL (Ont.).
9 Analytica Advisors. 2017. Canadian Clean Technology Industry Report; Israelson, David. 2018. Still room to grow in China for Canadian cleantech companies. Globe and Mail.10 Mahoney, J. 2012. Successful Cleantech Cooperation in China.11 Analysis on Canadian cleantech companies’ experiences in doing business in China reflected in this section was drawn from a series of roundtables conducted in four Canadian cities in early 2019, hosted by APF Canada. The roundtables solicited feedback from representatives of Canadian companies on opportunities and challenges in the cleantech market in China.12 Munk School of Global Affairs. 2015. Canadian Business Presence in China: A Closer Look.13 Orr, G., and E. Roth. 2012. A CEO’s guide to innovation in China. McKinsey Quarterly.14 MaRS Market Insights. 2017. Entering China’s Emerging Cleantech Markets: An opportunity for Ontario startups.15 For example, Umore Cleantech Consulting: http://umoregroup.com/.
20
SECTION III: ENVIRONMENTAL PERFORMANCE OF CHINA'S 31 PROVINCIAL CAPITALSChina’s shift to a more sustainable economic development model has generated high market potential in products and services in the environmental sector. Advanced clean technologies from international companies are in high demand – an area where Canada excels and has much to offer. However, Canadian companies face many challenges when doing business in or with China, in clean technology in particular. One of the hurdles is the huge and complicated market in China. Information on China’s environmental changes, especially at the city level, is instrumental for cleantech companies in their initial assessment for investment in China.
Using data from APF Canada’s China Eco-City Tracker, this section examines environmental performance trends in China’s 31 provincial capitals and national direct-administered municipalities and assesses how well these cities are doing in environmental protection.
Data and Analysis from the China Eco-City Tracker
Cities differ with respect to their relative environmental quality due to a host of economic, geographical, and institutional features. Over the past 10 years, major cities have experienced nominal improvements in average air quality. Water quality and solid waste management have also shown some improvement. However, national averages do not mean much in China, given its size, regional differences, and seasonality effects.
The China Eco-City Tracker,1 created and managed by APF Canada, traces and analyzes environmental development of China’s 31 provincial capital cities and direct-administered municipalities. It is a web-based tool that allows the public to access data and information to better understand environmental issues and trends in China related to air and water quality and solid waste management, and to see their relationship to socio-economic indicators. Data sources of the Tracker include China Statistical Yearbook, China Urban Construction Statistical Yearbook, environmental bulletins from each region, and statistical bulletins on the economic and social development of each city.
The 31 cities included in the Tracker are either capital cities of each province in China or national direct-administered municipalities. They are economic or political centres at the national or regional level, many of them as the core of a cluster of neighbouring cities. As these cities are geographically distributed across China, it also gives a full picture of how areas at different economic development levels are performing in terms of environmental protection.
Recent attention on China’s cities from a business perspective reveals steadily growing optimism for investment in the lower-tier cities. This is especially true for cities that are upgrading industry and restructuring themselves as hubs for new technology, innovation, and green growth.2 Major international investment firms, such as Morgan Stanley, are confident that as private consumption grows and drives economic growth in China, lower-tier cities – already making up 60% of GDP – will emerge as growth hubs in the technology and service sectors.
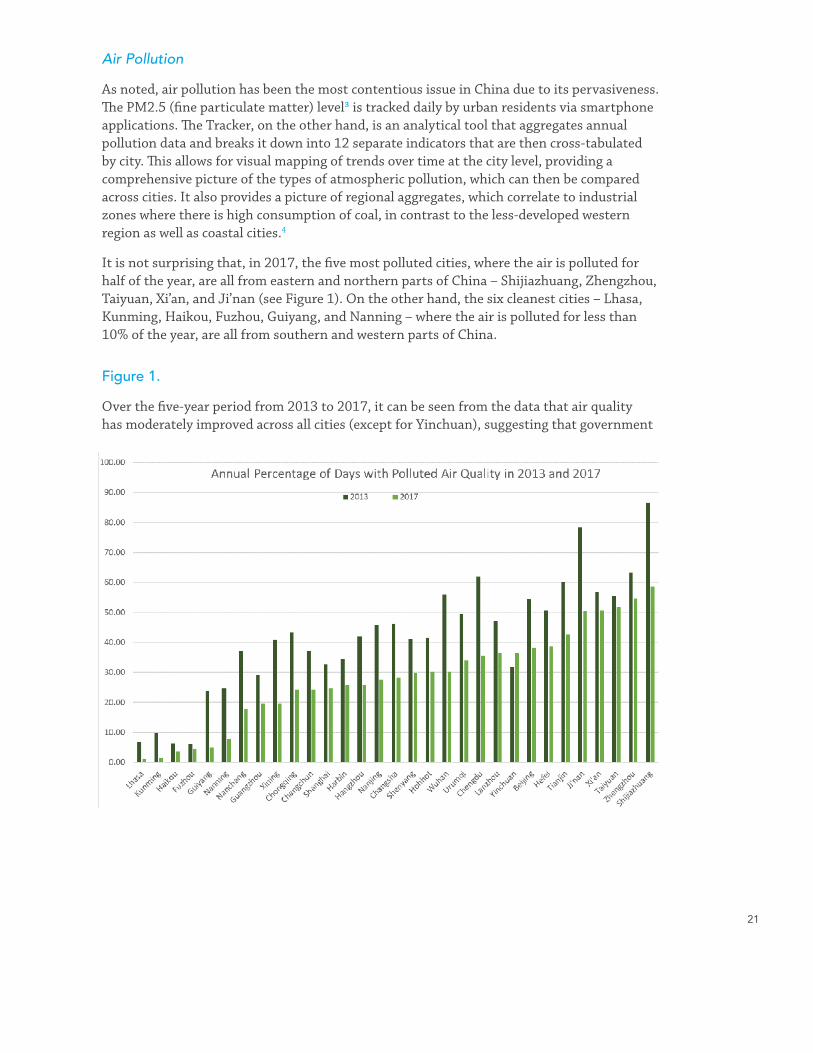
21
Air Pollution
As noted, air pollution has been the most contentious issue in China due to its pervasiveness. The PM2.5 (fine particulate matter) level3 is tracked daily by urban residents via smartphone applications. The Tracker, on the other hand, is an analytical tool that aggregates annual pollution data and breaks it down into 12 separate indicators that are then cross-tabulated by city. This allows for visual mapping of trends over time at the city level, providing a comprehensive picture of the types of atmospheric pollution, which can then be compared across cities. It also provides a picture of regional aggregates, which correlate to industrial zones where there is high consumption of coal, in contrast to the less-developed western region as well as coastal cities.4
It is not surprising that, in 2017, the five most polluted cities, where the air is polluted for half of the year, are all from eastern and northern parts of China – Shijiazhuang, Zhengzhou, Taiyuan, Xi’an, and Ji’nan (see Figure 1). On the other hand, the six cleanest cities – Lhasa, Kunming, Haikou, Fuzhou, Guiyang, and Nanning – where the air is polluted for less than 10% of the year, are all from southern and western parts of China.
Figure 1.
Over the five-year period from 2013 to 2017, it can be seen from the data that air quality has moderately improved across all cities (except for Yinchuan), suggesting that government
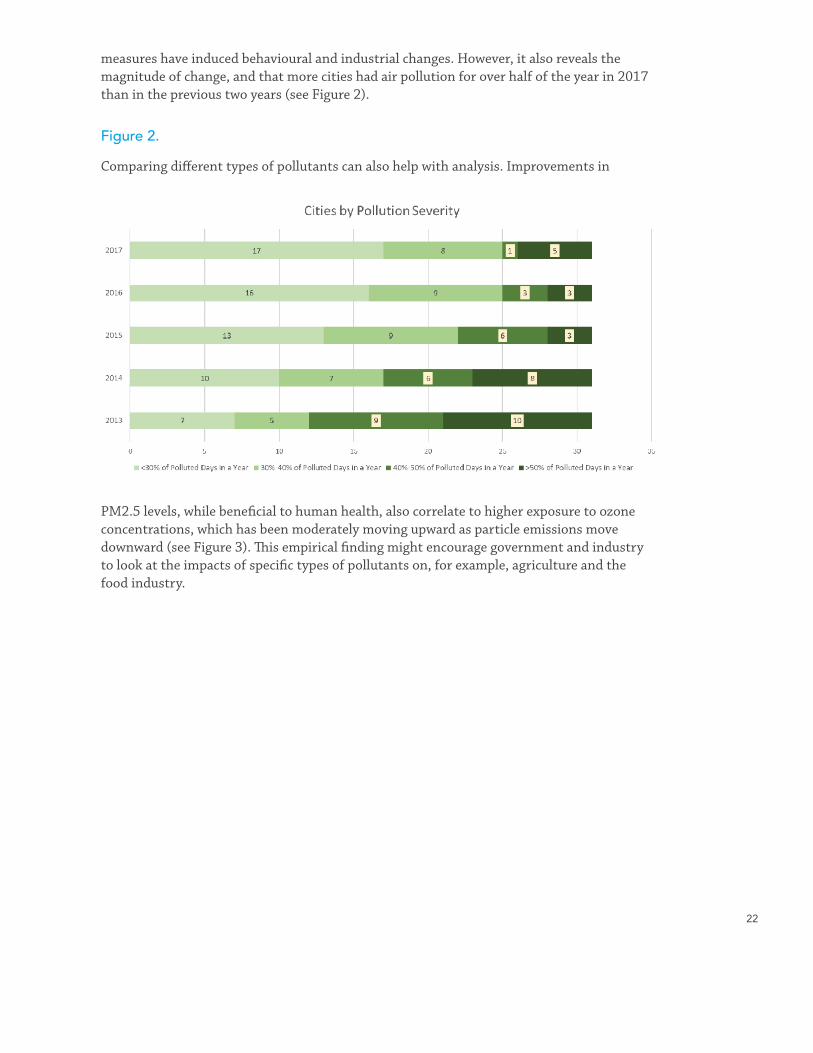
22
measures have induced behavioural and industrial changes. However, it also reveals the magnitude of change, and that more cities had air pollution for over half of the year in 2017 than in the previous two years (see Figure 2).
Figure 2.
Comparing different types of pollutants can also help with analysis. Improvements in
PM2.5 levels, while beneficial to human health, also correlate to higher exposure to ozone concentrations, which has been moderately moving upward as particle emissions move downward (see Figure 3). This empirical finding might encourage government and industry to look at the impacts of specific types of pollutants on, for example, agriculture and the food industry.
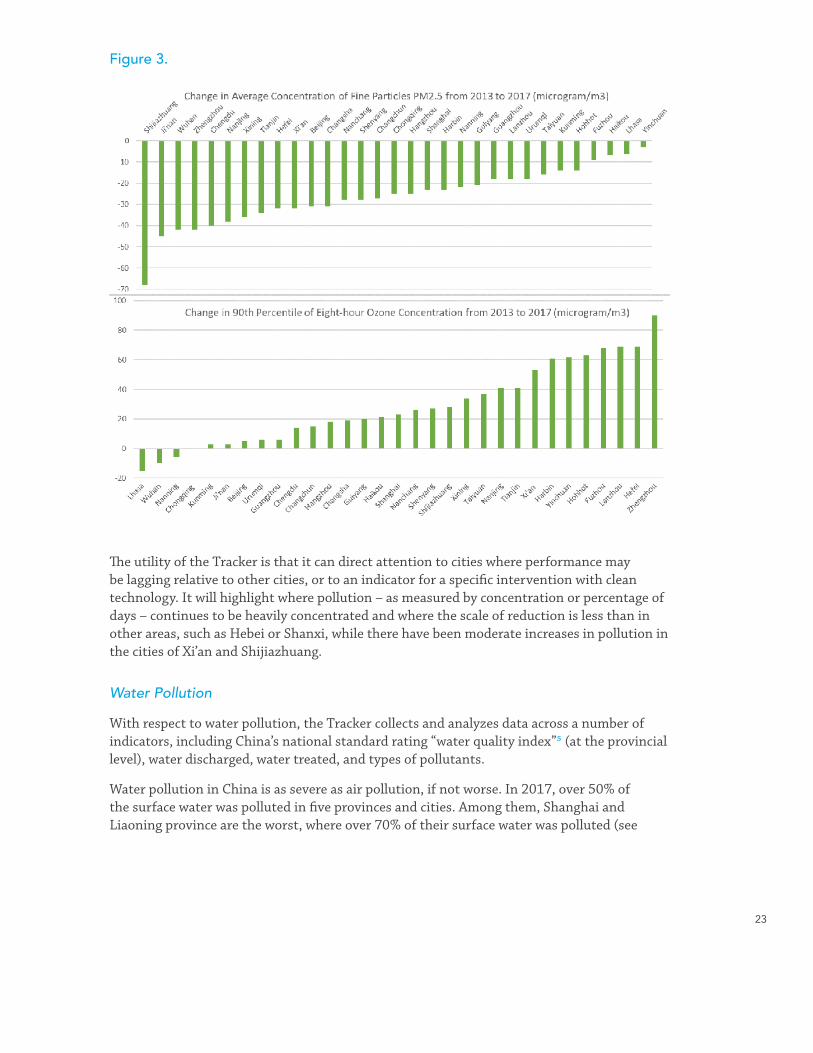
23
Figure 3.
The utility of the Tracker is that it can direct attention to cities where performance may be lagging relative to other cities, or to an indicator for a specific intervention with clean technology. It will highlight where pollution – as measured by concentration or percentage of days – continues to be heavily concentrated and where the scale of reduction is less than in other areas, such as Hebei or Shanxi, while there have been moderate increases in pollution in the cities of Xi’an and Shijiazhuang.
Water Pollution
With respect to water pollution, the Tracker collects and analyzes data across a number of indicators, including China’s national standard rating “water quality index”5 (at the provincial level), water discharged, water treated, and types of pollutants.
Water pollution in China is as severe as air pollution, if not worse. In 2017, over 50% of the surface water was polluted in five provinces and cities. Among them, Shanghai and Liaoning province are the worst, where over 70% of their surface water was polluted (see
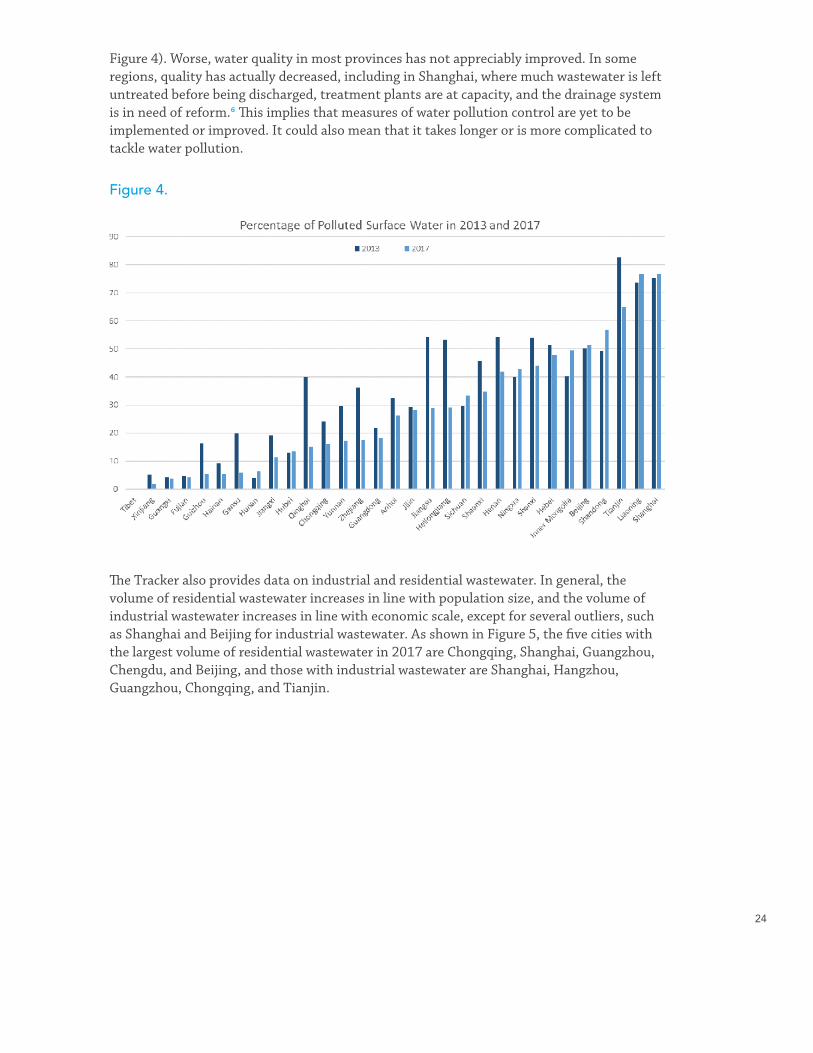
24
Figure 4). Worse, water quality in most provinces has not appreciably improved. In some regions, quality has actually decreased, including in Shanghai, where much wastewater is left untreated before being discharged, treatment plants are at capacity, and the drainage system is in need of reform.6 This implies that measures of water pollution control are yet to be implemented or improved. It could also mean that it takes longer or is more complicated to tackle water pollution.
Figure 4.
The Tracker also provides data on industrial and residential wastewater. In general, the volume of residential wastewater increases in line with population size, and the volume of industrial wastewater increases in line with economic scale, except for several outliers, such as Shanghai and Beijing for industrial wastewater. As shown in Figure 5, the five cities with the largest volume of residential wastewater in 2017 are Chongqing, Shanghai, Guangzhou, Chengdu, and Beijing, and those with industrial wastewater are Shanghai, Hangzhou, Guangzhou, Chongqing, and Tianjin.
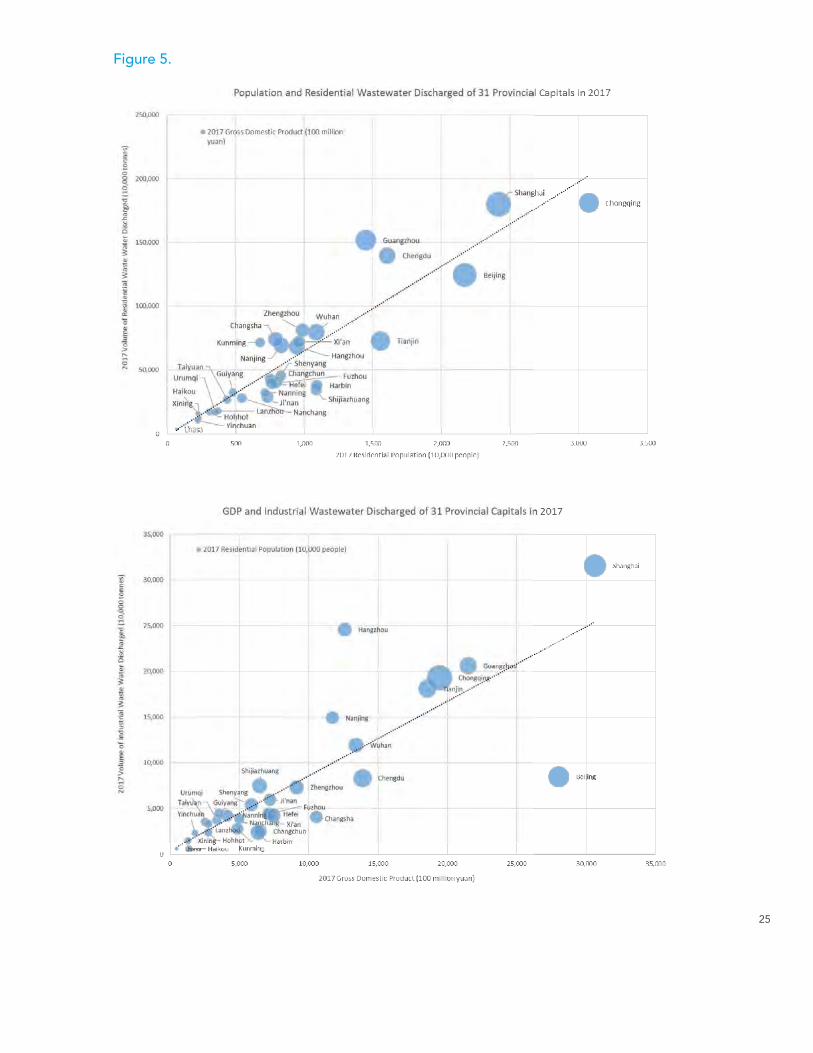
25
Figure 5.
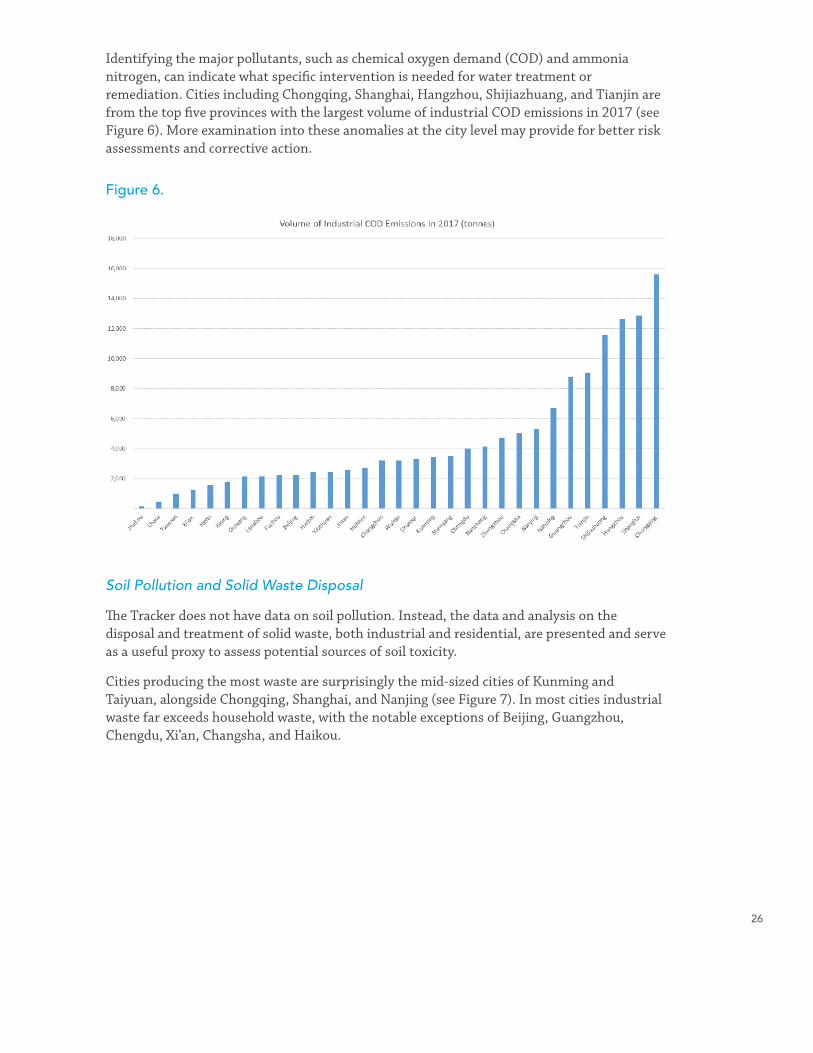
26
Identifying the major pollutants, such as chemical oxygen demand (COD) and ammonia nitrogen, can indicate what specific intervention is needed for water treatment or remediation. Cities including Chongqing, Shanghai, Hangzhou, Shijiazhuang, and Tianjin are from the top five provinces with the largest volume of industrial COD emissions in 2017 (see Figure 6). More examination into these anomalies at the city level may provide for better risk assessments and corrective action.
Figure 6.
Soil Pollution and Solid Waste Disposal
The Tracker does not have data on soil pollution. Instead, the data and analysis on the disposal and treatment of solid waste, both industrial and residential, are presented and serve as a useful proxy to assess potential sources of soil toxicity.
Cities producing the most waste are surprisingly the mid-sized cities of Kunming and Taiyuan, alongside Chongqing, Shanghai, and Nanjing (see Figure 7). In most cities industrial waste far exceeds household waste, with the notable exceptions of Beijing, Guangzhou, Chengdu, Xi’an, Changsha, and Haikou.

27
Figure 7.
It is interesting that there has been at most a modest decline in industrial solid waste over the 2013 to 2017 period for most cities, and as expected increases in household waste except in four cities. Household waste often increases along with the population size, while industrial solid waste depends more on the economic structure and industrial efficiency of each city.
The five cities with the largest volume of household solid waste in 2017 were Beijing, Shanghai, Chongqing, Guangzhou and Chengdu, while those for industrial solid waste are Taiyuan, Kunming, Nanjing, Chongqing, and Shanghai (see Figure 8).
Figure 8.
28
The relationship between waste disposal and pollution merits closer examination, especially with industrial waste and the methods of disposal (e.g., landfills, burning, storage). As shown in the APF Canada Tracker analysis, treatment processes vary between cities and some areas need better technological interventions to improve disposal methods, such as in Kunming and Taiyuan. Research on industrial solid waste disposal in Kunming, for example, shows that technical capacity is low and the utilization rate of industrial tailings remains below 20%, presenting environmental hazards for land and soil.7
1 For more information, please refer to the China Eco-City Tracker website at www.chinaecocitytracker.ca.
2 For example, Chongqing, Zhengzhou, Guiyang, Changchun, and Chengdu. Milken Institute. 2018; CDRF. 2018.
3 PM2.5 refers to atmospheric particulate matter that has a diameter of less than 2.5 micrometres, small enough to permeate lungs and enter the bloodstream, causing serious health damage. PM10 is particulate matter of a diameter of 10 micrometres or less, which can enter the lungs. The Air Quality Index is available in real time on smartphone apps and is regularly monitored by urban residents throughout China.
4 Jin, I., and S. Wan. 2018. A Clearing in the Airpocalypse for China.
5 Based on a five-level grading system, with Grades IV and V reflecting unsafe for use. Jin, I., and S. Wan. 2018. The Upstream Battle for Drinkable Water.
6 Shum, H. 2019. Coming Clean on Shanghai’s Water Worries. Asia Pacific Foundation of Canada.
7 Qiu, et al. 2015. Study on General Industrial Solid Waste and its Resource Utilization in Kunming in Recent Years.
29
SECTION IV: IDENTIFICATION OF PRIORITY MARKETS AND RECOMMENDATIONSThis report has presented some salient features of China’s environmental problems, the country’s transition toward a green growth economy, the emergence of a cleantech market, and opportunities for Canada’s cleantech industry. The report highlighted some environmental measures by China with respect to air pollution, water quality, solid waste management, and soil contamination, and the market for cleantech solutions. Using data and analysis provided by the APF Canada Eco-City Tracker, the report presents a detailed and localized picture of environmental performance, demonstrating trends at the city level with respect to China’s 31 provincial capitals, and revealing areas where more environmental interventions are needed.
This is a preliminary look into the vast and complex cleantech market in the air, water, soil, and waste management sectors of China. It sketches out areas where Canada’s cleantech industry, though small, has capabilities to offer and where opportunities should be exploited. Canadian companies have established a presence in some niche areas, but more needs to be done to improve the commercialization of Canadian cleantech products1 in order to take full advantage of the market in China. More support from government is required, but also more co-operation with the private sector, financial institutions, and intermediary organizations like the Asia Pacific Foundation of Canada with a focus on trade in China.
1. Selection of Priority Markets
One of the objectives of the research is to identify priority markets in selected provincial capitals for more in-depth analysis of the market potential for the clean technology sub-sectors of air, water, and solid waste treatment. Consideration is also given to soil since this is a priority area in China. This concluding section summarizes which of these provincial capitals may present the best opportunity for Canadian cleantech firms and where more market research is required.
In identifying some cities as key sector markets for further investigation, consideration is given to where the Canadian cleantech industry has strengths. However, it is recognized that Canadian strengths in the industry are highest and most internationally recognized in the research and development stage, and not often in the commercialization stage where technologies are embedded in the marketplace.2 Canadian technologies are widely recognized for innovation development, and while R&D funding ranks high internationally, the industry has not fared as well in scaling up for commercial development.3
Canada’s cleantech industry has been a focus for the Canadian government in terms of its export potential, and much support and investment has been given during the initial startup of cleantech SMEs. China is a priority country for exporters and the growth of the Trade Commissioner Service (TCS) is indicative of the interest in engaging the market there. In

30
the selection of priority markets, consideration is therefore given to where Canada may have some strengths – even if at the early development stage – and where demand on the Chinese side may provide opportunities for Canadian cleantech SMEs. More comprehensive and in-depth study on specific clean technologies is required to before “matchmaking” with demand in China.
To help identify these markets, analysis of environmental performance data of China’s 31 provincial capitals from the China Eco-City Tracker was used. Both pollution severity and performance trends of cities were considered. It is recognized that the Tracker data is indicative of trends and that rankings change alongside other development indicators as industry and consumers respond to fiscal incentives and policy directives relating to environmental protection, conservation, and efficient resource use. Wherever applicable, the Chinese government’s policies on priority regions for environmental protection was also taken into consideration when identifying priority markets. Hence, there is a qualitative element in the selection, based on the best information at hand.
The aim of this first step selection is to provide some guidance for a more comprehensive and deeper dive into local policies, investments, and players in the cleantech sector for each of the priority cities.
Priority Market: Air
As is evident, air pollution is the most public environmental issue throughout China. Even the far western remote city of Urumqi ranks as one of the worst polluted cities in the world. Looking more closely at where environmental protection performance is lagging, and where more research is needed, air quality data cross-tabulated with information from the Tracker on socio-economic indicators sheds more light. Here a few cities stand out from the others in terms of poor air quality performance and market potential.4 They are:
• Shijiazhuang (Hebei province);
• Zhengzhou (Henan Province);
• Taiyuan (Shanxi province);
• Xi’an (Shaanxi province); and
• Ji’nan (Shandong province).
Shijiazhuang consistently ranks at the bottom of the Tracker for percentage of days with polluted air quality, as well as on other indicators for air quality such as PM2.5. It is the largest industrial municipality in Hebei province, and located in the Beijing-Tianjin-Hebei region, one of the priority areas on the government’s agenda for air pollution control. It ranks fairly low on China’s green development index5 but has recently developed an action plan for tackling air pollution that includes the creation of “forest cities.” Emissions from coal consumption, industrial production, dust, and vehicle exhausts are the primary contributors to poor air quality.

31
Xi’an also ranks near the bottom for number of days with polluted air and has recently declined in the pollution index. With a population of 8.25 million, Xi’an is a new Tier-1 city. It is a destination for foreign direct investment in the “new economy” industries and is situated within the Belt and Road Initiative. In recent years there have been factory closures, but the heavy chemical industry continues to be a major reason for air contamination – an area where Canadian cleantech companies have excelled in air treatment. Xi’an is noted for its massive air purifier tower to filter pollutants, though its overall success and cost effectiveness remains to be seen. Xi’an is ranked as one of the top-performing cities in China by the Milken Institute,6 but it is also one of the most polluted. It is also in the Fen-Wei Plains, one of the top priority regions in the latest government plan on air pollution control.
Recommendation as a Priority Market
The selection of a priority market for air could include any of the above-mentioned cities having poor performance – that is, those that have had declining trends and are in the bottom quintile of the rankings. Taking into consideration market potential from green investments and development plans, and their low rankings in the Tracker, Shijiazhuang and Xi’an are recommended here as priority markets for further research in the cleantech market for air. Canadian companies with capabilities in monitoring, emissions control, and filtration systems may find opportunities in these markets.
Priority Market: Water
The water situation in China’s cities has not improved demonstrably. New funding was recently announced for municipalities to clean up rivers and waterways, which includes a pilot program of around US$150B to finance 20 cities over three years. Waterways in northeastern China have recently shown a worsening of pollution, such as the Liao and Songhua rivers.
However, it is the major industrial cities that show the biggest problems. As seen from the Tracker, the cities of Chongqing, Shanghai, Hangzhou, Guangzhou, and Tianjin all have serious water pollution and household and industrial effluent contamination. All those cities could be priority markets for Canadian clean technologies.
Chongqing is a megacity with the largest population in China (over 30 million) and ranks fourth in economic size. It is situated in a key waterway transport hub along the Yangtze River, making its position within a broader ecosystem especially sensitive. The recent economic downturn has led to a drop in the heavy industry sectors and an increase in new economy investments. With new public-private partnership projects coming on line in the water conservation and wastewater sectors, the potential for new technologies seems promising.
Shanghai is the largest city in China with wastewater issues, as shown in the APF Canada report.7 Situated on the Yangtze River Delta and identified by the national government as one of the key regions to protect water resources and control water and soil pollution, the pressure on water resources is huge. Environmental awareness is growing, and significant
32
resources have been allocated for water cleanup. However, demand for treatment plants is outpacing supply and treatment is inadequate.
Recommendation as a Priority Market
Since megacities have proportionately larger water pollution issues due to higher pressures on treatment and water resources, and taking into account economic investment opportunities, Shanghai and Chongqing are recommended as priority markets for further research in the water sector.
Canada has a number of water and wastewater treatment companies8 with high levels of engineering and science capabilities for wastewater treatment systems and waterways. Many have prototypes for application in large municipalities, appropriate for China. As noted, Canadian companies are particularly well placed in this sector and have a presence in China with multinational firms such as Veolia and SUEZ.
Priority Market: Solid Waste
Solid waste disposal is a growing problem for China’s cities. The adoption of resource use policies, such as the circular economy policy, has increased the utilization rate of industrial and residential waste, but increasing volumes of household and industrial wastes – especially hazardous wastes and waste electrical and electronic equipment – pose challenges to municipal governments.
Data from the Tracker shows notable trends, especially with performance in some mid-sized cities. Closer examination is necessary to better understand what technological interventions match with particular types of waste disposal problems. The Tracker indicates that the volume of household waste collected and treated matches relatively closely to population size, as one would expect. Beijing, Shanghai, Chongqing, and Guangzhou are on the top. Any of these cities could be priority markets for solid waste treatment, especially household waste. However, with respect to the volume of industrial waste produced and disposed of, Kunming and Taiyuan come out on top.
Kunming, the capital of Yunnan, has a population of around 6.8 million. It is one of the most important cities in southwestern China, and the gateway from China to South and Southeast Asia. Kunming has a high rate of real GDP growth at over 13% (2017), the service industry accounts for close to 58% of GDP, and growth prospects are promising as large investments are being made in innovation and technological sectors. Kunming is being designated as an economic and trade centre, a science and technology innovation centre, a financial service centre, and a people-to-people cultural exchange centre for the Southeast Asia region.9
Recommendation as a Priority Market
Taking into consideration the prospects for future investments in clean technologies and its high need for waste treatment, Kunming is recommended as the priority market for solid waste management.

33
Canada has developed a vibrant solid waste recycling and eco-friendly disposal industry largely in response to domestic demand, and the sector is relatively large with growing export capabilities.10
Priority Market: Soil
Soil remediation is a growth area that presents opportunities for the Canadian cleantech industry. Clean interventions are especially needed in brownfield sites – land previously used for industrial purposes that is contaminated by various pollutants – that are being developed for urban residents. Soil remediation companies in Canada have already made some preliminary market inroads into China, and China has expressed interest in having Canadian technology companies participate in the soil remediation market.11
Data on soil contamination or brownfields at the city level is not available, so data on solid waste landfill disposal may serve as a kind of proxy where urban development is nearby. Priority sites currently being identified by the government for remediation pilots may be useful reference points for Canadian soil remediation firms. Specific soil remediation priority markets cannot be identified at this time.
2. Recommendations on Doing Business in Cleantech in China
The demand for clean technology has sharply risen in China due to policy incentives and investment by the central government. This presents opportunities for Canada’s cleantech industry to enter specific markets in China where Canadian technologies are in demand. However, due to size and recognized commercial adoption, a more co-ordinated approach between government, the private sector, and intermediaries such as the business council is necessary to widen the Canadian footprint and to make known the significant capabilities of Canada’s cleantech sector.
Some recommendations for augmenting such an approach might include the following:
Better co-ordinated and more targeted support and endorsement:
• Given that Canada’s cleantech industry is largely made up of SMEs, matching capabilities with market opportunities in China may be augmented with better and more targeted government support. This includes more trade missions with financial support to Canadian cleantech firms to enable them to showcase their products, as well as missions to Canada inviting leading Chinese firms, government agencies, and other environmental organizations;
• Support is needed for Canadian SME clusters to become established in one of China’s technology parks. These parks are excellent breeding grounds for innovation, commercialization, partnership building, and potential financing; and
• Canadian cleantech SMEs have been able to access different programs providing
34
support for pre-commercial development, but face difficulties in accessing sufficient financing for later stage asset building, branding, and end-stage commercialization (roll out). Leveraging financial markets – in Canada as well as China – is needed to successfully commercialize cleantech products. Green financing, fiscal incentives, and blended financing products would help.
Information consolidation and networking:
• While there are many support programs and advisory services relating to cleantech market opportunities in China, information tends to be scattered and not well co-ordinated. The recent establishment of Canada’s Green Growth Hub, and support from the TCS and the Canada China Business Council, are valuable. However, SMEs would like to see a better consolidation of information in order to reduce transactional costs when exploring market opportunities in China; and
• Companies benefit from peer-to-peer exchanges with those who are in the Chinese market and learning from others’ experiences. Other platforms may include events and forums, establishing virtual networks, and accessing more web-based information such as that provided by the APF Canada China Eco-City Tracker.
Local knowledge and market information:
• More local information is needed with respect to opportunities in China. Most Canadian firms gravitate to Hong Kong, Shanghai, or Beijing because of support mechanisms, information, accessibility, and infrastructure. However, markets in second-, third-, and fourth-tier cities are expanding at a faster pace. There is much general knowledge, but less about the specificities of certain technology sectors and localities. Targeting markets in the lower-tier cities requires more detailed local knowledge and market information.
1 Kim, D. 2018. Navigating the ‘Valley of Death’: Financing and Commercializing Canada’s Cleantech Industry. Asia Pacific Foundation of Canada.
2 See: Analytica Advisors. 2017 and 2016. Canadian Clean Technology Industry Report; Bak, C. 2019. Leveraging Sustainable Finance Leadership in Canada. International Institute for Sustainable Development; Kim, D. 2018. Navigating the ‘Valley of Death’: Financing and Commercializing Canada’s Cleantech Industry. Asia Pacific Foundation of Canada; Jim Mahoney in personal conversations (Kachan & Co: www.kachan.com).
3 Analysis done by Analytica Advisors show this to be related to the relative lack of private sector financing and capital support for the roll out phases of R&D commercialization.
4 Urumqi is not considered here since it lies in the Xinjiang Autonomous Region.
5 China’s Green Development Index, published by the National Bureau of Statistics in China, covers 55 indicators, including energy consumption, carbon emissions, air quality, per capita disposable income, and other economic and environmental measures.
6 Milken Institute. 2018. Best Performing Cities in China; Personal conversations with Perry Wong, Managing Director Research, Milken Institute.
7 Shum, H. 2019. Coming Clean on Shanghai’s Water Worries. https://www.asiapacific.ca/theme/energy/china-eco-city-tracker/recent-publications.
8 See: https://www.environmental-expert.com/water-wastewater/water-treatment/companies/location-canada.
9 See: http://www.chinadaily.com.cn/cndy/2018-06/13/content_36378595.htm.10 See: https://www.environmental-expert.com/waste-recycling/companies/location-canada.11 For example, see: Ontario-China MOU on soil remediation. http://www.oneia.ca/page-1858869.

35
ACKNOWLEDGEMENT
The research forms part of an APF Canada project entitled “Market Intelligence and Policy Research: Cleantech Market Opportunities in China,” supported by a federal grant from Global Opportunities for Associations (GOA), a funding program under the Canadian Trade Commissioner Service of Global Affairs Canada.
36
ABOUT THE ASIA PACIFIC FOUNDATION OF CANADA
Th e Asia Pacifi c Foundation of Canada is dedicated to strengthening ties between Canada and Asia with a focus on expanding economic relations through trade, investment, and innovation; promoting Canada’s expertise in off ering solutions to Asia’s climate change, energy, food security, and natural resource management challenges; building Asia skills and competencies among Canadians, including young Canadians; and improving Canadians’ general understanding of Asia and its growing global infl uence.
Th e Foundation is well known for its annual national opinion polls of Canadian attitudes regarding relations with Asia, including Asian foreign investment in Canada and Canada’s trade with Asia. Th e Foundation places an emphasis on China, India, Japan, and South Korea while also developing expertise in emerging markets in the region, particularly economies within ASEAN.
Visit APF Canada at http://www.asiapacifi c.ca.

3737
1THE MOBILE PAYMENT REVOLUTION IN CHINA: WHAT CANADIAN BUSINESSES NEED TO KNOW
ASIA PACIFIC FOUNDATION OF CANADA
WHAT CANADIAN BUSINESSES NEED TO KNOW
THE MOBILE PAYMENT
REVOLUTION IN CHINA

2THE MOBILE PAYMENT REVOLUTION IN CHINA: WHAT CANADIAN BUSINESSES NEED TO KNOW
ASIA PACIFIC FOUNDATION OF CANADA
Executive Summary
Introduction
Methodology
The Rise of Mobile Payments in China
Key Drivers Behind the Adoption of Mobile Payments
A Tale of Two Titans
Main Functions and Services
Equally Powerful but with Different Strengths
Mobile Payments from the Merchants’ Perspective
From Cash-First to Mobile-First: Shifting Consumer Behaviour and Expectations
Implications for Financial Deepening and Inclusion
The Role of Millennials and Generation Z
Government and Regulatory Approaches
Security and Privacy Concerns
Dealing with Chinese Mobile Payments as Canadian Businesses
Four Takeaways for Canadian Businesses
Case One: Guizhou Goes Deeper into the Mobile Payment Revolution
Case Two: Mobile Payments in Southeast Asia
Acknowledgements
3
6
8
9
13
17
19
21
22
26
28
29
30
31
34
37
40
43
46
TABLE OF CONTENTS
3THE MOBILE PAYMENT REVOLUTION IN CHINA: WHAT CANADIAN BUSINESSES NEED TO KNOW
ASIA PACIFIC FOUNDATION OF CANADA
Technological advancements of the digital age are making today’s businesses
more powerful, productive, and efficient, with access to a much wider range
of options globally. On the flip side, it also means that they have to constantly
adapt to rapid changes and disruptions in order to thrive. For one thing,
innovations in payment technologies that are still at their early stage of
application in one’s home market might have already had profound impacts on
current consumer behaviour elsewhere.
In China, a light cash consumer culture has formed its shape as a result of the
uptake in mobile payment usage, from urban centres to remote areas, creating
new patterns in the ways people shop and unique expectations that merchants
are racing to meet. To succeed in such a context, it is necessary for Canadian
exporters to comprehend the opportunities and challenges arising from China
and Asia’s mobile payment ecosystems, hence making themselves better
prepared and positioned when mapping out expansion strategies into these
fastest-growing retail markets.
With the central objective of providing market insights in the context of
China’s massive mobile payments adoption tailored to Canadian merchants,
this study has three main aims: 1) to enhance Canadian businesses’
understanding of the evolving purchasing pattern and consumption behaviour
in this mobile-first market; 2) to present the possibilities and limitations when
engaging with Chinese mobile payment solutions; and 3) to identify lessons
Canadian companies can learn when contemplating establishing a footprint in
China and possibly beyond.
EXECUTIVE SUMMARY
4THE MOBILE PAYMENT REVOLUTION IN CHINA: WHAT CANADIAN BUSINESSES NEED TO KNOW
ASIA PACIFIC FOUNDATION OF CANADA
CHINA’S MOBILE PAYMENTS LANDSCAPELargely employing the quick-response code (QR code) technology, mobile
payment solutions in China achieved an unprecedented level of popularity
in less than a decade, creating a behemoth, well-developed ecosystem that
currently processes the equivalent of several trillion dollars of transactions in
a year. Two tech giants, Alibaba and Tencent, are taking the absolute lead with
their payment schemes Alipay and WeChat Pay, which together account for
more than 90% market share. Each is able to offer the users multidimensional
services on a single platform with the support of their respective strengths,
delivering a well-integrated and engaging experience. The popularization
of mobile payments in China also brings many benefits to the merchants,
in terms of cost-saving, improvement in operational efficiency and capital
assessment, and, more importantly, digitized and data-driven marketing
capacity. With that being said, it is noteworthy that the massive success of
mobile payments in China has a unique combination of conditions, namely: the
proliferation of mobile internet and smartphones; a high level of cash reliance
and the absence of a legacy card payment system; a collaborative banking
system; burgeoning digital economy and e-commerce sectors; as well as huge
mobile-minded user bases who value convenience and speed.
SHIFTING CONSUMER BEHAVIOURLeapfrogging card payments by going directly from cash to smartphones,
Chinese consumers, especially the younger segment, are actively embracing the
hugely improved convenience and novel ways of shopping enabled by it. Users
also gain substantial benefit from the democratization of financial services
driven by mobile payment tools. Regulatory efforts on this front have been
tolerant and prudent to allow experimentation to happen and new models
to develop; only recently has the government taken a more active policy
management approach to address the critical risks that have emerged as the
industry has grown in scale. While certain concerns and challenges are still
present, China’s mobile payment service providers and regulatory parties are
in general recognized by domestic users as being competent in ensuring the
safety of financial and personal data on these platforms.

5THE MOBILE PAYMENT REVOLUTION IN CHINA: WHAT CANADIAN BUSINESSES NEED TO KNOW
ASIA PACIFIC FOUNDATION OF CANADA
CANADIAN BUSINESSES’ USE OF CHINESE MOBILE PAYMENTSActively promoting mobile payments to markets beyond the Chinese
mainland, the two Chinese mobile payment titans offer their payment tools
to merchants in Canada through payment partners known as independent
software vendors. They are gaining traction – particularly among businesses
targeting Chinese tourists, and members of local Chinese communities who
prefer paying through the mobile channel and with yuan. Businesses interested
in capitalizing on this payment revolution in China and the wider region, and
in better engaging with mobile-savvy customers, can consider the following
takeaways to skilfully craft sensible mobile payment strategies:
• The process for integrating with Chinese mobile payment solutions can
vary, depending on the stage a business is at in engaging with Chinese
customers;
• Offering mobile payments is not one-size-fits-all, and it is crucial to find
the right mix of your selling process and the use of technology;
• Be sure to leverage the high-quality traffic and customer data coming
from your mobile payment transactions; and
• Think carefully before replicating strategies succeeded elsewhere in the
mobile-first context, and consult with local expertise to best employ the
many interlocked and consumer-focused innovations in China.

6THE MOBILE PAYMENT REVOLUTION IN CHINA: WHAT CANADIAN BUSINESSES NEED TO KNOW
ASIA PACIFIC FOUNDATION OF CANADA
INTRODUCTION
Asia Pacific countries today are at the forefront of incorporating smartphones
and technology-enabled financial solutions into their daily life. Sixty-seven
percent of all connected consumers who buy goods and services in a two-
second process of waving their mobile devices in front of a scanner are from
this region.1 Consumers in China alone account for nearly half of the world’s
mobile wallet users and contribute 61.8% of mobile point-of-sale transactions
globally.2 By now, smartphones have successfully dethroned cash to become
the average Chinese consumer’s favorite payment option, only five years
after the financial technology (fintech) revolution first took off there. Such
developments are transforming consumers’ way of paying, spending, and
living, and the most agile merchants have been quick to tailor their strategies
to the needs of their digital-savvy customers.
In Canada and many other developed economies, mobile payments have not
gained as much traction. With well-established debit and credit card systems
in place, Canadian consumers and merchants tend to view mobile payment
instruments with distaste and distrust, leading in part to the relatively slow
growth of the sector itself. As a result, the huge influence that this emerging
mode of payment actually has on consumers’ decision-making and purchasing
patterns on the other side of the Pacific can be far from reach – and difficult
to comprehend – for many Canadian businesses eyeing those markets. Even
fewer have come to the realization that mobile payment platforms in China
are already widely employed by merchants as a powerful marketing tool.
Acknowledging this knowledge gap, efforts have emerged across relevant
industries in Canada and the United States to raise awareness of the new
payment ecosystems and to more deeply understand them. For instance, Royal
Bank of Canada and Citigroup’s Global Consumer Bank have both recently
done studies on China’s fintech developments and the associated user patterns
1 “Global Mobile Wallets 2019 - Asia-Pacific Outpaces the World in Mobile Wallet Adoption,” Business Wire, April 18, 2019, https://www.businesswire.com/news/home/20190418005366/en/Global-Mobile-Wal-lets-2019---Asia-Pacific-Outpaces.
2 Ibid; John Engen, “Lessons from a Mobile Payments Revolution,” American Banker, April 29, 2018, https://www.americanbanker.com/news/why-chinas-mobile-payments-revolution-matters-for-us-bankers.

7THE MOBILE PAYMENT REVOLUTION IN CHINA: WHAT CANADIAN BUSINESSES NEED TO KNOW
ASIA PACIFIC FOUNDATION OF CANADA
to devise their own consumer operation strategies.3 Apart from its significance
to the financial and banking industries, understanding a mobile-first market
environment is equally – if not more – important for Canadian exporters
preparing to tap into markets such as China’s.
As Canada expands its trade diversification efforts, helping a number of
Canadian brands unveil their expansion plans in Asia, it becomes all the
more important for researchers to fill the knowledge void by equipping
businesses with essential market intelligence on China and Asia’s mobile
payment ecosystems.4 This report looks in detail into China’s mobile payments
landscape. It provides an overview of the Chinese mobile payment landscape
and the ecosystem built around the two dominant players; it then discusses
the shifting Chinese consumer culture and unique expectations due to massive
adoption of mobile payments, as well as regulatory and security aspects of the
issue. It concludes by providing recommendations on mobile-payment-oriented
strategies and approaches for customer-facing Canadian companies to consider
in their overseas ventures. The report also presents two case studies, one being
an example of regional specificities in the development of mobile payments in
China’s inland city of Guiyang, and the other providing additional context of
the mobile payment developments in Southeast Asia, with a particular focus
on Singapore, that shows some of the complexities surrounding the adoption
of this mode of payment.
3 Yuan Yang, “Why Millennials Are Driving Cashless Revolution in China,” Financial Times, July 7, 2018, https://www.ft.com/content/539e39b8-851b-11e8-a29d-73e3d454535d; John Engen, 2018.
4 There have been a number of studies on China’s mobile payment development. Social Networks, e-Commerce Platforms, and the Growth of Digital Payment Ecosystems in China: What it Means for Other Countries by Zennon Kapron and Michelle Meertens (2017) is one of the most comprehensive reports that uses China as a case to analyze how payment digitization drives financial inclusion and offers economic opportunities, which informs the framework of my research; while China Pay Insights: A Guide for Scottish Business (2018) is a walk-through tailored to Scottish merchants in better engaging with Chinese customers by employing Chinese mobile payment solutions, in the context of inbound Chinese tourism. Also worth mentioning is the domestically focused 2019 China Mobile Payment Development Report: Mobile Pay-ment Enhances the Future Competitiveness of the City (2019), which examines the macro-level impact of mobile payments on the basis of a city-level China Mobile Payment Index. This report adds to the body of knowledge by targeting Canadian businesses’ export strategy-making process and explaining why mobile payment development matters to them.
8THE MOBILE PAYMENT REVOLUTION IN CHINA: WHAT CANADIAN BUSINESSES NEED TO KNOW
ASIA PACIFIC FOUNDATION OF CANADA
METHODOLOGYThis study is the first of its kind in its Canadian focus, and it complements
secondary data on consumer behaviour and market dynamics obtained from
pre-existing surveys and reports with field research. More than 20 interviews
were conducted with researchers and analysts who study mobile payment and
relevant subject areas in China and Singapore; with mobile payment service
providers in China and their cross-border payment partners in Canada; with
Canadian trade and business representatives on the ground; and informally
with local consumers and merchants in China and Canada. To create a more
balanced analysis, field research was undertaken in China’s first-tier Beijing
and Shanghai as well as second-tier Guiyang.5 It is hoped that the findings
will help increase Canadian exporters’ attention to the technology-driven
transformations in consumer behaviour happening in Asia, and will contribute
to improve their strategic planning and marketing processes to successfully
gain a foothold in these markets.
5 The Chinese city-tier system is commonly used in studies of mainland China as a point of reference for tracking a particular city’s stage of development, population size, political administration, as well as market trends and opportunities. The Chinese government has not published an official classification of the city tiers, and definitions and categorizations vary across different indicators. The four largest and wealthiest metropolises of Beijing, Shanghai, Guangzhou, and Shenzhen are regarded as the “traditional first-tier cities,” and a city’s level of economic, political, and cultural influence generally decreases as one moves down the tiers. See Dorcas Wang, “China’s City-Tier Classification: What They Are and How Are They Defined,” China Briefing, February 27, 2019, https://www.china-briefing.com/news/chinas-city-tier-classification-defined/.
Fieldwork was undertaken in Beijing, Shanghai and Guiyang

9THE MOBILE PAYMENT REVOLUTION IN CHINA: WHAT CANADIAN BUSINESSES NEED TO KNOW
ASIA PACIFIC FOUNDATION OF CANADA
THE RISE OF MOBILE PAYMENTS IN CHINA
Nowhere in the world have consumers so successfully adopted the habit of
making payments by mobile phone than in China. But the path of development
of this relatively new mode of payment was never a straight line. Prior to 2010,
various groups of players, including telecommunications operators, state-
owned and commercial banks, the domestic bank card association UnionPay,
and internet companies as third-party payment platforms, were all making
attempts to gain a foothold in what they believed to be a lucrative business.6
Each party, though, was pursuing a somewhat different strategy and testing
out service with incompatible technology standards. Neither were there clear
rules and regulations allowing non-financial institutions to engage in payment
services nationwide. There were many doubts around payment security issues
and legal responsibilities if large amounts of funds were to be handled by non-
bank service providers. During this period, most mobile payment solutions
were based on near-field communication (NFC) technology, which requires
advanced hardware in people’s mobile devices, at a time when smartphones
were still uncommon in the country (see Box 1). This, combined with poor
mobile internet coverage, kept demand for mobile payments low in the then-
cash-dominant society.
It was not until around 2011 when People’s Bank of China (PBOC), the Chinese
central bank, formalized the practice by putting forth a number of measures
that defined barriers of entry. In that year, PBOC issued licences to 27 third-
party payment service providers.7 Two rapidly expanding third-party mobile
payment schemes – Alibaba’s Alipay and Tencent’s WeChat Pay – began
adopting the QR code as a much more simplistic, hardware-independent way
for both consumer and merchant users to execute physical payments offline
(see Box 1). At the same time, the exponential rise of small-ticket payment
6 “Third-party payment platforms” and “third-party payment service providers” are terms used to differ-entiate these providers from the so-called “traditional operators of payments,” which are the banking and credit institutions. With authorization given by the respective regulating agencies, these third-party service providers are able to access banks’ payment and settlement systems to enable transactions.
7 2019 China Mobile Payment Development Report: Mobile Payment Enhances the Future Competitiveness of the City (2019中国移动支付发展报告——移动支付提升城市未来竞争力). Beijing: State Information Center of China et al., 2019. http://upload.xinhua08.com/2019/0508/1557302957552.pdf.
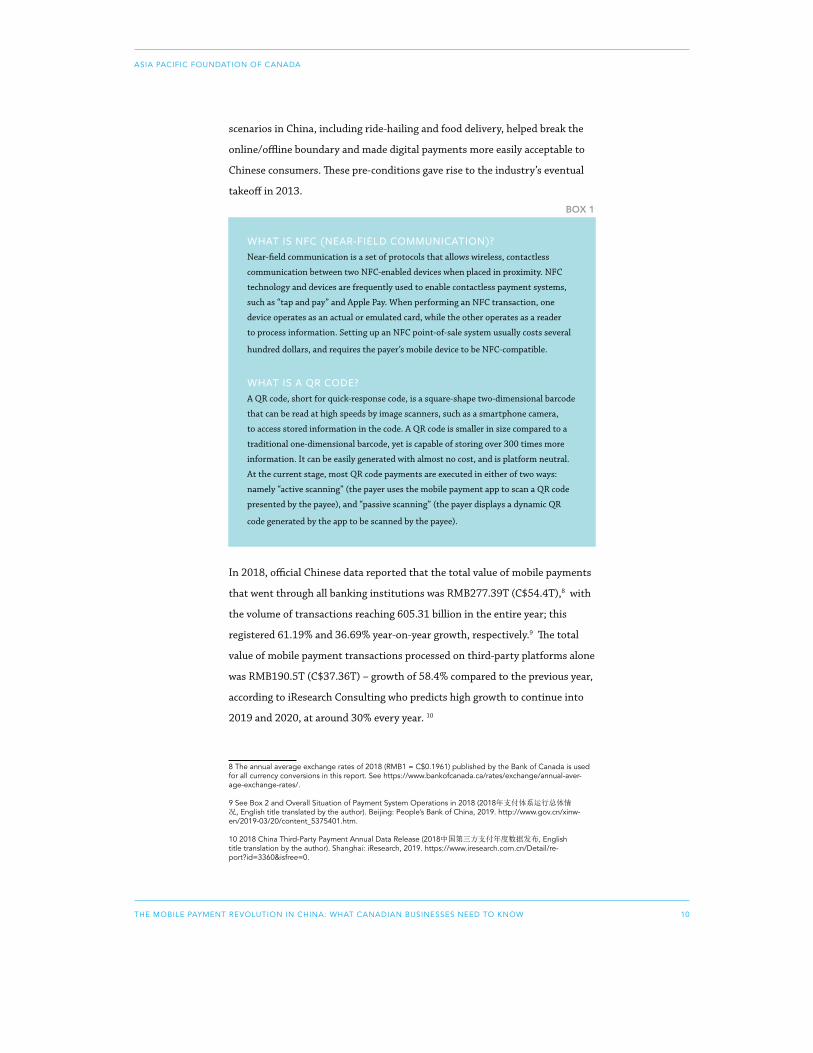
10THE MOBILE PAYMENT REVOLUTION IN CHINA: WHAT CANADIAN BUSINESSES NEED TO KNOW
ASIA PACIFIC FOUNDATION OF CANADA
scenarios in China, including ride-hailing and food delivery, helped break the
online/offline boundary and made digital payments more easily acceptable to
Chinese consumers. These pre-conditions gave rise to the industry’s eventual
takeoff in 2013.
In 2018, official Chinese data reported that the total value of mobile payments
that went through all banking institutions was RMB277.39T (C$54.4T),8 with
the volume of transactions reaching 605.31 billion in the entire year; this
registered 61.19% and 36.69% year-on-year growth, respectively.9 The total
value of mobile payment transactions processed on third-party platforms alone
was RMB190.5T (C$37.36T) – growth of 58.4% compared to the previous year,
according to iResearch Consulting who predicts high growth to continue into
2019 and 2020, at around 30% every year. 10
8 The annual average exchange rates of 2018 (RMB1 = C$0.1961) published by the Bank of Canada is used for all currency conversions in this report. See https://www.bankofcanada.ca/rates/exchange/annual-aver-age-exchange-rates/.
9 See Box 2 and Overall Situation of Payment System Operations in 2018 (2018年支付体系运行总体情况, English title translated by the author). Beijing: People’s Bank of China, 2019. http://www.gov.cn/xinw-en/2019-03/20/content_5375401.htm.
10 2018 China Third-Party Payment Annual Data Release (2018中国第三方支付年度数据发布, English title translation by the author). Shanghai: iResearch, 2019. https://www.iresearch.com.cn/Detail/re-port?id=3360&isfree=0.
WHAT IS NFC (NEAR-FIELD COMMUNICATION)? Near-field communication is a set of protocols that allows wireless, contactless
communication between two NFC-enabled devices when placed in proximity. NFC
technology and devices are frequently used to enable contactless payment systems,
such as “tap and pay” and Apple Pay. When performing an NFC transaction, one
device operates as an actual or emulated card, while the other operates as a reader
to process information. Setting up an NFC point-of-sale system usually costs several
hundred dollars, and requires the payer’s mobile device to be NFC-compatible.
WHAT IS A QR CODE? A QR code, short for quick-response code, is a square-shape two-dimensional barcode
that can be read at high speeds by image scanners, such as a smartphone camera,
to access stored information in the code. A QR code is smaller in size compared to a
traditional one-dimensional barcode, yet is capable of storing over 300 times more
information. It can be easily generated with almost no cost, and is platform neutral.
At the current stage, most QR code payments are executed in either of two ways:
namely “active scanning” (the payer uses the mobile payment app to scan a QR code
presented by the payee), and “passive scanning” (the payer displays a dynamic QR
code generated by the app to be scanned by the payee).
BOX 1

11THE MOBILE PAYMENT REVOLUTION IN CHINA: WHAT CANADIAN BUSINESSES NEED TO KNOW
ASIA PACIFIC FOUNDATION OF CANADA
In the first quarter of 2019, the mobile payment penetration rate among
internet users reached 95.1%, as measured by the percentage of survey
respondents who had used mobile payments at least once in the previous three
months, according to Ipsos China.11 Given the 1.27 billion mobile internet
user accounts in China, Ipsos estimated the number of mobile payment user
accounts to be approximately 1.01 billion by the end of February 2019.12
Third-party mobile payments have emerged as Chinese people’s primary
mode of payment, and were used for 47% of the respondents’ average daily
expenditures during the same period, outstripping card (23%) and cash (19%)
payments.13
11 Third-Party Mobile Payment User Research Report for the First Quarter of 2019 (2019第一季度第三方移动支付用户研究报告, English title translated by the author). Shenzhen: Ipsos China, 2019. https://www.ipsos.com/zh-cn/yipusuoipsoszhongbang-2019diyijidudisanfangyidongzhifuyonghuyanjiubaogao.
12 Ibid.
13 Ibid.
Street vendors in Guiyang, China, display static WeChat Pay and Alipay QR codes to receive payments
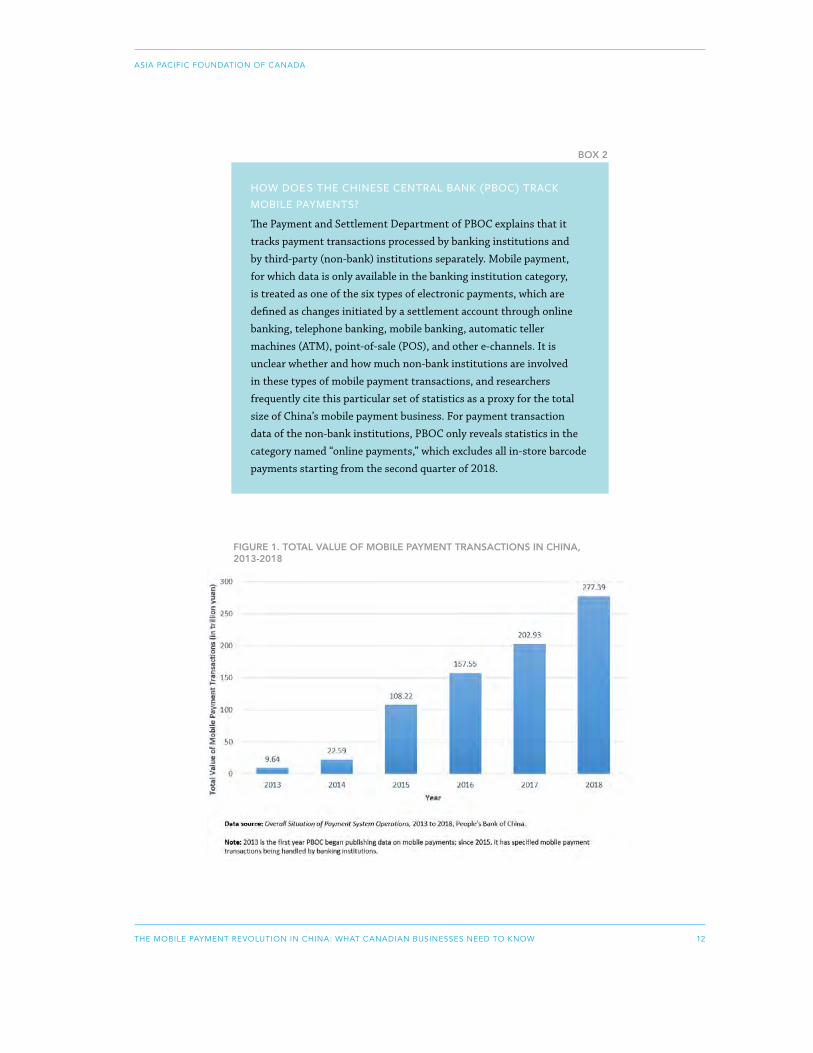
12THE MOBILE PAYMENT REVOLUTION IN CHINA: WHAT CANADIAN BUSINESSES NEED TO KNOW
ASIA PACIFIC FOUNDATION OF CANADA
FIGURE 1. TOTAL VALUE OF MOBILE PAYMENT TRANSACTIONS IN CHINA, 2013-2018
HOW DOE S THE CHINESE CENTRAL BANK (PBOC) TRACK MOBILE PAYMENTS?
The Payment and Settlement Department of PBOC explains that it
tracks payment transactions processed by banking institutions and
by third-party (non-bank) institutions separately. Mobile payment,
for which data is only available in the banking institution category,
is treated as one of the six types of electronic payments, which are
defined as changes initiated by a settlement account through online
banking, telephone banking, mobile banking, automatic teller
machines (ATM), point-of-sale (POS), and other e-channels. It is
unclear whether and how much non-bank institutions are involved
in these types of mobile payment transactions, and researchers
frequently cite this particular set of statistics as a proxy for the total
size of China’s mobile payment business. For payment transaction
data of the non-bank institutions, PBOC only reveals statistics in the
category named “online payments,” which excludes all in-store barcode
payments starting from the second quarter of 2018.
BOX 2
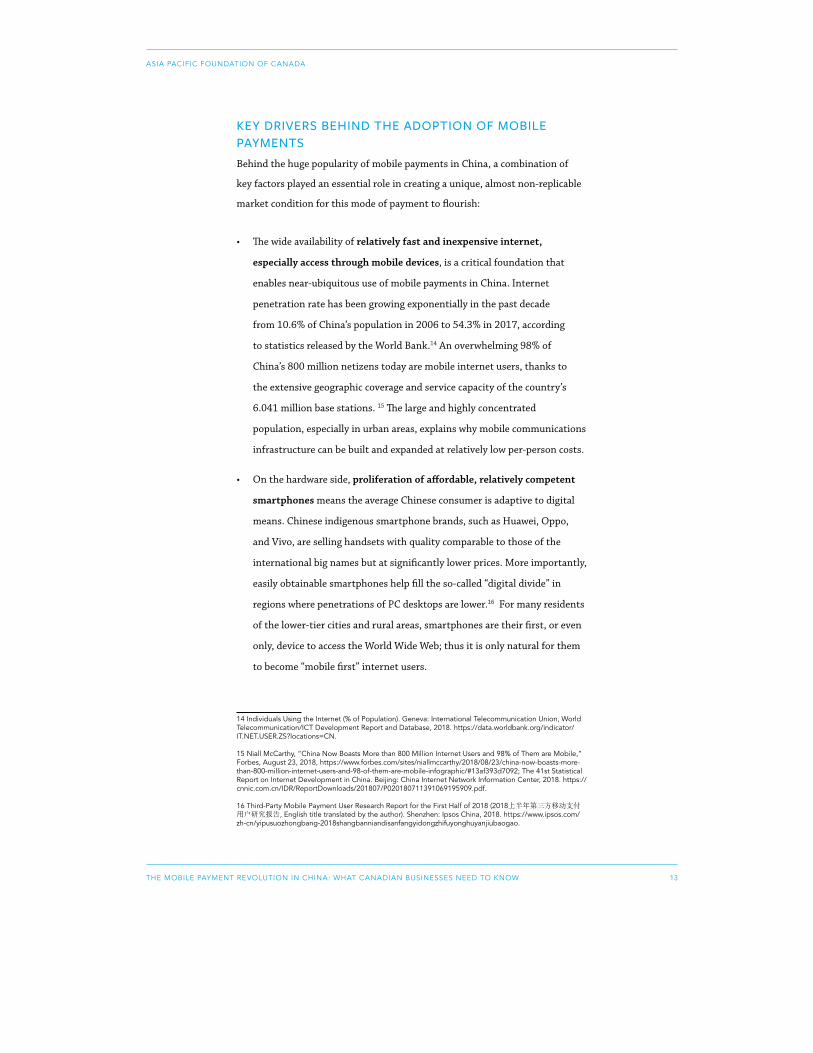
13THE MOBILE PAYMENT REVOLUTION IN CHINA: WHAT CANADIAN BUSINESSES NEED TO KNOW
ASIA PACIFIC FOUNDATION OF CANADA
KEY DRIVERS BEHIND THE ADOPTION OF MOBILE PAYMENTS Behind the huge popularity of mobile payments in China, a combination of
key factors played an essential role in creating a unique, almost non-replicable
market condition for this mode of payment to flourish:
• The wide availability of relatively fast and inexpensive internet,
especially access through mobile devices, is a critical foundation that
enables near-ubiquitous use of mobile payments in China. Internet
penetration rate has been growing exponentially in the past decade
from 10.6% of China’s population in 2006 to 54.3% in 2017, according
to statistics released by the World Bank.14 An overwhelming 98% of
China’s 800 million netizens today are mobile internet users, thanks to
the extensive geographic coverage and service capacity of the country’s
6.041 million base stations. 15 The large and highly concentrated
population, especially in urban areas, explains why mobile communications
infrastructure can be built and expanded at relatively low per-person costs.
• On the hardware side, proliferation of affordable, relatively competent
smartphones means the average Chinese consumer is adaptive to digital
means. Chinese indigenous smartphone brands, such as Huawei, Oppo,
and Vivo, are selling handsets with quality comparable to those of the
international big names but at significantly lower prices. More importantly,
easily obtainable smartphones help fill the so-called “digital divide” in
regions where penetrations of PC desktops are lower.16 For many residents
of the lower-tier cities and rural areas, smartphones are their first, or even
only, device to access the World Wide Web; thus it is only natural for them
to become “mobile first” internet users.
14 Individuals Using the Internet (% of Population). Geneva: International Telecommunication Union, World Telecommunication/ICT Development Report and Database, 2018. https://data.worldbank.org/indicator/IT.NET.USER.ZS?locations=CN.
15 Niall McCarthy, “China Now Boasts More than 800 Million Internet Users and 98% of Them are Mobile,” Forbes, August 23, 2018, https://www.forbes.com/sites/niallmccarthy/2018/08/23/china-now-boasts-more-than-800-million-internet-users-and-98-of-them-are-mobile-infographic/#13af393d7092; The 41st Statistical Report on Internet Development in China. Beijing: China Internet Network Information Center, 2018. https://cnnic.com.cn/IDR/ReportDownloads/201807/P020180711391069195909.pdf.
16 Third-Party Mobile Payment User Research Report for the First Half of 2018 (2018上半年第三方移动支付用户研究报告, English title translated by the author). Shenzhen: Ipsos China, 2018. https://www.ipsos.com/zh-cn/yipusuozhongbang-2018shangbanniandisanfangyidongzhifuyonghuyanjiubaogao.
14THE MOBILE PAYMENT REVOLUTION IN CHINA: WHAT CANADIAN BUSINESSES NEED TO KNOW
ASIA PACIFIC FOUNDATION OF CANADA
• The absence of a habit of using cards in daily consumption allows
China to leapfrog plastic-based payments to go straight from cash to
mobile. Mobile payments emerged at a time when the credit card system
was still at a relatively early stage of development in China, where credit
card ownership averages less than 0.5 cards per person.17 Unlike in many
developed countries where consumers are already quite satisfied with the
level of convenience that credit card payments offer, and where major
credit card issuers wield enormous market power, mobile payment service
providers in China faced much less resistance from legacy operators.
Offerings of various in-app discounts as well as lower transaction fees also
make mobile payment a more attractive option to both customers and
merchants, as compared with credit cards. 18
• China’s banking sector is in general collaborative with the operation of
non-bank third-party payment institutions, at the cost of a significant
portion of their own business revenue and the potentially profit-generating
customer insights derived from transaction data. Most third-party
mobile payment services in China require users to link their accounts to
a bank card to access all functions. Under the legally required “two-factor
authentication” process, banks are held responsible for verifying the
identity of account holders before they can start using mobile payment
tools,19 which in many cases is carried out in the country’s more than
100,000 commercial bank branches.20 State ownership of the “Big Four”
banks, who control the majority of the assets in the country’s banking
system, gives them stronger incentives to facilitate a fintech development
17 Xun Zhang, Jiajia Zhang, and Zongyue He, “Is Fintech Inclusive? Evidence from China’s Household Survey Data,” Copenhagen: 35th IARIW General Conference, 2018. http://www.iariw.org/copenhagen/zhang1.pdf.
18 Zennon Kapron and Michelle Meertens, Social Networks, e-Commerce Platforms, and the Growth of Dig-ital Payment Ecosystems in China: What it Means for Other Countries. New York: Better Than Cash Alliance, 2017. https://www.betterthancash.org/tools-research/case-studies/social-networks-ecommerce-platforms-and-the-growth-of-digital-payment-ecosystems-in-china.
19 Two-factor authentication here refers to the requirement set by the China Banking Regulatory Commis-sion that when a user establishes relations with a third-party payment service provider for the first time, the user’s identity needs to be verified by both the service provider and a commercial bank that the user is a customer of. See Notice of the China Banking Regulatory Commission and the People's Bank of China on Strengthening the Administration of Cooperative Business Between Commercial Banks and Third-party Pay-ment Institutions (中国银监会中国人民银行关于加强商业银行与第三方支付机构合作业务管理的通知, English title translated by the author). Beijing: China Banking Regulatory Commission, 2014. http://www.cbrc.gov.cn/govView_EA1CC481C843441FA93AE486FD03B43D.html.
20 IMF data shows that there were 100,064 commercial bank branches in mainland China in 2017. For more information, see http://data.imf.org/?sk=E5DCAB7E-A5CA-4892-A6EA-598B5463A34C.
15THE MOBILE PAYMENT REVOLUTION IN CHINA: WHAT CANADIAN BUSINESSES NEED TO KNOW
ASIA PACIFIC FOUNDATION OF CANADA
that can effectively reach the country’s still-numerous underserved
individuals and businesses and hence improve financial inclusion.
• The phenomenal rise of e-commerce, the sharing economy, and the
O2O market in recent years has created an abundance of scenarios for
people to adopt mobile payments. The 610 million e-shoppers in China’s
online marketplace are increasingly moving to their mobile devices and
are readily using mobile versions of the e-wallets they are probably already
quite familiar with to check out.21 On the other hand, mobile payment
played a key role in reducing friction and making on-demand, small-ticket
services easily adoptable when they first began to emerge in China; rapid
developments in these sectors in turn further drive the uptake in mobile
payment usage.
• China’s two largest mobile payment service operators, Alibaba and Tencent,
ventured into the payment industry with already huge customer bases
from their e-commerce and messaging businesses, respectively. On top
of this inherent advantage, Chinese consumers in general seem to place
more value on the benefits of convenience, speed, and the ability to
access financial means brought by mobile payments, and are thus more
accommodating to security and privacy concerns.22 KPMG’s survey found
that 9 in 10 Chinese consumers, in contrast to a 7.5-in-10 global average,
would share their personal data with a company in exchange for better
products, services, personalization, and security protection.23
Such willingness makes them more easily convertible to subscribers of
mobile payment services.
21 The 43rd China Statistical Report on Internet Development (第43次中国互联网络发展状况统计报告). Beijing: China Internet Network Information Center, 2019. http://www.cnnic.cn/hlwfzyj/hlwxzbg/hlwt-jbg/201902/P020190228510533388308.pdf.
22 Connected Life 2017: China Regional Summary. London: Kantar TNS, 2017. http://connectedlife.tnsglob-al.com/.
23 Joanna Lam, “Nine in 10 Chinese Consumers Are Ready to Share Data for Better Services, According to KPMG Poll,” South China Morning Post, November 6, 2018, https://www.scmp.com/business/companies/article/2171907/nine-10-chinese-consumers-are-ready-share-data-better-services?utm_source=Yahoo&utm_medium=partner&utm_campaign=contentexchange; Me, My Life, My Wallet (2nd edition). Atlanta: KPMG Global Consumer Insights Program, 2018. https://assets.kpmg/content/dam/kpmg/xx/pdf/2018/11/me-my-life-my-wallet.pdf.
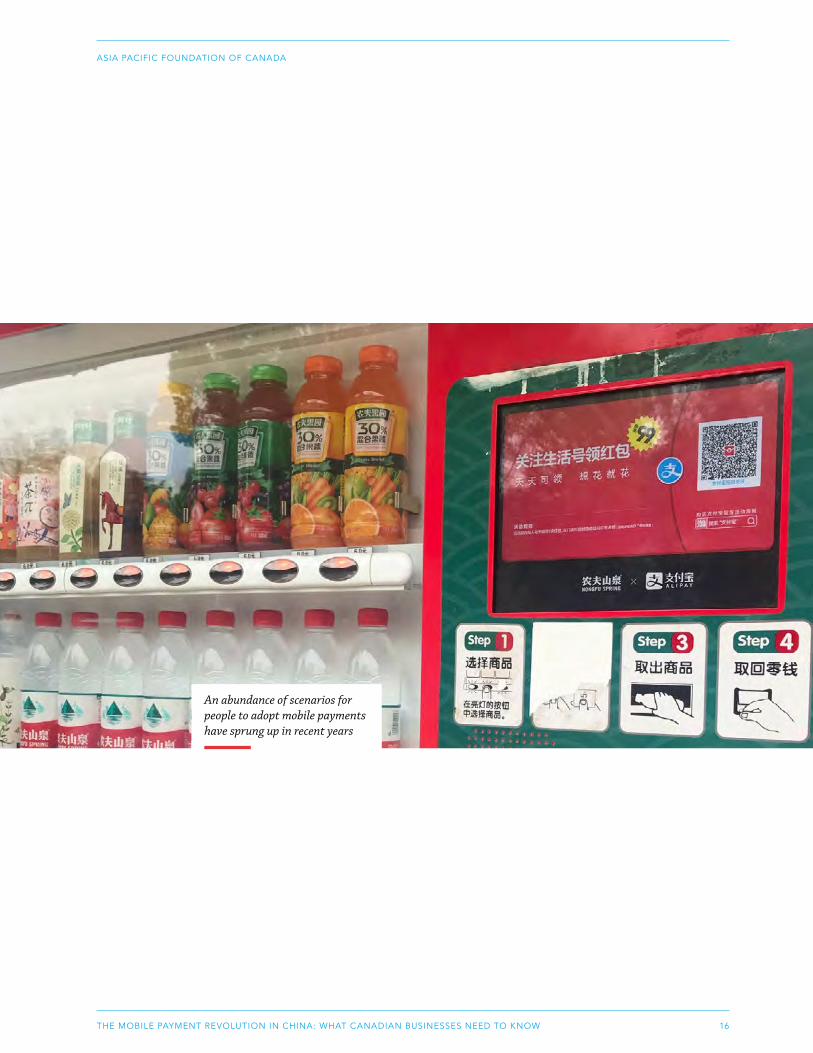
16THE MOBILE PAYMENT REVOLUTION IN CHINA: WHAT CANADIAN BUSINESSES NEED TO KNOW
ASIA PACIFIC FOUNDATION OF CANADA
An abundance of scenarios for people to adopt mobile payments have sprung up in recent years
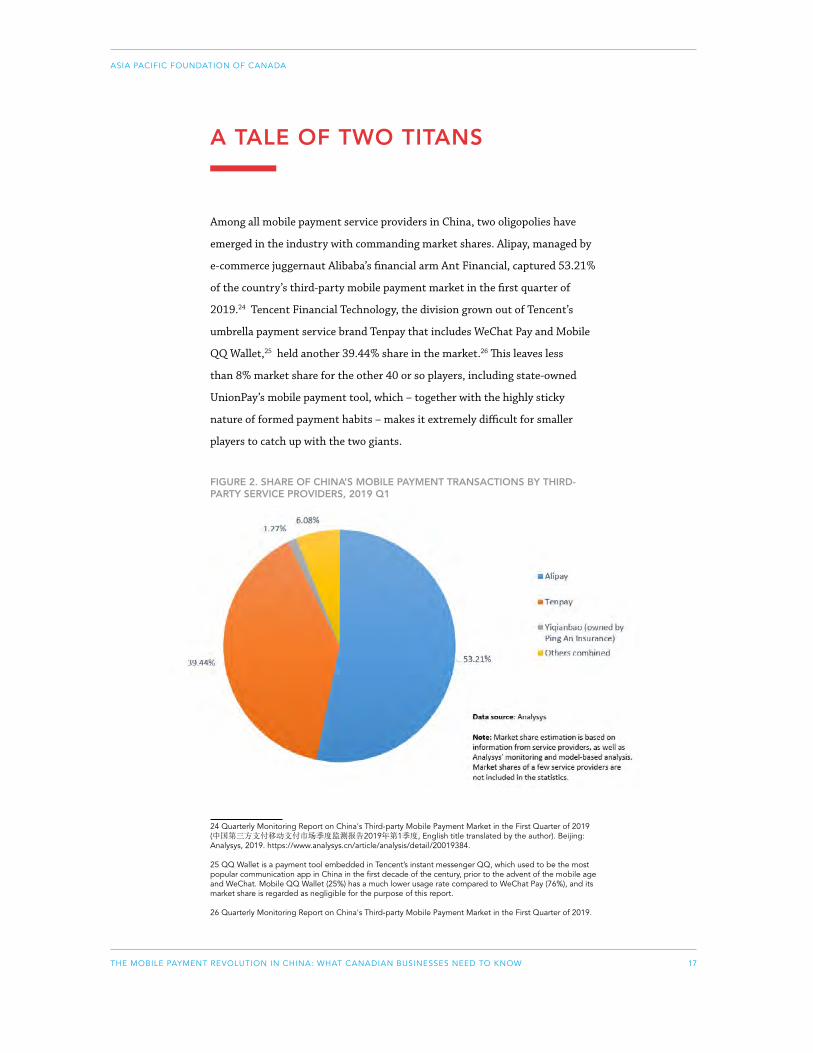
17THE MOBILE PAYMENT REVOLUTION IN CHINA: WHAT CANADIAN BUSINESSES NEED TO KNOW
ASIA PACIFIC FOUNDATION OF CANADA
A TALE OF TWO TITANS
Among all mobile payment service providers in China, two oligopolies have
emerged in the industry with commanding market shares. Alipay, managed by
e-commerce juggernaut Alibaba’s financial arm Ant Financial, captured 53.21%
of the country’s third-party mobile payment market in the first quarter of
2019.24 Tencent Financial Technology, the division grown out of Tencent’s
umbrella payment service brand Tenpay that includes WeChat Pay and Mobile
QQ Wallet,25 held another 39.44% share in the market.26 This leaves less
than 8% market share for the other 40 or so players, including state-owned
UnionPay’s mobile payment tool, which – together with the highly sticky
nature of formed payment habits – makes it extremely difficult for smaller
players to catch up with the two giants.
24 Quarterly Monitoring Report on China's Third-party Mobile Payment Market in the First Quarter of 2019 (中国第三方支付移动支付市场季度监测报告2019年第1季度, English title translated by the author). Beijing: Analysys, 2019. https://www.analysys.cn/article/analysis/detail/20019384.
25 QQ Wallet is a payment tool embedded in Tencent’s instant messenger QQ, which used to be the most popular communication app in China in the first decade of the century, prior to the advent of the mobile age and WeChat. Mobile QQ Wallet (25%) has a much lower usage rate compared to WeChat Pay (76%), and its market share is regarded as negligible for the purpose of this report.
26 Quarterly Monitoring Report on China's Third-party Mobile Payment Market in the First Quarter of 2019.
FIGURE 2. SHARE OF CHINA’S MOBILE PAYMENT TRANSACTIONS BY THIRD-PARTY SERVICE PROVIDERS, 2019 Q1

18THE MOBILE PAYMENT REVOLUTION IN CHINA: WHAT CANADIAN BUSINESSES NEED TO KNOW
ASIA PACIFIC FOUNDATION OF CANADA
Before growing into the full-fledged ecosystems we know today, Alipay and
WeChat Pay were born from quite different origins. The Alipay service was
first launched in 2004 on Alibaba’s consumer-to-consumer (C2C) shopping
site Taobao as a solution to address trust issues in the exchanges of value on
the internet in the very early days of e-commerce. It is based on an escrow
mechanism in which the service provider, Alibaba, holds onto the funds and
only transfers it to the seller after the buyer has received and verified the
purchased product. Initially employed by its users to facilitate transactions
almost exclusively on Taobao, on which sales were greatly boosted after
Alipay’s invention, the payment tool soon began to operate as an independent
subsidiary under Alibaba’s effort to build a separate profile and expand the
tool’s usage.27 Having teamed up with various banks in China throughout the
years to enable and improve the running of internet payments, in 2010 Alipay
launched – jointly with the Bank of China – a service named QuickPay that was
designed to streamline online credit card payments and became the first third-
party payment company in the country linking directly to banks’ payment
systems.28 Since then, Alipay has been focusing on the mobile end business
under its “ALL IN wireless” strategy.
WeChat Pay, on the other hand, was created in 2013. It was never a standalone
app, but an added function to the pre-existing WeChat messaging tool.
Despite being a latecomer in the business, the expansion of WeChat Pay was
expedited by a series of critical events, including its collaboration with ride-
hailing app Didi at a time of soaring usage of such on-demand services. The
other auspicious event was Tencent’s legendary gamification of China’s red-
packet-giving tradition during the Lunar New Year holiday period in 2014.29
Throughout what is now referred to as the first “fight for red packets,” users
sent virtual red packets topped up by funds in their WeChat Pay wallets to
individual contacts and chat groups; for the latter, a lucky-draw-like function
distributing the money randomly to first-comers further attracted people’s
interest. The campaign modernized a form of peer-to-peer money transfer
27 Xi You, Ant Financial: The Rise of the Fintech Unicorn (蚂蚁金服:科技金融独角兽的崛起, English title translated by the author). Beijing: CITIC Press Group, 2017.
28 Xiaoming Zhu et al., Business Trends in the Digital Era: Evolution of Theories and Applications. Shanghai: Shanghai Jiao Tong University Press and Springer, 2016.
29 Red packets are a common money-gifting custom, practised in China as well as in parts of East and Southeast Asia, to share blessings during traditional festivals and to celebrate special occasions such as weddings and births.
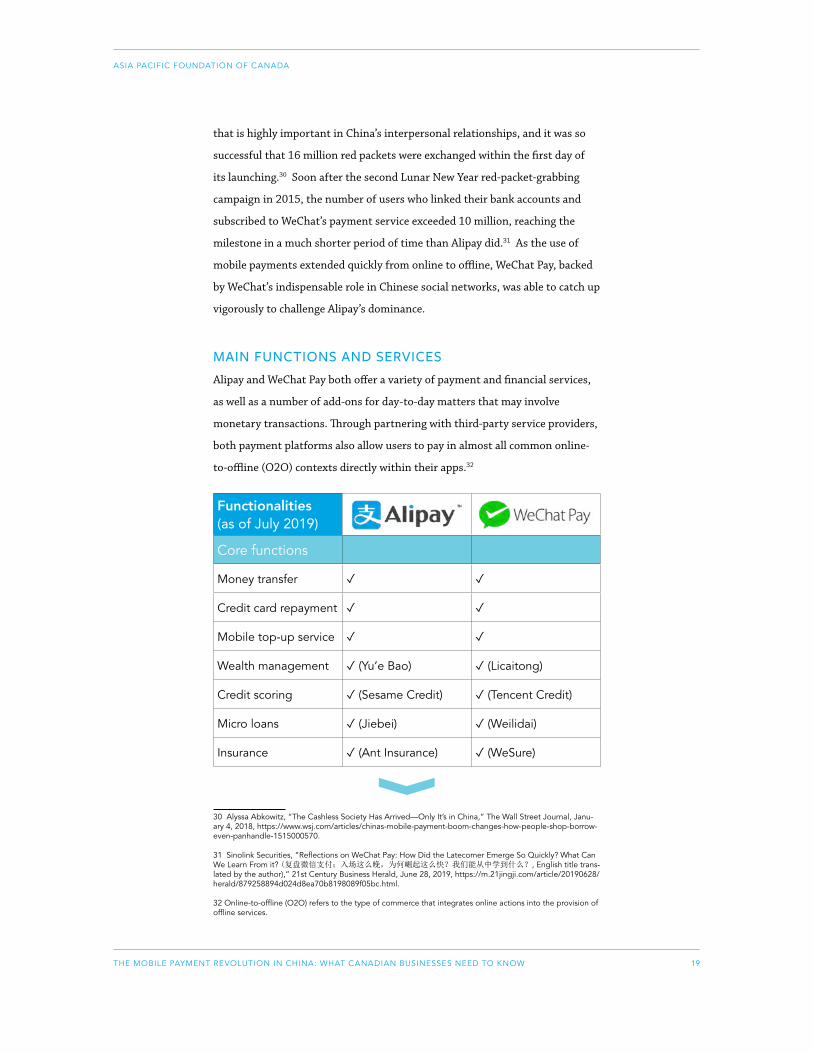
19THE MOBILE PAYMENT REVOLUTION IN CHINA: WHAT CANADIAN BUSINESSES NEED TO KNOW
ASIA PACIFIC FOUNDATION OF CANADA
that is highly important in China’s interpersonal relationships, and it was so
successful that 16 million red packets were exchanged within the first day of
its launching.30 Soon after the second Lunar New Year red-packet-grabbing
campaign in 2015, the number of users who linked their bank accounts and
subscribed to WeChat’s payment service exceeded 10 million, reaching the
milestone in a much shorter period of time than Alipay did.31 As the use of
mobile payments extended quickly from online to offline, WeChat Pay, backed
by WeChat’s indispensable role in Chinese social networks, was able to catch up
vigorously to challenge Alipay’s dominance.
MAIN FUNCTIONS AND SERVICESAlipay and WeChat Pay both offer a variety of payment and financial services,
as well as a number of add-ons for day-to-day matters that may involve
monetary transactions. Through partnering with third-party service providers,
both payment platforms also allow users to pay in almost all common online-
to-offline (O2O) contexts directly within their apps.32
Functionalities (as of July 2019)
Core functions
Money transfer ✓ ✓
Credit card repayment ✓ ✓
Mobile top-up service ✓ ✓
Wealth management ✓ (Yu’e Bao) ✓ (Licaitong)
Credit scoring ✓ (Sesame Credit) ✓ (Tencent Credit)
Micro loans ✓ (Jiebei) ✓ (Weilidai)
Insurance ✓ (Ant Insurance) ✓ (WeSure)
30 Alyssa Abkowitz, “The Cashless Society Has Arrived—Only It’s in China,” The Wall Street Journal, Janu-ary 4, 2018, https://www.wsj.com/articles/chinas-mobile-payment-boom-changes-how-people-shop-borrow-even-panhandle-1515000570.
31 Sinolink Securities, “Reflections on WeChat Pay: How Did the Latecomer Emerge So Quickly? What Can We Learn From it? (复盘微信支付:入场这么晚,为何崛起这么快?我们能从中学到什么?, English title trans-lated by the author),” 21st Century Business Herald, June 28, 2019, https://m.21jingji.com/article/20190628/herald/879258894d024d8ea70b8198089f05bc.html.
32 Online-to-offline (O2O) refers to the type of commerce that integrates online actions into the provision of offline services.
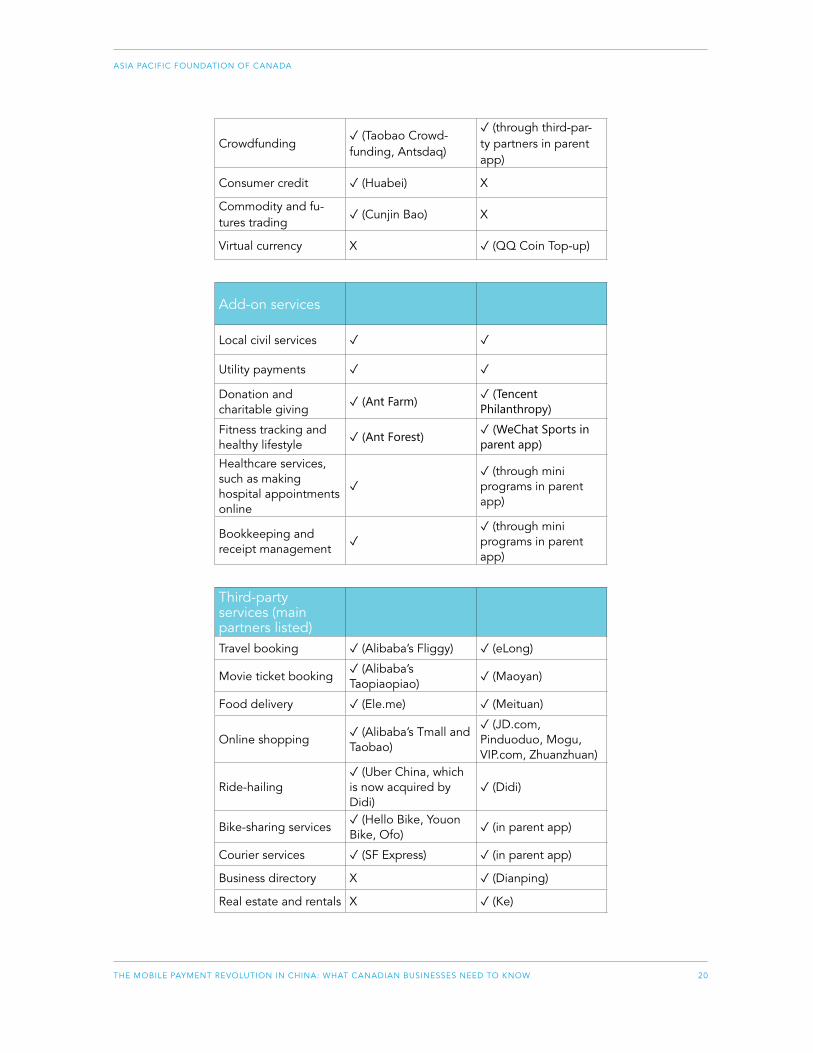
20THE MOBILE PAYMENT REVOLUTION IN CHINA: WHAT CANADIAN BUSINESSES NEED TO KNOW
ASIA PACIFIC FOUNDATION OF CANADA
Crowdfunding✓ (Taobao Crowd-funding, Antsdaq)
✓ (through third-par-ty partners in parent app)
Consumer credit ✓ (Huabei) X
Commodity and fu-tures trading
✓ (Cunjin Bao) X
Virtual currency X ✓ (QQ Coin Top-up)
Add-on services
Local civil services ✓ ✓
Utility payments ✓ ✓
Donation and charitable giving
✓ (Ant Farm)✓ (Tencent Philanthropy)
Fitness tracking and healthy lifestyle
✓ (Ant Forest)✓ (WeChat Sports in parent app)
Healthcare services, such as making hospital appointments online
✓✓ (through mini programs in parent app)
Bookkeeping and receipt management
✓✓ (through mini programs in parent app)
Third-party services (main partners listed)Travel booking ✓ (Alibaba’s Fliggy) ✓ (eLong)
Movie ticket booking✓ (Alibaba’s Taopiaopiao)
✓ (Maoyan)
Food delivery ✓ (Ele.me) ✓ (Meituan)
Online shopping✓ (Alibaba’s Tmall and Taobao)
✓ (JD.com, Pinduoduo, Mogu, VIP.com, Zhuanzhuan)
Ride-hailing✓ (Uber China, which is now acquired by Didi)
✓ (Didi)
Bike-sharing services✓ (Hello Bike, Youon Bike, Ofo)
✓ (in parent app)
Courier services ✓ (SF Express) ✓ (in parent app)
Business directory X ✓ (Dianping)
Real estate and rentals X ✓ (Ke)
21THE MOBILE PAYMENT REVOLUTION IN CHINA: WHAT CANADIAN BUSINESSES NEED TO KNOW
ASIA PACIFIC FOUNDATION OF CANADA
EQUALLY POWERFUL BUT WITH DIFFERENT STRENGTHSAlipay started off as the largest mobile payment service provider in terms of
market share, and has been able to maintain the overall leading position to
date. However, when it comes to service coverage and popularity, the Tenpay
family has already outperformed Alipay with a combined penetration rate
of 89.2%, compared to Alipay’s 69.5%.33 This discrepancy can very much be
explained by the WeChat parent app’s ubiquitous use for messaging and social
networking, boasting one billion monthly active users.34 WeChat’s strong
social advantage means that users are more likely to use the payment tool
as they are carrying out other daily activities in the app, such as chatting or
reading news. In offline physical scenarios where mobile payment transactions
are more visible, WeChat Pay exerts a strong peer influence between the
merchant and the customer as well as between customers, since those who
have the WeChat app installed, which is most likely the case in China, can
conveniently access it if they see others using it.35 Indeed, an Ipsos survey
confirmed that WeChat Pay has strongholds in peer-to-peer payments and
small-ticket offline retail payments. 36
Alipay also has unique strengths that allow it to prevail in a different set of
market segments. It is still the primary choice of payment in many online
scenarios, especially when it comes to e-commerce transactions, because of
Alibaba’s dominance in the online shopping space. Alibaba’s business-to-
consumer (B2C) platform Tmall has a larger market share (61.5% in the fourth
quarter of 2018) than all its rivals combined in the online B2C retail business.37
Another edge that Alipay has is the brand image of originally being a financial
management tool. It is able to offer a whole range of financial services and is
perceived by many as more professional and reliable when it comes to money
matters.
33 Third-Party Mobile Payment User Research Report for the First Quarter of 2019.
34 Monthly active users (MAU) is a performance indicator, used frequently for internet products, that counts the number of unique users who engaged with a website or an app within the past month.
35 Third-Party Mobile Payment User Research Report for the First Half of 2018.
36 Ibid.
37 “Tmall and JD Had a Combined Market Share of over 85% in China’s B2C E-commerce Market in Q4 2018,” China Internet Watch, February 13, 2019, https://www.chinainternetwatch.com/28169/b2c-ecom-merce-q4-2018/.
22THE MOBILE PAYMENT REVOLUTION IN CHINA: WHAT CANADIAN BUSINESSES NEED TO KNOW
ASIA PACIFIC FOUNDATION OF CANADA
WeChat Pay, on the other hand, offers more possibilities of being linked with
other services and functions to expand new sales channels. One of the most
successful new functions is WeChat’s mini program feature introduced in 2017,
which allows merchants to set up virtual stores within the app and process
transactions using the payment gateway, with minimal costs. This social-
network-driven form of e-commerce, known as social commerce, has gained
significant traction in China as the traditional e-commerce platforms have
become overly saturated and businesses look for new ways to gain traffic.38 By
riding the wave of social commerce and by collaborating with some of Alibaba’s
main competitors, including JD.com and Pinduoduo, WeChat Pay is now
actively challenging Alipay’s leadership online.
MOBILE PAYMENTS FROM THE MERCHANTS’ PERSPECTIVEChina’s mobile payment industry evolved out of a tool first adopted by one
of the nation’s largest online retailers Alibaba. As usage expands in offline
scenarios, brick-and-mortar merchants, especially smaller ones, arguably
stand to benefit more from the reduction in business operating costs and
improvement in efficiency when processing transactions through mobile
payments. Corner stores and street peddlers in China very rarely take card
payments since installation costs for a point-of-sale terminal and transaction
rates are regarded as too high to be cost-effective. Prior to the reform of bank-
card payment-pricing schemes in 2016, the average card transaction fee for
merchants in the food and beverage industry was 1.25%, while Alipay and
WeChat Pay charged around 0.6% – or even 0% during promotion periods – for
their mobile payment transactions, representing a significant difference even
for a million-dollar business.39
Moreover, the minimally required equipment for merchants to set up mobile
payments, other than the smartphones they most likely already owned, was
initially a static QR code. The code could just be generated from the shop
38 Social commerce refers to electronic commerce activities and transactions that occur through online social interactions and user-generated content. See Xiaoting Liu, “The Rising Tide of Social Commerce – and Why China is Leading It,” Asia Pacific Foundation of Canada, August 27, 2019, https://www.asiapacific.ca/research-report/rising-tide-social-commerce-and-why-china-leading-it.
39 Shufang Yang, “Adjustments Made on Card Payment Transaction Fees; New Changes to Third-party Payments Could Be Coming (刷卡费率调整,第三方支付有什么新变化?, English title translated by the author),” Sohu, September 9, 2016, http://m.sohu.com/n/468118209/?wscrid=95360_6.

23THE MOBILE PAYMENT REVOLUTION IN CHINA: WHAT CANADIAN BUSINESSES NEED TO KNOW
ASIA PACIFIC FOUNDATION OF CANADA
owner’s personal mobile payment account and printed out on a sheet of paper,
with the merchant incurring almost no cost. When a RMB500 daily transaction
cap was put in place for self-printed static QR codes in 2018 to prevent fraud
and scams, merchants had to pay an extra fee to apply for official fund-
collecting QR codes from payment operators – which in fact only cost less than
a dollar per code.40 The setup cost for accepting mobile payments therefore
remains to be extremely low.
Surveys of consumer-facing merchants also pointed to the substantial benefits
they have gained in operational efficiency from receiving mobile payments,
in terms of significantly shortened processing times and nearly instant
settlement, as well as reduced accounting work.41 Moreover, micro, small,
and medium-sized enterprises, whose need for microloan services is usually
neglected by China’s traditional banking sector, are able to borrow through
mobile-payment-supported B2B online lending services. In Ant Financial’s
MYBank and Tencent’s WeBank, credit limits and interest rates for each
business client are calculated based on their past mobile payment transactions
using big data and AI technologies, so that loans can be delivered within
minutes and with more flexible terms.42 Under the “more mobile payment
collections, more loans” campaign, in just six months MYBank approved loans
to 1.55 million credit-thirsty micro and small merchants, many of whom
operate in the lower-tier cities, with a default rate as low as 0.78%.43
The most profound impact that mobile payment has on businesses, compared
to any other modes of payment today, is its immense power when employed as
a marketing tool – which has become a “new normal” in China. The dynamic,
updatable nature of mobile payments, as opposed to static cash and cards,
allows communications and the flow of information to happen through a
channel that is already an integral part of the purchasing cycle. No other forms
40 See Notice from the People's Bank of China on Issuing the Standards for the Barcode Payment Business (for Trial Implementation) (人民银行关于印发 《条码支付业务规范(试行)》的通知, English title translated by the author). Beijing: People's Bank of China, 2017. http://www.gov.cn/gongbao/content/2018/con-tent_5299609.htm.
41 In-person and phone interviews conducted with anonymous food and beverage companies in Shanghai on March 22, 2019 and in Guizhou on March 28, 2019.
42 “Young People and Their Phones are Shaking Up Banking,” The Economist, May 2, 2019, https://www.economist.com/special-report/2019/05/02/young-people-and-their-phones-are-shaking-up-banking.
43 Yingying Chen, “MYBank Goes Offline: 1.55 Million ‘Barcode Merchants’ Received Loans in Six Months (网商银行走向线下:6个月155万“码商”获贷款 笔均7615元, English title translated by the author),” China Securities Journal, December 16, 2017, http://www.cs.com.cn/sylm/jsbd/201712/t20171216_5626815.html.
24THE MOBILE PAYMENT REVOLUTION IN CHINA: WHAT CANADIAN BUSINESSES NEED TO KNOW
ASIA PACIFIC FOUNDATION OF CANADA
of payment are capable of forging this automatic, living connection with the
payers – the payment apps can send push notifications and digital content to
constantly remind potential or returning customers about the brand, giving
merchants a quick and easy way to build brand awareness and encourage
purchases.
A good example is the in-app digital coupons that can be issued to customers
based on their purchase histories and membership information, and are
directly saved in their mobile wallets to be conveniently pulled up any time.44
For businesses in the food and beverage industry in particular, one popular
mobile-payment-oriented strategy is to set up their loyalty programs in
the WeChat and Alipay apps, so that the membership system can be readily
integrated with the payment tool, creating a higher chance of landing a sale.
Several fast food chains, including well-known Canadian brands operating
in the Chinese market, are investing significantly in encouraging customers
to sign up for their WeChat reward programs, using tactics such as lowering
the barriers to join and heavily subsidizing purchases.45 The most successful
merchants are able to leverage the one-stop convenience of the Tencent and
Alibaba ecosystems to habituate and retain their customers, thereby creating
a cycle of transaction data accumulation, precision marketing, and repeated
purchases that constantly feed into one another. Because of mobile payments’
extensive use in China, the massive amount of precipitated data can be utilized
to create high-quality customer analyses and user portraits of those whose
purchasing behaviour and intentions are tracked in the payment apps.46
By acquiring these anonymized and quantified real transaction data from
the payment service providers, merchants are able to avoid ineffective and
repetitive marketing and, hence, lower the customer acquisition cost.47
44 Charlie Liu, “Everything You Need to Know about Alipay and WeChat Pay,” March 1, 2017, https://medi-um.com/@charliecliu/everything-you-need-to-know-about-alipay-and-wechat-pay-2e5e6686d6dc.
45 Phone interview conducted with anonymous food & beverage company in Guiyang on March 28, 2019.
46 Phone interview conducted with an anonymous mobile payment industry analyst in Beijing on March 14, 2019; In-person interview conducted with an anonymous non-profit organization in Shanghai on March 22, 2019.
47 2019 China Mobile Payment Development Report.

25THE MOBILE PAYMENT REVOLUTION IN CHINA: WHAT CANADIAN BUSINESSES NEED TO KNOW
ASIA PACIFIC FOUNDATION OF CANADA
This advantage gets further amplified by the fact that both of China’s
major mobile payment tools are designed to be multi-functional, all-in-
one applications. Alipay and WeChat, which started out as an e-commerce
wallet and a messaging app, respectively, have expanded to form their own
ecosystems by offering a whole range of digital services that complement and
induce users’ demand for their payment solutions. Driven by the need to chat,
shop, or even collect points for walking, users find themselves entering these
two apps from various points of access, and are very likely to stay on the same
platform as they move from one stage to another in the buying process rather
seamlessly and effortlessly. As users get accustomed to using the payment
tools, the likelihood of them accessing other functions to fulfil other aspects
of their daily needs, such as financial and health care management, also rises.
The way that these different functions interlock with each other is blending
merchants’ sales, marketing, and customer engagement efforts together.
FIGURE 3. VIRTUOUS CYCLE OF MOBILE PAYMENT TRANSACTIONS

26THE MOBILE PAYMENT REVOLUTION IN CHINA: WHAT CANADIAN BUSINESSES NEED TO KNOW
ASIA PACIFIC FOUNDATION OF CANADA
FROM CASH-FIRST TO MOBILE-FIRST: SHIFTING CONSUMER BEHAVIOUR AND EXPECTATIONS
When mobile payments were just starting to gain traction in China in 2013,
cash still accounted for 45% of the total value of consumer payments across
the country.48 The differences between using cash and using a handy device to
pay were quite substantial – apart from being able to save the hassle of giving
and taking back change, Chinese banknotes are of relatively lower values
(the largest bill in circulation is RMB100, which is worth C$19.61) and cash
users would have to carry wads of paper money around.49 Risks of receiving
counterfeit bills or losing them, for which recovery is nearly impossible,
were also greatly reduced. In addition, the improved convenience and speed
of transaction in mobile payments have prompted people to spend more
money in both online marketplaces and brick-and-mortar shops. According
to a Nielsen study, 91% of Chinese consumers surveyed indicated a greater
willingness to make purchases if Chinese mobile payment tools are available
when they travel abroad.50 To them, seeing the familiar QR code is a sign of
goodwill that the merchants understand and care about their paying habits.
In macroeconomic terms, mobile payments are boosting private consumption
and creating a positive impact on China’s transition from an investment-led
economy to a consumption-driven one. Moreover, the widespread usage of
mobile payments in China has also facilitated the emergence of a number of
new business models and innovations, in retail as well as other sectors, which
today’s digital-savvy Chinese consumers are quite open and receptive to. For
the longest time, online and offline retailers in China have been serving very
different groups of consumers, with the delivery component of e-commerce
48 Hugh Thomas, Amit Jain, and Michael Angus, The Global Journey from Cash to Cashless. New York: MasterCard Advisors, 2013. https://newsroom.mastercard.com/wp-content/uploads/2013/09/Cashless-Jour-ney_WhitePaper_FINAL.pdf.
49 Aaron Klein, Is China’s New Payment System the Future? Washington D.C.: The Brookings Institution, 2019. https://www.brookings.edu/research/is-chinas-new-payment-system-the-future/.
50 Outbound Chinese Tourism and Consumption Trends: 2017 Survey. Shanghai: Nielsen Consumer Finance Research Team, 2018. https://www.nielsen.com/wp-content/uploads/sites/3/2019/05/outbound-chi-nese-tourism-and-consumption-trends.pdf.

27THE MOBILE PAYMENT REVOLUTION IN CHINA: WHAT CANADIAN BUSINESSES NEED TO KNOW
ASIA PACIFIC FOUNDATION OF CANADA
probably being the closest form of an O2O experience. The boundary has been
significantly blurred in recent years, however, as digital payments allow more
transactions to be conducted remotely, increasing the convenience for offline
retailers to establish an equally strong online presence, and vice versa.
On the one hand, many transactions and financial activities that previously
only took place offline can now be done online. Mobile payment users can skip
the lines with the option to pay utility bills, purchase wealth management
products, or even complete the entire grocery-shopping journey virtually
on mobile.51 The payment tools also help a number of unmanned services –
ranging from self-service convenience stores to “scan to order” and “scan to
pay” restaurants – to thrive. As a result, Chinese consumers have become more
impatient in the sense that they expect seamless transactions wherever they
shop, with well-integrated steps and minimal movements across different
platforms.
On the other hand, merchants who have traditionally sold in the virtual
space have found ways to seamlessly combine their online agility with offline
operations. The concept of “new retail,” proposed by Alibaba’s founder, Jack
Ma, and embodied by his supermarket chain Freshippo (known as Hema
Xiansheng in Chinese), is all about using data technology to enable the
integration of online, offline, and logistics components of the retail business.
The goal is to offer a more digitized and personalized experience to the ever-
more-complicated Chinese customers today. At physical stores like Freshippo,
Chinese urbanites are no stranger to going through a hybrid of both offline and
online steps to complete their shopping journey, in which payment apps and
QR codes forge the link. Mobile payment providers are now striving to get to
the next level of making payments truly hardware-independent and “mobile”
by testing out unconscious payment solutions and bio-recognition payment
technologies, such as facial recognition, in a number of scenarios.
51 Wealth management products in China usually refer to uninsured financial products with fixed return rates and set maturity dates. While wealth management products are traditionally sold by banks and other financial institutions, recent internet wealth management platforms launched by tech firms in partnership with fund companies are quickly gaining traction.
28THE MOBILE PAYMENT REVOLUTION IN CHINA: WHAT CANADIAN BUSINESSES NEED TO KNOW
ASIA PACIFIC FOUNDATION OF CANADA
IMPLICATIONS FOR FINANCIAL DEEPENING AND INCLUSIONConsumers in China nowadays have become far more financially literate than
even a decade ago, with mobile payments driving the democratization of
financial services, both in breadth and in depth. Being relatively inexpensive
and easy to use compared with other forms of non-cash payments, mobile
payment is an immensely powerful tool when it comes to improving financial
inclusion in the less developed rural areas of China. In these places, people
traditionally have difficulty accessing bank services and lines of credit. As
digital infrastructure expands, the use of mobile payments quickly became
many people’s hurdle-free entry point to participate in consuming, selling, and
other forms of economic activity. This in part explains why mobile payments in
China’s hinterlands are more popular than any other forms of digital payments
– of the provinces in which mobile payment users account for more than 90%
of all Alipay users, all 11 of them are located in the central and western parts
of China.52 In fact, the acceptance rates for mobile payment in townships and
villages are growing faster than in cities, albeit still at lower absolute levels.53
In terms of the depth of financial knowledge, the culture of saving is
traditionally very strong in China, and average consumers used to manage
their financial assets through only a limited number of ways – most commonly
by depositing them in bank accounts with ultra-low interest rates and by
investing in the highly volatile stock market. The introduction of wealth
management products as a value-added service on mobile payment platforms,
led by Yu’e Bao (which literally means “leftover treasure”) launched by Ant
Financial, dramatically transformed the way mobile payment users manage
their money, and at the same time further encouraged the use of the payment
tools themselves. In contrast to traditional money market funds, which
normally have high minimum investment thresholds for participation, users
of China’s mobile financial platforms now find it a lot easier to access financial
services. For instance, they can use the money they already have in their
52 Third-Party Mobile Payment User Research Report for the First Half of 2018.
53 2019 China Mobile Payment Development Report; According to a study conducted by Analysys, 15.4% and 43.7% of mobile payment users in China lived in “super first-tier cities” (defined as mega cities Beijing, Shanghai, Guangzhou, and Shenzhen) and “first-tier cities” (defined as provincial capitals and cities in the coastal areas that are relatively well developed and have substantial business activities), respectively, in 2017. See Thematic Analysis of China’s Mobile Payment Market 2018 (中国移动支付市场专题分析2018, English title translated by the author). Beijing: Analysys, 2019. https://www.analysys.cn/article/detail/20019084.

29THE MOBILE PAYMENT REVOLUTION IN CHINA: WHAT CANADIAN BUSINESSES NEED TO KNOW
ASIA PACIFIC FOUNDATION OF CANADA
e-wallets and enter the market with as little as a RMB1 (C$0.20) investment.54
The behemoth assets of these small users combined make it feasible for the
service providers to run the program. These online financial products offer the
population an in-between combination of risk and return, compared to the two
aforementioned options almost at the extreme ends.55 As a result, people in
China, especially the younger crowd, have become more conscious about how
to manage and invest their money through a channel that is also closely tied
with their daily spending.
THE ROLE OF MILLENNIALS AND GENERATION ZYoung Chinese consumers today are more influential in leading trends,
including the ascent of mobile payments, in their society than their
predecessors were. People born in 1978 and later make up the majority of
mobile payments users in China – 82% according to the Payment and Clearing
Association of China, with the under-30 group, which consists of some
millennials and all Generation Z,56 alone accounting for 54%.57 The “digital
natives” of China today wield enormous purchasing power; consumers 35
and younger are poised to contribute US$2.1T (C$2.72T) worth of purchases
in 2021,58 and 69% of the growth in urban consumption in the 2016-2021
period, according to Boston Consulting Group’s projection.59 Compared to their
parents’ generation, the younger Chinese consumers are in general much more
optimistic about their earnings prospects and are more willing to borrow to
spend. This mentality drives demand for consumer credit tools, another type
of financial service that is offered through many mobile payment platforms.
Ant Financial’s Huabei (which means “just spend”), and later Jiebei (means
“just borrow”), in the Alipay app function like a virtual credit card and a
microloan program, respectively. They utilize the Sesame Credit score derived
54 Kapron and Meertens, 2017.
55 “In Fintech, China Shows the Way,” The Economist, February 25, 2017, https://www.economist.com/finance-and-economics/2017/02/25/in-fintech-china-shows-the-way.
56 For the purpose of this report, millennials, or “Generation Y,” are defined as people who were born be-tween 1980 and 1994; “Generation Z” is defined as the demographic cohort born between 1995 and 2009, following the millennials.
57 2018 Research Report on Mobile Payment Users (2018年移动支付用户调研报告). Beijing: Payment and Clearing Association of China, 2018. http://m.mpaypass.com.cn/news/201812/27094816.html.
58 US$1 = C$1.2957, see https://www.bankofcanada.ca/rates/exchange/annual-average-exchange-rates/.
59 Jeff Walters et al., Five Profiles That Explain China’s Consumer Economy. Hong Kong: Boston Consulting Group, 2017. https://www.bcg.com/en-ca/publications/2017/globalization-accelerating-growth-consum-er-products-five-profiles-that-explain-chinas-consumer-economy.aspx.
30THE MOBILE PAYMENT REVOLUTION IN CHINA: WHAT CANADIAN BUSINESSES NEED TO KNOW
ASIA PACIFIC FOUNDATION OF CANADA
from data on the mobile payment platform such as the user’s financial history
and fulfilment of contractual obligations – which in itself also helps establish
a credit scoring system previously next to non-existent in China – to issue
loans to consumers.60 By early 2018, this consumer lending reached RMB600B
(C$117.66B), surpassing the country’s second largest bank in that aspect.61
At the same time, having a powerful young mobile payment user segment
also means that the service providers are more compelled than other payment
operators to constantly innovate and optimize their products. Members of
generations Y and Z in China, while readily embracing digital innovations,
are also more conscious about protecting their personal information and
privacy than preceding generations.62 Their high standards for the quality and
resilience of technology-based services are an important driving force that
keeps Chinese mobile payment operators vigilant and ahead of the curve.
GOVERNMENT AND REGULATORY APPROACHESSimilar to its attitude toward the internet economy at large, the Chinese
government, as highlighted by several interviewees, has been in general
supportive of non-state-owned tech companies leading the recent fintech
innovations, including development of the mobile payment sector. So far,
policy and regulatory steps on this front have been taken cautiously to let
the sector grow, first by giving ample room for experimentations and the
generation of new models. That being said, since security and risk control
are of paramount importance in financial services, the Chinese central bank
made sure that barrier of entry into the industry was set high from the very
beginning. Thus, it put in place a licensing system with stringent capital and
ownership requirements, fostering what could be called a fairly centralized
60 The Sesame Credit scoring and loyalty program is a third-party-operated system that is separate from the national Social Credit System currently under development by the Chinese central government, and Alibaba asserts that Sesame Credit data will not be shared with the government or any other third parties without us-ers’ consent. Nevertheless, the two programs share some similarities in terms of operational mechanism, and Ant Financial is one of the technological partners in the Social Credit System project. In terms of its applica-tions, Sesame Credit has been working with the Supreme People’s Court of China on enforcement measures against debtors. A number of countries, including Canada, Singapore, and Japan, are also accepting Sesame Credit scores as proof of financial standing when reviewing visa applications from Chinese nationals.
61 “Ant Financial Consumer Lending Reaches $95 Billion,” Bloomberg, March 12, 2018, https://www.bloomberg.com/news/articles/2018-03-12/ant-financial-consumer-lending-is-said-to-reach-95-billion.
62 Lam, 2018; Phone interview conducted with an anonymous mobile payment industry analyst in Beijing on March 14, 2019; In-person interview conducted with an anonymous academic in Shanghai on March 20, 2019.
31THE MOBILE PAYMENT REVOLUTION IN CHINA: WHAT CANADIAN BUSINESSES NEED TO KNOW
ASIA PACIFIC FOUNDATION OF CANADA
ecosystem.63 Meanwhile, various levels of government in China – users of
mobile payments themselves – see mobile payment tools as a convenient entry
point for people to access government and public services online. They are
actively looking to leverage these platforms to digitize and more effectively
carry out their work.
Since 2017, there has been a tightening of regulations as the industry grew
in scale, and potential problems and risks began to gradually emerge. One
most influential new policy effort, known as the “delinking” (Duanzhilian
in Chinese), was put in force with the aim of reducing mismanagement and
misusage of the over RMB1T (C$196.1B) prepaid reserves, which third-party
payment companies could in the past hold temporarily in accounts at their
own banking institutions and generate a good amount of interest.64 One cost
of this risk reduction and prudency was that mobile payment service providers
who used to profit from the interest earnings lost one of their main sources
of revenue and investment funding, as well as their bargaining power against
their respective partnering banks. In addition, new rules, such as the cap on
users’ daily maximum transaction values, were put in place to prevent fraud
and protect customers.
SECURITY AND PRIVACY CONCERNSConsumers in China are largely won over by the benefits of mobile payments
and are relatively less concerned with protecting their privacy on mobile
platforms, compared to consumers in many developed countries. However,
this is gradually changing as a generational shift and better education raise
awareness of these issues, but also because the mobile payment industry
has grown so much that data privacy and cybersecurity breaches can be
catastrophic in this nearly RMB300T ecosystem, where these payment tools
have been overwhelmingly adopted.
63 Administrative Measures for the Payment Services Provided by Non-Financial Institutions (非金融机构支付服务管理办法, English title translated by the author). Beijing: People's Bank of China, 2010. http://www.gov.cn/flfg/2010-06/21/content_1632796.htm; Yichen Zhu and Sarah Hui Li, “A Hangzhou Story: The Development of China's Mobile Payment Revolution,” Singapore: Lee Kuan Yew School of Public Policy at the National University of Singapore, 2018. https://lkyspp.nus.edu.sg/docs/default-source/case-studies/a-hangzhou-story.pdf?sfvrsn=2bb6690a_2.
64 The delinking policy requires third-party payment institutions to deposit the prepaid funds they get from the customers – starting from approximately 20% of those funds in October 2016 and incrementally increasing to 100% in January 2019 – into designated, interest-free accounts at the central bank. See Peng Chen and Di Fu, “Depositing 100% Prepaid Funds: Payment Institutions Say Goodbye to Easy Cash (备付金100%交存 支付机构告别躺着赚钱, English title translated by the author),” Xinhua, July 3, 2018, http://www.xinhuanet.com/fortune/2018-07/03/c_1123069544_2.htm.
32THE MOBILE PAYMENT REVOLUTION IN CHINA: WHAT CANADIAN BUSINESSES NEED TO KNOW
ASIA PACIFIC FOUNDATION OF CANADA
By far, China’s mobile payment service providers and regulatory parties have
been quite successful in managing risks and threats. For their part, users in
general recognize major third-party payment service operators as trusted
parties for managing their money and information, with almost similar
confidence to what they have in the banks, if not more.65 Alibaba, for instance,
has been investing heavily in the research and development of technology
solutions (approximately C$8.4M in 2015) to safeguard users’ data and
personal information.66 With its fifth-generation artificial-intelligence-powered
risk-control engine AlphaRisk, Alipay managed to lower its fraud loss rate to
5 in 10 million – laudable given that the leading third-party digital payment
operator in other markets maintains a much higher rate of 2 in 1,000.67 Both
Alipay and WeChat Pay have recently worked with the police to launch the
“deferred settlement” option to better prevent financial losses due to error or
fraud.68
On the flip side, Chinese mobile payment systems’ reliance on QR code
technologies for conducting transactions is arguably the most common source
of security risks to date. Compared to near-field communication devices, QR
codes are easy to adopt but also easy to forge. Research conducted by UnionPay
underscored malicious scanning or unidentified QR codes as one of the major
high-risk behaviours when using mobile payments, and the probability of
it leading to actual financial losses is higher compared with other types of
security concerns.69 For instance, fraudsters may replace merchants’ fund-
collecting QR codes with their own code, linked to their mobile wallets. It
can happen without being noticed if the merchant does not pay attention to
the QR code used (QR codes are highly similar in design) or does not check
payment confirmations, and can result in serious financial losses from time
to time. To address this problem, the big two mobile payment operators are
65 Yuan Yang, 2018.
66 Zhu and Li, 2018.
67 Mengyao Chen, “Account Security Protects Over 400 Million, Financial Security Education Reaches 100 Million: Alipay (支付宝:账户安全保障已覆盖超4亿人、金融安全教育已触达1亿人, English title translated by the author),” Xinhua, September 25, 2018, http://www.xinhuanet.com/tech/2018-09/25/c_1123480337.htm.
68 “Enabling This Function on WeChat and Alipay Will Allow You to Withdraw Money Transfer: Police (警方提醒:微信、支付宝开通这功能,遇到诈骗能撤回转账, English title translated by the author),” Sina Finance, July 17, 2019, https://t.cj.sina.com.cn/articles/view/2288064900/8861198402000nbrx?from=tech.
69 2018 Mobile Internet Payment Security Survey Report (2018 移动支付安全大调查分析报告, English title translated by the author). Shanghai: China UnionPay, 2019. http://m.mpaypass.com.cn/Down-load/201901/23111754.html.
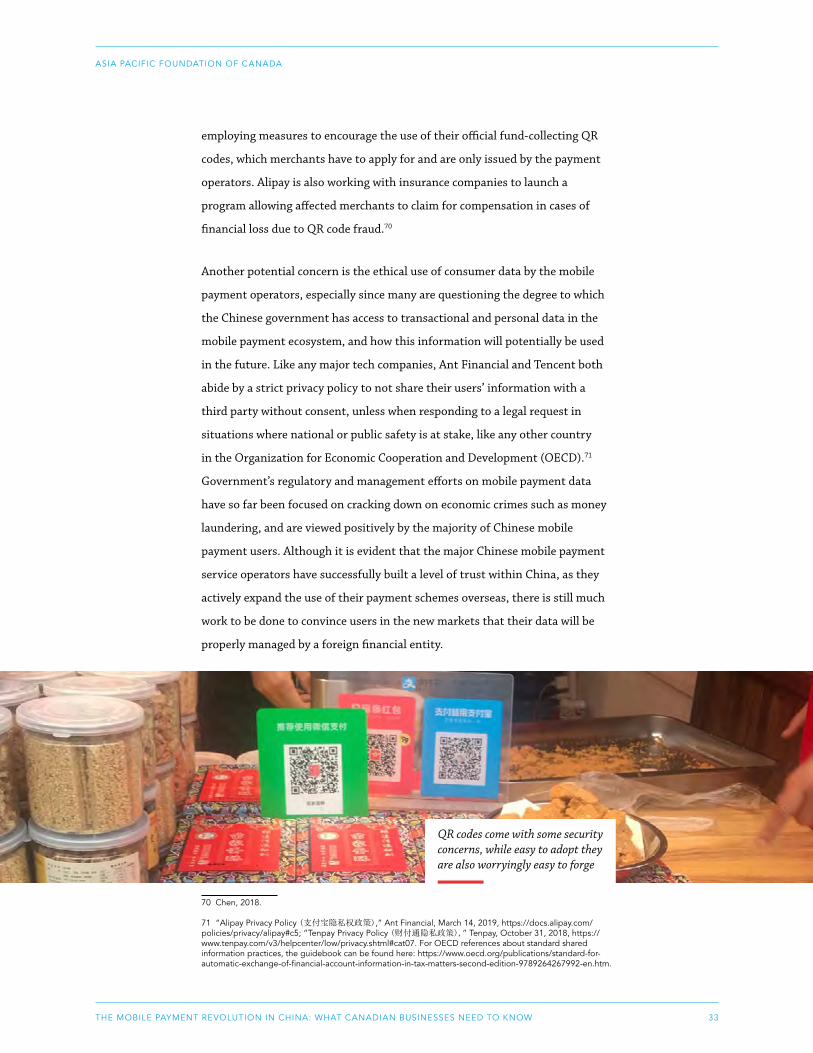
33THE MOBILE PAYMENT REVOLUTION IN CHINA: WHAT CANADIAN BUSINESSES NEED TO KNOW
ASIA PACIFIC FOUNDATION OF CANADA
employing measures to encourage the use of their official fund-collecting QR
codes, which merchants have to apply for and are only issued by the payment
operators. Alipay is also working with insurance companies to launch a
program allowing affected merchants to claim for compensation in cases of
financial loss due to QR code fraud.70
Another potential concern is the ethical use of consumer data by the mobile
payment operators, especially since many are questioning the degree to which
the Chinese government has access to transactional and personal data in the
mobile payment ecosystem, and how this information will potentially be used
in the future. Like any major tech companies, Ant Financial and Tencent both
abide by a strict privacy policy to not share their users’ information with a
third party without consent, unless when responding to a legal request in
situations where national or public safety is at stake, like any other country
in the Organization for Economic Cooperation and Development (OECD).71
Government’s regulatory and management efforts on mobile payment data
have so far been focused on cracking down on economic crimes such as money
laundering, and are viewed positively by the majority of Chinese mobile
payment users. Although it is evident that the major Chinese mobile payment
service operators have successfully built a level of trust within China, as they
actively expand the use of their payment schemes overseas, there is still much
work to be done to convince users in the new markets that their data will be
properly managed by a foreign financial entity.
70 Chen, 2018.
71 “Alipay Privacy Policy (支付宝隐私权政策),” Ant Financial, March 14, 2019, https://docs.alipay.com/policies/privacy/alipay#c5; “Tenpay Privacy Policy (财付通隐私政策),” Tenpay, October 31, 2018, https://www.tenpay.com/v3/helpcenter/low/privacy.shtml#cat07. For OECD references about standard shared information practices, the guidebook can be found here: https://www.oecd.org/publications/standard-for-automatic-exchange-of-financial-account-information-in-tax-matters-second-edition-9789264267992-en.htm.
QR codes come with some security concerns, while easy to adopt they are also worryingly easy to forge

34THE MOBILE PAYMENT REVOLUTION IN CHINA: WHAT CANADIAN BUSINESSES NEED TO KNOW
ASIA PACIFIC FOUNDATION OF CANADA
DEALING WITH CHINESE MOBILE PAYMENTS AS CANADIAN BUSINESSES
As the domestic market becomes increasingly saturated and mobile adoption
rates start to slow down, major Chinese mobile payment operators have been
trying hard since 2017 to promote this mode of payment and their products to
a broader audience outside of mainland China, with the hope of replicating the
success story on the international stage. Mobile payment leaders like Alipay,
WeChat Pay, and UnionPay have seen some results in expanding their presence
beyond the Chinese border, and they are now accepted in some 50 countries
and regions. However, due to the highly complex nature of financial and data
regulations in different jurisdictions, as well as users’ unfamiliarity and other
concerns, consumer usage of Chinese mobile payment tools outside of China is
more or less limited to outbound Chinese tourists and Chinese diasporas, and
they have not really been able to penetrate in the local communities.
The experience of subscribing to Chinese mobile payment services as
individuals living outside of mainland China is far from being frictionless
and can dissuade many from adopting them. Without meeting the real-name
authentication and bank-related requirements, usage of the tools will be
limited. Most Chinese mobile payment platforms, including Alipay and WeChat
Pay, require customers to link their account to either a valid ID or a card issued
by a bank located in mainland China, or likely both, to be able to access all
payment features. For Alipay, users are technically allowed to use Chinese
residential IDs, foreign passports, or the “mainland travel permits” (for Hong
Kong, Macau, and Taiwan residents) as the identification document, yet users
who do not have Chinese IDs on file will not be able to purchase Alipay’s wealth
management products (i.e., Yu’e Bao and Zhaocai Bao).72 WeChat, on the other
hand, is only permitted to provide its payment services to users registered
in mainland China, Hong Kong SAR, South Africa, and Malaysia (i.e., to
72 “Procedure for Activating Financial Management Services (理财开通流程),” Alipay Services Center, ac-cessed September 9, 2019, https://cshall.alipay.com/lab/help_detail.htm?help_id=257031.
35THE MOBILE PAYMENT REVOLUTION IN CHINA: WHAT CANADIAN BUSINESSES NEED TO KNOW
ASIA PACIFIC FOUNDATION OF CANADA
users with phone numbers from these regions), plus those who can link their
accounts to a Chinese mainland-issued bank card.73 Similar to Alipay, only
WeChat Pay users who have provided Chinese ID information can use certain
functions, including making payments to merchants when outside of mainland
China, purchasing wealth management products, and receiving or sending
more than RMB10,000 (C$1,961) in a single transaction.
In November 2019, the big two Chinese mobile payment operators both made
the significant move to start making their services available to international
card holders travelling to China. In Alipay’s case, it launched a separate
international version to provide short-term visitors a 90-day access to its
payment services without having to link a local mobile number or bank card;
for WeChat Pay, Tencent is partnering with Visa, MasterCard, American
Express, Discover Global Network, and JCB to start allowing users to pay with
these major international credit cards on several apps - such developments are
anticipated to give a good boost to the internationalization of Chinese mobile
payment platforms.
On the merchant side, though, Alipay and WeChat Pay are gaining traction
overseas relatively faster, especially in the brick-and-mortar shops targeting
tourists and Chinese communities, as the benefits of offering their customers’
preferred method of payment are significant enough to this type of merchant.
In 2018, Nielsen found that mobile payments accounted for an average of
32% of Chinese tourists’ overseas transactions, outstripping the use of cash
(30%) for the first time.74 When making shopping decisions, tourists from
China also seem to place greater weight on the modes of payment accepted
by local merchants – equally important as discounts and prices – as compared
to tourists from other countries.75 Among visitors to the United States and/
or Canada last year, 61% used mobile payments.76 Other than familiarity
and habit, using mobile payments abroad, whenever they are available, is
73 “Why Can't I Access the WeChat Pay?,” WeChat Help Center, accessed September 9, 2019, https://help.wechat.com/cgi-bin/micromsg-bin/oshelpcenter?t=help_center/topic_detail&opcode=2&plat=3&lang=en&id=150821aqi3y2150821bmjfqb&Channel=helpcenter
74 Perspectives from Merchants and Consumers: 2018 Trends for Mobile Payment in Chinese Outbound Tourism. Shanghai: Nielsen Consumer Finance Research Team, 2018.
75 Outbound Chinese Tourism and Consumption Trends: 2017 Survey.
76 Perspectives from Merchants and Consumers: 2018 Trends for Mobile Payment in Chinese Outbound Tourism.
36THE MOBILE PAYMENT REVOLUTION IN CHINA: WHAT CANADIAN BUSINESSES NEED TO KNOW
ASIA PACIFIC FOUNDATION OF CANADA
particularly convenient for Chinese customers since the in-app currency
conversion based on real-time exchange rates means they can pay in Chinese
yuan and the merchant receives payment in the local currency, removing the
hassle and the potential foreign exchange loss of using cash or credit.
With Chinese consumers taking 150 million outbound trips and spending
approximately C$156B overseas in 2018 alone, it is in fact a key global
expansion strategy of the Chinese mobile payment giants to follow
the footsteps of outbound Chinese tourists to extend their influence
internationally.77 In the most frequently visited destinations – including
Canada – major Chinese mobile payment platforms tend to be more co-
operative than competitive, working toward a shared goal of making this mode
of payment widely available. In most cases, you will see a merchant offering
WeChat Pay alongside Alipay. In Canada, they authorize a number of common
partnering intermediaries, known as independent software vendors, to operate
as payment solution providers and third-party fund-settlement agencies.
This way, Canadian merchants who are thinking about incorporating Chinese
mobile payment schemes in their home market are able to deal directly with
locally registered and complying institutions, and not be bounded by the
limitations of trying to access the Chinese payment platforms from abroad.
The Canadian payment partners, many of which are financial technology
firms themselves, offer business clients a number of options for integrating
mobile payments, including website-embedded and in-app payments online, as
well as smart POS terminals and QR code stickers offline. Many of them also
invest considerable time and effort in educating their potential clients on the
revenue-raising and marketing potential of mobile payment tools, such as the
opportunities to take part in promotional campaigns with Alipay and WeChat
Pay.78 Cadillac Fairview’s shopping malls in major Canadian cities and outdoor
clothing brand Arc'teryx were among the earliest Canadian retailers to have
integrated Chinese mobile payment systems and have been a step ahead when
it comes to serving Chinese customers coming from afar.
77 “Big Data Report on Chinese Outbound Tourism for 2018 Released (《2018年中国游客出境游大数据报告》出炉, English title translated by the author),” Travel Weekly China, March 14, 2019, https://www.travel-weekly-china.com/73800; 2019 China Mobile Payment Development Report.
78 In-person and phone interviews conducted with anonymous industry representatives in Vancouver on May 2, 2019 and June 17, 2019.
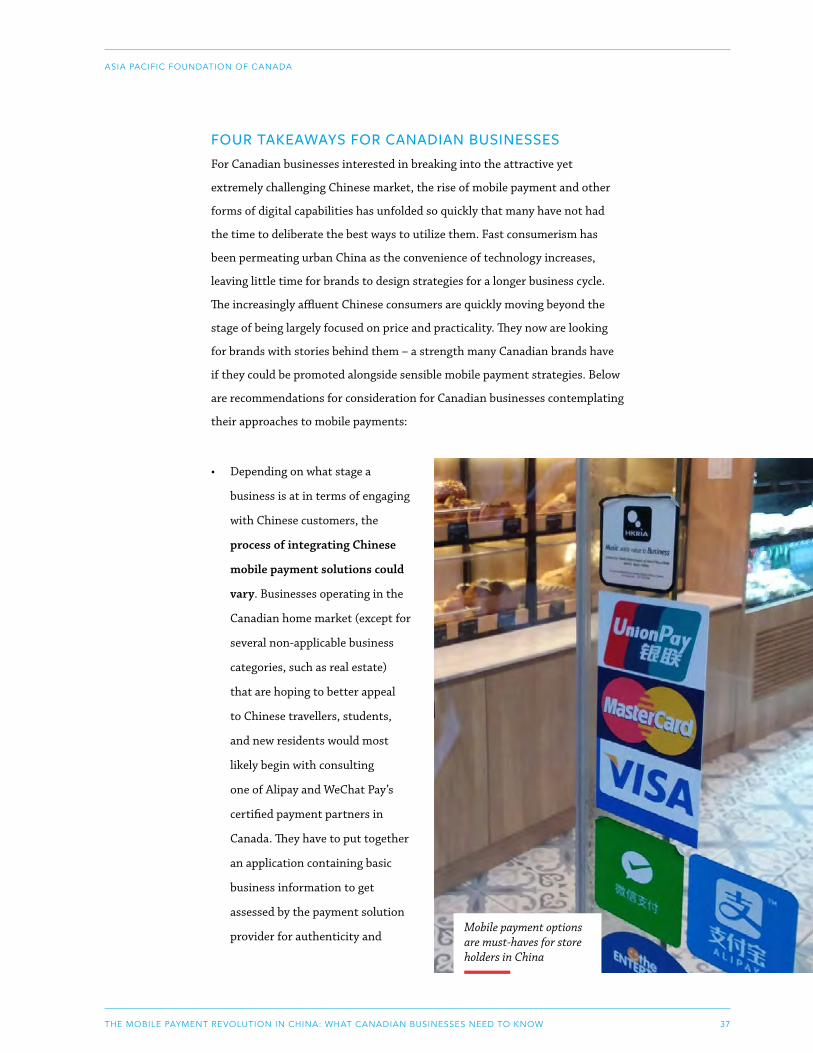
37THE MOBILE PAYMENT REVOLUTION IN CHINA: WHAT CANADIAN BUSINESSES NEED TO KNOW
ASIA PACIFIC FOUNDATION OF CANADA
FOUR TAKEAWAYS FOR CANADIAN BUSINESSESFor Canadian businesses interested in breaking into the attractive yet
extremely challenging Chinese market, the rise of mobile payment and other
forms of digital capabilities has unfolded so quickly that many have not had
the time to deliberate the best ways to utilize them. Fast consumerism has
been permeating urban China as the convenience of technology increases,
leaving little time for brands to design strategies for a longer business cycle.
The increasingly affluent Chinese consumers are quickly moving beyond the
stage of being largely focused on price and practicality. They now are looking
for brands with stories behind them – a strength many Canadian brands have
if they could be promoted alongside sensible mobile payment strategies. Below
are recommendations for consideration for Canadian businesses contemplating
their approaches to mobile payments:
• Depending on what stage a
business is at in terms of engaging
with Chinese customers, the
process of integrating Chinese
mobile payment solutions could
vary. Businesses operating in the
Canadian home market (except for
several non-applicable business
categories, such as real estate)
that are hoping to better appeal
to Chinese travellers, students,
and new residents would most
likely begin with consulting
one of Alipay and WeChat Pay’s
certified payment partners in
Canada. They have to put together
an application containing basic
business information to get
assessed by the payment solution
provider for authenticity and Mobile payment options are must-haves for store holders in China
38THE MOBILE PAYMENT REVOLUTION IN CHINA: WHAT CANADIAN BUSINESSES NEED TO KNOW
ASIA PACIFIC FOUNDATION OF CANADA
level of risk.79 For those aiming to have their products sold to Chinese
customers through cross-border e-commerce channels, the most popular
online marketplaces will already have either Alipay or WeChat Pay, or both,
embedded in the checkout system.80 If you are to go one step further and
operate a physical store in China, mobile payment becomes a must rather
than an option to consider. For small and medium-sized merchants, it is all
the more important to stand on an equal footing with the franchises – who
already accept mobile payments – from the very beginning.
• Offering mobile payments to your customers does not have a one-size-
fits-all strategy. Given the variety of tools and services merchants can
make use of when adopting mobile payment schemes, it is necessary to
think about what combination of applications will be the most suitable
for the nature of your business and products. Allowing the customers to
“scan to order” from an embedded digital menu so that billing is processed
seamlessly on the same mobile payment platform can be nice at fast food
restaurants. But for businesses for which human-to-human interactions
and personalized services are the key selling points, keeping a larger part
of that exchange of information offline is likely a more reasonable “less is
more” approach. Customizing your strategy to find the right mix of your
own selling process and the use of technology is crucial to the overall
success of your day-to-day operations.
• Leverage the high-quality traffic coming from your mobile payment
transactions. The ability to track customer behaviour and to conduct
precision marketing enabled by mobile payments is quite unprecedented,
and it offers a great opportunity for merchants to revamp their business
model and operations to become more digitized and data-driven.
Customers that forge a connection with the merchant by making an actual
purchase, rather than through shallower interactions in the forms of social
media and newsletter subscriptions, bring with them more accurate and
detailed information on their purchasing behaviours, and will likely have
79 Phone interviews conducted with anonymous industry representatives in Vancouver on April 30, 2019 and June 17, 2019.
80 For more information, see An Introduction to E-commerce in China (2017 edition). Ottawa: Trade Com-missioner Service of Global Affairs Canada, 2017.
39THE MOBILE PAYMENT REVOLUTION IN CHINA: WHAT CANADIAN BUSINESSES NEED TO KNOW
ASIA PACIFIC FOUNDATION OF CANADA
a stronger sense of attachment to the brand. Being able to know precisely
which groups to target, with the help of payment-associated data and
analysis, means that you have a much better chance of retaining them than
trying to identify potential customers in the sea of shoppers.
• Before replicating strategies that have worked in other places, think
through whether it would be compatible with a mobile-first market.
Many of your local competitors in China have already dived deep into
the art of using this all-in-one marketing, sales, and communications
channel enabled by mobile payments; new rules and business models
have emerged in the Chinese consumer market with the popularization
of mobile payments and the formation of an entire ecosystem behind
it, creating the need to reinvent operation and strategic thinking. In
this context, it becomes all the more important for Canadian businesses
entering the Chinese market to take a holistic approach mindful of the
local consumption habits, culture, and regulatory environment – meaning
that they should invest in local expertise to master interlocked innovations
such as mobile payments, social commerce, and O2O channels. Canadian
companies could also play a positive role in advocating for streamlining
mobile payment usage in cross-border contexts to reduce existing barriers
to trade, to greater benefit all the parties involved.
40THE MOBILE PAYMENT REVOLUTION IN CHINA: WHAT CANADIAN BUSINESSES NEED TO KNOW
ASIA PACIFIC FOUNDATION OF CANADA
CASE ONE: GUIZHOU GOES DEEPER INTO THE MOBILE PAYMENT REVOLUTION
While residents in China’s largest metropolitan areas may view mobile
payment through the lens of convenience for expediting a variety of daily
transaction needs, to many living in the country’s hinterland, mobile payment
is their first – if not their only – access to non-cash payments. In 2017,
Guizhou Province in southwest China tied for first place with central Shanxi
Province in Alipay’s ranking of user dependency on its mobile payment tool. In
these two provinces, 92% of all Alipay transactions during the year were done
on the mobile end, rather than on desktop PCs, outnumbering the already-high
national average of 82% in that year.81
Guizhou is located in a mountainous, landlocked region and remained one of
China’s least developed provinces for decades. Just at the time when massive
transport infrastructure projects began to unlock its economic potential, the
central government made a policy commitment in 2016 to establish the first
National Big Data Comprehensive Pilot Area in Guizhou and turn it into the
country’s “big-data hub.” Being built from scratch, Guizhou’s digital economy
has been growing faster than that of other provinces, and the big data sector
alone now accounts for over 20% of the provincial GDP growth.82 Signs
of a vibrant digital industry are frequently seen in urban areas and newly
developed districts in the form of innovation clusters, smart shopping malls
and supermarkets, data-powered logistics services, cross-border e-commerce
centres, and of course omnipresent QR codes that allow people to “scan to
access” and “scan to pay.”
Against the backdrop of a rapidly expanding digital economy, mobile payment
is arguably one of its most tangible and relatable aspects to local residents’
81 Yining Ding, “Alipay Reveals Nationwide User Habits for 2017,” SHINE, January 2, 2018, https://www.shine.cn/biz/tech/1801028539/.
82 Xinyu Tan, “Big Data Driving Digital Economy Boom in Guizhou,” China Daily, June 24, 2019, http://www.chinadaily.com.cn/a/201906/24/WS5d1099a9a3103dbf14329ed2.html.
41THE MOBILE PAYMENT REVOLUTION IN CHINA: WHAT CANADIAN BUSINESSES NEED TO KNOW
ASIA PACIFIC FOUNDATION OF CANADA
daily life. With a relatively large proportion of the population living under the
poverty line, governments in Guizhou were quick to leverage mobile payments
and other fintech tools to improve financial inclusion. One of capital city
Guiyang’s “Ten Practical Projects” in 2018 was to advance smart governance,
including the promotion of convenient modes of payment.83 In 2017, the city
was designated by Alipay as its fifth “cashless city” (and the first in southwest
China), which was followed by a series of joint projects between Ant Financial
and the municipal government launched to expand coverage of Alipay services.
The spread of mobile payment solutions in Guiyang, though, is never just a
repeated version of what has already happened in more developed regions
of China. While Alipay and WeChat Pay still dominate the game – especially
in the areas of food, beverage, and general stores – Guizhou’s indigenous
app GZTPay (or Guizhoutong, which literally means “the pass of Guizhou” in
Mandarin) gained a foothold in the local market by first focusing on certain
areas of specialization. Unlike in many first-tier cities where users would more
often “scan to pay” in the subway systems, the provincial capital has only one
subway line so far and buses remain the most commonly used form of public
transit. To suit this local context, GZTPay launched digital bus passes as one
of its very first functions and focused on really making it work. With a few
simple steps, users can register and obtain a “cloud bus pass” in the app, which
can be topped up with several mobile wallet and online banking options. The
funds are instantly ready to use, and perks such as free transfers were offered
to encourage residents to sign up. Within a year, coverage of the bus pass
quickly expanded to 70% of bus routes in the province’s nine major cities and
prefectures above county level.84 The app now has over 2.5 million registered
users, with nearly 80% of them – or 2 million users – activating the bus pass
function within it.85
83 “Proposed Ten Practical Projects of the Municipal Party Committee and Municipal Government of Gui-yang for 2018 (2018年市委、市政府为民办“十件实事” 拟办项目, English title translated by the author),” The People’s Government of Guiyang, February 26, 2018, http://www.guiyang.gov.cn/zfxxgk/ghjh/gzjh/sjss/20180226/i1473756.html.
84 Jian Li, “Scan Your Phone to Ride the Bus: GZTPay’s Guiyang Cloud Bus Pass Users Exceed 1 Million (刷手机坐公交 贵阳公交云卡用户破百万大关, English title translated by the author),” Guizhou City News, January 16, 2019, http://news.gzdsw.com/gz/2019/0116/100949.html; In-person interview conducted with an anony-mous industry representative in Guiyang on March 26, 2019.
85 Sourced from GZTPay.
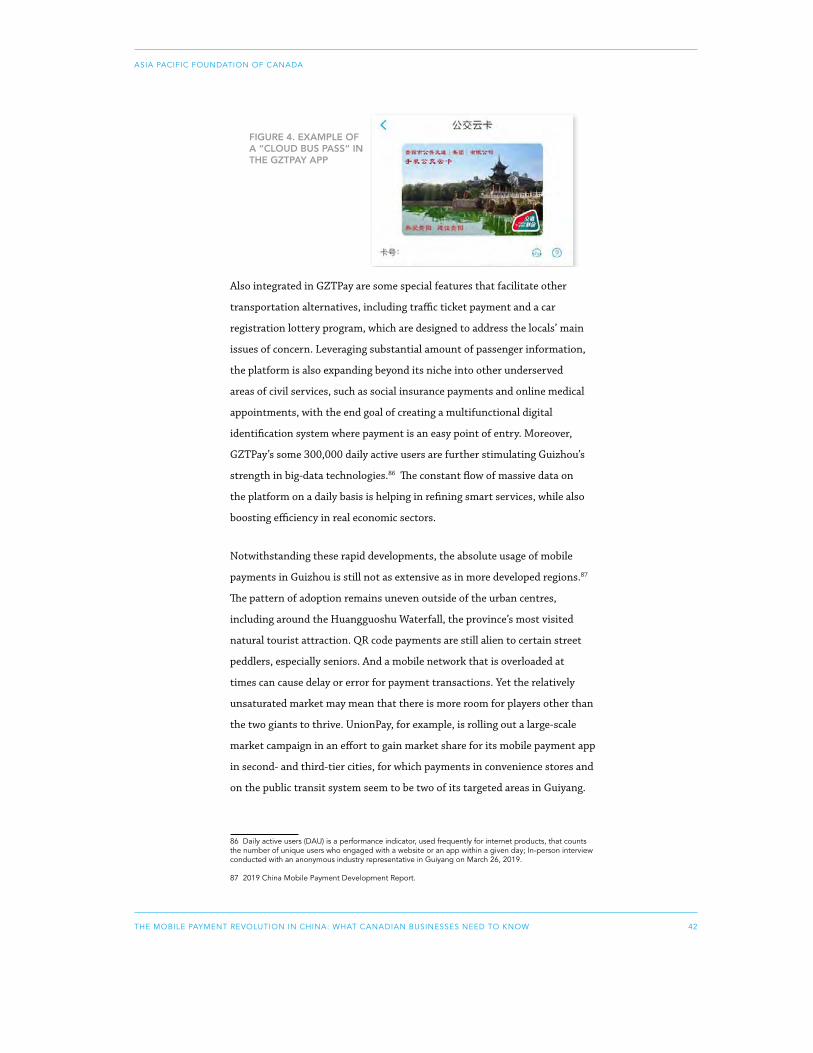
42THE MOBILE PAYMENT REVOLUTION IN CHINA: WHAT CANADIAN BUSINESSES NEED TO KNOW
ASIA PACIFIC FOUNDATION OF CANADA
Also integrated in GZTPay are some special features that facilitate other
transportation alternatives, including traffic ticket payment and a car
registration lottery program, which are designed to address the locals’ main
issues of concern. Leveraging substantial amount of passenger information,
the platform is also expanding beyond its niche into other underserved
areas of civil services, such as social insurance payments and online medical
appointments, with the end goal of creating a multifunctional digital
identification system where payment is an easy point of entry. Moreover,
GZTPay’s some 300,000 daily active users are further stimulating Guizhou’s
strength in big-data technologies.86 The constant flow of massive data on
the platform on a daily basis is helping in refining smart services, while also
boosting efficiency in real economic sectors.
Notwithstanding these rapid developments, the absolute usage of mobile
payments in Guizhou is still not as extensive as in more developed regions.87
The pattern of adoption remains uneven outside of the urban centres,
including around the Huangguoshu Waterfall, the province’s most visited
natural tourist attraction. QR code payments are still alien to certain street
peddlers, especially seniors. And a mobile network that is overloaded at
times can cause delay or error for payment transactions. Yet the relatively
unsaturated market may mean that there is more room for players other than
the two giants to thrive. UnionPay, for example, is rolling out a large-scale
market campaign in an effort to gain market share for its mobile payment app
in second- and third-tier cities, for which payments in convenience stores and
on the public transit system seem to be two of its targeted areas in Guiyang.
86 Daily active users (DAU) is a performance indicator, used frequently for internet products, that counts the number of unique users who engaged with a website or an app within a given day; In-person interview conducted with an anonymous industry representative in Guiyang on March 26, 2019.
87 2019 China Mobile Payment Development Report.
FIGURE 4. EXAMPLE OF A “CLOUD BUS PASS” IN THE GZTPAY APP

43THE MOBILE PAYMENT REVOLUTION IN CHINA: WHAT CANADIAN BUSINESSES NEED TO KNOW
ASIA PACIFIC FOUNDATION OF CANADA
CASE TWO: MOBILE PAYMENTS IN SOUTHEAST ASIA
The evolution of the Chinese mobile payment ecosystem prompted people
to ask whether this mode of payment is eventually going to gain the same
momentum elsewhere in the world. In particular, many set their sights on a
number of Southeast Asian countries where there exist similar conditions,
such as inadequate financial infrastructure with cash-reliant populations, a
burgeoning digital economy and e-commerce sector, dramatically increasing
smartphone and internet usage, as well as mobile-minded and overwhelmingly
affluent millennial consumer segments. PwC’s latest consumer insights
survey suggests that the percentage of consumers using in-store mobile
payments in Vietnam grew the most in 2018, from 37% to 61%, among all
27 economies studied.88 Moreover, 6 out of 10 markets with the highest
mobile payment adoption rates belong to the Association of Southeast Asian
Nations (ASEAN).89 In contrast to the largely duopolistic structure in China,
Southeast Asia’s mobile payment markets tend to be more competitive, with
service operators coming from very diverse backgrounds, including banking,
telecommunications, e-commerce, air transportation, ride hailing, and gaming.
Geographic proximity and demographic dividend (i.e. a relatively large
young, working-age population) in Southeast Asia also make it an important
battlefield for the Chinese tech giants – Alibaba and Tencent have already
emerged as prominent players in the region’s digital scene, to the point that
smaller local players have to align with one or the other “camp” to be able to
grow.90 Through acquiring and investing in indigenous companies, Alibaba
and Tencent hope to not just promote their payment tools, but to re-create
the kind of all-in-one platform that comprises e-commerce, logistics, and
other services to make users stay within the ecosystem – which is exactly the
strategy Ant Financial employs when working with Lazada, the region’s largest
88 Global Consumer Insights Survey 2019. New York: PricewaterhouseCoopers, 2019. https://www.pwc.com/gx/en/consumer-markets/consumer-insights-survey/2019/report.pdf.
89 Ibid.
90 Phone interview conducted with an anonymous mobile payment industry analyst in Vancouver on May 14, 2019.
44THE MOBILE PAYMENT REVOLUTION IN CHINA: WHAT CANADIAN BUSINESSES NEED TO KNOW
ASIA PACIFIC FOUNDATION OF CANADA
online shopping site.91 In fact, under its model of exporting technologies
and expertise to empower local partners – which allows for more flexibility
in calibrating areas of focus based on each local context and need – Alipay is
actively testing out localization of its payment solution in the cases of GCash
in the Philippines (for remittance), and the Touch ‘n Go eWallet in Malaysia
(for toll payments).92
To be sure, payment market conditions across Southeast Asian countries
are far from universal, creating a wide range of landscapes and thus ample
opportunities for alternative routes to be taken. With its well-built digital
infrastructure and tech-savvy consumer base, Singapore is one of the first
countries in the region to start building a cashless system as part of its Smart
Nation national initiative; since 2014, the government has invested heavy
top-down policy efforts to push for the adoption of mobile and other electronic
modes of payment.93
In contrast to the Chinese government’s approach of intentionally fostering a
centralized system with high barriers of entrance, the Singaporean government
has been very careful about not creating a monopoly by allowing as many
players as possible, so as to maximize users’ choices, encourage competition
and innovation, and avoid downside risks of market dominations.94 The
favourable regulatory environment and supposed abundance of options
have so far only generated an uptake in usage that is moderate at best, since
fragmentation has in fact created more confusion than convenience for both
merchants and consumers. Hence, the crucial appeal of mobile payments –
offering a seamless transaction experience – is missing.
91 Ibid; Ran Liu, “Alibaba and Tencent’s ‘Copy and Paste’ Game in Southeast Asia (阿里腾讯们在东南亚的复制粘贴游戏, English title translated by the author),” Huxiu, January 6, 2019, https://www.huxiu.com/arti-cle/279911.html.
92 See “Getting Started,” GCash, accessed September 10, 2019, https://www.gcash.com/get-started; and “PayDirect,” TnGDigital, accessed September 10, 2019, https://www.tngdigital.com.my/paydirect.html.
93 Ong Ye Kung, Singapore’s former Minister for Education, described electronic payment in Singapore’s context as being “associated with e-wallets or various tap-and-go payment modes” in his “E-Payments for Everyone” keynote speech delivered at the 45th Annual Dinner of the Association of Banks in Singapore on June 20, 2018. See https://www.mas.gov.sg/news/speeches/2018/epayments-for-everyone.
94 Phone interview conducted with an anonymous mobile payment industry analyst in Vancouver on May 14, 2019; Christina Soh and Dolly Leow, “A Tale of Two Ecosystems: E-payment in China and Singapore,” Nanyang Business School at the Nanyang Technological University, December 26, 2018.
45THE MOBILE PAYMENT REVOLUTION IN CHINA: WHAT CANADIAN BUSINESSES NEED TO KNOW
ASIA PACIFIC FOUNDATION OF CANADA
To address this, the Monetary Authority of Singapore (MAS) recently made a
major move by launching a unified QR code – something the Chinese central
bank is also said to be considering. This universal “SGQR code” is designed to
replace the 27 QR codes issued by different e-payment schemes that merchants
have to display to accept payments, with the aims of streamlining adoption and
improving interoperability between different platforms.95 It remains to be seen
whether such a measure will be effective in merging the country’s e-payment
space, but the real challenge may lie elsewhere – that Singaporeans are in
general quite content with the existing, traditional debit and credit payment
systems, and most likely do not view the adoption of a new payment method
as necessary or compelling.96 Lack of trust and confidence in the less familiar
payment providers is another major factor that discourages people from
going mobile, as J.D. Power finds.97 The use of cash payments, although on a
downward trend, is still preferred by the island nation’s small vendors such as
hawkers and heartland stores, who are in fact the government’s main targets in
pushing forward the cash-to-mobile transition. Given the government’s strong
resolution in promoting payment innovation and its belief that the country has
“the right ingredients,” it will be interesting to watch whether it will eventually
come up with a solution to overcome the problem of fragmentation and, most
importantly, to really succeed in driving the demand-side incentives.98
95 Irene Tham, “Universal SGQR Code for Cashless Payments, Interbank Fund Transfer System to be Opened to Non-banks,” The Straits Times, September 17, 2018, https://www.straitstimes.com/singapore/universal-sgqr-code-to-replace-multiple-qr-codes-interbank-fund-transfer-system-to-be.
96 Ploy Ten Kate, “Mobile Payments in Vietnam Fastest Growing Globally, Thailand Emerges Second in Southeast Asia,” PwC Thailand, April 30, 2019, https://www.pwc.com/th/en/press-room/press-release/2019/press-release-30-04-19-en.html.
97 “Singapore’s Path to Digital Economy Still Facing Some Roadblocks, J.D. Power Finds,” J.D. Power, July 25, 2018, https://www.jdpower.com/business/press-releases/2018-singapore-retail-banking-satisfac-tion-study.
98 Lee Hsien Loong, “National Day Rally 2017 Speech,” Singapore Prime Minister’s Office, August 20, 2017, https://www.pmo.gov.sg/Newsroom/national-day-rally-2017.
46THE MOBILE PAYMENT REVOLUTION IN CHINA: WHAT CANADIAN BUSINESSES NEED TO KNOW
ASIA PACIFIC FOUNDATION OF CANADA
ACKNOWLEDGEMENTS
• Grace Jaramillo Interim Program Manager
• Iris Jin Program Manager, Sustainable Asia
• Charles Labrecque Research Manager
• Isaac Lo Post-Graduate Research Scholar
• Jeffrey Reeves Vice-President, Research
• Pauline Stern Program Manager, Business Asia
• Kai Valdez-Bettcher Research Specialist
• Zining Wang Program Specialist, Youth Programming and Networks
This research project and fieldwork was funded by the Asia Pacific Foundation
of Canada’s Post-Graduate Research Fellowship. I would like to express
my gratitude to my colleagues at the Foundation who provided invaluable
expertise, insight, and support that greatly assisted the research, in particular
(last names in alphabetical order):
I am immensely grateful to the many experts, analysts, and industry and
business representatives who agreed to speak with me, for sharing with me their
wisdom and experience without reservation; I am also grateful to the people
who connected me to them. In addition, I’d like to express my sincere thanks to
the Canadian Trade Commissioner Service as well as the Canada-China Business
Council for their generous help during the course of this research.
LEAD RESEARCHER AND AUTHOR Xiaoting (Maya) Liu

47THE MOBILE PAYMENT REVOLUTION IN CHINA: WHAT CANADIAN BUSINESSES NEED TO KNOW
ASIA PACIFIC FOUNDATION OF CANADA
Contact us at [email protected]
or visit us online at www.asiapacific.ca
48THE MOBILE PAYMENT REVOLUTION IN CHINA: WHAT CANADIAN BUSINESSES NEED TO KNOW
ASIA PACIFIC FOUNDATION OF CANADA
1
E-COMMERCE IN SOUTH KOREA: A CANADIAN PERSPECTIVE
REPORT PREPARED BY:
Theresa Eriksson, Luleå University of Technology, Sweden
Kristin Matheson, Luleå University of Technology, Sweden
Dr. Leyland Pitt, Professor of Marketing, Beedie School of Business, Simon Fraser University
Dr. Kirk Plangger, King’s College, London, UK
Dr. Karen Robson, University of Windsor
3
TABLE OF CONTENTS
EXECUTIVE SUMMARY
INTRODUCTION
SOUTH KOREA: THE COUNTRY, THE ECONOMY
METHODOLOGY
THE SOUTH-KOREAN E-COMMERCE CONTEXT
Customer Context
The E-commerce Shopping process
Products and Brands
Online Behaviour
Shopping Events and Timing
Main Stakeholders
Technology and Infrastructure Landscape
For Canadian Firms Contemplating E-commerce in South Korea: Marketing Considerations
FUTURE OUTLOOK
CONCLUSION
CASE STUDIES
Case Study I: Yogiyo
Case Study II: Pinkfong and Baby Shark
APPENDIX
Digital Technology in South Korea and Canada — A Comparison of Digital Device Ownership, Digital Media Consumption, and Digital Behaviour.
ABOUT THE AUTHORS
4
5
7
8
9
9
11
15
16
20
24
27
32
40
41
42
42
46
53
68
4
EXECUTIVE SUMMARY
This report focuses on e-commerce opportunities for Canadian firms in South Korea, one of the world’s most connected markets. Korea is not for the faint-hearted: consumers are very sophisticated and markets are very competitive. Nevertheless, for Canadian firms with excellent offerings and a willingness to provide excellent service, coupled with patience and an ability to build good relationships at all levels, Korea offers significant opportunities.
The report proceeds as follows: First, it provides a broad overview of the nation of South Korea with particular focus on e-commerce and online connectivity in that country. Second, it describes the methodology employed in conducting this study. Then it goes into more detail on the context of e-commerce in Korea, with particular emphasis on the Korean e-commerce customer. Following that, a simple six-step e-commerce purchasing and consumption process is outlined, and each is examined with particular reference to Korea.
Next, a section is devoted to issues surrounding products and brands in Korea, with specific reference to product categories, luxury offerings, and issues of variety and uniqueness. Online behaviour in Korea is then discussed, with specific attention given to search engines in Korea, the evolution of mobile use, social media, and social media influencers. There are a number of important days that are celebrated in Korea, all of which entail special meals and gift-giving, and these are described and summarized.
The main stakeholders in e-commerce in Korea are addressed next, and here the focus is on the main e-commerce platforms, how they operate, and what distinguishes them from each other. Business-to-business e-commerce is also considered. Then the technology and infrastructure landscape is described, with attention also given to intellectual property, consumer protection, personal information privacy, logistics, import authorization, and taxes and duties.
An important aspect of the report is a discussion of the marketing considerations facing Canadian firms contemplating e-commerce ventures in South Korea. The well-known 4 Cs, 4 Ps framework provides some guidelines and caveats to Canadian firms with regard to their e-commerce marketing strategies. There are also details of Canadian government assistance to Canadian firms thinking about e-commerce ventures in South Korea.
Two case studies of e-commerce ventures in South Korea are also presented, namely Yogiyo and Pinkfong. These ventures are described and learning points drawn from them for decision-makers contemplating entry into the Korean market or searching for other business opportunities in that country.
Finally, the results of a study that compares a large sample of Canadian consumers and their Korean counterparts are presented. Particular focus is on the use of electronic devices and online behaviours, including shopping habits, social media usage, and attitudes toward online privacy.
5
INTRODUCTION
South Korea is one of the world’s most connected countries, where the overwhelming majority of households have access to the internet. The country is also very urbanized and well-developed, and is highly ranked in the World Bank Logistics ranking, above other leading Asian e-commerce markets such as China, India, and Taiwan.
E-commerce is of great importance in this market. In 2017, the country had the highest level of e-commerce penetration in the Asia Pacific region (74%) and cross-border e-commerce reached US$2.0B.1 It is ranked as the third-largest e-commerce market globally, with 16% of all the country’s retail sales taking place online in the same year.2
The expansion of e-commerce has been boosted by the high internet penetration in South Korea, which is one of the world leaders in IT infrastructure and high-speed technology. Most households have access to the internet and mobile phones. South Korea also boasts the world’s highest average internet connection speed, at 24.6 Mbps.3
To successfully penetrate the South Korean market, there are several key issues that Canadian firms wishing to do business there should consider. Obviously, just as in entering any foreign market, firms need to analyze and understand the political and regulatory environment, socio-cultural norms, the economy, and the technological environment. In the case of South Korea, however, Canadian firms should be particularly alert to the following: South Korea’s population, at 51.3 million, is 1.38 times that of Canada, at 37.3 million. Moreover, the population density of South Korea (503 people per km2) is more than 120 times that of Canada.4 Whereas Canada is a very sparsely populated country, with a population concentrated in a small number of large cities along the US border, South Korea is one of the world’s most densely populated countries, with the population spread across the country in many large cities and towns. This presents considerable logistics advantages to South Korean firms operating locally; goods do not have to travel vast distances from sellers to buyers, and a greater number of smaller warehouse facilities can be operated in many cities and towns.
Second, the internet and mobile phone technology situation in South Korea is much further advanced than in Canada: networks are much faster, devices are far less expensive, and Koreans have more immediate access to the latest in device technologies because Samsung, one of the leading manufacturers, is based in South Korea. Using mobile data is expensive in both countries, each of which is in the top five most costly per gigabyte nations, along with Switzerland, the United States, and China.5 The provider market in each country is dominated by three large
1 Retrieved from: https://www.export.gov/article?id=Korea-eCommerce Accessed on July 1, 2019.
2 Retrieved from: Ecommerce Spend Per Capita – Ecommerce Foundation: Global B2C Ecommerce Report, www.ecommercefoundation.org/reports. Accessed on July 1, 2019.
3 Commonwealth of Australia and Austrade. 2017. E-Commerce in Korea: A Guide for Australian Business. Canberra, Australia.
4 Retrieved from: http://worldpopulationreview.com Accessed on July 1, 2019.
5 Retrieved from: https://www.forbes.com/sites/niallmccarthy/2019/03/05/the-cost-of-mobile-internet-around-the-world-infographic/#5aed633d226e Accessed on July 1, 2019.
6
companies. In Canada, the main players are Rogers, Bell, and Telus; in South Korea, the market is dominated by KT, LG UPlus, and SK Telecom. South Korea became the first country in Asia to launch 5G networks in March 2019.6 Predictions for when 5G will come to Canada are for late 2020.7
Canadian firms should focus on providing a convenient end-to-end online shopping process, because this is what Korean consumers are used to from local providers. For example, while most customers in Korea expect same-day delivery for the majority of their purchases, and at most three days, in March this year, e-commerce companies and retail giants rolled out a “dawn delivery” service, which allows orders to be placed as late as midnight, with deliveries guaranteed to arrive by 7 a.m. the next day. Daily necessities and perishable fresh food products are popular items for dawn delivery.8 Canadian firms can also expect to spend effort and money on advertising. Interestingly, while total advertising spending in Korea (at US$12.55B) was higher than that for Canada (at US$10.76B), advertising per capita numbers are roughly the same for the two countries. However, for Canadian firms this means that reaching significant consumer markets through advertising is challenging and expensive, since the average Korean consumer is already being exposed to US$236 in advertising spending per year.9 Cutting through this clutter will require carefully targeted campaigns and astute media selection.
Korean consumers are very tech-savvy and have access to the best technologies – the nation ranked second to Iceland on the 2017 Information and Communication Technology (ICT) index, whereas Canada only ranked 29th.10 Korean consumers are familiar with how to shop online, and they expect high-end user interfaces, convenient payment methods, and fast delivery. Korean consumers (55%)11 also spend far more time on average than their Canadian counterparts (12%)12 on public transit. This has many implications – public transit users are more likely to engage with their mobile devices than other commuters; they will be more exposed to messages in stations and on platforms; and they will be more likely to shop in smaller quantities unless they order online because they will personally have to carry items home. Finally, an interesting difference between South Korea and North America in general is the large numbers of older consumers in Korea who are online and actively shopping. More than five million Koreans aged 60 and over are surfing the web, over half of the age group, mostly for instant messaging. Meanwhile, only 30% of their US peers aged 65 and over own a smartphone,13 and the numbers for Canada are 69% of 55- to 64-year-olds and 18% of those 75 years or older.14
6 Retrieved from: https://asia.nikkei.com/Business/Companies/South-Korea-moves-up-5G-mobile-network-launch-to-March Accessed on July 1, 2019.
7 Retrieved from: https://www.lifewire.com/5g-canada-4582444 Accessed on July 1, 2019.
8 Retrieved from: https://www.straitstimes.com/asia/east-asia/dawn-delivery-in-south-korea-takes-retail-industry-by-storm Accessed on July 1, 2019.
9 Retrieved from: https://www.statista.com/statistics/273736/advertising-expenditure-in-the-worlds-largest-ad-markets/ Accessed on July 1, 2019. 10 Retrieved from: https://www.itu.int/net4/ITU-D/idi/2017/index.html Accessed on July 1, 2019. 11 Retrieved from: https://www.worldatlas.com/articles/countries-with-the-highest-public-transit-use.html Accessed on July 1, 2019. 12 Retrieved from: https://www12.statcan.gc.ca/nhs-enm/2011/as-sa/99-012-x/99-012-x2011003_1-eng.cfm Accessed on July 1, 2019.13 Retrieved from: https://www.forbes.com/sites/elaineramirez/2017/01/31/nearly-100-of-households-in-south-korea-now-have-internet-access-thanks-to-seniors/#58bf3e2b5572 Accessed on July 1, 2019. 14 Retrieved from: https://mobilesyrup.com/2017/11/14/76-percent-canadians-owned-smartphone-2016-statscan-survey/ Accessed on July 1, 2019.
7
SOUTH KOREA: THE COUNTRY, THE ECONOMY
The Republic of Korea, commonly referred to as South Korea (or often, simply, Korea) is a mountainous country and home to over 51 million people. The capital, Seoul, is the country’s largest city, with a growing population of over 10 million. The country is a developed one and is governed as a constitutional democracy. It ranks high on the Human Development Index, which is calculated based on factors such as income, life expectancy, and education. South Korea is one of the world’s most densely populated countries. The majority of the population tends to be in or close to the larger cities.
South Korea is a wealthy economy, with a total gross domestic product (GDP) of over US$1.4T. It is a leader in industry and technology, and its economy continues to grow, with a GDP per capita currently at just above US$27,000 and expected to reach over US$31,000 by 2021. It is the 14th-richest country in the world, according to the World Bank’s rankings.
The Korean economy was closed off to foreign firms until the mid-1990s, when regulatory changes opened up access to foreign firms. Today, the country’s economy and markets are dominated by export-oriented companies. South Korea exported US$4.72B of goods to Canada in 2017, leveraging the free trade agreement between the two countries that began in 2015. Over the last 10 years, South Korean exports globally have been on the rise and include items such as cars, electronic goods, and petroleum products.
South Korea is a highly digital environment and a global leader in technology; therefore, it is no surprise that e-commerce is becoming a part of everyday life. Great access to broadband, high connectivity speed, high mobile phone penetration rates, and the emergence of new online platforms and networks all support internet usage and online shopping behaviour.
8
METHODOLOGY
This report has been created with the practitioner in mind, to satisfy the objective of providing Canadian firms with an understanding of e-commerce in South Korea.
The research has been conducted based on a theoretical approach through a lens of providing practical and accessible insights. The methodology is based on multiple sources of data, including secondary data, significant literature reviews, data analysis, statistics, and case studies.
The researchers have synthesized literature on consumption behaviour, patterns, trends, and consumer tastes and preferences. Statistical analysis has been conducted using data professionally collected by a large market research organization as part of its annual research program. The sample includes 1,001 individuals from Canada and 500 individuals from South Korea. Both samples aimed to be as representative as possible.
Additionally, the researchers have identified two case studies to give insights about the challenges and opportunities that face firms desiring to operate, or already operating, in South Korea. These have been crafted using secondary data to provide the readers of the report with examples of what has happened in real cases in the recent past.
9
THE SOUTH KOREAN E-COMMERCE CONTEXT
Being one of the world’s most connected countries, e-commerce is a key component of overall consumer behaviour in South Korea. The growth has been consistent over the years. In 2016, approximately 44% of Koreans participated in cross-border online shopping.15 In 2017, the country had the highest level of e-commerce penetration in the Asia Pacific region (74%), and cross-border e-commerce reached US$2.0B.16 The majority of the cross-border purchases are made from the United States (48%), followed by China (15%) and Japan 13%).17 Domestic online purchases in Korea, including purchases on PCs and mobile phones, reached US$69.2B in 2017, up from US$55.9B in 2016. By December 2017, domestic electronic commerce made up more than one-quarter of Korea’s total retail industry.18
Customers in South Korea spend a great proportion of their disposable income on online shopping. Over 30% of South Koreans spend more than half of their total monthly disposable income on internet purchases.19 By late 2017 there were an estimated 30.5 million e-commerce users in South Korea, with an additional 1.33 million users expected to be shopping online by 2021.20 Four years from now, these almost 32 million e-commerce users are expected to spend an annual average of over US$1,000 per person online.21
Customer Context
Well-Informed and Technologically Skilled Customers with High Expectations
South Korea takes education more seriously than most of the world’s nations. The Organisation for Economic Co-operation and Development (OECD) ranked the country second only to Singapore in the 2014 national rankings of students’ math and science scores, with average student scores exceeding 540.22 As a result, South Korea has one of the world’s most-educated labour forces; 85% of adults aged 25-64 have completed upper secondary education, higher
15 Retrieved from: http://www.agr.gc.ca/resources/prod/Internet-Internet/MISB-DGSIM/ATS-SEA/PDF/6831-eng.pdf Accessed on July 1, 2019.16 Retrieved from: https://www.export.gov/article?id=Korea-eCommerce Accessed on July 1, 2019. 17 Retrieved from: International Post Corporation (2019). Cross-Border E-Commerce Shopper Survey 2018, downloaded from: https://www.ipc.be/services/markets-and-regulations/cross-border-shopper-survey Accessed on July 1, 2019.18 Retrieved from: https://www.export.gov/article?id=Korea-eCommerce Accessed on July 1, 2019.19 Retrieved from: https://www.forbes.com/sites/elaineramirez/2017/01/31/nearly-100-of-households-in-south-korea-now-have-internet-access-thanks-to-seniors/#58bf3e2b5572 Accessed on July 1, 2019.20 Retrieved from: https://www.eshopworld.com/blog/south-korea-ecommerce-insights-2017/ Accessed on July 1, 2019.21 Retrieved from: https://www.eshopworld.com/blog/south-korea-ecommerce-insights-2017/ Accessed on July 1, 2019.22 Retrieved from: https://www.theatlantic.com/education/archive/2016/11/south-korean-seniors-have-been-preparing-for-today-since-kindergarten/508031/ Accessed on July 1, 2019.
10
than the OECD average of 76%.23 In our studied sample, the South Korean sample was more educated compared to respondents in Canada (75.2% graduating university versus only 41.0%). Koreans have strong technological skills and are ranked with Canadians as among the world’s most entrepreneurial citizens.24 They are among the world’s top credit card users and expect their online purchasing process to be efficient. There is a high interest in quality and luxury goods,25 and environmental and health claims carry weight in the decision process. They use online resources for the full purchasing process, from exploration to post-purchase reviews.
South Koreans dedicate time to researching and purchasing the best products they can find. Price is important but it generally comes second to high quality. They dedicate time to discovering new products and sharing their interests with others.26
Highly Connected Customers
By the end of 2017 South Korea had an internet penetration rate of 95.1%, one of the highest in the world. By comparison, Canada’s internet penetration rate is estimated by the Canadian Internet Registration Authority (CIRA) to be around 90%.27 All Korean age groups between 10 and 59 show internet usage of 99.9%, and even those between 60 and 69 show a usage of 88.8%. In 2018, Korean consumers in the 10-19 age group spent the most time online, at an average of 189 minutes a day, and this decreases slightly in a linear fashion over the age groups, although even those over 50 spent an average of 131 minutes per day on the internet. In similar fashion, 24.5% of Koreans spent 7-14 hours online per week, while 24.9% spent 14-21 hours, 25.8% spent 21-35 hours, and 8.7% spent 35 hours or more.28
Health and Wellness Conscious
South Koreans have high concern for personal health. This is evidenced by a steady increase in the number of health-care service providers per capita (doctors and nurses) and number of hospital beds per capita, and a life expectancy at birth of 82.4 years in 2016,29 almost identical to Canada’s at 82.3 years.30 The obesity rate in South Korea increased slightly over the 10 years from 2008 to 2017, when it stood at 34.1%; this is still almost half that of Canada, which was around 64% in 2017. 31
South Korea and Canada face different, although equally serious environmental problems. South Korea is confronted with air pollution in large cities; acid rain; water pollution from the discharge
23 Retrieved from: https://web.archive.org/web/20160608105147/http://www.oecdbetterlifeindex.org/countries/korea Accessed on July 1, 2019. 24 Retrieved from: https://www.usnews.com/news/best-countries/entrepreneurship-rankings Accessed on July 1, 2019.25 Retrieved from: https://cpp-luxury.com/south-koreas-growing-dominance-as-a-luxury-market/ Accessed on July 1, 2019.26 Retrieved from: https://en.portal.santandertrade.com/analyse-markets/south-korea/reaching-the-consumers Accessed on July 1, 2019.27 Retrieved from: https://www.thepeterboroughexaminer.com/living-story/8201308-canadian-internet-usage-is-at-90-/ Accessed on July 1, 2019.28 Retrieved from: https://www-statista-com.proxy.lib.sfu.ca/statistics/984795/south-korea-time-used-for-mobile-internet-weekdays-by-age/ Accessed on July 1, 2019.29 Retrieved from: https://www-statista-com.proxy.lib.sfu.ca/study/61197/health-care-in-south-korea/ Accessed on July 1, 2019.30 Retrieved from: https://yourhealthsystem.cihi.ca/hsp/inbrief?lang=en#!/indicators/011/life-expectancy-at-birth/;mapC1;mapLevel2;/ Accessed on July 1, 2019.31 Retrieved from: https://www.canada.ca/en/public-health/services/publications/healthy-living/obesity-excess-weight-rates-canadian-adults.html Accessed on July 1, 2019.
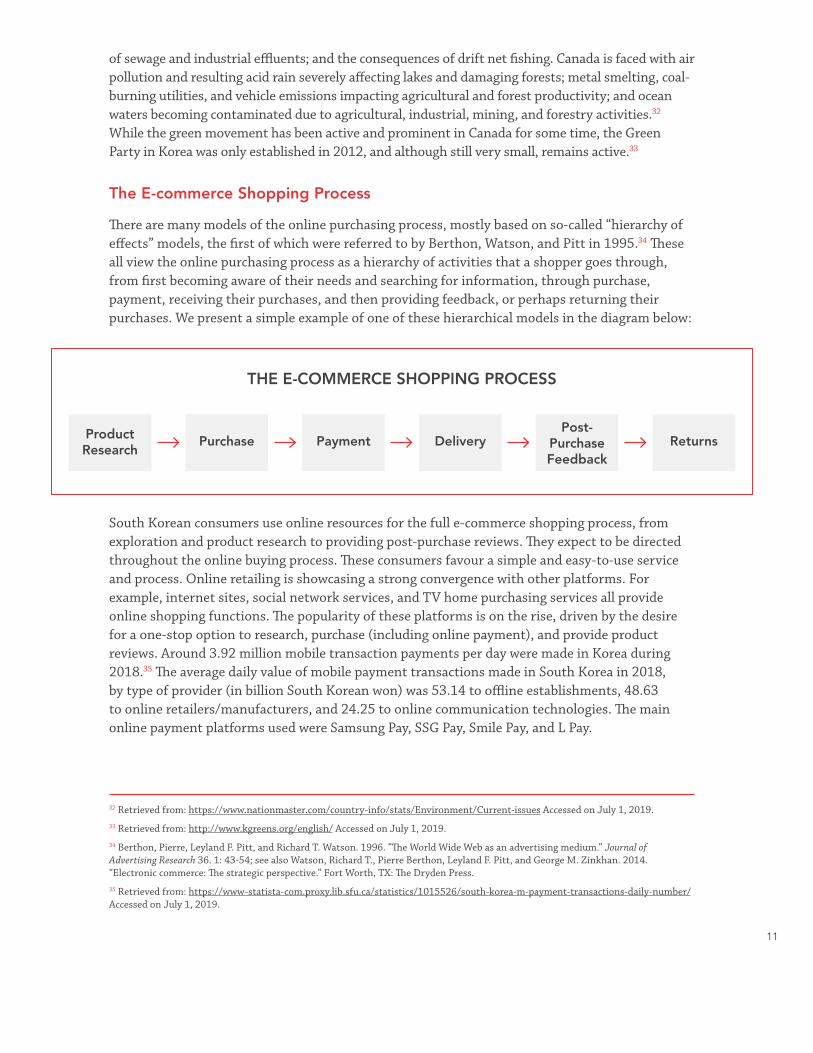
11
of sewage and industrial effluents; and the consequences of drift net fishing. Canada is faced with air pollution and resulting acid rain severely affecting lakes and damaging forests; metal smelting, coal-burning utilities, and vehicle emissions impacting agricultural and forest productivity; and ocean waters becoming contaminated due to agricultural, industrial, mining, and forestry activities.32 While the green movement has been active and prominent in Canada for some time, the Green Party in Korea was only established in 2012, and although still very small, remains active.33
The E-commerce Shopping Process
There are many models of the online purchasing process, mostly based on so-called “hierarchy of effects” models, the first of which were referred to by Berthon, Watson, and Pitt in 1995.34 These all view the online purchasing process as a hierarchy of activities that a shopper goes through, from first becoming aware of their needs and searching for information, through purchase, payment, receiving their purchases, and then providing feedback, or perhaps returning their purchases. We present a simple example of one of these hierarchical models in the diagram below:
South Korean consumers use online resources for the full e-commerce shopping process, from exploration and product research to providing post-purchase reviews. They expect to be directed throughout the online buying process. These consumers favour a simple and easy-to-use service and process. Online retailing is showcasing a strong convergence with other platforms. For example, internet sites, social network services, and TV home purchasing services all provide online shopping functions. The popularity of these platforms is on the rise, driven by the desire for a one-stop option to research, purchase (including online payment), and provide product reviews. Around 3.92 million mobile transaction payments per day were made in Korea during 2018.35 The average daily value of mobile payment transactions made in South Korea in 2018, by type of provider (in billion South Korean won) was 53.14 to offline establishments, 48.63 to online retailers/manufacturers, and 24.25 to online communication technologies. The main online payment platforms used were Samsung Pay, SSG Pay, Smile Pay, and L Pay.
32 Retrieved from: https://www.nationmaster.com/country-info/stats/Environment/Current-issues Accessed on July 1, 2019.33 Retrieved from: http://www.kgreens.org/english/ Accessed on July 1, 2019.34 Berthon, Pierre, Leyland F. Pitt, and Richard T. Watson. 1996. “The World Wide Web as an advertising medium.” Journal of Advertising Research 36. 1: 43-54; see also Watson, Richard T., Pierre Berthon, Leyland F. Pitt, and George M. Zinkhan. 2014. “Electronic commerce: The strategic perspective.” Fort Worth, TX: The Dryden Press.35 Retrieved from: https://www-statista-com.proxy.lib.sfu.ca/statistics/1015526/south-korea-m-payment-transactions-daily-number/ Accessed on July 1, 2019.
THE E-COMMERCE SHOPPING PROCESS
Product Research
Purchase Payment DeliveryPost-
Purchase Feedback
Returns
12
Product Research
Online shoppers in South Korea tend to search and buy online, with 45% of consumers following this path. A smaller percentage will search in store but buy online (14%), and 11% will search online but buy in store.36 Some media attention was given in Korea around 2010 to the reviews of so-called “Twinsumers,”37 shopping behaviour that essentially means that one purchases products based on the reviews of others that people feel are similar to them in preferences and values (their online “twin”). More recently, this phenomenon has become less significant as consumers turn more to major online influencers, for example, the Kardashians in North America and Jungkook in Korea, who has more than 6.2 million followers on Instagram.
Purchase
When considering which online provider to use, research in 2014 indicated that South Korean consumers contemplate a variety of factors, including the availability of product details and photos (23%), consumer or peer reviews (21%), product selection (18%), and retailer’s reputation (10%), among other factors such as delivery speed, return policy, pick-up location options, and convenience, as well as the number of delivery options available.38
In the same study,39 South Korean online shoppers were least satisfied with their ability to live chat with retailers to ask questions, create an account, and store their information on the platform for future use, their ability to find or contact a customer service representative, and their ability to find an online retailer’s return policy.
South Korean customers cross-border shop online primarily in three ways:
1. Purchasing directly from an organization’s website (~38%);
2. Using deputy purchasing agents who purchase the products for consumers and then have them shipped to Korea (~33%); and
3. Using local e-commerce websites that assist foreign vendors (~29%).
Consumers will use deputy purchasing agencies when there are barriers to online cross-border shopping, such as language considerations or concerns with the transaction process. For a commission fee, the agency will handle any inquiries and issues that may arise. The typical commission fee for this service is 10% to 20% based on the price of the goods.40 For products in high demand, these agencies can sometimes be seen as distributors in South Korea. Large deputy purchasing agents include Poombuy, Wizwid, Narrshop, and Njoy New York.
36 Retrieved from: https://www-statista-com.proxy.lib.sfu.ca/study/29755/e-commerce-in-south-korea-statista-dossier/ Accessed on July 1, 2019.37 Retrieved from: http://www.koreatimes.co.kr/www/news/biz/2016/10/123_78894.html Accessed on July 1, 2019 38 Retrieved from: https://www-statista-com.proxy.lib.sfu.ca/study/29755/e-commerce-in-south-korea-statista-dossier/ Accessed on July 1, 2019. 39 Retrieved from: Statista 2014: https://www.statista.com/statistics/441685/consumer-satisfaction-search-browsing-experience-online-korea/ Accessed on July 1, 2019. 40 Commonwealth of Australia and Austrade. 2017. E-Commerce in Korea: A Guide for Australian Business. Canberra, Australia.

13
Payment
With regard to card use, it is important to distinguish between credit cards and debit cards as plastic cards consumers use for payment. As far back as 2011, South Korea became the most plastic-oriented country in the world, with consumers there using plastic – a credit or debit card – on average 129.7 times per year, compared to Canada at 89.6 times per year. Canadians have a higher penetration of credit cards than Koreans, with 83% of Canadian individuals owning at least one credit card in 2017 versus 64% of Koreans.41 In 2017, Korean households had the highest average number of cards, at 6.7 cards per household.42 According to the Korean Consumer Agency (KCA), “By 2016 only about 20% of all payments in Korea were being made with cash – among the lowest in the world – according to the Bank of Korea. The central bank of Korea is aiming for the country to go cashless by 2020, beginning with plans to phase out coins so as to reduce the cost of minting them. It has already cut back on issuing paper money.”43 The KCA is a government organization, which was founded on the guiding principle of protecting consumer rights and interests, promoting rational consumption, and contributing to the development of the nation’s economy.44
In South Korea, 34% of consumers use social media payment gateways such as Kakao Pay and Naver Pay when shopping online on their mobile device.45 An additional 29% prefer using a bank payment app, such as Samsung Card and mpocket.46
One of South Korea’s biggest e-commerce platforms, WeMakePrice, also known as Wemepu, is integrating cryptocurrencies such as Bitcoin, Ethereum, and Litecoin in collaboration with Bithumb, the nation’s biggest cryptocurrency exchange. The collaboration will allow WeMakePrice to accept cryptocurrencies as part of the existing payment platform, OneThePay. Users will not have to register with Bithumb in order to pay for goods and services as the application will be fully integrated into their current infrastructure. However, while cryptocurrencies are a hot topic, caution is recommended because recently the government has placed very strict regulations on the trading of cryptocurrencies by citizens and foreigners alike.
Delivery
When consumers make a purchase online, the products may be delivered via a delivery agency office. In South Korea, the number of specialized package-posting companies is increasing. Prior to 2009, South Koreans living abroad, international students, and small enterprises provided this service. Since then, Malltail has opened distribution centres in the United States and has begun providing this service, focusing at first on Korean customers. Malltail describes itself as the leading parcel-forwarding service in Asia, with over a million users. Its infrastructure enables it to reach customers over many thousands of miles and provides a parcel-forwarding service
41 Retrieved from: https://www-statista-com.proxy.lib.sfu.ca/statistics/675371/ownership-of-credit-cards-globally-by-country/ Accessed on July 1, 2019. 42 Retrieved from: https://www-statista-com.proxy.lib.sfu.ca/statistics/650858/credit-cards-per-household-by-country/ Accessed on July 1, 2019. 43 Retrieved from: https://www.straitstimes.com/asia/card-not-cash-is-king-in-south-korea Accessed on July 1, 2019.44 Retrieved from: http://english.kca.go.kr/index.do Accessed on July 1, 2019.45 Retrieved from: https://www.statista.com/statistics/653865/south-korea-leading-types-of-mobile-payment-services/ Accessed on July 1, 2019.46 Retrieved from: https://www.statista.com/statistics/653865/south-korea-leading-types-of-mobile-payment-services/ Accessed on July 1, 2019.
14
where packages are received from one party and delivered to the customer’s door. In addition to this basic forwarding service, Malltail provides various services to overcome the shortcomings of international online shopping markets.47
Nowadays Malltail provides services and solutions for consumers shopping in other countries as well, including the United States, Japan, China, and Germany. The company provides customers with a unique local address that they can use to complete shipping information on e-commerce sites outside of their home nation. Malltail will also inspect the merchandise purchased by its customers, and when necessary, repackage it appropriately for international air shipping, and then ensure that the customer’s purchases are delivered to their door. In addition, it provides the service of completing customs declarations and handling import duties.48
The other main delivery agencies that now offer international shipping services to South Korea include iporter, Ehanex, New York Girls, Postbay, and Ohmyzip. These organizations do business in the United States, the United Kingdom, Germany, China, and Japan and often strategically place their warehouses and distribution centres in cities with little or no government taxes.
In the Korean context it is important to differentiate between delivery agencies such as Malltail and deputy purchasing agencies. Malltail provides the service of giving the customer the convenience of having a local address in another country that a supplier can ship to, inspecting and repackaging the goods, and then shipping them to the customer’s door with all customs formalities being handled. A deputy purchasing agency (DPA) is a true agent in the sense that it transacts on the customer’s behalf. After instruction, the DPA then buys the product on the customer’s behalf and delivers it to the customer’s home in Korea. However , some DPAs (e.g. Poombuy and Narrshop) are also able to fulfil the functions of parcel-forwarding services.
With the growth of e-commerce, there has also been an increase in business services that support cross-border trade, such as international shipping assistance companies. For instance, Lotte Global Logistics developed an international shipping support company called iDeLiVer. These types of companies offer their customers a local shipping address or warehouse in the desired country where they can have their goods sent. The company will then deliver the order on their client’s behalf. In some cases, these support companies also offer ordering services.
Despite high expectations for logistics and delivery, price still remains a factor. Consumers are willing to wait for a product to arrive if there is a significant cost saving.49
Post-purchase – Reviews and Feedback
Koreans are very active on social media: as of January 2019, South Korea had the third-highest rate of active social media users in the world.50 South Korean consumers produce a high volume of content in the form of reviews and feedback online, providing useful information concerning products specialized to individual consumers. Consumer reviews online are a strong factor in online
47 Retrieved from: https://www.malltailusa.com/malltail Accessed on July 1, 2019. 48 Retrieved from: https://www.malltailusa.com/malltail Accessed on July 1, 2019.49 For example: https://en.portal.santandertrade.com/analyse-markets/south-korea/reaching-the-consumers; https://import-export.societegenerale.fr/en/country/south-korea/market-consumer Accessed on: July 1, 2019.50 Retrieved from: https://www.statista.com/statistics/282846/regular-social-networking-usage-penetration-worldwide-by-country/ Accessed on July 1, 2019.
15
marketing success and are highlighted as an important element in making purchasing decisions.
Returns
It is important to keep the customer relationship strong by providing high-quality after-sales service. Like in Canada, customers generally expect a simple and flexible return policy for unused goods. According to a recent study, 8% of online consumers in South Korea consider a retailer’s return policy when comparison shopping. In addition, the same study found that 29% of online shoppers in South Korea are satisfied with the ability to find a retailer’s return policy during the product search phase.51
Products and Brands
Product Categories
By the end of 2017, total South Korean e-commerce revenue across all product categories hit US$21.38B, and is expected to grow to US$32.6B by 2021.52 Popular products that are foreign sourced and bought from online retailers are cosmetics, food, health products and dietary supplements, apparel and footwear, and electronics. Fashion, specifically, is currently a leading product category in South Korea, accounting for US$7B market share, followed by toys, hobbies, and do-it-yourself (decorating, repairing, or making things for the home oneself), which generate US$4.9B in sales. Travel and reservation services through Korean e-commerce platforms are also popular. Domestic electronic commerce makes up to a quarter of South Korea’s total retail industry sales.
Cosmopolitan and Luxury Inclined Consumers
Overall, South Korean consumption behaviour mirrors other developed economies’ consumption behaviours.53 Here brand names are important, and there is a decreasing focus on only buying products made in South Korea, especially when price is a factor and non-domestic products are offered at lower prices. South Korean consumers are mindful of their spending; however, high-end luxury spending is still common.54 Indeed, management consulting firm McKinsey’s identified Korea as a major market for luxury goods as far back as 2010: “Luxury is a $4 billion industry, accounting for more than 15% of all fashion spending. It is also becoming part of the fabric of Korean life.”55 More recently it has been noted that South Korea’s fashion market makes annual sales of US$18B at current exchange rates and was expected to grow 3% in 2018 from 2017, partly
51 Retrieved from: Statista /study_id29755_e-commerce-in-south-korea-statista-dossier.pdf, p26. Accessed on July 10, 2019.52 Retrieved from: https://www.eshopworld.com/blog/south-korea-ecommerce-insights-2017/ Accessed on July 10, 2019. 53 Retrieved from: https://www-statista-com.proxy.lib.sfu.ca/statistics/348197/south-korea-ecommerce-category-sales/ Accessed on July 10, 2019. 54 Retrieved from: https://www-statista-com.proxy.lib.sfu.ca/statistics/974873/south-korea-fashion-products-direct-overseas-sales-by-country-and-region/ Accessed on July 10, 2019. 55 Among the most important sources supporting this trend: Salsberg, Brian, and Martine Jae-Eun Shin. 2010. “South Korea: Living it up in luxury.” McKinsey & Co. https://www.mckinsey.com/~/media/McKinsey/Business%20Functions/Marketing%20and%20Sales/Our%20Insights/South%20Korea%20Living%20it%20up%20in%20luxury/9-CSI_2010%20Korea%20Luxury%20Report.ashx Accessed on July 10, 2019; see also Park, Hye-Jung, Nancy J. Rabolt, and Kyung Sook Jeon. 2008. “Purchasing global luxury brands among young Korean consumers.” Journal of Fashion Marketing and Management: An International Journal 12. 2: 244-259; https://www-statista-com.proxy.lib.sfu.ca/statistics/974873/south-korea-fashion-products-direct-overseas-sales-by-country-and-region/; and https://www.export.gov/article?id=Korea-eCommerce Accessed on July 10, 2019.
16
56 Retrieved from: https://www-statista-com.proxy.lib.sfu.ca/statistics/973358/south-korea-fashion-industry-market-size/ Accessed on July 10, 2019. 57 Retrieved from: https://www.cbc.ca/life/style/the-up-and-coming-canadian-beauty-brands-that-are-going-to-be-huge-in-2019-1.4943272 Accessed on July 10, 2019. 58 Retrieved from: Statista 2018 study_id23775_internet-usage-in-south-korea-statista-dossier.pdf, p. 22 Accessed on July 10, 2019. 59 Retrieved from: https://cira.ca/factbook/domain-industry-data-and-canadian-Internet-trends/internet-use-canada Accessed on July 10, 2019. 60 Retrieved from: Statista 2018 study_id23775_internet-usage-in-south-korea-statista-dossier.pdf, p. 23 Accessed on July 10, 2019.
due to the popularity of mobile e-commerce, which accounted for US$9.6B in sales.56 Online purchases from foreign retailers are steadily increasing due to price-hunting. This is especially prevalent when less-expensive prices are found using foreign websites, even after accounting for international shipping fees and import duties.
Variety and Uniqueness
Appearance is important in South Korea. As in most developed societies, apparel and fashion items are increasingly used, especially by youth, to express their individuality in what has traditionally been a rather uniform society. One avenue to achieve this is by using foreign brands that are viewed as unique due to the limited volume available. Further, Korean beauty products are gaining ground on the international stage thanks not only to the increased international appreciation of Korean pop music, fashion, and culture, but great innovations in chemistry and bioscience. Korean beauty products are known to not only be fashionable but functional as well. While the Korean market would therefore present a tough challenge for Canadian manufacturers57 to crack, there may yet be e-commerce opportunities for those Canadian firms desiring to import beauty care products from Korea.
Online Behaviour
There are many aspects of South Korean online behaviour that are similar to those in Canada. For example, 44% of all internet users in South Korea watch videos online on a daily basis,58 slightly more than the 26% of Canadians who reported doing so in 2016.59 In the early 2000s, domestic platforms such as Naver, Tistory, and Cyworld were most popular; however, online behaviour in the country is beginning to change. In recent years, social media platforms such as YouTube and Facebook have made significant ground in Korea; however, KakaoTalk, a local instant messaging application, is equally popular.
South Korea has a blend of Korean and international search engines available. Among the most popular are Naver.com, Daum.net, Tistory.com, and Google.
The five most popular website properties in Korea in 2018 are shown and described in the table below: 60
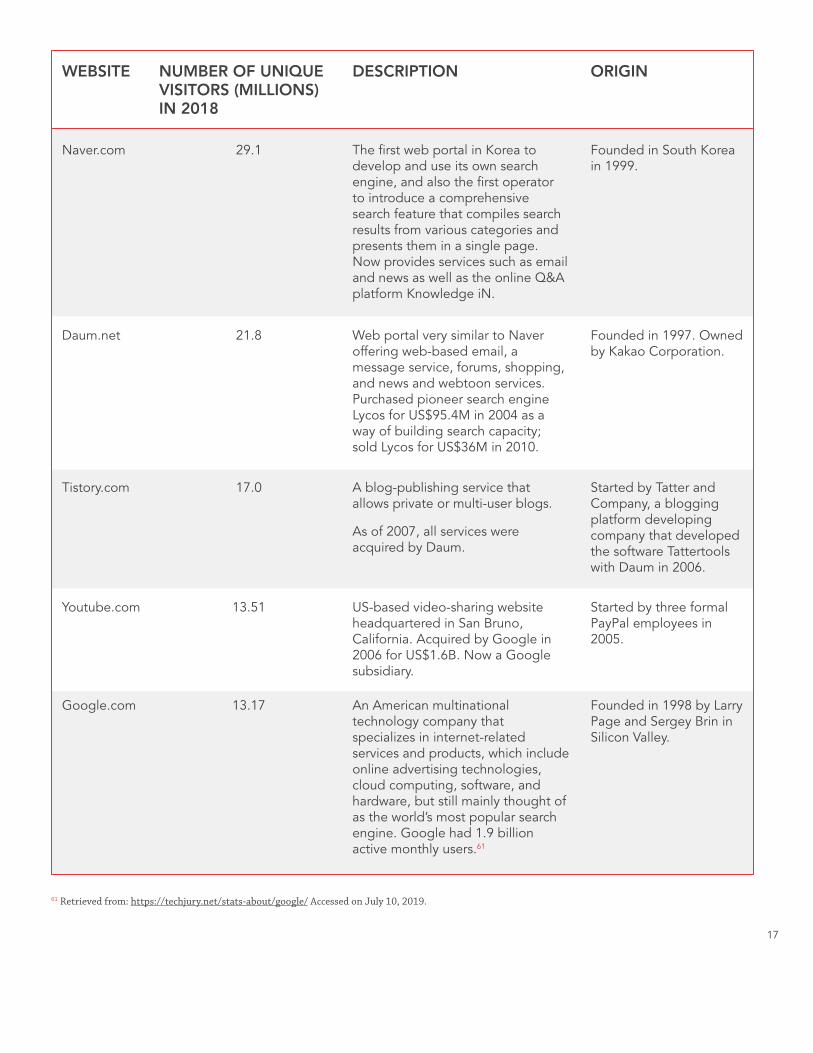
17
61 Retrieved from: https://techjury.net/stats-about/google/ Accessed on July 10, 2019.
WEBSITE
Naver.com
Daum.net
Tistory.com
Youtube.com
Google.com
29.1
21.8
17.0
13.51
13.17
The first web portal in Korea to develop and use its own search engine, and also the first operator to introduce a comprehensive search feature that compiles search results from various categories and presents them in a single page. Now provides services such as email and news as well as the online Q&A platform Knowledge iN.
Web portal very similar to Naver offering web-based email, a message service, forums, shopping, and news and webtoon services. Purchased pioneer search engine Lycos for US$95.4M in 2004 as a way of building search capacity; sold Lycos for US$36M in 2010.
A blog-publishing service that allows private or multi-user blogs.
As of 2007, all services were acquired by Daum.
US-based video-sharing website headquartered in San Bruno, California. Acquired by Google in 2006 for US$1.6B. Now a Google subsidiary.
An American multinational technology company that specializes in internet-related services and products, which include online advertising technologies, cloud computing, software, and hardware, but still mainly thought of as the world’s most popular search engine. Google had 1.9 billion active monthly users.61
Founded in South Korea in 1999.
Founded in 1997. Owned by Kakao Corporation.
Started by Tatter and Company, a blogging platform developing company that developed the software Tattertools with Daum in 2006.
Started by three formal PayPal employees in 2005.
Founded in 1998 by Larry Page and Sergey Brin in Silicon Valley.
NUMBER OF UNIQUE VISITORS (MILLIONS) IN 2018
DESCRIPTION ORIGIN
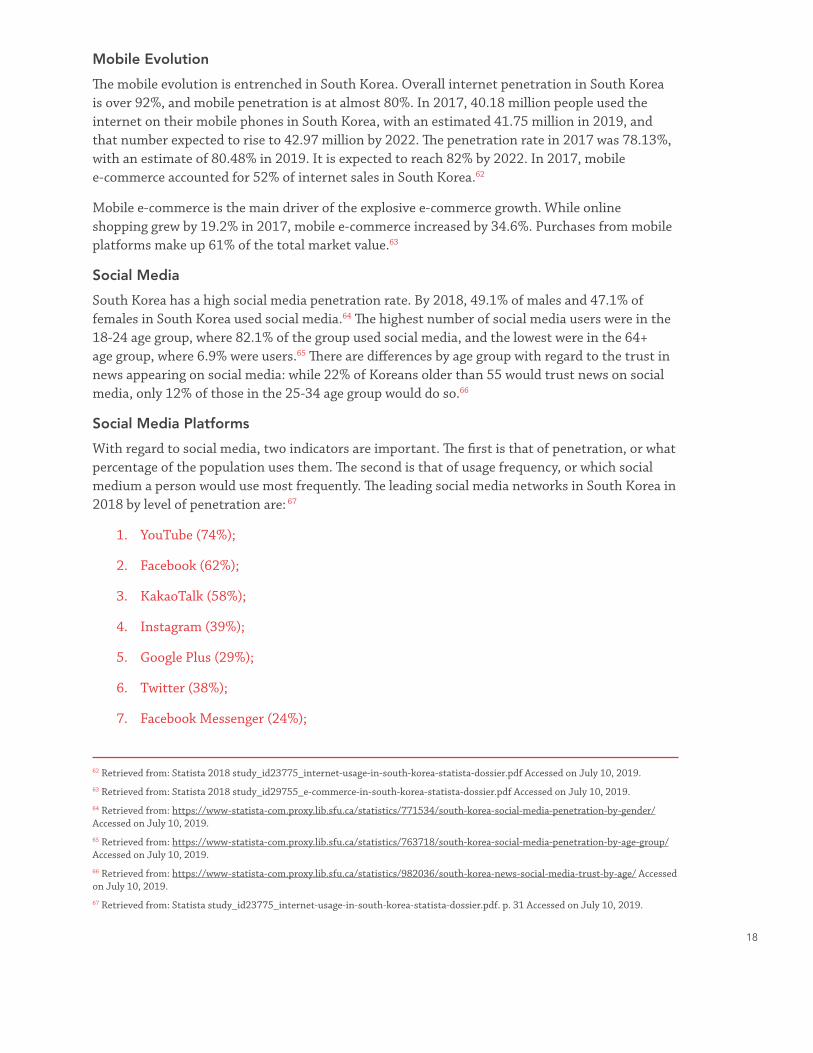
18
Mobile Evolution
The mobile evolution is entrenched in South Korea. Overall internet penetration in South Korea is over 92%, and mobile penetration is at almost 80%. In 2017, 40.18 million people used the internet on their mobile phones in South Korea, with an estimated 41.75 million in 2019, and that number expected to rise to 42.97 million by 2022. The penetration rate in 2017 was 78.13%, with an estimate of 80.48% in 2019. It is expected to reach 82% by 2022. In 2017, mobile e-commerce accounted for 52% of internet sales in South Korea.62
Mobile e-commerce is the main driver of the explosive e-commerce growth. While online shopping grew by 19.2% in 2017, mobile e-commerce increased by 34.6%. Purchases from mobile platforms make up 61% of the total market value.63
Social Media
South Korea has a high social media penetration rate. By 2018, 49.1% of males and 47.1% of females in South Korea used social media.64 The highest number of social media users were in the 18-24 age group, where 82.1% of the group used social media, and the lowest were in the 64+ age group, where 6.9% were users.65 There are differences by age group with regard to the trust in news appearing on social media: while 22% of Koreans older than 55 would trust news on social media, only 12% of those in the 25-34 age group would do so.66
Social Media Platforms
With regard to social media, two indicators are important. The first is that of penetration, or what percentage of the population uses them. The second is that of usage frequency, or which social medium a person would use most frequently. The leading social media networks in South Korea in 2018 by level of penetration are: 67
1. YouTube (74%);
2. Facebook (62%);
3. KakaoTalk (58%);
4. Instagram (39%);
5. Google Plus (29%);
6. Twitter (38%);
7. Facebook Messenger (24%);
62 Retrieved from: Statista 2018 study_id23775_internet-usage-in-south-korea-statista-dossier.pdf Accessed on July 10, 2019.63 Retrieved from: Statista 2018 study_id29755_e-commerce-in-south-korea-statista-dossier.pdf Accessed on July 10, 2019. 64 Retrieved from: https://www-statista-com.proxy.lib.sfu.ca/statistics/771534/south-korea-social-media-penetration-by-gender/ Accessed on July 10, 2019. 65 Retrieved from: https://www-statista-com.proxy.lib.sfu.ca/statistics/763718/south-korea-social-media-penetration-by-age-group/ Accessed on July 10, 2019. 66 Retrieved from: https://www-statista-com.proxy.lib.sfu.ca/statistics/982036/south-korea-news-social-media-trust-by-age/ Accessed on July 10, 2019. 67 Retrieved from: Statista study_id23775_internet-usage-in-south-korea-statista-dossier.pdf. p. 31 Accessed on July 10, 2019.

19
68 Retrieved from: https://www-statista-com.proxy.lib.sfu.ca/statistics/763748/south-korea-most-popular-social-media/ Accessed on July 10, 2019.69 Retrieved from: Statista study_id23775_internet-usage-in-south-korea-statista-dossier.pdf Accessed on July 10, 2019. 70 https://www.socialbakers.com/statistics/facebook/pages/total/south-korea/ Accessed on July 10, 2019. 71 Retrieved from: https://www.soompi.com/article/1280711wpp/instagram-korea-reveals-2018s-popular-accounts Accessed on July 10, 2019. 72 Retrieved from: https://www.instagram.com/real__pcy/?hl=en Accessed on July 10, 2019. 73 Retrieved from: https://www.instagram.com/oohsehun/?hl=en Accessed on July 10, 2019. 74 Retrieved from: https://www.instagram.com/xxxibgdrgn/?hl=en Accessed on July 10, 2019. 75 Retrieved from: https://www.instagram.com/baekhyunee_exo/?hl=en Accessed on July 10, 2019.
8. LINE (15%);
9. Skype (10%);
10. Tumbler (10%);
11. Twitch TV (8%); and
12. WeChat (7%).
In 2018, Facebook was the most popular social media platform in South Korea, with around 28.9% of survey respondents in that year stating that they used it the most frequently out of all the other social media services. The other leading social media in South Korea by frequency of use in 2018 are shown below:68
1. Facebook (28.9%);
2. Kakao Story (23.8%);
3. Instagram (17.4%);
4. Twitter (12.5%); and
5. Naver Band (12.5%).
Social Media Influencers
Fashion trends are important and influencers such as pop stars, celebrities, and actors have a strong impact on consumer preferences. As of January 2018, South Korea had approximately 43 million active social media users. In September 2017, South Korea had the highest rate of social media penetration among all Asia Pacific countries at 84%.69 Given the ongoing growth of social media networks and users in the country, influencers are an important aspect of the e-commerce landscape. Similar to North America, in South Korea, influencer marketing is growing, with 15% of consumers buying products that they have seen on social media. In 2018, Lee Minho was the leading social media influencer on Facebook, with 17.5 million fans, followed by Hi-Mart (1.7 million), PSY (10.8 million), BIGBANG (10.7 million), and 2NE1 (9.0 million).70 Instagram has also become a very relevant barometer of social trends in South Korea.71 The four Korean influencers currently with the most followers on Instagram are EXO_CY (17.9 million followers),72 Sehun (16.4 million followers),73 BIGBANG (16.2 million followers),74 and Beakhyunee (15 million followers).75
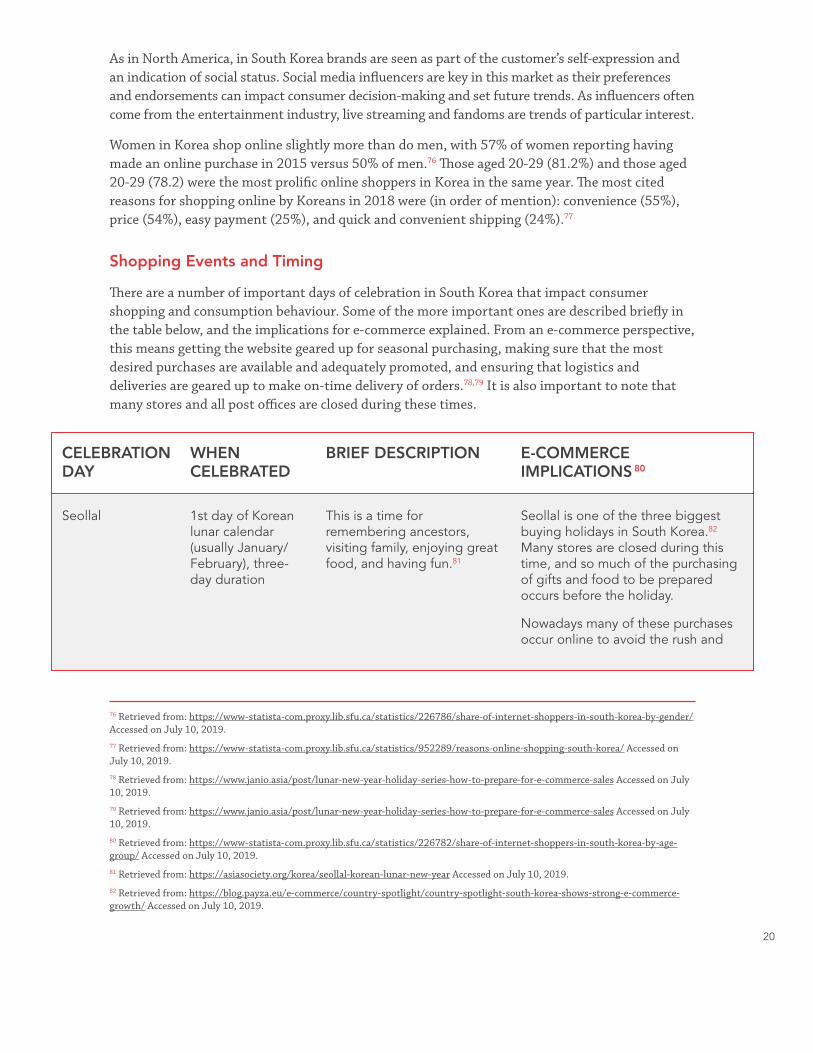
20
As in North America, in South Korea brands are seen as part of the customer’s self-expression and an indication of social status. Social media influencers are key in this market as their preferences and endorsements can impact consumer decision-making and set future trends. As influencers often come from the entertainment industry, live streaming and fandoms are trends of particular interest.
Women in Korea shop online slightly more than do men, with 57% of women reporting having made an online purchase in 2015 versus 50% of men.76 Those aged 20-29 (81.2%) and those aged 20-29 (78.2) were the most prolific online shoppers in Korea in the same year. The most cited reasons for shopping online by Koreans in 2018 were (in order of mention): convenience (55%), price (54%), easy payment (25%), and quick and convenient shipping (24%).77
Shopping Events and Timing
There are a number of important days of celebration in South Korea that impact consumer shopping and consumption behaviour. Some of the more important ones are described briefly in the table below, and the implications for e-commerce explained. From an e-commerce perspective, this means getting the website geared up for seasonal purchasing, making sure that the most desired purchases are available and adequately promoted, and ensuring that logistics and deliveries are geared up to make on-time delivery of orders.78,79 It is also important to note that many stores and all post offices are closed during these times.
CELEBRATION DAY
Seollal 1st day of Korean lunar calendar (usually January/February), three-day duration
This is a time for remembering ancestors, visiting family, enjoying great food, and having fun.81
Seollal is one of the three biggest buying holidays in South Korea.82 Many stores are closed during this time, and so much of the purchasing of gifts and food to be prepared occurs before the holiday.
Nowadays many of these purchases occur online to avoid the rush and
WHEN CELEBRATED
BRIEF DESCRIPTION E-COMMERCE IMPLICATIONS 80
76 Retrieved from: https://www-statista-com.proxy.lib.sfu.ca/statistics/226786/share-of-internet-shoppers-in-south-korea-by-gender/ Accessed on July 10, 2019. 77 Retrieved from: https://www-statista-com.proxy.lib.sfu.ca/statistics/952289/reasons-online-shopping-south-korea/ Accessed on July 10, 2019. 78 Retrieved from: https://www.janio.asia/post/lunar-new-year-holiday-series-how-to-prepare-for-e-commerce-sales Accessed on July 10, 2019. 79 Retrieved from: https://www.janio.asia/post/lunar-new-year-holiday-series-how-to-prepare-for-e-commerce-sales Accessed on July 10, 2019. 80 Retrieved from: https://www-statista-com.proxy.lib.sfu.ca/statistics/226782/share-of-internet-shoppers-in-south-korea-by-age-group/ Accessed on July 10, 2019. 81 Retrieved from: https://asiasociety.org/korea/seollal-korean-lunar-new-year Accessed on July 10, 2019. 82 Retrieved from: https://blog.payza.eu/e-commerce/country-spotlight/country-spotlight-south-korea-shows-strong-e-commerce-growth/ Accessed on July 10, 2019.
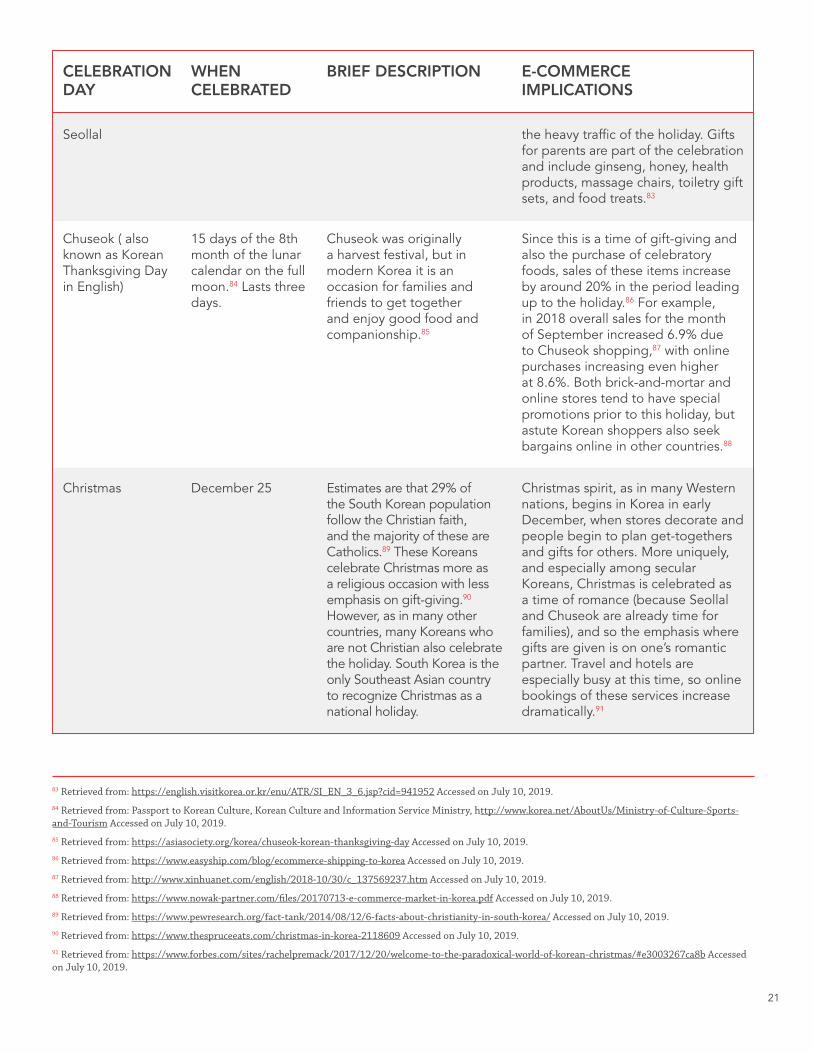
21
CELEBRATION DAY
Seollal
Chuseok ( also known as Korean Thanksgiving Day in English)
Christmas
15 days of the 8th month of the lunar calendar on the full moon.84 Lasts three days.
December 25
Chuseok was originally a harvest festival, but in modern Korea it is an occasion for families and friends to get together and enjoy good food and companionship.85
Estimates are that 29% of the South Korean population follow the Christian faith, and the majority of these are Catholics.89 These Koreans celebrate Christmas more as a religious occasion with less emphasis on gift-giving.90 However, as in many other countries, many Koreans who are not Christian also celebrate the holiday. South Korea is the only Southeast Asian country to recognize Christmas as a national holiday.
the heavy traffic of the holiday. Gifts for parents are part of the celebration and include ginseng, honey, health products, massage chairs, toiletry gift sets, and food treats.83
Since this is a time of gift-giving and also the purchase of celebratory foods, sales of these items increase by around 20% in the period leading up to the holiday.86 For example, in 2018 overall sales for the month of September increased 6.9% due to Chuseok shopping,87 with online purchases increasing even higher at 8.6%. Both brick-and-mortar and online stores tend to have special promotions prior to this holiday, but astute Korean shoppers also seek bargains online in other countries.88
Christmas spirit, as in many Western nations, begins in Korea in early December, when stores decorate and people begin to plan get-togethers and gifts for others. More uniquely, and especially among secular Koreans, Christmas is celebrated as a time of romance (because Seollal and Chuseok are already time for families), and so the emphasis where gifts are given is on one’s romantic partner. Travel and hotels are especially busy at this time, so online bookings of these services increase dramatically.91
WHEN CELEBRATED
BRIEF DESCRIPTION E-COMMERCE IMPLICATIONS
83 Retrieved from: https://english.visitkorea.or.kr/enu/ATR/SI_EN_3_6.jsp?cid=941952 Accessed on July 10, 2019.84 Retrieved from: Passport to Korean Culture, Korean Culture and Information Service Ministry, http://www.korea.net/AboutUs/Ministry-of-Culture-Sports-and-Tourism Accessed on July 10, 2019. 85 Retrieved from: https://asiasociety.org/korea/chuseok-korean-thanksgiving-day Accessed on July 10, 2019. 86 Retrieved from: https://www.easyship.com/blog/ecommerce-shipping-to-korea Accessed on July 10, 2019. 87 Retrieved from: http://www.xinhuanet.com/english/2018-10/30/c_137569237.htm Accessed on July 10, 2019. 88 Retrieved from: https://www.nowak-partner.com/files/20170713-e-commerce-market-in-korea.pdf Accessed on July 10, 2019. 89 Retrieved from: https://www.pewresearch.org/fact-tank/2014/08/12/6-facts-about-christianity-in-south-korea/ Accessed on July 10, 2019. 90 Retrieved from: https://www.thespruceeats.com/christmas-in-korea-2118609 Accessed on July 10, 2019. 91 Retrieved from: https://www.forbes.com/sites/rachelpremack/2017/12/20/welcome-to-the-paradoxical-world-of-korean-christmas/#e3003267ca8b Accessed on July 10, 2019.
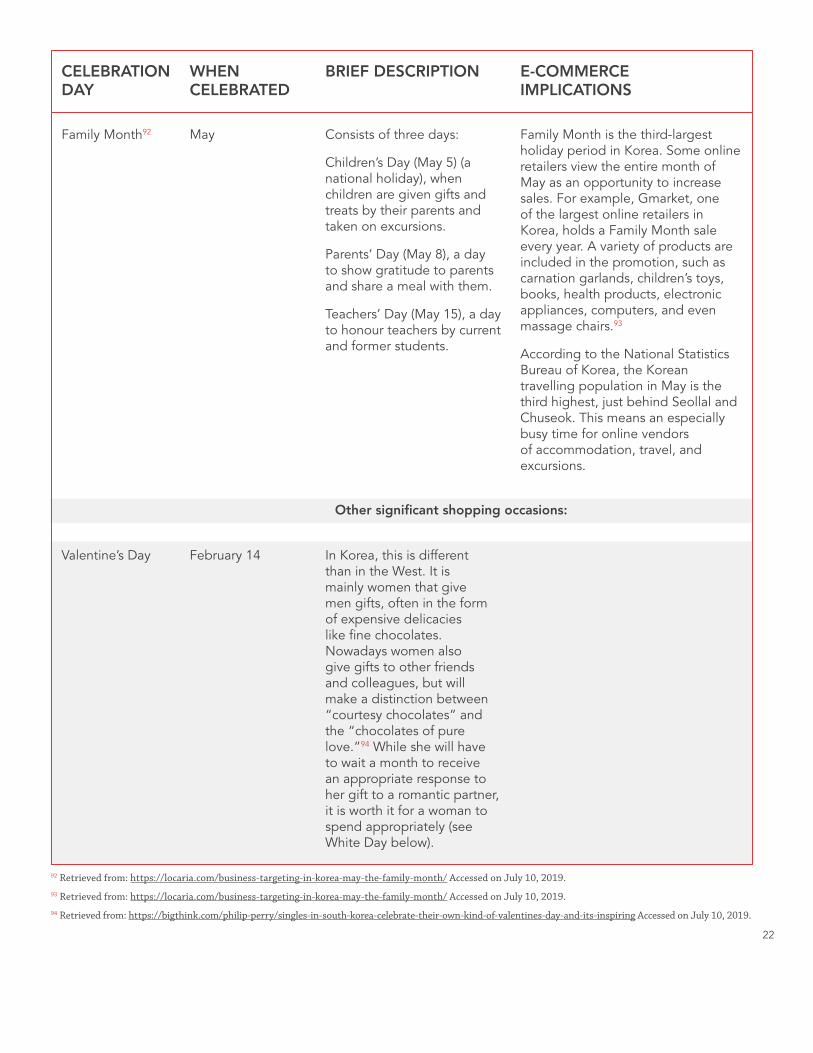
22
Family Month92
Valentine’s Day
Other significant shopping occasions:
May
February 14
Consists of three days:
Children’s Day (May 5) (a national holiday), when children are given gifts and treats by their parents and taken on excursions.
Parents’ Day (May 8), a day to show gratitude to parents and share a meal with them.
Teachers’ Day (May 15), a day to honour teachers by current and former students.
In Korea, this is different than in the West. It is mainly women that give men gifts, often in the form of expensive delicacies like fine chocolates. Nowadays women also give gifts to other friends and colleagues, but will make a distinction between “courtesy chocolates” and the “chocolates of pure love.”94 While she will have to wait a month to receive an appropriate response to her gift to a romantic partner, it is worth it for a woman to spend appropriately (see White Day below).
Family Month is the third-largest holiday period in Korea. Some online retailers view the entire month of May as an opportunity to increase sales. For example, Gmarket, one of the largest online retailers in Korea, holds a Family Month sale every year. A variety of products are included in the promotion, such as carnation garlands, children’s toys, books, health products, electronic appliances, computers, and even massage chairs.93
According to the National Statistics Bureau of Korea, the Korean travelling population in May is the third highest, just behind Seollal and Chuseok. This means an especially busy time for online vendors of accommodation, travel, and excursions.
92 Retrieved from: https://locaria.com/business-targeting-in-korea-may-the-family-month/ Accessed on July 10, 2019. 93 Retrieved from: https://locaria.com/business-targeting-in-korea-may-the-family-month/ Accessed on July 10, 2019. 94 Retrieved from: https://bigthink.com/philip-perry/singles-in-south-korea-celebrate-their-own-kind-of-valentines-day-and-its-inspiring Accessed on July 10, 2019.
CELEBRATION DAY
WHEN CELEBRATED
BRIEF DESCRIPTION E-COMMERCE IMPLICATIONS
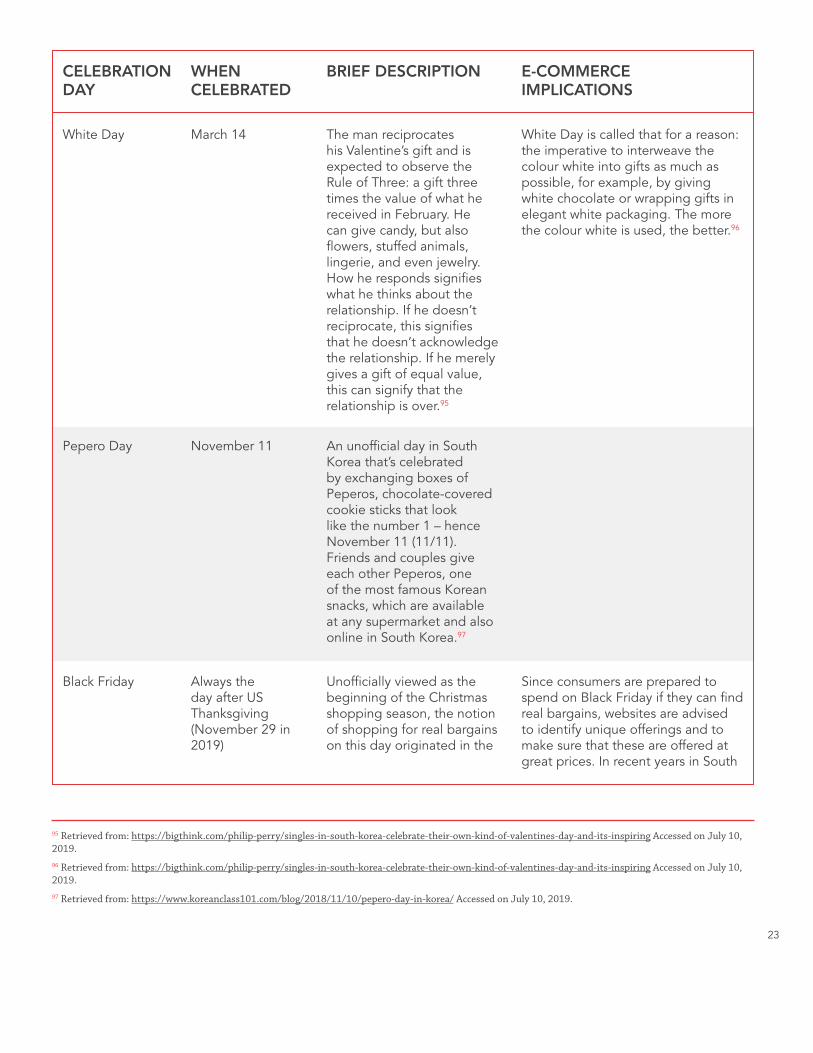
23
White Day
Pepero Day
Black Friday
March 14
November 11
Always the day after US Thanksgiving (November 29 in 2019)
The man reciprocates his Valentine’s gift and is expected to observe the Rule of Three: a gift three times the value of what he received in February. He can give candy, but also flowers, stuffed animals, lingerie, and even jewelry. How he responds signifies what he thinks about the relationship. If he doesn’t reciprocate, this signifies that he doesn’t acknowledge the relationship. If he merely gives a gift of equal value, this can signify that the relationship is over.95
An unofficial day in South Korea that’s celebrated by exchanging boxes of Peperos, chocolate-covered cookie sticks that look like the number 1 – hence November 11 (11/11). Friends and couples give each other Peperos, one of the most famous Korean snacks, which are available at any supermarket and also online in South Korea.97
Unofficially viewed as the beginning of the Christmas shopping season, the notion of shopping for real bargains on this day originated in the
White Day is called that for a reason: the imperative to interweave the colour white into gifts as much as possible, for example, by giving white chocolate or wrapping gifts in elegant white packaging. The more the colour white is used, the better.96
Since consumers are prepared to spend on Black Friday if they can find real bargains, websites are advised to identify unique offerings and to make sure that these are offered at great prices. In recent years in South
CELEBRATION DAY
WHEN CELEBRATED
BRIEF DESCRIPTION E-COMMERCE IMPLICATIONS
95 Retrieved from: https://bigthink.com/philip-perry/singles-in-south-korea-celebrate-their-own-kind-of-valentines-day-and-its-inspiring Accessed on July 10, 2019.96 Retrieved from: https://bigthink.com/philip-perry/singles-in-south-korea-celebrate-their-own-kind-of-valentines-day-and-its-inspiring Accessed on July 10, 2019.97 Retrieved from: https://www.koreanclass101.com/blog/2018/11/10/pepero-day-in-korea/ Accessed on July 10, 2019.
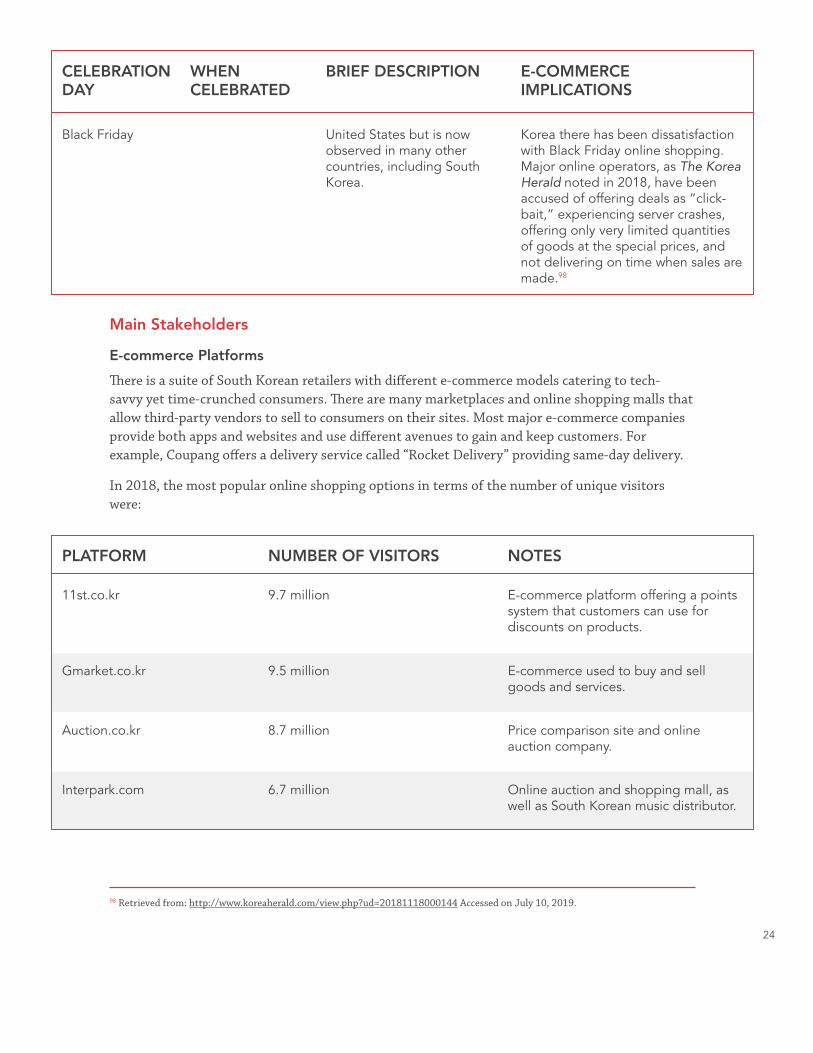
24
Black Friday
11st.co.kr
Gmarket.co.kr
Auction.co.kr
Interpark.com
United States but is now observed in many other countries, including South Korea.
9.7 million
9.5 million
8.7 million
6.7 million
Korea there has been dissatisfaction with Black Friday online shopping. Major online operators, as The Korea Herald noted in 2018, have been accused of offering deals as “click-bait,” experiencing server crashes, offering only very limited quantities of goods at the special prices, and not delivering on time when sales are made.98
E-commerce platform offering a points system that customers can use for discounts on products.
E-commerce used to buy and sell goods and services.
Price comparison site and online auction company.
Online auction and shopping mall, as well as South Korean music distributor.
CELEBRATION DAY
PLATFORM
WHEN CELEBRATED
BRIEF DESCRIPTION
NUMBER OF VISITORS
E-COMMERCE IMPLICATIONS
NOTES
Main Stakeholders
E-commerce Platforms
There is a suite of South Korean retailers with different e-commerce models catering to tech-savvy yet time-crunched consumers. There are many marketplaces and online shopping malls that allow third-party vendors to sell to consumers on their sites. Most major e-commerce companies provide both apps and websites and use different avenues to gain and keep customers. For example, Coupang offers a delivery service called “Rocket Delivery” providing same-day delivery.
In 2018, the most popular online shopping options in terms of the number of unique visitors were:
98 Retrieved from: http://www.koreaherald.com/view.php?ud=20181118000144 Accessed on July 10, 2019.
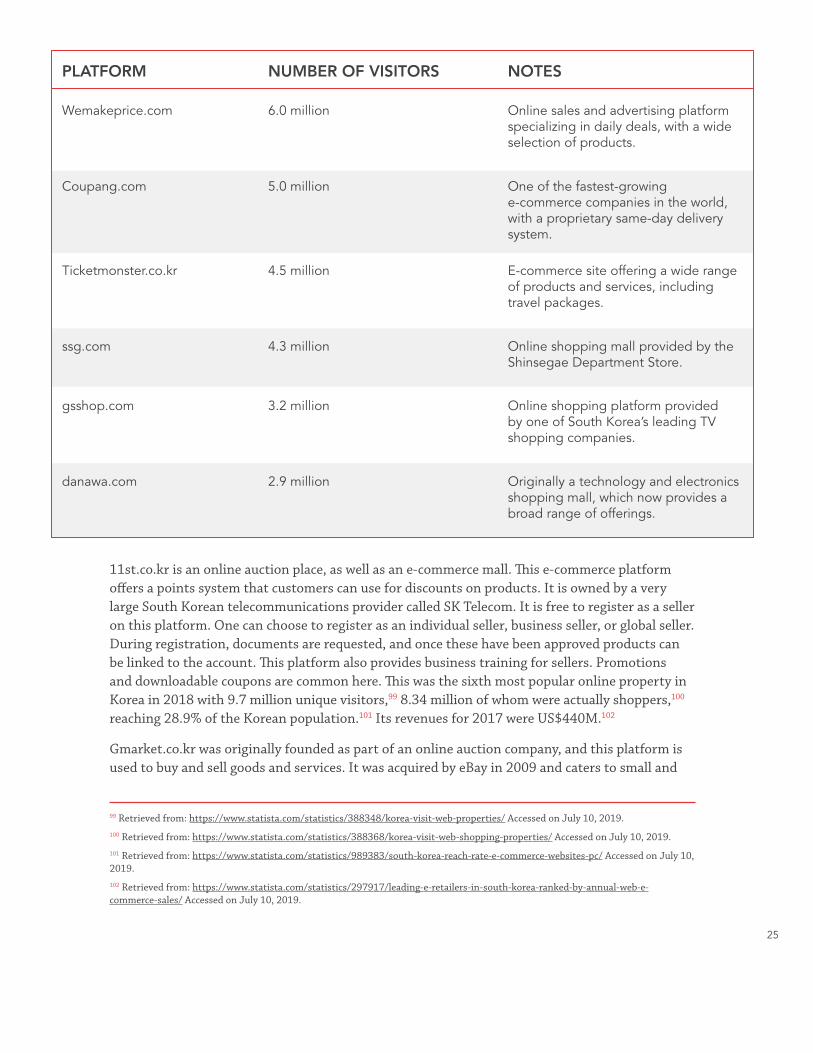
25
11st.co.kr is an online auction place, as well as an e-commerce mall. This e-commerce platform offers a points system that customers can use for discounts on products. It is owned by a very large South Korean telecommunications provider called SK Telecom. It is free to register as a seller on this platform. One can choose to register as an individual seller, business seller, or global seller. During registration, documents are requested, and once these have been approved products can be linked to the account. This platform also provides business training for sellers. Promotions and downloadable coupons are common here. This was the sixth most popular online property in Korea in 2018 with 9.7 million unique visitors,99 8.34 million of whom were actually shoppers,100 reaching 28.9% of the Korean population.101 Its revenues for 2017 were US$440M.102
Gmarket.co.kr was originally founded as part of an online auction company, and this platform is used to buy and sell goods and services. It was acquired by eBay in 2009 and caters to small and
Wemakeprice.com
Coupang.com
Ticketmonster.co.kr
ssg.com
gsshop.com
danawa.com
6.0 million
5.0 million
4.5 million
4.3 million
3.2 million
2.9 million
Online sales and advertising platform specializing in daily deals, with a wide selection of products.
One of the fastest-growing e-commerce companies in the world, with a proprietary same-day delivery system.
E-commerce site offering a wide range of products and services, including travel packages.
Online shopping mall provided by the Shinsegae Department Store.
Online shopping platform provided by one of South Korea’s leading TV shopping companies.
Originally a technology and electronics shopping mall, which now provides a broad range of offerings.
PLATFORM NUMBER OF VISITORS NOTES
99 Retrieved from: https://www.statista.com/statistics/388348/korea-visit-web-properties/ Accessed on July 10, 2019. 100 Retrieved from: https://www.statista.com/statistics/388368/korea-visit-web-shopping-properties/ Accessed on July 10, 2019. 101 Retrieved from: https://www.statista.com/statistics/989383/south-korea-reach-rate-e-commerce-websites-pc/ Accessed on July 10, 2019. 102 Retrieved from: https://www.statista.com/statistics/297917/leading-e-retailers-in-south-korea-ranked-by-annual-web-e-commerce-sales/ Accessed on July 10, 2019.

26
medium-sized business sellers. Sellers pay a fee, which is calculated based on item price. This was the seventh most popular online property in Korea in 2018, with 9.46 million unique visitors,103 8.95 million of whom were actually shoppers,104 reaching 30.1% of the Korean population.105 Its revenues for 2017 were US$563.48M.106
Coupang.com was founded in 2013 by Bom Kim. Much like Amazon.com, Coupang.com showcases a wide range of offerings from various merchants. These include clothing, electronics, food items, household goods, and many others. The platform also has a range of delivery options, including “Rocket Delivery,” which provides deliveries within 24 hours of purchase, and “Rocket Fresh,” which provides deliveries of fresh or perishable items by 7 a.m. as long as they are ordered by midnight the day before. To achieve these fast deliveries, it employs thousands of delivery personnel – each one known as a “Coupang man.” Coupang also offers a payment service known as “RocketPay,” which is a proprietary one-touch payment system. Coupang did not feature in the top 10 most popular online properties, although it listed as the sixth most popular shopping site with 6.4 million visitors who were actually shoppers,107 reaching 20.3% of the Korean population.108 Its revenues for 2017 were the highest for any Korean e-commerce website at US$2,313.29M.109
The table below organizes the platforms by the type and main activity. In addition to the domestic sites, foreign sites such as Amazon.com and eBay are also often used.
103 Retrieved from: https://www.statista.com/statistics/388348/korea-visit-web-properties/ Accessed on July 10, 2019. 104 Retrieved from: https://www.statista.com/statistics/388368/korea-visit-web-shopping-properties/ Accessed on July 10, 2019. 105 Retrieved from: https://www.statista.com/statistics/989383/south-korea-reach-rate-e-commerce-websites-pc/ Accessed on July 10, 2019. 106 Retrieved from: https://www.statista.com/statistics/297917/leading-e-retailers-in-south-korea-ranked-by-annual-web-e-commerce-sales/ Accessed on July 10, 2019. 107 Retrieved from: https://www.statista.com/statistics/388368/korea-visit-web-shopping-properties/ Accessed on July 10, 2019. 108 Retrieved from: https://www.statista.com/statistics/989383/south-korea-reach-rate-e-commerce-websites-pc/ Accessed on July 10, 2019. 109 Retrieved from: https://www.statista.com/statistics/297917/leading-e-retailers-in-south-korea-ranked-by-annual-web-e-commerce-sales/ Accessed on July 10, 2019.
General Marketplaces
11st.co.kr
Gmarket.co.kr
WeMakePrice
Coupang.com
Apparel Marketplaces
KakuuBasic
Kooding
YesStyle
MOCOBLING
Department Stores and Retails
ssg.com
gsshop.com
Lottemall
Hyundai Home Shopping (TV)
Online Auctions
Auction.co.kr
Interpark.com
Blogging Services
Naver
Nate
Kakao

27
The business-to-business (B2B) e-commerce market is very competitive, and it has been difficult for foreign companies to break into the market. While the US government’s International Trade Administration’s website export.gov110 noted that B2B e-commerce market data on South Korea was not available in June 2018 (and further extensive searches confirmed this), it did report as follows: “… however, due to the explosive expansion of business to consumer (B2C) e-commerce and tough competition among e-commerce players, e-commerce companies have been looking to expand into B2B e-commerce on consumable sales to small and medium size companies.”
Gmarket was the first to launch a B2B shopping site, called BizON, in 2012. It is relatively simple for a Canadian firm, or any firm for that matter, to register as a vendor on Gmarket Biz. The only documents needed are a certification of business registration, a bank statement, a copy of the passport of the representative shown on the business registration, a copy of the seller’s registration form on Gmarket, and a copy of the seller’s confirmation letter on Gmarket. The last two documents can be downloaded directly from the platform’s very helpful website, which offers other advice and a Q&A service.111
Auction.co.kr also has B2B sites, called Biz club for food ingredients and Biz plus for other consumables. (For an insightful video on how to register and operate on these, see https://www.youtube.com/watch?v=sjX2AzR-z7o.) Interpark has I Market Korea, which integrates B2B and B2C services. WeMakePrice started WeMakePrice Bizmall in 2016. With 5.4 million business owners and 3.5 million small and medium-sized companies, the B2B e-commerce market in South Korea is regarded as being very competitive.112
Technology and Infrastructure Landscape
Infrastructure
South Korea has one of the highest levels of internet penetration in the world, at 95.1%.113 Internet usage in the country has been growing steadily since 2000, when the internet penetration rate was approximately 45%. The country reached the highest internet connection speed in the world by 2017 and maintains that position to this day. In the same year, there were over 26 million unique IPv4 addresses in South Korea, compared with 142.7 million in the United States and 46.2 million in Japan. Korea also had over 21.2 million broadband subscriptions, compared with 39.2 million in Japan and 110 million in the United States.
According to Forbes,114 South Korea is home of the world’s best internet as their internet infrastructure allows for competition that drives down prices and increases service. Thanks to market friendly initiatives by the government, private sector innovation, and high population density, South Koreans have access to multiple internet service providers. Wi-Fi is available in public spaces such as the subway, and access in rural areas is relatively high speed as well, as
110 Retrieved from: https://www.export.gov/article?id=Korea-eCommerce Accessed on July 1, 2019.111 Retrieved from: http://www.koreasia.biz/how-to-become-a-foreign-seller-at-gmarket-in-korea/ Accessed on July 10, 2019. 112 Retrieved from: https://www.export.gov/article?id=Korea-eCommerce Accessed on July 10, 2019. 113 Retrieved from: https://www.statista.com/topics/2230/internet-usage-in-south-korea/ Accessed on July 10, 2019. 114 Retrieved from: https://www.forbes.com/sites/kevinmurnane/2018/12/11/heres-how-internet-speeds-fared-for-the-worlds-fastest-and-largest-countries-in-2018/#40687fd54976 Accessed on July 10, 2019.
28
regulations supported the required infrastructure in these areas. Furthermore, by the first quarter of 2018, it was estimated that 60% of online transactions were made via mobile phones.
In terms of net neutrality, South Korea has strong policies that help to ensure smaller websites receive the same privileges as larger players. South Korea is actively positioning itself as a startup-friendly economy and was rated 19th in the world in this regard in 2019.115 While the South Korean government heralded a “creative economy drive” in 2012 to foster a startup scene nearly from scratch, the situation is still not perfect, and the country is often overlooked in favour of other markets, such as Singapore and Hong Kong. Language and cultural barriers are mentioned as a reason for this.116
Intellectual Property
It is illegal to sell counterfeited products on e-commerce sites and to bring any counterfeit goods into Korea via cross-border e-commerce. While Korea has strict legislation in place, it has been observed that when it comes to actual enforcement of these rights, especially in the area of counterfeits, the country still needs to move further ahead, just like most other countries around the globe.117
Korea has a number of acts governing intellectual property rights. The main pieces of legislation include the Copyright Act, Computer Program Protection Act, Patent Act, Design Act, Utility Models Act, Trademark Act, and Unfair Competition Prevention and Trade Secret Protection Act.
Companies can register intellectual property (IP) for trademarks, patents, and designs online through the Korean Intellectual Property Office (www.kipo.go.kr). Foreign organizations that do not have an office in Korea must lodge patent, design, and trademark registrations through a Korean IP attorney.
According to the Global Innovation Policy Center (GIPC)’s International IP Index of 2019, South Korea is third in Asia, after Japan and Singapore, and 13th in the world with regard to its intellectual property environment. The GIPC Index consists of five key sets of indicators to map the national intellectual property environment. In 2019 the United States was ranked first with 42.66 points, and South Korea scored 36.06. Canada was ranked 19th with a score of 29.88 points. The key points considered are: (1) patents, related rights, and limitations; (2) copyrights, related rights, and limitations; (3) trademarks, related rights, and limitations; (4) enforcement; and (5) membership and ratification of international treaties.118 Two Korean companies were rated in the top 10 most innovative companies in the world by number of patents granted in the United States in 2018: Samsung was second and LG Electronics was fifth.119 Samsung was ranked fifth of the world’s companies with the highest spending on research and development in 2018.120
115 Retrieved from: https://ceoworld.biz/2019/01/02/most-startup-friendly-countries-in-the-world-2019/ Accessed on July 10, 2019. 116 Retrieved from: https://www.forbes.com/sites/elaineramirez/2017/05/25/why-entrepreneurs-come-to-south-korea-and-why-they-dont/#3a0a9667dbf5 Accessed on July 10, 2019. 117 Retrieved from: http://www.koreaherald.com/view.php?ud=20180318000161 Accessed on July 10, 2019. 118 Retrieved from: https://www-statista-com.proxy.lib.sfu.ca/statistics/257583/gipc-international-intellectual-property-index/ Accessed on July 10, 2019. 119 Retrieved from: https://www-statista-com.proxy.lib.sfu.ca/statistics/227230/worlds-most-innovative-companies/ Accessed on July 10, 2019. 120 Retrieved from: https://www-statista-com.proxy.lib.sfu.ca/statistics/265645/ranking-of-the-20-companies-with-the-highest-spending-on-research-and-development/ Accessed on July 10, 2019.

29
121 Retrieved from: https://www-statista-com.proxy.lib.sfu.ca/statistics/257114/ranking-of-the-20-countries-with-the-most-patent-applications/ Accessed on July 10, 2019. 122 Retrieved from: https://iapp.org/news/a/gdpr-matchup-south-koreas-personal-information-protection-act/ Accessed on July 10, 2019. 123 Retrieved from: https://iapp.org/news/a/gdpr-matchup-the-apec-privacy-framework-and-cross-border-privacy-rules/ Accessed on July 10, 2019. 124 Retrieved from: https://www.export.gov/article?id=Korea-Trade-Agreements Accessed on July 10, 2019. 125 Retrieved from: https://lpi.worldbank.org/international/global/2018 Accessed on July 10, 2019.
Korea’s national patent office was ranked fourth in the world (after China, the United States, and Japan) for issuing the most patents.121
Consumer Protection
The Korea Consumer Agency is a government organization that was developed in 1987 in accordance with the Consumer Protection Act to implement consumer protection policies. The Framework Act on Electronic Message and Electronic Commerce (1999) and the Electronic Signature Act (1999) were developed in response to the growing e-commerce sector. In 2002, the E-Commerce Consumer Protection Act was implemented to protect buyers by outlining the fair trade of goods or services via online transactions. The E-Commerce Mediation Committee was developed to resolve disputes between consumers and providers of this platform, as well as between providers and their partners, such as payment services and telecommunication companies. For Canadian firms wishing to conduct e-commerce in Korea, this means complying with legislation that protects Korean consumer rights and understanding that consumers have a right of recourse in cases where defective or faulty goods are delivered, when marketing communication is false or misleading, or when transactions are disputed.
Personal Information
South Korea’s comprehensive Personal Information Protection Act was enacted September 30, 2011, and is among the world’s strictest privacy legislation. It protects privacy rights and applies to most organizations, even government departments. The legislation also includes criminal and regulatory fines and even imprisonment, and it is strictly enforced.122 In June 2018, South Korea became the fifth member to bind to the APEC Cross-Border Privacy Rules, along with the United States, Japan, Canada, and Mexico. These rules establish effective privacy protections while avoiding barriers to information flows and ensuring continued trade and economic growth.123 For Canadian firms wishing to conduct e-commerce in South Korea, this means that privacy and data protection need to be taken seriously not simply because it is good business, but also because the consequences of any breaches can be costly and severe.
Logistics
South Korea has signed free trade agreements with a broad range of countries, supplying South Korean consumers with options, as well as supporting the export of Korean goods to other markets, particularly China. South Korea has free trade agreements with ASEAN, Australia, Canada, Chile, China, Colombia, India, New Zealand, Peru, Singapore, the European Union, the European Free Trade Association (Norway, Switzerland, Iceland, and Liechtenstein), the United States, Turkey, and Vietnam.124 South Korea ranked 25th in the 2016 World Bank Logistics ranking, down from 24th in 2016,125 and South Koreans have very high expectations for speedy
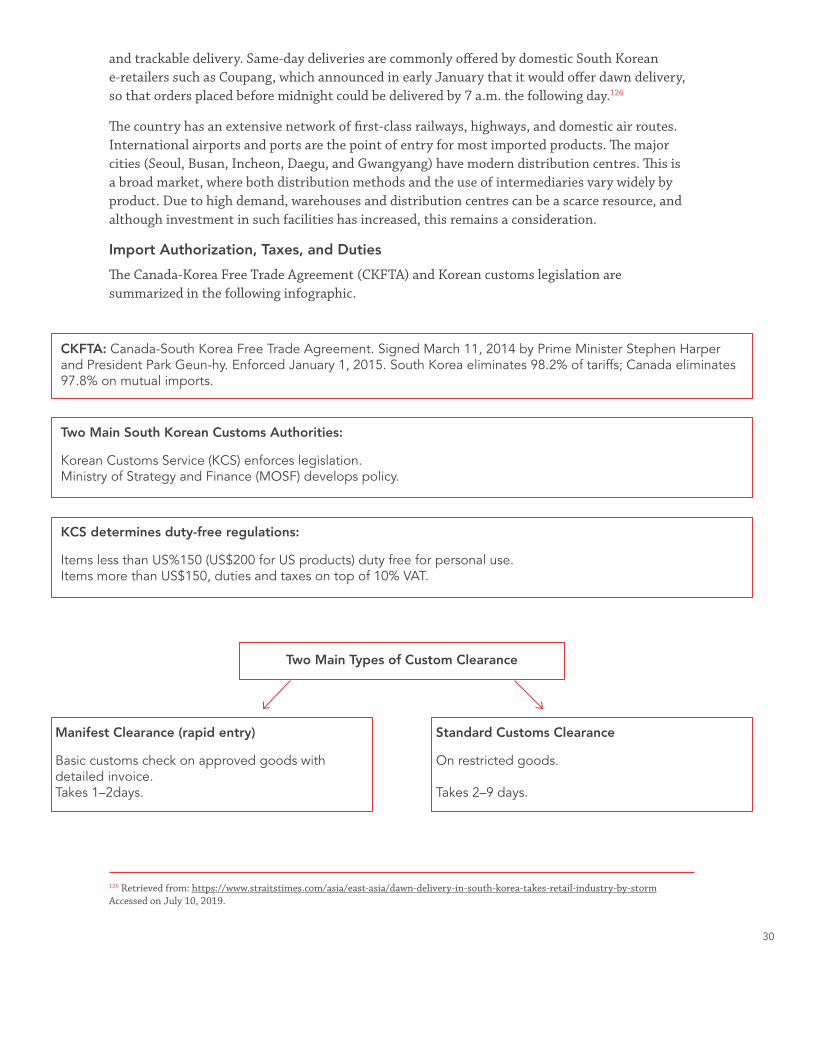
30
and trackable delivery. Same-day deliveries are commonly offered by domestic South Korean e-retailers such as Coupang, which announced in early January that it would offer dawn delivery, so that orders placed before midnight could be delivered by 7 a.m. the following day.126
The country has an extensive network of first-class railways, highways, and domestic air routes. International airports and ports are the point of entry for most imported products. The major cities (Seoul, Busan, Incheon, Daegu, and Gwangyang) have modern distribution centres. This is a broad market, where both distribution methods and the use of intermediaries vary widely by product. Due to high demand, warehouses and distribution centres can be a scarce resource, and although investment in such facilities has increased, this remains a consideration.
Import Authorization, Taxes, and Duties
The Canada-Korea Free Trade Agreement (CKFTA) and Korean customs legislation are summarized in the following infographic.
126 Retrieved from: https://www.straitstimes.com/asia/east-asia/dawn-delivery-in-south-korea-takes-retail-industry-by-storm Accessed on July 10, 2019.
CKFTA: Canada-South Korea Free Trade Agreement. Signed March 11, 2014 by Prime Minister Stephen Harper and President Park Geun-hy. Enforced January 1, 2015. South Korea eliminates 98.2% of tariffs; Canada eliminates 97.8% on mutual imports.
Two Main South Korean Customs Authorities:
Korean Customs Service (KCS) enforces legislation. Ministry of Strategy and Finance (MOSF) develops policy.
KCS determines duty-free regulations:
Items less than US%150 (US$200 for US products) duty free for personal use. Items more than US$150, duties and taxes on top of 10% VAT.
Manifest Clearance (rapid entry)
Basic customs check on approved goods with detailed invoice. Takes 1–2days.
Standard Customs Clearance
On restricted goods. Takes 2–9 days.
Two Main Types of Custom Clearance
31
Obviously CKFTA provides numerous opportunities for trade between the two countries. Despite resistance from firms on both sides (for example, the auto industry in Canada and agriculture in South Korea), from a Canadian e-commerce perspective the agreement makes it simpler to either directly set up an online presence in South Korea or to distribute through a Korean online platform. Moreover, the reduction in tariffs on the majority of products afforded by CKFTA enables Canadian firms to compete on a more or less level footing in South Korea. Data for 2017 indicate that CKFTA has had a positive effect for Canadian exporters overall, with an approximate 25% increase in trade for 2017 over 2016.127 This also had a very positive benefit on the balance of trade with Korea for Canada, turning it in Canada’s favour.128 Apart from mining and agricultural commodities, among the diverse range of Canadian exports for which Korea is a major trade partner are pet food,129 services,130 and vodka.131 Product categories in which Korea is a major market for Canadian exports and that lend themselves ideally to e-commerce are apparel (Canadian exports to Korea were C$25M in 2018),132 exercise equipment (US$12.272M in 2018),133 wine (C$2.39M in 2016), and ice wine (2,097,000 litres in 2017).134
For information about the Canada-Korea Free Trade Agreement (CKFTA), visit: http://international.gc.ca/trade-agreements-accords-commerciaux/agr-acc/korea-coree/overview-apercu.aspx?lang=eng (last accessed on July 10, 2019).
Product Import Logistics
As of 2015, people who purchase products online have been encouraged to get an e-clearance registration number called a Personal Customs Clearance Code, also known as an Individual Customs Number. These numbers are issued by the Korea Customs Service to expedite the clearance process. A resident registration number can also be used to receive products from cross-border e-commerce. In 2016, 3.4 million Koreans had an Individual Customs Number. Women accounted for 56% of the total number issued. Individuals in their thirties represented approximately 45%.
127 Retrieved from: https://www-statista-com.proxy.lib.sfu.ca/statistics/657600/south-korea-imported-goods-value-from-canada-since-free-trade-agreement/ Accessed on July 10, 2019. 128 Retrieved from: https://www-statista-com.proxy.lib.sfu.ca/statistics/657609/south-korea-trade-balance-with-canada-since-free-trade-agreement/ Accessed on July 10, 2019. 129 Retrieved from: https://www-statista-com.proxy.lib.sfu.ca/statistics/661775/south-korea-pet-food-import-value-from-canada/ Accessed on July 10, 2019. 130 Retrieved from: https://www-statista-com.proxy.lib.sfu.ca/statistics/463795/canadian-trade-balance-of-services-by-country/ Accessed on July 10, 2019. 131 Retrieved from: https://www-statista-com.proxy.lib.sfu.ca/statistics/556911/vodka-export-value-destination-canada/ Accessed on July 10, 2019. 132 Retrieved from: https://www-statista-com.proxy.lib.sfu.ca/statistics/484722/leading-export-countries-for-apparel-canada/ Accessed on July 10, 2019. 133 Retrieved from: https://www-statista-com.proxy.lib.sfu.ca/statistics/559221/exercise-equipment-export-value-destination-canada/ Accessed on July 10, 2019. 134 Retrieved from: https://www-statista-com.proxy.lib.sfu.ca/statistics/889940/ice-wine-export-volume-canada-destination/ Accessed on July 10, 2019.
32
For Canadian Firms Contemplating E-commerce in South Korea: Marketing Considerations
E-commerce in South Korea is expected to continue to grow and develop, with more domestic and foreign players entering the market. South Korea is expected to show particularly strong growth in total e-commerce revenue. Statista135 projects that retail e-commerce sales in South Korea will be US$68,554M in 2019 and increase to US$80,305M by 2023. Average revenue per user is also expected to continue to steadily increase.
The busy lifestyle of consumers and their high fluency with digital technology makes e-commerce an attractive alternative to spending time travelling to stores and shopping. Combining the ample infrastructure and technology savviness with growing disposable incomes, consumers are expected to continue to seek products that offer convenience.
Canada is already a top 10 provider of agri-food and seafood products to Korea, and is also active in other markets. Additionally, the free trade agreement with Canada continues to open up interesting avenues to enter the market. The Canadian Trade Commissioner Service136 for South Korea is a resource to potentially draw upon when looking to further commercial relationships in the region. Areas that are expected to continue to be on the rise are food related, such as convenient packaged food, where sales have been seen to grow steadily.
Other product areas that continue to warrant attention include consumer products, forestry and wood, and sustainable technologies.
From the perspective of a Canadian firm considering some kind of e-commerce initiative in South Korea, there is much that is positive, as evidenced in this report so far. The country is availed of the best internet technology in the world, and its citizens are not only among the world’s highest users of smartphones but are also willing to embrace innovations and new technologies. Korea is an appealing and lucrative market, and CKFTA means that for it will be easy for Canadian firms to enter the market, at least from an administrative perspective. The average Korean is reasonably wealthy by world standards: per capita income (in 2017) is around US$39,400, and of the major nations in Asia, only Taiwan (US$50,300) and Japan (US$42,800) were higher, compared to Canada at US$44,300.137 This means that Koreans have high discretionary income and are willing to spend it on themselves and their families, to enjoy new offerings and to celebrate special holidays.
However, as Korean marketing consultant Olivia Song points out, many major Western brands have been fooled into thinking that the Korean market is an easy one to enter and have experienced serious problems in doing so as a result. She points to firms such as Walmart, Carrefour, and Uber and argues that firms that adopt an over-simplified strategy of transplanting to Korea what they have done in their home markets will usually fail. In doing so they seriously underestimate the uniqueness of the Korean market.138 Dr. Chang Hoon Oh, William Saywell
135 Retrieved from: https://www.statista.com/outlook/243/125/ecommerce/south-korea Accessed on July 10, 2019.136 Retrieved from: https://www.tradecommissioner.gc.ca/e-f/kr/index.htm Accessed on July 10, 2019.137 Retrieved from: https://www.cia.gov/library/publications/the-world-factbook/rankorder/2004rank.html Accessed on July 10, 2019.138 Retrieved from: https://medium.com/@swansong719/marketing-in-korea-5-essential-tips-to-get-you-started-e96c8eac3c76 Accessed on July 10, 2019.

33
Professor in Asia Pacific Studies at Simon Fraser University’s Beedie School of Business and a Korean-Canadian international business expert, remarks, “The biggest issue that Canadian firms will face in Korea is market dynamics and business practices. Everything changes so quickly in Korea, and Koreans really go for trendy services and products. Canadian firms are not familiar with these dynamics and thus it would not be easy for Canadian firms to adjust their business practices and decision-making under such dynamics. I fear that most of them won’t be able to move fast enough.”139
The 4 Cs, 4 Ps framework140 can be used here for Canadian firms considering an e-commerce initiative in South Korea. To be able to identify its target market effectively, a firm must first understand who its Customers are, who its Competitors are, who its Collaborators are, and what its Competence is. To be able to optimally meet the needs of its customers, a firm must be able to offer them something unique that its competitors cannot match, because they do not have the collaborators that the firm has, and do not possess the necessary competence.
Once the firm has identified its target market, it can then construct its marketing mix using the 4 Ps: Product, Price, Place, and Promotion. This means that the firm must provide its target market with the right product (or service, nowadays more commonly referred to as the offering), at the right price, make it available at the place the customer desires it (nowadays more commonly referred to as distribution), and promote the offering to the customer accordingly (nowadays more commonly referred to as marketing communication, which encompasses advertising, personal selling, public relations efforts, online communication, and promotional tactics). This simple framework is illustrated in the figure below and forms the basis of our discussion on targeting the Korean e-commerce market by Canadian firms that follows.
139 Personal interview, Dr. Chang Hoon Oh, Vancouver, June 20, 2019. 140 E.g. Silk, Alvin J. 2006. What is Marketing? Boston, MA: Harvard Business School Press.
TARGET MARKET
CUSTOMERS
PRODUCT
COMPETITORS
PRICE
COLLABORATORS
PLACE
COMPETENCE
PROMOTION
34
The 4 Cs
Customers
Koreans are reasonably affluent, sophisticated customers who are highly connected and in principle represent an attractive online market. However, there are some barriers that need to be understood. First, language can be a major stumbling block to many foreign online marketers. While most Koreans under the age of 60 today have at least a moderate understanding of English – and this is equally true for both genders141 – potential Canadian e-commerce marketers should understand that communicating in Korean is mandatory and that a simple translation from English will probably not work.142 It will be worth spending money on messages that are culturally optimized rather than simply translated.
Second, while optimizing search on Google might work well in Canada, Naver is far more popular in Korea (used by 92% of the population, versus Google’s 65% in 2017).143 Naver uses it own proprietary marketing tools and its entire interface is in Korean, which means that a firm contemplating an e-commerce initiative would need to acquire these Naver skills in order to reach Naver users.
Third, due to the high rate of penetration of smartphones in Korea, accompanied by the fastest mobile connection speed in the world, a majority of Koreans are accessing the internet primarily on their mobile devices today.144 This means that entrants to the e-commerce market in South Korea need to optimize their content for mobile devices, rather than simply porting desktop websites to mobile devices, where lack-of-fit mistakes will be readily apparent. Also, because Korean consumers frequently interact with their devices in public spaces, this means that they might not always turn the sound on. So providing headlines and text on video that can summarize the crux of the message and can be followed on smartphones is a really good idea.
Competitors
In many offering categories there are established Korean firms with brands that are both world leaders and enjoy local dominance. Obvious examples are Hyundai in automobiles, Samsung in mobile devices, and LG in electronics. However, there are also other offering categories that might be less obvious to outsiders, such as beauty care products. US and European firms, such as the French brand Sephora, that have attempted to enter the Korean market have found that the local loyalty to homegrown products of equal quality that are sold at lower prices is a very tough force to deal with.145 In addition, Korean firms in these categories have long track records and a superb understanding of the market. So, a Canadian firm pondering whether to enter the South Korean market should make a very careful study of the competitors already in the market, as well as potential entrants.
141 Retrieved from: https://www.ef.com/ca/epi/regions/asia/south-korea/ Accessed on July 10, 2019. 142 Retrieved from: https://koreanconsulting.com/search-engine-marketing-in-korea/ Accessed on July 10, 2019. 143 Retrieved from: https://www.statista.com/forecasts/826419/popular-search-engines-in-south-korea Accessed on July 10, 2019. 144 Retrieved from: https://debatereport.com/scitech/interad-5-keys-to-korean-digital-marketing-strategies-for-content-marketing-2018/4475/ Accessed on July 10, 2019. 145 Retrieved from: https://medium.com/@swansong719/marketing-in-korea-5-essential-tips-to-get-you-started-e96c8eac3c76 Accessed on July 10, 2019.
35
Collaborators
The term “collaborators” refers to all the external parties that a firm must rely on to reach its target market effectively. These typically include suppliers, intermediaries, systems providers, service providers such as delivery firms, and, in many instances, government at local and national levels. A firm needs to have all of these on its side to effectively target and serve customers. For Canadian firms contemplating the Korean e-commerce market, this means that managing relationships effectively is essential for success.146 Starting and maintaining relationships takes time and requires resources. For example, the ride hailing service Uber, while successful in many countries, failed badly in Korea when entering in 2013 because it seemed to have ignored the importance of relationships with the local taxi industry, municipalities, and the government. Uber was obliged to exit Korea in 2015.147 Only recently (in April 2019) has Uber once more entered the Korean market, but not in its usual ride hailing format. Instead, the company has partnered with local taxi operators to start a service called Uber Taxi. Under this format, Uber customers can use the Uber app in Korea to hail a taxi partner.148
Competence
There are three main kinds of competence that Canadian firms desiring to enter the e-commerce arena in South Korea will either need to have, develop, or acquire. First, they will need online marketing skills to conceptualize offerings online in a way that appeals to a sophisticated and connected market. While this could perhaps be said of any e-commerce venture anywhere, it should be realized that the Korean market is truly sophisticated and truly connected, far more than most other nations. This has the effect of creating a virtuous circle akin to that argued by Michael Porter’s149 “diamond model” of a nation’s competitive advantage. The framework would contend that South Korea has a national advantage in e-commerce because it has strong related and supporting industries to e-commerce (e.g. smartphone and components manufacturers), the factor conditions (skills in internet technologies), and intense rivalry among local e-commerce firms, which causes them to compete fiercely against each other. All of these are in place and these in turn create sophisticated demand conditions – consumers who expect and receive the best, and in so doing further incite suppliers and the industry to do even better. In simple terms, South Korean online consumers won’t settle for second best when they already have the best. Entrants that don’t understand this will fail.
Second, Canadian firms wishing to enter the Korean e-commerce market will need to have technical skills above and beyond those used in home markets. For example, maximizing search optimization on Google is a hard task: the tools are complicated and real skills are expensive and rare. Now factor in the fact that Korea operates in another language entirely, and that Google skills, scarce as they may be, are not nearly enough. When Naver is the Korean search engine of choice and requires entirely different skills to manage and optimize, the magnitude of the challenge becomes apparent.
146 For example, see https://www.channeladvisor.com/about/news-events/press-releases/channeladvisor-and-interpark-announce-new-strategic-partnership-to-accelerate-e-commerce-sales-in-south-korea/ Accessed on July 10, 2019. 147 Retrieved from: https://blog.indiway.com/transportation-get-around-south-korea Accessed on July 10, 2019. 148 Retrieved from: https://pulsenews.co.kr/view.php?year=2019&no=201813 Accessed on July 10, 2019. 149 Porter, Michael E. 1993. The Competitive Advantage of Nations. Cambridge, MA: Harvard Business School Management Programs.
36
Third, as alluded above, Canadian firms desiring to enter the e-commerce market in Korea will require the skills to build extensive local relationships with parties not directly related to the offering itself. These include internet service providers, courier delivery services, financial institutions, and government departments, in addition to all manner of local partners.
The 4 Ps
Product
Decisions concerning the offering will not only include the design and conceptualization of the offering itself but also issues such as branding, packaging, labelling, sizes, quantities, and warranties. Shipping offerings purchased online will require strong, secure packaging for the product itself but also for its shipping and delivery. Korea also has specific labelling requirements for products such as pharmaceuticals, as well as for organic and functional food and food produced through biotechnology.150 There is also extensive legislation in Korea covering product liabilities and warranties.151
Price
It has long been known that the internet has been a price leveller, because its overall effect has been to reduce search costs for consumers and make markets more efficient.152 This is certainly the case in Korea, where almost everyone is connected and search engines are used. However, the pricing situation is even more complex in that Korean consumers are used to getting many things for free – free samples are everywhere, and ticket prices for most events are low.153 For Canadian firms desirous of entering the Korean e-commerce market, this means paying careful attention to competitive prices and finding ways of creative sampling. These might include physical sampling of products, such as food and drink or health-care products at retail locations and public spaces, electronic couponing whereby consumers receive free samples by submitting a virtual coupon online, or “freemium” strategies for non-physical offerings, whereby a consumer can obtain the basic service for free but will need to pay for more advanced features.
However, as Korean marketing specialist Grace Song notes, while Korean consumers are very price conscious, this does not mean that they’re unwilling to part with money. She observes that FOMO (fear of missing out) is a strong drive among many Korean consumers, and this means that they are quick to adopt new offerings and are willing to pay high prices for these.154
150 For a broad description of these requirements, see https://gain.fas.usda.gov/Recent%20GAIN%20Publications/Update%20to%20Korea’s%20New%20Biotech%20Labeling%20Requirements_Seoul_Korea%20-%20Republic%20of_6-23-2017.pdf Accessed on July 10, 2019. 151 For an extensive guide, see https://uk.practicallaw.thomsonreuters.com/w-017-6785?transitionType=Default&contextData=(sc.Default)&firstPage=true&comp=pluk&bhcp=1 Accessed on July 10, 2019. 152 Pitt, Leyland F., Pierre Berthon, Richard T. Watson, and Michael Ewing. 2001. “Pricing strategy and the net.” Business Horizons 44. 2:45.153 Retrieved from: https://medium.com/@swansong719/marketing-in-korea-5-essential-tips-to-get-you-started-e96c8eac3c76 Accessed on July 10, 2019. 154 Retrieved from: https://medium.com/@swansong719/marketing-in-korea-5-essential-tips-to-get-you-started-e96c8eac3c76 Accessed on July 10, 2019.
37
Distribution (Place)
In simple terms, distribution strategy is about determining the path a product or service will take from the time it is produced until the customer takes possession of it. There are two aspects to this: first, who takes title to the offering as it moves along this route, that is, who owns it, and second, what physical path the offering will take. For a Canadian firm desiring to enter the Korean e-commerce market, this means that two sets of decisions need to be made. First, whether taking title will be simple, as, for example, when a Korean consumer procures the offering directly off the Canadian firm’s website, or whether it will of necessity be more complex, if the Canadian firm chooses instead to use intermediaries such as import agents, wholesalers, or large or small Korean online presences, which can range from mega sites such as Coupang, to niche players in specialist categories. Second, especially in the case of physical goods, whether the Canadian firm is shipping from Canada or via a warehouse facility in Korea, and whether a third party such as a courier delivery service will be part of the supply chain in either both countries or in Korea alone. These observations bring us back to the admonition to either have, build, or acquire the skills to manage relationships; in this case either with other channel members or members of the physical supply chain.
For most Canadian firms this will require considerable time spent researching potential partners and then in all likelihood being on the ground in Korea to negotiate and strategize with them. Local expertise is crucial, and foreign firms that have been successful in Korea are those that have spent a lot of time finding strong local partners and building relationships with them, in order to obtain expertise at understanding local dynamics and avoiding costly local blunders.155 Firms that succeed in working with foreign partners in online environments are those that (1) exert considerable resources and time to identifying them; (2) carefully examine their current portfolio of partners and evaluate these; (3) spend time exploring just how well a potential partner markets themselves, which can be a giveaway; and (4), don’t expect the channel partner to do all the work. This is true in any international marketing situation; however, in the really dynamic Korean e-commerce arena, paying careful attention to these guidelines will definitely mean the difference between success and failure.
Promotion
Promotion, a convenient word because it starts with a P, is more properly conceived of as marketing communication, or how a firm will communicate with its target market. There are many ways in which a firm can do this, including mass media advertising, personal selling, publicity and public relations, and all manner of promotional methods such as samples, competitions, and coupons. In the age of e-commerce all of these tools can be combined, so that advertising (informing, persuading, and reminding), selling (undertaking transactions), publicity and public relations (news reports, blogs, social media presence), and all manner of promotional tactics can be conducted online. In the well-connected Korean e-commerce market, there are a number of specific issues that online Canadian marketing communicators should take note of.
First, a very large number of Korean consumers use social media in a variety of forms. While Facebook was used by 28.9% of Korean consumers in 2018 and Instagram by 17.4%, social media
155 Retrieved from: https://medium.com/@swansong719/marketing-in-korea-5-essential-tips-to-get-you-started-e96c8eac3c76 Accessed on July 10, 2019.
38
unique to Korea such as KakaoStory (23.8%) and Naver Band (12.5) also command a significant presence.156 Canadian firms considering using social media tools as part of their marketing communication armoury would be well-advised to incorporate local social media, and will probably have to pay for local expertise in order to do that. One of the benefits of using social media is that users do a lot of the work for you by spreading the message through word of mouth, but getting that to happen is easier said than done. One of the mechanisms that works very effectively in Korea is that of influencers, discussed briefly in the next paragraph.
Second, there is evidence that using celebrities and influencers in marketing communication works more effectively in South Korea than in Anglo nations such as the United Kingdom, the United States, and Canada. More than 40% of television advertising in South Korea features celebrities, compared to 12% in the United Kingdom, 10% in the United States, and 5% in Canada, according to the international marketing research firm Kantar Millward Brown.157 While use of celebrities might not directly equate to effectiveness, the large differences in numbers suggest that using celebrities and influencers works more strongly in Korea. Quite simply, Korean marketers are doing it because it works there. This means that Canadian firms seeking an e-commerce presence in Korea should seriously consider incorporating, depending of course on budget, either a celebrity, such as actress Gianna Jun, or a significant local influencer on social media into their online marketing communication strategy.
Third, localization of marketing communication is critical in Korea, and this does not simply mean translation. Foreign brands that have succeeded in Korea have all gone beyond translation and developed content that is directly relevant to Korean audiences, including sensitivity to cultural, historical, and political contexts.158 For an excellent summary in English of why simple written translation from English into the Korean language is beset with problems, see the post “Korean Localization: Unique Challenges of a Unique Language.”159
Canadian Government Help in Entering the Korean and Other Markets
For Canadian firms wishing to enter the Korean market, the most important government office is the Trade Commissioner Service. This government department has representative offices in more than 160 cities internationally. The website160 provides information on how the department can assist Canadian firms with funding and support programs, and in becoming part of trade missions and events. It also provides information on Canada’s trade agreements and country-specific information on tariffs, sanctions, and export controls.
156 Retrieved from: https://www-statista-com.proxy.lib.sfu.ca/statistics/763748/south-korea-most-popular-social-media/ Accessed on July 10, 2019. 157 Retrieved from: http://www.millwardbrown.com/mb-global/our-thinking/articles-opinion/articles/brand-matters/2018/celebrities-shine-in-ad-campaigns Accessed on July 10, 2019. 158 Retrieved from: https://medium.com/@swansong719/marketing-in-korea-5-essential-tips-to-get-you-started-e96c8eac3c76 Accessed on July 10, 2019. 159 Retrieved from: https://www.mtmlinguasoft.com/korean-localization-unique-challenges-of-a-unique-language/ Accessed on July 10, 2019. 160 Retrieved from: https://www.tradecommissioner.gc.ca/trade_commissioners-delegues_commerciaux/index.aspx?lang=eng Accessed on July 10, 2019.

39
The Canadian Trade Commissioner for South Korea is based in Seoul at: 21, Jeongdong-gil, Jung-gu Seoul, 04518 Tel: (82-2) 3783-6000 Email: [email protected]
It’s website can be found at https://www.tradecommissioner.gc.ca/korea-republic-coree-republique/office-bureau/index.aspx?lang=eng&office=SEOUL. On this website there is information on country market facts (such as the etiquette of doing business in Korea), market reports, trade events, and information on visits by Canadian firms.

40
FUTURE OUTLOOK
South Korea is a vibrant, very highly developed e-commerce market that has grown rapidly, and there are a number of factors that suggest this growth will continue into the future. First, the technology and online infrastructure in Korea is among the best in the world. The massive development investments by major local firms, such as Samsung continuing rapid progress in mobile devices, and the adoption of 5G networks that lead the world, will drive e-commerce forward.
Second, as this report has indicated, Korean consumers are now almost all online, particularly on mobile devices. They are generally well-educated and economically prosperous. They are also sophisticated and accustomed to the online environment, and if current trends provide any indication of the future, their use of online platforms will continue to grow. They demand a wide selection of new offerings and the logistics that enable these to be delivered on demand. When they are unable to satisfy their needs on the local market, they will turn to foreign online platforms, as suggested by strong trends in recent data. There were 14.94 million foreign direct online transactions worth US$1.32B in the first half of 2018, representing increases of around 36% and 35%, respectively, over the same period in the previous year.161 This represents tremendous opportunities for foreign firms with the right offerings and the right e-commerce strategy in place to enter a very attractive market.
Third, while both technological developments and a large market that is willing and keen to purchase online make Korea a very attractive market, Canadian firms would do well to remember that the market is intensely competitive and that local firms are aggressive in the pursuit of both Korean and overseas markets. Moreover, the pace of change is extremely rapid, which will make merely keeping up a challenge.
Perhaps the most interesting changes in the Korean e-commerce environment in the future will come from government. Online trading permits a reduction in transaction costs (the costs of search, evaluation, negotiation, etc.), and this allows consumers to obtain offerings at lower prices than in traditional offline markets.162 The Korean economists Cho, Kim, and Roh argue that there are spillover effects when transaction costs are reduced in one industry to other industries and that these ultimately affect the affect the economy as a whole.163 Their research shows that when the Korean government reduced tariffs on foreign online trade, foreign direct online purchasing reduced transaction costs and thereby increased the welfare of the Korean economy overall. They recommend that policy-makers pursue initiatives that make e-commerce more active in more diverse industries. The Korean government is almost certainly aware of this and the benefits that it brings. Under this scenario there will be even more opportunities for foreign firms (and Canadian firms in particular, given CKFTA) to conduct online business with Korean firms and consumers.
161 See Korea Customs Service (www. customs.go.kr) Accessed on July 10, 2019. 162 Strader, Troy J., and Michael J. Shaw. 1997. “Characteristics of electronic markets.” Decision Support Systems 21. 3:185-198.163 Cho, Yoonkyo, Taehwan Kim, and Jaewhak Roh. 2019. “An analysis of the effects of electronic commerce on the Korean economy using the CGE model.” Electronic Commerce Research. 1-24.
41
CONCLUSION
South Korea might appear daunting to Canadian firms considering market entry by means of e-commerce. There are a number of challenges. The market is intensely competitive, and major local companies present serious challenges to potential entrants. Consumers are sophisticated and demanding and are accustomed to being served rapidly and well. The pace of change in the e-commerce environment is among the most rapid in the world, and some experts have expressed concern that Canadian firms might not be able to adapt their practices and strategies rapidly enough to succeed.164
Nevertheless, there is much that makes e-commerce entry into South Korea an enticing business option. While the country is small in area, its economy is the third largest in Asia after China and Japan; its GDP ranked 12th in 2018 (Canada ranked 10th) and it is the world’s seventh-largest exporter.165 This means that consumers are generally well-off and are prepared to spend their money on offerings that provide novelty, quality, and good value. The country’s delivery and logistics services are second to none, which makes the shipping of offerings purchased online extremely efficient and inexpensive. These indicators are readily apparent, but there is an additional reason to seriously consider South Korea as a market for e-commerce: because the pace of change is so dynamic, the country provides an excellent opportunity for entering firms to learn and keep abreast of developments in the e-commerce sphere. South Korea can be seen as a bellwether in the broad field of technological innovation in general, and for e-commerce in particular. What happens in South Korea today will inevitably happen in other parts of the world in the future, in the e-commerce domain. By being present, studying, and learning from what is happening, Canadian firms might profit financially, but they will almost certainly gain transferable knowledge from being present and active in this dynamic market.
164 Personal interview, Dr. Chang Hoon Oh, Vancouver, June 20, 2019.165 Retrieved from: https://databank.worldbank.org/data/download/GDP.pdf Accessed on July 10, 2019.
42
CASE STUDIES
Case Study I: Yogiyo
Food Delivery in Korea
Long before the advent of food delivery apps such as Skip the Dishes and Door Dash in North America, fast courier delivery of meals was well-established in Korea. Back in the 1960s and 1970s, Korean households were able to order fast food for home delivery by simply calling a restaurant’s number and having a meal delivered to their homes or place of work in a very short time. The high population density in urban environments, as opposed to the more spread-out populations in North American suburbs, made this a more feasible business not only for restaurants and courier services, but also for other convenience goods and services providers such as dry cleaners and mom-and-pop convenience stores. When the internet became a reality in the 1990s, Koreans began to order online as well. Apps on smart devices accelerated the trend even further, and as this happened, the competition in the Korean fast food delivery service industry intensified. A major player is Yogiyo.
Yogiyo and Delivery Hero
Yogiyo is a significant competitor in the Korean food delivery service industry. It is a member of RGP Group Korea Ltd., a company that was founded in Seoul in 2011.166 In December 2018, RGP (restaurant growth partner) Group Korea announced that it would be changing its name to Delivery Hero Korea (DHK).167 According to DHK CEO Kang Shin-bong, the name change was intended to highlight the importance of the Korean market as one of the largest and most important global markets that Delivery Hero is present in. RGP Korea was established in late 2011 as a regional affiliate of Delivery Hero. Yogiyo was a service launched by RGP at the time of its establishment, and RGP then acquired two other Korean food delivery services, Baedaltong in 2014 and Foodfly in 2017.168
Delivery Hero is a German company based in Berlin and listed on the Frankfurt Stock Exchange. The company was founded in May 2011 by Niklas Östberg, whose vision was to be the world’s number one food ordering company. It operates in countries in Europe, Asia, Latin America, and the Middle East, and has partnerships with more than a quarter of a million restaurants.169 It claims to have delivered more than 369 million orders in 2018. Delivery Hero has a policy that foreign offices should run autonomously in a way best suited to each country.170
166 Retrieved from: https://www.bloomberg.com/research/stocks/private/snapshot.asp?privcapId=214472757 Accessed on July 10, 2019. 167 Retrieved from: http://koreajoongangdaily.joins.com/news/article/article.aspx?aid=3056458 Accessed on July 10, 2019. 168 Retrieved from: http://koreajoongangdaily.joins.com/news/article/article.aspx?aid=3056458 Accessed on July 10, 2019. 169 Retrieved from: https://techcrunch.com/2012/08/27/take-out-wars-heat-up-delivery-hero-raises-further-50m-to-race-just-eat-to-global-domination/ Accessed on July 10, 2019. 170 Ibid.
43
Kang Shin-bong, an MBA graduate of Duke University’s Fuqua School of Business, joined RGP Korea in January 2016 as the chief operating officer, and was then named CEO of the company in July 2017. Previously he was a marketing executive at eBay China as well as for the APEC region, and led the acquisition of eBay Korea’s Gmarket.171
The Korean Food Delivery Market
While Koreans have been enthusiastic consumers of fast delivered food for many years, Korea is still a very dynamic market in this regard, and the recent past has seen many changes. Advances in mobile technologies and changing demographics have mainly driven these changes.172 Whereas previously Koreans would order from printed menus by phone, or on websites via home or office desktop computers, the advent of apps on mobile devices now enables ordering and payment to happen with just a few clicks.
Korean demographics are also changing, and there are more single person households in large Korean cities today than previously. These consumers prefer to order in than to eat out on their own. The Korean market research firm Macromill Embrain173 surveyed 1,000 Koreans of both genders between the ages of 15 and 59 in the first half of 2018 concerning their attitudes toward delivered food and food ordering apps. The study indicated that more than 70% of respondents had used a food delivery app, and that the use of food delivery apps, rather than conventional phone orders, had increased by almost 50% between 2017 and 2018.174 Not surprisingly, younger consumers were more likely to use food ordering apps, and more than half of the respondents stated that the main reasons for using an app were being able to search, order, and pay for the service on one platform. A number of consumers did indicate their concerns that the pricing policies of food delivery apps were not transparent, and they were concerned with the split of the ticket price between profit to the restaurant and profit to the delivery company behind the app.
Competition in the Korean Food Delivery App Industry
There are two main players in the Korean food delivery app industry, although there is also a host of smaller firms. The first is Baedal Minjok, which iaccording to most reports is the largest player in the industry.175 The company was backed by major investors including Goldman Sachs, venture capitalists, and the Korean internet giant Naver when it launched in 2011.176 A study by Korean app data analysis firm Incross177 reported in 2019 that Baedal Minjok had enjoyed app and web traffic of 6.39 million visitors for the month of April. Yogiyo was second with 3.68 million. Burger King was third with 1.23 million, and the Asian fast food chain Lotteria, which originated in Tokyo, was fourth with 630,000 visitors. Baedaltong, also owned by DHK, came in fifth.178 Interestingly, both Burger King and Lotteria had grown faster in the past year than had Baedal Minjok and Yogiyo.
171 Retrieved from: https://www.deliveryhero.com/brands/yogiyo/ Accessed on July 10, 2019. 172 Retrieved from: http://www.koreaherald.com/view.php?ud=20180613000182 Accessed on July 10, 2019. 173 Retrieved from: http://www.embrain.com/eng/intro/intro1.asp Accessed on July 10, 2019. 174 Retrieved from: http://www.koreaherald.com/view.php?ud=20180613000182 Accessed on July 10, 2019. 175 Retrieved from: https://pulsenews.co.kr/view.php?year=2019&no=408648 Accessed on July 10, 2019.176 Retrieved from: http://www.koreaherald.com/view.php?ud=20180613000182 Accessed on July 10, 2019. 177 Retrieved from: https://www.incross.com/en/about-incross/aboutus/ Accessed on July 10, 2019. 178 Retrieved from: https://pulsenews.co.kr/view.php?year=2019&no=408648 Accessed on July 10, 2019.
44
Baedal Minjok was especially visible as a brand because of its independent delivery service called Baemin Riders, a team of motorcycle delivery riders who had been part of the workforce the company gained when it acquired a service provider called Dubaki Call in 2017. Dressed in their attractive light blue uniforms and on their similarly coloured scooters,179 the Baemin Riders deliver from restaurants that don’t offer delivery services of their own, for an additional fee, and in this way provide diners with more choice. Seemingly in retaliation, DHK acquired Barogo Riders for Yogiyo for US$18.5M in May 2018, having already purchased Foodfly in 2017. Barogo Riders is a similar motorcycle delivery service whose riders also wear distinctive uniforms. The proliferation of these delivery services in the capital, Seoul, prompted the city’s Metropolitan Police Agency to sign a memorandum of agreement with all the major delivery companies, including Yogiyo and Baedal Minjok, in January 2018 to promote safe motorcycle riding.180
Investment in the industry was significant, especially in the year 2015, and it continues unabated. Baedal Minjok received KRW$54.3B of investment in 2012, and this was surpassed by Delivery Hero’s KRW65.9B investment in Yogiyo in the same year. Delivery Hero invested a further US$35M in Yogiyo in 2015.181 “Korea is a successful and key market for Delivery Hero,” said Delivery Hero PR Manager Bodo von Braunmühl at the time. “We won’t hold back on investments that will inevitable enable Yogiyo to provide the most suitable solution.” Delivery Hero founder Östberg was equally optimistic about Yogiyo’s future, stating that the holding company would continue to invest in Yogiyo in order for it to diversify the service that would improve user experiences and bring additional revenue for Yogiyo’s restaurant partners.182
Key Takeaways
• Smartphone apps have changed many industries, from ride sharing and accommodation to the food delivery business. While the food delivery business had existed in Korea for many years, it was the advent of apps that enabled the industry to enter the phase of rapid growth that the Yogiyo case illustrates. Whereas ordering by phone and then from a computer-based website had been convenient, only apps could provide the real benefit of one-stop purchasing, by integrating selection, ordering, and payment into one transaction. This is not unique to the food delivery business; the same principles apply in a host of other settings. It would be almost impossible to enter many markets in Korea today without having a fast, reliable, and well-designed mobile app.
• The Korean market is intensely competitive and dynamic. As successful as Yogiyo appears to be, there are a number of other very strong competitors. Almost paradoxically, apps have allowed more traditional restaurant chains, such as Burger King and Lotteria, to become major players in the mobile e-commerce market once more, witnessed by their rapid growth. The intense and ever-changing competitive scenario requires that managers monitor the competitive situation and continually revise and update their strategies.
179 Retrieved from: http://www.koreaherald.com/view.php?ud=20180613000182 Accessed on July 10, 2019. 180 Retrieved from: http://www.koreaherald.com/view.php?ud=20180116000663 Accessed on July 10, 2019. 181 Ibid.182 Retrieved from: http://en.koreaportal.com/articles/985/20150922/korean-food-delivery-yogiyo-biggest-investment.htm Accessed on July 10, 2019.
45
• Consider why a German firm would enter the Korean market, which it already knows to be highly competitive. The reasons may be twofold: First, the execution of the Korean subsidiary’s strategy is still left almost entirely to local executives, trusting that they will know the local market environment far better and be able to execute decisions there. Second, there is much to learn internationally from operating a firm successfully in a highly competitive market like Korea. After that, less competitive and dynamic markets that the holding company might decide to enter will be relatively easy by comparison.
• Understand how changes in local demographics can create opportunities. In the case of Korea, for example, an increase in the number of small single-occupant dwellings means a change in the way that people dine. By understanding this change, and developing a solution to it, the home food delivery industry capitalized on a very attractive market.
46
Case Study II: Pinkfong and Baby Shark
The Baby Shark Phenomenon
In a video on YouTube that has almost 1.8 million views to date, a very cute toddler asks Amazon’s digital assistant to “Play Baby Shark.”183 Alexa gets it very wrong the first time, and the toddler quickly stops it and repeats her demand. Alexa gets it wrong again, and this time the frustrated tot shouts it down before repeating her request. Now Alexa plays the version of the song Baby Shark by Johnny Only, which is the right song, but not the version she wants. In frustration the child hails her mother for help. Her mom gets Alexa to play the version of the song her daughter is looking for: Pinkfong’s Baby Shark. The toddler yells her delight and immediately begins to sing along with the song, and to do all the hand movements that accompany it on the song’s YouTube video. It is one of the most watched YouTube videos of all time, with almost three billion downloads.184
Pinkfong and Baby Shark
The Baby Shark video features two cute, very young kids singing a very simple song about a family of sharks. It is filmed against a simple series of animated cartoon backdrops. The words are very simple, with each verse introducing a new family member, starting with baby, and moving through the parents and grandparents, and simply ending on “doo doo doo.” As each family member is introduced, the kids in the video do hand movements to mimic the character. In the last verse the shark family decide to go hunting, but the kids happily manage to escape by hiding safely in a large shell. The song is simple enough for children as young as two or three to learn the words, and to mimic the actions of the kids in the video.
The Baby Shark video possesses all of the characteristics of a property that has been referred to as “stickiness.” Stickiness, as defined by Malcolm Gladwell185 in his bestselling book, The Tipping Point, is the requirement for a successful message to be memorable to the extent that it can create change and spur someone to action. Gladwell uses the children’s TV classic Sesame Street to illustrate how stickiness works. The producers of the show realized that the attention span of the average five-year-old was very short, and that for a kids’ TV show to hold the attention of its audience it would have to be crafted with the specific purpose of doing this. Indeed, the producers would test scenes for future episodes of the show by showing them to sample audiences of small children, and then deliberately trying to distract these audience members while the scene was playing. For example, people would walk by carrying food, or enter the room and do something silly. If the distraction was successful, these scenes were removed from the show, under the reasoning that child audiences would not watch them because they were distracted. Arguably Baby Shark has been hugely successful because it possesses all the characteristics of stickiness: movement; simple repetitive lyrics and a very simple melody; and a call to action – children are encouraged to mimic the actions of the kids in the video.
The song was released in 2016 by the Korean children’s entertainment and education company Pinkfong, and the video was placed on YouTube. The song first went viral in South Korea, followed
183 Retrieved from: https://www.youtube.com/watch?v=JzfBedGaIjU Accessed on July 10, 2019. 184 Retrieved from: https://www.youtube.com/watch?v=XqZsoesa55w Accessed on July 10, 2019. 185 Gladwell, Malcolm. 2006. The Tipping Point: How Little Things Can Make a Big Difference. New York, NY: Little, Brown.
47
by the rest of Asia in 2017. The rest of the world quickly took up the song and the video in 2018. By January 2019 the Baby Shark song featured on the Billboard Top 40 charts in the United States, where it enjoyed a 20-week streak, and also reached number six on the singles charts in the United Kingdom. The Baby Shark song was also featured on the Ellen DeGeneres Show and on James Cordon’s Late Late Show, where it was performed by Josh Groban and Sophie Turner. It was also mentioned on social media by major influencers such as Kendall Jenner and Cardi B.186
Headquartered in Seoul, South Korea, Pinkfong is an entertainment company that targets families with young children around the world with content suitable for the education and entertainment of children. The company, whose brand is represented by a playful pink fox,187 has a library of over 4,000 songs and stories in its library, and has won many awards from online giants such as Amazon Video, YouTube, and Google Play.
Pinkfong and SmartStudy
Pinkfong is a subsidiary of SmartStudy. Also based in Seoul, Korea, SmartStudy is a company founded in 2010 that focuses on children’s entertainment and education. It produces videos featuring a range of characters, and these are in a number of languages, including Korean, English, Chinese, Spanish, and Russian. Its mobile app, which provides content to users, has been downloaded 150 million times by smartphone and tablet owners in more than 100 countries.188 SmartStudy’s CEO Kim Min-seok, aged 38, is the largest shareholder in the company, owning 23.1% of the stock. He is the son of Kim Jin-yong, CEO of Samsung Publishing, which is the second largest shareholder in SmartStudy, with 20.8% of the shares. According to reports in late 2018, SmartStudy was considering a public stock offering in 2020, having sent a request for proposals to major Korean securities firms.189
In a recent interview, Pinkfong’s US-based CEO, Bin Jeong, talked of the company’s founding and its current strategy.190 From her LinkedIn page,191 Bin Jeong notes that she has led the company’s international business development efforts focused on the US market, to open more distribution channels for digital content, apps, and offline products. She has particularly focused on Pinkfong’s YouTube operations, paying special attention to metrics. Previously she had worked in digital marketing within the arts and entertainment industries.
Jeong explains that Pinkfong was established in Korea in 2010, and opened its US office in 2016, where SmartStudy was already present and employed more than 150 people. Pinkfong’s objective with regard to content, she argues, is not to get the highest number of views; rather, its obligation is to produce quality educational content for kids. The company consults with educators, scholars, and child psychologists in its attempts to create materials that will work best for the education and entertainment of children, rather than simply attract lots of downloads.
186 Retrieved from: https://www.cbc.ca/radio/q/thursday-january-24-2019-steffi-didomenicantonio-johnny-only-and-more-1.4989911/the-long-complicated-history-of-baby-shark-and-the-artist-fighting-for-credit-1.4989936 Accessed on July 10, 2019. 187 Retrieved from: https://thesavvyscreener.com/2017/08/14/pinkfong-qa/ Accessed on July 10, 2019. 188 Retrieved from: http://www.theinvestor.co.kr/view.php?ud=20181101000668 Accessed on July 10, 2019. 189 Retrieved from: http://www.theinvestor.co.kr/view.php?ud=20181101000668 Accessed on July 10, 2019. 190 Retrieved from: https://thesavvyscreener.com/2017/08/14/pinkfong-qa/ Accessed on July 10, 2019. 191 Retrieved from: https://www.linkedin.com/in/bin-jeong-711766a9/ Accessed on July 10, 2019.
48
Jeong is also mindful of the cultural differences between the markets Pinkfong serves. “Because we deliver our content worldwide, we have to consider the cultural differences between countries. What is considered appropriate for kids in one country might not be in another,” she says.192 Pinkfong, she goes on to say, focuses on learning videos for children, but also on apps for mobile devices, games, songbooks, and more recently, toys. Other than Baby Shark, its other most popular videos include “Police Car” and “The Lion.” The company has already concluded deals with major online operators such as Amazon Prime and YouTube for the provision of content. Pinkfong’s future plans include further development of characters and animation series, expansion into other product offerings, and broadening the age appeal of its offerings.
Expanding Baby Shark
Baby Shark has expanded well beyond the original video. In June 2019, Pinkfong acknowledged that Baby Shark had enabled it to increase its revenues by 47% over the previous year.193 Apart from the original video, revenues were boosted by almost 40 licensing deals, including those with well-known companies such as WowWee, Harper Collins, and toy manufacturer Hasbro. These covered a wide range of offerings, including toys, health and beauty accessories, food, publishing, and clothing. The Baby Shark range of products on Amazon.com sold out only two days after becoming available in the first half of 2019.194 The brand is now also featured in concert tours in a number of countries including the United States, the United Kingdom, and Canada, where Pinkfong is working with children’s media company Nickelodeon, and Round Room Live, a premier live entertainment company that has worked with famous brands such as The Rolling Stones.195,196
Nickelodeon has been particularly enthusiastic about the Baby Shark opportunity and will develop a new original animated series based on Baby Shark for distribution worldwide.197 This will be accompanied by a host of other product categories that Nickelodeon will cultivate in partnership with Viacom. Pam Kaufman, president of Viacom Nickelodeon Consumer Products, says, “Our outstanding creative teams are moving fast to get more Baby Shark product across multiple categories to retailers, and our content team is excited to develop a terrific original animated series that will bring this property to new heights and even more fans.”198 There is even speculation that apps will be developed on Amazon’s Alexa and Google Home’s voice assistants to further engage kids and their families with Baby Shark.199 One of Pinkfong’s founders, Seungkyu Lee, informed news company Bloomberg that the company was working to develop a stage musical that would debut in North America.200
192 Retrieved from: https://thesavvyscreener.com/2017/08/14/pinkfong-qa/ Accessed on July 10, 2019. 193 Retrieved from: https://www.cnbc.com/2019/06/17/viral-baby-shark-song-to-expand-brand-to-tv-concerts-and-more.html; https://www.licenseglobal.com/television/pinkfong’s-baby-shark-gets-spin-series Accessed on July 10, 2019. 194 Retrieved from: https://www.cnbc.com/2019/06/17/viral-baby-shark-song-to-expand-brand-to-tv-concerts-and-more.html Accessed on July 10, 2019. 195 Retrieved from: https://roundroompresents.com/current/ Accessed on July 10, 2019. 196 Retrieved from: https://www.entertainmentone.com/companies/round-room/ Accessed on July 10, 2019. 197 Retrieved from: https://www.businesswire.com/news/home/20190605005609/en/Pinkfong’s-Baby-Shark-Joins-Nickelodeon-Family Accessed on July 10, 2019. 198 Ibid.199 Retrieved from: https://www.usatoday.com/story/life/allthemoms/2019/01/24/creators-baby-shark-bringing-videos-netflix/2667210002/ Accessed on July 10, 2019. 200 Ibid.

49
Intellectual Property Controversy
The Liberty Korea Party (LKP), a right-wing political party in that country, decided to use a Johnny Only 201 version of the Baby Shark song in 2018202 that had been on YouTube since 2011 to promote candidates in its political campaigns. Only gave them permission to use it because the song was in the public domain – it was an old German folk song called “Kleiner Hai” (or “small shark”).203
In late 2018, SmartStudy threatened a copyright infringement suit. Johnny Only’s YouTube page was soon flooded with comments from Koreans, mostly supporting him. One post encouraged him to take legal action against Pinkfong, while another wrote in English, “As I am a Korean, I am disgraceful to this case. Last, I am sorry.”204
He contacted a Korean intellectual property lawyer, not to claim copyright or to seek compensation, but simply to obtain a Korean court ruling, “on what they think regarding the issue between Pinkfong and my version.”205 Pinkfong has not responded to the suit as far as can be ascertained. Seunghyun Yoon, SmartStudy’s marketing manager, has said simply, “we took a fresh twist and recreated on a traditional singalong chant by adding upbeat rhythms and fresh melody. We have a team of content creators based in South Korea that plans and directs the design, choreography, storyboarding and localization of Pinkfong’s content.”206,207
Baby Shark: The Future
After very successful live shows in other countries including the United Kingdom,208 in June 2019, Pinkfong and Round Room Live announced that they were partnering to embark on a 100-city tour of the United States and Canada with a Baby Shark show that would deliver a “fully immersive concert experience.”209,210 In the show, Baby Shark joins up with his friend, Pinkfong (the little pink fox), to sing and dance such songs as “Five Little Monkeys” and “Wheels on the Bus,” both of which are songs that parents have sung to and with their children over many generations, and of course, the Baby Shark song. Tickets for the shows in North America were already available on the online booking website, StubHub.211 Naturally there are also a multitude of opportunities for children and their guardians to further engage with the Baby Shark brand
201 Retrieved from: https://www.youtube.com/watch?v=hkHdx0yWaow Accessed on July 10, 2019. 202 Retrieved from: https://www.cbc.ca/radio/q/thursday-january-24-2019-steffi-didomenicantonio-johnny-only-and-more-1.4989911/the-long-complicated-history-of-baby-shark-and-the-artist-fighting-for-credit-1.4989936 Accessed on July 10, 2019. 203 Retrieved from: https://www.rollingstone.com/music/music-news/baby-shark-charts-784755/ Accessed on July 10, 2019. 204 Retrieved from: https://www.cbc.ca/radio/q/thursday-january-24-2019-steffi-didomenicantonio-johnny-only-and-more-1.4989911/the-long-complicated-history-of-baby-shark-and-the-artist-fighting-for-credit-1.4989936 Accessed on July 10, 2019. 205 At the time of writing, the courts in Korea have not yet delivered a decision on this.206 Retrieved from: https://www.cbc.ca/radio/q/thursday-january-24-2019-steffi-didomenicantonio-johnny-only-and-more-1.4989911/the-long-complicated-history-of-baby-shark-and-the-artist-fighting-for-credit-1.4989936 Accessed on July 10, 2019. 207 Retrieved from: https://www.vulture.com/2019/01/how-death-dismemberment-and-jesus-made-baby-shark-a-hit.html Accessed on July 10, 2019. 208 Retrieved from: https://www.birminghammail.co.uk/special-features/kidtropolis-baby-shark-event-easter-15787983 Accessed on July 10, 2019. 209 Retrieved from: https://www.ctvnews.ca/entertainment/baby-shark-live-to-tour-100-north-american-cities-1.4465066 Accessed on July 10, 2019. 210 Retrieved from: https://roundroompresents.com/current/ Accessed on July 10, 2019. 211 Retrieved from: https://www.stubhub.ca/pinkfong-baby-shark-live-musical-tickets/grouping/50028036/ Accessed on July 10, 2019.

50
at the shows, with the prospect of seeing and photographing the characters at intervals,212 and purchasing merchandise including clothing and toys.
Pinkfong continues to expand the Baby Shark brand both online and in the real world. A selection of Baby Shark toys were displayed in January 2019 at the annual Toy Fair at Olympia London, one of the world’s major toy exhibitions. Baby Shark Sound Books are carefully designed to ensure an optimal learning experience for children aged 0-3. Each book carries 10 songs and is available in English, Chinese, and Korean. There are also stuffed toys such as the Shark Family Sound Doll whose tummy can be squeezed to hear a “Shark Song.” On September 6, 2018, shares in Samsung Publishing (which, as already stated, owns a 20% stake in SmartStudy) surged 13.2% in one day’s trading on the Seoul Stock Exchange, having already increased in value by 76% over the previous year. This was attributed to the fact that on August 31, 2018, the Baby Shark song had become the first children’s song to make it to the UK Top 40.213
The Baby Shark success story illustrates how a successful e-commerce venture can originate from a very basic idea: a simple concept, in this case a catchy tune with elementary lyrics and a rudimentary but fun video. Pinkfong used YouTube as an essentially free broadcast medium to reach a global market; this could only realistically have been done in an online environment. The power of the internet allowed the video to touch almost three billion people. Once this effect has been achieved, further growth opportunities are almost endless in both online and brick-and-mortar settings. The Baby Shark YouTube video becomes a meme214 that can then be propagated online in the form of further videos, games, apps, and e-reader books. It also permits the firm to create a range of tangible offerings, such as clothing and toys, that can be marketed both online and in brick-and-mortar stores, as well as producing or franchising live entertainment in theatres, for which tickets can be sold online.
Key Takeaways
• Understand how things go viral in online environments. Of the millions of posts every day on social media, only a handful garner more than a million responses. Great content is not enough on its own, although this is a prerequisite. First, this content must touch at least one of the basic human emotions, such as anger, sadness, disgust, or in the case of the Baby Shark video, both joy and fear.215 Second, the social media message always needs an accelerant in order to diffuse rapidly, and this usually comes in the form of broadcast media. This can be likened to starting a fire: making a fire requires fuel, but getting it going strongly usually requires an accelerant. In the Baby Shark case, the really cute and well-produced content supplied the fuel. While the company is not forthcoming on this, behind the scenes was almost certainly a well-oiled publicity machine spreading the news about the video to television channels and other mass media to act as an accelerant.
212 Retrieved from: https://www.birminghammail.co.uk/special-features/kidtropolis-baby-shark-event-easter-15787983 Accessed on July 10, 2019. 213 Retrieved from: https://www.cnbc.com/2018/09/06/baby-shark-samsung-publishing-stock-soars-on-success-of-viral-song.html Accessed on July 10, 2019. 214 A meme is an image, video, piece of text, etc., typically humorous in nature, that is copied and spread rapidly by internet users, often with slight variations. (Oxford English Dictionary)215 Ekman, Paul. 1992. “An argument for basic emotions.” Cognition & Emotion 6. 3-4:169-200.
51
• Understand the benefit of “platform” strategies.216 In a very real sense Baby Shark provides a platform from which Pinkfong can build both a business for itself and for its collaborators. This has many of the characteristics associated with both major and minor platform success stories, and suggests ways in which an original simple idea can be used as the platform to grow a successful business in a multitude of ways. At a very large level, for example, Disney has used simple, formulaic animated movies, mostly based on folk tales (e.g. Snow White, Cinderella, Aladdin) as platforms to sell a host of other offerings in addition to the original. These have included games, toys, and clothing. At a much smaller level, Dave Carroll, a Canadian musician, recorded a song called “United Breaks Guitars” and placed the video on YouTube as a form of protest when United Airlines indeed broke his expensive guitar on a flight and refused to compensate him. The “fuel” – the video – was excellent, funny, and entertaining. It was also helped by an accelerant: the story was picked up by all the major news media, which further accelerated the number of YouTube downloads (19 million by June 2019).217 Carroll was obviously able to monetize the video downloads on YouTube. More importantly, however, he also used it as a platform to sell a book about the incident; to act as a spokesperson for Taylor guitars, travel consultants, and service training companies; to sell a range of merchandise such as T-shirts and mugs; and to give talks on service quality and act as a consultant and motivational speaker for many large companies.218 Baby Shark has afforded Pinkfong a platform from which it can build a very substantial business. The original video has enabled the company to expand into publishing, live performances, toys, and a whole range of other offerings.
• Understand the importance of stickiness, namely, designing messages, especially online ones, to be memorable so that they can create change and spur people to action. This does not only apply to markets of young consumers; it applies to customers of all ages.
• Understand the power of alliances. Pinkfong has not attempted to monetize everything concerning Baby Shark for itself. While this may have been an attractive proposition, the company does not have unlimited resources, and instead, has sought partners all over the world, who serve a variety of different markets, and have different skills and resources. For Canadian firms desirous of entering the Korean market (and indeed others), this means that finding suitable partners with whom to form alliances is important and potentially rewarding. Firms could either market their own content through a partner like Pinkfong, or align with Pinkfong to represent it in either a broad or specific manner in the home country.
• Be culturally sensitive. Pinkfong has made sure to be culturally sensitive in selling its content online in different countries. While simple kids’ videos such as Baby Shark might seem innocuous, it is worth ensuring that whatever is placed online does not offend members of other cultures.
216 See https://www.mckinsey.com/business-functions/digital-mckinsey/our-insights/the-right-digital-platform-strategy Accessed on July 10, 2019. 217 Retrieved from: https://www.youtube.com/watch?v=5YGc4zOqozo Accessed on July 10, 2019. 218 See Deighton, John. 2009. United Breaks Guitars, Harvard Business School Case 9-510-057, Boston, MA: Harvard Business School Publishing.
52
• Be wary of intellectual property issues. The Pinkfong Baby Shark case raises important issues regarding intellectual property. First there is the issue of content that might be viewed in some countries as being in the public domain. For example, an old folk song whose composer might not even be identified, or for which the content has long expired. Second there is the issue of disputing an intellectual property issue in a jurisdiction outside of the home country.
• Understand the power and opportunities that conducting natural online experiments can provide. Producing a simple video such as Baby Shark is relatively inexpensive, and broadcasting it initially is essentially free. While not all videos will go viral or achieve the spectacular online success of the Baby Shark video, the odds of success increase in relation to the number of attempts to gain public attention. While the hit rate on successes might be low, a success even a tenth the magnitude of Baby Shark can result in major payoffs.

53
APPENDIX
Digital Technology in South Korea and Canada - A Comparison of Digital Device Ownership, Digital Media Consumption, and Digital Behaviour
1.0 Sample Panel Introduction
This data was professionally collected by a large market research organization as part of their annual research program. The sample panel includes 1,001 individuals from Canada and 500 individuals from South Korea. Both the Canadian and South Korean sample aimed to be as representative as possible.
2.0 Sample Panel Statistics
The Canadian sample is balanced in terms of gender, with 49.3% men and 50.7% women (see Figure 2.1). The South Korean sample had slightly fewer women with 45% and slightly more men with 55%.
The average age of the sample was older in Canada, at 42.9 years of age, than in South Korea at 39.1 (see Figure 2.2). The Canadian sample was evenly distributed around the average age, but the South Korean sample was younger, with 7.6% of the sample being above 55, compared to 20.6% in the Canadian sample.
Fig. 2.1: Gender mix (%)
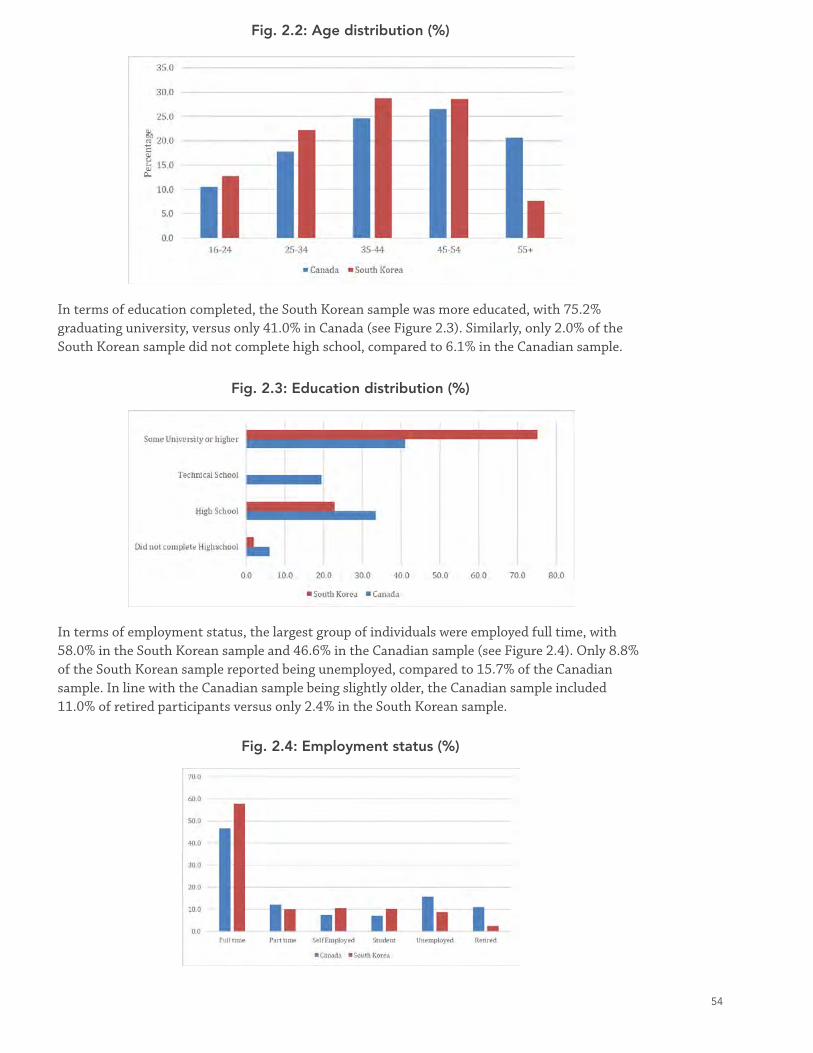
54
Fig. 2.2: Age distribution (%)
Fig. 2.3: Education distribution (%)
Fig. 2.4: Employment status (%)
In terms of education completed, the South Korean sample was more educated, with 75.2% graduating university, versus only 41.0% in Canada (see Figure 2.3). Similarly, only 2.0% of the South Korean sample did not complete high school, compared to 6.1% in the Canadian sample.
In terms of employment status, the largest group of individuals were employed full time, with 58.0% in the South Korean sample and 46.6% in the Canadian sample (see Figure 2.4). Only 8.8% of the South Korean sample reported being unemployed, compared to 15.7% of the Canadian sample. In line with the Canadian sample being slightly older, the Canadian sample included 11.0% of retired participants versus only 2.4% in the South Korean sample.

55
Fig. 2.5: Marital status (%)
Fig. 2.6: Investable household assets (%)
In terms of household investable assets, South Korean respondents on average reported that they hold more than individuals in the Canadian sample. Some individuals (11.8%) in the South Korean sample reported having no household investable assets, compared to 15.4% in the Canadian sample (see Figure 2.6).
3.0 Digital Device Ownership
Before investigating the extent to which digital technology has penetrated the daily lives of individuals in South Korea and Canada, it is important to assess their access to or ownership of basic digital technology.
Most individuals in both countries seemed to have access to at least one personal computer at home, with some having access to more than one computing device (see Figure 3.1). The South Korean sample reported having access to desktops (87.6%), laptops (64.0%), and tablet computers (22.2%). The South Korean sample reported owning more (87.6%) home desktops than the Canadian sample (61.6%).
In terms of marital status, most people in both countries were married, with 59.2% in the South Korean sample and 50.1% in the Canadian sample. Only 1.0% of the South Korean sample reported living as married, while this designation was more common, 17.7%, in the Canadian sample. Many respondents in both countries stated they were single, with 36.0% in South Korea and 24.3% in Canada.

56
Fig. 3.1: Own a computer (%)
Fig. 3.2: Own a mobile phone (%)
The picture changes slightly when examining mobile phone ownership (see Figure 3.2). The South Korean sample reported owning more other smartphones (62.4%), compared to 34.9% of the Canadian sample. With the Canadian sample, 23.6% reported owning an iPhone, while only 13.2% of the South Korean sample reported owning an iPhone.
Fig. 3.3: Home electronics devices ownership (%)
In terms of home electronic devices, the Canadian sample reported higher percentages of ownership of DVD players, e-readers, and game consoles (see Figure 3.3). Smart TVs are relatively more popular with the South Korean sample (33.2%) than the Canadian sample (11.1%).
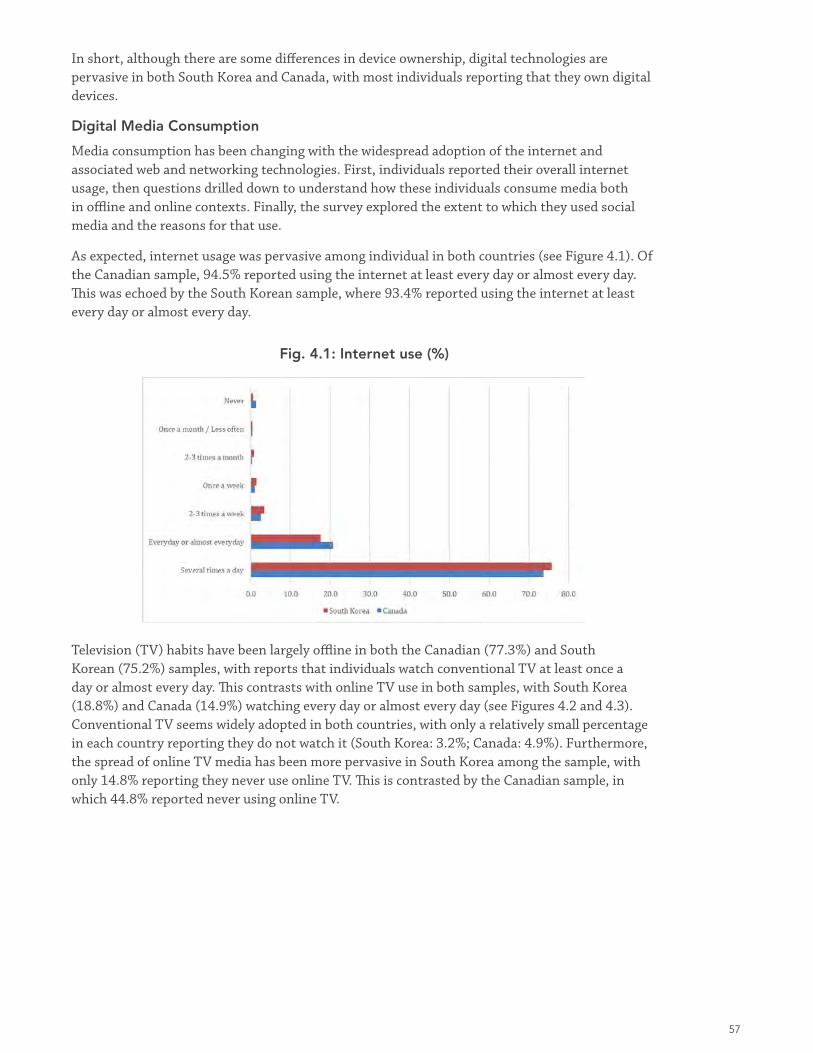
57
Fig. 4.1: Internet use (%)
Television (TV) habits have been largely offline in both the Canadian (77.3%) and South Korean (75.2%) samples, with reports that individuals watch conventional TV at least once a day or almost every day. This contrasts with online TV use in both samples, with South Korea (18.8%) and Canada (14.9%) watching every day or almost every day (see Figures 4.2 and 4.3). Conventional TV seems widely adopted in both countries, with only a relatively small percentage in each country reporting they do not watch it (South Korea: 3.2%; Canada: 4.9%). Furthermore, the spread of online TV media has been more pervasive in South Korea among the sample, with only 14.8% reporting they never use online TV. This is contrasted by the Canadian sample, in which 44.8% reported never using online TV.
In short, although there are some differences in device ownership, digital technologies are pervasive in both South Korea and Canada, with most individuals reporting that they own digital devices.
Digital Media Consumption
Media consumption has been changing with the widespread adoption of the internet and associated web and networking technologies. First, individuals reported their overall internet usage, then questions drilled down to understand how these individuals consume media both in offline and online contexts. Finally, the survey explored the extent to which they used social media and the reasons for that use.
As expected, internet usage was pervasive among individual in both countries (see Figure 4.1). Of the Canadian sample, 94.5% reported using the internet at least every day or almost every day. This was echoed by the South Korean sample, where 93.4% reported using the internet at least every day or almost every day.
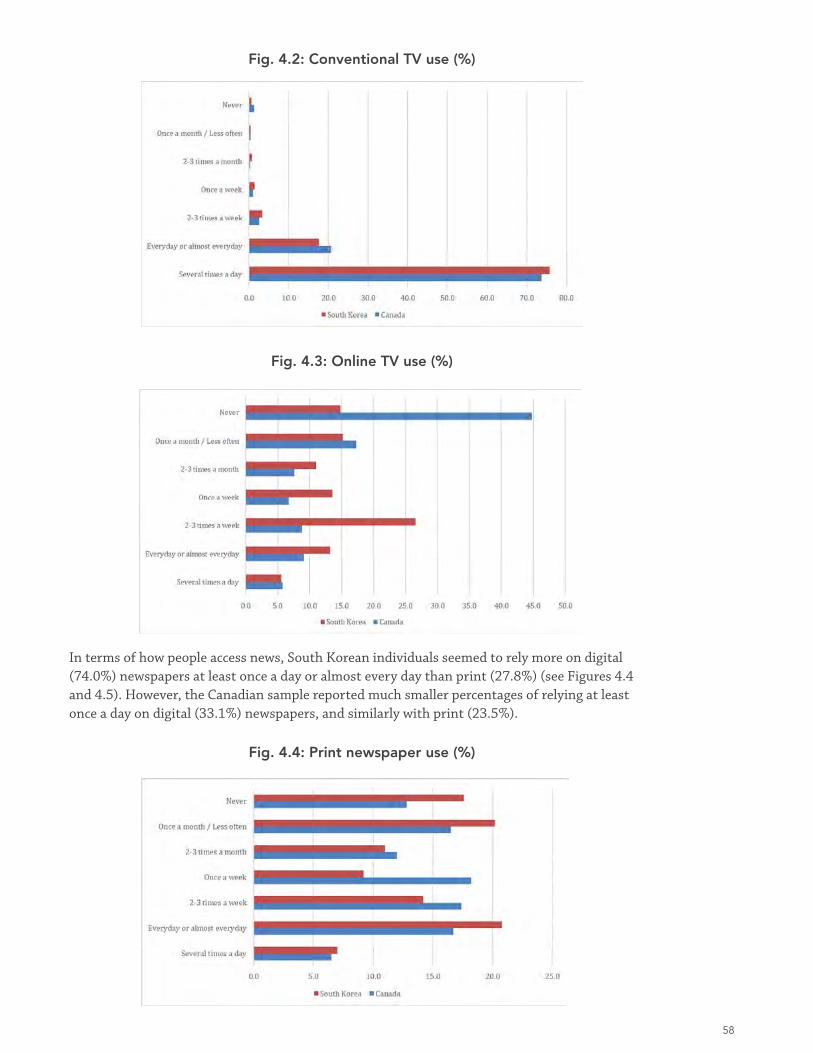
58
Fig. 4.2: Conventional TV use (%)
Fig. 4.3: Online TV use (%)
Fig. 4.4: Print newspaper use (%)
In terms of how people access news, South Korean individuals seemed to rely more on digital (74.0%) newspapers at least once a day or almost every day than print (27.8%) (see Figures 4.4 and 4.5). However, the Canadian sample reported much smaller percentages of relying at least once a day on digital (33.1%) newspapers, and similarly with print (23.5%).
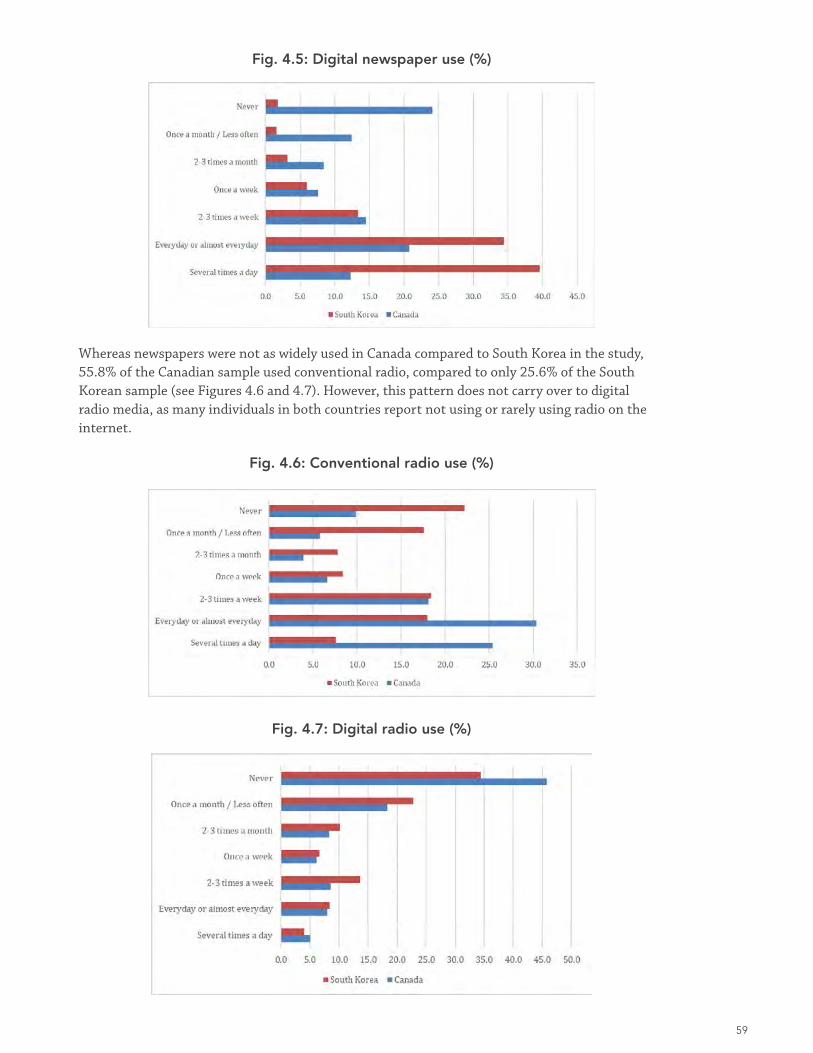
59
Fig. 4.5: Digital newspaper use (%)
Fig. 4.7: Digital radio use (%)
Fig. 4.6: Conventional radio use (%)
Whereas newspapers were not as widely used in Canada compared to South Korea in the study, 55.8% of the Canadian sample used conventional radio, compared to only 25.6% of the South Korean sample (see Figures 4.6 and 4.7). However, this pattern does not carry over to digital radio media, as many individuals in both countries report not using or rarely using radio on the internet.
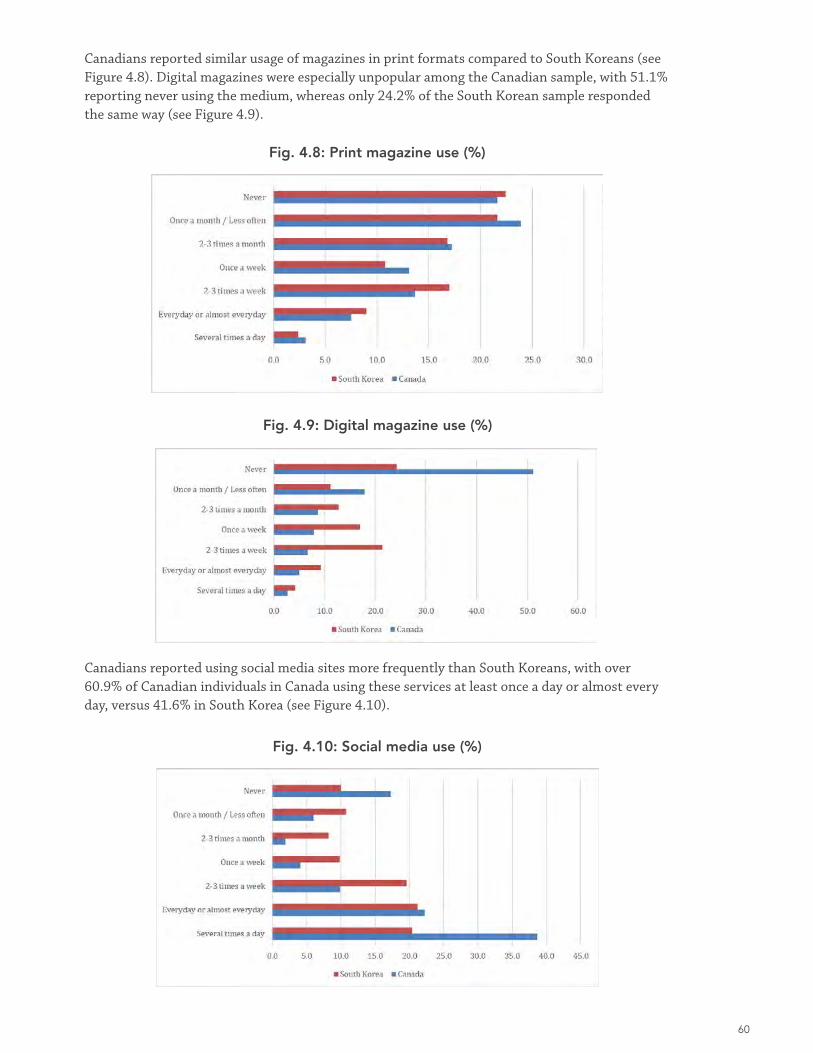
60
Fig. 4.8: Print magazine use (%)
Fig. 4.10: Social media use (%)
Canadians reported similar usage of magazines in print formats compared to South Koreans (see Figure 4.8). Digital magazines were especially unpopular among the Canadian sample, with 51.1% reporting never using the medium, whereas only 24.2% of the South Korean sample responded the same way (see Figure 4.9).
Fig. 4.9: Digital magazine use (%)
Canadians reported using social media sites more frequently than South Koreans, with over 60.9% of Canadian individuals in Canada using these services at least once a day or almost every day, versus 41.6% in South Korea (see Figure 4.10).
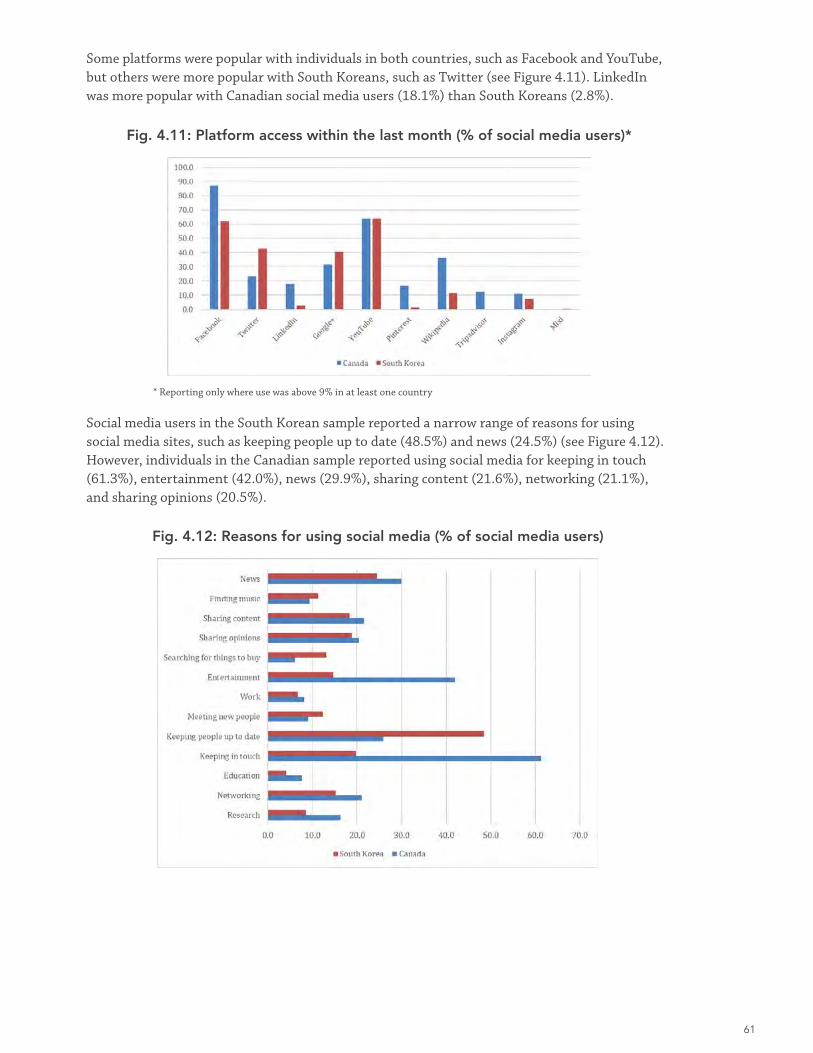
61
Fig. 4.11: Platform access within the last month (% of social media users)*
Fig. 4.12: Reasons for using social media (% of social media users)
* Reporting only where use was above 9% in at least one country
Some platforms were popular with individuals in both countries, such as Facebook and YouTube, but others were more popular with South Koreans, such as Twitter (see Figure 4.11). LinkedIn was more popular with Canadian social media users (18.1%) than South Koreans (2.8%).
Social media users in the South Korean sample reported a narrow range of reasons for using social media sites, such as keeping people up to date (48.5%) and news (24.5%) (see Figure 4.12). However, individuals in the Canadian sample reported using social media for keeping in touch (61.3%), entertainment (42.0%), news (29.9%), sharing content (21.6%), networking (21.1%), and sharing opinions (20.5%).
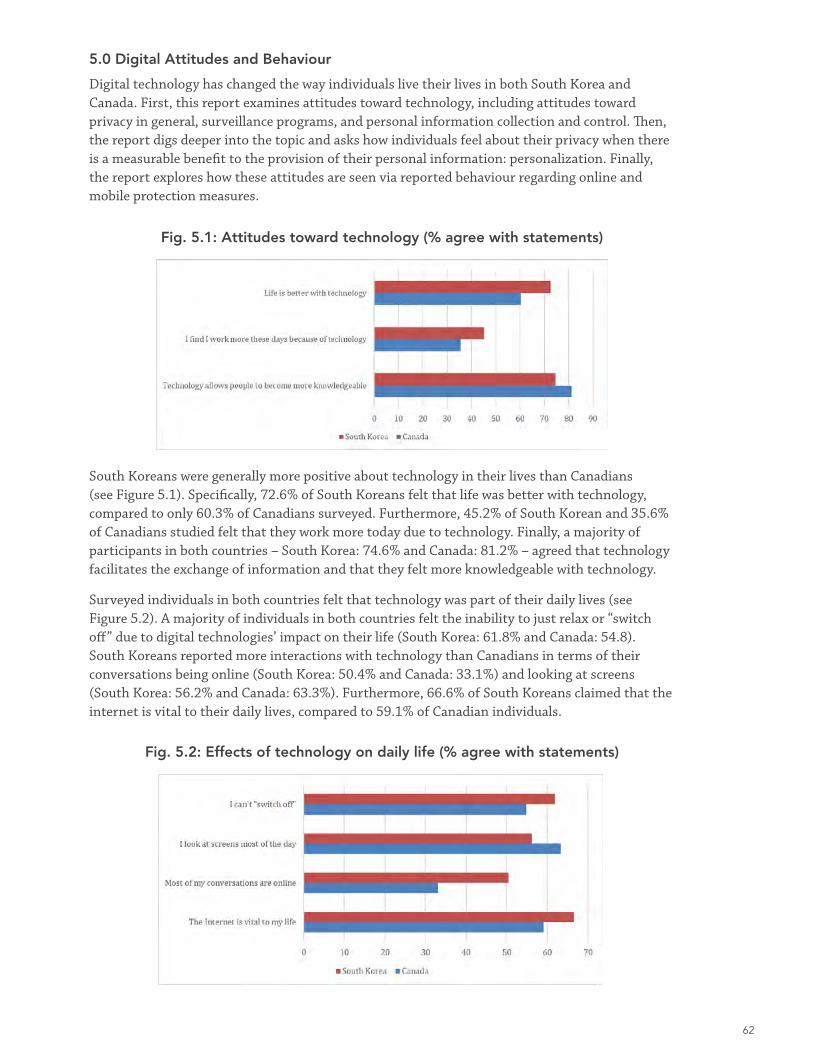
62
Fig. 5.1: Attitudes toward technology (% agree with statements)
Fig. 5.2: Effects of technology on daily life (% agree with statements)
5.0 Digital Attitudes and Behaviour
Digital technology has changed the way individuals live their lives in both South Korea and Canada. First, this report examines attitudes toward technology, including attitudes toward privacy in general, surveillance programs, and personal information collection and control. Then, the report digs deeper into the topic and asks how individuals feel about their privacy when there is a measurable benefit to the provision of their personal information: personalization. Finally, the report explores how these attitudes are seen via reported behaviour regarding online and mobile protection measures.
South Koreans were generally more positive about technology in their lives than Canadians (see Figure 5.1). Specifically, 72.6% of South Koreans felt that life was better with technology, compared to only 60.3% of Canadians surveyed. Furthermore, 45.2% of South Korean and 35.6% of Canadians studied felt that they work more today due to technology. Finally, a majority of participants in both countries – South Korea: 74.6% and Canada: 81.2% – agreed that technology facilitates the exchange of information and that they felt more knowledgeable with technology.
Surveyed individuals in both countries felt that technology was part of their daily lives (see Figure 5.2). A majority of individuals in both countries felt the inability to just relax or “switch off” due to digital technologies’ impact on their life (South Korea: 61.8% and Canada: 54.8). South Koreans reported more interactions with technology than Canadians in terms of their conversations being online (South Korea: 50.4% and Canada: 33.1%) and looking at screens (South Korea: 56.2% and Canada: 63.3%). Furthermore, 66.6% of South Koreans claimed that the internet is vital to their daily lives, compared to 59.1% of Canadian individuals.
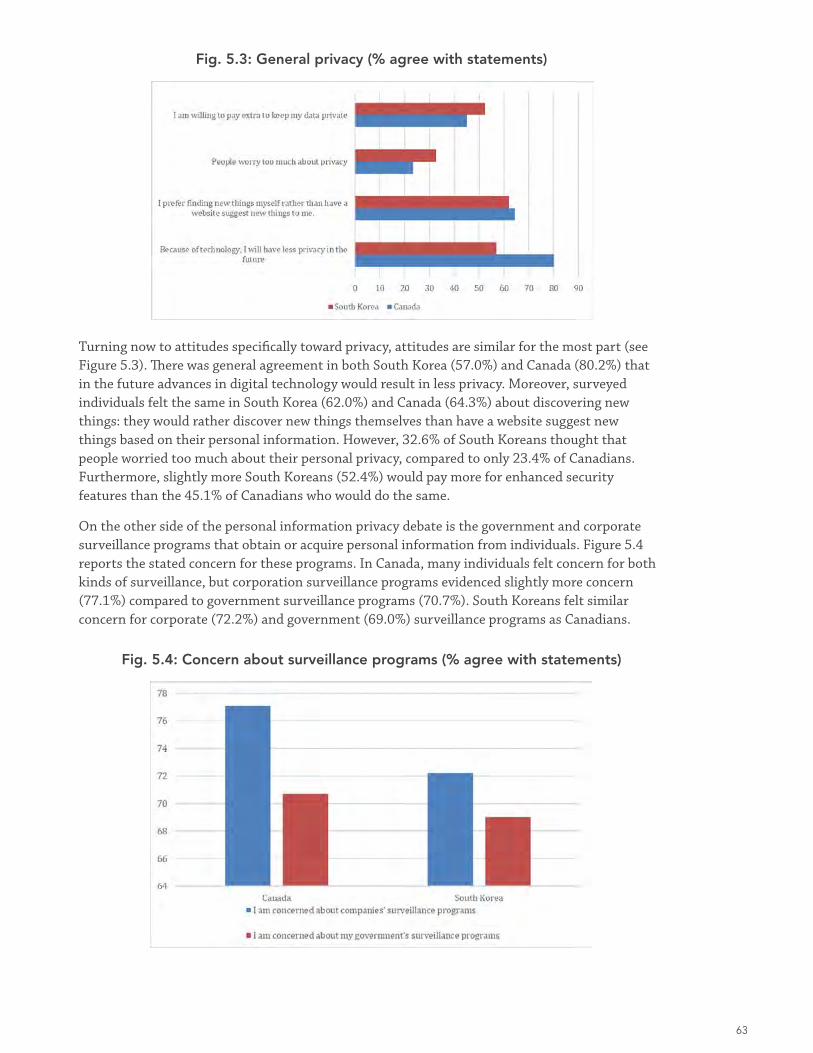
63
Fig. 5.3: General privacy (% agree with statements)
Fig. 5.4: Concern about surveillance programs (% agree with statements)
Turning now to attitudes specifically toward privacy, attitudes are similar for the most part (see Figure 5.3). There was general agreement in both South Korea (57.0%) and Canada (80.2%) that in the future advances in digital technology would result in less privacy. Moreover, surveyed individuals felt the same in South Korea (62.0%) and Canada (64.3%) about discovering new things: they would rather discover new things themselves than have a website suggest new things based on their personal information. However, 32.6% of South Koreans thought that people worried too much about their personal privacy, compared to only 23.4% of Canadians. Furthermore, slightly more South Koreans (52.4%) would pay more for enhanced security features than the 45.1% of Canadians who would do the same.
On the other side of the personal information privacy debate is the government and corporate surveillance programs that obtain or acquire personal information from individuals. Figure 5.4 reports the stated concern for these programs. In Canada, many individuals felt concern for both kinds of surveillance, but corporation surveillance programs evidenced slightly more concern (77.1%) compared to government surveillance programs (70.7%). South Koreans felt similar concern for corporate (72.2%) and government (69.0%) surveillance programs as Canadians.
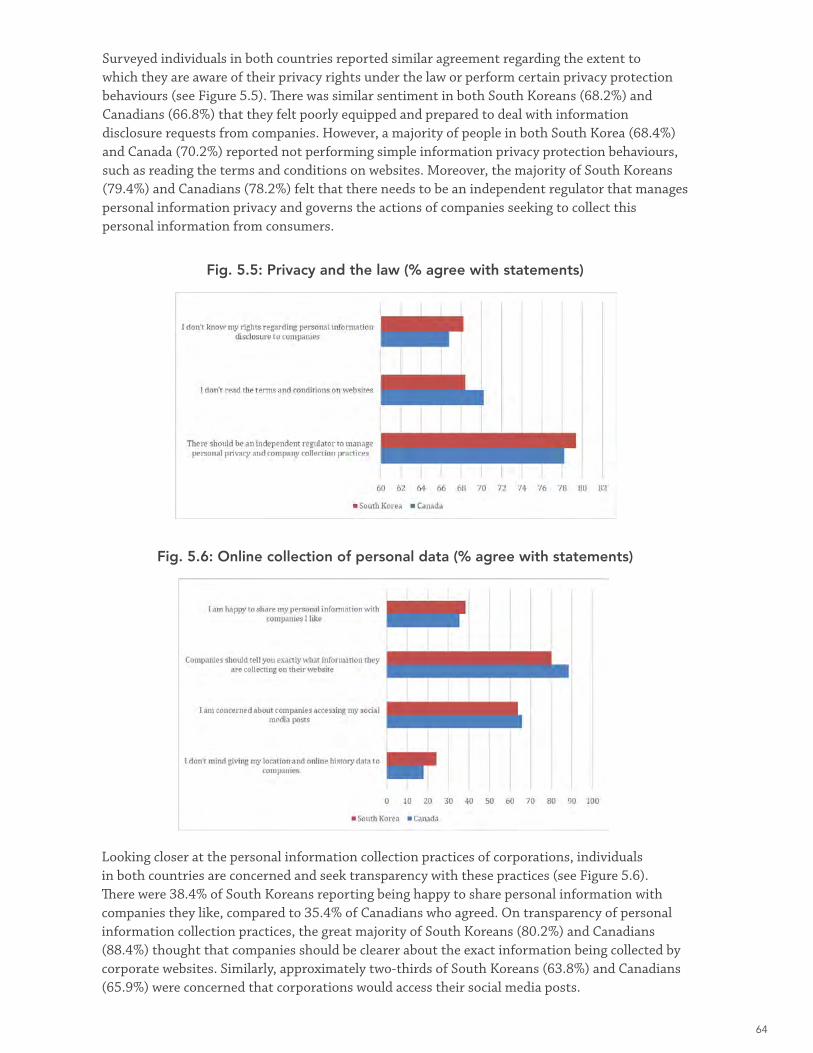
64
Fig. 5.5: Privacy and the law (% agree with statements)
Fig. 5.6: Online collection of personal data (% agree with statements)
Surveyed individuals in both countries reported similar agreement regarding the extent to which they are aware of their privacy rights under the law or perform certain privacy protection behaviours (see Figure 5.5). There was similar sentiment in both South Koreans (68.2%) and Canadians (66.8%) that they felt poorly equipped and prepared to deal with information disclosure requests from companies. However, a majority of people in both South Korea (68.4%) and Canada (70.2%) reported not performing simple information privacy protection behaviours, such as reading the terms and conditions on websites. Moreover, the majority of South Koreans (79.4%) and Canadians (78.2%) felt that there needs to be an independent regulator that manages personal information privacy and governs the actions of companies seeking to collect this personal information from consumers.
Looking closer at the personal information collection practices of corporations, individuals in both countries are concerned and seek transparency with these practices (see Figure 5.6). There were 38.4% of South Koreans reporting being happy to share personal information with companies they like, compared to 35.4% of Canadians who agreed. On transparency of personal information collection practices, the great majority of South Koreans (80.2%) and Canadians (88.4%) thought that companies should be clearer about the exact information being collected by corporate websites. Similarly, approximately two-thirds of South Koreans (63.8%) and Canadians (65.9%) were concerned that corporations would access their social media posts.
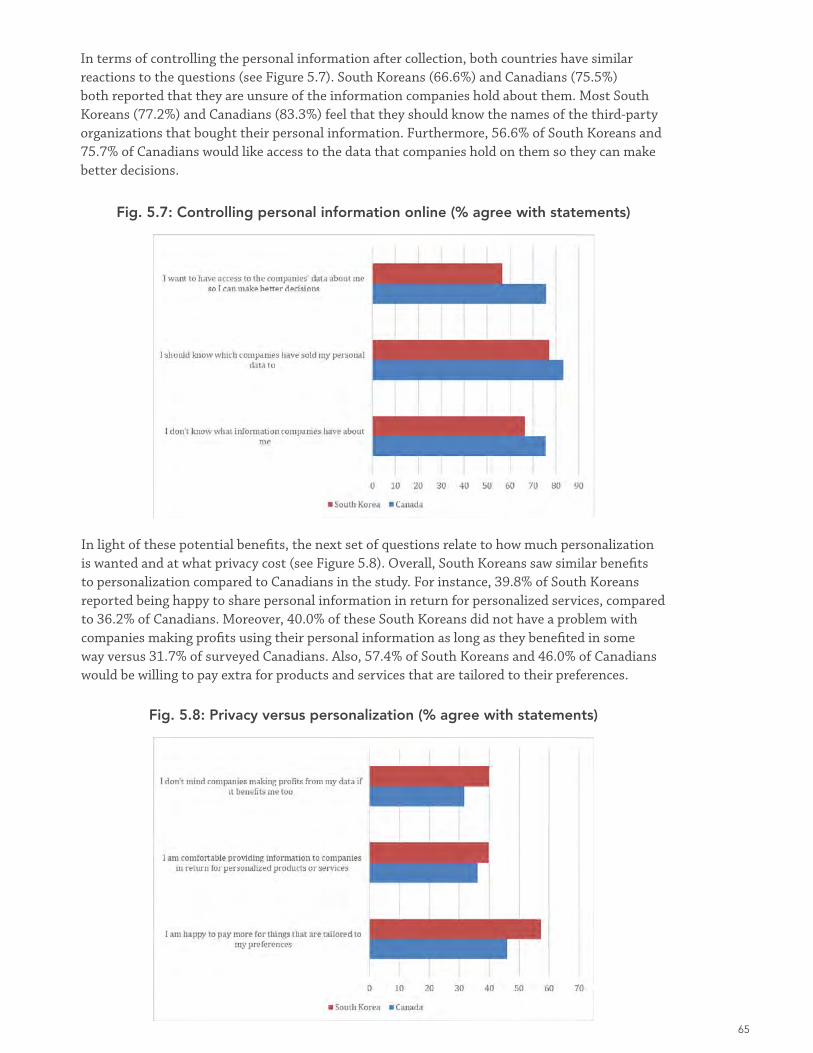
65
Fig. 5.7: Controlling personal information online (% agree with statements)
Fig. 5.8: Privacy versus personalization (% agree with statements)
In terms of controlling the personal information after collection, both countries have similar reactions to the questions (see Figure 5.7). South Koreans (66.6%) and Canadians (75.5%) both reported that they are unsure of the information companies hold about them. Most South Koreans (77.2%) and Canadians (83.3%) feel that they should know the names of the third-party organizations that bought their personal information. Furthermore, 56.6% of South Koreans and 75.7% of Canadians would like access to the data that companies hold on them so they can make better decisions.
In light of these potential benefits, the next set of questions relate to how much personalization is wanted and at what privacy cost (see Figure 5.8). Overall, South Koreans saw similar benefits to personalization compared to Canadians in the study. For instance, 39.8% of South Koreans reported being happy to share personal information in return for personalized services, compared to 36.2% of Canadians. Moreover, 40.0% of these South Koreans did not have a problem with companies making profits using their personal information as long as they benefited in some way versus 31.7% of surveyed Canadians. Also, 57.4% of South Koreans and 46.0% of Canadians would be willing to pay extra for products and services that are tailored to their preferences.

66
Fig. 5.9: Personalized recommendations from a bank (% agree with the practice)
Fig. 5.10: Personalized suggestions from a website (% agree with the practice)
Digging further into what kind of companies the respondents would like to receive personalized services and products from, we first look at banks, then websites in general, and then specifically social media companies (see Figure 5.9). With banks, South Koreans are slightly more willing to receive personalized banking services based on their characteristics (17.4%) or their spending habits (17.0%) than Canadians (15.5% based on characteristics and 16.4% on spending habits).
In terms of websites in general, again South Koreans were more comfortable receiving personalized suggestions based on location (16.0%) versus only 12.5% of Canadians. However, South Koreans were less comfortable receiving personalized suggestions based on browsing history of other sites (15.8%) versus 16.6% of Canadians, and browsing history of that site (20.8%) versus 28.9% of Canadians (see Figure 5.10). Moreover, 20.6% of surveyed South Koreans did not mind personalized suggestions where consumers had past purchases on the website, compared to 25.5% of Canadians.
For social media companies, South Koreans and Canadians seemed to be similarly sensitive to personalized suggestions from websites (see Figure 5.11). Only 16.4% of South Koreans and 19.4% of Canadians were comfortable having personalized suggestions based on their personal browsing history. Similarly, 19.1% of Canadians, versus 18.5% of South Koreans, were
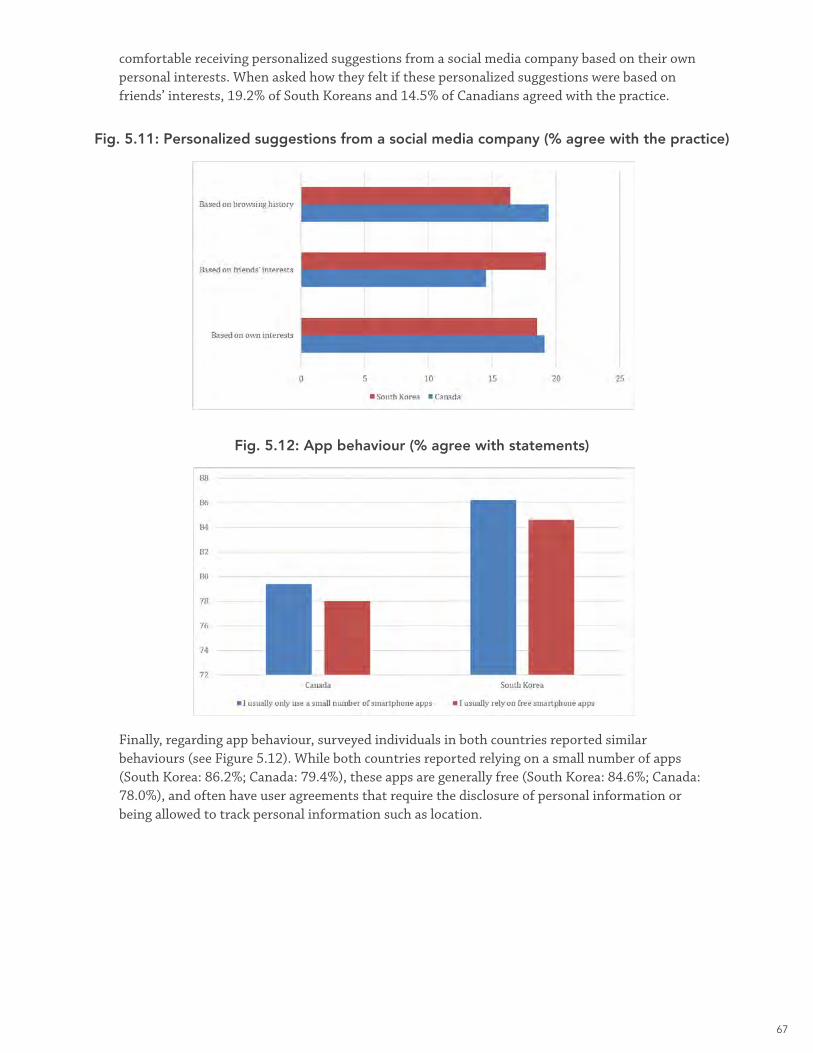
67
Fig. 5.11: Personalized suggestions from a social media company (% agree with the practice)
Fig. 5.12: App behaviour (% agree with statements)
comfortable receiving personalized suggestions from a social media company based on their own personal interests. When asked how they felt if these personalized suggestions were based on friends’ interests, 19.2% of South Koreans and 14.5% of Canadians agreed with the practice.
Finally, regarding app behaviour, surveyed individuals in both countries reported similar behaviours (see Figure 5.12). While both countries reported relying on a small number of apps (South Korea: 86.2%; Canada: 79.4%), these apps are generally free (South Korea: 84.6%; Canada: 78.0%), and often have user agreements that require the disclosure of personal information or being allowed to track personal information such as location.

68
ABOUT THE AUTHORS
Dr. Leyland Pitt is the Dennis F. Culver EMBA Alumni Professor of Business Administration at the Beedie School of Business, Simon Fraser University, Vancouver, BC, Canada, where he teaches marketing in MBA and doctoral programs. His work has appeared in journals such as Journal of the Academy of Marketing Science, Information Systems Research, Journal of Advertising, and MIS Quarterly. He is currently associate editor of Business Horizons and Journal of Advertising Research.
Theresa Eriksson is a doctoral student in industrial marketing at the Luleå University of Technology in Luleå, Sweden, where she researches entrepreneurship and technology. Her work has been published in journals such as Business Horizons and the Journal of Strategic Marketing.
Kristin Matheson is a doctoral student in industrial marketing at the Luleå University of Technology in Luleå, Sweden. She holds a bachelor’s degree in sociology from McGill University and an MBA from the University of Alberta. Her work has been published in the Journal of Wine Research.
Dr. Kirk Plangger is Associate Professor of Marketing at the King’s Business School, King’s College, London, UK, where he teaches and researches digital marketing. His undergraduate education in economics was at Western University, and his PhD in marketing was awarded by Simon Fraser University. His work has been published in journals such as the Journal of Business Research, Journal of Strategic Information Systems, and Academy of Marketing Science Review.
Dr. Karen Robson is Assistant Professor of Marketing at the Odette School of Business, University of Windsor, Ontario, where she teaches marketing and consumer behaviour. Her PhD in marketing was earned at the Beedie School of Business, Simon Fraser University. Her work has been accepted for publication in journals including Journal of Advertising Research, Journal of Advertising, Technovation, and MIS Quarterly Executive.

70
Asia Pacific Foundation of Canada | 1
Guidebook for Doing Business in the Asia Pacific: A Resource for Indigenous Businesses
September 2019
Asia Pacific Foundation of Canada | 2
Using this Guidebook
What Will it Provide? Who is it For?
This guidebook is intended to be a resource for Indigenous businesses interested in doing business with the Asia Pacific region, specifically importing and exporting goods and services and attracting investment. Given the diversity of Indigenous communities in Canada (First Nations, Métis, Inuit) and in type, size and sector of Indigenous businesses in Canada, this guidebook focuses on general considerations and resources rather than the details of how a particular business or community should or should not engage, although many of the resources introduced in this guidebook can assist in answering such inquiries.
Indigenous entrepreneurs, Indigenous-owned small, medium, and large enterprises, and economic development corporations will find useful information here, whether they are non-exporters in exploratory stages, or more experienced international players looking to expand or attract investment. The guidebook – or parts of it – may be shared with chief and council, your board of directors, and/or managers to present the case for engaging with Asia Pacific businesses. The guidebook can help you prepare for visits from Asia Pacific stakeholders or for your Asia Pacific in-market endeavours. There are introductions to topics like exporting 101, networking, financing, and cross-cultural business, along with links to external resources like websites, tools, and guides that can provide deeper dives into further understanding the opportunities, challenges and approaches to Asia Pacific business engagement.
Navigating the Guidebook
The guidebook can be read as a whole document. Online, you can use the navigation pane on the left to jump to the relevant section(s) for your interests and needs. You also can download PDFs of each section.
Section 1: Introduction provides an overview of the guidebook and presents the case for why doing business in the Asia Pacific might be a viable and fruitful option for your community to meet its social, cultural and economic goals. Section 2: Background, Best Practices and Winning Strategies for Indigenous Exporters provides a narrative introduction to the opportunities, challenges, and approaches to doing business with the Asia Pacific. Section 3: Tips, Tactics, and Resources for Success provides more detailed information on specific topics and lists of actionable resources focused on different topics of interest, like industry information or cultural guides.
Throughout, the guidebook will help answer the following questions for Asia-interested Indigenous businesses, economic development corporations, and communities, to help grow their presence in the Asia Pacific:
• What government resources are there in Canada and abroad?
• What non-government resources and organizations are available?
• What Indigenous resources are available for aiding in Asia Pacific expansion?
• Where are the obstacles and opportunities for potential Asian investment, business, or trade?
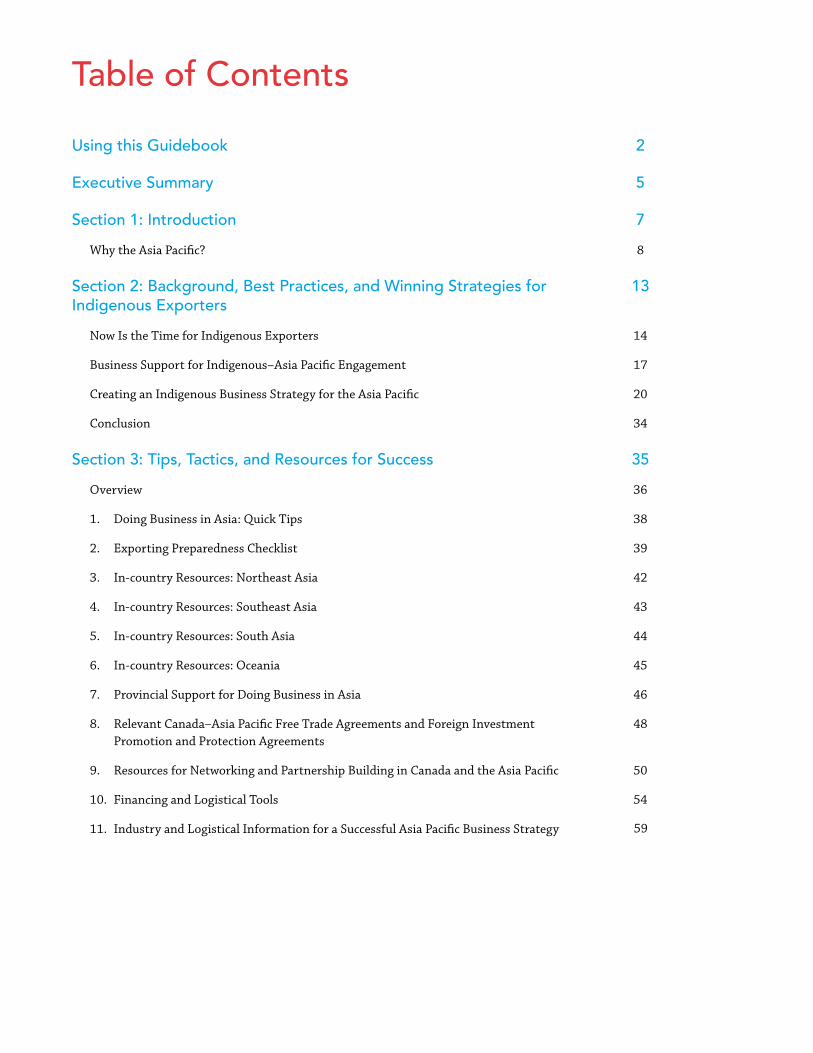
Asia Pacific Foundation of Canada | 3
Table of Contents
Using this Guidebook
Executive Summary
Section 1: Introduction
Why the Asia Pacific?
Section 2: Background, Best Practices, and Winning Strategies for Indigenous Exporters
Now Is the Time for Indigenous Exporters
Business Support for Indigenous–Asia Pacific Engagement
Creating an Indigenous Business Strategy for the Asia Pacific
Conclusion
Section 3: Tips, Tactics, and Resources for Success
Overview
1. Doing Business in Asia: Quick Tips
2. Exporting Preparedness Checklist
3. In-country Resources: Northeast Asia
4. In-country Resources: Southeast Asia
5. In-country Resources: South Asia
6. In-country Resources: Oceania
7. Provincial Support for Doing Business in Asia
8. Relevant Canada–Asia Pacific Free Trade Agreements and Foreign InvestmentPromotion and Protection Agreements
9. Resources for Networking and Partnership Building in Canada and the Asia Pacific
10. Financing and Logistical Tools
11. Industry and Logistical Information for a Successful Asia Pacific Business Strategy
2
5
7
8
13
14
17
20
34
35
36
38
39
42
43
44
45
46
48
50
54
59
Asia Pacific Foundation of Canada | 4
12. Dealing with Asian Governments
13. Asia Cultural Guides, Basic Phrases, and Additional Government of CanadaResources
14. Current Indigenous Economic Development Practices
15. Engagement Strategies of Previous Indigenous-Asia Stakeholders and IndigenousGlobal Business Examples
16. Examples of Shared Indigenous-Asian History, Culture, and Values
17. Trends of Indigenous Participation in Exporting Industries
Acknowledgements
About the Asia Pacific Foundation of Canada
61
62
63
67
69
76
82
83

Asia Pacific Foundation of Canada | 5
Executive Summary
The Asia Pacific Foundation of Canada presents the Guidebook for Doing Business in the Asia Pacific: A Resource for Indigenous Businesses. This resource aims to help catalyze Indigenous business engagement with the Asia Pacific region.
The Asia Pacific is a dynamic region that accounts for the largest portion of the global population and global Indigenous population, and will soon account for most of the global economy, middle class, and ultra-wealthy people. The region has a large interest in Indigeneity, not only among their own Indigenous populations, which are becoming more prominent, but also among other countries like Canada. Historical similarities including colonialist patterns and cultural similarities between the Asia Pacific and Indigenous Canadians can provide the grounds for deep engagement. A long history of Indigenous globalism and recent institutional changes have made it increasingly opportune for Indigenous businesses in Canada to enter the global economy with specific attention to the Asia Pacific. The resources and economic development goals that Indigenous peoples have and the diverse industries they operate in – such as energy, natural resources, agriculture, fish and seafood, the arts, tourism, and digital/technology economies – are complimentary with increasing demand from the Asia Pacific region.
Indigenous peoples are the fastest-growing demographic in Canada and have significant economic potential. There were 55,255 First Nations, Métis and Inuit -owned businesses in Canada in 2016 spread across every province and territory in a wide variety of sectors; this is an increase from 43,000 in 2011 and from 37,445 in 2006. According to one survey, these businesses export at a greater rate than the average Canadian business, and for each dollar lent under the Aboriginal Business Financing Program, C$3.60 is added to the Canadian GDP.
Despite these positive indicators, going global can be a challenge for Indigenous businesses and communities, especially when acting independently. Obstacles include capacity, having the experience to properly plan and prepare, accessing financing and support programs, understanding and engaging with other cultures, and utilizing resources for business purposes that are in line with community goals. Indigenous nations have many assets, but they can also be challenging to utilize and make doing business difficult. For example, the organizational structure of nations can make it quicker and easier to do some projects, and stall others. Overcoming the many obstacles and challenges is important, as connecting to the global economy is often seen as the next step to Indigenous economic development, which itself is a key to reconciliation.
The guidebook covers some general strategic considerations. For example, co-operation among Indigenous businesses and nations to increase their communications abilities, represent their interests, build partnerships, and increase autonomy in the global economy may help overcome some of the mentioned challenges. Many Indigenous businesses have deep experience in Canada and the United States, which is a positive predictor of success overseas among other factors like having a business plan. For a successful cross-pacific partnership, you will have to learn the formal and cultural aspects of doing business in Asia, just as your partners will have to when in Canada. The importance of cultural competency cannot be overstated.
Asia Pacific Foundation of Canada | 6
There are many resources and tips to help you, but the outlook on going global should be one of cautious optimism. Different business strategies may work differently for different businesses and nations, bringing to light positives and negatives that may be difficult to foresee. And just as many studies have taught us, like the insightful Harvard Project on American Indian Economic Development, access to all manner of resources and having a plan does not guarantee success. Success hinges on internal factors such as the thoughtful leadership of an enterprise or making hard decisions for the long-term that run counter to the immediate struggles of nations, like spending money on international travel or spending large amounts of time on proposals. This guidebook will not discuss how those decisions should be made or how difficult it will be. Nor is it a how-to guide for every possible configuration of potential Asia engagement.
This guidebook details the many financial, logistical, planning, networking, and Indigenous business supports for doing business and strategizing with the Asia Pacific. It shows which federal and provincial programs and offices, business associations, and Indigenous organizations might be able to help minimize risks and maximize successful engagement in Asia Pacific markets, and can help address some of the obstacles and challenges mentioned. By capitalizing on their resources, cultural and historical similarities, and overlapping goals, Indigenous businesses can be leaders in engagement and seizing opportunities in the Asia Pacific on their own terms.

Asia Pacific Foundation of Canada | 7
Section 1: Introduction
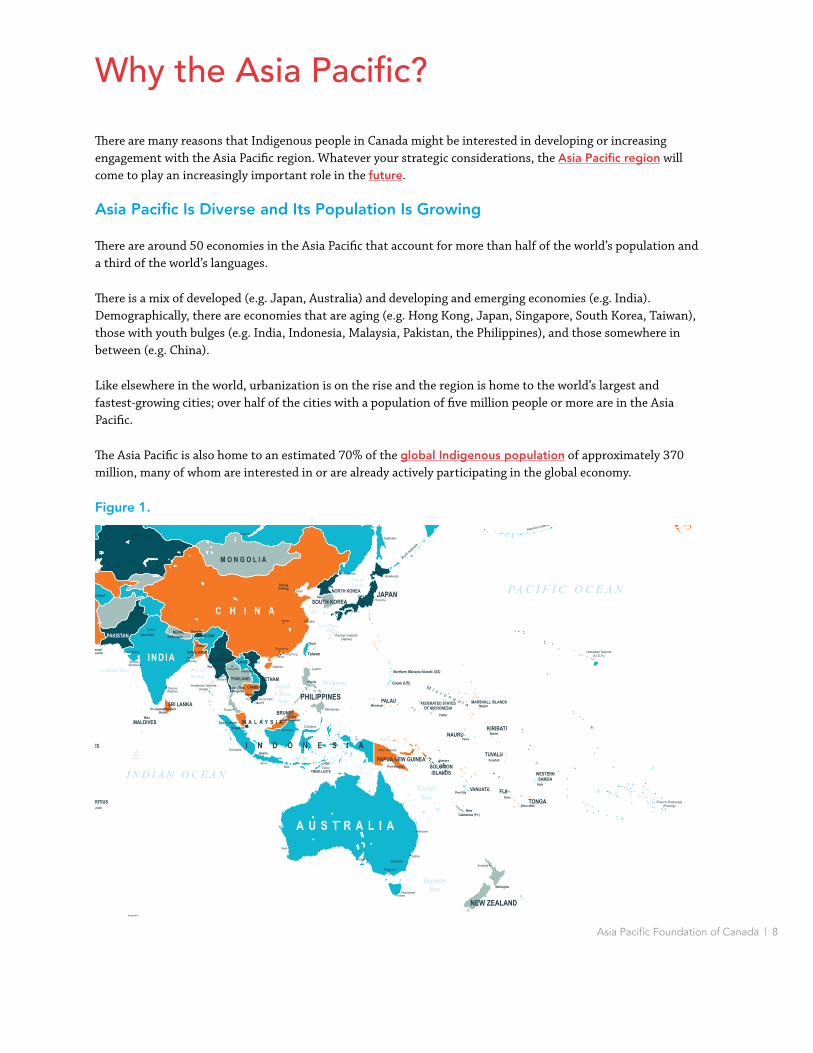
Asia Pacific Foundation of Canada | 8
Why the Asia Pacific?
There are many reasons that Indigenous people in Canada might be interested in developing or increasing engagement with the Asia Pacific region. Whatever your strategic considerations, the Asia Pacific region will come to play an increasingly important role in the future.
Asia Pacific Is Diverse and Its Population Is Growing
There are around 50 economies in the Asia Pacific that account for more than half of the world’s population and a third of the world’s languages.
There is a mix of developed (e.g. Japan, Australia) and developing and emerging economies (e.g. India). Demographically, there are economies that are aging (e.g. Hong Kong, Japan, Singapore, South Korea, Taiwan), those with youth bulges (e.g. India, Indonesia, Malaysia, Pakistan, the Philippines), and those somewhere in between (e.g. China).
Like elsewhere in the world, urbanization is on the rise and the region is home to the world’s largest and fastest-growing cities; over half of the cities with a population of five million people or more are in the Asia Pacific.
The Asia Pacific is also home to an estimated 70% of the global Indigenous population of approximately 370 million, many of whom are interested in or are already actively participating in the global economy.
Figure 1.
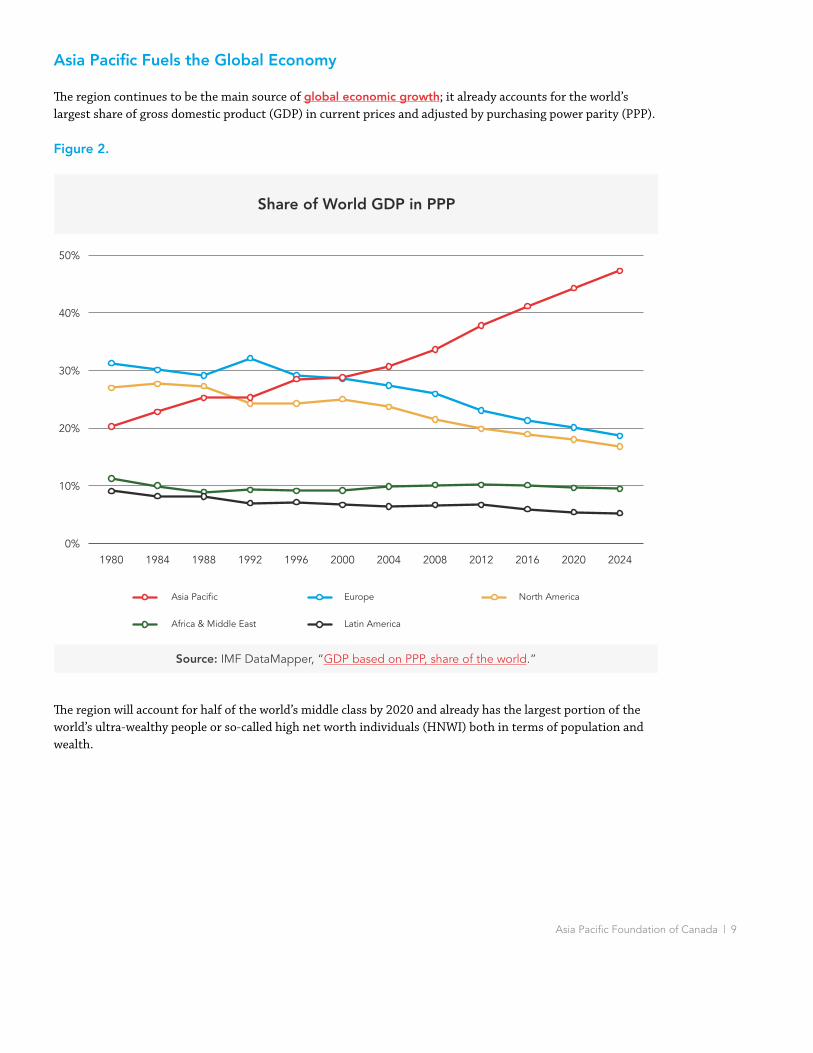
Asia Pacific Foundation of Canada | 9
Asia Pacific Fuels the Global Economy
The region continues to be the main source of global economic growth; it already accounts for the world’s largest share of gross domestic product (GDP) in current prices and adjusted by purchasing power parity (PPP).
Figure 2.
The region will account for half of the world’s middle class by 2020 and already has the largest portion of the world’s ultra-wealthy people or so-called high net worth individuals (HNWI) both in terms of population and wealth.
Share of World GDP in PPP
0%
10%
20%
30%
40%
50%
202420202016201220082004200019961992198819841980
Asia Pacific
Africa & Middle East
Europe North America
Latin America
Source: IMF DataMapper, “GDP based on PPP, share of the world.”
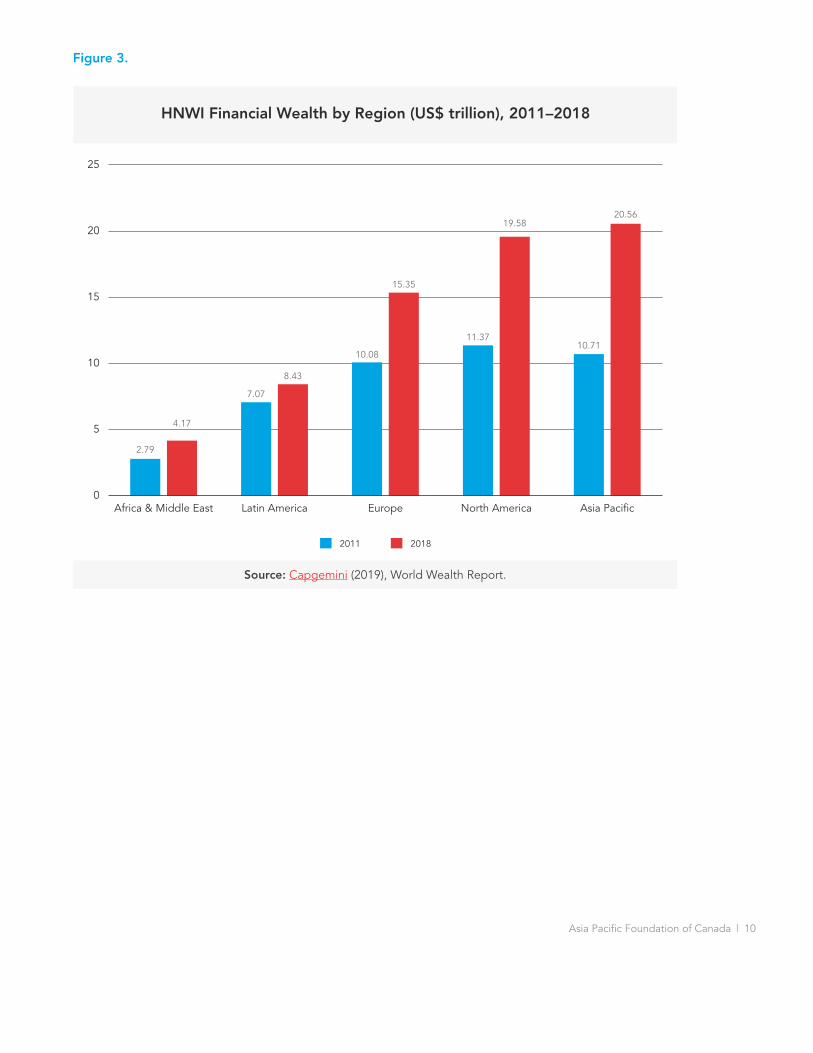
Asia Pacific Foundation of Canada | 10
Figure 3.
HNWI Financial Wealth by Region (US$ trillion), 2011–2018
0
5
10
15
20
25
Asia PacificNorth AmericaEuropeLatin AmericaAfrica & Middle East
2011 2018
2.79
4.17
7.07
8.43
10.08
15.35
11.37
19.58
10.71
20.56
Source: Capgemini (2019), World Wealth Report.
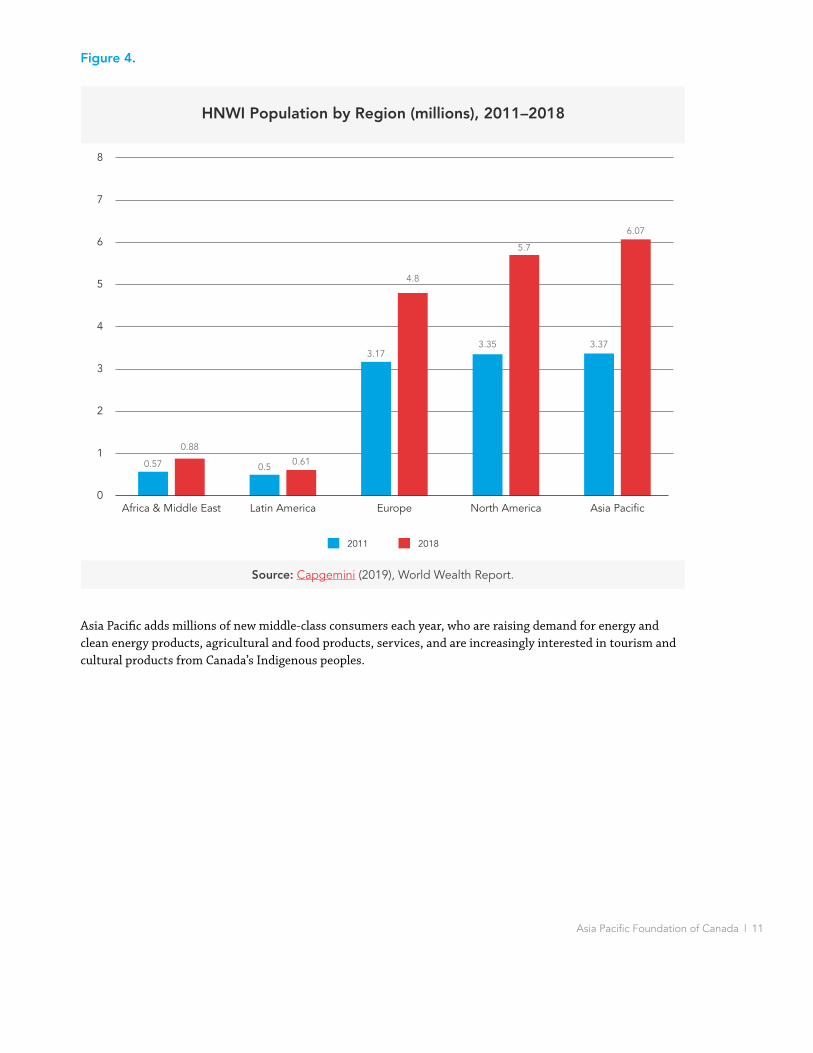
Asia Pacific Foundation of Canada | 11
Figure 4.
Asia Pacific adds millions of new middle-class consumers each year, who are raising demand for energy and clean energy products, agricultural and food products, services, and are increasingly interested in tourism and cultural products from Canada’s Indigenous peoples.
HNWI Population by Region (millions), 2011–2018
2011 2018
0
1
2
3
4
5
6
7
8
Asia PacificNorth AmericaEuropeLatin AmericaAfrica & Middle East
0.57
0.88
0.5 0.61
3.17
4.8
3.35
5.7
3.37
6.07
Source: Capgemini (2019), World Wealth Report.

Asia Pacific Foundation of Canada | 12
Figure 5.
The economies and businesses in the region have demonstrated interest in Canadian and Indigenous products, resources, and services, and they often view Canadian products and services as safe, reliable, and of high quality.
Less is known on the current engagement of Asia Pacific stakeholders with Indigenous businesses and communities in Canada, but anecdotal accounts from across the country suggest significant and growing interest in Indigenous Canada from the Asia Pacific.
While all this paints a rosy picture of opportunities in the Asia Pacific, business engagement can be far from easy or straightforward. Many of the Asia Pacific businesses that are engaged internationally are large or even massive conglomerates or state-owned enterprises, while most Indigenous businesses in Canada are micro to small in size. The Asia Pacific is the most diverse and dynamic region in the world; many of the markets are complex, filled with competitors from around the world, and difficult even for established Canadian companies to navigate.
That being so, working to address some of the increasing needs, desires, and opportunities arising from the Asia Pacific can be one means for ready and well-prepared Indigenous businesses to meet their community, social, and economic goals, and seize growth in the region.
Spending by Global Middle Class (PPP, constant 2011 US$billion and share)PPP, constant 2011 U
S$billionPe
rcen
tag
e of
Glo
bal
Sha
re
0%
10%
20%
30%
40%
50%
60%
70%3,492
0
500
1000
1500
2000
2500
3000
3500
20302015
Africa & Middle East Central & South America
Asia Pacific
North America
Europe
7%8%
18%
31%
36%
7%6%
10%
20%
57%
724
335285
306497
335
354
733
1,380
Source: Hoimi Kharas (2017), The Unprecedented Expansion of the Global Middle Class. Brookings Institute.

Asia Pacific Foundation of Canada | 13
Section 2: Background, Best Practices, and Winning Strategies for Indigenous Exporters

Asia Pacific Foundation of Canada | 14
Now is the Time for Indigenous Exporters
Entering the global economy on their own terms is a key factor to future Indigenous economic development, and the Asia Pacific region holds particular promise. Participating in the global economy can be done in a way that allows traditional lands, culture, history, and values to play a large role. Globalization can allow Indigenous cultural distinctiveness to survive and thrive by allowing direct marketing and political connections to international actors, in contrast to the common position that globalization reduces cultural diversity.1 Indigenous peoples have a strong history of global trade, relations, and engagement, but changes to today’s modern institutions, norms, and supports have made it easier for Indigenous communities and businesses to conduct these activities. These changes include:
• The 1989 International Labour Organization Convention 169 (building off its predecessor Convention 107 from 1957) aims to improve living conditions of Indigenous peoples through recognition and respect for Indigenous customs, institutions, and rights;
• The World Bank and regional development banks such as the Asian Development Bank have specific Indigenous policies and safeguards to help foster respect of Indigenous peoples and ensure their active and beneficial participation in projects that affect them;
• The 2007 United Nations Declaration on the Rights of Indigenous Peoples (UNDRIP) is supported by most of the world’s countries and is the most comprehensive international instrument on Indigenous rights and standards;
• A myriad of court cases in various jurisdictions have ruled in favour of Indigenous rights, title, and claims;
• The Truth and Reconciliation Commission of Canada’s calls to action that address education (62-65), professional development (57), and business (92); and
• A new focus in Canada on inclusive trade has resulted in changes to the United State-Mexico-Canada Agreement (USMCA, formerly NAFTA),2 the June 2019 joint Canadian Council for Aboriginal Business (CCAB)-Global Affairs Canada (GAC) report and recommendations on Indigenous exporting, and a Canadian government announcement of expanded trade services for Indigenous business.
While much work needs to be done, these all speak to the long-term sustained global efforts by Indigenous people for domestic and international economic inclusion.
Indigenous peoples are the fastest growing demographic in Canada and have significant economic potential – the Canadian Indigenous economy was worth an estimated C$32B in 2016 and is growing. There were 55,255 First Nations, Métis and Inuit -owned businesses in Canada spread across every province and territory in a wide variety of sectors in 2016, up from 43,000 in 2011 and 37,445 in 2006.3
1 Groenfeldt, D. 2003. The future of indigenous values: cultural relativism in the face of economic development. Futures. 35: 917-929. 2 The USMCA has several sections that promote Indigenous businesses; for example, Indigenous handicrafts are eligible to be duty free.3 Census. National Household. 2006, 2011, 2016.

Asia Pacific Foundation of Canada | 15
Most recent calculations estimate that Indigenous firms are both innovating and exporting at rates higher than the national average. With some caveats on sample size, a joint Global Affairs Canada–CCAB survey report found that while 11.8% of Canadian SMEs export, 24.4% of Aboriginal-owned businesses are exporting. Exporting goods or services matters for businesses because according to Export Development Canada “companies that export make 121% more money, grow faster, last longer, are better connected within supply chains, are more resilient to economic downturns, and are more productive, competitive and innovative.” For each dollar lent under the Aboriginal Business Financing Program, a key nation-wide financial tool for Indigenous business, C$3.60 is added to the Canadian GDP.
Regardless of the reported high rate of exporters among Indigenous-owned businesses, the fact remains that most do not export to international markets outside the United States. Among those that do export, 9.6% export only to the United States, 11.9% export to both US and international markets, and 2.9% export only to international markets outside the United States. While less is known on the portion of Indigenous businesses and entrepreneurs that are presently in or interested in Asia Pacific markets, recent activities ranging from roundtables on the topic to government and private sector trade missions and events show wide-ranging serious interest in the region.4
Going global can be a challenge for Indigenous businesses and communities, especially when acting independently. Obstacles include access to financing and support programs, understanding and engaging with other cultures, and utilizing resources for business purposes. The structure of Indigenous nations can be an asset, but it can also make doing business difficult. Strategies may work differently for different business and nations and bring to light positives and negatives that may be difficult to foresee. And just as many studies have taught us, like the insightful Harvard Project on American Indian Economic Development, access to all manner of resources and having a plan does not guarantee success. Success hinges on internal factors such as the thoughtful leadership of an enterprise, a lot of hard work over a sustained period of time, or making hard decisions for the long-term that may run counter to the immediate struggles of nations, like spending money on international travel or spending large amounts of time and resources on proposals.
4 Norris, Dakota. 2019. Finding common ground: Engaging Indigenous Canadian youth with Asia. APF Canada; Global Affairs Canada. 2018. Indigenous trade mission to New Zealand; and WIBF. 2019. The 2019 World Indigenous Business Forum.

Asia Pacific Foundation of Canada | 16
Authors of a 2016 article in the Harvard Business Review reported that in working with more than 100 global organizations over decades, most responded too eagerly to trends like growing middle classes and positive market indicators when entering new markets, like those we see in the Asia Pacific. Many of those businesses stated that they almost did or didn’t at all meet their performance objectives, which the authors attribute to not having their internal pieces in place. In other words, while engaging international markets can be rewarding, doing it successfully, especially in complex markets in the Asia Pacific, requires planning and commitment over the long term. A checklist to see if you are ready to export and your potential for doing so can be found in Section 3, Number 2: Exporting Preparedness Checklist.
Co-operation among like-minded Indigenous businesses and nations to increase their communications abilities, represent their interests, build partnerships, and increase autonomy in the global economy may help overcome some of these challenges – some communities are already doing this for domestic real estate, energy, and resource related ventures. By capitalizing on their resources, cultural and historical similarities, and overlapping goals, Indigenous businesses can be leaders in engagement and seizing opportunities in the Asia Pacific.
Asia Pacific Foundation of Canada | 17
Business Support for Indigenous–Asia Pacific Engagement
This section details the government, nongovernment, and business supports for doing business and strategizing with the Asia Pacific. It also highlights the current efforts to work with Indigenous peoples to enter the global economy on their own terms. Despite the many obstacles and challenges, connecting to the global economy is often seen as the next step to Indigenous economic development, which itself is a key to reconciliation.
Government and Non-Governmental Organizational Support
Diversification of Indigenous business toward the Asia Pacific is an important and already growing component for future economic growth. Indigenous peoples and governments are increasingly partnering to lead trade missions from Canada, Australia, New Zealand, Taiwan, and other economies that are seeking to promote and support the integration of their Indigenous populations into the global economy. State governments are increasingly supportive, such as the Australian government, which provides specific programs and support for global Indigenous business and created relevant reports, guides, and a five-year Indigenous strategy in its
Department of Foreign Affairs and Trade. The World Indigenous Business Forum, the International Inter-Tribal Trade Organization, and other non-profit organizations are successfully spurring discussion and action on these topics on the world stage, including on more inclusive trade agreements. Opportunities are arising to conduct business between Indigenous nations around the world. There are also an increasing number of opportunities to get Indigenous youth in Canada thinking about and engaged with the Asia Pacific to foster needed competencies, global mindsets, and skills for their future and future Asia Pacific engagement.
The Canadian Trade Commissioner Service (TCS) provides Canadian companies with free on-the-ground intelligence and practical advice on foreign markets to help potential and current exporters make better, more timely, and more cost-effective decisions in order to achieve their goals abroad. As Canada’s largest network of international trade professionals, the TCS has more than 1,000 trade commissioners located around the world. The TCS can help exporters:
• Pursue and close more export deals;
• Develop market-entry strategies;
• Identify qualified business contacts;
• Resolve complex business problems; and
• Avoid delays and costly mistakes.
In addition, the TCS offers funding programs and support for companies and communities to help them expand their global horizons and grow their communities.

Asia Pacific Foundation of Canada | 18
5 Dicken, Peter. 1992. International production in a volatile regulatory environment: the influence of national regulatory policies on the spatial strategies of transnational corporations. Geoforum. 23(3): 303-316.6 Anderson, Robert, et al. 2006. Indigenous land rights, entrepreneurship, and economic development in Canada: ‘Opting-in’ to the global economy. Journal of World Business. 41: 45-55.
The TCS also has a dedicated team that offers additional support for Indigenous exporters, including trade missions, events, and business delegations for Indigenous companies to connect them with international opportunities. Further information on these activities, as well as links to funding, resources, opportunities, and connections for Indigenous exporters is available on the Indigenous Business Export Support Program web page. For additional Indigenous international business questions or support, please contact the [email protected].
Doing business in Asia is not easy. Setbacks and failures in business and trade delegations as a result of not being prepared are common. Some lessons learned are that even if you have funding, an opportunity, and even a physical presence, you may not be able to sell your product or service. You will need to ensure your business is fully prepared and adapted for the market, both internally and externally. It can be difficult to be that prepared and knowledgeable, and that is one reason why there is such a wide variety of resources dedicated to helping Canadian companies abroad, and why programming regularly changes. Trade commissioners, export preparedness checklists, Canadian and Asian business mentorships, and other tools can increase your understanding of markets in the Asia Pacific and increase your odds of success.
Business Support
In addition to these opportunities, there are also economic changes that increase Indigenous opportunity. In today’s global economy, companies are realizing that they must co-operate with communities where their customers and employees live, and successful integration with the global economic system depends on local processes, where “economic structures, values, cultures, institutions and histories contribute profoundly to that success.”5 Viewing communities as valued members of a system rather than viewing communities as something external to be dealt with is becoming the norm. For this reason, especially as a matter of economic self-interest, large
corporations are increasingly supporting community development in Indigenous communities. This means that Indigenous people can enter the global economy on their own terms, where traditional lands, history, culture, and values play a critical role.6 To do so will require identifying business opportunities and then gathering the resources and developing the organizations and human resources required to meet them.
Accessing Resources
While opportunities in the Asia Pacific for Indigenous businesses and entrepreneurs are growing, difficulties remain. One piece of the puzzle is identifying and accessing resources and program supports. There is a good indication that many Indigenous businesses may be missing out on opportunities for support from a variety of Indigenous and non-Indigenous organizations, as well as government and non-government national, provincial and territorial programs and services. For example, according to a CCAB survey, only 4 in 10 Aboriginal business owners report having used a government program, and there was great variety (27) in the types of programs
reported being used. The most common programming accessed was related to loans and grants to small companies for financial support for employment-related activities. And how did owners find out about these government resources? The overwhelming majority cited word of mouth (43%) followed by internet search

Asia Pacific Foundation of Canada | 19
(16%). Despite their track record of success, Indigenous businesses face challenges accessing financing and in other business functions. With that in mind, this guidebook can be used to help find the services and support needed for Indigenous businesses to engage or increase engagement with the Asia Pacific.
And what were the reasons for not using a government resource? According to the CCAB, the top three were: don’t see a need or value in the programs (41%), were not aware of them or they were hard to find (22%), and there was too much bureaucracy involved (16%). While this guidebook might not be able to fully mitigate these concerns, it can help show many programs’ value to your particular endeavour, save you time finding them, and help target your approach to looking for support.
Asia Pacific Foundation of Canada | 20
Creating an Indigenous Business Strategy for the Asia Pacific
Regardless of the size or sector of your business, developing an Asia Pacific strategy will help you find new ways of addressing the needs and aspirations of your business, marketing and selling your products or services, and/or attracting investment from the region. Only 3 in 10 Aboriginal businesses in Canada have a business plan, largely due to not seeing a need or not having the resources to develop one. This is despite business plans being integral to many business functions, such as understanding long-term viability and increasing the ability to raise capital, which almost half of Indigenous businesses struggle with. Business plans are especially important to successfully navigate international expansion. This section will describe some of the broad considerations that go into making a strategic plan for seeking and pursuing opportunities in international markets with a focus on the Asia Pacific – and will provide resources available to develop such plans.
There are three components to developing an Asia Pacific strategy: resources, industries, and institutions. Each of these is addressed below. For example, if you are looking to sell a product or service in Asia, you need to consider what competitive advantage you can draw from your resources, what the competitive forces of your product or service are when looking at a particular country or market, and what institutions – such as regulations, trade agreements, and government offices – are relevant. The three components and relevant information are looked at in the following three sections.
Resources
Assessing your resources will help your organization meet the aspirations of your business or community and find and achieve a competitive advantage. Ideally, your resources should be valuable, rare, and hard for others to imitate or implement. Indigenous resources have been and are increasingly sought by businesses and are marketable throughout the Asia Pacific region. This section will discuss Indigenous resources that Asian economies may be interested in, including but not limited to land and culture, energy and natural resources, organizational structure, e-commerce, and agriculture and agri-food.
Land and Culture
Your Resources
Outright exploitation of land and culture and other Indigenous resources for economic gain is not fully compatible with the goals and interests of Indigenous communities. But some communities may find that such resources can be used to help meet long-term Indigenous economic and social goals, such as providing stable employment in the community and encouraging cultural practices through activities like tourism in a particular area or selling art. Land can be developed for economic purposes by being leased, used for production facilities, used for renewable energy production, tourism, and in other ways.
Asia Pacific Foundation of Canada | 21
It is difficult to provide a concise overview of Indigenous lands, as there are First Nations reserves, urban reserves, Métis communities, Inuit lands, Indigenous majority communities, and different regulatory and other considerations for each. Different communities will have their own ideas about how to use the resources available to them. In addition, modern land claim agreements and other changes mean that the current situation will continue to change. Briefly, having ownership and management of land can be beneficial for the reasons mentioned, but some Indigenous nations have had difficulty utilizing their land for business development purposes. These challenges can be due to isolation, governance and organizational structures, regulatory environments, and the decision-making process involved, among others. Overcoming these challenges will be unique to each nation or business venture, and rely largely on internal factors, but it is not impossible. If the challenges are overcome or are small to begin with, land development may be one of the easiest-to-access business options.
Indigenous culture is unique to each nation, making cultural products and experiences like art, beadwork, clothing, and local activities especially valuable to people who are interested in purchasing or experiencing them. Over half a million tourists came to Canada from China in 2017 alone, almost one-third of whom have participated in an Indigenous experience, with even more interested in doing so. And there are similar interest rates across Asia Pacific countries. The Indigenous tourism sector is set to capture demand from Asia as the Indigenous Tourism Association of Canada (ITAC) has set a goal of establishing 50 Indigenous tourism companies that are export ready by 2021 and supporting 200 such companies by 2024, and is providing funds of up to C$10,000 per business to spur such growth. ITAC also has information, such as market information and best practices, that may be useful.
Your Opportunities and Challenges
Viewing the Northern Lights, hunting, and other experiences that Indigenous people are well positioned to provide are gaining in popularity among Asian tourists. The Inuit art global market was worth C$64M in 2015, which has been attributed in part to growing demand in Asia resulting from Indigenous-government promotion of Canadian culture in the area. Leveraging cultural products requires identifying one or more markets that value Indigenous cultural goods and services, and taking steps to ensure that there is some form of authentication of the cultural goods or services so that they cannot be imitated or to differentiate from those that are inauthentic. Section 3, Number 12: Dealing with Asian Governments mentions key points to consider regarding protecting your intellectual property and traditional knowledge.
There are some cultural and historical similarities between Indigenous people in Canada and Indigenous and non-Indigenous people in the Asia Pacific. There is a large amount of cultural diversity, a shared colonial history, and common goals like environmentalism and self-determination. Recognizing and embracing the similarities opens the door to a deepened sense of mutual understanding and respect. For some accounts of this shared history, culture, and values, see Section 3, Number 16: Examples of Shared Indigenous-Asian History, Culture, and Values. As explained by Grand Chief Edward John:
[I]n China, culture is very big. It is a land of great culture; great cultures actually [...] On our trips to China, when our regalia and our masks and drums were brought forward, the dynamics of the meeting changed dramatically. It was culture meeting culture. Talking to each other on a cultural foundation about the long history and long traditions and roots of our respective cultures, we are able to talk on that level [...] You are not talking about bottom lines, dollars, and accents.7
7 John, Edward. 2011. Why BC’s First Nations Need a China Strategy. APF Canada as cited in Montsion, Jean Michel. 2015. Disrupting Canadian sovereignty? The ‘First Nations & China’ strategy revisited. Geoforun 58: 119.
Asia Pacific Foundation of Canada | 22
On the flip side, you will still need to deal with language and cultural barriers. Expect to have to deal with translators, local business agents, and learning new languages or at least a few words or phrases. This will be a difficult task that often leads to international business struggles and failures.
Energy and Natural Resources
Your Resources
Indigenous communities have access to vast energy and natural resources and these communities have continually expressed that they are not anti-development. Rather, they want to be included in the dialogue and benefit from development in line with community values, interests, and goals, which often include strong consideration of social, cultural and environmental variables in addition to economic variables. Some experts argue that the energy and resource sector offers the most potential for
country-wide Indigenous economic development and that Indigenous participation is key to the sector’s future. Organizations like the Indian Resource Council, the First Nations Major Projects Coalition and the BC First Nations Energy and Mining Council (BCFNEMC) are proof of this.
With many Indigenous people living near oil and gas deposits, mines, forests, lakes and rivers, and other such natural resources, this is a particularly important industry. Most Indigenous businesses in Canada that already do business with Asian companies or Asian-affiliated companies likely do so as part of natural resource agreements. Some other experts have noted that there exists what closely resembles the “resource curse” in certain areas: despite access to natural resources, many Indigenous peoples do not prosper from those resources. However, the industry is changing and is playing an increasingly important role in Indigenous economic development as more integration, effort, and investment is put into ensuring Indigenous peoples receive proper and sufficient consultation, compensation, and opportunities. And new tools are making it easier for government and industry to award resource sector-related contracts to Indigenous businesses.
Your Opportunities and Challenges
Some Indigenous organizations receive regular inquiries from stakeholders in Asia, indicating the opportunities for investment from Asia into Indigenous-owned energy, natural resources, and resource development. As previously mentioned, the majority of Indigenous businesses that have ongoing relationships with Asian stakeholders do so as part of resource agreements. From 2017 to 2018 alone, there were 21 deals totalling C$29.5B invested from the Asia Pacific to Canada in the energy sector, compared to C$19.46B invested from 2003 to 2010. This and other key investment information in several industries between Canada and the Asia Pacific can be found using APF Canada’s Investment Monitor tool.
The Asia Pacific already uses more energy than it produces, with a 75% increase in CO2 emissions in China alone from 2004 to 2012, and by 2035 the region will consume half the worlds energy supply. Another opportunity is to look for additional business spin-offs, for example in managing, servicing, or maintaining any resource investment projects. The Asia Pacific region is also disproportionately affected by climate change, including rising sea levels, increasing storms, and pollution, leading to increased investment from the region into clean tech. Indigenous people value the environment, and the environment in Asia is becoming increasingly stressed, leading to opportunities to collaborate in making the future a cleaner, greener one
Asia Pacific Foundation of Canada | 23
through clean energy and clean tech. APF Canada’s China Eco-City Tracker sheds light on the environmental indicators in 31 cities in China and can help businesses identify potential opportunities in that market.
A critical component of resource development projects is the duty to consult, accommodate, and negotiate with Indigenous peoples. This is important for Indigenous–Asia Pacific relations because there have been at least a few instances where Asian partners were unaware of this context or believed it to be a domestic rather than an international issue that they need not concern themselves with. Such misunderstandings can cause costly delays, uneasy relations, or even the cancellation of projects.
A BCFNEMC document succinctly describes the duty to consult and accommodate and negotiation practices:
An essential component of resource development in Canada is the legal requirement to consult and accommodate First Nations whose rights might be adversely impacted by the development. Working closely with First Nations and developing partnerships based on trust, respect and recognition of First Nations rights and title will help ensure the successful development and operation of resource-related projects. By building relationships and securing agreements with First Nations, companies will avoid project risks such as costly project delays due to litigation or injunctions, challenges to permits, restriction of access for works and negative media campaigns. Critical aspects of consultation and negotiation with First Nations on resource projects include:
• Open and honest communication throughout all aspects of the project.
• Agreement that the free, prior and informed consent of First Nations must be obtained before developing projects and activities affecting their communities.
• Negotiation of Impact and Benefit Agreements that include profit sharing, equity, and other social and economic provisions.

Asia Pacific Foundation of Canada | 24
• Resource development must be conducted in an environmentally, ecologically, socially, culturally, economically sustainable and viable manner for the benefit of future generations.
• The inclusion of Indigenous knowledge throughout the planning and development of a project.
• Financial resources for the First Nations to engage in the consultation and negotiation process.
• Education, training and capacity to ensure full participation in the planning, construction and operations of a project.
Preparing to discuss such practices and resource participation models with Asian stakeholders can help your potential partners understand the Indigenous community and business context and reduce risks.
Agriculture and Agri-food
Your Resources
The CCAB argues that there is significant potential for Indigenous businesses to grow in the agriculture and agri-food sector, a sector which currently has an underrepresentation of Indigenous businesses despite access to land, water, and sea. In 2016, 30% of Indigenous agriculture businesses exported, almost triple the Canadian average. Indigenous businesses produce and have potential to produce a wide variety of agriculture and agri-food products suitable for Asia Pacific markets, ranging from common to more traditional and niche grains, fruit, vegetables, meat, freshwater fish, and seafood products.
Your Opportunities and Challenges
With the growing economy and middle class in Asia, and the high regard for safe, high-quality, and niche/specialty Canadian agricultural products, Indigenous peoples with these resources or the potential to develop them have an opportunity. With increasing governmental support, including Indigenous funding, participation and skills development, and support for trade with Asia, it is increasingly easy to conduct business and trade in this sector. China is an especially large market for agri-food and seafood products, and many of these items are increasingly sold on e-commerce platforms like Alibaba, but it comes with its own set of tariff and non-tariff barriers that can be arbitrarily imposed, and it is by no means the only market. Trade in agriculture, agri-food, and seafood between Canada and the Asia Pacific region has increased by 300% since 2010, indicating the rapid growth in opportunities. However, as recent spats with China and India over canola, pork, and pulses have shown, a large market does not necessarily correlate with ease of doing business, and these are difficult markets to engage. These products rely heavily on the Canadian reputation or brand for safe and quality products and investment.
The Comprehensive and Progressive Agreement for the Trans Pacific Partnership (CPTPP) now gives Canadian products in this sector preferential treatment in member countries, which includes Japan, Vietnam, Malaysia, Australia, and New Zealand, and the Canada-Korea Free Trade Agreement reduces or eliminates tariffs on exports to that market. The CPTPP allows Canadians to provide many other products with reduced

Asia Pacific Foundation of Canada | 25
tariffs, which provides them a competitive position over other major exporters like the United States. The CPTPP provides a variety of other benefits and advantages, including reducing non-tariff barriers to trade.
Organizational Structure
Your Resources
The organizational structures of Indigenous organizations have potential to provide an ease of doing business that other businesses cannot. Self-governing Indigenous nations that have jurisdictional control may play a stronger role in development within their territories. In theory this could translate into making it easier to navigate the regulatory environment and to access key decision-makers and take less time to approve and scale projects. Some Indigenous nations have their own independently
governed economic development corporations. Being independently governed can help minimize business risk, and therefore these businesses make attractive partners.

Asia Pacific Foundation of Canada | 26
Indigenous cultures typically lend to a long-term orientation, meaning that Indigenous peoples generally think about the long-term consequences of business decisions today, and might prefer long-term relationships rather than focusing on short-term business dealings. Many countries in the Asia Pacific have a similar long-term orientation, meaning that they too prefer long term relationships and well-thought-out deliberation of business deals and their long-term effects. These similarities will act as a strength in Indigenous–Asia Pacific business, where both partners can feel comfortable and respected in the structure of their relationship.
Your Opportunities and Challenges
In practice, the organizational structure of Indigenous organizations often leads to a more difficult business environment, such as making it more difficult to access loans by providing collateral on reserve. The regulatory environment can also be complex and often spans Indigenous, local, provincial, and national regulatory frameworks, organizations, and decision-making authorities. Indigenous leaders have large portfolios of responsibilities and must make business decisions that account for more than just maximizing profits, leading to decision-making being less straightforward. These issues are being addressed to some extent as communities strengthen their governance and self-determination, as community and business leaders use creative governance and organizations structures, and as different levels of government recognize the issues and take initiatives to streamline bureaucracy and co-ordinate better, assess Indigenous barriers to business, and create new financial tools.
When developing your Asia Pacific strategy, understand that Indigenous organizational structures can be a strength, and communicating that internally to your team and to potential partners will help them understand that it is advantageous to partner with an Indigenous business or organization. Being well prepared for projects by understanding exactly what regulatory processes, decision-making, and internal factors are required can help. Many Asian stakeholders will not be aware of such Indigenous organizational structures and accompanying challenges and advantages. It may be challenging to have partners understand why and how Indigenous entities are advantageous, so be prepared to describe your unique context, such as how key decision-makers will be easy to communicate with or how less red tape can lead to more productive and mutually beneficial relationships.
E-commerce
Your Resources
E-commerce platforms have marketing channels with access to global markets that have demonstrated demand for Indigenous products and services. As such, every venture should consider how e-commerce fits into its Asia Pacific business strategy. Some products, such as freshwater fish, wild meat products, artisan crafts, and tour packages, are well suited to e-commerce. Some Indigenous entrepreneurs have spoken about the ability of e-commerce to overcome common Indigenous business
challenges, such as securing a loan, setting up a retail location, going to a bank, and accessing customers. For example, a Financial Post article noted that “By 2007, about 60 per cent of the world’s online gambling traffic ran through servers in Kahnawake,” a Quebec First Nations reserve. In addition, the CCAB found that less than half of Indigenous non-exporters use social media while 7 in 10 exporters have an online presence.
Asia Pacific Foundation of Canada | 27
Your Opportunities and Challenges
The Asia Pacific is a leader of e- and mobile commerce; China’s market alone has over 800 million internet users, 98% of whom are mobile users, and the country is expected to become the world’s largest e-commerce market with transactions of C$9.4T in 2020. The Asia Pacific region is home to 8 of the top 20 internet companies in the world, based on revenue. China-based e-commerce giant Alibaba, for example, is one of the world’s top 10 most valuable companies, worth around US$400B. Japan-based Rakuten, another one of the world’s largest e-commerce companies, had 82 million online shoppers in 2017, and South Korea has over 30 million online shoppers every year. Consumers in the Asia Pacific have some of the highest rates of online shopping, and consistently buy fairly priced and quality products from around the globe. APF Canada has free e-commerce reports on succeeding in China, a C$9.4T e-commerce market, Japan, the world’s fourth-largest e-commerce market, and South Korea, the world’s third-largest e-commerce market.
When preparing to use e-commerce for Asian markets, keep in mind that doing so may not be as straightforward or easy as it may first appear. These platforms are often not just a Chinese or Japanese version of Amazon. Not only will you need to navigate each platform’s requirements and peculiarities, you will likely need to provide content customized to the region you are operating in, for example with local language and cultural aspects. The Canadian Trade Commissioner Service has a free E-Commerce in China Guide that Canadians can obtain by emailing the China TCS team, and the World Trade Centre Vancouver offers a one-day International E-Commerce Essentials (ICE) program for BC businesses and will waive the fee for Indigenous businesses. The Asia-Pacific Economic Cooperation (APEC), of which Canada is one of the 21 members, created a free Cross Border E-Commerce Trading tool to help such efforts. Another important e-commerce consideration is how payments will be made and the strategic approach to specific markets. For example, it likely makes sense to begin exporting to a typical Canada-Asia trade hub like Taiwan or Hong Kong, and then scale to China or elsewhere based on success.
While most Indigenous business have access to the internet and consider it reliable, CCAB found that it is used less often and is less reliable in the territories, the Atlantic, and on many reserves. There remains a digital divide in Canada, and many Indigenous communities have no, limited, or unaffordable access to internet services, which hinders them and may contribute to slower economic development than the rest of Canada.

Asia Pacific Foundation of Canada | 28
Having an online presence may be a challenge for your business, but many communities are working to find connectivity solutions and modernize their internet capabilities.
Industries
An industry is the group of companies and related organizations in which you operate. For example, if you are looking to attract new investment from the Asia Pacific for your energy company, there will be other companies with potentially cheaper, easier to access, or different sources of energy and related businesses in Canada, in the Asia Pacific, and around the world that you will have to compete or collaborate with to attract investment. Industry information and opportunities are discussed in this section.
Industry Competition and Challenges
There are several forces that will impact industry-related considerations in your strategy, including the amount of power that your suppliers and buyers have over you, the existing level of competition, and how easy it would be for others to enter the industry or substitute your products and services. Unique competitive aspects of an Indigenous business might include geographic and financing challenges, or the taxation and structure of some Indigenous businesses. Additional Indigenous-specific considerations are shown in Figure 6, which shows the percentage of Indigenous businesses that face barriers to business expansion depending on their market. While your company may or may not face the same obstacles the figure provides a rough indication of which areas may prove more cumbersome or time-consuming for international exporters (e.g. access to financing and attracting employees with the right skills and qualifications) versus areas that are less likely to be impediments (e.g. access to support for employee training and skills development and competition).
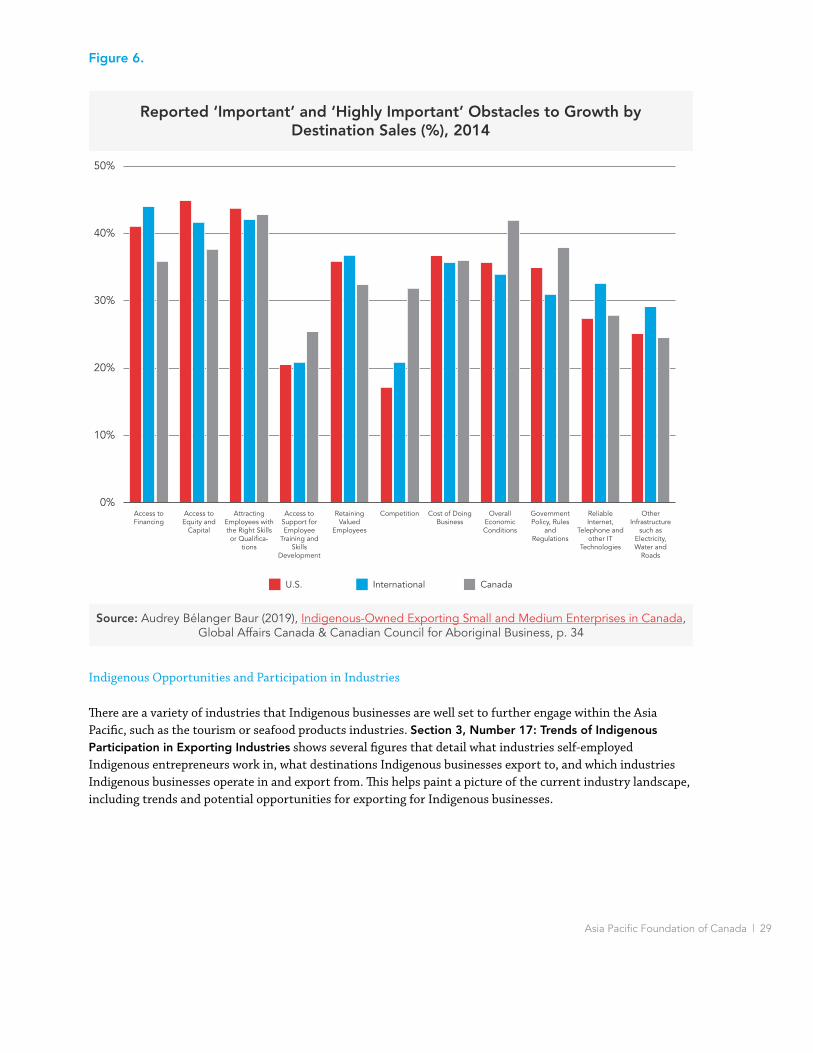
Asia Pacific Foundation of Canada | 29
Indigenous Opportunities and Participation in Industries
There are a variety of industries that Indigenous businesses are well set to further engage within the Asia Pacific, such as the tourism or seafood products industries. Section 3, Number 17: Trends of Indigenous Participation in Exporting Industries shows several figures that detail what industries self-employed Indigenous entrepreneurs work in, what destinations Indigenous businesses export to, and which industries Indigenous businesses operate in and export from. This helps paint a picture of the current industry landscape, including trends and potential opportunities for exporting for Indigenous businesses.
Reported ‘Important’ and ‘Highly Important’ Obstacles to Growth by Destination Sales (%), 2014
0%
10%
20%
30%
40%
50%
InternationalU.S. Canada
Access to Financing
Access to Equity and
Capital
Attracting Employees with the Right Skills or Qualifica-
tions
Access to Support for Employee
Training and Skills
Development
Retaining Valued
Employees
Competition Cost of Doing Business
Overall Economic Conditions
Government Policy, Rules
and Regulations
Reliable Internet,
Telephone and other IT
Technologies
Other Infrastructure
such as Electricity, Water and
Roads
Source: Office of the Chief Economist, Global Affairs Canada using data obtained from the Canadian Council for Aboriginal BusinessSource: Audrey Bélanger Baur (2019), Indigenous-Owned Exporting Small and Medium Enterprises in Canada,
Global Affairs Canada & Canadian Council for Aboriginal Business, p. 34
Figure 6.
Asia Pacific Foundation of Canada | 30
Despite resource and industry alignment with opportunities between Indigenous Canadian businesses and the Asia Pacific, success is not guaranteed. Some Indigenous organizations have worked proactively to build partnerships and others have experienced difficulty in building partnerships and having their needs and interests adequately represented when engaging with the region.
First Nations have been in a reactive mode when Chinese developers come to their territories. If there isn’t some structure to the relationship, First Nations risk renouncing companies and missing out on opportunities for economic development.8
Some Indigenous peoples have found that partnering to create their own institutions has helped in overcoming these challenges, and recent discussions at APF Canada with industry leaders came to a similar conclusion. It can increase confidence in your ability to meet demand, reduce risk, and is easier to deal with. By creating organizations that bring together various Indigenous nations in Canada or with those in the Asia Pacific, it could be easier to communicate, build partnerships, and increase autonomy. A simple starting point would be to agree to work together to deliver a product or service to the region. Such partnerships can be within or across multiple industries, like an economic co-operative or trade association such as the Nunatsiavut Group of Companies or the Ní’akindè National Business Consortium. It can otherwise be difficult to have a coherent strategy that is heard as many national interests and voices compete for attention in Asia Pacific markets.
Other Industry Opportunities
Retail, residential, and light industrial land development is a large economic driver for Indigenous businesses and has high potential investment from the Asia Pacific, as many communities have access to land that can be used for commercial purposes. Renewable energy, as numerous projects across the country attest, is also a high-potential investment for Indigenous communities with the land required for production and a shared interest in renewables.
Urban First Nations have the additional opportunity for Asian partners to invest in technology manufacturing, especially with a larger and more technical labour force available. For ideas on entering different technology industries, the Innovation Superclusters Initiative can give an approximation of which technologies will have favourable investment, labour, and activity in different areas of Canada. Another example would be to work with Asian partners to test technologies, such as automated online health services, 3D printed housing, and new clean energy technology, on Indigenous lands. Of Indigenous exporters, 14.4% are involved in manufacturing. Although there is no data on what they are exporting, this shows that it is a common activity. A related example is the previously mentioned First Nations community that hosted around 60% of the world’s online gambling traffic by 2007, an indicator of the opportunity and ability to use technology for business on reserves. The benefit for Asian partners would be that there are favourable organizational structures, testing conditions, and overlapping goals with Indigenous partners.
For industry information that can further inform your Asia Pacific strategy, see Section 3, Number 11: Industry and Logistical Information for a Successful Asia Pacific Business Strategy.
Institutions
Institutions are referred to in this guidebook as formal things like laws, rules, or regulations, and informal things like culture or business norms, that dictate how we should act. Becoming familiar with the institutions
8 BC First Nations Energy and Mining Council op. cit.
Asia Pacific Foundation of Canada | 31
relevant to your Asia Pacific strategy is important to ensure success. Some global business failures are a result of not knowing one’s institutional environment, such as relevant laws and certain aspects of business culture. It is particularly important to understand the local culture and learn how to do business in that context when dealing with global partners. This section will introduce some relevant formal and informal institutions.
Cultural Know-how for Businesses
Cross-cultural considerations are important in global business. There are many similarities in culture and values in Asia and in Indigenous Canada, including diversity, long-term orientation, importance of relationships, and trust building, which can provide deeper business connections. Indigenous businesses will benefit from having both strong business and Asia Pacific cultural acumen to engage successfully with the region. The onus is on Indigenous businesses to learn as much as they can about the cultures and business practices in their target markets or of the Asia Pacific-based company that is looking to invest in Canada.
Developing Asia competencies, such as language training, networking, and industry knowledge, can support cross-cultural business success. This can be accomplished by sending youth and students for internships, study abroad, job placement, and networking through conferences and ethnic business associations. Signing up for APF Canada’s tri-weekly Asia Watch newsletter, taking adult language classes, having your board meeting at an Asian restaurant, adding Asia competencies to your board matrix and director search criteria, engaging with an Asian business association, or visiting an Asia-based supplier are other ways of increasing Asia-related competencies within your business. Another option is to take the Forum for International Trade Training’s Intercultural Competence course for C$300. For a list of Indigenous and Asia cultural guides, basic phrases in Asian languages, a list of Asia-related centres at post-secondary institutions across the country, and Government of Canada cultural resources on the Asia Pacific region, see Section 3, Number 13: Asia Cultural Guides, Basic Phrases, and Additional Government of Canada Resources.
Not only is it necessary for Indigenous business leaders to have an understanding of the similarities and differences of the people and country of your intended market in the Asia Pacific, it is likely that companies and government officials in the Asia Pacific may be unfamiliar with Indigenous cultures, histories, and business practices. Directing your Asia Pacific partners to available resources that provide Indigenous cultures, histories, and business introductions can help improve mutual understanding and mitigate potential challenges upfront.
Asia Pacific Foundation of Canada | 32
While there is currently no document, program, or central organization geared specifically toward introducing Canada-wide Indigenous culture, history and business practices for a pan-Asia Pacific audience, there are a number of free and potentially useful resources. For example, Indigenous Works has created a seven-stage partnership framework for Indigenous and non-Indigenous interactions based on interviews and a survey with over 500 businesses. For a list of such partnership-building practices, see Section 3, Number 9: Resources for Networking and Partnership Building in Canada and Asia.
Meeting Clients and Partners
There are a variety of institutions and organizations in Canada and around the world that can help increase your Asia Pacific success by providing opportunities, including financing, to meet clients and partners in the region and gain market knowledge. The Asia Pacific Foundation, the Canadian Trade Commissioner Service, and the CanExport program are a few examples. To read more, see Section 3, Number 9: Resources for Networking and Partnership Building in Canada and Asia.
For more financial and logistic support resources, see Section 3, Number 10: Financing and Logistical Tools. For more information on offices and contacts that can assist in planning, financing, and networking, see Section 3, Numbers 3 to 7:
• Number 3: In-country Resources: Northeast Asia
• Number 4: In-country Resources: Southeast Asia
• Number 5: In-country Resources: South Asia
• Number 6: In-country Resources: Oceania
• Number 7: Provincial Support for Doing Business in Asia
Indigenous Networking in Canada and Asia
Networking with other Indigenous people and organizations can also be beneficial. Some organizations, like the CCAB, have a wealth of related information and resources and often host events around the country. Your network can provide mentorship, connect you with global opportunities, inform you of current events, and partner with you in business, such as by organizing trade events or working together to access a new market.
The first federally led Indigenous trade mission took place in October 2018 on the sidelines of the World Indigenous Business Forum, and the second federally led mission took place alongside the International Inter-Tribal Trade and Investment Organization (IITIO) mission to Texas and Oklahoma in June 2019. There are many other opportunities nationally and internationally. There are also a wide variety of consultancies with an Indigenous focus or department; for example, the Indigenous communications firm Creative Fire recently hosted a roundtable with APF Canada and several Indigenous organizations. For a list of Indigenous organizations that you may want to connect with or that provide networking events and general business networking in Canada and Asia, see Section 3, Number 9: Resources for Networking and Partnership Building in Canada and Asia.

Asia Pacific Foundation of Canada | 33
Indigenous businesses have also taken it into their own hands to organize trade missions to Asia and welcome reverse missions from Asia to Canada. Reaching out to organizers or participants to get involved or learn from their experiences could help ensure Indigenous businesses and communities are building from experience and learned best practices rather than reinventing the wheel.
Free Trade Agreements and Investment Treaties with Asia
Free trade agreements (FTA) are treaties that open international markets to Canadian businesses by reducing trade barriers, such as tariffs, quotas, or non-tariff barriers. Some countries use the term “economic partnership agreement” instead of free trade agreement. Canada has 14 FTAs with over 50 countries in force, two of which are with Asia. One is with South Korea, and the other is the Comprehensive and Progressive Agreement for Trans-Pacific Partnership (CPTPP) that came into force on December 30, 2018. Canada and Association of Southeast Asian Nations (ASEAN) member states announced the launch of exploratory discussions for a possible Canada-ASEAN FTA on September 8, 2017, with more discussions taking place in April 2019.
Foreign investment promotion and protection agreements (FIPAs) are bilateral agreements aimed at protecting and promoting foreign investment through legally binding rights and obligations. The Canadian government has concluded many FIPAs with Asian economies and continues to negotiate new agreements. Canada has 38 FIPAs in force, 5 of which are with Asian countries, and 2 of the 14 FIPAs in negotiation are with Asian counterparts. Asia Pacific-related FTAs and FIPAs can be found in Section 3, Number 8: Relevant Canada–Asia Pacific Free Trade Agreements and Foreign Investment Promotion and Protection Agreements.
You should contact a Trade Commissioner or Export Development Canada to discuss how trade agreements might benefit your company.
Institutional Engagement
Engaging with different institutions such as governments and legal systems can be difficult to navigate. For information on dealing with Asian governments, including protecting your intellectual property, government and business law, risk assessment, and trade and investment agreements, see Section 3, Number 12: Dealing with Asian Governments.
For tips and insights to ease the difficulty of engaging and doing business in different institutional and other contexts, see the following parts in section 3:
• For tips on doing business in Asia generally, see Section 3, Number 1: Doing Business in Asia: Quick Tips;
• For tips on Indigenous economic development practices, see Section 3, Number 14: Current Indigenous Economic Development Practices; and
• For examples of engagement actions from previous Indigenous-Asia business strategies, see Section 3, Number 15: Engagement Strategies of Previous Indigenous-Asia Stakeholders and Indigenous Global Business Examples.
Other resources to help get you started on developing your Asia Pacific strategy and set you on a path to begin or expand your business in Asia Pacific include this step-by-step guide, these introductory resources on exporting, and these resources on Indigenous exporting from the Government of Canada.
Asia Pacific Foundation of Canada | 34
Conclusion
Engaging with the Asia Pacific provides many opportunities for Indigenous businesses and communities to economically expand while meeting their business, community, and social goals. But doing so will not be for everyone; it will require conscious efforts over a significant period of time, such as ensuring support and interest from your chief and council, boards, and management; careful planning and creation of Asia Pacific strategies; solid market research and preparing your product or service appropriately; making frequent visits to the region; and weathering the ups and downs. Doing so may require building new partnerships with other Indigenous business or communities in Canada or abroad to address scale, brand, risk and capacity challenges. Understanding the context of the resources, industries, and institutions relevant to your strategy will help ensure you move down a good path toward engaging with the Asia Pacific region.
Indigenous individuals and communities have given rise to tens of thousands of businesses with their own resources, voices, and interests, which represent a unique and vital component of the Canadian economy and society. Indigenous peoples can and are increasingly co-operating across the country to represent their interests globally. That a quarter of Indigenous businesses are already exporting in one form or another shows that Indigenous Canada has a strong base from which to grow its globalized economic futures. Working collaboratively and cooperatively across Indigenous nations and organizations has the potential to make it easier to brand, communicate, and engage with the Asia Pacific.
Indigenous businesses can work alongside the rest of Canada toward reconciliation and development; promoting Indigenous opportunities and integration in the global economy can help make progress on both goals. Engaging with the Asia Pacific may help meet your business or community social and economic interests and goals, and this guidebook will hopefully help mitigate risks and maximize opportunities with engaging Asia Pacific markets and stakeholders. Even if you decide direct engagement is not right for you, having a better understanding and grasp of the region will help with long-term planning and understanding of global markets and communities, as the Asia Pacific will continue to be a key driver of the world economy for the foreseeable future.

Asia Pacific Foundation of Canada | 35
Section 3: Tips, Tactics, and Resources for Success
Asia Pacific Foundation of Canada | 36
This section provides more detailed information on specific topics and the most actionable resources that this guidebook holds, whereas section 1 and 2 makes a case for why Indigenous businesses should consider business engagement with the Asia Pacific and discuss the opportunities, challenges, and approaches to doing so. Each numbered item lists information or resources specific to a certain area of interest, such as industry information for specific Asian countries, details on current and potential trade and investment agreements, networking opportunities for Indigenous businesses, cultural guides, and more. All of these tips, tactics, and resources sections are introduced in sections 1 and 2 of the guidebook as they came up in relevant discussion, and below is a list of each with a brief description of what you will find within.
1. For tips on doing business in Asia generally, see Section 3, Number 1: Doing Business in Asia: Quick Tips;
2. A checklist to see if you are ready to export and your potential for doing so can be found in Section 3, Number 2: Exporting Preparedness Checklist;
3. For a list of offices and contacts that can assist in planning, financing, and networking in Northeast Asia, see Section 3, Number 3: In-country Resources: Northeast Asia;
4. For a list of offices and contacts that can assist in planning, financing, and networking in Southeast Asia, see Section 3, Number 4: In-country Resources: Southeast Asia;
5. For a list of offices and contacts that can assist in planning, financing, and networking in South Asia, see Section 3, Number 5: In-country Resources: South Asia;
6. For a list of offices and contacts that can assist in planning, financing, and networking in the Pacific, see Section 3, Number 6: In-country Resources: Oceania;
7. For support offered by the provinces, including offices and contacts that can assist in planning, financing, and networking, see Section 3, Number 7: Provincial Support for Doing Business in Asia;
8. For a list of relevant current and potential free trade agreements and foreign investment promotion and protection agreements, see Section 3, Number 8: Relevant Canada–Asia Pacific Free Trade Agreements and Foreign Investment Promotion and Protection Agreements;
9. For a list of partnership-building practices, see Section 3, Number 9: Resources for Networking and Partnership Building in Canada and the Asia Pacific;
10. For lists of financial and logistical support resources, see Section 3, Number 10: Financing and Logistical Tools;
11. For industry information that can inform your Asia Pacific strategy, see Section 3, Number 11: Industry and Logistical Information for a Successful Asia Pacific Business Strategy;
12. For information on dealing with Asian governments, including protecting your IP, government and business law, risk assessment, and trade and investment agreements, see Section 3, Number 12: Dealing with Asian Governments;
Overview

Asia Pacific Foundation of Canada | 37
13. For a list of Indigenous and Asian cultural guides, basic phrases in Asian languages, a list of Asia-related centres at post-secondary institutions across the country, and additional Government of Canada cultural resources on the Asia Pacific region, see Section 3, Number 13: Asia Cultural Guides, Basic Phrases, and Additional Government of Canada Resources;
14. For tips on Indigenous economic development practices, see Section 3, Number 14: Current Indigenous Economic Development Practices;
15. For examples of engagement actions from previous Indigenous-Asia business strategies, see Section 3, Number 15: Engagement Strategies of Previous Indigenous–Asia Stakeholders and Indigenous Global Business Examples;
16. For some accounts of shared Indigenous-Asia history, culture, and values, see Section 3, Number 16: Examples of Shared Indigenous–Asian History, Culture, and Values; and
17. For several figures from a 2019 GAC-CCAB report that detail what industries self-employed Indigenous entrepreneurs work in, what destinations Indigenous businesses export to, and which industries Indigenous businesses operate in and export from, see Section 3, Number 17: Trends of Indigenous Participation in Exporting Industries.
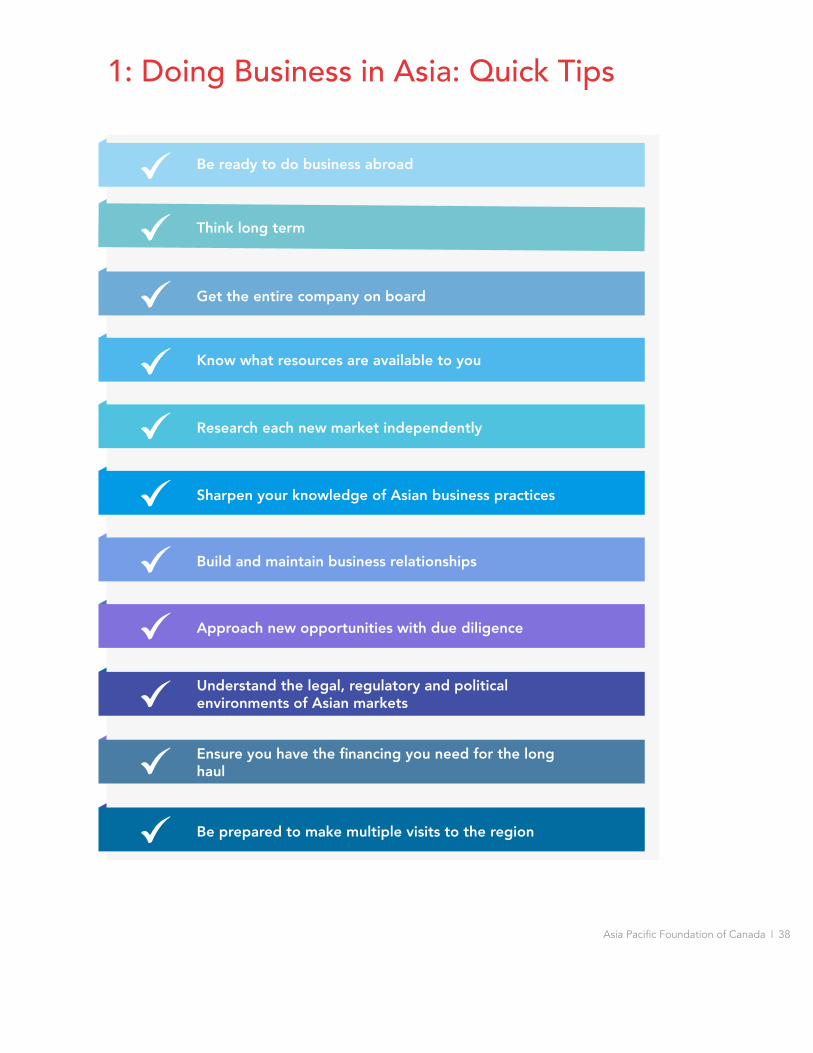
Asia Pacific Foundation of Canada | 38
1: Doing Business in Asia: Quick Tips
Think long term
Get the entire company on board
Know what resources are available to you
Research each new market independently
Sharpen your knowledge of Asian business practices
Build and maintain business relationships
Approach new opportunities with due diligence
Understand the legal, regulatory and political environments of Asian markets
Ensure you have the financing you need for the long haul
Be prepared to make multiple visits to the region
Be ready to do business abroad
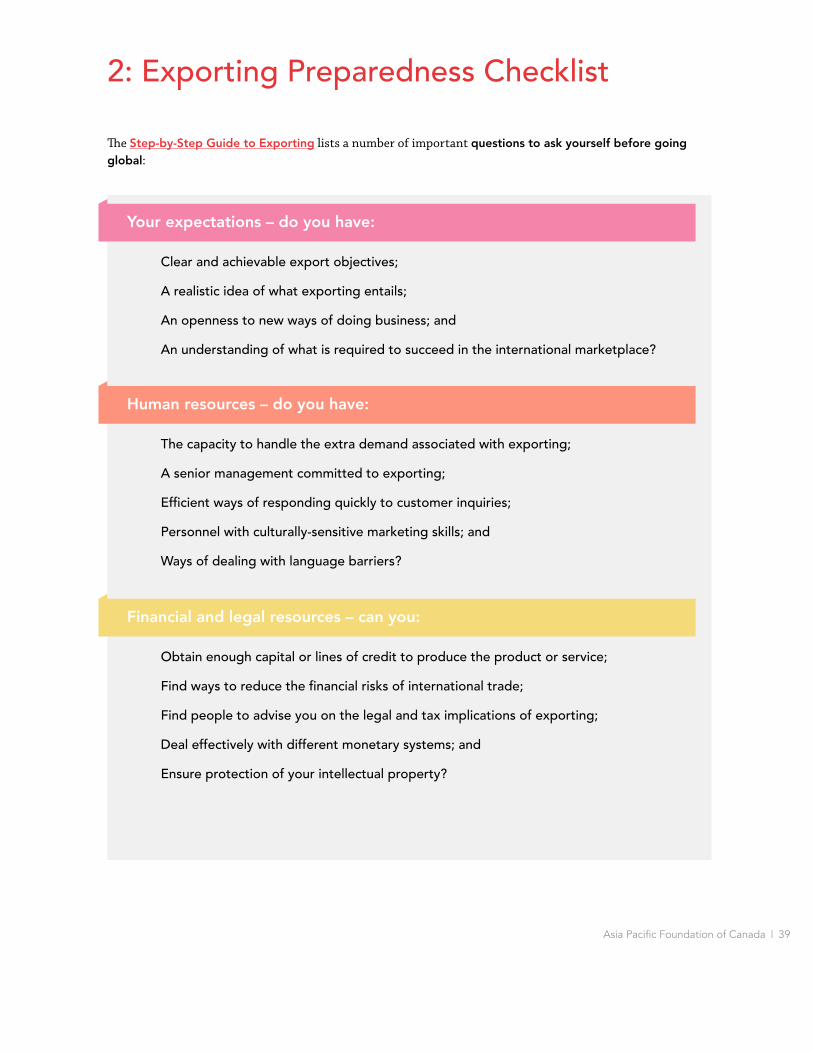
Asia Pacific Foundation of Canada | 39
2: Exporting Preparedness Checklist
The Step-by-Step Guide to Exporting lists a number of important questions to ask yourself before going global:
Your expectations – do you have:
Human resources – do you have:
Financial and legal resources – can you:
Clear and achievable export objectives;
A realistic idea of what exporting entails;
An openness to new ways of doing business; and
An understanding of what is required to succeed in the international marketplace?
The capacity to handle the extra demand associated with exporting;
A senior management committed to exporting;
Efficient ways of responding quickly to customer inquiries;
Personnel with culturally-sensitive marketing skills; and
Ways of dealing with language barriers?
Obtain enough capital or lines of credit to produce the product or service;
Find ways to reduce the financial risks of international trade;
Find people to advise you on the legal and tax implications of exporting;
Deal effectively with different monetary systems; and
Ensure protection of your intellectual property?
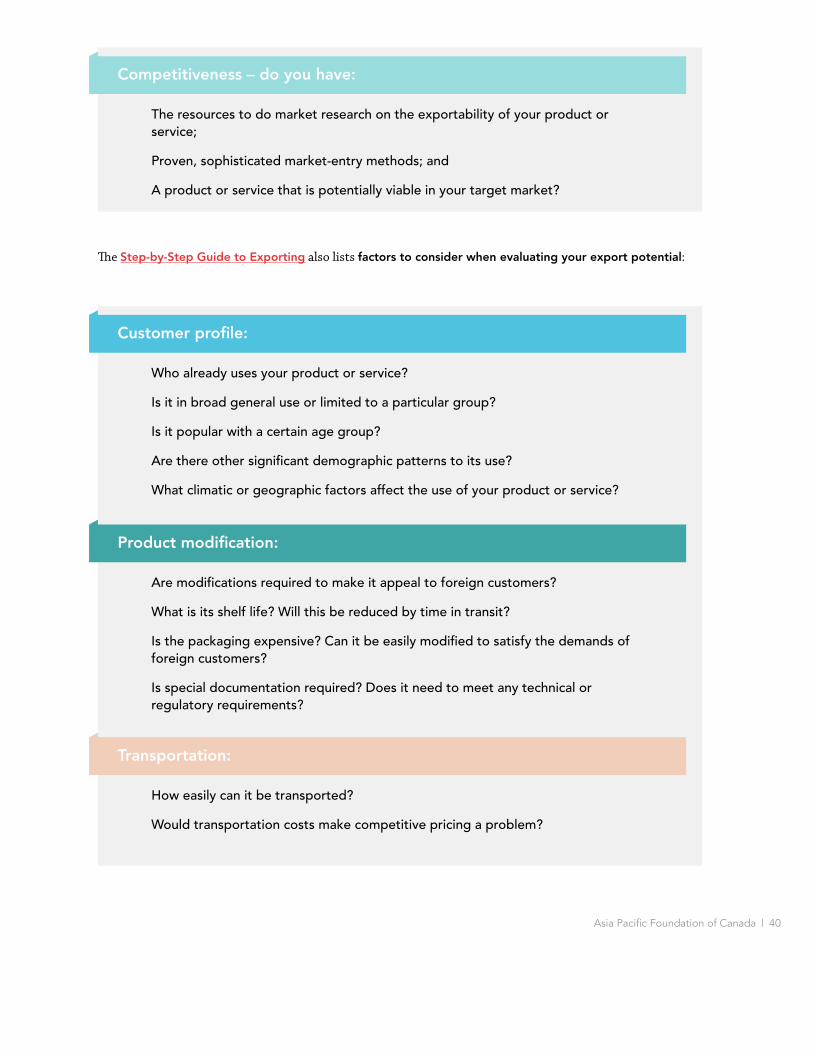
Asia Pacific Foundation of Canada | 40
Competitiveness – do you have:
The resources to do market research on the exportability of your product or service;
Proven, sophisticated market-entry methods; and
A product or service that is potentially viable in your target market?
The Step-by-Step Guide to Exporting also lists factors to consider when evaluating your export potential:
Customer profile:
Product modification:
Transportation:
Who already uses your product or service?
Is it in broad general use or limited to a particular group?
Is it popular with a certain age group?
Are there other significant demographic patterns to its use?
What climatic or geographic factors affect the use of your product or service?
Are modifications required to make it appeal to foreign customers?
What is its shelf life? Will this be reduced by time in transit?
Is the packaging expensive? Can it be easily modified to satisfy the demands of foreign customers?
Is special documentation required? Does it need to meet any technical or regulatory requirements?
How easily can it be transported?
Would transportation costs make competitive pricing a problem?
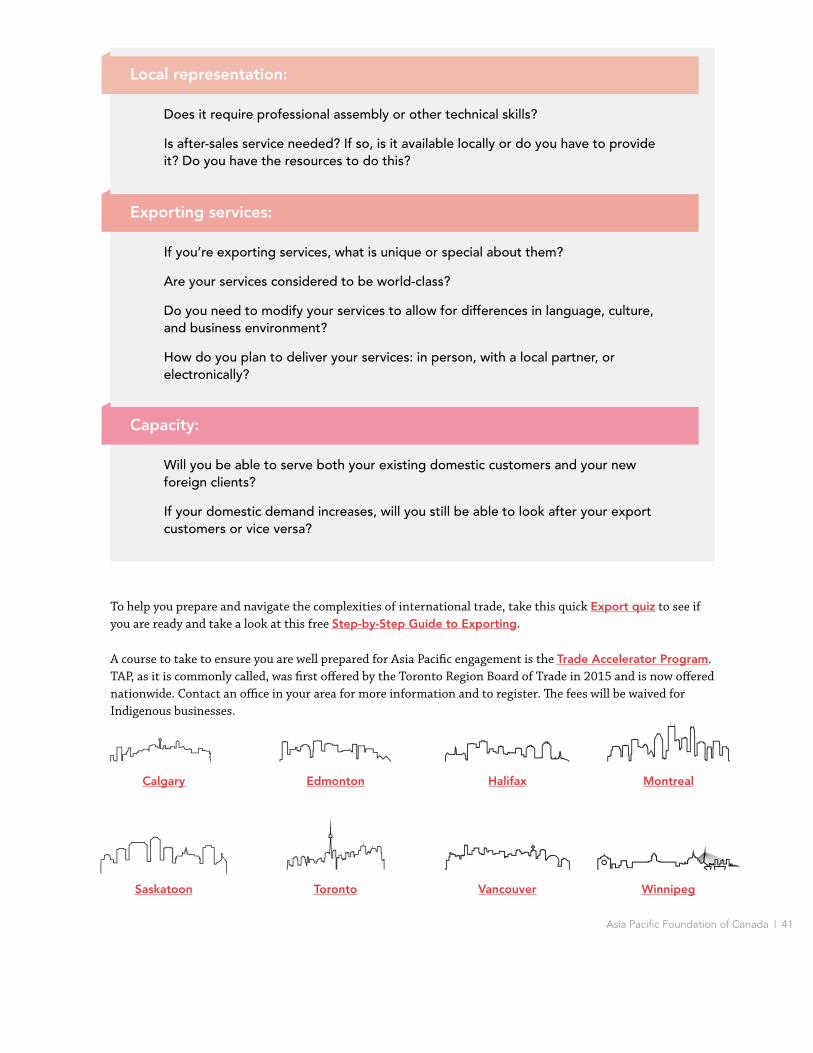
Asia Pacific Foundation of Canada | 41
Local representation:
Exporting services:
Capacity:
Does it require professional assembly or other technical skills?
Is after-sales service needed? If so, is it available locally or do you have to provide it? Do you have the resources to do this?
If you’re exporting services, what is unique or special about them?
Are your services considered to be world-class?
Do you need to modify your services to allow for differences in language, culture, and business environment?
How do you plan to deliver your services: in person, with a local partner, or electronically?
Will you be able to serve both your existing domestic customers and your new foreign clients?
If your domestic demand increases, will you still be able to look after your export customers or vice versa?
To help you prepare and navigate the complexities of international trade, take this quick Export quiz to see if you are ready and take a look at this free Step-by-Step Guide to Exporting.
A course to take to ensure you are well prepared for Asia Pacific engagement is the Trade Accelerator Program. TAP, as it is commonly called, was first offered by the Toronto Region Board of Trade in 2015 and is now offered nationwide. Contact an office in your area for more information and to register. The fees will be waived for Indigenous businesses.
Calgary Edmonton Halifax Montreal
Saskatoon Toronto Vancouver Winnipeg
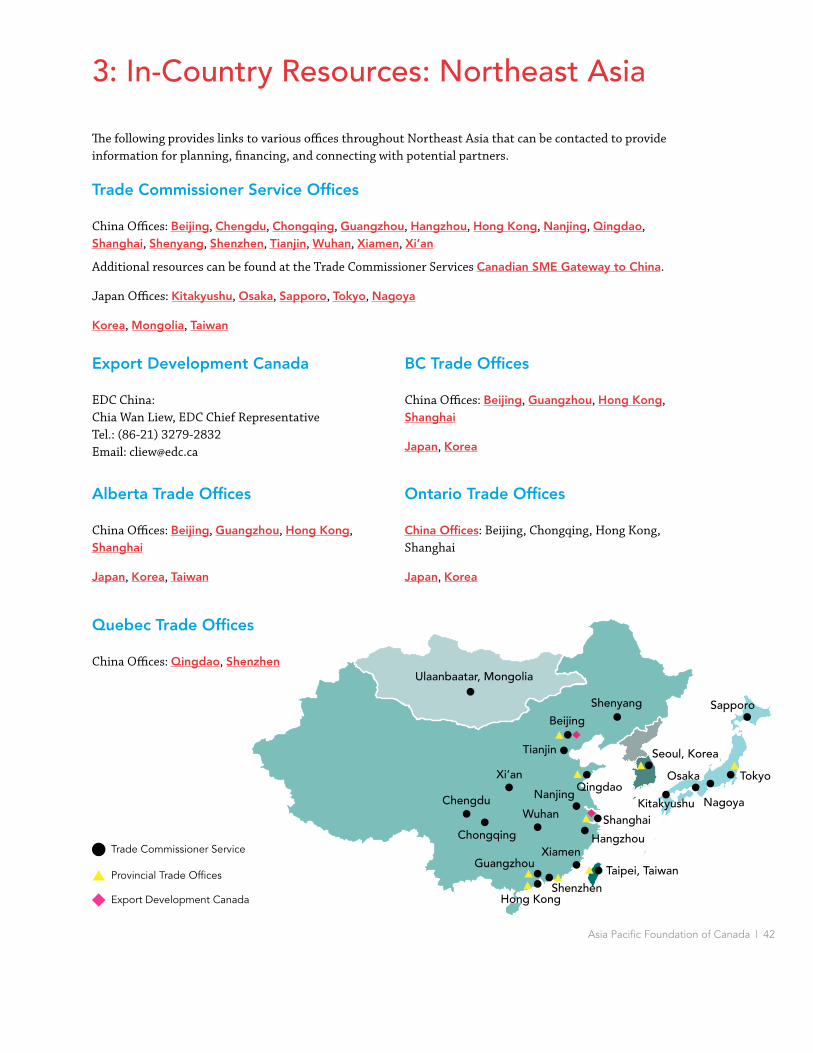
Asia Pacific Foundation of Canada | 42
3: In-Country Resources: Northeast Asia
The following provides links to various offices throughout Northeast Asia that can be contacted to provide information for planning, financing, and connecting with potential partners.
Trade Commissioner Service Offices
China Offices: Beijing, Chengdu, Chongqing, Guangzhou, Hangzhou, Hong Kong, Nanjing, Qingdao, Shanghai, Shenyang, Shenzhen, Tianjin, Wuhan, Xiamen, Xi’an
Additional resources can be found at the Trade Commissioner Services Canadian SME Gateway to China.
Japan Offices: Kitakyushu, Osaka, Sapporo, Tokyo, Nagoya
Korea, Mongolia, Taiwan
Quebec Trade Offices
China Offices: Qingdao, Shenzhen
Export Development Canada
EDC China: Chia Wan Liew, EDC Chief Representative Tel.: (86-21) 3279-2832 Email: [email protected]
Alberta Trade Offices
China Offices: Beijing, Guangzhou, Hong Kong, Shanghai
Japan, Korea, Taiwan
BC Trade Offices
China Offices: Beijing, Guangzhou, Hong Kong, Shanghai
Japan, Korea
Ontario Trade Offices
China Offices: Beijing, Chongqing, Hong Kong, Shanghai
Japan, Korea
Beijing
Chengdu
Chongqing
Guangzhou
Hangzhou
NanjingQingdao
Shanghai
Shenyang
Ulaanbaatar, Mongolia
ShenzhenHong Kong
Kitakyushu Nagoya
Osaka
Seoul, Korea
Taipei, Taiwan
Sapporo
Tokyo
Tianjin
Wuhan
Xiamen
Xi’an
Trade Commissioner Service
Provincial Trade Offices
Export Development Canada
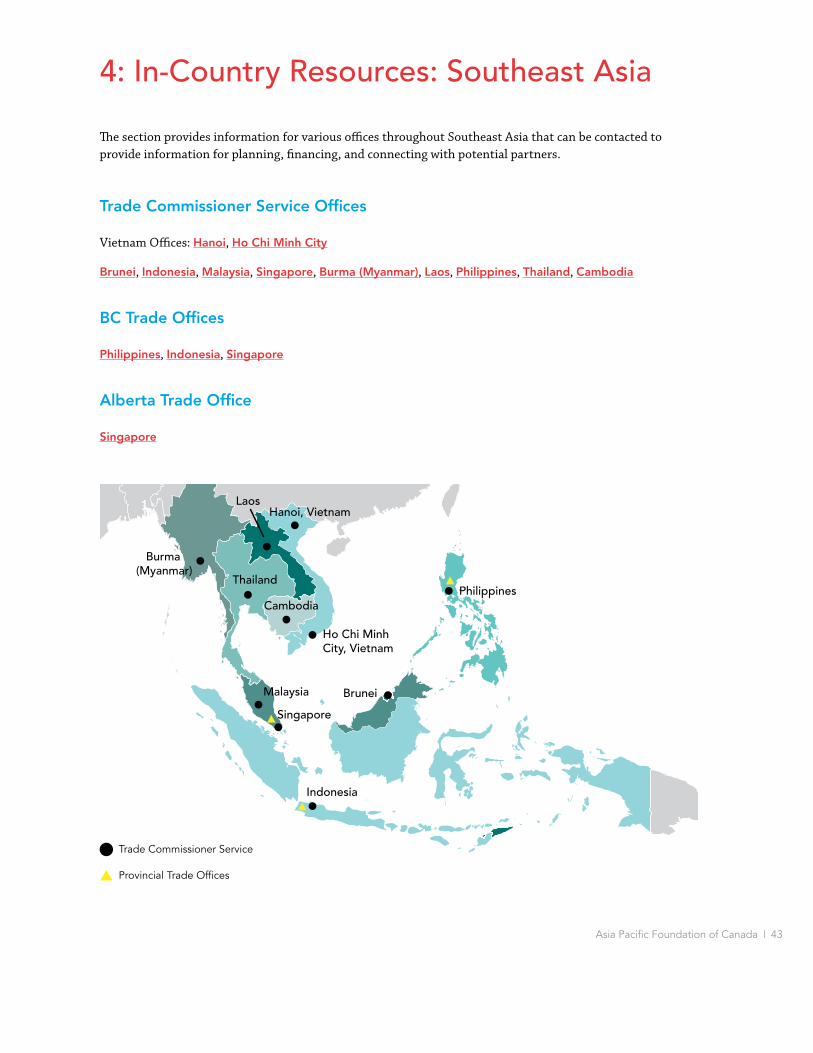
Asia Pacific Foundation of Canada | 43
4: In-Country Resources: Southeast Asia
The section provides information for various offices throughout Southeast Asia that can be contacted to provide information for planning, financing, and connecting with potential partners.
Trade Commissioner Service Offices
Vietnam Offices: Hanoi, Ho Chi Minh City
Brunei, Indonesia, Malaysia, Singapore, Burma (Myanmar), Laos, Philippines, Thailand, Cambodia
BC Trade Offices
Philippines, Indonesia, Singapore
Alberta Trade Office
Singapore
Hanoi, Vietnam
Ho Chi Minh City, Vietnam
Burma (Myanmar)
Laos
Brunei
Thailand
Singapore
Malaysia
PhilippinesCambodia
Indonesia
Trade Commissioner Service
Provincial Trade Offices

Asia Pacific Foundation of Canada | 44
5: In-Country Resources: South Asia
This section provides information for various offices throughout South Asia that can be contacted to provide information for planning, financing, and connecting with potential partners.
Trade Commissioner Service Offices
India Offices: Ahmedabad, Chandigarh, Hyderabad, Mumbai, Bangalore, Chennai, Kolkata, New Delhi
Pakistan Offices: Islamabad, Karachi
Bangladesh, Sri Lanka
Alberta Trade Office
India Office
BC Trade Offices
India Offices: Delhi, Chandigarh, Mumbai
Ontario Trade Offices
India Offices: Mumbai, New Delhi
Bangalore
Hyderabad
Dhaka, BangladeshAhmedabad
Mumbai
Chandigarh
New Delhi
Kolkata
Islamabad
Chennai
Colombo, Sri Lanka
Karachi
Trade Commissioner Service
Provincial Trade Offices

Asia Pacific Foundation of Canada | 45
6: In-Country Resources: Oceania
This section provides information for various offices throughout the Pacific that can be contacted to provide information for planning, financing, and connecting with potential partners.
Trade Commissioner Service Offices
Australia Offices: Canberra, Sydney
New Zealand Offices: Auckland, Wellington
Sydney
Wellington
CanberraAuckland
Trade Commissioner Service

Asia Pacific Foundation of Canada | 46
7: Provincial Support for Doing Business in Asia
In addition to federal government programming, provinces and territories also have services for supporting international business. Some provinces have their own trade offices in the region. Provinces with international trade offices are listed in numbers 3 to 6 of this section. Information for provincial domestic trade support is listed below.
Alberta Trade Support
Invest Alberta provides support for Alberta companies looking to grow internationally. Nine of the province’s 12 international offices are in Asia.
BC Trade Support
Trade and Invest British Columbia provides support for BC companies looking to grow internationally. They may have services for Asia Pacific regions.
Manitoba Trade Support
The World Trade Centre Winnipeg provides support for Manitoba companies looking to grow internationally. They may have services for Asia Pacific regions.
New Brunswick Trade Support
Opportunities New Brunswick (ONB) provides support for New Brunswick companies looking to grow internationally. They may have services for Asia Pacific regions.
Newfoundland and Labrador Trade Support
International Business Development (IBD) provides support for Newfoundland and Labrador companies looking to grow internationally. They have services for Asia Pacific regions.
Northwest Territories Trade Support
You may find trade support from the Northwest Territories Industry, Tourism, and Investment programs and services.
Asia Pacific Foundation of Canada | 47
Nova Scotia Trade Support
Nova Scotia Business Inc. (nsbi) provides support for Nova Scotia companies looking to grow internationally. They may have services for Asia Pacific regions.
Nunavut Trade Support
The Nunavut Department of Economic Development and Transportation has various programs and resources that may provide support for Nunavut companies looking to grow internationally.
Ontario Trade Support
Invest in Ontario provides support for Ontario companies looking to grow internationally. They have services for Asia Pacific regions.
PEI Trade Support
Global Trade Services provides support for PEI companies looking to grow internationally. They have services for Asia Pacific regions.
Trade Team PEI provides support for PEI companies looking to grow internationally. They have services for Asia Pacific regions.
Quebec Trade Support
Quebec International provides support for Quebec companies looking to grow internationally. They have services for Asia Pacific regions.
Saskatchewan Trade Support
The Saskatchewan Trade and Export Partnership (STEP) provides support for Saskatchewan companies looking to grow internationally. They may have services for Asia Pacific regions.
Yukon Trade Support
You may find trade support from the Government of Yukon funding and support for business.
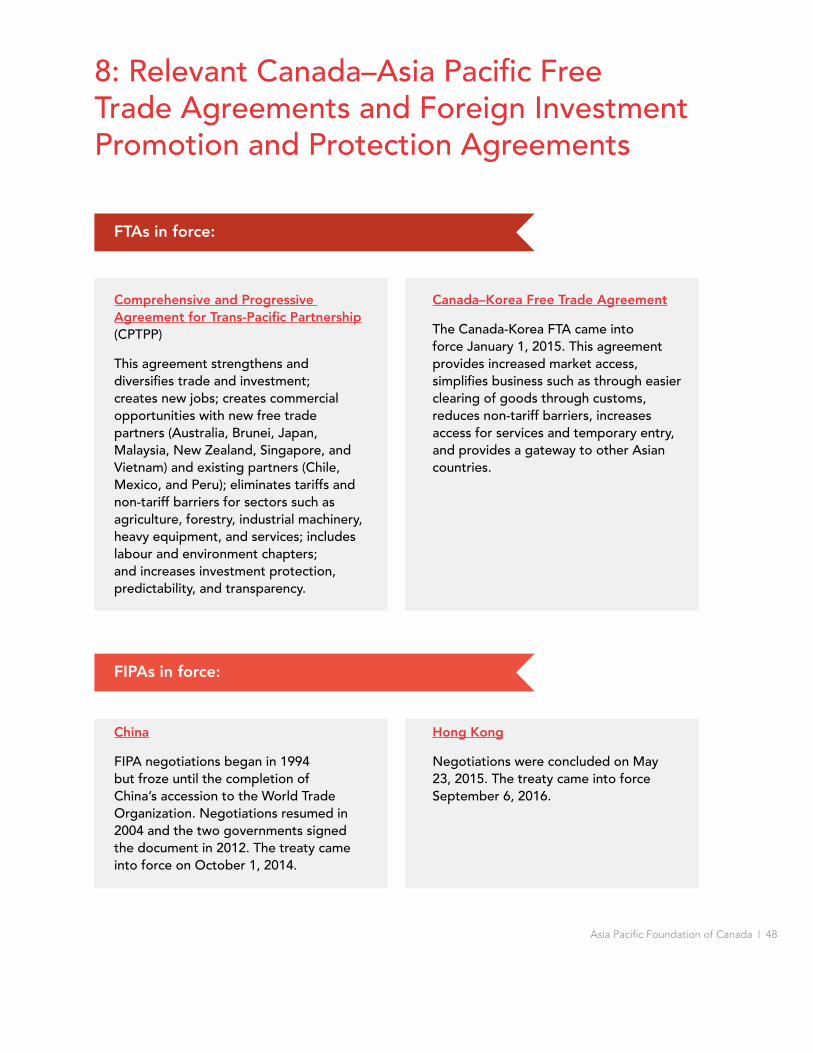
Asia Pacific Foundation of Canada | 48
8: Relevant Canada–Asia Pacific Free Trade Agreements and Foreign Investment Promotion and Protection Agreements
FTAs in force:
FIPAs in force:
Comprehensive and Progressive Agreement for Trans-Pacific Partnership (CPTPP)
This agreement strengthens and diversifies trade and investment; creates new jobs; creates commercial opportunities with new free trade partners (Australia, Brunei, Japan, Malaysia, New Zealand, Singapore, and Vietnam) and existing partners (Chile, Mexico, and Peru); eliminates tariffs and non-tariff barriers for sectors such as agriculture, forestry, industrial machinery, heavy equipment, and services; includes labour and environment chapters; and increases investment protection, predictability, and transparency.
China
FIPA negotiations began in 1994 but froze until the completion of China’s accession to the World Trade Organization. Negotiations resumed in 2004 and the two governments signed the document in 2012. The treaty came into force on October 1, 2014.
Canada–Korea Free Trade Agreement
The Canada-Korea FTA came into force January 1, 2015. This agreement provides increased market access, simplifies business such as through easier clearing of goods through customs, reduces non-tariff barriers, increases access for services and temporary entry, and provides a gateway to other Asian countries.
Hong Kong
Negotiations were concluded on May 23, 2015. The treaty came into force September 6, 2016.

Asia Pacific Foundation of Canada | 49
Mongolia
The first round of negotiations took place in 2009. The Canada-Mongolia FIPA came into force on February 24, 2017.
Thailand
This FIPA came into force September 24, 1998.
Philippines
This FIPA entered into force on November 13, 1996. In 2010, Canadian direct investment in the Philippines totalled C$761M.
FTAs and FIPAs in discussion and negotiation:
India FIPA
Negotiations of this FIPA were concluded in June 2007; the agreement was signed but has not been ratified. This FIPA is paving the way for discussions regarding the Canada–India Comprehensive Economic Partnership Agreement, which is now in negotiations.
India FTA
The tenth round of the Canada-India Comprehensive Economic Partnership Agreement negotiations took place in August 2017, with agreement for more negotiations.
Philippines FTA
Exploratory discussions for potential negotiations of a bilateral FTA were launched in May 2015, and a meeting took place in July 2015. Now the exploratory discussions are focused on overall economic engagement with ASEAN member states.
Pakistan FIPA
The third and most recent round of negotiations of this FIPA were held May 28 and 29, 2012, in Ottawa.
China FTA
On September 22, 2016, Canada and China announced the launch of exploratory discussions for a possible Canada-China FTA. The most recent set of meetings took place from July 31 to August 4, 2017.
Thailand FTA
In March 2013, Canada and Thailand announced the launch of exploratory discussions for potential negotiations of a bilateral free trade agreement. The exploratory discussions concluded in July 2015. Now the Canadian government is focused on exploratory discussions on overall economic engagement with ASEAN member states.9
9 Government of Canada. Trade and investment agreements.

Asia Pacific Foundation of Canada | 50
9: Resources for Networking and Partnership Building in Canada and the Asia Pacific
The following resources may help with preparing for visits from Asia Pacific stakeholders and informing them about Indigenous cultures, histories, and business.
Seven Stages of Building Indigenous–Non-Indigenous Partnerships
Indigenous Works, an organization in Canada that was created to address the need to understand and improve Indigenous – non-Indigenous partnerships, created a seven-stage partnership model based on surveys with over 500 businesses and interviews. The seven stages are:
This partnership model provides characteristics of each stage and recommendations for successfully navigating from one stage to the next.
Partnerless
Strategy Assessment and Visioning
Partnership Readiness
Partnership Search and Prospect Identification
Engagement
Relationship Building
High-Functioning, Authentic and Long-Term Partnerships
1
2
3
4
5
6
7

Asia Pacific Foundation of Canada | 51
Resources for Engaging Indigenous Canada
Engagement is a two-way process. Just as Indigenous businesses must learn about each particular market, culture, and people of a particular place in Asia Pacific, it may be beneficial for potential Asian partners to learn more about Indigenous Canada. While there are no comprehensive resources or organizations dedicated to this, there are a number of resources that could be shared to help inform and prepare Asia Pacific stakeholders for engaging with Indigenous Canada. These include:
There is also a wide variety of consulting firms that do work on Indigenous–non-Indigenous relations that may be able to help with Asia Pacific stakeholders.
• BC (2014): Building Relationships with First Nations: Respecting Rights and Doing Good Business;
Japanese Translation Mandarin Chinese Translation Korean Translation
• BC (2014): Guide to Involving Proponents When Consulting First Nations;
• Association for Mineral Exploration BC (2015): Aboriginal Engagement Guidebook: A Practical and Principled Approach for Mineral Explorers;
• City of Vancouver (2014): First Peoples: A Guide for Newcomers;
• Alberta (2013): Aboriginal Peoples of Alberta: Yesterday, Today, and Tomorrow;
• Canadian Construction Association (2016): Indigenous Engagement Guide;
• Engaging Saskatoon Region Employers (2019): The Business Case for Reconciliation can provide reasons, lessons learned, best practices, and more for employing Indigenous peoples. This resource can be especially useful in resource projects or others where your partner may hire Indigenous workers; and
• Bob Joseph & Cynthia Joseph (2017): Working Effectively with Indigenous Peoples.
• Canada Council for Aboriginal Business (2019): Business Reconciliation in Canada: Actions for Small Business Business Reconciliation in Canada: Actions for Large Business Business Reconciliation in Canada Guidebook
Asia Pacific Foundation of Canada | 52
Networking Through Canada-based Indigenous Organizations
The following organizations may be beneficial to connect with and several hold regular events.
• The International Inter-Tribal Trade and Investment Organization (IITIO) seeks to support and enhance the implementation of the global flow and exchange of Indigenous goods, services, and investments. Global Indigenous business information and news is available at this website;
• The International Indigenous Trade Mission and Conference is held twice a year and can provide information and networking opportunities for Indigenous global business;
• The World Indigenous Business Forum is an annual forum that attracts Indigenous people from around the world to discuss global economic issues and provides information and networking opportunities for Indigenous global business;
• The Canadian Council for Aboriginal Business, a national organization with over 700 Indigenous and non-Indigenous members, offers networking opportunities, research on Aboriginal businesses in Canada, and resources geared toward helping Indigenous business succeed;
• Raven Events’ Advanced Business Match Indigenous runs trade and business matching events across the country with a current focus on the Prairies, West, East, Alberta, and Vancouver Lower Mainland;
• The Aboriginal Women’s Business Entrepreneurship Network provides support and assistance for Aboriginal women in business at all levels of business, including with specific programs and resources and an annual conference;
• The Inuit Women in Business Network provides support and assistance for Inuit women in business at all levels of business;
• Business Women in International Trade provides trade support and advice, from women-focused trade missions to advice and financing, for majority (51%+) women-owned and managed businesses;
• The Reservation Economic Summit is the largest Indigenous business conference in the United States and provides a large networking and business opportunity; and
• The NMSDC Conference and Business Opportunity Exchange, located in the United States, provides a large forum with the purpose of connecting organizations to minority (including Indigenous) suppliers for procurement and business opportunities.
Networking Through Canada-based Asian Business Associations and Trade Offices
• Canada China Business Council
• Canada Korea Business Association
• Canada-India Business Council
• Canada-Vietnam Trade Council
• Hong Kong-Canada Business Association
• Taiwan Chamber of Commerce in B.C.
• Taiwan Trade Center
Asia Pacific Foundation of Canada | 53
Networking Through Asia-based Chambers, Consulates, and Trade Offices
Canadian Chambers of Commerce and Business Associations in Key Markets
• China, Hong Kong, India, Japan, Indonesia, Korea, Philippines, Singapore, Taiwan, Thailand, Vietnam
• Association of Southeast Asian Nations
• World Chamber Network
Consulates and Trade Offices
Chinese, Indian, Indonesian, Japanese, Korean, Filipino, Mongolian, Singaporean, Taiwanese, Thai, Vietnamese
Government of Canada
• Trade Commissioner Service: Events abroad and events in Canada
• Export Development Canada: Events
• Agriculture and Agri-Food Canada: Trade shows
Mentoring Support in Canada
The Canadian Council for Aboriginal Business reports that the majority of Aboriginal businesses (59%) seek informal networking and mentorship support, while less than a quarter, primarily large well-established companies, seek more formal mentorship opportunities. Below are a few related resources to help with your mentoring needs.
• Futurpreneur Canada
• MentorshipBC
• Forum for Women Entrepreneurs Mentor Program
• Startup Canada
• Ontario Small Business Services: Indigenous entrepreneur guide to starting a business
• Innu Business Development Centre
Asia Pacific Foundation of Canada | 54
10: Financing and Logistical Tools
A 2016 survey by the Canadian Council for Aboriginal Business reports that finding and then qualifying for financing are key obstacles for about half of Aboriginal businesses and that women probably find it more challenging to access financing than their male counterparts. Seven out of ten Aboriginal businesses do not have a formal business plan and cite not seeing the value of having one or not having the resources to develop one. This is noteworthy because having a formal business plan can provide a solid foundation for a company and is often a requirement for accessing financing.
As said by the CFO of Indigenous and Northern Affairs Canada,
I see two main challenges: community infrastructure and connectivity in First Nation communities and the persistent socio-economic gap between many First Nations and other Canadian communities. First Nations have entrepreneurial spirit the same as other Canadians, but were often not afforded the same resources and opportunities as other Canadians.
However, I am happy to say that these are all issues that are getting increasing attention and funding. My department is working with First Nation people and communities across Canada to support their aspirations to pursue economic development opportunities and wealth creation. There have also been substantial Government of Canada investments in infrastructure made in recent years in First Nation communities, and increased education funding to improve future opportunities for First Nation youth.10
The following links provide specific financing and logistics support for Indigenous peoples seeking to enter the global economy.
Indigenous Business Finance Support
• Aboriginal Financial Institutions (AFIs) are the primary Indigenous-owned financial supporters of Indigenous business. There are 59 AFIs located across every province and territory in Canada, and the National Aboriginal Capital Corporations Association (NACCA) website lists them by province or territory and provides a map indicating the location of each AFI. Fourteen of the AFIs, as shown on this website, also administer the Aboriginal Business and Entrepreneurship Development Fund provided by the Government of Canada to support Indigenous business development. These financial supports generally provide more support and favourable terms, such as lower interest rates, than other financial institutions;
• First Nations Financial Authority provides First Nations governments with investment options, capital planning advice, and long-term loans with favourable interest rates;
• Indigenous Tourism Association of Canada provides grants for Indigenous tourism companies, particularly those seeking international clients; and
• Joint Economic Development Initiative provides funding and programs for Indigenous economic development in New Brunswick.
10 APF Canada. 2018. Q&A with Paul Thoppil, CFO of Indigenous and Northern Affairs Canada.

Asia Pacific Foundation of Canada | 55
Government of Canada Support
There are several government programs specifically for Indigenous business financing and support.
• Community Opportunity Readiness supports Indigenous communities seeking or pursuing economic opportunities, such as for associated feasibility studies, marketing, or legal fees;
• Entrepreneurship and Business Development Fund is an Indigenous business establishment and development funds specifically for the three territories;
• Lands and Economic Development Services Program provides funding for First Nations and Inuit communities to pursue economic development and address reserve land and environmental management;
• Northern Participant Funding Program helps Indigenous peoples and northerners effectively participate in impact assessment reviews for major infrastructure and resource extraction proposals;
• Aboriginal Business and Entrepreneurship Development is a federal Indigenous business development fund administered by 14 of the Indigenous-owned Aboriginal Financial Institutions throughout Canada, which are themselves coordinated by NACCA;
• Indigenous Growth Fund (NACCA) will allow AFIs to provide more loans to Indigenous startups and Indigenous businesses;
• Funding for Indigenous Economic Development – Ontario provide funding for Indigenous business and economic development in Ontario;
• Indigenous Business Development Services provides funding for Indigenous business development in Manitoba; and
• The Export Financing web page lists a wide variety of federal and provincial level funding programs.
The Trade Commissioner Service also offers various funding programs in support of exporting and innovation.
Export
CanExport is a federal program that provides financing for exploring foreign markets for exporters. Several business activities are eligible for financing, including target market visits and trade shows.
• CanExport – SMEs provides financial assistance to Canadian registered small and medium-sized enterprises to help them develop export opportunities for their product or service in new international markets. The AgriMarketing Program SMEs Component supporting international promotion and market development activities in the agriculture and agri-food sectors is now part of CanExport – SMEs;
• CanExport – Community Investments provides support for communities looking for foreign direct investment;
• CanExport – Associations allows Canadian national trade organizations to access up to $400,000 in annual funding to cover up to 75% of the cost for new or expanded international development activities; and

Asia Pacific Foundation of Canada | 56
• CanExport – Innovation allows Canadian innovators who aim to commercialize technology to access up to C$75,000 in funding to establish new R&D collaborations with foreign partners to co-develop, validate, or adapt their technologies for commercialization.
Innovate
• Canadian International Innovation Program supports collaborative industrial R&D projects with potential for commercialization between Canada and five countries (Brazil, China, India, Israel, and South Korea).
Export Development Canada Resources
Managing risks:
• Credit Insurance protects against nonpayment;
– EDC Select Credit Insurance will cover up to 90% of losses in case on nonpayment;
– Portfolio Credit Insurance will cover up to 90% of losses in case on nonpayment; and
• Performance Security Insurance businesses can use this service if there is a concern that the customer will call a guarantee.
Securing financing:
• Buyer Financing helps provide a competitive financing package as part of a sales pitch to foreign customers;
• Direct Lending is financing to sell into markets outside Canada;
• Structured and Project Finance provides project financing for various international operations; and
• Purchase Order Financing covers up to 90% of purchase order financing and supports cash flow.
Growing working capital:
• Export Guarantee Program provides a guarantee to companies’ financial institutions, encouraging them to support foreign ventures;
• Account Performance Security Guarantee issues letters of guarantee without using your cash or capital and puts up a 100% guarantee to your bank;
• Foreign Exchange Facility Guarantee prevents having to use collateral for foreign exchange contracts, freeing up cash; and
• Surety Bond Insurance provides easier access to contract or performance bonds.

Asia Pacific Foundation of Canada | 57
Additional Canadian Financing Options
• Business Development Bank of Canada provides financing options, including for SMEs. Businesses can apply online for financing options for a wide variety of projects;
• Canadian Commercial Corporation helps companies doing business abroad, especially those pursuing contracts with foreign governments;
• Investment Agriculture Foundation of British Columbia can assist BC agriculture and agri-food exporters; and
• Futurpreneur Canada is a non-profit that provides financing and logistical support and mentorship specifically for Canadian youth (ages 18-39).
Canadian Banks with Dedicated Indigenous Banking
• BDC Indigenous Entrepreneur Programs and Resources
• RBC Aboriginal Banking Programs and Services
• TD Indigenous Banking
• BMO Indigenous Banking
• Scotiabank Services for Aboriginal Peoples
• CIBC Indigenous Banking
• Vancity Indigenous Investments (focus on BC)
• Me-Dian Credit Union (focus on Manitoba)
• National Aboriginal Capital Corporations Association (NACCA), a network of Aboriginal Financial Institutions throughout Canada.
• First Nations Bank of Canada
• Raven Indigenous Impact Fund
• Peace Hills Trust
International Financial Institutions
• International financial institutions have large social and economic development programs. They can play an important role in financing and supporting Indigenous businesses who work with emerging economies, including assistance with funding, advising, and establishing development projects. International financial institutions include the World Bank, which Canada is a partner with, and the regional development banks listed below. Canadian membership with these banks provides access to procurement contract opportunities through projects funded by the banks. To learn about such procurement opportunities, contact Canada’s Offices of Liaison with International Financial Institutions (OLIFI) at the banks listed below.
Asia Pacific Foundation of Canada | 58
World Bank (and Inter-American Development Bank)
OLIFI WashingtonMs. Carolyn CudmoreTrade CommissionerTel: (202) [email protected]
Ms. Julie MannTrade Commissioner AssistantTel: (202) [email protected]
Asian Infrastructure Investment Bank
OLIFI BeijingMs. Lilian ZhouTrade Commissioner (Liaison with the AIIB)Tel: (86-10) [email protected]
Asian Development Bank
OLIFI ManilaMrs. Meng Lulu LeBlancTrade CommissionerTel: (011-63-2) [email protected]
Ms. Lina PulianTrade Program AssistantTel: (011-63-2) [email protected]
Asia Pacific Foundation of Canada | 59
• To inform your Asia Pacific business strategy, find information on Canadian industries here. APF Canada provides industry information with these publications, the Investment Monitor tool has key investment information in several industries between Canada and the Asia Pacific, and the APEC MSMEs website has similar information. You can purchase access to tools like IBIS World and Frost and Sullivan that provide comprehensive industry information, and Mint Global that provides company data, which may be available for free if you are a member of an academic institution;
• You can find access to US and Canadian suppliers, manufacturers, and distributers at ThomasNet and international suppliers and traders of all types of products and services at Wand;
• Country information can help you to understand the trade and investment risk of different countries and sectors based on measurements like political stability, economic data, and cultural trends. Country information can be found from free services such as Export Development Canada (EDC), the EDC Global Export Forecast, and the Trade Commissioner Service Country and sector information for international business. More information is available from CountryWatch (paid), Co-face (free), and more in depth information can be found at the World Bank e-Library and the OECD iLibrary (paid and free options);
• The Port of Vancouver’s Moving Cargo and Terminals and Facilities resources can help you with the logistics of getting your products to Asia. Other ports such as the Ports of Halifax, Quebec, and Prince Rupert also have informative websites;
• The Canada Business Network can also help with logistics and provides links to other organizations that offer logistics information; and
• Here are some links to information on different industries in various Asian countries: China, Korea, Southeast Asia, India, Japan, Taiwan
11: Industry and Logistical Information for a Successful Asia Pacific Business Strategy

Asia Pacific Foundation of Canada | 60
Harmonized System (HS) Codes
All governments use a system to categorize the imports and exports of their country. Most of the world uses the Harmonized Commodity and Coding System, also known as Harmonized System Codes. You may have to find the HS code if you are seeking import or export information. All goods are assigned a six-digit classification code, where the first two digits refer to the product category, and the next four to six digits refer to different subcategories. Different countries can then add digits, up to 10 total, for more specific products. For example, using the Canada Post HS Code tool, if you put in Singapore as a destination and lentils as your product, the tool will ask you a few questions and then display 0713.40 as the HS code associated with dried and shelled lentils. The HS code is used when shipping products and for other trade information. You can put that code into Canada’s Tariff Finder, which has tariff information for countries with which Canada has a free trade agreement. You can also use the Tariff Finder itself to find which tariffs (if any) apply to the product you are exporting or importing. Otherwise, you can use Canada’s tariff information by country website, which has more countries.
Asia Pacific Foundation of Canada | 61
12: Dealing with Asian Governments
Dealing with different governments and foreign businesses can be difficult. This section provides information on how to do so.
Protecting Your Intellectual Property (IP) and Traditional Knowledge (TK)
See IP Beyond Our Borders, Intellectual Property for Exporting Businesses, and Protecting your Intellectual Property Rights in China for information on protecting your IP.
In addition to typical business IP, traditional knowledge is important to Indigenous peoples. TK provides valuable social and economic contributions and should be protected just as well as IP. Examples of TK include Indigenous peoples’ understanding of their local ecosystem, such as migration patterns; knowledge of how to make artwork or tools; and cultural materials like songs or symbols. Essentially, Indigenous peoples have some rights over what they know, have known, or will know, just like a technology company might know how to produce a certain product and have the right to use that knowledge and have it protected. TK is often crucial for Indigenous peoples’ subsistence and survival and may be crucial for Indigenous businesses to protect in global markets because it is a possible competitive advantage (e.g. authentic Indigenous products and/or services), and because there is often a sacredness of TK or cultural expression that has been provided from ancestors and passed on through generations, and is to be protected for future generations. For more information, see the World Intellectual Property Rights guide, Protect and Promote Your Culture – A Practical Guide to Intellectual Property for Indigenous Peoples and Local Communities.
Governments and Business Law
The following guides provide information on the ease of doing business and business law:
Hong Kong, India, Indonesia, Japan, Korea, Mongolia, Philippines, Singapore, Taiwan, Thailand, Vietnam
Risk Assessment
Economic Development Canada provides the Country Risk Quarterly, where you can learn about the risk of doing business in different countries, and Managing Risk: A guide for exporters, where you can learn about managing risk.
Benefiting from Trade and Investment Agreements
Trade and investment agreement information relevant to different Asia Pacific countries is provided by the Government of Canada.
Asia Pacific Foundation of Canada | 62
13: Asia Cultural Guides, Basic Phrases, and Additional Government of Canada Resources
These resources can help with cross-cultural business considerations to help you prepare before going to Asia and to prepare for visits from Asian stakeholders.
Asia Pacific News
Asia Watch is a free subscription offered by APF Canada that provides the latest analysis of news, trends, and happenings in the Asia Pacific three times a week.
Cultural Guides
China, Hong Kong, India, Indonesia, Japan, Korea, Mongolia, Philippines, Singapore, Taiwan, Thailand, Vietnam
Basic Phrases
China (Mandarin), Hong Kong (Cantonese), India, Indonesia, Japan, Korea, Mongolia, Philippines, Taiwan (Mandarin), Thailand, Vietnam
Canadian Post-Secondary Institutions with Asia Pacific Related Centres
• David Lam Centre at Simon Fraser University (BC);
• Centre for East Asian Research at McGill University (Quebec);
• York Centre for Asian Research at York University (Ontario);
• Asian Institute at Munk School of Global Affairs at University of Toronto (Ontario);
• Institute of Asian Research at University of BC (BC);
• China Institute at University of Alberta (Alberta);
• Asian Studies Centre at University of Manitoba (Manitoba); and
• Centre for Asia-Pacific Initiatives at University of Victoria (BC).
Government of Canada Country-Specific Resources
China, India, Indonesia, Japan, Korea, Mongolia, Philippines, Singapore, Thailand, Vietnam
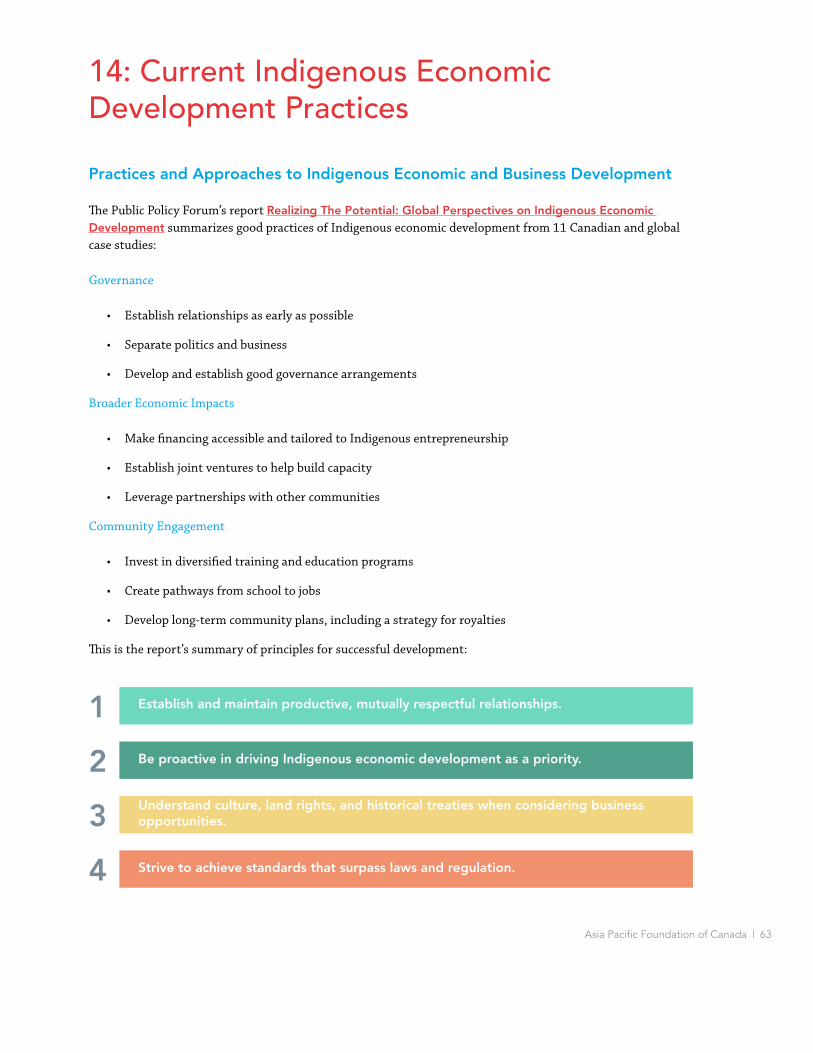
Asia Pacific Foundation of Canada | 63
14: Current Indigenous Economic Development Practices
Practices and Approaches to Indigenous Economic and Business Development
The Public Policy Forum’s report Realizing The Potential: Global Perspectives on Indigenous Economic Development summarizes good practices of Indigenous economic development from 11 Canadian and global case studies:
Governance
• Establish relationships as early as possible
• Separate politics and business
• Develop and establish good governance arrangements
Broader Economic Impacts
• Make financing accessible and tailored to Indigenous entrepreneurship
• Establish joint ventures to help build capacity
• Leverage partnerships with other communities
Community Engagement
• Invest in diversified training and education programs
• Create pathways from school to jobs
• Develop long-term community plans, including a strategy for royalties
This is the report’s summary of principles for successful development:
Establish and maintain productive, mutually respectful relationships.
Be proactive in driving Indigenous economic development as a priority.
Understand culture, land rights, and historical treaties when considering business opportunities.
Strive to achieve standards that surpass laws and regulation.
1
2
3
4
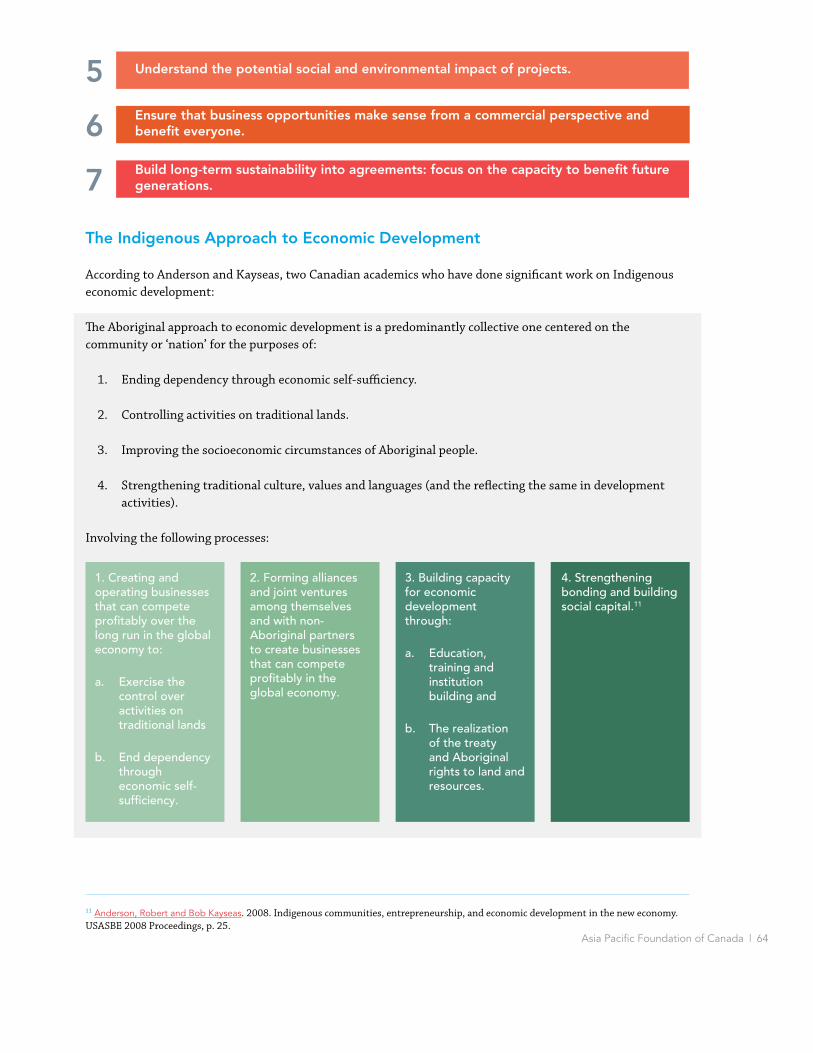
Asia Pacific Foundation of Canada | 64
Understand the potential social and environmental impact of projects.
Ensure that business opportunities make sense from a commercial perspective and benefit everyone.
Build long-term sustainability into agreements: focus on the capacity to benefit future generations.
5
6
7
The Indigenous Approach to Economic Development
According to Anderson and Kayseas, two Canadian academics who have done significant work on Indigenous economic development:
The Aboriginal approach to economic development is a predominantly collective one centered on the community or ‘nation’ for the purposes of:
1. Ending dependency through economic self-sufficiency.
2. Controlling activities on traditional lands.
3. Improving the socioeconomic circumstances of Aboriginal people.
4. Strengthening traditional culture, values and languages (and the reflecting the same in development activities).
Involving the following processes:
1. Creating and operating businesses that can compete profitably over the long run in the global economy to:
a. Exercise the control over activities on traditional lands
b. End dependency through economic self-sufficiency.
2. Forming alliances and joint ventures among themselves and with non-Aboriginal partners to create businesses that can compete profitably in the global economy.
3. Building capacity for economic development through:
a. Education, training and institution building and
b. The realization of the treaty and Aboriginal rights to land and resources.
4. Strengthening bonding and building social capital.11
11 Anderson, Robert and Bob Kayseas. 2008. Indigenous communities, entrepreneurship, and economic development in the new economy. USASBE 2008 Proceedings, p. 25.
Asia Pacific Foundation of Canada | 65
Additional Indigenous Business Development Tips
1. Any conversation on Indigenous entrepreneurship may benefit from including community perspectives and social objectives. Entrepreneurship can be a “multi-objective” endeavour, where achieving both social and economic objectives is possible. The lines between the two are often blurred in the Indigenous community. What makes a group Indigenous is often, though not always, conducive to a more communal approach to entrepreneurship. Connecting to the global economy is seen by many as the key to Indigenous development, and development in turn is seen as a key component of reconciliation. Entrepreneurship can be the catalyst for this action. Entrepreneurship is conducted and should be conceived of not only at the individual level, but also the communal level, for the Indigenous community where development corporations and co-operation are prominent.12 “The establishment of a successful Indigenous venture [may] require[s] dual leadership: a cultural authority and a practical ‘hard driver.’ … [C]ultural authority provides reassurance to every band member that these enterprises are compatible with the aspirations and traditions of the band.” Someone is also required to “translate intentions to actions.”13
2. Consider how Indigenous governments and development corporations act as mediating structures. Development corporations support bridging to external economies, and governments facilitate a positive social environment, reducing conflict and increasing bonding within the community. Together, these structures can enable communities to opt in to the global economy.14
3. Consider differences and similarities between Indigenous economic development and classic economic development. Indigenous economic development includes Indigenous values and social, environmental, historical, and cultural considerations, whereas classic economic development focuses on land, labour, and capital. These differences provide both challenges and opportunities for entering Asia Pacific markets.
4. Consider pros and cons of starting your business on reserve. Starting a business as a sole proprietorship on reserve may have tax benefits, but could limit future growth by reduced access to formal and informal equity capital.15
5. Plan for business leadership succession. “The durability of a successful Indigenous venture is potentially more vulnerable to generational change than is mainstream enterprise.”16
6. Remember that starting a business is just the start and that change and growth may take time. “For an Indigenous venture, change [may] be even harder than creation.” For example, this is often the case in situations when the correct business decision is to cease an enterprise but there is significant pressure to maintain jobs or a positive image within the community.17 The following figure lists obstacles to growth for exporting and non-exporting Indigenous businesses.
12 Anderson, Robert, et al. 2006. Communities in the global economy: where social and indigenous entrepreneurship meet. Entrepreneurship as Social Change: A Third Movements in Entrepreneurship Book. Edited by Chris Steyaert and Daniel Hjorth. Edward Elgar Publishing.13 Hindle, Kevin et al. 2005. Relating practice to theory in Indigenous entrepreneurship: A pilot investigation of the Kitsaki partnership portfolio. American Indian Quarterly 29 (1-2): 13-14.14 Anderson, Robert and Bob Kayseas 2008. op. cit. 15 Johnstone, Harvey. 2008. Membertou First Nation Indigenous people succeeding as entrepreneurs. Journal of Enterprising Communities: People and Places in the Global Economy 2(2): 140–150.16 Hindle op. cit. p. 14.17 Ibid. pp. 15-16.
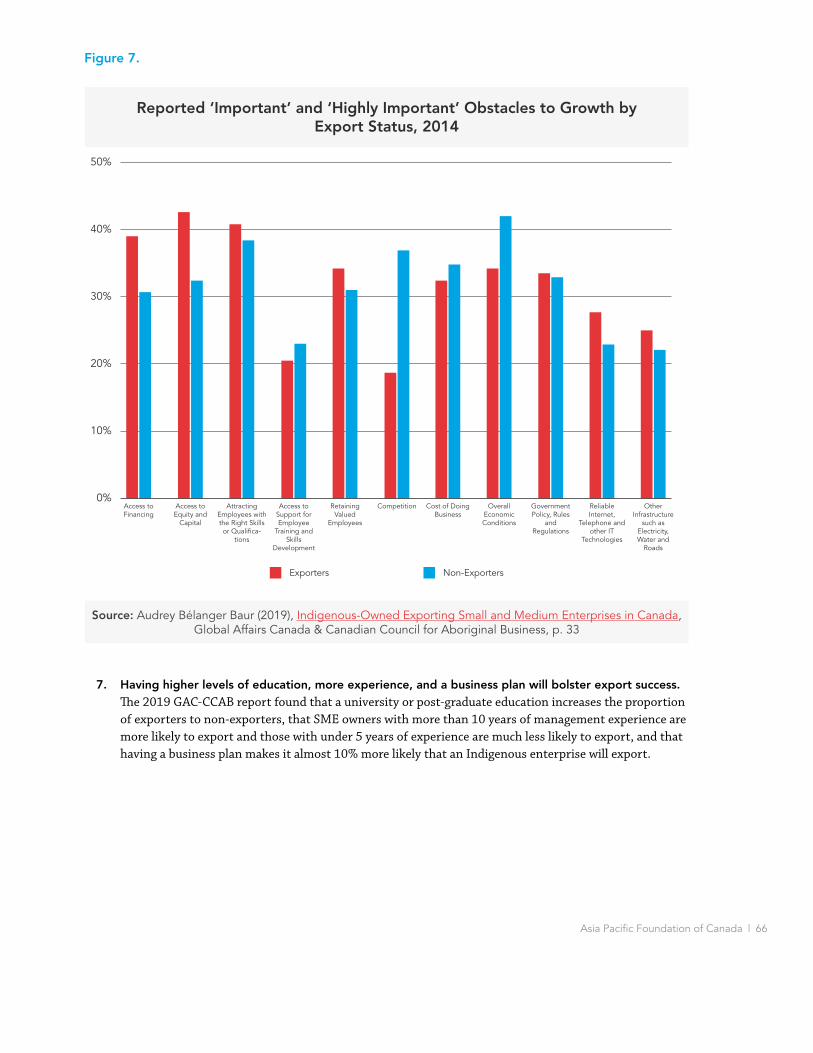
Asia Pacific Foundation of Canada | 66
Figure 7.
7. Having higher levels of education, more experience, and a business plan will bolster export success. The 2019 GAC-CCAB report found that a university or post-graduate education increases the proportion of exporters to non-exporters, that SME owners with more than 10 years of management experience are more likely to export and those with under 5 years of experience are much less likely to export, and that having a business plan makes it almost 10% more likely that an Indigenous enterprise will export.
Reported ‘Important’ and ‘Highly Important’ Obstacles to Growth by Export Status, 2014
0%
10%
20%
30%
40%
50%
Access to Financing
Access to Equity and
Capital
Attracting Employees with the Right Skills or Qualifica-
tions
Access to Support for Employee
Training and Skills
Development
Retaining Valued
Employees
Competition Cost of Doing Business
Overall Economic Conditions
Government Policy, Rules
and Regulations
Reliable Internet,
Telephone and other IT
Technologies
Other Infrastructure
such as Electricity, Water and
Roads
Non-ExportersExporters
Source: Office of the Chief Economist, Global Affairs Canada using data obtained from the Canadian Council for Aboriginal Business
Source: Audrey Bélanger Baur (2019), Indigenous-Owned Exporting Small and Medium Enterprises in Canada, Global Affairs Canada & Canadian Council for Aboriginal Business, p. 33

Asia Pacific Foundation of Canada | 67
15: Engagement Strategies of Previous Indigenous-Asia Stakeholders and Indigenous Global Business Examples
The following bulleted lists provide specific recommended actions developed by an Indigenous organization seeking to increase engagement with Asia.
BC First Nations Energy and Mining Council China Strategy Recommended Actions
• First Nations Capacity Building – partnering with provincial and federal governments and foreign universities to improve capacity and engagement ability;
• Promote opportunities for engagement with China interests – annual missions to and from China, developing formal and informal relationships with Asian organizations and associations in Canada (such as the Asia Pacific Foundation of Canada);
• Establish a China Desk to assist First Nations to respond to and develop business opportunities – will help access markets, promote products, understand opportunities, and connect with investors;
• Develop best practices for engagement – to promote adequate consultation and collaboration, advice for negotiating mining agreements;
• Expand market opportunities for First Nations in China – Exploring specific opportunities in forestry and tourism, seeking federal funding support;
• Approach the provincial and federal governments to discuss and develop mutual benefits/opportunities – promoting specific working groups and initiatives; and
• Create a unified message – branding to ensure inclusion of First Nations peoples, ensure needs and desires are heard, with specific plans to communicate to various levels of business and government in Canada and China.
BC First Nations Energy and Mining Council Japan Strategy Recommended Actions
• Conduct a First Nations trade mission to Japan;
• Formalize a cultural exchange with the Ainu people;
• Develop programs to foster Asia competence in First Nations youth;
• Engage in dialogue with Japanese counterparts to create understanding of First Nations;
• practices, traditions, and norms; and
• Build consensus with stakeholders and develop and adopt a First Nations strategy on Japan.
Asia Pacific Foundation of Canada | 68
Indigenous Global Business Examples
In addition to a variety of new services, the Trade Commissioner Service has collected a variety of Indigenous exporting and importing success stories on its Spotlight on Inclusive Trade – Indigenous Business web page. The TCS highlights the importance of free trade agreements, particularly the Canada-European Union Comprehensive Economic and Trade Agreement (CETA), as an important factor for all the examples. Briefly, they include:
• Glooscap Ventures, a Glooscap First Nation community-owned group of businesses, imports Greek feta cheese for use in other products through its partnership with the Greek cheesemaker Ilia Gourmet. Their partnership is based on shared social values. This story highlights how partnerships can provide unique opportunities and can be strong when they are based on shared values;
• Arctic UAV is an Indigenous-owned, Iqaluit, Nunavut, based business that provides Unmanned Aerial Vehicle services such as photography and videography. They recently went global by opening an office in Greenland, which provides them easier access and exporting to other European markets. This example shows that establishing a physical presence, when done strategically, can ease the process of accessing new markets and is often a smart first step when globalizing;
• Little Miss Gourmet Products Inc. is owned by Indigenous businesswoman Ellen Melcosky of Esketemc First Nation. She discussed how the TCS helped her begin exporting. This story highlights the importance of the TCS. Ellen recommends even reaching out and letting them know you may be interested in exporting; and
• Okwaho Equal Source is a global consultancy with offices in Canada and Australia and clients around the world. It is focused on Indigenous-owned enterprises and social, economic, and environmental impact. It is 100% owned by Anishinaabe, Kanien’kehá:ka, and Māori Indigenous peoples. This story highlights the possibility of partnering with Indigenous nations around the world with similar goals. There are Indigenous enterprises around the world that have the same needs and desires, particularly the large need for business development activities from the local to the global level.
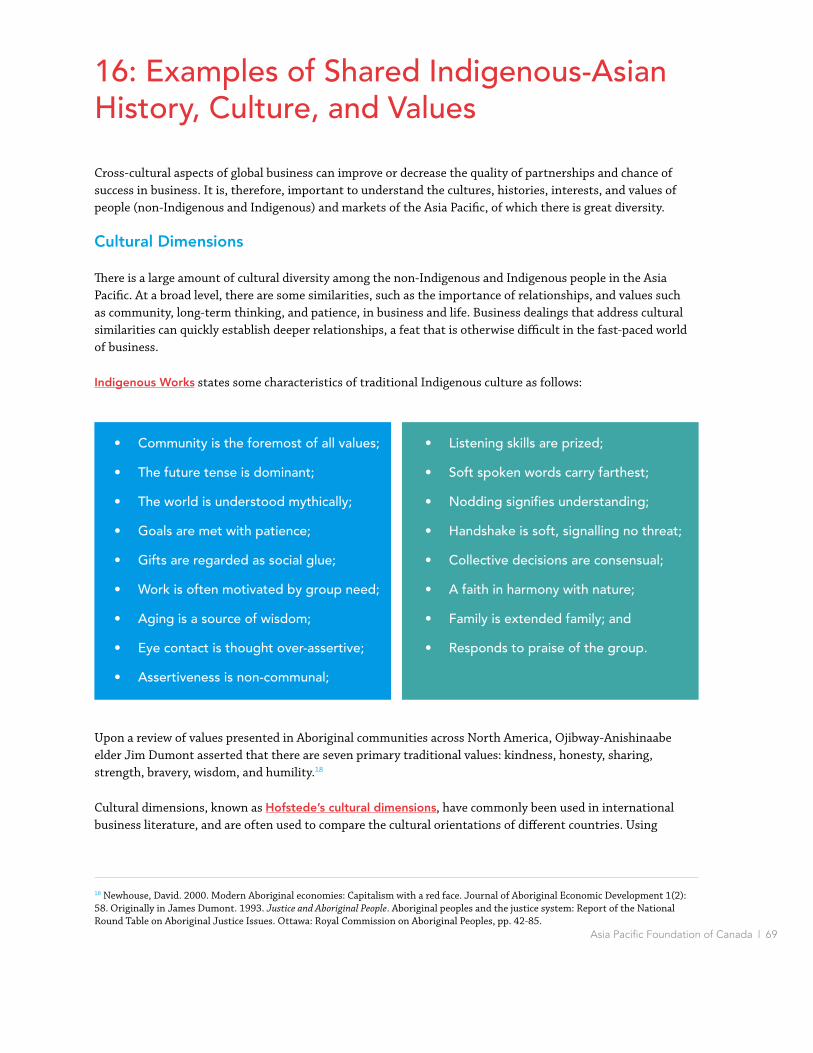
Asia Pacific Foundation of Canada | 69
16: Examples of Shared Indigenous-Asian History, Culture, and Values
Cross-cultural aspects of global business can improve or decrease the quality of partnerships and chance of success in business. It is, therefore, important to understand the cultures, histories, interests, and values of people (non-Indigenous and Indigenous) and markets of the Asia Pacific, of which there is great diversity.
Cultural Dimensions
There is a large amount of cultural diversity among the non-Indigenous and Indigenous people in the Asia Pacific. At a broad level, there are some similarities, such as the importance of relationships, and values such as community, long-term thinking, and patience, in business and life. Business dealings that address cultural similarities can quickly establish deeper relationships, a feat that is otherwise difficult in the fast-paced world of business.
Indigenous Works states some characteristics of traditional Indigenous culture as follows:
Upon a review of values presented in Aboriginal communities across North America, Ojibway-Anishinaabe elder Jim Dumont asserted that there are seven primary traditional values: kindness, honesty, sharing, strength, bravery, wisdom, and humility.18
Cultural dimensions, known as Hofstede’s cultural dimensions, have commonly been used in international business literature, and are often used to compare the cultural orientations of different countries. Using
• Community is the foremost of all values;
• The future tense is dominant;
• The world is understood mythically;
• Goals are met with patience;
• Gifts are regarded as social glue;
• Work is often motivated by group need;
• Aging is a source of wisdom;
• Eye contact is thought over-assertive;
• Assertiveness is non-communal;
• Listening skills are prized;
• Soft spoken words carry farthest;
• Nodding signifies understanding;
• Handshake is soft, signalling no threat;
• Collective decisions are consensual;
• A faith in harmony with nature;
• Family is extended family; and
• Responds to praise of the group.
18 Newhouse, David. 2000. Modern Aboriginal economies: Capitalism with a red face. Journal of Aboriginal Economic Development 1(2): 58. Originally in James Dumont. 1993. Justice and Aboriginal People. Aboriginal peoples and the justice system: Report of the National Round Table on Aboriginal Justice Issues. Ottawa: Royal Commission on Aboriginal Peoples, pp. 42-85.
Asia Pacific Foundation of Canada | 70
Hofstede’s dimensions, Indigenous cultures across eight countries have been generalized to have high collectivism/low individualism (meaning Indigenous peoples are more likely to work together and less likely to value individual achievements), low power distance (meaning Indigenous peoples are less likely to have a hierarchical organization, where decision-making and power are clearly given more to certain people and less to others), low uncertainty avoidance (meaning Indigenous peoples are more likely to embrace uncertainty), and high femininity/low masculinity.19 Figure 8 compares the cultural orientations of some Asia Pacific countries for reference. Several countries have cultural similarities to generalized Indigenous people’s cultures, but it should be noted that these scores don’t represent Indigenous populations, and the Indigenous cultural dimensions used above are based on eight countries.
19 Lindsay, Noel. 2005. Toward a cultural model of Indigenous entrepreneurial attitude. Academy of Marketing Science Review. 5.
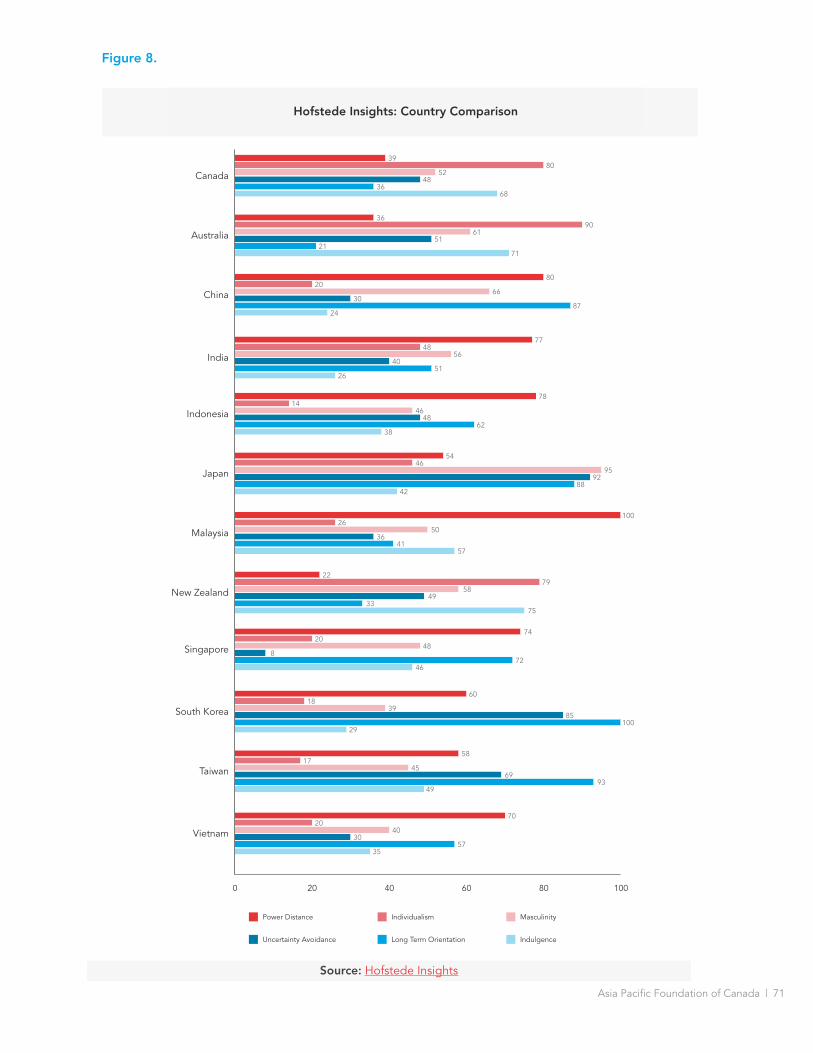
Asia Pacific Foundation of Canada | 71
Hofstede Insights: Country Comparison
Source: https://www.hofstede-insights.com/country-comparison/
0 20 40 60 80 100
Singapore
New Zealand
Malaysia
Vietnam
Taiwan
Indonesia
Australia
South Korea
Japan
India
China
Canada
Power Distance Individualism Masculinity
Uncertainty Avoidance Long Term Orientation Indulgence
3980
5248
3668
8020
6630
8724
7748
5640
5126
5446
9592
8842
3690
61
2151
71
7814
4648
6238
5817
4569
9349
7020
4030
5735
2279
5849
3375
2074
488
7246
10026
5036
4157
6018
3985
29100
Figure 8.
Source: Hofstede Insights
Asia Pacific Foundation of Canada | 72
Shared Canada–Asia Pacific Indigenous Experiences
The following historical accounts provide information on how Indigenous peoples have a long history of shared experiences, culture, and hardships, that can provide a base for meaningful engagement in business.
Historical Colonial Patterns
Details and timelines differ, but colonial experiences were often similar across Indigenous nations in Canada and the Asia Pacific, including Japan, Taiwan, New Zealand, and Australia. Similarities include systemic discrimination and oppression, forced relocation, assimilation, the separation of children through work programs or residential schools, and the resulting increase in negative outcomes such as poverty and incarceration and decrease in positive outcomes such as higher educational attainment or healthy lifestyles. These shared historical injustices led to a shared presence in global movements for Indigenous rights, leading to national and international recognition of rights, for example through UNDRIP. This led to the now-shared presence in the global movement for Indigenous business, for example with many states and Indigenous peoples collaborating to support Indigenous business, including through state Indigenous business strategies, trade missions, and articles in trade agreements.
Asia Pacific Cultural Affinities
• The Pacific Peoples Partnership works to support collaboration on issues of Indigenous peoples in the South Pacific and Canada. People around the Pacific share many similar cultures and concerns.
• The Asia Indigenous Peoples Pact is a regional organization focused on promoting rights and issues of interest and relevance to Indigenous peoples in the region.
• The Asia Indigenous Women’s Network is a regional organization that promotes the rights and issues of interest and relevance to Indigenous women in the region.
• The Asia Young Indigenous Peoples Network is a regional organization that promotes the rights and issues of interest and relevance to Indigenous youth in the region, particularly culture, self-determination, the environment, and human rights.
Current Canadian Indigenous–Asia Pacific Indigenous Relations
Māori-Canadian Indigenous Connections
• Three Māori representatives participated in a cultural exchange with the Inuit in Iqaluit in early 2019, with hopes of furthering cultural ties for the purpose of learning from each other and inspiring confidence to participate in their traditional cultures. There are many examples of such cultural exchanges.
• The University of Northern British Columbia provides a cross-cultural Indigenous knowledge exchange with the Māori, and the University of Otago provides similar exchanges for Māori. Māori from the University of Canterbury visited members of the First Nations Tax Commission and Tulo Centre of Indigenous Economics in 2016 to generate relationships and ideas for tax planning and economic development.
Asia Pacific Foundation of Canada | 73
• A Canadian Indigenous business delegate travelled to New Zealand and met with Māori people in 2018 during the World Indigenous Business Forum, and Canadian Indigenous and Māori delegates travelled together and had meetings on a trade mission to China. The Trade Commissioner Service of Canada has been actively working on Indigenous-Māori business opportunities in New Zealand.
Taiwan Aborigine-Canadian Indigenous Connections
• In June 2015, a 10-person delegation from the Taiwan Council of Indigenous Peoples met with Indigenous organizations around the country, including the First Nations Tax Commission. The delegation aimed to learn about economic development and financial practices on reserve.
• A Memorandum of Understanding was signed between the Canadian Trade Office in Taipei and the Taiwan Council of Indigenous Peoples on Indigenous co-operation in 1998, and renewed in 2008. Such co-operation includes culture, health, education, policy, and economic development.
• Taiwan held an international Indigenous economy forum in 2018 that included, among many other countries, Canadian delegates.
Japan Ainu-Canadian Indigenous
• Delegates of the Métis Nation visited several Ainu organizations and discussed the Métis people in Japan during 2013.
• Japan and Canada have many “twin” cities, established to promote relations between the two countries. These twin cities often have Indigenous cultural components including exchanges and art collaborations of the Ainu and Canadian Indigenous peoples.
• There have been various cultural exchanges with the Ainu, including with the Tlingit people of the Yukon and BC, Simon Fraser University, and some through the University of Manitoba.
Australian Aborigine-Canadian Indigenous Connections
• There is an Indigenous-Indigenous exchange program offered by the University of Victoria and the Wollotuka Institute in Australia, and the University of British Columbia provides the Indigenous-Indigenous Australia Leadership Program exchange with St. Catherine’s Residential University College. There are other examples of cultural exchanges with Thompson Rivers University and in art.
• Delegates from Canada and Australia met at the 2015 World Indigenous Business Forum.
Indigenous–Non-Indigenous Asia Pacific Relations in Canada
• Chinese visits to Canada were first recorded in 1788 to Nootka Sound, BC, but there exists evidence of Chinese trade with Indigenous peoples predating that time by centuries. In 1858, Chinese immigrants arrived in large numbers in Vancouver, where they faced dangerous working conditions on the Canadian Pacific Railroad and treatment as second-class residents. This status was reinforced by the Canadian government’s Chinese Immigrant Act of 1885. The Act enforced ever-increasing head taxes on the Chinese people. The updated 1923 Act entirely banned Chinese immigration, with some special circumstance exceptions, giving it the nickname of the Chinese Exclusion Act. Parallels have been drawn between the
Asia Pacific Foundation of Canada | 74
act and treatment of Chinese people in Canada with the Indian Act of 1876 and treatment of Indigenous peoples.20 The Canadian government issued a formal apology along with some symbolic payments to surviving head-tax payers in 2006.
• Japanese immigrants have had similar experiences in Canada, including in Steveston, BC, and along the BC coast. Japanese people likely met First Nations people for the first time in 1877 when the first known Japanese migrant came to Canada. Relations moved from hostile to friendly as Japanese and Indigenous peoples recognized their shard discriminatory treatment. The prominent fishing industry along the Pacific coast that employed many First Nations people soon employed many Japanese rather than First Nations people. The Canadian government attempted to limit the number of Japanese immigrants. Japanese people held many jobs previously held by First Nations people, such as in the town of Steveston that had a large canning industry. During the Second World War, the Canadian government interned 22,000 Japanese Canadians and stripped them of their belongings and property.
After the eviction and internment of Japanese Canadians by the Government of Canada during the Second World War, greater understanding developed between the two populations. An important symbol of this is the Nishga Girl, a fishing boat built in 1967 by the Japanese-Canadian boat builder Judo Tasaka and given to the Nyce family of the Nisga’a. Nishga Girl symbolizes the thousands of fishing boats that were confiscated by the Canadian government from Japanese-Canadian fishermen during the internment period. The Nyce family had taught Tasaka how to build boats, allowing his family to become financially independent again.21
After the Second World War, First Nations people began advocating for Japanese Canadian redress, including an apology and compensation, which was eventually achieved in a 1988 agreement with the Canadian government.
• In Grassy Narrows, Ontario, an Indigenous community began suffering from mercury poisoning, a debilitating and lethal disease, around 1970. After initial research, Canadians paid little attention to the community’s experiences despite ongoing effects. A Japanese research team, that first arrived in the community in 1975 has continued their research and outreach to the present. Over 100 people died of mercury poising in Minamata, Japan, during the 1950s. One of the Japanese scientists who arrived in 1975 made the first diagnosis of human effects, years after Canadians were aware of the issue, after hearing about a “mini-Minamata” from a Japanese photographer. He made over 100 diagnoses and identified dozens more suspected cases of poisoning. Canada has still not recognized any Minamata disease cases. Almost five decades later, the Japanese research team continues to use their experience to help Indigenous Canadians and advance our understanding of industrial affects on our food chain.
• Similarities have been drawn between “throat games” of the Ainu (an Indigenous people of Japan) and the Inuit, leading to a hypothesis that there was cultural diffusion from the Ainu of Northeast Asia to the Inuit of North America.22
• In the mid 20th century, the Inuit people of Canada, specifically in Cape Dorset, adopted the Japanese printmaking style. The style has had a significant impact on Inuit art.
20 BC First Nations Energy and Mining Council op. cit. p. 8.21 BC First Nations Energy and Mining Council and APF Canada. 2014. Towards a First Nations-Japan Strategy. pp. 1-2.22 Jean-Jacques Nattiez, Jean-Jacque. 1983. The Rekkukara of the Ainu (Japan) and the Katajjaq of the Inuit (Canada): A comparison. The World of Music 25(2): 33-44.
Asia Pacific Foundation of Canada | 75
Indigenous–Non-Indigenous Asia Pacific Relations in Asia
• The BCFNEMC has highlighted the cultural affinity between First Nations people and Chinese people using the example of cultural exchanges, such as the gifting of a totem pole after the 2008 Wenchuan earthquake for the lives lost and the Four Host First Nations cultural exchange during the Beijing Olympics. They also emphasize relationships built from historical discrimination and oppression by the BC and Canadian government, mutual support, respect, and shared values such as traditions and respecting elders.
• Government, business, and academic relations in China have been established by Grand Chief Edward John and the BCFNEMC. This includes interaction with the China Association for Intercultural Communication at Beijing Foreign Studies University, the sixth annual Canada-China Energy and Environment Forum, and meetings with Canada’s ambassador to the People’s Republic of China, Consul General of China to Canada in Vancouver Liang Shugen, Ambassador of China to Canada Zhang Junsai, Chinese banks, and mining and forestry companies.
• The Yinka Dene Alliance, consisting of five First Nations from northern B.C., sent a letter directly to Chinese President Hu Jintao in February 2012 in an attempt to create their own political connections, with the aim of preserving their lands from oil pipeline development without their involvement. The letter raised Indigenous issues including resistance to the northern gateway pipeline, in an attempt to add the issue to the agenda of a meeting between the Chinese leader and the Canadian Prime Minister shortly thereafter.23 The alliance has also directly reached out to governments in Japan, South Korea, and the United States and members of the European Parliament to raise issues of concern.
• The Ainu, an Indigenous people of Japan, also share a similar history with Indigenous peoples in Canada. Policies as far back as the 1800s aimed to assimilate the Ainu people and turn them into Japanese style farmers. Like the Indigenous peoples of Canada, they had no legal recognition as an Indigenous people, were stripped of their cultural and societal elements, were nationally controlled, and only in 2008 did the national government officially recognize the Ainu as an Indigenous people. Beyond support for traditional cultural revitalization and tourism (e.g. 1997 Ainu Cultural Promotion Protection Act, 2019 Ainu Promotion Act), Canadian-style reconciliation remains a long way off.
23 Montsion, Jean Michel op. cit.
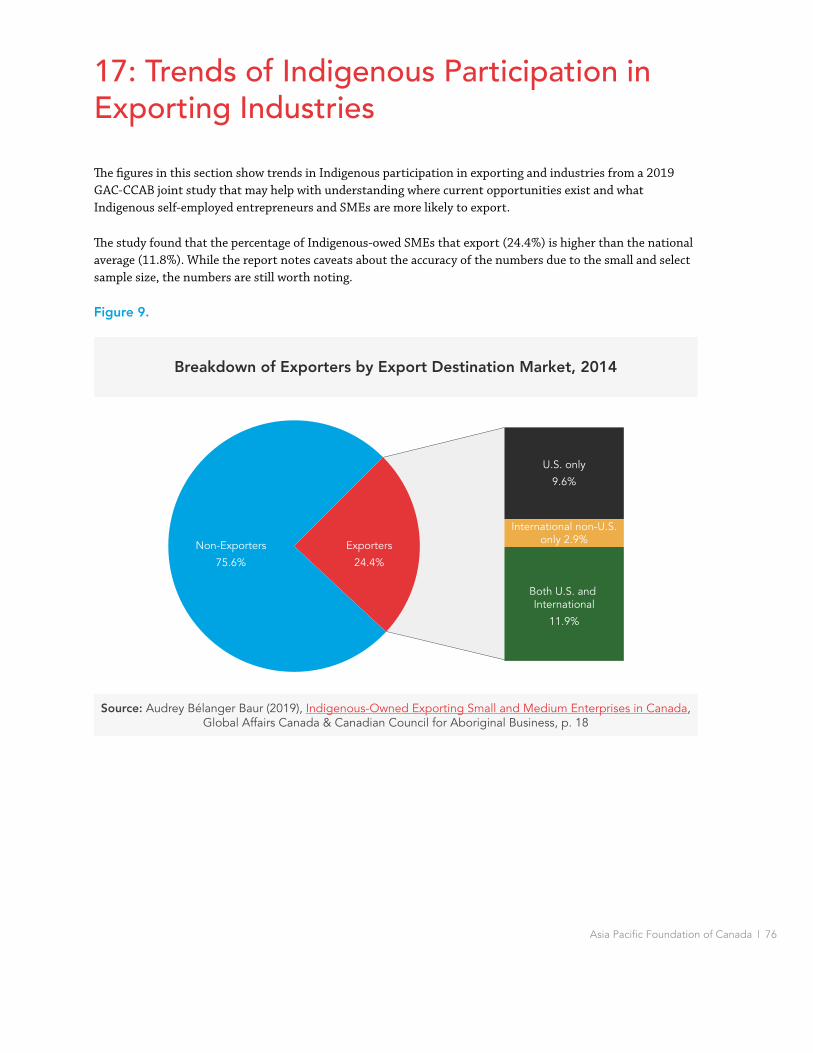
Asia Pacific Foundation of Canada | 76
17: Trends of Indigenous Participation in Exporting Industries
The figures in this section show trends in Indigenous participation in exporting and industries from a 2019 GAC-CCAB joint study that may help with understanding where current opportunities exist and what Indigenous self-employed entrepreneurs and SMEs are more likely to export.
The study found that the percentage of Indigenous-owed SMEs that export (24.4%) is higher than the national average (11.8%). While the report notes caveats about the accuracy of the numbers due to the small and select sample size, the numbers are still worth noting.
Figure 9.
Breakdown of Exporters by Export Destination Market, 2014
Non-Exporters
75.6%
Both U.S. and International
11.9%
International non-U.S.only 2.9%
U.S. only
9.6%
Exporters
24.4%
Source: Audrey Bélanger Baur (2019), Indigenous-Owned Exporting Small and Medium Enterprises in Canada, Global Affairs Canada & Canadian Council for Aboriginal Business, p. 18
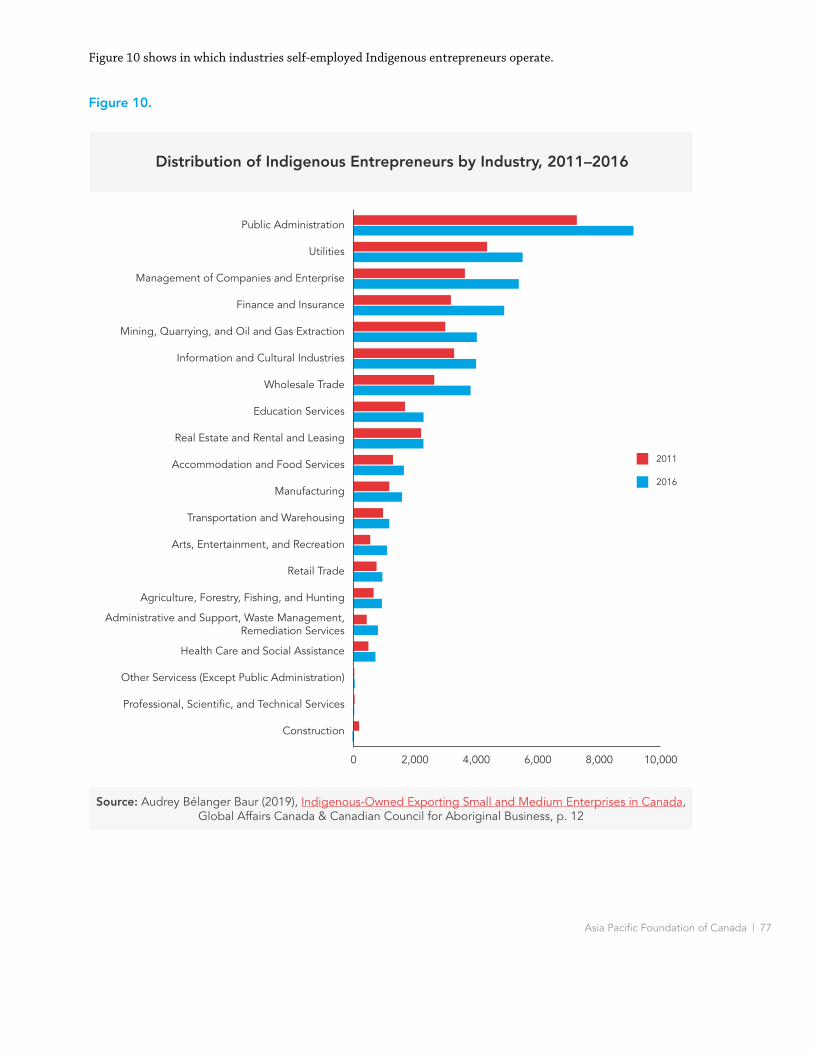
Asia Pacific Foundation of Canada | 77
Figure 10.
Distribution of Indigenous Entrepreneurs by Industry, 2011–2016
0 2,000 4,000 6,000 8,000 10,000
Construction
Professional, Scientific, and Technical Services
Other Servicess (Except Public Administration)
Health Care and Social Assistance
Administrative and Support, Waste Management,Remediation Services
Agriculture, Forestry, Fishing, and Hunting
Retail Trade
Arts, Entertainment, and Recreation
Transportation and Warehousing
Manufacturing
Accommodation and Food Services
Real Estate and Rental and Leasing
Education Services
Wholesale Trade
Information and Cultural Industries
Mining, Quarrying, and Oil and Gas Extraction
Finance and Insurance
Management of Companies and Enterprise
Utilities
Public Administration
2011
2016
Source: Office of the Chief Economist, Global Affairs Canada using data obtained from the Conference Board of Canada in the report Aboriginal Entrepreneurship in Canada; and Statistics Canada’s Census 2016Source: Audrey Bélanger Baur (2019), Indigenous-Owned Exporting Small and Medium Enterprises in Canada,
Global Affairs Canada & Canadian Council for Aboriginal Business, p. 12
Figure 10 shows in which industries self-employed Indigenous entrepreneurs operate.
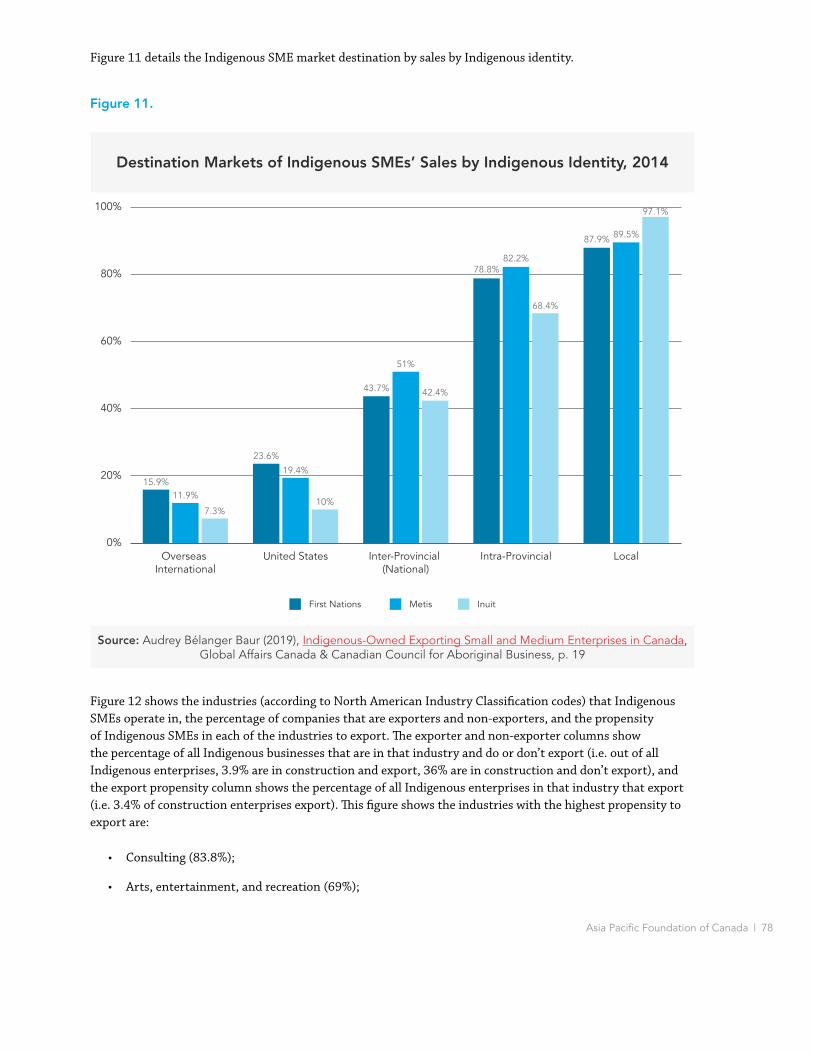
Asia Pacific Foundation of Canada | 78
Figure 11.
Figure 12 shows the industries (according to North American Industry Classification codes) that Indigenous SMEs operate in, the percentage of companies that are exporters and non-exporters, and the propensity of Indigenous SMEs in each of the industries to export. The exporter and non-exporter columns show the percentage of all Indigenous businesses that are in that industry and do or don’t export (i.e. out of all Indigenous enterprises, 3.9% are in construction and export, 36% are in construction and don’t export), and the export propensity column shows the percentage of all Indigenous enterprises in that industry that export (i.e. 3.4% of construction enterprises export). This figure shows the industries with the highest propensity to export are:
• Consulting (83.8%);
• Arts, entertainment, and recreation (69%);
Destination Markets of Indigenous SMEs’ Sales by Indigenous Identity, 2014
First Nations Metis Inuit
15.9%11.9%
7.3%
23.6%
19.4%
10%
43.7%
51%
42.4%
78.8%82.2%
68.4%
87.9% 89.5%
97.1%
0%
20%
40%
60%
80%
100%
LocalIntra-ProvincialInter-Provincial (National)
United StatesOverseas International
Source: Office of the Chief Economist, Global Affairs Canada using data obtained from the Canadian Council for Aboriginal BusinessSource: Audrey Bélanger Baur (2019), Indigenous-Owned Exporting Small and Medium Enterprises in Canada, Global Affairs Canada & Canadian Council for Aboriginal Business, p. 19
Figure 11 details the Indigenous SME market destination by sales by Indigenous identity.
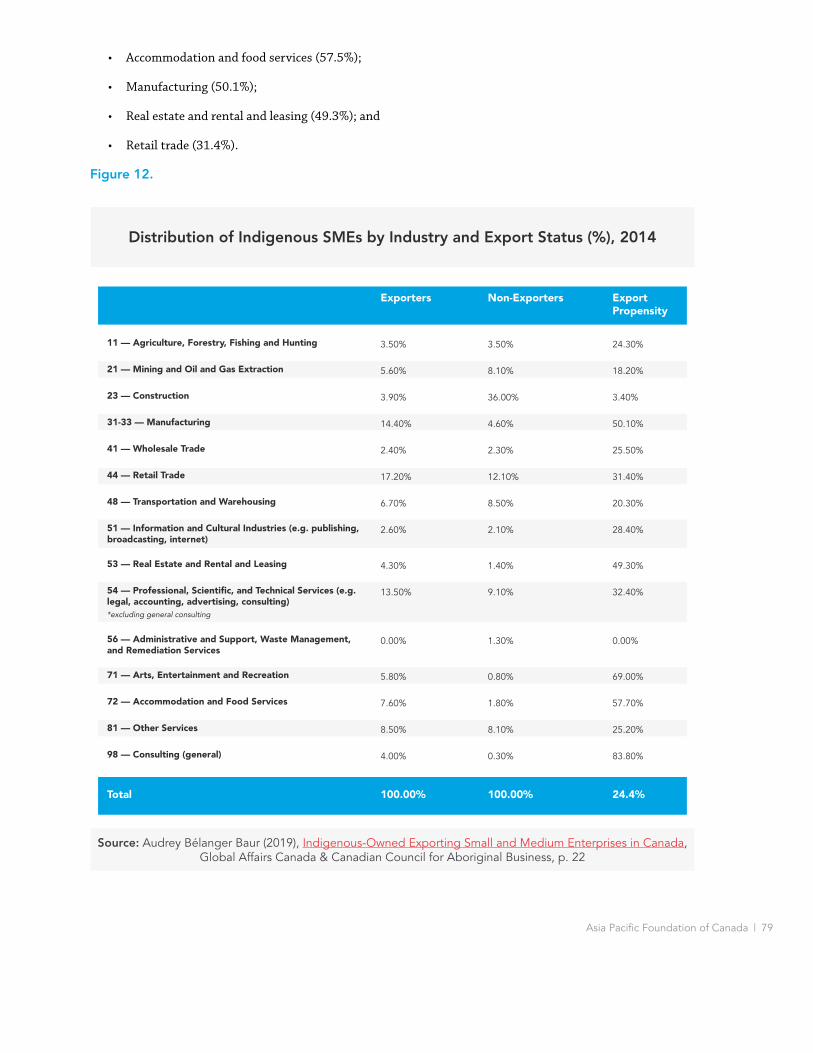
Asia Pacific Foundation of Canada | 79
• Accommodation and food services (57.5%);
• Manufacturing (50.1%);
• Real estate and rental and leasing (49.3%); and
• Retail trade (31.4%).
Figure 12.
Distribution of Indigenous SMEs by Industry and Export Status (%), 2014
Non-ExportersExporters
11 — Agriculture, Forestry, Fishing and Hunting
Export Propensity
100.00%100.00%Total 24.4%
3.50% 3.50% 24.30%
21 — Mining and Oil and Gas Extraction 5.60% 8.10% 18.20%
23 — Construction 3.90% 36.00% 3.40%
31-33 — Manufacturing 14.40% 4.60% 50.10%
41 — Wholesale Trade 2.40% 2.30% 25.50%
44 — Retail Trade 17.20% 12.10% 31.40%
48 — Transportation and Warehousing 6.70% 8.50% 20.30%
51 — Information and Cultural Industries (e.g. publishing, broadcasting, internet)
2.60% 2.10% 28.40%
53 — Real Estate and Rental and Leasing 4.30% 1.40% 49.30%
54 — Professional, Scienti�c, and Technical Services (e.g. legal, accounting, advertising, consulting)*excluding general consulting
13.50% 9.10% 32.40%
56 — Administrative and Support, Waste Management, and Remediation Services
0.00% 1.30% 0.00%
71 — Arts, Entertainment and Recreation 5.80% 0.80% 69.00%
72 — Accommodation and Food Services 7.60% 1.80% 57.70%
81 — Other Services 8.50% 8.10% 25.20%
98 — Consulting (general) 4.00% 0.30% 83.80%
Source: Office of the Chief Economist, Global Affairs Canada using data obtained from the Canadian Council for Aboriginal BusinessSource: Audrey Bélanger Baur (2019), Indigenous-Owned Exporting Small and Medium Enterprises in Canada,
Global Affairs Canada & Canadian Council for Aboriginal Business, p. 22
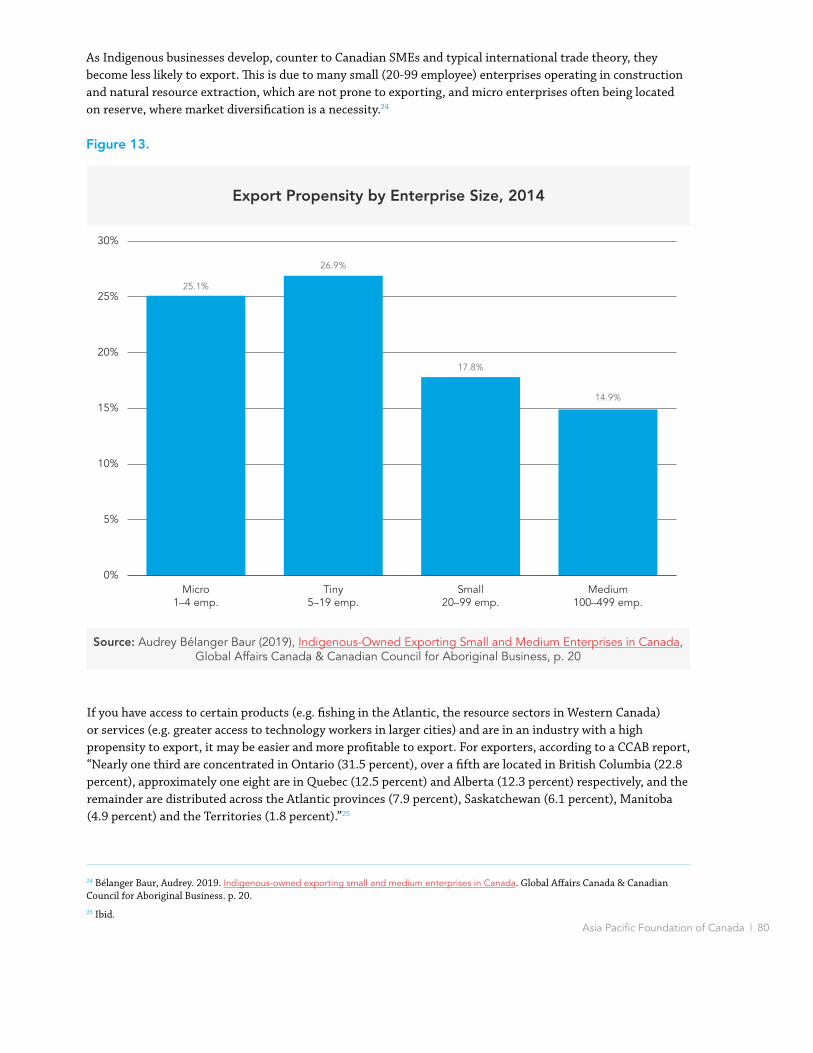
Asia Pacific Foundation of Canada | 80
As Indigenous businesses develop, counter to Canadian SMEs and typical international trade theory, they become less likely to export. This is due to many small (20-99 employee) enterprises operating in construction and natural resource extraction, which are not prone to exporting, and micro enterprises often being located on reserve, where market diversification is a necessity.24
Figure 13.
Export Propensity by Enterprise Size, 2014
25.1%
26.9%
17.8%
14.9%
Source: Office of the Chief Economist, Global Affairs Canada using data obtained from the Canadian Council for Aboriginal Business
0%
5%
10%
15%
20%
25%
30%
Medium100–499 emp.
Small20–99 emp.
Tiny5–19 emp.
Micro1–4 emp.
Source: Audrey Bélanger Baur (2019), Indigenous-Owned Exporting Small and Medium Enterprises in Canada, Global Affairs Canada & Canadian Council for Aboriginal Business, p. 20
If you have access to certain products (e.g. fishing in the Atlantic, the resource sectors in Western Canada) or services (e.g. greater access to technology workers in larger cities) and are in an industry with a high propensity to export, it may be easier and more profitable to export. For exporters, according to a CCAB report, “Nearly one third are concentrated in Ontario (31.5 percent), over a fifth are located in British Columbia (22.8 percent), approximately one eight are in Quebec (12.5 percent) and Alberta (12.3 percent) respectively, and the remainder are distributed across the Atlantic provinces (7.9 percent), Saskatchewan (6.1 percent), Manitoba (4.9 percent) and the Territories (1.8 percent).”25
24 Bélanger Baur, Audrey. 2019. Indigenous-owned exporting small and medium enterprises in Canada. Global Affairs Canada & Canadian Council for Aboriginal Business. p. 20.25 Ibid.

Asia Pacific Foundation of Canada | 81
Figure 14.
Export Propensity and Five Main Industries, Canadian Regions and Provinces, 2014
Five Main IndustriesExport PropensityRegion
Ontario Retail Trade; Professional, Scientific and Technical Services; Construction; Other Services; Manufacturing
Construction; Transportation and Warehousing; Professional, Scientific and Technical Services; Manufacturing; Other Services
Retail Trade; Construction; Accommodation and Food Services; Other Services; Professional, Scientific and Technical Services
Construction; Retail Trade; Manufacturing; Professional, Scientific and Technical Services; Transportation and Warehousing
Construction; Retail Trade; Transportation and Warehousing; Professional, Scientific and Technical Services; Agriculture, Forestry, Fishing and Hunting
Mining and Oil and Gas Extraction; Construction; Other Services; Professional, Scientific and Technical Services; Transportation and Warehousing
Construction; Transportation and Warehousing; Professional, Scientific and Technical Services; Manufacturing; Other Services
Construction; Manufacturing; Retail Trade; Professional, Scientific and Technical Services; Transportation and Warehousing
41.30%
British Columbia 31.80%
Atlantic Provinces 31.10%
Saskatchewan 22.90%
Quebec 19.60%
Alberta 15.10%
Territories
Manitoba
12.40%
10.00%
Source: Office of the Chief Economist, Global Affairs Canada using data obtained from the Canadian Council for Aboriginal BusinessSource: Audrey Bélanger Baur (2019), Indigenous-Owned Exporting Small and Medium Enterprises in Canada,
Global Affairs Canada & Canadian Council for Aboriginal Business, p. 25

Asia Pacific Foundation of Canada | 82
The authors of this report are:
Dr. Scott Harrison, Program Manager – Engaging Asia, Asia Pacific Foundation of Canada
Dakota Norris (Gwich’in First Nation), Junior Research Scholar – Indigenous-Asia Business Relations, Asia Pacific Foundation of Canada
We would like to thank everyone who provided insights, comments, and suggestions for this guidebook.
We would like to hear from you.
How can this guide be improved? What kind of information or supports would be helpful for your Asia Pacific-related business endeavours? Do you have lessons learned or experiences you would like to share? How can the Asia Pacific Foundation of Canada work with you moving forward?
Contact: [email protected]
Acknowledgements
Asia Pacific Foundation of Canada | 83
The Asia Pacific Foundation of Canada (APF Canada) is dedicated to strengthening ties between Canada and Asia with a focus on expanding economic relations through trade, investment, and innovation; promoting Canada’s expertise in offering solutions to Asia’s climate change, energy, food security, and natural resource management challenges; building Asia skills and competencies among Canadians, including young Canadians, and improving Canadians’ general understanding of Asia and its growing global influence.
Visit APF Canada at http://www.asiapacific.ca.
About the Asia Pacific Foundation of Canada

Asia Pacific Foundation of Canada | 84
I G N I T I N G I N D I G E N O U S - A S I A P A C I F I C B U S I N E S S R E L A T I O N S
10 TAKEAWAYS, CONTINUED 1
I G N I T I N G I N D I G E N O U S - A S I A P A C I F I C B U S I N E S S R E L A T I O N S
INDIGENOUS - ASIA PACIFIC BUSINESS RELATIONS ROUNDTABLESummary Report
February 13, 2019
Offices of the Asia Pacific Foundation of Canada Musqueam, Squamish, and Tsleil-Waututh Territory
Vancouver, British Columbia
creative-fire.com asiapacific.ca
I G N I T I N G I N D I G E N O U S - A S I A P A C I F I C B U S I N E S S R E L A T I O N S
10 TAKEAWAYS, CONTINUED 2CONTENTS
Overview .......................... 3
Agenda .............................. 7
Presentations .................. 8
10 Takeaways ................... 9
Resources ......................... 14
Discussion Notes ........... 15
I G N I T I N G I N D I G E N O U S - A S I A P A C I F I C B U S I N E S S R E L A T I O N S
10 TAKEAWAYS, CONTINUED 3OVERVIEW
Together, strategic communications firm Creative Fire and the Asia Pacific Foundation
of Canada convened a roundtable on how to accelerate Indigenous business relations
with Asia Pacific markets.
This first-ever meeting between Indigenous business leaders and Asia Pacific
stakeholders was a first step in establishing strong nation-to-nation trade, marketing,
and investment relationships between Indigenous Canada and Asia Pacific countries.
This report provides a detailed overview of the roundtable and discussion outcomes.
The roundtable concluded with a consensus around the need to reconvene, perhaps in
conjunction with the World Indigenous Business Forum in Vancouver, October 2019.
The Canadian Trade Commissioner Service is looking to coordinate Indigenous B2B
meetings as part of the event.
3
I G N I T I N G I N D I G E N O U S - A S I A P A C I F I C B U S I N E S S R E L A T I O N S
10 TAKEAWAYS, CONTINUED 4OPPORTUNITY
Asia’s economic rise is one of the most defining shifts of the 21st century. At the same
time, Canada’s First Nations are emerging as important economic drivers and partners
in the nation’s economy.
The roundtable was designed to assist Indigenous and Asian businesses in better
responding to this opportunity by sharing critical information on the opportunities and
challenges for Indigenous business and trade with Asia. It focused on how to accelerate
Indigenous business engagement with the Asia Pacific and address questions including:
• How can Asia-interested Indigenous businesses and economic development corporations
grow their presence in Asia?
• What are the main obstacles and opportunities?
• Where are the opportunities for potential Asian investment, business, or trade?
• How can the Asia Pacific Foundation of Canada and others best support Indigenous
businesses in these efforts?
4

I G N I T I N G I N D I G E N O U S - A S I A P A C I F I C B U S I N E S S R E L A T I O N S
10 TAKEAWAYS, CONTINUED 5CONVENERS
Sean Willy, CEO, Des Nedhe Group
Drawing on his experience as an industry executive and with his roots in the
Denesuline and Métis communities, Sean is a bridge builder between Indigenous
and mainstream businesses across Canada. Within the uranium industry, he is
credited with signing five community-based agreements in Australia and northern
Saskatchewan and launching a unique community legacy fund, the Six River
Trust. Since joining Des Nedhe in 2017, he has strengthened the company’s
network, partnerships and standing across Canada, negotiating new ventures and driving growth
through collaboration with leading Indigenous entities, major Canadian companies, and governments
at all levels. Formerly, Sean served as co-chair of the Canadian Council for Aboriginal Business, and is
currently chair of Northern Career Quest and director of the Global Indigenous Trust.
Stewart Beck, President & CEO, Asia Pacific Foundation of Canada
Prior to joining APF Canada, Mr. Stewart Beck served as the Canadian High
Commissioner to the Republic of India with concurrent accreditation to the
Kingdom of Bhutan and to Nepal. He joined Canada’s Department of External
Affairs and International Trade (now Global Affairs Canada) in 1982 and served
abroad in the United States, Taiwan, and the People’s Republic of China. In
Ottawa, Stewart held a number of progressively more senior positions, including
Director General of the North Asia Bureau, Director General Responsible for Senior Management
and Rotational Assignments, and Assistant Deputy Minister for International Business Development,
Investment, and Innovation. He was Consul General in Shanghai and prior to his posting to India, he
was Consul General in San Francisco.
5
I G N I T I N G I N D I G E N O U S - A S I A P A C I F I C B U S I N E S S R E L A T I O N S
10 TAKEAWAYS, CONTINUED 6MODERATORS
Bonnie Leask and Jason Aebig, Creative Fire
Creative Fire is an award-winning communications and
strategy firm and member of the Des Nedhe Group
of companies, one of Canada’s leading Indigenous
economic development corporations owned by English
River First Nation in Northern Saskatchewan. Learn more
at creative-fire.com.
6
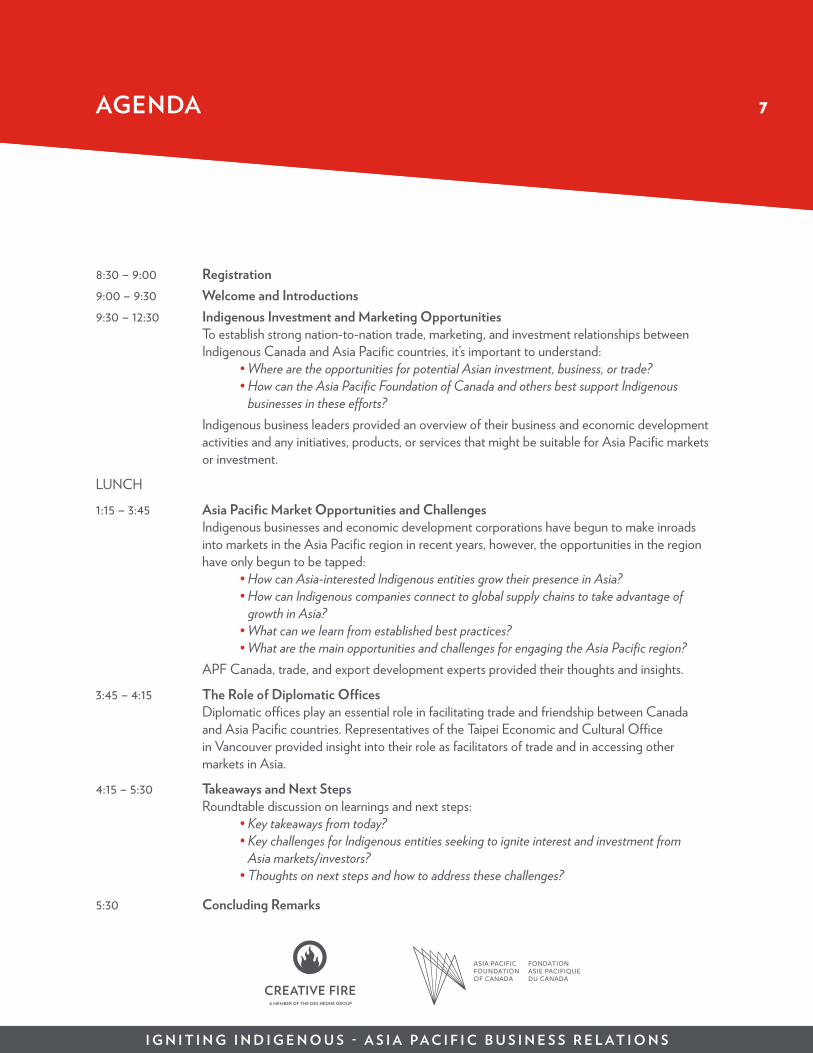
I G N I T I N G I N D I G E N O U S - A S I A P A C I F I C B U S I N E S S R E L A T I O N S
10 TAKEAWAYS, CONTINUED 7AGENDA
8:30 – 9:00 Registration 9:00 – 9:30 Welcome and Introductions9:30 – 12:30 Indigenous Investment and Marketing Opportunities To establish strong nation-to-nation trade, marketing, and investment relationships between
Indigenous Canada and Asia Pacific countries, it’s important to understand: • Where are the opportunities for potential Asian investment, business, or trade? • How can the Asia Pacific Foundation of Canada and others best support Indigenous
businesses in these efforts? Indigenous business leaders provided an overview of their business and economic development
activities and any initiatives, products, or services that might be suitable for Asia Pacific markets or investment.
LUNCH
1:15 – 3:45 Asia Pacific Market Opportunities and Challenges Indigenous businesses and economic development corporations have begun to make inroads
into markets in the Asia Pacific region in recent years, however, the opportunities in the region have only begun to be tapped:
• How can Asia-interested Indigenous entities grow their presence in Asia? • How can Indigenous companies connect to global supply chains to take advantage of
growth in Asia? • What can we learn from established best practices? • What are the main opportunities and challenges for engaging the Asia Pacific region? APF Canada, trade, and export development experts provided their thoughts and insights.
3:45 – 4:15 The Role of Diplomatic Offices Diplomatic offices play an essential role in facilitating trade and friendship between Canada
and Asia Pacific countries. Representatives of the Taipei Economic and Cultural Office in Vancouver provided insight into their role as facilitators of trade and in accessing other markets in Asia.
4:15 – 5:30 Takeaways and Next Steps Roundtable discussion on learnings and next steps: • Key takeaways from today? • Key challenges for Indigenous entities seeking to ignite interest and investment from
Asia markets/investors? • Thoughts on next steps and how to address these challenges?
5:30 Concluding Remarks
7

I G N I T I N G I N D I G E N O U S - A S I A P A C I F I C B U S I N E S S R E L A T I O N S
10 TAKEAWAYS, CONTINUED 8PRESENTATIONS
Presentations were provided by leaders of Indigenous economic development organizations on the following:
• The Taza Developments - Darrell Crowchild, Tsuut’ina
• The SRDL Business Group - Tom Many Heads, SRDL Business Group
• Musqueam Capital Corporation - Stephen Lee, Musqueam Capital Corporation
• Nunatsiavut Group of Companies - Clint Davis, Acasta Capital
• Cold Lake Priorities and Opportunities - Heather Bishop, Cold Lake First Nation
• Des Nedhe Development Overview - Sean Willy, Des Nedhe Development
• Lessons Learned - Matthew Coon Come, Grand Council of the Crees
Presentations were provided by trade and business relations experts, including:
• Stewart Beck, President and CEO, Asia Pacific Foundation of Canada
• Christian Hansen, Senior Trade Commissioner, Canadian Trade Commissioner Service
• Rosi Niedermayer, Trade Commissioner, Canadian Trade Commissioner Service
• Bryan Hughes, Export Development Canada
• Xenia Wong, Bennett Jones
• Andy Chen, Director General, Taipei Economic and Culture Office Vancouver
• Ruth Chang, Taiwan External Trade Council
8
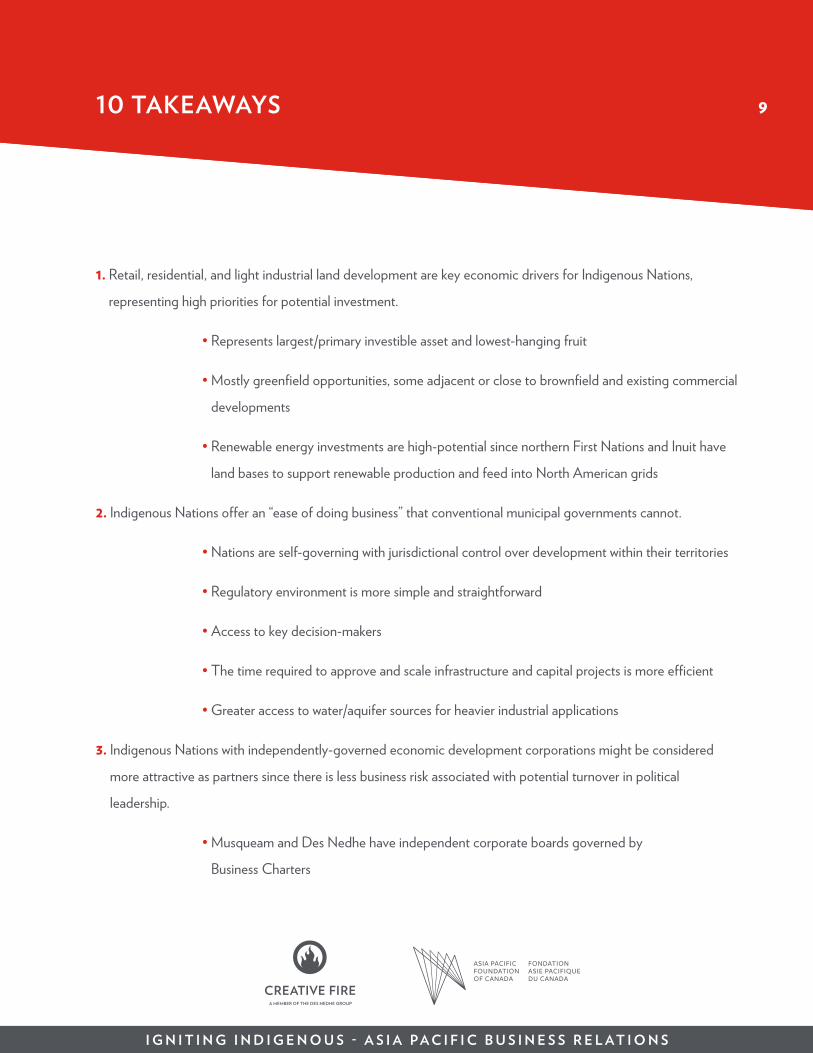
I G N I T I N G I N D I G E N O U S - A S I A P A C I F I C B U S I N E S S R E L A T I O N S
10 TAKEAWAYS, CONTINUED 910 TAKEAWAYS
1. Retail, residential, and light industrial land development are key economic drivers for Indigenous Nations,
representing high priorities for potential investment.
• Represents largest/primary investible asset and lowest-hanging fruit
• Mostly greenfield opportunities, some adjacent or close to brownfield and existing commercial
developments
• Renewable energy investments are high-potential since northern First Nations and Inuit have
land bases to support renewable production and feed into North American grids
2. Indigenous Nations offer an “ease of doing business” that conventional municipal governments cannot.
• Nations are self-governing with jurisdictional control over development within their territories
• Regulatory environment is more simple and straightforward
• Access to key decision-makers
• The time required to approve and scale infrastructure and capital projects is more efficient
• Greater access to water/aquifer sources for heavier industrial applications
3. Indigenous Nations with independently-governed economic development corporations might be considered
more attractive as partners since there is less business risk associated with potential turnover in political
leadership.
• Musqueam and Des Nedhe have independent corporate boards governed by
Business Charters
9
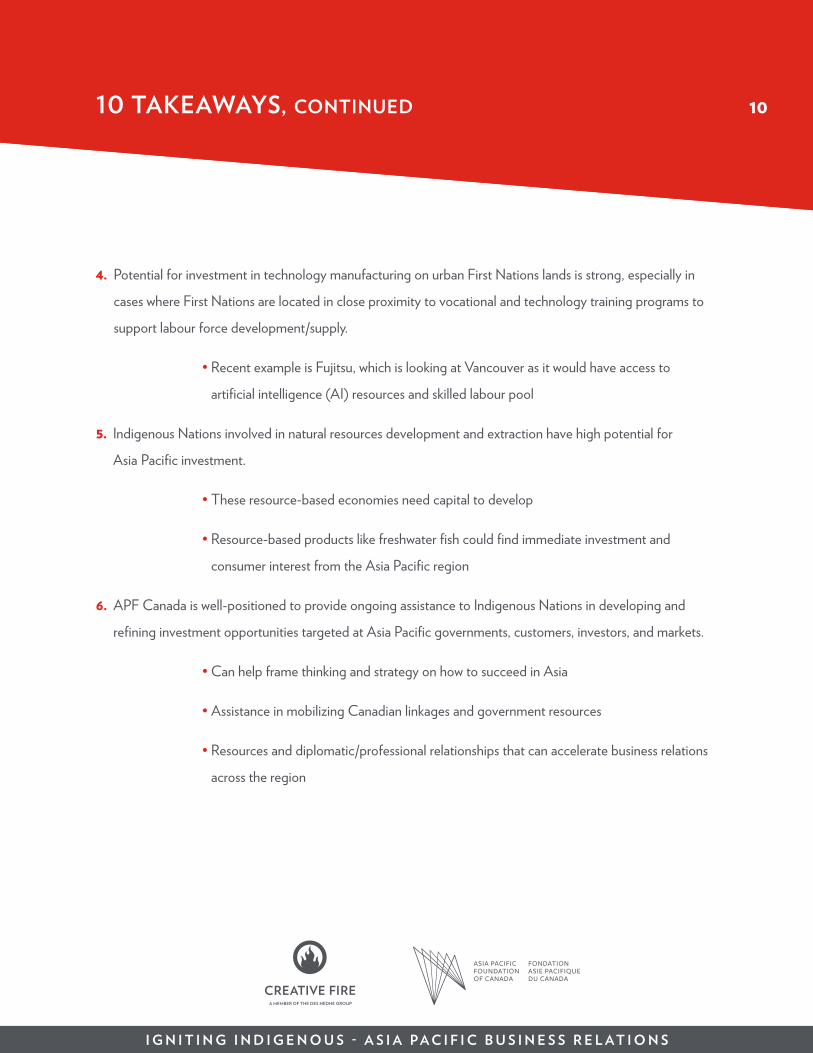
I G N I T I N G I N D I G E N O U S - A S I A P A C I F I C B U S I N E S S R E L A T I O N S
10 TAKEAWAYS, CONTINUED 1010 TAKEAWAYS, CONTINUED
4. Potential for investment in technology manufacturing on urban First Nations lands is strong, especially in
cases where First Nations are located in close proximity to vocational and technology training programs to
support labour force development/supply.
• Recent example is Fujitsu, which is looking at Vancouver as it would have access to
artificial intelligence (AI) resources and skilled labour pool
5. Indigenous Nations involved in natural resources development and extraction have high potential for
Asia Pacific investment.
• These resource-based economies need capital to develop
• Resource-based products like freshwater fish could find immediate investment and
consumer interest from the Asia Pacific region
6. APF Canada is well-positioned to provide ongoing assistance to Indigenous Nations in developing and
refining investment opportunities targeted at Asia Pacific governments, customers, investors, and markets.
• Can help frame thinking and strategy on how to succeed in Asia
• Assistance in mobilizing Canadian linkages and government resources
• Resources and diplomatic/professional relationships that can accelerate business relations
across the region
10

I G N I T I N G I N D I G E N O U S - A S I A P A C I F I C B U S I N E S S R E L A T I O N S
10 TAKEAWAYS, CONTINUED 1110 TAKEAWAYS, CONTINUED
7. Indigenous co-operation across First Nations, Inuit, and Metis will be required to project a bigger brand
image and supply strength to Asia Pacific governments, consumers, and markets.
• Unified brand as vehicle to sell, authenticate, deliver - “a $X million cooperative that
provides X products”
• In Asia, Canadian food products are considered high-quality, particularly if verified under
a quality standard
• Capacity to service demand in Asia Pacific region/expanding markets is important
• Concept of an Indigenous economic co-operative - presenting and flying as a brand -
would be vehicle to really engage Asia Pacific markets (investors, customers, consumers)
• Generally preferred to work with larger organizations - less risk, strong presence, greater
confidence, significant combined assets, consolidated touch-point for negotiation and
conflict resolution
• Trade associations like the Nunatsiavut Group of Companies or newly-formed Nia’Kinde
Indigenous Business Consortium are working examples that could be used as launchpads
for the development of such an entity to facilitate Asia Pacific trade
• If there are challenges to collaboration, start with a simple, neutral agreement between
selected First Nations with the objective of “selling X into X country” and then invite
others to participate
• To form an alliance, resources (and therefore financial commitments) would be required
with the price to participate increasing as the alliance grows
11
I G N I T I N G I N D I G E N O U S - A S I A P A C I F I C B U S I N E S S R E L A T I O N S
10 TAKEAWAYS, CONTINUED 12
8. The Canadian Trade Commissioner Service (TCS) office, World Chambers Network, Diplomatic Offices
and the APF Canada are sources of Asia Pacific market intelligence and can facilitate relationship-building
and marketing in specific countries.
• International trade diversification and supporting under-represented groups like
Indigenous businesses are priorities of current federal government
• To leverage and complement this service, Indigenous Nations would benefit from “boots
on the ground” sales and marketing support
• CanExport Program covers some costs associated with visiting a market to generate
business
• Invest in Canada Program covers some costs associated with promotional materials and
other associated expenses
• Many businesses competing for TCS attention and support - the better defined the
opportunity, the better the support and advice
I G N I T I N G I N D I G E N O U S - A S I A P A C I F I C B U S I N E S S R E L A T I O N S
10 TAKEAWAYS, CONTINUED 13
9. There is immediate interest by the Taiwanese to explore business relations with First Nations in Canada.
• Taiwan is a welcoming market where business is done in English and legal structures are
similar to North America
• Large-scale exhibitions are the primary business relationship-building tool
• Canadian Pavilion is a popular destination for regional customers and buyers - demand
for Indigenous products and services would be strong
• Director General extended an invitation for delegation of Indigenous business leaders to
participate in a (funded) trade mission to Taiwan, which APF Canada agreed to assist in
coordinating
10. E-commerce platforms should be included as part of any Asia Pacific business strategy.
• APF Canada collaborated with a Canadian company that now sells through JD.com and
Alibaba.com
• Fresh-water fish, specialized cuts of wild meat products are suited to this approach
• E-commerce platforms are popular ways to do business, even on large volume sales
• Payment is a critical issue to consider
• Decide on a strategic approach to a specific market (Hong Kong or Taiwan) and then
scale to others (China) based on success
• APF Canada has prepared white papers on e-commerce approaches that Indigenous
corporations should reference
I G N I T I N G I N D I G E N O U S - A S I A P A C I F I C B U S I N E S S R E L A T I O N S
14RESOURCES
Strategies
In 2011, APF Canada worked with BC First Nations Energy and Mining Council to produce a China engagement strategy and worked with it again in 2014 on a Japan engagement strategy. These are examples of what the Foundation could develop in partnership with Indigenous Nations across Canada.
China https://www.asiapacific.ca/sites/default/files/filefield/chinastrategy_final.pdf
Japan www.cccj.or.jp/sites/default/files/events/files/towards_a_first_nations-japan_strategy_page.pdf
Research
APF Canada has prepared research papers that speak to nation-to-nation opportunities for commerce and investment.
Pacific Partnerships: Connecting Indigenous People in Canada to Opportunities in Asia https://www.asiapacific.ca/blog/pacific-partnerships-connecting-indigenous-people-canada
Seizing International Opportunities: British Columbia’s First Nations Enhance Ties with China https://www.asiapacific.ca/sites/default/files/filefield/canada_asia_agenda_21_final2.pdf
Guides
The Asia Pacific Foundation of Canada created this online resource for the BC Government in 2016, which could serve as a launchpad for the development of a specific guide for Indigenous business and economic development corporations.
Guidebook to Doing Business in Asia https://www.investkelowna.com/application/files/2814/7795/5141/bc-sme-guidebookjune2016-2.pdf
For more information please contact:
Scott HarrisonProgram ManagerAsia Pacific Foundation of [email protected]
I G N I T I N G I N D I G E N O U S - A S I A P A C I F I C B U S I N E S S R E L A T I O N S
15DISCUSSION NOTES
Detailed Notes of the February 13, 2019 Indigenous – Asia Pacific Business Relations Roundtable held in Vancouver, BC | Page 1 of 26
Indigenous – Asia Pacific Business Relations Roundtable
DETAILED NOTES
February 13, 2019 Asia Pacific Foundation of Canada
#900 - 675 West Hastings Street, Vancouver, BC
Prepared by Carrie Peacock, Raincoast Ventures Ltd.
Roundtable Highlights
During the roundtable:
• Presentations were provided by representatives of Indigenous economic development organizations, on the following:o “The Taza Developments”, by Darrell Crowchild, Tsuut’inao “The SRDL Business Group”, by Tom Many Heads, SRDL Business Groupo “Musqueam Capital Corporation”, Stephen Lee, Musqueam Capital Corporationo “Nunatsiavut Group of Companies”, by Clint Davis, Acasta Capitalo “Indigenous AP Business Relations Roundtable”, by Heather Bishop, Cold Lake First Nationo “Des Nedhe Development”, by Sean Willy, Des Nedhe Development
• Presentations were provided related to “Asia Pacific Trade Opportunities” by the following:o Stewart Beck, President and CEO, Asia Pacific Foundation of Canadao Christian Hansen, Senior Trade Commissioner, Canadian Trade Commissioner Serviceo Rosie Niedermayer, Trade Commissioner, Canadian Trade Commissioner Serviceo Bryan Hughes, Export Development Canadao Xenia Wong, Bennett Joneso Matthew Coon Come, Grand Council of the Creeso Andy Chen, Director General, Taipei Economic and Culture Office Vancouvero Ruth Chang, Taiwan External Trade Council
• Next Steps / Key Takeaways:o Establishing relationships is critical for engaging in the Asian marketo A consolidated co-op or alliance of First Nations organizations, would make it easier to access the
Asian markets (or other markets); it is generally preferred to work with larger organizationso Support is available through the Asia Pacific Foundation of Canada, Trade Commissioners,
Export Development Canada, the foreign representatives’ offices, and other trade-related associations
o The Director General extended an invitation for a delegation of Indigenous business leaders to participate in a (funded) trade mission to Taiwan, which the APF agreed to assist in coordinating
DISCUSSION NOTES, CONTINUED 16
Detailed Notes of the February 13, 2019 Indigenous – Asia Pacific Business Relations Roundtable held in Vancouver, BC | Page 2 of 26
1. Welcome and Opening Remarks
1.1 Bonnie Leask, Creative Fire Ms. Leask welcomed participants to the roundtable at 9:00 a.m., introduced herself and her colleague Jason Aebig, and acknowledged the traditional lands on which the roundtable was being held. She extended appreciation to Sean Willy and others for their contributions to the coordination of the roundtable, and to key economic development leaders for their keen interest in attending.
1.2 Sean Willy, CEO, Des Nedhe Development Mr. Willy welcomed delegates and recalled past decisions to move towards creating own source revenue (OSR) opportunities. He acknowledged the opportunity to engage with the Asia Pacific Foundation (APF), noting that efforts were being made to look at opportunities to build on access to resources (i.e. oil, gas), and to discuss nation-to-nation partnerships. He noted the importance of discussing how to start working together, going forward.
1.3 Stewart Beck, President and CEO, Asia Pacific Foundation of Canada Mr. Beck reviewed his past experience in economic development strategies with First Nations, including the Rama Casino. He reviewed predictions that Asia could represent 66% of the global middle class by 2030, and recognized benefits of seeking a bridge between First Nations and Asian economies.
He reviewed his past experience in Taiwan, where there was a significant Indigenous population. In the late 1990s, the Ambassador to China saw opportunities to connect with Indigenous communities in Taiwan. The President of Taiwan formally apologized for the mistreatment of Indigenous people and proceeded towards reconciliation. New Zealand’s economy included a significant Maori presence.
Mr. Beck noted that he looked forward to the roundtable’s discussion and the later reception with representatives of the roundtable’s sponsors: LNG Canada, Teck, Port of Vancouver, Mosaic Forest Management, SFU, CP and Air Canada.
Attendees participated in a round of self-introductions.
2. Indigenous Investment and Marketing Opportunities
Ms. Leask welcomed delegates to consider the following questions, while listening to the prepared presentations from Indigenous leaders: • Where are the opportunities for potential Asian investment, business or trade?• How could the Asia Pacific Foundation and others best support you in these efforts?
2.1 Darrell Crowchild, Tsuut’ina Mr. Crowchild reviewed an overhead presentation titled “Taza and the Southwest Ring Road, Together at Tsuut’ina”, and the following: • The definition of “Taza” means an “expression of amazement” or “something great is about
DISCUSSION NOTES, CONTINUED 17
Detailed Notes of the February 13, 2019 Indigenous – Asia Pacific Business Relations Roundtable held in Vancouver, BC | Page 3 of 26
to happen” • The Taza development is a joint venture between the Tsuut’ina Nation and Canderel• The size of the development is estimated at 1,200 acres ($4.5 billion real estate value)• The Tsuut’ina Trail (“The Calgary Ring Road”):
o Alberta initially wanted to build a road through the nation, which was not supportedo Michael Clark was Lead Counsel in negotiating the Ring Road dealo The west leg of the Ring Road will likely complete by 2024o Access points to the First Nation were built into the ring road agreement
• The agreement with Alberta transportation affirms Alberta will build and maintain the roads• A development south of the casino is currently being negotiated• Alberta will soon be confirming timing for completion of the access points; this is critical to
the developments• A major tenant for the industrial park will soon be announced; the industrial park is intending
to open by November 2019, although the ring road will not yet be complete• A master service agreement has been achieved with the City of Calgary to provide water etc.• The completed roads will transfer back to the First Nation• Taxes collected will pay for servicing• Discussions are ensuing with 150 tenants throughout all three Taza developments• Key milestones include: adoption of the land use plan in December 2017; completion of Phase
1 (infrastructure) in Q4 2018; completion of Phase 1 (vertical construction) in Q2 2019; atenants open in Q3 2020
• With the Ring Road the community will be about 36 minutes to the Calgary Airport• There are three areas of the Taza development: Taza Park, Taza Crossing and Taza Exchange• Taza Park:
o A 530-acre parcel located on Glenmore Trail; the Ring Road bisects Taza Park into twoparcels
o Access from the Ring Road to Taza Park was critical; access is provided by threeinterchanges
o Land uses at Taza Park include: entertainment, shopping, etc.o Tenants for the Eagle Landing portion of Taza Park are being finalizedo Green space throughout the Eagle Landing development was critical
• Taza Crossing:o A 360-acre development to the south of the Glenmore Reservoiro Alberta will construct/maintain the road into Taza Crossing; the first layer of asphalt has
been laido Access is provided by an interchange on the Ring Roado The intent is that Taza Crossing will be a hub of “health, wellness and innovation”o Land uses in Taza Crossing include: innovation, technology, health care, recreation, multi-
unit residential, etc.• Taza Exchange:
o A 390-acre area located near the existing Tsuut’ina Nation facilitieso This section accommodates the administration building, the Tsuut’ina police station, and
the new Sportsplexo The old Sportsplex was in the middle of the Ring Road location; Alberta provided funding
to build a new facility which opens soon; it includes ice rinks, an outdoor facility, and otherelements
DISCUSSION NOTES, CONTINUED 18
Detailed Notes of the February 13, 2019 Indigenous – Asia Pacific Business Relations Roundtable held in Vancouver, BC | Page 4 of 26
o Land uses for this section include: retail, shopping, entertainment, hotel, etc.o The land was previously occupied by the Buffalo Run Golf Courseo “The Shops at Buffalo Run” will be constructed in the middle of Taza Exchange; tenants
for this shopping mall will soon be announcedo A large organization will be accommodated in this section (to be announced soon).
•Discussion: The following questions/comments (Q/C) were offered by roundtable participants, and responses (R) were provided by the presenter:
Q/C: Who did the planning for this project?
R: Tsuut’ina Nation entered into a partnership arrangement with Canderel Development. Representatives of the Tsuut’ina Nation Council and Canderel participate on the Board of Directors for the project. Experts are brought in as needed.
Q/C: What portion of those involved in doing design work are First Nations representatives?
R: There are only a few First Nations people involved in the design work. Other teams are focused on seeking opportunities and the community plan.
Q/C: What are the biggest challenges that have occurred with this project?
R: Some of our biggest challenges have been working with government. The Department of Justice Canada is focused on protecting the Crown. The project’s team remains focused on the project’s objectives.
Q/C: Many First Nations are getting involved in urban investment. We have 150 acres south of Saskatoon, which we are moving forward with, on a smaller scale.
Q/C: How open are you to outside investors?
R: We are open to all investments. We are finalizing a syndicate which seeks to raise $280 million. We are determining who will be taking the lead on this. We are open to looking at leasing land, investments, etc. A few First Nations have asked about investment opportunities.
Q/C: What are the challenges related to seeking out Asian investments in Canada?
Q/C: If you are looking at a green field investment, you are competing with others. Any investor will need to consider the tax environment, land costs, access to labour, etc. Commodity space is critical.
Access to natural resources is important. How much latitude do you have and how can you package it? This project could become an attractive investment, given its proximity to Calgary. Fujitsu is looking at Vancouver as they would have access to AI resources. Immigration programing needs to allow us to bring in skilled staff. Setting up a vocational

DISCUSSION NOTES, CONTINUED 19
Detailed Notes of the February 13, 2019 Indigenous – Asia Pacific Business Relations Roundtable held in Vancouver, BC | Page 5 of 26
R:
institution that would focus on technology skills, would be attractive to investors.
We have had a few workshops. There are a lot of concepts (i.e. education, technology) – Taza Crossing will be the last piece of the project to be developed.
2.2 Tom Many Heads, President and CEO, SRDL Business Group Mr. Many Heads reviewed an overhead presentation titled “SRDL Business Group – A Siksika Nation Company”, and noted that: • During the last 25 or 30 years, Siksika was focused on natural gas and oil production• The dropped gas and oil prices and production led to the market crashing• SRDL has become involved in other entities• SRDL recognized the need to diversify its business development agenda, which prompted
consideration on some external opportunities• Investments have been pursued closer to urban metropolitan centers• The SRDL’s core business is related to: agriculture, energy, construction, retail, hospital and
investment/future growth• Agribusiness has been critical to Siksika; there is potential for expansion in irrigation; Siksika
has an abundant water supply, which Siksika only accesses a fraction of• The Siksika Energy Resource Corporation was established in 1995; Siksika is getting out of the
oil business, but not the energy business• With Blackfoot Aggregate, Siksika has some of the most prolific gravel sources in Alberta• In 2011/12 Siksika recognized that a pipeline would be constructed; as construction growth
in southern Alberta was anticipated, an agreement was formed with Graham Construction tohelp build projects, including a retail business place
• Siksika took on construction contracts through Niitsitapi-Graham LP (NGLP) – with the intentto help with mitigating before a flood
• Siksika sought to provide services and sustainable business to the community, and included aPetro Canada, Subway, grocery store, WIFI services, and a business centre
• Recent hospitality investments have been secure• Siksika Holdings has seven hotel and conference properties covering distinct market sectors
in Alberta and BC; viable partnerships in the hotel sector and brand name entities werepursued; Siksika partnered with a group in BC – PHI Hotel Group, and invested in two hotelsin Calgary:o The Calgary Westin at the Calgary Airport, opened January 2019 on federal crown land
and Calgary Airport Authority Lands in the NW portion of Deerfoot North CalgaryInternational Airport Trade park
• Siksika partnered with the same entity to open “Edmonton West” a dual property with“Element by Westin” and “Four Points by Sheraton”
• Discussions on other opportunities have ensued:o In addition to developing properties in Calgary and Edmonton with PAL Hospitality, the
SRDL engaged with the Pomeroy Group on projects in Ft. St. John, Kelowna, Kananaskis,and Prince George
o The Kanaskis Mountain Lodge is a world-class resorto Investment and future growth opportunities include, “Siksika Herbz Ltd.” a 24,000 square
foot cannabis production facility, in the Siksika Industrial Park, approximately one hour
DISCUSSION NOTES, CONTINUED 20
Detailed Notes of the February 13, 2019 Indigenous – Asia Pacific Business Relations Roundtable held in Vancouver, BC | Page 6 of 26
east from the community in partnership with a BC organization (anticipated to open in late 2020)
• Regarding agri-business opportunities, the Stage 2 Irrigation Expansion Plan is projectedto irrigate an additional 6,000 acres in the Shouldice, Arrowwood and West Axe Flatsareas
• Siksika has a combined asset value of $140 million; the Business Group employs 101employees.
Discussion: The following questions/comments (Q/C) were offered by roundtable participants, and responses (R) were provided by the presenter:
Q/C: How could APF support your efforts?
R: We have strengths and assets, including a massive land base. We are situated one hour from Calgary. A challenge has been accessing markets. Siksika welcomes the opportunity to make direct contacts with Asian partners, and is looking at future potential investments. We want to entertain a long term growth strategy.
2.3 Stephen Lee, CEO, Musqueam Capital Corporation (MCC) Mr. Lee reviewed an overhead presentation titled, “Musqueam Capital Corporation” and reported that: • When he started working with Musqueam, they were recently out of receivership/remedial
management• With community and leadership’s support, the MCC was formed as the asset management
arm of the Musqueam Nation• The MCC’s Board of Directors reports to Chief and Council and is responsible to Musqueam
members• The MCC’s goal was to separate business from politics; significant collaboration and
communication with the community is critical• The land base is small – Musqueam is in the City of Vancouver, therefore land value is high• Musqueam has off-reserve assets and conducts business seamlessly with the Cities of
Vancouver, Burnaby, Delta, Richmond and others• Musqueam has three pieces of expensive land – the Musqueam Golf and Learning Academy
(on reserve), the University Golf Course (150 acres on University Endowment Lands), andShaughnessy Golf Course (a private membership club, under lease in Shaughnessy)
• The Milltown Marina on the Fraser River is situated between Richmond and Vancouver, andwas established through a long term lease agreement with the Port of Vancouver; there aretenants at the marina including a pub, brokerage firm, and marine repair/maintenance facility
• Other properties under management include: “Shalimar” a 76-unit residential property (onreserve)
• The Fraser Arms site (on Marine Drive) was acquired in 1993 by Musqueam• A 22-acre development on the University Endowment Lands, across from the University Golf
Course, took a few years to rezone and have incorporated green space and walkable areas;this is separate from the City of Vancouver
• Lelem Village (marketed as a “Master Planned Community at UBC Pacific Spirit Park”):
DISCUSSION NOTES, CONTINUED 21
Detailed Notes of the February 13, 2019 Indigenous – Asia Pacific Business Relations Roundtable held in Vancouver, BC | Page 7 of 26
o “Lelem” translates to “Home”o The project includes mixed use and a retail plaza to be anchored by a major grocery,
restaurants, and rental and market residential unitso The project will be built in two phases over a ten year timeline; for the first phase, the
First Nation partnered with Polygono Musqueam can lease the lands long-term (99 year leases); the key is that Musqueam will
retain ownership of the propertyo The Lelem Community Centre and Day Care is a 15,000 square foot projecto A lot of old growth trees were retained and incorporated in features of the development;
timber taken from the community was repurposed in the Musqueam communityo An adventure park/playground was included for the “young and young at heart”
• There may be just under 200 acres of lands, valued at billions of dollars• Musqueam is nearing ownership of 800 acres of lands (including industrial, residential, mixed-
use, office and reserve lands)• A pipeline of 30-40 years of strategic development has already been mapped out• The focus has been to partner with other First Nations to leverage a position to acquire lands
back; synergies have been created by transitioning accommodation into equity• Musqueam has materialized a large portfolio that will continue to monetize to create wealth
for future generations; a wealth fund may be created for community members• Musqueam has leveraged some strong partnerships and has worked with local long-term
development partners.
Discussion: The following questions/comments (Q/C) were offered by roundtable participants, and responses (R) were provided by the presenter:
Q/C: What have you done to insulate business from politics?
R: The Board of Directors is made up of nine directors, of which five are Musqueam members (three from Council, two from community) plus some external business representatives. A “Business Charter” governs the relationships between the MCC and government, and separates extraordinary decisions, and limits and restricts what we can do.
Q/C: Does the MCC get involved with projects?
R: An Asset Management Agreement lays out which assets the MCC is involved in. MCC representatives may be invited to sit in on some discussions, related to various business opportunities.
2.4 Clint Davis, Partner and Managing Director, Acasta Capital Mr. Davis reviewed an overhead presentation titled, “Nunatsiavut Group of Companies”, and noted that: • The Nunatsiavut Group of Companies is one of six Inuit development companies across the
country• Less than 4% of Canadians have been to the north (mostly for work)• There are three development corporations in Nunavut (representing each of the three
DISCUSSION NOTES, CONTINUED 22
Detailed Notes of the February 13, 2019 Indigenous – Asia Pacific Business Relations Roundtable held in Vancouver, BC | Page 8 of 26
different regions) • The Nunatsiavut Group of Companies owns a helicopter company (solely Inuit-owned), which
serves the north and the homeland; opportunities to collaborate with the other developmentcorporations in the north have been pursued
• A trade association sought a unified voice for Inuit business, to enable opportunities to bid onsome large scale opportunities (i.e. residential facilities for people travelling to the north)
• A land claim was settled in 2005 (for five communities), which was the last Inuit land claim tobe settled in Canada
• Most Inuit communities rely on diesel; many do not have road access; those who do haveroads, are often inaccessible during the winter months
• The Nunatsiavut Group of Companies is based out of Newfoundland/Labrador• An impact agreement has been negotiated with a copper mine• To separate business and politics, a trust was established, which is the sole shareholder of the
development corporation• There are procurement opportunities with the Government of Newfoundland/Labrador; land
claim management is governed by the Nunatsiavut government• The Board of Directors is comprised of government officials and three independent Directors;
the Board cannot intervene in daily operations; it would be helpful if they came out andsupported
• The vision of the organization is to be an Inuit-led business leader in the north; the goal is toproduce annual reports that demonstrate that Nunasiavut is open for business
• Nunasiavut owns a number of companies (solely and partially)• A “Corporate Social Responsibility” policy was designed to govern how to support the
community• There are 11 operating companies and joint ventures with major organizations including:
Kiewit, Bird Construction and others• Nunatsiavut is keenly open to discussions on operations
Discussion: The following questions/comments (Q/C) were offered by roundtable participants, and responses (R) were provided by the presenter:
Q/C: Have you pursued discussions with circumpolar and arctic connections?
R: The Arctic Indigenous Investment Conference 2019 is scheduled February 12-14, 2019 in Whitehorse. There are a number of different entities in the Arctic Secretariat – some are driven by non-polar countries while others are driven by other interests.
A few years ago, we came together at the table. We have not met with other business investors from elsewhere in terms of an approach to the arctic. There will likely be new transportation routes and greater access to resources. Russia is trying to assert its sovereignty over the region.
We think there will be a critical role for our development corporations to play – we could provide insight. If there is some opening up to the arctic, how can we ensure our communities, cultures and environments are respected? We are trying to coordinate a trade mission to Greenland. They want to seek capitalism opportunities with Canada. We
DISCUSSION NOTES, CONTINUED 23
Detailed Notes of the February 13, 2019 Indigenous – Asia Pacific Business Relations Roundtable held in Vancouver, BC | Page 9 of 26
have met with the Danish Consulate and are seeking to visit in May or June 2019.
Q/C: Do you do any fisheries business in Asia?
R: We were trying to get our fish products sold in Canada, but they are being sold to Asia. We just purchased helicopter companies in BC and in California. It is important to look at the far north – it is a remarkable opportunity for the country. Other countries recognize its value, as a strategic asset.
Q/C: It would be helpful to have a better understanding of how the APF works.
R: The APF can help you frame your thinking in how you can succeed in Asia. There are some common themes, but we will look at this as an exercise. Collaboration is critical – when First Nations go to different markets they do not have the same impact as if they collaborated into one group, representing a large group of First Nations.
Consider how to come up with a common script that reflects a larger group, with multiple assets and resources.
The process in Canada is complicated. Take what you are doing here, bring together a common theme, and project it when you go abroad, to make it easier for the APF to work with you. You need a larger image. The biggest companies in India will not want to deal with small entities. They prefer to deal with an entity with significant combined assets.
2.5 Heather Bishop, Director, Cold Lake First Nation (CLFN) Ms. Bishop reviewed an overhead presentation titled, “Indigenous AP Business Relations Roundtable – Cold Lake First Nation” and reported that: • Cold Lake First Nation:
o Is in Treaty 6 in NE Albertao Has traditional territory extending into Saskatchewano Has approximately 2,800 members and four different reserve parcels in close proximity,
near the City of Cold Lake• The “Cold Lake Air Weapons Range”:
o Was developed in the 1950s without dialogue with First Nationso Many First Nations people were displaced when government made the decision to
establish the range; ammunition testing still occurs on siteo Citizens were relocated to the south, to practice agriculture on the edge of the Boreal
Forest; there were catastrophic impacts on First Nations• The Cold Lake First Nations’ land claim was settled with federal government in 2001• Charts titled “Cold Lake First Nations, Changes in the Circle of Livelihood” indicated a typical
annual circular calendar, in three phases: pre-1952, 1952-present and future• The CLFN did not have a specific economic development arm, but was developing a business
trust• The “Primco Dene Group of Companies” includes over 20 companies; many community
members have had their own independent businesses for some time• CLFN is at the south end of the oil sands development, which is where most of the industrial
activity is derived; efforts are being made by many First Nations to diversify away from oil and

DISCUSSION NOTES, CONTINUED 24
Detailed Notes of the February 13, 2019 Indigenous – Asia Pacific Business Relations Roundtable held in Vancouver, BC | Page 10 of 26
gas • Most of the economy in Alberta is based on oil prices• The Alberta Energy Corporation provided a $100,000 loan to the CLFN, to establish a
construction company, which has subsequently evolved and expanded• The City of Cold Lake has approximately 10,000 residents, including residents at the weapons
range• The CLFN regained access to the weapons range lands, through a settlement agreement• Government may be seeking to get weapons ranges off of lands suited to energy production• CLFN owns and operates: Casino Dene, a Courtyard Marriott Hotel, and companies focused
on the environment, insurance, cement, etc.• There are significant opportunities in the Boreal Forest• Partnerships are in place with forestry companies keen to work with First Nations in
Saskatchewan• CLFN is proud to have an 80% Indigenous employment rate• Formal partnerships have been established with some First Nations across Canada• Initiatives include: the business trust and governance structure; reserve lands planning,
comprehensive community planning, economic development strategic plan, partnershipswith other Indigenous and non-Indigenous communities (government, industry, businesses,etc.); research and grant opportunities
• Opportunities to promote tourism have been considered (i.e. The Alex Janvier Gallery)• Efforts are being made to diversify with opportunities from the conventional oil/gas industry• CLFN is struggling with how to leverage finances, investments and trust.
2.6 Sean Willy, CEO, Des Nedhe Development Mr. Willy reviewed a distributed brochure on “Des Nedhe Development” and explained that: • Des Nedhe has approximately 1,200 band members• 30 years ago, Des Nedhe became involved in the uranium industry, and is now the second
largest uranium producer (second to Kazakhstan)• In the mid-1990s Des Nedhe purchased land situated to the south of Saskatoon• Des Nedhe Development:
o The Elders and community leaders created Tri-Con North, which is now “TronConstruction and Mining”, a 100% First Nations owned company
o Des Nedhe also owns a partnership with Tyson Miningo Efforts were being made to evolve towards modern joint-venture agreementso Des Nedhe appreciates the partnerships and the employment they createdo A “Freshwater Fish” Crown corporation is being pursued, to re-invigorate industry
• Des Nedhe projects:o The Grasswood Urban Reserve has a successful tobacco businesso Beauval has established a prosperous arrangement with Loblawso Des Nedhe purchased a welding fabrication businesso Creative Fire is a communications firm that can assist First Nations companies in telling
their storieso A setback experienced at the community level were impact benefit agreements (IBAs),
etc.• Des Nedhe hires more Indigenous people than non-Indigenous people• Efforts have been made to support for organizations seeking to employ First Nations people
DISCUSSION NOTES, CONTINUED 25
Detailed Notes of the February 13, 2019 Indigenous – Asia Pacific Business Relations Roundtable held in Vancouver, BC | Page 11 of 26
• Federal government spends $12 billion on services each year but they only use Indigenoussuppliers .5% of the time
• Des Nedhe has a 30-year history and strives to hire good people• Community members believe economic development leads to self-determination• It is important to work towards tying the Asian market to opportunities.
Discussion: The following questions/comments (Q/C) were offered by roundtable participants, and responses (R) were provided by the presenter:
Q/C: There are differences between First Nations, Inuit and Métis governments and communities. We partner with Innu for convenience.
R: Is “patient money” a real thing in the Asian market? We have 53 acres of land left to purchase in Saskatchewan.
Q/C: Are you seeing any movement with federal government?
R: Yes. There have been some internal mandates. We are working towards a better value proposition and the best quality of bids.
Q/C: The APF is involved with some work exchange programs in Asia. Consider what can be done to engage students and ensure they are “Asia-ready”. Can we share some already-developed curriculum?
Q/C: At a recent panel focused on diversification of the economy, someone questioned how to develop a technology hub in Calgary. A lack of talent has been identified as the biggest limiter.
Q/C: Calgary may attract some technology talent, where the cost-of-living is less than in Vancouver.
Q/C: Capacity is a key struggle. There have been a record numbers of Indigenous people graduating from law school, which we struggle to see translated into the workforce.
Q/C: The number of students coming from India has declined since 2010. Consider working with educational institutions. First Nations organizations could provide infrastructure and/or the skill to help diversify in traditional areas. In Ontario, 60% of students going to vocational institutions have a university degree. People need jobs. There is value to having a university degree in addition to a vocational skill.
Q/C: Many Indigenous people are pursuing roles in social sciences. We need to strive to be an “employer of choice”. A goal of the TD Bank has been to hire as many Indigenous people as possible. Organizations could attract talent by offering appealing approaches to lifestyle and work-life balance.
DISCUSSION NOTES, CONTINUED 26
Detailed Notes of the February 13, 2019 Indigenous – Asia Pacific Business Relations Roundtable held in Vancouver, BC | Page 12 of 26
Q/C: Migration to urban centres is occurring everywhere. Where there is population growth, there are social, education and other issues.
3. Overview of Trade Opportunities
3.1 Stewart Beck, President and CEO, Asia Pacific Foundation of Canada Mr. Beck explained that prior to joining the APF, he served as the Canadian High Commissioner to the Republic of India. He joined Canada's Department of External Affairs and International Trade (now Global Affairs Canada) in 1982 and served abroad in the United States, Taiwan, and the People's Republic of China. In Ottawa, he held a number of positions, including Director General of the North Asia Bureau, Director General Responsible for Senior Management and Rotational Assignments, and Assistant Deputy Minister for International Business Development, Investment, and Innovation. He was Consul General in Shanghai and prior to his posting to India, he was Consul General in San Francisco.
He further acknowledged that: • Saskatchewan was the largest exporting province to India (i.e. potash, pulp, etc.)• Diamonds from the NWT passed through Antwerp and were cut in India• A number of commodities are not being statistically credited to Canada (i.e. gold, engines,
etc.)• Asia is a growing region; abilities to export to Asian markets need to be considered• A lot of agricultural products were sold in Asia, based on stringent Canadian standards• “Transitioning from one meal of dahl per day to two, has a significant impact on the economy”• India has two of the largest refineries in the world; they would welcome oil sands crude from
Alberta, as it generates more products they could market• Alberta Petroleum Marketing Commission signed an agreement with an Indian organization,
but it could not proceed due to access issues• The gravity of oil from California is the same as from the oil sands; their refineries are geared
for this• It is important to consider the demographics; the median age in Asia is 30.7 years; there is an
aging demographic in China, meaning that health care is critical; the APF website showsStatistics Canada information on products Canada ships to Asia
• In 2014 we held 1.39% of the import market share; in the preceding years, the economyexpanded but Canada’s market share did not increase at the same pace
• It is fundamental to diversify trade away from the US; it takes patience and time to dobusiness in Asia
• Consideration could be given to creating a co-op around fresh-water fish, to be sold throughan e-commerce forum in Asia
• Direct flights currently move lobster from Halifax to China• Quality product is more important than price in China• It is critical to:
o Consider your assets, and then create a larger projectiono Work together as a group rather than as individual First Nationso Consider establishing an economic development co-op of a group of First Nationso Work with people that know and understand how to do business in the Asian markets
DISCUSSION NOTES, CONTINUED 27
Detailed Notes of the February 13, 2019 Indigenous – Asia Pacific Business Relations Roundtable held in Vancouver, BC | Page 13 of 26
o Determine what products you can provideo Payment is a critical issue to consider; how you sell into a super market is different from
how you sell to an e-commerce platformo Decide on a strategic approach to a market, then scale it to others, based on your success
• APF collaborated with a company that works with JD.com and Alibaba.com• Specialized cuts of beef from an Ontario packer are sold in Asia; although meat packers in
Alberta also wanted to ship beef, the Ontario seller provided cuts the Asian market wanted,on e-commerce platforms; his sales have grown exponentially
• Hong Kong or Taiwan could provide an opportunity to work a model out first; then look toChina.
Discussion: The following questions/comments (Q/C) were offered by roundtable participants, and responses (R) were provided by the presenter:
Q/C: Could the collective be a corporate entity comprised of multiple First Nations?
R: Yes. The corporation could introduce itself as “an $X million cooperative that provides ? products”. Consolidators do this – First Nations need to be their own consolidator. They could sell products including fish, seafood products, etc. Consider what value can you add to products that can be branded in a certain way. In China, Canadian food products are considered high quality, particularly if certified under a quality standard. We have prepared three papers on e-commerce, which are accessible on the APF website. They offer examples of how to sell into the market. It is important to work together.
Q/C: I have seen instances where organizations, begin to partner with others (through an agreement), before selling into the Asian market. It is about scaling, size and having a presence.
R: If you bring your resources together, your marketing budget is larger. If you decide to pursue the market in China – identify who to work with, based on the products you decide to sell.
Q/C: First Nations organizations may tend to look inwards.
Q/C: Consider a neutral agreement to state “We are selling seafood to Vietnam” - then invite others to participate.
Q/C: There is nothing you cannot buy online in Asia.
R: You can sell a tourism package online. Many of the packages sold in China, are directed to healthy and fit millennials, who are keen to travel north. You will need to adapt your marketing approach accordingly. Seeing the Northern Lights is a big deal for many people in Taiwan.
Q/C: Many people in Asia do not know a lot about Canada.
DISCUSSION NOTES, CONTINUED 28
Detailed Notes of the February 13, 2019 Indigenous – Asia Pacific Business Relations Roundtable held in Vancouver, BC | Page 14 of 26
R: Given the average income of people in China, a $10,000 tour package to Saskatchewan may not be significant. It is important to consider the market.
Q/C: What are some of the considerations when selecting the first “point of entry”, aside from whether or not there is a market for a product?
R: There are overlaps between “investing” and “selling a product”. Start in Hong Kong or Taiwan – they are easier markets, where you can do business in English. Legal structures are also similar.
Q/C: What about “niche to scale”?
R: One of our Directors talks about a “protein super-cluster” opportunities in Asia. In Canada we may think the market for a specific pea would be small, however, they are sold exclusively to China, where they grind it into a flour for noodles. A farmer has indicated that 50% of his blueberry crop is sold in advance to China. These are niche markets in a North American context. You could sell fresh fish on an e-commerce platform in China.
3.2 Christian Hansen, Senior Trade Commissioner, Canadian Trade Commissioner Service Mr. Hansen confirmed that he had been proud to serve Canada in Japan, Norway etc. and further explained that: • Trade Commissioners were an under-utilized resource• There are 1,000 Trade Commissioners in cities around the world; they do not charge for
helping clients do international business• “International business” could include seeking international investments, exporting goods or
services, or helping a client invest abroad• Trade Commissioners provide advice; more than half of the Trade Commissioner Service’s
clients are not Canadian; we hire people with experience in various industry sectors• We encourage clients to use Trade Commissioners for contacts• The Trade Commissioner Service offers advice, contacts and funding• The Honourable Jim Carr, Minister of International Trade Diversification:
o Speaks highly of diversifying amongst the export communityo Supports underrepresented groups, including Indigenous businesses
• Trade Commissioners can help Indigenous economic development from an internationalperspective
• An ideal client, that will do well in Asia:o Is 5-7 years oldo Has 20 employeeso Has previously exported to the US
• When your Trade Commissioner knows your business model, we can help to look atinternational opportunities, and the existing network
• Federal government’s “CanExport Program”1:o A risk-sharing program – which could pay 50% of the costs associated with visiting a
market to generate business
1 For information on CanExport visit: https://international.gc.ca/trade-commerce/funding-financement/canexport/index.aspx?lang=eng
DISCUSSION NOTES, CONTINUED 29
Detailed Notes of the February 13, 2019 Indigenous – Asia Pacific Business Relations Roundtable held in Vancouver, BC | Page 15 of 26
o For example, if you go to Germany, the program could cover half the costs associated withattending; this supports new markets and new opportunities
o The program is well-funded; it would be helpful to discuss how the program can helpexplore new markets
• The “Invest in Canada” Program2:o Could share 50% of costs associated with promotional materials and other associated
expenseso Can help promote opportunities; we also spend time considering the best way to
approach a market and risks to be assumed when travelling to China• The Trade Commissioner’s office can provide general information on various considerations
when contemplating doing business in China• Some clients entered into arrangements that did not turn out as anticipated• There is an approach to “negotiate, reach an agreement, do business”• If you are doing business in Asia, contact our High Commission or Embassy office to find out
more about contacts• There are challenges in protecting intellectual property when exporting to China• It is important to understand free trade agreements and how they apply when doing business
in Asia; the tariffs on wood and fish have come down; if your margin is between 5-8% - thisjust doubled
• If you have never exported before, look at the “Export Navigator Program3”• The International Inter-Tribal Trade and Investment Organization4 (chaired by Wayne
Garnons-Williams) has been engaging American Indian tribes; some have enhanced theircommunities through casino revenues and might welcome the opportunity to purchase foodfrom First Nations in Canada for their restaurants
• The International Indigenous Trade Mission and Conference5 is held twice a year (the next isscheduled June 2-4, 2019 in Oklahoma)
• The next World Indigenous Business Forum6 is scheduled October 8-10, 2019 in Vancouver.
3.3 Rosi Niedermayer, Trade Commissioner, Canadian Trade Commissioner Service Ms. Niedermayer acknowledged benefits of First Nations working as a conglomerate rather than working independently, and further noted that: • There are many opportunities for exporting product to Asia• Trade Commissioners frequently receive requests for qualified buyers in Asia• Whatever you want to sell – approach a Trade Commissioner for help in facilitating the right
connections.
Discussion: The following questions/comments (Q/C) were offered by roundtable participants, and responses (R) were provided by the presenter:
Q/C: We talked earlier about investments. For some projects, we are seeking investments. Would the Trade Commissioners office be able to assist us in tracking capital for specific
2 For information on the Invest in Canada program, visit: https://www.investcanada.ca 3 For information on the Export Navigator Program, visit: https://smallbusinessbc.ca/export-navigator/ 4 For information on the IITO, visit: https://iitio.org/about-iitio/ 5 For information on the IITM&C, visit: https://iitio.org 6 For information on the WIBF, visit: http://wibf.ca
DISCUSSION NOTES, CONTINUED 30
Detailed Notes of the February 13, 2019 Indigenous – Asia Pacific Business Relations Roundtable held in Vancouver, BC | Page 16 of 26
R:
opportunities?
Contact the Trade Commissioner’s office, to discuss opportunities. It would be helpful if you can provide a business plan and information on: the capital you are seeking, what the opportunity is, and what the time frame is.
Q/C: Would the “Invest in Canada” program help consider these opportunities?
R: Government put money into a “department corporation” – an investment promotional agency designed to look at premier investors and large projects.
Q/C: Ian Gerard McKay was appointed CEO of “Invest in Canada”. The office provides a concierge service and will work with someone wanting to invest. Connection(s) could be made particularly if the project was an energy-driven project, which requires discussion with investors in Japan, etc. There are different ways in which to make people aware of opportunities. Currently the investment environment is plagued by issues related to competition, taxation, regulatory environments, etc.
R: The Japanese government’s office for North America looks at energy and mining opportunities for investment.
Q/C: Are there studies that provide an inventory of resources that are conducive for an Asian market?
R: I am not aware of a comprehensive overview. In BC, I see a transfer of wealth in terms of resource rights and extracted capacity to Indigenous communities. I want to play a constructive role with respect to accessing foreign capital. It is important to build capacity.
Q/C: When looking at potential investments in Canada, particularly in the far north where there are some profound gaps, would geography be a barrier to investment?
R: In my experience with potential foreign investors, the bottom line is the bottom line. It is about making money.
Q/C: There was a significant investment made to enable a steel company in Quebec to sell to clients in the UK. There is capacity to analyze product locally.
Q/C: How many clients would a Trade Commissioner typically work with at the same time?
R: There are 17 Trade Commissioners in the Pacific Region – each has 30-50 clients, depending on the sector. The consumer products specialist likely has more clients.
Q/C: There are a lot of businesses and entities competing. The better defined an opportunity is, the easier it is for the Trade Commissioners to assist.
DISCUSSION NOTES, CONTINUED 31
Detailed Notes of the February 13, 2019 Indigenous – Asia Pacific Business Relations Roundtable held in Vancouver, BC | Page 17 of 26
Q/C: Consider collaborating as a consortium. Bring together a group. A fund could be created for a specific opportunity. Are there other similar consortiums?
R: I am not seeing this. It would be easier to service that type of organization.
Q/C: A consortium (led by Terry Matthews) included six or seven technology companies, to be represented in India. The concept was unique.
R: There is a group that brings together First Nations’ interests in mining, to China.
Q/C: In China, 68% of the energy is generated through coal plants. As they transition to reduce the use of coal, they are moving towards using gas. There was previously an agreement to take 100,000 barrels to India – the agreement could not proceed due to access issues. Energy in Asia will continue to have a carbon dimension to it.
Q/C: Is it critical to have “boots on the ground” to complement the intel that a Trade
R:
Commissioner can bring?
The importance of having “boots on the ground” depends on the size of the deal, the relationship with the client, and other factors. It is difficult to generalize the right response.
Q/C: If you want to achieve long-term business – you need “boots on the ground”. For example, when Teck came to India – they recognized that steel was needed. Don Lindsay, the CEO of Teck, took his board and management team and spent two weeks in India travelling around, to better understand their infrastructure. Today they sell more to India than they do in China.
Another example is with McCains. After seven years, McCains now has two french-fry manufacturing facilities. McCains prompted changes to the way potatoes are harvested. They now use drip irrigation on potato fields, which were previously flooded to harvest. McDonalds’ french-fry sales are significant in India.
3.4 Bryan Hughes, Export Development Canada (EDC) Mr. Hughes introduced an overhead presentation titled “Take on the World”, and explained that: • The EDC’s mission was to help companies go, grow and succeed in markets across the world• EDC has offices across Canada• After working as an engineer in construction, he had an opportunity as a Trade Commissioner• It is important to leverage Trade Commissioners; advance planning is beneficial• He coordinated deals in Columbia, Mexico and other countries before working with the Trade
Commissioners• The international EDC offices are generally located in the office of the Trade Commissioners• The EDC:
o Focuses on proactively identifying who to do business witho Is engaged in business in 190 marketso Works to identify preferred businesses to work with, in the long term
DISCUSSION NOTES, CONTINUED 32
Detailed Notes of the February 13, 2019 Indigenous – Asia Pacific Business Relations Roundtable held in Vancouver, BC | Page 18 of 26
o Insures transactions (approximately 2% - 3%)o Ensures whether a client is credit-worthy or otherwiseo Arranges corporate guarantees (not personal guarantees)o Partners with the five large banks and HSBC
• “Bonding Solutions” can be an impediment for First Nations organizations• For companies doing business outside Canada, getting an assurity bond can be challenging;
EDC does assurity bonds – for anywhere in the world• If LNG needs an assurity bond, bid bond, or performance bond – communicate with the EDC;
there may be some challenges, but EDC may be able to assist• EDC can get a company an operating line, before a bank would be comfortable doing so• Trade Commissioners will get you through “open doors”• EDC offers webinars on doing business abroad.
3.5
Discussion: The following questions/comments (Q/C) were offered by roundtable participants, and responses (R) were provided by the presenter):
Q/C: We worked with EDC for an acquisition outside of Canada, and would refer others to EDC.
Q/C: We are also working on a deal with EDC and would refer them.
Xenia Wong, Bennett Jones Ms. Wong reviewed her years of experience in Singapore and Hong Kong as an international lawyer, and explained that: • Some of Asia’s legal structures are similar to Canada’s, but may be named differently• Consideration is needed on whether you require an Indonesian partner before working in
Indonesia• Canada is generally under-represented in Asia• It is important to take time to establish business relationships• Networking and connections are critical in China; clients need to get to know you and trust
you as a person before deals can be engaged• The language of business in India is English• In SE Asian markets, English is common law• In Indonesia, rather than enforcing a legal agreement, dispute resolution is pursued• Each country in Asia is different; it is critical to know what you are getting into in advance• Hong Kong is an entry way to China; Singapore is a great market and a commercially minded
entry-point• “Face” is a big deal; it is critically important to not publicly embarrass or humiliate anyone;
you cannot put someone in a situation where they cannot gracefully say “no”; you cannotdemand an answer of them
• Chat apps are critical in Asia for doing business (i.e. “WhatsApp”, “WeChat”)• In SE Asia, law firms tend to carve up Asia into NE and SE, separately from Japan; South
Korea is beginning to open up• Be available – spend time; they need to get to know you and like you as a person; once a
relationship is established, there is a level of confidence and familiarity.
DISCUSSION NOTES, CONTINUED 33
Detailed Notes of the February 13, 2019 Indigenous – Asia Pacific Business Relations Roundtable held in Vancouver, BC | Page 19 of 26
Discussion: The following questions/comments (Q/C) were offered by roundtable participants, and responses (R) were provided by the presenter:
Q/C: In a current situation we are in with China, there is an issue of “face”; the issue has put Canada in a difficult place.
Q/C: What about legal considerations? How does an Indigenous organization prepare to enter into these markets?
R: It is about knowing the market you are going into. In International transactions, you can use English law. Secondarily, agreements may be pursued in local law. You need to know which law applies. English or New York Law likely applies when doing business in Asia.
Q/C: China has a civil law approach. India has a common law approach. If a decision is brought to a Judge, it will take a long time, as the court process is lengthy. A lot of business relationships are established in Singapore.
Q/C: We used to see Canadian companies coming in, setting up Indian businesses in Singapore.
Q/C: Is it important to seek legal counsel before entering into a new market?
R: It is important in many countries to have legal counsel in the country in which you are doing business. The choice of law for your agreements is important.
Q/C: You would need a lawyer. If we had a free trade agreement up for consideration, we would suggest using Canadian law and Canadian legal counsel.
Q/C: Japan should not be overlooked. They have a long standing trade relationship with BC. In preparing a package to present, know that the world is not “clamoring to come to Canada”. You are competing for attention. In China, you may not know what the yield is until the payment is received. Japan is sophisticated. Government agencies are under-utilized. Embassies and provincial offices should be considered. Embassies are looking at content; you could get the embassies to do a presentation. In Tokyo there is a 300-seat theatre that is a good venue. Accessing the Chamber of Commerce in the country is helpful.
Q/C: We worked with embassies in Ottawa and China. Their processes and structures were researched in advance.
Q/C: If there is any activity on Inuit-owned land, we issue them permits. We have protocol that applies.

DISCUSSION NOTES, CONTINUED 34
Detailed Notes of the February 13, 2019 Indigenous – Asia Pacific Business Relations Roundtable held in Vancouver, BC | Page 20 of 26
3.6 Matthew Coon Come, Grand Council of the Crees Dr. Coon Come, former Assembly of First Nations National Chief and former Grand Chief of the Grand Council of the Crees, reviewed his background and experience and noted that: • He was President of the region’s government, with over 300,000 square kilometres of land• Air Creebec connects a food distribution and other companies to the north• Representatives of a Cree community travelled to China seeking potential investors in
Shanghai• He was currently a director of Goldcorp• As National Chief his goal was to visit at least 400 of the 634 First Nations communities in
Canada; many had achieved contracts or were seeking opportunities in other countries• The windfarm SkyPower Global opened a number of opportunities in countries around the
world• A policy and protocol defines how a proponent can contact and build a relationship• A number of First Nations are looking for partnerships and investment opportunities outside
the country, in areas including natural resources, etc.
The Co-Facilitators referenced some common threads identified throughout the presentations: • A consolidated co-op or entity would make it easier for First Nations organizations to
penetrate the Asian markets (or other markets)• Others may have attempted to do this through a joint venture or otherwise, in response to a
specific opportunity• It would make mobilization of an entity easier, if someone came up with opportunities that
Indigenous companies could respond to.
Discussion: The following questions/comments (Q/C) were offered by roundtable participants, and responses (R) were provided by the presenter:
Q/C: In terms of forming a corporate entity, ask around to find others who are interested in connecting.
Q/C: A significant balance sheet would be appealing from the other side. If we gathered a group
R:
at this meeting, as an economic alliance, we could work together. The CCA markets Canada as a group of municipalities. They talk about what they can do in terms of joint marketing and sales. We could call this group, the “Alliance of First Nations Economic Development Agencies”. We could begin with an assessment of our assets.
Pulling something together before successfully entering these markets would be a significant undertaking?
Q/C: It would be a lot of work, but it is achievable. Consideration would be needed on identifying the correct market, etc.
Q/C: Entry through a south east Asian association could be considered.
DISCUSSION NOTES, CONTINUED 35
Detailed Notes of the February 13, 2019 Indigenous – Asia Pacific Business Relations Roundtable held in Vancouver, BC | Page 21 of 26
Q/C: How do we determine market demand?
R: This is an area that Trade Commissioners can provide advice on, based on the value proposition.
3.7
Q/C: Consider agri-food products, resource development or otherwise. If you outline the alliance’s assets, it becomes more powerful and easier to market.
Andy Chen, Director General, Taipei Economic and Culture Office Vancouver Mr. Chen explained that the population of Taiwan was 23 million, on an island similar to the size of Vancouver Island. He added that: • Taiwan is a democratic country• The current President extended an apology to Taiwan’s Indigenous people; more than 95%
of the Taiwanese population originated from mainland China• The map displayed, indicated immigration routes in Taiwan• When you visit Indigenous people in Taiwan, there are similarities to some Indigenous
people in Canada; a delegation to visit Taiwan would provide this opportunity• Taiwan’s technology is internationally renowned; 40 years ago, Taiwan only exported
bananas and sugar cane – now 1/3 of Taiwan’s GDP is from micro-chip technology• He invited delegates to visit Taiwan and extended best wishes for the Lunar New Year.
3.8 Ruth Chang, Taiwan External Trade Council Ms. Chang reviewed an overhead presentation on Taiwan’s Global Competitiveness, and reported that: • A world economic forum offered a “Global Competitiveness Report 2018” which compared
Taiwan’s economy in recent years• Taiwan’s foreign trade and economy valued development of local service industries, in
addition to circular economy, green energy, biotechnology, national defense, smartmachinery, new agriculture, and Asia’s Silicon Valley
• Each year, the Taiwan External Trade Council hosts the “Taiwan Excellence Awards” whichacknowledge excellence in research/development, quality, design and marketing
• Norco bikes, from the largest bicycle company in Canada, are manufactured in Taiwan• Some of Taiwan’s largest manufacturers are Acer, Giant, Asus, Transcend• Taiwan accounts for a large market share of motherboards, notebooks, desk top computers,
etc.• There are 15 multi-national companies set up in global distribution centers in Taiwan• It is convenient to fly from Taiwan to Hong Kong (1:40 hours), Shanghai (1:40 hours), etc.• Taiwan has competitive advantages, including a strong presence in the Asian markets• There are a number of trade shows held each year in Taiwan, including:
o Food-related trade shows (i.e. “Food Tapei”)o Medical/health related trade shows (i.e. “Medical Taiwan”)o A “Fisheries and Seafood Show”, September 26-28, 2019 at Kaohsiung Exhibition Centre
• The Taiwanese company “Blueseeds” assists local farmers in adopting natural farming toprovide opportunities and to reduce exposure to chemicals; they recently opened an officein BC
• The Taiwan External Trade Development Council (TAITRA) was established in 1970, with the

DISCUSSION NOTES, CONTINUED 36
Detailed Notes of the February 13, 2019 Indigenous – Asia Pacific Business Relations Roundtable held in Vancouver, BC | Page 22 of 26
intent to assist Taiwanese businesses in exporting their products; they brought delegates on international trade missions
• TAITRA is supported by government and various associations
Mr. Chen added that: • You can find solutions from Taiwan; it is the centre of the Asia Pacific• There are connections to Taiwanese business people who have been there for decades• Canada is an “international brand name”, and is known for advanced technology
(including AI)• Taiwan has more than 160 City Mayors attending a conference in March in Taipei• An Indigenous delegation from Canada to Taiwan can be arranged and should be
considered
Discussion: The following questions/comments (Q/C) were offered by roundtable participants, and responses (R) were provided by the presenter:
Q/C: Previously Canadian Airlines delivered lobsters from Canada to Taiwan. If a group of companies worked together, similar opportunities could be pursued.
Q/C: In 1995, Taiwan significantly improved its air quality.
Q/C: Consider when the Taiwan World Indigenous Forum in Taipei is scheduled.
A video was presented, prepared by the Taiwan Department of Foreign Trade.
Next Steps
Mr. Beck referenced the Director General’s invitation to bring (and cover the costs related to) a delegation of a group of Indigenous business leaders to Taiwan: • APF Canada could coordinate the mission, after the alliance was pulled together, and assets/
narratives were defined• About 20 years ago, Taiwan was a significant exporter of pork; their pork was eradicated following a
breakout of hoof and mouth disease• With the Comprehensive and Progressive Agreement for Trans-Pacific Partnership (CPTPP) – the
biggest market is Japan• The pork market in Asia is only going to get bigger; Taiwan has huge market opportunities• If you organize a mission to Taiwan - do something in the fall, when the weather is more pleasant;
meanwhile, preparations can begin
DISCUSSION NOTES, CONTINUED 37
Detailed Notes of the February 13, 2019 Indigenous – Asia Pacific Business Relations Roundtable held in Vancouver, BC | Page 23 of 26
Discussion: The following questions/comments (Q/C) were offered by roundtable participants, and responses (R) were provided by the presenter:
Q/C: Clarification on when to engage a Diplomatic Office versus a Trade Commission Office?
R:
R:
Foreign representative offices in Canada can explain the business culture and economy in another country. Taiwan does a lot of trade shows. When you work with the foreign representative’s office, their networks will be different from the Trade Commissioners connections. Wayfinding is important – you need to know sanitary regulations which they can help with, plus additional practical advice for travel visas.
There is a Canadian trade office in Taipei, with Trade Commissioners. The Alberta Government is the only province to have a trade representative office in Taiwan. Taiwan is not part of the CPTPP; it would be easier if it was. Taiwanese people can use their drivers licenses in all provinces of Canada, but not in the territories. People in Taiwan would gladly come to Canada to see the northern lights, but cannot drive in the territories. We invite government representatives to Taiwan, and welcome the opportunity to meet with business representatives.
Closing Comments
Mr. Aebig welcomed feedback on the following questions, which prompted the subsequently indicated responses: • What are your key take-aways from today?
o We need to work together better, to add clout; if we pool our resources we can offer abroader array of services. Food and renewable energy, are two commodities that stand out.
o If we are serious, we need to look at our respective portfolios. It will take time tocollaborate, forge relationships and identify a strategy to move forward.
o Relationships are critical. Some of the realities that Indigenous economicdevelopment organizations face in terms of the Indian Act and legislation, will need to beconsidered.
o There are challenges to address at the community level. Something that appears to be agood initiative at face value, may present some unexpected challenges in a different market. Itwould be beneficial to capitalize on opportunities available.
o Our structures are set up to give our partnership the ability to move forward without havingto constantly check back. It may take the group time to come together, but there areopportunities to consider.
o Are there any existing platforms in Canada where Indigenous organizations can come together ata national level?
o Consider contacting the World Chambers Network (WCN)7 for information and tools tosupport international e-Trade. The Aboriginal Chamber of Commerce (ACC)8 in Manitoba is alsoa source of information. There may be other Indigenous business-to-business organizations thatcould be leveraged.
7 For information on the WCN, visit: http://www.worldchambers.com 8 For information on the ACC, visit: https://www.aboriginalchamber.ca
DISCUSSION NOTES, CONTINUED 38
Detailed Notes of the February 13, 2019 Indigenous – Asia Pacific Business Relations Roundtable held in Vancouver, BC | Page 24 of 26
o A lot of good comments were offered on engaging in this market. Many First Nations have notinitiated any economic development efforts. There may be 25 First Nations in Canada, that areactive in economic development.
o A number of invited delegates were unable to attend this session, but expressed an interest injoining a future roundtable.
• What does this delegation need to remember coming out of today?o Focus on a particular project. I have had the most success in trade missions with Indigenous
business, that were focused on something (i.e. agriculture)o Pursue early wins and small wins.o Do not go too big or too ambitious; look at something achievable in the next yearo It is important for Indigenous economic development organizations to get to know each other; I
anticipate five or six Indigenous businesses would be keen to participate in a coalitiono There is a balance needed - stay small enough to manage but large enough to gain interesto Do not be intimidated; on a LNG trade mission in 2013 to Beijing, Seoul and Tokyo, people we met
with were aware and informed about Prince George and Kitimato Before venturing abroad, utilize resources available to assist you in getting thereo Look towards an “Indigenous Team Canada”o Establish relationships; download chat apps; it only takes a few good contacts to connect with
players in Asia.o In the 1980s, we pursued revenue-sharing opportunities. We looked at the coast of James Bay
and partnered with representatives from Japan (Yamaha) to combine our Indigenous knowledgeof the water, with their design technology to build larger canoes.
o We learned a lot about fur-tanning organizations in Italy, but could not pursue this direction dueto the creation of synthetic fur.
o It is important to keep the business and political arms separate. The biggest challenge forIndigenous communities has been trying to find partners. It is important to be organized, havecapital and gain experience by starting small.
o Find quick and small ways to gain and maintain momentum. An Indigenous body is needed thatfocuses on global Indigenous trade relations. It is important to build relationships without beingoverwhelmed by the “bigness of the map on the wall”.
Conclusion
Mr. Willy extended thanks to the APF for initiating the discussion. He recognized that although the priority of Indigenous economic development organizations was their own First Nations’ communities, the conversation prompted further consideration.
Mr. Beck commended delegates for participating in the discussion and welcomed APF Canada's role as a catalyst to continue the discussion. It was further noted that: • To form an alliance, a financial commitment could be required• With a financial commitment (i.e. $5,000-$25,000) the right people could be involved to work towards
developing a strategy to move forward with; as interest in the alliance grows, the price to participatecould increase
DISCUSSION NOTES, CONTINUED 39
Detailed Notes of the February 13, 2019 Indigenous – Asia Pacific Business Relations Roundtable held in Vancouver, BC | Page 25 of 26
• For example, “C100”9 was established with a small financial investment by each of the originalparticipants (a group of Canadian entrepreneurs and venture capital investors in Silicon Valley). Thecost of membership subsequently increased. C100 is a non-profit, member-driven association ofCanadian thought-leaders in the San Francisco Bay Area committed to supporting and acceleratingthe innovation economy in Canada
• Collaboration is critical to convey a larger image, in order to proceed into Asian markets. You need tospread the costs amongst more than one institution
• Education is fundamentally important. If you proceed to something like this, it would be helpful topursue post-secondary education opportunities for First Nations people. Education would be a majorcontributor to the economy
• There is a coop program that encourages young Canadians to live and work in Asia. If there are FirstNations youth interested in participating in the program, it could be beneficial for the alliance.
Mr. Beck confirmed that Mr. Teng had extended an invitation to the First Nations economic development representatives to participate in a mission to Taiwan. If there was interest in coordinating a delegation to Taiwan, efforts could proceed towards organizing a mission, potentially over the next six months.
Delegates were further encouraged to inform APF Canada if they wanted to attend the October 8-10, 2019 World Indigenous Business Forum in Vancouver, as a discussion with First Nations economic development organizations could be coordinated to coincide with the forum.
The February 13, 2019 Indigenous – Asia Pacific Business Relations Roundtable concluded at approximately 5:30 p.m.
* * *
9 For information on C100, visit: https://www.thec100.org
DISCUSSION NOTES, CONTINUED 40
Detailed Notes of the February 13, 2019 Indigenous – Asia Pacific Business Relations Roundtable held in Vancouver, BC | Page 26 of 26
List of Attendees
The following attended the February 13, 2019 Roundtable:
Stewart Beck, President & CEO, Asia Pacific Foundation of Canada Heather Bishop, Director, Cold Lake First Nation Rosie Bolderston, Development Manager, Asia Pacific Foundation of Canada Michael Clark, Partner, MLT Aikens Darrell Crowchild, Councillor, Tsuut'ina Nation Matthew Coon Come, Grand Council of the Crees Clint Davis, Partner, Acasta Capital Jake Dockstator, Vice-President, Bridge Financing Christian Hansen, Director, Senior Trade Consul, Canadian Trade Commissioner Service Scott Harrison, Program Manager, Asia Pacific Foundation of Canada Bryan Hughes, District Manager for British Columbia, Export Development Canada Serena Ko, Program Manager, Networks, Asia Pacific Foundation of Canada Drew Lafond, Partner, MLT Aikens Catherine Lappe, Regional Director General, Indigenous Services Canada Stephen Lee, CEO, Musqueam Capital Corporation Vilupti Lok Barrineau, VP Operations & Networks, Asia Pacific Foundation of Canada Tom Many Heads, CEO, Siksika Resource Development Rosi Niedermayer, Trade Commissioner, Canadian Trade Commissioner Service Jeff Reeves, VP Research, Asia Pacific Foundation of Canada Victor Thomas, VP Prairie Region, Asia Pacific Foundation of Canada Xenia Wong, Associate, Bennett Jones Sean Willy, CEO, Des Nedhe Development
Moderators: Jason Aebig, Creative Fire Bonnie Leask, Creative Fire
Notes prepared by: Carrie Peacock, Recording Secretary, Raincoast Ventures Ltd.
1
INVESTMENTMONITOR
2019
REPORT ON CITY-LEVEL FOREIGN DIRECT INVESTMENT BETWEEN CANADA AND THE ASIA PACIFIC
2
MESSAGE FROM THE PRESIDENT & CEO, ASIA PACIFIC FOUNDATION OF CANADA
EXECUTIVE SUMMARY
INTRODUCTION
Th e Growing Importance of Investment to and from Asia
How Canada Stacks up in its Investment Relationship with Asia
What Offi cial Statistics Cannot Tell Us
Th e APF Canada Investment Monitor Fills the Gap
CHAPTER 1: THE NATIONAL PICTURE
Key Section Takeaways
National Discussion on Fluctuations and Partners
Asia Pacifi c Investments in Canada’s Sectors: Natural Resources Dominate, Despite Decline
Method of Entry: Greenfi eld Dominant, but Growth in M&As
State-Owned Enterprises in Canada: Despite the Public Attention, a Declining Factor
Canadian Investment in the Asia Pacifi c: Fewer Deals, but More Dollars
Canada Investing in a Variety of Sectors
Canadian Firms Still Entering with Greenfi eld Deals
Canada’s SOEs Now Make Up the Majority of Yearly Flow
CHAPTER 2: THE PROVINCIAL PICTURE
Key Section Takeaways
Canada’s Biggest Provinces Continue to Lead Investments, but Some More Th an Others
British Columbia: Continuing as a Gateway to the Pacifi c
4
5
7
7
8
10
13
15
15
15
18
20
21
24
27
30
31
33
33
33
35
TABLE OF CONTENTS
3
Alberta: Th e Return of Oil and Gas Just a Pipe Dream?
Ontario: Southern Ontario Continues to Fuel the Province’s Investment Engine
Quebec: Striking a Technology Goldmine
Rest of Canada: Investments Few and Far Between
CHAPTER 3: CITY-LEVEL HUBS OF INVESTMENT ACTIVITY
Key Section Takeaways
Th e Street-Level View: Metropolitan Areas as Hubs of Investment
Montreal: City’s Best and Brightest Attract Asia Pacifi c Investment
Vancouver: Continuing to Record High Inbound Investment
Woodstock, Ontario, Manufactures Success, Ranks as the Sixth Largest in Inbound FDI
Just as Impactful: Canada’s Investment Across the Pacifi c
Melbourne: Canada’s Investment Capital of the Asia Pacifi c
Mumbai: A Fast-Growing Economy Attracts Canadian Asset Managers and State-Owned Enterprises’ Investment
China: Never Just Beijing and Shanghai
CONCLUSION
METHODOLOGY AND DATA SOURCES
LIST OF ABBREVIATIONS
APPENDIX
SOURCES
PARTNERS AND SPONSORS
ADVISORY COUNCIL
ABOUT THE ASIA PACIFIC FOUNDATION OF CANADA
38
40
44
47
51
51
51
55
58
60
62
63
65
68
71
72
73
74
76
78
79
80
4
The increasing significance of the Asia Pacific as the driver of the new global economy underscores the need for Canada to strategically deepen and diversify its two-way investment links with this vital region.
Canada has been fortunate to have strong trade and investment partners in the United States and Europe, and those links will evolve but endure. But as Canada pivots to new Asian markets as part of its national trade diversification strategy, both policy-makers and the public have begun turning their attention to the foreign direct investment (FDI) flowing in and out of Canada. A number of questions
permeate the discussion – and debate – around FDI: What amount of foreign investment comes into Canada, or flows into the Asia Pacific? Where does this investment come from, and where does it go?
This year, the Investment Monitor shifts its attention to Canadian and Asia Pacific FDI at the city level. New trends captured by the Investment Monitor show that Canadian cities are themselves hubs of activity and engagement, and are helping foster wider economic connectivity between Canada and Asia. It is our hope that this year’s report, by better aggregating and cataloguing investment trends at the city level, will fill the gap in the data that is otherwise publicly available, and support business, government, and civil society as they navigate Canada’s necessary pivot to Asia.
On behalf of APF Canada, I would like to acknowledge the efforts of those involved in producing this report, especially our partner, The School of Public Policy at the University of Calgary, and our sponsors – AdvantageBC, the Bank of Canada, Export Development Canada, the Government of British Columbia, and Invest in Canada. I would also like to extend my appreciation to our Advisory Council members – Sarah Albrecht, Eugene Beaulieu, Kursti Calder, Lori Rennison, Clark Roberts, Siobian Smith, and Stephen Tapp – for the valued feedback they have provided.
And finally, I would like to thank the members of our APF Canada research team who were responsible for writing and finalizing this report: Jeffrey Reeves, Vice-President, Research; Pauline Stern, Program Manager, Trade, Investment, and Innovation; Grace Jaramillo, Interim Program Manager, Trade, Investment, and Innovation; our Post-Graduate Research Scholars and Junior Research Scholars, Kai Valdez Bettcher, Mohit Verma, Nicole So, and Isaac Lo; and, APF Canada’s communications team for editing and designing the final publication, Michael Roberts, Communications Manager, and Sanya Arora, Graphic Designer.
Stewart Beck, President and CEO, Asia Pacific Foundation of Canada
MESSAGE FROM THE PRESIDENT & CEO,
ASIA PACIFIC FOUNDATION OF CANADA
5
The Asia Pacific is home to many of the world’s most dynamic and fastest-growing economies, and boasts unprecedented opportunities for foreign investment in a number of key markets – in terms of both opportunities for Canada to receive foreign investment and opportunities for Canadian investors to invest abroad. While there is anecdotal evidence to suggest that investors from Canada and the Asia Pacific are indeed crossing the Pacific, a lack of reliable public data makes it difficult to determine the volume, scale, or scope of the investments. To address this gap, the Asia Pacific Foundation of Canada (APF Canada) partnered with The School of Public Policy at the University of Calgary. The APF Canada Investment Monitor aggregates raw data from APF Canada’s archive of investment deal announcements from 2003 to present (see methodology section for further details). Each year of the project corresponds with an annual theme; this year’s theme is two-way investment ties between cities.
Data from the APF Canada Investment Monitor shows that Asia Pacific investment into Canada has grown in spurts from 2003 to 2018. The main sources of investment into Canada from the Asia Pacific are Mainland China, Japan, and Hong Kong, representing nearly 73 percent of the investment flows from the region to Canada. Canada’s natural resources industries, namely the energy industry and mining and chemicals industry, attracted the most investment. Even though the value was considerably larger for these two industries, the number of deals in other industries, such as consumer goods and services, technology, industrial goods and services, finance, and agriculture and forestry, accounted for nearly 69 percent of the total number of deals completed between 2003 and 2018.
At the provincial level, Asia Pacific investment focused primarily on the four provinces with the largest economies over this period – Alberta, Ontario, BC, and Quebec. Each of these provinces attracted different types of investment. BC and Alberta attracted more energy-related investments; Ontario, automobiles and electricity; and Quebec, mining. Canada’s remaining provinces and territories have seen little investment, and that was primarily in oil and gas producers.
Overall, 165 cities and city-level regions in Canada have received investment from the Asia Pacific in the 2003 to 2018 period, each with a unique investment story captured by the APF Canada Investment Monitor. Surprisingly, the relative rankings of destinations show that many smaller Canadian communities punch above their weight when compared to much larger cities. Three cities – Calgary, Kitimat, and Vancouver – accounted for the majority of investment, mainly due to large investments in energy and mining. Vancouver, Toronto, and Calgary also brought in over 40 percent of the total number of deals over the period. Of the 15 largest destinations for Asia Pacific investment, eight are in the west (Alberta and BC), five in Ontario, with an additional one each in Quebec and Newfoundland and Labrador. Many of the top destinations for investment in Alberta, BC, and Newfoundland and Labrador
EXECUTIVE SUMMARY

6
rank high due to a small number of large deals in oil and gas production, while repeated investments in the automotive industry led to several Ontario destinations also ranking high.
Canada’s investment into the Asia Pacific remained relatively flat into the middle of this decade, only to grow dramatically in the most recent years. The main destinations for Canada’s investment into the Asia Pacific are Australia, China, and India, representing nearly 63 percent of the investment flows from Canada to the Asia Pacific. The main industries that Canada invested in were the finance industry and the mining and chemicals industry. Even so, all other industries accounted for over 61 percent of the total number of deals completed from 2003 to 2018.
At the provincial level, investors from Ontario, BC, Alberta, and Quebec were the most active in Asia Pacific markets. Investors from Ontario focused their investment on financial and transport services, investors from BC and Quebec focused their investment on mining, and investors from Alberta focused their investment on energy. While investors from Canada’s other provinces and territories made noticeable investments in mining, these provinces drastically lagged behind the rest of the country in outward investment overall.
Canada’s investment footprint in the Asia Pacific is extensive, with 465 cities in the region receiving Canadian foreign direct investment over the last 16 years. Four cities – Melbourne, Sydney, Hong Kong, and Perth – received nearly 27 percent of Canada’s investment into the region, with a diverse basket of industries invested in between them. Additionally, Beijing, Hong Kong, Shanghai, Singapore, and Sydney received nearly 24 percent of the total number of deals from 2013 to 2018. Of the top 12 destinations for Canadian investment in the Asia Pacific, four are in Australia, three in China, three in South Asia, and two in Southeast Asia. In many cases, Canadian state-owned enterprises investing in real estate and transportation infrastructure have driven Canada’s largest investments in these cities. By looking down to the city level, the APF Canada Investment Monitor data also shows how some of the biggest destinations for Canadian investment are likely unfamiliar to many Canadians: names such as Gopalganj, Xuyên Môc District, and Gove Peninsula.
Although Canada’s investment relationship with the Asia Pacific has grown moderately over the past 16 years, the Asia Pacific remains far behind other sources of investment into Canada, and Canada represents only a small share of investment in the Asia Pacific. Canada needs to continue to leverage its strengths and build stronger ties with the region in the future in order to improve market access and position itself as an important investor in and investment recipient from the diverse economies that make up the Asia Pacific. APF Canada and The School of Public Policy at the University of Calgary hope that the APF Canada Investment Monitor will shine a spotlight on Asia Pacific investment in Canada and encourage a greater understanding of how this investment contributes to Canada’s current and future economic prosperity.
7
The Growing Importance of Investment to and from Asia
The role of the Asia Pacific in the world has never been as big or as important in modern times as it is today. Continuous growth across the Asia Pacific has been met with significant flows to and from the region. Previously led by Japan, Australia, and South Korea, China is now the main economic driver of the region following record-breaking economic growth over the past 20 years. China’s rise in wealth has occurred alongside rapid economic shifts across Southeast Asia, as countries like Vietnam, Thailand, and Malaysia, once primarily recipients of foreign aid, begin to pique interest as investment destinations and participate in multilateral trade deals.
Observers forecast that the Asia Pacific will continue to cement its position as the centre of the global economy over the next 30 years. By 2030, the region is expected to encompass 65 percent of the world’s middle class1, and by 2050, the region will contain four of the world’s 10 largest economies; according to PwC, China and India will both overtake the United States in terms of gross domestic product (GDP) at purchasing power parity.2 Indonesia, currently ranking eight, is expected to become the fourth-largest economy by 2050 and will take Japan’s current spot, with Japan in turn expected to drop four spots and take Indonesia’s current spot at eight. Accordingly, the Asia Pacific is increasingly becoming a major source of investments for Canada. While investments from Japan and Australia are long established and at a sustained level, the majority of investments now originate from China from both private and state-owned enterprises.
At the same time, the foreign investment landscape that we have become accustomed to is changing. As a wave of nationalism sweeps through western democracies, sentiments toward foreign investment are changing, forcing foreign firms to reconsider their approach to foreign investments. A significant change within the past five years is the United States’ role as a “safe” destination for investments, as the current US administration has adopted an increasingly nationalistic approach to foreign investments. With all this combined, the Asia Pacific is becoming both an increasingly attractive destination for companies wanting to diversify away from traditional investment destinations such as the United States, the United Kingdom, and Europe and an important source of investment capital for economies around the world.
Cities are the epicentres of Asia Pacific investment activities in Canada. From 2003 to 2018, Asia Pacific investors channelled more than C$67B in Canada’s four most populous cities – Toronto, Montreal, Vancouver, and Calgary. These investments fuel economic growth, induce technological “spillover,” increase productivity, and support job creation in the cities.3
INTRODUCTION
1 Kharas. The Unprecedented Expansion of the Global Middle Class: An Update. Brookings Institute, February 2017. https://www.brookings.edu/wp-content/uploads/2017/02/global_20170228_global-middle-class.pdf
2 PwC. The World in 2050. https://www.pwc.com/gx/en/world-2050/assets/pwc-the-world-in-2050-full-report-feb-2017.pdf
3 Arcand. The role of Canada’s Major Cities in Attracting Foreign Direct Investment. Conference Board of Canada, May 2012. https://www.conferenceboard.ca/e-library/abstract.aspx?did=4817
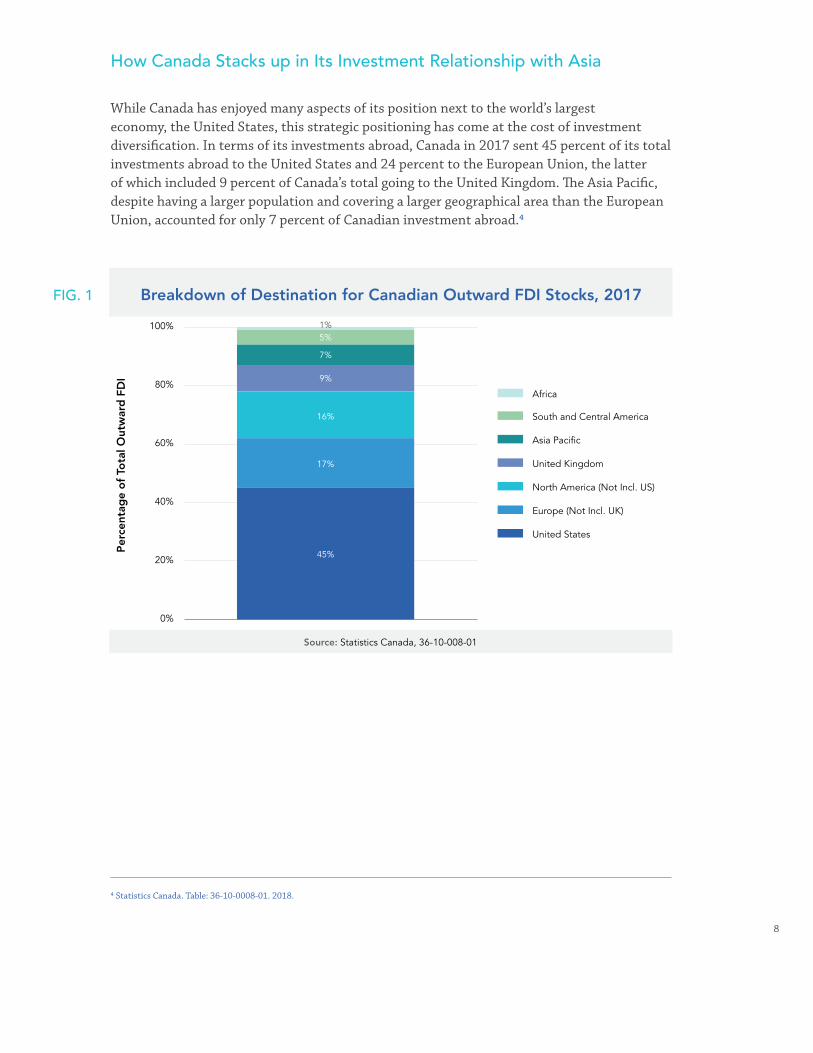
8
How Canada Stacks up in Its Investment Relationship with Asia
While Canada has enjoyed many aspects of its position next to the world’s largest economy, the United States, this strategic positioning has come at the cost of investment diversification. In terms of its investments abroad, Canada in 2017 sent 45 percent of its total investments abroad to the United States and 24 percent to the European Union, the latter of which included 9 percent of Canada’s total going to the United Kingdom. The Asia Pacific, despite having a larger population and covering a larger geographical area than the European Union, accounted for only 7 percent of Canadian investment abroad.4
4 Statistics Canada. Table: 36-10-0008-01. 2018.
Africa
0%
20%
40%
60%
80%
100%
South and Central America
Asia Pacific
United Kingdom
North America (Not Incl. US)
Europe (Not Incl. UK)
United States
Source: Statistics Canada, 36-10-008-01
Breakdown of Destination for Canadian Outward FDI Stocks, 2017
45%
17%
16%
9%
7%
5%1%
FIG. 1
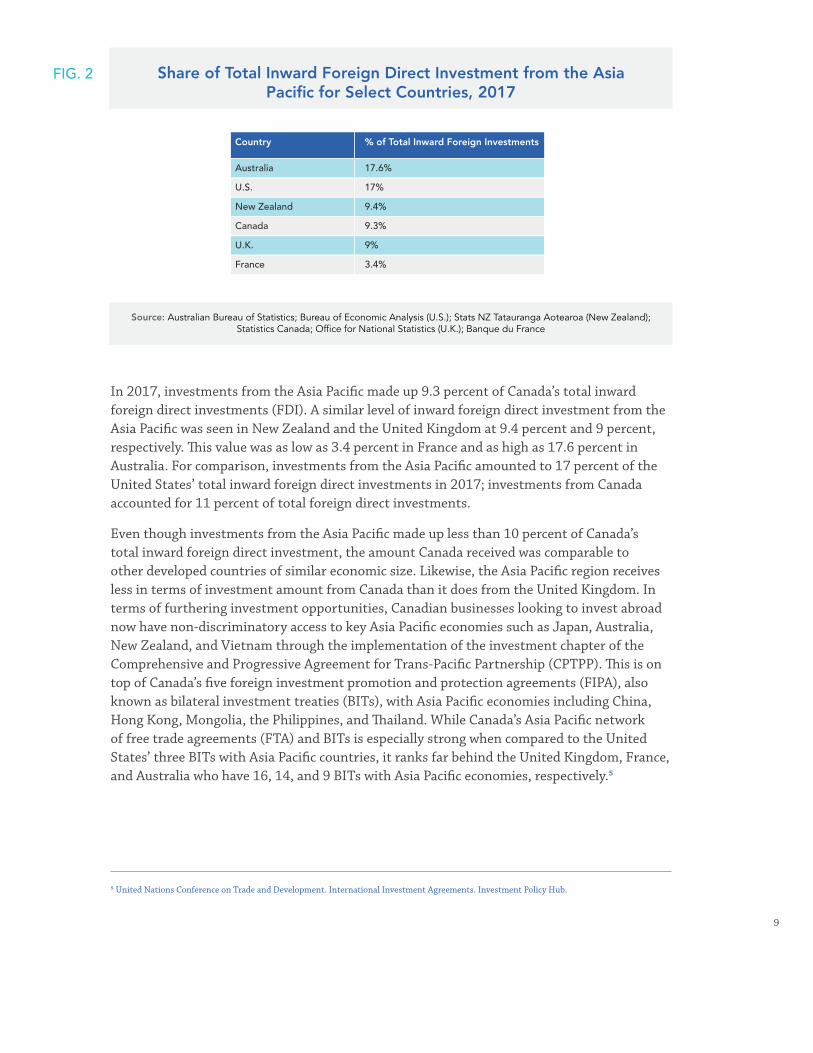
9
Share of Total Inward Foreign Direct Investment from the Asia Pacific for Select Countries, 2017
17.6%
17%
9.4%
9.3%
9%
3.4%
Australia
U.S.
New Zealand
Canada
U.K.
France
Country % of Total Inward Foreign Investments
Source: Australian Bureau of Statistics; Bureau of Economic Analysis (U.S.); Stats NZ Tatauranga Aotearoa (New Zealand); Statistics Canada; Of�ce for National Statistics (U.K.); Banque du France
In 2017, investments from the Asia Pacifi c made up 9.3 percent of Canada’s total inward foreign direct investments (FDI). A similar level of inward foreign direct investment from the Asia Pacifi c was seen in New Zealand and the United Kingdom at 9.4 percent and 9 percent, respectively. Th is value was as low as 3.4 percent in France and as high as 17.6 percent in Australia. For comparison, investments from the Asia Pacifi c amounted to 17 percent of the United States’ total inward foreign direct investments in 2017; investments from Canada accounted for 11 percent of total foreign direct investments.
Even though investments from the Asia Pacifi c made up less than 10 percent of Canada’s total inward foreign direct investment, the amount Canada received was comparable to other developed countries of similar economic size. Likewise, the Asia Pacifi c region receives less in terms of investment amount from Canada than it does from the United Kingdom. In terms of furthering investment opportunities, Canadian businesses looking to invest abroad now have non-discriminatory access to key Asia Pacifi c economies such as Japan, Australia, New Zealand, and Vietnam through the implementation of the investment chapter of the Comprehensive and Progressive Agreement for Trans-Pacifi c Partnership (CPTPP). Th is is on top of Canada’s fi ve foreign investment promotion and protection agreements (FIPA), also known as bilateral investment treaties (BITs), with Asia Pacifi c economies including China, Hong Kong, Mongolia, the Philippines, and Th ailand. While Canada’s Asia Pacifi c network of free trade agreements (FTA) and BITs is especially strong when compared to the United States’ three BITs with Asia Pacifi c countries, it ranks far behind the United Kingdom, France, and Australia who have 16, 14, and 9 BITs with Asia Pacifi c economies, respectively.5
FIG. 2
5 United Nations Conference on Trade and Development. International Investment Agreements. Investment Policy Hub.
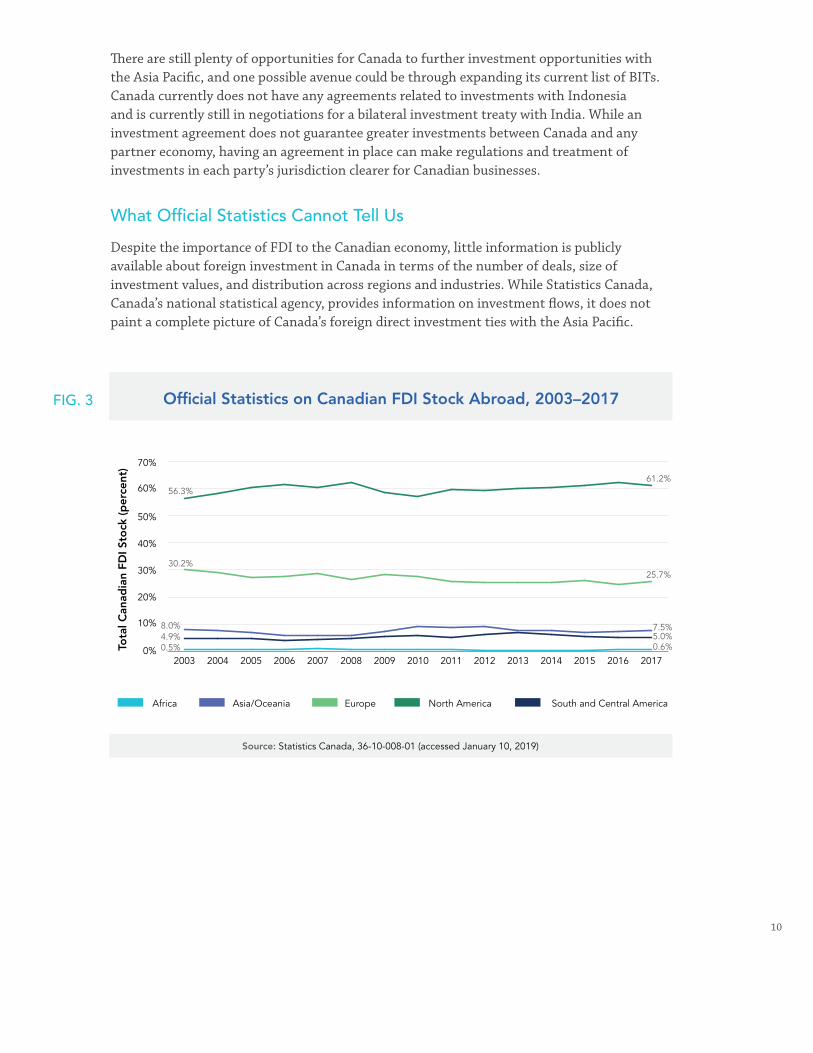
10
There are still plenty of opportunities for Canada to further investment opportunities with the Asia Pacific, and one possible avenue could be through expanding its current list of BITs. Canada currently does not have any agreements related to investments with Indonesia and is currently still in negotiations for a bilateral investment treaty with India. While an investment agreement does not guarantee greater investments between Canada and any partner economy, having an agreement in place can make regulations and treatment of investments in each party’s jurisdiction clearer for Canadian businesses.
What Official Statistics Cannot Tell Us
Despite the importance of FDI to the Canadian economy, little information is publicly available about foreign investment in Canada in terms of the number of deals, size of investment values, and distribution across regions and industries. While Statistics Canada, Canada’s national statistical agency, provides information on investment flows, it does not paint a complete picture of Canada’s foreign direct investment ties with the Asia Pacific.
20030.5%4.9%8.0% 7.5%
5.0%0.6%
30.2%
56.3%61.2%
25.7%
Africa Asia/Oceania Europe North America South and Central America
0%
10%
20%
30%
40%
50%
60%
70%
2004 2005 2006 2007 2008 2009 2010 2011 2012 2013 2014 2015 2016 2017
Source: Statistics Canada, 36-10-008-01 (accessed January 10, 2019)
Official Statistics on Canadian FDI Stock Abroad, 2003–2017FIG. 3
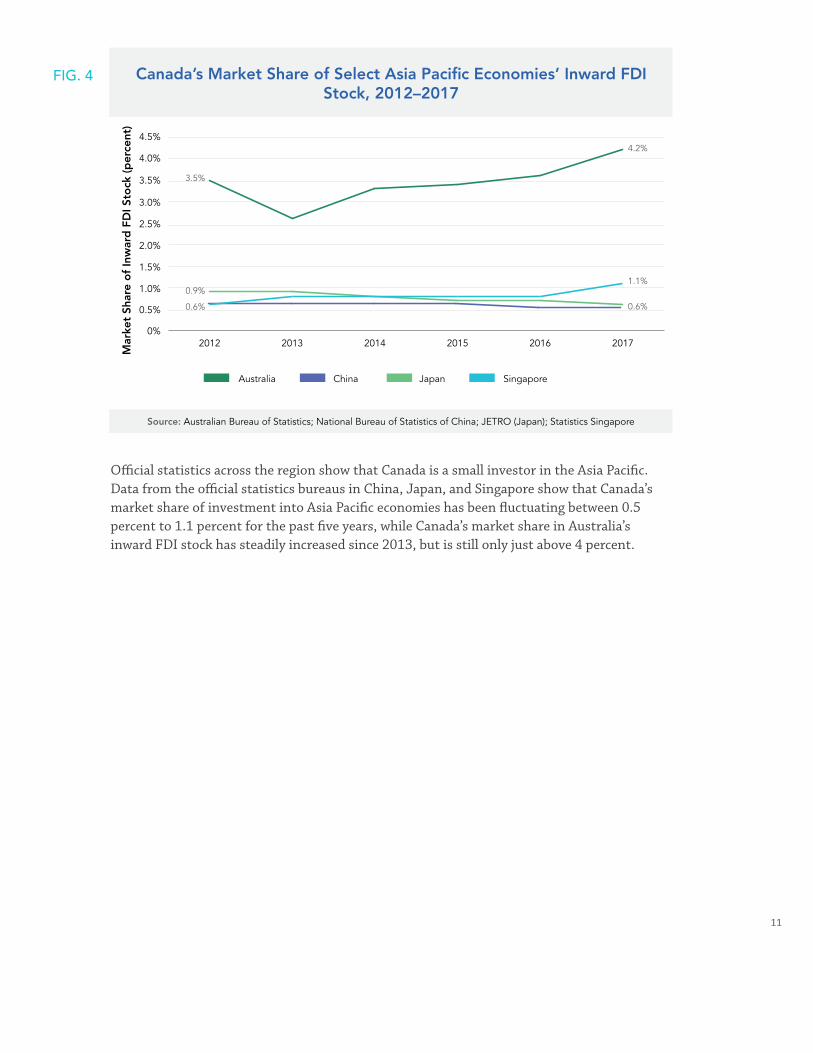
11
2012 2013 2014 2015 2016 2017
0.6%
Australia China Japan Singapore
0%
1.0%
0.5%
1.5%
2.5%
3.5%
4.5%
2.0%
3.0%
4.0%
Source: Australian Bureau of Statistics; National Bureau of Statistics of China; JETRO (Japan); Statistics Singapore
Canada’s Market Share of Select Asia Pacific Economies’ Inward FDI Stock, 2012–2017
0.9%
3.5%
4.2%
1.1%
0.6%
Official statistics across the region show that Canada is a small investor in the Asia Pacific. Data from the official statistics bureaus in China, Japan, and Singapore show that Canada’s market share of investment into Asia Pacific economies has been fluctuating between 0.5 percent to 1.1 percent for the past five years, while Canada’s market share in Australia’s inward FDI stock has steadily increased since 2013, but is still only just above 4 percent.
FIG. 4
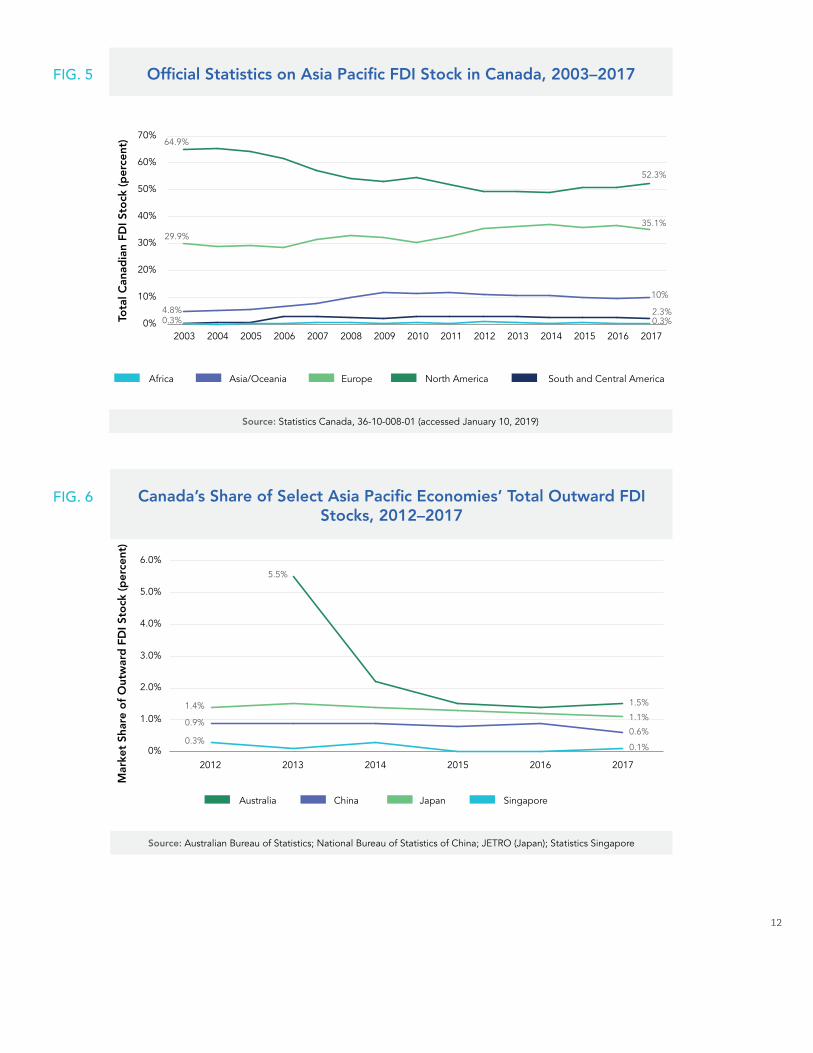
12
2003
Africa Asia/Oceania Europe North America South and Central America
0%
10%
20%
30%
40%
50%
60%
70%
2004 2005 2006 2007 2008 2009 2010 2011 2012 2013 2014 2015 2016 2017
Source: Statistics Canada, 36-10-008-01 (accessed January 10, 2019)
Official Statistics on Asia Pacific FDI Stock in Canada, 2003–2017
0.3%4.8%
29.9%
64.9%
52.3%
35.1%
10%
2.3%0.3%
2012 2013 2014 2015 2016 2017
Australia China Japan Singapore
0%
1.0%
2.0%
3.0%
4.0%
5.0%
6.0%
Source: Australian Bureau of Statistics; National Bureau of Statistics of China; JETRO (Japan); Statistics Singapore
Canada’s Share of Select Asia Pacific Economies’ Total Outward FDI Stocks, 2012–2017
0.3%
0.9%
1.4% 1.5%
1.1%
0.6%
0.1%
5.5%
FIG. 5
FIG. 6
13
Likewise, when it comes to Asia Pacific investment into Canada, the region’s official statistics bureaus in China, Japan, and Singapore show that their investment into Canada has remained more or less consistently marginal, while the proportion of Australian outward FDI destined to Canada has decreased from 5.5 percent in 2013 to 1.5 percent in 2017.
Official statistics show investment stock at a national level and use a top-down approach based on the international standard balance of payment calculations, which official statistics bureaus generate from banking system reports and direct surveys. However, the broad-level public data from Statistics Canada is often unable to capture the ultimate sources and destinations of inbound and outbound investments, the subnational-level data (namely, investment ties at the provincial and city levels), and the industry breakdown of investment from each Asia Pacific economy.
The lack of publicly available data on the volume, scale, and scope of Asia Pacific investment in Canada has important effects on the public perception of investment relations between the two regions. For example, according to the 2016 National Opinion Poll conducted by the Asia Pacific Foundation of Canada (APF Canada), Canadians estimated that FDI from China made up 25 percent of Canada’s total inward direct investment, while the actual figure at the time was closer to 3 percent. The polling further showed that this misperception of the size of Chinese investment in Canada is also tied to the negative opinion on foreign inbound investments, as Canadians who significantly overstated the value of Chinese investment in Canada were also more likely to say Canada has allowed “too much” investment into the country from China.
The APF Canada Investment Monitor Fills the Gap
Given the limitations in the official statistics, the purpose of the Investment Monitor is to complement Statistic Canada’s investment data in order to provide a more comprehensive picture of the two-way investment relations between Canada and the Asia Pacific. APF Canada has partnered with The School of Public Policy at the University of Calgary to develop its Investment Monitor and to track foreign direct investments at the establishment level. This has enabled the APF Canada Investment Monitor to add further detail beyond that available from official statistics and to unveil key trends in Canada’s investment ties with the Asia Pacific.
The inaugural Investment Monitor 2017 report looked at investment from the Asia Pacific in Canada, while the Investment Monitor 2018 report focused on Canadian outbound investment into the Asia Pacific. The reports depicted key trends on the sources of Canadian inbound and outbound investment from the national and provincial perspectives, as well as investment destinations in the Asia Pacific from the national perspective.
This year, the Investment Monitor 2019 annual report focuses on both inbound and outbound foreign direct investment between Canada and the Asia Pacific, while also highlighting key trends in the two-way investment ties at the national, provincial, and city level.

14
BOX 1. CROSS-BORDER INVESTMENT AND FDI
Cross-border investments can be separated into two major groups: 1) foreign portfolio investment (FPI) and 2) foreign direct investment (FDI).
1. FOREIGN PORTFOLIO INVESTMENT (FPI) FPI is considered a temporary investment by a resident or enterprise of one economy into a financial asset of another economy. This investment involves a non-controlling stake in an enterprise in the form of equity and/or debt securities as well as loans. For example, a resident of Australia buying a small share of stock on the TSX would be considered FPI.
2. FOREIGN DIRECT INVESTMENT (FDI) FDI is defined as a long-term or lasting-interest investment by a resident or enterprise of one economy into a tangible asset of another country. This type of investment is deemed “long term” or of “lasting interest” if it is either a greenfield investment or an acquisition of at least 10 percent of the equity or voting shares of an enterprise. This 10 percent threshold is considered a controlling interest in an enterprise and is what primarily distinguishes FDI from portfolio investment, since it usually coincides with a transfer of management, technology, and organizational skills along with capital. For example, a Japanese firm buying a 20 percent stake in a Canadian pulp mill would be considered FDI.
Source: APF Canada Investment Monitor

15
Key Section Takeaways
• Today’s investment stories and landscape are very different from those of the post-global financial crisis (2007–2010, and even 2011–2014).
• The oil and gas, basic resources (mining), and automobile and parts sectors continued to dominate foreign direct investment into the Canadian economy, but there is also increased diversification into the real estate, financial services, and technology services sectors.
• China, Japan, Hong Kong, and Australia continued to be the key investors from the Asia Pacific into Canada.
• Canada is investing in Asia Pacific’s mining, industrial transportation, real estate investment and services, and electricity sectors, particularly in Australia and China.
National Discussion on Fluctuation and Partners
CHAPTER 1: THE NATIONAL PICTURE
Over the past 16 years, investment from the Asia Pacific grew substantially in both volume and activity. For the period from 2003 to 2018, the APF Canada Investment Monitor captured C$151B in investments from the Asia Pacific into Canada through 905 deals from 14 Asia Pacific economies. Despite international economic tensions making significant global headlines in 2018, APF Canada Investment Monitor data shows that Asia Pacific investment in Canada has grown nine-fold over the past 16 years.
From 2015 to 2018, Canada continued to receive high foreign direct investment from the Asia Pacific, at C$51.2B over those four years, and additionally received the highest number of recorded deals (333 deals). The particularly high foreign investment dollar value stems in large part from a C$40B investment to build an export facility in Kitimat, BC. Of this deal’s dollar total, 60 percent (C$24B) was by Asia-based oil companies involved in LNG Canada – a joint venture between Shell, Petronas, PetroChina, Mitsubishi Corporation, and Korea Gas Corporation.
The trend of large investment deals from multinational corporations, particularly into Canada’s natural resources sectors, is consistent with the investment patterns from previous years and periods. For example, the exceptionally high foreign direct investment Canada received in the post-financial crisis period (from 2011 to 2014) was driven in large part by a few large multinational corporation deals, such as Mitsubishi Group’s C$3.2B investment in 2012, China National Offshore Oil Corporation’s C$16.7B investment in 2013, and Australia’s Woodside Energy’s C$2.2B investment in 2014. This resulted in large differences in year-to-year investment flows, and even across four-year periods. Despite the increased diversification into other sectors such as real estate, financial services, technology services, and pharmaceutical, oil and gas sectors continue to dominate Asia Pacific investment in Canada.

16
Asia Pacific Investment into Canada by Major Source Economy, 2003–2018
Source: APF Canada Investment Monitor and fDi Markets (accessed April 9, 2019)
0
10,000
Japan
Hong Kong SAR
Australia
South Korea
Malaysia India
Thailand
Singapore
Philippines
ASEANChina
20,000
30,000
40,000
50,000
60,00059,912
34,532
15,53712,937
10,992 10,671
2,799 2,693751 183
16,565
FIG. 8
Source: APF Canada Investment Monitor and fDi Markets (accessed April 9, 2019)
0
10,000
20,000
30,000
40,000
50,000
60,000
0
50
100
150
200
250
300
350
2003–2006 2007–2010 2011–2014 2015–2018
Value of Deals Number of Deals
Canadian Foreign Direct Investment Received, 2003–2018
182
15,448 28,971 55,646
231
51,212
159
333
FIG. 7
17
From within the Asia Pacific, China, Japan, and Hong Kong were the top investor source-economies from 2003 to 2018. From 2003 to 2018, China invested over C$59.9B in Canada, Japan invested C$34.5B, and Hong Kong invested C$15.5B. The scale of Chinese investment into Canada has been sporadic. China has invested significantly into Canada’s energy and mining industries since 2009 (currently valued at more than C$45B) and exhibited an extraordinary peak in the year 2013 at over C$17B. Although investments from Chinese firms continued to dominate the Canadian resources industries, investments in the past three years showed increased diversification into Canada’s real estate and health care sectors. Japan’s market share in the Canadian economy was consistently strong, particularly within Canada’s automotive sector. However, Japanese investment into Canada declined from 2003 to 2018. More recently, Japanese investment diversified into the retail sector, with players such as UNIQLO and Muji. Hong Kong had also been a significant investor into Canada’s energy sector. In the last three years, Hong Kong’s Husky Energy made significant investment (over C$4B) in Canada’s oil and gas sector in Saskatchewan and Newfoundland and Labrador.
Southeast Asian nations such as Singapore and the Philippines invested more into the Canadian economy, but the Association of Southeast Asian Nations (ASEAN) as an economic region still lagged behind the other Asia Pacific economies and captured only 5 percent of the inbound market share. ASEAN is one of the world’s fastest-growing economic regions and the Asia Development Bank has estimated its 2018 GDP growth rate at 5.1 percent, illustrating both a gap and an opportunity for Canada to strengthen its two-way investments with ASEAN and other emerging economies.
Although Canada expressed a growing interest in diversifying trade and investment opportunities beyond its traditional economic partners, Canada’s shift toward other markets over the past 10 years was modest. According to APF Canada’s 2018 National Opinion Poll, there is an inverse correlation between perceptions of a worsening Canada-US relationship and increased public support for further diversifying Canada’s economic engagement with the Asia Pacific – Canadians showed greater support for diversifying Canada’s economic engagement with the Asia Pacific. In the 2018 polling, 60 percent of Canadians agree that “the growing importance of China as an economic power is more of an opportunity than a threat,” whereas when the same question was asked in 2004, only 27 percent of Canadians agreed. As mentioned previously, Canada currently has only five FIPAs in force with the Asia Pacific economies: China, Hong Kong, Mongolia, the Philippines, and Thailand. Yet, key foreign direct investments from Asia Pacific economies in Canada were from China, Japan, Australia, and South Korea.
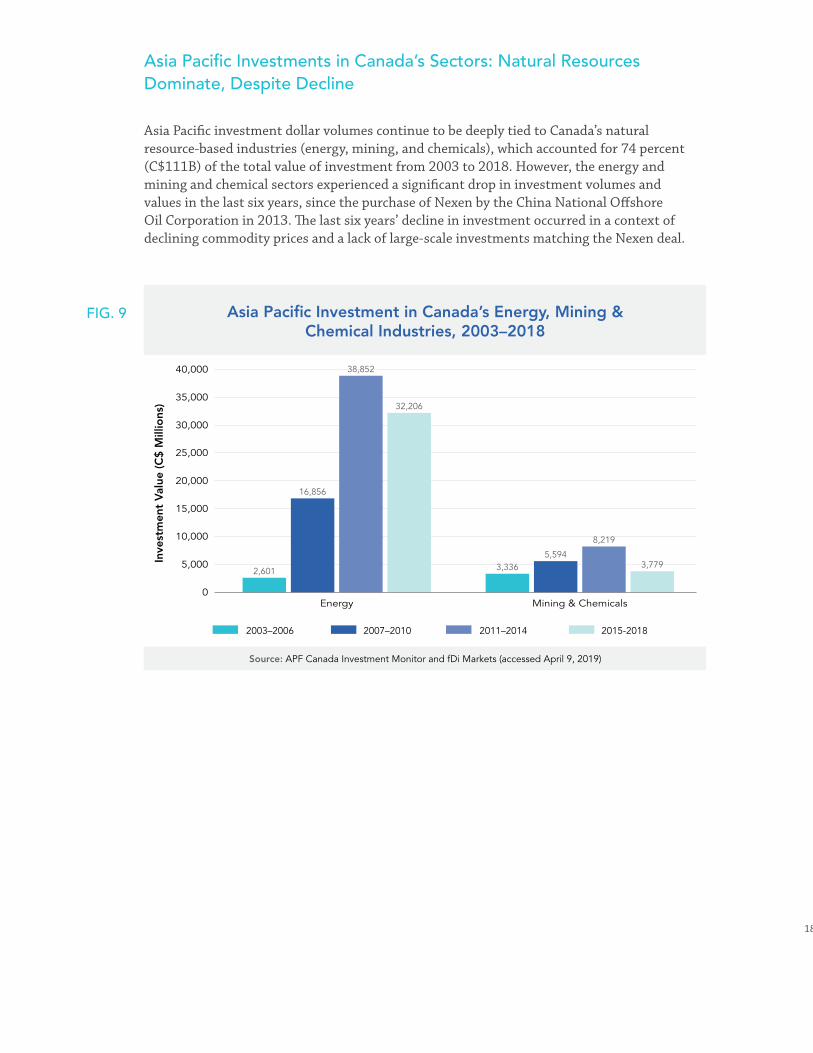
18
Asia Pacific Investments in Canada’s Sectors: Natural Resources Dominate, Despite Decline
Asia Pacific investment dollar volumes continue to be deeply tied to Canada’s natural resource-based industries (energy, mining, and chemicals), which accounted for 74 percent (C$111B) of the total value of investment from 2003 to 2018. However, the energy and mining and chemical sectors experienced a significant drop in investment volumes and values in the last six years, since the purchase of Nexen by the China National Offshore Oil Corporation in 2013. The last six years’ decline in investment occurred in a context of declining commodity prices and a lack of large-scale investments matching the Nexen deal.
Asia Pacific Investment in Canada’s Energy, Mining & Chemical Industries, 2003–2018
Source: APF Canada Investment Monitor and fDi Markets (accessed April 9, 2019)
0
10,000
15,000
5,000
20,000
25,000
30,000
35,000
40,000
Energy Mining & Chemicals
2003–2006 2007–2010 2011–2014 2015-2018
2,601
16,856
38,852
32,206
3,3365,594
8,219
3,779
FIG. 9

19
Source: APF Canada Investment Monitor and fDi Markets (accessed April 9, 2019)
Asia Pacific Investment into Canada by Sector, 2003–2018
0
20,000
Oil & Gas P
roducers
Automobiles & Parts
Mining
Electricity
Alternative Energy
Travel and Leisure
Industrial E
ngineering
Others
Oil Equipment, S
ervices
& Distributio
n
Real Esta
te Investm
ent
& Services
Software and Computer
Services
Industrial M
etals &
Mining
40,000
60,000
80,000
100,000
82,319
13,864 11,7258,697
3,580 2,837 2,749 2,461 2,437 2,104 1,901
16,603
The trend of large investments from multinational corporations was seen in the automobile and parts, foods and beverages, real estate, and software and computer sectors as well. Notable examples included Japan’s Toyota Group’s C$708M expansion in Woodstock, Ontario, in 2018; Japan’s Sapporo Holding’s C$400M acquisition of Sleeman Breweries in 2006; China’s Greenland Group’s C$400M residential development project in Toronto; and India’s Tata Group’s C$292M acquisition of Teleglobe International Holdings in Montreal.
Within Canada’s natural resources industries, there was very low investment from the Asia Pacific in agriculture and forestry. India-based Aditya Birla Group’s purchase of the assets of Terrace Bay Pulp Mill in Ontario for C$279M in 2012 was the largest deal in the agriculture and forestry industry. There were no investments in agriculture and forestry between 2016 and 2018.
Although Canada’s natural resources industries were the significant driver of investments from the Asia Pacific, investments in consumer goods and services, industrial goods and services, and the finance and technology industries are growing. Specifically, there was high investment activity from the Asia Pacific in Canada’s automobile and parts sector (C$13.3B), real estate investment and services sector (C$2.5B), and the software and computer services sector (C$2.4B). Japanese automotive giants Honda, Toyota, and Nissan, as well as Hyundai, the Korean automaker, were heavy investors in Canada’s automotive industry for automobiles and parts.
FIG. 10
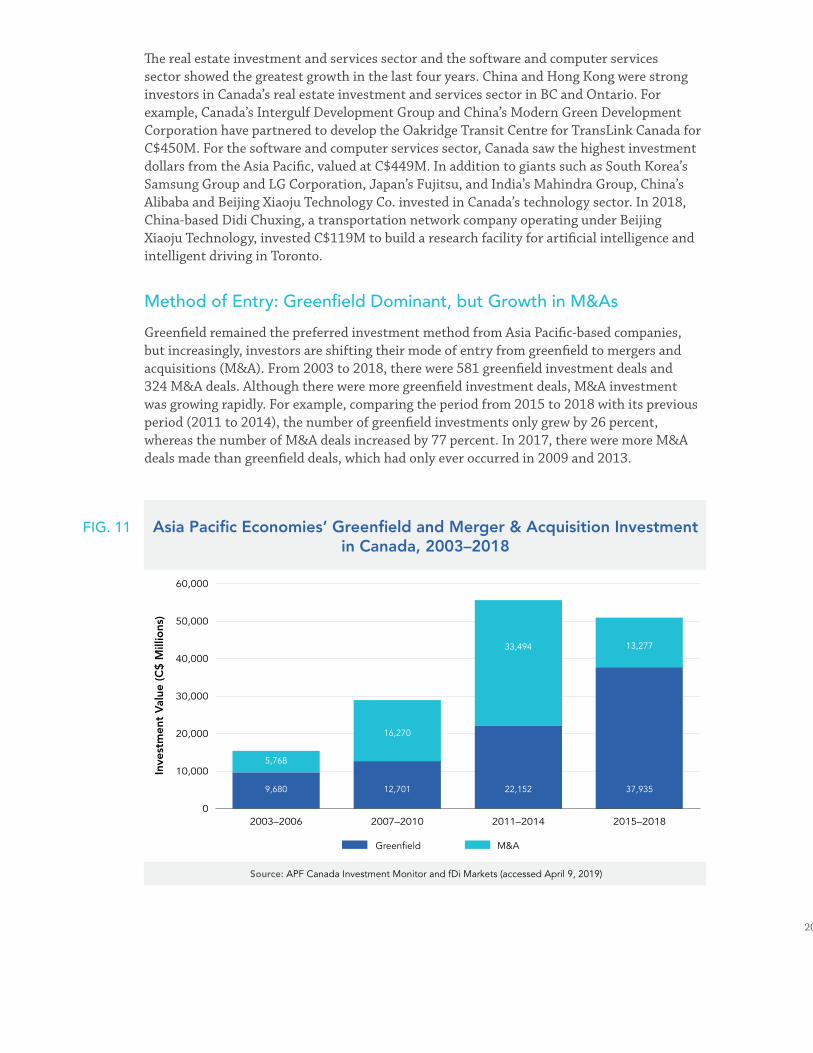
20
The real estate investment and services sector and the software and computer services sector showed the greatest growth in the last four years. China and Hong Kong were strong investors in Canada’s real estate investment and services sector in BC and Ontario. For example, Canada’s Intergulf Development Group and China’s Modern Green Development Corporation have partnered to develop the Oakridge Transit Centre for TransLink Canada for C$450M. For the software and computer services sector, Canada saw the highest investment dollars from the Asia Pacific, valued at C$449M. In addition to giants such as South Korea’s Samsung Group and LG Corporation, Japan’s Fujitsu, and India’s Mahindra Group, China’s Alibaba and Beijing Xiaoju Technology Co. invested in Canada’s technology sector. In 2018, China-based Didi Chuxing, a transportation network company operating under Beijing Xiaoju Technology, invested C$119M to build a research facility for artificial intelligence and intelligent driving in Toronto.
Method of Entry: Greenfield Dominant, but Growth in M&As
Greenfield remained the preferred investment method from Asia Pacific-based companies, but increasingly, investors are shifting their mode of entry from greenfield to mergers and acquisitions (M&A). From 2003 to 2018, there were 581 greenfield investment deals and 324 M&A deals. Although there were more greenfield investment deals, M&A investment was growing rapidly. For example, comparing the period from 2015 to 2018 with its previous period (2011 to 2014), the number of greenfield investments only grew by 26 percent, whereas the number of M&A deals increased by 77 percent. In 2017, there were more M&A deals made than greenfield deals, which had only ever occurred in 2009 and 2013.
Asia Pacific Economies’ Greenfield and Merger & Acquisition Investment in Canada, 2003–2018
Source: APF Canada Investment Monitor and fDi Markets (accessed April 9, 2019)
0
10,000
20,000
30,000
40,000
50,000
60,000
2003–2006 2007–2010 2011–2014 2015–2018
Greenfield M&A
9,680
5,768
16,270
33,494 13,277
12,701 22,152 37,935
FIG. 11
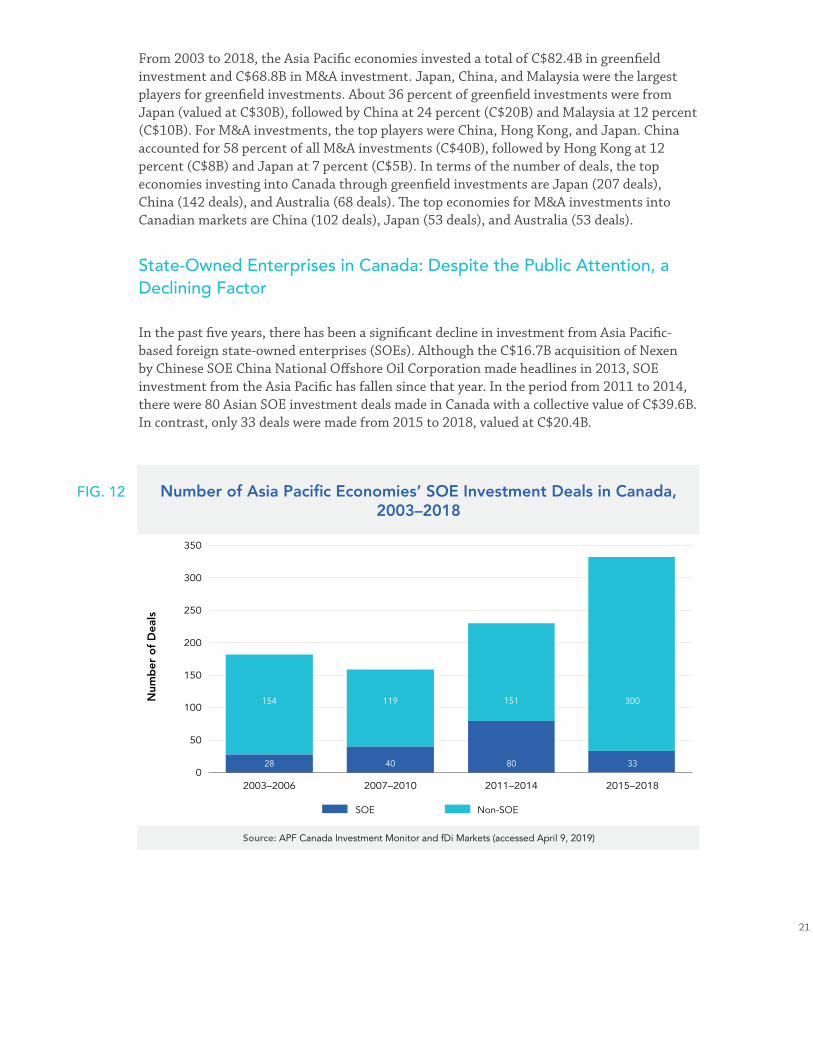
21
From 2003 to 2018, the Asia Pacific economies invested a total of C$82.4B in greenfield investment and C$68.8B in M&A investment. Japan, China, and Malaysia were the largest players for greenfield investments. About 36 percent of greenfield investments were from Japan (valued at C$30B), followed by China at 24 percent (C$20B) and Malaysia at 12 percent (C$10B). For M&A investments, the top players were China, Hong Kong, and Japan. China accounted for 58 percent of all M&A investments (C$40B), followed by Hong Kong at 12 percent (C$8B) and Japan at 7 percent (C$5B). In terms of the number of deals, the top economies investing into Canada through greenfield investments are Japan (207 deals), China (142 deals), and Australia (68 deals). The top economies for M&A investments into Canadian markets are China (102 deals), Japan (53 deals), and Australia (53 deals).
State-Owned Enterprises in Canada: Despite the Public Attention, a Declining Factor
In the past five years, there has been a significant decline in investment from Asia Pacific-based foreign state-owned enterprises (SOEs). Although the C$16.7B acquisition of Nexen by Chinese SOE China National Offshore Oil Corporation made headlines in 2013, SOE investment from the Asia Pacific has fallen since that year. In the period from 2011 to 2014, there were 80 Asian SOE investment deals made in Canada with a collective value of C$39.6B. In contrast, only 33 deals were made from 2015 to 2018, valued at C$20.4B.
Number of Asia Pacific Economies’ SOE Investment Deals in Canada, 2003–2018
Source: APF Canada Investment Monitor and fDi Markets (accessed April 9, 2019)
0
50
100
150
200
250
300
350
2003–2006 2007–2010 2011–2014 2015–2018
SOE Non-SOE
28
154 119 151 300
40 80 33
FIG. 12
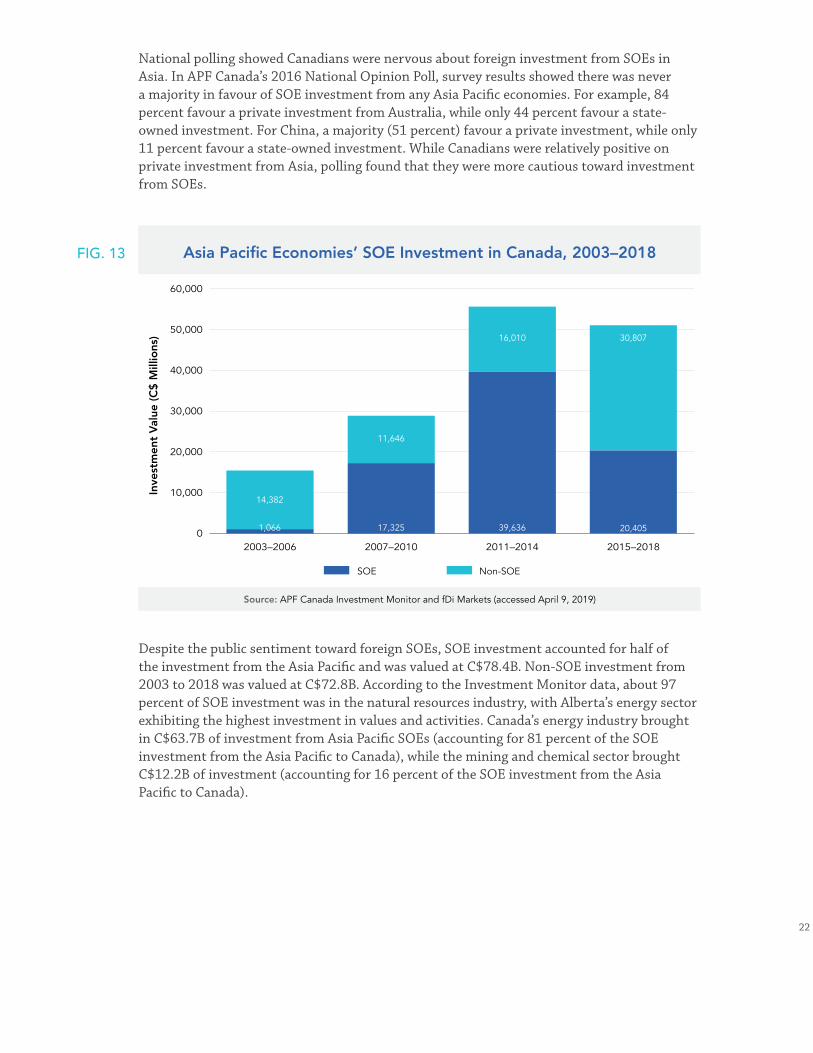
22
National polling showed Canadians were nervous about foreign investment from SOEs in Asia. In APF Canada’s 2016 National Opinion Poll, survey results showed there was never a majority in favour of SOE investment from any Asia Pacific economies. For example, 84 percent favour a private investment from Australia, while only 44 percent favour a state-owned investment. For China, a majority (51 percent) favour a private investment, while only 11 percent favour a state-owned investment. While Canadians were relatively positive on private investment from Asia, polling found that they were more cautious toward investment from SOEs.
Source: APF Canada Investment Monitor and fDi Markets (accessed April 9, 2019)
0
10,000
20,000
30,000
40,000
50,000
60,000
2003–2006 2007–2010 2011–2014 2015–2018
SOE Non-SOE
Asia Pacific Economies’ SOE Investment in Canada, 2003–2018
1,066
14,382
11,646
16,010 30,807
17,325 39,636 20,405
Despite the public sentiment toward foreign SOEs, SOE investment accounted for half of the investment from the Asia Pacific and was valued at C$78.4B. Non-SOE investment from 2003 to 2018 was valued at C$72.8B. According to the Investment Monitor data, about 97 percent of SOE investment was in the natural resources industry, with Alberta’s energy sector exhibiting the highest investment in values and activities. Canada’s energy industry brought in C$63.7B of investment from Asia Pacific SOEs (accounting for 81 percent of the SOE investment from the Asia Pacific to Canada), while the mining and chemical sector brought C$12.2B of investment (accounting for 16 percent of the SOE investment from the Asia Pacific to Canada).
FIG. 13
23
The SOE investment in Canada was largely driven by the Chinese, Malaysian, and South Korean economies, respectively. Canada saw C$47.5B of investment (61 percent of all SOE investment) from China, followed by C$12.8B (16 percent) from Malaysia, and C$5.8B (7 percent) from South Korea. In contrast, for non-SOE investments, the major Asia Pacific economies were Japan, China, and Australia, with cumulative investment values at C$31.4B (43 percent), C$12.4B (17 percent), and C$11.0B (15 percent), respectively, from 2003 to 2018.
BOX 2. FDI DEALS ARE NO LONGER JUST FDI DEALS
On July 20, 2017, Shenzhen-based Hytera Communications Co. completed the purchase of Vancouver-based Norsat International Inc. for C$85.2M. What seemed like an ordinary deal on the surface ended up being the centre of a media storm fuelled by comments made by US security officials regarding the deal. With respect to sovereignty related to business deals done within one’s own borders, the comments coming from the United States regarding Canada’s apparent “jeopardizing [of] its own security interests to gain favour with China” appeared to violate Canada’s freedom to pursue its own economic agenda. However, it seems investment deals coming out of China into Canada and North America in general are being increasingly politicized and scrutinized for concerns regarding potential national security threats, especially for deals involving SOEs or those with strong ties to the Chinese government.
This was the case for Hytera’s acquisition of Norsat, with concerns that client information from Norsat’s previous dealings with the US and Taiwanese militaries could be compromised following the acquisition. Anbang Insurance Group Co. Ltd.’s purchase of Retirement Concepts, the owner of several long-term care facilities in BC, was also scrutinized by security pundits after Anbang faced issues in the United States when regulators attempted to trace the ownership and leadership structure within Anbang. The Anbang deal was automatically reviewed by the Investments Canada Act due to the size of the deal. Reports following the decision, however, highlighted that the Anbang acquisition passed the national security review part of the overarching review.
A proposed acquisition of Calgary-based Aecon Group Inc. by China Communications Construction Co., a Chinese SOE, in October 2017 was also scrutinized by security analysts and government officials in both the United States and Canada. The deal was eventually blocked seven months later by the Canadian government following a full national security review. Had the deal gone ahead, Aecon would have been barred from bidding on the construction contract for the Gordie Howe International Bridge connecting Windsor, Ontario, to Detroit, Michigan, a key trading point between the United States and Canada and a project Aecon was actively pursuing. Aecon eventually signed on to the bridge contract, after the deal with China Communications Construction Co. was blocked.
24
Questions now arise about Canada’s ability to continue promoting itself as a friendly destination for Chinese FDI, a major initiative set forth by the current federal Liberal government and several of Canada’s provinces. Rising national security concerns expressed by four of the Five Eyes intelligence sharing coalition (Canada being the remaining fifth) in regard to Chinese FDI puts pressure on Canada to follow suit. On the flipside, however, the Chinese government has expressed displeasure at having deals originating from its country being reviewed, and officials have gone as far as calling for retaliatory measures in response to blocking Chinese FDI. Now with ever-rising security concerns in western economies, the Canadian government must choose whether it should have a firmer stance on FDI flows from SOEs or let the market take its course.
Canadian Investment in the Asia Pacific: Fewer Deals, but More Dollars
In the past three years, there was a decrease in the number of Canadian investment deals in the Asia Pacific. However, Canadian businesses are investing more dollars. Although the number of deals made between 2015 and 2018 dropped by 21 percent, from 555 deals to 437 deals, compared to its preceding period (2011 to 2014), the value of Canadian investment in the Asia Pacific had increased by 40 percent, from C$46B to C$64B.
In terms of investment values, Canadian companies have been investing in the natural resources-based industries in the Asia Pacific economies. The top sector for investment was mining. This sector consists of general mining, gold mining, mining for platinum and precious metals, and mining for diamonds and gemstones. From 2003 to 2018, the mining sector accounted for 10 percent (C$22B) of all investments. The top countries that Canada’s mining sector invested in were Australia, the Philippines, and Indonesia, for the highest dollars of investment, and China, Australia, and Mongolia for the highest number of investment deals. Canada invested more than C$8B in Australia’s mining sector, over C$4B in the Philippines’ mining sector, and over C$2B in China’s mining sector. To date, Canada has 149 deals in the mining sector with China, 127 deals with Australia, and 49 with Mongolia.
Outside the natural resources industries, Asia’s industrial transportation sector and its real estate investment and services sector saw increased investment from Canadian businesses in the last four years. Within the industrial transportation sector, Canada invested over C$20B, particularly in the Australian and Chinese economies. Australia saw the most dollars (C$11.8B) invested by Canadian companies such as Toronto-based Brookfield Asset Management Incorporated, while China had the highest number of deals (26 deals) and was the second highest (C$4B) in terms of dollars invested in the sector. Canada also invested

25
over C$19B in the Asia Pacific’s real estate investment and services sector, with Australia, China, and India as the leading destination economies. The year 2018 saw the greatest investment from Canada into the Asia Pacific’s real estate investment and services sector in both volume and activity, valued at C$5.9B over 14 deals. The growth was largely driven by Canadian state-owned enterprises’ outbound investments in Australia’s real estate sector, such as from the Canada Pension Plan Investment Board (CPPIB) and the Ontario Municipal Employees Retirement System.
Source: APF Canada Investment Monitor and fDi Markets (accessed April 9, 2019)
0
10,000
20,000
30,000
40,000
50,000
60,000
70,000
0
100
200
300
400
500
600
700
2003–2006 2007–2010 2011–2014 2015–2018
Value of Deals Number of Deals
Canadian Investment in the Asia Pacific, 2003–2018
49,522 50,607 45,601
437
63,704
566
630
555
FIG. 14
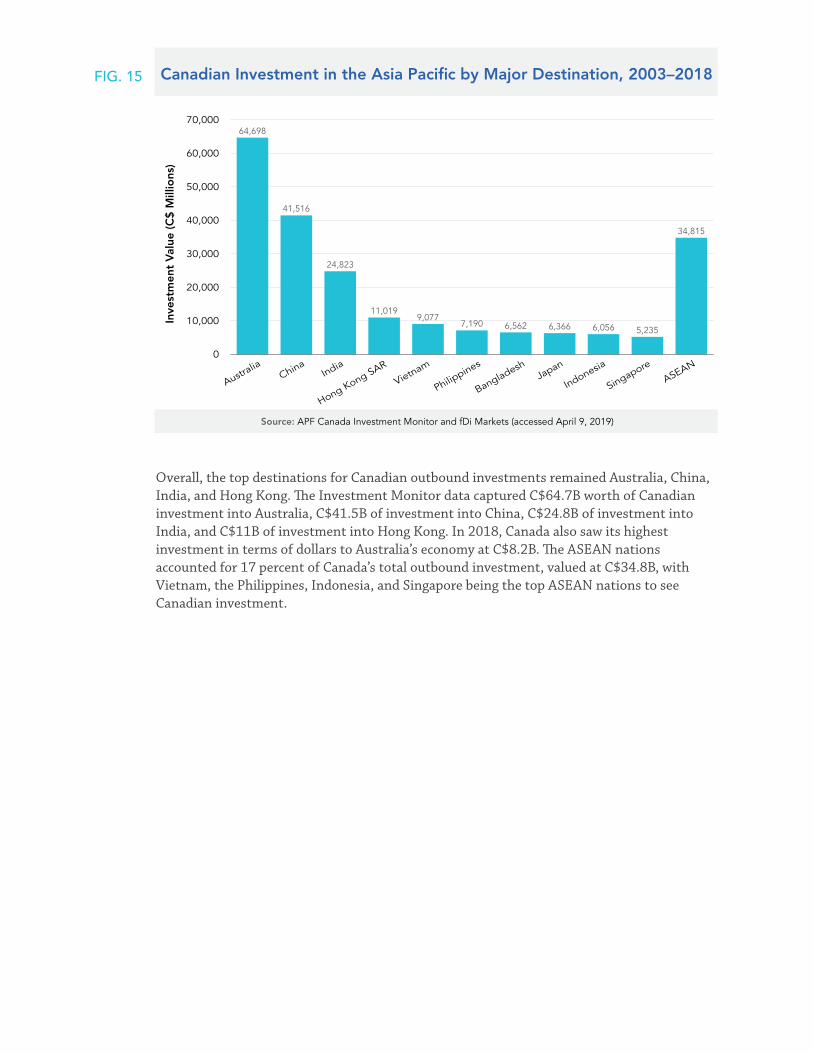
26
Source: APF Canada Investment Monitor and fDi Markets (accessed April 9, 2019)
0
10,000
ChinaIndia
Hong Kong SAR
Vietnam
Philippines
BangladeshJapan
Indonesia
Singapore
ASEAN
Australia
20,000
30,000
40,000
50,000
60,000
70,00064,698
41,516
24,823
11,019
Canadian Investment in the Asia Pacific by Major Destination, 2003–2018
9,0777,190 6,562 6,366 6,056 5,235
34,815
Overall, the top destinations for Canadian outbound investments remained Australia, China, India, and Hong Kong. The Investment Monitor data captured C$64.7B worth of Canadian investment into Australia, C$41.5B of investment into China, C$24.8B of investment into India, and C$11B of investment into Hong Kong. In 2018, Canada also saw its highest investment in terms of dollars to Australia’s economy at C$8.2B. The ASEAN nations accounted for 17 percent of Canada’s total outbound investment, valued at C$34.8B, with Vietnam, the Philippines, Indonesia, and Singapore being the top ASEAN nations to see Canadian investment.
FIG. 15
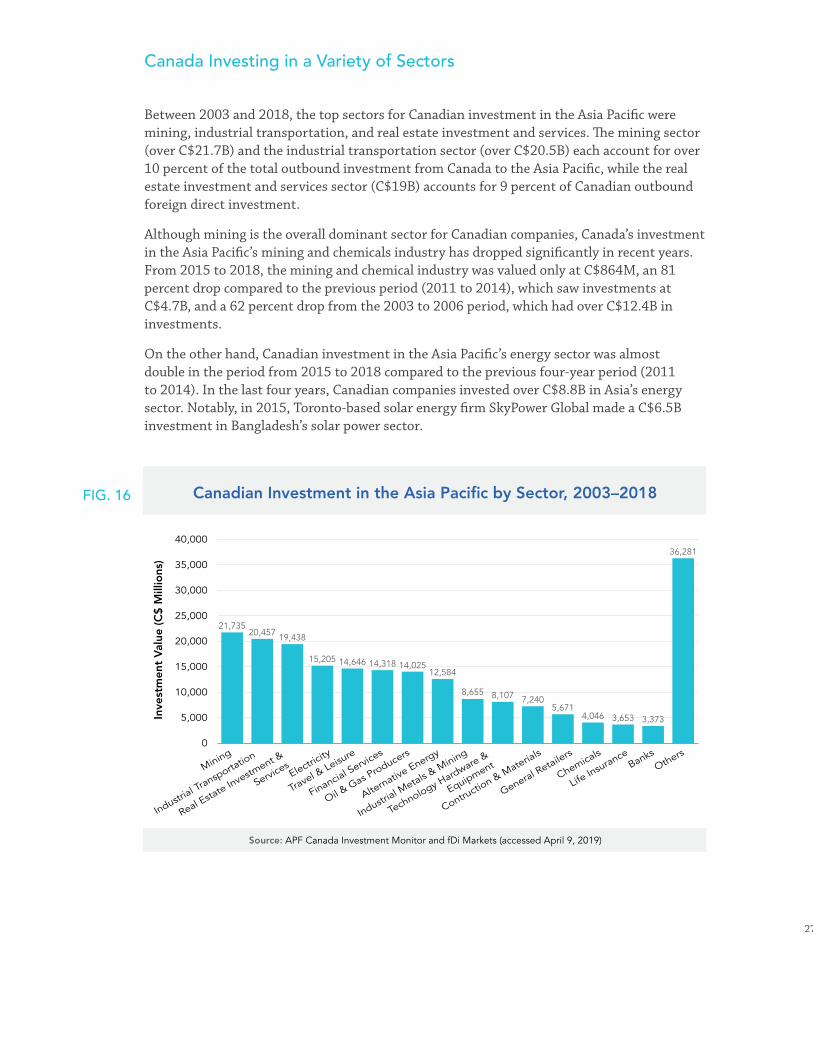
27
Canada Investing in a Variety of Sectors
Between 2003 and 2018, the top sectors for Canadian investment in the Asia Pacific were mining, industrial transportation, and real estate investment and services. The mining sector (over C$21.7B) and the industrial transportation sector (over C$20.5B) each account for over 10 percent of the total outbound investment from Canada to the Asia Pacific, while the real estate investment and services sector (C$19B) accounts for 9 percent of Canadian outbound foreign direct investment.
Although mining is the overall dominant sector for Canadian companies, Canada’s investment in the Asia Pacific’s mining and chemicals industry has dropped significantly in recent years. From 2015 to 2018, the mining and chemical industry was valued only at C$864M, an 81 percent drop compared to the previous period (2011 to 2014), which saw investments at C$4.7B, and a 62 percent drop from the 2003 to 2006 period, which had over C$12.4B in investments.
On the other hand, Canadian investment in the Asia Pacific’s energy sector was almost double in the period from 2015 to 2018 compared to the previous four-year period (2011 to 2014). In the last four years, Canadian companies invested over C$8.8B in Asia’s energy sector. Notably, in 2015, Toronto-based solar energy firm SkyPower Global made a C$6.5B investment in Bangladesh’s solar power sector.
Source: APF Canada Investment Monitor and fDi Markets (accessed April 9, 2019)
0
5,000
Industrial Transporta
tion
Real Esta
te Investm
ent &
Services
Technology Hardware &
EquipmentMining
Electricity
Travel & Leisu
re
Financial Services
Oil & Gas P
roducers
Contructio
n & Materials
General Retailers
Chemicals
Life Insurance
BanksOthers
Alternative Energy
Industrial M
etals & M
ining
10,000
15,000
20,000
25,000
30,000
35,000
40,000
70,000
21,73520,457
Canadian Investment in the Asia Pacific by Sector, 2003–2018
19,438
15,205 14,646 14,318 14,02512,584
8,655 8,107 7,2405,671
4,046 3,653 3,373
36,281
FIG. 16

28
Canadian Investment in the Asia Pacific’s Energy, Mining & Chemical Industries, 2003–2018
Source: APF Canada Investment Monitor and fDi Markets (accessed April 9, 2019)
0
5,000
10,000
15,000
20,000
Energy Mining & Chemicals
2003–2006 2007–2010 2011–2014 2015-2018
12,339
6,966
4,288
8,833
16,457
12,446
4,669
864
BOX 3. CANADIAN SOLAR INC. SHINES BRIGHTLY IN ASIA
Coal’s run as the go-to source for energy and heat is coming to an end for a large portion of the world. Many advanced economies at the national or state level in Europe and North America are abandoning coal in favour of cleaner and more renewable energy sources such as nuclear, solar, or wind. Asian countries are attempting to make a similar transition in the coming years as major cities like New Delhi, Beijing, and Seoul – to name a few – get choked by smog and fine dust particles resulting from activities related to coal use. Countries like India and China continue to use coal as it is relatively cheap compared to other sources, but government policies are starting to acknowledge the problem burning coal creates. In a speech at the World Economic Forum meeting in Davos in 2017, Chinese President Xi Jinping recognized the negative effects of climate change and called for a domestic “green shift” toward the use of alternative energy.
Helping pioneer this transition of energy sources in Asia is Guelph, Ontario, based Canadian Solar Inc. After establishing itself through a contract with Volkswagen Group, Canadian Solar capitalized on the renewable energy wave of the mid-2000s as governments offered large incentives for renewable energy solutions, including solar
FIG. 17
29
panels and components. Since Canadian Solar’s inception in 2001, it is now one of the world’s largest producers of solar panels, earning well over C$3.3B in revenues in 2017. The company has a significant presence in the Asia Pacific region, with a manufacturing plant in Changshu, China, and numerous solar farm projects in Japan, China, and Southeast Asia. Recently, the company made a foray into new markets, and 2018 saw the company open its first plant in India in a project worth C$20M. In 2019, it will enter South Korea for the first time with a project worth C$82M to set up a solar photovoltaic project in Gangwon.
As more of Asia begins transitioning from coal to other forms of energy sources, Canadian Solar’s long-standing presence in the region, along with its track record of producing quality solar farms, shows that Canadian investments in the energy sector can go beyond oil and gas. Canadian Solar is also part of a larger wave of Canadian companies exporting alternative energy sources in Asia. Since 2007, Canadian companies have taken part in nearly 80 deals involving the production, installation, or implementation of renewable energy technology in Asian economies.
In non-resources-related industries, Canadian companies in the real estate investment sector exhibited strong growth in the period between 2014 and 2018. In that period, the CPPIB made heavy investment in the Asia Pacific’s real estate and financial sectors, valued at more than C$4B in total. The CPPIB also drove the growth in the industrial goods and services industry in 2018. That year, the CPPIB invested over C$1.8B into the Asia Pacific’s industrial transportation sector, and over C$1.7B into the construction and material sector.
The food producer sector in the consumer goods and services industry also saw major investments, particularly by Montreal-based Saputo Inc. In 2018, Saputo acquired Murray Goulburn in Australia for C$1.3B and became the first and largest foreign-owned company in the history of Australia’s dairy industry.
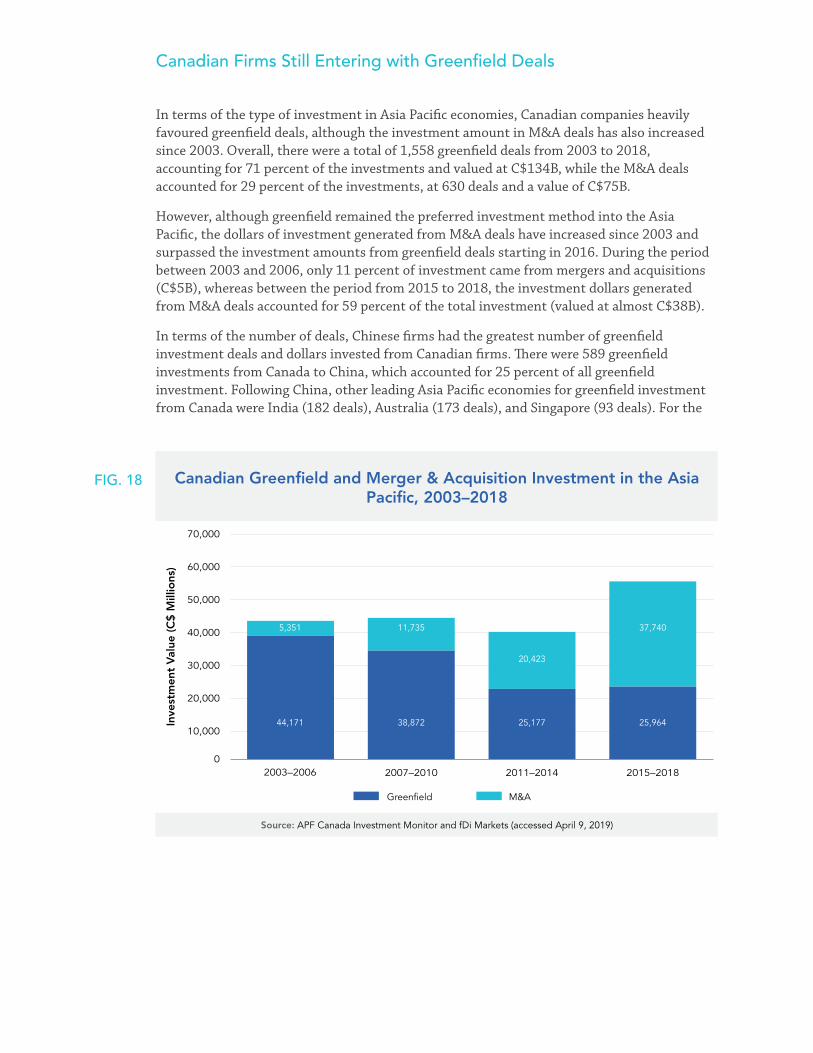
30
Canadian Firms Still Entering with Greenfield Deals
In terms of the type of investment in Asia Pacific economies, Canadian companies heavily favoured greenfield deals, although the investment amount in M&A deals has also increased since 2003. Overall, there were a total of 1,558 greenfield deals from 2003 to 2018, accounting for 71 percent of the investments and valued at C$134B, while the M&A deals accounted for 29 percent of the investments, at 630 deals and a value of C$75B.
However, although greenfield remained the preferred investment method into the Asia Pacific, the dollars of investment generated from M&A deals have increased since 2003 and surpassed the investment amounts from greenfield deals starting in 2016. During the period between 2003 and 2006, only 11 percent of investment came from mergers and acquisitions (C$5B), whereas between the period from 2015 to 2018, the investment dollars generated from M&A deals accounted for 59 percent of the total investment (valued at almost C$38B).
In terms of the number of deals, Chinese firms had the greatest number of greenfield investment deals and dollars invested from Canadian firms. There were 589 greenfield investments from Canada to China, which accounted for 25 percent of all greenfield investment. Following China, other leading Asia Pacific economies for greenfield investment from Canada were India (182 deals), Australia (173 deals), and Singapore (93 deals). For the
Canadian Greenfield and Merger & Acquisition Investment in the Asia Pacific, 2003–2018
Source: APF Canada Investment Monitor and fDi Markets (accessed April 9, 2019)
0
10,000
20,000
30,000
40,000
50,000
60,000
70,000
2003–2006 2007–2010 2011–2014 2015–2018
Greenfield M&A
44,171
5,351 11,735
20,423
37,740
38,872 25,177 25,964
FIG. 18

31
value of greenfield investment from Canadian firms, China is the top destination economy valued at almost C$34B, followed by Australia at C$22B, India at C$17.6B, and Vietnam at C$9B.
For M&A deals, the top destinations are Australia and China. Australia accounted for over 34 percent of M&A deals, with 215 deals and over C$42B in investment, and China accounted for over 27 percent of M&A deals, with 167 deals and over C$7.9B in investment.
Canada’s SOEs Now Make Up the Majority of Yearly Flow
While lively discussion surrounds foreign state-owned investments into Canada, less attention is paid to the active and growing presence of Canada’s own state-owned investments across the Asia Pacific. Although making up just 0.2 percent of deals in the 2003 to 2006 period, with a total value of C$375M, Canadian SOEs have consistently increased their role as investors in terms of both share and absolute values, to the point where 15 percent of Canada’s deals in the region, valued at C$25.8B, were conducted by Canadian SOEs in the 2015 to 2018 period. Even more notably, the most recent two years are the first time a majority of Canadian investment originated from SOEs: 54 percent in 2017 and 61 percent in 2018.
Source: APF Canada Investment Monitor and fDi Markets (accessed April 9, 2019)
0
10,000
20,000
30,000
40,000
50,000
60,000
70,000
2003–2006 2007–2010 2011–2014 2015–2018
SOE Non-SOE
Canadian SOE Investment in the Asia Pacific, 2003–2018
49,148 49,668 35,562 37,904
375 94010,039 25,800
FIG. 19
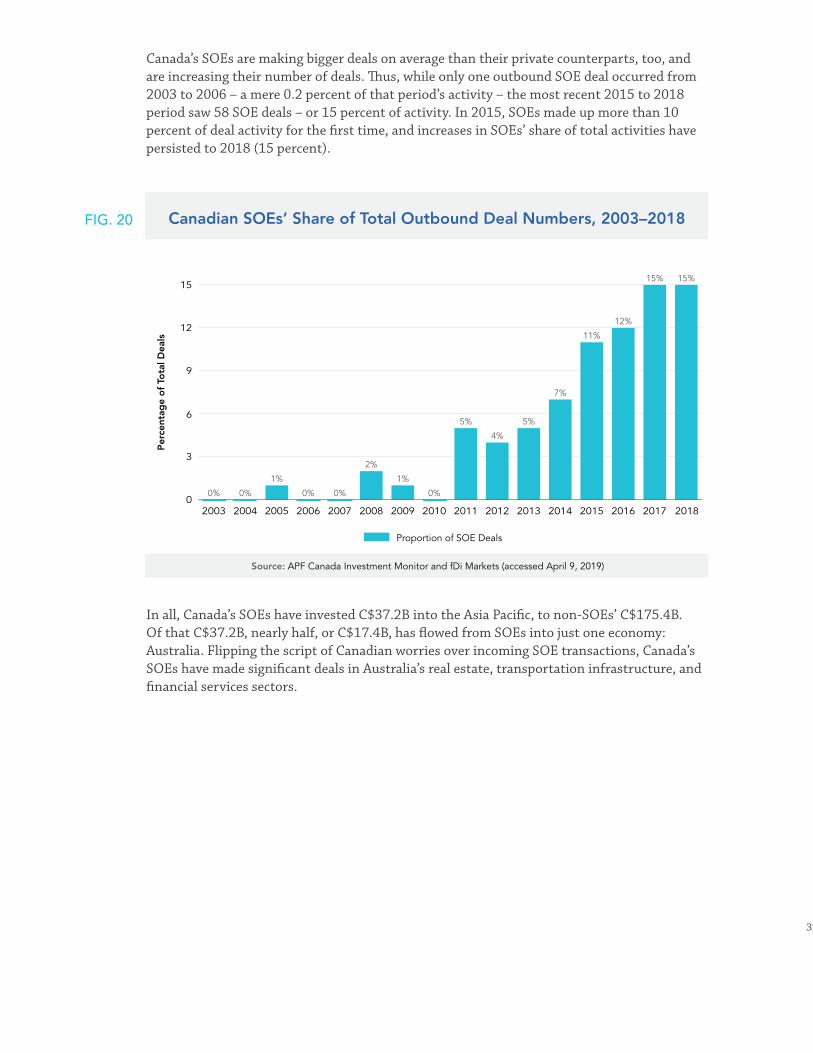
32
Canada’s SOEs are making bigger deals on average than their private counterparts, too, and are increasing their number of deals. Thus, while only one outbound SOE deal occurred from 2003 to 2006 – a mere 0.2 percent of that period’s activity – the most recent 2015 to 2018 period saw 58 SOE deals – or 15 percent of activity. In 2015, SOEs made up more than 10 percent of deal activity for the first time, and increases in SOEs’ share of total activities have persisted to 2018 (15 percent).
Canadian SOEs’ Share of Total Outbound Deal Numbers, 2003–2018
Source: APF Canada Investment Monitor and fDi Markets (accessed April 9, 2019)
0
3
6
9
12
15
2003 2004 2005 2006 2007 2008 2009 2010 2011 2012 2013 2014 2015 2016 2017 2018
Proportion of SOE Deals
0% 0%
1%
0% 0%
2%
1%
0%
5%
4%
5%
7%
11%
12%
15% 15%
In all, Canada’s SOEs have invested C$37.2B into the Asia Pacific, to non-SOEs’ C$175.4B. Of that C$37.2B, nearly half, or C$17.4B, has flowed from SOEs into just one economy: Australia. Flipping the script of Canadian worries over incoming SOE transactions, Canada’s SOEs have made significant deals in Australia’s real estate, transportation infrastructure, and financial services sectors.
FIG. 20
33
Key Section Takeaways
• BC and Alberta are investing less in the Asia Pacific relative to previous years.
• Investments flowing to Ontario are at their highest point; BC and Quebec are down, but above pre-recession levels.
• Alberta is still reeling following oil price shock, but slowly recovering.
• The big four provinces are seeing more diversified investments from Asia plus investments in their industry of strength.
• Investments into other provinces/territories are often characterized by a single or a few “whale” deals.
• The territories and the Prairies are playing to their strengths; Atlantic Canada is seeing more investments in support services.
Canada’s Biggest Provinces Continue to Lead Investments, but Some More Than Others
The flow of two-way international investment between Canada and the Asia Pacific continues to remain concentrated between Ontario, Quebec, Alberta, and BC, Canada’s largest provinces by GDP. As shown by APF Canada’s Investment Monitor, BC, Alberta, and the rest of Canada saw inward investments exceed outward investments following the recession, whereas the opposite was the case in Ontario and Quebec. Ontario was also the only province to have outward investment in excess of their pre-recession levels, while Quebecois investments in the Asia Pacific exceeded the investments the province received from the Asia Pacific in all years considered aside from the period between 2011 and 2014. All other provinces saw declines in their level of investment in the Asia Pacific. The other provinces fared a bit better in terms of receiving investments from the Asia Pacific, as only Alberta has seen fewer investments from the Asia Pacific since the Great Recession. BC was the standout here as the province has seen investments from the Asia Pacific grow nearly five-fold since the recession relative to pre-recession levels.
CHAPTER 2: THE PROVINCIAL PICTURE

34
Source: APF Canada Investment Monitor and fDi Markets (accessed April 9, 2019)
0
5,000
10,000
15,000
20,000
25,000
30,000
35,000
Asia Pacific Investment into Canada by Province, 2003–2018
Alberta British Columbia Ontario Rest of CanadaQuebec
2003–2006 2007–2010 2011–2014 2015–2018
3,952
1,678 955 1,565
15,780
3,712
5,780
5511,995
10,2648,418
4,366
464
3,627
7,909
2,6844,275
32,020 31,921
6,698
Inward investments into BC, Alberta, and Quebec from the Asia Pacific have primarily gone into the same sectors as did previous investments from the Asia Pacific. For BC and Alberta, these sectors include oil and gas. BC and Quebec also saw investments in their mining sectors, and Ontario saw sustained investments in its automobile and parts sector. At the same time, these provinces more recently saw investments shift away from their strengths and into more technology-focused sectors. In the past few years, Quebec has seen rapid development of its technology sector and has seen itself transform into a hub for artificial intelligence (AI) research and development. BC and Alberta have also seen increasing investments into the alternative energy sector. Beyond the big four provinces, deals from the Asia Pacific have been sporadic, and often are characterized by “whale” deals – one or two major investment deals from a single firm that outweigh other investments into the province. Recent deals in the provinces outside the big four have been in business support-related sectors, such as industrial transportation and computer services.
FIG. 21
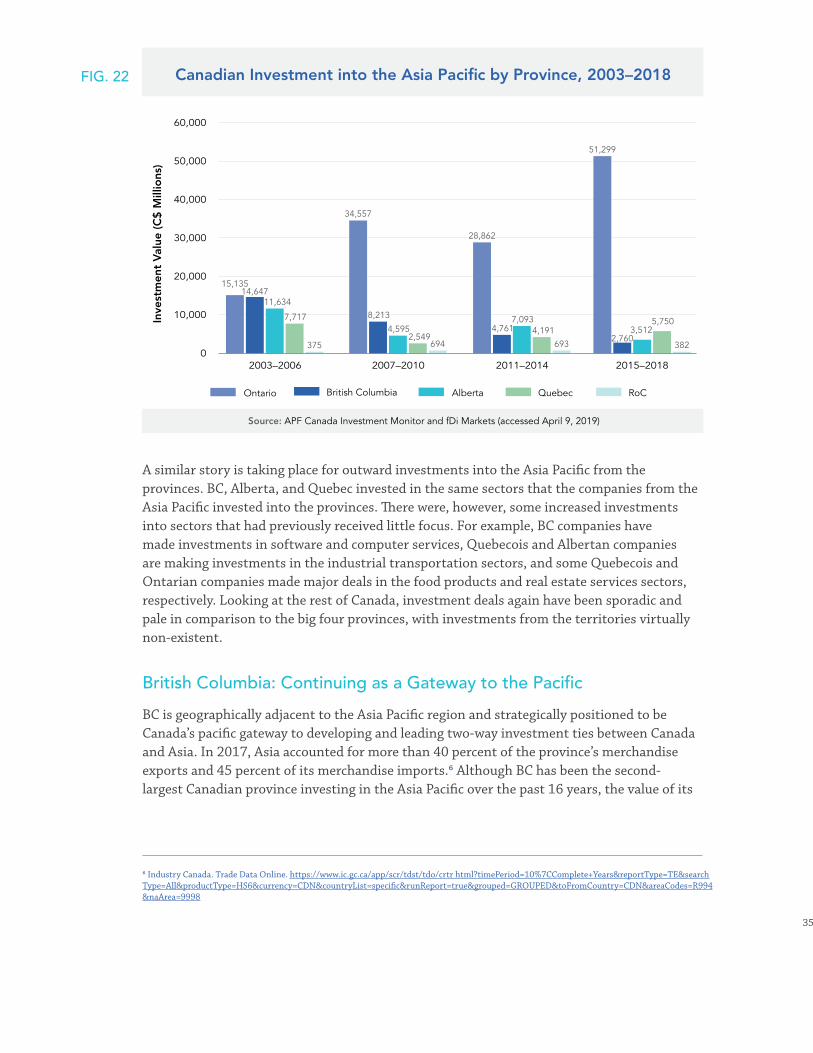
35
Source: APF Canada Investment Monitor and fDi Markets (accessed April 9, 2019)
0
10,000
20,000
30,000
40,000
50,000
60,000
Canadian Investment into the Asia Pacific by Province, 2003–2018
AlbertaBritish ColumbiaOntario RoCQuebec
2003–2006 2007–2010 2011–2014 2015–2018
15,13514,647
11,634
7,717
375
34,557
8,213
4,5952,549
694
4,7617,093
4,191
693
51,299
2,7603,512
5,750
382
28,862
A similar story is taking place for outward investments into the Asia Pacific from the provinces. BC, Alberta, and Quebec invested in the same sectors that the companies from the Asia Pacific invested into the provinces. There were, however, some increased investments into sectors that had previously received little focus. For example, BC companies have made investments in software and computer services, Quebecois and Albertan companies are making investments in the industrial transportation sectors, and some Quebecois and Ontarian companies made major deals in the food products and real estate services sectors, respectively. Looking at the rest of Canada, investment deals again have been sporadic and pale in comparison to the big four provinces, with investments from the territories virtually non-existent.
British Columbia: Continuing as a Gateway to the Pacific
BC is geographically adjacent to the Asia Pacific region and strategically positioned to be Canada’s pacific gateway to developing and leading two-way investment ties between Canada and Asia. In 2017, Asia accounted for more than 40 percent of the province’s merchandise exports and 45 percent of its merchandise imports.6 Although BC has been the second-largest Canadian province investing in the Asia Pacific over the past 16 years, the value of its
6 Industry Canada. Trade Data Online. https://www.ic.gc.ca/app/scr/tdst/tdo/crtr html?timePeriod=10%7CComplete+Years&reportType=TE&search Type=All&productType=HS6¤cy=CDN&countryList=specific&runReport=true&grouped=GROUPED&toFromCountry=CDN&areaCodes=R994 &naArea=9998
FIG. 22
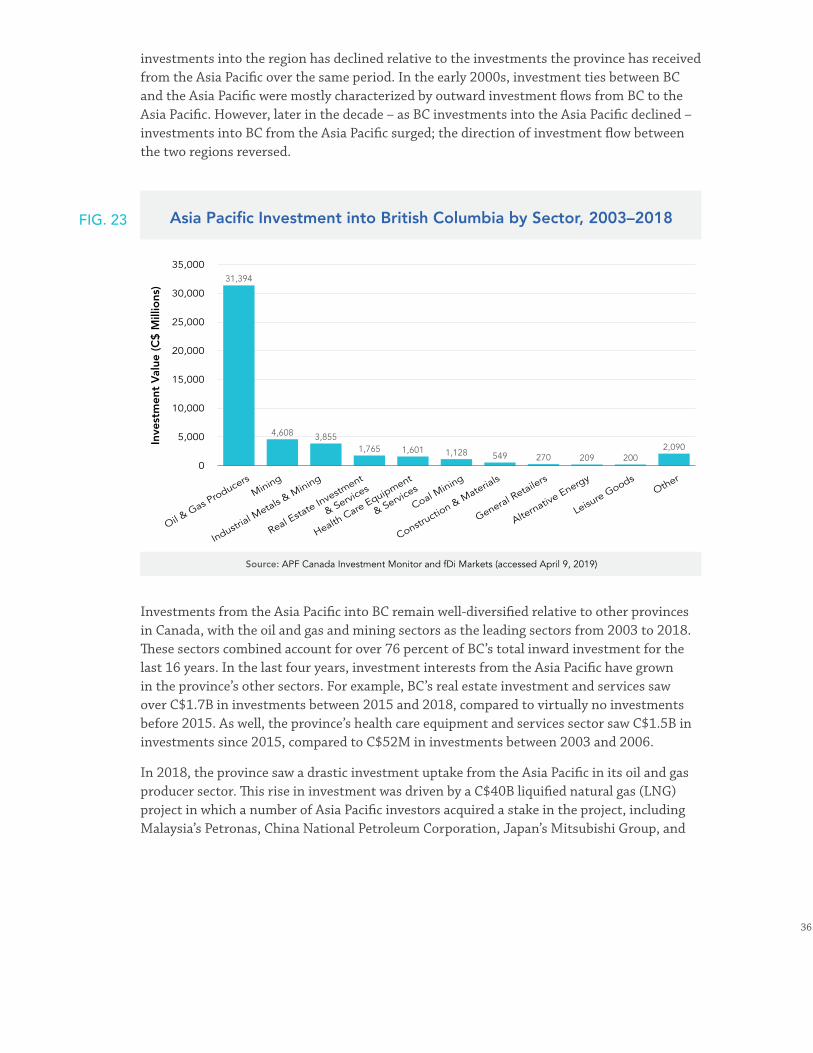
36
investments into the region has declined relative to the investments the province has received from the Asia Pacific over the same period. In the early 2000s, investment ties between BC and the Asia Pacific were mostly characterized by outward investment flows from BC to the Asia Pacific. However, later in the decade – as BC investments into the Asia Pacific declined – investments into BC from the Asia Pacific surged; the direction of investment flow between the two regions reversed.
Source: APF Canada Investment Monitor and fDi Markets (accessed April 9, 2019)
5,000
0
10,000
Mining
Industrial M
etals & M
ining
Real Esta
te Investm
ent
& Services
Health Care Equipment
& Services
Coal Mining
Constructio
n & Materials
General Retailers
Alternative Energy
Leisure Goods
Other
Oil & Gas P
roducers
15,000
20,000
25,000
30,000
35,000
Asia Pacific Investment into British Columbia by Sector, 2003–2018
31,394
4,608 3,8551,765 1,601 1,128 549 270 209 200
2,090
Investments from the Asia Pacific into BC remain well-diversified relative to other provinces in Canada, with the oil and gas and mining sectors as the leading sectors from 2003 to 2018. These sectors combined account for over 76 percent of BC’s total inward investment for the last 16 years. In the last four years, investment interests from the Asia Pacific have grown in the province’s other sectors. For example, BC’s real estate investment and services saw over C$1.7B in investments between 2015 and 2018, compared to virtually no investments before 2015. As well, the province’s health care equipment and services sector saw C$1.5B in investments since 2015, compared to C$52M in investments between 2003 and 2006.
In 2018, the province saw a drastic investment uptake from the Asia Pacific in its oil and gas producer sector. This rise in investment was driven by a C$40B liquified natural gas (LNG) project in which a number of Asia Pacific investors acquired a stake in the project, including Malaysia’s Petronas, China National Petroleum Corporation, Japan’s Mitsubishi Group, and
FIG. 23
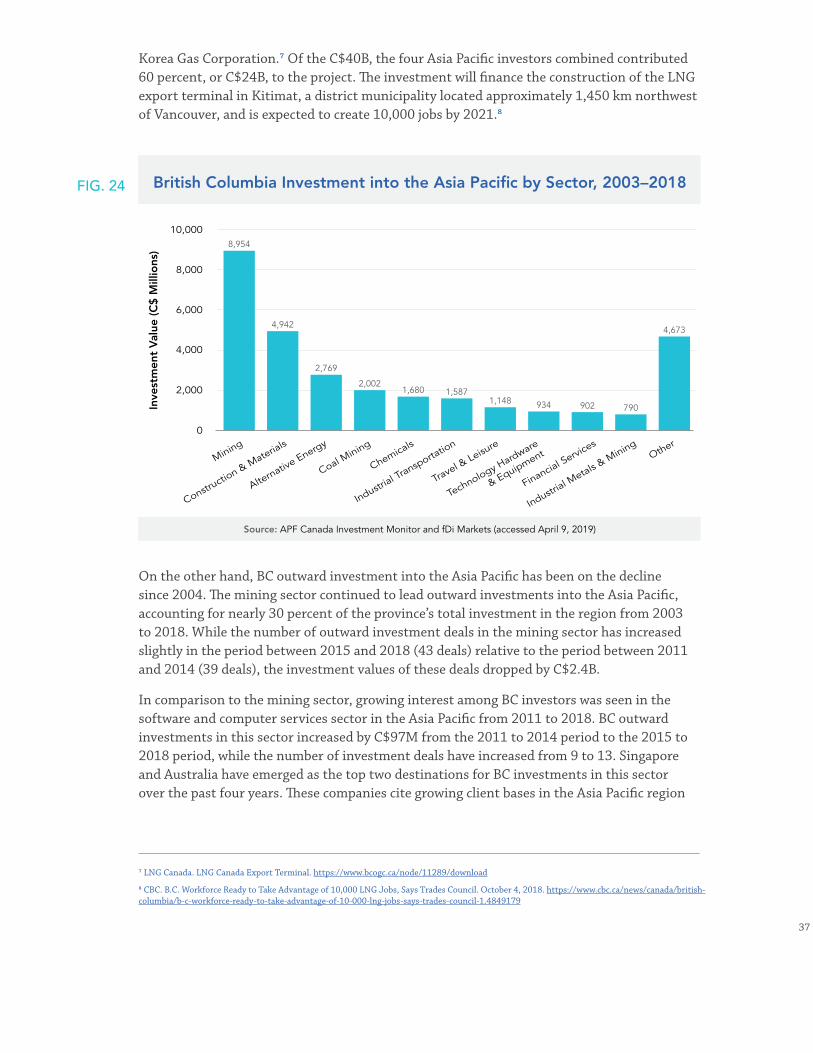
37
Korea Gas Corporation.7 Of the C$40B, the four Asia Pacific investors combined contributed 60 percent, or C$24B, to the project. The investment will finance the construction of the LNG export terminal in Kitimat, a district municipality located approximately 1,450 km northwest of Vancouver, and is expected to create 10,000 jobs by 2021.8
Source: APF Canada Investment Monitor and fDi Markets (accessed April 9, 2019)
0
2,000
Constructio
n & Materials
Alternative Energy
Coal Mining
Chemicals
Industrial Transporta
tion
Travel & Leisu
re
Technology Hardware
& Equipment
Financial Services
Industrial M
etals & M
iningOther
Mining
4,000
6,000
8,000
10,000
British Columbia Investment into the Asia Pacific by Sector, 2003–2018
8,954
4,942
2,769
2,0021,680 1,587
1,148 934 902 790
4,673
On the other hand, BC outward investment into the Asia Pacific has been on the decline since 2004. The mining sector continued to lead outward investments into the Asia Pacific, accounting for nearly 30 percent of the province’s total investment in the region from 2003 to 2018. While the number of outward investment deals in the mining sector has increased slightly in the period between 2015 and 2018 (43 deals) relative to the period between 2011 and 2014 (39 deals), the investment values of these deals dropped by C$2.4B.
In comparison to the mining sector, growing interest among BC investors was seen in the software and computer services sector in the Asia Pacific from 2011 to 2018. BC outward investments in this sector increased by C$97M from the 2011 to 2014 period to the 2015 to 2018 period, while the number of investment deals have increased from 9 to 13. Singapore and Australia have emerged as the top two destinations for BC investments in this sector over the past four years. These companies cite growing client bases in the Asia Pacific region
7 LNG Canada. LNG Canada Export Terminal. https://www.bcogc.ca/node/11289/download
8 CBC. B.C. Workforce Ready to Take Advantage of 10,000 LNG Jobs, Says Trades Council. October 4, 2018. https://www.cbc.ca/news/canada/british-columbia/b-c-workforce-ready-to-take-advantage-of-10-000-lng-jobs-says-trades-council-1.4849179
FIG. 24
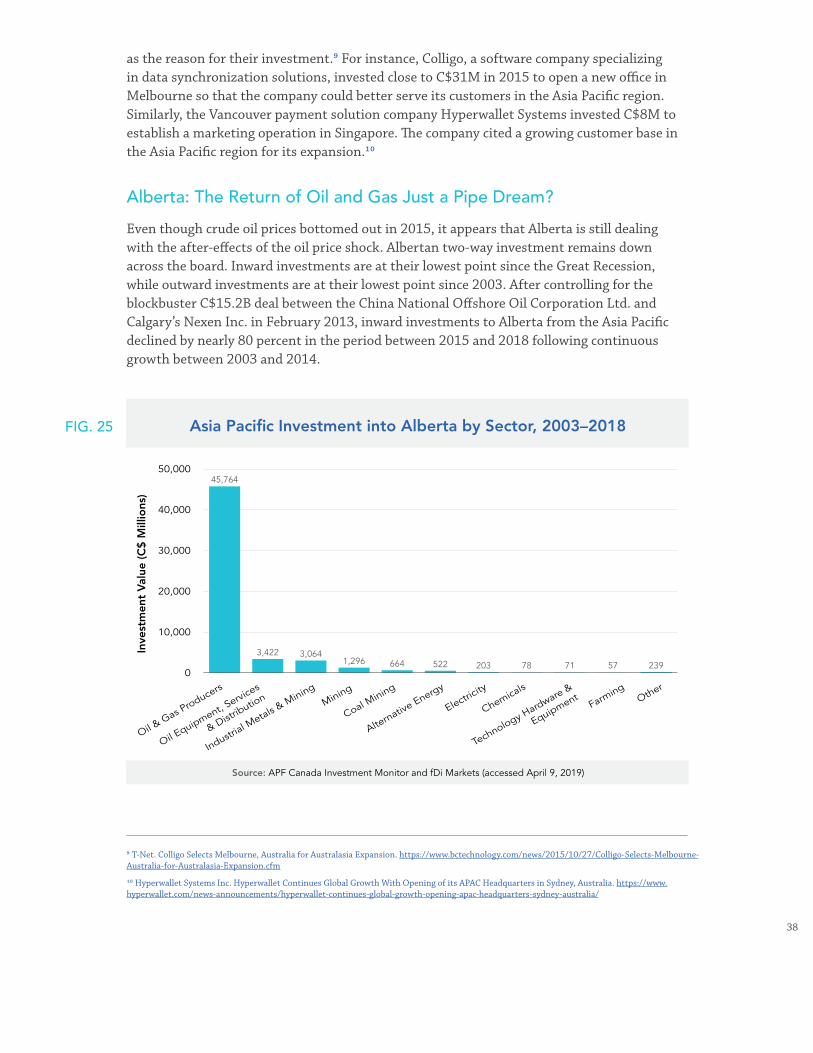
38
as the reason for their investment.9 For instance, Colligo, a software company specializing in data synchronization solutions, invested close to C$31M in 2015 to open a new office in Melbourne so that the company could better serve its customers in the Asia Pacific region. Similarly, the Vancouver payment solution company Hyperwallet Systems invested C$8M to establish a marketing operation in Singapore. The company cited a growing customer base in the Asia Pacific region for its expansion.10
Alberta: The Return of Oil and Gas Just a Pipe Dream?
Even though crude oil prices bottomed out in 2015, it appears that Alberta is still dealing with the after-effects of the oil price shock. Albertan two-way investment remains down across the board. Inward investments are at their lowest point since the Great Recession, while outward investments are at their lowest point since 2003. After controlling for the blockbuster C$15.2B deal between the China National Offshore Oil Corporation Ltd. and Calgary’s Nexen Inc. in February 2013, inward investments to Alberta from the Asia Pacific declined by nearly 80 percent in the period between 2015 and 2018 following continuous growth between 2003 and 2014.
9 T-Net. Colligo Selects Melbourne, Australia for Australasia Expansion. https://www.bctechnology.com/news/2015/10/27/Colligo-Selects-Melbourne-Australia-for-Australasia-Expansion.cfm
10 Hyperwallet Systems Inc. Hyperwallet Continues Global Growth With Opening of its APAC Headquarters in Sydney, Australia. https://www.hyperwallet.com/news-announcements/hyperwallet-continues-global-growth-opening-apac-headquarters-sydney-australia/
Source: APF Canada Investment Monitor and fDi Markets (accessed April 9, 2019)
0
10,000
Oil Equipment, S
ervices
& Distributio
n
Technology Hardware &
Equipment
Industrial M
etals & M
iningMining
Coal Mining
Alternative Energy
Electricity
Chemicals
Farming
Other
Oil & Gas P
roducers
20,000
30,000
40,000
50,000
Asia Pacific Investment into Alberta by Sector, 2003–2018
45,764
3,422 3,0641,296 664 522 203 78 71 57 239
FIG. 25
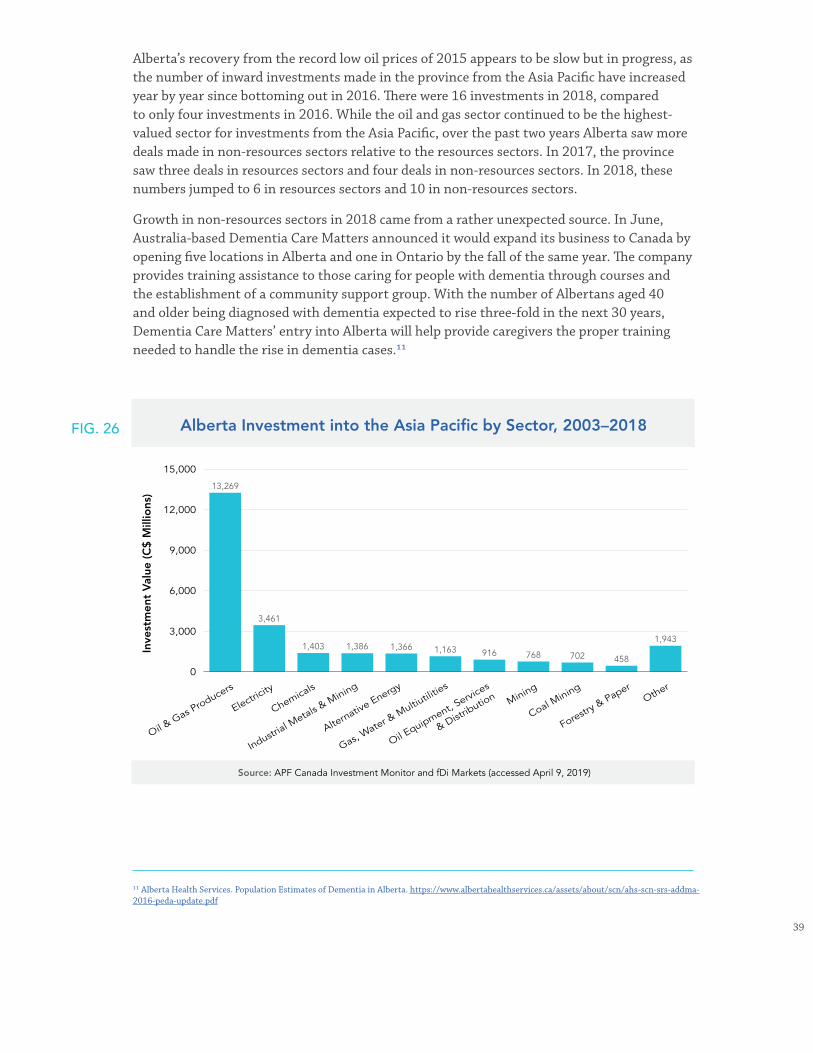
39
Alberta’s recovery from the record low oil prices of 2015 appears to be slow but in progress, as the number of inward investments made in the province from the Asia Pacific have increased year by year since bottoming out in 2016. There were 16 investments in 2018, compared to only four investments in 2016. While the oil and gas sector continued to be the highest-valued sector for investments from the Asia Pacific, over the past two years Alberta saw more deals made in non-resources sectors relative to the resources sectors. In 2017, the province saw three deals in resources sectors and four deals in non-resources sectors. In 2018, these numbers jumped to 6 in resources sectors and 10 in non-resources sectors.
Growth in non-resources sectors in 2018 came from a rather unexpected source. In June, Australia-based Dementia Care Matters announced it would expand its business to Canada by opening five locations in Alberta and one in Ontario by the fall of the same year. The company provides training assistance to those caring for people with dementia through courses and the establishment of a community support group. With the number of Albertans aged 40 and older being diagnosed with dementia expected to rise three-fold in the next 30 years, Dementia Care Matters’ entry into Alberta will help provide caregivers the proper training needed to handle the rise in dementia cases.11
11 Alberta Health Services. Population Estimates of Dementia in Alberta. https://www.albertahealthservices.ca/assets/about/scn/ahs-scn-srs-addma-2016-peda-update.pdf
Source: APF Canada Investment Monitor and fDi Markets (accessed April 9, 2019)
0
3,000
Chemicals
Industrial M
etals & M
ining
Electricity
Alternative Energy
Gas, Water &
Multiu
tilities
Oil Equipment, S
ervices
& Distributio
n Mining
Coal Mining
Forestry & Paper
Other
Oil & Gas P
roducers
6,000
9,000
12,000
15,000
Alberta Investment into the Asia Pacific by Sector, 2003–2018
13,269
3,461
1,403 1,386 1,366 1,163 916 768 702 458
1,943
FIG. 26
40
Outward investments by Alberta to the Asia Pacific since 2003 have been cyclical, with the Great Recession and the oil price shock of 2014 acting as turning points. The number of investment deals made and the value invested have both declined since 2014 and hit their lowest point in 2017, with only two deals going into the Asia Pacific valued at over C$13M. This again coincides with the declining oil prices prevalent during this time. Diversification away from oil and gas related investments appears to be more dramatic in this case relative to the inward investments Alberta experienced. Since 2017, Alberta only made seven investment deals in the Asia Pacific, valued at C$125M, and two of those seven deals were in the oil and gas sector, valued at C$8.5M. Both deals in the oil and gas sector occurred in 2018. The largest investment deal since 2017 came from Canadian Pacific, who opened an office in Shanghai. Canadian Pacific’s new office was valued at C$88M as announced in early 2018 and was designated the company’s Asian base as it looks to build up its business in the region.
While oil prices have rebounded from their lows in 2015, they still fall well below the highs seen earlier in the decade. It’s not clear if the Albertan economy can continue to weather oil prices at their current level, but increasing political tensions in major oil-producing countries like Venezuela, Libya, and Iran – along with the hastiness of the Organization of Petroleum Exporting Countries cutting and raising oil production goals overnight – continue to raise the question of whether the province will ever see stable investments in oil and gas related projects. The incentives and opportunities for Alberta to diversify its investments have never been greater.
Ontario: Southern Ontario Continues to Fuel the Province’s Investment Engine
Canada’s richest and most populated province continued its dominance as the top source province for Canadian investments into the Asia Pacific, and in the past three years it has overtaken Alberta as the number two Canadian destination for investments originating from the Asia Pacific as a result of declining investments in Alberta’s oil and gas sector. In terms of outbound investments to the Asia Pacific, Ontario has led all other provinces in both the number of deals brokered in the Asia Pacific and the amount invested. To put into perspective the province’s dominance in investments made in the Asia Pacific, Ontario’s C$129.8B exceeds the C$79.6B of total investments made by all the other provinces combined.
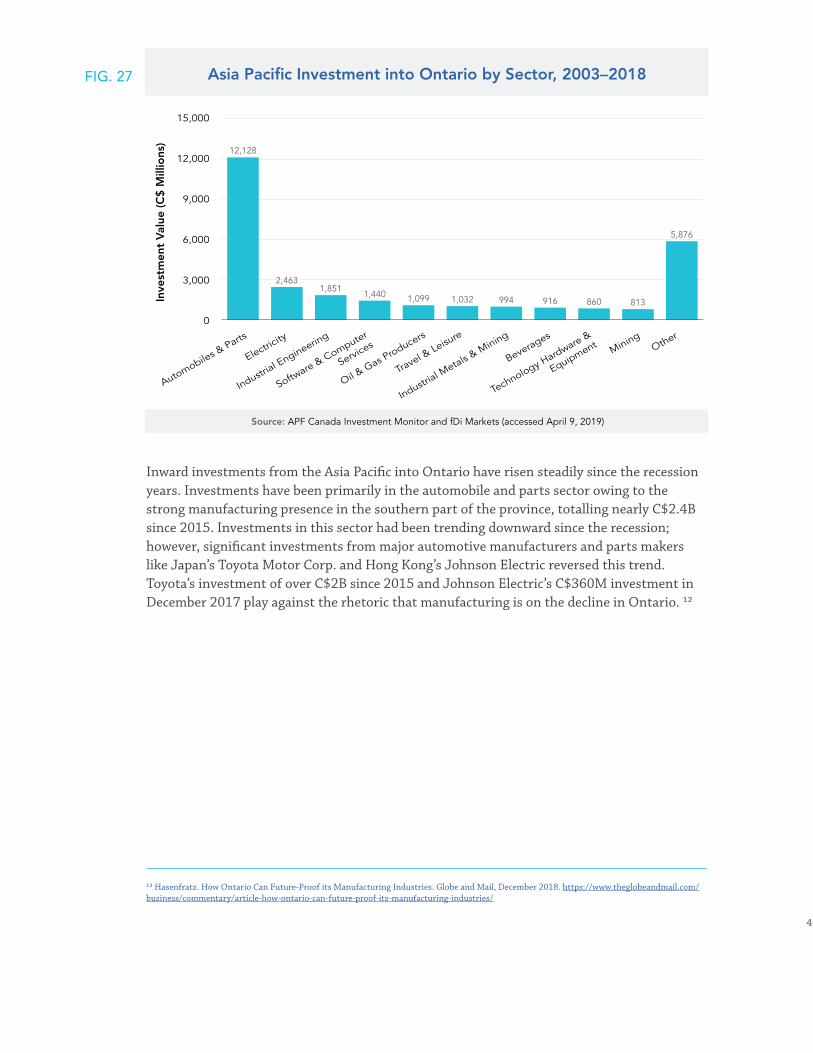
41
Source: APF Canada Investment Monitor and fDi Markets (accessed April 9, 2019)
0
3,000
Industrial E
ngineering
Software & Computer
Services
Technology Hardware &
EquipmentElectric
ity
Oil & Gas P
roducers
Industrial M
etals & M
ining
Travel & Leisu
re
BeveragesMining
Other
Automobiles & Parts
6,000
9,000
12,000
15,000
Asia Pacific Investment into Ontario by Sector, 2003–2018
12,128
2,4631,851
1,440 1,099 1,032 994 916 860 813
5,876
Inward investments from the Asia Pacific into Ontario have risen steadily since the recession years. Investments have been primarily in the automobile and parts sector owing to the strong manufacturing presence in the southern part of the province, totalling nearly C$2.4B since 2015. Investments in this sector had been trending downward since the recession; however, significant investments from major automotive manufacturers and parts makers like Japan’s Toyota Motor Corp. and Hong Kong’s Johnson Electric reversed this trend. Toyota’s investment of over C$2B since 2015 and Johnson Electric’s C$360M investment in December 2017 play against the rhetoric that manufacturing is on the decline in Ontario. 12
12 Hasenfratz. How Ontario Can Future-Proof its Manufacturing Industries. Globe and Mail, December 2018. https://www.theglobeandmail.com/business/commentary/article-how-ontario-can-future-proof-its-manufacturing-industries/
FIG. 27
42
BOX 4. COMMEMORATING 90 YEARS OF CANADA-JAPAN RELATIONS
2018 marked the 90th anniversary of diplomatic ties between Japan and Canada and the establishment of Japan’s diplomatic mission in Canada. Throughout these 90 years, Japan and Canada have enjoyed an amicable relationship, with Canada playing a major role in Japan’s economic recovery following the Second World War. Through numerous bilateral deals, Canada’s nomination of Japan to the United Nations and the Organisation for Economic Co-operation and Development, and the general receptivity of Japanese products by Canadians, among other factors, Japan was able to become the large and advanced economy it is today. Helping drive that growth was the establishment of large Japanese multinational companies.
Aichi-based Toyota Motor Corp. is one of those large multinational companies, and through its divisions Toyota and Lexus, it has maintained a presence in Southern Ontario since 1986 and has grown significantly since then. Toyota today operates four plants in Cambridge and Woodstock, Ontario, with an annual manufacturing capacity of 600,000 vehicles, while employing over 8,000 people. The two plants are noted for manufacturing the Corolla sedan and RAV4 sport utility vehicle, two of Toyota’s most popular models, along with Lexus’ best-selling RX sport utility vehicle. In May 2018, Toyota reaffirmed its commitment to Ontario and Canada by announcing that it will invest C$1.1B to upgrade its four plants for increased production of the RAV4, along with another C$200M over 10 years to support automotive research and development in Canada. At the announcement, Toyota Motor Manufacturing Canada president Fred Volf spoke about Toyota’s long-running relationship with the province of Ontario:
Ontario has always been a great home for Toyota Motor Manufacturing Canada. We benefit from investments in technology, innovation, and industry as well as the high-skilled workforce we’re fortunate to have as our team members. With our Ontario government partners, today we celebrate the results of our past 30 years of manufacturing in Canada, and continue on the path of building for our future.
Toyota’s announcement was a welcome sight to the province once considered the manufacturing hub for the automotive industry in North America. Changes to consumer tastes and the increasing access to cheap labour in Mexico via NAFTA and now CUSMA, along with rising trade nationalism in the United States, have forced companies to relocate manufacturing facilities further south. This sentiment was further underscored as General Motors decided to close to its plant in Oshawa, Ontario, at the end of 2019 and move four-door sedan and truck production to its plants in Indiana.
While Tokyo-based Honda Motor Co. Ltd. also established a manufacturing plant in Alliston, Ontario, around the same time as Toyota in 1986, other Japanese automakers have used Ontario as a base for parts manufacturing or have partnered with existing Canadian parts suppliers for their North American operations. Going forward, automakers are expected to invest heavily in research and development as the industry moves toward developing autonomous and electric vehicles.
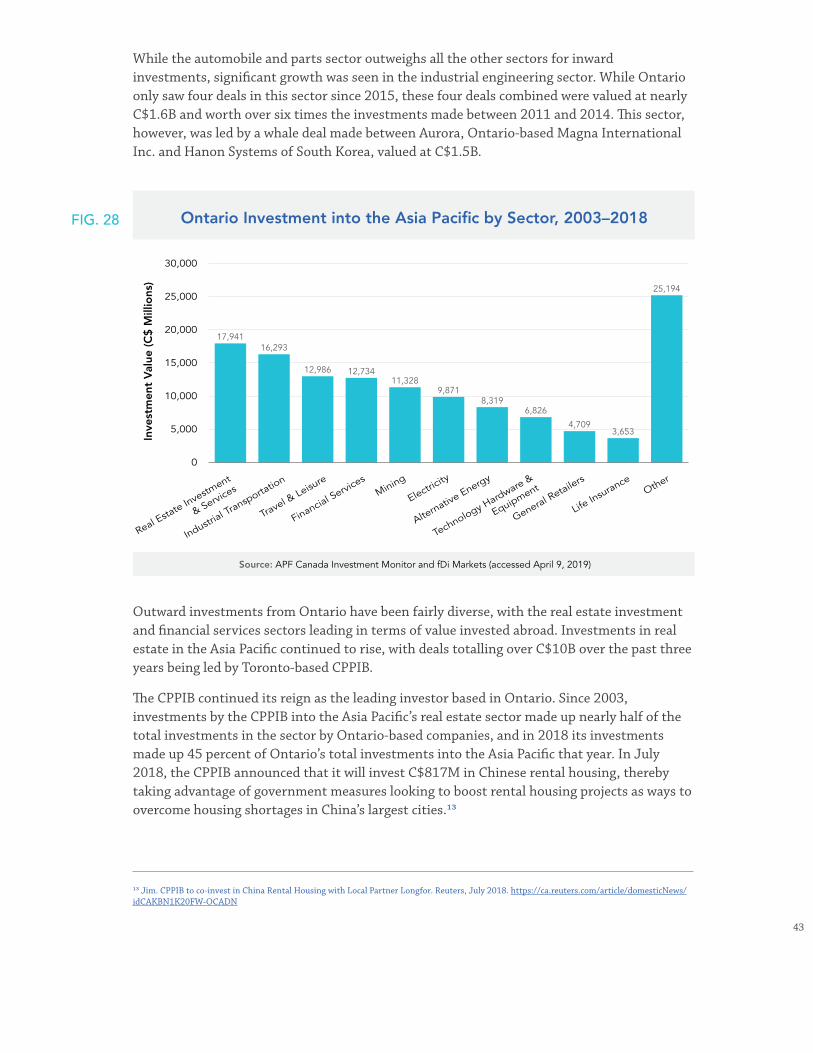
43
While the automobile and parts sector outweighs all the other sectors for inward investments, significant growth was seen in the industrial engineering sector. While Ontario only saw four deals in this sector since 2015, these four deals combined were valued at nearly C$1.6B and worth over six times the investments made between 2011 and 2014. This sector, however, was led by a whale deal made between Aurora, Ontario-based Magna International Inc. and Hanon Systems of South Korea, valued at C$1.5B.
Source: APF Canada Investment Monitor and fDi Markets (accessed April 9, 2019)
0
5,000
Travel & Leisu
re
Financial Services
Technology Hardware &
Equipment
Industrial Transporta
tion
Mining
Alternative Energy
Electricity
Life Insurance
General Retailers
Other
Real Esta
te Investm
ent
& Services
10,000
15,000
20,000
25,000
30,000
Ontario Investment into the Asia Pacific by Sector, 2003–2018
17,94116,293
12,986 12,73411,328
9,8718,319
6,826
4,7093,653
25,194
Outward investments from Ontario have been fairly diverse, with the real estate investment and financial services sectors leading in terms of value invested abroad. Investments in real estate in the Asia Pacific continued to rise, with deals totalling over C$10B over the past three years being led by Toronto-based CPPIB.
The CPPIB continued its reign as the leading investor based in Ontario. Since 2003, investments by the CPPIB into the Asia Pacific’s real estate sector made up nearly half of the total investments in the sector by Ontario-based companies, and in 2018 its investments made up 45 percent of Ontario’s total investments into the Asia Pacific that year. In July 2018, the CPPIB announced that it will invest C$817M in Chinese rental housing, thereby taking advantage of government measures looking to boost rental housing projects as ways to overcome housing shortages in China’s largest cities.13
13 Jim. CPPIB to co-invest in China Rental Housing with Local Partner Longfor. Reuters, July 2018. https://ca.reuters.com/article/domesticNews/idCAKBN1K20FW-OCADN
FIG. 28
44
Investments in the travel and leisure sector in the Asia Pacific have also been significant, totalling nearly C$13B since 2003. However, deals to the Asia Pacific in this sector have dropped off significantly, with the number of deals down to just nine, and the investment value down nearly 91 percent since 2014. Recent investments in this sector, however, have totalled C$85M since 2015 and have been concentrated in South and Southeast Asia, regions that are expected to be the drivers of economic growth within Asia in the coming years.14 Tim Hortons, for example, successfully established its first location in the Philippines in 2017. This kicked off the company’s Asia expansion plan, which will see them take advantage of growing middle classes across the region. By 2018, Tim Hortons had expanded to 11 restaurants in the country, and it has its sights set on entering the Chinese market.
Quebec: Striking a Technology Goldmine
As Canada’s largest province by geographic area and the second-largest contributor to the country’s GDP, Quebec plays a crucial role in Canada’s economy. Historically, the province has ranked fourth for both inward and outward investments with the Asia Pacific in terms of investment amount, ranking behind Ontario, BC, and Alberta. However, when looking strictly at the time period between 2015 and 2018, Quebec managed to pass Alberta in terms of investments to the Asia Pacific, but now ranks behind the rest of Canada as an aggregate for investments from the Asia Pacific. The value of inward investments from the Asia Pacific are higher now than in the years before the recession; however, since 2014 investment values have trended downward slightly. Despite this, Quebec has been seeing an increase in investment deals following a decline during the Great Recession. Since 2015, Quebec has received 35 investment deals, exceeding the 28 deals Quebec saw prior to the recession.
The value of Quebec’s outward investments in the Asia Pacific took a hit around the recession years and have recovered slightly but are still below the values seen prior to the recession. Despite the decline in investment value, the number of investment deals made in the Asia Pacific between 2007 and 2014 had been stable, followed by a slight decline between 2015 and 2018.
14 PwC. The World in 2050. https://www.pwc.com/gx/en/world-2050/assets/pwc-the-world-in-2050-full-report-feb-2017.pdf
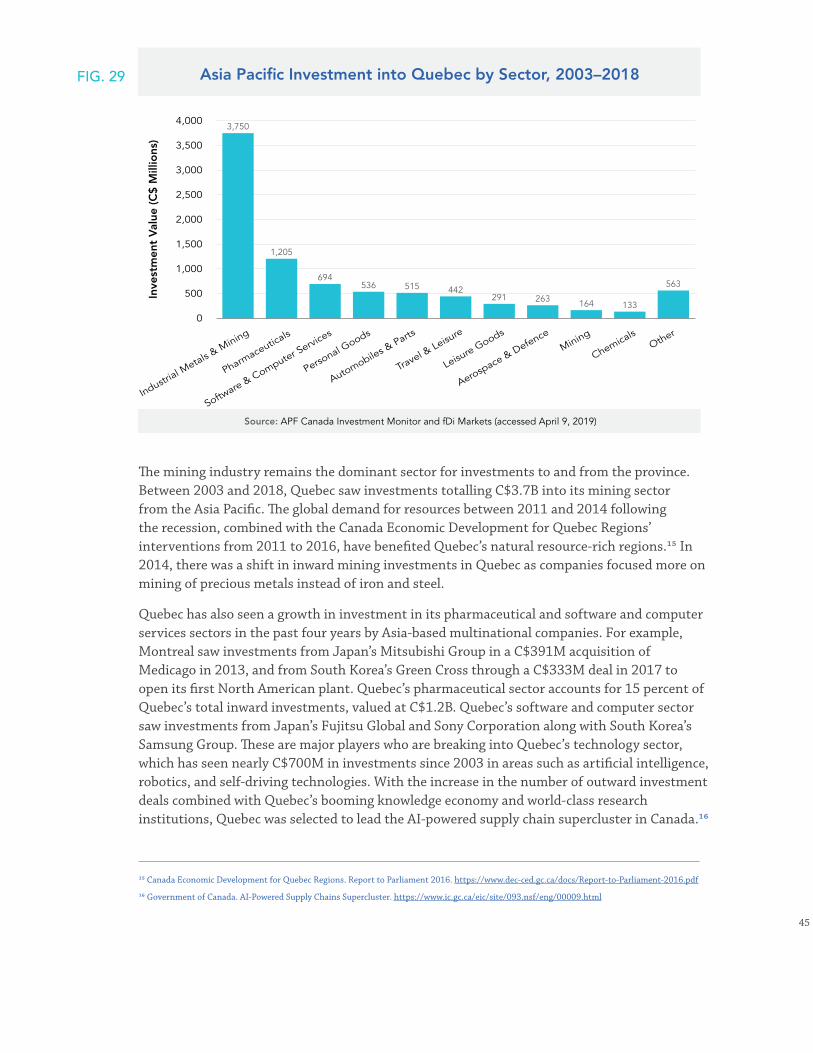
45
Source: APF Canada Investment Monitor and fDi Markets (accessed April 9, 2019)
0
500
Software & Computer S
ervices
Personal G
oods
Pharmaceuticals
Industrial M
etals & M
ining
Automobiles & Parts
Leisure Goods
Aerospace & Defence
Travel & Leisu
re
ChemicalsMining
Other
1,000
1,500
2,000
2,500
3,000
3,500
4,000
Asia Pacific Investment into Quebec by Sector, 2003–2018
3,750
1,205
694536 515 442
291 263 164 133
563
The mining industry remains the dominant sector for investments to and from the province. Between 2003 and 2018, Quebec saw investments totalling C$3.7B into its mining sector from the Asia Pacific. The global demand for resources between 2011 and 2014 following the recession, combined with the Canada Economic Development for Quebec Regions’ interventions from 2011 to 2016, have benefited Quebec’s natural resource-rich regions.15 In 2014, there was a shift in inward mining investments in Quebec as companies focused more on mining of precious metals instead of iron and steel.
Quebec has also seen a growth in investment in its pharmaceutical and software and computer services sectors in the past four years by Asia-based multinational companies. For example, Montreal saw investments from Japan’s Mitsubishi Group in a C$391M acquisition of Medicago in 2013, and from South Korea’s Green Cross through a C$333M deal in 2017 to open its first North American plant. Quebec’s pharmaceutical sector accounts for 15 percent of Quebec’s total inward investments, valued at C$1.2B. Quebec’s software and computer sector saw investments from Japan’s Fujitsu Global and Sony Corporation along with South Korea’s Samsung Group. These are major players who are breaking into Quebec’s technology sector, which has seen nearly C$700M in investments since 2003 in areas such as artificial intelligence, robotics, and self-driving technologies. With the increase in the number of outward investment deals combined with Quebec’s booming knowledge economy and world-class research institutions, Quebec was selected to lead the AI-powered supply chain supercluster in Canada.16
15 Canada Economic Development for Quebec Regions. Report to Parliament 2016. https://www.dec-ced.gc.ca/docs/Report-to-Parliament-2016.pdf
16 Government of Canada. AI-Powered Supply Chains Supercluster. https://www.ic.gc.ca/eic/site/093.nsf/eng/00009.html
FIG. 29

46
BOX 5. BRINGING THE “LIFE” BACK TO QUEBEC’S LIFE SCIENCES INDUSTRY
While Toronto is known as Canada’s financial capital and Calgary as Canada’s oil capital, Quebec has been establishing itself as a hub for the pharmaceutical and life sciences industry. Southeastern Quebec has been home to companies and research centres who have benefited from easy access to a highly skilled workforce along with investment incentives from the province of Quebec. A blip in the industry following the 2008 recession led to some centres closing or laying off staff. In 2012, industry giants Sanofi and Johnson & Johnson laid off 226 people in an industry that at the time had already lost nearly 3,000 jobs since 2006 despite the Quebec’s government continued support of the industry through incentives. However, this downturn in the industry did not seem to affect investments coming from Asia, as Quebec saw more investments in its pharmaceutical sector in the five years following the 2008 recession compared to the five years before the recession, capped off by an investment by Japanese multinational corporation Mitsubishi Group.
Mitsubishi Group, through its subsidiary Mitsubishi Tanabe Pharma Corp., acquired a 60 percent stake in Quebec City-based Medicago in a deal just shy of C$400M. While other companies were looking for ways to downsize and streamline operations, Medicago viewed this investment as an opportunity to “foster the development of innovative vaccines with the financial stability to expand our Quebec, Canadian, US, and global operations,” according to CEO Andy Sheldon. Karnataka-based Strides Pharma Global Private Limited has also maintained a presence in the southern Quebec region through a joint venture in 2012 with Jamp Pharma and an acquisition of Pharmapar in 2018 from KDA.
Going forward, Quebec remains committed in its support of the pharmaceutical sector. In 2017, the province introduced the Quebec Life Sciences Strategy, which set aside C$205M to help increase investments in research and innovation in the life sciences sector, to foster creation of innovating companies, to attract new private investments, and to promote the greater role innovation will play in the health and social services network. Through this strategy, the province hopes to attract C$4B in private investments by 2022 and to be one of North America’s top five life sciences hubs by 2027.
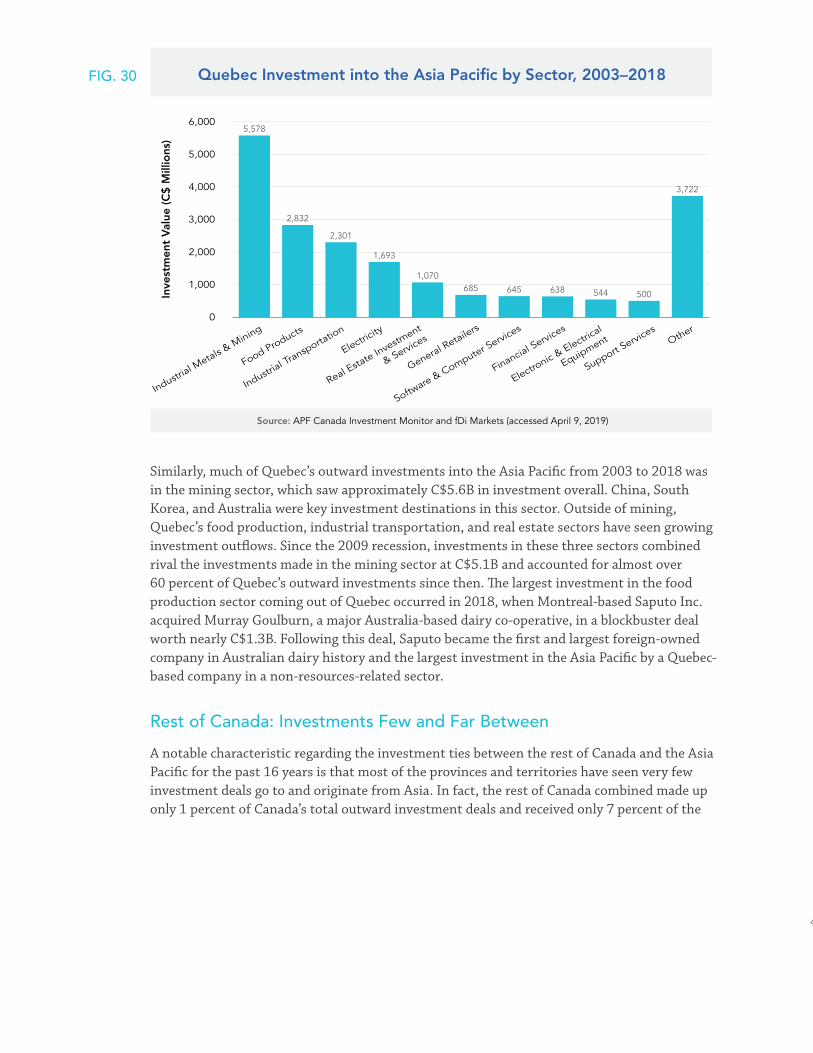
47
Source: APF Canada Investment Monitor and fDi Markets (accessed April 9, 2019)
0
Industrial Transporta
tion
Electricity
Food Products
Industrial M
etals & M
ining
Real Esta
te Investm
ent
& Services
Software & Computer S
ervices
Financial Services
General Retailers
Support Services
Electronic & Electric
al
Equipment Other
1,000
2,000
3,000
4,000
5,000
6,000
Quebec Investment into the Asia Pacific by Sector, 2003–2018
5,578
2,832
2,301
1,693
1,070685 645 638 544 500
3,722
Similarly, much of Quebec’s outward investments into the Asia Pacific from 2003 to 2018 was in the mining sector, which saw approximately C$5.6B in investment overall. China, South Korea, and Australia were key investment destinations in this sector. Outside of mining, Quebec’s food production, industrial transportation, and real estate sectors have seen growing investment outflows. Since the 2009 recession, investments in these three sectors combined rival the investments made in the mining sector at C$5.1B and accounted for almost over 60 percent of Quebec’s outward investments since then. The largest investment in the food production sector coming out of Quebec occurred in 2018, when Montreal-based Saputo Inc. acquired Murray Goulburn, a major Australia-based dairy co-operative, in a blockbuster deal worth nearly C$1.3B. Following this deal, Saputo became the first and largest foreign-owned company in Australian dairy history and the largest investment in the Asia Pacific by a Quebec-based company in a non-resources-related sector.
Rest of Canada: Investments Few and Far Between
A notable characteristic regarding the investment ties between the rest of Canada and the Asia Pacific for the past 16 years is that most of the provinces and territories have seen very few investment deals go to and originate from Asia. In fact, the rest of Canada combined made up only 1 percent of Canada’s total outward investment deals and received only 7 percent of the
FIG. 30
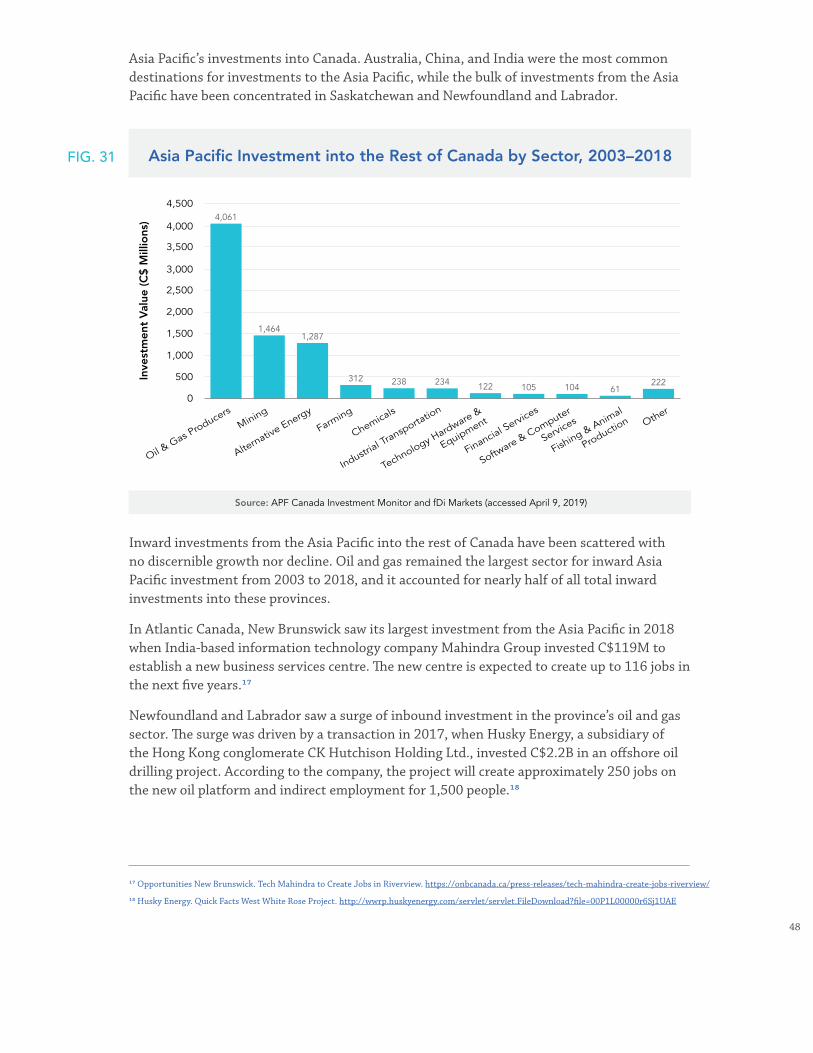
48
Asia Pacific’s investments into Canada. Australia, China, and India were the most common destinations for investments to the Asia Pacific, while the bulk of investments from the Asia Pacific have been concentrated in Saskatchewan and Newfoundland and Labrador.
Inward investments from the Asia Pacific into the rest of Canada have been scattered with no discernible growth nor decline. Oil and gas remained the largest sector for inward Asia Pacific investment from 2003 to 2018, and it accounted for nearly half of all total inward investments into these provinces.
In Atlantic Canada, New Brunswick saw its largest investment from the Asia Pacific in 2018 when India-based information technology company Mahindra Group invested C$119M to establish a new business services centre. The new centre is expected to create up to 116 jobs in the next five years.17
Newfoundland and Labrador saw a surge of inbound investment in the province’s oil and gas sector. The surge was driven by a transaction in 2017, when Husky Energy, a subsidiary of the Hong Kong conglomerate CK Hutchison Holding Ltd., invested C$2.2B in an offshore oil drilling project. According to the company, the project will create approximately 250 jobs on the new oil platform and indirect employment for 1,500 people.18
Source: APF Canada Investment Monitor and fDi Markets (accessed April 9, 2019)
0
Alternative Energy
Farming
ChemicalsMining
Oil & Gas P
roducers
Financial Services
Industrial Transporta
tion
Fishing & Animal
Production
Software & Computer
Services
Technology Hardware &
Equipment Other
1,000
500
1,500
2,000
2,500
3,000
3,500
4,000
4,500
Asia Pacific Investment into the Rest of Canada by Sector, 2003–2018
4,061
1,4641,287
312 238 234 122 105 104 61222
17 Opportunities New Brunswick. Tech Mahindra to Create Jobs in Riverview. https://onbcanada.ca/press-releases/tech-mahindra-create-jobs-riverview/
18 Husky Energy. Quick Facts West White Rose Project. http://wwrp.huskyenergy.com/servlet/servlet.FileDownload?file=00P1L00000r6Sj1UAE
FIG. 31
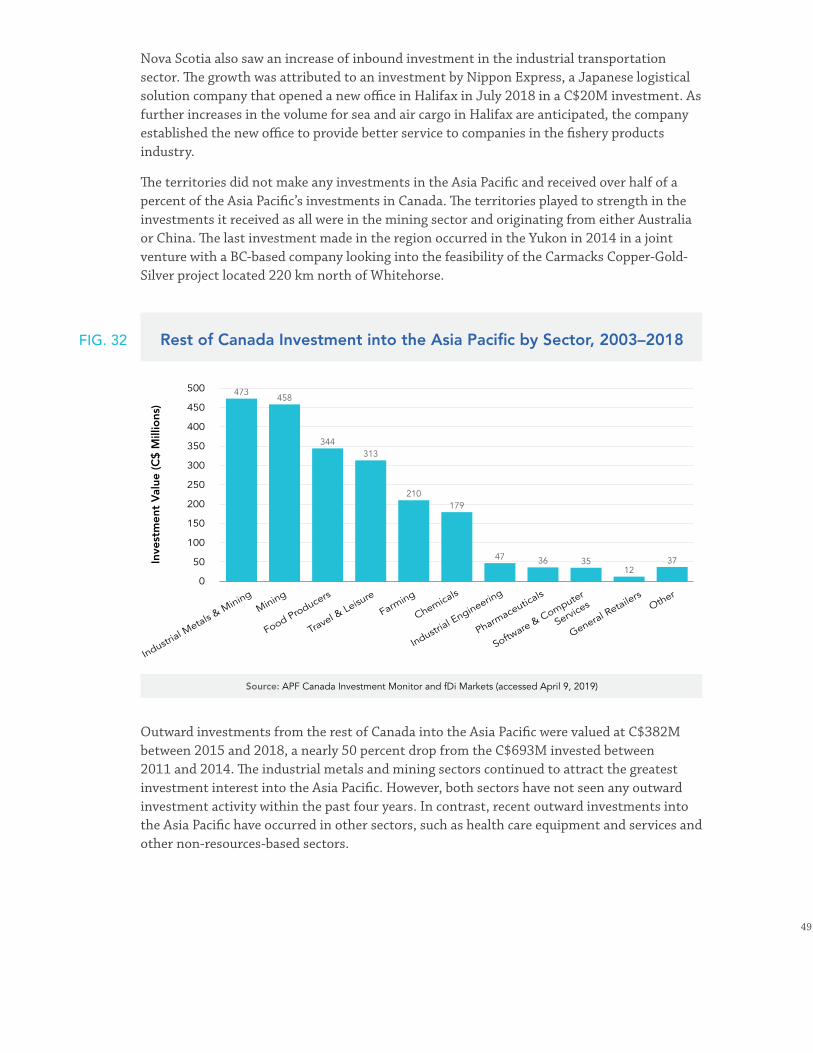
49
Nova Scotia also saw an increase of inbound investment in the industrial transportation sector. The growth was attributed to an investment by Nippon Express, a Japanese logistical solution company that opened a new office in Halifax in July 2018 in a C$20M investment. As further increases in the volume for sea and air cargo in Halifax are anticipated, the company established the new office to provide better service to companies in the fishery products industry.
The territories did not make any investments in the Asia Pacific and received over half of a percent of the Asia Pacific’s investments in Canada. The territories played to strength in the investments it received as all were in the mining sector and originating from either Australia or China. The last investment made in the region occurred in the Yukon in 2014 in a joint venture with a BC-based company looking into the feasibility of the Carmacks Copper-Gold-Silver project located 220 km north of Whitehorse.
Outward investments from the rest of Canada into the Asia Pacific were valued at C$382M between 2015 and 2018, a nearly 50 percent drop from the C$693M invested between 2011 and 2014. The industrial metals and mining sectors continued to attract the greatest investment interest into the Asia Pacific. However, both sectors have not seen any outward investment activity within the past four years. In contrast, recent outward investments into the Asia Pacific have occurred in other sectors, such as health care equipment and services and other non-resources-based sectors.
Source: APF Canada Investment Monitor and fDi Markets (accessed April 9, 2019)
0
Food Producers
Travel & Leisu
re
General Retailers
Farming
Mining
Industrial M
etals & M
ining
Pharmaceuticals
Chemicals
Industrial E
ngineering
Software & Computer
Services Other
100
50
150
200
250
300
350
400
450
500
Rest of Canada Investment into the Asia Pacific by Sector, 2003–2018
473458
344313
210179
47 36 3512
37
FIG. 32
50
Another interesting investment deal came in 2018 when Acadian Seaplants, a Nova Scotian company specializing in biostimulant and bionutritional solutions, established an Indian subsidiary and opened a processing facility in Vadodara, India. Through this investment, the company hoped to better meet the needs of the local farm owners with the new subsidiary and facility in an investment valued at C$36M.19
19 Hortidaily. Acadian Seaplants Established Subsidiary Company in India. https://www.hortidaily.com/article/6043023/can-ns-acadian-seaplants-establishes-subsidiary-company-in-india/
51
Key Section Takeaways
• Over the course of the last 16 years, Asia Pacific investors have invested in 165 Canadian cities.
• Major Canadian cities, such as Calgary, Toronto, Vancouver, and Montreal, are among the top recipients of Asia Pacific investment, but many smaller cities and regions, such as Kitimat, Fort McMurray, and Woodstock, punch above their weight and have become major hubs for Asia Pacific investment.
• Canadian investors have invested in 465 Asia Pacific cities from 2003 to 2018.
• Melbourne and Sydney are the top two destinations for Canadian investors, outranking other larger economic hubs in the regions such as Beijing, Shanghai, and Mumbai.
• Canadian investment into China has increasingly moved away from Beijing and Shanghai to other cities since 2011.
The Street-Level View: Metropolitan Areas as Hubs of Investment
CHAPTER 3: CITY-LEVEL HUBS OF INVESTMENT ACTIVITY
Canada’s cities provide unique insights into understanding patterns in the Canada-Asia Pacific investment relationship. At the city level, it becomes possible to identify the range of Canada’s investment hubs, talk about more distinct stories across the history of investment, and map out the landscape of where the relationship has gone thus far. While many of the top recipients of the Asia Pacific’s investment into Canada are likely not surprising and already well-known across Canada as population and economic hubs (such as Toronto, Vancouver, and Montreal), their relative rankings and variations in sectoral composition indicate that there is no standard relationship between Canada’s biggest centres and the Asia Pacific.
In addition to Canada’s major economic centres, a city-level look at direct investment uncovers some less-obvious destinations. While perhaps not household names outside of their immediate regions or sectors, several key, low-profile cities have emerged as hubs of Asian investment in Canada. For example, the hamlet of Duvernay, Alberta, has brought in 2 percent of all Asia Pacific investment into the country (C$2.4B of C$121.3B); smaller cities such as Woodstock and Cambridge, Ontario, have brought in billions apiece (C$5.1B and C$3.0B, respectively). In all, there is not just one story to tell about Asia Pacific investment in Canada, but 152: one for each distinct city-level recipient of Asia Pacific investment.
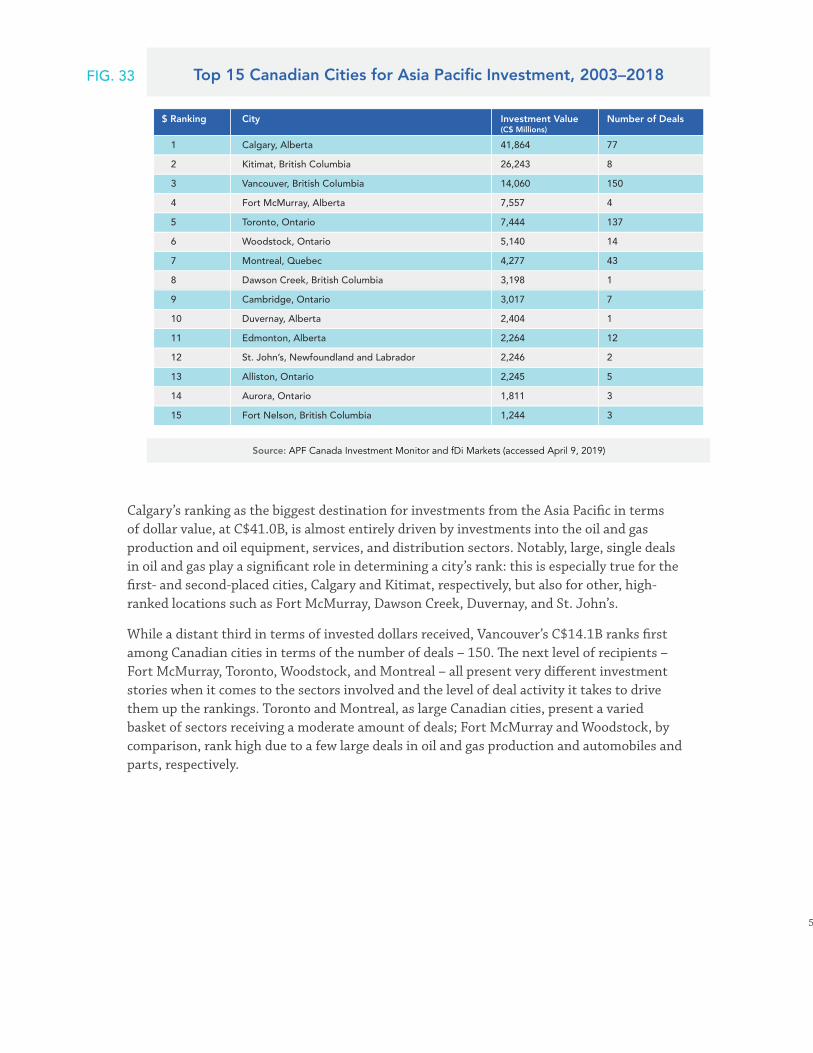
52
Calgary’s ranking as the biggest destination for investments from the Asia Pacifi c in terms of dollar value, at C$41.0B, is almost entirely driven by investments into the oil and gas production and oil equipment, services, and distribution sectors. Notably, large, single deals in oil and gas play a signifi cant role in determining a city’s rank: this is especially true for the fi rst- and second-placed cities, Calgary and Kitimat, respectively, but also for other, high-ranked locations such as Fort McMurray, Dawson Creek, Duvernay, and St. John’s.
While a distant third in terms of invested dollars received, Vancouver’s C$14.1B ranks fi rst among Canadian cities in terms of the number of deals – 150. Th e next level of recipients – Fort McMurray, Toronto, Woodstock, and Montreal – all present very diff erent investment stories when it comes to the sectors involved and the level of deal activity it takes to drive them up the rankings. Toronto and Montreal, as large Canadian cities, present a varied basket of sectors receiving a moderate amount of deals; Fort McMurray and Woodstock, by comparison, rank high due to a few large deals in oil and gas production and automobiles and parts, respectively.
Top 15 Canadian Cities for Asia Pacific Investment, 2003–2018
$ Ranking
1
2
3
4
5
6
7
8
9
10
11
12
13
14
15
41,864
26,243
14,060
7,557
7,444
5,140
4,277
3,198
3,017
2,404
2,264
2,246
2,245
1,811
1,244
77
8
150
4
137
14
43
1
7
1
12
2
5
3
3
Calgary, Alberta
Kitimat, British Columbia
Vancouver, British Columbia
Fort McMurray, Alberta
Toronto, Ontario
Woodstock, Ontario
Montreal, Quebec
Dawson Creek, British Columbia
Cambridge, Ontario
Duvernay, Alberta
Edmonton, Alberta
St. John’s, Newfoundland and Labrador
Alliston, Ontario
Aurora, Ontario
Fort Nelson, British Columbia
City Investment Value(C$ Millions)
Number of Deals
Source: APF Canada Investment Monitor and fDi Markets (accessed April 9, 2019)
FIG. 33

53
BOX 6. SOMETHING TO BE JOLLIBEE ABOUT
Ask your average Canadian to picture a fast-food chain mascot. Most likely they are picturing a clown named Ronald, a southern colonel, or a red-headed girl with two pigtails. Ask someone in the Philippines and their mind jumps to a jolly red-and-white bumblebee. Well, this jolly bumblebee from Quezon City may soon be buzzing around the minds of Canadians too.
The bumblebee is the mascot of the aptly named Jollibee, a Philippines-based fast-food giant. Jollibee began as an ice cream parlour in 1975. However, when its hot meals became even more popular than the ice cream, Jollibee was turned into a hamburger joint that would revolutionize the fast-food industry in the Philippines. Go to the Philippines and Jollibee is a must stop visit. Just ask Canadian Prime Minister Justin Trudeau, who stopped by an outlet on his way to attend the Association of Southeast Asian Nations Summit in November 2017.
There are currently four Jollibee locations in Canada. The first two locations opened in Winnipeg in 2016 and 2017, and the company continued its expansion into Canada with two more locations opening in the Greater Toronto Area in April and July 2018. Looking forward, Jollibee plans to open 100 Canadian stores by 2023, including in Edmonton, Calgary, and Vancouver.
The entry of Jollibee into the North American marketplace to meet the hungry demands of Canada’s growing Filipino population is an example of the transformational effects of migration and immigration between Canada and Asia, and the movement of not only people but also of goods, culture, and ideas. Statistics Canada reports that 188,805 of the 1.2 million immigrants who arrived between 2011 and 2016 are Filipino.
The global expansion of Jollibee in North America is representative of a recent trend of investments by restaurants and dessert chains from Asia into the Canadian market, such as Chatime, Uncle Tetsu, and Sulbing. While these names may not be familiar outside of Canada’s urban centres, they are growing in popularity each year. Chatime, with over 800 stores worldwide, has opened 31 locations in Ontario and 15 locations in BC, quenching the bubble tea cravings of Canadians one cup at a time since 2011. Sulbing, meanwhile, a South Korean-based bingsu dessert café chain, opened its first Canadian location in Burnaby, BC, in 2018, with plans to open more stores in major Canadian cities.
Perhaps someday a cute bee from the Philippines will also be one of the go-to images of a fast-food chain mascot in Canada.
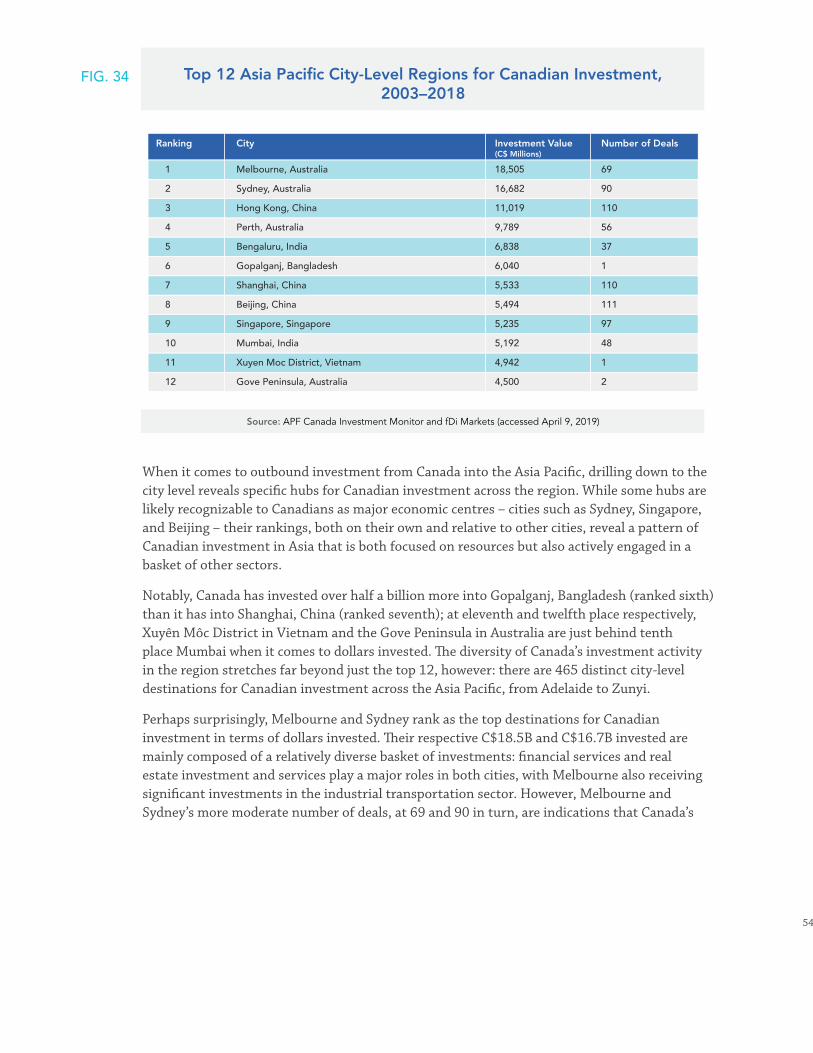
54
Top 12 Asia Pacific City-Level Regions for Canadian Investment, 2003–2018
Ranking
1
2
3
4
5
6
7
8
9
10
11
12
18,505
16,682
11,019
9,789
6,838
6,040
5,533
5,494
5,235
5,192
4,942
4,500
69
90
110
56
37
1
110
111
97
48
1
2
Melbourne, Australia
Sydney, Australia
Hong Kong, China
Perth, Australia
Bengaluru, India
Gopalganj, Bangladesh
Shanghai, China
Beijing, China
Singapore, Singapore
Mumbai, India
Xuyen Moc District, Vietnam
Gove Peninsula, Australia
City Investment Value(C$ Millions)
Number of Deals
Source: APF Canada Investment Monitor and fDi Markets (accessed April 9, 2019)
When it comes to outbound investment from Canada into the Asia Pacifi c, drilling down to the city level reveals specifi c hubs for Canadian investment across the region. While some hubs are likely recognizable to Canadians as major economic centres – cities such as Sydney, Singapore, and Beijing – their rankings, both on their own and relative to other cities, reveal a pattern of Canadian investment in Asia that is both focused on resources but also actively engaged in a basket of other sectors.
Notably, Canada has invested over half a billion more into Gopalganj, Bangladesh (ranked sixth) than it has into Shanghai, China (ranked seventh); at eleventh and twelfth place respectively, Xuyên Môc District in Vietnam and the Gove Peninsula in Australia are just behind tenth place Mumbai when it comes to dollars invested. Th e diversity of Canada’s investment activity in the region stretches far beyond just the top 12, however: there are 465 distinct city-level destinations for Canadian investment across the Asia Pacifi c, from Adelaide to Zunyi.
Perhaps surprisingly, Melbourne and Sydney rank as the top destinations for Canadian investment in terms of dollars invested. Th eir respective C$18.5B and C$16.7B invested are mainly composed of a relatively diverse basket of investments: fi nancial services and real estate investment and services play a major roles in both cities, with Melbourne also receiving signifi cant investments in the industrial transportation sector. However, Melbourne and Sydney’s more moderate number of deals, at 69 and 90 in turn, are indications that Canada’s
FIG. 34

55
activity in these two Australian cities involves relatively larger deals than many other major hubs for Canadian investment in the region.
Coming in at a more distant third and fourth are Hong Kong (C$11.0B) and Perth (C$9.8B). Despite close investment values, these two cities tell very different tales of Canadian investment in the region: Canadian investment in Hong Kong is especially focused on general retailers and financial services, part of a total 110 deals into the city; by contrast, Canada’s investment in Perth is focused on the oil and gas production and mining sectors, part of a much lower total of 56 deals.
As is often the case with FDI, some of the top-ranked hubs for investment rank highly due to a few, or sometimes even one, large investment; this was especially the case for Bengaluru, the Gove Peninsula, Gopalganj, and Xuyên Môc.
The city-level discussions presented below were selected to highlight city stories that demonstrate high levels of investment flow and activity in recent years and that reflect the breadth and depth of Canada-Asia Pacific investment relationships.
Montreal: City’s Best and Brightest Attract Asia Pacific Investment
Montreal, Canada’s second most populous city, ranks seventh among Canadian cities in attracting Asia Pacific investment. From 2003 to 2006, Montreal received more than C$654M in investment from the Asia Pacific, which dipped down to C$445M for the 2007 to 2010 period. After a substantial rise to C$2.0B from 2011 to 2014, inbound investment into Montreal then dropped by C$729M in 2015 to 2018 from the previous four-year period, down to C$1.2B. Over half the value for the 2011 to 2014 period was the result of a high-dollar-value acquisition in 2011, when a subsidiary of China Minmetals Corporation acquired the Montreal-based Anvil Mining Limited for C$1.3B. However, the number of inbound investment deals in Montreal in the most recent four years remained higher than it was in the previous four-year periods.
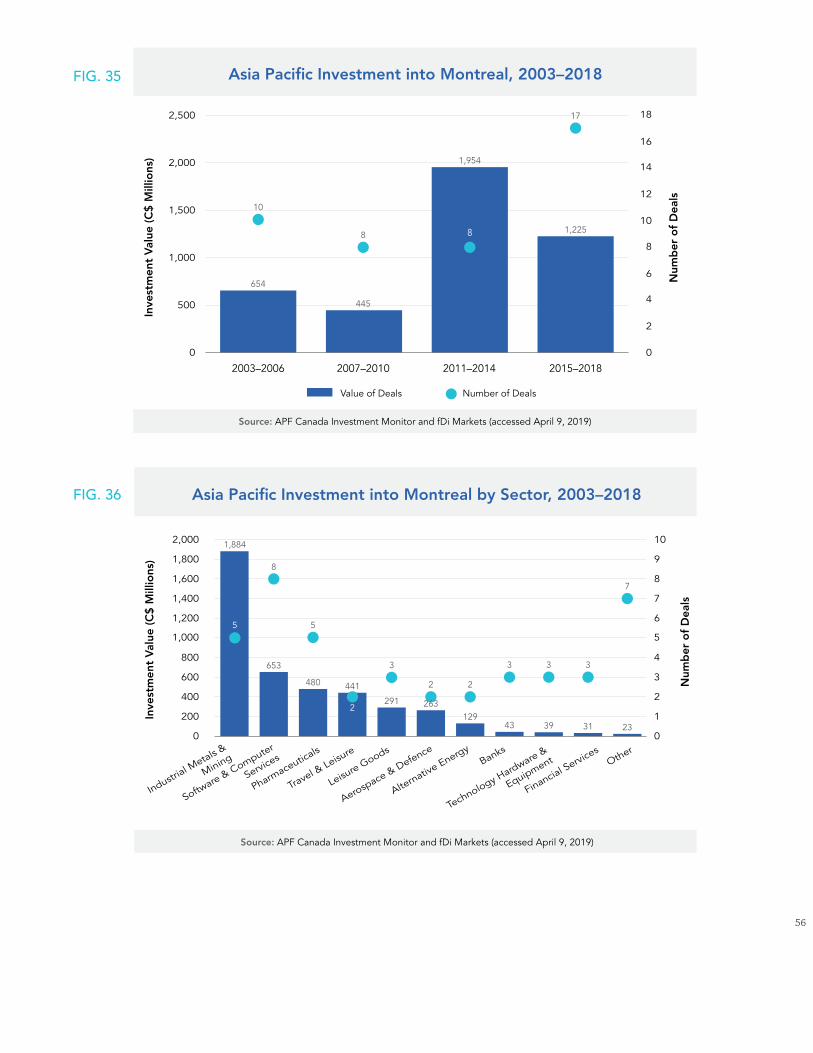
56
Source: APF Canada Investment Monitor and fDi Markets (accessed April 9, 2019)
0
Pharmaceuticals
Travel & Leisu
re
Financial Services
Leisure Goods
Industrial M
etals &
Mining
Software & Computer
Services Banks
Aerospace & Defence
Alternative Energy
Technology Hardware &
Equipment Other
400
200
600
800
1,000
1,200
1,400
1,600
1,800
2,000
0
2
1
3
4
5
6
7
8
9
10
Asia Pacific Investment into Montreal by Sector, 2003–2018
1,884
8
653
480
5
441
2
5
291
3
263129
43 39
3 3
7
31 23
3
22
FIG. 36
Source: APF Canada Investment Monitor and fDi Markets (accessed April 9, 2019)
0
500
1,000
1,500
2,000
2,500
0
2
4
6
8
10
12
14
16
18
2003–2006 2007–2010 2011–2014 2015–2018
Value of Deals Number of Deals
Asia Pacific Investment into Montreal, 2003–2018
1,2258
1,954
8
445
654
10
17
FIG. 35
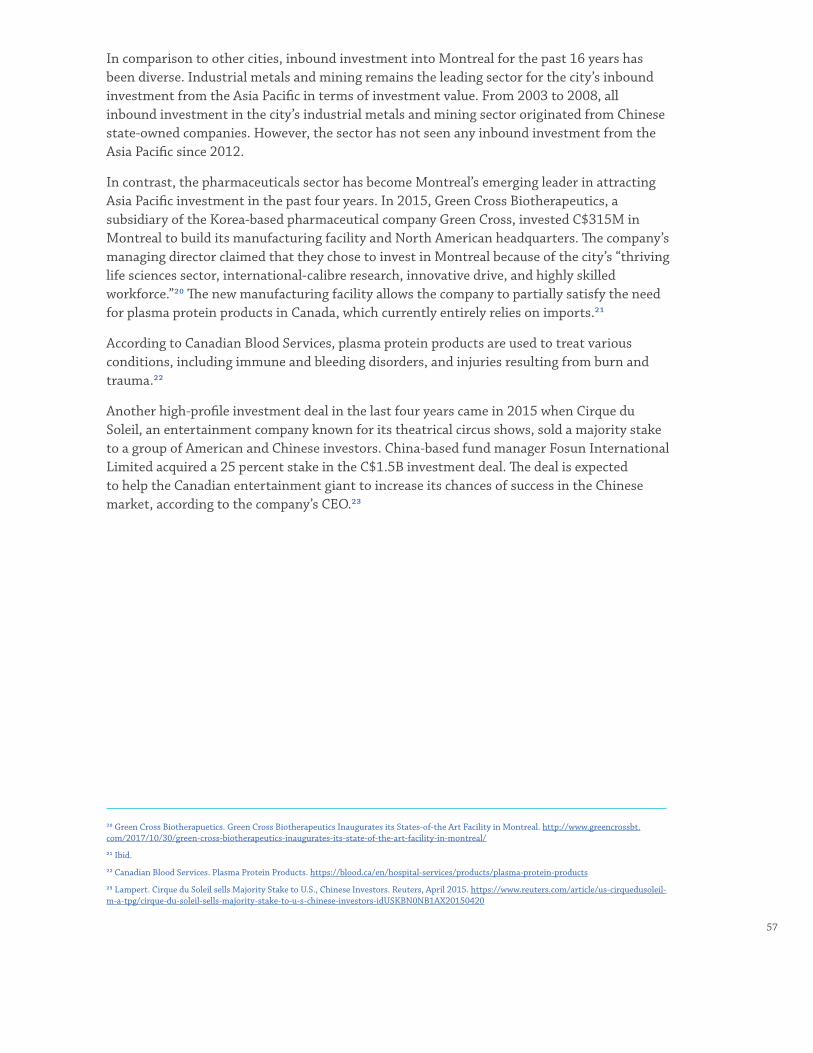
57
In comparison to other cities, inbound investment into Montreal for the past 16 years has been diverse. Industrial metals and mining remains the leading sector for the city’s inbound investment from the Asia Pacific in terms of investment value. From 2003 to 2008, all inbound investment in the city’s industrial metals and mining sector originated from Chinese state-owned companies. However, the sector has not seen any inbound investment from the Asia Pacific since 2012.
In contrast, the pharmaceuticals sector has become Montreal’s emerging leader in attracting Asia Pacific investment in the past four years. In 2015, Green Cross Biotherapeutics, a subsidiary of the Korea-based pharmaceutical company Green Cross, invested C$315M in Montreal to build its manufacturing facility and North American headquarters. The company’s managing director claimed that they chose to invest in Montreal because of the city’s “thriving life sciences sector, international-calibre research, innovative drive, and highly skilled workforce.”20 The new manufacturing facility allows the company to partially satisfy the need for plasma protein products in Canada, which currently entirely relies on imports.21
According to Canadian Blood Services, plasma protein products are used to treat various conditions, including immune and bleeding disorders, and injuries resulting from burn and trauma.22
Another high-profile investment deal in the last four years came in 2015 when Cirque du Soleil, an entertainment company known for its theatrical circus shows, sold a majority stake to a group of American and Chinese investors. China-based fund manager Fosun International Limited acquired a 25 percent stake in the C$1.5B investment deal. The deal is expected to help the Canadian entertainment giant to increase its chances of success in the Chinese market, according to the company’s CEO.23
20 Green Cross Biotherapuetics. Green Cross Biotherapeutics Inaugurates its States-of-the Art Facility in Montreal. http://www.greencrossbt.com/2017/10/30/green-cross-biotherapeutics-inaugurates-its-state-of-the-art-facility-in-montreal/
21 Ibid.
22 Canadian Blood Services. Plasma Protein Products. https://blood.ca/en/hospital-services/products/plasma-protein-products
23 Lampert. Cirque du Soleil sells Majority Stake to U.S., Chinese Investors. Reuters, April 2015. https://www.reuters.com/article/us-cirquedusoleil-m-a-tpg/cirque-du-soleil-sells-majority-stake-to-u-s-chinese-investors-idUSKBN0NB1AX20150420
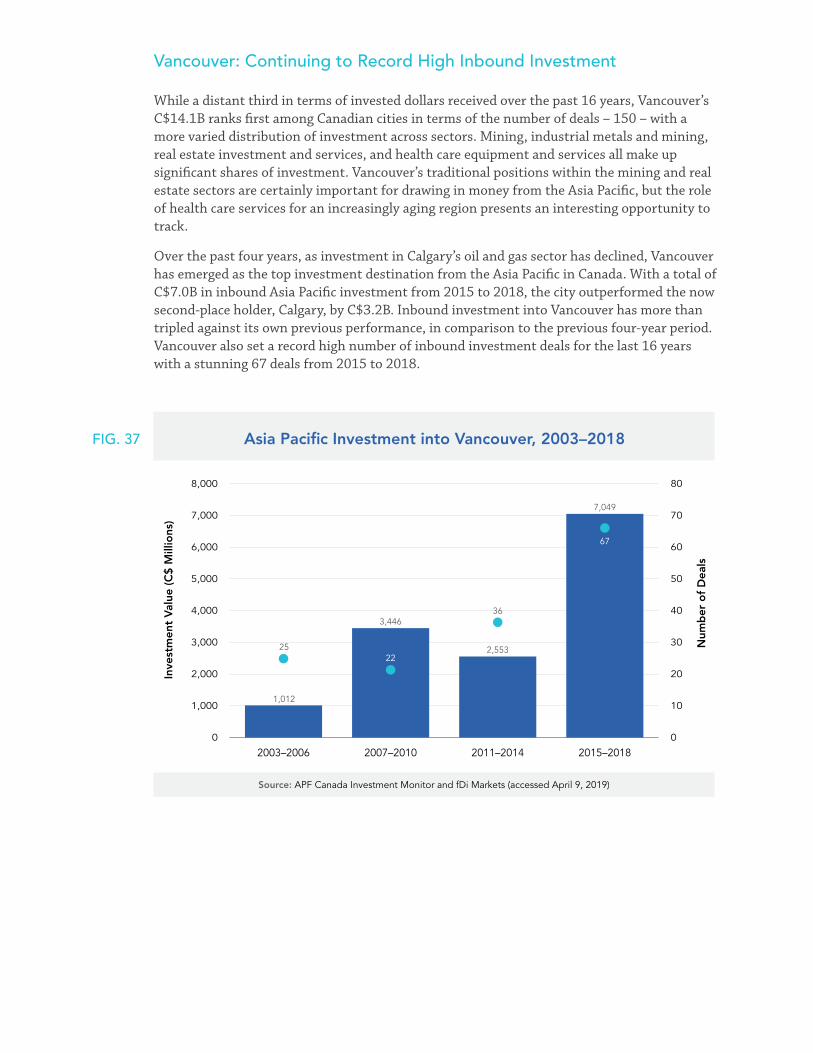
58
Source: APF Canada Investment Monitor and fDi Markets (accessed April 9, 2019)
0
2,000
1,000
3,000
4,000
5,000
6,000
7,000
8,000
0
20
10
30
40
50
60
70
80
Asia Pacific Investment into Vancouver, 2003–2018
2003–2006 2007–2010 2011–2014 2015–2018
1,012
2522
67
363,446
2,553
7,049
FIG. 37
Vancouver: Continuing to Record High Inbound Investment
While a distant third in terms of invested dollars received over the past 16 years, Vancouver’s C$14.1B ranks first among Canadian cities in terms of the number of deals – 150 – with a more varied distribution of investment across sectors. Mining, industrial metals and mining, real estate investment and services, and health care equipment and services all make up significant shares of investment. Vancouver’s traditional positions within the mining and real estate sectors are certainly important for drawing in money from the Asia Pacific, but the role of health care services for an increasingly aging region presents an interesting opportunity to track.
Over the past four years, as investment in Calgary’s oil and gas sector has declined, Vancouver has emerged as the top investment destination from the Asia Pacific in Canada. With a total of C$7.0B in inbound Asia Pacific investment from 2015 to 2018, the city outperformed the now second-place holder, Calgary, by C$3.2B. Inbound investment into Vancouver has more than tripled against its own previous performance, in comparison to the previous four-year period. Vancouver also set a record high number of inbound investment deals for the last 16 years with a stunning 67 deals from 2015 to 2018.

59
Vancouver is one of the two Canadian cities that have received at least C$100M for each of its top 10 sectors – only Toronto has received a similar spread of high investment values. In all, Vancouver has received C$14.1B in investment from the Asia Pacific from 2003 to 2018, covering 30 sectors from mining to pharmaceuticals.
Asia Pacific investors remain most interested in the Vancouver-headquartered mining sector in terms of investment value. From 2003 to 2018, the city’s mining sector has seen 20 inbound investment deals, which totalled more than C$4.6B in investment from the Asia Pacific. However, 41 percent of the investment in the city’s mining sector was attributed to a high-dollar-value investment deal in 2018. The China-based Zijin Mining Group Company Limited acquired Nevsun Resources Limited for C$1.9B, making the investment the largest the city has seen since 2009.
Vancouver also saw another high-profile investment deal in 2017, when a subsidiary of the Chinese Anbang Insurance Group Company Limited invested C$1.0B to acquire a majority stake in Vancouver-based Retirement Concepts, which owns and operates 24 retirement communities in BC, Calgary, and Montreal.24 However, in 2018 the Chinese government seized ownership of Anbang and all its subsidiary businesses, Retirement Concepts included.25
Source: APF Canada Investment Monitor and fDi Markets (accessed April 9, 2019)
0
Other
Oil & Gas P
roducersMining
Industrial M
etals &
Mining
Real Esta
te Investm
ent
& Services
Health Care Equipment
& Services
Coal Mining
General Retailers
Travel & Leisu
re
Leisure Goods
Technology Hardware &
Equipment
1,000
500
1,500
2,000
2,500
3,000
3,500
4,000
4,500
5,000
0
10
20
30
40
50
60
70
Asia Pacific Investment into Vancouver by Sector, 2003–2018
4,583
3,745
1,7651,601
535409 254
83 5 6186 172
128 682
64
2023
74
2 8
FIG. 38
24 Chase. Ottawa Approves Sale of B.C. Retirement-Home Chain to Chinese Group with Murky Ownership. Globe and Mail, February 2017 https://www.theglobeandmail.com/news/politics/ottawa-approves-sale-of-bc-retirement-home-chain-to-chinese-group-with-murky-ownership/article34107591/
25 Zhang et al. Anbang’s Ex-Chief Wu Xiaohui Sentenced to 18 Years Behind Bars for US$12 Billion Fraud, Embezzlement. South China Morning Post, May 2018.

60
At the time of the deal, the investment raised concern over an opaquely structured Chinese enterprise having a stake in the BC’s health care system. Since Anbang’s seizure by the Chinese government, the BC government has launched a review on the new ownership structure of the retirement home chain.
While discussions on investment in Vancouver often centre on real estate, they typically focus on housing, and not broader FDI across the real estate and services sector overall. In all, C$1.8B in foreign direct investment has flowed from the Asia Pacific into Vancouver’s real estate and services sector, the majority of which was a C$1.0B acquisition by Anbang of a controlling interest in Vancouver’s Bentall Centre towers.
Asia Pacific investment into Vancouver has seen significant growth over the last four years, and Chinese investors played a significant role in driving the growth. Within the various trends in the Canada-China economic relationship, Chinese investments account for 71 percent of Vancouver’s total inbound investment from 2003 to 2018, 31 percent higher than the national percentage.
Woodstock, Ontario, Manufactures Success, Ranks as the Sixth Largest in Inbound FDI
The city of Woodstock, Ontario, with a population hovering around 40,000 people, sits 143 km southwest of Toronto.26 Despite its small size, Woodstock ranks sixth among Canadian cities for inbound Asia Pacific investment from 2003 to 2018, outperforming larger cities such as Montreal and Edmonton.
26 Statistics Canada. Population and Dwelling Count Highlight Tables. https://www12.statcan.gc.ca/census-recensement/2016/dp-pd/hlt-fst/pd-pl/Table.cfm?Lang=Eng&T=301&SR=101&RPP=25&S=3&O=D&CMA=0&PR=0#2016A00053532042
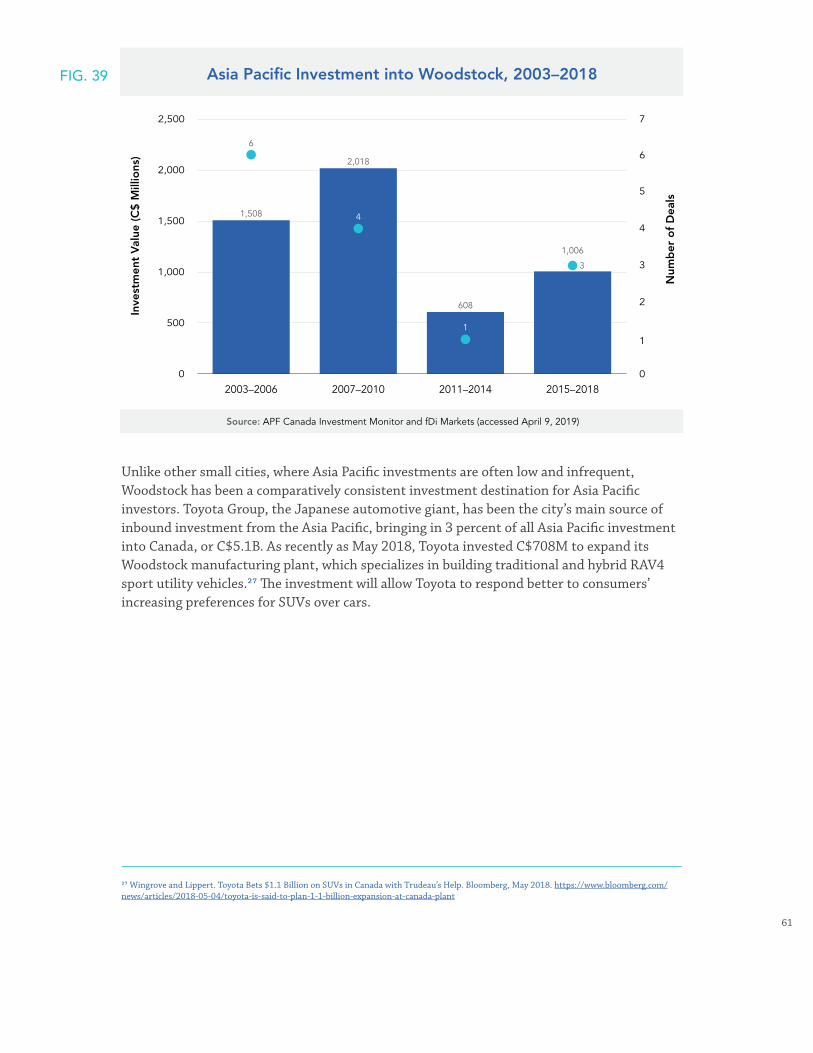
61
Unlike other small cities, where Asia Pacific investments are often low and infrequent, Woodstock has been a comparatively consistent investment destination for Asia Pacific investors. Toyota Group, the Japanese automotive giant, has been the city’s main source of inbound investment from the Asia Pacific, bringing in 3 percent of all Asia Pacific investment into Canada, or C$5.1B. As recently as May 2018, Toyota invested C$708M to expand its Woodstock manufacturing plant, which specializes in building traditional and hybrid RAV4 sport utility vehicles.27 The investment will allow Toyota to respond better to consumers’ increasing preferences for SUVs over cars.
27 Wingrove and Lippert. Toyota Bets $1.1 Billion on SUVs in Canada with Trudeau’s Help. Bloomberg, May 2018. https://www.bloomberg.com/news/articles/2018-05-04/toyota-is-said-to-plan-1-1-billion-expansion-at-canada-plant
Source: APF Canada Investment Monitor and fDi Markets (accessed April 9, 2019)
0
500
1,000
1,500
2,000
2,500
0
2
1
3
4
5
6
7
Asia Pacific Investment into Woodstock, 2003–2018
2003–2006 2007–2010 2011–2014 2015–2018
1,508
6
3
2,018
608
1,006
1
4
FIG. 39
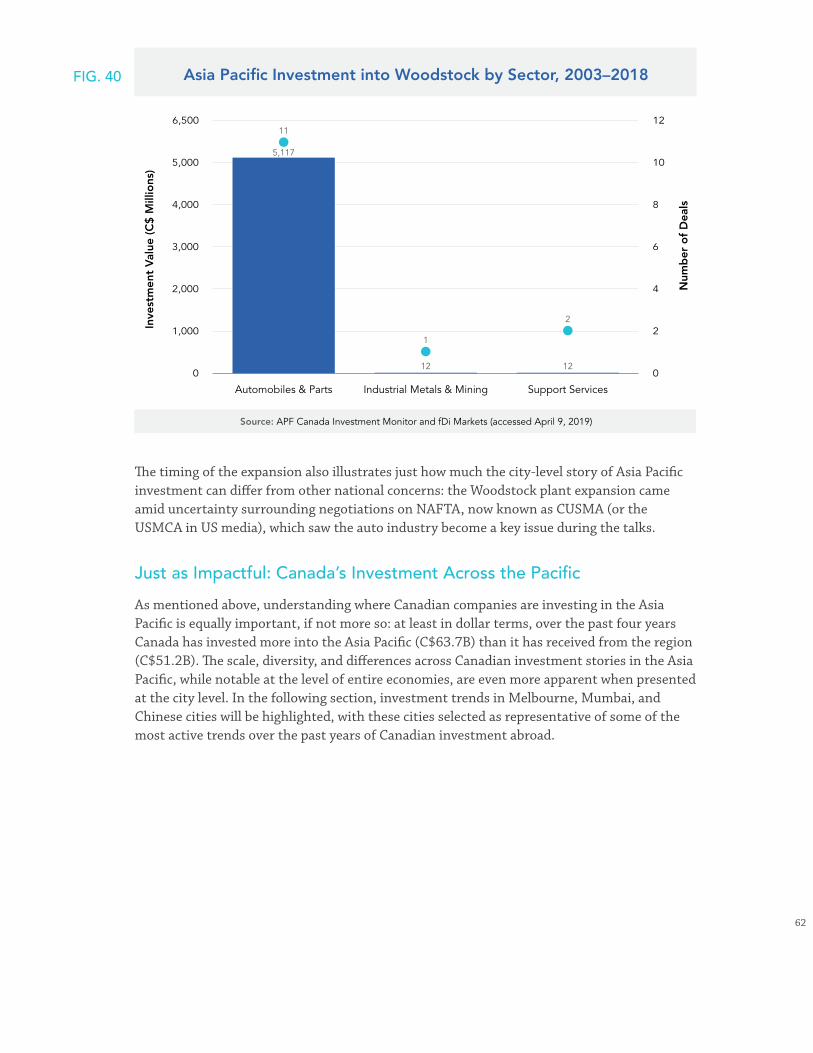
62
Source: APF Canada Investment Monitor and fDi Markets (accessed April 9, 2019)
0
1,000
2,000
3,000
4,000
5,000
6,500
0
4
2
6
8
10
12
Asia Pacific Investment into Woodstock by Sector, 2003–2018
Automobiles & Parts Industrial Metals & Mining Support Services
5,117
11
1
2
12 12
The timing of the expansion also illustrates just how much the city-level story of Asia Pacific investment can differ from other national concerns: the Woodstock plant expansion came amid uncertainty surrounding negotiations on NAFTA, now known as CUSMA (or the USMCA in US media), which saw the auto industry become a key issue during the talks.
Just as Impactful: Canada’s Investment Across the Pacific
As mentioned above, understanding where Canadian companies are investing in the Asia Pacific is equally important, if not more so: at least in dollar terms, over the past four years Canada has invested more into the Asia Pacific (C$63.7B) than it has received from the region (C$51.2B). The scale, diversity, and differences across Canadian investment stories in the Asia Pacific, while notable at the level of entire economies, are even more apparent when presented at the city level. In the following section, investment trends in Melbourne, Mumbai, and Chinese cities will be highlighted, with these cities selected as representative of some of the most active trends over the past years of Canadian investment abroad.
FIG. 40
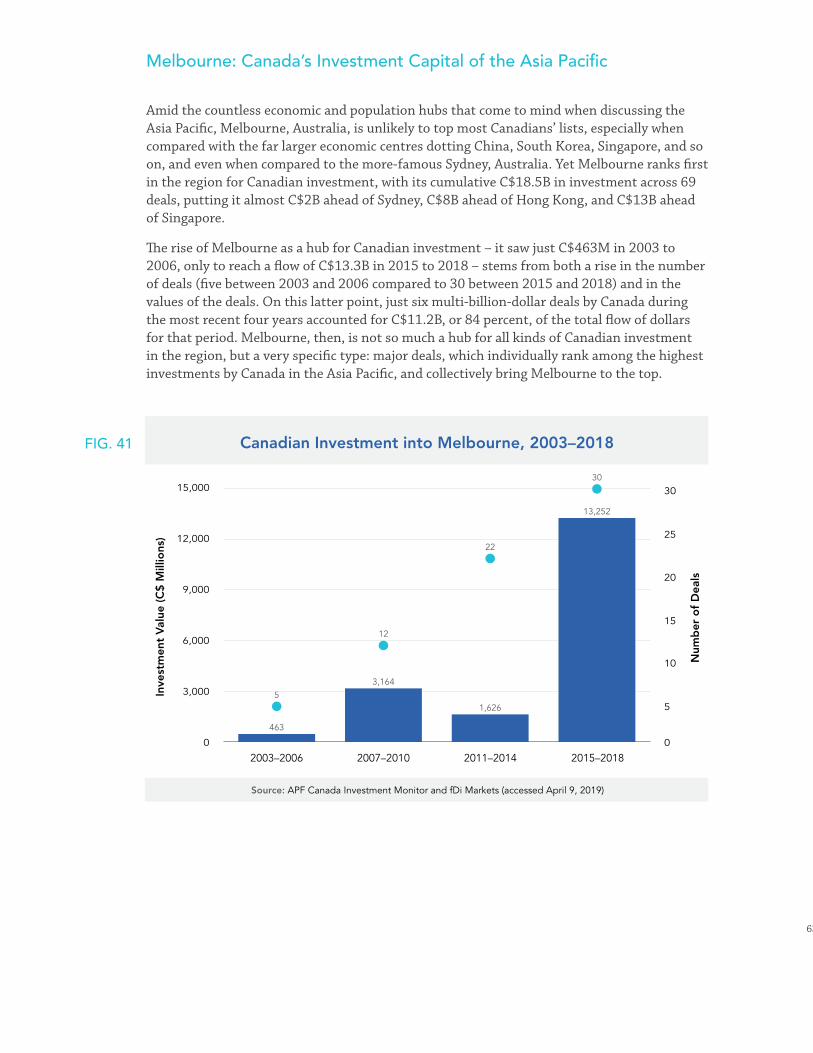
63
Melbourne: Canada’s Investment Capital of the Asia Pacific
Amid the countless economic and population hubs that come to mind when discussing the Asia Pacific, Melbourne, Australia, is unlikely to top most Canadians’ lists, especially when compared with the far larger economic centres dotting China, South Korea, Singapore, and so on, and even when compared to the more-famous Sydney, Australia. Yet Melbourne ranks first in the region for Canadian investment, with its cumulative C$18.5B in investment across 69 deals, putting it almost C$2B ahead of Sydney, C$8B ahead of Hong Kong, and C$13B ahead of Singapore.
The rise of Melbourne as a hub for Canadian investment – it saw just C$463M in 2003 to 2006, only to reach a flow of C$13.3B in 2015 to 2018 – stems from both a rise in the number of deals (five between 2003 and 2006 compared to 30 between 2015 and 2018) and in the values of the deals. On this latter point, just six multi-billion-dollar deals by Canada during the most recent four years accounted for C$11.2B, or 84 percent, of the total flow of dollars for that period. Melbourne, then, is not so much a hub for all kinds of Canadian investment in the region, but a very specific type: major deals, which individually rank among the highest investments by Canada in the Asia Pacific, and collectively bring Melbourne to the top.
Source: APF Canada Investment Monitor and fDi Markets (accessed April 9, 2019)
0
3,000
6,000
9,000
12,000
15,000
0
10
5
15
20
25
30
Canadian Investment into Melbourne, 2003–2018
2003–2006 2007–2010 2011–2014 2015–2018
463
3,164
1,626
12
22
13,252
30
5
FIG. 41
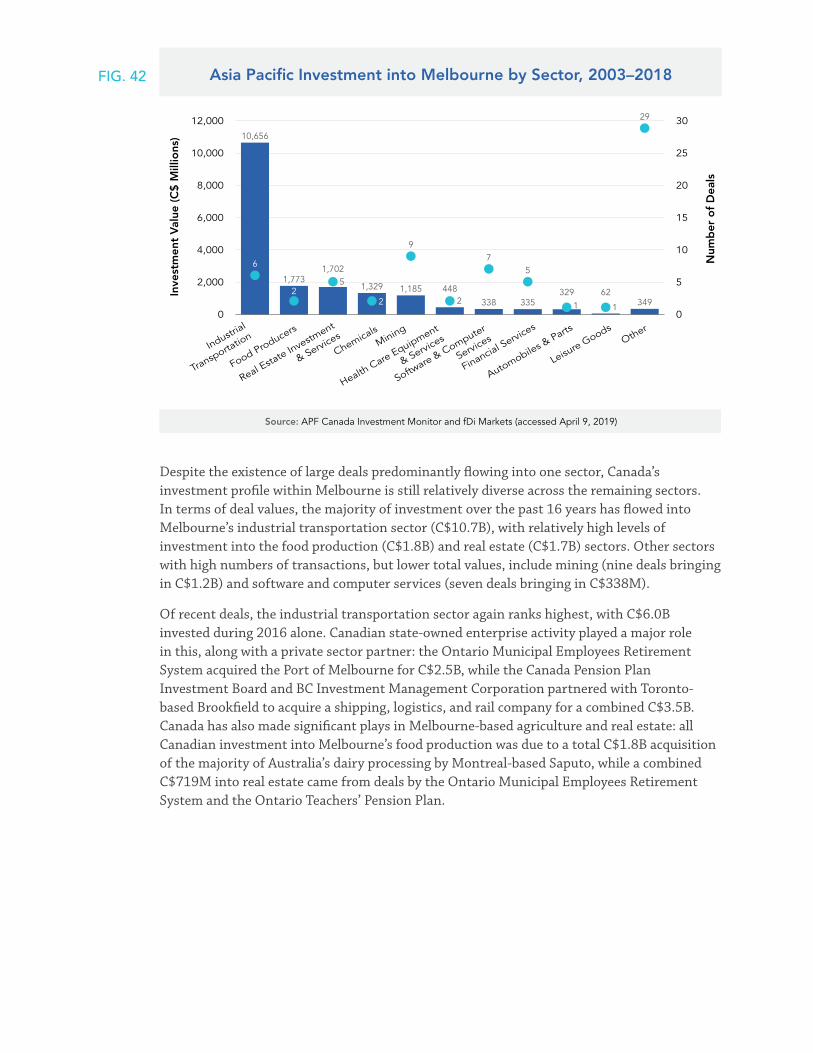
64
Source: APF Canada Investment Monitor and fDi Markets (accessed April 9, 2019)
0
Other
Mining
Chemicals
Food Producers
Industrial
Transportatio
n
Real Esta
te Investm
ent
& Services
Automobiles & Parts
Leisure Goods
Financial Services
Health Care Equipment
& Services
Software & Computer
Services
2,000
4,000
6,000
8,000
10,000
12,000
0
5
10
15
20
25
30
Asia Pacific Investment into Melbourne by Sector, 2003–2018
10,656
1,7731,702
1,329 1,185
9
448
338
7
335
5
329 62
11
5
2 349
29
22
6
Despite the existence of large deals predominantly flowing into one sector, Canada’s investment profile within Melbourne is still relatively diverse across the remaining sectors. In terms of deal values, the majority of investment over the past 16 years has flowed into Melbourne’s industrial transportation sector (C$10.7B), with relatively high levels of investment into the food production (C$1.8B) and real estate (C$1.7B) sectors. Other sectors with high numbers of transactions, but lower total values, include mining (nine deals bringing in C$1.2B) and software and computer services (seven deals bringing in C$338M).
Of recent deals, the industrial transportation sector again ranks highest, with C$6.0B invested during 2016 alone. Canadian state-owned enterprise activity played a major role in this, along with a private sector partner: the Ontario Municipal Employees Retirement System acquired the Port of Melbourne for C$2.5B, while the Canada Pension Plan Investment Board and BC Investment Management Corporation partnered with Toronto-based Brookfield to acquire a shipping, logistics, and rail company for a combined C$3.5B. Canada has also made significant plays in Melbourne-based agriculture and real estate: all Canadian investment into Melbourne’s food production was due to a total C$1.8B acquisition of the majority of Australia’s dairy processing by Montreal-based Saputo, while a combined C$719M into real estate came from deals by the Ontario Municipal Employees Retirement System and the Ontario Teachers’ Pension Plan.
FIG. 42
65
But the Canada-Melbourne connection can also be viewed through the lens of its sustained relationship over the past 16 years, all the way back to January 2003, when Toronto’s Geomaque Explorations entered the city’s mining sector, and forward as recently as Vancouver-based BlueBird Battery Metals’ own acquisition in the same sector in 2018. The past eight years have also seen a number of unique Canadian players enter Melbourne’s software and computer services sector, and even the large-deal oriented industrial transportation sector’s investment history from Canada began with a 2008 purchase of a toll road operator by the Canada Pension Plan Investment Board for C$747M.
Melbourne’s investment relationship with Canada reflects a larger trend in the Asia Pacific-Canada investment relationship: large, controlling acquisitions by Canada’s pensions plans of transportation infrastructure and real estate across the Asia Pacific.
Mumbai: A Fast-Growing Economy Attracts Canadian Asset Managers and State-Owned Enterprises’ Investment
In 2018, Mumbai was the seventh-largest city in the world.28 A major financial centre with a population of close to 20 million, Mumbai is one of India’s main economic engines. From 2003 to 2018, Canadians have invested more than C$5.2B in Mumbai, making the city the 10th-largest destination city for Canadian outbound investment.
Canada’s investments in Mumbai are relatively diverse, with high amounts moving into the technology hardware and equipment, real estate investment and services, financial services, and industrial transportation sectors. With the billions Canada has invested in Mumbai, a city-level look at Mumbai uncovers a number of ongoing opportunities and gaps presented by just one city within the rapidly changing Indian economy.
28 United Nations. The World’s Cities in 2018. http://www.un.org/en/events/citiesday/assets/pdf/the_worlds_cities_in_2018_data_booklet.pdf
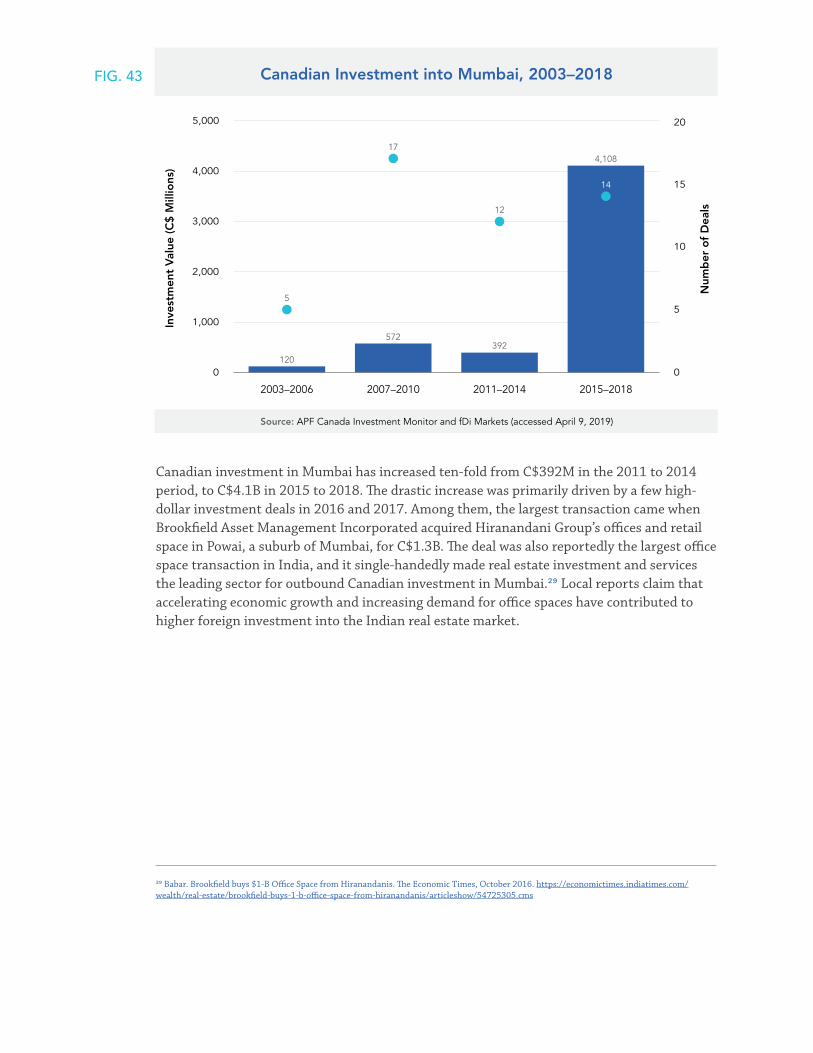
66
Source: APF Canada Investment Monitor and fDi Markets (accessed April 9, 2019)
0
1,000
2,000
3,000
4,000
5,000
0
5
15
20
10
Canadian Investment into Mumbai, 2003–2018
2003–2006 2007–2010 2011–2014 2015–2018
120
572
17
392
12
4,108
5
14
Canadian investment in Mumbai has increased ten-fold from C$392M in the 2011 to 2014 period, to C$4.1B in 2015 to 2018. The drastic increase was primarily driven by a few high-dollar investment deals in 2016 and 2017. Among them, the largest transaction came when Brookfield Asset Management Incorporated acquired Hiranandani Group’s offices and retail space in Powai, a suburb of Mumbai, for C$1.3B. The deal was also reportedly the largest office space transaction in India, and it single-handedly made real estate investment and services the leading sector for outbound Canadian investment in Mumbai.29 Local reports claim that accelerating economic growth and increasing demand for office spaces have contributed to higher foreign investment into the Indian real estate market.
29 Babar. Brookfield buys $1-B Office Space from Hiranandanis. The Economic Times, October 2016. https://economictimes.indiatimes.com/wealth/real-estate/brookfield-buys-1-b-office-space-from-hiranandanis/articleshow/54725305.cms
FIG. 43
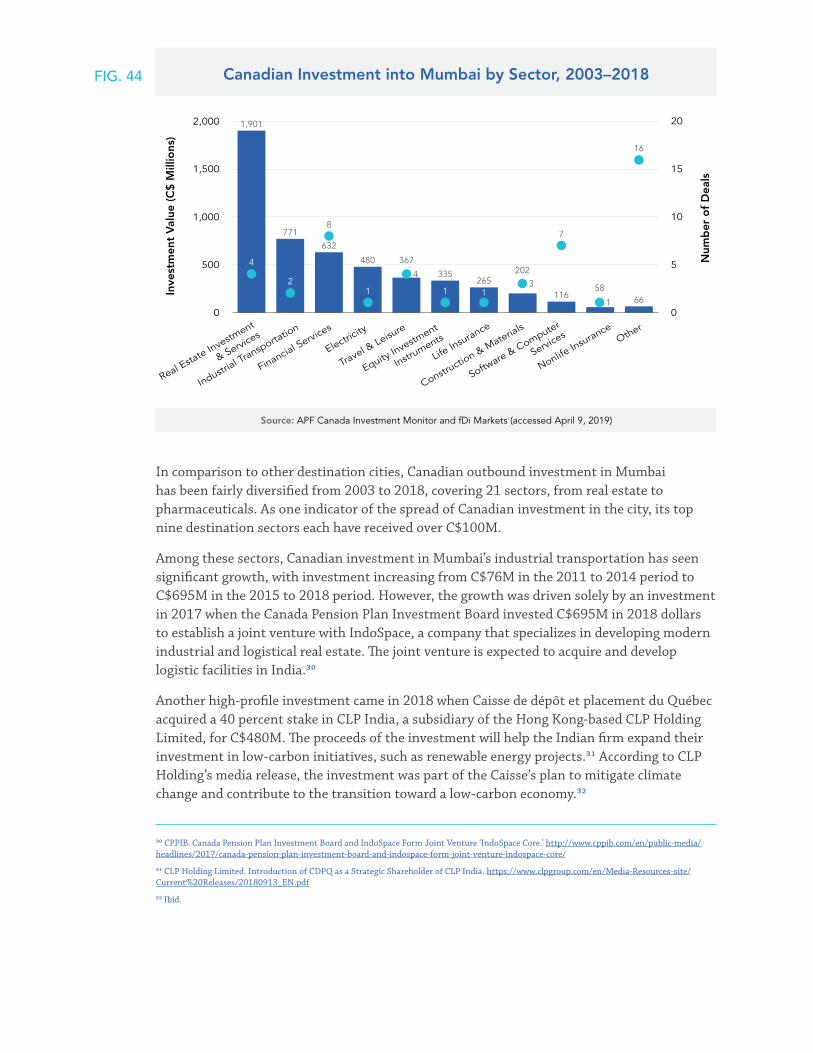
67
Source: APF Canada Investment Monitor and fDi Markets (accessed April 9, 2019)
0
Other
Travel & Leisu
re
Electricity
Industrial Transporta
tion
Financial Services
Real Esta
te Investm
ent
& Services
Software & Computer
Services
Constructio
n & Materials
Nonlife In
surance
Life Insurance
Equity Investm
ent
Instruments
500
1,000
1,500
2,000
0
5
10
15
20
Canadian Investment into Mumbai by Sector, 2003–2018
1
34
1,901
771632
8
480 367
335265
202
11658
66
16
7
4
21 1 1
In comparison to other destination cities, Canadian outbound investment in Mumbai has been fairly diversified from 2003 to 2018, covering 21 sectors, from real estate to pharmaceuticals. As one indicator of the spread of Canadian investment in the city, its top nine destination sectors each have received over C$100M.
Among these sectors, Canadian investment in Mumbai’s industrial transportation has seen significant growth, with investment increasing from C$76M in the 2011 to 2014 period to C$695M in the 2015 to 2018 period. However, the growth was driven solely by an investment in 2017 when the Canada Pension Plan Investment Board invested C$695M in 2018 dollars to establish a joint venture with IndoSpace, a company that specializes in developing modern industrial and logistical real estate. The joint venture is expected to acquire and develop logistic facilities in India.30
Another high-profile investment came in 2018 when Caisse de dépôt et placement du Québec acquired a 40 percent stake in CLP India, a subsidiary of the Hong Kong-based CLP Holding Limited, for C$480M. The proceeds of the investment will help the Indian firm expand their investment in low-carbon initiatives, such as renewable energy projects.31 According to CLP Holding’s media release, the investment was part of the Caisse’s plan to mitigate climate change and contribute to the transition toward a low-carbon economy.32
30 CPPIB. Canada Pension Plan Investment Board and IndoSpace Form Joint Venture ‘IndoSpace Core.’ http://www.cppib.com/en/public-media/headlines/2017/canada-pension-plan-investment-board-and-indospace-form-joint-venture-indospace-core/
31 CLP Holding Limited. Introduction of CDPQ as a Strategic Shareholder of CLP India. https://www.clpgroup.com/en/Media-Resources-site/Current%20Releases/20180913_EN.pdf
32 Ibid.
FIG. 44
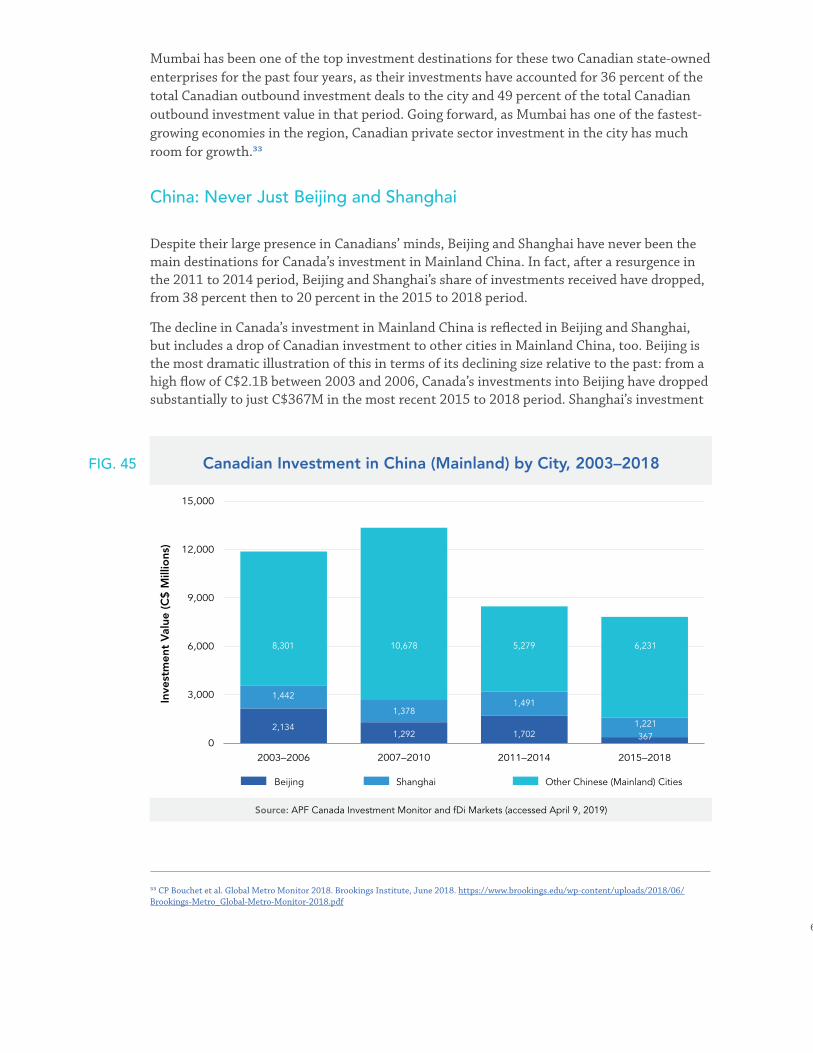
68
Mumbai has been one of the top investment destinations for these two Canadian state-owned enterprises for the past four years, as their investments have accounted for 36 percent of the total Canadian outbound investment deals to the city and 49 percent of the total Canadian outbound investment value in that period. Going forward, as Mumbai has one of the fastest-growing economies in the region, Canadian private sector investment in the city has much room for growth.33
China: Never Just Beijing and Shanghai
Despite their large presence in Canadians’ minds, Beijing and Shanghai have never been the main destinations for Canada’s investment in Mainland China. In fact, after a resurgence in the 2011 to 2014 period, Beijing and Shanghai’s share of investments received have dropped, from 38 percent then to 20 percent in the 2015 to 2018 period.
The decline in Canada’s investment in Mainland China is reflected in Beijing and Shanghai, but includes a drop of Canadian investment to other cities in Mainland China, too. Beijing is the most dramatic illustration of this in terms of its declining size relative to the past: from a high flow of C$2.1B between 2003 and 2006, Canada’s investments into Beijing have dropped substantially to just C$367M in the most recent 2015 to 2018 period. Shanghai’s investment
33 CP Bouchet et al. Global Metro Monitor 2018. Brookings Institute, June 2018. https://www.brookings.edu/wp-content/uploads/2018/06/Brookings-Metro_Global-Metro-Monitor-2018.pdf
Source: APF Canada Investment Monitor and fDi Markets (accessed April 9, 2019)
0
3,000
6,000
9,000
12,000
15,000
2003–2006 2007–2010 2011–2014 2015–2018
Beijing Shanghai Other Chinese (Mainland) Cities
Canadian Investment in China (Mainland) by City, 2003–2018
2,134
1,442
8,301 10,678 5,279 6,231
1,292
1,378
1,702
1,491
3671,221
FIG. 45
69
history, by contrast, has been far more stable, but Canada’s investments into the city have also dropped slightly, from C$1.5B between 2011 and 2014 to C$1.2B in 2015 to 2018. In turn, the rest of Mainland China has seen dramatic shifts in terms of the absolute value of investment: Canada invested C$11B in 2007 to 2010, only to be followed by a drop to C$5.3B in 2011 to 2014, and a slighter bounce-back to C$6.2B in Canadian investment for the most recent period, 2015 to 2018. Both Canada’s historical and current declining investment in Mainland China, then, is largely due to Canada’s declining interest in areas outside of Beijing and Shanghai – and to a smaller extent, declining interest in those cities, too.
In all, Canada has invested C$5.5B in Beijing by way of 111 transactions, primarily investments in the financial services, technology hardware and equipment, industrial transportation, and travel and leisure sectors, with a lower-value flurry of activity in the software and computer services industry. But the bulk of the largest investments occurred before 2015: only travel and leisure and software and computer services have seen any significant activity in recent years, with Quebec-based D-BOX Technologies opening a C$45M motion-coding studio in a play to interface with China’s film industry. Other, non-traditional sectors have instead become the targets of Canadian investors, such as St-Georges Eco-Mining of Montreal’s acquisition in 2018 of blockchain technologies from a Beijing software firm for C$150M.
For Shanghai, the C$5.5B invested by Canada across 110 transactions has primarily flowed into the city’s real estate investment and services and financial services sectors, but with relatively high amounts of investment activity in the industrial transportation, software and computer services, and support services sectors as well. In a twist of typical reporting on Canada-China investment ties, one of the most significant recent deals involved a Canadian state-owned enterprise, the Caisse de dépôt et placement du Québec, investing C$487M into Shanghai’s real estate in 2015. This deal was almost matched by another real estate investment by a Canadian state-owned enterprise in 2018, with the Canada Pension Plan Investment Board investing C$400M.
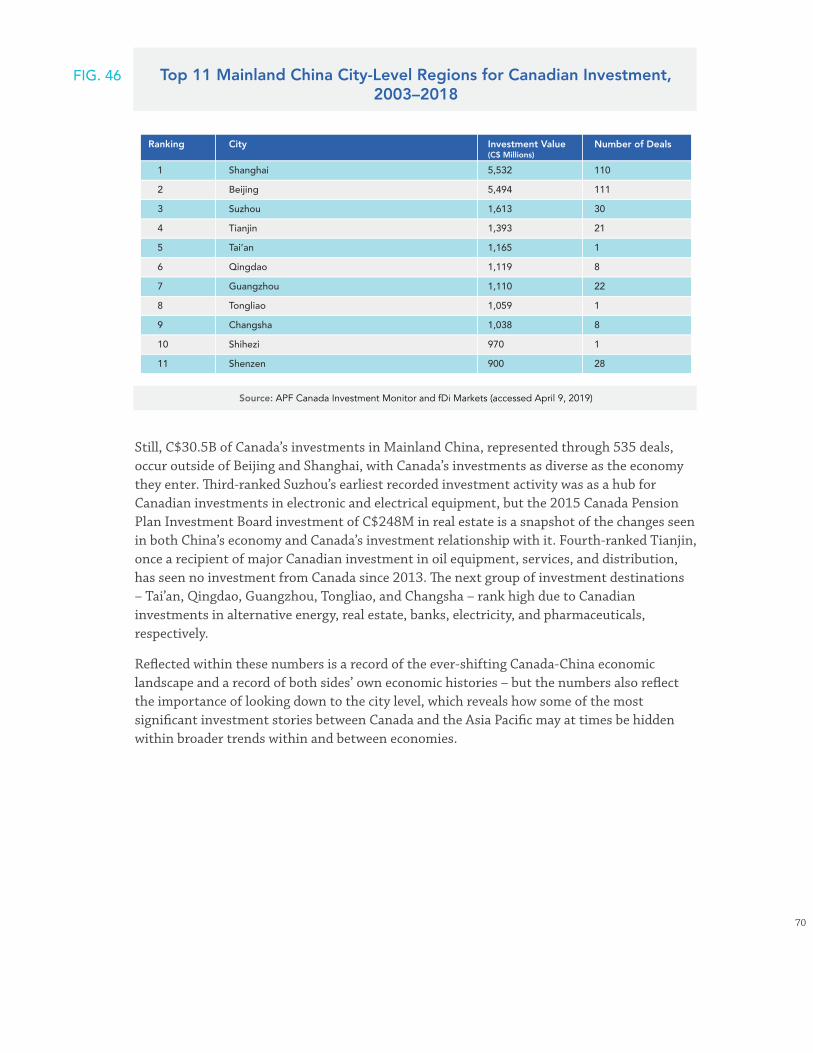
70
Top 11 Mainland China City-Level Regions for Canadian Investment, 2003–2018
Ranking
1
2
3
4
5
6
7
8
9
10
11
5,532
5,494
1,613
1,393
1,165
1,119
1,110
1,059
1,038
970
900
110
111
30
21
1
8
22
1
8
1
28
Shanghai
Beijing
Suzhou
Tianjin
Tai’an
Qingdao
Guangzhou
Tongliao
Changsha
Shihezi
Shenzen
City Investment Value(C$ Millions)
Number of Deals
Source: APF Canada Investment Monitor and fDi Markets (accessed April 9, 2019)
Still, C$30.5B of Canada’s investments in Mainland China, represented through 535 deals, occur outside of Beijing and Shanghai, with Canada’s investments as diverse as the economy they enter. Th ird-ranked Suzhou’s earliest recorded investment activity was as a hub for Canadian investments in electronic and electrical equipment, but the 2015 Canada Pension Plan Investment Board investment of C$248M in real estate is a snapshot of the changes seen in both China’s economy and Canada’s investment relationship with it. Fourth-ranked Tianjin, once a recipient of major Canadian investment in oil equipment, services, and distribution, has seen no investment from Canada since 2013. Th e next group of investment destinations – Tai’an, Qingdao, Guangzhou, Tongliao, and Changsha – rank high due to Canadian investments in alternative energy, real estate, banks, electricity, and pharmaceuticals, respectively.
Refl ected within these numbers is a record of the ever-shifting Canada-China economic landscape and a record of both sides’ own economic histories – but the numbers also refl ect the importance of looking down to the city level, which reveals how some of the most signifi cant investment stories between Canada and the Asia Pacifi c may at times be hidden within broader trends within and between economies.
FIG. 46
71
As Asia Pacific economies rapidly develop, investment ties with these economies have become increasingly central to Canadian diversification strategies. However, other than the information available from official statistics, Canadians have very limited resources available to help them understand the impact of Canada’s two-way investment relationship with the Asia Pacific, especially at the city and sector level. The lack of detailed information on the size and scope of Canada-Asia Pacific investment ties can lead to ineffective policies and a misinformed public. By providing this discrete level of information, the APF Canada Investment Monitor sets the stage for more informed discussions for Canada’s foreign relations, business, and research communities, all ultimately helping the public learn more about the Canada-Asia Pacific investment relationship.
The goal of the APF Canada Investment Monitor is to provide the foundation for evidence-based decision-making, not only for policy makers, but also for all interested stakeholders in the Canadian public, by providing a growing data set of both Asia Pacific companies’ investment into Canada and Canadian companies’ investment into the Asia Pacific. This year’s report also highlights Canadian and Asia Pacific cities with clusters of investment, adding another layer to the Canada-Asia Pacific investment story.
CONCLUSION
72
The APF Canada Investment Monitor tracks foreign direct investment announcements at the firm level, taking a bottom-up approach rather than reviewing the balance of payments in Canada’s national accounts.
In order to generate the APF Canada Investment Monitor data, APF Canada uses its own unique legacy data, third-party data sources, metasearch engines, and other search tools to aggregate data obtained from public sources including media reports, company documents, industry associations, and investment promotion agencies. Investment announcements that will be entered in the database include greenfield investments, asset purchases, equity investment, mergers, acquisitions, joint ventures, etc.
The APF Canada Investment Monitor sources its investment stories primarily from its decades-long archive of announcements on deals, trade missions, memorandums of understanding (MOUs), and other developments of note in the Canada-Asia relationship. Such a vast archive allows the APF Canada Investment Monitor to build a strong foundation on which to track deal flow both historically and going forward. Each deal announcement is recorded, catalogued, and added to our database. Deals are recorded using 30 different observations ranging from parent company to destination city. Key to this cataloguing of investments for trend analysis is the use of a user-friendly sector classification system. Whereas deals catalogued with the widely used North American Industry Classification System (NAICS) often hide key trends in budding industries, the APF Canada Investment Monitor’s use of the modified Industrial Classification Benchmark (Modified ICB) allows it to clearly see growth in areas such as clean tech and the video gaming industry.
Dollar values for the APF Canada Investment Monitor are obtained through a thorough investigation of the deal value and, barring an official value, the best publicly available estimate. This methodology allows for the avoidance of errors that occur in databases that estimate deal value using proprietary algorithms.
Data for this report was also obtained from the United Nations Committee on Trade and Development (UNCTAD), Statistics Canada (StatCan), and Ministry of Commerce of the People’s Republic of China (MOFCOM), Australian Bureau of Statistics (ABS), Japan External Trade Organization (JETRO), and Statistics Singapore.
METHODOLOGY AND DATA SOURCES
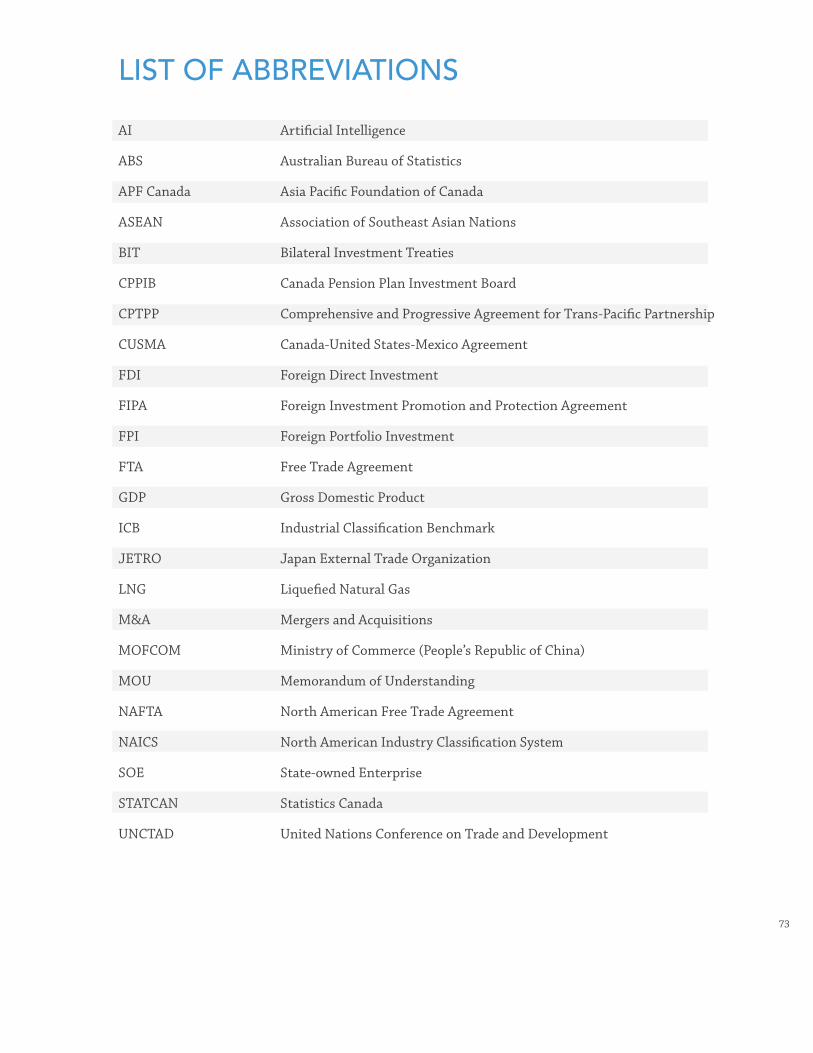
73
AI
ABS
APF Canada
ASEAN
BIT
CPPIB
CPTPP
CUSMA
FDI
FIPA
FPI
FTA
GDP
ICB
JETRO
LNG
M&A
MOFCOM
MOU
NAFTA
NAICS
SOE
STATCAN
UNCTAD
Artifi cial Intelligence
Australian Bureau of Statistics
Asia Pacifi c Foundation of Canada
Association of Southeast Asian Nations
Bilateral Investment Treaties
Canada Pension Plan Investment Board
Comprehensive and Progressive Agreement for Trans-Pacifi c Partnership
Canada-United States-Mexico Agreement
Foreign Direct Investment
Foreign Investment Promotion and Protection Agreement
Foreign Portfolio Investment
Free Trade Agreement
Gross Domestic Product
Industrial Classifi cation Benchmark
Japan External Trade Organization
Liquefi ed Natural Gas
Mergers and Acquisitions
Ministry of Commerce (People’s Republic of China)
Memorandum of Understanding
North American Free Trade Agreement
North American Industry Classifi cation System
State-owned Enterprise
Statistics Canada
United Nations Conference on Trade and Development
LIST OF ABBREVIATIONS

74
Boxes
Box 1.
Box 2.
Box 3.
Box 4.
Box 5.
Box 6.
Figures
Fig. 1
Fig. 2
Fig. 3
Fig. 4
Fig. 5
Fig. 6
Fig. 7
Fig. 8
Fig. 9
Fig. 10
Fig. 11
Fig. 12
Fig. 13
Fig. 14
Fig. 15
Fig. 16
Fig. 17
Cross-Border Investment and FDI (p. 14)
FDI Deals are no longer just FDI Deals (p. 23)
Canadian Solar Inc. Shines Brightly in Asia (p. 28)
Commemorating 90 Years of Canada-Japan Relations (p. 42)
Bringing the “Life” Back to Quebec’s Life Sciences Industry (p. 46)
Something to be Jollibee About (p. 53)
Breakdown of Destination for Canadian Outward FDI Stocks, 2017 (p. 8)
Share of Total Inward Foreign Direct Investment from the Asia Pacifi c for Select Countries, 2017 (p. 9)
Offi cial Statistics on Canadian FDI Stock Abroad, 2003–2017 (p. 10)
Canada’s Market Share of Select Asia Pacifi c Economies’ Inward FDI Stock, 2012–2017 (p. 11)
Offi cial Statistics on Asia Pacifi c FDI Stock in Canada, 2003–2017 (p. 12)
Canada’s Share of Select Asia Pacifi c Economies’ Total Outward FDI Stocks, 2012–2017 (p. 12)
Canadian Foreign Direct Investment Received, 2003–2018 (p. 16)
Asia Pacifi c Investment into Canada by Major Source Economy, 2003–2018 (p. 16)
Asia Pacifi c Investment in Canada’s Energy, Mining & Chemical Industries, 2003–2018 (p. 18)
Asia Pacifi c Investment into Canada by Sector, 2003–2018 (p. 19)
Asia Pacifi c Economies’ Greenfi eld & Merger Acquisition Investment in Canada, 2003–2018 (p. 20)
Number of Asia Pacifi c Economies’ SOE Investment Deals in Canada, 2003–2018 (p. 21)
Asia Pacifi c Economies’ SOE Investment in Canada, 2003–2018 (p. 22)
Canadian Investment in the Asia Pacifi c, 2003–2018 (p. 25)
Canadian Investment in the Asia Pacifi c by Major Destination, 2003–2018 (p. 26)
Canadian Investment in the Asia Pacifi c by Sector, 2003–2018 (p. 27)
Canadian Investment in the Asia Pacifi c’s Energy, Mining & Chemical Industries, 2003–2018 (p. 28)
APPENDIX
75
Fig. 18
Fig. 19
Fig. 20
Fig. 21
Fig. 22
Fig. 23
Fig. 24
Fig. 25
Fig. 26
Fig. 27
Fig. 28
Fig. 29
Fig. 30
Fig. 31
Fig. 32
Fig. 33
Fig. 34
Fig. 35
Fig. 36
Fig. 37
Fig. 38
Fig. 39
Fig. 40
Fig. 41
Fig. 42
Fig. 43
Fig. 44
Fig. 45
Fig. 46
Canadian Greenfield and Merger & Acquisition Investment in the Asia Pacific, 2003–2018 (p. 30)
Canadian SOE Investment in the Asia Pacific, 2003–2018 (p. 31)
Canadian SOE’s Share of Total Outbound Deal Numbers, 2003–2018 (p. 32)
Asia Pacific Investment into Canada by Province, 2003–2018 (p. 34)
Canadian Investment into the Asia Pacific by Province, 2003–2018 (p. 35)
Asia Pacific Investment into British Columbia by Sector, 2003–2018 (p. 36)
British Columbia Investment into the Asia Pacific by Sector, 2003–2018 (p. 37)
Asia Pacific Investment into Alberta by Sector, 2003–2018 (p. 38)
Alberta Investment into the Asia Pacific by Sector, 2003–2018 (p. 39)
Asia Pacific Investment into Ontario by Sector, 2003–2018 (p. 41)
Ontario Investment into the Asia Pacific by Sector, 2003–2018 (p. 43)
Asia Pacific Investment into Quebec by Sector, 2003–2018 (p. 45)
Quebec Investment into the Asia Pacific by Sector, 2003–2018 (p. 47)
Asia Pacific Investment into the Rest of Canada by Sector, 2003–2018 (p. 48)
Rest of Canada Investment into the Asia Pacific by Sector, 2003–2018 (p. 49)
Top 15 Canadian Cities for Asia Pacific Investment, 2003–2018 (p. 52)
Top 12 Asia Pacific City-Level Regions for Canadian Investment, 2003–2018 (p. 54)
Asia Pacific Investment into Montreal, 2003–2018 (p. 56)
Asia Pacific Investment into Montreal by Sector, 2003–2018 (p. 56)
Asia Pacific Investment into Vancouver, 2003–2018 (p. 58)
Asia Pacific Investment into Vancouver by Sector, 2003–2018 (p. 59)
Asia Pacific Investment into Woodstock, 2003–2018 (p. 61)
Asia Pacific Investment into Woodstock by Sector, 2003–2018 (p. 62)
Canadian Investment into Melbourne, 2003–2018 (p. 63)
Asia Pacific Investment into Melbourne by Sector, 2003–2018 (p. 64)
Canadian Investment into Mumbai, 2003–2018 (p. 66)
Canadian Investment into Mumbai by Sector, 2003–2018 (p. 67)
Canadian Investment in China (Mainland) by City, 2003–2018 (p. 68)
Top 11 Mainland China City-Level Regions for Canadian Investment, 2003–2018 (p. 70)
76
Alberta Health Services. 2016. Population Estimates of Dementia in Alberta. https://www.albertahealthservices.ca/assets/about/scn/ahs-scn-srs-addma-2016-peda-update.pdf
Ballard Power Systems. 2018. Ballard Closes Strategic Collaboration with Weichai Power. http://www.ballard.com/about-ballard/newsroom/news-releases/2018/11/13/ballard-closes-strategic-collaboration-with-weichai-power
Bloomberg. 2018. Josh Wingrove and John Lippert. Toyota Bets $1.1 Billion on SUVs in Canada with Trudeau’s Help. https://www.bloomberg.com/news/articles/2018-05-04/toyota-is-said-to-plan-1-1-billion-expansion-at-canada-plant
Brookings Institute. 2017. Homi Kharas. The Unprecedented Expansion of the Global Middle Class: An Update. https://www.brookings.edu/wp-content/uploads/2017/02/global_20170228_global-middle-class.pdf
Brookings Institute. 2018. Max Bouchet, Sifan Liu, Joseph Parilla, and Nader Kabbani. Global Metro Monitor 2018. https://www.brookings.edu/wp-content/uploads/2018/06/Brookings-Metro_Global-Metro-Monitor-2018.pdf
Canada Economic Development for the Quebec Regions. 2016. Report to Parliament. https://www.dec-ced.gc.ca/docs/Report-to-Parliament-2016.pdf
Canadian Blood Services. 2019. Plasma Protein Products. https://blood.ca/en/hospital-services/products/plasma-protein-products
CLP Holdings Limited. 2018. Introduction of CDPQ as a Strategic Shareholder of CLP India. https://www.clpgroup.com/en/Media-Resources-site/Current%20Releases/20180913_EN.pdf
Conference Board of Canada. 2012. Alan Arcand. The Role of Canada’s Major Cities in Attracting Foreign Direct Investment. https://www.conferenceboard.ca/e-library/abstract.aspx?did=4817
CPPIB. 2017. Canada Pension Plan Investment Board and IndoSpace Form Joint Venture ‘IndoSpace Core.’ http://www.cppib.com/en/public-media/headlines/2017/canada-pension-plan-investment-board-and-indospace-form-joint-venture-indospace-core/
The Economic Times. 2016. Kailash Babar. Brookfield buys $1-B Office Space from Hiranandanis. https://economictimes.indiatimes.com/wealth/real-estate/brookfield-buys-1-b-office-space-from-hiranandanis/articleshow/54725305.cms
Globe and Mail. 2018. Linda Hasenfratz. How Ontario Can Future-Proof its Manufacturing Industries. https://www.theglobeandmail.com/business/commentary/article-how-ontario-can-future-proof-its-manufacturing-industries/
Globe and Mail. 2017. Steven Chase. Ottawa Approves Sale of B.C. Retirement-Home Chain to Chinese Group with Murky Ownership.
SOURCES
77
https://www.theglobeandmail.com/news/politics/ottawa-approves-sale-of-bc-retirement-home-chain-to-chinese-group-with-murky-ownership/article34107591/
Government of Canada. 2018. AI-Powered Supply Chains Supercluster. https://www.ic.gc.ca/eic/site/093.nsf/eng/00009.html
Green Cross Biotherapeutics. 2017. Green Cross Biotherapeutics Inaugurates its States-of-the Art Facility in Montreal. http://www.greencrossbt.com/2017/10/30/green-cross-biotherapeutics-inaugurates-its-state-of-the- art-facility-in-montreal/
Hortidaily. 2018. Acadian Seaplants Established Subsidiary Company in India. https://www.hortidaily.com/article/6043023/can-ns-acadian-seaplants-establishes-subsidiary- company-in-india/
Husky Energy. n.d. Quick Facts West White Rose Project. http://wwrp.huskyenergy.com/servlet/servlet.FileDownload?file=00P1L00000r6Sj1UAE
Industry Canada. Trade Data Online. https://www.ic.gc.ca/app/scr/tdst/tdo/crtrhtml?timePeriod=10%7CComplete+Years&reportType=TE &searchType=All&productType=HS6¤cy=CDN&countryList=specific&runReport=true& grouped=GROUPED&toFromCountry=CDN&areaCodes=R994&naArea=9998
Investment Policy Hub. International Investment Agreements.
Opportunities New Brunswick. 2018. Tech Mahindra to Create Jobs in Riverview. https://onbcanada.ca/press-releases/tech-mahindra-create-jobs-riverview/
PwC. 2017. The World in 2050. https://www.pwc.com/gx/en/world-2050/assets/pwc-the-world-in-2050-full-report-feb-2017.pdf
Reuters. 2015. Allison Lampert. Cirque du Solei Sells Majority Stake to U.S., Chinese Investors. https://www.reuters.com/article/us-cirquedusoleil-m-a-tpg/cirque-du-soleil-sells-majority-stake-to- u-s-chinese-investors-idUSKBN0NB1AX20150420
Reuters. 2018. Clare Jim. CPPIB to co-Invest in China Rental Housing with Local Partner Longfor. https://ca.reuters.com/article/domesticNews/idCAKBN1K20FW-OCADN
South China Morning Post. 2018. Maggie Zhang, Xie Yu, and Jun Mai. Anbang’s Ex-Chief Wu Xiaohui Sentenced to 18 Years Behind Bars for US$12 Billion Fraud, Embezzlement. https://www.scmp.com/business/companies/article/2145458/anbangs-ex-chief-wu-xiaohui-sentenced -18-years-behind-bars-us12
Statistics Canada. 2018. Table 36-10-0008-01.
Statistics Canada. 2019. Population and Dwelling Count Highlights Tables. https://www12.statcan.gc.ca/census-recensement/2016/dp-pd/hlt-fst/pd-pl/Table.cfm?Lang=Eng&T= 301&SR=101&RPP=25&S=3&O=D&CMA=0&PR=0#2016A00053532042
T-Net. 2015. Colligo Selected Melbourne, Australia for Australasia Expansion. https://www.bctechnology.com/news/2015/10/27/Colligo-Selects-Melbourne-Australia-for- Australasia-Expansion.cfm
United Nations, Department of Economic and Social Affairs, Population Division. 2018. The World’s Cities in 2018—Data Booklet. http://www.un.org/en/events/citiesday/assets/pdf/the_worlds_cities_in_2018_data_booklet.pdf

78
The Asia Pacific Foundation of Canada would like to acknowledge and thank our generous sponsors and partner; without their support, this project would not have been possible. This project is completed in partnership with The School of Public Policy at the University of Calgary and with sponsorship from the Government of British Columbia, AdvantageBC, Bank of Canada, Export Development Canada, and Invest in Canada.
PARTNERS AND SPONSORS

79
In addition to our sponsors and partner, we would like to especially thank the sponsors’ representatives who sit on the APF Canada Investment Monitor Advisory Council and whose input and guidance from the conception to the launch of this project has proved invaluable.
Sarah Albrecht, Director, Partnership Strategy, Invest in Canada.
Dr. Eugene Beaulieu, Professor of Economics and Program Director, International Economics, The School of Public Policy, University of Calgary.
Kursti Calder, Director, International Strategy and Business Intelligence, Ministry of Jobs, Trade, and Technology, Government of British Columbia.
Dr. Jeff Reeves, Vice-President, Research, Asia Pacific Foundation of Canada.
Lori Rennison, Senior Policy Advisor, Canadian Economic Analysis Department, Bank of Canada.
Clark Roberts, President and CEO, AdvantageBC.
Siobian Smith, Strategy Lead, British Columbia Ministry of Jobs, Trade, and Technology.
Dr. Stephen Tapp, Deputy Chief Economist and Director, Research Department, Export Development Canada.
ADVISORY COUNCIL
80
ABOUT THE ASIA PACIFIC FOUNDATION OF CANADATh e Asia Pacifi c Foundation of Canada is dedicated to strengthening ties between Canada and Asia with a focus on expanding economic relations through trade, investment, and innovation; promoting Canada’s expertise in off ering solutions to Asia’s climate change, energy, food security, and natural resource management challenges; building Asia skills and competencies among Canadians, including young Canadians; and improving Canadians’ general understanding of Asia and its growing global infl uence.
Th e Foundation is well known for its annual national opinion polls of Canadian attitudes regarding relations with Asia, including Asian foreign investment in Canada and Canada’s trade with Asia. Th e Foundation places an emphasis on China, India, Japan, and South Korea while also developing expertise in emerging markets in the region, particularly economies within ASEAN.
Visit APF Canada at http://www.asiapacifi c.ca.

81
1REPORT ON TRADE AGREEMENTS AND FOREIGN DIRECT INVESTMENT BETWEEN CANADA AND THE ASIA PACIFIC
ASIA PACIFIC FOUNDATION OF CANADA
INVESTMENTMONITOR2020
REPORT ON TRADE AGREEMENTS
AND FOREIGN DIRECT INVESTMENT BETWEEN
CANADA AND THE ASIA PACIFIC
About the Asia Pacific Foundation of Canada
About the APF Canada Investment Monitor
Message from the President & CEO, Asia Pacific Foundation of Canada
Executive Summary
Key Takeaways from the Report
Introduction
General Trends in Investment to 2019
How Canada Stacks Up in its Investment Relationship with the Asia Pacific
Box 1. What Official Statistics Can and Cannot Tell Us
Box 2. Cross-Border Investment and FDI
Box 3. Stock and Flow
Free Trade Agreements in the Asia Pacific and FDI: Any Correlation?
FDI and Trade Theory
FTAs and Investment
The Comprehensive Progressive Trans-Pacific Partnership
Canada-Korea Free Trade Agreement
Looking Ahead: Canada’s Investment Ties with ASEAN and Pacific Alliance Economies
Canada and ASEAN
Canada and the Pacific Alliance
Usage Challenges and Future Promises
The National Picture
Inbound Trends and Partners in a Year of Record Deals
Asia Pacific Investment in Canada’s Sectors: Resources, Technologies, and the Rest
Box 4. Asia Pacific Investment in Natural Resources
Box 5. Asia Pacific Studios in Canada’s C$4.5B Video Game Industry
Investment Types: Greenfield Investment vs. M&A
4
5
6
8
9
11
11
12
13
15
16
17
18
20
20
23
25
25
27
29
30
30
33
36
37
38
TABLE OF CONTENTS
State-Owned Enterprises in Canada: Despite the Public Attention, a Declining Factor
Box 6. Two-Way FDI During the 2008-2009 Economic Crisis
Outbound Trends and Partners: Canada Conducting Fewer Deals, with Fewer Dollars
Canada Investing in a Variety of Sectors
Box 7. Canadian Investment in Cleantech
Box 8. FDI Flows Between Canada and the Asia Pacific in Health Care-Related Sectors
Canadian Firms Still Entering with Greenfield Deals
Canada’s SOEs Now Make Up a Significant Portion of Yearly Flow
Box 9. The Rise of Canada’s Pensions
The Provincial Picture
Four Provinces Make Up 90 Percent of Inbound Investment
Four Provinces Make Up Almost All of Outbound FDI
A Decade of Changes for Canadian Provinces and Territories
Inbound
Outbound
City-Level Hubs of Investment Activity
Canadian Cities Outbound to Asia Pacific: From Anzac to Waterloo
Canadian Cities Inbound from the Asia Pacific: Investments from Coast to Coast to Coast
Box 10. Asia Pacific Investment into Canada’s Rural Communities
Asia Pacific Cities’ Investment into Canada: In a Year of Tense Ties, China’s Cities Still Led
Asia Pacific Cities’ Investments from Canada: Mumbai Leads the Year
Conclusions
Methodology and Data Sources
Glossary and Abbreviations
Sources
Partners and Sponsors
Advisory Council
39
33
42
44
47
48
49
50
51
53
53
55
56
56
60
63
64
66
68
69
71
73
74
75
78
79
79
T he Asia Pacific Foundation of Canada (APF Canada) is a not-for-
profit organization focused on Canada’s relations with Asia. Our
mission is to be Canada’s catalyst for engagement with Asia and
Asia’s bridge to Canada. APF Canada is dedicated to strengthening ties between
Canada and Asia with a focus on seven thematic areas: trade and investment,
surveys and polling, regional security, digital technologies, domestic networks,
sustainable development, and Asia Competency
Our research provides high-quality, relevant, and timely information, insights,
and perspectives on Canada-Asia relations. Providing policy considerations and
business intelligence for stakeholders across the Asia Pacific, our work includes
Reports, Policy Briefs, Case Studies, Dispatches, and a regular Asia Watch
newsletter that together support these thematic areas.
APF Canada also works with business, government, and academic stakeholders
to provide custom research, data, briefings and Asia Competency training for
Canadian organizations. Consulting services are available by request. We
would be pleased to work with you to meet your research and business
intelligence needs.
Visit APF Canada at www.asiapacific.ca.
ABOUT THE ASIA PACIFIC FOUNDATION OF CANADA
5REPORT ON TRADE AGREEMENTS AND FOREIGN DIRECT INVESTMENT BETWEEN CANADA AND THE ASIA PACIFIC
ASIA PACIFIC FOUNDATION OF CANADA
I n Canada, there is a general lack of awareness of the scope and
impact of our investment ties with the Asia Pacific. Recognizing
this gap, the Asia Pacific Foundation of Canada developed the
APF Canada Investment Monitor to deepen understanding of the scale, nature,
and scope of Canada’s investment ties across the Pacific. The APF Canada
Investment Monitor offers detailed information related to Canada-Asia
investments, drawn from public sources and APF Canada’s own unique legacy
data, which has been collected over more than a decade.
Since 2017, APF Canada has published reports on the Canada-Asia Pacific
foreign direct investment (FDI) relationship, providing an evidence-based
discussion on the amounts, locations, and investors shaping Canada’s
engagement with this vital region. The inaugural Investment Monitor 2017
report looked at investment from the Asia Pacific into Canada, the Investment
Monitor 2018 report focused on Canadian outbound investment into the
Asia Pacific, and the Investment Monitor 2019 annual report focused on both
inbound and outbound foreign direct investment between Canada and the Asia
Pacific, while also highlighting key trends in the two-way investment ties at the
national, provincial, and city level.
This year, the 2020 annual report focuses on the relationship of FDI with
free trade agreements between Canada and the Asia Pacific. The 2020 annual
report also highlights new areas of interest, such as Canadian source cities
of investment in the Asia Pacific, and inbound investments in Canada’s
technology industry.
The APF Canada Investment Monitor is able to act as a complementary source
to official FDI statistics. APF Canada has partnered with The School of Public
Policy at the University of Calgary to develop the Investment Monitor. This
has enabled the APF Canada Investment Monitor to add more nuance to the
official statistics. By collecting transaction data on a national, provincial, and
city level, as well as providing analysis, the Investment Monitor presents a
more comprehensive picture of FDI flows between Canada and the Asia Pacific.
ABOUT THE APF CANADA INVESTMENT MONITOR
6REPORT ON TRADE AGREEMENTS AND FOREIGN DIRECT INVESTMENT BETWEEN CANADA AND THE ASIA PACIFIC
ASIA PACIFIC FOUNDATION OF CANADA
T he extraordinary first months of this new decade serve as a
stark reminder of how central the Asia Pacific has become to
all aspects of our lives. Now more than ever, Canada is witness
to the increasing significance of the region as the engine of the new global
economy – and witness to what happens when the engine stops, however
temporarily.Since 2017, APF Canada has published reports on the Canada-Asia
Pacific foreign direct investment (FDI) relationship, providing an evidence-
based discussion on the amounts, locations, and investors shaping Canada’s
engagement with this vital region. The inaugural Investment Monitor 2017
report looked at investment from the Asia Pacific into Canada, the Investment
Monitor 2018 report focused on Canadian outbound investment into the
Asia Pacific, and the Investment Monitor 2019 annual report focused on both
inbound and outbound foreign direct investment between Canada and the Asia
Pacific, while also highlighting key trends in the two-way investment ties at the
national, provincial, and city level.
The need for Canada to strategically deepen and diversify its linkages with
the Asia Pacific has become more pressing, as even the strong, historical trade
and investment ties with our partners in the United States and Europe face
stress from the confluence of disease and economic downturn. As Canada looks
ahead to a period of recovery and re-engagement, policy-makers, the business
community, and the public will need to return to discussions – and debate –
around foreign direct investment (FDI).
In 2020, the APF Canada Investment Monitor is turning its attention to
the connections between Canada’s free trade agreements with Asia Pacific
economies and FDI. Canada’s trade agreements provide a rules-based system
that encourages both trade and investment with partners in the region. With
2019 concluding the first year of our participation in the Comprehensive and
Progressive Agreement for Trans-Pacific Partnership (CPTPP), this report
MESSAGE FROM THE PRESIDENT & CEO, ASIA PACIFIC FOUNDATION OF CANADA
7REPORT ON TRADE AGREEMENTS AND FOREIGN DIRECT INVESTMENT BETWEEN CANADA AND THE ASIA PACIFIC
ASIA PACIFIC FOUNDATION OF CANADA
adds to our understanding of how agreements can provide a road map for Asia
Pacific engagement.
Additionally, the report expands on our city-level coverage of FDI by analyzing
how Canada’s cities are hubs as both investors and recipients and describing
FDI’s role in rural Canadian communities. You will also find new analysis
on investment in health care, pharmaceuticals, biotechnology, and clean
technologies, and descriptions of bidirectional impacts on FDI in 2008-2009,
filling gaps in the data and analysis that is otherwise publicly available on
where investment opportunities have been – and where we can expect them to
re-emerge once again.
On behalf of APF Canada, I would like to acknowledge the efforts of those
involved in producing this report, especially our partner, The School of Public
Policy at the University of Calgary, and our sponsors – Export Development
Canada, Invest in Canada, the Government of British Columbia, Advantage
BC, and the Bank of Canada. I would also like to extend my appreciation
to our Advisory Council members – Sarah Albrecht, Eugene Beaulieu, Joan
Elangovan, Lori Rennison, Clark Roberts, Siobian Smith, and Stephen Tapp –
for the valued feedback they have provided.
And finally, I would like to thank the members of our APF Canada research
team who were responsible for writing and finalizing this report: Jeffrey
Reeves, Vice-President, Research; Pauline Stern, Program Manager, Business
Asia; Grace Jaramillo, Interim Program Manager, Business Asia; Kai Valdez
Bettcher, Research Specialist; our Post-Graduate Research Scholars and Junior
Research Scholars, Isaac Lo, Phebe Ferrer, and Sainbuyan Munkhbat; and APF
Canada’s communications team for editing and designing the final publication,
Michael Roberts, Communications Manager, and Jamie Curtis, Graphic
Designer.
Stewart Beck,
President and CEO, Asia Pacific Foundation of Canada
8REPORT ON TRADE AGREEMENTS AND FOREIGN DIRECT INVESTMENT BETWEEN CANADA AND THE ASIA PACIFIC
ASIA PACIFIC FOUNDATION OF CANADA
O ver the past two decades, the Asia Pacific’s dynamic, fastest-
growing economies have played a central role in the global
economy, boasting unprecedented opportunities for foreign
investment in a number of key markets – in terms of both opportunities
for Canada to receive foreign investment and opportunities for Canadian
investors to invest abroad. To describe this relationship, the APF Canada
Investment Monitor aggregates raw data from the Asia Pacific Foundation of
Canada’s archive of investment deal announcements from 2003 to present (see
methodology section for further details).
Each year of the project corresponds with an annual theme; this year’s theme
is investment and free trade agreements, with previous years focusing on
inbound investment, outbound investment, and city-level data.
This annual report presents the following:
1. General trends in Canada’s foreign direct investment
relationship, with specific reference to the Asia Pacific, up to 2019;
2. The connections between Canada’s free trade agreements in the
Asia Pacific and investment; and
3. Inbound and outbound relationships at the national, provincial,
and city levels.
EXECUTIVE SUMMARY
9REPORT ON TRADE AGREEMENTS AND FOREIGN DIRECT INVESTMENT BETWEEN CANADA AND THE ASIA PACIFIC
ASIA PACIFIC FOUNDATION OF CANADA
IN 2019, THE TOTAL TWO-WAY VALUE OF CANADIAN INVESTMENT WITH CPTPP-RATIFIED ECONOMIES WAS C$5.8B BY WAY OF 56 DEALS.
Of these, C$3.0B was in Canadian outbound investment to these trade
partners, while C$2.9B came into Canada. However, investment flows for 2019
between Canada and CPTPP economies decreased from 2018.
IN THE ASIA PACIFIC, THE STRONGEST EVIDENCE FOR INCREASED FDI AFTER A FREE TRADE AGREEMENT IS THE CANADA-SOUTH KOREA FREE TRADE AGREEMENT SIGNED IN 2015.
Canada received an additional C$870M from South Korea from 2015 to 2019,
while the total value of two-way investment flow in the period increased
significantly by 35 percent, from C$5.1B in the five years prior to the
agreement to C$7.8B in the five years post-agreement.
IN 2019, CANADA RECEIVED A TOTAL OF C$8.3B OF FOREIGN DIRECT INVESTMENT FROM ASIA PACIFIC ECONOMIES.
This represents a decline in new investment received from the historic high
of C$33B in 2018. From 2015 to 2019, Canada received C$56B in Asia Pacific
investment through 428 deals, hitting a 16-year high.
THE NUMBER OF INBOUND INVESTMENT DEALS IN 2019 SET A RECORD WITH 151 DEALS.
The Asia Pacific’s investment activity in Canada was high, part of a multi-year
trend with investments increasing each year since 2015.
KEY TAKEAWAYS FROM THE REPORT
10REPORT ON TRADE AGREEMENTS AND FOREIGN DIRECT INVESTMENT BETWEEN CANADA AND THE ASIA PACIFIC
ASIA PACIFIC FOUNDATION OF CANADA
IN 2019, CANADA INVESTED A TOTAL OF C$7.2B IN THE ASIA PACIFIC.
This represents a significant drop from 2018’s C$18B in investment. Deal
counts also dropped and reached the lowest point since 2003, with only 75
outbound FDI deals made that year.
MANY PROVINCES SAW INCREASES IN NEW INVEST-MENT RECEIVED ACROSS THE PAST DECADE.
The value of Ontario’s new investments received increased C$12.6B in the
second half of the decade, while Quebec added C$5.1B in new investment.
Flows of Asia Pacific investment received by BC nearly tripled, rising to
C$32.8B, but new Asia Pacific investment into Alberta dropped from C$44.0B
in the first half of the 2010s to just C$2.9B in the second half.
OVER THE PAST 17 YEARS, 97 CANADIAN CITIES HAVE INVESTED INTO THE ASIA PACIFIC, AND 191 CITIES HAVE RECEIVED INVESTMENT, REPRESENTING A STRONG NET-WORK OF TIES ACROSS THE PACIFIC.
During that same period, 21 Canadian cities invested half a billion or more
into the region, some with hundreds of deals. On the Asia Pacific side, Beijing,
Tokyo, and Hong Kong lead as sources of investment in Canada, while
Melbourne and Sydney are the top destinations for Canada.

11REPORT ON TRADE AGREEMENTS AND FOREIGN DIRECT INVESTMENT BETWEEN CANADA AND THE ASIA PACIFIC
ASIA PACIFIC FOUNDATION OF CANADA
W ith the turn of the new decade, the Asia Pacific continues to
be a dynamic region of economic growth and opportunity.
In 2020, some are heralding the start of an “Asian century,”
where the region becomes “the new centre of the world” as it continues to
grow and expand. According to the 2019 World Investment Report released
by the United Nations Committee on Trade and Development (UNCTAD),
Asia remains the largest recipient region of FDI flows, with 4 percent growth
since 2018. China is the second FDI receiving economy after the United
States, closely followed by Hong Kong and Singapore, in third and fourth place,
respectively. In particular, Southeast Asian economies like Singapore and
Indonesia are expected to continue being “the region’s growth engine,” with an
estimated 19 percent increase in FDI flows for 2019. Overall, in terms of shares
of world GDP in purchasing power parity, the Asia Pacific region is projected to
become larger than all other economies combined.
Recent developments in US-China trade tensions have led to uncertainty in the
global economy, as have slowdowns in the US and Chinese economies, raising
the risk of slowed economic growth. Indeed, the growth of the Asia Pacific
was expected to slow, even before the ongoing COVID-19 pandemic: the most
recent Global Investment Trend Monitor update forecast a 6 percent drop in
regional FDI inflows for 2019.
For Canada, while the Asia Pacific region is a small part of its FDI flows, it
is a growing region of interest. From 2015 to 2018, Canada’s FDI flows to
the region made up 7 percent of its total outbound FDI. In the same period,
incoming flows from the region made up 10 percent of Canada’s total inbound
FDI.
INTRODUCTION GENERAL TRENDS IN INVESTMENT TO 2019
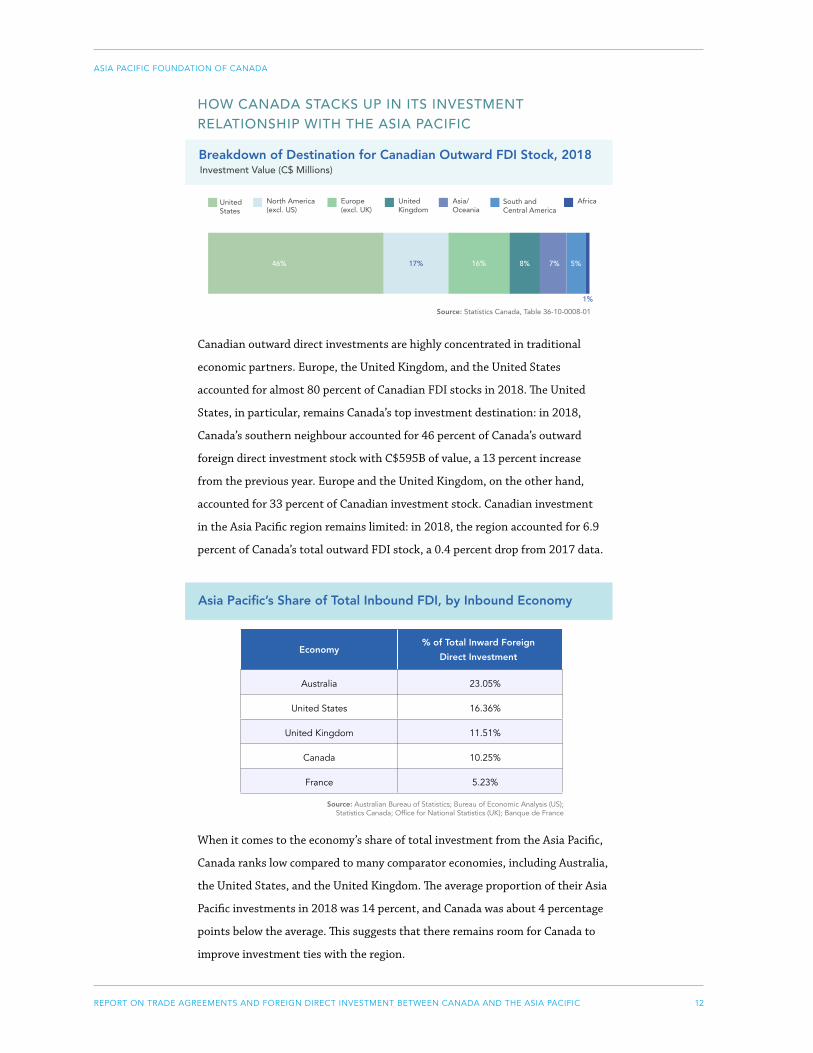
12REPORT ON TRADE AGREEMENTS AND FOREIGN DIRECT INVESTMENT BETWEEN CANADA AND THE ASIA PACIFIC
ASIA PACIFIC FOUNDATION OF CANADA
Breakdown of Destination for Canadian Outward FDI Stock, 2018Investment Value (C$ Millions)
United States
North America (excl. US)
17% 7%16%46% 8% 5%
1%
Europe (excl. UK)
United Kingdom
South and Central America
Asia/Oceania
Africa
Canadian outward direct investments are highly concentrated in traditional
economic partners. Europe, the United Kingdom, and the United States
accounted for almost 80 percent of Canadian FDI stocks in 2018. The United
States, in particular, remains Canada’s top investment destination: in 2018,
Canada’s southern neighbour accounted for 46 percent of Canada’s outward
foreign direct investment stock with C$595B of value, a 13 percent increase
from the previous year. Europe and the United Kingdom, on the other hand,
accounted for 33 percent of Canadian investment stock. Canadian investment
in the Asia Pacific region remains limited: in 2018, the region accounted for 6.9
percent of Canada’s total outward FDI stock, a 0.4 percent drop from 2017 data.
When it comes to the economy’s share of total investment from the Asia Pacific,
Canada ranks low compared to many comparator economies, including Australia,
the United States, and the United Kingdom. The average proportion of their Asia
Pacific investments in 2018 was 14 percent, and Canada was about 4 percentage
points below the average. This suggests that there remains room for Canada to
improve investment ties with the region.
Source: Australian Bureau of Statistics; Bureau of Economic Analysis (US); Statistics Canada; Office for National Statistics (UK); Banque de France
Economy% of Total Inward Foreign
Direct Investment
Australia 23.05%
United States 16.36%
United Kingdom 11.51%
Canada 10.25%
France 5.23%
Asia Pacific’s Share of Total Inbound FDI, by Inbound Economy
HOW CANADA STACKS UP IN ITS INVESTMENT RELATIONSHIP WITH THE ASIA PACIFIC
Source: Statistics Canada, Table 36-10-0008-01
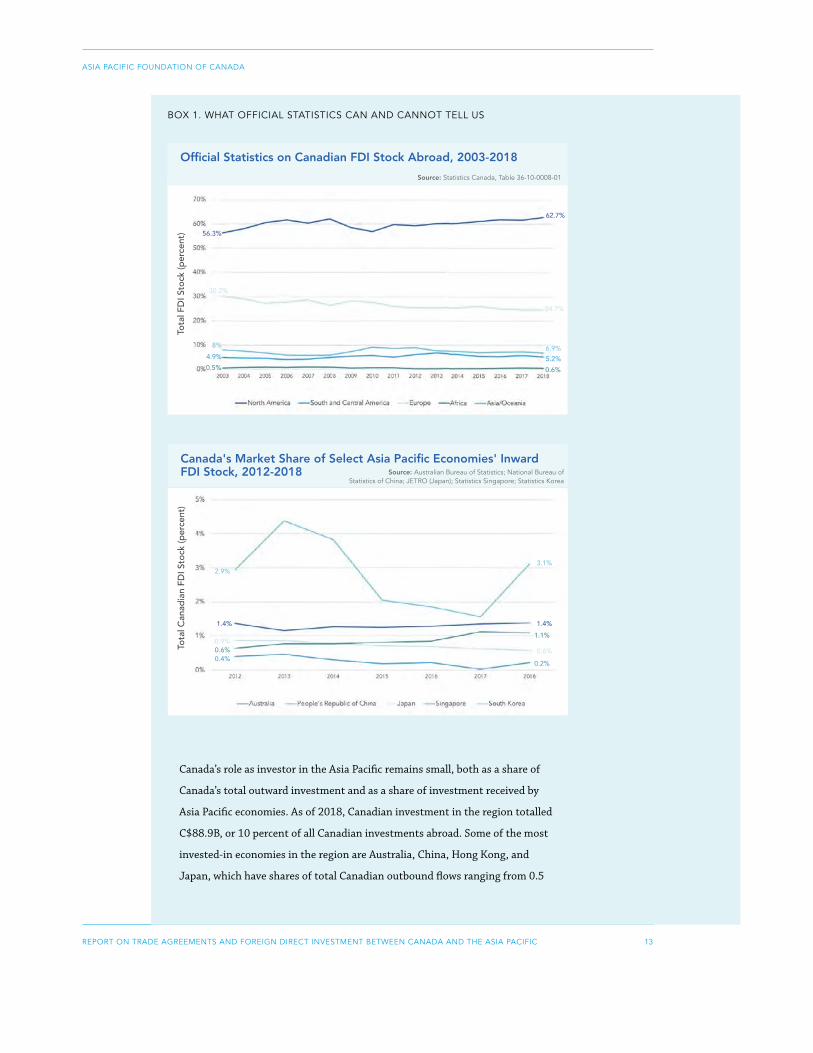
13REPORT ON TRADE AGREEMENTS AND FOREIGN DIRECT INVESTMENT BETWEEN CANADA AND THE ASIA PACIFIC
ASIA PACIFIC FOUNDATION OF CANADA
Official Statistics on Canadian FDI Stock Abroad, 2003-2018
Tota
l FD
I Sto
ck (p
erce
nt)
62.7%
56.3%
24.7%
30.2%
6.9%8%
5.2%4.9%
0.6%0.5%
Source: Statistics Canada, Table 36-10-0008-01
BOX 1. WHAT OFFICIAL STATISTICS CAN AND CANNOT TELL US
Canada's Market Share of Select Asia Pacific Economies' Inward FDI Stock, 2012-2018
Tota
l Can
adia
n FD
I Sto
ck (p
erce
nt)
1.4%1.4%
0.6%0.9%
3.1%2.9%
0.2%0.4%
1.1%
0.6%
Source: Australian Bureau of Statistics; National Bureau of Statistics of China; JETRO (Japan); Statistics Singapore; Statistics Korea
Canada’s role as investor in the Asia Pacific remains small, both as a share of
Canada’s total outward investment and as a share of investment received by
Asia Pacific economies. As of 2018, Canadian investment in the region totalled
C$88.9B, or 10 percent of all Canadian investments abroad. Some of the most
invested-in economies in the region are Australia, China, Hong Kong, and
Japan, which have shares of total Canadian outbound flows ranging from 0.5
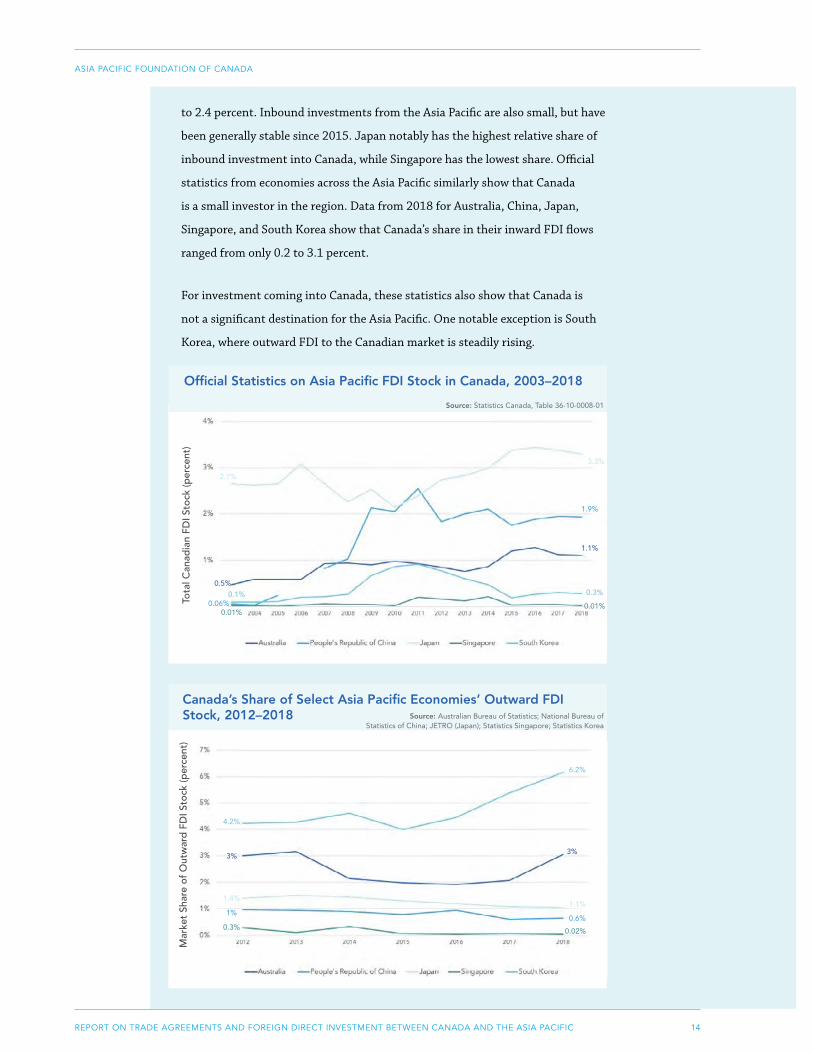
14REPORT ON TRADE AGREEMENTS AND FOREIGN DIRECT INVESTMENT BETWEEN CANADA AND THE ASIA PACIFIC
ASIA PACIFIC FOUNDATION OF CANADA
to 2.4 percent. Inbound investments from the Asia Pacific are also small, but have
been generally stable since 2015. Japan notably has the highest relative share of
inbound investment into Canada, while Singapore has the lowest share. Official
statistics from economies across the Asia Pacific similarly show that Canada
is a small investor in the region. Data from 2018 for Australia, China, Japan,
Singapore, and South Korea show that Canada’s share in their inward FDI flows
ranged from only 0.2 to 3.1 percent.
For investment coming into Canada, these statistics also show that Canada is
not a significant destination for the Asia Pacific. One notable exception is South
Korea, where outward FDI to the Canadian market is steadily rising.
Official Statistics on Asia Pacific FDI Stock in Canada, 2003–2018
Tota
l Can
adia
n FD
I Sto
ck (p
erce
nt)
1.1%
0.5%
3.3%
2.7%
0.3%0.1%
1.9%
0.06% 0.01%0.01%
Canada’s Share of Select Asia Pacific Economies’ Outward FDI Stock, 2012–2018
Mar
ket
Shar
e of
Out
war
d F
DI S
tock
(per
cent
)
3%3%
1.1%1.4%
6.2%
4.2%
0.6%1%
0.02%0.3%
Source: Statistics Canada, Table 36-10-0008-01
Source: Australian Bureau of Statistics; National Bureau of Statistics of China; JETRO (Japan); Statistics Singapore; Statistics Korea
15REPORT ON TRADE AGREEMENTS AND FOREIGN DIRECT INVESTMENT BETWEEN CANADA AND THE ASIA PACIFIC
ASIA PACIFIC FOUNDATION OF CANADA
The official statistics provided by Statistics Canada show Canada’s international
investment position on a national level, using a top-down approach in its
collection of data. The data is mainly gathered from surveys of Canadian and
foreign firms, as well as reports from government bodies like the Bank of
Canada.
Due to the top-down nature of the data, Statistics Canada is unable to record
the ultimate sources and destinations of investments, the subnational-
level distribution of investments, and the distribution of investments by
industry. As such, national data provided by Statistics Canada and Asia Pacific
economies does not offer transaction-level information on FDI, nor details on
the number of deals and distribution of investments across geographic regions
and industries.
Cross-border investments can be separated into two major groups: 1)
foreign portfolio investment (FPI) and 2) foreign direct investment (FDI).
FPI is a temporary investment by a resident or enterprise of one economy
into a financial asset of another economy. This investment involves
a non-controlling stake in an enterprise in the form of equity, debt
securities, or loans. For example, a Canadian firm increasing its stake
from 3 percent to 5 percent in a South Korean firm would be an FPI.
FDI is a long-term or lasting-interest investment by a resident or enterprise
of one economy into a tangible asset of another country. This type of
investment is deemed “long term” or of “lasting interest” if it is either a
greenfield investment or an acquisition of at least 10 percent of the equity
or voting shares of an enterprise. This 10 percent threshold is considered
a controlling interest in an enterprise and is what primarily distinguishes
FDI from portfolio investment, since it usually coincides with a transfer of
management, technology, and organizational skills along with capital. One
example of FDI is Canada-based Gildan Activewear’s investment of $45M
into a new manufacturing plant in another country that would expand its
textile and sewing operations in the country.
BOX 2. CROSS-BORDER INVESTMENT AND FDI
Foreign Portfolio Investment
Foreign Direct Investment
16REPORT ON TRADE AGREEMENTS AND FOREIGN DIRECT INVESTMENT BETWEEN CANADA AND THE ASIA PACIFIC
ASIA PACIFIC FOUNDATION OF CANADA
BOX 3. STOCK AND FLOW
The concepts of stock and flow are commonly used in economics and
accounting. Stock refers to an existing quantity at one specific time,
whereas flow refers to the movement of quantities in and out of the
stock. There are two types of flows: inflow, which is an addition to the
stock, and outflow, which is a deduction from the stock. The numerical
difference between the inflow and outflow is called a net inflow. If the
net inflow is positive, this means that the stock is rising, whereas if it
the net inflow is negative, this means that the stock is falling. A bank
account can illustrate these concepts. The balance of the account is the
stock, while deposits and withdrawals from the account are the flows.
In an investment scenario, the total amount of capital that Canada
has accumulated and depleted through investment over the years is
considered the stock. The amount of investment flows coming into and
exiting Canada then represent its inflows and outflows, respectively.
17REPORT ON TRADE AGREEMENTS AND FOREIGN DIRECT INVESTMENT BETWEEN CANADA AND THE ASIA PACIFIC
ASIA PACIFIC FOUNDATION OF CANADA
FREE TRADE AGREEMENTS IN THE ASIA PACIFIC AND FDI: ANY CORRELATION?
KEY SECTION TAKEAWAYS
• Free trade agreements have a strong positive effect on boosting foreign
direct investment among developed economies. The main causal
mechanisms are the additional investment protection clauses included in
all agreements, the expanded market, and the lowered costs and barriers
for doing business.
• In the Asia Pacific, the strongest evidence for increased FDI after a free
trade agreement is the Canada-South Korea free trade agreement signed in
2015. Canada received an additional C$870M from 2015 to 2019.
• In 2019, two-way investment flows between Canada and the CPTPP
economies were mostly tied to the software and computer services sector,
which accounted for 25 percent (C$1.4B) of the total value of inward and
outward investment. The next two biggest sectors were mining (C$1.2B)
and aerospace and defence (C$963M).
• In 2019, the Association of Southeast Asian Nations (ASEAN) economies
invested over C$1.2B (12 deals) in Canada, whereas Canada invested
C$112M (8 deals) into ASEAN.
• In the past five years, Canadian companies have been investing in
greenfield deals in the economies of the Pacific Alliance, with a cumulative
investment value of C$17.1B.
18REPORT ON TRADE AGREEMENTS AND FOREIGN DIRECT INVESTMENT BETWEEN CANADA AND THE ASIA PACIFIC
ASIA PACIFIC FOUNDATION OF CANADA
FDI AND TRADE THEORY
In this report, APF Canada decided to explore one of the most common
questions about foreign direct investment: What is the relationship between
FDI and trade, and more specifically free trade agreements? Since the 1990s,
economic theory and research has been conducted on if and how increasing
bilateral investment treaties and free trade agreements heightens investors’
confidence by securing equal treatment, respect for international norms, and
rule of law, including protection of the right to profit and capital repatriation.1
The proliferation of free trade agreements after the 2000s put this theory to
the test. Different studies have proved that there are not one, but numerous
causal mechanisms behind the strong relationship existing between FTAs and
foreign direct investment, depending on the size of the market, the levels of
commercial exchange, and the possibilities of expansion. 2
The first and most important incentive for investment as a result of an FTA
is the enhancing credibility of the chapter on investment protection that is
included in every FTA. Investment protection chapters now not only prohibit
expropriation without prompt and adequate compensation, but they also
prohibit discriminatory treatment toward foreign investors. In addition, all
FTAs, as well as most bilateral investment treaties (BITs), offer the additional
benefit of settling any international investor-state dispute through third-party
arbitration and other dispute-settlement mechanisms.
These benefits provide levels of guarantees that help investors feel safe moving
in and out of the member countries in the new agreement. They reassure
the investor that the host country will eliminate production distortions and
procedural or institutional barriers to conducting business in that country.3 For
the Canadian economy this is significant because FTA investment protection
chapters have protected one of its most important investment sectors, mining
and extractive industries, whose products are usually not covered by tariff
reductions.
Other scholars have found that the potential size of the market induced
investment in local production and incorporation in core value chains of
the most developed country.4 For instance, South Korea’s FDI in greenfield
investments and advanced manufacturing expanded rapidly with FTA partners
because of the added value of bilateral tariffs over time.5 Trade openness offers
19REPORT ON TRADE AGREEMENTS AND FOREIGN DIRECT INVESTMENT BETWEEN CANADA AND THE ASIA PACIFIC
ASIA PACIFIC FOUNDATION OF CANADA
additional incentives for South Korean companies as they use the agreements
to expand manufacturing facilities and create economies of scale. Our own
findings suggest this relationship in the case of South Korea, as Canada’s
investment in South Korea increased almost threefold after the ratification
of the FTA. While Korean investment in Canada was already significant, it
increased even more after the agreement. Korea’s wide manufacturing base
and Canada’s large market provided additional incentives, but the FTA explains
at least 50 percent of the additional investment Canada received from this new
partnership.
Mega free trade agreements tend to provide further incentives to increase
foreign direct investment. Jang has shown that, at least for developed
countries like Canada, the existence of a regional FTA increased FDI by 14 to
35 percent from member countries alone and by 28 to 35 percent from non-
member countries.6 Multilateral and plurilateral trade agreements such as the
CPTPP can create additional incentives, such as regional market integration
and regional supply chains in both goods and services, which make investment
flows easier and more attractive. In other words, these mega agreements
not only enhance investors’ confidence in a common set of rules and legal
protections for investments, but also in the fluidity and increase in labour
services, equity markets, financial services, innovation, and technology that
become available when distance stops being an issue.
In sum, FTAs are potentially better at increasing foreign direct investment
– rather than trade – in the new member countries, at least in the first five
years after ratification.7 Increasing investment protection, national treatment,
expanded market possibilities, and implicit economic co-ordination compound
the incentives that boost FDI in new FTA partners, even before the agreement
enters into force. The Investment Monitor 2020 report presents only an
example of what Canadians should observe about the relationship between
FTAs and foreign direct investment inward and outward. We start by analyzing
the deals and investment in the largest free trade agreement in the Pacific, the
CPTPP, and then look at the Canada-Korea Free Trade Agreement (CKFTA). For
comparative purposes, this chapter will also examine Canada’s investment ties
with the ASEAN economies and the Pacific Alliance FTA under analysis by the
Canadian government.
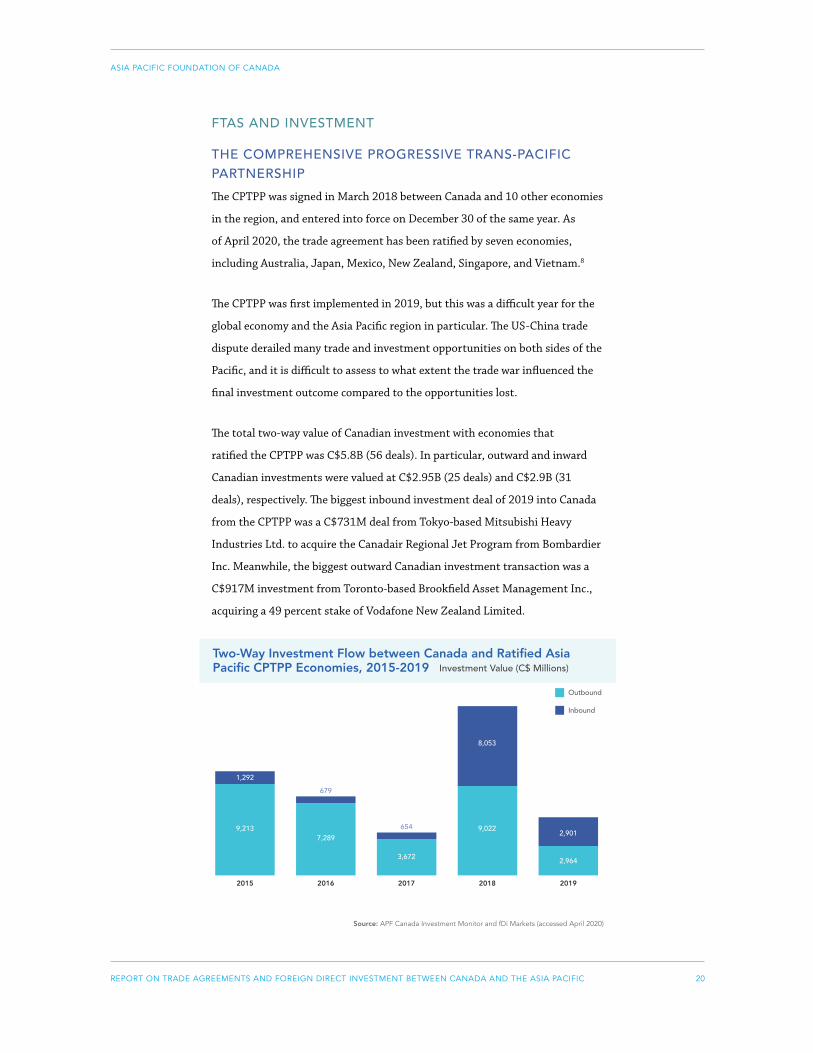
20REPORT ON TRADE AGREEMENTS AND FOREIGN DIRECT INVESTMENT BETWEEN CANADA AND THE ASIA PACIFIC
ASIA PACIFIC FOUNDATION OF CANADA
FTAS AND INVESTMENT
THE COMPREHENSIVE PROGRESSIVE TRANS-PACIFIC PARTNERSHIP
The CPTPP was signed in March 2018 between Canada and 10 other economies
in the region, and entered into force on December 30 of the same year. As
of April 2020, the trade agreement has been ratified by seven economies,
including Australia, Japan, Mexico, New Zealand, Singapore, and Vietnam.8
The CPTPP was first implemented in 2019, but this was a difficult year for the
global economy and the Asia Pacific region in particular. The US-China trade
dispute derailed many trade and investment opportunities on both sides of the
Pacific, and it is difficult to assess to what extent the trade war influenced the
final investment outcome compared to the opportunities lost.
The total two-way value of Canadian investment with economies that
ratified the CPTPP was C$5.8B (56 deals). In particular, outward and inward
Canadian investments were valued at C$2.95B (25 deals) and C$2.9B (31
deals), respectively. The biggest inbound investment deal of 2019 into Canada
from the CPTPP was a C$731M deal from Tokyo-based Mitsubishi Heavy
Industries Ltd. to acquire the Canadair Regional Jet Program from Bombardier
Inc. Meanwhile, the biggest outward Canadian investment transaction was a
C$917M investment from Toronto-based Brookfield Asset Management Inc.,
acquiring a 49 percent stake of Vodafone New Zealand Limited.
Source: APF Canada Investment Monitor and fDi Markets (accessed April 2020)
Two-Way Investment Flow between Canada and Ratified Asia Pacific CPTPP Economies, 2015-2019 Investment Value (C$ Millions)
Outbound
Inbound
2015 2016
9,213
1,292
7,289
679
3,672
654 9,022
8,053
2,964
2,901
2017 2018 2019
21REPORT ON TRADE AGREEMENTS AND FOREIGN DIRECT INVESTMENT BETWEEN CANADA AND THE ASIA PACIFIC
ASIA PACIFIC FOUNDATION OF CANADA
Canada and five other economies in the region have ratified the CPTPP,
including Australia, Japan, New Zealand, and Singapore. Overall, the
investment flows for 2019 between Canada and CPTPP-ratified economies
decreased from 2018. However, in 2018, there were a few deals that dominated
the share of total investment flow. Of these high-scale deals, state-owned
enterprises such as the Ontario Municipal Employees Retirement System
and the Canada Pension Plan Investment Board had the lion’s share (over 50
percent) of investments into the Australian real estate and mining sectors.
These pension-backed enterprises from Canada invest in a diverse range of
assets in public and private sectors worldwide.
Similarly, the volume of inward Canadian investment in 2018 was dominated
by a few investment deals. Over three-quarters of the total inward investment
(C$6.1B) was from Japanese Mitsubishi Corporation through its joint
venture, LNG Canada, into the oil and gas producers’ sector of Canada,
building a liquefied natural gas export facility in BC. LNG Canada is a joint
venture among Shell Canada Energy, Petronas, PetroChina Company Limited,
Mitsubishi Corporation, and Korea Gas Corporation.
Within the CPTPP economies, Australia, New Zealand, and Japan were the
top investment destinations for Canada in 2019. Canada invested over C$1.4B
(18 deals) into Australia, C$1.1B (3 deals) into New Zealand, and C$436M (4
deals) into Japan. The target investment sectors in Australia were diverse, with
chemicals (C$623M), health care equipment and services (C$335M), and travel
and leisure (C$150M) at the top. On the other hand, New Zealand’s software
and computer sector attracted the most Canadian investment (C$1B) to the
country. Canada invested in Japan’s utilities sector (C$436M), particularly in
alternative electricity.
In terms of Canadian inward investment from the CPTPP economies in 2019,
Australian investment into Canada amounted to over C$1.5B (25 deals), and
Japan invested C$1.3B (31 deals). The majority of Australian investment
(C$1.2B) went to the mining sector of Canada, while a big share of the
Japanese investment (C$933M) was in the aerospace and defence sector.
Overall two-way investment with Australia is the highest in both scale
(C$2.9B) and number (43 deals) of deals among the CPTPP-ratified economies,
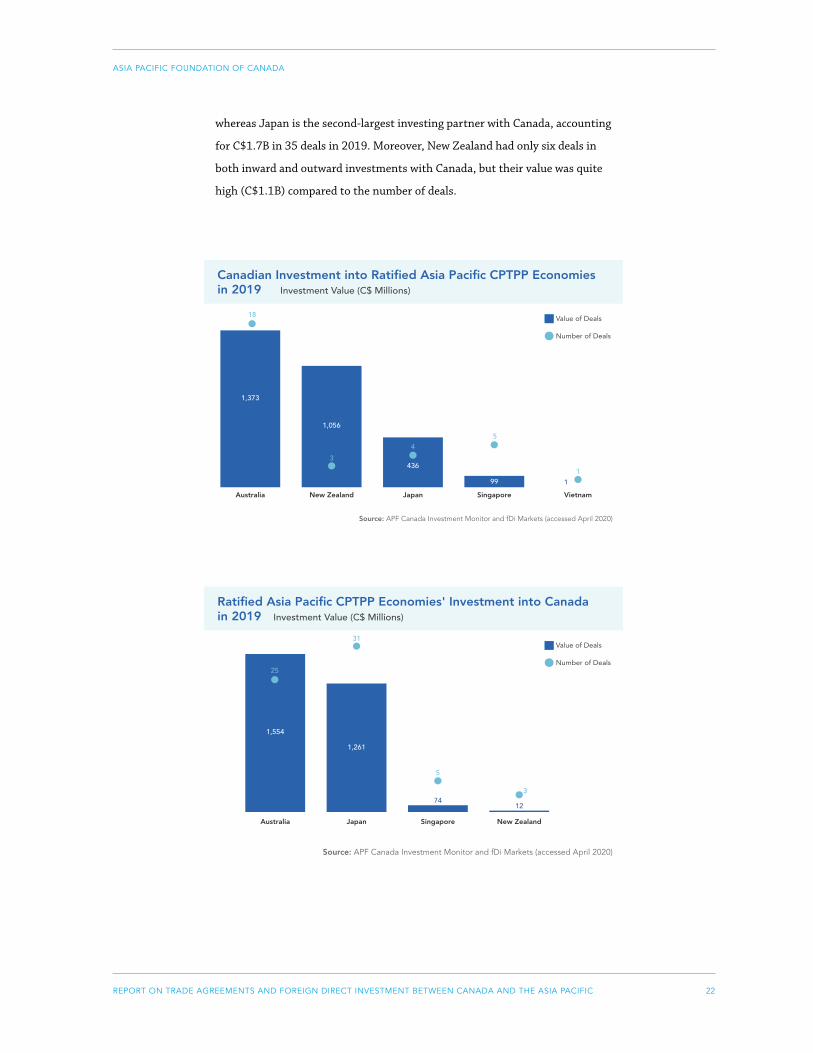
22REPORT ON TRADE AGREEMENTS AND FOREIGN DIRECT INVESTMENT BETWEEN CANADA AND THE ASIA PACIFIC
ASIA PACIFIC FOUNDATION OF CANADA
whereas Japan is the second-largest investing partner with Canada, accounting
for C$1.7B in 35 deals in 2019. Moreover, New Zealand had only six deals in
both inward and outward investments with Canada, but their value was quite
high (C$1.1B) compared to the number of deals.
Source: APF Canada Investment Monitor and fDi Markets (accessed April 2020)
Source: APF Canada Investment Monitor and fDi Markets (accessed April 2020)
Canadian Investment into Ratified Asia Pacific CPTPP Economies in 2019 Investment Value (C$ Millions)
Value of Deals
Number of Deals
5
1,373
1,056
Australia New Zealand Japan Singapore
436
99
18
3
4
1
Vietnam
1
Ratified Asia Pacific CPTPP Economies' Investment into Canada in 2019 Investment Value (C$ Millions)
Value of Deals
Number of Deals
3
1,554
1,261
Australia Japan Singapore New Zealand
7412
25
31
5

23REPORT ON TRADE AGREEMENTS AND FOREIGN DIRECT INVESTMENT BETWEEN CANADA AND THE ASIA PACIFIC
ASIA PACIFIC FOUNDATION OF CANADA
Two-way investment flows between Canada and the CPTPP economies were
mostly tied to the software and computer services sector, which accounted
for 25 percent (C$1.4B) of the total value of inward and outward investment
in 2019. The next two biggest sectors were mining (C$1.2B) and aerospace
and defence (C$963M). While the former accounted for 21 percent, the latter
accounted for 16 percent in the last year. Other sectors did not receive as much
investment as these three sectors received in 2019.
Source: APF Canada Investment Monitor and fDi Markets (accessed April 2020)
CANADA-KOREA FREE TRADE AGREEMENT
Canada and South Korea signed their free trade agreement in 2014, and the
treaty came into force in January 2015. The CKFTA contains protection clauses
that aim to set out a more transparent and predictable environment for both
Canadian and Korean investors.9 After the CKFTA was ratified, there were a
total of 37 investment deals between the two countries, and the value of the
two-way investment flow was C$7.8B between 2015 and 2019.
87
87
Two-Way Investment Flow between Canada and Ratified Asia Pacific CPTPP Economies by Top 10 Sectors, 2019Investment Value (C$ Millions)
Mining 1,222
Software & Computer Services 1,437
Aerospace & Defence
Electricity
Chemicals
Travel & Leisure
Health Care Equipment & Services
631
963
371
501
124
151
Pharmaceuticals
Industrial Metals & Mining
Personal Goods
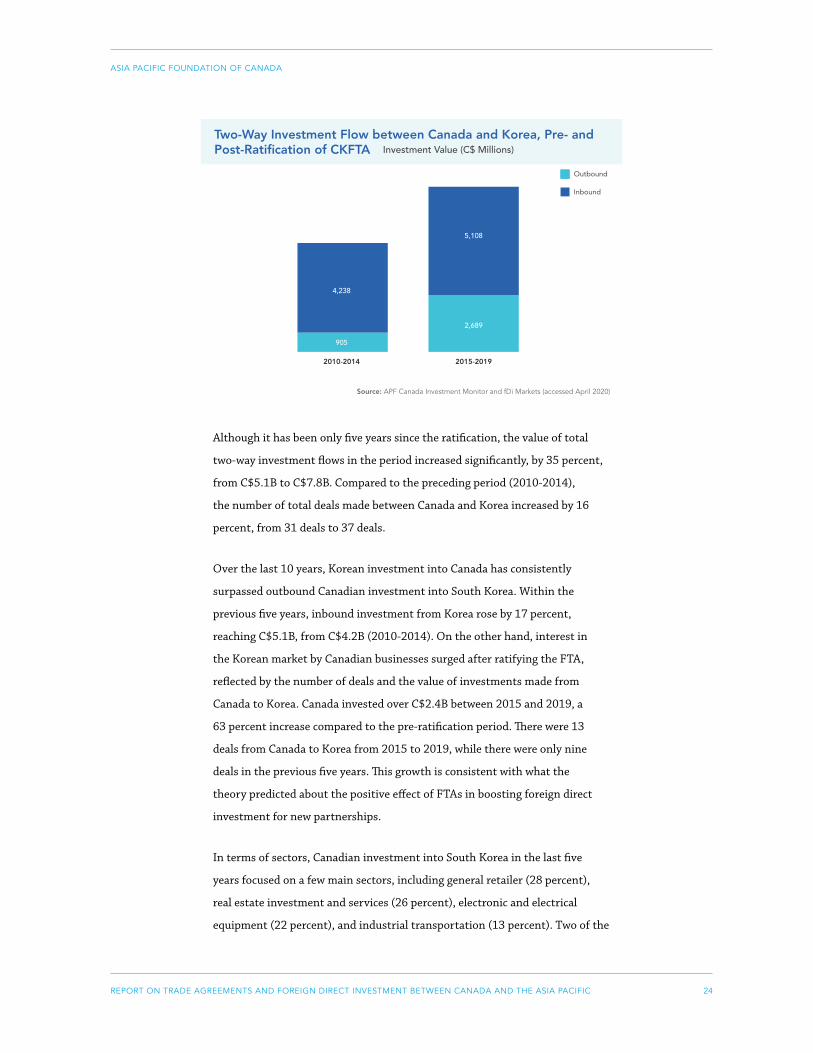
24REPORT ON TRADE AGREEMENTS AND FOREIGN DIRECT INVESTMENT BETWEEN CANADA AND THE ASIA PACIFIC
ASIA PACIFIC FOUNDATION OF CANADA
Source: APF Canada Investment Monitor and fDi Markets (accessed April 2020)
Although it has been only five years since the ratification, the value of total
two-way investment flows in the period increased significantly, by 35 percent,
from C$5.1B to C$7.8B. Compared to the preceding period (2010-2014),
the number of total deals made between Canada and Korea increased by 16
percent, from 31 deals to 37 deals.
Over the last 10 years, Korean investment into Canada has consistently
surpassed outbound Canadian investment into South Korea. Within the
previous five years, inbound investment from Korea rose by 17 percent,
reaching C$5.1B, from C$4.2B (2010-2014). On the other hand, interest in
the Korean market by Canadian businesses surged after ratifying the FTA,
reflected by the number of deals and the value of investments made from
Canada to Korea. Canada invested over C$2.4B between 2015 and 2019, a
63 percent increase compared to the pre-ratification period. There were 13
deals from Canada to Korea from 2015 to 2019, while there were only nine
deals in the previous five years. This growth is consistent with what the
theory predicted about the positive effect of FTAs in boosting foreign direct
investment for new partnerships.
In terms of sectors, Canadian investment into South Korea in the last five
years focused on a few main sectors, including general retailer (28 percent),
real estate investment and services (26 percent), electronic and electrical
equipment (22 percent), and industrial transportation (13 percent). Two of the
Two-Way Investment Flow between Canada and Korea, Pre- and Post-Ratification of CKFTA
Outbound
Inbound
4,238
5,108
905
2,689
2010-2014 2015-2019
Investment Value (C$ Millions)
25REPORT ON TRADE AGREEMENTS AND FOREIGN DIRECT INVESTMENT BETWEEN CANADA AND THE ASIA PACIFIC
ASIA PACIFIC FOUNDATION OF CANADA
largest investment deals into South Korea were from one source, the Canada
Pension Plan Investment Board (CPPIB). In the year the CKFTA was ratified,
the CPPIB invested over C$763M in one of the largest retailers in Korea,
Homeplus. Also, in 2018, the pension fund invested C$250M to own a 50
percent stake in real estate located in the centre of Seoul, the Kumho Asiana
Main Tower. The CPPIB has stated that its investment in the Korean real estate
sector reflected its desire to enhance the firm’s investments in the Asia Pacific
region as well as its strategy to invest in top-tier, well-located properties.
In the previous five years, inbound investment from South Korea was worth
C$5.1B. Of this C$5.1B, 43 percent went into the oil and gas producers
sector, 32 percent into the industrial engineering sector, 8 percent into the
pharmaceuticals sector, and 5 percent into the construction and materials
sector of Canada. The biggest investment deal made in the oil and gas
producers sector was C$2B from Korea Gas Corporation, which entered the
Canadian market through its joint venture, LNG Canada, in 2018. In the same
year, Korean Hanon Systems invested over C$1.6B to acquire the fluid pressure
and controls business of Magna International Inc., an Ontario-based auto
parts company.
LOOKING AHEAD: CANADA’S INVESTMENT TIES WITH ASEAN AND PACIFIC ALLIANCE ECONOMIES
CANADA AND ASEAN
ASEAN is one of the world’s fastest-growing economic regions, including
Brunei Darussalam, Cambodia, Indonesia, Lao PDR, Malaysia, Myanmar,
Philippines, Singapore, Thailand, and Vietnam. According to the 2019 ASEAN
Economic Integration Brief, the economic growth rate of ASEAN was 5.1
percent in 2018, compared to 3.6 percent of the world growth rate. From 2003
to 2019, two-way investment between Canada and ASEAN accounted for
only 13 percent of total investment between Canada and the Asia Pacific, still
lagging behind the other Asia Pacific economies. Therefore, both a gap and an
opportunity exist for Canada to strengthen its two-way investment ties with
ASEAN and other emerging economies.
In 2019, the ASEAN economies invested over C$1.2B (12 deals) in Canada,
whereas Canada invested C$238M (11 deals) in ASEAN. Those 12 deals
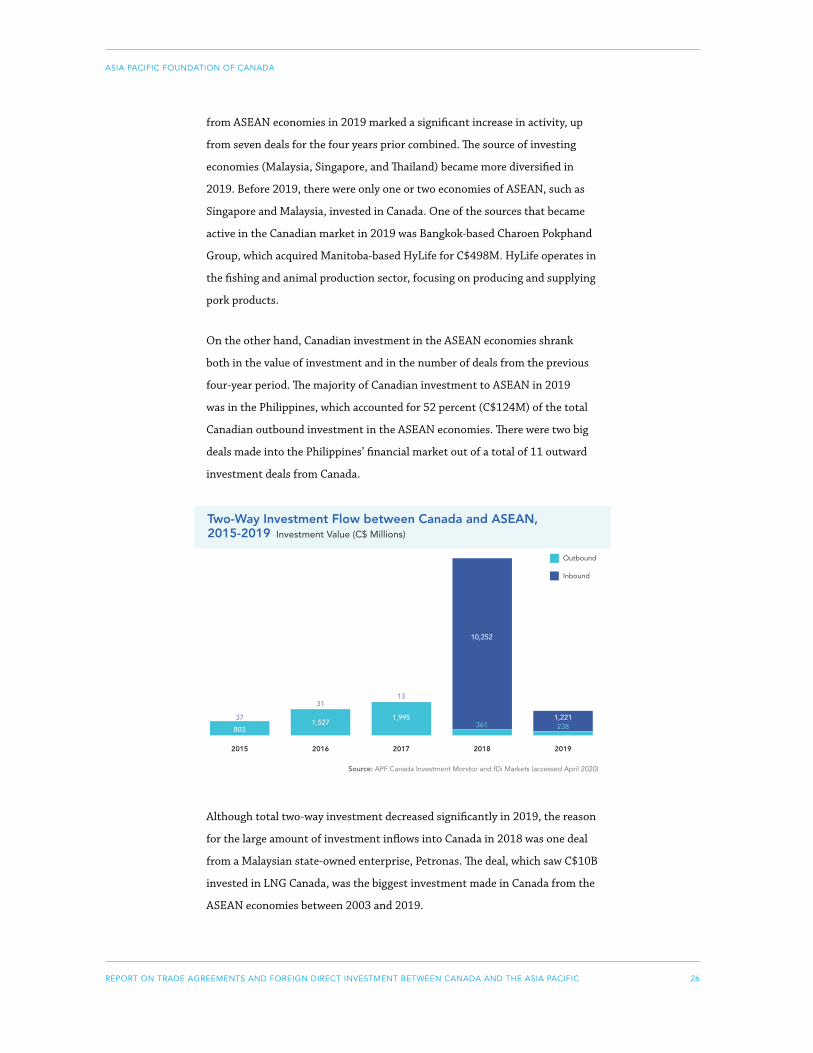
26REPORT ON TRADE AGREEMENTS AND FOREIGN DIRECT INVESTMENT BETWEEN CANADA AND THE ASIA PACIFIC
ASIA PACIFIC FOUNDATION OF CANADA
from ASEAN economies in 2019 marked a significant increase in activity, up
from seven deals for the four years prior combined. The source of investing
economies (Malaysia, Singapore, and Thailand) became more diversified in
2019. Before 2019, there were only one or two economies of ASEAN, such as
Singapore and Malaysia, invested in Canada. One of the sources that became
active in the Canadian market in 2019 was Bangkok-based Charoen Pokphand
Group, which acquired Manitoba-based HyLife for C$498M. HyLife operates in
the fishing and animal production sector, focusing on producing and supplying
pork products.
On the other hand, Canadian investment in the ASEAN economies shrank
both in the value of investment and in the number of deals from the previous
four-year period. The majority of Canadian investment to ASEAN in 2019
was in the Philippines, which accounted for 52 percent (C$124M) of the total
Canadian outbound investment in the ASEAN economies. There were two big
deals made into the Philippines’ financial market out of a total of 11 outward
investment deals from Canada.
Source: APF Canada Investment Monitor and fDi Markets (accessed April 2020)
Although total two-way investment decreased significantly in 2019, the reason
for the large amount of investment inflows into Canada in 2018 was one deal
from a Malaysian state-owned enterprise, Petronas. The deal, which saw C$10B
invested in LNG Canada, was the biggest investment made in Canada from the
ASEAN economies between 2003 and 2019.
Two-Way Investment Flow between Canada and ASEAN, 2015-2019 Investment Value (C$ Millions)
Outbound
Inbound
2015 2016
803
371,527
31
1,995
13
361
10,252
2381,221
2017 2018 2019
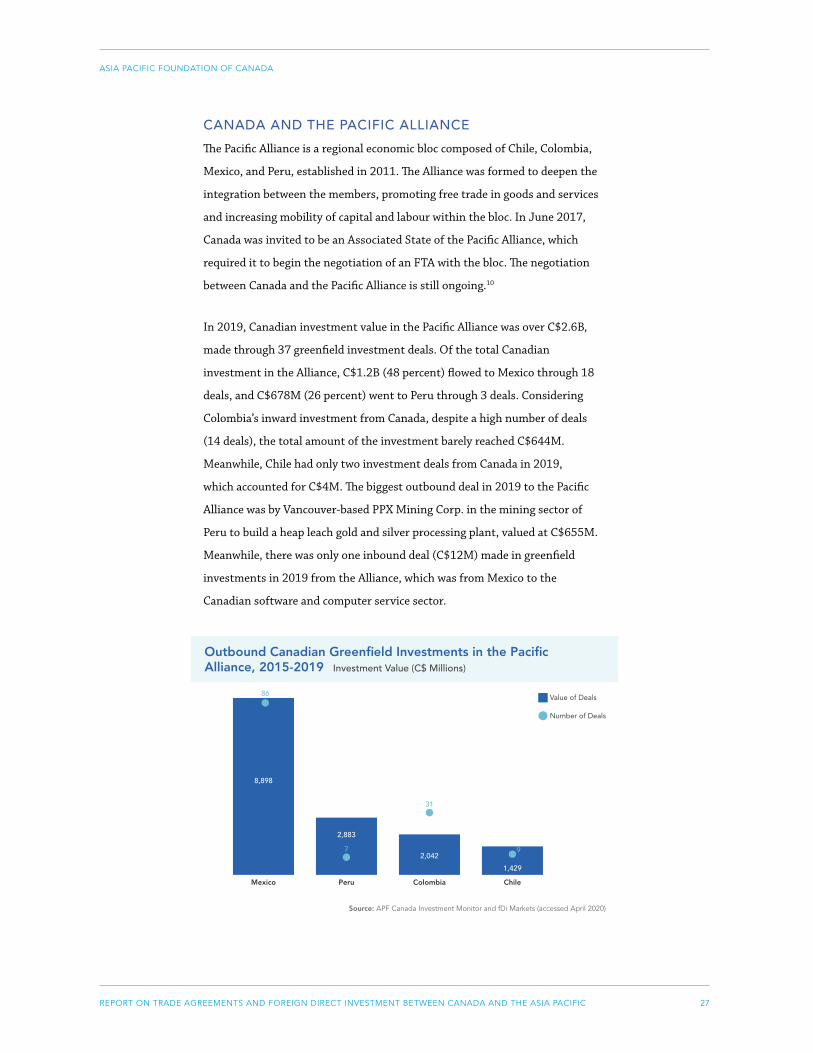
27REPORT ON TRADE AGREEMENTS AND FOREIGN DIRECT INVESTMENT BETWEEN CANADA AND THE ASIA PACIFIC
ASIA PACIFIC FOUNDATION OF CANADA
CANADA AND THE PACIFIC ALLIANCE
The Pacific Alliance is a regional economic bloc composed of Chile, Colombia,
Mexico, and Peru, established in 2011. The Alliance was formed to deepen the
integration between the members, promoting free trade in goods and services
and increasing mobility of capital and labour within the bloc. In June 2017,
Canada was invited to be an Associated State of the Pacific Alliance, which
required it to begin the negotiation of an FTA with the bloc. The negotiation
between Canada and the Pacific Alliance is still ongoing.10
In 2019, Canadian investment value in the Pacific Alliance was over C$2.6B,
made through 37 greenfield investment deals. Of the total Canadian
investment in the Alliance, C$1.2B (48 percent) flowed to Mexico through 18
deals, and C$678M (26 percent) went to Peru through 3 deals. Considering
Colombia’s inward investment from Canada, despite a high number of deals
(14 deals), the total amount of the investment barely reached C$644M.
Meanwhile, Chile had only two investment deals from Canada in 2019,
which accounted for C$4M. The biggest outbound deal in 2019 to the Pacific
Alliance was by Vancouver-based PPX Mining Corp. in the mining sector of
Peru to build a heap leach gold and silver processing plant, valued at C$655M.
Meanwhile, there was only one inbound deal (C$12M) made in greenfield
investments in 2019 from the Alliance, which was from Mexico to the
Canadian software and computer service sector.
Source: APF Canada Investment Monitor and fDi Markets (accessed April 2020)
Outbound Canadian Greenfield Investments in the Pacific Alliance, 2015-2019 Investment Value (C$ Millions)
Value of Deals
Number of Deals
9
8,898
2,883
Mexico Peru Colombia Chile
2,042
1,429
86
7
31
28REPORT ON TRADE AGREEMENTS AND FOREIGN DIRECT INVESTMENT BETWEEN CANADA AND THE ASIA PACIFIC
ASIA PACIFIC FOUNDATION OF CANADA
Over the past five years, Canadian investment in Pacific Alliance economies
had a cumulative value of C$17.1B, and the investment flow trend has
fluctuated. A majority of Canadian outbound investment in the Alliance
went to Mexico, valued at over C$8.9B (86 deals). The second most popular
investment destination in the Alliance for Canadian business was Peru, with
over C$2.9B invested (7 deals), the third was Colombia, valued at C$2B (31
deals), and the last was Chile, with C$1.4B (9 deals) between 2015 and 2019.
Despite the significant flow of Canadian investments into the bloc, the reverse
flow of investment has not occurred, except for sporadic Mexican investments
into Canada, which were valued at C$56M (4 deals) from 2015 to 2019.
The reason for the higher investment scale between Canada and Mexico is
that these two countries have a long-term partnership rooted in the North
American Free Trade Agreement (NAFTA), while the other economies have
only recently partnered with Canada. The additional reason is that the positive
effect of FTAs on investment is stronger in developed economies and weaker
when the partnership includes developing ones. Even when an FTA provides
the same clauses for investment protection, the realities on the ground and the
size of the market works against a stronger benefit for the developed economy,
while the benefit is still there for the developing one.11
USAGE CHALLENGES AND FUTURE PROMISES
In all, the CPTPP adds an additional positive effect, as predicted by the
theory. Within the Pacific Alliance, the economies of the CPTPP are the top
investment partners of Canada in terms of the number of deals and the value
of investments. Although the investment volume with the CPTPP did not
increase after the FTA ratification, it is still too early to determine the potential
of the FTA based on the one-year investment flows between Canada and the
CPTPP.
On the other hand, the CKFTA has showed a significant increase in the number
of deals as well as the value of investments between Canada and South Korea
over the past five years. Thanks to the FTA, opportunities were provided
not only to South Korea to increase its investment into Canada, but also to
Canadian businesses to expand their investments in the South Korean market.
Meanwhile, Canadian investments with ASEAN and the Pacific Alliance
showed inconsistencies in investment trends, because Canada’s investment
29REPORT ON TRADE AGREEMENTS AND FOREIGN DIRECT INVESTMENT BETWEEN CANADA AND THE ASIA PACIFIC
ASIA PACIFIC FOUNDATION OF CANADA
flows were often distorted by high-scale transactions, particularly in inbound
investments with ASEAN in 2018. However, with the Pacific Alliance, the
two-way flow in greenfield investments was mainly composed of outbound
Canadian investment, the majority of which went to Mexico based on their
relatively long-term partnership through NAFTA.
The Pacific Alliance represents a promise for Canadian foreign direct
investment that needs to be monitored and understood in the future as Canada
moves closer to securing a free trade agreement with the bloc. The economies
of scale, especially in the energy and mining sectors, can be multiplied with an
enhanced trade ecosystem that involves the Canadian service sector.
30REPORT ON TRADE AGREEMENTS AND FOREIGN DIRECT INVESTMENT BETWEEN CANADA AND THE ASIA PACIFIC
ASIA PACIFIC FOUNDATION OF CANADA
Key Section Takeaways• Between 2016 and 2019, Canada received C$60B in inbound investment
from the Asia Pacific through 413 deals, hitting a 16-year high.
• While investments from the Asia Pacific into Canada are still primarily in
natural resources, which comprises the energy, mining, and agriculture
industries, inbound investments in the technology sector have been
increasing, from C$396M from 2008 to 2011, to C$1.7B from 2016 to
2019.
• Since 2003, Australia, China, and India have been the top destinations for
outbound Canadian investment into the Asia Pacific. Investment in these
economies totalled C$136.7B, accounting for 73 percent of all outbound
investment to the region.
• In 2019, 17 percent of Canadian investment went to the automobiles and
parts sector, with a dollar value of C$1.3B. Most of these deals involved the
establishment of new manufacturing plants for electric cars in China.
INBOUND TRENDS AND PARTNERS IN A YEAR OF RECORD DEALS
In 2019, Canada received a total of C$8.3B of foreign direct investment from
Asia Pacific economies. While it was a drop from the historic high of C$33B in
2018, of which the liquefied natural gas (LNG) project in Kitimat made up close
to C$25B, the number of inbound investment deals in 2019 set a record with
151 deals.
From 2015 to 2019, Canada received C$56B of Asia Pacific investment through
428 deals, hitting a 16-year high. Compared to the previous four-year period,
inbound investment from the Asia Pacific has jumped by C$9B, or 19 percent.
Other than the well-known LNG project in 2018, one of the largest Asia Pacific
investments came in 2019, when Jiangxi Copper Corporation acquired PIM
Cupric Holdings Limited from Pangaea Investment Management Limited for
C$1.5B.12
THE NATIONAL PICTURE

31REPORT ON TRADE AGREEMENTS AND FOREIGN DIRECT INVESTMENT BETWEEN CANADA AND THE ASIA PACIFIC
ASIA PACIFIC FOUNDATION OF CANADA
Over the last 16 years, Asia Pacific investment into Canada has been growing
both in terms of the investment amount and the number of deals. In this
period, APF Canada’s Investment Monitor has captured approximately C$161B
in investment through 997 deals. The bulk of the investment came in the last
eight years, accounting for 66 percent of the captured investment.
Source: APF Canada Investment Monitor and fDi Markets (accessed April 2020)
While high-dollar-value investments continue to have significant sway in
shaping the total amount of inbound FDI from the Asia Pacific to Canada, the
sharp increase in investment deals in the 2016 to 2019 period renders a lower
concentration of investment per transaction in comparison to the previous
four-year period. The average investment per deal has dropped from C$201M
in the 2012 to 2015 period to C$131M in the most recent four years. This
figure suggests that while Asia Pacific investment into Canada continues to
grow in dollar amount, investment activities – an indicator of investment ties
– are increasing at a more rapid pace and smaller-dollar-amount investment
forms a growing proportion of inbound investment into Canada.
Source: APF Canada Investment Monitor and fDi Markets (accessed April 2020)
Canadian Foreign Direct Investment Received, 2004-2019Investment Value (C$ Millions)
Value of Deals
Number of Deals
428
14,512
39,600
2004-2007 2008-2011 2012-2015 2016-2019
47,140
56,168177172
235
Time PeriodAverage Amount Invested
Per Deal (C$ Millions)
2004-2007 82
2008-2011 230
2012-2015 201
2016-2019 131
Total 156
Comparison of Average Dollar Amount Invested Per Deal, 2004-2019
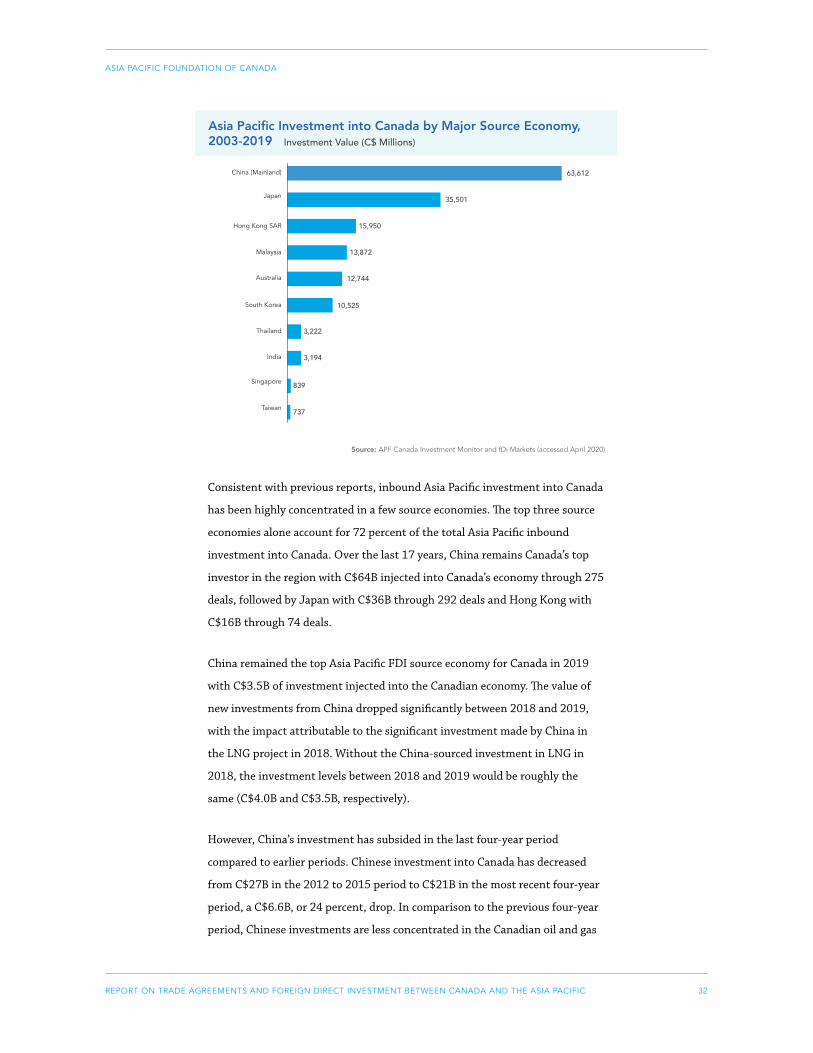
32REPORT ON TRADE AGREEMENTS AND FOREIGN DIRECT INVESTMENT BETWEEN CANADA AND THE ASIA PACIFIC
ASIA PACIFIC FOUNDATION OF CANADA
Source: APF Canada Investment Monitor and fDi Markets (accessed April 2020)
Consistent with previous reports, inbound Asia Pacific investment into Canada
has been highly concentrated in a few source economies. The top three source
economies alone account for 72 percent of the total Asia Pacific inbound
investment into Canada. Over the last 17 years, China remains Canada’s top
investor in the region with C$64B injected into Canada’s economy through 275
deals, followed by Japan with C$36B through 292 deals and Hong Kong with
C$16B through 74 deals.
China remained the top Asia Pacific FDI source economy for Canada in 2019
with C$3.5B of investment injected into the Canadian economy. The value of
new investments from China dropped significantly between 2018 and 2019,
with the impact attributable to the significant investment made by China in
the LNG project in 2018. Without the China-sourced investment in LNG in
2018, the investment levels between 2018 and 2019 would be roughly the
same (C$4.0B and C$3.5B, respectively).
However, China’s investment has subsided in the last four-year period
compared to earlier periods. Chinese investment into Canada has decreased
from C$27B in the 2012 to 2015 period to C$21B in the most recent four-year
period, a C$6.6B, or 24 percent, drop. In comparison to the previous four-year
period, Chinese investments are less concentrated in the Canadian oil and gas
737
839
Asia Pacific Investment into Canada by Major Source Economy, 2003-2019 Investment Value (C$ Millions)
Japan 35,501
China (Mainland) 63,612
Hong Kong SAR
Australia
Malaysia
Thailand
South Korea
13,872
15,950
10,525
12,744
3,194
3,222
India
Singapore
Taiwan
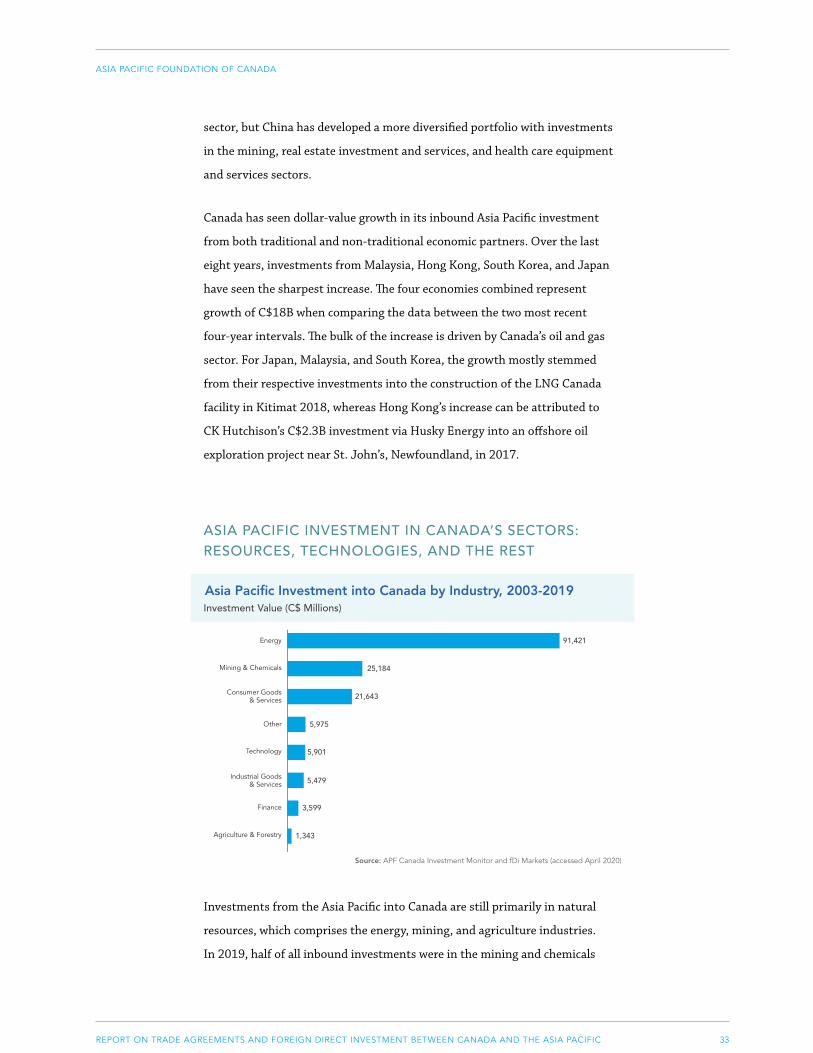
33REPORT ON TRADE AGREEMENTS AND FOREIGN DIRECT INVESTMENT BETWEEN CANADA AND THE ASIA PACIFIC
ASIA PACIFIC FOUNDATION OF CANADA
sector, but China has developed a more diversified portfolio with investments
in the mining, real estate investment and services, and health care equipment
and services sectors.
Canada has seen dollar-value growth in its inbound Asia Pacific investment
from both traditional and non-traditional economic partners. Over the last
eight years, investments from Malaysia, Hong Kong, South Korea, and Japan
have seen the sharpest increase. The four economies combined represent
growth of C$18B when comparing the data between the two most recent
four-year intervals. The bulk of the increase is driven by Canada’s oil and gas
sector. For Japan, Malaysia, and South Korea, the growth mostly stemmed
from their respective investments into the construction of the LNG Canada
facility in Kitimat 2018, whereas Hong Kong’s increase can be attributed to
CK Hutchison’s C$2.3B investment via Husky Energy into an offshore oil
exploration project near St. John’s, Newfoundland, in 2017.
ASIA PACIFIC INVESTMENT IN CANADA’S SECTORS: RESOURCES, TECHNOLOGIES, AND THE REST
Source: APF Canada Investment Monitor and fDi Markets (accessed April 2020)
Investments from the Asia Pacific into Canada are still primarily in natural
resources, which comprises the energy, mining, and agriculture industries.
In 2019, half of all inbound investments were in the mining and chemicals
Asia Pacific Investment into Canada by Industry, 2003-2019Investment Value (C$ Millions)
Mining & Chemicals 25,184
Energy 91,421
Consumer Goods & Services
Technology
Other
Finance
Industrial Goods & Services
5,975
21,643
5,479
5,901
1,343
3,599
Agriculture & Forestry
34REPORT ON TRADE AGREEMENTS AND FOREIGN DIRECT INVESTMENT BETWEEN CANADA AND THE ASIA PACIFIC
ASIA PACIFIC FOUNDATION OF CANADA
industry. This includes the largest deal made in 2019: the C$1.5B acquisition of
a 17.6 percent stake in Vancouver-based First Quantum Minerals by Chinese
state-owned enterprise (SOE) Jiangxi Copper, through its purchase of PIM
Cupric Holdings. This investment is closely followed by the C$1.3B acquisition
of Continental Gold by another Chinese SOE, Zijin Mining. Zijin Mining’s
acquisition of Toronto-based Continental Gold is its second in Canada,
following the company’s 2018 acquisition of Nevsun Resources for C$1.9B. In
contrast, Jiangxi Copper’s acquisition of a stake in First Quantum Metals is its
first deal in Canada.
Another noteworthy deal in the mining industry is the acquisition of Halifax-
based Atlantic Gold Corporation and Atlantic Mining NS Corp for C$723M
by Australian company St. Barbara Ltd. This acquisition is St. Barbara’s first
Canadian mine, adding to its existing assets in Western Australia, Papua New
Guinea, and the Solomon Islands. Considering other investments in natural
resources, one notable deal in 2019 occurred in the agriculture industry.
Manitoba-based pork producer and supplier La Broquerie was acquired for
C$498 by Thailand-based Charoen Pokphand Foods PCL through its Canadian
subsidy.
As for the main sectors of inbound investment in Canadian natural resources,
in 2019 the mining sector received the highest dollar amount, made up of the
deals mentioned above. Overall since 2003, the top sector continues to be oil
and gas production, totalling C$83.1B. From 2016 to 2019, this sector again
tops inbound investment at C$30.4B, remaining largely consistent with the
2012 to 2015 period, when the sector received C$30.6B. For the mining sector,
there was a substantial increase in investments, from C$1.9B from 2012 to
2015 to C$7.3B during the 2016 to 2019 period. This increase is largely due to
acquisition deals in 2018 and 2019.
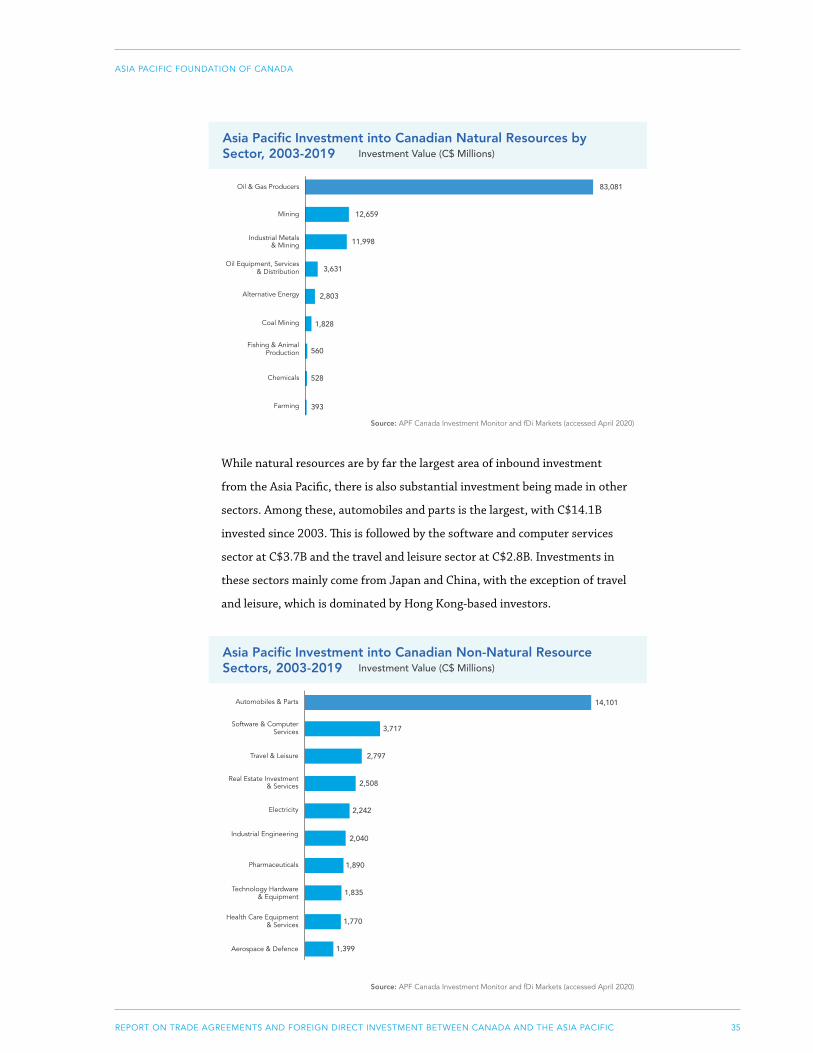
35REPORT ON TRADE AGREEMENTS AND FOREIGN DIRECT INVESTMENT BETWEEN CANADA AND THE ASIA PACIFIC
ASIA PACIFIC FOUNDATION OF CANADA
Source: APF Canada Investment Monitor and fDi Markets (accessed April 2020)
While natural resources are by far the largest area of inbound investment
from the Asia Pacific, there is also substantial investment being made in other
sectors. Among these, automobiles and parts is the largest, with C$14.1B
invested since 2003. This is followed by the software and computer services
sector at C$3.7B and the travel and leisure sector at C$2.8B. Investments in
these sectors mainly come from Japan and China, with the exception of travel
and leisure, which is dominated by Hong Kong-based investors.
Source: APF Canada Investment Monitor and fDi Markets (accessed April 2020)
Asia Pacific Investment into Canadian Natural Resources by Sector, 2003-2019 Investment Value (C$ Millions)
390
393
12,659
Oil & Gas Producers 83,081
Mining
Industrial Metals & Mining
Alternative Energy
Oil Equipment, Services & Distribution 3,631
11,998
1,828
2,803
528
560
Chemicals
Farming
Forestry & Paper
Coal Mining
Fishing & Animal Production
1,399
1,770
Asia Pacific Investment into Canadian Non-Natural Resource Sectors, 2003-2019 Investment Value (C$ Millions)
Software & Computer Services 3,717
Automobiles & Parts 14,101
Travel & Leisure
Electricity
Real Estate Investment & Services
Pharmaceuticals
Industrial Engineering
2,508
2,797
2,040
2,242
1,835
1,890
Technology Hardware & Equipment
Health Care Equipment & Services
Aerospace & Defence
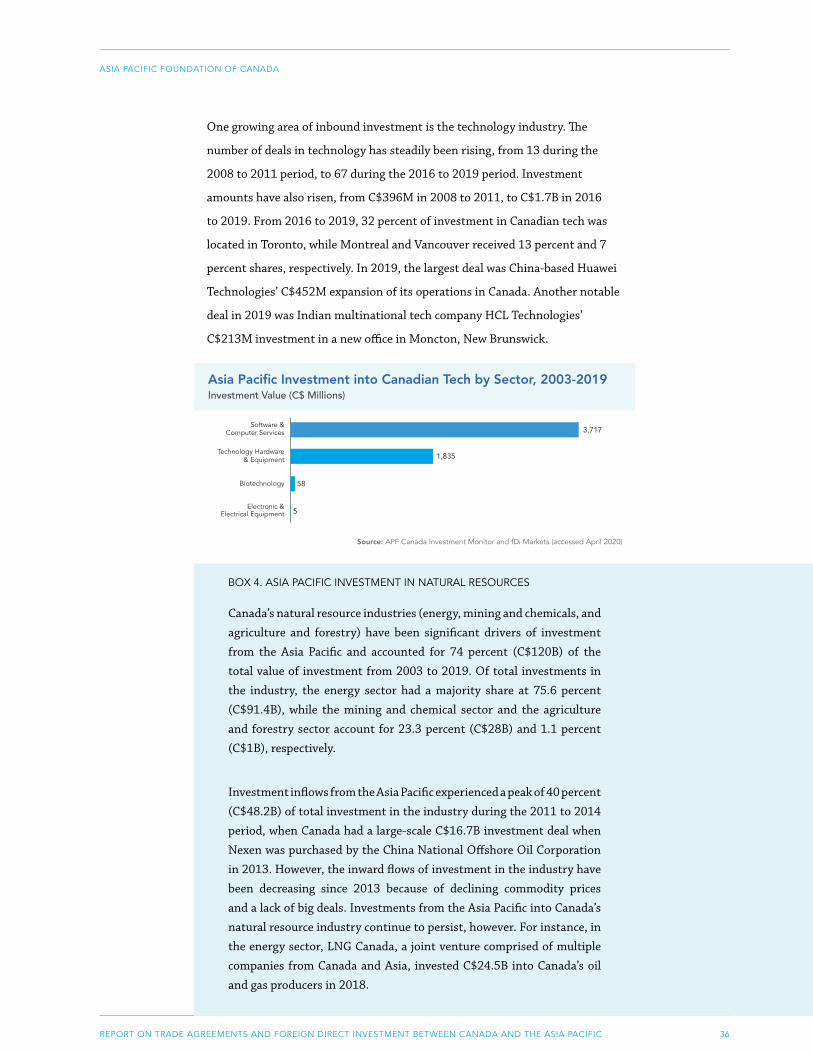
36REPORT ON TRADE AGREEMENTS AND FOREIGN DIRECT INVESTMENT BETWEEN CANADA AND THE ASIA PACIFIC
ASIA PACIFIC FOUNDATION OF CANADA
One growing area of inbound investment is the technology industry. The
number of deals in technology has steadily been rising, from 13 during the
2008 to 2011 period, to 67 during the 2016 to 2019 period. Investment
amounts have also risen, from C$396M in 2008 to 2011, to C$1.7B in 2016
to 2019. From 2016 to 2019, 32 percent of investment in Canadian tech was
located in Toronto, while Montreal and Vancouver received 13 percent and 7
percent shares, respectively. In 2019, the largest deal was China-based Huawei
Technologies’ C$452M expansion of its operations in Canada. Another notable
deal in 2019 was Indian multinational tech company HCL Technologies’
C$213M investment in a new office in Moncton, New Brunswick.
Asia Pacific Investment into Canadian Tech by Sector, 2003-2019Investment Value (C$ Millions)
Technology Hardware & Equipment 1,835
Software & Computer Services 3,717
Biotechnology
Electronic & Electrical Equipment 5
58
Source: APF Canada Investment Monitor and fDi Markets (accessed April 2020)
BOX 4. ASIA PACIFIC INVESTMENT IN NATURAL RESOURCES
Canada’s natural resource industries (energy, mining and chemicals, and
agriculture and forestry) have been significant drivers of investment
from the Asia Pacific and accounted for 74 percent (C$120B) of the
total value of investment from 2003 to 2019. Of total investments in
the industry, the energy sector had a majority share at 75.6 percent
(C$91.4B), while the mining and chemical sector and the agriculture
and forestry sector account for 23.3 percent (C$28B) and 1.1 percent
(C$1B), respectively.
Investment inflows from the Asia Pacific experienced a peak of 40 percent
(C$48.2B) of total investment in the industry during the 2011 to 2014
period, when Canada had a large-scale C$16.7B investment deal when
Nexen was purchased by the China National Offshore Oil Corporation
in 2013. However, the inward flows of investment in the industry have
been decreasing since 2013 because of declining commodity prices
and a lack of big deals. Investments from the Asia Pacific into Canada’s
natural resource industry continue to persist, however. For instance, in
the energy sector, LNG Canada, a joint venture comprised of multiple
companies from Canada and Asia, invested C$24.5B into Canada’s oil
and gas producers in 2018.
37REPORT ON TRADE AGREEMENTS AND FOREIGN DIRECT INVESTMENT BETWEEN CANADA AND THE ASIA PACIFIC
ASIA PACIFIC FOUNDATION OF CANADA
Within Canada’s natural resources industries, investment in the
agriculture and forestry sector was not as big as it was in other sectors.
One of the largest deals in the sector was a purchase of the assets of
the Terrace Bay Pulp Mill in Ontario by India-based Aditya Birla Group
for C$279M in 2012. Moreover, no investments were recorded between
2016 and 2018 in the sector. However, in 2019, Thailand’s Charoen
Pokphand Foods acquiring Manitoba-based HyLife for C$498M was one
of the highlights in the sector.
BOX 5. ASIA PACIFIC STUDIOS IN CANADA’S C$4.5B VIDEO GAME INDUSTRY
Canada is a global hub for video games. With appealing tax incentives
and globally recognized creative talent, Canada has attracted renowned
foreign studios, like the French company Ubisoft and American studios
Epic Games and Electronic Arts, to settle in cities like Montreal and
Vancouver. Beloved game franchises like Ubisoft’s Assassin’s Creed series
and Epic Games’ online game Fortnite are being developed in Canada with
homegrown talent. Overall, according to the Entertainment Software
Association of Canada, the Canadian video game industry contributed
C$4.5B to national GDP in 2019. (Moreover, an estimated two-thirds
of Canadians are gamers.) It comes as no surprise that studios based in
the Asia Pacific are also interested in benefitting from Canada’s growing
video game industry. According to the Investment Monitor, from 2005
to 2019, C$1.3B in investment arrived from the region into Montreal,
Vancouver, Burnaby, Toronto, and Saskatoon.
Montreal, in particular, has become one of the top cities in the world
for video game development. Called by some the “Hollywood of video
games,” Montreal is the fifth most popular city for game development,
after Tokyo, London, San Francisco, and Austin. This is largely thanks
to Quebec’s multimedia tax credit, which subsidizes up to 37.5 percent
of labour costs for eligible companies that develop digital products. One
notable studio that has chosen to put down roots in Montreal is Square
Enix, a Japanese game developer globally renowned for its Final Fantasy
and Kingdom Hearts game franchises. In 2007, Square Enix invested
C$226M to establish its first studio in Montreal, named Eidos-Montréal.
It has since invested in expanding the studio in 2011 and 2019. Eidos-
Montréal is best known for producing games in the Tomb Raider and
Deus Ex franchises. Most recently, in 2019, one of China’s top online
game providers, NetEase, invested C$130M into a new studio focused
on research and design. NetEase is known for publishing games like
Crusaders of Light and UNO! the mobile game.
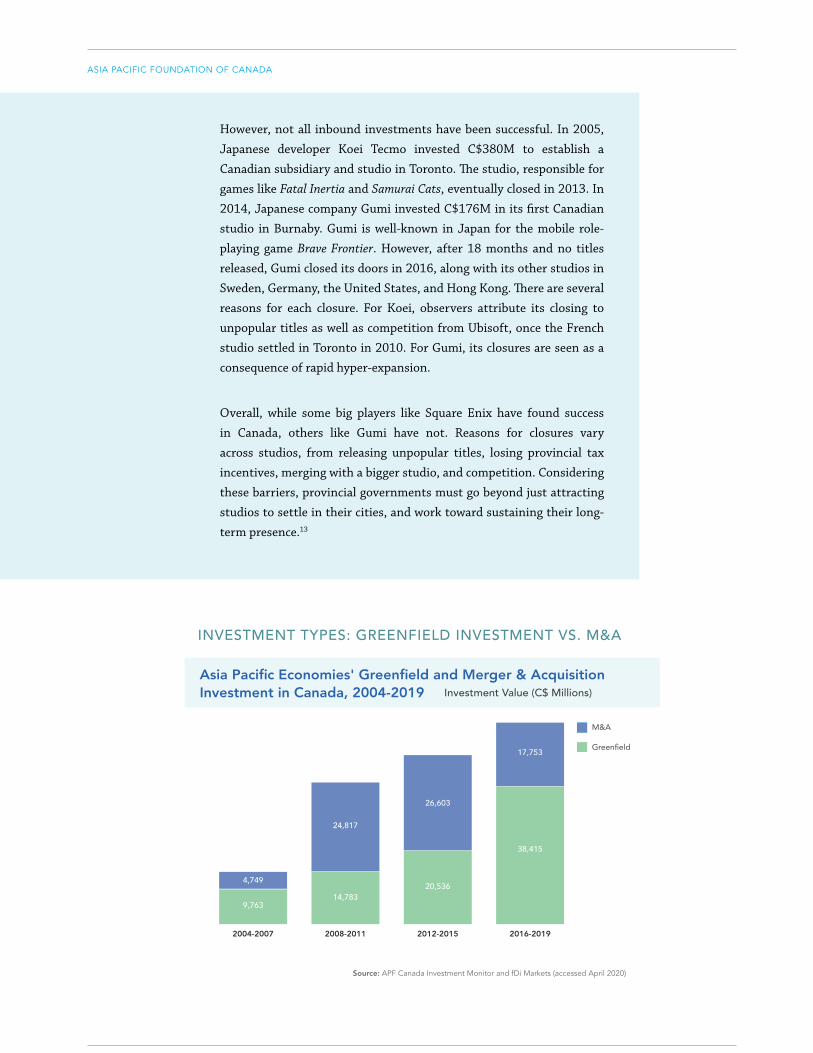
38REPORT ON TRADE AGREEMENTS AND FOREIGN DIRECT INVESTMENT BETWEEN CANADA AND THE ASIA PACIFIC
ASIA PACIFIC FOUNDATION OF CANADA
However, not all inbound investments have been successful. In 2005,
Japanese developer Koei Tecmo invested C$380M to establish a
Canadian subsidiary and studio in Toronto. The studio, responsible for
games like Fatal Inertia and Samurai Cats, eventually closed in 2013. In
2014, Japanese company Gumi invested C$176M in its first Canadian
studio in Burnaby. Gumi is well-known in Japan for the mobile role-
playing game Brave Frontier. However, after 18 months and no titles
released, Gumi closed its doors in 2016, along with its other studios in
Sweden, Germany, the United States, and Hong Kong. There are several
reasons for each closure. For Koei, observers attribute its closing to
unpopular titles as well as competition from Ubisoft, once the French
studio settled in Toronto in 2010. For Gumi, its closures are seen as a
consequence of rapid hyper-expansion.
Overall, while some big players like Square Enix have found success
in Canada, others like Gumi have not. Reasons for closures vary
across studios, from releasing unpopular titles, losing provincial tax
incentives, merging with a bigger studio, and competition. Considering
these barriers, provincial governments must go beyond just attracting
studios to settle in their cities, and work toward sustaining their long-
term presence.13
INVESTMENT TYPES: GREENFIELD INVESTMENT VS. M&A
Source: APF Canada Investment Monitor and fDi Markets (accessed April 2020)
Asia Pacific Economies' Greenfield and Merger & Acquisition Investment in Canada, 2004-2019 Investment Value (C$ Millions)
M&A
Greenfield
4,749
24,817
26,603
17,753
14,7839,763
20,536
38,415
2004-2007 2008-2011 2012-2015 2016-2019
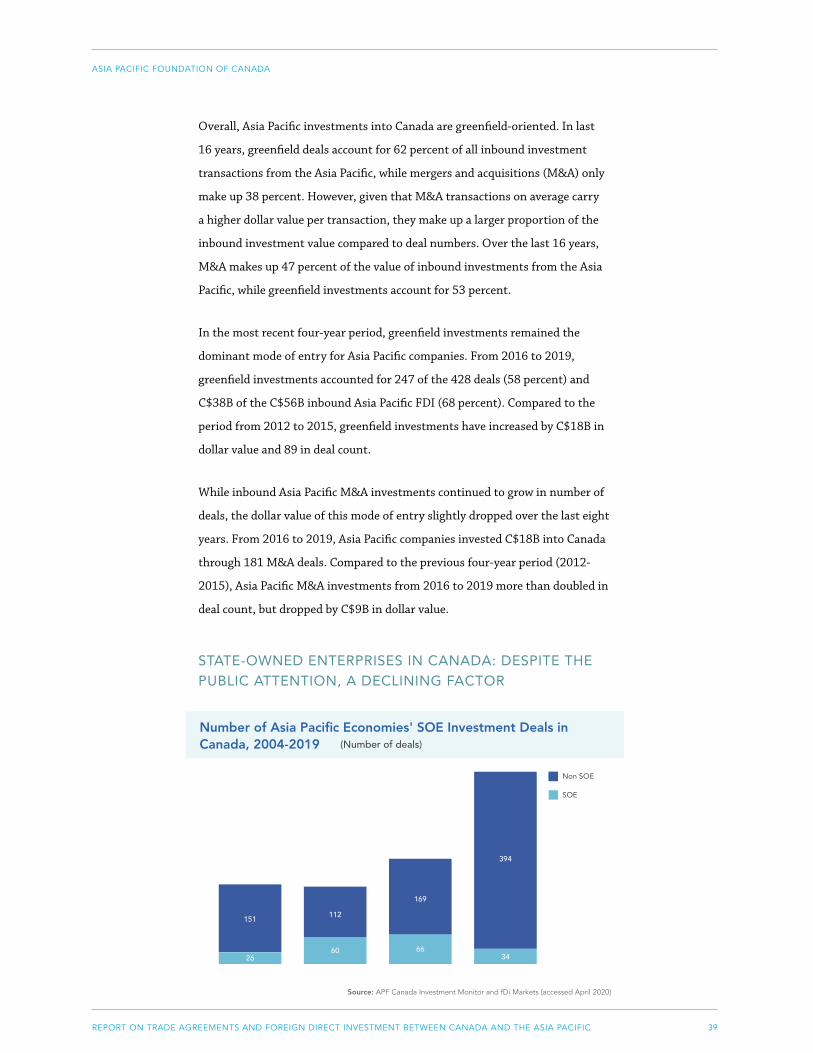
39REPORT ON TRADE AGREEMENTS AND FOREIGN DIRECT INVESTMENT BETWEEN CANADA AND THE ASIA PACIFIC
ASIA PACIFIC FOUNDATION OF CANADA
Overall, Asia Pacific investments into Canada are greenfield-oriented. In last
16 years, greenfield deals account for 62 percent of all inbound investment
transactions from the Asia Pacific, while mergers and acquisitions (M&A) only
make up 38 percent. However, given that M&A transactions on average carry
a higher dollar value per transaction, they make up a larger proportion of the
inbound investment value compared to deal numbers. Over the last 16 years,
M&A makes up 47 percent of the value of inbound investments from the Asia
Pacific, while greenfield investments account for 53 percent.
In the most recent four-year period, greenfield investments remained the
dominant mode of entry for Asia Pacific companies. From 2016 to 2019,
greenfield investments accounted for 247 of the 428 deals (58 percent) and
C$38B of the C$56B inbound Asia Pacific FDI (68 percent). Compared to the
period from 2012 to 2015, greenfield investments have increased by C$18B in
dollar value and 89 in deal count.
While inbound Asia Pacific M&A investments continued to grow in number of
deals, the dollar value of this mode of entry slightly dropped over the last eight
years. From 2016 to 2019, Asia Pacific companies invested C$18B into Canada
through 181 M&A deals. Compared to the previous four-year period (2012-
2015), Asia Pacific M&A investments from 2016 to 2019 more than doubled in
deal count, but dropped by C$9B in dollar value.
STATE-OWNED ENTERPRISES IN CANADA: DESPITE THE PUBLIC ATTENTION, A DECLINING FACTOR
Source: APF Canada Investment Monitor and fDi Markets (accessed April 2020)
Number of Asia Pacific Economies' SOE Investment Deals in Canada, 2004-2019 (Number of deals)
Non SOE
SOE
151
60 66
394
112
26
169
34
2004-2007 2008-2011 2012-2015 2016-2019
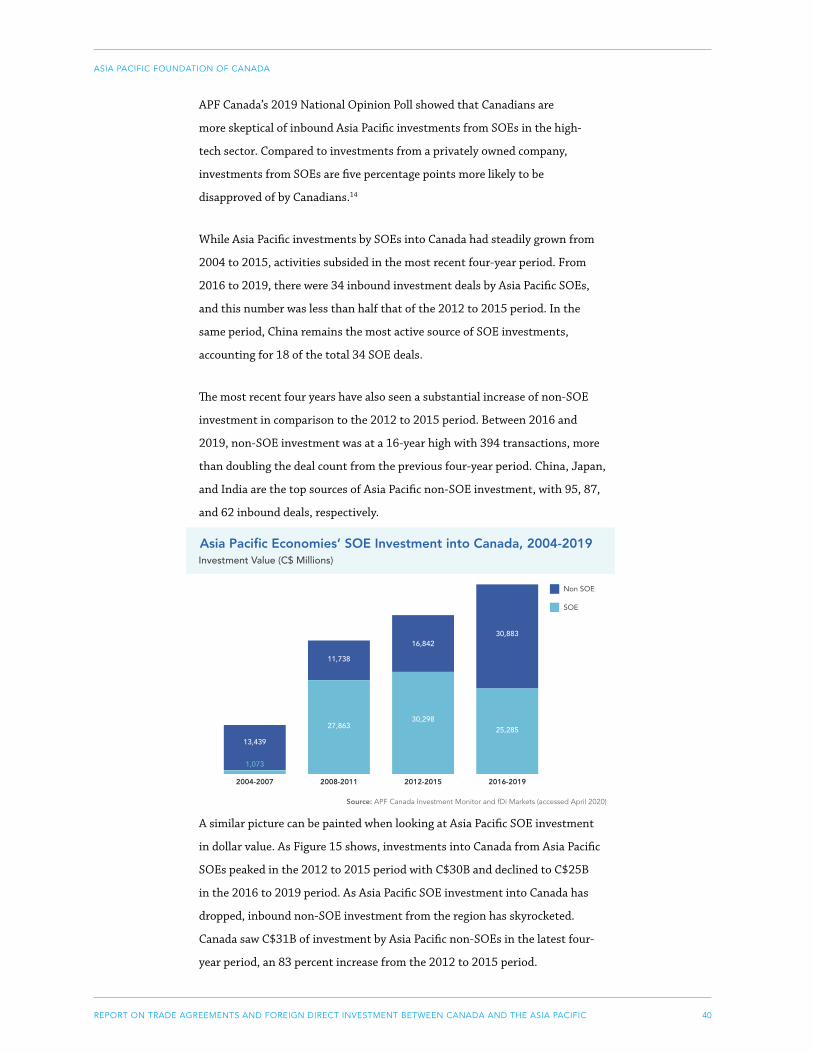
40REPORT ON TRADE AGREEMENTS AND FOREIGN DIRECT INVESTMENT BETWEEN CANADA AND THE ASIA PACIFIC
ASIA PACIFIC FOUNDATION OF CANADA
APF Canada’s 2019 National Opinion Poll showed that Canadians are
more skeptical of inbound Asia Pacific investments from SOEs in the high-
tech sector. Compared to investments from a privately owned company,
investments from SOEs are five percentage points more likely to be
disapproved of by Canadians.14
While Asia Pacific investments by SOEs into Canada had steadily grown from
2004 to 2015, activities subsided in the most recent four-year period. From
2016 to 2019, there were 34 inbound investment deals by Asia Pacific SOEs,
and this number was less than half that of the 2012 to 2015 period. In the
same period, China remains the most active source of SOE investments,
accounting for 18 of the total 34 SOE deals.
The most recent four years have also seen a substantial increase of non-SOE
investment in comparison to the 2012 to 2015 period. Between 2016 and
2019, non-SOE investment was at a 16-year high with 394 transactions, more
than doubling the deal count from the previous four-year period. China, Japan,
and India are the top sources of Asia Pacific non-SOE investment, with 95, 87,
and 62 inbound deals, respectively.
Source: APF Canada Investment Monitor and fDi Markets (accessed April 2020)
A similar picture can be painted when looking at Asia Pacific SOE investment
in dollar value. As Figure 15 shows, investments into Canada from Asia Pacific
SOEs peaked in the 2012 to 2015 period with C$30B and declined to C$25B
in the 2016 to 2019 period. As Asia Pacific SOE investment into Canada has
dropped, inbound non-SOE investment from the region has skyrocketed.
Canada saw C$31B of investment by Asia Pacific non-SOEs in the latest four-
year period, an 83 percent increase from the 2012 to 2015 period.
Asia Pacific Economies’ SOE Investment into Canada, 2004-2019Investment Value (C$ Millions)
Non SOE
SOE
13,439
11,738
16,84230,883
27,863
1,073
30,29825,285
2004-2007 2008-2011 2012-2015 2016-2019
41REPORT ON TRADE AGREEMENTS AND FOREIGN DIRECT INVESTMENT BETWEEN CANADA AND THE ASIA PACIFIC
ASIA PACIFIC FOUNDATION OF CANADA
BOX 6. TWO-WAY FDI DURING THE 2008-2009 ECONOMIC CRISIS
During the 2008 financial crisis, Canadian FDI inflows from Asia Pacific
economies remained strong as a new wave of investments led by China’s
“Go Global” policy in Canada started. In 2008, Canada received C$5.2B
in investment from the region, an 85 percent increase from the previous
year’s total of C$2.8B. Furthermore, in 2009, Canadian inbound
investment from the Asia Pacific reached C$7.3B, a 42 percent increase
from 2008. During the economic crisis, three economies – China, Japan,
and Australia – dominated Canadian inbound investment. The biggest
source economy between 2008 and 2009 was China with C$5.8B,
accounting for 46 percent of the total C$12B of investment from the
Asia Pacific. Meanwhile Japan invested C$4.6B, making up 37 percent
of the total amount. Lastly, Australia invested C$1.7B, accounting for
14 percent of the total investment inflow from the region during this
period.
The biggest deal made in 2008 was a C$1.2B investment by the Japanese
automaker Toyota Group in the Canadian automobiles and parts sector,
for a new auto assembly plant in Ontario. In 2009, the biggest deal was a
C$2.3B investment by Chinese SOE China National Petroleum Corp. in
the Canadian mining and oil and gas sector, when it acquired 60 percent
of the shares of Calgary-based Athabasca Oil Sands Corp.
On the other hand, outbound Canadian investment into the Asia Pacific
amounted to C$17B in 2008, a 35 percent increase from the previous
year’s total of C$12.6B. However, in 2009, Canadian outward investment
dropped by 43 percent to C$9.7B. Between 2008 and 2009, China saw the
lion’s share of Canadian investment, receiving C$8.6B and accounting
for 32 percent of the total C$26.7B of outward investment flows to the
region. In second place, Vietnam received C$5.6B, accounting for 21
percent of the total outward investment, while in third place Australia
received C$4.2B, accounting for 16 percent. India also received C$3B
of investment from Canada (11 percent), making it the fourth-largest
recipient among the Asia Pacific economies during the economic crisis.
In 2008, the biggest outbound Canadian investment to the Asia Pacific
was made by Toronto-based Asian Coast Development Ltd. with a
C$5.1B investment in the Vietnamese travel and leisure sector to build a
casino and beach resort. In 2009, the biggest deal was made by Toronto-
based Brookfield Asset Management with a C$1.4B investment in
Sydney-based Babcock & Brown Infrastructure to acquire a 40 percent
stake of the firm.
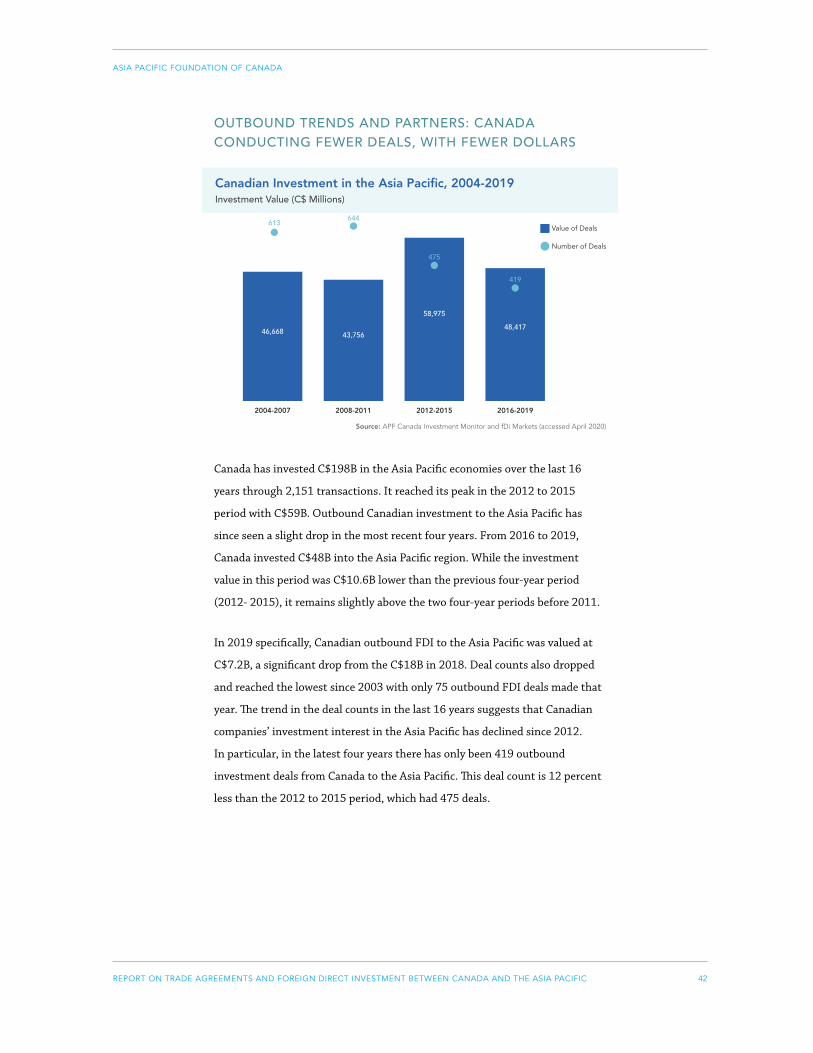
42REPORT ON TRADE AGREEMENTS AND FOREIGN DIRECT INVESTMENT BETWEEN CANADA AND THE ASIA PACIFIC
ASIA PACIFIC FOUNDATION OF CANADA
OUTBOUND TRENDS AND PARTNERS: CANADA CONDUCTING FEWER DEALS, WITH FEWER DOLLARS
Source: APF Canada Investment Monitor and fDi Markets (accessed April 2020)
Canada has invested C$198B in the Asia Pacific economies over the last 16
years through 2,151 transactions. It reached its peak in the 2012 to 2015
period with C$59B. Outbound Canadian investment to the Asia Pacific has
since seen a slight drop in the most recent four years. From 2016 to 2019,
Canada invested C$48B into the Asia Pacific region. While the investment
value in this period was C$10.6B lower than the previous four-year period
(2012- 2015), it remains slightly above the two four-year periods before 2011.
In 2019 specifically, Canadian outbound FDI to the Asia Pacific was valued at
C$7.2B, a significant drop from the C$18B in 2018. Deal counts also dropped
and reached the lowest since 2003 with only 75 outbound FDI deals made that
year. The trend in the deal counts in the last 16 years suggests that Canadian
companies’ investment interest in the Asia Pacific has declined since 2012.
In particular, in the latest four years there has only been 419 outbound
investment deals from Canada to the Asia Pacific. This deal count is 12 percent
less than the 2012 to 2015 period, which had 475 deals.
Canadian Investment in the Asia Pacific, 2004-2019Investment Value (C$ Millions)
Value of Deals
Number of Deals
419
46,668 43,756
2004-2007 2008-2011 2012-2015 2016-2019
58,975
48,417
613644
475
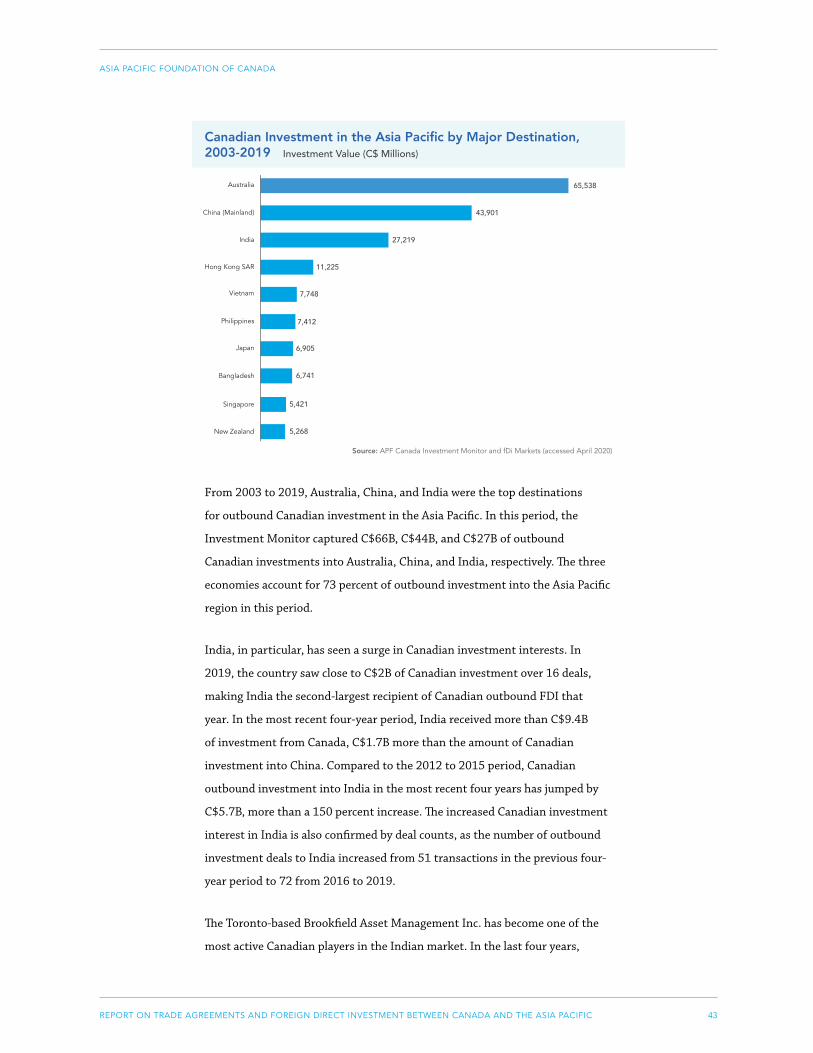
43REPORT ON TRADE AGREEMENTS AND FOREIGN DIRECT INVESTMENT BETWEEN CANADA AND THE ASIA PACIFIC
ASIA PACIFIC FOUNDATION OF CANADA
Source: APF Canada Investment Monitor and fDi Markets (accessed April 2020)
From 2003 to 2019, Australia, China, and India were the top destinations
for outbound Canadian investment in the Asia Pacific. In this period, the
Investment Monitor captured C$66B, C$44B, and C$27B of outbound
Canadian investments into Australia, China, and India, respectively. The three
economies account for 73 percent of outbound investment into the Asia Pacific
region in this period.
India, in particular, has seen a surge in Canadian investment interests. In
2019, the country saw close to C$2B of Canadian investment over 16 deals,
making India the second-largest recipient of Canadian outbound FDI that
year. In the most recent four-year period, India received more than C$9.4B
of investment from Canada, C$1.7B more than the amount of Canadian
investment into China. Compared to the 2012 to 2015 period, Canadian
outbound investment into India in the most recent four years has jumped by
C$5.7B, more than a 150 percent increase. The increased Canadian investment
interest in India is also confirmed by deal counts, as the number of outbound
investment deals to India increased from 51 transactions in the previous four-
year period to 72 from 2016 to 2019.
The Toronto-based Brookfield Asset Management Inc. has become one of the
most active Canadian players in the Indian market. In the last four years,
5,268
5,421
Canadian Investment in the Asia Pacific by Major Destination, 2003-2019 Investment Value (C$ Millions)
China (Mainland) 43,901
Australia 65,538
India
Vietnam
Hong Kong SAR
Japan
Philippines
11,225
27,219
7,412
7,748
6,741
6,905
Bangladesh
Singapore
New Zealand
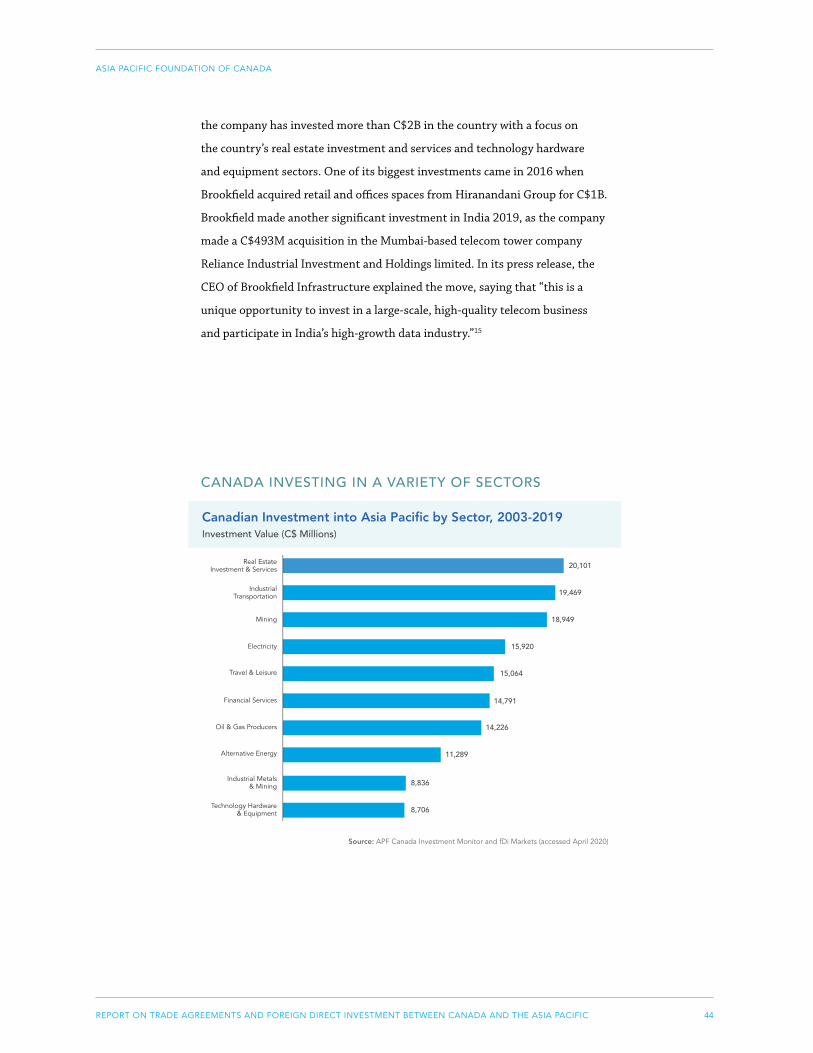
44REPORT ON TRADE AGREEMENTS AND FOREIGN DIRECT INVESTMENT BETWEEN CANADA AND THE ASIA PACIFIC
ASIA PACIFIC FOUNDATION OF CANADA
the company has invested more than C$2B in the country with a focus on
the country’s real estate investment and services and technology hardware
and equipment sectors. One of its biggest investments came in 2016 when
Brookfield acquired retail and offices spaces from Hiranandani Group for C$1B.
Brookfield made another significant investment in India 2019, as the company
made a C$493M acquisition in the Mumbai-based telecom tower company
Reliance Industrial Investment and Holdings limited. In its press release, the
CEO of Brookfield Infrastructure explained the move, saying that “this is a
unique opportunity to invest in a large-scale, high-quality telecom business
and participate in India’s high-growth data industry.”15
CANADA INVESTING IN A VARIETY OF SECTORS
Source: APF Canada Investment Monitor and fDi Markets (accessed April 2020)
8,706
8,836
Canadian Investment into Asia Pacific by Sector, 2003-2019Investment Value (C$ Millions)
Industrial Transportation 19,469
Real Estate Investment & Services 20,101
Mining
Travel & Leisure
Electricity
Oil & Gas Producers
Financial Services
15,920
18,949
14,791
15,064
11,289
14,226
Alternative Energy
Industrial Metals & Mining
Technology Hardware & Equipment
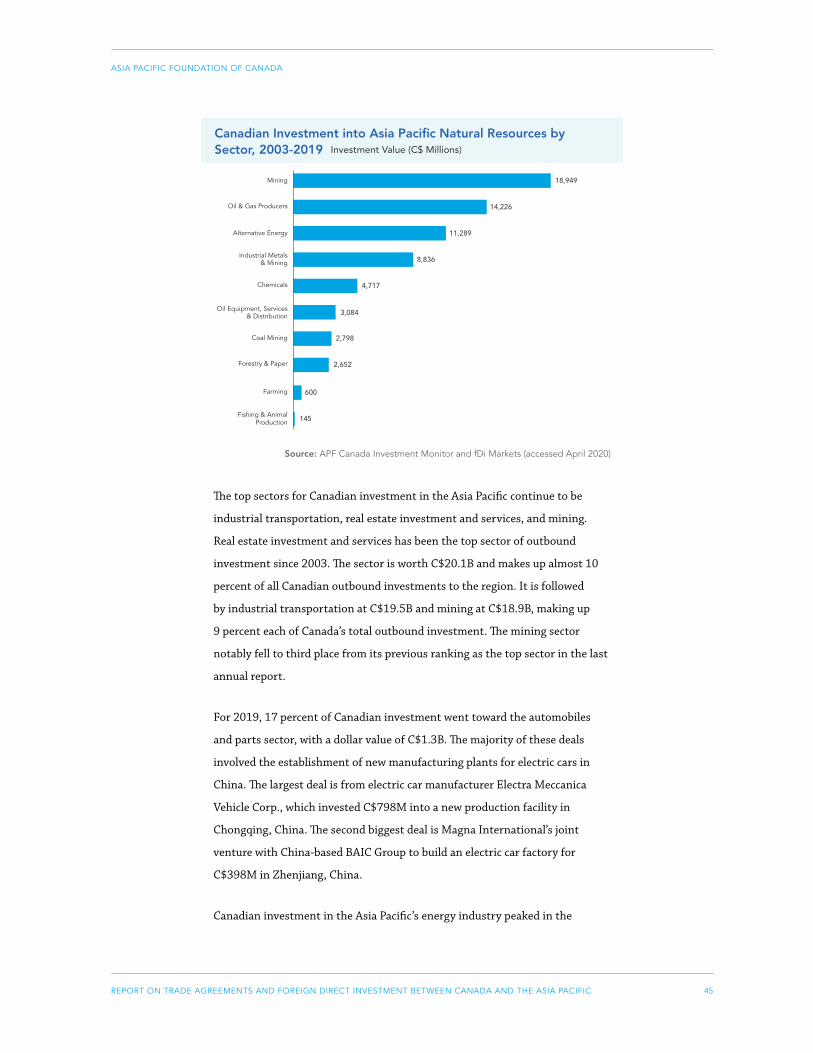
45REPORT ON TRADE AGREEMENTS AND FOREIGN DIRECT INVESTMENT BETWEEN CANADA AND THE ASIA PACIFIC
ASIA PACIFIC FOUNDATION OF CANADA
Source: APF Canada Investment Monitor and fDi Markets (accessed April 2020)
The top sectors for Canadian investment in the Asia Pacific continue to be
industrial transportation, real estate investment and services, and mining.
Real estate investment and services has been the top sector of outbound
investment since 2003. The sector is worth C$20.1B and makes up almost 10
percent of all Canadian outbound investments to the region. It is followed
by industrial transportation at C$19.5B and mining at C$18.9B, making up
9 percent each of Canada’s total outbound investment. The mining sector
notably fell to third place from its previous ranking as the top sector in the last
annual report.
For 2019, 17 percent of Canadian investment went toward the automobiles
and parts sector, with a dollar value of C$1.3B. The majority of these deals
involved the establishment of new manufacturing plants for electric cars in
China. The largest deal is from electric car manufacturer Electra Meccanica
Vehicle Corp., which invested C$798M into a new production facility in
Chongqing, China. The second biggest deal is Magna International’s joint
venture with China-based BAIC Group to build an electric car factory for
C$398M in Zhenjiang, China.
Canadian investment in the Asia Pacific’s energy industry peaked in the
145
600
Canadian Investment into Asia Pacific Natural Resources by Sector, 2003-2019 Investment Value (C$ Millions)
Oil & Gas Producers 14,226
Mining 18,949
Alternative Energy
Chemicals
Industrial Metals & Mining
Coal Mining
Oil Equipment, Services & Distribution
8,836
11,289
3,084
4,717
2,652
2,798
Forestry & Paper
Farming
Fishing & Animal Production
46REPORT ON TRADE AGREEMENTS AND FOREIGN DIRECT INVESTMENT BETWEEN CANADA AND THE ASIA PACIFIC
ASIA PACIFIC FOUNDATION OF CANADA
2012 to 2015 period, at C$12.4B, more than doubling its previous value of
C$5.3B during the 2008 to 2011 period. However, for 2016 to 2019, this value
fell to just C$673M. The reason for this decrease is several large deals from
2012 to 2015. The biggest of these took place in 2015, made by SkyPower,
Baytex Energy Corp., and Fulcrum Environmental Solutions Inc. SkyPower
is a Toronto-based solar power producing company that invested C$6.1B in
Bangladesh’s solar power sector. Baytex Energy Corp. is a Calgary-based oil
and gas company that acquired Australia-based Aurora Oil & Gas Limited for
C$2.9B. Fulcrum Environmental Solutions Inc. is an Edmonton-based clean
technology company that invested C$1.2B worth of proprietary technology
into China-based DGF Shandong Industries Corporation’s new clean-coal
thermal steam power facility.
On the other hand, Canadian investment in the region’s mining and chemicals
industry has significantly decreased. The industry experienced a 73 percent
drop in investment since the 2008 to 2011 period, from C$6B during this
time to just C$1.6B during the current period (2016-2019). However, 2019
saw several notable deals for the industry. The largest deal is Toronto-based
global agribusiness Nutrien’s C$623M acquisition of Australian agricultural
merchandiser Ruralco. This is followed by two Toronto-based mining
companies’ expansions of operations in Australia, namely Kirkland Lake
Gold’s C$361M expansion of its Fosterville mine, and RNC Mineral’s C$361M
expansion of its Kambalda mine.
47REPORT ON TRADE AGREEMENTS AND FOREIGN DIRECT INVESTMENT BETWEEN CANADA AND THE ASIA PACIFIC
ASIA PACIFIC FOUNDATION OF CANADA
BOX 7. CANADIAN INVESTMENT IN CLEANTECH
Canada is one of the leading countries in clean technology in the
world. The country supplies 17.3 percent of its energy from renewable
sources, whereas other Organisation for Economic Co-operation and
Development (OECD) countries only produce 10.2 percent, on average.
Moreover, Canada was recorded as the second-largest producer of
hydroelectricity, providing 60 percent of the country’s electricity
generation in 2016. The country has developed not only hydroelectricity
intensively but also biomass, wind power, solar power, and liquid
biofuels. With such high potential and capacity, Canadian businesses
have invested in cleantech markets all over the world, and APF Canada
monitors these outflows and investment trends in the Asia Pacific using
the modified Industrial Classification Benchmark (Modified ICB) as well
as the North American Industry Classification System (NAICS).
From 2003 to 2019, Canada invested over C$22.6B in 72 cleantech
deals in the Asia Pacific. Top destinations for the outbound investments
were China, Bangladesh, Japan, Pakistan, India, and Australia. The
Investment Monitor data captured C$6.6B worth of Canadian cleantech
investment into Bangladesh (3 deals), C$5.1B worth of investment into
China (22 deals), C$3.5B worth of investment into Japan (18 deals),
C$2.8B worth of investment into Pakistan (2 deals), C$1.9B worth of
investment into India (9 deals), and C$1.4B worth of investment into
Australia (8 deals). In the past four years, there was a significant increase
in the number of Canadian investment deals in the Asia Pacific cleantech
sector. The number of deals made between 2015 and 2019 doubled from
16 deals to 35 deals compared to the preceding period (2011-2014),
and the amount of Canadian investment in the Asia Pacific increased
from C$4.2B to C$13.7B. In 2015, the biggest deal made in cleantech
was from Toronto-based SkyPower Global to Bangladesh’s solar power
sector, worth C$6.1B.
Considering outbound cleantech investments from Canada, between
2003 and 2019, 50.2 percent was in alternative electricity, 43.7 percent
was in renewable energy equipment, and 6.1 percent was in alternative
fuels. While almost 55 percent of the total cleantech investment went
through greenfield deals, 44 percent went to M&A deals.
Between 2016 and 2019, the Asia Pacific cleantech industry received
22 investment deals (C$3.7B) from Canada, 14 in alternative electricity
(C$3B), 6 in renewable energy equipment (C$0.4B), and 2 in alternative
fuels (C$0.2B). Top destinations were Japan (40%), India (26%),
Australia (17%), and China (6%).16
48REPORT ON TRADE AGREEMENTS AND FOREIGN DIRECT INVESTMENT BETWEEN CANADA AND THE ASIA PACIFIC
ASIA PACIFIC FOUNDATION OF CANADA
BOX 8. FDI FLOWS BETWEEN CANADA AND THE ASIA PACIFIC IN
HEALTH CARE-RELATED SECTORS
In the past 17 years, health care-related sectors in Canada have
received C$3.7B of Asia Pacific investment. The bulk of the Asia Pacific
investment in Canada concentrates in the pharmaceutical and health
care equipment and services sector, with C$1.9B and C$1.8B of capital
injected, respectively. There has been a dramatic increase in inbound
investment from the Asia Pacific in the last eight years. In the latest four-
year period, Canada has received C$2.1B of Asia Pacific investments, a
C$874M increase from the 2012 to 2015 period. Much of the increase
has been driven by a 2017 transaction that saw Cedar Tree Investment,
a subsidiary of Chinese SOE Anbang Insurance Group, acquire the
Vancouver-based Retirement Concept, a retirement home chain, for
C$1B. One notable investment in 2019 was the Japan-based Terumo
Medical Corporation, a medical device manufacturer, which expanded
into the Canadian market with a C$27M investment to open a new
facility in Vaughan, Ontario.
From 2003 to 2019, Canadian outbound FDI to the Asia Pacific in
health care-related sectors saw a similar level of investment in dollar
terms to the inbound FDI from the region. In this period, Asia Pacific
economies saw a total of C$3.8B of Canadian investments in health care-
related sectors. Of the C$3.8B in outbound investment, C$1.7B went
to the pharmaceutical sector, C$1.1B to biotechnology, and C$945M to
health care equipment and services. In the last eight years, Canadian
investment in the region has drastically increased, from C$273M in
the 2012 to 2015 period to C$1.1B in the most recent four-year period.
One of the largest dollar-value transactions in the recent period came in
2018, when Toronto-based NorthWest Healthcare Properties acquired a
10 percent stake in Melbourne-based Healthscope, a private healthcare
provider, through a C$402 investment.
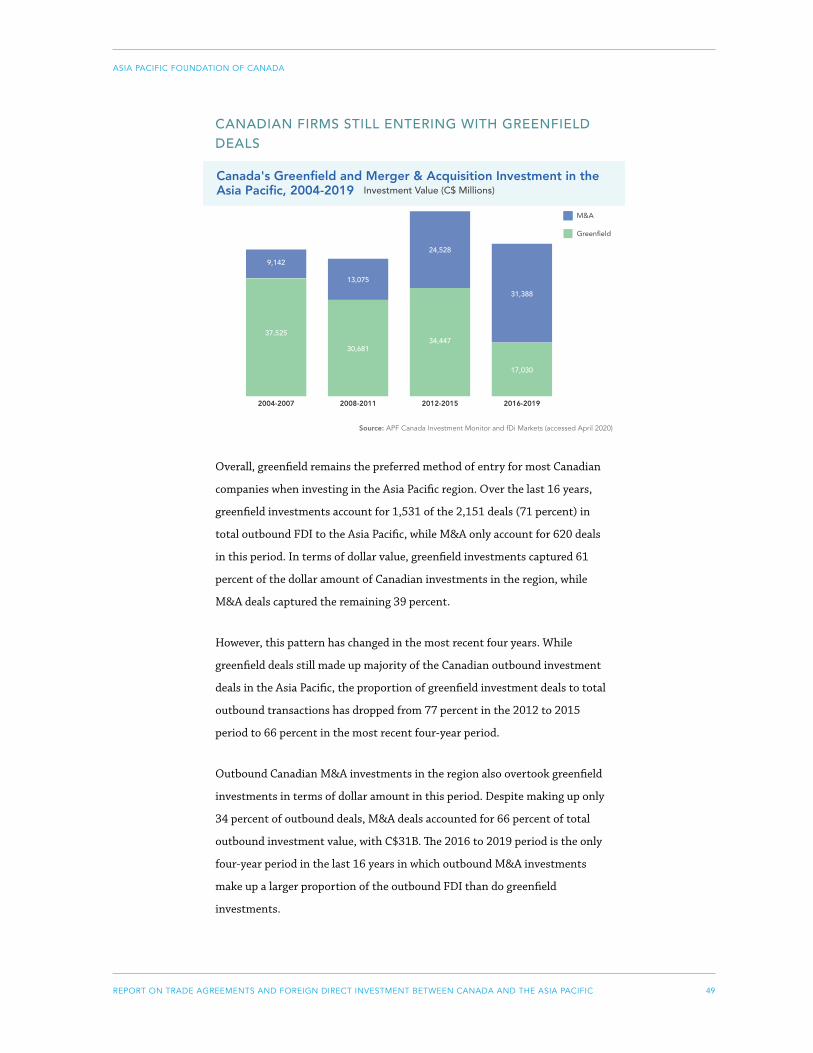
49REPORT ON TRADE AGREEMENTS AND FOREIGN DIRECT INVESTMENT BETWEEN CANADA AND THE ASIA PACIFIC
ASIA PACIFIC FOUNDATION OF CANADA
CANADIAN FIRMS STILL ENTERING WITH GREENFIELD DEALS
Source: APF Canada Investment Monitor and fDi Markets (accessed April 2020)
Overall, greenfield remains the preferred method of entry for most Canadian
companies when investing in the Asia Pacific region. Over the last 16 years,
greenfield investments account for 1,531 of the 2,151 deals (71 percent) in
total outbound FDI to the Asia Pacific, while M&A only account for 620 deals
in this period. In terms of dollar value, greenfield investments captured 61
percent of the dollar amount of Canadian investments in the region, while
M&A deals captured the remaining 39 percent.
However, this pattern has changed in the most recent four years. While
greenfield deals still made up majority of the Canadian outbound investment
deals in the Asia Pacific, the proportion of greenfield investment deals to total
outbound transactions has dropped from 77 percent in the 2012 to 2015
period to 66 percent in the most recent four-year period.
Outbound Canadian M&A investments in the region also overtook greenfield
investments in terms of dollar amount in this period. Despite making up only
34 percent of outbound deals, M&A deals accounted for 66 percent of total
outbound investment value, with C$31B. The 2016 to 2019 period is the only
four-year period in the last 16 years in which outbound M&A investments
make up a larger proportion of the outbound FDI than do greenfield
investments.
Canada's Greenfield and Merger & Acquisition Investment in the Asia Pacific, 2004-2019 Investment Value (C$ Millions)
M&A
Greenfield
9,142
13,075
24,528
31,388
30,681
37,52534,447
17,030
2004-2007 2008-2011 2012-2015 2016-2019
APF Canada Investment Monitor and fDi Markets (accessed April 2020)
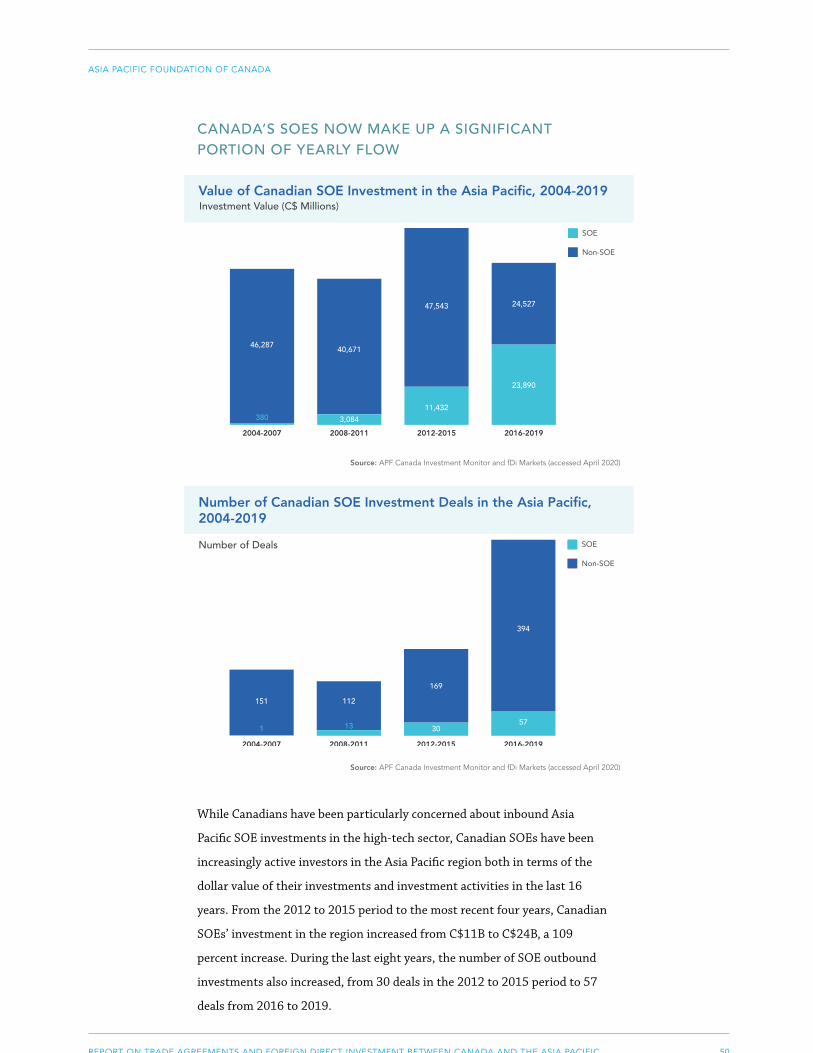
50REPORT ON TRADE AGREEMENTS AND FOREIGN DIRECT INVESTMENT BETWEEN CANADA AND THE ASIA PACIFIC
ASIA PACIFIC FOUNDATION OF CANADA
CANADA’S SOES NOW MAKE UP A SIGNIFICANT PORTION OF YEARLY FLOW
Source: APF Canada Investment Monitor and fDi Markets (accessed April 2020)
Source: APF Canada Investment Monitor and fDi Markets (accessed April 2020)
While Canadians have been particularly concerned about inbound Asia
Pacific SOE investments in the high-tech sector, Canadian SOEs have been
increasingly active investors in the Asia Pacific region both in terms of the
dollar value of their investments and investment activities in the last 16
years. From the 2012 to 2015 period to the most recent four years, Canadian
SOEs’ investment in the region increased from C$11B to C$24B, a 109
percent increase. During the last eight years, the number of SOE outbound
investments also increased, from 30 deals in the 2012 to 2015 period to 57
deals from 2016 to 2019.
Value of Canadian SOE Investment in the Asia Pacific, 2004-2019Investment Value (C$ Millions)
SOE
Non-SOE
46,28740,671
47,543 24,527
3,08438011,432
23,890
2004-2007 2008-2011 2012-2015 2016-2019
Number of Canadian SOE Investment Deals in the Asia Pacific, 2004-2019
SOE
Non-SOE
151 112
169
394
131 3057
2004-2007 2008-2011 2012-2015 2016-2019
Number of Deals
51REPORT ON TRADE AGREEMENTS AND FOREIGN DIRECT INVESTMENT BETWEEN CANADA AND THE ASIA PACIFIC
ASIA PACIFIC FOUNDATION OF CANADA
The CPPIB is one of the most active Canadian SOEs in the region. Of the 57
SOE outbound investments recorded from 2016 to 2019, the CPPIB accounted
for 25 deals, with a total investment value close to C$14B. Some of its recent
notable investments include a C$1.7B investment in Sydney’s WestConnex
toll road project and C$1.9B in a Chinese logistics company in 2018. In 2019,
the CPPIB also committed C$296M of investment in the Mumbai-based India
Resurgence Fund, a distressed asset buyout platform, through its subsidiary
CPPIB Credit Investment Inc.
Another notable SOE investment in 2019 was made by the Caisse de dépôt
et placement du Québec (CDPQ), which acquired C$346M of compulsory
convertible debentures from the Mumbai-based Piramal Enterprises Ltd. In
its company statement, the CDPQ said that the transaction will include a real
estate co-investment platform between its subsidiary Ivanhoé Cambridge and
the Mumbai-based company.17
BOX 9. THE RISE OF CANADA’S PENSIONS
More than ever, Canada’s outbound investment relationship is being
shaped by the presence of large, state-owned funds. The 2010s saw
their activity increase dramatically, as these funds – primarily pensions
– nearly tripled their flow of new investments, from C$10.2B in the
first half of the decade to C$28.3B in the latter half. But while more
than half of the investment value in the 2010 to 2014 period was in
Australia’s financial services and real estate sectors, more recent years
have seen a diversification of investment targets. Investments in
Australia’s industrial transportation and real estate sectors still played
a major role in the 2015 to 2019 period, but were supplemented by large
flows into Mainland China’s real estate investment and services sector
and Hong Kong’s general retail sector. Additional flows of investment,
worth hundreds of millions of dollars apiece, went into India’s industrial
transportation, electricity, and real estate sectors and into South Korea’s
general retail and real estate sectors.
The Toronto-headquartered Canada Pension Plan Investment Board, a
Canadian state-owned Crown corporation, leads the pack for all Canadian
investors in the Asia Pacific. Last year’s C$296M invested into India’s
equity investment sector was a small fraction of the C$26.6B in CPPIB
investments recorded by the APF Canada Investment Monitor, C$14.7B
of which was invested in just the past four years. These high investments
have been driven by the CPPIB’s acquisitions in the Australian financial
52REPORT ON TRADE AGREEMENTS AND FOREIGN DIRECT INVESTMENT BETWEEN CANADA AND THE ASIA PACIFIC
ASIA PACIFIC FOUNDATION OF CANADA
services and industrial transportation sectors, Mainland China’s real
estate and industrial transportation sectors, and Hong Kong’s general
retail sector.
Another of Canada’s largest, state-owned pension plans entered
the Indian market last year, with the Ontario Municipal Employees
Retirement System (OMERS) investing C$160M into India’s financial
services sector. OMERS’s C$6.1B invested into the region has been
mainly focused on Australia’s real estate investment and services
sector. Likewise, state-owned pension and institutional investor CDPQ
invested C$346M into Indian non-equity investment instruments last
year, bringing the firm’s total to C$4.2B in the region. Aside from non-
equity investments in India, the CDPQ’s investments in the region
have centred on India’s electricity sector, Mainland China’s real estate
investment and services sector, and Australia’s health care equipment
and services sector.
Another state-owned Canadian investor to cross the billion-dollar mark
is British Columbia Investment Management Corp., a pension and
investment manager, with C$1.3B invested in Australia’s industrial
transportation sector. Similarly, the Public Sector Pension Board crossed
that threshold with its C$1.1B invested in the region, almost entirely in
New Zealand’s travel and leisure sector.
Even with the emergence of Canadian state-owned pensions in the
region, large private-sector funds continue to invest significant amounts
in the Asia Pacific, typified by the C$1.0B invested in 2019 by Brookfield
Asset Management Inc. in New Zealand’s software and computer
services sector. The Toronto-based asset management company’s
C$14.0B invested in the region, C$9.5B of which was invested in just the
five most recent years, has been heavily focused on Australia’s industrial
transportation and financial services sectors and in India’s real estate
investment and services sector.
Similarly, Toronto-based financial institution Manulife Financial has
invested C$6.1B in the Asia Pacific region, mainly in Mainland China’s
financial services sector, Singapore’s real estate investment and services
sector, and Hong Kong’s life insurance sector.
53REPORT ON TRADE AGREEMENTS AND FOREIGN DIRECT INVESTMENT BETWEEN CANADA AND THE ASIA PACIFIC
ASIA PACIFIC FOUNDATION OF CANADA
KEY SECTION TAKEAWAYS
• For 2019, Ontario made up the majority of all inbound investment
(40 percent), followed by Quebec (18) and BC (3).
• Similarly, for 2019, Ontario made up half of all outbound investment. It is
followed by Quebec (23 percent) and BC (14), while Alberta only received
one deal this year.
• Comparing the two halves of the decade (2010-2014 and 2015-2019),
inbound investment into Alberta dropped dramatically, while inbound
investment into BC rose. Meanwhile, Ontario and Quebec both saw slight
increases in their inbound flows. The Prairies and Atlantic Canada also saw
increased inbound investments in the second half of the decade.
• Considering outbound investment, both Alberta- and BC-sourced flows of
investment declined across the decade. On the other hand, Ontario and
Quebec both increased their flow of outbound investments throughout the
decade.
• On the provincial level, FDI flows between Canada and the Asia Pacific
are still concentrated in the same four provinces: Alberta, BC, Ontario,
and Quebec. Since 2003, 92 percent of all inbound investments have
gone to these four provinces, while almost all outbound investments have
originated from them. However, while these four retain their status as
centres of investment, their relative positions have changed.
FOUR PROVINCES MAKE UP 90 PERCENT OF INBOUND INVESTMENT
Since 2003, Alberta has been the centre of investment from the Asia Pacific,
with a third of all inbound investment concentrated in the province. However,
in 2019, it received few investments. One example is India-based digital
products and services provider Grazitti Interactive’s C$12M investment in a
THE PROVINCIAL PICTURE
54REPORT ON TRADE AGREEMENTS AND FOREIGN DIRECT INVESTMENT BETWEEN CANADA AND THE ASIA PACIFIC
ASIA PACIFIC FOUNDATION OF CANADA
new office in Edmonton. Other investments include Australian engineering
company Cardno’s C$7.9M expansion of its Edmonton-based subsidiary,
T2 Utility Engineers, and the expansion of Japan-based 7-Eleven across the
province, through its subsidiary in Surrey, BC. Overall, Alberta’s inbound
investments have dropped significantly, from C$26.4B from 2012 to 2015, to
just C$2.8B from 2016 to 2019.
Ontario, in contrast, has seen consistent growth in its inbound investment
transaction amounts from 2016 to 2019. In 2019, it received the highest
amount of inbound investment and half of all Asia Pacific investments into
Canada. This is largely due to several acquisitions by Chinese mining SOEs of
Ontario-based mining companies. Jiangxi Copper bought the entire equity
interest in PIM Cupric Holdings for C$1.5B, which also gained it a 17.6 percent
share in First Quantum Metals. Zijin Mining then acquired the gold mining
company Continental Gold for C$1.3B.
Quebec saw an uptick in investments for 2019 and 20 percent of all inbound
investments for the year. This is largely due to a deal between Mitsubishi
Heavy Industries and Bombardier. Bombardier agreed to sell its regional jet
business to Mitsubishi for C$730M, making this the province’s largest inbound
deal from 2016 to 2019. Overall, investments from Mitsubishi made up 56
percent of the province’s total inbound investments for 2019. Mitsubishi’s
other 2019 deals include its acquisition of Bombardier’s assets for C$550M,
and the opening of a new Montreal office for Mitsubishi Aircraft for C$202M.
Lastly, BC saw its largest amount of inbound investment from 2016 to 2019,
with a total of C$32.3B for the period. This uptick is due to the C$24.5B in
investments for the LNG Canada project. However, for 2019, the province
received only a few investments, making up just 3 percent of total inbound
investment for the year. The major deal for 2019 is Australian company
Jervois Mining Limited’s mergers with eCobalt Solutions Inc. and M2 Cobalt
Corp. for C$57.6M. Another notable deal is Mitsubishi Corporation’s C$5.9M
investment in Vancouver-based Spare, an artificial intelligence enabled
platform for on-demand mobility.
55REPORT ON TRADE AGREEMENTS AND FOREIGN DIRECT INVESTMENT BETWEEN CANADA AND THE ASIA PACIFIC
ASIA PACIFIC FOUNDATION OF CANADA
FOUR PROVINCES MAKE UP ALMOST ALL OF OUTBOUND FDI
Ontario continues to lead Canada’s outbound investment to the Asia Pacific
region. Since 2003, the province has provided 61 percent of all Canadian
investments in the Asia Pacific, and for 2019, 57 percent of all outbound
investments came from the province. The biggest news of 2019 is the sale
of Vodafone New Zealand to a consortium including Brookfield Asset
Management for C$917M, gaining it a 49 percent stake in the mobile company.
Other large deals in 2019 include Brookfield Infrastructure Partners’ C$493M
acquisition of a telecom company owned by India-based Reliance Industrial
Limited, and the Ontario Teachers’ Pension Plan’s C$330M investment in
India’s National Investment and Infrastructure Fund.
Quebec closely follows Ontario, having the second-highest amount of
investments for 2019 and 19.5 percent of all outbound investments to the
Asia Pacific for the year. The province’s largest outbound deals in 2019 were all
made by the pension SOE CDPQ. The biggest of these is the CDPQ’s C$346M
investment in Indian conglomerate Piramal Enterprises Ltd. Another notable
investment from the CDPQ is its acquisition of Australian hospital operator
Healthscope Limited for C$335M, together with a conglomerate including
Brookfield Business Partners. Overall, from 2016 to 2019, the CDPQ has
invested a total of C$2.7B in the Asia Pacific, mostly in India and Australia.
BC has the third-largest share of outbound investments for 2019, with 14
percent originating from the province. However, its outbound flows have been
steadily decreasing, from C$11B from 2004 to 2007, to C$3.7B from 2016 to
2019. That being said, the province saw one noteworthy deal in 2019. Electric
microcar manufacturer Electra Meccanica Vehicles invested C$783M in a
new production facility in Chongqing, China. This deal made up the bulk of
outbound investments in 2019.
Lastly, in 2019 Alberta saw its lowest amount of outbound investments
since 2003, with only one deal made. The transaction came from Eguana
Technologies, a supplier of energy storage systems for residential and
commercial use, which invested C$3.4M in a new office in Australia. Overall,
the number of outbound investments from Alberta has dropped in recent
years. For the 2016 to 2019 period, Alberta invested just C$292M in the
region, compared to C$8.6B from 2012 to 2015.

56REPORT ON TRADE AGREEMENTS AND FOREIGN DIRECT INVESTMENT BETWEEN CANADA AND THE ASIA PACIFIC
ASIA PACIFIC FOUNDATION OF CANADA
As a whole, the provinces combined saw an increase in inbound investment
and a decrease in outbound investment for the 2016 to 2019 period. However,
not all provinces experienced these changes in the same way. While Ontario
has the largest share of both inbound and outbound investment for 2019,
Alberta experienced a significant drop in both, marking the province’s lowest
investment totals since 2003. Quebec’s outbound investment decreased in
2019 from its total in 2018, while its inbound investment total for 2019 is its
highest for the current period. Conversely for BC, its outbound investment
increased in 2019 from its total in 2018, while its inbound investment total for
2019 is the lowest for the current period.
A DECADE OF CHANGES FOR CANADIAN PROVINCES AND TERRITORIES
INBOUND
Canada’s two westernmost provinces saw the most dramatic changes in
absolute terms across the decade, moving in opposite directions as Asia Pacific
investment reflected broader economic trends.
Source: APF Canada Investment Monitor and fDi Markets (accessed April 2020)
New Asia Pacific investment into Alberta dropped from C$44.0B in the first
half of the 2010s to just C$2.9B in the second half, by far the largest drop
in dollar terms among all provinces. While the province made notable gains
between periods in investment received in alternative energy (a net increase of
C$531M), farming (C$58M), and pharmaceuticals (C$38M), these were more
Asia Pacific Investment into Alberta and British ColumbiaInvestment Value (C$ Millions)
2010-2014
2015-2019
2,958
32,820
44,001
11,055
Alberta British Columbia

57REPORT ON TRADE AGREEMENTS AND FOREIGN DIRECT INVESTMENT BETWEEN CANADA AND THE ASIA PACIFIC
ASIA PACIFIC FOUNDATION OF CANADA
than offset by deep drops in oil and gas producers (a net decrease of C$36.6B)
and industrial metals and mining (C$2.8B).
In comparison, new Asia Pacific investment received by BC nearly tripled,
rising from C$11.1B to C$32.8B. This increase was driven in part by gains
between periods in oil and gas producers (a net increase of C$17.3B), real
estate investment and services (C$1.8B), mining (C$1.7B), and health care
equipment and services (C$1.6B), all offsetting a net drop in coal mining
investment of C$1.1B.
Both Manitoba and Saskatchewan saw increases in the flow of new Asia Pacific-
sourced investment received across the decade, and the territories saw a drop
from an already marginal flow.
Source: APF Canada Investment Monitor and fDi Markets (accessed April 2020)
In Manitoba, the flow of Asia Pacific investment increased from C$169M in
new investment in the first half of the decade to C$520M in the second half.
With gains in fishing and animal production (a net increase of C$436M in
new investment) and travel and leisure (C$13M), the net decline in financial
services of C$107M was more than offset.
Saskatchewan saw its investment received increase from C$429M in new
investment during the 2010 to 2014 period to C$1.9B in new investment
during the latter half of the decade. The net increase in new investment
received in oil and gas producers, at C$1.8B, more than outweighed declines
in mining (a net decrease of C$298M in new investment between periods),
Asia Pacific Investment into the Prairies and TerritoriesInvestment Value (C$ Millions)
2010-2014
2015-2019
169
SaskatchewanManitoba Territories
565
060
1,852
429
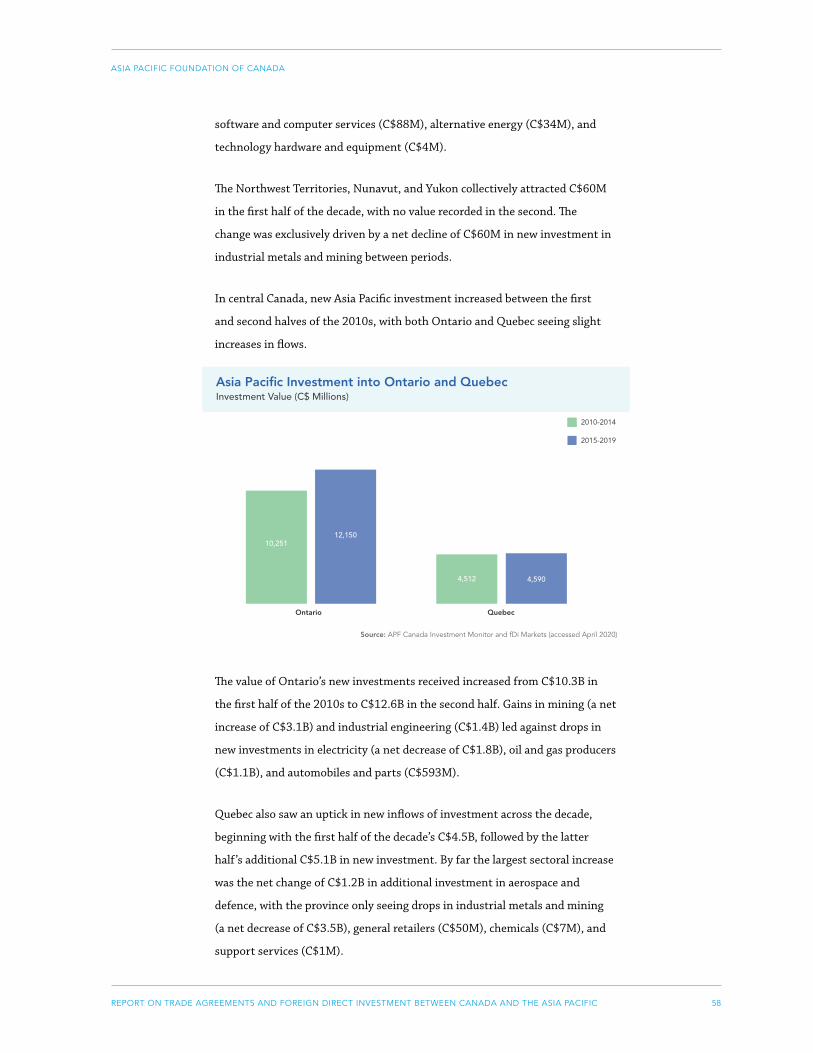
58REPORT ON TRADE AGREEMENTS AND FOREIGN DIRECT INVESTMENT BETWEEN CANADA AND THE ASIA PACIFIC
ASIA PACIFIC FOUNDATION OF CANADA
software and computer services (C$88M), alternative energy (C$34M), and
technology hardware and equipment (C$4M).
The Northwest Territories, Nunavut, and Yukon collectively attracted C$60M
in the first half of the decade, with no value recorded in the second. The
change was exclusively driven by a net decline of C$60M in new investment in
industrial metals and mining between periods.
In central Canada, new Asia Pacific investment increased between the first
and second halves of the 2010s, with both Ontario and Quebec seeing slight
increases in flows.
Source: APF Canada Investment Monitor and fDi Markets (accessed April 2020)
The value of Ontario’s new investments received increased from C$10.3B in
the first half of the 2010s to C$12.6B in the second half. Gains in mining (a net
increase of C$3.1B) and industrial engineering (C$1.4B) led against drops in
new investments in electricity (a net decrease of C$1.8B), oil and gas producers
(C$1.1B), and automobiles and parts (C$593M).
Quebec also saw an uptick in new inflows of investment across the decade,
beginning with the first half of the decade’s C$4.5B, followed by the latter
half ’s additional C$5.1B in new investment. By far the largest sectoral increase
was the net change of C$1.2B in additional investment in aerospace and
defence, with the province only seeing drops in industrial metals and mining
(a net decrease of C$3.5B), general retailers (C$50M), chemicals (C$7M), and
support services (C$1M).
Asia Pacific Investment into Ontario and QuebecInvestment Value (C$ Millions)
2010-2014
2015-2019
4,590
10,251
4,512
Ontario Quebec
12,150
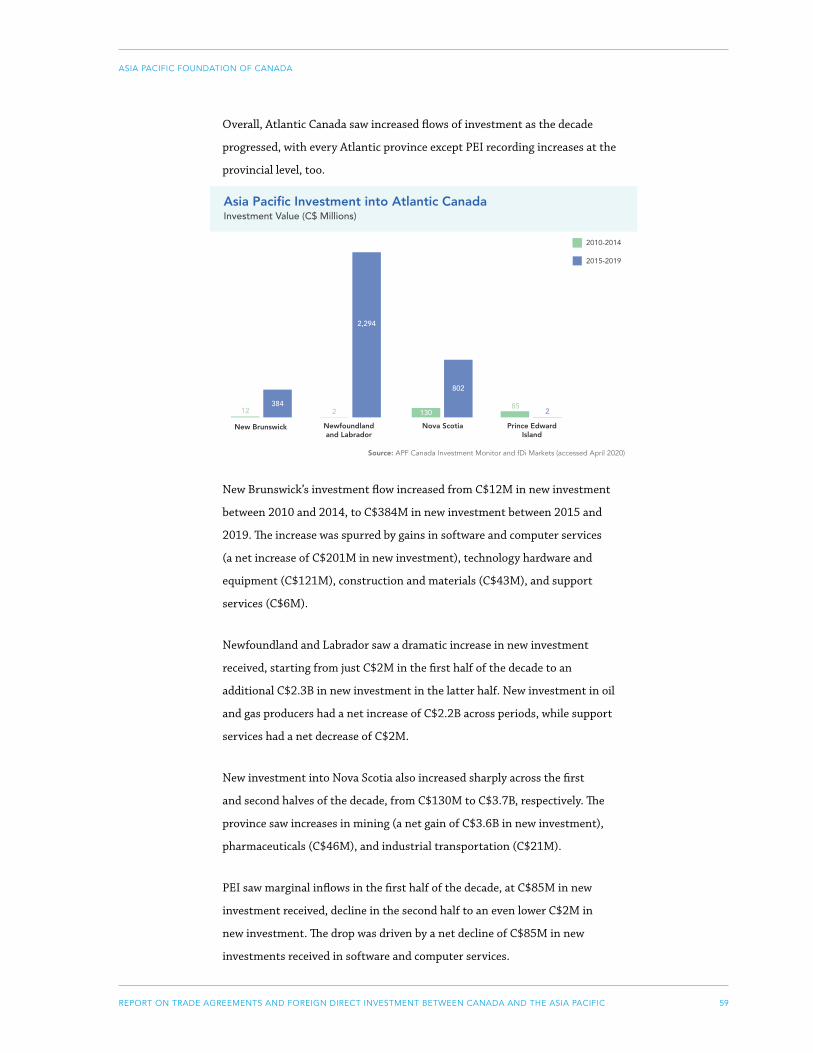
59REPORT ON TRADE AGREEMENTS AND FOREIGN DIRECT INVESTMENT BETWEEN CANADA AND THE ASIA PACIFIC
ASIA PACIFIC FOUNDATION OF CANADA
Overall, Atlantic Canada saw increased flows of investment as the decade
progressed, with every Atlantic province except PEI recording increases at the
provincial level, too.
Source: APF Canada Investment Monitor and fDi Markets (accessed April 2020)
New Brunswick’s investment flow increased from C$12M in new investment
between 2010 and 2014, to C$384M in new investment between 2015 and
2019. The increase was spurred by gains in software and computer services
(a net increase of C$201M in new investment), technology hardware and
equipment (C$121M), construction and materials (C$43M), and support
services (C$6M).
Newfoundland and Labrador saw a dramatic increase in new investment
received, starting from just C$2M in the first half of the decade to an
additional C$2.3B in new investment in the latter half. New investment in oil
and gas producers had a net increase of C$2.2B across periods, while support
services had a net decrease of C$2M.
New investment into Nova Scotia also increased sharply across the first
and second halves of the decade, from C$130M to C$3.7B, respectively. The
province saw increases in mining (a net gain of C$3.6B in new investment),
pharmaceuticals (C$46M), and industrial transportation (C$21M).
PEI saw marginal inflows in the first half of the decade, at C$85M in new
investment received, decline in the second half to an even lower C$2M in
new investment. The drop was driven by a net decline of C$85M in new
investments received in software and computer services.
Asia Pacific Investment into Atlantic CanadaInvestment Value (C$ Millions)
2010-2014
2015-2019
2
Nova ScotiaNewfoundland and Labrador
Prince Edward Island
2,294
38412
802
285
130
New Brunswick
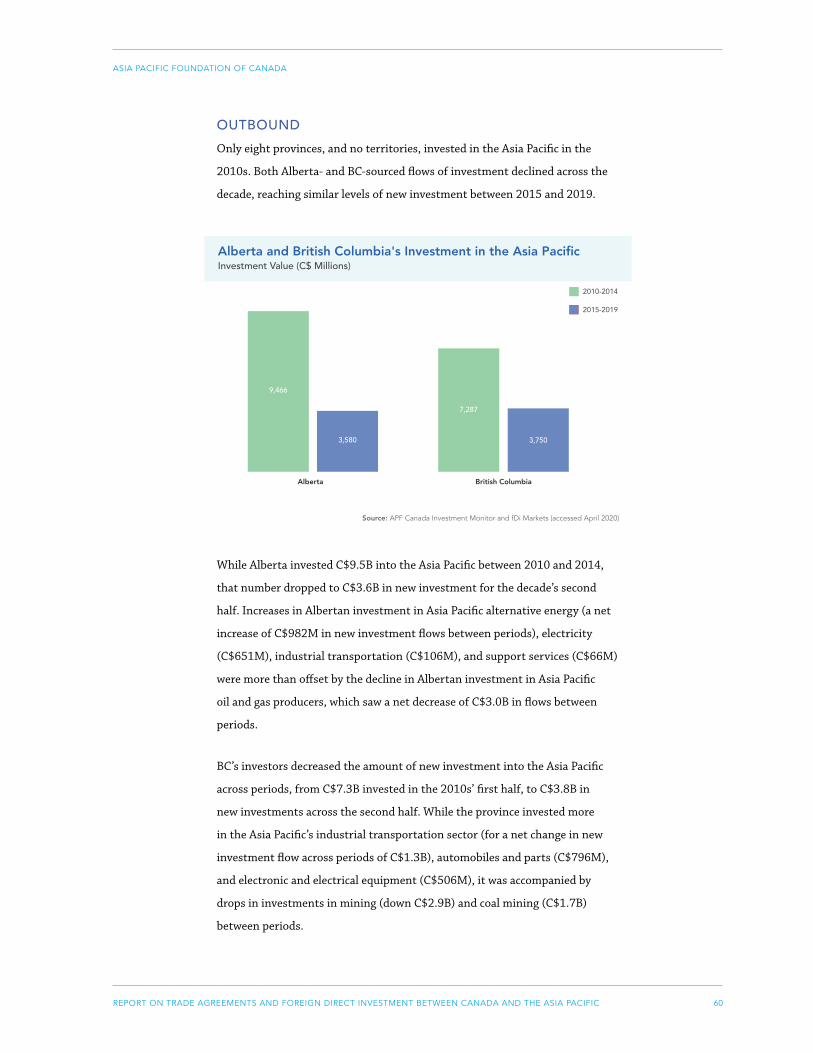
60REPORT ON TRADE AGREEMENTS AND FOREIGN DIRECT INVESTMENT BETWEEN CANADA AND THE ASIA PACIFIC
ASIA PACIFIC FOUNDATION OF CANADA
OUTBOUND
Only eight provinces, and no territories, invested in the Asia Pacific in the
2010s. Both Alberta- and BC-sourced flows of investment declined across the
decade, reaching similar levels of new investment between 2015 and 2019.
Source: APF Canada Investment Monitor and fDi Markets (accessed April 2020)
While Alberta invested C$9.5B into the Asia Pacific between 2010 and 2014,
that number dropped to C$3.6B in new investment for the decade’s second
half. Increases in Albertan investment in Asia Pacific alternative energy (a net
increase of C$982M in new investment flows between periods), electricity
(C$651M), industrial transportation (C$106M), and support services (C$66M)
were more than offset by the decline in Albertan investment in Asia Pacific
oil and gas producers, which saw a net decrease of C$3.0B in flows between
periods.
BC’s investors decreased the amount of new investment into the Asia Pacific
across periods, from C$7.3B invested in the 2010s’ first half, to C$3.8B in
new investments across the second half. While the province invested more
in the Asia Pacific’s industrial transportation sector (for a net change in new
investment flow across periods of C$1.3B), automobiles and parts (C$796M),
and electronic and electrical equipment (C$506M), it was accompanied by
drops in investments in mining (down C$2.9B) and coal mining (C$1.7B)
between periods.
Alberta and British Columbia's Investment in the Asia PacificInvestment Value (C$ Millions)
2010-2014
2015-2019
3,580 3,750
9,466
7,287
Alberta British Columbia
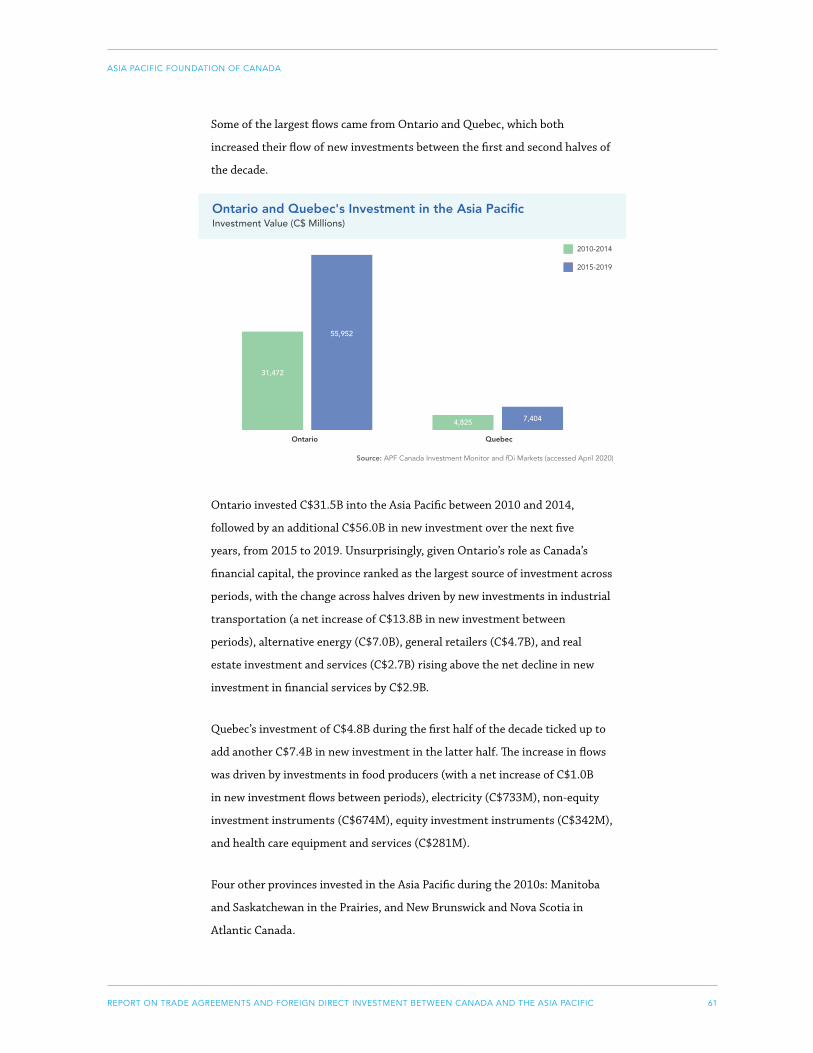
61REPORT ON TRADE AGREEMENTS AND FOREIGN DIRECT INVESTMENT BETWEEN CANADA AND THE ASIA PACIFIC
ASIA PACIFIC FOUNDATION OF CANADA
Some of the largest flows came from Ontario and Quebec, which both
increased their flow of new investments between the first and second halves of
the decade.
Source: APF Canada Investment Monitor and fDi Markets (accessed April 2020)
Ontario invested C$31.5B into the Asia Pacific between 2010 and 2014,
followed by an additional C$56.0B in new investment over the next five
years, from 2015 to 2019. Unsurprisingly, given Ontario’s role as Canada’s
financial capital, the province ranked as the largest source of investment across
periods, with the change across halves driven by new investments in industrial
transportation (a net increase of C$13.8B in new investment between
periods), alternative energy (C$7.0B), general retailers (C$4.7B), and real
estate investment and services (C$2.7B) rising above the net decline in new
investment in financial services by C$2.9B.
Quebec’s investment of C$4.8B during the first half of the decade ticked up to
add another C$7.4B in new investment in the latter half. The increase in flows
was driven by investments in food producers (with a net increase of C$1.0B
in new investment flows between periods), electricity (C$733M), non-equity
investment instruments (C$674M), equity investment instruments (C$342M),
and health care equipment and services (C$281M).
Four other provinces invested in the Asia Pacific during the 2010s: Manitoba
and Saskatchewan in the Prairies, and New Brunswick and Nova Scotia in
Atlantic Canada.
Ontario and Quebec's Investment in the Asia PacificInvestment Value (C$ Millions)
2010-2014
2015-2019
55,952
7,404
31,472
4,825
Ontario Quebec
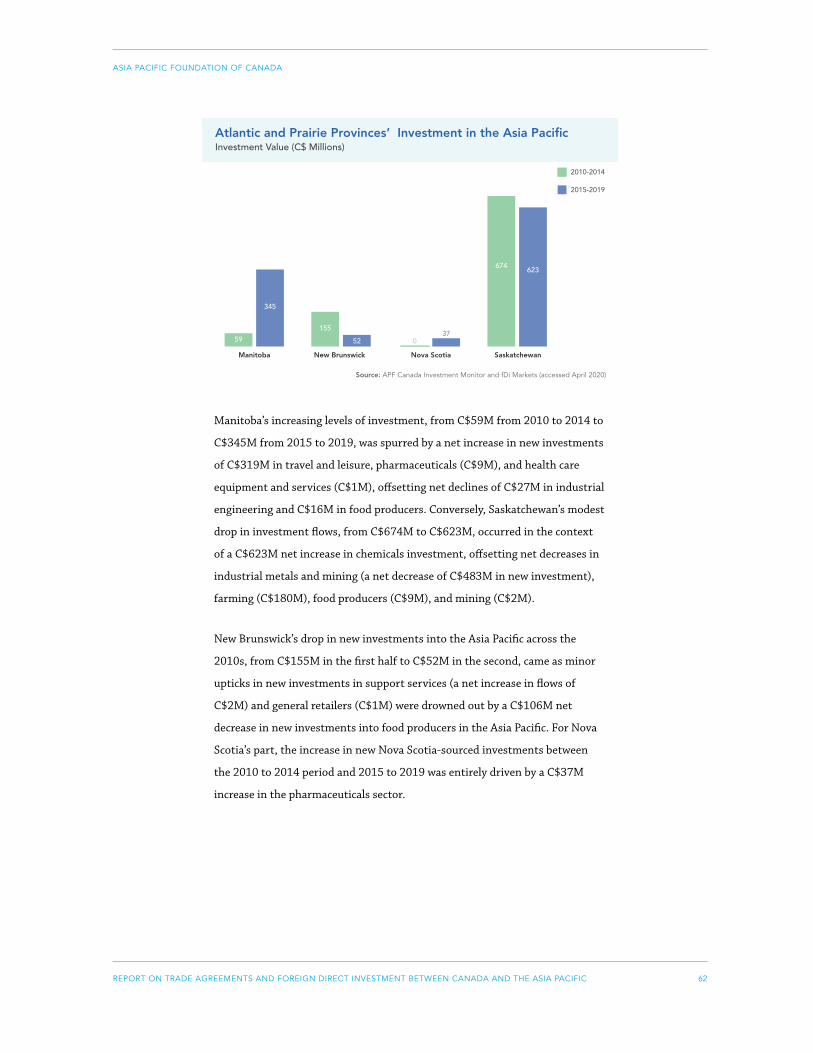
62REPORT ON TRADE AGREEMENTS AND FOREIGN DIRECT INVESTMENT BETWEEN CANADA AND THE ASIA PACIFIC
ASIA PACIFIC FOUNDATION OF CANADA
Source: APF Canada Investment Monitor and fDi Markets (accessed April 2020)
Manitoba’s increasing levels of investment, from C$59M from 2010 to 2014 to
C$345M from 2015 to 2019, was spurred by a net increase in new investments
of C$319M in travel and leisure, pharmaceuticals (C$9M), and health care
equipment and services (C$1M), offsetting net declines of C$27M in industrial
engineering and C$16M in food producers. Conversely, Saskatchewan’s modest
drop in investment flows, from C$674M to C$623M, occurred in the context
of a C$623M net increase in chemicals investment, offsetting net decreases in
industrial metals and mining (a net decrease of C$483M in new investment),
farming (C$180M), food producers (C$9M), and mining (C$2M).
New Brunswick’s drop in new investments into the Asia Pacific across the
2010s, from C$155M in the first half to C$52M in the second, came as minor
upticks in new investments in support services (a net increase in flows of
C$2M) and general retailers (C$1M) were drowned out by a C$106M net
decrease in new investments into food producers in the Asia Pacific. For Nova
Scotia’s part, the increase in new Nova Scotia-sourced investments between
the 2010 to 2014 period and 2015 to 2019 was entirely driven by a C$37M
increase in the pharmaceuticals sector.
Atlantic and Prairie Provinces’ Investment in the Asia PacificInvestment Value (C$ Millions)
2010-2014
2015-2019
155
3,750
Manitoba Nova ScotiaNew Brunswick Saskatchewan
52
345
59 037
623674
63REPORT ON TRADE AGREEMENTS AND FOREIGN DIRECT INVESTMENT BETWEEN CANADA AND THE ASIA PACIFIC
ASIA PACIFIC FOUNDATION OF CANADA
CITY-LEVEL HUBS OF INVESTMENT ACTIVITY
KEY SECTION TAKEAWAYS
• Over the past 17 years, 97 Canadian cities have invested into the Asia
Pacific, representing a strong network of ties across the Pacific. During that
same period, 21 Canadian cities invested half a billion or more into the
region, some with hundreds of deals.
• Toronto, as the financial capital of Canada, stands apart as the largest
source of outbound investment into the Asia Pacific in terms of both
dollar value and deal numbers, with C$110B invested across 800 deals.
Meanwhile, Calgary ranks first in terms of dollars received from the Asia
Pacific, given its capital-intensive oil and gas production sector.
• There is a diverse range of Canadian cities receiving inbound investment,
notably where mining sites are located or where mining companies are
headquartered.
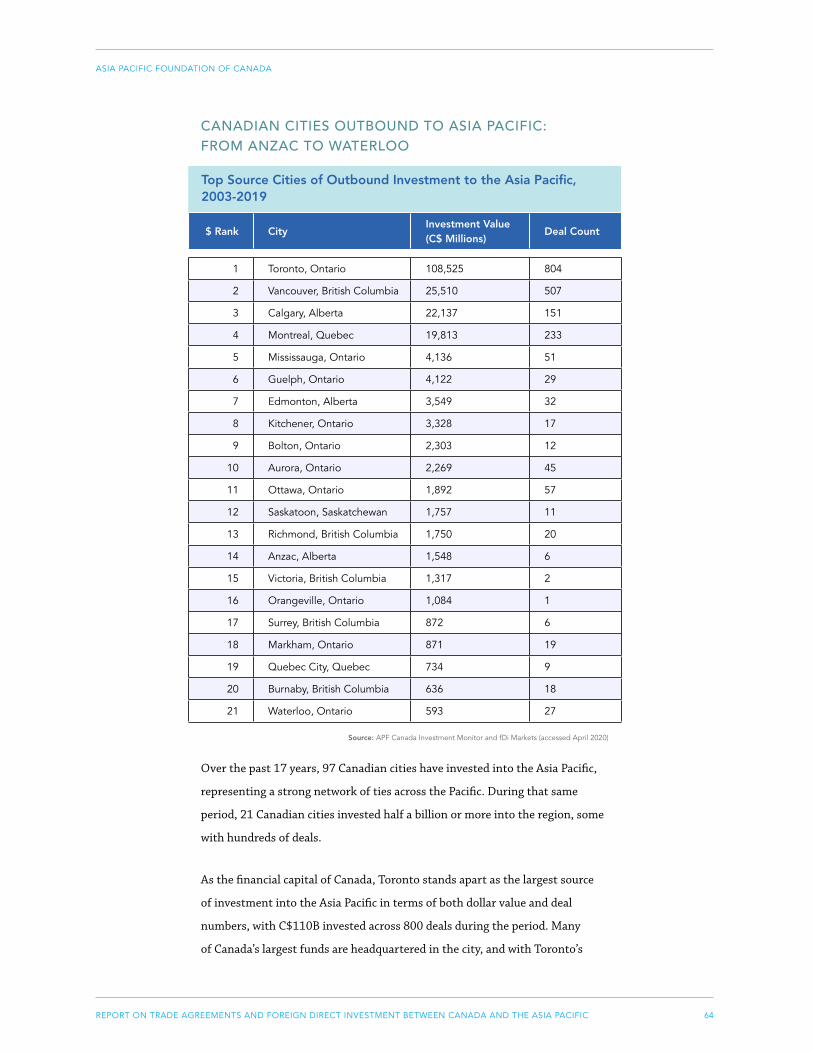
64REPORT ON TRADE AGREEMENTS AND FOREIGN DIRECT INVESTMENT BETWEEN CANADA AND THE ASIA PACIFIC
ASIA PACIFIC FOUNDATION OF CANADA
CANADIAN CITIES OUTBOUND TO ASIA PACIFIC: FROM ANZAC TO WATERLOO
Source: APF Canada Investment Monitor and fDi Markets (accessed April 2020)
Over the past 17 years, 97 Canadian cities have invested into the Asia Pacific,
representing a strong network of ties across the Pacific. During that same
period, 21 Canadian cities invested half a billion or more into the region, some
with hundreds of deals.
As the financial capital of Canada, Toronto stands apart as the largest source
of investment into the Asia Pacific in terms of both dollar value and deal
numbers, with C$110B invested across 800 deals during the period. Many
of Canada’s largest funds are headquartered in the city, and with Toronto’s
Top Source Cities of Outbound Investment to the Asia Pacific, 2003-2019
$ Rank CityInvestment Value (C$ Millions)
Deal Count
1 Toronto, Ontario 108,525 804
2 Vancouver, British Columbia 25,510 507
3 Calgary, Alberta 22,137 151
4 Montreal, Quebec 19,813 233
5 Mississauga, Ontario 4,136 51
6 Guelph, Ontario 4,122 29
7 Edmonton, Alberta 3,549 32
8 Kitchener, Ontario 3,328 17
9 Bolton, Ontario 2,303 12
10 Aurora, Ontario 2,269 45
11 Ottawa, Ontario 1,892 57
12 Saskatoon, Saskatchewan 1,757 11
13 Richmond, British Columbia 1,750 20
14 Anzac, Alberta 1,548 6
15 Victoria, British Columbia 1,317 2
16 Orangeville, Ontario 1,084 1
17 Surrey, British Columbia 872 6
18 Markham, Ontario 871 19
19 Quebec City, Quebec 734 9
20 Burnaby, British Columbia 636 18
21 Waterloo, Ontario 593 27

65REPORT ON TRADE AGREEMENTS AND FOREIGN DIRECT INVESTMENT BETWEEN CANADA AND THE ASIA PACIFIC
ASIA PACIFIC FOUNDATION OF CANADA
large flow driven in no small part by repeated, major deals by investors
such as Brookfield, the Canada Pension Plan Investment Board, the Ontario
Teachers’ Pension Plan, and Scotiabank. While Toronto-sourced investments
can be found across the Asia Pacific, the bulk of their value flowed to just
three economies: Australia, Mainland China, and India. Likewise, the highly
diversified set of sectors targeted by Toronto’s investors were still largely
dominated by investments in the core targets of real estate investment and
services, industrial transportation, financial services, and travel and leisure.
The next three cities are also Canada’s largest cities, and they each invested
tens of billions into the region. With C$27B invested across 506 deals,
Vancouver sits comfortably in second place in both investment values and deal
counts. As with Toronto, Vancouver’s target economies were mainly Australia,
Mainland China, and India, while the majority of its capital flowed into the
mining and construction sectors. In contrast, Calgary’s C$22B invested into
the region mainly flowed into Australia, and at the sector level, into oil and
gas producers. Montreal, fourth in terms of dollars invested but third in terms
of deal counts, had Australia and Mainland China as its main targets in dollar
terms, with a sectoral focus on the Asia Pacific’s industrial metals and mining,
food producers, and industrial transportation sectors.
Rounding out the top sources for investment into the Asia Pacific are three
cities in southern Ontario, and one from Alberta. Mississauga invested C$4.1B
across 51 deals, mostly into Mainland China and Australia, with forestry and
pharmaceuticals the main targets over the 17-year period. Narrowly behind,
Guelph also invested C$4.1B through 29 deals, the majority of which flowed
into Japan, mainly into electricity. Edmonton’s 31 deals in the Asia Pacific
came to a total of C$3.5B, with the majority flowing to either Mainland China
or Thailand, while its sectoral targets were alternative energy and industrial
metals and mining. For Kitchener’s C$3.3B invested in 21 deals, the majority
of dollars flowed into electricity in Pakistan.
Remaining cities on the list rank high for a variety of reasons. For Bolton,
Ontario, the bulk of the value was driven by one deal into oil equipment,
services, and distribution in Mainland China, while Orangeville, Ontario,
ranks high due to just one deal, by Global 8 Environmental Technologies,
into Mainland China’s electricity sector. Conversely, the presence of Aurora,
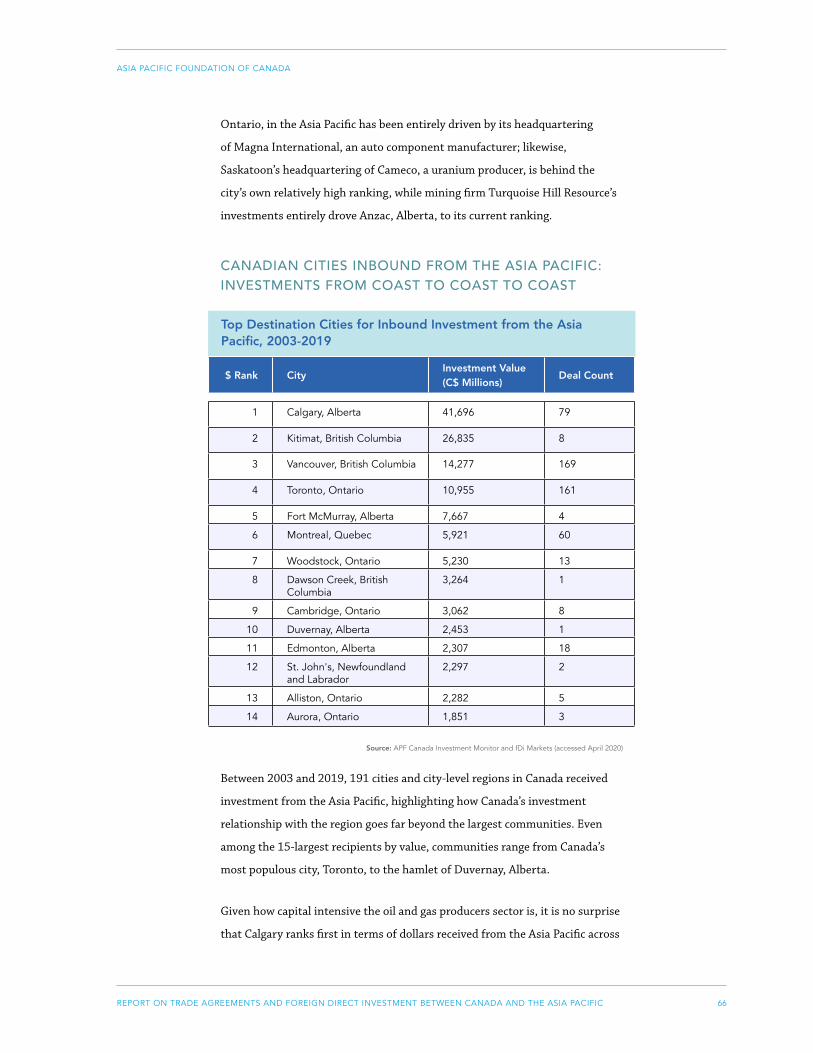
66REPORT ON TRADE AGREEMENTS AND FOREIGN DIRECT INVESTMENT BETWEEN CANADA AND THE ASIA PACIFIC
ASIA PACIFIC FOUNDATION OF CANADA
Ontario, in the Asia Pacific has been entirely driven by its headquartering
of Magna International, an auto component manufacturer; likewise,
Saskatoon’s headquartering of Cameco, a uranium producer, is behind the
city’s own relatively high ranking, while mining firm Turquoise Hill Resource’s
investments entirely drove Anzac, Alberta, to its current ranking.
CANADIAN CITIES INBOUND FROM THE ASIA PACIFIC: INVESTMENTS FROM COAST TO COAST TO COAST
Source: APF Canada Investment Monitor and fDi Markets (accessed April 2020)
Between 2003 and 2019, 191 cities and city-level regions in Canada received
investment from the Asia Pacific, highlighting how Canada’s investment
relationship with the region goes far beyond the largest communities. Even
among the 15-largest recipients by value, communities range from Canada’s
most populous city, Toronto, to the hamlet of Duvernay, Alberta.
Given how capital intensive the oil and gas producers sector is, it is no surprise
that Calgary ranks first in terms of dollars received from the Asia Pacific across
Top Destination Cities for Inbound Investment from the Asia Pacific, 2003-2019
$ Rank CityInvestment Value (C$ Millions)
Deal Count
1 Calgary, Alberta 41,696 79
2 Kitimat, British Columbia 26,835 8
3 Vancouver, British Columbia 14,277 169
4 Toronto, Ontario 10,955 161
5 Fort McMurray, Alberta 7,667 4
6 Montreal, Quebec 5,921 60
7 Woodstock, Ontario 5,230 13
8 Dawson Creek, British Columbia
3,264 1
9 Cambridge, Ontario 3,062 8
10 Duvernay, Alberta 2,453 1
11 Edmonton, Alberta 2,307 18
12 St. John's, Newfoundland and Labrador
2,297 2
13 Alliston, Ontario 2,282 5
14 Aurora, Ontario 1,851 3

67REPORT ON TRADE AGREEMENTS AND FOREIGN DIRECT INVESTMENT BETWEEN CANADA AND THE ASIA PACIFIC
ASIA PACIFIC FOUNDATION OF CANADA
this 17-year period. While the deal count, at 78, ranks below other cities’,
the C$41.7B received is larger than investment into Toronto, Vancouver, and
Montreal combined. With the bulk of investment coming from Mainland
China and flowing into oil and gas production, the city’s ranking was also
heavily determined by state-owned investment by China National Offshore Oil
Corporation, China Petroleum & Chemical Corporation, and Thailand’s PTT
Exploration and Production. While Calgary is likely to retain this top position
given the substantial gap between it and other Canadian cities, the city has
lagged in recent years: the bulk of the C$41.7B occurred before 2014, with only
C$4.2B received since, behind Kitimat, Vancouver, and Toronto for that same
time period.
Ranked second in terms of received investment is Kitimat, BC, which saw
eight deals lead to C$26.8B in investment. Further illustrating how connected
Asia Pacific-Canada investment is to energy, the entire amount flowed into
oil and gas producers, stemming mainly from Malaysia, Mainland China, and
Japan. In Kitimat’s case, these investments were largely driven by a mix of
state-owned investors – namely, Petronas of Malaysia and the China National
Petroleum Corporation – and private investment from Japan-based Mitsubishi
Corporation into the LNG Canada project.
Vancouver and Toronto’s investments received and deal counts rank at similar
levels. For Vancouver, 166 deals led to a third-placed C$14.3B in investment,
with the majority of investment stemming from Mainland China. Again,
natural resources played a significant role in determining this ranking, with the
bulk of dollars received going into the mining and industrial metals and mining
sectors. As with Vancouver, Mainland China was the source for most of the
C$11.5B received by Toronto across 155 deals from 2003 to 2019. Presenting a
slightly more diversified set of sectors, the mining sector still made up the top
sectoral destination for investment into Toronto, with software and computer
services and travel and leisure rounding out the majority of the investment
value.
68REPORT ON TRADE AGREEMENTS AND FOREIGN DIRECT INVESTMENT BETWEEN CANADA AND THE ASIA PACIFIC
ASIA PACIFIC FOUNDATION OF CANADA
BOX 10. ASIA PACIFIC INVESTMENT INTO CANADA’S RURAL
COMMUNITIES
While Canada’s largest cities and towns have received the majority of
the Asia Pacific’s investment into Canada, a full quarter of investment
value since 2003 has been into communities and areas classified as rural
by Statistics Canada. In all, the APF Canada Investment Monitor records
investment from the Asia Pacific into 61 different rural communities, for
a total of C$40B in received investment over the past 17 years.
A significant share of rural investment is associated with one location
in BC, in the oil and gas production sector: specifically, the C$26.8B
invested into Kitimat, BC, for light natural gas export facility projects.
Oil and gas production was also the target for second-ranked Duvernay,
Alberta, with C$2.5B going into the exploration and development of
oil resources by China National Petroleum Corporation under a joint
venture agreement with Encana.
Other locations have also passed, or are close to, the billion-dollar mark,
spurred by investments into varying forms of energy and mining. Fort
Nelson, BC, saw C$1.3B flow into oil and gas producers, primarily driven
by a consortium of five Japanese companies collaborating on a shale
gas project. For Quebec’s Labrador Trough, C$1.2B was invested into
industrial metals and mining under a joint venture agreement with a
consortium led by South Korea’s Pohang Iron and Steel Company and
Taiwan’s China Steel Corporation. Letellier, Manitoba, received C$1.2B
stemming from an investment in alternative energy as the Australia-
based Babcock & Brown invested in the development of a 300-megawatt
wind farm. Investments in coal mining brought the Peace River coalfields
to C$976M, as Australia’s Xstrata Coal and Japan’s JX Nippon Oil &
Energy Corporation invested to develop metallurgical coal in the region.
Spruce Lake, Saskatchewan, saw C$744M, also driven by oil and gas
production, namely Hong Kong-owned Husky Energy’s two steam-
assisted heavy oil extraction plants near the hamlet. For Wheatland
County, Alberta, C$677M stemmed from Japan’s Toyota Group reaching
an agreement with Encana to acquire an interest in Encana’s coalbed
methane project. Red Lake received the largest investment into rural
Ontario, with C$499M invested in mining as Australia’s Evolution
Mining bought a Canadian gold mining complex at Red Lake from US-
based Newmont Goldcorp.
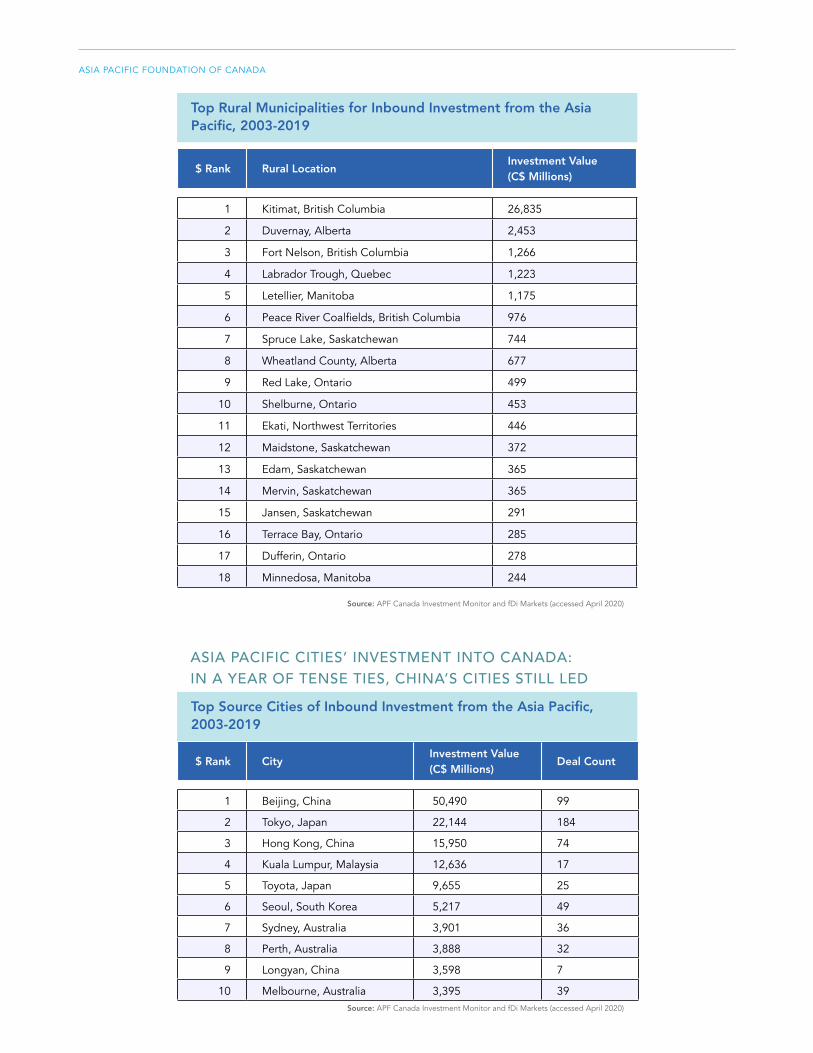
69REPORT ON TRADE AGREEMENTS AND FOREIGN DIRECT INVESTMENT BETWEEN CANADA AND THE ASIA PACIFIC
ASIA PACIFIC FOUNDATION OF CANADA
Source: APF Canada Investment Monitor and fDi Markets (accessed April 2020)
ASIA PACIFIC CITIES’ INVESTMENT INTO CANADA: IN A YEAR OF TENSE TIES, CHINA’S CITIES STILL LED
Source: APF Canada Investment Monitor and fDi Markets (accessed April 2020)
$ Rank Rural LocationInvestment Value (C$ Millions)
1 Kitimat, British Columbia 26,835
2 Duvernay, Alberta 2,453
3 Fort Nelson, British Columbia 1,266
4 Labrador Trough, Quebec 1,223
5 Letellier, Manitoba 1,175
6 Peace River Coalfields, British Columbia 976
7 Spruce Lake, Saskatchewan 744
8 Wheatland County, Alberta 677
9 Red Lake, Ontario 499
10 Shelburne, Ontario 453
11 Ekati, Northwest Territories 446
12 Maidstone, Saskatchewan 372
13 Edam, Saskatchewan 365
14 Mervin, Saskatchewan 365
15 Jansen, Saskatchewan 291
16 Terrace Bay, Ontario 285
17 Dufferin, Ontario 278
18 Minnedosa, Manitoba 244
Top Rural Municipalities for Inbound Investment from the Asia Pacific, 2003-2019
$ Rank CityInvestment Value (C$ Millions)
Deal Count
1 Beijing, China 50,490 99
2 Tokyo, Japan 22,144 184
3 Hong Kong, China 15,950 74
4 Kuala Lumpur, Malaysia 12,636 17
5 Toyota, Japan 9,655 25
6 Seoul, South Korea 5,217 49
7 Sydney, Australia 3,901 36
8 Perth, Australia 3,888 32
9 Longyan, China 3,598 7
10 Melbourne, Australia 3,395 39
Top Source Cities of Inbound Investment from the Asia Pacific, 2003-2019
70REPORT ON TRADE AGREEMENTS AND FOREIGN DIRECT INVESTMENT BETWEEN CANADA AND THE ASIA PACIFIC
ASIA PACIFIC FOUNDATION OF CANADA
Considering inbound investment from the Asia Pacific, an analysis at the city
level enables a greater understanding of where investments originate in the
region. At a glance, the top-ranked source cities in the region reflect the top
source economies of inbound investment, namely China, Japan, Hong Kong,
and Australia. The ranking of these cities is largely due to their locations as
headquarters for energy and mining companies.
Looking closer at 2019, the largest inbound deal this year came from
Nanchang, China, with SOE Jiangxi Copper’s acquisition of a 17.6 percent
stake in copper mining company First Quantum Metals for C$1.5B. The
second-largest deal then came from Longyan, China, with SOE Zijin Mining’s
acquisition of gold mining company Continental Gold for C$1.3B. This one deal
makes up more than a third of the total amount of investments originating
from Longyan. Other big deals for the year include Tokyo-based Mitsubishi’s
acquisition of Bombardier for C$731M and Melbourne-based St. Barbara
Limited’s acquisition of a stake in Atlantic Gold Corporation for C$723M.
One noteworthy deal is Kuala Lumpur-based leisure company Genting Group’s
C$649M sale of a 35 percent stake in its subsidiary, Genting Hong Kong Ltd.,
to a consortium including the Ontario Teachers’ Pension Plan. Kuala Lumpur,
Malaysia, fourth on the list, is the only city located in Southeast Asia. Indeed,
this deal is the Ontario Teachers’ Pension Plan’s first investment in the
Southeast Asian region. Overall, the city is notable for having only a few deals,
but the fourth-largest amount of investment into Canada. Similar to Beijing
and Tokyo, the majority of investments from the city are in oil and gas as well
as industrial metals and mining.
Overall, Beijing, China, maintains its place as the largest source city of inbound
investment from the Asia Pacific. Since 2003, C$50.5B in investments have
arrived in Canada, in sectors ranging from oil and gas production to real
estate investment. However, in 2019, investments from the city totalled just
C$138M, its lowest amount for the 2016 to 2019 period.
As for the second-highest ranking city, Tokyo, Japan, the majority of deals
in Canada are in the software and computer services sector. This includes
popular Japanese software companies like Sony as well as well-known video
game studios like Square Enix. However, in contrast, the largest investments
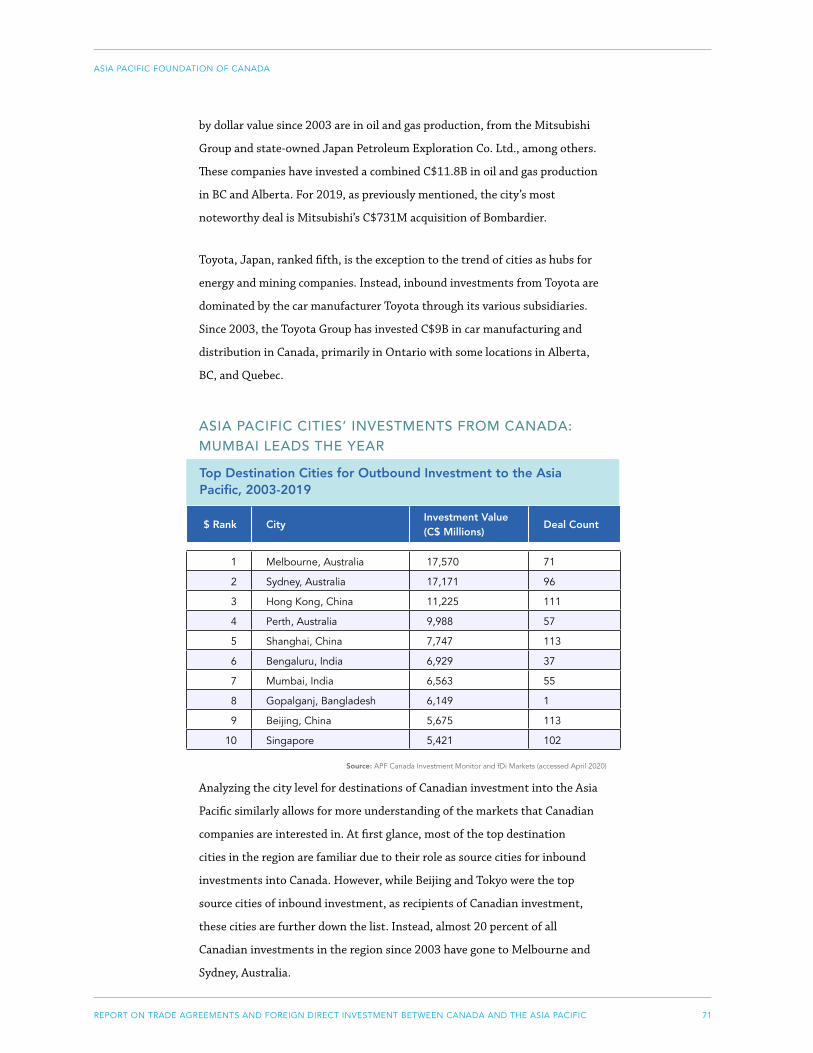
71REPORT ON TRADE AGREEMENTS AND FOREIGN DIRECT INVESTMENT BETWEEN CANADA AND THE ASIA PACIFIC
ASIA PACIFIC FOUNDATION OF CANADA
by dollar value since 2003 are in oil and gas production, from the Mitsubishi
Group and state-owned Japan Petroleum Exploration Co. Ltd., among others.
These companies have invested a combined C$11.8B in oil and gas production
in BC and Alberta. For 2019, as previously mentioned, the city’s most
noteworthy deal is Mitsubishi’s C$731M acquisition of Bombardier.
Toyota, Japan, ranked fifth, is the exception to the trend of cities as hubs for
energy and mining companies. Instead, inbound investments from Toyota are
dominated by the car manufacturer Toyota through its various subsidiaries.
Since 2003, the Toyota Group has invested C$9B in car manufacturing and
distribution in Canada, primarily in Ontario with some locations in Alberta,
BC, and Quebec.
ASIA PACIFIC CITIES’ INVESTMENTS FROM CANADA: MUMBAI LEADS THE YEAR
Source: APF Canada Investment Monitor and fDi Markets (accessed April 2020)
Analyzing the city level for destinations of Canadian investment into the Asia
Pacific similarly allows for more understanding of the markets that Canadian
companies are interested in. At first glance, most of the top destination
cities in the region are familiar due to their role as source cities for inbound
investments into Canada. However, while Beijing and Tokyo were the top
source cities of inbound investment, as recipients of Canadian investment,
these cities are further down the list. Instead, almost 20 percent of all
Canadian investments in the region since 2003 have gone to Melbourne and
Sydney, Australia.
$ Rank CityInvestment Value (C$ Millions)
Deal Count
1 Melbourne, Australia 17,570 71
2 Sydney, Australia 17,171 96
3 Hong Kong, China 11,225 111
4 Perth, Australia 9,988 57
5 Shanghai, China 7,747 113
6 Bengaluru, India 6,929 37
7 Mumbai, India 6,563 55
8 Gopalganj, Bangladesh 6,149 1
9 Beijing, China 5,675 113
10 Singapore 5,421 102
Top Destination Cities for Outbound Investment to the Asia Pacific, 2003-2019
72REPORT ON TRADE AGREEMENTS AND FOREIGN DIRECT INVESTMENT BETWEEN CANADA AND THE ASIA PACIFIC
ASIA PACIFIC FOUNDATION OF CANADA
For 2019, Mumbai, India, received the largest amount of Canadian investment.
The city received C$1.3B in investments, making up 17 percent of all
outbound investments for 2019. The largest of these investments is Brookfield
Infrastructure Partners L.P.’s investment in Reliance Industries Limited,
wherein Brookfield acquired a 100 percent stake in a telecom tower company
owned by Reliance for C$493M. Another notable deal is the CDPQ’s C$346M
investment in Mumbai-based conglomerate Piramal Enterprises Ltd. together
with its partners. Overall, many of the large investments in Mumbai were
made by Brookfield and various Canadian pension companies, specifically the
CPPIB and the CDPQ.
Melbourne, Australia, has been a main hub for Canadian investment in the
Asia Pacific since 2003, while in 2019 it received just C$346M, its lowest
amount for the 2016 to 2019 period. Moreover, its 2019 total is largely
made up of one deal from the CDPQ and Brookfield Business Partners, which
acquired Healthscope Ltd., a private health care company that operates private
hospitals and medical centres. Other deals that Melbourne received in 2019
include Vancouver-based customer intelligence company Vision Critical’s
expansion into the city with a C$30M investment for a new office, and
Toronto-based software company Sourced Group’s investment of C$11M into a
new office.
Across the board, Canadian investments in the region encompass a great
diversity of sectors that differ by city. For Perth, as a hub for energy
companies, half of Canadian investments since 2003 have gone to its oil and
gas production and mining sectors. For Sydney and Beijing, 40 percent and 28
percent, respectively, of Canadian investment has gone to the cities’ financial
services sectors. Meanwhile, 43 percent of investments in Mumbai have gone
to its real estate investment and services sector. For Singapore, its most highly
invested sector is travel and leisure, making up 41 percent of investment
there. In Melbourne and Shanghai, 60 percent and 36 percent, respectively,
of Canadian investments have gone to the cities’ industrial transportation
sectors. For Hong Kong, 39 percent of investment has gone toward its general
retailers sector. For Bengaluru, 75 percent of Canadian investment went to
its construction and materials sector. Lastly, the ranking of Gopalganj as the
seventh-largest destination city of outbound investments is due to a single
investment in solar power, made in 2015 by Toronto-based SkyPower.
73REPORT ON TRADE AGREEMENTS AND FOREIGN DIRECT INVESTMENT BETWEEN CANADA AND THE ASIA PACIFIC
ASIA PACIFIC FOUNDATION OF CANADA
CONCLUSIONS
The first months of 2020 have demonstrated just how central the Asia Pacific
is to the world economy, with Canada being no exception. The indiscriminate
effects of COVID-19 have been felt in all parts of the economy, and there
are strong reasons to believe that Canada’s historic growth in investment
relationships with the Asia Pacific will halt, reversing course as economies
across the Pacific withdraw over at least the immediate term.
Even so, Canada’s experiences in the Asia Pacific over the past 17 years are
informative for what comes next and the large, whole-economy trends in the
region that will be, at worst, temporarily halted. Asia Pacific economies have
rapidly grown and adjusted since 2003, and that development will continue
to be crucial to Canadian diversification strategies – perhaps now more than
ever. Canadians have very limited resources available to help them understand
the impact of Canada’s two-way investment relationship with the Asia Pacific,
especially at the city and sector level, while there is still more space to improve
investment flows under free trade agreement frameworks.
By providing this discrete level of information, the APF Canada Investment
Monitor sets the stage for more informed discussions for Canada’s foreign
relations, business, and research communities, all ultimately helping the public
learn more about the Canada-Asia Pacific investment relationship. The goal of
the APF Canada Investment Monitor is to provide the foundation for evidence-
based decision-making, not only for policy-makers, but also for all interested
stakeholders in the Canadian public, by providing a growing set of data and
analysis on both Asia Pacific companies’ investment into Canada and Canadian
companies’ investment into the Asia Pacific.
74REPORT ON TRADE AGREEMENTS AND FOREIGN DIRECT INVESTMENT BETWEEN CANADA AND THE ASIA PACIFIC
ASIA PACIFIC FOUNDATION OF CANADA
METHODOLOGY AND DATA SOURCES
The APF Canada Investment Monitor tracks foreign direct investment
announcements at the firm level, taking a bottom-up approach rather than
reviewing the balance of payments in Canada’s national accounts.
To generate the APF Canada Investment Monitor data, APF Canada uses its
own unique legacy data, third-party data sources, metasearch engines, and
other search tools to aggregate data obtained from public sources including
media reports, company documents, industry associations, and investment
promotion agencies. Investment announcements that are entered in the
database include greenfield investments, asset purchases, equity investment,
mergers, acquisitions, joint ventures, and so on.
The APF Canada Investment Monitor sources its investment stories primarily
from its decades-long archive of announcements on deals, trade missions,
memorandums of understanding (MOUs), and other developments of note
in the Canada-Asia relationship. Such a vast archive allows the APF Canada
Investment Monitor to build a strong foundation on which to track deal flow
both historically and going forward. Each deal announcement is recorded,
catalogued, and added to our database. Deals are recorded using 30 different
observations, ranging from parent company to destination city. Key to this
cataloguing of investments for trend analysis is the use of a user-friendly
sector classification system. Whereas deals catalogued with the widely used
North American Industry Classification System (NAICS) often hide key trends
in budding industries, the APF Canada Investment Monitor’s use of the
modified Industrial Classification Benchmark (Modified ICB) allows it to clearly
see growth in areas such as cleantech and the video gaming industry.
Dollar values for the APF Canada Investment Monitor are obtained through a
thorough investigation of the deal value and, barring an official value, the best
publicly available estimate. This methodology allows for the avoidance of errors
that occur in databases that estimate deal value using proprietary algorithms.
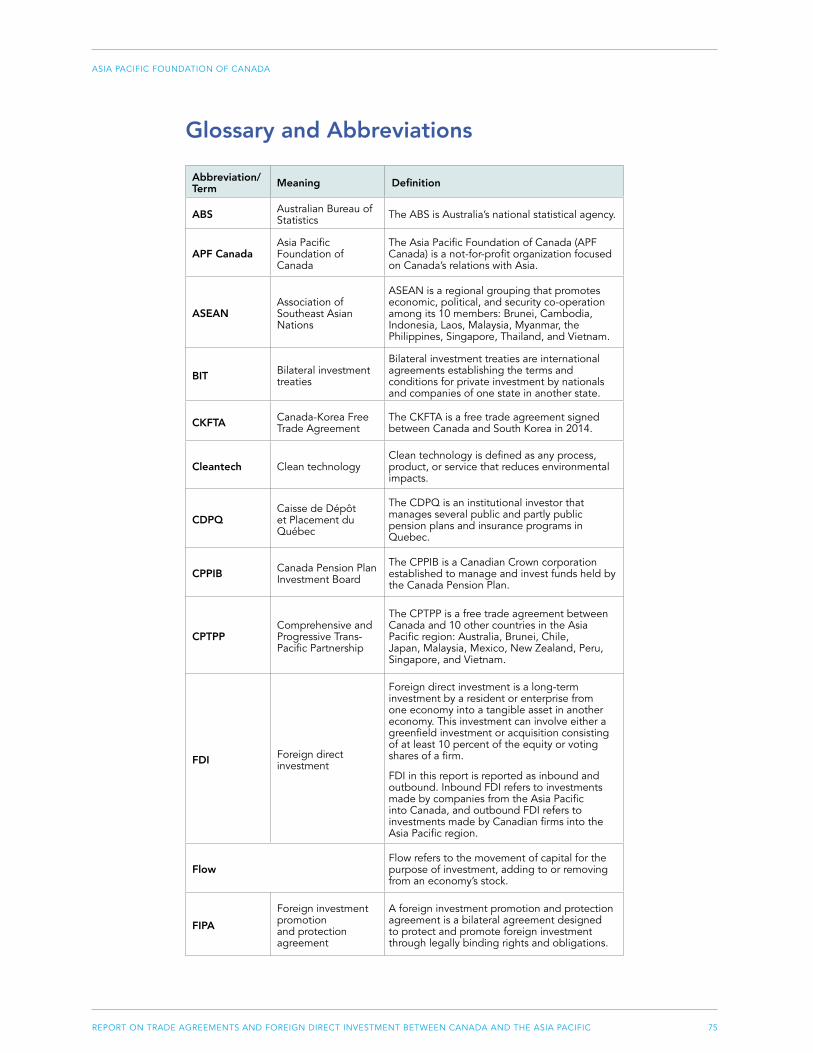
75REPORT ON TRADE AGREEMENTS AND FOREIGN DIRECT INVESTMENT BETWEEN CANADA AND THE ASIA PACIFIC
ASIA PACIFIC FOUNDATION OF CANADA
Glossary and Abbreviations
Abbreviation/Term Meaning Definition
ABS Australian Bureau of Statistics The ABS is Australia’s national statistical agency.
APF CanadaAsia Pacific Foundation of Canada
The Asia Pacific Foundation of Canada (APF Canada) is a not-for-profit organization focused on Canada’s relations with Asia.
ASEANAssociation of Southeast Asian Nations
ASEAN is a regional grouping that promotes economic, political, and security co-operation among its 10 members: Brunei, Cambodia, Indonesia, Laos, Malaysia, Myanmar, the Philippines, Singapore, Thailand, and Vietnam.
BIT Bilateral investment treaties
Bilateral investment treaties are international agreements establishing the terms and conditions for private investment by nationals and companies of one state in another state.
CKFTA Canada-Korea Free Trade Agreement
The CKFTA is a free trade agreement signed between Canada and South Korea in 2014.
Cleantech Clean technologyClean technology is defined as any process, product, or service that reduces environmental impacts.
CDPQCaisse de Dépôt et Placement du Québec
The CDPQ is an institutional investor that manages several public and partly public pension plans and insurance programs in Quebec.
CPPIB Canada Pension Plan Investment Board
The CPPIB is a Canadian Crown corporation established to manage and invest funds held by the Canada Pension Plan.
CPTPPComprehensive and Progressive Trans-Pacific Partnership
The CPTPP is a free trade agreement between Canada and 10 other countries in the Asia Pacific region: Australia, Brunei, Chile, Japan, Malaysia, Mexico, New Zealand, Peru, Singapore, and Vietnam.
FDI Foreign direct investment
Foreign direct investment is a long-term investment by a resident or enterprise from one economy into a tangible asset in another economy. This investment can involve either a greenfield investment or acquisition consisting of at least 10 percent of the equity or voting shares of a firm.
FDI in this report is reported as inbound and outbound. Inbound FDI refers to investments made by companies from the Asia Pacific into Canada, and outbound FDI refers to investments made by Canadian firms into the Asia Pacific region.
Flow Flow refers to the movement of capital for the purpose of investment, adding to or removing from an economy’s stock.
FIPAForeign investment promotion and protection agreement
A foreign investment promotion and protection agreement is a bilateral agreement designed to protect and promote foreign investment through legally binding rights and obligations.
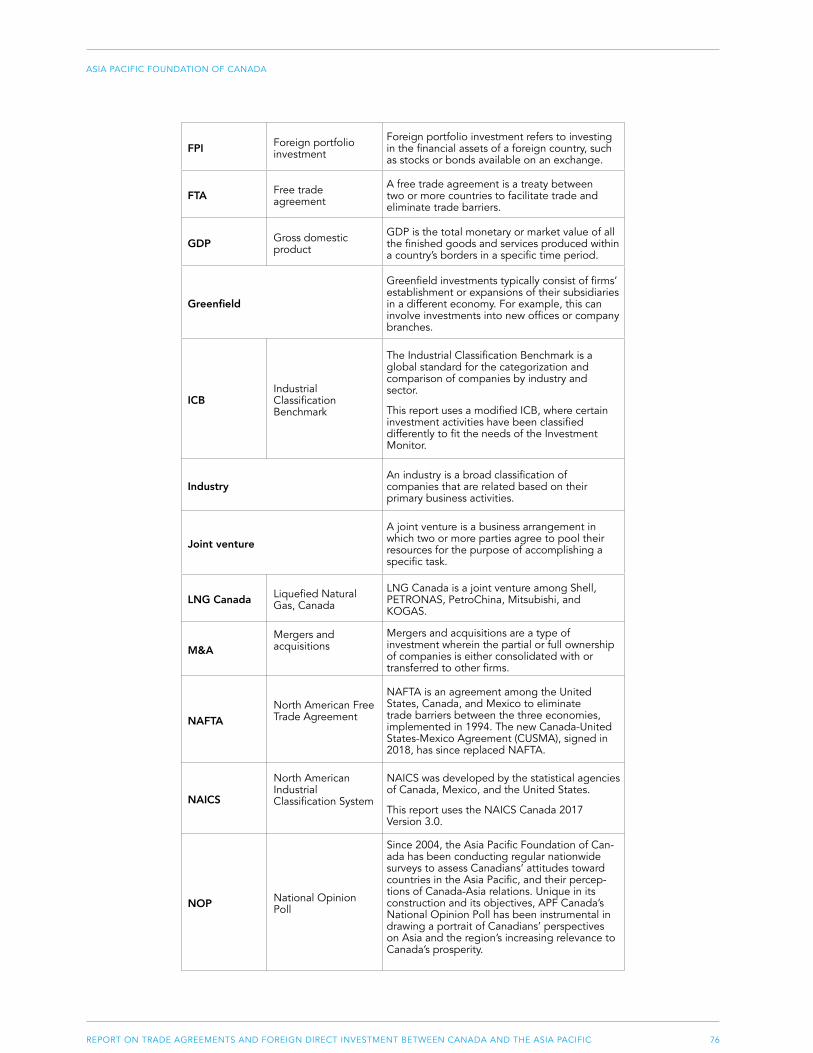
76REPORT ON TRADE AGREEMENTS AND FOREIGN DIRECT INVESTMENT BETWEEN CANADA AND THE ASIA PACIFIC
ASIA PACIFIC FOUNDATION OF CANADA
FPI Foreign portfolio investment
Foreign portfolio investment refers to investing in the financial assets of a foreign country, such as stocks or bonds available on an exchange.
FTA Free trade agreement
A free trade agreement is a treaty between two or more countries to facilitate trade and eliminate trade barriers.
GDP Gross domestic product
GDP is the total monetary or market value of all the finished goods and services produced within a country’s borders in a specific time period.
Greenfield
Greenfield investments typically consist of firms’ establishment or expansions of their subsidiaries in a different economy. For example, this can involve investments into new offices or company branches.
ICBIndustrial Classification Benchmark
The Industrial Classification Benchmark is a global standard for the categorization and comparison of companies by industry and sector.
This report uses a modified ICB, where certain investment activities have been classified differently to fit the needs of the Investment Monitor.
IndustryAn industry is a broad classification of companies that are related based on their primary business activities.
Joint venture A joint venture is a business arrangement in which two or more parties agree to pool their resources for the purpose of accomplishing a specific task.
LNG Canada Liquefied Natural Gas, Canada
LNG Canada is a joint venture among Shell, PETRONAS, PetroChina, Mitsubishi, and KOGAS.
M&AMergers and acquisitions
Mergers and acquisitions are a type of investment wherein the partial or full ownership of companies is either consolidated with or transferred to other firms.
NAFTANorth American Free Trade Agreement
NAFTA is an agreement among the United States, Canada, and Mexico to eliminate trade barriers between the three economies, implemented in 1994. The new Canada-United States-Mexico Agreement (CUSMA), signed in 2018, has since replaced NAFTA.
NAICS
North American Industrial Classification System
NAICS was developed by the statistical agencies of Canada, Mexico, and the United States.
This report uses the NAICS Canada 2017 Version 3.0.
NOP National Opinion Poll
Since 2004, the Asia Pacific Foundation of Can-ada has been conducting regular nationwide surveys to assess Canadians’ attitudes toward countries in the Asia Pacific, and their percep-tions of Canada-Asia relations. Unique in its construction and its objectives, APF Canada’s National Opinion Poll has been instrumental in drawing a portrait of Canadians’ perspectives on Asia and the region’s increasing relevance to Canada’s prosperity.
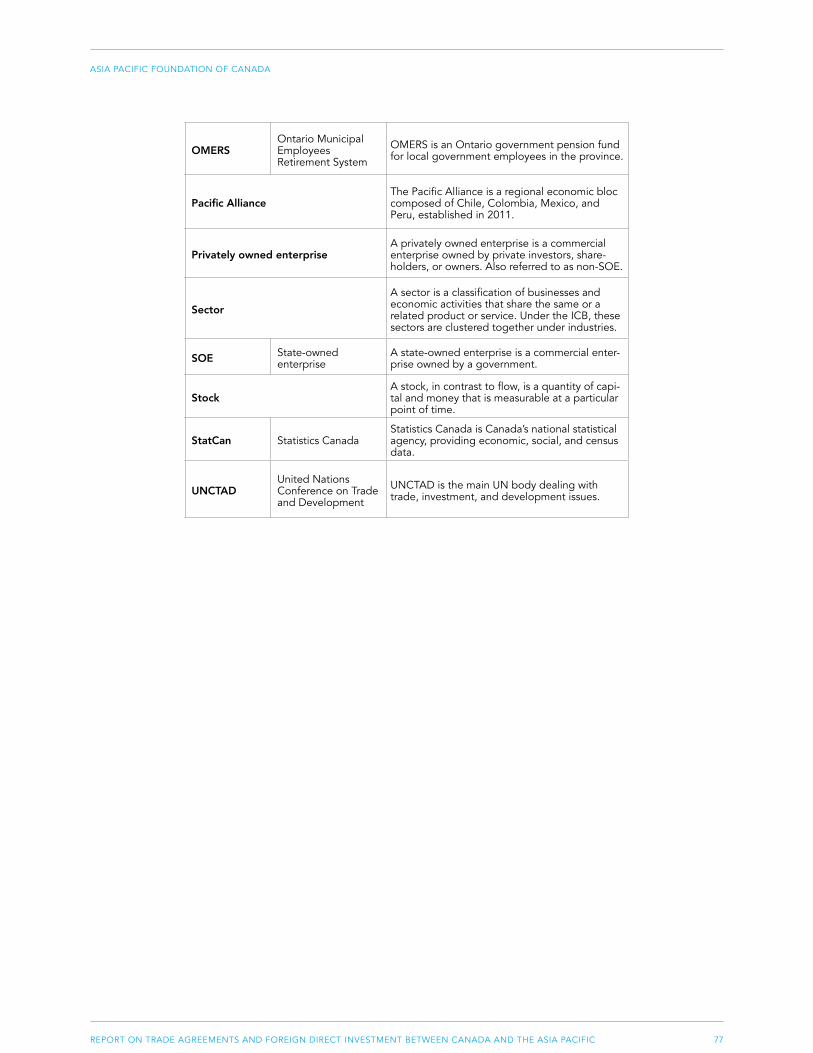
77REPORT ON TRADE AGREEMENTS AND FOREIGN DIRECT INVESTMENT BETWEEN CANADA AND THE ASIA PACIFIC
ASIA PACIFIC FOUNDATION OF CANADA
OMERSOntario Municipal Employees Retirement System
OMERS is an Ontario government pension fund for local government employees in the province.
Pacific Alliance The Pacific Alliance is a regional economic bloc composed of Chile, Colombia, Mexico, and Peru, established in 2011.
Privately owned enterpriseA privately owned enterprise is a commercial enterprise owned by private investors, share-holders, or owners. Also referred to as non-SOE.
SectorA sector is a classification of businesses and economic activities that share the same or a related product or service. Under the ICB, these sectors are clustered together under industries.
SOE State-owned enterprise
A state-owned enterprise is a commercial enter-prise owned by a government.
StockA stock, in contrast to flow, is a quantity of capi-tal and money that is measurable at a particular point of time.
StatCan Statistics CanadaStatistics Canada is Canada’s national statistical agency, providing economic, social, and census data.
UNCTADUnited Nations Conference on Trade and Development
UNCTAD is the main UN body dealing with trade, investment, and development issues.
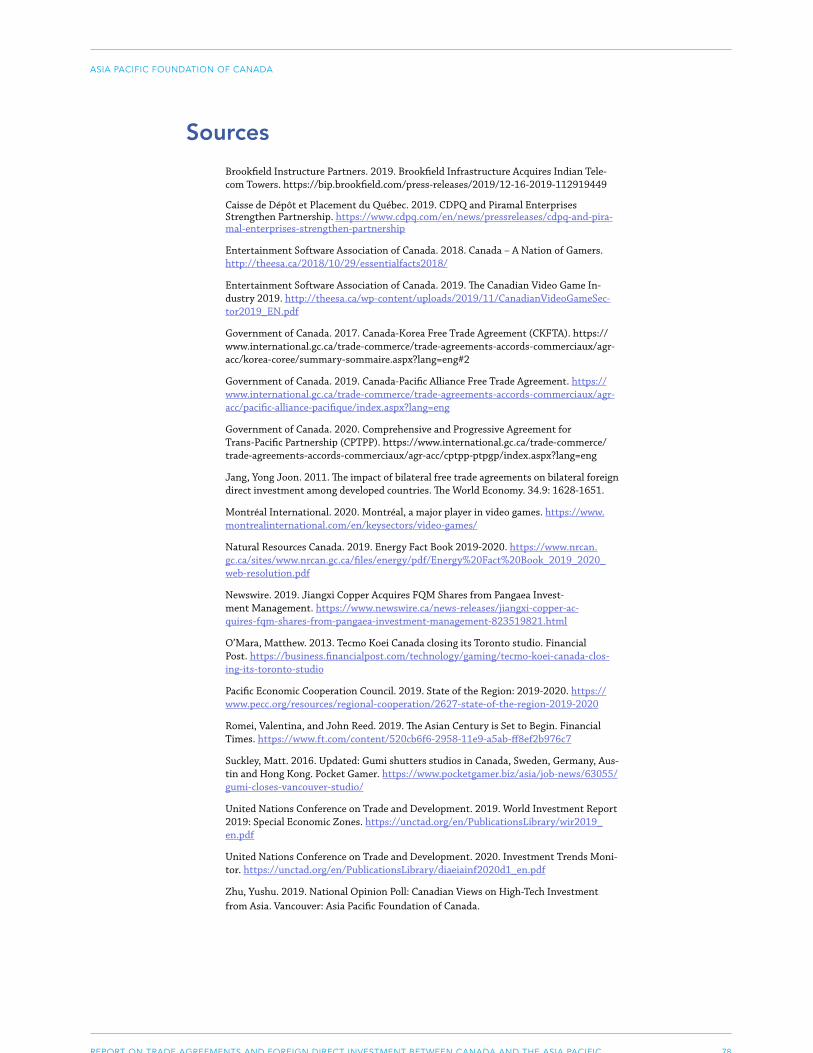
78REPORT ON TRADE AGREEMENTS AND FOREIGN DIRECT INVESTMENT BETWEEN CANADA AND THE ASIA PACIFIC
ASIA PACIFIC FOUNDATION OF CANADA
Sources
Brookfield Instructure Partners. 2019. Brookfield Infrastructure Acquires Indian Tele-com Towers. https://bip.brookfield.com/press-releases/2019/12-16-2019-112919449
Caisse de Dépôt et Placement du Québec. 2019. CDPQ and Piramal Enterprises Strengthen Partnership. https://www.cdpq.com/en/news/pressreleases/cdpq-and-pira-mal-enterprises-strengthen-partnership
Entertainment Software Association of Canada. 2018. Canada – A Nation of Gamers. http://theesa.ca/2018/10/29/essentialfacts2018/
Entertainment Software Association of Canada. 2019. The Canadian Video Game In-dustry 2019. http://theesa.ca/wp-content/uploads/2019/11/CanadianVideoGameSec-tor2019_EN.pdf
Government of Canada. 2017. Canada-Korea Free Trade Agreement (CKFTA). https://www.international.gc.ca/trade-commerce/trade-agreements-accords-commerciaux/agr-acc/korea-coree/summary-sommaire.aspx?lang=eng#2
Government of Canada. 2019. Canada-Pacific Alliance Free Trade Agreement. https://www.international.gc.ca/trade-commerce/trade-agreements-accords-commerciaux/agr-acc/pacific-alliance-pacifique/index.aspx?lang=eng
Government of Canada. 2020. Comprehensive and Progressive Agreement for Trans-Pacific Partnership (CPTPP). https://www.international.gc.ca/trade-commerce/trade-agreements-accords-commerciaux/agr-acc/cptpp-ptpgp/index.aspx?lang=eng
Jang, Yong Joon. 2011. The impact of bilateral free trade agreements on bilateral foreign direct investment among developed countries. The World Economy. 34.9: 1628-1651.
Montréal International. 2020. Montréal, a major player in video games. https://www.montrealinternational.com/en/keysectors/video-games/
Natural Resources Canada. 2019. Energy Fact Book 2019-2020. https://www.nrcan.gc.ca/sites/www.nrcan.gc.ca/files/energy/pdf/Energy%20Fact%20Book_2019_2020_web-resolution.pdf
Newswire. 2019. Jiangxi Copper Acquires FQM Shares from Pangaea Invest-ment Management. https://www.newswire.ca/news-releases/jiangxi-copper-ac-quires-fqm-shares-from-pangaea-investment-management-823519821.html
O’Mara, Matthew. 2013. Tecmo Koei Canada closing its Toronto studio. Financial Post. https://business.financialpost.com/technology/gaming/tecmo-koei-canada-clos-ing-its-toronto-studio
Pacific Economic Cooperation Council. 2019. State of the Region: 2019-2020. https://www.pecc.org/resources/regional-cooperation/2627-state-of-the-region-2019-2020
Romei, Valentina, and John Reed. 2019. The Asian Century is Set to Begin. Financial Times. https://www.ft.com/content/520cb6f6-2958-11e9-a5ab-ff8ef2b976c7
Suckley, Matt. 2016. Updated: Gumi shutters studios in Canada, Sweden, Germany, Aus-tin and Hong Kong. Pocket Gamer. https://www.pocketgamer.biz/asia/job-news/63055/gumi-closes-vancouver-studio/
United Nations Conference on Trade and Development. 2019. World Investment Report 2019: Special Economic Zones. https://unctad.org/en/PublicationsLibrary/wir2019_en.pdf
United Nations Conference on Trade and Development. 2020. Investment Trends Moni-tor. https://unctad.org/en/PublicationsLibrary/diaeiainf2020d1_en.pdf
Zhu, Yushu. 2019. National Opinion Poll: Canadian Views on High-Tech Investment from Asia. Vancouver: Asia Pacific Foundation of Canada.

79REPORT ON TRADE AGREEMENTS AND FOREIGN DIRECT INVESTMENT BETWEEN CANADA AND THE ASIA PACIFIC
ASIA PACIFIC FOUNDATION OF CANADA
Partners and SponsorsThe Asia Pacific Foundation of Canada would like to acknowledge and recognize
our partner, The School of Public Policy at the University of Calgary, without which
this project could not have grown as it has. We also want to thank and acknowledge
our generous sponsors: Export Development Canada, Invest in Canada, the
Government of British Columbia, AdvantageBC, and the Bank of Canada.
Advisory CouncilIn addition to our sponsors and partner, we would like to especially thank their
representatives who sit on the APF Canada Investment Monitor Advisory Council,
whose input and guidance from the conception to the launch of this project has
proved invaluable.
Sarah Albrecht, Director, Partnership Strategy, Invest in Canada.
Dr. Eugene Beaulieu, Professor of Economics and Program Director, International
Economics, The School of Public Policy, University of Calgary.
Dr. Jeff Reeves, Vice-President, Research, Asia Pacific Foundation of Canada.
Lori Rennison, Senior Policy Advisor, Canadian Economic Analysis Department,
Bank of Canada.
Clark Roberts, President and CEO, AdvantageBC.
Siobian Smith, International Strategy and Business Intelligence, British Columbia
Ministry of Jobs, Economic Development and Competitiveness.
Dr. Stephen Tapp, Deputy Chief Economist and Director, Research Department,
Export Development Canada.
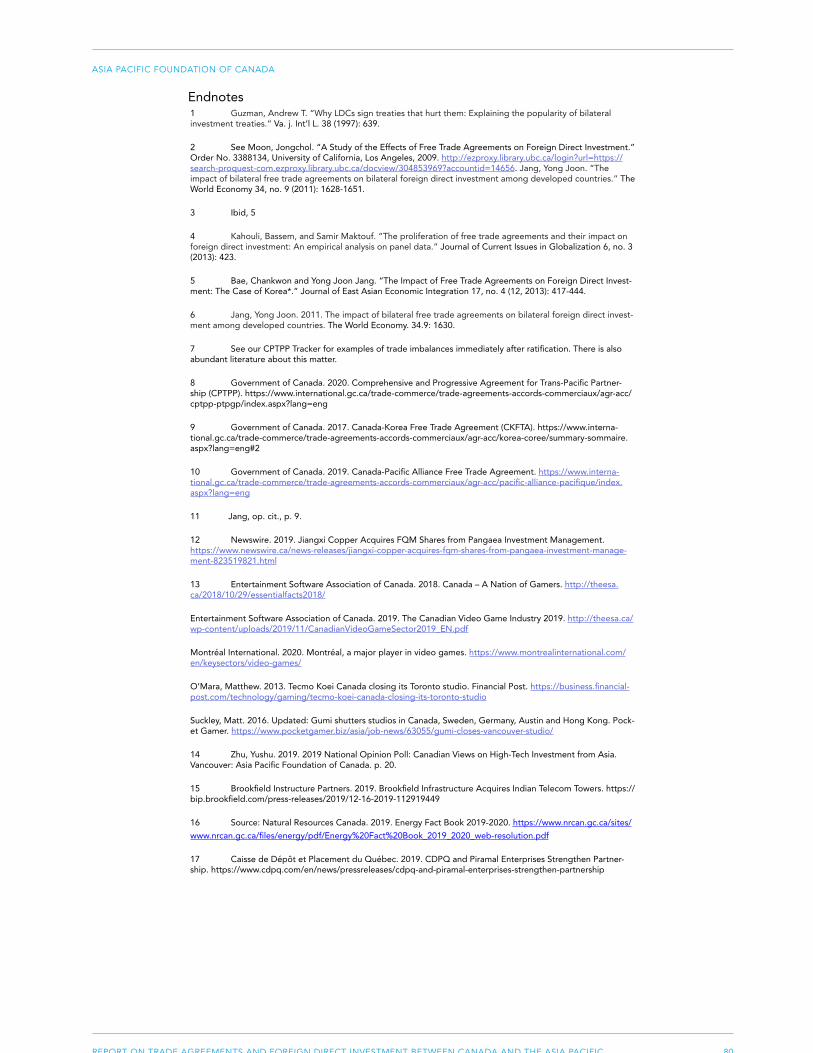
80REPORT ON TRADE AGREEMENTS AND FOREIGN DIRECT INVESTMENT BETWEEN CANADA AND THE ASIA PACIFIC
ASIA PACIFIC FOUNDATION OF CANADA
Endnotes1 Guzman, Andrew T. “Why LDCs sign treaties that hurt them: Explaining the popularity of bilateral investment treaties.” Va. j. Int’l L. 38 (1997): 639.
2 See Moon, Jongchol. “A Study of the Effects of Free Trade Agreements on Foreign Direct Investment.” Order No. 3388134, University of California, Los Angeles, 2009. http://ezproxy.library.ubc.ca/login?url=https://search-proquest-com.ezproxy.library.ubc.ca/docview/304853969?accountid=14656. Jang, Yong Joon. “The impact of bilateral free trade agreements on bilateral foreign direct investment among developed countries.” The World Economy 34, no. 9 (2011): 1628-1651.
3 Ibid, 5
4 Kahouli, Bassem, and Samir Maktouf. “The proliferation of free trade agreements and their impact on foreign direct investment: An empirical analysis on panel data.” Journal of Current Issues in Globalization 6, no. 3 (2013): 423.
5 Bae, Chankwon and Yong Joon Jang. “The Impact of Free Trade Agreements on Foreign Direct Invest-ment: The Case of Korea*.” Journal of East Asian Economic Integration 17, no. 4 (12, 2013): 417-444.
6 Jang, Yong Joon. 2011. The impact of bilateral free trade agreements on bilateral foreign direct invest-ment among developed countries. The World Economy. 34.9: 1630.
7 See our CPTPP Tracker for examples of trade imbalances immediately after ratification. There is also abundant literature about this matter.
8 Government of Canada. 2020. Comprehensive and Progressive Agreement for Trans-Pacific Partner-ship (CPTPP). https://www.international.gc.ca/trade-commerce/trade-agreements-accords-commerciaux/agr-acc/cptpp-ptpgp/index.aspx?lang=eng
9 Government of Canada. 2017. Canada-Korea Free Trade Agreement (CKFTA). https://www.interna-tional.gc.ca/trade-commerce/trade-agreements-accords-commerciaux/agr-acc/korea-coree/summary-sommaire.aspx?lang=eng#2
10 Government of Canada. 2019. Canada-Pacific Alliance Free Trade Agreement. https://www.interna-tional.gc.ca/trade-commerce/trade-agreements-accords-commerciaux/agr-acc/pacific-alliance-pacifique/index.aspx?lang=eng
11 Jang, op. cit., p. 9.
12 Newswire. 2019. Jiangxi Copper Acquires FQM Shares from Pangaea Investment Management. https://www.newswire.ca/news-releases/jiangxi-copper-acquires-fqm-shares-from-pangaea-investment-manage-ment-823519821.html
13 Entertainment Software Association of Canada. 2018. Canada – A Nation of Gamers. http://theesa.ca/2018/10/29/essentialfacts2018/
Entertainment Software Association of Canada. 2019. The Canadian Video Game Industry 2019. http://theesa.ca/wp-content/uploads/2019/11/CanadianVideoGameSector2019_EN.pdf
Montréal International. 2020. Montréal, a major player in video games. https://www.montrealinternational.com/en/keysectors/video-games/
O’Mara, Matthew. 2013. Tecmo Koei Canada closing its Toronto studio. Financial Post. https://business.financial-post.com/technology/gaming/tecmo-koei-canada-closing-its-toronto-studio
Suckley, Matt. 2016. Updated: Gumi shutters studios in Canada, Sweden, Germany, Austin and Hong Kong. Pock-et Gamer. https://www.pocketgamer.biz/asia/job-news/63055/gumi-closes-vancouver-studio/
14 Zhu, Yushu. 2019. 2019 National Opinion Poll: Canadian Views on High-Tech Investment from Asia. Vancouver: Asia Pacific Foundation of Canada. p. 20.
15 Brookfield Instructure Partners. 2019. Brookfield Infrastructure Acquires Indian Telecom Towers. https://bip.brookfield.com/press-releases/2019/12-16-2019-112919449
16 Source: Natural Resources Canada. 2019. Energy Fact Book 2019-2020. https://www.nrcan.gc.ca/sites/
www.nrcan.gc.ca/files/energy/pdf/Energy%20Fact%20Book_2019_2020_web-resolution.pdf
17 Caisse de Dépôt et Placement du Québec. 2019. CDPQ and Piramal Enterprises Strengthen Partner-ship. https://www.cdpq.com/en/news/pressreleases/cdpq-and-piramal-enterprises-strengthen-partnership

81REPORT ON TRADE AGREEMENTS AND FOREIGN DIRECT INVESTMENT BETWEEN CANADA AND THE ASIA PACIFIC
ASIA PACIFIC FOUNDATION OF CANADA
1
2019
NATIONAL OPINION POLLCanadian Views on High-Tech Investment from Asia
2
About the Asia Pacific Foundation of Canada
About the National Opinion Poll
Foreword
Executive Summary
Overall Feelings on Asia and High-Tech FDI
Dissecting Public Opinion on Asian High-Tech Investment
Explaining Public Sentiment
Role of Government
Regional Differences
Conclusion
Methodology
Acknowledgements
3
4
5
6
9
12
16
23
26
31
33
34
TABLE OF CONTENTS
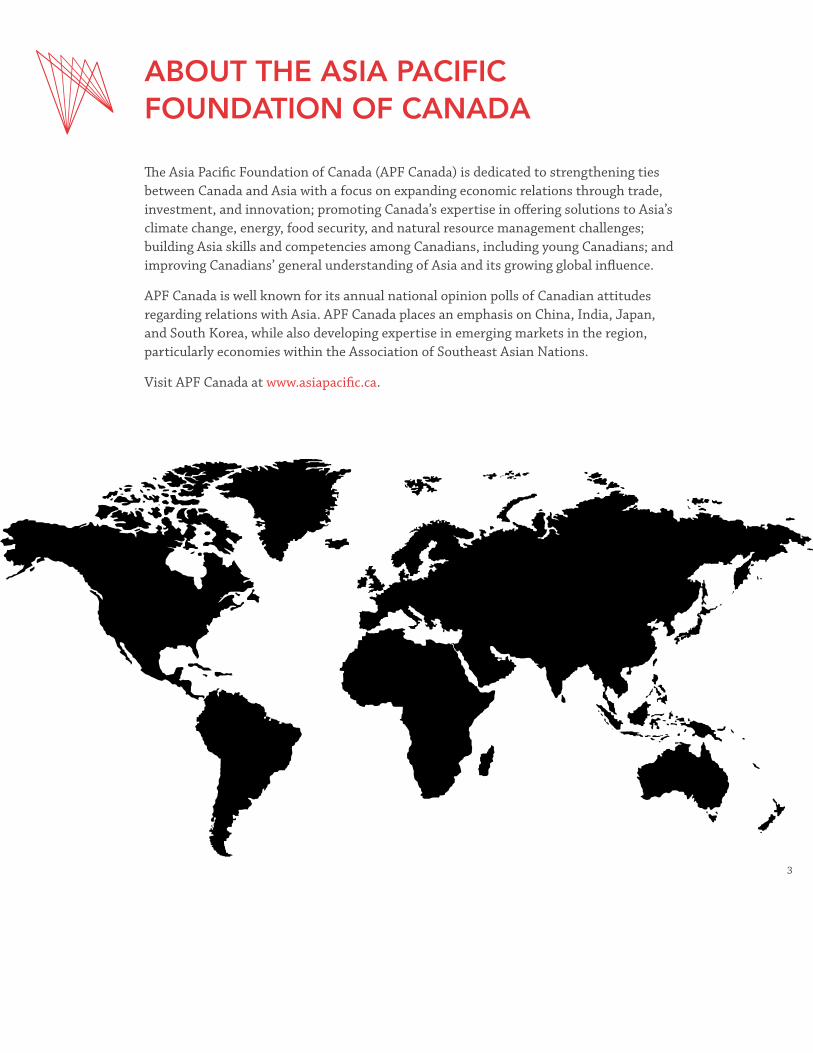
3
ABOUT THE ASIA PACIFIC FOUNDATION OF CANADA
The Asia Pacific Foundation of Canada (APF Canada) is dedicated to strengthening ties between Canada and Asia with a focus on expanding economic relations through trade, investment, and innovation; promoting Canada’s expertise in offering solutions to Asia’s climate change, energy, food security, and natural resource management challenges; building Asia skills and competencies among Canadians, including young Canadians; and improving Canadians’ general understanding of Asia and its growing global influence.
APF Canada is well known for its annual national opinion polls of Canadian attitudes regarding relations with Asia. APF Canada places an emphasis on China, India, Japan, and South Korea, while also developing expertise in emerging markets in the region, particularly economies within the Association of Southeast Asian Nations.
Visit APF Canada at www.asiapacific.ca.
4
Since 2004, the Asia Pacific Foundation of Canada has been conducting regular nationwide surveys to assess Canadians’ attitudes toward countries in the Asia Pacific, and their perceptions of Canada-Asia relations. Unique in its construction and its objectives, APF Canada’s National Opinion Poll has been instrumental in drawing a portrait of Canadians’ perspectives on Asia and the region’s increasing relevance to Canada’s prosperity.
The 2019 National Opinion Poll: Canadian Views on High-Tech Investment from Asia is the first thematic survey of the year with a focus on Asian direct investment in the Canadian high-tech sector. With a representative sample of the Canadian population, the objectives of this poll are three-fold:
1. To gauge Canadian attitudes toward inbound foreign direct investment, especially from different Asian economies, into the high-tech sector;
2. To examine factors (country, mode of investment, sector, perceived risks and benefits, etc.) that shape these attitudes; and
3. To inform public policy on engaging Asia in the high-tech sector.
ABOUT THE NATIONAL OPINION POLL
5
FOREWORD
For the past 15 years, the Asia Pacific Foundation of Canada has conducted regular nation-wide surveys to assess Canadians’ attitudes toward, and perceptions of, Canada-Asia relations. Not only does the National Opinion Poll (NOP) serve as a valuable source of information on Canadian perspectives on the rise of Asia and its importance to Canada’s economic well-being, but it also provides a unique tool for our nation’s policy-makers.
Every year, the NOP gauges Canada’s broader views on Asia, as well as polling Canadians on specific areas of interest, including views from specific cohorts, on particular economies, and on specific aspects of the Canada-Asia trade and investment dynamic.
This is the first of two polls in 2019, and it targets Canadian views on high-tech investment from Asia, and in particular, investment from China. Our second poll will focus on human capital, gauging Canadians’ attitudes toward skilled workers and foreign talent.
Given the federal government’s investment in the Canada Innovation Superclusters Initiative and other innovation policy issues, we feel this poll on high-tech foreign investment is particularly timely. It clearly demonstrates that Canadians acknowledge and understand the pivotal role Asia will play in global innovation and advancement, but highlights areas and issues of concern that will demand further public policy considerations.
I would like to acknowledge and thank the members of our APF Canada research team who are responsible for collating our survey data and finalizing this report, in particular Yushu Zhu, our Program Manager, Surveys and Polling, who oversaw this important project.
Stewart Beck, President and CEO, Asia Pacific Foundation of Canada
6
EXECUTIVE SUMMARY
While Canada boasts a vibrant and diverse tech sector, many Canadian high-tech businesses still face challenges such as barriers to scaling up, accessing capital, and/or developing human capital. The rise of Asia as a technological powerhouse and as a source of growing outbound foreign direct investment (FDI) underscores the importance of the region to Canada’s high-tech businesses and overall economic growth. As the U.S.-China tech war and the global Huawei crisis continue, however, Canada finds itself at a crossroads of how to tap into the vast potential of Asian markets while safeguarding national security and Canadian values, particularly when it comes to China, which has entrenched itself as a global disruptor in the high-tech space.
Against this backdrop, the 2019 National Opinion Poll: Canadian Views on High-Tech Investment from Asia aims to understand Canadian attitudes toward Asian FDI in the Canadian high-tech sector, key drivers of these attitudes, and the expected role of the government in engaging Asia in the sector.
10 key takeaways from the poll:
Canadians have an optimistic outlook of Asia as a future forerunner and source of capital in innovation and technology. Seven in 10 Canadians believe Asia will be driving global innovation and technological advancement in 10 years, and 66% think that Asia will outperform the United States to become a more important source of capital in Canada’s high-tech sector over that same period. Half of Canadians also see the high-tech sector as a key driver of the Canadian economy.
This optimistic outlook does not translate into favourable views of Asian FDI in Canada’s high-tech sector. Over half of Canadians disagree that the potential benefits of having more high-tech-oriented Asian investment in Canada outweigh the potential risks. A slim majority (56%) would also oppose having more FDI from Asian economies enter the high-tech sector, although the opposition is weaker for high-tech compared with strong opposition (over 65%) for both the financial services and non-renewable energy sectors.
Canadians tend to perceive “too much” as opposed to “too little” high-tech FDI from China, India, and the U.S. A significantly higher percentage of people believe that Canada is allowing in too much investment from these three countries compared to those
7
who think the government is allowing in too little. For Australia, the European Union, the United Kingdom, and Japan, meanwhile, Canadians are more likely to perceive too little than too much investment into Canada.
Canadians are more open to Asian FDI in the digital media, cleantech, and life science sectors than in information and communication technology (ICT) and artificial intelligence (AI). The subsector receiving investment is an important factor in public attitudes toward high-tech investment from China and India. Support for Chinese investment drops from 34% in digital media to 16% and 15% in AI and ICT, respectively, while India’s support rate drops from 42% in digital media to 28% in AI. Support for high-tech investment from Japan and Australia, meanwhile, remains high for all subsectors.
Joint ventures with Canadian firms and funding high-tech research and education programs are the most welcomed modes of Asian investment in Canada’s high-tech sector. Japan, India, and China all receive strong support for investment through these channels, ranging from 43% support for China to 67% support for Japan. In contrast, greenfield and brownfield investments are much less welcomed.
Among selected factors on public attitudes toward high-tech FDI, the most influential ones are country of origin, subsector, and access to information addressing public concerns. Statistical modelling shows that “China” and “telecommunications” are driving the skepticism around FDI in the high-tech sector. Public information addressing concerns around national security and economic benefits of an investment is conducive to significant mitigation of that skepticism. Mode of investment (greenfield versus brownfield) and ownership structure (state-owned versus privately owned), although also important factors, carry less weight in shaping public opinion.
Canadians associate different benefits and risks with high-tech FDI from China, Japan, India, and the U.S. Job creation is one of the top benefits associated with receiving investment from these four countries. Other top benefits include access to capital (China, U.S.), access to foreign markets (China, India), access to high-tech talent (Japan, India), and know-how transfer into Canada (Japan, U.S.). Concerns around Chinese investment are all security-related – i.e. national security, cyber security, and intellectual property infringement. People also associate “risks to cyber security” with Indian investment and “foreign influences on Canadian values” with U.S. investment. Japanese, Indian, and U.S. investment is also associated with increased foreign competition (Japan, India) and the transfer of high-tech talent (Japan, U.S.) or know-how (Japan, India) outside Canada.
8
There is public trust in Canadian regulations related to data and privacy protection, but a lack of confidence in the government’s risk-benefit assessment of foreign investments. Half of Canadians think Canada has strong regulations to protect individuals’ data and privacy. But over half (54%) are not confident that the government performs a balanced review of the risks and benefits of prospective investment projects, and the vast majority (81%) desire a more open and transparent national security review process.
Canadians would support a proactive government in shaping global norms on technology use and deepening engagement with Asia in the high-tech sphere through research and education. The vast majority (87%) of Canadians would like to see the government play a proactive role in “shaping a global norm on responsible and accountable use of advanced technologies.” Meanwhile, the public would welcome public policies to support Canada-Asia partnerships/collaboration on innovation research (71%) and to encourage Asian investment into high-tech start-ups (53%).
There is a regional divide in public opinion on Asian FDI in the high-tech sector, with Quebec being the most positive and British Columbia the most negative. Quebecers hold more positive attitudes toward Asian high-tech investment across a number of metrics – they are the most supportive of having more Asian investment in the high-tech sector, less likely to see “too much” high-tech investment from China, and less likely to oppose relieving restrictions on high-tech FDI. In contrast, British Columbians show the strongest skepticism toward high-tech-oriented FDI from Asia, with the most skeptical view of potential benefits of Asian investment and the strongest opposition to relaxing restrictions on high-tech FDI.
9
OVERALL FEELINGS ON ASIA AND HIGH-TECH FDI
Overall, Canadians are optimistic about Asia’s innovation performance and the region’s importance for the Canadian high-tech sector; yet they also show skepticism about technology-oriented Asian investment into Canada.
Canadians see Asia as central to technology and innovation yet are concerned with the potential risks of having more high-tech FDI from Asia into Canada.
Asia is seen by the majority of Canadians as a future forerunner in innovation and technology and an important source of capital for the Canadian high-tech sector. Seventy three percent agree with the statement that “looking 10 years ahead, Asia will be driving global innovation and technological advancement” and 66% agree that “Asia will become a more important source of capital than the United States for the growth of Canada’s high-tech sector.”
In contrast, Canadians hold a more modest view of Canadian performance in technology and innovation. While Canada ranks 18 out of the 126 countries in the Global Innovation Index 2018, the public is divided (44% agree; 45% disagree) on whether Canada is a world leader in technology and innovation. However, most Canadians do recognize the importance of technology/innovation in the Canadian economy, with 50% saying that the high-tech sector is driving Canada’s economic growth.
Despite the overall optimism about Asia in technology and innovation, Canadians remain skeptical of the potential benefits Canada can get from technology-oriented Asian investment. About half (52%) of Canadians disagree that having more Asian FDI in the Canadian high-tech sector would involve more benefits than risks, compared with 35% who agree.
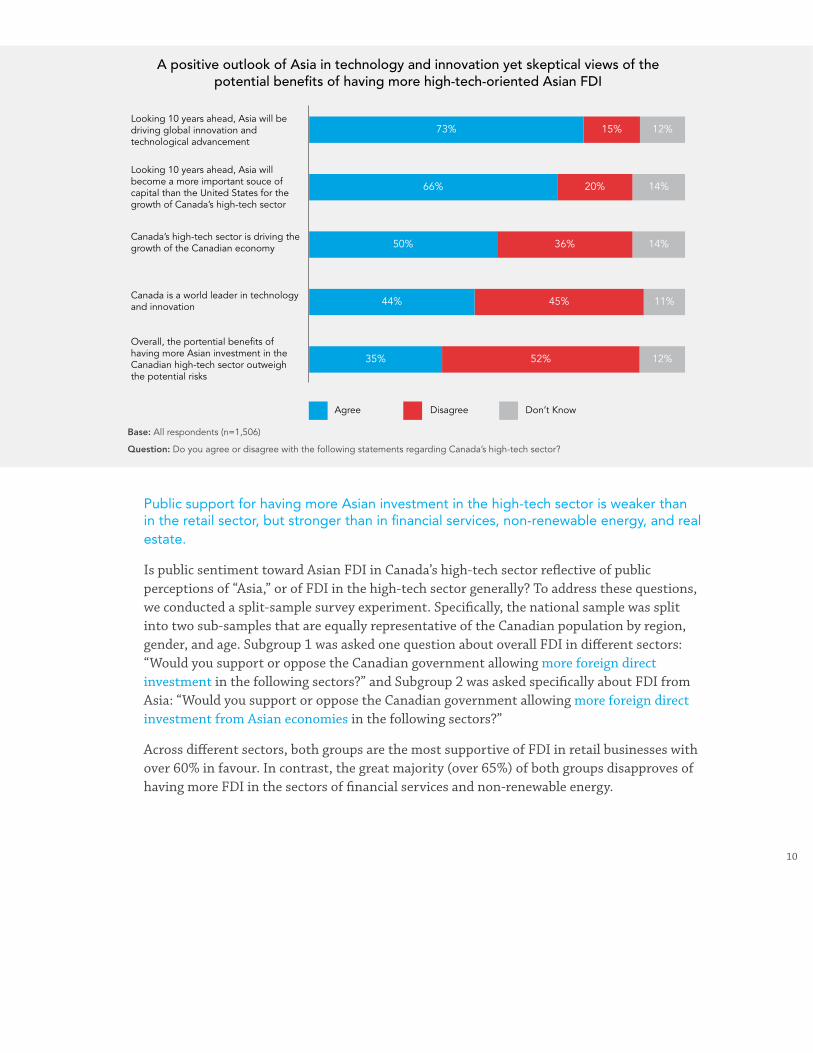
10
A positive outlook of Asia in technology and innovation yet skeptical views of the potential benefits of having more high-tech-oriented Asian FDI
Looking 10 years ahead, Asia will be driving global innovation and technological advancement
Overall, the portential benefits of having more Asian investment in the Canadian high-tech sector outweigh the potential risks
Canada’s high-tech sector is driving the growth of the Canadian economy
Canada is a world leader in technology and innovation
Looking 10 years ahead, Asia will become a more important souce of capital than the United States for the growth of Canada’s high-tech sector
Agree Disagree Don’t Know
73% 15% 12%
14%
14%
11%
12%
20%
36%
45%
52%
66%
50%
44%
35%
Base: All respondents (n=1,506)
Question: Do you agree or disagree with the following statements regarding Canada’s high-tech sector?
Public support for having more Asian investment in the high-tech sector is weaker than in the retail sector, but stronger than in financial services, non-renewable energy, and real estate.
Is public sentiment toward Asian FDI in Canada’s high-tech sector reflective of public perceptions of “Asia,” or of FDI in the high-tech sector generally? To address these questions, we conducted a split-sample survey experiment. Specifically, the national sample was split into two sub-samples that are equally representative of the Canadian population by region, gender, and age. Subgroup 1 was asked one question about overall FDI in different sectors: “Would you support or oppose the Canadian government allowing more foreign direct investment in the following sectors?” and Subgroup 2 was asked specifically about FDI from Asia: “Would you support or oppose the Canadian government allowing more foreign direct investment from Asian economies in the following sectors?”
Across different sectors, both groups are the most supportive of FDI in retail businesses with over 60% in favour. In contrast, the great majority (over 65%) of both groups disapproves of having more FDI in the sectors of financial services and non-renewable energy.
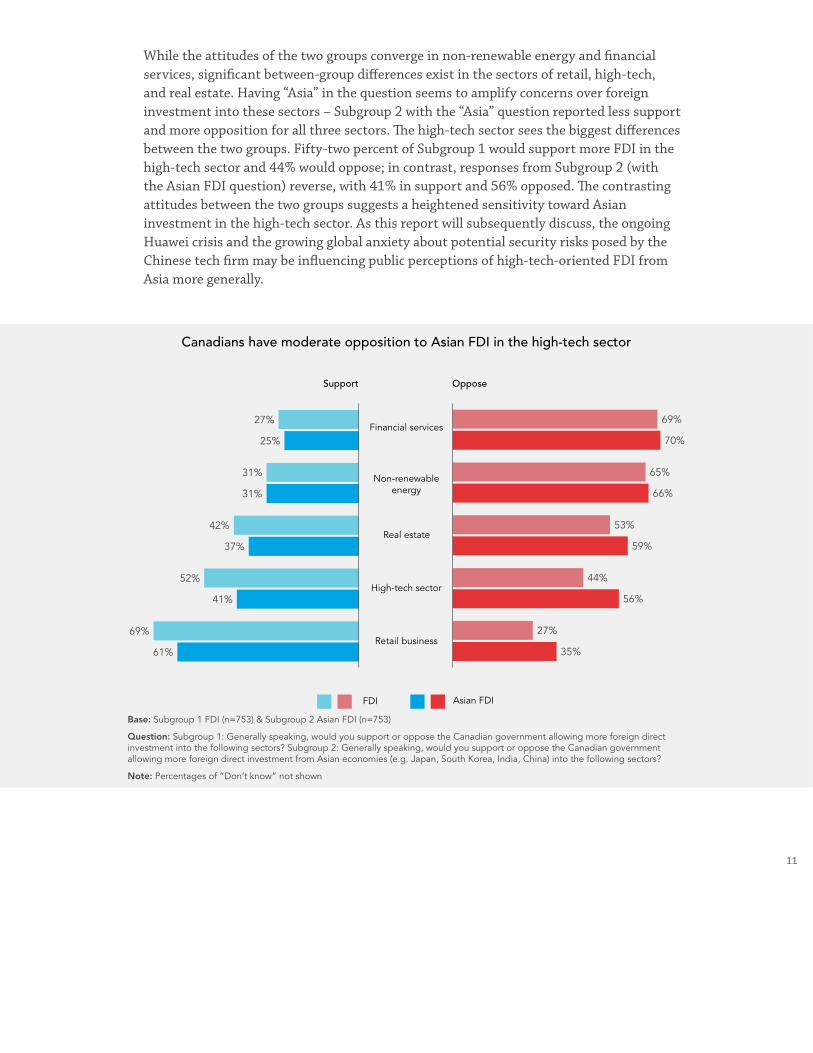
11
While the attitudes of the two groups converge in non-renewable energy and financial services, significant between-group differences exist in the sectors of retail, high-tech, and real estate. Having “Asia” in the question seems to amplify concerns over foreign investment into these sectors – Subgroup 2 with the “Asia” question reported less support and more opposition for all three sectors. The high-tech sector sees the biggest differences between the two groups. Fifty-two percent of Subgroup 1 would support more FDI in the high-tech sector and 44% would oppose; in contrast, responses from Subgroup 2 (with the Asian FDI question) reverse, with 41% in support and 56% opposed. The contrasting attitudes between the two groups suggests a heightened sensitivity toward Asian investment in the high-tech sector. As this report will subsequently discuss, the ongoing Huawei crisis and the growing global anxiety about potential security risks posed by the Chinese tech firm may be influencing public perceptions of high-tech-oriented FDI from Asia more generally.
FDI Asian FDI
Canadians have moderate opposition to Asian FDI in the high-tech sector
Financial services
Support Oppose
Real estate
High-tech sector
Retail business
Non-renewable energy
69%27%
25%
31%
31%
42%
37%
52%
69%
61%
41%
70%
65%
66%
53%
59%
44%
56%
27%
35%
Base: Subgroup 1 FDI (n=753) & Subgroup 2 Asian FDI (n=753)
Question: Subgroup 1: Generally speaking, would you support or oppose the Canadian government allowing more foreign direct investment into the following sectors? Subgroup 2: Generally speaking, would you support or oppose the Canadian government allowing more foreign direct investment from Asian economies (e.g. Japan, South Korea, India, China) into the following sectors?
Note: Percentages of “Don’t know” not shown
12
DISSECTING PUBLIC OPINION ON ASIAN HIGH-TECH INVESTMENT
Analyses in the subsequent sections reveal a more complex picture of Canadian views, which vary with the origin country of investors, mode of investment, ownership structure, and perceived outcomes.
Canadians are more likely to perceive that Canada receives “too much” high-tech investment from China, the U.S., and India than from Japan, the EU, the U.K., and Australia.
When asked whether they think Canada has “too much,” “about the right amount,” or “too little” investment in the high-tech sector from each of the listed economies, 59% of Canadians say there is too much investment from China, substantially higher than the U.S. (29%) and India (24%), the other two countries that top the list. For Japan, the EU, the U.K., and Australia, Canadians are more likely to perceive that Canada receives “too little” than “too much” high-tech FDI from these countries.
Notably, a significant number (23%-43%) of the population indicates a lack of knowledge (“Don’t know” responses) about this question. Similarly, 63% of the respondents say that they are “not very knowledgeable” or “not knowledgeable at all” about FDI in Canada. As our 2015 National Opinion Poll: Canadian Views on Asian Investment shows, a lack of information could create misperceptions and lead to ill-informed public opinion. This underscores the importance of accessible and transparent information for a better-informed public.
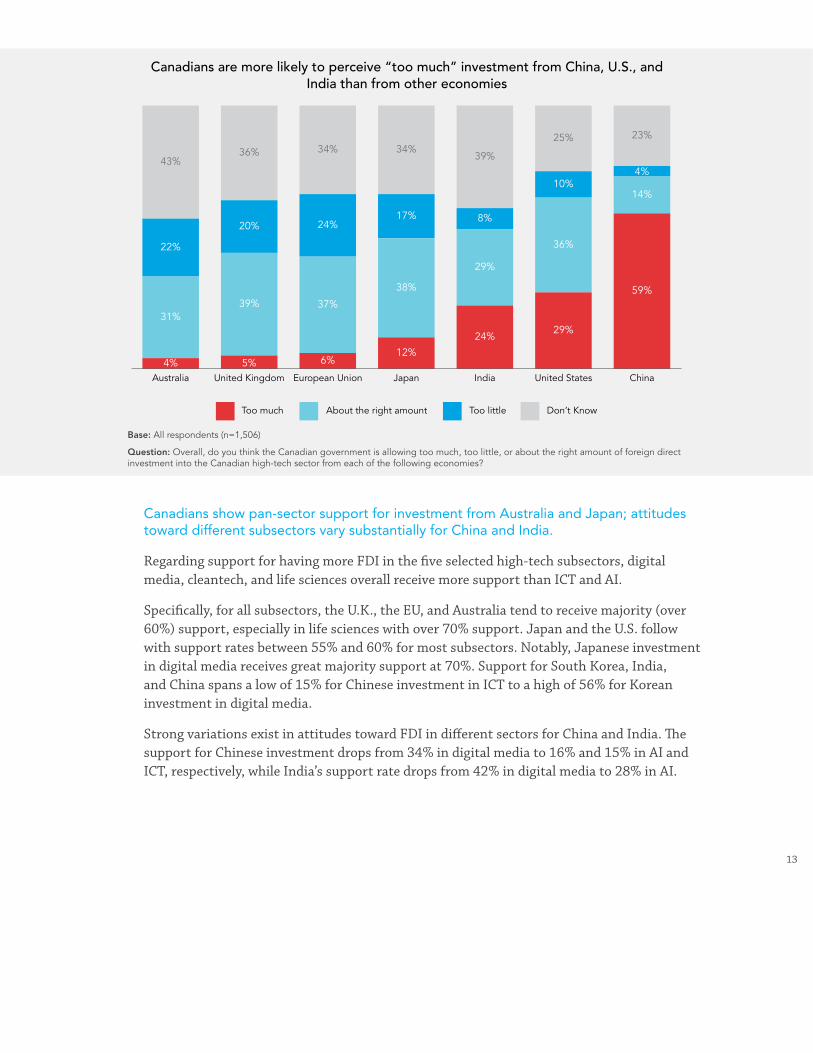
13
Canadians are more likely to perceive “too much” investment from China, U.S., and India than from other economies
Too much
Australia United Kingdom European Union Japan India United States China
About the right amount Too little Don’t Know
4% 5% 6%12%
24%29%
59%
31%
22%
43%36% 34% 34%
39%
25% 23%
39%
20%
37%
24%
38%
17%
29%
8%
36%
10%14%
4%
Base: All respondents (n=1,506)
Question: Overall, do you think the Canadian government is allowing too much, too little, or about the right amount of foreign direct investment into the Canadian high-tech sector from each of the following economies?
Canadians show pan-sector support for investment from Australia and Japan; attitudes toward different subsectors vary substantially for China and India.
Regarding support for having more FDI in the five selected high-tech subsectors, digital media, cleantech, and life sciences overall receive more support than ICT and AI.
Specifically, for all subsectors, the U.K., the EU, and Australia tend to receive majority (over 60%) support, especially in life sciences with over 70% support. Japan and the U.S. follow with support rates between 55% and 60% for most subsectors. Notably, Japanese investment in digital media receives great majority support at 70%. Support for South Korea, India, and China spans a low of 15% for Chinese investment in ICT to a high of 56% for Korean investment in digital media.
Strong variations exist in attitudes toward FDI in different sectors for China and India. The support for Chinese investment drops from 34% in digital media to 16% and 15% in AI and ICT, respectively, while India’s support rate drops from 42% in digital media to 28% in AI.
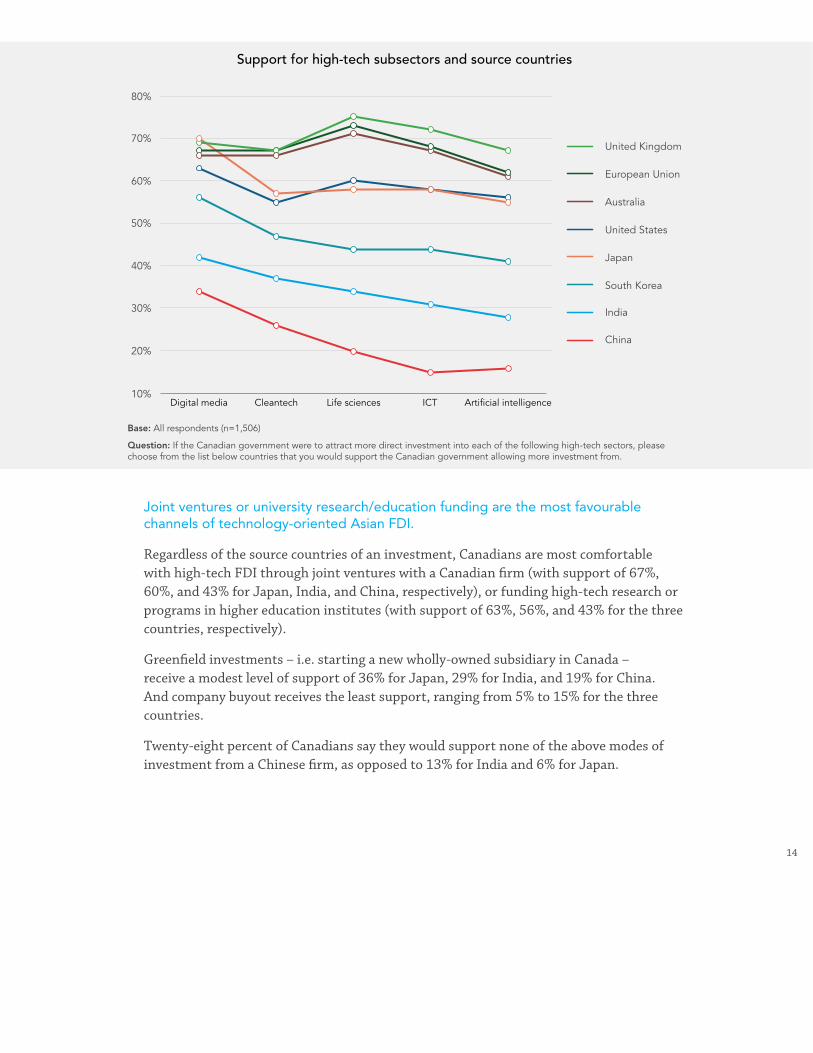
14
Support for high-tech subsectors and source countries
Digital media Cleantech Life sciences ICT Artificial intelligence
70%
80%
60%
50%
40%
30%
20%
10%
United Kingdom
European Union
Australia
United States
Japan
South Korea
India
China
Base: All respondents (n=1,506)
Question: If the Canadian government were to attract more direct investment into each of the following high-tech sectors, please choose from the list below countries that you would support the Canadian government allowing more investment from.
Joint ventures or university research/education funding are the most favourable channels of technology-oriented Asian FDI.
Regardless of the source countries of an investment, Canadians are most comfortable with high-tech FDI through joint ventures with a Canadian firm (with support of 67%, 60%, and 43% for Japan, India, and China, respectively), or funding high-tech research or programs in higher education institutes (with support of 63%, 56%, and 43% for the three countries, respectively).
Greenfield investments – i.e. starting a new wholly-owned subsidiary in Canada –receive a modest level of support of 36% for Japan, 29% for India, and 19% for China. And company buyout receives the least support, ranging from 5% to 15% for the three countries.
Twenty-eight percent of Canadians say they would support none of the above modes of investment from a Chinese firm, as opposed to 13% for India and 6% for Japan.
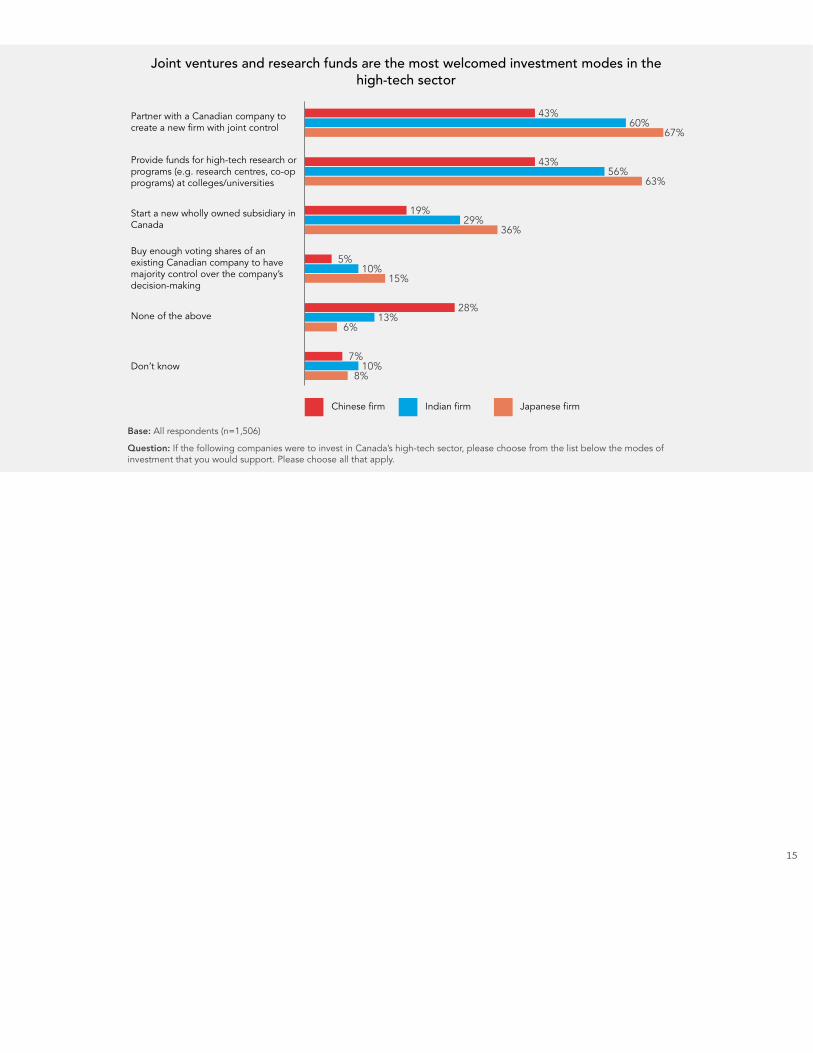
15
Joint ventures and research funds are the most welcomed investment modes in the high-tech sector
Partner with a Canadian company to create a new firm with joint control
Buy enough voting shares of an existing Canadian company to have majority control over the company’s decision-making
Don’t know
Start a new wholly owned subsidiary in Canada
None of the above
Provide funds for high-tech research or programs (e.g. research centres, co-op programs) at colleges/universities
Indian firmChinese firm Japanese firm
67%60%
43%
43%
19%
5%10%
15%
28%13%
6%
7%10%
8%
29%36%
56%63%
Base: All respondents (n=1,506)
Question: If the following companies were to invest in Canada’s high-tech sector, please choose from the list below the modes of investment that you would support. Please choose all that apply.
16
EXPLAINING PUBLIC SENTIMENT
To better understand the driving forces behind public opinion, in this section we disentangle effects of the confounding factors discussed earlier and examine what factors are most influential on public sentiment toward inward high-tech-oriented FDI. To do so, we implemented a conjoint survey experiment1 to analyze how Canadians take into account different factors when evaluating an investment project. The factors assessed here are country of origin, mode of investment, high-tech subsector, ownership structure, and outcome.
In this experiment, respondents were asked to review three hypothetical FDI projects, randomly selected from 108 scenarios. These scenarios present different combinations of attributes related to the five factors – mode of investment (set up a wholly owned subsidiary in Canada; acquire a Canadian firm), high-tech subsector (the telecommunications sector; the animation sector; the cleantech sector), ownership structure (state-owned enterprise; privately owned enterprise), country (China; Japan; the U.S.), and outcome (has passed the national security review by the Canadian government; is estimated to create a significant number of jobs for the local community; none). Notably, in the outcome attribute, we assess whether providing information on potential outcomes of a project – i.e. the national security review results or job creation – is associated with public perceptions.
These scenarios were presented to respondents using the following vignette template.
Company A/B/C is attempting to [mode of investment] in [high-tech subsector]. This company is a [ownership structure] based in [country]. This investment project [outcome].
Respondents were then asked to rate each project – support, oppose, or don’t know. The 108 projects received a total of 4,518 ratings from the respondents.
Across the board, these hypothetical projects received 44% of the votes in support, 42% in opposition, and 14% don’t knows. In order words, overall, the probability of a project being opposed is about 42%, compared with 58% for non-opposition. To understand what is driving public skepticism of Asian investment in the high-tech sector, we performed statistical modelling to predict the probability of a hypothetical project being opposed based on each specific attribute. The overall results are presented in the following chart. Separate charts for different factors are also presented.
1 “Conjoint survey experiment” is a statistical technique to determine what factors are most influential on respondent choice or decision-making. The implicit impact of a factor is determined by examining how people make choices or preferences between hypothetical scenarios/projects with a combination of different factors of research interest.

17
Predicted probability of an investment project being opposed
10% 20% 30% 40% 50% 60% 70%
China
Country
United States
Japan
Subsector
Telecommunications
Cleantech
Animation
Outcome
None
Has passed the national security review
Is estimated to create a significant number of jobs
Mode of Investment
Acquire a Canadian firm
Set up a wholly owned subsidiary in Canada
Ownership
State owned
Privately owned
Note: The probabilities are calculated based on statistical modelling results. Bars indicate predicted probability of being opposed for a project with each attribute; lines indicate we are 95% confident that the prediction falls within the range of values indicated.
“China” and “telecommunications” are driving the skepticism about FDI in Canada’s high-tech sector.
The highest probability of a project being opposed is when the investor is from China (64%), followed by when the investment is in telecommunications (51%). The high profile of the Huawei case and the controversies it aroused around 5G and telecommunications security could have contributed to the sentiment. Among all factors, the source country exerts the strongest effect – Chinese investment is 36 percentage points more likely to be opposed than Japanese investment, and 32 percentage points more than U.S. investment.
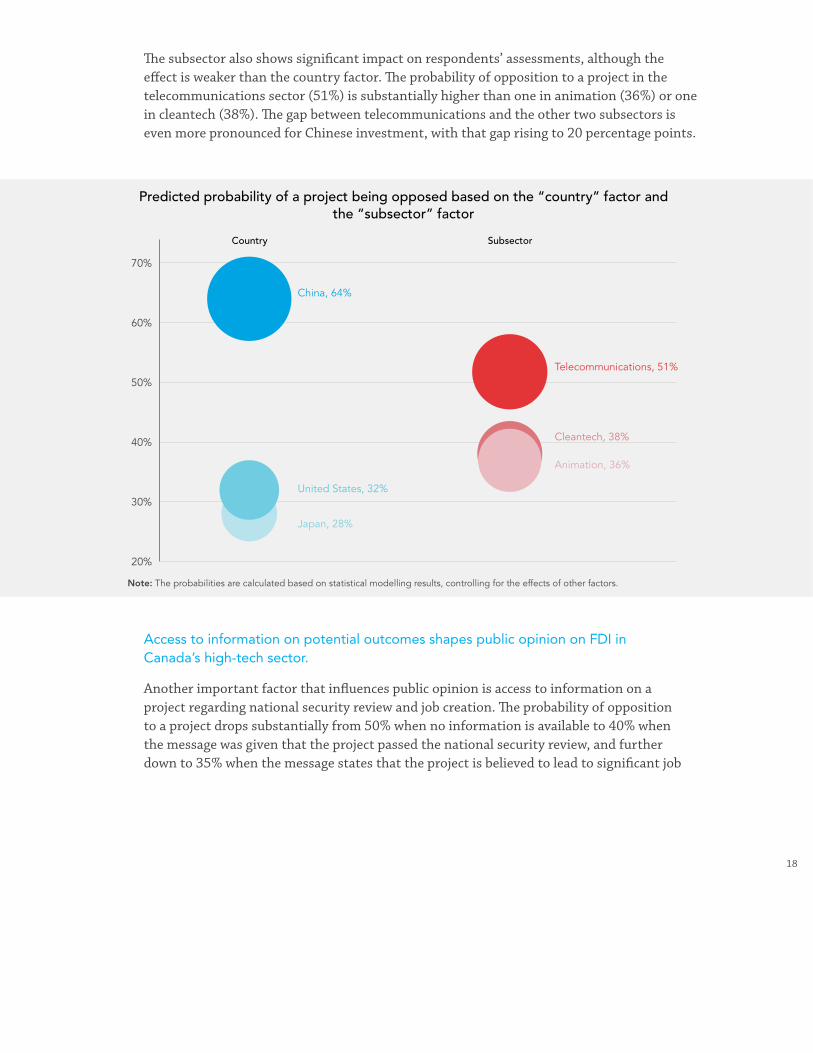
18
The subsector also shows significant impact on respondents’ assessments, although the effect is weaker than the country factor. The probability of opposition to a project in the telecommunications sector (51%) is substantially higher than one in animation (36%) or one in cleantech (38%). The gap between telecommunications and the other two subsectors is even more pronounced for Chinese investment, with that gap rising to 20 percentage points.
Access to information on potential outcomes shapes public opinion on FDI in Canada’s high-tech sector.
Another important factor that influences public opinion is access to information on a project regarding national security review and job creation. The probability of opposition to a project drops substantially from 50% when no information is available to 40% when the message was given that the project passed the national security review, and further down to 35% when the message states that the project is believed to lead to significant job
20%
30%
40%
50%
60%
70%
Predicted probability of a project being opposed based on the “country” factor and the “subsector” factor
China, 64%
Telecommunications, 51%
United States, 32%
Japan, 28%
Cleantech, 38%
Animation, 36%
Country Subsector
Note: The probabilities are calculated based on statistical modelling results, controlling for the effects of other factors.
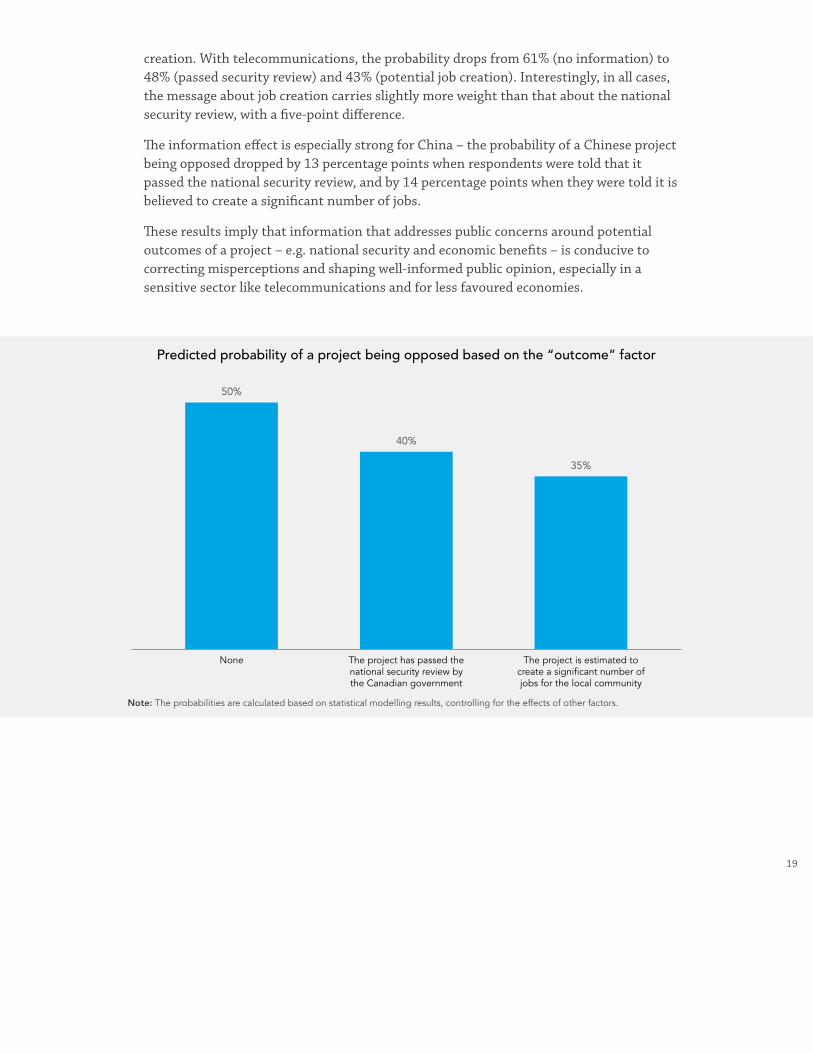
19
creation. With telecommunications, the probability drops from 61% (no information) to 48% (passed security review) and 43% (potential job creation). Interestingly, in all cases, the message about job creation carries slightly more weight than that about the national security review, with a five-point difference.
The information effect is especially strong for China – the probability of a Chinese project being opposed dropped by 13 percentage points when respondents were told that it passed the national security review, and by 14 percentage points when they were told it is believed to create a significant number of jobs.
These results imply that information that addresses public concerns around potential outcomes of a project – e.g. national security and economic benefits – is conducive to correcting misperceptions and shaping well-informed public opinion, especially in a sensitive sector like telecommunications and for less favoured economies.
Predicted probability of a project being opposed based on the “outcome” factor
None The project has passed the national security review by the Canadian government
The project is estimated to create a significant number of jobs for the local community
35%
40%
50%
Note: The probabilities are calculated based on statistical modelling results, controlling for the effects of other factors.
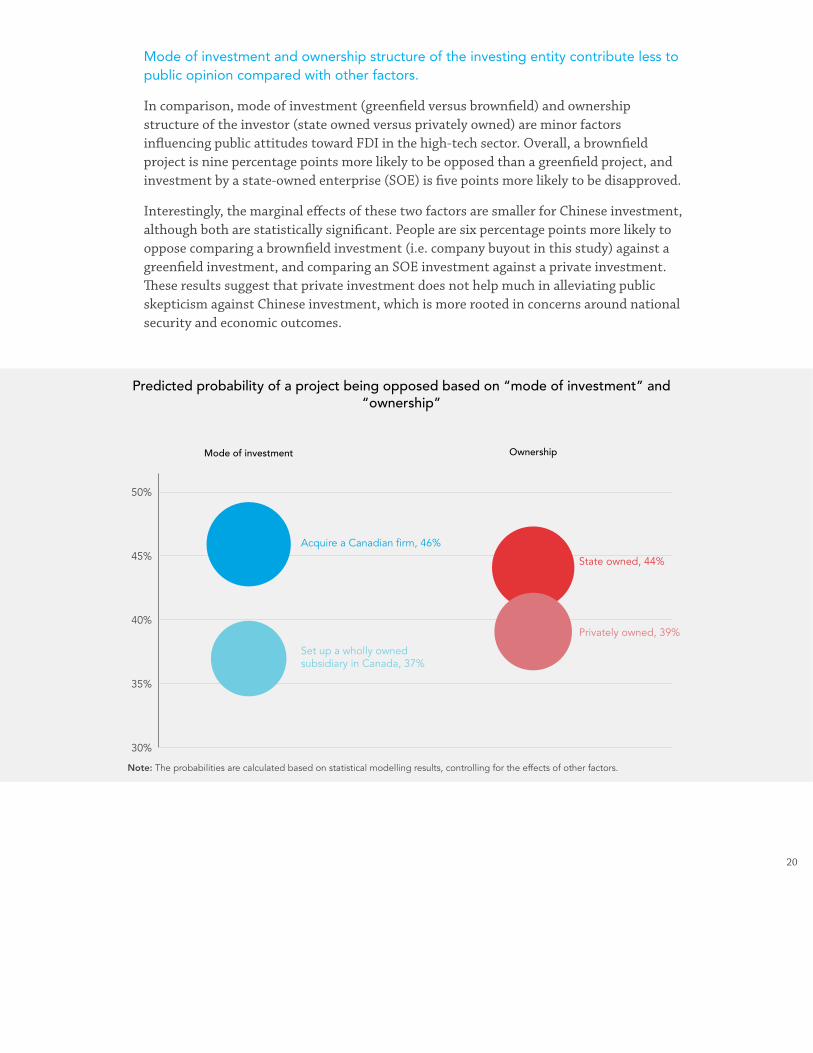
20
Mode of investment and ownership structure of the investing entity contribute less to public opinion compared with other factors.
In comparison, mode of investment (greenfield versus brownfield) and ownership structure of the investor (state owned versus privately owned) are minor factors influencing public attitudes toward FDI in the high-tech sector. Overall, a brownfield project is nine percentage points more likely to be opposed than a greenfield project, and investment by a state-owned enterprise (SOE) is five points more likely to be disapproved.
Interestingly, the marginal effects of these two factors are smaller for Chinese investment, although both are statistically significant. People are six percentage points more likely to oppose comparing a brownfield investment (i.e. company buyout in this study) against a greenfield investment, and comparing an SOE investment against a private investment. These results suggest that private investment does not help much in alleviating public skepticism against Chinese investment, which is more rooted in concerns around national security and economic outcomes.
30%
35%
40%
45%
50%
Predicted probability of a project being opposed based on “mode of investment” and “ownership”
Acquire a Canadian firm, 46%
State owned, 44%
Privately owned, 39%
Set up a wholly owned subsidiary in Canada, 37%
Mode of investment Ownership
Note: The probabilities are calculated based on statistical modelling results, controlling for the effects of other factors.
21
Canadians associate tech-oriented FDI from different economies with different benefits and risks.
To probe further on perceptions of FDI from different source countries, we asked respondents what the greatest benefits and the greatest risks they think are associated with having more high-tech-oriented FDI from China, Japan, India, and the U.S., respectively.
Canadians believe that Chinese investment is most likely to benefit Canada in economic terms. The top three benefits associated with Chinese investment are “access to foreign markets for Canadian businesses” (16%), “access to capital for Canadian high-tech businesses” (15%), and “job creation” (15%). A higher percentage (18%) of respondents also says “none of the above,” compared with the other countries. The biggest concerns about Chinese investment stem from “risks to national security” (31%), “risks to cyber security” (20%), and “intellectual property infringement” (12%).
Benefits associated with Japanese investment are often perceived to be about knowledge and talent transfer – the top three descriptors for perceived benefits are “transfer of new technologies and knowledge into Canada” (26%), “access to high-tech talent for Canadian high-tech businesses” (13%), and “job creation” (12%). Risks are most likely to be increased competition for Canadian domestic firms (26%), followed by the transfer of technology/knowledge (12%) and high-tech talent (12%) outside Canada.
Regarding Indian investment, access to foreign markets (19%), job creation (15%), and access to high-tech talent (11%) are the most highly expected benefits, while perceived risks are more likely to involve foreign competition for domestic businesses (15%), cyber security (14%), and the transfer of technology/knowledge outside Canada (12%).
Benefits from U.S. investment in the high-tech sector is most likely to be job creation (20%), access to capital (17%), and the transfer of new technologies and knowledge (12%) into Canada. However, people are concerned that having more U.S. investment may drive high-tech talent outside Canada (20%), increase foreign competition for domestic firms (17%), and introduce foreign influences on Canadian values (15%).
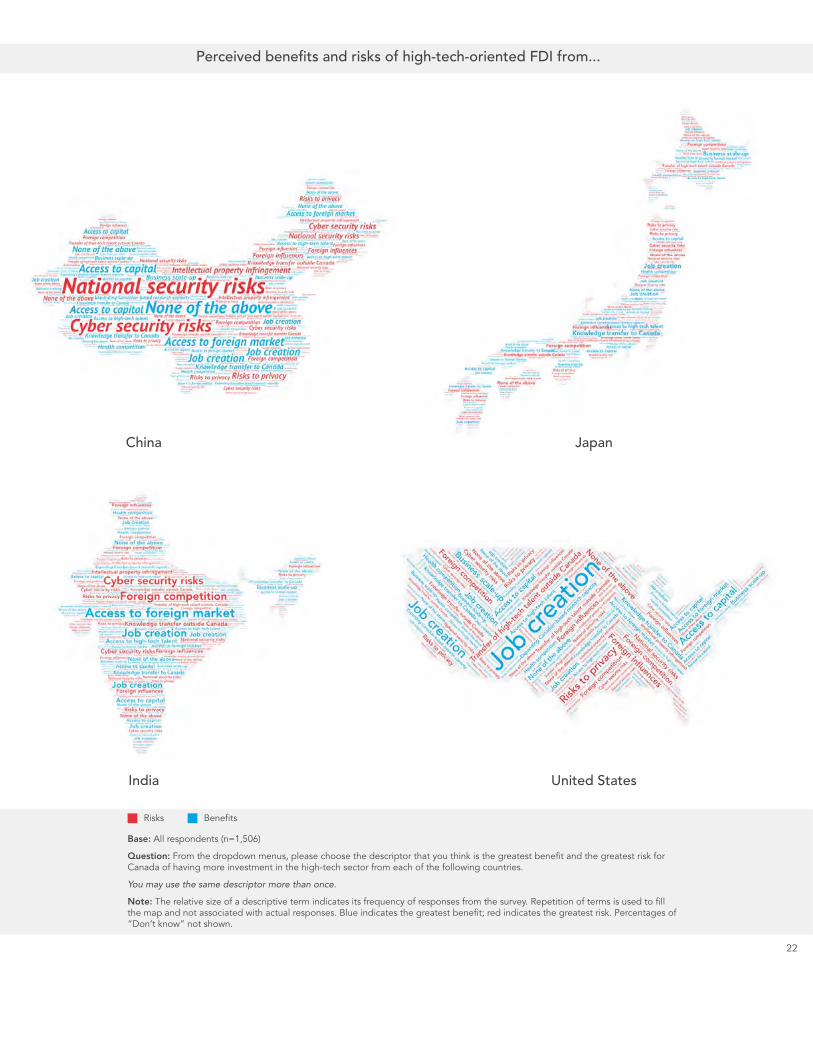
22
Base: All respondents (n=1,506)
Question: From the dropdown menus, please choose the descriptor that you think is the greatest benefit and the greatest risk for Canada of having more investment in the high-tech sector from each of the following countries.
You may use the same descriptor more than once.
Note: The relative size of a descriptive term indicates its frequency of responses from the survey. Repetition of terms is used to fill the map and not associated with actual responses. Blue indicates the greatest benefit; red indicates the greatest risk. Percentages of “Don’t know” not shown.
China
India
Japan
United States
Perceived benefits and risks of high-tech-oriented FDI from...
Risks Benefits

23
ROLE OF GOVERNMENT
Canadians believe Canada has strong regulations on data and privacy protection but are not confident that the government is doing a balanced review of the risks and benefits of foreign investments.
Canadians in general trust the domestic regulatory framework for protecting data security. About half of Canadians agree that “Canada has strong regulations that protect an individual’s privacy, personal information, and data ownership,” as opposed to 40% who disagree.
However, when it comes to national security reviews and net-benefits assessments that apply to certain FDI projects,2 54% of Canadians say they are not confident that “the government is doing a balanced assessment in reviewing the risks and benefits of foreign investments,” in contrast with 39% who say they are confident. As such, there is strong support for a more open and transparent process of national security review with 81% in support. This echoes previous findings and points to the importance of accessible and transparent information on foreign investments.
2 The Investment Canada Act stipulates that the government may “commerce” a national security review when it has “reasonable grounds” to believe a foreign investment could be “injurious to national security,” and that foreign investors seeking to acquire Canadian companies exceeding a certain value threshold must demonstrate net benefits to Canada.
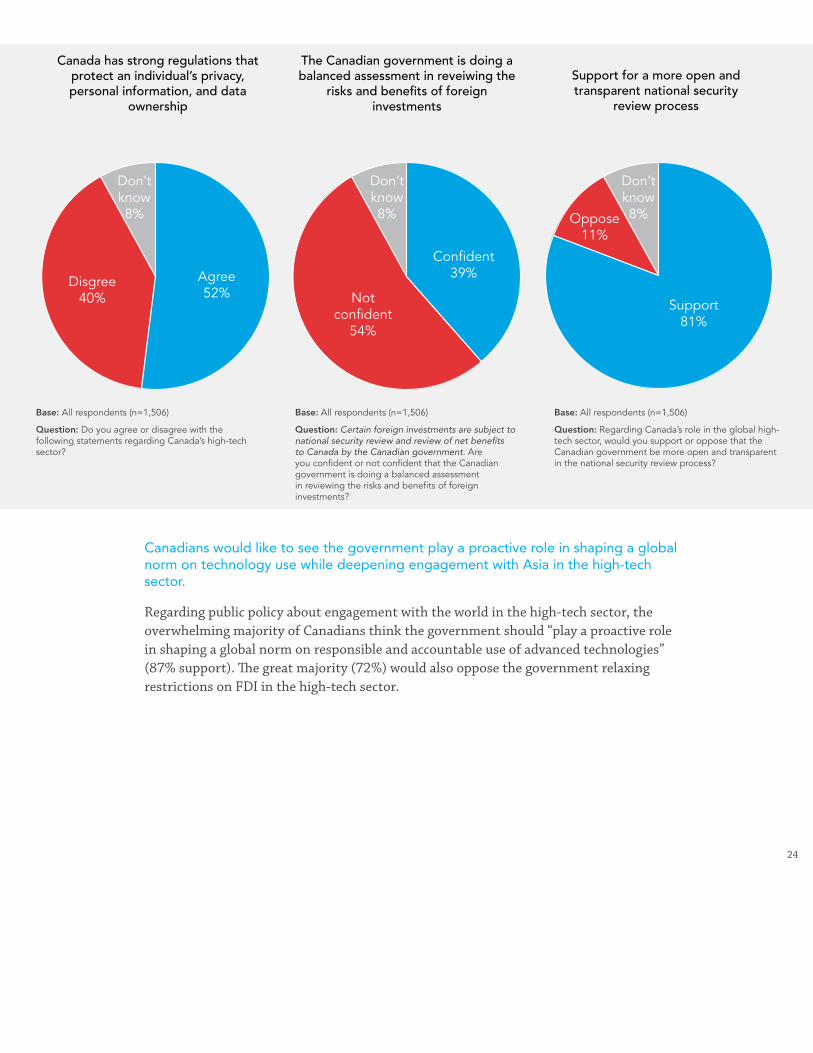
24
Canada has strong regulations that protect an individual’s privacy, personal information, and data
ownership
Support for a more open and transparent national security
review process
The Canadian government is doing a balanced assessment in reveiwing the
risks and benefits of foreign investments
Agree52%
Support81%
Oppose11%
Confident39%
Not confident
54%
Disgree40%
Don’t know8%
Don’t know8%
Don’t know8%
Base: All respondents (n=1,506)
Question: Do you agree or disagree with the following statements regarding Canada’s high-tech sector?
Base: All respondents (n=1,506)
Question: Certain foreign investments are subject to national security review and review of net benefits to Canada by the Canadian government. Are you confident or not confident that the Canadian government is doing a balanced assessment in reviewing the risks and benefits of foreign investments?
Base: All respondents (n=1,506)
Question: Regarding Canada’s role in the global high-tech sector, would you support or oppose that the Canadian government be more open and transparent in the national security review process?
Canadians would like to see the government play a proactive role in shaping a global norm on technology use while deepening engagement with Asia in the high-tech sector.
Regarding public policy about engagement with the world in the high-tech sector, the overwhelming majority of Canadians think the government should “play a proactive role in shaping a global norm on responsible and accountable use of advanced technologies” (87% support). The great majority (72%) would also oppose the government relaxing restrictions on FDI in the high-tech sector.
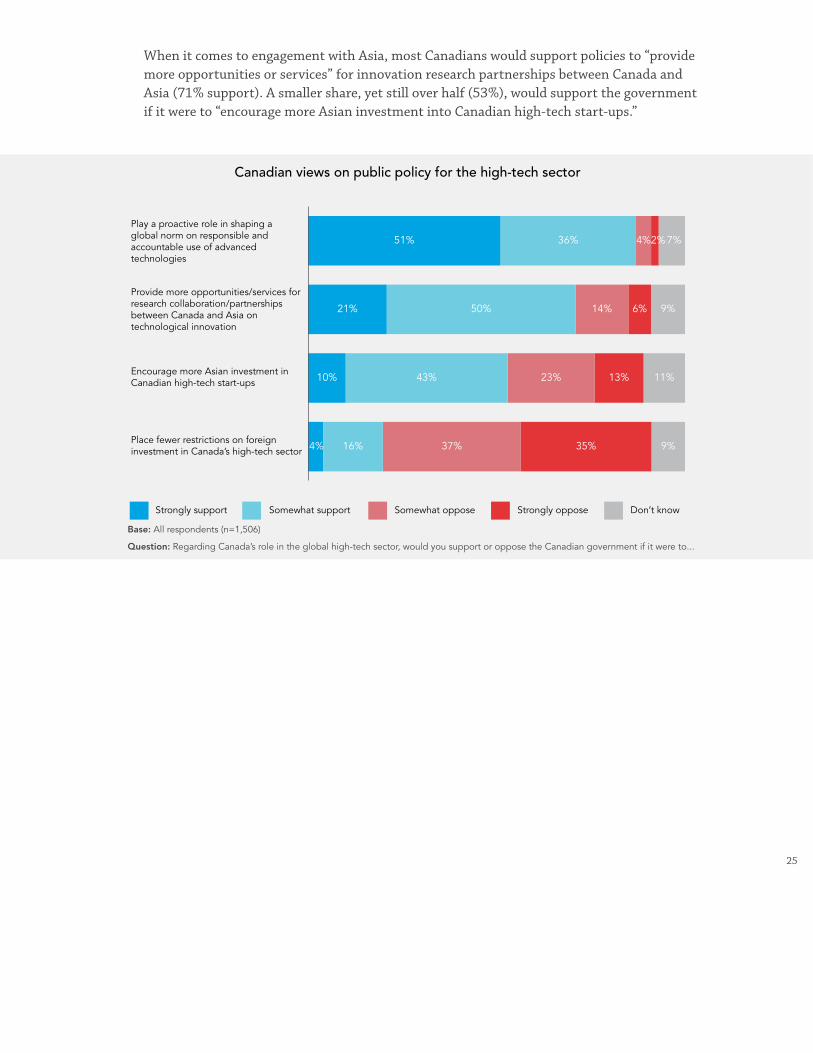
25
When it comes to engagement with Asia, most Canadians would support policies to “provide more opportunities or services” for innovation research partnerships between Canada and Asia (71% support). A smaller share, yet still over half (53%), would support the government if it were to “encourage more Asian investment into Canadian high-tech start-ups.”
Play a proactive role in shaping a global norm on responsible and accountable use of advanced technologies
Place fewer restrictions on foreign investment in Canada’s high-tech sector
Encourage more Asian investment in Canadian high-tech start-ups
Provide more opportunities/services for research collaboration/partnerships between Canada and Asia on technological innovation
Strongly support Somewhat support Somewhat oppose Strongly oppose Don’t know
Canadian views on public policy for the high-tech sector
51%
21%
10%
16% 37% 35% 9%4%
43% 23% 13% 11%
50% 14% 6% 9%
36% 4%2% 7%
Base: All respondents (n=1,506)
Question: Regarding Canada’s role in the global high-tech sector, would you support or oppose the Canadian government if it were to...
26
REGIONAL DIFFERENCES
Although Canadian opinions show more convergences than divergences over Asian investment in Canada’s high-tech sector, some variances exist among the provinces/regions. This section highlights regional differences that are worth noting.
For the purpose of regional analysis and in view of the sample size, some provinces/territories were collapsed into one region, resulting in the following provinces/regions:
• British Columbia
• The Prairies – Alberta, Saskatchewan, and Manitoba
• Ontario
• Quebec
• Atlantic – New Brunswick, Prince Edward Island, Nova Scotia, and Newfoundland and Labrador
Northern Canada (Yukon, Northwest Territories, and Nunavut) had only four respondents; therefore, they were removed from the analysis.
Quebecers are the most open to more high-tech-oriented FDI from Asia.
While all provinces/regions see a drop in support for having more Asian FDI as opposed to general FDI in the high-tech sector, Quebec stands out with the highest support rate (51%), indicating the relative openness of this region compared with the rest of the country.

27
FDI
Quebec Atlantic British Columbia The Prairies Ontario
Asian FDI
Quebec most supportive of Asian FDI in high-tech
56%
51%52%
42%
54%
38%
49%
38%
51%
36%
Base: Subgroup 1 FDI – Quebec (n=182); Atlantic (n=46); British Columbia (n=91); The Prairies (n=119); Ontario (n=208) Subgroup 2 Asian FDI – Quebec (n=169); Atlantic (n=55); British Columbia (n=114); The Prairies (n=146); Ontario (n=268)
Question: Subgroup 1: Generally speaking, would you support or oppose the Canadian government allowing more foreign direct investment into the following sectors? Subgroup 2: Generally speaking, would you support or oppose the Canadian government allowing more foreign direct investment from Asian economies (e.g. Japan, South Korea, India, China) into the following sectors?
Considering the significant “China” impact on public opinion toward Asian investment in this poll, the more positive views of Quebecers toward Asian FDI could be because of their less negative views of Chinese investment – Quebecers are less likely than non-Quebecers to perceive “too much” high-tech investment from China (54% versus the national average of 59%) and less likely to associate Chinese investment with national security risks (22% versus 31% at the national level).
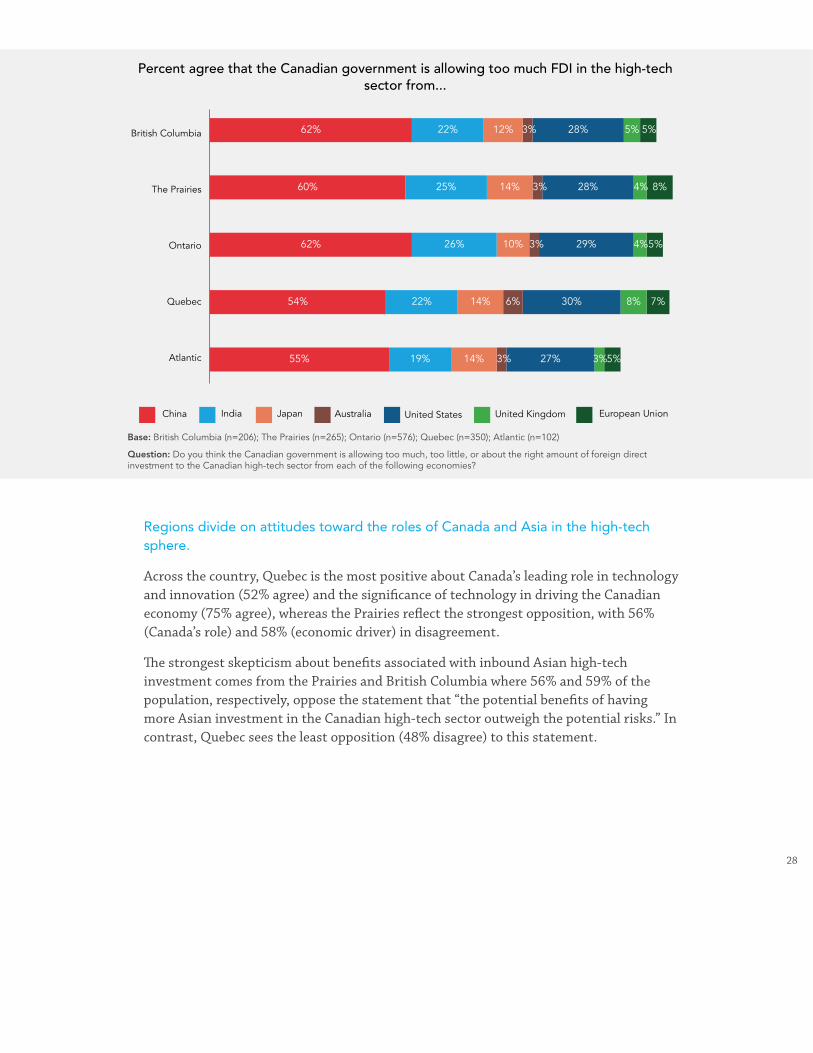
28
Percent agree that the Canadian government is allowing too much FDI in the high-tech sector from...
China India Japan Australia United States United Kingdom European Union
Atlantic
Quebec
Ontario
The Prairies
British Columbia 62%
60%
62%
54%
55%
22% 12% 3% 5% 5%
8%
5%
7%
5%
4%
4%
8%
3%
3%
3%
6%
3%
14%
10%
14%
14%
25%
26%
22%
19%
28%
28%
29%
30%
27%
Base: British Columbia (n=206); The Prairies (n=265); Ontario (n=576); Quebec (n=350); Atlantic (n=102)
Question: Do you think the Canadian government is allowing too much, too little, or about the right amount of foreign direct investment to the Canadian high-tech sector from each of the following economies?
Regions divide on attitudes toward the roles of Canada and Asia in the high-tech sphere.
Across the country, Quebec is the most positive about Canada’s leading role in technology and innovation (52% agree) and the significance of technology in driving the Canadian economy (75% agree), whereas the Prairies reflect the strongest opposition, with 56% (Canada’s role) and 58% (economic driver) in disagreement.
The strongest skepticism about benefits associated with inbound Asian high-tech investment comes from the Prairies and British Columbia where 56% and 59% of the population, respectively, oppose the statement that “the potential benefits of having more Asian investment in the Canadian high-tech sector outweigh the potential risks.” In contrast, Quebec sees the least opposition (48% disagree) to this statement.
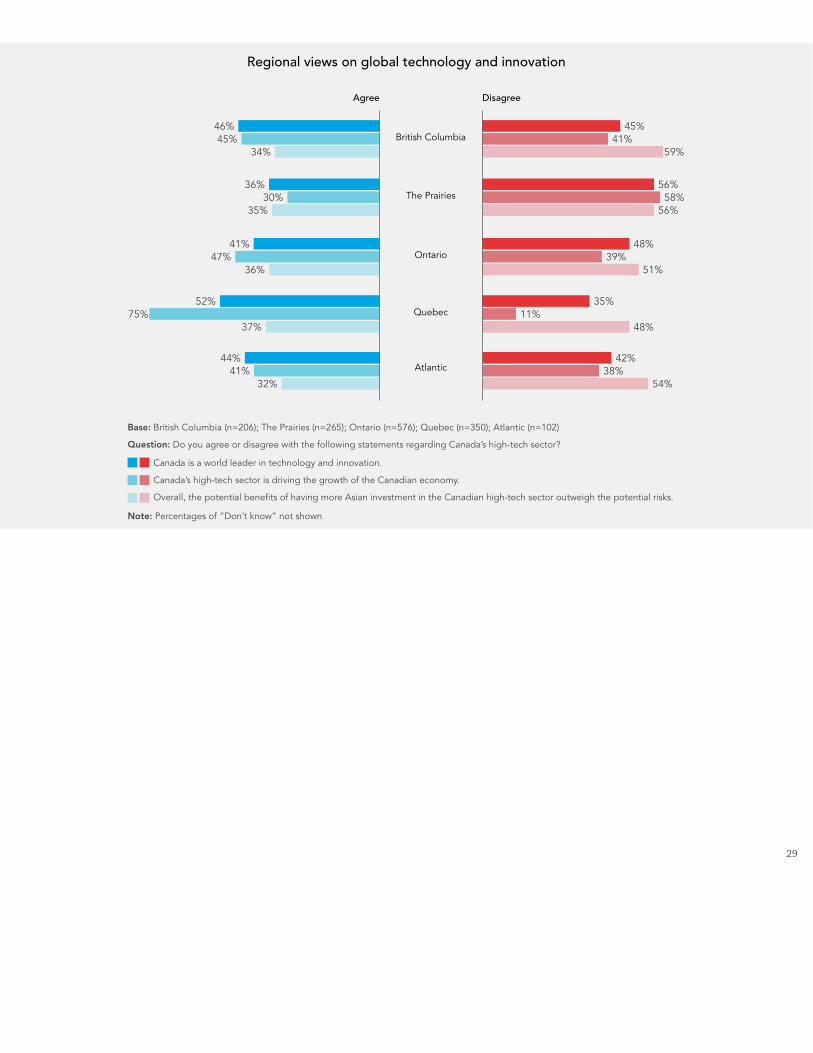
29
Do you agree or disagree with the following statements regarding Canada’s high-tech sector?
q8a. Canada is a world leader in technology and innovation.
q8e. Overall, the potential benefits of having more Asian investment in the Canadian high-tech sector outweigh the potential risks.
q8d. Canada’s high-tech sector is driving the growth of the Canadian economy.
Regional views on global technology and innovation
British Columbia
The Prairies
Ontario
Quebec
Atlantic
45%46%45%
34%
36%30%
35%
41%47%
36%
52%75%
37%
44%41%
32%
41%59%
56%58%
56%
48%39%
35%11%
48%
42%38%
54%
51%
Agree Disagree
Base: British Columbia (n=206); The Prairies (n=265); Ontario (n=576); Quebec (n=350); Atlantic (n=102)
Question: Do you agree or disagree with the following statements regarding Canada’s high-tech sector?
Note: Percentages of “Don’t know” not shown
Canada is a world leader in technology and innovation.
Canada’s high-tech sector is driving the growth of the Canadian economy.
Overall, the potential benefits of having more Asian investment in the Canadian high-tech sector outweigh the potential risks.

30
British Columbia is more likely to oppose easing restrictions on high-tech-oriented FDI and to support more transparency in national security reviews.
Among the regions, British Columbia has the strongest opinions in opposing more relaxed FDI restrictions (13% support, 82% oppose) and in supporting more transparency in the process of national security review (90% support, 6% oppose); Quebec, in comparison, holds the least strong opinions in these regards, with the smallest gaps between the support versus oppose groups for easing high-tech FDI restrictions (45 points) and for more transparent national security reviews (64 points). This is in line with the more positive views Quebecers have toward the potential benefits of Asian investment than British Columbians.
Place fewer restrictions on foreign investment into Canada’s high-tech sector
Be more open and transparent in the national security review process
Quebec
The Prairies
Ontario
Atlantic
British Columbia
Differences (% points) between support vs oppose on more restrictions on high-tech oriented FDI and more transparent national security reviews
64%
68%
70%
76%
84%
-45%
-49%
-46%
-55%
-69%
Base: British Columbia (n=206); The Prairies (n=265); Ontario (n=576); Quebec (n=350); Atlantic (n=102)
Question: Regarding Canada’s role in the global high-tech sector, would you support or oppose the Canadian government if it were to...
31
CONCLUSION
As a powerhouse of technology and innovation and a vast source of capital, Asia has the potential to play a vital role in Canada’s future. Canadians, however, remain cautious about engagement with Asia in the high-tech sector, the core economic driver of tomorrow. This is the key takeaway from APF Canada’s 2019 National Opinion Poll: Canadian Views on High-Tech Investment from Asia.
As Canadians’ anxiety toward China over the Huawei affair lingers, it is not surprising that this poll picks up on a sense of skepticism about Asian investment in Canada’s high-tech sector, particularly with regard to both Chinese investment and the telecommunications sector. This, however, does not undermine the importance of Asia to Canada’s investment diversification – there is a broad consensus that Asia will drive future technological advancement and become more important than the U.S. as a source of capital for Canadian tech business in the foreseeable future. The poll also reveals that there is a strong public desire to deepen engagement with Asia, including China, in innovation research and education. Several implications can be drawn from the results.
First, overall public sentiment toward Asian FDI in Canada’s high-tech sector is impeded by the current heightened negativity toward China and as well as sensitivity around the telecommunications sector more generally. Recent surveys have shown a significant drop in Canadian warmth of feeling toward China over the past 16 months. Our analysis further demonstrates that the “China” factor and the “telecommunications” factor are the strongest in explaining public opposition toward FDI in the high-tech sector.
Second, engagement with different countries in technology needs to take into account different risk factors as public concerns vary with different countries. Traditional, like-minded allies like Australia and Japan are the most favoured sources of investment in Canadian high-tech. Concerns associated with high-tech-oriented FDI from these countries are more likely to be “increased foreign competition with domestic firms’ and ‘the transfer of talent or know-how outside Canada.” China and India are less favoured source countries as they are often associated with risks to national security (China) or cyber security (China, India).
Third, a sector-wise approach for engagement prioritizing less sensitive subsectors may be preferred, especially for countries for which public sentiment is less positive. Digital media, life sciences, and cleantech are the most favoured areas for Asian FDI, while ICT
32
and AI are the least favoured. The between-sector gaps are more evident for China and India than for Australia, Japan, and South Korea.
Fourth, high-tech research and education boasts great potential for deepened investment relationships with Asia. Asian funding to university high-tech research or education programs receives widespread public support, and so do public policies to support such research collaboration/partnerships.
Finally, Canadian skepticism about Asian investment into the high-tech sector also reflects a sense of public distrust in the government as a gatekeeper of incoming investment able to safeguard Canadian interests. The public overall is not confident in the government’s risks and benefits assessments of FDI projects. Indeed, Canadians would support a more transparent national security review process. Our analysis indicates that this might well include providing transparent information that adequately addresses public concerns about a specific project as a means of mitigating public skepticism.
In conclusion, this poll reveals the complexity and nuances underlying public skepticism toward Asian high-tech FDI in Canada. Our findings suggest that engagement with Asia in technology and innovation warrants a well-crafted agenda with a differentiated approach to individual economies and subsectors, as well as a transparent domestic regulatory environment to mitigate public concerns and skepticism.
33
METHODOLOGY
APF Canada commissioned EKOS Research Associates to conduct a survey of 1,506 Canadian adults (permanent residents and citizens 18 years and older). The survey was conducted from February 4 to February 15, 2019, using EKOS’s research panel, Probit. This panel offers coverage of the Canadian population accessible through internet, phone or cellphone. A random, stratified sample for this study was drawn from the panel database using random digit dialling. All data was collected online.
Considering potential inconsistent understandings of FDI and “high-tech sector” due to the complexity of the two concepts, before the survey questions we provided broad definitions of the two terms that are aligned with our understanding. The definitions are as follows:
“Below we would like to have your opinions about foreign direct investment into Canada. Foreign direct investment (FDI) in Canada is defined as a long-term or lasting-interest investment that allows an investor (i.e. a person or an entity) of another economy to have a significant degree of influence in the management of an enterprise in Canada. ‘Significant degree of influence’ usually means ownership of 10 per cent or more of the ordinary shares or voting power or the equivalent of an enterprise.”
“Below we would like to ask your opinions on foreign direct investment in the Canadian high-tech sector. The high-tech sector encompasses industries that have high concentrations of employers in STEM (science, technology, engineering, and mathematics). Examples of the high-tech sector include, but are not limited to, information and communication technology, artificial intelligence, life sciences, cleantech, digital media, aerospace manufacturing, and scientific research and development.”
The margin of error – which measures sampling variability – is +/- 2.53% for the entire sample. The average completion time for the survey was 10 minutes. The results have been statistically weighted by EKOS according to the current census data on age, gender, and region to ensure the representativeness of the sample. Discrepancies in or between totals are due to rounding.
34
ACKNOWLEDGEMENTS
Strategic Advisor
Dr. Jeffrey Reeves Vice President, Research Asia Pacific Foundation of Canada
Lead Researcher
Dr. Yushu Zhu Program Manager Asia Pacific Foundation of Canada
Editorial Review
Dr. Charles Labrecque Research Manager Asia Pacific Foundation of Canada
Michael Roberts Communications Manager Asia Pacific Foundation of Canada
Communications
Michael Roberts Communications Manager Asia Pacific Foundation of Canada
Nathalie Green Social Media and Communications Specialist Asia Pacific Foundation of Canada
Creative Design
Sanya Arora Graphic Designer Asia Pacific Foundation of Canada
Advisory Panel
Dr. Paul Evans Professor of Political Science The University of British Columbia
Dr. Margaret McCuaig-Johnston Senior Fellow, Institute of Science, Society and Policy, University of Ottawa Senior Fellow, China Institute, University of Alberta Distinguished Fellow, Asia Pacific Foundation of Canada
Dr. Daniel Savas Visiting Professor, School of Public Policy, Simon Fraser University Distinguished Fellow, Asia Pacific Foundation of Canada

35
1NATIONAL OPINION POLL 2019: CANADIAN VIEWS ON HUMAN CAPITAL FROM ASIA
ASIA PACIFIC FOUNDATION OF CANADA
CANADIAN VIEWS ON HUMAN CAPITAL FROM ASIA
2019 NATIONAL
OPINION POLL

2NATIONAL OPINION POLL 2019: CANADIAN VIEWS ON HUMAN CAPITAL FROM ASIA
ASIA PACIFIC FOUNDATION OF CANADA
About the Asia Pacific Foundation of Canada
About the National Opinion Poll
Executive Summary
Key Takeaways from the Poll
Perceptions of the High-Skilled Talent Market
Feelings Toward High-Skilled Talent from Asia
Criteria for the Recruitment of International High-Skilled Talent
Immigration and Public Policy
Political Differences on High-Skilled International Talent from Asia
Conclusion
Methodology
Acknowledgements
3
4
5
7
10
13
19
25
30
34
36
37
TABLE OF CONTENTS
3NATIONAL OPINION POLL 2019: CANADIAN VIEWS ON HUMAN CAPITAL FROM ASIA
ASIA PACIFIC FOUNDATION OF CANADA
The Asia Pacific Foundation of Canada (APF Canada) is dedicated to
strengthening ties between Canada and Asia with a focus on expanding
economic relations through trade, investment, and innovation; promoting
Canada’s expertise in offering solutions to Asia’s climate change, energy, food
security, and natural resource management challenges; building Asia skills and
competencies among Canadians, including young Canadians; and improving
Canadians’ general understanding of Asia and its growing global influence.
APF Canada is well known for its annual national opinion polls of Canadian
attitudes regarding relations with Asia. APF Canada places an emphasis on
China, India, Japan, and South Korea, while also developing expertise in
emerging markets in the region, particularly economies within the Association
for Southeast Asian Nations.
Visit APF Canada at www.asiapacific.ca.
ABOUT THE ASIA PACIFIC FOUNDATION OF CANADA
4NATIONAL OPINION POLL 2019: CANADIAN VIEWS ON HUMAN CAPITAL FROM ASIA
ASIA PACIFIC FOUNDATION OF CANADA
Since 2004, the Asia Pacific Foundation of Canada has been conducting regular
nationwide surveys to assess Canadians’ attitudes toward countries in the
Asia Pacific, and their perceptions of Canada-Asia relations. Unique in its
construction and its objectives, APF Canada’s National Opinion Poll has been
instrumental in drawing a portrait of Canadians’ perspectives on Asia and the
region’s increasing relevance to Canada’s prosperity.
The 2019 National Opinion Poll is the second thematic survey of the year,
with a focus on Canadian attitudes toward international high-skilled talent
migration to Canada.
WITH A REPRESENTATIVE SAMPLE OF THE CANADIAN
POPULATION, THE OBJECTIVE OF THIS POLL IS THREE-FOLD:
1. To explore Canadian attitudes toward inbound high-skilled international
talent, especially from Asia;
2. To examine factors (e.g., country of origin; language proficiency; science,
technology, engineering, and mathematics [STEM] knowledge) that are
crucial considerations for Canada in attracting high-skilled and educated
international talent; and
3. To inform policy-makers on the challenges of attracting and retaining
international talent.
PLEASE NOTE THE FOLLOWING DEFINITIONS USED IN THIS REPORT:
• Talent refers to highly educated (i.e., university degree) workers or students
with management, professional, or technical skills.
• High-skilled worker, unless noted otherwise, refers to highly educated
workers with management, professional, or technical skills.
ABOUT THE NATIONAL OPINION POLL

5NATIONAL OPINION POLL 2019: CANADIAN VIEWS ON HUMAN CAPITAL FROM ASIA
ASIA PACIFIC FOUNDATION OF CANADA
The development of increasingly sophisticated technologies is transforming
the future of work and driving up the demand for high-skilled talent – highly
educated (i.e., university degree) workers and students with management,
professional, or technical skills. In addition to the issues posed by an aging
workforce, this creates additional challenges for advanced economies, including
Canada. While Canada has a reputation of being a talent hub, “brain drain”
– the outmigration of high-skilled Canadians – has been an issue for Canada
since the 1990s, making it even harder to meet the growing demand for high-
skilled talent.
As competition for the acquisition of
international talent becomes fierce,
Asia presents a hopeful opportunity.
Many Asian countries, including
emerging economies such as India
and Vietnam, boast a relatively young
and educated labour force. Investing
more than any other countries in
research and development (R&D),
South Korea, Japan, and Taiwan are
also leaders in research, especially
in technology. Consequently, Asian
universities are rapidly climbing up
global rankings, further equipping
domestic talent with in-demand skills
for the future. However, the region
has also seen a growing trend of
international outmigration for better
opportunities. This, together with
the existing strong Asian diaspora in
Canada and the United States losing
attractiveness for international talent
EXECUTIVE SUMMARY
Source: Photo by Hike Shaw on Unsplash
Many Asian countries boast a young, high-skilled work force

6NATIONAL OPINION POLL 2019: CANADIAN VIEWS ON HUMAN CAPITAL FROM ASIA
ASIA PACIFIC FOUNDATION OF CANADA
following the recent rise of anti-immigrant sentiment, has opened a window
of opportunity for Canada to harness the Asian talent pool. This window
of opportunity, however, is closing with Asian economies joining the global
competition for high-skilled talent. A 2019 Independent Task Force Report
from the Council of Foreign Relations urges the United States government
to take an active role in attracting and retaining international students,
particularly in the fields of science and technology. Similarly, to ensure Canada
remains competitive globally, the country’s future immigration policy must
address the pressing challenges posed by a growing talent deficit.
With an aim to inform public policies around attracting and retaining
international talent, this edition of APF Canada’s National Opinion Poll
assesses Canadian attitudes toward the recruitment of foreign workers,
with special attention to high-skilled talent from Asia, their importance for
the future of the Canadian economy, and immigration policies Canada
should pursue.
7NATIONAL OPINION POLL 2019: CANADIAN VIEWS ON HUMAN CAPITAL FROM ASIA
ASIA PACIFIC FOUNDATION OF CANADA
KEY TAKEAWAYS FROM THE POLL
CANADIANS RECOGNIZE THE IMPORTANCE OF TAPPING INTO THE
GLOBAL TALENT POOL AND, MORE SPECIFICALLY, ACQUIRING
TALENT FROM ASIA WITH STEM SKILLS. Fifty-six percent of Canadians
believe that Canada’s shortage of high-skilled workers is becoming a deterrent
to its competitiveness in the global economy. Accordingly, slightly more
than half of Canadians (54%) agree that Canada should look to Asia for
international talent in the next 10 years, while 34% disagree and 12% are
not sure of their opinion. When presented with the opportunity to capitalize
on the tightened immigration policy in the United States, 60% of Canadians
support attracting high-skilled talent from Asia. Finally, a considerable
majority (74%) think highly educated workers with STEM skills deserve
further attention in our immigration policy.
CANADIANS DO NOT BELIEVE THAT THEIR CONCERNS RELATED TO
IMMIGRATION FROM ASIA OUTWEIGH THE POTENTIAL BENEFITS OF
HAVING MORE INTERNATIONAL TALENT IMMIGRATION FROM ASIA.
Fifty-three percent of Canadians believe that the potential benefits of having
more talent from Asia outweighs the potential concerns, while slightly more
than one-third of Canadians disagree with that statement. Most Canadians
associate potential benefits of international talent immigration with
addressing workforce shortages and transferring knowledge and technology to
the country while they remain concerned about Canada’s capacity to support
social integration of the foreigners, the inconsistent credential recognition
system, and mismatch between skills and labour market demand.
AMID CURRENT TENSIONS BETWEEN CANADA AND CHINA,
CANADIANS PERCEIVE A LESS RECEPTIVE ENVIRONMENT IN CANADA
FOR INTERNATIONAL TALENT FROM CHINA. Six out of 10 Canadians
believe receptiveness to Chinese talent has decreased, while 24% disagree
8NATIONAL OPINION POLL 2019: CANADIAN VIEWS ON HUMAN CAPITAL FROM ASIA
ASIA PACIFIC FOUNDATION OF CANADA
with that statement. Nonetheless, 65% of Canadians are still in favour of the
immigration of highly educated workers in the STEM fields from China. But,
in comparison, Canadians are more in favour of immigration of STEM talent
from the Philippines (69%), India (73%), South Korea (76%), as well as from
the United States (79%) and the European Union (82%).
DESPITE MODERATE CONCERNS ABOUT INTERNATIONAL TALENT
FROM ASIA AND CHINA, CANADIANS CONSISTENTLY CONVEYED
THAT PLACE OF BIRTH IS NOT AN IMPORTANT CRITERION WHEN
CHOOSING INTERNATIONAL TALENT. Only 3% of Canadians think that
birthplace should be a priority when recruiting international talent, while
9% think it should be considered when recruiting STEM talent. Furthermore,
while 53% of Canadians believe that international talent should originate
from countries sharing Canada’s core values to some extent, as many as 40%
think that immigration policy should focus solely on individual characteristics,
without any consideration of the country of origin.
CANADIANS WANT THE GOVERNMENT TO PRIORITIZE
INTERNATIONAL TALENT THAT HAS STEM SKILLS, IS PROFICIENT
IN ENGLISH OR FRENCH, AND IS LIKELY TO ADAPT TO CANADIAN
CULTURE EASILY. Forty-six percent of Canadians include STEM skills and
language competencies among the top skills that international talent joining
the Canadian workforce should possess. Forty-four percent also consider
adaptability to Canadian culture to be a top priority. When considering the
criteria for Canada to select international talent with STEM skills specifically,
Canadians express a similar set of expectations. They stress the need to
consider factors such as skills and competencies (74%), language proficiency
(64%), cultural adaptability (54%), and work experience (54%).
CANADIANS SUPPORT A RANGE OF POTENTIAL PUBLIC POLICIES
AIMING TO ATTRACT AND RETAIN MORE INTERNATIONAL TALENT
FROM ASIA. The policies getting the most support aim to enhance Asian
student exchange and co-op programs in Canada (77%) and extend the
length of temporary work permits for international talent (71%). When the

9NATIONAL OPINION POLL 2019: CANADIAN VIEWS ON HUMAN CAPITAL FROM ASIA
ASIA PACIFIC FOUNDATION OF CANADA
focus is on talent from China specifically, support for policies drops about 10
percentage points. Nonetheless, support remains significantly stronger than
opposition for all suggested policies. Furthermore, 65% of Canadians support
the ongoing Start-up Visa Program that is aimed at attracting immigrant
entrepreneurs to Canada, and only one out of 10 does not believe the program
to be beneficial.
THERE IS A STARK DIVIDE IN RESPONSES BETWEEN LIBERAL AND
CONSERVATIVE CANADIANS, BOTH IN TERMS OF INTERNATIONAL
TALENT RECRUITMENT PRIORITIES AND CURRENT CONCERNS
REGARDING THE CANADIAN ECONOMY. Liberals are more likely than
Conservatives to believe that a shortage of high-skilled workers is becoming
a deterrent to Canada’s competitiveness in the global economy. Furthermore,
a slight majority of Conservatives believe the concerns of accepting more
talent from Asia outweigh the potential benefits. Additionally, 72% of Liberals
agree that Canada should capitalize on the tightened immigration policy in
the United States to encourage international migration of high-skilled talent
from Asia, while only 49% of Conservatives agree with that statement. More
broadly, Conservatives generally exhibit lower support for policies favouring
Asian talent immigration, as opposed to supporters of all other major political
parties of Canada.

10NATIONAL OPINION POLL 2019: CANADIAN VIEWS ON HUMAN CAPITAL FROM ASIA
ASIA PACIFIC FOUNDATION OF CANADA
PERCEPTIONS OF THE HIGH-SKILLED TALENT MARKET
Canadians recognize the importance of tapping into the global talent pool and,
more specifically, acquiring talent from Asia.
First of all, Canadians are aware of the challenges posed by
the global shortage of talent and its negative impact on the
Canadian economy.
Projections suggest that, due to the discrepancies between the growth of
demand for high-skilled workers and the number of available trained workers
globally, there will be a deficit of 21% in the global pool of high-skilled workers
by 2020.1 As their populations age, more and more developed countries lack
high-skilled workers. This is the case for Canada and it will have adverse effects
on the Canadian economy by impeding productivity and business growth. The
Canadian tech sector, for example, suffers from brain drain because the sector
is not compelling enough yet to compete with the world leaders in tech. To
drive growth in the sector and close the gap with global leaders, Canada needs
to actively recruit international talent and attract creative investors.
Canadians are demonstrably aware of this issue as 56% are concerned by the
impact of the talent shortage in Canada, while 29% are not (Figure 1).
1 | Korn Ferry defines “highly skilled worker” as individuals who have completed post-secondary education, such as college or university, or a high-level trade college qualification.
FIGURE 1
Most Canadians believe that a shortage of high-skilled workers is becoming a deterrent to Canada's competitiveness in the global economy
15%
29% 56%
Don’t know
Agree
Disagree
Question: Do you agree or disagree with the following statement about international talent - A shortage of high-skilled workers is becoming a deterrent to Canada's competitiveness in the global economy. Base: n=1,524
FIGURE 1
Question: Do you agree or disagree with the following statement about international talent - A shortage of high-skilled workers is becoming a deterrent to Canada’s competitiveness in the global economy. Base: n=1,524
Most Canadians believe that a shortage of high-skilled workers is becoming a deterrent to Canada’s
competitiveness in the global economy

11NATIONAL OPINION POLL 2019: CANADIAN VIEWS ON HUMAN CAPITAL FROM ASIA
ASIA PACIFIC FOUNDATION OF CANADA
Second, Canadians are generally open to the immigration of
international talent from Asia to alleviate the talent shortage
in Canada.
There is – quite literally – a world of opportunities when it comes to attracting
international talent (high-skilled workers, STEM scientists, or international
students). However, global competition to attract high-skilled talent is
increasing, with a sharp rise in developed labour markets drawing from the
surplus of workers in emerging economies. A prime example of this is China,
which has a surplus of workers at the moment, but that surplus is expected to
vanish in 10 years. The Chinese government’s investment in R&D is possibly
one of the reasons behind this declining surplus. Beijing’s R&D investment has
increased tenfold over the last 20 years and is projected to continue growing,
which will in turn lead to the retention of local high-skilled talent, and will
arguably attract more from the global pool.
Source: Photo by Road Trip with Raj on Unsplash
The Chinese are investing heavily in R&D

12NATIONAL OPINION POLL 2019: CANADIAN VIEWS ON HUMAN CAPITAL FROM ASIA
ASIA PACIFIC FOUNDATION OF CANADA
At this crucial time, 54% of Canadians agree that Canada should look to Asia
for international talent in the next 10 years. However, only a few respondents
had a firm opinion on the question – either strongly agreeing (12%) or strongly
disagreeing (11%) with the proposition – suggesting that the majority of the
public is uncertain on the subject.
In the context of rising anti-immigration sentiment in the United States,
Canadians are also in favour of a more assertive immigration policy – but one
that encourages and eases the migration of international talent to Canada.
Sixty percent of Canadians agree that Canada should capitalize on the
tightened immigration policy under the Trump administration by encouraging
international migration of high-skilled talent from Asia. When presented
in this context, the immigration of high-skilled talent from Asia gets more
support, as shown in Figure 2.
FIGURE 2
Opinions on immigration of international talent from Asia
Agree
Don’t know
Disagree
54%
60%
34%
32%
12%
9%
Canada should capitalize on the tightened immigration policy under the Trump administration by encouraging international talent migration from Asia
Canada should look to Asia for international talent in the next 10 years
Question: Do you agree or disagree with the following statements about international talent? Base: n=1,524
FIGURE 2
Question: Do you agree or disagree with the following statements about international talent. Base: n=1,524
Opinions on immigration of international talent from Asia
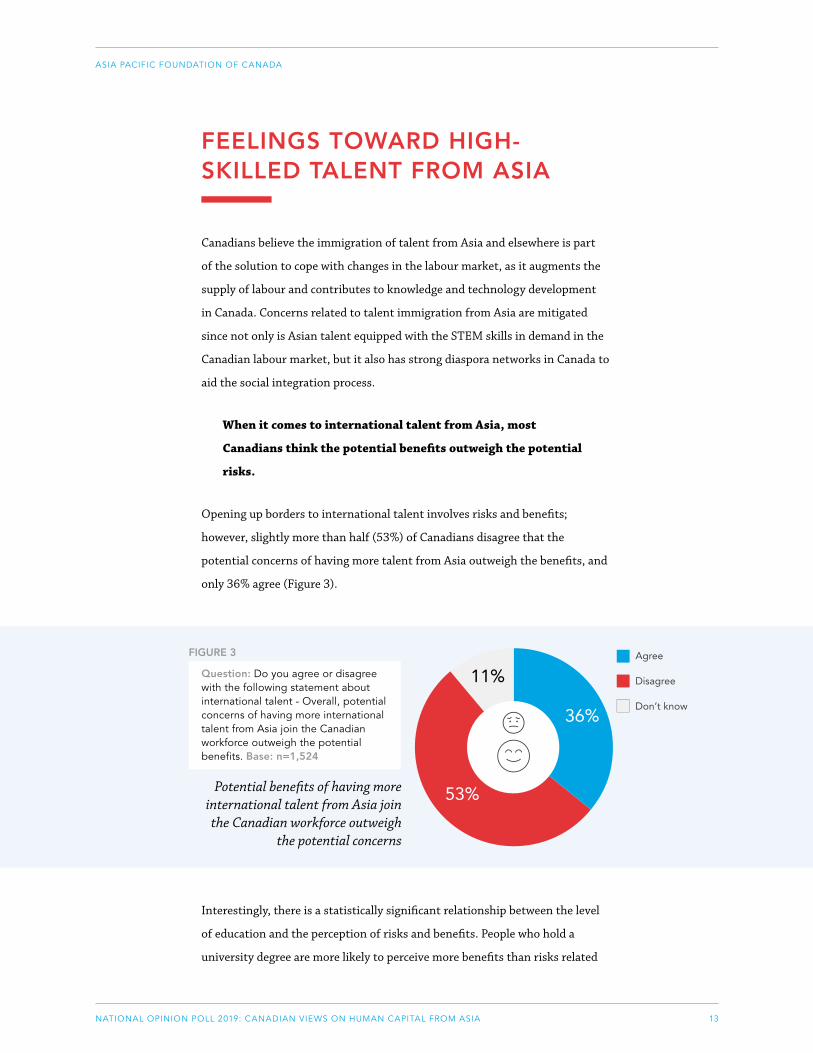
13NATIONAL OPINION POLL 2019: CANADIAN VIEWS ON HUMAN CAPITAL FROM ASIA
ASIA PACIFIC FOUNDATION OF CANADA
FEELINGS TOWARD HIGH-SKILLED TALENT FROM ASIA
Canadians believe the immigration of talent from Asia and elsewhere is part
of the solution to cope with changes in the labour market, as it augments the
supply of labour and contributes to knowledge and technology development
in Canada. Concerns related to talent immigration from Asia are mitigated
since not only is Asian talent equipped with the STEM skills in demand in the
Canadian labour market, but it also has strong diaspora networks in Canada to
aid the social integration process.
When it comes to international talent from Asia, most
Canadians think the potential benefits outweigh the potential
risks.
Opening up borders to international talent involves risks and benefits;
however, slightly more than half (53%) of Canadians disagree that the
potential concerns of having more talent from Asia outweigh the benefits, and
only 36% agree (Figure 3).
FIGURE 3
Potential benefits of having more international talent from Asia join the Canadian workforce outweigh the potential concerns
Don’t know
Agree
Disagree
Question: Do you agree or disagree with the following statement about international talent - Overall, potential concerns of having more international talent from Asia join the Canadian workforce outweigh the potential bene�ts. Base: n=1,524
11%
53%
36%
FIGURE 3
Question: Do you agree or disagree with the following statement about international talent - Overall, potential concerns of having more international talent from Asia join the Canadian workforce outweigh the potential benefits. Base: n=1,524
Potential benefits of having more international talent from Asia join the Canadian workforce outweigh
the potential concerns
Interestingly, there is a statistically significant relationship between the level
of education and the perception of risks and benefits. People who hold a
university degree are more likely to perceive more benefits than risks related
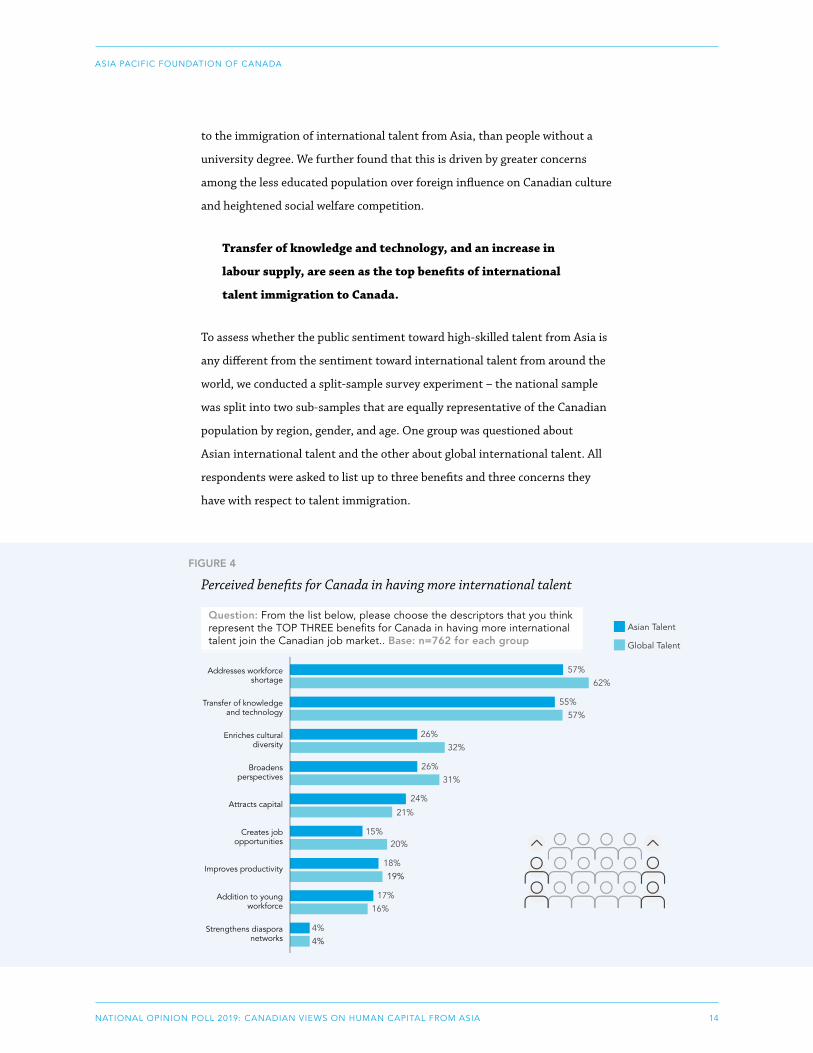
14NATIONAL OPINION POLL 2019: CANADIAN VIEWS ON HUMAN CAPITAL FROM ASIA
ASIA PACIFIC FOUNDATION OF CANADA
to the immigration of international talent from Asia, than people without a
university degree. We further found that this is driven by greater concerns
among the less educated population over foreign influence on Canadian culture
and heightened social welfare competition.
Transfer of knowledge and technology, and an increase in
labour supply, are seen as the top benefits of international
talent immigration to Canada.
To assess whether the public sentiment toward high-skilled talent from Asia is
any different from the sentiment toward international talent from around the
world, we conducted a split-sample survey experiment – the national sample
was split into two sub-samples that are equally representative of the Canadian
population by region, gender, and age. One group was questioned about
Asian international talent and the other about global international talent. All
respondents were asked to list up to three benefits and three concerns they
have with respect to talent immigration.
Transfer of knowledge and technology
55%57%
FIGURE 4
Perceived benefits for Canada in having more international talentQuestion: From the list below, please choose the descriptors that you think represent the TOP THREE bene�ts for Canada in having more international talent join the Canadian job market. Base: n=762 for each group
Addresses workforce shortage
57%62%
Broadens perspectives
Enriches cultural diversity
Creates job opportunities
Attracts capital
Addition to young workforce
Improves productivity
Strengthens diaspora networks
26%31%
26%32%
15%20%
24%
21%
17%16%
18%19%
4%4%
Asian Talent
Global Talent
FIGURE 4
Perceived benefits for Canada in having more international talent
Question: From the list below, please choose the descriptors that you think represent the TOP THREE benefits for Canada in having more international talent join the Canadian job market.. Base: n=762 for each group
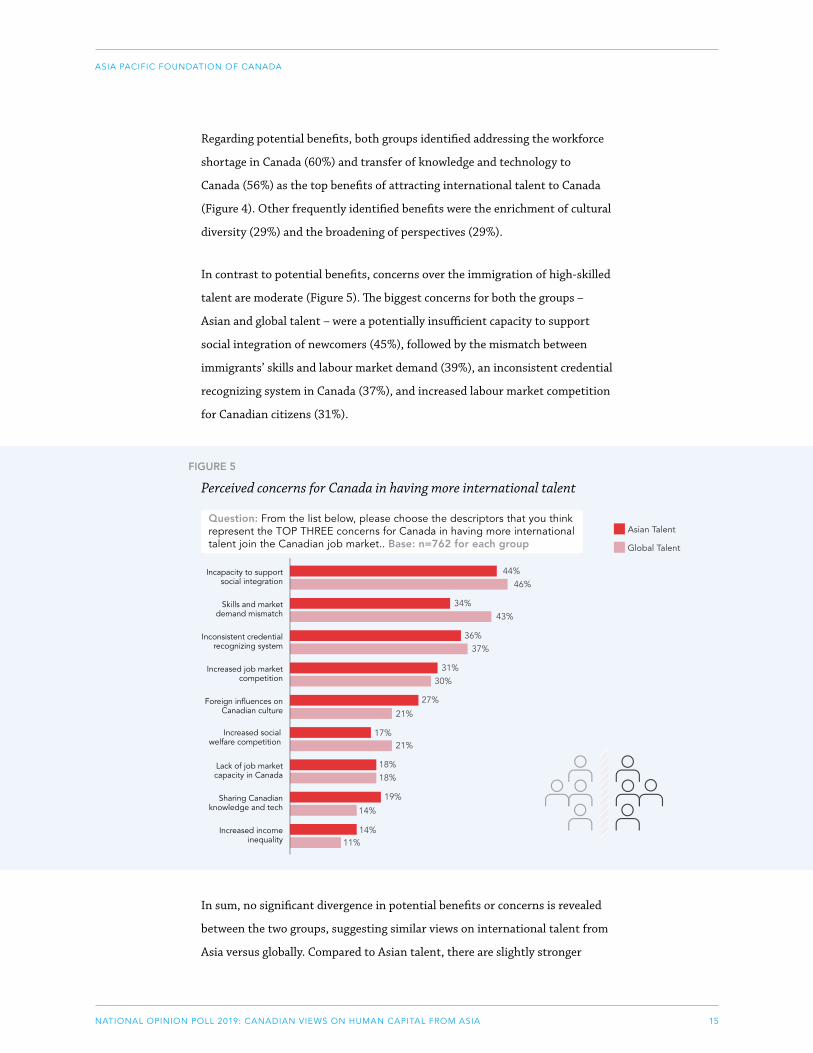
15NATIONAL OPINION POLL 2019: CANADIAN VIEWS ON HUMAN CAPITAL FROM ASIA
ASIA PACIFIC FOUNDATION OF CANADA
Regarding potential benefits, both groups identified addressing the workforce
shortage in Canada (60%) and transfer of knowledge and technology to
Canada (56%) as the top benefits of attracting international talent to Canada
(Figure 4). Other frequently identified benefits were the enrichment of cultural
diversity (29%) and the broadening of perspectives (29%).
In contrast to potential benefits, concerns over the immigration of high-skilled
talent are moderate (Figure 5). The biggest concerns for both the groups –
Asian and global talent – were a potentially insufficient capacity to support
social integration of newcomers (45%), followed by the mismatch between
immigrants’ skills and labour market demand (39%), an inconsistent credential
recognizing system in Canada (37%), and increased labour market competition
for Canadian citizens (31%).
FIGURE 5
Perceived concerns for Canada in having more international talent
Question: From the list below, please choose the descriptors that you think represent the TOP THREE concerns for Canada in having more international talent join the Canadian job market.. Base: n=762 for each group
Skills and market demand mismatch
34%43%
FIGURE 5
Perceived concerns for Canada in having more international talentQuestion: From the list below, please choose the descriptors that you think represent the TOP THREE concerns for Canada in having more international talent join the Canadian job market. Base: n=762 for each group
Incapacity to support social integration
44%46%
Increased job market competition
Inconsistent credential recognizing system
Increased social welfare competition
Foreign influences on Canadian culture
Sharing Canadian knowledge and tech
Lack of job market capacity in Canada
Increased income inequality
31%30%
36%37%
17%21%
27%
21%
19%
14%
18%18%
14%11%
Asian Talent
Global Talent
In sum, no significant divergence in potential benefits or concerns is revealed
between the two groups, suggesting similar views on international talent from
Asia versus globally. Compared to Asian talent, there are slightly stronger
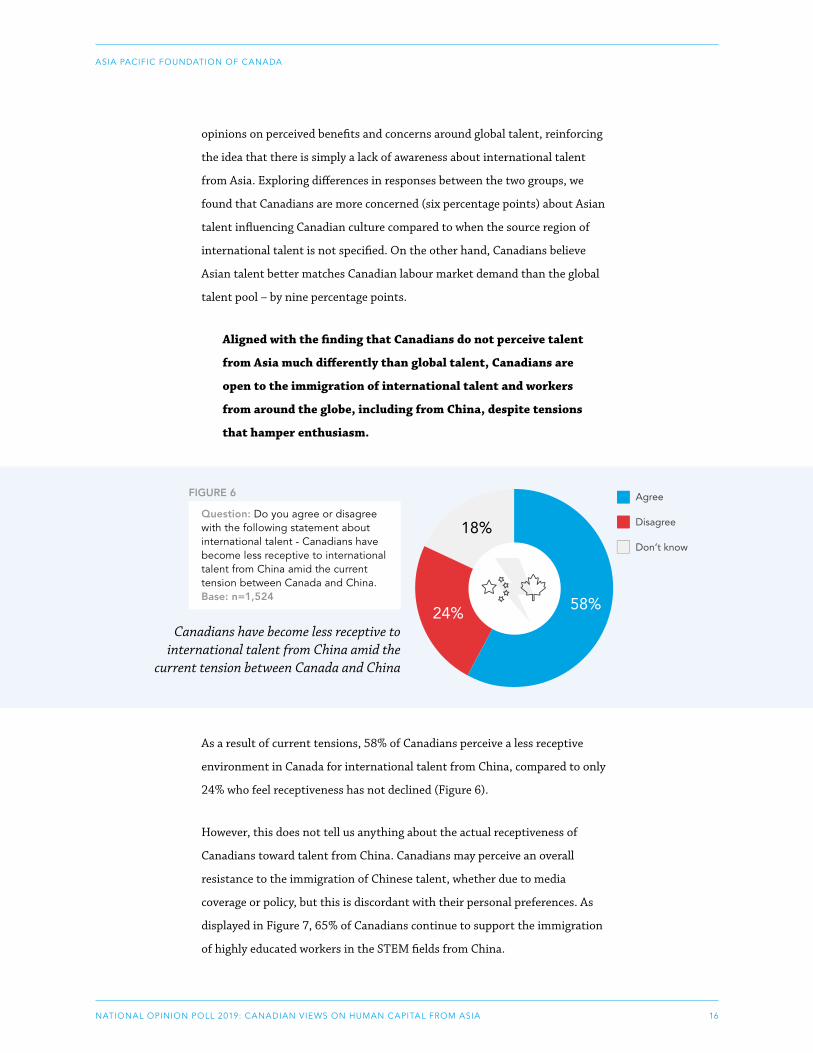
16NATIONAL OPINION POLL 2019: CANADIAN VIEWS ON HUMAN CAPITAL FROM ASIA
ASIA PACIFIC FOUNDATION OF CANADA
opinions on perceived benefits and concerns around global talent, reinforcing
the idea that there is simply a lack of awareness about international talent
from Asia. Exploring differences in responses between the two groups, we
found that Canadians are more concerned (six percentage points) about Asian
talent influencing Canadian culture compared to when the source region of
international talent is not specified. On the other hand, Canadians believe
Asian talent better matches Canadian labour market demand than the global
talent pool – by nine percentage points.
Aligned with the finding that Canadians do not perceive talent
from Asia much differently than global talent, Canadians are
open to the immigration of international talent and workers
from around the globe, including from China, despite tensions
that hamper enthusiasm.
FIGURE 6
Canadians have become less receptive to international talent from China amid the current tension between Canada and China
Don’t know
Agree
Disagree
Question: Do you agree or disagree with the following statement about international talent - Canadians have become less receptive to international talent from China amid the current tension between Canada and China. Base: n=1,524
18%
24% 58%
FIGURE 6
Question: Do you agree or disagree with the following statement about international talent - Canadians have become less receptive to international talent from China amid the current tension between Canada and China. Base: n=1,524
Canadians have become less receptive to international talent from China amid the
current tension between Canada and China
As a result of current tensions, 58% of Canadians perceive a less receptive
environment in Canada for international talent from China, compared to only
24% who feel receptiveness has not declined (Figure 6).
However, this does not tell us anything about the actual receptiveness of
Canadians toward talent from China. Canadians may perceive an overall
resistance to the immigration of Chinese talent, whether due to media
coverage or policy, but this is discordant with their personal preferences. As
displayed in Figure 7, 65% of Canadians continue to support the immigration
of highly educated workers in the STEM fields from China.
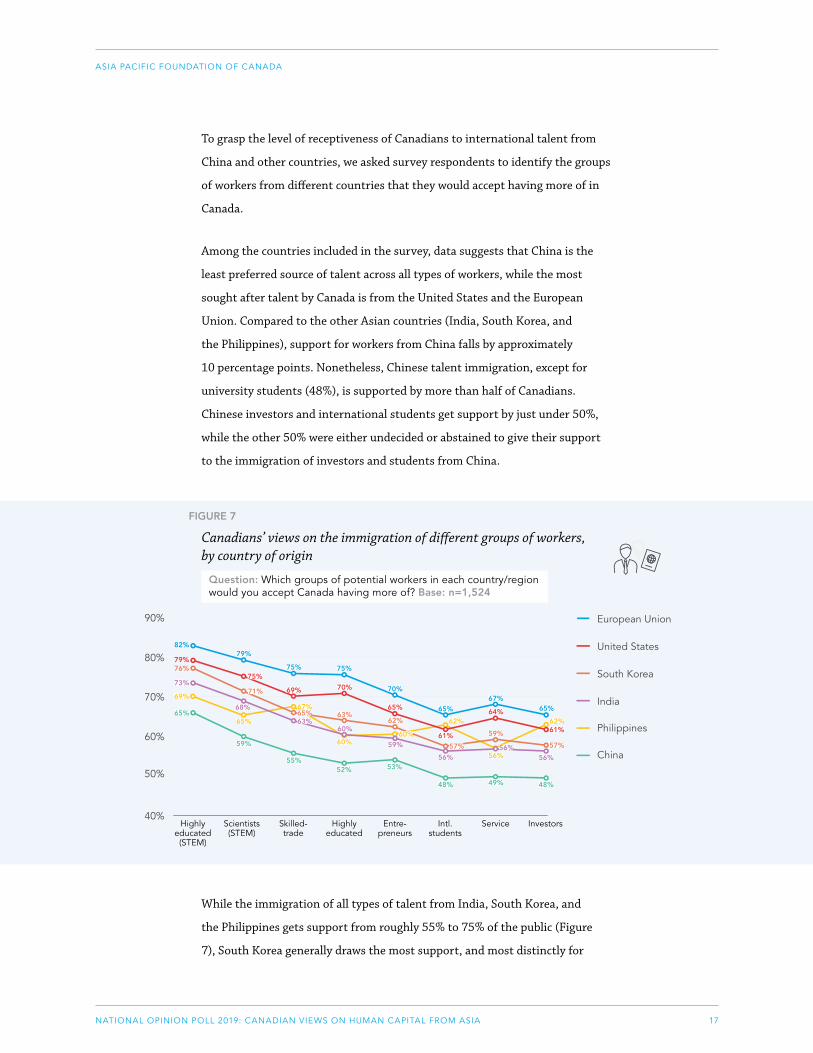
17NATIONAL OPINION POLL 2019: CANADIAN VIEWS ON HUMAN CAPITAL FROM ASIA
ASIA PACIFIC FOUNDATION OF CANADA
To grasp the level of receptiveness of Canadians to international talent from
China and other countries, we asked survey respondents to identify the groups
of workers from different countries that they would accept having more of in
Canada.
Among the countries included in the survey, data suggests that China is the
least preferred source of talent across all types of workers, while the most
sought after talent by Canada is from the United States and the European
Union. Compared to the other Asian countries (India, South Korea, and
the Philippines), support for workers from China falls by approximately
10 percentage points. Nonetheless, Chinese talent immigration, except for
university students (48%), is supported by more than half of Canadians.
Chinese investors and international students get support by just under 50%,
while the other 50% were either undecided or abstained to give their support
to the immigration of investors and students from China.
FIGURE 7
Canadians’ views on the immigration of different groups of workers, by country of origin
Question: Which groups of potential workers in each country/region would you accept Canada having more of? Base: n=1,524
90%
80%
70%
60%
50%
40%
European Union
United States
South Korea
India
Philippines
China
Scientists (STEM)
Highly educated(STEM)
Skilled-trade
Intl. students
Highly educated
ServiceEntre-preneurs
Investors
82%
79%76%
65%
69%
73%
65%
59%
68%
71%
75%
79%
75%
69%
67%65%63%
55%
75%
70%
63%
60%
60%
52%
70%
65%
62%
60%
53%
59%
65%
62%
61%57%
56%
48% 49%
56%56%
59%
64%
67%
48%
56%
57%
61%62%
65%
FIGURE 7
Canadians’ views on the immigration of different groups of workers, by country of origin
Question: Which groups of potential workers in each country/region would you accept Canada having more of? Base: n=1,524
While the immigration of all types of talent from India, South Korea, and
the Philippines gets support from roughly 55% to 75% of the public (Figure
7), South Korea generally draws the most support, and most distinctly for
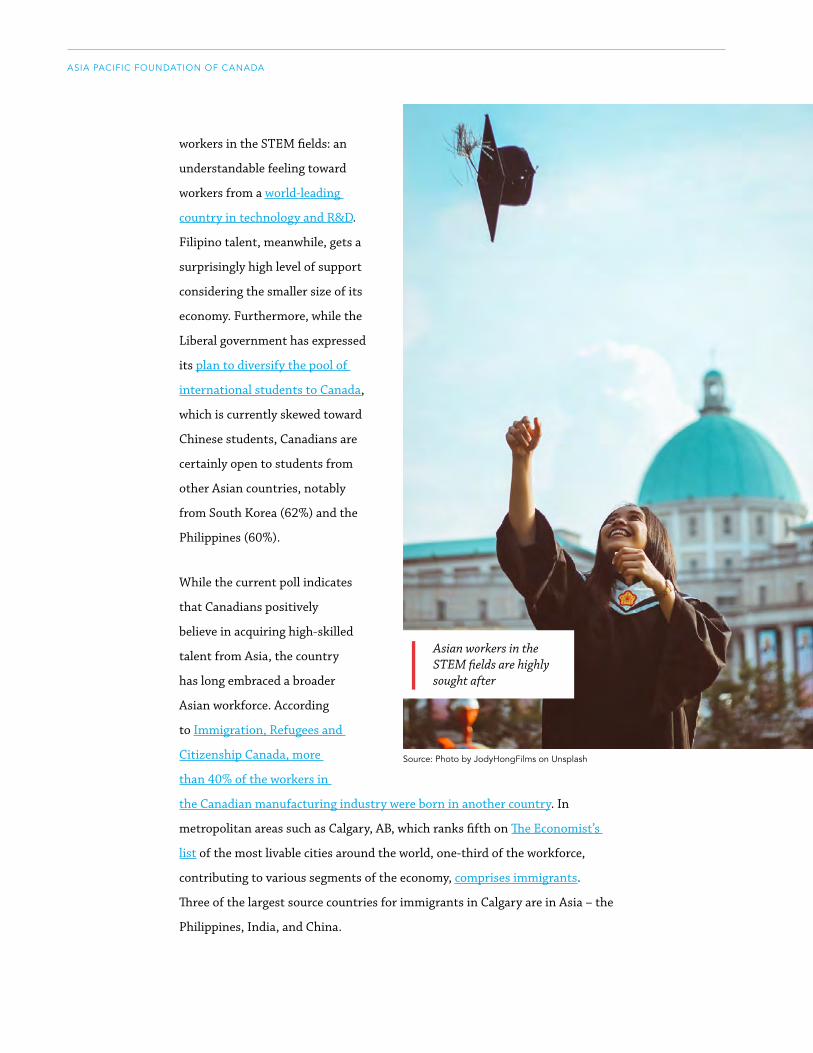
18NATIONAL OPINION POLL 2019: CANADIAN VIEWS ON HUMAN CAPITAL FROM ASIA
ASIA PACIFIC FOUNDATION OF CANADA
workers in the STEM fields: an
understandable feeling toward
workers from a world-leading
country in technology and R&D.
Filipino talent, meanwhile, gets a
surprisingly high level of support
considering the smaller size of its
economy. Furthermore, while the
Liberal government has expressed
its plan to diversify the pool of
international students to Canada,
which is currently skewed toward
Chinese students, Canadians are
certainly open to students from
other Asian countries, notably
from South Korea (62%) and the
Philippines (60%).
While the current poll indicates
that Canadians positively
believe in acquiring high-skilled
talent from Asia, the country
has long embraced a broader
Asian workforce. According
to Immigration, Refugees and
Citizenship Canada, more
than 40% of the workers in
the Canadian manufacturing industry were born in another country. In
metropolitan areas such as Calgary, AB, which ranks fifth on The Economist’s
list of the most livable cities around the world, one-third of the workforce,
contributing to various segments of the economy, comprises immigrants.
Three of the largest source countries for immigrants in Calgary are in Asia – the
Philippines, India, and China.
Source: Photo by JodyHongFilms on Unsplash
Asian workers in the STEM fields are highly sought after
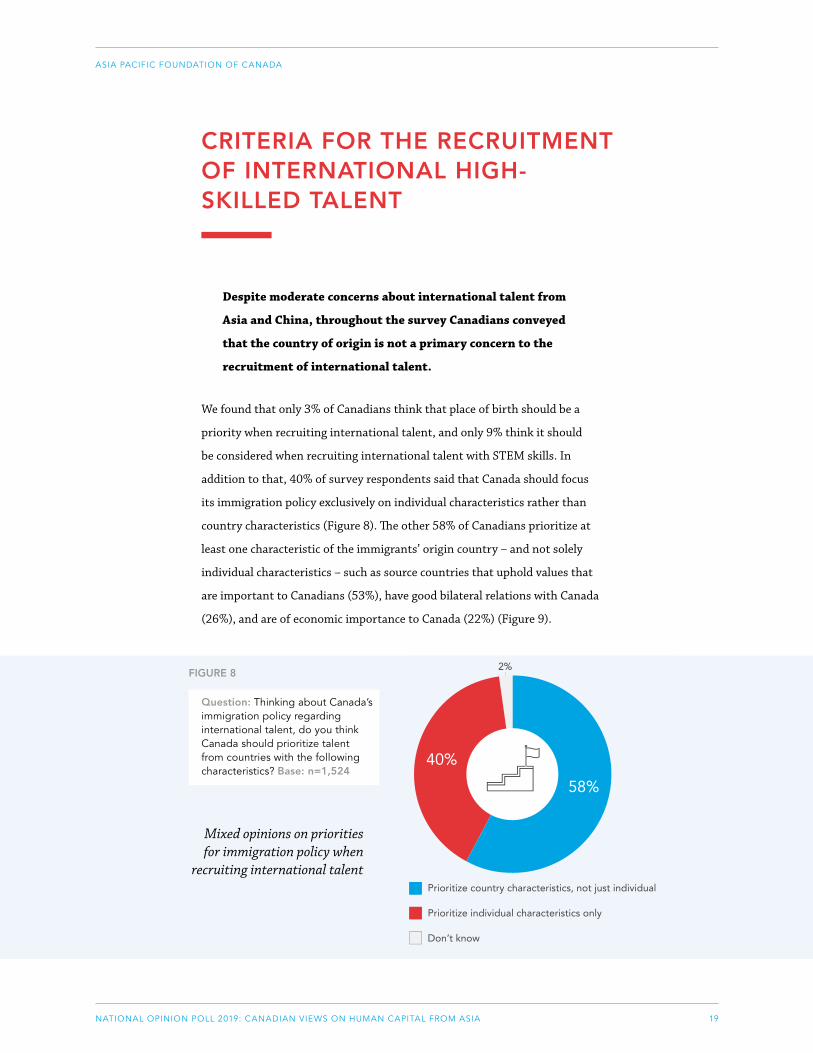
19NATIONAL OPINION POLL 2019: CANADIAN VIEWS ON HUMAN CAPITAL FROM ASIA
ASIA PACIFIC FOUNDATION OF CANADA
CRITERIA FOR THE RECRUITMENT OF INTERNATIONAL HIGH-SKILLED TALENT
Despite moderate concerns about international talent from
Asia and China, throughout the survey Canadians conveyed
that the country of origin is not a primary concern to the
recruitment of international talent.
We found that only 3% of Canadians think that place of birth should be a
priority when recruiting international talent, and only 9% think it should
be considered when recruiting international talent with STEM skills. In
addition to that, 40% of survey respondents said that Canada should focus
its immigration policy exclusively on individual characteristics rather than
country characteristics (Figure 8). The other 58% of Canadians prioritize at
least one characteristic of the immigrants’ origin country – and not solely
individual characteristics – such as source countries that uphold values that
are important to Canadians (53%), have good bilateral relations with Canada
(26%), and are of economic importance to Canada (22%) (Figure 9).
FIGURE 8
Mixed opinions on priorities for immigration policy when recruiting international talent
Don’t know
Prioritize country characteristics, not just individual
Prioritize individual characteristics only
Question: Thinking about Canada's immigration policy regarding international talent, do you think Canada should prioritize talentfrom countries with the following characteristics? Base: n=1,524
40%
58%
2%FIGURE 8
Question: Thinking about Canada’s immigration policy regarding international talent, do you think Canada should prioritize talentfrom countries with the following characteristics? Base: n=1,524
Mixed opinions on priorities for immigration policy when
recruiting international talent
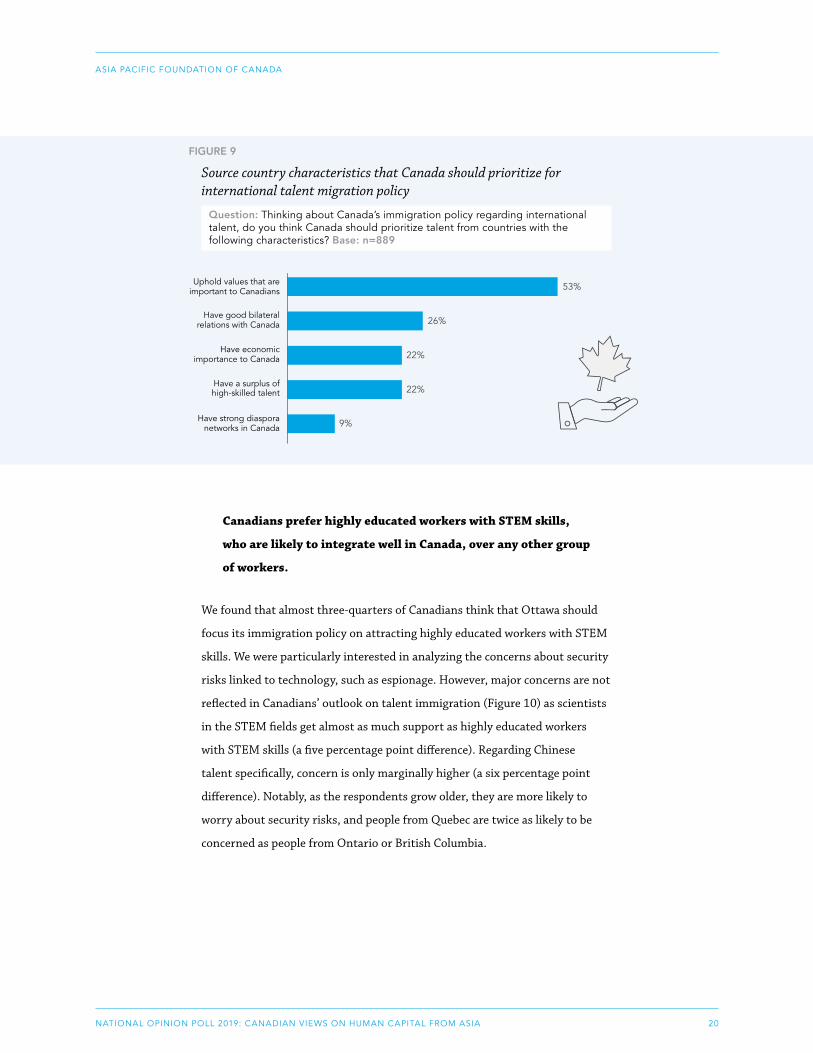
20NATIONAL OPINION POLL 2019: CANADIAN VIEWS ON HUMAN CAPITAL FROM ASIA
ASIA PACIFIC FOUNDATION OF CANADA
FIGURE 9
Source country characteristics that Canada should prioritize for international talent migration policy
Question: Thinking about Canada’s immigration policy regarding international talent, do you think Canada should prioritize talent from countries with the following characteristics? Base: n=889
Have good bilateral relations with Canada 26%
FIGURE 9
Source country characteristics that Canada should prioritize for international talent migration policy
Question: Thinking about Canada's immigration policy regarding international talent, do you think Canada should prioritize talent from countries with the following characteristics? Base: n=889
Uphold values that are important to Canadians 53%
Have economic importance to Canada
Have strong diaspora networks in Canada
Have a surplus of high-skilled talent 22%
22%
9%
Canadians prefer highly educated workers with STEM skills,
who are likely to integrate well in Canada, over any other group
of workers.
We found that almost three-quarters of Canadians think that Ottawa should
focus its immigration policy on attracting highly educated workers with STEM
skills. We were particularly interested in analyzing the concerns about security
risks linked to technology, such as espionage. However, major concerns are not
reflected in Canadians’ outlook on talent immigration (Figure 10) as scientists
in the STEM fields get almost as much support as highly educated workers
with STEM skills (a five percentage point difference). Regarding Chinese
talent specifically, concern is only marginally higher (a six percentage point
difference). Notably, as the respondents grow older, they are more likely to
worry about security risks, and people from Quebec are twice as likely to be
concerned as people from Ontario or British Columbia.
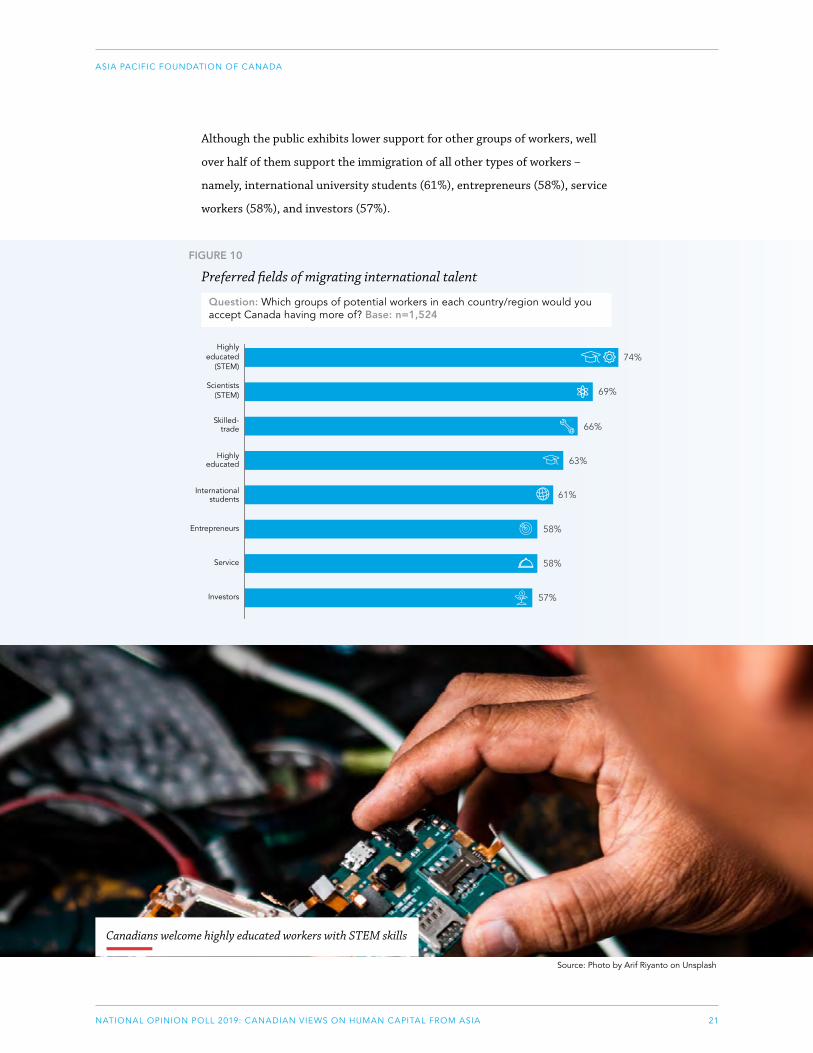
21NATIONAL OPINION POLL 2019: CANADIAN VIEWS ON HUMAN CAPITAL FROM ASIA
ASIA PACIFIC FOUNDATION OF CANADA
Although the public exhibits lower support for other groups of workers, well
over half of them support the immigration of all other types of workers –
namely, international university students (61%), entrepreneurs (58%), service
workers (58%), and investors (57%).
FIGURE 10
Preferred fields of migrating international talent
Question: Which groups of potential workers in each country/region would you accept Canada having more of? Base: n=1,524
FIGURE 10
Preferred fields of migrating international talentQuestion: Which groups of potential workers in each country/region would you accept Canada having more of? Base: n=1,524
Scientists (STEM) 69%
Highly educated
(STEM)74%
Skilled-trade
International students
Highly educated
Service
Entrepreneurs
63%
66%
58%
61%
57%
58%
Investors
Source: Photo by Arif Riyanto on Unsplash
Canadians welcome highly educated workers with STEM skills
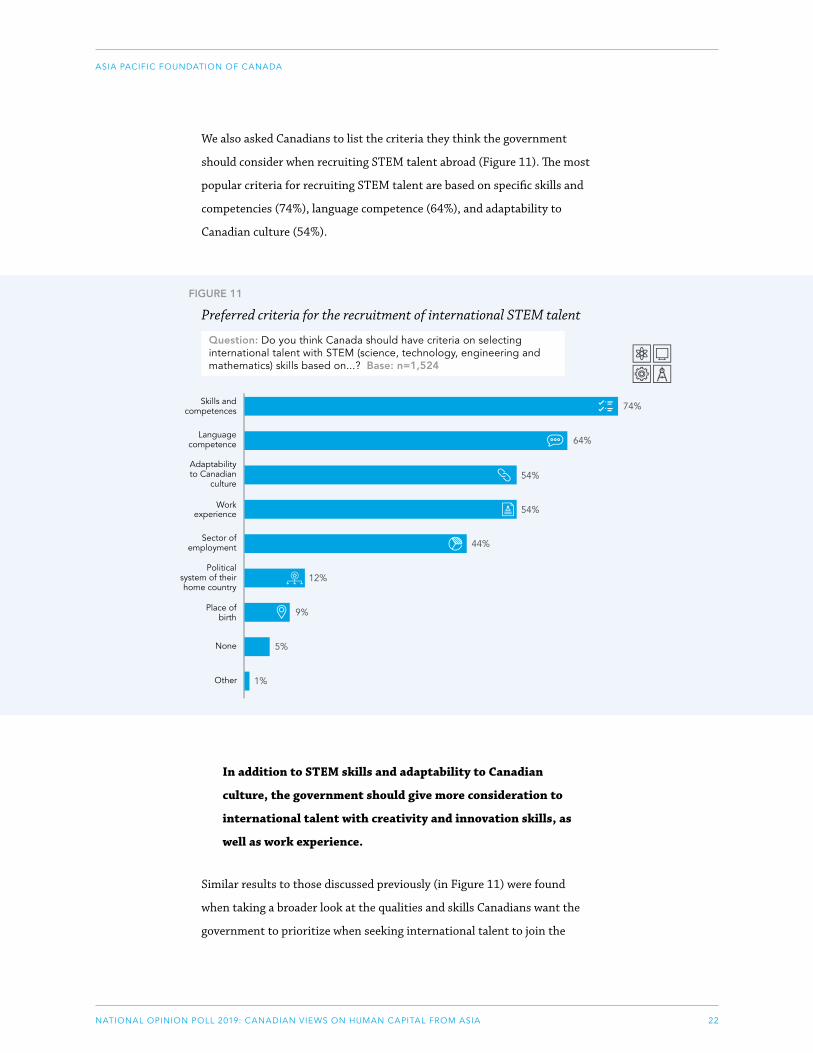
22NATIONAL OPINION POLL 2019: CANADIAN VIEWS ON HUMAN CAPITAL FROM ASIA
ASIA PACIFIC FOUNDATION OF CANADA
We also asked Canadians to list the criteria they think the government
should consider when recruiting STEM talent abroad (Figure 11). The most
popular criteria for recruiting STEM talent are based on specific skills and
competencies (74%), language competence (64%), and adaptability to
Canadian culture (54%).
FIGURE 11
Preferred criteria for the recruitment of international STEM talent
Question: Do you think Canada should have criteria on selecting international talent with STEM (science, technology, engineering and mathematics) skills based on...? Base: n=1,524
FIGURE 11
Preferred criteria for the recruitment of international STEM talentQuestion: Do you think Canada should have criteria on selecting international talent with STEM (science, technology, engineering and mathematics) skills based on...? Base: n=1,524
Language competence 64%
Skills and competences 74%
Adaptability to Canadian
culture
Sector of employment
Work experience
Place of birth
Political system of their home country
54%
54%
12%
44%
5%
9%
None
Other 1%
In addition to STEM skills and adaptability to Canadian
culture, the government should give more consideration to
international talent with creativity and innovation skills, as
well as work experience.
Similar results to those discussed previously (in Figure 11) were found
when taking a broader look at the qualities and skills Canadians want the
government to prioritize when seeking international talent to join the
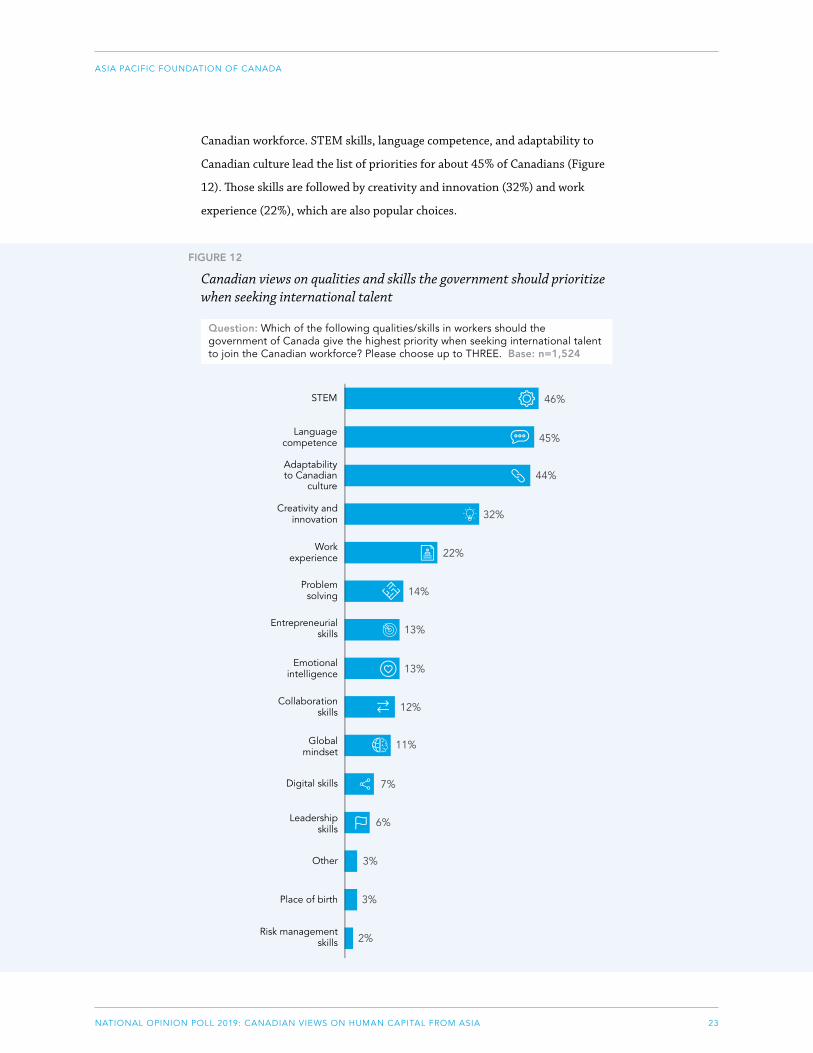
23NATIONAL OPINION POLL 2019: CANADIAN VIEWS ON HUMAN CAPITAL FROM ASIA
ASIA PACIFIC FOUNDATION OF CANADA
FIGURE 12
Canadian views on qualities and skills the government should prioritize when seeking international talent
Question: Which of the following qualities/skills in workers should the government of Canada give the highest priority when seeking international talent to join the Canadian workforce? Please choose up to THREE. Base: n=1,524
Language competence 45%
STEM 46%
Adaptability to Canadian
culture
Work experience
Entrepreneurial skills
Problemsolving
32%
44%
14%
13%
13%
Emotional intelligence
Collaborationskills 12%
Creativity and innovation
Digital skills
Global mindset
Leadership skills
Other
Place of birth
Risk managementskills
22%
3%
11%
7%
6%
3%
2%
Canadian workforce. STEM skills, language competence, and adaptability to
Canadian culture lead the list of priorities for about 45% of Canadians (Figure
12). Those skills are followed by creativity and innovation (32%) and work
experience (22%), which are also popular choices.

24NATIONAL OPINION POLL 2019: CANADIAN VIEWS ON HUMAN CAPITAL FROM ASIA
ASIA PACIFIC FOUNDATION OF CANADA
Finally, according to the McKinsey Global Institute, emotional skill has been
identified, alongside STEM skills, as an essential skill for the labour market
of the future. However, we found that emotional intelligence is considered
a priority by only 13% of Canadians, which might be an underestimation of
the importance of this skill for the future of work. Emotional intelligence was
defined by early proponents Peter Salovey and John Mayer as “the ability to
monitor one’s own and others’ emotions, to discriminate among them, and to
use the information to guide one’s thinking and actions.”
Source: Photo by Mimi Thian on Unsplash
Emotional intelligence ranks low on Canadians' priorities when seeking international talent
25NATIONAL OPINION POLL 2019: CANADIAN VIEWS ON HUMAN CAPITAL FROM ASIA
ASIA PACIFIC FOUNDATION OF CANADA
IMMIGRATION AND PUBLIC POLICY
In 2016, a Canadian government-led national opinion poll on immigration
showed that more than twice as many Canadians supported an increase in the
number of immigrants as Canadians who opposed it. In 2019, we found that
this has not changed, as Canadians endorse broadening immigration policies to
secure more international talent and expanding immigration programs.
Canadians are in favour of a more open immigration policy to
Asian talent, including from China.
We asked Canadians if they supported or opposed different immigration
policies geared toward attracting and retaining international talent from
Asia. In doing so, we conducted a split-sample survey experiment, asking the
same questions to two equally representative sub-samples of the Canadian
population by region, gender, and age. To further assess the difference in
sentiments toward China specifically, one group was asked if they supported
policies aimed at Chinese immigrants and the second group was asked if they
supported policies aimed at Asian immigrants more broadly.
The six policies that were proposed are supported by a majority of Canadians,
for both China and Asia (Figure 13). Even though about 10% of the
respondents do not have an opinion on the question, there remains support
from more than 50% of Canadians for each policy. The most popular policies
for Asia are encouraging university students to gain experience in Canada
through exchange or co-op programs (77%), extending the length of temporary
work permits for international talent (70%), encouraging family reunification
for immigrating talent through visa programs (67%), and providing support
for career development for international students (62%).
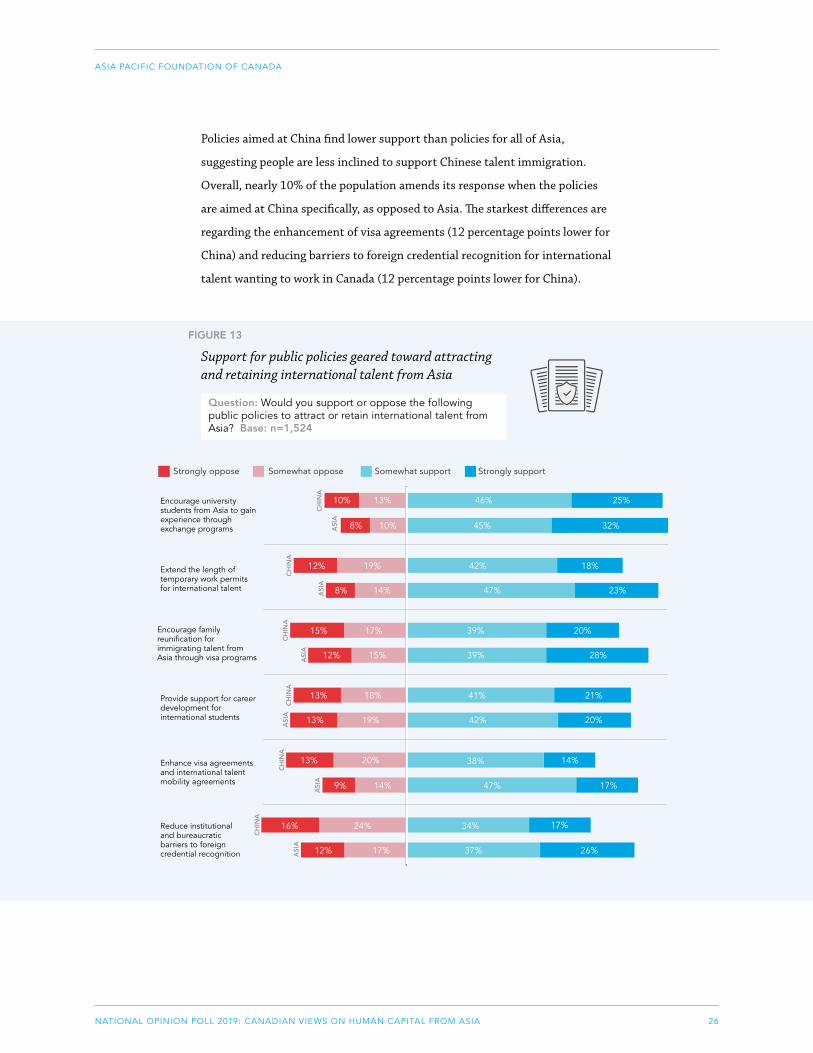
26NATIONAL OPINION POLL 2019: CANADIAN VIEWS ON HUMAN CAPITAL FROM ASIA
ASIA PACIFIC FOUNDATION OF CANADA
Policies aimed at China find lower support than policies for all of Asia,
suggesting people are less inclined to support Chinese talent immigration.
Overall, nearly 10% of the population amends its response when the policies
are aimed at China specifically, as opposed to Asia. The starkest differences are
regarding the enhancement of visa agreements (12 percentage points lower for
China) and reducing barriers to foreign credential recognition for international
talent wanting to work in Canada (12 percentage points lower for China).
FIGURE 13
Support for public policies geared toward attracting and retaining international talent from Asia
Question: Would you support or oppose the following public policies to attract or retain international talent from Asia? Base: n=1,524
FIGURE 13
Support for public policies geared toward attracting and retaining international talent from Asia
Question: Would you support or oppose the following public policies to attract or retain international talent from Asia? Base: n=1,524
Strongly oppose Somewhat oppose Somewhat support Strongly support
10% 13% 46% 25%
8% 10% 45% 32%
12% 19% 42% 18%
8% 14% 47% 23%
15% 17% 39% 20%
12% 15% 39% 28%
13% 18% 41% 21%
13% 19% 42% 20%
13% 20% 38% 14%
9% 14% 47% 17%
16% 24% 34% 17%
12% 17% 37% 26%
Encourage university students from Asia to gain experience through exchange programs
Extend the length of temporary work permits for international talent
Encourage family reuni�cation for immigrating talent from Asia through visa programs
Provide support for career development for international students
Enhance visa agreements and international talent mobility agreements
Reduce institutional and bureaucratic barriers to foreign credential recognition
27NATIONAL OPINION POLL 2019: CANADIAN VIEWS ON HUMAN CAPITAL FROM ASIA
ASIA PACIFIC FOUNDATION OF CANADA
In a recent report from Georgetown University on strengthening the artificial
intelligence (AI) workforce in the United States, the authors acknowledge
the global talent shortage with regard to the field of AI, and that it can
have negative outcomes in terms of the economy and security. In Canada,
immigration minister Ahmed Hussen further declared that Canada must be
proactive and smart in its immigration policy if it wants to remain a global
leader in attracting high-skilled talent and sustain the Canadian labour market
supply. The recommendations from the Georgetown University report and the
position of Canada’s immigration minister are in sync with our 2019 National
Opinion Poll findings. It can be deduced from the data that open immigration
policies that attract and retain foreign-born, high-skilled workers and students
in Canada, particularly those with STEM skills, are a pertinent issue for the
public, as was underscored in the previous section (in Figure 10).
Following from this poll, it can be argued that the Canadian government needs
to frame policies that promote exchange programs for international students,
such as the Kakehashi project that encourages student exchange between
Japan and Canada, and provide support for the students’ career development
in Canada. The government also needs to reduce institutional and bureaucratic
barriers to foreign credential recognition, and encourage professional (medical,
law, etc.) associations to do the same in order to prevent billion-dollar
losses to the Canadian economy. Furthermore, it is pertinent to enhance
the agreements that promote international talent mobility, improve family
reunification visa programs for high-skilled workers, and extend the length of
temporary work permits given to international talent, thereby making Canada
a more lucrative destination. Ottawa needs to consider further research in
identifying the educational degrees that are most useful for the Canadian
labour market, locate the problems that incoming international talent are
facing, and overall reduce the barriers for retaining such talent.
Broader immigration programs also have an impact on talent in the Canadian
labour market by promoting the immigration of international talent as
investors or entrepreneurs, and by growing the demand for high-skilled
workers when investment is made in fields requiring such workers.
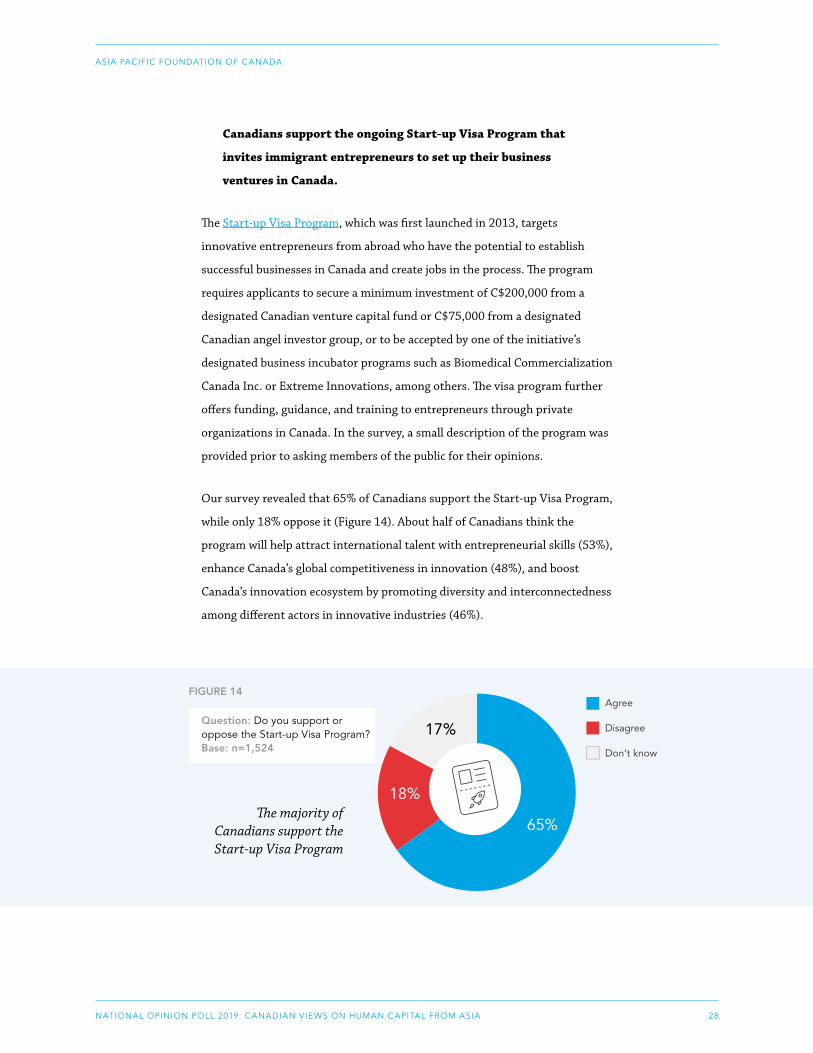
28NATIONAL OPINION POLL 2019: CANADIAN VIEWS ON HUMAN CAPITAL FROM ASIA
ASIA PACIFIC FOUNDATION OF CANADA
Canadians support the ongoing Start-up Visa Program that
invites immigrant entrepreneurs to set up their business
ventures in Canada.
The Start-up Visa Program, which was first launched in 2013, targets
innovative entrepreneurs from abroad who have the potential to establish
successful businesses in Canada and create jobs in the process. The program
requires applicants to secure a minimum investment of C$200,000 from a
designated Canadian venture capital fund or C$75,000 from a designated
Canadian angel investor group, or to be accepted by one of the initiative’s
designated business incubator programs such as Biomedical Commercialization
Canada Inc. or Extreme Innovations, among others. The visa program further
offers funding, guidance, and training to entrepreneurs through private
organizations in Canada. In the survey, a small description of the program was
provided prior to asking members of the public for their opinions.
Our survey revealed that 65% of Canadians support the Start-up Visa Program,
while only 18% oppose it (Figure 14). About half of Canadians think the
program will help attract international talent with entrepreneurial skills (53%),
enhance Canada’s global competitiveness in innovation (48%), and boost
Canada’s innovation ecosystem by promoting diversity and interconnectedness
among different actors in innovative industries (46%). FIGURE 14
The majority of Canadians support the Start-up Visa Program
Question: Do you support or oppose the Start-up Visa Program?Base: n=1,524
17%
18%
65%
Don’t know
Agree
Disagree
FIGURE 14
Question: Do you support or oppose the Start-up Visa Program? Base: n=1,524
The majority of Canadians support the Start-up Visa Program
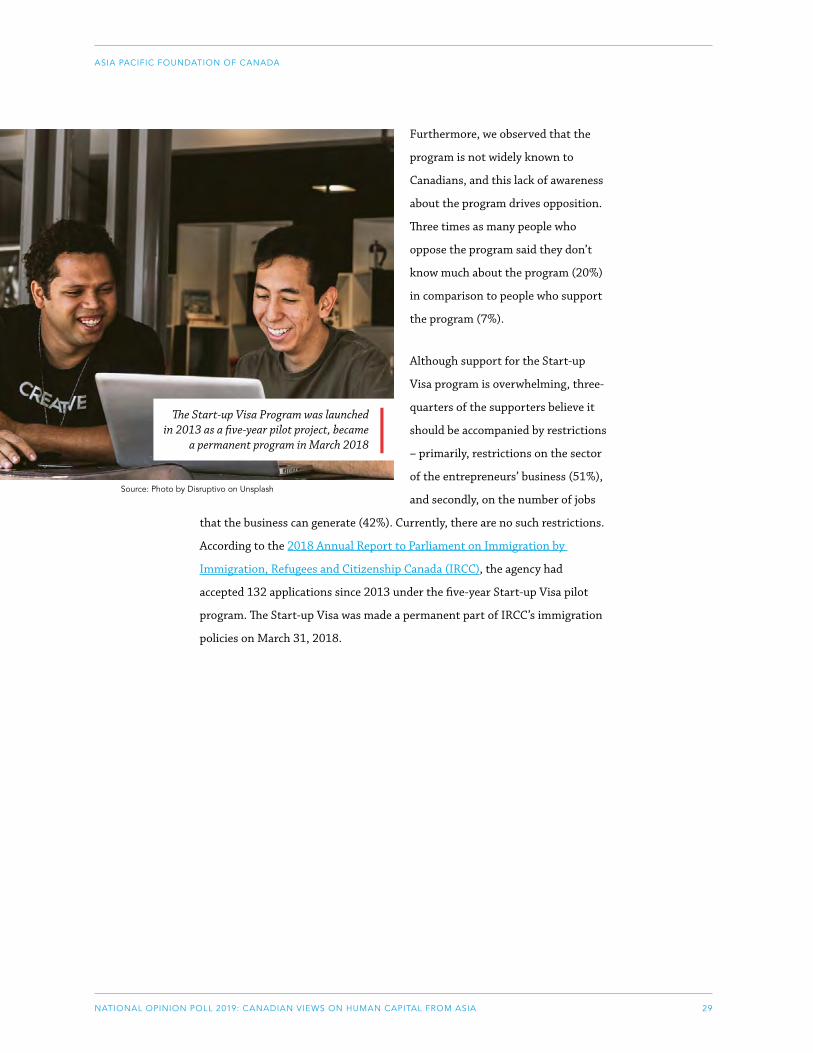
29NATIONAL OPINION POLL 2019: CANADIAN VIEWS ON HUMAN CAPITAL FROM ASIA
ASIA PACIFIC FOUNDATION OF CANADA
Furthermore, we observed that the
program is not widely known to
Canadians, and this lack of awareness
about the program drives opposition.
Three times as many people who
oppose the program said they don’t
know much about the program (20%)
in comparison to people who support
the program (7%).
Although support for the Start-up
Visa program is overwhelming, three-
quarters of the supporters believe it
should be accompanied by restrictions
– primarily, restrictions on the sector
of the entrepreneurs’ business (51%),
and secondly, on the number of jobs
that the business can generate (42%). Currently, there are no such restrictions.
According to the 2018 Annual Report to Parliament on Immigration by
Immigration, Refugees and Citizenship Canada (IRCC), the agency had
accepted 132 applications since 2013 under the five-year Start-up Visa pilot
program. The Start-up Visa was made a permanent part of IRCC’s immigration
policies on March 31, 2018.
Source: Photo by Disruptivo on Unsplash
The Start-up Visa Program was launched in 2013 as a five-year pilot project, became
a permanent program in March 2018
30NATIONAL OPINION POLL 2019: CANADIAN VIEWS ON HUMAN CAPITAL FROM ASIA
ASIA PACIFIC FOUNDATION OF CANADA
POLITICAL DIFFERENCES OVER HIGH-SKILLED INTERNATIONAL TALENT FROM ASIA
There is a stark divide in response across political party lines in terms
of perceptions of the state of the Canadian high-skilled talent market,
international talent recruitment priorities, and Asian and Chinese talent
immigration.
While Liberals are more likely than Conservatives to perceive
a lack of high-skilled talent in Canada and to be open to Asian
immigration, both Liberals and Conservatives recognize
distinct benefits from the immigration of international talent.
We asked survey respondents which political party is most closely aligned with
their political views in federal politics. The weighted sample of respondents
is composed of 28% Liberals, 22% Conservatives, 17% New Democrats,
13% who associate with the Green Party, 10% who associate with other
parties, and 10% who preferred not to disclose their political views. We then
identified statistically significant variation in opinions among Canadians with
contrasting political views.
Sixty-five percent of Liberals and 53% of Conservatives believe a shortage of
high-skilled workers is becoming a deterrent to Canada’s competitiveness in
the global economy. At the same time, 44% more Liberals than Conservatives
are likely to look toward Asia for international talent in the next 10 years.
This drastic difference cannot entirely be explained by the fact that Liberals
are more likely to perceive a shortage of high-skilled workers. Both New
Democrats and Green Party supporters are as unlikely as Conservatives to
perceive a shortage of workers, but are almost as likely as Liberals to look
toward Asia for international talent. Rather, this difference can be explained by
different sentiments toward Asia. Canadians sharing different political views
exhibit major differences in their perception of the benefits and concerns of
Asian talent immigration.

31NATIONAL OPINION POLL 2019: CANADIAN VIEWS ON HUMAN CAPITAL FROM ASIA
ASIA PACIFIC FOUNDATION OF CANADA
First, 51% of New Democrats perceive the enrichment of cultural diversity as
a prime benefit of international talent immigration from Asia to Canada. The
same is true for 29% of Liberals, but only 8% of Conservatives. Concurrently,
nearly 30% of both Liberals and Conservatives think immigration from Asia is
especially beneficial for capital attraction.
Second, reflecting upon the concerns of having more international talent from
Asia, Conservatives identified one of their main concerns as the influence of
Asia on Canadian culture (44%), compared to 22% of Liberals, 17% of Green
Party supporters, and 15% of New Democrats sharing the same concern.
Conjoined with that uneasiness, more than half of the respondents who
identified as Conservatives think Canada should include Canadian language
competencies and adaptability to Canadian culture as the highest priorities
when recruiting talent, something that is not true for the other parties.
In addition, 32% of Conservatives are concerned about increased social
welfare competition for Canadian citizens, whereas only 14% of Green Party
supporters, 13% of Liberals, and 8% of New Democrats are concerned with
increased welfare competition.
Unlike all other major political parties in Canada,
Conservatives mostly oppose public policies supporting
Chinese and Asian talent immigration to Canada.
It is pertinent to consider the qualities and skills, prioritized by the public,
in selecting international talent, as they inevitably shape stances on public
policies focusing on international talent immigration. While Conservatives
give more importance to language competencies and adaptability to Canadian
culture, Liberals and New Democrats give much more importance to
individual characteristics such as creativity, innovation, as well as skills and
competencies. However, Liberals side with Conservatives on one thing: as
opposed to Green Party supporters and New Democrats, supporters of the two
dominant parties of Canada give more importance to immigrants coming from
countries that uphold values that are important to Canadians, regardless of
individual characteristics.
As seen in Figure 15a, Conservatives ride alone when it comes to international
talent immigration policy regarding Asia. Liberals, New Democrats, and
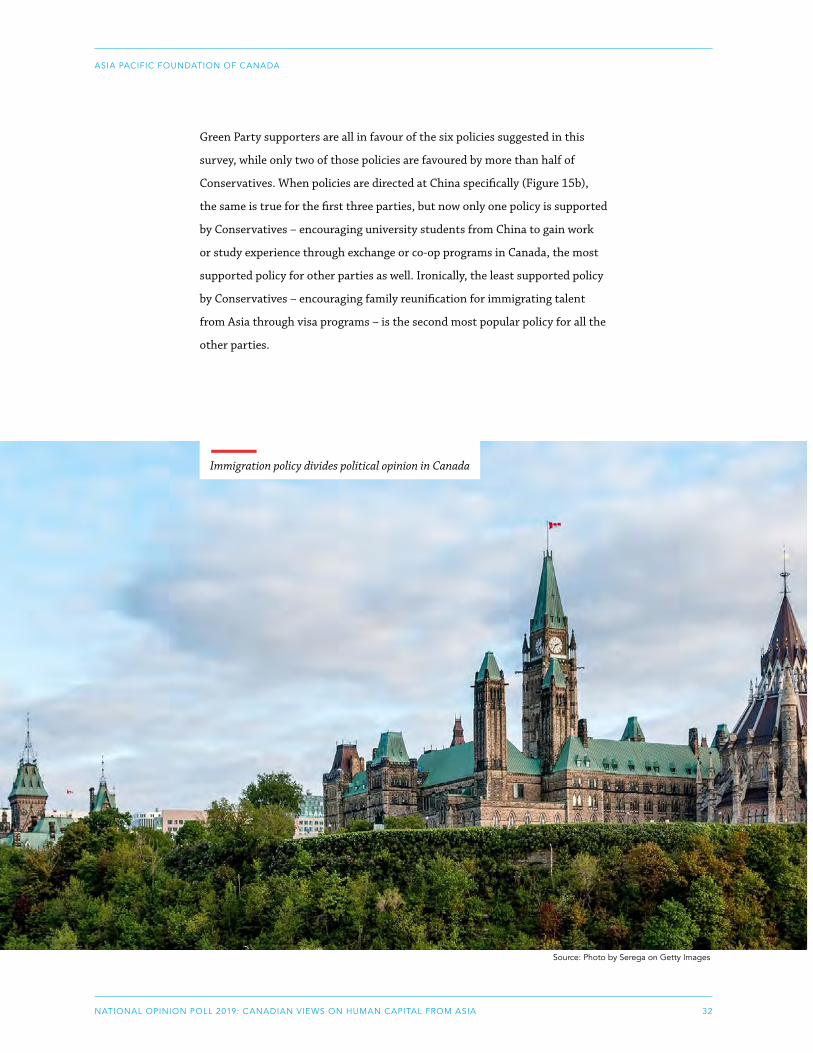
32NATIONAL OPINION POLL 2019: CANADIAN VIEWS ON HUMAN CAPITAL FROM ASIA
ASIA PACIFIC FOUNDATION OF CANADA
Green Party supporters are all in favour of the six policies suggested in this
survey, while only two of those policies are favoured by more than half of
Conservatives. When policies are directed at China specifically (Figure 15b),
the same is true for the first three parties, but now only one policy is supported
by Conservatives – encouraging university students from China to gain work
or study experience through exchange or co-op programs in Canada, the most
supported policy for other parties as well. Ironically, the least supported policy
by Conservatives – encouraging family reunification for immigrating talent
from Asia through visa programs – is the second most popular policy for all the
other parties.
Source: Photo by Serega on Getty Images
Immigration policy divides political opinion in Canada
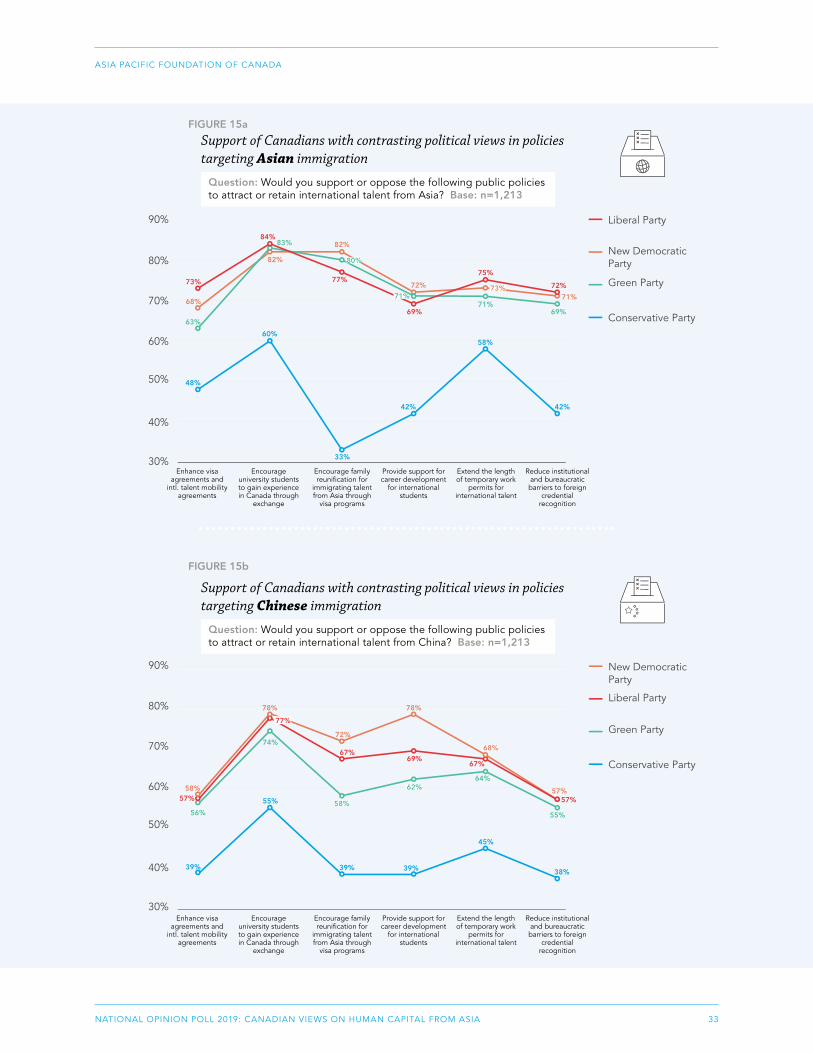
33NATIONAL OPINION POLL 2019: CANADIAN VIEWS ON HUMAN CAPITAL FROM ASIA
ASIA PACIFIC FOUNDATION OF CANADA
FIGURE 15a
Support of Canadians with contrasting political views in policies targeting Asian immigration
Question: Would you support or oppose the following public policies to attract or retain international talent from Asia? Base: n=1,213
FIGURE 15(a)
Support of Canadians with contrasting political views in policies targeting Asian immigration
90%
80%
70%
60%
50%
40%
Enhance visa agreements and
intl. talent mobility agreements
30%Encourage
university students to gain experience in Canada through
exchange
Encourage family reuni�cation for
immigrating talent from Asia through
visa programs
Provide support for career development
for international students
Extend the length of temporary work
permits for international talent
Reduce institutional and bureaucratic barriers to foreign
credential recognition
Question: Would you support or oppose the following public policies to attract or retain international talent from Asia? Base: n=1,213
Liberal Party
Conservative Party
New Democratic Party
Green Party73%
68%
63%
48%
84%
82%
83%
60%
77%
82%
80%
33%
69%
72%
42%
75%
71%
58%
72%
71%
69%
42%
71%73%
FIGURE 15b
Support of Canadians with contrasting political views in policies targeting Chinese immigration
Question: Would you support or oppose the following public policies to attract or retain international talent from China? Base: n=1,213
FIGURE 15(b)
Support of Canadians with contrasting political views in policies targeting Chinese immigration
Question: Would you support or oppose the following public policies to attract or retain international talent from China? Base: n=1,213
90%
80%
70%
60%
50%
40%
Enhance visa agreements and
intl. talent mobility agreements
30%Encourage
university students to gain experience in Canada through
exchange
Encourage family reuni�cation for
immigrating talent from Asia through
visa programs
Provide support for career development
for international students
Extend the length of temporary work
permits for international talent
Reduce institutional and bureaucratic barriers to foreign
credential recognition
New Democratic Party
Conservative Party
Liberal Party
Green Party
57%58%
56%
39%
78%
74%
55%
67%
72%
58%
39%
69%
78%
39%
67%
64%
45%
57%57%
55%
38%
62%
68%
77%
34NATIONAL OPINION POLL 2019: CANADIAN VIEWS ON HUMAN CAPITAL FROM ASIA
ASIA PACIFIC FOUNDATION OF CANADA
CONCLUSION
Asia offers one of the few promising opportunities to strengthen the high-
skilled workforce that Canada needs to meet the labour market demand in
a Canadian economy that seeks to remain globally competitive. The Asian
region, a leader in the high-tech sector, is booming with a young and educated
workforce and has strong ties to Canada. The key takeaway from the Asia
Pacific Foundation of Canada’s 2019 National Opinion Poll: Canadian Views
on Human Capital from Asia is that most Canadians want the government
to develop public policies promoting the immigration of international talent
from Asia to Canada to compensate for Canada’s lack of high-skilled workers.
Concerns toward China have risen amid the current trade war between
the United States and China and the Huawei affair, but our poll found that
Canadians are generally willing to withhold their concerns toward China and
Asia to recruit talent, especially in the STEM fields. Additional implications
and policy recommendations can be drawn from the results of the survey.
First, although most Canadians think benefits outweigh concerns regarding
Asian talent immigration, a sizable 36% of the public feels otherwise.
Therefore, if the Canadian government chooses to move forward with the
majority’s desire to attract more Asian talent, it will also need to address
public concerns. Some of the primary concerns over recruiting Asian talent
are increased labour market competition and foreign influence on Canadian
culture. For the former, policies extending Canadian workers’ job protection
would mitigate the impact of changes in the labour market and further
protect Canadians who are vulnerable to international competition. In case
of concerns about Asian influence on Canadian culture, it can be mitigated
in two ways. On one hand, actions can be taken to promote Canadian culture
and values among incoming international (Asian) workers through social
integration practices, education, and training, thereby enabling them to adapt
to life in Canada. On the other hand, the concerns about Asian influence on
Canadian culture may be driven by a lack of awareness and could be alleviated
by building Asia competency among Canadians through education and other
public programs. As identified by Thomson (2010), the process of settling
35NATIONAL OPINION POLL 2019: CANADIAN VIEWS ON HUMAN CAPITAL FROM ASIA
ASIA PACIFIC FOUNDATION OF CANADA
and integrating immigrants into the country is a two-way process, and it
requires a commitment from both the immigrants and Canadians: the former
have to adapt while the latter must learn to be supportive and welcome the
newcomers.
Second, while the incapacity to support social integration of high-skilled
immigrants has been identified in this poll as the greatest concern by the
Canadian public, as underscored by Kaushik and Drolet in their 2018 article,
it is fuelled by several challenges that incoming high-skilled immigrants are
facing in Canada. Some of the biggest challenges impacting the social and
economic integration of immigrants include lack of recognition of foreign
credentials and work experience, lack of information and guidance, racism
and discrimination, and health deterioration after arriving in Canada, among
others. The public support of immigration, as identified in our latest poll, is a
significant step in the direction of effective integration of international talent.
However, policy-makers need to co-ordinate with professional associations
such as that of law, medicine, and education to reduce the barriers against
foreign credential recognition, develop a system to recognize foreign work
experience, and plan programs that provide immigrants with information
and guidance to adapt to the Canadian way of life. Research has shown that
underutilization of education and skills have a direct effect on immigrants’
health and well-being, which in turn affect their social and economic
integration process. Therefore, it is crucial for the Canadian government to
consider policies that not only attract and retain high-skilled workers, but also
enable them to flourish in Canada.
In conclusion, this national opinion poll is helpful in unravelling public
concerns regarding immigration from Asia, revealing the type and origin
of high-skilled international talent that Canadians are looking for, and
uncovering specific immigration policies supported by Canadians. Despite
general skepticism toward talent from Asia and China, the Canadian public
feels the government must craft a well-rounded immigration policy that
addresses the issue of talent shortage and related public concerns. In light
of the transformative nature of modern work with an increased dependence
on technology, it is pertinent to both examine how the international talent
pool, in particular from Asia, can bolster the Canadian economy, and to lay the
groundwork for future action by Canada in acquiring this vital human resource.
36NATIONAL OPINION POLL 2019: CANADIAN VIEWS ON HUMAN CAPITAL FROM ASIA
ASIA PACIFIC FOUNDATION OF CANADA
METHODOLOGY
APF Canada commissioned EKOS Research Associates to conduct a survey of
1,524 Canadian adults (permanent residents and citizens 18 years and older).
The survey was conducted from July 29 to August 6, 2019, using EKOS’s
research panel, Probit. This panel offers coverage of the Canadian population
accessible through internet, home phone, or cellphone. A random, stratified
sample for this study was drawn from the panel database using random digit
dialling. All data was collected online.
The margin of error – which measures sampling variability – is +/- 2.51% for
the entire sample. The average completion time for the survey was 16 minutes.
The results have been statistically weighted by EKOS according to the current
census data on age, gender, and region to ensure the representativeness of the
sample. Discrepancies in or between totals are due to rounding.
37NATIONAL OPINION POLL 2019: CANADIAN VIEWS ON HUMAN CAPITAL FROM ASIA
ASIA PACIFIC FOUNDATION OF CANADA
ACKNOWLEDGEMENTS
STRATEGIC ADVISORS Stewart Beck President and CEO Asia Pacific Foundation of Canada Dr. Jeffrey Reeves Vice-President, Research Asia Pacific Foundation of Canada
EDITORIAL REVIEW Dr. Charles Labrecque Research Manager Asia Pacific Foundation of Canada Michael Roberts Communications Manager Asia Pacific Foundation of Canada
CREATIVE DESIGN Jamie Curtis Graphic Designer Asia Pacific Foundation of Canada
EXTERNAL ADVISOR Daniel Savas Visiting Professor, School of Public Policy, Simon Fraser University Distinguished Fellow, Asia Pacific Foundation of Canada
LEAD RESEARCHERS Hugo RoyJunior Research ScholarAsia Pacific Foundation of Canada Dr. Sreyoshi DeyProgram Manager, Surveys & PollingAsia Pacific Foundation of Canada Dr. Yushu ZhuAssistant Professor, Urban Studies, Simon Fraser UniversityFormer Program ManagerAsia Pacific Foundation of Canada
COMMUNICATIONS Michael RobertsCommunications ManagerAsia Pacific Foundation of Canada
Karina KwokSocial Media and Communications SpecialistAsia Pacific Foundation of Canada
38NATIONAL OPINION POLL 2019: CANADIAN VIEWS ON HUMAN CAPITAL FROM ASIA
ASIA PACIFIC FOUNDATION OF CANADA
Contact us at [email protected]
or visit us online at www.asiapacific.ca

39NATIONAL OPINION POLL 2019: CANADIAN VIEWS ON HUMAN CAPITAL FROM ASIA
ASIA PACIFIC FOUNDATION OF CANADA
1CHINA'S EVOLVING SENIOR CARE SECTOR
ASIA PACIFIC FOUNDATION OF CANADA
CHINA'S EVOLVING SENIOR CARE SECTOR
JANUARY 2020
OPPORTUNITIES AND CHALLENGES FOR CANADIAN CARE PROVIDERS AND BUSINESSES
FEBRUARY 2020
About the Asia Pacific Foundation of Canada
Executive Summary
Introduction
Report Outline and Methodology
China’s Senior Care Strategy
Promotion of Private and Foreign Investment
China's Senior Care Policy (The 9073 Plan)
Subsectors in China’s Senior Care Sector
Smart Technology Senior Care
Home Care
Chronic Disease
Patient Care
Incapacitated/Disabled Seniors
CASE STUDY #1 Opportunities in Home Care and Smart Care: The Case of Buurtzorg
Assistive Devices for Senior Populations with Disabilities
Specialized Medical Services for Senior Citizens
Chronic Disease Management
CASE STUDY #2 Chronic Disease Management in China: The Case of Canada Wellness Institute
Rehabilitation/Post-Acute Care
Dementia Care
Geriatrics
Other Relevant Medical Niches
4
5
7
9
10
11
12
14
14
14
15
15
15
17
18
19
20
21
22
22
23
24
TABLE OF CONTENTS
Pensions and Long-Term-Care Insurance
Senior Care Residences
Considerations for Entering the Chinese Market
Embracing a Collaborative Approach
Carefully Vetting Local Partners
Building on Existing Canada-China Collaborations
Adapting to Local Culture
Learning from Japanese Counterparts
CASE STUDY #3 Management and Operation: The Case of Nichii Gakkan
Creating a 'Canada Brand' in Senior Care
Carefully Selecting the Market
IP Considerations
Thinking Long Term
Conclusion
Bibliography
26
28
31
31
32
33
34
35
37
37
37
38
39
40
42

T he Asia Pacific Foundation of Canada (APF Canada) is a not-for-
profit organization focused on Canada’s relations with Asia. Our
mission is to be Canada’s catalyst for engagement with Asia and
Asia’s bridge to Canada. APF Canada is dedicated to strengthening ties between
Canada and Asia with a focus on seven thematic areas: trade and investment,
surveys and polling, regional security, digital technologies, domestic networks,
sustainable development, and Asia Competency
Our research provides high-quality, relevant, and timely information, insights,
and perspectives on Canada-Asia relations. Providing policy considerations and
business intelligence for stakeholders across the Asia Pacific, our work includes
Reports, Policy Briefs, Case Studies, Dispatches, and a regular Asia Watch
newsletter that together support these thematic areas.
APF Canada also works with business, government, and academic stakeholders
to provide custom research, data, briefings and Asia Competency training for
Canadian organizations. Consulting services are available by request. We
would be pleased to work with you to meet your research and business
intelligence needs.
Visit APF Canada at www.asiapacific.ca.
ABOUT THE ASIA PACIFIC FOUNDATION OF CANADA

5CHINA'S EVOLVING SENIOR CARE SECTOR
ASIA PACIFIC FOUNDATION OF CANADA
L ike many countries in North America, Europe, and Asia, China is
facing the problem of an aging population. In 2017, 240 million
Chinese were over the age of 60 – about 17% of the population.
And this number is expected to grow, reaching about 35% of the population by
2050. As Chinese society ages, medical problems, particularly chronic diseases,
abound. But, amid a growing demand for senior care services, the existing
system to support China’s elderly is insufficient.
The Chinese government has taken active measures to tackle this problem.
Since the previous decade, there has been a “double movement” in state
response to social problems in China. After three decades of fast-paced
economic reforms, the government has withdrawn from a policy of
retrenchment in welfare, committing substantive resources to provide
subsidies to poor and rural populations, including seniors. But, simultaneously,
it has also altered existing regulations to allow for the operation of private
actors in the delivery of services to China’s more affluent urban residents,
especially senior care and health-care services.
The combination of increasing demand for high-quality care and the Chinese
government’s policies to invigorate private delivery of senior care services,
including by foreign companies, creates opportunities for Canadian senior care
providers. In particular, Canadian public hospitals with expertise in medical
services for seniors, such as chronic disease management, geriatrics, dementia
and memory care, and rehabilitation (post-acute care), are in a position to offer
solutions for a growing demand in China for high-quality senior care services.
Further, Canadian companies specializing in the delivery of nursing and
personal support care, either at seniors’ homes or at senior care facilities, are
likely to find promising market opportunities in China.
Canadian companies can also benefit from the relative openness of China
in the areas of medical care and senior care. In both arenas, the Chinese
government has actively sought the advice of foreign experts and has
EXECUTIVE SUMMARY

6CHINA'S EVOLVING SENIOR CARE SECTOR
ASIA PACIFIC FOUNDATION OF CANADA
encouraged open debates. This climate of relative openness translates into a
welcoming approach in these areas to foreigners, both experts and businesses.
While China’s expanding senior care market offers business opportunities,
Canadian senior care providers should also be mindful of existing challenges
relating to China’s complex regulatory system, local cultural preferences,
intellectual property theft, identification of reliable partners, and the difficulty
in generating profits in the short term. Success in the Chinese market is
attainable, but it requires thorough due diligence prior to market entry as well
as resources and steadfast commitment to remain in China despite the growing
pains associated with the early years of operation in this market.
Source: Getty Images. Photo by Wang Zhao
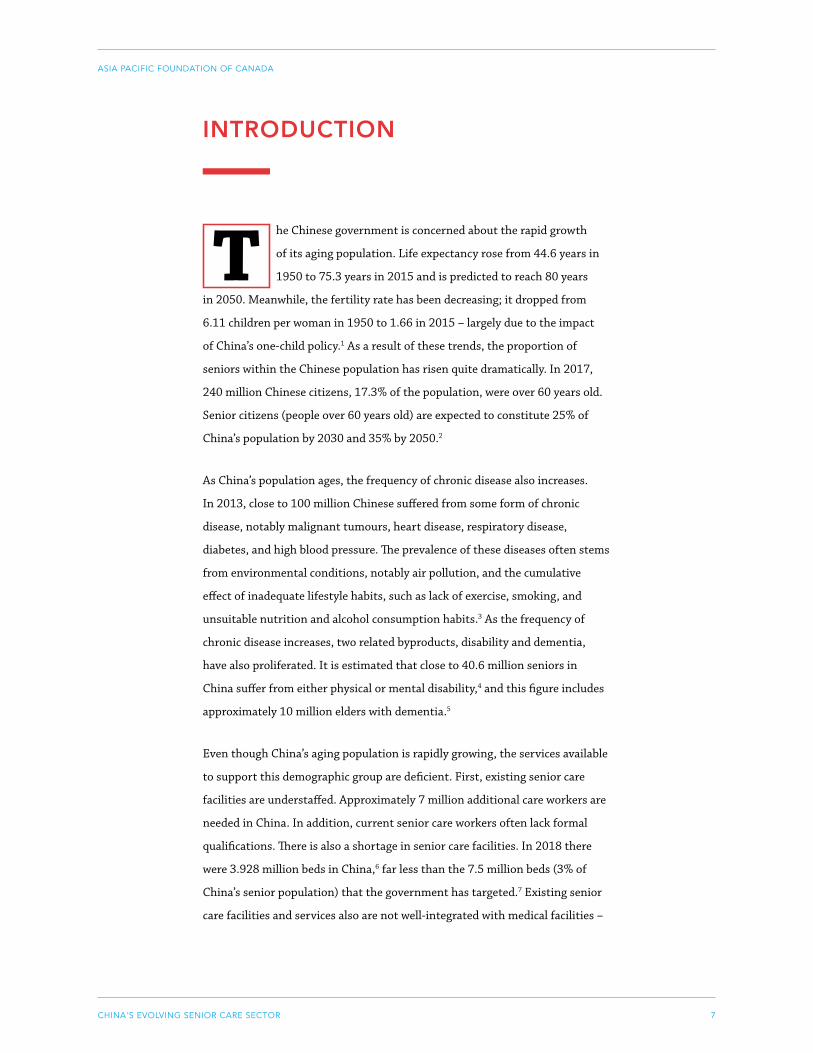
7CHINA'S EVOLVING SENIOR CARE SECTOR
ASIA PACIFIC FOUNDATION OF CANADA
T he Chinese government is concerned about the rapid growth
of its aging population. Life expectancy rose from 44.6 years in
1950 to 75.3 years in 2015 and is predicted to reach 80 years
in 2050. Meanwhile, the fertility rate has been decreasing; it dropped from
6.11 children per woman in 1950 to 1.66 in 2015 – largely due to the impact
of China’s one-child policy.1 As a result of these trends, the proportion of
seniors within the Chinese population has risen quite dramatically. In 2017,
240 million Chinese citizens, 17.3% of the population, were over 60 years old.
Senior citizens (people over 60 years old) are expected to constitute 25% of
China’s population by 2030 and 35% by 2050.2
As China’s population ages, the frequency of chronic disease also increases.
In 2013, close to 100 million Chinese suffered from some form of chronic
disease, notably malignant tumours, heart disease, respiratory disease,
diabetes, and high blood pressure. The prevalence of these diseases often stems
from environmental conditions, notably air pollution, and the cumulative
effect of inadequate lifestyle habits, such as lack of exercise, smoking, and
unsuitable nutrition and alcohol consumption habits.3 As the frequency of
chronic disease increases, two related byproducts, disability and dementia,
have also proliferated. It is estimated that close to 40.6 million seniors in
China suffer from either physical or mental disability,4 and this figure includes
approximately 10 million elders with dementia.5
Even though China’s aging population is rapidly growing, the services available
to support this demographic group are deficient. First, existing senior care
facilities are understaffed. Approximately 7 million additional care workers are
needed in China. In addition, current senior care workers often lack formal
qualifications. There is also a shortage in senior care facilities. In 2018 there
were 3.928 million beds in China,6 far less than the 7.5 million beds (3% of
China’s senior population) that the government has targeted.7 Existing senior
care facilities and services also are not well-integrated with medical facilities –
INTRODUCTION
8CHINA'S EVOLVING SENIOR CARE SECTOR
ASIA PACIFIC FOUNDATION OF CANADA
a problem that undermines seniors’ access to health care.8 While the Chinese
government intends to have the vast majority of seniors cared for at home,
the practices and technologies to facilitate such a system are still at a nascent
stage.
The Chinese government is well-aware of these challenges and has formulated
policies to address them. Notably, the Chinese government made a strategic
decision to enhance the role of the private sector in senior care provision,
altering the existing regulatory structure to facilitate the participation of
private actors as well as the entry of foreign investment into China’s senior
care market.
This report, which focuses on China’s evolving senior care sector, poses and
answers the following questions:
1. What are the Chinese government policies to address the needs of a
growing senior care population?;
2. Which subsectors within China’s senior care sector are the most promising
for the market entry of Canadian companies?; and
3. What issues should Canadian companies wishing to enter the Chinese
market consider?
9CHINA'S EVOLVING SENIOR CARE SECTOR
ASIA PACIFIC FOUNDATION OF CANADA
Report Outline and Methodology
The report is divided into four sections. Section 1 provides a broad overview
of China’s policies to promote private sector operation, including foreign
investment, in the senior care market. It then discusses the Chinese
government’s overarching 9073 plan to build a system of care for its senior
population for the future. Section 2 surveys the key subsectors within China’s
senior care market: a) smart senior care; b) assistive devices; c) specialized
medical services; d) pensions and long-term-care insurance; and e) senior
care facilities, including assistive residences, long-term facilities, and
continuing care retirement communities. Section 3 proposes a set of guiding
considerations for Canadian companies on how to enter China’s senior care
market. Section 4 concludes the report by providing recommendations on
market priorities for Canadian companies in China, arguing that specialized
medical services for seniors is the most promising subsector for Canadians
to pursue commercial opportunities in China, especially for Canadian public
hospitals. It also suggests that since existing nursing and personal support
services for seniors in China are of low quality, Canadian companies offering
such services have strong prospects of success in this emerging market.
Research for this report relies on a variety of sources, including Chinese
government official documents, media reports, academic publications, market
analyses, WHO reports on China, and various company websites. In addition
to desk research, this study is complemented by insights drawn from 22 in-
depth insiders’ interviews conducted in person in Beijing and Shanghai in May
2019. These interviewees included Chinese government officials, business
consultants, senior care facility executives, academics and researchers,
employees in smart technology companies, and Canadian government officials
operating in China. In addition, the report also builds on 10 phone interviews
with Canadian senior care executives and BC Ministry of Health officials to
identify areas of strength in Canada’s senior care system.

10THE FREE AND OPEN INDO-PACIFIC: CHARTING A COMMON APPROACH | CONFERENCE NOTES
ASIA PACIFIC FOUNDATION OF CANADA
C hina has been pursuing a “double movement” in the
reconstruction of its welfare system, including senior care.
Since the previous decade, the government has dramatically
expanded investment in welfare services, particularly with a focus on rural
and poor populations. Simultaneously, the government has also encouraged
the emergence of private, high-end services to satisfy the demands of affluent
urban populations. The same approach has also been applied to the senior care
sector, where both the promotion of private operators and encouragement of
home care were part of an attempt to preserve the state’s fiscal solvency amid
growing demand for welfare services. Chinese government efforts at private
sector development, in particular, have created an auspicious environment for
the entry of Canadian companies into the Chinese market.
CHINA’S SENIOR CARE STRATEGY
The Chinese government has increased spending on welfare services, particularly in rural and poor populations
Source: Getty Images. Photo by Peter Parks.
By Yoel Kornreich, Post-Graduate Research Scholar, APF Canada
11THE FREE AND OPEN INDO-PACIFIC: CHARTING A COMMON APPROACH | CONFERENCE NOTES
ASIA PACIFIC FOUNDATION OF CANADA
Promotion of Private and Foreign Investment Senior care is a fast-growing market in China. The market was valued at
RMB5.6T (approximately C$1.06T) in 2017, a 12% increase from the previous
year, and it is projected to reach RMB20T (approximately C$3.8T) by 2030.9
The senior care sector is a component of the “Big Health” industry (da
jiankang chanye) – one of the key markets that the Chinese government is
actively promoting to stimulate future economic development. The Big Health
industry consists of five sectors: health service providers, pharmaceutical and
medical devices, health products, health management and consulting services,
and senior care. In 2017, senior care was the second-largest sector, (after
pharmaceutical and medical devices with 50% market size) constituting 33% of
the total market size of the industry.10
Since 2012, China has encouraged private sector participation in senior care.11
In 2016, the government issued a directive specifying its plan to manage
50% of the scope of China’s elderly care facilities’ beds, while encouraging the
private sector to run the remaining 50%.12 In May 2019, Premier Li Keqiang
announced that the government will provide incentives for private providers
to run community elder care facilities. Between June 1, 2019, and the end of
2025, the government will exempt earnings generated from these services
from the payment of value-added tax (VAT) and reduce the taxable income of
these providers by 10%.13 In addition, private investors are exempted from
business taxes on both nursing and household services delivered to senior
citizens.14 To further encourage private investment, the central government
also intends to simplify the administrative procedures for obtaining approval
to operate private elderly care facilities.15 For example, in February 2019, the
Ministry of Civil Affairs (MCA) cancelled the licence approval procedure for
the construction of senior care facilities. As the existing document submission
and MCA branch registration procedure remain in place,16 the abolishment of
the former procedure does away with an additional layer of bureaucracy, thus
relieving prospective investors from the hassle of dealing with this bureaucratic
process. Meanwhile, the Ministry continues to exercise oversight both during
and after facilities are structured.17
12CHINA'S EVOLVING SENIOR CARE SECTOR
ASIA PACIFIC FOUNDATION OF CANADA
SENIOR CARE FACILITIES These include both assisted-living and long-term care facilities. The former refers to
residential apartments/units for seniors who are still independent. These facilities
normally provide catering and cleaning services, and also organize social, recreational,
and entertainment activities. Often, a resident medical doctor and nursing aides are
affiliated with such facilities. Long-term care facilities serve elderly clients who have special
care needs and are not independent due to either physical or mental conditions (such as
dementia), providing around the clock nursing services and access to medical doctors, such
as respiratory specialists.
Several other incentives have been implemented to facilitate private
investment in seniors’ medical care. For example, in June 2019, the
government announced the implementation of preferential tax treatment for
for-profit investors establishing small-scale medical facilities.18 According to
the two-step new policy, small-scale enterprises will pay a tax rate of 20% for
75% on the first RMB1M of their taxable revenues, and 20% on 50% on their
taxable income that is greater than RMB1M but equal or less than RMB3M.19
The plan for private delivery of senior care services also includes the
participation of foreign senior care operators and providers. In 2013, the
Chinese government permitted foreign investors to establish fully owned, for-
profit senior care institutions.20 In April 2019, the State Council announced
that elderly care facilities run by foreign investors will be eligible for the same
policy treatment as local ones, including government subsidies.21
The broad outline of the government’s senior care policy – officially laid out in
the 13th Five Year Plan (2017-2021) – divides senior care into the following
categories: 1) home care for 90% of seniors;22 2) daytime community care for
7% of seniors; and 3) residence in senior care facilities for 3% of seniors.23
Currently, 96% of Chinese seniors live at home, 3% receive community-based
support, and 1% are in residential care.24 This implies that 6% of all seniors –
about 13.8 million seniors – are expected to move from living at home to these
facilities. Simultaneously, the government also plans to build the largely absent
infrastructure to support home care.25
China's Senior Care Policy (The 9073 Plan)
13CHINA'S EVOLVING SENIOR CARE SECTOR
ASIA PACIFIC FOUNDATION OF CANADA
However, there is often a difference between the central government’s
declared goals, as stated in formal documents, and the dynamics at play
during the implementation stage. Local governments – either provinces,
cities, or counties – usually have considerable leeway in the interpretation and
implementation of central government directives. If a policy does not clearly
align with local government’s incentives, its execution may be deficient. For
example, a prominent Chinese expert has pointed out that the 7% target for
community-based care is unrealistic given the limited number of adult care
facilities in China and the economic infeasibility of constructing new adult care
facilities; ultimately, the majority of Chinese seniors are likely to receive home
care rather than community care.
14CHINA'S EVOLVING SENIOR CARE SECTOR
ASIA PACIFIC FOUNDATION OF CANADA
SUBSECTORS IN CHINA’S SENIOR CARE SECTOR
C hina’s senior care sector is composed of several key subsectors,
including smart care, assistive care, specialized medical services,
pensions and long-term insurance, and senior care facilities,
each having unique features. The following section will discuss each of these
subsectors, while identifying both the opportunities and challenges associated
with investing in each subsector.
Smart Technology Senior Care To make home care possible, the Chinese government is actively promoting the
application of smart technology to the senior care sector, which incorporates
wearable medical sensors, actuators, computers, cellphones, and other
information technologies to enable continuous and remote monitoring of
elderly health and well-being at a low cost.26 The Chinese government envisions
that smart tech will facilitate diverse types of care for seniors, in the following
critical domains:
HOME CARE
The Chinese government is promoting experimentation and construction
of online platforms through which seniors can order basic services, such as
cleaning, cooking, and nursing. Meanwhile, health authorities and platform
operators will be able to monitor the quality of services, requiring care workers
to take a photo after completing their care service (e.g., if they cleaned the
kitchen, a photo of the clean kitchen should be uploaded to the platform).
Platform operators also use the platform to conduct digital surveys of clients’
satisfaction with the service.

15CHINA'S EVOLVING SENIOR CARE SECTOR
ASIA PACIFIC FOUNDATION OF CANADA
CHRONIC DISEASE
For seniors suffering from chronic disease, the government intends to promote
smart tech solutions, such as digital self-assessment tools, smart testing apps,
and emergency alert monitors.
PATIENT CARE
Smart care technology is likely to facilitate access to medical services through
digital medical consultation, online registration for medical checkups, pre-
checkup guidelines, and after-checkup monitoring.
INCAPACITATED/DISABLED SENIORS
For seniors who cannot function independently, smart technology can help
family and care providers protect seniors, avoiding life-threatening risks.
Smart tech will be able to detect the location of seniors with dementia and
track their behaviour, ensuring that they will not leave their place of residence
unattended. To help care for seniors in critical condition, there will be smart
tech solutions to monitor patients’ health during the night.27
In addition to planning for the integration of smart tech into the above-
mentioned domains of senior care, the Chinese government encourages the
development of the following four types of smart senior care products:
1. Wearables, such as medical wrist watches, to test seniors’ blood
pressure, sugar level, and heart rate.
2. Portable medical devices, to allow medical staff to conduct
medical examinations either in community clinics or at
patients’ homes.
3. Self-check medical devices, to be used by both seniors living at
home and medical staff conducting home visits.
16CHINA'S EVOLVING SENIOR CARE SECTOR
ASIA PACIFIC FOUNDATION OF CANADA
4. Monitoring smart care devices, such as smart chairs and beds,
to detect seniors’ breath (while sleeping), heart rate, and
brain functioning both at home and in senior care facilities.
These devices can also be connected to smart care platforms,
allowing either medical staff or senior care professionals to
monitor changes in seniors’ conditions in real time.
5. Household robots will perform household tasks at seniors’
homes and ensure their health and safety.
Throughout 2017 and 2018, the government administered a competitive
national application process among companies for inclusion in the smart
care pilot project. So far, 99 companies have been selected and have received
financial support and other policy benefits from the government.28 Because
the Chinese government actively focuses on the promotion of local companies,
foreign companies entering this market might face challenges, as they will
not be eligible to receive the same kind of support as the local champions
participating in the pilot project. The most viable option for entering this
market is through partnership with local companies.
One of the companies that is likely to lead the future smart tech senior
care market is Potevio (zhongguo putian), a central government state-
owned enterprise with 23,000 employees and assets worth RMB10B.
Specializing in information technology, Potevio is active in the following
sectors: internet security, smart cities, clean mining and resources, finance
information services, and industrial automation.29 In the senior care sector,
Potevio is starting to develop its capacity. One of its signature products is a
telecommunication platform to provide medical guidance for the treatment of
stroke to approximately 300 hospitals across the country. Potevio collaborates
with Xuanwu Hospital, one of China’s leading medical institutes, in developing
this service. Potevio has also built an online platform to enable seniors to
contact household and nursing services, and monitor quality and client
satisfaction levels. Potevio has set these platforms – which are part of the
government’s smart senior care demonstration sites – in 10 different locations
across the country.30

17CHINA'S EVOLVING SENIOR CARE SECTOR
ASIA PACIFIC FOUNDATION OF CANADA
CASE STUDY #1 OPPORTUNITIES IN HOME CARE AND SMART CARE: THE CASE OF BUURTZORG The Chinese government’s efforts to promote the emergence of local capacity does not
preclude the opportunities for foreign companies to enter into this space. The recent
headway of a Dutch company, Buurtzorg, into China’s smart tech senior care market is a
case in point. With 10,000 employees, Buurtzorg provides community nursing services in
the Netherlands and across the globe, including in China, Japan, and Taiwan.
Buurtzorg’s approach to care neatly fits with the senior care model envisioned by the
Chinese government: cost-effective, community-based senior care run by non-government
actors and backed by IT platforms to support these services. Buurtzorg’s model consists of
small, decentralized teams of 10 to 12 nurses who are granted the autonomy to innovate
and adjust their practices to the needs of local people. These nurses primarily serve as
health coaches, emphasizing preventive health care. To achieve these goals, Buurtzorg
relies on the OMAHA IT platform for nurses, which enables documentation, analysis,
and assessment of patients’ needs and the outcome of medical interventions.31 In China,
Buurtzorg partners with like-minded companies that provide community services to
seniors in various locations across the country, including Shanghai, Suzhou, and Qingdao.32
Canada has one company like Buurtzorg. Saint Elizabeth Health (SE Health) has provided
home care services, senior care staff training, and senior care facilities operation services
for more than 100 years. Like Buurtzorg, it is a non-profit organization that is successfully
generating revenue. In recent years, SE Health has made progress in integrating technology
into its practice and has also started to explore business opportunities abroad. In 2016,
SE Health established Saint Elizabeth Global to actively seek to establish consulting
practices, joint ventures, or memorandums of understanding (MOUs) with like-minded
organization abroad.33 Because the Chinese government intends to promote home living
for 90% of seniors, and because the establishment of a smart care system is essential for
enabling this, opportunities for organizations like Saint Elizabeth Global in China may
abound. Canada has a number of innovative companies with specialization in these areas,
some of which participated in the 2019 Women-Only Business Mission to Japan that
focused on the care economy.34
Source: Getty Images. Photo by BongkarnThanyakij
18CHINA'S EVOLVING SENIOR CARE SECTOR
ASIA PACIFIC FOUNDATION OF CANADA
Assistive Devices for Senior Populations with Disabilities
To help seniors cope with both cognitive and physical impairments, the
government promotes the assistive device sector, offering tax incentives and
financial subsidies to companies developing such devices. The government
also seeks to establish three geographic clusters to promote innovation in the
field: Beijing-Tianjin-Hubei (Jing-Jin-Ji Metropolitan Region), the Yangtze
River Delta (Shanghai, Jiangsu, and Zhejiang), and the Pearl River Delta
(Guangdong).35 In addition, the Ministry of Civil Affairs is overseeing the
implementation of a pilot project in which local governments in 12 different
locations across the country experiment with effective ways to rent out
assistive devices to patients.36
The government focuses on the promotion of the following categories of
assistive devices for seniors suffering from either physical or cognitive
disabilities: 1) mobility aids; 2) hearing aids; 3) cognitive aids (computer or
digital assistive devices, to help people with memory, attention, or other
challenges in their thinking skills); 4) software and hardware, such as speech
recognition devices and screen readers, to assist seniors with impairments to
either use technology or communicate with their environment; 5) physical
modifications in buildings, including ramps, grab bars, and wider doorways to
enable access to homes, businesses, and workplaces; and 6) adaptive switches
and utensils to allow those with limited motor skills to eat, play games, and
accomplish other activities.37
The government is opening up the assistive device market for international
collaboration, primarily for gaining exposure to the state-of-the-art
technologies in the field. Foreign companies are permitted to invest and hold
shares in Chinese assistive device companies and are also encouraged to open
research and development (R&D) and manufacturing facilities within China.
Meanwhile, the government is committed to supporting Chinese companies
establishing R&D facilities abroad. It now also permits local companies to
merge with foreign companies.38
19CHINA'S EVOLVING SENIOR CARE SECTOR
ASIA PACIFIC FOUNDATION OF CANADA
Specialized Medical Services for Senior Citizens
The Chinese government encourages the establishment of specialized medical
services for seniors, notably for chronic disease management, rehabilitation/
post-acute care, dementia care, and geriatrics, which are in high demand in
China.
The shortage of these services in China has its origins in the country’s uneven
distribution of health resources. Medical services of the highest quality are
concentrated in big, urban tertiary hospitals. Yet seeking medical care at
these public hospitals is both difficult (due to the high volume of patients)
and expensive.39 As medical resources are distributed primarily to tertiary
hospitals, the quality of specialized medical services, which are normally
delivered outside of tertiary hospitals, is low. The Chinese government is aware
of these problems and is taking active measures to address them. However,
institutional change may take a long time. Reliance on best practices and the
know-how of foreign providers might be the shortcut for the establishment of
such services in China.
In addition, Chinese government policies to promote the integration of senior
care and medical care further enhance the market opportunities in China’s
senior care sector. Currently, most senior care facilities lack the capacity to
provide seniors with medical care.40 To address this problem, the government
has encouraged senior care operators to open up medical services, simplifying
the approval procedure for senior care facilities to establish and integrate
medical services and medical wards into their operations. Existing senior care
operators are now permitted to open up complementary seniors’ hospitals,
nursing hospitals, rehabilitation hospitals, and Chinese medicine facilities.
Current policies also encourage medical doctors and nurses to sign private
contracts with senior care facilities. Medical services and treatments provided
by these facilities are now also eligible for medical insurance compensation.41
To further explore how to implement these policies, in 2016, the central
government selected 100 sites across the country, ordering relevant local
governments to conduct policy experiments to explore effective ways of
integrating senior and medical care services.42 But, while the government seeks

20CHINA'S EVOLVING SENIOR CARE SECTOR
ASIA PACIFIC FOUNDATION OF CANADA
to stimulate private providers of medical services, local care providers, most
notably within senior care facilities and community medical facilities, lack
knowledge and specialization in the treatment of seniors.43 The combination
of favourable government policies toward private care operators and the local
absence of experience in the area represents an opportunity for Canadian
senior care providers specializing in medical services.
In light of these opportunities, the remainder of this section surveys the
specialized medical services that seem most promising.
CHRONIC DISEASE MANAGEMENT
The Chinese government plans to significantly lower the mortality rates
from chronic diseases,44 and it has emphasized the development of practices
to minimize the occurrence of chronic diseases, such as cardiovascular and
cerebrovascular diseases, diabetes, malignant tumours, respiratory diseases,
and oral diseases.45 One of the measures used in China to promote effective
chronic disease management is the creation of contract-based relationships
between patients and family doctors. Seniors may select and sign a contract
to have a family doctor provide basic care services, including chronic disease
management, free of charge.46 These family doctors, who are usually affiliated
with primary care facilities, are in a position to be more responsive to the
immediate needs of chronic disease patients than doctors in the crowded
tertiary hospitals.47 Since 2016, Shanghai has been a pioneer in implementing
this policy, with 3.22 million seniors signing agreements with family doctors.
Concomitantly, to adjust the health system to the needs of patients with
chronic disease, the state is revamping the medical insurance reimbursement
policy. Public insurance plans will now cover treatment of a specific disease,
rather than medical procedures, which will lower the financial burden for
seniors with chronic disease.48 A complementary strategy pursued by the
Chinese government is the harnessing of technology, notably, information
systems, wearables, and other apps, to better manage and monitor chronic
disease patients.
But these policies have their limits. First, considering the high number of
patients per family doctor — more than 1,000 — the ability of these doctors to
deliver personalized services is quite limited. Second, as most qualified doctors
are still working within tertiary hospitals, it has been difficult to attract high-

21CHINA'S EVOLVING SENIOR CARE SECTOR
ASIA PACIFIC FOUNDATION OF CANADA
quality physicians to serve as family doctors at the community level.49 Third,
the adjustment of insurance payments from program-based reimbursement to
diagnostic-related groups is going to take time to accomplish, as it will require
finding alternative sources of income for public hospitals.
CASE STUDY #2 CHRONIC DISEASE MANAGEMENT IN CHINA: THE CASE OF CANADA WELLNESS INSTITUTE Canada Wellness Institute (CWI), a Canadian non-profit institute run by Seven Oaks
Hospital in Winnipeg, has benefited from the gaps in chronic disease treatment services
in China. In 2015, CWI established — in partnership with a local hospital and a private
company, More Health — China’s first medical fitness facility in Rizhao, Shandong.50
Recently, a new, high-end facility was opened in Beijing to service the top income groups in
the city. Following accolades from the Chinese government, CWI has an ambitious plan to
broaden its operations in China and establish 100 new medical fitness facilities in different
locations across the country.51
CWI offers personalized programs for patients with chronic disease, notably diabetes,
cancer, cardiovascular disease, kidney disease, and lung disease. The program includes
one-on-one consultations, phone support, workshops, exercise programs, and educational
workshops. CWI also targets chronic disease prevention by coaching seniors on how to
maintain healthy lifestyles and offering specialized smoking cessation and weight loss
programs.52 CWI’s strength is that these programs draw on best practices and expertise
that are embedded in the clinical procedures and research emerging from one of Canada’s
leading hospitals, Seven Oaks.
A key factor in CWI’s success in China is its partnership with More Health, a Chinese
mobile health startup. More Health provides personalized programs for chronic disease
prevention and management through the use of a mobile app and a digital wearable
apparatus to monitor patients’ health and lifestyle. More Health is also part of China’s
growing e-commerce sector, and as such it has an efficient mobile payment mechanism.
The partnership with More Health, which has leveraged its e-commerce know-how for
promoting CWI, has provided Seven Oaks with greater access to potential users.53
Source: Getty Images. Photo by STR / Stringer.

22CHINA'S EVOLVING SENIOR CARE SECTOR
ASIA PACIFIC FOUNDATION OF CANADA
REHABILITATION/POST-ACUTE CARE
As China’s senior population grows, demand for multiple facets of
rehabilitation care also expands. There is an acute need in China for
rehabilitation that does not rely on drugs. More specifically, this category
consists of the following types of rehabilitation: post surgery, especially bone
and joint disease (osteoporosis and arthritis), heart and bypass surgeries,
and brain tumour removal; post stroke (and other cerebrovascular disease);54
swallowing therapy (dysphagia treatment); speech therapy; brain function
(cognitive rehab); physiotherapy; and occupational therapy.55
Meanwhile, the current supply of rehabilitation care, a relatively new
specialization (it first started in China only during the 1980s) is limited,
especially physiotherapy.56 The number of programs is small, and their quality
is low. There is also a shortage in qualified professionals, and those who
are currently working in the field receive low pay.57 In addition, the scope
of medical insurance coverage for recovery, which is a long and expensive
process, is limited.58 Although there have been efforts to secure access to
these treatments, they are insufficient. In 2016, the government rendered 20
different types of rehabilitation programs eligible for public medical insurance
compensation.59 But these measures are only the beginning – it is likely to take
a decade for insurance to provide appropriate coverage for rehabilitation care.
The Chinese government intends to promote rehabilitation care, encouraging
the construction of rehabilitation hospitals and mandating an increase in beds
at community medical facilities. Further, the government plans to train more
rehabilitation professionals and promote fitness rehabilitation activities for the
elderly.60 Canada Wellness Institute has also entered this space, offering stroke,
cardiac, and pulmonary rehabilitation. Additionally, there has been an interest
in China in the rehab services offered by the Toronto Rehabilitation Institute.
DEMENTIA CARE
Occurrences of dementia are increasing as the population ages. There were an
estimated 9.6 million seniors suffering from dementia in China in 2010, and
these figures are predicted to reach 14.1 million in 2020 and 23.3 million in
2030. The annual costs of caring for dementia patients were also expected to
rise, peaking at US$69.9B in 2020 and US$114.1B in 2030.61
23CHINA'S EVOLVING SENIOR CARE SECTOR
ASIA PACIFIC FOUNDATION OF CANADA
The services to care for dementia patients do not match existing demand. The
majority of medical professionals in China have little knowledge of dementia
and are unable to diagnose it.62 There is also a shortage of facilities equipped
with trained clinicians to treat patients suffering from dementia. In the
absence of medical practitioners to support these patients, 96% of people
suffering from this condition are cared for by family members, primarily
spouses.63 The Chinese government is searching for strategies to tackle this
problem, but it has so far come up short of solutions.
GERIATRICS
There is also a mismatch between the quality of education and training of
medical doctors specializing in geriatrics and a growing demand for this field
of medicine in China. Geriatrics departments in Chinese public hospitals
normally engage in a medical assessment with the assumption of a single
disease, instead of conducting a comprehensive assessment to identify parallel
causes of failing health. In addition, geriatrics does not exist as an independent
discipline in China's medical school curriculums. It has never been taught as a
subject, let alone as a course.64 To address this problem, in 2015, the National
Health Commission established the National Center for Geriatrics and
Gerontology at Beijing Hospital. The Center conducts academic research in the
field and is also responsible for implementing training programs for geriatric
care and research, co-ordinating national geriatric initiatives, monitoring
disease trends in the elderly population, and issuing regular senior health
status reports.65
Canadian training for geriatricians is likely to be welcomed in China. Canada,
along with the United Kingdom and Australia, developed a unique approach
to acute senior care and frailty. Building on the assumption that seniors are
suffering from multiple medical complications, rather than a single health
problem, Canadian geriatricians developed a geriatrics assessment tool to
detect numerous medical conditions.66 Because geriatrics in China is not
considered a specialty and is not taught as such, managing a comprehensive
geriatric assessment for elderly patients is difficult. Seniors are usually
assigned to specialists who are not qualified to evaluate the multiple
problems of their patients and, thus, are unable to offer adequate treatment.
24CHINA'S EVOLVING SENIOR CARE SECTOR
ASIA PACIFIC FOUNDATION OF CANADA
Consequently, specialists are often frustrated with their inability to help
their elderly patients. The Chinese Medical Doctor Association, a national
organization under the auspices of the National Health Commission, and
Beijing Hospital are well-aware of this problem, as well as of Canadian strength
in this area.
Beijing Hospital has welcomed international collaboration, including with
Canadian counterparts. In 2017, Beijing Hospital signed an MOU with
Baycrest Hospital in Toronto on co-operation in geriatric training.67 In
addition, Professor Kenneth Rockwood, a geriatrics specialist from Dalhousie
University, has, on numerous occasions, advised Beijing Hospital and the
Chinese Hospital Association on how to improve the practice of geriatrics
across the country.
OTHER RELEVANT MEDICAL NICHES
Quality Indicators:
In China, the system for measuring the quality of health and senior care
services is not well-developed, yet there is an awareness of the pressing need to
develop such a system. Recently, the State Council established a committee of
experts to develop guidelines for a future quality evaluation system.68 Canada,
alongside the United States and Finland, is one of the leading countries in
the world in its system of quality indicators to measure aspects of senior
care, including clinical care, in both hospital and long-term facilities, and
report them in a systematic way.69 It is thus within this niche that Canadian
professionals specializing in quality indicators could serve as consultants to the
Chinese government, businesses, and hospitals.
Accreditation of Senior Care Providers:
The Chinese government is now seeking to set up a unified accreditation
standards for the senior sector.70 Canada is one of the world’s leaders in the
accreditation of medical and senior care services.71 Accreditation Canada and
Health Standards Organization (HSO), with both Canadian and international
experience, could contribute to the development and implementation of world-
class accreditation standards72 in China’s emerging accreditation system.
25CHINA'S EVOLVING SENIOR CARE SECTOR
ASIA PACIFIC FOUNDATION OF CANADA
Training of Senior Care Personnel:
The shortage in trained personnel to care for seniors also opens up
opportunities for Canadian universities and vocational colleges, particularly in
the area of nursing and personal support workers. However, finding a credible
academic counterpart in China that can secure funding to pay for such training
may be challenging. Recently, BPS Strategies, an Ontario-based consulting
company specializing in senior care, signed an MOU with the Nursing School
at Hebei University in Shijiazhuang, stating that the Canadian company will
be responsible for nurse training programs at the school.73 This example might
attest to the potential that Canadian companies have in this area.
26CHINA'S EVOLVING SENIOR CARE SECTOR
ASIA PACIFIC FOUNDATION OF CANADA
Pensions and Long-Term-Care Insurance
The pension market in China entails both great pitfalls and opportunities
for investment in senior care in China. An ongoing deficit in public pensions
undermines market growth, as seniors cannot afford to pay for services.
Meanwhile, the emergence of private insurance holds promise for Canadian
insurance companies that are already well-established in China.
The size of China’s pension assets was RMB11T in 2017 (US$1.6T), with
the majority, RMB5T, in public pension funds (PPFs) managed by provinces
and municipalities. Currently, these locally managed funds are in deficit.74
However, the public National Social Security Fund (NSSF), which now manages
the pension surpluses of China’s richest provinces, is currently generating
revenues, with an average 7.1% annual return rate on investments.75 If more
pension funds are transferred from the underperforming PPFs to the NSSF, the
quality of pension management is likely to improve, and Chinese seniors are
likely to have a more robust consumption power.
While PPFs are running into deficit, the Chinese government is actively
promoting the development of private pensions. In June 2018, the
government introduced pilot projects of tax-deferred commercial pension
products in which participants pay income tax only when they become the
beneficiaries. When seniors retire, 25% of pension benefits are exempt from
tax, while for the remaining 75%, they pay a rate of 10%. Experiments in tax-
deferred pensions are now taking place in Shanghai, Suzhou Industrial Park,
and Fujian.76
China’s private pensions market is poised for growth. According to KPMG
estimates, the total assets of China’s private pensions are likely to grow by 24%
from 2017 to 2030 and reach a volume of RMB46T (out of a projected total of
RMB113T pension assets in China).77 The promising projections give rise to
opportunities for private pension players.
The Chinese government is also encouraging the entry of foreign insurance
companies into the private pension market. In 2018, the Chinese government
permitted foreign insurance companies to own 51% of shares in joint ventures.
27CHINA'S EVOLVING SENIOR CARE SECTOR
ASIA PACIFIC FOUNDATION OF CANADA
Recently, it was announced that in 2020 foreign insurance companies will
be allowed to set up wholly owned ventures in China.78 Manulife, however,
received a licence by the Chinese government to establish a wholly foreign-
owned enterprise – Manulife Investment (Shanghai) Limited Company – as
early as 2017.79 This is a testament to the company’s strength in China and the
robustness of its relations with the Chinese government. Currently, Manulife
is exploring the opportunity of forming a joint-venture pension management
company with the Agricultural Bank of China.80 Along with Manulife, Sunlife,
which already has existing operations in China,81 is poised to benefit from
the liberalization of the insurance market, as long as it can leverage its
existing presence to quickly expand in what is likely to become an extremely
competitive post-deregulation market.
Absence of knowledge on retirement planning is a problem in China. Only
20.5% of seniors’ retirement assets are invested in pensions plans. But, as
those born in the 1950s and 1960s grow old, this situation may change, and
that will create more business opportunities for private insurance.82
A growing private insurance market could also consist of long-term-care
insurance. To address the problem of a growing need for nursing services for
the 40 million seniors with disabilities in China,83 the Chinese government is
introducing long-term-care insurance plans. In 2016, the Ministry of Human
Resources and Social Security introduced 15 pilot sites, including Shanghai,
Qingdao, Guangzhou, and Chengdu, for experimentation with long-term
nursing insurance to cover nursing and care for elderly people with disabilities.
Yet funding for such insurance is limited, and the Chinese government, in a
period of economic slowdown, does not seek to place an additional burden on
enterprises.84 Hence nursing insurance funding is derived from the surplus
in health insurance pools, and the compensation rate for nursing services is
capped at 70%.85 Experimentation with these insurance plans is expected to
end in 2020,86 when some of the experiments’ successful practices could be
expanded to the entire country. If these experiments are successful, this is
likely to increase the consumption capabilities of Chinese seniors. In addition,
the introduction of these insurance plans is likely to open further business
opportunities for private insurance companies, including Canadian ones.
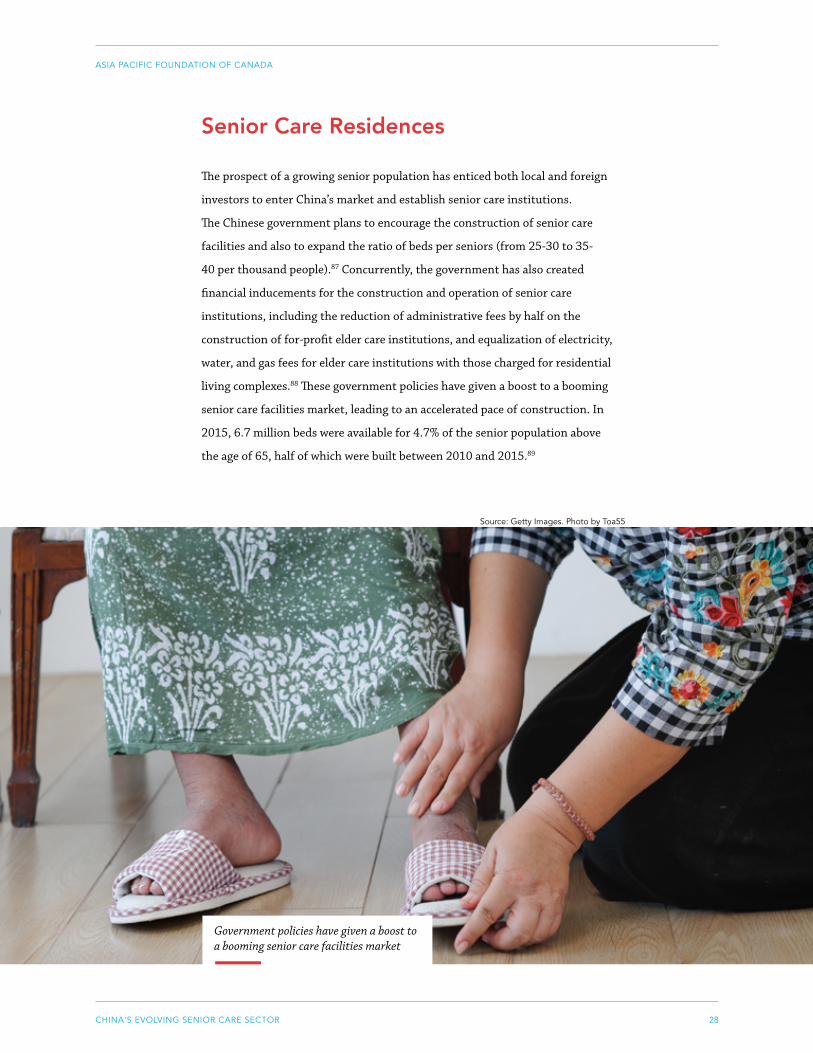
28CHINA'S EVOLVING SENIOR CARE SECTOR
ASIA PACIFIC FOUNDATION OF CANADA
Senior Care Residences
The prospect of a growing senior population has enticed both local and foreign
investors to enter China’s market and establish senior care institutions.
The Chinese government plans to encourage the construction of senior care
facilities and also to expand the ratio of beds per seniors (from 25-30 to 35-
40 per thousand people).87 Concurrently, the government has also created
financial inducements for the construction and operation of senior care
institutions, including the reduction of administrative fees by half on the
construction of for-profit elder care institutions, and equalization of electricity,
water, and gas fees for elder care institutions with those charged for residential
living complexes.88 These government policies have given a boost to a booming
senior care facilities market, leading to an accelerated pace of construction. In
2015, 6.7 million beds were available for 4.7% of the senior population above
the age of 65, half of which were built between 2010 and 2015.89
Government policies have given a boost to a booming senior care facilities market
Source: Getty Images. Photo by Toa55

29CHINA'S EVOLVING SENIOR CARE SECTOR
ASIA PACIFIC FOUNDATION OF CANADA
Domestic real estate companies have been the leading investors in senior care
facilities since 2010, primarily focusing on high-end senior care facilities. These
developers enter the senior care market for two key reasons: 1) to liquidize
idle assets; and 2) to build senior care capacity that could be used as a
bargaining chip to gain access to land. These developers, who include leading,
local real estate companies such as Vanke, Poly CN, and Sino-Ocean Group,
excel in development and construction of high-end facilities. However, they
have very little experience in the management and operation of senior care
facilities, particularly the provision of nursing care, medical services, and
entertainment.90
Local insurance companies, such as Taikang, Union Life, NCI, Taiping Life,
and Ping An, have also entered the market and established high-end senior
care facilities. Their business model consists of levying a membership fee (for
example, approximately RMB2M in one of Taikang’s facilities) and a monthly
fee of several thousand yuan, depending on the unit’s size. The accumulation
of capital from the sale of life insurance premiums and legislation from 2008
that permits insurance companies to invest in the senior care market have all
contributed to this trend.91
The prospect of an ever-increasing senior care residence market has also
attracted investors from abroad, such as two of the largest owners of senior
care facilities in the United States, Fortress and Watermark. In a high-
profile move, in 2016, the French company ORPEA opened up a high-end
nursing home in Nanjing. The new facility, which includes 140 beds and
111 rooms, provides around the clock nursing and medical services to an
affluent population of 80-year-olds and above. ORPEA has plans for further
expansion, establishing new facilities across China. The purpose of this venture
is to address the absence in high-quality nursing services in a sector that is
dominated by real estate developers.92
So far, the construction and management of senior care facilities has not
been highly profitable for either local or foreign investors. And this trend
has not matched investors’ expectations for a fast turnover rate, particularly
for Chinese developers, who have been accustomed to quick and high profit
margin rates. Given the costs of developing the variety of services associated
with high-end senior care, profits may arrive only in the long term.
30CHINA'S EVOLVING SENIOR CARE SECTOR
ASIA PACIFIC FOUNDATION OF CANADA
One reason for the operation losses is the low occupancy rate in senior care
facilities. For example, in 2015 the occupancy rate in senior care facilities was
only 48%. The reasons for this are both economic and cultural. Economically,
the current generation of seniors cannot always afford expensive senior
housing. These seniors, who were born during the 1930s and early 1940s,
have not been the main beneficiaries of China’s economic reforms, and the
absence of long-term insurance plans has also hindered their access to senior
care housing. Culturally, the current generation of elders prefers to live next
to their offspring, and their offspring also find it culturally inappropriate to
let their parents live in senior care instead of caring for them at home. Seniors
who grew up in the 1930s and 1940s, when China was poor, have a developed
an ethos of self-sacrifice. Their priority is to maximize resources in order to
guarantee the future welfare of their children and grandchildren. Spending
money on themselves clashes with their value of self-sacrifice.93
Currently the senior care real estate sector is not generating surpluses. For
example, according to a Chinese government report, only 9% of elderly care
homes in China were profitable in 2015.94 Further, a survey from 2016 finds
that only 4% of senior care facilities were making a profit.95 But this situation
might change in the long term. In 10 to 15 years’ time, as the rather affluent
generation of Chinese who were born in the 1950s ages, the demand for
high-end senior care housing is likely to expand. In addition to the aging of
a comparatively rich population, the introduction of a viable long-term-care
insurance plan is likely to further stimulate the senior care market.
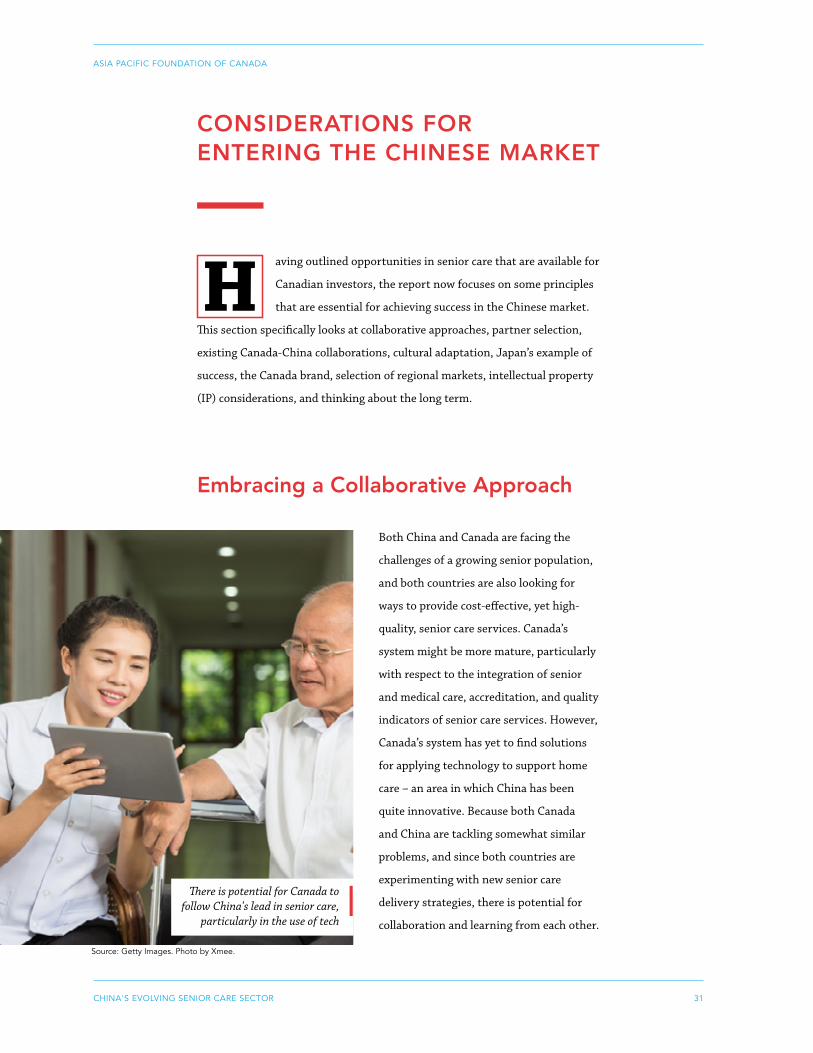
31CHINA'S EVOLVING SENIOR CARE SECTOR
ASIA PACIFIC FOUNDATION OF CANADA
CONSIDERATIONS FOR ENTERING THE CHINESE MARKET
H aving outlined opportunities in senior care that are available for
Canadian investors, the report now focuses on some principles
that are essential for achieving success in the Chinese market.
This section specifically looks at collaborative approaches, partner selection,
existing Canada-China collaborations, cultural adaptation, Japan’s example of
success, the Canada brand, selection of regional markets, intellectual property
(IP) considerations, and thinking about the long term.
Embracing a Collaborative Approach
Both China and Canada are facing the
challenges of a growing senior population,
and both countries are also looking for
ways to provide cost-effective, yet high-
quality, senior care services. Canada’s
system might be more mature, particularly
with respect to the integration of senior
and medical care, accreditation, and quality
indicators of senior care services. However,
Canada’s system has yet to find solutions
for applying technology to support home
care – an area in which China has been
quite innovative. Because both Canada
and China are tackling somewhat similar
problems, and since both countries are
experimenting with new senior care
delivery strategies, there is potential for
collaboration and learning from each other.
There is potential for Canada to follow China's lead in senior care,
particularly in the use of tech
Source: Getty Images. Photo by Xmee.
32CHINA'S EVOLVING SENIOR CARE SECTOR
ASIA PACIFIC FOUNDATION OF CANADA
Carefully Vetting Local Partners Whereas foreign providers of senior care services are permitted to establish
wholly owned foreign enterprises, Chinese regulations compel foreign
investors in medical facilities to work with a local partner, either through
equity investment or collaborative joint venture.96 Canadian senior and
medical care providers are often uneasy about forming partnerships with
Chinese counterparts, particularly those from the real estate sector. They
are concerned that these potential partners do not share the same goals and
values, and that they are in it for the short-term gain at the expense of seniors’
welfare. Canadians also fear reputational damage, as a Chinese partner might
use the brand name of a top-quality Canadian provider to deliver cheap,
substandard care. To identify effective business partners, Canadian senior care
providers are advised to use leading public hospitals in China as market entry
points. Meanwhile, they can consider business partnerships with a leading
public Chinese hospital, and thus benefit from the hospital’s reputation in
China. Among China’s hospitals, Beijing Hospital, which houses the National
Center for Geriatrics and Gerontology, proved to be an effective partner for
Baycrest Global Solutions.
In addition to public hospitals, Canadian organizations can consider other
possible intermediaries. First, China-based lawyers with extensive experience
in brokering business and partnerships between international and Chinese
entities could be helpful in selecting a partner and ensuring compliance with
the partnership agreement. Second, Canada has the advantage of a large
Chinese community with elaborate connections and nuanced understanding
of the business culture in China – many of whom work within Canada’s
medical and senior care sector. These Chinese-Canadians can serve as a bridge
between Canadian providers and their Chinese counterparts.97 Third, Chinese
professional organizations, such as the Chinese Hospital Association, which
has close institutional ties to the Chinese government (China’s National
Health Commission) can help in ensuring that the authorities are supportive
of the Canadian entry into the local market. Fourth, Canada’s well-connected
Canadian Trade Commissioner Service (TCS) in China is in a position to
identify and introduce potential Chinese partners.
33CHINA'S EVOLVING SENIOR CARE SECTOR
ASIA PACIFIC FOUNDATION OF CANADA
Building on Existing Canada-China Collaborations
MOUs signed between Canadian and Chinese counterparts can facilitate
access to important Chinese brokers and partners. For example, in 2016, the
Canada Pension Plan Investment Board (CPPIB) signed an MOU with the
National Development and Reform Commission (NDRC), China’s economic
development department, in Ottawa. According to this agreement, the
CPPIB will share with its Chinese counterpart the Canadian experience in the
governance of pension funds and its investment portfolio policies – especially
with identifying strategies for coping with China’s deficit-ridden public
pension funds.
CPPIB has already gained access to the Chinese market. Currently, 10% of
CPPIB funds are invested in its China portfolio, and the organization is also
planning to establish an office in Beijing.98 On top of that, CPPIB is already
invested in senior care facilities in China – it is the largest shareholder in
the French company ORPEA, which opened a high-end nursing care home
in Nanjing in 2014.99 It is also invested in Chindex, a Beijing-based company
owned by Americans living in China, which is running a chain of private
hospitals across China – the United Family Hospitals.100
Capitalizing on the CPPIB’s government contacts and reputation in China,
Canadian senior care providers could use this existing MOU to forge new
contacts and expand their networks in China.
A second example of existing co-operation is the Royal College of Physicians
and Surgeons of Canada’s MOU on medical education and training with the
Chinese Medical Doctor Association, a national, professional association
of 2.1 million practising physicians in China.101 Building on these contacts,
Canadian hospitals and senior care providers can gain direct access to one
of the key professional networks in China, which could potentially facilitate
the identification of local partners. In particular, it may be worth exploring
leveraging these contacts to set up training programs for geriatricians, to take
place either in China or in Canada.

34CHINA'S EVOLVING SENIOR CARE SECTOR
ASIA PACIFIC FOUNDATION OF CANADA
Adapting to Local Culture
On numerous occasions, interviewees specified that having an understanding
of Chinese culture is necessary for achieving success in China. The concept of
Chinese culture, however, is diffuse. First, Chinese seniors often appreciate
elements of both Chinese and Western medicine. In specific contexts, they
select among a “supermarket” of possibilities – either Western or Chinese
medicine treatment – according to what they deem to be the most efficacious
option.102 Second, Chinese culture is also divided across geographic locations,
exhibiting a diversity of customs, dialects, cuisines, business cultures, and
so on.
To be successful, Canadian companies entering the Chinese senior care market
must apprise themselves of the preferences, values, and tastes of their Chinese
customers. In particular, Canadians should take into account the integration of
Chinese medicine into their senior care operations in China, paying attention
to how Canadian disease prevention methods can resonate with existing
preventive practices in Chinese medicine. Canadians should also take into
account Chinese dietary habits. Our diet can have a determinant effect on our
health in old age and the probability of suffering from a chronic disease. Yet
Canadian and Chinese seniors may not have the same culinary preferences,
and, thus, the menu needs to be adjusted to local tastes.103 Other cultural
aspects, such as interior design and having frontline workers with cultural
compatibility (notably speakers of local dialects), should not be ignored.
Canadians must be highly sensitized to the persisting importance of filial
piety in Chinese society. Currently, filial piety is one of the key reasons for the
low occupancy rate in senior care facilities. Having one’s parents sent away
to a senior care facility, rather than cared for by their children at home, is
still deemed by many as “un-filial.” To counter that trend, senior care service
providers must find strategies to have seniors’ families actively involved in the
care process – even if the parents no longer reside with their family members.
Regular updates and consultations between the medical staff, seniors and their
family members can be one way of making the absence of physical presence
next to one’s parents commensurate with the imperatives of filial piety. Recent
advancements in smart senior care technologies can facilitate communication

35CHINA'S EVOLVING SENIOR CARE SECTOR
ASIA PACIFIC FOUNDATION OF CANADA
and monitoring among the seniors and their family members. Canadian
providers should ensure that their senior care practices are consistent with
Chinese perceptions of filial piety.
Use of technology and social media is pervasive in China. Urban residents
already expect that providers will sell their products online and will also have
a digital, interactive platform. Canadians who wish to enter the market must
take this into account and integrate technology and social media into their
services. A successful operation should have a strong online and social media
presence and provide digitally responsive services. Because Canadian public
hospitals are not accustomed to these kinds of interfaces, they may need to
form partnerships with local companies specializing in this area.
Because culture is a key ingredient for success in China’s senior care sector,
having a local partner, who is an insider, will be an advantage.
Learning from Japanese Counterparts
Cultural adaptation is important in senior care, and the Japanese brand
is held in high regard in China. The Japanese are perceived to have shared
cultural norms with the Chinese, especially regarding filial piety and care for
the elderly. Japan has a reputation both in China and around the world for
having the most advanced system of care for seniors. The Japanese senior care
system consists of a publicly funded long-term-care insurance, an integrated,
single entry assessment system, and the longest and most rigorous training
system for senior care staff.104 Japanese aged care facilities are known for
providing high-quality services, including mandatory employment of nutrition
specialists and promotion of activities to maximize both physical and cognitive
performance.105 Japan is also one of the early entrants into the Chinese senior
care market, and as such, Japanese providers are benefiting from both name
recognition and understanding of the Chinese market.
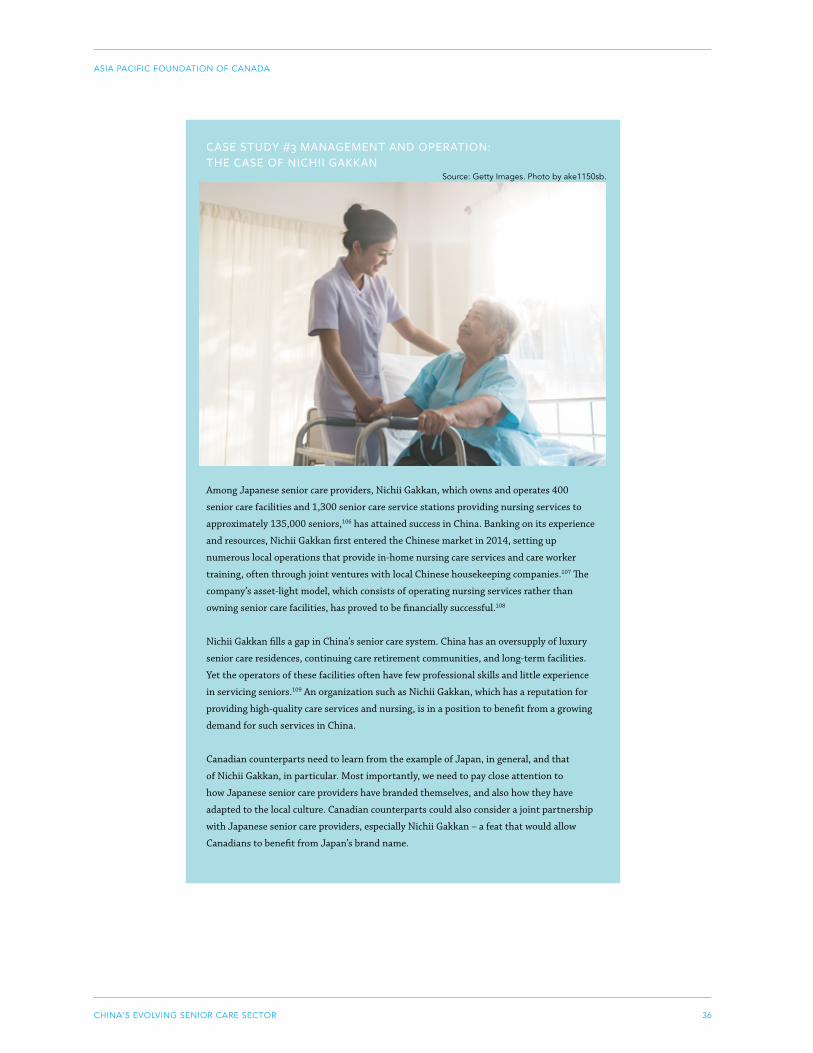
36CHINA'S EVOLVING SENIOR CARE SECTOR
ASIA PACIFIC FOUNDATION OF CANADA
CASE STUDY #3 MANAGEMENT AND OPERATION: THE CASE OF NICHII GAKKAN
Among Japanese senior care providers, Nichii Gakkan, which owns and operates 400
senior care facilities and 1,300 senior care service stations providing nursing services to
approximately 135,000 seniors,106 has attained success in China. Banking on its experience
and resources, Nichii Gakkan first entered the Chinese market in 2014, setting up
numerous local operations that provide in-home nursing care services and care worker
training, often through joint ventures with local Chinese housekeeping companies.107 The
company’s asset-light model, which consists of operating nursing services rather than
owning senior care facilities, has proved to be financially successful.108
Nichii Gakkan fills a gap in China’s senior care system. China has an oversupply of luxury
senior care residences, continuing care retirement communities, and long-term facilities.
Yet the operators of these facilities often have few professional skills and little experience
in servicing seniors.109 An organization such as Nichii Gakkan, which has a reputation for
providing high-quality care services and nursing, is in a position to benefit from a growing
demand for such services in China.
Canadian counterparts need to learn from the example of Japan, in general, and that
of Nichii Gakkan, in particular. Most importantly, we need to pay close attention to
how Japanese senior care providers have branded themselves, and also how they have
adapted to the local culture. Canadian counterparts could also consider a joint partnership
with Japanese senior care providers, especially Nichii Gakkan – a feat that would allow
Canadians to benefit from Japan’s brand name.
Source: Getty Images. Photo by ake1150sb.

37CHINA'S EVOLVING SENIOR CARE SECTOR
ASIA PACIFIC FOUNDATION OF CANADA
Creating a 'Canada Brand' in Senior Care
Canada’s senior and medical care systems – as opposed to their British and
Japanese counterparts – do not have a distinct brand name in China. For
example, the Japanese senior care system is known in China for delivering
services that are consistent with the virtue of filial piety, and the UK’s National
Health System is recognized for the quality of its primary care and its general
practitioner training and medical education system.110 This distinct identity
facilitates the creation of a brand name abroad which, in turn, enables market
promotion.
Canada’s system also has some areas of excellence, but Canada has yet to craft
a unique brand, primarily because of the fragmentation of Canada’s medical
system, as compared to the UK and Japan.111 The provinces are directly in
charge of the management of the medical system and its resources, which
makes it difficult to identify areas of excellence in the Canadian system, and
thus the generation of a Canadian brand name in senior care. Medical sector
insiders and academic experts are primarily familiar with the services available
in their geographic areas of operation, but they generally lack a good grasp
of the inner workings of the systems outside of their province. Canada will
need to take a systematic approach to identifying areas of excellence, and then
accordingly create a credible brand name to facilitate market entry in China
and beyond.
Carefully Selecting the Market
The proportion of Chinese seniors in the population varies across different
localities. For example, in Guangdong Province, which has seen an influx of
young migrants, the rate of seniors within the total population is about 8.6%.
However, in six provinces, including Liaoning, Sichuan, Shanghai, Shandong,
Jiangsu, and Chongqing, seniors over 65 constitute more than 14% of the local
population.112 Canada’s focus should be on the urban areas in these provinces,
particularly Shanghai and Jiangsu, which have the highest GDP per capita
38CHINA'S EVOLVING SENIOR CARE SECTOR
ASIA PACIFIC FOUNDATION OF CANADA
in the country,113 and where both local governments have welcomed foreign
investments. Further, the Canadian Consulate in Shanghai and its TCS offices
in both Shanghai and Nanjing could offer invaluable support to Canadians.
Shandong Province is another potential destination, primarily because the
local success of the Wellness Institute in Rizhao City has cemented Canada’s
reputation in the province. Because of their hospitable climate, Shandong’s
coastal cities, such as Yantai, Qingdao, Weifang, and Rizhao, are often a tourist
destination for seniors and could be ideal for the operation of senior care
services and facilities.
Saying that, we should note that in most cases Canadians are not in a position
to select the location in China. In cases of collaboration, it is generally
the Chinese counterparts that have initially sought out Canadian senior
care providers and suggested the location. Personal connections between
Canadian and Chinese companies have also been a strong factor in enabling
collaboration, even in geographic areas outside of the TCS radar. This implies
that Canadians should be open-minded and flexible, as offers for collaboration
could come from partners in diverse parts of the country.
IP Considerations
The protection of IP is a major concern for foreign investors in China, including
those in the senior care business. While the threat of IP theft is real, there are
several mitigating factors, and protection of IP in China has improved over
the last decade. For example, China is establishing a system of specialized
IP courts, which rely on the advice of specialized IP technical investigators
and expert witnesses. Further, there has been increased professionalism
among Chinese judges.114 China has also been stepping up its efforts to root
out IP violations. For example, in late 2018, the NDRC specified 38 new
punishments for IP infringements,115 and during the G20 meeting in Osaka, Xi
Jinping personally vowed to both compensate victims of IP theft and set up a
complaint channel for foreign companies.116 Xi’s discourse and recent policies
can be seen as genuine because China now has a real interest in protecting IP.
China is undergoing a shift in its economic structure, from manufacturing to
services and innovation. In 2017 Chinese companies accounted for 44% of
39CHINA'S EVOLVING SENIOR CARE SECTOR
ASIA PACIFIC FOUNDATION OF CANADA
the world’s patent filings117, with Huawei as the world’s leading patent filer.
As an increasing number of Chinese companies are the owners of intellectual
property, it is expected that IP protection in China will be strengthened.
While the recent commitment to the protection of IP might result in more
strict enforcement, policy implementation in China is inconsistent and
incremental. In locations where the economy relies on copycats, rather than
innovation, judges are more likely to be lenient toward IP infringements.118
Canadian companies should, therefore, operate in localities with higher
enforcement standards and identify partners with unblemished records in IP
protection. Selection of these localities will require meticulous due diligence,
including consultation with TCS offices in China and lawyers specializing in IP.
Thinking Long Term
China’s senior care system is in its infancy. The public pension system, which
could be the vehicle undergirding seniors’ consumption power, is in deficit,
whereas the commercial pension option is only beginning to evolve. There
is sufficient supply of high-end senior care facilities; this supply is currently
outpacing existing demand. Similarly, a budding smart care sector is still at
the pilot project phase, losing money. Hence, those who enter the market now
should not expect quick returns on their investment; it might take several
years before their operations in China start generating a surplus. Patience,
resources, and commitment are necessary for attaining success in the future.
Nevertheless, investing for the long term is likely to have its payoffs. In a
decade from now, the sector is going to go through a major transformation. As
the generation of Chinese born in the late 1950s and 1960s ages, the culture
of consumption is expected to change quite dramatically – there will be a
large demographic group of comparatively affluent seniors with the means to
afford high-quality care. It is also expected that the welfare system to support
senior care consumption will improve, as the Chinese government considers
major reforms in both pensions and long-term-care insurance. Long-term-care
insurance is expected to be implemented throughout the country by 2021,119
and the public pension fund is undergoing governance reforms that are likely
to improve its solvency in the future.120

40CHINA'S EVOLVING SENIOR CARE SECTOR
ASIA PACIFIC FOUNDATION OF CANADA
China's innovative approaches to senior healthcare can be emulated by Canada
T his study has shown how much China’s senior care sector
is rapidly evolving. Its development is fuelled by active
government support of private sector participation and foreign
investment. As the Chinese senior care market is in an early stage, there is still
considerable space for growth. It offers an opportunity that Canadian senior
and medical care providers wishing to expand abroad can seize. Joining the
market at a later stage might be less promising, as it is likely to become either
extremely competitive or saturated.
The sector of integrated care and specialized medical services for seniors is
the most promising, given the absence of these services in China, and because
of the existence of government policies to actively address this need via the
promotion of private and foreign operators. Because Canada’s public hospitals
have a reputation for the provision of high-quality services, and because of the
success of Canada Wellness Institute in Shandong, there is goodwill and trust
on the part of Chinese counterparts. Thus, Canadian hospitals could seek these
opportunities and identify potential partners in China.
CONCLUSION
Source: Getty Images. Photo by Pornpak Khunatorn.
41CHINA'S EVOLVING SENIOR CARE SECTOR
ASIA PACIFIC FOUNDATION OF CANADA
The success of the Japanese nursing care provider, Nichii Gakkan, in China
also attests to another area of opportunity. Because the quality of training and
practice of nursing and personal support workers for the elderly in China is
low, there is a demand both within upscale facilities and in home care for such
services. Canadian companies, such as Saint Elizabeth Global, that offer both
nursing services and training still have the space to enter the Chinese market,
provided they are able to adjust to local culture and identify a reliable partner.
The senior and medical care sectors could become fruitful avenues of economic
engagement and knowledge exchange with China. As these arenas are not
sensitive, the government is more open for feedback and engagement with
non-government actors. In the course of reforming its health-care system,
the Chinese government has encouraged debate and solicited the advice of
diverse experts, including foreign experts and international organizations.121
This atmosphere of openness has informed Chinese government policies to
promote foreign investment in senior care. The relations between Canada
and China are at their lowest point since 1989. But this does not necessarily
stop all channels of engagement with China. The recent opening of a new
Wellness Institute facility in Beijing is a case in point.122 It demonstrates that
China’s emerging senior care sector opens up outlets for constructive business
relations and knowledge exchange with foreign countries, including Canada.
Even if the Chinese senior care market holds promise, great challenges for new
entrants remain. For example, the Chinese market operates very differently
from the Canadian one, local culture also diverges from Canada, and finding
a reliable partner is often a long and complicated process. After entering the
market, companies may have to wait several years for their businesses to
become solvent, and they will need to maintain vigilance against potential IP
theft. Successful entry will require considerable time devoted to careful due
diligence. Afterwards, the company must have the resources and commitment
to remain despite the challenges associated with the early years of operation in
China. The task of entering the Chinese market may seem daunting in the
early stages, but China’s senior care sector offers great opportunities that
cannot be matched by any other country. This is important in the current
period, when trade and investment diversification is high on the agenda of the
Canadian government.
42CHINA'S EVOLVING SENIOR CARE SECTOR
ASIA PACIFIC FOUNDATION OF CANADA
1 WHO. 2016. China’s Population Aging and Healthy Country Evaluation Report. https://apps.who.int/iris/bitstream/handle/10665/194271/9789245509318-chi.pdf;jsessionid=6B882A59E9E8F88788D6D13623B86441?sequence=5.
2 Ministry of Civil Affairs (MoCA). 2018. 2017 Statistical Public Data. http://www.mca.gov.cn/article/sj/tjgb/2017/201708021607.pdf; Xinhua. 2019b. Population Aging Accelerates: Have We Prepared Well? http://www.xinhuanet.com/politics/2018-04/18/c_1122702322.htm.
3 WHO. 2016.
4 Lin Miaomiao and Wang Shuo. 2018. China’s Rehabilitation Resources Are Insufficient, Yet the Potential Is Great: We Should Strengthen the Capacity of Community Facilities. Xinhua. http://www.xinhuanet.com/fortune/2018-02/09/c_1122390397.htm; Song Wei and Liu Jige. 2018. Who’s Going to Take Care of 240 Million Seniors? Xinhua. http://www.xinhuanet.com/health/2018-04/02/c_1122627297.htm; Zhang Yuqiong and Xu Lin. 2016. Endowment Service Research of Disabled Elderly from the Perspective of Family Policy. Theoretical Discussion. http://www.cdpf.org.cn/ztzl/special/CDRS/cjryjzz/201609/W020160906474975061747.pdf.
5 Hu, Mingsheng. 2019. Scholar: 2033 China’s Dementia Will Reach the Level of an Outbreak: A Test for China Senior Care Services. http://www.sohu.com/a/309249411_161795
6 Qianzhan. 2019. 2019 China Senior Care Sector Market Analysis: Senior Care Structure Two Big Problems that Await Solution. 2019. Haitao Tech. http://www.haitao-tech.com/industry/1031.jhtml.
7 Calculations are based on numbers in this report. Sohu. 2019a. In 2018 the Proportion of People over 60 Year Old People Reached 17.9%, China Is Rapidly Approaching an Aging Society. http://www.sohu.com/a/293348655_794891.
8 Qianzhan. 2019.
9 Qianzhan. 2019. 2018 Senior Care Volume and Development Prospect Analysis: Market Demand Still Rising. https://www.qianzhan.com/analyst/detail/220/190416-3ff6b1d3.html.
10 Qianzhan. 2019. 2018 China’s Big Health Industry Market and Development Trends: Still at Infancy Stage, Tremendous Space for Development. https://www.qianzhan.com/analyst/detail/220/190123-d57306b2.html.
11 See Ministry of Civil Affairs. 2012. Implementation Opinions on Encouraging and Guiding Private Capi-tal’s Entry into Eldercare Service Sector. http://www.gov.cn/zhengce/2016-05/22/content_5075659.htm
12 State Council. 2016c. Several Opinions on the Full Opening Up of the Elderly Care Services Market and the Improvement in Quality of Elderly Care services. http://www.gov.cn/zhengce/content/2016-12/23/con-tent_5151747.htm
13 Zhang Yue. 2019. Multi-Pronged Support for Community-Based Elderly Care, Child Care, and Domestic Services. http://english.gov.cn/premier/news/2019/05/29/content_281476688627618.htm.
14 Harris, Greg. 2018. Foreign Investment in Chinese Eldercare and Healthcare: Overview. Winston & Strawn. https://www.winston.com/images/content/1/4/v2/142310/ForeignInvestmentinChineseEldercareand-Healthcare.pdf.
15 State Council. 2016. Several Opinions on the Full Opening Up of the Elderly Care Services Market and the Improvement in Quality of Elderly Care Services. http://www.gov.cn/zhengce/content/2016-12/23/con-tent_5151747.htm; Ministry of Civil Affairs (MoCA). 2017. Notice on the Promotion of Opening Up Reform in the Elderly Care Industry. http://www.mca.gov.cn/article/gk/wj/201702/20170200003171.shtml.
16 Liu Wenyang. 2019. MCA Document#1: Cancellation of senior care facility license, and strengthening of post-construction oversight. https://www.cn-healthcare.com/article/20190103/content-513299.html.
17 The Ministry will also publish a new document, regulating land use, investment etc. Yu Yi. 2019. MoCA Cancels the Approval License for the Construction of Senior Care Facilities, Encouraging Social Capital to Enter the Senior Care Market. China Economy Net.
18 State Council. 2019c. Opinion on the Promotion of Social Capital Running Medical Facilities and Con-tinuing Health Service Standardization. http://www.gov.cn/xinwen/2019-06/12/content_5399740.htm
19 Ministry of Finance and Tax Affairs Administration. 2019. Notice On the Implementation of Tax Reduction and Exemption for Small Enterprises. http://www.gov.cn/fuwu/2019-01/21/content_5359591.htm
BIBLIOGRAPHY

43CHINA'S EVOLVING SENIOR CARE SECTOR
ASIA PACIFIC FOUNDATION OF CANADA
20 Huang Hai and Chen Yu. 2017. MoCA and Ministry of Commerce Publicly Announce: Encourage Foreign Investor to Establish For-profit Senior Care Structures. Global Law Office. http://www.glo.com.cn/content/details_13_659.html
21 State Council Office. 2019. Opinions on the Promotion of Elderly Care Service. http://www.gov.cn/zhengce/content/2019-04/16/content_5383270.htm.
22 The government intends to have seniors independently residing in their homes, while providing them with a host of services, including in-house housekeeping, cooking, emotional support, and nursing/rehabilitation. Elderly citizens living at home should be able to have access to services, such as health care, learning and education, fitness and recreation, emotional comfort, and legal counselling. For home care, see Chen Youhua. 2014. Home Care and Its Related Issues. http://www.ccswf.org.tw/files.pdf; Wang Meiling. 2013. Structure of ‘9073’ in Shanghai: Home Care as Basis. Sohu. http://finance.sina.com.cn/roll/20130408/160915076239.shtml.
23 State Council. 2017. Notice on the 13th 5 Year Plan for the Construction of Senior Care System and the Development of National Senior Care Service Sector. http://www.gov.cn/zhengce/content/2017-03/06/content_5173930.htm; Tianhua Group. 2016. Understanding the ‘9073’ Policy and Sorting Out the Different Categories of Senior Care Real Estate Projects. http://tianhuagp.com/cn/news/194.
24 KPMG. 2019. Senior Care in China: Fast Growth Is Imperative.
25 Dai Yuhua. 2019. Senior Care Structure: Part of Senior Care Concept. Jianshu. https://www.jianshu.com/p/548204eaba86.
26 Sumit Majumder et al. 2017. Smart Homes for Elderly Healthcare—Recent Advances and Research Chal-lenges. https://www.ncbi.nlm.nih.gov/pmc/articles/PMC5712846/.
27 MIIT, MoCA, and NHFPC. 2017. Notice on Smart Healthy Senior Care Development Action Plan. 2017-2020. http://www.gov.cn/xinwen/2017-02/20/content_5169385.htm#1
28 Ministry of Industry, Information and Technology (MIIT). 2017. Public standard list of 100 smart care pilot project enterprises. http://www.nhc.gov.cn/jtfzs/s7873/201711/60a8b77b42c149a4a9f2c632f8a6eec6.shtml; MIIT. 2018. Second list of 100 smart care pilot project enterprises. http://www.gov.cn/fuwu/2018-11/23/content_5342676.htm.
29 Potevio. 2019. Company Overview. http://www.potevio.com/g309.aspx.
30 State Owned Assets Supervision and Administration Commission. 2018. Potevio Uses Internet and Smart Tech Senior Care to Elevate the Quality of Senior Care Service. http://www.sasac.gov.cn/n2588030/n2588934/c8465823/content.html.
31 Buurtzorg. 2019. The Buurtzorg Model. https://www.buurtzorg.com/about-us/buurtzorgmodel/
32 Sui Jun. 2018. Buurtzorg Netherlands Home Care Service Company Signed a Contract with Qingdao’s Yanlin Medical. Beijing Xiao Yi Xiao.
33 SE Health. 2019. https://global.sehc.com/about
34 APFC. 2019. Building Women’s Partnerships in the Care Economy: The First Canadian Women-only Business Mission to Japan.
35 State Council. 2016b. Several Opinions on Accelerating the Development of the Rehabilitation Assistive Device Sector. http://www.gov.cn/zhengce/content/2016-10/27/content_5125001.htm.
36 MoCA. 2019. Notice on Rehabilitation Assistive Device Community Rental Service Pilot Project. http://www.gov.cn/xinwen/2019-06/28/content_5404284.htm
37 The current list is not a comprehensive inventory of all categories of assistive devices promoted by the Chinese government. It is a compilation of what the author deems as key categories according to an explanatory document published by the Ministry of Civil Affairs (MoCA). The author supplements this official document from China with further elaboration on the classification of assisted devices, which appears on the website of the National Institute of Child Health and Human Development (NICHD). For more details on these categories, see MoCA. 2014. Explanation of China’s Rehabilitation Assistive Device Catalogue. http://www.mca.gov.cn/article/gk/jd/shflhcssy/201406/20140615658660.shtml, and NCIHD. 2018.
38 State Council. 2016b.
39 APFC. 2016. Building a Healthy and Sustainable System: China’s Health-care Service Sector. | https://www.asiapacific.ca/sites/default/files/filefield/healthtech-report-final.pdf.
40 Deloitte. 2018. Exploring Healthy Senior Care Last Mile: China’s Integrated Care Trend Outlook. https://www2.deloitte.com/content/dam/Deloitte/cn/Documents/life-sciences-health-care/deloitte-cn-lshc-the-last-mile-of-senior-care-zh-180720.pdf.
41 Deloitte. 2018.
42 Deloitte. 2018; National Health and Family Planning Commission and Ministry of Civil Affairs. 2016. Notice on the Pilot Program for the Integration of Medical and Senior Care Services. http://www.nhc.gov.cn/jtfzs/pqt/201605/85c96731fcbc43e2bb093c982581a5f1.shtml
44CHINA'S EVOLVING SENIOR CARE SECTOR
ASIA PACIFIC FOUNDATION OF CANADA
43 Pulin Yu, Xiang Liu, and Jianye Wang. 2018. Geriatric Medicine in China: The Past, Present, and Future. Aging Medicine. https://doi.org/10.1002/agm2.12008.
44 Sina. 2018. China’s Chronic Disease Management Situation and the Exploration of Different Manage-ment Styles in China and Abroad. https://med.sina.com/article_detail_103_2_54224.html.
45 State Council. 2017
46 Zhao Yanrong et al. 2017. Demand and Signing of General Practitioner Contract Service among the Urban Elderly: A Population-Based Analysis in Zhejiang Province, China. https://www.ncbi.nlm.nih.gov/pmc/articles/PMC5409557/#B5-ijerph-14-00356.
47 State Council. 2017. http://www.gov.cn/zhengce/content/2017-02/14/content_5167886.htm.
48 Sina. 2018.
49 Interview. May 25. Beijing
50 The Wellness Institute. 2019. China Models Medical Fitness after Wellness. https://wellnessinstitute.ca/cwi_rizhao/.
51 Nathan Vanderklippe. 2019. Despite political tensions, Canadian health clinic finds success in China. The Globe and Mail. https://www.theglobeandmail.com/business/article-china-still-offers-business-opportuni-ties-for-canadians-at-least-for/.
52 The Wellness Institute. 2019. Living with Chronic Conditions. https://wellnessinstitute.ca/chronic-condi-tions/.
53 More Health. 2019. http://www.miao.cn/aboutUs.html.
54 Xinhua. 2017. Comprehensive Plan for Senior Care Rehabilitation Officially Published. http://www.xinhuanet.com/fortune/2017-08/28/c_129690981.htm.
55 Lin and Wang. 2018.
56 Lin and Wang. 2018.
57 Cui Xuyu. Wang Qing, and Yang Zhiqiang. 2015. Senior Rehabilitation Service System Building Outlook: Human Talent, Demand and Corresponding Policies. China Journal of Rehabilitation Medicine. http://www.rehabi.com.cn/ch/reader/create_pdf.aspx?file_no=201502014&year_id=2015&quarter_id=2&falg=1.
58 Caijing. 2019. Senior Rehabilitation Welcomes Path-breaking Policies, Payment, Talent Cultivation and Complementary Measures. https://www.yicai.com/news/100131131.html.
59 The Ministry of Human Resources and Social Security. 2016. Notice on Making Part of Medical Rehabili-tation Care Program Enter within the Scope of Medical Insurance Reimbursement. http://www.carm.org.cn/Uploads/Editor/2016-03-25/56f4e8621963d.pdf.
60 State Council. 2017. 13th Senior Care 5 Year Plan. http://www.gov.cn/zhengce/content/2017-03/06/con-tent_5173930.htm.
61 WHO. 2016. The Economic Burden of Dementia in China, 1990–2030: Implications for Health Policy. https://www.who.int/bulletin/volumes/95/1/15-167726/en/.
62 Nathan Vanderklippe. 2017. Facing a ‘Tidal Wave’ of Dementia, China Is Running Out of Time. The Globe and Mail. https://www.theglobeandmail.com/news/world/dementia-crisis-in-china-public-health-crisis/article33047108/.
63 Chen Zheng et al. 2017. Challenges of Dementia Care in China. Geriatrics.
64 Pulin Yu, Xiang Liu, and Jianye Wang. 2018.
65 Pulin Yu, Xiang Liu, and Jianye Wang. 2018.
66 Kenneth Rockwood et al. 2005. A global clinical measure of fitness and frailty in elderly people. CMAJ. https://www.ncbi.nlm.nih.gov/pmc/articles/PMC1188185/.
67 Baycrest. 2017. Baycrest Global Solutions Signs Deal to Establish New Services to Senior Adults in China. https://www.baycrest.org/Baycrest-Pages/News-Media/News/Baycrest-Global-Solutions/Baycrest-Global-Solutions-signs-deal-to-establish.
68 State Council. 2019. China’s Health Action Organization Implementation and Evaluation Blueprint. http://www.sohu.com/a/327045930_100122244.
69 OECD. 2013. A Good Life in Old Age (United Kingdom). https://www.oecd.org/els/health-systems/Unit-edKingdom-OECD-EC-Good-Time-in-Old-Age.pdf.
70 State Council. 2019.

45CHINA'S EVOLVING SENIOR CARE SECTOR
ASIA PACIFIC FOUNDATION OF CANADA
71 Interview. July 2019.
72 Health Standard Organization. 2019. What Is HSO? https://healthstandards.org/about/.
73 Chinese Canadian Times. 2018. Introducing China to Canada’s Advanced Senior Care System: BPS Strategies and Hebei University Sign an MOU. http://www.ccbestlink.com/wap/info/commu_in-fos/20181116/13207.html?from=singlemessage&isappinstalled=0.
74 KPMG. 2019. China Pensions Landscape: The Year in Review and What’s Ahead. https://assets.kpmg/content/dam/kpmg/cn/pdf/en/2019/03/china-pensions-landscape.pdf.
75 KPMG. 2017. China Pensions Outlook: Evolutions, Diversification and Convergence. https://assets.kpmg/content/dam/kpmg/cn/pdf/en/2017/12/china-pension-outlook.pdf.
76 KPMG. 2019; Ministry of Finance and State Taxation Administration. 2018. Notice on the Opening Up Individual Tax-Deferred Commercial Pensions Pilot Project. http://www.chinatax.gov.cn/n810341/n810755/c3389866/content.html.
77 KPMG. 2019.
78 The Economist. 2019. Foreign Financiers Look Past the Trade War and Ramp Up in China. https://www.economist.com/finance-and-economics/2019/07/06/foreign-financiers-look-past-the-trade-war-and-ramp-up-in-china; Kevin Yao. 2019. China to Scrap Ownership Limits in Financial Sector in 2020, Earlier than Planned. The Globe and Mail. https://www.theglobeandmail.com/business/international-business/article-chi-na-to-scrap-ownership-limits-in-financial-sector-in-2020-earlier/.
79 Manulife. 2017. Manulife Becomes the First Financial Institution to Receive Investment Com-pany WFOE License. http://manulife.force.com/Master-Article-Detail?content_id=a0Q5000000MI-HwvEAH&ocmsLang=en_US.
80 Sumeet Chatterjee and Alun John. 2019. Foreign insurers gear up to tap China’s $1.6 trillion pensions business – sources. Reuters. https://www.reuters.com/article/us-china-pensions-exclusive/exclusive-foreign-insurers-gear-up-to-tap-chinas-1-6-trillion-pensions-business-sources-idUSKCN1RO0FA.
81 APFC Investment Monitor. 2019. Both Fairfax Financial Holdings and its subsidiary, Odyssey Reinsurance Corporations have either operation or investments in China, yet these companies do not offer any retirement management products.
82 McKinsey & Co. 2019. How to Win China’s Pension Market. https://www.mckinsey.com.cn/wp-content/uploads/2019/05/2019_麦肯锡_制胜中国养老金融市场.pdf.
83 Xinhua. 2018. How to Solve the Problem of 40 Million Either Disabled or Half-Disabled Elderly? http://www.xinhuanet.com/2018-10/17/c_1123569645.htm
84 Interview. Beijing University. May 25
85 MOHRSS. 2016. Guiding Opinion on Opening Up Long Care Nursing Insurance Experimental Locations. http://www.mohrss.gov.cn/gkml/xxgk/201607/t20160705_242951.html. But this excludes Qingdao, where the rate is 90%. People.cn. 2016. China Opens Up Long Term Nursing Care Insurance, 15 Cities Enter the First Stage of Experimentation. http://society.people.com.cn/n1/2016/0712/c1008-28545668.html.
86 People.cn. 2016.
87 Deloitte. 2014. China’s Senior Housing: Now and the Future. https://www2.deloitte.com/content/dam/Deloitte/cn/Documents/life-sciences-health-care/deloitte-cn-lshc-seniorhousing-en-080616.pdf.
88 Deloitte. 2014
89 Deloitte. 2014
90 DBS.
91 Deloitte.
92 Wedaeli Chibelushi. 2017. ORPEA Pioneer the China Social Care Sector. Healthcare Global. https://www.healthcareglobal.com/company/orpea-pioneer-chinas-social-care-sector#.
93 DBS Asian Insights. 2017. China Senior Housing: An Attractive Trap.
94 Jamie Smyth, Wang Xueqiao, and Tom Hancock. 2019. China’s Aging Population Lures Foreign Operators into Care Market. Financial Times. https://www.ft.com/content/30d52cc8-a466-11e9-974c-ad-1c6ab5efd1.
95 Xinhua. 2019a. More Than 90% of Senior Citizens in Beijing Are Living at Home: As a Result Senior Care Facilities Are Not Generating Profits. http://www.xinhuanet.com/fortune/2019-04/24/c_1124407037.htm.
96 Harris. 2018.
97 Interviews. April and July. 2019.
46CHINA'S EVOLVING SENIOR CARE SECTOR
ASIA PACIFIC FOUNDATION OF CANADA
98 Vinicy Chan. 2019. CPPIB Mulls Opening First Office in China. Bloomberg News. https://www.bnn-bloomberg.ca/cppib-mulls-opening-first-office-in-china-1.1230891.
99 Jiang Xueping. 2018. Canada Pension Fund to Lift China Investment. China Daily. http://www.chinadaily.com.cn/a/201810/12/WS5bbffe16a310eff303281fa2.html.
100 Chindex. 2019. Our Business. http://www.chindex.com/intro/scope.html.
101 Royal College of Physicians and Surgeons of Canada. 2019. Collaborative Partners. http://www.royalcol-lege.ca/rcsite/international/rci-collaborative-partners-e.
102 Ian Johnson. 2015. Q. and A.: Paul U. Unschuld on Reconciling Chinese and Western Medicine. https://sinosphere.blogs.nytimes.com/2015/10/13/chinese-medicine-paul-unschuld-nobel/?action=click&mod-ule=RelatedCoverage&pgtype=Article®ion=Footer.
103 Interview. July 25, 2019.
104 OECD. 2013.A Good Life in Old Age: Monitoring and Improving Quality in Long Term Care. https://www.oecd.org/els/health-systems/Japan-OECD-EC-Good-Time-in-Old-Age.pdf.
105 MJ Annear et al. 2016. Experiences of Japanese Aged Care: the Pursuit of Optimal Health and Cultural Engagement. Age and Ageing.
106 Nichii Gakkan. 2019. About Us. https://www.nichii.net.cn/aboutus/.
107 Juntaro Arai. 2014. Japan’s Nichii Gakkan to roll out care services in China. https://asia.nikkei.com/Busi-ness/Japan-s-Nichii-Gakkan-to-roll-out-care-services-in-China.
108 DBS. 2017.
109 Summer Zhen. 2017. China yet to exploit potential market for care facilities for its rapidly ageing population. https://www.scmp.com/business/companies/article/2118750/china-yet-exploit-potential-mar-ket-care-facilities-its-rapidly.
110 KPMG. 2016. Commercial opportunities in the primary care market in China. https://assets.kpmg/content/dam/kpmg/cn/pdf/en/2016/10/commercial-opportunities-in-the-primary-care-market-in-china.pdf.
111 See OECD. 2019. Decentralization in the health sector and responsibilities across levels of government. http://www.oecd.org/officialdocuments/publicdisplaydocumentpdf/?cote=COM/DELSA/GOV(2019)2&do-cLanguage=En.
112 Sohu. 2019b. Six Provinces Reached the Threshold of Deeply Aging Society, Liaoning Has the Highest Rate of Senior Citizens. http://www.sohu.com/a/303315423_794891.
113 KPMG. 2016. Commercial Opportunities in the Primary Care Market in China. https://assets.kpmg/content/dam/kpmg/cn/pdf/en/2016/10/commercial-opportunities-in-the-primary-care-market-in-china.pdf.
114 Xie Guanbin and Zhang Bin. 2018. Judicial Protection of IP in China Improves. Managing Intellectual Property. https://www.managingip.com/Article/3795606/Judicial-protection-of-IP-in-China-improves.htm-l?ArticleId=3795606.
115 Bloomberg. 2018. China announces punishments for intellectual-property theft. https://www.bloomberg.com/news/articles/2018-12-04/china-announces-new-punishments-for-intellectual-proper-ty-theft.
116 Liu Zhen. 2019. Victims of intellectual property theft will be compensated, Xi Jinping tells world leaders. SCMP. https://www.scmp.com/news/china/diplomacy/article/3016578/victims-intellectual-proper-ty-theft-will-be-compensated-xi.
117 The Economist. 2019. Chinese firms are not all serial intellectual-property thieves. https://www.econo-mist.com/business/2019/02/09/chinese-firms-are-not-all-serial-intellectual-property-thieves.
118 The Economist. 2019
119 MOHRSS. 2016.
120 KPMG. 2019.
121 Yoel Kornreich, Ilan Vertinsky, and Pitman Potter. 2012. Consultation and Deliberation in China: The Making of China’s Recent Health-care Reform. The China Journal. No. 68 (July 2012), pp. 176-203; Yoel Kornreich. 2019. Authoritarian Responsiveness: Online Consultation with ‘Issue Public’ in China. Gover-nance.
122 Nathan Vanderklippe. 2019.
47CHINA'S EVOLVING SENIOR CARE SECTOR
ASIA PACIFIC FOUNDATION OF CANADA

1TECHNOLOGY AND GEOPOLITICS: NAVIGATING A FUTURE OF TECH UNCERTAINTY
ASIA PACIFIC FOUNDATION OF CANADA
TECHNOLOGY AND GEOPOLITICS:
NAVIGATING A FUTURE OF TECH UNCERTAINTYCONFERENCE REPORT
WITH THANKS TO OUR SPONSORS
3TECHNOLOGY AND GEOPOLITICS: NAVIGATING A FUTURE OF TECH UNCERTAINTY
ASIA PACIFIC FOUNDATION OF CANADA
INTRODUCTION
The Asia Pacific Foundation of Canada (APF Canada) organized the Technology
and Geopolitics: Navigating a Future of Tech Uncertainty conference
in Toronto, Canada on October 9-10, 2019. More than 60 experts and
stakeholders from a broad range of backgrounds, sectors, and nationalities
convened to address implications of the rapidly-changing intersections
between geopolitics and technology, to identify key opportunities
and challenges, and to offer insights into how Canada can and should
navigate these issues. Conference panels focused on the national security/
technology nexus; the impact of national security on technology supply
chain management; data management and governance; and investment and
partnerships in R&D in technology and related sectors.
The World Economic Forum’s Klaus Schwab coined the term “Fourth Industrial
Revolution,” underscoring the transformative effects of newly emerging
technologies upon our society and economy. Artificial intelligence (AI), one of
the key technologies that have become a reality in our daily lives, is expected
to add US$15.7 trillion to the global economy and displace up to 30 per cent
of labour by 2030. As our future prosperity and competitiveness increasingly
become dependent on these new forms of technologies, geopolitical
competitions between nations – most notably China and the U.S. – have
become technological in nature. As a result, technology supply chains and
people-to-people networks, which are global and interdependent, have come
under threat, posing challenges to middle power countries like Canada. APF
Canada convened this group of experts and practitioners to facilitate a timely
conversation and translate ideas into action.
CONFERENCE SUMMARY
4TECHNOLOGY AND GEOPOLITICS: NAVIGATING A FUTURE OF TECH UNCERTAINTY
ASIA PACIFIC FOUNDATION OF CANADA
NEW TRENDS IN TECHNOLOGY AND GEOPOLITICS
While panellists expressed a diversity of opinions and diverged on specific
issues, there were more points of consensus than disagreement on high-level
policy questions, which set the foundation for a fruitful discussion on aspects
of Canada’s approach to technology, security, and governance.
Participants identified several trends related to the intersection between
technology and geopolitics. The proliferation of dual-use (used for
both civilian and military purposes) and data-driven technologies like AI
throughout business and society now pose unprecedented security challenges,
and several panellists underscored that the ‘industrial age model’ of thinking is
no longer viable for ensuring the security and prosperity of Canadians. Several
speakers emphasized that government and the private sector must provide
new leadership and infrastructure that meets the needs of the age of the
Fourth Industrial Revolution.
The need for new modes of thinking was evident in the discussion on data
governance. Working from the premise that data is now a key resource in
this new model of economy, panellists examined the lack of consensus on data
governance at the global level, and the challenges of facilitating cross-border
data flows that meet diverse stakeholder interests. It was raised during the
conference that the Office of the Privacy Commissioner (OPC) should focus on
enhancing consumer trust in the digital eco-system, versus prescriptive rules,
something that can be accomplished through principles-based legislation that
is technology agnostic.
Further, panellists stressed that standards and good data governance could
be a source of global competitiveness for Canada, which again underscored
the need to depart from the industrial age model, which builds on tangible

5TECHNOLOGY AND GEOPOLITICS: NAVIGATING A FUTURE OF TECH UNCERTAINTY
ASIA PACIFIC FOUNDATION OF CANADA
goods (e.g. manufacturing), and develop a new ‘intangibles’-based economic
framework driven by intellectual property, data, etc.
In the context of the ongoing disagreements between Beijing and Washington,
a number of participants highlighted that isolating China is neither
desirable nor possible. One panellist underscored that because there is
‘stickiness’ in the world’s leading technology clusters that leverage and invest
in local networks and infrastructure, the development of talent and capacity
in tech sectors requires both significant time and resources. Consequently,
moving production away from China’s tech manufacturing hubs would be
extraordinarily costly and logistically fraught. Chinese leadership in this
area and Chinese investments in innovation have made it a global tech
manufacturing leader, which forces us to engage with China, whether we like
it or not. Other panellists highlighted that the China-U.S. standoff has begun
to fragment global technology supply chains and has contributed to increased
uncertainty.
THE NEED FOR CAPACITY BUILDING
Conference participants agreed that Canada must develop the capacity
to withstand these trends in technology and geopolitics. Participants
agreed that while Canada does not have the geopolitical heft to unilaterally
counter these forces, it has the opportunity to be proactive in its adaptation,
the responsibility to ensure the security and prosperity of Canadians, and
the ability to influence domestic and/or global regimes for succeeding in the
Fourth Industrial Revolution.
6TECHNOLOGY AND GEOPOLITICS: NAVIGATING A FUTURE OF TECH UNCERTAINTY
ASIA PACIFIC FOUNDATION OF CANADA
Throughout the conference, participants echoed the point that Canada has
a special set of advantages when it comes to science and technology.
AI was highlighted as a special area in which Canada is “in the game” to lead
globally, thanks in part to early investments in basic research through CIFAR.
In this context, Canada’s research institutes and talent were highlighted as key
assets. Canada’s strengths in turning research into innovative products and
services were highlighted through the success stories of several start-ups and
hubs such as Toronto’s MaRS Discovery District. Further attractive assets are
the liveability, stability, and diversity of Canadian cities.
Speakers stressed the importance of a good policy environment for
capacity building in the technology sector. It was stressed that geopolitical
and technological shifts do not occur suddenly, and that there is room for
proactive policy development that can prepare and build capacity to navigate
these greater changes. One panellist emphasized that Nortel’s market demise,
for example, was not a surprise as the decline of the company’s profitability
happened gradually and in a stable policy environment. Similarly, the purchase
and deployment of Huawei hardware by Canadian telecommunications
companies was predictable given the understanding and nature of the
technology and the approvals received to deploy it. A more agile and proactive
policy framework reflective of the changing paradigms is required today, as
opposed to falling back on an Industrial Age mindset.
Throughout the conference, speakers and participants encouraged broader
government support for building the Canadian tech sector. Investment
in new tools such as standards, combined with Canada’s strength in R&D
and innovation, were highlighted as keys to building tech capacity. Further,
speakers and participants stressed the need to better support Canada’s
innovation sector in scaling start-ups to ensure the security and prosperity of
Canadians amid the transition to the Fourth Industrial Revolution.
7TECHNOLOGY AND GEOPOLITICS: NAVIGATING A FUTURE OF TECH UNCERTAINTY
ASIA PACIFIC FOUNDATION OF CANADA
OUR RECOMMENDATIONS
APF Canada provides the following five broad recommendations based on the
discussions at the conference. These recommendations should serve as starting
points for more targeted discussions and action items moving forward.
1. IDENTIFY WAYS OF ENGAGING WITH CHINA AS AN UNAVOIDABLE
PLAYER
Identify ways of engaging with China as an unavoidable player. China is no
longer just the “factory of the world,” but a leading innovator and investor,
especially in tech. Considering its deep involvement and market opportunity,
bypassing China is neither desirable nor possible. Further, considering the
trend of regionalization in the Asia Pacific, Canada’s opportunities in the
region are now contingent upon its successful navigation of relations with
China. Subsequently, it is necessary to embrace the inevitability of engaging
with China, and identify ways of doing so in a smart and pragmatic manner
that balances commercial opportunities and national security. One immediate
action item would be, in the short term, to increase the ‘China Competence’
– and more broadly, the ‘Asia Competence’ – of Canadian policy-makers
through targeted briefings and short-term business and technology education
programs. In the long term, Canada should create more work and study
opportunities in China for Canadian post-secondary students and early-career
professionals.
2. DEPART FROM THE INDUSTRIAL AGE MINDSET AND EMBRACE THE
FOURTH INDUSTRIAL REVOLUTION.
Success in today’s economy requires different types of talent, policy, and
infrastructure. It is imperative for Canadians to embrace the value of
‘intangible’ goods such as data and intellectual property, and to learn how to
leverage these assets to increase Canada’s competitiveness on the global stage.
Canada today needs to invest in new infrastructure that will allow Canadians
to benefit from this transition into the Fourth Industrial Revolution.
8TECHNOLOGY AND GEOPOLITICS: NAVIGATING A FUTURE OF TECH UNCERTAINTY
ASIA PACIFIC FOUNDATION OF CANADA
This means investment in agile and ambitious policies and infrastructure,
cybersecurity, and data governance. In particular, Canadians face the challenge
of balancing their right to privacy with the harnessing of data for new
technologies. In this regard, defining the appropriate role for the OPC will be
key, including ensuring the consistent application of enforcement mechanisms
as they pertain to privacy issues. The next federal government should clarify
the role of the OPC in balancing support for a data-driven economy and
respect for Canadians’ privacy rights, and how this will be achieved – i.e.
opening legislation versus the OPC adapting to other global frameworks. All
in all, innovative thinking is required to design more agile and responsive
government organizational structures to cope with rapid change associated
with the Fourth Industrial Revolution.
3. LEAD THROUGH GOOD, PROACTIVE PRACTICES.
The transition to the digital economy is new for everyone, and countries
around the world are trying to identify the best way of governing new
technologies. In this context, there are opportunities to exercise leadership
by setting standards for good practices in technology governance. Canada,
which enjoys a positive reputation in terms of good governance, has a special
advantage in this respect. A notable example is Canada’s CIO Strategy Council’s
publication of the world’s first national AI standard, which reflects input from
public, private, and voluntary sectors. The standard, which reflects Canada’s
values, will serve as a benchmark for other countries seeking to do the same.
Another potential opportunity is to partner or collaborate with countries
such as India, which has access to large data sets, on the development of ‘data
trusts’ and bilateral data governance to develop a set of best practices for data
sharing among different stakeholders for specific sectors where data is used.
Canada should identify similar opportunities, act proactively, and lead at the
global level.

9TECHNOLOGY AND GEOPOLITICS: NAVIGATING A FUTURE OF TECH UNCERTAINTY
ASIA PACIFIC FOUNDATION OF CANADA
4. CONTINUE LEVERAGING CANADA’S WORLD-CLASS RESEARCH
CAPACITY TO ATTRACT TALENT
Talent is a key factor of success in the era of the Fourth Industrial Revolution.
Canada’s world-class research universities already attract international STEM
talent and organizations. Organizations such as CIFAR and the National
Research Council further add competitiveness to Canada’s research capacity.
As the U.S. continues to build a wall to exclude researchers from countries that
it deems hostile, Canada should not only keep its doors open, but also actively
attract and retain international talent seeking opportunities outside the U.S.
5. SUPPORT CANADA’S INNOVATION SECTOR TO INCREASE THE
CAPACITY TO NAVIGATE NEW GEOPOLITICAL CHALLENGES.
Recent trends feature politically-driven attempts to disrupt global tech supply
chains as technology increasingly becomes intertwined with geopolitics.
In this context, a stronger, more globally competitive innovation sector
requires a greater capacity within Canada to navigate commercial and
geopolitical disruptions. Building a favourable and agile policy and regulatory
environment, and proactively setting standards for a stronger innovation
sector will increase Canada’s ability to attract and retain talent necessary to
build scalable and globally competitive companies.
10TECHNOLOGY AND GEOPOLITICS: NAVIGATING A FUTURE OF TECH UNCERTAINTY
ASIA PACIFIC FOUNDATION OF CANADA
Panel 1: The Technology & National Security Nexus –
Opportunities and Vulnerabilities
Panel 2: National Security Impact on Technology Supply Chain
Management
Panel 3: Data Management and Data Governance in the G20
and Beyond
Panel 4: Technology Investment and Partnerships in Research
and Development
Panel 5: Navigating a Tech Future
APPENDIX A: PANEL SESSIONS
11TECHNOLOGY AND GEOPOLITICS: NAVIGATING A FUTURE OF TECH UNCERTAINTY
ASIA PACIFIC FOUNDATION OF CANADA
Contact us at [email protected]
or visit us online at
www.asiapacific.ca
ABOUT THE ASIA PACIFIC FOUNDATION OF CANADA
The Asia Pacific Foundation of Canada
(APF Canada) is a not-for-profit
organization focused on Canada’s
relations with Asia. Our mission is to be
Canada’s catalyst for engagement with
Asia and Asia’s bridge to Canada. APF
Canada is dedicated to strengthening
ties between Canada and Asia with a
focus on seven thematic areas: trade
and investment, surveys and polling, regional security, digital technologies,
domestic networks, sustainable development, and Asia Competency.
Our research provides high-quality, relevant, and timely information, insights,
and perspectives on Canada-Asia relations. Providing policy considerations and
business intelligence for stakeholders across the Asia Pacific, our work includes
Reports, Policy Briefs, Case Studies, Dispatches, and a regular Asia Watch
newsletter that together support these thematic areas.
APF Canada also works with business, government, and academic stakeholders
to provide custom research, data, briefing and Asia Competency training for
Canadian organizations. This ‘micro-consulting’ service is available by request
and we would be pleased to work with you to meet your business intelligence
needs.
CPTPP TRACKER: THE FIRST YEAR
ASIA PACIFIC FOUNDATION OF CANADA
1
THE CPTPPTRACKER
THE FIRST YEAR
2019
CPTPP TRACKER: THE FIRST YEAR
ASIA PACIFIC FOUNDATION OF CANADA
2
About the Asia Pacific Foundation of Canada
About the Trade Tracker
Executive Summary
Key Takeaways from the Report
Overview and Rationale for the Analysis
Methodology
The US-China Trade War
Canada’s Participation in the CPTPP: Basic Trends
Provincial Breakdown of Canada’s CPTPP Engagement
Sectors that are Growing and Declining
Growing
Declining
Canada and Global Value Chains
Trend for Exports of Value Added Goods
Growing
Declining
What about the Imports?
Investment Trends after the CPTPP
CPTPP Countries Investing in Canada
Canada Investing in CPTPP Countries
Conclusion
Acknowledgements
3
4
5
6
8
11
13
18
22
24
24
26
28
31
33
39
45
48
48
50
52
54
TABLE OF CONTENTS
CPTPP TRACKER: THE FIRST YEAR
ASIA PACIFIC FOUNDATION OF CANADA
3
The Asia Pacific Foundation of Canada (APF Canada) is dedicated to
strengthening ties between Canada and Asia with a focus on expanding
economic relations through trade, investment, and innovation; promoting
Canada’s expertise in offering solutions to Asia’s climate change, energy, food
security, and natural resource management challenges; building Asia-related
skills and competencies among Canadians, including young Canadians; and
improving Canadians’ general understanding of Asia and its growing global
influence.
APF Canada is well known for its annual national opinion polls of Canadian
attitudes regarding relations with Asia. APF Canada places an emphasis on
China, India, Japan, and South Korea, while also developing expertise in
emerging markets in the region, particularly economies within the Association
for Southeast Asian Nations.
Visit APF Canada at www.asiapacific.ca.
ABOUT THE ASIA PACIFIC FOUNDATION OF CANADA
CPTPP TRACKER: THE FIRST YEAR
ASIA PACIFIC FOUNDATION OF CANADA
4
ABOUT THE TRADE TRACKER
The future of the global economy is in the Asia Pacific. The region is home to
many of the world's fastest-growing economies and is already responsible for
46% of global GDP and 34% of global exports. But with trade liberalization
under attack and protectionism on the rise, free trade agreements (FTAs)
with Asian powerhouses become even more important, especially for trading
nations such as Canada.
In order to contribute to Canada's engagement in Asia, the Asia Pacific
Foundation of Canada (APF Canada) has developed the Trade Tracker, an
instrument dedicated to providing performance assessments of the main FTAs
that Canada is a part of in the Asia Pacific region. The Trade Tracker monitors,
analyzes, and forecasts trends and opportunities in Canada's international
trade and investment relations with its partner countries. It also identifies
markets and sectors where Canadian exports of goods and services have been
the most successful in taking advantage of the elimination of trade barriers
facilitated by FTAs.
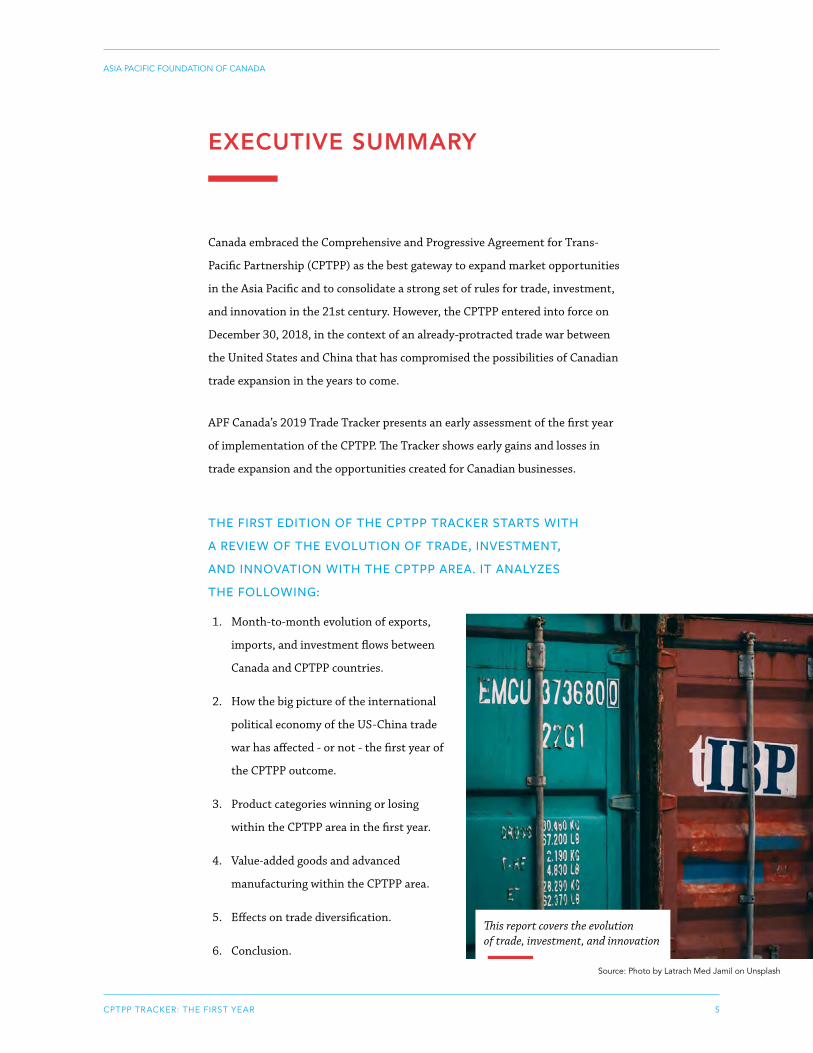
CPTPP TRACKER: THE FIRST YEAR
ASIA PACIFIC FOUNDATION OF CANADA
5
EXECUTIVE SUMMARY
Canada embraced the Comprehensive and Progressive Agreement for Trans-
Pacific Partnership (CPTPP) as the best gateway to expand market opportunities
in the Asia Pacific and to consolidate a strong set of rules for trade, investment,
and innovation in the 21st century. However, the CPTPP entered into force on
December 30, 2018, in the context of an already-protracted trade war between
the United States and China that has compromised the possibilities of Canadian
trade expansion in the years to come.
APF Canada’s 2019 Trade Tracker presents an early assessment of the first year
of implementation of the CPTPP. The Tracker shows early gains and losses in
trade expansion and the opportunities created for Canadian businesses.
THE FIRST EDITION OF THE CPTPP TRACKER STARTS WITH
A REVIEW OF THE EVOLUTION OF TRADE, INVESTMENT,
AND INNOVATION WITH THE CPTPP AREA. IT ANALYZES
THE FOLLOWING:
1. Month-to-month evolution of exports,
imports, and investment flows between
Canada and CPTPP countries.
2. How the big picture of the international
political economy of the US-China trade
war has affected - or not - the first year of
the CPTPP outcome.
3. Product categories winning or losing
within the CPTPP area in the first year.
4. Value-added goods and advanced
manufacturing within the CPTPP area.
5. Effects on trade diversification.
6. Conclusion.
Source: Photo by Latrach Med Jamil on Unsplash
This report covers the evolution of trade, investment, and innovation

CPTPP TRACKER: THE FIRST YEAR
ASIA PACIFIC FOUNDATION OF CANADA
6
KEY TAKEAWAYS FROM THE REPORT
CANADA EXPORTED A TOTAL OF C$19B WORTH OF GOODS TO CPTPP
COUNTRIES BETWEEN JANUARY AND SEPTEMBER 2019.
Canada’s domestic exports to CPTPP signatories have not seen a significant
increase since the beginning of the year, in spite of efforts to promote exports
to this new mega free trade zone. On the contrary, Canada’s domestic exports
to these countries in the first nine months of 2019 have declined by 3%, or
C$538M, in comparison to the same period of the previous year.
CANADA’S EXPORTS TO CPTPP COUNTRIES ARE HIGHLY
CONCENTRATED. The top three export markets – Japan, Mexico, and
Australia – account for 82% of Canada’s total CPTPP exports. As of September
2019, Canada has exported a total of C$16B worth of products to these three
countries alone.
CANADIAN EXPORTS ARE GROWING FASTER IN MALAYSIA, VIETNAM,
AND NEW ZEALAND THAN IN THE LARGEST EXPORT DESTINATIONS
OF JAPAN, MEXICO, AND AUSTRALIA. The distribution of Canadian
exports might change going forward if this trend continues.
ANIMAL PRODUCTS, MACHINERY, AND MINERAL PRODUCTS ARE THE
FASTEST-GROWING EXPORT SECTORS FOR CANADA WITHIN THE
CPTPP. Animal products, which made up 11% of Canada’s total CPTPP exports
in the first nine months of 2019, have increased the most out of all product
categories.
CPTPP TRACKER: THE FIRST YEAR
ASIA PACIFIC FOUNDATION OF CANADA
7
TRADE IN THE PACIFIC REGION MUST BE ANALYZED WITHIN THE
CONTEXT OF THE UNRELENTING TRADE WAR BETWEEN CHINA AND
THE UNITED STATES. The accumulated rate of trade deceleration in exports
to China reached -67% for Japan, -55% for Mexico, and -40.5% for Canada.
China’s economic slowdown is also slowing down exports in the wider Asia
Pacific region, and the bad news is that the United States is not picking up the
slack to stop the trend.
MACHINERY HAS BEEN LEADING THE EXPORT GROWTH OF VALUE-
ADDED GOODS TO CPTPP COUNTRIES IN 2019. From January 2018 to
September 2019, Canada’s machinery exports to CPTPP countries increased by
C$213M, or 10%. As of September 2019, Canada has already exported C$2B
worth of machinery products to member countries.
DESPITE GAINS, THERE ARE SECTORS WITH SIGNIFICANT DECLINES.
While Canada’s base metal exports have seen growth in five of the 10 CPTPP
markets, Canadian base metal exports to Japan decreased to half of their 2018
level, a drop of more than C$328M. The drop in the Japanese market alone
offset gains of C$31M in the other five markets, and it is the strongest signal
to date of the crisis in Japan’s automotive sector.
CPTPP TRACKER: THE FIRST YEAR
ASIA PACIFIC FOUNDATION OF CANADA
8
OVERVIEW AND RATIONALE FOR THE ANALYSIS
The Comprehensive and Progressive Agreement for Trans-Pacific Partnership
(CPTPP) is the first mega free trade agreement negotiated in the Asia Pacific.
The agreement began in 2005 as a small initiative from Singapore, New
Zealand, Chile, and Brunei aimed at creating a Pacific Rim free market area.
The concept was soon embraced by the United States and other countries
on both sides of the Pacific. In 2017, President Donald Trump withdrew the
United States, forcing the remaining members to renegotiate a new version of
the deal, which was signed in March 2018. Today, the 11 remaining members
of the amended CPTPP are Australia, Brunei Darussalam, Canada, Chile,
Japan, Malaysia, Mexico, New Zealand, Peru, Singapore, and Vietnam.
The CPTPP formally entered into force on December 30, 2018. For Canada, it
represents a breakthrough in accessing the most diverse and promising region
of the world, where most global value chains have been created in the last two
decades: Asia.1 And the possibility of participating in these global value chains
is precisely the central comparative advantage of the CPTPP. First, the deal
includes the services sector, allowing increased talent mobility within the free
trade area. Second, the deal goes beyond existing World Trade Organization
rules in areas such as intellectual property rights, as well as Indigenous
traditional knowledge and investment protection. Third, and probably
most important for Canada’s future economic prosperity, the deal expands
traditionally limited rules of origin to allow for the flow of more intermediate
goods around the region. And finally, by the end of the deal’s negotiations,
Canada was able to secure additional “comprehensive and progressive”
measures – the most important among them being exceptions for trade issues
related to Indigenous people and cultural industries.
To assess how Canada would benefit from joining the CPTPP, the Office of the
Chief Economist at Global Affairs Canada ran a simulation in 2018 using the
Computable General Equilibrium (CGE) model.2
CPTPP TRACKER: THE FIRST YEAR
ASIA PACIFIC FOUNDATION OF CANADA
9
That assessment anticipated significant gains and estimated that Canada could
add C$4.2B to its GDP by 2040 as a result of additional exports in goods and
services to member economies (valued at C$2.7B), as well as new investments
received by Canada. This gain is considerably higher than it would have been
if the United States had joined the agreement, nabbing vast market share in
economies across the region. According to the CGE model, total exports to all
countries are expected to increase another C$2B, since it is expected that some
exports will deviate from non-CPTPP countries into the CPTPP area because a
new trade deal tends to increase the rate of trade with other areas as well.3
The CGE forecast anticipated an increase in Canadian exports to four key
countries, in order of benefit: Japan, Australia, Vietnam, and Malaysia. The
CGE model singled out Japan as the most promising market for Canadian
exporters, not only because of swift reductions in tariffs across the board
through the CPTPP, but also because Canadian exports were estimated to grow
as much as 8.6% until 2040 if the United States, Canada’s major competitor in
the Japanese market, were not to join the agreement.
While the CGE model provides a valuable baseline to estimate the CPTPP’s
benefits for Canada, it relies on assumptions of regularity in the functioning
of the economy where “all things are equal,” and a moderate ratio of tariff use
among member economies. Further, it cannot account for other variables
across time, like unexpected crises or sudden economic downturns. Beyond
the CGE baseline, and to fully realize the economic benefits of the CPTPP to
Canada, it is important to assess Canada’s CPTPP performance in the context
not only of trade liberalization and diversification, but also of Canadian
integration into larger production networks in the Asia Pacific.
The CPTPP Trade Tracker was created to do just that – to monitor over time
the evolution of exports from Canada to CPTPP countries, identifying markets
and sectors where Canadian products have been the most successful in taking
advantage of this historic trade deal.
The Tracker pays particular attention to product lines that insert Canada into
global value chains within the Asia Pacific region. The underlying assumption
is that the CPTPP offers an already mostly tariff-free environment with
significantly low tariffs for most agricultural products and raw materials. But
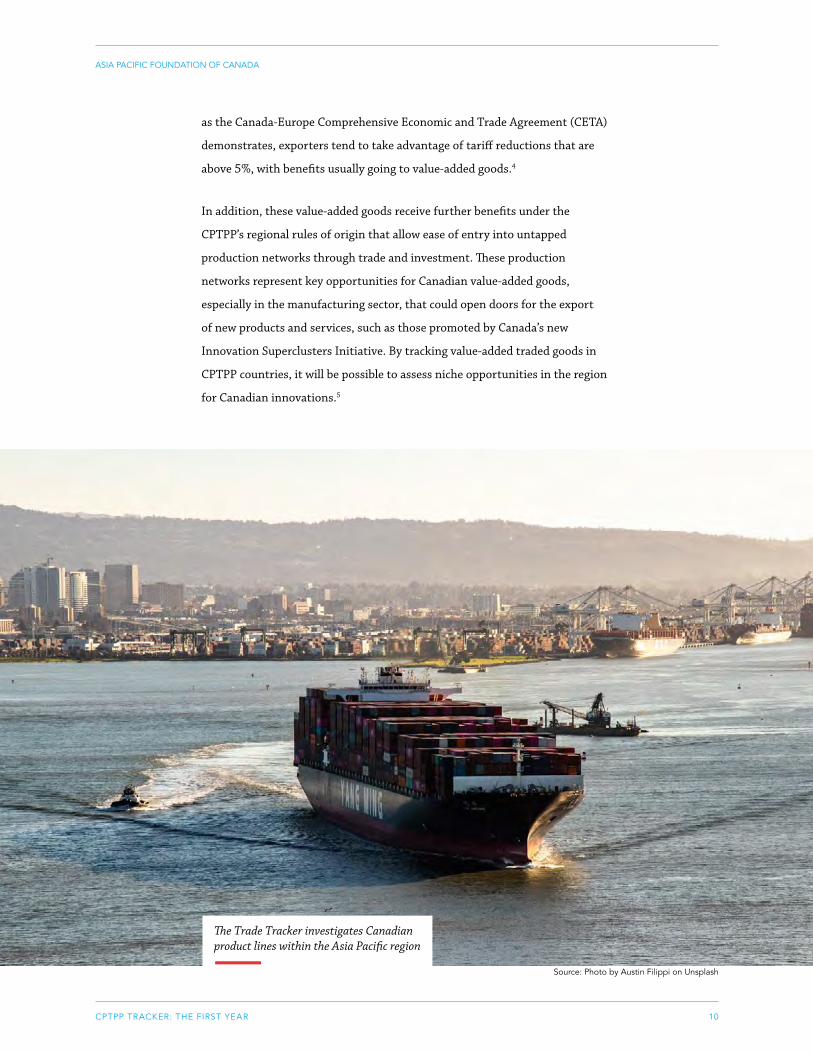
CPTPP TRACKER: THE FIRST YEAR
ASIA PACIFIC FOUNDATION OF CANADA
10
as the Canada-Europe Comprehensive Economic and Trade Agreement (CETA)
demonstrates, exporters tend to take advantage of tariff reductions that are
above 5%, with benefits usually going to value-added goods.4
In addition, these value-added goods receive further benefits under the
CPTPP’s regional rules of origin that allow ease of entry into untapped
production networks through trade and investment. These production
networks represent key opportunities for Canadian value-added goods,
especially in the manufacturing sector, that could open doors for the export
of new products and services, such as those promoted by Canada’s new
Innovation Superclusters Initiative. By tracking value-added traded goods in
CPTPP countries, it will be possible to assess niche opportunities in the region
for Canadian innovations.5
The Trade Tracker investigates Canadian product lines within the Asia Pacific region
Source: Photo by Austin Filippi on Unsplash
CPTPP TRACKER: THE FIRST YEAR
ASIA PACIFIC FOUNDATION OF CANADA
11
Methodology
APF Canada collected monthly statistics primarily from the Canadian
International Merchandise Trade Database (CIMTB) as well as from primary
official sources from CPTPP members to perform this analysis. Additional data
was collected from the International Monetary Fund, the World Bank, the
World Trade Organization, and the United Nations Conference on Trade and
Development.
Using monthly data from the CIMTB, APF Canada assessed relative gains
calculating the compound average growth rate (CAGR) for exported goods in
the last 33 available months (January 2017 to September 2019) to forecast
trends in trade. The CAGR is also contrasted with simple growth rates to
control for seasonal changes where the comparison is done through the same
months in previous years. In both cases, charts and trendlines have been
drawn to help visualize. Current export values were used to determine growth
rates within the months under study.
This year’s Trade Tracker has four main sections. The first assesses the impact
of the U.S.-China trade war on the world economy and, more specifically, on
the largest CPTPP economies. The second section presents the evolution of
Canada’s export growth to the CPTPP area in the last 33 months and compares
the seasonal behaviour of the first nine months of 2019 to the same period
in 2018. The third section identifies the winning sectors of the year and the
ones that experienced the sharpest declines. This section also breaks down
value-added manufacturing, identifying the products that have set a stronger
record for exports within the CPTPP. Finally, as investment is one of the key
indicators of an FTA’s success, this report includes a section about foreign
direct investment coming into and out of Canada in the last year. It also
provides a glimpse of how investment has performed in the first two quarters
of 2019.
APF Canada has expanded its Investment Monitor database to include all
CPTPP countries, including Chile, Mexico, and Peru, which were not previously
part of this online service. Our Investment Monitor will present a full
assessment of investment patterns in its 2020 annual report.
CPTPP TRACKER: THE FIRST YEAR
ASIA PACIFIC FOUNDATION OF CANADA
12
The limitations of this study derive mainly from the fact that we are comparing
data for just nine months of 2019. We acknowledge that the overall calculation
of Canada’s performance within the CPTPP in 2019 will only be conclusive
once yearly statistics become available. The Trade Tracker: CPTPP offers an
early assessment of Canadian trade and investment performance in the new
trade bloc to inform decision-makers in the public and private sectors before
the new year begins. However, by collecting month-to-month information
about trade within the Asia Pacific region, APF Canada has established a strong
database that will enable us to forecast cycles of trade in the years to come.
Lastly, APF Canada collected statistics on the four most important sectors
and categories of goods that are sold into the CPTPP area following the
Harmonized System (HS) code. Box 1 below explains in detail how the system
is organized, and the appendix presents a detailed list of sections and product
categories used in Canadian trade statistics to help readers navigate the
difficult trade jargon and classifications.
WHAT IS THE HARMONIZED COMMODITY DESCRIPTION AND CODING SYSTEM (HS)?
The Harmonized System - henceforth HS - is a commodity classification standard
adopted by nearly 200 countries or economic unions. It is the basis of how export and
import statistics are reported around the world and in the Canadian International
Merchandise Trade Database used in this study.6 The HS system divides products into
21 sections, each encompassing product categories produced within the same sector
of the economy. For example, Section 16, machinery and mechanical appliances,
includes HS 84, nuclear reactors, boilers, machinery, and mechanical appliances, and
HS 85, electrical machinery and equipment.
There are two main classifications used by this report:
• Sections refer to the groups of product categories that are generally produced in
the same sector of the economy.
• Product categories are used to describe products at the HS level ranging
from two to six digits. It is also the most common term used by businesses in
reference to their export products. Canada has expanded its system up to eight
levels for exports and 10 for imports. For the purpose of this study, we analyze
product categories only at the two-digit HS level.
For a detailed list of product categories at the HS-2 level, please see the appendix.
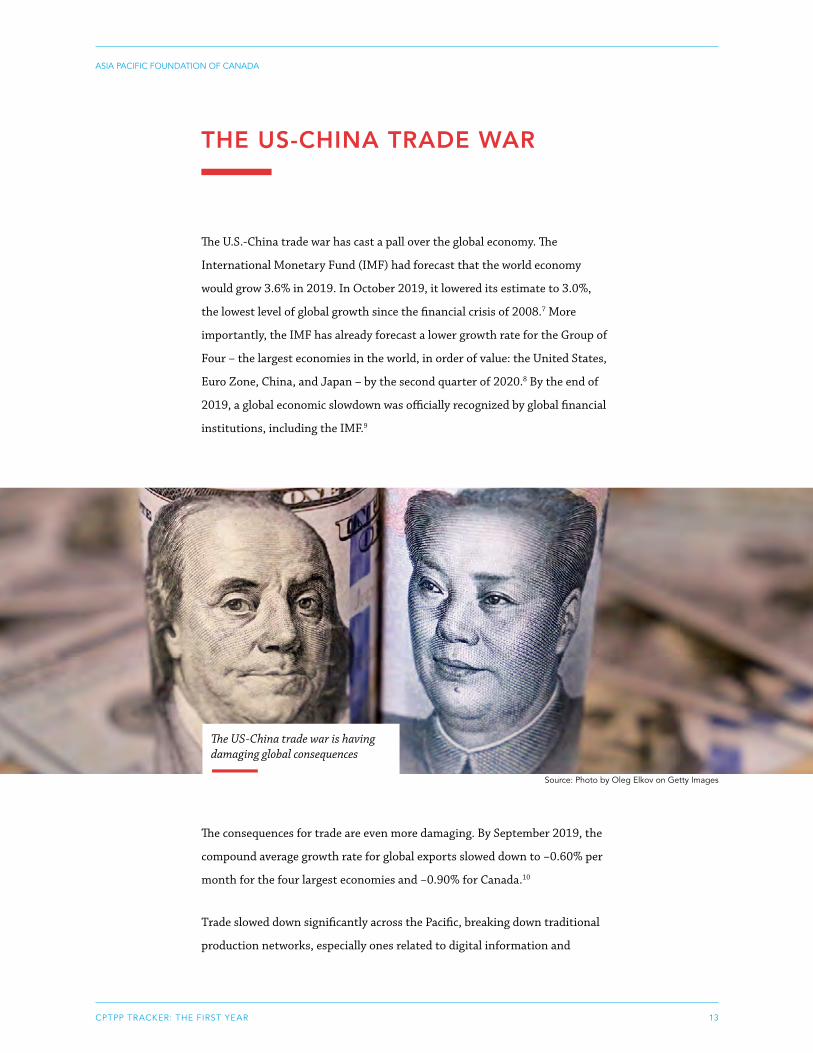
CPTPP TRACKER: THE FIRST YEAR
ASIA PACIFIC FOUNDATION OF CANADA
13
THE US-CHINA TRADE WAR
The U.S.-China trade war has cast a pall over the global economy. The
International Monetary Fund (IMF) had forecast that the world economy
would grow 3.6% in 2019. In October 2019, it lowered its estimate to 3.0%,
the lowest level of global growth since the financial crisis of 2008.7 More
importantly, the IMF has already forecast a lower growth rate for the Group of
Four – the largest economies in the world, in order of value: the United States,
Euro Zone, China, and Japan – by the second quarter of 2020.8 By the end of
2019, a global economic slowdown was officially recognized by global financial
institutions, including the IMF.9
The consequences for trade are even more damaging. By September 2019, the
compound average growth rate for global exports slowed down to −0.60% per
month for the four largest economies and −0.90% for Canada.10
Trade slowed down significantly across the Pacific, breaking down traditional
production networks, especially ones related to digital information and
The US-China trade war is having damaging global consequences
Source: Photo by Oleg Elkov on Getty Images
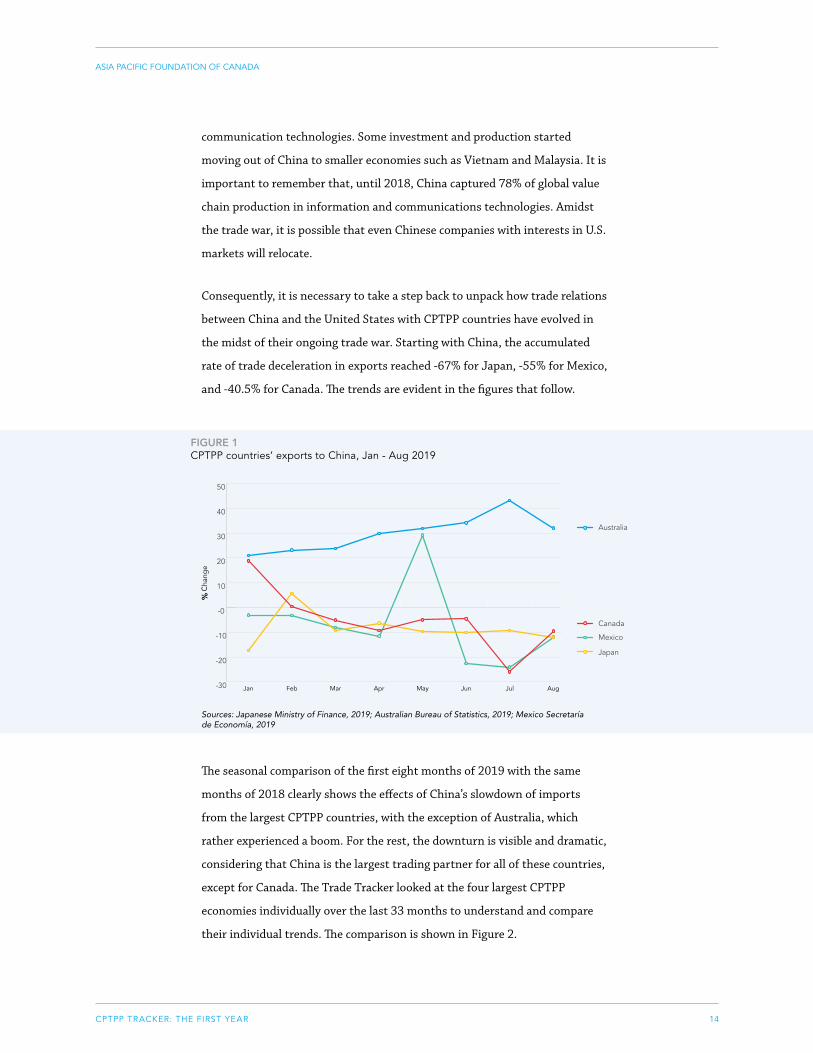
CPTPP TRACKER: THE FIRST YEAR
ASIA PACIFIC FOUNDATION OF CANADA
14
-30
-20
-10
-0
10
20
30
40
50
Mexico
Australia
Japan
Canada
AugJulJunMayAprMarFebJan
Major CPTPP Partners Exports to China, Jan-Aug 2019
FIGURE 1CPTPP countries’ exports to China, Jan - Aug 2019
communication technologies. Some investment and production started
moving out of China to smaller economies such as Vietnam and Malaysia. It is
important to remember that, until 2018, China captured 78% of global value
chain production in information and communications technologies. Amidst
the trade war, it is possible that even Chinese companies with interests in U.S.
markets will relocate.
Consequently, it is necessary to take a step back to unpack how trade relations
between China and the United States with CPTPP countries have evolved in
the midst of their ongoing trade war. Starting with China, the accumulated
rate of trade deceleration in exports reached -67% for Japan, -55% for Mexico,
and -40.5% for Canada. The trends are evident in the figures that follow.
The seasonal comparison of the first eight months of 2019 with the same
months of 2018 clearly shows the effects of China’s slowdown of imports
from the largest CPTPP countries, with the exception of Australia, which
rather experienced a boom. For the rest, the downturn is visible and dramatic,
considering that China is the largest trading partner for all of these countries,
except for Canada. The Trade Tracker looked at the four largest CPTPP
economies individually over the last 33 months to understand and compare
their individual trends. The comparison is shown in Figure 2.
Sources: Japanese Ministry of Finance, 2019; Australian Bureau of Statistics, 2019; Mexico Secretaría de Economía, 2019
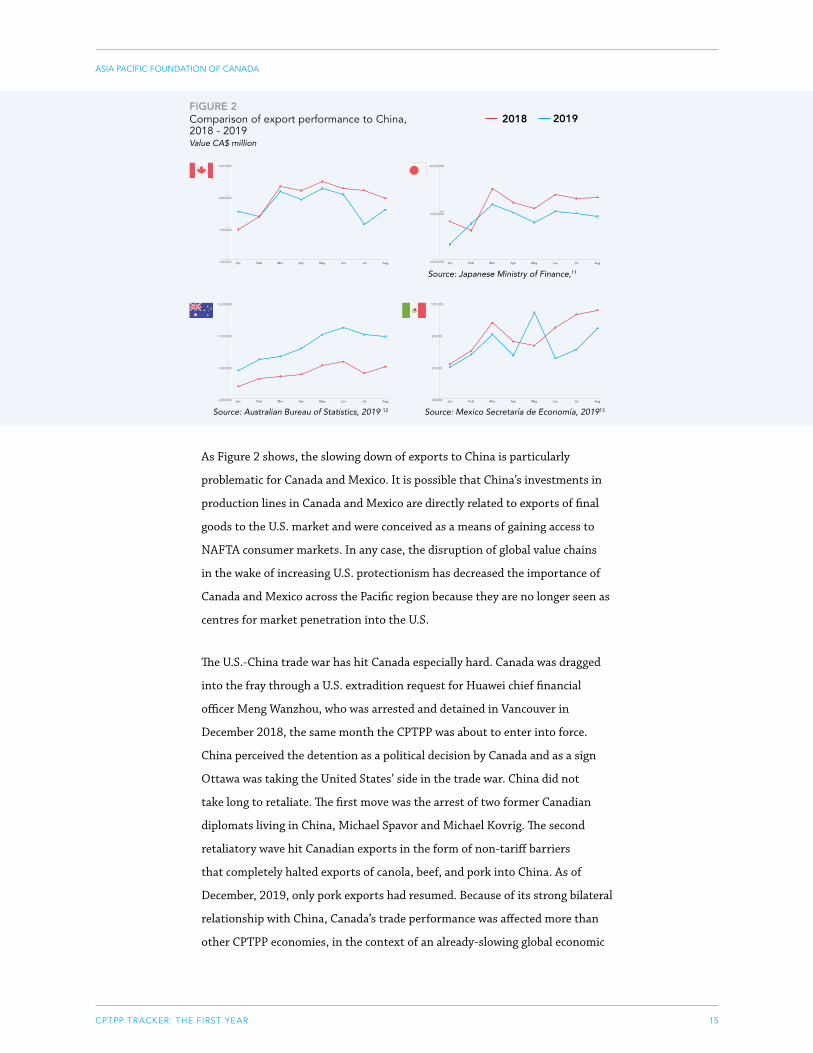
CPTPP TRACKER: THE FIRST YEAR
ASIA PACIFIC FOUNDATION OF CANADA
15
FIGURE 2Comparison of export performance to China, 2018 - 2019Value CA$ million
10,000,000
15,000,000
20,000,000
2018
2019
AugJulJunMayAprMarFebJan
Comparison of Japan's Export to China, 2018 v 2019Value C$ Thousand
1,000,000
1,500,000
2,000,000
2,500,000
2018
2019
AugJulJunMayAprMarFebJan
Comparison of Canada's Export to China, 2018 v 2019Value C$ Thousand
400,000
600,000
800,000
1,000,000
2018
2019
AugJulJunMayAprMarFebJan
Comparison of Mexico's Export to China, 2018 v 2019Value C$ Thousand
6,000,000
9,000,000
12,000,000
15,000,000
2018
2019
AugJulJunMayAprMarFebJan
Comparison of Australia's Export to China, 2018 v 2019Value C$ Thousand
2018 2019
Source: Japanese Ministry of Finance,11
Source: Australian Bureau of Statistics, 2019 12 Source: Mexico Secretaría de Economía, 201913
As Figure 2 shows, the slowing down of exports to China is particularly
problematic for Canada and Mexico. It is possible that China’s investments in
production lines in Canada and Mexico are directly related to exports of final
goods to the U.S. market and were conceived as a means of gaining access to
NAFTA consumer markets. In any case, the disruption of global value chains
in the wake of increasing U.S. protectionism has decreased the importance of
Canada and Mexico across the Pacific region because they are no longer seen as
centres for market penetration into the U.S.
The U.S.-China trade war has hit Canada especially hard. Canada was dragged
into the fray through a U.S. extradition request for Huawei chief financial
officer Meng Wanzhou, who was arrested and detained in Vancouver in
December 2018, the same month the CPTPP was about to enter into force.
China perceived the detention as a political decision by Canada and as a sign
Ottawa was taking the United States’ side in the trade war. China did not
take long to retaliate. The first move was the arrest of two former Canadian
diplomats living in China, Michael Spavor and Michael Kovrig. The second
retaliatory wave hit Canadian exports in the form of non-tariff barriers
that completely halted exports of canola, beef, and pork into China. As of
December, 2019, only pork exports had resumed. Because of its strong bilateral
relationship with China, Canada’s trade performance was affected more than
other CPTPP economies, in the context of an already-slowing global economic

CPTPP TRACKER: THE FIRST YEAR
ASIA PACIFIC FOUNDATION OF CANADA
16
FIGURE 3Logarithm trend line for Canadian exports to China Value CA$
1,000,000
1,500,000
2,000,000
2,500,000
3,000,000
3,500,000
Canada's Exports to China in the Last 36 MonthsValue C$ Thousand
2017 2018 2019
outlook. As Table 1 shows, the month-to-month percentage change of export
growth compared to the exact months of the previous year confirm the effects
of political tensions on Canadian export growth in China.
Months 2017 2018 2019
January 25.7 −22.4 18.8
February 3.7 5.2 0.4
March 33.3 −2.2 −5.1
April 25.1 17.5 −9.4
May 20.5 29.9 −5
June 13.5 23.4 −4.6
July 13.5 26.9 −26
August −2.1 21.0 −9.6
September 29.2 41.7 2.2
Average % change 18.0 15.6 −4.2
TABLE 1 | Percentage change related to previous years
Canadian exports to China were growing at an annual pace of 11% between
2009 and 2018, with an accumulated net growth of 58.7% in the same years.
This positive growth trend started on a consistent reversal beginning in
February 2019, and while there was a small uptick this September, the trend
continues to be consistent, as Figure 3 shows.

CPTPP TRACKER: THE FIRST YEAR
ASIA PACIFIC FOUNDATION OF CANADA
17
Japan is facing a similar challenge, since its exports have not fared particularly
well with the United States either, as Figure 4 illustrates. It is possible that
this trend will reverse itself once the recently negotiated U.S.-Japan free
trade agreement enters into force. Still, it is too early to see any changes. It
is important to highlight that the situation in Australia is reversed: while
its exports to China are booming, trade growth with the United States has
consistently slowed down since May 2019, as Figure 4 shows.
FIGURE 4Major CPTPP partners export growth to U.S. Jan - Aug 2019
-10
-5
0
5
10
15
20
25
30
35
Mexico
Australia
Japan
Canada
AugJulJunMayAprMarFebJan
Major CPTPP Partners Export Growth to U.S. January to August of 2019
Source: Japanese Ministry of Finance, 2019; Australian Bureau of Statistics, 2019; Mexico Secretaría de Economía, 201914
The U.S.-China trade war has definitely had an impact on how the CPTPP area
evolved in 2019. The analysis below breaks down the basic observable trends
for Canada.
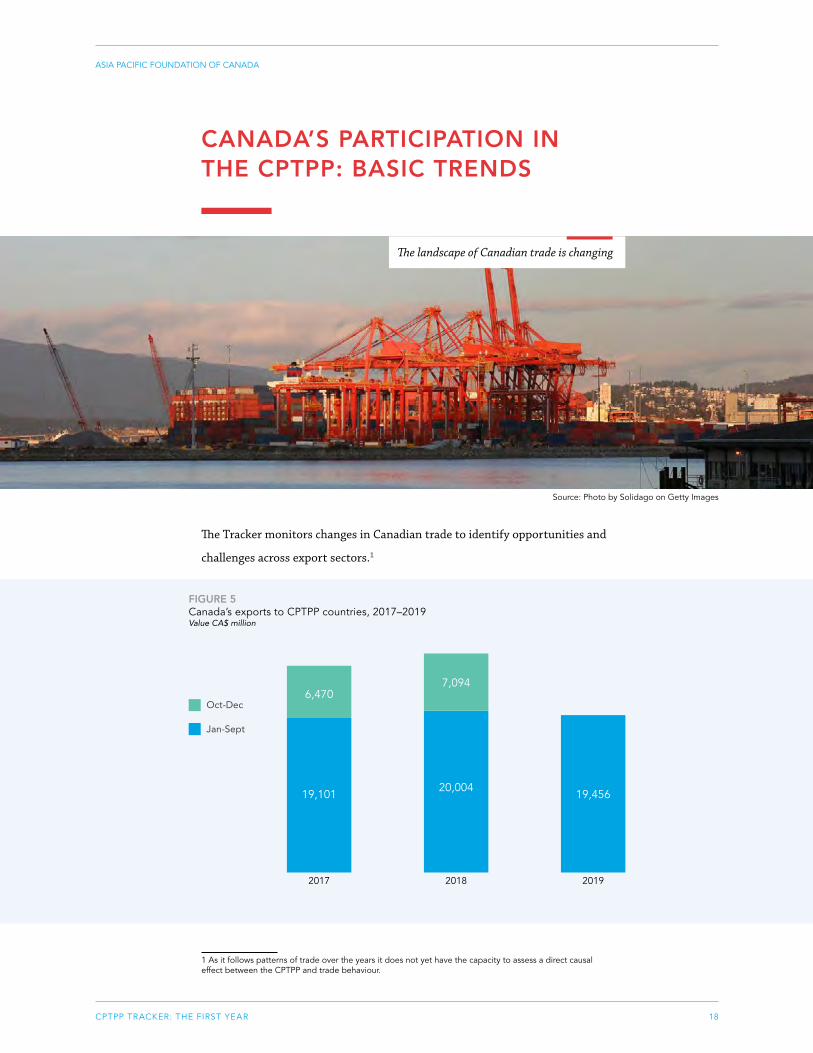
CPTPP TRACKER: THE FIRST YEAR
ASIA PACIFIC FOUNDATION OF CANADA
18
CANADA’S PARTICIPATION IN THE CPTPP: BASIC TRENDS
The Tracker monitors changes in Canadian trade to identify opportunities and
challenges across export sectors.1
1 As it follows patterns of trade over the years it does not yet have the capacity to assess a direct causal effect between the CPTPP and trade behaviour.
The landscape of Canadian trade is changing
Source: Photo by Solidago on Getty Images
FIGURE 5Canada’s exports to CPTPP countries, 2017–2019Value CA$ millionCanada's Domestic Export to CPTPP Countries
6,470
2017
19,101
7,094
20,00419,456
2018 2019
Value C$ Million
Oct-Dec
Jan-Sept
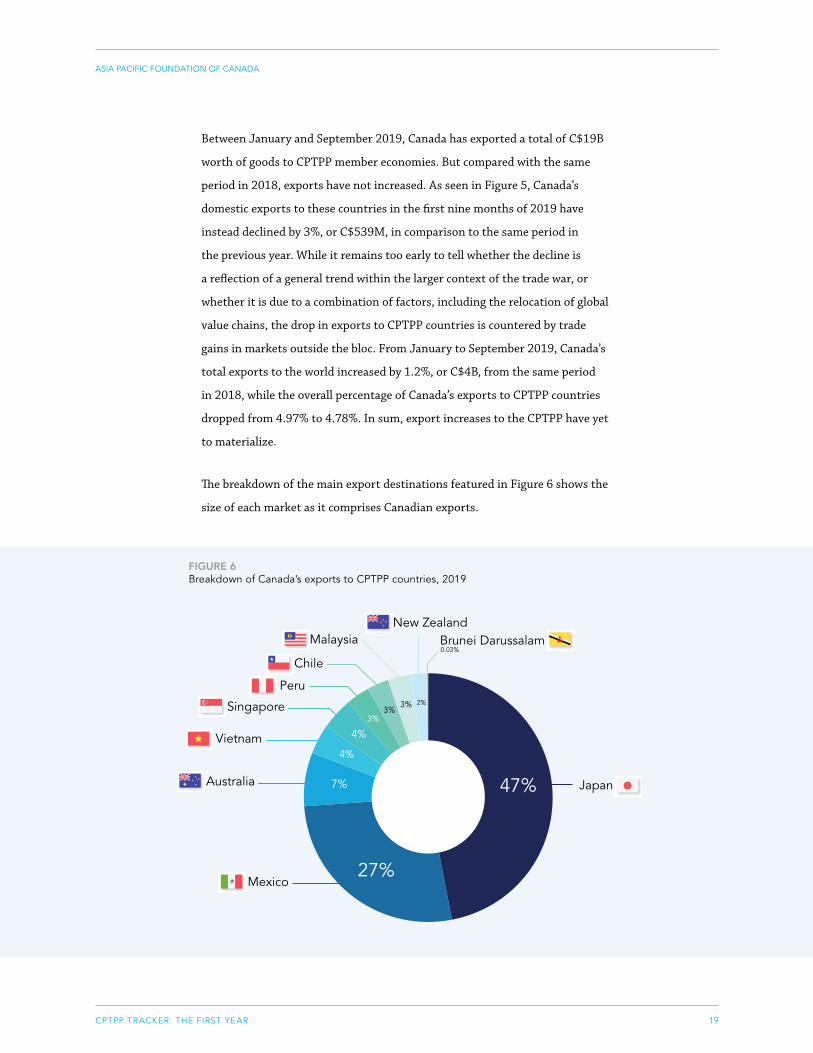
CPTPP TRACKER: THE FIRST YEAR
ASIA PACIFIC FOUNDATION OF CANADA
19
Between January and September 2019, Canada has exported a total of C$19B
worth of goods to CPTPP member economies. But compared with the same
period in 2018, exports have not increased. As seen in Figure 5, Canada’s
domestic exports to these countries in the first nine months of 2019 have
instead declined by 3%, or C$539M, in comparison to the same period in
the previous year. While it remains too early to tell whether the decline is
a reflection of a general trend within the larger context of the trade war, or
whether it is due to a combination of factors, including the relocation of global
value chains, the drop in exports to CPTPP countries is countered by trade
gains in markets outside the bloc. From January to September 2019, Canada’s
total exports to the world increased by 1.2%, or C$4B, from the same period
in 2018, while the overall percentage of Canada’s exports to CPTPP countries
dropped from 4.97% to 4.78%. In sum, export increases to the CPTPP have yet
to materialize.
The breakdown of the main export destinations featured in Figure 6 shows the
size of each market as it comprises Canadian exports.
FIGURE 6Breakdown of Canada’s exports to CPTPP countries, 2019Canada's Domestic Export to CPTPP Countries
0.03%
2%3%3%
3%
4%
4%
7%
27%
47% Japan
Mexico
Australia
Vietnam
Singapore
Peru
Chile
MalaysiaNew Zealand
Brunei Darussalam

CPTPP TRACKER: THE FIRST YEAR
ASIA PACIFIC FOUNDATION OF CANADA
20
Canada’s exports to CPTPP countries are highly concentrated in Japan, Mexico,
and Australia, which together absorb about 82% of Canada’s total CPTPP
exports. As of September 2019, Canada has exported over C$16B worth of
products to these three countries alone, while it exported about C$4B to the
remaining seven CPTPP countries. The importance of Canada’s exports to
CPTPP countries corresponds roughly to the size of their respective economies.
The larger the economy, the greater its purchasing power in international trade.
However, the distribution of Canadian exports might change going forward.
The economies of countries like Malaysia and Vietnam are developing rapidly,
and after the CPTPP entered into force these countries became the fastest-
growing consumers of Canadian exports. If this trend continues, these countries
could become important destinations for Canadian goods and services.
FIGURE 7Gains and setbacks in Canada’s exports to CPTPP countries, Jan–Sep, 2018–2019 Value CA$ Million
Gains and Setbacks of Canada's Export to CPTPP Countries, Jan - Sep of 2018-2019 Value C$ Million
136101
223
-11 -24
19
-67
-158
-558-538
TotalCPTPP
As Figure 7 demonstrates, Canadian exports have seen growth in five of the
10 markets and a decline in the other half. Comparing the first nine months
of 2019 with the same period last year, Canadian exports to Australia have
increased by 11%, or C$136M. However, the success in the Australian market
could not offset the decline in exports to Japan and Mexico. From January
to September 2019, Canadian exports to Japan dropped by C$158M, a 2%
decrease from the first nine months of 2018. Canadian exports to Mexico
over the same period dropped more steeply – a 9%, or C$558M, decrease –
compared with the first nine months of 2018. In sum, Australia is the only
large CPTPP economy where Canadian exports increased.
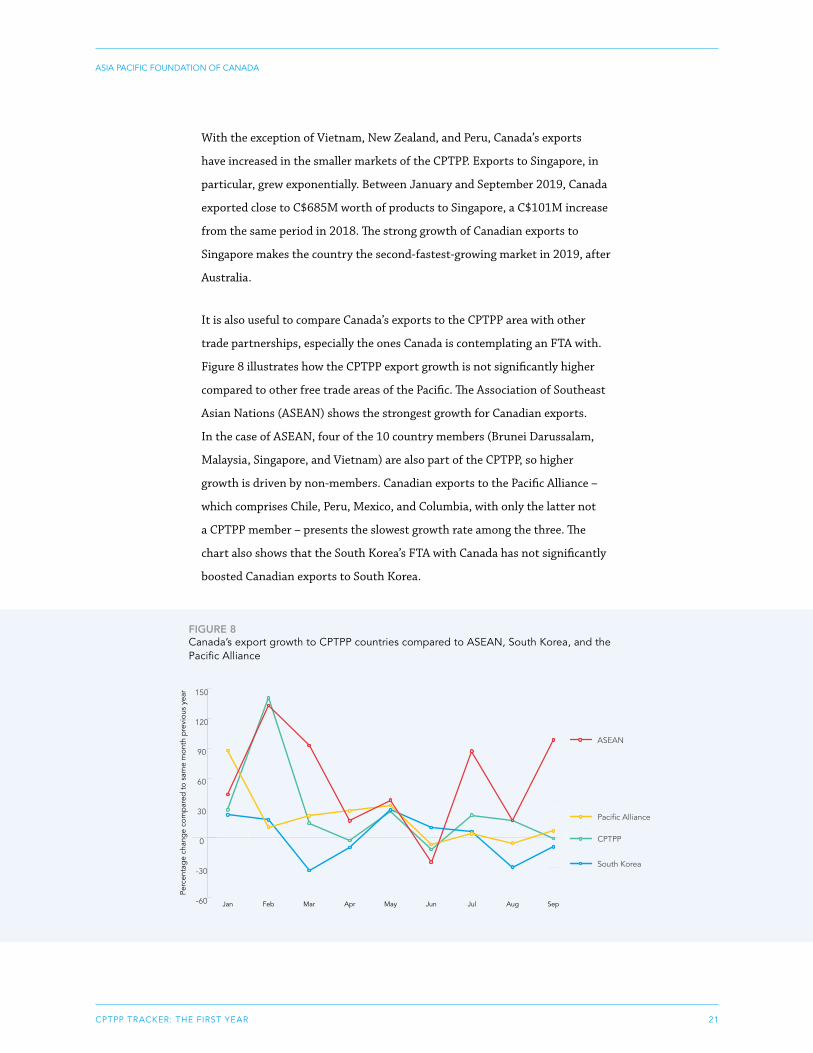
CPTPP TRACKER: THE FIRST YEAR
ASIA PACIFIC FOUNDATION OF CANADA
21
With the exception of Vietnam, New Zealand, and Peru, Canada’s exports
have increased in the smaller markets of the CPTPP. Exports to Singapore, in
particular, grew exponentially. Between January and September 2019, Canada
exported close to C$685M worth of products to Singapore, a C$101M increase
from the same period in 2018. The strong growth of Canadian exports to
Singapore makes the country the second-fastest-growing market in 2019, after
Australia.
It is also useful to compare Canada’s exports to the CPTPP area with other
trade partnerships, especially the ones Canada is contemplating an FTA with.
Figure 8 illustrates how the CPTPP export growth is not significantly higher
compared to other free trade areas of the Pacific. The Association of Southeast
Asian Nations (ASEAN) shows the strongest growth for Canadian exports.
In the case of ASEAN, four of the 10 country members (Brunei Darussalam,
Malaysia, Singapore, and Vietnam) are also part of the CPTPP, so higher
growth is driven by non-members. Canadian exports to the Pacific Alliance –
which comprises Chile, Peru, Mexico, and Columbia, with only the latter not
a CPTPP member – presents the slowest growth rate among the three. The
chart also shows that the South Korea’s FTA with Canada has not significantly
boosted Canadian exports to South Korea.
FIGURE 8Canada’s export growth to CPTPP countries compared to ASEAN, South Korea, and the Pacific Alliance
-60
-30
0
30
60
90
120
150
CPTPP
South Korea
Pacific Alliance
ASEAN
SepAugJulJunMayAprMarFebJan
Canada's Export Growth to CPTPP Compared to ASEAN, South Korea and the Pacific Alliance

CPTPP TRACKER: THE FIRST YEAR
ASIA PACIFIC FOUNDATION OF CANADA
22
26%C$5,059M
21%C$4,201M
18%C$3,430M
15%C$2,845M
10%C$1,940M
6%C$1,173M
British Columbia
Quebec
Ontario
Alberta
Saskatchewan
Manitoba
4%C$807M
0.06% TerritoriesC$11M
Atlantic Provinces
Provincial Breakdown of Canada’s CPTPP Engagement
FIGURE 9Share of Canada’s CPTPP exports by province to date
The provincial distribution of Canada’s CPTPP exports is relatively diversified.
The top four provinces exporting to CPTPP members are Ontario, British
Columbia, Quebec, and Alberta making up for 64% of Canada’s total CPTPP
exports. While Ontario remains the largest exporting province to CPTPP
countries, with over C$4B worth of exports by September 2019, British
Columbia, Quebec, and Alberta’s CPTPP exports all exceeded C$2.8B.
FIGURE 10Gains and setbacks in Canada’s exports to CPTPP countries by province, Jan–Sep, 2018–2019 Value CA$ Million
Gains and Setbacks of Canada's Exports to CPTPP Countries by province and territory, Jan - Sep of 2018-2019 Value C$ Million
198
5938 3238
0.0030.5
-8
-66
-12
-132
-536
-151
CPTPP TRACKER: THE FIRST YEAR
ASIA PACIFIC FOUNDATION OF CANADA
23
Figure 10 shows that three of Canada’s four most economically powerful
provinces, British Columbia, Quebec, and Alberta, have experienced setbacks
in their CPTPP exports in 2019. British Columbia’s exports sustained the
biggest losses with a decline of close to C$536M (11%) when comparing the
first nine months of 2019 to the same period of 2018. Saskatchewan faced
the second-largest decrease. Quebec and Alberta’s CPTPP exports sustained
relatively lighter losses with drops of C$132M and C$66M, respectively.
Ontario remains the only province among the top four to have increased
exports to the CPTPP. Comparing the January-to-September period of 2019 to
that of 2018, Ontario’s exports to CPTPP markets increased by C$38M.
Six of the other eight provinces have also increased their exports to CPTPP
countries, in order of value: Newfoundland and Labrador, Manitoba, New
Brunswick, Prince Edward Island, Nunavut, and Yukon. Together, these six
provinces and territories exported an additional C$328M in the first nine
months of 2019. Newfoundland and Labrador, in particular, made the largest
inroad, as the province’s exports to CPTPP countries have gone up by C$198M.
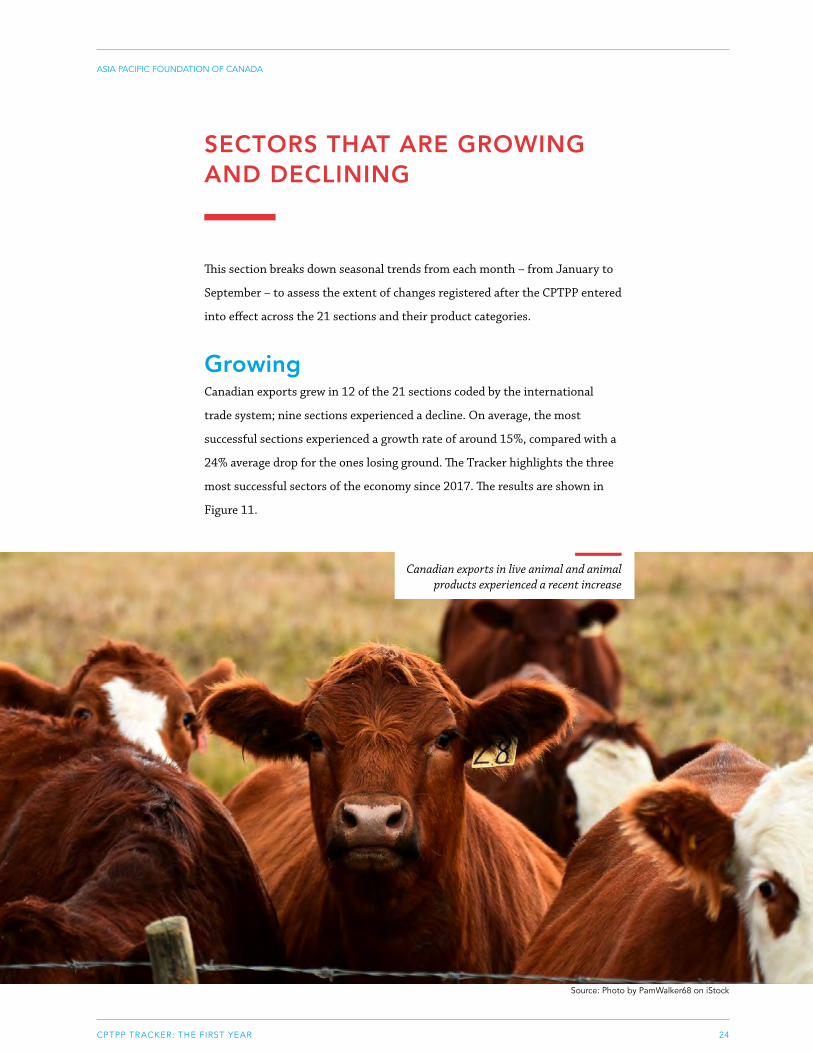
CPTPP TRACKER: THE FIRST YEAR
ASIA PACIFIC FOUNDATION OF CANADA
24
SECTORS THAT ARE GROWING AND DECLINING
This section breaks down seasonal trends from each month – from January to
September – to assess the extent of changes registered after the CPTPP entered
into effect across the 21 sections and their product categories.
GrowingCanadian exports grew in 12 of the 21 sections coded by the international
trade system; nine sections experienced a decline. On average, the most
successful sections experienced a growth rate of around 15%, compared with a
24% average drop for the ones losing ground. The Tracker highlights the three
most successful sectors of the economy since 2017. The results are shown in
Figure 11.
Canadian exports in live animal and animal products experienced a recent increase
Source: Photo by PamWalker68 on iStock
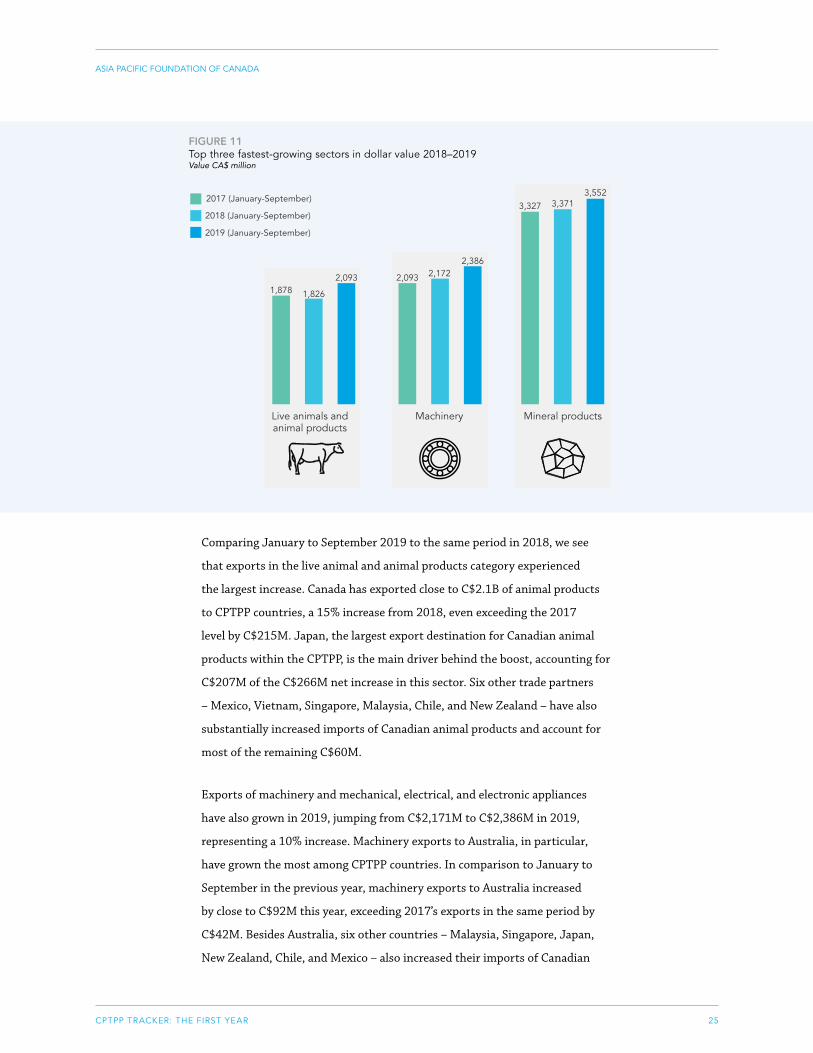
CPTPP TRACKER: THE FIRST YEAR
ASIA PACIFIC FOUNDATION OF CANADA
25
Comparing January to September 2019 to the same period in 2018, we see
that exports in the live animal and animal products category experienced
the largest increase. Canada has exported close to C$2.1B of animal products
to CPTPP countries, a 15% increase from 2018, even exceeding the 2017
level by C$215M. Japan, the largest export destination for Canadian animal
products within the CPTPP, is the main driver behind the boost, accounting for
C$207M of the C$266M net increase in this sector. Six other trade partners
– Mexico, Vietnam, Singapore, Malaysia, Chile, and New Zealand – have also
substantially increased imports of Canadian animal products and account for
most of the remaining C$60M.
Exports of machinery and mechanical, electrical, and electronic appliances
have also grown in 2019, jumping from C$2,171M to C$2,386M in 2019,
representing a 10% increase. Machinery exports to Australia, in particular,
have grown the most among CPTPP countries. In comparison to January to
September in the previous year, machinery exports to Australia increased
by close to C$92M this year, exceeding 2017’s exports in the same period by
C$42M. Besides Australia, six other countries – Malaysia, Singapore, Japan,
New Zealand, Chile, and Mexico – also increased their imports of Canadian
FIGURE 11Top three fastest-growing sectors in dollar value 2018–2019 Value CA$ millionTop 3 Emerging Export Sectors in Dollar ValueValue C$ Million
1,878 1,826
2,093 2,093 2,1722,386
3,327 3,3713,552
Live animals and animal products
Machinery Mineral products
2017 (January-September)
2018 (January-September)
2019 (January-September)
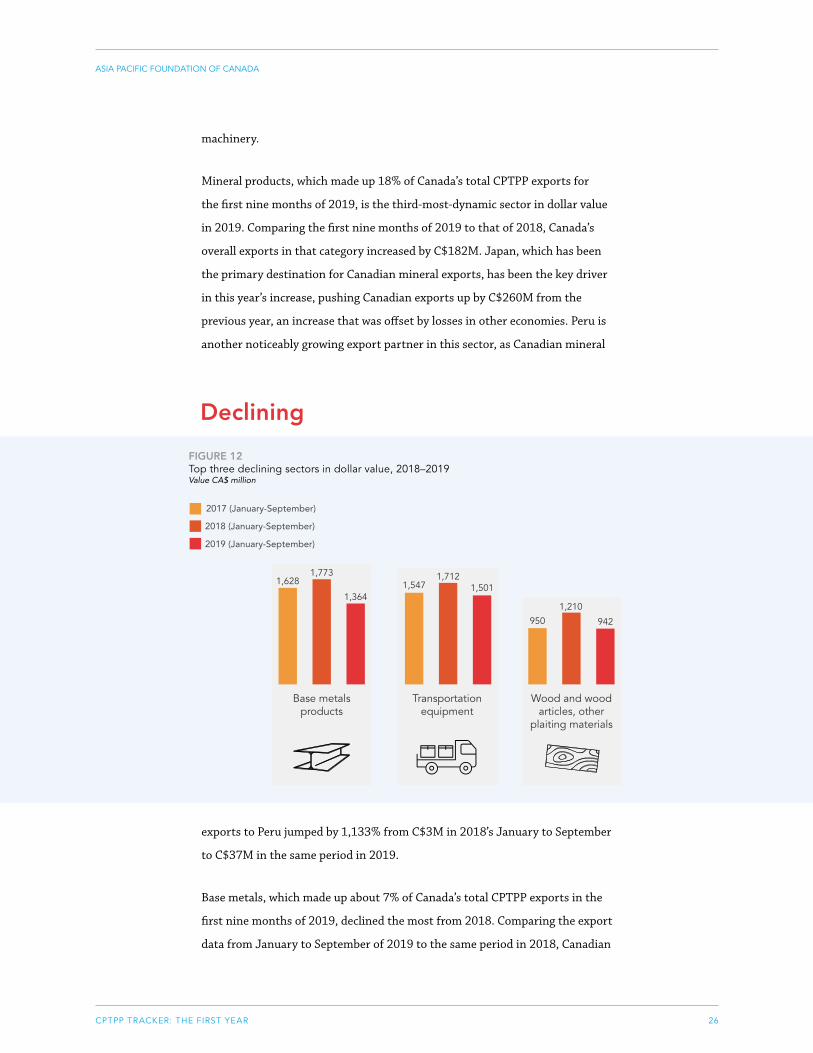
CPTPP TRACKER: THE FIRST YEAR
ASIA PACIFIC FOUNDATION OF CANADA
26
machinery.
Mineral products, which made up 18% of Canada’s total CPTPP exports for
the first nine months of 2019, is the third-most-dynamic sector in dollar value
in 2019. Comparing the first nine months of 2019 to that of 2018, Canada’s
overall exports in that category increased by C$182M. Japan, which has been
the primary destination for Canadian mineral exports, has been the key driver
in this year’s increase, pushing Canadian exports up by C$260M from the
previous year, an increase that was offset by losses in other economies. Peru is
another noticeably growing export partner in this sector, as Canadian mineral
FIGURE 12Top three declining sectors in dollar value, 2018–2019 Value CA$ millionTop 3 Declining Export Sectors in Dollar ValueValue C$ Million
1,5471,712
1,501
950
1,210
942
1,6281,773
1,364
Transportation equipment
Wood and wood articles, other
plaiting materials
Base metals products
2017 (January-September)
2018 (January-September)
2019 (January-September)
exports to Peru jumped by 1,133% from C$3M in 2018’s January to September
to C$37M in the same period in 2019.
Base metals, which made up about 7% of Canada’s total CPTPP exports in the
first nine months of 2019, declined the most from 2018. Comparing the export
data from January to September of 2019 to the same period in 2018, Canadian
Declining
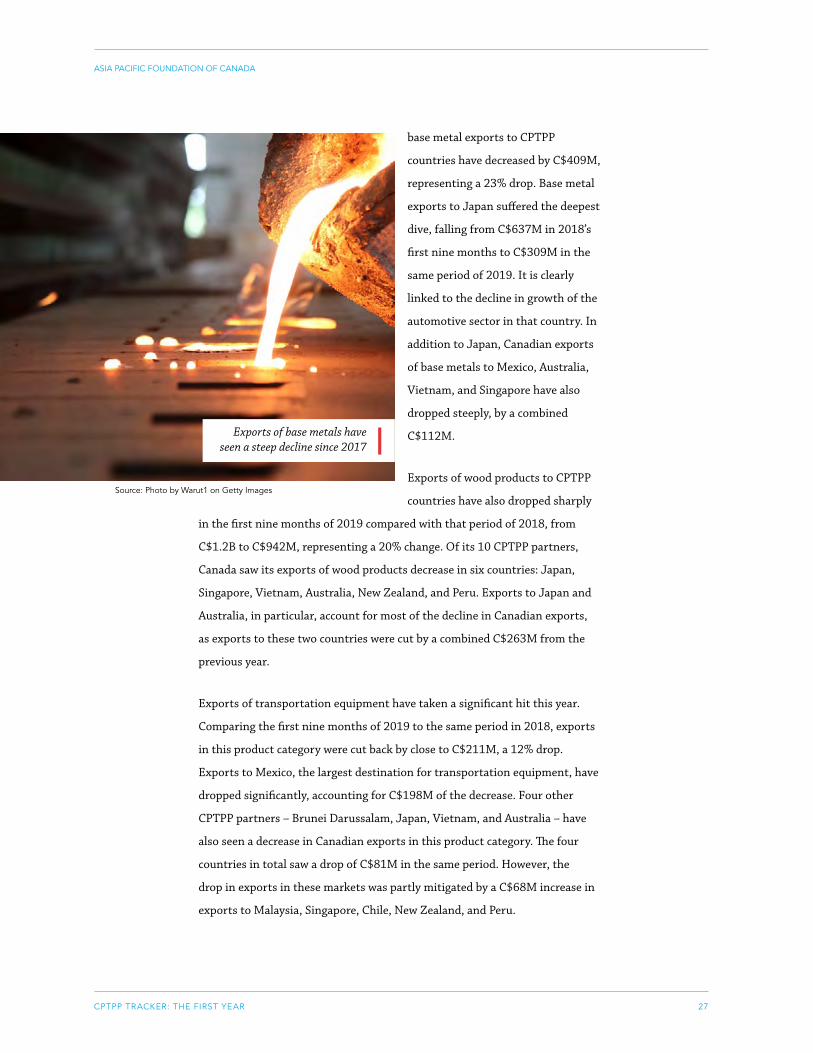
CPTPP TRACKER: THE FIRST YEAR
ASIA PACIFIC FOUNDATION OF CANADA
27
base metal exports to CPTPP
countries have decreased by C$409M,
representing a 23% drop. Base metal
exports to Japan suffered the deepest
dive, falling from C$637M in 2018’s
first nine months to C$309M in the
same period of 2019. It is clearly
linked to the decline in growth of the
automotive sector in that country. In
addition to Japan, Canadian exports
of base metals to Mexico, Australia,
Vietnam, and Singapore have also
dropped steeply, by a combined
C$112M.
Exports of wood products to CPTPP
countries have also dropped sharply
in the first nine months of 2019 compared with that period of 2018, from
C$1.2B to C$942M, representing a 20% change. Of its 10 CPTPP partners,
Canada saw its exports of wood products decrease in six countries: Japan,
Singapore, Vietnam, Australia, New Zealand, and Peru. Exports to Japan and
Australia, in particular, account for most of the decline in Canadian exports,
as exports to these two countries were cut by a combined C$263M from the
previous year.
Exports of transportation equipment have taken a significant hit this year.
Comparing the first nine months of 2019 to the same period in 2018, exports
in this product category were cut back by close to C$211M, a 12% drop.
Exports to Mexico, the largest destination for transportation equipment, have
dropped significantly, accounting for C$198M of the decrease. Four other
CPTPP partners – Brunei Darussalam, Japan, Vietnam, and Australia – have
also seen a decrease in Canadian exports in this product category. The four
countries in total saw a drop of C$81M in the same period. However, the
drop in exports in these markets was partly mitigated by a C$68M increase in
exports to Malaysia, Singapore, Chile, New Zealand, and Peru.
Source: Photo by Warut1 on Getty Images
Exports of base metals have seen a steep decline since 2017
CPTPP TRACKER: THE FIRST YEAR
ASIA PACIFIC FOUNDATION OF CANADA
28
CANADA AND GLOBAL VALUE CHAINS
International trade, investment, and innovation are increasingly organized
in what are called global value chains (GVCs), a concept that describes how
the various stages of the production process for value-added goods take
place in different countries across the globe. Since the 1990s, companies
have optimized their production by breaking down production lines through
offshoring and outsourcing activities, choosing the country that offers the best
technology, best trained labour force, or the best cost for their investment.15
For these reasons, value-added manufacturing exports have become the
main indicator of engagement in global production networks. The capacity to
become and stay competitive exporting value-added goods is a strong indicator
of a country’s ability to innovate and lead its own production lines across the
globe. Participation in GVC exports are deemed to have the strongest positive
incentive in increasing productivity and improving export performance. For
these reasons, value-added manufacturing exports have become the main
indicator of engagement in global production networks. The capacity to
become and stay competitive exporting value-added goods is a strong indicator
of a country’s ability to innovate and lead its own production lines across the
globe. Participation in GVC exports are deemed to have the strongest positive
incentive in increasing productivity and improving export performance.
The Asia Pacific region is the most active when it comes to GVCs where
foreign value-added goods are traded. A United Nations Economic and
Social Commission for Asia and the Pacific (ESCAP) 2018 report made clear
that this is especially the case in the electronics and automotive sectors,
where a whopping 70.6% of intermediate and 75.9% of final GVC goods,
respectively, are centred in Asia. Intra-regional trade related to GVCs has been
strengthening over the last five years.
According to ESCAP, the U.S.-China trade war has significantly affected GVCs.
This is because the Asia Pacific concentrates 52.1% of GVC intermediate goods
and 40.9% of GVC final goods, with most of this concentrated in China (47.7%
and 36%, respectively).16 ESCAP predicts that the U.S.-China trade war will

CPTPP TRACKER: THE FIRST YEAR
ASIA PACIFIC FOUNDATION OF CANADA
29
push value-added production lines to move to Southeast Asian countries, like
Vietnam, and other less-developed countries.17
The implications for Canada are significant. Participation in GVC exports are
deemed to have the strongest positive incentive in increasing productivity
and improving export performance. As John Baldwin puts it, “Access to larger
foreign markets allows exporting firms to exploit scale economies and learn
about new technologies and products, and it increases their incentives to
invest and innovate.”18
If Baldwin’s argument is correct, Canada has a unique opportunity to ramp
up relationships to increase its participation in GVCs precisely because the
U.S.-China trade war offers a unique opportunity to diversify Canadian GVC
exports that were, until recently, extremely concentrated in the NAFTA (soon
Canada-U.S.-Mexico Agreement, or CUSMA) region. Up until 2011, Canada’s
participation in GVCs as a percentage of total global trade was 28.0%, but
within NAFTA, it was a whopping 68.2% in gross exports and 62.5% in final
exports. Most of the value was going to the United States as of 2011, the latest
year this estimate was available. 19,20
The Government of Canada has studied export behaviour with other trade
agreements like CETA and determined that entrepreneurs tend to claim
tariff advantages mostly in value-added goods. This is where tariff savings are
greater, because most primary products and raw materials already have very
low tariffs under most favoured-nation clauses. However, the average tariff
utilization in the case of CETA ranges between 24.9 to 36.4%.21 If Canadian
exporters manage to sustain and expand their export of goods for which
they already have a comparative advantage, the CPTPP area presents a good
opportunity to expand and create market niches, using them to leap-frog into
expanding production lines in other sectors and countries in the Pacific.
That being so, Canada’s decision makers will need to work extra hard to make
this a reality. As discussed in the first section of this report, Canadian domestic
value-added content in gross exports to Japan, for instance, is only 3.3% for
GVC intermediate goods and 4.1% for GVC final goods of Japan’s total with
estimates of 2011.22
CPTPP TRACKER: THE FIRST YEAR
ASIA PACIFIC FOUNDATION OF CANADA
30
The extent to which Canadian value-added exports gain market share in the
CPTPP market will determine how successful Canadian companies are at
inserting themselves into the largest GVC market region. Learned experience
from exporting paves the way for future export success, as recent studies made
by Global Affairs Canada’s Office of the Chief Economist attest.23
The following section shows the most successful exports of value-added
manufacturing goods to the CPTPP area (motor vehicles, base metals, mining,
and chemicals, in that order) and the sectors where Canada has lost market
share in the past year.24
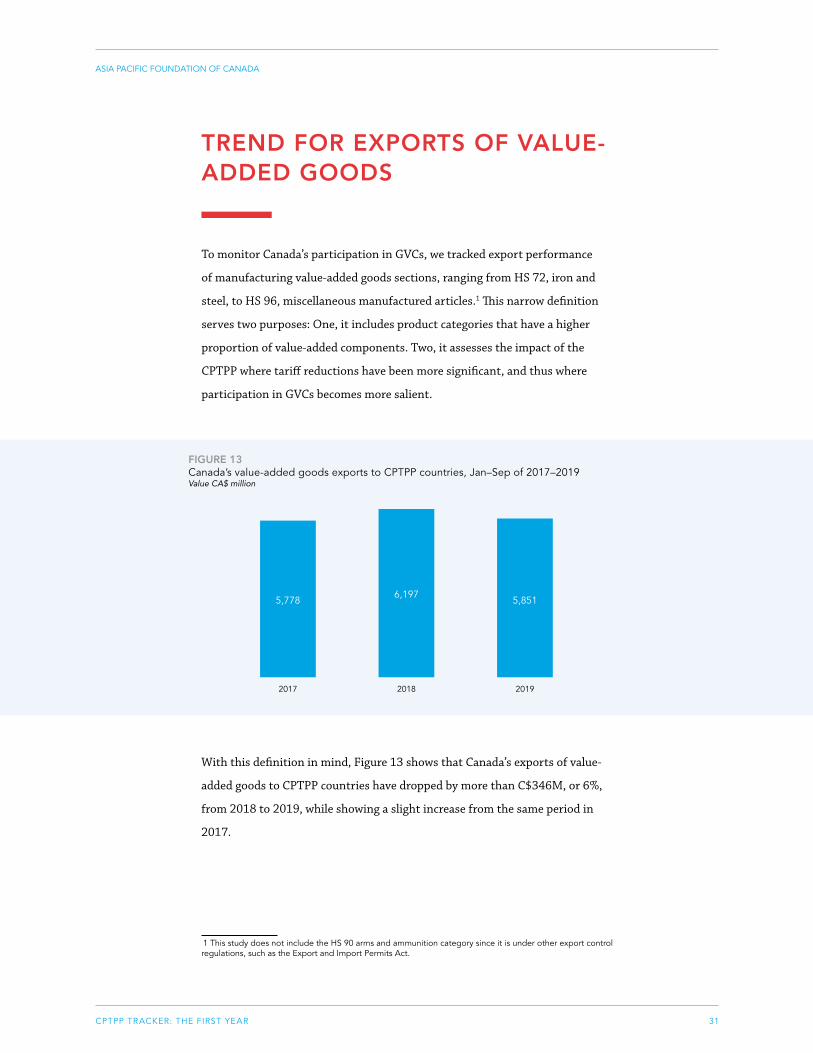
CPTPP TRACKER: THE FIRST YEAR
ASIA PACIFIC FOUNDATION OF CANADA
31
TREND FOR EXPORTS OF VALUE-ADDED GOODS
To monitor Canada’s participation in GVCs, we tracked export performance
of manufacturing value-added goods sections, ranging from HS 72, iron and
steel, to HS 96, miscellaneous manufactured articles.1 This narrow definition
serves two purposes: One, it includes product categories that have a higher
proportion of value-added components. Two, it assesses the impact of the
CPTPP where tariff reductions have been more significant, and thus where
participation in GVCs becomes more salient.
1 This study does not include the HS 90 arms and ammunition category since it is under other export control regulations, such as the Export and Import Permits Act.
FIGURE 13Canada’s value-added goods exports to CPTPP countries, Jan–Sep of 2017–2019 Value CA$ million
Canada Value Added Goods Export to CPTPP Countries
2017
5,7786,197
5,851
2018 2019
Value C$ Million
With this definition in mind, Figure 13 shows that Canada’s exports of value-
added goods to CPTPP countries have dropped by more than C$346M, or 6%,
from 2018 to 2019, while showing a slight increase from the same period in
2017.
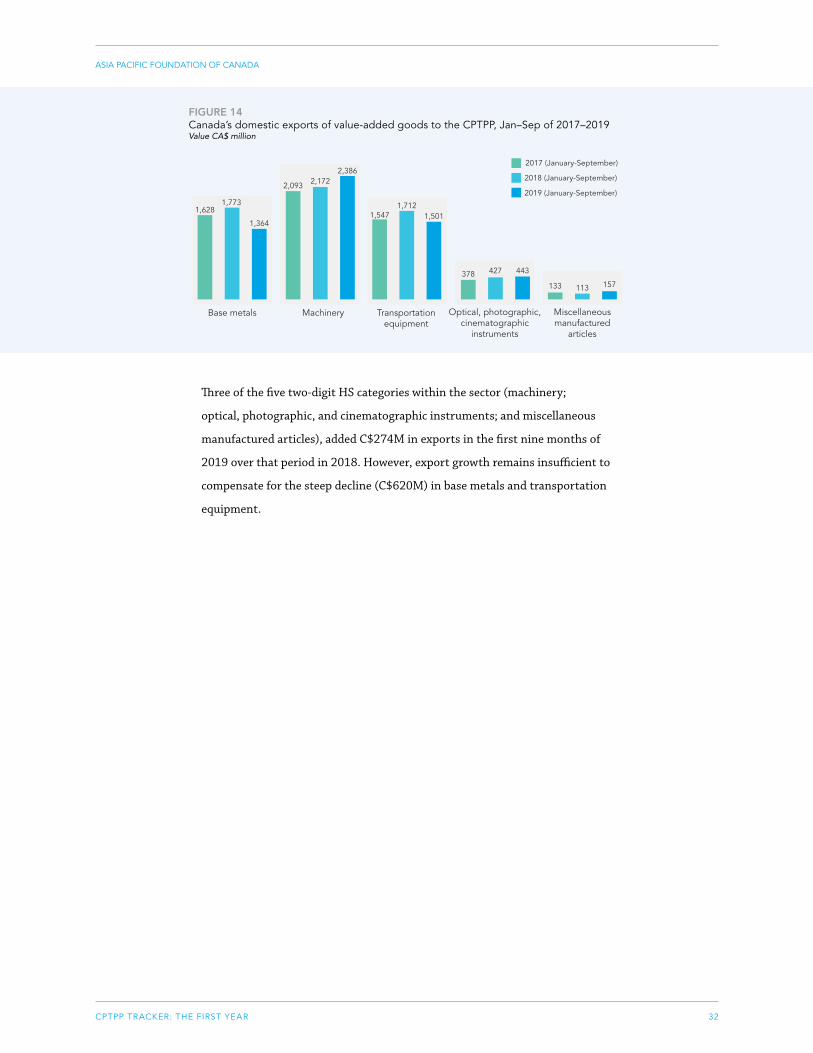
CPTPP TRACKER: THE FIRST YEAR
ASIA PACIFIC FOUNDATION OF CANADA
32
Three of the five two-digit HS categories within the sector (machinery;
optical, photographic, and cinematographic instruments; and miscellaneous
manufactured articles), added C$274M in exports in the first nine months of
2019 over that period in 2018. However, export growth remains insufficient to
compensate for the steep decline (C$620M) in base metals and transportation
equipment.
FIGURE 14Canada’s domestic exports of value-added goods to the CPTPP, Jan–Sep of 2017–2019 Value CA$ millionCanada's Domestic Export of Value Added Goods to CPTPPValue C$ Million
1,6281,773
1,364
2,093 2,1722,386
1,5471,712
1,501
Base metals Machinery Transportation equipment
2017 (January-September)
2018 (January-September)
2019 (January-September)
378 427 443
133 113 157
Optical, photographic, cinematographic
instruments
Miscellaneous manufactured
articles
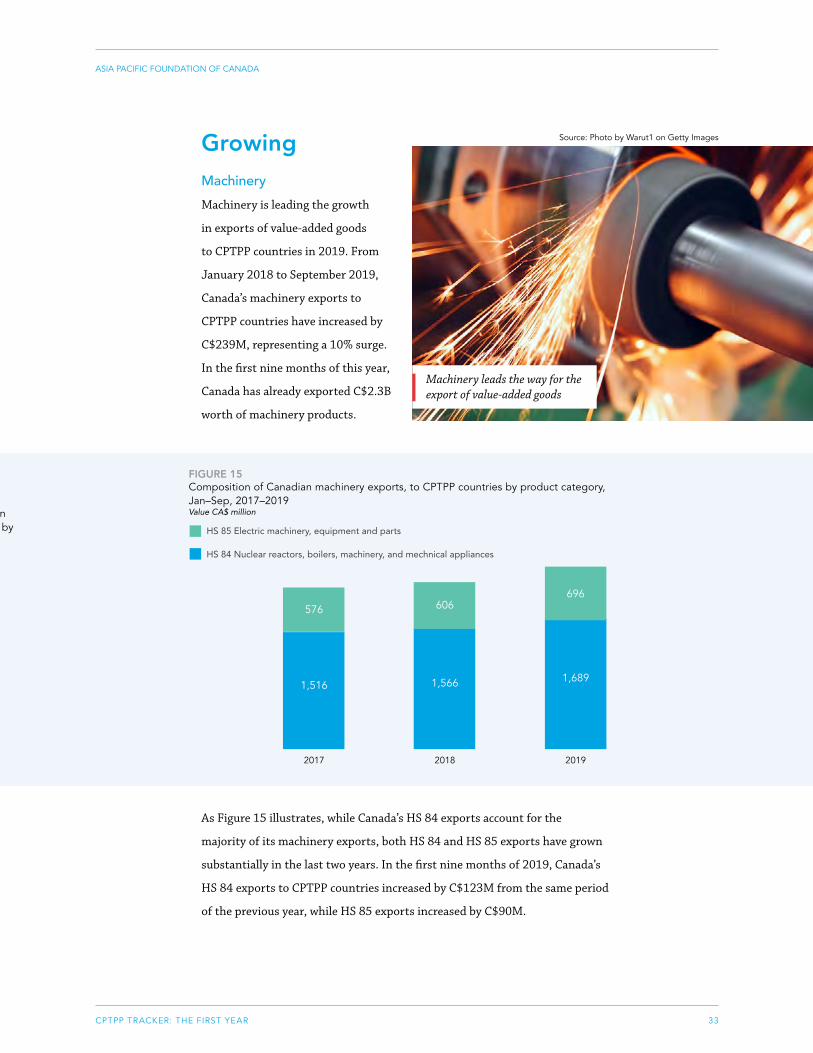
CPTPP TRACKER: THE FIRST YEAR
ASIA PACIFIC FOUNDATION OF CANADA
33
GrowingMachinery
Machinery is leading the growth
in exports of value-added goods
to CPTPP countries in 2019. From
January 2018 to September 2019,
Canada’s machinery exports to
CPTPP countries have increased by
C$239M, representing a 10% surge.
In the first nine months of this year,
Canada has already exported C$2.3B
worth of machinery products.
FIGURE 15Composition of Canadian machinery exports, to CPTPP countries by product category, Jan–Sep, 2017–2019 Value CA$ million
Composition of Canada's Machinery Export to CPTPP Countries
576
2017
1,516
606
1,566 1,689
2018 2019
Value C$ Million
HS 84 Nuclear reactors, boilers, machinery, and mechnical appliances
HS 85 Electric machinery, equipment and parts
696
As Figure 15 illustrates, while Canada’s HS 84 exports account for the
majority of its machinery exports, both HS 84 and HS 85 exports have grown
substantially in the last two years. In the first nine months of 2019, Canada’s
HS 84 exports to CPTPP countries increased by C$123M from the same period
of the previous year, while HS 85 exports increased by C$90M.
Source: Photo by Warut1 on Getty Images
Machinery leads the way for the export of value-added goods
Composition of Canadian transportation equipment exports to CPTPP countries by product category, Jan–Sep 2017–2019
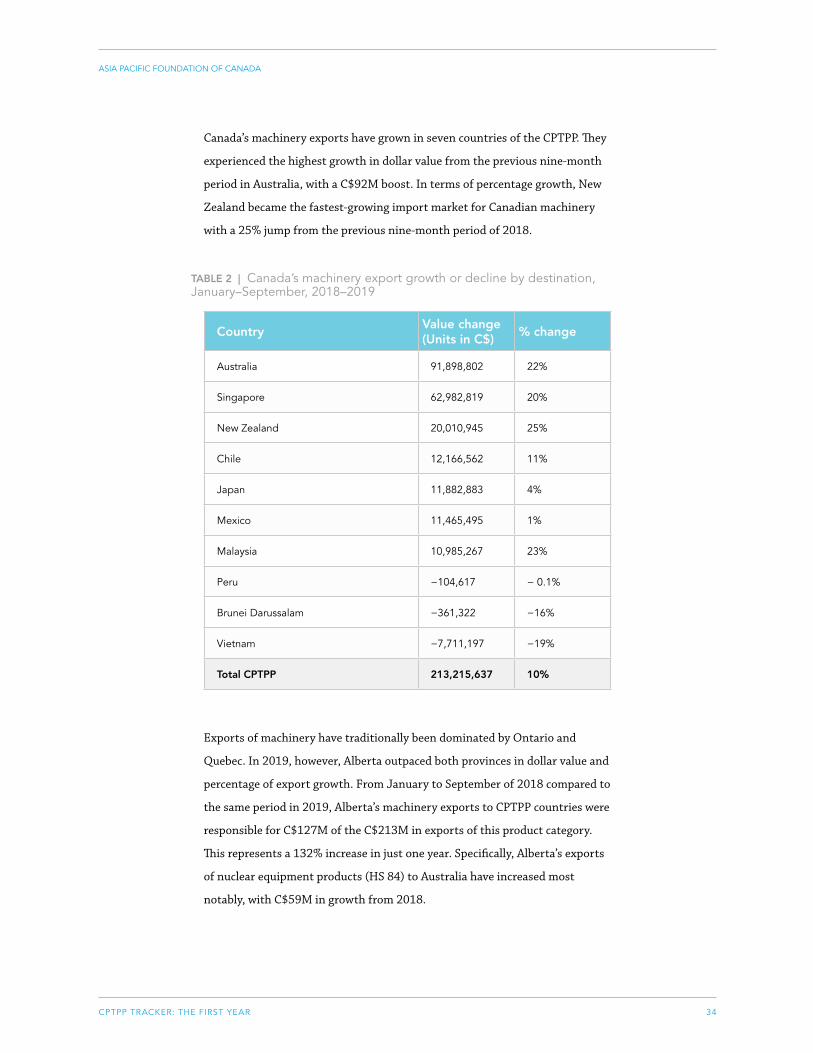
CPTPP TRACKER: THE FIRST YEAR
ASIA PACIFIC FOUNDATION OF CANADA
34
Canada’s machinery exports have grown in seven countries of the CPTPP. They
experienced the highest growth in dollar value from the previous nine-month
period in Australia, with a C$92M boost. In terms of percentage growth, New
Zealand became the fastest-growing import market for Canadian machinery
with a 25% jump from the previous nine-month period of 2018.
CountryValue change (Units in C$)
% change
Australia 91,898,802 22%
Singapore 62,982,819 20%
New Zealand 20,010,945 25%
Chile 12,166,562 11%
Japan 11,882,883 4%
Mexico 11,465,495 1%
Malaysia 10,985,267 23%
Peru −104,617 − 0.1%
Brunei Darussalam −361,322 −16%
Vietnam −7,711,197 −19%
Total CPTPP 213,215,637 10%
TABLE 2 | Canada’s machinery export growth or decline by destination, January–September, 2018–2019
Exports of machinery have traditionally been dominated by Ontario and
Quebec. In 2019, however, Alberta outpaced both provinces in dollar value and
percentage of export growth. From January to September of 2018 compared to
the same period in 2019, Alberta’s machinery exports to CPTPP countries were
responsible for C$127M of the C$213M in exports of this product category.
This represents a 132% increase in just one year. Specifically, Alberta’s exports
of nuclear equipment products (HS 84) to Australia have increased most
notably, with C$59M in growth from 2018.
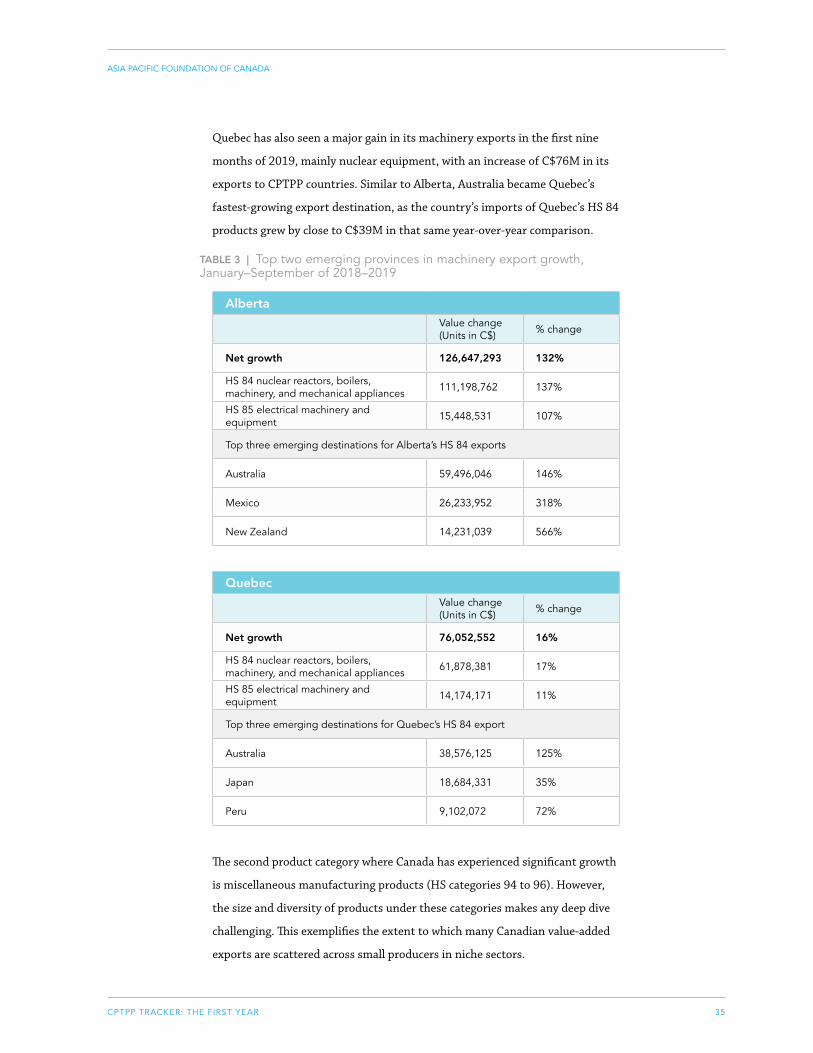
CPTPP TRACKER: THE FIRST YEAR
ASIA PACIFIC FOUNDATION OF CANADA
35
Quebec has also seen a major gain in its machinery exports in the first nine
months of 2019, mainly nuclear equipment, with an increase of C$76M in its
exports to CPTPP countries. Similar to Alberta, Australia became Quebec’s
fastest-growing export destination, as the country’s imports of Quebec’s HS 84
products grew by close to C$39M in that same year-over-year comparison.
AlbertaValue change (Units in C$) % change
Net growth 126,647,293 132%
HS 84 nuclear reactors, boilers, machinery, and mechanical appliances 111,198,762 137%
HS 85 electrical machinery and equipment 15,448,531 107%
Top three emerging destinations for Alberta’s HS 84 exports
Australia 59,496,046 146%
Mexico 26,233,952 318%
New Zealand 14,231,039 566%
TABLE 3 | Top two emerging provinces in machinery export growth, January–September of 2018–2019
QuebecValue change (Units in C$) % change
Net growth 76,052,552 16%
HS 84 nuclear reactors, boilers, machinery, and mechanical appliances 61,878,381 17%
HS 85 electrical machinery and equipment 14,174,171 11%
Top three emerging destinations for Quebec’s HS 84 export
Australia 38,576,125 125%
Japan 18,684,331 35%
Peru 9,102,072 72%
The second product category where Canada has experienced significant growth
is miscellaneous manufacturing products (HS categories 94 to 96). However,
the size and diversity of products under these categories makes any deep dive
challenging. This exemplifies the extent to which many Canadian value-added
exports are scattered across small producers in niche sectors.
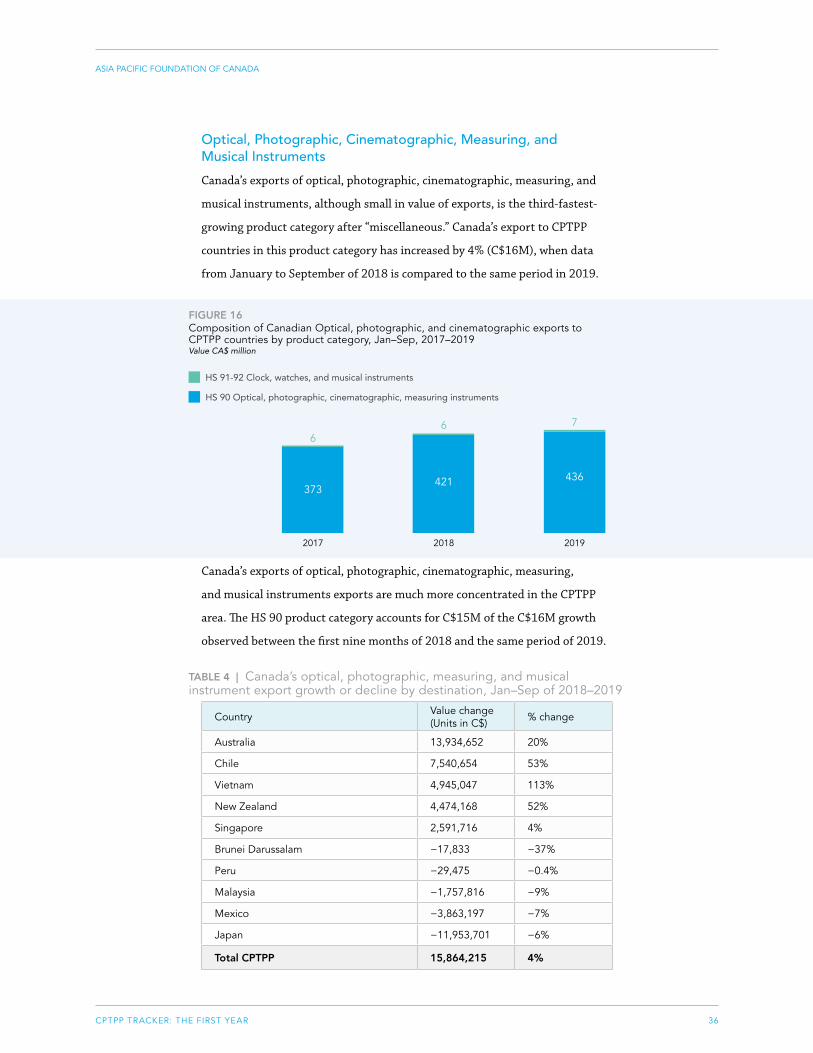
CPTPP TRACKER: THE FIRST YEAR
ASIA PACIFIC FOUNDATION OF CANADA
36
Optical, Photographic, Cinematographic, Measuring, and Musical Instruments
Canada’s exports of optical, photographic, cinematographic, measuring, and
musical instruments, although small in value of exports, is the third-fastest-
growing product category after “miscellaneous.” Canada’s export to CPTPP
countries in this product category has increased by 4% (C$16M), when data
from January to September of 2018 is compared to the same period in 2019.
FIGURE 16Composition of Canadian Optical, photographic, and cinematographic exports to CPTPP countries by product category, Jan–Sep, 2017–2019 Value CA$ million
Composition of Canada's Optical, Photographic, Cinematographic, Instruments Export to CPTPP Countries
6
2017
373
6
421 436
2018 2019
Value C$ Million
HS 90 Optical, photographic, cinematographic, measuring instruments
HS 91-92 Clock, watches, and musical instruments
7
Canada’s exports of optical, photographic, cinematographic, measuring,
and musical instruments exports are much more concentrated in the CPTPP
area. The HS 90 product category accounts for C$15M of the C$16M growth
observed between the first nine months of 2018 and the same period of 2019.
Country Value change (Units in C$) % change
Australia 13,934,652 20%
Chile 7,540,654 53%
Vietnam 4,945,047 113%
New Zealand 4,474,168 52%
Singapore 2,591,716 4%
Brunei Darussalam −17,833 −37%
Peru −29,475 −0.4%
Malaysia −1,757,816 −9%
Mexico −3,863,197 −7%
Japan −11,953,701 −6%
Total CPTPP 15,864,215 4%
TABLE 4 | Canada’s optical, photographic, measuring, and musical instrument export growth or decline by destination, Jan–Sep of 2018–2019
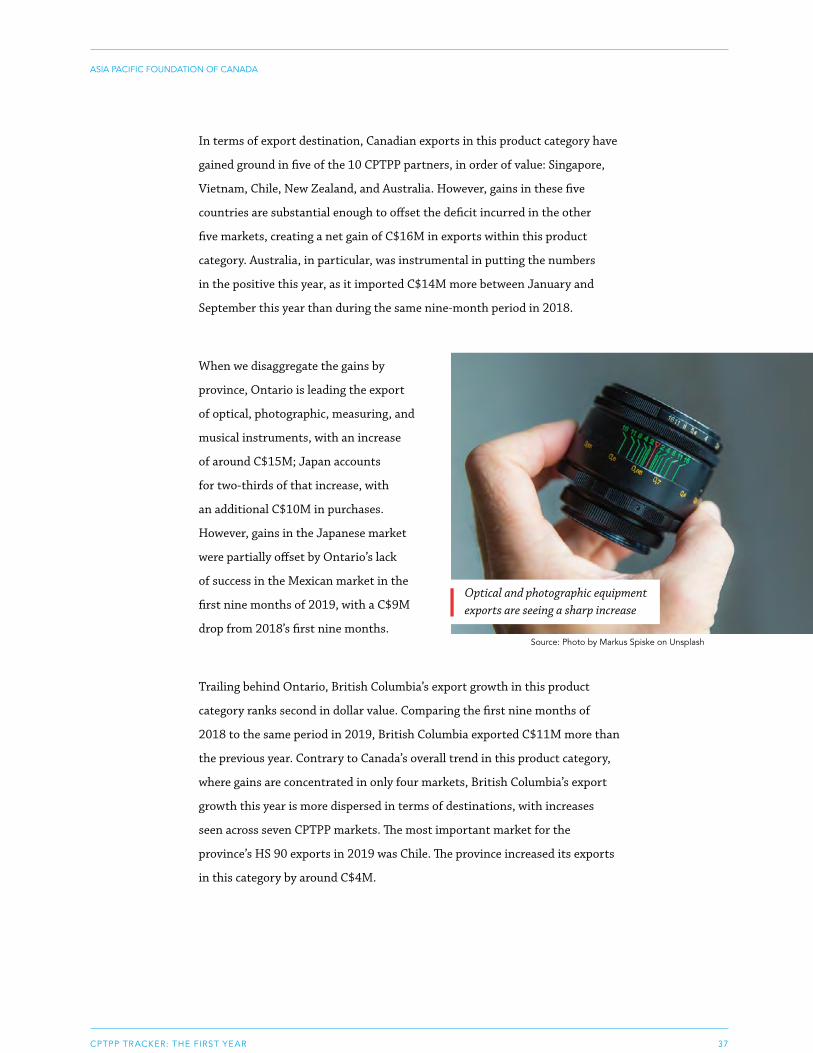
CPTPP TRACKER: THE FIRST YEAR
ASIA PACIFIC FOUNDATION OF CANADA
37
In terms of export destination, Canadian exports in this product category have
gained ground in five of the 10 CPTPP partners, in order of value: Singapore,
Vietnam, Chile, New Zealand, and Australia. However, gains in these five
countries are substantial enough to offset the deficit incurred in the other
five markets, creating a net gain of C$16M in exports within this product
category. Australia, in particular, was instrumental in putting the numbers
in the positive this year, as it imported C$14M more between January and
September this year than during the same nine-month period in 2018.
When we disaggregate the gains by
province, Ontario is leading the export
of optical, photographic, measuring, and
musical instruments, with an increase
of around C$15M; Japan accounts
for two-thirds of that increase, with
an additional C$10M in purchases.
However, gains in the Japanese market
were partially offset by Ontario’s lack
of success in the Mexican market in the
first nine months of 2019, with a C$9M
drop from 2018’s first nine months.
Trailing behind Ontario, British Columbia’s export growth in this product
category ranks second in dollar value. Comparing the first nine months of
2018 to the same period in 2019, British Columbia exported C$11M more than
the previous year. Contrary to Canada’s overall trend in this product category,
where gains are concentrated in only four markets, British Columbia’s export
growth this year is more dispersed in terms of destinations, with increases
seen across seven CPTPP markets. The most important market for the
province’s HS 90 exports in 2019 was Chile. The province increased its exports
in this category by around C$4M.
Optical and photographic equipment exports are seeing a sharp increase
Source: Photo by Markus Spiske on Unsplash
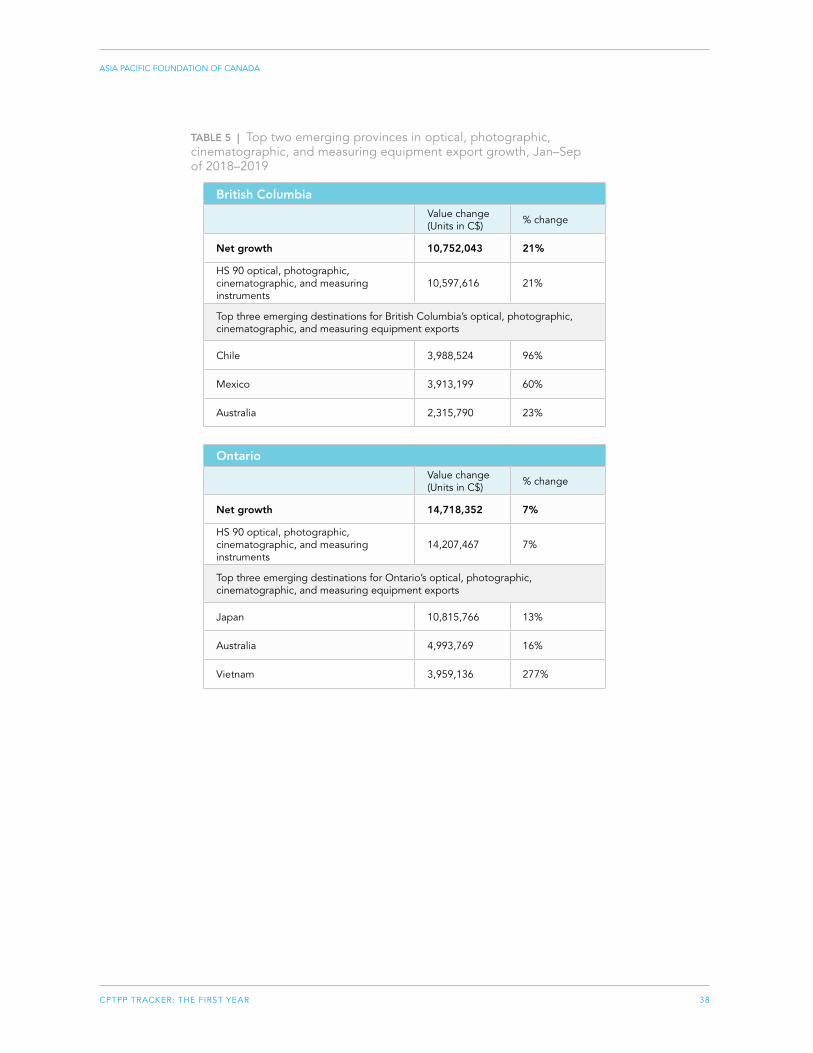
CPTPP TRACKER: THE FIRST YEAR
ASIA PACIFIC FOUNDATION OF CANADA
38
British ColumbiaValue change (Units in C$) % change
Net growth 10,752,043 21%
HS 90 optical, photographic, cinematographic, and measuring instruments
10,597,616 21%
Top three emerging destinations for British Columbia’s optical, photographic, cinematographic, and measuring equipment exports
Chile 3,988,524 96%
Mexico 3,913,199 60%
Australia 2,315,790 23%
TABLE 5 | Top two emerging provinces in optical, photographic, cinematographic, and measuring equipment export growth, Jan–Sep of 2018–2019
OntarioValue change (Units in C$) % change
Net growth 14,718,352 7%
HS 90 optical, photographic, cinematographic, and measuring instruments
14,207,467 7%
Top three emerging destinations for Ontario’s optical, photographic, cinematographic, and measuring equipment exports
Japan 10,815,766 13%
Australia 4,993,769 16%
Vietnam 3,959,136 277%
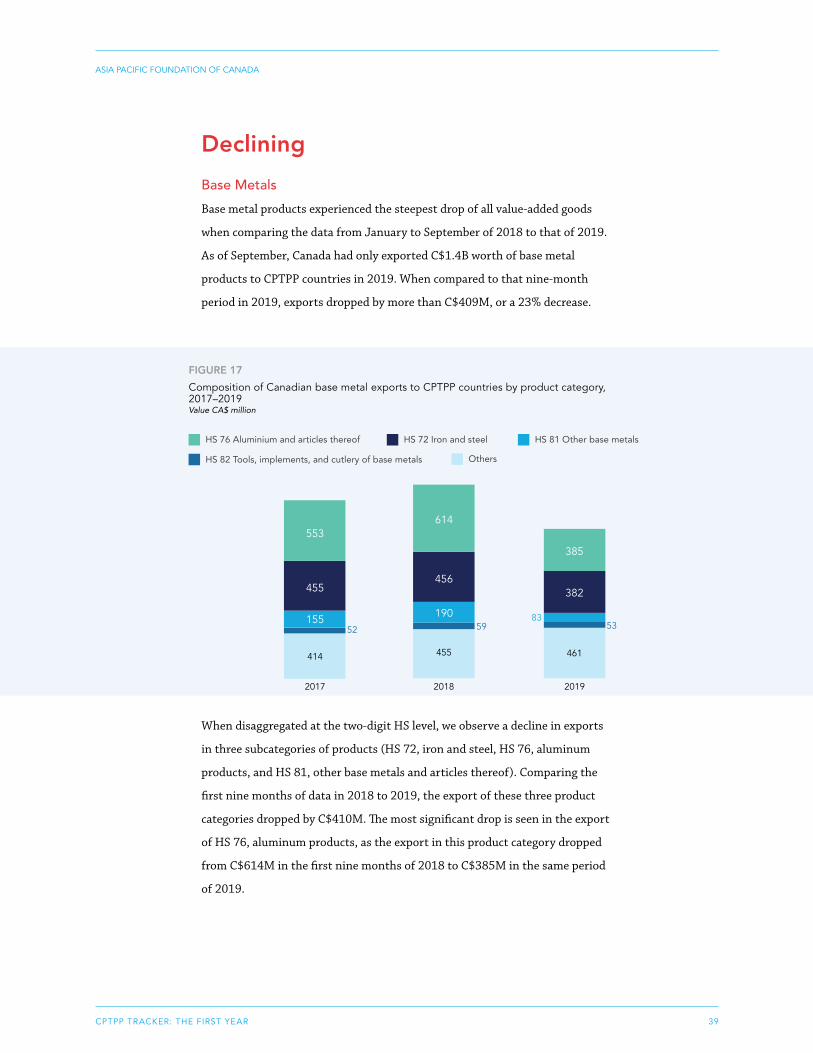
CPTPP TRACKER: THE FIRST YEAR
ASIA PACIFIC FOUNDATION OF CANADA
39
Declining
Base Metals
Base metal products experienced the steepest drop of all value-added goods
when comparing the data from January to September of 2018 to that of 2019.
As of September, Canada had only exported C$1.4B worth of base metal
products to CPTPP countries in 2019. When compared to that nine-month
period in 2019, exports dropped by more than C$409M, or a 23% decrease.
FIGURE 17
Composition of Canadian base metal exports to CPTPP countries by product category, 2017–2019 Value CA$ millionComposition of Canada's Base Metal Export to CPTPP Countries, Jan-Sep 2017-2019
2017
455
2018 2019
Value C$ Million
HS 76 Aluminium and articles thereof
HS 82 Tools, implements, and cutlery of base metals
553
155
414
52
456
614
190
455
59
382
385
461
5383
HS 72 Iron and steel HS 81 Other base metals
Others
When disaggregated at the two-digit HS level, we observe a decline in exports
in three subcategories of products (HS 72, iron and steel, HS 76, aluminum
products, and HS 81, other base metals and articles thereof). Comparing the
first nine months of data in 2018 to 2019, the export of these three product
categories dropped by C$410M. The most significant drop is seen in the export
of HS 76, aluminum products, as the export in this product category dropped
from C$614M in the first nine months of 2018 to C$385M in the same period
of 2019.
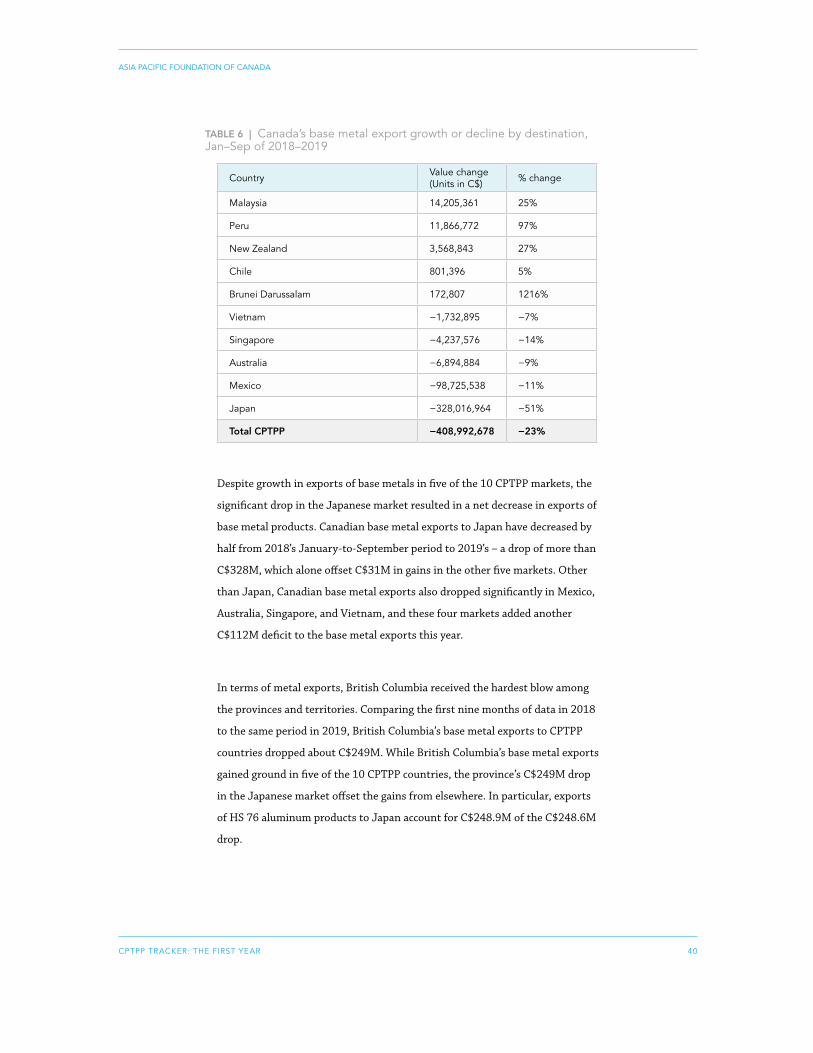
CPTPP TRACKER: THE FIRST YEAR
ASIA PACIFIC FOUNDATION OF CANADA
40
Country Value change (Units in C$) % change
Malaysia 14,205,361 25%
Peru 11,866,772 97%
New Zealand 3,568,843 27%
Chile 801,396 5%
Brunei Darussalam 172,807 1216%
Vietnam −1,732,895 −7%
Singapore −4,237,576 −14%
Australia −6,894,884 −9%
Mexico −98,725,538 −11%
Japan −328,016,964 −51%
Total CPTPP −408,992,678 −23%
TABLE 6 | Canada’s base metal export growth or decline by destination, Jan–Sep of 2018–2019
Despite growth in exports of base metals in five of the 10 CPTPP markets, the
significant drop in the Japanese market resulted in a net decrease in exports of
base metal products. Canadian base metal exports to Japan have decreased by
half from 2018’s January-to-September period to 2019’s – a drop of more than
C$328M, which alone offset C$31M in gains in the other five markets. Other
than Japan, Canadian base metal exports also dropped significantly in Mexico,
Australia, Singapore, and Vietnam, and these four markets added another
C$112M deficit to the base metal exports this year.
In terms of metal exports, British Columbia received the hardest blow among
the provinces and territories. Comparing the first nine months of data in 2018
to the same period in 2019, British Columbia’s base metal exports to CPTPP
countries dropped about C$249M. While British Columbia’s base metal exports
gained ground in five of the 10 CPTPP countries, the province’s C$249M drop
in the Japanese market offset the gains from elsewhere. In particular, exports
of HS 76 aluminum products to Japan account for C$248.9M of the C$248.6M
drop.
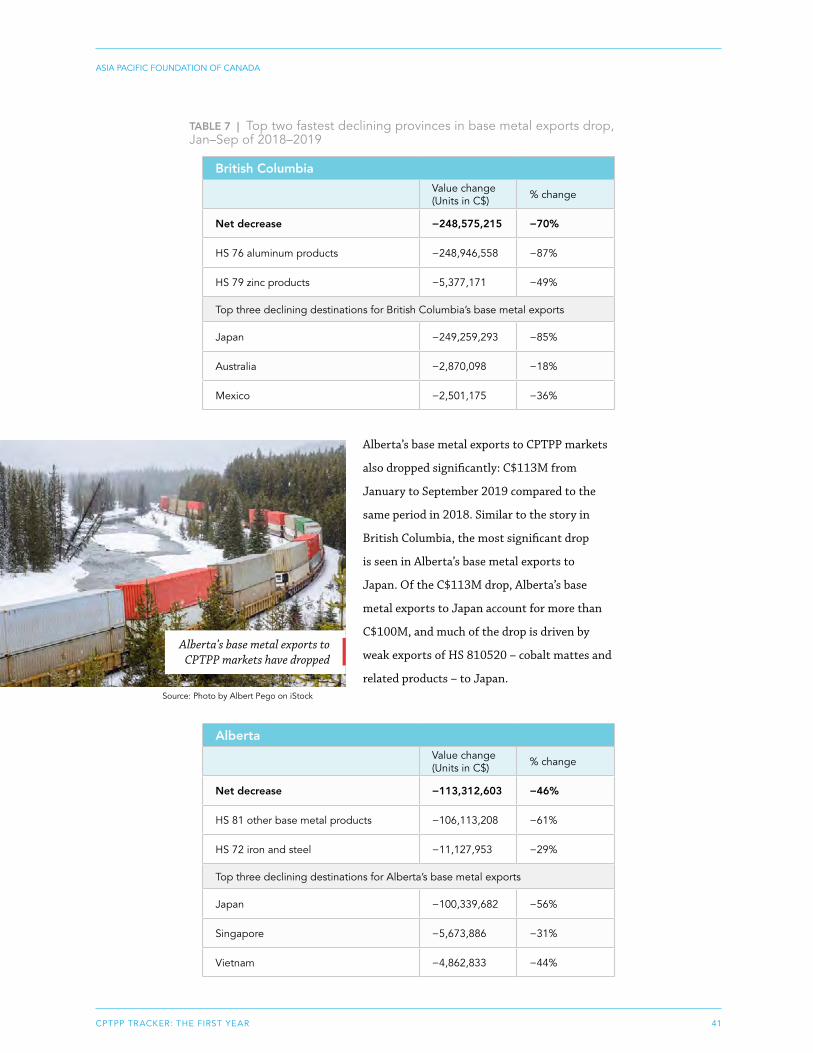
CPTPP TRACKER: THE FIRST YEAR
ASIA PACIFIC FOUNDATION OF CANADA
41
Alberta’s base metal exports to CPTPP markets
also dropped significantly: C$113M from
January to September 2019 compared to the
same period in 2018. Similar to the story in
British Columbia, the most significant drop
is seen in Alberta’s base metal exports to
Japan. Of the C$113M drop, Alberta’s base
metal exports to Japan account for more than
C$100M, and much of the drop is driven by
weak exports of HS 810520 – cobalt mattes and
related products – to Japan.
British ColumbiaValue change (Units in C$) % change
Net decrease −248,575,215 −70%
HS 76 aluminum products −248,946,558 −87%
HS 79 zinc products −5,377,171 −49%
Top three declining destinations for British Columbia’s base metal exports
Japan −249,259,293 −85%
Australia −2,870,098 −18%
Mexico −2,501,175 −36%
TABLE 7 | Top two fastest declining provinces in base metal exports drop, Jan–Sep of 2018–2019
AlbertaValue change (Units in C$) % change
Net decrease −113,312,603 −46%
HS 81 other base metal products −106,113,208 −61%
HS 72 iron and steel −11,127,953 −29%
Top three declining destinations for Alberta’s base metal exports
Japan −100,339,682 −56%
Singapore −5,673,886 −31%
Vietnam −4,862,833 −44%
Alberta’s base metal exports to CPTPP markets have dropped
Source: Photo by Albert Pego on iStock
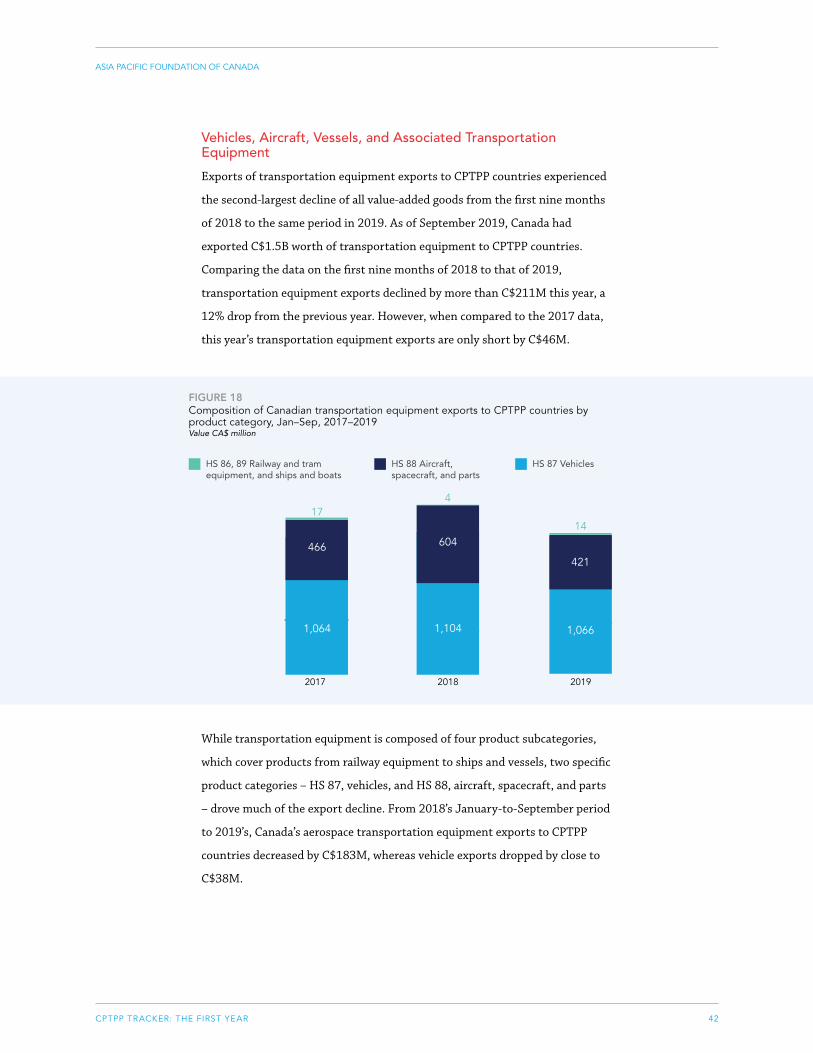
CPTPP TRACKER: THE FIRST YEAR
ASIA PACIFIC FOUNDATION OF CANADA
42
Vehicles, Aircraft, Vessels, and Associated Transportation Equipment
Exports of transportation equipment exports to CPTPP countries experienced
the second-largest decline of all value-added goods from the first nine months
of 2018 to the same period in 2019. As of September 2019, Canada had
exported C$1.5B worth of transportation equipment to CPTPP countries.
Comparing the data on the first nine months of 2018 to that of 2019,
transportation equipment exports declined by more than C$211M this year, a
12% drop from the previous year. However, when compared to the 2017 data,
this year’s transportation equipment exports are only short by C$46M.
FIGURE 18Composition of Canadian transportation equipment exports to CPTPP countries by product category, Jan–Sep, 2017–2019 Value CA$ million
Composition of Canada's Transport Equipment Export to CPTPP Countries, Jan-Sep 2017-2019
466
Value C$ Million
HS 86, 89 Railway and tram equipment, and ships and boats
17
1,064
14604
1,104 1,066
421
HS 88 Aircraft, spacecraft, and parts
HS 87 Vehicles
4
2017 2018 2019
While transportation equipment is composed of four product subcategories,
which cover products from railway equipment to ships and vessels, two specific
product categories – HS 87, vehicles, and HS 88, aircraft, spacecraft, and parts
– drove much of the export decline. From 2018’s January-to-September period
to 2019’s, Canada’s aerospace transportation equipment exports to CPTPP
countries decreased by C$183M, whereas vehicle exports dropped by close to
C$38M.

CPTPP TRACKER: THE FIRST YEAR
ASIA PACIFIC FOUNDATION OF CANADA
43
Country Value change (Units in C$) % change
Singapore 37,783,727 106%
Chile 20,672,634 89%
Peru 6,059,141 116%
Brunei Darussalam 1,861,840 16%
New Zealand 1,444,807 6%
Malaysia −59,562 −88%
Vietnam −20,600,076 −12%
Japan −20,698,773 −60%
Australia −39,617,654 −24%
Mexico −198,033,528 −16%
Total CPTPP −211,187,444 −12%
TABLE 8 | Canada’s transportation equipment export growth or decline by destination, Jan–Sep of 2018–2019
The nine-month comparison between 2018 and 2019 shows that Canada’s
exports of transportation equipment declined in five of the 10 CPTPP markets.
The most significant drop is driven by decreased sales to the Mexican market.
From 2018 to 2019, Canadian transportation equipment exports to Mexico
decreased by 16%, accounting for C$198M of the C$211M drop in the period
under analysis. Aside from Mexico, exports to Australia, Japan, Vietnam, and
Brunei Darussalam have also experienced setbacks, as declining by a combined
C$81M between January to September 2018 and the same period of 2019.
Quebec’s transportation equipment exports sustained the steepest drop in
dollar value this year among the provinces. From January to September of
2018 to the same period of 2019, Quebec’s exports in this product category
decreased by C$211M, a 12% drop. Quebec’s exports of transportation
equipment dropped steeply in eight of the 10 CPTPP partners. With a C$105M
decrease, Quebec’s exports to Mexico have faced the most significant drop. The
decline is mainly driven by weak exports under HS 88, aircraft, spacecraft, and
parts, pulling down this year’s exports by C$211M.
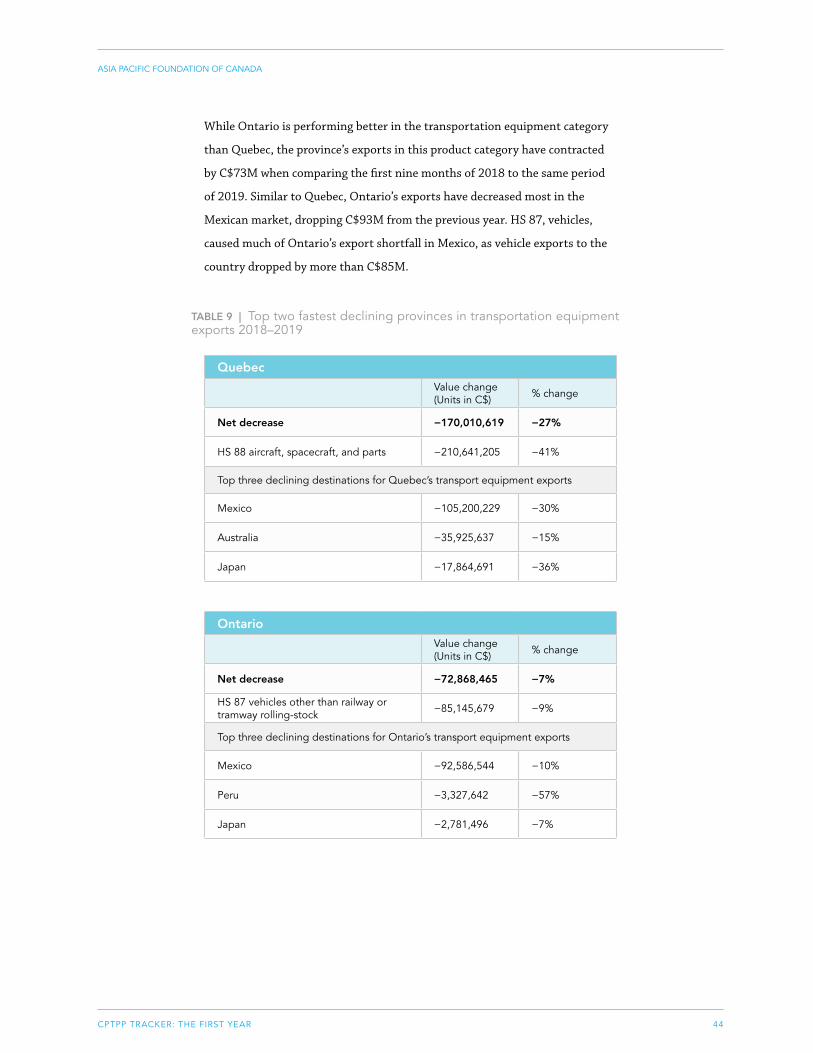
CPTPP TRACKER: THE FIRST YEAR
ASIA PACIFIC FOUNDATION OF CANADA
44
While Ontario is performing better in the transportation equipment category
than Quebec, the province’s exports in this product category have contracted
by C$73M when comparing the first nine months of 2018 to the same period
of 2019. Similar to Quebec, Ontario’s exports have decreased most in the
Mexican market, dropping C$93M from the previous year. HS 87, vehicles,
caused much of Ontario’s export shortfall in Mexico, as vehicle exports to the
country dropped by more than C$85M.
QuebecValue change (Units in C$) % change
Net decrease −170,010,619 −27%
HS 88 aircraft, spacecraft, and parts −210,641,205 −41%
Top three declining destinations for Quebec’s transport equipment exports
Mexico −105,200,229 −30%
Australia −35,925,637 −15%
Japan −17,864,691 −36%
TABLE 9 | Top two fastest declining provinces in transportation equipment exports 2018–2019
OntarioValue change (Units in C$) % change
Net decrease −72,868,465 −7%
HS 87 vehicles other than railway or tramway rolling-stock −85,145,679 −9%
Top three declining destinations for Ontario’s transport equipment exports
Mexico −92,586,544 −10%
Peru −3,327,642 −57%
Japan −2,781,496 −7%

CPTPP TRACKER: THE FIRST YEAR
ASIA PACIFIC FOUNDATION OF CANADA
45
WHAT ABOUT THE IMPORTS?
Canada imports from the CPTPP area grew faster than its exports to it. The
readjustment of trade patterns is something to expect in the first years after a
free trade agreement enters into force. For this reason, it is important to track
the evolution of imports to have a full picture of trade relations within the
CPTPP area, since export and import relations are usually complementary and
– in a world of global value chains – many import components are re-exported
or processed to be further integrated into international production lines.
Imports are also key to identifying ways to build production networks across
the Asia Pacific, where to add value, and where to better promote Canadian
innovation. Value-added manufacturing continues to be the main import
category, with Canada mostly exporting primary products to the CPTPP area.
(Jan – Sep) Year
Value imported(C$)
2017–2018 change
2018–2019 change
2017 51,546,510,4381.4%
C$736M2018 52,282,148,021
4.9%C$2,580M
2019 54,862,374,369
TABLE 10 | Summary of Canadian imports from the CPTPP area
Canadian imports from CPTPP countries have increased in the last two years,
as Table 10 shows. Canada imported nearly C$55B from CPTPP countries from
January to September 2019. Canadian imports increased by 4.9%, or C$2.6B,
from the same period in 2018. The rate of growth of imports more than
doubled between 2018 and 2019 compared to the increase registered between
2017 and 2018. Notwithstanding, it is too early to assess whether this trend
will continue.
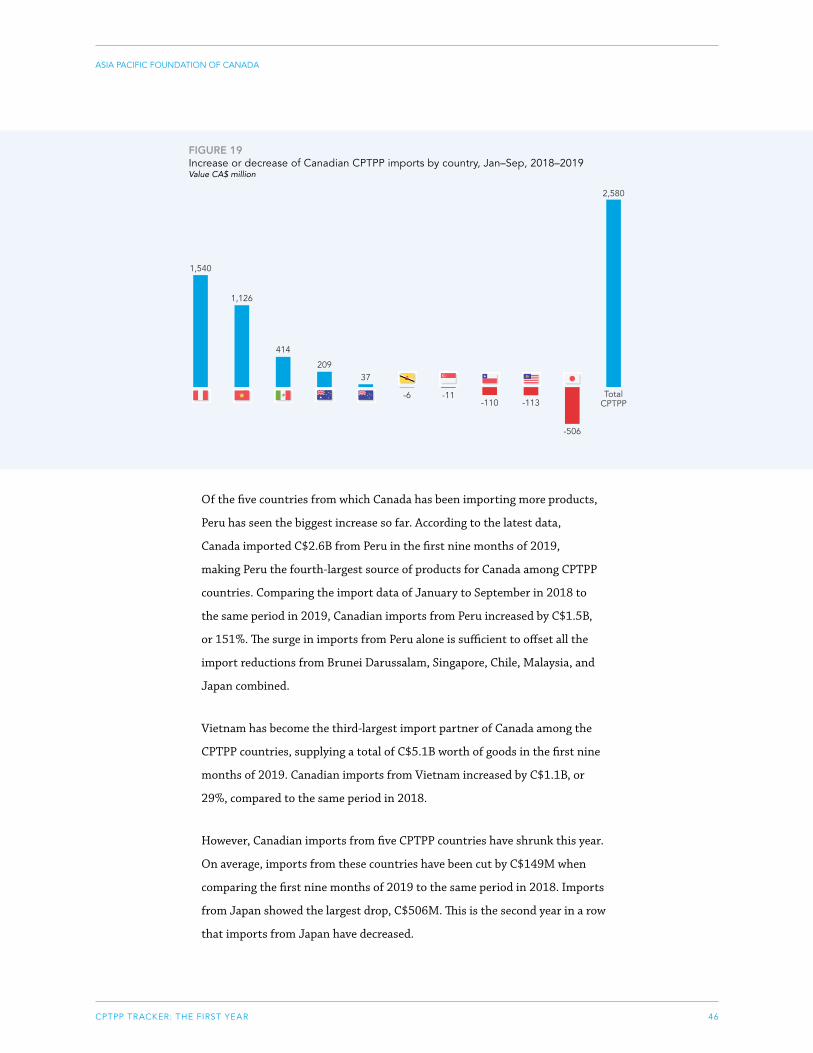
CPTPP TRACKER: THE FIRST YEAR
ASIA PACIFIC FOUNDATION OF CANADA
46
FIGURE 19Increase or decrease of Canadian CPTPP imports by country, Jan–Sep, 2018–2019 Value CA$ million
Gains and Setbacks of Canadian Import from CPTPP Countries, Year to Date 2018 v 2019Value C$ Million
1,540
1,126
414
37
-6 -11
209
-110 -113
-506
2,580
TotalCPTPP
Of the five countries from which Canada has been importing more products,
Peru has seen the biggest increase so far. According to the latest data,
Canada imported C$2.6B from Peru in the first nine months of 2019,
making Peru the fourth-largest source of products for Canada among CPTPP
countries. Comparing the import data of January to September in 2018 to
the same period in 2019, Canadian imports from Peru increased by C$1.5B,
or 151%. The surge in imports from Peru alone is sufficient to offset all the
import reductions from Brunei Darussalam, Singapore, Chile, Malaysia, and
Japan combined.
Vietnam has become the third-largest import partner of Canada among the
CPTPP countries, supplying a total of C$5.1B worth of goods in the first nine
months of 2019. Canadian imports from Vietnam increased by C$1.1B, or
29%, compared to the same period in 2018.
However, Canadian imports from five CPTPP countries have shrunk this year.
On average, imports from these countries have been cut by C$149M when
comparing the first nine months of 2019 to the same period in 2018. Imports
from Japan showed the largest drop, C$506M. This is the second year in a row
that imports from Japan have decreased.
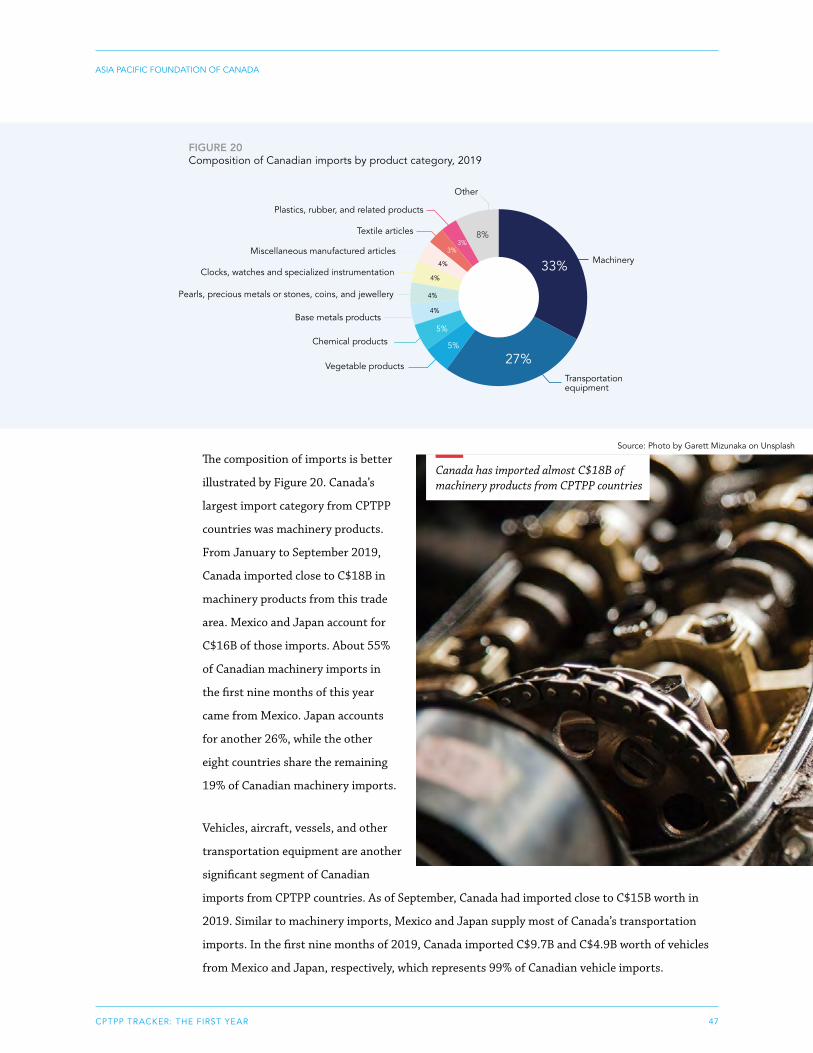
CPTPP TRACKER: THE FIRST YEAR
ASIA PACIFIC FOUNDATION OF CANADA
47
The composition of imports is better
illustrated by Figure 20. Canada’s
largest import category from CPTPP
countries was machinery products.
From January to September 2019,
Canada imported close to C$18B in
machinery products from this trade
area. Mexico and Japan account for
C$16B of those imports. About 55%
of Canadian machinery imports in
the first nine months of this year
came from Mexico. Japan accounts
for another 26%, while the other
eight countries share the remaining
19% of Canadian machinery imports.
Vehicles, aircraft, vessels, and other
transportation equipment are another
significant segment of Canadian
imports from CPTPP countries. As of September, Canada had imported close to C$15B worth in
2019. Similar to machinery imports, Mexico and Japan supply most of Canada’s transportation
imports. In the first nine months of 2019, Canada imported C$9.7B and C$4.9B worth of vehicles
from Mexico and Japan, respectively, which represents 99% of Canadian vehicle imports.
FIGURE 20Composition of Canadian imports by product category, 2019
8%3%
3%
4%
4%
4%
4%
5%
5%
27%
33%
Composition of Canadian Imports from CPTPP Countries, 2019
Machinery
Vegetable products
Chemical products
Pearls, precious metals or stones, coins, and jewellery
Textile articles
Plastics, rubber, and related products
Other
Transportation equipment
Base metals products
Clocks, watches and specialized instrumentation
Miscellaneous manufactured articles
Canada has imported almost C$18B of machinery products from CPTPP countries
Source: Photo by Garett Mizunaka on Unsplash
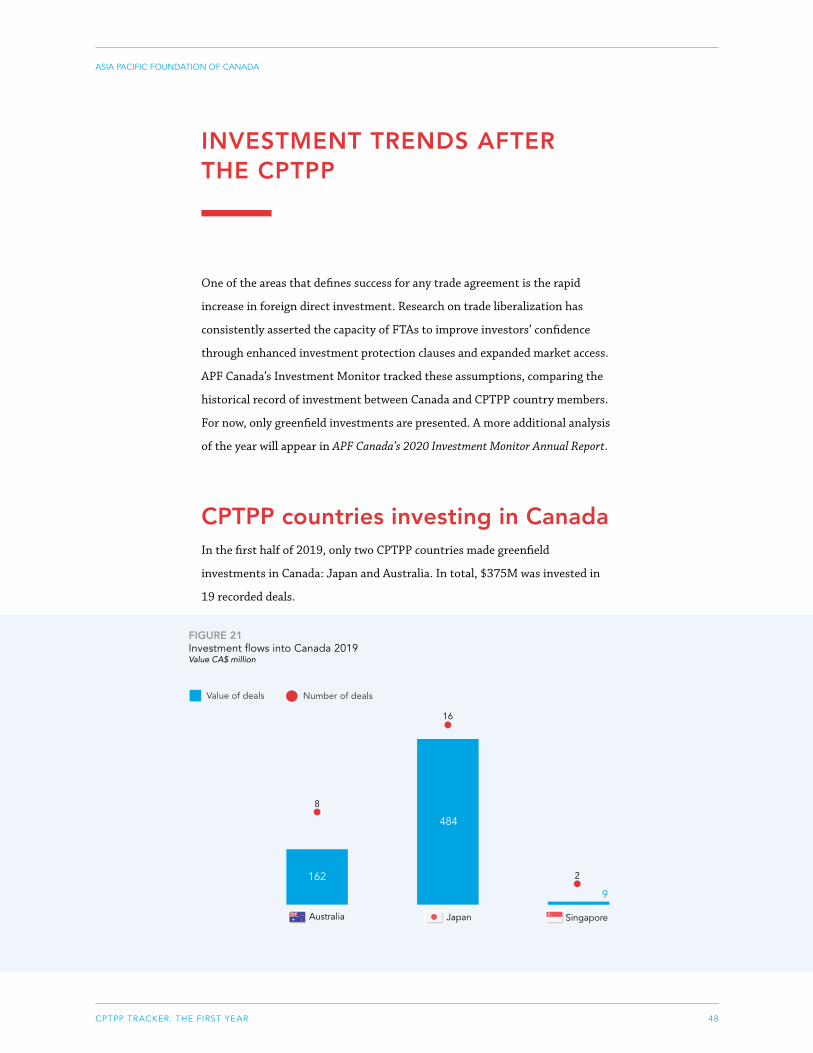
CPTPP TRACKER: THE FIRST YEAR
ASIA PACIFIC FOUNDATION OF CANADA
48
INVESTMENT TRENDS AFTER THE CPTPP
One of the areas that defines success for any trade agreement is the rapid
increase in foreign direct investment. Research on trade liberalization has
consistently asserted the capacity of FTAs to improve investors’ confidence
through enhanced investment protection clauses and expanded market access.
APF Canada’s Investment Monitor tracked these assumptions, comparing the
historical record of investment between Canada and CPTPP country members.
For now, only greenfield investments are presented. A more additional analysis
of the year will appear in APF Canada’s 2020 Investment Monitor Annual Report.
CPTPP countries investing in CanadaIn the first half of 2019, only two CPTPP countries made greenfield
investments in Canada: Japan and Australia. In total, $375M was invested in
19 recorded deals.
FIGURE 21Investment flows into Canada 2019 Value CA$ millionAsia Pacific Greenfield Investment Flow into Canada by Country. Dec 2018 - Oct 2019
8
Australia
Value C$ Million
16
Japan
Number of dealsValue of deals
162
484
9
Singapore
2
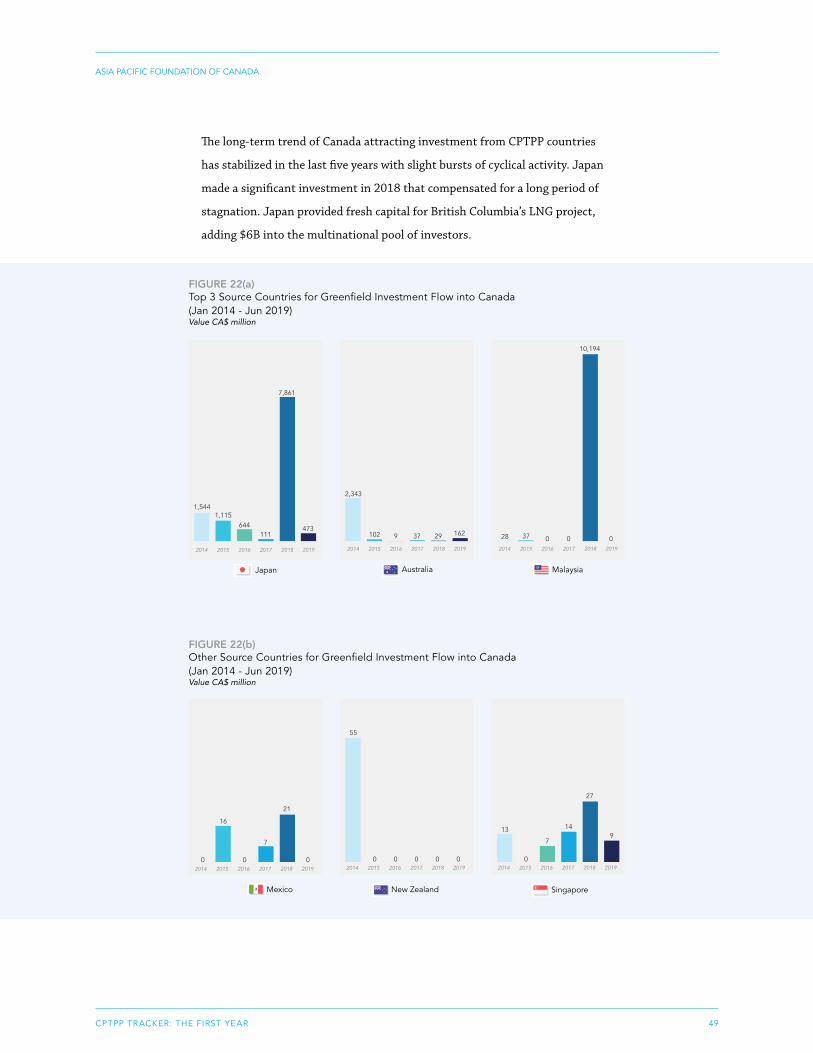
CPTPP TRACKER: THE FIRST YEAR
ASIA PACIFIC FOUNDATION OF CANADA
49
The long-term trend of Canada attracting investment from CPTPP countries
has stabilized in the last five years with slight bursts of cyclical activity. Japan
made a significant investment in 2018 that compensated for a long period of
stagnation. Japan provided fresh capital for British Columbia’s LNG project,
adding $6B into the multinational pool of investors.
FIGURE 22(a)Top 3 Source Countries for Greenfield Investment Flow into Canada (Jan 2014 - Jun 2019) Value CA$ million
Top 3 Source Countries for Greenfield Investment Flow into Canada, Jan 2014 - Oct 2019
1,5441,115
644111
7,861
473
2,343
102 9 37 29 162 28 37 0 0
10,194
0
Value C$ Million
AustraliaJapan Malaysia
FIGURE 22(b)Other Source Countries for Greenfield Investment Flow into Canada (Jan 2014 - Jun 2019) Value CA$ million
Other Source Countries for Greenfield Investment Flow into Canada, Jan 2014 - Oct 2019
16
7
21
55
13
7
14
27
0 0 0 0 0 0 0 0 0
Value C$ Million
New ZealandMexico Singapore
9

CPTPP TRACKER: THE FIRST YEAR
ASIA PACIFIC FOUNDATION OF CANADA
50
Canada investing in the CPTPP area
Although the existence of a new FTA is not in itself a trigger to export or
invest, research has demonstrated that it improves investors’ confidence. FTAs
enhance the rule of law for investors since it usually contains a chapter on
investment protection that reduces risks by securing an environment of clear
rules. The data shows that Canada was ready to make significant investments
within the CPTPP region. In the first two quarters of 2019, Canada invested
C$807M in eight CPTPP members, as Figure 23 shows.
The majority of investments were made in energy and mining, sectors that
have traditionally not depended on FTAs’ protective measures. Unsurprisingly,
Mexico, Australia, and Peru received the largest amount of Canadian
investments.
FIGURE 23Canadian investment in the CPTPP in 2019 Value CA$ millionCanadian Greenfield Investment Flow into the Asia Pacific, Dec. 2018 - Oct. 2019Value C$ Million
7 20 148 831
8
3
1
20
23
Number of dealsValue of deals
152218 4
1,285
201 1 1
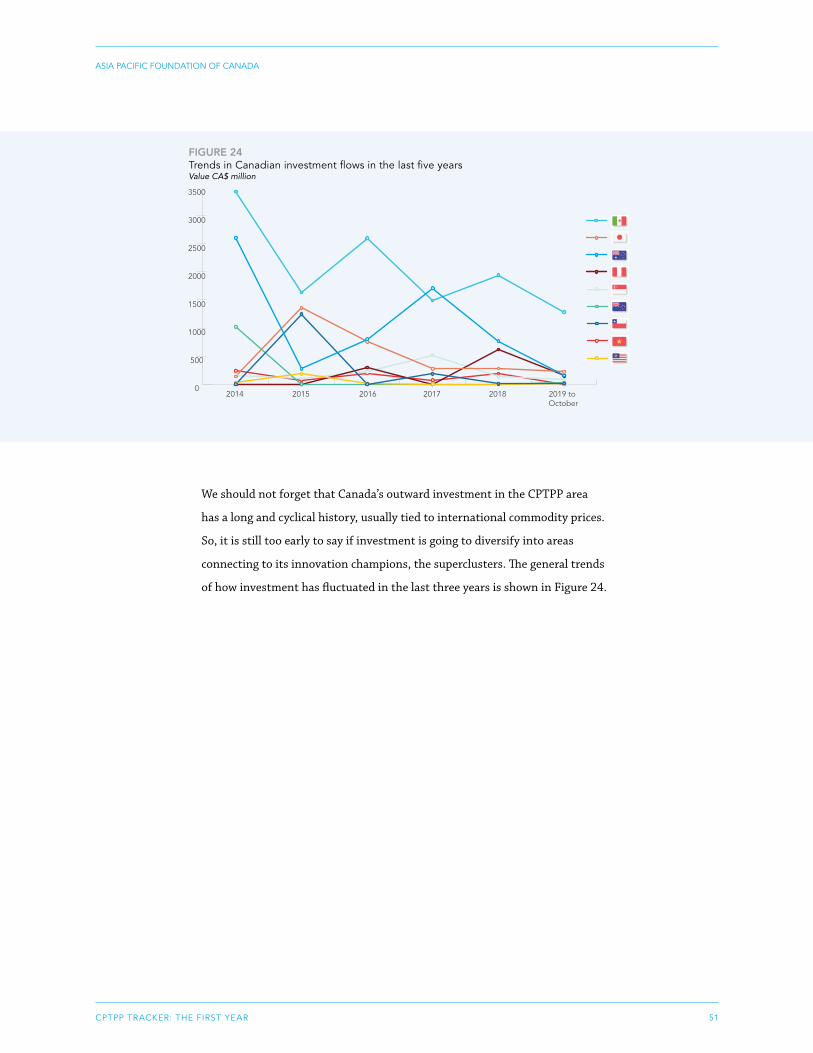
CPTPP TRACKER: THE FIRST YEAR
ASIA PACIFIC FOUNDATION OF CANADA
51
FIGURE 24Trends in Canadian investment flows in the last five years Value CA$ million
0
500
1000
1500
2000
2500
3000
3500
2019 to October
Canadian Greenfield Investment into the Asia Pacific, Jan. 2014 - Oct. 2019Value C$ Million
20182017201620152014
We should not forget that Canada’s outward investment in the CPTPP area
has a long and cyclical history, usually tied to international commodity prices.
So, it is still too early to say if investment is going to diversify into areas
connecting to its innovation champions, the superclusters. The general trends
of how investment has fluctuated in the last three years is shown in Figure 24.
CPTPP TRACKER: THE FIRST YEAR
ASIA PACIFIC FOUNDATION OF CANADA
52
CONCLUSION
The CPTPP entered into its first year against the backdrop of a U.S.-China
trade war and the global economic slowdown that ensued. Despite the gains
in export value in the first nine months of 2019, our CPTPP Trade Tracker
Report shows that the protracted conflict is impeding CPTPP economies,
including Canada, in maximizing the benefits of tariff reductions in the new
commercial partnership. For instance, significant export growth to Japan
has not materialized as earlier forecasts of the CPTPP projected. The fastest-
growing markets for Canadian export sectors in 2019 have been Australia,
Peru, Singapore, Vietnam, and Chile. The leading categories in export value
in 2019 have been live animals and animal products, machinery, and mineral
products, in that order.
This study also shows that despite the significant investments in research,
innovation, and trade diversification, Canada’s exports are still concentrated in
a few primary products with minimal value-added goods, usually controlled by
a small number of large companies. While there have been significant gains in
agriculture and raw materials, Canada is still underperforming when it comes
to value-added goods.
Exports of transport equipment, wood and wood products, and base metal
products have experienced the sharpest dollar-value declines in the CPTPP
area. These products experienced significant declines in the Japanese,
Australian, and Mexican markets. The increasing slowdown in Japan’s and
Mexico’s automotive sectors is one of the explanations for this significant
decline. The U.S.-China trade war has also forced a realignment of production
networks across the Pacific, with Southeast Asian economies like Vietnam,
Malaysia, and Thailand capturing most relocations of production lines of
intermediate and final goods that were produced in China in the last two
decades. This element alone explains a great deal of the high growth rate of
Canadian exports to these small economies, far outpacing the largest ones in
the region. The new year will confirm whether this relocation process is going
to accelerate or not, and that will depend on the evolution of the trade conflict
between China and the United States.
CPTPP TRACKER: THE FIRST YEAR
ASIA PACIFIC FOUNDATION OF CANADA
53
However, value-added exports do show a high capacity to diversify into
new areas and product categories. For instance, Alberta has exponentially
expanded its exports of nuclear reactors, boilers, machinery, and mechanical
appliances, with New Zealand becoming the fastest-growing purchaser of
this line of products. Quebec has become the second-largest exporter of the
same machinery line, with significant increases in its market participation in
Australia and New Zealand.
This report represents the first exercise in measuring Canadian export
performance within the CPTPP region. This snapshot of the first year of the
CPTPP offers opportune information and analysis to decision-makers in the
private and public sectors so they can plan and readjust their strategies for the
upcoming years.
CPTPP TRACKER: THE FIRST YEAR
ASIA PACIFIC FOUNDATION OF CANADA
54
ACKNOWLEDGEMENTS
STRATEGIC ADVISORS Stewart Beck President and CEO Asia Pacific Foundation of Canada Dr. Jeffrey Reeves Vice-President, Research Asia Pacific Foundation of Canada
EDITORIAL REVIEW Dr. Charles Labrecque Research Manager Asia Pacific Foundation of Canada Michael Roberts Communications Manager Asia Pacific Foundation of Canada
CREATIVE DESIGN Jamie Curtis Graphic Designer Asia Pacific Foundation of Canada
LEAD RESEARCHERS Dr. Grace JaramilloBusiness Asia Interim ManagerAsia Pacific Foundation of Canada Isaac LoPostgraduate Research FellowAsia Pacific Foundation of Canada
COMMUNICATIONS Michael RobertsCommunications ManagerAsia Pacific Foundation of Canada
Karina KwokSocial Media and Communications SpecialistAsia Pacific Foundation of Canada

CPTPP TRACKER: THE FIRST YEAR
ASIA PACIFIC FOUNDATION OF CANADA
55
APPENDIX I
Section I — LIVE ANIMALS AND ANIMAL PRODUCTS
HS 01 Live Animals
HS 02 Meat and Edible Meat Offal
HS 03 Fish, Crustaceans, Molluscs, and Other Aquatic Invertebrates
HS 04 Dairy Produce, Eggs, Honey, and Other Similar Edible Products of Animal Origin
HS 05 Products of Animal Origin Not Elsewhere Classified
Section II — VEGETABLE PRODUCTS
HS 06 Live Trees and Other Plants (Incl. Cut Flowers and Ornamental Foliage)
HS 07 Edible Vegetables and Certain Roots and Tubers
HS 08 Edible Fruits and Nuts
HS 09 Coffee, Tea, Maté, and Spices
HS 10 Cereals
HS 11 Products of the Milling Industry; Malt, Starches, Inulin, and Wheat Gluten
HS 12 Oil Seeds, Oleaginous Fruits, Industrial or Medicinal Plants, Straw, and Fodder
HS 13 Lac, Gums, Resins, and Other Vegetable Saps and Extracts
HS 14 Vegetable Plaiting Material and Other Similar Vegetable Products
Section III — FATS, OILS, THEIR CLEAVAGE PRODUCTS AND WAXES
HS 15 Fats, Oils, Their Cleavage Products, and Waxes
Section IV — FOOD PRODUCTS, BEVERAGES, SPIRITS, VINEGAR AND TOBACCO PRODUCTS
HS 16 Meat, Fish, and Seafood Preparations
HS 17 Sugars and Sugar Confectionery
HS 18 Cocoa and Cocoa Preparations
HS 19 Preparations of Cereals, Flour, Starch, or Milk (Including Bread and Pastry)
HS 20 Preparations of Vegetables, Fruit, Nuts, or Other Parts of Plants
HS 21 Miscellaneous Edible Preparations
HS 22 Beverages, Spirits, and Vinegar
HS 23 Residues and Waste from the Food Industries, and Prepared Animal Fodder
HS 24 Tobacco and Manufactured Tobacco Substitutes
Broad Structure of the Harmonized Commodity Description and Coding System

CPTPP TRACKER: THE FIRST YEAR
ASIA PACIFIC FOUNDATION OF CANADA
56
Section V — MINERAL PRODUCTS
HS 25 Salt, Sulphur , Earths, Lime, Stone, Cement, and Plastering Materials
HS 26 Ores, Slag, and Ash
HS 27 Mineral Fuels, Mineral Oils, Bituminous Substances, and Mineral Waxes
Section VI — PRODUCTS OF THE CHEMICAL OR ALLIED INDUSTRIES
HS 28 Inorganic Chemicals and Compounds of Precious Metals and Radioactive Elements
HS 29 Organic Chemicals (Including Vitamins, Alkaloids, and Antibiotics)
HS 30 Pharmaceutical Products
HS 31 Fertilizers
HS 32 Tannins, Dyes, Pigments, Paints, Varnishes, Inks, Putty, and Other Similar Substances
HS 33 Essential Oils and Resinoids, Perfumes, Cosmetics, and Toilet Preparations
HS 34 Soap, Washing and Lubricating Preparations, Waxes, and Related Articles
HS 35 Albuminoidal Substances, Modified Starches, Glues, and Enzymes
HS 36 Explosives, Matches, and Other Miscellaneous Combustible Preparations
HS 37 Photographic or Cinematographic Goods
HS 38 Miscellaneous Chemical Products
Section VII — PLASTICS, RUBBER, AND ARTICLES MADE FROM THESE MATERIALS
HS 39 Plastics and Articles Thereof
HS 40 Rubber and Articles Thereof
Section VIII — RAW HIDES, SKINS, LEATHER, FUR, AND ARTICLES MADE FROM THESE MATERIALS
HS 41 Raw Hides, Skins (Other than Furskins), and Leather
HS 42Articles of Leather; Saddlery and Harness, Travel Goods, Handbags, and Similar Con-tainers
HS 43 Furskins, Artificial Fur, and Related Articles of Apparel or Clothing Accessories
Section IX — WOOD AND WOOD ARTICLES, CORK, STRAW, AND OTHER PLAITING MATERIALS
HS 44 Wood and Articles of Wood (Incl. Wood Charcoal)
HS 45 Cork and Articles of Cork
HS 46 Straw and Other Plaiting Materials; Basketware and Wickerwork
Section X — WOOD PULP, PAPER, AND PAPER ARTICLES
HS 47 Pulp of Wood and the Like; Waste and Scrap of Paper or Paperboard
HS 48 Paper, Paperboard, and Articles Made from These Materials
HS 49 Printed Books, Newspapers, Pictures, Manuscripts, and the Like
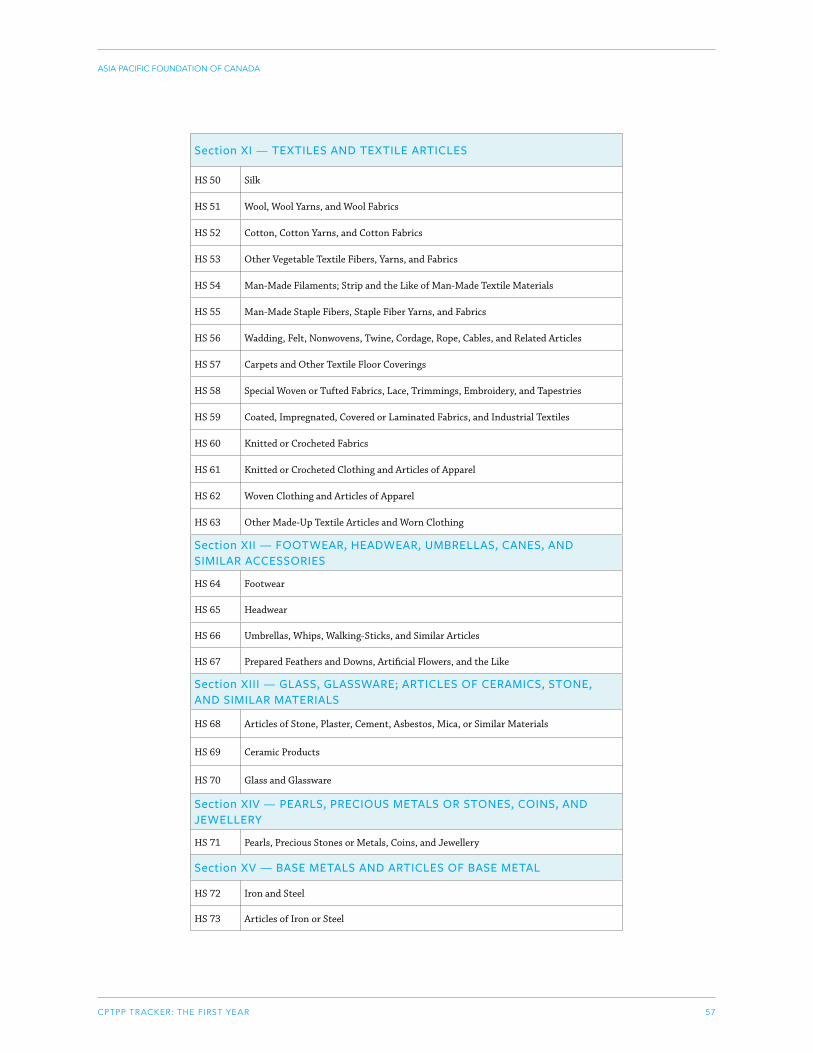
CPTPP TRACKER: THE FIRST YEAR
ASIA PACIFIC FOUNDATION OF CANADA
57
Section XI — TEXTILES AND TEXTILE ARTICLES
HS 50 Silk
HS 51 Wool, Wool Yarns, and Wool Fabrics
HS 52 Cotton, Cotton Yarns, and Cotton Fabrics
HS 53 Other Vegetable Textile Fibers, Yarns, and Fabrics
HS 54 Man-Made Filaments; Strip and the Like of Man-Made Textile Materials
HS 55 Man-Made Staple Fibers, Staple Fiber Yarns, and Fabrics
HS 56 Wadding, Felt, Nonwovens, Twine, Cordage, Rope, Cables, and Related Articles
HS 57 Carpets and Other Textile Floor Coverings
HS 58 Special Woven or Tufted Fabrics, Lace, Trimmings, Embroidery, and Tapestries
HS 59 Coated, Impregnated, Covered or Laminated Fabrics, and Industrial Textiles
HS 60 Knitted or Crocheted Fabrics
HS 61 Knitted or Crocheted Clothing and Articles of Apparel
HS 62 Woven Clothing and Articles of Apparel
HS 63 Other Made-Up Textile Articles and Worn Clothing
Section XII — FOOTWEAR, HEADWEAR, UMBRELLAS, CANES, AND SIMILAR ACCESSORIES
HS 64 Footwear
HS 65 Headwear
HS 66 Umbrellas, Whips, Walking-Sticks, and Similar Articles
HS 67 Prepared Feathers and Downs, Artificial Flowers, and the Like
Section XIII — GLASS, GLASSWARE; ARTICLES OF CERAMICS, STONE, AND SIMILAR MATERIALS
HS 68 Articles of Stone, Plaster, Cement, Asbestos, Mica, or Similar Materials
HS 69 Ceramic Products
HS 70 Glass and Glassware
Section XIV — PEARLS, PRECIOUS METALS OR STONES, COINS, AND JEWELLERY
HS 71 Pearls, Precious Stones or Metals, Coins, and Jewellery
Section XV — BASE METALS AND ARTICLES OF BASE METAL
HS 72 Iron and Steel
HS 73 Articles of Iron or Steel
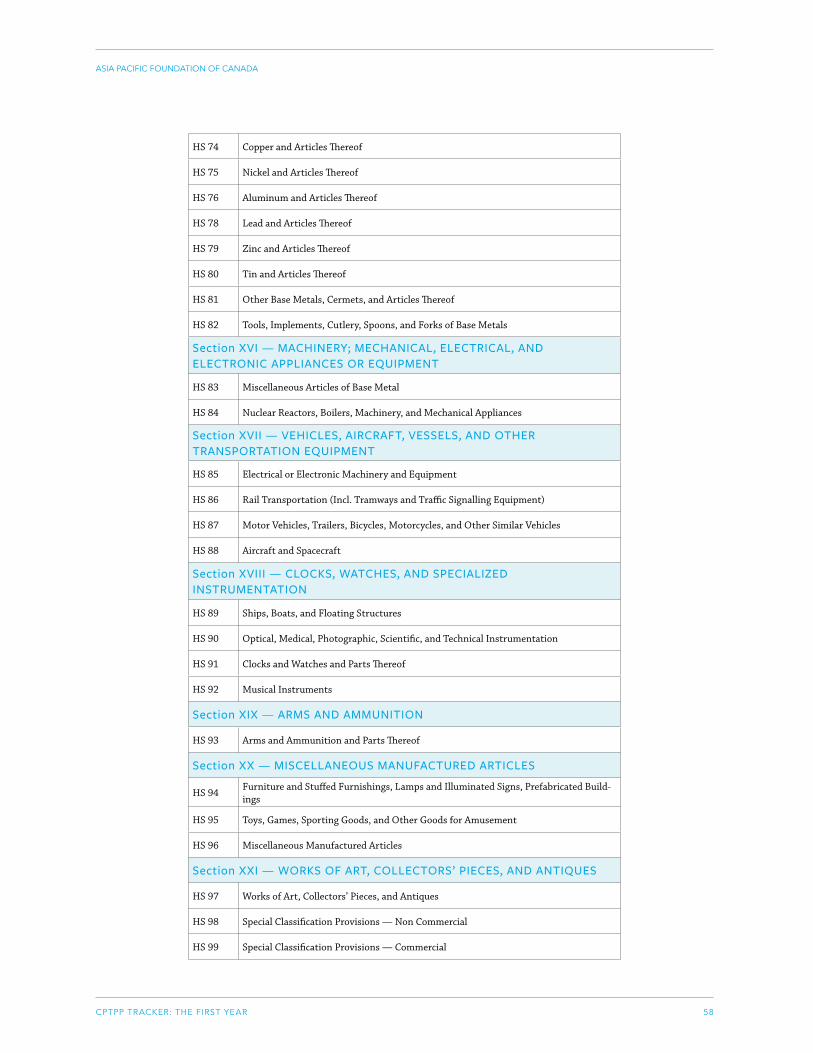
CPTPP TRACKER: THE FIRST YEAR
ASIA PACIFIC FOUNDATION OF CANADA
58
HS 74 Copper and Articles Thereof
HS 75 Nickel and Articles Thereof
HS 76 Aluminum and Articles Thereof
HS 78 Lead and Articles Thereof
HS 79 Zinc and Articles Thereof
HS 80 Tin and Articles Thereof
HS 81 Other Base Metals, Cermets, and Articles Thereof
HS 82 Tools, Implements, Cutlery, Spoons, and Forks of Base Metals
Section XVI — MACHINERY; MECHANICAL, ELECTRICAL, AND ELECTRONIC APPLIANCES OR EQUIPMENT
HS 83 Miscellaneous Articles of Base Metal
HS 84 Nuclear Reactors, Boilers, Machinery, and Mechanical Appliances
Section XVII — VEHICLES, AIRCRAFT, VESSELS, AND OTHER TRANSPORTATION EQUIPMENT
HS 85 Electrical or Electronic Machinery and Equipment
HS 86 Rail Transportation (Incl. Tramways and Traffic Signalling Equipment)
HS 87 Motor Vehicles, Trailers, Bicycles, Motorcycles, and Other Similar Vehicles
HS 88 Aircraft and Spacecraft
Section XVIII — CLOCKS, WATCHES, AND SPECIALIZED INSTRUMENTATION
HS 89 Ships, Boats, and Floating Structures
HS 90 Optical, Medical, Photographic, Scientific, and Technical Instrumentation
HS 91 Clocks and Watches and Parts Thereof
HS 92 Musical Instruments
Section XIX — ARMS AND AMMUNITION
HS 93 Arms and Ammunition and Parts Thereof
Section XX — MISCELLANEOUS MANUFACTURED ARTICLES
HS 94Furniture and Stuffed Furnishings, Lamps and Illuminated Signs, Prefabricated Build-ings
HS 95 Toys, Games, Sporting Goods, and Other Goods for Amusement
HS 96 Miscellaneous Manufactured Articles
Section XXI — WORKS OF ART, COLLECTORS’ PIECES, AND ANTIQUES
HS 97 Works of Art, Collectors’ Pieces, and Antiques
HS 98 Special Classification Provisions — Non Commercial
HS 99 Special Classification Provisions — Commercial
CPTPP TRACKER: THE FIRST YEAR
ASIA PACIFIC FOUNDATION OF CANADA
59
Endnotes
1 Torsekar, Mihir P., and John VerWey. 2019. “East Asia-Pacific’s Participation in the Global Value Chain for Electronic Products.” Journal of International Commerce and Economics. March 2019.
2 Global Affairs Canada, Office of the Chief Economist. Economic Impact of Canada’s Participation in the CPTPP. February 16, 2018. Retrieved from: https://www.international.gc.ca/trade-commerce/trade-agreements-accords-commerciaux/agr-acc/cptpp-ptpgp/impact-repercussions.aspx?lang=eng.
3 Ibid p. 8.
4 Global Affairs Canada. The Office of the Chief Economist. Canada’s Merchandise Trade Performance with the EU under CETA. September 20, 2018. P. 4.
5 Japan's Ministry of Finance."Trade Statistics of Japan."November 28, 2019. Retrieved from: https://www.customs.go.jp/toukei/shinbun/happyou_e.htm
6 Statistics Canada. “Commodity Classification.” November 15, 2019. Retrieved from: https://www5.statcan.gc.ca/cimt-cicm/page-page?lang=eng&mode=commodityClassification
7 IMF. World Economic Outlook. October 2019. Retrieved from: https://www.imf.org/en/Publications/WEO/Issues/2019/10/01/world-economic-outlook-october-2019
8 Ibid p. 6.
9 IMF. Global Economic Outlook. Retrieved from https://www.imf.org/en/News/Articles/2019/10/18/na102319-prolonged-uncertainty-weighs-on-asias-economy
10 IMF. World Economic Outlook. October 2019. P. 6.
11 Ministry of Finance, 2019. Trade Statistics of Japan. Accessible through http://www.customs.go.jp/toukei/shinbun/trade-st_e/2019/201908de.xml
12 Australian Bureau of Statistics, 2019. Accessible through https://www.abs.gov.au/AUSSTATS/[email protected]/DetailsPage/5368.0Aug%202019?OpenDocument
13 Secretaría de Economía, 2019. Balanza Comercial de Mercancías de México. Accessible through http://www.economia-snci.gob.mx/sic_php/pages/estadisticas/
14 Globe & Mail, November 5, 2019. Retrieved from: https://www.theglobeandmail.com/politics/arti-cle-china-resumes-importing-canadian-beef-and-pork/
15 OECD, 2019. Global Value Chains. Para. 1. Retrieved from: https://www.oecd.org/sti/ind/global-val-ue-chains.htm
16 UN ESCAP. Asia-Pacific Trade and Investment Report 2018. P. 15.
17 Ibid. P. 21.
18 Baldwin, John R., and Beiling Yan. 2016. Global Value Chain Participation and the Productivity of Canadian Manufacturing Firms. Institute for Research on Public Policy. P. 3.
19 Ibid. P. 7.
20 Van Assche, Ari, and Byron Gangnes. 2019. “Global Value Chains and the Fragmentation of Trade Policy Coalitions.” Transnational Corporations 26, no.: 31–60.
21 Global Affairs Canada. The Office of the Chief Economist. Canada’s Merchandise Trade Performance with the EU under CETA. September 20, 2018. P. 12.
22 Van Assche and Gangnes, 2019. P. 38. Note that Canadian domestic content in gross exports to China was a little bit higher at 5.1% in gross exports and 4.6% for final products.
CPTPP TRACKER: THE FIRST YEAR
ASIA PACIFIC FOUNDATION OF CANADA
60
23 Yu, Emily. The Office of the Chief Economist, March 21, 2019. Size and pattern of exporter trade diversification: Preliminary results from firm-level data research. Paper presented at the Trade Diversification Roundtable organized by Global Affairs Canada.
24 De Backer, Koen, and Sébastien Miroudot. 2016. New International Evidence on Canada's Participation in Global Value Chains. Institute for Research on Public Policy. P. 448.

CPTPP TRACKER: THE FIRST YEAR
ASIA PACIFIC FOUNDATION OF CANADA
61
Contact us at [email protected]
or visit us online at www.asiapacific.ca
CPTPP TRACKER: THE FIRST YEAR
ASIA PACIFIC FOUNDATION OF CANADA
62
5-YEAR BOARD REPORT
ASIA PACIFIC FOUNDATION OF CANADA
745