annexes final for tc changes - european commission
TRANSCRIPT

2017
Annual Activity Report
Annexes
Directorate-General for Agriculture and Rural Development
Ref. Ares(2018)2205365 - 25/04/2018

agri_aar_2017_annexes Page 2 of 278
Table of Contents
ANNEX 1: STATEMENT OF THE DEPUTY DIRECTOR-GENERAL IN CHARGE OF RISK MANAGEMENT AND INTERNAL CONTROL ...... 3 ANNEX 2: REPORTING – HUMAN RESOURCES, BETTER REGULATION, INFORMATION MANAGEMENT AND EXTERNAL
COMMUNICATION ......................................................................................................................................................... 4 2.2.1 HUMAN RESOURCE MANAGEMENT .......................................................................................................... 4 2.2.2 BETTER REGULATION ............................................................................................................................. 6 2.2.3 INFORMATION MANAGEMENT ASPECTS .................................................................................................... 13 2.2.4 EXTERNAL COMMUNICATION ACTIVITIES................................................................................................... 15 ANNEX 3: DRAFT ANNUAL ACCOUNTS AND FINANCIAL REPORTS .................................................................................. 18 ANNEX 4: MATERIALITY CRITERIA ......................................................................................................................... 44 ANNEX 5: INTERNAL CONTROL TEMPLATE(S) FOR BUDGET IMPLEMENTATION (ICTS) ...................................................... 52 ANNEX 6: IMPLEMENTATION THROUGH NATIONAL OR INTERNATIONAL PUBLIC-SECTOR BODIES AND BODIES GOVERNED BY
PRIVATE LAW WITH A PUBLIC SECTOR MISSION (NOT APPLICABLE) .......................................................................................... 57 ANNEX 7: EAMR OF THE UNION DELEGATIONS (NOT APPLICABLE) ............................................................................. 57 ANNEX 8: DECENTRALISED AGENCIES (NOT APPLICABLE) ........................................................................................... 57 ANNEX 9: EVALUATIONS AND OTHER STUDIES FINALISED OR CANCELLED DURING THE YEAR .............................................. 58 ANNEX 10: SPECIFIC ANNEXES RELATED TO "FINANCIAL MANAGEMENT" ....................................................................... 63 ANNEX 11: SPECIFIC ANNEXES RELATED TO "ASSESSMENT OF THE EFFECTIVENESS OF THE INTERNAL CONTROL SYSTEMS" (NOT
APPLICABLE) ...................................................................................................................................................... 187 ANNEX 12: PERFORMANCE TABLES ....................................................................................................................... 188 ANNEX 13: INTERRUPTIONS, REDUCTIONS AND SUSPENSIONS .................................................................................... 258 ANNEX 14: COURT OF AUDITORS' SPECIAL REPORTS ................................................................................................. 267 ANNEX 15: ABBREVIATIONS ................................................................................................................................ 276

agri_aar_2017_annexes Page 3 of 278
ANNEX 1: Statement of the Deputy Director-General in charge of Risk Management and Internal Control
I declare that in accordance with the Commission’s communication on clarification of the
responsibilities of the key actors in the domain of internal audit and internal control in the
Commission1, I have reported my advice and recommendations to the Director-General on the
overall state of internal control in the DG.
I hereby certify that the information provided in Section 2 of the present AAR and in its annexes is,
to the best of my knowledge, accurate and complete.”
24 April 2018
(signed)
Rudolf MÖGELE Deputy Director-General in charge of Risk
Management and Internal Control
1 Communication to the Commission: Clarification of the responsibilities of the key actors in the domain of
internal audit and internal control in the Commission; SEC(2003)59 of 21.01.2003.

agri_aar_2017_annexes Page 4 of 278
ANNEX 2: Reporting – Human Resources, Better Regulation, Information Management and External
Communication
This annex is the annex of section 2.2 "Other organisational management dimensions".
2.2.1 Human Resource Management
Objective (mandatory): The DG deploys effectively its resources in support of
the delivery of the Commission's priorities and core business, has a competent and engaged workforce, which is driven by an effective and gender-balanced
management and which can deploy its full potential within supportive and healthy working conditions.
Indicator 1 (mandatory): Percentage of female first appointments to middle management
Source of data: SEC(2017)505
Baseline (01/11/2017)
Target (2019) Latest known results (2017)
0% 57% (4 out of 7) = DG AGRI's quantitative target for first
appointments to middle management 2017-2019 (adopted
by the Commission on 17 November 2017 – SEC(2017)505)
0%*
Indicator 2 (mandatory): Percentage of staff who feel that the Commission cares about their well-being
Source of data: Commission staff survey
Baseline (2014) Target Latest known results
(2017)
31% Reach a result above Commission average (35% in 2014)
Target agreed at level of resource director
Staff survey 2016: 32% (COM 2016:
35%)
Indicator 3 (mandatory): Staff engagement index Source of data: Commission staff survey
Baseline (2014) Target Latest known results
(2017)
67.6% Maintain a result above Commission
average (65% in 2014) Target agreed at level of resource
director
Staff survey 2016:
65% (COM 2016: 64%)
Indicator: Average vacancy rate of available permanent posts
Source: HR Dashboard
Baseline (2015) Target Latest known results (2017)
5.6 % Vacancy rate < or = Commission average (Jan 15-Dec 15: 5.3 %)
Target agreed at level of resource director
6.9%
(COM: 6.4%)

agri_aar_2017_annexes Page 5 of 278
Indicator: HR capacity utilisation
Definition: Staff time available for allocation to activities after deducting absences (except annual leaves and flexitime Recuperation) and use of flexible working
arrangements from the total number of available working days. Source: HR Dashboard
Baseline (Dec. 2014-Nov. 2015)
Target Latest known results (2017)
90.3 % Utilisation > or = Commission
average (Dec 14-Nov 15: 90.1 %)
Target agreed at level of resource director
89.1%
(COM: 89.9%)
Indicator: Staff satisfaction with:
- job - private/ professional life balance
Source: Commission staff survey
Baseline (31/12/15) Target Latest known results
(2017)
Job satisfaction: 70.5 %
Life balance: 53.3 %
Equal or better results than
Commission average (target agreed at level of resource
director) COM average: Job satisfaction: 68.5
%, Life balance: 53.7 %
Job satisfaction: 74%
(COM 2016: 76%)
Life balance: 58% (COM 2016: 57%)
Indicator: Local Overheads
Source: Screening 2017
Baseline (23/01/15) Target (2016) Latest known results (2017)
7.8 % Commission average: 7.7 % (target agreed at level of resource
director)
AGRI: 5.2% COM: 6.2%
Main outputs in 2017:
Description Indicator Target Latest known
results
Efficient and effective
staff allocation
Vacancy rate = or <
Commission average
1/01/2018
AGRI: 6.3% COM: 6.5%
Strategic, forward
planning HR
management
Posts returned to DG
HR (i.e. staff
reduction and staff redeployment)
within deadlines All payments
according to
schedule
Women in management
positions in close cooperation with DG HR
Female
representation rate in middle
management
= or > 2016 rate 30% (= to 2016
rate)
Staff allocation according
to interest and competences
Overall job
satisfaction
= or >
Commission average results in
next HR survey
2016: 74%
(COM 2016:
76%)

agri_aar_2017_annexes Page 6 of 278
Staff health Sick leave rate = or <
Commission average for the
same period
2017 Q1-3: 4.7%
(COM: 4.1%)
Staff well- being (in
cooperation with DG HR/Medical Service and
DG MARE)
Well-being indicator
in Commission staff survey
= or >
Commission average results in
next HR survey
2016: 57%
(COM 2016: 57%)
Management of
administrative budget
Budget execution
(commitments)
> 95% by end of
the year
99.3%
Internal communication Staff has appropriate and timely
information to perform well at work
= or > Commission
average results in next HR survey
2016: 63% (COM 2016:
62%)
* Two middle management positions were published in December 2017 - the first ones since mid-2015-, for which the selection process is still ongoing. DG AGRI also requested the appointment of a new female HoU in unit AGRI.DDG1.B.2 effective as of 1.03.2018. On 31.12.2017, female
representation in DG AGRI's middle management was 30.2 %.
2.2.2 Better Regulation
Objective (mandatory): Prepare new policy initiatives and manage the EU's
acquis in line with better regulation practices to ensure that EU policy objectives are achieved effectively and efficiently.
Indicator 1 (mandatory – monitored by the DGs concerned): Percentage of
Impact assessments submitted by DG AGRI to the Regulatory Scrutiny Board
that received a favourable opinion on first submission. Explanation: The opinion of the RSB will take into account the better regulation
practices followed for new policy initiatives. Gradual improvement of the percentage of positive opinions on first submission is an indicator of progress made by the DG in
applying better regulation practices. Source of data: -
Baseline 2015 Interim Milestone 2016
Target 2020 Latest known results (2017)
68% = Commission average
in 2014 N/A for DG AGRI (no Impact
assessment in 2015)
Positive trend
compared to DG's 2014
situation.
Positive trend
compared to DG's 2016 situation.
N/A
Indicator 2 (mandatory – monitored by the DGs concerned): Percentage of the
DG's primary regulatory acquis covered by retrospective evaluation findings and Fitness Checks not older than five years.
Explanation: Better Regulation principles foresee that regulatory acquis is evaluated at regular intervals. As evaluations help to identify any burdens, implementation problems,
and the extent to which objectives have been achieved, the availability of performance
feedback is a prerequisite to introduce corrective measures allowing the acquis to stay fit for purpose.
Relevance of Indicator 2: The application of better regulation practices would progressively lead to the stock of legislative acquis covered by regular evaluations to
increase. Source of data: -
Baseline 2015 Interim Milestone 2016
Target 2020 Latest known results (2017)
64%2 70% 64%
2 This figure excludes spending-related acquis, individual and temporary measures.

agri_aar_2017_annexes Page 7 of 278
Indicator: Common monitoring and evaluation framework for the CAP towards
2020 Source: DG AGRI task Force on Monitoring and Evaluation
Baseline (2015) Target (2015) Latest known results (2017)
Common Monitoring and
evaluation Framework in place. Meetings of the expert
group on M&E (17.3.2015-
25.6.2015-12.11.2015) CMEF discussed in agri
management meeting+2 meetings task force M&E
Documentation for MS available.
Comprehensive framework for the
monitoring and evaluation of the whole CAP in place
- 4 meetings with the expert group
on M&E; - 2 meetings of DG AGRI task force
on M&E; -Starting the compilation of data
Meeting of the
Task Force on 28.11.2017 (and
several meeting of
the CMEF working groups) allowed
finalising the definitions of all
indicators, clarifying which
data source to use and start
preparing for the
CMEF report to EP and Council
anticipated to mid-2018
Compilation of data is ongoing.
Part of the data is already available
in Agriview.
Development of CATS reports on
direct payments and lunch time to
show how AGRI users can access
them.
One meeting of
the expert group on monitoring and
evaluation (10.05.2017)
Indicator: Degree of implementation of the annual evaluation plan
Source: Data collected by DG AGRI
Baseline (2015) Target (mid-term) Latest known
results (2017)
100 % complete 100 % of evaluations completed/launched according to the
initially set timetable The evaluations to be conducted in a
given year are decided at senior management level, based on the
legal and policy requirements and introduced in a rolling evaluation
and studies plan which is updated at
least yearly.
86 % All scheduled
evaluations launched, all
reports of contractors
finalised, yet Staff Working
Document still to
be finalised.

agri_aar_2017_annexes Page 8 of 278
Indicator: Degree of implementation of the annual studies plan set in the
evaluation and studies plan Source: Data collected by DG AGRI
Baseline (2015) Target (mid-term) Latest known results
(2017)
100 %3 100 % of studies completed/launched according to the initially set timetable
The studies to be conducted in a given year
are decided at senior management level, based on the legal and policy requirements
and introduced in a rolling evaluation and studies plan which is updated yearly.
100 %
Indicator: Contribution to the Commission Regulatory Fitness initiative (REFIT)
Source: DG AGRI files on simplification
Baseline (2015) Target Latest known
results (2017)
Contribution and exchanges with SG
on REFIT initiatives. Timely
contribution to the REFIT platform
screening exercise: periodical
contribution to the
"assessment fiches" prepared by
SG following requests received
by the REFIT Platform
Timely contribution to the REFIT initiative including follow-up of the Administrative
Burden Reduction programme (ABRplus) upon request of the Secretariat General
100 %
Main outputs in 2017:
Description Indicator Target Latest known results
(situation on 31/12/17)
Coordination of monitoring and
evaluation of the CAP
- Coordination
of a common monitoring and
evaluation framework for the
CAP 2014-2020 - Analysis of
results for use in policy development
(indicators, studies,
evaluations)
Coordination of the internal Task Force
on Monitoring and Evaluation of the
CAP
Organisation of 2 meetings per
year
Meeting of the Task Force (and several
meeting of the CMEF working groups) allowed
finalising the definitions
of all indicators, clarifying which data
source to use and start preparing for the CMEF
report to EP and Council anticipated to mid-2018.
Organisation of the meetings of the
expert group on "M&E of the CAP"
Organisation of 2 meetings per
year
Only 1 meeting needed in 2017
3 While all procedures for new studies were launched, for one no contract was attributed

agri_aar_2017_annexes Page 9 of 278
Evaluations
Assess the effectiveness,
efficiency and coherence of CAP
(1st and 2nd pillar)
instruments in collaboration with
the inter service steering group
Establishment of
the DG AGRI pluri-annual evaluation
and studies plan
DG AGRI
evaluation plan established /
updated on time for inclusion (as
annex) in the
management plan of year N+1
On time for the
management plan
Degree of
implementation of the DG AGRI
studies and
evaluation plan
100 % 93%
Manage the EP Pilot projects foreseen in
the evaluation plan
Degree of implementation of
EP Pilot projects and preparatory
actions
100 % 100 %
Reviewing the
potential for further simplification in the
CAP in the short and long term
Number of
Commission documents adopted
with a view to simplify the policy
More than 5
December 2017
12 acts4 have been
adopted in view of simplification
Contribution to the Commission
Regulatory Fitness initiative (REFIT)
Timely contribution to the REFIT
initiative including reaction to
simplification requests under the
REFIT platform.
90% replies within deadlines
100 %
Relations with EU
institutions, national
parliaments, other institutional
stakeholders and
civil society, incl. the participation in
meetings of the Council, the SCA
and working parties, European
Parliament, COMAGRI and
other committees,
as well as attendance to
trilogues (accompany &
follow-up on the ordinary legislative
Questions/requests
from other Institutions,
including Parliamentary
Questions,
Petitions, Opinions from National
Parliaments and letters from MEPs
to the Commissioner
replied to within the deadline
Maintain the
present high rate of replies within
deadline.
99%
(Totals: Parliamentary Questions AGRI CF: 367,
Parliamentary Questions AGRI ASOC: 708,
Petitions 25, MEP letters
to the Commissioner: 56, Opinions from National
Parliaments: 17)
Participation of the Commissioner and
DG AGRI's officials in high level
meetings with other EU institutions and
advisory groups
The Commissioner
represents the Commission in
the most important
meetings
Commissioner’s participation in 2017:
3 times in EP plenary and 5 in COMAGRI.
DG AGRI's participation in all plenaries and in all
meetings of COMAGRI
4 IACS: DA 2017/723 and IA 2017/807
DA 2017/1155 on greening, young farmers, VCS, BPS
School schemes : DA 2017/40, IA 2017/39
6 DAs and IAs for CMO alignment
Omnibus regulation 2017/2393

agri_aar_2017_annexes Page 10 of 278
procedure). (civil dialogue
groups)
EESC: in 2017 the
Commissioner did not attend an EESC meeting
Participation of DG AGRI in:
Section meetings NAT: 7
Plenary: 3 COR: in 2017 the
Commissioner did not attended a COR meeting
Participation of DG AGRI in:
Section meeting NAT: 5 Plenary: 3
DG AGRI's participation in 2016:
- Council: 11 times - SCA: 28 times
- trilogue meetings: 9 (5 for organics, 4 for
Omnibus) pre-GRI: DG AGRI
participation in all
meetings DG AGRI participation in
Civil Dialogue Groups /working groups/: 75
- FWG 14 - CDG 61
Relations with the Court of Auditors
Number of overdue recommendations
in RAD5 addressed to AGRI as chef de
file
0 5 (29 January 2017)
5 RAD ("Recommendations/Actions/Discharge") is a DG BUDG database to monitor the implementation of
European Court of Auditors, Council and European Parliament recommendations.

agri_aar_2017_annexes Page 11 of 278
Objective: To provide sound legal services and to ensure correct application and
enforcement of the CAP law
Indicator: Proportion of positive opinions from the Legal service in Inter-service
consultations launched by DG AGRI Source of data: Decide
Baseline (2015) Target Latest known results
(2017)
100% >90 % of consultations
Target was fixed taking into account a minimal margin of manoeuvre for legal
disagreements/need to pursuit proposal for policy issues.
100%
Indicator: Timeliness of treatment of notifications of state aid cases Source of data: ISIS database
Baseline (2015) Target Latest known results
(2017)
100% 100%
Legal requirement
100%
Indicator: Proportion of agreements from the Legal service to proposals launched by DG AGRI in the context of the infringement procedure
Source of data: NIF data base
Baseline (2017) Target Latest known results
(2017)
100% 90% of consultation
Procedural requirement Internal Guideline "Monitoring the
application of EU Law (C(2017)4973final)
100%
Main outputs in 2017:
Description Indicator Target Latest known results
(situation on 31/12/17)
DG AGRI proposals
for legal acts need to comply with EU
legal framework
Proportion of
positive opinions from the LS in
inter-service consultations
launched by DG AGRI
>90 % of
consultations December 2017
100%
Legal soundness of DG AGRI positions
needs to be ensured, and this,
in a timely manner
Rapidity of response on
signataires submitted for
paraphe on legal issues and on notes
submitted asking
for legal advice
>85 % dealt with within deadlines
laid down in the vademecum fixing
the rules for legal consultation
December 2017
93,31 %
Examination of notified and alleged
State aids in the agricultural and
forestry sectors in
cooperation with various other
Commission Services, notably
the SG, the Legal
Examination of notified State aid
cases within the statutory deadlines
and timely
examination of all other State aid
cases (NN, CP …)
100% of cases to be handled within
the statutory deadlines if any or
foreseen within
the best Practice Code.
100%

agri_aar_2017_annexes Page 12 of 278
Service and
DG COMP
Management of
complaints and infringement
proceedings in cooperation with
the SG
Appropriate
administrative treatment of all new
complaint cases notified
95% of new
complaints registered
100%
Management of
notifications made under Directive
(EU) 2015/1535 on technical rules in
cooperation with DG GROW
Timeliness of
treatment of all new draft technical
received
100% of deadlines
to be met
100%
Coordination DG AGRI's replies to
the European Ombudsman (EO)
in cooperation with the SG
Timeliness of delivery of replies
to the EO
100% of SG accepted
deadlines to be met
100%
Coordination DG AGRI's replies to
access to documents
requests (Regulation
1049/2001) in cooperation with
the SG
Timeliness of delivery of replies
to access for documents requests
100% of requests for documents
answered within the deadlines
98%
Objective: To ensure an effective and efficient planning and programming
process and to support the preparation and adoption of agricultural legislation
Indicator: Implementation of the performance culture in DG AGRI
Source of data:
Baseline (2015) Target Latest known results
(2017)
Active involvement in Budget Focused
On Results initiative, including the
participation of
Commissioner Hogan at the BFOR
conference Development of an
more focused performance
reporting in the AAR Creation of a
network of
performance correspondents
Continuous improvement DG AGRI contributes actively to the "Budget focused on
results" initiative: preparation of the regular meetings of the
BFOR interservice working
group and the group of Commissioners, participation
in the Workshops on the future of indicators and
routine ongoing contacts with central services and other DGs
to share information.
The Communication on the
Future of Food and Farming underlines the commitment of
DG AGRI to the performance and results of the CAP,
including a new delivery model for the CAP post-2020

agri_aar_2017_annexes Page 13 of 278
which would link the CAP
expenditure with achievement of results by the Member
States.
Indicator: Timeliness of DG AGRI replies to Inter-service consultations
Source of data: Decide
Baseline (2015) Target Latest known results (2017)
101 out of 2055 (4.91%) delayed
Steady reduction The target is a permanent goal
of DG AGRI
Statistical data not available in Decide
Main outputs in 2017:
Description Indicator Target Latest known results (2017)
Implementation of the
Commission planning and
programming process (in close
cooperation with
SG and DG BUDG)
Percentage of elements of the
Strategic Planning and Programming
(SPP) cycle delivered on time
100 % 80%
Delivery rate (adoption by the
College): - CWP
- Other Decide Planning
proposals
100 % 100 %
Number of delays in
DG AGRI replies to Interservice
Consultations (ISC)
Steady
reduction
Statistical data not available
in Decide
2.2.3 Information management aspects
Objective (mandatory): Information and knowledge in your DG is shared and reusable by other DGs. Important documents are registered, filed and
retrievable
Indicator (mandatory): Percentage of registered documents that are not filed
(ratio) Source of data: Hermes-Ares-Nomcom (HAN) statistics
Baseline Target Latest known results (2017)
2014: 482 docs =
0.150% 2015: 924 docs = 0.24%
0% 0.10
Indicator (mandatory): Percentage of HAN files readable/accessible by all units in the DG
Source of data: HAN statistics
Baseline Target Latest known results
(2017)
2015: 82.58% 75% 79.10%

agri_aar_2017_annexes Page 14 of 278
Indicator (mandatory): Percentage of HAN files shared with other DGs
Source of data: HAN statistics
Baseline Target Latest known results
(2017)
2015: 0.5% 50% 0.28%*
Main outputs in 2017:
Description Indicator Target Latest known results
(situation on 31/12/17)
Document
management
% of filing of
documents in DG AGRI
100 % of
documents ARES filed
99.9%
% of files in NOMCOM where no documents
are filed within the last 12 months from
the total number of active files in AGRI
(including subfiles)
0% files in NOMCOM where
no documents are filed within the last
12 months
20.89%
Percentage of HAN
files readable/accessible by
all units in the DG
75 % 79.10%
Percentage of HAN
files shared with other DGs
10 %* 0.28%
Personal data
protection, in cooperation with
SG/DPO
Notification of
identified personal data processings in
DG AGRI
100 % of identified
processings included in the
register of the DPO
2017: 100% (34
identified personal data processings, all of which
are in the register)
IT infra-
structure, tools and services
Implementation of the
relevant parts of the IT Master Plan, in co-
operation with DG DIGIT and the other
DGs where relevant
(Common building blocks, support to
ESIF policy, …)
95 % 97%
Servers' availability (averaged over one
year)
≥ 99 % 99%
Information Systems
User Satisfaction (positive assessment)
> 80 % 83%
Number of security breaches (new
indicator)
No major security breaches
No major security breaches
* In line with the principle of sharing information within the Commission, DG AGRI set a long-term target of 50% to be achieved by 2020 with a view to improve transparency and avoid duplications in filing at Commission level. Progress is proving rather slow. There are however encouraging
developments. Following the latest review, the share of files visible within the DG has significantly increased. Renewed efforts will be made in 2018 to further promote full visibility of AGRI HAN files. In this sense, Units were encouraged to choose Commission read-access level for the creation of
the new 2018 Ares files.

agri_aar_2017_annexes Page 15 of 278
2.2.4 External communication activities
Objective (mandatory): Citizens perceive that the EU is working to improve their lives and engage with the EU. They feel that their concerns are taken into
consideration in European decision making and they know about their rights in the EU.
Indicator: Percentage of EU citizens having a positive image of the EU
Definition: Eurobarometer measures the state of public opinion in the EU Member States. This global indicator is influenced by many factors, including the work of other EU
institutions and national governments, as well as political and economic factors, not just the communication actions of the Commission. It is relevant as a proxy for the overall
perception of the EU citizens. Positive visibility for the EU is the desirable corporate
outcome of Commission communication, even if individual DGs’ actions may only make a small contribution.
Source of data: Standard Eurobarometer (DG COMM budget) [monitored by DG COMM here]
Baseline:
November 2014
Target: 2020 Baseline: November
2014
Total "Positive":
39% Neutral: 37 %
Total "Negative": 22%
Positive image
of the EU ≥ 50%
Positive: 40%
Neutral: 37 % Negative: 21%
Specific objective: To build trust within the EU and among all citizens, farmers and non-farmers, alike. The key issues of food security, climate change and
environment protection as well as the maintenance of sustainable rural areas
are consistent features of the messaging and with the Commission's legal requirement to carry out information measures on the CAP.
For the general public, the objective is to raise awareness on the relevance of EU support to agriculture and rural development through the CAP.
For the stakeholders, the objective is to engage with stakeholders (mainly farmers and other parties in rural areas) in order to further communicate about
the CAP to their constituencies and to the wider public.
Indicator: Public awareness of CAP
Source: Eurobarometer
Baseline (2015) Target Latest known results (2017)
The Latest Eurobarometer survey
(field research October 2015, results published
on 6 January 2016) shows that 94% of
Europeans believe that
agriculture and rural areas play an important
role for their future (+ 2 percentage points since
the last survey in 2013) and that 69% have
heard about the support that the EU gives farmers
through its CAP (+ 5
percentage points since the last survey in 2013).
Maintain and if possible increase awareness of the
CAP
The Latest Eurobarometer survey (field research
November – December 2017shows that 92% of
Europeans believe that agriculture and rural areas
play an important role for their
future (- 2 percentage points since the last survey in 2015)
and that 67% have heard about the support that the EU
gives farmers through its CAP (-2 percentage points since
the last survey). There is a broad consensus and strong
support on the key priorities of
the CAP and its contribution to the strategic priorities of the

agri_aar_2017_annexes Page 16 of 278
There is a broad
consensus on the key priorities of the CAP and
its contribution to the strategic priorities of the
Commission.
The next Eurobarometer survey will be conducted
in the last quarter of 2017. The results will be
published in first quarter of 2018
Commission.
The results will be published on 1 February 2018
Main outputs in 2017:
Description Indicator Target Latest known results
Main
communication actions:
Media and Web
6 study trips (positive
evaluation feedback), Ag.press e-platform
(maintain members as active users),
Europa web digital
transformation
2017 3 study trips and 2 AG-
Press seminars have been organised in 2017.
All results will be included in the report on
the implementation of
AGRI's 2017 external communication AP to be
produced soon
Conferences, fairs and events
Conference on the modernisation of the
CAP and Conference
"agricultural markets outlook" (satisfaction
feedback from participants)
2nd semester 2017 and December
2017
Conference "Taking stock of the public
consultation" on 7 July
and the "outlook Conference" on 18 and
19 December. All results will be
included in the report on the implementation of
AGRI's 2017 external communication AP to be
produced soon
Participation at
Agricultural fairs in Berlin, Paris, Estonia
and Poland and in EU Open Days in
Brussels (number of
visitors and degree of satisfaction with the
activities proposed)
2017 AGRI participated in all
these fairs as foreseen. All results will be
included in the report on the implementation of
AGRI's 2017 external
communication AP to be produced soon
Launch of and communication on
school schemes and
edutainment package Communication
activities concerning the modernisation of
the CAP
2017 AGRI's "edutainment pack" on agriculture and
the CAP for school
children has been further promoted and
distributed and other relevant communication
material has been produced.
Communication
activities, including a

agri_aar_2017_annexes Page 17 of 278
social media campaign
and an important "outreach team
exercise" have been organised to accompany
the major policy
initiative of the year i.e. the adoption by the
Commission on the 29 November of the
Communication on the Future of Food and
Farming
Grants Co-financing 15 to 20
"information measures on the
CAP" following the last call for proposals
May 2017 – April
2018
16 grants have been
awarded following the annual call for proposals
Corporate communication
Campaign to be conducted by DG
COMM
2017-2018 DG AGRI participated in the development and
implementation of the DG COMM 2017
corporate communication
campaigns ("EU invest", "EU empowers" and "EU
protects)
Annual communication spending (based on estimated commitments):
Baseline (2016) Estimated
commitments (2017)
Total amount
spent
Total of FTEs working on
external communication
EUR 4 million EUR 8 million:
- Direct actions (Media and Web,
Conferences, fairs and events): EUR
4.500.000 - Indirect actions
(Grants): EUR 3.500.000
EUR 4.1 million
EUR 3.7 million
10
Corporate communication by
DG COMM: EUR 8.400.000 (co-
delegated to DG COMM) from EAGF
budget lines
EUR 8.5 million 1

agri_aar_2017_annexes Page 18 of 278
ANNEX 3: Draft annual accounts and financial reports
1. Financial reports
1.1 Commitments and payments (tables 1 and 2)
Overall, in 2017, the execution rate of commitment appropriations of DG AGRI remained
at the same high level as the year before, reaching 96,80% in 2017 (96,35% in 2016). The execution rate of payment appropriations has also globally remained unchanged
reaching 97,04% in 2017 (96,61% in 2016). The total amount committed in 2017 amounts to EUR 59.250,35 million and the total amount paid in 2017 amounts to EUR
55.871,78 million. Some detailed information on the implementation of the main budget lines can be found below.
– 05 02 Improving the competitiveness of the agricultural sector: These
appropriations intend to finance various programs for the promotion of agricultural products and to cover mainly costs linked in particular to the financial depreciation
of stocks of agricultural products, and they have remained relatively stable. An amount of EUR 2.948,61 million was committed in 2017 (3.135,80 million in 2016)
representing 93,48% of the available credits. The amount paid in 2017 was EUR 2.945,60 million, representing 93,11% of the available appropriations (compared to
3.127,90 in 2016).
– 05 03 Direct payments to farmers: With regard to EAGF expenditure covering
direct payments to EU farmers the amount committed in 2017 was EUR 41.551,16
million (EUR 40.984,13 million in 2016) representing 97,96% of the available appropriations. The amount paid in 2017 was EUR 41.551,16 million, representing
97,56% of the available appropriations (compared to EUR 40.808,73 million in 2016).
– 05 04 Rural Development: This appropriation is intended to cover the financing of the 2014 to 2020 rural development programmes funded by the European
Agricultural Fund for Rural Development (EAFRD). The amount committed in 2017 was EUR 14.348,93 million (EUR 18.675,94 million in 2016), representing 94,31%
of the available commitment appropriations. The committed amount is decreasing
as compared to previous years as we are moving forward into the programming period. The amount paid in 2017 was EUR 11.105,49 million (EUR 12.365,00 million
in 2016), representing 96,43% of the available appropriations. It should be noted that almost the entirety of this year's payments concerns the 2014-2020 period
Commitment
appropriation
s authorised
Commitment
s made% C hapter C hapter
P ayment
appro priat i
o ns
autho rised
*
P ayments
made%
1 2 3=2/1 1 2 3=2/ 1
Title 05 Agriculture and rural development
05 05 01
Administrative expenditure of the
'Agriculture and rural development' policy
area
20.12 19.38 96.33 %
05 05 01
Administrative expenditure of the 'Agriculture and
rural development' policy area15.04 7.75 51.49 %
05 02
Improving the competitiveness of the
agricultural sector through interventions in
agricultural markets
3,154.30 2,948.61 93.48 %
05 02
Improving the competitiveness of the agricultural
sector through interventions in agricultural markets3,163.66 2,945.60 93.11 %
05 03
Direct payments aimed at contributing to
farm incomes, limiting farm income
variability and meeting environment and
climate objectives
42,414.44 41,551.16 97.96 %
05 03
Direct payments aimed at contributing to farm
incomes, limiting farm income variability and meeting
environment and climate objectives
42,589.84 41,551.16 97.56 %
05 04 Rural development 15,214.71 14,348.93 94.31 % 05 04 Rural development 11,516.55 11,105.49 96.43 %
05 05Instrument for Pre-accession Assistance -
Agriculture and rural development212.02 199.00 93.86 %
05 05
Instrument for Pre-accession Assistance -
Agriculture and rural development104.67 91.66 87.57 %
05 06International aspects of the 'Agriculture
and rural development' policy area4.73 4.49 94.89 %
05 06
International aspects of the 'Agriculture and rural
development' policy area4.49 4.49 100.00 %
05 07
Audit of agricultural expenditure f inanced
by the European Agricultural Guarantee
Fund (EAGF)
142.97 142.29 99.52 %
05 07
Audit of agricultural expenditure f inanced by the
European Agricultural Guarantee Fund (EAGF)140.91 140.91 100.00 %
05 08
Policy strategy and coordination of the
'Agriculture and rural development' policy
area
37.13 36.49 98.29 %
05 08
Policy strategy and coordination of the 'Agriculture
and rural development' policy area34.07 24.73 72.57 %
05 09Horizon 2020 - Research and innovation
related to agriculture6.77 - 0.00 %
05 09
Horizon 2020 - Research and innovation related to
agriculture6.77 - 0.00 %
61,207.19 59,250.35 96.80% Total Title 05 57,576.00 55,871.78 97.04%
TABLE 2: OUTTURN ON PAYMENT APPROPRIATIONS IN 2017 (in Mio €)TABLE 1: OUTTURN ON COMMITMENT APPROPRIATIONS IN 2017 (in Mio €)
Title 05 Agriculture and rural development
Total Title 05

agri_aar_2017_annexes Page 19 of 278
whereas for 2016 the payments included the reimbursement of the final balance for 64 RDP's of the 2007-2013 period.
– 05 05 Pre Accession Assistance: This appropriation is intended to finance the Instrument for Pre-accession Assistance related to rural development. An amount of
EUR 199 million was committed in 2017 (112 million in 2016) representing 93,86% of the available appropriations as the implementation of IPA II programs is
gradually progressing. EUR 91,66 million was paid in 2017 (compared to 339,24 in 2016), representing 87,57 % of the available appropriations. The decrease in
payments is due to the fact that 2016 was the last year of the eligibility for 2 IPA I
programs so the payments were increased.
1.2 Unused balance of Commitments (table 3)
The unused balance on commitments, commonly known as budgetary RAL ("Reste à Liquider"), was approximatively EUR 33.425 million at the end of 2017 (EUR 30.205
million in 2016), of which EUR 32.734,08 million relates to rural development, EUR 445,04 million to pre-accession assistance and EUR 12,04 million to direct payments
to farmers in the form of EAGF.
1.3 Payment time limits (table 6a/b)
As far as payment time limits are concerned, the progress made during last years
remained stable:
– For "direct management expenditure" (see table 6a), the average delay has decreased significantly to 10 days in 2017 (compared to 13 days in 2016). Only 16
payments exceeded the legal payment deadline (45 payments in 2016), which represents 1,8% of the total number of payments (4,4% in 2016).
– For "rural development" (see table 6b), the average payment delay has remained rather stable at 34,1 days (33 days in 2016). Just 4 payments were executed
outside the legal payment deadline (against 82 in 2016) which represents 0,7% of the total number of payments.
Commitment
s to be settled
from
Total of commitments to be
sett led at end
Total of
commitments to
be sett led at
end
Commitments
2017
Payments
2017RAL 2017 % to be settled
financial years
previous to
2017
of f inancial year 2017of f inancial year
2016
1 2 3=1-2 4=1-2/1 5 6=3+5 7
05 05 01 19.24 10.86 8.39 43.58 % - 8.39 7.08
05 02 2,969.96 2,957.92 12.04 0.41 % - 12.04 9.36
05 03 42,755.94 42,580.53 175.40 0.41 % - 175.40 175.40
05 04 14,349.45 182.62 14,166.83 98.73 % 18,567.25 32,734.08 29,636.32
05 05 199.00 - 199.00 100.00 % 246.04 445.04 337.69
05 06 4.49 4.49 - 0.00 % - - -
05 07 142.29 140.91 1.38 0.97 % - 1.38 -
05 08 36.49 9.70 26.79 73.41 % 22.35 49.14 39.16
60,476.86 45,887.03 14,589.83 24.12% 18,835.64 33,425.46 30,205.01 Total Title 05
Rural development
Instrument for Pre-accession Assistance - Agriculture
and rural development
International aspects of the 'Agriculture and rural
development' policy area
Audit of agricultural expenditure f inanced by the
European Agricultural Guarantee Fund (EAGF)
Policy strategy and coordination of the 'Agriculture and
rural development' policy area
Title 05 : Agriculture and rural development
Administrative expenditure of the 'Agriculture and rural
development' policy area
Improving the competitiveness of the agricultural sector
through interventions in agricultural markets
Direct payments aimed at contributing to farm incomes,
limiting farm income variability and meeting environment
2017 Commitments to be settled
Chapter

agri_aar_2017_annexes Page 20 of 278
1.4 Revenue and income
The total income/revenue recognised for DG AGRI corresponds to EUR 2.044,38 million
in 2017, while the amount cashed is EUR 1.953,47 million. At the end of 2017, EUR 90,9 million is therefore still owed to DG AGRI (EUR 41,6 million in 2016).
The income/revenue in 2017 concerning the EAGF and EAFRD funds amounts to EUR 1.969,97 million (2016 EUR 2.853,89 million). Out of this amount, EUR 1.482,47
million concern EAGF and EUR 487,50 million for EAFRD and EAGGF-O (of which the amount of EUR 232,19 million concerns recoveries of unused pre-financing of the
2007-2013 programming period for programs that have not reached 95% of implementation).
The budgetary regularised income for EAGF corresponds to a total amount of
EUR 1.482,47 million in 2017 (EUR 2.527,1 million in 2016) of assigned revenue linked to milk levies, irregularities and conformity clearance6. The significant decrease reflects the
phase out of the milk quota system. An additional amount of EUR 61 million still has to be recovered at year-end.
With regard to the "ageing balance of recovery orders" at 31.12.2017, no significant movement was registered for old recovery orders issued between 1998 and 2004 (-6.8%
in 2017; -3,8% in 2016; -1,2% in 2014; -0,2% in 2013; -3% in 2012; -5% in 2011).
Annexes:
Table 1: Commitments
Table 2: Payments Table 3: Commitments to be settled (RAL)
Table 4: Balance sheet Table 5: Economic Outturn Account
Table 6 - 6a/6b: Average Payment Time Limits (Rural development and Direct expenses) Table 7: Income
Table 8/8bis: Recovery context Table 9/9bis: Ageing balance of Recovery Orders
Table 10: Waivers of Recovery Orders
Table 11: Negotiated Procedures Table 12: Summary of Contracts
Table 13: Building Contracts Table 14: Secret Contracts
6 This amount includes EUR 1.348,04 million for income line 6701 (clearance), EUR 130,7 million for income line
6702 (irregularities), EUR 3.69 million for income line 6703 (milk).
Outstanding
Chapter Current year RO Carried over RO Total Current Year RO Carried over RO Total balance
1 2 3=1+2 4 5 6=4+5 7=3-6
61 REPAYMENT OF MISCELLANEOUS EXPENDITURE - 4,659,319.52 4,659,319.52 - - - 4,659,319.52
65 FINANCIAL CORRECTIONS 32,614,795.69 15,206,648.24 47,821,443.93 27,494,122.10 5,830,547.19 33,324,669.29 14,496,774.64
67
REVENUE CONCERNING THE EUROPEAN
AGRICULTURE GUARANTEE FUND AND THE
EUROPEAN AGRICULTURAL FUND FOR RURAL
1,969,973,503.45 21,794,654.25 1,991,768,157.70 1,898,224,340.21 21,794,654.25 1,920,018,994.46 71,749,163.24
90 MISCELLANEOUS REVENUE 130,531.01 - 130,531.01 130,531.01 - 130,531.01 -
2,002,718,830.15 41,660,622.01 2,044,379,452.16 1,925,848,993.32 27,625,201.44 1,953,474,194.76 90,905,257.40
TABLE 7 : SITUATION ON REVENUE AND INCOME IN 2017
Revenue and income recognized Revenue and income cashed from
Total DG AGRI

agri_aar_2017_annexes Page 21 of 278
2. Draft annual accounts
2.1 Accounting principles and methods
The annual accounts of DG AGRI have been prepared in accordance with the generally accepted accounting principles. Estimates have been made, where necessary, in
accordance with the methodology agreed upon with the services of the Accountant of the European Commission.
It should be noted that the balance sheet and economic outturn account of this Directorate-General, presented in Annex 3 to this Annual Activity Report, represent only
the assets, liabilities, expenses and revenues that are under the control of this
Directorate-General. Significant amounts such as own resource revenues and cash held in Commission bank accounts are not included in this Directorate-General's accounts
since they are managed centrally by DG BUDG, on whose balance sheet and economic outturn account they appear.
Other items not included are:
the intangible assets (IT software bought externally) or the tangible fixed assets
(hardware, technical equipment, office furniture, buildings) declared/recorded by DG DIGIT and by OIB respectively;
personnel and management expenses which are managed centrally;
the appropriation of the net result of the year and of prior years, except for the opening balance in 2005. As the accumulated result of the Commission is not split
amongst the various Directorates-General, the balance sheet presented here is not in equilibrium.
Additionally, the figures included in tables 4 and 5 are, at this date, still subject to audit by the Court of Auditors. Thus, it is possible that amounts included in these tables may
have to be adjusted following this audit.
2.2 Acronyms
EAGF: European Agricultural Guarantee Fund
EAFRD: European Agriculture Fund for Rural Development
EAGGF: European Agricultural Guarantee and Guidance Fund

agri_aar_2017_annexes Page 22 of 278
2.3 Balance Sheet
Assets
Non-current assets
Non-Current pre-financing: It concerns mainly shared management expenditure but also indirect management. For shared management it includes 3.170.830.343,44 EUR which
corresponds to the total pre-financing paid in 2014, 2015 and 2016 to Member States for the programming period 2014-2020 (EAFRD) for which the period of settlement exceeds
one year. An amount of 4.502.513,75 EUR that corresponds to a pre-financing for IPA I
programs will be recovered from the Member State only after 2018 (since the closure of the programs will most probably not take place until after 2018). It also includes
246.158.914,75 EUR advances paid by Member States to beneficiaries and reimbursed from EAGF funds. In addition, the amounts of 2.710.990,88 EUR of pre-financing paid to
third countries for IPA I program and 91.658.650,00 EUR from IPA II programs (2014-2020 period) are included.
2017 2016
4,120,500,583.28 4,228,569,395.42
10,614,699.20 8,726,583.86
-
3,515,861,412.82 3,519,927,569.09
594,024,471.26 699,915,242.47
3,330,567,023.81 3,731,197,555.52
1,426,595,040.10 1,654,007,638.79
1,903,971,983.71 2,077,189,916.73
7,451,067,607.09 7,959,766,950.94
- (148,550,431.58)
- (148,550,431.58)
(62,837,116,274.83) (62,748,448,158.84)
(12,046,682,979.06) (12,657,676,460.23)
(50,790,433,295.77) (50,090,771,698.61)
(62,837,116,274.83) (62,896,998,590.42)
(55,386,048,667.74) (54,937,231,639.48)
228,270,270,678.21 173,232,065,358.66
(172,884,222,010.47) (118,294,833,719.18)
0.00 0.00
A.I. NON CURRENT ASSETSA.I.1. Intangible Assets
TABLE 4 : BALANCE SHEET AGRI
BALANCE SHEET
A.I. NON CURRENT ASSETS
A.I.2. Property, Plant and Equipment
A.I.5. Non-Current Pre-Financing
A.I.6. Non-Cur Exch Receiv & Non-Ex Recoverab
A.II. CURRENT ASSETS
A.II. CURRENT ASSETSA.II.2. Current Pre-Financing
A.II.3. Curr Exch Receiv &Non-Ex Recoverables
ASSETS
P.I. NON CURRENT LIABILITIES
P.I. NON CURRENT LIABILITIESP.I.2. Non-Current Provisions
P.II. CURRENT LIABILITIES
P.II. CURRENT LIABILITIESP.II.4. Current Payables
P.II.5. Current Accrued Charges &Defrd Income
LIABILITIES
NET ASSETS (ASSETS less LIABILITIES)
TOTAL
P.III.2. Accumulated Surplus/Deficit
Non-allocated central (surplus)/deficit*

agri_aar_2017_annexes Page 23 of 278
Non-Current exchange receivables and non-exchange recoverable: It concerns not yet executed clearance decisions under shared management (548.065.050,65 EUR for EAGF
and 45.959.420,61 EUR for EAFRD). The period of settlement exceeds one year.
Current assets
Current pre-financing: The amounts have been decreasing gradually between 2017 and 2016. This reflects the clearing of some still outstanding pre-financing of the programs of
the 2007-2013 period (EAFRD). An amount of 584.225.710,22 EUR from this item relates to shared management (pre-financing that should be recuperated from the Member-
States, since the execution of the respective RDPs did not reach 95%). The amounts of
828.944.030,90 EUR and 8.280.058,98 EUR concern advances paid by Member States to beneficiaries and unspent amounts reimbursed to Financial Instruments, respectively.
These amounts have already been paid to the Member States from EAFRD and EAGF funds and should be used by the final beneficiaries within the following year. The
remaining 5.145.240,00 EUR concerns open pre-financing from direct management contracts.
Non-Exchange receivables: EUR 1.903,97 million are owed to DG AGRI by Member States and third countries. The amount owed by Member States concerns non-exchange
transactions; it includes mostly amounts to be recovered under EAGF, EAFRD and EAGGF
Guidance section, TRDI and Sapard (financing period 2000-2006) for irregularities committed by final beneficiaries and detected by the Member States (EUR 1.658,30
million) or by Third States (EUR 4,59 million); a value reduction of EUR 693,21 million has been applied to these receivables. It also includes the short term amount of the not
yet executed clearance decisions under EAGF and EAFRD of EUR 793,01 million and various amounts receivables/adjustments of EUR 141,2 million.
Liabilities
Non-current liabilities
Long-term provisions: This item mainly relates to the estimate (if any) of potential future
expenses resulting from court cases awaiting judgement. For 2017, it is zero.
Current liabilities
Accounts payable: This item concerns amounts payable to private firms, to Member States and to Third States. Almost the whole amount of the accounts payable relates to
outstanding balances of Member States under EAGF, EAGGF Guidance section (2000-2006) and EAFRD. It includes amounts already requested by Member States but
not yet paid.
Accrued charges: This item includes an estimate of the amounts which Member States
and other beneficiaries are entitled to claim (accrued charges).
The total short-term liabilities remain roughly the same as in the previous year.

agri_aar_2017_annexes Page 24 of 278
2.4 Economic Outturn Account
Surplus/Deficit from activities
Exchange and Non-Exchange Revenue:
Almost the entirety of the revenue, which amounts to EUR 1.160,77 million, results from non-exchange transactions; it corresponds essentially to recovery of expenses due to
financial and conformity clearance decisions or irregularities. The revenue from other non-exchange transactions amounts up to EUR 334,43 million and corresponds mainly to
restoring to profit old provisions for bad or doubtful debts that have been previously
made but are no longer required.
Expenses:
99,7% of the expenses relate to shared management expenditure comprising EAGF, EAFRD, EAGGF Guidance section, SAPARD and IPARD:
Under the heading "II.2.1 "Expenses implemented by MS", the EAGF amount corresponds to EUR 44.159,8 million;
The amount for SAPARD-EAGGF Guidance section 2000-2006 and EAFRD under shared management corresponds to EUR 11.541,03 million.
STATEMENT OF FINANCIAL PERFORMANCE 2017 2016
II.1 REVENUES (1,488,599,294.85) (2,031,939,127.37)
II.1.1. NON-EXCHANGE REVENUES (1,495,203,889.97) (2,034,400,178.90)
II.1.1.5. RECOVERY OF EXPENSES (1,160,770,976.72) (1,868,113,166.51)
II.1.1.6. OTHER NON-EXCHANGE REVENUES (334,432,913.25) (166,287,012.39)
II.1.2. EXCHANGE REVENUES 6,604,595.12 2,461,051.53
II.1.2.1. FINANCIAL INCOME 3,736,140.20 (58,930.61)
II.1.2.2. OTHER EXCHANGE REVENUE 2,868,454.92 2,519,982.14
II.2. EXPENSES 55,850,889,986.83 57,070,144,446.92
II.2. EXPENSES 55,850,889,986.83 57,070,144,446.92
II.2.10.OTHER EXPENSES 11,632,869.16 51,416,752.31
II.2.1. EXP IMPLEM BY MEMBER STATES (SHARED) 55,700,884,766.04 56,774,397,885.79
II.2.2. EXP IMPLEM BY COMMISS&EX.AGENC. (DM) 33,437,587.02 32,301,047.59
II.2.4. EXP IMPL BY 3RD CNTR & INT ORG (IM) 105,541,546.16 165,281,629.91
II.2.6. STAFF AND PENSION COSTS (618,243.75) (416,395.84)
II.2.8. FINANCE COSTS 11,462.20 47,163,527.16
STATEMENT OF FINANCIAL PERFORMANCE 54,362,290,691.98 55,038,205,319.55
TABLE 5 : STATEMENT OF FINANCIAL PERFORMANCE AGRI

agri_aar_2017_annexes Page 25 of 278
Annex 3 Financial Reports - DG AGRI - Financial Year 2017
Table 1 : Commitments
Table 2 : Payments
Table 3 : Commitments to be settled
Table 4 : Balance Sheet
Table 5 : Statement of Financial Performance
Table 5 Bis : Off Balance Sheet
Table 6 : Average Payment Times
Table 7 : Income
Table 8 : Recovery of undue Payments
Table 9 : Ageing Balance of Recovery Orders
Table 10 : Waivers of Recovery Orders
Table 11 : Negotiated Procedures (excluding Building Contracts)
Table 12 : Summary of Procedures (excluding Building Contracts)
Table 13 : Building Contracts
Table 14 : Contracts declared Secret

agri_aar_2017_annexes Page 26 of 278
TABLE 1: OUTTURN ON COMMITMENT APPROPRIATIONS IN 2017 (in Mio €)
Commitment appropriations
authorised
Commitments made
%
1 2 3=2/1
Title 04 Employment, social affairs and inclusion
04 04 01 Administrative expenditure of the 'Employment, social affairs and inclusion' policy area
0,30 0,30 99,98 %
Total Title 04 0,30 0,30 99,98%
Title 05 Agriculture and rural development
05 05 01 Administrative expenditure of the 'Agriculture and rural development' policy area
20,12 19,38 96,33 %
05 02 Improving the competitiveness of the agricultural sector through interventions in agricultural markets
3.154,30 2.948,61 93,48 %
05 03 Direct payments aimed at contributing to farm incomes, limiting farm income variability and meeting environment and climate objectives
42.414,44 41.551,16 97,96 %
05 04 Rural development 15.214,71 14.348,93 94,31 %
05 05 Instrument for Pre-accession Assistance - Agriculture and rural development
212,02 199,00 93,86 %
05 06 International aspects of the 'Agriculture and rural development' policy area
4,73 4,49 94,89 %
05 07 Audit of agricultural expenditure financed by the European Agricultural Guarantee Fund (EAGF)
142,97 142,29 99,52 %
05 08 Policy strategy and coordination of the 'Agriculture and rural development' policy area
37,13 36,49 98,29 %
05 09 Horizon 2020 - Research and innovation related to agriculture
6,77 - 0,00 %
Total Title 05 61.207,19 59.250,35 96,80%
Title 13 Regional and urban policy
13 13 03 European Regional Development Fund and other regional operations
0,21 0,21 100,00 %
13 04 Cohesion Fund (CF) 0,09 0,09 100,00 %
Total Title 13 0,30 0,30 100,00%
Title 18 Migration and home affairs
18 18 01 Administrative expenditure of the 'Migration and home affairs' policy area
0,21 0,21 99,85 %
Total Title 18 0,21 0,21 99,85%
Total DG AGRI 61.207,99 59.251,15 96,80 %
* Commitment appropriations authorised include, in addition to the budget voted by the legislative authority, appropriations carried over from the previous exercise, budget amendments as well as miscellaneous commitment
appropriations for the period (e.g. internal and external assigned revenue).

agri_aar_2017_annexes Page 27 of 278
TABLE 2: OUTTURN ON PAYMENT APPROPRIATIONS IN 2017 (in Mio €)
Chapter Payment
appropriations authorised *
Payments made %
1 2 3=2/1
Title 04 Employment, social affairs and inclusion
04 04 01 Administrative expenditure of the 'Employment, social affairs and inclusion' policy area
0,30 0,13 44,64 %
Total Title 04 0,30 0,13 44,64%
Title 05 Agriculture and rural development
05 05 01 Administrative expenditure of the 'Agriculture and rural development' policy area
15,04 7,75 51,49 %
05 02 Improving the competitiveness of the agricultural sector through interventions in agricultural markets
3.163,66 2.945,60 93,11 %
05 03 Direct payments aimed at contributing to farm incomes, limiting farm income variability and meeting environment and climate objectives
42.589,84 41.551,16 97,56 %
05 04 Rural development 11.516,55 11.105,49 96,43 %
05 05 Instrument for Pre-accession Assistance - Agriculture and rural development
104,67 91,66 87,57 %
05 06 International aspects of the 'Agriculture and rural development' policy area
4,49 4,49 100,00 %
05 07 Audit of agricultural expenditure financed by the European Agricultural Guarantee Fund (EAGF)
140,91 140,91 100,00 %
05 08 Policy strategy and coordination of the 'Agriculture and rural development' policy area
34,07 24,73 72,57 %
05 09 Horizon 2020 - Research and innovation related to agriculture
6,77 - 0,00 %
Total Title 05 57.576,00 55.871,78 97,04%
Title 18 Migration and home affairs
18 18 01 Administrative expenditure of the 'Migration and home affairs' policy area
0,21 0,09 43,37 %
Total Title 18 0,21 0,09 43,37%
Total DG AGRI 57.576,51 55.872,00 97,04 %
* Payment appropriations authorised include, in addition to the budget voted by the legislative authority, appropriations carried over from the previous exercise, budget amendments as well as miscellaneous payment appropriations for the period (e.g.
internal and external assigned revenue).

agri_aar_2017_annexes Page 28 of 278
TABLE 3 : BREAKDOWN OF COMMITMENTS TO BE SETTLED AT 31/12/2017 (in Mio €)
2017 Commitments to be settled Commitments to be
settled from Total of commitments to
be settled at end Total of commitments to be
settled at end
Chapter Commitments 2017
Payments 2017 RAL 2017 % to be settled
financial years previous to 2017
of financial year 2017 of financial year 2016
1 2 3=1-2 4=1-2/1 5 6=3+5 7
Title 04 : Employment, social affairs and inclusion
04 04 01 Administrative expenditure of the 'Employment, social affairs and inclusion' policy area
0,30 0,13 0,17 55,35 % - 0,17 -
Total Title 04 0,30 0,13 0,17 55,35% - 0,17 -
Title 05 : Agriculture and rural development
05 05 01 Administrative expenditure of the 'Agriculture and rural development' policy area
19,24 10,86 8,39 43,58 % - 8,39 7,08
05 02 Improving the competitiveness of the agricultural sector through interventions in agricultural markets
2.969,96 2.957,92 12,04 0,41 % - 12,04 9,36
05 03
Direct payments aimed at contributing to farm incomes, limiting farm income variability and meeting environment and climate objectives
42.755,94 42.580,53 175,40 0,41 % - 175,40 175,40
05 04 Rural development 14.349,45 182,62 14.166,83 98,73 % 18.567,25 32.734,08 29.636,32
05 05 Instrument for Pre-accession Assistance - Agriculture and rural development
199,00 - 199,00 100,00 % 246,04 445,04 337,69
05 06 International aspects of the 'Agriculture and rural development' policy area
4,49 4,49 - 0,00 % - - -
05 07 Audit of agricultural expenditure financed by the European Agricultural Guarantee Fund (EAGF)
142,29 140,91 1,38 0,97 % - 1,38 -
05 08 Policy strategy and coordination of the 'Agriculture and rural development' policy area
36,49 9,70 26,79 73,41 % 22,35 49,14 39,16
Total Title 05 60.476,86 45.887,03 14.589,83 24,12% 18.835,64 33.425,46 30.205,01
Title 13 : Regional and urban policy
13 13 03 European Regional Development Fund and other regional operations
0,21 - 0,21 100,00 % - 0,21 -
13 04 Cohesion Fund (CF) 0,09 - 0,09 100,00 % - 0,09 -
Total Title 13 0,29 - 0,29 100,00% - 0,29 -
Title 18 : Migration and home affairs
18 18 01 Administrative expenditure of the 'Migration and home affairs' policy area
0,21 0,09 0,12 56,56 % - 0,12 -
Total Title 18 0,21 0,09 0,12 56,56% - 0,12 -
Total DG AGRI 60.477,66 45.887,25 14.590,40 24,13 % 18.835,64 33.426,04 30.205,01

agri_aar_2017_annexes Page 29 of 278

agri_aar_2017_annexes Page 30 of 278
TABLE 4 : BALANCE SHEET AGRI
BALANCE SHEET 2017 2016
A.I. NON CURRENT ASSETS 4.120.500.583,28 4.228.569.395,42
A.I.1. Intangible Assets 10.614.699,20 8.726.583,86
A.I.2. Property, Plant and Equipment -
A.I.5. Non-Current Pre-Financing 3.515.861.412,82 3.519.927.569,09
A.I.6. Non-Cur Exch Receiv & Non-Ex Recoverab 594.024.471,26 699.915.242,47
A.II. CURRENT ASSETS 3.330.567.023,81 3.731.197.555,52
A.II.2. Current Pre-Financing 1.426.595.040,10 1.654.007.638,79
A.II.3. Curr Exch Receiv &Non-Ex Recoverables 1.903.971.983,71 2.077.189.916,73
ASSETS 7.451.067.607,09 7.959.766.950,94
P.I. NON CURRENT LIABILITIES - (148.550.431,58)
P.I.2. Non-Current Provisions - (148.550.431,58)
P.II. CURRENT LIABILITIES (62.837.116.274,83) (62.748.448.158,84)
P.II.4. Current Payables (12.046.682.979,06) (12.657.676.460,23)
P.II.5. Current Accrued Charges &Defrd Income (50.790.433.295,77) (50.090.771.698,61)
LIABILITIES (62.837.116.274,83) (62.896.998.590,42)
NET ASSETS (ASSETS less LIABILITIES) (55.386.048.667,74) (54.937.231.639,48)
P.III.2. Accumulated Surplus/Deficit 228.270.270.678,21 173.232.065.358,66
Non-allocated central (surplus)/deficit* (172.884.222.010,47) (118.294.833.719,18)
TOTAL 0,00 0,00
It should be noted that the balance sheet and statement of financial performance presented in Annex 3 to this
Annual Activity Report, represent only the assets, liabilities, expenses and revenues that are under the control
of this Directorate General. Significant amounts such as own resource revenues and cash held in Commission
bank accounts are not included in this Directorate General's accounts since they are managed centrally by DG
Budget, on whose balance sheet and statement of financial performance they appear. Furthermore, since the
accumulated result of the Commission is not split amongst the various Directorates General, it can be seen that
the balance sheet presented here is not in equilibrium.

agri_aar_2017_annexes Page 31 of 278
TABLE 5 : STATEMENT OF FINANCIAL PERFORMANCE AGRI
STATEMENT OF FINANCIAL PERFORMANCE 2017 2016
II.1 REVENUES (1.488.599.294,85) (2.031.939.127,37)
II.1.1. NON-EXCHANGE REVENUES (1.495.203.889,97) (2.034.400.178,90)
II.1.1.5. RECOVERY OF EXPENSES (1.160.770.976,72) (1.868.113.166,51)
II.1.1.6. OTHER NON-EXCHANGE REVENUES (334.432.913,25) (166.287.012,39)
II.1.2. EXCHANGE REVENUES 6.604.595,12 2.461.051,53
II.1.2.1. FINANCIAL INCOME 3.736.140,20 (58.930,61)
II.1.2.2. OTHER EXCHANGE REVENUE 2.868.454,92 2.519.982,14
II.2. EXPENSES 55.850.889.986,83 57.070.144.446,92
II.2. EXPENSES 55.850.889.986,83 57.070.144.446,92
II.2.10.OTHER EXPENSES 11.632.869,16 51.416.752,31
II.2.1. EXP IMPLEM BY MEMBER STATES (SHARED) 55.700.884.766,04 56.774.397.885,79
II.2.2. EXP IMPLEM BY COMMISS&EX.AGENC. (DM) 33.437.587,02 32.301.047,59
II.2.4. EXP IMPL BY 3RD CNTR & INT ORG (IM) 105.541.546,16 165.281.629,91
II.2.6. STAFF AND PENSION COSTS (618.243,75) (416.395,84)
II.2.8. FINANCE COSTS 11.462,20 47.163.527,16
STATEMENT OF FINANCIAL PERFORMANCE
54.362.290.691,98 55.038.205.319,55
Explanatory Notes (facultative): Please enter the text directly (no copy/paste of formatted text which would then disappear when saving the document in pdf), use \\\"ctrl+enter\\\" to go to the next line and \\\"enter\\\" to validate your typing.
It should be noted that the balance sheet and statement of financial performance presented in Annex 3 to this Annual Activity Report, represent only the assets, liabilities, expenses and revenues that are under the control of this Directorate General. Significant amounts such as own resource revenues and cash held in Commission bank accounts are not included in this Directorate General's accounts since they are managed centrally by DG Budget, on whose balance sheet and statement of financial performance they appear. Furthermore, since the accumulated result of the Commission is not split amongst the various Directorates General, it can be seen that the balance sheet presented here is not in equilibrium. Additionally, the figures included in tables 4 and 5 are provisional since they are, at this date, still subject to audit by the Court of Auditors. It is thus possible that amounts included in these tables may have to be adjusted following this audit.

agri_aar_2017_annexes Page 32 of 278
TABLE 5bis : OFF BALANCE SHEET AGRI
OFF BALANCE 2017 2016
OB.1. Contingent Assets 315.137,89 226.694,50
GR for performance -
GR for pre-financing 315.137,89 226.694,50
OB.2. Contingent Liabilities (1.711.244.940,47) (1.711.244.940,47)
OB.2.3. CL EAGGF Guarantee (1.711.244.940,47) (1.711.244.940,47)
OB.3. Other Significant Disclosures (69.945.456.750,61) (69.945.456.750,61)
OB.3.2. Comm against app. not yet consumed (12.661.806.610,61)
(12.661.806.610,61)
OB.3.3.1 Structural operations (57.283.650.140,00)
(57.283.650.140,00)
OB.4. Balancing Accounts 76.574.311.315,73 76.574.399.759,12
OB.4. Balancing Accounts 76.574.311.315,73 76.574.399.759,12
OFF BALANCE 4.917.924.762,54 4.917.924.762,54
Explanatory Notes (facultative): Please enter the text directly (no copy/paste of formatted text which would then disappear when saving the document in pdf), use \\\"ctrl+enter\\\" to go to the next line and \\\"enter\\\" to validate your typing.
It should be noted that the balance sheet and statement of financial performance presented in Annex 3 to this Annual Activity Report, represent only the assets, liabilities, expenses and revenues that are under the control of this Directorate General. Significant amounts such as own resource revenues and cash held in Commission bank accounts are not included in this Directorate General's accounts since they are managed centrally by DG Budget, on whose balance sheet and statement of financial performance they appear. Furthermore, since the accumulated result of the Commission is not split amongst the various Directorates General, it can be seen that the balance sheet presented here is not in equilibrium. Additionally, the figures included in tables 4 and 5 are provisional since they are, at this date, still subject to audit by the Court of Auditors. It is thus possible that amounts included in these tables may have to be adjusted following this audit.

agri_aar_2017_annexes Page 33 of 278
TABLE 6: AVERAGE PAYMENT TIMES FOR 2017 - DG AGRI
Legal Times
Maximum Payment
Time (Days)
Total Number of Payments
Nbr of Payments
within Time Limit
Percen-tage
Average Payment
Times (Days)
Nbr of Late Payments
Percen-tage
Average Payment Times (Days)
30 828 815 98,43 % 11,09 13 1,57 % 51,69230769
45 574 544 94,77 % 30,42 30 5,23 % 61,53333333
60 35 35 100,00 % 33,60
90 36 36 100,00 % 41,89
Total Number of Payments
1473 1430 97,08 % 43 2,92 %
Average Net Payment Time
20,89952478 19,77 58,55813953
Average Gross Payment Time
25,23964698 21,71 142,627907
Suspensions
Average Report
Approval Suspension
Days
Average Payment Suspen-
sion Days
Number of Suspen-
ded Payments
% of Total
Number
Total Number of Pay-ments
Amount of Suspended Payments
% of Total
Amount Total Paid Amount
0 23 281 19,08 % 1473 4.565.222.755,56 42,28 % 10.796.835.249,51
DG
GL Account
Description Amount (Eur)

agri_aar_2017_annexes Page 34 of 278
Table 6a - Exercice 2017
Délais de paiement au 31/12/2017
Ligne budgétaire Libellé Unité NB
paiements Workfl.
SI2 Délai AGRI
Délai total Commission.
Nombre trans.
> délai autor.
% sur total
trans.
05.010211.00.02.40 Conférences 40 AGRI-H1 1 3 8 13
05.010401
Support expenditure for the European Agricultural Guarantee Fund (EAGF) - Non-operational technical assistance
AGRI-B1 6 4 15 19
05.080600 Enhancing public awareness of the common agricultural policy
AGRI-B1 MAR
103 3 9 13 4 3,9 %
05.080600 Enhancing public awareness of the common agricultural policy
AGRI-B1 SUB
18 4 49 54
05.010503 Other management expenditure for research and innovation programmes - Horizon 2020
AGRI-B2 17 3 10 15
05.046002 Operational technical assistance AGRI-B2 12 4 21 26
05.080300 Restructuring of systems for agricultural surveys
AGRI-C2 2 4 4 8 1 50,0 %
05.010201.00.02.20 Assistance technique AGRI-C3 7 9 17 21 1 14,3 %
05.080100 Farm Accountancy Data Network (FADN)
AGRI-C3 75 3 11 16 2 2,7 %
05.010401
Support expenditure for the European Agricultural Guarantee Fund (EAGF) - Non-operational technical assistance
AGRI-C4 37 5 19 23
05.010404.11 autres cr.adm.siege AGRI-C4 2 2 24 30
05.046002 Operational technical assistance AGRI-C4 5 3 40 45
05.087709 Preparatory action - Union plant and animal genetic resources
AGRI-C4 2 5 62 65
05.087710 Pilot project - Agropol: development of a European cross-border Agribusiness Model Region
AGRI-C4 1 7 32 35
05.070102 Monitoring and preventive measures - Direct payments by the Union
AGRI-D3 2 5 16 17
05.046002 Operational technical assistance AGRI-E2 29 2 16 20
05.046002 Operational technical assistance AGRI-E4 5 5 26 30
09.030100 Preparing broadband projects for public and/or private financing
AGRI-E4 1 1 32 35
05.060200 International agricultural organisations
AGRI-G2 1 0 40 45
05.080900 European Agricultural Guarantee Fund (EAGF) -¿Operational technical assistance
AGRI-G2 1 18 27 30
05.010401
Support expenditure for the European Agricultural Guarantee Fund (EAGF) - Non-operational technical assistance
AGRI-G3 18 8 16 21 3 16,7 %
05.060100 International agricultural agreements
AGRI-G4 3 22 36 39 1 33,3 %
05.010211.00.02.40 Conférences AGRI-H1 2 7 13 16
05.046002 Operational technical assistance AGRI-H1 7 6 15 18
05.080900 European Agricultural Guarantee Fund (EAGF) -¿Operational technical assistance
AGRI-H1 MAR
2 2 4 8
05.080900 European Agricultural Guarantee Fund (EAGF) -¿Operational technical assistance
AGRI-H1 SUB
2 4 10 15
05.010401
Support expenditure for the European Agricultural Guarantee Fund (EAGF) - Non-operational technical assistance
AGRI-ORCO
43 3 6 10
04.010401.11 autres cr.adm.siege AGRI-R3 11 2 3 8

agri_aar_2017_annexes Page 35 of 278
05.010401
Support expenditure for the European Agricultural Guarantee Fund (EAGF) - Non-operational technical assistance
AGRI-R3 188 3 5 9
05.010404.11 autres cr.adm.siege AGRI-R3 42 3 6 9
05.046002 Operational technical assistance AGRI-R3 92 3 4 8
05.080900 European Agricultural Guarantee Fund (EAGF) -¿Operational technical assistance
AGRI-R3 89 3 5 9
18.010401 Support expenditure for Internal Security Fund
AGRI-R3 4 3 5 9
18.010402 Support expenditure for Asylum, Migration and Integration Fund
AGRI-R3 5 5 7 11
05.010211.00.01.30 Réceptions AGRI-R5 16 2 9 14 1 6,3 %
05.010211.00.02.40 Conférences AGRI-R5 27 3 8 12
05.010211.00.06 Further training and management training
AGRI-R5 36 2 13 17 3 8,3 %
DG AGRI 914 3 10 14 16 1,8 %

agri_aar_2017_annexes Page 36 of 278
Table 6b - Exercice 2017
Délais de paiement et suspensions au 31/12/2017
Trans.clôtur.>délai autorisé Ligne budgétaire Libellé NB Délai moyen (45 jours) Paiements *** Nombre trans. % sut total
>délai autor. */** trans. 05.040501 FEADER: Programmes 2007-2013 0
05.050200 IPARD: Programmes 2007-2013 0
Total système local RDIS (1) 0 0 n/a
05.046001 FEADER: Programmes 2014-2020* 574 34,1 4 0,7%
Total système local RDIS 2 (2) 574 34,1 4 0,7%
05.04 / 05.05 Total Développement rural 574 34,1 4 0,7%
* All payments were treated in DG AGRI within the legal deadline (45 days), this figures includes the delay taken by DG BUDG for executing the bank transfer (on average 5,2 days per transaction) ** Due to limited payment appropriations available under 2017 budget, the Commission has proceeded with partial and proportional reimbursements for Q32017 declarations within the legal deadline. The remaining balances were paid from appropriations becoming available from the end-of-year adjustments to the 2017 budget.
*** It includes the partial payments executes in Q32017 (113 in the 1st tranche and 112 in the 2nd tranche) and 10 regularisation payments with no valid date for bank execution

agri_aar_2017_annexes Page 37 of 278
TABLE 7 : SITUATION ON REVENUE AND INCOME IN 2017
Revenue and income recognized Revenue and income cashed from Outstanding
Chapter Current year RO Carried over RO Total Current Year RO Carried over RO Total balance
1 2 3=1+2 4 5 6=4+5 7=3-6
61 REPAYMENT OF MISCELLANEOUS EXPENDITURE
- 4.659.319,52 4.659.319,52 - - - 4.659.319,52
65 FINANCIAL CORRECTIONS
32.614.795,69 15.206.648,24 47.821.443,93 27.494.122,10 5.830.547,19 33.324.669,29 14.496.774,64
67
REVENUE CONCERNING THE EUROPEAN AGRICULTURE GUARANTEE FUND AND THE EUROPEAN AGRICULTURAL FUND FOR RURAL DEVELOPMENT
1.969.973.503,45 21.794.654,25 1.991.768.157,70 1.898.224.340,21 21.794.654,25 1.920.018.994,46 71.749.163,24
90 MISCELLANEOUS REVENUE
130.531,01 - 130.531,01 130.531,01 - 130.531,01 -
Total DG AGRI 2.002.718.830,15 41.660.622,01 2.044.379.452,16 1.925.848.993,32 27.625.201,44 1.953.474.194,76 90.905.257,40
PS: Les montants du tableau Income de la DG BUDG ont été modifiés pour y inclure la balance des receivables ouverts pour le FEAGA
(61,502,982.78 € sur la ligne 67): cette modification est nécessaire car la table initiale n'inclut jamais la situation réelle du FEAGA

agri_aar_2017_annexes Page 38 of 278
TABLE 8 : RECOVERY OF PAYMENTS (Number of Recovery Contexts and corresponding Transaction Amount)
Total undue payments recovered
Total transactions in recovery context (incl. non-qualified)
% Qualified/Total RC
Year of Origin (commitment)
Nbr RO
Amount Nbr RO Amount Nbr
RO Amount
2007 4,00 185.748.371,56
2008 8,00 41.239.606,03
No Link 143,00 308.181.761,45
Sub-Total 155,00 535.169.739,04
EXPENSES BUDGET Error Irregularity OLAF Notified Total undue payments
recovered
Total transactions in recovery context
(incl. non-qualified)
% Qualified/Total RC
Nbr Amount Nbr Amount Nbr Amount Nbr Amount Nbr Amount Nbr Amount
INCOME LINES IN INVOICES 366,00 57.636.971,53
NON ELIGIBLE IN COST CLAIMS
13,00 20.180,45 13,00 20.180,45 15,00 35.587,31 0,87 0,57
CREDIT NOTES 7,00 399.257,72 13,00 363.905,25 20,00 763.162,97 46,00 1.348.649,21 0,43 0,57
Sub-Total 7,00 399.257,72 26,00 384.085,70 33,00 783.343,42 427,00 59.021.208,05 0,08 0,01
GRAND TOTAL 7,00 399.257,72 26,00 384.085,70 33,00 783.343,42 582,00 594.190.947,09 0,06 0,00

agri_aar_2017_annexes Page 39 of 278
TABLE 8 : RECOVERY OF PAYMENTS (Number of Recovery Contexts and corresponding Transaction Amount)
RECOVERY ORDERS Total undue payments recovered
Total transactions in recovery context (incl. non-qualified)
% Qualified/Total RC
Year of Origin (commitment)
Nbr RO
Amount Nbr RO Amount Nbr RO Amount
2017 1 98.686,53
Sub-Total 1 98.686,53
EXPENSES BUDGET Error Irregularity OLAF Notified
Total undue payments recovered
Total transactions in recovery context
(incl. non-qualified) % Qualified/Total RC
Nbr Amount Nbr Amount Nbr Amount Nbr Amount Nbr Amount Nbr Amount
INCOME LINES IN INVOICES
5 320.672,00 0,00% 0,00%
NON ELIGIBLE IN COST CLAIMS
13 20.180,45 13 20.180,45 13 20.180,45 100,00% 100,00%
CREDIT NOTES 7 399.257,72 13 363.905,25 20 763.162,97 46 1.348.649,21 43,48% 56,59%
GRAND TOTAL 7 399.257,72 26 384.085,70 33 783.343,42 64 1.689.501,66 51,56% 46,37%

agri_aar_2017_annexes Page 40 of 278
TABLE 9: AGEING BALANCE OF RECOVERY ORDERS AT 31/12/2017 FOR AGRI
Number at 01/01/2017
Number at 31/12/2017
Evolution Open Amount
(EUR) at 01/01/2017
Open Amount (EUR) at
31/12/2017 Evolution
1998 1 1 0,00 % 80.255,49 76.283,59 -4,95 %
1999 10 10 0,00 % 7.236.856,35 7.227.648,02 -0,13 %
2000 1 1 0,00 % 1.678.232,59 1.506.032,59 -10,26 %
2001 2 1 -50,00 % 1.134.110,41 474.952,85 -58,12 %
2003 1 1 0,00 % 3.674.865,52 3.674.865,52 0,00 %
2004 1 1 0,00 % 984.454,00 984.454,00 0,00 %
2016 20 1 -95,00 % 26.898.340,58 91.184,00 -99,66 %
2017 2 15 650,00 % 122.343,72 76.869.836,83 62731,04 %
38 31 -18,42 % 41.809.458,66 90.905.257,40 117,43 %
TABLE 9: AGEING BALANCE OF RECOVERY ORDERS AT 31/12/2017 FOR AGRI
(Direct Management)
Number at 01/01/2017
Number at 31/12/2017
Evolution Open Amount
(EUR) at 01/01/2017
Open Amount (EUR) at
31/12/2017 Evolution
1998 1 1 0,00 % 80.255,49 76.283,59 -4,95 %
1999 10 10 0,00 % 7.236.856,35 7.227.648,02 -0,13 %
2000 1 1 0,00 % 1.678.232,59 1.506.032,59 -10,26 %
2001 2 1 -50,00 % 1.134.110,41 474.952,85 -58,12 %
2003 1 1 0,00 % 3.674.865,52 3.674.865,52 0,00 %
2004 1 1 0,00 % 984.454,00 984.454,00 0,00 %
16 15 -6,25 % 29.577.548,72 27.888.473,14 5,71 %
* remboursement 172.200,00 € encaissés en date valeur du 29/12/2017, enregistré dans Abac le 03/01/2018 (réf. FEO.86).
** renonciation -659.157,56 € (cf. table 10) (réf. FEO.97).

agri_aar_2017_annexes Page 41 of 278
TABLE 10 : RECOVERY ORDER WAIVERS IN 2017 >= EUR 100.000
Waiver Central
Key Linked RO Central Key
RO Accepted Amount
(Eur)
LE Account Group
Commission Decision
Comments
1 3233170075 3240309596 -659.157,56 Private Companies
Total DG AGRI -659.157,56
Number of RO waivers 1
TABLE 11 : CENSUS OF NEGOTIATED PROCEDURES - DG AGRI - 2017
Negotiated Procedure Legal base Number of Procedures
Amount (€)
Total
No data to be reported
TABLE 12 : SUMMARY OF PROCEDURES OF DG AGRI EXCLUDING BUILDING CONTRACTS
Internal Procedures > € 60,000
Procedure Legal base Number of Procedures
Amount (€)
Open Procedure (Art. 104(1) (a) FR) 7 12.778.588,13
Open Procedure (Art. 127.2 RAP) 3 1.418.525,00
Total 10 14.197.113,13

agri_aar_2017_annexes Page 42 of 278
Table 12bis - Internal Procedures > € 60,000
Procedure Local Key
DG
Procedure External Action Code
Procedure Central
Identifier
Procedure Type/Legal Basis Desc
Procedure User Reference Procedure Lot
Awarded Amount (EUR)
Publication
SI2.118771.CNTS_MIGR
AGRI NOT PR-00020090 Open Procedure (Art. 104(1) (a) FR)
AGRI-2016-EVAL-04 - FRAMEWORK CONTRACT FOR THE EVALUATION STUDIES OF THE CAP: SYNTHESIS AND CROSS-THEMATIC ISSUES
4.357.687,50 07/10/2016
SI2.1358 AGRI NOT PR-00045023 Open Procedure (Art. 127.2 RAP) AGRI-2017-EVAL-01 418.525,00
01/07/2017
SI2.1376 AGRI NOT PR-00045621 Open Procedure (Art. 127.2 RAP) AGRI-2017-EVAL-04 640.000,00
29/08/2017
SI2.1379 AGRI NOT PR-00045661 Open Procedure (Art. 127.2 RAP) AGRI-2017-EVAL-08 360.000,00
29/03/2017
SI2.1467 AGRI NOT PR-00047202
Open Procedure (Art. 104(1) (a) FR) AGRI-2017-EVAL-07 298.500,00
20/07/2017
SI2.1487 AGRI NOT PR-00047622
Open Procedure (Art. 104(1) (a) FR) AGRI-2017-EVAL-06 297.740,00
01/08/2017
SI2.1613 AGRI NOT PR-00050061
Open Procedure (Art. 104(1) (a) FR) AGRI-2017-EVAL-03 229.000,00
25/07/2017
SI2.1728 AGRI NOT PR-00051882
Open Procedure (Art. 104(1) (a) FR) AGRI-2017-EVAL-05 899.200,00
18/07/2017
SI2.1896 AGRI NOT PR-00053105
Open Procedure (Art. 104(1) (a) FR)
AGRI-2016-EVAL-03 -EVALUATION STUDIES OF CAP MEASURES CONTRIBUTING TO THE GENERAL OBJECTIVES OF BALANCED TERRITORIAL DEVELOPMENT 3.496.460,63
23/04/2016
SI2.54 AGRI NOT PR-00027661 Open Procedure (Art. 104(1) (a) FR)
AGRI/2016/J1/04 - FRAMEWORK CONTRACT FOR THE PROVISION OF EXTERNAL AUDIT SERVICES IN RELATION TO FINANCIAL CLEARANCE OF ACCOUNTS FOR EAGF AND EAFRD TO EC DIRECTORATE-GENERAL FOR AGRICULTURE AND RURAL DEVELOPMENT
3.200.000,00 30/12/2016
10 14.197.113,13

agri_aar_2017_annexes Page 43 of 278
TABLE 13 : BUILDING CONTRACTS
Legal base Contract Number
Contractor Name Description Amount (€)
No data to be reported
TABLE 14 : CONTRACTS DECLARED SECRET
Legal base Contract Number Contractor Name Description Amount (€)
No data to be reported

agri_aar_2017_annexes Page 44 of 278
ANNEX 4: Materiality criteria
General Principle
Reasonable assurance is the judgement of the Authorising Officer by Delegation (hereafter referred to as the Director General). For this purpose, he/she is required to
assess all relevant information at his/her disposal available to support the declaration of assurance. Under shared management, implementation tasks including controls and
payments are delegated to the Member States in accordance with the criteria and procedures laid down in the Financial Regulation and in sector-specific rules. For EAGF
and EAFRD the provision of assurance has therefore to be based on the assessment of
the information and indicators resulting from the management reporting and supervision arrangements in place and of the functioning of the internal control systems operated by
the Member States' implementing bodies. This assessment allows the Director General to form an opinion as to the effectiveness of the management and control systems operated
at the level of the Member States' implementing bodies.
Assurance model for expenditure implemented under shared management
The EAGF and EAFRD are implemented through a management and control system based
on four levels. Taken together, these four levels and the results they produce are the
basis for the Director General to obtain reasonable assurance as to the effectiveness of management and control systems and the legality and regularity of the expenditure.

agri_aar_2017_annexes Page 45 of 278
Levels
of assura
nce
from
the
Mem
ber
Sta
tes' contr
ol syste
ms
Administrative structure set up at Member States level: management, control and payment of the expenditure are entrusted to
accredited Paying Agencies. Compliance with strict accreditation criteria (which are laid down in Commission Implementing Regulation
(EU) No 908/2014 and in Commission Delegated Regulation (EU) No 907/2014) is subject to constant supervision by the competent national
authority (at Ministerial level). The Paying Agencies are required to
provide an annual Management Declaration which includes a declaration that the system in place provides reasonable assurance on
the legality and regularity of the underlying transactions.
Administrative controls and on-the-spot checks (prior to payment): for each support scheme financed by the EAGF or EAFRD,
the Paying Agencies apply a system of exhaustive administrative controls (100% of aid applications must be checked) and on-the-
spot checks (at least 5% in the case of most schemes) prior to any payment. These controls are made in accordance with precise rules set
out in the sector specific legislation (e.g., the Integrated Administration
and Control System – IACS, including a Land Parcel Identification System – LPIS). Member States are required to send detailed
information on the checks carried out and their results on a yearly basis to the Commission (control data and statistics).
Audits by Certification Bodies and controls after payment by the
Paying Agencies: The Certification Bodies deliver each year an opinion on the completeness, accuracy and veracity of the Paying
Agencies' annual accounts, on the proper functioning of their internal control systems and on the legality and regularity of the expenditure
for which reimbursement has been requested from the Commission. They also verify compliance of the Paying Agencies with accreditation
criteria and the Management Declarations. In addition all aid
measures other than direct payments covered by the IACS are also subject to ex-post controls, either by a specific control body (in the
case of the EAGF) or by the Paying Agency itself (in the case of the EAFRD)
Assura
nce fro
m t
he C
om
mis
sio
n's
checks
DG AGRI audits: The audits carried out by DG AGRI serve a number
of purposes.
In the first place, they protect the EU budget from irregular payment
by recovering amounts unduly spent by the Member State as a result of deficiencies detected in their management and control systems.
This is done via a clearance procedure consisting of both an annual financial clearance (limited to the Paying Agencies' annual accounts)
and a multi-annual conformity clearance, whose aim is to exclude
the expenditure not compliant through net financial corrections which return to the EU budget as assigned revenue.
Secondly, by revealing deficiencies to be remedied and by leading to financial corrections up to the moment those deficiencies have been
corrected, they have a remedial and preventive role.
Thirdly, DG AGRI's audits are also used to provide assurance to the
Director General on the Member States' management and control systems.

agri_aar_2017_annexes Page 46 of 278
Assessment of management and control systems in the Member States
The Director General carries out an assessment on the extent to which he/she can draw
assurance from the four levels of the management and control systems described. This assessment is based on three elements as follows:
The first element is the assessment of the functioning of management and control systems in the Paying Agencies. This is carried out by DG AGRI’s audit
directorate and includes:
Checking compliance of the Paying Agencies with the accreditation criteria. This is
carried out by the Certification Bodies with, where appropriate, the placing under
probation of those Paying Agencies with serious deficiencies in their application of the accreditation criteria by the Competent Authority.
The performance by DG AGRI, on the basis of a detailed risk analysis, of accreditation audits in order to check by itself the respect by Paying Agencies of
accreditation criteria as well as audits on the proper functioning and operation of the Certification Bodies.
The qualitative analysis of the Management Declarations issued by the directors of the Paying Agencies whereby they are required to declare whether they have put
in place systems which provide reasonable assurance on the legality and
regularity of the underlying transactions.
The qualitative analysis of the opinions from the Certification Bodies on these
Management Declarations.
An annual financial clearance exercise carried out by DG AGRI examining the
completeness, accuracy and veracity of the accounts declared by the Paying Agencies and resulting in the adoption of a clearance of accounts decision without
prejudice to the conformity procedure with regard to the legality and regularity of the expenditure.
The second element assessed is the result of the controls carried out by the
Member States on the final beneficiaries and their certification.
For most of the agriculture budget, each year Member States are required to send
detailed information to the Commission in relation to the more than 900 000 on-the-spot checks carried out. For the large part7, these results relate to the
financial year covered by the AAR in question. These data provide detailed information on the errors discovered in the course of administrative and/or on-
the-spot checks and enable DG AGRI to determine the reported error rate per Paying Agency or aid scheme.
The Certification Bodies are required to give an opinion on the legality and
regularity of the expenditure for which reimbursement has been requested from the Commission.
The third assurance element is comprised of the Commission's own conformity audits on Member States management and control systems. DG AGRI's conformity
clearance procedure can exclude from EU financing expenditure made in the 24 months prior to the notification to the Member States of a deficiency and up to the moment the
identified deficiencies are remedied. Around 150 such audits are opened each year on the basis of a detailed risk analysis and enable the Commission to obtain direct assurance as
to the effectiveness of the Paying Agencies' management and control systems.
7 This is presently not always the case for statistics for certain measures under Rural Development where there
is a limited overlap between reporting period and financial year.

agri_aar_2017_annexes Page 47 of 278
Materiality criteria
DG AGRI estimates the error rate on the basis of control statistics for each Paying Agency (or measure for market measures, ABB 02) and for each ABB activity and also takes into
account all available information and audit results (Certification Bodies, Commission and Court of Auditors), including on-the-spot missions; this information is used as the best
estimate of the possible risk for expenditure in the reporting year. In the event that the
error rates reported by Member States are not accurate or found not to be reliable or are not available, the audit directorate either re-calculates them when it has sufficient
information to do so or, alternatively, adjusts them upwards by flat rates in line with the results of the assessment of the functioning of the management and control systems.
This results in an error rate at Paying Agency level validated and adjusted by the management of DG AGRI (adjusted error rate).
Further steps in the process determine when a reservation shall be made by the Director General, what elements are included in the amount at risk and how he/she can
demonstrate the overall remaining financial risk to the EU budget when all corrective
measures have been taken into account.
As regards "corrective measures", the net financial corrections imposed by the
Commission and the recoveries operated by the Member States themselves are ex-post exercises and multi-annual in nature. It is extremely rare that financial corrections and
recoveries are executed in the same financial year as that of the expenditure concerned. However, the performance of the ex-post corrective system can be estimated from its
results in the most recent years. Consequently, DG AGRI reports on a corrective capacity that is estimated as the annual average of the implemented net financial corrections
imposed by the Commission and recoveries of undue payments declared by the Member
States for the last five years.
Comparing the corrective capacity with the amount at risk gives a solid indication of the
remaining financial risk to the EU budget when all corrective actions are taken into account ("estimated overall amount at risk at closure", presented for DG AGRI as
"Estimated final amount at risk" in table under chapter 2.1.1)..
Step 1: Estimation of an error rate at Paying Agency level = REPORTED ERROR
RATE
In the first place, for each ABB, the statistical data sent by the Paying Agencies on the results of the administrative and on-the-spot checks carried out is collected, compiled
and checked for consistency and completeness. The error rate per Paying Agency used as the basis for the subsequent assessment is the error rate found in the random on-the-
spot check sample, and after deduction of the errors found as a result of administrative controls. On that basis, a "reported error rate" is calculated, which represents the error
rate that remains in the non-controlled population (= the aid applications/payment
claims which have not been controlled on-the-spot by the Paying Agencies). This reported error rate is used for calculating a first estimate of the amount at risk. It is
noted that the vast majority of this statistical data relates to checks carried out in respect of the financial year which is the subject of the report.

agri_aar_2017_annexes Page 48 of 278
Step 2: Validation and adjustment of the reported error rate by DG AGRI at
Paying Agency/Member State and ABB level = ADJUSTED ERROR RATE
All available information is considered in determining to what extent the reported error rate is reliable for each Paying Agency for each ABB activity. Where ex-post audits (by
the Commission, Certification Bodies or the European Court of Auditors (ECA)) have revealed management and control systems' deficiencies, these are not reflected in the
Member States' control statistics and, therefore, those statistics do not reflect the risk resulting from those deficiencies. In order to estimate the level of unreported errors, the
auditors make adjustments to the reported error rates taking into account the following
evidence:
DG AGRI's own audits over the previous three years (including conformity audits
and accreditation audits); older reports in cases where available information indicates that no or insufficient remedial actions have been implemented. This
includes the auditors' professional judgement on the evolution of the control environment in the Paying Agency.
The opinion which the Certification Bodies have delivered on the legality and regularity of the expenditure for which reimbursement has been requested from
the Commission, including the reliability of the control statistics reported by the
Paying Agencies and the quality of the underlying controls, is also examined.
ECA's previous three annual reports are also taken into account; older reports in
cases where available information indicates that no or insufficient remedial actions have been implemented. In the event that a DG AGRI audit has taken place more
recently than the ECA's audit, it is possible that the assessment arising from the latter is replaced by the DG AGRI more recent appreciation of the situation.
Information furnished by the operational units within the DG regarding the reliability of Member States' statistics or other information obtained pertaining to
deficiencies in their management and control systems, or remedial action taken by
Member States.
Other relevant evidence including elements signalled by
o the Anti-Fraud Correspondent of DG AGRI;
o the director of the Paying Agency in his/her Management Declaration;
In determining the extent of the adjustment to make to the reported error rate, DG AGRI applies the professional judgement of its auditors and in particular the criteria for
estimating the seriousness and extent of the identified deficiencies established in its "Guidelines on the calculation of the financial corrections in the framework of the
conformity and financial clearance of accounts procedures"8. When using these criteria,
the auditors take into account that the methodology for preparing financial corrections aims at covering the risk to the EU budget whereas the top-up to be applied should
represent the audit assessment of the extent to which the Paying Agency's reported error rate is understated; for instance, insufficient sanctions represent a risk to the EU budget
but shall not be considered as errors to be included in the error rate for the expenditure of the year in question.
For ABB 03 and ABB 04, the decision making process for the assessment is carried out by the auditors concerned, on a case by case basis, for each Paying Agency. All
available information, including the input of the operational units, is integrated to
complete the assessment process. The professional judgement of the audit services of the DG is applied particularly when weighing contradictory information or
considering abnormal statistical results. This results in an additional error rate top-up
8 See C(2015) 3675 final; previously Document VI/5330/97, AGRI/60637/2006, AGRI-2005-64043, COM(2010)
2498 final and D(2012)1338812 were considered.

agri_aar_2017_annexes Page 49 of 278
to the reported error rate and the calculation of an adjusted error rate and the corresponding amount at risk.
For ABB 02, the same approach is followed but per measure instead of per Paying Agency.
Coordination is carried out at the level of DG AGRI's audit directorate to ensure that there is a consistency of approach taken as regards the adjustments made to the
Member States' error rates.
For measures about which there is no information on the risk (no reporting required
by the legislation), the average adjusted error rate (for that part of the ABB for
which statistics are available) is extrapolated to the expenditure concerned.
The additional amount at risk resulting from an adjustment or "top-up" is added to
the initial amount at risk calculated in Step 1, resulting in an adjusted amount at risk for each Paying Agency.
The adjusted error rate per Paying Agency is obtained by dividing the adjusted amount at risk by the expenditure declared to the Commission for the financial year.
Adjusted error rates are aggregated at Member State and ABB levels by aggregating the adjusted amounts at risk.
Step 3: DG AGRI materiality criteria
Article 66(9) of the Financial Regulation provides that
"The authorising officer by delegation shall report to his or her institution on the
performance of his or her duties in the form of an annual activity report containing financial and management information, including the results of controls, declaring that,
except as otherwise specified in any reservation related to defined areas of revenue and expenditure, he or she has reasonable assurance …"
The Director General for DG AGRI shall make financial reservations at Paying Agency
level (and/ or aid scheme level as regards market measures within ABB02).
Paying Agencies with an adjusted error rate above 5% shall in general be
subject to a reservation.
For Paying Agencies with an adjusted error rate between 2% and 5%,
professional judgement shall be applied in assessing whether the risk is sufficiently covered by mitigating factors and thus whether a financial reservation
is necessary. The operational units of DG AGRI are integrated into the decision making process for determining the existence of mitigating factors. The mitigating
factors are disclosed in all cases where a reservation is deemed to be not
necessary. They shall include notably whether the necessary remedial actions have been implemented by the Member State/Paying Agency concerned and
whether there is an on-going conformity clearance procedure covering the expenditure for the financial year of the AAR.
A de minimis approach for deciding on reservations shall be applied. Given the amounts at stake for the CAP with expenditure of ± 55 billion EUR, a de minimis
threshold of 1 million EUR is applied. All cases for which the amount at risk is below that threshold are not subject to a reservation (unless on reputational
grounds). Reservations made for the preceding year shall not be issued for the
financial year concerned by the AAR if the amount at risk for that financial year is below the 1 million EUR threshold.

agri_aar_2017_annexes Page 50 of 278
For market measures a flexible approach may also be taken when deciding on reservations, notably where the adjusted error rate is calculated on a purely
risk based sample. For most market schemes, the legislation does not require that a random sample is selected for on-the-spot checks. The latter are, rather, risk
based. Extrapolating the result of the risk sample therefore to the uncontrolled population would result in overstating the error rate and amount at risk. In such
cases it shall be evaluated if there are elements which mitigate against applying a reservation even where the adjusted error rate is above 5%.
If the adjusted error rate is below 2%, generally no reservation is made.
Coordination is carried out between all relevant parts of DG AGRI to ensure that there is a consistency of approach as regards the mitigating factors examined when deciding
whether a reservation is necessary.
In the framework of shared management, as set out in the Financial Regulation and the
rules on the financing of the CAP, it is the Member State, which has to assume the overall responsibility for ensuring that actions financed by the budget are implemented
correctly in accordance with the rules. Therefore, while the action plans, accompanying reservations where necessary, should identify the deficiencies and Paying Agencies
concerned, it is the Member State which must ensure that the corresponding remedial
actions are precisely defined and actually implemented.
Step 4: Quantification of the reservation
The amount under reservation is the amount at risk for each Paying Agency (or Member State in respect of ABB02) for which a reservation has been made. It is aggregated at
Member State level.
Step 5: Calculation of the amount at risk at ABB level
The amount at risk aggregated at ABB level is the amount of EU expenditure which
risks to have been misspent on the basis of the adjusted error rates; it covers all Paying Agencies irrespective of whether they are subject to a reservation.

agri_aar_2017_annexes Page 51 of 278
Paying Agency
control statistics
DG AGRI Validation
Process = PA control
statistics + DG AGRI
adjustment
adjusted
Error Rate
(aER)/PA
Reservation
Amount
subject to
reservation
aER >5%
Yes Yes
Yes
No
aER < 2%
Step 1 Step 2 Step 3 Step 4 Step 5
DG AGRI'S DECISION
PROCESS FO
R MAKIN
G RESERVATION
S
Action Plan
Paying agency level MS level ABB Level
Amount at
risk
estimation of a
reported error rate at
Paying Agency level
validation and adjustment
by DG AGRI; calculation of
an adjusted Error Rate (aER)
DG AGRI materiality criteria
aER 2-5%
Risk
mitigation
factors
No
de minimis
quantification of
the reservation
calculation of the
amount at risk at
ABB level
Insufficient
risk
mitigation
factors

agri_aar_2017_annexes Page 52 of 278
ANNEX 5: Internal Control Template(s) for budget implementation (ICTs)
EXPENDITURE IN SHARED MANAGEMENT9
Stage 1 – (Negotiation and) assessment/approval of spending proposals:
Main control objectives: Ensuring that the Commission (COM) adopts the actions that contribute the most towards the achievement of
the policy objectives (effectiveness);
Main risks Mitigating controls How to determine coverage frequency
and depth
How to estimate the costs and benefits of
controls
Control indicators
The actions financed10 do not adequately reflect
the policy objectives or priorities.
Internal consultation, hierarchical validation at
DG-level of each action. Inter-service
consultation (including all relevant DGs)
Adoption by
Commission Decision, where foreseen by EU
law.
Coverage / Frequency: 100%.
Depth: checklist, guidelines and lists of
requirements in the relevant regulatory
provisions.
Costs: estimation of cost of staff involved in the
validation of the spending proposals put
forward by the Member States (for 2014-2020).
Benefits: adopted
actions have a clear intervention logic,
allowing the Commission to evaluate their impact
[non-quantifiable individually]
Effectiveness: - % of actions adopted/
approved11 - % of financial allocation
approved12 Efficiency:
- average time to adopt/
approve an action13
9 DG AGRI uses the Internal Control Template for shared management covering 99.6 % of its total expenditure and other management modes fall under the 'de minimis'
threshold. 10 For CAP: the programmes, measures and schemes supported under the Market measures, Direct Aids and Rural Development pillars (EAGF and EAFRD). 11 For the 1st pillar, the indicator refers to legal acts adopted; for the 2nd pillar to legal acts adopted, to the modification of RDP 2007-2013 and to the approval of RDP 2014-
2020. 12 For the 1st pillar the indicator refers to the execution of financial ceilings, for the 2nd pillar to budget allocation of RDP 2014-2020 approved in 2014. 13 For the 1st pillar, the indicator refers to legal acts adopted, for the second pillar to legal acts adopted and to the approval of RDP 2014-2020.

agri_aar_2017_annexes Page 53 of 278
Stage 2 – Implementation of operations (Member States):
A. Setting up of the systems
Main control objectives: ensuring that the management and control systems are adequately designed
Main risks It may happen (again)
that…
Mitigating controls How to determine coverage, frequency
and depth
How to estimate the costs and benefits of
controls
Control indicators
The process of designation (and
accreditation) of national authorities in
the Member States (MS) is not effective and, as a
result, the management and control systems are
not compliant with the
applicable rules.
Supervision by Commission (for 2014-2020):
- Commission review (and audits) of a sample
of national designations/
accreditations - submission of MS Audit
Strategies to the
Commission (on request)* * [For Cohesion policy]
Coverage / Frequency: fixed in
sector-specific rules Depth: verification
(desk review + audit missions where
necessary) of description of
management and
control systems communicated by MS.
Accreditation audits are generally done on-the-
spot.
Costs: estimation of cost of COM staff involved in
the audits of samples of national designations/
accreditations (for 2014-2020)
Benefits:(part of) the amounts associated with
unreliable systems for
which the Commission audit work revealed
substantial compliance problems (for 2014-2020
) [not quantifiable]
For 2014-2020: Effectiveness:
- % of authorities designated/accredited
- number of authorities for which serious system
weaknesses were found following accreditation
reviews/audits
Efficiency: - number of authorities for
which serious weaknesses found by accreditation
reviews/audits (% of total checked)

agri_aar_2017_annexes Page 54 of 278
B. Member states' controls to prevent, detect and correct errors within the declared certified expenditure
Main control objectives: ensuring that the periodic expenditure declarations submitted to the Commission for each action are legal and
regular
Main risks It may happen (again)
that…
Mitigating controls
How to determine coverage, frequency and
depth
How to estimate the costs and benefits of
controls Control indicators
Periodic expenditure
declarations submitted to the Commission
include expenditure which is irregular or non-
compliant with EU and/or national eligibility rules
and legislation.
Management
verifications: first level checks by
designated/accredited programme authorities
or bodies.14 Certification, audit
opinion and annual
report by the relevant authorities or bodies
designated/accredited.15
MS recoveries from final beneficiaries (CAP)
Coverage: fixed in sector-
specific rules Depth:
- management verifications: performance of first-level
checks (administrative and on the spot controls).
- certification: [limited]
additional verification (desk checks and on-the-spot),
with where appropriate additional checks.
- audit opinion: system audits on the checks already
carried out, where necessary with re-performance of on-
the-spot checks; where
applicable, audits of operations (on a statistical
basis) and additional substantive testing on
expenditure.
Costs: real costs for the
management and control activities of
paying agency
Benefits: - Amounts of corrected
undue payments (prior
to reimbursement from the control statistics)
- MS recoveries
Effectiveness:
- Amount and % of corrected undue
payments (prior to reimbursement from the
control statistics) as reported by MS.
- annual certificate
opinions of the Member States.
- MS recoveries Efficiency:
Ratio = (amount of corrected undue
payments plus MS recoveries) divided by
costs of management and
controls - time to lift interruption
of payments16
14 For CAP: Paying Agency (PA) 15 For CAP: Certification Body (CB) 16 For EAFRD: average time of interruption/suspension.

agri_aar_2017_annexes Page 55 of 278
Stage 3 – Monitoring and supervision of the execution, including ex-post control
Main control objectives: ensuring that the expenditure reimbursed from the EU budget is eligible and regular
Main risks
It may happen (again) that…
Mitigating controls
How to determine
coverage, frequency and depth
How to estimate the
costs and benefits of controls
Control indicators
The management verifications and
subsequent audits/controls by the
Member States have failed to detect and
correct ineligible costs or calculation
errors.
The audit work
carried out by the audit/certification
authorities is not sufficient to obtain
adequate assurance on the submitted
declarations.
The Commission
services have failed to take appropriate
measures to safeguard EU funds, based on the
information it received.
Commission checks of periodic MS expenditure
declarations. Commission
assessment of
management and control systems in the
Member States, in particular of work done
and/or reported by the AA17/PA/CB, namely:
- assessment of annual control/audit/certifica
tion report
- calculation of projected error rate
(where applicable)
- estimation of a
residual error rate (RER)
- assessment of systems audits
reports from AA/CB
- assessment of annual
Coverage: verification
of information provided in the annual
(audit/control /certification) report
and annual audit opinions.
Depth: desk checks and/or on-the-spot
audits based on risk
assessment; verification of the
quality and reliability of the information
based on Commission’s own
audit work; ‘validation’ and where necessary
adjusting of error rates
reported by MS to calculate a cumulative
residual error risk (RER);
[at closure: where
applicable scrutiny of closure report and
Costs:
- cost of Commission financial officers
checking MS expenditure (financial
circuits) - estimation of cost of
Commission staff involved in the
assessment of
management and control systems in MS,
including analysis of AA/CB report, own
audit work18,and drafting of interruption
letters Benefits: errors
prevented
[unquantifiable], errors detected or corrected
(amount of financial corrections).
Effectiveness:
- best estimate of residual risk of error per MS
- number of programmes/MS/PA with a
reported error rate assessed as reliable (and not subject to an
adjustment) - Number, amount and % (of
expenditure declared in 2014)
of interruptions/suspensions of payments
- net financial corrections made resulting from Commission
audit work Efficiency:
- cost of control/financial management of the
Commission checks and
assessment (% of total appropriations)
- Ratio = cost of Commission staff involved in the assessment
of management and control systems in MS divided by total
17 Audit Authority (AA) 18 Systems audit, re-performance of annual control reports (ACR), follow-up of audit authorities, closure audits, fact finding audits, conformity audits of PA (CAP), etc.

agri_aar_2017_annexes Page 56 of 278
Main risks It may happen
(again) that…
Mitigating controls How to determine coverage, frequency
and depth
How to estimate the costs and benefits of
controls
Control indicators
summaries (where applicable)
- own Commission
audits
- technical and bilateral
meetings with MS
Interruptions and suspensions of
payments Financial corrections
(implemented by
Commission) Annual financial
clearance procedure and multi-annual
conformity clearance procedure (CAP)
closure opinion, if needed with audits on
sample of OPS]
amount of net financial corrections adopted by the
Commission
- Time-to-payment / % of
Commission payments within delays

agri_aar_2017_annexes Page 57 of 278
ANNEX 6: Implementation through national or international public-sector bodies and bodies governed
by private law with a public sector mission (not applicable)
ANNEX 7: EAMR of the Union Delegations (not
applicable)
ANNEX 8: Decentralised agencies (not applicable)

agri_aar_2017_annexes Page 58 of 278
ANNEX 9: Evaluations and other studies finalised or cancelled during the year
No used
in MP 2017
Title Reason1
Scope2 Type3
Associated DGs
Costs (EUR)
Comments4
Reference5
I. Evaluations finalised or cancelled in 2017
a. Evaluations finalised in 2017
no evaluations
finalised in 2017
b. Evaluations cancelled in 2017
no evaluations cancelled in 2017
II. Other studies finalised or cancelled in 2017
a. Other studies finalised in 2017
NA Logistical facilities
and storage capacity for EU
food trade (open call)
identify and
analyse capacity,
bottlenecks and their
impact
395000,0
0
https://publications.europa.eu/en/publicat
ion-detail/-/publication/b102ecaa-2cbd-11e8-b5fe-01aa75ed71a1/language-
en/format-PDF/source-67300102.
NA Risk management for EU agriculture
(open call)
analysis of multiple risks
agriculture
faces and the risk
management instruments
deployed, EU level and
Member States
571750,00
Publication envisaged in May 2018

agri_aar_2017_annexes Page 59 of 278
b. Other studies cancelled in 2017
1 Reason why the evaluation/other study was carried out, please align with Annex 3 of the MP 2016. The individual symbols used have the following meaning: L - legal act, LMFF -
legal base of MFF instrument, FR - financial regulation, REFIT, REFIT/L, CWP - 'evaluate first', O - other (please specify in Comments) 2 specify what programme/regulatory measure/initiative/policy area etc. has been covered 3FC – fitness check, E – expenditure programme/measure, R – regulatory measure (not recognised as a FC), C – communication activity, I – internal Commission activity, O –
other – please specify in the Comments 4Allows to provide any comments related to the item (in particular changes compared to the planning). When relevant, the reasons for cancelling evaluations/ other studies also need
to be explained in this column. 5For evaluations the references should be 1) number of its Evaluation Staff Working Document and number of the SWD's executive summary; 2) link to the supportive study of the
SWD in EU bookshop. For other studies the references should be the link to EU bookshop or other reference where the ‘other study’ is published via different point.

agri_aar_2017_annexes Page 60 of 278
EVALUATION OF THE "GREENING MEASURES" UNDER THE CAP (DIRECT PAYMENTS REGULATION)
Overall, only small changes in farmers' management practices, except in a few specific areas. Hence, environmental and climate impacts limited and locally specific. Limited
effect on production output or economic viability; administrative costs relatively low.
Series of recommendations to improve the "greening measures'" living up to their
environmental potential within CAP.
Main findings
Drivers influencing implementation choices:
o Member States: Administrative issues such as straightforward implementation, less administrative burden, avoiding mapping errors and risks of disallowance.
Environmental priorities were not a major factor. Equivalent practices were not extensively used (complex requirements and approval process).
o Farmers: minimising the risk of non-compliance and penalties; avoiding administrative complexity and burden; as well as the degree of fit with existing
farm practices and other CAP instruments (e.g. coupled support) or the requirements of cross-compliance, to minimise any changes in practices or
additional costs.
Effects of the measures on farming practices and production
o Crop diversification: At least 70% was already meeting this requirement; slow
down of trend towards monocropping; no significant effect on the profitability of farmers.
o Permanent Grassland: Changes in the definition and eligibility have led to an increase in the area of permanent grassland to be counted for the ratio in 15
Member States, and a decrease in 12. Clear pressures on permanent grassland are evident in 2015-2016 in 12 Member States. Pre-authorisation systems
disincentive ploughing-up. It is likely that ESPG designation ("environmentally
sensitive permanent grassland") in Natura 2000 areas leads to closer control for these areas; outside these areas the designation is low.
o Ecological Focus Areas: more declared than required (9.7% instead of 5%), mainly productive or potentially productive areas (N-fixing and catch crops 73%,
land lying fallow 24%). Impact on landscape features small.
Environmental and climate effects (effectiveness)
o EFA: Potential to deliver benefits for biodiversity, water, soils and climate.
o Crop Diversification: Net effects very limited, although potentially locally
significant.
o Permanent grassland: Benefits depend on the location and type of grassland maintained, degree of ploughing-up or reseeding.
o ESPG: Limited, as often low designation by MS.
o Farmers’ awareness of environmental issues: Limited.

agri_aar_2017_annexes Page 61 of 278
Administrative costs and efficiency
o Transaction costs for farmers 3-9 hours per year, largely independent of farm
size.
Coherence (internal and external), relevance & EU added value
o Generally coherent with other relevant measures (cross-compliance and agri-environment-climate measure); more synergies possible.
o Permanent grassland: Incoherence also due to MS implementation rules; large areas of environmentally valuable permanent grassland can be excluded from
the scope of the measure.
o Relevance: limited.
o EU Added Value: Higher level of environmental ambition, greater degree of
uniformity, stronger financial incentive.
STUDY ON STORAGE CAPACITIES AND LOGISTICAL INFRASTRUCTURE FOR EU AGRICULTURAL COMMODITIES TRADE
The study provides an overview and mapping of the storage capacity and logistical infrastructure for cereals, the oilseed complex and protein crops (COP) in the EU,
identifies the related bottlenecks, and analyses their evolution since 2005.
The current storage capacity for COP in the EU28 amounts to 359 million tonnes, up 20% from 2005. EU COP production increased by 11% in the same period. Structural shortage
of COP storage capacity currently affects a limited number of Member States. Storage capacity has increased in all 28 MS, with substantial growth especially in Eastern EU
Member States. Some key factors behind this evolution are specific to the COP supply chain, such as growth in yields, production and exports, and increased price volatility.
The switch to just in-time inventory management models by processors also played a role, especially in the United Kingdom and Germany.
Inland waterways and railways handle almost all long-distance COP tonnage (60-70% for
inland waterways, 30-40% for railways) along the four main COP transportation corridors (Baltic-Adriatic, North Sea-Baltic, Rhine-Alpine and Rhine-Danube); truck transportation
prevails in short-distance moves.
Member States which have increased COP exports have often also improved their
availability of storage capacity compared to their theoretical needs. Location of additional COP storage capacity at sites with access to adequate logistical infrastructure can
address the identified bottlenecks for storage capacity. Solutions to address infrastructural bottlenecks include the completion of missing links in the main COP
transportation corridors, capacity increases and technological upgrade on critical corridor
sections and at key hubs, enhancement of intermodal COP transportation and harmonisation of technological standards in transportation infrastructure.

agri_aar_2017_annexes Page 62 of 278
STUDY ON RISK MANAGEMENT IN EU AGRICULTURE
The 'Study on risk management in EU agriculture' provides a mapping as well as an
analysis of current agricultural risks and risk management instruments. Information on availability and use of risk management instruments was collected in all Member States
though consultations with public authorities, farmers’ associations and insurance companies. The final report is complemented by eight case studies: six on specific risk
management instruments in selected Member States and two on risk management in agriculture in the United States and Canada. The study finds that European farmers are
increasingly exposed to a wide range of risks while the availability of risk management
instruments lags behind. Insurance remains the most commonly used instrument, while both availability and uptake of other instruments such as mutual funds and contractual
price agreements (including futures) is more limited. There is a need to strengthen capacity to design and implement risk management instruments. The report elaborates
several recommendations, including on how to gain experience on the ground.

agri_aar_2017_annexes Page 63 of 278
ANNEX 10: Specific annexes related to "Financial Management"
This annex explains in detail the complex relationship between the Directorate General for Agriculture and Rural Development and the 28 Member States (comprising 78 Paying
Agencies at the end of 2017).
The two principal funds under the Common Agricultural Policy (the European Agricultural Guarantee Fund - EAGF and the European Agricultural Fund for Rural Development –
EAFRD) are implemented under shared management through a comprehensive
management and control system based on four levels. This system includes, on the one hand, all the necessary building blocks to guarantee a sound administration at Member
States’ level and, on the other hand, allows the Commission to audit the proper functioning of their management and control systems and, if need be, to counter the risk
of financial losses as a result of any deficiencies in the set-up and operation of those systems through the conformity clearance mechanism. Taken together, these levels and
the results that they produce are the basis for DG AGRI to gain reasonable assurance as to the effective management of the risk of error in the legality and regularity of the
underlying transactions.
An explanation of these four levels as well as the findings and the indicators which result
from them are set out in detail in this annex which is organised as follows:
Part 1: Description of the system for shared management and the
various levels of control in place
Level 1: Compulsory administrative structure at the level of Member States
Level 2: Detailed systems for controls before payments and dissuasive penalties Level 3: Audits by Certification Bodies and controls after payment
Level 4: Commission audits and Clearance of accounts
Part 2: Functioning of the Paying Agencies
2. Financial clearance exercise for financial year 2017 2.1: Compliance with the accreditation criteria
2.2: Management Declaration from the Directors of the Paying Agencies and related opinions from the Certification Bodies
2.3: Legality and regularity of expenditure
2.4: Overall conclusions of the Certification Bodies' work
Part 3: Control results at the level of the final beneficiaries, the
assessment thereon by the Certification Bodies and the overall
appreciation of the Commission on their reliability taking into account all available information
3.1: ABB02: Market Measures
3.2: ABB03: Direct Payments 3.3: ABB04: Rural Development
3.4: Root causes of the error rate
Part 4: Conformity Clearance Procedure and Net Financial
corrections
Part 5: Debt management by the Member States
Part 6: Cross compliance

agri_aar_2017_annexes Page 64 of 278
Part 1: Description of the system for shared management and the various levels of control in place
Level 1: Compulsory administrative structure at the level of Member States Management and control of the expenditure is entrusted to dedicated Paying Agencies,
which prior to their operation must be accredited by the Member States on the basis of a
comprehensive set of accreditation criteria laid down in EU law. The Paying Agencies' compliance with these criteria is subject to a constant supervision by the competent
national authority, and clear procedures exist as to how to address and remedy any problems.
Moreover, the directors of the Paying Agencies are required to provide an annual
management declaration which covers the completeness, accuracy and veracity of the accounts as well as a declaration that a system is in place which provides reasonable
assurance on the legality and regularity of the underlying transactions. For those Member
States with only one Paying Agency, this management declaration from the director of the Paying Agency, together with the certificate and opinion of the Certification Body (see
Part 2), constitutes, by definition, the annual summary referred to in point (b) of Article 59(5) of the Financial Regulation19.
Level 2: Detailed systems for controls before payments and dissuasive penalties
For each aid support scheme financed by the EAGF or EAFRD, there is a system of administrative and on-the-spot checks to be performed before payments to beneficiaries,
with dissuasive penalties in case of serious non-compliance by the beneficiary. These
systems are to be applied by the Paying Agencies and contain some common features and special rules tailored to the specificities of each aid regime. The systems generally
provide for exhaustive administrative controls of 100% of the aid applications, cross-checks with other databases where this is considered appropriate as well as on-the-spot
checks of a sample of transactions ranging between 1% and 100%, depending on the risk associated with the regime in question. If the on-the-spot checks reveal a high
number of irregularities, additional controls must be carried out.
In this context, the, by far, most important system is the Integrated Administration and
Control System (IACS), which in financial year 2017 covered 93.1% of EAGF expenditure
(93.9% in 2016). To the extent possible, the IACS is also used to manage and control rural development measures relating to parcels or livestock, which in 2017 accounted for
61.4% of payments under the EAFRD (50.1% in 2016). For both Funds together, the IACS covered 86.8% (84.2% in 2016) of total expenditure.
A detailed reporting from the Member States to the Commission on the individual results of the checks they carried out is provided for in the legislation. The reporting system
enables a calculation, for the main aid schemes, of the extent of error found by the Member States at the level of the final beneficiaries. The reliability of the control data
reported by the Paying Agencies and the quality of the underlying controls are also to be
verified and validated by the Certification Bodies.
Level 3: Audits by Certification Bodies and controls after payment
The Paying Agencies' annual accounts, the functioning of their internal control procedures and the legality and regularity of the expenditure for which reimbursement has been
requested from the Commission are to be verified and certified by the Certification Bodies. The report of the Certification Bodies also includes a detailed review of the Paying
Agencies' compliance with the accreditation criteria and a verification of the Management Declarations. In addition, all aid measures under EAGF other than direct payments
covered by the IACS are subject to ex-post controls under Articles 79 to 88 of Regulation
19 Regulation (EU, Euratom) No. 966/2012 of the European Parliament and of the Council on the financial rules
applicable to the general budget of the Union

agri_aar_2017_annexes Page 65 of 278
(EU) No 1306/201320. As regards EAFRD, ex-post checks are carried out for investment operations according to Article 52 of Commission Implementing Regulation (EU) No
809/201421.
Level 4: Commission audits and clearance of accounts Finally, the clearance system applied by the Commission consists of both an annual
financial clearance of accounts and a multi-annual conformity procedure.
The financial clearance of accounts covers the completeness, accuracy and veracity of
the Paying Agencies' accounts, and is without prejudice to decisions subsequently
adopted pursuant to the conformity procedure.
Moreover, it includes a mechanism under which 50% of any undue payments which the Member States have not recovered from the beneficiaries within 4 or, in the case of legal
proceedings, 8 years will be charged to their respective national budgets (50/50 rule). If the undue payments are the result of administrative errors committed by the national
authorities, the entire amount involved is deducted from the annual accounts and, thus, excluded from EU financing. Even after the application of the 50/50 rule, Member States
are, however, obliged to pursue their recovery procedures and, if they fail to do so with
the necessary diligence, the Commission may decide to charge the entire outstanding amounts to the Member State concerned.
The conformity audits, for their part, relate to the legality and regularity of the
expenditure. The conformity clearance is designed to exclude expenditure as regards EAGF from EU financing which has not been executed in conformity with EU rules, or as
regards the EAFRD, has not been spent in conformity with the applicable EU and national rules, thus shielding the EU budget from expenditure that should not be charged to it
(net financial corrections). In contrast, it is not a mechanism by which irregular
payments to beneficiaries are recovered from beneficiaries, which according to the principle of shared management is the sole responsibility of Member States.
Financial corrections are determined on the basis of the nature and gravity of the
infringement and the financial damage caused to the EU. Where possible, the amount is calculated on the basis of the loss actually caused or on the basis of an extrapolation
(usually such calculations are based on work carried out by or information supplied by the Member States). Where this is not possible, flat-rates are used which take account of
the severity of the deficiencies in the national control systems in order to reflect the
financial risk for the EU. Where undue payments are or can be identified as a result of the conformity procedures, Member States are required to follow them up by recovery
actions against the final beneficiaries. However, even where this is not possible because the financial corrections only relate to deficiencies in the Member States' management
and control systems, financial corrections are an important means to improve these systems and, thus, to prevent or detect and recover irregular payments to final
beneficiaries. The conformity clearance procedure thereby contributes to the legality and regularity of the transactions at the level of the final beneficiaries.
20 Regulation (EU) No 1306/2013 of the European Parliament and of the Council on the financing, management
and monitoring of the common agricultural policy 21 Commission Implementing Regulation (EU) No 809/2014 of 17 July 2014 laying down rules for the application
of Regulation (EU) No 1306/2013 of the European Parliament and of the Council with regard to the integrated
administration and control system, rural development measures and cross compliance

agri_aar_2017_annexes Page 66 of 278
In order to determine which measures and/or Paying Agencies to visit each year, DG AGRI carries out, in accordance with the audit strategy, a comprehensive risk
assessment, which includes both quantitative and qualitative analysis of risks. In the preparation of the audit work programme, the Paying Agencies, Member States,
Certification Bodies and the specific part of the control system to be audited in a 3-year time period are selected on the basis of risk mapping using all available information and
the following main elements:
Central Risk Analysis (CRA)
Sector-specific risk analysis
Risk mapping based on the Annual Activity Report and Certification Bodies opinion on legality and regularity
Risk mapping based on the CAP reform and other external factors.
What is the Central Risk Analysis?
DG AGRI's Central Risk Analysis (CRA) serves the purpose to apply a common and
unique approach for planning its conformity audits. It is based on the latest certified expenditure under the clearance of accounts exercise. It aims to ensure that the work of
the entire directorate is orientated and focussed on the main risks.
For the CRA the following indicators are taken into account: 1) materiality (amounts of declared expenditure), 2) latest audit year (period elapsed since the latest audit of the
measure in question), 3) inherent risk to the measure in question, 4) control system risks (risk associated with the control system), 5) Paying Agency risk (risk related to the
Paying Agency) and finally 6) the OLAF risk (related to OLAF denunciations and irregularities) and 7) the European Court of Auditors (ECA) risk (related to the findings
from the ECA).
The CRA is established at Paying Agency / audit field level (audit field = aid measures
with a similar control system) as the audits are addressed to a specific Paying Agency for
auditing expenditure spent for aid schemes under one or more specific audit fields.
From mid-2014, DG AGRI introduced a rolling three-year audit work programme. The
CRA is now carried out after the financial clearance exercise in order to use information resulting from the analysis of the opinions of the Certification Bodies, including not
carrying out audit missions where the subject has already been covered by a reliable Certification Body, and also to include in the audit work programme any audits
necessary in the context of following up reservations or as a result of findings notified by
the Certification Bodies.
Explanatory Box: Annex 10-1-1

agri_aar_2017_annexes Page 67 of 278
With a view to taking a more multi-annual perspective for the new programming period, in 2014 the DG AGRI audit directorate adopted an audit strategy for the period 2014-
2020.
DG AGRI audit strategy for 2014-2020
The DG AGRI audit strategy aims to formalise the main elements of the clearance of accounts system in terms of background, context, objectives, risks assessment, audit
approach and indicators for the audit activities. In particular, it aims to identify the main inherent risks and control risks that will have to be addressed in the coming years, not
only taking into account the changes introduced by policy developments and the
implementation of the CAP 2014-2020 but also considering previous years' experience and audit findings.
This audit strategy recalls the principle that DG AGRI audits are first and foremost system-based with risk-based audits checking specific components of the Paying
Agencies' or Member States' internal control systems. Notwithstanding, it opens the door to defining other ways of addressing specific risks or situations in particular Paying
Agencies or Member States.
In addition, it anticipated the impact of the extended role given by the Horizontal
Regulation on the financing, management and monitoring of the Common Agricultural
Policy (Regulation No 1306/2013) to the Certification Bodies. From the beginning of 2016 (in respect of financial year 2015), Certification Bodies give an opinion on the legality and
regularity of the expenditure for which reimbursement was requested from the Commission to a much greater extent and detail than has been the case under the
previous regulatory frameworks. Not only the information thus gathered have to be evaluated and input to DG AGRI's own risk analysis, but its impact on the focus and
scopes of DG AGRI audit activities are to be fully taken into account. When done in accordance with applicable rules and guidelines, the audit work of the Certification Bodies
becomes the key element for assurance on the legality and regularity of the CAP
expenditure. Therefore DG AGRI is progressively rebalancing its audit activities towards checking the reliability of the opinion of the Certification Bodies. Conformity clearance
procedures continue to be used in cases where insufficient assurance, for instance because the work of the Certification Body is not in accordance with guidelines, creates a
risk to the EU budget.
Explanatory Box: Annex 10-1-2

agri_aar_2017_annexes Page 68 of 278
Part 2: Functioning of the Paying Agencies
2. Financial clearance exercise for financial year 2017
The rules on the financing of the CAP provide for an annual financial clearance exercise covering the completeness, accuracy and veracity of the Paying Agencies' accounts. By
15 February (with possible extension to 1 March) following the end of the financial year
in question, Member States are required to send the annual accounts of their Paying Agencies to the Commission, together with an audit opinion from the Certification Body
of each Paying Agency stating whether it has obtained reasonable assurance that these accounts are complete, accurate and true, that the agency's internal control procedures
have operated satisfactorily and, since 2015, that the expenditure for which reimbursement was requested from the Commission is legal and regular. The
Commission has until 30 April to review this information and communicate its findings to the Member States. Where the information received is considered acceptable, the
Commission has, until 31 May, to adopt a decision clearing the accounts of the Paying
Agencies concerned.
The financial year 2017 for the EAGF and EAFRD Funds runs from 16 October 2016 to 15
October 2017. By 1 March 2018, the accounts of 79 out of 80 Paying Agencies for Financial Year (FY) 2017 were submitted. For 1 PA (DE09 - Hamburg) the Member State
confirmed that the PA had been closed during the year and that no clearance documents will be submitted.
As in previous financial clearance exercises, the accounts of a limited number of Paying Agencies will probably not be cleared by the 31 May deadline. This is either because the
opinions from the Certification Bodies are qualified, thus requiring further work from the
Paying Agencies and/or from the Certification Bodies, or the level of error exceeds the materiality threshold (2% of expenditure) for the fund. The accounts of these Paying
Agencies will be disjoined from the financial clearance decision due by 31 May 2018 and cleared at a later stage. In such cases, DG AGRI takes into account the qualifications
and/or the levels of detected error when making adjustments to the error rate of the population concerned (for details on the specific cases considered for financial year 2017,
please see sections 3 to 5 of Annex 10).
2.1 Compliance with the accreditation criteria
2.1.1 Status of the Paying Agencies' accreditation
At 15 October 2017, the 28 Member States had 78 operating accredited Paying Agencies.
In comparison to the previous financial year, two Paying Agencies (PL02 and DE09) ceased to exist while another (HU01) was replaced by HU02:
as from 1 September 2017, there is only one Paying Agency in Poland as the functions of PL02 - Agricultural Market Agency has been taken over by PL01 -
Agency for Restructuring and Modernization of Agriculture. on 13 October 2017, the accreditation of Paying Agency DE09 – Hamburg was
removed by the Competent Authority. No Annual accounts were submitted for Financial Year 2017.
the Hungarian Paying Agency HU01 - Agricultural and Rural Development Agency
(ARDA), was terminated with legal succession on 1 January 2017. On termination of ARDA, the Competent Authority withdrew the body’s accredited status as the
EAGF-EAFRD Paying Agency. As from 1 January 2017, the HU02 - Hungarian State Treasury (‘Treasury’) started operating as the new Paying Agency.

agri_aar_2017_annexes Page 69 of 278
The status of accreditation of the 78 Paying Agencies was as follows on 15 October 2017:
77 fully accredited Paying Agencies
1 Paying Agency (OPEKEPE in Greece) continued to be under limited accreditation; accreditation continues to be limited to those EAFRD
measures for which a proper control system and procedures have been put in place. No expenditure is declared for the measures where accreditation
is not granted.
Status of Paying Agencies' accreditation
At the beginning
of financial year
2017
At the end of
financial year
2017
Fully accredited Limited accreditation
Accreditation under probation or provisional accreditation
79 122
0
76 1
123
Total Member States: 28 80 78
Table: Annex 10 – 2.1.1-1
2.1.2 Certification of the functioning of the Paying Agencies' internal
control systems and the accounts
In the context of the financial clearance exercise for financial year 2017, the Certification Bodies are required – besides certifying the accounts of the Paying Agencies - to report
on and certify whether the Paying Agencies' internal control systems operated satisfactorily.
Taking into consideration the EAGF / EAFRD split, 150 opinions (70 Paying Agencies dealing with both Funds and 10 Paying Agencies dealing only with one Fund – 8 dealing
exclusively with EAGF and 2 exclusively with EAFRD) covering the internal control
systems, should be received.
11 Paying Agencies requested permission24 to submit the accounts or audit opinions and
related reports after the deadline of 15 February 201825. 9 requests were accepted. All audit opinions and reports had been received by the ultimate deadline 1 March 2018
except for DE09 – Hamburg (see above).
By 31 March, 148 audit opinions had been received and assessed. In all cases, the
Certification Body concluded that the internal control system of the Paying Agencies operated at least satisfactorily26. Despite this assessment, in 5 cases, the Certification
Body qualified its opinion on the EAFRD accounts. In all 5 cases (BG01 - SFA, IT26 -
ARCEA, FR18 – ODARC, PL01 - ARMA and SK01 - APA), the qualification was due to the presence of material error, either at fund level or at population level (EAFRD IACS or
EAFRD Non-IACS) in the EAFRD accounts. In 4 of the cases (except FR18-ODARC), this resulted also in a qualification on the Management declaration for EAFRD. See Annex 10,
part 3.3, for more information on these 4 cases.
22 OPEKEPE (Greece) 23 PL01 - Agency for Restructuring and Modernization of Agriculture. 24 According to the provisions of Article 59(5) of the Financial Regulation (EU, Euratom) No 966/2012 and
Article 7(3) of Regulation (EU) No 1306/2013 of the European Parliament and of the Council, the deadline of 15
February may exceptionally be extended by the Commission to 1 March. 25 DE17 - Rhineland-Pfalz, ES03 – Asturias, ES12 – Madrid, ES14 – Navarra, ES17 - Valencia, GR01 – OPEKEPE,
IE01 - DAFM, IT07 – ARTEA, RO01 - RIFA, and RO02 – PIAA and SE01 – SJV. 26 ratings of “works well”, “works” or “works partially”

agri_aar_2017_annexes Page 70 of 278
For EAGF a qualified opinion was issued for ES07-Castilla la Mancha due to material errors in EAGF Non-IACS (mainly concerning the wine restructuring measures) and for
RO02-APIA due to differences encountered in the annual accounts. For FR20- France AGRIMER, the Certification Body issues a qualified opinion on the basis of limitation of
scope for some expenditure on which they were unable to conclude. In addition, for MT01 – MRRA a disclaimer of opinion has been issued concerning the EAGF IACS population.
See Annex 10, part 3.2, for information on these 3 cases.
2.1.3 The Commission's accreditation audits
The Commission regularly performs accreditation audits. The selection of these audits is based on a detailed risk assessment, to check whether the Paying Agencies (continue to)
respect the accreditation criteria. As the accreditation criteria are checked by the Certification Bodies DG AGRI only conducted two dedicated accreditation missions during
the year. This was to the BG01 - State Fund Agriculture and HU02 - Hungarian State
Treasury27.
2.1.4 The Certification Bodies' main findings on accreditation for
financial year 2017
In the opinion of the Certification Bodies, none of the Paying Agencies have deficiencies
that are serious enough to conclude that they no longer comply with the accreditation criteria.
Concerning the Italian Paying Agency IT01 – AGEA, it is recalled that the Competent
Authority placed the Paying Agency under probation on 25 April 2014. Full accreditation was reinstated on 25 April 2015 after a remedial plan required by the Competent
Authority had been implemented. However, the reinstatement of accreditation was accompanied by a recommendation that the Paying Agency successfully implemented a
separate action plan, that was more detailed than the remedial plan of the Competent Authority and which covered various accreditation criteria. The deadline for full
implementation of the action plan was 15 October 2015. After several delays in its implementation, the deadline was subsequently extended to 15 October 2016. A mission
carried out by DG AGRI in November 2016 found that the Action Plan had not yet been
fully implemented by the extended deadline. DG AGRI has been following the developments since then also with a view to assessing the financial risk for the EU funds.
The Certification Body, in its audit report concerning FY2017, reported on some deficiencies of intermediate level in the accreditation criteria, but did not identify major
deficiencies. However, in its comments on the Action Plan, the Certification Body concluded that, despite the clear progress made by the Paying Agency AGEA in the
implementation of the Action Plan, various problems remain.
Concerning the Paying Agency in the Czech Republic CZ01 - State Agricultural
Intervention Fund, there is an ongoing conformity procedure by DG AGRI in relation to a
possible conflict of interest situation and possible breach of the accreditation criteria, as members of the supervisory board of the Paying Agency were at the same time
connected to beneficiaries of agricultural funds.
27 As of 1 January 2017, based on the Hungarian Government Decision No 1312/2016, the functions of Paying
Agency HU01 - Agricultural and Rural Development Agency (ARDA) were taken over by new paying Agency
HU02 - Hungarian State Treasury.

agri_aar_2017_annexes Page 71 of 278
2.1.5 Conclusion on the opinion on the Internal Control System
The opinions of the Certification Bodies' reports received are that the Internal Control
Systems of all the Paying Agencies function adequately.
2.2 Management Declaration from the Directors of the Paying Agencies
and related opinions from the Certification Bodies
2.2.1 Management Declaration from the Directors of the Paying Agencies
In respect of financial year 2017, the Directors of all Paying Agencies, except DE09-Hamburg which was closed during the year, submitted to the Commission their
Management Declarations on the completeness, accuracy and veracity of the accounts,
on the proper functioning of the internal control systems and on the legality and regularity of the underlying transactions. All declarations were without reservations,
except BG01-SFA (see table 1 below).
For BG01- SFA, reservations were made by the Head of the Paying Agency because of 5 ongoing conformity clearance enquiries of DG AGRI.
According to the Guideline on the Management Declaration, in the event that any
deficiency is identified in the context of establishing the Management Declaration which
does not fulfil the criteria for justifying a reservation but which, in the opinion of the Director of the Paying Agency nonetheless constitutes an issue which should be brought
to the attention of the Commission services, this should be disclosed in a document attached to the Management Declaration.
The declaration of 8 Paying Agencies, BE03 – Region Wallonia, FR19 - ASP, FR20- France
AGRIMER, GB05 - DAERA, GB06 – SGRPID, GB07 - WAG, GB09 – RPA and SE01 – SJV, included such a document.
For BE03 – Region Wallonia, it concerned issues related to debt management and explanations of the actions taken to remedy the high error rate in EAFRD.
For FR19 - ASP, it concerns the implementation of the ongoing action plan on EAFRD
IACS, as well as explanations on the 2016 direct payments claim year, the calendar for which is returning to normal according to the Head of the Paying Agency.
For FR20 – France AGRIMER, the Head of the Paying Agency issued 3 observations as
follows: on delayed payments for the wine measures, on the high error rate for
promotion measures and on an additional budget for exceptional measures.
For GB05 - DAERA it concerned management and control issues related to debts under EAFRD Less Favoured Areas. For GB06 – SGRPID it covered delays and possible
inaccuracy in the production of control statistics, ongoing monitoring of the action plan related to EAFRD, issues related to the Internal Audit Function and challenges related to
the 2016 direct payments claim year. In the case of GB07 - WAG, it concerned the need for further improvement of the administrative processing of EAFRD IACS claims, a
complete review of the compilation of some control statistics and delay in the Internal
audit 5-year audit plan implementation. For GB09 – RPA it concerned various issues: partial BPS payments paid from national funds until the finalisation of all checks, revised
and/or outstanding control statistics for claim year 2016 and need for enhanced monitoring of delegated bodies.
For SE01 – SJV the specific document concerned the challenges related to the
implementation of the CAP reform, although the situation has improved in 2017, some control statistics for claim year 2016 were still outstanding and a high error rate in
producer organisations.

agri_aar_2017_annexes Page 72 of 278
EAGF IACS EAGF NIACS EAFRD IACSEAFRD
NIACS
1 AT01 AMA Y Y Y Y
2 AT03 Zollamt Salzburg N/A Y N/A N/A
3 BE02 ALV Y Y Y Y
4 BE03 Rég. Wallonne Y Y Y Y
5 BG01 State Fund Agriculture N Y N N
6 CY01 CAPO Y Y Y Y
7 CZ01 SAIF Y Y Y Y
8 DE01 BLE N/A Y N/A Y
9 DE02 Hamburg-Jonas N/A Y N/A N/A
10 DE03 Baden-Württemberg MLR Y Y Y Y
11 DE04 Bayern StMLF Y Y Y Y
12 DE07 Brandenburg MLUV Y Y Y Y
13 DE09 Hamburg
14 DE11Mecklenburg-Vorpommern
MELFFY Y Y Y
15 DE12 Niedersachsen Y Y Y Y
16 DE15 Nordrhein-Westfalen Y Y Y Y
17 DE17 Rheinland-Pfalz Y Y Y Y
18 DE18 Saarland AAL Y Y Y Y
19 DE19 Sachsen Y Y Y Y
20 DE20 Sachsen-Anhalt Y Y Y Y
21 DE21 Schleswig-Holstein Y Y Y Y
22 DE23 Thüringen Y Y Y Y
23 DE26 Hessen Y Y Y Y
24 DK02 DAFA Y Y Y Y
25 EE01 PRIA Y Y Y Y
26 ES01 Andalucia Y Y Y Y
27 ES02 Aragón Y Y Y Y
28 ES03 Asturias Y Y Y Y
29 ES04 Islas Baleares Y Y Y Y
30 ES05 Islas Canarias Y Y Y Y
2.5/ TABLE 1 PAYING AGENCY DIRECTOR'S MANAGEMENT DECLARATION
Paying Agency
Is the Management Declaration free of reservations?
Reservation/Additional remark
Additional remark: material error rate in
the EAGF Non-IACS and EAFRD IACS
population; explanations provided
Additional remark: material error rate in
EAFRD, issues with debt management ;
explanations provided
Reservations on EAGF IACS, EAFRD IACS
and Non-IACS linked to various DG AGRI
enquiries
Additional remark: material error rate in
the EAFRD IACS population;
explanations provided
Additional remark: material error rate in
the EAGF Non-IACS and EAFRD IACS
population; explanations provided
Additional remark: material error rate in
EAGF and EAFRD IACS; explanations
provided
Additional remark: material error rate in
the EAFRD IACS population;
explanations provided
Additional remark: material error rate in
the EAGF Non-IACS and EAFRD IACS
populations; explanations provided
Additional remark: material error rate in
EAFRD; explanations provided
Additional remark: material error rates
in EAGF IACS and Non-IACS, and EAFRD
IACS, explanation provided
Additional remark: material error rate in
EAFRD IACS, explanation provided
Additional remark: material error rates
in EAGF Non-IACS; explanations
provided
Additional remark: material error rate in
EAFRD IACS, explanation provided
not received

agri_aar_2017_annexes Page 73 of 278
31 ES06 Cantabria Y Y Y Y
32 ES07 Castilla La Mancha Y Y Y Y
33 ES08 Castilla y Léon Y Y Y Y
34 ES09 Cataluña Y Y Y Y
35 ES10 Extremadura Y Y Y Y
36 ES11 Galicia Y Y Y Y
37 ES12 Madrid Y Y Y Y
38 ES13 Murcia Y Y Y Y
39 ES14 Navarra Y Y Y Y
40 ES15 País Vasco Y Y Y Y
41 ES16 La Rioja Y Y Y Y
42 ES17 C. Valenciana Y Y Y Y
43 ES18 FEGA N/A Y N/A Y
44 FI01 MAVI Y Y Y Y
45 FR05 ODEADOM Y Y N/A N/A
46 FR18 ODARC N/A N/A Y Y
47 FR19 ASP Y N/A Y Y
48 FR20 France Agrimer N/A Y N/A N/A
49 GB05 DAERA Y Y Y Y
50 GB06 SGRPID Y Y Y Y
51 GB07 WAG Y Y Y Y
52 GB09 RPA Y Y Y Y
53 GR01 OPEKEPE Y Y Y Y
54 HR01 PAAFRD Y Y Y Y
Additional remark: 3 observations on
various measures
Additional remark: explanation of
issues related to management and
control of debts under EAFRD Less
Favoured Area Compensatory
Allowances scheme.
Additional remark: delays and possible
inaccuracy in the production of control
statistics; issues related to the Internal
Audit Function and challenges in the
2016 direct payments campaign
Additional remark: material error rate in
the EAFRD IACS population and
explanations of the actions taken; need
for review of some statistics
compilation.
Additional remark: monitoring of
delegated bodies; revised or delayed
control statistics submissions; partial
BPS payments from national funds
Additional remark: material error rates
in the EAGF and the EAFRD IACS
populations, and in EAGF Non-IACS;
explanations provided
Additional remark: material error rate in
EAFRD IACS; explanations provided
Additional remark: material error rate in
the EAGF IACS population; explanations
provided
No control statistics submitted for
EAFRD IACS
Additional remark: EAFRD action plan
ongoing and the 2016 direct payments
campaign
Additional remark: material error rate in
EAFRD IACS, explanation provided
Additional remark: material error rate in
EAFRD IACS, explanation and actions
provided
Additional remark: material error rate in
EAGF Non-IACS, explanations provided
Additional remark: material error rate in
EAFRD IACS, explanation and actions
provided
Additional remark: material error rate in
EAGF, explanation and actions
provided

agri_aar_2017_annexes Page 74 of 278
55 HU01
Agricultural and Rural
Development Subsidies of
the Hungarian State
Treasury
Y Y Y Y
56 IE01 DAFM Y Y Y Y
57 IT01 AGEA Y Y Y Y
58 IT02 SAISA N/A Y N/A N/A
59 IT03 ENR Y N/A N/A N/A
60 IT05 Veneto (AVEPA) Y Y Y Y
61 IT07 Toscana (ARTEA) Y Y Y Y
62 IT08 Emilia-Romagna (AGREA) Y Y Y Y
63 IT10 ARPEA Y N/A Y Y
64 IT23 OPR Lombardia Y Y Y Y
65 IT24 OPPAB Y N/A Y Y
66 IT25 APPAG Y N/A Y Y
67 IT26 ARCEA Y N/A Y Y
68 LT01 NMA Y Y Y Y
69 LU01 Min. Agric. Y Y Y Y
70 LV01 RSS Y Y Y Y
71 MT01 MRRA PA Y Y Y Y
72 NL04 RVO Y Y Y Y
73 PL01 ARMA Y Y Y Y
74 PL02 AMA N/A Y N/A N/A
75 PT03 IFAP Y Y Y Y
76 RO01 PARDF N/A N/A Y Y
77 RO02 PIAA Y Y N/A N/A
78 SE01 SJV Y Y Y Y
79 SI01 AAMRD Y Y Y Y
80 SK01 APA Y Y Y Y
Additional remark: material error rate in
EAFRD IACS; explanations provided
Additional remark: material error rate in
the EAFRD IACS populations;
explanations provided
Additional remark: the anti-fraud
strategy implementation continues
Additional remark: material error rate in
the EAFRD IACS population;
explanations provided
Additional remark: material error rate in
the EAFRD IACS population;
explanations provided
Additional remark: material error rate in
the EAFRD IACS population;
explanations provided
Additional remark: material error rates
in EAGF Non-IACS and EAFRD IACS;
explanations provided
Additional remark: material error rate in
the EAFRD IACS population;
explanations provided
Additional remark: material error rate in
the EAGF IACS and Non-IACS
populations; explanations provided
Additional remark: some IACS control
statistics still outstanding; high error
rate in Producer organisations
Additional remark: material error rate in
EAGF and EAFRD IACS; explanations
provided
Additional remark: material error rate in
the EAGF and EAFRD IACS populations;
explanations provided
Additional remark: material error rates
in the EAGF and the EAFRD IACS
populations; explanations provided
Additional remark: material error rates
in EAGF IACS; explanations provided
Additional remark: material error rates
in EAFRD IACS and EAFRD Non-IACS;
explanations provided
Additional remark: material error rates
in EAGF; explanations provided

agri_aar_2017_annexes Page 75 of 278
2.2.2 Opinion of the Certification Bodies on the Management Declaration
Table 2 lists the individual opinions of Certification Bodies on the Paying Agencies'
Management Declarations. Please also see section 2.3.3.
EAGF IACS EAGF NIACS EAFRD IACS EAFRD NIACS
1 AT01 AMA Y Y Y Y
2 AT03 Zollamt Salzburg N/A Y N/A N/A
3 BE02 ALV Y Y Y Y
4 BE03 Rég. Wallonne Y Y Y Y
5 BG01 State Fund Agriculture N N N N
6 CY01 CAPO N N N Y
7 CZ01 SAIF Y Y Y Y
8 DE01 BLE N/A Y N/A Y
9 DE02 Hamburg-Jonas N/A Y N/A N/A
10 DE03 Baden-Württemberg MLR Y Y Y Y
11 DE04 Bayern StMLF Y Y Y Y
12 DE07 Brandenburg MLUV Y Y Y Y
13 DE09 Hamburg
14 DE11Mecklenburg-Vorpommern
MELFFY Y Y Y
15 DE12 Niedersachsen Y Y Y Y
16 DE15 Nordrhein-Westfalen Y Y Y Y
17 DE17 Rheinland-Pfalz N N N N
18 DE18 Saarland AAL Y Y Y Y
19 DE19 Sachsen Y Y Y Y
20 DE20 Sachsen-Anhalt Y Y Y Y
21 DE21 Schleswig-Holstein Y Y Y Y
22 DE23 Thüringen Y Y Y Y
23 DE26 Hessen Y Y Y Y
24 DK02 DAFA Y Y Y Y
25 EE01 PRIA Y Y Y Y
26 ES01 Andalucia Y Y Y Y
27 ES02 Aragón Y Y Y Y
28 ES03 Asturias Y Y Y Y
29 ES04 Islas Baleares Y Y Y Y
30 ES05 Islas Canarias Y Y Y Y
31 ES06 Cantabria Y Y Y Y
32 ES07 Castilla La Mancha Y Y Y Y
33 ES08 Castilla y Léon Y Y Y Y
34 ES09 Cataluña Y Y Y Y
35 ES10 Extremadura N Y Y Y
36 ES11 Galicia Y Y Y Y
37 ES12 Madrid Y Y Y Y
38 ES13 Murcia Y Y Y Y
39 ES14 Navarra Y Y Y Y
40 ES15 País Vasco Y Y Y Y
41 ES16 La Rioja Y Y Y Y
42 ES17 C. Valenciana Y Y Y Y
43 ES18 FEGA N/A Y N/A Y
44 FI01 MAVI Y Y Y Y
45 FR05 ODEADOM Y Y N/A N/A
46 FR18 ODARC N/A N/A Y Y
Reservation/Remarks
CERTIFICATION BODIES' OPINION ON THE PAs' MANAGEMENT DECLARATION
Is the Management Declaration confirmed by the Audit
Opinion?
2.5/TABLE 2
Paying Agency
Anti-fraud strategy not effectively implemented
Qualified for high error rares in EAGF IACS and
Non-IACS, and EAFRD IACS; also not submitted
control statistics for some EAFRD IACS measures
Qualified on issues related to debts
Emphasis of matter due to high error rate in
EAFRD IACS
Qualified opinion due to the EAGF IACS control
statistics
Emphasis of matter due to high error rate in
EAGF Non-IACS
Emphasis of matter due to high error rates in
EAGF IACS, EAGF Non-IACS and EAFRD IACS
Emphasis of matter for lack of control statistics
for EAFRD IACS
not received
Emphasis of matter on small differences
detected in the error rate for EAGF IACS

agri_aar_2017_annexes Page 76 of 278
47 FR19 ASP Y N/A Y Y
48 FR20 France Agrimer N/A Y N/A N/A
49 GB05 DAERA Y Y Y Y
50 GB06 SGRPID Y Y N Y
51 GB07 WAG Y Y N Y
52 GB09 RPA Y Y Y Y
53 GR01 OPEKEPE Y Y Y Y
54 HR01 PAAFRD Y Y Y Y
55 HU01Agricultural and Rural
Development Subsidies of the
Hungarian State Treasury
Y Y Y Y
56 IE01 DAFM Y Y Y Y
57 IT01 AGEA Y Y Y Y
58 IT02 SAISA N/A Y N/A N/A
59 IT03 ENR Y N/A N/A N/A
60 IT05 Veneto (AVEPA) Y Y Y Y
61 IT07 Toscana (ARTEA) Y Y Y Y
62 IT08 Emilia-Romagna (AGREA) Y Y Y Y
63 IT10 ARPEA Y N/A Y Y
64 IT23 OPR Lombardia Y Y Y Y
65 IT24 OPPAB Y N/A Y Y
66 IT25 APPAG Y N/A Y Y
67 IT26 ARCEA Y N/A Y N
68 LT01 NMA Y Y Y Y
69 LU01 Min. Agric. N N N N
70 LV01 RSS Y Y Y Y
71 MT01 MRRA PA Y Y Y Y
72 NL04 RVO Y Y Y Y
73 PL01 ARMA Y Y N N
74 PL02 AMA N/A Y N/A N/A
75 PT03 IFAP Y Y Y Y
76 RO01 PARDF N/A N/A Y Y
77 RO02 PIAA Y Y N/A N/A
78 SE01 SJV N Y N Y
79 SI01 AAMRD Y Y Y Y
80 SK01 APA N N N N
Emphasis on delayed payments and on high
errors in the wine promotion measure
Qualified for EAGF and EAFRD
Qualified for EAFRD
Emphasis of matter due to need for
improvement in the complication and reporting
of control statisticsEmphasis of matter due to need for
improvement in the complication and reporting
of control statistics
Qualified on EAFG and EAFRD IACS
Qualified for EAFRD Non-IACS
Anti-fraud strategy not fully implemented
Emphasis of matter on EAFRD IACS
Emphasis of matter on: high erorr rate for EAFRD
IACS; remedial actions needed for a more
efficient recovery procedures and action plan
under EAGF IACS
Qualified for EAFRD IACS
Qualified for EAFRD IACS

agri_aar_2017_annexes Page 77 of 278
2.2.3 Follow-up of reservations included in the Paying Agency Directors' Management Declarations
There was no reservation included in the Management Declarations in the previous
financial year that would have required a follow up.
2.2.4 Conclusion on the opinion on the Management Declarations of the
Paying Agencies
As mentioned in section 2, the Certification Bodies have to provide an opinion on the
Paying Agencies' Management Declarations based on their assessment of the residual risk
for the given population. A detailed assessment is included in section 2.3.3.
This year, Certification Bodies assessed more comprehensively the Management
Declaration and control statistics and issued an opinion based on this comprehensive audit work. Nonetheless, a few Certification Bodies, while they gave a qualified opinion
on the accounts, gave an unqualified opinion on the Paying Agency's Management Declaration even though the issues and errors identified are linked to legality and
regularity of the expenditure declared and so should have had an impact on the opinion on the Management Declaration.
In such cases DG AGRI cannot use directly the conclusion on the Management
Declaration.
2.3 Legality and regularity of the expenditure
2.3.1 Opinion of the Certification Bodies' work on legality and regularity
of expenditure
In accordance with Article 9 of Regulation (EU) 1306/2013, the Certification Bodies are
requested to give an opinion on the legality and regularity of expenditure for which reimbursement has been requested. The Certification Bodies shall also provide an opinion
on the completeness, accuracy and veracity of the accounts and the functioning of the internal control system.
The opinion on legality and regularity should certify whether the expenditure effected in the Member States during the financial year is legal and regular. Moreover, through their
audit work on legality and regularity, the Certification Bodies should confirm the level of
errors in the management and control systems of the Paying Agencies in their opinion on the Management Declaration. This is done through a review of the control results which
include the results of the eligibility checks (administrative and on-the-spot controls) carried out by the Paying Agency and the Management Declaration of the Paying Agency
The opinion is given at the level of each Paying Agency, covering both Funds (EAGF and EAFRD) and the following four populations, organised as per the main internal control
systems of the Paying Agency:
- EAGF IACS (schemes covered by the Integrated Administrative and Control System)
- EAGF Non-IACS (schemes not covered by the IACS)
- EAFRD IACS (schemes covered by the Integrated Administrative and Control System) - EAFRD Non-IACS (schemes not covered by the IACS)
Integrated sampling approach: According to Article 9 (2)(b) of Regulation (EU) 1306/2013 the Certification Bodies can use a single integrated sample for each
population where appropriate. The integrated sampling approach means that the Certification Bodies can use one statistical sample to test the legality and regularity of
expenditure declared (including the administrative and on-the-spot eligibility checks) and
the annual accounts.

agri_aar_2017_annexes Page 78 of 278
The method starts with the review and assessment of the internal control system of the Paying Agency, including compliance testing, i.e. testing the systems and procedures of
the Paying Agency for compliance with the applicable regulations (see section 2.1). The second and key part of the audit work is the substantive testing: through testing of
transactions (based on a statistical sample), the Certification Body auditors are requested to confirm the level of errors found in the initial eligibility checks performed by the Paying
Agency and, if not confirmed, to give a qualified opinion. The purpose of the Certification Body's substantive testing is twofold:
- to confirm the level of error in the checks of the Paying Agency in order to give an
opinion on the legality and regularity of the expenditure and on the assertions made in the Management Declaration and the control results of the Paying
Agencies;
- to confirm the level of error in the payments and to give an opinion on the
accounts.
The Certification Body must provide two rates to assess the level of error in the checks of
the Paying Agency:
- An error rate related to the errors found in the payments made to the beneficiaries
based on comparing their results to the accounts of the Paying Agency. This will
support the basis for the Certification Body’s' opinion on the annual accounts of the Paying Agencies (see section 2.1.2).
- An incompliance rate related to the errors found based on the re-verified eligibility
checks (including administrative and on-the-spot controls), namely verification of legality and regularity. The maximum level of risk needs to be assessed taking
account of this incompliance rate. The Certification Body's opinion on the Paying Agency's Management Declaration (see section 2.2) is based on this result (see
section 2.3).
For the purpose of assessing the reliability of the Paying Agencies' reported error rates stemming from their control results and for estimating an adjusted error rate, DG
AGRI takes into account the incompliance rate established by the Certification Bodies. In this assessment the following three scenarios may occur:
- The Certification Body calculated the incompliance rate, it validated the control results expressed in the control statistics (unqualified opinion on the Paying
Agency's Management Declaration) and it performed its work to standard: in this case the Paying Agency's error rate should be retained as the final error rate unless
DG AGRI auditors are aware of any systemic weaknesses not detected or not
quantified by the Certification Body.
- The Certification Body calculated the incompliance rate but it did not validate the control results (qualified opinion on the Paying Agency's Management Declaration)
and it performed its work to standard; In this case the Paying Agency's initial error rate shall be topped up by the incompliance rate where material in order to
establish the “adjusted error rate”;
- The Certification Body did not perform its task to standard; In this case the Paying
Agency's reported error rate shall be topped up as proposed by DG AGRI auditors.
DG AGRI auditors also use the error rate (most likely error) established by the Certification Body when determining the extent of the adjustment (top-up) to be made to
the error rate reported by the Paying Agency.
Explanatory box: Annex 10 – 2.3.1-1

agri_aar_2017_annexes Page 79 of 278
The method is based on the audit method used for auditing financial statements in accordance with internationally accepted audit standards. The focus is on compliance
with applicable eligibility rules. Thus, through a statistical sample the auditors verify at final beneficiary level if all eligibility criteria are met. Therefore, the Certification Bodies
also need to perform re-verification of the on-the-spot controls done by the Paying Agencies.
The reliability of the Certification Bodies' work has been assessed through dedicated audit missions and in the framework of the 2017 financial clearance exercise as well as through
conformity audit missions which review the work of the Certification Bodies. The results
are outlined in the subsequent sections.
2.3.2 DG AGRI's audits of Certification Bodies' work on legality and
regularity
In this third year of the Certification Body work on legality and regularity, DG AGRI in its audit programme gave priority to those Certification Bodies which were not visited in the
previous years and for which there may have been a specific risk to be covered (i.e. a newly appointed Certification Body). These Certification Bodies were subject to dedicated
audit missions on legality and regularity. Moreover, the results and conclusions from the
first and second years of the Certification Bodies' work on legality and regularity were also taken into account.
Mission programme implemented in 2017
In 2017, the 15 missions listed in Table 2.3.1-1 below were carried out. The missions
covered the audit strategy of the Certification Bodies and the re-verifications of on-the-spot and administrative controls depending on the state of play of the Certification Body's
work at the time of the mission.
Over the past three years, DG AGRI has carried out 47 legality and regularity missions
covering 30 different Certification Bodies which have delivered an opinion on the legality
and regularity of the expenditure in 42 different Paying Agencies28.
This means that 50% of the 60 appointed Certification Bodies in 28 Member States have
now audited by DG AGRI in dedicated missions with more having been included in the conformity audit missions.
28 For 5 Paying Agencies, a second mission was carried out.

agri_aar_2017_annexes Page 80 of 278
Table: Annex 10 – 2.3.1-1
Summary of the main findings of these audits and monitoring activities
Based on the observations from the above listed missions, the majority of the Certification Bodies' established the audit strategy in line with the approach outlined in
the guidelines. Improvement was noted in the Certification Bodies' work in terms of audit strategy and quality of the re-verifications for the legality and regularity of expenditure.
Some issues, though, were encountered with the Certification Bodies' sampling methodology. In 6 missions out of 15 it was noted that the Certification Body used an
external body for the on-the-spot reverifications, for which the monitoring and quality control on the external provider's work requires improvement.
There has been an improvement in the timing of the Certification Bodies' reverification
controls but there are still some cases where the reverifications of the Paying Agencies' controls were not performed at the optimal time due to delays in obtaining the
information from the Paying Agency/Coordinating Body. The timing is particularly important for the IACS measures where controls and their re-verification shall be carried
out in the summer/autumn of the claim year in question. In some cases, the Certification Bodies relied to a too large extent on the experience of the Paying Agency's own
inspectors, without ensuring an independent re-verification. The above instances were noted in various degrees in 5 of the missions carried out in 2017 in respect of the IACS
populations.
Where the error evaluation and the review of the control statistics could not be reviewed by DG AGRI at the time of carrying out the missions (as the Certification Bodies' audit
had not reached that stage yet) the Certification Body's work on the control statistics and the error evaluation for the previous year was reviewed.
List of Paying Agencies and related Certification Bodies audited on legality and regality in 2017
Paying Agency Certification Body
BE03 OPW RSM InterAudit Cvba
ES16 La Rioja Intervención General de la Comunidad de La Rioja
ES03 Asturias
Intervención General de la Consejería de Hacienda y Administración Pública del Gobierno del Principado de Asturias
DE07 Brandenburg and Berlin
Ministerium der Finanzen des Landes Brandenburg, Referat 42, Finanzkontrolle der E-Fonds,
Bescheinigende Stelle für EGFL und ELER
ES15 País Vasco Oficina de Control Económico del Departamento de Hacienda y Finanzas del Gobierno Vasco
RO01 RIFA [AFIR] Curtea de Conturi a Romaniei - Autoritatea de Audit Romanian Court of Accounts - Audit Authority
SK01 APA Deloitte Audit, s.r.o.
IT01 AGEA Deloitte
ES14 Navarra
Servicio de Intervención General del Departamento
de Economía, Hacienda, Industria y Empleo del Gobierno de Navarra
FR05 ODEADOM CCCOP
DK02 DAFA Deloitte
SE01* SJV
Ekonomistyrningsverket [Swedish National
Financial Management Authority]
DE15 Nordrhein-Westfalen Deloitte & Touche GmbH
SI01 ARSKTRP Ministry of Finance
ES17 Comunidad Valenciana Intervención General de la Generalitat Valenciana * Mission carried out in January 2018 but relating to FY2017

agri_aar_2017_annexes Page 81 of 278
In 10 of the 15 missions it was observed that the Certification Bodies' check on the eligibility criteria was not always sufficient (i.e. it did not cover all eligibility
requirements) or the conclusion was incorrect. Nevertheless, a significant improvement in the Certification Bodies' working papers and documentation was noted in comparison
to previous years. Recommendations issued in previous years' audits in the same Member State had been properly communicated to all Certification Bodies in that Member
State and corrective measures had been taken. This led to further improvement in the audit work of some Certification Bodies, which was noted also in the financial clearance
exercise.
It was concluded that full reliance could be placed on 4 Certification Bodies for their work on the audited population in the scope of the Legality and Regularity mission. For some
Certification Bodies, the preliminary assessment, after the Legality and Regularity mission, was that limited reliance could be placed on their work. Following the
assessment of the certification reports during the financial clearance exercise, this level of reliance is increased, based on the corrective measures implemented and the progress
reported already in the certification report for FY2017.
2.3.3 Summary of the opinions of the Certification Bodies' work on legality and
regularity of the expenditure
A complete review of the results of the Certification Bodies’ work and assessment of the
work on legality and regularity took place in the financial year 2017 financial clearance assessment which started in February 2018.
The results of the work on legality and regularity are expressed through assessment of the residual risk by the Certification Bodies. The conclusion of the assessment is reflected
in the Certification Body's opinion on the Paying Agency's Management Declaration.
EAGF IACS population
70 out of the 80 Paying Agencies declared expenditure under EAGF IACS schemes
Opinion on the Paying Agency's
Management Declaration
Number
of Paying Agencies
Related Paying Agencies
Unqualified
Qualified opinion
Opinion with an emphasis of matter
59
7
4
-
BG01; CY01; DE17; ES10; LU01; SE01; SK01
ES13;ES16; PT03;RO02
Total Member States: 28 70
Table: Annex 10 – 2.3.1-2
For LU01 – Ministère de l’Agriculture, the reservation concerns the delay in the implementation of the anti-fraud strategy.
For BG01 - SFA, the Certification Body issued a qualified opinion as in their opinion, the Paying Agency is not implementing in practice the anti-fraud strategy.
For DE17 - Rheinland-Pfalz, the Certification Body issued a qualified opinion because of debt issues.
The Certification Bodies for CY01-CAPO, ES10-Extremadura and SE01- SJV issued a
qualified opinion because of the delay in the production/incompleteness of control statistics for EAGF IACS. It should be noted that all control statistics were received by DG
AGRI in January 2018.

agri_aar_2017_annexes Page 82 of 278
For SK01 - APA, the Certification Body qualified the opinion because of the high error rate in EAGF IACS.
The residual risk was assessed as not material for all Paying Agencies except for Paying Agencies ES10, MT01 and RO02.
There were material incompliance rates established for ES10, IT01, IT08, IT10 and R002.
EAGF Non-IACS population29
71 out of the 80 Paying Agencies declared expenditure under EAGF Non-IACS schemes.
There were four qualified opinions (BG01, DE17, LU01, SK01), for the same reasons as
mentioned above under the EAGF-IACS population.
For CY01 - CAPO, the opinion was qualified because the Paying Agency's error rate is
above 2%.
For ES07 - Castilla La Mancha, ES13 - Murcia and FR20 – France AGRIMER the respective
Certification Bodies made an emphasis of matter due to material error rates reported on some of the market measures.
The Certification Bodies of the Paying Agencies BG01-SFA, DE17 - Rheinland-Pfalz, ES07 - Castilla la Mancha, GR01-OPEKEPE and PL01 - ARMA found material error (Most Likely
Error exceeding the materiality) in this population. For some of them, it was reflected in
their assessment of the residual risk, but not for all.
In 9 cases30 no separate opinion on the residual risk for the EAGF Non-IACS population
has been provided as the Certification Body treated this population as a de minimis population.
EAFRD IACS population
69 Paying Agencies declared expenditure under EAFRD IACS measures.
Opinion on the Paying Agency's Management Declaration
Number of Paying
Agencies
Related Paying Agencies
Unqualified
Qualified opinion
Opinion with an emphasis of matter
59
9
6
-
BG01;CY01;DE17;LU01;GB06; GB07; PL01; SE01; SK01;
ES09; ES13; FR18; NL04; PT03; RO01
Total Member States: 28 69
Table: Annex 10 -2.3.1-3
There were six qualified opinions (BG01, CY01, DE17, LU01, SE01, SK01), for the same
reasons as mentioned above under the EAGF-IACS population.
29 EAGF Non IACS measure are essentially the market measures. 30 DE04 – Bayern, DE20- Sachsen-Anhalt, DE21 - Schleswig-Holstein, DE23- Thüringen; DE26- Hessen, GB05 –
DARD, GB06 – SGRPID, GB07 – WAG, GB09 – RPA

agri_aar_2017_annexes Page 83 of 278
For GB06 - SGRPID and GB07- WAG, the Certification Bodies qualified the opinion because of potentially incomplete and inaccurate control statistics.
For PL01 - ARMA, the Certification Body qualified the opinion because the Upper Error Limit for EAFRD exceeded the materiality level.
For SK01 - APA, the Certification Body, on the basis of its testing, assessed the residual risk as significant for both EAFRD IACS and Non-IACS and thus did not confirm the
control statistics and issued a qualified opinion.
For 5 Paying Agencies, the residual risk was assessed as material: GB06-SGRPID, GB07-
WAG, IT01-AGEA, RO01-PARDF and SK01-APA for the rest of the Paying Agencies the
risk was not material. The residual risk could not be calculated by the Certification Body for SE01-SJV, because the Paying Agency did not produce control statistics in time for
the Certification Body to check.
EAFRD Non-IACS
71 Paying Agencies have expenditure declared under EAFRD Non-IACS measures.
Opinion on the Paying Agency's
Management Declaration
Number
of Paying Agencies
Related Paying Agencies
Unqualified Qualified opinion
65 6
- BG01;DE17;IT26;LU01;
PL01; SK01;
Total Member States: 28 71
Table: Annex 10 – 2.3.1-4
As regards the Certification Body's opinion on the Paying Agency's Management
Declaration, qualifications were included for the same 3 Paying Agencies (BG01, DE17
and LU01) as mentioned above for the EAFRD IACS population and for the same reasons.
The Certification Body for PL01-ARMA issued a qualified opinion because of material
differences encountered for some files, which led to an Upper Error Limit exceeding the materiality threshold.
For 3 Paying Agencies (FR18-ODARC, IT26-ARCEA and SK01-APA), the Certification Body found material error (Most Likely Error exceeding the materiality) for this population.
General assessment of the Certification Bodies' opinions on legality and
regularity of the expenditure
In most cases it was confirmed by the Certification Bodies that, where applicable, the Paying Agencies had established the necessary action plans to remedy the weaknesses
leading to reservations in the 2016 Annual Activity Report of DG AGRI. The state of play and potential delays in implementation were indicated by the Certification Bodies but the
deficiencies which had led to the implementation of an Action Plan, when still persisting in the audited financial year, were not always reflected in the incompliance rate
established by the Certification Bodies.

agri_aar_2017_annexes Page 84 of 278
In this, the third year of delivering an opinion on the Paying Agency's Management Declaration based on the substantive testing, the Certification Bodies took into account
the results of their own tests, especially when a material incompliance rate was determined, when drawing conclusions on the Management declaration and the control
statistics. There were cases where some Certification Bodies did not consider their own results when assessing the residual risk. In addition, as mentioned in section 2.2.4, in a
few cases the Certification Bodies' conclusions on the residual risk are inconsistent with the error rates reported by the Paying Agencies in the control statistics.
As summarised above, the reports from the Certification Bodies contain substantial and
valuable information on the legality and regularity of expenditure that has been examined in detail by DG AGRI auditors and taken into account for their assessment of
the adjustments to be made to the error rates reported by the Paying Agencies. Annex 10.3 indicates where the audit work of the Certification Bodies is used to top-up the error
rates. In this third year of legality and regularity reporting by the Certification Bodies, the findings of the Certification Bodies on legality and regularity which are taken into account
for the top-ups has increased substantially compared to the first two years of legality and regularity reporting by the Certification Bodies.
Taking into account the experience from the first two exercises (for FY 2015 and FY
2016), DG AGRI presented to Member States and finalised on 19 January 2017 new guidelines for the Certification Bodies with voluntary application from FY2018 (mandatory
as of FY2019). The application of the new guidelines will ensure a more focused legality and regularity audit work by the Certification Bodies and thus support and accelerate the
accomplishment of the single audit approach.
DG AGRI will continue to work closely with the Certification Bodies, in order to further
refine, where necessary, the audit methodology on legality and regularity and to assist them in the implementation thereof.
2.3.4 Assessment of the Certification Bodies' work on legality and regularity
The Certification Body's work on legality and regularity was assessed taking into account
the following components:
Timing of the re-verification of the on-the-spot controls, in particular whether the on-
the-spot controls carried out by the Paying Agency in claim year 2016 were verified by the Certification body in the same year, to minimise the risk that the situation of the
land parcels or animals concerned might have changed in the meantime.
Quality of Certification Body's re-verification of eligibility checks (administrative and
on-the-spot controls) through the DG AGRI audit missions and assessment of the
Certification Body's results, and in particular the technical skills and expertise that are necessary to be able, for instance, to precisely assess the eligibility of land or to check
in detail that a given procurement procedure respects all applicable rules.
Adequacy of the Certification Body's audit strategy, in particular correct sampling
approach, proper monitoring of external bodies performing the on-the-spot re-verifications, evaluation of the representativeness of the Paying Agency random on-
the-spot check sample and sufficient testing for one or both audit objectives.
and reported results (see previous sections).

agri_aar_2017_annexes Page 85 of 278
Main observations per population:
EAGF IACS
This is the population for which the Certification Bodies could provide results on legality and regularity to the greatest extent after the implementation of the new audit approach
(under the reformed legal framework). The situation with regard to the timing of reverifications has improved, although there were still some Certification Bodies which
could not start the re-verification of on-the-spot controls on time with the result that their re-verifications on claim year 2016 were done rather late, resulting in lower reliance
on the work of the specific Certification Bodies' concerned. This was mainly due to the
Certification Body not receiving the Paying Agency's samples and schedule of on-the-spot checks on time. Some Certification Bodies applied proper monitoring and quality control
mechanisms in line with the audit standards and the guidelines, where they delegated the on-the-spot re-verifications to another body.
In general, the Certification Bodies work on this population is of a good standard and has improved in comparison to previous years. Issues, such as insufficient checks on the
representativeness of the Paying Agency's initial random sample for on-the-spot controls, the completeness of the population before selection of their own re-verification sample
and incomplete assessment of the eligibility of the transaction, were present to a lesser
extent than in previous years.
EAGF Non-IACS
With regard to the audit work of the Certification Bodies for this population, the situation
is more complex compared to the other three populations. The Certification Bodies' legality and regularity samples for EAGF Non-IACS were rather small given the number,
range and heterogeneity of the market measures. Nonetheless, the audit efforts should be balanced against the expenditure involved, which is limited compared to the other
populations. For the Certification Bodies of Paying Agencies dealing mainly with market
measures, the legality and regularity work was to a high standard.
In a number of cases, no assessment of the residual risk was provided for the EAGF Non-
IACS population either because it was treated as a de minimis population or because of lack of control statistics. If the expenditure of the given population is below 2% of the
total expenditure declared to the Fund and if no specific risk is linked to the schemes or measures of that population the Certification Bodies can decide to test the whole
expenditure of the Fund under one single population. When this approach was used, an opinion on the residual risk should have been provided for this population as well. In
several cases, the Certification Bodies did not conclude on the residual risk as no
incompliance rate was calculated although conclusions could have been provided considering the error rate established for the certification of the accounts and considering
the internal control system testing.
EAFRD IACS
For this population, like EAGF IACS, the Certification Bodies could provide results on
legality and regularity. The Certification Bodies' work on legality and regularity can be relied upon to a lesser extent than in the case of the EAGF IACS population. Apart from
the reasons mentioned under the EAGF IACS population, especially the timing issue, it
was observed during the DG AGRI audits that for several cases the re-verifications of the Paying Agencies' on-the-spot controls were not performed correctly in 2017, (i.e. all
commitments linked to respective measures are not always appropriately re-verified by the Certification Bodies).

agri_aar_2017_annexes Page 86 of 278
EAFRD Non-IACS
The Certification Bodies' audit work for this population was executed to a higher standard
compared to the two previous years of legality and regularity reporting and a significant improvement compared to previous years in terms of number and quality of findings was
noted.
More Certification Bodies, compared to last year, managed to test appropriately EAFRD
Non-IACS and to provide conclusive results on the control statistics and the residual risk Due to the mismatch between payment claims, control statistics and payments, some
Certification Bodies could not establish an incompliance rate and conclude on the control
statistics. For this population, it was also found through the DG AGRI audits carried out in 2017 and the assessment of the Certification Bodies' results in the financial clearance
exercise that eligibility conditions are not always verified to their full extent by the Certification Bodies. However, this was observed to a lesser extent compared to the 2016
missions.
Conclusion on the Certification Bodies' work as regards DG AGRI's adjusted error rate calculation
In the third year of application of the new approach, the Certification Bodies delivered
better established and substantiated results on auditing the legality and regularity of the expenditure on all populations compared to the first two years. The overall reliance on
the results of the Certification Bodies' work on legality and regularity has increased compared to FY2016. Therefore, the Certification Bodies' results could be taken into
account to a greater extent in the calculation of DG AGRI's adjusted error rate for FY2017.
There are some limitations of the reliability of the results of the work due to sample size. Several Certification Bodies limited the size of their samples to the minimum, without, as
set out in the Commission guidelines, assessing properly the Paying Agency's internal
control system) or limitations in the effectiveness of the Certification Bodies' checks (resulting for example from the late timing). Furthermore it was noted that the sample
tested did not always allow the detection of conformity issues identified by other auditors (Commission and/or Court of Auditors).
2.3.5 Findings from DG AGRI's conformity audits with regard to the
Certification Bodies' work on Legality and Regularity.
While DG AGRI carried out 15 dedicated legality and regularity mission in 2017 on the
Certification Bodies, it also reviewed the work of the latter as part of its conformity audits. Certification Bodies are invited to participate in DG AGRI's conformity audit
missions and do so in most cases and, where possible, their reverifications are tested by DG AGRI during its audit visits. In 2017 23 audit missions have been carried out on
ABB0331 (16 for direct payments, 3 for VCS and 2 for payment entitlements, 2 audits on POSEI) and 8 desk audits on VCS and 26 on ABB04 reviewed the work of the Certification
Bodies.
31 Four specific IT application audits on data integrity are not taken into account.

agri_aar_2017_annexes Page 87 of 278
Area Aids
For area aids (ABB03) the starting point for the 16 conformity audits carried out
was the work carried out by the Certification Bodies as part of their opinions on legality and regularity for financial years 2016 to 2018. Therefore, the DG AGRI
audit work, in the first instance, reviewed the work of the Certification Bodies.
Where Certification Bodies did not address or envisage addressing a particular
issue, under the principle of single audit, DG AGRI completed the Certification Body work in this area in order to gain the necessary assurance on the basis of its
own work.
Where the work was found not to be to the standard required, DG AGRI made comments and/or recommendations so as to enable its use for reliance in the
context of the AAR. Because of the early timing of the DG AGRI work (often carried out after Paying Agency and Certification Body control work had taken
place but before payment), Certification Bodies were in a position to remedy any shortcomings in the work carried out or complement the work to be done so as to
enable full reliance in respect of the financial year 2017.
DG AGRI auditors have, in their audits for direct payments, witnessed an
improvement in the quality and documentation of the work of the Certification
Bodies, when compared with previous years, particularly with regard to the work carried out on administrative controls and the on-the-spot checks for the basic
payment scheme.
Payment entitlements and voluntary coupled support
A similar approach was in applied in the case of the audits concerning the allocation and management of Payments entitlements under Basic payment
scheme and the voluntary coupled support for animals carried out by DG AGRI in the financial years 2016 to 2018. The quality of the work of the Certification
Bodies concerning the voluntary coupled support for animals was found by the DG
AGRI auditors to be of satisfactory quality from the first year of the implementation of these schemes.
Concerning the allocation and management of payment entitlements under Basic payment scheme, DG AGRI auditors noticed more variability in the scope and
quality of the work carried out by different Certification Bodies
Rural Development
An important component of the audits carried out on both IACS (14) and non-IACS Rural Development expenditure was to evaluate the work carried out by the
Certification Body on legality and regularity of the expenditure. This implied
interviews with the representatives of the Certification Body and their participation during the audit, as well as specific checks on their re-performance of the on-the-
spot controls carried out by the Paying Agency. Areas where reliance can be placed on the work of the Certification Body were identified, while
recommendations for improvements were made where deficiencies were found.
Many of the improvements noted in the Certification Body work on EAGF IACS are
also valid for EAFRD IACS although, for additional elements, in particular, commitments, insufficient reliance can be placed on the work.

agri_aar_2017_annexes Page 88 of 278
For Rural Development, the large number of heterogeneous measures to be audited by DG AGRI means that so far, the auditors have not reviewed a
sufficiently large selection of Certification Body reverifications to be able to conclude on the progress of the latter's work, in particular since they have not
been able to compare current work with earlier work over the three year period since the Certification Bodies commenced their work on legality and regularity.
While considerable improvement has been observed for Certification Body work on ABB03, progress on ABB04 is not at the same level. This is due to the greater
complexity of the rules and procedures with regard to Rural Development resulting from
the range of different measures applicable.
2.4 Overall conclusion on the Certification Bodies' work
As in the previous year, DG AGRI considers the Certification Bodies' work on legality and
regularity of expenditure, when carried out in accordance with applicable regulations and
guidelines, the key element in DG AGRI's assurance building model (cf. the pyramid of controls) where each upper layer builds its work upon the results of the previous layer,
and where each layer may use the results of the upper layer to improve its own controls.
In this third year of application of the reporting requirements on legality and regularity,
increased assurance can be obtained from the Certification Bodies' opinions on legality and regularity on all four populations, as compared to the previous years. DG AGRI also
notes significant progress towards the full implementation of the single audit approach.
While, in some cases the Certification Bodies' work on legality and regularity was affected
by the weaknesses described above, some of which have already been rectified in the
Certification Bodies' reporting for FY2017, in FY2017, in most cases, the Certification Bodies' work on legality and regularity was of a higher standard compared to the years
before. This was the case even for EAFRD Non-IACS which is a complex population with a variety of measures and complex rules. In general, the Certification Bodies identified a
significant number of conformity issues and took into consideration the findings coming from DG AGRI/ECA's audits. As in previous years most and increasing reliance can be put
on the work of the Certification Bodies for EAGF IACS (direct payments).
The work of the Certification Bodies has been taken into account for the adjusted error
rate as described in the following Part 3.
DG AGRI will continue to work closely with the Certification Bodies in order to further progress and improve their work on legality and regularity and thus maximise the level of
assurance that can be obtained from their work in the future.

agri_aar_2017_annexes Page 89 of 278
Part 3: Control results at the level of the final beneficiaries, the
assessment thereon by the Certification Bodies and the overall
appreciation of the Commission on their reliability taking into account all
available information
Annex 10 - part 3 presents DG AGRI's process to calculate an adjusted error rate and the
amounts at risk to the EU budget from the starting point of the control data sent by the Member States and taking into account all other available relevant information.
This part of the Annex is split into three separate sections to deal with the three distinct AAB activities:
Part 3.1: ABB02: Market Measures
Part 3.2: ABB03: Direct Payments
Part 3.3: ABB04: Rural Development
Part 3.4: Error rate and corrective capacity
Part 3.5: Root causes of the error rate

agri_aar_2017_annexes Page 90 of 278
Part 3.1 ABB02 – Market Measures
Index for part 3.1 – ABB02: Market Measures
3.1.1 Introduction
3.1.2 ABB02 Expenditure
3.1.3 What assurance does the Director General have regarding
the expenditure under ABB02 – Market Measures?
3.1.4 Fruit & Vegetable Sector
3.1.5 Wine sector
3.1.6 Olive oil
3.1.7 Posei & Aegean Islands
3.1.8 School Milk Scheme
3.1.9 Temporary Exceptional Measures
3.1.10 Promotion Measures
3.1.11 France AGRIMER
3.1.12 Conclusions for ABB02

agri_aar_2017_annexes Page 91 of 278
3.1.1 Introduction
This ABB activity deals with measures many of which were put in place to provide a
safety net for producers and support markets. Since the beginning of the CAP, price support was the main instrument for ensuring market stability and a reasonable income
to farmers. Price support or "intervention" was based on institutional prices set for
agricultural products which guaranteed a fixed price to farmers for their products. In today's CAP, market instruments are instead used to provide targeted, market safety
nets. Intervention prices are set at levels that ensure they are used only in times of real price crisis and when there is a risk of market disruption.
3.1.2 ABB02 Expenditure
The following chapter sets out the elements which DG AGRI uses in order to give
assurance on expenditure reimbursed to Member States in 2017.
The total expenditure for market measures under Title 0502 in 2017 amounts to
EUR 2 945 604 663.
The following table sets out the shared management expenditure reimbursed by DG AGRI
in 2017 for the various market sectors:
Table: Annex 10 – 3.1.2-1
3.1.3 What assurance does the Director General have regarding the expenditure under ABB02 – Market Measures?
The assurance of the Director General is drawn from the various levels of management
and control that are in place and the results which can be obtained from them. ABB02 is characterised by a number of very diverse measures some of which incur very limited
expenditure and some of which are applicable in a limited number of Member States only. The various market measures are completely different from each other with their
own distinct control systems. In particular, control statistics only exist for around 75% of
expenditure. There is not enough data of a sufficiently broad, comprehensive and representative nature to allow the calculation of an adjusted error rate at individual
Chapter Article Sector/measure Expenditure (EUR)
050201 Cereals 0
050202 Rice 0
050203 Refunds on non-Annex I products 0
050204 Food programmes 0
050205 Sugar 0
050206 Olive oil 42 769 942
050207 Textile plants 6 134 399
050208 Fruit and vegetables 995 420 706
050209 Products of the wine-growing sector 1 011 750 116
050210 Promotion 69 762 033
050211 Other plant products/measures 236 857 065
050212 Milk and milk products 468 018 983
050213 Beef and veal 23 649 431
050214 Sheepmeat and goatmeat 3 505 102
050215 Pigmeat, eggs and poultry, bee-keeping and other animal products 90 744 077
2 948 611 854
Suspension of payments 3 007 191
2 945 604 663
ABB 02 Total Direct Management 05 02 10 02 Promotion measures - Direct payments by the Union 0
ABB 02 Grand Total 2 945 604 663
Expenditure reimbursed by DG AGRI to the Member States in 2017
0502
Subtotal
ABB 02 Total Shared Management

agri_aar_2017_annexes Page 92 of 278
Paying Agency level. DG AGRI therefore deviates from the methodology used for ABB03 and ABB04 as set out in its Materiality Criteria at Annex 4 of this report. Where statistics
exist, an adjusted error rate has been calculated for the measure concerned. It does intend however to adhere as closely as possible to the principles set out in that Annex
and to diverge only where technically necessary.
The approach taken by DG AGRI, therefore, was to examine the situation for the largest
spending measures in particular and for any measure for which it had statistical data. A qualitative approach was taken on a measure by measure basis for the main expenditure
items (annual spending above EUR 100 million). This approach was differentiated
depending on the information available for each scheme.
(i) Where statistics existed, along with a meaningful extent of other audit opinions (from
Certification Bodies, DG AGRI audits, ECA assessment) an adjusted error rate was estimated at scheme level.
With regard to using the opinion of the Certification Bodies, the situation is more complex for market measures than for ABB03 and ABB04 in view of the relatively
lower expenditure in ABB 02 and at the same time the number, range and heterogeneity of the market measures. DG AGRI's assurance assessment is carried
out at the level of individual measures, and generally not for those measures with
low financial incidence, whereas the Certification Bodies give an opinion based on the entire population (EAGF Non IACS).
Where the Certification Bodies have established material error in the market measure population DG AGRI has taken account of the Most Likely Error and any
known error and analysed the findings of the Certification Body to establish which measures the findings could affect and used professional judgement to adjust the
reported error rate.
(ii) Where it was not possible to adjust the error rate based on audit opinions, the
approach taken examined the control environment for each scheme, reported on DG
AGRI's audit response over the preceding years as well as any other audit evidence, notably from ECA and from the Certification Bodies. The professional audit
judgement of the DG AGRI auditors was sought, on a measure by measure basis, as to the assurance that could be given to the Director General as well as to give an
assessment of the maximum amount of the expenditure which might be at risk.
(iii) For those measures for which there was neither statistical nor audit information
available, the average adjusted error rate resulting from the examination at points (i) and (ii) was extrapolated in order to assess the risk. For 2017, this was necessary
in respect of around 2% of expenditure for the ABB.
This approach has resulted in a clear conclusion being drawn for each of the measures concerned on the effectiveness of each system in preventing, detecting and correcting
errors as well as on the amount of expenditure considered to be at risk at measure level and at ABB level.
3.1.4 Fruit and Vegetable Sector
The EU funding for the fruit and vegetable sector is targeted at measures to structure the
market. Growers are encouraged to join producer organisations (POs) in order to strengthen the position of producers in the market. POs receive support for
implementing operational programmes, based on a national strategy. They are the principle operators in the fruit and vegetables regime.

agri_aar_2017_annexes Page 93 of 278
The EU fruit and vegetable regime supports operational programmes implemented by recognised producer organisations (POs), by making a funding contribution to the
programmes' operational funds. National authorities "recognise" groups of producers that meet the requirements of PO status. A recognised PO may set up an operational fund to
finance its operational programme (the latter must be approved by the national authorities). This fund is financed by the financial contribution of members (or the
producer organisation itself) and the EU financial assistance.
In certain regions, transitional support is also given to encourage producers, who wish to
acquire the status of recognised POs, to form producer groups (PGs), to cover
administration costs and the investments needed to attain recognition as producer organisations. This funding may be partially reimbursed by the EU and it ceases once the
PG is recognised as a PO. From EAFRD programming period 2014-2020 new producer groups in the fruit and vegetable sectors are no longer financed under EAGF but under
the EAFRD programmes.
The school fruit scheme is an EU-wide voluntary scheme which provides school
children with fruit and vegetables, aiming thus to encourage good eating habits in young people. Besides providing fruit and vegetables to the children the scheme requires
participating Member States to set up strategies including educational and awareness-
raising initiatives. Since school year 2017/2018 (i.e. as from 01/08/2017) the school fruit and school milk schemes (see points 3.1.4.3 and 3.1.7) have been merged in a single
school scheme under Regulations (EU) 2017/39 and 2017/40. In 2017 there has been no expenditure under this new scheme.
Temporary exceptional support measures for producers of certain fruit and vegetables were introduced by the Commission in August 2014 in order to provide relief to European
producers as a result of the market disturbances caused by the Russian ban on certain food imports. Since 2014, the Commission has periodically extended the implementation
of the measure. The last Regulation (2017/1165) has extended the period of eligibility for
the operations until 30/06/2018.
Table: Annex 10- 3.1.4-1
Member StateOperational programmes for
producer organisations
Pre-recognition of
producer groupsSchool Fruit Scheme
Temporary exceptional
measures
Total Fruit &
Vegetables
AT 6 754 008 2 931 592 9 685 600
BE 53 978 059 2 180 474 3 259 541 59 418 075
BG - 2 314 585 3 086 249 36 366 5 437 201
CY 511 198 254 904 1 317 324 2 083 426
CZ 2 823 291 65 463 4 557 566 9 670 7 455 989
DE 41 294 459 25 539 508 66 833 966
DK 4 599 982 1 541 937 6 141 920
EE - 651 896 14 653 666 549
ES 216 115 641 9 525 036 11 589 065 237 229 742
FI 2 695 731 2 695 731
FR 108 237 519 1 904 925 1 826 906 111 969 349
GB 40 175 148 40 175 148
GR 10 198 211 14 580 9 759 925 19 972 716
HR - 1 945 825 2 111 417 4 057 242
HU 3 965 281 925 562 4 571 019 1 140 121 10 601 983
IE 227 768 1 348 353 1 576 121
IT 225 871 369 23 216 681 8 282 872 257 370 923
LT - 85 715 1 194 560 75 196 1 355 471
LU - 383 936 383 936
LV 591 839 487 033 881 965 130 898 2 091 735
MT - 357 342 357 342
NL 41 433 472 4 926 248 922 393 47 282 113
PL 2 545 505 12 028 764 16 912 425 38 197 968 69 684 663
PT 11 997 500 1 204 953 1 974 685 15 177 138
RO 760 260 395 402 4 449 198 916 363 6 521 223
SE 3 543 145 3 543 145
SI - 790 784 610 190 1 400 974
SK 1 171 902 2 725 123 354 262 4 251 287
Grand Total 779 491 289 16 302 524 117 097 079 82 529 815 995 420 706
Expenditure by Measure in 2017 - Fruit and Vegetables

agri_aar_2017_annexes Page 94 of 278
3.1.4.1 Operational programmes of producer organisations
In 2017, the expenditure under this measure amounted to EUR 779.5 million.
Article 97(b) of Commission Regulation (EU) No 543/201132 obliges Member States to submit to the Commission by 15 November of each year an annual report on the
implementation of financial accounting controls and other checks on producer
organisations' operational programmes.
The statistical reports received concern operational programme (OP) expenditure
incurred in financial year 2017 in respect of operational year 2016. The level of error detected by the Member States was 1.4 % with rates above 2% reported by a number of
Member States.
It should be noted that this measure is subject to a very high degree of scrutiny by the
national authorities. Every producer organisation (PO) has to be checked on-the-spot at least once every three years in order to verify respect of recognition criteria as well as
the correct implementation of the operational programme. Due therefore, to the 100%
(or close to 100%) control coverage in several of these Member States, there is little or no error remaining in the uncontrolled population for those Member States on the basis
of their "reported" error rates.
DG AGRI audits on operational programmes of producer organisations carried out
between 2015 and 2017 identified both recognition criteria issues and control deficiencies for a number of Member States. The auditors consider that the error rates reported by
some of these Member States do not fully reflect the irregular spending. In order, therefore, to compensate for uncertainties with regard to the assurance that can be
taken from the Member States’ reported data, DG AGRI auditors reviewed all available
data in order to come to a conclusion based on their professional audit judgment on what was the likely extent of understatement in the error reported and (in line with the
principles set out in step 3 of DG AGRI's materiality criteria – see Annex 4 to this AAR), have adjusted the error rates concerned (CZ, DE, ES, FR, GR ,IT, SE).
The Certification Bodies have also found errors in respect of certain Member States (DE, ES, FR and GR). In one case (ES), the Certification Body errors concerned different
Paying Agencies to the Paying Agency concerned by DG AGRI's deficiencies and in this case, both amounts at risk have been added. In the cases of DE, FR and GR, where both
DG AGRI and the Certification Body had detected the same deficiencies, only the
estimated amount at risk of the latter has been used as it was deemed to be more precise than the initial assessments of DG AGRI.
DG AGRI's adjustments to the reported error rates (resulting from the assessments of the Certification Bodies and /or its own audit findings) and their impact on the amounts
at risk are summarised in the following table:
32 Corresponding to Article 54 (b) of Regulation (EU) 2017/891, in force as from March 2017.

agri_aar_2017_annexes Page 95 of 278
Table: Annex 10 – 3.1.4.1.-1
The following summary sets out for the Operational Programmes for Producer Organisations, for all cases where the adjusted error rate is above 2%, the reasons
which led to DG AGRI making top-ups to the reported error rates. In each case it is assessed whether it is necessary to make a reservation and if so, an indication is given of
the follow-up action required. It is noted that the error rates reported by all MS are inflated to an unknown extent by the results of the administrative checks which are
carried out on all files.
Member
State Adjusted
error rate
Amount
at Risk
Reason for top-up Reser-
vation
Mitigating factors/ reservation
follow-up
AT 6.28% EUR 0.424
m
The adjusted error rate is
solely based on the control
data reported by the Member
State.
No As the amount at risk is below the
de minimis threshold established in
DG AGRI's materiality threshold
(see Annex 4) no reservation is required.
CZ 20.95% EUR 0.592
m
A DG AGRI audit in 2017 found
deficiencies as regards the
checks to establish the access
to the aid.
No As the amount at risk is below the
de minimis threshold established in
DG AGRI's materiality threshold
(see Annex 4) no reservation is
required.
The conformity clearance
procedure already ongoing in
respect of financial year 2017 and
onwards will ensure that the
financial risk to the EU budget is
covered.
DE 2.20% EUR 0.910
m
Two DG AGRI audits in 2017
found deficiencies as regards
checks of the value of
marketed production, control
of eligibility of the OP, on-the-
spot checks on measures, aid
No As the amount at risk is below the
de minimis threshold established in
DG AGRI's materiality threshold
(see Annex 4) no reservation is
required.
Member
State
Aid paid for OPs
in 2017
% of claims
checked OTS
reported
error rateadjustment
amount at risk if
no top-up
amount at risk if
top-up
adjusted
error rate
Total amount
at risk
EUR EUR EUR EUR
(a) (b) (c) (d) (e) (f) = b*(1-c)*d (g)= (b)*(e) (h) = (f+g)/b (i) = (f) +((g)
AT 6 754 008 68.9% 20.19% - 423 868 - 6.28% 423 868
BE 53 978 059 32.6% 0.11% - 39 010 - 0.07% 39 010
CY 511 198 100.0% 3.85% - - - - -
CZ 2 823 291 100.0% 0.02% 21.0% - 591 541 20.95% 591 541
DE 41 294 459 88.6% 1.37% 2.0% 64 457 845 087 2.20% 909 544
DK 4 599 982 70.5% - - - - - -
ES 216 115 641 33.4% 2.39% 1.7% 3 435 275 3 677 197 3.29% 7 112 472
FI 2 695 731 58.4% 0.01% - 72 - 0.00% 72
FR 108 237 519 44.4% 2.02% 1.0% 1 217 112 1 070 599 2.11% 2 287 712
GB 40 175 148 65.6% 0.41% - 56 636 - 0.14% 56 636
GR 10 198 211 100.0% 0.56% 7.8% - 792 001 7.77% 792 001
HU 3 965 281 100.0% 3.30% - 0- - 0.00%- 0-
IE 227 768 100.0% 0.05% - - - - -
IT 225 871 369 76.3% 0.34% 3.0% 180 062 6 862 741 3.12% 7 042 803
LV 591 839 100.0% - - - - - -
NL 41 433 472 33.8% 0.27% - 74 477 - 0.18% 74 477
PL 2 545 505 100.0% 0.66% - - - - -
PT 11 997 500 36.8% 2.63% - 199 269 - 1.66% 199 269
RO 760 260 100.0% 2.96% - - - - -
SE 3 543 145 45.0% 4.77% 5.0% 92 924 177 157 7.62% 270 081
SK 1 171 902 100.0% 0.27% - - - - -
Grand Total 779 491 289 54.6% 1.4% 5 783 162 14 016 324 2.54% 19 799 486
Fruit and Vegetables - Operational Programmes for Producer Organisations
Calculation of adjusted Error Rate and Amount at Risk

agri_aar_2017_annexes Page 96 of 278
Member
State Adjusted
error rate
Amount
at Risk
Reason for top-up Reser-
vation
Mitigating factors/ reservation
follow-up
applications and eligibility of
the OP.
Based on the Certification
Body's assessment, an
adjustment was made to the
error rate reported by the
Member State.
The ongoing conformity clearance
procedure will ensure that the
financial risk to the EU budget is
covered.
ES 3.29% EUR 7.112
m
A DG AGRI audit in 2017 in
Murcia (ES013) found
deficiencies as regards the
checks to establish the
consistency and technical
quality of the programmes, the
control of eligibility of the
operational programme and
the on-the-spot checks on
measures of operational
programmes.
The follow up of the
environmental actions in Spain
revealed that there were still
some shortcomings for limiting
the expenditure of environ-
mental actions to the
additional costs.
Based on the Certification
Body's assessment, a further
adjustment was made to the
error rate reported by the
Member State.
Yes A reservation is entered in respect
of 2017 expenditure.
For Murcia, the Spanish authorities
are taking the remedial measures
from OP 2017 and therefore no
action plan is necessary.
The Spanish authorities amended
the Framework for Environmental
Actions and have finished the
studies for calculating the specific
cost of certain environmental
actions and therefore the
shortcoming has been remedied.
The Member State should address
the findings of the Certification
Body.
The ongoing conformity clearance
procedure will ensure that the
financial risk to the EU budget is
covered.
FR 2.11% EUR
2.288 m
The deficiencies have been
detected in previous DG AGRI
audits and a reservation was
made in the 2016 AAR. DG
AGRI found deficiencies in the
controls carried out on the
eligibility of OPs, compliance of
the recognition status of PO,
checks to establish the access
to the aid claimed and
performance of on-the-spot
checks.
Based on the Certification
Body's assessment, an adjust-
ment was made to the error
rate reported by the Member
State.
No (see
overall
reserva
tion for
FR20)
A specific reservation is not
considered necessary.
The FR authorities have already
implemented some corrective
measures to remedy the
deficiencies found and are in the
process of finalising the
implementation of the remaining
ones.
The ongoing conformity clearance
procedure will ensure that the
financial risk to the EU budget is
covered.
GR 7.77% EUR
0.792 m
A DG AGRI audit in 2016
identified deficiencies as
regards the verification of the
soundness of estimates,
actions implemented before
approval of the amendments
to OPs, compliance with the
minimum number of
environmental actions, assess-
ment of recognition criteria in
the context of the main activity
and technical means.
Based on the Certification
Body's assessment, an
adjustment was made to the
error rate reported by the
Member State
No As the amount at risk is below the
de minimis threshold established in
DG AGRI's materiality threshold
(see Annex 4) no reservation is
required.
The on-going Action Plan is closely
monitored by DG AGRI.
The ongoing conformity clearance
procedure will ensure that the
financial risk to the EU budget is
covered.

agri_aar_2017_annexes Page 97 of 278
Member
State Adjusted
error rate
Amount
at Risk
Reason for top-up Reser-
vation
Mitigating factors/ reservation
follow-up
IT 3.12% EUR
7.043 m
DG AGRI audits in 2016 and
2017 found several deficiencies
in the controls carried out on
eligibility of operational
programmes and the aid
claimed, checks on outsourcing
of the PO' main activity,
checks on democratic account-
ability and checks on delivery
of full production.
Yes A reservation is entered in respect
of 2017 expenditure.
The Member State should
implement an action plan to
address the deficiencies detected
in the Paying Agency of AGEA.
The ongoing conformity clearance
procedure will ensure that the
financial risk to the EU budget is
covered.
SE 7.62% EUR
0.270 m
A DG AGRI audit in 2016
identified an absence in the
checks performed before the
approval of the OP i.e. the
consistency, technical quality
and soundness of estimates as
well as deficiencies in the
controls on eligibility of actions
and expenditure proposed, in
the compliance of operations
with national regulations and
in controls carried out on OP
measures.
No As the amount at risk is below the
de minimis threshold established in
DG AGRI's materiality threshold
(see Annex 4) no reservation is
required.
The ongoing conformity clearance
procedure will ensure that the
financial risk to the EU budget is
covered.
Table: Annex 10 – 3.1.4.1-2
3.1.4.2 Pre-recognition of producer groups
In 2016 the expenditure under this measure amounted to EUR 71.4 million. In 2017, expenditure had fallen to EUR 16.3 million. As stated above in under point 3.1.4, once
producer groups (PGs) have attained producer organisation status, they no longer receive aid under the producer group scheme. Expenditure has reduced significantly
under this measure over recent years as PGs reach maturity and become recognised as producer organisations and new PGs can only be financed under EAFRD.
Article 97(b) of Commission Regulation (EU) No 543/201133 obliges Member States to submit to the Commission, by 15 November of each year an annual report on the
implementation of financial accounting controls and other checks on producer groups’
recognition plans in the preceding year.
The overall error rate calculated on the basis of the Member States' statistics was 1.8%,
with HU and RO the only Member States reporting a material error rate (respectively 7.31% and 17.92 %%). However, due to the 100% control rate in these two MS there is
no residual error for this Member State.
DG AGRI audits on operational programmes of producer groups carried out between
2015 and 2017 identified serious control deficiencies for HU and PL. The enquiries for HU have been closed with financial correction and there are currently no open audit findings
for this Member State. Since the Commission had suspended payments to Poland (at a
rate of 25%) due to long standing serious deficiencies which had not yet been remedied
33 Corresponding to Article 54 (b) of Regulation (EU) 2017/891, in force as from March 2017.

agri_aar_2017_annexes Page 98 of 278
via an action plan, and since this suspension was in effect for all of 2017 and thus covered the risk to the EU budget, it was not necessary to make an adjustment to the
reported error rate.
Table: Annex 10 – 3.1.4.2-1
3.1.4.3 School Fruit scheme
In 2017, the expenditure under this scheme (i.e. for school year 2016/2017) amounted to EUR 117.1 million (EUR 110 million in 2016).
Article 15(1) of Regulation (EC) No 288/200934 requires Member States to report on the School Fruit Scheme. Member States' statistical data show that on-the-spot checks were
conducted on 44.9 % of aid distributed for the 2016/2017 school year resulting in errors of 0.27 %. RO has reported a material error rate of 2.33%. However, due to the high
level of the control rate in RO (99.2%) the adjusted error rate (0.02%) is not material.
DG AGRI audits in 2017 identified deficiencies in MT as regards the checks to establish eligibility of the aid and in CZ in respect of the performance of on-the-spot checks of
sufficient quality and adjustments have been made to the reported error rates for those Member States.
For BE, BG and FR, errors have been reported by the respective Certification Bodies for 2017 and DG AGRI has included the estimated amount of error as amounts at risk.
DG AGRI's adjusted the reported error rates and their impact on the amounts as summarised in the following table:
34 Corresponding to Article 11 of Regulation (EU) 2016/248.
Member
StateAid Paid in 2017
% of claim
checked
OTS
reported error
rate
DG AGRI
top-up
amount at risk
where no top-
up
amount at risk
for top-up
adjusted
error rate
Total amount
at risk
EUR EUR EUR EUR
(a) (b) (c) (d) (e) (f) = b*(1-c)*d (g)= (b)*(e) (h) = (f+g)/b (i) = (f) +((g)
BG 2 314 585 100.0% 0.80% - - - - -
CZ 65 463 100.0% - - - - - -
FR - 13.2% - - - - - -
HU 925 562 100.0% 7.31% - - - - -
LT 85 715 100.0% - - - - - -
LV 487 033 100.0% 0.01% - - - - -
PL 12 028 764 98.5% 1.10% - 2 025 - 0.02% 2 025
RO 395 402 100.0% 17.92% - - - - -
Grand Total 16 302 524 98.9% 1.8% 2 025 0 2 025
Fruit and Vegetables -Prerecognition of Producer Groups
Calculation of Adjusted Error Rate and Amount at Risk

agri_aar_2017_annexes Page 99 of 278
Table: Annex 10 – 3.1.4.3-1
Member
State
Adjusted
error rate
Amount
at Risk
Reason for top-up Reser-
vation
Mitigating factors/ reservation
follow-up
BE 8.85 % EUR
0.193 m
Based on the Certification Body's
assessment, an adjustment was
made to the error rate reported by
the Member State.
No As the amount at risk is below
the de minimis threshold
established in DG AGRI's
materiality threshold (see
Annex 4) no reservation is
required.
BG 3.31% EUR
0.102 m
Based on the Certification Body's
assessment, an adjustment was
made to the error rate reported by
the Member State.
No As the amount at risk is below
the de minimis threshold
established in DG AGRI's
materiality threshold (see
Annex 4) no reservation is
required.
CZ 5% EUR
0.228 m
A DG AGRI audit in 2017 identified
deficiencies as regards the checks to
establish eligibility of the aid.
No As the amount at risk is below
the de minimis threshold
established in DG AGRI's
materiality threshold (see
Annex 4) no reservation is
required.
The ongoing conformity
clearance procedure will
ensure that the financial risk
to the EU budget is covered.
Member
State
Aid Paid in
2017
% of claim
checked OTS
reported
error rate
DG AGRI
top-up
amount at risk
where no top-up
amount at risk
for top-up
adjusted
error rate
Total
amount at
risk
EUR EUR EUR EUR
(a) (b) (c) (d) (e) (f) = b*(1-c)*d (g)= (b)*(e) (h) = (f+g)/b (i) = (f) +((g)
AT 2 931 592 9.8% 0.00% 124 - 0.00% 124
BE 2 180 474 7.3% 0.04% 9% 733 192 220 8.85% 192 953
BG 3 086 249 27.7% 0.04% 3% 953 101 056 3.31% 102 008
CY 254 904 9.8% - - - - -
CZ 4 557 566 39.9% 0.00% 5% 1 227 878 5.00% 227 879
DE 25 539 508 12.0% 0.01% 0% 3 235 123 901 0.50% 127 136
DK 1 541 937 67.4% 1.35% 6 763 - 0.44% 6 763
EE 651 896 15.1% 0.40% 2 233 - 0.34% 2 233
ES 9 525 036 72.6% 0.05% 1 433 - 0.02% 1 433
FR 1 904 925 6.7% 1.96% 53% 34 917 1 003 555 54.52% 1 038 472
HR 1 945 825 45.0% - - - - -
HU 4 571 019 11.7% - - - - -
IE 1 348 353 20.9% 0.01% 122 - 0.01% 122
IT 23 216 681 100.0% 0.56% - - - -
LT 1 194 560 6.7% - - - - -
LU 383 936 100.0% - - - - -
LV 881 965 9.3% - - - - -
MT 357 342 100.0% - 5% - 17 867 5.00% 17 867
NL 4 926 248 100.0% - - - - -
PL 16 912 425 11.2% 0.03% 4 579 - 0.03% 4 579
PT 1 204 953 17.0% - - - - -
RO 4 449 198 99.2% 2.33% 868 - 0.02% 868
SI 790 784 16.0% - - - - -
SK 2 725 123 28.3% 0.00% 38 - 0.00% 38
Grand Total 117 097 079 44.9% 0.27% 56 000 1 666 478 1 722 477
Fruit and Vegetables -School Fruit Scheme
Calculation of Adjusted Error Rate and Amount at Risk

agri_aar_2017_annexes Page 100 of 278
FR 54.52
%
EUR
1.038 m
Based on the Certification Body's
assessment, an adjust-ment was
made to the error rate reported by
the Member State.
Yes -
overall
reserva
tion for
FR
A reservation is entered in
respect of 2017 expenditure
(covered by the overall
reservation for FR).
The Member State should
address the deficiencies
identified by the Certification
Body.
MT 5% EUR
0.018 m
A DG AGRI audit in 2017 identified
deficiencies as regards the checks to
establish eligibility of the aid.
No As the amount at risk is below
the de minimis threshold
established in DG AGRI's
materiality threshold (see
Annex 4) no reservation is
required.
A remedial Action Plan is
under implementation.
The ongoing conformity
clearance procedure will
ensure that the financial risk
to the EU budget is covered.
Table: Annex 10 – 3.1.4.3-2
3.1.4.4 Exceptional Support Measures for Fruit and Vegetables
Following market disturbances in summer 2014 caused by the Russian ban on various
products, which impacted heavily on fruit exports, temporary exceptional support measures were introduced for producers of certain fruit and vegetables. Expenditure for
exceptional support measures in 2017 was EUR 82.5 million (see table: Annex 10-3.1.7).
No control statistics are required for these temporary support measures. DG AGRI audit
missions in 2017 detected deficiencies leading it to propose adjustments for two MS: BE and GR. This results in an overall amount at risk of EUR 0.45 million (see table: Annex 10
3.1.4.4-1).

agri_aar_2017_annexes Page 101 of 278
Table: Annex 10 - 3.1.4.4-1
Member
State
Adjuste
d error
rate
Amount
at Risk
Reason for top-up Reser-
vation
Mitigating factors/ reservation
follow-up
BE 5% EUR
0.163
m
A DG AGRI audit in 2017 identified
deficiencies as regards the checks to
establish eligibility of the aid,
performance of on-the-spot-checks of
sufficient number and performance of
on-the-spot-checks of sufficient quality.
No As the amount at risk is below
the de minimis threshold
established in DG AGRI's
materiality threshold (see
Annex 4) no reservation is
required.
The ongoing conformity
clearance procedure will
ensure that the financial risk
to the EU budget is covered.
GR 3% EUR
0.293
m
A DG AGRI audit in 2017 identified
deficiencies as regards the performance
of on-the-spot-checks of sufficient
number.
No As the amount at risk is below
the de minimis threshold
established in DG AGRI's
materiality threshold (see
Annex 4) no reservation is
required.
The ongoing conformity
clearance procedure will
ensure that the financial risk
to the EU budget is covered.
Table: Annex 10 – 3.1.4.4-2
Member
State Aid paid in 2017
% of claims
checked OTS
reported
error rateadjustment
amount at risk if
no top-up
amount at risk if
top-up
adjusted
error rate
Total amount
at risk
EUR EUR EUR EUR(a) (b) (c) (d) (e) (f) = b*(1-c)*d (g)= (b)*(e) (h) = (f+g)/b (i) = (f) +((g)
AT - N/D - - - - - -
BE 3 259 541 N/D - 5% - 162 977 5.00% 162 977
BG 36 366 N/D - - - - - -
CY 1 317 324 N/D - - - - - -
CZ 9 670 N/D - - - - - -
DE - N/D - - - - - -
DK - N/D - - - - - -
EE 14 653 N/D - - - - - -
ES 11 589 065 N/D - - - - - -
FI - N/D - - - - - -
FR 1 826 906 N/D - - - - - -
GB - N/D - - - - - -
GR 9 759 925 N/D - 3% - 292 798 3.00% 292 798
HR 2 111 417 N/D - - - - - -
HU 1 140 121 N/D - - - - - -
IE - N/D - - - - - -
IT 8 282 872 N/D - - - - - -
LT 75 196 N/D - - - - - -
LU - N/D - - - - - -
LV 130 898 N/D - - - - - -
MT - N/D - - - - - -
NL 922 393 N/D - - - - - -
PL 38 197 968 N/D - - - - - -
PT 1 974 685 N/D - - - - - -
RO 916 363 N/D - - - - - -
SE - N/D - - - - - -
SI 610 190 N/D - - - - - -
Grand Total 82 529 815 - - 455 775 0.55% 455 775
Fruit and Vegetables - Temporary Exceptional Measures
Calculation of adjusted Error Rate and Amount at Risk

agri_aar_2017_annexes Page 102 of 278
3.1.4.5 Conclusion for the Fruit and Vegetable sector
For the fruit and vegetables sector there are a limited number of Member States for
which serious problems have been detected by DG AGRI and the Certification Bodies in recent years. The errors which such deficiencies would produce were not indicated in the
results of control carried out and reported by those Member States. The resulting
adjusted error rate and reservations are summarised below.
The table below summarises the data which is set out in detail above and indicates that 3
reservations are required in respect of 3 Member States for a total amount of EUR 17.48 million. The total amount at risk in the 2017 expenditure is estimated at EUR 21.52
million.
Table: Annex 10 – 3.1.4.5-1
The 2016 reservations for operational programmes for producer organisations for
ES and IT are carried over. For AT, CZ, DE GR and SE, as the amount at risk is below the de minimis threshold, there is no reservation. For FR no specific reservation is needed for
this measure as most of the deficiencies have already been addressed by the FR authorities who are also in the process of finalising the implementation of the remaining
ones.
The 2014/2015/2016 reservation for pre-recognition of producer groups in PL is not carried over as for the full financial year 2017 a suspension of payments (25%) was in
place for Poland for this measure in order to protect the EU budget.
For temporary exceptional support measures for the fruit and vegetables sector, the
2016 reservation is not carried over for expenditure incurred by Poland.
For the school fruit scheme, a reservation for FR is indicated but this is covered by the
general reservation for the Paying Agency France AGRIMER.
It is emphasised furthermore, that in the case of all of the amounts under reservation,
the conformity clearance procedure shall ensure that undue expenditure will be
recovered from the Member States concerned.
Measure Expenditure
Adjusted
error rate
MS with
reservation
Amount under
reservation
Total amount
at risk
EUR EUR EUR
ES 7 112 472
IT 7 042 803
Total OPPO 14 155 276
-
Total PRPG -
FR 1 038 472
Total SFS 1 038 472
-
Total TEM -
Grand Total 995 420 706 2.16% 15 193 748 21 523 988
Operational programmes for
Producer Organisation
School Fruit Scheme 117 097 079 1 722 477
Temporary Exceptional Measures 82 529 815 455 775
Summary of reservations and amounts at risk for Fruit & Vegetable Sector
779 491 289
19 799 486
Pre-Recognition of Producer
Groups16 302 524
2 025

agri_aar_2017_annexes Page 103 of 278
3.1.5 Wine sector
The common organisation of the market in wine is aimed essentially at improving the
competitiveness of EU wine producers and balancing supply and demand in the wine sector. The main financial instruments of this reform included a temporary grubbing-up
scheme and the setting up of national support programmes: a specific budget made available for each Member State, which can choose the breakdown best adapted to its
particular situation. The most significant measures, in financial terms, have been restructuring and conversion of vineyards; investments; promotion on third country
markets and information within EU; by-product distillation and harvest insurance.
Regulation (EC) No 1308/2013 added further support measures to the existing ones. The existing measures now are: promotion; restructuring and conversion of vineyards; green
harvesting; mutual funds; harvest insurance; investments; innovation in the wine sector and by-product distillation. Regulations (EU) No 1149/2016, and (EU) No 1150/2016,
have extended the obligation for the MS to report on the controls carried out for all wine measures (with the exception of the very small amounts under other measures for the
wine-growing sector).
Table: Annex 10 – 3.1.5-1
Restructuring and conversion of vineyards
Aid applications for restructuring and conversion in the wine sector are subject to 100 % on-the-spot checks before and after operations, and in all cases before the final payment.
The controls, which aim at assessing the eligibility of parcels and operations, and at
measuring the areas, are performed by means of both remote sensing and classical (on-the-spot) checks both prior and subsequent to restructuring operations.
DG AGRI has carried out 7 audits on the measure between 2015 and 2017 in AT, BG, IT (2), DE, HU and RO. The most significant issue detected was that the Paying Agency did
not systematically and/or completely perform the required ex-ante on-the-spot checks.
Investment measures
The investment measure provides for the possibility to invest in tangible and non-
tangible "goods" in order to improve the quality of wine (such as expertise). The aid is paid for 40 to 75% of the investment depending on the region. Investment measures
require a 100% control on the spot prior to payment. Between 2015 and 2017, DG AGRI carried out audits in FR, ES and IT. The most significant issue detected being the non-
Member
State
Restructuring
and
Conversion of
Vineyards
Investment
Promotion in
Third
Countries and
Information in
EU
By-product
distillation
Harvest
Insurance
Green
harvestingInnovation Others Total Wine
AT 5 742 476 2 761 506 1 834 030 10 338 012
BG 22 267 912 - 438 293 22 706 205
CY 882 935 2 465 114 255 397 3 603 446
CZ 4 122 618 1 030 340 5 152 957
DE 15 485 381 15 182 382 2 093 109 159 033 32 919 906
ES 77 360 666 51 151 994 41 623 079 31 710 259 42 322 201 888 319
FR 123 333 572 93 009 335 35 313 445 28 881 060 7 476 280 544 887
GR 8 987 427 - 4 249 575 13 237 002
HR 202 934 2 950 785 167 261 3 320 979
HU 27 544 505 12 770 342 552 1 200 000 29 099 828
IT 141 770 302 62 520 198 73 986 943 17 927 804 26 403 392 1 189 394 323 798 032
PT 54 617 179 - 5 796 724 1 424 081 3 370 016 65 208 000
RO 9 981 686 1 147 834 144 212 260 701 11 534 433
SI 4 501 542 - 543 458 5 045 000
SK 2 815 790 532 530 13 440 255 397 3 617 157
Grand Total 499 616 926 232 764 787 166 546 122 81 143 203 30 703 936 1 189 394 42 322 7 476 1 012 014 164
Expenditure by Measure in 2017 - Wine

agri_aar_2017_annexes Page 104 of 278
recovery of aid by the Member States when the overall operation had not been fully implemented as approved.
Promotion on third country markets
A 100% administrative check is carried out by the Member States in order to detect
ineligible costs. Between 2015 and 2017, the MS audited by DG AGRI were IT (twice), ES
and FR. Deficiencies were detected with regard to the latter.
Green harvesting
The green harvesting measure provides for the possibility of total destruction or removal
of grape bunches while still in their immature stage, in order to contribute to restoring the balance of supply and demand in the Union wine market. The aid can reach a
maximum of 50% of the related direct costs. This measure requires a 100% control on the spot prior to payment.
In 2017, IT was the only MS where this measure was used.
By-product distillation
By-product distillation is a simple measure. Member States can decide that the wine
producer should bring the by-products ("must" and "lies") to a distillery. By–products should be removed from the market in order to avoid that (low quality) wine can be
produced from it.
DG AGRI considers that distillation measures are low risk as the interest of the MS, to
keep every drop of alcohol produced under control, is very high.
Harvest Insurance
Harvest insurance is another simple measure. Wine producers can claim up to 80% of the
cost of their insurance policy. This requires a straightforward administrative control. On top of that, the aid amount is capped by maximum insurance premium and maximum
insured value of the harvest. DG AGRI audit missions took place between 2012 and 2015 to IT and RO. Based on both the evaluation on the spot as well as the structure of the
control system, the auditors conclude that there is no or very low risk in this measure.
Other (innovation measure)
These amounts are extremely marginal and the risk is considered to be zero. No audit
has yet been performed for this expenditure.
Conclusion for the wine sector
For the wine sector, based on the audits carried out, DG AGRI found that there was some
risk with regard to restructuring and conversion measures due to ex-ante on-the-spot checks in AT as well as deficiencies in the checks for investment measures for wine in ES
and FR and for promotional measures in FR. The DG AGRI auditors have therefore, used their professional audit judgment to propose adjustments to the error rates
reported (i.e. restructuring and conversion, investment and promotional measures).
The Certification Bodies for BG, DE, ES, and FR have also found errors with regard to
restructuring of vineyards, investments and promotion and estimations of the error have been added to the respective amounts at risk.

agri_aar_2017_annexes Page 105 of 278
Table: Annex 10 – 3.1.5.1-1
The above table indicates that 1 reservation is required in respect of FR for a total
amount of EUR 25.87 million. The adjusted error rate for the wine sector is 2.89% which represents a total amount at risk in the 2017 expenditure of EUR 29.28 million.
Member
State Adjusted
error rate
Amount at
Risk
Reason for top-up Reser-
vation
Mitigating factors/ reservation
follow-up
AT 5.11% EUR 0.528
m
DG AGRI audit found deficiencies
in the number and quality of the
OTSC.
Based on the Certification Body's
assessment, a further adjustment
was made to the error rate
reported by the Member State, as
orders were placed and down
payment made prior to the
approval of investments.
No As the amount at risk is below
the de minimis threshold
established in DG AGRI's
materiality threshold (see
Annex 4) no reservation is
required.
The ongoing conformity
clearance procedure will
ensure that the financial risk
to the EU budget is covered.
BG 2.73% EUR 0.620
m
Based on the Certification Body's
assessment, an adjustment was
made to the error rate reported
by the Member State.
No As the amount at risk is below
the de minimis threshold
established in DG AGRI's
materiality threshold (see
Annex 4) no reservation is
required.
FR 9.22% EUR
25.869 m
AGRI audits found deficiencies in
the performance of the
administrative and on the spot
checks, and the risk analysis.
Based on the Certification Body's
assessment, a further adjustment
was made to the error rate
reported by the Member State.
Yes -
overall
reserva
tion for
FR
A reservation is entered in
respect of 2017 expenditure
(covered by the overall
reservation for FR).
The Member State should
implement an action plan
addressing the deficiencies
identified by DG AGRI and the
Certification Body.
The ongoing conformity
clearance procedure will
ensure that the financial risk
to the EU budget is covered.
Table: Annex 10 – 3.1.5.1-2
Member
StateAid paid in 2017
% of claims
checked OTS
Reported
error rateAdjustment
Amount at risk if
no top-up
Amount at risk if
top-up
Adjusted
error rate
Total amount
at risk
EUR EUR EUR EUR
(a) (b) (c) (d) (e) (f) = b*(1-c)*d (g)= (b)*(e) (h) = (f+g)/b (i) = (f) +((g)
AT 10 338 012 100.0% 2.3% 1.47% - 528 496 5.11% 528 496
BG 22 706 205 - - 0.00% - 619 612 2.73% 619 612
CY 3 603 446 - - - - - - -
CZ 5 152 957 100.0% 4.2% - - - - -
DE 32 919 906 100.0% 1.6% 1.53% 197 503 407 1.53% 503 604
ES 201 888 319 99.6% 0.6% 0.82% 5 639 1 665 215 0.83% 1 670 854
FR 280 544 887 100.0% 7.0% 9.22% 827 25 867 989 9.22% 25 868 816
GR 13 237 002 - - - 98 - 0.00% 98
HR 3 320 979 96.2% 1.2% - 1 546 - 0.05% 1 546
HU 29 099 828 100.0% 17.5% - 2 226 - 0.01% 2 226
IT 323 798 032 99.2% 2.9% - 79 260 - 0.02% 79 260
PT 65 208 000 - - - - - - -
RO 11 534 433 100.0% 1.5% - - - - -
SI 5 045 000 95.3% - - 2 879 - 0.06% 2 879
SK 3 617 157 92.9% - - - - - -
Grand Total 1 012 014 164 89.2% 3.6% 92 673 29 184 718 2.89% 29 277 391
Wine - 2017 Expenditure :
Calculation of Adjusted Error Rate and Amount at Risk

agri_aar_2017_annexes Page 106 of 278
3.1.6 Olive oil
In 2017, the expenditure under this scheme, which is implemented only by three MS (FR,
IT and GR) amounted to EUR 42.77 million.
For FR an error has been reported by the Certification Body in its report for 2017 and DG
AGRI has included it as amount at risk.
Table: Annex 10 – 3.1.6-1
Member
State/PA
Adjusted
error rate
Amount
at risk
Reasons for top-up Reservation Mitigating factors/reservation
follow up.
FR 14.41% EUR
0.070
m
Based on the Certification Body's
assessment, an adjustment was
made to the error rate reported
by the Member State.
No (see
overall
reservati
on for
FR)
As the amount at risk is below
the de minimis threshold
established in DG AGRI's
materiality threshold (see
Annex 4) no reservation is
required.
Table: Annex 10 – 3.1.6-2

agri_aar_2017_annexes Page 107 of 278
3.1.7 POSEI
The EU´s outermost regions benefit from the POSEI arrangements ("Programme
d'Options Spécifiques à l'Éloignement et l'Insularité") in the agricultural sector. These programmes are designed to take account of their geographical and economic handicaps
such as remoteness, insularity, small size, difficult topography and climate, and economic
dependence on a few products.
The outermost regions, as identified in Art 349 of the Treaty for the Functioning of the
European Union (TFEU) are:
France: Guadeloupe, French Guyana, Martinique, Réunion, Saint-Barthélemy and
Saint-Martin
Portugal: the Azores and Madeira
Spain: the Canary Islands
For Greece, the smaller Aegean islands also benefit from specific supply arrangements
for certain agricultural products and adapted support measures for local agricultural
production (even if under a different legal basis than the "real" POSEI regions).
The POSEI measures are funded both under ABB02 and ABB03. This sub-chapter only
deals with ABB02 expenditure.
ABB02 measures fall into two categories:
specific supply arrangements, aimed at mitigating the additional costs for the supply of essential products for human consumption, for processing
and as agricultural inputs, and
measures to assist local agricultural products.
The measures to assist local agricultural products concern a multitude of products and
include measures aimed at supporting production, marketing or processing. Each Member State concerned defines the products and the eligible actions.
Article 32(2) of Regulation (EU) No 228/2013, Article 39(1)(k) of Regulation (EU) No 180/2014 Article 20(2) of Regulation (EU) No 229/2013) and Article 31(1)(k) of
Regulation (EU) No 181/2014 oblige Member States to submit statistics on the checks carried out by the competent authorities.
The measures financed by POSEI are extremely differentiated in terms of scope and financial importance. The analysis of the statistics indicates that the error rates for the
individual actions fluctuate considerably. Several conformity clearance procedures are
ongoing in different Member States.
Further to the result of enquiries carried out in 2014 and 2017 the error rates reported
for FR has been adjusted.
The Certification Body for FR has also found errors with regard to POSEI Market
measures and this has been taken into account in the calculation of adjusted error rate.

agri_aar_2017_annexes Page 108 of 278
Table: Annex 10 – 3.1.7-1
The table above indicates that one reservation is required in respect of France for an
amount of EUR 6.84 million. The adjusted error rate for the market measures under POSEI is 3.06% which represents a total amount at risk in the 2017 expenditure of EUR
7.18 million. The table above also shows the error rates detected by the Member States.
POSEI – ABB02
Member
State/PA
Adjusted
error
rate
Amount
at risk
Reasons for top-up Reservation Mitigating factors/reservation
follow up.
FR05
ODEADOM
5.52 % EUR
6.844
m
A DG AGRI audit in 2014
identified deficiencies as
regards the administra-
tive checks.
Based on the
Certification Body's
assessment, an
adjustment was made to
the error rate reported
by the Member State.
Yes A reservation is entered in
respect of 2017 expenditure.
The Paying Agency should
follow the recommendations for
remedial actions of the
Certification Body.
The ongoing conformity
clearance procedure will ensure
that the financial risk to the EU
budget is covered.
Table: Annex 10 – 3.1.7-2
3.1.8 School Milk Scheme
In 2017, expenditure in respect of this measure amounted to EUR 64.2 million. There is
a high level of control generally for the scheme with over 30.5 % of aid claimed being
subject to on-the-spot checks.
No MS reported material errors. Further to an audit carried out in 2016, a top-up is
applied for SE. The resulting adjusted error rate is not material.
An adjustment is made to the error rate reported by France based on the assessment of
the Certification Body.
Member
StateAid paid in 2017
% of claims
checked OTS
Reported
error rateAdjustment
Amount at risk if
no top-up
Amount at risk if
top-up
Adjusted
error rate
Total amount
at risk
EUR EUR EUR EUR
(a) (b) (c) (d) (e) (f) = b*(1-c)*d (g)= (b)*(e) (h) = (f+g)/b (i) = (f) +((g)
ES 82 598 334 12.4% 0.46% 330 717 - 0.40% 330 717
FR 124 079 717 51.6% 1.98% 0.04% 1 187 013 5 657 274 5.52% 6 844 287
GR 5 375 403 100.0% - - - - -
PT 22 526 610 58.2% 0.00% 45 - 0.00% 45
Grand Total 234 580 065 39.5% 1.21% 1 517 776 5 657 274 3.06% 7 175 049
POSEI Market measures
Calculation of adjusted Error Rate and Amount at Risk

agri_aar_2017_annexes Page 109 of 278
Table: Annex 10 – 3.1.8-1
The adjusted error rate for the school milk scheme is 2.74 % which represents a total
amount at risk in the 2017 expenditure of EUR 1.76 million.
Member
State Adjusted
error rate
Amount at
Risk
Reason for top-up Reser-
vation
Mitigating factors/ reservation
follow-up
FR 23.09% EUR 1.710
m
Based on the Certification Body's
assessment, an adjustment was
made to the error rate reported
by the Member State.
Yes -
overall
reserva
tion for
FR
A reservation is entered in
respect of 2017 expenditure
(covered by the overall
reservation for FR).
The Member State should
implement an action plan
addressing the deficiencies
identified by DG AGRI and the
Certification Body.
The ongoing conformity
clearance procedure will
ensure that the financial risk
to the EU budget is covered.
Table: Annex 10 – 3.1.8-2
Member
StateAid paid in 2017
% of claims
checked
Reported
error rateAdjustment
Amount at risk if
no top-up
Amount at risk if
top-up
Adjusted
error rate
Total amount at
risk
EUR EUR EUR EUR
(a) (b) (c) (d) (e) (f) = b*(1-c)*d (g)= (b)*(e) (h) = (f+g)/b (i) = (f) +((g)
AT 563 140 32.7% 0.1% 207 - 0.04% 207
BE 358 931 17.3% - - - - -
BG 733 063 22.1% - - - - -
CY 139 673 5.9% - - - - -
CZ 429 143 98.8% 0.0% 1 - 0.00% 1
DE 4 030 753 68.3% - - - - -
DK 1 565 922 87.1% 0.1% 197 - 0.01% 197
EE 748 859 16.7% - - - - -
ES 265 733 44.0% 0.0% 33 - 0.01% 33
FI 3 693 909 10.0% 0.7% 23 672 - 0.64% 23 672
FR 7 403 388 4.8% 0.1% 9 259 1 700 382 23.09% 1 709 641
GB 4 580 261 9.6% - - - - -
GR 17 412 10.1% - - - - -
HR 91 411 99.0% - - - - -
HU 2 085 567 16.3% - - - - -
IE 275 413 20.0% - - - - -
IT 3 200 805 22.7% - - - - -
LT 480 635 62.3% - - - - -
LU 29 377 100.0% - - - - -
LV 933 350 5.7% - - - - -
MT 17 897 13.5% - - - - -
NL 237 215 100.0% 0.0% - - - -
PL 10 115 620 14.9% - - - - -
PT 2 882 227 6.0% 0.2% 5 683 - 0.20% 5 683
RO 9 885 535 99.8% 0.2% 50 - 0.00% 50
SE 8 756 377 15.4% - 19 364 - 19 364 0.22% 19 364
SI 3 525 98.1% - - - - -
SK 674 513 53.8% - - - - -
Grand Total 64 199 654 30.5% 0.1% 39 103 1 719 746 2.74% 1 758 849
School Milk Scheme - 2017 expenditure and calculation of amount at risk
Calculation of adjusted Error Rate and Amount at Risk

agri_aar_2017_annexes Page 110 of 278
3.1.9 Temporary exceptional measures in the milk and livestock sectors
From October 2015, the Commission has adopted a number of Regulations providing for
temporary exceptional aid to farmers in the milk and livestock sectors. This was in order to address market disturbances since 2014 in the milk products and pigmeat sectors.
In financial year 2017 expenditure amounted to EUR 403.82 million.
Given the temporary nature of the measure, there are no control statistics available and no adjustments have been considered necessary by the DG AGRI auditors. Seven audits
have been carried out between 2016 and 2017 confirming that the measures are, in general, very straightforward with none resulting in the opening of conformity
procedures. However, adjustments have been made, as indicated in the tables below, for France as a result of errors detected by the Certification Body.
Table: Annex 10 – 3.1.9-1
Member
State Aid paid in 2017
% of claims
checked OTS
reported
error rateadjustment
amount at risk if
no top-up
amount at risk if
top-up
adjusted
error rate
Total amount
at risk
EUR EUR EUR EUR
(a) (b) (c) (d) (e) (f) = b*(1-c)*d (g)= (b)*(e) (h) = (f+g)/b (i) = (f) +((g)
AT 5 250 884 N/D N/D - - - - -
BE 15 477 429 N/D N/D - - - - -
BG 6 449 107 N/D N/D - - - - -
CY 1 680 N/D N/D - - - - -
CZ 7 678 631 N/D N/D - - - - -
DE 92 269 407 N/D N/D - - - - -
DK 12 368 518 N/D N/D - - - - -
EE 6 340 518 N/D N/D - - - - -
ES 17 839 553 N/D N/D - - - - -
FI 7 683 938 N/D N/D - - - - -
FR 70 431 352 N/D N/D 0.2% - 166 737 0.24% 166 737
GB 42 447 743 N/D N/D - - - - -
GR 1 635 748 N/D N/D - - - - -
HR 1 942 971 N/D N/D - - - - -
HU 10 720 978 N/D N/D - - - - -
IE 19 779 042 N/D N/D - - - - -
IT 3 628 325 N/D N/D - - - - -
LT 2 710 803 N/D N/D - - - - -
LU 772 115 N/D N/D - - - - -
LV 10 623 964 N/D N/D - - - - -
MT 106 451 N/D N/D - - - - -
NL 32 797 399 N/D N/D - - - - -
PL 11 442 358 N/D N/D - - - - -
PT 6 038 317 N/D N/D - - - - -
RO 5 706 808 N/D N/D - - - - -
SE 8 848 618 N/D N/D - - - - -
SI 1 253 164 N/D N/D - - - - - SK 1 573 506 N/D N/D - - - - -
Grand Total 403 819 329 - - 166 737 0.0% 166 737
Temporary and Exceptional measures - Milk and Milk Products
Calculation of adjusted Error Rate and Amount at Risk

agri_aar_2017_annexes Page 111 of 278
Table: Annex 10 – 3.1.9-2
Table Annex 10-3.1.9-2 above indicates that a reservation is required for FR in respect of
2017 expenditure on temporary exceptional measures in the "Pigmeat, eggs, poultry &
apiculture" sector.
Member
State/PA
Adjusted
error
rate
Amount at risk Reasons for top-up Reserv
ation
Mitigating factors/reservation
follow up.
FR
7.23 % EUR 2.387 m
Based on the
Certification Body's
assessment, an adjust-
ment was made to the
error rate reported by
the Member State.
Yes -
overall
reserva
tion for
FR
A reservation is entered in
respect of 2017 expenditure
(covered by the overall
reservation for FR).
The Member State should
address the deficiencies
identified by the Certification
Body.
Table: Annex 10 – 3.1.9-3
Member
StateAid paid in 2017
% of claims
checked OTS
reported error
rateadjustment
amount at risk
if no top-up
amount at risk
if top-up
adjusted
error rate
Total
amount at
risk
EUR EUR EUR EUR
(a) (b) (c) (d) (e) (f) = b*(1-c)*d (g)= (b)*(e) (h) = (f+g)/b (i) = (f) +((g)
AT 870 637 N/D N/D - - - - -
BE 1 048 683 N/D N/D - - - - -
BG 830 237 N/D N/D - - - - -
CY 378 964 N/D N/D - - - - -
CZ 5 388 825 N/D N/D - - - - -
DE 1 543 836 N/D N/D - - - - -
DK 143 621 N/D N/D - - - - -
EE 2 412 277 N/D N/D - - - - -
ES 5 787 458 N/D N/D - - - -
FI 136 442 N/D N/D - - - - -
FR 33 034 894 N/D N/D 7.2% - 2 387 120 7.23% 2 387 120
GB 591 283 N/D N/D - - - - -
GR 3 380 612 N/D N/D - - - - -
HR 971 036 N/D N/D - - - - -
HU 2 348 101 N/D N/D - - - - -
IE 36 239 N/D N/D - - - - -
IT 4 943 689 N/D N/D - - - - -
LT 954 118 N/D N/D - - - - -
LU 15 062 N/D N/D - - - - -
LV 193 484 N/D N/D - - - - -
MT 8 326 N/D N/D - - - - -
NL 4 132 385 N/D N/D - - - - -
PL 9 249 083 N/D N/D - - - - -
PT 1 191 065 N/D N/D - - - - -
RO 8 990 285 N/D N/D - - - - -
SE 260 753 N/D N/D - - - - -
SI 282 360 N/D N/D - - - - -
SK 1 620 324 N/D N/D - - - - -
Grand Total 90 744 077 - - 2 387 120 2.6% 2 387 120
Pigmeat, eggs, poultry & apiculture
Calculation of adjusted Error Rate and Amount at Risk

agri_aar_2017_annexes Page 112 of 278
3.1.10 Promotion Measures
Control statistics are not available in respect of promotion measures but are being
required under the new promotion legislation which entered into force on 1/12/2015.
Expenditure reimbursed by DG AGRI in 2017 amounted to EUR 69.76 million under the
old and new promotion regimes.
Table: Annex 10 – 3.1.10-1
Audits carried out from 2015 to 2017 have identified deficiencies in Bulgaria, Greece, Italy, Lithuania and Spain in respect of procurement procedures (selection criteria,
equality of treatment, transparency). Since procurement procedures provide for large flat rate corrections in the event of such breaches of procurement procedures, top-ups have
been applied accordingly and this leads to top-ups of 5% for GR, ES, 25% for IT, LT and 27.1 % for BG.
An adjustment has been made for France as a result of errors detected by the Certification Body.
Member
StateExpenditure
% of
claims
checked
Reported
error rateAdjustment
Amount at risk
if no top-up
Amount at risk
if top-up
Adjusted
error rate
Total amount
at risk
EUR OTS EUR EUR EUR
(a) (b) (c) (d) (e) (f) = b*(1-c)*d (g)= (b)*(e) (h) = (f+g)/b (i) = (f) +((g)
AT 2 458 221 N/D N/D - - - - -
BE 2 401 374 N/D N/D - - - - -
BG 1 344 507 N/D N/D 27.1% - 363 758 27.06% 363 758
CY 1 057 718 N/D N/D - - - - -
CZ 1 622 334 N/D N/D - - - - -
DE 1 632 182 N/D N/D - - - - -
DK 974 584 N/D N/D - - - - -
EE 191 911 N/D N/D - - - - -
ES 4 034 450 N/D N/D 14.9% - 599 618 14.86% 599 618
FI 200 078 N/D N/D - - - - -
FR 10 479 890 N/D N/D 0.3% - 36 147 0.34% 36 147
GB 2 640 168 N/D N/D - - - - -
GR 12 068 074 N/D N/D 5.0% - 603 404 5.00% 603 404
IE 1 230 608 N/D N/D - - - - -
IT 12 736 881 N/D N/D 25.0% - 3 184 220 25.00% 3 184 220
LT 2 505 398 N/D N/D 25.0% - 626 350 25.00% 626 350
LV 653 802 N/D N/D - - - - -
NL 2 662 451 N/D N/D - - - - -
PL 6 821 125 N/D N/D - - - - -
PT 1 184 257 N/D N/D - - - - -
RO 265 847 N/D N/D - - - - -
SI 596 176 N/D N/D - - - - -
Grand Total 69 762 033 - - - 5 413 496 7.76% 5 413 496
Promotion Measures - Expenditure in 2017
Calculation of amount at risk

agri_aar_2017_annexes Page 113 of 278
DG AGRI's adjustments and their impact on the amounts at risk are summarised in the following table:
Paying
Agency/measur
e
Adjusted
error rate
Amount
at Risk
Reason for top-up Reser-
vation
Mitigating factors/ reservation
follow-up
BG 27.06% EUR 0.364
m
A DG AGRI audit in 2016
detected deficiencies in the
controls on selection
procedures of implementing
bodies. Another enquiry
ensures the follow-up of the
financial consequences of an
OLAF investigation.
No As the amount at risk is below
the de minimis threshold
established in DG AGRI's
materiality threshold (see
Annex 4) no reservation is
required.
The ongoing conformity
clearance procedure will
ensure that the financial risk
to the EU budget is covered.
ES 14.86% EUR 0.600
m
A DG AGRI audit in 2017
detected deficiencies in the
controls on selection
procedures of implementing
bodies.
No As the amount at risk is below
the de minimis threshold
established in DG AGRI's
materiality threshold (see
Annex 4) no reservation is
required.
The ongoing conformity
clearance procedure will
ensure that the financial risk
to the EU budget is covered.
GR 5% EUR 0.603
m
A DG AGRI audit in 2015
detected deficiencies in the
controls on selection
procedures of implementing
bodies.
No As the amount at risk is below
the de minimis threshold
established in DG AGRI's
materiality threshold (see
Annex 4) no reservation is
required.
The ongoing conformity
clearance procedure will
ensure that the financial risk
to the EU budget is covered.
IT 25% EUR
3.184 m
A DG AGRI audit in 2015
found serious deficiencies in
the controls on selection
procedures of implementing
bodies, leading to a top-up of
25%.
Yes A reservation is entered in
respect of 2017 expenditure.
An action plan is not
considered necessary as in
the context of the reform of
the promotion regime, a new
control set-up will in any
event be established.
The ongoing conformity
clearance procedure will
ensure that the financial risk
to the EU budget is covered.
LT 25 % EUR
0.626 m
A DG AGRI audit in 2017
found serious deficiencies in
the controls on selection
procedures of implementing
bodies leading to a top-up of
25%.
No As the amount at risk is below
the de minimis threshold
established in DG AGRI's
materiality threshold (see
Annex 4) no reservation is
required.
The ongoing conformity
clearance procedure will
ensure that the financial risk
to the EU budget is covered.
Table: Annex 10 – 3.1.10-2

agri_aar_2017_annexes Page 114 of 278
3.1.11 France AGRIMER
DG AGRI's assessment of the error of the various market measures managed by the
French Paying Agency, France AGRIMER, based on its own audit findings, did not lead to a reservation as there were either no adjustments necessary or in the case of wine
measures, the amount at risk/error rate was not material/above the materiality
threshold. However, the Certification Body for France AGRIMER found significant amounts at error (including known errors for late payments) across all aid schemes managed by
that Paying Agency and those amounts have been used to adjust the error rate at Paying Agency level
The following table summarises the situation with regard to the risk at the level of France AGRIMER:
Table: Annex 10 – 3.1.11-1
DG AGRI's adjustments and their impact on the amounts at risk are summarised in the following table:
Paying
Agency/
measure
Adjusted
error rate
Amount
at Risk
Reason for adjustment Reservation Mitigating factors/ reservation
follow-up
FR 20
Market
measures
6.5% EUR
33.597
m
The Certification Body has
identified significant errors
with regard to 2017
expenditure on market
measures for FR20 including
known errors for late
payments. Based on the
Certification Body's assess-
ment, adjustments have been
was made to the error rate
reported by the Member State
or for measures for which
there are no control statistics,
the amount at risk has been
estimated.
Yes
(see also
Wine, school
fruit and
school milk
schemes and
temporary
exceptional
measures)
A reservation is entered in
respect of 2017 expenditure.
The Member State should
address, in an action plan, the
deficiencies identified by the
Certification Body as well as
the deficiencies which have
also been identified by DG
AGRI in the Wine sector for
investment and promotion
measures.
Table: Annex 10 – 3.1.11-2
Expenditure Amount at risk
050206 Olive Oil 484 047 69 744
050208 Fruit & Vegetables 111 969 349 3 326 183
050209 Wine 280 544 887 25 868 816
050210 Promotion measures 10 479 890 36 147
050212 Milk and milk products 77 834 740 1 876 378
050215 Pigmeat, eggs, poultry & apiculture 33 034 894 2 387 120
Other 1 630 425 38 746
FR20 France AGRIMER 515 978 232 33 603 135 6.5%
Budget Article MeasureSector Level
Error rate

agri_aar_2017_annexes Page 115 of 278
3.1.12 Conclusions as regards assurance for ABB02
As a result of the "tops-ups" made by DG AGRI to the error rates reported by the
Member States, an adjusted error rate of 2.38 % has been calculated for shared management. As there was no direct expenditure for promotion measures in 2017, for
ABB02 as a whole, the adjusted error rate is also 2.38%.
Following is a summary of all cases where a reservation is applied in respect of the various measures within ABB02. In the section dealing with each aid measure there is an
explanation for those cases where a reservation was considered unnecessary (error rate between 2 and 5% or de minimis amount at risk) and details are also given for
reservations made in the 2016 AAR which are not carried over in respect of 2017.
9 reservations from 2016 and earlier can be lifted BE, GR, FR and NL for operational programmes for producer organisations
PL for pre-recognition of producer groups
PL for F&V temporary exceptional measures GR for promotion measures
FR for temporary exceptional measures – milk and milk products HU for Wine.
4 reservations from 2016 are carried over as the remedial action plans are still underway and the error is material:
ES and IT for operational programmes for producer organisations
FR for POSEI measures IT for promotion measures
While a reservation is again indicated for FR for wine measures, it is included in the general reservation for France,
1 new reservation is introduced: FR for all market measures implemented by the Paying Agency AGRIMER.
The reservation is necessary because of the errors found by the Certification Body across all aid schemes. However, systemic issues have not been identified for
specific aid schemes. Therefore, a specific reservation is not considered for each of the schemes (reservations are indicated for the school fruit and school milk
schemes, for wine and for temporary exceptional measures in the livestock sector but are covered in the one overall reservation for the Paying Agency). The
reservation is issued at Paying Agency level and corrective actions will also have to be addressed at that level with regard to the Certification Body's findings.
The following table details all cases where a reservation was considered necessary in respect of 2017 expenditure:

agri_aar_2017_annexes Page 116 of 278
Paying
Agency/
measure
Adjuste
d error
rate
Amount
at Risk
Reason for adjustment Reservation Mitigating factors/ reservation
follow-up
ES
Fruit & Veg
Producer
organis-
ations
3.29% EUR
7.112 m
A DG AGRI audit in 2017 in
Murcia (ES013) found
deficiencies as regards the
checks to establish the
consistency and technical
quality of the programmes,
the control of eligibility of
the operational programme
and the on-the-spot checks
on measures of operational
programmes.
The follow up of the
environmental actions in
Spain revealed that there
were still some
shortcomings for limiting the
expenditure of
environmental actions to the
additional costs.
Based on the Certification
Body's assessment, a
further adjustment was
made to the error rate
reported by the Member
State.
Yes A reservation is entered in
respect of 2017 expenditure.
For Murcia, the Spanish
authorities are taking the
remedial measures from OP
2017 and therefore no action
plan is necessary.
The Spanish authorities
amended the Framework for
Environmental Actions and
have finished the studies for
calculating the specific cost of
certain environmental actions
and therefore the shortcoming
has been remedied. The
Member State should address
the findings of the
Certification Body.
The ongoing conformity
clearance procedure will
ensure that the financial risk
to the EU budget is covered.
IT
Fruit & Veg
Producer
organis-
ations
3.12% EUR
7.043 m
A DG AGRI audits in 2016
and 2017 found several
deficiencies in the controls
carried out on eligibility of
operational programmes and
the aid claimed, checks on
outsourcing of the PO' main
activity, checks on
democratic accountability
and checks on delivery of
the full production.
Yes A reservation is entered in
respect of 2017 expenditure.
The Member State should
implement an action plan to
address the deficiencies
detected in the Paying Agency
of AGEA.
The ongoing conformity
clearance procedure will
ensure that the financial risk
to the EU budget is covered.
FR
School
Fruit
Scheme
54.52
%
EUR
1.038 m
Based on the Certification
Body's assessment, an
adjustment was made to the
error rate reported by the
Member State.
Yes - overall
reservation
for FR
A reservation is entered in
respect of 2017 expenditure
(covered by the overall
reservation for FR).
The Member State should
address the deficiencies
identified by the Certification
Body.
FR
Wine
9.22% 25.869
m EUR
AGRI audits found
deficiencies in the
performance of the
administrative and on the
spot checks, and the risk
analysis.
Based on the Certification
Body's assessment, a
further adjustment was
made to the error rate
reported by the Member
State.
Yes - overall
reservation
for FR
A reservation is entered in
respect of 2017 expenditure
(covered by the overall
reservation for FR).
The Member State should
implement an action plan
addressing the deficiencies
identified by DG AGRI and the
Certification Body.
The ongoing conformity
clearance procedure will
ensure that the financial risk
to the EU budget is covered.

agri_aar_2017_annexes Page 117 of 278
IT
Promotion
measures
25% EUR
3.184 m
A DG AGRI audit in 2015
found serious deficiencies in
the controls on selection
procedures of implementing
bodies, leading to a top-up
of 25%.
Yes A reservation is entered in
respect of 2017 expenditure.
An action plan is not
considered necessary as in
the context of the reform of
the promotion regime, a new
control set-up is applicable.
The ongoing conformity
clearance procedure will
ensure that the financial risk
to the EU budget is covered.
FR05
POSEI
5.52 % EUR
6.844 m
A DG AGRI audit in 2014
identified deficiencies as
regards the administrative
checks.
Based on the Certification
Body's assessment, an
adjustment was made to the
error rate reported by the
Member State.
Yes A reservation is entered in
respect of 2017 expenditure.
The Paying Agency should
follow the recommendations
for remedial actions of the
Certification Body.
The ongoing conformity
clearance procedure will
ensure that the financial risk
to the EU budget is covered.
FR
School
milk
scheme
23.09
%
EUR
1.71 m
Based on the Certification
Body's assessment, an
adjustment was made to the
error rate reported by the
Member State.
Yes - overall
reservation
for FR
A reservation is entered in
respect of 2017 expenditure
(covered by the overall
reservation for FR).
The Member State should
implement an action plan
addressing the deficiencies
identified by DG AGRI and the
Certification Body.
The ongoing conformity
clearance procedure will
ensure that the financial risk
to the EU budget is covered.
FR
Temporary
Excep-
tional
Measures –
Livestock
7.23 % 2.387 m
EUR
Based on the Certification
Body's assessment, an
adjustment was made to the
error rate reported by the
Member State.
Yes - overall
reservation
for FR
A reservation is entered in
respect of 2017 expenditure
(covered by the overall
reservation for FR).
The Member State should
address the deficiencies
identified by the Certification
Body.
FR 20
Market
measures
6.5% EUR
33.603
m
The Certification Body has
identified significant errors
with regard to 2017
expenditure on market
measures for FR20.
Based on the Certification
Body's assessment, adjust-
ments have been was made
to the error rate reported by
the Member State or for
measures for which there
are no control statistics, the
amount at risk has been
estimated).
Yes – overall
reservation
(see also
Wine, school
fruit and
school milk
schemes and
temporary
exceptional
measures)
A reservation is entered in
respect of 2017 expenditure.
The Member State should
address, in an action plan, the
deficiencies identified by the
Certification Body as well as
the deficiencies which have
also been identified by DG
AGRI in the Wine sector for
investment and promotion
measures.
Table: Annex 10 – 3.1.12-1

agri_aar_2017_annexes Page 118 of 278
The following table gives details of cases where a reservation made in the 2016 AAR was
not carried over in the 2017 AAR:
MS Adjusted
error
rate
Justification
NL F&V
Producer
organisations
0.18 % NL has taken corrective action with regard to deficiencies detected in the past and
which were the subject of reservations in previous years.
BE F&V
Producer
organisation
0.07 % The deficiencies have been remedied by the BE authorities.
GR F&V
Producer
organisation
5 % Following the reservation entered in the 2016 AAR, an Action Plan is ongoing and
closely monitored by DG AGRI.
PL F&V
Producer
Groups
0.02%
The Commission suspended payments (25%) to PL in respect of 2017 expenditure
on Producer Groups. The action plan has been completed at the beginning of 2018.
The ongoing clearance procedure will ensure that the financial risk to the EU budget
is covered.
PL F&V
Temporary
Exceptional
Measures
0 %
The measures were temporary one-off measures with no payments in year 2017.
The conformity clearance procedure ensured that the financial risk to EU budget was
covered.
HU Wine 0.01% A DG AGRI audit has confirmed that HU has taken corrective actions with regard to
deficiencies detected by the Certification Body in 2016.
GR
Promotion
measures
5% The amount at risk for FY2017 is below the de minimis threshold established in DG
AGRI's materiality threshold (see Annex 4).
FR TEM (milk
measures) 0.2% The error rate for 2017 is not material. The specific reservation is not carried over.
Table: Annex 10 – 3.1.12-2
The following table shows the portion of ABB02 expenditure covered by Member States' control statistics and the amounts at risk which results from DG AGRI's validation and
adjustment process. Control statistics are available in respect of 75.4% of the
expenditure covering EUR 2.224 million.
For a further EUR 647.3 million for which no statistics were available, DG AGRI auditors
have used their judgement to estimate the maximum amount at risk in that expenditure. For the remaining EUR 77.6 million the aggregate error rate for the other measures
(2.38%) was extrapolated to the expenditure concerned.

agri_aar_2017_annexes Page 119 of 278
Table: Annex 10 – 3.1.12-3
Overall, the adjustments made resulted in the reported error rate of 0.52% increasing to
2.38% for ABB02. The adjusted error rate has significantly decreased from the error rate of 2.85 % for 2016.
The total amount at risk for ABB02 is EUR 70.08 million with an error rate of
2.38%.
It is noted that the average amount of net financial corrections per year for the
five-year period 2013-2017 (excluding corrections made for cross-compliance
and no longer existing schemes) is EUR 88 million for ABB02.
Expenditure(1) Risk Expenditure(1) Risk
050204 Food Aid - - - -
050205 Sugar - - - -
050206 Olive Oil 42 769 942 42 769 942 484 047 69 744 42 285 895 1 004 899
050207 Textile Plants 6 134 399 6 134 399 6 134 399 145 780
050208 Fruit and Vegetables 995 420 706 912 890 892 21 523 988 82 529 815 82 529 815 455 775 - -
050209 Wine (2) 1 011 750 116 1 012 014 164 29 277 391 -264 048 -264 048 1 676
050210 Promotion (shared management only) 69 762 033 69 762 033 69 762 033 5 413 496 - -
050211 Other plant products and POSEI 236 857 065 234 580 065 7 175 049 2 277 000 2 277 000 54 112
050212 Milk and Milk Products 468 018 983 64 199 654 1 758 849 403 819 329 403 819 329 166 737 - -
050213 Beef and Veal 23 649 431 23 649 431 23 649 431 562 014
050214 Sheepmeat and goatmeat 3 505 102 3 505 102 3 505 102 83 297
050215 Pigmeat, eggs, poultry & apiculture 90 744 077 90 744 077 90 744 077 2 387 120 - -
Total 2 948 611 854 2 223 684 775 59 735 277 724 927 079 647 339 301 8 492 872 77 587 779 1 851 777
ExpenditureAmount at
risk% coverage Error rate
2 223 684 775 59 735 277 75.41%
647 339 301 8 492 872 21.95%
2 871 024 075 68 228 149 97.37%
2.38%
77 587 779 1 851 777
2 948 611 854 70 079 926
-3 007 191 -
2 945 604 663 70 079 926 2.38%
-
2 945 604 663 70 079 926 2.38%
Footnote:
Suspension of payments (2)
ABB02 - shared management - payments made
(1) Monthly declaration of expenditure affected by Paying Agencies.
Expenditure(1)
EUR
Overall assessment of risk for ABB02 - Market Measures
Expenditure for which no control statistics are availableExpenditure covered by statistics
Expenditure (1)
EURSector
Budget
articleABB02 error rate applied*
2.38%
(2) There are still payments and reimbursements made in respect of certain measures from previous claim years/marketing years. The net expenditure is negative (i.e.
reimbursement to the Commission). Since no control statistics are available on these measures, the average error rate is applied only on payments made but not on
reimbursements.
Measure risk assessed by auditors
No statistics
available
EUR
Risk
EUR
(3) Suspension of payments made in respect of financial year 2017 for Poland. The amounts corresponding to payments suspended have been declared by the Paying Agency to
the Commission in its monthly declarations (i.e. no recovery order issued for the amounts concerned) but the the amounts are suspended and not reimbursed to the Member
State by the Commission.
Total ABB 02 - payments made
Expenditure covered by control statistics
Expenditure for which there are no statistics but for which risk assessment carried out
Risk for expenditure covered by statistics and by risk assessment
*Error rate used on expenditure covered by statisitcs and risk assessed
Extrapolated risk for non-risk assessed expenditure
ABB02 - direct management - payments made on Promotion measures - direct payments by the Union
ABB02 - shared management - monthly declaration

agri_aar_2017_annexes Page 120 of 278
Part 3.2: ABB03 – Direct Payments
Index for part 3.2 – ABB03: Direct Payments
3.2.1 Introduction
3.2.2 ABB03 Expenditure
3.2.3 What assurance does the Director General have regarding the
expenditure under ABB03 – Direct Payments?
3.2.4 How is all this information used in order to "validate" and adjust the
error rate reported in the Member States control statistics?
3.2.5 What mitigating factors exist in order to render a reservation
unnecessary?
3.2.6 Conclusions as regards assurance for ABB03
3.2.1 Introduction
With a yearly budget of more than EUR 40 billion, Direct Payments (also called direct
aids, direct support, area aids) represent the most significant part of the CAP budget and a substantial part of the EU budget.
Direct payments benefited nearly 6.5 million farms throughout the European Union in
financial year 2016. They often represent an important share of their agricultural income (on average, nearly half of farmers' income in the last ten years came from this direct
support).
The new direct payment system (applied as from 2015 and paid-out as from 2016) is a
move towards a fairer, greener and more targeted distribution of support. As from 2015, active farmers in the EU have access to compulsory schemes applicable in all EU
countries, as well as to voluntary schemes if established at the national level.
Direct payments are granted to farmers in the form of a basic income support based on
the number of hectares farmed. This so-called 'basic payment' is complemented by a
series of other support schemes targeting specific objectives or types of farmers:
a 'green' direct payment for agricultural practices beneficial for the climate and
the environment, which conditions the payment of 30% Member States’ annual allocation to meeting three categories of generalised, non-contractual and annual
obligations beneficial for the environment and climate: crop diversification, maintenance of permanent grassland, and the dedication of five per cent of
arable land to ecologically beneficial areas ("ecological focus areas"). 77% of the total EU agricultural area is subject to at least one "greening" obligation35.
a payment to young farmers, a top-up payment added to the basic payment –
which is also obligatory in every Member State. It is granted for a maximum of five years from the moment a young farmer takes over as the head of a farm
holding. This payment can account for up to 2% of total direct payment national allocations.
35 Source: 2016 notifications from Member States.

agri_aar_2017_annexes Page 121 of 278
(where applied) a redistributive payment to provide improved support to small and middle-size farms. Under this scheme, Member States may allocate up to
30% of their national budget to a top-up payment for the first eligible hectares. The number of hectares for which this payment can be allocated is limited to a
threshold set by national authorities (30 hectares or the average farm size in member states if the latter is more than 30 hectares). The amount per hectare is
the same for all farmers in the country where it is applied, and cannot exceed 65% of the average payment per hectare.
(where applied) payments for areas with natural constraints (ANC), where
farming conditions are particularly difficult, such as mountain areas. Under this scheme, up to 5% of the national allocation for direct payments can be used for
top-up payments to farmers in areas with natural constrains – an option applied at present only by Denmark as from 2015, and Slovenia as from 2017.
(where applied) a small farmers scheme, a simplified scheme for small farmers replacing the other schemes. It is a simplified direct payment scheme granting a
one-off payment to farmers who choose to participate. The maximum level of the payment is decided at the national level, but in any case may not exceed €1,250.
The small farmers scheme includes simplified administrative procedures, and
participating farmers are exempt from greening and cross-compliance sanctions and controls.
and (where applied) voluntary support coupled to production (VCS) to help certain sectors undergoing difficulties. Under this scheme, Member States may
continue to link (or couple) a limited amount of direct payments to certain products. The aim of this type of support is to maintain the level of production in
regions or in sectors undergoing difficulties and that are particularly important for economic, social or environmental reasons. This option is presently applied by 27
Member States (not Germany).
In addition, a crop specific payment to cotton is also available to cotton producing countries.

agri_aar_2017_annexes Page 122 of 278
Active farmer
In order to be eligible to receive direct payments, applicants have to be active farmers.
In the 2013 CAP reform, the co-legislators adopted the active farmer provision which aims at preventing individuals and companies from receiving support from the CAP when
their business is not agricultural or is only marginally so.
The key element of the active farmer provision is a negative list of businesses/activities,
which includes persons operating airports, waterworks, real estate services, railway services and permanent sport and recreational grounds. Generally speaking, entities with
activities on the negative list are not usually farms. They just happen to have some
farmland. Entities operating an activity on the "negative list" are not considered "active farmers" unless they can prove that their farming activity is not marginal, using one of
the 3 possibilities to rebut the negative presumption.
If Member States want to, they can apply a stricter definition of active farmer:
• they can enlarge this negative list to include other similar activities;
• they can apply a test on all claimants, so that claimants with a marginal
agricultural activity are excluded (even if they do not perform an activity of the negative list).
However, those who received less than a certain amount of direct payments in the
previous year are considered de facto active farmer. This amount is set by Member States but may not be higher than € 5000.
Finally, those farmers who have mainly areas which do not need any intervention to remain in a state suitable for grazing or cultivation and who do not perform a minimum
activity on those areas, whatever the level of direct payments they were granted in the
previous year, are considered non-active and may not receive support.
Explanatory box: Annex 10 – 3.2.1-1
Omnibus amendments that only start to apply after 2017:
As from 2018 Member States may:
- discontinue the application of the list of negative activities;
- restrict the possibilities for rebutting from the negative list to just one or two of the
three options;
- exclude from eligibility for direct payments, farmers who are not in national fiscal or
social security registers for their agricultural activities.
Explanatory box: Annex 10 – 3.2.1-2
Member States can combine different direct payment schemes to ensure efficient support
to farmers, adapted to their national context. Some are compulsory and some are optional. For example, all eligible farmers receive the basic payment and greening
payments (subject to respect of the greening requirements), while some farmers may also qualify for a further payment under the compulsory young farmers scheme, and,
depending on member states' choices, a possible additional payment under one or more of the voluntary schemes.
The relevance of the new flexibility in the system is also illustrated by the range of implementation decisions made by Member States, e.g. the modalities for
implementation of the young farmers' scheme, the application of the small farmers'
scheme, or the range of measures implementing voluntary coupled support.

agri_aar_2017_annexes Page 123 of 278
As a result of the new system:
The distribution of payments is more balanced due to external and internal
convergence: first data show that the average direct payments per hectare are converging (at Member State and farmer levels)
The payments are better targeted, addressing the particular needs of the young farmers, smaller farmers and specific sectors or regions with certain difficulties.
Payment entitlements
The basic payment is applied either as the basic payment scheme (BPS) or as a
transitional simplified scheme, the single area payment scheme (SAPS).
The BPS works on the basis of payment entitlements distributed to farmers.
In the first year of implementation of the BPS (2015) eligible farmers were allocated
payment entitlements. The general rule was that each eligible hectare gave right to one entitlement (although some Member States applied limitations on the number of
entitlements that could be allocated). All entitlements allocated to a farmer have the same value, but differences in the value of entitlements may exist between farmers, if a
Member State opted for such an approach. In that case, the past level of direct payments to individual farmers was taken into account (or the value of the entitlements they
possessed under the previous direct payments regime) in order to avoid too abrupt
disruptions in their level of support. However, since one of the objectives of the new system is to move away from these historical references, the Member States that take
this approach have agreed to progressively reduce the differences in the values of entitlements and bring these values to (or closer to) the average by 2019.
The actual payment is made to active farmers based on the activation of the payment
entitlements they hold and calculated in relation to the eligible land they declare.
Explanatory box: Annex 10 – 3.2.1-3

agri_aar_2017_annexes Page 124 of 278
3.2.2 ABB03 Expenditure
ABB03 expenditure in financial year 2017 was as follows:
Table: Annex 10 – 3.2.2-1
3.2.3 What assurance does the Director General have regarding the
expenditure under ABB03 – Direct Payments?
The assurance of the Director General is drawn from the various levels of management
and control that are in place and the results which can be obtained from them. In the first place, the Member States, with 69 accredited Paying Agencies, are responsible for
managing and checking the aid applications received from nearly 7 million beneficiaries
and for paying them.
All direct aid payments to farmers are dealt with within the framework of the Integrated
Administration and Control System (IACS). This system enables the processing of the aid claims received by the Paying Agencies and also provides for several eligibility
checks including cross-checks between databases and on-the-spot checks.
Budget item Measure Expenditure (EUR) Totals (EUR)
050301 Decoupled direct payments 35 366 165 635
05030101 Single payment scheme (SPS) 19 033 297
05030102 Single area payment scheme (SAPS) 4 068 122 943
05030103 Separate sugar payment 330 233
05030104 Separate fruit and vegetables payment 0
05030105 Specific support (Article 68 of Regulation (EC) No 73/2009) — Decoupled direct payments 279 193
05030106 Separate soft fruit payment -63
05030107 Redistributive payment 1 615 671 631
05030110 Basic payment scheme (BPS) 17 540 160 538
05030111 Payment for agricultural practices beneficial for the climate and the environment 11 767 133 017
05030112 Payment for farmers in areas with natural constraints 2 763 172
05030113 Payment for young farmers 352 786 662
05030199 Other (decoupled direct payments) -114 989
050302 Other direct payments 5 759 407 676
05030206 Suckler-cow premium 395 961
05030207 Additional suckler-cow premium 29 860
05030213 Sheep and goat premium 212 855
05030214 Sheep and goat supplementary premium 12 383
05030240 Crop-specific payment for cotton 233 798 708
05030244 Specific support (Article 68 of Regulation (EC) No 73/2009) — Coupled direct payments 644 455
05030250 POSEI — European Union support programmes 410 111 677
05030252 POSEI — Smaller Aegean islands 16 394 403
05030260 Voluntary coupled support scheme 3 898 828 906
05030261 Small farmers scheme 1 201 073 723
05030299 Other (direct payments) -2 095 256
050303 Additional amounts of aid 3 116
05030300 Additional amounts of aid 3 116
05030900 Reimbursement of direct payments to farmers from appropriations carried-over in relation to financial discipline 425 579 560 425 579 560
41 551 155 987
Expenditure reimbursed by DG AGRI to the Member States in 2017
ABB 03 Total

agri_aar_2017_annexes Page 125 of 278
3.2.3.1 Control results reported by the Member States.
Member States are required to perform administrative checks on all aid applications
received as well as on-the-spot checks for at least 5% of applications, unless derogations apply. By 15 July of year N+1, the Member States are obliged to send to the
Commission, data on the outcome of the controls carried out in respect of claim year N. These control statistics contain information on amounts claimed, errors detected as a
result of administrative, risk based and random on-the-spot checks. The latter result in particular is considered to be the one which is most representative of the error which the
Member State would have detected if it had carried out on-the-spot checks on all farms,
and thus is the one which is used as the basis for the calculation of the reported error rate.
3.2.3.2 DG AGRI validation and adjustment process
The reliability of the statistics communicated by the Member States depends on the effectiveness of their control and reporting systems. DG AGRI carries out an extensive
review and validation process (explained in detail in its Annex 4 to this report setting out its materiality criteria) in order to adjust this error rate upwards to a level which it
considers better reflects the actual level of error. In so doing, it uses its professional
judgement on the basis of all available information. The main elements assessed are the following
A. Assessment of the Certification Bodies' opinions
As described in Annex 10 – part 2, the Certification Bodies are required to give an
opinion on the completeness, accuracy and veracity of the annual accounts of the Paying Agency, on the proper functioning of its internal control system and on the legality and
regularity of the expenditure for which reimbursement has been requested from the Commission. That opinion shall also state whether the examination puts in doubt the
assertions made in the management declaration.
Depending on whether a qualified or unqualified opinion was received and any other information available in the opinion, an adjustment was made to the error rate reported
by the Member State.
In a number of cases, when the errors exceeded the materiality level, the work carried
out by the Certification Bodies was considered for the error rate adjustment. Depending on whether the deficiencies detected by the Certification Body and DG AGRI's auditors
were similar and/or covered the same population, the adjustment applied ensured that the risk to the Fund is covered.
In the case of France (FR19) and Romania, the adjustment took into account the
calculated most likely error amount and the known errors identified by the Certification Body, but also findings of DG AGRI.
For Lithuania, the adjustment is based on the calculated most likely error amount and the known errors identified by the Certification Body.
For Spain – Extremadura (ES10), the adjustment applied took into account the material incompliance rate detected by the Certification Body but also findings of DG
AGRI.
Only for Romania did the resulting adjusted error rate exceed 2 % (see table in point
3.2.5).

agri_aar_2017_annexes Page 126 of 278
B. Assessment of findings from the European Court of Auditors (ECA)
The annual reports of the European Court of Auditors (ECA) and important findings of the
ECA in the context of its Special Report on the Basic Payment Scheme were also taken into account in the final assessment of the adjustments to be made.
C Assessment of findings from DG AGRI audit missions carried out in 2015-2017
(i) Direct Decoupled Aids
In 2017, 16 Paying Agencies in 12 Member States were audited. The Paying Agencies
audited were selected on the basis of a risk analysis. Over the period 2015-2017, the
multi-annual work programme of DG AGRI has scheduled audits in order to ensure that Member States are visited with respect to covering a certain % of expenditure declared
in financial year 2017.
The general objective of the audits performed was to review if Member States carry out
the administration and control of the area based decoupled direct payments to farmers in accordance with EU legislation. In these audits particular attention is paid to the
existence and functioning of the following key elements of the IACS: the implementation of the LPIS-GIS (Land Parcel Identification System – Geographical information system),
the Geospatial Aid Application (GSAA), the functioning of cross-checks, the quality of the
on-the-spot checks, the correct payment and application of administrative penalties. In all these cases, the starting point for the audits was the work carried out by the
Certification Body as part of its opinion on legality and regularity for financial years 2016 to2018. Therefore, the DG AGRI audit work, in the first instance, reviewed the work of
the Certification Bodies.
Where Certification Bodies did not address or envisage addressing a particular issue,
under the principle of single audit, DG AGRI carried out checks in order to gain the necessary assurance on the basis of its own work.
Where the work was found not to be to the standard required, DG AGRI made comments
and/or recommendations so as to enable its use for reliance in the context of the AAR. Because of the early timing of the DG AGRI work (often carried out after Paying Agency
and Certification Body control work had taken place but before payment), Certification Bodies were in a position to remedy any shortcomings in the work carried out or
complement the work to be done so as to enable full reliance in respect of the financial year 2017.
DG AGRI auditors have, in their audits for direct payments, witnessed an improvement in the quality and documentation of the work of the Certification Bodies, when compared
with previous years, particularly with regard to the work carried out on administrative
controls and the on-the-spot checks for the basic payment scheme.
The audit missions in 2017 showed that the implementation of the reform was generally
satisfactory, with the exception of a few Member States, where deficiencies were noted and which caused a material risk for the Fund, within a subpopulation of farmers. It
concerned:
The correct interpretation of permanent grassland following the new definition and
the effect on the correct allocation of entitlements. The distinction of permanent versus temporary grassland and the Land Laying
Fallow combined with the inappropriate choice of the crop diversification period.
The inappropriate timing of on-the-spot checks in relation to greening and area based voluntary coupled support measures.

agri_aar_2017_annexes Page 127 of 278
In 2016/2017, the management and control systems concerning the allocation of Payment entitlements implemented by 11 Paying Agencies in 11 Member States that
implemented the Basic Payment Scheme were also subject to a conformity audit. The Paying Agencies audited were selected on the basis of a risk analysis.
In these audits particular attention is paid to the existence and functioning of the
following key elements: the administrative controls concerning the establishment of the correct number and value of Payment entitlements, the administrative controls
concerning the establishment and management of the national (regional) reserve, the
management of the transfer of Payment entitlements and the recovery of undue Payment entitlements.
These audits showed that the allocation of Payment entitlements was generally
satisfactory with the exception of a few Member States, where deficiencies were noted and which caused a material risk for the Fund.
An overview of the findings in the case of those Paying Agencies with an adjusted error
rate above 2% is provided in the table under point 3.2.5.
(ii) Voluntary Coupled Support measures
27 Member States have decided to make use of the new voluntary coupled support
(VCS), and farmers could apply for this aid for the first time in claim year 2015 (financial year 2016). The Member States' decisions on VCS measures were not subject to prior
approval by the Commission. However, DG AGRI ensured an extensive review of the notifications.
An essential point of this review is the compliance with Article 52(3) of Regulation (EU)
No 1307/2013, which provides for the legal condition that such coupled support can only be granted to sectors or regions undergoing certain difficulties and to the extent
necessary to create an incentive to maintain current level of production. Following assessments of the Member States' notifications and further correspondence with
Member States concerned, DG AGRI had opened in 2016 conformity audits on the risk of non-compliance with this condition in 8 Member States. The purpose of these audits is to
collect additional information that will allow the Commission to get assurance that the concerned measures comply with the legal condition and, where it is not the case, to
request Member States to amend the concerned measures as well as to apply net
financial corrections to protect the EU budget from ineligible expenditure. DG AGRI entered an unquantified reservation covering the 8 Member States concerned (FR, GR,
IE, IT, LT, MT, PL and RO) in its 2016 AAR.
For Malta, Ireland and Lithuania, the conformity procedure was finalised during 2017 as
these Member States were found to be in compliance with the legislation. For the other five Member states, France, Greece, Italy, Poland and Romania, the conformity
procedures have reached their final stages. As appropriate justification of the policy decisions made by these Member States was provided for a significant number of
Voluntary coupled support measures, DG AGRI considers that it is not necessary to
maintain the unquantified reservation. Where a risk continued to exist for 2017 financial year, this risk has been quantified and taken into account in the adjustments to the error
rate made by DG AGRI.
In addition, in 2016/2017, a further 8 Paying Agencies in 8 MS were also audited. The
Paying Agencies audited were selected on the basis of a risk analysis. Over the period 2015-2017, the multi-annual work programme of DG AGRI has scheduled audits in order
to ensure that Member States are visited with respect to covering a certain % of expenditure declared in financial year 2017.

agri_aar_2017_annexes Page 128 of 278
The general objective of these audits was to review if Member States carry out the administration and control of the voluntary coupled support to farmers in accordance
with EU legislation. In these audits particular attention is paid to the existence and functioning of the following key elements of the IACS: the implementation of the
administrative (cross-)checks with the computerised database for the identification and registration of animals, the quality of the on-the-spot checks, the correct payment and
application of administrative penalties. These audits showed that the implementation of the Voluntary coupled support measures was generally satisfactory with the exception of
a few Member States, where deficiencies were noted.
An overview of the findings in the case of those Paying Agencies with an adjusted error rate above 2% is provided in the table under point 3.2.5.
Voluntary coupled support
Chapter 1 of Title IV of Regulation of the European Parliament and the Council (EU) No 1307/2013 provides for the possibility for Member States to use up to a maximum
percentage of their annual national ceiling for direct payments to finance voluntary coupled support (VCS).
That support can only be granted to a list of sectors and productions (cereals, oilseeds,
protein crops, grain legumes, flax, hemp, rice, nuts, starch potato, milk and milk products, seeds, sheepmeat and goatmeat, beef and veal, olive oil, silkworms, dried
fodder, hops, sugar beet, cane and chicory, fruit and vegetables and short rotation coppice).
With retroactive effect as from claim year 2015, the Omnibus amendment36 of Regulation (EU) No 1307/2013, which was published on 29/12/2017, clarified the Member States'
responsibilities with regard to VCS. Accordingly, it replaced the condition that VCS may only be granted to the extent necessary to create an incentive to maintain current levels
of production in the sectors or regions concerned. Instead, it introduced the principle that
VCS is a production-limiting scheme based on fixed areas and yields or on a fixed number of animals and respecting the financial ceilings at measure level.
Coupled support is granted as an annual payment per hectare or head. Accordingly, and based upon its granting based on fixed areas and yields or on a fixed number of animals,
for each measure, the corresponding areas/yields or number of animals has been determined by Member States. This reflects the production levels in the targeted region
or sector in at least one year in the period of 5 years that precedes the year of the decision about VCS (for the 27 Member States that decided to apply the VCS from 2015,
this is 2009-2013).
In 2014, 27 Member States decided to apply VCS between 2015 and 2020. From the EUR 41-42 billion per year available to direct payments (EU-28), they earmarked EUR 4.1-4.2
billion per year to this purpose. Overall, this represented more than 250 different measures. These amounts/numbers remained roughly stable over the years.
Member States had the possibility to revise their VCS decisions by 1 August 2016 so that the intended changes could apply as from 2017. 19 Member States reviewed their
decisions impacting more than 150 measures.
Explanatory box: Annex 10 – 3.2.3.2-1
36 Regulation (EU) 2017/2393 of the European Parliament and of the Council of 13 December 2017

agri_aar_2017_annexes Page 129 of 278
Further Omnibus amendments that only start to apply after 2017:
- With effect from claim year 2018, the Omnibus amendment empowered the
Commission to adopt delegated acts allowing Member States to continue paying VCS until 2020 on the basis of historical production units in sectors suffering from
structural market imbalances.
- With effect from claim year 2019, the Omnibus amendment also introduced the
possibility of annual reviews by Member States of their VCS decisions.
Explanatory box: Annex 10 – 3.2.3.2-2
Do all the adjustments made mean that the Member States' control statistics are unreliable?
The adjustments of the error rate by the Commission do NOT mean that the control
statistics of the Member State are unreliable. Checks are carried out by the Commission on how they are compiled and reported. They are generally a reliable and accurate
reporting of the results of the controls carried out by the Member States' control authorities.
The results from the 900 000 on-the-spot checks carried out by those control authorities is too important and relevant an element of data for the Commission to ignore. If the
Commission decided to ignore this data from its assurance model, it would be criticised for wasting a valuable data source.
However weaknesses in control system may mean that Member States may not have
detected all the errors. Therefore if the Commission's audits have identified that there is a weakness in a Member States' control system, then it considered that there is some
expenditure at risk which has not been detected by that Member States' on-the-spot checks and therefore, not reflected in the control statistics.
That is why the Commission makes adjustments to the error rates resulting from Member
States' control statistics – to reflect what the Member States are not detecting.
Explanatory box: Annex 10 – 3.2.3.2-3
3.2.4 How is all this information used in order to "validate" and adjust
the error rate reported in the Member States control statistics?
Adjustments have been made by DG AGRI to the reported error rates calculated on the
basis of the Member States' control data. These adjustments or top-ups have been established in line with the criteria set out in Annex 4 to this AAR and have been made
where there were indications of error arising notably from the findings of the Certification
Bodies, the Court of Auditors and DG AGRI's own audits. Where possible the amount at risk was quantified and where this was not the case a % flat rate was used to express
the risk for the budget arising from error in the expenditure which is not reflected in the Member States' control statistics.

agri_aar_2017_annexes Page 130 of 278
The table below summarises this information for all Paying Agencies:
Paying Agency
Paying Agency Name Relevant Expenditure
(1) in FY 2017
EUR
Reported (residual) Error Rate
%
Adjusted Error Rate
%
Amount at Risk EUR
AT01 AMA 692 625 803 0.18% 1.09% 7 536 728
BE02 ALV 227 959 944 0.21% 0.21% 484 544
BE03 SPW-DGARNE 280 604 037 0.91% 0.91% 2 566 813
BG01 DFZ [SFA] 774 080 205 0.82% 1.42% 11 005 441
CY01 ΚΟΑΠ [CAPO] 49 759 915 2.11% 2.46% 1 223 422
CZ01 SZiF [SAIF] 837 551 104 0.34% 0.91% 7 596 842
DE03 Baden-Württemberg MLR 398 939 054 0.28% 0.59% 2 342 960
DE04 Bayern StMLF 992 777 199 0.29% 0.43% 4 253 055
DE07 Brandenburg MLUV 330 697 157 0.14% 0.32% 1 048 636
DE11 Mecklenburg-Vorpommern MELFF
352 095 380 0.11% 0.27% 961 581
DE12 Niedersachsen 791 746 352 0.37% 0.52% 4 079 535
DE15 LWK Nordrhein-Westfalen 464 236 007 0.26% 0.40% 1 853 885
DE17 Rheinland- Pfalz 188 945 938 1.24% 1.39% 2 633 561
DE18 Saarland 20 619 307 0.27% 0.43% 89 353
DE19 Sachsen 252 847 881 0.34% 0.50% 1 260 637
DE20 Sachsen-Anhalt 321 771 363 0.05% 0.20% 642 973
DE21 Schleswig-Holstein 305 895 194 0.44% 0.58% 1 786 361
DE23 Thüringen 211 551 300 0.49% 0.65% 1 375 973
DE26 Helaba 214 451 926 0.43% 0.59% 1 270 191
DK02 DAFA 844 288 387 0.86% 0.86% 7 239 529
EE01 PRIA 113 911 721 1.90% 1.90% 2 166 947
ES01 Andalucía 1 449 231 226 1.18% 2.12% 30 758 760
ES02 Aragón 421 521 268 0.74% 0.75% 3 140 642
ES03 Asturias 62 985 866 0.11% 0.36% 223 988
ES04 FOGAIBA 27 928 053 0.92% 1.18% 329 974
ES05 Islas Canarias 182 922 694 1.42% 1.65% 3 021 430
ES06 Cantabria 42 693 514 1.42% 4.02% 1 714 222
ES07 Castilla La Mancha 659 183 755 0.47% 1.33% 8 736 791
ES08 Castilla y Léon 899 442 285 0.14% 1.09% 9 846 845
ES09 Cataluña 265 245 811 1.01% 1.03% 2 724 942
ES10 Extremadura 508 745 327 0.96% 1.63% 8 275 315
ES11 FOGGA 170 974 553 1.12% 1.72% 2 934 064
ES12 Madrid 37 585 244 0.43% 2.50% 938 387
ES13 Murcia 57 753 290 1.91% 2.42% 1 396 824
ES14 Navarra 100 617 261 0.53% 0.72% 721 059
ES15 País Vasco 44 031 718 0.96% 0.98% 431 043
ES16 La Rioja 27 687 622 0.79% 3.09% 855 022
ES17 AVFGA 105 363 789 0.89% 1.49% 1 574 739
FI01 MAVI 523 378 209 0.51% 0.51% 2 678 700
FR05 ODEADOM 138 983 078 2.35% 3.05% 4 236 767

agri_aar_2017_annexes Page 131 of 278
FR19 ASP 7 228 700 277 0.33% 1.69% 122 506 749
GB05 DARD 324 521 785 0.74% 0.74% 2 391 598
GB06 SGRPID 504 252 602 0.81% 5.30% 26 738 915
GB07 WG 264 061 560 0.22% 0.22% 570 035
GB09 RPA 1 989 118 166 0.27% 1.08% 21 522 641
GR01 Ο.Π.Ε.Κ.Ε.Π.Ε. [O.P.E.K.E.P.E.] 2 021 457 680 1.86% 1.90% 38 352 471
HR01 PAAFRD 198 931 754 2.72% 4.50% 8 947 554
HU02 HST 1 257 870 115 1.62% 2.07% 26 095 655
IE01 DAFM 1 208 265 278 0.23% 0.73% 8 828 937
IT01 AGEA 1 766 845 912 1.16% 6.16% 108 862 655
IT05 AVEPA 360 406 710 0.62% 5.62% 20 240 550
IT07 ARTEA 161 742 073 0.66% 5.66% 9 158 593
IT08 AGREA 354 195 605 0.26% 5.26% 18 626 750
IT10 ARPEA 369 900 364 0.16% 5.16% 19 076 326
IT23 OPR Lombardia 487 594 220 0.17% 5.17% 25 215 491
IT24 OPPAB 27 982 031 1.19% 6.19% 1 733 024
IT25 APPAG 15 899 535 0.50% 5.50% 874 329
IT26 ARCEA 250 414 651 0.84% 5.84% 14 617 947
LT01 NMA [NPA] 437 174 065 0.46% 1.09% 4 745 641
LU01 Ministère de l'Agriculture 33 311 178 0.33% 0.33% 108 591
LV01 RSS 203 771 342 0.97% 0.97% 1 968 689
MT01 MRRA PA 5 042 676 2.31% 4.36% 219 893
NL04 RVO 734 734 015 0.36% 1.14% 8 408 758
PL01 ARiMR [ARMA] 3 354 843 170 1.17% 1.17% 39 165 572
PT03 IFAP 655 059 841 1.18% 1.35% 8 842 545
RO02 PIAA 1 690 659 153 1.96% 3.66% 61 910 838
SE01 SJV 687 983 137 0.62% 3.52% 24 234 643
SI01 ARSKTRP 135 788 090 1.68% 1.68% 2 284 461
SK01 APA 432 061 694 3.36% 5.63% 24 343 665
Grand Total ABB 03 41 556 218 420
Amounts reimbursed to DG AGRI by Coordinating Bodies
-5 062 434
ABB03 - Payments made 41 551 155 987 0.78% 1.92% 798 551 996
Footnote: (1) Monthly declaration of expenditure affected by Paying Agencies.
Table: Annex 10 – 3.2.4-1
In a limited number of cases – Austria, Bulgaria, Czech Republic, Germany (all PAs for greening), Spain (12 Paying Agencies), France, United Kingdom (GB09), Greece, Ireland,
Lithuania, The Netherlands and Portugal, top-ups, based on DG AGRI audits or the
Certification Bodies' work, were made to the reported error rate but the resulting adjusted error rate was not above the materiality threshold of 2% and therefore a
reservation was not considered.

agri_aar_2017_annexes Page 132 of 278
3.2.5 What mitigating factors exist in order to render a reservation unnecessary?
The following table sets out the situation for all cases where the adjusted error rate is
above 2%. A brief explanation is given for the top-up applied and any mitigating factors which exist are examined in order to determine if a reservation is required. Both
DG AGRI auditors and the operational unit concerned are involved in this process.
PA Adjusted error rate
Amount at risk
Reasons for top-up Reserv-
ation Mitigating factors/reservation follow up.
CY01 2.46% EUR
1.223 m
A 2017 DG AGRI audit
identified weaknesses in
the ovine sector concern-
ing the sufficient number
and quality of on-the-spot
checks.
No A reservation is not
considered necessary.
The Action Plan requested has
been implemented by the
Member State.
The ongoing conformity
clearance procedure will
ensure that the financial risk
to the EU budget is covered.
ES01 Andalucía
2.12% EUR
30.759
m
A DG AGRI audit covering
all Spanish PAs identified
weaknesses in the small
farmers scheme, and in
the correct allocation of
payment entitlements
following the action plan
on the correct ident-
ification of the Permanent
Pasture. A 2017 DG AGRI
audit identified deficiencies
in the performance of the
on the spot checks,
affecting the Greening
payment.
No A reservation is not
considered necessary, as the
main issue for the top up is
linked to findings of a limited
financial impact relative to
national expenditure.
Furthermore, the error rate
for Spain as a whole is below
2%.The ongoing conformity
clearance procedure will
ensure that the financial risk
to the EU budget is covered.
ES06 Cantabria
4.02% EUR
1.714 m
ES13 Murcia
2.42% EUR
1.397 m
ES12 Madrid
2.50% EUR
0.938 m
Idem as above for the
other Spanish Paying
Agencies
No
As the amount at risk is below
the de minimis threshold
established in DG AGRI's
materiality threshold (see
Annex 4) no reservation is
required.
The ongoing conformity
clearance procedure will
ensure that the financial risk
to the EU budget is covered.
ES16 La Rioja
3.09% EUR
0.855 m
GB06 Scotland
5.30% EUR
26.739
m
A 2016 audit by DG AGRI
identified weaknesses in
the administrative checks
concerning the active
farmer status. In addition,
in July 2017, the European
Court of Auditors
concluded on the existence
of weaknesses in the
administrative checks
concerning the fixing of
value of the payment
entitlements.
Yes A reservation is entered in
respect of 2017 expenditure.
The Member State should
implement an Action Plan to
address the weaknesses
detected.
The ongoing conformity
clearance procedure will
ensure that the financial risk
to the EU budget is covered.

agri_aar_2017_annexes Page 133 of 278
PA Adjusted
error rate
Amount at
risk Reasons for top-up
Reserv-
ation
Mitigating factors/reservation
follow up.
HR01 4.50% EUR
8.948 m
The Member State
reported a material error
rate.
A 2017 DG AGRI audit
identified weaknesses in
the on the spot checks,
the fixing of the
entitlements and the
young farmer status.
Yes A reservation is entered in
respect of 2017 expenditure.
The Member State should
address where necessary the
causes underlying the error
rate reported in the control
statistics and following the
exchanges with the Member
State in framework of the
ongoing conformity clearance
procedure the necessary
remedial action will be agreed
with the Member State.
The ongoing conformity
clearance procedure will
ensure that the financial risk
to the EU budget is covered.
HU02 2.07% EUR
26.096
m
A 2016 DG AGRI audit
identified weaknesses in
the control of the greening
payment regarding the
definition of the Ecological
Focus Area.
Yes A reservation is entered in
respect of 2017 expenditure.
The Member State has been
requested to take the
necessary remedial action for
the findings in framework of
the ongoing conformity
clearance procedure.
The conformity clearance
procedure already ongoing in
respect of financial year 2017
and onwards will ensure that
the financial risk to the EU
budget is covered.
IT01 AGEA
6.16% EUR
108.863
m
In 2016 and 2017, DG
AGRI audits identified
weaknesses that affect all
the Italian Pas which
mainly concern
weaknesses in the LPIS
(correct recording of
permanent grassland), the
fixing of entitlements and
the verification of the
Active Farmer status.
The related top ups are
applied for all the Italian
Paying Agencies.
Yes A reservation is entered in
respect of 2017 expenditure.
As there is a centralised
IACS, an Action Plan covering
all Italian Paying Agencies has
been elaborated. This Action
Plan should be reinforced to
address the deficiencies
identified in 2017 concerning
the correct allocation of
payment entitlements
The ongoing conformity
clearance procedure will
ensure that the financial risk
to the EU budget is covered.
IT05 Veneto
5.62% EUR
20.241
m
IT07 Toscano
5.66% EUR
9.159
m
IT08 Emilia Romano
5.26% EUR
18.627
m
IT10 Piemonte
5.16% EUR
19.076
m
IT23 Lombardia
5.17% EUR
25.215
m
IT24 Bolzano
6.19% EUR
1.733 m
IT26 Calabria
5.84% EUR
14.618
m

agri_aar_2017_annexes Page 134 of 278
PA Adjusted
error rate
Amount at
risk Reasons for top-up
Reserv-
ation
Mitigating factors/reservation
follow up.
IT25 Trento
5.50% EUR
0.874 m
Idem as above for other IT
Paying Agencies
No As the amount at risk is below
the de minimis threshold
established in DG AGRI's
materiality threshold (see
Annex 4) no reservation is
required.
The ongoing conformity
clearance procedure will
ensure that the financial risk
to the EU budget is covered.
MT01 4.36% EUR
0.220 m
The Member State
reported a material error
rate.
A 2017 DG AGRI audit
identified weaknesses in
the voluntary coupled
support schemes concern-
ing the administrative
checks, including cross
checks (late updating of
the animal database) and
checks on the correctness
of the calculation of the
aid.
No As the amount at risk is below
the de minimis threshold
established in DG AGRI's
materiality threshold (see
Annex 4) no reservation is
required. However, the
Member State will be
requested to analyse the
reasons for the high error and
take appropriate action.
The ongoing conformity
clearance procedure will
ensure that the financial risk
to the EU budget is covered.
RO02 3.66% EUR
61.911
m
A 2016 DG AGRI audit
identified that for one VCS
measure, the difficulties of
the targeted population
were not properly justified.
Both the Certification Body
and a 2017 DG AGRI audit
identified deficiencies in
the on the spot checks.
Yes A reservation is entered in
respect of 2017 expenditure.
The on-going action plan
should continue to be
implemented by the Member
State. DG AGRI will closely
monitor the situation.
The ongoing conformity
clearance procedure will
ensure that the financial risk
to the EU budget is covered.
SE01 3.52% EUR
24.235
m
A 2016 DG AGRI audit
detected weaknesses in
the administrative checks
to establish the eligibility
of the aid for animal based
VCS measures (the first
instalment of 85% done
without taking into
account the irregular
animals) and the
administrative checks to
verify the Active Farmer
status.
A further 2016 DG AGRI
audit identified weak-
nesses mainly in the LPIS
(correct recording of
permanent grassland), and
incorrect definition of land
lying fallow, temporary or
permanent grassland. The
audit in 2017 revealed
issues in the fixing of the
entitlements.
Yes A reservation is entered in
respect of 2017 expenditure.
An Action Plan has been
elaborated and should be
reinforced to address also the
deficiencies identified in 2017
concerning the correct
allocation of payment
entitlements.
The ongoing conformity
clearance procedure will
ensure that the financial risk
to the EU budget is covered.
SK01 5.63% EUR
24.344
m
The Member State
reported a material error
rate.
Yes A reservation is entered in
respect of 2017 expenditure.
The Member State should

agri_aar_2017_annexes Page 135 of 278
PA Adjusted
error rate
Amount at
risk Reasons for top-up
Reserv-
ation
Mitigating factors/reservation
follow up.
A 2017 DG AGRI audit
identified deficiencies in
the performance of the on
the spot checks.
implement an Action Plan to
address the weaknesses
detected and should address
where necessary the causes
underlying the error rate
reported in the control
statistics.
The ongoing conformity
clearance procedure will
ensure that the financial risk
to the EU budget is covered.
FR05
ODEADOM
3.05% EUR
4.237 m
A DG AGRI audit in 2014
detected a weakness in
checks and calculation of
the aid in respect of
certain banana shipments.
A DG AGRI audit in 2017
detected a weakness in
administrative checks in
respect of transport of
sugar cane.
A top up was applied on
the expenditure for
Mayotte, as the control
statistics have not been
submitted.
Yes A reservation is entered in
respect of 2017 expenditure.
The action plan is still to be
implemented by the FR
authorities.
No action plan is needed for
transport of sugar cane as the
remedial actions are already
under implementation.
The ongoing conformity
clearance procedure will
ensure that the financial risk
to the EU budget is covered.
Table: Annex 10 - 3.2.5-1
The following table gives details of cases for Direct Payments where a reservation made in the 2016 AAR was not carried forward in the 2017 AAR:
Member
State/PA
Adjuste
d error
rate
Amount at
risk
Justification
BG01 1.42% EUR 11.005 m A 2016 DG AGRI audit identified weaknesses in the control of the
greening payment (incorrect definition of the fallow
land/temporary grassland/permanent grassland, deficiencies in the
definition of the Ecological Focus Area and issues with the organic
status). The need for remedial actions in the form of an action plan
is being assessed based on the latest reply of the Member State.
DK02 0.86% EUR 7.240 m In 2016 a top up was applied as the Member State did not submit
on time the package of final accounts, audit reports and audit
certificates. In 2017, the annual accounts package has been
submitted within the regulatory deadline, so no top up was
necessary.
ES17
Valencia
1.49% EUR 1.575 m The high adjusted error rate for FY2016 was based solely on the
control data reported by the MS. In 2017 the error rate reported
by the Member State was under 2% and no top up was considered
necessary.
PT03 1.35% EUR 8.843 m 2016 DG AGRI audits identified weaknesses in the administrative
checks concerning the active farmer status and the management
of the national reserve. It also found weaknesses in the LPIS
(correct recording of permanent grassland) and in the on-the-spot
checks.
An Action Plan is ongoing and is being monitored by DG AGRI.
PL01 1.17% EUR 39.166 m No top up applied for FY2017. Following further exchanges with the
Member State in the framework of the conformity clearance
procedure, it was assessed that the deficiencies identified in the
2016 audit did not call for further remedial action on the part of
the Member State via an action plan.
Table: Annex 10 - 3.2.5-2

agri_aar_2017_annexes Page 136 of 278
3.2.6 Conclusions as regards assurance for ABB03
As a result of the "top-ups" made, an adjusted error rate has been calculated of 1.92% with 23 out of 69 Paying Agencies having an adjusted error rate above 2% and
11 above 5% – see Table: Annex 10 - 3.2.5-1 above. Overall, the reported error rate for
ABB03 increased from 0.78% to 1.92% as a result of adjustments made by DG AGRI.
For the Paying Agencies with an error rate between 2 and 5%, an examination was
carried out of any risk mitigating factors which indicated that the EU budget was protected for the past (conformity clearance procedure, culminating in an ongoing
financial correction) and that it is protected for the future (the deficiencies have been addressed by the Paying Agency). In 4 cases (Cyprus and Spain (3 Paying Agencies)), it
was considered that, given the mitigating factors present (see summary under point 3.2.3), it would not be necessary to make reservations.
In a further 4 cases, as the amount at risk was below DG AGRI's de minimis threshold,
no reservation is required. Table: Annex 10 – 3.2.5-1 sets out the reasoning in respect of each case.
The overall outcome of this exercise is that 15 reservations are necessary at
Paying Agency level:
Croatia
France (ODEADOM) Hungary
Italy (8 Paying Agencies)
Romania Slovakia
Sweden United Kingdom (GB06)
5 Reservations from 2016 (Bulgaria, Denmark, Poland, Portugal and Spain (Valencia) are not carried forward in the 2017 AAR due to error rates in 2017 below 2%.
For direct payments, the adjusted error rate of 1.92% is slightly lower than that of 2016 (1.996%) while the number of Paying Agencies under reservation has also decreased
from 18 to 15. The overall result continues to confirm that the Integrated Administration
and Control System (IACS), when implemented in accordance with applicable rules and guidelines, limits effectively the risk of irregular expenditure.
The error rate for ABB03 is 1.92% with an amount at risk of EUR 798.6 million.
It is noted that the average amount of net financial corrections per year for the five-year period 2013-2017 (excluding corrections made for cross-compliance)
is EUR 659.3 million for ABB0337.
37 See section 2.4.1.5.1 of the main body of the report on "corrective capacity". No information is given on the
corrective capacity which derives from recoveries as this is not split by ABB activity and is available only at
Fund level.

agri_aar_2017_annexes Page 137 of 278
Part 3.3: ABB04 – Rural Development
Index for part 3.3 – ABB04: Rural Development
3.3.1 Introduction
3.3.2 ABB04 expenditure
3.3.3 What assurance does the Director General have regarding the expenditure under ABB04 – Rural Development?
3.3.4 How is this information used in order to assess the error rate reported in Member States' control data?
3.3.5 What mitigating factors exist in order to render a reservation unnecessary?
3.3.6 Conclusions as regards assurance for ABB04
3.3.1 Introduction
One of DG AGRI's key objectives is to contribute to the sustainable development of rural areas. It does this through its rural development policy which is funded under the
European Agricultural Fund for Rural Development (EAFRD). In total, 118 national and regional programmes co-funded by the EAFRD are being implemented, with some 3.36
million beneficiaries of Rural Development programmes in the Member States where their aid claims are processed, checked and monitored.
While the EAFRD bears many similarities to the European Structural and Investment Funds (ESIF) of DGs REGIO, EMPL and MARE, there are also a number of differences. In
particular, the EAFRD has been increasingly aligned with the EAGF management system
which deals with direct payments to farmers. Many of the EAFRD measures are 'area and animal-based' and are managed under the IACS, with alignment in particular to
application, payment dates, penalties and the maximum eligible area for area-based measures.
Maximum eligible area
Since 2015, Member States have had to define a maximum eligible area for all rural
development area-based measures, in line with IACS and the land parcel identification system (LPIS). Practically, this means that a specific layer for rural development
measures has had to be implemented in the LPIS.
Explanatory Box: Annex 10 – 3.3.1-1

agri_aar_2017_annexes Page 138 of 278
In the last programming period, one difference between the EAFRD and the other ESIF was that, to protect the EU budget, the other ESIF used interruption and
reduction/suspension (of interim payments) mechanisms, as well as recycled recovery procedures (i.e. the recovered amounts are retained by the Member States to re-use for
other projects). However, the main instrument used by DG AGRI was the conformity clearance procedure, which resulted in net financial corrections being clawed back to the
EU budget. Since the Common Provisions Regulation as well as the Regulation (EU) No 1306/201338 entered into force, DG AGRI has, in addition to the effective mechanism
under the conformity clearance procedure, tightened up the use of its interruption and
reduction/suspension mechanisms. For further information on the use of these mechanisms in 2017, see Chapter 2.1.1.3.2 of this report.
3.3.2 ABB04 expenditure
The current programming period of EU Rural Development policy runs from 2014-2020, and Member States base their Rural Development programmes on at least four of the six
common EU priorities:
1. fostering knowledge transfer and innovation in agriculture, forestry and rural
areas;
2. enhancing the viability/competitiveness of all types of agriculture, and promoting innovative farm technologies and sustainable forest management;
3. promoting food chain organisation, animal welfare and risk management in agriculture;
4. restoring, preserving and enhancing ecosystems related to agriculture and forestry;
5. promoting resource efficiency and supporting the shift toward a low-carbon and climate-resilient economy in the agriculture, food and forestry sectors;
6. promoting social inclusion, poverty reduction and economic development in
rural areas.
These priorities were based on 20 proposed measures which are either area- and animal-
related measures or non-area- and non-animal-related measures (see Table: Annex 10 – 3.3.2-1). The list of measures and sub-measures is described in Annex I, Part 5 of
Commission Implementing Regulation (EU) No 808/201439.
38 Regulation (EU) No 1306/2013 of the European Parliament and of the Council on the financing, management
and monitoring of the common agricultural policy (OJ L 347 of 20.12.2013). 39 Commission Implementing Regulation (EU) No 808/2014 of 17 July 2014 laying down rules for the application
of Regulation (EU) No 1305/2013 of the European Parliament and of the Council on support for rural
development by the European Agricultural Fund for Rural Development (EAFRD) (OJ L 227 of 31.7.2014).

agri_aar_2017_annexes Page 139 of 278
Rural Development measures – 2014-2020 programming period
01 Knowledge transfer and information actions
02 Advisory services, farm management and farm relief services
03 Quality schemes for agricultural products and food stuffs
04 Investments in physical assets
05 Restoring agricultural production potential damaged by natural disasters and introducing
appropriate prevention
06 Farm and business development
07 Basic services and village renewal in rural areas
08 Investments in forest area development and improvement of the viability of forests
09 Setting up producer groups and organisations
10 Agri-environment climate
11 Organic farming
12 Natura 2000 and Water Framework Directive payments
13 Payments to areas facing natural or other specific constraints
14 Animal welfare
15 Forest-environmental and climate services and forest conservation
16 Cooperation
17 Risk management
18 Financing of complementary national direct payments for Croatia
19 Support for Leader local development (CLLD)
20 Technical assistance
Table: Annex 10 – 3.3.2-1
In the 2014-2020 programming period, Member States have the opportunity to
implement simplified cost options for investment measures of their rural development programme.
Why implementing a simplified cost option ('SCO') for investment measures?
Using simplified costs means that the human resources and administrative effort involved
in management of the Funds can be focused on achieving policy objectives rather than being concentrated on collecting and verifying financial documents. It also gives small
beneficiaries easier access to the funds thanks to the simplified management process.
Explanatory Box: Annex 10 – 3.3.2-1
To speed up execution of programmes and contribute to sound financial management, the Commission makes automatic decommitments for rural development programmes.
What are automatic decommitments?
Article 38 of Regulation (EU) No 1306/2013 provides that the Commission must automatically decommit any portion of a budget commitment for a rural development
programme that has not been used for the purpose of pre-financing or making intermediate payments. The Funds must be used by 31 December of the third year40 (in
accordance with Regulation (EU) No 1306/2013) following that of the budget
commitment (so called N+3 rule).
Explanatory Box: Annex 10 – 3.3.2-2
40 For the rural development programmes under the 2007-2013 programming period, the Funds had to be used
by 31 December of the second year following that of the budget commitment (so called N+2 rule).

agri_aar_2017_annexes Page 140 of 278
Expenditure reimbursed by DG AGRI to Member States in 2017 amounted to EUR 11 105 493 347.
Expenditure paid and financed under the 2007-2013 programming period, amounted to EUR 43 121 173, paid as interim payments. Expenditure paid and financed under the
2014-2020 programming period, amounted to EUR 11 051 784 091, all of that amount was as intermediate payments. No pre-financing has been paid in respect of financial
year 2017. In addition, a reimbursement of EUR 519 525 has been made by Member States to the Commission in respect of previous programming period (budget item
05040114) and an amount of EUR 11 107 050 paid in respect of technical assistance for
the 2014-2020 programming period. This means that there is no cleared prefinancing for ABB 04 for financial year 2017.
Table: Annex 10 – 3.3.2-2
3.3.3 What assurance does the Director General have regarding
expenditure under ABB04 – Rural Development?
The assurance of the Director General derives from the various levels of management
and controls that are in place, and the results that can be obtained from them. In the first place, the Member States, through 71 accredited Paying Agencies for Rural
Development, are responsible for managing and checking the aid applications received
from some 3.36 million beneficiaries and for paying them.
3.3.3.1 Control results reported by the Member States
In order to provide information on controls and error rates for rural development,
Commission Implementing Regulation (EU) No 809/201441 provides for detailed and systematic reporting of the results of the controls and reductions applied by the Member
States.
By 15 July of year N+1, the Paying Agencies are required to send to the Commission
data on the outcome of the controls carried out for year N. These control data contain
41 Commission Implementing Regulation (EU) No 809/2014 of 17 July 2014 laying down rules for the application
of Regulation (EU) No 1306/2013 of the European Parliament and of the Council with regard to the integrated
administration and control system, rural development measures and cross compliance (OJ L 227 of 31.7.2014).
Management
typeChapter
Budget
itemDescription
Payments
(EUR)
05040114 Completion of rural development financed by the EAGGF Guarantee Section - Programming
period 2000 to 2006 -519 525
05040201 Completion of the European Agricultural Guidance and Guarantee Fund, Guidance Section -
Objective 1 regions (2000 to 2006) -
Rural development programmes 2007-201343 121 731
Interim payments 2007-201343 121 731
Promoting sustainable rural development, a more territorially and environmentally
balanced, climate-friendly and innovative Union agricultural sector11 051 784 091
Interim payments for promoting sustainable rural development, a more territorially and
environmentally balanced, climate-friendly and innovative Union agricultural sector 2014-2020 11 051 784 091
Pre-financing for promoting sustainable rural development, a more territorially and
environmentally balanced, climate-friendly and innovative Union agricultural sector 2014-2020 -
11 094 386 297
05040206 Completion of Leader (2000 to 2006) -
05040502 Operational technical assistance 2007-2013 -
05046002 Operational technical assistance 2014-2020 11 107 050
11 107 050
11 105 493 347
Payments reimbursed by DG AGRI to the Member States in 2017
05040501
05046001
Sub-Total Direct Management
Shared
Management
Direct
Management
0504
Sub-Total Shared Management
Grant Total 0504

agri_aar_2017_annexes Page 141 of 278
information on amounts claimed, errors corrected as a result of administrative checks, risk and random on-the-spot checks and the resulting reductions applied. The result of
the random on-the-spot checks is considered to be the most representative of the likely error that the Paying Agency would have detected if it had carried out on-the-spot checks
on all holdings. This result is the reported error rate that is used as the basis for calculating the adjusted error rate.
The control statistics (aggregated figures at Paying Agency level) and control data (at claimant level) received in 2017 by DG AGRI correspond to the payment claims made by
the claimant in the year 2016 (i.e. claim year).
Checks to be carried out by each Member State
The checks are composed of three separate sets:
– administrative checks on all applications that must cover all elements that can be checked by administrative means, including:
- cross-checks with the IACS database for the IACS-related measures, and - one visit to the operation to verify the realisation of the investment for the
non-IACS-related measures; – on-the-spot checks (OTSC) that were tightened up in 2015 by the Commission
Implementing Regulation (EU) No 809/2014, where:
– for the IACS-related measures, a minimum of 5% of all claimants have to be assessed on the spot, including 5% of claimants for measures 10 and 11;
– for the non-IACS-related measures, a minimum of 5% of the whole expenditure has to be assessed on the spot, including 5% of the expenditure under Leader
measures. - ex-post checks on investment operations that must, in each calendar year,
cover at least 1% of EAFRD expenditure for investment operations that are still
subject to commitment.
Explanatory Box: Annex 10 – 3.3.3.1-1
3.3.3.2 DG AGRI validation and adjustment process
The reliability of the control data from the Paying Agencies depends on the efficiency of
their control systems. DG AGRI carries out an extensive review and validation process
(explained in detail in Annex 4 setting out its materiality criteria) in order to adjust, if appropriate, the reported error rate upwards to a level which it considers better reflects
the actual level of error. In so doing, it uses its professional judgement on the basis of all the information available. The main elements assessed are described in the following
paragraphs.
In 2017, according to the transitional provisions in Regulation (EU) No 1310/2013,
measures from the 2007-2013 programming period are, under certain conditions, eligible for EAFRD co-financing under the 2014-2020 budget. In 2017, there were EUR 43.121
million as such transitional expenditure.
What is considered as transitional expenditure'?
In 2017, Member States could, under certain conditions, implement measures from
both programming periods in line with the transitional provisions of Regulation (EU) No 1310/2013. This means that expenditure was claimed under the new 2014-2020
programming period for projects to which the commitments for the 2007-2013
programming period applied. This is called 'transitional expenditure'.
Explanatory Box: Annex 10 – 3.3.3.2-1

agri_aar_2017_annexes Page 142 of 278
A. Assessment of the opinions of the Certification Bodies on the control data
As described in Annex 10 – part 2, the Certification Bodies are required to give an opinion on the completeness, accuracy and veracity of the annual accounts of the Paying
Agency, on the proper functioning of its internal control system and on the legality and regularity of the expenditure for which reimbursement from the Commission has been
requested. That opinion must also specify whether the examination puts in doubt the assertions made in the management declaration. This opinion is received with the annual
declaration of the Member State on 15 February of N+1.
Based on the opinion received and on any other information provided, an adjustment is made to the error rate reported by the Member State. Below is a summary of the impact
of the Certification Body findings on the reported error rates of 15 Paying Agencies:
- BG01 – Bulgaria:
For the IACS expenditure, the calculated most likely error (MLE) and the known errors were taken into account;
For the non-IACS population, the upper error limit of the incompliance rate was taken into account;
- DE11 and DE15 – Germany - Mecklenburg-Vorpommern and Nordrhein-Westfalen:
For the non-IACS expenditure, the calculated most likely error and the known errors were taken into account;
- DK02 – Denmark: For both the IACS and the non-IACS expenditure, the calculated most likely error
and the known errors were taken into account;
- ES05 and ES10 – Spain - Islas Canarias and Extremadura:
For the non-IACS expenditure, the calculated most likely error and the known errors were taken into account;
- ES07, ES09 and ES16 – Spain – Castilla La Mancha, Cataluña and La Rioja:
For the IACS expenditure, the calculated most likely error was taken into account;
- FI01 – Finland:
For the IACS and on the non-IACS expenditure, the calculated most likely error and the known errors were taken into account;
- FR18 – France - Corsica: For both the IACS and on the non-IACS expenditure, the calculated most likely
error and the known errors were taken into account;
- GB06 and GB07 – United Kingdom – Scotland and Wales:
For the IACS expenditure, a 2% top-up was applied due to issue with the control
statistics;
- IT26 – Italy – Calabria:
For the non-IACS expenditure, the calculated most likely error and the known errors were taken into account;
- PL01 – Poland: For the non-IACS expenditure, the calculated most likely error and the known
errors were taken into account.
B. Assessment of findings from the European Court of Auditors (ECA)
The ECA's annual reports and the available findings from the Statement of Assurance
work for 2017 indicating an error rate above 5% were analysed, and may result in adjustments being made depending on the severity and extent of the deficiencies
identified. However, as the ECA has not carried out system audits after 2013, no adjustment was made based on ECA's annual reports.

agri_aar_2017_annexes Page 143 of 278
C. Assessment of findings from DG AGRI audits carried out in 2015-2017
A. Audit fields
DG AGRI has decided to carry out audits on measures with similar control systems or targets, and has then grouped measures within so-called audit fields. Since 2016, all
on-the-spot audits have been based on all measures within a specific audit field. These groupings are the following:
Audit field Measures of the programming period 2014-2020
Name Code Name Code
Investment -
private
beneficiaries
RD-INVEST-
PRIVATE
Investments in physical assets 04
131 — Meeting standards based on Union legislation 98
Investment -
public
beneficiaries
RD-INVEST-
PUBLIC
Basic services and village renewal in rural areas 07
Technical assistance 20
Measures with flat
rate support RD-FLAT-RATE
Farm and business development 06
Setting up of producer groups and organisations 09
113 — Early retirement 97
Leader RD-LEADER Support for Leader local development (CLLD) 19
Knowledge and
innovation RD-KNOW-INNOV
Knowledge transfer and information actions 01
Advisory services, farm management and farm relief
services 02
Quality schemes for agricultural products and food stuffs 03
Cooperation 16
341 — Skills acquisition, animation and implementation of
local development strategies 99
Risk management RD-RISK-MANAGE
Restoring agricultural production potential damaged by
natural disasters and introduction of appropriate prevention 05
Risk management 17
IACS RD-IACS
Agri-environment climate 10
Organic farming 11
Natura 2000 and Water Framework Directive payments 12
Payments to areas facing natural or other specific
constraints 13
Animal welfare 14
Financing of complementary national direct payments for
Croatia 18
Forestry RD-FORESTRY
Investments in forest area development and improvement of
the viability of forests 08
Forest-environmental and climate services and forest
conservation 15
Table: Annex 10 – 3.3.2-1
What are flat-rate measures?
Flat-rate measures are those with a fixed amount of support for particular actions with
a view to simplifying the application and payment procedures.
Explanatory Box: Annex 10 – 3.3.2-2

agri_aar_2017_annexes Page 144 of 278
B. Audits carried out In 2017, 41 on-the-spot audits were carried out; these audits were selected mainly on
the basis of DG AGRI's central risk analysis. In addition, 20 desk audits were performed, mainly:
to get assurance in relation to avoidance of double funding between greening (EFA) payments under EAGF and afforestation measures under EAFRD;
based on findings from previous enquiries, to cover the expenditure effected in accordance with the rules of the programming period 2007-2013 that might have
been still at risk;
follow-up on ECA DAS findings;
assess the risk linked to the non-respect of minimum control rates for OTSC.
What is a desk audit?
A desk audit is an enquiry launched without an on-the-spot audit being carried out, and
based on a specific subject. It follows all steps of the conformity clearance procedure in
the same way as on-the-spot audits.
Explanatory Box: Annex 10 – 3.3.2-3
3.3.3.5.1 Audits carried out on IACS and Forestry measures
a) Audit plan and coverage
In 2017, based on the results of the central risk analysis and on reservations made in the 2016 annual activity report (AAR), 15 full-scope audits on IACS-related measures and/or
on Forestry measures were carried out:
1. 10 on-the-spot audits concerned IACS-related measures, based on agri-environmental measures and/or agri-environment climate, organic farming,
payments to areas facing natural constraints, animal welfare payments and Natura 2000 payments which took into account the new EU rules of the CAP, and
particularly the implementation of Article 5 of Regulation (EU) No 640/201442; and one on-the-spot audit carried out in Luxembourg covered both EAGF and EAFRD
(including IACS measures);
2. two on-the-spot audits covered both IACS-related and Forestry measures;
3. two on-the-spot audits were carried out only on Forestry measures.
In addition, the below two audits also covered (among other schemes/measures) audit fields IACS and Forestry:
1. one on-the-spot audit was carried out in Spain covering all non-IACS measures (including Forestry measures) with the specific objective of assessing public
procurement procedures in the case of sub-contracting;
2. one on-the-spot audit in Spain (Asturias), carried out to assess the work of the
Certification Bodies on the legality and regularity of the expenditure, which also identified an issue related to the work of the Paying Agency.
42 Commission Delegated Regulation (EU) No 640/2014 of 11 March 2014 supplementing Regulation (EU)
No 1306/2013 of the European Parliament and of the Council with regard to the integrated administration and
control system and conditions for refusal or withdrawal of payments and administrative penalties applicable to
direct payments, rural development support and cross compliance (OJ L 181 of 20.6.2014).

agri_aar_2017_annexes Page 145 of 278
Moreover, 9 desk audits were opened to get assurance in relation to avoidance of double funding between greening (EFA) payments under EAGF and afforestation measures under
EAFRD.
The audits assessed the management, control and sanction systems set up by Member
States to ensure that they complied with EU and national rules, that the eligibility criteria had been met and that the commitments were controllable, verifiable, and respected by
the beneficiaries. They covered the assessment of the new obligation for IACS related measures to have specific layers defined in the LPIS for each specific measure as stated
in Article 5(2)(b) of Regulation (EU) No 640/2014. Moreover, these enquiries assessed
whether the controls were effectively applied, if appropriate reductions and penalties had been imposed for non-compliance and if the control data sent by the Member States
were consistent and reliable. These enquiries also helped to detect the root causes for the high error rate communicated by the Member States by 15 of July in their control
data under Article 9 of Regulation (EU) No 809/2014 as well as possible actions to remedy the deficiencies. In addition, these audits enabled the assessment of the
implementation of the recommendations made by DG AGRI during the previous audits.
An important component of these audits was to evaluate the work carried out by the
Certification Body on legality and regularity of the expenditure. This implied interviews
with the representatives of the Certification Body and their participation during the audit, as well as specific checks on their re-performance of the on-the-spot controls carried out
by the Paying Agency. Areas where reliance can be placed on the work of the Certification Body were identified, while recommendations for improvements were made
where deficiencies had been found.
Many of the improvements noted in the Certification Body work on EAGF IACS are also
valid for EAFRD IACS although, for additional elements, in particular, commitments, much less reliance can be placed on the work.
For Rural Development, the large number of heterogeneous measures to be audited by
DG AGRI means that, so far, the auditors have not reviewed a sufficiently large selection of Certification Body reverifications to be able to conclude on the progress of the latter's
work, in particular since they have not been able to compare current work with earlier work over the three year period since the Certification Bodies commenced their work on
legality and regularity.
b) Results and possible improvements
The control systems in the Paying Agencies visited in 2017 were not always found to be
effective, and there was scope for significant improvement in a number of cases. In some
Paying Agencies, important delays were found in implementing the control systems due to difficulties in the development of new IT systems. DG AGRI auditors recommended
actions to increase the robustness of the control system for some specific issues and registered these weaknesses in an internal database to ensure timely follow-up to be
done during the next audits or requested the Certification Bodies to report on these issues in the annual reports.
The audits carried out in 2017 found scope for improving the following issues in relation to audits on IACS-related measures:
for organic farming, there were significant inconsistencies in the system which
required additional work from the Paying Agency. In addition, cross-notification between the different bodies involved was not sufficiently developed or formalised;

agri_aar_2017_annexes Page 146 of 278
continued efforts are required to reduce the high error rate found in some Member States on the basis of simple and clear eligibility criteria and commitments that must
be respected by the farmers;
additional improvements are required to extend the administrative checks of certain
agri-environmental commitments that are easy to check administratively (training certificate, organic certificate, state of the crops, etc.), and to better target risk
analysis to the 5% sample of beneficiaries to be checked on the spot;
continued improvements in the on-the-spot check systems are necessary to better
assess farmers' compliance with the commitments made, mainly concerning respect
for the maximum livestock density, to perform checks at the best time of the season for assessing compliance, and to integrate visual checks with other control tools
wherever is possible as well as to respect in case of multiple checks the maximum pre-notifications rules (48 hours for animals related measures and 14 days for area related
measures);
more targeted and proportionate penalty systems need to be developed in respect of
the commitments and obligations, as poor targeting may also be one of the causes of a high error rate;
better traceability and clear conclusions as to the quality of the controls carried out
must be achieved by indicating how the checks were performed and how the inspectors came to their conclusions. The control methods used during the on-the-spot
check, to verify compliance with the farmer's commitments, must be indicated in the control report together with measurements, verification of fertilisers and animal
counting, to assess whether the livestock density is correct, wherever appropriate;
control data provided under Article 9 of Regulation (EU) No 809/2014 must be
improved in terms of quality and deadline compliance;
control system to avoid double financing of afforested areas that receive the annual
premium to cover the loss of income under the afforestation measure of rural
development and are, at the same time, declared as ecological focus areas (EFA) in order to receive the greening payment;
additional improvements in assessing the maximum eligible area for IACS measures to ensure that payments are only made for land falling within the delimited area in order
to be fully in line with the EU rules.
Control to avoid double-funding under afforestation measure
In order to avoid double financing of afforested areas that receive the annual premium to
cover the loss of income under the afforestation measure of rural development and are,
at the same time, declared as ecological focus areas (EFA) in order to receive the greening payment, the income foregone for Afforestation has to be deducted from the
Greening Payments.
Explanatory Box: Annex 10 – 3.3.3.5.1-1
From a general point of view, when serious deficiencies are found, follow-up audits are
carried out to assess the implementation of the recommendations made by DG AGRI. The conformity clearance procedure leads to net financial corrections so as to protect the EU
budget from irregular spending resulting from the deficiencies found.

agri_aar_2017_annexes Page 147 of 278
3.3.3.5.2 Audits carried out on non-IACS-related measures
a) Audit plan and coverage
In 2017, based mainly on the results of DG AGRI's central risk analysis, 24 on-the-spot audits were carried out on non-IACS-related measures, comprising 14 audits of
investments measures, 3 audits of Leader, 5 audits of the audit field RD-FLAT-RATE, 2 audits on knowledge and innovation measures.
In addition, the below three audits also covered (among other schemes/measures) audit fields for non-IACS-related measures:
1. two on-the-spot audits carried out in Malta and Luxembourg (Umbrella missions)
covered both EAGF and EAFRD (including several audit fields for non-IACS measures);
2. one on-the-spot audit in Spain (Valencia), carried out to assess the work of the Certification Bodies on the legality and regularity of the expenditure, which also
identified an issue related to the work of the Paying Agency.
Moreover, a total of 11 desk audits were opened: 2 desk audits to assess the risk linked
to the non-respect of minimum control rates for OTSC for LEADER measures, 1 desk enquiry to follow-up on deficiencies identified by the ECA in relation to sub-contracting of
services as part of public procurement procedures, and 8 desk audits to cover the
expenditure effected in accordance with the rules of the programming period 2007-2013 that might have been still at risk according to findings from previous enquiries.
The audits covered the procedures implemented by Member States to ensure that administrative checks, on-the-spot checks and ex-post checks had been carried out in
line with EU legislation, paying special attention to the correct application of selection criteria and compliance with the eligibility criteria. They also checked that the costs had
been correctly evaluated as reasonable, that there was compliance with procurement rules, that coverage of the risk of double funding was adequate and that reductions and
sanctions imposed for non-compliance were adequate. In addition, these enquiries also
helped to detect the root causes for the high error rate communicated by the Member States by 15 of July in their control data under Article 9 of Regulation (EU) No 809/2014
as well as possible actions to remedy the deficiencies.
An important component of most of these audits was to evaluate the work carried out by
the Certification Body on legality and regularity of the expenditure. This implied interviews with the representatives of the Certification Body and their participation during
the audit, as well as specific checks on their re-performance of the on-the-spot controls carried out by the Paying Agency. Areas where reliance can be placed on the work of the
Certification Body were identified, while recommendations for improvements were made
where deficiencies had been found.

agri_aar_2017_annexes Page 148 of 278
Identification of links between applicants and other stakeholders
The identification of links between applicants and other stakeholders can play an
important role in establishing the eligibility of the beneficiary or the eligibility of the operation.
Article 48(2) of Regulation (EU) No 809/2014 states that administrative checks should be made to check (among others) the eligibility of the beneficiary and of the operation
following applicable obligations established by Union law or by the Rural Development Programme.
Member States have, in their rural development programmes, opted for several
measures to restrict the eligibility, to give more priority points in the project selection process, or to give higher aid intensity to applicants of a certain size (e.g. small and
medium enterprises – SMEs, semi-large enterprises – SLEs). The way in which the Member States check compliance with the size criteria (in particular the existence of
linked and partner enterprises) differs significantly. For example, some Member States rely on a self-declaration by the applicant; others check the companies' shareholdings on
the basis of extracts from chambers of commerce, consolidated accounts, etc. (non-exhaustive list).
Commission Recommendation 2003/361/EC of 06.05.2003, concerning the definition of
micro, small and medium sized enterprises, highlights that linked and partner enterprises should be taken into account when determining the size of the applicant. Therefore,
Member States should include the linked and partner enterprises (in their country and abroad) in their checks, also in cases where shareholders are natural persons. Member
States should therefore set up a system allowing them to assess these obligations and to keep an audit trail of these checks.
In other cases, Member States decided to impose ceilings for the size of the project. In such situations they have to implement appropriate controls to detect the creation of
artificial situations to receive the support, including checking the links between the
applicants and other stakeholders.
Since the detection of such links proves to be difficult, DG AGRI provides guidance and
plans to disseminate best practices among national authorities (e.g. the use of Arachne
IT tool available for the Structural Funds).
Explanatory Box: Annex 10 – 3.3.3.5.2-1
b) Results and possible improvements
The control systems in the Paying Agencies visited in 2017 were generally found to be
effective, albeit with scope for improvement in several cases. The DG AGRI auditors recommended actions to increase the robustness of the control system for some specific
issues and registered these weaknesses in an internal database to ensure a timely follow-up.

agri_aar_2017_annexes Page 149 of 278
Creation of artificial conditions
Article 60 of Regulation (EU) No 1306/2013 of the European Parliament and of the
Council states that "Without prejudice to specific provisions, no advantage provided for under sectoral agricultural legislation shall be granted in favour of a natural or legal
person in respect of whom it is established that the conditions required for obtaining such advantages were created artificially, contrary to the objectives of that legislation".
Paying Agencies are recommended to have a system of "red flags" for the possible creation of artificial situations to receive the aid. Red flags are indicators (not evidence)
of fraud / irregularity, meaning elements that indicate something unusual, create
suspicion and generate the necessity of making further checks. The more red flags - the greater the suspicion.
Several audits carried out in 2017 identified shortcomings in the procedures to detect and deal with the creation of artificial situations to receive the aid. In some cases, an
adequate system of red flags was missing, in other cases the red-flags were not used
properly (didn't trigger more in-depth checks).
Explanatory Box: Annex 10 – 3.3.3.5.2-2
The audits carried out in 2017 found scope for improving the following elements of the
management and control system for investment and/or flat-rate measures, including
when they were implemented under Leader (non-exhaustive list):
checks on the eligibility of the applicant/application/project/investment:
o additional improvements are required to include verification of the linked and partner enterprises when assessing the SME status and to keep an audit
trail of these checks;
o implementation of appropriate procedures to detect and deal with the
creation of artificial situations to receive the aid (see explanatory box).
selection and appraisal of applications – lack of selection criteria allowing to
select the best projects;
assessment of cost reasonableness: additional improvements are required to effectively assess the reasonableness of costs including checks on the
independence and authenticity of the offers received, on the transparency of the decisions taken by the experts committees and to keep an audit trail of these
checks;
public procurement verifications – see explanatory box;
lack of in-situ visits to verify the realisation of some types of investments;
quality of the on-the-spot checks, including verifications to establish that no
artificial situations were created;
quality (check on the durability of the investment) and quantity of ex-post checks on investment measures (non-compliance with the 1% minimum control
requirement);
checks of the payment claims to verify that the completed operation corresponds
with the operation for which support was granted;
verifiability of the methodology and calculation of the Simplified Cost Options
(SCOs), as the data underlying the SCOs calculation were not available;
adequate quality of the sanction system: it should be ensured that sanctions are
applied in case of over-declaration by beneficiaries;

agri_aar_2017_annexes Page 150 of 278
checks on double funding to avoid the risk of multiple submission of the same expenditure;
lack of an adequate audit trail of the checks carried-out.
Respect of Public Procurement rules: key control element
The respect of public procurement EU rules is considered as a key element amongst the
controls to be carried out by the Paying Agencies for rural development investment measures where the beneficiaries are public authorities.
In 2017, specific audits focussed on the respect of public procurement rules and detected
non-compliances at all stages of this procedure as implemented by the public beneficiaries. These non-compliances mainly concern the preparation of the procurement
documents (artificial splitting of the work, discriminatory procedure, thresholds not respected), the call for tender itself where time limits were not sufficient enough, the
evaluation phase (lack of transparency, discriminatory, unlawful selection), the notification of the outcome of the procedure (lack or delayed publication).
These audits also highlighted problems occurring during the administrative and on-the-spot checks to be carried out by the Paying Agency where not all steps, phases and
documents of the procedure were assessed, including the selection of the tender.
Explanatory Box: Annex 10 – 3.3.3.5.2-3
3.3.3.5.3 Audits of Financial Instruments
Two audits were carried out in respect of Financial Instruments in 2017. The preliminary
findings in one case point to a possible case of State aid: the interest rate of the loans granted by the banks does not take into consideration the solvency ratio of the
Guarantee Fund although these loans are guaranteed for free.
What are financial instruments?
Financial instruments are measures of financial support provided on a complementary basis from the EU budget in order to address one or more policy objectives. Such
instruments may take the form of loans, guarantees, equity or quasi-equity investments,
or other risk-sharing instruments and may, where appropriate, be combined with grants.
Explanatory Box: Annex 10 – 3.3.3.5.3-1
3.3.4 How is this information used to assess the error rate reported in Member
States' control data?
As described in Annex 4 on DG AGRI's materiality criteria, DG AGRI's Assurance and
Audit Directorate analysed the audit evidence arising from, in particular, the findings of the Certification Bodies, the ECA and its own audit findings. This was with a view to
assessing the risk that errors are not detected by the Paying Agency before payments are
made to beneficiaries. Where possible, the amount at risk was precisely quantified. Where this was not the case, a % flat rate was used to express the risk to the budget
arising from error in the expenditure that is not reflected in the Member States' control data.
When taking into account the relevant expenditure (interim payments and the amounts of prefinancing cleared in 2017), the information for all Paying Agencies is summarised in
the table below:

agri_aar_2017_annexes Page 151 of 278
Paying Agency
Paying Agency Name
Relevant Expenditure FY
2017 EUR
Reported (residual) error
rate
Adjusted error rate
Amount at Risk EUR
AT01 AMA 478 470 408 1.53% 3.06% 14 652 523
BE02 ALV 14 116 044 2.17% 2.17% 306 417
BE03 SPW-DGARNE 23 015 673 2.21% 7.61% 1 750 843
BG01 DFZ [SFA] 196 158 182 2.40% 5.41% 10 615 989
CY01 ΚΟΑΠ [CAPO] 14 573 450 3.92% 3.92% 570 899
CZ01 SZiF [SAIF] 259 351 803 4.36% 7.65% 19 845 719
DE01 BLE 847 676 0.60% 0.60% 5 069
DE03 Baden-Württemberg MLR
84 034 762 1.23% 1.23% 1 029 465
DE04 Bayern StMLF 202 106 079 0.70% 0.70% 1 408 700
DE07 Brandenburg MLUV 87 242 956 0.50% 0.52% 456 551
DE09 Hamburg - - - -
DE11 Mecklenburg-Vorpommern MELFF
89 292 124 1.21% 1.64% 1 467 684
DE12 Niedersachsen 85 047 513 0.88% 0.88% 748 793
DE15 LWK Nordrhein-Westfalen
64 552 783 0.67% 0.85% 551 371
DE17 Rheinland-Pfalz 19 829 188 1.63% 1.63% 322 622
DE18 Saarland 3 683 036 0.21% 0.21% 7 900
DE19 Sachsen 77 774 863 2.59% 2.86% 2 222 243
DE20 Sachsen-Anhalt 57 136 841 0.19% 0.19% 106 999
DE21 Schleswig-Holstein 44 500 549 0.57% 0.57% 255 823
DE23 Thüringen 94 644 755 3.09% 3.09% 2 921 444
DE26 Helaba 40 262 187 0.23% 0.23% 94 310
DK02 DAFA 99 878 000 2.20% 5.52% 5 508 688
EE01 PRIA 99 413 291 1.71% 1.71% 1 700 099
ES01 Andalucía 133 362 897 2.05% 2.09% 2 784 842
ES02 Aragón 54 006 656 0.63% 0.80% 429 896
ES03 Asturias 24 057 915 0.39% 0.52% 125 941
ES04 FOGAIBA 7 438 202 0.37% 0.37% 27 748
ES05 Islas Canarias 9 324 029 0.00% 4.54% 423 530
ES06 Cantabria 15 454 254 0.45% 0.45% 69 948
ES07 Castilla La Mancha 72 881 243 0.42% 0.70% 507 349
ES08 Castilla y Léon 89 305 643 3.69% 3.70% 3 300 798
ES09 Cataluña 39 910 753 1.47% 1.59% 635 274
ES10 Extremadura 62 017 459 1.26% 6.08% 3 769 880
ES11 FOGGA 103 801 431 0.75% 2.83% 2 937 641
ES12 Madrid 1 060 084 0.00% 0.00% 0
ES13 Murcia 24 966 781 0.69% 0.69% 171 221
ES14 Navarra 12 760 387 0.05% 0.05% 6 779
ES15 País Vasco 18 088 450 0.37% 0.37% 66 786
ES16 La Rioja 8 991 761 0.43% 0.54% 48 524
ES17 AVFGA 13 777 645 0.37% 1.65% 227 646
ES18 FEGA 11 427 505 0.21% 0.21% 23 440
FI01 MAVI 319 207 655 1.34% 2.40% 7 653 087
FR18 ODARC 22 789 400 2.56% 5.94% 1 354 568

agri_aar_2017_annexes Page 152 of 278
Paying Agency
Paying Agency Name
Relevant Expenditure FY
2017 EUR
Reported (residual) error
rate
Adjusted error rate
Amount at Risk EUR
FR19 ASP 1 730 918 594 2.31% 7.03% 121 756 731
GB05 DARD 16 439 627 2.15% 2.37% 389 482
GB06 SGRPID 89 561 592 1.29% 2.58% 2 311 641
GB07 WG 62 590 703 1.97% 3.02% 1 887 707
GB09 RPA 369 182 707 0.03% 3.65% 13 477 664
GR01 Ο.Π.Ε.Κ.Ε.Π.Ε. [O.P.E.K.E.P.E.]
712 889 562 0.69% 0.77% 5 522 483
HR01 PAAFRD 150 173 479 1.08% 1.32% 1 980 862
HU02 HST 196 592 509 2.45% 3.58% 7 033 122
IE01 DAFM 254 572 032 1.67% 1.68% 4 272 464
IT01 AGEA 445 664 991 1.48% 3.79% 16 898 777
IT05 AVEPA 83 036 895 1.96% 2.15% 1 787 953
IT07 ARTEA 45 484 866 0.41% 0.96% 436 351
IT08 AGREA 46 200 789 1.11% 1.26% 580 772
IT10 ARPEA 33 121 036 0.74% 0.93% 307 791
IT23 OPR Lombardia 28 764 913 1.20% 1.33% 383 596
IT24 OPPAB 23 788 928 1.27% 1.51% 358 790
IT25 APPAG 13 438 549 0.52% 1.20% 161 803
IT26 ARCEA 70 771 541 4.38% 9.80% 6 934 806
LT01 NMA [NPA] 254 682 143 0.59% 0.96% 2 455 851
LU01 Ministère de l'Agriculture
8 863 575 0.50% 1.21% 107 162
LV01 RSS 162 496 969 0.55% 0.55% 899 128
MT01 MRRA PA 2 170 973 8.63% 8.63% 187 440
NL04 ELFPO 57 613 814 0.61% 0.61% 353 337
PL01 ARiMR [ARMA] 573 629 366 0.70% 1.53% 8 761 764
PT03 IFAP 524 233 177 9.36% 9.56% 50 115 975
RO01 PARDF 1 605 065 964 0.49% 0.57% 9 122 875
SE01 SJV 104 276 200 0.91% 5.78% 6 022 970
SI01 ARSKTRP 80 254 822 1.47% 1.47% 1 178 396
SK01 APA 167 863 196 6.33% 10.44% 17 526 642
ABB04 Rural Development Programmes
11 094 905 822 1.83% 3.37% 374 329 385
Table: Annex 10 – 3.3.4-1

agri_aar_2017_annexes Page 153 of 278
3.3.5 What mitigating factors exist in order to render a reservation unnecessary?
The following table sets out the situation for all Paying Agencies where the adjusted error rate is above 2%. It indicates if reservations are required and details mitigating factors.
The amount at risk is calculated based on the relevant expenditure.
Paying
Agency
Adjusted
error
rate
Amount
at risk Reasons for top-up
Reserv
ation Mitigating factors/reservation follow up
AT01 -
Austria
3.06% EUR
14.653
m
DG AGRI audit in 2017
detected a deficiency in the
controls on reasonableness of
costs and serious
shortcomings under public
procurement procedures.
Furthermore, DG AGRI has
identified deficiencies in the
checks on active farmer
status.
Yes A reservation is entered in respect of 2017
expenditure.
The Member State should put in place an
action plan addressing the deficiencies
identified under reasonableness of costs,
public procurement and active farmer
status.
The ongoing conformity clearance
procedure will ensure that the financial risk
to the EU budget is covered.
BE02
Belgium -
Flanders
2.17% EUR
0.306
m
The Member State has
reported high error rates
under IACS measures.
No As the amount at risk is below the de
minimis threshold established by DG
AGRI's materiality threshold (see Annex
4), no reservation is required.
The Member State should address the
underlying causes of the high error rates
reported under IACS measures.
BE03 -
Belgium
7.61% EUR
1.751
m
DG AGRI audit performed in
2017 revealed serious
deficiencies in the
management and control
system of the Paying Agency
for area-related measures. In
2016, audits also revealed
serious deficiencies for start-
up support and investments,
the latter supported by
findings from the ECA.
Yes A reservation is entered in respect of 2017
expenditure.
The Member State has reported that the
action plan has been implemented
addressing the identified weaknesses
under investment and start-up support.
The action plan should be reinforced to
address the identified deficiencies under
area-related measures.
The ongoing conformity clearance
procedure will ensure that the financial risk
to the EU budget is covered.
BG01 -
Bulgaria
5.41% EUR
10.615
m
The Member States reported
high error rates for IACS
measures. DG AGRI audits in
2017 and previous years
identified deficiencies under
organic farming and Leader
support.
Based on the Certification
Body's assessment, a further
adjustment was made to the
error rate reported by the
Member State.
Yes A reservation is entered in respect of 2017
expenditure.
The Member State has reported the
implementation of actions to address the
deficiencies under organic farming and
Leader.
The Member State should continue
correcting the deficiencies identified and
address the findings of the Certification
Body. DG AGRI will closely monitor the
situation.
The ongoing conformity clearance
procedure will ensure that the financial risk
to the EU budget is covered.
CY01 -
Cyprus
3.92% EUR
0.571
m
The Member State has
reported high error rate for
IACS measures.
No As the amount at risk is below the de
minimis threshold established by DG
AGRI's materiality threshold (see Annex
4), no reservation is required.
The Member State should address the
underlying causes of the high error rates
reported under IACS measures.

agri_aar_2017_annexes Page 154 of 278
Paying
Agency
Adjusted
error
rate
Amount
at risk Reasons for top-up
Reserv
ation Mitigating factors/reservation follow up
CZ01 –
Czech
Republic
7.65% EUR
19.846
m
The Member State has
reported high error rates
under IACS measures and the
control rate has not been
respected for non-IACS
measures. DG AGRI audits in
2017 observed deficiencies
under agro-environment-
climate and animal welfare
measures. Moreover, DG AGRI
audits identified in 2016 and
2017 deficiencies under the
management and control
system for investment
measures. Finally, DG AGRI
has identified deficiencies in
the checks on active farmer
status.
Yes A reservation is entered in respect of 2017
expenditure.
The Member State has reported the
implementation of actions to improve the
controllability of investments. The action
plan should be continued and reinforced to
address findings related to agro-
environment-climate, animal welfare and
active farmer status. Finally, the
underlying causes of high error rates,
including correct reporting, should also be
addressed.
The ongoing conformity clearance
procedure will ensure that the financial risk
to the EU budget is covered.
DE19 –
Germany
Sachsen
2.86% EUR
2.222
m
The Member State has
reported high error rates
under agro-environment-
climate and organic farming
measures.
Moreover, DG AGRI audit in
2017 identified deficiencies
under investment measures.
Yes A reservation is entered in respect of 2017
expenditure.
The Member State should implement an
action plan addressing the deficiencies
identified under investments and the
underlying causes of the high error rates
reported.
The ongoing conformity clearance
procedure will ensure that the financial risk
to the EU budget is covered.
DE23 –
Germany
Thüringen
3.09% EUR
2.921
m
The Member State has
reported high error rates
under IACS measures.
Yes A reservation is entered in respect of 2017
expenditure.
The Member has reported corrective
actions for claim year 2017.
DG AGRI will closely monitor the situation.
DK02 -
Denmark
5.52% EUR
5.509
m
The Member State has
reported high error rates.
DG AGRI audits confirmed in
2017 that deficiencies in the
management and control
system identified under
Leader measure affect transit-
ional expenditure paid in
financial year 2017.
Based on the Certification
Body's assessment, a further
adjustment was made to the
error rate reported by the
Member State.
Yes A reservation is entered in respect of 2017
expenditure.
The Member State has reported the
implementation of an action plan
addressing the audit findings under
Leader. The underlying causes of high
error rates and the Certification Body's
findings should also be addressed.
The ongoing conformity clearance
procedure will ensure that the financial risk
to the EU budget is covered.
ES01 –
Spain
Andalucía
2.09% EUR
2.785
m
The Member State has
reported high error rates
under IACS measures. DG
AGRI audit in 2017, following
deficiencies identified by ECA,
confirmed shortcomings under
investments, infrastructure
and afforestation related with
public procurement, reason-
ableness of costs and VAT
eligibility.
No A reservation is not considered necessary.
The Member State has implemented an
action plan addressing deficiencies related
to reasonableness of costs and eligibility of
beneficiary. The Member State should
address the underlying causes of high
error rate reported under IACS measures.
The ongoing conformity clearance
procedure will ensure that the financial risk
to the EU budget is covered.
ES05 –
Spain
Canary
Islands
4.54% EUR
0.424
m
Based on the Certification
Body's assessment, an adjust-
ment was made to the error
rate reported by the Member
State.
No As the amount at risk is below the de
minimis threshold established by DG
AGRI's materiality threshold (see Annex
4), no reservation is required.

agri_aar_2017_annexes Page 155 of 278
Paying
Agency
Adjusted
error
rate
Amount
at risk Reasons for top-up
Reserv
ation Mitigating factors/reservation follow up
ES08 –
Spain
Castilla y
León
3.70% EUR
3.301
m
The Member State has
reported high error rates
under non-IACS measures.
Yes A reservation is entered in respect of 2017
expenditure.
The Member State should continue to
implement the actions addressing the
underlying causes of the high errors
reported.
DG AGRI will closely monitor the situation.
ES10 –
Spain
Extremadu
ra
6.08 % EUR
3.770
m
DG AGRI audits detected
deficiencies in 2017 under
agro-environment-climate,
organic farming, areas with
natural constraints and
forestry measures.
Based on the Certification
Body's assessment, a further
adjustment was made to the
error rate reported by the
Member State.
Yes A reservation is entered in respect of 2017
expenditure.
The Member State should implement an
action plan addressing the deficiencies
identified.
The ongoing conformity clearance
procedure will ensure that the financial risk
to the EU budget is covered.
ES11 –
Spain
Galicia
2.83% EUR
2.938
m
DG AGRI audit in 2017 has
identified several deficiencies
under forestry measures.
Yes A reservation is entered in respect of 2017
expenditure.
The Member State should implement an
action plan addressing the deficiencies
identified under forestry measures.
The ongoing conformity clearance
procedure will ensure that the financial risk
to the EU budget is covered.
FI01 -
Finland
2.40% EUR
7.653
m
Based on the Certification
Body's assessment, an adjust-
ment was made to the error
rate reported by the Member
State.
Yes A reservation is entered in respect of 2017
expenditure.
The Member State should address the
findings identified by the Certification
Body.
FR18 –
France
Corsica
5.94% EUR
1.355
m
Based on the Certification
Body's assessment, a further
adjustment was made to the
error rate reported by the
Member State.
Yes A reservation is entered in respect of 2017
expenditure.
The Member State should implement an
action plan addressing the deficiencies
under forestry measures and the findings
of the Certification Body.
FR19 –
France ASP
7.03% EUR
121.75
7 m
The Member State has
reported high error rates for
non-IACS measures
payments.
DG AGRI audit in 2017
followed up deficiencies in the
management and control
systems reported in 2015 for
area-related payments, which
had been adequately
addressed, although new
deficiencies were identified.
Moreover, serious deficiencies
persist in investments, start-
up aid and public
procurement.
Furthermore, DG AGRI has
identified deficiencies in the
checks on active farmer
status.
Yes A reservation is entered in respect of 2017
expenditure.
The Member State has reported the
implementation of an action plan which
should be reinforced to address the
deficiencies identified by DG AGRI in 2017
and should assess the underlying causes of
the high error rates reported under non-
IACS measures.
The ongoing conformity clearance
procedure will ensure that the financial risk
to the EU budget is covered.

agri_aar_2017_annexes Page 156 of 278
Paying
Agency
Adjusted
error
rate
Amount
at risk Reasons for top-up
Reserv
ation Mitigating factors/reservation follow up
GB05 –
United
Kingdom
Northern
Ireland
2..37% EUR
0.389
m
The minimum control rate is
not respected for non-IACS
measures.
No As the amount at risk is below the de
minimis threshold established by DG
AGRI's materiality threshold (see Annex
4), no reservation is required.
The Member State should ensure the
minimum control rate.
GB06 –
United
Kingdom
Scotland
2.58% EUR
2.312
m
DG AGRI audit in 2016
identified a minor deficiency
under forestry investments.
Furthermore, DG AGRI has
identified deficiencies in the
checks on active farmer
status.
Based on the Certification
Body's assessment, an
adjustment was made to the
error rate reported by the
Member State.
Yes A reservation is entered in respect of 2017
expenditure.
The Member State should implement an
action plan addressing the deficiencies
identified by the Certification Body.
The ongoing conformity clearance
procedure will ensure that the financial risk
to the EU budget is covered.
GB07 –
United
Kingdom
Wales
3.02% EUR
1.888
m
The minimum control rate for
organic measure is not
achieved. DG AGRI audit in
2017 identified deficiencies
under agro-environment-
climate and organic farming
measures. Based on the
Certification Body's assess-
ment, an adjustment was
made to the error rate
reported by the Member
State.
Yes A reservation is entered in respect of 2017
expenditure.
The Member State should implement an
action plan addressing the deficiencies
identified under IACS measures and the
findings of the Certification Body.
The ongoing conformity clearance
procedure will ensure that the financial risk
to the EU budget is covered.
GB09 –
United
Kingdom
England
3.65% EUR
13.478
m
The minimum control rate for
organic farming is not
achieved. DG AGRI audit in
2017 identified deficiencies
under public procurement.
Furthermore, DG AGRI has
identified deficiencies in the
checks on active farmer
status.
Yes A reservation is entered in respect of 2017
expenditure.
The Member State should implement an
action plan addressing the deficiencies
identified under forestry investments,
public procurement and active farmer
status.
The ongoing conformity clearance
procedure will ensure that the financial risk
to the EU budget is covered.
HU01 -
Hungary
3.58% EUR
7.033
m
The Member State has
reported high error rates
under IACS measures.
DG AGRI audits in 2017 and
previous years identified
deficiencies in the manage-
ment and control system
under producer groups'
support still affecting
payments in 2017 financial
year.
Furthermore, deficiencies
have been identified under
animal welfare support and
afforestation measure.
Yes A reservation is entered in respect of 2017
expenditure.
The Member State has reported the
implementation of actions to avoid the
repetition of the deficiencies detected
under RDP 2007-2013 in the 2014-2020
RDP for producers groups. The Member
State should address the deficiencies
under animal welfare, Leader and the
underlying causes of high error rates
reported under IACS measures.
The ongoing conformity clearance
procedure will ensure that the financial risk
to the EU budget is covered.

agri_aar_2017_annexes Page 157 of 278
Paying
Agency
Adjusted
error
rate
Amount
at risk Reasons for top-up
Reserv
ation Mitigating factors/reservation follow up
IT01 –
Italy Agea
3.79% EUR
16.899
m
DG AGRI audits in 2017 and
previous years have identified
deficiencies in public
procurement under certain
transitional non-IACS
measures, as well as
deficiencies for IACS
measures.
Furthermore, DG AGRI has
identified deficiencies in the
checks on active farmer
status.
Yes A reservation is entered in respect of 2017
expenditure.
The Action Plan reported by the Member
State includes corrective actions to
address deficiencies linked to the
reservation entered in 2016 AAR.
As regards the findings relating to public
procurement, the Member State informed
that the action plan has been
implemented. DG AGRI will closely monitor
the situation.
Finally, the Member State should address
deficiencies identified in the checks on
active farmer status.
The ongoing conformity clearance
procedure will ensure that the financial risk
to the EU budget is covered.
IT05 –
Italy
Veneto
2.15% EUR
1.788
m
The Member State has
reported high error rates
under IACS measures. ECA
audits identified a deficiency
in administrative checks under
agro-environment transitional
measure.
Furthermore, DG AGRI has
identified deficiencies in the
checks on active farmer
status.
No A reservation is not considered necessary.
The Member State should nonetheless
implement corrective actions to address
deficiencies identified in the checks on
active farmer status and the underlying
causes of high error rates reported under
IACS measures.
The ongoing conformity clearance
procedure will ensure that the financial risk
to the EU budget is covered.
IT26 –
Italy
Calabria
9.8% EUR
6.935
m
The Member State has
reported high error rates
under IACS measures.
DG AGRI audits in 2017
identified deficiencies under
agro-environment-climate,
organic and areas with natural
constraint measures. As
regards non-IACS, several
deficiencies have been
identified by DG AGRI
affecting investment, infra-
structure, business start-up,
afforestation and technical
assistance support.
Furthermore, DG AGRI has
identified deficiencies in the
checks on active farmer
status.
Based on the Certification
Body's assessment, a further
adjustment was made to the
error rate reported by the
Member State.
Yes A reservation is entered in respect of 2017
expenditure.
The Member State should implement a
new action plan addressing the deficiencies
identified in 2017 under IACS and non-
IACS measures.
The ongoing conformity clearance
procedure will ensure that the financial risk
to the EU budget is covered.
MT01 -
Malta
8.63% EUR
0.187
m
The Member State has
reported high error rates
under IACS measures.
No As the amount at risk is below the de
minimis threshold established by DG
AGRI's materiality threshold (see Annex
4), no reservation is required. The Member
State should address the underlying
causes of the high error rates reported
under IACS measures.
PT03 -
Portugal
9.56% EUR
50.116
m
The Member State has
reported high error rates and
the minimum control rate for
Yes A reservation is entered in respect of 2017
expenditure.
The Member State should reinforce the

agri_aar_2017_annexes Page 158 of 278
Paying
Agency
Adjusted
error
rate
Amount
at risk Reasons for top-up
Reserv
ation Mitigating factors/reservation follow up
non-IACS measures is not
achieved.
DG AGRI audit in 2017 has
identified deficiencies under
afforest-ation (double
financing) and transitional
expenditure under processing
and marketing investments.
Furthermore, DG AGRI has
identified deficiencies in the
checks on active farmer
status.
action plan to address the underlying
causes of the high error rate reported,
including correct reporting under non-IACS
measures, and the checks on active farmer
status and the findings of the Certification
Body.
SE01 -
Sweden
5.78% EUR
6.023
m
The Member State has not
achieved the minimum control
rate for non-IACS measures.
DG AGRI audits in 2016 have
identified several deficiencies
in the management and
control system for IACS
measures Moreover, audits in
2016 and 2017 identified
deficiencies under invest-ment
and infrastructure measures.
Furthermore, DG AGRI has
identified deficiencies in the
checks on active farmer
status.
Yes A reservation is entered in respect of 2017
expenditure.
The Member State has reported the
ongoing implementation of an action plan
addressing the deficiencies identified under
IACS measures and has improved the
checks on public procurement. Further
actions should be put in place to address
deficiencies identified under investment
measure and checks on active farmer
status.
The ongoing conformity clearance
procedure will ensure that the financial risk
to the EU budget is covered.
SK01 -
Slovakia
10.44% EUR
17.527
m
The Member State has
reported high error rates
under IACS measures. DG
AGRI audits in 2017 identified
deficiencies under forestry
measures, both in area
payments and investments.
Moreover, deficiencies were
identified in 2016 under
investments and start-up
support for non-agricultural
activities, and in 2017 for
public procurement.
Yes A reservation is entered in respect of 2017
expenditure.
The Member State has reported the
implementation of an action plan
addressing the underlying causes of the
high error rates under IACS measures. As
regards deficiencies in investments, the
Member State has informed having put in
place corrective actions addressing the
findings identified by DG AGRI in 2016.
The action plan should be reinforced to
address newly identified deficiencies by DG
AGRI as regards public procurement and
forestry measures.
The ongoing conformity clearance
procedure will ensure that the financial risk
to the EU budget is covered.
Table: Annex 10-3.3.5-1
Note that the calculation of the top-up is based on the results of the audit and the
financial correction proposed for the audited single population at the level of the Paying Agencies concerned.

agri_aar_2017_annexes Page 159 of 278
2016 Reservations not carried forward in the 2017 AAR (8 Paying Agencies):
Paying Agency Adjusted
error rate Justification
Germany
Niedersachsen 0.88% The Member State has taken the necessary actions to remedy the
underlying causes for the high error reported in 2016 under agro-
environment-climate and organic measures
Spain
Andalucía 2.09% The Member State has implemented an action plan addressing the
deficiencies related to reasonableness of costs and eligibility of beneficiary.
The financial risk to the EU budget for financial year 2017 is covered by
ongoing conformity clearance procedures
Greece 0.77% The Member State has implemented an action plan addressing most of the
deficiencies linked to the Reservation in 2016. The financial risk to the EU
budget for financial year 2017 is covered by ongoing conformity clearance
procedures
Ireland 1.68% The Member State has implemented an action plan addressing the
deficiencies linked to the Reservation in 2016. The financial risk to the EU
budget for financial year 2017 is covered by ongoing conformity clearance
procedures
Lithuania 0.96% The Member State has taken the necessary actions to remedy the
underlying causes for the high error reported in 2016. The financial risk to
the EU budget for financial year 2017 is covered by ongoing conformity
clearance procedures.
The Netherlands 0.61% The Member State has implemented an action plan addressing the
previously identified deficiencies under public procurement and Leader.
Poland 1.53% The Member State has implemented an action plan addressing the
deficiencies that led to 2016 reservation in the action plan related to the
management of agri-environment and organic farming payments, Producer
Groups and Technical Assistance. The financial risk to the EU budget for
financial year 2017 is covered by ongoing conformity clearance procedures
Romania 0.57% The Member State has implemented an action plan addressing the
deficiencies related to the Reservation in 2016 and payments were
interrupted for animal welfare in 2017 financial year.
Table: Annex 10 – 3.3.5-2

agri_aar_2017_annexes Page 160 of 278
3.3.6 Conclusions for ABB04
3.3.6.1 Expenditure under the Rural Development Programme
Total expenditure for the Rural Development Programmes in 2017 amounted to EUR 11 105 493 347 of which EUR 43 121 731 were financed by the budget for the 2007-2013
programming period (budget item 05040501), and EUR 11 051 784 091 were financed by the budget for the 2014-2020 programming period (budget item 05046001). DG
AGRI's assessment results in an adjusted error rate for the total relevant expenditure of 3.37%.
29 out of the 72 Paying Agencies have an adjusted error rate above 2% (of which 11
were above 5%: Belgium (Wallonia), Bulgaria, Czech Republic, Denmark, France (Corsica and ASP), Italy (Calabria), Malta, Portugal, Slovakia and Sweden).
In line with its materiality criteria in Annex 4, 11 cases where the error rate is above 5% (Belgium (Wallonia), Bulgaria, Czech Republic, Denmark, Spain (Extremadura)
France (ODARC and ASP), Italy (ARCEA), Portugal, Slovakia and Sweden) were automatically subject to a reservation. In all of these cases, the high adjusted error
rate was determined further adjustment of the error rate by DG AGRI, based on the assessment of the Certification Bodies and DG AGRIs own audits. In one case (Malta),
the amount at risk is below DG AGRI's de minimis threshold of EUR 1 million as
established in Annex 4 (materiality criteria) therefore no reservation was necessary.
For 17 Paying Agencies with an error rate between 2% and 5%, DG AGRI examined the
situation for each Paying Agency concerned to determine if risk mitigation conditions existed rendering it unnecessary to make a reservation. In 2 cases (Spain (Andalucía)
and Italy (Veneto)) it was considered that, given the mitigating factors present it would not be necessary to make reservations. For 4 Paying Agencies (Belgium (Flanders),
Cyprus, United Kingdom (Scotland) and Spain (Islas Canarias) the amount at risk is below DG AGRI's de minimis threshold of EUR 1 million as established in Annex 4
(materiality criteria) therefore no reservation was necessary. For the remaining 11
Paying Agencies a reservation was deemed necessary.
The overall outcome of this exercise is that 22 reservations are necessary at Paying
Agency level:
Austria
Belgium Bulgaria
Czech Republic Denmark
Finland
France (2 Paying Agencies) Germany (2 Paying Agencies)
Hungary Italy (2 Paying Agencies)
United Kingdom (3 Paying Agencies) Slovakia
Spain (3 Paying Agencies) Sweden
Portugal

agri_aar_2017_annexes Page 161 of 278
3.3.6.2 Risk assessment for other budget items within ABB04
While budget item 05040501 and 05046001 concern the Rural Development programmes
for 2007-2013 and 2014-2020 and thus accounts for the large majority of the expenditure for ABB04, it is also necessary to assess the risk for the entire expenditure
under chapter 0504. The following table sets out the budget items and the error rates which have been used to assess the amounts at risk. The overall adjusted error rate of
3.37 % represents a decrease compared to 2016 and confirms the stable downward trend.
Table: Annex 10 - 3.3.6.2-1
The adjusted error rate for ABB04 is 3.37% and the total amount at risk is EUR 374.44 million.
The assessment of the risk for the entire chapter 0504 covers all payments to Member States in 2017
The average amount of net financial corrections per year for the five year period 2013-2017 (excluding corrections made for cross compliance) is EUR 212.83
million for ABB0443 while recoveries from Member States from beneficiaries
amounted to EUR 112.74 million.
43 See section 2.4.1.5.1 of the main body of the report on "corrective capacity".
Management
typeChapter
Budget
itemDescription
Payments
(EUR)
Error rate
(%)
Amount at risk
(EUR)
05040114 Completion of rural development financed by the EAGGF Guarantee Section - Programming
period 2000 to 2006 -519 525 0.00% -
05040201 Completion of the European Agricultural Guidance and Guarantee Fund, Guidance Section -
Objective 1 regions (2000 to 2006) - - -
Rural development programmes 2007-201343 121 731 3.37% 1 454 878
Interim payments 2007-201343 121 731 3.37% 1 454 878
Promoting sustainable rural development, a more territorially and environmentally
balanced, climate-friendly and innovative Union agricultural sector11 051 784 091 3.37% 372 874 507
Interim payments for promoting sustainable rural development, a more territorially and
environmentally balanced, climate-friendly and innovative Union agricultural sector 2014-2020 11 051 784 091 3.37% 372 874 507
Pre-financing for promoting sustainable rural development, a more territorially and
environmentally balanced, climate-friendly and innovative Union agricultural sector 2014-2020 - - -
11 094 386 297 3.37% 374 329 385
05040206 Completion of Leader (2000 to 2006) - - -
05040502 Operational technical assistance 2007-2013 - - -
05046002 Operational technical assistance 2014-2020 11 107 050 1.00% 111 071
11 107 050 1.00% 111 071
11 105 493 347 3.37% 374 440 455
Shared
Management
Direct
Management
0504
Sub-Total Shared Management
Grant Total 0504
05040501
05046001
Sub-Total Direct Management
Payments reimbursed by DG AGRI to the Member States in 2017

agri_aar_2017_annexes Page 162 of 278
Part 3.4: Root causes of the error rates in the CAP – what is DG AGRI doing about it?
Communication on the root causes of errors and actions taken
In February 2017 the Commission published a Communication to the Council and the European Parliament on the root causes of errors and actions taken (COM (2017) 124
final), following Article 35(2) of the Financial Regulation, including several spending policies.
As regard the CAP, the Communication explains the main root causes of errors under the
EAGF and EAFRD, acknowledging the relatively low level and stability of the former and the decreasing although still high level of the latter.
The actions taken during the past years are also described in the Communication.
Simplification and Omnibus
During 2016 and 2017 several legal simplification initiatives were proposed by DG AGRI, affecting a number of implementing and delegated acts. Thanks to these amendments,
the management and control system was simplified and new possibilities were introduced, such as the "yellow card" system for penalties or simplification of controls for
financial instruments.
But the major simplification initiative was proposed though the Omnibus Regulation, including the 4 CAP Regulations, the Common Provisions Regulation together for the ESI
Funds and the Financial Regulation. The agricultural part of the Omnibus Regulation was published in 2017 introducing some simplification and technical improvements to the four
basic regulations of the CAP.
The changes introduced for the risk management tools will give farmers a better
protection in case of production risks. A sector-specific income stabilization tool covering drops in farmer's income exceeding 20% has been introduced. Furthermore, the
threshold for insurance has been reduced from 30% to 20% of the value of average
annual production, making these instruments more accessible to farmers. The support rate for Crop, animal, and plant insurance, mutual funds and income stabilisation tools
has been increased from 65 to 70%.
The new rules introduce further flexibility for Member States in the definition of active
farmers. Member States can now implement only one or two of the criteria for being regarded as active farmer or may choose to discontinue altogether, the application of the
negative list.
Some simplification provisions were introduced in the package by the co-legislators. The
permanent grassland definition now contains elements that are optional for Member
States such as the ploughing-up or the extension of the definition to land that has so far not been eligible such as areas covered with shrubs or trees that produce animal feed but
are not directly grazed by animals.
Amendments to the voluntary coupled support have been also introduced by the co-
legislators. Notably these introduce clarifications of the applicable rules, while also fully aligning them to the terms of the Blue Box Agreement on Agriculture.

agri_aar_2017_annexes Page 163 of 278
Finally, a set of changes has been introduced in the competition provisions of the Common Market Organisation (CMO) Regulation. The position of producer organisations
will be strengthened: an explicit competition derogation is now possible for sales and production planning activities of POs and Associations of POs which genuinely integrate
activities of their members while sector specific provisions have been deleted. Furthermore, the farmer will now have the right to ask for a written contract, unless his
trading partner is a SME. These provisions entered into force on 1 January 2018
Conferences, workshops and networking
In 2017 DG AGRI participated in 3 Conferences with the Heads of the Paying Agencies in
Gozo (Malta), Tartu (Estonia) and Brussels (Belgium) (the latter organised by DG AGRI). These Conferences allow for the sharing of good practices in the implementation of the
CAP and inform about strategic issues as regards assurance and audit. Meetings are also regularly organised with representatives of the Leaning Network of the Paying Agencies,
in which strategic issues and implementation challenges are discussed.
Furthermore, since 2013 seven seminars on error rate in rural development have been
organised, of which the latest took place in June 2017. The seminars aim at presenting the lessons learnt from the audit work, sharing good practices in Member States'
experience with the implementation of the programmes and provide guidance. These
seminars are organised jointly in the framework of the Rural Development Committee and the Agricultural Funds Committee in order to ensure the involvement of both
Managing Authorities and Paying Agencies. In the meantime, the "geographical desks" (the DG AGRI units responsible for the Member States' Rural Development programmes)
ensure regular monitoring of the action plans and carry out follow-up activities in annual and ad-hoc meetings with Member States, monitoring committees and, if relevant, in the
context of programme amendments.
The European Network for Rural Development also has an enhanced role in disseminating
good practices and guidance related to the reduction of errors, and improving overall RDP
implementation. In 2017, workshops and other events for Managing Authorities and Paying Agencies have been carried out in relation to the following topics: fostering farm
resilience including generating and stabilising farm income, RDP measures to support generational renewal, effective use of support possibilities for Natura 2000, LEADER
innovation, social inclusion in rural areas and more general events aiming to unlock the potential and improve overall implementation of RDPs.
DG AGRI has reinforced its actions to inform the responsible bodies in the Member States about applicable rules under direct payments and their implementation and has also
developed guidance documents addressing problematic issues, in particular in the
following areas:
• principles of the LPIS and the layer identifying the Ecological Focus Areas,
• on-the-spot checks and area measurement,
• aid applications by farmers,
• the "active farmer" provision and
• the definition and implementation of permanent grassland.
Other technical guidance, established in collaboration with the Commission’s Joint Research Centre have followed, on e.g. the implementation of a pro-rata system for
permanent grassland or more technical features of on-the-spot controls for greening
(e.g. on measurement of EFA or on the control of crop diversification), the LPIS upkeep and the LPIS QA methodology execution.

agri_aar_2017_annexes Page 164 of 278
Finally, several expert group meetings on simplification have taken place in 2017, in the framework of the "Refit" initiative of the Commission leading to some of the legal
amendments mentioned above.
Action plans
As from 2015, DG AGRI has further improved the system of action plans reporting by Member States concerned, including a reinforced focus on audit findings as well as
improved indicators and milestones for monitoring purposes. The action plans are expected to address the identified deficiencies by describing, for each of them, the
corrective actions to be taken and the established benchmarks and timetable for
implementing their actions. The action plans are normally triggered by serious deficiencies identified in the framework of conformity procedures.
The regulatory quality assessment (QA) which Member States must carry out of their LPIS is actively followed-up by DG AGRI to ensure that Member States take the remedial
actions required to meet the quality standards that are considered appropriate, in view of the fundamental role played by the LPIS in ensuring correct claims and payments.
Moreover, an assessment of the correct application of the LPIS QA method will continue to be included in the conformity clearance procedure

agri_aar_2017_annexes Page 165 of 278
Part 4: Conformity Clearance Procedure and Net Financial corrections
4.1 What is "Clearance "?
While it is the Member States which have the responsibility for managing and controlling the various aid schemes provided for by the CAP legislation, there must be a mechanism
in place which enables the Commission to ensure that they carry out their work properly and, if they fail to do so, draw the necessary financial consequences. This mechanism
consists of the clearance procedures operated by the Commission, which include an annual financial clearance of the accounts of each Paying Agency and a multi-annual
conformity clearance covering the conformity of the expenditure with EU rules, and as
regards the EAFRD in conformity with the applicable EU and national rules.
The legal basis for the Clearance of Accounts procedures in place is provided by
Regulation (EU) No 1306/201344, Commission Delegated Regulation (EU) No 907/201445 and Commission Implementing Regulation (EU) No 908/201446.
4.1.1 Financial clearance of accounts – Completeness, accuracy and
veracity of the annual accounts
The financial clearance is based on an examination by the Certification Body, an audit body which is independent from the Paying Agency. This body draws up a certificate
stating whether it has reasonable assurance that the accounts of the Paying Agency are true, complete and accurate, that the internal control procedures have operated
satisfactorily and whether the expenditure for which reimbursement has been requested
from the Commission have been in conformity with the applicable rules (see above Part 2). They also give an opinion on the management declaration signed by the head of the
Paying Agency, i.e. stating whether the examination puts in doubt the assertions made in the management declaration.
The financial clearance covers the annual accounts of each Paying Agency and the control
systems set up by these. Within this framework, particular attention is paid to the
Certification Bodies’ conclusions and recommendations (where weaknesses are found), following their reviews of the Paying Agencies’ management and control systems. This
review also covers aspects relating to the accreditation criteria for the Paying Agencies. Commission's audits under the annual financial clearance procedure may lead to opening
a conformity clearance procedure when errors are found in the annual accounts and and/or findings from certification/accreditation missions require that a financial correction
is proposed.
The Commission adopts an annual clearance of accounts decision, by which it conveys
that it accepts the Paying Agencies annual accounts on the basis of the certificates and
reports from the Certification Bodies, but without prejudicing any subsequent decisions to recover expenditure which proves not to have been effected in conformity with the
applicable rules (this is reserved for the conformity clearance). The Commission must adopt this decision by 31 May of the year following the financial year in question (for
agricultural expenditure a financial year starts on 16 October of one year and ends on 15 October of the next year).
44 Regulation (EU) No 1306/2013 of the European Parliament and of the Council on the financing, management
and monitoring of the common agricultural policy (OJ L 347 of 20.12.2013) 45 Commission Delegated Regulation (EU) No. 907/2014 of 11 March 2014 supplementing Regulation (EU) No.
1306/2013 with regard to paying agencies and other bodies, financial management, clearance of accounts,
securities and use of euro (OJ L 255 of 28.08.2014). 46 Commission Implementing Regulation (EU) No 908/2014 of 6 August 2014 laying down rules for the
application of Regulation (EU) No 1306/2013 with regard to paying agencies and other bodies, financial
management, clearance of accounts, rules on checks, securities and transparency (OJ L 255 of 28.08.2014).

agri_aar_2017_annexes Page 166 of 278
4.1.2 Conformity clearance – checking the system
In contrast to the financial clearance, the conformity clearance is designed to exclude
expenditure from EU financing which has not been paid in conformity with EU rules, thus shielding the EU budget from expenditure that should not be charged to it. These "net
financial corrections" are recovered from the Member States. The conformity clearance is, therefore, not a mechanism by which irregular payments are recovered from the final
beneficiaries, which according to the principle of shared management is the sole responsibility of the Member States.
However, net financial corrections are a strong incentive for the Member States to improve their management and control systems and thus to prevent or detect and
recover irregular payments to final beneficiaries. The conformity clearance thereby
contributes to the legality and regularity of the transactions at the level of the final beneficiaries.
Financial corrections
Financial corrections relate to expenditure which as regards the EAGF has not been spent by the Member States in conformity with EU rules or as regards the EAFRD has not been
spent in conformity with the applicable EU and national rules, and which are therefore recovered to the EU budget. Please note that financial corrections cannot be qualified as
"penalties" or "fines". A penalty or fine implies a sanction over and above the undue
expenditure which is not the case for DG AGRI's financial corrections.
Explanatory Box: Annex 10 - 4.1.2-1
While the financial clearance is an annual exercise, conformity clearance does not follow
an annual cycle. It covers expenditure incurred in more than one financial year, with the exception of expenditure made more than 24 months before the Commission officially
notifies the Member State of its audit findings.
Every year, the Commission‘s Directorate General for Agriculture and Rural Development
carries out over 250 audits, more than half of which include on-the-spot missions to the Paying Agencies in the Member States. The Paying Agencies to be visited are selected on
the basis of a detailed risk analysis, and the audit work normally concentrates on the
functioning of the Paying Agencies‘ management and control systems (see explanatory box 1.1 in Annex 10 – part 1 for more information on the Central Risk Analysis (CRA)).

agri_aar_2017_annexes Page 167 of 278
Diagram: Annex 10-4.1.2-1
4.1.3 How does the conformity procedure work in practice?
If an audit reveals deficiencies in the functioning of the national systems, the
Commission initiates a conformity clearance procedure with a view to determining whether to impose a net financial correction on the Member State in question and, if so,
what the amount of that correction that needs to be excluded from Union financing
should be. Such a procedure comprises the following steps (see diagram Annex 10 – 4.4):
The Commission officially notifies the Member State of its audit findings and indicates the corrective measures which the Member State should take to remedy the
deficiencies found. The Member State then has two months to reply to the Commission‘s findings.
The Commission arranges a bilateral meeting with the Member State where both parties shall endeavour to reach an agreement on the corrective measures to be
taken as well as on the gravity of the infringement and the financial damage caused
to the EU budget. The Member State has fifteen working days after having received the minutes of the meeting to react and provide further information (if requested,
two more months).
CLEARANCE OF ACCOUNTS
Two independent procedures
Financial Clearance Conformity Clearance
Completeness, accuracy and veracity of the annual accounts of the Paying Agency
Annual exerciseafter the end of the financial year N
Starting on 16 October N-1 and ending on 15 October N
Compliance with Union law and, in respect of the EAFRD, with the applicable Union and national law
Ad hoc compliance decisions cover up to 24 months prior to Commission's notification of audit findings to the Member
States
Audit to check:Whether the Paying Agency's annual accounts are kept as
requiredWhether the internal control procedures have operated
satisfactorilyOn legality and regularity of the expenditure for which
reimbursement has been requested from the Commission
System-based and risk based auditscheck:
Whether the expenditure is effected in compliance with Union law and, in respect of the EAFRD, with the applicable
Union and national lawWhether the Paying Agency has carried out the checks
required to a satisfactory standard
Financial clearance decision by the Commission covering expenditure of financial year N
Without prejudice to conformity clearance decisions
Annually, by 31 May of the year following the financial year
Conformity clearance decisions by the Commission covering expenditure effected over several financial years
2-4 times per year

agri_aar_2017_annexes Page 168 of 278
The Commission formally communicates its conclusions to the Member State, including the financial correction which it envisages to impose on the Member
State.
Within 30 working days following receipt of these conclusions, the Member State
may submit the case for conciliation to the "Conciliation Body"(see Explanatory Box below). The Conciliation Body has four months to try to reconcile the positions of
the Commission and the Member State and, at the end of this period, to draw up a report on the results of its efforts and any recommendations it may wish to make to
the parties.
After having examined the Conciliation Body‘s report, the Commission notifies the Member State of its final conclusions.
What is the role of the Conciliation Body?
The conciliation procedure was set up in order to reconcile the divergent positions of the
Commission and the Member State, occurring during the conformity clearance procedure.
The Conciliation Body is composed of five members, who are highly qualified in matters
regarding the financing of the CAP or in the practice of financial audit and originate from different Member States. The chairman and the four other members are nominated by
the Commission, after having consulted the Committee on the Agricultural Funds. They are appointed for three years (renewable for a year at a time only). The secretariat of the
Body is provided by the Commission.
Only reasoned requests from the Member States are accepted by the Conciliation Body. A
request for conciliation is only admissible when the correction proposed by the
Commission services either exceeds EUR 1 million or accounts for more than 25 % of the Member State‘s total annual expenditure under the budget headings concerned or, if
these thresholds are not reached, if the request concerns a matter of principle relating to the application of EU rules.
The Conciliation Body has four months to reconcile the positions of the Commission and the Member State. At the end of its work – which takes place as informal and rapid as
possible – the results are to be reported to the Member State concerned, to the Commission and to the other Member States through the Committee on the Agricultural
Funds.
The Conciliation Body is completely independent; it carries out its duties neither seeking
nor accepting any instructions from Member States or other body.
Explanatory Box: Annex 10 - 4.1.3-1
Once this procedure has been completed, any resulting financial correction is included in a formal decision adopted by the Commission (referred to as ad-hoc decision) after
having consulted the Member States through the Committee on the Agricultural Funds. Such a conformity decision can then be challenged by the Member States before the
Court of Justice of the European Union. Throughout the procedure Member States have the right to a fair contradictory procedure. Also because Member States have the right
(which they regularly exercise) to challenge conformity decisions in the Court of Justice of the European Union, the Commission is very vigilant that it fully respects the Member
States' rights under the conformity procedure. Failure to do so would expose the EU
budget to the risk that financial corrections would have to be reimbursed to the Member States.

agri_aar_2017_annexes Page 169 of 278
4.1.4 Shortening the conformity clearance procedure
Carrying out a contradictory procedure is legally indispensable before making financial
corrections. Prior to implementing any net financial correction, the Commission must therefore offer the Member States the opportunity to provide evidence and arguments
that may contradict its initial findings. Indeed both Regulation (EC) No 1290/2005 (in
application up to end of 2014) and the new CAP Horizontal Regulation, Regulation (EU) No 1306/2013, provide that "Member States shall be given the opportunity to
demonstrate that the actual extent of the non-compliance is less than the Commission's assessment". The principle of a contradictory process between the auditor and the
auditee is also an essential element of audit quality standards.
In addition to the contradictory procedure, the legislation (Article 52(3) of the CAP
Horizontal Regulation) provides for a "procedure aimed at reconciling each party's position" if an agreement is not reached at the end of the contradictory procedure. The
duration of the conciliation as such is limited to four months. But the whole process from
the request of the Member State concerned to the final result of the analysis by the Commission of the recommendations of the Conciliation Body takes at least six months47.
The Commission has streamlined the procedure to the extent possible. Firstly, the Horizontal Regulation describes precisely the nature, scope and sequence of the
successive steps, as well as the different types of financial corrections. Secondly, provisions in the delegated act (method and criteria for calculating the financial
correction) and implementing act (details of the conformity procedure, with deadlines for each step of the procedure) are intended to further streamline the legal framework and
limit the risk of unnecessary delays. Thirdly, on that stronger basis, DG AGRI intensified
its monitoring of the progress of the conformity procedures to ensure a strict respect of the deadlines. Furthermore, for conformity procedures dating from earlier years,
particular action was taken with regard to the procedures open from before 2013 to ensure a close follow-up with clear indicators with a view to clearing all such files by end
of 2016. As a result, all 358 audits identified as 'backlog' (i.e. 285 audits from 2012 and before and another 73 audits from 2013) have been closed by end of 2016.
The following diagram describes the successive steps of a conformity clearance procedure leading to a net financial correction carried out under the new implementing act.
47 It can take even longer if the whole case has to be re-examined.

agri_aar_2017_annexes Page 170 of 278
Diagram: Annex 10 – 4.1.4-1
Year Month Procedural steps Procedural PhaseCoverage of the
financial correction
Preparatory Phase
2014 S Audit MissionO
N
D
2015 J Notification of audit finding to MSF
M MS reply to the Letter of FindingsA
M
J
JBilateral meeting with MS to discuss the deficiencies
identified, action to be taken and the risk to the EU Budget
A Minutes of Bilateral Meeting
S Member State's reply to the minutes of bilateral meeting
O
N
D
2016 J
F Notification of financial correction to MS
MMS submission of reasoned request for conciliation
- optional to MS -
A
M
J
J
A
S
O
N
D
2017J
Final Letter to MS with definitive financial correction
F
M
A Commission decision on financial corrections
M
J
J Actual reimbursement to EU Budget by MS
Co
ntr
adic
tory
ph
ase
wit
h M
S
START OF CONFORMITY PROCEDURE
Fin
anci
al c
orr
ecti
on
may
co
ver
exp
end
itu
re in
curr
ed f
or
24
mo
nth
s
pri
or
to n
oti
fica
tio
n
Co
mit
olo
gy &
CO
M
dec
isio
n p
roce
du
re
END OF PROCEDURE
Fin
anci
al c
orr
ecti
on
may
co
ver
exp
end
itu
re in
curr
ed f
or
the
per
iod
afte
r n
oti
fica
tio
n o
f fi
nd
ing
un
til
MS
can
sh
ow
th
at r
emed
ial a
ctio
n
has
bee
n t
aken
.
Co
nci
liati
on
ph
ase
for
MS
Conciliation procedure (if requested by MS)
The Conciliation Body is independent from the COM and the MS.
Its role is to conciliate the positions of both parties.
Its conclusions are not binding on the COM.
Preparation of the Final Letter
Conformity Clearance Procedure
DG AGRI Conformity Clearance Procedure for Net Financial Corrections
Example of the timing of the procedure for an audit mission carried out on-the-spot at the end of September 2014 (standard procedure)
Mission report & preparation of the Letter of Findings

agri_aar_2017_annexes Page 171 of 278
4.2 Net financial corrections
4.2.1 How does the Commission calculate net financial corrections?
Financial corrections are determined on the basis of the nature and gravity of the infringement and the financial damage caused to the EU budget. Where possible, the
amount is calculated on the basis of the loss actually caused (Article 12(2) of
Commission Delegated Regulation (EU) No 907/2014) or on the basis of an extrapolation (Article 12(3) of Commission Delegated Regulation (EU) No 907/2014).
Where this is not possible, flat-rates (Article 12(6) of Commission Delegated Regulation (EU) No 907/2014) are used which take account of the severity of the deficiencies in the
national management and control systems in order to reflect the financial risk for the EU budget. In order to ensure equal treatment of all cases of this kind, the Commission has
adopted guidelines48 which provide for standard correction rates of 2%, 3%, 5%, 7%, 10% or 25% of the expenditure at risk, depending on whether the deficiencies concern
key or ancillary control requirements which are determined for each aid schemes.
What are key and ancillary controls?
- Key controls are the administrative and on-the-spot checks necessary to determine the
eligibility of the aid and the relevant application of reductions and penalties. It concerns those physical and administrative checks required to verify substantive elements, in
particular the existence of the subject of the claim, identification of duplicate claims for
the same subject, the quantity, the qualitative conditions including the respect of time limits, harvesting requirements, retention periods, etc. in order to ensure the accurate
calculation of the amount due to the beneficiary. They are performed on-the-spot, and by administrative cross-checks with independent data (such as a land parcel identification
system).
- Ancillary controls involve all other administrative operations required to correctly
process claims, such as a risk analysis and appropriate supervision of the procedures.
- When assessing the administrative and on-the-spot (OTS) process (the authorisation of
claims) for a given population, the Certification Body's assessment should be based on the key and ancillary controls. The Certification Bodies are also using the key and
ancillary controls when they assess the legality and regularity of the expenditure (under
their compliance and substantive testing).
Explanatory Box: Annex 10 - 4.2.1-1
On this basis, the guidelines provide that:
• When a Member State has adequately performed the key controls, but completely
failed to operate one or two ancillary controls then a correction of 2% is justified in view of the lower risk of financial damage to the Union's budget, and in view of the
lesser gravity of the infringement;
• When one or two key controls are not applied, in the number, frequency, or depth
required by the regulations, then a correction of 5% is justified, as it can reasonably
be concluded they do not provide sufficient level of assurance of the regularity of claims, and that the risk to the Funds was significant;
48 Guidelines on the calculation of the financial corrections in the framework of the conformity and financial
clearance of accounts procedures C(2015) 3675 final

agri_aar_2017_annexes Page 172 of 278
• When one or more key controls are not applied or applied so poorly or so infrequently that they are completely ineffective in determining the eligibility of the
claim or preventing irregularities, then a correction of 10% is justified, as it can reasonably be concluded that there was a high risk of wide-spread financial damage
to the Union's budget;
• When three or more deficiencies are detected with respect to the same control
system, a financial correction of 3% is justified if the deficiencies concern only ancillary controls which have completely failed;
• When three or more deficiencies are detected with respect to the same control
system, a financial correction of 7% is justified if these deficiencies include maximum two key controls not being carried out in the number, frequency, or depth required
by the regulations;
• When a Member State’s application of a control system is found to be absent or
gravely deficient, and there is evidence of wide-spread irregularity and negligence in countering irregular or fraudulent practices", then a correction of 25% is justified as
it can reasonably be assumed that the freedom to submit irregular claims with impunity will occasion exceptionally high financial damages to the Union's budget.
The rate of correction may be fixed at an even higher rate to exclude all expenditure
when weaknesses are so serious that they constitute a complete failure to comply with EU rules.
4.2.2 Net financial corrections in 2017
Table Annex 10 – 4.6 below sets out the net financial corrections (excluding cross-compliance corrections) reimbursed to the EU budget for ABB02, ABB03 and ABB04 over
the past five years and its average:
Table: Annex 10 – 4.6
As mentioned in the body of the report (under section 2.1.1.3.1), for this year's corrective capacity, DG AGRI carefully reviewed the individual corrections for market
measures ABB02 and has excluded factors from the past years, that would no longer be relevant for current measures, in order to come to the best but conservative estimate of
the expected corrective capacity average to be applied to the reporting year's relevant expenditure, so as to get the related estimated future corrections. The corrections
excluded, compared to last year, refer exclusively to ABB02 (market measures) and are those concerning aid schemes which no longer exist, notably, export refunds, food for the
most deprived, sugar restructuring, historic wine plantation right, certain irregularities
and aid for fruit and vegetables producer groups with historically high financial corrections as the measure is now under EAFRD and with limited expenditure.
million EUR
ABB02 ABB03 ABB04 Total
2013 100.425 297.861 227.639 625.925
2014 102.245 533.356 62.342 697.943
2015 205.255 756.932 243.985 1 206.172
2016 213.272 1 191.485 226.396 1 631.153
2017 363.533 517.097 303.807 1 184.437
Total 984.730 3 296.731 1 064.169 5 345.630
5-year average 196.946 659.346 212.834 1 069.126
All corrections except cross-compliance, late payments and overshooting

agri_aar_2017_annexes Page 173 of 278
As in previous years, in its calculation of corrective capacity for net financial corrections, DG AGRI excludes corrections in respect of cross-compliance infringements as these are
not considered to be “errors” as regards eligibility and therefore are not included in the estimates of the error rates. These amounts are, however significant, and are therefore
disclosed separately in the table below:
Cross-compliance executed in 2017 and 5-year average
million EUR
ABB02 ABB03 ABB04 Total
2017 0.152 38.081 5.592 43.825
5-year average 0.165 100.653 6.767 107.585
Table: Annex 10 – 4.7
4.2.3 Instalments and Deferrals
Net financial corrections do put a real strain on the national budgets of Member States. Therefore, an option was introduced according to which corrections of a certain volume
can be executed in three annual instalments on request of the Member State concerned. Execution in instalments was so far accepted for Bulgaria, Czech Republic,
France, Greece, Hungary, Lithuania, Poland, Portugal, Romania, Spain and Slovenia.
The following table (Annex 10 - 4.2.3-1) sets out the financial impact of the instalment
decisions, showing when they were adopted and when the various instalments are
actually reimbursed by the Member States.
Corrections adopted for which payment was postponed via instalments decision
(in million EUR)
Year of reimbursement
Ad-hoc Decision Adopted
Amount in instalments(*)
until 2014 2015 2016 2017 2018 2019 2020
34-41 2010-2013 657.671 649.869 7.802
43 2013 92.489 30.830 30.830 30.830
44 2014 16.560 5.520 5.520 5.520
46 2014 96.829 32.276 32.276 32.276
47 2015 1279.173 426.391 426.391 426.391
48 2015 177.366 59.122 59.122 59.122
49 2015 7.099 2.366 2.366 2.366
50 2016 103.476 34.492 34.492 34.492
51 2016 340.069 113.356 113.356 113.356
52 2016 219.177 73.059 73.059 73.059
54 2017 275.195 91.732 91.732 91.732
55 2017 11.303 3.768 3.768 3.768
Total 3276.407 686.219 561.941 704.354 832.795 318.773 168.558 3.768
(*) not including 302.491M in instalments due by Greece (following ad-hoc decisions 34 and 35) that were subsequently deferred
Table: Annex 10 – 4.2.3-1

agri_aar_2017_annexes Page 174 of 278
In 2015 a deferral decision under Reg. 908/2014 Art. 34(8a) was adopted for Greece. This type of decision allows deferring the execution date for financial corrections for a
period of 24 months from the date of the adoption. After the expiry of the deferral period the corrections are required to be executed in five annual instalments. The deferral
granted to Greece was due to expire on 22 of June 2017 but on 8 June 2017 the Commission adopted decision C(2017)3780 extending the deferral period to 22 June
2018. So far the following amounts (in million EUR) were deferred:
Ad-hoc 48 Ad-hoc 49 Ad-hoc 50 Ad-hoc 53 Ad-hoc 54 Ad-hoc 56
Decision number 2015/1119/EU 2015/2098/EU 2016/417/EU 2017/264/EU 2017/1144/EU 2018/304/EU
Adoption date 22/06/2015 13/11/2015 17/03/2016 14/02/2017 26/06/2017 27/02/2018
EAGF 321.119 12.648 167.957 0.143 0.895 0.588
EAFRD 1.028 0 3.88 23.037 0.287 14.857
TOTAL 322.148 12.648 171.837 23.181 1.182 15.445
Table: Annex 10 – 4.2.3-2
4.2.4 Amounts of financial corrections decided each year
Section 2.1.1.3 of this report provides further information on financial impact of financial
corrections and how they protect the EU budget. Three conformity clearance decisions were adopted by the Commission in 2017:
Net financial corrections decided in 2017
million EUR
Commission Conformity Decisions EAGF EAFRD Total
ad-hoc 53 2017/264/EU 95.285 35.062 130.348
ad-hoc 54 2017/1144/EU 322.228 54.562 376.791
ad-hoc 55 2017/2014/EU 282.645 115.330 397.976
Total 700.159 204.955 905.114
Table: Annex 10 – 4.2.4-1
Impact of net financial corrections on Member States
In all Member States the national and regional authorities responsible for implementing the CAP are directly affected by EU net financial corrections. Such corrections which
relate to expenditure made by Member States in previous budget years lead to a reduction of EU financing in the current budget year. This requires Member States in
many cases to find the financial means necessary to fill the gap by making budget transfers or amending budgets.
Explanatory Box: Annex 10 - 4.2.4-1

agri_aar_2017_annexes Page 175 of 278
4.2.5 Legal Mechanisms for net financial corrections were strengthened from 2015
4.2.5.1 Focus on more risky expenditure
DG AGRI audit activities are driven by risk analysis, i.e. more audits focus on Member States, measures and programmes affected by higher risks. Formerly, DG AGRI
conducted an annual Central Risk Analysis (CRA) covering all CAP expenditure in all Member States in order to produce an annual audit work programme. In mid-2014, in
line with its audit strategy, DG AGRI developed a rolling three-year audit programme.
(Explanatory boxes 1.1 and 1.2 in Annex 10 - part 1 set out the elements which comprise the risk analysis.) The risk assessment for this multi-annual plan has been complimented
by risk mapping (see Part 1 of this Annex) and it was decided to carry it out mid-year in order to exploit the opinions of the Certification Bodies (which are available in March) and
to take into account any follow up work resulting from the AAR (in particular action plans which have to be followed up with the Member States). This new approach will ensure
sufficient audit coverage of the overall expenditure while taking into account DG AGRI's audit capacity. Where the risk is considered to be high, the Paying Agency concerned will
continue to be subject to intense audit supervision by DG AGRI in order to ensure that
remedial actions are undertaken in line with an agreed schedule of work.
4.2.5.2 The Commission is legally bound to correct
Any identified risk to the EU budget systematically triggers a net financial correction. The Commission has no discretion to not correct as it is legally bound to exclude any
identified illegal expenditure from EU financing. For both EAGF and EAFRD financial corrections for audit enquiries launched up from 2015 onwards are governed by the
legislation referred to in section 4.1 above49.
This legislation frames the procedure even more tightly with the method and the criteria
for fixing the amount of financial corrections now set out in the delegated act. In the case
of flat-rate corrections, it is specified how the severity of deficiency shall be assessed, taking into account its nature (key or ancillary control) but also its recurrence (repetition
from a previous year without improvement) and the accumulation with other deficiencies (the risk of errors is likely to be higher when there are several deficiencies). The
Commission guidelines50 on how it determines financial corrections fully reflect the changes.The implementing act sets out mandatory legal deadlines for both Member State
and Commission for the various steps of the conformity clearance procedure.
4.2.5.3 Less recourse to flat-rate corrections
Both the Financial Regulation and the new CAP Horizontal Regulation provide for a
ranking of types of financial corrections where flat-rate corrections may only be used if calculated or extrapolated corrections cannot be established with proportionate efforts.
49 Up until the end of 2014, the clearance of accounts procedures were governed by Council Regulation (EC) No
1290/2005 and Commission Regulation (EC) No 885/2006. 50 Guidelines on the calculation of the financial corrections in the framework of the conformity and financial
clearance of accounts procedures C(2015) 3675 final.

agri_aar_2017_annexes Page 176 of 278
Part 5: Debt management by the Member States
Regulation (EU) No 1306/2013 on the financing of the CAP requires the Member States to
recover sums lost as a result of irregular payments detected. However, the recovery procedures, in accordance with the principle of subsidiarity, are the whole responsibility
of the Member States concerned and, thus, subject to their individual administrative and judicial procedures. Therefore, while some procedures deliver rapid results, others take
more time.
In order to address delays by some Member States in recovering undue payments, the
legislator introduced an automatic clearing mechanism under which 50% of any undue payments which the Member States have not recovered from the beneficiaries within 4
years or, in the case of legal proceedings, 8 years, would be charged to their national
budgets (50/50 rule).
Even after the application of this mechanism, Member States are still obliged to pursue
their recovery procedures and, if they fail to do so with the necessary diligence, the Commission may decide to charge the entire outstanding amounts to the Member States
concerned. Moreover, pursuant to Article 28 of Regulation (EU) No 908/2014, Member States are required to off-set any outstanding debts against future payments to the
debtor (compulsory compensation).
From financial year 2014, the 50/50 rule is applied to EAFRD in the financial year when it
occurs and not at the closure of the programme. Consequently, the Member States are
required to indicate amounts to be charged under the 50/50 rule also for EAFRD 2007-2013 as well as for EAFRD 2014-2020 programmes51.
Undue payments that are the result of administrative errors committed by the national authorities also have to be deducted from the annual accounts of the Paying Agencies
concerned and, thus, excluded from EU financing.
51 Article 54(2) of Regulation (EU) No 1306/2013.

agri_aar_2017_annexes Page 177 of 278
5.2 Amounts recovered by the Member States in financial year
2017 for the EAGF
Table Annex 10 – 5.2-1 below sets out the amounts recovered in 2017 from the beneficiaries by the Member States as reported in their debtors' ledger for the EAGF52.
Table: Annex 10 – 5.2-1
52 Since the entry into force of Regulation 908/2014 (implementing Regulation for Regulation 1306/2013),
Paying Agencies are required to record the budget code of the amounts recovered. However, this requirement
is only applicable to new debt cases (as per Article 41 (5) of regulation (EU) No 907/2014). Consequently, since
Paying Agencies are still presently reporting old debts cases, it is still not possible to provide a breakdown of
recovered amounts at ABB level and this is why the corrective capacity is still reported at Fund level.
MS EAGF recoveriesEAGF recoveries
cross-compliance
EAGF recoveries
Total
AT 4 837 539 472 939 5 310 478
BE 1 433 207 996 771 2 429 979
BG 255 087 1 193 434 1 448 521
CY 45 723 206 097 251 820
CZ 145 268 438 032 583 300
DE 5 472 924 6 166 715 11 639 639
DK 3 411 286 699 567 4 110 853
EE 118 205 1 671 051 1 789 257
ES 9 810 158 2 092 931 11 903 089
FI 390 358 306 711 697 069
FR 9 266 741 5 064 908 14 331 649
GB 2 455 591 373 539 2 829 130
GR 5 093 766 4 315 083 9 408 849
HR 549 324 498 156 1 047 480
HU 1 481 041 5 562 529 7 043 570
IE 473 327 1 272 599 1 745 926
IT 17 588 140 23 360 277 40 948 418
LT 1 089 731 410 530 1 500 261
LU 5 494 71 809 77 303
LV 87 877 258 597 346 474
MT 399 409 48 138 447 547
NL 2 822 420 2 587 309 5 409 729
PL 2 669 701 821 570 3 491 271
PT 2 652 945 1 518 925 4 171 871
RO 8 543 376 10 357 564 18 900 939
SE 313 317 44 823 358 140
SI 819 830 284 063 1 103 893
SK 248 489 1 113 083 1 361 572
Total 82 480 274 72 207 752 154 688 026

agri_aar_2017_annexes Page 178 of 278
For the purpose of calculating corrective capacity (see Table Annex 10 – 5.2-2 below and section 2.1.1.3 of the main body of the report), amounts recovered from the beneficiaries
by the Member States and reimbursed to the Commission as assigned revenue (67 02) for the EAGF in 2017 are taken into account. These amounts slightly differ from the
debtors' ledgers as reported by the Member State as it accounts for recovered amounts subject to the retention of a 20% flat rate recovery cost, as well as recovered amounts of
recovery cases that were subject to the 50/50 rule in the financial clearance of accounts for financial year 2017 and assigned revenue from (disjoined) financial clearance
decisions of previous financial years.
The total amount recovered and reimbursed to the EU budget is 130.7 million EUR. This corresponds to the amount declared by DG AGRI in the consolidated accounts for 2017.
Amounts recovered in respect of cross-compliance infringements (i.e. 30.5 million EUR) are indicated separately and deducted to show the amount of recoveries for 2017 which
DG AGRI considers to be relevant for its corrective capacity, i.e. 100.2 million EUR for 2017.
Table: Annex 10 – 5.2-2
MS EAGF recoveries
EAGF recoveries
cross-
compliance
EAGF recoveries
Total
AT 5 378 910 406 643 5 785 553
BE 1 125 011 1 173 576 2 298 588
BG 1 269 392 174 888 1 444 279
CY 150 038 66 303 216 342
CZ 319 841 316 351 636 192
DE 7 715 903 8 384 412 16 100 315
DK 3 113 109 607 086 3 720 195
EE 161 963 227 748 389 710
ES 11 079 653 1 482 585 12 562 239
FI 473 099 258 237 731 336
FR 12 662 908 130 971 12 793 879
GB 2 773 540 2 334 984 5 108 524
GR 6 475 033 1 101 466 7 576 499
HR 857 783 186 853 1 044 637
HU 3 919 465 199 327 4 118 792
IE 717 605 3 074 401 3 792 006
IT 15 810 071 1 586 142 17 396 213
LT 795 230 566 767 1 361 997
LU 5 494 143 936 149 429
LV 241 733 68 894 310 627
MT 407 798 9 095 416 893
NL 4 731 416 877 637 5 609 053
PL 3 664 695 1 135 052 4 799 748
PT 3 634 829 744 516 4 379 345
RO 11 317 030 4 312 667 15 629 697
SE 335 809 24 426 360 235
SI 569 138 167 299 736 438
SK 495 698 765 709 1 261 406
Total 100 202 193 30 527 972 130 730 165

agri_aar_2017_annexes Page 179 of 278
5.3 Amounts recovered by the Member States in financial year
2017 for the EAFRD
Table Annex 10 – 5.3-1 below sets out the amounts recovered in 2017 from the beneficiaries by the Member States as reported in their debtors' ledger for the EAFRD.
Table: Annex 10 – 5.3-1
For the purpose of calculating the corrective capacity, (see section 2.1.1.3 of the main body of the report), recoveries in respect of SAPARD and TRDI are excluded as they are
not relevant to EAFRD. Recovered amounts in respect of cross-compliance infringements are also deducted. The resulting amount of recoveries for 2017 which DG AGRI considers
relevant for its corrective capacity is EUR 83.2 million.
MS EAFRD recoveriesEAFRD recoveries
cross-compliance
EAFRD recoveries
Total
AT 4 507 818 102 739 4 610 557
BE 295 786 -30 033 265 753
BG 1 166 480 893 296 2 059 776
CY 14 030 12 837 26 866
CZ 1 121 841 272 481 1 394 322
DE 5 144 804 572 488 5 717 292
DK 947 825 5 236 953 062
EE 964 397 120 326 1 084 723
ES 4 968 224 294 782 5 263 007
FI 778 512 161 920 940 432
FR 2 894 469 192 648 3 087 116
GB 5 345 212 132 152 5 477 364
GR 3 938 120 4 625 920 8 564 040
HR 1 310 040 781 084 2 091 124
HU 2 378 210 942 344 3 320 554
IE 1 783 745 330 563 2 114 308
IT 4 322 679 14 434 464 18 757 143
LT 1 372 835 285 947 1 658 782
LU 5 645 101 400 107 045
LV 899 850 376 355 1 276 205
MT 1 607 856 34 275 1 642 131
NL 339 760 113 194 452 953
PL 9 045 062 427 864 9 472 926
PT 12 271 469 422 215 12 693 684
RO 13 328 418 3 985 952 17 314 370
SE 639 457 970 640 428
SI 582 991 142 941 725 932
SK 1 228 884 242 192 1 471 076
Total 83 204 417 29 978 552 113 182 969

agri_aar_2017_annexes Page 180 of 278
5.4 Application of the 50/50 Rule
The financial consequences of non-recovery for cases dating from 2013 (4 year deadline for recovery) or 2009 (8 year deadline in case of legal proceedings) will be determined
for 2017 in accordance with the 50/50 rule mentioned above by charging approximately EUR 14.1 million to the Member States concerned53. On the other hand, around EUR 21.4
million represents cases reported as fully irrecoverable during financial year 201754. The final figures will be established in May 2018 when the financial clearance decision for
financial year 2017 will be adopted. Due to the application of the 50/50 rule, important
non-recovered sums have already been charged to the Member States for EAGF, EAFRD and TRDI expenditure.
The overall outstanding amount still to be recovered from the beneficiaries at the end of 2017 was EUR 1 666.2 million for all the Funds. Of this amount, EUR 1 374.7 million is
outstanding to the EU budget (the difference, EUR 291.5 million, having already been charged to the Member States via the 50/50 mechanism in previous years or amounts
recovered and returned to the Funds).
The clearance mechanism (50/50 rule), referred to above, provides a strong incentive for
Member States to recover undue payments from the beneficiaries as quickly as possible.
Even after the application of the 50/50 rule, Member States are still obliged to pursue their recovery procedures in order to recover, in full, the unduly paid amount and to
return this to the EU budget. As a result, by the end of financial year 2017, 61% of the new EAGF debts, registered as from 2007, had already been recovered, which is a
significant improvement compared to the past. The detailed breakdown of this recovery rate has developed as follows:
Rate of recovery from beneficiaries of irregularities detected since
2007 – EAGF
until
end of
2007
until
end
of
2008
until
end
of
2009
until
end
of
2010
until
end
of
2011
until
end
of
2012
until
end
of
2013
until
end
of
2014
until
end of
201555
until
end of
201658
until
end
of
2017
year o
f d
isco
very o
f th
e irreg
ula
rit
y 2007 33% 47% 50% 53% 60% 68% 69% 69% 69% 69% 72%
2008 - 24% 40% 47% 49% 58% 59% 60% 68% 69% 98%
2009 - - 24% 33% 42% 44% 46% 48% 52% 63% 84%
2010 - - - 29% 39% 44% 45% 47% 48% 53% 66%
2011 - - - - 23% 37% 39% 43% 49% 50% 57%
2012 - - - - - 34% 60% 64% 67% 69% 70%
2013 - - - - - - 23% 30% 36% 39% 40%
2014 - - - - - - - 14% 31% 36% 36%
2015 - - - - - - - - 45% 61% 67%
2016 - - - - - - - - - 39% 38%
56
2017 - - - - - - - - - - 52%
2007-
2017 - - - - - - - - -
- 61%
Table: Annex 10 – 5.4-1
53 Please note that these amounts relate to EAGF, EAFRD and TRDI. 54 For EAFRD, based on the new legal regime, from financial year 2014 the Member States have to report as
well the irrecoverable cases established during the financial year in question. 55 Due to some inaccuracies in the reporting from some Member States in FY2015 and FY2016, the recovery
rates in italics related to FY2015 and FY2016 are reinstated in this year's report. 56 The decrease by 1% is mainly due to a significant increase in the amount of debts outstanding.

agri_aar_2017_annexes Page 181 of 278
The recovery rates quoted in this table are based on the data communicated by the Paying Agencies in their annual accounts and only present a snapshot of the situation as
at 15 October 2017 of the recovery rate of the Paying Agencies in relation to the unduly paid amounts for EAGF. This should not be confused with the financial exposure of the
Fund since parts of these amounts have already been returned to the fund through the 50/50 mechanism. The recovery rate in the table above only gives an indication of the
Paying Agencies' average recovery rate, over time, of the undue amounts from the beneficiaries. For most of the debt cases outstanding, national legal proceedings are on-
going, the length of which varies between Members States and explains, to a large
extent, the average speed of recovery. It is also noted that more recent years include new debts which have not yet been subject to the 50/50 mechanism.
Moreover, it should be noted that some of these debt amounts were already written off
as unrecoverable by Member States in the period 2007-2017 (EUR 176.9 million) and therefore, in the vast majority of cases, they will not be recovered from the beneficiaries.
For more details on the recovery rates at Member State level, see Table Annex 10–5.4-2
below.
Recoveries (EUR) from beneficiaries for cases detected since 2007 – EAGF
MS New cases since 2007 Adjustments 57 Recoveries Recovery rate
AT 54 364 780.09 -1 129 408.75 -52 997 713.14 99.6%
BE 81 690 507.72 - 29 554 941.96 - 29 818 429.33 57%
BG 2 563 109.91 428 031.87 - 333 333.67 11%
CY 3 053 990.59 - 82 253.22 - 2 260 049.49 76%
CZ 3 133 172.66 - 154 314.43 - 2 729 034.45 92%
DE 91 554 870.01 - 5 124 044.60 - 78 364 726.06 91%
DK 34 554 168.14 8 529 297.56 - 30 200 784.37 70%
EE 2 640 189.74 - 1 013 504.65 - 1 462 652.13 90%
ES 281 494 036.67 - 39 294 278.16 -167 733 781.13 69%
FI 11 352 337.74 220 785.70 - 11 042 478.94 95%
FR 422 538 945.17 -137 973 466.15 - 96 739 643.64 34%
GB 58 501 498.80 - 9 687 629.24 - 45 942 731.59 94%
GR 147 910 809.20 - 38 778 455.65 - 38 232 720.16 35%
HR 1 318 262.59 6 117.85 - 750 013.55 57%
HU 95 116 125.76 - 64 539 310.84 - 19 117 781.04 63%
IE 29 935 490.32 - 2 825 339.48 - 26 399 271.65 97%
IT 344 331 113.79 -170 446 832.47 -157 750 520.29 91%
LT 8 662 709.39 - 2 771 988.77 - 5 305 744.85 90%
LU 1 114 841.19 - 501 982.37 - 357 168.92 58%
LV 2 231 498.28 - 29 115.27 - 1 776 335.65 81%
MT 1 520 934.29 224 866.64 - 1 049 364.75 60%
NL 76 827 670.09 1 623 916.79 - 28 607 659.10 36%
57 Adjustments include: any correction (+ or -) arising from the revision of the initial debt amount (as a result
of recovery procedures in the Member States) reported in Annex 2 of the Annual Accounts.

agri_aar_2017_annexes Page 182 of 278
PL 112 199 516.93 - 71 434 725.87 - 27 677 936.25 68%
PT 80 840 730.52 - 19 321 701.20 - 39 049 234.29 63%
RO 100 110 995.77 - 2 364 284.81 - 30 435 432.94 31%
SE 29 822 906.64 - 5 273 193.97 - 20 543 343.78 84%
SI 17 959 410.18 - 2 354 013.29 - 6 467 842.70 41%
SK 4 124 516.29 - 694 884.50 - 1 592 434.37 46%
Totals 2 101 469 138.48 - 94,316,653.23 -924 738 162.23 61%
Table: Annex 10 – 5.4-2
The recovery rates quoted in this table are based on the data communicated by the Paying Agencies in their annual accounts. Similarly to the previous table, this table
presents a snapshot of the situation of recoveries as at 15 October 2017.
5.5 DG AGRI Enquiries
Based on the annual accounts of FY 2017, the global amount subject to debt management is approximately EUR 1.7 billion.
Based on the results of the audit work carried out by DG AGRI (desk audits and missions)
as well as on the audit work of external audit bodies (Certification Bodies, European Court of Auditors, OLAF), the consolidated assessment of DG AGRI, at the end of 2017,
as regards the effectiveness of irregularities and debt management and control systems (IDMCS) can be described as follows:
the IDMCS implemented in the following Paying Agencies is partially effective and some substantial improvements are necessary: BG01, DE17, ES05, ES16, FR19,
FR20,HU02, IT01, PL01, RO01 and RO02.
Concerning the Italian Paying Agency AGEA (IT01), a DG AGRI audit carried out in 2014
confirmed the serious concerns regarding the management of irregularities and other debts for financial year 2010 and earlier, and more generally all irregularities and debts
for which the payment of origin was made in financial year 2007 or before. A number of weaknesses concerning the accreditation criteria for debts were noted (improper internal
environment; insufficient control activities and monitoring mechanisms). Based on its findings, DG AGRI considered that the non-recovery of the debts in financial year 2010
and earlier was attributable to the negligence of the Italian authorities in the recovery procedure and therefore proposed financial corrections for the debt cases relating to
these financial years.
The Italian Competent Authority placed the Paying Agency under probation on 25 April 2014. Full accreditation was reinstated on 25 April 2015 after a remedial plan required by
the Competent Authority had been implemented. However, the reinstatement of accreditation was accompanied by a recommendation that the Paying Agency successfully
implemented a separate action plan, that was more detailed than the remedial plan of the Competent Authority and which covered various accreditation criteria (criteria:
'procedures for debts' included).
The deadline for full implementation of the action plan was 15 October 2015. After
several delays in its implementation, the deadline was subsequently extended to 15
October 2016. A mission carried out by DG AGRI in November 2016 found that the Action Plan had not yet been fully implemented by the extended deadline. DG AGRI has been
closely following the developments since then also with a view to assessing the financial risk for the EU funds and is considering proposing a financial correction (see also 2.1.4).

agri_aar_2017_annexes Page 183 of 278
Part 6: Cross compliance Cross-compliance is a mechanism by which farmers are penalised when they do not
respect a series of rules which stem in general from policies other than the CAP and which apply to EU citizens independently of the CAP.
The respect of cross-compliance obligations does not constitute an eligibility criterion for CAP payments and therefore the checks of these requirements do not pertain to the
legality and regularity of the underlying transactions. Thus penalties imposed for non-
compliance with cross-compliance requirements are not taken into account for the calculation of the error rates for the CAP.
The control statistics referred to below do not therefore correspond to errors in underlying transactions. See also part 2.1.2.2 European Court of Auditors reports, under
"2016 Annual Report".
The results of the checks on cross-compliance are shown in Table: Annex 10 – 6-1 for
claim year 2016 (financial year 2017). That table shows that 2.54% of all claimants were checked as regards their compliance with cross-compliance requirements in claim year
2016, and thereby the minimum control rate of 1% was globally respected. The claim
year 2016 rate of farmers checked on the spot and subsequently subject to a cross-compliance sanction was 24.4%.
According to the control statistics, total cross-compliance sanctions in respect of claim year 2016 amounted to EUR 49.4 million. Sanctions following regulatory on-the-spot
checks amounted to EUR 46.7 million in total.
A further analysis allows identifying the sanctions applied in case of negligence of the
farmer, i.e. excluding the sanctions for repetition and intentional non-compliance. Those sanctions amount to EUR 23.4 million (2.52% of the aid covered by on-the-spot checks).
An additional EUR 23.3 million of sanctions was applied following repetition and
intentional non-compliance.
It should be noted that at the time of the drafting of the report neither France nor
Sweden had submitted their claim year 2016 control statistics.

agri_aar_2017_annexes Page 184 of 278
Member State
Population Subject to on-the-spot
checks Results of on-the-spot
checks
Total number of
beneficiaries
Number of beneficiaries
As share of total number of
beneficiaries
Beneficiaries sanctioned for
non-compliances
As share of total number
of on-the-spot-checks
number number % number %
A B C=B/A D E=D/B
AT 97,510 2,284 2.34% 488 21.37%
BE 36,223 3,502 9.67% 676 19.30%
DE 296,910 9,044 3.05% 3,646 40.31%
DK 40,005 411 1.03% 131 31.87%
EL 445,516 4,542 1.02% 738 16.25%
ES 555,860 8,848 1.59% 2,129 24.06%
FI 51,794 1,717 3.32% 301 17.53%
FR
IE 127,862 1,372 1.07% 740 53.94%
IT 603,738 32,293 5.35% 1,929 5.97%
LU 1,812 243 13.41% 98 40.33%
NL 49,409 865 1.75% 198 22.89%
PT 119,257 2,373 1.99% 907 38.22%
SE
UK 151,122 5,265 3.48% 1,228 23.32%
EU-15 2016 2,577,018 72,759 2.82% 13,209 18.15%
EU-15 2015 2,353,271 76,182 3.24% 13,581 17.83%
CY 32,451 490 1.51% 115 23.47%
CZ 30,697 2,304 7.51% 80 3.47%
EE 18,192 582 3.20% 50 8.59%
HU 138,297 6,685 4.83% 1,026 15.35%
LV 46,840 1,119 2.39% 185 16.53%
LT 136,825 2,852 2.08% 1,274 44.67%
MT 479 149 31.11% 119 79.87%
PL 647,788 16,052 2.48% 2,327 14.50%
SK 19,209 779 4.06% 235 30.17%
SI 57,077 965 1.69% 355 36.79%
EU-10 2016 1,127,855 31,977 2.84% 6,767 21.16%
EU-10 2015 1,072,913 33,454 3.12% 8,879 26.54%
BG 68,768 982 1.43% 247 25.15%
RO 901,502 13,527 1.50% 5,814 42.98%
EU-2 2016 970,270 14,509 1.50% 6,061 41.77%
EU-2 2015 1,019,948 15,663 1.54% 6,046 38.60%
HR 101,534 2,130 2.10% 1,445 67.84%
EU-1 2016 101,534 2,130 2% 1,445 67.84%
EU-1 2015 99,295 1,682 1.69% 1,300 77.29%
EU-28 2016 4,776,677 121,375 2.54% 27,482 22.64%
EU-28 2015 4,545,427 126,981 2.79% 29,806 23.47%
Table: Annex 10 – 6-1

agri_aar_2017_annexes Page 185 of 278
ANNEX 11: Specific annexes related to "Assessment of the effectiveness of the internal control systems" (not
applicable)

agri_aar_2017_annexes Page 186 of 278
ANNEX 12: Performance tables58
General objective: A New Boost for Jobs, Growth and Investment
Impact indicator: Percentage of EU GDP invested in R&D (combined public and private
investment) Source of the data: Eurostat59
Baseline
(2012)
Latest known value
(2016)
Target
(2020) Europe 2020 target
2.01% 2.03% 3%
Impact indicator: Employment rate population aged 20-64 Source of the data: Eurostat
Baseline (2014)
Latest known value (2016)
Target (2020)
Europe 2020 target
69.2% 71.1% At least 75%
General objective: A Connected Digital Single Market
Impact indicator: Aggregate score in Digital Economy and Society Index (DESI) EU-28
Explanation: DESI is a composite index that summarises relevant indicators on Europe's
digital performance and tracks the evolution of EU Member States in digital competitiveness. The closer the value is to 1, the better. The DESI index is calculated as
the weighted average of the five main DESI dimensions: 1 Connectivity (25%), 2 Human Capital (25%), 3 Use of Internet (15%), 4 Integration of Digital Technology (20%) and 5
Digital Public Services (15%). The DESI index is updated once a year. Source of the data: DESI
Baseline (DESI 2015)
Latest known value (DESI-2017 )
Target (2020)
0.46 0.52 Increase
General objective: A Resilient Energy Union with a Forward-Looking Climate Change Policy
Impact indicator: Greenhouse gas emissions
(index 1990=100) Source of the data: European Environment Agency
Baseline (2013)
Latest known value (2016 prox estimates by EEA)
Target (2020)
Europe 2020 target
80.2% 77.4% At least 20% reduction (index
≤80)
58 The performance indicators reported in this annex reflect the set of indicators of DG AGRI's Strategic Plan
2016-2020, and are reported upon with a view to ensure coherence with other reporting documents such as the
Programme Statements which accompagny the Draft Budget for a given year
(http://ec.europa.eu/budget/biblio/documents/index_en.cfm) 59 Please note that Eurostat periodically revises its published data to reflect new or improved information, also
for previous years. The latest published data is available by clicking on "Bookmark". The "latest known value"
column reflects the data that was available at the time of the preparation of the AARs 2017 and it is the
reference point for the AARs of Commission services.

agri_aar_2017_annexes Page 187 of 278
General objective: A balanced and progressive trade policy to harness
globalisation60
Impact indicator: Percentage of EU trade in goods and services as well as investment
covered by applied EU preferential trade and investment agreements Source of the data: Eurostat for the raw indicators and DG Trade for the list of countries
covered by trade and investments agreements*
Baseline Goods average for 2014-
2016, Services and FDI
average for 2013-2015
Latest known value (2017)
Goods, Services and FDI
average for 2014-2016
Milestone** (2018)
Target** (2020)
Goods: Imports 27%
Exports 32% Total 29%
Services: Imports 10%
Exports 9% Total 9%
FDI stocks:
Imports 4% Exports 7%
Total 6%
Goods: Imports 27%
Exports 32% Total 30%
Services: Imports 10%
Exports 10% Total 10%
FDI stocks:
Imports 4% Exports 7%
Total 6%
Goods: Imports 32%
Exports 37% Total 34%
Services: Imports 15%
Exports 15% Total 15%
FDI stocks:
Imports 9% Exports 13%
Total 11%
Goods: Imports 51%
Exports 61% Total 56%
Services: Imports 54%
Exports 52% Total 53%
FDI stocks:
Imports 55% Exports 59%
Total 57% * See agreements under "In place" and "Agreements partly in place".
** The milestone and target figures are based on expectations of provisional application/entry into force of
agreements that are currently under negotiation (see also result indicator 1.1 : "Number of on-going EU trade and
investment negotiations and number of applied EU trade and investment agreements" of DG TRADE's Strategic
Plan 2016-2020).
60 The title of Priority 6 has been updated and made geographically neutral in view of the slowing down of trade
talks with the United States, the new geopolitical context, and the new dynamism in trade talks with other
important regions of the world. The Commission has reflected this reality by changing the previous General
Objective ("A Reasonable and Balanced Free Trade Agreement with the U.S") and introducing a new impact
indicator replacing the old one.

agri_aar_2017_annexes Page 188 of 278
Common CAP objective 1: Viable food production
Common CAP objective 1: Viable food production
CAP Impact indicator: Agricultural factor income61 Definition: Agricultural factor income (net value added at factor costs) per annual work
unit (AWU) (in real terms)62 Source of the data: Eurostat – Economic Accounts for Agriculture (calculations by DG
AGRI)
Baseline
(2012 - EU-28)
Target Latest known results
(2016 – EU-28)
14 938 €/AWU (in real prices)
To increase Article 39 (1)(b) TFEU
15 433 €/AWU
61 In 2015, Eurostat changed the base year for the economic accounts for agriculture from 2005 to 2010, which
has retroactive effects on values published previously. Eurostat has also updated values for previous years. 62 Agricultural factor income is defined as the net value added at factor costs, calculated according to the
following equation:
Value of agricultural production
- variable input costs (fertilisers, pesticides, feed, etc.)
- depreciation
- total taxes (on products and production)
+ total subsidies (on products and production)
= factor income (net value added at factor costs)
An annual work unit is the work performed by one person who is occupied on an agricultural holding on a full-
time basis.
11.085 11.484
12.694 12.383 11.210
13.952
15.129 14.938 15.517 15.734
15.240 15.433
16 713*
0
2.000
4.000
6.000
8.000
10.000
12.000
14.000
16.000
18.000
2005 2006 2007 2008 2009 2010 2011 2012 2013 2014 2015 2016 2017
EUR
/AW
U

agri_aar_2017_annexes Page 189 of 278
CAP Impact indicator: Total factor productivity in agriculture
Definition: Total factor productivity (TFP) compares total outputs relative to the total inputs used in production of the output (both output and inputs are expressed in term of
volumes) Source of the data: DG AGRI calculation based on Eurostat data
Baseline (2012-2014, average)
Target Latest known results (2016)
106.2
(index 2005 = 100)
To increase
Article 39 (1)(a) TFEU
108,0
Total Factor Productivity and partial productivity growth in the EU-28 (3-year
moving average)
Source: DG AGRI, https://ec.europa.eu/agriculture/cap-indicators/context_en
80
85
90
95
100
105
110
115
120
125
130
2002
2003
2004
2005
2006
2007
2008
2009
2010
2011
2012
2013
2014
2015
2016
TFP Labour Land Capital Int. cons.

agri_aar_2017_annexes Page 190 of 278
Specific objective: To improve the competitiveness of the
agricultural sector and enhance its value share in the food chain
Related to spending
programme: EAGF
Result indicator: Share of EU agricultural exports in total value of production Definition:
Agricultural primary products: value of annual exports in agricultural primary products (source Eurostat, Comext) as a percentage share of total value of production in agricultural
products Source of data: Eurostat, agricultural accounts
Processed food products: value of annual exports in processed food products as a percentage of total value of production by the food industry
Source of data: Eurostat63, Prodcom64
Baseline
(2011)
Target
(2020)
Latest known results
(2016)
Agricultural primary
products: 9.8% Processed food products:
8.9%
Agricultural Primary products:
14% Processed food products:
11.5%
Agricultural Primary products:
12.3% Processed food products:
10.5%
63 Eurostat has updated values for previous years. 64 Eurostat / Prodcom - Statistics by product (http://ec.europa.eu/eurostat/web/prodcom)

agri_aar_2017_annexes Page 191 of 278
Result indicator: Share of value added for primary products in the food chain
Definition: The indicator looks at the value added of the primary production in comparison to other stages of the food chain (mainly food processing, food distribution and food service
activities). Source of data: Eurostat – National Accounts, Structural Business Statistics
(2011)65 Target Latest known results (2015)
EU-28
Value
added (in
billion
EUR)
%
Primary
production 213 26
Processing 214 26
Retail and
wholesale 256 31
Food
services 142 17
Higher share of
value added for
primary products in the food chain
Regulation n°1308/2013
EU-28
Value
added (in
billion
EUR)
%
Primary
production 214 24
Processing 237 26
Retail and
wholesale 288 32
Food
services 167 18
Result indicator: Ratio between EU and World agricultural commodity prices See below under the specific objective "To better reflect consumer expectations"
Main outputs in 2017:
Policy–related outputs
Description Indicator Target date Latest known results (situation on 31/12/2017)
Alignment of rules for
market measures
(leading to reduction of Commission regulations
from more than 200 to no more than 40)
Adoption of
delegated and
implementing acts
June 2017 Delegated Regulation (EU)
2017/1183 and
Implementing Regulation (EU) 2017/1185 of 20 April
2017 on MS notifications
Delegated Regulation (EU) 2017/1965 and
Implementing Regulation (EU) 2017/1964 of 17
August 2017 amending
Implementing Regulation (EU) 2016/1239 as
regards notifications related to licences in the
rice sector
Commission
implementing decision on the definitive
allocation of Union aid to Member States under
the school fruit, vegetables and milk
scheme for the period 1 August 2017 to 31 July
2018
Adoption Planned
1st quarter 2017
COM(2017) 1792 final of
23.03.2017
65 Change of baseline year to 2011 to account for more detailed information available on distribution and
services.

agri_aar_2017_annexes Page 192 of 278
Member States
strategies, at national or regional level, to
implement the school scheme in the period
2017-2023
No of strategies
published in the Europa website
By
31/12/2017
As of 31/12/2017, 24 of
the 44 notified strategies (=implementation of the
scheme in 23 of the 28 MS) published in Europa,
further to the
Commission's assessment of the completeness and
clarity of information
2017/AGRI/004 Delegated act amending
Regulation (EU) No
543/2011 as regards marketing standards in
the fruit and vegetables sector (alignment to
UNECE standards)
Adoption 2018 ISC/2018/00198 deadline: 2/2/2018
Alignment of Regulation
(EU) No 543/2011 on fruit and vegetables
(excluding marketing standards)
Adoption 2017 Regulations adopted in
May 2017 Delegated Regulation (EU)
2017/891 (OJ L 138, 25.5.2017)
Implementing Regulation (EU) 2017/892 (OJ L 138,
25.5.2017)
2017/AGRI/045-046
Delegated and Implementing
Regulations as regards the scheme of
authorisations for vine plantings, vineyard
register, accompanying
documents, inward and outward register,
compulsory declarations and checks in the wine
sector.
Adoption 2017 Regulations adopted in
December 2017: - Delegated Regulation –
adoption ref. n° C(2017)8261 of
11.12.2017; - Implementing
Regulation – adoption
ref. n° C(2017) 8258 of 11.12.2017.
- Estimated publication in OJ by end of February
2018.
2015/AGRI/098
Proposal of Council Decisions on the
conclusion and on the EU implementing
procedures of the International Olive
Agreement 2015
COM adoption Planned 2nd
quarter 2017
Adoption by the
Commission on Council Decisions COM (2017)
263final and COM (2017) 264final on 1 June 2017
Proposal of Council
Decisions on granting negotiation authority to
the Commission to amend or renegotiate
the International Sugar Agreement (cooperation
with EEAS and DG
DEVCO, ENV, GROW as DGs also being in
charge for International Commodity Bodies)
Adoption Planned 3rd
quarter 2017
Adoption of negotiation
position by Council on 1 December 2017
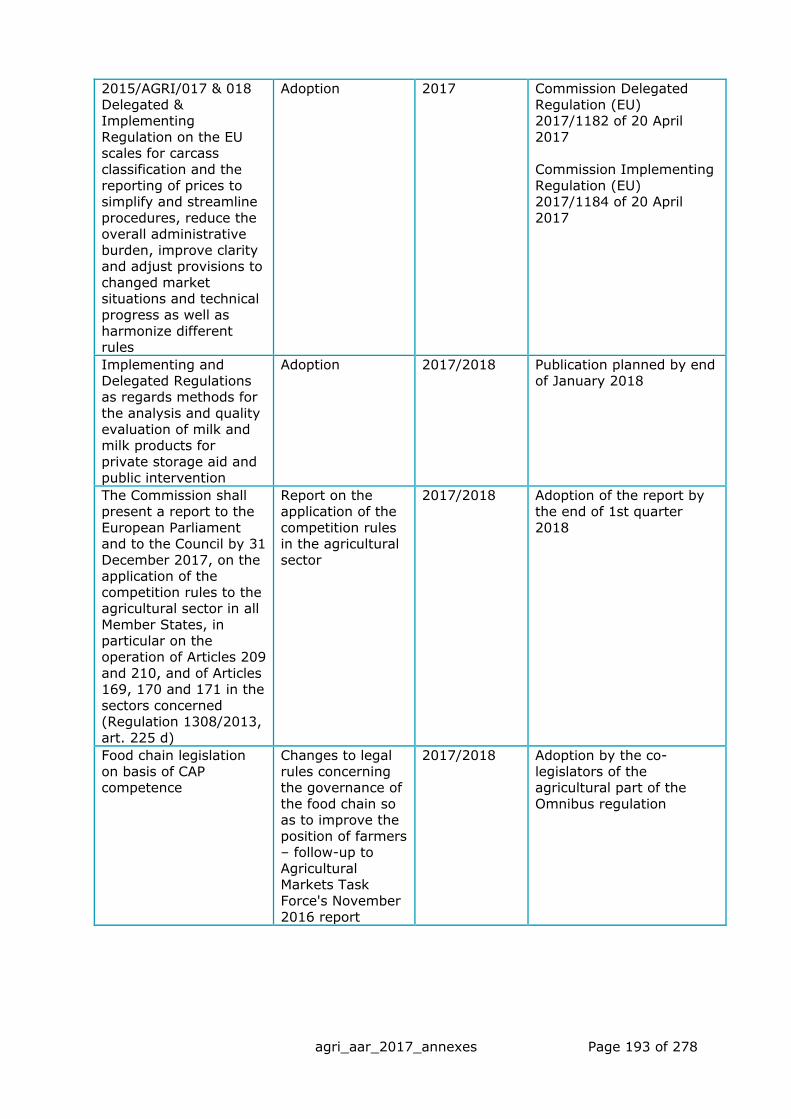
agri_aar_2017_annexes Page 193 of 278
2015/AGRI/017 & 018
Delegated & Implementing
Regulation on the EU scales for carcass
classification and the
reporting of prices to simplify and streamline
procedures, reduce the overall administrative
burden, improve clarity and adjust provisions to
changed market situations and technical
progress as well as
harmonize different rules
Adoption 2017 Commission Delegated
Regulation (EU) 2017/1182 of 20 April
2017
Commission Implementing
Regulation (EU) 2017/1184 of 20 April
2017
Implementing and
Delegated Regulations as regards methods for
the analysis and quality
evaluation of milk and milk products for
private storage aid and public intervention
Adoption 2017/2018 Publication planned by end
of January 2018
The Commission shall
present a report to the
European Parliament and to the Council by 31
December 2017, on the application of the
competition rules to the agricultural sector in all
Member States, in particular on the
operation of Articles 209
and 210, and of Articles 169, 170 and 171 in the
sectors concerned (Regulation 1308/2013,
art. 225 d)
Report on the
application of the
competition rules in the agricultural
sector
2017/2018 Adoption of the report by
the end of 1st quarter
2018
Food chain legislation
on basis of CAP competence
Changes to legal
rules concerning the governance of
the food chain so as to improve the
position of farmers – follow-up to
Agricultural Markets Task
Force's November
2016 report
2017/2018 Adoption by the co-
legislators of the agricultural part of the
Omnibus regulation

agri_aar_2017_annexes Page 194 of 278
Specific objective: To maintain market stability Related to spending
programme: EAGF
Result indicator: Public intervention Definition: Ratio of volume of the products bought in the intervention storage and the
total EU production of those respective products Source of data: DG AGRI
Baseline 2012
Target Latest known results
0% Used only in case of need
(seen against market
developments) Regulation n° 1308/2013
Estimation for 2017: 2.1%
(30 647 t / 1 485 000* t)
Result indicator: Private storage
Definition: Ratio of volume of the products placed into the publicly aided private storage and the total EU production of those respective products
Source of data: Market monitoring data DG AGRI
Baseline
2013
Target Latest known results
Butter: 4%
Olive oil: 0%
Used only in case of need
(seen against market developments)
Regulation n° 1308/2013
1.8% for Skimmed Milk
Powder (26 011 / 1 485 000* t)
0% for butter 0% for cheese
0% for pigmeat 0% for olive oil
*: 2017 production figures estimated
Main outputs in 2017:
Policy–related outputs
Description Indicator Target date Latest known results (situation on 31/12/2017)
Temporary exceptional support measures for
producers of certain fruit and vegetables
Adoption In place till June 2018
Commission Delegated Regulation (EU)
2017/1165 of 20 April 2017 laying down
temporary exceptional support measures for
producers of certain fruits
Exceptional support
measures for producers of certain fruit and
vegetables
Share of volume
withdrawn in support of market
(0.91%)
Maintain
market stability
Volume withdrawn
amounts 245 800 t for 2016/17 and 89 321 t for
2017/18 (up to 1 Feb), i.e. around 0.2% in average of
EU fruit and vegetable
production
Implementing regulations to address a
smooth functioning of the sugar market in the
final quota year
Relatively stable prices
a price range between 500
and 600 euro/tonne
No measure adopted. EU average sugar price was
relatively stable, close and around the level of 500
euro/tonne until
September 2017 (end of the production quotas). In
October and November it went down to 422 and
410 euro/tonne

agri_aar_2017_annexes Page 195 of 278
respectively. As a normal
consequence of the increase in production of
new harvest.
Implementing
Regulation on exceptional market
support measures for the poultry meat sector
in France following avian influenza
outbreaks
Adoption 2017 Commission Implementing
Regulation (EU) 2017/295 of 20 February 2017
Implementing
Regulation on exceptional market
support measures for the pig meat sector in
Poland following African
Swine Fever outbreaks
Adoption 2017 Commission Implementing
Regulation (EU) 2017/647 of 5 April 2017
Implementing Regulation
on an emergency
measure in the form of
aid due to new
requirements in relation
to African swine fever in
Poland
Adoption 2017 Commission Implementing Regulation (EU) No
2017/1536 of 11 September 2017
Implementing
Regulations fixing
minimum selling prices for skimmed milk
powder held in public stocks
Adoption Throughout
the year and
next years until stocks
are fully disposed of
Sixteen tenders were
completed until end
January 201866
Temporary exceptional
measures for livestock
farmers
Adoption if
necessary to
maintain market stability
Depend on
market
developments
None in 2017
To ensure sound and
efficient financial management of the
European Agricultural
Guarantee Fund (EAGF)
Correct and timely
monthly payments (12 payments + 1
complementary)
3rd working
day of every month
All payments made in time
Public Storage
expenditure management (12
monthly declarations + 1
annual declaration
from Member states holding
stocks)
Declarations
received by the 12th each
month. Continuous
follow up
required
Public Storage expenditure
declarations timely received and reimbursed.
66 An example is Commission Implementing Regulation (EU) 2017/2186 of 23 November 2017 on the minimum
selling price for skimmed milk powder for the fourteenth partial invitation to tender within the tendering
procedure opened by Implementing Regulation (EU) 2016/208

agri_aar_2017_annexes Page 196 of 278
Delegated regulation to
adjust marketing standards for free range
eggs where hens' access to open air runs
is restricted
Commission Delegated
Regulation (EU) 2017/2168 of
20 September 2017
Specific objective: To sustain farmers' income stability by providing direct income support
Related to spending
programme: EAGF
Result indicator: Share of direct support in agricultural entrepreneurial income (family
farm income) Definition: The indicator gives the share of direct support (coupled and de-coupled
payments) in entrepreneurial income. Source of data: EAGF Financial Report and –EUROSTAT Economic Accounts for
Agriculture
Baseline
2013
Target Latest known results
(2016)
41% To maintain the ratio Regulation n° 1307/2013
44%
Main outputs in 2017:
Policy–related outputs
Description Indicator Target date Latest known results
(situation on 31/12/2017)
Follow-up of the
changes in the Direct Payment regulation as
part of the Omnibus regulation
(assessment of
proposals by MS / EP, drafting of background
notes etc.) and preparation of MS for
implementation of the changes
MS prepared to
implement the changes contained in
the Omnibus by end 2017
2017 (Omnibus-CAP adopted)
New notification forms
ready and online for new decisions to be taken by
MS as from 2018 following
the Omnibus Regulation changes for direct
payments
Preparation of legal acts (financial ceilings
for 2017, approval decisions for reviewed
Voluntary Coupled support for BE, FI, PT),
and possible further simplifications
Necessary delegated Acts and
Implementing Acts prepared and
adopted
All along the year
All needed Delegated / implementing acts were
adopted: - Commission Delegated
Regulation (EU) 2017/1155 of 15.2.2017
amending Delegated Regulation (EU) No
639/2014 on several
provisions, for simplification purposes;
- 3 implementing acts were adopted approving
the decisions of Portugal, Finland and Belgium to
use than 13% of their DP envelope for coupled
support.

agri_aar_2017_annexes Page 197 of 278
- 3 other implementing
acts concerning hemp, transparency and the
granting of Complementary National
Direct Payments in
Croatia.
Draft delegated regulation to adjust provisions
following the Omnibus were already submitted to
and discussed with MS in Q4
Continuing follow-up of the implementation of
Direct Payments in the different MS (update of
notifications / exchanges with MS,
including by the
organisation of workshops on policy
issues / legal interpretations and
guidance)
− Organisation of Expert groups
and Committees − Replies to letters
to MS − Bilateral
meetings with
MS − Assessment of
notifications
All along the year
- 2 committees and 5 expert groups organised in
2017; - about 150 letters to MS;
- 11 bilateral meetings with MS
Reporting and
communication activities, as regards
the different schemes and their
implementation
− Finalisation and
dissemination of monitoring
reports for 2015
Early 2017 for
2015 reports
- 6 detailed reports on
2015 implementation circulated internally and a
synthetic report published on Europa.
− Preparation of
the monitoring
reports for 2016
Second
semester for
2016 reports
- notifications received
from MS on 2016
implementation + preparation of combined
reports using complementary data
Contribution to policy
analysis / provision of
an expertise on Direct Payments in various
exercises (e.g. work on the modernisation
of the CAP)
- Internal
analytical notes
- Participation in working groups
and various meetings
All along the
year
- Analytical package of
notes on Direct Payments
in May 2017 + complementary notes in
the Autumn; - contribution to the
Communication on the Future of Food and
Farming; - participation in Impact
Assessment group and
'New Delivery Model' group.
Preparation of legal
acts and guidelines to review, amend
and simplify the
IACS legislative framework
Providing interpretation to
Necessary delegated
/ implementing acts for IACS and
guidelines to be
prepared and adopted
All along the
year
Adopted acts:
- Commission Delegated Regulation (EU) 2017/723
of 25.04.2017 introducing
more proportionate reductions for non-
compliances with greening requirements

agri_aar_2017_annexes Page 198 of 278
Member States
with regard to the implementation of
direct payments, in particular from an
IACS perspective
Follow-up and support of the
implementation of Direct Payments in
particular as regards IACS,
including the dissemination of
good practices,
exchange of experience and
development with support of JRC and
GROW. Monitoring the
implementation of direct payments
and ensuring that
action is taken when implemen-
tation is lacking / failing.
Initiation and follow up as
appropriate of Member State
Action Plans
according to Art 41.2 of Reg
1306/2013. Analysing and
reporting in cooperation with
JRC on MS Quality Assessment of
their LPIS (LPIS).
- Commission
Implementing Regulation (EU) 2017/807 of
11.5.2017 allowing MS to postpone the deadline for
submitting the single
application - Commission
Implementing Decision C(2017) 5905 of
31/08/2017 authorising 10 MS (BE, CZ, ES, IT, LT,
LV, HU, PL, PT, FI) to increase advance
payments due to adverse
weather conditions - Commission
Implementing Decision C(2017) 6801 on
11/10/2017 authorising 5 MS (IE, EL, HR, RO, UK)
to increase advance payments due to adverse
weather conditions
Acts presented to MS: - Draft modification of
Regulation (EU) No 809.2014 to introduce
new technologies in IACS
Guidelines revised: - LPIS guidance including
the EFA-layer, following
the adoption of amendments to the EFA
provisions of Regulation (EU) 639/2014
- OTSC guidance in view of the greening review
- Aid-application guidance in view of the greening
review
Replies to
MS/stakeholders questions in a timely
manner
All along the
year
45 bilateral replies to MS
+ 22 replies to MEPs, citizens and other
organisations
Organisation of
workshops/expert groups facilitating
MS exchange of experience and of
good practices [number
undetermined yet]
All along the
year
1 workshop on introducing
new technologies in IACS (March 2017)
Organisation of
missions/visits to MS and bilateral
meetings with MS in
All along the
year
8 missions and 5 bilateral
meetings

agri_aar_2017_annexes Page 199 of 278
Brussels, mostly
upon MS request [number
undetermined yet]
Contribution to DG
AGRI Annual Activity Report and assessing
whether reservations, and
subsequently action plans are necessary
Preparation of
reduction/suspension decisions whenever
necessary.
By
15.04.2017 for the AAR
All along the
year
Contribution to AAR 2016
165 VCS measures assessed in view of
possible follow up actions in cases found to be non-
compliant.
Initiate action plans in good time and
maintain their
momentum according to agreed
timetables
All along the year
2 action plans on-going (RO and PT)
3 MS requested to set up action plans (SE, PL and
IT incl. Calabria) - For IT (Calabria) the
scope of the action plan has been widened
to a national plan. - PL and SE were
requested to set-up an
action plan to address the weaknesses in key
controls identified during conformity
clearance procedures'
1 action plan has been successfully implemented
and closed (CY)
Assessing the MS
LPIS QA reports/scoreboards
and reporting through the direct
payments committee
/ LPIS workshops. Giving feedback to
MS in writing as to potential
weaknesses identified in the
exercise. Follow up visits to MS
according to priority
criteria.
By 30 April
2017 for QA reports and
scoreboards.
44 ETS reports analysed .
Results presented in LPIS workshop at IACS
Workshop 05/2017 and 23rd Mars conference
11/2017,
11 e-mails and 5 follow-up letters to MS
3 follow-up visits

agri_aar_2017_annexes Page 200 of 278
To ensure sound and
efficient financial management of the
European Agricultural Guarantee Fund
(EAGF)67
Correct and timely
monthly payments (12 payments + 1
complementary)
3rd working
day of every month
All payments made in
time.
Specific objective: To promote a more market oriented agriculture by ensuring a significant level of decoupled
income support68
Related to spending
programme: EAGF
Result indicator: % of total direct payments which is decoupled Source of data: Budget
Baseline (Calendar year 2013 /
Budget year 2014)
Target Latest known results
93.54% To maintain
Regulation n° 1307/2013
Calendar year 2015/budget
year 2016: 88.9%69
Calendar year 2016/budget
year 2017: 88.9%70 Calendar year 2017/budget
year 2018: 88.6%71
As of calendar year 2015 the figures take into account that
in accordance with the
methodology for implementation of the small
farmers scheme, as chosen by the Member States, part of
the expenditure under that scheme is "decoupled".
67 This output is applicable to all DG AGRI objectives related to the EAGF spending programme. 68 The wording of this objective was adapted to take into account the provisions of the Regulation (EU) No
1307/2013 of the European Parliament and of the Council of 17 December 2013 establishing rules for direct
payments to farmers under support schemes within the framework of the common agricultural policy and
repealing Council Regulation (EC) No 637/2008 and Council Regulation (EC) No 73/2009, as regards their
application as of 2015. 69 Execution of the Budget 2016 70 Execution of the Budget 2017 – provisional figures 71 Based on the Budget 2018 estimated needs, excl. the crisis reserve.

agri_aar_2017_annexes Page 201 of 278
Specific objective: Enhancing farm viability and
competitiveness of all types of agriculture in all regions and promoting innovative farm technologies and
sustainable management of forest (Priority 2)
Related to spending
programme: EAFRD
Result indicator: % of agricultural holdings with RDP support for investment in
restructuring or modernisation (Focus area 2A: improving the economic performance of all farms and facilitating farm restructuring and modernisation notably with a view to
increase market participation and orientation, as well as agricultural diversification) Source: Rural development programmes
Baseline72
Target (2023)
Latest known results73
0 2.7%74 0.6 % (which represents
21.9% of achievement of the target set in the RDPs)
Result indicator: % of agricultural holdings with RDP supported business development plan/investments for young farmers (Focus area 2B: facilitating entry of
adequately skilled farmers into the agricultural sector and in particular generational renewal)
Source: Rural development programmes
Baseline Target
(2023)
Latest known results75
0 1.5% 0.1% (corresponding to 6.5% of achievement of the target
set in the RDPs)
Main outputs in 2017:
Policy–related outputs
Description Indicator Target date Latest known results
(situation on 31/12/2017)
Events of the
European Network for Rural Development
(Number of events)
Number of events 1 EU rural
networks' Assembly
meeting
1 EU rural networks'
Assembly meeting
2 EU rural
networks' Steering Group
meetings
2 EU rural networks'
Steering Group meetings 1 LEADER/CLLD subgroup
meeting
2 Thematic work
themes completed
2 Thematic work themes
completed
10 Workshops 11 Workshops
1 Seminar 2 Seminars
72 Baseline is 0 at the start of the programming period and all the targets are cumulated over the period. 73 The data on the achievement of the targets come from the Annual Implementation report MS have to submit
by end of June of each year. Last known results were submitted on 30/06/17 referring to the calendar year
2016. 74 Certain targets have been updated from last AAR because of modifications in Rural Development programmes
which were made in accordance with the legislation for rural development. In addition, for all targets expressed
in relative terms, DG AGRI has changed the method of aggregation at EU level, in view of providing a more
comprehensive overview on expected/achieved results. 75 The data on the achievement of the targets come from the Annual Implementation report MS have to submit
by end of June of each year. Last known results were submitted on 30/06/17 referring to the calendar year
2016.

agri_aar_2017_annexes Page 202 of 278
Events of fi-compass
(number of events and participants)
Number of events
Number of
participants
1 macro-regional
workshop (100 participants)
1 macro-regional
workshop (100 participants)
1 annual EAFRD conference on FIs
(220 participants)
1 annual EAFRD conference on FIs (220
participants)
2 workshops on Targeted
Coaching (85
participants)
2 workshops on Targeted Coaching (85 participants)
Publications and communication of the
European Network for Rural Development
(Number), in
cooperation with other relevant DGs
Number 2 EU Rural Reviews
2 EU Rural Reviews
2 Rural
Connections magazines
2 Rural Connections
magazines
2 Project Brochures
2 Project Brochures
12 ENRD
newsletters
12 ENRD newsletters
ENRD website
(page views per month) 100 000
ENRD website (page
views) 116 000
Social media presence:
Twitter followers:
3000 Facebook page
likes: 5000
Social media presence: Twitter followers: 2700
Facebook page likes: 4500
LinkedIn Group
members: 650
LinkedIn Group members:
600
Activities under fi-compass, including
communication actions
Number of activities
4 analytical studies (2 newly
launched)
1 study closed, 3 studies ongoing
1 case-studies of
FIs
2 case-studies of FIs
2 brochures 2 brochures
16 launched
coaching cases
12 closed coaching cases
and 4 ongoing; around 150 people coached
3 Videos
4 newsletters
3 Videos
3 newsletters
Joint ESIF activities Number 1 annual report
to Council and EP on FIs
1 annual report
Operational FIs Number of
running FIs
4 4

agri_aar_2017_annexes Page 203 of 278
FIs in preparation Number of
Financial Instruments in
preparation
23 (approximate
estimate)
28
- of which with signed
funding agreements
Number of signed
funding agreements
13 13
EAFRD – EFSI Pilot
cases on financial
instruments
Number of EAFRD
– EFSI pilot cases
on financial instruments
5 3
Assessment of Annual
Implementation Reports in close
cooperation with ESIF
and other relevant DGs
118 reports 2017 118 assessed
Assessment, in
cooperation with other relevant DGs, of
proposals for
programmes amendments
120 modifications
(estimate)
2017 172
DG AGRI – EIB / EIF
coordination meetings
Number of
meetings
6 6
Meetings with Member
States (Monitoring Committees, Annual
Review Meetings, etc.)
280 meetings
(estimate)
2017 Around 300 (estimation)
To ensure sound and
efficient financial management of the
European Agricultural Fund for Rural
Development (EAFRD)76
Correct and
timely quarterly payments
45 days after the
reception of the declaration of
expenditure
All payments made within
the legal deadline77 Average payment time in
2017 – 34 days
76 This output is applicable to all DG AGRI objectives related to the EAFRD spending programme. 77 Due to limited payment appropriations available under 2017 budget, the Commission has proceeded with
partial and proportional reimbursements for Q32017 declarations within the legal deadline. The remaining
balances were paid from appropriations becoming available from the end-of-year adjustments to the 2017
budget.

agri_aar_2017_annexes Page 204 of 278
Specific objective: Promoting food chain organisation,
including processing and marketing of agricultural products, animal welfare and risk management in
agriculture (Priority 3)
Related to spending
programme: EAFRD
Result indicator: % of agricultural holdings receiving support for participating in
quality schemes, local markets and short supply circuits, and producer groups/organisations (Focus area 3A: improving competitiveness of primary producers
by better integrating them into the food chain through quality schemes, promotion in local markets and short supply circuits, producer groups and inter-branch organisations)
Source: Rural development programmes
Baseline78
Target
(2023)
Latest known results79
0 2.5%80 0.2% (which represents 6.4% of achievement of the target
set in the RDPs)
Result indicator: % of agricultural holdings participating in risk management
schemes (Focus area 3B: supporting farm risk management) Source: Rural development programmes
Baseline Target (2023)
Latest known results81
0 5.3%82 0.5% (which represents 9.2%
of achievement of the target set in the RDPs)
Main outputs in 2017:
Policy–related outputs
Description Indicator Target date Latest known results (situation on 31/12/2017)
Registration of names as PDO/PGI/TSG/GI
following scrutiny of applications from EU
Member States and from third countries.
Number of applications
examined (dependent on
submissions made to the
Commission)
Within 6 months for agricultural
products and foodstuffs; within
12 months for wine, spirit
drinks,
aromatised wine
Commission services scrutinised dossiers for 77
agricultural products and foodstuffs, 33 wines and
68 spirit drinks.
Management of the Community registers
and lists of PDO/PGI/TSG/GI.
Registers kept updated
Ongoing Registers updated on regular basis.
78 Baseline is 0 at the start of the programming period and all the targets are cumulated over the period. 79 The data on the achievement of the targets come from the Annual Implementation report MS have to submit
by end of June of each year. Last known results were submitted on 30/06/17 referring to the calendar year
2016. 80 Certain targets have been updated from last AAR because of modifications in Rural Development programmes
which were made in accordance with the legislation for rural development. In addition, for all targets expressed
in relative terms, DG AGRI has changed the method of aggregation at EU level, in view of providing a more
comprehensive overview on expected/achieved results. 81 The data on the achievement of the targets come from the Annual Implementation report MS have to submit
by end of June of each year. Last known results were submitted on 30/06/17 referring to the calendar year
2016. 82 Certain targets have been updated from last AAR because of modifications in Rural Development programmes
which were made in accordance with the legislation for rural development. In addition, for all targets expressed
in relative terms, DG AGRI has changed the method of aggregation at EU level, in view of providing a more
comprehensive overview on expected/achieved results.

agri_aar_2017_annexes Page 205 of 278
2016/AGRI/001 and
2016/AGRI/002 Delegated and
implementing acts for wine labelling and
presentation, traditional
terms and geographical indications
Meetings of
Expert group and Committee
By end 2017 Postponed to Q3/2018
2011/AGRI/039
Alignment proposal for spirit drinks
Following the
adoption of the Commission
proposal,
discussions in the Council and
the EP
By end 2018 Geographical indications
discussed in six meetings of the Council Working
Party and three meetings
of the Special Committee on Agriculture. A vote in
the EP committees AGRI and INTA took place while
a vote in ENVI committee is planned for January
2018.
In co-operation notably
with SANTE, monitor supervision of the
control systems put in place by the Member
States for registered PDO/PGI/TSG/GI and
exchange best practice
Participation in
Commission audits
performed by SANTE
Ongoing Participations in all audits
ensured (three Member States).
Completion of seminars in co-
operation with EUIPO
By end 2017 Joint AGRI-EUIPO Control seminar organised on
26-27 October 2017.
Contribution to
trainings in the
framework of BTSF (lead
service SANTE)
Ongoing Written material for the
BTSF training validated.
Contribute to negotiations on
international
agreements as regards geographical indications
Third countries' specifications of
geographical
indications examined
Ongoing All examinations done (249 in total).
Specifications
of EU geographical
indications
provided
Specifications provided (for
Mercosur, Mexico, Cariforum and Indonesia
negotiations).
See also the outputs of the previous Specific objective.

agri_aar_2017_annexes Page 206 of 278
Common CAP objective 2: To promote a sustainable management of natural resources and climate action
Common CAP objective 2: To promote a sustainable management of natural resources and climate action
CAP Impact indicator: Net greenhouse gas emissions from agriculture Definition: The indicator measures net GHG emissions from agriculture including
agricultural soils. Source of the data: Annual European Union GHG inventory (sectors 3.a, 3.b, 3.c, 3.d, 4.c
and 4.d). The inventory is based on national submissions to the UNFCCC and to the EU Monitoring Mechanism of CO2 and other GHG emissions. It is compiled and held by the
European Environment Agency (EEA) and the European Topic Centre on Air and Climate
Change (ETC/ACC)
Baseline (2012)
Target Latest known results (2015)83
492 95284
(in 1000 t of CO2
equivalent)
To decrease EU2020
493 032 (in 1000 t of CO2 equivalent)
83 The European Union (EU) as a party to the United Nations Framework Convention on Climate Change
(UNFCCC) reports annually its greenhouse gas inventory for the year t-2 and within the area covered by its
Member States. The EEA publishes the validated GHG inventory data in June. Eurostat re-publishes the data
shortly after. 84 Figures are different from previous years due to a different aggregation method.
400.000
450.000
500.000
550.000
600.000
650.000
700.000
19
90
19
91
19
92
19
93
19
94
19
95
19
96
19
97
19
98
19
99
20
00
20
01
20
02
20
03
20
04
20
05
20
06
20
07
20
08
20
09
20
10
20
11
20
12
20
13
20
14
20
15
kt C
O2 e
qu
ival
en
t
GHG emissions from agriculture (incl. soils), EU-28
Average annual rate of decline (1990-2015): -
1.03%

agri_aar_2017_annexes Page 207 of 278
CAP Impact indicator: Nitrate levels in freshwater
Definition: Nitrates in freshwater (Context indicator.40 – Water quality) consists of: 2.a) Groundwater quality: % of monitoring sites in 3 water quality classes (high, moderate
and poor); 2.b) Surface water quality: % of monitoring sites in 3 water quality classes (high, moderate
and poor).
The three water quality classes are defined as follows: - High quality: concentration close to natural values or within the threshold
indicated in the legislation for low-polluted water. - Moderate quality: concentration above natural standard but still below
hazardous level. - Poor quality: concentration above hazardous level.
The actual concentration classes are the following: Groundwater
- High ("<10 mg/l NO3 " + ">=10 mg/l NO3 and <25 mg/l NO3 ")[1]
- Moderate (">=25 mg/l NO3 and <50 mg/l NO3 ") - Poor (">=50 mg/l NO3 ").
Surface water - High ("<0.8 mg/l N " + ">=0.8 mg/l N and <2.0 mg/l N ")[2]
- Moderate (">=2.0 mg/l N and <3.6 mg/l N " + ">=3.6 mg/l N and >5.6 mg/l N ")
- Poor (">=5.6 mg/l N and <11.3 mg/l N " + ">=11.3 mg/l N ") Source of the data: European Environment Agency (EEA) – Nutrients in freshwater: Data
voluntary reported by MSs via the WISE/SOE data flow annually.
Baseline
EU-28, 2012
Target Latest known results
Freshwater:
- High: 56.9 % - Moderate: 31.7%
- Poor: 11.4% Groundwater:
- High: 74.1% - Moderate: 14.2%
- Poor: 11.7%
To decrease
Regulations n° 1305, 1306 and 1307/2013
No more recent data
available85
85 The next report to the European Environment Agency is due 31.12.2018.
80
85
90
95
100
105
110
115
1993 1994 1995 1996 1997 1998 1999 2000 2001 2002 2003 2004 2005 2006 2007 2008 2009 2010 2011
Rivers - EU (17 countries) Groundwaters - EU (13 countries)

agri_aar_2017_annexes Page 208 of 278
Impact indicator: Farmland bird index
Definition: The indicator is a composite index that measures the rate of change in the relative abundance of common bird species at selected sites: trends of index of population
of farmland birds (base year 2000 = 100). Source: EBCC/RSPB/BirdLife/Statistics Netherlands: the European Bird Census Council
(EBCC) and its Pan-European Common Bird Monitoring Scheme (PECBMS); data are
published on Eurostat database
Baseline (year & value) Target Latest known results86
2012: 45.75 (index
1980=100)87
To increase 2015: 44.3
86 New data will become available in Q3/2018. 87 The baseline has been updated in order to show a longer time series for this indicator (index 100 in 1980
instead of 2000 in the previous AAR). New data will become available in Q3/2018.

agri_aar_2017_annexes Page 209 of 278
Specific objective: To better reflect consumer
expectations
Related to spending
programme: EAGF-
EAFRD
Result indicator: Ratio between EU and World agricultural commodity prices Definition: Weighted average, covering beef, pig meat, poultry, soft wheat, maize, barley,
sugar, butter, cheddar, WMP and SMP. World price references are mainly based on US prices for meat and crops and Oceania for dairy products, except for beef (Brazil), Barley
(Black Sea) and Sugar (London white sugar 05)88. Source of data: DG Agriculture and Rural Development, based on European Commission,
USDA, World Bank, IGC, London International Financial Futures and Options Exchange,
National sources.
Baseline Target (annual)
In 2013, the EU prices were on average 20% above world prices (ratio 1.20) 89
Prices brought closer to the world prices (ratio 1.00)
Regulation n° 1308/2013
Latest known results:
2008 2009 2010 2011 2012 2013 2014 2015 2016 2017
Beef (Australia) 1.50 1.69 1.26 1.21 1.19 1.24 0.98 0.95 1.03 1.01
Beef (Brazil) 1.59 1.79 1.36 1.33 1.61 1.72 1.46 1.50 1.49 1.56
Pigmeat (US) 1.59 1.59 1.16 1.12 1.19 1.21 0.94 1.02 1.15 1.18
Pigmeat (Brazil) 1.22 1.45 1.00 1.13 1.37 1.25 1.02 1.10 1.25 1.24
Poultry 1.64 1.56 1.29 1.63 1.38 1.23 1.14 1.08 1.11 1.04
Soft wheat 1.11 1.00 0.99 1.07 1.04 1.04 1.02 0.94 0.99 1.04
Maize 1.16 1.10 1.19 1.04 0.98 1.04 1.13 1.03 1.11 1.16
Barley 1.01 1.04 0.97 0.99 1.00 0.98 0.98 0.99 0.95 0.96
Sugar 2.48 1.58 1.04 1.10 1.55 1.90 1.62 1.24 0.99 1.26
Butter 1.08 1.47 1.09 1.17 1.19 1.27 1.23 1.06 1.09 1.07
Cheddar 1.08 1.17 0.95 1.03 1.14 1.10 1.12 1.03 1.02 1.00
WMP 1.04 1.18 1.02 1.07 1.09 0.98 1.11 1.10 1.06 1.07
SMP 0.98 1.10 0.93 0.90 0.95 0.90 0.97 0.96 0.99 0.98
Weighted average 1.31 1.37 1.11 1.15 1.20 1.20 1.12 1.08 1.11 1.13
Note: World price references are mainly based on US prices for meat and crops and Oceania for dairy
products, except for beef (Australia, Brazil), Pigmeat (US and Brazil), Barley (Black Sea) and Sugar (London white sugar 05).
88 Compared to Pacific prices (US and Australia), EU prices were very competitive in 2015 because of the
exchange rate effect but also because US demand drove significant price increases. If the comparison would be
made with Brazil for meat especially, the increase in EU competitiveness would be less pronounced. 89 The data presented in this graph has changed from the data in 2016 AAR because of adjustments in the US
poultry price (previously: broiler/frier, whole birds, 2-1/2 to 3 pounds USDA grade "A" ice packed Georgia Dock
preliminary weighted average, wholesale; now: USDA quotations of fresh chicken grade A, Chicago), so that it
is more comparable with the EU price.

agri_aar_2017_annexes Page 210 of 278
The price relationship EU/world deteriorated in 2017, driven by rising EU sugar prices (following with
delay the high world prices in 2016) while increased world production pressed world prices downwards. Source: DG Agriculture and Rural Development, based on European Commission, USDA, World Bank, IGC, London International Financial Futures and Options Exchange, National sources.
Main outputs in 2017:
Policy–related outputs
Description Indicator Target date Latest known results
(situation on 31/12/2017)
Management of running promotion programmes
Number of running, partially
running or
accepted programmes
Running or partially
running: 198
(estimate - 138 under the
old scheme, 60 for the new
scheme)
Total of 266 programmes of which:
- 111 under new regulation
- 155 under previous regulation (132 running,
23 partially running)
Communication on the
promotion scheme
Participation in 6-
8 Info Days Lively Europa
website (updated Q/A section…)
Provide legal interpretation on
the new regime
First Info Day
on 31/01/2017.
-31/01/2017: Info Day in
Brussels
12 National Info Days in
2017
- 12 National Info Days (FR, HU, EE, FI, RO, IT,
BG, SK, DK, PL, ES, DE)
4 specific Info
Days for civil society (on
request) in March-April
2017
- 6 specific Info Days for
civil society on request (Copa, Europatat, AHDB,
CSO Italy, CEFS, Meat Market Observatory)
0,80
0,90
1,00
1,10
1,20
1,30
1,40
2008 2009 2010 2011 2012 2013 2014 2015 2016 2017
Ratio between EU and World agricultural commodity prices

agri_aar_2017_annexes Page 211 of 278
Call for proposals Publication of 2
annual calls for proposals (1 for
Simple + 1 for Multi promotion
programmes)
January 2017 12/01/2017
OJ C009 Call for proposals for
SIMPLE and for MULTI Programmes 2017
Annual Work
Programme for 2018
Adoption of an
implementing decision
4th quarter
2017
15/11/2017, C(2017) 7475
final
To ensure an appropriate follow-up of
simple programmes under shared
management with the Member States.
Committee for the Common
Organisation of the Agricultural
Markets established by
Article 229 of Regulation (EU)
No 1308/2013
15.06.2017 31.10.2017
- 15/06/2017 - 03/10/2017
(in margin of Quality
Committee)
- 31/10/2017
Commission
Adoption of simple programmes
November
2017
19.10.2017, C(2017) 6934
final
Organisation of high level promotional events
in third countries in 2017.
Logistics organised by CHAFEA; political
coordination by B1.
High level missions with
business delegation.
2 high level missions:
- May 2017: Canada
- 2nd semester 2017 Saudi
Arabia, Iran
1 – 3 May 2017 – High Level Mission to Canada
7 – 13 November 2017 – Saudi Arabia, Iran
Number of
participating stakeholders
- Up to 60
participants in the HLM to
Canada -around 50
participants in the HLM to
Saudi Arabia
and Iran
HLM Canada : 60
participants Saudi Arabia : 44
participants Iran : 42 participants
Statistics Development of a Common tool to
be able to follow simple/multi
programmes
managed under the promotion
regime
Operational by the end of
2017
No agreement found with Chafea for the
development of a common data base. Discussion
ongoing.
Delivery of statistics
On request Statistics still extracted from DG AGRI DG (MPP)
Coordination with Agency
Preparation and decisions of the
CHAFEA Steering Committee
Continuous task over the
course of 2017
4 Steering Committee meetings
(08/03, 29/06, 20/10, 13/12/2017)

agri_aar_2017_annexes Page 212 of 278
Specific objective: Contribute to the enhancement of the
environmental performance of the CAP through the greening component of the direct payments. Contribute
to the development of sustainable agriculture and to making the CAP more compatible with the expectations
of the society through the cross compliance system.
Contribute to preventing soil erosion, maintaining soil organic matter and soil structure, ensuring a minimum
level of maintenance and avoiding the deterioration of habitats, protecting and managing water through the
standards of good agricultural and environmental condition of land
Related to spending
programme: EAGF
Result indicator: Share of area under greening practices90 Source of data: MS annual notifications (ISAMM - Information System for Agricultural
Market Management and Monitoring)91
Baseline (Calendar year 2015)
Target
Latest known results
75%92 To maintain Regulation n° 1307/2013
79% (Calendar year 2017)
Result indicator: % of CAP payments covered by cross compliance Source of data: DG AGRI
Baseline (2013) Target Latest known results
82.36% Maintain the ratio
Regulation n° 1306/2013
84.8% (
Result indicator: Opinion expressed by the public on cross compliance
Definition: Aggregate figures on the opinion by the public on cross compliance Source of data: Eurobarometer
Baseline (2015) Target Latest known results93
87% support the reduction of direct payments to
farmers not complying with environmental rules
87% support the reduction
for non-compliance of animal welfare rules
87% support the reduction for non-compliance of food
safety rules
Maintain the positive opinion With the cross compliance the
CAP is more sustainable and more compatible with the
society's expectations.
Therefore if cross compliance shows an important support
by the public opinion, its impact will be significant.
87% support the reduction of direct payments to farmers
not complying with environmental rules
87% support the reduction
for non-compliance of animal welfare rules
87% support the reduction for non-compliance of food
safety rules
90 Indicator contributing to the KPI Minimum share of agricultural land with specific environmental
practices/commitment. 91 The Strategic Plan 2016-2020 provides an incorrect source. 92 Year 2015: including notifications from all MS. Year 2017: Including notifications from 24 MS, so the
indicated share is provisional. The share is calculated as total agricultural area for farms with at least one
greening obligation on total agricultural area from Eurostat statistics revised by DG Agri. 93 Results of the latest Special Eurobarometer "Europeans, Agriculture and the Common Agricultural Policy"
published in 2015

agri_aar_2017_annexes Page 213 of 278
Result indicator: Control rate for GAEC (Standards of Good Agricultural and
Environmental Condition) Definition: GAECs form part of the requirements under Cross Compliance and apply to
anyone who receives payments under Single Payment Scheme and certain rural development schemes
Source of data: Control statistics notified annually by MS94
Baseline (2013) Target Latest known results
(2016)
100% implementation of
the minimum regulatory control rate in all Member
States
100% implementation of the
minimum regulatory control rate
Regulation n° 1306/2013
100% implementation of the
minimum regulatory control rate in all Member States
(except Bulgaria, France and Sweden still pending to notify
their data)
Result indicator: The ratio of permanent pasture within a Member State in
relation to the total agricultural area Definition: The maintenance of the ratio of permanent pasture means that there should
not be, at national or regional level, a decrease by more than 5 % of the current ratio of permanent pasture in relation to the total agricultural area by comparison with a reference
ratio reflecting this ratio at a reference period. Source of data: MS annual notification (ISAMM – Information System for Agricultural
Market Management and Monitoring)
Baseline (2015) Target Latest known results
Ratio has not decreased
beyond the limit of 5% in any Member State
Maintain the ratio within the
limit of 5 % in relation to a reference ratio
Regulation n° 1307/2013
In 2015: 2 MS, a French
region and a UK region communicated a decline in
the ratio of permanent
grassland above the threshold of 5%. Of these
MS, 1 communicated to have triggered a reconversion
obligation. In 2016: 3 MS and a French
region communicated a decline in the ratio of
permanent grassland above
the threshold of 5%. 3 of these MS communicated to
have also triggered a reconversion obligation.
In 2017: 2 MS and a French region communicated a
decline in the ratio of permanent grassland above
the threshold of 5%. None of
these MS communicated to have triggered a reconversion
obligation95
94 The Strategic Plan 2016-2020 provides an incorrect source. 95 Provisional information based on 2015 communications from all MS as the notifications are still under
assessment. 2016 notifications sent by 27 MS and 2017 notifications sent by 22 MS at the time of preparation
of the Annual Report.

agri_aar_2017_annexes Page 214 of 278
Main outputs in 2017:
Policy–related outputs
Description Indicator Target date Latest known results
(situation on 31/12/2017)
2016/AGRI/016
Commission Delegated Regulation amending
delegated regulation 639/2014 on rules for
direct payments to farmers including greening (follow-
up greening review)
Adoption 3rd quarter
2017
Approved
2016/AGRI/066
Commission report to the European Parliament and
the Council on the implementation of the
Ecological Focus Area (EFA) obligation required
further to Article 46(1) of
Regulation (EU) No 1307/2013 by 31 March
2017
Commission
report + accompanying
analytical document
1st quarter
2017
Finalised as Staff Working
Document on 29/03/2017 COM(2017) 152 final
Follow-up of the implementation of
Greening and Cross-
compliance: update of notifications , exchanges
with MS including expert groups, legal
interpretations and guidance
Organisation of experts groups
and
Committees
All along the year
Organised as planned
Assessment notes on the
MS notifications
All along the year
Delivered in due time
Evaluation of greening Finalisation of staff working
document
End 2017 / beginning
2018
Staff working document scheduled for review by the
Regulatory Scrutiny Board in March 2018

agri_aar_2017_annexes Page 215 of 278
Specific objective: Restoring, preserving and enhancing
ecosystems related to agriculture and forestry (Priority 4)
Related to spending
programme: EAFRD
Result indicator96: a) % of agricultural land under management contracts supporting biodiversity
and/or landscapes b) % of forest area/other wooded land under management contracts supporting
biodiversity (Focus area 4A: Restoring and preserving and enhancing biodiversity, including in Natura
2000 area, areas facing natural constraints and high nature value farming and the state of European landscapes)
Source of data: Rural development programmes
Baseline97
Target
(2023)
Latest known results98
0 a) 17.7%99
b) 2.2%
a) 13.0% (which represents
73.1% of achievement of the target set in the RDPs)
b) 0.2% (which represents 8% of achievement of the
target set in the RDPs)
Result indicator100:
a) % of agricultural land under management contracts to improve water management
b) % of forestry land under management contracts to improve water management
(Focus area 4B: improving water management including fertiliser and pesticide management)
Source of data: Rural development programmes
Baseline Target
(2023)
Latest known results101
0 a) 15.1%102 b) 0.8%
a) 8.8% (which represents 58% of achievement of the
target set in the RDPs)
b) 0.1% (which represents 13% of achievement of the
target set in the RDPs)
96 Indicator contributing to the KPI Minimum share of agricultural land with specific environmental
practices/commitment. 97 Baseline is 0 at the start of the programming period and all the targets are cumulated over the period. 98 The data on the achievement of the targets come from the Annual Implementation report MS have to submit
by end of June of each year. Last known results were submitted on 30/06/17 referring to the calendar year
2016. 99 Certain targets have been updated from last AAR because of modifications in Rural Development programmes
which were made in accordance with the legislation for rural development. In addition, for all targets expressed
in relative terms, DG AGRI has changed the method of aggregation at EU level, in view of providing a more
comprehensive overview on expected/achieved results. 100 Indicator contributing to the KPI Minimum share of agricultural land with specific environmental
practices/commitment. 101 The data on the achievement of the targets come from the Annual Implementation report MS have to submit
by end of June of each year. Last known results were submitted on 30/06/17 referring to the calendar year
2016. 102 Certain targets have been updated from last AAR because of modifications in Rural Development
programmes which were made in accordance with the legislation for rural development. In addition, for all
targets expressed in relative terms, DG AGRI has changed the method of aggregation at EU level, in view of
providing a more comprehensive overview on expected/achieved results.

agri_aar_2017_annexes Page 216 of 278
Result indicator103:
a) % of agricultural land under management contracts to prevent soil erosion and to improve soil management
b) % of forestry land under management contracts to prevent soil erosion and to improve soil management
(Focus area 4C: preventing soil erosion and improving soil management)
Source of data: Rural development programmes
Baseline Target (2023)
Latest known results104
0 a) 14.5%105 b) 1.3%
a) 9.0% (which represents 62.2% of achievement of the
target set in the RDPs) b) 0.1% (which represents
5.2% of achievement of the target set in the RDPs)
103 Indicator contributing to the KPI Minimum share of agricultural land with specific environmental
practices/commitment. 104 The data on the achievement of the targets come from the Annual Implementation report MS have to submit
by end of June of each year. Last known results were submitted on 30/06/17 referring to the calendar year
2016. 105 Certain targets have been updated from last AAR because of modifications in Rural Development
programmes which were made in accordance with the legislation for rural development. In addition, for all
targets expressed in relative terms, DG AGRI has changed the method of aggregation at EU level, in view of
providing a more comprehensive overview on expected/achieved results.

agri_aar_2017_annexes Page 217 of 278
Result indicator: Share of area under organic farming106
Definition: The number of hectares under organic farming and the share of area under organic farming in the total utilised agricultural area (UAA).
The area under organic farming is the sum of the fully converted area and the area in conversion.
Source of data: Eurostat
Baseline (2012) Target Latest known results
10 104 699 ha
5.6% of total UAA
To increase 2016: 11 931 589 ha
6.7% of total UAA
Area under organic cultivation in the EU
Evolution of the share of the organic area in the UAA in the EU
106 Indicator contributing to the KPI Minimum share of agricultural land with specific environmental
practices/commitment.
0
2.000.000
4.000.000
6.000.000
8.000.000
10.000.000
12.000.000
14.000.000
2002 2003 2004 2005 2006 2007 2008 2009 2010 2011 2012 2013 2014 2015 2016
he
ctar
es
Agricultural area under organic farming, EU-28
2,6% 2,9% 3,1% 3,4% 3,6% 3,8% 4,2% 4,4%
5,0% 5,3% 5,6% 5,7% 5,8%
6,2% 6,7%
0,0%
1,0%
2,0%
3,0%
4,0%
5,0%
6,0%
7,0%
8,0%
2002 2003 2004 2005 2006 2007 2008 2009 2010 2011 2012 2013 2014 2015 2016
Share of organic area in total UAA (EU-28)

agri_aar_2017_annexes Page 218 of 278
Main outputs in 2017:
Policy–related outputs
Description Indicator Target date Latest known results
(situation on 31/12/2017)
New legislative and
political framework on organic production
Finalisation of the
reform on organic production and
adoption by the European
Parliament and the Council
Basic act to be
adopted by the end of
2017
Basic act endorsed in the
SCA and voted in COMAGRI
Production of secondary
legislation
2017 onwards No secondary legislation produced.
Implementation of Action Plan for the
future of Organic
Production in the European Union
Number of completed actions
To be finalised by the end of
2020
Currently 70% of the actions completed or
ongoing
Effective supervision of
the set up and functioning of the
control system for
organic production in Member States.
Contribution to
FVO audits in Member States
Continuous 3 audits in 2017 in MS
Assessment of annual reports
Continuous
100%
Follow-up to
irregularities
Continuous Ongoing
Effective supervision of
MS handling of irregularities and fraud
allegations related to EU organic production
Timely notification
of irregularities
Continuous Continuous
Timely reply to
notified irregularities'
Continuous
Continuous
Timely
transmission of information on
circulation of
alleged fraudulent products and on
remedial action
Continuous
Continuous
Development of the electronic
documentary
evidence
Ongoing Preparatory actions ongoing.
Fostering organics by promoting equivalence
with third countries
Number of negotiation on
mutual recognition
Ongoing 3 ongoing (Colombia Ecuador and Mexico)
Number of on the
spot mission to check the progress
of the country
2 2 (Taiwan and Japan)
Follow-up of
equivalence arrangements with
recognised third countries carried
out, in particular USA, Canada and
Switzerland
Ongoing
(annual video conference
with US and Canada)
bilateral meeting with
Switzerland
1 Annual video conference
(DVC) with US; 1 Annual DVC with Canada
1 DVC with S. Korea 1 DVC with Japan
1 on the spot mission of S Korean authorities to PL
Regular meetings with CH

agri_aar_2017_annexes Page 219 of 278
Signature and
conclusion of the Trade agreement
with Chile
2017 Entered into application
Progress in
negotiations for an equivalence
agreement with Colombia, Ecuador
and possibly Mexico
2017 onwards Ongoing talks
On the spot visit to progress in
trade relations with Taiwan
June 2017 June 2017
On the spot visit to extend to new
products the equivalence
arrangement with Japan
July 2017 July 2017
Progress in the development of a
plurilateral arrangement
Ongoing Several DVC with participants and meeting in
Chile to progress in Dec. 2017
Enhancement of
relations with
accreditation bodies
Ongoing Ongoing
Fostering organics by
enhancing the supervision of the
activities of control
bodies for imported products from non-
equivalent third countries.
Contribution to the
DG SANTE audit in recognised third
countries and
recognised control bodies for import
of organic products
6 audit per
year in CB and equivalent
third
countries.
6 audit done
Control bodies
annual report
analysed
100%
analysed by
the end of 2017
100% done
Entry into force of
the electronic certification of
imported organic
products from third countries
April 2017 Entered into force in April
2017, compulsory as from 19 October 2017
For this specific objective, please see also the policy-related outputs provided under
Specific objective: Enhancing farm viability and competitiveness of all types of agriculture in all regions and promoting innovative farm technologies and sustainable management
of forest (Priority 2).

agri_aar_2017_annexes Page 220 of 278
Specific objective: Promoting resource efficiency and
supporting the shift towards a low carbon and climate resilient economy in agriculture, food and forestry
sectors (Priority 5)
Related to spending
programme: EAFRD
Result indicator: % of irrigated land switching to more efficient irrigation systems
(Focus area 5A: increasing efficiency in water use by agriculture) Source of data: Rural development programmes
Baseline107
Target
(2023)
Latest known results108
0 13.0%109 1.8% (which represents
14.1% of achievement of the target set in the RDPs)
Result indicator: Total investment for energy efficiency (Focus area 5B: increasing efficiency in energy use in agriculture and food processing)
Source of data: Rural development programmes
Baseline Target (2023)
Latest known results110
0 2 861 246 986.74 EUR111 93 637 115.07 EUR (which represents 3.3% of
achievement of the target set in the RDPs)
Result indicator: Total investment in renewable energy production (Focus area 5C: Facilitating the supply and use of renewable sources of energy, of by products, wastes,
residues and other non food raw material for purposes of the bio-economy) Source of data: Rural development programmes
Baseline Target
(2023)
Latest known results112
0 2 663 036 865.96 EUR113 59 103 898.32 EUR (which
represents 2.2% of achievement of the target set
in the RDPs)
107 Baseline is 0 at the start of the programming period and all the targets are cumulated over the period. 108 The data on the achievement of the targets come from the Annual Implementation report MS have to submit
by end of June of each year. Last known results were submitted on 30/06/17 referring to the calendar year
2016. 109 Certain targets have been updated from last AAR because of modifications in Rural Development
programmes which were made in accordance with the legislation for rural development. In addition, for all
targets expressed in relative terms, DG AGRI has changed the method of aggregation at EU level, in view of
providing a more comprehensive overview on expected/achieved results. 110 The data on the achievement of the targets come from the Annual Implementation report MS have to submit
by end of June of each year. Last known results were submitted on 30/06/17 referring to the calendar year
2016. 111 Certain targets have been updated from last AAR because of modifications in Rural Development
programmes which were made in accordance with the legislation for rural development. 112 The data on the achievement of the targets come from the Annual Implementation report MS have to submit
by end of June of each year. Last known results were submitted on 30/06/17 referring to the calendar year
2016. 113 Certain targets have been updated from last AAR because of modifications in Rural Development
programmes which were made in accordance with the legislation for rural development.

agri_aar_2017_annexes Page 221 of 278
Result indicator114: a) % of LU concerned by investments in livestock
management in view of reducing greenhouse gas and/or ammonia emissions b) % of agricultural land under management contracts targeting reduction of
greenhouse gas and/or ammonia emissions (Focus area 5D: Reducing greenhouse gas and ammonia emissions from agriculture)
Source of data: Rural development programmes
Baseline Target
(2023)
Latest known results115
0 a) 0.8%116
b) 3.0%117
a) 0.1% (which represents
11.0% of achievement of the target set in the RDPs)
b) 1.6% (which represents 52.7% of achievement of the
target set in the RDPs)
Result indicator: % of agricultural and forest area under management contracts
contributing to carbon sequestration and conservation (Focus area 5E: Fostering carbon sequestration in agriculture and forestry)
Source of data: Rural development programmes
Baseline Target (2023)
Latest known results118
0 1.1%119 0.6% (which represents 54.4% of achievement of the
target set in the RDPs)
For this specific objective, please see the policy-related outputs provided under Specific
objective: Enhancing farm viability and competitiveness of all types of agriculture in all regions and promoting innovative farm technologies and sustainable management of
forest (Priority 2).
114 Indicator contributing to the KPI Minimum share of agricultural land with specific environmental
practices/commitment. 115 The data on the achievement of the targets come from the Annual Implementation report MS have to submit
by end of June of each year. Last known results were submitted on 30/06/17 referring to the calendar year
2016. 116 Certain targets have been updated from last AAR because of modifications in Rural Development
programmes which were made in accordance with the legislation for rural development. In addition, for all
targets expressed in relative terms, DG AGRI has changed the method of aggregation at EU level, in view of
providing a more comprehensive overview on expected/achieved results. 117 Certain targets have been updated from last AAR because of modifications in Rural Development
programmes which were made in accordance with the legislation for rural development. In addition, for all
targets expressed in relative terms, DG AGRI has changed the method of aggregation at EU level, in view of
providing a more comprehensive overview on expected/achieved results. 118 The data on the achievement of the targets come from the Annual Implementation report MS have to submit
by end of June of each year. Last known results were submitted on 30/06/17 referring to the calendar year
2016. 119 Certain targets have been updated from last AAR because of modifications in Rural Development
programmes which were made in accordance with the legislation for rural development. In addition, for all
targets expressed in relative terms, DG AGRI has changed the method of aggregation at EU level, in view of
providing a more comprehensive overview on expected/achieved results.

agri_aar_2017_annexes Page 222 of 278
Common CAP objective 3: To promote a balanced territorial development
Common CAP objective 3: To promote a balanced territorial development
CAP Impact indicator: Rural employment rate
Definition: Employment rate for the population aged 15-64 in rural areas
Source of the data: Eurostat – Labour Force Survey
Baseline120 (2012 – EU-28)
Target Latest known results
63.4% To increase Article 110 (2)(c) of
Regulation n° 1306/2013
66% (2016)
120 Values have changed compared to figures published in the Strategic Plan 2016-2020 because Eurostat has
updated figures.
64,8%
62,8% 62,7% 62,5%
63,4% 63,5%
64,3%
65,0%
66,0%
60,0%
61,0%
62,0%
63,0%
64,0%
65,0%
66,0%
67,0%
2008 2009 2010 2011 2012 2013 2014 2015 2016
Employment rates in rural areas, EU-28

agri_aar_2017_annexes Page 223 of 278
Specific objective: Promoting social inclusion, poverty
reduction and economic development in rural areas (Priority 6)
Related to spending
programme: EAFRD
Result indicator: Number of jobs created through supported projects (not LEADER) (Focus area 6A: Facilitating diversification, creation of new small enterprises and job
creation) Source of data: Rural development programmes
Baseline121
Target
(2023)
Latest known results122
0 79 370123 990 (which represents 1.3% of
achievement of the target set in the RDPs)
Result indicator: a) % of rural population covered by local development strategies b) Number of jobs created through supported projects (LEADER)
c) % of rural population benefiting from improved services / infrastructures (Focus area 6B: Fostering local development in rural areas)
Source of data: Rural development programmes
Baseline Target
(2023)
Latest known results124
0 a) 52.7%125 b) 44 034
c) 17.3%
a) 50.4 (which represents 95.6 % of achievement of the target
set in the RDPs) b) 424.8 (which represents 0.96
% of achievement of the target
set in the RDPs) c) 11.6% (which represents
67.0 % of achievement of the target set in the RDPs)
CAP Indicator: % of rural population benefiting from improved IT
infrastructures/services (Focus area 6C: Enhancing accessibility to use and quality of
information and communication technologies (ICT) in rural areas) Source of data: Rural development programmes
Baseline Target
(2023)
Latest known results126
0 6.1%127 0.2% (which represents 2.4% of
achievement of the target set in the RDPs)
121 Baseline is 0 at the start of the programming period and all the targets are cumulated over the period. 122 The data on the achievement of the targets come from the Annual Implementation report MS have to submit
by end of June of each year. Last known results were submitted on 30/06/17 referring to the calendar year
2016. 123 Certain targets have been updated from last AAR because of modifications in Rural Development
programmes which were made in accordance with the legislation for rural development. 124 The data on the achievement of the targets come from the Annual Implementation report MS have to submit
by end of June of each year. Last known results were submitted on 30/06/17 referring to the calendar year
2016. 125 Certain targets have been updated from last AAR because of modifications in Rural Development
programmes which were made in accordance with the legislation for rural development. In addition, for all
targets expressed in relative terms, DG AGRI has changed the method of aggregation at EU level, in view of
providing a more comprehensive overview on expected/achieved results. 126 The data on the achievement of the targets come from the Annual Implementation report MS have to submit
by end of June of each year. Last known results were submitted on 30/06/17 referring to the calendar year
2016. 127 Certain targets have been updated from last AAR because of modifications in Rural Development
programmes which were made in accordance with the legislation for rural development. In addition, for all
targets expressed in relative terms, DG AGRI has changed the method of aggregation at EU level, in view of
providing a more comprehensive overview on expected/achieved results.

agri_aar_2017_annexes Page 224 of 278
Main outputs in 2017:
Policy–related outputs
Description Indicator Target date Latest known results
(situation on 31/12/2017)
Broadband Competence
Office (BCO)
Brussels-based
Broadband Competence Office
is operational
2017 -BCO-SF fully operational
- Official launch of the BCO Network
- Toolkit for rural broadband launched by the
Commission
BCO Network Launching event
of the BCO Network with the
contributions of DGs CNECT,
REGIO and COMP
First quarter
2017
In 2017 DG AGRI, CNECT,
REGIO and COMP launched the Broadband
Competence Offices (BCOs), with the aim to
offer, as a single desk, support to public
administrations, telecom operators, investors and all
other public and private
stakeholders interested in developing broadband
infrastructure and related basic services. The
network was launched on 20 November 2017 during
a public event in Brussels.
Annual Work
Programme (AWP) of the Support Facility for
BCOs
Implementation of
activities included in the AWP 2017
with the contributions of
DGs CNECT, REGIO and COMP
2017 DG AGRI, CNECT, REGIO
and COMP also worked together on a specific
toolkit to bring more broadband in rural areas of
the EU: development of solid mapping to identify
precisely lagging behind
areas, targeted common missions, a rural 'proof
test' to ensure that rural areas are given sufficient
attention, a guide to high-speed investment in
broadband, and development of common
methodology for planning,
reporting and monitoring investments in broadband.
Life call for the
European Solidarity Corps for nature
protection in rural
areas, in cooperation with DG ENV
Second call
launched – proposals
evaluated
2017 DG AGRI participates to
the European Solidarity Corps initiative, working
together with DG EAC and
all other Commission services involved, in
particular DG ENV. The Initiative will finance the
engagement of 100 000 young people across
Europe until 2020 in solidarity activities. EAFRD

agri_aar_2017_annexes Page 225 of 278
contributed to the pilot
phase of the initiative with 1,8 million in 2016 and
2017 used to support several LIFE projects
where 1 700 young across
Europe will work on nature and environment
protection.
Legislative proposal on the European Solidarity
Corps as member of the
working group led by EAC and including in
particular SG and DGs EMPL, REGIO, ENV,
DEVCO, SANTE
Adoption of the proposal
Second quarter 2017
DG AGRI also participated to the preparation of the
Commission proposal for
the 2nd phase of the initiative (adopted 24 May
2017). The proposal ensures that young can be
engaged in solidarity activities in rural areas,
including provision of food, rural development,
environment and nature
protection, climate change, disaster prevention and
recovery (e.g. forests fires), integration of third
country nationals (migrants and refugees).
DG AGRI actively participates to the 2nd
phase of the initiative with
an additional 1,8 million euro that will be managed
by DG EAC with the involvement of EU main
agricultural and forestry organisations, national
authorities, networks and LEADER groups. High
involvement of young
people in related activities in rural areas is expected
in the coming years.
For this specific objective, please see also the policy-related outputs on ENRD provided under Specific objective: Enhancing farm viability and competitiveness of all types of
agriculture in all regions and promoting innovative farm technologies and sustainable
management of forest (Priority 2).

agri_aar_2017_annexes Page 226 of 278
Specific objective: To promote local agricultural
production and to ensure a fair level of prices for commodities for direct consumption and for processing
by local industries in the Outermost Regions of the EU and in the Aegean Islands
Related to spending
programme: EAGF
Result indicator: Support to the Local Production to maintain/develop the agricultural production
Definition: Utilised agricultural area (variation with respect to the previous year) Source: MS Annual Reports
Baseline (Calendar year 2013 / Budget year
2014)128
Target Latest known results129
POSEIDOM130: Mainland France: 26 888
215 ha
Guadeloupe: 31 401 ha Martinique: 24 445 ha
Guyane: 28 626 ha Réunion: 43 833 ha
Mayotte: no data
To at least maintain local agricultural production
Objective of the regulation 228/2013, Article 2 (1c)
POSEIDOM: Mainland France: 26 832 353
ha (-0.2%)
Guadeloupe: 30 415 ha (-3.14%)
Martinique: 22 827 ha (-6.61%)
Guyane: 31 208 ha (+9.02%) Réunion: 41 945 ha (-4.3%)
Mayotte: 8 739 ha
POSEICAN131:
Mainland Spain: 23 523 000
Canaries: 84 950 ha
POSEICAN:
Mainland Spain: 23 432 700 ha (-0.38%)
Canaries: 86 000 ha (+1.24%)
POSEIMA132: Mainland Portugal 3 641
592 Madeira: 5 262 ha
Azores: 118 589 ha
POSEIMA: Mainland Portugal: 3 641 592
ha (-0.7% with respect to 2009)
Madeira: 5 262 ha133(-3.1% with respect to 2009)
Azores: 118 589 ha (-1.5% with respect to 2009)
Smaller AEGEAN ISLANDS: 333 107 ha
Smaller AEGEAN ISLANDS: 309 882 ha (-6.97%)
For this specific objective, please see the outputs provided under the following Specific
objective: Specific Supply Arrangements (SSA) to ensure the supply of essential
products: SSA coverage rate (relation between quantities of products benefiting from SSA support and total quantities of the same products introduced in the respective
outermost region).
128 Baseline updated from 2012 to 2013 as it provides consolidated data for all outermost regions for that year,
given that Portugal data collection is done every five years, 2013 being the latest survey. 129 The Annual Implementation Report (AIR) transmitted by Member States in year N provides data
corresponding to year N-1. In this sense, the column "latest known result" shows 2016 data from the AIR
transmitted in 2017. Yet, Spain's data are gathered late; the latest available data included in the 2016 AIR are
from 2015. In addition, Portugal's farm structure data are collected every five years (data are available for
2009 and 2013), thus the latest known data refer to year 2013. Nevertheless, the variation is calculated with
respect to the previous available data, i.e. 2009. 130 Programme of options specific to the remote and insular nature of the overseas departments 131 Programme of options specific to the remote and insular nature of the Canary Islands 132 Programme of options specific to the remote and insular nature of Madeira and the Azores 133 Data provided for Madeira is provisional, pending final validation by the Member State paying agency.

agri_aar_2017_annexes Page 227 of 278
Specific objective: Specific Supply Arrangements (SSA)
to ensure the supply of essential products: SSA coverage rate (relation between quantities of products benefiting
from SSA support and total quantities of the same products introduced in the respective outermost region)
Related to spending
programme: EAGF
Result indicator: Percentage of SSA products coverage of local needs Source: MS Annual Reports
Baseline (2013 –
variations with respect to
2012)134
Target Latest known results
(2016)
POSEIDOM135 (all products): 39% (-4%)
POSEICAN: (cereals only): 99.64% (+0.6%)
100% The objective included in
Article 2 (1a) of regulation 228/2013 and 229/2013 is
the "guaranteed supply to the
outermost regions of products essential for human
consumption (…)". This target contributes to achieving this
objective.
POSEIDOM (all products): 36% (-3%)136
POSEICAN: (cereals only): 99.51% (-0.13%)
POSEIMA: Madeira (cereals only):
98.6% (+3,6%) Azores (cereals only):
85.3% (EU) (-3.3%)
POSEIMA: Madeira (cereals only):
99.8%137 (+1.2%) Azores (cereals only): 82.4%
(EU) (-0.7%)
Smaller Aegean Islands
(animal feed): 100.8% (+1.2%)
Smaller Aegean Islands
(animal feed): 99.8% (-1%)
To be noted: as regards POSEI and SAI programmes, in their annual implementation
reports for 2016, the Member States concerned communicated data related to the
common performance indicators as requested by Annexes VIII and II of Commission Implementing Regulations (EU) No 180/2014 and 181/2014, respectively. However, the
provided data may not be fully in line with the requirements of these annexes and thus not mutually comparable. Therefore, these indicators shall be evaluated with due caution.
A meeting with MS was held in June 2017 in order to improve the collection of these data.
Main outputs in 2017:
Policy–related outputs
Description Indicator Target date Latest known results (situation on 31/12/2017)
2016/AGRI/005 General
report to be presented
to the European Parliament and to the
Council showing the impact of the action
taken under Regulation (EU) No 228/2013
(art.32 of this Regulation). This report
will be partially based
on the results of the external evaluation
Transmission from
the Commission to
EP and Council of the Report
1st quarter
2017
Adopted on 15.12.2016
134 Baseline is set to 2013 in coherence with baseline of previous indicator. 135 The French authorities used in their annual reports a different methodology and data source to calculate this
indicator (calculation based on value and not quantities, data taken from customs sources and not from SSA
operators). 136 This result refers to all French outermost regions, including Mayotte since 2014. 137 Data provided for Madeira is provisional, pending final validation by the Member State paying agency.

agri_aar_2017_annexes Page 228 of 278
launched in 2015 under
the REFIT programme to be formally
completed with the preparation of a Staff
Working Document by
the Commission services.
2016/AGRI/006 General
report to be presented to the European
Parliament and to the
Council showing the impact of the action
taken under Regulation (EU) No 229/2013
(art.20 of this Regulation). This report
will be partially based on the results of the
external evaluation
launched in 2015 under the REFIT programme
to be formally completed with the
preparation of a Staff Working Document by
the Commission services.
Transmission from
the Commission to EP and Council of
the Report
1st quarter
2017
Adopted on 15.12.2016
2016/AGRI/007 Modification of
Commission Implementing
Regulation (EU) No 180/2014.
Adoption by the College and
published in EUOJ
2nd semester 2017
Planned for 2018
2016/AGRI/008 Modification of
Commission Implementing
Regulation (EU) No 181/2014.
Adoption by the College and
published in EUOJ
2nd semester 2017
Planned for 2018
Commission decisions and DG letters for
amendments approvals (according to kind of
modifications)
Date of notification to the
MS
2017 Foreseen in 2018

agri_aar_2017_annexes Page 229 of 278
The following objectives contribute to all 3 common CAP objectives
Specific objective: Fostering knowledge transfer and
innovation in agriculture, forestry and rural areas (Priority 1)
Related to spending
programme: EAFRD
Result indicator: % of expenditure for the three measures Knowledge transfer &
information action, advisory services and cooperation in relation to the total expenditure for the RDP (Focus area 1A: Fostering innovation and the knowledge base in
rural areas)
Source of data: Rural development programmes
Baseline138
Target (2023)
Latest known results139
3.9% 0.1% (which represents 1.9% of achievement of the target
set in the RDPs)
Result indicator: Number of cooperation operations planned under the cooperation measure (groups, networks/clusters, pilot projects) (Focus area 1B:
strengthening the links between agriculture and forestry and research and innovation)
Source of data: Rural development programmes
Baseline Target (2023)
Latest known results140
15 235141 804 (which represent 5.3% of achievement of the target set
in the RDPs)
Result indicator: Total number of participants trained (across all focus areas) (Focus area 1C: fostering lifelong learning and vocational training in agriculture and
forestry sectors)
Source of data: Rural development programmes
Baseline Target (2023)
Latest known results142
3 826 119143 258 108 (which represent 6.7% of achievement of the
target set in the RDPs)
138 Baseline is 0 at the start of the programming period and all the targets are cumulated over the period. 139 The data on the achievement of the targets come from the Annual Implementation report MS have to submit
by end of June of each year. Last known results were submitted on 30/06/17 referring to the calendar year
2016. 140 The data on the achievement of the targets come from the Annual Implementation report MS have to submit
by end of June of each year. Last known results were submitted on 30/06/17 referring to the calendar year
2016. 141 Certain targets have been updated from last AAR because of modifications in Rural Development
programmes which were made in accordance with the legislation for rural development. 142 The data on the achievement of the targets come from the Annual Implementation report MS have to submit
by end of June of each year. Last known results were submitted on 30/06/17 referring to the calendar year
2016. 143 Certain targets have been updated from last AAR because of modifications in Rural Development
programmes which were made in accordance with the legislation for rural development.

agri_aar_2017_annexes Page 230 of 278
Main outputs in 2017:
Policy–related outputs
Description Indicator Target date Latest known results
(situation on 31/12/2017)
EIP-AGRI events 5 New Focus
Groups launched 10 Focus Group
meetings 4 workshops
1 Seminar 3 meetings of the
Innovation Subgroup
2017 11 FG meetings
4 workshops 2 Seminars
3 meetings of the Innovation Subgroup
EIP-AGRI publications 1 magazine (Agrinnovation)
10 factsheets 4 brochures
12 newsletters 24 press articles
2017 1 magazine 12 factsheets
4 brochures 12 Newsletters
11 press articles
Specific objective: Societal challenges - to secure
sufficient supplies of safe and high quality food and other
bio-based products, by developing productive and resource-efficient primary production systems, fostering
related ecosystem services and the recovery of biological diversity, alongside competitive and low carbon supply,
processing and marketing chains
Related to spending
programme: Horizon
2020
Result indicator: Publications in peer-reviewed high impact journals in the area of
food security Definition: This indicator measures the number of publications in peer-reviewed high
impact journals in a specific societal challenge per 10M€ of EC-funding144. High impact journals are defined to be the top 10% (in terms of Scimago Journal Ranking (SJR) index)
of all journals within a given scientific category. Source of data: Horizon 2020 common IT system, i.e. CORDA (Common Research
Datawarehouse) and RESPIR (SESAM Research Performance and Impact Reports)
Baseline145
(2013)
Milestone 2019 Target
(2020)
Latest known
results
22.7 publications per 10 million € funding
(baseline FP7,
January 2015)
On average, 20 On average, 20 publications per 10
million € funding
N/A at this stage
144 From the launch of the programme and until a critical mass of finished projects (ca. 10 % of all funded
projects) has been reached, information about the two indicators below will be provided in the form of absolute
number by the funded projects. On the basis of FP7 data it is considered that this critical mass of finished
projects should be reached by 2019. 145 The reference for all the targets is the year when the last actions financed under Horizon 2020 will be
finished, i.e. several years after the formal end of the programming period.

agri_aar_2017_annexes Page 231 of 278
Result indicator: Patent applications in the area of food security146
Definition: This indicator measures the number of patent applications in a specific societal challenge per EUR 10 M€ funding147.
Source of data: Horizon 2020 common IT system, i.e. CORDA (Common Research Datawarehouse) and RESPIR (SESAM Research Performance and Impact Reports)
Baseline (2013)
Milestone 2019 Target (2020)
Latest known results
For FP7 Cooperation
projects finished by
January 2015: 1.2 patent applications
per 10 million € funding
On average, 2 On average, 2 patent
applications per 10
million € funding
N/A at this stage
Main outputs in 2017:
Policy–related outputs
Description Indicator Target date Latest known results
(situation on 31/12/2017)
Grants Budget allocated
to grants in the WP
EUR 254.066.313,58
Proposal submission for
2017 calls
Proposals
submitted (first deadline)
February 2017 44 (single stage
procedure); 246 (two-stage procedure)
Selection of proposals for funding from 2017
calls – implementation by the executive agency
REA
Proposals selected for funding
December 2017
17 (single stage procedure);
26 (two-stage procedure)
Preparation of the
2018-2020 Work Programme in close
cooperation with DG RTD and other policy
DGs (mainly SANTE, CLIMA, ENV, CNECT)
Calls published November
2017
WP successfully published
in October 2017
146 The result indicator was aligned with the respective indicator provided for in the Management Plan 2014 of
DG RTD, i.e. reporting on patent applications only but not on patents awarded (as stated in the Programme
Statement DB2014) since no meaningful information (or none at all) can be expected before 2019-2020. 147 See footnote in the previous indicator.

agri_aar_2017_annexes Page 232 of 278
Specific objective: To contribute to the sustainable
adaptation of the agricultural sector and rural areas in the three countries (Bulgaria, Romania and Croatia)
eligible for Sapard support until 2009148
Related to spending
programme: SAPARD
Main outputs in 2017:
Policy–related outputs
Description Indicator Target date Latest known results
(situation on 31/12/2017)
SAPARD programmes of
HR, RO and BG closed.
Final balance
settled for the SAPARD
programmes of HR, RO and BG.
2017 Final balances have been
calculated and communicated to the
respective countries.
IPARD
The following 3 objectives also contribute to IPA objective "support
candidate countries and potential candidates (‘beneficiary countries’) in
implementing the political, institutional, legal, administrative, social and
economic reforms required by those beneficiaries in order to comply
with the Union's values and to progressively align to Union rules, standards, policies and practices with a view to Union membership."
Specific objective: To contribute to the sustainable
adaptation of the agricultural sector and rural areas and to the new Member State Croatia's and Candidate
Countries' preparation for the implementation of the
acquis communautaire concerning the CAP and related policies under IPARD 2007-2013 (IPARD I) by:
1. improving market efficiency and implementation of Union standards,
2. preparatory actions for the implementation of the agri-environmental measures and local rural development
strategies, 3. development of the rural economy.
Related to spending
programme: IPARD
2007-2013 (IPARD I)
1. Improving market efficiency and implementation of Union standards (AXIS 1)
Result indicator: Number of applications received Source: IPARD programmes 2007-2013, annual149 and bi-monthly150 reports
Baseline (2014) Target Latest known results (2017)
HR: 656 applications
fYRoM: 1557 applications
TR: 3394 applications
833 in HR
2890 in fYRoM
4818 in TR151
630
2725
4763
148 This objective concerning only the closure of the programme (until 2009) is not present in the DG AGRI
Strategic Plan 2016-2020. 149 Throughout this specific objective: baseline – end of 2014 – based on the respective annual reports. 150 Throughout this specific objective: current – end of 2015 – based on the bi-monthly reports, data still
provisional. 151 Updated target based on the latest programme modifications.

agri_aar_2017_annexes Page 233 of 278
Result indicator: Number of applications approved
Source: IPARD programmes 2007 – 2013, annual and bi-monthly reports
Baseline (2014) Target Latest known results
(2017)
HR: 234 applications fYRoM: 559 applications
TR: 2023 applications
514 in HR 2330 in fYRoM
3084 in TR152
366 1331
2942
Result indicator: Number of farms/enterprises supported (paid by the IPARD
Agency) Source: IPARD programmes 2007 – 2013, annual and bi-monthly reports
Baseline (2014) Target Latest known results
(2017)
177 projects in HR
248 projects in fYRoM 1479 projects in TR
414 in HR
2330 in fYRoM n/a in TR153
359
730 TR: 2664
Result indicator: Total volume of investment (paid) Source: IPARD programmes 2007 – 2013, annual and bi-monthly reports
Baseline (2014) Target Latest known results
(2017)
€96.8m in HR
€3.4m in fYRoM €72.6m in TR
€220m in HR
€75.7m in fYRoM Target in TR154 - n/a
84.28 million EUR
33.57 million EUR TR: 2,13 billion EUR
Result indicator: Increase on gross value added (GVA) in supported holdings
Source: IPARD programmes 2007 – 2013 and annual reports
Baseline (2014) Target Latest known results
(2017)
Information not available
in HR fYRoM and TR
5% in HR
5-8% in fYRoM Target in TR by 15%155
TR: by 28%
Result indicator: Number of farms/enterprises introducing Union standards
Source: IPARD programs 2007-2013 and annual reports
Baseline (2014) Target Latest known results
(2017)
Information not available in HR and fYRoM
TR: 1479
290 in HR Target in fYRoM (100%)
Target in TR: 2776156
HR: 251 fYRoM: 730
TR: 2631
Result indicator: Economic growth in agriculture – net additional added value in
PPS (Purchase Power Standards = purchasing power of the same goods with different currencies)
Source: IPARD programmes 2007 – 2013 and annual reports
Baseline (2014) Target Latest known results
(2017)
Information not available for any of the countries
5% in HR Information not available
152 Updated target based on the latest programme modifications. 153 Updated target based on the latest programme modifications. 154 No target agreed at the time when programme was set up. 155 Updated target based on the latest programme modifications. 156 Updated target based on the latest programme modifications.

agri_aar_2017_annexes Page 234 of 278
Result indicator: Labour productivity in agriculture – change in gross value added
(GVA) Source: IPARD programmes 2007 – 2013 and annual reports
Baseline (2014) Target Latest known results (2017)
Information not available
for any of the countries
To increase Information not available
2. Preparatory actions for the implementation of the agri-environmental
measures and local rural development strategies (AXIS 2)
Result indicator: Local rural development strategies A) Number of applications received
B) Number of applications approved
C) Number of recognised LAGs D) Total population of LAGs
Source: IPARD programmes 2007 – 2013 and annual and bi-monthly reports
Baseline (2014) Target Latest known results (2017)
In HR A) 71 applications received
B) 42 LAGs contracted C) 41 LAGs
D) 1 321 155 Leader measure has not
been accredited in TR and
fYRoM under IPARD I.
In HR A) 40
B) 25 C) 25
D) 1 055 000
A) 80 B) 40
C) 40 D) 1.495 .541
3. Development of the rural economy (AXIS 3)
Result indicator: Improvement of rural infrastructure
A) Number of applications received B) Number of applications approved
C) Number of beneficiaries D) Total volume of investment
Source: IPARD programmes 2007-2013 and annual and bi-monthly reports
Baseline (2014) Target Latest known results
(2017)
A) HR: 210 B) HR: 106
C) HR: 33 D) HR: €10m
This measure has not been
accredited in TR and fYRoM under IPARD I.
A) 205 in HR B) 174 in HR
C) 148 in HR D) €59m in HR
A) HR: 210 B) HR: 104
C) HR: 104 D) HR: €36 million

agri_aar_2017_annexes Page 235 of 278
Result indicator: Diversification of rural economy
E) Number of applications received F) Number of applications approved
G) Number of beneficiaries supported and paid H) Total volume of investment (data from Monitoring Tables)
Source: IPARD programmes 2007-2013 and annual and bi-monthly reports
Baseline (2014) Target Latest known results
(2017)
E) HR: 329
fYRoM: 276 TR: 8322
F) HR: 171
fYRoM: 17 TR: 5991
G) HR: 41
fYRoM: 1
TR: 5618
H) HR: €5.3 m fYRoM: €0.01 m
E) 380 in HR
229 in fYRoM 5697 in TR
F) 350 in HR
95 in fYRoM 5127 in TR
G) 329 in HR
95 in fYRoM
n/a in TR157
H) €39m in HR €7.2m in fYRoM
€395m in TR158
E) 329 in HR
362 in FYROM 11 809 in TR
F) 129 in HR
38 in FYROM 8 319 in TR
G) 129 in HR
8 in FYROM
7 992 in TR
H) 19 million EUR in HR 3.97 million EUR in fYRoM
372 million EUR in TR
Completed evaluations: "Ex-post evaluation of IPARD 2007-2013 in Republic of Croatia"
"Ex-post evaluation of IPARD 2007-2013 in Turkey"
Main outputs in 2017:
Policy–related outputs
Description Indicator Target date Latest known results (situation on 31/12/2017)
Management of the implementation of three
IPARD programmes 2007-2013
Percentage of the relevant IPARD
allocation159 contracted and
paid
2017 HR: 83% fYRoM: 51%
TR: 99%
157 Updated target based on the latest programme modifications. 158 Updated target based on the latest programme modifications. 159 Based on adjusted commitment figures.

agri_aar_2017_annexes Page 236 of 278
Specific objective: Supporting the development of
management and control systems which are compliant with good governance standards of a modern public
administration and where the relevant country structures apply standards equivalent to those in similar
organisations in the Member States of the European
Union.
Related to spending
programme: IPARD
2014-2020
(IPARD II)
Result indicator: Number of measures for which entrustment of budget implementation tasks granted to the IPA II beneficiaries under rural development
programmes Source: Estimate, based on experience gained under Sapard and IPARD I
Baseline (2014) Target 2020 Latest known results (2017)
0 32 11
Result indicator160: Financing Agreements (FA) concluded Source: DG AGRI
Baseline (2014) Target Latest known results
(2017)
No FA signed. Financing Agreements are to
be concluded once and will be updated in order to reflect
new budgetary allocations and entrustments of budget
implementation tasks for new
measures
3
Completed evaluations: No evaluations so far, since implementation of programmes is only starting.
However, at the request of DG AGRI, JRC.D.4 (Economics of Agriculture Unit) of DG Joint Research Centre has carried out a study on "Agricultural policy developments in the
Western Balkan countries".
160 New indicator; new types of Financing Agreements must be prepared and concluded reflecting the new IPA
2014-2020 legal base.

agri_aar_2017_annexes Page 237 of 278
Main outputs in 2017:
Policy–related outputs
Description Indicator Target date Latest known results
(situation on 31/12/2017)
Management and
control systems ready to start implementation
of the programmes; the framework for the
systems has been developed in close
cooperation with DGs NEAR, BUDG and LS,
based on provisions of
the Financial Regulation and Framework
Agreement.
Entrustment of
budget implementation
tasks granted on a number of
measures under individual country
IPARD programmes
Entrustment at
least for some measures
under the five programmes.
Expected total by 2020 – 32
entrustments.
Entrustment granted for 5
measures for Turkey; for 4 measures for the former
Yugoslav Republic of Macedonia and for 2
measures for Montenegro.
All legal and institutional
arrangements in place
to start implementation of IPARD 2014-2020;
each entrustment decision, which is
granted per measure, is communicated to DG
NEAR and is aligned to their overall
assessments of the
'horizontal bodies' of the management and
control system for IPA.
Conclusion and annual
amendments of
the Financing Agreements with
IPARD Beneficiary countries.
Financing Agreements
concluded with
all IPA II Beneficiary
countries having
received entrustment of
budget implementation
tasks under
indirect management.
Financing Agreements signed with the former
Yugoslav Republic of
Macedonia, Montenegro and Turkey.
Smooth transition between IPARD I and
IPARD II programmes
in Turkey and former Yugoslav Republic of
Macedonia, start of implementation in
Albania, Montenegro and Serbia.
TK and the former Yugoslav Republic
of Macedonia
ready to start contracting under
IPARD II; contracting also
starts in Albania, Montenegro and
Serbia.
2017 The former Yugoslav Republic of Macedonia,
Montenegro and Turkey
have received entrustment for budget implementation
tasks during 2017. Albania and Serbia are
expected to receive entrustment in early 2018.

agri_aar_2017_annexes Page 238 of 278
Specific objective: To increase the food-safety of the
IPA II beneficiary and the ability of their agri-food sector to cope with competitive pressure as well as to
progressively align the sector with Union standards, in particular those concerning hygiene and environment,
while pursuing balanced territorial development of rural
areas.
Related to spending
programme: IPARD
2014-2020
(IPARD II)
Result indicator: Number of economic entities performing modernisation projects in agri-food sector
Source: IPARD programmes 2014-2020 and annual and bi-monthly reports
Baseline (2014) Target 2023161 Latest known results
(2017)
0 6450 0
Result indicator: Number of economic entities developing additional or diversified
sources of income in rural areas Source: IPARD programmes 2014-2020 and annual and bi-monthly reports
Baseline (2014) Target 2023 Latest known results
(2017)
0 3300 0
Result indicator: Overall investment in physical capital in agri-food and rural
development (EUR)
Definition: Overall investment in machines, equipment, production facilities made by farmers, food processing and marketing enterprises as well as micro and small
enterprises in rural areas Source: IPARD programmes 2014-2020 and annual and bi-monthly reports
Baseline (2014) Target 2023 Latest known results
(2017)
0 2.29 billion € 0
Result indicator: Number of economic entities progressively upgrading towards
EU standards
Definition: Number of farmers and food processing and marketing enterprises progressively upgrading to EU environmental, food safety and hygiene,
occupational standards Source: IPARD programmes 2014-2020 and annual and bi-monthly reports
Baseline (2014) Target 2023 Latest known results
(2017)
0 4440 0
Main outputs in 2017:
Policy–related outputs
Description Indicator Target date Latest known results
(situation on 31/12/2017)
Start of contracting Number of
economic entities performing
modernisation projects in agri-
food sector
6450 583 contracted
161 All targets under this specific objective have been updated. The old targets were based on the extrapolations
of the IPARD I programmes. Now, that all programmes have been adopted, more reliable estimates stemming
from the programmes can be provided.

agri_aar_2017_annexes Page 239 of 278
Start of contracting Number of
economic entities developing
additional or diversified sources
of income in rural
areas
3300 1018 contracted
Start of contracting Overall investment in physical capital
in agri-food and rural development
(EUR) (investment
in machines, equipment,
production facilities made by
farmers, food processing and
marketing enterprises as well
as micro and small
enterprises in rural areas)
EUR 2.29 billion
Process ongoing
Start of contracting Number of
economic entities progressively
upgrading towards
EU standards Definition:
Number of farmers and food
processing and marketing
enterprises progressively
upgrading to EU
environmental, food safety and
hygiene, occupational
standards
4440 Process ongoing
Start of implementation
of IPARD II programmes; the
programmes had been adopted in consultation
with DGs NEAR, ENV, REGIO, EMPL, SANTE,
CLIMA, MARE, BUDG, SG, LS. Implementation
is closely coordinated
with DG NEAR and EEAS, mainly through
EU Delegations.
First calls for
applications carried out under
the five programmes
2017 The Former Yugoslav
Republic of Macedonia, Serbia and Turkey have
carried out first calls under IPARD II. Serbia –
launched the first call with a suspensive/reserve
clause, as the Financing Agreement did not yet
entered into force.

agri_aar_2017_annexes Page 240 of 278
Commission general objective 6: A balanced and progressive trade policy to
harness globalisation162
CAP Impact indicator: Total EU agri-food trade value
Source of the data: Comext, Eurostat
Baseline (2011)163
Target (2020)
Latest known results (2017)
EUR 199 billion Maintain at high level EUR 255,3 billion
162 The title of Priority 6 has been updated and made geographically neutral in view of the slowing down of
trade talks with the United States, the new geopolitical context, and the new dynamism in trade talks with
other important regions of the world. The Commission has reflected this reality by changing the previous
General Objective ("A Reasonable and Balanced Free Trade Agreement with the U.S") and introducing a new
impact indicator replacing the old one. 163 Baseline modified to 2011 instead of 2016 to better take into account the longer-term trend.

agri_aar_2017_annexes Page 241 of 278
Specific objective: To promote the EU agricultural sector
by contributing to successful negotiation and cooperation within the World Trade Organisation (WTO) and other
multilateral organisations such as the Organisation for Economic Co-operation and Development (OECD) and the
Food and Agriculture Organisation (FAO).
Related to spending
programme: NA
Result indicator: Timely contribution to negotiations and other ongoing processes
in multilateral fora Source: DG AGRI
Baseline (2015) Target Latest known results (2017)
100% of contributions in
time. Examples:
Provision of negotiating
lines to take in the context of WTO DDA negotiations
following the 9th Ministerial Conference (Bali,
December 2013). Relevant input to
agriculture-related FAO activities.
100% of contributions in time
This target was agreed within
DG AGRI and is reflected by
relevant procedures for conducting negotiations.
100 % of contributions on
time
Main outputs in 2017:
Policy–related outputs
Description Indicator Target date Latest known results (situation on 31/12/2017)
WTO Agricultural negotiations
Contributions to the negotiations
on the post-Nairobi agenda,
notably in preparation for the
11th WTO
Ministerial Conference
(Buenos Aires, 10-13 December
2017).
Throughout 2017, notably
for each Special
Session of the WTO
Committee on
Agriculture. Participation
in three Special
Sessions held in June, July
and September
2017.
Positions co-ordinated in
constant and extremely
close co-ordination
with DG TRADE and EU
Geneva
delegation.
EU proposal on domestic support formally submitted
to WTO on 17 July 2017 Participation in 6
substantive meetings of the Special Session (June,
July, September, October
and November) held in 2017. Participation in the
11th Ministerial Conference. Positions coordinated in
constant and extremely close coordination with DG
TRADE and EU Geneva Delegation.

agri_aar_2017_annexes Page 242 of 278
Finalisation and
implementation of negotiations under
GATT Article XXIV.6 on compensatory
adjustments
(Negotiations carried out in close co-
operation with DG TRADE; implementation
with SJ and DG TAXUD).
Contributions
made to negotiations, and
their conclusion and
implementation
End 2017 All negotiations have been
completed. 1 January 2017:
entry into force of agreements with China
and Uruguay
18 May 2017: initialling at negotiators'
level of (final) agreement with New Zealand
30 June 2017: entry into force of
agreement with Brazil. 17 July 2017:
Council authorisation for
signing agreement with New Zealand.
Incorporation of outcome of negotiations into the
EU28 schedule. Negotiations carried out in
close cooperation with DG TRADE; implementation
with LS and DG TAXUD.
OECD activities related
to agriculture, food and rural development
Attend all relevant
meetings (minimum, n=8)
Review all OECD papers and
provide comments
according to EU policy objectives
Throughout
2017, notably each session
of the OECD Committee for
Agriculture
and its working
parties
Contributions provided as
appropriate and on time.
Influence of agriculture policy in UN (notably
FAO), GFFA, G-20
(agriculture) and G-7 (agriculture).
List of key committees in
which AGRI
participates and speaks in main
FAO and IFAD bodies (especially
FAO Conference)
31/12/17 40th FAO Conference 3-8 July
FAO European
40th Commission on Agriculture Europe 27-28
September 44th Committee on Food
Security (CFS) 9-13 October
Number of SDG-indicators for
Agenda 2030 affecting
agriculture policy that are adopted.
30/12/2017 A set of 6 main indicators to measure progress on
SDG2 Zero Hunger was agreed with and adopted
by ESTAT and is used for yearly reports
Extent to which conclusions of
GFFA, G-20, G-7 and other
agricultural ministerials reflect
or are compatible with EU policy.
As dates of each ministe-
rial. Consideration
being given to taking a case
to the ECJ regarding
exercise of
Union
GFFA (January 2017 on water management):
conclusions fully compatible with EU policy
All conclusions of G7 and
G20 ministerial meetings are coherent, consistent
and compatible with the
EU policy

agri_aar_2017_annexes Page 243 of 278
competences
in FAO.
Proposal to the Council
on EU accession to the Lisbon Agreement on
Appellations of Origin (2016/AGRI/076)
Adoption of
proposal; EU accession.
End 2017 or
early 2018.
25 October 2017:
judgement of the Court of Justice in case C-385/15
confirming exclusive EU competence for Lisbon
Agreement. 21 December 2017:
roadmap on EU accession published.
Specific objective: To improve market access for
agricultural products by contributing to negotiating,
revising bilateral agreements, by resolving trade irritants, ensuring protection for EU geographical
indications in third countries by negotiating relevant provisions within Free Trade or Associations Agreements
or stand-alone agreements, carrying out dialogues in agriculture and cooperation activities and contributing to
sustainable economic development in particular in developing countries.
Related to spending
programme: N/A
Result indicator: Timely preparation of and contribution to bilateral negotiations leading to the objectives given.
Source: DG AGRI
Baseline (2015) Target Latest known results
(2017)
100% of timely contributions.
Examples: Contributing to
negotiations with WTO
partners in the framework of Art XXIV.6 GATT;
Contributing to negotiations with
Mercosur, Mexico and Chile;
Contributing to ratification and implementation of
Economic Partnership
Agreements including built-in agendas on GIs
and wines and spirits; facilitating responsible
private sector agri-business investments in
ACP; Contributing to
negotiations with Viet Nam
and Japan on the agricultural aspects of the
respective Free Trade Agreements;
Negotiating a stand-alone agreement with China on
cooperation on, and
100% of contributions in time
This target was agreed within DG AGRI and is reflected by
relevant procedures for
conducting negotiations.
All contributions prepared in time and to the quality
required

agri_aar_2017_annexes Page 244 of 278
protection of, geographical
indications Steering the process
leading to the protection of EU geographical
indications in Central
America, in the framework of the agreement with
these countries Carrying out dialogues on
agricultural issues with some third countries
(China, Brazil, India, EPAs) and cooperation activities
in the agricultural field
Main outputs in 2017:
Policy–related outputs
Description Indicator Target date Latest known results
(situation on
31/12/2017)
Monitoring of EU agri-food trade
Monthly analysis and publication of latest
developments in EU agri-food trade
Monthly publication
12 monthly reports published on Europa
Implementation of full EPAs in: East African
Community; SADC-EPA Group; West Africa;
CARIFORUM
a. implementation (or preparation for
implementation) of agricultural sub-
committees/dialogues,
b. value of
development projects that
support EPA implementation in
agricultural and agri-business
sector c. finalisation of
CARIFORUM GI
protection (2016/AGRI/032)
30.12.2017 for all
First full year of SADC EPA implementation: 2
meetings of Trade and Development
Committee, 1 meeting of Special Committee on
GIs and trade in wines &
spirits, arrangements for the 1st agricultural
dialogue meeting in early 2018
CARIFORUM: negotiation directives for GI
agreement adopted December 1, 2017
Implementation of
interim EPAs in Eastern and Southern Africa;
Central Africa; Pacific
Monitoring of
agreements and possible development
of informal
agricultural dialogues. Number of
contributions to events pursuant to
agreements
30.12.2017 Fiji: plans to ratify the
interim EPA in second half of 2018

agri_aar_2017_annexes Page 245 of 278
Contribute to the
implementation of EPAs (TRADE)
Contribution to work
coordinated by TRADE and DEVCO
Participation
in all coordination
meetings; provide
examples for
agri-food sector
SADC EPA: participation
in preparation for the Trade-related meetings
(TDC with SADC and TCC with SA)
Addressing Root causes
of irregular migration from SSA
List of initiatives
promoting agribusiness
investment, including
with the African Union
30.12.2017 Agribusiness Investment
Forum, 1 July 2017, Rome (in the margins of
the AU EU Agriculture
Ministerial Meeting, with DEVCO support)
EU Africa Business Forum 27 November
2017 (three specific workshops organised by
AGRI: 1) Greater co-operation for agricultural
investments in Africa, 2)
Leveraging Digitisation for profitable and
sustainable Agriculture and 3) How to promote
African quality products
Building partnerships
with International Organisations, AUC,
ACP and selected countries
Number of agriculture
policy (incl. GI) initiatives & events
Organisation
of an African Union – EU
Agricultural Ministerial
Conference on 2/07/2017
in cooperation with DEVCO,
TRADE etc.
2nd AU-EU Agricultural
Ministerial Meeting, 2 July 2017, Rome (351
participants, incl. 28 Ministers)
Tunisia: contribution
to DCFTA, in close cooperation with DG
TRADE
Continuation of
bilateral negotiations
2019 Negotiations should
resume in 2018 with a view to concluding in
2019
Morocco: conclusion
of a GI agreement
Adoption by Council
and Parliament and implementation of the
Agreement
2018 Adoption of the
agreement will depend on resolving issues
related to the EU-Morocco agricultural
agreement
Georgia, Moldova,
Ukraine: Association Agreement including
DCFTA, in close cooperation with EEAs
and DG TRADE
Implementation,
approximation monitoring (including
update of GIs lists). Possible start of
discussions on review clause with Moldova.
2018 Moldova 1) review
clause: the first discussion took place 17
Oct 2017 within the EU-MD TRADE Committee
2) GIs update- ongoing GI update under the
DCFTA.
Ukraine: 1) ongoing GI update under the
DCFTA; 2) entry into force of the EU

agri_aar_2017_annexes Page 246 of 278
autonomous trade
measures on 1.10.17 and on 1.01.18 for
cereals TRQs
Armenia: negotiation
of the bilateral Comprehensive and
Enhanced Partnership Agreement (including
GIs), in close cooperation with DG
TRADE
Negotiations started
in 2016 Agreement concluded
and signed
2017-2018 Negotiations have been
concluded and the agreement was signed in
November 2017. Agreement to enter into
force later in 2018
Azerbaijan :
negotiation of a new Agreement including
GIs, in close cooperation with DG
TRADE
Negotiations started
in 2017.
2017-2018 Negotiations started in
2017.
Russia, Turkey:
resolving trade irritants, in close
cooperation with DG TRADE and DG SANTE
Contribute to the
resolution of ongoing trade bans and/or
safeguard measures
2017-2018 High-level mission by
Commissioner Hogan in Turkey in July 2017
Belarus: dialogue, in close cooperation with
EEAS and DG TRADE
Participate in discussions of the
Trade dialogue led by DG TRADE
2017 Last dialogue held on 19/12/17
Iran: dialogue in close cooperation with EEAS,
DG TRADE and DG SANTE
Establishment of agriculture
cooperation + visit of High Level business
mission by Commissioner Hogan
in November 2017.
2017 Joint Press Statement issued between
Commissioner Hogan and Iranian Minister of
Agriculture Hojjati, setting terms of future
cooperation
Lebanon: dialogue in
close cooperation with EEAS and DG TRADE
Participate in
discussions of the Trade and Investment
working group lead by DG TRADE
2017 Three meetings of the
JWG took place in 2017, focused in particular on
SPS and RoO for agricultural products.
Possible flexibilisation on RoO going ahead in
2018.
Saudi Arabia:
promoting agro-food trade
High-Level business
mission led by Commissioner Hogan
2017 Both sides agreed to
step up their cooperation on
agriculture and SPS-related issues. More MS
received authorisation to
export poultry, goat&sheep and beef
meat to Saudi Arabia.
Israel, Palestine, Egypt, Jordan:
dialogue, in close
cooperation with EEAS and DG TRADE
Dialogue on agriculture and
cooperation (including
on GI's, organic farming, etc.) via
ENPARD and TAIEX
2017 Agriculture sub-committee meetings
with Egypt and Jordan
took place in 2017.

agri_aar_2017_annexes Page 247 of 278
Switzerland:
reclassification of seasoned meat
Find a solution to the
trade irritant of reclassification of
seasoned meat from Chapter 16 to Chapter
02
2017 The two sides found at
the end of 2017 a solution to the trade
irritant: the CH will increase the global WTO
TRQ No5 by 1200
tonnes. This is to be implemented in 2018
2015/AGRI/030 and
2015/AGRI/031: Proposal for a Council
Decision on the
conclusion and the signature of an EU-
Iceland agreement on protection of
geographical indications
Council adoption with
EP consent
2017 The agreement will
enter into force on 1 May 2018.
2015/AGRI/035 and 2015/AGRI/036:
Proposal for a Council Decision on the
conclusion and the signature of an EU-
Iceland Article 19 agreement on further
trade liberalisation
Council adoption with EP consent
2017 The agreement will enter into force on 1
May 2018.
2015/AGRI/037 and
2015/AGRI/038 Proposal for a Council
Decision on the conclusion and the
signature of an EU-
Norway Article 19 agreement on further
trade liberalisation
Council adoption with
EP consent
Planned 2018 The Agreement was
signed on 4.12.17.
2015/AGRI/080 and 2015/AGRI/081
Proposal for a Council
Decision on the conclusion and the
signature of an agreement between
the European Union and Chile on trade in
organic products
Council adoption with EP consent
2017 Negotiations were launched in later 2017
Canada: CETA Provisional application
and monitoring of the implementation In
coordination with DG TRADE and the EU
Delegation in Canada.
Provisional
entry into force
September 2017
Provisional entry into
force on 21 September 2017 – Monitoring of the
implementation
US: TTIP Stand ready to
continue negotiations Pour mémoire. No
development expected
2017 Negotiations continue to
be suspended

agri_aar_2017_annexes Page 248 of 278
US: trade irritants To manage trade
irritants e.g. on SPS matters, hormone free
beef, anti-subsidy measures on olives
2017 to early
2018
Consultations on
hormone-free beef quota management of
SPS irritants and anti-subsidy case on olives
Mexico: modernisation of existing agreement;
Mercosur
Continuation of negotiations. In
coordination with DG TRADE, DG GROW
and DG SANTE.
Conclusion planned by
end 2017
Continuation of the negotiations
Central America:
Free Trade Agreement implementation
Continuation of
monitoring of implementation
2017 Continuation of
monitoring of implementation
Peru-Colombia-
Ecuador: Free Trade
Agreement implementation
Continuation of
monitoring of
implementation
2017 Continuation of
monitoring of
implementation
Mercosur Continuation of
negotiations. In coordination with DG
TRADE, DG GROW
and DG SANTE
Conclusion
possible at end 2017
Continuation of the
negotiations
Chile: modernisation of existing association
agreement
Preparatory work in cooperation with DG
TRADE, notably to obtain Council
approval of
negotiating directives to reflect EU priorities.
Launch of negotiations
Possible launch before
end 2017
Launch of negotiations in November 2017
China: agreement on protection of
geographical
indications (2011/AGRI/008
and2025/AGRI/058) Monitoring of and
addressing trade barriers, in close
cooperation with DG TRADE and SANTE
Continuation and possible conclusion of
negotiations
Conclusion possible at
end 2017 or
shortly thereafter
Conclusion probable in 2018
China: cooperation activities in the field of
agriculture and rural development
Continuation of cooperation resulting
in avoidance of new trade barriers.
2017 China –EU 10th Agricultural Dialogue on
15-18 February in (Sanya) China
Japan: Free Trade Agreement
negotiations under DG TRADE's coordination
conclusion of negotiations
First semester 2017
Agreement in Principle reached on 6 July 2017
– Formal conclusion of EPA negotiations on 8
December 2017
Philippines and
Indonesia: Free Trade Agreement
negotiations under DG TRADE's coordination
Continuation of
negotiations
2017 Negotiations are
continuing

agri_aar_2017_annexes Page 249 of 278
Australia/New
Zealand: Free Trade Agreement
negotiations
Cooperation activities in the field of
agriculture and rural development
Preparatory work in
cooperation with DG TRADE, notably to
obtain Council approval of
negotiating directives
to reflect EU priorities. Launch of negotiations
Preparatory
work by end 2017. Launch
of negotiations
expected in
2018
Conclusion of scoping
exercises on a possible FTA with New Zealand
(March 2017) and Australia (5 April 2017).
Draft negotiating
directives adopted by the Commission College
on 13 September 2017. Draft mandate discussed
but not yet adopted by the Council.
Agricultural Trade and Marketing Experts
Group(ATMEG)
organised on 16 March 2017.
India, Thailand,
Malaysia: Free Trade Agreements
Talks towards possible
resumption of negotiations
2017 for at
least Malaysia
Malaysia: likely to
resume by mid-2018 Thailand: resumption
possibly end 2018
India: resumption being considered
Korea: Free Trade
Agreement implementation with
the support of the EU
Delegation to Korea
Continuation of
monitoring of implementation
2017 GI working Group held
on 19 July 2017
Specific objective: To promote the EU interests and positions on agriculture and rural development in the
relations with enlargement countries and to assist the enlargement countries in their alignment to the CAP
Related to spending programme: EAGF
and EAFRD
Result indicator: Timely contribution to the Commission's work in the area of
enlargement
Source: DG AGRI
Baseline (2015) Target Latest known results (2017)
100% of timely contributions
Example: Preparation of screening
report for Montenegro.
100% of contributions in time This target was agreed within
DG AGRI and is reflected by relevant procedures for
conducting negotiations.
100% of contributions in time
Main outputs in 2017:
Policy–related outputs
Description Indicator Target date Latest known results
(situation on 31/12/2017)
All enlargement
countries
Alignment to the
Common Agricultural Policy
Accession
date (unknown)
Ongoing work
Turkey : revision of
Customs Union agricultural aspects
Adoption of
negotiation directives by
Council
2018 Council has not yet
adopted negotiation directives

agri_aar_2017_annexes Page 250 of 278
Montenegro :
negotiations on agriculture chapter in
accession negotiations
Opening of
negotiations on chapter agriculture
and rural development
2017 Chapter opened in
December 2016 with 2 closing benchmarks to be
fulfilled.
Serbia : negotiations on agriculture chapter
in accession negotiations
Action plan on acquis alignment
to be prepared by Serbia as step
towards opening negotiations in the
chapter agriculture
and rural development
(opening benchmark)
2017 2nd draft of Action plan received in December
2017
Bosnia and
Herzegovina: Analysis
of application
Review of replies
to questionnaire
sent by the Commission to the
BiH authorities in preparation of the
opinion of the country's
membership application.
Opinion to be
submitted to the Council.
2018 Commission still awaiting
reply by BiH to its
questionnaire
Specific objective: To facilitate decision-making on
strategic choices for the CAP and to support other activities of the DG by means of economic and policy
analyses and studies
Related to spending
programme: N/A
Result indicator: Timely contribution to the decision-making process for the CAP
towards 2020 Source: DG AGRI
Baseline (2015) Target Latest known results
(2017)
100 % 100 % timely deliveries:
- supporting policy and economic analysis
- publication of key documents on the CAP
100 %

agri_aar_2017_annexes Page 251 of 278
Result indicator: Representativeness of information about the EU farm economic
situation collected by the Farm Accountancy Data Network (FADN) Source: EU FADN
Baseline (2015) Target (2016) Latest known results
Observed coverage of EU agricultural production in
the accounting year 2013: - 96 % coverage of the
Standard Output
- 94 % coverage of the Utilised Agricultural Area
- Farm returns collected: 86 840
Observed coverage of EU agricultural production in the
accounting year 2014: - 90 % coverage of the EU
agricultural production as
expressed in Standard Output - 90 % coverage of the
Utilised Agricultural Area - Farm returns to be
delivered (Reg. 1291/2009 and successive
amendments): 86 755 NB: Target corrected according to
the SP 2016-2020. Maybe the year
could be removed.
Observed coverage of EU agricultural production for
accounting year 2015: - 96% coverage of the
Standard Output;
- 91% coverage of the Utilised Agricultural Area.
- Farm returns collected for accounting year 2015:
82 909
Result indicator: Adequate knowledge of Farm structure
Source: Eurostat – Farm Structure Survey
Baseline (2015) Target (2016) Latest known results
Data from the 2013 Farm
Structure Survey are extensively used in
internal analyses, publications and indicators
of the common monitoring
and evaluation framework for the CAP 2014-2020
Use of the 2013 Farm
Structure Survey data in internal analyses, publications
and indicators of the common monitoring and evaluation
framework for the CAP 2014-
2020 New survey in 2016.
Data of Farm Structure
Survey 2013 are available in the Eurostat database. The
Farm Structure Survey 2016 has been carried out by
Member States; data are
expected to be made available by Eurostat by the
end of 2018. The legal framework for the 2020
agricultural census is under preparation.
Main outputs in 2017:
Policy–related outputs
Description Indicator Target date Latest known results (situation on 31/12/2017)
Simplification and modernisation of the
Common Agricultural Policy
Launching and implementing a
public consultation on the future of
the CAP
1st half 2017 Public consultation took place from 02/02 to
02/05/2017. 322 916 replies were received and
analysed. Results were
communicated at a conference on 07/07/2017.
A Communication on the
Future of Food and Farming was adopted on
29/11/2017 (COM(2017)713).
Preparatory work for the impact assessment
supporting the legislative proposals in 2018 has
started.

agri_aar_2017_annexes Page 252 of 278
AGRICULTURAL POLICY
ANALYSIS AND DEVELOPMENT
Contribute to the definition of the long-
term strategy for the
CAP Follow-up of the
implementation of the CAP 2014-2020;
Follow-up of policy developments in fields
relevant for agriculture and rural development
(environmental and
climate policies, trade negotiations,
employment policies, etc.), both at global and
EU level
Notes and
documents on the CAP post-2020
On request 100 %
Support to other policy initiatives
(sustainable food, etc.)
On time contributions
to other policy initiatives
100 %
COUNTRY
INTELLIGENCE Monitoring of
agricultural policy developments in
Member States and policy positions in the
field of agriculture; Analysis of
documents on the
evolution of agriculture and rural areas from
Member States Other data collection
and analysis
Monitoring of
policy development in
MS
Ongoing 100 %
Data, analysis, fact sheets and
briefings on MS
Ongoing 100 %
OUTLOOK
To provide short- and medium-term outlook
for EU agricultural markets and income, to
assess the likely developments in the
current policy framework and under
alternative scenarios.
This activity is carried out in cooperation with
DG JRC. Outlook validated also through
workshop with external experts and other DGs
(ECFIN, TRADE, ENVI, CLIMA, JRC, etc.)
Report on
medium-term prospects for
agricultural commodity
markets published paper/electronic
versions
Publish new
Report before end of the
year 2017
EU Agricultural outlook for
the agricultural markets and income 2017-2030
published on 18.12.2017.
Organisation of
the EU agricultural outlook conference
18-19
December 2017
The conference took place
on 18 and 19 December 2017.
More than 600 participants and more than 3500 in
web-streaming.
Timely publication
of 3 reports on short-term outlook
for agricultural commodity
markets
Reports to be
published in March, July,
October 2017
The 3 reports were timely
published.

agri_aar_2017_annexes Page 253 of 278
ANALYSIS
Use quantitative and qualitative information
and tools to analyse main developments in
EU and world
agriculture and assess the impact of market
and policy changes
Timely preparation
of analytical notes, markets briefs and
contribution to other analytical
work in AGRI and
in other DGs
Analyses on
request
Publication of 2 market
briefs: Risk management schemes
in EU agriculture (09/2017)
Managing risk in the dairy
sector: how futures markets could help
(03/2017) Contribution to the
European Semester exercise for FR.
Contribution to many chapters of the Statistical
Annex
MODELLING
Development, maintenance and use of
quantitative analysis tools like partial
equilibrium models both
at macro- and micro-economic level,
biophysical models and other forward looking
methods.
Operational
platform of economic and
biophysical models and related
databases (in
collaboration with JRC).
Main use: trade, environment,
biofuels, climate and CAP reform
analysis.
Operational
tools for timely results
Analyses on
request
Tools were used by DG
AGRI and/or JRC to produce among others: the
outlook, a contribution to the concept paper,
contributions to the impact
assessment, the publication of the SCENAR
2030 study164
DATA INTEGRATION
To co-ordinate the statistical needs related
to the Monitoring and Evaluation Framework
of the CAP. To analyse the food
supply chain especially
price formation. Analysis of trade
statistics
Development, up-
dating and maintenance of
CMEF indicators
According to
detailed workplan.
Numerous data requests
fulfilled on time
Monthly
dashboard of EU and world
commodity prices, including along
the food supply chain
Monthly
updates.
Numerous ad-hoc analyses
delivered on time
Regular updates, ad-hoc requests
and annual trade statistics report
On demand Publication of
trade statistics report in the
summer.
Delayed due to implementation of IT
infrastructure linked to the new Farm Return
164 https://ec.europa.eu/jrc/en/publication/eur-scientific-and-technical-research-reports/scenar-2030-
pathways-european-agriculture-and-food-sector-beyond-2020

agri_aar_2017_annexes Page 254 of 278
MANAGEMENT AND
DEVELOPMENT OF FADN LEGISLATION AND
INFRASTRUCTURE Adaptation of
systems and reporting
tools following implementation of the
new Farm Return (Regulations
1217/2009, 1198/2014 and 2015/220)
Amendment of Delegated Regulation
EC 1217/2009 following
Germany's request to amend FADN divisions
by merging Schleswig-Holstein and Hamburg
Amendment of Implementing
Regulation (EU) 2015/2020 changing
the number of Farm
Returns for some Member States and
introducing additional financial incentives for
early sending and correcting data.
Further monitoring and development of
FADN IT systems.
Starting introduction of a new
analytical/visualisation tool.
Adaptation of the FADN data to the CAP
evolution and requirements/demands
for the analyses
Improve the efficiency and the
performance of the FADN reporting
Maintenance and
support of the RICA Information
Systems
100 %
availability of the system to
users (outside maintenance
periods)
Target reached.
Enhancement of
RICA2 functionality.
Amended Delegated and
Implementing
Regulations.
All business
requirements implemented
as scheduled
RICA Information Systems
adapted to the new Farm Return Regulations. Fine
tuning and configuration of amendments ongoing.
Contracting procedure for
development of a new analytical/visualisation tool
has been initiated. New modelling tool of the
CAP under development.
Basic and Implementing Regulations were
successfully amended and
published in the OJ.
ECONOMIC ANALYSES
High quality economic
analyses based in particular on FADN data
in line with the needs of DG AGRI for the
assessment of policy proposals (ex-ante) and
CAP measures (ex-post).
Delivery of
relevant and high
quality data for specific analyses
supporting policy development of
CAP after 2020
Ongoing Done
Delivery of
relevant ad-hoc analysis and
special FADN reports
Ongoing Done

agri_aar_2017_annexes Page 255 of 278
Finalisation of
FADN annual reports
Before 30
September 2017
Done
STATISTICAL COORDINATION AND
ANALYSES Coordinate the
information needs of DG AGRI within DG AGRI
and with ESTAT and ensure their
dissemination
Contribute to Commission proposals
on legislation for agricultural statistics
(e.g. Framework Regulation on
integrated Farm Statistics; Framework
Regulation on Statistics
for Agricultural Inputs and Outputs)
Provide updates of statistical factsheets
and CAP context indicators
Analyse the evolution of farm structures and
agricultural income
based on statistics
Contribute to the development of
Eurostat's framework
regulations on integrated farm
surveys and statistics on
agricultural inputs
and outputs
Ongoing Framework regulation for integrated farm statistics is
in co-decision process; framework regulation on
agricultural inputs and outputs is in drafting
stage.
Contribution to the development and
implementation of Eurostat's work
programme in
agricultural statistics, in line
with DG AGRI's data needs
Ongoing Eurostat work programme 2018 adopted in December
2017
2017 update of
statistical country
factsheets
March 2017 Done
2017 update of CAP context
indicators
December 2017
Done
2017 update of
farm income developments
December
2017
Done (information
available in the Farm Economy Focus)
GIS support to statistics
and economic/policy
analysis
Number of DG
AGRI units using
the service.
Increase 16
Number of maps and data analyses
produced.
Maintain or increase
219

agri_aar_2017_annexes Page 256 of 278
ANNEX 13: Interruptions, reductions and suspensions
EAGF

agri_aar_2017_annexes Page 257 of 278

agri_aar_2017_annexes Page 258 of 278

agri_aar_2017_annexes Page 259 of 278

agri_aar_2017_annexes Page 260 of 278

agri_aar_2017_annexes Page 261 of 278

agri_aar_2017_annexes Page 262 of 278

agri_aar_2017_annexes Page 263 of 278

agri_aar_2017_annexes Page 264 of 278

agri_aar_2017_annexes Page 265 of 278
ANNEX 14: Court of Auditors' special reports
1) Special Report 34/2016: Combating Food Waste: an opportunity for the EU
to improve the resource-efficiency of the food supply chain (multi DG audit)
The Court criticises the lack of a common definition of “food waste”, the lack of an
agreed baseline from which to target food waste reductions as well as the lack of assessment of the impact of EU policies on the fight against food waste. Major policy
areas such as agriculture, fisheries and food safety all have, according to the Court, a role to play and could be used to combat food waste better.
The Court recommended to the Commission to:
include the topic of food waste in the forthcoming review of the policy (not accepted);
promote the option of donating food that is safe for consumption and that would otherwise be wasted by completing the legislative requirement to allow
the use of food from agricultural stocks from public intervention (accepted).
In its response to the Court's recommendations, the Commission made the following
observations:
Several actions are already ongoing. Involvement of international organisations
(Food and Agriculture Organisation, United Nations Environment programme) in
the EU Platform on Food Losses and Food Waste will help facilitate cooperation and coordination of efforts at national, EU and global levels.
The Commission is already implementing initiatives to fight food waste as part of the 2015 Circular Economy Action Plan. The Commission is already
elaborating a methodology which will illustrate what constitutes food waste at each stage of the food value chain on the basis of the existing legal framework.
This methodology will support consistent measurement of food waste levels needed to assess the impact of measures taken.
The Commission will take measures to clarify EU legislation in order to facilitate
food donation, as specified in the Communication on Circular Economy. This includes a commitment to develop EU food donation guidelines for food donors
and food banks on how to comply with relevant EU legislation in the current regulatory framework (e.g. food safety, food hygiene, traceability, liability,
etc.).
The Commission has proposed several amendments to the FEAD regulation as
part of the proposal for revision of the financial regulation, adopted on 14/09/2016. One of these amendments, if approved, will offer the possibility for
Member States to use simplified cost options when financing food donations.
This is a measure aiming to facilitate the use of food donations under the FEAD.
2) Special Report 36/2016: An assessment of the arrangements for closure of
the 2007-2013 cohesion and rural development programmes (multi DG audit)
The Court criticized the lack of link between the payment of the final balance with the actual achievement of outputs and results. Further on, the Court identified that
checks by Member States and the Commission are not sufficient to ensure the legality and regularity at closure of expenditure concerning financial instruments,
contractual advances and some state aid-relevant major projects. The Court also
finds that the Commission should provide the European Parliament and the Council

agri_aar_2017_annexes Page 266 of 278
with a consolidated closure report containing key information on the most relevant performance and compliance aspects of programme implementation.
The Court recommended to the Commission should:
In its legislative proposals for the post-2020 period:
propose further alignment of the regulatory provisions for closure between cohesion and for the investment-related measures under rural
development, aiming to achieve a harmonised annual assurance process in both areas (not accepted);
introduce a final acceptance concerning the legality and regularity of
programme expenditure and the outputs and results achieved at programme closure (not accepted);
specify how it will inform the budgetary authority about the outcome of the closure procedure once the Commission has issued its final acceptance
(not accepted);
ensure that eligibility periods no longer overlap with the subsequent
programme period and that the closure procedure is finalised promptly after the end of the eligibility period (not accepted);
Adopt major project decisions still pending for the 2007-2013 and 2014-2020
(accepted);
Ensure that Member States implement specific procedures to verify the
eligibility of expenditure (accepted).
In its response to the Court's recommendations, the Commission made the following
observations:
A significant effort was already made to harmonise rules for the ESI Funds for
the 2014-2020 period, both for the annual accounting years and at closure. The Commission will seek to further harmonise regulatory provisions between the
funds, including on terminology, assurance and closure processes, whenever it
enables to improve the management of EU funds and it contributes to a simpler and more effective implementation in Member States and regions.
The Commission considers that alignment of arrangements in rural development and cohesion must not undermine the consistency of
implementation of the CAP. The importance of preserving the synergies achieved between the two pillars (EAGF and EAFRD) was recognised by the
legislator (Recital 4 of Regulation 1303/20133). For both pillars of the CAP, the conformity clearance is separate from the annual financial clearance.
The Commission will continue to inform the budgetary authority in full
transparency about programme implementation, including about the outcome of closure. However, it is not in a position at this stage to make any specific
commitment in relation to legislative proposals for the post-2020 period.
The Commission strongly believes that discontinuing the overlap of eligibility
periods will result in less policy implementation, will reduce the possibility for multiannual projects to be decided in the last year of implementation period by
imposing additional administrative burden and will cause disruption in transition between periods. For EAFRD, this would negatively affect the smooth
implementation of multiannual environmental commitments or business start-
up projects based on multi-annual business plans.

agri_aar_2017_annexes Page 267 of 278
The Commission is currently processing the remaining major project decisions for the 2007-2013 with the intention of adopting them as far as possible by the
end of 2016. Procedures are in place to adopt major project decisions within 3 months as required by the regulations. Less than 2 % of all major projects in
the 2007-2013 period remain to be approved.
In relation to eligibility of expenditure relating to financial instruments and
contractual advances, specific clarifications have already been provided to programme authorities for their assurance at closure.
3) Special Report 1/2017: More efforts needed to implement the Natura 2000
network to its full potential (multi DG audit)
The Court concluded that the Natura 2000 network had not been implemented to its
full potential. The Court criticized that EU funding schemes, including under the CAP, were insufficiently tailored to the objectives of the Natura 2000 sites. The Court also
criticized that no specific performance indicator system to monitor the expected outputs, results and impacts for the Natura 2000 network was put in place.
The Court recommended to the Commission to:
give guidance to the Member States on better target the support for Natura
2000 from EU funding programmes (accepted);
establish cross-cutting Natura 2000 indicators for all EU funds (accepted).
In its response to the Court's recommendations, the Commission made the following
observations:
It recognises the existing linguistic barriers and it aims to make guidance
documents available in all official languages. However, due to constraints in financial resources, this is only possible in a progressive manner: according to
the subject covered, some languages are prioritized as compared to others, also taking into account the most spoken languages in the EU. Key guidance
documents are translated into all official languages as from the date of their
release. All of them are made available on the Commission website. It also relies on Member States to make sure they are disseminated to the target
groups.
The Commission will consider improvement to existing indicators in Natura
2000 and the possibility to establish new ones, where relevant.
4) Special Report 7/2017: The certification bodies’ new role on CAP
expenditure: a positive step towards a single audit model but with significant weaknesses to be addressed
The Court assessed whether the framework set up by the Commission, for the first year
of implementation (2015 financial year), enabled the certification bodies (CB) to draw an opinion on the legality and regularity of CAP expenditure in accordance with the
applicable EU regulations and internationally accepted audit standards, thus providing reliable results for Commission’s assurance model.
The Court considered that the Commission could only take limited assurance from CBs' work on legality and regularity, in the first year of implementation (financial year 2015)
and that this was partially due to significant weaknesses found in the framework designed by the Commission.
The Commission replied that the Court's conclusions should be limited to the first year of
implementation of the new system and that significant progress in the quality of CB's

agri_aar_2017_annexes Page 268 of 278
work has been achieved since. To take account of the experience from the first exercise for 2015 FY (i.e. reported by the CBs to the Commission in 2016), the guidelines to CBs
were revised. Although a major change in the methodology is established as from the audit of FY2018, in order to separate the audit work done on the accounts and on legality
& regularity, the guidelines in use, for the audit of financial years subsequent to 2015, had already been reinforced on several aspects raised by the Court. The CBs have also
adjusted their annual certification audit on legality & regularity based on the first years' experience. Thus, the recommendations are considered as already implemented (and
some had already been implemented at the time of the Court's audit). In two cases, as
set out below, the Commission only partially accepted the Court's recommendation.
Recommendations raised by the Court; actions and position taken by the Commission:
(1) Assurance from the CBs' work on legality and regularity: when the work is defined and performed in accordance with the applicable regulations and
internationally accepted audit standards, the CBs' results should be used as a key element in the Commission's assurance model.
The Commission only partially accepted the recommendation, as it considered that, while the guidelines for FY2015 had to be improved, where they
were correctly applied, they already, in their 2015 form, enabled the CBs to give an
opinion on legality and regularity in compliance with applicable rules and standards. The Commission agreed with the Court that, where the audit work of the CBs is
done in accordance with the applicable regulations and guidelines, their opinion is an important and valuable additional building block and should be the key element
for the Commission's assurance.
(2) Risk assessment focused on key and ancillary controls: the CBs' risk
assessment should be focused on the key and ancillary controls used by the Commission and complemented by any other evidence judged appropriate by the
CBs.
The CBs had already been advised to use the Commission definitions of key and ancillary controls when testing the procedures for authorisation of claims in the
FY2015 Guideline and it was further reinforced in the FY2018 Guideline. Therefore, the Commission accepted this recommendation and considered it already
implemented.
(3) Safeguards for IACS sampling based on paying agencies' (PAs) on-the-spot
checks: the Commission should reinforce its guidelines requiring that CBs' samples are representative; CBs shall plan and carry out visits shortly after the PAs' own
checks; CBs shall not disclose their sample to the PAs before the PAs' own checks.
The Commission accepted the recommendation and considered it as implemented in the new guidelines for FY2018. The new guidelines have been
reinforced as regards the following aspects:
the CB should check that the PA sample is selected in accordance with
relevant legislation, rules and guidelines including representativeness and then, the CB should check the representativeness of its own sample;
crucial importance of the timing for the IACS re-verifications: a recommended timing of the audit activities is included in the guidelines;
as part of the audit procedures, the CB should check the completeness and
assurance of the control results reported in the control statistics.
(4) Non-IACS sampling based on payments: sampling method for non-IACS
expenditure should be revised, so that the sample is drawn from the payments made during the financial year being audited.

agri_aar_2017_annexes Page 269 of 278
The Commission accepted the recommendation and considered that it has already been implemented in the new guidelines for FY2018. As regards the
non-IACS populations, actual payments should be the basis for the CB's sample. In case of time constraints, e.g. for measures entailing many payments close to the
end of the year, the CBs are recommended to use estimated payments.
(5) Substantive testing carried out on-the-spot: the CBs shall be able to carry out
on-the-spot testing for any transaction audited and all audit steps and procedures that they themselves consider appropriate, without being limited to re-performing
the PAs’ initial checks.
The Commission only partially accepted the recommendation. It did not accept the part which would entail that the CBs go on-the-spot for transactions
which have not been controlled on–the-spot by the PA. This would not be in line with the Commission’s CAP assurance model and single audit approach. The
Commission accepted the recommendation as regards allowing the CBs to carry out all the audit steps and procedures that they themselves consider
appropriate and considered that it has already been implemented.
(6) A single error rate in relation to legality and regularity: calculation of two
different error rates regarding legality and regularity should not be required; and
error rate on legality and regularity should not be used to judge the completeness, accuracy and veracity of the PA's annual accounts.
The Commission accepted the recommendation and considered that it has already been implemented. The new guidelines for FY2018 clearly separate the
conformity and financial clearance procedures. To that end, CBs are to calculate two separate rates of error: an error rate (ERR) including only errors from the
annual accounts testing, and an incompliance rate (IRR) including all legality and regularity errors not detected by the PA. The IRR will be used both for the audit
opinion on legality and regularity and to confirm (or not) the assertions in the
Management declaration of the PA. The IRR will be used to top up the control results reported by the PAs.
(7) An error rate representative of the population covered by the audit opinion: as regards IACS populations, the overall error calculated by the CBs
should also include the level of error reported by the PAs in the control statistics, extrapolated to the remaining transactions not subject to PA on-the-spot checks;
The CBs have to ensure that the control statistics compiled by the PAs are complete and accurate.
The Commission accepted the recommendation and considered that it has
already been implemented. The new guidelines for FY2018 provide that the incompliance rate for the IACS populations be based on the PA's random on-the-
spot check sample, however, the extrapolated result for the part of the population is then extrapolated to the whole population in order to conclude on the legality and
regularity of all IACS expenditure. For the Non-IACS populations, the approach is slightly different to take into account the different design of the measures and the
fact that the PA's random samples may not be representative in all cases. Thus, the incompliance rate to be calculated by the CBs should be based on a sample drawn
from all expenditure which is then extrapolated.
5) Special Report 10/2017: EU support to young farmers should be better targeted to foster effective generational renewal
The Court criticized that this aid is often poorly defined, with no expected result and impact specified. The Court recommended to better define the objectives and target
the EU support in order to foster effective generational renewal.

agri_aar_2017_annexes Page 270 of 278
The Court recommended to the Commission to:
improve the intervention logic by reinforcing needs assessment and defining
SMART objectives (partially accepted);
improve the monitoring and evaluation system (partially accepted).
The Court recommended to the Member States to:
- improve the targeting of the measures;
- collect actual data on the structural and financial characteristics of the supported holdings allowing assessing the efficiency and effectiveness of the
measures in achieving the desired policy objectives.
In its response to the Court's recommendations, the Commission made the following observations:
The Commission will analyse and consider possible relevant policy instruments for the support to young farmers and their logic of intervention in the context of
the preparation of future legislative proposals.
The Commission will continue to carry out relevant studies and investigations at
the level of the EU, about which needs could be addressed by EU policy instruments and will continue to promote best practices through networking
activities. The Commission will also reflect about the definition of SMART
objectives as regards any possible future Union support to young farmers and of an appropriate performance framework.
While the Commission is strongly committed to improve the performance framework for the CAP post 2020, the concrete way to achieve this
improvement will depend on the overall new policy setting. However, also such a monitoring and evaluation system needs to be proportionate and provide
value for money. In this context, inevitably a balance will need to be found between scope and depth of the monitoring and evaluation system and related
costs and burdens. As often several measures contribute to the same
objectives, the effectiveness and efficiency of measures should be assessed in the course of an evaluation, not directly observed via result or impact
indicators. For this reason, the indicators are linked to specific (result indicators) and general (impact indicators) objectives.
In its response to the Court's recommendations to the Member States, the Commission made the following observations:
The Commission takes note of the need for clearer criteria in the case of joint control of legal holdings, but underlines that:
assessing the role of young farmers in legal persons is interlinked with
important aspects at national level, in particular national company law that vary widely across the EU;
Young farmers often work and gradually take control over joint holdings with elder farmers;
and that farm diversification is an important aspect of the CAP.

agri_aar_2017_annexes Page 271 of 278
The Commission is of the opinion that the different elements of this recommendation (applying clear selection criteria – also in case of joint setting-
up, applying minimum thresholds, and require business plans) are already under the scope of the current legal framework. The Commission in its advisory
role will continue to encourage the Member States to improve the quality of the required business plan and more generally, the selection process.
6) Special Report 16/2017: Rural Development Programming: Less complexity and more focus on results needed
The Court considered that the design of the 2014 – 2020 programming framework
was more ambitious, but the implementation was affected by significant shortcomings, such as a lack of evident link between the RD thematic objectives and
the Europe 2020 Strategy, no ensured consistency between RDPs’ and the partnership agreements, no real results from the application of the reinforced
intervention logic. The Court finds that the new performance framework has limited potential to enhance the focus on performance and results and that the "performance
reserve" is a misnomer because the indicators used for the performance review do not measure policy results but explicitly seek to measure expenditure and direct
output. The Court issues several recommendations for the post 2020 design of the
RD policy as regards the complexity, the consistency, the implementation reporting, the result-oriented indicators and the use of the performance reserve.
The Court recommended to the Commission to:
- ensure that its policy proposals further develop the requirements concerning
consistency between individual programmes (partially accepted);
- review the design of programming documents with a view to simplifying their
content and reducing the number of requirements (accepted);
- work with the Member States to ensure that the enhanced annual
implementation reporting of 2019 provides clear and comprehensive
information on programme achievements (accepted);
- define the various types of indicators more accurately, benefiting from good
practices established by national authorities and international organisations (partially accepted);
- review and take stock of the experience from the implementation of the current system including: the impact of the performance reserve, the appropriateness
of result indicators used to access the performance reserve and the use made of financial sanctions to address underperformance (accepted);
- prepare its legislative proposals for rural development policy post 2020 in good
time (accepted).
In its response to the Court's recommendations, the Commission made the following
observations:
The Commission has the responsibility of the implementation of the
Regulations, avoiding the introduction of elements of complexity and promoting further simplification to the maximum possible extent.
The Commission commits to analyse possible ways to simplify the structure and level of requirements of programming documents to the most possible extent.
Reflections in this respect have already been initiated in the context of the
preparation of the Commission Communication on CAP Modernisation and Simplification.

agri_aar_2017_annexes Page 272 of 278
The reliability of data submitted to the Commission falls under the responsibility of the Member States. The quality of the data submitted by the Member States
in the context of monitoring requirements is assessed by the Commission, which takes appropriate follow-up actions where relevant. The Commission also
supports Member States through capacity buildings networking activities.
As regards the definition of common indicators, there are intrinsic limitations
which have to be considered. The same applies as regards the possibility to impose large data collection requirements at the level of beneficiaries.
The performance framework provides a mechanism for monitoring whether the
implementation of the priorities is on track. The performance reserve provides an incentive to achieve the milestones, which necessarily are the precondition
for obtaining the intended results.
The Commission commits to analyse possible ways to improve the performance
measurement of the CAP as a whole. Reflections in this respect have already been initiated in the context of the preparation of the Commission
Communication on CAP Modernisation and Simplification.
7) Special Report 21/2017: Greening – A more complex income support
scheme, not yet environmentally effective
The Court considers that the intervention logic of greening is uncomplete and that, as currently implemented by Member States and farmers, greening is unlikely to provide
the expected environmental and climate delivery. In addition the Court finds complexity entailed by overlaps with other instruments.
The Court recommended to the Commission to:
- develop a complete intervention logic for the CAP’s contribution to the
environmental and climate-related objectives of the EU, including specific targets and based on up-to-date scientific understanding of the phenomena
concerned for the next CAP reform (accepted);
- review and take stock of the implementation of the current CAP guided by the following principles (partially accepted):
Farmers should only have access to CAP payments if they meet a set of basic environmental norms encompassing areas covered by the current
GAECs and the generalised greening requirements.
Specific, local environmental and climate-related needs can be
appropriately addressed through stronger programmed action regarding agriculture (based on the achievement of performance targets and
funding reflecting an assessment of the average costs incurred and
income foregone in relation to actions and practices going beyond the environmental baseline).
When Member States are given options to choose from their implementation of the CAP, they should be required to demonstrate, prior
to implementation, that the options they select are effective and efficient in terms of achieving policy objectives.

agri_aar_2017_annexes Page 273 of 278
In its response to the Court's recommendations, the Commission made the following observations:
It is not in a position at this stage to make specific commitments in relation to legislative proposals for the post 2020 period and for the target implementation
date. However work has already started to further develop the intervention logics of environmental and climate-related instruments of the CAP including
greening.
The Commission is already reviewing and taking stock of the implementation of
the current CAP in view of the Commission's legislative proposals for the post-
2020 CAP. In this respect, the Commission has already issued two reports on the implementation of greening in 2016 and 2017.
The Commission actively supervises Member States' implementation of greening and follows up on the incorrect implementation of EU rules. However
there are limits to the assessment capabilities of the Commission, which is not in the position to validate in details whether these choices are environmentally
relevant in specific national or local situations.

agri_aar_2017_annexes Page 274 of 278
ANNEX 15: Abbreviations
Abbreviation Full text
A AAR Annual Activity Report
ABB Activity-Based Budgeting ACP African, Caribbean, and Pacific Group of States
DG AGRI Directorate-General Agriculture and Rural Development AMIS Agricultural Market Information System
ANC Areas facing natural and other specific constraints
ARES Advanced Records System AT Austria
AWBM Activity Without Budgetary Measure AWP Annual Work Programme
AWU Annual Work Unit B
BCO Broadband Competence Offices BE Belgium
BG Bulgaria
BiH Bosnia-Herzegovina DG BUDG DG Budget
C CAP Common Agricultural Policy
CAS Common Audit Service CB Certification Body
CETA EU-Canada Free Trade Agreement (Comprehensive Economic and Free Trade Agreement)
CHAFEA Consumers, Health, Agriculture and Food Executive Agency
CLAR Client in Audit Research DG CLIMA Directorate-General Climate Action
CMO Common Market Organisation COMAGRI Committee on Agriculture and Rural Development in the European
Parliament DG CNECT Directorate-General Communication Networks, Content and
Technology DG COMP Directorate-General Competition
COP Cereal, Oilseed and Protein crops
CSF Common Strategic Framework CWP Commission Work Programme
CY Cyprus CZ Czech Republic
D DCFTA Deep and Comprehensive Free Trade Areas
DDA Doha Development Agenda DE Germany
DG Directorate-General
DG DEVCO Directorate-General International Cooperation and Development DG DIGIT DG Informatics
DIH Digital Innovation Hubs DK Denmark
DSM Digital Single Market E
DG EAC Directorate-General Education and Culture EAFRD European Agricultural Fund for Rural Development
EAGF European Agricultural Guarantee Fund
EAGGF European Agricultural Guarantee and Guidance Fund ECA European Court of Auditors

agri_aar_2017_annexes Page 275 of 278
Abbreviation Full text
EE Estonia
EEA European Environment Agency EFA Environmental Focus Area
EFSI European Fund for Strategic Investments EIP European Innovation Partnership
EL (GR) Greece DG EMPL Directorate-General Employment, Social Affairs and Inclusion
DG ENER Directorate-General Energy
ENRD European Network for Rural Development DG ENV Directorate-General Environment
EP European Parliament EPA Economic Partnership Agreement
ERR Error rate ES Spain
ESIF European Structural and Investment Funds ESPG Environmentally sensitive permanent grassland
DG ESTAT Eurostat
ETC/ACC European Topic Centre on Air and Climate Change EU European Union
EU-15 AT, BE, DE, DK, EL, ES, FI, FR, IE, IT, LU, NL, PT, SE, UK EU-28 All EU Member States
EU-N10 Members States that joined the EU in 2004: Czech Republic (CZ), Estonia (EE), Cyprus (CY), Latvia (LV), Lithuania (LT), Hungary
(HU), Malta (MT), Poland (PL), Slovenia (SI) and Slovakia (SK) EU-N13 EU-N10 plus Member States that joined the EU in 2007 (Bulgaria
(BG), Romania (RO) and 2013 (Croatia (HR)) respectively
EUR (€) Euro F
FADN Farm Accountancy Data Network FAO Food and Agriculture Organization of the United Nations
FEAD Fund for European Aid to the Most Deprived FI Financial instruments
FI Finland FP7 7th Framework Programme
FR France
FTA Free Trade Agreement FVO Food and Veterinary Office
FY Financial Year fYRoM Former Yugoslav Republic of Macedonia
G G7 Group of Seven (leading industrialised nations: Canada, France,
Germany, Italy, Japan, UK, USA) G20 Group of Twenty (governments and central bank governors from
Argentina, Australia, Brazil, Canada, China, France, Germany,
India, Indonesia, Italy, Japan, Mexico, the Republic of Korea, the Russian Federation, Saudi Arabia, South Africa, Turkey, the United
Kingdom, the United States, and the EU) GAEC Good Agricultural and Environmental Conditions
GHG Greenhouse gases GI Geographical Indications
GR Greece DG GROW Directorate-General Internal Market, Industry, Entrepreneurship
and SMEs
GVA Gross Value Added

agri_aar_2017_annexes Page 276 of 278
Abbreviation Full text
H
HR Croatia HR Human Resources
HU Hungary I
IAC Internal Audit Capability IACS Integrated Administration and Control System
IAS Internal Audit Service
ICM Internal Control Monitoring ICT Information and Communication Technology
IE Ireland IEPA Interim Economic Partnership Agreement
IoF Internet of Food and Farm IoT Internet of Things
IPA Instrument for Pre-accession Assistance IPARD Instrument for Pre-Accession Assistance Rural Development
IRR Incompliance rate
IT Information Technology IT Italy
J JRC Joint Research Centre
DG JUST Directorate-General Justice and Consumers L
LAG Local Action Group LAU2 Local Administrative Units
LEADER Liaison Entre Actions de Développement de l'Économie Rurale
LPIS Land Parcel Identification System LT Lithuania
LU Luxembourg LV Latvia
M MAFA Multi Annual Financing Agreement (SAPARD)
DG MARE Directorate-General Maritime Affairs and Fisheries ME Montenegro
MEP Member of the European Parliament
MFA Multi Annual Financing Agreement (IPARD) MFF Multi-annual Financial Framework
MoU Memorandum of Understanding DG MOVE Directorate-General Mobility and Transport
MS Member State MT Malta
N NAO National Authorizing Officer
NIPAC National 'Instrument for Pre-accession Assistance' Coordinator
NL Netherlands NRN National Rural Networks
O OECD Organisation for Economic Co-operation and Development
OIB Office for Infrastructures and Logistics in Brussels OJ Official Journal
OLAF Office de Lutte Antifraude OTSC On-the-spot checks
P
PA Paying Agency PDO Protected Designations of Origin
PGI Protected Geographical Indications PL Poland

agri_aar_2017_annexes Page 277 of 278
Abbreviation Full text
PMO Office for Administration and Payment of Individual Entitlements
PO Product organisation POSEI Programme d'Options Spécifiques à l'Éloignement et l'Insularité
(Programme of Options Specifically Relating to Remoteness and Insularity)
POSEICAN Programme of options specific to the remote and insular nature of the Canary Islands
POSEIDOM Programme of options specific to the remote and insular nature of
the overseas departments POSEIMA Programme of options specific to the remote and insular nature of
Madeira and the Azores PT Portugal
R RAD DG BUDG database ("Recommendations/Actions/Discharge")
RBN Research Budget Network RD Rural Development
RDP Rural Development Programme
REA Research Executive Agency DG REGIO Directorate-General Regional and Urban Policy
RO Romania RoO Rules of Origin
DG RTD Directorate-General Research and Innovation S
SAPARD Special Accession Programme for Agriculture and Rural Development
DG SANTE Directorate-General Health and Food Safety
SAPS Single Area Payment Scheme SC Societal Challenge (Horizon 2020)
SDGs Sustainable Development Goals SE Sweden
SF Support Facility SG Secretariat-General of the European Commission
SI Slovenia SJ Legal Service of the European Commission
SK Slovakia
SMP Skimmed milk powder SPS Single Payment Scheme
SPS Sanitary and Phytosanitary SR Special Report
T DG TAXUD Directorate-General Taxation and Customs Union
TFEU Treaty on the Functioning of the European Union TFP Total Factor Productivity
ToR Terms of Reference
TR Turkey DG TRADE Directorate-General for Trade
TRDI Transitional Rural Development Instrument TRIPs Agreement on Trade-Related Aspects of Intellectual Property Rights
TRQ Tariff-Rate Quota TSG Traditional Specialities Guaranteed
TTG Time to grant TTIP Transatlantic Trade and Investment Partnership
TTP Time to pay

agri_aar_2017_annexes Page 278 of 278
Abbreviation Full text
U
UAA Utilised agricultural area UK (GB) United Kingdom
UN United Nations UNFCCC UN Framework Convention on Climate Change
US United States of America V
VCS Voluntary Coupled Support
W WTO World Trade Organization