andover and romsey retail capacity & leisure
TRANSCRIPT
ANDOVER AND ROMSEY RETAIL CAPACITY & LEISURE STUDY - 2018 FINAL REPORT
April 2018
One Chapel Place, London, W1G 0BG
ANDOVER AND ROMSEY RETAIL CAPACITY & LEISURE STUDY - 2018 Page 2 of 190
CONTENTS
EXECUTIVE SUMMARY 6
1 INTRODUCTION 13
2 PLANNING POLICY REVIEW 15
National Planning Policy Framework (NPPF) (2012) 15 National Planning Practice Guidance (PPG) 17 Draft Revised National Planning Policy Framework (Draft NPPF) 18 Local Planning Policy Context 18 Housing 20 Retail 22 Summary 24
3 NATIONAL RETAIL AND TOWN CENTRE TRENDS 25
Retail Trends 25 Special Forms of Trading and Internet Shopping 26 Floorspace 'Productivity' Growth 29 Changing Retailer Requirements 30 Vacancy Levels 31 Trends in Retail-Led Investment and Development 32 Independents and Street Markets 34 Impact of Out-Of-Centre Retailing 35 Summary 36
4 CATCHMENT AREA & SHOPPING PATTERNS 38
Study Area and Zones 38 Household Telephone Interview Survey & Market Share Analysis 40 Summary 47
5 IN-CENTRE SURVEY RESULTS 49
Method 49 Socio-Economic Profile of Shopper and Visitors to Centres 50 Mode of Travel 52 Length of stay 53 Frequency of Visits 54 Main Reason for Visit 55 Main Types of Shops Visited 55 Main Shops Visited 55 Spending Levels in Andover and Romsey 56 Linked Trips in Andover and Romsey 57 Respondents views of Andover and Romsey 58 Potential Improvements to Andover and Romsey 59 Retailer ‘Gap’ Analysis 60 Competing Shopping Destinations 61 Why Respondents Shop Elsewhere 62 Provision of Leisure facilities 63 Street Markets 64 Summary 65
6 BUSINESS SURVEY RESULTS 66
Method 66 Types of Business 66 Time Businesses Have Been Operating in Centres 68 Size of Businesses 69
ANDOVER AND ROMSEY RETAIL CAPACITY & LEISURE STUDY - 2018 Page 3 of 190
Main Reasons why Businesses located in Andover and Romsey 69 Future Business Plans 70 Key Constraints to Growth 70 Actions to Facilitate Growth 71 Andover Town Centre 72 Romsey Town Centre 76 Business Performance 79 Trading Performance 80 Benefits to the Businesses 81 Summary 81
7 TOWN CENTRE HEALTH CHECKS: METHODOLOGY 84
Engagement of Key Stakeholders 84 Retail Composition & Diversity of Uses 85 Goad Town Centre Definitions and Floorspace 86 Vacancies 86 Multiple and Independent Retailers 86 Street/Covered Markets 87 Retailer Demand and Requirements 87 Prime Zone A Rents 87 Customer Views and Behaviour 87 Environmental Quality 87 Accessibility 88 Out of Centre Provision 88 New Investment & Potential Development 88
8 ANDOVER TOWN CENTRE – HEALTH CHECK ASSESSMENT 89
Context 89 Retail Composition & Diversity of Uses 91 Multiple and Independent Retail Representation 96 Markets and Events 96 Retailer Demand & Requirements 97 Prime Zone A Rents 97 Environmental Quality 98 Accessibility & Pedestrian Flows 98 Customer Views and Behaviour / Household Survey 100 Out of Centre Provision 101 New Investment & Potential Development 101 Summary 102
9 ROMSEY TOWN CENTRE – HEALTH CHECK ASSESSMENT 105
Context 105 Retail Composition & Diversity of Uses 107 Vacancies 110 Multiple and Independent Retail Representation 111 Markets and Events 111 Retailer Demand & Requirements 112 Prime Zone A Rents 112 Environmental Quality 113 Accessibility & Pedestrian Flows 113 Customer Views and Behaviour / Household Survey 114 Out-of-Centre Provision 115 New Investment & Potential Development 115 Summary 115
10 COMPARATOR CENTRES 118
Methodology 118 Bury St Edmunds 118
ANDOVER AND ROMSEY RETAIL CAPACITY & LEISURE STUDY - 2018 Page 4 of 190
Petersfield 120 Yeovil 121 Sherborne 122 Andover Gap Analysis 122 Romsey Gap Analysis 124 Summary 125
11 QUANTITATIVE RETAIL NEEDS ASSESSMENT 127
The CREATe Model: Key Baseline Assumptions & Forecasts 127 Base Year Population and Projections 128 Base Year Expenditure Per Capita and Forecasts 128 Total Available Expenditure 129 Market Share Analysis (excluding SFT) 129 ‘Inflow’ (Trade Draw) 130 Retail Floorspace Commitments & Allocations 131 Test Valley Capacity Forecasts 132 Summary 135
12 COMMERCIAL LEISURE NEEDS 136
Leisure Expenditure Growth 136 Cinema Capacity 138 Eating & Drinking Out 142 Health & Fitness Need 145 Bingo & Gambling Needs 149 Other Commercial Leisure Needs 151 Cultural Activities 152 Hotel Provision 154 Conclusion 155
13 SHOPPING FRONTAGES & BOUNDARIES POLICY CONTEXT 158
Shopping Frontages & Boundaries National Policy and Context 158 Test Valley Council’s Current Policy Context 161
14 TOWN CENTRE STRATEGIES: SUMMARY OF KEY FINDINGS AND RECOMMENDATIONS 168
Needs Assessment 168 Ensuring the Vitality of Town Centres 170 Retail Hierarchy Recommendations 172 Recommendations on Frontages 173 Local Impact Threshold: Recommendations 174 Sequential Test Threshold: Recommendations 176
15 GLOSSARY 177
Appendix 1: STUDY AREA 179
Appendix 2: POPULATION AND EXPENDITURE (CONVENIENCE GOODS) 180
Appendix 3: POPULATION AND EXPENDITURE (COMPARISON GOODS) 181
Appendix 4: CONVENIENCE GOODS MARKET SHARES 182
Appendix 5: COMPARISON GOODS MARKET SHARES 183
Appendix 6: FORECAST CONVENIENCE GOODS TURNOVER 184
Appendix 7: FORECAST COMPARISON GOODS TURNOVER 185
ANDOVER AND ROMSEY RETAIL CAPACITY & LEISURE STUDY - 2018 Page 5 of 190
Appendix 8: CONVENIENCE GOODS CAPACITY ASSESSMENT 186
Appendix 9: COMPARISON GOODS CAPACITY ASSESSMENT 187
Appendix 10: NEMS HOUSEHOLD SURVEY RESULTS 188
Appendix 11: NEMS IN-CENTRE SURVEY RESULTS 189
Appendix 12: NEMS BUSINESS SURVEY RESULTS 190
ANDOVER AND ROMSEY RETAIL CAPACITY & LEISURE STUDY - 2018 Page 6 of 190
EXECUTIVE SUMMARY
Introduction
1. Carter Jonas was commissioned by Test Valley Borough Council to produce a Retail Capacity and Leisure Study (the ‘Study’) to help inform both plan-making, and development management decisions across the local authority area.
2. The Study has been prepared in the context of current and emerging national and development plan policy guidance, as well as other key material considerations; principally the National Planning Policy Framework (NPPF) published in March 2012, and the draft National Planning Policy Framework (NPPF) published in March 2018.
3. The key elements include:
� a review of national and local planning policy pertaining to retail planning and town centres;
� a review of trends driving changes in the retail and leisure sectors;
� market share analysis for convenience and comparison goods shopping and leisure uses across the
Borough based on a specifically commissioned Household Telephone Interview Survey (HTIS);
� a health check for the Council’s main town centres of Andover and Romsey;
� quantitative need (capacity) assessment for new retail (comparison and convenience goods) floorspace in
the Council area up to 2036;
� a ‘gap’ assessment of commercial leisure and other town centre uses;
� recommendations on the extent of the existing Primary Shopping Frontages (PSFs) and Secondary
Shopping Frontages (SSFs) in the Borough’s main centres; and
� strategic advice on how the Council can effectively plan for, manage and promote the vitality and viability
of the main centres over the plan period to 2036.
Planning Policy & Retail Trends
4. The review of the adopted and draft NPPF and Local Plan policy highlights the importance to maintain and enhance the vitality and viability of Town Centres, and to promote new sustainable development and economic growth in Town Centre locations 'first', prior to the consideration of edge of centre, and then out of centre locations. This policy objective is crucial as Town Centres are facing increasing economic challenges associated with alternative forms of retailing, in particular online shopping.
5. Existing floorspace in Town Centres face a myriad of challenges. These will continue to grow over the short, medium and long term. Centres within the Borough will need to embrace the new dynamics and build in resilience to adapt seamlessly to future changes where necessary. There is still a role for existing floorspace and physical ‘store based’ retailing in town centres. However, within the Borough, there will be a need to build in resilience to the changes in shopping habits - town centres are likely to move away from being solely retail led locations to those which offer a wider range of retail, leisure, cultural and other amenities.
Market Shares
6. The Study addresses the requirement for the Council to update their evidence base in respect of retailing, commercial leisure and town centre uses. To understand the local retail and commercial dynamics, a Study (catchment) Area was defined for the retail and town centre assessment. This is shown in Figure 1:
ANDOVER AND ROMSEY RETAIL CAPACITY & LEISURE STUDY - 2018 Page 7 of 190
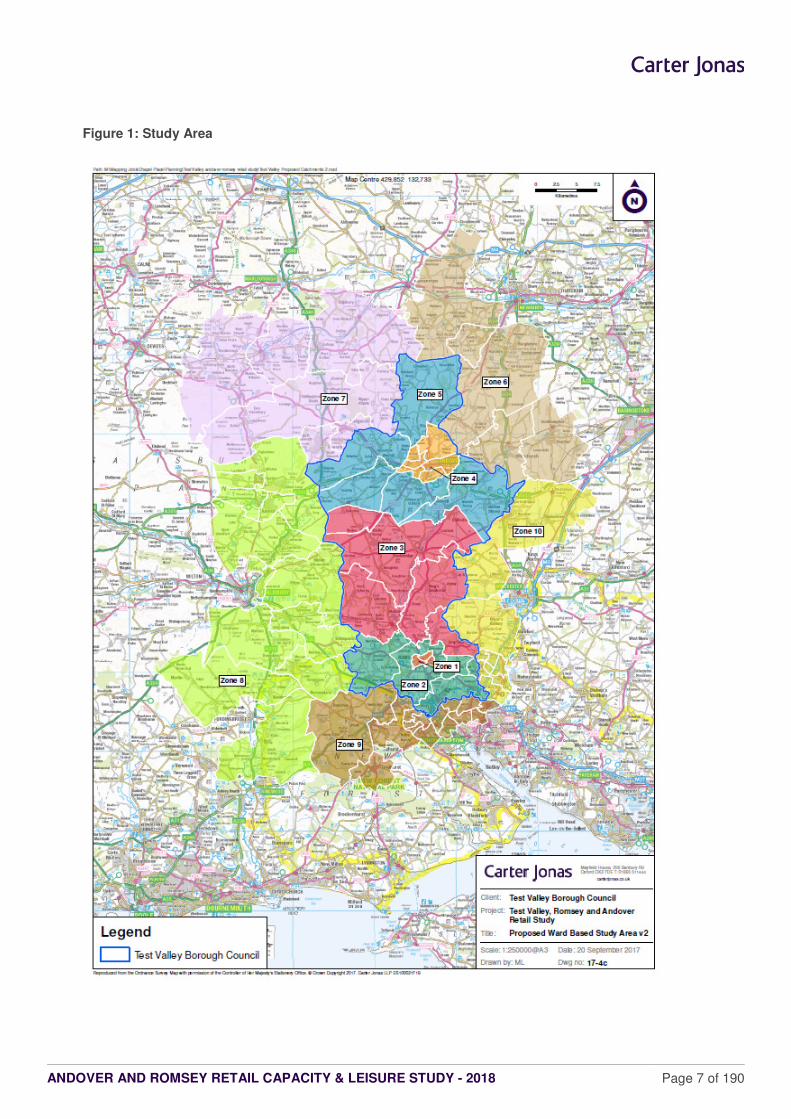
Figure 1: Study Area
ANDOVER AND ROMSEY RETAIL CAPACITY & LEISURE STUDY - 2018 Page 8 of 190
7. The Study Area comprised ten zones based on ward geography. A household telephone interview survey of some 1,000 respondents was carried out across this area.
8. Across the Council area (Zones 1-5) the market share for Special Forms of Trading1 (SFT) for convenience goods is lower than the national average, which suggests that there is potential for internet food shopping to increase its market share over time. This may reduce the expenditure available to support the need for physical space over the longer term. The comparison goods market share across the Council Area (Zones 1-5) for SFT is higher than the national average. This may indicate there is a gap in the existing comparison shopping facilities, specifically within Andover which has an unusually high SFT retention rate of 40.1%.
9. Convenience food stores within the Council area are achieving an overall market share of 67.6% across the Council Area, which represents a good retention rate reflecting the strength and quality of the overall food shopping offer. In terms of each centre, the results show:
� In Andover, the in-centre and out-of-centre stores retain 88.4% of convenience expenditure within its PCA; and 46.7% in the Borough Area. This is very positive and suggests a good provision and choice of food convenience stores.
� In Romsey, the in-centre and out-of-centre stores retain 36.3% of convenience expenditure within its PCA; and 16.5% across the Borough Area. The key competition comes from locations outside of the Borough, including Eastleigh (drawing 24.4% of the PCA convenience expenditure) and Southampton (10.8%).
10. In contrast, the comparison goods market share for the main centres and stores in the Borough is lower at 41.6%. The comparison spend for Andover is being leaked out to:
� Retail facilities outside of the Test Valley Council Area, including Basingstoke, Salisbury, Southampton, and Winchester, which take 41.6% of the comparison expenditure;
� Online shopping which accounts for 36.3% of comparison expenditure in the PCA; and
� The immediate out-of-centre facilities, such as Churchill Retail Park and Enham Arch Retail Park which draw 18.1% of the comparison expenditure in the PCA.
11. In Romsey, comparison spend is being leaked out to:
� Retail facilities outside the Borough, which take 58.6% of comparison expenditure; notably to shops in Eastleigh (9.9%), Hedge End (5.5%) and Southampton (30.1%); and
� Online shopping which accounts for 24.8% of comparison expenditure in the PCA.
12. Based on the above, it would appear that there are gaps in Andover and Romsey’s comparison offer.
Health Check: Andover
13. Although Andover is a relatively healthy centre, it is vulnerable to impacts from online shopping and competition from out-of-centre stores. This is illustrated by the recent announcement of the store closure of M&S. These trends will inevitably impact on the centre’s overall vitality and viability and turnover performance; including the additional loss of footfall and linked trip expenditure to other shops and businesses in the town. The key strengths and weaknesses are summarised below:
� Andover’s convenience provision is strong, due to the wide choice and presence of multiples including: Lidl, Asda, Waitrose and M&S.
� The comparison provision is adequate. There could be potential to increase high street fashion brands as well as the opportunity to increase the quality of the independent retailers, both of which however, are subject market demand.
1 Special Forms of Trading (SFT) comprises all non-store retail sales made via the internet, mail order, stalls and markets, door-to-door and
telephone sales.
ANDOVER AND ROMSEY RETAIL CAPACITY & LEISURE STUDY - 2018 Page 9 of 190
� The market could also support the convenience provision but it needs significant improvement by raising the quality of goods sold, and by establishing a more holistic management.
� In terms of services, the provision is relatively good. The diversity of the majority of uses is in line with or above the national average. However, Andover’s leisure facilities are currently scattered around the centre and there is a lack of family-friendly restaurants. Overall, there is a need to establish an evening economy, which ideally could concentrate around the main square.
� Andover has a below average vacancy rate of 8.8%.
� Andover is a historic market town with unique character, good accessibility and pedestrian flows. There are key areas which require improvement: firstly, the Chantry Centre has a large amount of vacancies and is outdated in layout, which contributes to a poor shopping environment; and secondly Bridge Street Mall, which is also characterised by high vacancy levels and a poor environment.
� In terms of development opportunities and future strategies, there is potential to establish a Cultural Quarter around the Lights and Andover Leisure Centre. The Andover BID is currently in consultation with Town Centre businesses and if the ballot is successful, a future BID will be established to improve the Town Centre through marketing and enhancing the environment.
Health Check: Romsey
14. Romsey is a healthy and vital centre, and is fulfilling its role and function in the hierarchy of centres. The key strengths and weaknesses are summarised below:
� Romsey’s retail composition is characterised by independent businesses and retailers that contribute positively to its overall attraction, health and vitality.
� Convenience goods are in line with the national average, with key anchor food stores including Waitrose and Aldi.
� The comparison offer is above the national average and strengthened through the presence of independent stores and the Bradbeers department store.
� There could be potential to introduce higher-end fashion retailers to raise Romsey’s profile, and to improve its independent niche and boutique offer.
� The market supplements the retailer offer and contributes to the centre’s overall offer and unique attraction.
� The range of services within Romsey is good, given its size, role and function. There is potential to introduce more evening economy uses that appeal to the younger generation (such as a cinema etc.).
� Romsey has a below average vacancy rate of 5.8%.
� The overall environment is welcoming and attractive with good accessibility and pedestrian flows. The town is characterised by historic and listed buildings that contribute to the sense of place.
� However, Romsey is located in a conservation area which limits the potential for major new development and investment.
� In terms of proposed developments, the strategic housing allocations at Whitenap will increase the town’s catchment population and spend, but could also add pressure to comparison and service sector.
Quantitative Capacity Assessment
15. The convenience capacity assessment has demonstrated the following:
� There will be residual expenditure capacity of £25.3m by 2036;
ANDOVER AND ROMSEY RETAIL CAPACITY & LEISURE STUDY - 2018 Page 10 of 190
� With regards to superstore format, the forecasts show a limited capacity up to 2021. The Borough-wide capacity increases to 2,093 sqm net in 2036. The majority of this capacity is forecast for Romsey Town Centre (633 sqm by 2036), and Andover Town Centre (529 sqm by 2036); and
� In terms of supermarket/discounter formats, the forecasts show no capacity at 2021, with an increase to 3,349 sqm net at 2036. The majority of the capacity is forecast for Romsey Town Centre (1,013 sqm by 2036), and Andover Town Centre (846 sqm by 2036).
16. The comparison capacity assessment has demonstrated the following:
� By 2036 there will be forecast ‘residual’ comparison goods capacity of £112m for the Borough area.
� This produces a Borough-wide capacity for 12,487 sqm net of new comparison goods floorspace by 2036.
� The capacity for new floorspace over the short to medium term is more limited, with a forecast of 909 sqm in 2021, increasing to 4,134 sqm by 2026.
� In Andover there is a potential need for 1,749 sqm net in 2026, increasing to 4,938 sqm net by 2036.
� In Romsey, there is a potential need for 762 sqm net in 2026, increasing to 2,207 sqm net.
� Existing out of centre shopping facilities generate the biggest forecast capacity with a potential need for 1,543 sqm by 2026, increasing to 5,121 sqm by 2036. This out-of-centre generated capacity should be directed to existing centres first in accordance with the NPPF and the sequential test.
Leisure Needs Assessment
17. The results of the household survey indicate that there is currently an adequate level of leisure facilities. However, there are some qualitative and quantitative gaps in provision that should be addressed over the plan period. The key headlines include:
� Although there is no cinema in Romsey, there is no quantitative capacity for additional cinema screens in the Borough. However, there is a gap in both family entertainment facilities and cultural attractions in both Andover and Romsey.
� There is capacity for new food and beverage floorspace of between 464 sqm gross in 2021 increasing to 6,804 sqm gross by 2036.
� There is a good provision of health and fitness facilities in Andover, but a potential qualitative gap in Romsey.
18. In compliance with the objectives of the NPPF, the above forecast need should be directed to the Borough’s main centres first to help increase competition and choice, and to help underpin their daytime/evening economies. However, the prospect for new facilities will ultimately be determined by the level of market demand and interest for representation in the area and its main centres.
Frontages
19. Based on our assessment, the broad conclusions by centre are as follows:
� Andover Town Centre: We consider that no changes are necessary. However, we would recommend that
the boundaries are reviewed when the Council considers the availability and suitability of in-centre, and
potentially edge-of-centre sites to accommodate the forecast for new retail floorspace.
� Romsey Town Centre: We have put forward three recommendations based on the research evidence.
� Firstly, that the Town Centre Boundary and Primary Shopping Area (PSAs) should be retained;
� Secondly, that the Primary Shopping Frontages (PSFs) should be reduced to exclude Latimer Street
and Latimer Walk; and finally
� The secondary Shopping Frontages (SSFs) should be extended to include Latimer Street and Latimer
Walk

ANDOVER AND ROMSEY RETAIL CAPACITY & LEISURE STUDY - 2018 Page 11 of 190
Impact Threshold
20. We have advised a 350 sqm impact threshold. This will provide the local planning authority with sufficient flexibility to assess the merits and implications of edge and out-of-centre foodstore applications that could potentially have significant implications for the viability and delivery of new or extended floorspace in these existing centres.
Summary of Key Recommendations – Andover
21. Drawing on the research findings and evidence we consider that the health of Andover Town Centre over the plan period could be improved by addressing the following matters:
� Further out-of-centre development could be harmful to Andover’s overall vitality and viability, and any new floorspace should be directed to the Borough’s centres first in compliance with the NPPF; subject to market demand and the identification of suitable sites to accommodate the forecast need.
� There is a gap in Andover Town Centre’s comparison floorspace provision. Opportunities to improve this situation should therefore be explored to help ‘claw back’ some shoppers and trade from out-of-centre shops and stores, and competing centres.
� In qualitative terms there is potential for more high street mid-range fashion brands.
� In order to establish its Unique Selling Proposition (USP), Andover will need adapt to current trends and the changing role of retailing by introducing more high quality and ‘niche’ independent shops to build on Andover’s character and attraction.
� There are two areas in Andover with a high concentration of vacant units, which detract from the quality of the environment: the Chantry Shopping Centre and The Bridge Street Mall. These locations represent potential opportunities to increase activity (for example by redeveloping the sites, and/or by seeking operators to locate here).
� The Chantry Shopping Centre is in need for investment to create modern larger format shopping premises
to attract retailers, with a prominent anchor.
� Andover’s daytime and evening leisure economy needs to be improved. The centre would benefit from establishing a leisure ‘hub’ or ‘quarter’, principally focussed on improving the food and beverage offer; focused on the High Street, the south of the Guildhall building (i.e. in the PSA). This would allow for alfresco dining to help animate the market place.
� A better utilisation of the market square should also be promoted, focussed on more cafés and quality restaurants, to create interest and increase footfall.
� The centre lacks family-friendly restaurants; and there is a potential gap in the choice of higher quality of family entertainment venues and activities.
� It would be beneficial to draw up a Masterplan to guide the planning and development of Cultural Quarter
around The Lights Theatre and Andover Leisure Centre, covering the appropriate uses, the legibility of the
area, and the need to improve the wider connections/ linkages to the PSA. The Cultural Quarter should
also be designed and curated in a manner that complements and encourages the establishment of a leisure
‘quarter’ in the PSA.
� Andover Street Market should be significantly improved by raising the quality of goods sold, and by establishing more holistic management and marketing.
� Andover would benefit from partnerships with local retailers to promote and improve the Town Centre. It is noted that Andover BID has recently been set up to progress towards a BID ballot.
� Andover Town Centre would benefit from public ream improvements. For example, the centre could benefit from more seating, green landscaping (e.g. trees), and a well-integrated recreational space.
ANDOVER AND ROMSEY RETAIL CAPACITY & LEISURE STUDY - 2018 Page 12 of 190
� The parking management system should be improved (such as incorporating payment on exit).
Summary of Key Recommendations - Romsey
22. Drawing on the research findings and evidence we consider that the health of Romsey Town Centre over the plan period could be improved by addressing the following matters:
� There is potential to improve the quality and scale of the town’s convenience offer. This can be achieved
by introducing a mid-range supermarket, subject to market demand.
� In terms of its comparison provision it would appear that there is a gap in the comparison retail provision
(even after taking account of Romsey’s geographic position and its role and function as a market town).
Further out-of-centre comparison floorspace development could therefore be detrimental to the town
centre. In qualitative terms, the centre lacks fashion stores for men, and teenagers/young adults. Based
on our observations, we recommended that Romsey should seek to host more higher-end fashion retailers
to raise its profile, as well as to continue to build and improve its independent niche and boutique offer.
However, this is dependent on future market demand and trends in the retail sector.
� In qualitative terms, the leisure services in Romsey Town Centre could be improved by introducing more
evening economy uses and uses that appeal more to a younger population profile (such as a cinema etc.).
There also appears to be a potential gap in the health and fitness provision, as well as the potential for a
wider range and higher quality of family entertainment venues and activities.
� It is considered that better marketing of the centre would also be highly beneficial to the centre.
� The parking management system should also be improved (such as incorporating payment on exit, and
incorporating better car park signage and capacity).
ANDOVER AND ROMSEY RETAIL CAPACITY & LEISURE STUDY - 2018 Page 13 of 190
1 INTRODUCTION
1.1 Carter Jonas (‘CJ’) was instructed by Test Valley Borough Council (the ‘Council’) to prepare a Retail Capacity and
Leisure Study (the ‘Study’). The main objective of this strategic study is to provide the robust evidence base
needed by the Council to help inform the future planning of the Borough to 2036 from a retail and leisure
perspective, and specifically Andover and Romsey Town Centres2.
1.2 This strategic study has been prepared in the context of current and emerging national and development plan
policy guidance; principally the National Planning Policy Framework (NPPF) published in March 2012. Where
relevant, this study also draws on other key material considerations and evidence. This includes the advice set
out in the National Planning Practice Guidance (PPG), published in March 2014, which places significant weight
on the development of positive plan-led visions and strategies to help ensure the vitality of Town Centres. The
sequential and impact ‘tests’ are also key to both plan-making and decision-taking at the local level.
1.3 The assessment of the need (or ‘capacity’) for new retail (convenience and comparison goods) floorspace has
been carried out at the strategic Borough-wide level to help inform the likely scale, type, location and phasing of
new retail development over the short (0-5 years), medium (6-10 years) and long term (11-15 years).
1.4 The study/catchment area defined for the purpose of this study principally covers the Test Valley local authority
area, but also necessarily extends to a wider area incorporating parts of neighbouring local planning authority
areas (Appendix 1). The Study Area has been divided into 10 zones that broadly reflect the population distribution
and local catchments of the main study centres. The defined Study Area and zones provide the framework for the
new telephone interview survey of some 1,000 households conducted by NEMS Market Research (NEMS) from
2nd – 13th October 2017. The full (weighted) survey results are set out in Appendix 10. The survey provides the
most up-to-date and robust evidence on shopping patterns, leisure preferences and expenditure flows within the
Study Area. The survey findings have also informed the health check assessments for the main study centres, as
well as the quantitative (‘capacity’) and qualitative need assessments for new retail (convenience and comparison
goods) floorspace and leisure uses.
1.5 For ease of reference this report is structured as follows:
� Section 2 reviews the national and local planning policy context material to retail planning and Town
Centres.
� Section 3 highlights some of the key trends that are driving the dynamic changes in the retail sector at the
national and local level, and how this has shaped (and is likely to shape) the UK’s urban and retail
landscape.
� Section 4 sets out the results of the market share analysis for convenience and comparison goods
shopping and leisure use across the Study Area based on the household telephone interview survey. The
market share tabulations for convenience and comparison goods are set out in Appendix 4 and Appendix
5 respectively.
� Section 5 sets out the results of the street interview surveys for Andover and Romsey Town Centres.
Some 298 interviews were carried out (197 in Andover and 101 in Romsey) between 2nd and 18th October
2017.
2 The Council has commenced work on preparing the first stage of public consultation ‘Issues and Options’ on its future Local Plan. The outputs of
the Study will also form part of the evidence base for the formal ‘Preferred Approach’ (Regulation 18) consultation in 2018.
ANDOVER AND ROMSEY RETAIL CAPACITY & LEISURE STUDY - 2018 Page 14 of 190
� Section 6 summarises the results of the business survey conducted in Andover and Romsey Town
Centres. Some 101 telephone interviews were carried out (65 in Andover, and 36 in Romsey) between
28th September and 5th October 2017.
� Sections 7 - 9 describe the methodology and key findings of the health check assessments for Andover
and Romsey. These assessments draw on the Key Performance Indicators (KPIs) identified by the PPG;
informed by recent research, audits and site visits, and the survey results.
� Section 10 sets out the comparator centres research, which benchmarks Andover and Romsey against
other similar and/or aspirational centres. Andover was compared with Bury St Edmunds in St Edmundsbury
and Yeovil in South Somerset. Romsey was compared with Petersfield in East Hampshire and Sherborne
in West Dorset. A high level ‘gap’ analysis of key retailers was also undertaken, which compares the
prominent national retail and leisure operators present in the respective comparator centres against
Andover and Romsey.
� Section 11 describes the key assumptions and outputs of CJ’s in-house CREATe (excel spreadsheet)
economic capacity model, including: the forecast population and expenditure available in the Study Area
(Appendices 2 and 3); the forecast convenience (Appendix 6) and comparison (Appendix 7) turnovers
of all existing centres/stores; and the forecast trading characteristics of all known committed retail
floorspace at the time of preparing this assessment. It also presents the detailed Council-wide and main
centre capacity forecasts for both convenience (Appendix 8) and comparison goods (Appendix 9).
� Section 12 sets out the findings of the commercial leisure ‘gap’ assessment. This looks at the main leisure
uses, and provides a high level review of the potential need for new food and beverage uses, cinema and
gyms based on the health checks, household and in-centre survey evidence.
� Section 13 reviews and provides our recommendations on robust definitions of shopping frontages,
Primary Shopping Areas (PSA) and Town Centre Boundaries (TCB) based on the evidence.
� Section 14 draws on the previous sections of the Study. It summaries the relative health, role and function
of the Council’s main centres, and provides our key advice on recommendations.
1.6 When considering and assessing the findings of this retail assessment it is important to understand at the outset
that capacity forecasts beyond a five year time period should be interpreted with caution by the Council as they
are subject to increasing margins of error. We therefore advise that although this updated study provides the
robust evidence base required to help inform plan-making, site allocations and the determination of planning
applications at the local level, the forecasts should be constantly monitored, and updated. These should take into
account any significant new retail development and changes in the retail expenditure and population growth
forecasts over time, as well as any potential impacts arising from other key trends in the retail and leisure sectors
(such as, the growth in internet shopping) and commercial leisure sectors.
ANDOVER AND ROMSEY RETAIL CAPACITY & LEISURE STUDY - 2018 Page 15 of 190
2 PLANNING POLICY REVIEW
2.1 This section provides a high level overview of the relevant national and local development plan planning policy
pertaining to retail, leisure and town centre uses, along with other material considerations.
National Planning Policy Framework (NPPF) (2012)
2.2 The NPPF was published in March 2012 and sets out the planning policies for England and how these are
expected to be applied. It reinforces the importance of up-to-date plans and strengthens local decision making.
The NPPF must be taken into account in the preparation of Local Plans and Neighbourhood Plans. At the heart
of the NPPF is a presumption in favour of sustainable development, which is regarded as “a golden thread running
through both plan-making and decision-taking” (paragraph 14). The NPPF (paragraph 14) sets out the
Government’s view of what sustainable development means in practice for both plan-making and decision-taking
at the local level.
2.3 For plan-making the Framework states that local planning authorities should positively seek opportunities to meet
the development needs of their area. Local Plans should meet objectively assessed needs, with sufficient flexibility
to adapt to rapid change, unless any adverse impacts of doing so would significantly and demonstrably outweigh
the benefits. The Framework (paragraph 15) states that policies in Local Plans should follow the approach of the
presumption in favour of sustainable development so that “…it is clear that development which is sustainable can
be approved without delay”.
2.4 The NPPF (paragraph 17) sets out twelve core planning principles that underpin both plan-making and decision-
taking. Amongst other objectives these principles confirm that planning should be genuinely plan-led; proactively
drive and support sustainable economic development to deliver thriving local places; promote mixed use
developments; focus significant development in locations which are or can be made sustainable; and deliver
sufficient community and cultural facilities and services to meet local needs.
2.5 The Framework (paragraph 150) emphasises that Local Plans are “…the key to delivering sustainable
development that reflects the vision and aspirations of local communities”. They should be “aspirational but
realistic” and should set out the opportunities for development and clear policies on “…what will or will not be
permitted and where” (paragraph 154). Only those policies that provide a clear indication of how a decision maker
should react to a development proposal should be included in the plan. Any additional Development Plan
Documents (DPDs) should only be used where clearly justified (paragraph 153).
2.6 The NPPF (paragraph 156) requires strategic priorities for the area covered by the Local Plan to deliver the homes
and jobs needed in the area; the provision of retail, leisure and other commercial development; and the provision
of health, security, community and cultural infrastructure and other local facilities; etc. Crucially the NPPF
(paragraph 157) indicates that Local Plans should, amongst other key requirements plan positively for the
development and infrastructure required in the area; be drawn up over an appropriate time scale (preferably 15
years; indicate broad locations for strategic development on a key diagram and land-use designations on a
Proposals Map; allocate sites to promote development and flexible use of land, bringing forward new land where
necessary, and provide detail on form, scale, access and quantum of development where appropriate; and identify
land where development would be inappropriate, for instance because of its environmental or historic significance.
2.7 In terms of the evidence-based approach to planning, the Framework states LPAs should ensure that the Local
Plan is based on “…adequate, up-to-date and relevant evidence about the economic, social and environmental
characteristics and prospects of the area” (paragraph 158). Furthermore the assessment of, and strategies for
housing, employment and other uses should be integrated, and take full account of relevant market and economic
ANDOVER AND ROMSEY RETAIL CAPACITY & LEISURE STUDY - 2018 Page 16 of 190
signals. LPAs should use this evidence base to assess the needs for land or floorspace for economic
development, including for retail and leisure development; examine the role and function of Town Centres and the
relationship between them; assess the capacity of existing centres to accommodate new Town Centre
development; and identify locations of deprivation that may benefit from planned remedial action. The NPPF is
clear that pursuing sustainable development requires “…careful attention to viability and costs in plan-making and
decision-taking” (paragraph 173).
2.8 The Framework (paragraphs 18-149) sets out thirteen key ‘principles’ for delivering sustainable development,
including building a strong, competitive economy; ensuring the vitality of Town Centres; promoting sustainable
transport; delivering a wide choice of high quality homes; requiring good design; promoting healthy communities;
protecting Green Belt land; and conserving and enhancing the natural and historic environment. In terms of
‘ensuring the vitality of Town Centres’ the NPPF (paragraph 23) states that planning policies should be positive
and promote competitive Town Centre3 environments, as well as setting out policies for the management and
growth of centres over the plan period. When drawing up Local Plans, LPAs should amongst other considerations:
� recognise Town Centres as the heart of their communities and pursue policies to support their viability and
vitality;
� define a network and hierarchy of centres that is resilient to anticipated future economic changes;
� define the extent of Town Centres and primary shopping areas4, based on a clear definition of primary and
secondary frontages5 in designated centres, and set policies that make clear which uses will be permitted
in such locations;
� promote competitive Town Centres;
� retain and enhance existing markets and, where appropriate, re-introduce or create new ones, ensuring
that markets remain attractive and competitive;
� allocate a range of suitable sites to meet the scale and type of retail and leisure development needed in
Town Centres;
� ensure that the needs for retail and leisure are “met in full” and “not compromised by limited site availability”.
Assessments should therefore be undertaken of the need to expand Town Centres to ensure a sufficient
supply of suitable sites;
� allocate appropriate edge of centre sites for main Town Centre uses that are well connected to the Town
Centre where suitable and viable Town Centre sites are not available. If sufficient edge of centre sites
cannot be identified, set policies for meeting the identified needs in other accessible locations that are well
connected to the Town Centre;
� set policies for the consideration of proposals for main Town Centre uses which cannot be accommodated
in or adjacent to Town Centres;
3 The NPPF (Annex 2) states that references to Town Centres or centres apply to city centres, Town Centres, district centres and local centres, but
exclude small parades of shops of purely neighbourhood significance. Unless they are identified as centres in Local Plans, existing out-of-centre
developments, comprising or including main Town Centre uses, do not constitute Town Centres.
4 Primary shopping area is defined by the NPPF (Annex 2) as the defined area where retail development is concentrated (generally comprising the
primary and those secondary frontages which are adjoining and closely related to the primary shopping frontage).
5 The NPPF (Annex 2) states that ‘primary frontages’ are likely to include a high proportion of retail uses which may include food, drinks, clothing
and household goods. ‘Secondary frontages’ provide greater opportunities for a diversity of uses such as restaurants, cinemas and businesses.
ANDOVER AND ROMSEY RETAIL CAPACITY & LEISURE STUDY - 2018 Page 17 of 190
� recognise that residential development can play an important role in ensuring the vitality of centres and set
out policies to encourage residential development on appropriate sites; and
� where Town Centres are in decline, local planning authorities should plan positively for their future to
encourage economic activity.
2.9 When assessing and determining applications for main Town Centre uses6 that are not in an existing centre and
not in accordance with an up-to-date Local Plan, the Framework requires that LPAs should:
� Apply a sequential test7, which requires applications for main Town Centre uses to be located in Town
Centres first, then in edge-of-centre locations and only consider out-of-centre locations if suitable
sequentially more preferable sites are not available. When considering edge and out of centre proposals,
“…preference should be given to accessible sites that are well connected to the Town Centre” (paragraph
24). Applicants and LPAs should demonstrate flexibility on issues such as format and scale.
� Require an impact assessment if the development is over a proportionate, locally set floorspace threshold
(if there is no locally set threshold, the default threshold is 2,500 sqm). The NPPF (paragraph 26) states
that this should include assessment of the impact of the proposal on existing, committed and planned public
and private investment in a centre or centres in the catchment area of the proposal; and on Town Centre
vitality and viability, including local consumer choice and trade in the Town Centre and wider area, up to
five years from the time the application is made. For major schemes where the full impact will not be realised
in five years, “…the impact should also be assessed up to ten years from the time the application is made”.
2.10 The NPPF (paragraph 27) states that “…where an application fails to satisfy the sequential test or is likely to have
significant adverse impact on one or more of the above factors, it should be refused”.
National Planning Practice Guidance (PPG)
2.11 This study also draws on advice set out in the National Planning Practice Guidance (PPG), published in March
2014. The PPG has streamlined and replaced the advice previously set out in the PPS4 Practice Guidance on
Need, Impact and the Sequential Approach. The revised PPG still places significant weight on the development
of positive plan-led visions and strategies for Town Centres, and thus retains the key sequential and ‘impact tests’.
Of relevance to this study the PPG (para 003) states that the assessment of the potential for centres to
accommodate new development and different types of development should cover a “three-five year period” but
should “also take the lifetime of the Local Plan into account and be regularly reviewed”
6 NPPF (Annex 2) defines ‘main Town Centre uses’ as retail development (including warehouse clubs and factory outlet centres); leisure, entertainment facilities the more intensive sport and recreation uses (including cinemas, restaurants, drive-through restaurants, bars and pubs, night-clubs, casinos, health and fitness centres, indoor bowling centres, and bingo halls); offices; and arts, culture and tourism development (including theatres, museums, galleries and concert halls, hotels and conference facilities).
7 This sequential approach should not be applied to applications for small scale rural offices or other small scale rural development.
ANDOVER AND ROMSEY RETAIL CAPACITY & LEISURE STUDY - 2018 Page 18 of 190
Draft Revised National Planning Policy Framework (Draft NPPF)
2.12 The new Draft NPPF was published on 5th March 2018 with consultation taking place until 10th Mary 2018. The
NPPF (2012) still remains the adopted Framework, however, the Draft NPPF is now a material consideration in
planning decisions. It will gain more weight as it moves through the process to adoption however the weight given
to it is a matter for the decision maker.
2.13 With the publication of the revised draft Framework, there are some important proposed changes to policy aimed
at ‘ensuring the vitality of town centres’ that promotes a ‘town centre first’ policy approach. These changes are
summarised below:
� In terms of plan-making, the revised draft Framework (paragraph 86d) now proposes a shorter ten year
time horizon for allocating sites to meet the forecast needs for new retail, leisure, office and other main
town centre uses. This contrasts with the current policy position, which requires local planning authorities
to allocate sites to “meet needs in full” over the plan period; currently 15 years or more.
� In terms of decision-taking and specifically the sequential test, the revised draft Framework is also seeking
to strengthen the ‘town centre first’ approach by bringing back the more flexible wording last seen in the
PPS4; namely that suitable town centre or edge of centre sites do not have to be available immediately for
development, but within a “reasonable period of time” (paragraph 87).
� The draft Framework also recognises that where centres are in decline then policies and measures should
be promoted that support diversification and changes of use (paragraph 86g).
Local Planning Policy Context
2.14 The current Development Plan consists of the following documents:
� The Test Valley Borough Revised Local Plan DPD (adopted January 2016) (“the Local Plan”) – contains
proposed policies for determining planning applications and identifying strategic allocations for housing,
employment and other uses, and covers the plan period from 2011 to 2029.
2.15 In addition, whilst there are no adopted Neighbourhood Plans within the Borough, there are 11 designated
Neighbourhood Areas that have been approved by the Council. Once prepared, the respective Neighbourhood
Plans will present detailed policies, complementing the strategic policies in the Development Plan. The designated
Neighbourhood Areas which are progressing with the respective Neighbourhood Plans are as follows:
� Andover
� Charlton
� Chilbolton
� Goodworth Clatford
� Houghton
� King’s Somborne
� Romsey
� Sherfield English
� Thruxton
� Wellow
� West Tytherley and Frenchmoor
ANDOVER AND ROMSEY RETAIL CAPACITY & LEISURE STUDY - 2018 Page 19 of 190
2.16 There are a number of Supplementary Planning Documents (SPDs) which provide more detailed guidance to
explain policies and proposals set out in Development Plan Documents. The following documents are of particular
relevance to this Study:
� Romsey Town Access Plan (TAP) SPD (adopted September 2015) – this sets out the vision for
accessibility with regards to facilities and services within Romsey and how these can be improved. The
TAP seeks to agree the list of future transport schemes for which funding can be sought and for which
contributions can be collected under Section 106 Agreements and the Community Infrastructure Levy (CIL).
It acts as a guide for the way funding is collected and spent within the Borough.
� Andover Town Access Plan (ATAP) SPD (adopted February 2015) – this sets out the vision for
accessibility with regards to facilities and services within Andover and how these can be improved. The
ATAP sets out a range of measures for which the contributions collected through the Transport
Contributions Policy (TCP) (an approach to calculating the level of transport contribution for new
developments) and the CIL. The ATAP will help steer the developments in the town, including the Major
Development Areas: East Anton, Picket Twenty, Picket Piece for housing and the former Andover Airfield
site for employment. The Major Development Areas (New Neighbourhoods) are discussed in more detail
later in this section.
� Shopfront Design Guide (SDG) SPD (adopted September 2010) – this document assists in the general
advice for owners, tenants, developers and architects when considering the development of shopfronts for
retail and commercial premises. It aims to encourage good design and provide guidance on the
architectural integrity of a building and its setting.
� Village Design Statements (VDS) – these statements describe the individual characteristics of a specific
area and provide guidance for future development. The Romsey Town Design Statement SPD (adopted
January 2008) is of relevance to this Study. The objective of this statement was to analyse the appearance
of Romsey to determine what contributes to its unique appearance by identifying visual features that are
important in the townscape.
2.17 There are a number of evidence based documents that support the Development Plan. Of relevance to this study
there have been a number of retail studies conducted for the Council. The following are of the most relevant:
� Southampton and Eastleigh Retail Study: Retail Addendum for Test Valley (2011) – this report
summarised the shopping patterns at the current time across the Southern parts of Test Valley (including
Romsey), to analyse the patterns of retail behaviour of residents living within these settlements and the
interaction between Test Valley, Southampton and Eastleigh. This would be an important comparison to
understand how patterns of shopping have changed within Romsey and further afield.
� Romsey Town Centre Study (2011) – this report covered an in‐depth study of Romsey by a research
team from the University of Southampton from March and April 2011. This report built upon earlier findings
from the research conducted in 1998 by Colliers Erdman Lewis.
� Retail Capacity Study Update (2012) – this report informed the preparation of the Local Plan and
summarised the changes to the retail capacity, retail trends, and the scope for accommodating growth
within the Borough. This Study updated and superseded the Retail Capacity Study 2007, the Retail
Development Potential in Romsey 2008, and the Test Valley Retail Advice 2009.
� Topic Papers Policy LE11, LE12 and LE13 (2014) – these topic papers were prepared to provide the
background justification for both Policy LE11, LE12 and LE13 of Local Plan (2016). These were based on
ANDOVER AND ROMSEY RETAIL CAPACITY & LEISURE STUDY - 2018 Page 20 of 190
the evidence base from the Retail Study Update (2012). The specific policies will be discussed in detail in
Table 2.2 below.
� Strategic Housing Land Availability Assessment (2015) (“SHLAA”) – this technical document informed
the current Local Plan. It forms part of the evidence base in preparation of Development Plan Documents.
It is intended to assist the Council in the assessment to identify a potential supply of land, which has been
promoted by landowners, that is suitable, available and achievable for housing development. The Council
are currently preparing a Strategic Housing and Economic Land Availability Assessment (SHELAA). The
closing date for submissions was the 20 October 2017. This document will supersede the SHLAA. The
SHELAA was published in February 2018.
2.18 There are also a number of documents that are material consideration to the preparation of this Study. They are
set out below:
� Andover Vision (2017) – this document sets out the vision for Andover over the next 20 years, up to 2037.
The document has been prepared by the Andover Vision Partnership, a partnership of Andover’s residents,
community groups, businesses and public bodies. There are five ambitions and themes which run
throughout the document. These concern: being part of a connected community; having a great green
environment; being part of a thriving Town Centre; supporting businesses, jobs and skills in the town; and
access to great health. This document is therefore a significant for guiding and encouraging development
within Andover Town Centre.
� Romsey Future (2015) – was prepared by the Romsey Future Vision Partnership, and sets out the vision
for Romsey up to 2035 with aims to ensure the town's future as a vibrant and thriving market town,
interacting with its surrounding communities. The strategic ambitions include: getting around Romsey;
enhancing Romsey; enjoying Romsey; living well in Romsey; and developing the economy in Romsey. This
document is therefore a significant for guiding and encouraging development within Romsey Town Centre.
2.19 A high level review of the local planning policy documents follows below.
Housing
2.20 The NPPF requires Local Planning Authorities to: “ensure that their Local Plan meets the full, objectively assessed
needs for market and affordable housing in the housing market area” and “identify the scale and mix of housing
and the range of tenures that the local population is likely to need over the plan period which meets household
and population projections, taking account of migration and demographic change” (paragraphs 47 and 159).
2.21 Policy COM1 in the Local Plan identifies a requirement of 10,584 houses across the plan period (from 2011 to
2029), equivalent to 588 dwellings per annum across the Borough. The proposed housing delivery across the plan
period for the entire Borough is outlined in the table below.
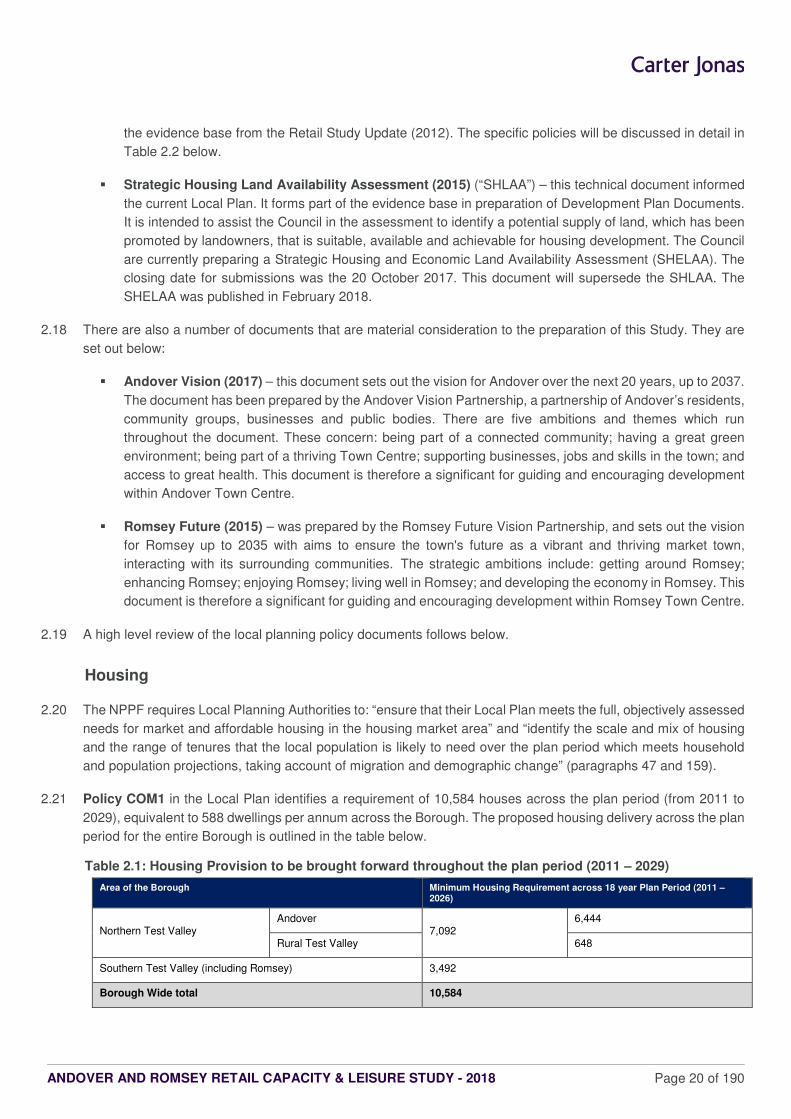
Table 2.1: Housing Provision to be brought forward throughout the plan period (2011 – 2029)
Area of the Borough Minimum Housing Requirement across 18 year Plan Period (2011 – 2026)
Northern Test Valley Andover
7,092 6,444
Rural Test Valley 648
Southern Test Valley (including Romsey) 3,492
Borough Wide total 10,584
ANDOVER AND ROMSEY RETAIL CAPACITY & LEISURE STUDY - 2018 Page 21 of 190
Source: Policy COM1: The Local Plan (2016)
2.22 In order to deliver the housing figures set out above the Local Plan allocates a number of strategies sites:
2.23 In Andover:
� Policy COM6: New Neighbourhood at Picket Piece Andover - seeks a new neighbourhood of
approximately 400 dwellings together with a range of associated facilities. It should be noted that planning
permission for a new neighbourhood of 530 dwellings together with a local centre offering community
facilities and retail units (A1, A3 and A5), public open space, vehicular, pedestrian and cycle access and
landscaping (Ref: 10/00242/OUTN) is under construction.
� Policy COM6A: New Neighbourhood at Picket Twenty - seeks a new neighbourhood of approximately
300 dwellings together with a range of facilities. It should be noted that planning permission for a new
neighbourhood of approximately 1200 dwellings together with a range community facilities, education,
retail, offices, recreational areas and associated highway works (Ref: TVN.09275) and is under
construction. Policy COM6A allocation (300 dwellings) is an extension to this development. Permission
was granted for an extension of 540 dwellings (16/03120/FULLN) on 23 January 2018.
� The Local Plan also refers to the site at East Anton, which is an existing housing commitment; and which
is shown on the Key Diagram reproduced below. Planning permission Ref: 16/01816/RESN secured a local
centre at Northern Local Centre, East Anton Farm Road (15/00729/FULLN). It consists of: the erection of
a two and a half storey, mixed use building comprising of 760 sqm commercial floorspace (A1, A2, A3, A5
and B1a), and 20 dwellings.
2.24 In Romsey:
� Policy COM3: New Neighbourhood at Whitenap, Romsey sets out the proposal for a new
neighbourhood of approximately 1,300 dwellings together with a range of facilities.
2.25 The Key Diagram below provides an overview of the housing proposals within the Local Plan for specific locations.
This includes East Anton, Picket Twenty and Picket Piece:
Figure 2.1: Key Diagram of Test Valley Borough Council
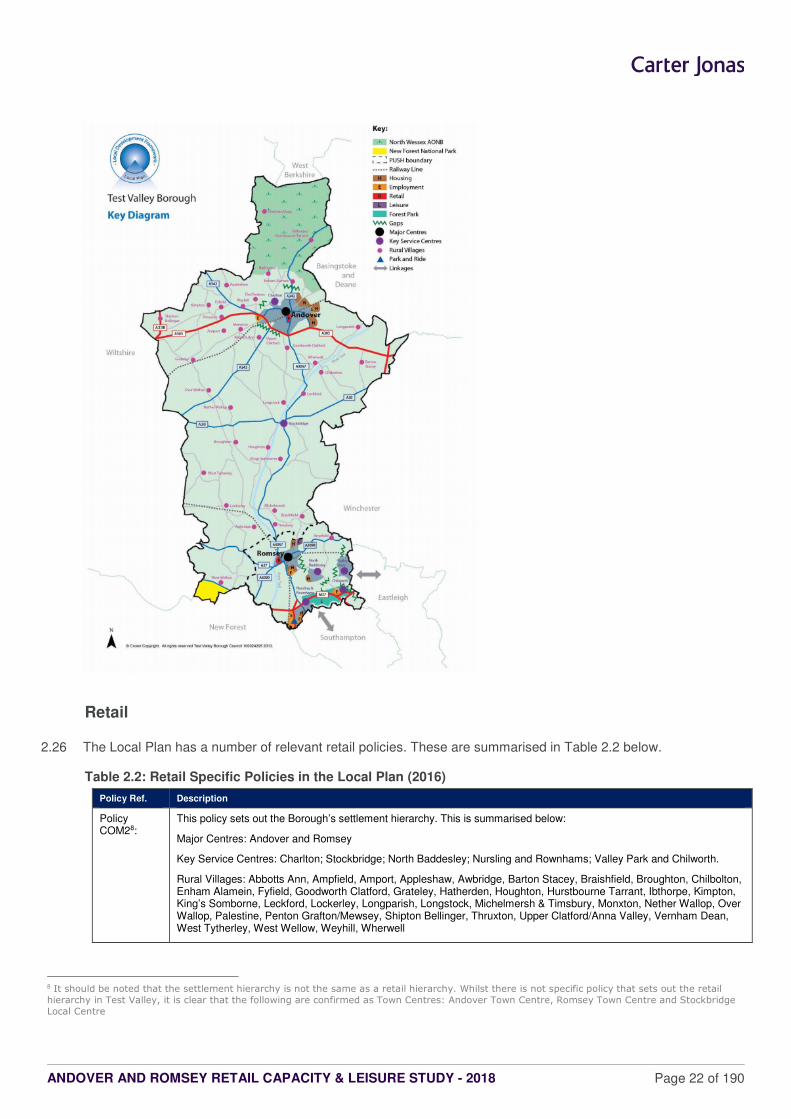
ANDOVER AND ROMSEY RETAIL CAPACITY & LEISURE STUDY - 2018 Page 22 of 190
Retail
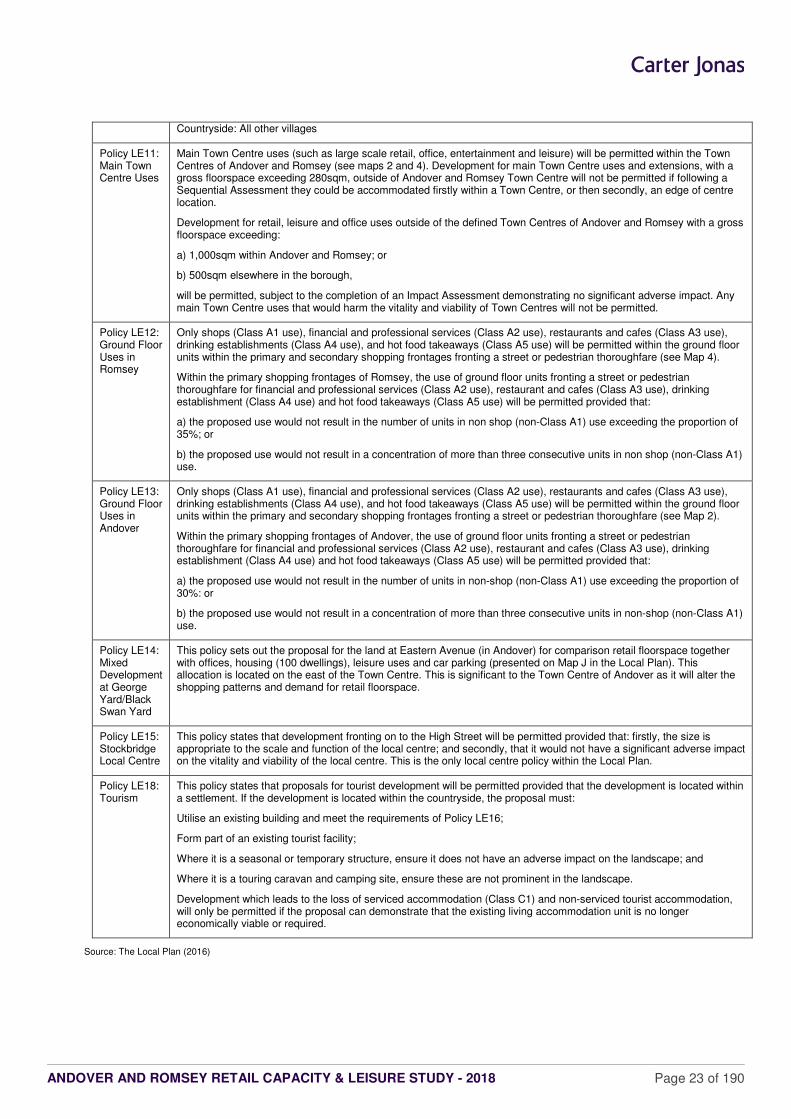
2.26 The Local Plan has a number of relevant retail policies. These are summarised in Table 2.2 below.
Table 2.2: Retail Specific Policies in the Local Plan (2016)
Policy Ref. Description
Policy COM28:
This policy sets out the Borough’s settlement hierarchy. This is summarised below:
Major Centres: Andover and Romsey
Key Service Centres: Charlton; Stockbridge; North Baddesley; Nursling and Rownhams; Valley Park and Chilworth.
Rural Villages: Abbotts Ann, Ampfield, Amport, Appleshaw, Awbridge, Barton Stacey, Braishfield, Broughton, Chilbolton, Enham Alamein, Fyfield, Goodworth Clatford, Grateley, Hatherden, Houghton, Hurstbourne Tarrant, Ibthorpe, Kimpton, King’s Somborne, Leckford, Lockerley, Longparish, Longstock, Michelmersh & Timsbury, Monxton, Nether Wallop, Over Wallop, Palestine, Penton Grafton/Mewsey, Shipton Bellinger, Thruxton, Upper Clatford/Anna Valley, Vernham Dean, West Tytherley, West Wellow, Weyhill, Wherwell
8 It should be noted that the settlement hierarchy is not the same as a retail hierarchy. Whilst there is not specific policy that sets out the retail
hierarchy in Test Valley, it is clear that the following are confirmed as Town Centres: Andover Town Centre, Romsey Town Centre and Stockbridge
Local Centre
ANDOVER AND ROMSEY RETAIL CAPACITY & LEISURE STUDY - 2018 Page 23 of 190
Countryside: All other villages
Policy LE11: Main Town Centre Uses
Main Town Centre uses (such as large scale retail, office, entertainment and leisure) will be permitted within the Town Centres of Andover and Romsey (see maps 2 and 4). Development for main Town Centre uses and extensions, with a gross floorspace exceeding 280sqm, outside of Andover and Romsey Town Centre will not be permitted if following a Sequential Assessment they could be accommodated firstly within a Town Centre, or then secondly, an edge of centre location.
Development for retail, leisure and office uses outside of the defined Town Centres of Andover and Romsey with a gross floorspace exceeding:
a) 1,000sqm within Andover and Romsey; or
b) 500sqm elsewhere in the borough,
will be permitted, subject to the completion of an Impact Assessment demonstrating no significant adverse impact. Any main Town Centre uses that would harm the vitality and viability of Town Centres will not be permitted.
Policy LE12: Ground Floor Uses in Romsey
Only shops (Class A1 use), financial and professional services (Class A2 use), restaurants and cafes (Class A3 use), drinking establishments (Class A4 use), and hot food takeaways (Class A5 use) will be permitted within the ground floor units within the primary and secondary shopping frontages fronting a street or pedestrian thoroughfare (see Map 4).
Within the primary shopping frontages of Romsey, the use of ground floor units fronting a street or pedestrian thoroughfare for financial and professional services (Class A2 use), restaurant and cafes (Class A3 use), drinking establishment (Class A4 use) and hot food takeaways (Class A5 use) will be permitted provided that:
a) the proposed use would not result in the number of units in non shop (non-Class A1) use exceeding the proportion of 35%; or
b) the proposed use would not result in a concentration of more than three consecutive units in non shop (non-Class A1) use.
Policy LE13: Ground Floor Uses in Andover
Only shops (Class A1 use), financial and professional services (Class A2 use), restaurants and cafes (Class A3 use), drinking establishments (Class A4 use), and hot food takeaways (Class A5 use) will be permitted within the ground floor units within the primary and secondary shopping frontages fronting a street or pedestrian thoroughfare (see Map 2).
Within the primary shopping frontages of Andover, the use of ground floor units fronting a street or pedestrian thoroughfare for financial and professional services (Class A2 use), restaurant and cafes (Class A3 use), drinking establishment (Class A4 use) and hot food takeaways (Class A5 use) will be permitted provided that:
a) the proposed use would not result in the number of units in non-shop (non-Class A1) use exceeding the proportion of 30%: or
b) the proposed use would not result in a concentration of more than three consecutive units in non-shop (non-Class A1) use.
Policy LE14: Mixed Development at George Yard/Black Swan Yard
This policy sets out the proposal for the land at Eastern Avenue (in Andover) for comparison retail floorspace together with offices, housing (100 dwellings), leisure uses and car parking (presented on Map J in the Local Plan). This allocation is located on the east of the Town Centre. This is significant to the Town Centre of Andover as it will alter the shopping patterns and demand for retail floorspace.
Policy LE15: Stockbridge Local Centre
This policy states that development fronting on to the High Street will be permitted provided that: firstly, the size is appropriate to the scale and function of the local centre; and secondly, that it would not have a significant adverse impact on the vitality and viability of the local centre. This is the only local centre policy within the Local Plan.
Policy LE18: Tourism
This policy states that proposals for tourist development will be permitted provided that the development is located within a settlement. If the development is located within the countryside, the proposal must:
Utilise an existing building and meet the requirements of Policy LE16;
Form part of an existing tourist facility;
Where it is a seasonal or temporary structure, ensure it does not have an adverse impact on the landscape; and
Where it is a touring caravan and camping site, ensure these are not prominent in the landscape.
Development which leads to the loss of serviced accommodation (Class C1) and non-serviced tourist accommodation, will only be permitted if the proposal can demonstrate that the existing living accommodation unit is no longer economically viable or required.
Source: The Local Plan (2016)
ANDOVER AND ROMSEY RETAIL CAPACITY & LEISURE STUDY - 2018 Page 24 of 190
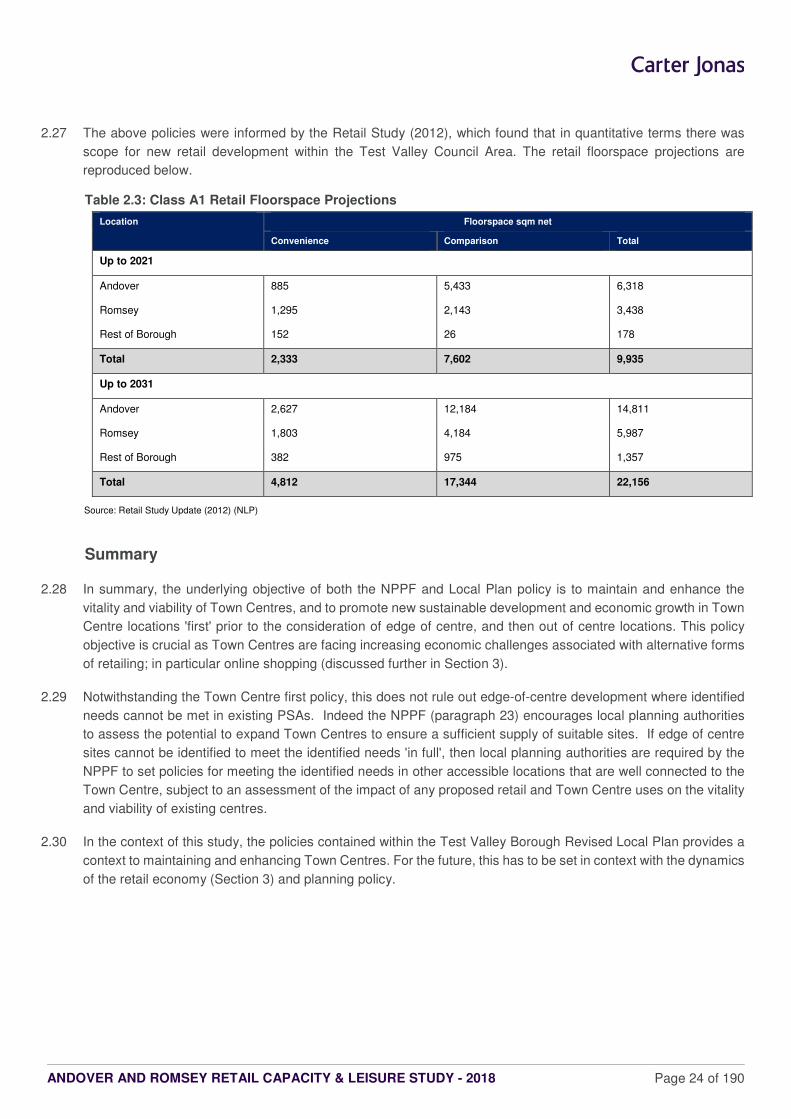
2.27 The above policies were informed by the Retail Study (2012), which found that in quantitative terms there was
scope for new retail development within the Test Valley Council Area. The retail floorspace projections are
reproduced below.
Table 2.3: Class A1 Retail Floorspace Projections
Location Floorspace sqm net
Convenience Comparison Total
Up to 2021
Andover 885 5,433 6,318
Romsey 1,295 2,143 3,438
Rest of Borough 152 26 178
Total 2,333 7,602 9,935
Up to 2031
Andover 2,627 12,184 14,811
Romsey 1,803 4,184 5,987
Rest of Borough 382 975 1,357
Total 4,812 17,344 22,156
Source: Retail Study Update (2012) (NLP)
Summary
2.28 In summary, the underlying objective of both the NPPF and Local Plan policy is to maintain and enhance the
vitality and viability of Town Centres, and to promote new sustainable development and economic growth in Town
Centre locations 'first' prior to the consideration of edge of centre, and then out of centre locations. This policy
objective is crucial as Town Centres are facing increasing economic challenges associated with alternative forms
of retailing; in particular online shopping (discussed further in Section 3).
2.29 Notwithstanding the Town Centre first policy, this does not rule out edge-of-centre development where identified
needs cannot be met in existing PSAs. Indeed the NPPF (paragraph 23) encourages local planning authorities
to assess the potential to expand Town Centres to ensure a sufficient supply of suitable sites. If edge of centre
sites cannot be identified to meet the identified needs 'in full', then local planning authorities are required by the
NPPF to set policies for meeting the identified needs in other accessible locations that are well connected to the
Town Centre, subject to an assessment of the impact of any proposed retail and Town Centre uses on the vitality
and viability of existing centres.
2.30 In the context of this study, the policies contained within the Test Valley Borough Revised Local Plan provides a
context to maintaining and enhancing Town Centres. For the future, this has to be set in context with the dynamics
of the retail economy (Section 3) and planning policy.
ANDOVER AND ROMSEY RETAIL CAPACITY & LEISURE STUDY - 2018 Page 25 of 190
3 NATIONAL RETAIL AND TOWN CENTRE TRENDS
3.1 This section summarises some of the key trends that have fuelled the changes in the retail sector over the last
three decades, and the impact of these trends on the UK's Town Centres. It provides a commentary on the impact
of the downturn in the economy since 2007 and the growth of internet ('multi-channel') retailing on consumer
spending, retail development and retailers' business strategies. Drawing on the latest research it also describes
how these trends may continue to shape changes in the future, and whether and how Town Centres can respond
to help maintain and enhance their overall vitality and viability. Section 12 also provides a more detailed overview
of current leisure trends.
Retail Trends
3.2 Following an unprecedented period of growth in retail sales and expenditure since the mid-1990s, the onset of the
longest and deepest economic recession in living memory in 2007/08 had a dramatic impact on consumer
spending and market demand. Business and consumer confidence was further weakened by public sector cuts,
the rise in VAT, increasing unemployment, less expansionary consumer credit and the rising cost of living
(including higher energy costs, petrol and housing prices). This reduced disposable income and retailers' margins
were squeezed further.
3.3 Official figures show that the UK recovery began in early 2013 and although GDP growth peaked at 2.9% in 2014,
it slowed to around 2% in 2015 and 2016 against the backdrop of a weaker global economy and further uncertainty
on financial markets. The Brexit vote and subsequent triggering of Article 50 is likely to further dampen
business/consumer confidence and the prospects for new investment and growth in the near future. Indeed, over
the last 12 months the UK has shifted from being one of the fastest growing G7 economies to among the slowest.
Against this background of economic and political uncertainty, Experian Business Strategies project lower GDP
growth of around +1.5% in 2017 and 2018.
3.4 This dampening in economic growth is also impacting on household income and spending, and ultimately retail
sales. The combination of higher inflation, a decline in real wages, a rise in interest rates and a tightening of
consumer credit will continue to place a drag on real incomes and consumer spending. Experian forecast that
retail sales growth will average 1% in 2018 and 1.9% in 2019.
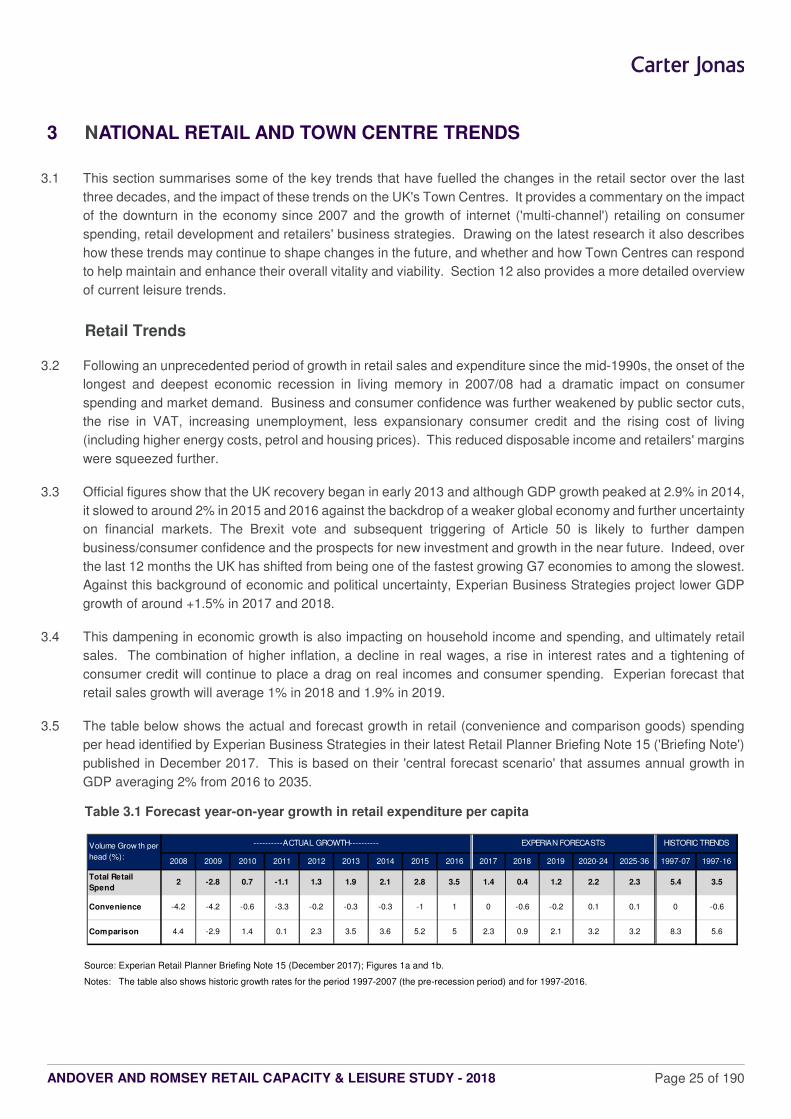
3.5 The table below shows the actual and forecast growth in retail (convenience and comparison goods) spending
per head identified by Experian Business Strategies in their latest Retail Planner Briefing Note 15 ('Briefing Note')
published in December 2017. This is based on their 'central forecast scenario' that assumes annual growth in
GDP averaging 2% from 2016 to 2035.
Table 3.1 Forecast year-on-year growth in retail expenditure per capita
Source: Experian Retail Planner Briefing Note 15 (December 2017); Figures 1a and 1b.
Notes: The table also shows historic growth rates for the period 1997-2007 (the pre-recession period) and for 1997-2016.
2008 2009 2010 2011 2012 2013 2014 2015 2016 2017 2018 2019 2020-24 2025-36 1997-07 1997-16
Total Retail
Spend2 -2.8 0.7 -1.1 1.3 1.9 2.1 2.8 3.5 1.4 0.4 1.2 2.2 2.3 5.4 3.5
Convenience -4.2 -4.2 -0.6 -3.3 -0.2 -0.3 -0.3 -1 1 0 -0.6 -0.2 0.1 0.1 0 -0.6
Comparison 4.4 -2.9 1.4 0.1 2.3 3.5 3.6 5.2 5 2.3 0.9 2.1 3.2 3.2 8.3 5.6
Volume Grow th per
head (%):
HISTORIC TRENDS----------ACTUAL GROWTH---------- EXPERIAN FORECASTS
ANDOVER AND ROMSEY RETAIL CAPACITY & LEISURE STUDY - 2018 Page 26 of 190
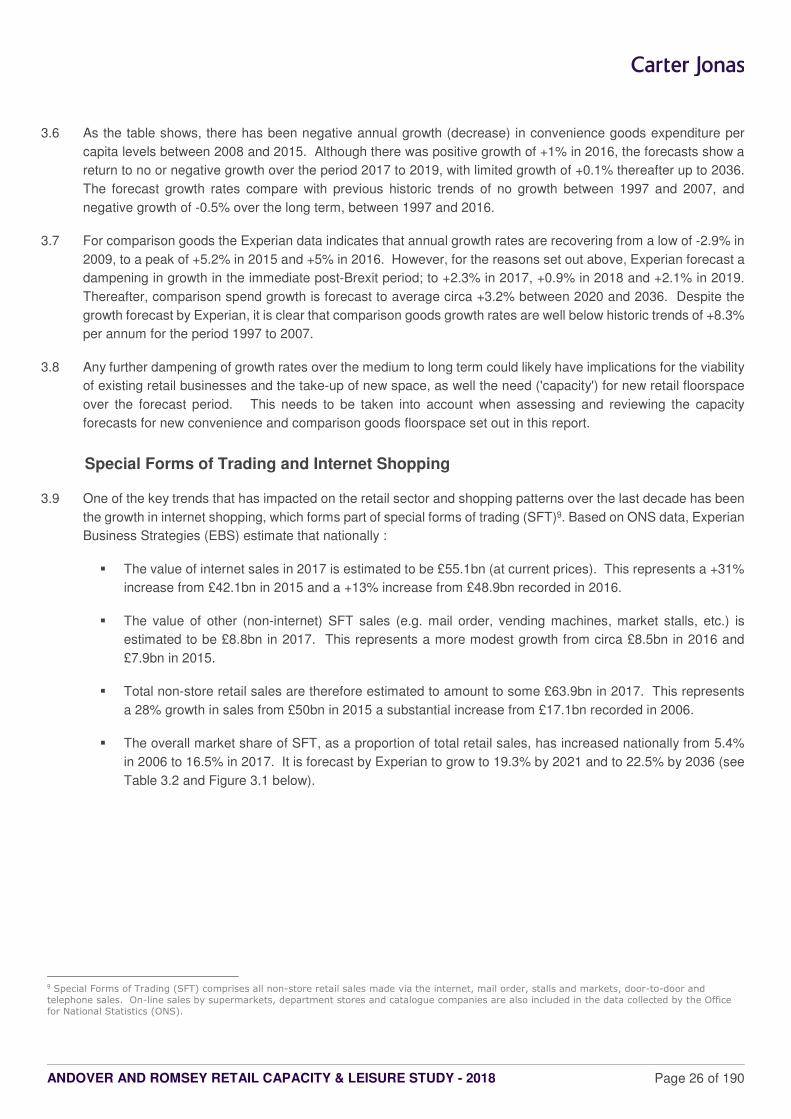
3.6 As the table shows, there has been negative annual growth (decrease) in convenience goods expenditure per
capita levels between 2008 and 2015. Although there was positive growth of +1% in 2016, the forecasts show a
return to no or negative growth over the period 2017 to 2019, with limited growth of +0.1% thereafter up to 2036.
The forecast growth rates compare with previous historic trends of no growth between 1997 and 2007, and
negative growth of -0.5% over the long term, between 1997 and 2016.
3.7 For comparison goods the Experian data indicates that annual growth rates are recovering from a low of -2.9% in
2009, to a peak of +5.2% in 2015 and +5% in 2016. However, for the reasons set out above, Experian forecast a
dampening in growth in the immediate post-Brexit period; to +2.3% in 2017, +0.9% in 2018 and +2.1% in 2019.
Thereafter, comparison spend growth is forecast to average circa +3.2% between 2020 and 2036. Despite the
growth forecast by Experian, it is clear that comparison goods growth rates are well below historic trends of +8.3%
per annum for the period 1997 to 2007.
3.8 Any further dampening of growth rates over the medium to long term could likely have implications for the viability
of existing retail businesses and the take-up of new space, as well the need ('capacity') for new retail floorspace
over the forecast period. This needs to be taken into account when assessing and reviewing the capacity
forecasts for new convenience and comparison goods floorspace set out in this report.
Special Forms of Trading and Internet Shopping
3.9 One of the key trends that has impacted on the retail sector and shopping patterns over the last decade has been
the growth in internet shopping, which forms part of special forms of trading (SFT)9. Based on ONS data, Experian
Business Strategies (EBS) estimate that nationally :
� The value of internet sales in 2017 is estimated to be £55.1bn (at current prices). This represents a +31%
increase from £42.1bn in 2015 and a +13% increase from £48.9bn recorded in 2016.
� The value of other (non-internet) SFT sales (e.g. mail order, vending machines, market stalls, etc.) is
estimated to be £8.8bn in 2017. This represents a more modest growth from circa £8.5bn in 2016 and
£7.9bn in 2015.
� Total non-store retail sales are therefore estimated to amount to some £63.9bn in 2017. This represents
a 28% growth in sales from £50bn in 2015 a substantial increase from £17.1bn recorded in 2006.
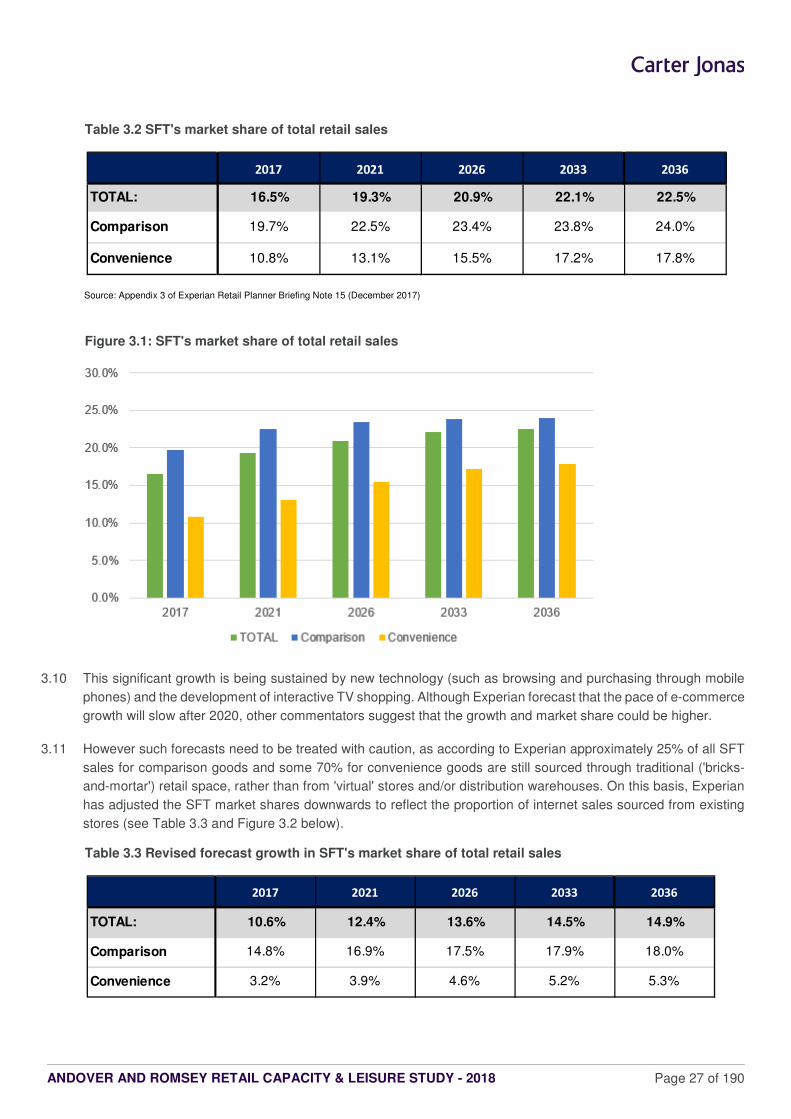
� The overall market share of SFT, as a proportion of total retail sales, has increased nationally from 5.4%
in 2006 to 16.5% in 2017. It is forecast by Experian to grow to 19.3% by 2021 and to 22.5% by 2036 (see
Table 3.2 and Figure 3.1 below).
9 Special Forms of Trading (SFT) comprises all non-store retail sales made via the internet, mail order, stalls and markets, door-to-door and
telephone sales. On-line sales by supermarkets, department stores and catalogue companies are also included in the data collected by the Office
for National Statistics (ONS).
ANDOVER AND ROMSEY RETAIL CAPACITY & LEISURE STUDY - 2018 Page 27 of 190
Table 3.2 SFT's market share of total retail sales
Source: Appendix 3 of Experian Retail Planner Briefing Note 15 (December 2017)
Figure 3.1: SFT's market share of total retail sales
3.10 This significant growth is being sustained by new technology (such as browsing and purchasing through mobile
phones) and the development of interactive TV shopping. Although Experian forecast that the pace of e-commerce
growth will slow after 2020, other commentators suggest that the growth and market share could be higher.
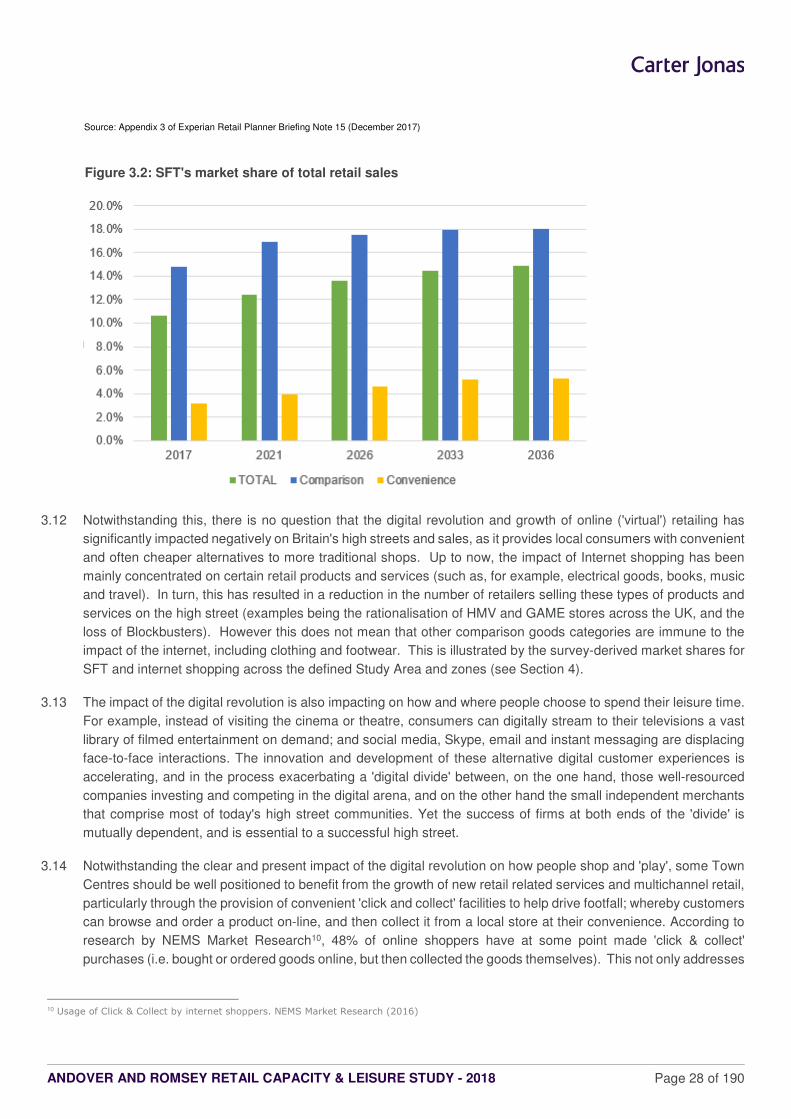
3.11 However such forecasts need to be treated with caution, as according to Experian approximately 25% of all SFT
sales for comparison goods and some 70% for convenience goods are still sourced through traditional ('bricks-
and-mortar') retail space, rather than from 'virtual' stores and/or distribution warehouses. On this basis, Experian
has adjusted the SFT market shares downwards to reflect the proportion of internet sales sourced from existing
stores (see Table 3.3 and Figure 3.2 below).
Table 3.3 Revised forecast growth in SFT's market share of total retail sales
2017 2021 2026 2033 2036
TOTAL: 16.5% 19.3% 20.9% 22.1% 22.5%
Comparison 19.7% 22.5% 23.4% 23.8% 24.0%
Convenience 10.8% 13.1% 15.5% 17.2% 17.8%
2017 2021 2026 2033 2036
TOTAL: 10.6% 12.4% 13.6% 14.5% 14.9%
Comparison 14.8% 16.9% 17.5% 17.9% 18.0%
Convenience 3.2% 3.9% 4.6% 5.2% 5.3%
ANDOVER AND ROMSEY RETAIL CAPACITY & LEISURE STUDY - 2018 Page 28 of 190
Source: Appendix 3 of Experian Retail Planner Briefing Note 15 (December 2017)
Figure 3.2: SFT's market share of total retail sales
3.12 Notwithstanding this, there is no question that the digital revolution and growth of online ('virtual') retailing has
significantly impacted negatively on Britain's high streets and sales, as it provides local consumers with convenient
and often cheaper alternatives to more traditional shops. Up to now, the impact of Internet shopping has been
mainly concentrated on certain retail products and services (such as, for example, electrical goods, books, music
and travel). In turn, this has resulted in a reduction in the number of retailers selling these types of products and
services on the high street (examples being the rationalisation of HMV and GAME stores across the UK, and the
loss of Blockbusters). However this does not mean that other comparison goods categories are immune to the
impact of the internet, including clothing and footwear. This is illustrated by the survey-derived market shares for
SFT and internet shopping across the defined Study Area and zones (see Section 4).
3.13 The impact of the digital revolution is also impacting on how and where people choose to spend their leisure time.
For example, instead of visiting the cinema or theatre, consumers can digitally stream to their televisions a vast
library of filmed entertainment on demand; and social media, Skype, email and instant messaging are displacing
face-to-face interactions. The innovation and development of these alternative digital customer experiences is
accelerating, and in the process exacerbating a 'digital divide' between, on the one hand, those well-resourced
companies investing and competing in the digital arena, and on the other hand the small independent merchants
that comprise most of today's high street communities. Yet the success of firms at both ends of the 'divide' is
mutually dependent, and is essential to a successful high street.
3.14 Notwithstanding the clear and present impact of the digital revolution on how people shop and 'play', some Town
Centres should be well positioned to benefit from the growth of new retail related services and multichannel retail,
particularly through the provision of convenient 'click and collect' facilities to help drive footfall; whereby customers
can browse and order a product on-line, and then collect it from a local store at their convenience. According to
research by NEMS Market Research10, 48% of online shoppers have at some point made 'click & collect'
purchases (i.e. bought or ordered goods online, but then collected the goods themselves). This not only addresses
10 Usage of Click & Collect by internet shoppers. NEMS Market Research (2016)

ANDOVER AND ROMSEY RETAIL CAPACITY & LEISURE STUDY - 2018 Page 29 of 190
the major weakness of online shopping, which is that customers may not be at home when their goods are
delivered, but also offers an opportunity for the successful adaptation of traditional high street retailing. John Lewis
has led the way in this field and Argos has reported that sales through its 'click & collect' service account for circa
one-third of the company's total turnover. Amazon also has an agreement with the Co-operative and Morrisons to
locate self-service lockers in local stores. According to research by NEMS Market Research Ltd, a wide range
of retailers are rated positively in terms of having a good 'click and collect' service, but a few stand out. For example
Argos was rated positively by a third of the people interviewed who have used a 'click & collect', followed by Tesco
(27% rated its service as good), ASDA (15%), John Lewis (13%) and Marks & Spencer (7%). The only 'pure' (i.e.
non High Street) online retailer that was rated highly was Amazon (7% of those questioned rated Amazon’s click-
and-collect facilities positively).
3.15 Further to this is the potential for 'showrooms' on the high street, where customers can view and test products in-
store before purchasing online, for example IKEA. This co-ordinated multi-channel strategy should therefore help
to support the vitality and viability of some Town Centres over time, and help drive the demand for retail space
from non-traditional retailers, but only where the demand is being directed toward Town Centres and High Streets.
Floorspace 'Productivity' Growth
3.16 Floorspace 'productivity' (or turnover 'efficiency') growth represents the ability of retailers to absorb higher than
inflation increases in their costs over time (such as, for example, rents, rates, service charges and staff costs) to
help maintain their profitability and viability. Practically, this is achieved by increasing the amount of sales
(revenue) within a given retailer's available floorspace (measured in square feet or metres).
3.17 It is standard practice for retail planning assessments to make an allowance for the year-on-year growth in the
average sales densities of existing and new (comparison and convenience) retail floorspace. However, there is
limited evidence detailing actual changes in the turnover and profitability of retailers over time. Furthermore
analysis of past data and trends is complicated by the fact that sales density increases have been affected by
changes in the use of retail floorspace over the last 20 years; such as, for example, the growth in out-of-centre
retailing; Sunday-trading; longer opening hours; and the very strong growth of retail expenditure relative to the
growth in floorspace. Following the recession many retailers struggled to increase or even maintain sales density
levels and, together with other financial problems, this resulted in some retailers going out of business.
3.18 Table 3.4 below sets out the latest sales density growth forecasts for comparison and convenience goods
floorspace published by Experian Business Strategies (EBS), based on predicted changes in retail floorspace
over time and after making an allowance for 'non-store' (SFT) retailing.
Table 3.4 Forecast 'productivity' growth rates
Source: Figures 4a and 4b, Experian Retail Planner Briefing Note 15 (December 2017)
3.19 The forecasts show that the scope for sales density growth is limited for convenience goods retailing. This is
mainly due to slow growth in sales volumes and limited additions to the floorspace stock following the shelving of
major foodstore expansion programmes by the leading national grocers (i.e. Tesco, Waitrose, Sainsbury's,
Morrisons and Asda). Notwithstanding this, the turnover densities of existing food stores in strong trading locations
will inevitably be driven upwards where they are serving catchments that are forecast to benefit from strong
2014 2015 2016 2017 2021 2026 2020-24 2025-36
Comparison 5.4% 5.3% 4.3% 1.3% 0.9% 1.8% 2.3% 2.2%
Convenience -2.0% -1.2% 0.7% -0.1% -0.1% -0.2% 0.0% 0.1%
ANDOVER AND ROMSEY RETAIL CAPACITY & LEISURE STUDY - 2018 Page 30 of 190
population and expenditure growth over the short, medium and long term, and particularly where there is limited
or no addition to the floorspace stock.
3.20 For comparison goods retailing, the trends towards more modern, higher density stores and the demolition of older
inefficient space is forecast to continue, resulting in average growth rates of over +2.3% per annum over the next
15-20 years. However, this is still well below the rate seen during the boom of the early years of this century.
3.21 The floorspace 'productivity' growth rates forecast by EBS have been used to inform the retail capacity assessment
set out in Section 10 of this study. It should be noted however that we consider that existing retailers and
floorspace will have the potential to achieve higher annual revenue growth rates to absorb increasing costs in
order to remain viable, and this is especially the case where opportunities for additional new floorspace is limited.
Changing Retailer Requirements
3.22 The economic downturn, the growth in internet shopping and the continued demand for out-of-centre shopping
has resulted in national retailers reviewing and rapidly adapting their business strategies, requirements and store
formats to keep pace with these dynamic changes in the sector and consumer demand.
3.23 This is probably best illustrated by the changes in the grocery sector over the last 2-3 years. Following a sustained
period of growth over almost 20 years up to 2009/10, principally driven by new store openings, the focus for the
main grocery operators (i.e. Tesco, Sainsbury's, Asda, Waitrose and Morrison’s) has now shifted to growing
market share through opening new smaller convenience store formats (such as Tesco Express, Sainsbury's Local
and Little Waitrose) and online sales. Over this period applications for large store formats have slowed to a virtual
standstill and in some cases permissions are not being built out11. At the other end of the grocery spectrum, the
European-led 'deep discount' food operators (namely Aldi and Lidl) are increasing their market shares through
new store openings across the UK. This will inevitably have implications for the scale and type of new floorspace
required by food stores in the future.
3.24 In the non-food sector, those retailers that experienced significant growth up to 2007/08 have had to adapt to the
very different market conditions. The retailers that have not been flexible enough to respond to changing consumer
needs, or are being squeezed in the increasingly competitive 'middle ground' between high-end and value retailing,
have largely struggled to maintain market share. In some cases, this has resulted in a series of high profile
'casualties' and a number of key retailers have either disappeared from our high streets altogether (e.g.
Woolworths, TJ Hughes, Jessops and Jane Norman), or have significantly reduced their store portfolio in centres
across the UK (e.g. HMV, GAME etc.). Although the number of retailer 'casualties' has slowed over the last 12-
18 months, there are still a number of traditional high street retailers that have recently been forced into
administration, most notably BHS.
3.25 Research also shows that there is an increasing polarisation and concentration of retailer demand and investment
interest in the larger regional and sub-regional centres (i.e. the 'top 25-50' UK centres as defined by Javelin
VenueScore rankings). This is because these centres usually have large and established catchment areas, and
therefore represent less 'risky' investments in the current uncertain economic climate. These larger centres have
also generally benefitted from recent new shopping centre development and investment over the last decade, and
are therefore better placed than smaller and medium sized centres to accommodate retailers' requirements for
modern larger format units. At the same time, retailer and investment demand is also mainly focussed on the
prime retail pitches, with the secondary and tertiary pitches contracting and deteriorating in some centres due to
11 For example, in 2015 Tesco disposed of some 49 sites with relatively recent permissions for new food stores, including sites in Ipswich,
Basingstoke and Dartford.
ANDOVER AND ROMSEY RETAIL CAPACITY & LEISURE STUDY - 2018 Page 31 of 190
limited demand, smaller shop units and increasing vacancies. The continuation of these trends will impact on
future operator requirements, with retailers looking to satisfy their demand for larger modern premises in prime
shopping locations, with strong catchment areas and a good supply of appropriate retail space.
3.26 Furthermore, many of the major multiples and traditional high street retailers are changing their store formats and
locational requirements. For example, key anchor retailers such as Boots, Next, Mothercare, TK Maxx, John
Lewis and Marks & Spencer are actively seeking larger format units to showcase their full product range and to
provide an exciting shopper environment backed by the latest (digital) technology. As a result, it is the larger
centres and out-of-centre retail parks that are often best placed to meet this demand; as larger units are difficult
to accommodate within existing traditional high streets and Town Centres, particularly historic areas characterised
by conservation areas and listed buildings. As a result, some traditional high street retailers are moving out of
Town Centres to retail parks. For example, over recent years Marks & Spencer has closed a number of traditional
variety stores on high streets (including in Harlow, Great Yarmouth and Rugby) and opened new M&S Simply
Food stores in out-of-centre locations. M&S has also recently announced a further wave of closures for 2018/19,
including the closure of M&S in Andover. This further underlines the growing demand from multiple retailers for
larger format shop units, and the need for Town Centres to provide a good mix of large modern units to help attract
and retain high street retailers, or potentially risk their relocation to new competing shopping destinations as and
when leases expire.
3.27 These changes in retailer requirements and market demand will continue to have a significant impact on the UK's
Town Centres and high streets, particularly in those cases where retailers make the decision to relocate from
Town Centres to out-of-centre locations, or even out of the area altogether.
Vacancy Levels
3.28 The impact of retail closures in Town Centres due to administration (beginning with Woolworths in 2008, BHS in
2016, and Jaeger in 2017) and portfolio rationalisation (such as Clinton Cards planned closure of 120 stores in
2017/18, as well closure of all Banana Republic stores in 2017) has led to a dramatic increase in national vacancy
rates.
3.29 Experian's figures show that the national average vacancy level (expressed as a proportion of total outlets) more
than doubled between 2006 and 2013; from circa 7% to 16%. Although vacancy levels have more recently have
fallen back to circa 11.2% in 2017, the national average figure 'masks' the reality for different centres and locations,
for example:
� Research by the Local Data Company shows that there is a significant polarisation in vacancy levels
between prime and secondary centres, and between centres in the north and south. The generally more
'healthy' centres, closer to London and the south-east have vacancy levels of less than 10%, whereas the
more challenging conditions in centres such as Blackpool, Grimsby and Hull is resulting in vacancy levels
of over 20%.
� Since 201212 a significant number of shopping centre and high street retail leases have expired as 25 year
leases agreed in the late 1980's to early 1990's and more recent sub-10 year leases all reach maturity. In
some cases/locations this has helped retailers with their portfolio rationalisation, as they adjust their store
requirements for the new multi-channel environment.
12 Jones Lang LaSalle, Property Predictions, 2012.
ANDOVER AND ROMSEY RETAIL CAPACITY & LEISURE STUDY - 2018 Page 32 of 190
� In many centres, there can be as many as 25-30% of occupied shops on temporary short-term lets, with
little or no rent being paid13.
3.30 Experience shows that long-term vacancies and concentrations of vacant properties in centres can lead to a 'spiral
of decline', engender feelings of neglect and lack of confidence in Town Centres, and act as a magnet for crime
and antisocial behaviour. Redeveloping and bringing vacant and under-used sites and properties back into use
can help stimulate vitality and economic viability, and kick-start local growth14. In those cases where vacancies
are long-term and units cannot be let, it will be necessary to consider alternative uses and options for
redevelopment. This can include temporary uses that ensure Town Centres and frontages remain active, with the
potential to accommodate business start-ups, art studios and galleries, community/youth centres, etc. Another
option is 'meanwhile uses/leases', which can facilitate temporary occupation of empty buildings while a permanent
solution is being found. Furthermore, local planning authorities can provide greater flexibility for changes of use
in areas with high vacancy levels, particularly secondary frontages, through local plan policies, area action plans
and other planning tools.
Trends in Retail-Led Investment and Development
3.31 The weak UK retail economy, the low growth in retail sales volumes, high vacancy levels and the lack of traditional
development funds are all combining with other factors to create a very difficult climate for new shopping centre
development and investment. One of the key impacts at the height of the economic recession was to 'weed out'
some of the more expensive and unviable development schemes that were in the pipeline before the downturn in
2007/08.
3.32 The Shopping Centre Development Pipeline Report published by the British Council of Shopping Centres (BCSC
– now known as Revo) shows that the UK experienced, on average, nine new centre openings in each of the first
10 years of the 21st century. However, following the development of circa 260,000 sqm in 2009, 232,000 sqm in
2010 and 280,000 sqm in 2011, 2012 was the first year since records began in 1983 that no significant new
shopping centres opened. Notwithstanding this, there are more positive recent signs of new shopping centre
investment and development activity, with UK-based and international funds seeking assets (principally in prime
and secondary locations) that offer the potential for growth. In terms of new development, three significant
schemes opened in 2013 with a total floorspace of circa 140,000 sqm (including Trinity Leeds); the Old Market
scheme in Hereford opened in 2014; and in 2015 there were a number of significant openings, including Grand
Central in Birmingham as part of the New Street station redevelopment and Friars Walk in Newport. Other
shopping centre schemes have opened in centres across the UK since 2015, but none are of the scale witnessed
during the 'golden age' of shopping centre development between 1997/98 and 2007/08.
3.33 Recent trends suggest that average scheme size is generally smaller than previous schemes (i.e. less than 27,870
sqm), apart from in the larger 'top ranking' cities with the strongest catchment populations and expenditure to
support new floorspace. Furthermore, recent developments and schemes in the pipeline have a significantly
higher proportion of leisure uses and space than earlier shopping centre developments. For example, Land
Securities recently reported that leisure space had grown four-fold in their new development schemes over the
last 10 years; as illustrated by their major Trinity Leeds scheme which includes a significant leisure and catering
offer. In London, the High Street Quarter scheme in Hounslow Metropolitan Centre will also include a significant
food and beverage offer, anchored by a multi-screen cinema, with a reduced retail offer.
13 Sourced from Beyond Retail (2013)
14 London Assembly Economy Committee: Open for Business. Empty shops on London’s high streets GLA, March 2013.
ANDOVER AND ROMSEY RETAIL CAPACITY & LEISURE STUDY - 2018 Page 33 of 190
3.34 Even smaller schemes, such as those in Hereford and Salisbury, are providing between 5-10 restaurant (Class
A3) units. Such demand is especially true in those Town Centres that have wider employment, tourist or other
attractions and offer the potential for longer stay shopping. It is apparent that the trend towards more eating out
and more informal restaurants and catering outlets across Town Centres is now very much part of new investment
and development. This trend clearly has implications for the future planning and development of the Council's
main centres and the delivery of a realistic retail vision.
3.35 Given that it takes on average over ten years for a Town Centre scheme to be planned and developed, then it
follows that it will take a number of years for centres to benefit from the economic upturn and renewed investment
and development confidence. Town Centre redevelopment is complex and complicated by fragmented ownership
in many centres, which acts as a barrier to site assembly and the creation of new development and infill schemes
that might provide the right type of larger format retail units to attract expanding retailers. Small units and
fragmented ownership are not conducive to accommodating many of today's modern retailer requirements. As a
result, local planning authorities will need to take a more proactive role in attracting and/or delivering new
investment and development in Town Centres. This was a key recommendation of the BCSC research 'Enabling
Retail Development' (2015), which identified the following interventions by local authorities based on their case
study research:
� Investor: Newport, Sheffield, Oldham, Walsall
� Developer: Sheffield, Oldham, Bradford, Walsall
� Masterplanner/site assembly: Ealing, Hounslow, Newport
� Owner and management company: Woking
� Public Realm delivery: Hemel Hempstead, Bradford
� High Street improvements and grants: Newport, Hounslow, Bradford
3.36 Furthermore, the more challenging retail environment means that those shopping locations outside the 'top 25-50'
centres that missed the previous (pre-recession) development cycle may face a long wait for new Town Centre
development, as investors look to reduce their exposure and risks. While existing shopping centres may provide
the opportunity for asset management by their owners to improve their overall attraction, offer and turnover (such
as, for example, through extensions and/or increasing the food, beverage and leisure offer), it can still be
problematical and prohibitively expensive to reconfigure units in the more dated early generation shopping centres.
In addition, a lack of finance in recent years has severely limited investment in these centres. So, even where
there is single ownership and control, activity to create the right type of units for retailers has been restricted.
However it is preferable to work with existing schemes, where possible, to avoid simply moving retailers from one
scheme to another and creating yet more vacant units.
3.37 Even with internet growth, additional floorspace remains one of the primary mechanisms that retailers use to grow
profit and if they cannot occupy or adapt existing space, they will often look elsewhere. This means that new retail
development solutions are likely to need to become more imaginative in the way in which existing properties
(including listed buildings, while mindful of avoiding harm to such heritage assets) are altered in order to help
prevent further diversion of trade to out-of-centre locations. Notwithstanding this, the economic rationale for new
ANDOVER AND ROMSEY RETAIL CAPACITY & LEISURE STUDY - 2018 Page 34 of 190
floorspace in many Town Centres is much reduced and some commentators15 argue that the focus will
increasingly be on enhancing and updating the existing Town Centre fabric.
Independents and Street Markets
3.38 Multiples continue to be a powerful force within the retail sector, both as marketable brands, and in their ability to
secure prime locations in Town Centres. However this does not underestimate or undervalue the important role
of small independent shops16 and street markets, which help to improve consumer choice and convenience to
the communities they serve, as well as generating significant benefits for Town Centre economies in terms of local
employment and income generation. Furthermore, it is widely accepted that a good mix of independent shops and
market stalls help to enhance the character, diversity and vibrancy of Town Centres, preventing the growth of so-
called 'clone towns'17 due to the increasing colonisation of centres by larger chain stores. The homogenisation of
the high street is discussed below:
'…Is the spread of clone towns and the creeping homogenisation of the high street anything more than
an aesthetic blight? We think so. Yes, distinctiveness and a sense of place matter to people. Without
character in our urban centres, living history and visible proof that we can in some way shape and
influence our living environment we become alienated in the very places that we should feel at home.'
(New Economics Foundation, Reimagining the High Street, 2010)
3.39 Notwithstanding this, research shows that the number of small shops in the UK has declined in the past decade.
This decline has been caused by multiple factors including changes in shopping behaviour, competition from
supermarkets, internet shopping and rising costs (including rents and rates).
3.40 In terms of street markets, the 1994 Rhodes Report demonstrated its collective and economic strength. From this
report the industry has been successful in demonstrating its national economic value and successive governments
have started to value the role of markets as a vibrant and active part of the future of our Town Centres and the
high street. This is illustrated by the NPPF (paragraph 23), which places weight on the need to 'retain and enhance
existing markets and, where appropriate, re-introduce or create new ones, ensuring that markets remain attractive
and competitive'.
3.41 The Portas Review18 also identified markets as an important factor in the future of successful Town Centres. This
review produced 28 recommendations for reforms and whilst the success (or otherwise) of the Portas Pilots and
other interventions are still the subject of debate, recommendation No 17, a national market day, was grasped by
the retail market industry. In May 2012 the first 'Love Your Local Market Fortnight' (LYLM) was rolled out as an
annual national celebration of all things positive about retail markets in the UK. The Department for Communities
and Local Government (DCLG) have also been very proactive in supporting the positive role of markets in the UK
and Town Centre economies.
3.42 Retail markets therefore continue to make a meaningful and important contribution to towns and cities across the
UK. The successful markets we see today are those which have embraced change and adapted alongside the
15 English Heritage (2013), The Changing Face of the High Street: Decline and Revival
16 There is no national definition however the Town Centres SPG defines ‘small independent shops’ as a shop with a gross floorspace of 80 sqm or
less.
15 New Economics Foundation (NEF) Clone Town Britain Report (2005 and 2010)
16 The Portas Review: An independent review into the future of our high streets (2011)
ANDOVER AND ROMSEY RETAIL CAPACITY & LEISURE STUDY - 2018 Page 35 of 190
town in which they trade; as the demographics of a town change a successful market will reflect this change and
continue to cater for and attract the town's residents creating a vibrant and successful market. This will in turn
attract visitors from outside the area and increase the value of the market19.
3.43 In summary, providing for the needs of modern retailers in larger format stores, principally through new retail-led
developments, whilst maintaining the viability, representation and mix of independent businesses and market
stalls is a difficult balancing act for local planning authorities. It will be a greater challenge going forward with the
threat of internet shopping and a fragile economy in the post-Brexit age, but it is vitally important that the diversity
of a centre's offer is not undermined by the new retail brands.
Impact of Out-Of-Centre Retailing
3.44 Alongside the dramatic growth in online shopping and sales over the last decade, it is apparent that the appetite
from investors and operators for new retail and leisure floorspace in out of centre locations has not diminished.
3.45 Research20 shows that there has been a significant shift of institutional retail investment away from Town Centres
over the last 20 years. In 1993, the proportion of investment held out of town was less than a fifth of that in Town
Centres; today the value of property owned out of town has overtaken that held in Town Centres.
3.46 Larger format units in out-of-centre shopping parks are increasingly attractive locations for more traditional high
street retailers, with the benefits of good accessibility, lower costs and ample surface car parking compared with
Town Centres. Out-of-centre retailing also accounts for a significant proportion of existing and new retail
floorspace and sales in the UK. For example research has highlighted the fact that of the new retail developments
approved since the NPPF was published in March 2012, 72% were in out of town locations, 16% were edge of
centre and just 12% were in Town Centres.
3.47 Although planning policies and more restrictive conditions on what goods can and cannot be sold from some retail
warehouses and parks has slowed down the growth of out-of-centre retailing to a degree, the sector continues to
mature and move away from 'bulky' goods21 retailing to the provision of larger stores selling fashion and
homewares that compete directly with the high street. Examples include Next at Home (which now includes a
significant proportion of fashion sales), John Lewis at Home and Outfit (which includes the Arcadia brands in one
store, including Dorothy Perkins, Topshop, Burton, Wallis, etc.).
3.48 Continuation of this trend will further challenge the future vitality of many high streets as retailers choose edge
and out of centre locations ahead of Town Centres. The impact of these changes will also affect centres differently
depending on their function and the future growth in their catchment populations and expenditure. For many towns,
the simple fact is that in the future they will require a smaller, more concentrated retail core repositioned for future
consumer and retailer needs, and not focused on the past. This will further reinforce the polarisation trend already
being witnessed. The impact is likely to be felt across all centres to a greater or lesser extent, manifested through
high vacancy rates, falling rent levels, decreasing footfall, weakening multiple retail offer and, potentially, a
worsening Town Centre environment.
19 Recent research documents supporting the benefits of markets can be found via the following link:
http://www.nabma.com/publications/research-documents/.
20 Property Data Report 2012, sourced from English Heritage Report (2013), The Changing Face of the High Street: Decline and Revival
21 ‘Bulky’ goods retailing is generally defined as comprising DIY goods, furniture and floor coverings, major household appliances and audio-visual
equipment.
ANDOVER AND ROMSEY RETAIL CAPACITY & LEISURE STUDY - 2018 Page 36 of 190
Summary
3.49 This section has illustrated that existing floorspace in Town Centres faces a myriad of challenges. These will
continue to grow over the short, medium and long term. This notwithstanding, for the centres within Test Valley
(specifically Andover and Romsey) to perform strongly they will need to embrace the new dynamics and build in
resilience to adapt seamlessly to future changes where necessary. There is still a role for existing floorspace and
physical 'store based' retailing in Town Centres.
3.50 There are positive signs that the UK is emerging from the shadow of the longest and deepest economic downturn
in living memory, but it is clear that our Town Centres and high streets post-recession are under pressures to
simply retain retail businesses, let alone attract new investment and development.
� First, although the economy in general, and retail sector in particular, is forecast to experience growth over
the short to medium term at least, there are risks to these growth forecasts; not least the slowdown in global
economies, an increase in interest rates and the potential fallout from Brexit and other global uncertainties
arising from international politics.
� Second, the growth of online shopping is impacting on the vitality and viability of many of Britain's centres
and high streets.
� Third, although the NPPF reinforces the longstanding policy objective of promoting development and
investment in Town Centres first, the market appetite for new and extended shopping facilities in out-of-
centre locations shows no signs of slowing. The lack of available, suitable and viable sites in Town Centres
- and particularly historic centres - to meet the demands of modern retailers and commercial leisure
operators for larger format units will inevitably result in an increase in new out-of-centre applications and/or
applications to widen 'bulky goods' conditions on existing retail parks.
3.51 Within the Test Valley Area, there will be a need to build in resilience to the changes in shopping habits, which
are likely to move away from solely being retail led locations to those which offer a wider range of retail, leisure,
cultural and other amenities. This is to encourage increased dwell times and to create more purpose in frequenting
centres. For example, the introduction of cinemas and more quality food and beverage outlets in-centre over
recent years has helped to promote more robust, diverse and viable daytime and evening economies. Further to
this, quality street markets, events and promotions can draw new customers to centres and encourage repeat
visits.
3.52 These trends, and others, are also placing pressures on rental growth and market demand in many centres,
particularly the smaller secondary centres and market towns outside the 'top 25-50' shopping locations. This has
been further compounded by rising vacancy levels and the loss of key retailers. As a result, the share of non-food
retail sales conducted through Town Centre shops has declined; from 64% in 2002 to just over 40% by 2013.
Indeed research predicts that by 2020, the impact of declining in-store sales will result in a 31% reduction in high
street stores22.
3.53 As a result a far more uncertain future awaits the next wave of new retail investment and development. The
evidence suggests that:
� At one end of the spectrum the larger, more dominant 'top 25-50' cities and towns should strengthen their
competitive position. Because of their scale and catchment populations they will continue to attract market
22 Javelin Group (October 2011), ‘How Many Stores Will We Really Need?’
ANDOVER AND ROMSEY RETAIL CAPACITY & LEISURE STUDY - 2018 Page 37 of 190
interest from high profile domestic and international retailers seeking space, as well as from commercial
leisure operators.
� At the other end of the spectrum the smaller local and neighbourhood centres will be less affected. They
are principally meeting the everyday retail (food), service and community needs of their local ('walk-in')
resident catchment populations. It will therefore be important for local planning authorities to protect the
important offer, role and function of these smaller centres.
� It is the medium-sized towns that occupy the middle ground that are increasingly being squeezed by the
dynamic shifts in retailer demand and investment. Historically, such towns have had a reasonably large
comparison shopping function, but this is beginning to shrink back because the demand from multiples is
slowing and the space offered is often of the wrong size and configuration, and in the wrong location to
meet today's retailer requirements. The challenge for local planning authorities will therefore be how to
revitalise and regenerate these centres, looking beyond retail as a key driver for growth. This could involve
Councils taking more of a lead role in assembling, planning, funding and developing Town Centre
regeneration, ranging from investment in the public realm and shop frontages, through to developing new
mixed use schemes often in partnership with the private sector.
3.54 Notwithstanding these threats, industry experts still predict that the demand from major retailers for new physical
space in the right locations with strong catchments will continue, as it still remains one of the primary mechanisms
for retailers to 'reach' their customers, to grow their businesses and to increase market share and profitability.
Over the short to medium term any increased demand for space from retailers will have to be met by the current
retail stock (i.e. existing shopping centres, the high street and out-of-centre facilities). This is because there is
limited new retail floorspace in the pipeline in Town Centres and, in any case, it can take a long time to deliver
new development on complex Town Centres sites.
3.55 Therefore those shopping locations that are able to accommodate and deliver new developments over the next 5-
10 years should be in a good position to attract operator interest. However, this will depend on the new retail
floorspace being in the right location (i.e. preferably prime shopping locations, with good accessibility, etc.) and
having the right size, format and specification to meet the needs of modern retailers. Due care and attention will
also need to be paid to ensuring that the new floorspace and tenants complement rather than compete with the
centre's existing offer, and strengthen rather than weaken the existing pedestrian circuit so as to generate the
maximum benefits for the centre's overall vitality and viability.
3.56 In this context, it is clear that the 'top 25-50' prime centres and shopping locations in Britain should continue to
flourish once the economy recovers. The greatest challenge facing local planning authorities will be how to
revitalise the fortunes of struggling small and medium sized centres and market towns that do not have the critical
mass of retail, leisure and other uses to compete for more limited investment and development.
3.57 This provides the important background and context for assessing and understanding the potential for new retail
investment and development in Test Valley and its main centres over the short, medium and long term.
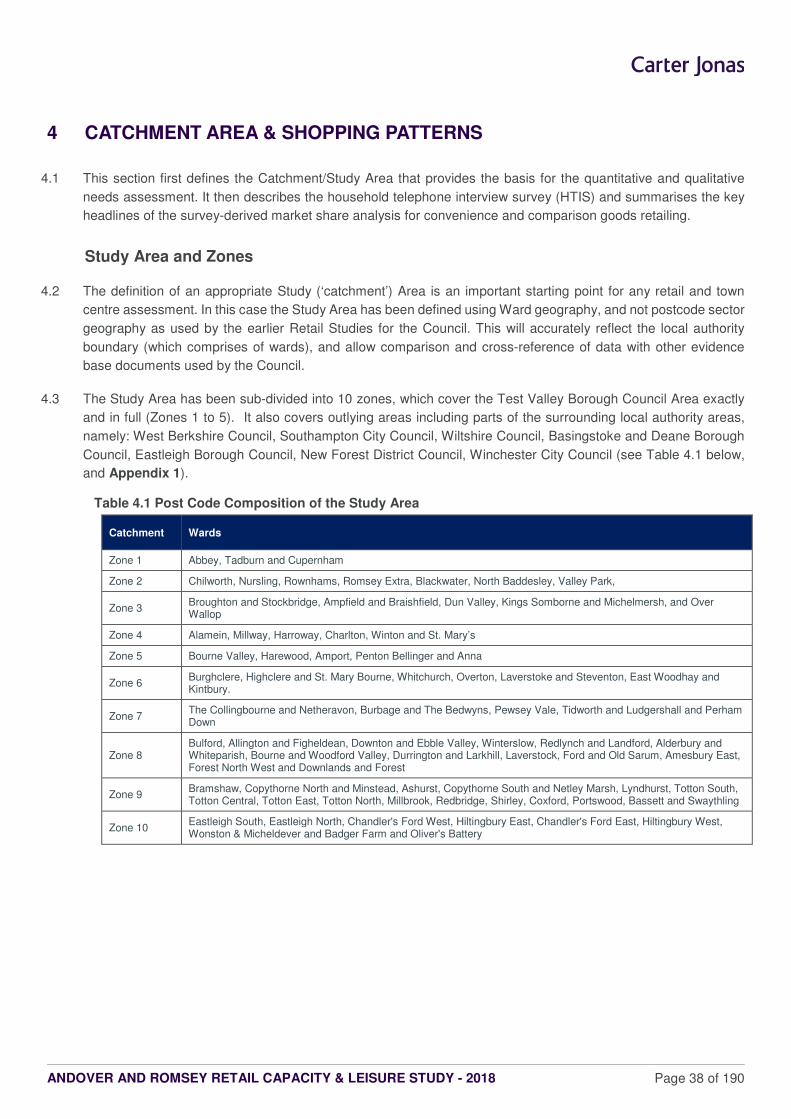
ANDOVER AND ROMSEY RETAIL CAPACITY & LEISURE STUDY - 2018 Page 38 of 190
4 CATCHMENT AREA & SHOPPING PATTERNS
4.1 This section first defines the Catchment/Study Area that provides the basis for the quantitative and qualitative
needs assessment. It then describes the household telephone interview survey (HTIS) and summarises the key
headlines of the survey-derived market share analysis for convenience and comparison goods retailing.
Study Area and Zones
4.2 The definition of an appropriate Study (‘catchment’) Area is an important starting point for any retail and town
centre assessment. In this case the Study Area has been defined using Ward geography, and not postcode sector
geography as used by the earlier Retail Studies for the Council. This will accurately reflect the local authority
boundary (which comprises of wards), and allow comparison and cross-reference of data with other evidence
base documents used by the Council.
4.3 The Study Area has been sub-divided into 10 zones, which cover the Test Valley Borough Council Area exactly
and in full (Zones 1 to 5). It also covers outlying areas including parts of the surrounding local authority areas,
namely: West Berkshire Council, Southampton City Council, Wiltshire Council, Basingstoke and Deane Borough
Council, Eastleigh Borough Council, New Forest District Council, Winchester City Council (see Table 4.1 below,
and Appendix 1).
Table 4.1 Post Code Composition of the Study Area
Catchment Wards
Zone 1 Abbey, Tadburn and Cupernham
Zone 2 Chilworth, Nursling, Rownhams, Romsey Extra, Blackwater, North Baddesley, Valley Park,
Zone 3 Broughton and Stockbridge, Ampfield and Braishfield, Dun Valley, Kings Somborne and Michelmersh, and Over Wallop
Zone 4 Alamein, Millway, Harroway, Charlton, Winton and St. Mary’s
Zone 5 Bourne Valley, Harewood, Amport, Penton Bellinger and Anna
Zone 6 Burghclere, Highclere and St. Mary Bourne, Whitchurch, Overton, Laverstoke and Steventon, East Woodhay and Kintbury.
Zone 7 The Collingbourne and Netheravon, Burbage and The Bedwyns, Pewsey Vale, Tidworth and Ludgershall and Perham Down
Zone 8 Bulford, Allington and Figheldean, Downton and Ebble Valley, Winterslow, Redlynch and Landford, Alderbury and Whiteparish, Bourne and Woodford Valley, Durrington and Larkhill, Laverstock, Ford and Old Sarum, Amesbury East, Forest North West and Downlands and Forest
Zone 9 Bramshaw, Copythorne North and Minstead, Ashurst, Copythorne South and Netley Marsh, Lyndhurst, Totton South, Totton Central, Totton East, Totton North, Millbrook, Redbridge, Shirley, Coxford, Portswood, Bassett and Swaythling
Zone 10 Eastleigh South, Eastleigh North, Chandler's Ford West, Hiltingbury East, Chandler's Ford East, Hiltingbury West, Wonston & Micheldever and Badger Farm and Oliver's Battery
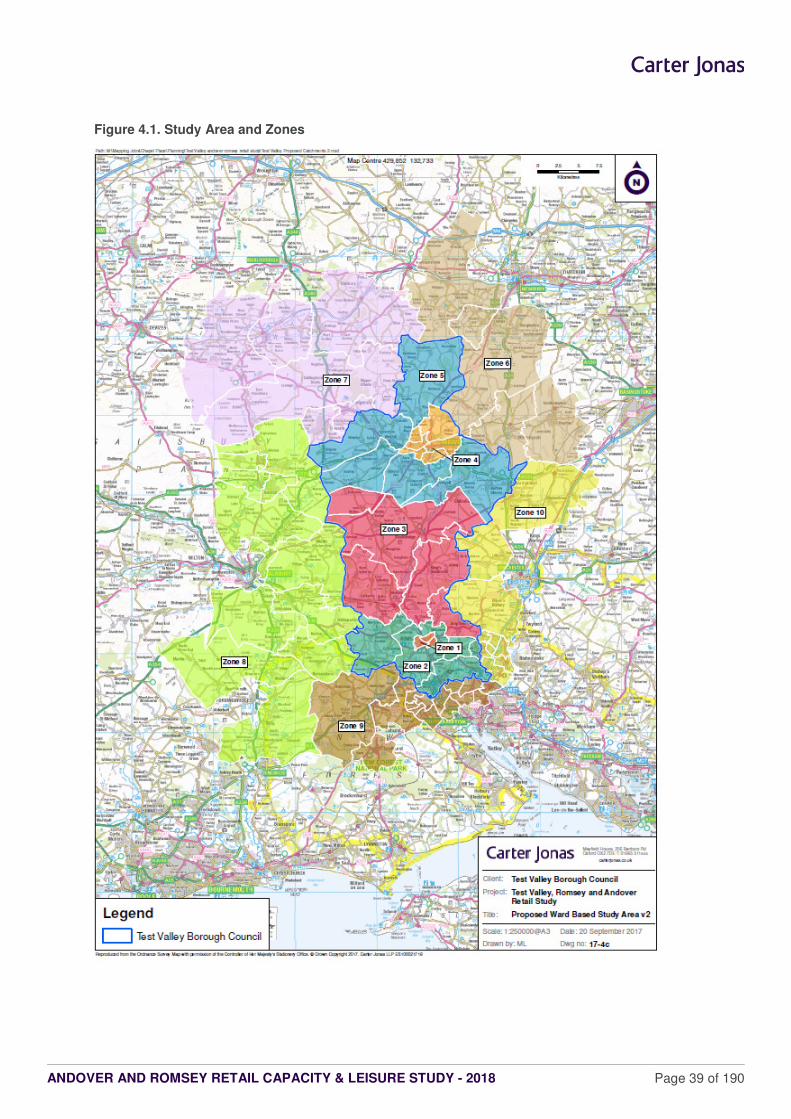
ANDOVER AND ROMSEY RETAIL CAPACITY & LEISURE STUDY - 2018 Page 39 of 190
Figure 4.1. Study Area and Zones
ANDOVER AND ROMSEY RETAIL CAPACITY & LEISURE STUDY - 2018 Page 40 of 190
4.4 These zones provide the sampling framework for the HTIS. This zone-by-zone approach also enables more
detailed analysis of shopping patterns, market shares and expenditure flows both within and outside the Study
Area for the purpose of the retail capacity assessment, in accordance with good practice
Household Telephone Interview Survey & Market Share Analysis
4.5 NEMS Market Research was commissioned to carry out a HTIS across the defined Study Area and zones. The
interviews took place between 2nd and 13th October 2017. The questionnaire was designed by CJ in collaboration
with Test Valley Borough Council. The full ‘weighted’ survey results are set out in Appendix 10.
4.6 In total, some 1,000 interviews were conducted across 10 zones. This involved structured interviews by telephone
with the person responsible for the main household shopping. A number of measures were put in place by NEMS
to ensure each sample was representative of the profile of the person responsible for shopping in the household.
Responses across the Study Area were further weighted by the population in each zone to ensure that the results
of respondents in more sparsely or heavily populated areas were not under or over represented in terms of the
market share assessment. This is a standard approach that helps to ensure the survey results provide a robust
and realistic picture of shopping and leisure patterns. Appendix 10 provides a detailed overview of the survey
sample size and methodology used to ensure a representative sample of a zone’s population profile.
4.7 The survey results help to identify broad patterns and preferences for different types of convenience and
comparison goods shopping purchases, as well as leisure use across the Study Area. The key findings are used
to inform the baseline market share analysis23 and turnover estimates that underpin the quantitative retail capacity
assessment, as well as the qualitative needs assessment.
Convenience Goods – Market Share Analysis
4.8 Convenience goods24 retailing is generally defined as comprising everyday essential items (including food, drinks,
newspapers/magazines and confectionery), as well as an element of non-durable housing goods (such as washing
up liquid, kitchen roll, bin bags, etc.). The survey-derived market share (%) analysis for all convenience goods
shopping is set out in Table 1 (Appendix 4). It should be noted that for this stage of the analysis the market
shares for both convenience and comparison goods retailing include expenditure on Special Forms of Trading25
(including internet sales), but exclude ‘null’ responses (such as ‘don’t knows’, etc.) in accordance with good
practice.
4.9 The overall market shares in Table 1 have been derived from the analysis of the responses as to where people
normally shop for their main (‘bulk’) and ‘top up’ grocery purchases. The market shares for these different types
of food shopping are set out in detail in Tables 2-3 (Appendix 4).
4.10 In order to avoid the market share analysis of food shopping patterns being ‘skewed’ by larger superstores and
food stores in the Study Area, the survey also asked respondents where else they normally shop (if anywhere) for
their ‘main’ and ‘top up’ purchases in addition to the first store identified. The market shares are set out in Table
4 for ‘top up food purchases’ and Table 5 for ‘other top up food purchases’ (Appendix 4).
23 It is common practice in retail assessments to deduct special forms of trading (i.e. purchases over the internet, mail order shopping and market
stalls) from average expenditure per capita figures at the outset according to national forecasts derived from Experian Business Strategies.
Internet shopping and special forms of trading have therefore been filtered out from the survey results before undertaking the market share
assessment.
24 For the purpose of this retail assessment ‘convenience goods’ and ‘food’ shopping have the same meaning.
25 A more detailed explanation of SFT is set out in Section 3
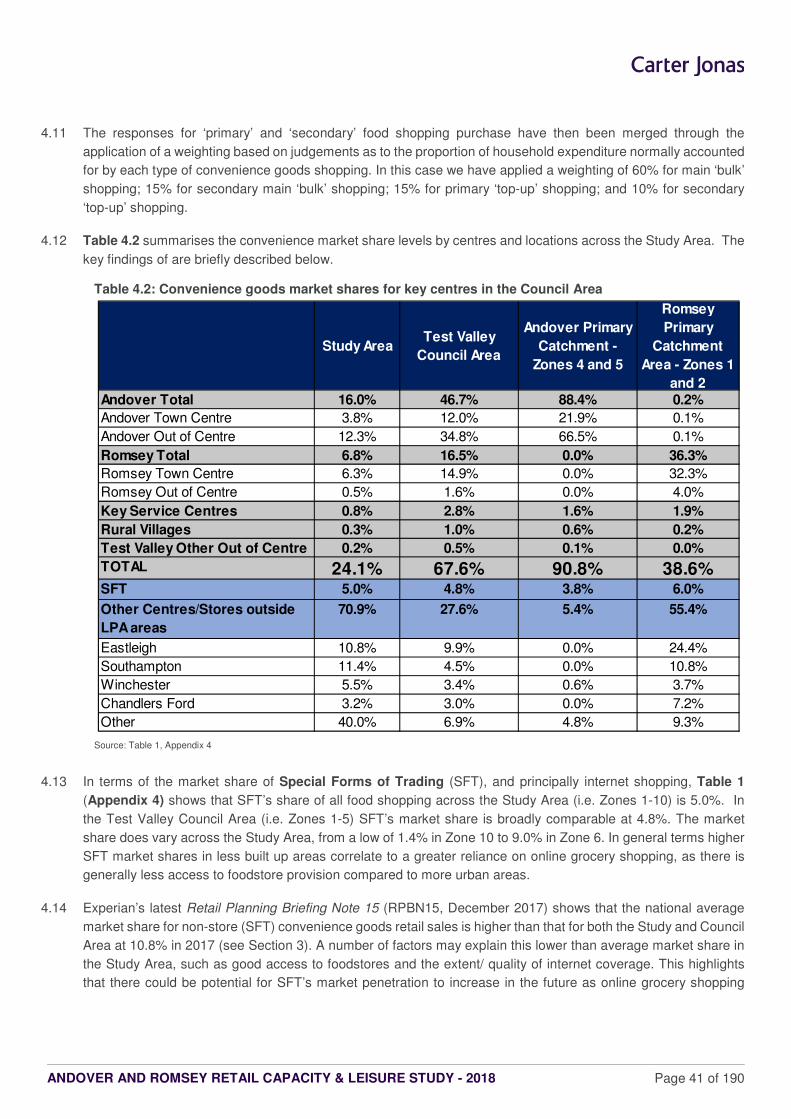
ANDOVER AND ROMSEY RETAIL CAPACITY & LEISURE STUDY - 2018 Page 41 of 190
4.11 The responses for ‘primary’ and ‘secondary’ food shopping purchase have then been merged through the
application of a weighting based on judgements as to the proportion of household expenditure normally accounted
for by each type of convenience goods shopping. In this case we have applied a weighting of 60% for main ‘bulk’
shopping; 15% for secondary main ‘bulk’ shopping; 15% for primary ‘top-up’ shopping; and 10% for secondary
‘top-up’ shopping.
4.12 Table 4.2 summarises the convenience market share levels by centres and locations across the Study Area. The
key findings of are briefly described below.
Table 4.2: Convenience goods market shares for key centres in the Council Area
Source: Table 1, Appendix 4
4.13 In terms of the market share of Special Forms of Trading (SFT), and principally internet shopping, Table 1
(Appendix 4) shows that SFT’s share of all food shopping across the Study Area (i.e. Zones 1-10) is 5.0%. In
the Test Valley Council Area (i.e. Zones 1-5) SFT’s market share is broadly comparable at 4.8%. The market
share does vary across the Study Area, from a low of 1.4% in Zone 10 to 9.0% in Zone 6. In general terms higher
SFT market shares in less built up areas correlate to a greater reliance on online grocery shopping, as there is
generally less access to foodstore provision compared to more urban areas.
4.14 Experian’s latest Retail Planning Briefing Note 15 (RPBN15, December 2017) shows that the national average
market share for non-store (SFT) convenience goods retail sales is higher than that for both the Study and Council
Area at 10.8% in 2017 (see Section 3). A number of factors may explain this lower than average market share in
the Study Area, such as good access to foodstores and the extent/ quality of internet coverage. This highlights
that there could be potential for SFT’s market penetration to increase in the future as online grocery shopping
Study AreaTest Valley
Council Area
Andover Primary
Catchment -
Zones 4 and 5
Romsey
Primary
Catchment
Area - Zones 1
and 2Andover Total 16.0% 46.7% 88.4% 0.2%
Andover Town Centre 3.8% 12.0% 21.9% 0.1%
Andover Out of Centre 12.3% 34.8% 66.5% 0.1%
Romsey Total 6.8% 16.5% 0.0% 36.3%
Romsey Town Centre 6.3% 14.9% 0.0% 32.3%
Romsey Out of Centre 0.5% 1.6% 0.0% 4.0%
Key Service Centres 0.8% 2.8% 1.6% 1.9%
Rural Villages 0.3% 1.0% 0.6% 0.2%
Test Valley Other Out of Centre 0.2% 0.5% 0.1% 0.0%
TOTAL 24.1% 67.6% 90.8% 38.6%SFT 5.0% 4.8% 3.8% 6.0%
Other Centres/Stores outside
LPA areas
70.9% 27.6% 5.4% 55.4%
Eastleigh 10.8% 9.9% 0.0% 24.4%
Southampton 11.4% 4.5% 0.0% 10.8%
Winchester 5.5% 3.4% 0.6% 3.7%
Chandlers Ford 3.2% 3.0% 0.0% 7.2%
Other 40.0% 6.9% 4.8% 9.3%
ANDOVER AND ROMSEY RETAIL CAPACITY & LEISURE STUDY - 2018 Page 42 of 190
becomes more popular and convenient. If this was to occur, then it would potentially reduce the expenditure
available to support the need (‘capacity’) for new (‘physical’) retail floorspace over the forecast period to 2031.
4.15 Turning to the market share analysis for the main centres and stores in the Council’s area, Table 1 of Appendix
4 shows that they are achieving an overall convenience goods market share (‘retention level’) of 24.1% within the
Study Area. However, the main food and convenience stores in the Test Valley Council Area are achieving a good
‘retention level’ of 67.6% of total available convenience expenditure within the Borough area. Although this is a
good retention level in our experience, there could potentially be scope to improve this retention level through new
provision; subject to economic need and market demand.
Andover
4.16 Andover Town Centre retains a market share of 12.0% with the Test Valley Council Area; and 21.9% within its
Primary Catchment Area (PCA - Zone 4 and 5). Waitrose in the Chantry Centre and the Marks and Spencer’s on
the High Street are the main convenience shopping facilities.
4.17 The key competition comes from the out-of-centre food stores near Andover. These retain 66.5% of convenience
trade across the PCA; and 34.8% across the Borough Area. The most popular locations are Tesco Extra, River
Way; Aldi, Weyhill Road; Sainsbury's Superstore, Shepherds Spring Lane; and Asda Superstore, Anton Mill Road.
4.18 As such, Andover as a whole (in-centre and out-of-centre) retains 88.4% of convenience expenditure within its
PCA; and 46.7% in the Test Valley Council Area. Its local retention of 88.4% is positive in our view and suggests
a good provision and choice of food and convenience stores.
4.19 From the Primary Catchment, only 5.4% of Andover’s convenience trade is ‘lost’ to locations outside of the Test
Valley Council Area; namely to Tidworth (1.6%), Salisbury (0.8%), Winchester (0.6%), Basingstoke (0.6%),
Amesbury (0.4%), Marlborough (0.4%) and Whitchurch (0.4%).
4.20 From the primary catchment, only 3.8% of Andover’s convenience trade is accounted for by SFT.
4.21 Overall, the market share results would appear to indicate that Andover as a whole has a strong provision, albeit
the scale and choice of out-of-centre facilities are superior to those in-centre.
Romsey
4.22 Romsey Town Centre retains a market share of 14.9% within the Test Valley Council Area; and 32.3% within the
Romsey Primary Catchment Area (PCA). The main town centre food stores are Aldi, The Hundred (retaining
8.4% of convenience expenditure in the Borough Area) and Waitrose, Alma Road (5.8%).
4.23 Romsey’s out-of-centre convenience facilities are limited; accounting for only 1.6% of convenience spend in the
Test Valley Council Area and 4.0% within its PCA.
4.24 As such, within its PCA Romsey’s overall provision (in-centre and out-of-centre) retains 36.3% of convenience
expenditure; and 16.5% across the Borough Area.
4.25 The key competition comes from locations outside of the Borough. The key locations are Eastleigh (drawing
24.4% of the PCA convenience expenditure) and Southampton (10.8%). This is not entirely surprising given the
geographical location of Romsey; however it does indicate that is a potential ‘gap’ in foodstore provision in Romsey
(especially when comparing to the performance of Andover).
ANDOVER AND ROMSEY RETAIL CAPACITY & LEISURE STUDY - 2018 Page 43 of 190
4.26 Finally, the Key Service Centres within Test Valley have lower retention rates, given their more localised role and
function. Collectively they are aching a market share of 2.8%; reflecting their relatively limited convenience goods
floorspace and the fact that the mainly serve the day-to-day more frequent top-up food shopping needs of their
local resident catchment populations. The Rural Villages collectively retain 1.0% in in the Test Valley Council’s
Area.
4.27 Considering the Study Area as a whole, competing stores outside of the Test Valley Council Area, are achieving
a 70.9% market share. However, when considering the Test Valley area only, the leakage to centres outside the
area is a much lower, at27.65%; the key competitor locations being Eastleigh (9.9%), Southampton (4.5%),
Winchester (3.4%) and Chandlers Ford (3.0%).
Comparison Goods – Market Share Analysis
4.28 Comparison goods26 are generally defined as items not obtained on a frequent basis and include clothing,
footwear, household and recreational goods (see Glossary of Terms). The household survey comprised
questions on the main groupings of non-food expenditure, as defined by Experian in the latest Retail Planner
Briefing Note, including: ‘clothing and footwear’; recording media; electrical goods; books; furniture and carpets;
DIY and garden products; medical goods; etc.
4.29 Table 1 (Appendix 5) shows the market shares (%) for all comparison goods shopping purchases made both
within and outside the Study Area, as well as within the Test Valley Borough Council Area. These total market
shares have been informed by the shopping patterns for the different types of comparison goods expenditure set
out in Tables 2-10 (Appendix 5). The market share analysis (%) takes account of the distribution and weight of
spend (£) by households on the different comparison goods categories. This ensures that that the resultant shares
are not ‘skewed’ by any particular comparison goods expenditure category. This is a standard approach for retail
assessments.
4.30 As for the analysis of convenience goods, the market shares include expenditure on Special Forms of Trading
(SFT), but exclude all ‘null’ responses. The key findings of the market share analysis are briefly described below.
4.31 Table 1 (Appendix 5) shows that SFT’s share of all non-food shopping across the total Study Area (i.e. Zones 1-
10) is 24.4%. The SFT share for the Borough Area (i.e. Zones 1-5) is higher than that of the Study Area, at 29.9%.
In comparison, Experian’s latest RPBN15 shows that the national average market share for non-store (SFT)
comparison goods retail sales is 19.7% in 2017. The market shares from the HTIS therefore indicate a higher SFT
rate than the national average.
4.32 SFT market shares vary for the different zones within the Council Area; from 17.6% in Zone 3, up to 40.1% in
Zone 4. On the basis that Zone 4 covers the immediate catchment area of Andover, this unusually high SFT
retention rate could be explained by a number of factors:
� Andover is well connected logistically for internet distribution facilities, meaning that delivery of goods is
easy;
� The existing shopping and service facilities could have a well-established “click and collect” function;
� The there is a gap in the existing comparison shopping facilities (such as quality, number and scale). This
would force the local population to shop on-line (as well as to look to other centres to cater for their needs).
26 Please note that comparison goods and non-food shopping have the same meanings.
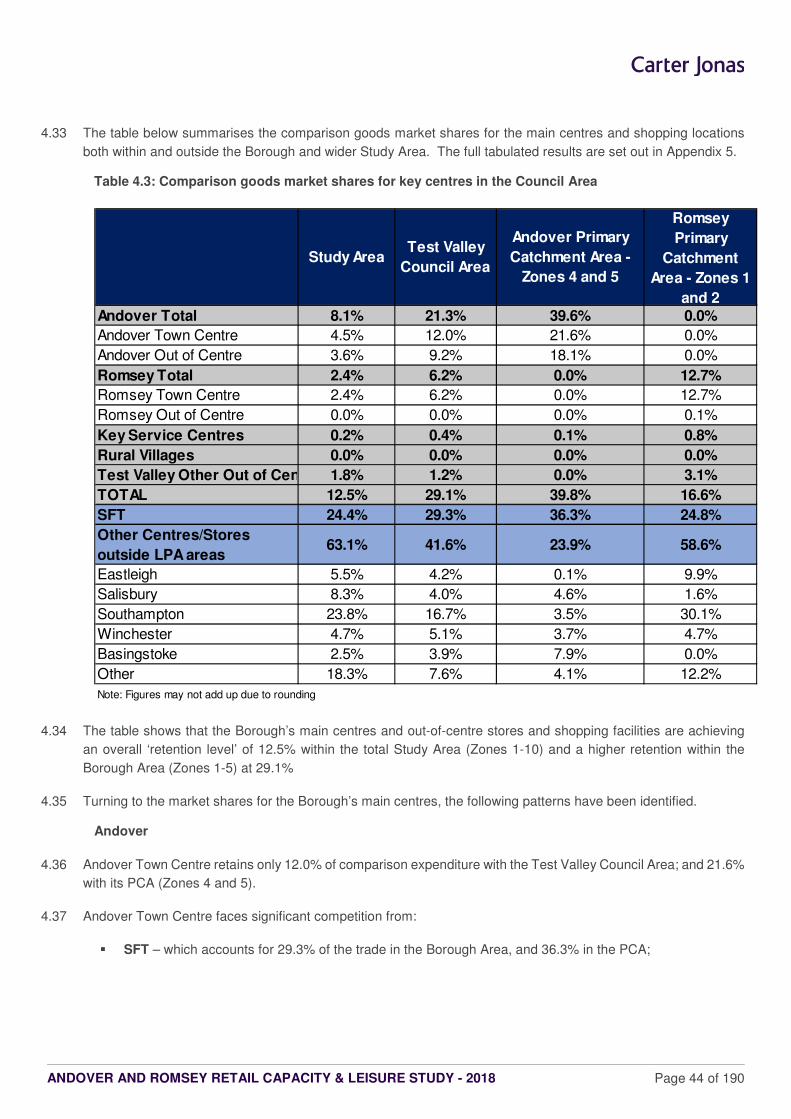
ANDOVER AND ROMSEY RETAIL CAPACITY & LEISURE STUDY - 2018 Page 44 of 190
4.33 The table below summarises the comparison goods market shares for the main centres and shopping locations
both within and outside the Borough and wider Study Area. The full tabulated results are set out in Appendix 5.
Table 4.3: Comparison goods market shares for key centres in the Council Area
4.34 The table shows that the Borough’s main centres and out-of-centre stores and shopping facilities are achieving
an overall ‘retention level’ of 12.5% within the total Study Area (Zones 1-10) and a higher retention within the
Borough Area (Zones 1-5) at 29.1%
4.35 Turning to the market shares for the Borough’s main centres, the following patterns have been identified.
Andover
4.36 Andover Town Centre retains only 12.0% of comparison expenditure with the Test Valley Council Area; and 21.6%
with its PCA (Zones 4 and 5).
4.37 Andover Town Centre faces significant competition from:
� SFT – which accounts for 29.3% of the trade in the Borough Area, and 36.3% in the PCA;
Study AreaTest Valley
Council Area
Andover Primary
Catchment Area -
Zones 4 and 5
Romsey
Primary
Catchment
Area - Zones 1
and 2 Andover Total 8.1% 21.3% 39.6% 0.0%
Andover Town Centre 4.5% 12.0% 21.6% 0.0%
Andover Out of Centre 3.6% 9.2% 18.1% 0.0%
Romsey Total 2.4% 6.2% 0.0% 12.7%
Romsey Town Centre 2.4% 6.2% 0.0% 12.7%
Romsey Out of Centre 0.0% 0.0% 0.0% 0.1%
Key Service Centres 0.2% 0.4% 0.1% 0.8%
Rural Villages 0.0% 0.0% 0.0% 0.0%
Test Valley Other Out of Centre 1.8% 1.2% 0.0% 3.1%
TOTAL 12.5% 29.1% 39.8% 16.6%
SFT 24.4% 29.3% 36.3% 24.8%
Other Centres/Stores
outside LPA areas63.1% 41.6% 23.9% 58.6%
Eastleigh 5.5% 4.2% 0.1% 9.9%
Salisbury 8.3% 4.0% 4.6% 1.6%
Southampton 23.8% 16.7% 3.5% 30.1%
Winchester 4.7% 5.1% 3.7% 4.7%
Basingstoke 2.5% 3.9% 7.9% 0.0%
Other 18.3% 7.6% 4.1% 12.2%
Note: Figures may not add up due to rounding
ANDOVER AND ROMSEY RETAIL CAPACITY & LEISURE STUDY - 2018 Page 45 of 190
� Retail facilities outside of the Test Valley Council Area - with Basingstoke, Salisbury, Southampton,
and Winchester being the main competitors, taking 41.6% of the trade in the Borough Area and 23.9% in
the PCA; and
� Its immediate out-of-centre facilities – including Churchill Retail Park and Enham Arch Retail Park draw
18.1% of the comparison expenditure in the PCA.
4.38 This would suggest that Andover Town Centre has a gap in comparison floorspace provision, and opportunities
to improve quality and choice of provision should be explored to help the centre ‘claw back’ shoppers and trade.
Romsey
4.39 Romsey Town Centre has a lower market share of 6.2% within the Test Valley Borough Area than Andover (12%).
Within Romsey’s Primary Catchment Area (PCA - Zones 1 and 2) the Town Centre retains 12.7% of comparison
expenditure. This reflects the scale and range of the town’s non-food offer.
4.40 There are limited comparison facilities out-of-centre, drawing only 0.1% market share from the PCA. They do not
register a market share within the Borough Area.
4.41 As such, the key competition comes from retail facilities outside the Borough. For example, the PCA experiences
58.6% ‘leakage’ of comparison expenditure; principally to shops and stores in Eastleigh (9.9%), Hedge End (5.5%)
and Southampton (30.1%). Given Romsey’s geographic position and its role and function as a market town, it is
not surprising that expenditure is leaking to these larger and higher order centres.
4.42 The SFT accounts for 24.8% of all comparison expenditure in the PCA. This is higher than the national average
of 19.7%.
4.43 Based on the above, given the high level of leakage and the market share for online shopping, it would appear
that there are gaps in the Town Centre’s comparison offer. This is explored in more detail throughout this Study.
Study and Borough Area
4.44 The HTIS shows that from across the Study Area, competing locations outside of the Borough Area draw a 63.1%
of the comparison goods market share. In comparison, when considering the Test Valley Council Area on its own,
the market share to competing locations is lower at 41.6%. The main competing comparison retail locations are
Southampton, Eastleigh, Salisbury and Winchester.
4.45 The figure below shows the market shares for the Council’s main centres and stores (aggregated), other centres
and SFT/internet shopping for residents in the Study Area and the Borough Area only for different categories of
comparison goods expenditure. This figure summarises the survey-derived results set out in Tables 2-10
(Appendix 5).
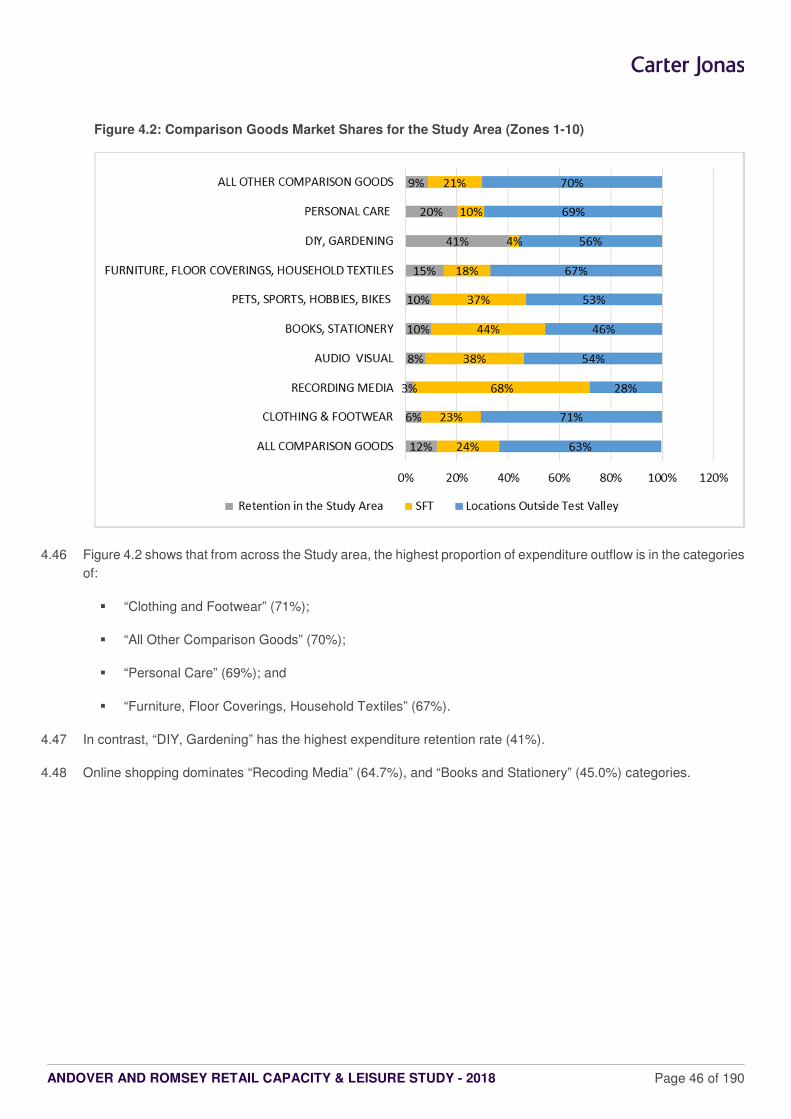
ANDOVER AND ROMSEY RETAIL CAPACITY & LEISURE STUDY - 2018 Page 46 of 190
Figure 4.2: Comparison Goods Market Shares for the Study Area (Zones 1-10)
4.46 Figure 4.2 shows that from across the Study area, the highest proportion of expenditure outflow is in the categories
of:
� “Clothing and Footwear” (71%);
� “All Other Comparison Goods” (70%);
� “Personal Care” (69%); and
� “Furniture, Floor Coverings, Household Textiles” (67%).
4.47 In contrast, “DIY, Gardening” has the highest expenditure retention rate (41%).
4.48 Online shopping dominates “Recoding Media” (64.7%), and “Books and Stationery” (45.0%) categories.
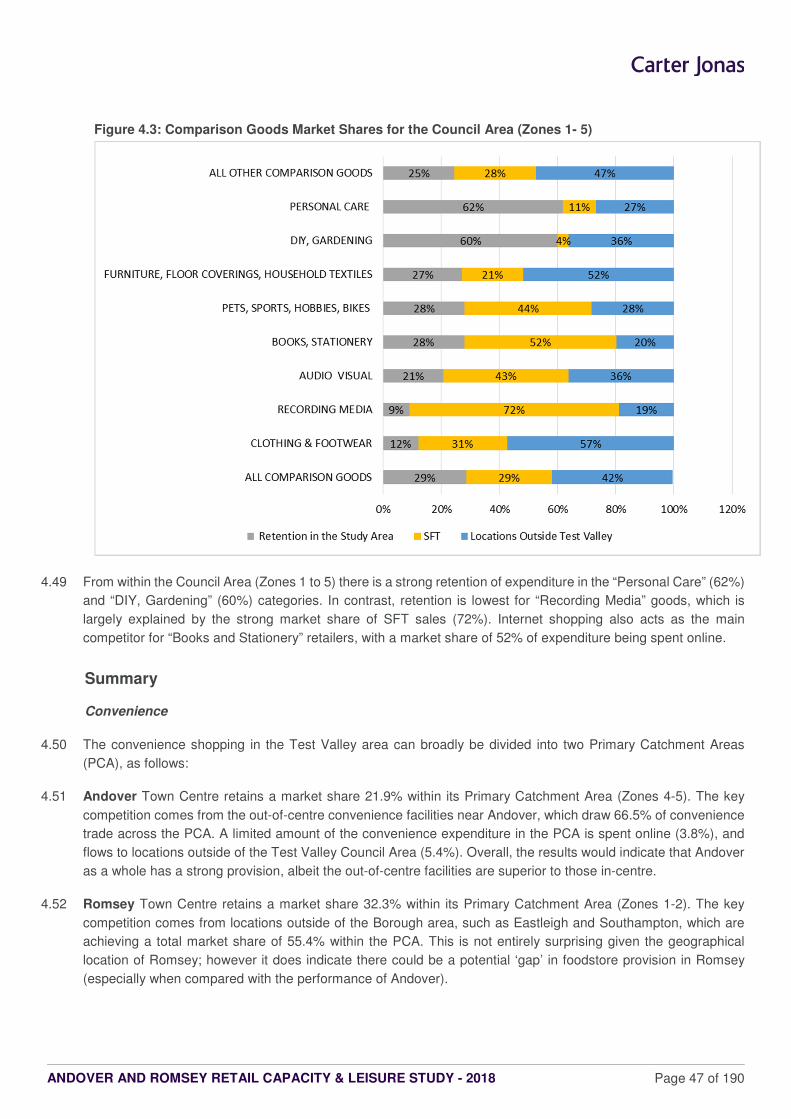
ANDOVER AND ROMSEY RETAIL CAPACITY & LEISURE STUDY - 2018 Page 47 of 190
Figure 4.3: Comparison Goods Market Shares for the Council Area (Zones 1- 5)
4.49 From within the Council Area (Zones 1 to 5) there is a strong retention of expenditure in the “Personal Care” (62%)
and “DIY, Gardening” (60%) categories. In contrast, retention is lowest for “Recording Media” goods, which is
largely explained by the strong market share of SFT sales (72%). Internet shopping also acts as the main
competitor for “Books and Stationery” retailers, with a market share of 52% of expenditure being spent online.
Summary
Convenience
4.50 The convenience shopping in the Test Valley area can broadly be divided into two Primary Catchment Areas
(PCA), as follows:
4.51 Andover Town Centre retains a market share 21.9% within its Primary Catchment Area (Zones 4-5). The key
competition comes from the out-of-centre convenience facilities near Andover, which draw 66.5% of convenience
trade across the PCA. A limited amount of the convenience expenditure in the PCA is spent online (3.8%), and
flows to locations outside of the Test Valley Council Area (5.4%). Overall, the results would indicate that Andover
as a whole has a strong provision, albeit the out-of-centre facilities are superior to those in-centre.
4.52 Romsey Town Centre retains a market share 32.3% within its Primary Catchment Area (Zones 1-2). The key
competition comes from locations outside of the Borough area, such as Eastleigh and Southampton, which are
achieving a total market share of 55.4% within the PCA. This is not entirely surprising given the geographical
location of Romsey; however it does indicate there could be a potential ‘gap’ in foodstore provision in Romsey
(especially when compared with the performance of Andover).
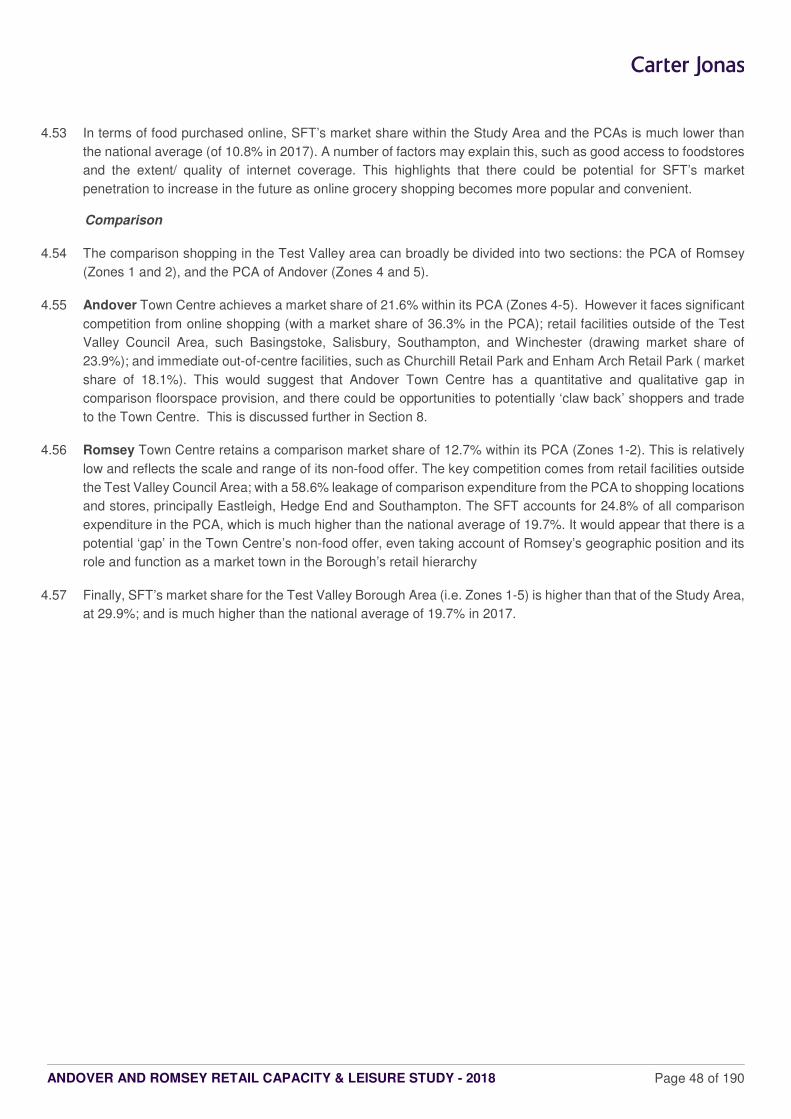
ANDOVER AND ROMSEY RETAIL CAPACITY & LEISURE STUDY - 2018 Page 48 of 190
4.53 In terms of food purchased online, SFT’s market share within the Study Area and the PCAs is much lower than
the national average (of 10.8% in 2017). A number of factors may explain this, such as good access to foodstores
and the extent/ quality of internet coverage. This highlights that there could be potential for SFT’s market
penetration to increase in the future as online grocery shopping becomes more popular and convenient.
Comparison
4.54 The comparison shopping in the Test Valley area can broadly be divided into two sections: the PCA of Romsey
(Zones 1 and 2), and the PCA of Andover (Zones 4 and 5).
4.55 Andover Town Centre achieves a market share of 21.6% within its PCA (Zones 4-5). However it faces significant
competition from online shopping (with a market share of 36.3% in the PCA); retail facilities outside of the Test
Valley Council Area, such Basingstoke, Salisbury, Southampton, and Winchester (drawing market share of
23.9%); and immediate out-of-centre facilities, such as Churchill Retail Park and Enham Arch Retail Park ( market
share of 18.1%). This would suggest that Andover Town Centre has a quantitative and qualitative gap in
comparison floorspace provision, and there could be opportunities to potentially ‘claw back’ shoppers and trade
to the Town Centre. This is discussed further in Section 8.
4.56 Romsey Town Centre retains a comparison market share of 12.7% within its PCA (Zones 1-2). This is relatively
low and reflects the scale and range of its non-food offer. The key competition comes from retail facilities outside
the Test Valley Council Area; with a 58.6% leakage of comparison expenditure from the PCA to shopping locations
and stores, principally Eastleigh, Hedge End and Southampton. The SFT accounts for 24.8% of all comparison
expenditure in the PCA, which is much higher than the national average of 19.7%. It would appear that there is a
potential ‘gap’ in the Town Centre’s non-food offer, even taking account of Romsey’s geographic position and its
role and function as a market town in the Borough’s retail hierarchy
4.57 Finally, SFT’s market share for the Test Valley Borough Area (i.e. Zones 1-5) is higher than that of the Study Area,
at 29.9%; and is much higher than the national average of 19.7% in 2017.
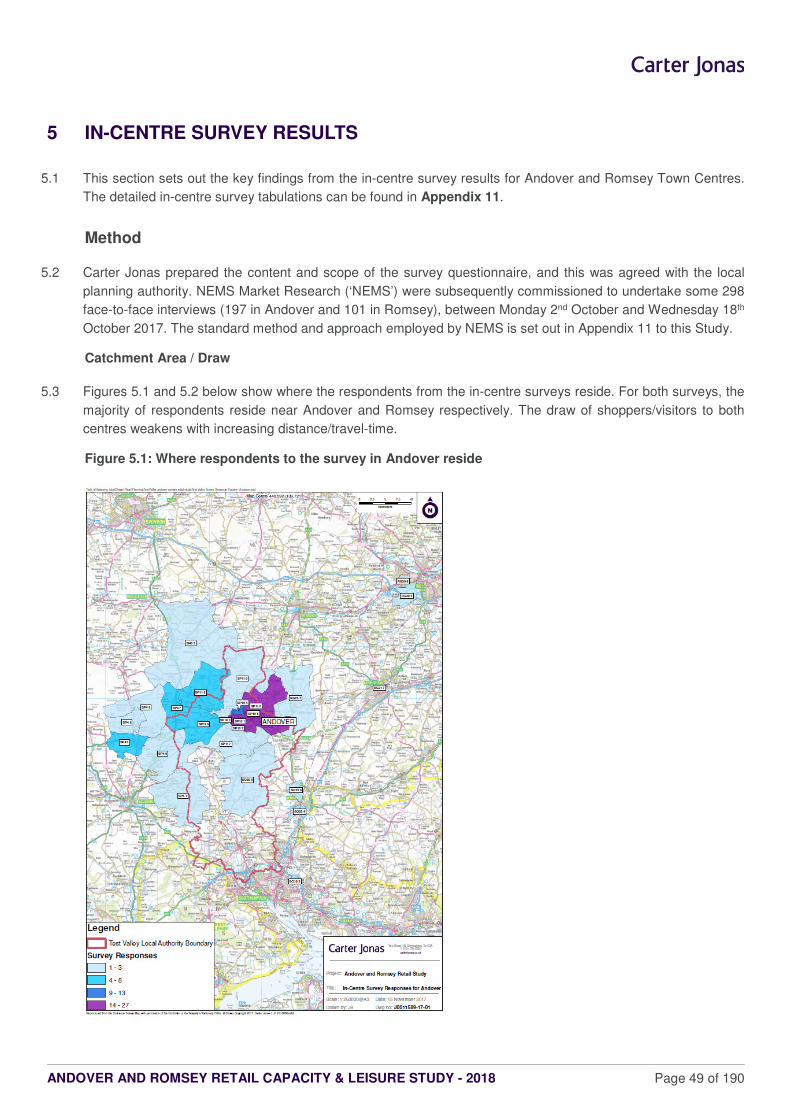
ANDOVER AND ROMSEY RETAIL CAPACITY & LEISURE STUDY - 2018 Page 49 of 190
5 IN-CENTRE SURVEY RESULTS
5.1 This section sets out the key findings from the in-centre survey results for Andover and Romsey Town Centres.
The detailed in-centre survey tabulations can be found in Appendix 11.
Method
5.2 Carter Jonas prepared the content and scope of the survey questionnaire, and this was agreed with the local
planning authority. NEMS Market Research (‘NEMS’) were subsequently commissioned to undertake some 298
face-to-face interviews (197 in Andover and 101 in Romsey), between Monday 2nd October and Wednesday 18th
October 2017. The standard method and approach employed by NEMS is set out in Appendix 11 to this Study.
Catchment Area / Draw
5.3 Figures 5.1 and 5.2 below show where the respondents from the in-centre surveys reside. For both surveys, the
majority of respondents reside near Andover and Romsey respectively. The draw of shoppers/visitors to both
centres weakens with increasing distance/travel-time.
Figure 5.1: Where respondents to the survey in Andover reside
ANDOVER AND ROMSEY RETAIL CAPACITY & LEISURE STUDY - 2018 Page 50 of 190
Figure 5.2: Where respondents to the survey in Romsey reside
Socio-Economic Profile of Shopper and Visitors to Centres
5.4 The socio-economic profile of the respondents in the surveys for both centres was broadly determined by asking
the occupation of the chief wager of each household. The responses were then coded by NEMS into socio-
economic categories.
5.5 The table below shows the socio-economic profiles of respondents to the surveys conducted in Andover and
Romsey Town Centre. These figures have been benchmarked against the wider areas of Andover and Romsey
(within a 10 miles radius), and the national UK average.
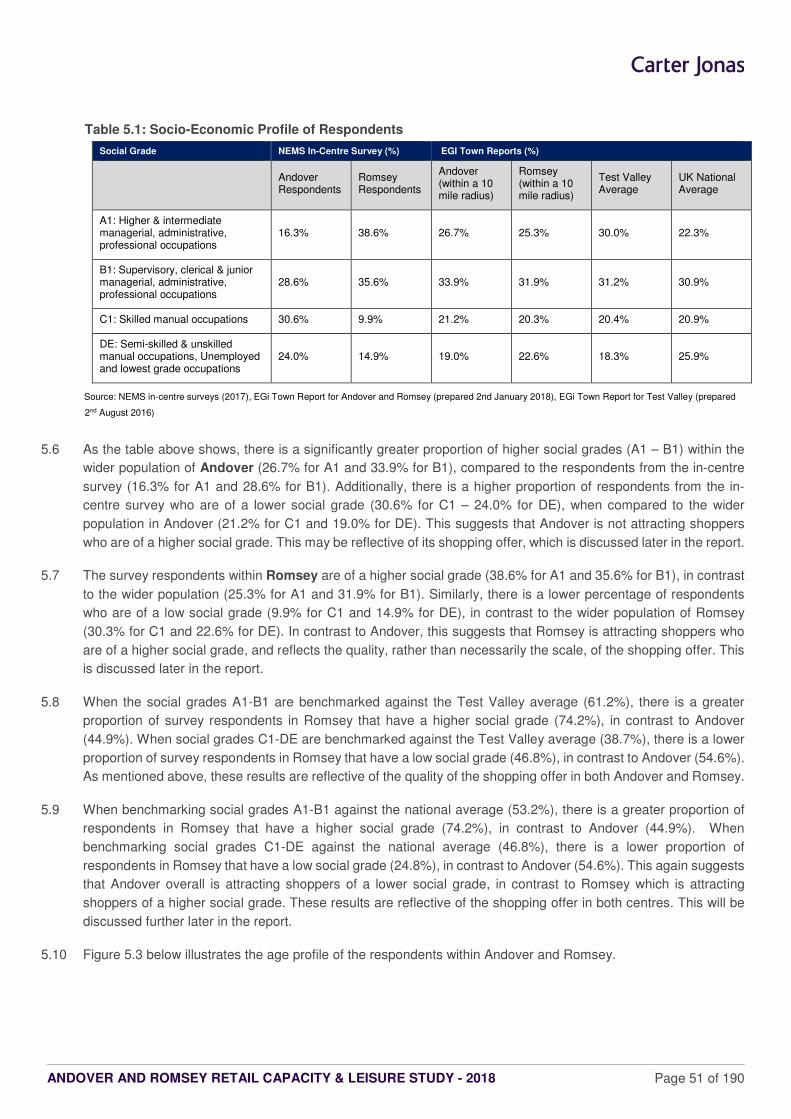
ANDOVER AND ROMSEY RETAIL CAPACITY & LEISURE STUDY - 2018 Page 51 of 190
Table 5.1: Socio-Economic Profile of Respondents
Social Grade NEMS In-Centre Survey (%) EGI Town Reports (%)
Andover Respondents
Romsey Respondents
Andover (within a 10 mile radius)
Romsey (within a 10 mile radius)
Test Valley Average
UK National Average
A1: Higher & intermediate managerial, administrative, professional occupations
16.3% 38.6% 26.7% 25.3% 30.0% 22.3%
B1: Supervisory, clerical & junior managerial, administrative, professional occupations
28.6% 35.6% 33.9% 31.9% 31.2% 30.9%
C1: Skilled manual occupations 30.6% 9.9% 21.2% 20.3% 20.4% 20.9%
DE: Semi-skilled & unskilled manual occupations, Unemployed and lowest grade occupations
24.0% 14.9% 19.0% 22.6% 18.3% 25.9%
Source: NEMS in-centre surveys (2017), EGi Town Report for Andover and Romsey (prepared 2nd January 2018), EGi Town Report for Test Valley (prepared
2nd August 2016)
5.6 As the table above shows, there is a significantly greater proportion of higher social grades (A1 – B1) within the
wider population of Andover (26.7% for A1 and 33.9% for B1), compared to the respondents from the in-centre
survey (16.3% for A1 and 28.6% for B1). Additionally, there is a higher proportion of respondents from the in-
centre survey who are of a lower social grade (30.6% for C1 – 24.0% for DE), when compared to the wider
population in Andover (21.2% for C1 and 19.0% for DE). This suggests that Andover is not attracting shoppers
who are of a higher social grade. This may be reflective of its shopping offer, which is discussed later in the report.
5.7 The survey respondents within Romsey are of a higher social grade (38.6% for A1 and 35.6% for B1), in contrast
to the wider population (25.3% for A1 and 31.9% for B1). Similarly, there is a lower percentage of respondents
who are of a low social grade (9.9% for C1 and 14.9% for DE), in contrast to the wider population of Romsey
(30.3% for C1 and 22.6% for DE). In contrast to Andover, this suggests that Romsey is attracting shoppers who
are of a higher social grade, and reflects the quality, rather than necessarily the scale, of the shopping offer. This
is discussed later in the report.
5.8 When the social grades A1-B1 are benchmarked against the Test Valley average (61.2%), there is a greater
proportion of survey respondents in Romsey that have a higher social grade (74.2%), in contrast to Andover
(44.9%). When social grades C1-DE are benchmarked against the Test Valley average (38.7%), there is a lower
proportion of survey respondents in Romsey that have a low social grade (46.8%), in contrast to Andover (54.6%).
As mentioned above, these results are reflective of the quality of the shopping offer in both Andover and Romsey.
5.9 When benchmarking social grades A1-B1 against the national average (53.2%), there is a greater proportion of
respondents in Romsey that have a higher social grade (74.2%), in contrast to Andover (44.9%). When
benchmarking social grades C1-DE against the national average (46.8%), there is a lower proportion of
respondents in Romsey that have a low social grade (24.8%), in contrast to Andover (54.6%). This again suggests
that Andover overall is attracting shoppers of a lower social grade, in contrast to Romsey which is attracting
shoppers of a higher social grade. These results are reflective of the shopping offer in both centres. This will be
discussed further later in the report.
5.10 Figure 5.3 below illustrates the age profile of the respondents within Andover and Romsey.
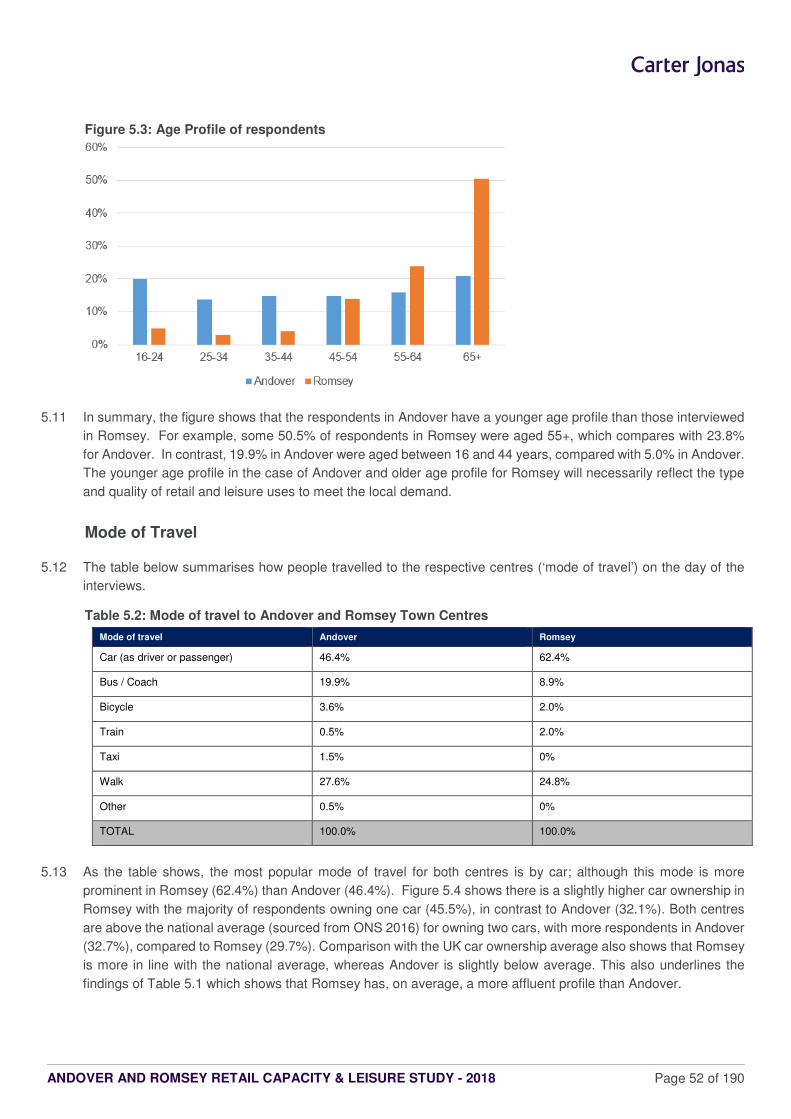
ANDOVER AND ROMSEY RETAIL CAPACITY & LEISURE STUDY - 2018 Page 52 of 190
Figure 5.3: Age Profile of respondents
5.11 In summary, the figure shows that the respondents in Andover have a younger age profile than those interviewed
in Romsey. For example, some 50.5% of respondents in Romsey were aged 55+, which compares with 23.8%
for Andover. In contrast, 19.9% in Andover were aged between 16 and 44 years, compared with 5.0% in Andover.
The younger age profile in the case of Andover and older age profile for Romsey will necessarily reflect the type
and quality of retail and leisure uses to meet the local demand.
Mode of Travel
5.12 The table below summarises how people travelled to the respective centres (‘mode of travel’) on the day of the
interviews.
Table 5.2: Mode of travel to Andover and Romsey Town Centres
Mode of travel Andover Romsey
Car (as driver or passenger) 46.4% 62.4%
Bus / Coach 19.9% 8.9%
Bicycle 3.6% 2.0%
Train 0.5% 2.0%
Taxi 1.5% 0%
Walk 27.6% 24.8%
Other 0.5% 0%
TOTAL 100.0% 100.0%
5.13 As the table shows, the most popular mode of travel for both centres is by car; although this mode is more
prominent in Romsey (62.4%) than Andover (46.4%). Figure 5.4 shows there is a slightly higher car ownership in
Romsey with the majority of respondents owning one car (45.5%), in contrast to Andover (32.1%). Both centres
are above the national average (sourced from ONS 2016) for owning two cars, with more respondents in Andover
(32.7%), compared to Romsey (29.7%). Comparison with the UK car ownership average also shows that Romsey
is more in line with the national average, whereas Andover is slightly below average. This also underlines the
findings of Table 5.1 which shows that Romsey has, on average, a more affluent profile than Andover.
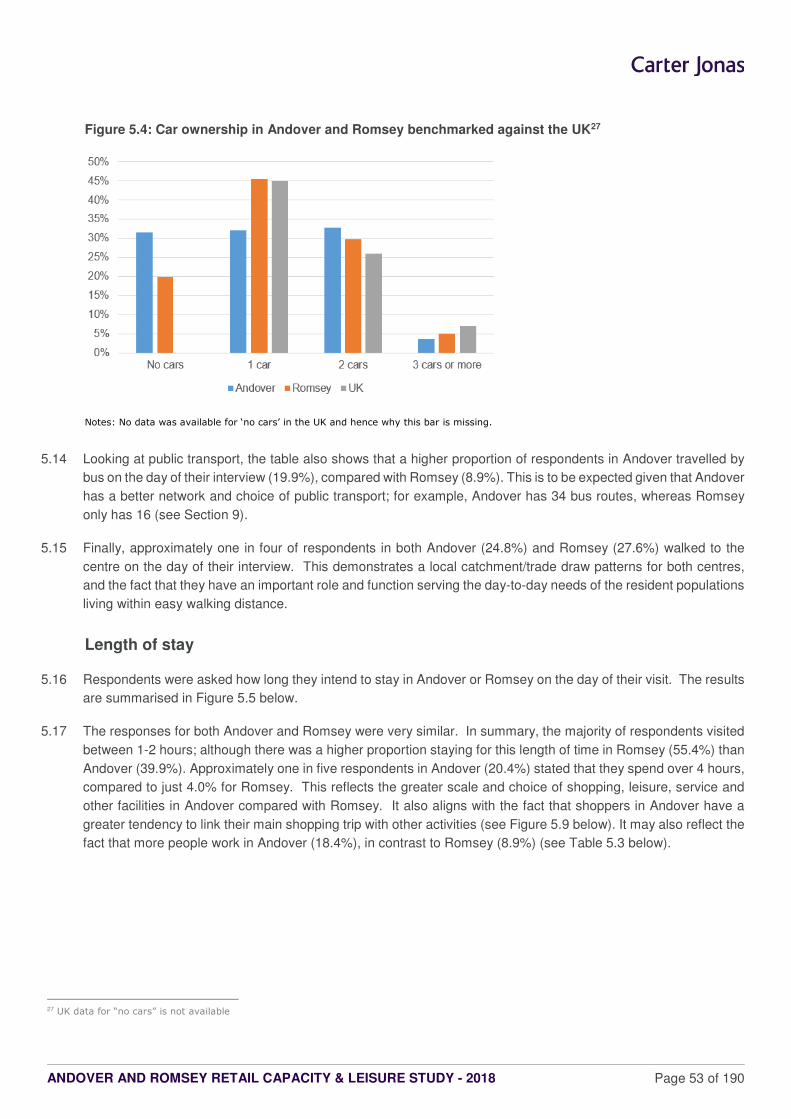
ANDOVER AND ROMSEY RETAIL CAPACITY & LEISURE STUDY - 2018 Page 53 of 190
Figure 5.4: Car ownership in Andover and Romsey benchmarked against the UK27
Notes: No data was available for ‘no cars’ in the UK and hence why this bar is missing.
5.14 Looking at public transport, the table also shows that a higher proportion of respondents in Andover travelled by
bus on the day of their interview (19.9%), compared with Romsey (8.9%). This is to be expected given that Andover
has a better network and choice of public transport; for example, Andover has 34 bus routes, whereas Romsey
only has 16 (see Section 9).
5.15 Finally, approximately one in four of respondents in both Andover (24.8%) and Romsey (27.6%) walked to the
centre on the day of their interview. This demonstrates a local catchment/trade draw patterns for both centres,
and the fact that they have an important role and function serving the day-to-day needs of the resident populations
living within easy walking distance.
Length of stay
5.16 Respondents were asked how long they intend to stay in Andover or Romsey on the day of their visit. The results
are summarised in Figure 5.5 below.
5.17 The responses for both Andover and Romsey were very similar. In summary, the majority of respondents visited
between 1-2 hours; although there was a higher proportion staying for this length of time in Romsey (55.4%) than
Andover (39.9%). Approximately one in five respondents in Andover (20.4%) stated that they spend over 4 hours,
compared to just 4.0% for Romsey. This reflects the greater scale and choice of shopping, leisure, service and
other facilities in Andover compared with Romsey. It also aligns with the fact that shoppers in Andover have a
greater tendency to link their main shopping trip with other activities (see Figure 5.9 below). It may also reflect the
fact that more people work in Andover (18.4%), in contrast to Romsey (8.9%) (see Table 5.3 below).
27 UK data for “no cars” is not available
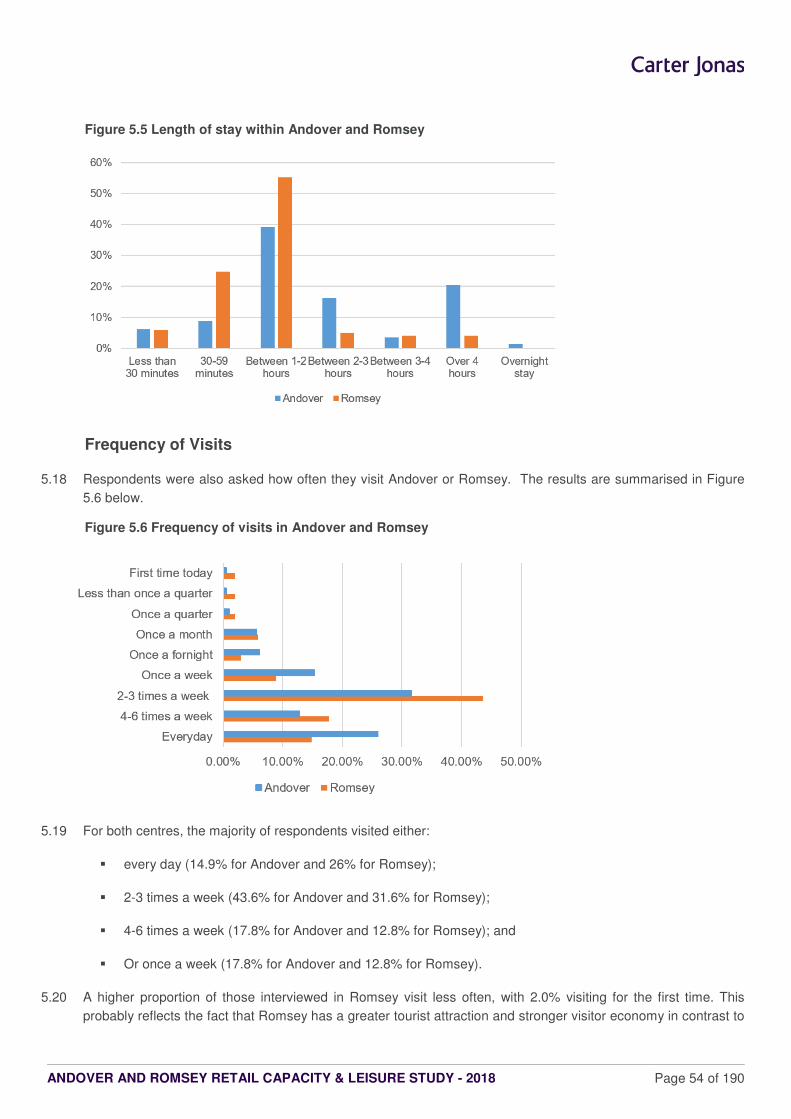
ANDOVER AND ROMSEY RETAIL CAPACITY & LEISURE STUDY - 2018 Page 54 of 190
Figure 5.5 Length of stay within Andover and Romsey
Frequency of Visits
5.18 Respondents were also asked how often they visit Andover or Romsey. The results are summarised in Figure
5.6 below.
Figure 5.6 Frequency of visits in Andover and Romsey
5.19 For both centres, the majority of respondents visited either:
� every day (14.9% for Andover and 26% for Romsey);
� 2-3 times a week (43.6% for Andover and 31.6% for Romsey);
� 4-6 times a week (17.8% for Andover and 12.8% for Romsey); and
� Or once a week (17.8% for Andover and 12.8% for Romsey).
5.20 A higher proportion of those interviewed in Romsey visit less often, with 2.0% visiting for the first time. This
probably reflects the fact that Romsey has a greater tourist attraction and stronger visitor economy in contrast to
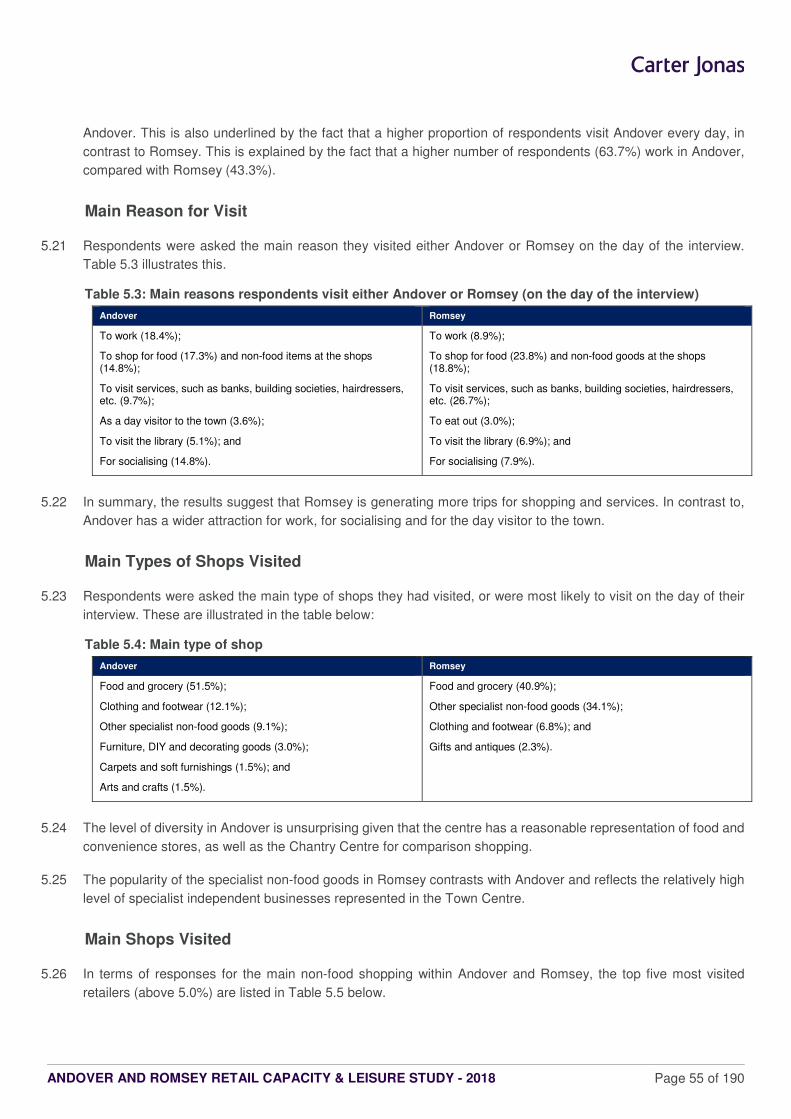
ANDOVER AND ROMSEY RETAIL CAPACITY & LEISURE STUDY - 2018 Page 55 of 190
Andover. This is also underlined by the fact that a higher proportion of respondents visit Andover every day, in
contrast to Romsey. This is explained by the fact that a higher number of respondents (63.7%) work in Andover,
compared with Romsey (43.3%).
Main Reason for Visit
5.21 Respondents were asked the main reason they visited either Andover or Romsey on the day of the interview.
Table 5.3 illustrates this.
Table 5.3: Main reasons respondents visit either Andover or Romsey (on the day of the interview)
Andover Romsey
To work (18.4%);
To shop for food (17.3%) and non-food items at the shops (14.8%);
To visit services, such as banks, building societies, hairdressers, etc. (9.7%);
As a day visitor to the town (3.6%);
To visit the library (5.1%); and
For socialising (14.8%).
To work (8.9%);
To shop for food (23.8%) and non-food goods at the shops (18.8%);
To visit services, such as banks, building societies, hairdressers, etc. (26.7%);
To eat out (3.0%);
To visit the library (6.9%); and
For socialising (7.9%).
5.22 In summary, the results suggest that Romsey is generating more trips for shopping and services. In contrast to,
Andover has a wider attraction for work, for socialising and for the day visitor to the town.
Main Types of Shops Visited
5.23 Respondents were asked the main type of shops they had visited, or were most likely to visit on the day of their
interview. These are illustrated in the table below:
Table 5.4: Main type of shop
Andover Romsey
Food and grocery (51.5%);
Clothing and footwear (12.1%);
Other specialist non-food goods (9.1%);
Furniture, DIY and decorating goods (3.0%);
Carpets and soft furnishings (1.5%); and
Arts and crafts (1.5%).
Food and grocery (40.9%);
Other specialist non-food goods (34.1%);
Clothing and footwear (6.8%); and
Gifts and antiques (2.3%).
5.24 The level of diversity in Andover is unsurprising given that the centre has a reasonable representation of food and
convenience stores, as well as the Chantry Centre for comparison shopping.
5.25 The popularity of the specialist non-food goods in Romsey contrasts with Andover and reflects the relatively high
level of specialist independent businesses represented in the Town Centre.
Main Shops Visited
5.26 In terms of responses for the main non-food shopping within Andover and Romsey, the top five most visited
retailers (above 5.0%) are listed in Table 5.5 below.
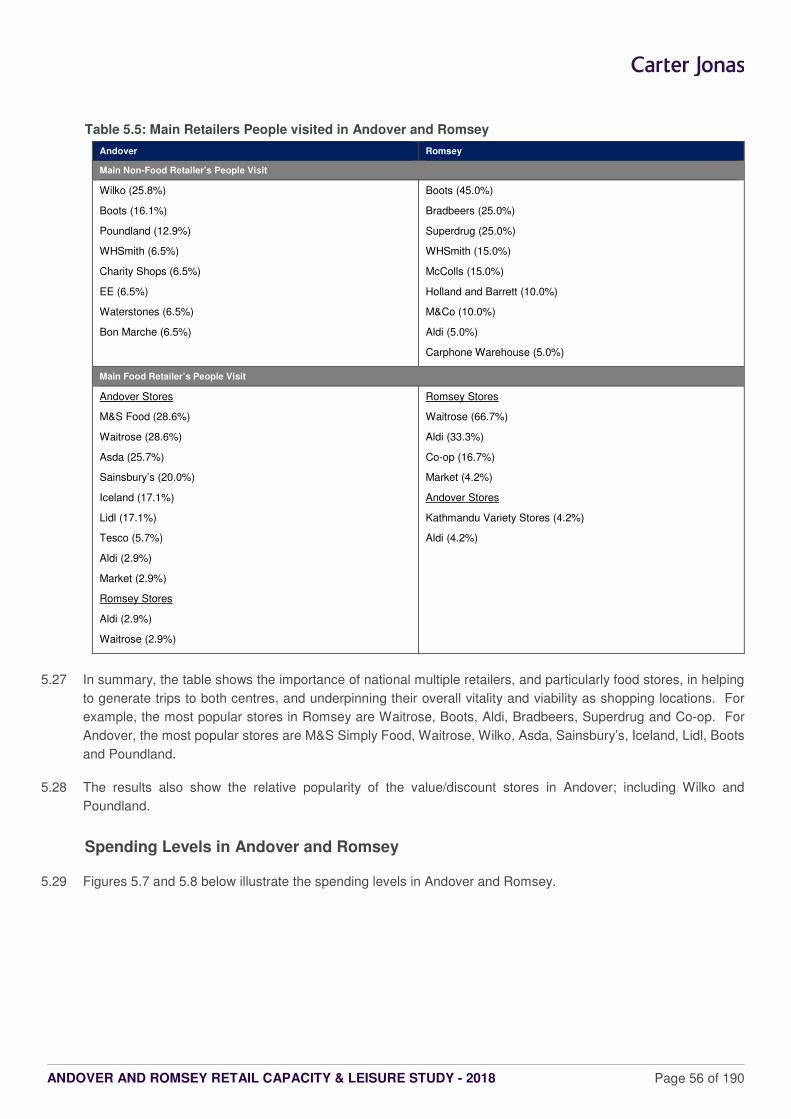
ANDOVER AND ROMSEY RETAIL CAPACITY & LEISURE STUDY - 2018 Page 56 of 190
Table 5.5: Main Retailers People visited in Andover and Romsey
Andover Romsey
Main Non-Food Retailer’s People Visit
Wilko (25.8%)
Boots (16.1%)
Poundland (12.9%)
WHSmith (6.5%)
Charity Shops (6.5%)
EE (6.5%)
Waterstones (6.5%)
Bon Marche (6.5%)
Boots (45.0%)
Bradbeers (25.0%)
Superdrug (25.0%)
WHSmith (15.0%)
McColls (15.0%)
Holland and Barrett (10.0%)
M&Co (10.0%)
Aldi (5.0%)
Carphone Warehouse (5.0%)
Main Food Retailer’s People Visit
Andover Stores
M&S Food (28.6%)
Waitrose (28.6%)
Asda (25.7%)
Sainsbury’s (20.0%)
Iceland (17.1%)
Lidl (17.1%)
Tesco (5.7%)
Aldi (2.9%)
Market (2.9%)
Romsey Stores
Aldi (2.9%)
Waitrose (2.9%)
Romsey Stores
Waitrose (66.7%)
Aldi (33.3%)
Co-op (16.7%)
Market (4.2%)
Andover Stores
Kathmandu Variety Stores (4.2%)
Aldi (4.2%)
5.27 In summary, the table shows the importance of national multiple retailers, and particularly food stores, in helping
to generate trips to both centres, and underpinning their overall vitality and viability as shopping locations. For
example, the most popular stores in Romsey are Waitrose, Boots, Aldi, Bradbeers, Superdrug and Co-op. For
Andover, the most popular stores are M&S Simply Food, Waitrose, Wilko, Asda, Sainsbury’s, Iceland, Lidl, Boots
and Poundland.
5.28 The results also show the relative popularity of the value/discount stores in Andover; including Wilko and
Poundland.
Spending Levels in Andover and Romsey
5.29 Figures 5.7 and 5.8 below illustrate the spending levels in Andover and Romsey.
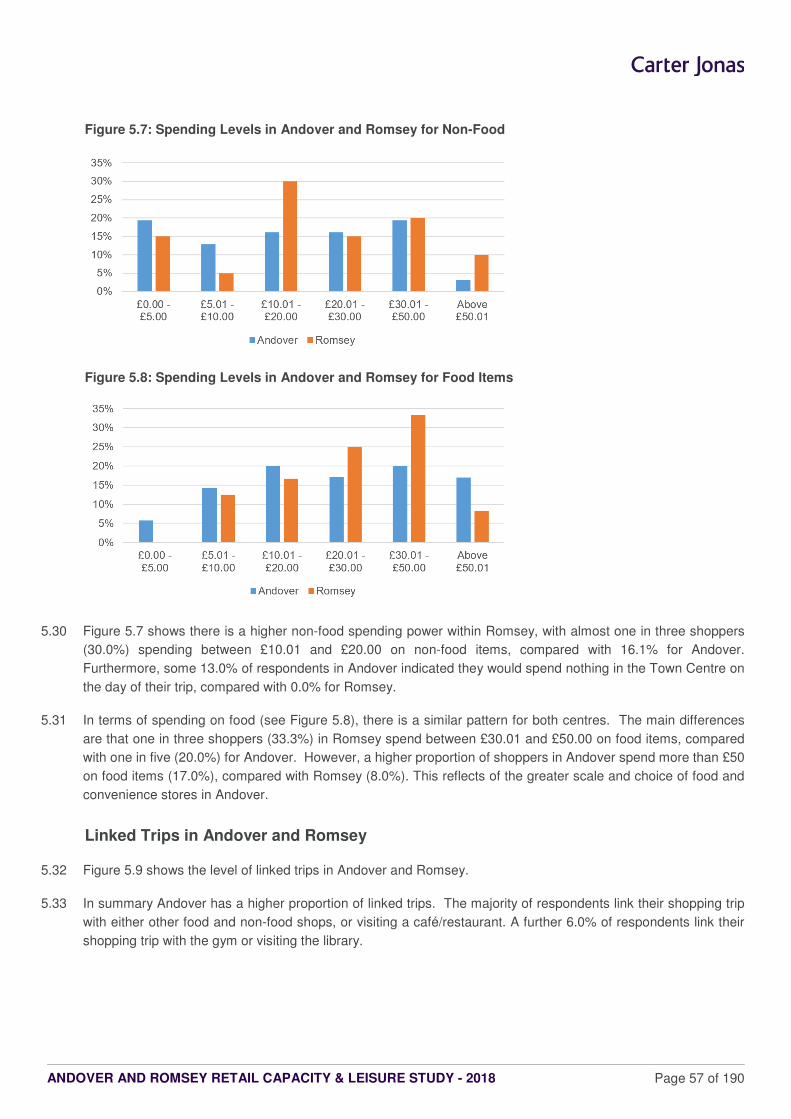
ANDOVER AND ROMSEY RETAIL CAPACITY & LEISURE STUDY - 2018 Page 57 of 190
Figure 5.7: Spending Levels in Andover and Romsey for Non-Food
Figure 5.8: Spending Levels in Andover and Romsey for Food Items
5.30 Figure 5.7 shows there is a higher non-food spending power within Romsey, with almost one in three shoppers
(30.0%) spending between £10.01 and £20.00 on non-food items, compared with 16.1% for Andover.
Furthermore, some 13.0% of respondents in Andover indicated they would spend nothing in the Town Centre on
the day of their trip, compared with 0.0% for Romsey.
5.31 In terms of spending on food (see Figure 5.8), there is a similar pattern for both centres. The main differences
are that one in three shoppers (33.3%) in Romsey spend between £30.01 and £50.00 on food items, compared
with one in five (20.0%) for Andover. However, a higher proportion of shoppers in Andover spend more than £50
on food items (17.0%), compared with Romsey (8.0%). This reflects of the greater scale and choice of food and
convenience stores in Andover.
Linked Trips in Andover and Romsey
5.32 Figure 5.9 shows the level of linked trips in Andover and Romsey.
5.33 In summary Andover has a higher proportion of linked trips. The majority of respondents link their shopping trip
with either other food and non-food shops, or visiting a café/restaurant. A further 6.0% of respondents link their
shopping trip with the gym or visiting the library.
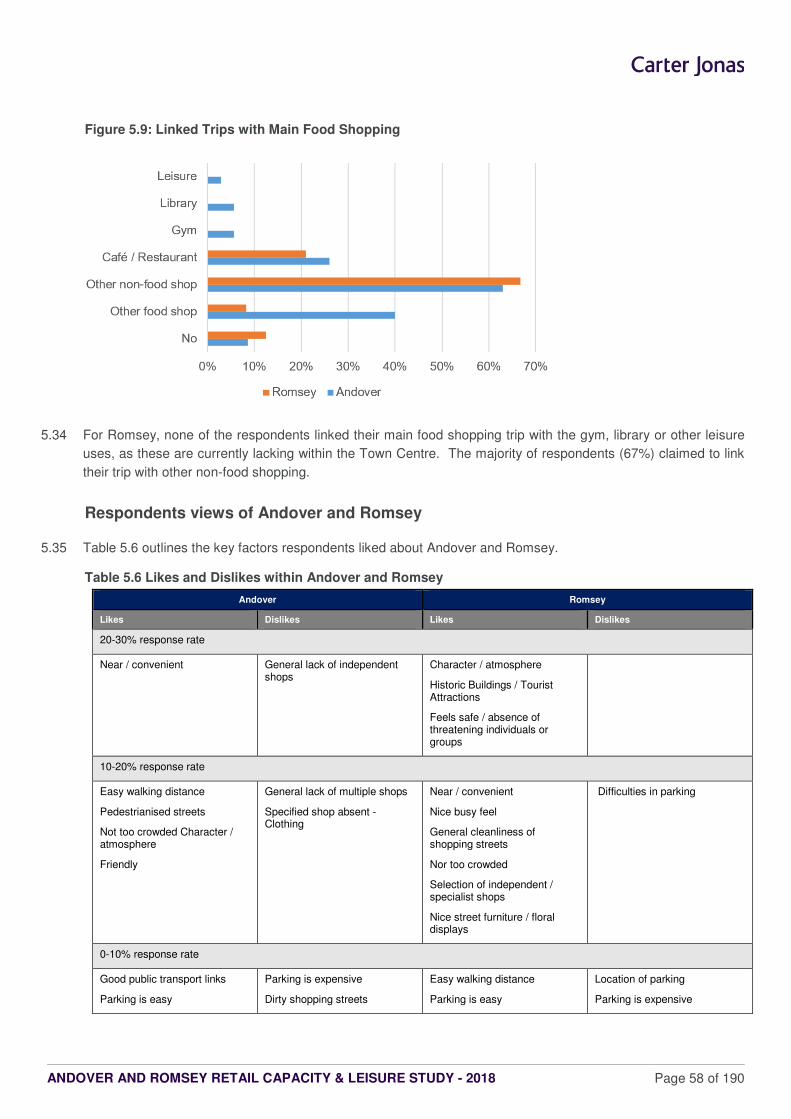
ANDOVER AND ROMSEY RETAIL CAPACITY & LEISURE STUDY - 2018 Page 58 of 190
Figure 5.9: Linked Trips with Main Food Shopping
5.34 For Romsey, none of the respondents linked their main food shopping trip with the gym, library or other leisure
uses, as these are currently lacking within the Town Centre. The majority of respondents (67%) claimed to link
their trip with other non-food shopping.
Respondents views of Andover and Romsey
5.35 Table 5.6 outlines the key factors respondents liked about Andover and Romsey.
Table 5.6 Likes and Dislikes within Andover and Romsey
Andover Romsey
Likes Dislikes Likes Dislikes
20-30% response rate
Near / convenient General lack of independent shops
Character / atmosphere
Historic Buildings / Tourist Attractions
Feels safe / absence of threatening individuals or groups
10-20% response rate
Easy walking distance
Pedestrianised streets
Not too crowded Character / atmosphere
Friendly
General lack of multiple shops
Specified shop absent - Clothing
Near / convenient
Nice busy feel
General cleanliness of shopping streets
Nor too crowded
Selection of independent / specialist shops
Nice street furniture / floral displays
Difficulties in parking
0-10% response rate
Good public transport links
Parking is easy
Parking is expensive
Dirty shopping streets
Easy walking distance
Parking is easy
Location of parking
Parking is expensive
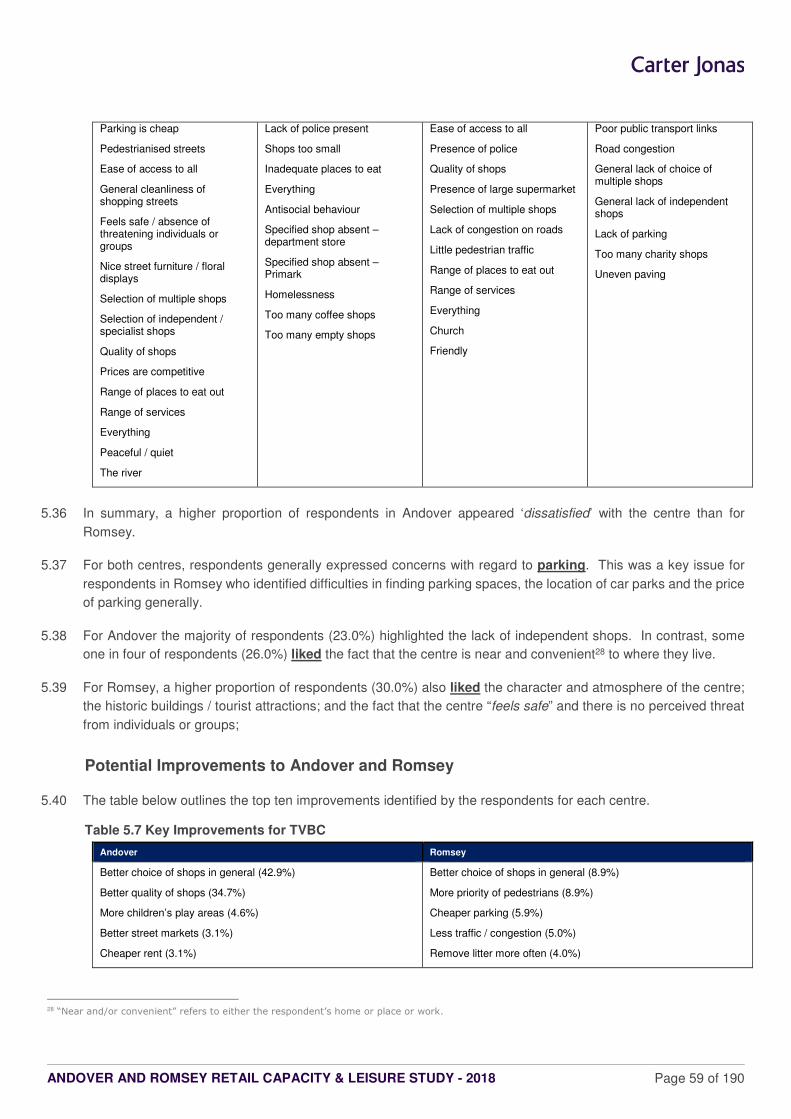
ANDOVER AND ROMSEY RETAIL CAPACITY & LEISURE STUDY - 2018 Page 59 of 190
Parking is cheap
Pedestrianised streets
Ease of access to all
General cleanliness of shopping streets
Feels safe / absence of threatening individuals or groups
Nice street furniture / floral displays
Selection of multiple shops
Selection of independent / specialist shops
Quality of shops
Prices are competitive
Range of places to eat out
Range of services
Everything
Peaceful / quiet
The river
Lack of police present
Shops too small
Inadequate places to eat
Everything
Antisocial behaviour
Specified shop absent – department store
Specified shop absent – Primark
Homelessness
Too many coffee shops
Too many empty shops
Ease of access to all
Presence of police
Quality of shops
Presence of large supermarket
Selection of multiple shops
Lack of congestion on roads
Little pedestrian traffic
Range of places to eat out
Range of services
Everything
Church
Friendly
Poor public transport links
Road congestion
General lack of choice of multiple shops
General lack of independent shops
Lack of parking
Too many charity shops
Uneven paving
5.36 In summary, a higher proportion of respondents in Andover appeared ‘dissatisfied’ with the centre than for
Romsey.
5.37 For both centres, respondents generally expressed concerns with regard to parking. This was a key issue for
respondents in Romsey who identified difficulties in finding parking spaces, the location of car parks and the price
of parking generally.
5.38 For Andover the majority of respondents (23.0%) highlighted the lack of independent shops. In contrast, some
one in four of respondents (26.0%) liked the fact that the centre is near and convenient28 to where they live.
5.39 For Romsey, a higher proportion of respondents (30.0%) also liked the character and atmosphere of the centre;
the historic buildings / tourist attractions; and the fact that the centre “feels safe” and there is no perceived threat
from individuals or groups;
Potential Improvements to Andover and Romsey
5.40 The table below outlines the top ten improvements identified by the respondents for each centre.
Table 5.7 Key Improvements for TVBC
Andover Romsey
Better choice of shops in general (42.9%)
Better quality of shops (34.7%)
More children’s play areas (4.6%)
Better street markets (3.1%)
Cheaper rent (3.1%)
Better choice of shops in general (8.9%)
More priority of pedestrians (8.9%)
Cheaper parking (5.9%)
Less traffic / congestion (5.0%)
Remove litter more often (4.0%)
28 “Near and/or convenient” refers to either the respondent’s home or place or work.
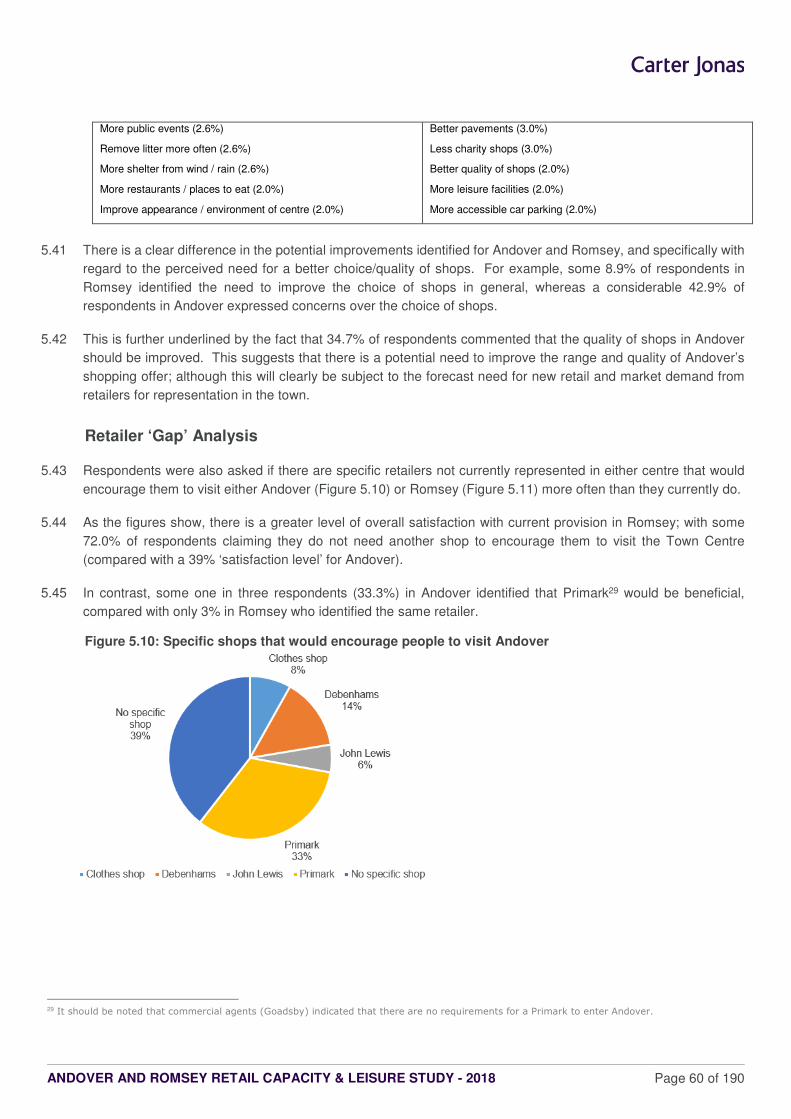
ANDOVER AND ROMSEY RETAIL CAPACITY & LEISURE STUDY - 2018 Page 60 of 190
More public events (2.6%)
Remove litter more often (2.6%)
More shelter from wind / rain (2.6%)
More restaurants / places to eat (2.0%)
Improve appearance / environment of centre (2.0%)
Better pavements (3.0%)
Less charity shops (3.0%)
Better quality of shops (2.0%)
More leisure facilities (2.0%)
More accessible car parking (2.0%)
5.41 There is a clear difference in the potential improvements identified for Andover and Romsey, and specifically with
regard to the perceived need for a better choice/quality of shops. For example, some 8.9% of respondents in
Romsey identified the need to improve the choice of shops in general, whereas a considerable 42.9% of
respondents in Andover expressed concerns over the choice of shops.
5.42 This is further underlined by the fact that 34.7% of respondents commented that the quality of shops in Andover
should be improved. This suggests that there is a potential need to improve the range and quality of Andover’s
shopping offer; although this will clearly be subject to the forecast need for new retail and market demand from
retailers for representation in the town.
Retailer ‘Gap’ Analysis
5.43 Respondents were also asked if there are specific retailers not currently represented in either centre that would
encourage them to visit either Andover (Figure 5.10) or Romsey (Figure 5.11) more often than they currently do.
5.44 As the figures show, there is a greater level of overall satisfaction with current provision in Romsey; with some
72.0% of respondents claiming they do not need another shop to encourage them to visit the Town Centre
(compared with a 39% ‘satisfaction level’ for Andover).
5.45 In contrast, some one in three respondents (33.3%) in Andover identified that Primark29 would be beneficial,
compared with only 3% in Romsey who identified the same retailer.
Figure 5.10: Specific shops that would encourage people to visit Andover
29 It should be noted that commercial agents (Goadsby) indicated that there are no requirements for a Primark to enter Andover.
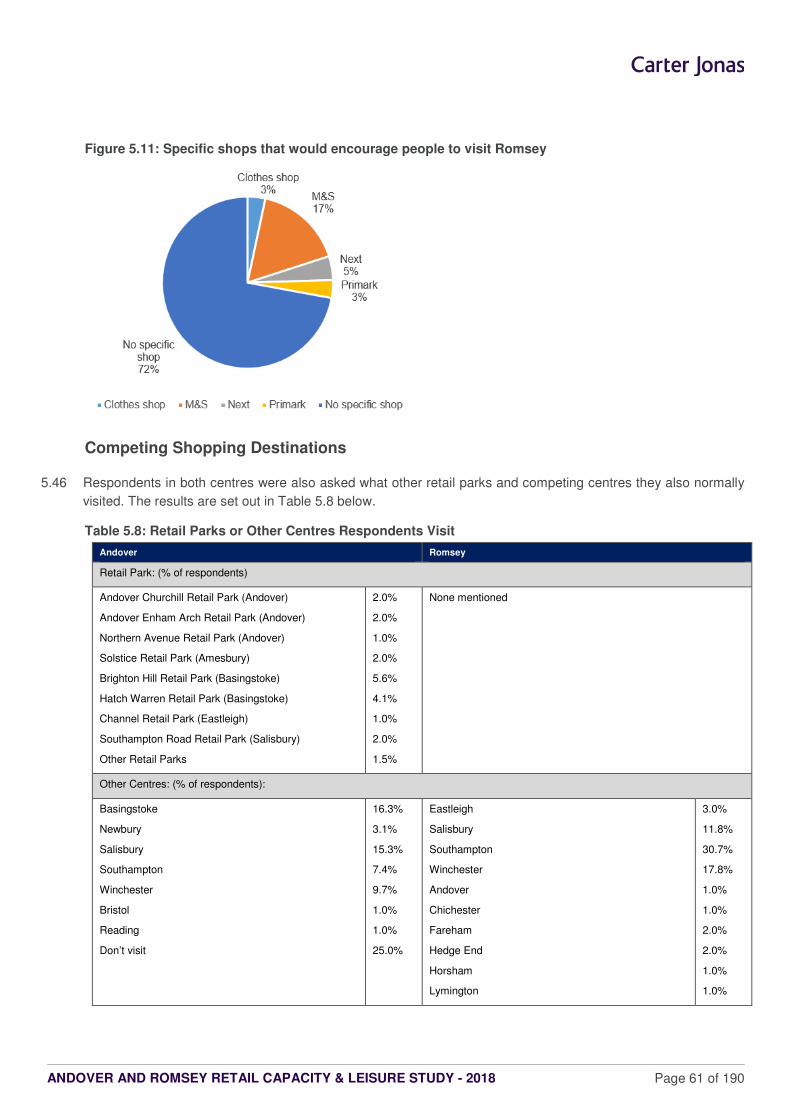
ANDOVER AND ROMSEY RETAIL CAPACITY & LEISURE STUDY - 2018 Page 61 of 190
Figure 5.11: Specific shops that would encourage people to visit Romsey
Competing Shopping Destinations
5.46 Respondents in both centres were also asked what other retail parks and competing centres they also normally
visited. The results are set out in Table 5.8 below.
Table 5.8: Retail Parks or Other Centres Respondents Visit
Andover Romsey
Retail Park: (% of respondents)
Andover Churchill Retail Park (Andover)
Andover Enham Arch Retail Park (Andover)
Northern Avenue Retail Park (Andover)
Solstice Retail Park (Amesbury)
Brighton Hill Retail Park (Basingstoke)
Hatch Warren Retail Park (Basingstoke)
Channel Retail Park (Eastleigh)
Southampton Road Retail Park (Salisbury)
Other Retail Parks
2.0%
2.0%
1.0%
2.0%
5.6%
4.1%
1.0%
2.0%
1.5%
None mentioned
Other Centres: (% of respondents):
Basingstoke
Newbury
Salisbury
Southampton
Winchester
Bristol
Reading
Don’t visit
16.3%
3.1%
15.3%
7.4%
9.7%
1.0%
1.0%
25.0%
Eastleigh
Salisbury
Southampton
Winchester
Andover
Chichester
Fareham
Hedge End
Horsham
Lymington
3.0%
11.8%
30.7%
17.8%
1.0%
1.0%
2.0%
2.0%
1.0%
1.0%
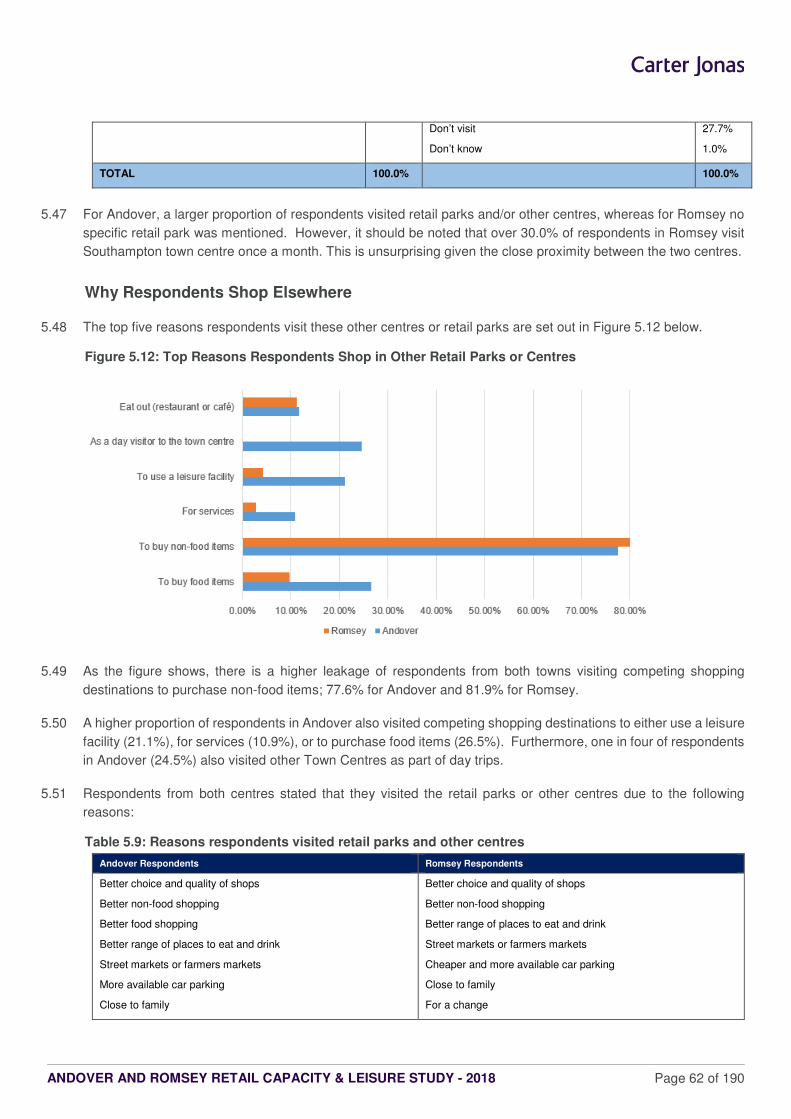
ANDOVER AND ROMSEY RETAIL CAPACITY & LEISURE STUDY - 2018 Page 62 of 190
Don’t visit
Don’t know
27.7%
1.0%
TOTAL 100.0% 100.0%
5.47 For Andover, a larger proportion of respondents visited retail parks and/or other centres, whereas for Romsey no
specific retail park was mentioned. However, it should be noted that over 30.0% of respondents in Romsey visit
Southampton town centre once a month. This is unsurprising given the close proximity between the two centres.
Why Respondents Shop Elsewhere
5.48 The top five reasons respondents visit these other centres or retail parks are set out in Figure 5.12 below.
Figure 5.12: Top Reasons Respondents Shop in Other Retail Parks or Centres
5.49 As the figure shows, there is a higher leakage of respondents from both towns visiting competing shopping
destinations to purchase non-food items; 77.6% for Andover and 81.9% for Romsey.
5.50 A higher proportion of respondents in Andover also visited competing shopping destinations to either use a leisure
facility (21.1%), for services (10.9%), or to purchase food items (26.5%). Furthermore, one in four of respondents
in Andover (24.5%) also visited other Town Centres as part of day trips.
5.51 Respondents from both centres stated that they visited the retail parks or other centres due to the following
reasons:
Table 5.9: Reasons respondents visited retail parks and other centres
Andover Respondents Romsey Respondents
Better choice and quality of shops
Better non-food shopping
Better food shopping
Better range of places to eat and drink
Street markets or farmers markets
More available car parking
Close to family
Better choice and quality of shops
Better non-food shopping
Better range of places to eat and drink
Street markets or farmers markets
Cheaper and more available car parking
Close to family
For a change
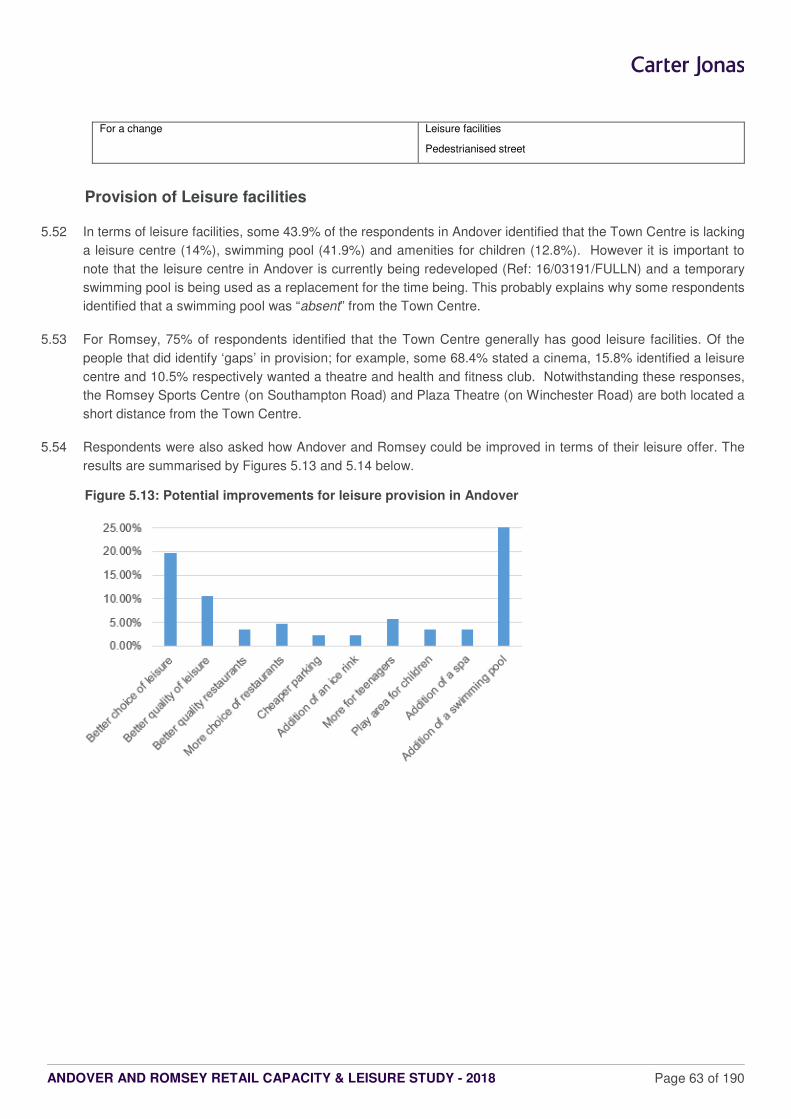
ANDOVER AND ROMSEY RETAIL CAPACITY & LEISURE STUDY - 2018 Page 63 of 190
For a change Leisure facilities
Pedestrianised street
Provision of Leisure facilities
5.52 In terms of leisure facilities, some 43.9% of the respondents in Andover identified that the Town Centre is lacking
a leisure centre (14%), swimming pool (41.9%) and amenities for children (12.8%). However it is important to
note that the leisure centre in Andover is currently being redeveloped (Ref: 16/03191/FULLN) and a temporary
swimming pool is being used as a replacement for the time being. This probably explains why some respondents
identified that a swimming pool was “absent” from the Town Centre.
5.53 For Romsey, 75% of respondents identified that the Town Centre generally has good leisure facilities. Of the
people that did identify ‘gaps’ in provision; for example, some 68.4% stated a cinema, 15.8% identified a leisure
centre and 10.5% respectively wanted a theatre and health and fitness club. Notwithstanding these responses,
the Romsey Sports Centre (on Southampton Road) and Plaza Theatre (on Winchester Road) are both located a
short distance from the Town Centre.
5.54 Respondents were also asked how Andover and Romsey could be improved in terms of their leisure offer. The
results are summarised by Figures 5.13 and 5.14 below.
Figure 5.13: Potential improvements for leisure provision in Andover
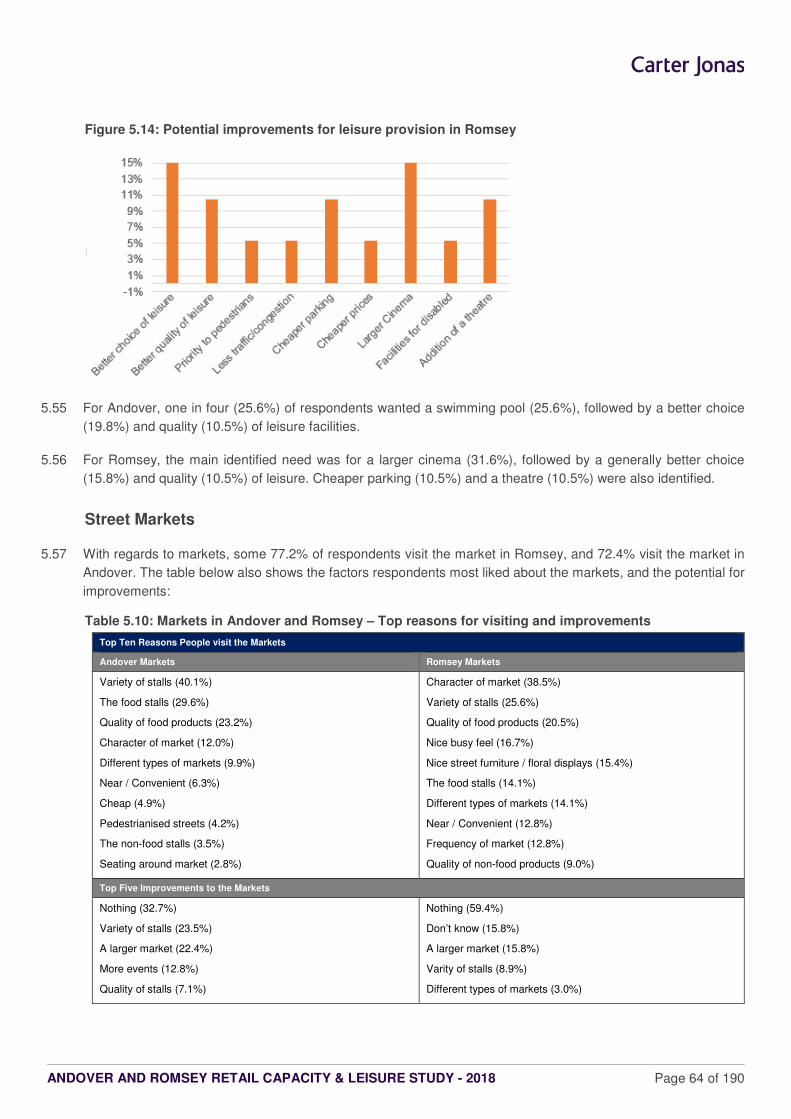
ANDOVER AND ROMSEY RETAIL CAPACITY & LEISURE STUDY - 2018 Page 64 of 190
Figure 5.14: Potential improvements for leisure provision in Romsey
5.55 For Andover, one in four (25.6%) of respondents wanted a swimming pool (25.6%), followed by a better choice
(19.8%) and quality (10.5%) of leisure facilities.
5.56 For Romsey, the main identified need was for a larger cinema (31.6%), followed by a generally better choice
(15.8%) and quality (10.5%) of leisure. Cheaper parking (10.5%) and a theatre (10.5%) were also identified.
Street Markets
5.57 With regards to markets, some 77.2% of respondents visit the market in Romsey, and 72.4% visit the market in
Andover. The table below also shows the factors respondents most liked about the markets, and the potential for
improvements:
Table 5.10: Markets in Andover and Romsey – Top reasons for visiting and improvements
Top Ten Reasons People visit the Markets
Andover Markets Romsey Markets
Variety of stalls (40.1%)
The food stalls (29.6%)
Quality of food products (23.2%)
Character of market (12.0%)
Different types of markets (9.9%)
Near / Convenient (6.3%)
Cheap (4.9%)
Pedestrianised streets (4.2%)
The non-food stalls (3.5%)
Seating around market (2.8%)
Character of market (38.5%)
Variety of stalls (25.6%)
Quality of food products (20.5%)
Nice busy feel (16.7%)
Nice street furniture / floral displays (15.4%)
The food stalls (14.1%)
Different types of markets (14.1%)
Near / Convenient (12.8%)
Frequency of market (12.8%)
Quality of non-food products (9.0%)
Top Five Improvements to the Markets
Nothing (32.7%)
Variety of stalls (23.5%)
A larger market (22.4%)
More events (12.8%)
Quality of stalls (7.1%)
Nothing (59.4%)
Don’t know (15.8%)
A larger market (15.8%)
Varity of stalls (8.9%)
Different types of markets (3.0%)
ANDOVER AND ROMSEY RETAIL CAPACITY & LEISURE STUDY - 2018 Page 65 of 190
5.58 In summary, there are some similarities between what respondents like and dislike about each market in both
centres:
� For Andover, the key “likes” primarily consisted of the variety of stalls (40.1%), the food stalls (29.6%) and
the quality of the food products (23.2%).
� For Romsey, the main “likes” were the character (38.5%), variety (25.6%) and quality (20.5%).
5.59 With regards to the improvements, the majority of respondents claimed nothing needed improving. This was
significantly higher for respondents in Romsey (59.4%) than Andover (32.7%). This suggests that Romsey has
higher quality markets. This is reinforced by the fact that respondents in Andover predominantly commented on
the offer including the variety, size, number of events and quality.
Summary
5.60 In summary, it appears that respondents are generally more satisfied with the overall shopping and leisure offer
in Romsey than for Andover. This is explained, in part, by the high quality shopping environment, the more affluent
customer profile, the strong visitor economy and the relatively good range and choice of shops and leisure services
in Romsey for a centre of its size.
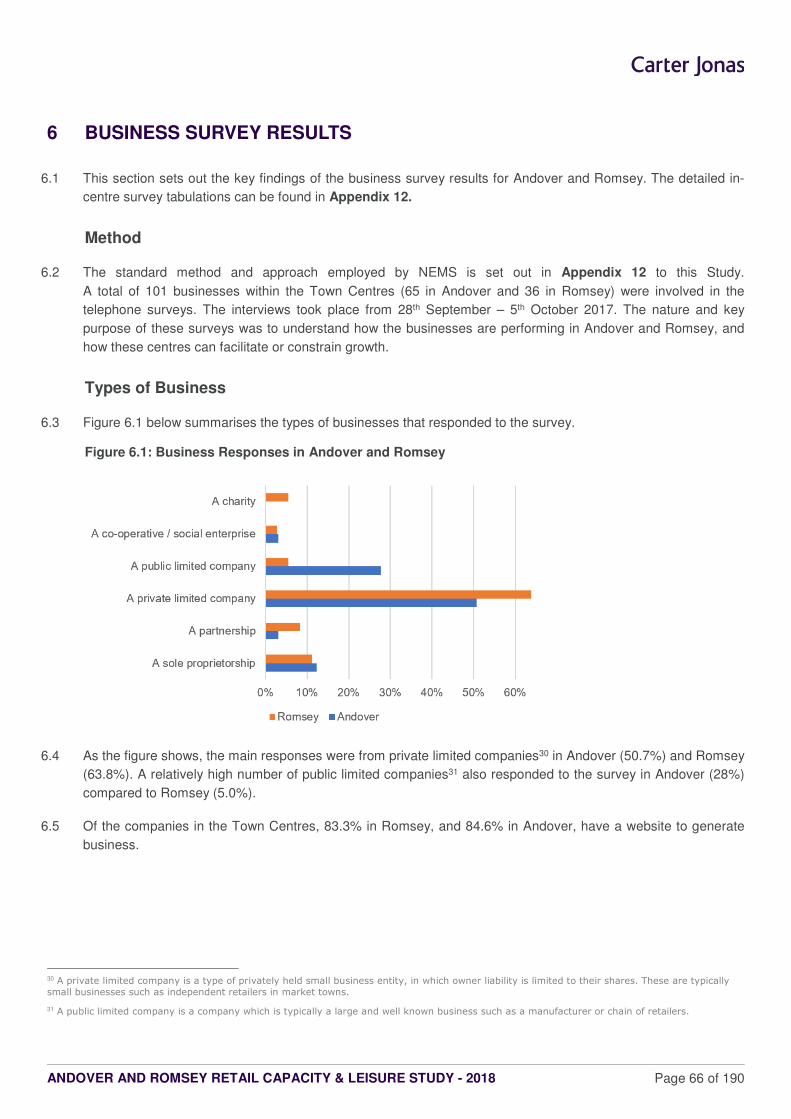
ANDOVER AND ROMSEY RETAIL CAPACITY & LEISURE STUDY - 2018 Page 66 of 190
6 BUSINESS SURVEY RESULTS
6.1 This section sets out the key findings of the business survey results for Andover and Romsey. The detailed in-
centre survey tabulations can be found in Appendix 12.
Method
6.2 The standard method and approach employed by NEMS is set out in Appendix 12 to this Study.
A total of 101 businesses within the Town Centres (65 in Andover and 36 in Romsey) were involved in the
telephone surveys. The interviews took place from 28th September – 5th October 2017. The nature and key
purpose of these surveys was to understand how the businesses are performing in Andover and Romsey, and
how these centres can facilitate or constrain growth.
Types of Business
6.3 Figure 6.1 below summarises the types of businesses that responded to the survey.
Figure 6.1: Business Responses in Andover and Romsey
6.4 As the figure shows, the main responses were from private limited companies30 in Andover (50.7%) and Romsey
(63.8%). A relatively high number of public limited companies31 also responded to the survey in Andover (28%)
compared to Romsey (5.0%).
6.5 Of the companies in the Town Centres, 83.3% in Romsey, and 84.6% in Andover, have a website to generate
business.
30 A private limited company is a type of privately held small business entity, in which owner liability is limited to their shares. These are typically
small businesses such as independent retailers in market towns.
31 A public limited company is a company which is typically a large and well known business such as a manufacturer or chain of retailers.
ANDOVER AND ROMSEY RETAIL CAPACITY & LEISURE STUDY - 2018 Page 67 of 190
6.6 In terms of the type of businesses operating from each premises, the figure below shows that the majority who
responded to the survey were either a food or non-food retailer, or they were a type of industry32.
32 ‘Industry’ was categorised in the business centre for the following responses: source and supply engineered components; agricultural merchants;
consulting engineers; bearings supplier; construction project management; construction; instrumentation engineers; drill bore holes for water
supply; construction; joinery; shop fitters; industrial design and manufacture; solar panels installation; glazing; and building.
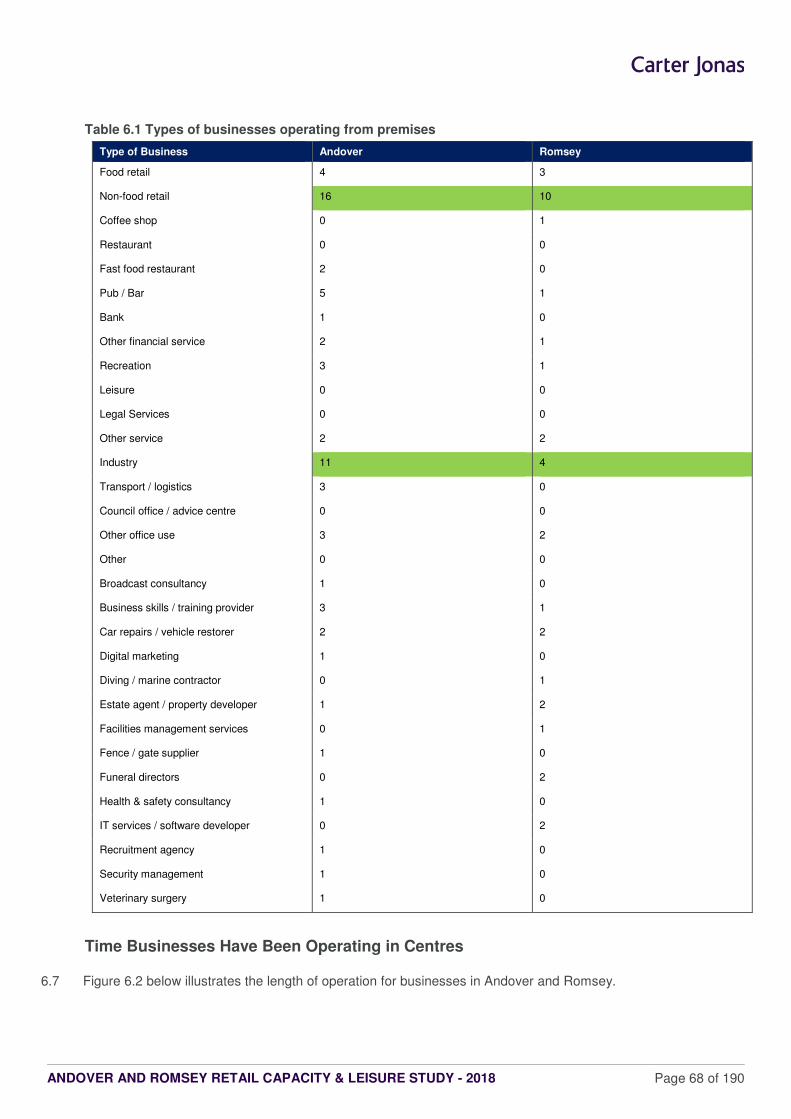
ANDOVER AND ROMSEY RETAIL CAPACITY & LEISURE STUDY - 2018 Page 68 of 190
Table 6.1 Types of businesses operating from premises
Type of Business Andover Romsey
Food retail 4 3
Non-food retail 16 10
Coffee shop 0 1
Restaurant 0 0
Fast food restaurant 2 0
Pub / Bar 5 1
Bank 1 0
Other financial service 2 1
Recreation 3 1
Leisure 0 0
Legal Services 0 0
Other service 2 2
Industry 11 4
Transport / logistics 3 0
Council office / advice centre 0 0
Other office use 3 2
Other 0 0
Broadcast consultancy 1 0
Business skills / training provider 3 1
Car repairs / vehicle restorer 2 2
Digital marketing 1 0
Diving / marine contractor 0 1
Estate agent / property developer 1 2
Facilities management services 0 1
Fence / gate supplier 1 0
Funeral directors 0 2
Health & safety consultancy 1 0
IT services / software developer 0 2
Recruitment agency 1 0
Security management 1 0
Veterinary surgery 1 0
Time Businesses Have Been Operating in Centres
6.7 Figure 6.2 below illustrates the length of operation for businesses in Andover and Romsey.
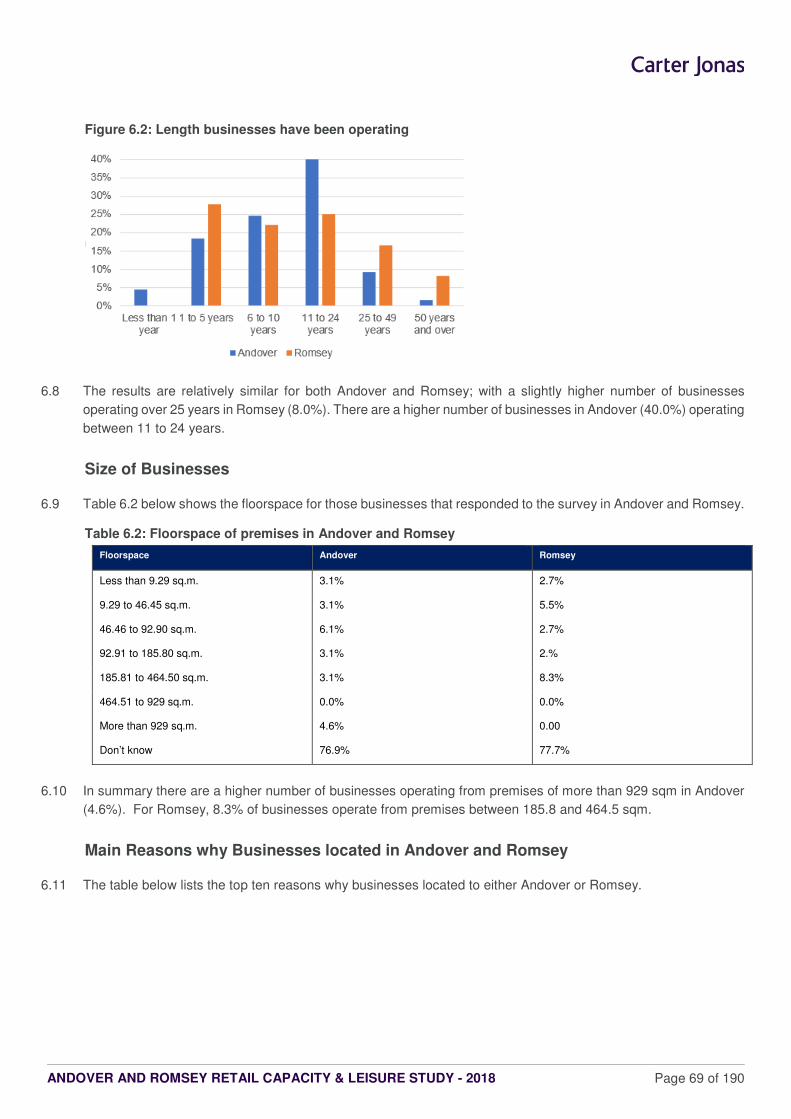
ANDOVER AND ROMSEY RETAIL CAPACITY & LEISURE STUDY - 2018 Page 69 of 190
Figure 6.2: Length businesses have been operating
6.8 The results are relatively similar for both Andover and Romsey; with a slightly higher number of businesses
operating over 25 years in Romsey (8.0%). There are a higher number of businesses in Andover (40.0%) operating
between 11 to 24 years.
Size of Businesses
6.9 Table 6.2 below shows the floorspace for those businesses that responded to the survey in Andover and Romsey.
Table 6.2: Floorspace of premises in Andover and Romsey
Floorspace Andover Romsey
Less than 9.29 sq.m. 3.1% 2.7%
9.29 to 46.45 sq.m. 3.1% 5.5%
46.46 to 92.90 sq.m. 6.1% 2.7%
92.91 to 185.80 sq.m. 3.1% 2.%
185.81 to 464.50 sq.m. 3.1% 8.3%
464.51 to 929 sq.m. 0.0% 0.0%
More than 929 sq.m. 4.6% 0.00
Don’t know 76.9% 77.7%
6.10 In summary there are a higher number of businesses operating from premises of more than 929 sqm in Andover
(4.6%). For Romsey, 8.3% of businesses operate from premises between 185.8 and 464.5 sqm.
Main Reasons why Businesses located in Andover and Romsey
6.11 The table below lists the top ten reasons why businesses located to either Andover or Romsey.
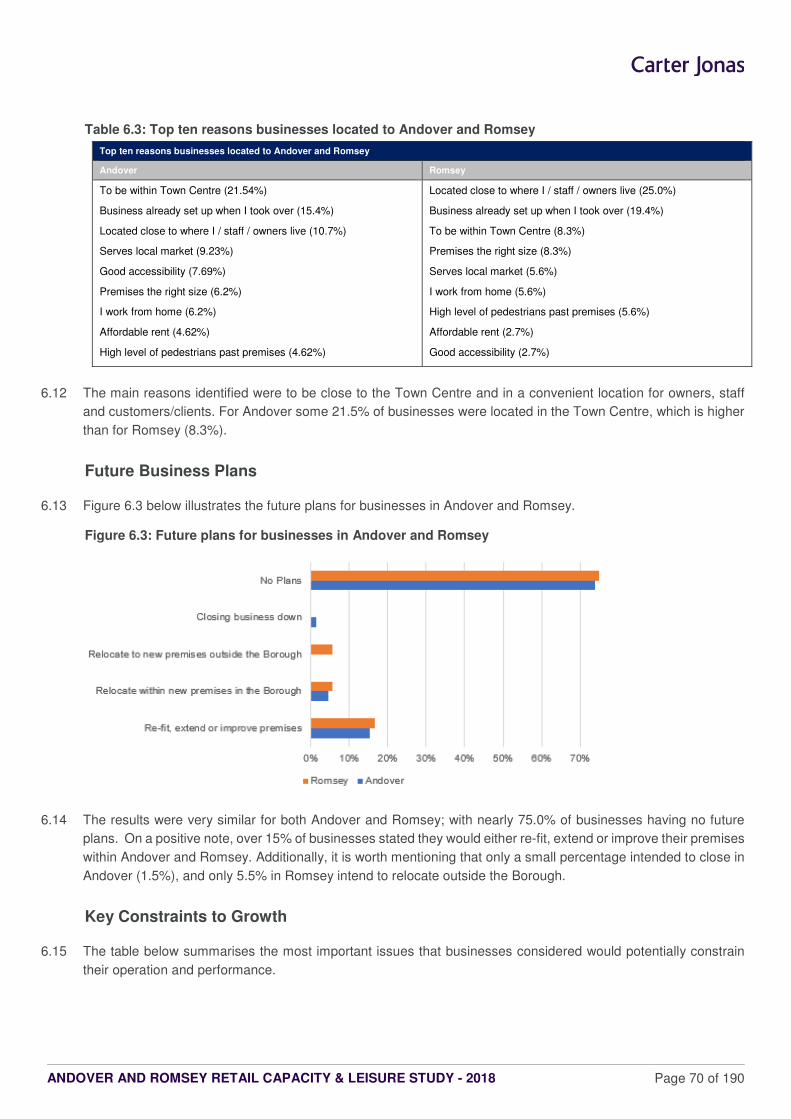
ANDOVER AND ROMSEY RETAIL CAPACITY & LEISURE STUDY - 2018 Page 70 of 190
Table 6.3: Top ten reasons businesses located to Andover and Romsey
Top ten reasons businesses located to Andover and Romsey
Andover Romsey
To be within Town Centre (21.54%)
Business already set up when I took over (15.4%)
Located close to where I / staff / owners live (10.7%)
Serves local market (9.23%)
Good accessibility (7.69%)
Premises the right size (6.2%)
I work from home (6.2%)
Affordable rent (4.62%)
High level of pedestrians past premises (4.62%)
Located close to where I / staff / owners live (25.0%)
Business already set up when I took over (19.4%)
To be within Town Centre (8.3%)
Premises the right size (8.3%)
Serves local market (5.6%)
I work from home (5.6%)
High level of pedestrians past premises (5.6%)
Affordable rent (2.7%)
Good accessibility (2.7%)
6.12 The main reasons identified were to be close to the Town Centre and in a convenient location for owners, staff
and customers/clients. For Andover some 21.5% of businesses were located in the Town Centre, which is higher
than for Romsey (8.3%).
Future Business Plans
6.13 Figure 6.3 below illustrates the future plans for businesses in Andover and Romsey.
Figure 6.3: Future plans for businesses in Andover and Romsey
6.14 The results were very similar for both Andover and Romsey; with nearly 75.0% of businesses having no future
plans. On a positive note, over 15% of businesses stated they would either re-fit, extend or improve their premises
within Andover and Romsey. Additionally, it is worth mentioning that only a small percentage intended to close in
Andover (1.5%), and only 5.5% in Romsey intend to relocate outside the Borough.
Key Constraints to Growth
6.15 The table below summarises the most important issues that businesses considered would potentially constrain
their operation and performance.
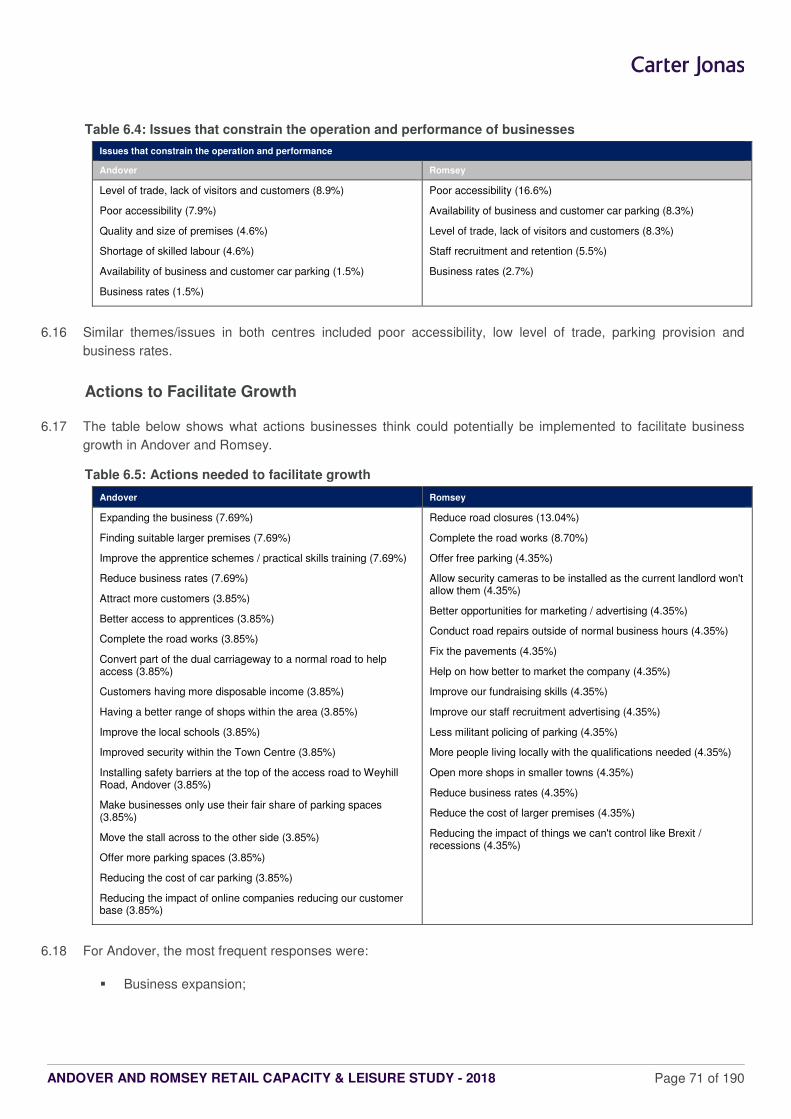
ANDOVER AND ROMSEY RETAIL CAPACITY & LEISURE STUDY - 2018 Page 71 of 190
Table 6.4: Issues that constrain the operation and performance of businesses
Issues that constrain the operation and performance
Andover Romsey
Level of trade, lack of visitors and customers (8.9%)
Poor accessibility (7.9%)
Quality and size of premises (4.6%)
Shortage of skilled labour (4.6%)
Availability of business and customer car parking (1.5%)
Business rates (1.5%)
Poor accessibility (16.6%)
Availability of business and customer car parking (8.3%)
Level of trade, lack of visitors and customers (8.3%)
Staff recruitment and retention (5.5%)
Business rates (2.7%)
6.16 Similar themes/issues in both centres included poor accessibility, low level of trade, parking provision and
business rates.
Actions to Facilitate Growth
6.17 The table below shows what actions businesses think could potentially be implemented to facilitate business
growth in Andover and Romsey.
Table 6.5: Actions needed to facilitate growth
Andover Romsey
Expanding the business (7.69%)
Finding suitable larger premises (7.69%)
Improve the apprentice schemes / practical skills training (7.69%)
Reduce business rates (7.69%)
Attract more customers (3.85%)
Better access to apprentices (3.85%)
Complete the road works (3.85%)
Convert part of the dual carriageway to a normal road to help access (3.85%)
Customers having more disposable income (3.85%)
Having a better range of shops within the area (3.85%)
Improve the local schools (3.85%)
Improved security within the Town Centre (3.85%)
Installing safety barriers at the top of the access road to Weyhill Road, Andover (3.85%)
Make businesses only use their fair share of parking spaces (3.85%)
Move the stall across to the other side (3.85%)
Offer more parking spaces (3.85%)
Reducing the cost of car parking (3.85%)
Reducing the impact of online companies reducing our customer base (3.85%)
Reduce road closures (13.04%)
Complete the road works (8.70%)
Offer free parking (4.35%)
Allow security cameras to be installed as the current landlord won't allow them (4.35%)
Better opportunities for marketing / advertising (4.35%)
Conduct road repairs outside of normal business hours (4.35%)
Fix the pavements (4.35%)
Help on how better to market the company (4.35%)
Improve our fundraising skills (4.35%)
Improve our staff recruitment advertising (4.35%)
Less militant policing of parking (4.35%)
More people living locally with the qualifications needed (4.35%)
Open more shops in smaller towns (4.35%)
Reduce business rates (4.35%)
Reduce the cost of larger premises (4.35%)
Reducing the impact of things we can't control like Brexit / recessions (4.35%)
6.18 For Andover, the most frequent responses were:
� Business expansion;

ANDOVER AND ROMSEY RETAIL CAPACITY & LEISURE STUDY - 2018 Page 72 of 190
� Finding larger premises;
� Improving skills; and
� Reducing business rates.
6.19 For Romsey, the most common responses consisted of:
� Reducing road closures; and
� Completing road works.
Andover Town Centre
6.20 The following summarises the responses to the business survey for Andover Town Centre only, specifically with
regard to:
� Business perceptions of the relative ‘strengths’ and ‘weaknesses’ of the Town Centre;
� The performance of Andover Town Centre over the last year; and
� Business perceptions of how Andover has improved and declined.
Strengths and Weaknesses of Andover as a Business Location
6.21 Table 6.6 below summarises the ‘strengths’ and ‘weaknesses’ of Andover as a business location based on the
responses to the survey.
Table 6.6: Strengths and Weaknesses of Andover
Aspect Strength Weakness
Good road network 92.3% 6.1%
Employees live in area 83.0% 10.7%
Easy for employees to get to 81.5% 12.3%
Local demand for product/service 81.5% 16.9%
Easy for customers to get to 73.8% 20.0%
Availability of car parking 64.6% 30.7%
Presence of other businesses 60.0% 35.3%
Good bus services 55.3% 30.7%
Good rail services 55.3% 32.3%
Room to expand 52.3% 40.0%
Affordable rents 50.7% 33.8%
Affordable premises for expansion 40.0% 47.6%
The variety of shops 36.9% 53.8%
6.22 In summary, the responses show that the main ‘strengths’ of the centre as perceived by businesses include:
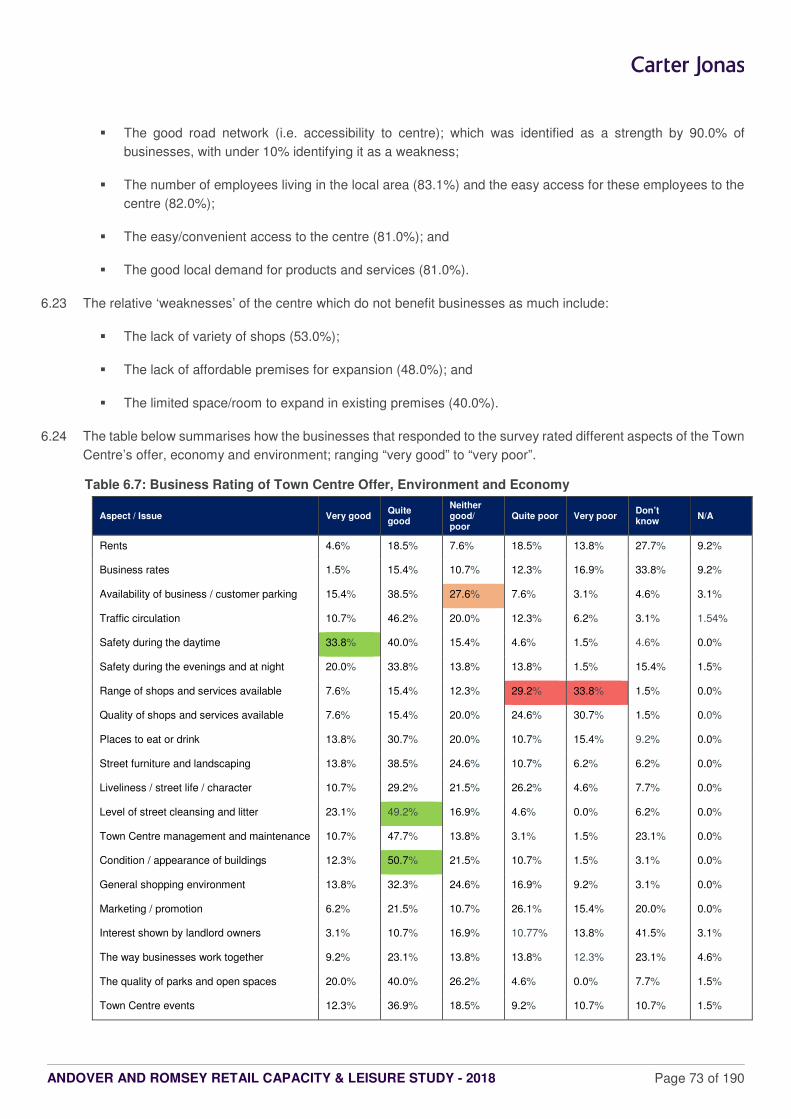
ANDOVER AND ROMSEY RETAIL CAPACITY & LEISURE STUDY - 2018 Page 73 of 190
� The good road network (i.e. accessibility to centre); which was identified as a strength by 90.0% of
businesses, with under 10% identifying it as a weakness;
� The number of employees living in the local area (83.1%) and the easy access for these employees to the
centre (82.0%);
� The easy/convenient access to the centre (81.0%); and
� The good local demand for products and services (81.0%).
6.23 The relative ‘weaknesses’ of the centre which do not benefit businesses as much include:
� The lack of variety of shops (53.0%);
� The lack of affordable premises for expansion (48.0%); and
� The limited space/room to expand in existing premises (40.0%).
6.24 The table below summarises how the businesses that responded to the survey rated different aspects of the Town
Centre’s offer, economy and environment; ranging “very good” to “very poor”.
Table 6.7: Business Rating of Town Centre Offer, Environment and Economy
Aspect / Issue Very good Quite good
Neither good/ poor
Quite poor Very poor Don’t know
N/A
Rents 4.6% 18.5% 7.6% 18.5% 13.8% 27.7% 9.2%
Business rates 1.5% 15.4% 10.7% 12.3% 16.9% 33.8% 9.2%
Availability of business / customer parking 15.4% 38.5% 27.6% 7.6% 3.1% 4.6% 3.1%
Traffic circulation 10.7% 46.2% 20.0% 12.3% 6.2% 3.1% 1.54%
Safety during the daytime 33.8% 40.0% 15.4% 4.6% 1.5% 4.6% 0.0%
Safety during the evenings and at night 20.0% 33.8% 13.8% 13.8% 1.5% 15.4% 1.5%
Range of shops and services available 7.6% 15.4% 12.3% 29.2% 33.8% 1.5% 0.0%
Quality of shops and services available 7.6% 15.4% 20.0% 24.6% 30.7% 1.5% 0.0%
Places to eat or drink 13.8% 30.7% 20.0% 10.7% 15.4% 9.2% 0.0%
Street furniture and landscaping 13.8% 38.5% 24.6% 10.7% 6.2% 6.2% 0.0%
Liveliness / street life / character 10.7% 29.2% 21.5% 26.2% 4.6% 7.7% 0.0%
Level of street cleansing and litter 23.1% 49.2% 16.9% 4.6% 0.0% 6.2% 0.0%
Town Centre management and maintenance 10.7% 47.7% 13.8% 3.1% 1.5% 23.1% 0.0%
Condition / appearance of buildings 12.3% 50.7% 21.5% 10.7% 1.5% 3.1% 0.0%
General shopping environment 13.8% 32.3% 24.6% 16.9% 9.2% 3.1% 0.0%
Marketing / promotion 6.2% 21.5% 10.7% 26.1% 15.4% 20.0% 0.0%
Interest shown by landlord owners 3.1% 10.7% 16.9% 10.77% 13.8% 41.5% 3.1%
The way businesses work together 9.2% 23.1% 13.8% 13.8% 12.3% 23.1% 4.6%
The quality of parks and open spaces 20.0% 40.0% 26.2% 4.6% 0.0% 7.7% 1.5%
Town Centre events 12.3% 36.9% 18.5% 9.2% 10.7% 10.7% 1.5%
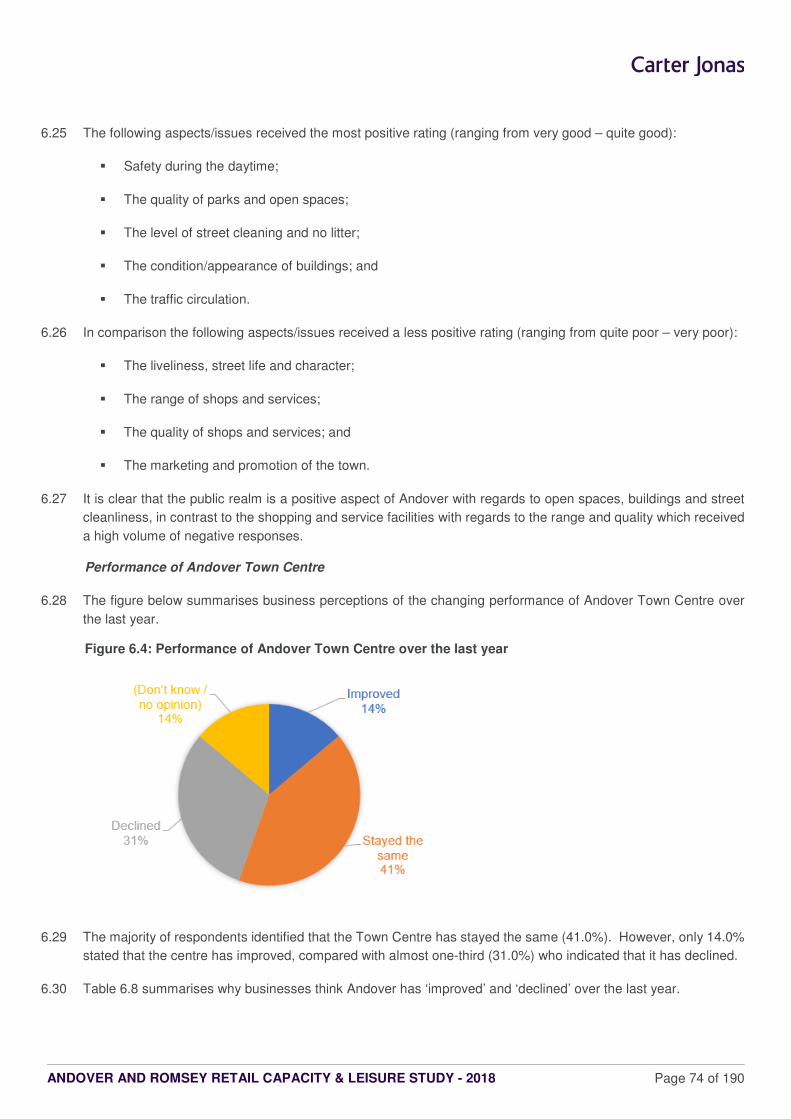
ANDOVER AND ROMSEY RETAIL CAPACITY & LEISURE STUDY - 2018 Page 74 of 190
6.25 The following aspects/issues received the most positive rating (ranging from very good – quite good):
� Safety during the daytime;
� The quality of parks and open spaces;
� The level of street cleaning and no litter;
� The condition/appearance of buildings; and
� The traffic circulation.
6.26 In comparison the following aspects/issues received a less positive rating (ranging from quite poor – very poor):
� The liveliness, street life and character;
� The range of shops and services;
� The quality of shops and services; and
� The marketing and promotion of the town.
6.27 It is clear that the public realm is a positive aspect of Andover with regards to open spaces, buildings and street
cleanliness, in contrast to the shopping and service facilities with regards to the range and quality which received
a high volume of negative responses.
Performance of Andover Town Centre
6.28 The figure below summarises business perceptions of the changing performance of Andover Town Centre over
the last year.
Figure 6.4: Performance of Andover Town Centre over the last year
6.29 The majority of respondents identified that the Town Centre has stayed the same (41.0%). However, only 14.0%
stated that the centre has improved, compared with almost one-third (31.0%) who indicated that it has declined.
6.30 Table 6.8 summarises why businesses think Andover has ‘improved’ and ‘declined’ over the last year.
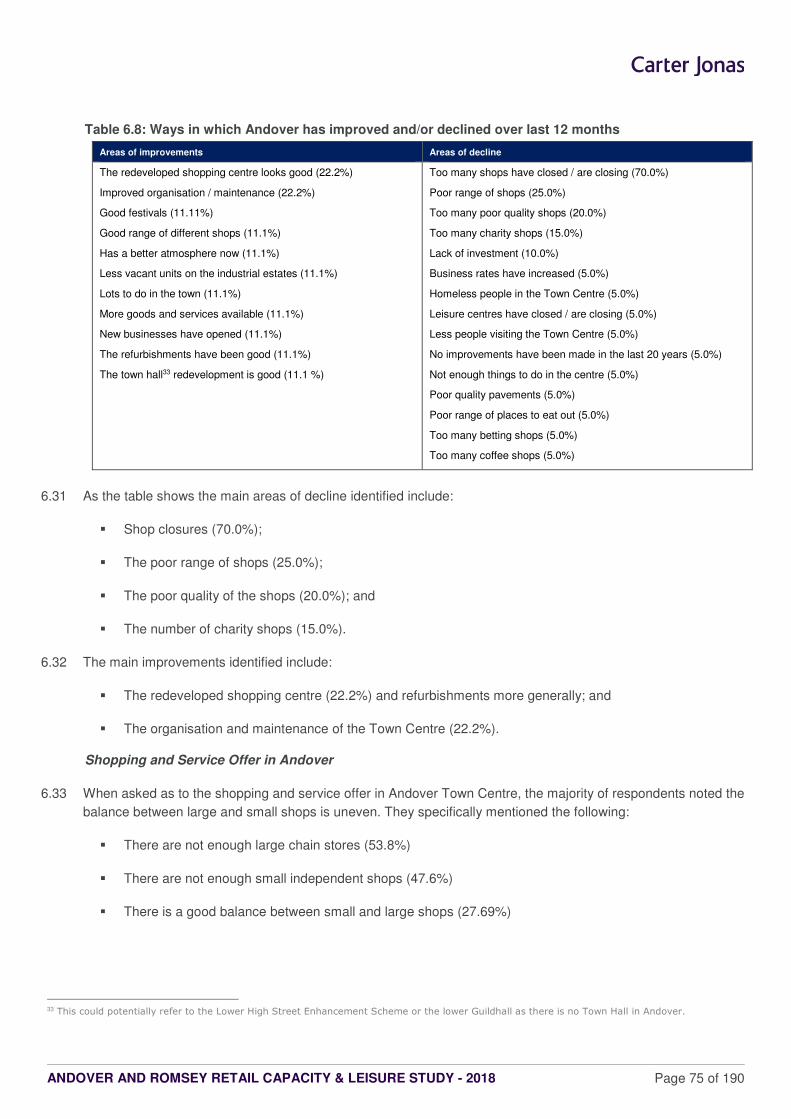
ANDOVER AND ROMSEY RETAIL CAPACITY & LEISURE STUDY - 2018 Page 75 of 190
Table 6.8: Ways in which Andover has improved and/or declined over last 12 months Areas of improvements Areas of decline
The redeveloped shopping centre looks good (22.2%)
Improved organisation / maintenance (22.2%)
Good festivals (11.11%)
Good range of different shops (11.1%)
Has a better atmosphere now (11.1%)
Less vacant units on the industrial estates (11.1%)
Lots to do in the town (11.1%)
More goods and services available (11.1%)
New businesses have opened (11.1%)
The refurbishments have been good (11.1%)
The town hall33 redevelopment is good (11.1 %)
Too many shops have closed / are closing (70.0%)
Poor range of shops (25.0%)
Too many poor quality shops (20.0%)
Too many charity shops (15.0%)
Lack of investment (10.0%)
Business rates have increased (5.0%)
Homeless people in the Town Centre (5.0%)
Leisure centres have closed / are closing (5.0%)
Less people visiting the Town Centre (5.0%)
No improvements have been made in the last 20 years (5.0%)
Not enough things to do in the centre (5.0%)
Poor quality pavements (5.0%)
Poor range of places to eat out (5.0%)
Too many betting shops (5.0%)
Too many coffee shops (5.0%)
6.31 As the table shows the main areas of decline identified include:
� Shop closures (70.0%);
� The poor range of shops (25.0%);
� The poor quality of the shops (20.0%); and
� The number of charity shops (15.0%).
6.32 The main improvements identified include:
� The redeveloped shopping centre (22.2%) and refurbishments more generally; and
� The organisation and maintenance of the Town Centre (22.2%).
Shopping and Service Offer in Andover
6.33 When asked as to the shopping and service offer in Andover Town Centre, the majority of respondents noted the
balance between large and small shops is uneven. They specifically mentioned the following:
� There are not enough large chain stores (53.8%)
� There are not enough small independent shops (47.6%)
� There is a good balance between small and large shops (27.69%)
33 This could potentially refer to the Lower High Street Enhancement Scheme or the lower Guildhall as there is no Town Hall in Andover.
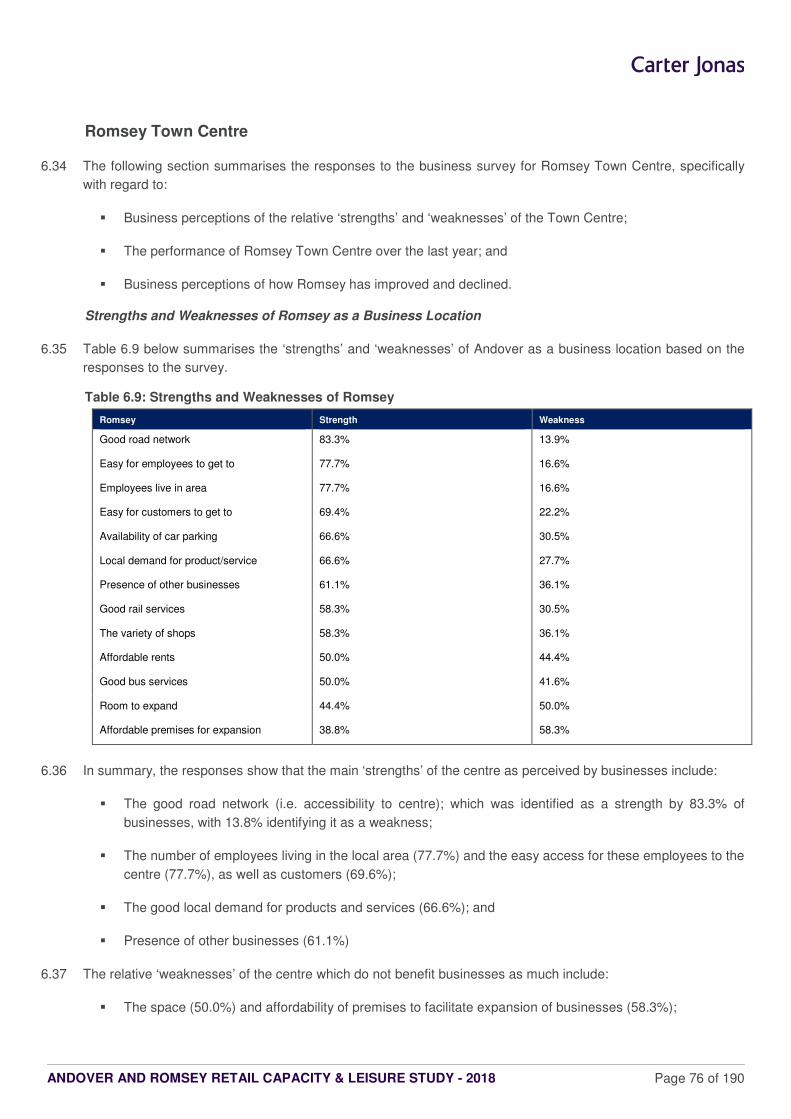
ANDOVER AND ROMSEY RETAIL CAPACITY & LEISURE STUDY - 2018 Page 76 of 190
Romsey Town Centre
6.34 The following section summarises the responses to the business survey for Romsey Town Centre, specifically
with regard to:
� Business perceptions of the relative ‘strengths’ and ‘weaknesses’ of the Town Centre;
� The performance of Romsey Town Centre over the last year; and
� Business perceptions of how Romsey has improved and declined.
Strengths and Weaknesses of Romsey as a Business Location
6.35 Table 6.9 below summarises the ‘strengths’ and ‘weaknesses’ of Andover as a business location based on the
responses to the survey.
Table 6.9: Strengths and Weaknesses of Romsey
Romsey Strength Weakness
Good road network 83.3% 13.9%
Easy for employees to get to 77.7% 16.6%
Employees live in area 77.7% 16.6%
Easy for customers to get to 69.4% 22.2%
Availability of car parking 66.6% 30.5%
Local demand for product/service 66.6% 27.7%
Presence of other businesses 61.1% 36.1%
Good rail services 58.3% 30.5%
The variety of shops 58.3% 36.1%
Affordable rents 50.0% 44.4%
Good bus services 50.0% 41.6%
Room to expand 44.4% 50.0%
Affordable premises for expansion 38.8% 58.3%
6.36 In summary, the responses show that the main ‘strengths’ of the centre as perceived by businesses include:
� The good road network (i.e. accessibility to centre); which was identified as a strength by 83.3% of
businesses, with 13.8% identifying it as a weakness;
� The number of employees living in the local area (77.7%) and the easy access for these employees to the
centre (77.7%), as well as customers (69.6%);
� The good local demand for products and services (66.6%); and
� Presence of other businesses (61.1%)
6.37 The relative ‘weaknesses’ of the centre which do not benefit businesses as much include:
� The space (50.0%) and affordability of premises to facilitate expansion of businesses (58.3%);
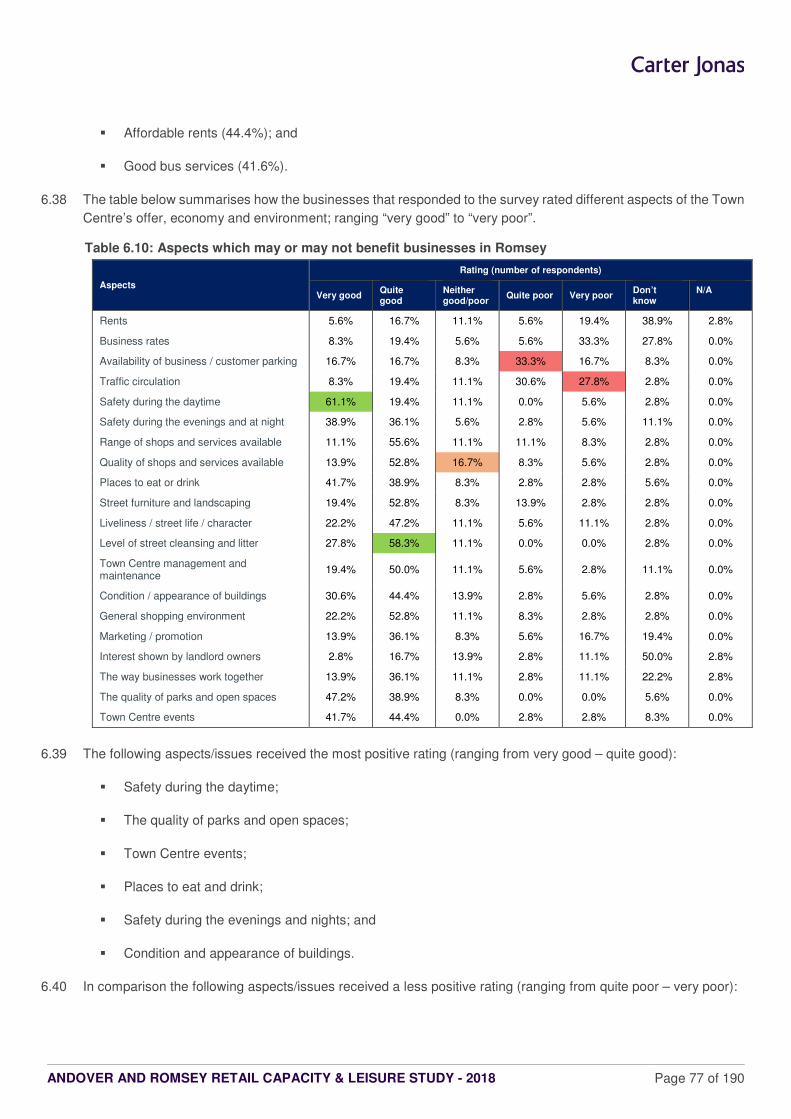
ANDOVER AND ROMSEY RETAIL CAPACITY & LEISURE STUDY - 2018 Page 77 of 190
� Affordable rents (44.4%); and
� Good bus services (41.6%).
6.38 The table below summarises how the businesses that responded to the survey rated different aspects of the Town
Centre’s offer, economy and environment; ranging “very good” to “very poor”.
Table 6.10: Aspects which may or may not benefit businesses in Romsey
Aspects
Rating (number of respondents)
Very good Quite good
Neither good/poor
Quite poor Very poor Don’t know
N/A
Rents 5.6% 16.7% 11.1% 5.6% 19.4% 38.9% 2.8%
Business rates 8.3% 19.4% 5.6% 5.6% 33.3% 27.8% 0.0%
Availability of business / customer parking 16.7% 16.7% 8.3% 33.3% 16.7% 8.3% 0.0%
Traffic circulation 8.3% 19.4% 11.1% 30.6% 27.8% 2.8% 0.0%
Safety during the daytime 61.1% 19.4% 11.1% 0.0% 5.6% 2.8% 0.0%
Safety during the evenings and at night 38.9% 36.1% 5.6% 2.8% 5.6% 11.1% 0.0%
Range of shops and services available 11.1% 55.6% 11.1% 11.1% 8.3% 2.8% 0.0%
Quality of shops and services available 13.9% 52.8% 16.7% 8.3% 5.6% 2.8% 0.0%
Places to eat or drink 41.7% 38.9% 8.3% 2.8% 2.8% 5.6% 0.0%
Street furniture and landscaping 19.4% 52.8% 8.3% 13.9% 2.8% 2.8% 0.0%
Liveliness / street life / character 22.2% 47.2% 11.1% 5.6% 11.1% 2.8% 0.0%
Level of street cleansing and litter 27.8% 58.3% 11.1% 0.0% 0.0% 2.8% 0.0%
Town Centre management and maintenance
19.4% 50.0% 11.1% 5.6% 2.8% 11.1% 0.0%
Condition / appearance of buildings 30.6% 44.4% 13.9% 2.8% 5.6% 2.8% 0.0%
General shopping environment 22.2% 52.8% 11.1% 8.3% 2.8% 2.8% 0.0%
Marketing / promotion 13.9% 36.1% 8.3% 5.6% 16.7% 19.4% 0.0%
Interest shown by landlord owners 2.8% 16.7% 13.9% 2.8% 11.1% 50.0% 2.8%
The way businesses work together 13.9% 36.1% 11.1% 2.8% 11.1% 22.2% 2.8%
The quality of parks and open spaces 47.2% 38.9% 8.3% 0.0% 0.0% 5.6% 0.0%
Town Centre events 41.7% 44.4% 0.0% 2.8% 2.8% 8.3% 0.0%
6.39 The following aspects/issues received the most positive rating (ranging from very good – quite good):
� Safety during the daytime;
� The quality of parks and open spaces;
� Town Centre events;
� Places to eat and drink;
� Safety during the evenings and nights; and
� Condition and appearance of buildings.
6.40 In comparison the following aspects/issues received a less positive rating (ranging from quite poor – very poor):

ANDOVER AND ROMSEY RETAIL CAPACITY & LEISURE STUDY - 2018 Page 78 of 190
� The availability of businesses and customer parking;
� Traffic circulation;
� Range of shops and services available;
� Business rates;
� Marketing and promotion
Performance of Romsey Town Centre
6.41 The figure below summarises business perceptions of the changing performance of Andover Town Centre over
the last year.
Figure 6.5: Performance of Romsey Town Centre over the last year
6.42 Similar to Andover, the majority of respondents identified that the Town Centre has stayed the same (36%). Over
a third indicated that the centre has declined (34.0%) and only 22.0% stated the centre had improved.
6.43 Table 6.11 summarises why businesses think Romsey has ‘improved’ and ‘declined’ over the last year. A higher
proportion of responses in Romsey identified areas for improvement in contrast to Andover.
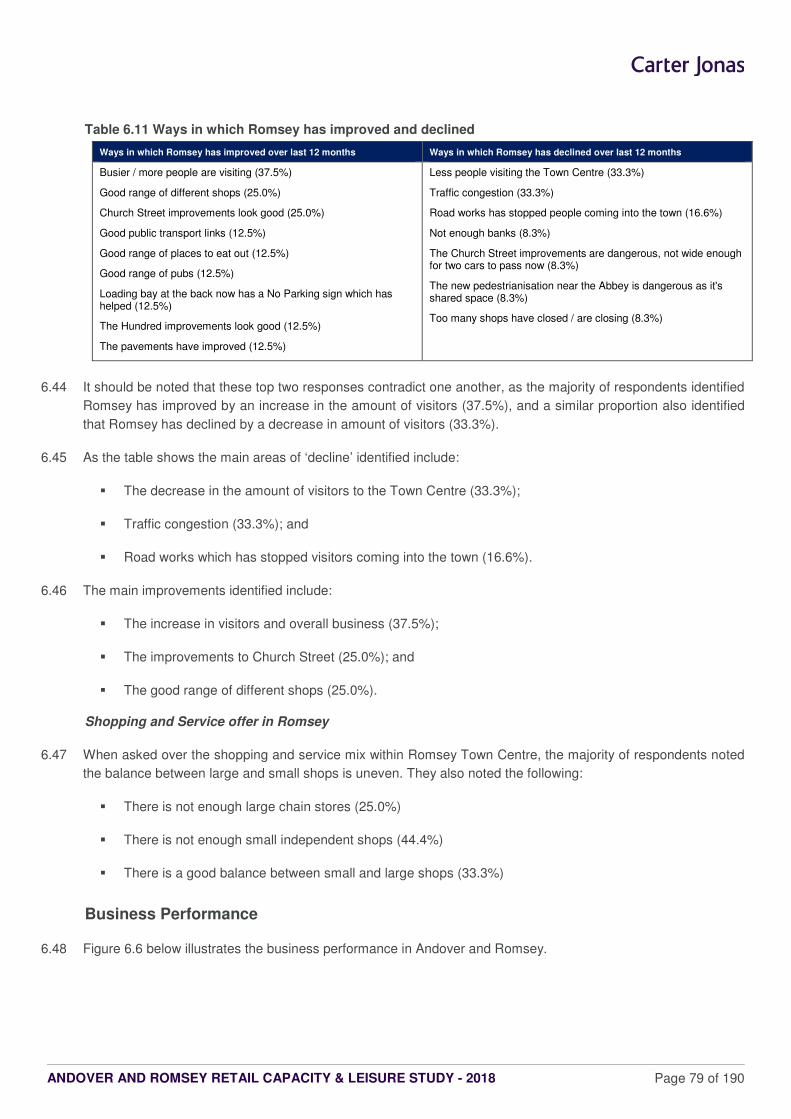
ANDOVER AND ROMSEY RETAIL CAPACITY & LEISURE STUDY - 2018 Page 79 of 190
Table 6.11 Ways in which Romsey has improved and declined
Ways in which Romsey has improved over last 12 months Ways in which Romsey has declined over last 12 months
Busier / more people are visiting (37.5%)
Good range of different shops (25.0%)
Church Street improvements look good (25.0%)
Good public transport links (12.5%)
Good range of places to eat out (12.5%)
Good range of pubs (12.5%)
Loading bay at the back now has a No Parking sign which has helped (12.5%)
The Hundred improvements look good (12.5%)
The pavements have improved (12.5%)
Less people visiting the Town Centre (33.3%)
Traffic congestion (33.3%)
Road works has stopped people coming into the town (16.6%)
Not enough banks (8.3%)
The Church Street improvements are dangerous, not wide enough for two cars to pass now (8.3%)
The new pedestrianisation near the Abbey is dangerous as it's shared space (8.3%)
Too many shops have closed / are closing (8.3%)
6.44 It should be noted that these top two responses contradict one another, as the majority of respondents identified
Romsey has improved by an increase in the amount of visitors (37.5%), and a similar proportion also identified
that Romsey has declined by a decrease in amount of visitors (33.3%).
6.45 As the table shows the main areas of ‘decline’ identified include:
� The decrease in the amount of visitors to the Town Centre (33.3%);
� Traffic congestion (33.3%); and
� Road works which has stopped visitors coming into the town (16.6%).
6.46 The main improvements identified include:
� The increase in visitors and overall business (37.5%);
� The improvements to Church Street (25.0%); and
� The good range of different shops (25.0%).
Shopping and Service offer in Romsey
6.47 When asked over the shopping and service mix within Romsey Town Centre, the majority of respondents noted
the balance between large and small shops is uneven. They also noted the following:
� There is not enough large chain stores (25.0%)
� There is not enough small independent shops (44.4%)
� There is a good balance between small and large shops (33.3%)
Business Performance
6.48 Figure 6.6 below illustrates the business performance in Andover and Romsey.
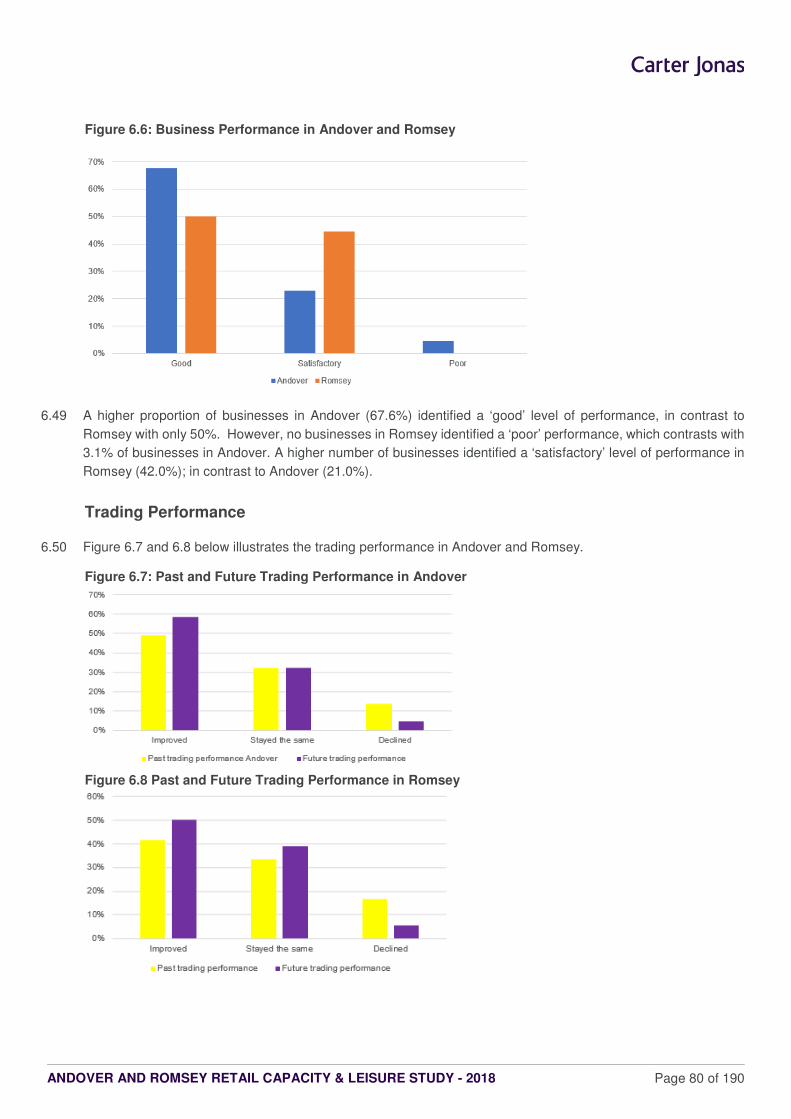
ANDOVER AND ROMSEY RETAIL CAPACITY & LEISURE STUDY - 2018 Page 80 of 190
Figure 6.6: Business Performance in Andover and Romsey
6.49 A higher proportion of businesses in Andover (67.6%) identified a ‘good’ level of performance, in contrast to
Romsey with only 50%. However, no businesses in Romsey identified a ‘poor’ performance, which contrasts with
3.1% of businesses in Andover. A higher number of businesses identified a ‘satisfactory’ level of performance in
Romsey (42.0%); in contrast to Andover (21.0%).
Trading Performance
6.50 Figure 6.7 and 6.8 below illustrates the trading performance in Andover and Romsey.
Figure 6.7: Past and Future Trading Performance in Andover
Figure 6.8 Past and Future Trading Performance in Romsey
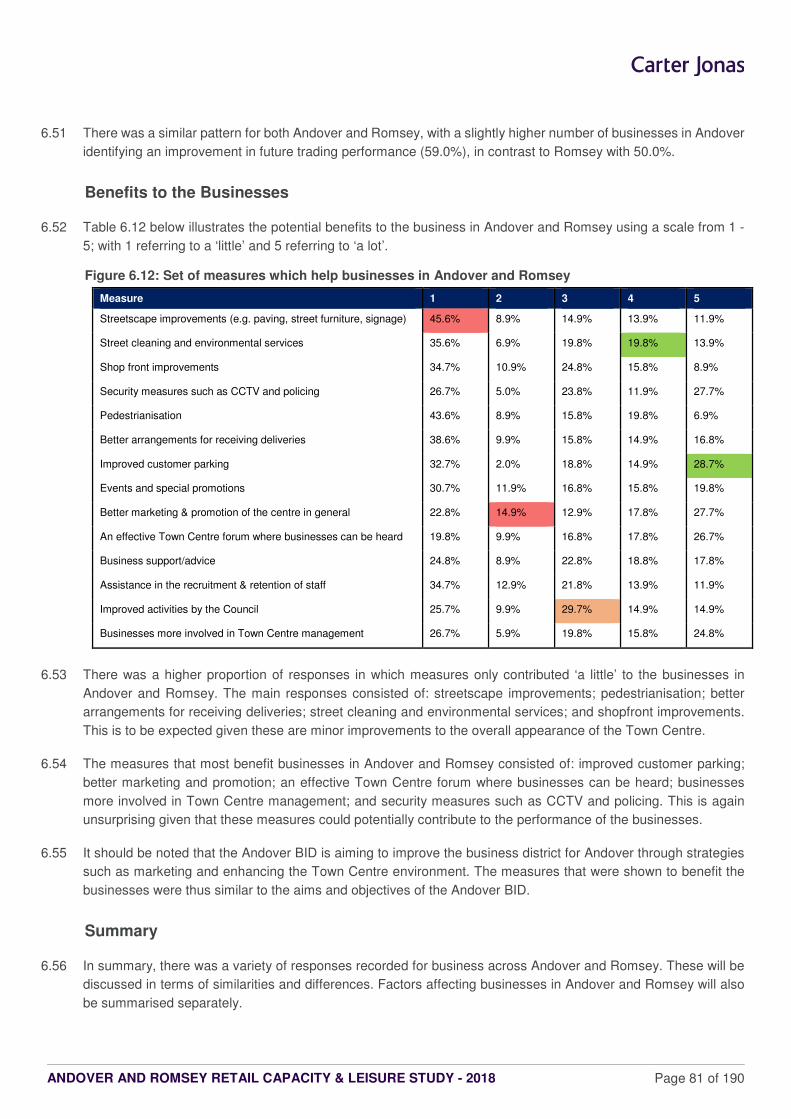
ANDOVER AND ROMSEY RETAIL CAPACITY & LEISURE STUDY - 2018 Page 81 of 190
6.51 There was a similar pattern for both Andover and Romsey, with a slightly higher number of businesses in Andover
identifying an improvement in future trading performance (59.0%), in contrast to Romsey with 50.0%.
Benefits to the Businesses
6.52 Table 6.12 below illustrates the potential benefits to the business in Andover and Romsey using a scale from 1 -
5; with 1 referring to a ‘little’ and 5 referring to ‘a lot’.
Figure 6.12: Set of measures which help businesses in Andover and Romsey
Measure 1 2 3 4 5
Streetscape improvements (e.g. paving, street furniture, signage) 45.6% 8.9% 14.9% 13.9% 11.9%
Street cleaning and environmental services 35.6% 6.9% 19.8% 19.8% 13.9%
Shop front improvements 34.7% 10.9% 24.8% 15.8% 8.9%
Security measures such as CCTV and policing 26.7% 5.0% 23.8% 11.9% 27.7%
Pedestrianisation 43.6% 8.9% 15.8% 19.8% 6.9%
Better arrangements for receiving deliveries 38.6% 9.9% 15.8% 14.9% 16.8%
Improved customer parking 32.7% 2.0% 18.8% 14.9% 28.7%
Events and special promotions 30.7% 11.9% 16.8% 15.8% 19.8%
Better marketing & promotion of the centre in general 22.8% 14.9% 12.9% 17.8% 27.7%
An effective Town Centre forum where businesses can be heard 19.8% 9.9% 16.8% 17.8% 26.7%
Business support/advice 24.8% 8.9% 22.8% 18.8% 17.8%
Assistance in the recruitment & retention of staff 34.7% 12.9% 21.8% 13.9% 11.9%
Improved activities by the Council 25.7% 9.9% 29.7% 14.9% 14.9%
Businesses more involved in Town Centre management 26.7% 5.9% 19.8% 15.8% 24.8%
6.53 There was a higher proportion of responses in which measures only contributed ‘a little’ to the businesses in
Andover and Romsey. The main responses consisted of: streetscape improvements; pedestrianisation; better
arrangements for receiving deliveries; street cleaning and environmental services; and shopfront improvements.
This is to be expected given these are minor improvements to the overall appearance of the Town Centre.
6.54 The measures that most benefit businesses in Andover and Romsey consisted of: improved customer parking;
better marketing and promotion; an effective Town Centre forum where businesses can be heard; businesses
more involved in Town Centre management; and security measures such as CCTV and policing. This is again
unsurprising given that these measures could potentially contribute to the performance of the businesses.
6.55 It should be noted that the Andover BID is aiming to improve the business district for Andover through strategies
such as marketing and enhancing the Town Centre environment. The measures that were shown to benefit the
businesses were thus similar to the aims and objectives of the Andover BID.
Summary
6.56 In summary, there was a variety of responses recorded for business across Andover and Romsey. These will be
discussed in terms of similarities and differences. Factors affecting businesses in Andover and Romsey will also
be summarised separately.
ANDOVER AND ROMSEY RETAIL CAPACITY & LEISURE STUDY - 2018 Page 82 of 190
6.57 Similarities:
� The majority of responses to the survey were by private limited companies.
� Nearly 75.0% of businesses in Andover and Romsey had no future plans to expand.
� Only 15.0% of businesses in both centres stated they would either re-fit, extend or improve their premises.
� Businesses in Andover and Romsey decided to locate to each centre as they were convenient for owners,
staff and customers/clients.
� Similar issues constraining the operation of business performance in Andover and Romsey concerned
accessibility; the level of trade, lack of visitors and customers; parking and business rates.
6.58 Differences:
� Within Andover, a higher proportion of businesses were located in the Town Centre.
� In Romsey a higher proportion of businesses have been operating for a longer period of time (more than
25 years) compared with Andover.
� The businesses in Andover are generally larger in terms of floorspace (over 929 sqm) than in Romsey.
� With regards to limitations on the centres, businesses in Romsey identified road closures and road works.
� For Andover the main limitations included: expansion of the business; finding larger premises; improving
skills and reducing business rates.
� A higher proportion of businesses in Andover identified a ‘good’ level of performance (67.6%), in contrast
to Romsey (50.0%).
� A higher number of businesses identified a ‘satisfactory’ level of performance in Romsey (42.0%); in
contrast to Andover (21.0%).
6.59 Businesses in Andover:
� Aspects which were found to benefit businesses in Andover included: the road network; ease for employers
and customers; and the local demand for products and services.
� Issues which were found to not benefit businesses in Andover included: the variety of shops; and the room
and affordability to expand premises.
� Respondent’s mentioned the following positive aspects of Andover Town Centre: the good road network
(i.e. accessibility to centre) (90.0%); the number of employees living in the local area (83.1%); the easy
access for these employees to the centre (82.0%); and the good local demand for products and services
(81.0%).
� Respondent’s mentioned the following negative aspects of Andover Town Centre: the lack of variety of
shops (53.0%); the lack of affordable premises for expansion (48.0%); and the limited space/room to
expand in existing premises (40.0%).
ANDOVER AND ROMSEY RETAIL CAPACITY & LEISURE STUDY - 2018 Page 83 of 190
� With regards to the performance of Andover Town Centre, 41.0% of businesses stated it has stayed the
same; 31.0% noted decline; and 13.8% mentioned it has improved.
� The survey highlighted the following with regards to improvements in Andover Town Centre: the
organisation and maintenance of the Town Centre; the redeveloped shopping centre; and the
refurbishments.
� The survey highlighted the following with regards to how Andover Town Centre has declined: the poor
range of shops; the number of charity shops; and the poor quality of the shops.
6.60 Businesses in Romsey:
� Aspects which were found to benefit businesses in Romsey include: the road network (i.e. accessibility to
the centre) (83.3%); the number of employees living in the local area (77.7%); and ease for employers
(77.7%) and customers (69.6%) to get to; the good local demand for products and services (66.6%); and
presence of other businesses (61.1%).
� Issues which were found to not benefit businesses in Romsey included: the room (50.0%) and affordability
of premises to facilitate expansion of businesses (58.3%); affordable rents (44.4%); and good bus services
(41.6%).
� Respondent’s mentioned the following positive aspects of Romsey Town Centre: safety during the daytime
(61.1%); the quality of parks and open spaces (47.2%); Town Centre events (41.7%); places to eat and
drink (41.7%); safety during the evenings and nights (38.9%); and the condition and appearance of
buildings (30.6%).
� Respondent’s mentioned the following negative aspects of Romsey Town Centre: the availability of
businesses and customer parking (33.3%); traffic circulation (27.8%); range of shops and services available
(11.1%); business rates (33.3%); and marketing and promotion (16.7%).
� With regards to the performance of Romsey Town Centre, 36.0% of businesses stated it has stayed the
same; 34.0% noted decline; and 22.0% mentioned it has improved.
� The survey highlighted the following with regards to improvements in Romsey Town Centre: busier
atmosphere and more people visiting; and the improvements to Church Street.
� The survey highlighted the following with regards to how Romsey Town Centre has declined: traffic
congestion; less people visiting the Town Centre; and road works which stop people visiting Romsey.
ANDOVER AND ROMSEY RETAIL CAPACITY & LEISURE STUDY - 2018 Page 84 of 190
7 TOWN CENTRE HEALTH CHECKS: METHODOLOGY
7.1 Sections 8 and 9 provide detailed health check assessment for main centres in Test Valley, as follows:
� Andover Town Centre (Section 8)
� Romsey Town Centre (Section 9)
7.2 Health checks are recognised as important planning 'tools' for appraising and monitoring the changes in the overall
vitality and viability of Town Centres, and informing both plan-making and decision-taking at the local level.
7.3 In accordance with the PPG (paragraph 005 Reference ID: 2b-005-20140306), there are a number of indicators
that are widely used (where the information exists) to help assess and monitor the overall health and performance
of centres. Some of the indicators include:
� The diversity of uses (e.g. Retail and services offer);
� Proportion of vacant street level property;
� Commercial yields on non-domestic property;
� Customers' views and behaviour;
� Retailer representation and intentions to change representation;
� Commercial rents;
� Pedestrian flows;
� Accessibility;
� Perception of safety and occurrence of crime; and
� State of Town Centre environmental quality.
7.4 In this case the most reliable KPIs have been gathered (where possible) for the centres to help inform the
assessment of their overall strengths and weaknesses in in terms of their retail and leisure provision, the
opportunities for new sustainable development and growth, and any potential current and future threats to their
overall vitality and viability. We have referred to a number of datasets and research to help assess the relative
vitality and viability of the Councils' main Town Centres, as referenced throughout the report. The general
methodology is set out below.
Engagement of Key Stakeholders
7.5 As part of undertaking the Town Centre health checks, we have been asked by the Councils to contact a number
of key stakeholders. Carter Jonas sought to contact all organisations/representatives on the list, in the time given.
The table below shows the key stakeholders with whom a successful engagement was held. The engagement
exercise was undertaken by both email and/or telephone calls, as well as business workshops for both Andover
and Romsey that took place on 28th and 29th November 2017 respectively.
Table 5.2: List of Stakeholders
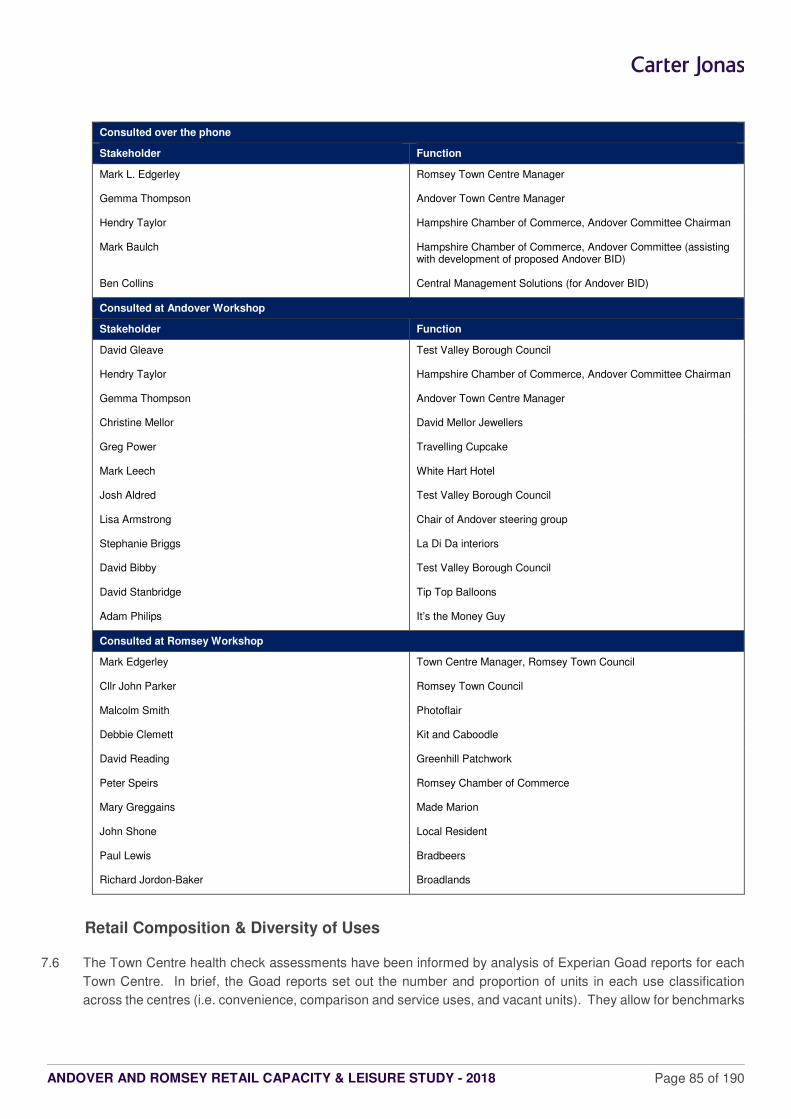
ANDOVER AND ROMSEY RETAIL CAPACITY & LEISURE STUDY - 2018 Page 85 of 190
Consulted over the phone
Stakeholder Function
Mark L. Edgerley Romsey Town Centre Manager
Gemma Thompson Andover Town Centre Manager
Hendry Taylor Hampshire Chamber of Commerce, Andover Committee Chairman
Mark Baulch Hampshire Chamber of Commerce, Andover Committee (assisting with development of proposed Andover BID)
Ben Collins Central Management Solutions (for Andover BID)
Consulted at Andover Workshop
Stakeholder Function
David Gleave Test Valley Borough Council
Hendry Taylor Hampshire Chamber of Commerce, Andover Committee Chairman
Gemma Thompson Andover Town Centre Manager
Christine Mellor David Mellor Jewellers
Greg Power Travelling Cupcake
Mark Leech White Hart Hotel
Josh Aldred Test Valley Borough Council
Lisa Armstrong Chair of Andover steering group
Stephanie Briggs La Di Da interiors
David Bibby Test Valley Borough Council
David Stanbridge Tip Top Balloons
Adam Philips It’s the Money Guy
Consulted at Romsey Workshop
Mark Edgerley Town Centre Manager, Romsey Town Council
Cllr John Parker Romsey Town Council
Malcolm Smith Photoflair
Debbie Clemett Kit and Caboodle
David Reading Greenhill Patchwork
Peter Speirs Romsey Chamber of Commerce
Mary Greggains Made Marion
John Shone Local Resident
Paul Lewis Bradbeers
Richard Jordon-Baker Broadlands
Retail Composition & Diversity of Uses
7.6 The Town Centre health check assessments have been informed by analysis of Experian Goad reports for each
Town Centre. In brief, the Goad reports set out the number and proportion of units in each use classification
across the centres (i.e. convenience, comparison and service uses, and vacant units). They allow for benchmarks
ANDOVER AND ROMSEY RETAIL CAPACITY & LEISURE STUDY - 2018 Page 86 of 190
with the UK national average for all circa 2,000 centres and shopping locations covered by Experian Goad. It
should be noted that 'services' as defined by Experian Goad are sub-divided into the following three sub-
categories.
� Retail services - Class A1 and certain sui generis uses (including hairdressers, beauty salons, travel
agents, launderettes, opticians, etc.);
� Leisure services - comprise cafés and restaurants (Class A3), betting shops (sui generis) and fast food/
takeaway outlets (Class A5); and
� Financial and professional services - cover all Class A2 uses (such as banks, estate agents, etc).
Goad Town Centre Definitions and Floorspace
7.7 The health checks provide an effective 'gap' analysis tool to help identify retail types and categories that are under
or over represented in centres. This is based on benchmarking against Goad UK averages for all circa 2,000
centres and shopping locations covered by Experian.
7.8 It should be noted that where Experian Goad data is relied on for composition, the area surveyed by Goad is not
necessarily identical to the Councils' identified Town Centre boundaries. As such, it is possible that the number of
units set out in our analysis may not relate directly to the Councils' defined centre boundaries.
7.9 The floorspace figures shown in the report are also derived from the relevant Goad Plan which shows only the
'footprint' floorspace and the site area without the building lines. They should therefore not be read as a definitive
report of floorspace, but do provide a useful means of comparison between centres, as all outlets are measured
in a consistent manner.
Vacancies
7.10 The number and scale of vacancies in a centre, and the length of time properties have been vacant, represents a
key performance indicator (KPI) to help assess a centre's overall vitality and viability. For example, high vacancy
levels, or a concentration of vacancies in certain areas/streets, could point to underlying weaknesses in terms of
retailer demand and/or the fact that vacant units are not meeting demand and are not 'fit-for-purpose'.
Notwithstanding this, vacancies can arise in even the strongest centres due to the natural 'churn' in businesses
opening and closing at any point in time. This KPI must therefore be used and interpreted with care.
7.11 The data for vacancies has been collected from the GOAD Category Reports (June and September 2016), and
commentary has been provided on the vacancy data as surveyed by the Council in May 2017.
Multiple and Independent Retailers
7.12 The Experian Goad Category Reports also provide analysis on multiple retail representation. A multiple is defined
by Experian Goad as being part of a network of nine or more outlets. It is widely accepted that a good presence
and mix of multiples in a centre, alongside a strong independent offer, helps to increase the overall attraction and
performance of shopping centres. Multiples are a strong draw for customers and they help to generate frequent
shopping trips and footfall, and linked expenditure for other shops, businesses and services.
ANDOVER AND ROMSEY RETAIL CAPACITY & LEISURE STUDY - 2018 Page 87 of 190
Street/Covered Markets
7.13 Whether or not a centre has a market, and the quality and offer of a market, can give an indication as to whether
a centre is vital and viable. Information regarding the health of the markets discussed in this report has been
obtained from our own research and observations of the centres, as well as stakeholder consultation. In line with
Paragraph 23 of the NPPF, existing markets should be retained and enhanced and, where appropriate, new ones
should be created, ensuring that markets remain attractive and competitive.
Retailer Demand and Requirements
7.14 Evidence of requirements ('market demand') from retail and leisure operators for representation in a Town Centre
can provide a further indication of the overall health and attraction of centre, and investor confidence. In this case
we have drawn on standard published sources to inform our assessment of current market demand; including the
Requirements List. However, it should be noted that this published information is not definitive, as many retailers
and leisure operators prefer not to announce their requirements as it can undermine their negotiating position with
potential landlords. Furthermore, market demand is often opportunity-driven; for example in response to the
marketing of new development and regeneration initiatives.
Prime Zone A Rents
7.15 The level of rent that businesses are prepared to pay for retail space, and the commercial yields achieved provide
a further indication of the relative strength of the centre and its prime retail pitch. However, it should be noted that
Prime Zone A rents was only available for Andover, and not Romsey. Therefore, an assessment of Prime Zone A
rents and yields is only provided where available.
Customer Views and Behaviour
7.16 Our assessment of customers' views and behaviours draws on the findings of the household survey and in-centre
surveys. The household survey comprised in total 1,000 interviews across ten zones and asked specific questions
regarding respondents likes and dislikes about Andover and Romsey. These interviews took place from 2nd – 13th
October 2017. The full ‘weighted’ survey results are set out in Appendices 10 and 11.
7.17 The in-centre surveys were commissioned specifically for Andover and Romsey, as these are the two main Town
Centres in the Council Area. A total of 298 interviews were carried out (197 in Andover and 101 in Romsey). These
interviews took place from 2nd – 18th October 2017. Respondents were asked a range of questions to better
understand the overall attraction and performance of the main centres; including questions on the purpose of their
visit, mode of travel, duration and frequency of visits, and likes and dislikes about the centre.
Environmental Quality
7.18 Environmental quality represents a key performance indicator (KPI) to help assess a centre's overall vitality and
viability. An assessment of environmental quality (including cleanliness and attractiveness, security, treatment of
buildings and open spaces) has been undertaken using our own research and observations of the centres, as well
as stakeholder consultation.
ANDOVER AND ROMSEY RETAIL CAPACITY & LEISURE STUDY - 2018 Page 88 of 190
Accessibility
7.19 A centre's vitality and viability can also be impacted by the ease of accessibility by different modes of travel, and
the level and quality of car parking. This assessment has been informed by the survey evidence, along with our
own research and observations of how easy a centre is to access; mobility time and cost; public transportation;
traffic management and signage; barriers; car parking; and access by other modes. Consultation with key
stakeholders has supplemented our research.
Out of Centre Provision
7.20 Out of centre provision has been determined using a number of sources. For example, Completely Retail34 is a
comprehensive retail database, has been referenced to identify the location, scale and operators trading outside
of the main centres. We have also referred to the results of the household survey and consultation with key
stakeholders.
New Investment & Potential Development
7.21 Carter Jonas has relied on the Councils to identify new investments and potential development opportunities within
the Council Area. This has also been supplemented by consultation with key stakeholders, as well as a review of
relevant planning history.
34 A data source which includes information on every shopping centre and retail park in the UK.
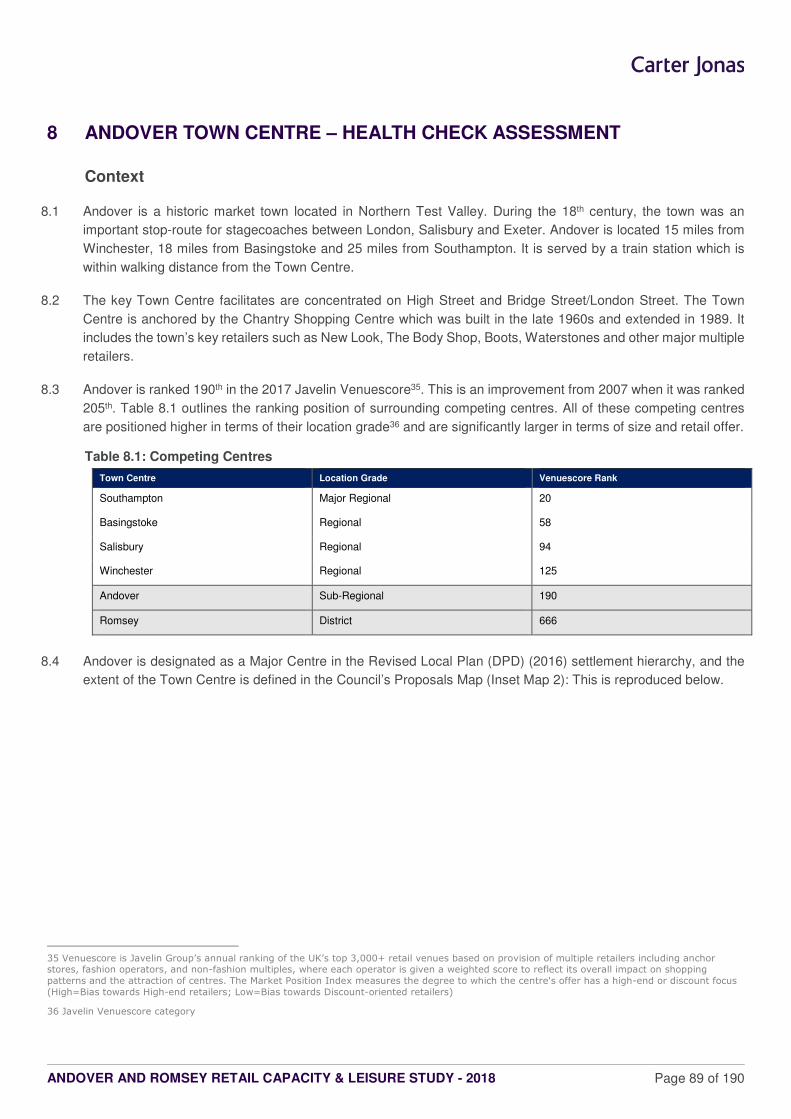
ANDOVER AND ROMSEY RETAIL CAPACITY & LEISURE STUDY - 2018 Page 89 of 190
8 ANDOVER TOWN CENTRE – HEALTH CHECK ASSESSMENT
Context
8.1 Andover is a historic market town located in Northern Test Valley. During the 18th century, the town was an
important stop-route for stagecoaches between London, Salisbury and Exeter. Andover is located 15 miles from
Winchester, 18 miles from Basingstoke and 25 miles from Southampton. It is served by a train station which is
within walking distance from the Town Centre.
8.2 The key Town Centre facilitates are concentrated on High Street and Bridge Street/London Street. The Town
Centre is anchored by the Chantry Shopping Centre which was built in the late 1960s and extended in 1989. It
includes the town’s key retailers such as New Look, The Body Shop, Boots, Waterstones and other major multiple
retailers.
8.3 Andover is ranked 190th in the 2017 Javelin Venuescore35. This is an improvement from 2007 when it was ranked
205th. Table 8.1 outlines the ranking position of surrounding competing centres. All of these competing centres
are positioned higher in terms of their location grade36 and are significantly larger in terms of size and retail offer.
Table 8.1: Competing Centres
Town Centre Location Grade Venuescore Rank
Southampton Major Regional 20
Basingstoke Regional 58
Salisbury Regional 94
Winchester Regional 125
Andover Sub-Regional 190
Romsey District 666
8.4 Andover is designated as a Major Centre in the Revised Local Plan (DPD) (2016) settlement hierarchy, and the
extent of the Town Centre is defined in the Council’s Proposals Map (Inset Map 2): This is reproduced below.
35 Venuescore is Javelin Group’s annual ranking of the UK’s top 3,000+ retail venues based on provision of multiple retailers including anchor stores, fashion operators, and non-fashion multiples, where each operator is given a weighted score to reflect its overall impact on shopping
patterns and the attraction of centres. The Market Position Index measures the degree to which the centre's offer has a high-end or discount focus
(High=Bias towards High-end retailers; Low=Bias towards Discount-oriented retailers)
36 Javelin Venuescore category
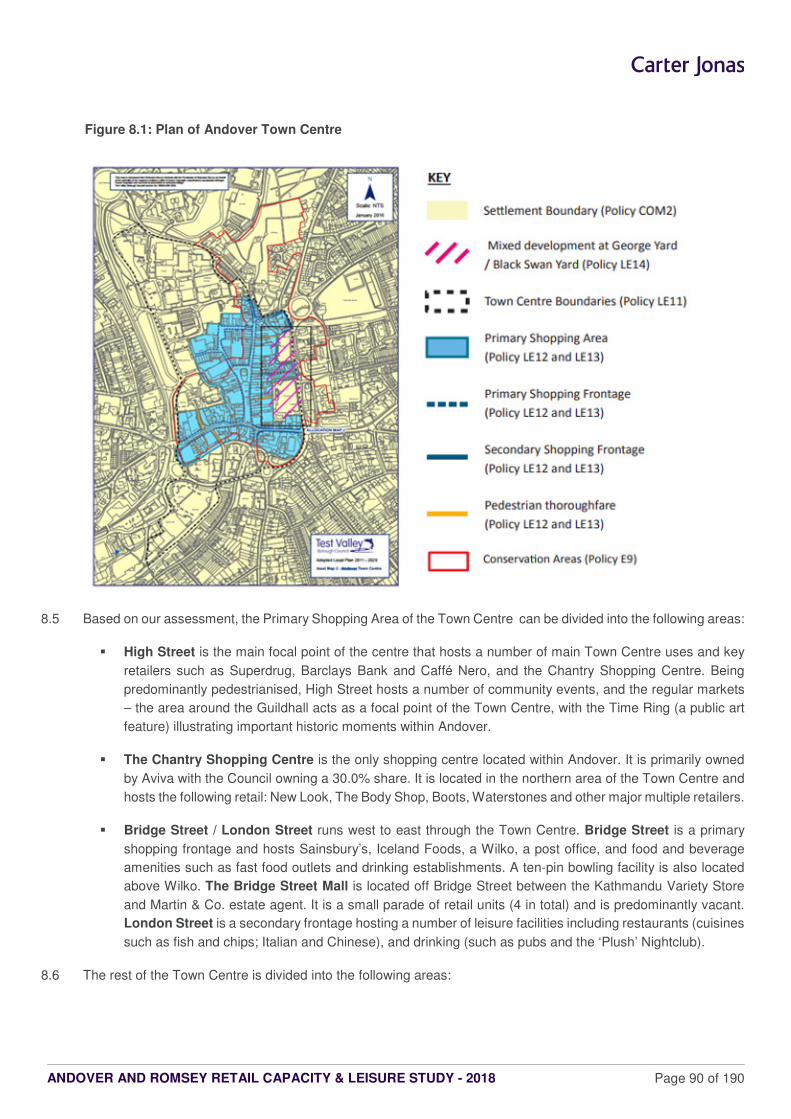
ANDOVER AND ROMSEY RETAIL CAPACITY & LEISURE STUDY - 2018 Page 90 of 190
Figure 8.1: Plan of Andover Town Centre
8.5 Based on our assessment, the Primary Shopping Area of the Town Centre can be divided into the following areas:
� High Street is the main focal point of the centre that hosts a number of main Town Centre uses and key
retailers such as Superdrug, Barclays Bank and Caffé Nero, and the Chantry Shopping Centre. Being
predominantly pedestrianised, High Street hosts a number of community events, and the regular markets
– the area around the Guildhall acts as a focal point of the Town Centre, with the Time Ring (a public art
feature) illustrating important historic moments within Andover.
� The Chantry Shopping Centre is the only shopping centre located within Andover. It is primarily owned
by Aviva with the Council owning a 30.0% share. It is located in the northern area of the Town Centre and
hosts the following retail: New Look, The Body Shop, Boots, Waterstones and other major multiple retailers.
� Bridge Street / London Street runs west to east through the Town Centre. Bridge Street is a primary
shopping frontage and hosts Sainsbury’s, Iceland Foods, a Wilko, a post office, and food and beverage
amenities such as fast food outlets and drinking establishments. A ten-pin bowling facility is also located
above Wilko. The Bridge Street Mall is located off Bridge Street between the Kathmandu Variety Store
and Martin & Co. estate agent. It is a small parade of retail units (4 in total) and is predominantly vacant.
London Street is a secondary frontage hosting a number of leisure facilities including restaurants (cuisines
such as fish and chips; Italian and Chinese), and drinking (such as pubs and the ‘Plush’ Nightclub).
8.6 The rest of the Town Centre is divided into the following areas:
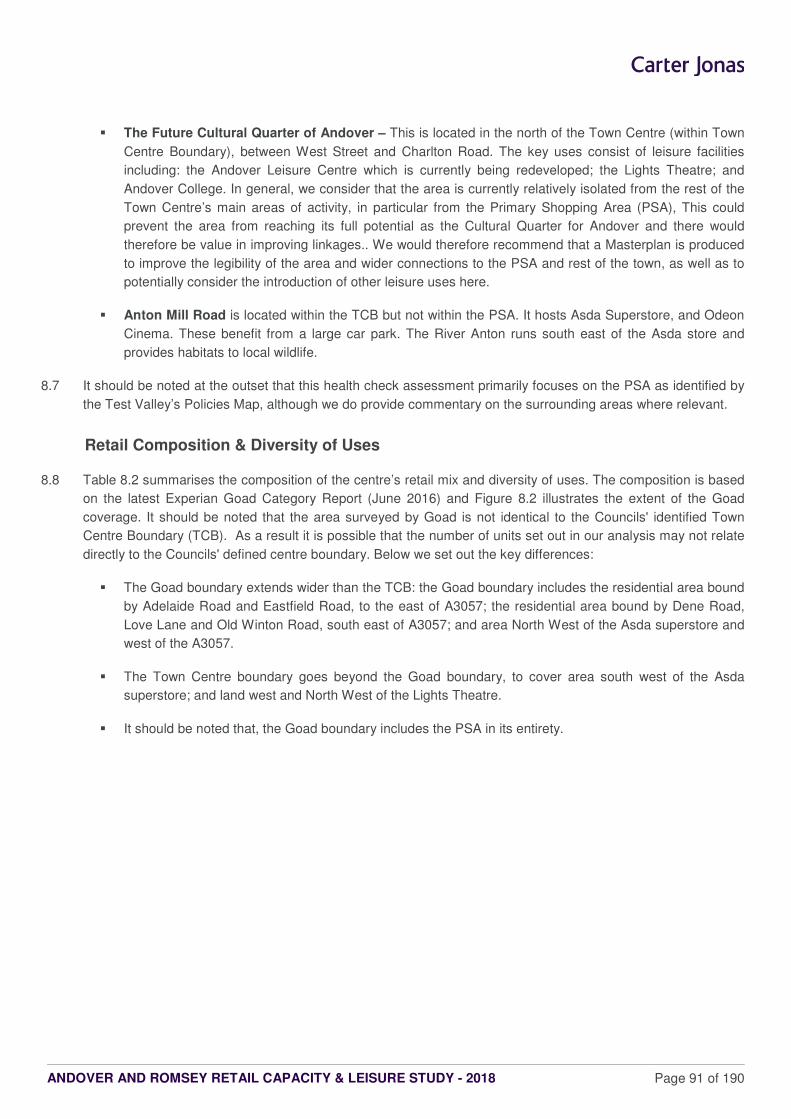
ANDOVER AND ROMSEY RETAIL CAPACITY & LEISURE STUDY - 2018 Page 91 of 190
� The Future Cultural Quarter of Andover – This is located in the north of the Town Centre (within Town
Centre Boundary), between West Street and Charlton Road. The key uses consist of leisure facilities
including: the Andover Leisure Centre which is currently being redeveloped; the Lights Theatre; and
Andover College. In general, we consider that the area is currently relatively isolated from the rest of the
Town Centre’s main areas of activity, in particular from the Primary Shopping Area (PSA), This could
prevent the area from reaching its full potential as the Cultural Quarter for Andover and there would
therefore be value in improving linkages.. We would therefore recommend that a Masterplan is produced
to improve the legibility of the area and wider connections to the PSA and rest of the town, as well as to
potentially consider the introduction of other leisure uses here.
� Anton Mill Road is located within the TCB but not within the PSA. It hosts Asda Superstore, and Odeon
Cinema. These benefit from a large car park. The River Anton runs south east of the Asda store and
provides habitats to local wildlife.
8.7 It should be noted at the outset that this health check assessment primarily focuses on the PSA as identified by
the Test Valley’s Policies Map, although we do provide commentary on the surrounding areas where relevant.
Retail Composition & Diversity of Uses
8.8 Table 8.2 summarises the composition of the centre’s retail mix and diversity of uses. The composition is based
on the latest Experian Goad Category Report (June 2016) and Figure 8.2 illustrates the extent of the Goad
coverage. It should be noted that the area surveyed by Goad is not identical to the Councils' identified Town
Centre Boundary (TCB). As a result it is possible that the number of units set out in our analysis may not relate
directly to the Councils' defined centre boundary. Below we set out the key differences:
� The Goad boundary extends wider than the TCB: the Goad boundary includes the residential area bound
by Adelaide Road and Eastfield Road, to the east of A3057; the residential area bound by Dene Road,
Love Lane and Old Winton Road, south east of A3057; and area North West of the Asda superstore and
west of the A3057.
� The Town Centre boundary goes beyond the Goad boundary, to cover area south west of the Asda
superstore; and land west and North West of the Lights Theatre.
� It should be noted that, the Goad boundary includes the PSA in its entirety.
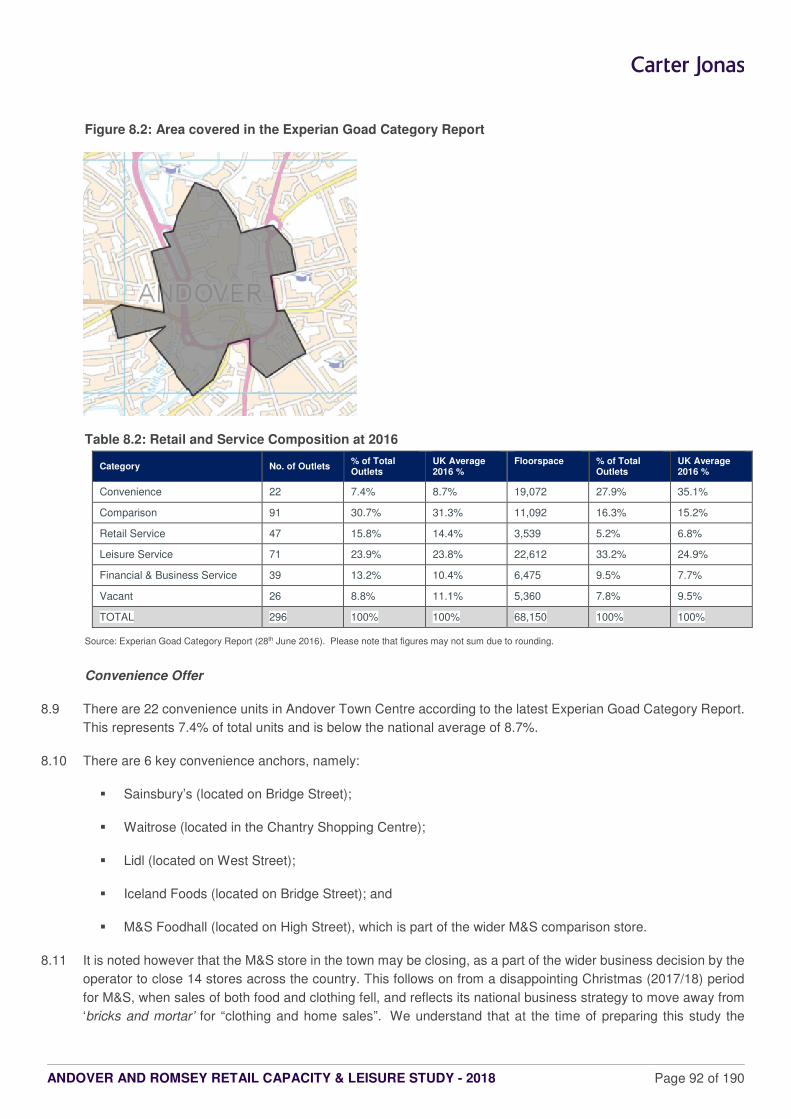
ANDOVER AND ROMSEY RETAIL CAPACITY & LEISURE STUDY - 2018 Page 92 of 190
Figure 8.2: Area covered in the Experian Goad Category Report
Table 8.2: Retail and Service Composition at 2016
Category No. of Outlets % of Total Outlets
UK Average 2016 %
Floorspace % of Total Outlets
UK Average 2016 %
Convenience 22 7.4% 8.7% 19,072 27.9% 35.1%
Comparison 91 30.7% 31.3% 11,092 16.3% 15.2%
Retail Service 47 15.8% 14.4% 3,539 5.2% 6.8%
Leisure Service 71 23.9% 23.8% 22,612 33.2% 24.9%
Financial & Business Service 39 13.2% 10.4% 6,475 9.5% 7.7%
Vacant 26 8.8% 11.1% 5,360 7.8% 9.5%
TOTAL 296 100% 100% 68,150 100% 100%
Source: Experian Goad Category Report (28th June 2016). Please note that figures may not sum due to rounding.
Convenience Offer
8.9 There are 22 convenience units in Andover Town Centre according to the latest Experian Goad Category Report.
This represents 7.4% of total units and is below the national average of 8.7%.
8.10 There are 6 key convenience anchors, namely:
� Sainsbury’s (located on Bridge Street);
� Waitrose (located in the Chantry Shopping Centre);
� Lidl (located on West Street);
� Iceland Foods (located on Bridge Street); and
� M&S Foodhall (located on High Street), which is part of the wider M&S comparison store.
8.11 It is noted however that the M&S store in the town may be closing, as a part of the wider business decision by the
operator to close 14 stores across the country. This follows on from a disappointing Christmas (2017/18) period
for M&S, when sales of both food and clothing fell, and reflects its national business strategy to move away from
‘bricks and mortar’ for “clothing and home sales”. We understand that at the time of preparing this study the
ANDOVER AND ROMSEY RETAIL CAPACITY & LEISURE STUDY - 2018 Page 93 of 190
operator was in discussion with the Council. Also we understand that M&S has stated that the Andover store was
underperforming in terms of its fashion offer, although the food section was doing well. M&S are keen, we
understand, to have a Simply Food presence in Andover, but have indicated to the Council that their current
premises are not fit for that purpose. It has been agreed that they will work in partnership with the Council in their
search for the right replacement store in the right location.
8.12 There is a large Asda Superstore located outside, but within 300m of the PSA on Anton Mill Road, which is
relatively well connected to the rest of the PSA (this store is walkable from the Town Centre, despite the cut off
from the A3057). The results of the in-centre survey show that it is one of the most popular food stores in the
town centre. However, the results of the household survey indicate that 75% of those visiting Asda for their main
food shop do not combine their trip with a visit to the rest of the centre. As such, it would appear that there is not
such a strong functional ‘linked trip’ relationship between the PSA and the Asda. This Asda Superstore retains a
market share of 9.0%.
8.13 As reported in Section 4, the household survey shows that Andover Town Centre is achieving a 21.9% market
share in its PCA (Zones 4-5). Waitrose and M&S are the main attractors and are achieving market shares of
12.8% and 5.4% respectively. The household survey results also show that Andover’s out-of-centre stores are
achieving a much higher retention rate of 66.5% within the PCA. The most popular out-of-centre stores are:
� Tesco Extra, River Way (retaining 28.8% across the Primary Catchment Area);
� Aldi, Weyhill Road (10.2%); and
� Sainsbury's Superstore, Shepherds Spring Lane (9.1%).
8.14 In terms of the in-centre results, a larger proportion of respondents stated that they visit Andover Town Centre for
a food and grocery shop (50.1%). This level of patronage is unsurprising given that Andover has a good
representation of convenience goods within the Town Centre.
8.15 According to the Experian Goad Category Report, there are also four bakers and confectioners (Travelling
Cupcake, on Bridge Street and a Greggs located on High Street).
8.16 Overall, we consider that Andover has a good foodstore and convenience provision. There is a wide offer that
ranges from budget food store retailers such as Lidl, to high end convenience retailers such as Waitrose and M&S.
Table 8.5 highlights there is interest for a FarmFoods to enter Andover. This would further help to build upon the
strong convenience offer already present in the town.
Comparison Offer
8.17 According to the Goad Category Report, Andover has 91 comparison outlets. This represents 30.7% of the town
centres total outlets, which is below the national average of 31.3%. The current floorspace provision represents
27.9% of total floorspace in the centre, which is also below the national average of 35.1%.
8.18 There is a reasonable representation across the majority of the comparison (Goad) categories, when compared
to the national average, given the town’s role and function in the retail hierarchy, and its status as a Market Town.
8.19 In terms of its overall non-food provision the key headlines are:
� There is a relatively high number of charity shops (including brands such as Age UK, British Heart
Foundation and Cancer Research UK), with 12 outlets in Andover. This represents 4.0% of the total
ANDOVER AND ROMSEY RETAIL CAPACITY & LEISURE STUDY - 2018 Page 94 of 190
comparison units, which is significantly above the national average of 2.7%. If more charity shops were to
enter Andover, it could result in an over concentration of uses and detract from the retail offer and diversity.
� There are a number of prominent fashion retailers: including Clarks; New Look; Dorothy Perkins; The
Body Shop and Topshop/Topman. It should however be noted that whilst the number of units in the ladies
wear and accessories category is at 2.7% which is broadly consistent with the national average of 2.1%,
there is a shortage of units in ladies/menswear and accessories37 (0.3%) compared to the national average
(1.6%). The centre could therefore potentially benefit from improvements to its fashion offer: either by
attracting typical high-street fashion retails, and/or by seeking to establish a niche/ boutique high-end
independent offer. It should be noted the engagement with stakeholders and respondents from in-centre
survey (33.3%) stated that the introduction of Primark would encourage them to visit the centre. However,
it should be noted that the feedback from CJ’s commercial agents and local agents (Goadsby) indicates
that there are no outstanding requirements from Primark for representation in Andover.
8.20 The household survey results show that Andover Town Centre is achieving a comparison market share of 12.0%
within the Borough Area. The Town Centre’s retention rate is higher in the PCA (Zones 4-5) at 21.6%. A further
18.1% of expenditure in the PCA s going to out-of-centre stores (mainly comprising Churchill Retail Park and
Enham Arch Retail Park); 36.3% to SFT/online shopping; and 23.9% to key competitor locations, principally
Basingstoke, Salisbury, Southampton, and Winchester.
8.21 In terms of the in-centre survey results, the top three major retailers visited in Andover Town Centre by
respondents are Wilko (25.8%), Boots (16.1%) and Poundland (12.9%). This suggests there is currently a higher
demand for budget/value end retailers.
8.22 In summary, we consider that Andover has an adequate comparison offer. Whilst the evidence shows there is a
high representation of national multiples, in qualitative terms there would appear to be potential scope to attract
new high street fashion brands which sell both women’s and men’s clothing. This was also highlighted by the
feedback from the stakeholder consultation. There is also an opportunity to enhance the quality of the independent
offer. However this is all dependent on market demand from operators for representation in the Town Centre.
Service Offer
8.23 Service businesses are defined by Experian Goad include retail, professional and financial services. These are
discussed below:
� There are 47 retail service units. This represents 15.9% of total outlets and is slightly above the national
average (14.4%). The types of retail services largely consist of health and beauty retailers (32 outlets -
mainly independent hair salons), opticians (5 outlets including a Specsavers; Vision Express and Boots
Opticians) and travel agents (4 outlets including a Thomas Cook and a TUI Holiday Store). Furthermore,
there is a post office located Bridge Street, opposite the Sainsbury’s and Iceland Foods, and a dry cleaners.
� With regards to leisure services, there are 71 units. Current provision of 23.9% is in line with the national
average (23.8%). The types of leisure services predominately consist of fast food and take away outlets
(19 outlets including multiples such as McDonald’s, Domino’s and KFC), restaurants (12 outlets serving a
range of cuisines such as Thai, Asian, Italian and English) and cafés (13 outlets which mainly consists of
independent operators as well as multiples such as Caffe Nero and Costa Coffee). There are two nightclubs
located on London Street (Cameo and Vinyl and Plush). There is also a ten-pin bowling located above the
Wilko store. Other key facilities which are located outside the PSA include The Lights Theatre on West
37 i.e. shops which sell both women’s and men’s clothing i.e. Topshop/Topman, Primark, Hollister, Jack Wills etc
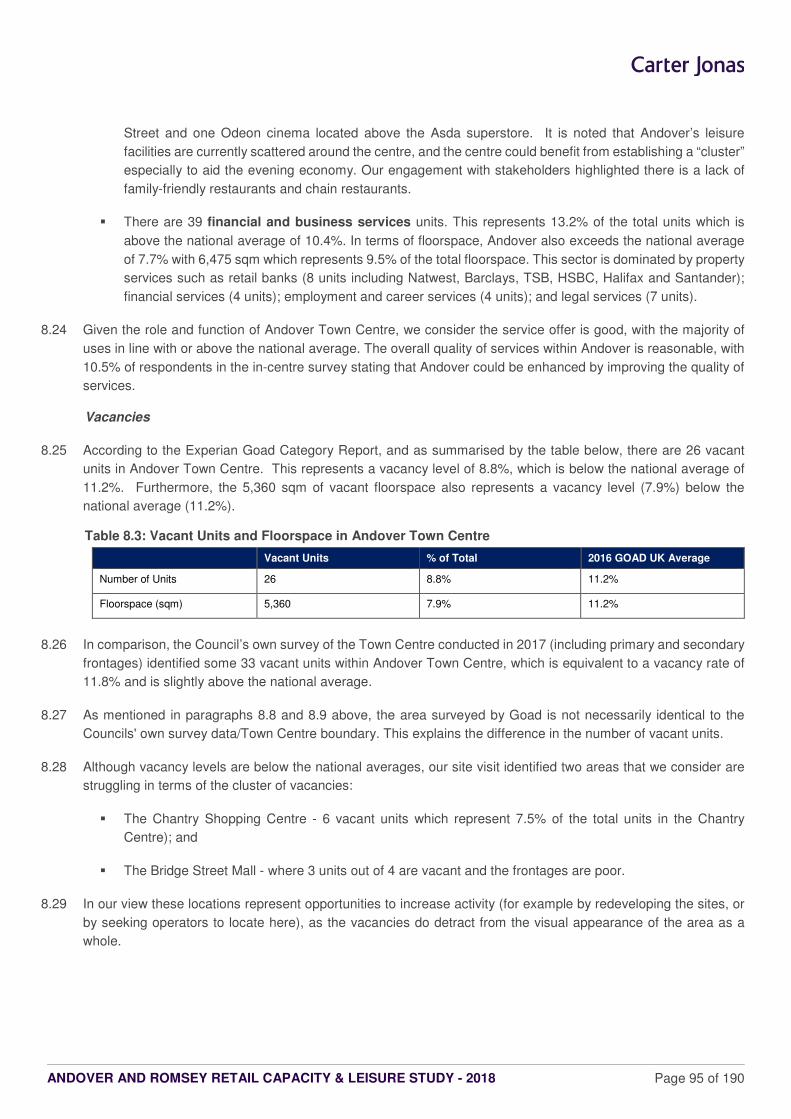
ANDOVER AND ROMSEY RETAIL CAPACITY & LEISURE STUDY - 2018 Page 95 of 190
Street and one Odeon cinema located above the Asda superstore. It is noted that Andover’s leisure
facilities are currently scattered around the centre, and the centre could benefit from establishing a “cluster”
especially to aid the evening economy. Our engagement with stakeholders highlighted there is a lack of
family-friendly restaurants and chain restaurants.
� There are 39 financial and business services units. This represents 13.2% of the total units which is
above the national average of 10.4%. In terms of floorspace, Andover also exceeds the national average
of 7.7% with 6,475 sqm which represents 9.5% of the total floorspace. This sector is dominated by property
services such as retail banks (8 units including Natwest, Barclays, TSB, HSBC, Halifax and Santander);
financial services (4 units); employment and career services (4 units); and legal services (7 units).
8.24 Given the role and function of Andover Town Centre, we consider the service offer is good, with the majority of
uses in line with or above the national average. The overall quality of services within Andover is reasonable, with
10.5% of respondents in the in-centre survey stating that Andover could be enhanced by improving the quality of
services.
Vacancies
8.25 According to the Experian Goad Category Report, and as summarised by the table below, there are 26 vacant
units in Andover Town Centre. This represents a vacancy level of 8.8%, which is below the national average of
11.2%. Furthermore, the 5,360 sqm of vacant floorspace also represents a vacancy level (7.9%) below the
national average (11.2%).
Table 8.3: Vacant Units and Floorspace in Andover Town Centre
Vacant Units % of Total 2016 GOAD UK Average
Number of Units 26 8.8% 11.2%
Floorspace (sqm) 5,360 7.9% 11.2%
8.26 In comparison, the Council’s own survey of the Town Centre conducted in 2017 (including primary and secondary
frontages) identified some 33 vacant units within Andover Town Centre, which is equivalent to a vacancy rate of
11.8% and is slightly above the national average.
8.27 As mentioned in paragraphs 8.8 and 8.9 above, the area surveyed by Goad is not necessarily identical to the
Councils' own survey data/Town Centre boundary. This explains the difference in the number of vacant units.
8.28 Although vacancy levels are below the national averages, our site visit identified two areas that we consider are
struggling in terms of the cluster of vacancies:
� The Chantry Shopping Centre - 6 vacant units which represent 7.5% of the total units in the Chantry
Centre); and
� The Bridge Street Mall - where 3 units out of 4 are vacant and the frontages are poor.
8.29 In our view these locations represent opportunities to increase activity (for example by redeveloping the sites, or
by seeking operators to locate here), as the vacancies do detract from the visual appearance of the area as a
whole.
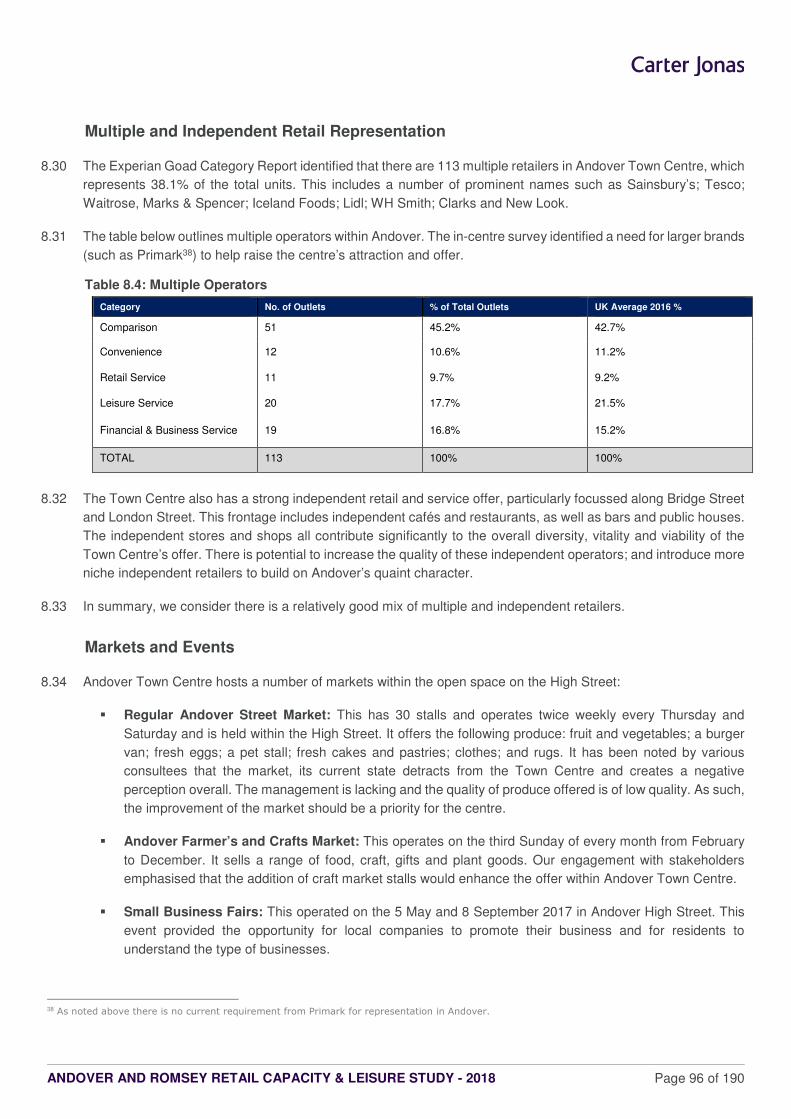
ANDOVER AND ROMSEY RETAIL CAPACITY & LEISURE STUDY - 2018 Page 96 of 190
Multiple and Independent Retail Representation
8.30 The Experian Goad Category Report identified that there are 113 multiple retailers in Andover Town Centre, which
represents 38.1% of the total units. This includes a number of prominent names such as Sainsbury’s; Tesco;
Waitrose, Marks & Spencer; Iceland Foods; Lidl; WH Smith; Clarks and New Look.
8.31 The table below outlines multiple operators within Andover. The in-centre survey identified a need for larger brands
(such as Primark38) to help raise the centre’s attraction and offer.
Table 8.4: Multiple Operators
Category No. of Outlets % of Total Outlets UK Average 2016 %
Comparison 51 45.2% 42.7%
Convenience 12 10.6% 11.2%
Retail Service 11 9.7% 9.2%
Leisure Service 20 17.7% 21.5%
Financial & Business Service 19 16.8% 15.2%
TOTAL 113 100% 100%
8.32 The Town Centre also has a strong independent retail and service offer, particularly focussed along Bridge Street
and London Street. This frontage includes independent cafés and restaurants, as well as bars and public houses.
The independent stores and shops all contribute significantly to the overall diversity, vitality and viability of the
Town Centre’s offer. There is potential to increase the quality of these independent operators; and introduce more
niche independent retailers to build on Andover’s quaint character.
8.33 In summary, we consider there is a relatively good mix of multiple and independent retailers.
Markets and Events
8.34 Andover Town Centre hosts a number of markets within the open space on the High Street:
� Regular Andover Street Market: This has 30 stalls and operates twice weekly every Thursday and
Saturday and is held within the High Street. It offers the following produce: fruit and vegetables; a burger
van; fresh eggs; a pet stall; fresh cakes and pastries; clothes; and rugs. It has been noted by various
consultees that the market, its current state detracts from the Town Centre and creates a negative
perception overall. The management is lacking and the quality of produce offered is of low quality. As such,
the improvement of the market should be a priority for the centre.
� Andover Farmer’s and Crafts Market: This operates on the third Sunday of every month from February
to December. It sells a range of food, craft, gifts and plant goods. Our engagement with stakeholders
emphasised that the addition of craft market stalls would enhance the offer within Andover Town Centre.
� Small Business Fairs: This operated on the 5 May and 8 September 2017 in Andover High Street. This
event provided the opportunity for local companies to promote their business and for residents to
understand the type of businesses.
38 As noted above there is no current requirement from Primark for representation in Andover.
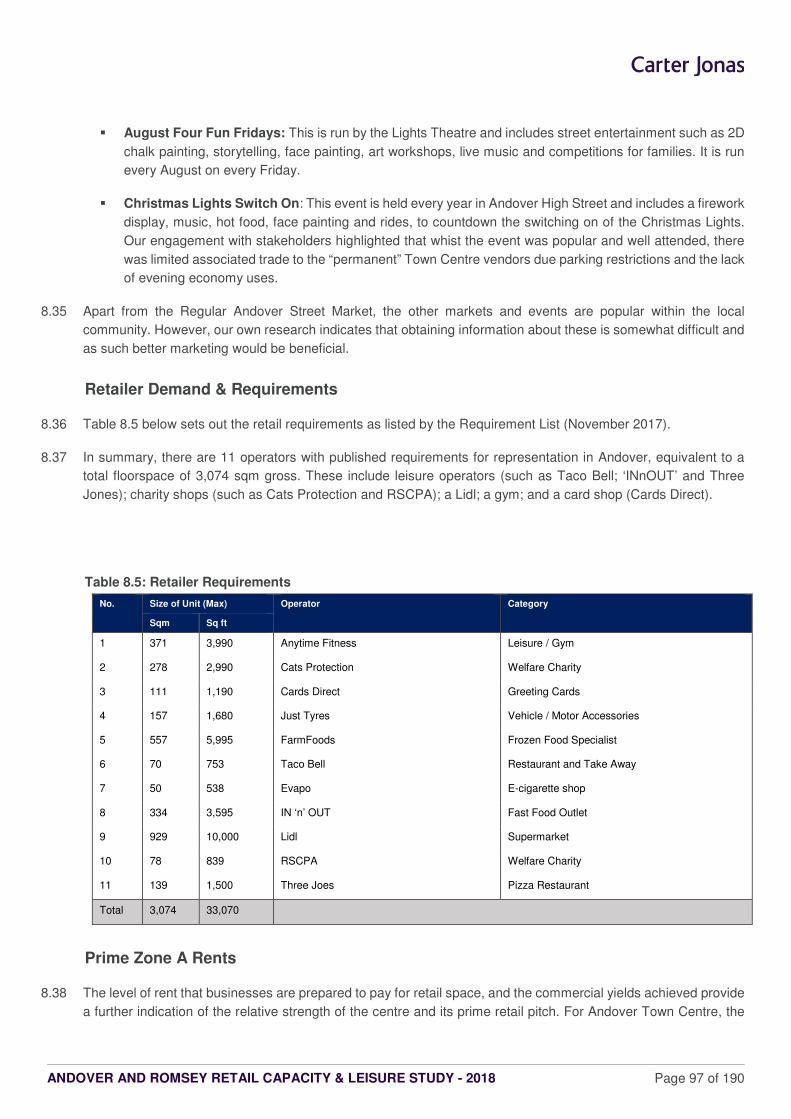
ANDOVER AND ROMSEY RETAIL CAPACITY & LEISURE STUDY - 2018 Page 97 of 190
� August Four Fun Fridays: This is run by the Lights Theatre and includes street entertainment such as 2D
chalk painting, storytelling, face painting, art workshops, live music and competitions for families. It is run
every August on every Friday.
� Christmas Lights Switch On: This event is held every year in Andover High Street and includes a firework
display, music, hot food, face painting and rides, to countdown the switching on of the Christmas Lights.
Our engagement with stakeholders highlighted that whist the event was popular and well attended, there
was limited associated trade to the “permanent” Town Centre vendors due parking restrictions and the lack
of evening economy uses.
8.35 Apart from the Regular Andover Street Market, the other markets and events are popular within the local
community. However, our own research indicates that obtaining information about these is somewhat difficult and
as such better marketing would be beneficial.
Retailer Demand & Requirements
8.36 Table 8.5 below sets out the retail requirements as listed by the Requirement List (November 2017).
8.37 In summary, there are 11 operators with published requirements for representation in Andover, equivalent to a
total floorspace of 3,074 sqm gross. These include leisure operators (such as Taco Bell; ‘INnOUT’ and Three
Jones); charity shops (such as Cats Protection and RSCPA); a Lidl; a gym; and a card shop (Cards Direct).
Table 8.5: Retailer Requirements
No. Size of Unit (Max) Operator Category
Sqm Sq ft
1 371 3,990 Anytime Fitness Leisure / Gym
2 278 2,990 Cats Protection Welfare Charity
3 111 1,190 Cards Direct Greeting Cards
4 157 1,680 Just Tyres Vehicle / Motor Accessories
5 557 5,995 FarmFoods Frozen Food Specialist
6 70 753 Taco Bell Restaurant and Take Away
7 50 538 Evapo E-cigarette shop
8 334 3,595 IN ‘n’ OUT Fast Food Outlet
9 929 10,000 Lidl Supermarket
10 78 839 RSCPA Welfare Charity
11 139 1,500 Three Joes Pizza Restaurant
Total 3,074 33,070
Prime Zone A Rents
8.38 The level of rent that businesses are prepared to pay for retail space, and the commercial yields achieved provide
a further indication of the relative strength of the centre and its prime retail pitch. For Andover Town Centre, the
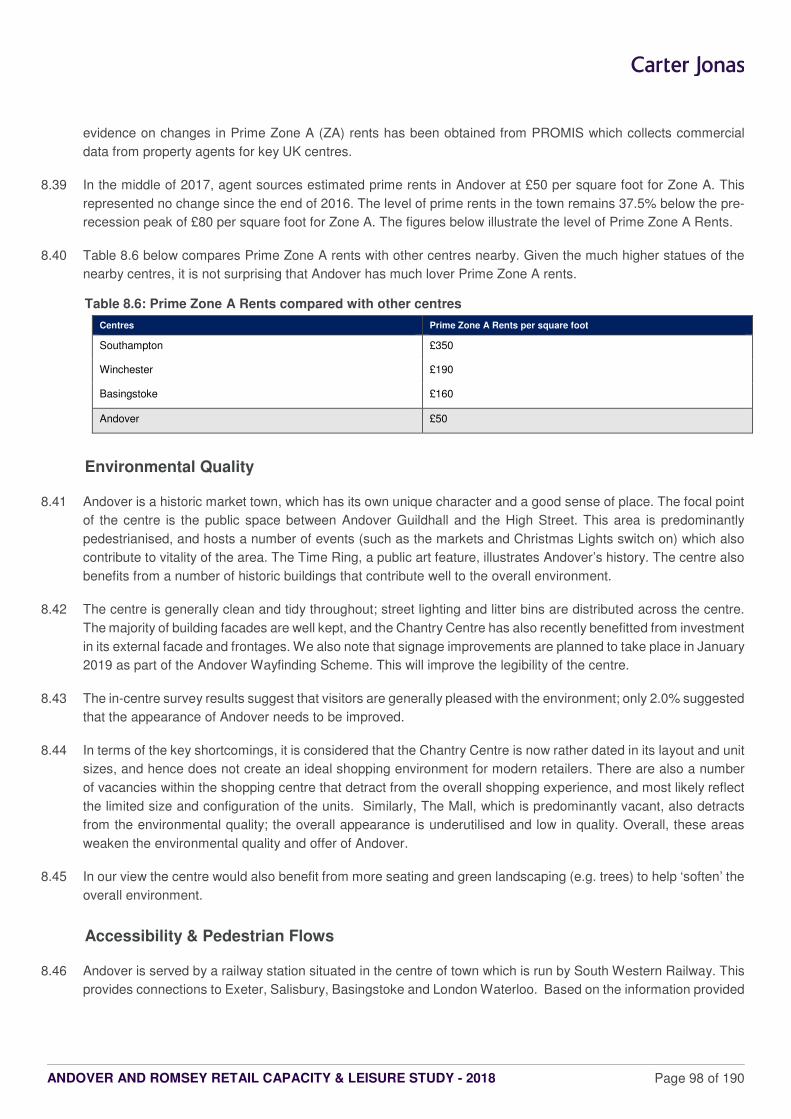
ANDOVER AND ROMSEY RETAIL CAPACITY & LEISURE STUDY - 2018 Page 98 of 190
evidence on changes in Prime Zone A (ZA) rents has been obtained from PROMIS which collects commercial
data from property agents for key UK centres.
8.39 In the middle of 2017, agent sources estimated prime rents in Andover at £50 per square foot for Zone A. This
represented no change since the end of 2016. The level of prime rents in the town remains 37.5% below the pre-
recession peak of £80 per square foot for Zone A. The figures below illustrate the level of Prime Zone A Rents.
8.40 Table 8.6 below compares Prime Zone A rents with other centres nearby. Given the much higher statues of the
nearby centres, it is not surprising that Andover has much lover Prime Zone A rents.
Table 8.6: Prime Zone A Rents compared with other centres
Centres Prime Zone A Rents per square foot
Southampton £350
Winchester £190
Basingstoke £160
Andover £50
Environmental Quality
8.41 Andover is a historic market town, which has its own unique character and a good sense of place. The focal point
of the centre is the public space between Andover Guildhall and the High Street. This area is predominantly
pedestrianised, and hosts a number of events (such as the markets and Christmas Lights switch on) which also
contribute to vitality of the area. The Time Ring, a public art feature, illustrates Andover’s history. The centre also
benefits from a number of historic buildings that contribute well to the overall environment.
8.42 The centre is generally clean and tidy throughout; street lighting and litter bins are distributed across the centre.
The majority of building facades are well kept, and the Chantry Centre has also recently benefitted from investment
in its external facade and frontages. We also note that signage improvements are planned to take place in January
2019 as part of the Andover Wayfinding Scheme. This will improve the legibility of the centre.
8.43 The in-centre survey results suggest that visitors are generally pleased with the environment; only 2.0% suggested
that the appearance of Andover needs to be improved.
8.44 In terms of the key shortcomings, it is considered that the Chantry Centre is now rather dated in its layout and unit
sizes, and hence does not create an ideal shopping environment for modern retailers. There are also a number
of vacancies within the shopping centre that detract from the overall shopping experience, and most likely reflect
the limited size and configuration of the units. Similarly, The Mall, which is predominantly vacant, also detracts
from the environmental quality; the overall appearance is underutilised and low in quality. Overall, these areas
weaken the environmental quality and offer of Andover.
8.45 In our view the centre would also benefit from more seating and green landscaping (e.g. trees) to help ‘soften’ the
overall environment.
Accessibility & Pedestrian Flows
8.46 Andover is served by a railway station situated in the centre of town which is run by South Western Railway. This
provides connections to Exeter, Salisbury, Basingstoke and London Waterloo. Based on the information provided
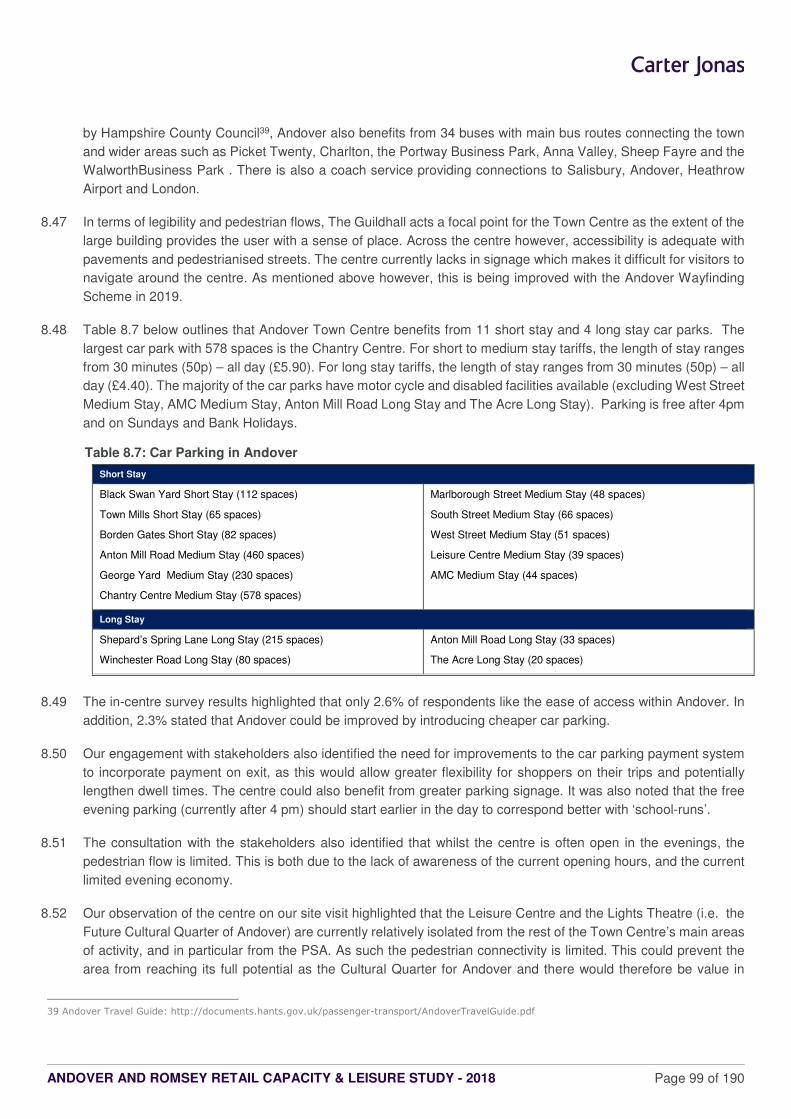
ANDOVER AND ROMSEY RETAIL CAPACITY & LEISURE STUDY - 2018 Page 99 of 190
by Hampshire County Council39, Andover also benefits from 34 buses with main bus routes connecting the town
and wider areas such as Picket Twenty, Charlton, the Portway Business Park, Anna Valley, Sheep Fayre and the
WalworthBusiness Park . There is also a coach service providing connections to Salisbury, Andover, Heathrow
Airport and London.
8.47 In terms of legibility and pedestrian flows, The Guildhall acts a focal point for the Town Centre as the extent of the
large building provides the user with a sense of place. Across the centre however, accessibility is adequate with
pavements and pedestrianised streets. The centre currently lacks in signage which makes it difficult for visitors to
navigate around the centre. As mentioned above however, this is being improved with the Andover Wayfinding
Scheme in 2019.
8.48 Table 8.7 below outlines that Andover Town Centre benefits from 11 short stay and 4 long stay car parks. The
largest car park with 578 spaces is the Chantry Centre. For short to medium stay tariffs, the length of stay ranges
from 30 minutes (50p) – all day (£5.90). For long stay tariffs, the length of stay ranges from 30 minutes (50p) – all
day (£4.40). The majority of the car parks have motor cycle and disabled facilities available (excluding West Street
Medium Stay, AMC Medium Stay, Anton Mill Road Long Stay and The Acre Long Stay). Parking is free after 4pm
and on Sundays and Bank Holidays.
Table 8.7: Car Parking in Andover
Short Stay
Black Swan Yard Short Stay (112 spaces)
Town Mills Short Stay (65 spaces)
Borden Gates Short Stay (82 spaces)
Anton Mill Road Medium Stay (460 spaces)
George Yard Medium Stay (230 spaces)
Chantry Centre Medium Stay (578 spaces)
Marlborough Street Medium Stay (48 spaces)
South Street Medium Stay (66 spaces)
West Street Medium Stay (51 spaces)
Leisure Centre Medium Stay (39 spaces)
AMC Medium Stay (44 spaces)
Long Stay
Shepard’s Spring Lane Long Stay (215 spaces)
Winchester Road Long Stay (80 spaces)
Anton Mill Road Long Stay (33 spaces)
The Acre Long Stay (20 spaces)
8.49 The in-centre survey results highlighted that only 2.6% of respondents like the ease of access within Andover. In
addition, 2.3% stated that Andover could be improved by introducing cheaper car parking.
8.50 Our engagement with stakeholders also identified the need for improvements to the car parking payment system
to incorporate payment on exit, as this would allow greater flexibility for shoppers on their trips and potentially
lengthen dwell times. The centre could also benefit from greater parking signage. It was also noted that the free
evening parking (currently after 4 pm) should start earlier in the day to correspond better with ‘school-runs’.
8.51 The consultation with the stakeholders also identified that whilst the centre is often open in the evenings, the
pedestrian flow is limited. This is both due to the lack of awareness of the current opening hours, and the current
limited evening economy.
8.52 Our observation of the centre on our site visit highlighted that the Leisure Centre and the Lights Theatre (i.e. the
Future Cultural Quarter of Andover) are currently relatively isolated from the rest of the Town Centre’s main areas
of activity, and in particular from the PSA. As such the pedestrian connectivity is limited. This could prevent the
area from reaching its full potential as the Cultural Quarter for Andover and there would therefore be value in
39 Andover Travel Guide: http://documents.hants.gov.uk/passenger-transport/AndoverTravelGuide.pdf
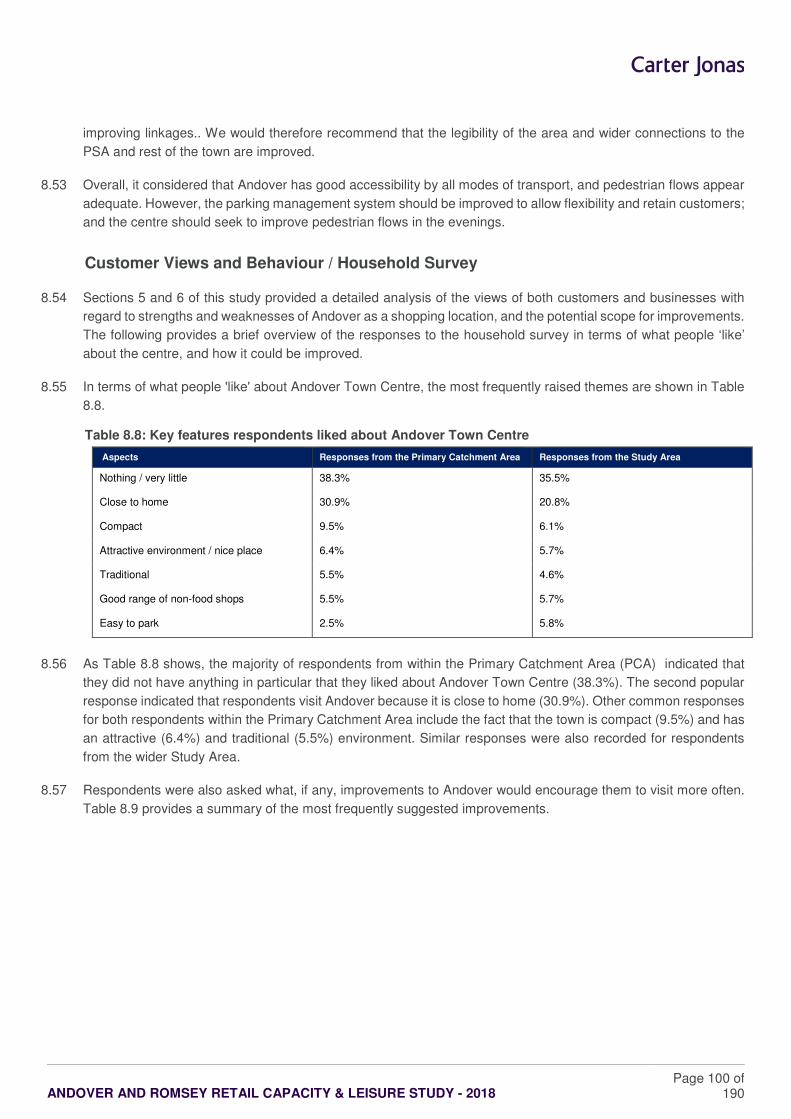
ANDOVER AND ROMSEY RETAIL CAPACITY & LEISURE STUDY - 2018
Page 100 of 190
improving linkages.. We would therefore recommend that the legibility of the area and wider connections to the
PSA and rest of the town are improved.
8.53 Overall, it considered that Andover has good accessibility by all modes of transport, and pedestrian flows appear
adequate. However, the parking management system should be improved to allow flexibility and retain customers;
and the centre should seek to improve pedestrian flows in the evenings.
Customer Views and Behaviour / Household Survey
8.54 Sections 5 and 6 of this study provided a detailed analysis of the views of both customers and businesses with
regard to strengths and weaknesses of Andover as a shopping location, and the potential scope for improvements.
The following provides a brief overview of the responses to the household survey in terms of what people ‘like’
about the centre, and how it could be improved.
8.55 In terms of what people 'like' about Andover Town Centre, the most frequently raised themes are shown in Table
8.8.
Table 8.8: Key features respondents liked about Andover Town Centre
Aspects Responses from the Primary Catchment Area Responses from the Study Area
Nothing / very little 38.3% 35.5%
Close to home 30.9% 20.8%
Compact 9.5% 6.1%
Attractive environment / nice place 6.4% 5.7%
Traditional 5.5% 4.6%
Good range of non-food shops 5.5% 5.7%
Easy to park 2.5% 5.8%
8.56 As Table 8.8 shows, the majority of respondents from within the Primary Catchment Area (PCA) indicated that
they did not have anything in particular that they liked about Andover Town Centre (38.3%). The second popular
response indicated that respondents visit Andover because it is close to home (30.9%). Other common responses
for both respondents within the Primary Catchment Area include the fact that the town is compact (9.5%) and has
an attractive (6.4%) and traditional (5.5%) environment. Similar responses were also recorded for respondents
from the wider Study Area.
8.57 Respondents were also asked what, if any, improvements to Andover would encourage them to visit more often.
Table 8.9 provides a summary of the most frequently suggested improvements.

ANDOVER AND ROMSEY RETAIL CAPACITY & LEISURE STUDY - 2018
Page 101 of 190
Table 8.9: Key improvements for Andover Town Centre
Aspects Responses from the Primary Catchment Area Responses from the Study Area
More National Multiple Shops / High Street shops 36.2% 9.9%
More independent shops 25.5% 6.7%
Nothing 23.8% 57.9%
More / better comparison retailers (i.e. non-food) 12.8% 3.0%
More / better value or affordable shops 9.8% 1.4%
Needs a refurb 5.0% 0.9%
A department store 3.9% 0.6%
Don’t know 1.6% 20.4%
8.58 As Table 8.9 shows, the majority of respondents across the Study Area stated that more national multiple shops
or high street shops would improve the town (36.2%). Similarly, respondents also noted a need for more
independent shops (25.5%), non-food comparison retailers (12.8%), and affordable, value-led retailers (9.8%).
The majority of respondents from the wider Study Area stated that ‘nothing’ (57.9%) would improve the centre, or
they could not think of any improvements (20.4%).
Out of Centre Provision
8.59 There are a number of out-of-centre shopping locations in Andover, namely:
� Churchill Retail Park, Northern Business Park and Enham Arch Retail Park: These are located north
east of the TCB, adjacent to the Enham Arch roundabout. Tenants are primarily within the bulky goods
retailers or large format retailers categories (such as: Halfords; Currys PC World; Carpet Right; Bensons
for Beds; Homebase; Wickes and The Range); supermarkets (Sainsbury’s and Tesco Extra) associated
restaurants (such as McDonald’s and KFC). Other retailers include: TK Maxx; Next; Pets at Home; and
Brantano.
� Other out-of-centre provision includes: the Andover Trade Park on Joule Road (including retailers such
as: Toolstation; McDonald’s; IN’nOUT’; and YESSS Electrical); and the Commercial Centre at Picket
Piece which has commercial and industrial units as well as office space. Furthermore, there are also stand-
alone out-of-centre food stores including the Co-operative Food (located on London Road and Charlton
Road); Tesco Express (located on Cricketers Way and Weyhill Road); an Aldi located on (Weyhill Road);
a SPAR (located on Charlton Road).
8.60 As highlighted in Section 4, Andover Town Centre faces significant competition from the out-of-centre offer, which
currently draws 18.1% of the comparison expenditure in the PCA.
New Investment & Potential Development
8.61 The main new investments and potential development/allocations in Andover which we were made aware of by
the local planning authority at the time of preparing this study included the following:
In-Centre Proposals
a. George Yard / Black Swan Yard – This is a Council owned site and is allocated under Policy
LE14 for comparison retail together with office, housing (100 units), leisure and car parking to the
ANDOVER AND ROMSEY RETAIL CAPACITY & LEISURE STUDY - 2018
Page 102 of 190
east of the Town Centre. This site currently consists of two public car parks, with shops and offices
located on Union Street which provides pedestrian links to the high street. There are no relevant
planning permissions/applications in place.
b. Andover Wayfinding Scheme (2019) – This scheme seeks to improve the signage in Andover
Town Centre in January 2019, which forms part of the wider aim of the Hampshire Wayfinding
approach.
Strategic Housing Allocations
c. As discussed on Section 2, Policy COM1 in the Local Plan seeks the provision of 6,444 new homes
in Andover by 2026. The following key sites are to play a major role in meeting this aspiration:
Land at Picket Piece (allocated under Policy COM6), Land at Picket Twenty (allocated under
Policy COM6A) and East Anton.
Other Potential Opportunities in the Town Centre:
a. The Bridge Street Mall and the Borden Gates Car Park – Some three out of four units in the
Mall are currently vacant. This significantly detracts from the physical environment of Andover.
Borden Gates car park is located adjacent to The Mall, and is Council owned. With a good
geographical relation to the PSA, these two sites could together create an opportunity for
redevelopment / regeneration.
b. The Chantry Shopping Centre – As mentioned previously, this shopping centre has a relatively
large number of vacant units. The addition of retail and leisure uses into vacant units would
significantly enhance the shopping centre as a whole.
c. Cultural Quarter – As mentioned previously, this area is envisioned to become the Cultural
Quarter of Andover to include: The Lights Theatre, Andover Leisure Centre, which is currently
under redevelopment (Ref: 16/03191/FULLN), Andover College, Former Magistrates Court and the
River Anton. We would recommend that a Masterplan is drawn up to guide the development of this
area, covering the appropriate uses, the legibility of the area and the need to improve the wider
connections to the PSA.
Summary
8.62 In summary, the health check assessment has demonstrated that although Andover is a relatively healthy centre,
it is clearly vulnerable to further impacts from the continued growth of online shopping and competition from out-
of-centre stores and centres located both within and outside the Borough area. The recent announcement that
Marks & Spencer is to close its store in the town centre is a major concern and will inevitably impact on the centre’s
overall vitality and viability and turnover performance; including the additional loss off footfall and linked trip
expenditure to other shops and businesses in the town.
8.63 The key strengths and weaknesses of the centre are summarised below:
� It has a strong convenience provision. There is a wide offer including Lidl, Asda, Waitrose and M&S; and
a number of smaller independent retailers including bakers and confectioners; grocers and delicatessens;
and health foods (including a Holland and Barrett). The convenience offer is also supplemented by the
markets.
ANDOVER AND ROMSEY RETAIL CAPACITY & LEISURE STUDY - 2018
Page 103 of 190
� The comparison provision is adequate. Whilst the evidence shows there is a relatively good representation
of national multiples, in qualitative terms there would appear to be more potential for more high street
fashion brands that sell both women’s and men’s clothing. However this will be subject to market demand
from potential retailers for representation in the town, and the availability and suitability of premises and/or
sites to meet any demand. We consider that there is also an opportunity to enhance the quality of the
independent offer.
� The Town’s services provision is relatively good, with the majority of uses in line with or above the national
average. The current leisure offer is being improved with the redevelopment of the leisure centre (Ref:
16/03191/FULLN). However, it is noted that Andover’s leisure facilities are currently scattered around the
centre, and the centre could benefit from establishing a food and beverage “cluster” or “focus”, especially
to aid the evening economy. In qualitative terms the centre also lacks family-friendly restaurants.
� The centre is performing adequately in terms of vacancy levels. Experian has identified a vacancy level of
8.8%, which is below the national average, while the Council’s own survey of a slightly wider Town Centre
area identified a slightly above national average vacancy rate of 11.8%. There are two areas with a
relatively high concentration of vacant units: the Chantry Shopping Centre and The Bridge Street Mall.
These locations represent potential opportunities to improve the shopping and town centre environment,
and increase activity and footfall (for example by redeveloping the sites and/or by attracting new operators).
� There is a relatively good mix of multiple and independent retailers. It would be however beneficial to
introduce multiple mid-range operators that would raise the profile of the centre. It would also be beneficial
to increase the quality of the independent operators, and introduce more niche independent retailers to
build on Andover’s quaint character.
� Andover hosts a number of events and promotions. These should continue to be encouraged, supported
by better marketing. In our judgement the Andover Street Market should be significantly improved by raising
the quality of goods sold, and by establishing a more holistic management.
� Andover is a historic market town, which has its own unique character and a good sense of place, and
overall a pleasant environment. However, it is considered that the Chantry Centre is now rather dated in
its layout, and hence does not create an ideal shopping environment. There are also a number of vacancies
within the shopping centre that detract from the overall shopping experience. Similarly, The Bridge Street
Mall, which is predominantly vacant, also significantly detracts from the environmental quality. Furthermore,
the overall appearance is underutilised, and low in quality. Overall, these areas weaken the environmental
quality of Andover. The centre could also benefit from more seating, and green landscaping (e.g. trees) to
help ‘soften’ the environment.
� Andover has good accessibility by all modes of transport, and pedestrian flows appear adequate. However,
stakeholder feedback has suggested that the parking management system could be improved (for
example, by incorporating payment on exit). The pedestrian flow in the evenings is limited, despite the
centre staying open. This could be improved by seeking further evening leisure uses (that are well
connected with the main shopping facilities), and by better marketing of the centre to raise awareness of
the later opening hours.
� There are two strategic housing allocations surrounding Andover Town Centre, namely: Land at Picket
Piece (allocated under Policy COM6) and Land at Picket Twenty (allocated under Policy COM6A). East
Anton is also referred to in the local plan as a site for housing development. These potential developments
ANDOVER AND ROMSEY RETAIL CAPACITY & LEISURE STUDY - 2018
Page 104 of 190
will add pressure to Andover Town Centre, specifically in terms of the demand for new retail, leisure and
service uses.
� The vision to establish a Cultural Quarter around The Lights Theatre and Andover Leisure Centre is
currently informal. We would recommend that a Masterplan is drawn up to guide the development of this
area, covering the appropriate uses, the legibility of the area, and the need to improve the wider
connections to the PSA.
� It should also be noted that the Andover BID40 is currently consulting with Town Centre businesses on the
types of services that will help to solve local issues such as, for example, marketing, parking management
and new developments.
� In terms of customer demographics, Section 5 highlighted from the in-centre survey that there is a greater
proportion of shoppers in Andover who are of a lower social grade (30.6% for C1 – 24.0% for DE), in
contrast to the higher social grades (16.3% for A1 and 28.6% for B1) in the wider catchment. This suggests
that Andover Town Centre could do more to draw shoppers and visitors who are of a higher social grade,
whilst meeting the needs of its ‘core’ customers.
40 A BID is led and funded by businesses that would oversee Town Centre management within a defined area. The revenue generated by the
initiative will be invested in activities and services which are decided by participating organisations to promote the town centre and its businesses.
ANDOVER AND ROMSEY RETAIL CAPACITY & LEISURE STUDY - 2018
Page 105 of 190
9 ROMSEY TOWN CENTRE – HEALTH CHECK ASSESSMENT
Context
9.1 Romsey is a small and compact market town located in southern Test Valley. It is a historic town and benefits
from medieval architecture, most notably The Romsey Abbey (which dates back to 907 AD during the Anglo-
Saxon times) and King John’s House (which was the main building in the town during the 13th century in a major
medieval complex). These act as major attractions for Romsey’s tourism and visitor economy and contribute to
the overall character of the town.
9.2 Romsey is located 7 miles from Southampton, 11 miles from Winchester and 17 miles from Salisbury. It is served
by a train station, which is within walking distance from the Town Centre. It is anchored by the Bradbeers
department store, as well as Waitrose (located on Alma Road); and an Aldi (located on The Hundred).
9.3 Romsey is ranked 666th in the 2017 Javelin Venuescore ranking of all town and shopping centres. It has fallen
slightly in the rankings since 2007, when it was 644th. Table 9.1 outlines the ranking position of Andover (190th)
and nearby centres in neighbouring authorities. All of these higher order centres have a greater scale, range and
choice of retailing than Romsey.
Table 9.1: Competing Centres
Town Centre Location Grade Venuescore Rank
Southampton Major Regional 20
Basingstoke Regional 58
Salisbury Regional 94
Winchester Regional 125
Andover Sub-Regional 190
Romsey District 666
9.4 Romsey is designated as a Major Centre in the Revised Local Plan (DPD) (2016) settlement hierarchy, and the
extent of the Town Centre is defined in the Council’s Proposals Map (Inset Map 4): This is reproduced below for
ease of reference:
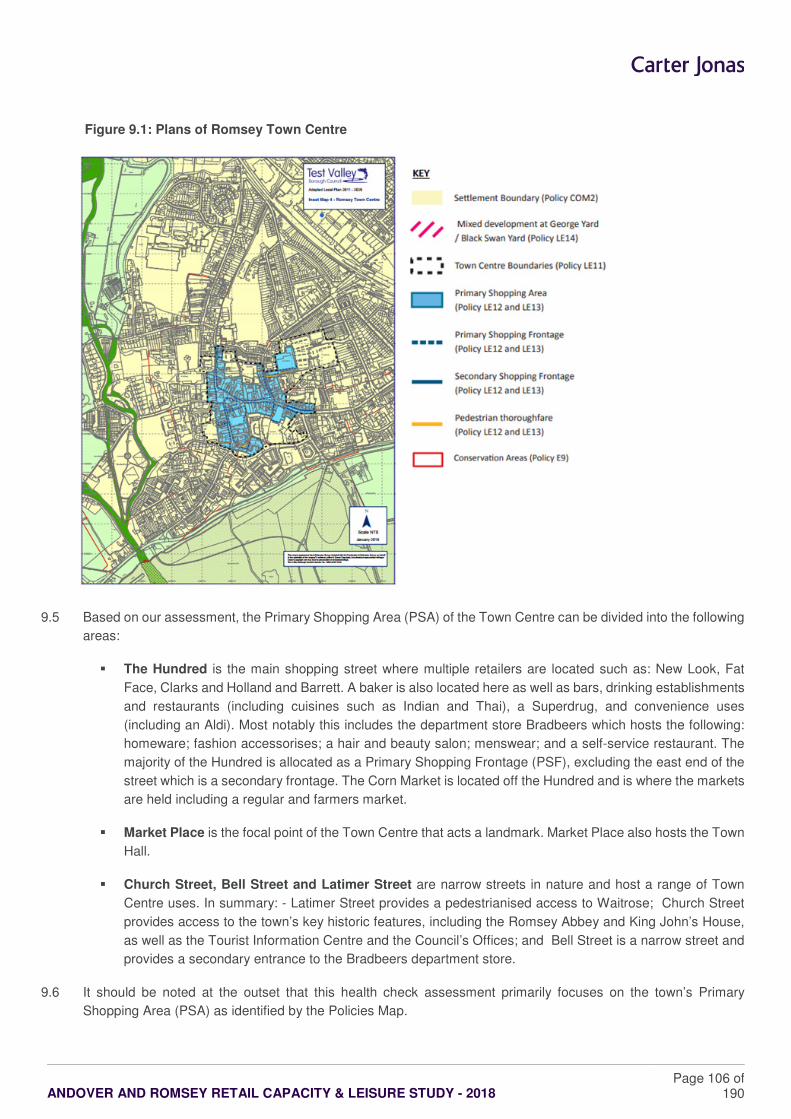
ANDOVER AND ROMSEY RETAIL CAPACITY & LEISURE STUDY - 2018
Page 106 of 190
Figure 9.1: Plans of Romsey Town Centre
9.5 Based on our assessment, the Primary Shopping Area (PSA) of the Town Centre can be divided into the following
areas:
� The Hundred is the main shopping street where multiple retailers are located such as: New Look, Fat
Face, Clarks and Holland and Barrett. A baker is also located here as well as bars, drinking establishments
and restaurants (including cuisines such as Indian and Thai), a Superdrug, and convenience uses
(including an Aldi). Most notably this includes the department store Bradbeers which hosts the following:
homeware; fashion accessorises; a hair and beauty salon; menswear; and a self-service restaurant. The
majority of the Hundred is allocated as a Primary Shopping Frontage (PSF), excluding the east end of the
street which is a secondary frontage. The Corn Market is located off the Hundred and is where the markets
are held including a regular and farmers market.
� Market Place is the focal point of the Town Centre that acts a landmark. Market Place also hosts the Town
Hall.
� Church Street, Bell Street and Latimer Street are narrow streets in nature and host a range of Town
Centre uses. In summary: - Latimer Street provides a pedestrianised access to Waitrose; Church Street
provides access to the town’s key historic features, including the Romsey Abbey and King John’s House,
as well as the Tourist Information Centre and the Council’s Offices; and Bell Street is a narrow street and
provides a secondary entrance to the Bradbeers department store.
9.6 It should be noted at the outset that this health check assessment primarily focuses on the town’s Primary
Shopping Area (PSA) as identified by the Policies Map.
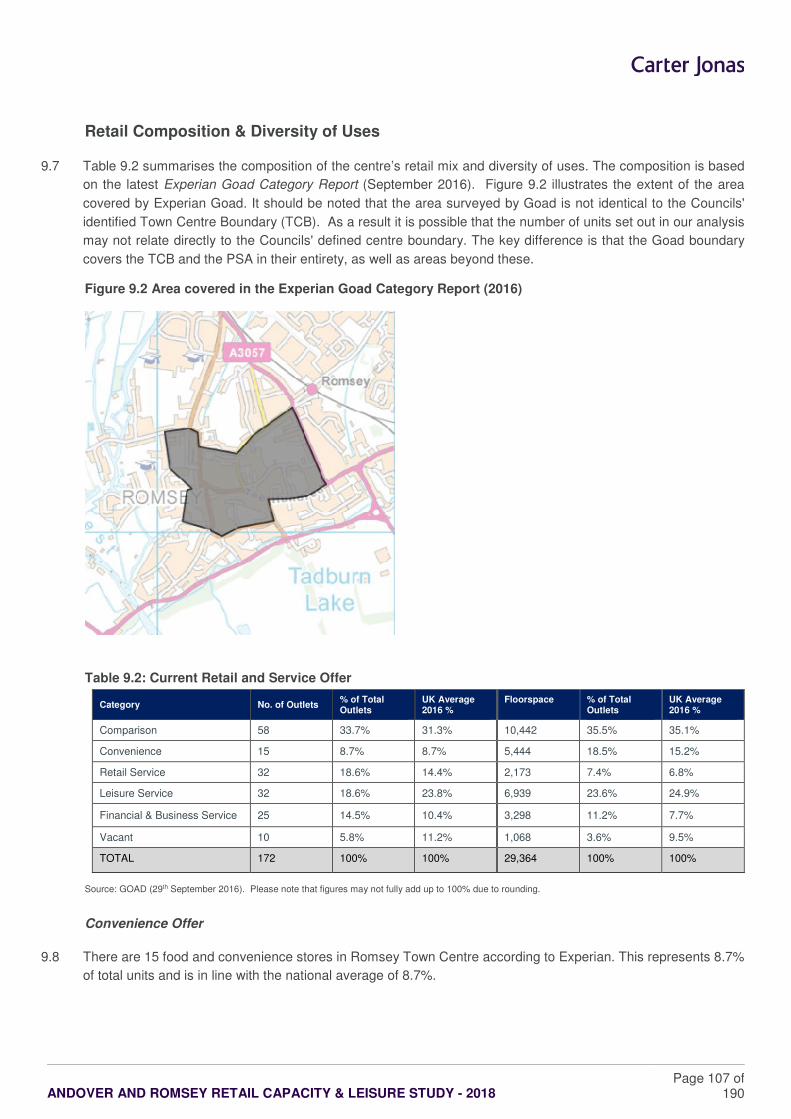
ANDOVER AND ROMSEY RETAIL CAPACITY & LEISURE STUDY - 2018
Page 107 of 190
Retail Composition & Diversity of Uses
9.7 Table 9.2 summarises the composition of the centre’s retail mix and diversity of uses. The composition is based
on the latest Experian Goad Category Report (September 2016). Figure 9.2 illustrates the extent of the area
covered by Experian Goad. It should be noted that the area surveyed by Goad is not identical to the Councils'
identified Town Centre Boundary (TCB). As a result it is possible that the number of units set out in our analysis
may not relate directly to the Councils' defined centre boundary. The key difference is that the Goad boundary
covers the TCB and the PSA in their entirety, as well as areas beyond these.
Figure 9.2 Area covered in the Experian Goad Category Report (2016)
Table 9.2: Current Retail and Service Offer
Category No. of Outlets % of Total Outlets
UK Average 2016 %
Floorspace % of Total Outlets
UK Average 2016 %
Comparison 58 33.7% 31.3% 10,442 35.5% 35.1%
Convenience 15 8.7% 8.7% 5,444 18.5% 15.2%
Retail Service 32 18.6% 14.4% 2,173 7.4% 6.8%
Leisure Service 32 18.6% 23.8% 6,939 23.6% 24.9%
Financial & Business Service 25 14.5% 10.4% 3,298 11.2% 7.7%
Vacant 10 5.8% 11.2% 1,068 3.6% 9.5%
TOTAL 172 100% 100% 29,364 100% 100%
Source: GOAD (29th September 2016). Please note that figures may not fully add up to 100% due to rounding.
Convenience Offer
9.8 There are 15 food and convenience stores in Romsey Town Centre according to Experian. This represents 8.7%
of total units and is in line with the national average of 8.7%.
ANDOVER AND ROMSEY RETAIL CAPACITY & LEISURE STUDY - 2018
Page 108 of 190
9.9 With regards to floorspace, however, Romsey is above the national average (15.2%); the 5,444 sqm of (Goad)
floorspace represents 18.5% of the centre’s total floorspace. This reflects the scale of its two key anchor
foodstores; namely Waitrose (located on Alma Road) and Aldi (located on The Hundred). According to Experian
there are also:
� Three bakers and confectioners (including: Reeve the Baker; Humbugs Confectionary Shop Ltd;
Angelcake; and The Daisy Cake Company Ltd)
� Three grocers and delicatessens (including: Long’s Farm Shop); and
� Two health food stores (including a Holland and Barratt).
9.10 Romsey Town Centre retains a market share of 32.3% within the Romsey Primary Catchment Area. Aldi, The
Hundred and Waitrose, Alma Road act as the main town centre convenience shopping facilities.
9.11 In terms of the in-centre results, a larger proportion of respondents stated that they visit Romsey for a food and
grocery shop (40.9%). The main food retailers that respondents visit are Waitrose (66.7%); Aldi (33.3%); Co-op
(16.7%) (located on the Hundred); and the Market (4.2%).
9.12 The convenience offer is also supplemented by two markets. The regular market takes place every Tuesday,
Friday and Saturday. The farmers’ market takes place on the first Sunday of every month. Both of these sell a
wide range of food produce, including fruit, vegetables and meat.
9.13 Our consultation with some of the town’s main stakeholders indicated that, in qualitative terms, the centre’s
convenience offer is good, albeit the centre could benefit from a mid-range supermarket.
9.14 Romsey’s out-of-centre foodstores are limited, and only account for only 4% of convenience expenditure within
its PCA. The key foodstore competition comes from locations outside of Test Valley Council; namely Eastleigh
and Southampton.
9.15 Whilst overall, we consider that Romsey Town Centre has a relatively good food and convenience store provision,
there would appear to be potential to improve the choice on offer by introducing a mid-range supermarket that is
not currently represented in the Town Centre. However this will be subject to the findings of the economic need
assessment and the market demand from operators for representation in the Town Centre.
Comparison Offer
9.16 According to the Experian, Romsey has 58 comparison outlets. This represents 33.7% of the total number of units,
which is above the national average of 31.3%. In terms of floorspace, comparison retail is in line with the national
average (35.1%); with the 10,442 sqm of (Goad) floorspace representing 35.5% of total floorspace in the Town
Centre.
9.17 There appears to be a reasonable representation across the (Goad) comparison sub-categories when compared
to the national average; particularly when considered in terms of the role and function of Romsey in the retail
hierarchy and its proximity to larger competing centres, including Winchester and Southampton. The key headlines
are summarised as follows:
� The comparison offer is anchored by the Bradbeers department store, which offers homeware goods,
fashion and beauty, jewellery and soft furnishings. The department store adds to the attraction and
character of the centre. In terms of the in-centre results, Bradbeers was visited by a significant 25.0% of
respondents as part of their main non-food shop.
ANDOVER AND ROMSEY RETAIL CAPACITY & LEISURE STUDY - 2018
Page 109 of 190
� There is also a good range of multiple retailers selling ladieswear and accessorises; including brands such
as New Look; FatFace; M&Co; Clarks; and Wallis. This offer could be strengthened by attracting other
higher end multiple fashion retailers, subject to market demand and the provision of suitably sized units in
prime locations.
� There is an under-provision in the menswear and accessorises category, especially when compared to
ladieswear. This was also identified as a ‘gap’ in provision by stakeholders.
� There is a good representation of independent comparison retailers including a bridal boutique; jewellery
stores; a dress shop; a fashion accessorises shop; and a chinaware shop. Although the range of the
independent offer is strong, this could be further improved, subject to market demand, by introducing
higher-end independent stores that focus on high quality merchandise and the niche / boutique offer.
� There is an over representation of charity shops (11 outlets) including: Marie Curie; Oxfam; and the
Salvation Army. This represents 6.4% of the total comparison units, which is significantly above the national
average of 2.7%. However, the consultation from the stakeholders highlighted that these are of high quality
and do make an important contribution to the centre’s overall vitality and viability as a shopping location.
9.18 For comparison goods, the household survey indicates that Romsey Town Centre’s non-food offer is achieving a
market share within the Primary Catchment Area (PCA) of 12.7%. Within the zones that make up the PCA it is
achieving a stronger market share in Zone 1 (25.2%) than in Zone 2 (7.5%).
9.19 Romsey’s out-of-centre comparison facilities are limited and are only achieving a 0.1% market share from the
PCA based on the household survey results. Overall, the HTIS shows that from within its PCA Romsey (in-centre
and out-of-centre) retains 12.7% of comparison expenditure, with a substantial 58.6% leakage to larger shopping
locations and centres outside of the Borough Area; principally (Eastleigh (9.9%), Hedge End (5.5%) and
Southampton (30.1%). SFT also accounts for a 24.8% market share within the PCA.
9.20 In terms of the in-centre survey results, the top three major retailers visited by respondents are Boots (45.0%);
Bradbeers (25.0%); and WHSmith (15.0%). One of the key improvements mentioned by respondents included
enhancing the choice of shops in general. A further 14.9% of respondents mentioned that having a Marks &
Spencer in the town would encourage them to visit Romsey more often. However, based on their recent
performance and decisions to close stores in a number of centres across the UK, including Andover, it is highly
unlikely that Marks & Spencer will be seeking representation in Romsey.
9.21 In summary, we consider Romsey’s comparison offer to be of a good quality. There could be potential for the town
to attract more multiple fashion retailers to help raise its attraction and profile, as well as strengthen its quality
independent niche and boutique offer. This will be subject to market demand and the provision of suitable
accommodation in the prime shopping areas.
Service Offer
9.22 Service businesses are defined by Experian as including retail, professional and financial services. These main
provision in Romsey is as follows:
� There are 32 retail services which represents 18.6% of the total units. This is above the national average
of 14.4%. In terms of floorspace, retail services are above the national average (6.8%) with 2,173 sqm
representing 7.4% of the total floorspace. The retail services primarily consist of health and beauty (20
units including independent operators which provide beauty services for nails, hair and skin), opticians (6
units including Specsavers and Boots Opticians); travel agents (2 units including Purely Maldives Ltd and
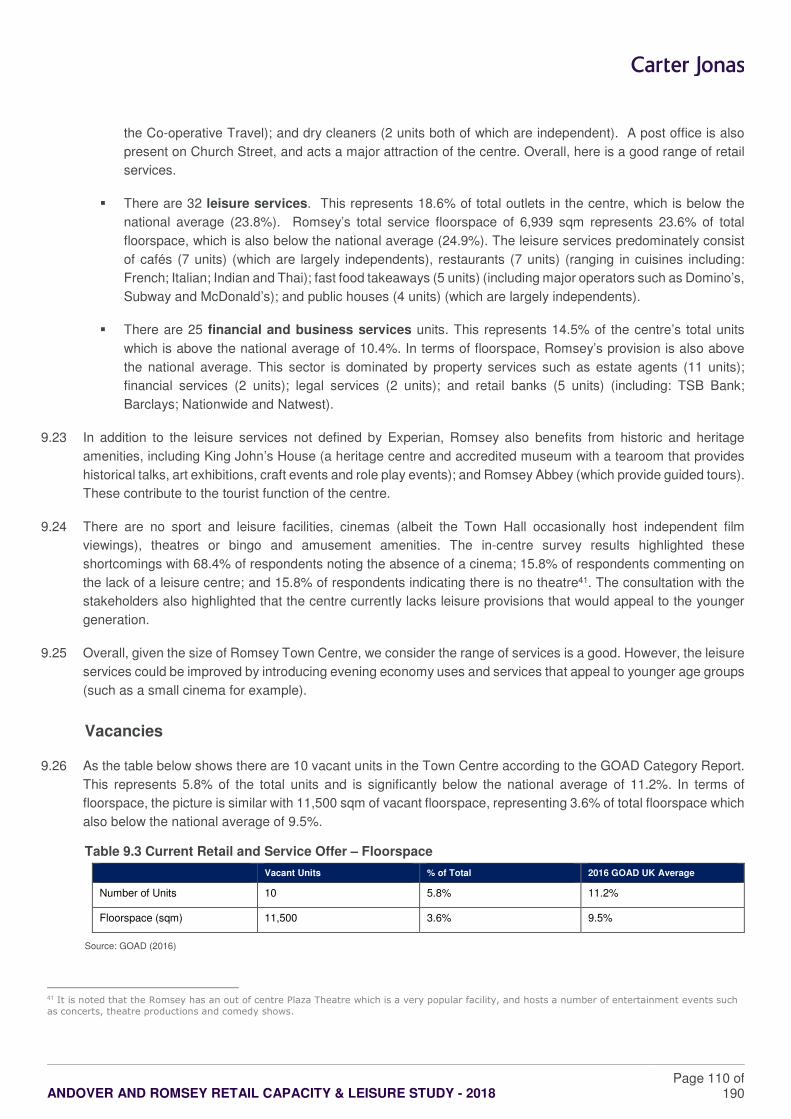
ANDOVER AND ROMSEY RETAIL CAPACITY & LEISURE STUDY - 2018
Page 110 of 190
the Co-operative Travel); and dry cleaners (2 units both of which are independent). A post office is also
present on Church Street, and acts a major attraction of the centre. Overall, here is a good range of retail
services.
� There are 32 leisure services. This represents 18.6% of total outlets in the centre, which is below the
national average (23.8%). Romsey’s total service floorspace of 6,939 sqm represents 23.6% of total
floorspace, which is also below the national average (24.9%). The leisure services predominately consist
of cafés (7 units) (which are largely independents), restaurants (7 units) (ranging in cuisines including:
French; Italian; Indian and Thai); fast food takeaways (5 units) (including major operators such as Domino’s,
Subway and McDonald’s); and public houses (4 units) (which are largely independents).
� There are 25 financial and business services units. This represents 14.5% of the centre’s total units
which is above the national average of 10.4%. In terms of floorspace, Romsey’s provision is also above
the national average. This sector is dominated by property services such as estate agents (11 units);
financial services (2 units); legal services (2 units); and retail banks (5 units) (including: TSB Bank;
Barclays; Nationwide and Natwest).
9.23 In addition to the leisure services not defined by Experian, Romsey also benefits from historic and heritage
amenities, including King John’s House (a heritage centre and accredited museum with a tearoom that provides
historical talks, art exhibitions, craft events and role play events); and Romsey Abbey (which provide guided tours).
These contribute to the tourist function of the centre.
9.24 There are no sport and leisure facilities, cinemas (albeit the Town Hall occasionally host independent film
viewings), theatres or bingo and amusement amenities. The in-centre survey results highlighted these
shortcomings with 68.4% of respondents noting the absence of a cinema; 15.8% of respondents commenting on
the lack of a leisure centre; and 15.8% of respondents indicating there is no theatre41. The consultation with the
stakeholders also highlighted that the centre currently lacks leisure provisions that would appeal to the younger
generation.
9.25 Overall, given the size of Romsey Town Centre, we consider the range of services is a good. However, the leisure
services could be improved by introducing evening economy uses and services that appeal to younger age groups
(such as a small cinema for example).
Vacancies
9.26 As the table below shows there are 10 vacant units in the Town Centre according to the GOAD Category Report.
This represents 5.8% of the total units and is significantly below the national average of 11.2%. In terms of
floorspace, the picture is similar with 11,500 sqm of vacant floorspace, representing 3.6% of total floorspace which
also below the national average of 9.5%.
Table 9.3 Current Retail and Service Offer – Floorspace
Vacant Units % of Total 2016 GOAD UK Average
Number of Units 10 5.8% 11.2%
Floorspace (sqm) 11,500 3.6% 9.5%
Source: GOAD (2016)
41 It is noted that the Romsey has an out of centre Plaza Theatre which is a very popular facility, and hosts a number of entertainment events such
as concerts, theatre productions and comedy shows.
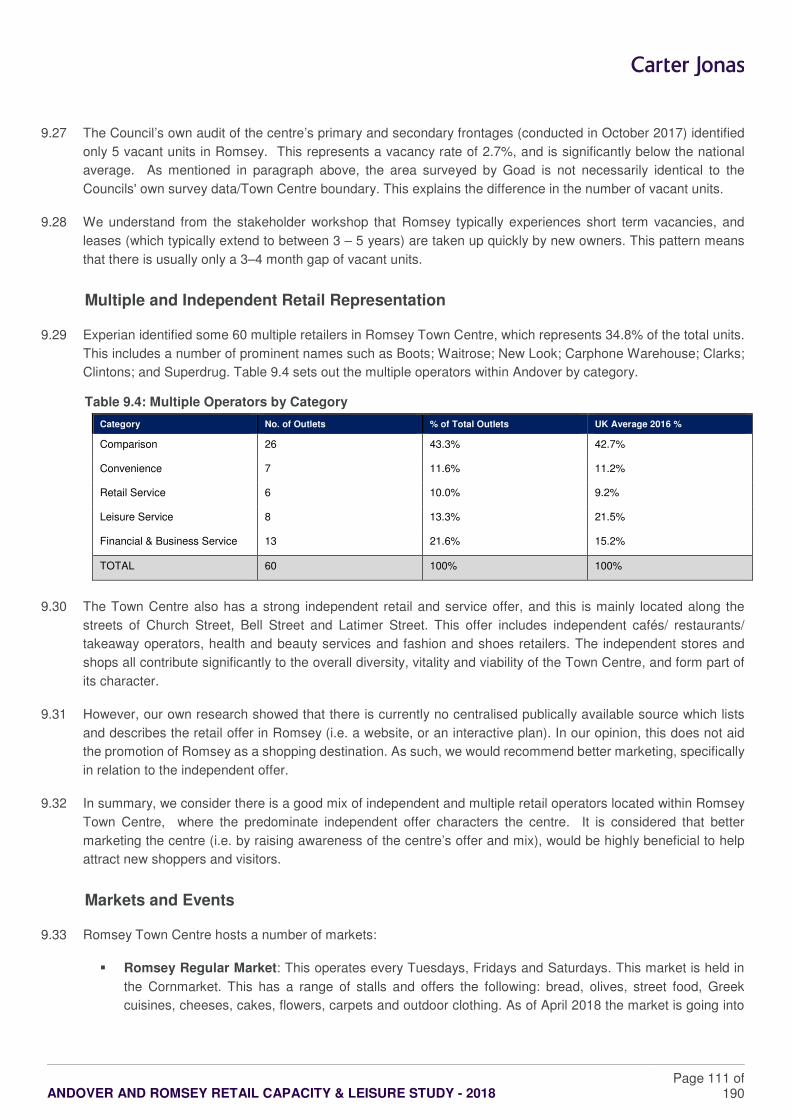
ANDOVER AND ROMSEY RETAIL CAPACITY & LEISURE STUDY - 2018
Page 111 of 190
9.27 The Council’s own audit of the centre’s primary and secondary frontages (conducted in October 2017) identified
only 5 vacant units in Romsey. This represents a vacancy rate of 2.7%, and is significantly below the national
average. As mentioned in paragraph above, the area surveyed by Goad is not necessarily identical to the
Councils' own survey data/Town Centre boundary. This explains the difference in the number of vacant units.
9.28 We understand from the stakeholder workshop that Romsey typically experiences short term vacancies, and
leases (which typically extend to between 3 – 5 years) are taken up quickly by new owners. This pattern means
that there is usually only a 3–4 month gap of vacant units.
Multiple and Independent Retail Representation
9.29 Experian identified some 60 multiple retailers in Romsey Town Centre, which represents 34.8% of the total units.
This includes a number of prominent names such as Boots; Waitrose; New Look; Carphone Warehouse; Clarks;
Clintons; and Superdrug. Table 9.4 sets out the multiple operators within Andover by category.
Table 9.4: Multiple Operators by Category
Category No. of Outlets % of Total Outlets UK Average 2016 %
Comparison 26 43.3% 42.7%
Convenience 7 11.6% 11.2%
Retail Service 6 10.0% 9.2%
Leisure Service 8 13.3% 21.5%
Financial & Business Service 13 21.6% 15.2%
TOTAL 60 100% 100%
9.30 The Town Centre also has a strong independent retail and service offer, and this is mainly located along the
streets of Church Street, Bell Street and Latimer Street. This offer includes independent cafés/ restaurants/
takeaway operators, health and beauty services and fashion and shoes retailers. The independent stores and
shops all contribute significantly to the overall diversity, vitality and viability of the Town Centre, and form part of
its character.
9.31 However, our own research showed that there is currently no centralised publically available source which lists
and describes the retail offer in Romsey (i.e. a website, or an interactive plan). In our opinion, this does not aid
the promotion of Romsey as a shopping destination. As such, we would recommend better marketing, specifically
in relation to the independent offer.
9.32 In summary, we consider there is a good mix of independent and multiple retail operators located within Romsey
Town Centre, where the predominate independent offer characters the centre. It is considered that better
marketing the centre (i.e. by raising awareness of the centre’s offer and mix), would be highly beneficial to help
attract new shoppers and visitors.
Markets and Events
9.33 Romsey Town Centre hosts a number of markets:
� Romsey Regular Market: This operates every Tuesdays, Fridays and Saturdays. This market is held in
the Cornmarket. This has a range of stalls and offers the following: bread, olives, street food, Greek
cuisines, cheeses, cakes, flowers, carpets and outdoor clothing. As of April 2018 the market is going into
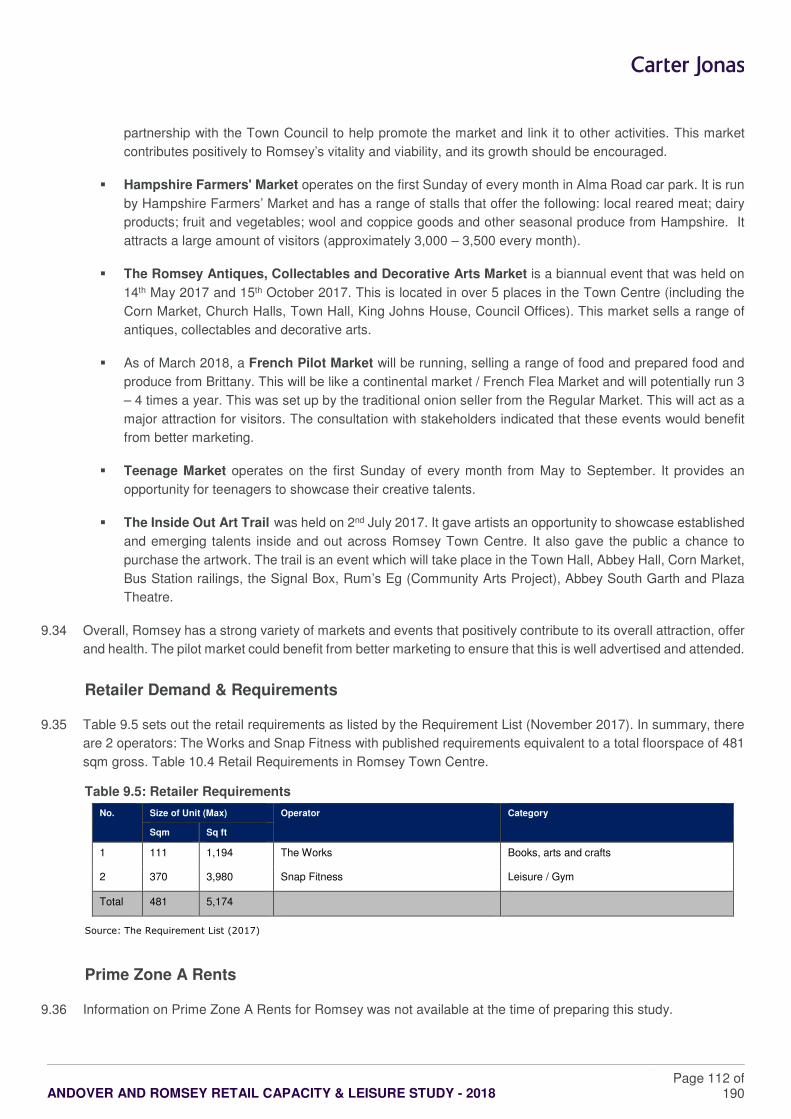
ANDOVER AND ROMSEY RETAIL CAPACITY & LEISURE STUDY - 2018
Page 112 of 190
partnership with the Town Council to help promote the market and link it to other activities. This market
contributes positively to Romsey’s vitality and viability, and its growth should be encouraged.
� Hampshire Farmers' Market operates on the first Sunday of every month in Alma Road car park. It is run
by Hampshire Farmers’ Market and has a range of stalls that offer the following: local reared meat; dairy
products; fruit and vegetables; wool and coppice goods and other seasonal produce from Hampshire. It
attracts a large amount of visitors (approximately 3,000 – 3,500 every month).
� The Romsey Antiques, Collectables and Decorative Arts Market is a biannual event that was held on
14th May 2017 and 15th October 2017. This is located in over 5 places in the Town Centre (including the
Corn Market, Church Halls, Town Hall, King Johns House, Council Offices). This market sells a range of
antiques, collectables and decorative arts.
� As of March 2018, a French Pilot Market will be running, selling a range of food and prepared food and
produce from Brittany. This will be like a continental market / French Flea Market and will potentially run 3
– 4 times a year. This was set up by the traditional onion seller from the Regular Market. This will act as a
major attraction for visitors. The consultation with stakeholders indicated that these events would benefit
from better marketing.
� Teenage Market operates on the first Sunday of every month from May to September. It provides an
opportunity for teenagers to showcase their creative talents.
� The Inside Out Art Trail was held on 2nd July 2017. It gave artists an opportunity to showcase established
and emerging talents inside and out across Romsey Town Centre. It also gave the public a chance to
purchase the artwork. The trail is an event which will take place in the Town Hall, Abbey Hall, Corn Market,
Bus Station railings, the Signal Box, Rum’s Eg (Community Arts Project), Abbey South Garth and Plaza
Theatre.
9.34 Overall, Romsey has a strong variety of markets and events that positively contribute to its overall attraction, offer
and health. The pilot market could benefit from better marketing to ensure that this is well advertised and attended.
Retailer Demand & Requirements
9.35 Table 9.5 sets out the retail requirements as listed by the Requirement List (November 2017). In summary, there
are 2 operators: The Works and Snap Fitness with published requirements equivalent to a total floorspace of 481
sqm gross. Table 10.4 Retail Requirements in Romsey Town Centre.
Table 9.5: Retailer Requirements
No. Size of Unit (Max) Operator Category
Sqm Sq ft
1 111 1,194 The Works Books, arts and crafts
2 370 3,980 Snap Fitness Leisure / Gym
Total 481 5,174
Source: The Requirement List (2017)
Prime Zone A Rents
9.36 Information on Prime Zone A Rents for Romsey was not available at the time of preparing this study.
ANDOVER AND ROMSEY RETAIL CAPACITY & LEISURE STUDY - 2018
Page 113 of 190
Environmental Quality
9.37 Romsey is a historic Town Centre that has an individual character and an attractive and pleasant environment, all
set within a conservation area. The significant medieval architecture contributes to the overall character of the
centre and the ‘sense of place’; most notably Romsey Abbey which dates back to 907 AD during the Anglo-Saxon
times. The well-connected streets that link towards Market Place reinforce this ‘sense of place’ and attract visitors
to the hub of activity within Cornmarket.
9.38 The majority of the facades and frontages in the centre are well maintained, with historic buildings contributing to
the sense of place. Furthermore, Romsey is generally clean and tidy throughout and has an adequate provision
of street furniture with planting, street lighting and litter bins distributed across the centre.
9.39 The in-centre survey results suggest that visitors are generally pleased with the environment, with positive
comments on the feeling of safety and absence of threatening individuals (24.8% of respondents); the general
cleanliness of shopping streets (18.8% of respondents); and the nice street furniture and floral displays (17.8% of
respondents).
9.40 The key shortcoming of the centre at present are the ongoing road works (associated with the road improvement
and enhancement schemes), which detract from the centre’s appearance and generate the traffic congestion.
Accessibility & Pedestrian Flows
9.41 Romsey is served by a railway station situated north east of the Town Centre, which is run by Great Western
Railway and South Western Railway. This provides connections to Portsmouth, Salisbury, Eastleigh,
Southampton and Cardiff. There are 16 buses in Romsey, providing connections to Southampton, and Winchester.
The bypass road (A3090) is located south of the Town Centre and provides connections to the A27 and the M27
to Southampton, Eastleigh and Winchester.
9.42 The centre also benefits from good legibility, with Market Place acting as the focal point. However, signage could
be improved throughout the Town Centre, and the centre would generally benefit from a plan showing the retailer
composition of the centre.
9.43 It is noted that Hampshire County Council and Test Valley Borough Council are implementing the Environment
Enhancement Schemes which focus on Church Street (complete); Bell Street (underway); and Market Place
(proposed for 2019). This scheme seeks to improve the accessibility for pedestrians and cyclists, reduce traffic
speeds and enhance the landscaping of the Town Centre.
9.44 The consultation with the key stakeholders highlighted their concerns that the ongoing road works and associated
congestion had negatively impacted on pedestrian flows across the centre, and the overall performance. The in-
centre survey indicated that 6.9% of respondents thought road congestion was an issue for the Town Centre.
9.45 Based on our observation, the centre benefits from a reasonable pedestrian flow, with the main concentration
taking place near Waitrose and The Hundred. As noted by the in-centre survey, 19.8% of respondents found the
centre to be “near” and “convenient”, and 9.9% found the centre to be easily accessible by walking.
9.46 Table 9.6 outlines the car parks located within Romsey. For short to medium stay tariffs, the length of stay ranges
from 30 minutes (50p) – all day (£5.90). For long stay tariffs, the length of stay ranges from 30 minutes (50p) – all
day (£4.40). All the car parks have motor cycle and disabled facilities available. Parking is free after 4pm and on
Sundays and Bank Holidays
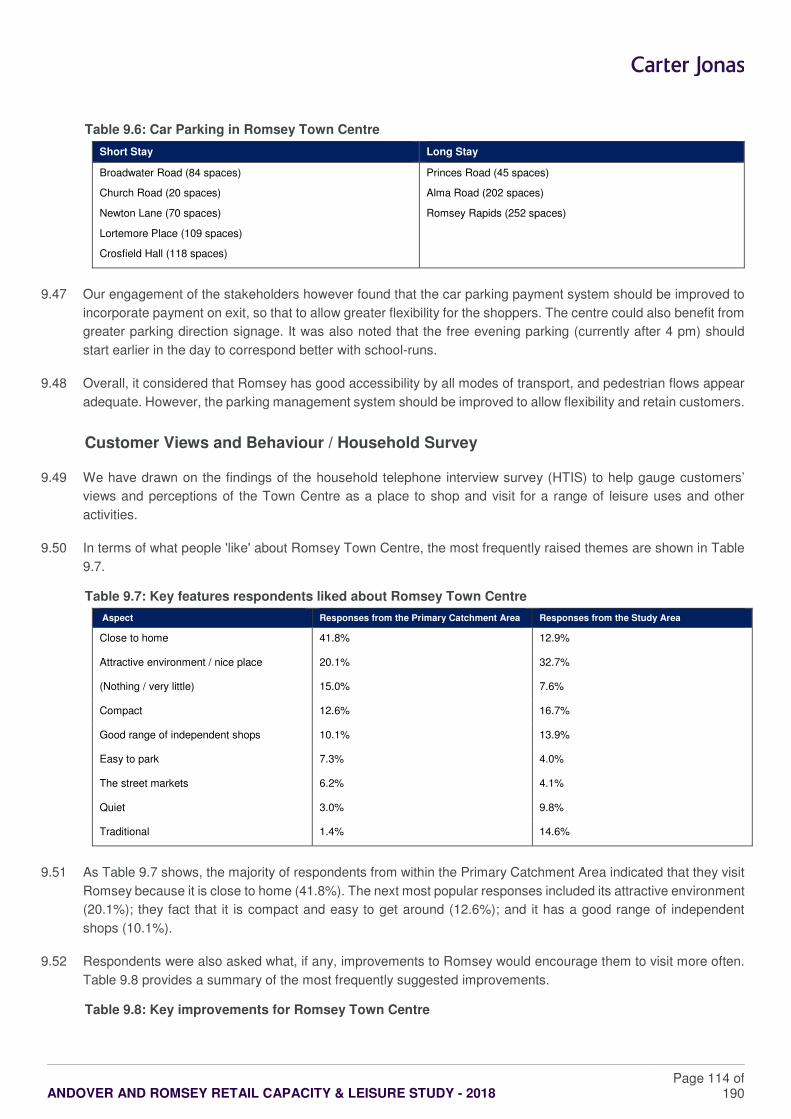
ANDOVER AND ROMSEY RETAIL CAPACITY & LEISURE STUDY - 2018
Page 114 of 190
Table 9.6: Car Parking in Romsey Town Centre
Short Stay Long Stay
Broadwater Road (84 spaces)
Church Road (20 spaces)
Newton Lane (70 spaces)
Lortemore Place (109 spaces)
Crosfield Hall (118 spaces)
Princes Road (45 spaces)
Alma Road (202 spaces)
Romsey Rapids (252 spaces)
9.47 Our engagement of the stakeholders however found that the car parking payment system should be improved to
incorporate payment on exit, so that to allow greater flexibility for the shoppers. The centre could also benefit from
greater parking direction signage. It was also noted that the free evening parking (currently after 4 pm) should
start earlier in the day to correspond better with school-runs.
9.48 Overall, it considered that Romsey has good accessibility by all modes of transport, and pedestrian flows appear
adequate. However, the parking management system should be improved to allow flexibility and retain customers.
Customer Views and Behaviour / Household Survey
9.49 We have drawn on the findings of the household telephone interview survey (HTIS) to help gauge customers’
views and perceptions of the Town Centre as a place to shop and visit for a range of leisure uses and other
activities.
9.50 In terms of what people 'like' about Romsey Town Centre, the most frequently raised themes are shown in Table
9.7.
Table 9.7: Key features respondents liked about Romsey Town Centre
Aspect Responses from the Primary Catchment Area Responses from the Study Area
Close to home 41.8% 12.9%
Attractive environment / nice place 20.1% 32.7%
(Nothing / very little) 15.0% 7.6%
Compact 12.6% 16.7%
Good range of independent shops 10.1% 13.9%
Easy to park 7.3% 4.0%
The street markets 6.2% 4.1%
Quiet 3.0% 9.8%
Traditional 1.4% 14.6%
9.51 As Table 9.7 shows, the majority of respondents from within the Primary Catchment Area indicated that they visit
Romsey because it is close to home (41.8%). The next most popular responses included its attractive environment
(20.1%); they fact that it is compact and easy to get around (12.6%); and it has a good range of independent
shops (10.1%).
9.52 Respondents were also asked what, if any, improvements to Romsey would encourage them to visit more often.
Table 9.8 provides a summary of the most frequently suggested improvements.
Table 9.8: Key improvements for Romsey Town Centre
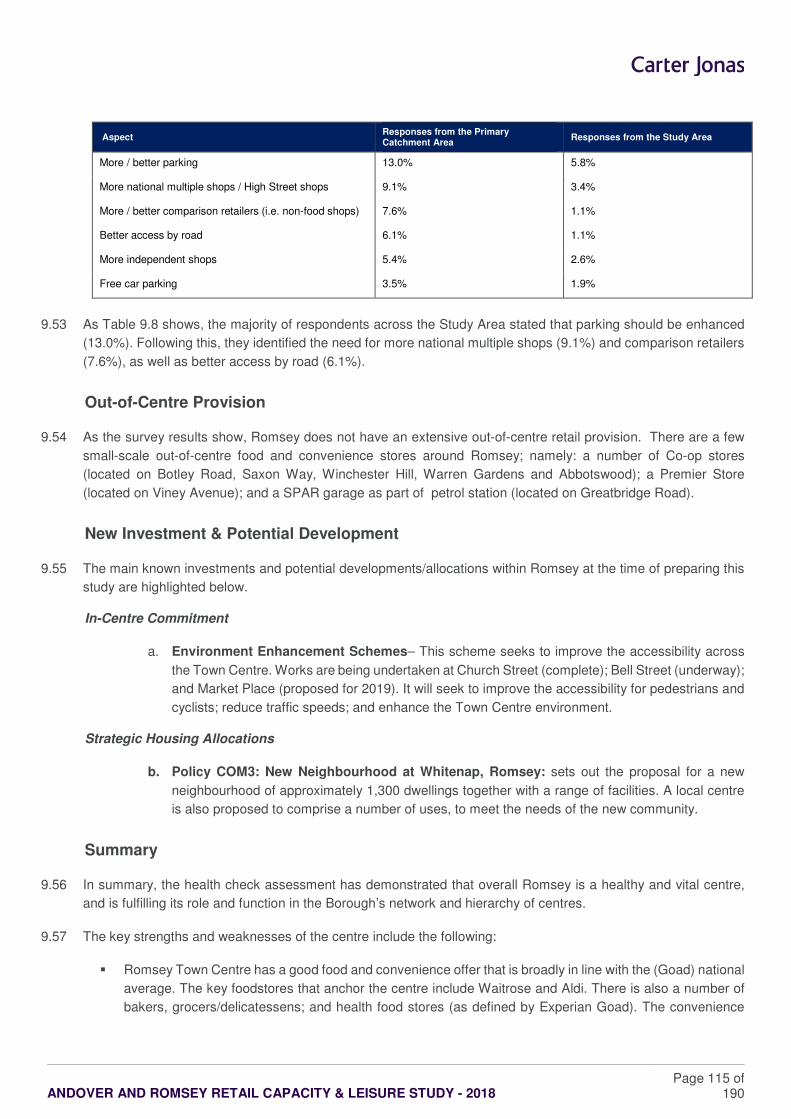
ANDOVER AND ROMSEY RETAIL CAPACITY & LEISURE STUDY - 2018
Page 115 of 190
Aspect Responses from the Primary Catchment Area
Responses from the Study Area
More / better parking 13.0% 5.8%
More national multiple shops / High Street shops 9.1% 3.4%
More / better comparison retailers (i.e. non-food shops) 7.6% 1.1%
Better access by road 6.1% 1.1%
More independent shops 5.4% 2.6%
Free car parking 3.5% 1.9%
9.53 As Table 9.8 shows, the majority of respondents across the Study Area stated that parking should be enhanced
(13.0%). Following this, they identified the need for more national multiple shops (9.1%) and comparison retailers
(7.6%), as well as better access by road (6.1%).
Out-of-Centre Provision
9.54 As the survey results show, Romsey does not have an extensive out-of-centre retail provision. There are a few
small-scale out-of-centre food and convenience stores around Romsey; namely: a number of Co-op stores
(located on Botley Road, Saxon Way, Winchester Hill, Warren Gardens and Abbotswood); a Premier Store
(located on Viney Avenue); and a SPAR garage as part of petrol station (located on Greatbridge Road).
New Investment & Potential Development
9.55 The main known investments and potential developments/allocations within Romsey at the time of preparing this
study are highlighted below.
In-Centre Commitment
a. Environment Enhancement Schemes– This scheme seeks to improve the accessibility across
the Town Centre. Works are being undertaken at Church Street (complete); Bell Street (underway);
and Market Place (proposed for 2019). It will seek to improve the accessibility for pedestrians and
cyclists; reduce traffic speeds; and enhance the Town Centre environment.
Strategic Housing Allocations
b. Policy COM3: New Neighbourhood at Whitenap, Romsey: sets out the proposal for a new
neighbourhood of approximately 1,300 dwellings together with a range of facilities. A local centre
is also proposed to comprise a number of uses, to meet the needs of the new community.
Summary
9.56 In summary, the health check assessment has demonstrated that overall Romsey is a healthy and vital centre,
and is fulfilling its role and function in the Borough’s network and hierarchy of centres.
9.57 The key strengths and weaknesses of the centre include the following:
� Romsey Town Centre has a good food and convenience offer that is broadly in line with the (Goad) national
average. The key foodstores that anchor the centre include Waitrose and Aldi. There is also a number of
bakers, grocers/delicatessens; and health food stores (as defined by Experian Goad). The convenience
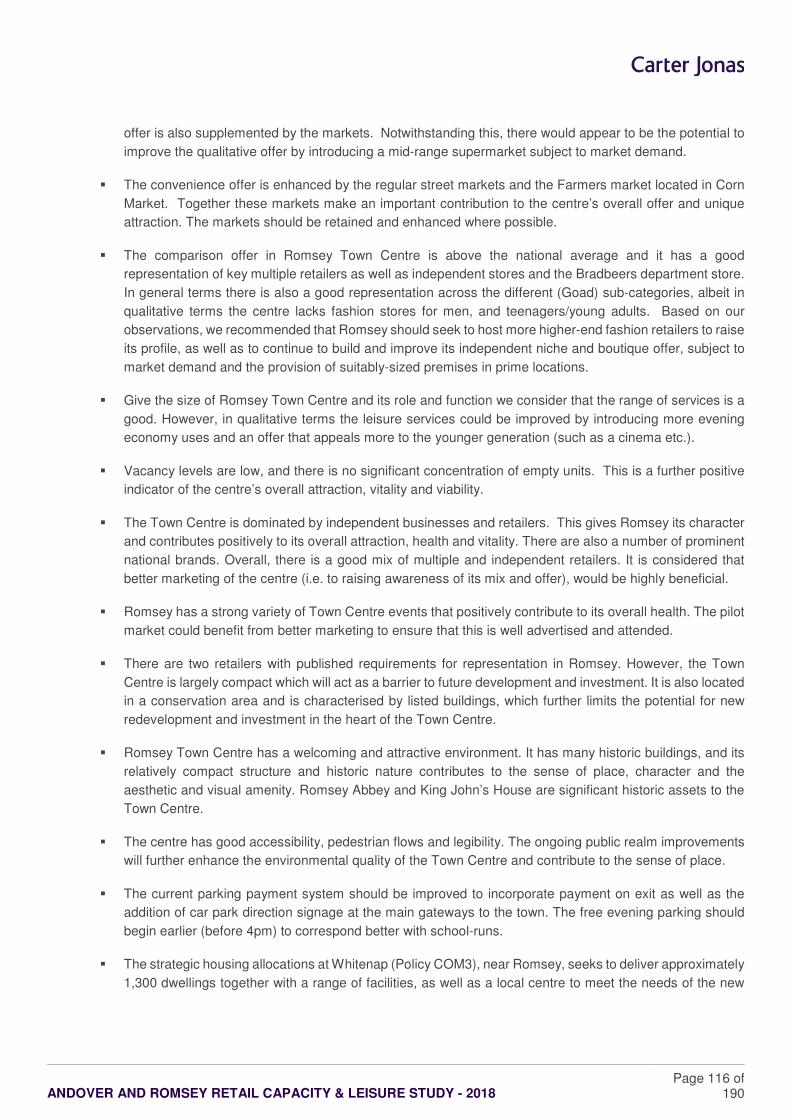
ANDOVER AND ROMSEY RETAIL CAPACITY & LEISURE STUDY - 2018
Page 116 of 190
offer is also supplemented by the markets. Notwithstanding this, there would appear to be the potential to
improve the qualitative offer by introducing a mid-range supermarket subject to market demand.
� The convenience offer is enhanced by the regular street markets and the Farmers market located in Corn
Market. Together these markets make an important contribution to the centre’s overall offer and unique
attraction. The markets should be retained and enhanced where possible.
� The comparison offer in Romsey Town Centre is above the national average and it has a good
representation of key multiple retailers as well as independent stores and the Bradbeers department store.
In general terms there is also a good representation across the different (Goad) sub-categories, albeit in
qualitative terms the centre lacks fashion stores for men, and teenagers/young adults. Based on our
observations, we recommended that Romsey should seek to host more higher-end fashion retailers to raise
its profile, as well as to continue to build and improve its independent niche and boutique offer, subject to
market demand and the provision of suitably-sized premises in prime locations.
� Give the size of Romsey Town Centre and its role and function we consider that the range of services is a
good. However, in qualitative terms the leisure services could be improved by introducing more evening
economy uses and an offer that appeals more to the younger generation (such as a cinema etc.).
� Vacancy levels are low, and there is no significant concentration of empty units. This is a further positive
indicator of the centre’s overall attraction, vitality and viability.
� The Town Centre is dominated by independent businesses and retailers. This gives Romsey its character
and contributes positively to its overall attraction, health and vitality. There are also a number of prominent
national brands. Overall, there is a good mix of multiple and independent retailers. It is considered that
better marketing of the centre (i.e. to raising awareness of its mix and offer), would be highly beneficial.
� Romsey has a strong variety of Town Centre events that positively contribute to its overall health. The pilot
market could benefit from better marketing to ensure that this is well advertised and attended.
� There are two retailers with published requirements for representation in Romsey. However, the Town
Centre is largely compact which will act as a barrier to future development and investment. It is also located
in a conservation area and is characterised by listed buildings, which further limits the potential for new
redevelopment and investment in the heart of the Town Centre.
� Romsey Town Centre has a welcoming and attractive environment. It has many historic buildings, and its
relatively compact structure and historic nature contributes to the sense of place, character and the
aesthetic and visual amenity. Romsey Abbey and King John’s House are significant historic assets to the
Town Centre.
� The centre has good accessibility, pedestrian flows and legibility. The ongoing public realm improvements
will further enhance the environmental quality of the Town Centre and contribute to the sense of place.
� The current parking payment system should be improved to incorporate payment on exit as well as the
addition of car park direction signage at the main gateways to the town. The free evening parking should
begin earlier (before 4pm) to correspond better with school-runs.
� The strategic housing allocations at Whitenap (Policy COM3), near Romsey, seeks to deliver approximately
1,300 dwellings together with a range of facilities, as well as a local centre to meet the needs of the new
ANDOVER AND ROMSEY RETAIL CAPACITY & LEISURE STUDY - 2018
Page 117 of 190
community. This development could add pressure to Romsey Town Centre, specifically the comparison
and service sector.
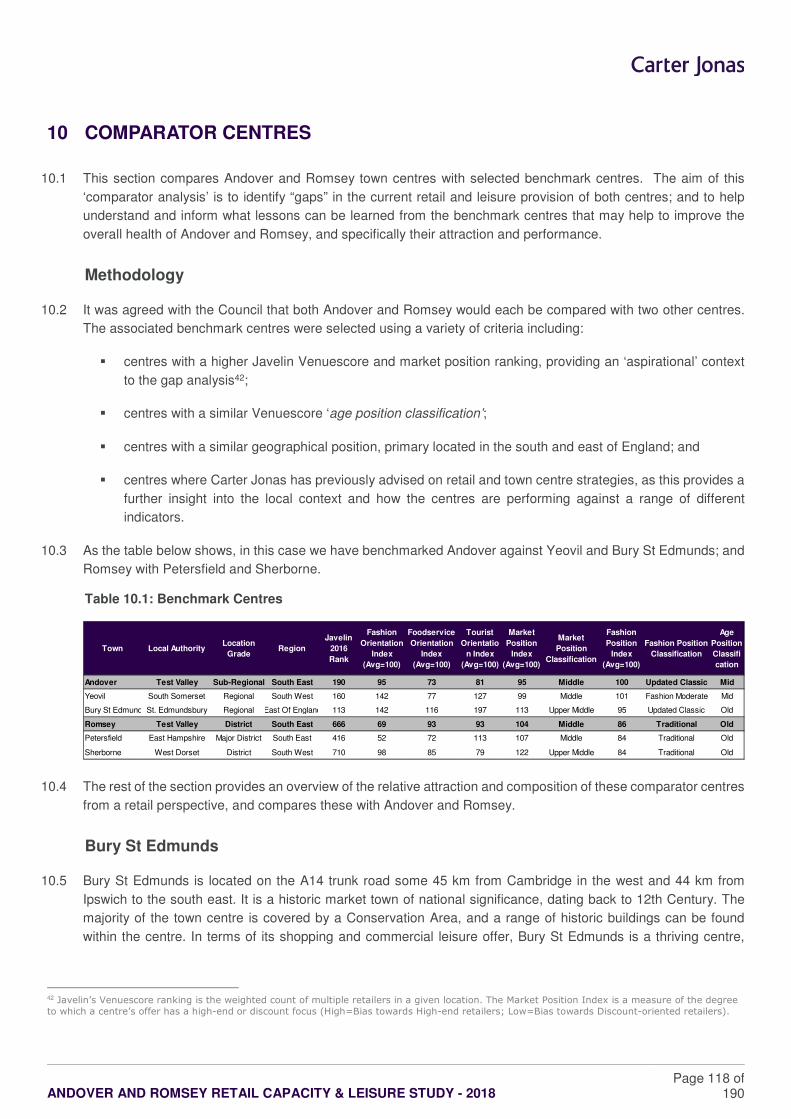
ANDOVER AND ROMSEY RETAIL CAPACITY & LEISURE STUDY - 2018
Page 118 of 190
10 COMPARATOR CENTRES
10.1 This section compares Andover and Romsey town centres with selected benchmark centres. The aim of this
‘comparator analysis’ is to identify “gaps” in the current retail and leisure provision of both centres; and to help
understand and inform what lessons can be learned from the benchmark centres that may help to improve the
overall health of Andover and Romsey, and specifically their attraction and performance.
Methodology
10.2 It was agreed with the Council that both Andover and Romsey would each be compared with two other centres.
The associated benchmark centres were selected using a variety of criteria including:
� centres with a higher Javelin Venuescore and market position ranking, providing an ‘aspirational’ context
to the gap analysis42;
� centres with a similar Venuescore ‘age position classification’;
� centres with a similar geographical position, primary located in the south and east of England; and
� centres where Carter Jonas has previously advised on retail and town centre strategies, as this provides a
further insight into the local context and how the centres are performing against a range of different
indicators.
10.3 As the table below shows, in this case we have benchmarked Andover against Yeovil and Bury St Edmunds; and
Romsey with Petersfield and Sherborne.
Table 10.1: Benchmark Centres
10.4 The rest of the section provides an overview of the relative attraction and composition of these comparator centres
from a retail perspective, and compares these with Andover and Romsey.
Bury St Edmunds
10.5 Bury St Edmunds is located on the A14 trunk road some 45 km from Cambridge in the west and 44 km from
Ipswich to the south east. It is a historic market town of national significance, dating back to 12th Century. The
majority of the town centre is covered by a Conservation Area, and a range of historic buildings can be found
within the centre. In terms of its shopping and commercial leisure offer, Bury St Edmunds is a thriving centre,
42 Javelin’s Venuescore ranking is the weighted count of multiple retailers in a given location. The Market Position Index is a measure of the degree
to which a centre’s offer has a high-end or discount focus (High=Bias towards High-end retailers; Low=Bias towards Discount-oriented retailers).
Town Local AuthorityLocation
GradeRegion
Javelin
2016
Rank
Fashion
Orientation
Index
(Avg=100)
Foodservice
Orientation
Index
(Avg=100)
Tourist
Orientatio
n Index
(Avg=100)
Market
Position
Index
(Avg=100)
Market
Position
Classification
Fashion
Position
Index
(Avg=100)
Fashion Position
Classification
Age
Position
Classifi
cation
Andover Test Valley Sub-Regional South East 190 95 73 81 95 Middle 100 Updated Classic Mid
Yeovil South Somerset Regional South West 160 142 77 127 99 Middle 101 Fashion Moderate Mid
Bury St EdmundsSt. Edmundsbury Regional East Of England 113 142 116 197 113 Upper Middle 95 Updated Classic Old
Romsey Test Valley District South East 666 69 93 93 104 Middle 86 Traditional Old
Petersfield East Hampshire Major District South East 416 52 72 113 107 Middle 84 Traditional Old
Sherborne West Dorset District South West 710 98 85 79 122 Upper Middle 84 Traditional Old
ANDOVER AND ROMSEY RETAIL CAPACITY & LEISURE STUDY - 2018
Page 119 of 190
characterised by a good mix of high street multiples and independent shops, as well as a very popular street
market.
10.6 Our review and assessment of the town’s relative health and performance is informed by the “West Suffolk Retail
and Leisure Study 2016”, which was prepared by Carter Jonas. The main headline findings are as follows.
10.7 The Old Town comprises the centre’s historic shopping streets, and comparable to Andover in terms of its broad
layout and configuration. The main section of the Old Town is focused around a traditional market square, which
is somewhat similar to the pedestrianised section of the High Street outside of the Guildhall. Here a twice-weekly
street market takes place. It is one of the key attractions of Bury St Edmunds. Additionally a number of events
are hosted here throughout the year including a popular Christmas market. The Old Town area is anchored by
Marks & Spencer and an independent Department store (Palmers), and hosts a number of other prominent
retailers (such as JD Sports, Superdrug, WHSmith and Boots), as well as some high quality independent stores.
Indeed, the town’s independent retail and service offer is strong, particularly along the secondary streets. This
includes independent cafés/restaurants/take away operators, health and beauty services (hairdressers, barbers,
beauty salons, nail bars) and fashion and shoe retailers. The independent stores and shops all contribute
significantly to the overall diversity, vitality and viability of the town centre’s offer.
10.8 The Arc Shopping Centre opened in March 2009 and has further extended the main (historic) shopping area
westwards and significantly improved the scale and quality of the town’s offer. It includes 37 shops, residential
units, a concert hall (the Apex) and over 850 car parking spaces. The scheme has enabled the centre to increase
the amount of national multiple retailers by providing modern larger format units, which are more suitable to the
needs of such retailers. As well as reintroducing Debenhams (75,000 sqft) to the town, the Arc has been highly
successful in attracting a number of high quality multiple fashion clothing and footwear retailers; including
Topshop, Hobbs, Fat Face, New Look, River Island, and H&M. Many of the retailers in the Arc were newcomers
to the town centre where there is likely to be preference to locate next to anchor stores (i.e. Debenhams). There
are also numerous bars, cafes and restaurants, several with outside seating areas, which add to the vibrancy of
the shopping area. On the back of this scheme and other investments/ initiatives the wider town centre has also
successfully attracted new retail and leisure brands into previously vacant units. The Arc Shopping Centre is now
one of the main shopping destinations in the town centre.
10.9 The Market is also one of the most successful traditional street markets in the country. The market comprises
over 80 stalls with approximately 1,600 sqft of stall frontages on Saturdays, and slightly less on Wednesdays. The
market sells a wide variety of goods, including fresh fruit and vegetables, clothes, hardware, fabric, pet foods,
flowers, seafood, shoes and other speciality goods. There are also a number of hot food vendors (including hog
roast, burgers and crêpes) and we understand the market has a license to sell alcohol. The market attracts many
visitors, not just from the immediate locality but also from across East Anglia, with coaches bringing tourists in on
market days. The market is well managed and marketed, and there is plenty of information available on the internet
to promote it. The market is of a high quality, it is very successful and a major attraction; positively contributing to
the unique character of Bury St Edmunds and its wide ranging shopping and food and beverage offer.
10.10 To the west of the Arc, on the edge of the Town Centre there is also a “leisure hub” that is anchored by a
multiscreen cinema (Cineworld), supported by a number food and beverage uses. This area is somewhat
comparable to the existing cinema in Andover, or potentially the envisaged cultural quarter to the north of
Andover’s PSA; on the basis that it is within the walking distance from the PSA but is not necessary well connected
to it (there is a car park and a main road segregates the two areas). As such, we understand, this is used somewhat
independently of the main town centre.
ANDOVER AND ROMSEY RETAIL CAPACITY & LEISURE STUDY - 2018
Page 120 of 190
10.11 Bury St Edmunds also benefits from an attractive, historic and green environment, characterised by the Abbey
Gardens, which although not within the Town Centre boundary, is well connected to the shopping area and
provides a pleasant recreational space for town centre visitors. It is noted that Andover currently lacks a
recreational space.
10.12 Based on the above, we consider that the key lessons that can be applied to Andover from Bury St Edmunds are
as follows:
� Invest in modern shopping premises to attract high-end fashion retailers, with a prominent anchor.
� Ensure that the existing town centre adapts by focusing on attracting a high-quality independent offer.
� Ensure a well-integrated and attractive shopping environment and public realm.
� Place weight on investment in an attractive and proactively managed market, supported by a series of town
centre events and promotions.
� Establish a well-integrated recreation space.
� Ensure adequate leisure facilities.
Petersfield
10.13 Petersfield is a market town located in East Hampshire, some 17 miles north of Portsmouth, and is located in the
South Downs National Park. Many people visit Petersfield for leisure activities and to enjoy its cultural and built
heritage (estimated at 3.5m day trips to the area annually).
10.14 Our assessment is informed in part by the “Petersfield Neighbourhood Development Plan” (2015), supplemented
by our own research. The following sets out our understanding of the key characteristics of Petersfield’s offer.
10.15 The profile of Petersfield’s shops has changed over the years, reflecting the general upheavals on high streets
across the country over the last decade, mainly due to the increased use of the internet for day-to-day items and
shopping as a leisure activity. Petersfield has adapted relatively well by offering increased numbers of unique
shops that appeal to leisure shoppers at weekends and leisure-based services such as beauty, hairdressing and
cafés. At the same time it has managed to retain some its key multiples, such as Phase Eight, Joules, Fat Face
and Monsoon, that help to drive trips and footfall. This trend is expected to continue with standard shops being
replaced with quality, niche retail and leisure outlets.
10.16 Petersfield’s historic centre attracts visitors to enjoy food and drink in attractive and pleasant surroundings. The
town is well equipped with pubs, restaurants and cafés, many of which now offer outdoor seating around the
Market Square. Festivals, events and specialist markets have helped to promote the concept, and the Market
Square has proved a great asset to the town which has assisted and improved its retail offer. Seasonal festivals
and events strengthen the town’s community spirit, provide a focus for people from the surrounding area and also
make Petersfield a destination in its own right for people visiting the South Downs.
10.17 Based on the above, we consider that the key lessons that can be learned from Petersfield are as follows:
� Adapt to the changing high street by introducing more unique shops and leisure based uses; and at the
same time seek to retain and attract a number of key multiple comparison (ideally fashion) anchors.
ANDOVER AND ROMSEY RETAIL CAPACITY & LEISURE STUDY - 2018
Page 121 of 190
� Utilise the market square to its full potential to create interest and activity to complement the wider shopping
and service offer.
� Host festivals, events and specialist markets to create more reasons to visit the centre, and diversity the
customer base.
Yeovil
10.18 Yeovil is the largest town in South Somerset. The town serves as the District’s commercial and administrative
centre and provides facilities and services for the wider hinterland. In retail terms Yeovil is designated as a
Principal Settlement at the top of the settlement hierarchy.
10.19 To inform our assessment we have reviewed the recent “South Somerset Retail and Main Town Centres Uses
Study” (2017) and also undertaken our own research to better understand the key attractions and offer in Yeovil
Town Centre. The following sets out our summary of the headline findings, and our main recommendations
10.20 The Quedam Shopping Centre acts as the main comparison anchor. Originally built in 1984, it benefitted from a
£4m refurbishment in 2015 by the new owners. This primarily consisted of securing new double height frontages
with high specification finishes to all store units, and the enhancement of entrances, directories and signage
packages. These works allowed the shopping centre to secure high profile national retailers such as H&M,
Topshop and JD Sports in newly created modern units to enter the Yeovil market. It is not surprising that since
2014 the centre’s Venuescore ranking has improved from 165th to 160th. Other prominent fashion retailers in the
centre include River Island, Monsoon and Primark.
10.21 The other key element of Yeovil is the presence of an active team of local retailers that seeks to promote the
centre and drive its health. Specifically “Love Yeovil” is a group of local businesses from the retail, leisure, culture
and services sector who together contribute financially to provide core funding for the promotion and development
of the Town Centre. The group works with South Somerset District Council, Yeovil Town Council and the Parish
Council. It meets regularly to action ways of promoting and improving the Town Centre. The key aims are to attract
people to Yeovil and encourage them to buy into retail, leisure and culture offerings; and to encourage a sense of
pride amongst those who live and work in Yeovil. The Team has an active Facebook page, as well as Twitter and
Instagram; and provides news and updates on upcoming events, deals and offers for shopping, eating and
entertainment.
10.22 It should also be noted that South Somerset District Council, in partnership with consultants and a number of key
partners have produced, a number of vision documents (namely Yeovil: Your Somerset Town Centre of Choice
(undated) and Yeovil Refresh “Town Centre Strategy” (February 2018)) that explore in detail opportunities to invest
in Yeovil's future and guide development, creating a vibrant place to live, work, learn and visit.
10.23 Based on the evidence and research, we consider that the key lessons that can be learned from Yeovil are as
follows:
� Provide modern format units, attractive shopping frontages and pleasant surrounding public realm to help
attract new retailers and upgrade “tired” shopping centres.
� Establish partnerships of local retailers to promote and improve the Town Centre.
� Create detailed Town Centre Strategies to identify investment opportunities and guide future development.
ANDOVER AND ROMSEY RETAIL CAPACITY & LEISURE STUDY - 2018
Page 122 of 190
Sherborne
10.24 Sherborne is a historic market town located in the north of the West Dorset district. It is known for its high quality
built heritage and the attractions of Sherborne Abbey and Sherborne School. The town centre is situated within a
Conservation Area and the majority of the buildings of Medieval and Georgian architecture in the town centre are
listed.
10.25 To inform our assessment we have reviewed the “Joint Dorset Town Centres & Retail Study” prepared by Carter
Jonas in 2018 for North Dorset, West Dorset and Weymouth & Portland Councils. As part of the study we
undertook our own research and site visits to better understand the attraction, health and performance of
Sherborne. The following provides the headline findings of our review.
10.26 In brief, Sherborne is characterised by a diverse range and choice of quality independent retailers. They sell a
range of goods such as clothing, gifts and homeware. This independent offer is complementary to the high street
retailers also located in the centre; including Joules, Fat Face, Crew Clothing Company and Mountain Warehouse.
The variety of independent and multiple retailers appeal to both residents’ and visitors’ needs, and are appropriate
for a centre of its size, role and function.
10.27 The traditional and historic built environment of the town centre helps to attract both visitors and residents alike to
Sherborne. Shops fronts and facades are well-maintained throughout the centre. The painted wooden shop fronts
characterising the prime retail pitch along Cheap Street add to the overall attraction of the centre. Overall, the
quality of Sherborne’s public realm is considered exceptional, with enhancements such as decorative bunting as
well as hanging baskets (introduced through funding generated by ‘Sherborne in Bloom’) helping to create an
aesthetically pleasing town centre environment.
10.28 Based on the above, the key lessons that can be learned from Sherborne are as follows:
� Adapt to the changing role of retail by introducing more quality independent shops and high street retailers
that are commensurate with the size of the centre and the local populations’ needs, as well as a wider
visitor and tourist market.
� Use public realm enhancement schemes to help create an appealing town centre environment and public
realm which attracts both visitors and residents to the centre
Andover Gap Analysis
10.29 In simple terms a “gap” analysis of comparator centres can help to identify those retailers and leisure operators
not currently represent in the subject town. It represents an “aspirational list” of target operators, as there is no
guarantee that: (i) the identified operators have requirements for the town centre; and (ii) there are suitable and
viable units/sites in the subject town that can meet their needs.
10.30 In this case we have compared the prominent national retail and leisure operators present in Bury St Edmunds
and Yeovil town centres respectively, to those in Andover. The tenant mix data for Bury St Edmunds and Yeovil
has been sourced from Experian Goad, and is based on the respective centre surveys undertaken by Experian in
March 2017 and September 2016 (the latest available surveys at the time of writing). The operator (‘facia’) data
for Andover was provided by the Council, and is based on their own audit of the centre’s primary and secondary
frontages conducted in October 2017.
10.31 When comparing Andover to Bury St Edmunds and Yeovil, it should also be noted at the outset that both Bury St
Edmunds and Yeovil are much larger centres. Andover has 230 town centre operators, whereas Bury St Edmunds
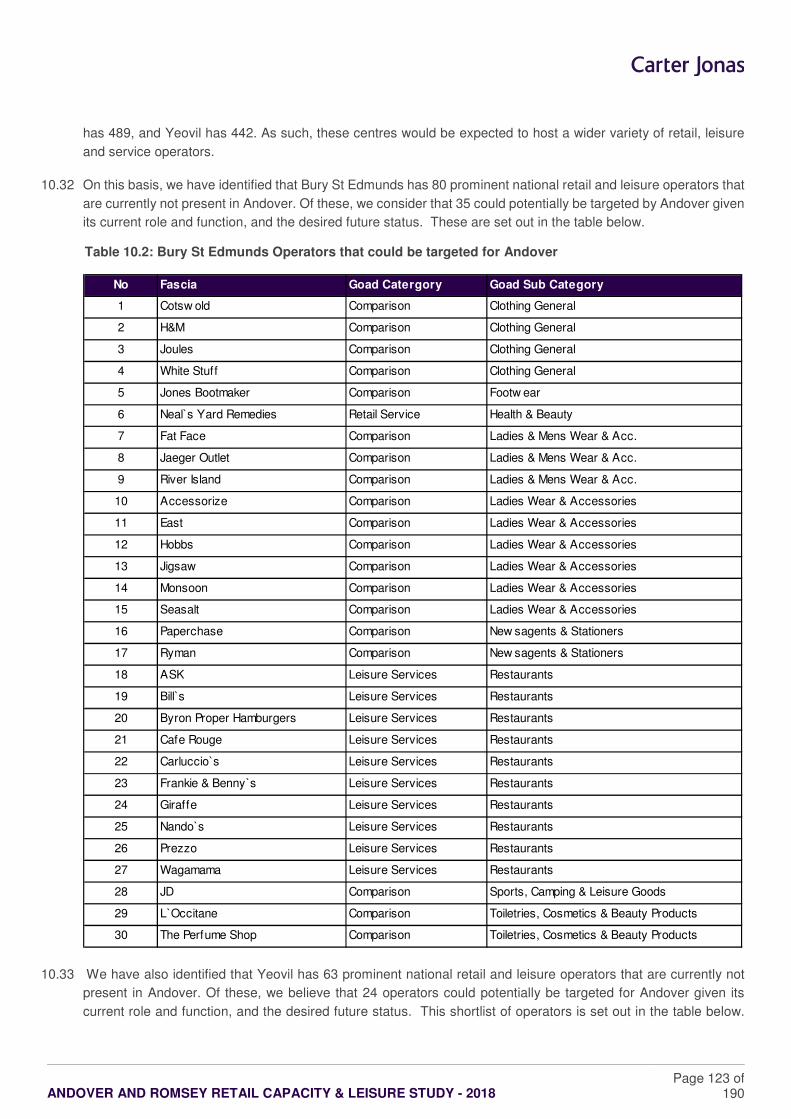
ANDOVER AND ROMSEY RETAIL CAPACITY & LEISURE STUDY - 2018
Page 123 of 190
has 489, and Yeovil has 442. As such, these centres would be expected to host a wider variety of retail, leisure
and service operators.
10.32 On this basis, we have identified that Bury St Edmunds has 80 prominent national retail and leisure operators that
are currently not present in Andover. Of these, we consider that 35 could potentially be targeted by Andover given
its current role and function, and the desired future status. These are set out in the table below.
Table 10.2: Bury St Edmunds Operators that could be targeted for Andover
10.33 We have also identified that Yeovil has 63 prominent national retail and leisure operators that are currently not
present in Andover. Of these, we believe that 24 operators could potentially be targeted for Andover given its
current role and function, and the desired future status. This shortlist of operators is set out in the table below.
No Fascia Goad Catergory Goad Sub Category
1 Cotsw old Comparison Clothing General
2 H&M Comparison Clothing General
3 Joules Comparison Clothing General
4 White Stuff Comparison Clothing General
5 Jones Bootmaker Comparison Footw ear
6 Neal̀ s Yard Remedies Retail Service Health & Beauty
7 Fat Face Comparison Ladies & Mens Wear & Acc.
8 Jaeger Outlet Comparison Ladies & Mens Wear & Acc.
9 River Island Comparison Ladies & Mens Wear & Acc.
10 Accessorize Comparison Ladies Wear & Accessories
11 East Comparison Ladies Wear & Accessories
12 Hobbs Comparison Ladies Wear & Accessories
13 Jigsaw Comparison Ladies Wear & Accessories
14 Monsoon Comparison Ladies Wear & Accessories
15 Seasalt Comparison Ladies Wear & Accessories
16 Paperchase Comparison New sagents & Stationers
17 Ryman Comparison New sagents & Stationers
18 ASK Leisure Services Restaurants
19 Bill̀ s Leisure Services Restaurants
20 Byron Proper Hamburgers Leisure Services Restaurants
21 Cafe Rouge Leisure Services Restaurants
22 Carluccio`s Leisure Services Restaurants
23 Frankie & Benny`s Leisure Services Restaurants
24 Giraffe Leisure Services Restaurants
25 Nando`s Leisure Services Restaurants
26 Prezzo Leisure Services Restaurants
27 Wagamama Leisure Services Restaurants
28 JD Comparison Sports, Camping & Leisure Goods
29 L`Occitane Comparison Toiletries, Cosmetics & Beauty Products
30 The Perfume Shop Comparison Toiletries, Cosmetics & Beauty Products
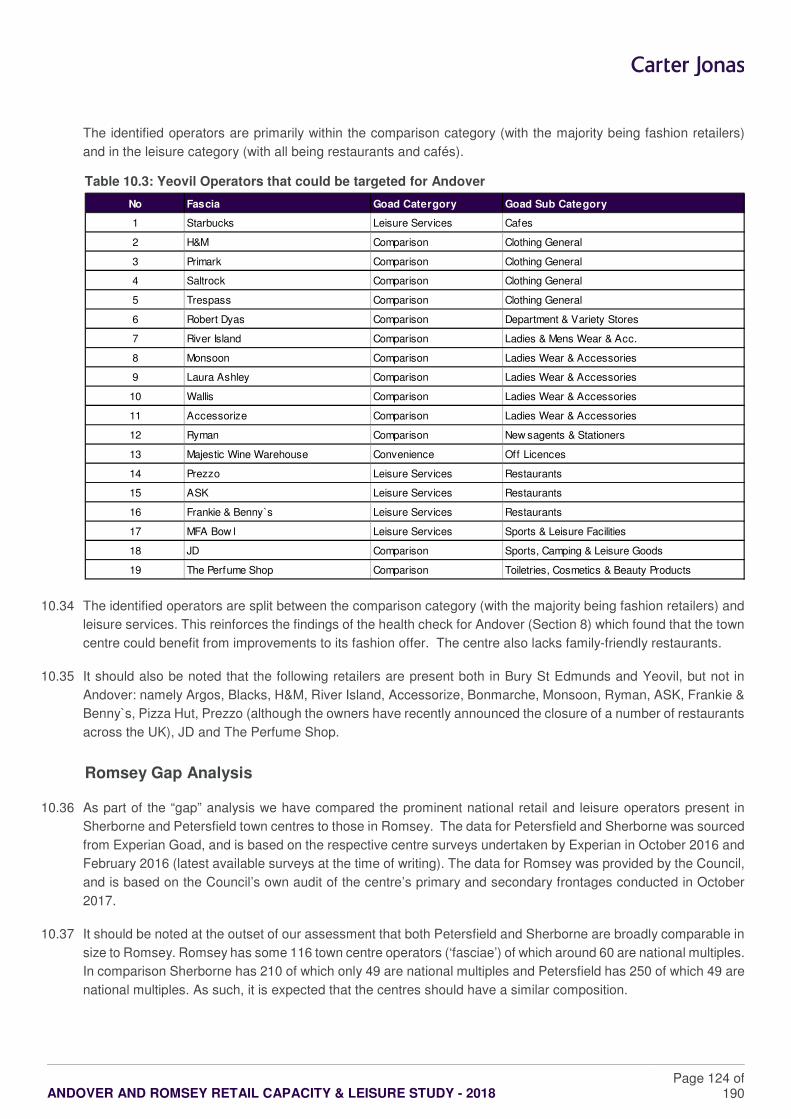
ANDOVER AND ROMSEY RETAIL CAPACITY & LEISURE STUDY - 2018
Page 124 of 190
The identified operators are primarily within the comparison category (with the majority being fashion retailers)
and in the leisure category (with all being restaurants and cafés).
Table 10.3: Yeovil Operators that could be targeted for Andover
10.34 The identified operators are split between the comparison category (with the majority being fashion retailers) and
leisure services. This reinforces the findings of the health check for Andover (Section 8) which found that the town
centre could benefit from improvements to its fashion offer. The centre also lacks family-friendly restaurants.
10.35 It should also be noted that the following retailers are present both in Bury St Edmunds and Yeovil, but not in
Andover: namely Argos, Blacks, H&M, River Island, Accessorize, Bonmarche, Monsoon, Ryman, ASK, Frankie &
Benny`s, Pizza Hut, Prezzo (although the owners have recently announced the closure of a number of restaurants
across the UK), JD and The Perfume Shop.
Romsey Gap Analysis
10.36 As part of the “gap” analysis we have compared the prominent national retail and leisure operators present in
Sherborne and Petersfield town centres to those in Romsey. The data for Petersfield and Sherborne was sourced
from Experian Goad, and is based on the respective centre surveys undertaken by Experian in October 2016 and
February 2016 (latest available surveys at the time of writing). The data for Romsey was provided by the Council,
and is based on the Council’s own audit of the centre’s primary and secondary frontages conducted in October
2017.
10.37 It should be noted at the outset of our assessment that both Petersfield and Sherborne are broadly comparable in
size to Romsey. Romsey has some 116 town centre operators (‘fasciae’) of which around 60 are national multiples.
In comparison Sherborne has 210 of which only 49 are national multiples and Petersfield has 250 of which 49 are
national multiples. As such, it is expected that the centres should have a similar composition.
No Fascia Goad Catergory Goad Sub Category
1 Starbucks Leisure Services Cafes
2 H&M Comparison Clothing General
3 Primark Comparison Clothing General
4 Saltrock Comparison Clothing General
5 Trespass Comparison Clothing General
6 Robert Dyas Comparison Department & Variety Stores
7 River Island Comparison Ladies & Mens Wear & Acc.
8 Monsoon Comparison Ladies Wear & Accessories
9 Laura Ashley Comparison Ladies Wear & Accessories
10 Wallis Comparison Ladies Wear & Accessories
11 Accessorize Comparison Ladies Wear & Accessories
12 Ryman Comparison New sagents & Stationers
13 Majestic Wine Warehouse Convenience Off Licences
14 Prezzo Leisure Services Restaurants
15 ASK Leisure Services Restaurants
16 Frankie & Benny`s Leisure Services Restaurants
17 MFA Bow l Leisure Services Sports & Leisure Facilities
18 JD Comparison Sports, Camping & Leisure Goods
19 The Perfume Shop Comparison Toiletries, Cosmetics & Beauty Products
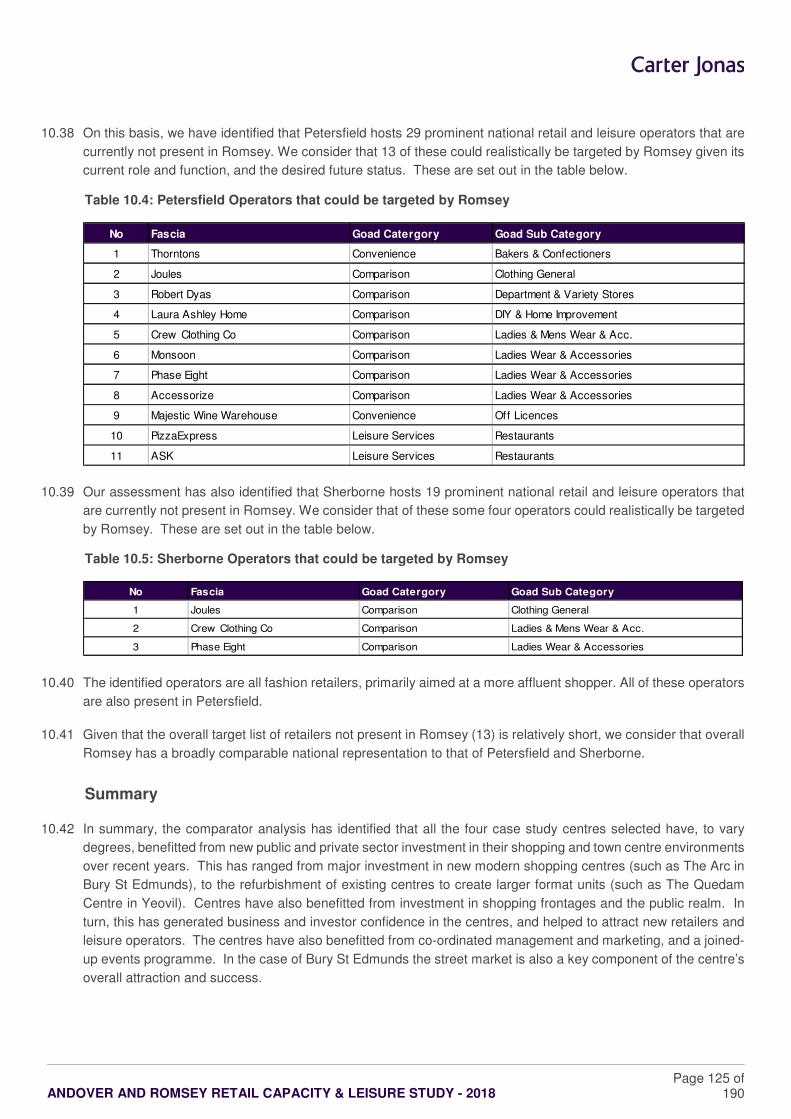
ANDOVER AND ROMSEY RETAIL CAPACITY & LEISURE STUDY - 2018
Page 125 of 190
10.38 On this basis, we have identified that Petersfield hosts 29 prominent national retail and leisure operators that are
currently not present in Romsey. We consider that 13 of these could realistically be targeted by Romsey given its
current role and function, and the desired future status. These are set out in the table below.
Table 10.4: Petersfield Operators that could be targeted by Romsey
10.39 Our assessment has also identified that Sherborne hosts 19 prominent national retail and leisure operators that
are currently not present in Romsey. We consider that of these some four operators could realistically be targeted
by Romsey. These are set out in the table below.
Table 10.5: Sherborne Operators that could be targeted by Romsey
10.40 The identified operators are all fashion retailers, primarily aimed at a more affluent shopper. All of these operators
are also present in Petersfield.
10.41 Given that the overall target list of retailers not present in Romsey (13) is relatively short, we consider that overall
Romsey has a broadly comparable national representation to that of Petersfield and Sherborne.
Summary
10.42 In summary, the comparator analysis has identified that all the four case study centres selected have, to vary
degrees, benefitted from new public and private sector investment in their shopping and town centre environments
over recent years. This has ranged from major investment in new modern shopping centres (such as The Arc in
Bury St Edmunds), to the refurbishment of existing centres to create larger format units (such as The Quedam
Centre in Yeovil). Centres have also benefitted from investment in shopping frontages and the public realm. In
turn, this has generated business and investor confidence in the centres, and helped to attract new retailers and
leisure operators. The centres have also benefitted from co-ordinated management and marketing, and a joined-
up events programme. In the case of Bury St Edmunds the street market is also a key component of the centre’s
overall attraction and success.
No Fascia Goad Catergory Goad Sub Category
1 Thorntons Convenience Bakers & Confectioners
2 Joules Comparison Clothing General
3 Robert Dyas Comparison Department & Variety Stores
4 Laura Ashley Home Comparison DIY & Home Improvement
5 Crew Clothing Co Comparison Ladies & Mens Wear & Acc.
6 Monsoon Comparison Ladies Wear & Accessories
7 Phase Eight Comparison Ladies Wear & Accessories
8 Accessorize Comparison Ladies Wear & Accessories
9 Majestic Wine Warehouse Convenience Off Licences
10 PizzaExpress Leisure Services Restaurants
11 ASK Leisure Services Restaurants
No Fascia Goad Catergory Goad Sub Category
1 Joules Comparison Clothing General
2 Crew Clothing Co Comparison Ladies & Mens Wear & Acc.
3 Phase Eight Comparison Ladies Wear & Accessories
ANDOVER AND ROMSEY RETAIL CAPACITY & LEISURE STUDY - 2018
Page 126 of 190
10.43 Although the ‘gap’ analysis has identified a number of retailers and brands that are represented in the four
comparator centres that would normally be expected to trade from Andover and Romsey. However, this is clearly
dependent on market demand and providing the right accommodation in the right locations that meets the needs
of these prospective tenants. The ‘gap’ analysis also has to be considered in the context of current retail trends,
whereby retailers are reducing their presence on many high streets due to the impact of online shopping and wider
economic forces.
10.44 Notwithstanding this, it is apparent that investment in a town’s shopping offer, frontages and public realm can help
to create a ‘sense of place’, and also generate consumer, business and investment confidence in centres. In turn,
this can help to attract new independent and multiple business to take space in a centre.
10.45 We therefore recommend that more detailed market testing be undertaken to gauge the level of market demand
in the Borough’s main centres, and the potential actions and investment that will be needed to attract new retailers
and businesses to the centres, and to retain existing retailers and businesses.
ANDOVER AND ROMSEY RETAIL CAPACITY & LEISURE STUDY - 2018
Page 127 of 190
11 QUANTITATIVE RETAIL NEEDS ASSESSMENT
11.1 This section sets out the results of the quantitative retail needs (‘capacity’) assessment for new retail (comparison
and convenience goods) floorspace in the Test Valley Borough Council area covering the period from 2017 to
2036; further broken down into sub-periods (i.e. 2021, 2026 and 2031). This assessment updates and supersedes
the findings of the Council’s previous evidence-based studies.
The CREATe Model: Key Baseline Assumptions & Forecasts
11.2 The CREATe economic capacity model has been specifically designed and developed by Carter Jonas over a
number of years to assess the capacity for and impact of new retail (convenience and comparison goods)
development and investment.
11.3 The (Excel-based) model adopts a transparent ‘step-by-step’ approach in which all the key assumptions and
forecasts can be easily tested, in accordance with good practice advice. The model draws on the market share
analysis derived from the household telephone interview to help inform the assessment of the current turnover
and trading performance of existing centres, shops and stores at the base year.
11.4 It has been assumed for the purpose of the capacity assessment that the local retail markets in the local authority
area are in ‘equilibrium’ at the base year. In other words all existing centres and stores are broadly assumed to
be trading in line with their expected (‘benchmark’) turnover levels at the base year. This approach is reasonable,
robust and realistic in this case as it reflects the impact of the economic downturn and the significant growth in
internet sales on the trading levels and performance of retailers and stores across the UK. It also reflects the
potential impact of Brexit on the economy and retail sector going forward. Further to this, there is no qualitative
evidence from the health check assessments to clearly show that any of the main centres and stores in the local
authority areas are significantly over-trading or under-trading at the base year (2017).
11.5 On this basis any residual expenditure available to support new retail floorspace over the development plan period
will be derived from the difference between the forecast growth in ‘current’ (survey-derived) turnover levels (based
on population and expenditure growth), and the constrained growth in ‘benchmark’ turnovers43 based on applying
robust year-on-year ‘productivity’ (‘efficiency’) growth rates to all existing and new retail floorspace44.
11.6 It is important to restate that long-term forecasts should be treated with caution, as they will be influenced by
changes in economic, demographic and market trends. As a result we advise that greater weight should be placed
on the short term forecasts carried out over a five year period (see PPG, para 003). Notwithstanding this, the
Council will need to take account of the forecast capacity for new retail floorspace over the plan period to inform
its policy making and site allocations, as the NPPF (paragraph 23) states that local planning authorities should
meet the need for retail and town centre uses ‘in full’ (see Section 2 of this study).
11.7 The updated capacity forecasts set out in this section are intended as a broad guide to enable the Council to
assess the broad strategic options for the spatial distribution of new retail-led floorspace and development over
43 In this case, under the ‘equilibrium’ approach, the ‘benchmark’ turnovers at the base year (2017) are assumed to be the ‘current’ turnovers
derived from the market share analysis.
44 The ‘efficiency’ growth rates are informed Experian’s latest Retail Planner Briefing Note (Figures 4a and 4b) These year-on-year turnover growth
rates help to maintain the viability and vitality of existing centres and stores over time, particularly against the backdrop of increasing occupancy costs (e.g. rents, business rates, service charges, etc.) and labour costs. It should be noted that individual centres, stores and shopping facilities
will be capable of achieving higher and/or lower annual ‘efficiency’ growth depending on a range of trading factors (including the size, quality and
type of retail floorspace). In this case we have assumed slightly higher turnover ‘efficiency’ growth levels for existing and committed floorspace in
the local authority areas for the period 2025-2036 than forecast by Experian (see Section 3 of this study for a more detailed explanation).
ANDOVER AND ROMSEY RETAIL CAPACITY & LEISURE STUDY - 2018
Page 128 of 190
the plan period, and to make informed policy choices about where any forecast need should be met, in accordance
with the advice set out in the NPPF (paragraph 24). It follows that the allocation of sites to meet any identified
need over the next five years, and over the lifetime of the development plan, will depend on a range of key
considerations, including the suitability, viability and availability of sites in or on the edge of existing centres, and
the potential to expand existing centres to accommodate the forecast needs.
11.8 The key steps in the retail capacity assessment, and the main assumptions and forecasts underpinning the
CREATe Model are described in more detail below.
Base Year Population and Projections
11.9 The 2017 (‘base year’) population estimates and projections (to 2021, 2026, 2031 and 2036) for the Study Area
and zones have been sourced as follows.
� For Wards located within Hampshire County Council (i.e. comprising the Test Valley Council Area entirely),
the population figures have been taken from Hampshire County Council’s 2016-based Small Area
Population Forecasts (SAPF) (2016-2023). These figures have then been forecast forward by Carter
Jonas on pro-rata basis up to 2036, using SAPF average year-on year growth rates between 2016-2023.
� For the remaining Wards, the population figures have been sourced from Experian's 'Retail Planner
Reports” using CJ's (Experian-based) MMG3 Geographic Information System (GIS)). The population
figures are based on the latest ONS Sub-National Population Projections, although they do not take
account of the impact of local housing-led policy allocations on potential population growth. The population
projections for zones are derived from Experian's revised 'demographic component model’ and take into
account mid-year age and gender estimates. The population is projected forward year-on-year based on
Government population projections for local authority areas in England. The yearly components of
population change that are taken into account include the birth rate (0-4 age band), ageing, net migration,
death rates, etc.
11.10 Table 1 (Appendices 2 and 3) sets out the base year population for the Study Area and 10 study zones. It shows
that there are estimated to be some 461,138 people living in the defined Study Area at 2017. Of these, 125,195
people reside within the Council’s administrative boundary. The population projections show a total population
growth of +11.6% (+53,634 people) across the Study Area to 514,772 by 2036.
Base Year Expenditure Per Capita and Forecasts
11.11 Tables 2 and 3 set out the expenditure per capita estimates for convenience goods (Appendix 2) and comparison
goods (Appendix 3) for each of the study zones; after making an allowance for special forms of trading (SFT)45.
11.12 The base year (2017) average expenditure per capita figures have been derived from our in-house Experian
MMG3 GIS. The expenditure per capita figures by zone have then been grown year-on-year based on the latest
forecasts set out in Experian Retail Planner Briefing Note 15 (RPBN) published in December 2017. As described
in Section 3, Experian forecast more limited year-on-year growth in convenience and comparison goods
expenditure than previous forecasts.
11.13 Our allowance for SFT at the base year has been informed by the results of the household survey. The survey-
derived shares have necessarily been adjusted downwards to reflect the fact that a proportion of online sales are
45 SFT comprises non-store sales via the internet, mail order, stalls and markets, door-to-door and telephone sales.
ANDOVER AND ROMSEY RETAIL CAPACITY & LEISURE STUDY - 2018
Page 129 of 190
still sourced from traditional stores rather than from dedicated (‘dotcom’) warehouses46. This is in compliance with
the advice set out in Experian’s 2017 RPBN15. The adjusted market share analysis shows that SFT’s current
share of available expenditure in the total Study Area is 18.3% for comparison goods in 2017, which is much
above the national average figure of 14.8% identified by Experian (for 2017). For convenience goods the locally
adjusted SFT market share is 1.5%, which is lower than the national average of 3.2% (in 2017).
11.14 The base year SFT market shares have then been projected forward to 2036 informed by Experian’s national
forecasts as set out in RPBN15. It should be noted that if the growth in SFT market shares is higher for the
Borough area than forecast by Experian then this will effectively reduce the residual expenditure capacity available
to support new retail floorspace over the plan period.
Total Available Expenditure
11.15 Tables 2 and 3 (Appendix 2 and Appendix 3) set out the total available retail expenditure for convenience and
comparison goods respectively in the Study Area and zones (excluding SFT). This is derived by multiplying the
population and average expenditure per capita levels together. The expenditure forecasts show that for:
� Convenience Goods expenditure is forecast to increase by +11.6% (+£117.3m) within the Study Area,
from £1,011.2m in 2017 to £1,128.5 by 2036. For the Council Area total convenience expenditure is
forecast to increase over the same period by +21.5% (+£59.3m).
� Comparison Goods expenditure is forecast to increase by +87.5% (+£1,264.5m) within the Study Area,
from £1,445.9m in 2017 to £2,710.5m by 2036. For the Council Area the total comparison expenditure is
forecast to increase over the same period by +102.6% (+£424.7m).
11.16 The growth in available comparison goods expenditure significantly outstrips convenience goods spend up to
2036. This effectively means that there should be greater capacity potential for new comparison goods floorspace
over the forecast period than for convenience goods retailing; although this will be dependent on the level of retail
commitments in the pipeline and the forecast growth in the ‘productivity’ levels of existing floorspace and stores.
Market Share Analysis (excluding SFT)
11.17 Section 4 described the headline results of the survey-derived (%) market share analysis, including SFT. For the
purpose of the retail capacity assessment, and in line with accepted approaches, the market share analysis has
been adjusted for both convenience goods (Table 1, Appendix 6) and comparison goods (Table 1, Appendix 7)
to exclude SFT47.
11.18 The next key stage in the capacity assessment involves allocating the baseline convenience and comparison
expenditure (£ million) within the Study Area and zones to the identified centres, stores and floorspace based on
the survey-derived market shares. This helps to establish the current ‘baseline’ (2017) trading performance for the
main centres and stores across the Council Area based on expenditure drawn from the Study Area only. It should
be noted that no allowance is made at this stage for any potential “inflow” (trade draw) of expenditure to centres
and stores from outside the defined Study Area.
46 Drawing on Experian’s latest research we have assumed that some 25% of SFT convenience goods sales and 70% of comparison goods sales are
sourced from traditional (‘physical’) retail space.
47 This is in accordance with the standard approach for retail assessments, which make a deduction for SFT at the outset from the expenditure per
capita figures.

ANDOVER AND ROMSEY RETAIL CAPACITY & LEISURE STUDY - 2018
Page 130 of 190
11.19 For both convenience and comparison goods the ‘baseline’ turnovers are projected forward to 2021 (Table 3),
2026 (Table 4), 2031 (Table 5), 2036 (Table 6) assuming no changes in market shares.
11.20 This ‘constant market share approach’ is standard practice for retail capacity and impact assessments. However,
the Council will be aware that it is a highly theoretical in that it does not, for example, take account of the potential
impact of new retail investment and development (both within and outside the Council Area) on existing shopping
patterns and market shares over time.
‘Inflow’ (Trade Draw)
11.21 In order to provide a complete picture of the current trading (turnover) performance of the main centres and stores
in the Council Area we have necessarily made informed judgements with regard to the likely ‘inflow’ (trade draw)
from outside the Study Area. In the absence of detailed published turnover and trade draw information at the local
level, our judgements have been informed by previous studies and retail assessments, as well as the survey and
health check evidence. The ’inflow‘ assumptions also take account of:
� the scale, offer and location of all existing centres and stores in the Council Area;
� the likely extent of their catchment areas;
� the competition from centres, stores and shopping facilities outside the Council Area and the wider Study
Area; and
� the likely retail expenditure derived from people who live outside the Study Area (including visitors and
commuters) to main centres and stores in the Council Area.
11.22 Although the assessment of ‘inflow’ is not a straightforward exercise, due to the complex nature of overlapping
catchments and shopping patterns, it is reasonable to assume that the Council’s main centres will draw a
proportion of their turnovers from outside the widely defined Study Area. On the other hand the local centres and
smaller villages will generally draw the majority of their shoppers and trade from within their more localised
catchments, with limited or no ’inflow’ from outside the Study Area.
11.23 The ‘inflow’ of convenience goods expenditure to the main centres and stores from outside the wider Study Area
will also be more limited than for comparison goods, as households generally carry out their main food shop at
their more local and convenient stores, and do not generally travel longer distances for food purchases.
11.24 To inform our judgment of the likely inflow figures we have reviewed a number of different sources and evidence,
including: the ‘inflow’ figures that were assumed by previous retail studies for Test Valley and neighbouring
authorities; the results of the In-centre surveys showing where people visiting Andover and Romsey live; and our
general observation of the role and function of the centres and retail destinations in the Borough based on the
health check assessments (see Sections 8 and 9).
11.25 On this basis we have assumed that 5% of the Andover Town Centre’s total comparison trade is drawn from
outside the Study Area, and 10% of Romsey Town Centre’s total comparison trade is drawn from outside the
Study Area. Romsey’s assumed ‘inflow’ is higher than for Andover as we believe Romsey’s shops and stores
benefit from more visitor and tourist expenditure due its historical attractions and specialist shops and services.
11.26 In terms of convenience trade, we have assumed that a smaller proportion of Andover Town Centre’s (5%) and
Romsey’s turnover (3%) is drawn from outside the Study Area. This reflects the fact that food and convenience
ANDOVER AND ROMSEY RETAIL CAPACITY & LEISURE STUDY - 2018
Page 131 of 190
shopping purchases are usually more localised, and households generally gravitate to the nearest and most
convenient stores where they live and/or work.
11.27 Based on the (survey-derived) market analysis and the ‘inflow’ assumptions, Table 1 sets out the revised (survey-
derived) ‘current’ turnover levels for convenience goods (Appendix 8) and comparison goods (Appendix 9) for
the Council’s main centres.
Retail Floorspace Commitments & Allocations
11.28 Table 2 of Appendices 8 and 9 set out the major known commitments and policy-led floorspace allocations in the
Council Area. This is based on the information provided by the Council, and our forecasts of the likely convenience
goods and comparison goods turnovers of the new floorspace, taking into account the available floorspace and
turnover evidence, and our own judgements.
Comparison Commitments
11.29 The main retail floorspace with planning permission and/or under construction in the Borough area are:
� Picket Twenty New Local Centre (TVN.09275) - Erection of 1,200 residential units, community facilities,
education, retail, offices, recreational areas and associated highway works. We have been advised by the
Council that local centre will comprise a comparison floorspace of 300 sqm net.
� East Anton Local Centre (15/00729/FULLN) - Erection of a two and a half storey, mixed use building
comprising of 760 square metres (gross internal area) commercial floorspace (Use Classes A1, A2, A3, A5
and B1a), and 20 dwellings, a local recycling centre, access, car and cycle parking, waste storage, and
associated infrastructure and landscape. We have been advised by the Council that the comparison
floorspace element of the local centre will extend to circa 150 sqm net.
Convenience Commitments
� Picket Twenty New Local Centre (TVN.09275) – As above. We understand from the Council that the
local centre is likely to be anchored by a Coop foodstore with an estimated convenience sales area of 375
sqm net.
� Picket Piece New Local Centre (10/00242/OUTN) - Outline permission for a mixed use development
comprising up to 530 dwellings, a local centre offering community facilities and retail units, public open
space, vehicular, pedestrian and cycle access and landscaping. We have been advised by the Council
that the convenience element will have a sales area of 182 sqm net.
� East Anton Local Centre (15/00729/FULLN) – As above. We understand that the local centre is likely to
be anchored by a Coop foodstore with a net sales are of 408 sqm.
� 82 Salisbury Road (15/03026/FULLN) - Demolition of existing premises and erection of single storey
building to provide a convenience retail unit (Use Class A1) with a sales area of c.372 sqm net, and likely
to be occupied by Co-op. The scheme also comprises two hot food takeaway units (Use Class A5) parking,
car parking, installation of plant and associated works.
� Weyhill Services (14/02116/FULLN and 14/02115/FULLN) - Demolition of former roadside services and
construction of petrol filling station, forecourt and canopy, amenity building with convenience store and two
A1 units and two ATM's, HGV canopy, Drive Thru' Coffee Shop, car parks and HGV spaces, landscaping
ANDOVER AND ROMSEY RETAIL CAPACITY & LEISURE STUDY - 2018
Page 132 of 190
and associated ancillary works 24 hours. We understand that the permitted scheme will be anchored by a
Spar convenience store, with a gross sales area of 508 sqm.
11.30 Our assessment of the baseline convenience and comparison turnovers of the main commitments have been
projected forward to 2036 by applying a standard floorspace “productivity” growth rate (also referred to as “turnover
efficiency”) informed by Experian’s RPBN15. As described in Section 3 (Table 3.4) Experian forecast annual
average growth of around +2.2% for comparison goods between 2025-2036, and a nominal +0.1% growth for
convenience goods.
11.31 In summary, we forecast that all the known retail commitments at the time of preparing this Study will achieve a
total convenience goods turnover of £14.3m in 2021, increasing to £14.4m by 2036, based on Experian’s
‘productivity’ growth rate for existing and new retail floorspace (Appendix 8).
11.32 We also forecast that all the comparison goods floorspace commitments will achieve a total combined turnover of
£2.9m in 2021, increasing to £4.0m by 2036 (Appendix 9).
Test Valley Capacity Forecasts
11.33 The ‘global’ (Borough-wide) capacity forecasts for new retail floorspace in the Council Area up to 2036 are set out
in Table 3 for convenience goods (Appendix 8) and comparison goods (Appendix 9).
Convenience Goods Capacity
11.34 In order to assess the potential capacity for new convenience goods floorspace up to 2036 we have necessarily
tested two trading scenarios for different types and formats of food/convenience retailing in order to convert the
residual expenditure (after taking account of new commitments) into a (net) sales area figure:
� “Superstore format’ trading scenario” – we have first assumed that the residual expenditure could
support one of the ‘top 6’ foodstore operators (i.e. Tesco, Sainsbury’s, Asda, Morrison’s, Waitrose and
Marks & Spencer), which together could achieve an average sales density of approximately £12,000 per
sqm in 2017 (2015 prices) based on the latest Mintel UK Retail Rankings; and
� “Supermarket/discounter” trading scenario – we have also tested the impact on the capacity forecasts
of assuming the residual expenditure is taken up by a supermarket (e.g. Co-op, Bugden’s, etc.) and/or
‘discount’ retailer (principally Aldi and Lidl) trading at a slightly lower average sales levels of circa £7,500
per sqm in 2017. However, it should be noted that both Aldi and Lidl have increased their company average
sales densities significantly over recent years due to their expansive store opening programmes and their
increasing market share of the grocery sector. If this trend continues then we consider that the gap between
the ‘top 6’ grocers and the main discounters will narrow further over time.
11.35 As stated previously, it has been assumed that the local retail market is in ‘equilibrium’ at the base year. There is
no qualitative evidence to show that existing stores/floorspace are significantly over and/or under trading. We
have also allowed for the year-on-year growth in the turnover ‘efficiency’ (floorspace ‘productivity’) of all new and
existing convenience floorspace in line with the latest forecasts set out in Experian’s RPBN15 (Figure 4a).
11.36 Table 3 (Appendix 8) sets out and explains the key steps underpinning the convenience goods capacity
assessment.
11.37 The table below summarises the convenience goods capacity forecasts in Tables 4-10 (Appendix 8) for new
‘superstore format’ floorspace:
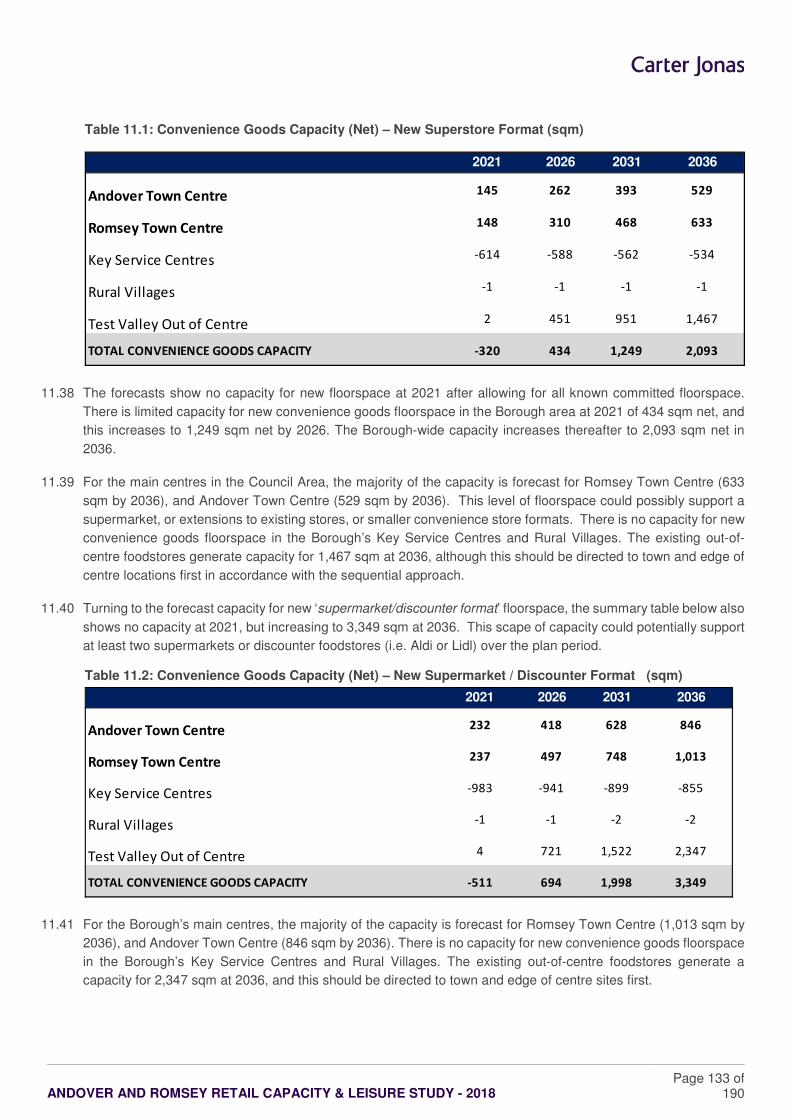
ANDOVER AND ROMSEY RETAIL CAPACITY & LEISURE STUDY - 2018
Page 133 of 190
Table 11.1: Convenience Goods Capacity (Net) – New Superstore Format (sqm)
11.38 The forecasts show no capacity for new floorspace at 2021 after allowing for all known committed floorspace.
There is limited capacity for new convenience goods floorspace in the Borough area at 2021 of 434 sqm net, and
this increases to 1,249 sqm net by 2026. The Borough-wide capacity increases thereafter to 2,093 sqm net in
2036.
11.39 For the main centres in the Council Area, the majority of the capacity is forecast for Romsey Town Centre (633
sqm by 2036), and Andover Town Centre (529 sqm by 2036). This level of floorspace could possibly support a
supermarket, or extensions to existing stores, or smaller convenience store formats. There is no capacity for new
convenience goods floorspace in the Borough’s Key Service Centres and Rural Villages. The existing out-of-
centre foodstores generate capacity for 1,467 sqm at 2036, although this should be directed to town and edge of
centre locations first in accordance with the sequential approach.
11.40 Turning to the forecast capacity for new ‘supermarket/discounter format’ floorspace, the summary table below also
shows no capacity at 2021, but increasing to 3,349 sqm at 2036. This scape of capacity could potentially support
at least two supermarkets or discounter foodstores (i.e. Aldi or Lidl) over the plan period.
Table 11.2: Convenience Goods Capacity (Net) – New Supermarket / Discounter Format (sqm)
11.41 For the Borough’s main centres, the majority of the capacity is forecast for Romsey Town Centre (1,013 sqm by
2036), and Andover Town Centre (846 sqm by 2036). There is no capacity for new convenience goods floorspace
in the Borough’s Key Service Centres and Rural Villages. The existing out-of-centre foodstores generate a
capacity for 2,347 sqm at 2036, and this should be directed to town and edge of centre sites first.
2021 2026 2031 2036
Andover Town Centre 145 262 393 529
Romsey Town Centre 148 310 468 633
Key Service Centres -614 -588 -562 -534
Rural Villages -1 -1 -1 -1
Test Valley Out of Centre 2 451 951 1,467
TOTAL CONVENIENCE GOODS CAPACITY -320 434 1,249 2,093
2021 2026 2031 2036
Andover Town Centre 232 418 628 846
Romsey Town Centre 237 497 748 1,013
Key Service Centres -983 -941 -899 -855
Rural Villages -1 -1 -2 -2
Test Valley Out of Centre 4 721 1,522 2,347
TOTAL CONVENIENCE GOODS CAPACITY -511 694 1,998 3,349
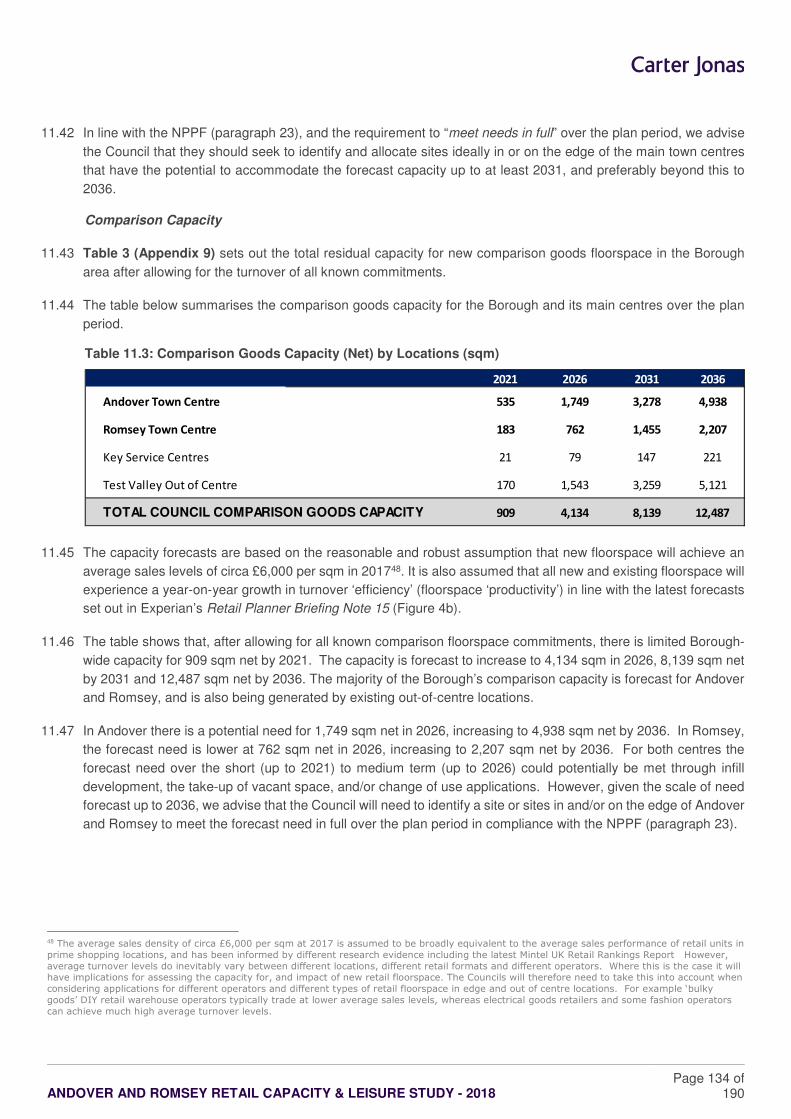
ANDOVER AND ROMSEY RETAIL CAPACITY & LEISURE STUDY - 2018
Page 134 of 190
11.42 In line with the NPPF (paragraph 23), and the requirement to “meet needs in full” over the plan period, we advise
the Council that they should seek to identify and allocate sites ideally in or on the edge of the main town centres
that have the potential to accommodate the forecast capacity up to at least 2031, and preferably beyond this to
2036.
Comparison Capacity
11.43 Table 3 (Appendix 9) sets out the total residual capacity for new comparison goods floorspace in the Borough
area after allowing for the turnover of all known commitments.
11.44 The table below summarises the comparison goods capacity for the Borough and its main centres over the plan
period.
Table 11.3: Comparison Goods Capacity (Net) by Locations (sqm)
11.45 The capacity forecasts are based on the reasonable and robust assumption that new floorspace will achieve an
average sales levels of circa £6,000 per sqm in 201748. It is also assumed that all new and existing floorspace will
experience a year-on-year growth in turnover ‘efficiency’ (floorspace ‘productivity’) in line with the latest forecasts
set out in Experian’s Retail Planner Briefing Note 15 (Figure 4b).
11.46 The table shows that, after allowing for all known comparison floorspace commitments, there is limited Borough-
wide capacity for 909 sqm net by 2021. The capacity is forecast to increase to 4,134 sqm in 2026, 8,139 sqm net
by 2031 and 12,487 sqm net by 2036. The majority of the Borough’s comparison capacity is forecast for Andover
and Romsey, and is also being generated by existing out-of-centre locations.
11.47 In Andover there is a potential need for 1,749 sqm net in 2026, increasing to 4,938 sqm net by 2036. In Romsey,
the forecast need is lower at 762 sqm net in 2026, increasing to 2,207 sqm net by 2036. For both centres the
forecast need over the short (up to 2021) to medium term (up to 2026) could potentially be met through infill
development, the take-up of vacant space, and/or change of use applications. However, given the scale of need
forecast up to 2036, we advise that the Council will need to identify a site or sites in and/or on the edge of Andover
and Romsey to meet the forecast need in full over the plan period in compliance with the NPPF (paragraph 23).
48 The average sales density of circa £6,000 per sqm at 2017 is assumed to be broadly equivalent to the average sales performance of retail units in
prime shopping locations, and has been informed by different research evidence including the latest Mintel UK Retail Rankings Report However,
average turnover levels do inevitably vary between different locations, different retail formats and different operators. Where this is the case it will have implications for assessing the capacity for, and impact of new retail floorspace. The Councils will therefore need to take this into account when
considering applications for different operators and different types of retail floorspace in edge and out of centre locations. For example ‘bulky
goods’ DIY retail warehouse operators typically trade at lower average sales levels, whereas electrical goods retailers and some fashion operators
can achieve much high average turnover levels.
2021 2026 2031 2036
Andover Town Centre 535 1,749 3,278 4,938
Romsey Town Centre 183 762 1,455 2,207
Key Service Centres 21 79 147 221
Test Valley Out of Centre 170 1,543 3,259 5,121
TOTAL COUNCIL COMPARISON GOODS CAPACITY 909 4,134 8,139 12,487
ANDOVER AND ROMSEY RETAIL CAPACITY & LEISURE STUDY - 2018
Page 135 of 190
11.48 Further to this capacity, the Borough’s existing out-of-centre comparison goods floorspace is generating capacity
for 1,543 sqm in 2026, increasing to 5,121 sqm by 2036. In line with the “town centre first” approach, the Council
should seek to meet this forecast need within and on the edge of existing centres first.
11.49 Although the forecast capacity for new comparison goods floorspace in the Borough’s other smaller centres is
more limited over the plan period, the Council will nevertheless still have to consider how best to meet this need
as part of its plan-making. In our view, without carrying out a more detailed assessment of the availability and
suitability of sites, we consider that in the case of these smaller centres this need could be met through infill
development and/or change of use applications.
Summary
11.50 In summary there is no forecast Borough-wide capacity for new convenience goods floorspace over the short term
to 2021, and limited capacity for new comparison goods retail space (909 sqm net). Over the plan period, up to
2036, capacity increases to between 2,093 sqm and 3,349 sqm net for convenience floorspace (depending on
whether the sales area is for superstore-format or supermarket/discounter stores), and to 12,487 sqm net for
comparison goods retailing.
11.51 The forecast need is predominantly focussed in the Borough’s two main centres. However, significant floorspace
capacity for convenience and comparison goods retailing is also being generated by existing out-of-centre stores
and shopping locations.
11.52 The NPPF (paragraph 23) requires that all needs are met in full over the plan period and are not compromised by
limited site availability.
11.53 Although some of this need could potentially be met in existing centres through the take-up of vacant units, infill
developments and changes of use, we nevertheless advise the Council that it will need to carry out a more detailed
assessment of the availability and suitability of sites in and on the edge of centres to accommodate the forecast
need/capacity; including the potential to expand centres to ensure a sufficient supply of sites.
11.54 If the Council is not able to identify and allocate sites in and on the edge of centres to accommodate the forecast
need, then it will have to consider how to best meet the need on sites that are well connected to the Borough’s
main town centres and that will help to maintain and enhance their overall vitality and viability.
ANDOVER AND ROMSEY RETAIL CAPACITY & LEISURE STUDY - 2018
Page 136 of 190
12 COMMERCIAL LEISURE NEEDS
12.1 The NPPF (paragraph 23) states that in drawing up Local Plans to ensure the vitality of town centres, local planning
authorities should promote competitive Town Centres that provide customer choice and a diverse retail offer which
reflects the individuality of Town Centres.
12.2 Against this background, leisure uses can make a significant contribution to a Town Centre's vitality and viability.
For example, a good provision and choice of leisure facilities and uses can help to increase 'dwell times', footfall
and turnover in centres, with significant benefits for both daytime and evening economies.
12.3 However, forecasting the need for new commercial leisure uses is more complicated and problematic than for
retailing, as the sector is highly complex and dynamic, and particularly sensitive to changes in economic,
demographic, lifestyle and fashion trends. Consequently, the methods and approaches developed to forecast the
need for new commercial leisure floorspace and uses are more wide-ranging and less sophisticated than for retail
capacity forecasts.
12.4 The NPPF recommends that need assessments for new leisure uses and floorspace should take account of both
quantitative and qualitative considerations (paragraph 161). In this context our analysis focuses on the following
key elements:
� A review of the key trends driving market demand in the sector over the last decade;
� An audit of existing commercial leisure uses in the Council Area to help identify any marked ‘gaps’ in
provision;
� A review of the results of the household survey to understand current commercial leisure participation rates
and preferences across the Study Area; and
� A broad economic assessment of the need for new additional leisure facilities across the main centres
based on different datasets and accepted approaches.
12.5 For the purpose of our assessment we have necessarily focussed on the main commercial leisure uses that are
widely accepted as making a significant contribution to the overall vitality and viability of Town Centres; namely
food and beverage uses (Class A3-A5), cinemas and health clubs and gyms, and to a lesser extent ten-pin
bowling, casinos and bingo halls.
12.6 Detailed tables on forecast commercial leisure capacity, including projections on expenditure and need are set
out below.
Leisure Expenditure Growth
12.7 Like the retail market, the commercial leisure sector has experienced significant growth in consumer and market
demand since the mid-1990s; fuelled by a buoyant economy, growing disposable income and low unemployment
levels. Although the leisure sector has not been immune to the impact of the recent economic downturn, leisure
activities remain an important lifestyle choice for many consumers who are prioritising leisure over other areas of
spending.
12.8 The table below shows the UK average expenditure per head per annum on commercial leisure services and the
average for the defined Study Area based on Experian data. It shows that UK household spending on leisure
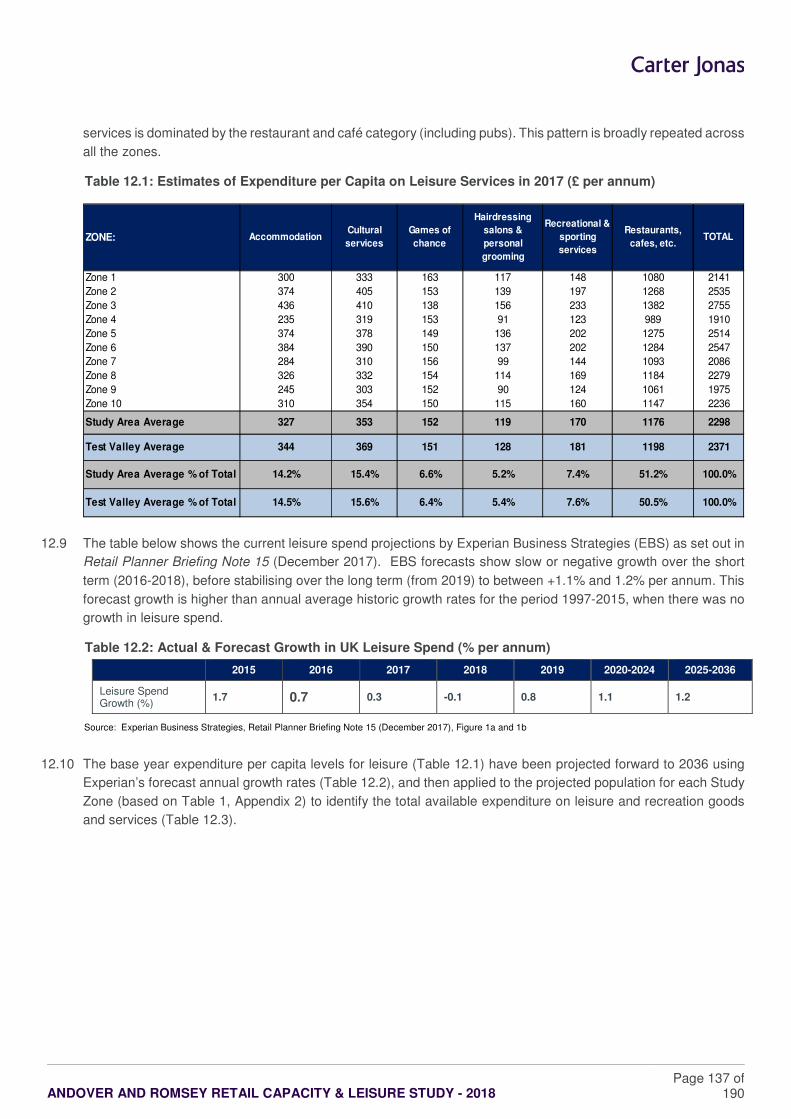
ANDOVER AND ROMSEY RETAIL CAPACITY & LEISURE STUDY - 2018
Page 137 of 190
services is dominated by the restaurant and café category (including pubs). This pattern is broadly repeated across
all the zones.
Table 12.1: Estimates of Expenditure per Capita on Leisure Services in 2017 (£ per annum)
12.9 The table below shows the current leisure spend projections by Experian Business Strategies (EBS) as set out in
Retail Planner Briefing Note 15 (December 2017). EBS forecasts show slow or negative growth over the short
term (2016-2018), before stabilising over the long term (from 2019) to between +1.1% and 1.2% per annum. This
forecast growth is higher than annual average historic growth rates for the period 1997-2015, when there was no
growth in leisure spend.
Table 12.2: Actual & Forecast Growth in UK Leisure Spend (% per annum)
2015 2016 2017 2018 2019 2020-2024 2025-2036
Leisure Spend Growth (%)
1.7 0.7 0.3 -0.1 0.8 1.1 1.2
Source: Experian Business Strategies, Retail Planner Briefing Note 15 (December 2017), Figure 1a and 1b
12.10 The base year expenditure per capita levels for leisure (Table 12.1) have been projected forward to 2036 using
Experian’s forecast annual growth rates (Table 12.2), and then applied to the projected population for each Study
Zone (based on Table 1, Appendix 2) to identify the total available expenditure on leisure and recreation goods
and services (Table 12.3).
ZONE: AccommodationCultural
services
Games of
chance
Hairdressing
salons &
personal
grooming
Recreational &
sporting
services
Restaurants,
cafes, etc.TOTAL
Zone 1 300 333 163 117 148 1080 2141
Zone 2 374 405 153 139 197 1268 2535
Zone 3 436 410 138 156 233 1382 2755
Zone 4 235 319 153 91 123 989 1910
Zone 5 374 378 149 136 202 1275 2514
Zone 6 384 390 150 137 202 1284 2547
Zone 7 284 310 156 99 144 1093 2086
Zone 8 326 332 154 114 169 1184 2279
Zone 9 245 303 152 90 124 1061 1975
Zone 10 310 354 150 115 160 1147 2236
Study Area Average 327 353 152 119 170 1176 2298
Test Valley Average 344 369 151 128 181 1198 2371
Study Area Average % of Total 14.2% 15.4% 6.6% 5.2% 7.4% 51.2% 100.0%
Test Valley Average % of Total 14.5% 15.6% 6.4% 5.4% 7.6% 50.5% 100.0%
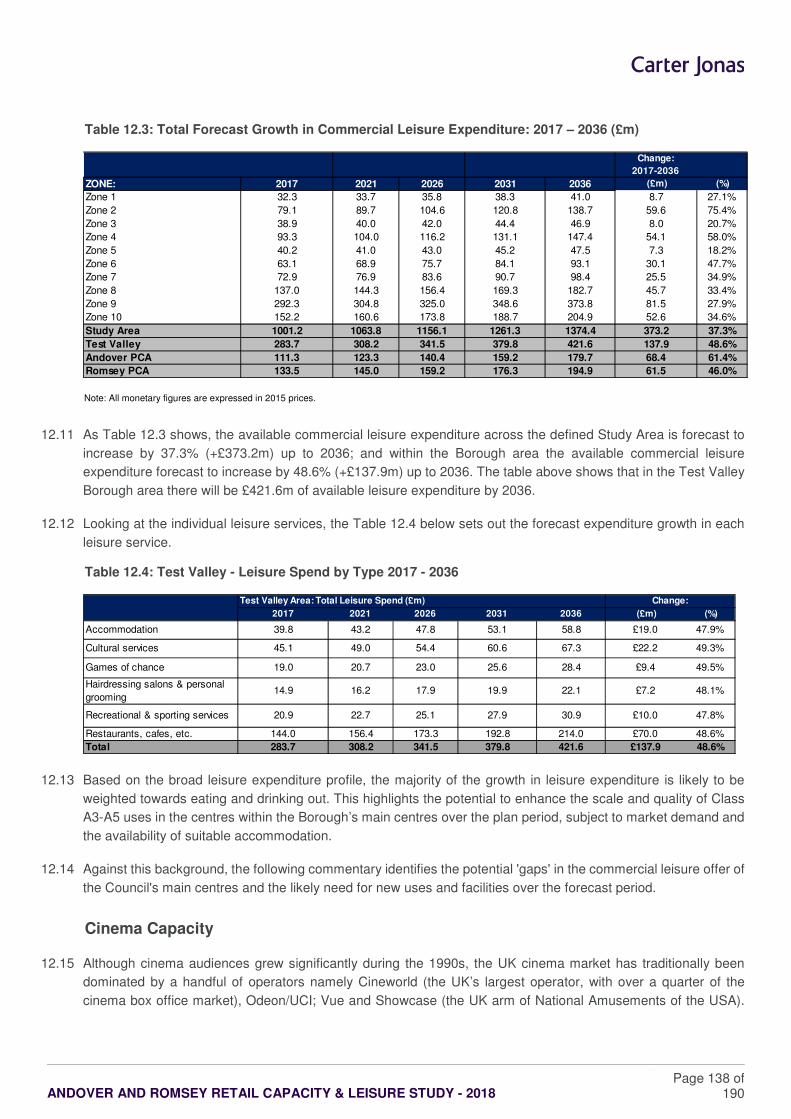
ANDOVER AND ROMSEY RETAIL CAPACITY & LEISURE STUDY - 2018
Page 138 of 190
Table 12.3: Total Forecast Growth in Commercial Leisure Expenditure: 2017 – 2036 (£m)
Note: All monetary figures are expressed in 2015 prices.
12.11 As Table 12.3 shows, the available commercial leisure expenditure across the defined Study Area is forecast to
increase by 37.3% (+£373.2m) up to 2036; and within the Borough area the available commercial leisure
expenditure forecast to increase by 48.6% (+£137.9m) up to 2036. The table above shows that in the Test Valley
Borough area there will be £421.6m of available leisure expenditure by 2036.
12.12 Looking at the individual leisure services, the Table 12.4 below sets out the forecast expenditure growth in each
leisure service.
Table 12.4: Test Valley - Leisure Spend by Type 2017 - 2036
12.13 Based on the broad leisure expenditure profile, the majority of the growth in leisure expenditure is likely to be
weighted towards eating and drinking out. This highlights the potential to enhance the scale and quality of Class
A3-A5 uses in the centres within the Borough’s main centres over the plan period, subject to market demand and
the availability of suitable accommodation.
12.14 Against this background, the following commentary identifies the potential 'gaps' in the commercial leisure offer of
the Council's main centres and the likely need for new uses and facilities over the forecast period.
Cinema Capacity
12.15 Although cinema audiences grew significantly during the 1990s, the UK cinema market has traditionally been
dominated by a handful of operators namely Cineworld (the UK’s largest operator, with over a quarter of the
cinema box office market), Odeon/UCI; Vue and Showcase (the UK arm of National Amusements of the USA).
Change:
2017-2036
ZONE: 2017 2021 2026 2031 2036 (£m) (%)
Zone 1 32.3 33.7 35.8 38.3 41.0 8.7 27.1%
Zone 2 79.1 89.7 104.6 120.8 138.7 59.6 75.4%
Zone 3 38.9 40.0 42.0 44.4 46.9 8.0 20.7%
Zone 4 93.3 104.0 116.2 131.1 147.4 54.1 58.0%
Zone 5 40.2 41.0 43.0 45.2 47.5 7.3 18.2%
Zone 6 63.1 68.9 75.7 84.1 93.1 30.1 47.7%
Zone 7 72.9 76.9 83.6 90.7 98.4 25.5 34.9%
Zone 8 137.0 144.3 156.4 169.3 182.7 45.7 33.4%
Zone 9 292.3 304.8 325.0 348.6 373.8 81.5 27.9%
Zone 10 152.2 160.6 173.8 188.7 204.9 52.6 34.6%
Study Area 1001.2 1063.8 1156.1 1261.3 1374.4 373.2 37.3%
Test Valley 283.7 308.2 341.5 379.8 421.6 137.9 48.6%
Andover PCA 111.3 123.3 140.4 159.2 179.7 68.4 61.4%
Romsey PCA 133.5 145.0 159.2 176.3 194.9 61.5 46.0%
Test Valley Area: Total Leisure Spend (£m)
2017 2021 2026 2031 2036 (£m) (%)
Accommodation 39.8 43.2 47.8 53.1 58.8 £19.0 47.9%
Cultural services 45.1 49.0 54.4 60.6 67.3 £22.2 49.3%
Games of chance 19.0 20.7 23.0 25.6 28.4 £9.4 49.5%
Hairdressing salons & personal
grooming14.9 16.2 17.9 19.9 22.1 £7.2 48.1%
Recreational & sporting services 20.9 22.7 25.1 27.9 30.9 £10.0 47.8%
Restaurants, cafes, etc. 144.0 156.4 173.3 192.8 214.0 £70.0 48.6%
Total 283.7 308.2 341.5 379.8 421.6 £137.9 48.6%
Change:
ANDOVER AND ROMSEY RETAIL CAPACITY & LEISURE STUDY - 2018
Page 139 of 190
There was significant consolidation in the UK market in 2012 when Odeon acquired the BFI Southbank and a site
from AMC; Vue acquired the Apollo cinema chain; and Cineworld acquired Picturehouse.
12.16 According to research by Dodona (a specialist market research consultancy in the cinema industry) at the end of
2016, the UK had 766 cinemas and 4,015 screens. This was 140 more screens than 2014. Approximately three-
quarters (77%) of the screens are in multiplexes. It should be noted that the number of cinemas has fluctuated,
with a low of 697 in 2006 and a high of 769 in 2012. This has been influenced by the increase in the number of
multiplex screens and the loss of ‘traditional’ cinemas. The rest of the market is mainly represented by smaller
multiplex operators and independents which tend to operate non-multiplex cinemas (i.e. less than six screens)
and screens in mixed-use venues (such as arts centres); including The Light, Curzon and Everyman cinemas.
Everyman cinema reported in early 2017 that demand for its “home from home” experience is growing around the
UK with new opening planned for 2018 venues in York, Liverpool and Newcastle, as well as London’s Borough
Market in 2020.
12.17 The cinema industry has not been immune from the recession and there have been some closures since 2008,
although the majority have been smaller art centre venues rather than the larger chains. Notwithstanding this, the
industry generally appears to be in good health and the UK is the second largest consumer market for filmed
entertainment in the world after the USA. The latest research shows that box office revenue in 2016 in the UK
exceeded £1bn for the fifth year in succession, based on 168.3m admissions. Overall the cinema sector has
remained relatively resilient in the prevailing economic and consumer environment.
12.18 In recent years, cinema operators have also introduced changes to the cinema experience, including premium
seating areas and better quality refreshments, such as alcohol and higher quality food. For example, Vue Cinemas
introduced their ‘Evolution’ concept, which provides a mix of seating types comprising bean bags and sofas, as
well as regular seats. Cineworld has also introduced the ‘Screening Room’ concept, characterised by leather
chairs and table service.
12.19 The most recent change to the industry – the transition to digital cinema technology – was one of the most
fundamental shifts in the history of the sector, and has allowed the traditional cinema offer to expand to give
audiences even greater choice in what they see. There has also been a growth in smaller (Digital) cinemas to
serve smaller catchment areas. These Digital cinemas are more flexible and less “space-hungry”, as they do not
require the large shopping auditoriums needed to accommodate traditional projectors. There are therefore
opportunities for modern cinema offer to be provided in existing buildings. Examples include the HMV in
Wimbledon which has a small Curzon cinemas above the store; Genesis in Whitechapel; The Grosvenor in
Glasgow; Watershed in Bristol and the Lynton Cinema in Lynton.
12.20 At the other end of spectrum, smaller, boutique cinemas are also performing well. Focused on comfort, often by
offering higher quality food, alcohol and larger reclining seats, and holding special screening events, these
cinemas typically appeal to demographic that differs to that of the multiplexes. However, a further category of film
screening has started to emerge: event cinema. Mirroring trends in retail, people are prepared to pay significantly
more for a unique, bespoke film experience – particularly one that lends itself to be shared on social media such
as Secret Cinema.
12.21 Turning to the cinema provision in the Study Area, the key commercial purpose built cinemas are listed in the table
below:
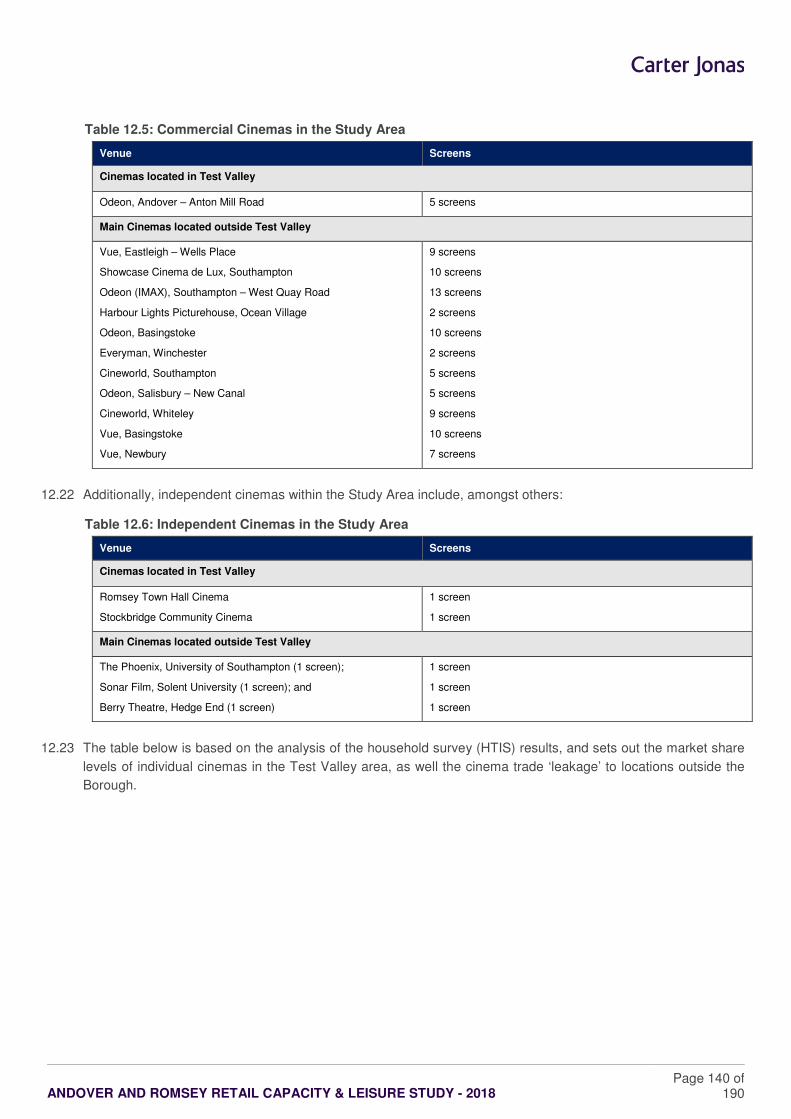
ANDOVER AND ROMSEY RETAIL CAPACITY & LEISURE STUDY - 2018
Page 140 of 190
Table 12.5: Commercial Cinemas in the Study Area
Venue Screens
Cinemas located in Test Valley
Odeon, Andover – Anton Mill Road 5 screens
Main Cinemas located outside Test Valley
Vue, Eastleigh – Wells Place
Showcase Cinema de Lux, Southampton
Odeon (IMAX), Southampton – West Quay Road
Harbour Lights Picturehouse, Ocean Village
Odeon, Basingstoke
Everyman, Winchester
Cineworld, Southampton
Odeon, Salisbury – New Canal
Cineworld, Whiteley
Vue, Basingstoke
Vue, Newbury
9 screens
10 screens
13 screens
2 screens
10 screens
2 screens
5 screens
5 screens
9 screens
10 screens
7 screens
12.22 Additionally, independent cinemas within the Study Area include, amongst others:
Table 12.6: Independent Cinemas in the Study Area
Venue Screens
Cinemas located in Test Valley
Romsey Town Hall Cinema
Stockbridge Community Cinema
1 screen
1 screen
Main Cinemas located outside Test Valley
The Phoenix, University of Southampton (1 screen);
Sonar Film, Solent University (1 screen); and
Berry Theatre, Hedge End (1 screen)
1 screen
1 screen
1 screen
12.23 The table below is based on the analysis of the household survey (HTIS) results, and sets out the market share
levels of individual cinemas in the Test Valley area, as well the cinema trade ‘leakage’ to locations outside the
Borough.
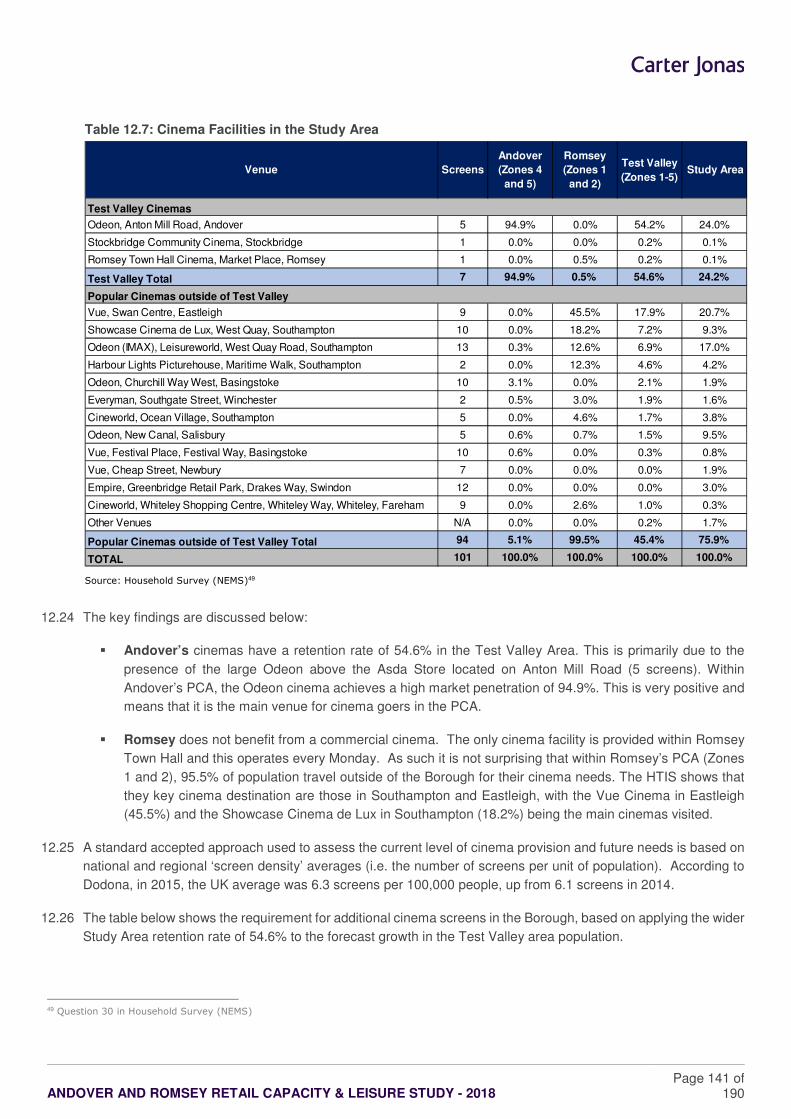
ANDOVER AND ROMSEY RETAIL CAPACITY & LEISURE STUDY - 2018
Page 141 of 190
Table 12.7: Cinema Facilities in the Study Area
Source: Household Survey (NEMS)49
12.24 The key findings are discussed below:
� Andover’s cinemas have a retention rate of 54.6% in the Test Valley Area. This is primarily due to the
presence of the large Odeon above the Asda Store located on Anton Mill Road (5 screens). Within
Andover’s PCA, the Odeon cinema achieves a high market penetration of 94.9%. This is very positive and
means that it is the main venue for cinema goers in the PCA.
� Romsey does not benefit from a commercial cinema. The only cinema facility is provided within Romsey
Town Hall and this operates every Monday. As such it is not surprising that within Romsey’s PCA (Zones
1 and 2), 95.5% of population travel outside of the Borough for their cinema needs. The HTIS shows that
they key cinema destination are those in Southampton and Eastleigh, with the Vue Cinema in Eastleigh
(45.5%) and the Showcase Cinema de Lux in Southampton (18.2%) being the main cinemas visited.
12.25 A standard accepted approach used to assess the current level of cinema provision and future needs is based on
national and regional ‘screen density’ averages (i.e. the number of screens per unit of population). According to
Dodona, in 2015, the UK average was 6.3 screens per 100,000 people, up from 6.1 screens in 2014.
12.26 The table below shows the requirement for additional cinema screens in the Borough, based on applying the wider
Study Area retention rate of 54.6% to the forecast growth in the Test Valley area population.
49 Question 30 in Household Survey (NEMS)
Venue Screens
Andover
(Zones 4
and 5)
Romsey
(Zones 1
and 2)
Test Valley
(Zones 1-5) Study Area
Odeon, Anton Mill Road, Andover 5 94.9% 0.0% 54.2% 24.0%
Stockbridge Community Cinema, Stockbridge 1 0.0% 0.0% 0.2% 0.1%
Romsey Town Hall Cinema, Market Place, Romsey 1 0.0% 0.5% 0.2% 0.1%
Test Valley Total 7 94.9% 0.5% 54.6% 24.2%
Vue, Swan Centre, Eastleigh 9 0.0% 45.5% 17.9% 20.7%
Showcase Cinema de Lux, West Quay, Southampton 10 0.0% 18.2% 7.2% 9.3%
Odeon (IMAX), Leisureworld, West Quay Road, Southampton 13 0.3% 12.6% 6.9% 17.0%
Harbour Lights Picturehouse, Maritime Walk, Southampton 2 0.0% 12.3% 4.6% 4.2%
Odeon, Churchill Way West, Basingstoke 10 3.1% 0.0% 2.1% 1.9%
Everyman, Southgate Street, Winchester 2 0.5% 3.0% 1.9% 1.6%
Cineworld, Ocean Village, Southampton 5 0.0% 4.6% 1.7% 3.8%
Odeon, New Canal, Salisbury 5 0.6% 0.7% 1.5% 9.5%
Vue, Festival Place, Festival Way, Basingstoke 10 0.6% 0.0% 0.3% 0.8%
Vue, Cheap Street, Newbury 7 0.0% 0.0% 0.0% 1.9%
Empire, Greenbridge Retail Park, Drakes Way, Swindon 12 0.0% 0.0% 0.0% 3.0%
Cineworld, Whiteley Shopping Centre, Whiteley Way, Whiteley, Fareham 9 0.0% 2.6% 1.0% 0.3%
Other Venues N/A 0.0% 0.0% 0.2% 1.7%
Popular Cinemas outside of Test Valley Total 94 5.1% 99.5% 45.4% 75.9%
TOTAL 101 100.0% 100.0% 100.0% 100.0%
Test Valley Cinemas
Popular Cinemas outside of Test Valley
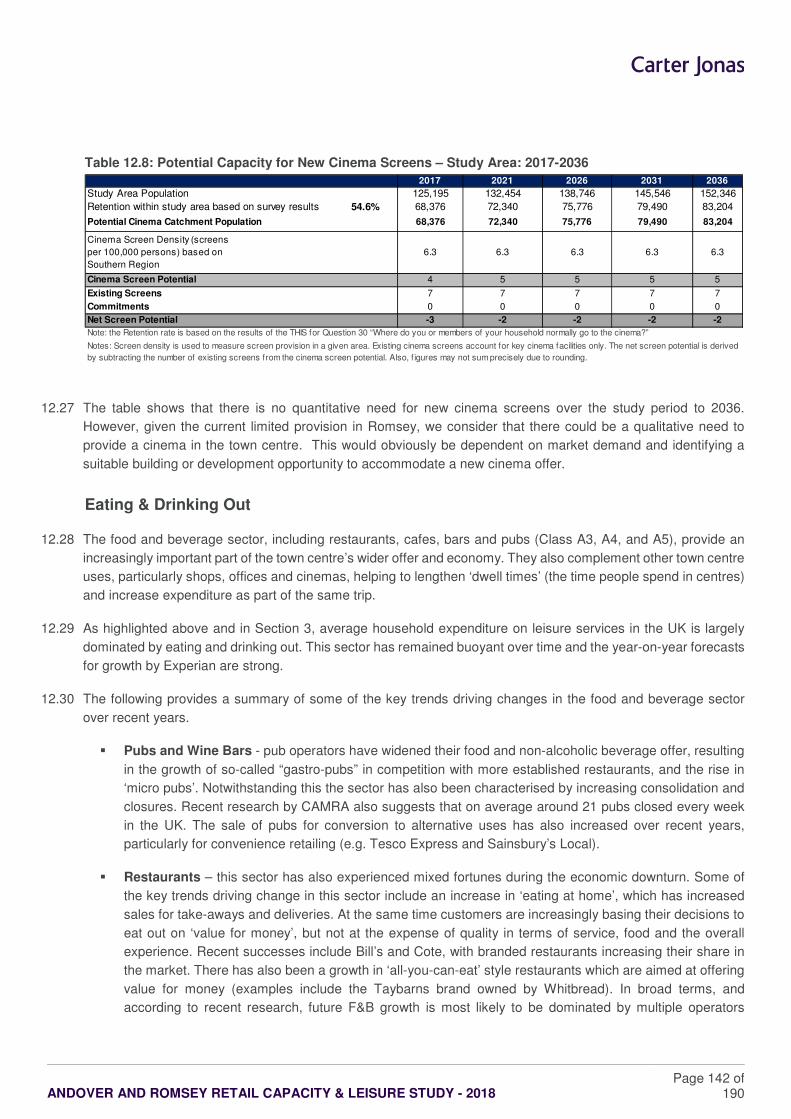
ANDOVER AND ROMSEY RETAIL CAPACITY & LEISURE STUDY - 2018
Page 142 of 190
Table 12.8: Potential Capacity for New Cinema Screens – Study Area: 2017-2036
12.27 The table shows that there is no quantitative need for new cinema screens over the study period to 2036.
However, given the current limited provision in Romsey, we consider that there could be a qualitative need to
provide a cinema in the town centre. This would obviously be dependent on market demand and identifying a
suitable building or development opportunity to accommodate a new cinema offer.
Eating & Drinking Out
12.28 The food and beverage sector, including restaurants, cafes, bars and pubs (Class A3, A4, and A5), provide an
increasingly important part of the town centre’s wider offer and economy. They also complement other town centre
uses, particularly shops, offices and cinemas, helping to lengthen ‘dwell times’ (the time people spend in centres)
and increase expenditure as part of the same trip.
12.29 As highlighted above and in Section 3, average household expenditure on leisure services in the UK is largely
dominated by eating and drinking out. This sector has remained buoyant over time and the year-on-year forecasts
for growth by Experian are strong.
12.30 The following provides a summary of some of the key trends driving changes in the food and beverage sector
over recent years.
� Pubs and Wine Bars - pub operators have widened their food and non-alcoholic beverage offer, resulting
in the growth of so-called “gastro-pubs” in competition with more established restaurants, and the rise in
‘micro pubs’. Notwithstanding this the sector has also been characterised by increasing consolidation and
closures. Recent research by CAMRA also suggests that on average around 21 pubs closed every week
in the UK. The sale of pubs for conversion to alternative uses has also increased over recent years,
particularly for convenience retailing (e.g. Tesco Express and Sainsbury’s Local).
� Restaurants – this sector has also experienced mixed fortunes during the economic downturn. Some of
the key trends driving change in this sector include an increase in ‘eating at home’, which has increased
sales for take-aways and deliveries. At the same time customers are increasingly basing their decisions to
eat out on ‘value for money’, but not at the expense of quality in terms of service, food and the overall
experience. Recent successes include Bill’s and Cote, with branded restaurants increasing their share in
the market. There has also been a growth in ‘all-you-can-eat’ style restaurants which are aimed at offering
value for money (examples include the Taybarns brand owned by Whitbread). In broad terms, and
according to recent research, future F&B growth is most likely to be dominated by multiple operators
2017 2021 2026 2031 2036
Study Area Population 125,195 132,454 138,746 145,546 152,346
Retention within study area based on survey results 54.6% 68,376 72,340 75,776 79,490 83,204
Potential Cinema Catchment Population 68,376 72,340 75,776 79,490 83,204
Cinema Screen Density (screens
per 100,000 persons) based on
Southern Region
6.3 6.3 6.3 6.3 6.3
Cinema Screen Potential 4 5 5 5 5
Existing Screens 7 7 7 7 7
Commitments 0 0 0 0 0
Net Screen Potential -3 -2 -2 -2 -2
Notes: Screen density is used to measure screen provision in a given area. Existing cinema screens account for key cinema facilities only. The net screen potential is derived
by subtracting the number of existing screens from the cinema screen potential. Also, f igures may not sum precisely due to rounding.
Note: the Retention rate is based on the results of the THIS for Question 30 “Where do you or members of your household normally go to the cinema?”
ANDOVER AND ROMSEY RETAIL CAPACITY & LEISURE STUDY - 2018
Page 143 of 190
expanding their presence across the UK. Notwithstanding this, there is recent evidence that some
restaurant operators are struggling in the current market for a number of reasons, including rising
overheads impacting on their profitability, and are rationalising their existing portfolio. For example TPG
Capital announced in February 2018 that it is to close up to one-third of its Prezzo restaurants in the UK
and all of its Chimichanga restaurants. Byron Burgers and Jamie’s Italian are also undergoing similar
restructuring to remain solvent in the current market.
� Cafés/Coffee Shops – This sector has experienced strong growth over the last five years. According to
Mintel research, the UK coffee shop market rose by 37%, up from £2.4 billion in 2011 to reach £3.4 billion
in 2016. What is more, between 2015 and 2016 sales increased by 10.4% – the biggest year-on-year boost
witnessed in the last five years. The market is forecast to grow by a further 29% between 2017-2022, to
reach an estimated value of £4.3 billion. With some 22,845 outlets, the total UK coffee shop market grew
by 6% in 2016. Costa Coffee, Starbucks Coffee Company, and Caffè Nero remain the UK’s leading chains
with a 53% share of the branded coffee shop market. Market leader Costa operates 2,121 UK outlets,
adding 129 units in 2016. Starbucks and Caffè Nero operate 898 and 650 UK outlets respectively. Leading
chains continue to expand and enjoy positive like-for-like sales growth, albeit at a slowing pace. However
small and medium sized boutique chains such as Coffee#1, Joe & the Juice, and Taylor St. Baristas are
gaining momentum and driving the comparable sales growth across the sector, ahead of the leading chains.
Increased merger and acquisition activity throughout 2016 also highlighted the relative strength of the
vibrant coffee shop market in the UK. For example, Whitbread’s 49% acquisition of Pure, Tchibo’s
acquisition of Matthew Algie, and Caffè Nero’s purchase of Harris+Hoole has resulted in further market
convergence. Notwithstanding the rise of the multiples, there has also been growth in independent and
specialist cafés and coffee houses, particularly those serving a more luxury or specialist offer (e.g. organic
and Fairtrade). The strong independent coffee sector has fuelled many new start-up businesses in centres.
While many forecasters considered the café market to be saturated a few years ago, Allegra reveals that
after 18 years of considerable continued growth, the coffee shop market is one of the most successful in
the UK economy and is set to outnumber pubs by 2030.
12.31 The household survey identified where people living in the Study Area currently chose to eat and drink, and
whether there are potential ‘gaps’ in the current offer. The survey shows that 67.1% of respondents from the Study
Area visit restaurants and cafes, and 57.0% visit pubs/ bars/ nightclubs50.
12.32 The survey also assessed the frequency of eating out in restaurants and cafes. The findings are as follows:
� Within the Study Area, 34.1% of respondents eat out in restaurants and cafes once a fortnight, 23.7%
once a month; 16.5% once a week; and 14.1% visit once every two months.
� Within Andover Primary Catchment Area: 25.8% of respondents eat out once a fortnight, 23.2% once a
month, and 17.9% once a week.
� Within Romsey Primary Catchment Area: 29.6% of respondents eat out once a month, 26.8% once a
fortnight, and 23.9% once a week.
� Within Test Valley: 25.8% of respondents eat out once a fortnight, 25.2% once a month, and 19.7% once
a week.
50 Question 26 in the Household Survey (NEMS)
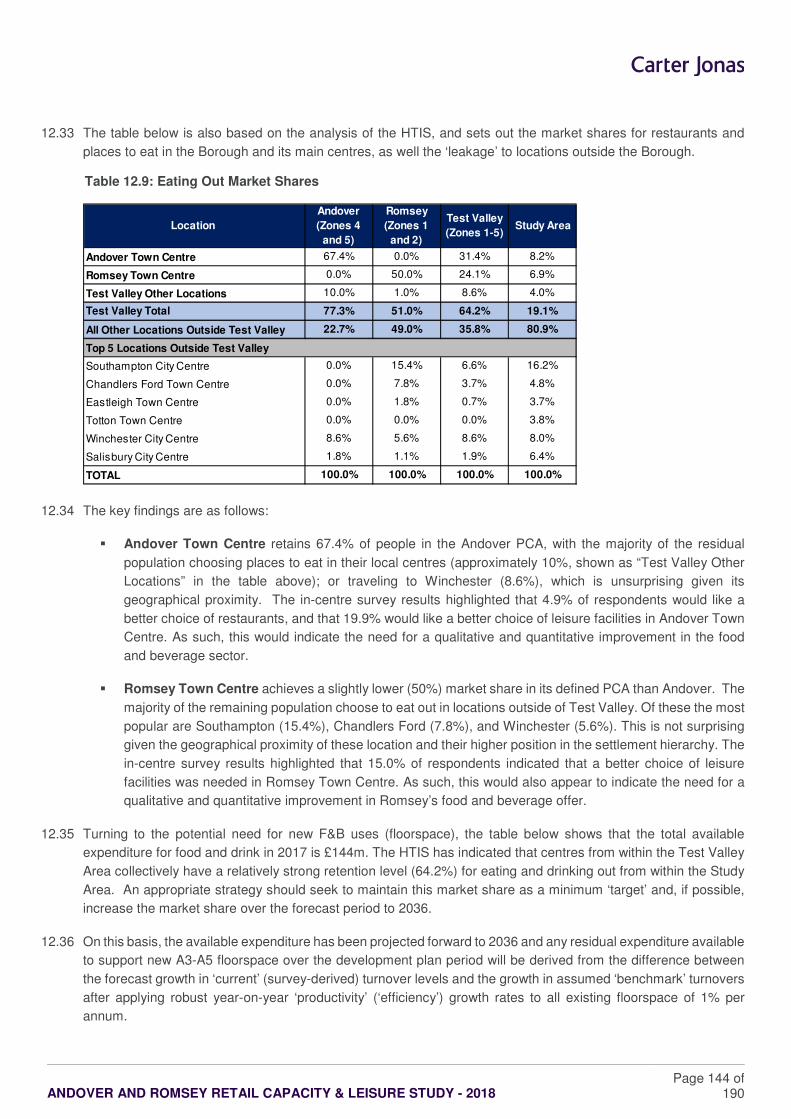
ANDOVER AND ROMSEY RETAIL CAPACITY & LEISURE STUDY - 2018
Page 144 of 190
12.33 The table below is also based on the analysis of the HTIS, and sets out the market shares for restaurants and
places to eat in the Borough and its main centres, as well the ‘leakage’ to locations outside the Borough.
Table 12.9: Eating Out Market Shares
12.34 The key findings are as follows:
� Andover Town Centre retains 67.4% of people in the Andover PCA, with the majority of the residual
population choosing places to eat in their local centres (approximately 10%, shown as “Test Valley Other
Locations” in the table above); or traveling to Winchester (8.6%), which is unsurprising given its
geographical proximity. The in-centre survey results highlighted that 4.9% of respondents would like a
better choice of restaurants, and that 19.9% would like a better choice of leisure facilities in Andover Town
Centre. As such, this would indicate the need for a qualitative and quantitative improvement in the food
and beverage sector.
� Romsey Town Centre achieves a slightly lower (50%) market share in its defined PCA than Andover. The
majority of the remaining population choose to eat out in locations outside of Test Valley. Of these the most
popular are Southampton (15.4%), Chandlers Ford (7.8%), and Winchester (5.6%). This is not surprising
given the geographical proximity of these location and their higher position in the settlement hierarchy. The
in-centre survey results highlighted that 15.0% of respondents indicated that a better choice of leisure
facilities was needed in Romsey Town Centre. As such, this would also appear to indicate the need for a
qualitative and quantitative improvement in Romsey’s food and beverage offer.
12.35 Turning to the potential need for new F&B uses (floorspace), the table below shows that the total available
expenditure for food and drink in 2017 is £144m. The HTIS has indicated that centres from within the Test Valley
Area collectively have a relatively strong retention level (64.2%) for eating and drinking out from within the Study
Area. An appropriate strategy should seek to maintain this market share as a minimum ‘target’ and, if possible,
increase the market share over the forecast period to 2036.
12.36 On this basis, the available expenditure has been projected forward to 2036 and any residual expenditure available
to support new A3-A5 floorspace over the development plan period will be derived from the difference between
the forecast growth in ‘current’ (survey-derived) turnover levels and the growth in assumed ‘benchmark’ turnovers
after applying robust year-on-year ‘productivity’ (‘efficiency’) growth rates to all existing floorspace of 1% per
annum.
Location
Andover
(Zones 4
and 5)
Romsey
(Zones 1
and 2)
Test Valley
(Zones 1-5) Study Area
Andover Town Centre 67.4% 0.0% 31.4% 8.2%
Romsey Town Centre 0.0% 50.0% 24.1% 6.9%
Test Valley Other Locations 10.0% 1.0% 8.6% 4.0%
Test Valley Total 77.3% 51.0% 64.2% 19.1%
All Other Locations Outside Test Valley 22.7% 49.0% 35.8% 80.9%
Southampton City Centre 0.0% 15.4% 6.6% 16.2%
Chandlers Ford Town Centre 0.0% 7.8% 3.7% 4.8%
Eastleigh Town Centre 0.0% 1.8% 0.7% 3.7%
Totton Town Centre 0.0% 0.0% 0.0% 3.8%
Winchester City Centre 8.6% 5.6% 8.6% 8.0%
Salisbury City Centre 1.8% 1.1% 1.9% 6.4%
TOTAL 100.0% 100.0% 100.0% 100.0%
Top 5 Locations Outside Test Valley
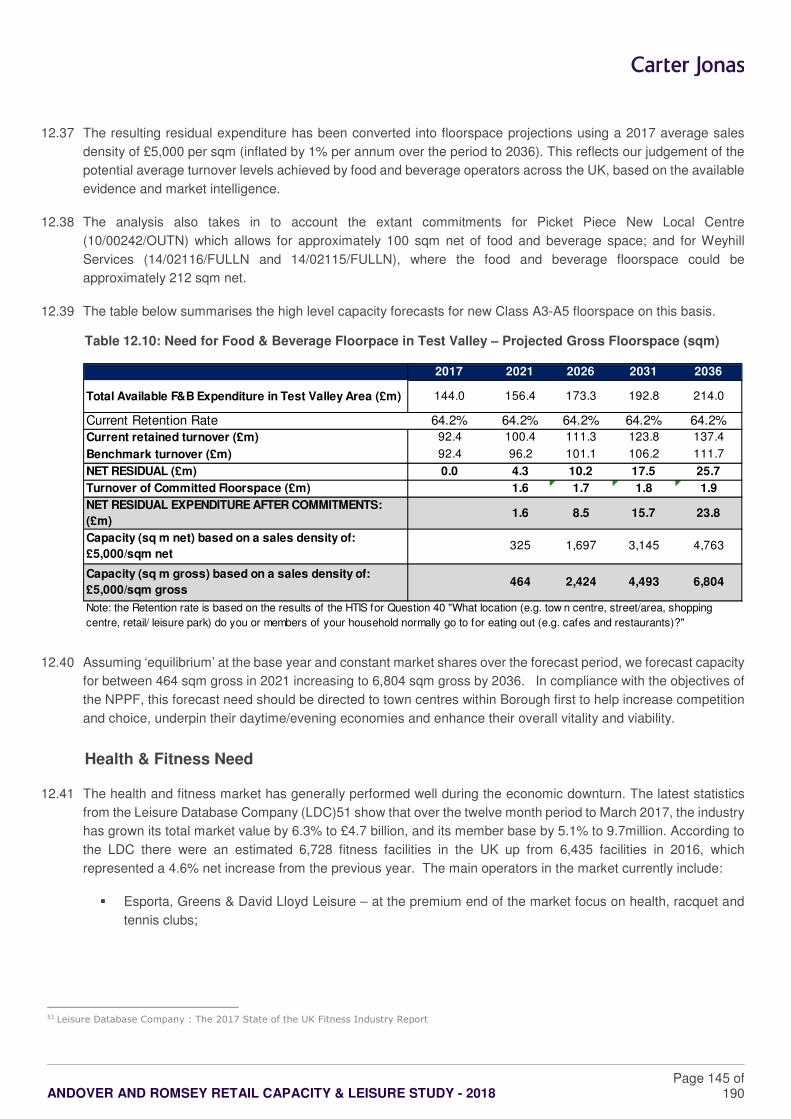
ANDOVER AND ROMSEY RETAIL CAPACITY & LEISURE STUDY - 2018
Page 145 of 190
12.37 The resulting residual expenditure has been converted into floorspace projections using a 2017 average sales
density of £5,000 per sqm (inflated by 1% per annum over the period to 2036). This reflects our judgement of the
potential average turnover levels achieved by food and beverage operators across the UK, based on the available
evidence and market intelligence.
12.38 The analysis also takes in to account the extant commitments for Picket Piece New Local Centre
(10/00242/OUTN) which allows for approximately 100 sqm net of food and beverage space; and for Weyhill
Services (14/02116/FULLN and 14/02115/FULLN), where the food and beverage floorspace could be
approximately 212 sqm net.
12.39 The table below summarises the high level capacity forecasts for new Class A3-A5 floorspace on this basis.
Table 12.10: Need for Food & Beverage Floorpace in Test Valley – Projected Gross Floorspace (sqm)
12.40 Assuming ‘equilibrium’ at the base year and constant market shares over the forecast period, we forecast capacity
for between 464 sqm gross in 2021 increasing to 6,804 sqm gross by 2036. In compliance with the objectives of
the NPPF, this forecast need should be directed to town centres within Borough first to help increase competition
and choice, underpin their daytime/evening economies and enhance their overall vitality and viability.
Health & Fitness Need
12.41 The health and fitness market has generally performed well during the economic downturn. The latest statistics
from the Leisure Database Company (LDC)51 show that over the twelve month period to March 2017, the industry
has grown its total market value by 6.3% to £4.7 billion, and its member base by 5.1% to 9.7million. According to
the LDC there were an estimated 6,728 fitness facilities in the UK up from 6,435 facilities in 2016, which
represented a 4.6% net increase from the previous year. The main operators in the market currently include:
� Esporta, Greens & David Lloyd Leisure – at the premium end of the market focus on health, racquet and
tennis clubs;
51 Leisure Database Company : The 2017 State of the UK Fitness Industry Report
2017 2021 2026 2031 2036
Total Available F&B Expenditure in Test Valley Area (£m) 144.0 156.4 173.3 192.8 214.0
Current Retention Rate 64.2% 64.2% 64.2% 64.2% 64.2%
Current retained turnover (£m) 92.4 100.4 111.3 123.8 137.4
Benchmark turnover (£m) 92.4 96.2 101.1 106.2 111.7
NET RESIDUAL (£m) 0.0 4.3 10.2 17.5 25.7
Turnover of Committed Floorspace (£m) 1.6 1.7 1.8 1.9
NET RESIDUAL EXPENDITURE AFTER COMMITMENTS:
(£m)1.6 8.5 15.7 23.8
Capacity (sq m net) based on a sales density of:
£5,000/sqm net325 1,697 3,145 4,763
Capacity (sq m gross) based on a sales density of:
£5,000/sqm gross464 2,424 4,493 6,804
Note: the Retention rate is based on the results of the HTIS for Question 40 "What location (e.g. tow n centre, street/area, shopping
centre, retail/ leisure park) do you or members of your household normally go to for eating out (e.g. cafes and restaurants)?"
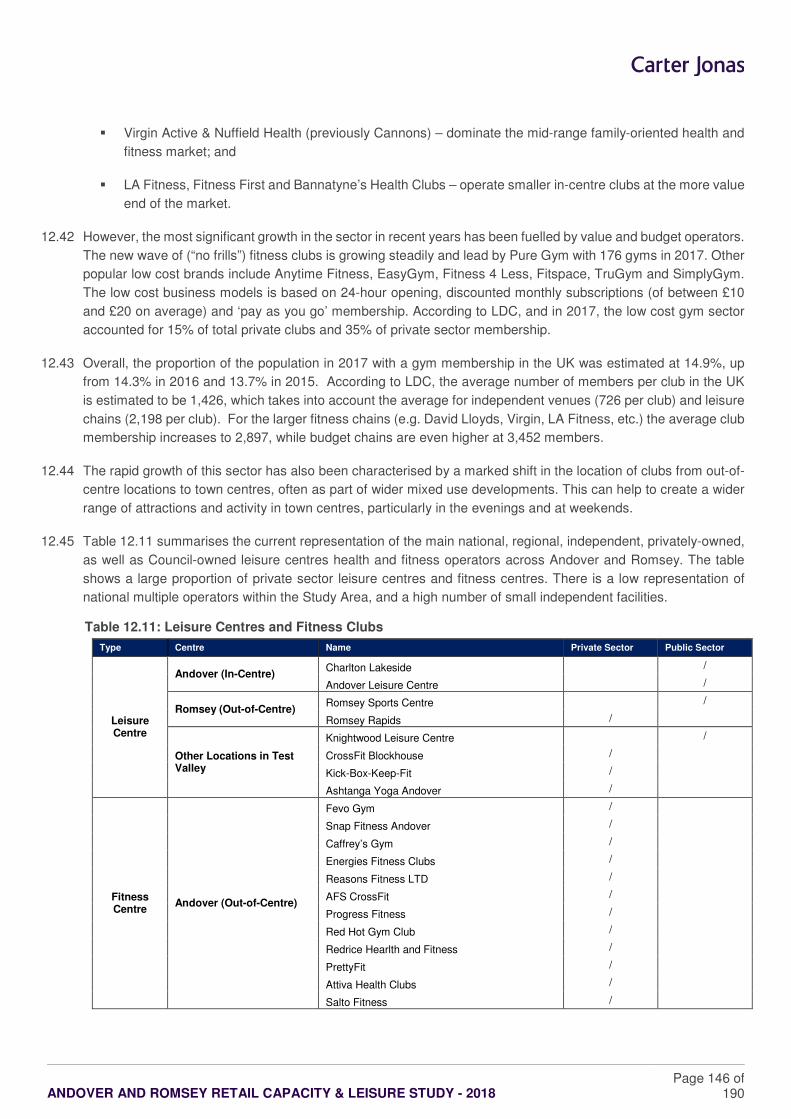
ANDOVER AND ROMSEY RETAIL CAPACITY & LEISURE STUDY - 2018
Page 146 of 190
� Virgin Active & Nuffield Health (previously Cannons) – dominate the mid-range family-oriented health and
fitness market; and
� LA Fitness, Fitness First and Bannatyne’s Health Clubs – operate smaller in-centre clubs at the more value
end of the market.
12.42 However, the most significant growth in the sector in recent years has been fuelled by value and budget operators.
The new wave of (“no frills”) fitness clubs is growing steadily and lead by Pure Gym with 176 gyms in 2017. Other
popular low cost brands include Anytime Fitness, EasyGym, Fitness 4 Less, Fitspace, TruGym and SimplyGym.
The low cost business models is based on 24-hour opening, discounted monthly subscriptions (of between £10
and £20 on average) and ‘pay as you go’ membership. According to LDC, and in 2017, the low cost gym sector
accounted for 15% of total private clubs and 35% of private sector membership.
12.43 Overall, the proportion of the population in 2017 with a gym membership in the UK was estimated at 14.9%, up
from 14.3% in 2016 and 13.7% in 2015. According to LDC, the average number of members per club in the UK
is estimated to be 1,426, which takes into account the average for independent venues (726 per club) and leisure
chains (2,198 per club). For the larger fitness chains (e.g. David Lloyds, Virgin, LA Fitness, etc.) the average club
membership increases to 2,897, while budget chains are even higher at 3,452 members.
12.44 The rapid growth of this sector has also been characterised by a marked shift in the location of clubs from out-of-
centre locations to town centres, often as part of wider mixed use developments. This can help to create a wider
range of attractions and activity in town centres, particularly in the evenings and at weekends.
12.45 Table 12.11 summarises the current representation of the main national, regional, independent, privately-owned,
as well as Council-owned leisure centres health and fitness operators across Andover and Romsey. The table
shows a large proportion of private sector leisure centres and fitness centres. There is a low representation of
national multiple operators within the Study Area, and a high number of small independent facilities.
Table 12.11: Leisure Centres and Fitness Clubs
Type Centre Name Private Sector Public Sector
Leisure Centre
Andover (In-Centre) Charlton Lakeside
/
Andover Leisure Centre /
Romsey (Out-of-Centre) Romsey Sports Centre
/
Romsey Rapids /
Other Locations in Test Valley
Knightwood Leisure Centre /
CrossFit Blockhouse /
Kick-Box-Keep-Fit /
Ashtanga Yoga Andover /
Fitness Centre
Andover (Out-of-Centre)
Fevo Gym /
Snap Fitness Andover /
Caffrey’s Gym /
Energies Fitness Clubs /
Reasons Fitness LTD /
AFS CrossFit /
Progress Fitness /
Red Hot Gym Club /
Redrice Hearlth and Fitness /
PrettyFit /
Attiva Health Clubs
/
Salto Fitness /

ANDOVER AND ROMSEY RETAIL CAPACITY & LEISURE STUDY - 2018
Page 147 of 190
Romsey (Out-of-Centre)
CrossFit Romsey /
Starlight Trampoline and Gymnastics Club /
Curves Romsey /
SO51 Fitness and Wellbeing /
Yoga For Everyone /
Gentle Yoga /
Pilates Works /
Indivdually Unique Ltd Toning Tables /
Physically Free /
Pranamay (Massage and Yoga) /
Other Locations in Test Valley
BodyPlus /
3D Health and Fitness /
Studio Yoga /
Sarah Bristow Yoga Classes /
Middle Wallop Gym /
12.46 In terms of fitness/health activity participation rates, the household survey results show that 24.7% of respondents
in the Study Area visited a gym, health club or sport facility. The findings are as follows:
� Within the Study Area, 75.5% visit more than once a week and 15.4% visited once a week.
� Within Andover Primary Catchment Area: 91.3% visit more than once a week; 7.3% visit once a week;
and 0.5% every month.
� Within Romsey Primary Catchment Area: 80.5% visit more than once a week; 12.8% visit once a week;
and 2.7 % every month.
� Within Test Valley: 75.5% visit more than once a week; 15.4% visit once a week; and 1.5% every month.
12.47 The table below is based on the household survey analysis, and sets out the retention levels of the health and
fitness facilities in the Test Valley Area, as well the trade leakage to locations outside the Council Area.
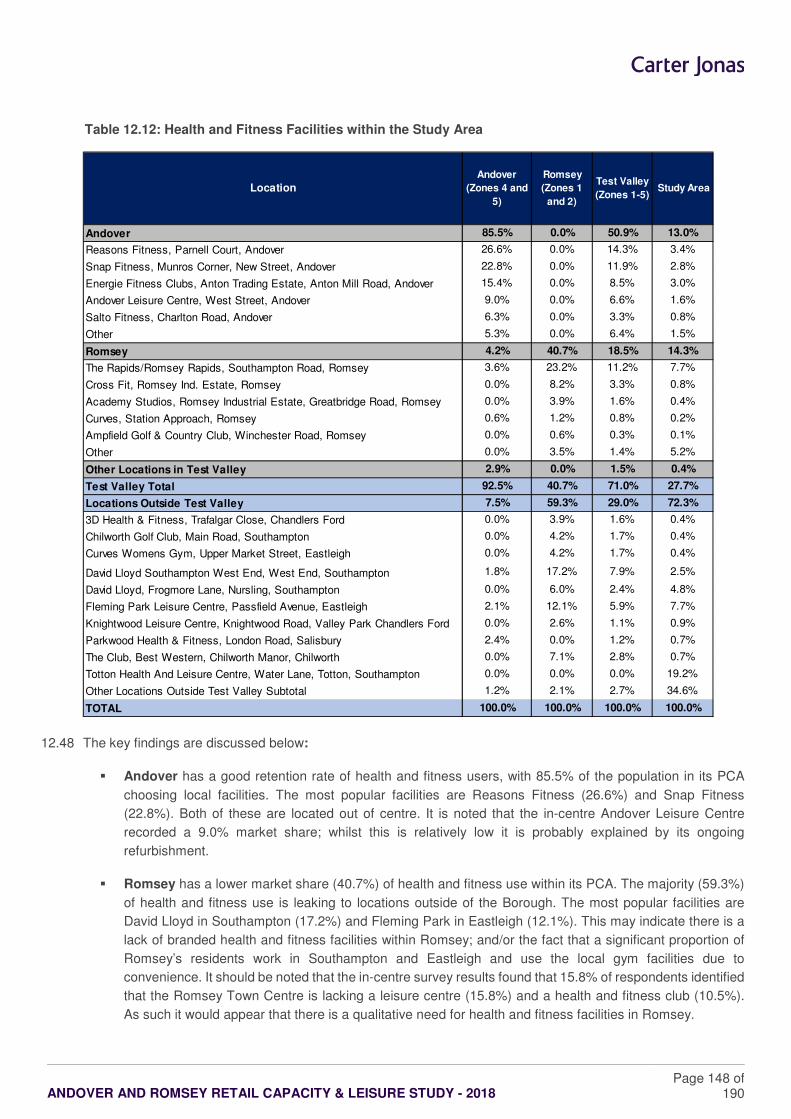
ANDOVER AND ROMSEY RETAIL CAPACITY & LEISURE STUDY - 2018
Page 148 of 190
Table 12.12: Health and Fitness Facilities within the Study Area
12.48 The key findings are discussed below:
� Andover has a good retention rate of health and fitness users, with 85.5% of the population in its PCA
choosing local facilities. The most popular facilities are Reasons Fitness (26.6%) and Snap Fitness
(22.8%). Both of these are located out of centre. It is noted that the in-centre Andover Leisure Centre
recorded a 9.0% market share; whilst this is relatively low it is probably explained by its ongoing
refurbishment.
� Romsey has a lower market share (40.7%) of health and fitness use within its PCA. The majority (59.3%)
of health and fitness use is leaking to locations outside of the Borough. The most popular facilities are
David Lloyd in Southampton (17.2%) and Fleming Park in Eastleigh (12.1%). This may indicate there is a
lack of branded health and fitness facilities within Romsey; and/or the fact that a significant proportion of
Romsey’s residents work in Southampton and Eastleigh and use the local gym facilities due to
convenience. It should be noted that the in-centre survey results found that 15.8% of respondents identified
that the Romsey Town Centre is lacking a leisure centre (15.8%) and a health and fitness club (10.5%).
As such it would appear that there is a qualitative need for health and fitness facilities in Romsey.
Location
Andover
(Zones 4 and
5)
Romsey
(Zones 1
and 2)
Test Valley
(Zones 1-5) Study Area
Andover 85.5% 0.0% 50.9% 13.0%
Reasons Fitness, Parnell Court, Andover 26.6% 0.0% 14.3% 3.4%
Snap Fitness, Munros Corner, New Street, Andover 22.8% 0.0% 11.9% 2.8%
Energie Fitness Clubs, Anton Trading Estate, Anton Mill Road, Andover 15.4% 0.0% 8.5% 3.0%
Andover Leisure Centre, West Street, Andover 9.0% 0.0% 6.6% 1.6%
Salto Fitness, Charlton Road, Andover 6.3% 0.0% 3.3% 0.8%
Other 5.3% 0.0% 6.4% 1.5%
Romsey 4.2% 40.7% 18.5% 14.3%
The Rapids/Romsey Rapids, Southampton Road, Romsey 3.6% 23.2% 11.2% 7.7%
Cross Fit, Romsey Ind. Estate, Romsey 0.0% 8.2% 3.3% 0.8%
Academy Studios, Romsey Industrial Estate, Greatbridge Road, Romsey 0.0% 3.9% 1.6% 0.4%
Curves, Station Approach, Romsey 0.6% 1.2% 0.8% 0.2%
Ampfield Golf & Country Club, Winchester Road, Romsey 0.0% 0.6% 0.3% 0.1%
Other 0.0% 3.5% 1.4% 5.2%
Other Locations in Test Valley 2.9% 0.0% 1.5% 0.4%
Test Valley Total 92.5% 40.7% 71.0% 27.7%
Locations Outside Test Valley 7.5% 59.3% 29.0% 72.3%
3D Health & Fitness, Trafalgar Close, Chandlers Ford 0.0% 3.9% 1.6% 0.4%
Chilworth Golf Club, Main Road, Southampton 0.0% 4.2% 1.7% 0.4%
Curves Womens Gym, Upper Market Street, Eastleigh 0.0% 4.2% 1.7% 0.4%
David Lloyd Southampton West End, West End, Southampton 1.8% 17.2% 7.9% 2.5%
David Lloyd, Frogmore Lane, Nursling, Southampton 0.0% 6.0% 2.4% 4.8%
Fleming Park Leisure Centre, Passfield Avenue, Eastleigh 2.1% 12.1% 5.9% 7.7%
Knightwood Leisure Centre, Knightwood Road, Valley Park Chandlers Ford 0.0% 2.6% 1.1% 0.9%
Parkwood Health & Fitness, London Road, Salisbury 2.4% 0.0% 1.2% 0.7%
The Club, Best Western, Chilworth Manor, Chilworth 0.0% 7.1% 2.8% 0.7%
Totton Health And Leisure Centre, Water Lane, Totton, Southampton 0.0% 0.0% 0.0% 19.2%
Other Locations Outside Test Valley Subtotal 1.2% 2.1% 2.7% 34.6%
TOTAL 100.0% 100.0% 100.0% 100.0%
ANDOVER AND ROMSEY RETAIL CAPACITY & LEISURE STUDY - 2018
Page 149 of 190
Bingo & Gambling Needs
12.49 Gambling represents a significant element of the leisure industry. The main sectors of the gambling industry
comprise ‘games of chance’ (i.e. bingo clubs, casinos, betting shops, amusement arcades, etc.). We briefly
describe the key trends in this sector and the forecast need/ demand for new facilities in the Study Area, if any,
based on the available evidence.
12.50 In terms of Bingo Halls, the latest research by The Gambling Commission (Industry Statistics November 2015)
indicates that there are over 599 licensed premises in operation in the UK, which is a reduction from 653 recorded
in 2014. Gala Leisure and Mecco Bingo are the leading operators accounting for over a third (36.9%) of all
premises. Research by Mintel indicates that the industry has experienced a fall in revenues and admissions over
recent years as a result of legislative changes (such as the ban on smoking in public places), the impact of the
economic downturn and the growth of online gaming. In response to falling admissions, bingo operators are
increasingly taking advantage of the online market and embracing smart-phone technology through new ‘app’
development. This forms part of a wider trend and growth in ‘remote/online’ gambling, which includes gambling
activities through the internet, telephone, radio, etc. Bingo operators are also increasingly looking to diversify their
customer profile, and are marketing their clubs at a younger, predominantly female audience. As a result there
has been an increase in the number of younger and more affluent bingo players over recent years, particularly as
deregulation has enabled clubs to offer bigger (national) prizes. The above has resulted in the closure of many
bingo halls across the UK.
12.51 For Casinos research shows that there were some 147 venues in the UK in September 2015. The number of
premises has remained fairly static over the past five years. This sector is dominated by two companies: the Rank
Group (incorporating Grosvenor Casinos and Gala Coral Casinos) and Genting UK. There has been consolidation
of the sector in the past few years, with acquisitions such as Rank Group’s purchase of Gala Coral Casinos making
it the largest operator in the UK. While casino attendance has grown from 18.24m in 2012 to 20.44m in 2015,
attendance dropped by 2.6% from 2014 (20.99m). The increase in attendance since 2012 is largely explained by
larger new casino venues granted licences under the 2005 Gambling Act. As far as we are aware there is no
casino facility located within the LPA area. The nearest commercial casinos are in Newbury (Casino Slots);
Reading (Genting and Grosvenor Casino); Southampton (the Genting and Grosvenor Casino) and Bournemouth
(the Genting, Grosvenor Casino, Absolute Fun Casino and Viva Las Vegas).
12.52 Betting shops do represent a growing market in the gambling sector and are ever present on the UK’s high
streets. There are approximately 9,000 betting shops in the UK, of which around half are operated by Ladbrokes
and William Hill. Regulatory changes in 2015 led to a fall in revenue and profit. In response, William Hill announced
their intention to close 150 of their 2,300 outlets. As gambling activities continue their shift to online channels,
demand for physical outlets could dampen in the future. The presence of betting shops in high streets is a
contentious issue, particularly the perceived social issues that are linked to this particular activity (e.g. anti-social
behaviour) and their concentration in deprived areas. The Government has recognised that betting shops have
specific impacts and in 2016 reclassified betting shops from A2 to Sui Generis use. This reclassification gave local
authorities greater control on managing the number of outlets and therefore greater potential to limit impacts
associated with betting shops.
12.53 The household survey results indicate that visiting bingo halls, casinos and/or bookmakers is not an important
activity for respondents living within the Study Area since only 4.8% take part in this activity. In terms of
participation rates across the Study Area, findings are as follows:
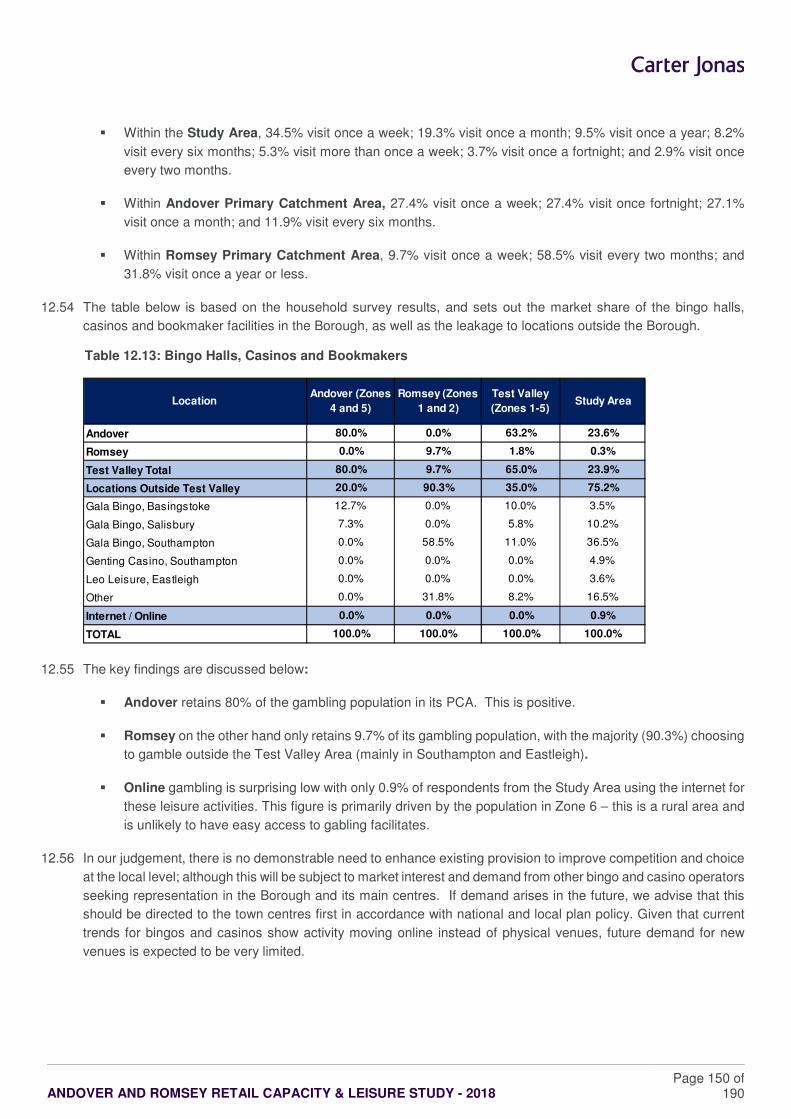
ANDOVER AND ROMSEY RETAIL CAPACITY & LEISURE STUDY - 2018
Page 150 of 190
� Within the Study Area, 34.5% visit once a week; 19.3% visit once a month; 9.5% visit once a year; 8.2%
visit every six months; 5.3% visit more than once a week; 3.7% visit once a fortnight; and 2.9% visit once
every two months.
� Within Andover Primary Catchment Area, 27.4% visit once a week; 27.4% visit once fortnight; 27.1%
visit once a month; and 11.9% visit every six months.
� Within Romsey Primary Catchment Area, 9.7% visit once a week; 58.5% visit every two months; and
31.8% visit once a year or less.
12.54 The table below is based on the household survey results, and sets out the market share of the bingo halls,
casinos and bookmaker facilities in the Borough, as well as the leakage to locations outside the Borough.
Table 12.13: Bingo Halls, Casinos and Bookmakers
12.55 The key findings are discussed below:
� Andover retains 80% of the gambling population in its PCA. This is positive.
� Romsey on the other hand only retains 9.7% of its gambling population, with the majority (90.3%) choosing
to gamble outside the Test Valley Area (mainly in Southampton and Eastleigh).
� Online gambling is surprising low with only 0.9% of respondents from the Study Area using the internet for
these leisure activities. This figure is primarily driven by the population in Zone 6 – this is a rural area and
is unlikely to have easy access to gabling facilitates.
12.56 In our judgement, there is no demonstrable need to enhance existing provision to improve competition and choice
at the local level; although this will be subject to market interest and demand from other bingo and casino operators
seeking representation in the Borough and its main centres. If demand arises in the future, we advise that this
should be directed to the town centres first in accordance with national and local plan policy. Given that current
trends for bingos and casinos show activity moving online instead of physical venues, future demand for new
venues is expected to be very limited.
Location Andover (Zones
4 and 5)
Romsey (Zones
1 and 2)
Test Valley
(Zones 1-5) Study Area
Andover 80.0% 0.0% 63.2% 23.6%
Romsey 0.0% 9.7% 1.8% 0.3%
Test Valley Total 80.0% 9.7% 65.0% 23.9%
Locations Outside Test Valley 20.0% 90.3% 35.0% 75.2%
Gala Bingo, Basingstoke 12.7% 0.0% 10.0% 3.5%
Gala Bingo, Salisbury 7.3% 0.0% 5.8% 10.2%
Gala Bingo, Southampton 0.0% 58.5% 11.0% 36.5%
Genting Casino, Southampton 0.0% 0.0% 0.0% 4.9%
Leo Leisure, Eastleigh 0.0% 0.0% 0.0% 3.6%
Other 0.0% 31.8% 8.2% 16.5%
Internet / Online 0.0% 0.0% 0.0% 0.9%
TOTAL 100.0% 100.0% 100.0% 100.0%
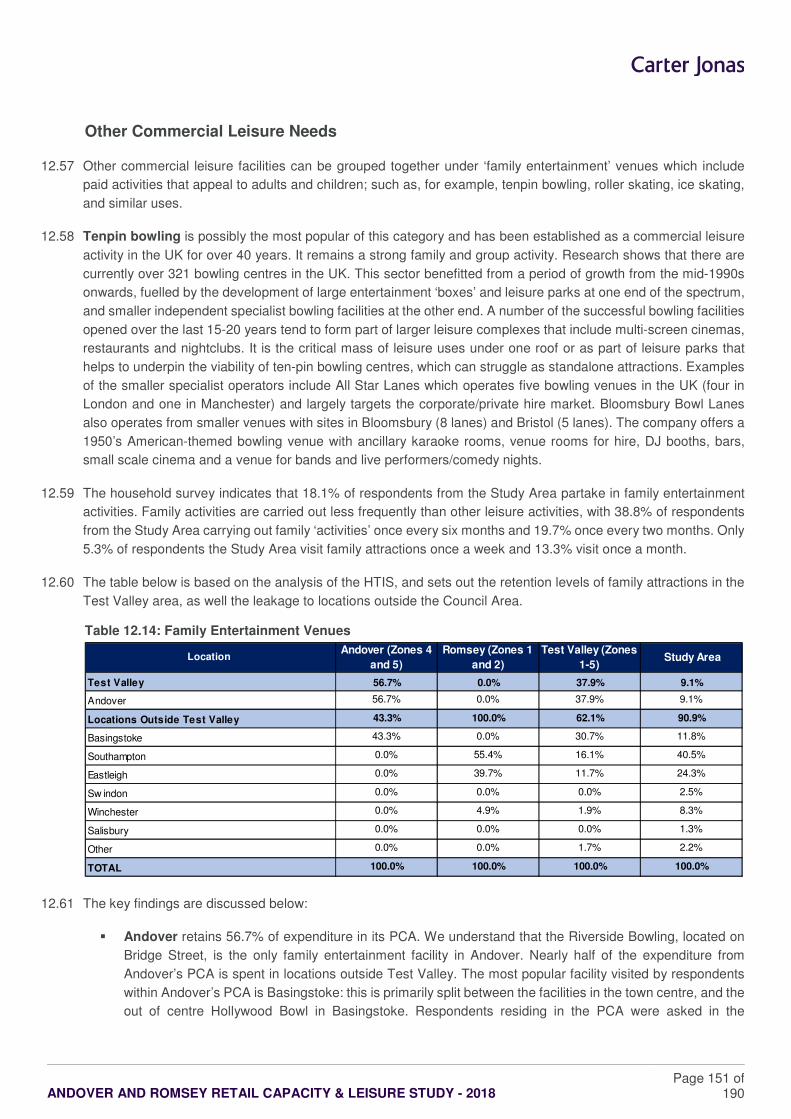
ANDOVER AND ROMSEY RETAIL CAPACITY & LEISURE STUDY - 2018
Page 151 of 190
Other Commercial Leisure Needs
12.57 Other commercial leisure facilities can be grouped together under ‘family entertainment’ venues which include
paid activities that appeal to adults and children; such as, for example, tenpin bowling, roller skating, ice skating,
and similar uses.
12.58 Tenpin bowling is possibly the most popular of this category and has been established as a commercial leisure
activity in the UK for over 40 years. It remains a strong family and group activity. Research shows that there are
currently over 321 bowling centres in the UK. This sector benefitted from a period of growth from the mid-1990s
onwards, fuelled by the development of large entertainment ‘boxes’ and leisure parks at one end of the spectrum,
and smaller independent specialist bowling facilities at the other end. A number of the successful bowling facilities
opened over the last 15-20 years tend to form part of larger leisure complexes that include multi-screen cinemas,
restaurants and nightclubs. It is the critical mass of leisure uses under one roof or as part of leisure parks that
helps to underpin the viability of ten-pin bowling centres, which can struggle as standalone attractions. Examples
of the smaller specialist operators include All Star Lanes which operates five bowling venues in the UK (four in
London and one in Manchester) and largely targets the corporate/private hire market. Bloomsbury Bowl Lanes
also operates from smaller venues with sites in Bloomsbury (8 lanes) and Bristol (5 lanes). The company offers a
1950’s American-themed bowling venue with ancillary karaoke rooms, venue rooms for hire, DJ booths, bars,
small scale cinema and a venue for bands and live performers/comedy nights.
12.59 The household survey indicates that 18.1% of respondents from the Study Area partake in family entertainment
activities. Family activities are carried out less frequently than other leisure activities, with 38.8% of respondents
from the Study Area carrying out family ‘activities’ once every six months and 19.7% once every two months. Only
5.3% of respondents the Study Area visit family attractions once a week and 13.3% visit once a month.
12.60 The table below is based on the analysis of the HTIS, and sets out the retention levels of family attractions in the
Test Valley area, as well the leakage to locations outside the Council Area.
Table 12.14: Family Entertainment Venues
12.61 The key findings are discussed below:
� Andover retains 56.7% of expenditure in its PCA. We understand that the Riverside Bowling, located on
Bridge Street, is the only family entertainment facility in Andover. Nearly half of the expenditure from
Andover’s PCA is spent in locations outside Test Valley. The most popular facility visited by respondents
within Andover’s PCA is Basingstoke: this is primarily split between the facilities in the town centre, and the
out of centre Hollywood Bowl in Basingstoke. Respondents residing in the PCA were asked in the
Location Andover (Zones 4
and 5)
Romsey (Zones 1
and 2)
Test Valley (Zones
1-5) Study Area
Test Valley 56.7% 0.0% 37.9% 9.1%
Andover 56.7% 0.0% 37.9% 9.1%
Locations Outside Test Valley 43.3% 100.0% 62.1% 90.9%
Basingstoke 43.3% 0.0% 30.7% 11.8%
Southampton 0.0% 55.4% 16.1% 40.5%
Eastleigh 0.0% 39.7% 11.7% 24.3%
Sw indon 0.0% 0.0% 0.0% 2.5%
Winchester 0.0% 4.9% 1.9% 8.3%
Salisbury 0.0% 0.0% 0.0% 1.3%
Other 0.0% 0.0% 1.7% 2.2%
TOTAL 100.0% 100.0% 100.0% 100.0%
ANDOVER AND ROMSEY RETAIL CAPACITY & LEISURE STUDY - 2018
Page 152 of 190
household survey if there are any potential improvements that could be made, with regards to the leisure
provision in Andover: in terms of family attractions, respondents indicated that the wider variety and choice
of children’s amenities (3.6%); and an ice rink (1.5%) would benefit the centre. The in-centre survey indicate
that some 12.7% of respondents in Andover would like more amenities for children.
� Romsey does not retain any expenditure within its PCA, with all the residents visiting attractions outside
Test Valley. The key attractions are those in Southampton (55.4%) and Eastleigh (39.75), with bowling
facilities being specifically popular. Respondents residing in the PCA were asked in the household survey
if there are any potential improvements that could be made, with regards to the leisure provision in Romsey.
In terms of family attractions, respondents indicated that an ice rink (0.5%) would benefit the centre.
12.62 As such, there is a qualitative gap in the family entertainment facilities in both Andover and Romsey. Such facilities
should be encourage to locate in the town centres.
Cultural Activities
12.63 Cultural activities include a broad range of activities that are focused on the arts and historic attractions. For the
purpose of this assessment, consideration is given firstly to the provision of theatres and music venues, and
secondly, historic/cultural attractions. The current provision of cultural venues (including theatres, music venues,
museums, and art galleries) is set out in the table below:
Table 12.15: Cultural Facilities in Test Valley
Venue Type Town Name
Theatre and Music Andover The Lights
Romsey Plaza Theatre
Historical & Cultural
Andover Andover Museum and Museum of the Iron Age
Museum of Arm Chaplaincy
Romsey
King Johns House Museum
Romsey Abbey
Rum’s Eg Gallery
Theatres and Music Venues
12.64 The results of the household survey indicate that 40.6% of respondents from the Study Area visit theatres and
music venues (10.9% in Andover PCA; 13.5% in Romsey PCA and 1.2% for the Test Valley Area).
12.65 The table below shows where respondents living in the Study Area go to visit theatres and music venues.
Table 12.16: Theatres and Music Venues
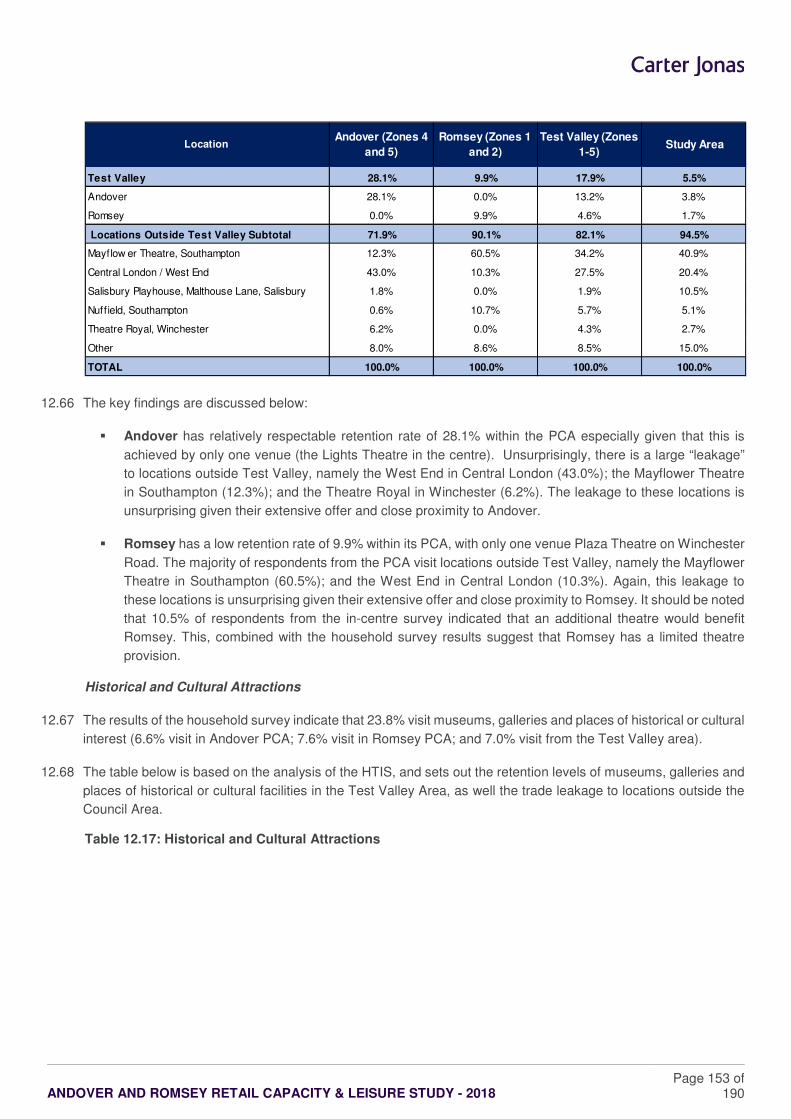
ANDOVER AND ROMSEY RETAIL CAPACITY & LEISURE STUDY - 2018
Page 153 of 190
12.66 The key findings are discussed below:
� Andover has relatively respectable retention rate of 28.1% within the PCA especially given that this is
achieved by only one venue (the Lights Theatre in the centre). Unsurprisingly, there is a large “leakage”
to locations outside Test Valley, namely the West End in Central London (43.0%); the Mayflower Theatre
in Southampton (12.3%); and the Theatre Royal in Winchester (6.2%). The leakage to these locations is
unsurprising given their extensive offer and close proximity to Andover.
� Romsey has a low retention rate of 9.9% within its PCA, with only one venue Plaza Theatre on Winchester
Road. The majority of respondents from the PCA visit locations outside Test Valley, namely the Mayflower
Theatre in Southampton (60.5%); and the West End in Central London (10.3%). Again, this leakage to
these locations is unsurprising given their extensive offer and close proximity to Romsey. It should be noted
that 10.5% of respondents from the in-centre survey indicated that an additional theatre would benefit
Romsey. This, combined with the household survey results suggest that Romsey has a limited theatre
provision.
Historical and Cultural Attractions
12.67 The results of the household survey indicate that 23.8% visit museums, galleries and places of historical or cultural
interest (6.6% visit in Andover PCA; 7.6% visit in Romsey PCA; and 7.0% visit from the Test Valley area).
12.68 The table below is based on the analysis of the HTIS, and sets out the retention levels of museums, galleries and
places of historical or cultural facilities in the Test Valley Area, as well the trade leakage to locations outside the
Council Area.
Table 12.17: Historical and Cultural Attractions
Location Andover (Zones 4
and 5)
Romsey (Zones 1
and 2)
Test Valley (Zones
1-5) Study Area
Test Valley 28.1% 9.9% 17.9% 5.5%
Andover 28.1% 0.0% 13.2% 3.8%
Romsey 0.0% 9.9% 4.6% 1.7%
Locations Outside Test Valley Subtotal 71.9% 90.1% 82.1% 94.5%
Mayflow er Theatre, Southampton 12.3% 60.5% 34.2% 40.9%
Central London / West End 43.0% 10.3% 27.5% 20.4%
Salisbury Playhouse, Malthouse Lane, Salisbury 1.8% 0.0% 1.9% 10.5%
Nuffield, Southampton 0.6% 10.7% 5.7% 5.1%
Theatre Royal, Winchester 6.2% 0.0% 4.3% 2.7%
Other 8.0% 8.6% 8.5% 15.0%
TOTAL 100.0% 100.0% 100.0% 100.0%
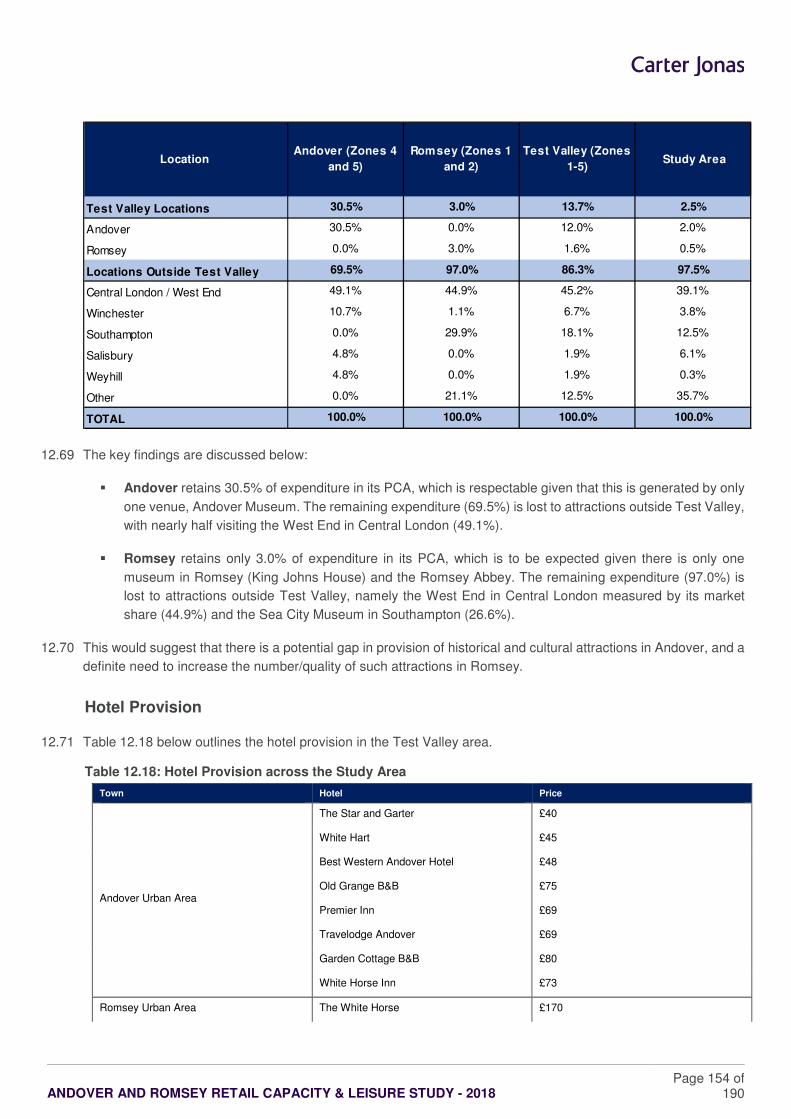
ANDOVER AND ROMSEY RETAIL CAPACITY & LEISURE STUDY - 2018
Page 154 of 190
12.69 The key findings are discussed below:
� Andover retains 30.5% of expenditure in its PCA, which is respectable given that this is generated by only
one venue, Andover Museum. The remaining expenditure (69.5%) is lost to attractions outside Test Valley,
with nearly half visiting the West End in Central London (49.1%).
� Romsey retains only 3.0% of expenditure in its PCA, which is to be expected given there is only one
museum in Romsey (King Johns House) and the Romsey Abbey. The remaining expenditure (97.0%) is
lost to attractions outside Test Valley, namely the West End in Central London measured by its market
share (44.9%) and the Sea City Museum in Southampton (26.6%).
12.70 This would suggest that there is a potential gap in provision of historical and cultural attractions in Andover, and a
definite need to increase the number/quality of such attractions in Romsey.
Hotel Provision
12.71 Table 12.18 below outlines the hotel provision in the Test Valley area.
Table 12.18: Hotel Provision across the Study Area
Town Hotel Price
Andover Urban Area
The Star and Garter £40
White Hart £45
Best Western Andover Hotel £48
Old Grange B&B £75
Premier Inn £69
Travelodge Andover £69
Garden Cottage B&B £80
White Horse Inn £73
Romsey Urban Area The White Horse £170
Location Andover (Zones 4
and 5)
Romsey (Zones 1
and 2)
Test Valley (Zones
1-5) Study Area
Test Valley Locations 30.5% 3.0% 13.7% 2.5%
Andover 30.5% 0.0% 12.0% 2.0%
Romsey 0.0% 3.0% 1.6% 0.5%
Locations Outside Test Valley 69.5% 97.0% 86.3% 97.5%
Central London / West End 49.1% 44.9% 45.2% 39.1%
Winchester 10.7% 1.1% 6.7% 3.8%
Southampton 0.0% 29.9% 18.1% 12.5%
Salisbury 4.8% 0.0% 1.9% 6.1%
Weyhill 4.8% 0.0% 1.9% 0.3%
Other 0.0% 21.1% 12.5% 35.7%
TOTAL 100.0% 100.0% 100.0% 100.0%
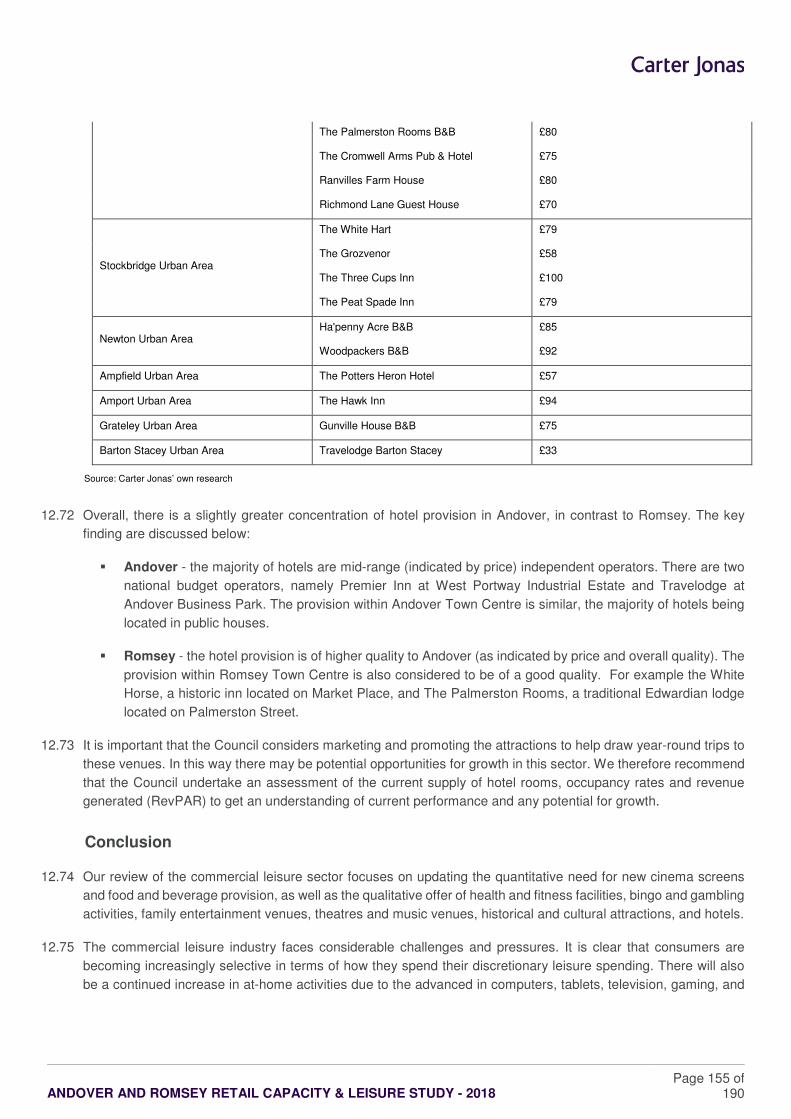
ANDOVER AND ROMSEY RETAIL CAPACITY & LEISURE STUDY - 2018
Page 155 of 190
The Palmerston Rooms B&B £80
The Cromwell Arms Pub & Hotel £75
Ranvilles Farm House £80
Richmond Lane Guest House £70
Stockbridge Urban Area
The White Hart £79
The Grozvenor £58
The Three Cups Inn £100
The Peat Spade Inn £79
Newton Urban Area Ha'penny Acre B&B £85
Woodpackers B&B £92
Ampfield Urban Area The Potters Heron Hotel £57
Amport Urban Area The Hawk Inn £94
Grateley Urban Area Gunville House B&B £75
Barton Stacey Urban Area Travelodge Barton Stacey £33
Source: Carter Jonas’ own research
12.72 Overall, there is a slightly greater concentration of hotel provision in Andover, in contrast to Romsey. The key
finding are discussed below:
� Andover - the majority of hotels are mid-range (indicated by price) independent operators. There are two
national budget operators, namely Premier Inn at West Portway Industrial Estate and Travelodge at
Andover Business Park. The provision within Andover Town Centre is similar, the majority of hotels being
located in public houses.
� Romsey - the hotel provision is of higher quality to Andover (as indicated by price and overall quality). The
provision within Romsey Town Centre is also considered to be of a good quality. For example the White
Horse, a historic inn located on Market Place, and The Palmerston Rooms, a traditional Edwardian lodge
located on Palmerston Street.
12.73 It is important that the Council considers marketing and promoting the attractions to help draw year-round trips to
these venues. In this way there may be potential opportunities for growth in this sector. We therefore recommend
that the Council undertake an assessment of the current supply of hotel rooms, occupancy rates and revenue
generated (RevPAR) to get an understanding of current performance and any potential for growth.
Conclusion
12.74 Our review of the commercial leisure sector focuses on updating the quantitative need for new cinema screens
and food and beverage provision, as well as the qualitative offer of health and fitness facilities, bingo and gambling
activities, family entertainment venues, theatres and music venues, historical and cultural attractions, and hotels.
12.75 The commercial leisure industry faces considerable challenges and pressures. It is clear that consumers are
becoming increasingly selective in terms of how they spend their discretionary leisure spending. There will also
be a continued increase in at-home activities due to the advanced in computers, tablets, television, gaming, and
ANDOVER AND ROMSEY RETAIL CAPACITY & LEISURE STUDY - 2018
Page 156 of 190
audio technology. The challenge for town centres and leisure operators in the future is to attract customers away
from their homes.
12.76 Our review indicates that there is a currently an adequate provision of leisure facilities in the Borough, but there
are areas that are in need for improvement.
12.77 In terms of cinema provision, the assessment found that the Odeon cinema (5 screens) in Andover acts as one
of the key attractions, retaining a significant proportion of the population in the Andover PCA (94.9%) – this is very
positive. Romsey on the other hand does not benefit from a commercial cinema; and the only cinema facility is
that within Romsey Town Hall which operates every Monday. As such it is not surprising that within Romsey’s
Primary Catchment Area 95.5% of population travel outside of the Test Valley Area for their cinema needs. This
level of “leakage” indicates that in qualitative terms Romsey lacks a cinema. Our quantitative assessment,
however, found that there is no capacity for additional cinema screens across the Council Area. If demand from
operators does exist, this should be directed to town centres first (and ideally into Romsey) in accordance with
national and local policy objectives.
12.78 Looking at eating and drinking out, the household survey has indicated that centres in the Borough collectively
have a relatively strong retention level (64.2%) for eating and drinking out from within the wider Study Area.
However, within both Andover and Romsey there is need for a qualitative and quantitative improvement in the
food and beverage sector. The quantitative assessment shows that across the Council Area, there is capacity for
new food and beverage floors for between 464 sqm gross in 2021 increasing to 12,300 sqm gross by 2036. In
compliance with the objectives of the NPPF, this forecast need should be directed to town centres within Test
Valley first to help increase competition and choice, and to help underpin their daytime/evening economies.
12.79 Our assessment of the health and fitness facilities across the Council Area shows that Andover has a strong
provision on the basis that 85.5% of the population in its PCA is choosing to use local facilities. Romsey on the
other hand is ‘losing’ 59.3% of health and fitness expenditure to locations outside of the Test Valley Area. This
may indicate there is a lack of branded health and fitness facilities within Romsey. The in-centre survey results
also confirm that Romsey Town Centre lacks health and fitness facilities. As such it would appear that there is a
qualitative need for health and fitness facilities in Romsey.
12.80 In terms of bingo and gambling activities, the household survey results indicate that visiting bingo halls, casinos
and/or bookmakers is not an important activity for respondents living within the Study Area. In our judgement,
there is no demonstrable need to enhance existing provision to improve competition and choice at the local level,
although this will be subject to market interest and demand from other bingo and casino operators. If demand
arises in the future, we advise that this should be directed to the town centres first in accordance with national and
local plan policy. Given that current trends for bingos and casinos show activity moving online instead of physical
venues, future demand for new venues is expected to be very limited.
12.81 Looking at family entertainment, our analysis of the existing provision shows that nearly half of the expenditure
from Andover’s PCA is spent in locations outside Test Valley, and primarily in Basingstoke; Romsey does not
retain any expenditure within its PCA, with all the residents visiting attractions outside Test Valley. The key
attractions are those in Southampton and Eastleigh with bowling facilities being particularly popular. As such,
there is a qualitative gap in the family entertainment facilities available in both Andover and Romsey. Such facilities
should be encouraged to locate in the town centres.
12.82 An assessment of cultural activities (such as theatres, music venues, historical and cultural attractions) was
carried out as part of the Study. This highlighted that there is a potential gap in provision of historical and cultural
ANDOVER AND ROMSEY RETAIL CAPACITY & LEISURE STUDY - 2018
Page 157 of 190
attractions in Andover, and a definite need to increase the number/quality of such attractions in Romsey. Romsey
also has a limited theatre provision.
12.83 In terms of hotels, the provision across Test Valley is characterised by independent operators. Looking at the
individual centres, the provision in Andover is considered to be mid-range, whereas in Romsey, the offer is of a
higher quality. To help maintain and enhance the visitor and tourist economy across the Study Area and its main
centres, Test Valley Borough Council should proactively seek to increase hotel and visitor/tourist accommodation
in the main centres, subject to market demand. To further help inform the proactive planning and development of
new accommodation we recommend that a more detailed hotel needs assessment is undertaken.
ANDOVER AND ROMSEY RETAIL CAPACITY & LEISURE STUDY - 2018
Page 158 of 190
13 SHOPPING FRONTAGES & BOUNDARIES POLICY CONTEXT
Shopping Frontages & Boundaries National Policy and Context
13.1 In setting out policies for the management and growth of centres over the plan period, and promoting competitive
Town Centre environments, local planning authorities are required by the NPPF (paragraph 23) to define the
extent of Town Centres and Primary Shopping Areas (PSAs), based on a clear definition of primary and secondary
frontages in designated centres, and set policies that make clear which uses will be permitted in such locations.
13.2 The NPPF (Annex 2) defines primary and secondary frontages as follows:
� Primary Shopping Frontages (PSFs) - likely to include a high proportion of retail uses, which may include
food, drinks, clothing and household goods.
� Secondary Shopping Frontages (SSFs) - provide greater opportunities for a diversity of uses such as
restaurants, cinemas and businesses.
13.3 The difference between the definition of the Primary Shopping Area and Town Centre Boundary is defined by
NPPF (Annex 2) as follows:
� Primary Shopping Area (PSA) - the area where retail development is concentrated and generally
comprises the PSFs and those SSFs which are “adjoining and closely related to the primary shopping
frontage”.
� Town Centre Boundary (TCB) – defined as the area on the local authority’s proposal map, including the
primary shopping area and areas predominantly occupied by main Town Centre uses within or adjacent to
the primary shopping area.
13.4 The definition of a centre’s PSA and TCB is important in retail planning terms in a number of important respects:
� First, for the purposes of plan-making and development management, sites and applications for new retail,
leisure and other main Town Centre uses that are not in an existing centre and not in accordance with an
up-to-date Local Plan will be subject to the sequential and impact ‘tests’ in accordance with the NPPF
(paragraphs 24-27).
� Second, in terms of applying the sequential approach for both plan-making and decision-taking, an ‘edge-
of-centre’ site is defined for retail purposes by the NPPF (Annex 2) as a location that is “well connected
and up to 300 metres of the primary shopping area”. For all other main Town Centre uses it is a location
“within 300 metres of a Town Centre boundary”; and for office development, it includes “locations outside
the Town Centre but within 500 metres of a public transport interchange”. The NPPF states that in
determining whether a site falls within the definition of edge of centre, “account should be taken of local
circumstances”, and preference should be given to “accessible sites that are well connected to the Town
Centre” (NPPF, paragraph 24).
� Third, defining the extent of the PSF and PSA for Town Centres will also enable local planning authorities
to manage Permitted Development Rights (PDR), principally from retail to residential use.
13.5 It is against this policy background and guidance that we have necessarily reviewed and identified the extent of
each centre’s primary and secondary shopping frontages, PSA and Town Centre Boundaries. Our assessment
has been based by our health checks and site visits of the main centres during 2017.
ANDOVER AND ROMSEY RETAIL CAPACITY & LEISURE STUDY - 2018
Page 159 of 190
Frontage Policy Trends
13.6 To inform this Study we have reviewed the Development Plan Documents that have been adopted by other Local
Planning Authorities in 2015 and 2016. This was done in order to understand how frontage policies are dealt with
by others and to establish general trends for dealing with this matter. The following Local Plan Documents have
been found particular useful as part of the exercise, reflecting a variety of types of frontage policies:
� Chorley Local Plan 2012-2026 Site Allocations and Development Management Policies Development Plan
Document, adopted in July 2016.
� Tunbridge Wells Borough Site Allocations Local Plan, adopted in July 2016
� Hinckley and Bosworth Borough Council Local Plan 2006 – 2026 Site Allocations and Development
Management Policies DPD, adopted in July 2016.
� North Somerset Council Development Management Policies Sites and Policies Plan Part 1, adopted in July
2016.
� Fareham Local Plan Part 2: Development Sites and Policies, adopted in June 2015.
� Rochford District Council adopted its Rochford Town Centre Area Action Plan in April 2015.
� South Ribble Borough Council adopted its Local Plan in July 2015.
13.7 As part of this review, it has been recognised that in general, recently adopted policies seek to control the
combination of retail and Town Centre uses as defined by the Framework. The following three trends in frontage
policies have been identified:
1. Minimum Threshold Policy
13.8 A minimum threshold policy can be adopted to control the composition of the shopping frontages in centres. This
is where certain Use Classes, typically non-A1 uses, are not permitted if it they would result in the reduction of A1
uses below a certain level. This can either be a measured proportion of a particular frontage of a certain area of
the centre (i.e. the length of individual shop fronts compare to the total frontage length, or the number of units
measured against the number of units in a particular frontage) or the centre as a whole.
13.9 The minimum threshold can be set to any use, which the Council desires to maintain, or a combination of uses.
13.10 Such approach is very precise in application and monitoring, but does not offer the flexibility that may be desired
to adapt to changing Town Centre trends and consumer demands and habits. As such, the use of these types of
policies is increasingly becoming less popular with Local Planning Authorities. Nevertheless, as an example the
following recently adopted development plan documents contain this type of policies:
� Broadland District Council, Development Management DPD, 2015 – see Policy R1
� London Borough of Brent, Local Plan, 2016 – see policy DMP2
� Newham Council, Newham’s Local Plan Detailed Sites and Policies Development Plan Document, 2016 –
see policy SP10
2. Criteria-based Policy
ANDOVER AND ROMSEY RETAIL CAPACITY & LEISURE STUDY - 2018
Page 160 of 190
13.11 In seeking to control the composition of the shopping frontages in their centres, it is possible to employ a number
of criteria, which would need to be met before certain uses are permitted. This would typically apply to non-A1
uses or even the wider “Town Centre uses” as defined by the Framework. The latter is more commonly employed
for Secondary Frontages, however not in all cases.
13.12 The wording of the qualifying criteria differs depending on the Local Planning Authority to reflect their local
circumstances. However, below we provide examples of the themes that such policies cover:
a. Permit proposals where they do not adversely impact either individually or cumulatively, on the
function, vitality and viability of a particular type of frontage, specific area of the centre or the centre
as a whole. or
b. Permit proposals where they maintain and enhance the vitality of the particular type of frontage,
specific area of the centre or the centre as a whole for example by:
i. Promoting evening and daytime economy;
ii. Providing for (independent) retailers that contribute to the overall vitality of the centre;
iii. Not resulting in such a concentration/ excessive concentration as to lead to a significant
interruption in the shopping frontage, reducing its character/ attractiveness/ function. Some
local plans defined “concentration” by stating a maximum number of adjoin units in the
same Use Class;
iv. Retaining active shop window display;
v. Opening (staying open) between certain hours;
vi. Promoting diversity of offer/ extend the range of activities available to shoppers/ other uses
as to enhance the experience of visiting the centre;
vii. Increasing footfall/ not resulting in the reduction of footfall;
viii. Not resulting in an over proliferation of any one use type;
ix. Maintaining the dominant shopping character;
13.13 As an example, the following recently adopted development plan documents contain these types of policies:
� Chorley Council, Local Plan 2012-2026 Site Allocations and Development Management Policies, 2016 –
see Policy EP6.
� North Somerset Council, Development Management Policies Sites and Policies Plan Part 1, 2016 – see
Policy DM63
� Fareham Local Plan Part 2: Development Sites and Policies, 2015 – see Policies DSP21, DSP22
� Hinckley and Bosworth Borough Council, Local Plan 2006 – 2026 Site Allocations and Development
Management Policies DPD, 2016 – see Policy DM22
� Blackburn with Darwen Borough Council, Local Plan Part 2 Site Allocations and Development Management
Policies, 2015 – see Policy 27
ANDOVER AND ROMSEY RETAIL CAPACITY & LEISURE STUDY - 2018
Page 161 of 190
� Bristol City Council, Bristol Central Area Plan, 2015 – see Policies BCAP16, BCAP 17
� Taunton Deane Borough Council, Taunton Deane Adopted Site Allocations and Development Management
Plan, 2016 – see Policy TC1
3. Hybrid Threshold and Criteria Policy
13.14 In seeking to control the composition of the shopping frontages, it is possible employ a combination of the above
options. For example the following Local Plan documents use “hybrid” frontage policies:
� Tunbridge Wells Borough Site Allocations Local Plan , July 2016 - see Polices CR5 to CR12
� Hackney Council, The Hackney Development Management Local Plan, 2015 – see Policy DM9
� Hastings Borough Council, Hastings Development Management Plan, 2015 – see Policy SA1
� South Ribble Borough Council, Local Plan, 2015 – see Policy E3
� Rochford District Council, Rochford Town Centre Area Action Plan, 2015 - see Policy 2
13.15 In order to allow for more flexibly it is common for the minimum A1 Use Class threshold to be supplemented by
an “exception” policy where other Use Classes are allowed subject to passing a set of criteria. It should also be
noted that in such hybrid cases some policies do not set a fixed threshold, but rather encourage achieving /
maintaining a certain threshold.
13.16 It is also possible to supplement a minimum A1 Use Class threshold with criteria based polices, where a proposal
would have to pass both sets of tests before being permitted. This is considered to be a very rigid approach that
allows for no flexibility.
Test Valley Council’s Current Policy Context
Andover
13.17 The Council’s Proposals Map (Inset Map 2) outlines the Primary Shopping Frontages (PSF) and the Secondary
Shopping Frontages (SSF) for Andover. This is reproduced below.
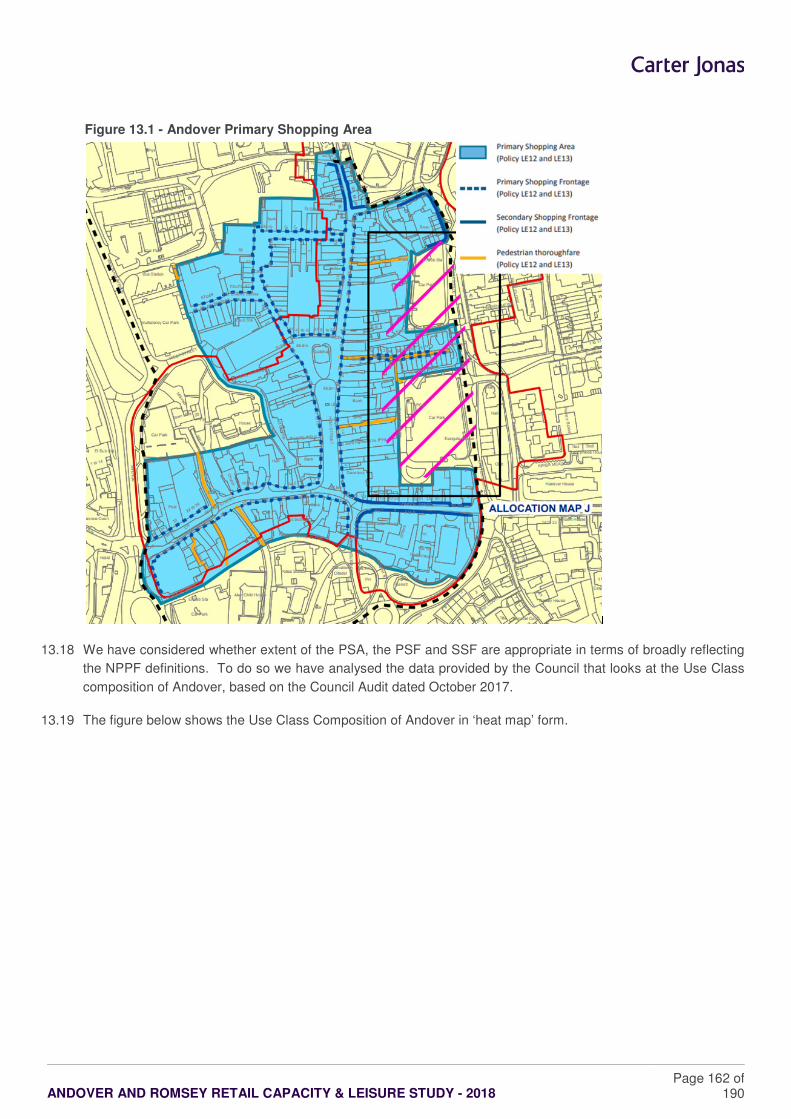
ANDOVER AND ROMSEY RETAIL CAPACITY & LEISURE STUDY - 2018
Page 162 of 190
Figure 13.1 - Andover Primary Shopping Area
13.18 We have considered whether extent of the PSA, the PSF and SSF are appropriate in terms of broadly reflecting
the NPPF definitions. To do so we have analysed the data provided by the Council that looks at the Use Class
composition of Andover, based on the Council Audit dated October 2017.
13.19 The figure below shows the Use Class Composition of Andover in ‘heat map’ form.
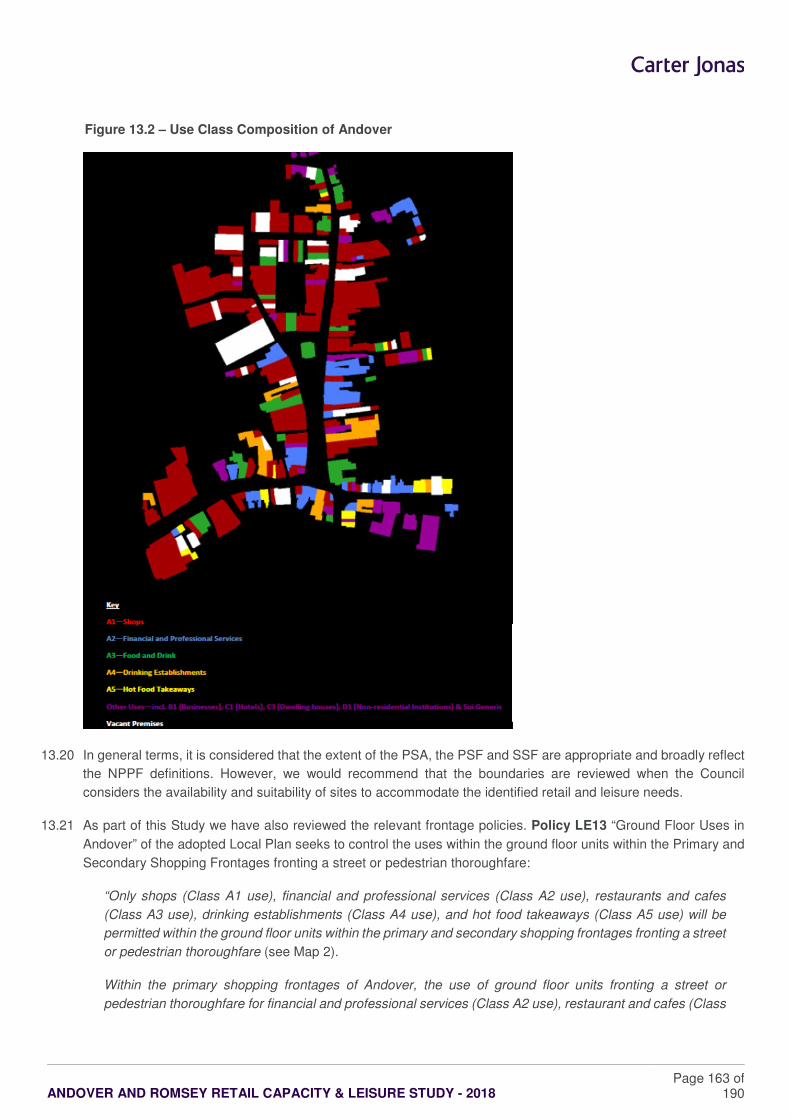
ANDOVER AND ROMSEY RETAIL CAPACITY & LEISURE STUDY - 2018
Page 163 of 190
Figure 13.2 – Use Class Composition of Andover
13.20 In general terms, it is considered that the extent of the PSA, the PSF and SSF are appropriate and broadly reflect
the NPPF definitions. However, we would recommend that the boundaries are reviewed when the Council
considers the availability and suitability of sites to accommodate the identified retail and leisure needs.
13.21 As part of this Study we have also reviewed the relevant frontage policies. Policy LE13 “Ground Floor Uses in
Andover” of the adopted Local Plan seeks to control the uses within the ground floor units within the Primary and
Secondary Shopping Frontages fronting a street or pedestrian thoroughfare:
“Only shops (Class A1 use), financial and professional services (Class A2 use), restaurants and cafes
(Class A3 use), drinking establishments (Class A4 use), and hot food takeaways (Class A5 use) will be
permitted within the ground floor units within the primary and secondary shopping frontages fronting a street
or pedestrian thoroughfare (see Map 2).
Within the primary shopping frontages of Andover, the use of ground floor units fronting a street or
pedestrian thoroughfare for financial and professional services (Class A2 use), restaurant and cafes (Class
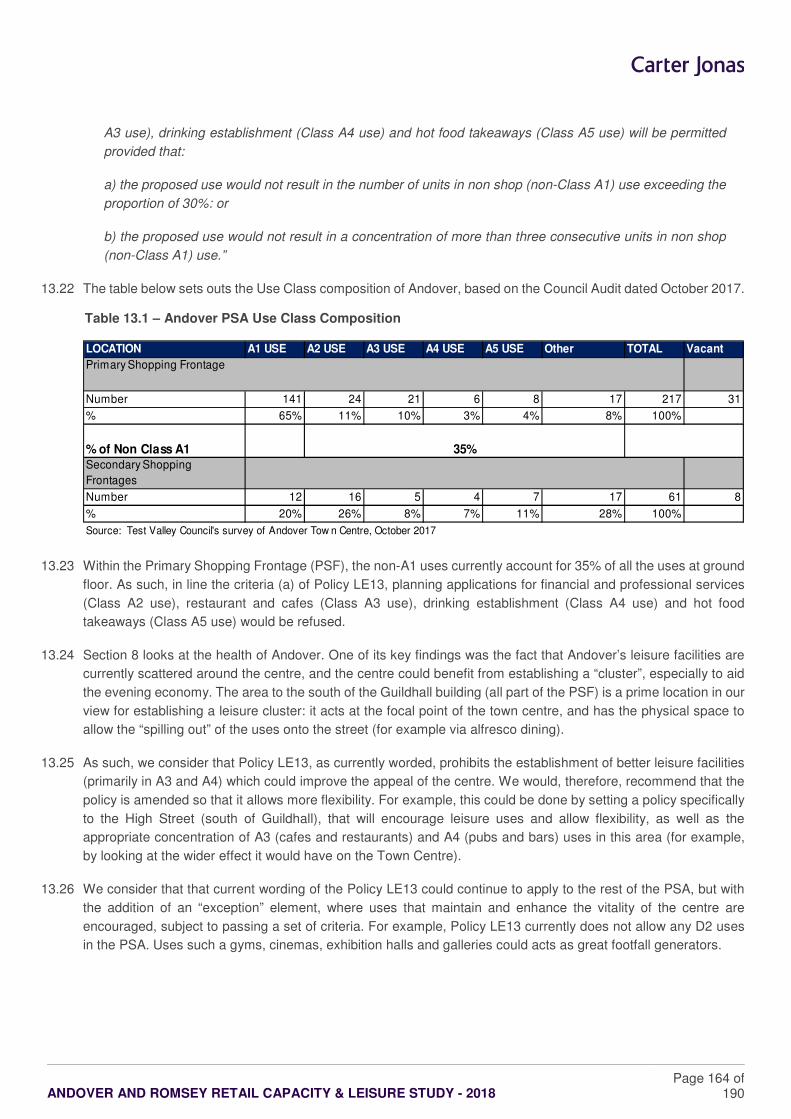
ANDOVER AND ROMSEY RETAIL CAPACITY & LEISURE STUDY - 2018
Page 164 of 190
A3 use), drinking establishment (Class A4 use) and hot food takeaways (Class A5 use) will be permitted
provided that:
a) the proposed use would not result in the number of units in non shop (non-Class A1) use exceeding the
proportion of 30%: or
b) the proposed use would not result in a concentration of more than three consecutive units in non shop
(non-Class A1) use.”
13.22 The table below sets outs the Use Class composition of Andover, based on the Council Audit dated October 2017.
Table 13.1 – Andover PSA Use Class Composition
13.23 Within the Primary Shopping Frontage (PSF), the non-A1 uses currently account for 35% of all the uses at ground
floor. As such, in line the criteria (a) of Policy LE13, planning applications for financial and professional services
(Class A2 use), restaurant and cafes (Class A3 use), drinking establishment (Class A4 use) and hot food
takeaways (Class A5 use) would be refused.
13.24 Section 8 looks at the health of Andover. One of its key findings was the fact that Andover’s leisure facilities are
currently scattered around the centre, and the centre could benefit from establishing a “cluster”, especially to aid
the evening economy. The area to the south of the Guildhall building (all part of the PSF) is a prime location in our
view for establishing a leisure cluster: it acts at the focal point of the town centre, and has the physical space to
allow the “spilling out” of the uses onto the street (for example via alfresco dining).
13.25 As such, we consider that Policy LE13, as currently worded, prohibits the establishment of better leisure facilities
(primarily in A3 and A4) which could improve the appeal of the centre. We would, therefore, recommend that the
policy is amended so that it allows more flexibility. For example, this could be done by setting a policy specifically
to the High Street (south of Guildhall), that will encourage leisure uses and allow flexibility, as well as the
appropriate concentration of A3 (cafes and restaurants) and A4 (pubs and bars) uses in this area (for example,
by looking at the wider effect it would have on the Town Centre).
13.26 We consider that that current wording of the Policy LE13 could continue to apply to the rest of the PSA, but with
the addition of an “exception” element, where uses that maintain and enhance the vitality of the centre are
encouraged, subject to passing a set of criteria. For example, Policy LE13 currently does not allow any D2 uses
in the PSA. Uses such a gyms, cinemas, exhibition halls and galleries could acts as great footfall generators.
LOCATION A1 USE A2 USE A3 USE A4 USE A5 USE Other TOTAL Vacant
Primary Shopping Frontage
Number 141 24 21 6 8 17 217 31
% 65% 11% 10% 3% 4% 8% 100%
% of Non Class A1Secondary Shopping
Frontages
Number 12 16 5 4 7 17 61 8
% 20% 26% 8% 7% 11% 28% 100%
Source: Test Valley Council's survey of Andover Tow n Centre, October 2017
35%
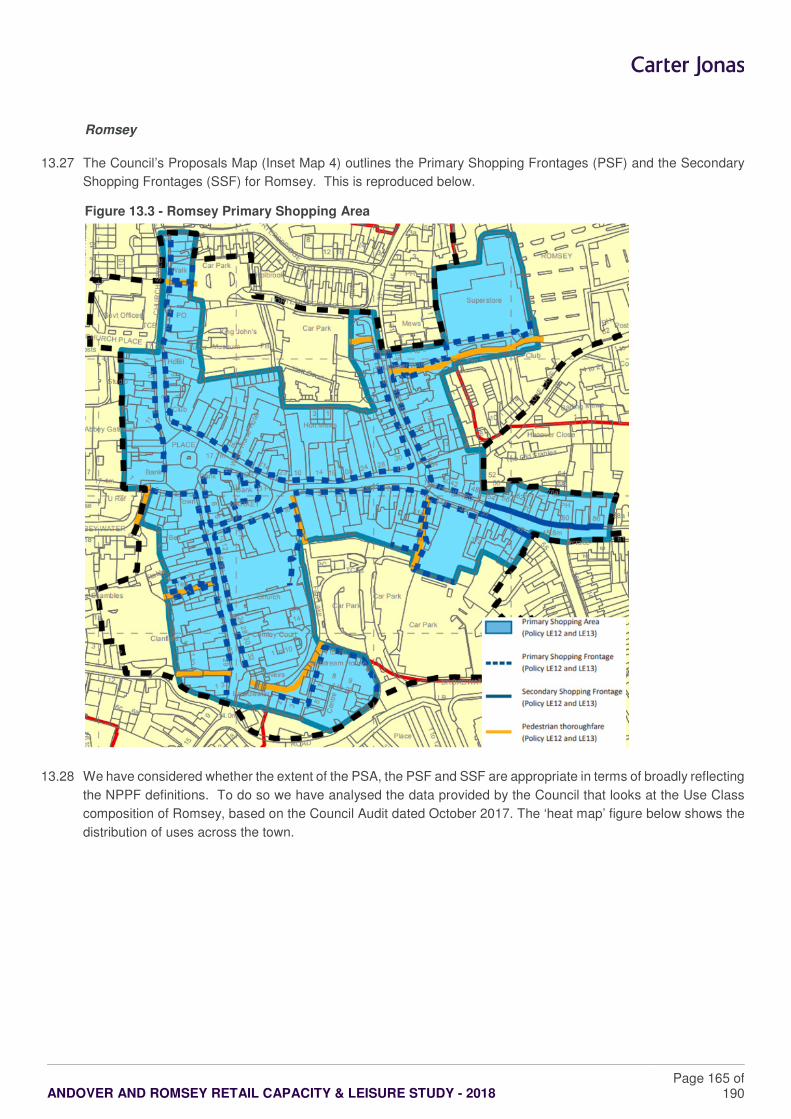
ANDOVER AND ROMSEY RETAIL CAPACITY & LEISURE STUDY - 2018
Page 165 of 190
Romsey
13.27 The Council’s Proposals Map (Inset Map 4) outlines the Primary Shopping Frontages (PSF) and the Secondary
Shopping Frontages (SSF) for Romsey. This is reproduced below.
Figure 13.3 - Romsey Primary Shopping Area
13.28 We have considered whether the extent of the PSA, the PSF and SSF are appropriate in terms of broadly reflecting
the NPPF definitions. To do so we have analysed the data provided by the Council that looks at the Use Class
composition of Romsey, based on the Council Audit dated October 2017. The ‘heat map’ figure below shows the
distribution of uses across the town.
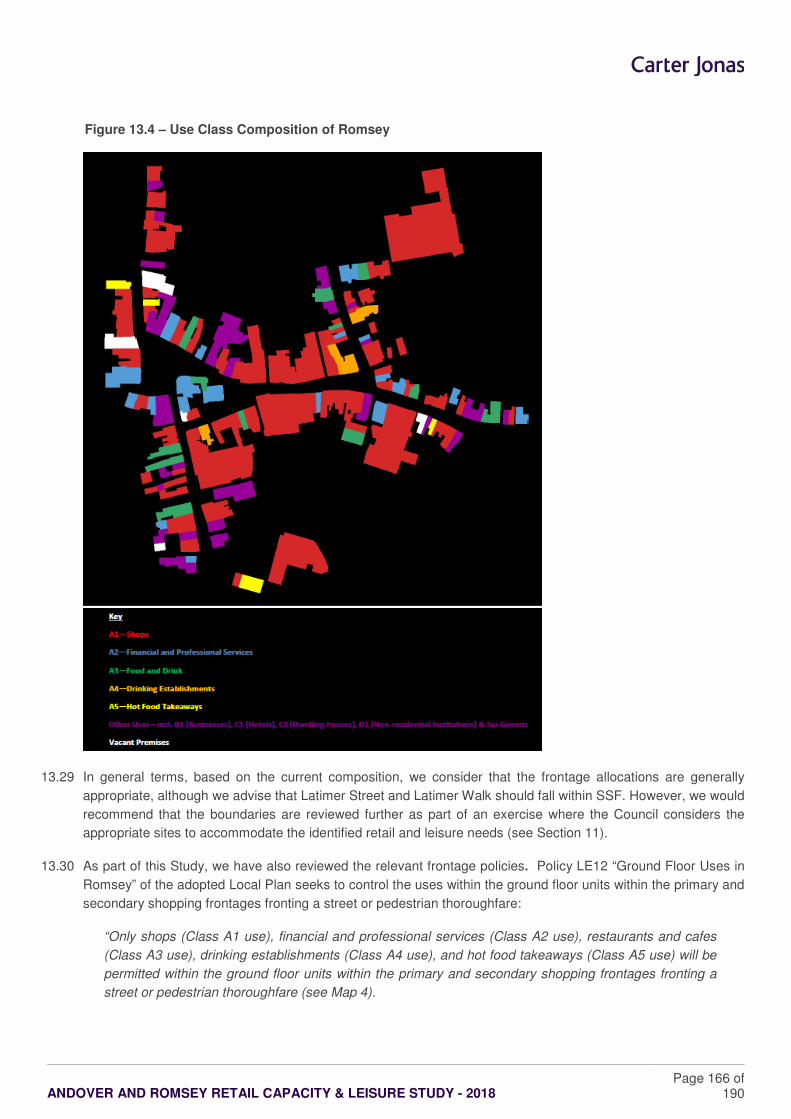
ANDOVER AND ROMSEY RETAIL CAPACITY & LEISURE STUDY - 2018
Page 166 of 190
Figure 13.4 – Use Class Composition of Romsey
13.29 In general terms, based on the current composition, we consider that the frontage allocations are generally
appropriate, although we advise that Latimer Street and Latimer Walk should fall within SSF. However, we would
recommend that the boundaries are reviewed further as part of an exercise where the Council considers the
appropriate sites to accommodate the identified retail and leisure needs (see Section 11).
13.30 As part of this Study, we have also reviewed the relevant frontage policies. Policy LE12 “Ground Floor Uses in
Romsey” of the adopted Local Plan seeks to control the uses within the ground floor units within the primary and
secondary shopping frontages fronting a street or pedestrian thoroughfare:
“Only shops (Class A1 use), financial and professional services (Class A2 use), restaurants and cafes
(Class A3 use), drinking establishments (Class A4 use), and hot food takeaways (Class A5 use) will be
permitted within the ground floor units within the primary and secondary shopping frontages fronting a
street or pedestrian thoroughfare (see Map 4).
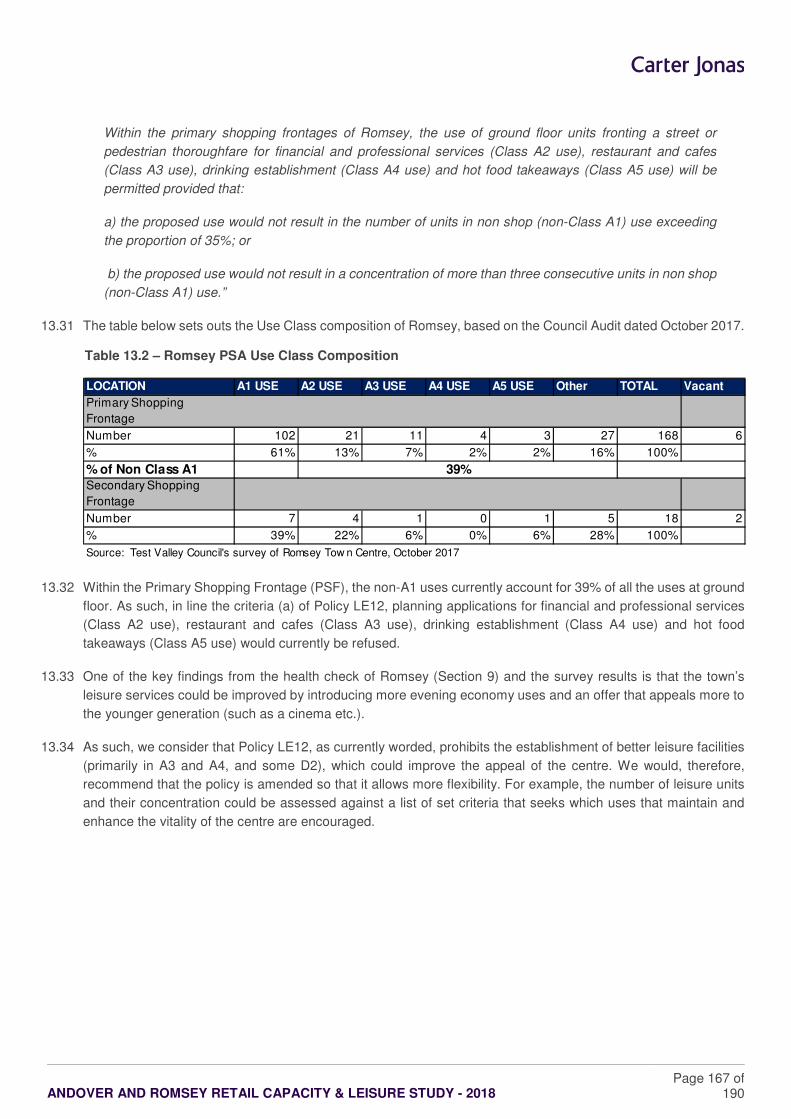
ANDOVER AND ROMSEY RETAIL CAPACITY & LEISURE STUDY - 2018
Page 167 of 190
Within the primary shopping frontages of Romsey, the use of ground floor units fronting a street or
pedestrian thoroughfare for financial and professional services (Class A2 use), restaurant and cafes
(Class A3 use), drinking establishment (Class A4 use) and hot food takeaways (Class A5 use) will be
permitted provided that:
a) the proposed use would not result in the number of units in non shop (non-Class A1) use exceeding
the proportion of 35%; or
b) the proposed use would not result in a concentration of more than three consecutive units in non shop
(non-Class A1) use.”
13.31 The table below sets outs the Use Class composition of Romsey, based on the Council Audit dated October 2017.
Table 13.2 – Romsey PSA Use Class Composition
13.32 Within the Primary Shopping Frontage (PSF), the non-A1 uses currently account for 39% of all the uses at ground
floor. As such, in line the criteria (a) of Policy LE12, planning applications for financial and professional services
(Class A2 use), restaurant and cafes (Class A3 use), drinking establishment (Class A4 use) and hot food
takeaways (Class A5 use) would currently be refused.
13.33 One of the key findings from the health check of Romsey (Section 9) and the survey results is that the town’s
leisure services could be improved by introducing more evening economy uses and an offer that appeals more to
the younger generation (such as a cinema etc.).
13.34 As such, we consider that Policy LE12, as currently worded, prohibits the establishment of better leisure facilities
(primarily in A3 and A4, and some D2), which could improve the appeal of the centre. We would, therefore,
recommend that the policy is amended so that it allows more flexibility. For example, the number of leisure units
and their concentration could be assessed against a list of set criteria that seeks which uses that maintain and
enhance the vitality of the centre are encouraged.
LOCATION A1 USE A2 USE A3 USE A4 USE A5 USE Other TOTAL Vacant
Primary Shopping
Frontage
Number 102 21 11 4 3 27 168 6
% 61% 13% 7% 2% 2% 16% 100%
% of Non Class A1Secondary Shopping
Frontage
Number 7 4 1 0 1 5 18 2
% 39% 22% 6% 0% 6% 28% 100%
Source: Test Valley Council's survey of Romsey Tow n Centre, October 2017
39%
ANDOVER AND ROMSEY RETAIL CAPACITY & LEISURE STUDY - 2018
Page 168 of 190
14 TOWN CENTRE STRATEGIES: SUMMARY OF KEY FINDINGS AND RECOMMENDATIONS
14.1 This section provides a summary of the relative health, role and function of the Council’s main centres based on
the survey evidence and health check assessments, along with the forecast quantitative/qualitative need for new
retail floorspace and leisure uses across the Borough and the main centres of Andover and Romsey to 2036. We
also set out a summary of the key recommendations to help inform plan-making and decision-taking in compliance
with the NPPF and other key material considerations.
Needs Assessment
14.2 This evidence-based study has forecast the quantitative and qualitative need for new retail (convenience and
comparison) floorspace and leisure uses over the plan period, to 2036, in compliance with the NPPF.
Convenience Floorspace
14.3 Our assessment shows there will be ‘residual’ convenience goods expenditure capacity for £25.3m by 2036, after
taking into account all known retail commitments. In order to translate this potential expenditure capacity into
sales floorspace we have tested the following two different trading scenarios.
14.4 The first “superstore format” trading scenario assumes that the residual expenditure can support the higher
average ‘benchmark’ turnover levels of the leading foodstore operators (i.e. Tesco, Sainsbury’s, Asda, Morrison’s,
Waitrose and Marks & Spencer). Under this scenario the forecasts show limited capacity for new convenience
goods floorspace in the Council Area between 2021 and 2026. The Council-wide capacity increases thereafter to
2,093 sqm net in 2036. For the main centres in the Borough area, the majority of the capacity is forecast for
Romsey Town Centre (633 sqm net by 2036), and Andover Town Centre (529 sqm net). This capacity could
potentially be met through the take-up of vacant units, change of use applications, extensions to existing stores
or by new development. There is no capacity for new convenience goods floorspace in the Borough’s Key Service
Centres and Rural Villages.
14.5 The alternative “supermarket/discounter” trading scenario assumes that the forecast residual expenditure
capacity can be supported by a supermarket (e.g. Co-op, Budgen’s, etc.) and/or ‘discount’ retailer (principally Aldi
and Lidl) trading at lower average turnover levels than assumed for the larger grocery stores. Under this scenario
the forecasts show no capacity at 2021, increasing to 3,349 sqm net at 2036. For the main centres in the Borough
the majority of the capacity is forecast for Romsey Town Centre (1,013 sqm net by 2036), and Andover Town
Centre (846 sqm net by 2036). This is equivalent to one additional supermarket/discounter in each centre. The
need could be met through the conversion of existing buildings, or more likely through new development. There
is no capacity for new convenience goods floorspace in the Borough’s Key Service Centres and Rural Villages.
14.6 The existing out-of-centre foodstores generate capacity for 1,467 sqm at 2036 under the “superstore format”
scenario, increasing to 2,347 sqm net for new “supermarket/discounter” floorspace.
14.7 The Framework is clear that all needs should be met in full and should not be compromised by limited site
availability (paragraph 23). It is recommend that local authorities should seek to identify and allocate sites within
their main centres first, followed by edge of centre sites that are well connected to the town centre where suitable
and viable town centre sites are not available. If sufficient edge of centre sites cannot be identified, local authorities
are required to set policies for meeting the identified needs in other accessible locations that are well connected
to the town centre. We therefore advise the Council that it will need to identify and allocate potential sites to
accommodate the forecast need for new convenience goods floorspace over the plan period.
ANDOVER AND ROMSEY RETAIL CAPACITY & LEISURE STUDY - 2018
Page 169 of 190
Comparison Floorspace
14.8 Our assessment shows that by 2036 there will be forecast ‘residual’ comparison goods capacity of £112m for the
Borough area, after taking account of all known commitments. This translates into a Council-wide capacity for
12,487 sqm net of new comparison goods floorspace by 2036. The capacity for new floorspace over the short to
medium term is more limited’ forecast at 909 sqm in 2021 and increasing to 4,134 sqm by 2026.
14.9 In Andover there is a potential need for 1,749 sqm net in 2026, increasing to 4,938 sqm net by 2036. In Romsey,
there is a potential need for 762 sqm net in 2026, increasing to 2,207 sqm net by 2036. In our view, without
undertaking a detailed assessment of the availability and suitability of potential development site opportunities in
both centres, we nevertheless consider that this need could potentially be met over the short (up to 2021) to
medium term (up to 2026) through the take-up of vacant floorspace, infill development and/or change of use
applications. However, given the scale of need forecast up to 2036, we advise that the Council will need to identify
a site or sites in and/or on the edge of Andover to meet the forecast need in full in compliance with the NPPF
(paragraph 23).
14.10 The biggest forecast capacity for new comparison floorspace in the Borough is being generated by existing out of
centre shopping facilities. In the short term (up to 2026) we forecast that there is a potential need for 1,543 sqm,
increasing to 5,121 sqm by 2036. In line with the “town centre first” approach, the local planning authority should
be seeking to allocate sites to accommodate the identified capacity within their existing centres.
Leisure Uses
14.11 Our review of the Council’s existing commercial leisure offer has been informed by the results of the household
survey, the health check assessment and wider stakeholder engagement.
14.12 In summary the evidence shows that across the Borough area there is an adequate provision of leisure facilities,
although there are qualitative and quantitative gaps in provision that should be addressed over the plan period.
The key forecasts and findings are summarised below:
� There is not quantitative need/capacity for additional cinema screens in the Borough. However, in
qualitative terms Romsey lacks a cinema. If market demand from operators should arise over the plan
period, this should be directed to Romsey (and other centres first) in accordance with the NPPF and local
plan policy objectives.
� Within both Andover and Romsey there is need for a qualitative and quantitative improvement in the food
and beverage sector. The quantitative assessment shows that across the Borough there is capacity for
new food and beverage floors for between 464 sqm gross in 2021 increasing to 6,804 sqm gross by 2036.
In compliance with the objectives of the NPPF, this forecast need should be directed to the Borough’s main
centres first to help increase competition and choice, and to help underpin their daytime/evening
economies. However, the prospect for new facilities will ultimately be determined by the level of market
demand and interest for representation in the area and its main centres.
� Our assessment of the health and fitness facilities across the Council Area shows that, whilst Andover
has a good provision there is a qualitative need for health and fitness facilities in Romsey.
� There is a gap in family entertainment facilities in both Andover and Romsey. In terms of addressing
future needs, the Borough would benefit from a wider choice of family entertainment venues and activities.
Such facilities should be directed towards the main town centres where demand and suitable sites exist.
ANDOVER AND ROMSEY RETAIL CAPACITY & LEISURE STUDY - 2018
Page 170 of 190
� There is a potential gap in provision of historical and cultural attractions in Andover, and a definite need
to increase the number/quality of such attractions in Romsey where the potential exists. Romsey also has
a limited theatre provision.
Ensuring the Vitality of Town Centres
14.13 Further to our assessment of the likely forecast need for new retail floorspace and leisure uses in the Borough
and its main centres, the following provides a summary of the key issues and challenges facing Andover and
Romsey Town Centres, and our recommendations on how to maintain and enhance their overall vitality and
viability, and their respective roles and functions in the network and hierarchy of centres.
Andover Town Centre
14.14 Drawing on the research findings and evidence we consider that the health of Andover Town Centre over the plan
period could be improved by addressing the following matters:
� Whilst Andover as a whole has a strong convenience provision, it is mainly concentrated outside the town’s
primary shopping area. This is confirmed by the household survey results which show that the out-of-
centre stores are drawing approximately two-thirds (66.5%) of expenditure in the Andover Primary
Catchment Area (PCA) compared to the 21.9% market share for town centre stores. In our view further
out-of-centre food store development could therefore be detrimental to the town centre’s overall vitality and
viability, and any new floorspace should be directed to the Borough’s centres first in compliance with the
NPPF; subject to market demand and the identification of suitable sites to accommodate the forecast need.
� The comparison offer faces significant competition from the following:
- online shopping, which has a market share of 36.3% within the PCA;
- retail facilities outside of the Test Valley Council Area (such as Basingstoke, Salisbury,
Southampton, and Winchester), with a 23.9% market share in the PCA; and
- immediate out-of-centre facilities (such as Churchill Retail Park and Enham Arch Retail
Park), which are achieving a 18.1% market share of all available comparison expenditure
in the PCA.
� This market share patterns indicate that there is a gap in Andover Town Centre’s comparison floorspace
provision. Opportunities to improve this situation should therefore be explored to help ‘claw back’ some
shoppers and trade from out-of-centre shops and stores, and competing centres. Further out-of-centre
comparison floorspace development should be therefore resisted as we consider that it would harmful to
the town centre’s overall vitality and viability.
� Whilst the evidence shows there is a high representation of national multiples and the overall comparison
provision is adequate, in qualitative terms we consider there is potential for more high street mid-range
fashion brands. This would help to raise the attraction and draw of the centre. However, this will be subject
to market demand from potential retailers for representation in the town, and the availability and suitability
of premises in terms of format and scale to meet any forecast needs and demand.
� In order to establish its Unique Selling Proposition (USP), Andover will need adapt to current trends and
the changing role of retailing by introducing more high quality and ‘niche’ independent shops to build on
Andover’s character and attraction.
ANDOVER AND ROMSEY RETAIL CAPACITY & LEISURE STUDY - 2018
Page 171 of 190
� There are two areas in Andover with a high concentration of vacant units, which detract from the quality of
the environment: the Chantry Shopping Centre and The Bridge Street Mall. These locations represent
potential opportunities to increase activity (for example by redeveloping the sites, and/or by seeking
operators to locate here).
� The Chantry Shopping Centre is rather dated in terms of its layout and the scale and type of retail premises
its offers. It does not present a modern shopping environment, either for occupiers or customers in our
view. As such, we consider that more investment is needed in the shopping centre to create modern larger
format shopping premises to attract retailers, with a prominent anchor.
� Andover’s daytime and evening leisure economy needs to be improved. The existing leisure facilities are
currently scattered around the centre, and we consider that the town would benefit from establishing a
leisure ‘hub’ or ‘quarter’, principally focussed on improving the food and beverage offer. The health checks
and surveys have identified that the centre lacks family-friendly restaurants; and there is a potential gap in
the choice of higher quality of family entertainment venues and activities. It is considered that the High
Street, focussed to the south of the Guildhall building, represents a prime location for establishing a leisure
‘hub’ / ‘quarter’. In our view it has the environment and physical space to allow for alfresco dining to help
animate the market place.
� There is a vision to establish a Cultural Quarter around The Lights Theatre and Andover Leisure Centre
(located within the Town Centre Boundary, but outside the Primary Shopping Area). Taking this into
account we recommend that a Masterplan is drawn up to guide the planning and development of this area,
covering the appropriate uses, the legibility of the area, and the need to improve the wider connections/
linkages to the PSA. The Cultural Quarter should also be designed and curated in a manner that
complements and encourages the establishment of a leisure ‘quarter’ in the PSA.
� Andover hosts a number of events and promotions that help to draw new visitors to the area and town.
These should be encouraged and marketing should be afforded priority. A better utilisation of the market
square should also be promoted, focussed on more cafés and quality restaurants, to create interest and
increase footfall.
� It is recommended that the regular Andover Street Market should be significantly improved by raising the
quality of goods sold, and by establishing more holistic management and marketing. The market would
help to complement the promotion of more places to eat and drink focussed on the market square, attracting
new shoppers and visitor to the town.
� Andover would benefit from partnerships with local retailers to promote and improve the Town Centre. It is
noted that Andover BID has recently been set up to progress towards a BID ballot. If this ballot is held and
is successful, a future BID will be established. The main strategies aim to improve the Town Centre through
marketing and enhancing the environment.
� Andover Town Centre would benefit from public ream improvements. For example, the centre could benefit
from more seating, green landscaping (e.g. trees), and a well-integrated recreational space. A public realm
enhancement scheme could help create an appealing town centre environment which attracts both visitors
and residents to the centre.
� The parking management system should be improved (such as incorporating payment on exit).
ANDOVER AND ROMSEY RETAIL CAPACITY & LEISURE STUDY - 2018
Page 172 of 190
Romsey Town Centre
14.15 Based on the survey evidence and health checks assessments we consider that the health and vitality of Romsey
Town Centre could be improved through the following actions and initiatives:
� Whilst Romsey Town Centre in general has a good convenience offer (based on the current market shares),
it would appear that there is a potential ‘gap’ in foodstore provision. For example, the key competition
comes from locations outside the Borough, such as Eastleigh and Southampton (which draw 55.4% with
the Primary Catchment Area – albeit this is not entirely surprising given the geographical location of
Romsey). As such, we consider that there is potential to improve the quality and scale of the town’s
convenience offer. This can be achieved by introducing a mid-range supermarket, subject to market
demand. It is noted that Romsey does not have any significant out-of-centre supermarkets/ superstores,
which has helped to maintain its overall vitality and viability for food shopping purchases by local residents.
� In terms of its comparison provision Romsey Town centre has a good representation of key multiple
retailers as well as independent stores. However, based on the current market shares, it would appear that
there is a gap in the comparison retail provision (even after taking account of Romsey’s geographic position
and its role and function as a market town). The retention of expenditure is relatively low within its PCA
(with a 12.7% market share). The key competition comes from retail facilities outside the Test Valley
Council Area (there is 58.6% leakage of comparison expenditure to locations such as Eastleigh, Hedge
End and Southampton) and online shopping (which is achieving a 24.8% market share, compared with the
national average of 19.7%). Further out-of-centre comparison floorspace development could therefore be
detrimental to the town centre. In qualitative terms, the centre lacks fashion stores for men, and
teenagers/young adults. Based on our observations, we recommended that Romsey should seek to host
more higher-end fashion retailers to raise its profile, as well as to continue to build and improve its
independent niche and boutique offer. However the will dependent on future market demand and trends
in the retail sector.
� In qualitative terms, the leisure services in Romsey Town Centre could be improved by introducing more
evening economy uses and uses that appeal more to a younger population profile (such as a cinema etc.).
There also appears to be a potential gap in the health and fitness provision, as well as the potential for a
wider range and higher quality of family entertainment venues and activities.
� It is considered that better marketing of the centre would also be highly beneficial to the centre.
� The parking management system should also be improved (such as incorporating payment on exit, and
incorporating better car park signage and capacity).
Retail Hierarchy Recommendations
14.16 Based on the findings of the household survey, centre health checks and quantitative need assessment, we have
also undertaken a high level review of the retail hierarchy.
14.17 In the first instance it should be noted the Test Valley currently does not benefit from a policy that clearly sets out
the Town Centre hierarchy. The centres are defined through a combination of polices, namely Policies COM2,
LE11 and LE15 (which confirm Andover as a Town Centre, Romsey as a Town Centre and Stockbridge as a Local
Centre). This is a somewhat fragmented approach. We also note that a that “Key Service Centres” and “Rural
Villages”, as mentioned by Policy COM2, currently do not form part the retail hierarchy.
ANDOVER AND ROMSEY RETAIL CAPACITY & LEISURE STUDY - 2018
Page 173 of 190
14.18 As such we would recommend that in the first instance, and in order to achieve consistency with the NPPF, that
the Council adopts a policy that sets out the retail hierarchy in the following manner:
� 1) City Centre – not applicable to Test Valley.
� 2) Town Centres – Andover and Romsey.
� 3) District Centres, and Local Centres – Whilst Stockbridge is currently defined as a “Local Centre”, it has
not been assessed as part of this Study and hence we are unable to comment on its rightful position in the
retail hierarchy. Nor we are able to comment on whether any of the “Key Service Centres” or “Rural Villages”
should be part of the hierarchy. We recommend that Council, as part of the emerging Local Plan clearly
defines the District and Local Centres in line with paragraph 23 of the NPPF (i.e. “define the extent of town
centres and primary shopping areas, based on a clear definition of primary and secondary frontages in
designated centres, and set policies that make clear which uses will be permitted in such locations”). It may
be the case that the Council may wish to undertake a separate study to identify such centres and review
their health.
14.19 As part of reviewing the retail and town centre hierarchy, we have also necessarily examined the role and function
of existing out-of-centre retail and leisure locations in the local authority area. It is clear that these existing out-of-
centre facilities do not have the range or choice of retail, leisure and other uses normally associated with City,
Town, Local and District Centres. We therefore advise the Council that these out-of-centre shopping and leisure
destinations should not be classified as ‘town centres’ in the emerging development plan, and should not be
afforded any policy protection. This is because the main thrust of national and local plan policy is to direct new
retail, leisure and wider town centre uses and investment to town centres first, ahead of edge and out of centre
locations. If some or all of the existing out-of-centre facilities were designated as ‘centres’ in this case it would, in
our judgement, have a significant adverse impact on the delivery of existing, planned and committed investment
in the main centres, as well as any future proposals for new public and private sector development. Therefore
any proposals for new retail, commercial leisure and town centre uses in out-of-centre locations should necessarily
be assessed against the key sequential and impact tests set out in the NPPF under paragraphs 24-27.
Recommendations on Frontages
14.20 We have reviewed the adopted frontage policies and the associated Proposals Map, in relation to Andover and
Romsey Town Centres.
14.21 In general terms, in accordance with the NPPF the Proposals Map sets out the four key components of town
central Town Centre Boundary, Primary Shopping Area (PSAs), Primary Shopping Frontages (PSFs), and
Secondary Shopping Frontages (SSFs). We recommend that the Council formulates policies that reflect and
elaborate on these designations, and which incorporate the trends and key shortcomings of the centres, outlined
above. The Council may wish to create overarching policies for the four elements, or set out such policies on a
centre-by-centre basis. We must highlight at this stage that frontage policies should be treated differently from
site-specific policies.
14.22 To assist the Council in the plan-making, below we provide our initial key recommendations on potential changes
to the current Proposals Map Boundaries, and the associate policies.
ANDOVER AND ROMSEY RETAIL CAPACITY & LEISURE STUDY - 2018
Page 174 of 190
Andover
14.23 Looking at the current Proposals Map Boundary, we consider that based on the research evidence, no changes
are necessary. However, we would recommend that the boundaries are reviewed as part of the exercise where
the Council considers the appropriate sites to accommodate the identified retail capacity.
14.24 We consider that Policy LE13, as currently worded, prohibits the establishment of better leisure facilities (primarily
A3 and A4), which could improve the appeal of the centre. We would, therefore, recommend that the policy is
amended so that it allows more flexibility. For example, this could be done by setting a policy specifically to the
High Street (south of Guildhall), that will encourage leisure uses and allow flexibility, as well as the appropriate
concentration of A3 (cafes and restaurants) and A4 (pubs and bars) uses in this area (for example, by looking at
the wider effect it would have on the Town Centre).
14.25 We consider that that current wording of the Policy LE13 could continue to apply to the rest of the PSA, but with
the addition of an “exception” element, where uses that maintain and enhance the vitality of the centre are
encouraged, subject to passing a set of criteria. For example, Policy LE13 currently does not allow any D2 uses
in the PSA. Uses such a gyms, cinemas, exhibition halls and galleries could acts as great footfall generators.
Romsey
14.26 Looking at the current Proposals Map Boundary we set out our recommended changes based on the research
evidence as follows:
� The currently defined Town Centre Boundary and Primary Shopping Area (PSAs) should be retained.
� The currently defined Primary Shopping Frontages (PSFs) should be reduced to exclude Latimer Street
and Latimer Walk
� The currently defined Secondary Shopping Frontages (SSFs) should be extended to include Latimer
Street and Latimer Walk
14.27 We would also recommend that the boundaries are reviewed as part of the exercise where the Council considers
the appropriate sites to accommodate the identified retail capacity.
14.28 We consider that Policy LE12, as currently worded, prohibits the establishment of better leisure facilities (primarily
in A3 and A4, and some D2), which could improve the appeal of the centre. We would, therefore, recommend that
the policy is amended so that it allows more flexibility. For example, the number of leisure units and their
concentration could be assessed against a list of set criteria which encourages uses that maintain and enhance
the vitality of the centre.
Local Impact Threshold: Recommendations
14.29 We have also assessed whether there is a requirement for the local planning authority to set a local (floorspace-
based) impact threshold, rather than use the default of 2,500 sqm gross identified by the NPPF (paragraph 26).
This is important as it will determine whether applicants should carry out an impact assessment for new retail,
leisure and office development outside of Town Centres that are not in accordance with an up-to-date Local Plan.
14.30 In summary the Planning Practice Guidance (PPG) published in March 2014 provides advice in setting a locally
appropriate threshold and states that it will be important to consider the:
� scale of proposals relative to Town Centres;
ANDOVER AND ROMSEY RETAIL CAPACITY & LEISURE STUDY - 2018
Page 175 of 190
� the existing viability and vitality of Town Centres;
� cumulative effects of recent developments;
� whether local Town Centres are vulnerable;
� likely effects of development on any Town Centre strategy; and
� impact on any other planned investment.
14.31 While the quantitative and qualitative research evidence indicates that the majority of centres appear to be vital
and viable, they are nevertheless vulnerable to increased competition from out-of-centre retailing and the growth
of internet shopping.
14.32 Our assessment of retail trends in Section 3 has highlighted the dynamic growth in smaller convenience stores
operated by the major grocers (i.e. Sainsbury’s Local, Tesco Express, Little Waitrose, etc.). Although sizes vary
from location-to-location, the main grocers are generally seeking new convenience stores (e.g. Tesco Express,
Sainsbury’s Local, Little Waitrose) with a minimum gross floorspace of circa 372 sqm gross. In circumstances
where these smaller stores are proposed on the edge or outside of smaller local and village centres, often as part
of petrol filling stations, they could result in a significant adverse impact on their trading performance, and overall
vitality and viability. This will particularly be the case where smaller centres and villages are dependent on smaller
supermarkets and convenience (‘top-up’) stores to anchor their retail offer and generate footfall and linked
trips/expenditure to the benefit of other shops, services and facilities.
14.33 In addition, modern retailers selling a range of comparison goods (including fashion, homestore and ‘bulky’ goods
retailers), generally have requirements for larger format shop units with a minimum floorspace of approximately
465 sqm gross. This scale of floorspace provides operators with the necessary minimum ‘critical mass’ of sales
needed to display their full range of goods in-store and attract customers from a wider catchment area, particularly
where they are co-located alongside similar stores in Town Centre and out-of-centre locations. In general terms,
larger format non-food stores of over 465 sqm gross are also unlikely to trade as a purely local facility.
14.34 We therefore conclude in this case that it is reasonable for applicants proposing developments for new comparison
and convenience goods retailing of 350 sqm gross and above to demonstrate that they will not have a significant
adverse impact cumulatively with other commitments in the area, in accordance with the NPPF on any defined
centre within the Council Area.
14.35 In our judgement 350 sqm is a reasonable impact threshold as it will provide the local planning authority with
sufficient flexibility to assess the merits and implications of edge and out-of-centre foodstore applications that
could potentially have significant implications for the viability and delivery of new or extended floorspace in these
existing centres. We also advise that this threshold should be applied, where relevant, to change of use
applications and applications seeking variations of conditions.
14.36 A 350 sqm gross impact threshold is also reasonable based on our experience of advising other local planning
authorities, and also drawing on the minimum impact thresholds identified in recently adopted local plans
(including, for example, Richmondshire District Council, Rother District Council, Rotherham Metropolitan Council,
Stafford Borough Council, Warrington Borough Council and Norwich City Council).
14.37 Notwithstanding the above, it is important that the scope of any Retail Impact Assessment (RIA) in support of
planning applications is discussed and agreed between the applicants and the Council at an early stage in the
pre-application process. The level of detail included within a RIA should be proportionate to the scale and type of
ANDOVER AND ROMSEY RETAIL CAPACITY & LEISURE STUDY - 2018
Page 176 of 190
retail floorspace proposed, and should be agreed between the Council and applicant on a case-by-case basis. In
all cases, the local planning authority should adopt a pragmatic and reasonable approach with regard to the scope
and detail of evidence required in support of planning applications.
Sequential Test Threshold: Recommendations
14.38 Policy LE11: Main Town Centre Uses of the currently states:
“Development for main town centre uses and extensions, with a gross floorspace exceeding 280sqm,
outside of Andover and Romsey town centre will not be permitted if following a Sequential Assessment
they could be accommodated firstly within a town centre, or then secondly, an edge of centre location.”
14.39 This policy essentially suggests that any development for main town centre uses outside of the town centres below
280 sqm do not need to pass the sequential test.
14.40 Paragraphs 24, 25 and 27 of the NPPF sets out the application of the sequential test:
“24. Local planning authorities should apply a sequential test to planning applications for main town
centre uses that are not in an existing centre and are not in accordance with an up-to-date Local Plan.
They should require applications for main town centre uses to be located in town centres, then in edge
of centre locations and only if suitable sites are not available should out of centre sites be considered.
When considering edge of centre and out of centre proposals, preference should be given to accessible
sites that are well connected to the town centre. Applicants and local planning authorities should
demonstrate flexibility on issues such as format and scale.
25. This sequential approach should not be applied to applications for small scale rural offices or other
small scale rural development.
27. Where an application fails to satisfy the sequential test … it should be refused.”
14.41 Unlike in the Impact Test (paragraph 26 of the NPPF), the NPPF ( and the NPPG) does not set a threshold for
applying the sequential test, nor does it make provision for the Local Planning Authorities to set their own
threshold. As such, it is considered that adopting a general floorspace threshold for undertaking a sequential test
would not be NPPF-compliant.
14.42 It is however noted that, in line with the paragraph 25 of the NPPF, that the sequential approach should not be
applied to applications for small scale rural offices or other small scale rural development. The Council may wish
to adopt further policy wording to elaborate on this matter, and establish parameters on what may be considered
as “small scale” and “rural” within the Test Valley context. We would advise that appropriate evidence is gathered
to support any such wording. It is noted that the Sunday Trading law defines “small shops” as those under 280
sqm gross.
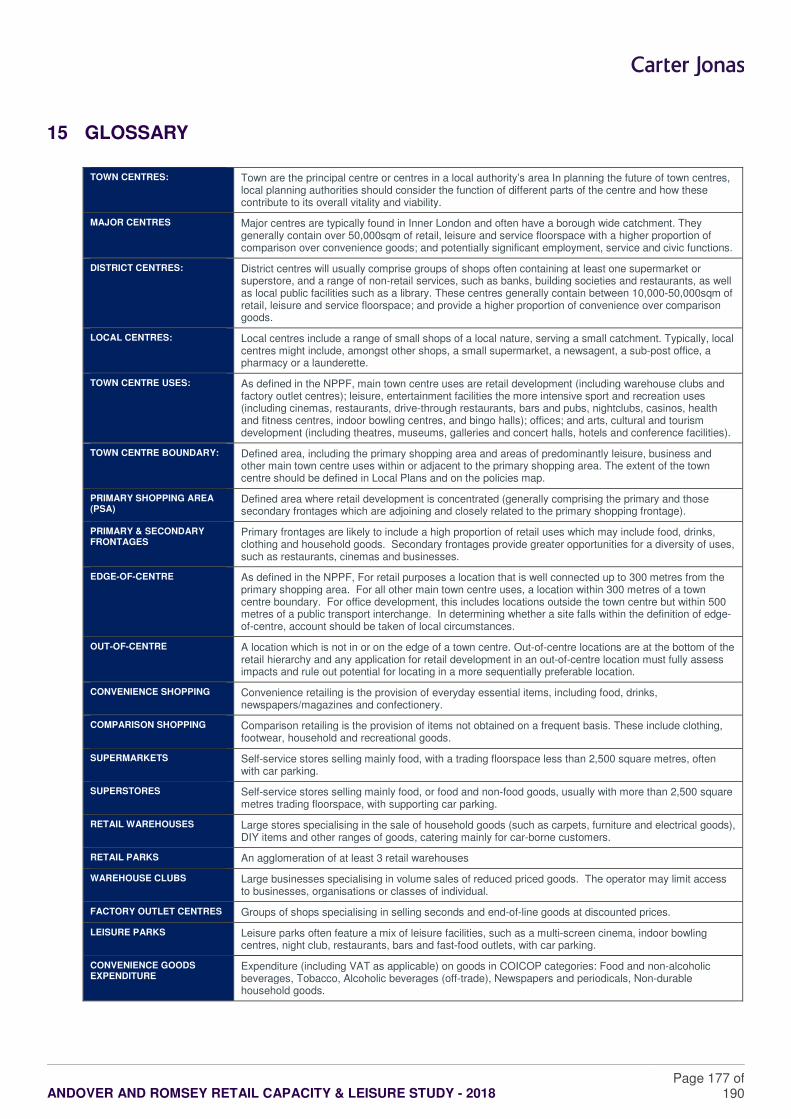
ANDOVER AND ROMSEY RETAIL CAPACITY & LEISURE STUDY - 2018
Page 177 of 190
15 GLOSSARY
TOWN CENTRES: Town are the principal centre or centres in a local authority’s area In planning the future of town centres, local planning authorities should consider the function of different parts of the centre and how these contribute to its overall vitality and viability.
MAJOR CENTRES Major centres are typically found in Inner London and often have a borough wide catchment. They generally contain over 50,000sqm of retail, leisure and service floorspace with a higher proportion of comparison over convenience goods; and potentially significant employment, service and civic functions.
DISTRICT CENTRES: District centres will usually comprise groups of shops often containing at least one supermarket or superstore, and a range of non-retail services, such as banks, building societies and restaurants, as well as local public facilities such as a library. These centres generally contain between 10,000-50,000sqm of retail, leisure and service floorspace; and provide a higher proportion of convenience over comparison goods.
LOCAL CENTRES: Local centres include a range of small shops of a local nature, serving a small catchment. Typically, local centres might include, amongst other shops, a small supermarket, a newsagent, a sub-post office, a pharmacy or a launderette.
TOWN CENTRE USES: As defined in the NPPF, main town centre uses are retail development (including warehouse clubs and factory outlet centres); leisure, entertainment facilities the more intensive sport and recreation uses (including cinemas, restaurants, drive-through restaurants, bars and pubs, nightclubs, casinos, health and fitness centres, indoor bowling centres, and bingo halls); offices; and arts, cultural and tourism development (including theatres, museums, galleries and concert halls, hotels and conference facilities).
TOWN CENTRE BOUNDARY: Defined area, including the primary shopping area and areas of predominantly leisure, business and other main town centre uses within or adjacent to the primary shopping area. The extent of the town centre should be defined in Local Plans and on the policies map.
PRIMARY SHOPPING AREA (PSA)
Defined area where retail development is concentrated (generally comprising the primary and those secondary frontages which are adjoining and closely related to the primary shopping frontage).
PRIMARY & SECONDARY FRONTAGES
Primary frontages are likely to include a high proportion of retail uses which may include food, drinks, clothing and household goods. Secondary frontages provide greater opportunities for a diversity of uses, such as restaurants, cinemas and businesses.
EDGE-OF-CENTRE As defined in the NPPF, For retail purposes a location that is well connected up to 300 metres from the primary shopping area. For all other main town centre uses, a location within 300 metres of a town centre boundary. For office development, this includes locations outside the town centre but within 500 metres of a public transport interchange. In determining whether a site falls within the definition of edge-of-centre, account should be taken of local circumstances.
OUT-OF-CENTRE A location which is not in or on the edge of a town centre. Out-of-centre locations are at the bottom of the retail hierarchy and any application for retail development in an out-of-centre location must fully assess impacts and rule out potential for locating in a more sequentially preferable location.
CONVENIENCE SHOPPING Convenience retailing is the provision of everyday essential items, including food, drinks, newspapers/magazines and confectionery.
COMPARISON SHOPPING Comparison retailing is the provision of items not obtained on a frequent basis. These include clothing, footwear, household and recreational goods.
SUPERMARKETS Self-service stores selling mainly food, with a trading floorspace less than 2,500 square metres, often with car parking.
SUPERSTORES Self-service stores selling mainly food, or food and non-food goods, usually with more than 2,500 square metres trading floorspace, with supporting car parking.
RETAIL WAREHOUSES Large stores specialising in the sale of household goods (such as carpets, furniture and electrical goods), DIY items and other ranges of goods, catering mainly for car-borne customers.
RETAIL PARKS An agglomeration of at least 3 retail warehouses
WAREHOUSE CLUBS Large businesses specialising in volume sales of reduced priced goods. The operator may limit access to businesses, organisations or classes of individual.
FACTORY OUTLET CENTRES Groups of shops specialising in selling seconds and end-of-line goods at discounted prices.
LEISURE PARKS Leisure parks often feature a mix of leisure facilities, such as a multi-screen cinema, indoor bowling centres, night club, restaurants, bars and fast-food outlets, with car parking.
CONVENIENCE GOODS EXPENDITURE
Expenditure (including VAT as applicable) on goods in COICOP categories: Food and non-alcoholic beverages, Tobacco, Alcoholic beverages (off-trade), Newspapers and periodicals, Non-durable household goods.
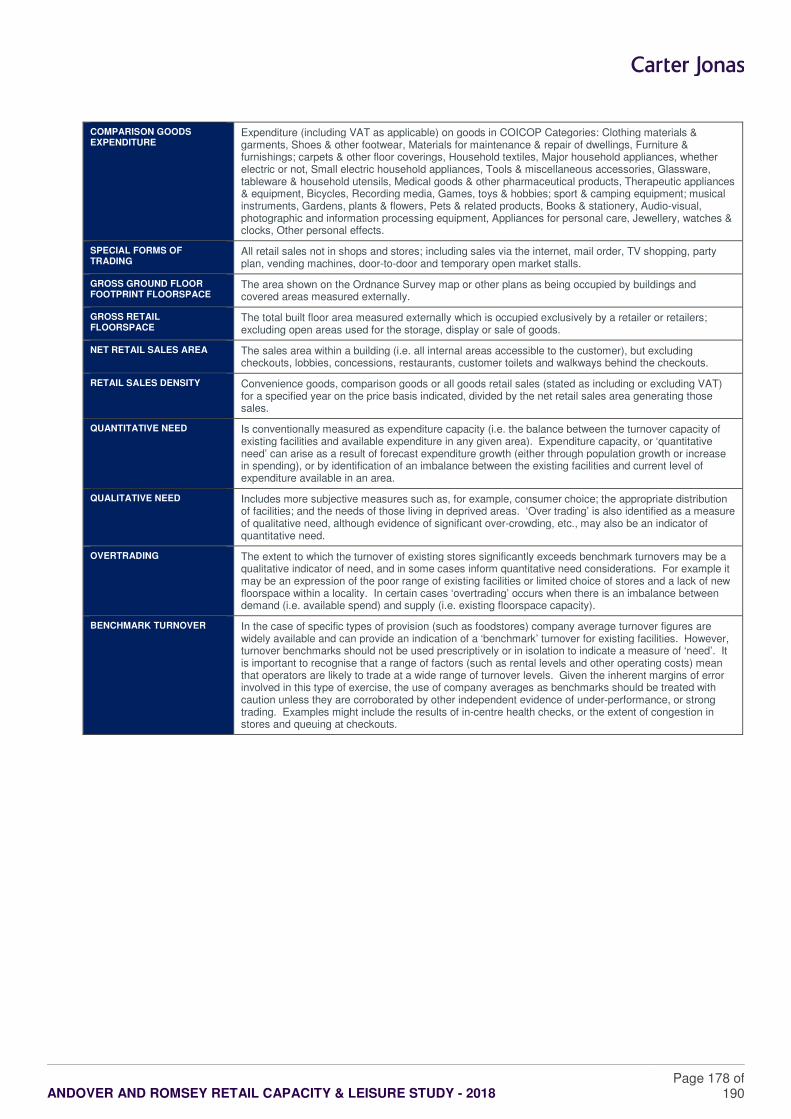
ANDOVER AND ROMSEY RETAIL CAPACITY & LEISURE STUDY - 2018
Page 178 of 190
COMPARISON GOODS EXPENDITURE
Expenditure (including VAT as applicable) on goods in COICOP Categories: Clothing materials & garments, Shoes & other footwear, Materials for maintenance & repair of dwellings, Furniture & furnishings; carpets & other floor coverings, Household textiles, Major household appliances, whether electric or not, Small electric household appliances, Tools & miscellaneous accessories, Glassware, tableware & household utensils, Medical goods & other pharmaceutical products, Therapeutic appliances & equipment, Bicycles, Recording media, Games, toys & hobbies; sport & camping equipment; musical instruments, Gardens, plants & flowers, Pets & related products, Books & stationery, Audio-visual, photographic and information processing equipment, Appliances for personal care, Jewellery, watches & clocks, Other personal effects.
SPECIAL FORMS OF TRADING
All retail sales not in shops and stores; including sales via the internet, mail order, TV shopping, party plan, vending machines, door-to-door and temporary open market stalls.
GROSS GROUND FLOOR FOOTPRINT FLOORSPACE
The area shown on the Ordnance Survey map or other plans as being occupied by buildings and covered areas measured externally.
GROSS RETAIL FLOORSPACE
The total built floor area measured externally which is occupied exclusively by a retailer or retailers; excluding open areas used for the storage, display or sale of goods.
NET RETAIL SALES AREA The sales area within a building (i.e. all internal areas accessible to the customer), but excluding checkouts, lobbies, concessions, restaurants, customer toilets and walkways behind the checkouts.
RETAIL SALES DENSITY Convenience goods, comparison goods or all goods retail sales (stated as including or excluding VAT) for a specified year on the price basis indicated, divided by the net retail sales area generating those sales.
QUANTITATIVE NEED Is conventionally measured as expenditure capacity (i.e. the balance between the turnover capacity of existing facilities and available expenditure in any given area). Expenditure capacity, or ‘quantitative need’ can arise as a result of forecast expenditure growth (either through population growth or increase in spending), or by identification of an imbalance between the existing facilities and current level of expenditure available in an area.
QUALITATIVE NEED Includes more subjective measures such as, for example, consumer choice; the appropriate distribution of facilities; and the needs of those living in deprived areas. ‘Over trading’ is also identified as a measure of qualitative need, although evidence of significant over-crowding, etc., may also be an indicator of quantitative need.
OVERTRADING The extent to which the turnover of existing stores significantly exceeds benchmark turnovers may be a qualitative indicator of need, and in some cases inform quantitative need considerations. For example it may be an expression of the poor range of existing facilities or limited choice of stores and a lack of new floorspace within a locality. In certain cases ‘overtrading’ occurs when there is an imbalance between demand (i.e. available spend) and supply (i.e. existing floorspace capacity).
BENCHMARK TURNOVER In the case of specific types of provision (such as foodstores) company average turnover figures are widely available and can provide an indication of a ‘benchmark’ turnover for existing facilities. However, turnover benchmarks should not be used prescriptively or in isolation to indicate a measure of ‘need’. It is important to recognise that a range of factors (such as rental levels and other operating costs) mean that operators are likely to trade at a wide range of turnover levels. Given the inherent margins of error involved in this type of exercise, the use of company averages as benchmarks should be treated with caution unless they are corroborated by other independent evidence of under-performance, or strong trading. Examples might include the results of in-centre health checks, or the extent of congestion in stores and queuing at checkouts.