analyzing evacuation versus shelter-in-place strategies after a terrorist nuclear detonation:...
TRANSCRIPT
Risk Analysis, Vol. 30, No. 9, 2010 DOI: 10.1111/j.1539-6924.2010.01430.x
Analyzing Evacuation Versus Shelter-in-Place StrategiesAfter a Terrorist Nuclear Detonation
Lawrence M. Wein,1,∗ Youngsoo Choi,2 and Sylvie Denuit3
We superimpose a radiation fallout model onto a traffic flow model to assess the evacuationversus shelter-in-place decisions after the daytime ground-level detonation of a 10-kt impro-vised nuclear device in Washington, DC. In our model, ≈80k people are killed by the prompteffects of blast, burn, and radiation. Of the ≈360k survivors without access to a vehicle, 42.6kwould die if they immediately self-evacuated on foot. Sheltering above ground would saveseveral thousand of these lives and sheltering in a basement (or near the middle of a largebuilding) would save ≈ 1
3 of them. Among survivors of the prompt effects with access to avehicle, the number of deaths depends on the fraction of people who shelter in a basementrather than self-evacuate in their vehicle: 23.1k people die if 90% shelter in a basement and54.6k die if 10% shelter. Sheltering above ground saves approximately half as many lives assheltering in a basement. The details related to delayed (i.e., organized) evacuation, searchand rescue, decontamination, and situational awareness (via, e.g., telecommunications) havevery little impact on the number of casualties. Although antibiotics and transfusion supporthave the potential to save ≈10k lives (and the number of lives saved from medical care in-creases with the fraction of people who shelter in basements), the logistical challenge appearsto be well beyond current response capabilities. Taken together, our results suggest that thegovernment should initiate an aggressive outreach program to educate citizens and the pri-vate sector about the importance of sheltering in place in a basement for at least 12 hoursafter a terrorist nuclear detonation.
KEY WORDS: Evacuation models; nuclear radiation; terrorism.
1. INTRODUCTION
The U.S. Department of Homeland Security hasdeveloped 15 national planning scenarios for use inpreparedness activities, and we consider the first ofthese scenarios: a surface blast of a 10-kt impro-vised nuclear device (IND) in the Washington, DC
1Graduate School of Business, Stanford University, Stanford, CA,USA.
2Institute for Computational and Mathematical Engineering,Stanford University, Stanford, CA, USA.
3Institute for Computational and Mathematical Engineering,Stanford University, Stanford, CA, USA.
∗Address correspondence to Lawrence M. Wein, Graduate Schoolof Business, Stanford University, Stanford, CA 94305, USA;tel: 650-724-1676; fax: 650-725-6152; [email protected].
Mall at 10 a.m. on a weekday.(1) In contrast to theCold War scenario of simultaneous 1-mt airblastsover 100 cities,(2) this terrorist scenario allows forsome consequence management. Although(1) claimsthat “by far, the greatest factor impacting the re-duction of the effects of the detonation on the gen-eral population” is the speed and appropriatenessof the shelter/evacuation-in-place protective actiondecisions that are made in the first 24 hours, noanalysis was performed to suggest what an optimalshelter/evacuation strategy might be.
We formulate and analyze a mathematical modelof this scenario to investigate the impact of var-ious shelter/evacuation strategies. The mathemati-cal model first calculates the number of deaths and
1315 0272-4332/10/0100-1315$22.00/1 C© 2010 Society for Risk Analysis
1316 Wein, Choi, and Denuit
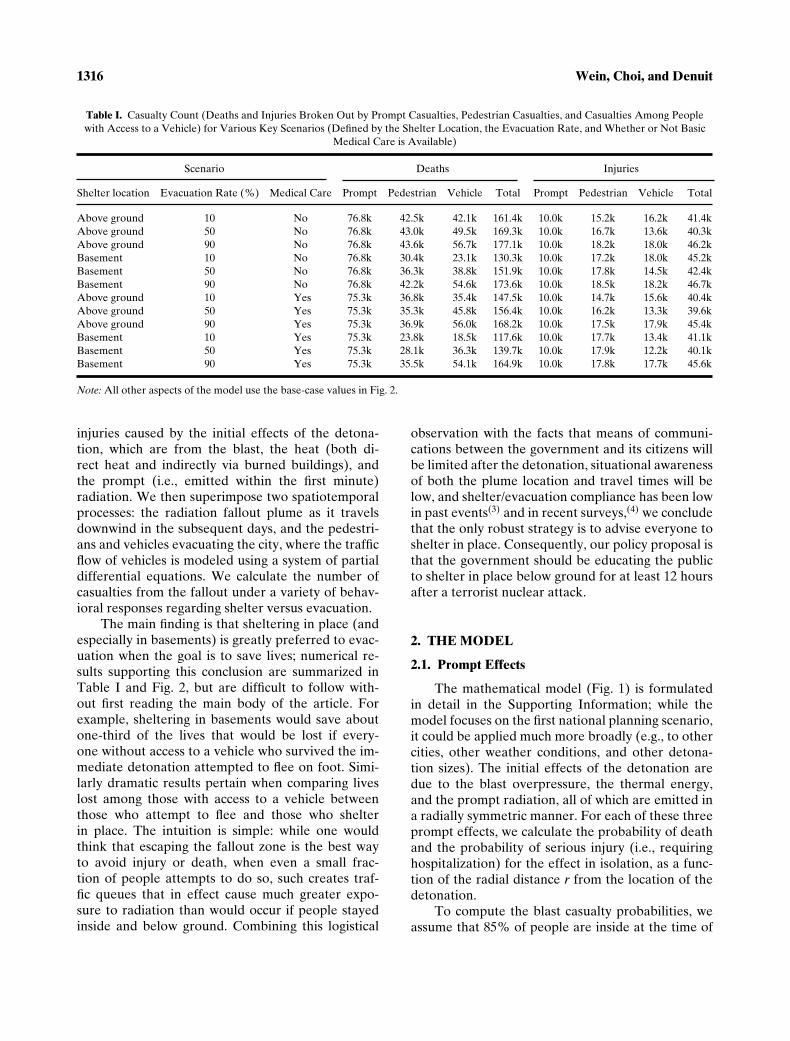
Table I. Casualty Count (Deaths and Injuries Broken Out by Prompt Casualties, Pedestrian Casualties, and Casualties Among Peoplewith Access to a Vehicle) for Various Key Scenarios (Defined by the Shelter Location, the Evacuation Rate, and Whether or Not Basic
Medical Care is Available)
Scenario Deaths Injuries
Shelter location Evacuation Rate (%) Medical Care Prompt Pedestrian Vehicle Total Prompt Pedestrian Vehicle Total
Above ground 10 No 76.8k 42.5k 42.1k 161.4k 10.0k 15.2k 16.2k 41.4kAbove ground 50 No 76.8k 43.0k 49.5k 169.3k 10.0k 16.7k 13.6k 40.3kAbove ground 90 No 76.8k 43.6k 56.7k 177.1k 10.0k 18.2k 18.0k 46.2kBasement 10 No 76.8k 30.4k 23.1k 130.3k 10.0k 17.2k 18.0k 45.2kBasement 50 No 76.8k 36.3k 38.8k 151.9k 10.0k 17.8k 14.5k 42.4kBasement 90 No 76.8k 42.2k 54.6k 173.6k 10.0k 18.5k 18.2k 46.7kAbove ground 10 Yes 75.3k 36.8k 35.4k 147.5k 10.0k 14.7k 15.6k 40.4kAbove ground 50 Yes 75.3k 35.3k 45.8k 156.4k 10.0k 16.2k 13.3k 39.6kAbove ground 90 Yes 75.3k 36.9k 56.0k 168.2k 10.0k 17.5k 17.9k 45.4kBasement 10 Yes 75.3k 23.8k 18.5k 117.6k 10.0k 17.7k 13.4k 41.1kBasement 50 Yes 75.3k 28.1k 36.3k 139.7k 10.0k 17.9k 12.2k 40.1kBasement 90 Yes 75.3k 35.5k 54.1k 164.9k 10.0k 17.8k 17.7k 45.6k
Note: All other aspects of the model use the base-case values in Fig. 2.
injuries caused by the initial effects of the detona-tion, which are from the blast, the heat (both di-rect heat and indirectly via burned buildings), andthe prompt (i.e., emitted within the first minute)radiation. We then superimpose two spatiotemporalprocesses: the radiation fallout plume as it travelsdownwind in the subsequent days, and the pedestri-ans and vehicles evacuating the city, where the trafficflow of vehicles is modeled using a system of partialdifferential equations. We calculate the number ofcasualties from the fallout under a variety of behav-ioral responses regarding shelter versus evacuation.
The main finding is that sheltering in place (andespecially in basements) is greatly preferred to evac-uation when the goal is to save lives; numerical re-sults supporting this conclusion are summarized inTable I and Fig. 2, but are difficult to follow with-out first reading the main body of the article. Forexample, sheltering in basements would save aboutone-third of the lives that would be lost if every-one without access to a vehicle who survived the im-mediate detonation attempted to flee on foot. Simi-larly dramatic results pertain when comparing liveslost among those with access to a vehicle betweenthose who attempt to flee and those who shelterin place. The intuition is simple: while one wouldthink that escaping the fallout zone is the best wayto avoid injury or death, when even a small frac-tion of people attempts to do so, such creates traf-fic queues that in effect cause much greater expo-sure to radiation than would occur if people stayedinside and below ground. Combining this logistical
observation with the facts that means of communi-cations between the government and its citizens willbe limited after the detonation, situational awarenessof both the plume location and travel times will below, and shelter/evacuation compliance has been lowin past events(3) and in recent surveys,(4) we concludethat the only robust strategy is to advise everyone toshelter in place. Consequently, our policy proposal isthat the government should be educating the publicto shelter in place below ground for at least 12 hoursafter a terrorist nuclear attack.
2. THE MODEL
2.1. Prompt Effects
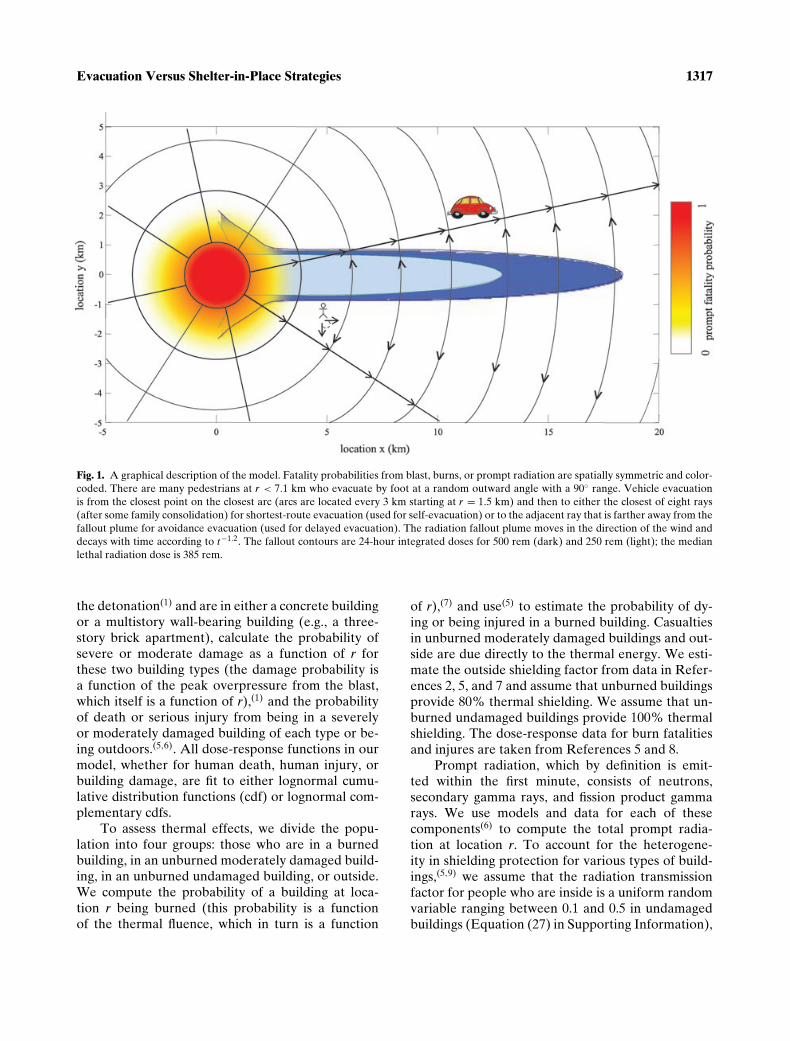
The mathematical model (Fig. 1) is formulatedin detail in the Supporting Information; while themodel focuses on the first national planning scenario,it could be applied much more broadly (e.g., to othercities, other weather conditions, and other detona-tion sizes). The initial effects of the detonation aredue to the blast overpressure, the thermal energy,and the prompt radiation, all of which are emitted ina radially symmetric manner. For each of these threeprompt effects, we calculate the probability of deathand the probability of serious injury (i.e., requiringhospitalization) for the effect in isolation, as a func-tion of the radial distance r from the location of thedetonation.
To compute the blast casualty probabilities, weassume that 85% of people are inside at the time of
Evacuation Versus Shelter-in-Place Strategies 1317
Fig. 1. A graphical description of the model. Fatality probabilities from blast, burns, or prompt radiation are spatially symmetric and color-coded. There are many pedestrians at r < 7.1 km who evacuate by foot at a random outward angle with a 90◦ range. Vehicle evacuationis from the closest point on the closest arc (arcs are located every 3 km starting at r = 1.5 km) and then to either the closest of eight rays(after some family consolidation) for shortest-route evacuation (used for self-evacuation) or to the adjacent ray that is farther away from thefallout plume for avoidance evacuation (used for delayed evacuation). The radiation fallout plume moves in the direction of the wind anddecays with time according to t−1.2. The fallout contours are 24-hour integrated doses for 500 rem (dark) and 250 rem (light); the medianlethal radiation dose is 385 rem.
the detonation(1) and are in either a concrete buildingor a multistory wall-bearing building (e.g., a three-story brick apartment), calculate the probability ofsevere or moderate damage as a function of r forthese two building types (the damage probability isa function of the peak overpressure from the blast,which itself is a function of r),(1) and the probabilityof death or serious injury from being in a severelyor moderately damaged building of each type or be-ing outdoors.(5,6). All dose-response functions in ourmodel, whether for human death, human injury, orbuilding damage, are fit to either lognormal cumu-lative distribution functions (cdf) or lognormal com-plementary cdfs.
To assess thermal effects, we divide the popu-lation into four groups: those who are in a burnedbuilding, in an unburned moderately damaged build-ing, in an unburned undamaged building, or outside.We compute the probability of a building at loca-tion r being burned (this probability is a functionof the thermal fluence, which in turn is a function
of r),(7) and use(5) to estimate the probability of dy-ing or being injured in a burned building. Casualtiesin unburned moderately damaged buildings and out-side are due directly to the thermal energy. We esti-mate the outside shielding factor from data in Refer-ences 2, 5, and 7 and assume that unburned buildingsprovide 80% thermal shielding. We assume that un-burned undamaged buildings provide 100% thermalshielding. The dose-response data for burn fatalitiesand injures are taken from References 5 and 8.
Prompt radiation, which by definition is emit-ted within the first minute, consists of neutrons,secondary gamma rays, and fission product gammarays. We use models and data for each of thesecomponents(6) to compute the total prompt radia-tion at location r. To account for the heterogene-ity in shielding protection for various types of build-ings,(5,9) we assume that the radiation transmissionfactor for people who are inside is a uniform randomvariable ranging between 0.1 and 0.5 in undamagedbuildings (Equation (27) in Supporting Information),
1318 Wein, Choi, and Denuit
which represents sheltering in small buildings aboveground; later, we consider sheltering in basementsor near the middle of large buildings. Dose-responsedata (in the absence of medical care) for radiationfatalities and injuries are taken from References 1and 6.
We compute the total prompt probability ofdeath and of serious injury as a function of r by ac-counting for the facts that many people receive fa-tal doses of more than one effect, and that combinedserious injuries can be fatal (e.g., the fatal radiationdose is significantly smaller for someone who hasa serious burn or blast injury(8)). Multiplying theseprobabilities times the spatial daytime populationyields the total number of prompt fatalities and in-juries in each location. We use LandScan USA(10) toconstruct the spatial nighttime population of Wash-ington, DC, and its surrounding areas, and (followingRef. (1)) obtain the daytime population by adding481k people uniformly to the region r < 5 km andadding 220k uniformly to the annulus between r = 5and 11 km.
2.2. Radiation Fallout
Turning to the temporal part of the model, wecompute the fallout dose rate at each location andeach point in time assuming a wind speed of 10mph, using a relatively simple model(11) that has beencalibrated against the more complicated NARACmodel.(12) For ease of exposition, we assume that thecoordinate system is such that the wind direction isalong the positive x-axis (Fig. 1). In the base case, thewind direction is 11.25◦N of east.
2.3. Self-Evacuation
We consider two types of evacuation: self-evacuation, in which people evacuate by vehicle oron foot (if they have no access to a vehicle) soon af-ter the detonation, and delayed evacuation, in whichpeople evacuate (again, by vehicle or on foot) onlyafter sheltering in place for a significant amount oftime (hours or days). While sheltering in place, peo-ple experience the same random indoor shieldingfactor that was used during our prompt radiationcalculations. We assume that no one has access to avehicle for r < 1.5 km because the roads are not pass-able due to blast and burn damage, and that 38% ofpeople in r ∈ [1.5, 7.1] km do not have access to a ve-hicle because they are commuters(13) or are residentswho do not own one.(14)
The detonation occurs at time t = 0 and the load-ing time is the time at which the self-evacuationis initiated, and consists of a diffusion time plus apreparation time. We assume the preparation time(which occurs indoors) is 15 minutes for everyone.(15)
The diffusion time (85% of people are inside duringthis interval) depends upon personal and interper-sonal situational awareness. We assume the diffusiontime is 0 for r < rp, where rp represents the distancewithin which people are directly aware of a nucleardetonation. We consider two different values: rp = 4km is the value at which windows break in our modeland represents low personal situational awareness,and rp = 17 km is the visibility distance on a clearday (the mushroom cloud is visible for 1 hour(5)) andrepresents high personal situational awareness. Weassume that the diffusion time is 1 hour for r > ri
(consistent with diffusion times from nearby indus-trial accidents(16,17)), where ri is the minimum dis-tance at which electronic communications (phones,television, Internet) are intact; we ignore the fact thateven in areas where the telephone system is opera-tional, it is likely to be overloaded.(18) We considertwo values, ri = 17 and 320 km (Table 1–15 of Ref.(1)), which correspond to high and low interpersonalsituational awareness, respectively. Hence, we con-sider four scenarios in total, with two values of ri andtwo values of rp, although we focus on the case whererp = 4 km, ri = 17 km. People located in [rp, ri ] haveto rely on battery-powered radios, face-to-face con-tact with neighbors, nonelectronic communicationswith the government (e.g., loudspeakers atop vehi-cles(1)), or family members driving home with thenews. We assume that the mean diffusion time in thisrange is 3 hours.
People who self-evacuate on foot from location(x, y) (where the detonation is at (0,0)) are assumedto travel at 1 mph in a random direction that is uni-formly distributed in [arctan( y
x ) − π4 , arctan( y
x ) + π4 ]
(i.e., with a range of 90◦); the slow speed and ran-dom direction account for initial confusion, move-ment around buildings, injuries, and the need to carrythings (or children). We assume that there are nocongestion effects among evacuating pedestrians orbetween pedestrians and vehicles.
We assume that there are 2.5 people per evac-uating vehicle.(19) Vehicles evacuate (Fig. 1) the cityvia arcs (paths of constant radius from the detonationlocation, each of which has two lanes of traffic mov-ing in each direction, and interference due to cross-traffic) that exist every 3 km starting at r = 1.5 km,and eight(20) outgoing rays (paths emanating from the
Evacuation Versus Shelter-in-Place Strategies 1319
detonation location, each of which has four lanes oftraffic). The angle between the wind direction andthe closest ray is set equal to the median value ofπ16 = 11.25◦ (Fig. 1).
In our model, evacuating vehicles instanta-neously move in the radial direction to the closestarc. In shortest-route evacuation (which is appropri-ate for self-evacuation), to account for the 50% in-crease in local traffic due to family consolidation,(21)
we assume that 34 of the vehicles travel on the arc to
the closest ray and 14 travel to the other adjacent arc.
For avoidance evacuation (which may be more ap-propriate for modeling delayed evacuation—this isreferred to as lateral evacuation in Ref. (22)), all ve-hicles travel on arcs in the direction away from thecenterline of the fallout plume, and hence there isonly one direction of traffic flow on the arcs in thiscase.
Traffic flow along rays and along each direc-tion of the arcs is modeled according to the classickinematic wave model,(23) incorporating traffic engi-neering data that quantify the relationship betweentraffic flow and traffic density.(24) These partial dif-ferential equations are coupled together, so that ex-its from arcs correspond to entrances on rays. Flowat the arc-ray intersections is restricted by the sparecapacity in the right lane of the ray and the capacityout of the single-lane exit ramp of the arc, and hencea traffic jam on a ray can cause traffic buildups on thearcs. In addition, vehicles wait in a queue to enter thearc at each location if there is no spare arc capacityat this location.
2.4. Delayed Evacuation
People (pedestrians or those with vehicles) whodo not self-evacuate are assumed to shelter in placeuntil the delayed evacuation, which begins at time τe.We consider two extreme policies for the delayedevacuation of vehicles: a high-dose-first policy, whichgives evacuation priority to people in areas with highfallout doses, and a low-dose-first policy, which givespriority to people in areas with low fallout doses.Delayed vehicle evacuation uses avoidance evacu-ation, and evacuation is optimized under both ex-treme policies so as to evacuate as quickly as possiblewhile maintaining the congestion below a specifiedlevel: the density on the arcs and rays never exceedsthe level that achieves maximum flow, there are nobackups at the arc-ray intersections, and no queuebuildups for vehicles trying to enter the arcs. We also
impose an outer limit (re, which is 50 km) on allow-able ray evacuation; that is, vehicles are not allowedto enter a ray at location r > re.
To model delayed pedestrian evacuation, we de-fine the evacuation region to be the intersection ofthe region r > 1.5 km (because evacuation stationsneed to be outside of the blast and burn zones) andthe region where the fallout dose rate at time τe isgreater than or equal to 10 rem/hour (where rem isthe standard unit of measurement for the biologicallyequivalent dose), which allows emergency workers toperform lifesaving activities for 5 hours.(25) Pedestri-ans walk (at 1 mph in a random direction with a 22.5◦
range) to the perimeter of the evacuation region, atwhich point they are assumed to be at an evacua-tion station. Pedestrians who are outside of the evac-uation region at time τe are assumed to be immedi-ately evacuated without incurring additional fallout.We assume that pedestrians are not exposed to anyradiation fallout after they arrive at the perimeterof the evacuation region, which essentially assumesthat people are either well sheltered from fallout atthe evacuation station or that there are ample vehi-cles (e.g., buses) and hence no waiting at the evac-uation station, and that these vehicles incur very lit-tle traffic congestion (e.g., some of the inbound laneson the rays are devoted to these vehicles and otheremergency vehicles). Hence, our casualty estimatesfor delayed pedestrian evacuations should be viewedas lower bounds.
3. RESULTS
3.1. Prompt Casualties
Prompt effects are dominated primarily by burnsand to a lesser extent by prompt radiation (Fig. 1 inSupporting Information): blast fatalities drop rapidlyfrom near 50% to < 10% at r = 0.5 km and blast in-juries are rare for r > 1.5 km, prompt radiation is100% fatal for r < 1 km but drops off rapidly withno injuries for r > 1.2 km, and burns are > 80% fa-tal for r < 0.8 km, but thermal fatalities and injuriesdrop off more slowly and can occur out to several km.Overall, there are 76.8k fatalities and 10.0k seriousinjuries due to the prompt effects of the detonation.
3.2. Sensitivity Analysis for Prompt Casualties
The prompt casualty results are qualitativelysimilar to those in References 1 and 26. Ourmodel produces somewhat fewer blast injuries thanReferences 1 and 26, but many of those injured by
1320 Wein, Choi, and Denuit
blast are subsequently victims of burns, which wasnot explicitly considered in Reference 1. Our modelappears to have fewer blast injuries and more burninjuries than in References 27 and 28 (they do notprovide details), which is probably due to their ex-plicit modeling of the urban terrain and either theirpossible omission of the fire data in Reference 7 ortheir assumption that not all people in burned build-ings die. Because blast effects are dominated by theother two effects, our model is insensitive to two pa-rameters that are quite uncertain in our model: thefraction of concrete and brick buildings, and the frac-tion of outside blast casualties that are fatal. Finally,changing the inside thermal shielding factor from80% to 50% increases the number of prompt fatal-ities and prompt injuries by only 0.1k each.
3.3. Pedestrian Evacuation
Among the survivors of the prompt effects,358.6k are pedestrians (i.e., have no access to a ve-hicle). The casualty rates are independent of theinterpersonal awareness parameter ri because allpedestrians are located at r < 17 km. If the shel-ter/evacuation decision is made independently of lo-cation then among pedestrians who self-evacuate,12.4% die and 5.1% are injured from radiation fall-out when personal awareness is low (rp = 4 km); thecasualty rates change to 12.2% and 5.4% with im-proved personal awareness (rp = 17 km). For de-layed evacuators, the casualty probabilities increasewith the time of delayed evacuation (τe), with thedeath rate ranging from 11.5% when τe = 12 hours to12.0% when τe = 96 hours in the low personal aware-ness case (rp = 4 km), and decreasing by 0.5–1.0%when personal awareness is high (rp = 17 km) (Fig. 2in Supporting Information). Pedestrians located nearthe centerline of the fallout zone (i.e., near y = 0) arebetter off self-evacuating (but the difference is verysmall because nearly all of them die in either case), asare pedestrians near x = 0 but just behind the fallout(for a total of 16% of pedestrians), while pedestrianslocated elsewhere in—and around the periphery of—the fallout zone (19% of pedestrians) are better offdelaying their evacuation (Fig. 3 of Supporting Infor-mation); the remaining 65% of pedestrians surviveregardless of their shelter/evacuation decision. If weassume that delayed evacuation does not offer im-proved situational awareness (via a narrower rangeof walking angles) or less fallout exposure (via theevacuation stations), then the optimal time to evac-uate for those in the periphery of the fallout zone
varies between 6 and 80 hours (Fig. 4 in SupportingInformation).
3.4. Vehicle Evacuation
Among survivors of the prompt effects, 8.4Mpeople in our study region (within 117 km of theblast) have access to a vehicle. We consider vehicleself-evacuation strategies that are location-dependent and location-independent; the location-dependent strategy represents a best-case scenario(and hence a lower bound on the number of casu-alties), while the location-independent strategy issomewhat more realistic in the immediate aftermathof a detonation. The location-independent strategyis characterized by Pev , which is the fraction ofpeople with access to a vehicle that self-evacuate,regardless of location (x, y). Let Df (x, y) be the totalunprotected fallout dose over the first 24 hours atlocation (x, y), using Equation (42) in Supporting In-formation. We consider a three-parameter location-dependent self-evacuation strategy, where thefraction of people with access to a vehicle in location(x, y) who self-evacuate is 1 − fn if Df (x, y) > D̄e,and is fp if Df (x, y) ≤ D̄e; here D̄e is the dosethreshold, fn is the false negative probability, andfp is the false positive probability. Delayed vehicleevacuation begins at time τe, and hence vehicleevacuation strategies are defined by four parametersif self-evacuation is location-dependent and two pa-rameters if self-evacuation is location-independent.
Until we get to the sensitivity analysis, we as-sume that delayed evacuation uses the high-dose-firstpolicy and the situational awareness parameters arerp = 4 km, ri = 17 km. We first investigate three vari-ants of the location-dependent strategy. In the firsttwo of these variants, we set fn = fp = 0 to representthe best-case scenario. Setting D̄e = ∞ (i.e., all peo-ple with access to a vehicle initially shelter), we findthat the optimal (i.e., death-minimizing) time to be-gin delayed vehicle evacuation is τ ∗
e = 4.4 hr, whichresults in 35.9k deaths among prompt survivors withaccess to a vehicle (Fig. 5 in Supporting Informa-tion). Next we jointly optimize D̄e and τe. Definingn(D̄e) to be the total population of prompt survivorswith access to a vehicle who live in locations (x, y)that have Df (x, y) > D̄e (i.e., the number of peo-ple who self-evacuate in a vehicle if fp = fn = 0),we find that the optimal values satisfy n(D̄∗
e ) = 35.8k(which involves a 6.2 km2 region just downwind fromthe blast) and τ ∗
e = 4.4 hours, with 31.1k deaths. Fi-nally, using more practical values, we set the false
Evacuation Versus Shelter-in-Place Strategies 1321
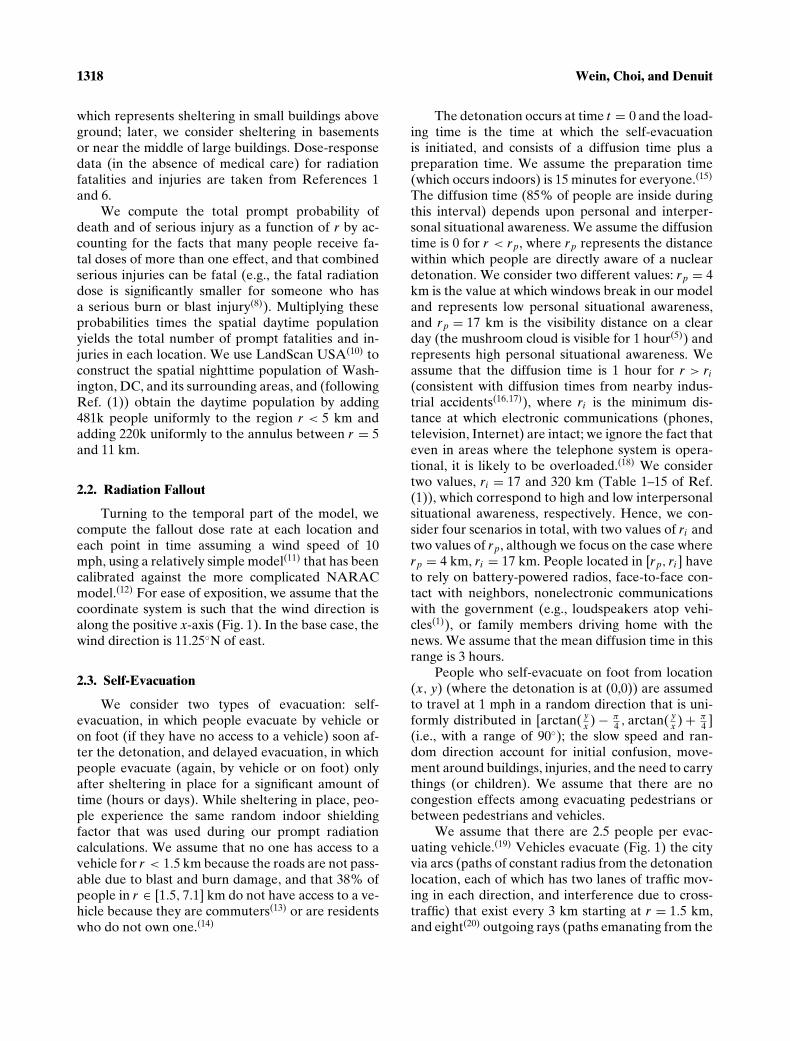
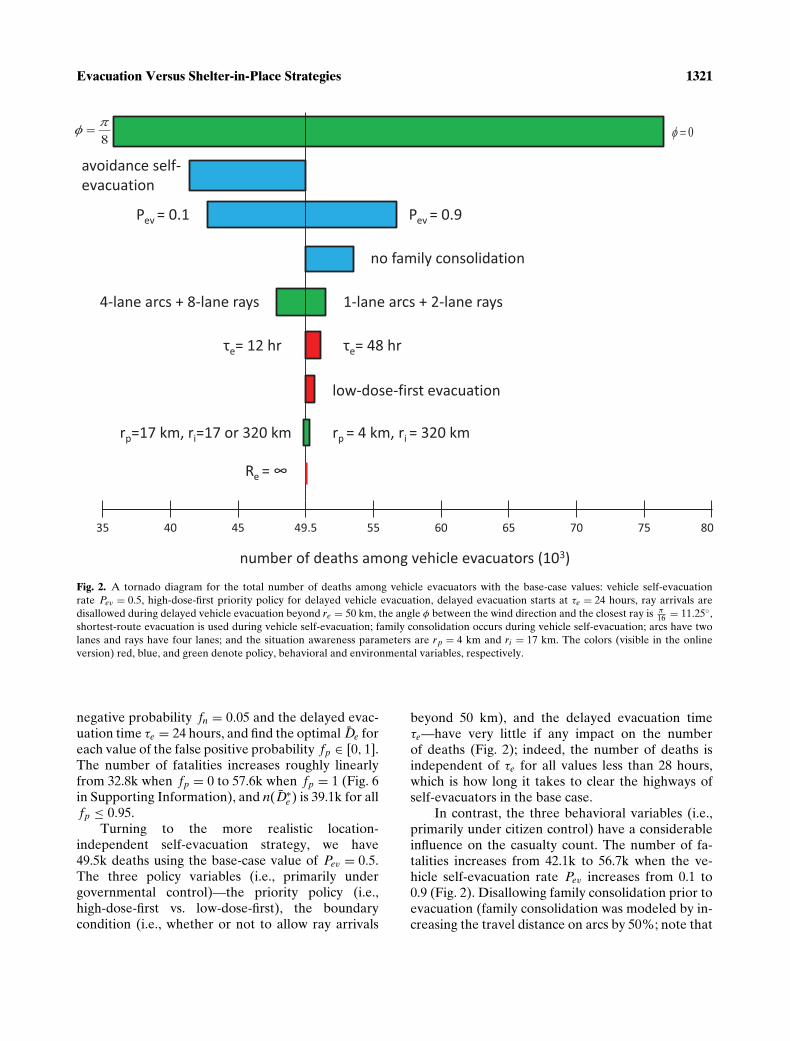
Fig. 2. A tornado diagram for the total number of deaths among vehicle evacuators with the base-case values: vehicle self-evacuationrate Pev = 0.5, high-dose-first priority policy for delayed vehicle evacuation, delayed evacuation starts at τe = 24 hours, ray arrivals aredisallowed during delayed vehicle evacuation beyond re = 50 km, the angle φ between the wind direction and the closest ray is π
16 = 11.25◦,shortest-route evacuation is used during vehicle self-evacuation; family consolidation occurs during vehicle self-evacuation; arcs have twolanes and rays have four lanes; and the situation awareness parameters are rp = 4 km and ri = 17 km. The colors (visible in the onlineversion) red, blue, and green denote policy, behavioral and environmental variables, respectively.
negative probability fn = 0.05 and the delayed evac-uation time τe = 24 hours, and find the optimal D̄e foreach value of the false positive probability fp ∈ [0, 1].The number of fatalities increases roughly linearlyfrom 32.8k when fp = 0 to 57.6k when fp = 1 (Fig. 6in Supporting Information), and n(D̄∗
e ) is 39.1k for allfp ≤ 0.95.
Turning to the more realistic location-independent self-evacuation strategy, we have49.5k deaths using the base-case value of Pev = 0.5.The three policy variables (i.e., primarily undergovernmental control)—the priority policy (i.e.,high-dose-first vs. low-dose-first), the boundarycondition (i.e., whether or not to allow ray arrivals
beyond 50 km), and the delayed evacuation timeτe—have very little if any impact on the numberof deaths (Fig. 2); indeed, the number of deaths isindependent of τe for all values less than 28 hours,which is how long it takes to clear the highways ofself-evacuators in the base case.
In contrast, the three behavioral variables (i.e.,primarily under citizen control) have a considerableinfluence on the casualty count. The number of fa-talities increases from 42.1k to 56.7k when the ve-hicle self-evacuation rate Pev increases from 0.1 to0.9 (Fig. 2). Disallowing family consolidation prior toevacuation (family consolidation was modeled by in-creasing the travel distance on arcs by 50%; note that
1322 Wein, Choi, and Denuit
Washington, DC, public schools have a lock downplan, in which students cannot leave and parents can-not pick up their children(14)) increases the numberof deaths by 4.6k because when all vehicles travel tothe closest ray, half of the arc capacity remains un-used. Avoidance self-evacuation of vehicles leads toa sizable drop in deaths, to 41.4k: the fallout-avoidingnature of the evacuation more than offsets the in-creased congestion caused by reducing the arc capac-ity in half.
Among environmental variables (i.e., largely outof everyone’s control), the situational awareness pa-rameters rp and ri have very little influence on thenumber of casualties, and halving or doubling thenumber of lanes on each ray and arc has a surpris-ingly small effect on the number of deaths becausethe congestion bottleneck shifts to the one-lane en-trance and exit ramps. The parameter that has thebiggest impact is the angle φ between the wind direc-tion and the closest ray, which is assessed by changingthe wind direction while keeping the roadway loca-tions fixed. This effect is asymmetric and the numberof deaths increases by >50% when φ = 0.
3.5. Sheltering in Basements
Until now, we have conservatively (with re-spect to our ultimate recommendation that everyoneshould shelter) assumed that people shelter aboveground in small buildings. This assumption affectsthe survival of all delayed evacuators. To modelsheltering in basements or near the middle of a largeresidential or office building, we change the indoorradiation transmission factor (after time τl) to a uni-form random variable ranging between 0.05 and 0.1(Fig. 2 in Ref. (9)) for r > 0.5 km. The death rateamong delayed pedestrian evacuators drops from11.7% to 8.0%, and to 6.3% when the personal situa-tional awareness parameter increases from rp = 4 torp = 17 km. When τe = 12 hours, only 0.2% of pedes-trians are better off self-evacuating than sheltering(compared to 16% when sheltering is above ground).Leaving all other vehicle evacuation parameters attheir base-case values, the number of deaths amongprompt survivors with access to a vehicle decreasesfrom 49.5k to 38.8k when sheltering is in basements.The fatality count changes to 23.1k and 54.6k whenPev = 0.1 and 0.9, respectively. The interpersonal sit-uational parameter ri still has no impact, but now im-proving rp from 4 to 17 km reduces the number ofdeaths (under Pev = 0.5) from 38.8k to 34.4k.
3.6. Medical Care
Although we do not model the detailed logis-tics of medical care delivery, we estimate the num-ber of lives that could potentially be saved via an-tibiotics and transfusion support by increasing themedian and 90th fractile radiation doses that causedeath or injury by 30%, which is a compromise be-tween the canine studies(8) and the lower end of therange of the improvements claimed on page 508 ofReference 29. Using the base-case values in Fig. 2,and assuming that 50% of pedestrians self-evacuate,the total (due to prompt effects, and during pedes-trian and vehicle evacuation) number of deaths de-creases by 12.9k when the dose-response parame-ters are changed (Table I). Sheltering in place andmedical care are somewhat synergistic mitigationschemes: medical care has the potential to save 8.9klives when the self-evacuation rates are 90% and13.9k lives when the self-evacuation rates are 10%(Table I).
4. DISCUSSION
4.1. Previous Studies
A consensus has not emerged on the evacu-ation versus shelter decision after a 10-kt nucleardetonation. Recommendations include evacuate un-less a quick evacuation is not possible,(30) shelterin place,(31) evacuate only people in the 24-hourdose-integrated median lethal dose range (a 5-mile-long oval),(32) and if the shelter transmission fac-tor is 0.7, evacuate if the 24-hour integrated dose is>100 rem (i.e., within 10 miles).(33) Two recent stud-ies(27,28) perform a more detailed analysis of shel-ter versus evacuation strategies. These models em-ploy a more complicated effects and fallout modelby accounting for urban terrain and non-Gaussianplumes generated by altitude-dependent wind direc-tion (while these refinements would be very valu-able for aiding in postevent situational awareness,they are not required for assessing shelter versusevacuation strategies prior to an event, as long as—as noted in Reference 28—the idealized Gaussianplume is not exploited for evacuation purposes). Onthe other hand, our analysis has a more detailed op-erational model by incorporating a traffic congestionmodel, distinguishing between pedestrians and peo-ple with vehicles, and considering imperfect plumeknowledge, communications, and compliance withgovernment recommendations. Both of these studiesassess informed evacuation based on perfect plume
Evacuation Versus Shelter-in-Place Strategies 1323
knowledge and perfect communications; while in-formed evacuation is recommended in Reference 28in some cases (transmission factor of 0.25, good situ-ational awareness, and rapid evacuation route), thisstrategy is viewed as risky in Reference 27, due totheir assumption of perfect plume knowledge andperfect communications. As explained later, afterexplicitly accounting for traffic congestion and im-perfect citizen compliance (in addition to limitedplume knowledge and communications), we recom-mend against informed evacuation, and believe thatthe most robust strategy is to advise everyone toshelter.
4.2. Pedestrian Evacuation
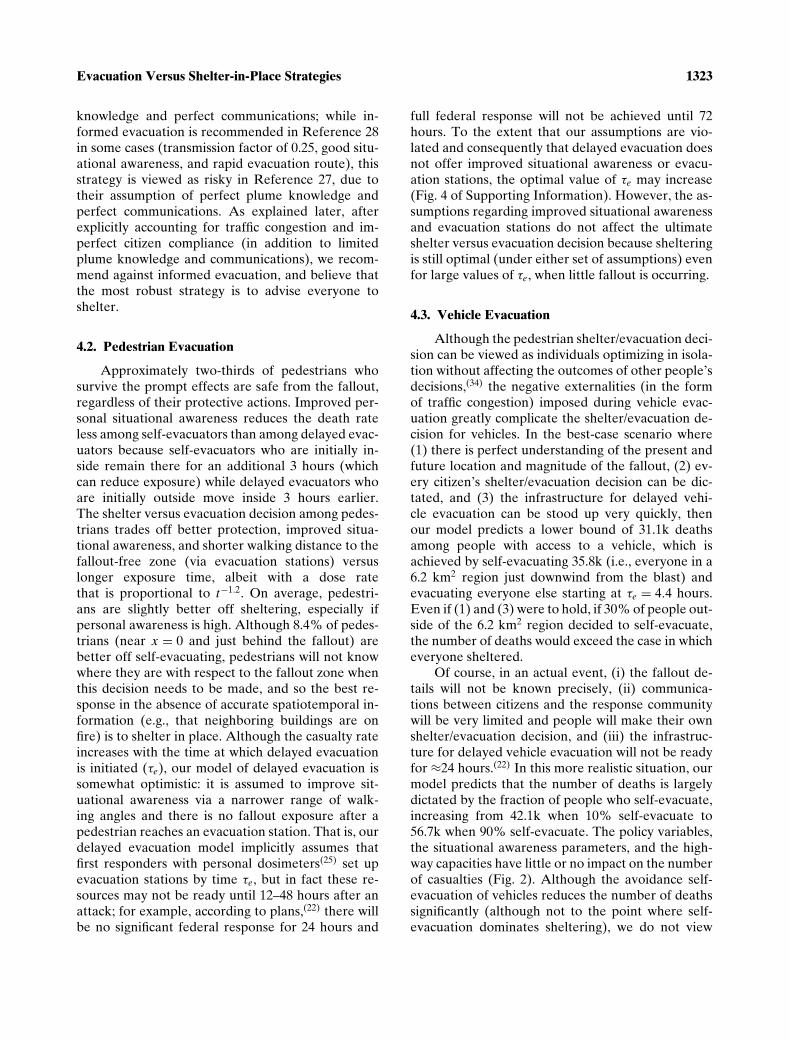
Approximately two-thirds of pedestrians whosurvive the prompt effects are safe from the fallout,regardless of their protective actions. Improved per-sonal situational awareness reduces the death rateless among self-evacuators than among delayed evac-uators because self-evacuators who are initially in-side remain there for an additional 3 hours (whichcan reduce exposure) while delayed evacuators whoare initially outside move inside 3 hours earlier.The shelter versus evacuation decision among pedes-trians trades off better protection, improved situa-tional awareness, and shorter walking distance to thefallout-free zone (via evacuation stations) versuslonger exposure time, albeit with a dose ratethat is proportional to t−1.2. On average, pedestri-ans are slightly better off sheltering, especially ifpersonal awareness is high. Although 8.4% of pedes-trians (near x = 0 and just behind the fallout) arebetter off self-evacuating, pedestrians will not knowwhere they are with respect to the fallout zone whenthis decision needs to be made, and so the best re-sponse in the absence of accurate spatiotemporal in-formation (e.g., that neighboring buildings are onfire) is to shelter in place. Although the casualty rateincreases with the time at which delayed evacuationis initiated (τe), our model of delayed evacuation issomewhat optimistic: it is assumed to improve sit-uational awareness via a narrower range of walk-ing angles and there is no fallout exposure after apedestrian reaches an evacuation station. That is, ourdelayed evacuation model implicitly assumes thatfirst responders with personal dosimeters(25) set upevacuation stations by time τe, but in fact these re-sources may not be ready until 12–48 hours after anattack; for example, according to plans,(22) there willbe no significant federal response for 24 hours and
full federal response will not be achieved until 72hours. To the extent that our assumptions are vio-lated and consequently that delayed evacuation doesnot offer improved situational awareness or evacu-ation stations, the optimal value of τe may increase(Fig. 4 of Supporting Information). However, the as-sumptions regarding improved situational awarenessand evacuation stations do not affect the ultimateshelter versus evacuation decision because shelteringis still optimal (under either set of assumptions) evenfor large values of τe, when little fallout is occurring.
4.3. Vehicle Evacuation
Although the pedestrian shelter/evacuation deci-sion can be viewed as individuals optimizing in isola-tion without affecting the outcomes of other people’sdecisions,(34) the negative externalities (in the formof traffic congestion) imposed during vehicle evac-uation greatly complicate the shelter/evacuation de-cision for vehicles. In the best-case scenario where(1) there is perfect understanding of the present andfuture location and magnitude of the fallout, (2) ev-ery citizen’s shelter/evacuation decision can be dic-tated, and (3) the infrastructure for delayed vehi-cle evacuation can be stood up very quickly, thenour model predicts a lower bound of 31.1k deathsamong people with access to a vehicle, which isachieved by self-evacuating 35.8k (i.e., everyone in a6.2 km2 region just downwind from the blast) andevacuating everyone else starting at τe = 4.4 hours.Even if (1) and (3) were to hold, if 30% of people out-side of the 6.2 km2 region decided to self-evacuate,the number of deaths would exceed the case in whicheveryone sheltered.
Of course, in an actual event, (i) the fallout de-tails will not be known precisely, (ii) communica-tions between citizens and the response communitywill be very limited and people will make their ownshelter/evacuation decision, and (iii) the infrastruc-ture for delayed vehicle evacuation will not be readyfor ≈24 hours.(22) In this more realistic situation, ourmodel predicts that the number of deaths is largelydictated by the fraction of people who self-evacuate,increasing from 42.1k when 10% self-evacuate to56.7k when 90% self-evacuate. The policy variables,the situational awareness parameters, and the high-way capacities have little or no impact on the numberof casualties (Fig. 2). Although the avoidance self-evacuation of vehicles reduces the number of deathssignificantly (although not to the point where self-evacuation dominates sheltering), we do not view
1324 Wein, Choi, and Denuit
this assumption as realistic. The shortest-route andavoidance self-evacuation schemes deviate in twogeographical regions: a small group of people whoare not in the fallout plume and a larger groupwho are in the plume. At the time of self-evacuation,with perhaps human visibility as the only guide,it may be possible for the former group to assessthe situation; but it would be much more difficultfor the latter group, particularly if the plume isnot Gaussian-shaped.(28) That is, we do not believethat most of the benefits of evacuation avoidance inFig. 2 could be realized in practice. Similarly, self-evacuation would fare better among pedestrians if weincreased the walking speed and narrowed the rangeof walking angles, but we do not believe that largechanges would be practical .
4.4. Sheltering in Basements
The 15.7% reduction in deaths among survivorsof the prompt effects (from 43.6k to 42.5k amongpedestrians and from 56.7k to 42.1k among peoplein vehicles) by decreasing the self-evacuation ratesfrom 90% to 10% is rather modest, but conserva-tively assumes that everyone shelters above ground.In contrast to the avoidance self-evacuation assump-tion, there is no compelling reason why people can-not shelter in basements: most buildings near Wash-ington, DC, have a basement, and if people canbe educated to shelter inside then they should be ableto be convinced to shelter in a basement. If peopleshelter in basements, our results are somewhat moreoptimistic. Reducing self-evacuation rates from 90%to 10% reduces the number of deaths among promptsurvivors by 44.7% (57.7% among people in vehi-cles, 28.0% among pedestrians), from 96.8k to 53.5k.With sheltering in basements, the shelter/evacuationdecision becomes overwhelmingly straightforward: itis optimal for only 0.2% of pedestrians to evacu-ate when τe = 12 hours (compared to 16% in Fig. 3of Supporting Information), and—mimicking ear-lier calculations for vehicles—it is optimal for 9.6k(rather than 35.8k) people to self-evacuate in vehi-cles if fp = fn = 0, and the break-even false positiveprobability (where we are indifferent between shel-tering everyone or attempting to evacuate this smallgroup of people) for these people is 0.005 (ratherthan 0.3). In other words, after one accounts for com-pliance, informed evacuation is bound to backfire ifmany people are sheltering in basements. In addition,when sheltering is in basements rather than aboveground, the benefits from medical care and improved
situational awareness increase, as does the optimaltime for delayed evacuation.
4.5. Model Limitations
In our view, the biggest threat to the robustnessof our “everyone should shelter” recommendation isthat the topology of our highway network is an ide-alized version of the actual network; we used thisidealized topology because it is tractable enough toallow for explicit optimization of traffic flow dur-ing delayed evacuation. However, calculations inthe second paragraph of Section 3.3 in Support-ing Information suggest that our idealized networkis a reasonable representation of the actual net-work, and the number of casualties is very insen-sitive to the number of lanes on each road be-cause the bottleneck shifts to the one-lane exit ramps(Fig. 2). In addition, several of our assumptions leadus to underestimate the amount of traffic conges-tion, making our recommendation to shelter moreconservative. We use the nominal highway capacitiesin Reference 24, although some researchers assumethat roads operate at only 80% of their nominal ca-pacity to account for accidents (which could be exac-erbated by flash blindness(28)) and vehicles runningout of gas, etc.(35) Moreover, we ignore the possibilitythat some roads may close to secure key officials(14)
and assume that the roads are empty at the time ofthe detonation.
A second aspect of the model that has the po-tential to impact the shelter versus evacuation strat-egy is our use of a Gaussian plume model. Differingwind speeds at different altitudes can lead to non-Gaussian plumes that are somewhat more diffuse.(28)
Our use of a Gaussian plume model favors evacu-ation (and hence is a conservative assumption) intwo ways: evacuees will have to travel a shorter dis-tance on average to get out of the plume, and peoplewho shelter in the middle of the plume will have alower likelihood of survival (as noted earlier, a thirdpossible way that favors evacuation—that situationalawareness is easier—is not exploited in our model).
Although our recommendation to shelter is rea-sonably robust, our casualty estimates are not. Re-cent modeling suggests (details appear to be for of-ficial use only) that urban terrain mitigates thermaleffects(36) and prompt radiation effects.(37) Althoughwe currently account for this with our indoors andoutdoors transmission factors, our approach is notvery refined. In addition, we make the extreme as-sumption that being in a burned building is 100%
Evacuation Versus Shelter-in-Place Strategies 1325
fatal. We also do not explicitly account for additionalblast injuries due to broken glass. If we assume thatthe probability of glass injury is 0.01 (it would clearlybe upper bounded by 0.1, which is the blast injuryprobability in a moderately damaged building,(5) andsomeone would have to be close to a window and re-ceive a serious injury from the glass) for people livingbetween 1.5 and 4 km, then there would be an extra5.3k blast injuries (few of these would be combinedinjuries), which does not qualitatively change any ofour results. Indeed, all of these modeling refinementsonly affect the initial conditions in our model, andhave no impact on the sheltering versus evacuationcomparison.
Among the parameters in our model, the twothat have a large impact on the number of deathsare the fraction of people who have access to a ve-hicle that evacuate (Pev) and the angle φ between thewind direction and the closest highway ray. The ef-fect of the latter is nonlinear, and if the wind direc-tion coincides with a ray, then the number of deathscan increase >50% over our base case; a related fac-tor (not fully investigated here) is the wind directionitself, which generates different results because thepopulation density around Washington, DC, is notisotropic.
Predicting evacuation behavior is very difficult.At the Three Mile Island nuclear accident, which isperhaps the event in U.S. history that is most closelyrelated to the fallout from an IND, 3,500 people weretold to evacuate (pregnant women and preschoolchildren within 5 miles) and people within 10 mileswere told to shelter. However, 200k people within25 miles evacuated,(3) including 76k within 10 miles,144k within 15 miles (which was 39% of the popu-lation in this range(38)), and 195k within 20 miles.(39)
Moreover, in a 2007 survey of 1,505 urban residents,65% would evacuate after a dirty bomb in the ab-sence of a government recommendation, and 39%would evacuate if the government advised againstevacuation.(4) These data suggest that our base-casevalue of Pev = 0.5 is not impractical.
In summary, given the considerable uncertaintyabout the weather, citizen behavior, and the size ofan IND that terrorists could obtain, it is very difficultto precisely estimate the number of casualties, evenif the model refinements mentioned earlier were in-corporated.
We note that our results for this scenario areconservative with respect to a 10-kt attack in NewYork City (NYC): sheltering would save many morelives in NYC than in Washington for three rea-
sons: NYC’s population density is much greater andso the population affected by the fallout would in-crease by nearly an order-of-magnitude,(26) NYChas many more tall buildings, which would allowfor greater protection for those who shelter, andNYC has fewer roadways that exit the city, whichwould greatly exacerbate both pedestrian and vehicleevacuation.
4.6. Mitigation Options
In our model, 76.8k are killed by prompt effects,and afterward 23k–44k pedestrians die and 19k–57kpeople with vehicles die, depending upon the shel-ter/evacuation decisions, whether sheltering is aboveground or in basements, and basic medical care (flu-ids and antibiotics); see Table I for a summary ofthe casualty count for various scenarios. Other mit-igation factors that are not explicitly included in ourmodel are decontamination, search and rescue oper-ations, and specialized medical care. Decontamina-tion is not considered a life-saving issue: showeringand changing clothes or simply brushing it off gar-ments should suffice.(22) Search and rescue, 90% ofwhich is typically carried out by civilians,(40) is mostpractical in the moderate blast zone but outside ofthe burn zone and outside of the fallout plume. Be-cause of the interaction of the prompt effects (Fig. 1in Supporting Information), there are only 10k seri-ous injuries due to prompt effects (concentrated inthe 0.9–1.5 km region), 7k of whom are outside of thefallout zone. Only 15% of these people have blast in-juries, and the others (with radiation and/or burn in-juries) can probably evacuate by themselves. Hence,the mitigation potential of search and rescue oper-ations is limited. Regarding medical care, drugs toreduce internal radiation will be in extremely shortsupply and are not effective against most radioactiveisotopes.(1) We estimate that antibiotics and trans-fusion support has the potential to save ≈10k lives.However, this would be a daunting logistical task thatappears to be well beyond current response capabili-ties.(9,41)
In contrast, reducing the fraction ofpeople—particularly among those with accessto a vehicle—who self-evacuate and convincingthem to shelter in place in a basement for 12–24 hours has the potential to reduce the death tollby tens of thousands of people (and perhaps byseveral hundred thousand if this happened in NYC).Although the government recommendation is toshelter until given advice to evacuate, it does not
1326 Wein, Choi, and Denuit
preclude the possibility of recommending immediateevacuation in certain areas.(22) Evacuation would beprioritized by radiation fallout intensity, adequacyof shelter, impending hazard (e.g., fire, buildingcollapse), food and water availability, and specialneeds.(22) However, this recommendation does notappear to account for the fact that—in contrast to abioterror or chemical attack—it may not be possiblefor the government to provide timely advice to thepopulace after the event. Moreover, as noted onpage x of Reference 9, “efforts to prepare the publicto take the appropriate steps to protect themselvesfrom fallout are almost nonexistent.” The resultsof this article suggest that the government needsan aggressive outreach program that educates thepublic about this issue, encouraging them to shelterin place in their basement, and to store severaldays of food and water at home. The governmentshould also encourage the private sector to developa basement shelter strategy and to store food andwater and perhaps antibiotics and blankets at theirfacilities that are located near large cities. Thiseducational outreach would appear to be much morecost effective than other approaches (e.g., the $877Mcontract for an anthrax vaccine(42)) for mitigating theimpact of catastrophic terrorist threats.
ACKNOWLEDGMENTS
This research was supported by the Center forSocial Innovation, Graduate School of Business,Stanford University and by the Winnick Family Fac-ulty Fellowship (L.M.W.). The authors thank AlexMontgomery for helpful discussions, Brooke Bud-demeier and an anonymous reviewer for valuablecomments on an earlier draft of the article, andRoss Marrs for sharing unpublished data related toReference 11.
REFERENCES
1. Department of Homeland Security. National planning scenar-ios, Washington, DC, April 2005. Available at: http://media.washingtonpost.com/wp-srv/nation/nationalsecurity/earlywarning/NationalPlanningScenariosApril2005.pdf, Accessed onFebruary 26, 2010.
2. Daugherty W, Levi B, Hippel FV. Casualties due to the blast,heat, and radioactive fallout from various hypothetical nuclearattacks on the United States. Pp. 207–232 in Medical Implica-tions of Nuclear War. Institute of Medicine, Washington, DC:National Academy Press, 1986.
3. Johnson JH, Jr., Zeigler DJ. Modelling evacuation behaviorduring the Three Mile Island crisis. Socio-Economics PlanningSciences, 1986; 20:165–171.
4. Meit M, Briggs T, Kennedy A, Sutton J, Feldman J. Spon-taneous evacuation following a dirty bomb or pandemic in-
fluenza: Highlights from a national survey of urban resi-dents’ intended behavior. Chicago, IL: Walsh Center for Ru-ral Health Analysis, W Series #12, National Opinion ResearchCenter, University of Chicago, November 2007.
5. Glasstone S, Dolan PJ. The Effects of Nuclear Weapons, thirded. U.S. Department of Defense and Energy Research andDevelopment Administration, Washington, DC, 1977.
6. Dolan PJ (eds). Effects Manual Number 1: Capabilities of Nu-clear Weapons. Washington, DC: Defense Nuclear Agency,1972.
7. Brode HL, Small RD. A review of the physics of large urbanfires. In The Medical Implications of Nuclear War. Institute ofMedicine, Washington, DC: National Academy Press, 1986.
8. Walker RI, Cerveny TJ (eds). Medical Consequences of Nu-clear Warfare: Textbook of Military Medicine, Part I, Volume2. Office of the Surgeon General, Department of the Army,1989.
9. Benjamin GC, McGeary M, McCutchen SE (eds). Assess-ing Medical Preparedness to Respond to a Terrorist NuclearEvent: Workshop Report. Institute of Medicine. Washington,DC: National Academies Press, 2009.
10. LandScan USA. Available at: www.ornl.gov/sci/landscan/, Ac-cessed on October 1, 2009.
11. Marrs RE. Radioactive Fallout from Terrorist Nuclear Deto-nations. Livermore, CA: Lawrence Livermore National Labo-ratory Report UCRL-TR-230908, May 11, 2007.
12. Nasstrom JS, Sugiyama G, Baskett RL, Larson SC, BradleyMM. The National Atmospheric Release Advisory Center(NARAC) Modeling and Decision Support System for Radio-logical and Nuclear Emergency Presparedness and Response.Livermore, CA: Lawrence Livermore National LaboratoryReport UCRL-JRNL-211678, April 2005.
13. U.S. Census Bureau. American Community Survey 2006, Ta-ble S0802.
14. District Department of Transportation. District ResponsePlan: Emergency Transportation Annex. Washington, DC,August 2006.
15. Lindell MK, Prater CS. Critical behavioral assumptions inevacuation time estimate analysis for private vehicles: Exam-ples from hurricane research and planning. Journal of UrbanPlanning Development, 2007; 133:18–29.
16. Vogt BM, Sorenson JH. Description of Survey Data Regard-ing the Chemical Replackaging Plant Accident West Helena,Arkansas. Oak Ridge, TN: Oak Ridge National Laboratory,ORNL/TM-13722, March 1999.
17. Sorenson JH, Vogt BM. Emergency Evacuation Handbook.Oak Ridge, TN: Oak Ridge National Laboratory, February2006.
18. Meade C, Molander RC. Considering the Effects of a Catas-trophic Terrorist Attack. Santa Monica, CA: Rand Corpora-tion TR-391-CTRMP, 2006.
19. Dombroski MJ, Fischbeck PS. An integrated physical disper-sion model and behavioral response model for risk assessmentof radiological dispersion device (RDD) events. Risk Analy-sis, 2006; 26:501–514.
20. Road map of Washington DC, Beltway. Available at:www.aaccessmaps.com/show/map/us/dc/dcmetro beltway,Accessed on November 4, 2009.
21. Murray-Tuite PM, Mahmassani HS. Transportation networkevacuation planning with household activity interactions.Transportation Research Record, 2004; 1894:150–159.
22. Homeland Security Council Interagency Policy Coordina-tion Subcommittee for Preparedness & Response to Radi-ological and Nuclear Threats. Planning Guidance for Re-sponse to a Nuclear Detonation. Washington, DC, January 16,2009.
23. Lighthill MJ, Whitham GB. On kinematic waves II. A theoryof traffic flow on long crowded roads. Proceedings Royal Soci-ety London, 1955; A229;317–345.
Evacuation Versus Shelter-in-Place Strategies 1327
24. Federal Highway Administration. The 1985 Highway Capac-ity Manual. U.S. Department of Transportation, Washington,DC, April 1986.
25. Conference of Radiation Control Program Directors, Inc.Handbook for Responding to a Radiological Dispersal De-vice: First Responder’s Guide—The First 12 Hours. CRCPDPublication 06-6, September 2006.
26. Bell WC, Dallas CE. Vulnerability of populations and the ur-ban health care systems to nuclear weapon attack—Examplesfrom four American cities. International Journal of HealthGeographics, 2007; 6:Art. 5.
27. Brandt LD, Yoshimura AS. Analysis of Sheltering and Evac-uation Strategies for an Urban Nuclear Detonation Scenario.Livermore, CA: Sandia National Laboratories SANS2009-3299, June 2009.
28. Buddemeier BR, Dillon MB. Key Response Planning Fac-tors for the Aftermath of Nuclear Terrorism. Livermore, CA:Lawrence Livermore National Laboratory LLNL-TR-410067,August 2009.
29. Goans RE, Waselenko JK. Medical management of radiolog-ical casualties. Health Physics, 2005; 89:505–512.
30. Davis LE, Latourrette T, Mosher DE, Davis LM, Howell DR.Individual Preparedness and Response to Chemical, Radio-logical, Nuclear, and Biological Terrorist Attacks. Santa Mon-ica, CA: RAND Corporation, 2003.
31. Levi M. On Nuclear Terrorism. Cambridge, MA: HarvardUniversity Press, 2007.
32. Carter AB, May MM, Perry WJ. The Day After. Stanford, CA:A Report Based on a Workshop Hosted by the Preventive De-fense Project, Stanford University, 2007.
33. Poeten RW, Glines WM, McBaugh D. Planning for the worstin Washington State: Initial response planning for improvisednuclear device explosions. Health Physics, 2009; 96:19–26.
34. Florig HK, Fischoff B. Individuals’ decisions affecting radia-tion exposure after a nuclear explosion. Health Physics, 2007;92:475–483.
35. Sheffi Y, Mahmassani H, Powell WB. A transportationnetwork evacuation model. Transportation Research, 1982;16A:209–218.
36. Marrs RE, Moss WC, Whitlock B. Thermal Radiation fromNuclear Detonations in Urban Environments. Livermore, CA:Lawrence Livermore National Laboratory Report UCRL-TR-231593, June 7, 2007.
37. Goorley T. Nuclear Weapon Effects for Urban Consequences.Los Alamos, NM: Los Alamos National Laboratory ReportLA-UR-09-00703, 2009.
38. Johnson JH, Jr. A model of evacuation-decision making ina nuclear reactor emergency. Geographical Review, 1985;71:405–418.
39. Cutter SL, Barnes K. Evacuation behavior and Three Mile Is-land. Disasters, 1982; 6:116–124.
40. Quarantelli EL. A Half Century of Social Science DisasterResearch: Selected Major Findings and Their Applicability.Newark, DE: Preliminary Paper #336, Disaster Research Cen-ter, University of Delaware, 2003.
41. Dallas CE, Bell WC. Prediction modeling to determine the ad-equacy of medical response to urban nuclear attack. DisasterMedicine and Public Health Preparedness, 2007; 1:80–89.
42. Lipton E. U.S. cancels order for 75 million doses of anthraxvaccine. NY Times, December 20, 2006.
SUPPORTING INFORMATION
The following supporting information is among thatavailable for this article, but is not a completelist.
Table 1: Values of μ and F(0) for the three categoriesof radiation, as a function of the distance r from theblast.Table 2: Values of the plume width parameters inEquation (42) as a function of the distance alongthe wind direction (x) from the detonation. Data ob-tained from Ross & Marrs in a personal communica-tion on June 29, 2009.Fig. 1: Spatial probability of fatalities (—) or injuries(- - -) due to (a) blast effects, (b) thermal effects, (c)prompt radiation, and (d) combined effects.Fig. 2: The fallout death and injury rate vs. the time atwhich delayed evacuation of pedestrians is initiated(τ e), when personal situational awareness is (a) low(rp = 4 km) and (b) high (rp = 17 km).Fig. 3: Spatial comparison of self-evacuation vs. de-layed evacuation when τ e = 12 hr and rp = 4 km.Each location (x, y) is categorized in one of threeways: the death probability is the same for self-evacuation and delayed evacuation (�(x, y) = 0), thedeath probability is higher for self-evacuation (�(x,y) > 0), or the death probability is higher for delayedevacuation (�(x, y) < 0). The dose contours dictatingthe location of the evacuation stations for four valuesof τ e are displayed, with the exception that evacua-tion stations cannot be within 1.5 km of the blast.Fig. 4: Under the assumption that delayed evacuationoffers neither improved situational awareness (via anarrower range of walking angles) nor less fallout ex-posure (via evacuation stations), we compute the op-timal value of τ e(x, y), which is the time to initiatedelayed pedestrian evacuation from location (x, y).Fig. 5: Delayed vehicle evacuation when everyoneinitially shelters. The number of deaths vs. the timethat delayed vehicle evacuation is initiated (τ e) un-der the assumption that n(De) = f n = f p = 0; i.e.,all prompt survivors with access to a vehicle initiallyshelter in place.Fig. 6: Delayed vehicle evacuation for varying falsepositive probabilities. With the false negative proba-bility f n = 0.05 and the delayed evacuation time τ e =24 hr, for each value of the false positive probabilityf p we choose the death-minimizing value of D̄e andplot the number of deaths vs f p. The optimal value ofn(D̄
∗e)) is 39.1k for f p = 0.95.
Please note: Wiley-Blackwell is not responsible forthe content or functionality of any supporting ma-terials supplied by the authors. Any queries (otherthan missing material) should be directed to the cor-responding author for the article.