analysis of uncertainty in building acoustic predictions using monte-carlo methods
TRANSCRIPT
4aAAc17: Analysis of uncertainty in
building acoustic predictions using Monte-
Carlo methods
Ralph T. Muehleisen
Civil, Architectural, and Environmental Engineering
Director of the Miller Acoustics Lab
Illinois Institute of Technology
Overview
• Quick Review of Analytic Method and Applicability
• Quick Review of Monte Carlo Numerical Method
• Discussion of Assignment of Probability
Distribution Functions (PDF) to input variables
• Application to Building Acoustics
– Calculation of STC/Rw
4aAAc17 Uncertainty in building acoustics using Monte Carlo Methods, Muehleisen
Methods of Prediction Uncertainty Analysis
The uncertainty analysis of computer predictions
is usually done in one of two ways:
• Analytic Methods
– Well described in the ISO Guide to the Expression of
Uncertainty in Models (GUM)
• Numerical (statistical) Methods
– One popular method described in Supplement 1 to
GUM
4aAAc17 Uncertainty in building acoustics using Monte Carlo Methods, Muehleisen
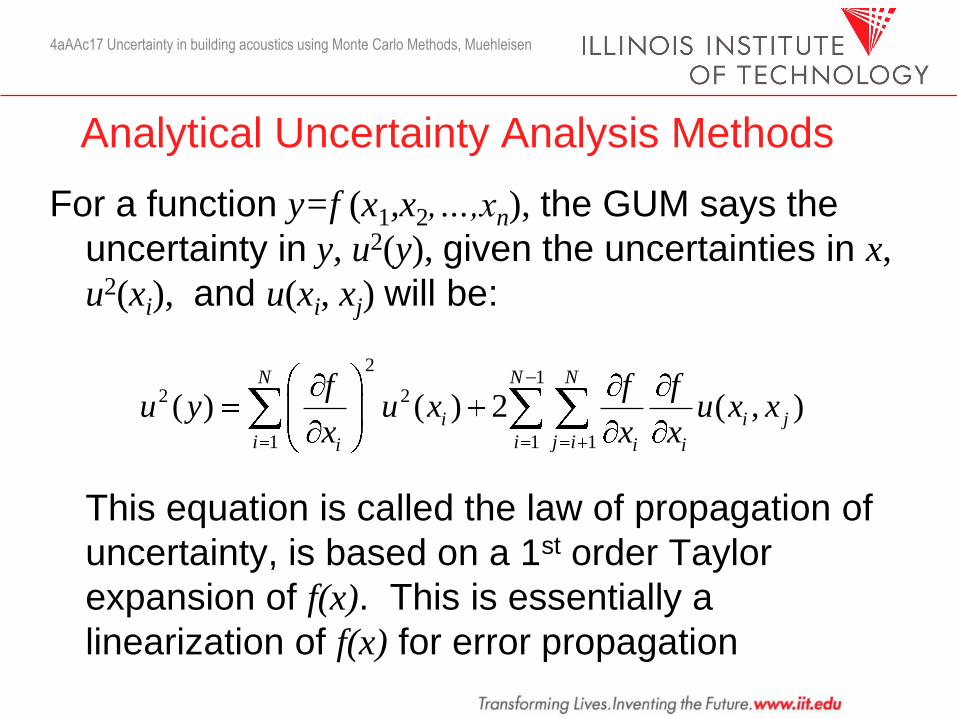
Analytical Uncertainty Analysis Methods
For a function y=f (x1,x2,…,xn), the GUM says the
uncertainty in y, u2(y), given the uncertainties in x,
u2(xi), and u(xi, xj) will be:
This equation is called the law of propagation of
uncertainty, is based on a 1st order Taylor
expansion of f(x). This is essentially a
linearization of f(x) for error propagation
4aAAc17 Uncertainty in building acoustics using Monte Carlo Methods, Muehleisen
21
2 2
1 1 1
( ) ( ) 2 ( , )N N N
i i j
i i j ii i i
f f fu y u x u x x
x x x
Applicability of Analytic Equation
• The partial derivatives can be obtained
– Difficult if y is determined by numerical solution such
as FEM, BEM, or CFD analysis
• The uncertainties in xi are not too large
• The uncertainties in xi are of similar value
• Uncertainties in xi are uncorrelated
• The probability distributions (PDF) of the xi are
symmetric (not necessarily Gaussian though)
• The PDF of y will be close to Gaussian or a t-
distribution
4aAAc17 Uncertainty in building acoustics using Monte Carlo Methods, Muehleisen
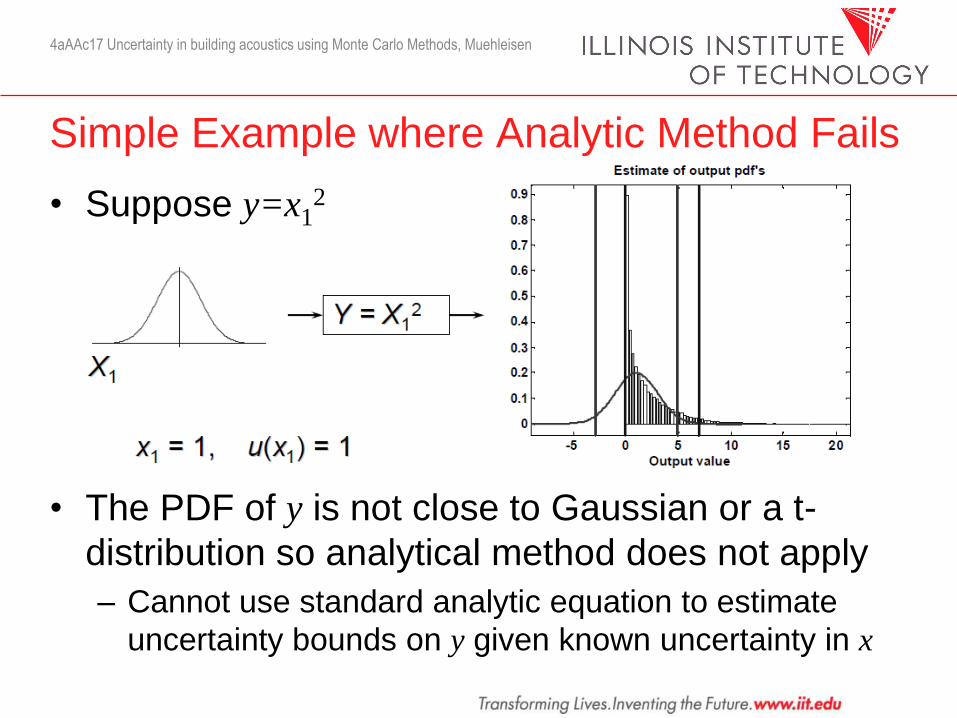
Simple Example where Analytic Method Fails
• Suppose y=x12
• The PDF of y is not close to Gaussian or a t-
distribution so analytical method does not apply
– Cannot use standard analytic equation to estimate
uncertainty bounds on y given known uncertainty in x
4aAAc17 Uncertainty in building acoustics using Monte Carlo Methods, Muehleisen
Numerical Analysis Methods
If the analytical requirements do not hold, or if
finding the partial derivatives is difficult, numerical
methods can be used
In these cases, the full probability distribution can
be propagated through the model using
numerical methods. One such numerical method
is the Monte Carlo Method (MCM) and its
implementation is described in Supplement 1 to
the GUM.
4aAAc17 Uncertainty in building acoustics using Monte Carlo Methods, Muehleisen
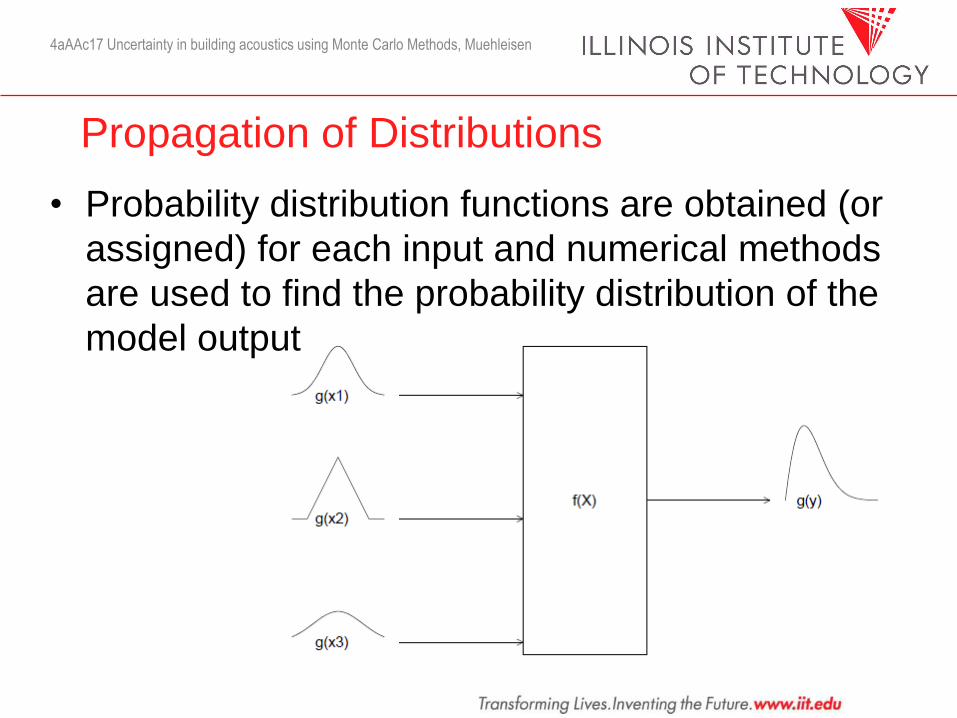
Propagation of Distributions
• Probability distribution functions are obtained (or
assigned) for each input and numerical methods
are used to find the probability distribution of the
model output
4aAAc17 Uncertainty in building acoustics using Monte Carlo Methods, Muehleisen
Input Probability Distribution Functions (PDF)
• Selecting the proper PDF can be important– Selecting something with correct range may be more
important than getting the exact shape right
• Equipment and product manufacturers usually give accuracy of some sensor or measurement as x x with no indication of the uncertainty PDF.– Users often incorrectly take this to mean the quantity must
be bounded between x x and therefore assign a uniform PDF between x- x and x+ x
– The meaning of the x usually the 95% confidence intervals, not the bounds and values in the middle are more likely than at the ends. Use a Gaussian with a standard deviation equal to ½ of the x values
4aAAc17 Uncertainty in building acoustics using Monte Carlo Methods, Muehleisen
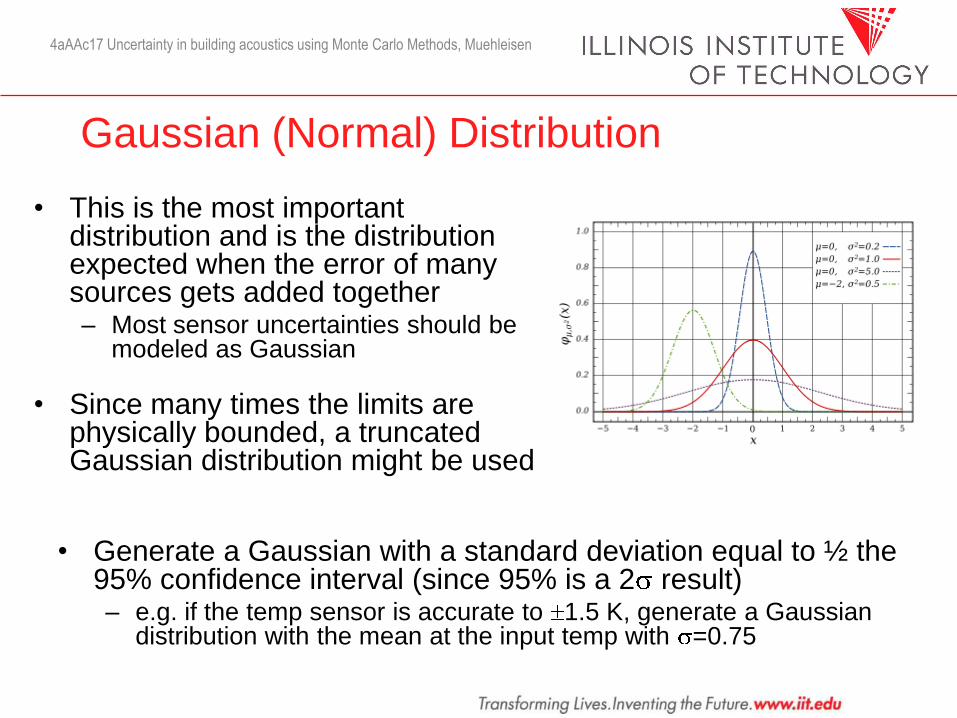
Gaussian (Normal) Distribution
• This is the most important distribution and is the distribution expected when the error of many sources gets added together– Most sensor uncertainties should be
modeled as Gaussian
• Since many times the limits are physically bounded, a truncated Gaussian distribution might be used
• Generate a Gaussian with a standard deviation equal to ½ the 95% confidence interval (since 95% is a 2 result)– e.g. if the temp sensor is accurate to 1.5 K, generate a Gaussian
distribution with the mean at the input temp with =0.75
4aAAc17 Uncertainty in building acoustics using Monte Carlo Methods, Muehleisen
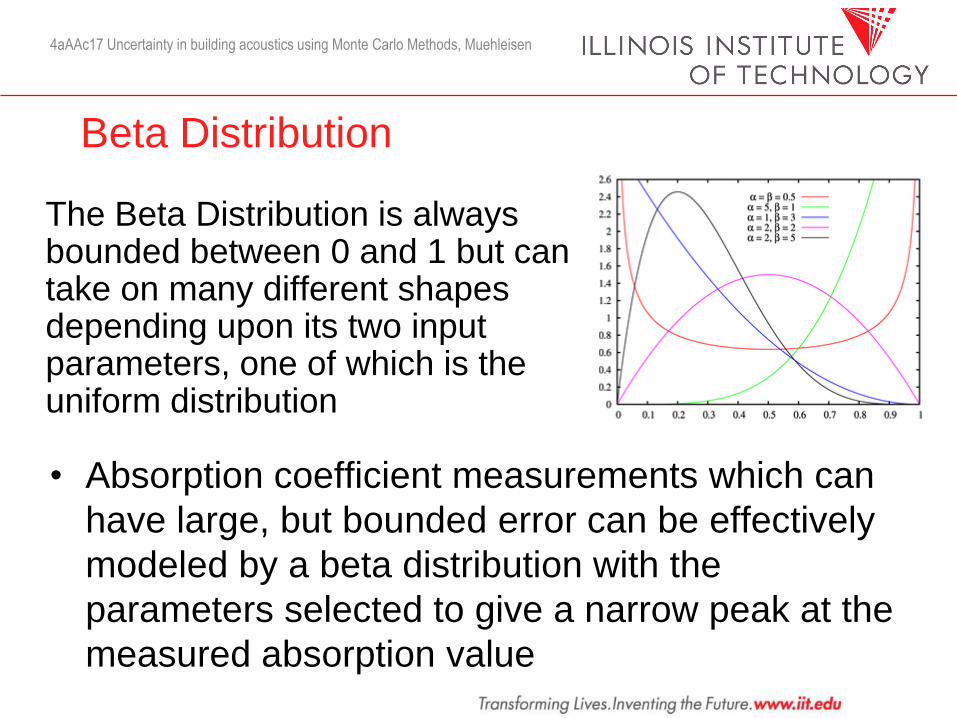
Beta Distribution
The Beta Distribution is always bounded between 0 and 1 but can take on many different shapes depending upon its two input parameters, one of which is the uniform distribution
• Absorption coefficient measurements which can
have large, but bounded error can be effectively
modeled by a beta distribution with the
parameters selected to give a narrow peak at the
measured absorption value
4aAAc17 Uncertainty in building acoustics using Monte Carlo Methods, Muehleisen
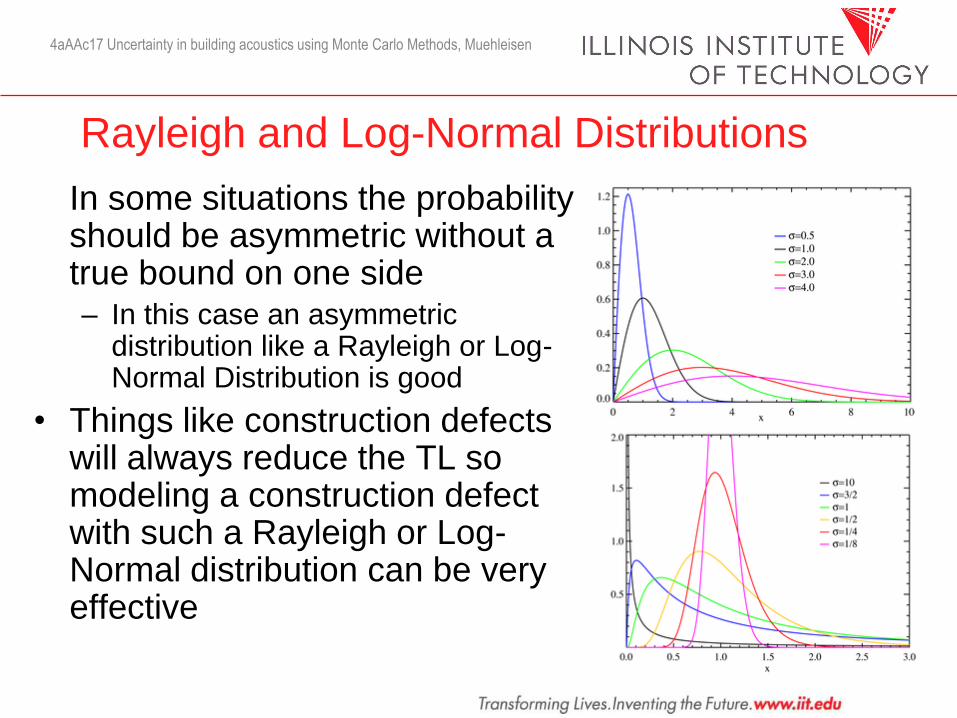
Rayleigh and Log-Normal Distributions
In some situations the probability should be asymmetric without a true bound on one side– In this case an asymmetric
distribution like a Rayleigh or Log-Normal Distribution is good
• Things like construction defects will always reduce the TL so modeling a construction defect with such a Rayleigh or Log-Normal distribution can be very effective
4aAAc17 Uncertainty in building acoustics using Monte Carlo Methods, Muehleisen
Application to Building Acoustics
• Estimation of Reverberation Time (RT or T60)– Sabine and Eyring equations can be easily differentiated by
hand, but the uncertainty in the inputs are not necessarily small and the PDFs of the inputs are not necessarily symmetric
• Estimation of STC or Rw– Assigning of STC/Rw is a very nonlinear procedure and an
analytic derivative cannot be computed
– Uncertainty in TL is asymmetric if the possibility of construction defects which drop the TL are to be included in the probability
– If defects are to be measured though reductions in TL will happen at various frequencies so some correlation between the inputs is a good idea
4aAAc17 Uncertainty in building acoustics using Monte Carlo Methods, Muehleisen
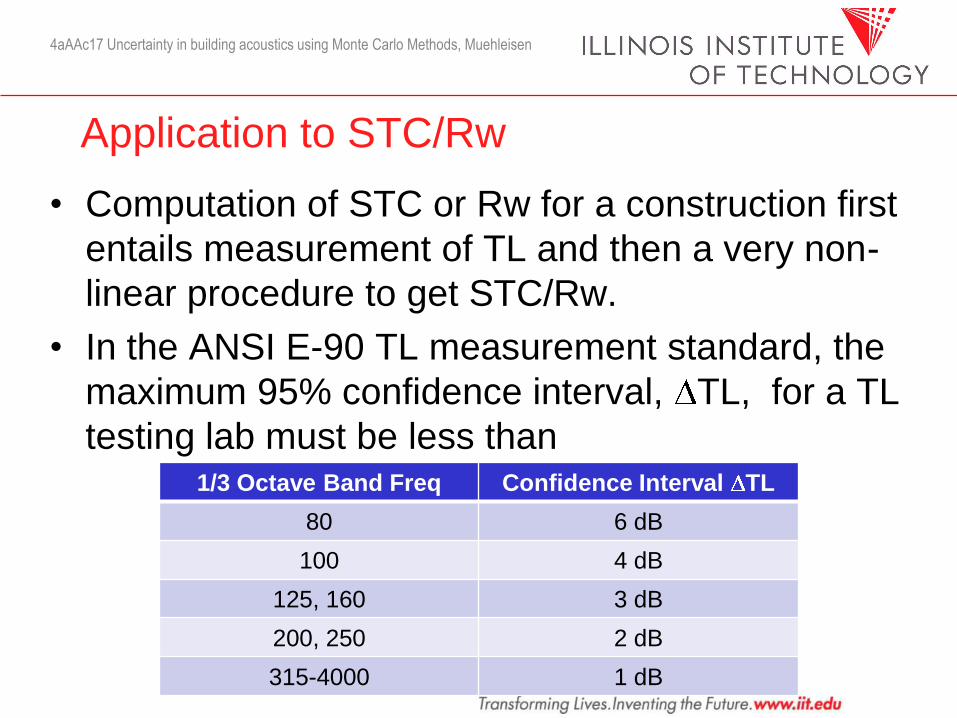
Application to STC/Rw
• Computation of STC or Rw for a construction first
entails measurement of TL and then a very non-
linear procedure to get STC/Rw.
• In the ANSI E-90 TL measurement standard, the
maximum 95% confidence interval, TL, for a TL
testing lab must be less than
4aAAc17 Uncertainty in building acoustics using Monte Carlo Methods, Muehleisen
1/3 Octave Band Freq Confidence Interval TL
80 6 dB
100 4 dB
125, 160 3 dB
200, 250 2 dB
315-4000 1 dB
STC/Rw Cont
• There is limited information about the interlab
repeatability and confidence intervals for TL
measurements, so use the intralab requirements
• Assign a Normal PDF with = TL/2, truncated
at 3 to add to the TL at each frequency to
represent measurement error in TL
• Include a second PDF to model the uncertainty in
typical construction. This PDF should always
reduce the TL since the in-field TL is always less
than the lab TL and construction defects always
reduce TL
4aAAc17 Uncertainty in building acoustics using Monte Carlo Methods, Muehleisen
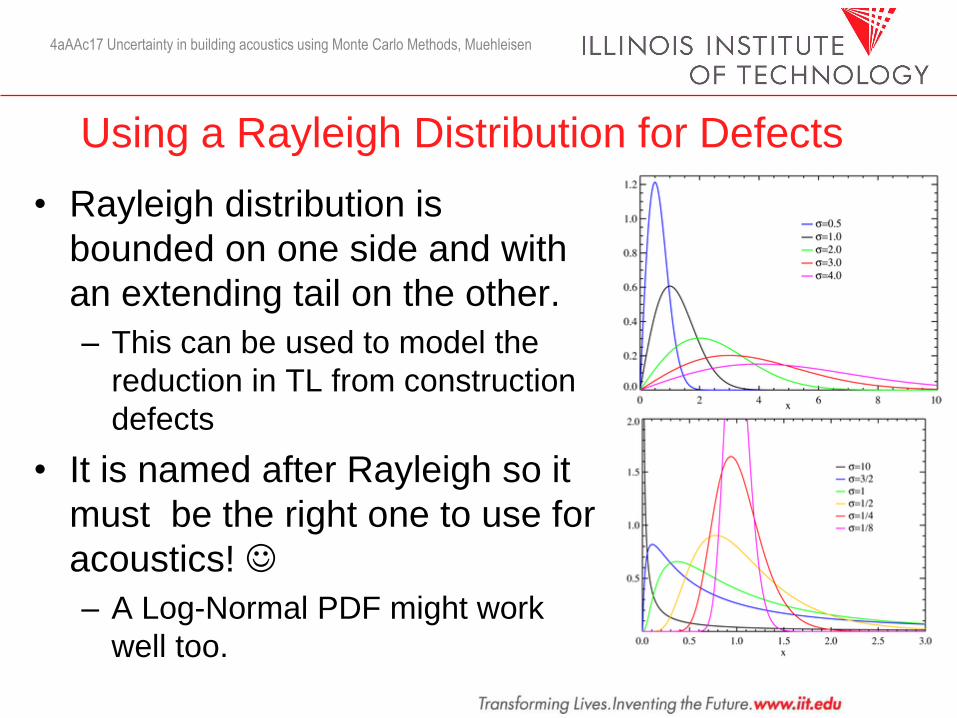
Using a Rayleigh Distribution for Defects
• Rayleigh distribution is
bounded on one side and with
an extending tail on the other.
– This can be used to model the
reduction in TL from construction
defects
• It is named after Rayleigh so it
must be the right one to use for
acoustics!
– A Log-Normal PDF might work
well too.
4aAAc17 Uncertainty in building acoustics using Monte Carlo Methods, Muehleisen
Example: Constructed STC of a steel stud wall
• As an example consider estimating the STC/Rw
value of a common steel stud wall with STC 39
• Look up TL from a manufacturer or text
• Assign a PDF at each frequency of the input with
a long tail toward lower TL to simulate
construction defects. In this case I chose a
Rayleigh distribution that has a mean value of 3
dB. This leads to a most likely value of
constructed STC to be about 36
4aAAc17 Uncertainty in building acoustics using Monte Carlo Methods, Muehleisen
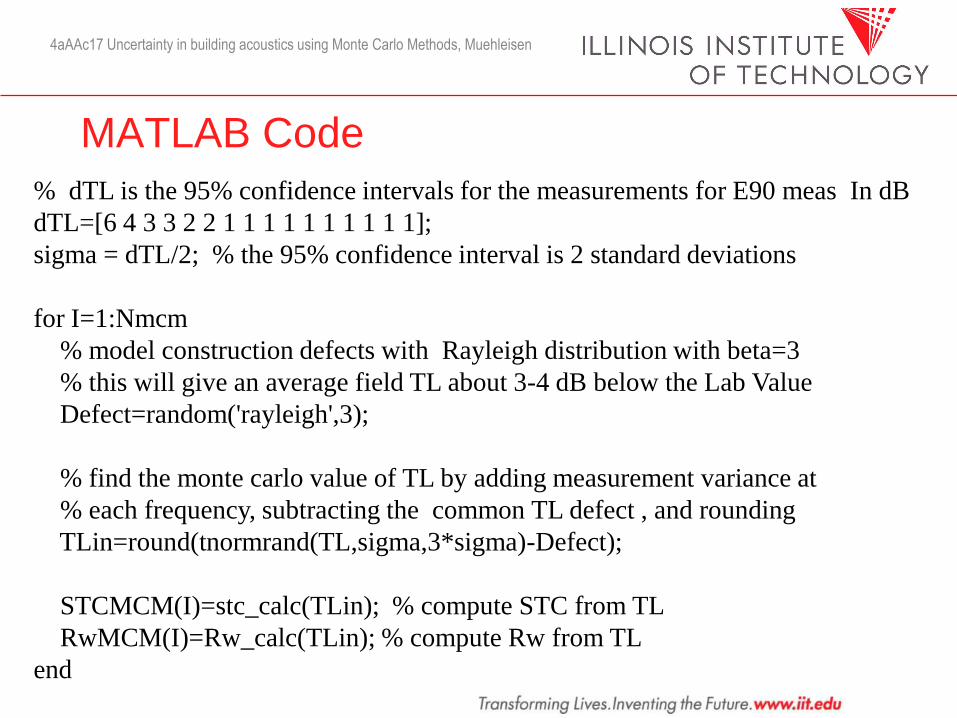
MATLAB Code
4aAAc17 Uncertainty in building acoustics using Monte Carlo Methods, Muehleisen
% dTL is the 95% confidence intervals for the measurements for E90 meas In dB
dTL=[6 4 3 3 2 2 1 1 1 1 1 1 1 1 1 1];
sigma = dTL/2; % the 95% confidence interval is 2 standard deviations
for I=1:Nmcm
% model construction defects with Rayleigh distribution with beta=3
% this will give an average field TL about 3-4 dB below the Lab Value
Defect=random('rayleigh',3);
% find the monte carlo value of TL by adding measurement variance at
% each frequency, subtracting the common TL defect , and rounding
TLin=round(tnormrand(TL,sigma,3*sigma)-Defect);
STCMCM(I)=stc_calc(TLin); % compute STC from TL
RwMCM(I)=Rw_calc(TLin); % compute Rw from TL
end
4aAAc17 Uncertainty in building acoustics using Monte Carlo Methods, Muehleisen
22 24 26 28 30 32 34 36 38 400
0.5
1
1.5
2x 10
4
1 1 5 20 63 194 5091300
2889
5443
9508
13858
17777
19470
16799
9843
2259
61
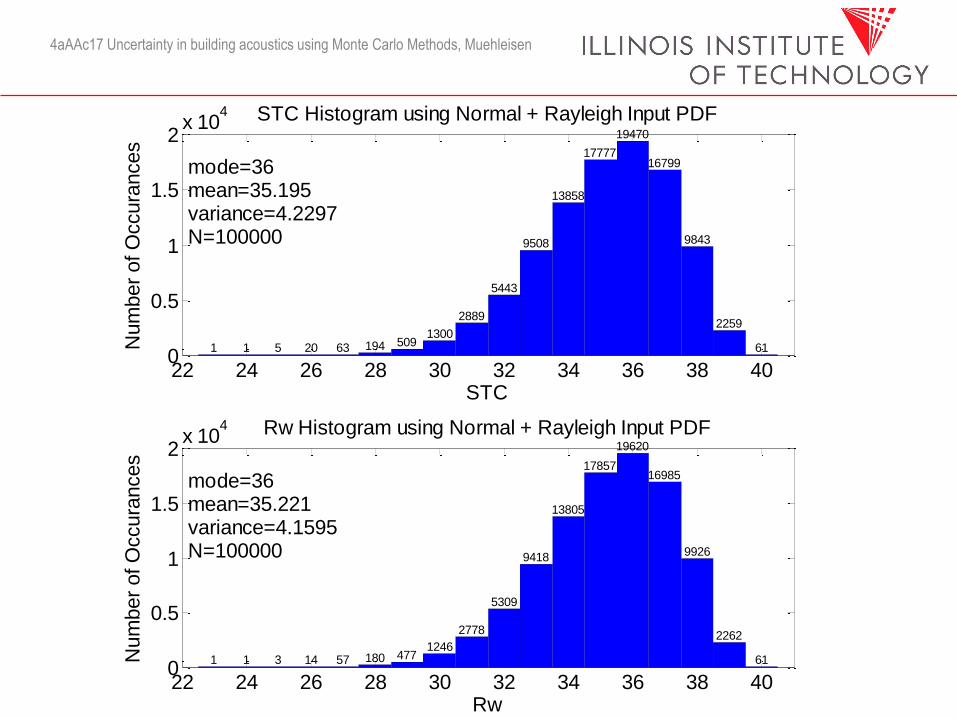
mode=36 mean=35.195 variance=4.2297 N=100000
STC Histogram using Normal + Rayleigh Input PDFN
um
ber
of O
ccura
nces
STC
22 24 26 28 30 32 34 36 38 400
0.5
1
1.5
2x 10
4
1 1 3 14 57 180 4771246
2778
5309
9418
13805
17857
19620
16985
9926
2262
61
mode=36 mean=35.221 variance=4.1595 N=100000
Rw Histogram using Normal + Rayleigh Input PDF
Num
ber
of O
ccura
nces
Rw
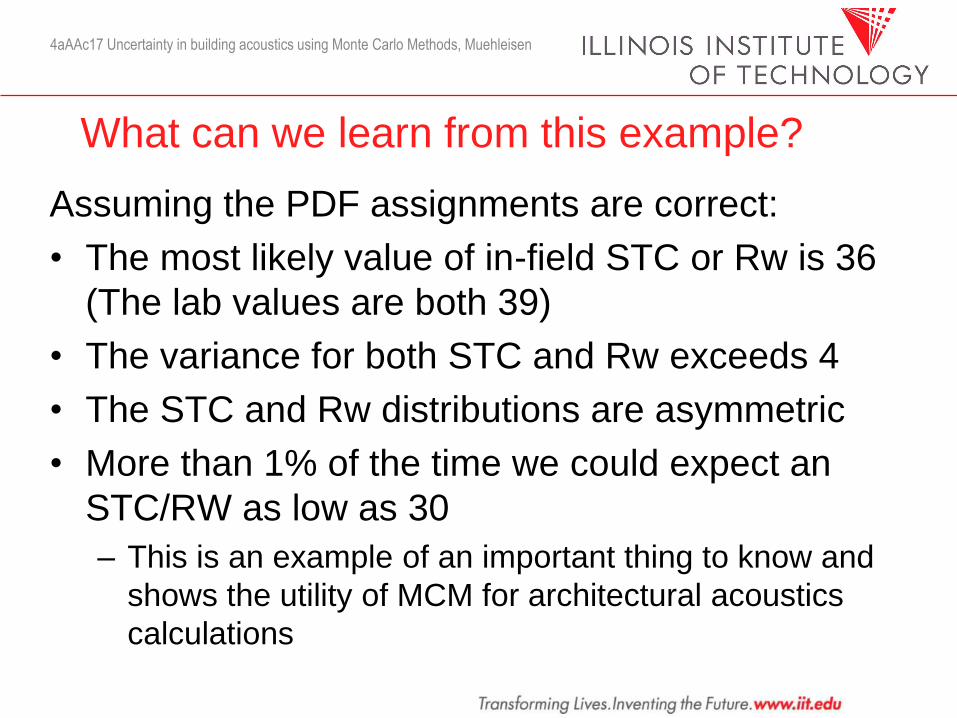
What can we learn from this example?
Assuming the PDF assignments are correct:
• The most likely value of in-field STC or Rw is 36
(The lab values are both 39)
• The variance for both STC and Rw exceeds 4
• The STC and Rw distributions are asymmetric
• More than 1% of the time we could expect an
STC/RW as low as 30
– This is an example of an important thing to know and
shows the utility of MCM for architectural acoustics
calculations
4aAAc17 Uncertainty in building acoustics using Monte Carlo Methods, Muehleisen
Conclusions about MCM
• When errors are large or asymmetric in the inputs to a model, Monte Carlo Methods are one way of finding the range and statistics of expected values in the output
• For nonlinear models such as STC and Rw the MCM can be used with Normal and Rayleigh distributions on inputs to simulate measurement error and construction defects at the same time.
• More research should be done to be able to characterize the input PDFs better, especially if we want to include construction defects
4aAAc17 Uncertainty in building acoustics using Monte Carlo Methods, Muehleisen