analysis of surface roughness and cutting force when turning aisi 1045 steel with grooved tools...
TRANSCRIPT

This article appeared in a journal published by Elsevier. The attachedcopy is furnished to the author for internal non-commercial researchand education use, including for instruction at the authors institution
and sharing with colleagues.
Other uses, including reproduction and distribution, or selling orlicensing copies, or posting to personal, institutional or third party
websites are prohibited.
In most cases authors are permitted to post their version of thearticle (e.g. in Word or Tex form) to their personal website orinstitutional repository. Authors requiring further information
regarding Elsevier’s archiving and manuscript policies areencouraged to visit:
http://www.elsevier.com/copyright
Author's personal copy
Analysis of surface roughness and cutting force components in hardturning with CBN tool: Prediction model and cutting conditionsoptimization
Hamdi Aouici a,⇑, Mohamed Athmane Yallese a, Kamel Chaoui b, Tarek Mabrouki c,Jean-François Rigal c
a Mechanics and Structures Research Laboratory (LMS), May 8th 1945 University, P.O. Box 401, Guelma 24000, Algeriab Mechanics of Materials and Plant Maintenance Research Laboratory (LR3MI), Badji Mokhtar University, P.O. Box 12, Annaba 23000, Algeriac LaMCoS, CNRS, INSA – Lyon, UMR5259, Lyon University, F69621, France
a r t i c l e i n f o
Article history:Received 16 June 2011Received in revised form 15 October 2011Accepted 17 November 2011Available online 2 December 2011
Keywords:Hard turningAISI H11 steelCBNCutting parametersANOVARSM
a b s t r a c t
In this study, the effects of cutting speed, feed rate, workpiece hardness and depth of cut onsurface roughness and cutting force components in the hard turning were experimentallyinvestigated. AISI H11 steel was hardened to (40; 45 and 50) HRC, machined using cubicboron nitride (CBN 7020 from Sandvik Company) which is essentially made of 57% CBNand 35% TiCN. Four-factor (cutting speed, feed rate, hardness and depth of cut) andthree-level fractional experiment designs completed with a statistical analysis of variance(ANOVA) were performed. Mathematical models for surface roughness and cutting forcecomponents were developed using the response surface methodology (RSM). Results showthat the cutting force components are influenced principally by the depth of cut and work-piece hardness; on the other hand, both feed rate and workpiece hardness have statisticalsignificance on surface roughness. Finally, the ranges for best cutting conditions are pro-posed for serial industrial production.
� 2011 Elsevier Ltd. All rights reserved.
1. Introduction
CBN tools are widely used in the metal-working industryfor cutting various hard materials such as high-speed toolsteels, die steels, bearing steels, case-hardened steels, whitecast iron, and alloy cast irons. In many applications, cuttingof ferrous materials in their hardened condition can replacegrinding to give significant savings in cost and productivityrates [1–3]. Hard turning process differs from conventionalturning because of the workpiece hardness, the requiredcutting tool, and the mechanisms involved during chip for-mation. Whenever machining given parts straightforwardlyafter they have been hardened, hard turning offers a number
of potential advantages over traditional grinding, includinglower equipment costs, shorter setup time, fewer processsteps, greater part geometry flexibility, and usually thereis no need cutting fluid use. If hard turning could be appliedto fabricate complex parts, manufacturing costs could be re-duced by up to 30 times [4].
Many studies have been conducted to investigate theperformance of CBN tool in the cutting of various hardenedmaterials. Özel and Karpat [5] used regression and artificialneural network models for predicting the surface rough-ness and tool wear in hard turning of AISI H11 steel usingCBN inserts. Bouacha et al. [6] applied response surfacemethodology (RSM) to investigate the effect of cuttingparameters on surface roughness and cutting force compo-nents in hard turning of AISI 52100 with CBN tool. The re-sults show how much the surface roughness is influencedby both feed rate and cutting speed, and that the depthof cut exhibits maximum influence on the cutting forces
0263-2241/$ - see front matter � 2011 Elsevier Ltd. All rights reserved.doi:10.1016/j.measurement.2011.11.011
⇑ Corresponding author. Address: ENST-ex CT siège DG. SNVI, RouteNationale N�5 Z.I. 16012, Rouiba, Algérie. Tel.: +213 670 060 908,fax: +213 21 815 674.
E-mail address: [email protected] (H. Aouici).
Measurement 45 (2012) 344–353
Contents lists available at SciVerse ScienceDirect
Measurement
journal homepage: www.elsevier .com/ locate /measurement
Author's personal copy
as compared to feed rate and cutting speed. Sahin andMotorcu [7] developed the surface roughness model usingsurface methodology when machining hardened AISI 1050steel. They reported that CBN cutting tools produced a bet-ter surface roughness than those of KY1615 (uncoatedceramic) cutting tools in most experimental conditions.Grzesik and Wanat [8] investigated the surface finish gen-erated in hard turning of quenched alloy steel using con-ventional and wiper ceramic inserts. They concluded thatsurfaces produced by wiper contained blunt peaks withdistinctly smaller slopes resulting in better bearing proper-ties. Matsumoto et al. [9] and Thiele and Melkote [10] stud-ied the effect of workpiece hardness on residual stressdistribution. In a recent study, Guo and Liu [11] investi-gated material properties of hardened AISI 52100 bearingsteel using temperature controlled tensile tests andorthogonal cutting tests and hence; they demonstratedthat hardness greatly influences the material cutting pro-cess. When using alumina–TiC ceramic tools, Benga andArabo [12] and Kumar et al. [13] observed a better surfacequality in turning of hardened steel components. Limaet al. [14] analyzed the effects of cutting speed, feed rateand depth of cut on cutting forces and surface roughnessin hardened AISI 4340 high strength low alloy steel andAISI D2 cold work tool steel materials. Feng and Wang[15] presented an investigation for the prediction of sur-face roughness in finish turning operations by developingan empirical model considering various parameters: work-piece hardness, feed rate, cutting tool point angle, depth ofcut, spindle speed, and cutting time. Methods, such as dataprocessing techniques, non-linear regression analysis withlogarithmic data transformation, were employed for devel-oping the empirical model to predict the surface rough-ness. Suresh et al. [16] focused on machining mild steeland TiN-coated tungsten carbide (CNMG) cutting toolsfor developing a surface roughness prediction model usingresponse surface methodology (RSM). Genetic algorithms(GAs) were also used to optimize the objective functionand compared with RSM results. It was observed that GAprogram provided minimum and maximum values of sur-face roughness and their respective optimal machiningconditions. Neseli et al. [17] have applied response surfacemethodology (RSM) to optimize the effect of tool geometryparameters on surface roughness in the case of the hardturning of AISI 1040 with P25 tool.
In this paper, an experimental contribution that focuseson prediction and optimization of both surface roughnessand cutting force components during hard turning of AISIH11 steel with a cubic boron nitride (CBN 7020) cutting
tool is presented. The ANOVA study involves the effectsof cutting parameters (cutting speed, feed rate and depthof cut) coupled with workpiece hardness.
2. Experimental procedure
2.1. Workpiece and tool materials
Turning experiments were performed in dry conditionsusing a universal lathe type SN 40C with 6.6 kW spindlepower. The workpiece material was AISI H11, hot worksteel which is popularly used in hot form pressing. Itsresistance to high temperature and its aptitude for polish-ing enable it to answer most requests for hot dieing andmolding under pressure. Its chemical composition (inwt.%) is given as: C 0.35; Cr 5.26; Mo 1.19; V 0.50; Si1.01; Mn 0.32; S 0.002; P 0.016; Fe 90.31 and other compo-nents 1.042. The workpiece was through-hardened fol-lowed by a tempering process to attain three differenthardness levels, namely 40; 45 and 50 HRC (Rockwellhardness). Its hardness was measured by a digital durom-eter (DM2-D 390). Details of the thermal treatment processare given in Table 1.
The cutting insert is a removable type and offered eightsquared working edges. The chosen CBN tool in commer-cially known as CBN7020 and it is essentially made of 57%CBN and 35% Ti(C, N). Its standard designation is SNGA1204 08 S01020 and it is manufactured by Sandvik company.The physical properties are summarized in Table 2.
Tool holder is codified as PSBNR 25 � 25 K12 with acommon active part tool geometry described byvr = +75�, k = �6�, c = �6� and a = +6�.
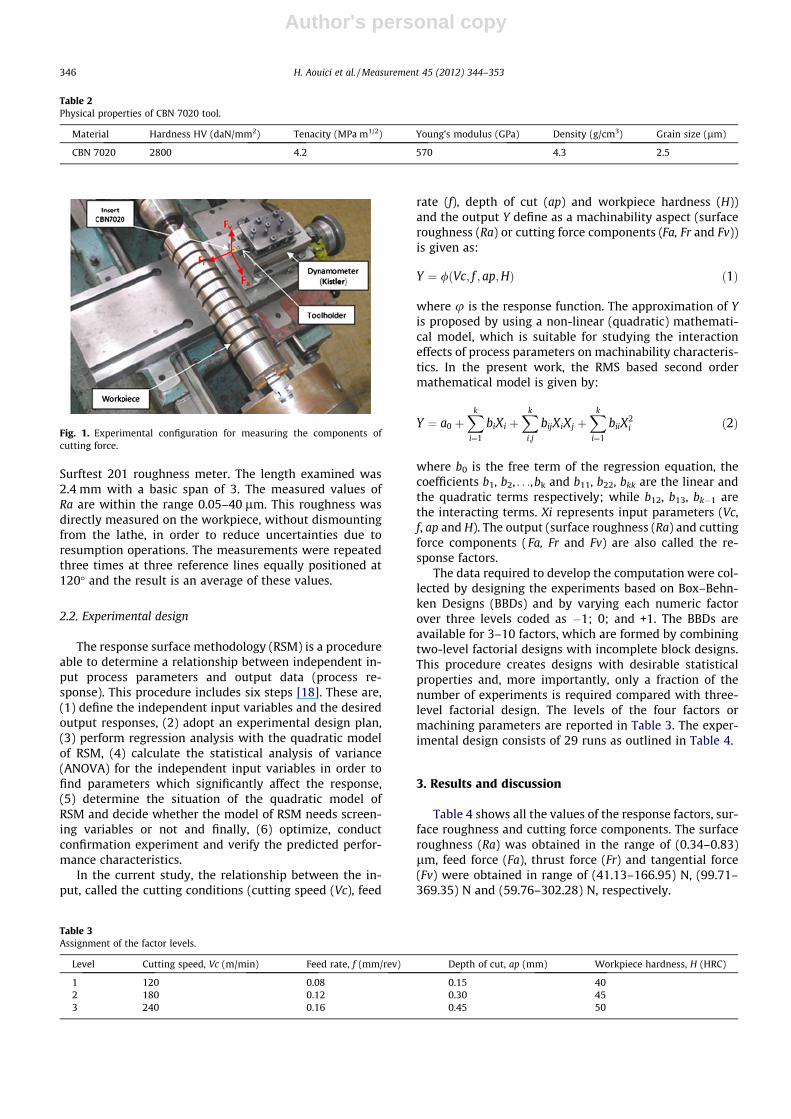
The three components of the cutting forces; feed force(Fa), thrust force (Fr) and tangential force (Fv), schemati-cally shown in Fig. 1, were recorded using a standardquartz dynamometer (Kistler 9257B) allowing measure-ments from �5 to 5 KN. Instantaneous roughness criteriameasurements (arithmetic mean roughness, Ra), for eachcutting condition, are obtained by means of a Mitutoyo
Nomenclature
ap depth of cut (mm)f feed rate (mm/rev)Fa feed force (N)Fr thurst force (N)Fv tangential force (N)H workpiece hardnessHRC rockwell hardness
Ra surface roughness (lm)t cutting time (min)Vc cutting speed (m/min)a clearance angle (�)c rake angle (�)k inclination angle (�)v major cutting edge angle (�)
Table 1Heat treatment process for AISI H11.
Workpiece hardness Temperature (�C)
Temper Quench
�50 HRC �[570 � 585]�45 HRC �[1025 � 1050] �[600 � 620]�40 HRC �[620 � 650]
H. Aouici et al. / Measurement 45 (2012) 344–353 345
Author's personal copy
Surftest 201 roughness meter. The length examined was2.4 mm with a basic span of 3. The measured values ofRa are within the range 0.05–40 lm. This roughness wasdirectly measured on the workpiece, without dismountingfrom the lathe, in order to reduce uncertainties due toresumption operations. The measurements were repeatedthree times at three reference lines equally positioned at120� and the result is an average of these values.
2.2. Experimental design
The response surface methodology (RSM) is a procedureable to determine a relationship between independent in-put process parameters and output data (process re-sponse). This procedure includes six steps [18]. These are,(1) define the independent input variables and the desiredoutput responses, (2) adopt an experimental design plan,(3) perform regression analysis with the quadratic modelof RSM, (4) calculate the statistical analysis of variance(ANOVA) for the independent input variables in order tofind parameters which significantly affect the response,(5) determine the situation of the quadratic model ofRSM and decide whether the model of RSM needs screen-ing variables or not and finally, (6) optimize, conductconfirmation experiment and verify the predicted perfor-mance characteristics.
In the current study, the relationship between the in-put, called the cutting conditions (cutting speed (Vc), feed
rate (f), depth of cut (ap) and workpiece hardness (H))and the output Y define as a machinability aspect (surfaceroughness (Ra) or cutting force components (Fa, Fr and Fv))is given as:
Y ¼ /ðVc; f ; ap;HÞ ð1Þ
where u is the response function. The approximation of Yis proposed by using a non-linear (quadratic) mathemati-cal model, which is suitable for studying the interactioneffects of process parameters on machinability characteris-tics. In the present work, the RMS based second ordermathematical model is given by:
Y ¼ a0 þXk
i¼1
biXi þXk
i;j
bijXiXj þXk
i¼1
biiX2i ð2Þ
where b0 is the free term of the regression equation, thecoefficients b1, b2, . . .,bk and b11, b22, bkk are the linear andthe quadratic terms respectively; while b12, b13, bk�1 arethe interacting terms. Xi represents input parameters (Vc,f, ap and H). The output (surface roughness (Ra) and cuttingforce components (Fa, Fr and Fv) are also called the re-sponse factors.
The data required to develop the computation were col-lected by designing the experiments based on Box–Behn-ken Designs (BBDs) and by varying each numeric factorover three levels coded as �1; 0; and +1. The BBDs areavailable for 3–10 factors, which are formed by combiningtwo-level factorial designs with incomplete block designs.This procedure creates designs with desirable statisticalproperties and, more importantly, only a fraction of thenumber of experiments is required compared with three-level factorial design. The levels of the four factors ormachining parameters are reported in Table 3. The exper-imental design consists of 29 runs as outlined in Table 4.
3. Results and discussion
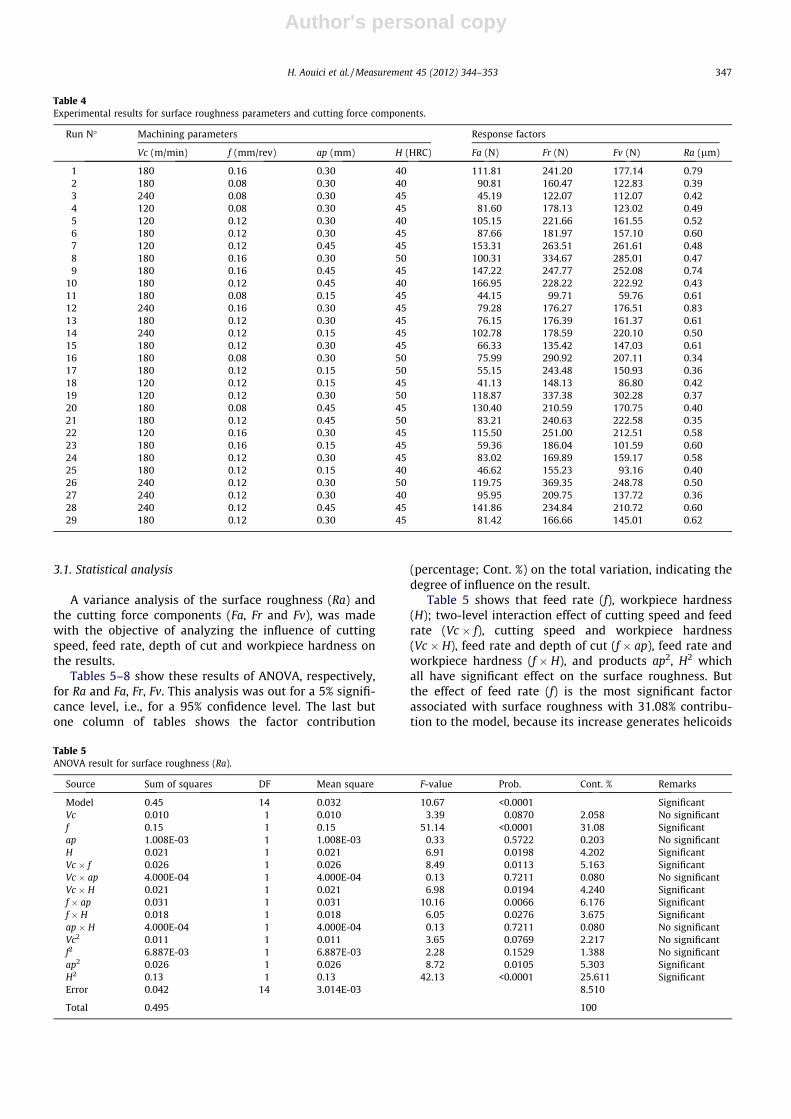
Table 4 shows all the values of the response factors, sur-face roughness and cutting force components. The surfaceroughness (Ra) was obtained in the range of (0.34–0.83)lm, feed force (Fa), thrust force (Fr) and tangential force(Fv) were obtained in range of (41.13–166.95) N, (99.71–369.35) N and (59.76–302.28) N, respectively.
Table 2Physical properties of CBN 7020 tool.
Material Hardness HV (daN/mm2) Tenacity (MPa m1/2) Young’s modulus (GPa) Density (g/cm3) Grain size (lm)
CBN 7020 2800 4.2 570 4.3 2.5
Fig. 1. Experimental configuration for measuring the components ofcutting force.
Table 3Assignment of the factor levels.
Level Cutting speed, Vc (m/min) Feed rate, f (mm/rev) Depth of cut, ap (mm) Workpiece hardness, H (HRC)
1 120 0.08 0.15 402 180 0.12 0.30 453 240 0.16 0.45 50
346 H. Aouici et al. / Measurement 45 (2012) 344–353
Author's personal copy
3.1. Statistical analysis
A variance analysis of the surface roughness (Ra) andthe cutting force components (Fa, Fr and Fv), was madewith the objective of analyzing the influence of cuttingspeed, feed rate, depth of cut and workpiece hardness onthe results.
Tables 5–8 show these results of ANOVA, respectively,for Ra and Fa, Fr, Fv. This analysis was out for a 5% signifi-cance level, i.e., for a 95% confidence level. The last butone column of tables shows the factor contribution
(percentage; Cont. %) on the total variation, indicating thedegree of influence on the result.
Table 5 shows that feed rate (f), workpiece hardness(H); two-level interaction effect of cutting speed and feedrate (Vc � f), cutting speed and workpiece hardness(Vc � H), feed rate and depth of cut (f � ap), feed rate andworkpiece hardness (f � H), and products ap2, H2 whichall have significant effect on the surface roughness. Butthe effect of feed rate (f) is the most significant factorassociated with surface roughness with 31.08% contribu-tion to the model, because its increase generates helicoids
Table 4Experimental results for surface roughness parameters and cutting force components.
Run N� Machining parameters Response factors
Vc (m/min) f (mm/rev) ap (mm) H (HRC) Fa (N) Fr (N) Fv (N) Ra (lm)
1 180 0.16 0.30 40 111.81 241.20 177.14 0.792 180 0.08 0.30 40 90.81 160.47 122.83 0.393 240 0.08 0.30 45 45.19 122.07 112.07 0.424 120 0.08 0.30 45 81.60 178.13 123.02 0.495 120 0.12 0.30 40 105.15 221.66 161.55 0.526 180 0.12 0.30 45 87.66 181.97 157.10 0.607 120 0.12 0.45 45 153.31 263.51 261.61 0.488 180 0.16 0.30 50 100.31 334.67 285.01 0.479 180 0.16 0.45 45 147.22 247.77 252.08 0.74
10 180 0.12 0.45 40 166.95 228.22 222.92 0.4311 180 0.08 0.15 45 44.15 99.71 59.76 0.6112 240 0.16 0.30 45 79.28 176.27 176.51 0.8313 180 0.12 0.30 45 76.15 176.39 161.37 0.6114 240 0.12 0.15 45 102.78 178.59 220.10 0.5015 180 0.12 0.30 45 66.33 135.42 147.03 0.6116 180 0.08 0.30 50 75.99 290.92 207.11 0.3417 180 0.12 0.15 50 55.15 243.48 150.93 0.3618 120 0.12 0.15 45 41.13 148.13 86.80 0.4219 120 0.12 0.30 50 118.87 337.38 302.28 0.3720 180 0.08 0.45 45 130.40 210.59 170.75 0.4021 180 0.12 0.45 50 83.21 240.63 222.58 0.3522 120 0.16 0.30 45 115.50 251.00 212.51 0.5823 180 0.16 0.15 45 59.36 186.04 101.59 0.6024 180 0.12 0.30 45 83.02 169.89 159.17 0.5825 180 0.12 0.15 40 46.62 155.23 93.16 0.4026 240 0.12 0.30 50 119.75 369.35 248.78 0.5027 240 0.12 0.30 40 95.95 209.75 137.72 0.3628 240 0.12 0.45 45 141.86 234.84 210.72 0.6029 180 0.12 0.30 45 81.42 166.66 145.01 0.62
Table 5ANOVA result for surface roughness (Ra).
Source Sum of squares DF Mean square F-value Prob. Cont. % Remarks
Model 0.45 14 0.032 10.67 <0.0001 SignificantVc 0.010 1 0.010 3.39 0.0870 2.058 No significantf 0.15 1 0.15 51.14 <0.0001 31.08 Significantap 1.008E-03 1 1.008E-03 0.33 0.5722 0.203 No significantH 0.021 1 0.021 6.91 0.0198 4.202 SignificantVc � f 0.026 1 0.026 8.49 0.0113 5.163 SignificantVc � ap 4.000E-04 1 4.000E-04 0.13 0.7211 0.080 No significantVc � H 0.021 1 0.021 6.98 0.0194 4.240 Significantf � ap 0.031 1 0.031 10.16 0.0066 6.176 Significantf � H 0.018 1 0.018 6.05 0.0276 3.675 Significantap � H 4.000E-04 1 4.000E-04 0.13 0.7211 0.080 No significantVc2 0.011 1 0.011 3.65 0.0769 2.217 No significantf2 6.887E-03 1 6.887E-03 2.28 0.1529 1.388 No significantap2 0.026 1 0.026 8.72 0.0105 5.303 SignificantH2 0.13 1 0.13 42.13 <0.0001 25.611 SignificantError 0.042 14 3.014E-03 8.510
Total 0.495 100
H. Aouici et al. / Measurement 45 (2012) 344–353 347
Author's personal copy
Table 6ANOVA result for feed force (Fa).
Source Sum of squares DF Mean square F-value Prob. Cont. % Remarks
Model 26631.86 14 1902.28 4.60 0.0036 SignificantVc 78.80 1 78.80 0.19 0.6691 0.239 No significantF 1760.31 1 1760.31 4.26 0.0582 5.342 No significantap 18704.04 1 18704.04 45.22 <0.0001 56.769 SignificantH 341.44 1 341.44 0.83 0.3789 1.036 No significantVc � f 9.025E-03 1 9.025E-03 2.182E-05 0.9963 2.739E-05 No significantVc � ap 1335.90 1 1335.90 3.23 0.0939 4.054 No significantVc � H 25.40 1 25.40 0.061 0.8079 0.0771 No significantf � ap 0.65 1 0.65 1.567E-03 0.9690 0.0019 No significantf � H 2.76 1 2.76 6.662E-03 0.9361 0.0083 No significantap � H 2128.44 1 2128.44 5.15 0.0396 6.460 SignificantVc2 1315.38 1 1315.38 3.18 0.0962 3.992 No significantF2 2.36 1 2.36 5.710E-03 0.9408 0.0072 No significantap2 744.25 1 744.25 1.80 0.2011 2.259 No significantH2 717.23 1 717.23 1.73 0.2090 2.177 No significantError 5790.39 14 413.60 17.57
Total 32422.26 28 100
Table 7ANOVA result for thrust force (Fr).
Source Sum of squares DF Mean square F-value Prob. Cont. % Remarks
Model 1.008E + 05 14 7198.92 6.04 0.0009 SignificantVc 988.99 1 988.99 0.83 0.3779 0.826 No significantf 11722.50 1 11722.50 9.83 0.0073 9.789 Significantap 14309.23 1 14309.23 12.00 0.0038 11.949 SignificantH 29990.00 1 29990.00 25.14 0.0002 25.044 SignificantVc � f 87.14 1 87.14 0.073 0.7909 0.073 No significantVc � ap 874.09 1 874.09 0.73 0.4064 0.729 No significantVc � H 481.36 1 481.36 0.40 0.5355 0.402 No significantf � ap 603.93 1 603.93 0.51 0.4884 0.504 No significantf � H 341.88 1 341.88 0.29 0.6008 0.285 No significantap � H 1437.93 1 1437.93 1.21 0.2907 1.201 No significantVc2 6328.35 1 6328.35 5.31 0.0371 5.284 Significantf2 341.41 1 341.41 0.29 0.6010 0.285 No significantap2 1.67 1 1.67 1.401E-03 0.9707 0.0014 No significantH2 35539.12 1 35539.12 29.79 <0.0001 29.678 SignificantError 16699.22 14 1192.80 13.945
Total 1.175E + 05 28 100
Table 8ANOVA result for tangential force (Fv).
Source Sum of squares DF Mean square F-value Prob. Cont. % Remarks
Model 90402.85 14 6457.35 6.35 0.0007 SignificantVc 146.09 1 146.09 0.14 0.7103 0.139 No significantf 13960.54 1 13960.54 13.73 0.0023 13.366 Significantap 32898.84 1 32898.84 32.37 <0.0001 31.498 SignificantH 20947.66 1 20947.66 20.61 0.0005 20.055 SignificantVc � f 156.88 1 156.88 0.15 0.7003 0.150 No significantVc � ap 8481.49 1 8481.49 8.34 0.0119 8.120 SignificantVc � H 220.08 1 220.08 0.22 0.6489 0.210 No significantf � ap 390.06 1 390.06 0.38 0.5456 0.373 No significantf � H 139.12 1 139.12 0.14 0.7170 0.133 No significantap � H 844.19 1 844.19 0.83 0.3775 0.808 No significantVc2 3976.70 1 3976.70 3.91 0.0680 3.807 No significantf2 308.90 1 308.90 0.30 0.5901 0.295 No significantap2 0.68 1 0.68 6.675E-04 0.9798 0.00065 No significantH2 7744.21 1 7744.21 7.62 0.0153 7.414 SignificantError 14230.46 14 1016.46 13.624
Total 1.046E + 05 28 100
348 H. Aouici et al. / Measurement 45 (2012) 344–353
Author's personal copy
furrows the result of tool shape and helicoids movementtool–workpiece. These furrows are deeper and broader asthe feed rate increases. For this reason, weak feed rate haveto be employed during turning operation. Similar resultswere reported by Bouacha [6] when turning AISI 52100steel (64 HRC) using CBN tool. The interactions (Vc � ap),(ap � H), (f � f) and the cutting speed (Vc) do not show asignificant contribution on the surface roughness evolu-tion. Similar observations were also made by Dureja et al.[19].
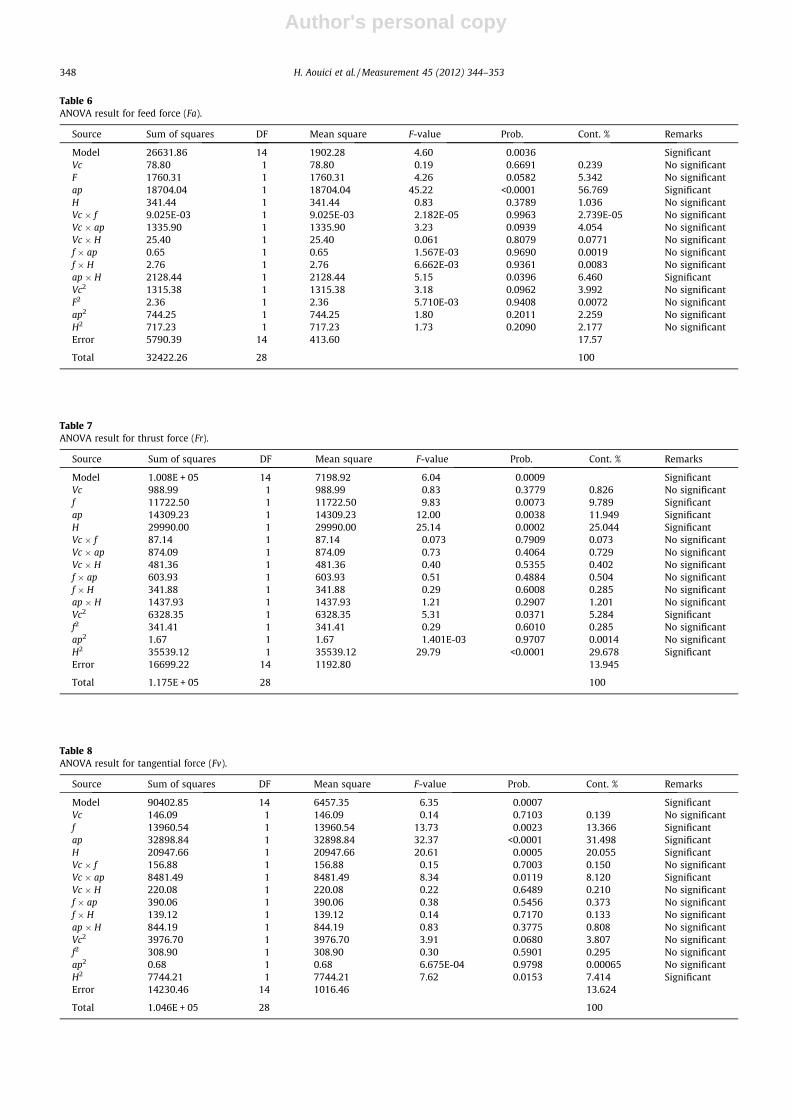
Concerning now force components, the analysis ofinfluence on the feed force (Fa) is summed up in Table 6.It can be seen that the depth of cut (Cont. � 56.769%), thefeed rate (Cont. � 5.342%), and the interaction depth ofcut and workpiece hardness (Cont. � 6.460%) have statisti-cal significances on Fa, in particular the depth of cut factor.The cutting speed and the interactions do not present anystatistical significance on the feed force (Fa).
ANOVA results for the thrust force (Fr) are indicated inTable 7. It can be noted that the product (H2) affects Fr ina considerable way. Its contribution is 29.678%. The work-piece hardness (H), depth of cut (ap) and feed rate (f) aresignificant. Respectively, their contributions are (25.044;11.949 and 9.789)%. On the opposite side, the cutting speedwith 0.826% contribution is not significant.
Table 8 presents (ANOVA) results for tangential force(Fv). It can be seen that the depth of cut (ap) is the mostimportant factor affecting Fv. Its contribution is 31.498%.The next largest factor influencing (Fv) is workpiece hard-ness (H) with 20.055% contribution. The cutting speed (Vc)with 0.139% contribution, has a very weak significance ef-fect. Similarly, the interactions (Vc � f), (Vc � H), (f � ap),(f � H), (Vc2) and (ap � H) are not significant. Respectively,their contributions are (0.150; 0.210; 0.373; 0.133; 3.807and 0.808)%.
3.2. Regression equations
The relationship between the factors and the perfor-mance measures were modeled by quadratic regression.The regression equations obtained were as follows.
The roughness Ra model is given below in Eq. (3). Itscoefficient of determination (R2) is 91.43%.
Ra ¼ �9:872� 0:0106Vc þ 2:758f þ 0:4908ap
þ 0:496H þ 0:0334Vc � f þ 1:111� 10�3Vc
� apþ 2:416� 10�4Vc � H þ 14:583f � ap
� 0:337f � H � 0:01334ap� H � 1:143
� 10�5Vc2 þ 20:364f 2 � 2:829ap2 � 5:596H2 ð3Þ
The feed force model (Fa) is given by Eq. (4) with adetermination coefficient (R2) of 82.14%.
Fa ¼ 605:064� 1:237Vc þ 182:867f þ 1719:057ap
� 31:705H þ 0:0198Vc � f � 2:030Vc � apþ 8:4
� 10�3Vc � H þ 67:083f � apþ 4:15f � H
� 30:756ap� H þ 3:955� 10�3Vc2
� 3:77:135f 2 þ 476:07ap2 þ 0:42H2 ð4Þ
The thrust force model (Fr) is given by Eq. (5) and thedetermination coefficient (R2) is 85.79%.
Fr ¼ 5421:406� 4:194Vc þ 2737:7f þ 1922:746ap
� 249:924H � 1:945Vc � f � 1:642Vc � ap
þ 0:0365Vc � H � 2047:916f � ap� 46:225f
� H � 25:28ap� H þ 8:676� 10�3Vc2
þ 4534:32f 2 � 22:559ap2 þ 2:961H2 ð5Þ
The tangential force model (Fv) is given by the followingEq. (6). Its coefficient of determination is 86.40%.
Fv ¼ 1963:62þ 0:426Vc þ 1952:79f þ 1952:79ap
� 109:311H � 2:609Vc � f � 5:116Vc � ap
� 0:0247Vc � H þ 1645:833f � apþ 29:487f
� H � 19:37ap� H þ 6:877� 10�3Vc2
� 4313:07f 2 � 14:374ap2 þ 1:382H2 ð6Þ
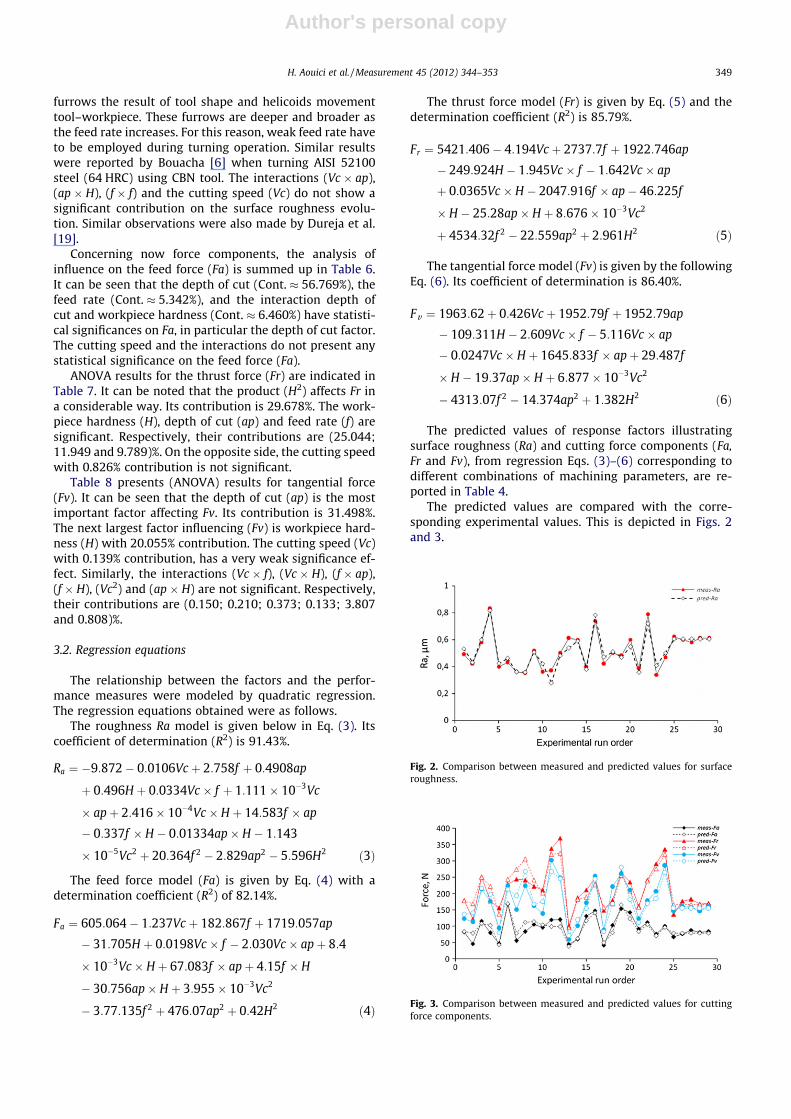
The predicted values of response factors illustratingsurface roughness (Ra) and cutting force components (Fa,Fr and Fv), from regression Eqs. (3)–(6) corresponding todifferent combinations of machining parameters, are re-ported in Table 4.
The predicted values are compared with the corre-sponding experimental values. This is depicted in Figs. 2and 3.
Fig. 2. Comparison between measured and predicted values for surfaceroughness.
Fig. 3. Comparison between measured and predicted values for cuttingforce components.
H. Aouici et al. / Measurement 45 (2012) 344–353 349
Author's personal copy
3.3. Effect of machining parameters on surface responsefactors
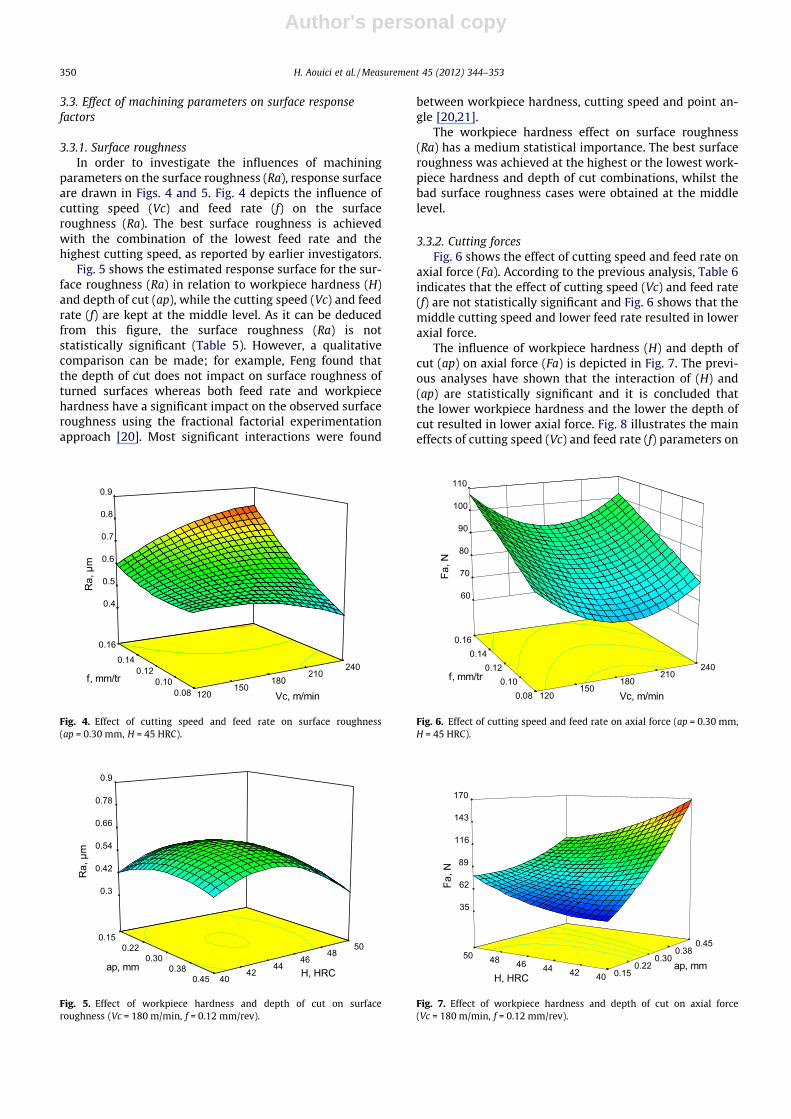
3.3.1. Surface roughnessIn order to investigate the influences of machining
parameters on the surface roughness (Ra), response surfaceare drawn in Figs. 4 and 5. Fig. 4 depicts the influence ofcutting speed (Vc) and feed rate (f) on the surfaceroughness (Ra). The best surface roughness is achievedwith the combination of the lowest feed rate and thehighest cutting speed, as reported by earlier investigators.
Fig. 5 shows the estimated response surface for the sur-face roughness (Ra) in relation to workpiece hardness (H)and depth of cut (ap), while the cutting speed (Vc) and feedrate (f) are kept at the middle level. As it can be deducedfrom this figure, the surface roughness (Ra) is notstatistically significant (Table 5). However, a qualitativecomparison can be made; for example, Feng found thatthe depth of cut does not impact on surface roughness ofturned surfaces whereas both feed rate and workpiecehardness have a significant impact on the observed surfaceroughness using the fractional factorial experimentationapproach [20]. Most significant interactions were found
between workpiece hardness, cutting speed and point an-gle [20,21].
The workpiece hardness effect on surface roughness(Ra) has a medium statistical importance. The best surfaceroughness was achieved at the highest or the lowest work-piece hardness and depth of cut combinations, whilst thebad surface roughness cases were obtained at the middlelevel.
3.3.2. Cutting forcesFig. 6 shows the effect of cutting speed and feed rate on
axial force (Fa). According to the previous analysis, Table 6indicates that the effect of cutting speed (Vc) and feed rate(f) are not statistically significant and Fig. 6 shows that themiddle cutting speed and lower feed rate resulted in loweraxial force.
The influence of workpiece hardness (H) and depth ofcut (ap) on axial force (Fa) is depicted in Fig. 7. The previ-ous analyses have shown that the interaction of (H) and(ap) are statistically significant and it is concluded thatthe lower workpiece hardness and the lower the depth ofcut resulted in lower axial force. Fig. 8 illustrates the maineffects of cutting speed (Vc) and feed rate (f) parameters on
0.08 0.10
0.12 0.14
0.16
120 150
180 210
240
0.4
0.5
0.6
0.7
0.8
0.9
Ra,
µm
Vc, m/min
f, mm/tr
Fig. 4. Effect of cutting speed and feed rate on surface roughness(ap = 0.30 mm, H = 45 HRC).
40 42
44 46
48 50
0.15 0.22
0.30 0.38
0.45
0.3
0.42
0.54
0.66
0.78
0.9
Ra,
µm
ap, mm H, HRC
Fig. 5. Effect of workpiece hardness and depth of cut on surfaceroughness (Vc = 180 m/min, f = 0.12 mm/rev).
0.08 0.10
0.12 0.14
0.16
120 150
180 210
240
60
70
80
90
100
110
Fa,
N
Vc, m/min
f, mm/tr
Fig. 6. Effect of cutting speed and feed rate on axial force (ap = 0.30 mm,H = 45 HRC).
40 42 44 46 48 50
0.15 0.22
0.30 0.38
0.45
35
62
89
116
143
170
Fa,
N
ap, mm H, HRC
Fig. 7. Effect of workpiece hardness and depth of cut on axial force(Vc = 180 m/min, f = 0.12 mm/rev).
350 H. Aouici et al. / Measurement 45 (2012) 344–353
Author's personal copy
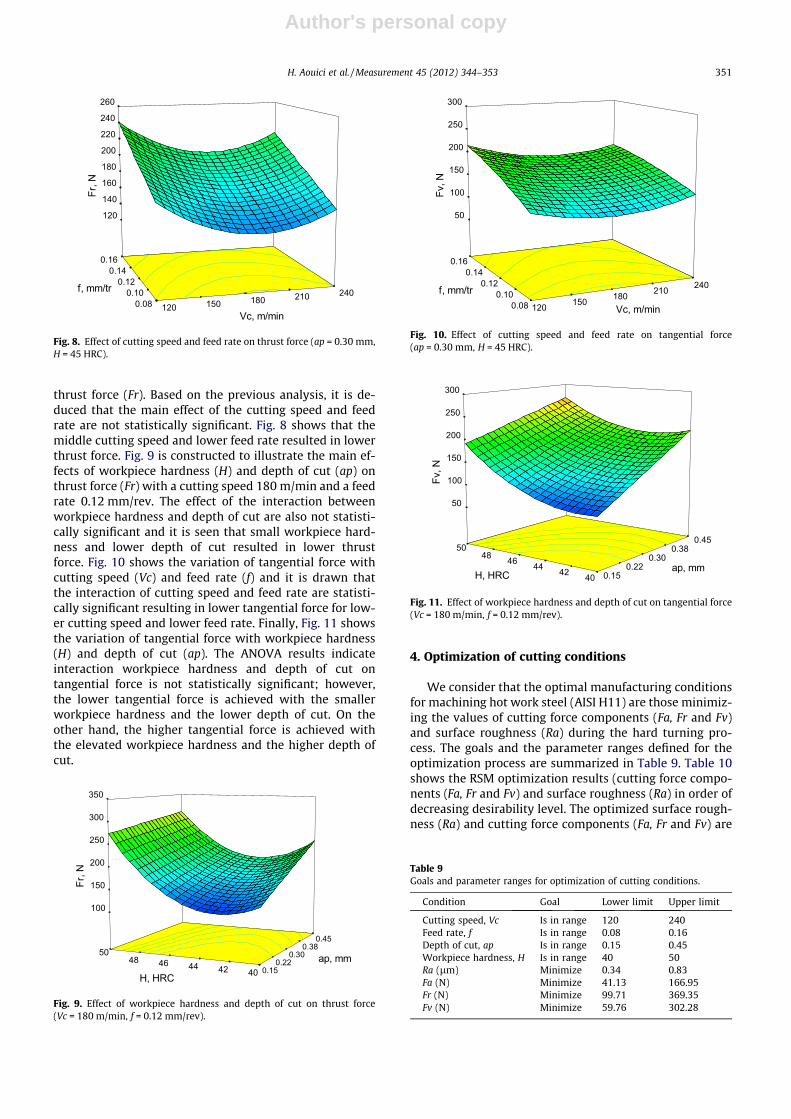
thrust force (Fr). Based on the previous analysis, it is de-duced that the main effect of the cutting speed and feedrate are not statistically significant. Fig. 8 shows that themiddle cutting speed and lower feed rate resulted in lowerthrust force. Fig. 9 is constructed to illustrate the main ef-fects of workpiece hardness (H) and depth of cut (ap) onthrust force (Fr) with a cutting speed 180 m/min and a feedrate 0.12 mm/rev. The effect of the interaction betweenworkpiece hardness and depth of cut are also not statisti-cally significant and it is seen that small workpiece hard-ness and lower depth of cut resulted in lower thrustforce. Fig. 10 shows the variation of tangential force withcutting speed (Vc) and feed rate (f) and it is drawn thatthe interaction of cutting speed and feed rate are statisti-cally significant resulting in lower tangential force for low-er cutting speed and lower feed rate. Finally, Fig. 11 showsthe variation of tangential force with workpiece hardness(H) and depth of cut (ap). The ANOVA results indicateinteraction workpiece hardness and depth of cut ontangential force is not statistically significant; however,the lower tangential force is achieved with the smallerworkpiece hardness and the lower depth of cut. On theother hand, the higher tangential force is achieved withthe elevated workpiece hardness and the higher depth ofcut.
4. Optimization of cutting conditions
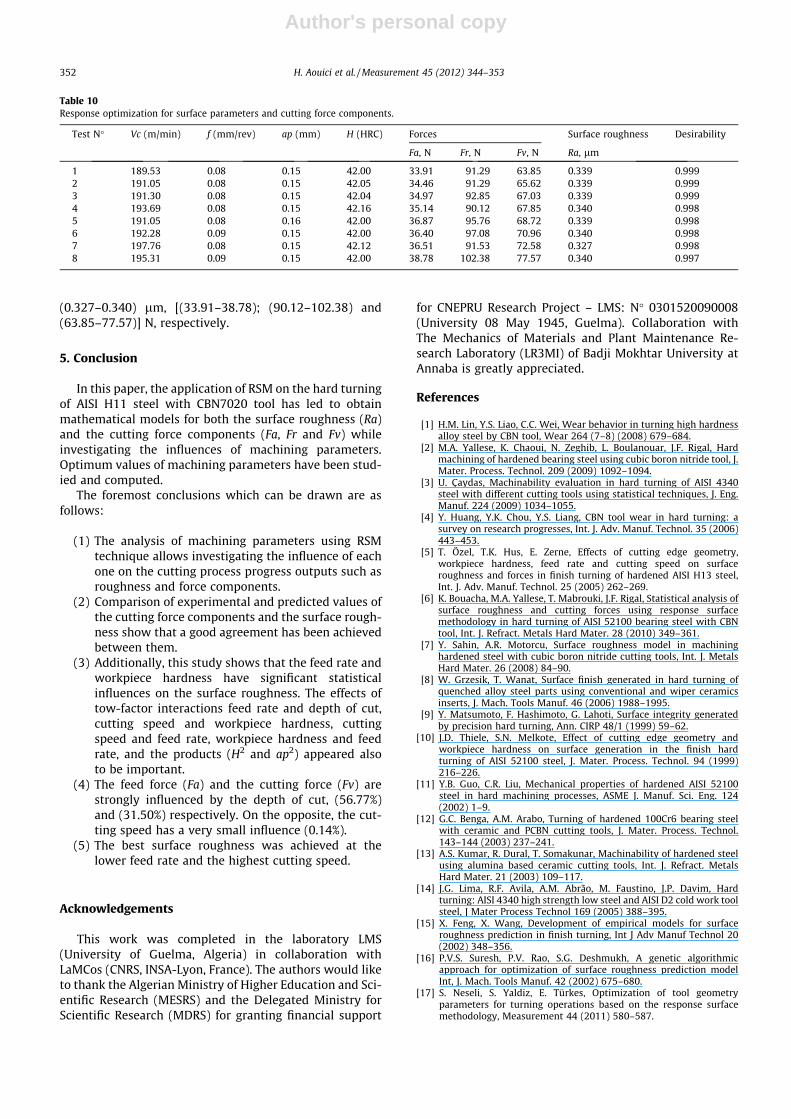
We consider that the optimal manufacturing conditionsfor machining hot work steel (AISI H11) are those minimiz-ing the values of cutting force components (Fa, Fr and Fv)and surface roughness (Ra) during the hard turning pro-cess. The goals and the parameter ranges defined for theoptimization process are summarized in Table 9. Table 10shows the RSM optimization results (cutting force compo-nents (Fa, Fr and Fv) and surface roughness (Ra) in order ofdecreasing desirability level. The optimized surface rough-ness (Ra) and cutting force components (Fa, Fr and Fv) are
0.08 0.10
0.12 0.14
0.16
120 150 180 210 240
120
140
160
180
200
220
240
260 F
r, N
Vc, m/min
f, mm/tr
Fig. 8. Effect of cutting speed and feed rate on thrust force (ap = 0.30 mm,H = 45 HRC).
40 42 44 46 48 50
0.15 0.22
0.30 0.38
0.45
100
150
200
250
300
350
Fr,
N
ap, mm
H, HRC
Fig. 9. Effect of workpiece hardness and depth of cut on thrust force(Vc = 180 m/min, f = 0.12 mm/rev).
0.08 0.10
0.12 0.14
0.16
120 150 180 210 240
50
100
150
200
250
300
Fv,
N
Vc, m/min
f, mm/tr
Fig. 10. Effect of cutting speed and feed rate on tangential force(ap = 0.30 mm, H = 45 HRC).
40 42 44 46 48 50
0.15 0.22
0.30 0.38
0.45
50
100
150
200
250
300
Fv,
N
ap, mm H, HRC
Fig. 11. Effect of workpiece hardness and depth of cut on tangential force(Vc = 180 m/min, f = 0.12 mm/rev).
Table 9Goals and parameter ranges for optimization of cutting conditions.
Condition Goal Lower limit Upper limit
Cutting speed, Vc Is in range 120 240Feed rate, f Is in range 0.08 0.16Depth of cut, ap Is in range 0.15 0.45Workpiece hardness, H Is in range 40 50Ra (lm) Minimize 0.34 0.83Fa (N) Minimize 41.13 166.95Fr (N) Minimize 99.71 369.35Fv (N) Minimize 59.76 302.28
H. Aouici et al. / Measurement 45 (2012) 344–353 351
Author's personal copy
(0.327–0.340) lm, [(33.91–38.78); (90.12–102.38) and(63.85–77.57)] N, respectively.
5. Conclusion
In this paper, the application of RSM on the hard turningof AISI H11 steel with CBN7020 tool has led to obtainmathematical models for both the surface roughness (Ra)and the cutting force components (Fa, Fr and Fv) whileinvestigating the influences of machining parameters.Optimum values of machining parameters have been stud-ied and computed.
The foremost conclusions which can be drawn are asfollows:
(1) The analysis of machining parameters using RSMtechnique allows investigating the influence of eachone on the cutting process progress outputs such asroughness and force components.
(2) Comparison of experimental and predicted values ofthe cutting force components and the surface rough-ness show that a good agreement has been achievedbetween them.
(3) Additionally, this study shows that the feed rate andworkpiece hardness have significant statisticalinfluences on the surface roughness. The effects oftow-factor interactions feed rate and depth of cut,cutting speed and workpiece hardness, cuttingspeed and feed rate, workpiece hardness and feedrate, and the products (H2 and ap2) appeared alsoto be important.
(4) The feed force (Fa) and the cutting force (Fv) arestrongly influenced by the depth of cut, (56.77%)and (31.50%) respectively. On the opposite, the cut-ting speed has a very small influence (0.14%).
(5) The best surface roughness was achieved at thelower feed rate and the highest cutting speed.
Acknowledgements
This work was completed in the laboratory LMS(University of Guelma, Algeria) in collaboration withLaMCos (CNRS, INSA-Lyon, France). The authors would liketo thank the Algerian Ministry of Higher Education and Sci-entific Research (MESRS) and the Delegated Ministry forScientific Research (MDRS) for granting financial support
for CNEPRU Research Project – LMS: N� 0301520090008(University 08 May 1945, Guelma). Collaboration withThe Mechanics of Materials and Plant Maintenance Re-search Laboratory (LR3MI) of Badji Mokhtar University atAnnaba is greatly appreciated.
References
[1] H.M. Lin, Y.S. Liao, C.C. Wei, Wear behavior in turning high hardnessalloy steel by CBN tool, Wear 264 (7–8) (2008) 679–684.
[2] M.A. Yallese, K. Chaoui, N. Zeghib, L. Boulanouar, J.F. Rigal, Hardmachining of hardened bearing steel using cubic boron nitride tool, J.Mater. Process. Technol. 209 (2009) 1092–1094.
[3] U. Çaydas, Machinability evaluation in hard turning of AISI 4340steel with different cutting tools using statistical techniques, J. Eng.Manuf. 224 (2009) 1034–1055.
[4] Y. Huang, Y.K. Chou, Y.S. Liang, CBN tool wear in hard turning: asurvey on research progresses, Int. J. Adv. Manuf. Technol. 35 (2006)443–453.
[5] T. Özel, T.K. Hus, E. Zerne, Effects of cutting edge geometry,workpiece hardness, feed rate and cutting speed on surfaceroughness and forces in finish turning of hardened AISI H13 steel,Int. J. Adv. Manuf. Technol. 25 (2005) 262–269.
[6] K. Bouacha, M.A. Yallese, T. Mabrouki, J.F. Rigal, Statistical analysis ofsurface roughness and cutting forces using response surfacemethodology in hard turning of AISI 52100 bearing steel with CBNtool, Int. J. Refract. Metals Hard Mater. 28 (2010) 349–361.
[7] Y. Sahin, A.R. Motorcu, Surface roughness model in machininghardened steel with cubic boron nitride cutting tools, Int. J. MetalsHard Mater. 26 (2008) 84–90.
[8] W. Grzesik, T. Wanat, Surface finish generated in hard turning ofquenched alloy steel parts using conventional and wiper ceramicsinserts, J. Mach. Tools Manuf. 46 (2006) 1988–1995.
[9] Y. Matsumoto, F. Hashimoto, G. Lahoti, Surface integrity generatedby precision hard turning, Ann. CIRP 48/1 (1999) 59–62.
[10] J.D. Thiele, S.N. Melkote, Effect of cutting edge geometry andworkpiece hardness on surface generation in the finish hardturning of AISI 52100 steel, J. Mater. Process. Technol. 94 (1999)216–226.
[11] Y.B. Guo, C.R. Liu, Mechanical properties of hardened AISI 52100steel in hard machining processes, ASME J. Manuf. Sci. Eng. 124(2002) 1–9.
[12] G.C. Benga, A.M. Arabo, Turning of hardened 100Cr6 bearing steelwith ceramic and PCBN cutting tools, J. Mater. Process. Technol.143–144 (2003) 237–241.
[13] A.S. Kumar, R. Dural, T. Somakunar, Machinability of hardened steelusing alumina based ceramic cutting tools, Int. J. Refract. MetalsHard Mater. 21 (2003) 109–117.
[14] J.G. Lima, R.F. Avila, A.M. Abrão, M. Faustino, J.P. Davim, Hardturning: AISI 4340 high strength low steel and AISI D2 cold work toolsteel, J Mater Process Technol 169 (2005) 388–395.
[15] X. Feng, X. Wang, Development of empirical models for surfaceroughness prediction in finish turning, Int J Adv Manuf Technol 20(2002) 348–356.
[16] P.V.S. Suresh, P.V. Rao, S.G. Deshmukh, A genetic algorithmicapproach for optimization of surface roughness prediction modelInt, J. Mach. Tools Manuf. 42 (2002) 675–680.
[17] S. Neseli, S. Yaldiz, E. Türkes, Optimization of tool geometryparameters for turning operations based on the response surfacemethodology, Measurement 44 (2011) 580–587.
Table 10Response optimization for surface parameters and cutting force components.
Test N� Vc (m/min) f (mm/rev) ap (mm) H (HRC) Forces Surface roughness Desirability
Fa, N Fr, N Fv, N Ra, lm
1 189.53 0.08 0.15 42.00 33.91 91.29 63.85 0.339 0.9992 191.05 0.08 0.15 42.05 34.46 91.29 65.62 0.339 0.9993 191.30 0.08 0.15 42.04 34.97 92.85 67.03 0.339 0.9994 193.69 0.08 0.15 42.16 35.14 90.12 67.85 0.340 0.9985 191.05 0.08 0.16 42.00 36.87 95.76 68.72 0.339 0.9986 192.28 0.09 0.15 42.00 36.40 97.08 70.96 0.340 0.9987 197.76 0.08 0.15 42.12 36.51 91.53 72.58 0.327 0.9988 195.31 0.09 0.15 42.00 38.78 102.38 77.57 0.340 0.997
352 H. Aouici et al. / Measurement 45 (2012) 344–353

Author's personal copy
[18] V.N. Gaitonde, S.R. Karnik, M. Faustino, J.P. Davim, Machinabilityanalysis in turning tungsten–copper composite for application in EDMelectrodes, Int. J. Refract. Metals Hard Mater. 27 (2009) 754–763.
[19] J.S. Dureja, V.K. Gupta, M. Dogra, Design optimization of cuttingconditions and analysis of their effect on tool wear and surfaceroughness during hard turning of AISI-H11 steel with a coated-mixed ceramic tool, J. Eng. Manuf. 223 (B) (2009) 1441–1453.
[20] C.X. Feng, An experimental study of the impact of turningparameters on surface roughness, in: Proceedings of the 2001,Industrial Engineering Research Conference, Paper N� 2036, 2001.
[21] M.A. El Baradie, Surface roughness prediction in the turning of highstrength steel by factorial design of experiments, J. Mater. Process.Technol. 67 (1997) 55–61.
H. Aouici et al. / Measurement 45 (2012) 344–353 353