analysis of surface and root-zone soil moisture dynamics with ers scatterometer and the...
TRANSCRIPT
Hydrol. Earth Syst. Sci., 12, 1415–1424, 2008www.hydrol-earth-syst-sci.net/12/1415/2008/© Author(s) 2008. This work is distributed underthe Creative Commons Attribution 3.0 License.
Hydrology andEarth System
Sciences
Analysis of surface and root-zone soil moisture dynamics with ERSscatterometer and the hydrometeorological modelSAFRAN-ISBA-MODCOU at Grand Morin watershed (France)
T. Paris Anguela1, M. Zribi 1,2, S. Hasenauer3, F. Habets4, and C. Loumagne5
1CETP/CNRS, Velizy, France2CESBIO, Toulouse, France3Vienna University of Technology, Institute of Photogrammetry and Remote Sensing, Vienna, Austria4UMR-Sisyphe, Universite Paris VI, CNRS, Paris, France5UR Hydrosystemes et Bio-Procedes, Antony, France
Received: 25 June 2008 – Published in Hydrol. Earth Syst. Sci. Discuss.: 17 July 2008Revised: 2 December 2008 – Accepted: 9 December 2008 – Published: 18 December 2008
Abstract. Spatial and temporal variations of soil mois-ture strongly affect flooding, erosion, solute transport andvegetation productivity. Its characterization, offers an av-enue to improve our understanding of complex land surface-atmosphere interactions. In this paper, soil moisture dynam-ics at soil surface (first centimeters) and root-zone (up to1.5 m depth) are investigated at three spatial scales: localscale (field measurements), 8×8 km2 (hydrological model)and 25×25 km2 scale (ERS scatterometer) in a French wa-tershed. This study points out the quality of surface and root-zone soil moisture data for SIM model and ERS scatterom-eter for a three year period. Surface soil moisture is highlyvariable because is more influenced by atmospheric condi-tions (rain, wind and solar radiation), and presents RMSEup to 0.08 m3 m−3. On the other hand, root-zone moisturepresents lower variability with small RMSE (between 0.02and 0.06 m3 m−3). These results will contribute to satelliteand model verification of moisture, but also to better appli-cation of radar data for data assimilation in future.
1 Introduction
Soil moisture is the water held in the pores of the unsatu-rated zone. It is one of the most important soil variables,relative to climatology, hydrology and ecology (Beven and
Correspondence to:T. Paris Anguela([email protected])
Fisher, 1996; Houser et al., 1998). Surface and root-zonesoil moisture regulate the water and energy budgets at thesoil-vegetation-atmosphere interface. Moisture content is animportant parameter in watershed modeling as well, since itpartially controls the partitioning of rainfall, infiltration andsurface runoff and thus the hydrodynamic of the riverflow atthe outlet (Koster et al., 2003).
Despite the importance of soil moisture, its accurate as-sessment is difficult due to strong spatial and temporal vari-ability, due primarily to the topography, variation of the soiltype and land use (Cosh et al., 2004; Famiglietti et al., 2008).Teuling and Troch (2005) reviewed several studies dealingwith soil moisture variability. They found that a simplephysically-based model can capture the relationship betweenmean soil moisture and variability. Vachaud et al. (1985)postulated that fields maintain spatial patterns of soil mois-ture through time. If patterns are maintained, then it is pos-sible to minimize the number of observations without sig-nificant loss of information. Grayson and Western (1998),Mohanty and Skaggs (2001), Jacobs et al. (2004), and Coshet al. (2004) demonstrated that a few time stable sites wellrepresent the mean soil moisture within small watersheds.However, these studies only examined time stability for nearsurface soil moisture.
There are three alternative sources to estimate soil mois-ture dynamics over large areas: the first method is basedon hydrological modeling, the second on satellite observa-tions and the third on representative Catchments AverageSoil Moisture Monitoring sites (Grayson and Western 1998).
Land surface models, can synthesize spatially distributed
Published by Copernicus Publications on behalf of the European Geosciences Union.
1416 T. Paris Anguela et al.: Analysis of surface and root-zone soil moisture dynamics
Table 1. Overview of ERS scatterometer root-zone soil moisture (0to 100 cm) retrievals compared with observations.
Sensor Data type and values Application Reference
ER
Ssc
ttero
met
er
Roo
t-zo
neso
ilm
oist
ure
RMSE: 0.05 m3 m−3 Ukraine WagnerR2: 0.25 et al. (1999c)
RMSE: 0.03 to 0.07 m3 m−3 Global WagnerR2: 0.25 et al. (2003)
RMSE: 0.02 m3 m−3 NW Spain CeballosR2: 0.75 et al. (2005)
RMSE: 0.05 m3 m−3 Russia, Ukraine, ScipalR2: 0.80 Mongolia, US et al. (2005)
RMSE: 0.38 m3 m−3 European forests VerstraetenR2: 0.44 et al. (2005)
rainfall, land use, soil, and topographic maps to produce sur-face soil moisture predictions over large-spatial areas. How-ever, the use of models is not free from errors, e.g. rainfall,soil texture, model calibration and parameter identification(Beven, 1993; Gupta et al., 1999). The SIM (SAFRAN-ISBA-MODCOU) model is used at METEO-FRANCE in anoperational mode over the entire France since 2003 (Habetset al., 2008). The SIM model is a semi-distributed model thatuses a grid cell of 8×8 km2 to simulate the water and energybudget at the surface, the soil moisture and the discharge ofthe main French rivers.
Considerable efforts have been made, over the past 3decades, to develop remote sensing techniques for the char-acterization of the spatial and temporal variability of soilmoisture over large regions. In particular, active and pas-sive microwave techniques as well as interpretation toolshave been developed (Jackson et al., 1996). The effective-ness of low-resolution space-borne scatterometers (active mi-crowave) for land surface characterization has been demon-strated by a large number of studies related to moisture esti-mation (e.g., Frison and Mougin, 1996; Wagner et al., 1999c;Zribi et al., 2003).
Different studies (Quesney et al., 2001; Le Hegarat-Mascle et al., 2002; Weisse et al., 2002; Oudin et al., 2003)have been performed in Grand Morin watershed with the aimto monitor soil moisture form space in an operational way,in order to improve hydrological model simulations, usingsoil moisture data form European Remote Sensing / Syn-thetic Aperture Radar (ERS/SAR). One of the conclusions ofthese studies is that soil moisture data assimilation showedlittle improvements because of the scarcity of ERS/SAR data(temporal resolution of 35 days).
In order to overcome the temporal resolution problem,we decided to work with ERS (European Remote SensingSatellite) scatterometer soil moisture product from the Vi-enna University of Technology (Wagner et al., 1999c). ERS
scatterometer data has the advantage to provide soil mois-ture data two times per week, to be freely available (http://www.ipf.tuwien.ac.at/radar) and to provide global spatialcoverage since 1991. Moreover, ERS scatterometer data hasalready been successfully used in other studies (e.g. Table 1).
Remote-sensing data, when combined with numerical sim-ulation and other data, should provide estimates of soil mois-ture with higher spatial and temporal resolution and less er-ror than either remotely sensed data or model simulationsseparately (Houser et al., 1998). In essence, the data assim-ilation system attempts in improving the land model perfor-mance using satellite retrievals in space and time. Via theland model, the system also propagates the surface informa-tion from the satellite into the deeper soil and thereby pro-vides improved estimates of root-zone soil moisture (Reichleet al., 2007). A number of prior works deal with data assim-ilation procedures (e.g., Francois et al., 2003; Houser et al.,1998; Reichle et al., 2007; Sabater et al., 2007; Walker andHouser, 2001).
The aim of this paper is to investigate the quality of dif-ferent soil moisture products in order to be used for data as-similation. The soil moisture products compared are: TDR(Time Domain Reflectometry) which is a local scale prod-uct; SIM model at 8×8 km2 scale; and ERS scatterometer ata 25×25 km2 scale. For each product, we will compare thedata at two soil depths:
1. the soil surface (up to 5 cm) which is more variable and
2. the root-zone (up to 1.5 m depth).
This investigation applies ERS and SIM products like theyare delivered by Vienna University of Technology andMeteo-France, respectively, for the purpose to see if they areable to represent the soil moisture in our particular water-shed. We do not have the aim or possibility to modify theseproducts.
The paper is set out as follows:
1. presentation of the study area and soil moisture dataproducts;
2. examination and discussion of the results and their im-plications over 3 years study;
3. concluding remarks.
2 Study area and data validation
2.1 Grand Morin
The Grand Morin (France) is a tributary of the Marne river,35 km east of Paris (Fig. 1). The total length of the streamis about 120 km, for a catchment area of 1070 km2 (around1/10 of the Marne catchment area, which is a main tributary
Hydrol. Earth Syst. Sci., 12, 1415–1424, 2008 www.hydrol-earth-syst-sci.net/12/1415/2008/
T. Paris Anguela et al.: Analysis of surface and root-zone soil moisture dynamics 1417
Grand Morin WatershedGrand Morin Watershed
PARIS
BoissyBoissy --lele--ChâtelChâtel (TDR)(TDR)
Voulton (TDR)Voulton (TDR)
SuizySuizy (TDR)(TDR)
Chevru (Chevru ( ThetaProbeThetaProbe ))
Cerneux (Cerneux ( ThetaProbeThetaProbe ))
Esternay Esternay
((ThetaProbeThetaProbe ))
Paris GrandMorin
Crécy la ChapelleCrécy la Chapelle
Km
Altitude (m)Grand Morin WatershedGrand Morin Watershed
PARIS
BoissyBoissy --lele--ChâtelChâtel (TDR)(TDR)
Voulton (TDR)Voulton (TDR)
SuizySuizy (TDR)(TDR)
Chevru (Chevru ( ThetaProbeThetaProbe ))
Cerneux (Cerneux ( ThetaProbeThetaProbe ))
Esternay Esternay
((ThetaProbeThetaProbe ))
Paris GrandMorin
Crécy la ChapelleCrécy la Chapelle
Km
Altitude (m)
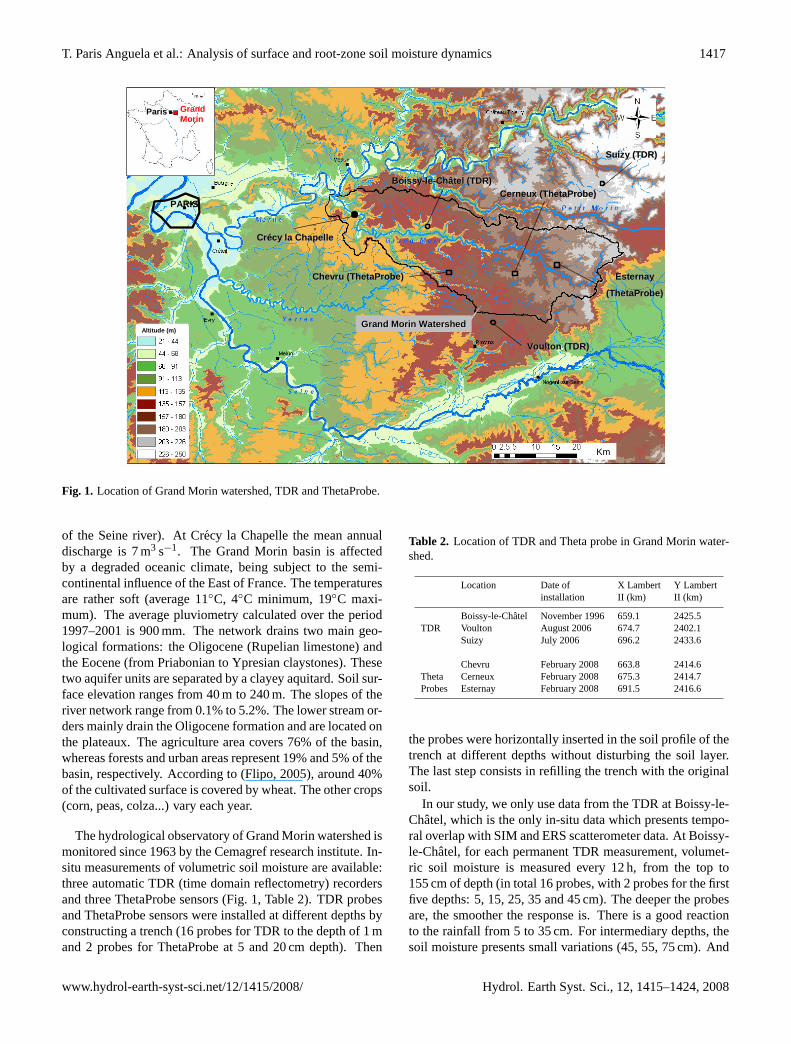
Fig. 1. Location of Grand Morin watershed, TDR and ThetaProbe.
of the Seine river). At Crecy la Chapelle the mean annualdischarge is 7 m3 s−1. The Grand Morin basin is affectedby a degraded oceanic climate, being subject to the semi-continental influence of the East of France. The temperaturesare rather soft (average 11◦C, 4◦C minimum, 19◦C maxi-mum). The average pluviometry calculated over the period1997–2001 is 900 mm. The network drains two main geo-logical formations: the Oligocene (Rupelian limestone) andthe Eocene (from Priabonian to Ypresian claystones). Thesetwo aquifer units are separated by a clayey aquitard. Soil sur-face elevation ranges from 40 m to 240 m. The slopes of theriver network range from 0.1% to 5.2%. The lower stream or-ders mainly drain the Oligocene formation and are located onthe plateaux. The agriculture area covers 76% of the basin,whereas forests and urban areas represent 19% and 5% of thebasin, respectively. According to (Flipo, 2005), around 40%of the cultivated surface is covered by wheat. The other crops(corn, peas, colza...) vary each year.
The hydrological observatory of Grand Morin watershed ismonitored since 1963 by the Cemagref research institute. In-situ measurements of volumetric soil moisture are available:three automatic TDR (time domain reflectometry) recordersand three ThetaProbe sensors (Fig. 1, Table 2). TDR probesand ThetaProbe sensors were installed at different depths byconstructing a trench (16 probes for TDR to the depth of 1 mand 2 probes for ThetaProbe at 5 and 20 cm depth). Then
Table 2. Location of TDR and Theta probe in Grand Morin water-shed.
Location Date of X Lambert Y Lambertinstallation II (km) II (km)
Boissy-le-Chatel November 1996 659.1 2425.5TDR Voulton August 2006 674.7 2402.1
Suizy July 2006 696.2 2433.6
Chevru February 2008 663.8 2414.6Theta Cerneux February 2008 675.3 2414.7Probes Esternay February 2008 691.5 2416.6
the probes were horizontally inserted in the soil profile of thetrench at different depths without disturbing the soil layer.The last step consists in refilling the trench with the originalsoil.
In our study, we only use data from the TDR at Boissy-le-Chatel, which is the only in-situ data which presents tempo-ral overlap with SIM and ERS scatterometer data. At Boissy-le-Chatel, for each permanent TDR measurement, volumet-ric soil moisture is measured every 12 h, from the top to155 cm of depth (in total 16 probes, with 2 probes for the firstfive depths: 5, 15, 25, 35 and 45 cm). The deeper the probesare, the smoother the response is. There is a good reactionto the rainfall from 5 to 35 cm. For intermediary depths, thesoil moisture presents small variations (45, 55, 75 cm). And
www.hydrol-earth-syst-sci.net/12/1415/2008/ Hydrol. Earth Syst. Sci., 12, 1415–1424, 2008
1418 T. Paris Anguela et al.: Analysis of surface and root-zone soil moisture dynamics
near the water table, soil moisture is under the influence ofthe water table (95 to 155 cm).
Surface soil moisture data corresponds to the moisture av-erage of the two probes inserted at 5 cm. Root-zone soilmoisture data is obtained by averaging the values of theprobes installed from 5 to 95 cm depth. We note that thereare no differences for root-zone moisture average from 5 to95 cm and from 5 to 155 cm due to water table influence.
2.2 SIM hydrological model
The SIM, SAFRAN-ISBA-MODCOU (Habets et al., 1999;Rousset et al., 2004), model is run operationally in real timeby Meteo-France. The SIM model is the combination ofthree independent parts. The first one is SAFRAN (Durandet al., 1993; Quintana Seguı et al., 2008), which provides ananalysis of the atmospheric forcing. SAFRAN analyses areperformed in homogeneous climatic zones and assume a ver-tical gradient of the variables in these zones. In each zone,the atmospheric forcing is interpolated hourly and on a regu-lar 8×8 km2 grid.
The second part is ISBA (Boone et al., 1999; Noilhan andPlanton, 1989). The ISBA surface scheme is used to sim-ulate the surface water and energy budgets on the 8×8 km2
grid. Three soil layers are used: the surface layer of 1cmdepth, a root-zone layer (with a depth depending on the veg-etation, and which is set to 1.5 m for most of crops types)and the hydrological layer (usually down to 2 m below thesoil surface for most of crops types). The last component ofthe modeling system is the macroscale hydrological modelMODCOU (Gomez, 2002; Ledoux et al., 1989), which sim-ulates the riverflow and the evolution of the aquifers.
There is only one previous study presenting a verifica-tion of the SIM surface soil moisture product over France(Rudiger et al., 2008). This study shows that good correla-tion exists between ERS and SIM, generally for low altitudesand low-to-moderate vegetation cover.
Our dataset comes from Seine basin simulation, which in-cludes the Grand Morin watershed, where two aquifers areexplicitly simulated: the Eocene and the chalk aquifer. Thesimulated variables include surface (1 cm) and root-zone soilmoisture at which is associated to a depth of 1.5 m for theGrand Morin watershed, both in volumetric units.
2.3 ERS scatterometer data
The ERS scatterometer radar (active microwave) operates atC-band (5.3 GHz) in vertical polarization. It has been flownon board of the European Remote Sensing Satellites ERS-1(1991–1996) and ERS-2 (1995 up to present). Data sets arenot available in the period 2001 to end 2003 due to satellitetechnical problems. Over land, the measured backscatteringcoefficient depends on soil moisture, surface roughness, veg-etation characteristics and the incidence angle. Soil mois-ture data is retrieved from the radar backscattering coeffi-
cient using a change detection method, developed at the Insti-tute of Photogrammetry and Remote Sensing (IPF), ViennaUniversity of Technology (TU-Wien) described by Wagneret al. (1999a, 1999c). This method has been applied withsuccess over different climatic regions, the Canadian Prairies(Wagner et al., 1999a), the Iberian Peninsula (Wagner et al.,1999b), Ukraine (Wagner et al., 1999c) and Western Africa(Wagner and Scipal, 2000). However, because of the indirectnature of the measurements and the concurrent influence ofvegetation and soil, remote sensing techniques must be ver-ified with on-site measurements of good quality in differentregions.
In the TU-Wien model, long-term scatterometer data areused to model the incidence angle dependency of the radarbackscattering signalσ ◦. Knowing the incidence angle de-pendency, the backscattering coefficients are normalized toa reference incidence angle (40◦). Finally, the relative soilmoisture data ranging between 0% and 100% are derived byscaling the normalized backscattering coefficientsσ ◦(40) be-tween the lowest/highestσ ◦(40) values corresponding to thedriest / wettest soil conditions (Wagner, 1998).
The derived soil moisture product, surface soil moisture(ms), represents the water content in the first 5 cm of thesoil in relative units between totally dry conditions and to-tal water capacity. The spatial resolution is about 50 km cellswith 25 km grid spacing. The temporal resolution is approx-imately of two measurements per week.
In order to compare surface soil moisture (ms) with sur-face TDR measurements and surface modeled moisture, ms
products were converted to physical units of m3m−3 by usingthe 90% confidence interval of a Gaussian distribution (Pel-larin et al., 2006) equal toµ±1.65×σ , whereµ andσ arerespectively the mean and the standard deviation of the TDRor simulated data (depending on which soil moisture productms is compared to) in volumetric units:
θ(t) = ms(t) × (θmax − θmin) + θmin (1)
whereθ(t) is the soil moisture content at a timet [m3 m−3],ms(t) is the ERS scatterometer surface soil moisture [−]at a timet , θmax is the maximum wetness value [m3 m−3]equal to (µ+1.65×σ ) andθmin is the minimum wetness value[m3 m−3] equal to (µ−1.65×σ ).
With the aim to investigate the soil moisture content in thesoil profile, a two-layer water model (Wagner et al., 1999c)was used to obtain root-zone soil moisture from surface soilmoisture radar measurements, ms . The Soil Water Index data(SWI) was derived from ms using, Eq. 2, and represents theroot-zone soil moisture content in the first meter of the soilin relative units ranging between wilting point and field ca-pacity.
SWI(t) =
∑i
ms (ti) e−(t−ti )/T∑i
e−(t−ti )/Tfor ti ≤ t (2)
Hydrol. Earth Syst. Sci., 12, 1415–1424, 2008 www.hydrol-earth-syst-sci.net/12/1415/2008/
T. Paris Anguela et al.: Analysis of surface and root-zone soil moisture dynamics 1419
0
0,1
0,2
0,3
0,4
0,5
19/06/97 05/01/98 24/07/98 09/02/99 28/08/99 15/03/00 01/10/00
Sur
face
soi
l moi
stur
e (m
3 .m-3
)
0
100
200
300
400
500
Dai
ly r
ainf
all (
mm
.day
-1)
TDRERSRainfall
Efficiency : 0.48R² : 0.53 RMSE : 0.05 m3.m-3
Bias : 0.004 m3.m-3
0
0,1
0,2
0,3
0,4
0,5
19/06/97 05/01/98 24/07/98 09/02/99 28/08/99 15/03/00 01/10/00
Roo
t-zo
ne s
oil m
oist
ure
(m3 .m
-3)
0
100
200
300
400
500
Dai
ly r
ainf
all (
mm
.day
-1)
TDRERSRainfall
Efficiency : -1,22R² : 0.66 RMSE : 0.06 m3.m-3
Bias : -0.06 m3.m-3
0
0,05
0,1
0,15
0,2
0,25
0,3
0,35
0,4
0,45
0,5
0 0,1 0,2 0,3 0,4 0,5
TDR soil moisture (m3.m-3)
ER
S s
oil m
oist
ure
(m3 .m
-3)
Surface soil moistureRoot-zone soil moisture
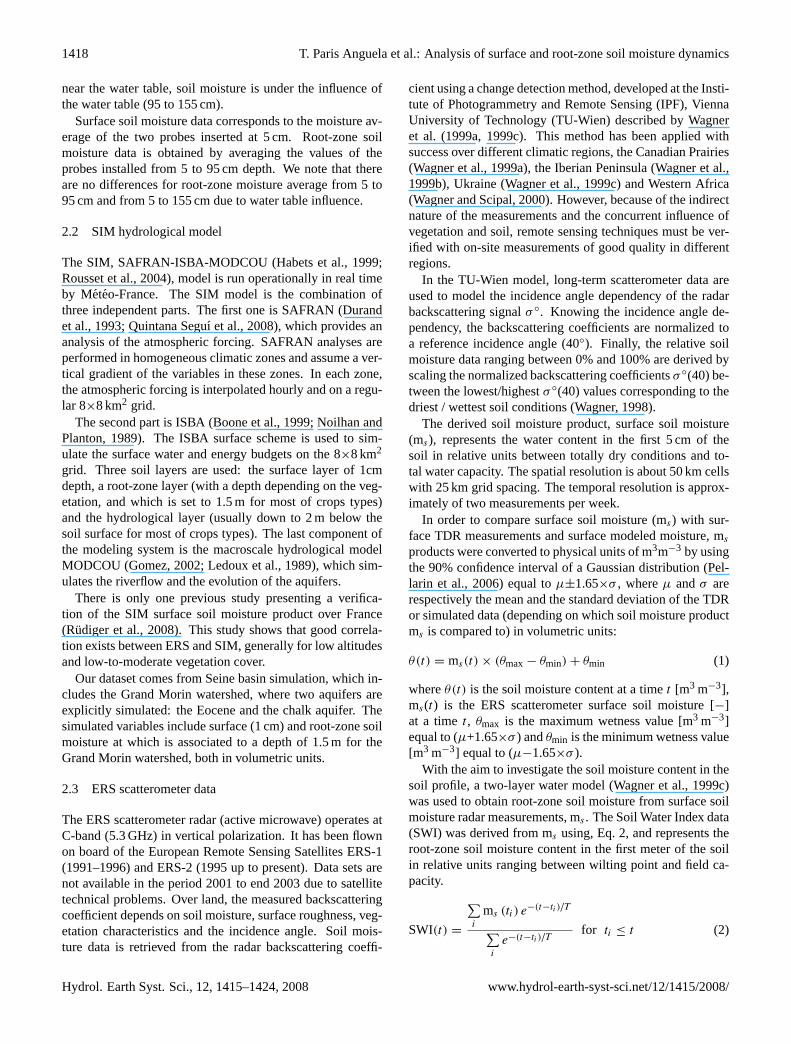
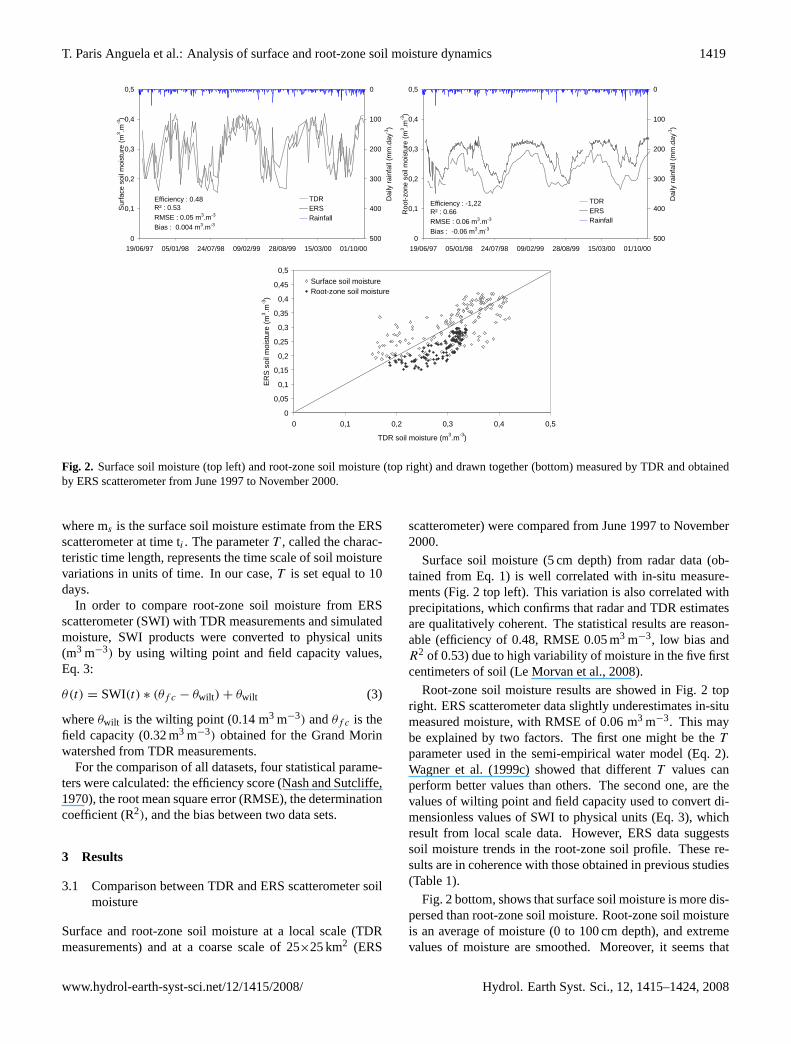
Fig. 2. Surface soil moisture (top left) and root-zone soil moisture (top right) and drawn together (bottom) measured by TDR and obtainedby ERS scatterometer from June 1997 to November 2000.
where ms is the surface soil moisture estimate from the ERSscatterometer at time ti . The parameterT , called the charac-teristic time length, represents the time scale of soil moisturevariations in units of time. In our case,T is set equal to 10days.
In order to compare root-zone soil moisture from ERSscatterometer (SWI) with TDR measurements and simulatedmoisture, SWI products were converted to physical units(m3 m−3) by using wilting point and field capacity values,Eq. 3:
θ(t) = SWI(t) ∗ (θf c − θwilt ) + θwilt (3)
whereθwilt is the wilting point (0.14 m3 m−3) andθf c is thefield capacity (0.32 m3 m−3) obtained for the Grand Morinwatershed from TDR measurements.
For the comparison of all datasets, four statistical parame-ters were calculated: the efficiency score (Nash and Sutcliffe,1970), the root mean square error (RMSE), the determinationcoefficient (R2), and the bias between two data sets.
3 Results
3.1 Comparison between TDR and ERS scatterometer soilmoisture
Surface and root-zone soil moisture at a local scale (TDRmeasurements) and at a coarse scale of 25×25 km2 (ERS
scatterometer) were compared from June 1997 to November2000.
Surface soil moisture (5 cm depth) from radar data (ob-tained from Eq. 1) is well correlated with in-situ measure-ments (Fig. 2 top left). This variation is also correlated withprecipitations, which confirms that radar and TDR estimatesare qualitatively coherent. The statistical results are reason-able (efficiency of 0.48, RMSE 0.05 m3 m−3, low bias andR2 of 0.53) due to high variability of moisture in the five firstcentimeters of soil (Le Morvan et al., 2008).
Root-zone soil moisture results are showed in Fig. 2 topright. ERS scatterometer data slightly underestimates in-situmeasured moisture, with RMSE of 0.06 m3 m−3. This maybe explained by two factors. The first one might be theT
parameter used in the semi-empirical water model (Eq. 2).Wagner et al. (1999c) showed that differentT values canperform better values than others. The second one, are thevalues of wilting point and field capacity used to convert di-mensionless values of SWI to physical units (Eq. 3), whichresult from local scale data. However, ERS data suggestssoil moisture trends in the root-zone soil profile. These re-sults are in coherence with those obtained in previous studies(Table 1).
Fig. 2 bottom, shows that surface soil moisture is more dis-persed than root-zone soil moisture. Root-zone soil moistureis an average of moisture (0 to 100 cm depth), and extremevalues of moisture are smoothed. Moreover, it seems that
www.hydrol-earth-syst-sci.net/12/1415/2008/ Hydrol. Earth Syst. Sci., 12, 1415–1424, 2008
1420 T. Paris Anguela et al.: Analysis of surface and root-zone soil moisture dynamics
0
0,1
0,2
0,3
0,4
0,5
19/06/97 05/01/98 24/07/98 09/02/99 28/08/99 15/03/00 01/10/00
Sur
face
soi
l moi
stur
e (m
3 .m-3
)
0
100
200
300
400
500
Dai
ly r
ainf
all (
mm
.day
-1)
TDRSIMRainfall
Efficiency : -0.08 , R² : 0.47 RMSE : 0.08 m3.m-3 , Bias : -0.05 m3.m-3
0
0,1
0,2
0,3
0,4
0,5
19/06/97 05/01/98 24/07/98 09/02/99 28/08/99 15/03/00 01/10/00
Roo
t zon
e so
il m
oist
ure
(m3 .m
-3)
0
100
200
300
400
500
Dai
ly r
ainf
all (
mm
.day
-1)
TDRSIMRainfall
Efficiency : -0.56R² : 0.90 RMSE : 0.05 m3.m-3
Bias : -0.05 m3.m-3
0
0,1
0,2
0,3
0,4
0,5
0 0,1 0,2 0,3 0,4 0,5
TDR soil moisture (m3.m-3)
Sim
ulat
ed s
oil m
oist
ure
(m3 .m
-3)
Surface soil moistureRoot-zone soil moisture
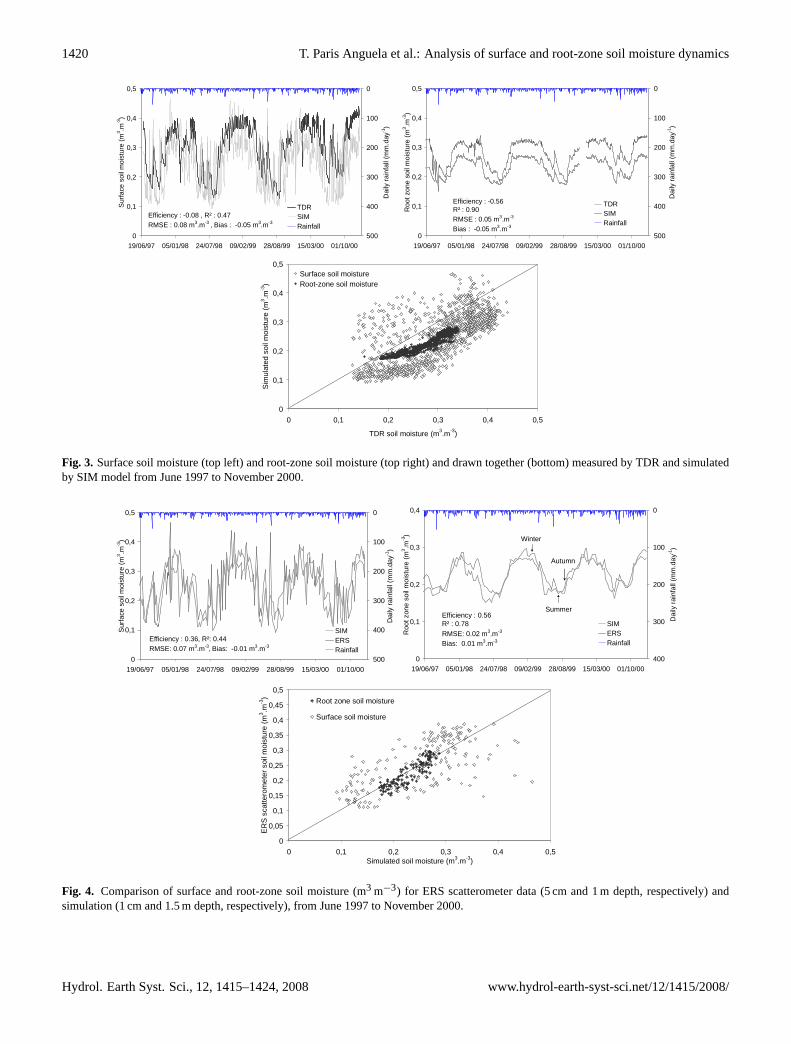
Fig. 3. Surface soil moisture (top left) and root-zone soil moisture (top right) and drawn together (bottom) measured by TDR and simulatedby SIM model from June 1997 to November 2000.
0
0,1
0,2
0,3
0,4
0,5
19/06/97 05/01/98 24/07/98 09/02/99 28/08/99 15/03/00 01/10/00
Sur
face
soi
l moi
stur
e (m
3 .m-3
)
0
100
200
300
400
500
Dai
ly r
ainf
all (
mm
.day
-1)
SIMERSRainfall
Efficiency : 0.36, R²: 0.44RMSE: 0.07 m3.m-3, Bias: -0.01 m3.m-3
0
0,1
0,2
0,3
0,4
19/06/97 05/01/98 24/07/98 09/02/99 28/08/99 15/03/00 01/10/00
Roo
t zon
e so
il m
oist
ure
(m3 .m
-3)
0
100
200
300
400
Dai
ly r
ainf
all (
mm
.day
-1)
SIMERSRainfall
Efficiency : 0.56R² : 0.78 RMSE: 0.02 m3.m-3
Bias: 0.01 m3.m-3
Winter
Summer
Autumn
0
0,05
0,1
0,15
0,2
0,25
0,3
0,35
0,4
0,45
0,5
0 0,1 0,2 0,3 0,4 0,5Simulated soil moisture (m3.m-3)
ER
S s
catte
rom
eter
soi
l moi
stur
e (m
3 .m-3
) Root zone soil moisture
Surface soil moisture
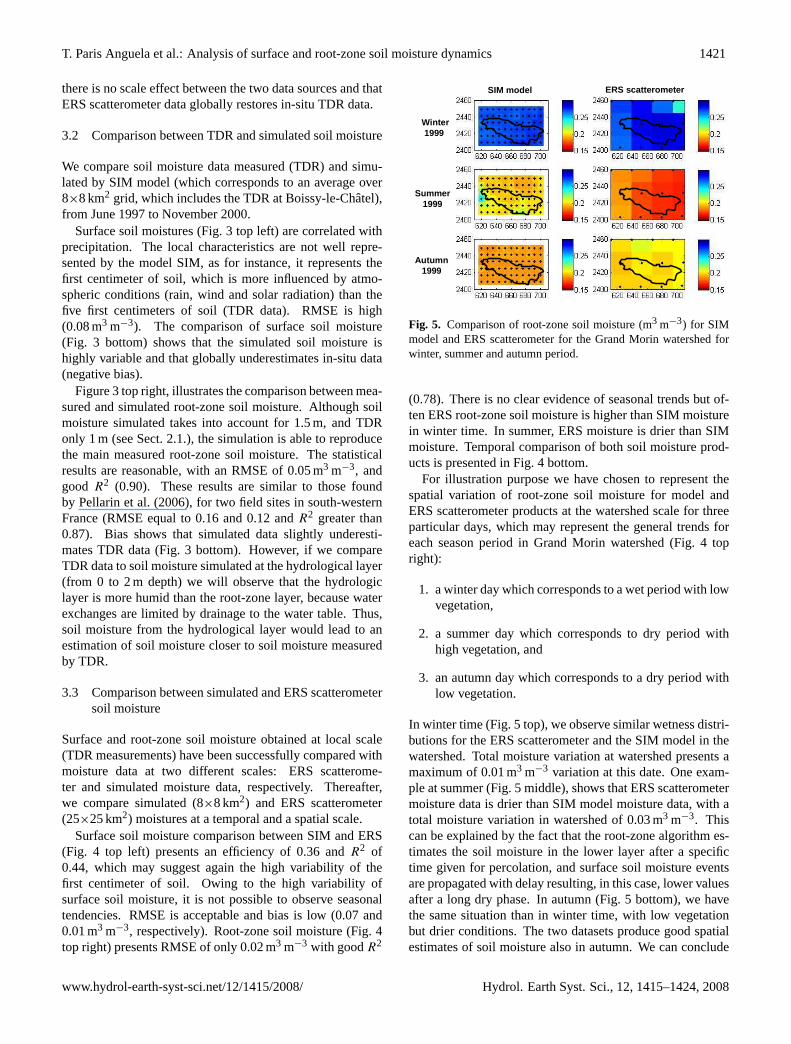
Fig. 4. Comparison of surface and root-zone soil moisture (m3 m−3) for ERS scatterometer data (5 cm and 1 m depth, respectively) andsimulation (1 cm and 1.5 m depth, respectively), from June 1997 to November 2000.
Hydrol. Earth Syst. Sci., 12, 1415–1424, 2008 www.hydrol-earth-syst-sci.net/12/1415/2008/
T. Paris Anguela et al.: Analysis of surface and root-zone soil moisture dynamics 1421
there is no scale effect between the two data sources and thatERS scatterometer data globally restores in-situ TDR data.
3.2 Comparison between TDR and simulated soil moisture
We compare soil moisture data measured (TDR) and simu-lated by SIM model (which corresponds to an average over8×8 km2 grid, which includes the TDR at Boissy-le-Chatel),from June 1997 to November 2000.
Surface soil moistures (Fig. 3 top left) are correlated withprecipitation. The local characteristics are not well repre-sented by the model SIM, as for instance, it represents thefirst centimeter of soil, which is more influenced by atmo-spheric conditions (rain, wind and solar radiation) than thefive first centimeters of soil (TDR data). RMSE is high(0.08 m3 m−3). The comparison of surface soil moisture(Fig. 3 bottom) shows that the simulated soil moisture ishighly variable and that globally underestimates in-situ data(negative bias).
Figure 3 top right, illustrates the comparison between mea-sured and simulated root-zone soil moisture. Although soilmoisture simulated takes into account for 1.5 m, and TDRonly 1 m (see Sect. 2.1.), the simulation is able to reproducethe main measured root-zone soil moisture. The statisticalresults are reasonable, with an RMSE of 0.05 m3 m−3, andgood R2 (0.90). These results are similar to those foundby Pellarin et al. (2006), for two field sites in south-westernFrance (RMSE equal to 0.16 and 0.12 andR2 greater than0.87). Bias shows that simulated data slightly underesti-mates TDR data (Fig. 3 bottom). However, if we compareTDR data to soil moisture simulated at the hydrological layer(from 0 to 2 m depth) we will observe that the hydrologiclayer is more humid than the root-zone layer, because waterexchanges are limited by drainage to the water table. Thus,soil moisture from the hydrological layer would lead to anestimation of soil moisture closer to soil moisture measuredby TDR.
3.3 Comparison between simulated and ERS scatterometersoil moisture
Surface and root-zone soil moisture obtained at local scale(TDR measurements) have been successfully compared withmoisture data at two different scales: ERS scatterome-ter and simulated moisture data, respectively. Thereafter,we compare simulated (8×8 km2) and ERS scatterometer(25×25 km2) moistures at a temporal and a spatial scale.
Surface soil moisture comparison between SIM and ERS(Fig. 4 top left) presents an efficiency of 0.36 andR2 of0.44, which may suggest again the high variability of thefirst centimeter of soil. Owing to the high variability ofsurface soil moisture, it is not possible to observe seasonaltendencies. RMSE is acceptable and bias is low (0.07 and0.01 m3 m−3, respectively). Root-zone soil moisture (Fig. 4top right) presents RMSE of only 0.02 m3 m−3 with goodR2
Winter1999
Summer1999
Autumn1999
SIM model ERS scatterometer
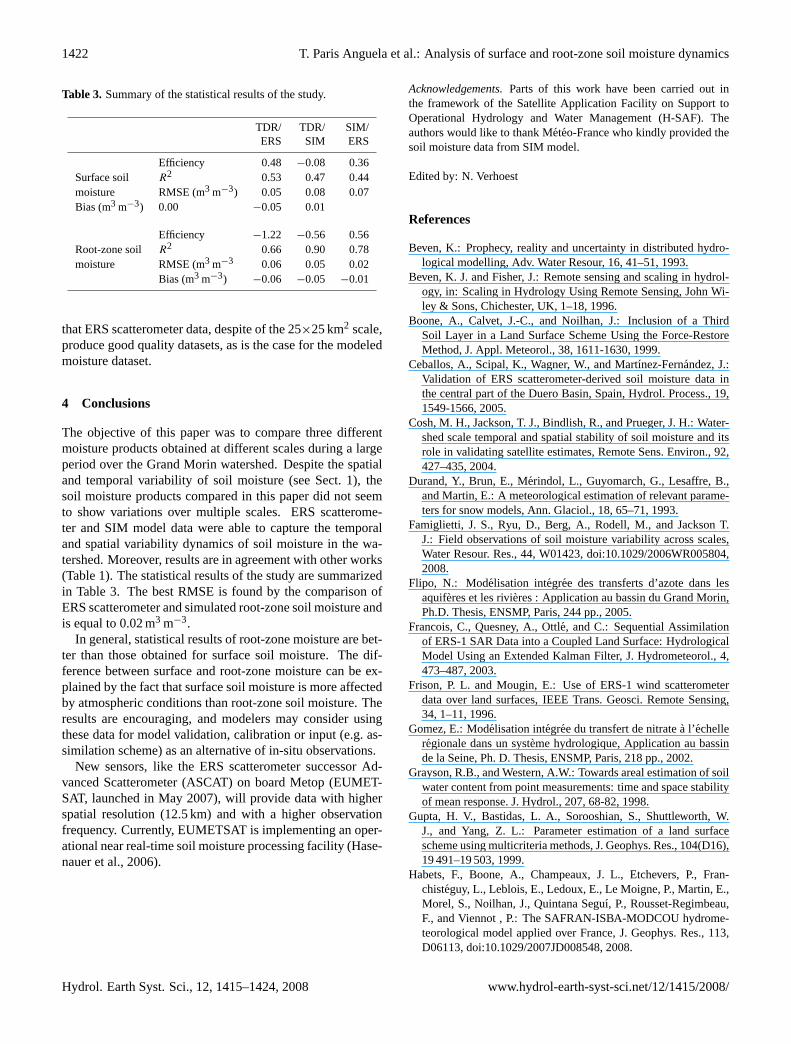
Fig. 5. Comparison of root-zone soil moisture (m3 m−3) for SIMmodel and ERS scatterometer for the Grand Morin watershed forwinter, summer and autumn period.
(0.78). There is no clear evidence of seasonal trends but of-ten ERS root-zone soil moisture is higher than SIM moisturein winter time. In summer, ERS moisture is drier than SIMmoisture. Temporal comparison of both soil moisture prod-ucts is presented in Fig. 4 bottom.
For illustration purpose we have chosen to represent thespatial variation of root-zone soil moisture for model andERS scatterometer products at the watershed scale for threeparticular days, which may represent the general trends foreach season period in Grand Morin watershed (Fig. 4 topright):
1. a winter day which corresponds to a wet period with lowvegetation,
2. a summer day which corresponds to dry period withhigh vegetation, and
3. an autumn day which corresponds to a dry period withlow vegetation.
In winter time (Fig. 5 top), we observe similar wetness distri-butions for the ERS scatterometer and the SIM model in thewatershed. Total moisture variation at watershed presents amaximum of 0.01 m3 m−3 variation at this date. One exam-ple at summer (Fig. 5 middle), shows that ERS scatterometermoisture data is drier than SIM model moisture data, with atotal moisture variation in watershed of 0.03 m3 m−3. Thiscan be explained by the fact that the root-zone algorithm es-timates the soil moisture in the lower layer after a specifictime given for percolation, and surface soil moisture eventsare propagated with delay resulting, in this case, lower valuesafter a long dry phase. In autumn (Fig. 5 bottom), we havethe same situation than in winter time, with low vegetationbut drier conditions. The two datasets produce good spatialestimates of soil moisture also in autumn. We can conclude
www.hydrol-earth-syst-sci.net/12/1415/2008/ Hydrol. Earth Syst. Sci., 12, 1415–1424, 2008
1422 T. Paris Anguela et al.: Analysis of surface and root-zone soil moisture dynamics
Table 3. Summary of the statistical results of the study.
TDR/ TDR/ SIM/ERS SIM ERS
Efficiency 0.48 −0.08 0.36Surface soil R2 0.53 0.47 0.44moisture RMSE (m3 m−3) 0.05 0.08 0.07Bias (m3 m−3) 0.00 −0.05 0.01
Efficiency −1.22 −0.56 0.56Root-zone soil R2 0.66 0.90 0.78moisture RMSE (m3 m−3 0.06 0.05 0.02
Bias (m3 m−3) −0.06 −0.05 −0.01
that ERS scatterometer data, despite of the 25×25 km2 scale,produce good quality datasets, as is the case for the modeledmoisture dataset.
4 Conclusions
The objective of this paper was to compare three differentmoisture products obtained at different scales during a largeperiod over the Grand Morin watershed. Despite the spatialand temporal variability of soil moisture (see Sect. 1), thesoil moisture products compared in this paper did not seemto show variations over multiple scales. ERS scatterome-ter and SIM model data were able to capture the temporaland spatial variability dynamics of soil moisture in the wa-tershed. Moreover, results are in agreement with other works(Table 1). The statistical results of the study are summarizedin Table 3. The best RMSE is found by the comparison ofERS scatterometer and simulated root-zone soil moisture andis equal to 0.02 m3 m−3.
In general, statistical results of root-zone moisture are bet-ter than those obtained for surface soil moisture. The dif-ference between surface and root-zone moisture can be ex-plained by the fact that surface soil moisture is more affectedby atmospheric conditions than root-zone soil moisture. Theresults are encouraging, and modelers may consider usingthese data for model validation, calibration or input (e.g. as-similation scheme) as an alternative of in-situ observations.
New sensors, like the ERS scatterometer successor Ad-vanced Scatterometer (ASCAT) on board Metop (EUMET-SAT, launched in May 2007), will provide data with higherspatial resolution (12.5 km) and with a higher observationfrequency. Currently, EUMETSAT is implementing an oper-ational near real-time soil moisture processing facility (Hase-nauer et al., 2006).
Acknowledgements.Parts of this work have been carried out inthe framework of the Satellite Application Facility on Support toOperational Hydrology and Water Management (H-SAF). Theauthors would like to thank Meteo-France who kindly provided thesoil moisture data from SIM model.
Edited by: N. Verhoest
References
Beven, K.: Prophecy, reality and uncertainty in distributed hydro-logical modelling, Adv. Water Resour, 16, 41–51, 1993.
Beven, K. J. and Fisher, J.: Remote sensing and scaling in hydrol-ogy, in: Scaling in Hydrology Using Remote Sensing, John Wi-ley & Sons, Chichester, UK, 1–18, 1996.
Boone, A., Calvet, J.-C., and Noilhan, J.: Inclusion of a ThirdSoil Layer in a Land Surface Scheme Using the Force-RestoreMethod, J. Appl. Meteorol., 38, 1611-1630, 1999.
Ceballos, A., Scipal, K., Wagner, W., and Martınez-Fernandez, J.:Validation of ERS scatterometer-derived soil moisture data inthe central part of the Duero Basin, Spain, Hydrol. Process., 19,1549-1566, 2005.
Cosh, M. H., Jackson, T. J., Bindlish, R., and Prueger, J. H.: Water-shed scale temporal and spatial stability of soil moisture and itsrole in validating satellite estimates, Remote Sens. Environ., 92,427–435, 2004.
Durand, Y., Brun, E., Merindol, L., Guyomarch, G., Lesaffre, B.,and Martin, E.: A meteorological estimation of relevant parame-ters for snow models, Ann. Glaciol., 18, 65–71, 1993.
Famiglietti, J. S., Ryu, D., Berg, A., Rodell, M., and Jackson T.J.: Field observations of soil moisture variability across scales,Water Resour. Res., 44, W01423, doi:10.1029/2006WR005804,2008.
Flipo, N.: Modelisation integree des transferts d’azote dans lesaquiferes et les rivieres : Application au bassin du Grand Morin,Ph.D. Thesis, ENSMP, Paris, 244 pp., 2005.
Francois, C., Quesney, A., Ottle, and C.: Sequential Assimilationof ERS-1 SAR Data into a Coupled Land Surface: HydrologicalModel Using an Extended Kalman Filter, J. Hydrometeorol., 4,473–487, 2003.
Frison, P. L. and Mougin, E.: Use of ERS-1 wind scatterometerdata over land surfaces, IEEE Trans. Geosci. Remote Sensing,34, 1–11, 1996.
Gomez, E.: Modelisation integree du transfert de nitratea l’echelleregionale dans un systeme hydrologique, Application au bassinde la Seine, Ph. D. Thesis, ENSMP, Paris, 218 pp., 2002.
Grayson, R.B., and Western, A.W.: Towards areal estimation of soilwater content from point measurements: time and space stabilityof mean response. J. Hydrol., 207, 68-82, 1998.
Gupta, H. V., Bastidas, L. A., Sorooshian, S., Shuttleworth, W.J., and Yang, Z. L.: Parameter estimation of a land surfacescheme using multicriteria methods, J. Geophys. Res., 104(D16),19 491–19 503, 1999.
Habets, F., Boone, A., Champeaux, J. L., Etchevers, P., Fran-chisteguy, L., Leblois, E., Ledoux, E., Le Moigne, P., Martin, E.,Morel, S., Noilhan, J., Quintana Seguı, P., Rousset-Regimbeau,F., and Viennot , P.: The SAFRAN-ISBA-MODCOU hydrome-teorological model applied over France, J. Geophys. Res., 113,D06113, doi:10.1029/2007JD008548, 2008.
Hydrol. Earth Syst. Sci., 12, 1415–1424, 2008 www.hydrol-earth-syst-sci.net/12/1415/2008/
T. Paris Anguela et al.: Analysis of surface and root-zone soil moisture dynamics 1423
Habets, F., Noilhan, J., Golaz, C., Goutorbe, J. P., Lacarrere, P.,Leblois, E., Ledoux, E., Martin, E., Ottle, C., and Vidal-Madjar,D.: The ISBA surface scheme in a macroscale hydrologicalmodel applied to the Hapex-Mobilhy area: Part I: Model anddatabase, J. Hydrol., 217, 75–96, 1999.
Hasenauer, S., Wagner, W., Scipal, K., Naeimi, V., Bartalis, Z.:Implementation of near real time soil moisture products in theSAF network based on METOP ASCAT data, Proceedings of theEUMETSAT Meteorological Satellite Conference, 12–16 June2006, Helsinki, Finland, 2006.
Houser, P. R., Shuttleworth, W. J., Famiglietti, J. S., Gupta, H. V.,Syed, K. H., and Goodrich, D. C.: Integration of Soil MoistureRemote Sensing and Hydrologic Modeling Using Data Assimi-lation, Water Resour. Res., 34, 3405–3420, 1998.
Jacobs, J.M., Mohanty, B.P., Hsu, E.C., and Miller, D.: SMEX02:Field scale variability, time stability and similarity of soil mois-ture, Remote Sens. Environ., 92, 436–46, 2004.
Jackson, T. J., Schmugge, J., and Engman, E. T.: Remote sensingapplications to hydrology: soil moisture, Hydrolog. Sci. J., 41(4),517–530, 1996.
Koster, R., Suarez, M., Higgins, R., and van den Dool, H.: Observa-tional evidence that soil moisture variations affect precipitation,Geophys. Res. Lett., 30(5), 1241, doi:10.1029/2002GL016571,2003.
Le Hegarat-Mascle, S., Zribi, M., Alem, F., Weisse, A., and Lou-magne, C.: Soil moisture estimation from ERS/SAR data: to-ward an operational methodology, IEEE T. Geosci. Remote,40(12), 2647–2658, 2002.
Le Morvan, A., Zribi, M., Baghdadi, N., and Chanzy, A.: SoilMoisture Profile Effect on Radar Signal Measurement, Sensors,8, 256–270, 2008.
Ledoux, E., Girard, G., Marsilly, G., and Deschenes, J.: Spatiallydistributed modelling: conceptual approach, coupling surfacewater and groundwater, in: Unsatured Flow Hydrologic Mod-eling – Theory and Practice, edited by: Morel-Seytoux, H. J.,Kluwer Academic Publishers, Norwell, Mass., 435–454, 1989.
Mohanty, B. P. and Skaggs, T. H.: Spatio-temporal evolution andtime-stable characteristics of soil moisture within remote sensingfootprints with varying soil, slope, and vegetation, Adv. Water.Resour., 24, 1051–67, 2001.
Nash, J. E. and Sutcliffe, J. V.: Riverflow forecasting through con-ceptual models, discussion of principles, J. Hydrol., 10(3), 282–290, 1970.
Noilhan, J. and Planton, S.: A Simple Parameterization of Land Sur-face Processes for Meteorological Models, Mon. Weather Rev.,117, 536-549, 1989.
Oudin, L., Weisse, A., Loumagne, C., and Le Hegarat-Mascle, S.:Assimilation of soil moisture into hydrological models for floodforecasting: a variational approach, Can. J. Remote Sens., 29,679–686, 2003.
Pellarin, T., Calvet, J.-C., and Wagner, W.: Evaluation of ERSscatterometer soil moisture products over a half-degree re-gion in southwestern France, Geophys. Res. Lett., 33, L17401,doi:17410.11029/12006GL027231, 2006.
Quesney, A., Ottle, C., Francois, C. Le Hegarat-Mascle, S.,Loumagne, C., and Normand, M.: Sequential assimilation ofSAR/ERS data in a lumped rainfall-runoff model with an ex-tend Kalman filter, in: Remote Sensing and Hydrology, editedby: Owe, M., Brubaker, K., Ritchie, J., and Rango, A., IASH
Red Book Publication, 267, 495–498, 2001.Quintana Seguı, P., Le Moigne, P., Durand, Y., Martin, E., Habets,
F., Baillon, M., Canellas, C., Franchisteguy, L., and Morel, S.:Analysis of Near-Surface Atmospheric Variables: Validation ofthe SAFRAN Analysis over France, J. Appl. Meteorol. Clim., 47,92–107, 2008.
Reichle, R. H., Koster, R. D., Liu, P., Mahanama, S. P. P., Njoku,E. G., and Owe, M.: Comparison and assimilation of globalsoil moisture retrievals from the Advanced Microwave Scan-ning Radiometer for the Earth Observing System (AMSR-E) andthe Scanning Multichannel Microwave Radiometer (SMMR), J.Geophys. Res., 112, D09108, doi:10.1029/2006JD008033, 2007.
Rousset, F., Habets, F., Gomez, E., Le Moigne, P., Morel,S., Noilhan, J., and Ledoux, E.: Hydrometeorologi-cal modeling of the Seine basin using the SAFRAN-ISBA-MODCOU system, J. Geophys. Res., 109, D14105,doi:14110.11029/12003JD004403, 2004.
Rudiger, C., Calvet, J.C., Gruhier, C., Holmes, T., de Jeu, T., andWagner, W.: An Intercomparison of ERS-Scat and AMSRE SoilMoisture Observations with Model Simulations over France, J.Hydrometeorol., in press, 2008.
Sabater, J. M., Jarlan, L., Calvet, J. C., Bouyssel, F., and De Rosnay,P.: From Near-Surface to Root-Zone Soil Moisture Using Dif-ferent Assimilation Techniques, J. Hydrometeorol., 8, 194-206,2007.
Scipal, K., Scheffler, C., and Wagner, W.: Soil moisture-runoff re-lation at the catchment scale as observed with coarse resolutionmicrowave remote sensing, Hydrol. Earth Syst. Sci., 9, 173–183,2005,http://www.hydrol-earth-syst-sci.net/9/173/2005/.
Teuling, A. J. and Troch, P. A.: Improved understanding of soilmoisture variability dynamics, Geophys. Res. Lett., 32, L05404,doi:10.1029/2004GL021935, 2005.
Vachaud, G., Passerat de Silans, A., Balabanis, P., and Vauclin, M.:Temporal stability of spatially measured soil water probabilitydensity function, Soil Sci. Soc. Am. J., 49, 822–828, 1985.
Verstraeten, W. W., Veroustraete, F., van der Sande, C. J., Grootaers,I., and Feyen, J.: Soil moisture retrieval using thermal inertia, de-termined with visible and thermal spaceborne data, validated forEuropean forests, Remote Sens. Environ., 101, 299-314, 2006.
Wagner, W.: Soil Moisture Retrieval from ERS Scatterometer Data,PhD dissertation, Vienna University of Technology, Austria,1998.
Wagner, W., Lemoine, G., Borgeaud, M., and Rott, H.: A studyof vegetation cover effects on ERS scatterometer data, IEEEGeosci. Remote, 37b, 938–948, 1999b.
Wagner, W., Lemoine, G., and Rott, H.: A method for EstimatingSoil Moisture from ERS Scatterometer and Soil Data, RemoteSens. Environ., 70, 191–207, 1999c.
Wagner, W., Noll, J., Borgeaud, M., and Rott, H.: Monitoring soilmoisture over the Canadian Prairies with the ERS scatterometer,IEEE Geosci. Remote, 37a, 206–216, 1999a.
Wagner, W., and Scipal, K.: Large-scale soil moisture mapping inwestern Africa using the ERS scatterometer, IEEE T. Geosci. Re-mote, 28, 1777-1782, 2000.
Wagner, W., Scipal, K., Pathe, C., Gerten, D., Lucht, W., andRudolf, B.: Evaluation of the agreement between the first globalremotely sensed soil moisture data with model and precipitationdata, J. Geophys. Res.-Atmos., 108, 4611-4626, 2003.
www.hydrol-earth-syst-sci.net/12/1415/2008/ Hydrol. Earth Syst. Sci., 12, 1415–1424, 2008

1424 T. Paris Anguela et al.: Analysis of surface and root-zone soil moisture dynamics
Walker, J. P., and Houser, P. R.: A methodology for initializing soilmoisture in a global climate model: Assimilation of near-surfacesoil moisture observations, J. Geophys. Res., 106(D11), 11 761–11 774, 2001.
Weisse, A., Le Hegarat-Mascle, S., Aubert, D., and Loumagne, C.:The European AIMWATER project: using surface soil moisturemonitoring from ERS/SAR for the rainfall-runoff modelisation,Houille Blanche, 1, 35–40, 2002.
Zribi, M., Le Hegarat-Mascle, S., Ottle, C., Kammoun, B., andGuerin, C.: Surface soil moisture estimation from the synergis-tic use of the (multi-incidence and multi-resolution) active mi-crowave ERS Wind Scatterometer and SAR data, Remote Sens.Environ., 86, 30–41, 2003.
Hydrol. Earth Syst. Sci., 12, 1415–1424, 2008 www.hydrol-earth-syst-sci.net/12/1415/2008/