analysis of customer lifetime value and marketing expenditure decisions through a markovian-based...
TRANSCRIPT

European Journal of Operational Research xxx (2014) xxx–xxx
Contents lists available at ScienceDirect
European Journal of Operational Research
journal homepage: www.elsevier .com/locate /e jor
Innovative Applications of O.R.
Analysis of customer lifetime value and marketing expenditure decisionsthrough a Markovian-based model
0377-2217/$ - see front matter � 2014 Elsevier B.V. All rights reserved.http://dx.doi.org/10.1016/j.ejor.2014.01.014
⇑ Corresponding author. Address: Istanbul Bilgi University, SantralIstanbul Cam-pus, Kazım Karabekir Cad. No: 2/13, Eyup, Istanbul, Turkey. Tel.: +90 212 311 73 65;fax: +90 212 625 30 86.
E-mail address: [email protected] (Y. Ekinci).
Please cite this article in press as: Ekinci, Y., et al. Analysis of customer lifetime value and marketing expenditure decisions through a Markovianmodel. European Journal of Operational Research (2014), http://dx.doi.org/10.1016/j.ejor.2014.01.014
Yeliz Ekinci a,⇑, Füsun Ülengin b, Nimet Uray c, Burç Ülengin c
a Industrial Engineering, Istanbul Bilgi University, Istanbul, Turkeyb Sabanci School of Management, Sabanci University, Istanbul, Turkeyc Management Engineering, Istanbul Technical University, Istanbul, Turkey
a r t i c l e i n f o
Article history:Received 27 April 2012Accepted 7 January 2014Available online xxxx
Keywords:Customer lifetime valueForecast modelsMarkov decision process
a b s t r a c t
The general aim of this study is to provide a guide to the future marketing decisions of a firm, using amodel to predict customer lifetime values. The proposed framework aims to eliminate the limitationsand drawbacks of the majority of models encountered in the literature through a simple and industry-specific model with easily measurable and objective indicators. In addition, this model predicts thepotential value of the current customers rather than measuring the current value, which has generallybeen used in the majority of previous studies. This study contributes to the literature by helping to makefuture marketing decisions via Markov decision processes for a company that offers several types of prod-ucts. Another contribution is that the states for Markov decision processes are also generated using thepredicted customer lifetime values where the prediction is realized by a regression-based model. Finally,a real world application of the proposed model is provided in the banking sector to show the empiricalvalidity of the model. Therefore, we believe that the proposed framework and the developed model canguide both practitioners and researchers.
� 2014 Elsevier B.V. All rights reserved.
1. Introduction
In recent times, firms have been increasing their focus on estab-lishing and maintaining good customer relations during the cus-tomers’ life in the firm (Haenlein, Kaplan, & Beeser, 2007), andhence, researchers and practitioners have realized the importanceof the lifetime value of customers. Customer lifetime value (CLV)can be defined as the present value of all future profits obtainedfrom a customer over the life of his or her relationship with a firm(Gupta et al., 2006). Researches on optimal marketing decisionswith the objective of maximizing CLV and also predicting the po-tential CLV, have been scarce. In addition, those studies were basedon many assumptions and mostly did not present empirically validmodels since they are mostly theoretical (Jain & Singh, 2002). Fur-thermore, they concentrated on the optimal marketing strategy forcompanies that offer only one type of product or service such asinternet usage and flight tickets. Hence, they used recency–fre-quency–monetary (RFM) variables to define the different marketsegments based on CLV (Ching, Ng, Wong, & Altman, 2004; Labbi& Berrospi, 2007). However, this may not be appropriate forcompanies offering more than one type of product or service. In
fact, for the latter case, many RFM values exist and this makes itimpossible to apply the former models.
The aim of this study is, thus, to develop a simple model toguide future marketing decisions via Markov decision processesfor a company that offers several types of products. This is realizedby using predicted potential customer values and making predic-tion through a regression-based model. The resulting model willdetermine the segments of customers based on their profitabilityvalues. For this purpose, we use the customer pyramid approach,which segments the customers according to their contributionsto the profitability of the company. Finally, in order to show itsempirical validity, the proposed model is applied to a specific bankthat offers a wide range of services and products. Thus, this studyaims to eliminate the important drawback of previous CLV-basedstudies, which consider general indicators rather than industry-specific attributes. This real world application of the proposedframework is another important contribution to the literaturebecause the applicability of the previous studies is generally ques-tioned. To the best of our knowledge, there has been no studyabout the integration of the planning of future marketing with po-tential CLV predictions. Therefore, we believe that the proposedframework and the developed model can guide both practitionersand researchers.
Section 2 gives a summary of the previous studies. Section 3presents brief information on Markov decision processes andSection 4 provides the proposed framework. Fifth section
-based

2 Y. Ekinci et al. / European Journal of Operational Research xxx (2014) xxx–xxx
demonstrates the proposed framework with an application in thebanking sector. The last section presents conclusions and areasfor future research.
2. Literature review on the use and measurement of CLV
Studies on the use of CLV for marketing decisions can begrouped based on division of the calculations (measurements) ofCLV into two broad categories: those that solely predict CLV andthose that maximize CLV. Most of the studies that only predictthe potential CLV are based on many assumptions (e.g. Aeron,Bhaskar, Sundararajan, Kumar, & Moorthy, 2008; Chan, Ip, & Cho,2010; Jain & Singh, 2002; Venkatesan, Kumar, & Bohling, 2007).In addition, as mentioned by Jain and Singh (2002), the empiricalvalidation of many models is lacking (e.g. Chin Liu, Petruzzi, &Sudharshan, 2007; Ho, Park, & Zhou, 2006). Jain and Singh (2002)also state that most CLV models do not include demographicsand product usage variables, which are crucial and should be con-sidered in the CLV prediction models. Furthermore, most of themodels trying to predict CLV deal with deterministic cash flowstreams from the customers (e.g. Berger & Bechwati, 2001; Ryals& Knox, 2005). Our review of the studies about the prediction ofCLV shows that regression-based forecast models, despite theirsimplicity, perform better (Benoit & Van den Poel, 2009; Donkers,Verhoef, & de Jong, 2007; Malthouse & Blattberg, 2005). Thesemodels also eliminate the drawbacks mentioned by Jain and Singh(2002) by considering many variables simultaneously. In the stud-ies that purely predict CLV, the variables are as follows: the typeand intensity of product ownership (Gelbrich & Nakhaeizadeh,2000; Haenlein et al., 2007); the customer activity level (Haenleinet al., 2007; Jain & Singh, 2002); the age and demographic/lifestylevariables (Haenlein et al., 2007); acquisiton–retention expensesand probabilities (Jain & Singh, 2002); recency values (Jain & Singh,2002; Shih & Liu, 2003); frequency values (Borle, Singh, & Jain,2008; Gelbrich & Nakhaeizadeh, 2000; Shih & Liu, 2003); purchas-ing probabilities (Donkers et al., 2007); income of the customer(Gelbrich & Nakhaeizadeh, 2000); lifetime of the customer (Borleet al., 2008) and monetary values. In fact, the purchase amountsand values are the common variables/indicators used in all of thestudies.
A second group of studies on CLV are based on its applicationareas. Within this group, studies about optimization problemsrelated to CLV are scarce and include Ching et al. (2004), Jonker,Piersma, and Poel (2004), Labbi and Berrospi (2007), Piersma andJonker (2004) and Venkatesan et al. (2007). The first four studiesuse stochastic dynamic programming, whereas Venkatesan et al.(2007) use Bayesian decision theory. The application areas forthese studies are advertising and promotion decisions, optimalmailing policy, customer selection for marketing actions, optimalpromotion strategy and mailing frequency problems.
Our review of these studies shows that the determination ofoptimal promotion with the objective of maximizing customerlifetime value is still underutilized. This is because the previousstudies solved the optimization problem for companies that offeronly one type of product or service (e.g. internet usage, flight tick-ets) and because some of them concentrated only on one type ofmarketing action. Additionally, the previous studies generallydetermined the segments, which are called states in a stochasticdynamic problem, via RFM variables as the indicators of CLV.
Contrary to the previous studies, which deal with companiesoffering only one type of product, more than one RFM value existswhen the number of products offered increases. Furthermore,there might be differences in terms of the number of productsowned by each customer. In this case, it becomes impossible tocreate a standard RFM variable for each customer. To overcome
Please cite this article in press as: Ekinci, Y., et al. Analysis of customer lifetimmodel. European Journal of Operational Research (2014), http://dx.doi.org/10.10
this problem, this study determines the different states by usingcustomer values for a company that offers more than one type ofproduct.
All firms are usually aware that their customers differ in profit-ability, and they generally divide their customers into differentsegments based on the profitability of each customer. The tradi-tional classification has often been called the ‘‘80/20 rule’’ – 20%of customers produce 80% of sales or value to the company. Zei-thaml, Rust, and Lemon (2001) claim, however, that this ‘‘best’’(20%) and ‘‘remaining’’ (80%) customer division is rarely sufficient.They add that, once a system has been established for categorizingcustomers, multiple levels can be identified, motivated and servedand can then be expected to deliver differential levels of profit.They propose a framework called the Customer Pyramid thatcontains four levels (Zeithaml et al., 2001). Storbacka (1997) alsoproposes dividing the customer base into four groups. The bottomsegment consists of the 20% least profitable customers, the secondsegment consists of the next 30%, the third includes the next 30%and, finally, the top 20% constitutes the most profitable segment.Since RFM based segmentation is not considered to be suitablefor companies offering more than one type of product, CustomerPyramid based segmentation is used in this paper.
3. Methods used for the optimization of CLV: stochasticdynamic programming and Markov decision processes
Stochastic dynamic programming and Markov DecisionProcesses (MDP) have a long history in CLV studies (Morrison,Chen, Karpis, & Britney 1982; Pfeifer & Carraway, 2000; Rust,Lemon, & Zeithamal, 2004). Stochastic programming is a frame-work for modeling optimization problems that involve uncertainty.Stochastic programming models take advantage of the fact thatprobability distributions governing the data are known or can beestimated. The goal here is to find some policy that is feasible forall possible data instances and maximizes the expectation of somefunction of the decisions and the random variables. More generally,such models are formulated, solved analytically or numerically,and analyzed in order to provide useful information to adecision-maker (Ross, 2000).
Stochastic dynamic programming is roughly introduced here,the interested reader is referred to (Puterman, 2005) for more de-tails. In the area of stochastic dynamic programming, one shouldkeep one property of the dynamic programming algorithm, namelythat there will be one decision for each state in each stage, but itwill no longer be possible to plan for the whole period ahead oftime. Decisions for all but the first period will depend on what hap-pens in the mean time (Kall & Wallace, 1994). It is considered thata dynamical system that stochastically evolves in time dependingupon your decision and it is assumed that time is discrete andhas finitely or infinitely many time steps (Gelly, Mary, & Teytaud,2006).
MDPs, also referred to as discrete stochastic dynamic program-ming or stochastic control problems, are models for sequentialdecision making when outcomes are uncertain. MDPs allow theintroduction of uncertainty into the effects of actions, the modelingof uncertain exogenous events, the presence of multiple, priori-tized objectives, and the solution of nonterminating process-ori-ented problems (Atkeson, Moore, & Schaal, 1997). MDPs can beviewed as stochastic automata in which actions have uncertain ef-fects, inducing stochastic transitions between states, and in whichthe precise state of the system is known only with a certain prob-ability. In addition, the expected value of a certain course of actionis a function of the transitions it induces, allowing rewards to beassociated with different aspects of the problem rather than withan all-or-nothing goal proposition (Borrero & Akhavan-Tabatabaei,
e value and marketing expenditure decisions through a Markovian-based16/j.ejor.2014.01.014

Y. Ekinci et al. / European Journal of Operational Research xxx (2014) xxx–xxx 3
2013). Finally, plans can be optimized over a fixed finite period oftime, or over an infinite horizon, the latter is suitable for modelingongoing processes. These make MDPs ideal models for manydecision theoretic planning problems (Boutilier, Dearden, &Goldszmidt, 2000).
In the Markov Decision Processes (MDP), at each time step, theprocess is in some state s, and the decision maker may choose anyaction a that is available in states. The process responds at the nexttime step by randomly moving into a new state s0, and giving thedecision maker a corresponding reward Ra(s,s0). The probability thatthe process chooses s0 as its new state is influenced by the chosenaction. Specifically, it is given by the state transition function Pa(-s,s0). Thus, the next state s0 depends on the current state s and thedecision maker’s action a. But given s and a, it is conditionally inde-pendent of all previous states and actions; in other words, the statetransitions of an MDP possess the Markov property. Markov decisionprocesses are an extension of Markov chains; the difference is theaddition of actions (allowing choice) and rewards (giving motiva-tion). Conversely, and ignoring rewards, if only one action existsfor each state, a Markov Decision Process (MDP) reduces to a Mar-kov chain. Following these definitions, the problem of solving theoptimal promotion strategy can be fitted into the framework ofstochastic dynamic programming models (Winston, 1994).
The problem of solving the optimal promotion strategy can befitted into the above explained framework since the companiestry to find optimal policies which maximize their profitabilitiesunder some uncertainty and probability.
4. Proposed framework for CLV measurement
The general aim of this study is to develop a simple, applicablemodel, using predicted potential customer values, that provides aguide for future marketing decisions. Under this general aim, thespecific objectives are:
1. to determine the variables that are significant for measuringcustomer potential values in the banking industry,
2. to develop a model that measures the customer potentialvalues,
3. to develop a guide indicating the future marketing strategies forcustomers based on the estimated potential CLVs.
Although CLV is the value of a customer’s entire lifetime with thecompany, forecasts in the literature usually focus on a short timeperiod (Donkers et al., 2007; Gurau & Ranchhod, 2002; Malthouse& Blattberg, 2005; Mulhern, 1999) because the models incorporat-ing predicted future purchases for a long time period are subjectto a great deal of forecasting error (Mulhern, 1999). Also, most com-panies focus their marketing plans on the next year. For this reason,as is the case in Malthouse and Blattberg (2005) and Donkers et al.(2007), the proposed framework tries to estimate the value of thecustomer for a short time period, namely one year. For this purpose,the variables used in the previous studies, together with theadditional indicators derived from our exploratory researchthrough in-depth interviews, are analyzed based on a regressionmodel similar to those of Benoit and Van den Poel (2009), Donkerset al. (2007) and Malthouse and Blattberg (2005). Expert opinionhas assisted the discovery of additional variables that are relevantto both the banking industry and Turkey as a country.
The proposed framework is composed of the following steps:
4.1. Step 1. Determination of decision areas and variables of CLV vialiterature survey and exploratory study
The variables that are going to be used in the annual customervalue prediction model and the aims of the CLV maximization
Please cite this article in press as: Ekinci, Y., et al. Analysis of customer lifetimmodel. European Journal of Operational Research (2014), http://dx.doi.org/10.10
model are determined according to the exploratory study and liter-ature survey.
In addition to the literature review, in-depth interviews areconducted with experts in the banking industry in order to developan industry-specific CLV model. CLV measurement is easier andmore applicable for companies that maintain continuous relation-ships with a substantial percentage of customers and can therebycustomize marketing ‘‘investments’’, at least to some extent, acrosscustomers. Such companies include hotels, airlines, credit cardcompanies, banks and financial service providers, companies thatsell over the internet, telecommunications companies, cataloguers,retail stores with ‘‘loyalty/frequent-shopper’’ programmes, pub-lishers and computer companies that sell direct to consumers.These kinds of companies are operating mostly in serviceindustries and are also called database marketing companies inthe literature (Malthouse & Blattberg, 2005). We selected the bank-ing sector for this study and conducted in-depth interviews withexperts from 11 banks operating in Turkish banking industry. In or-der to reveal the use of CLV in this sector, eight of those banks aredeposit banks while three of them are non-deposit banks. Amongthose banks, seven are privately owned and four are foreign banks.
4.2. Step 2. Data acquisition
The data corresponding to the selected variables are derivedfrom the database for the years (2008 and 2009) underconsideration.
4.3. Step 3. Comparison of alternative forecasting models to estimatethe next year’s customer values
Using the determined variables, three regression models arebuilt by artificial neural network (ANN) and least square estima-tion (LSE) based regression methods. Eighty percent of the data istaken as the train set and 20% as the test set (Hassoun, 1995;Montgomery, Peck, & Vining, 2007).
4.4. Step 4. Measurement of the performance of the model
The predictive accuracies of the models are calculated by thehit-ratio criterion (Duman, Ekinci, & Tanrıverdi, 2012). This perfor-mance measure is selected in order to compare the results withthose of the previous studies of Donkers et al. (2007) and Malt-house and Blattberg (2005), which used the same criterion. Asone of the aims of CLV analysis is to ascertain the most profitablecustomers, the hit ratio is calculated based on the grouping ofcustomers into the top 20% and bottom 80% profitability segments.Following industry experience, the most profitable 20% of thecustomers are assumed to generate 80% of the profits. Once thevalues of the customers are predicted via the regression model,the ratio of the predicted top 20% of customers versus the actualtop 20% of customers and the ratio of the predicted bottom 80%of customers versus the actual bottom 80% of customers are found.
4.5. Step 5. Determination of the states of the customers for next yearvia a segmentation technique
Customers are clustered according to the customer pyramidapproach and the clusters are set as states. Mean customer valuesare calculated for each state.
The clusters are formed based on the annual profit values ofcustomers, as both the literature review on CLV and expert opinionsupport the idea of using customer values for segmentation–tar-geting studies. Therefore, the customer pyramid approach, whichwas explained in the previous section, is used for segmentation.
e value and marketing expenditure decisions through a Markovian-based16/j.ejor.2014.01.014

4 Y. Ekinci et al. / European Journal of Operational Research xxx (2014) xxx–xxx
Using this approach, the states of customers for the year 2009 aredetermined.
4.6. Step 6. Calculation of transition probabilities for segment specificpromotion and no segment specific promotion periods
The marketing actions that are offered to the customers, as wellas their periods, are derived from the data and, from this informa-tion, the transition probabilities between states are found. Statesare the segments determined in Step 5 and actions are ‘‘doing/not doing segment-specific promotion’’. Transition probabilitiesare elements of Markov chains. A Markov chain model is character-ized by an N � N transition matrix, say P, where Pik (i, k = 1,2, . . . ,N)is the transition probability that a customer will move to state k inthe next period given that currently he/she is in state i (the reten-tion probability of a customer in state i (i = 1, . . . ,N) is given by Pii)(Durango-Cohen, 2013).
The transition probabilities across the states are calculated bythe formula:
PikðjÞ ¼# of customers transiting from state i to state k underaction j=# of customers in state i that are offered action j
4.7. Step 7. Determination of discount factor, problem formulation andsolution for maximum CLV
Determination of discount factor. The discount factor is deter-mined. The discount factor is the yearly rate appropriate for invest-ment in marketing. Businesses need to consider the discount factorwhen deciding whether to spend some of their profits on invest-ment or whether to give the profit back to their shareholders. Itis the rate that is used by businesses to discount money with timeto make financial decision that span several years. Therefore, com-panies can form their marketing action plans according to theirforecast of the discount factor based on the conditions of the mar-ket, technology, competition and other environmental dimensions.
(i) Formulation of the problem as stochastic dynamicprogramming.
(ii) Maximization of CLV and the specification of the optimalpromotion decision for each state.
(iii) Comparison of the results with status quo.
As stochastic dynamic programming is the most widely usedtechnique for optimal promotion strategy determination problems(Ching et al., 2004; Ho et al., 2006; Jonker et al., 2004; Labbi & Ber-rospi, 2007; Piersma & Jonker, 2004), the problem in this study isalso formulated as a stochastic dynamic programming model –the Markov decision process (MDP). This maximizes the value foreach state in an infinite horizon. At this point, the annual customer(profit) values turn into CLVs.
In a Markov decision process, the optimal values vi (maximumexpected CLV of a customer in state i) satisfy the following rela-tionship (Ching et al., 2004; Winston, 1994) for each state i andj = 1, . . . ,M:
Vi P maxj¼1;...;M
cðjÞi þ aXN�1
k¼0
pðjÞik vk
( )ð3:1Þ
where vi is the expected CLV of a customer in state i (i = 1, . . . ,N); Mthe total number of marketing actions (j = 1, . . . ,M); pðjÞik the transi-tion probability for the customer to move from state i to state k un-der the jth marketing action in each period; cðjÞi the mean customervalue of state i and a the discount factor.
The solution to the problem gives the maximum expectedlifetime values for customers (CLVs) in each state together with
Please cite this article in press as: Ekinci, Y., et al. Analysis of customer lifetimmodel. European Journal of Operational Research (2014), http://dx.doi.org/10.10
the optimal promotion plan. For the solution of this problem pleaserefer to (Ching et al., 2004; Ross, 2000; Winston, 1994). The valuesobtained from this experiment are compared with the status quo.
4.8. Step 8. Specification of the optimal promotion plan
Section 5 provides the application of the proposed methodologyin the banking sector.
5. Application of the proposed framework to the banking sector
In order to investigate the potential for the practical applicationof the proposed methodology, the banking sector is selected as acase study. There are 49 banks operating in Turkey as of 31 Decem-ber 2009, with 32 being in the commercial banks group, 13 in themerchant banks group, and 4 in the interest free banks group.Among commercial banks, there were 3 state-owned, 11 pri-vately-owned and 17 foreign banks (TBA, 2009).
Banks offer a wide range of services and products. Moreover,they have good customer databases due to the importance of man-aging ongoing relationships with their customers. Our dataset in-cludes the monthly data of 10,000 customers of a bank. It alsoincludes the annual profit values of 10,000 consumer banking cus-tomers for two years.
5.1. Step 1. Determination of decision areas and variables of CLV vialiterature survey and exploratory study
5.1.1. Exploratory study IThe opinions of the experts about the decisions that should be
made in respect of customer lifetime values are obtained fromin-depth interviews. Experts were asked to evaluate the need touse the CLV for different decision areas found in the literature,which are listed in Table 1. They were also asked to add anotheraim other than those listed if they deem it to be necessary. Table 1shows the number of the experts who think that CLV should beused to make the related decision.
As shown in Table 1, nine of the experts believe that CLV shouldbe used for selecting priority customers, as well as for segmenta-tion and targeting. Eight of the experts think it should be usedfor determining when to scale down or discontinue attention to-wards customers and for developing strategies for the marketingmix. Seven believe it should be used for developing strategies todetermine appropriate distribution channels and to derive themarketing budget allocation/optimal promotion while maximizingCLV. One additional decision, which is shown as bold in Table 1,was nominated by three of the experts. Selecting priority custom-ers and segmentation–targeting via customer value topics are fre-quently found to receive the maximum number of votes in similarinterviews referred to in the literature. Accordingly, in this studywe also used CLV to select priority customers and to segment cus-tomers. Although it was not the case in most previous studies inthe literature, determination of an optimal promotion campaign,with the objective of maximizing CLV, was selected as one of themost important decision areas by seven of the experts. Thus, thisstudy aims to fill this gap in the literature by focusing on the roleof CLV as a tool for optimal promotion determination.
5.1.2. Exploratory study IIExperts from the 11 banks were also interviewed to get infor-
mation about their opinion of the necessity of variables found fromthe literature review. Table 2 shows the number of the experts whothink that this variable should be included in a model for CLV mea-surement. Eight additional variables, which are shown in bold inTable 2, were added to this list by some of the experts. Some of
e value and marketing expenditure decisions through a Markovian-based16/j.ejor.2014.01.014
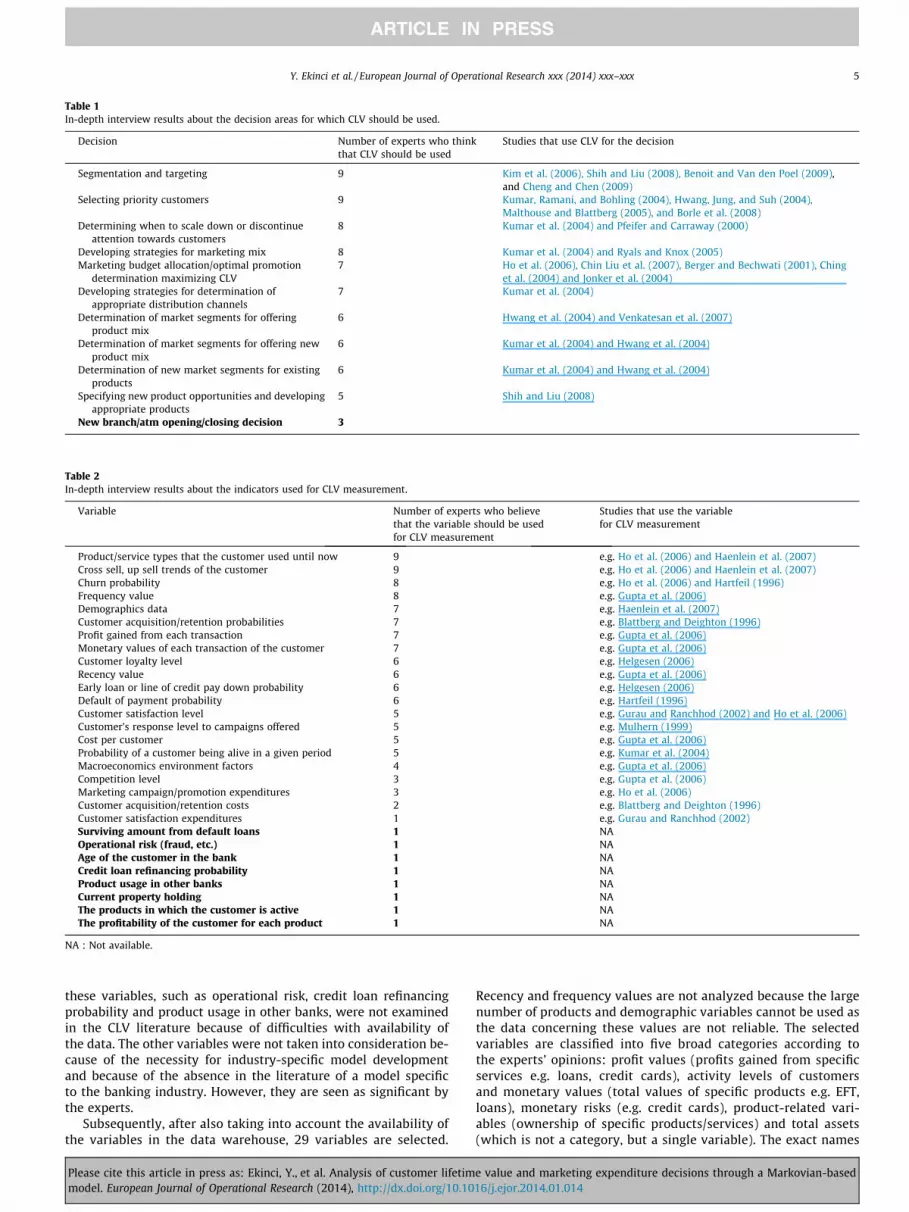
Table 1In-depth interview results about the decision areas for which CLV should be used.
Decision Number of experts who thinkthat CLV should be used
Studies that use CLV for the decision
Segmentation and targeting 9 Kim et al. (2006), Shih and Liu (2008), Benoit and Van den Poel (2009),and Cheng and Chen (2009)
Selecting priority customers 9 Kumar, Ramani, and Bohling (2004), Hwang, Jung, and Suh (2004),Malthouse and Blattberg (2005), and Borle et al. (2008)
Determining when to scale down or discontinueattention towards customers
8 Kumar et al. (2004) and Pfeifer and Carraway (2000)
Developing strategies for marketing mix 8 Kumar et al. (2004) and Ryals and Knox (2005)Marketing budget allocation/optimal promotion
determination maximizing CLV7 Ho et al. (2006), Chin Liu et al. (2007), Berger and Bechwati (2001), Ching
et al. (2004) and Jonker et al. (2004)Developing strategies for determination of
appropriate distribution channels7 Kumar et al. (2004)
Determination of market segments for offeringproduct mix
6 Hwang et al. (2004) and Venkatesan et al. (2007)
Determination of market segments for offering newproduct mix
6 Kumar et al. (2004) and Hwang et al. (2004)
Determination of new market segments for existingproducts
6 Kumar et al. (2004) and Hwang et al. (2004)
Specifying new product opportunities and developingappropriate products
5 Shih and Liu (2008)
New branch/atm opening/closing decision 3
Table 2In-depth interview results about the indicators used for CLV measurement.
Variable Number of experts who believethat the variable should be usedfor CLV measurement
Studies that use the variablefor CLV measurement
Product/service types that the customer used until now 9 e.g. Ho et al. (2006) and Haenlein et al. (2007)Cross sell, up sell trends of the customer 9 e.g. Ho et al. (2006) and Haenlein et al. (2007)Churn probability 8 e.g. Ho et al. (2006) and Hartfeil (1996)Frequency value 8 e.g. Gupta et al. (2006)Demographics data 7 e.g. Haenlein et al. (2007)Customer acquisition/retention probabilities 7 e.g. Blattberg and Deighton (1996)Profit gained from each transaction 7 e.g. Gupta et al. (2006)Monetary values of each transaction of the customer 7 e.g. Gupta et al. (2006)Customer loyalty level 6 e.g. Helgesen (2006)Recency value 6 e.g. Gupta et al. (2006)Early loan or line of credit pay down probability 6 e.g. Helgesen (2006)Default of payment probability 6 e.g. Hartfeil (1996)Customer satisfaction level 5 e.g. Gurau and Ranchhod (2002) and Ho et al. (2006)Customer’s response level to campaigns offered 5 e.g. Mulhern (1999)Cost per customer 5 e.g. Gupta et al. (2006)Probability of a customer being alive in a given period 5 e.g. Kumar et al. (2004)Macroeconomics environment factors 4 e.g. Gupta et al. (2006)Competition level 3 e.g. Gupta et al. (2006)Marketing campaign/promotion expenditures 3 e.g. Ho et al. (2006)Customer acquisition/retention costs 2 e.g. Blattberg and Deighton (1996)Customer satisfaction expenditures 1 e.g. Gurau and Ranchhod (2002)Surviving amount from default loans 1 NAOperational risk (fraud, etc.) 1 NAAge of the customer in the bank 1 NACredit loan refinancing probability 1 NAProduct usage in other banks 1 NACurrent property holding 1 NAThe products in which the customer is active 1 NAThe profitability of the customer for each product 1 NA
NA : Not available.
Y. Ekinci et al. / European Journal of Operational Research xxx (2014) xxx–xxx 5
these variables, such as operational risk, credit loan refinancingprobability and product usage in other banks, were not examinedin the CLV literature because of difficulties with availability ofthe data. The other variables were not taken into consideration be-cause of the necessity for industry-specific model developmentand because of the absence in the literature of a model specificto the banking industry. However, they are seen as significant bythe experts.
Subsequently, after also taking into account the availability ofthe variables in the data warehouse, 29 variables are selected.
Please cite this article in press as: Ekinci, Y., et al. Analysis of customer lifetimmodel. European Journal of Operational Research (2014), http://dx.doi.org/10.10
Recency and frequency values are not analyzed because the largenumber of products and demographic variables cannot be used asthe data concerning these values are not reliable. The selectedvariables are classified into five broad categories according tothe experts’ opinions: profit values (profits gained from specificservices e.g. loans, credit cards), activity levels of customersand monetary values (total values of specific products e.g. EFT,loans), monetary risks (e.g. credit cards), product-related vari-ables (ownership of specific products/services) and total assets(which is not a category, but a single variable). The exact names
e value and marketing expenditure decisions through a Markovian-based16/j.ejor.2014.01.014

6 Y. Ekinci et al. / European Journal of Operational Research xxx (2014) xxx–xxx
of the variables cannot be given because of confidentialityrestrictions.
5.2. Step 2. Data acquisition
The average monthly values of the variables for the year 2008are obtained and the annual profits are calculated for 2008 and2009. The profit value of a customer in 2009 is the dependent var-iable for the regression models, and other variables are selected asindependent variables.
5.3. Step 3. Comparison of alternative forecasting models to estimatethe next year’s customer values
In order to build a linear regression model, dependent variablevalues are analyzed. It can be seen that the variance is very highwhile the skewness is far from 0.000 and the kurtosis is under3.000 (Belsey, Kuh, & Welsch, 1980; Draper & Smith, 1998). There-fore, it is concluded that the data are not normally distributed. Thedataset includes very small and very high values and there areoutliers. Therefore, some values have been removed and thepercentiles table is then derived (Table 3).
As it is seen from descriptive statistics (Table 3), the distributionis extremely skewed. Despite using the total data, we trimmed by10% on both of the sides. By this way, the outliers were removedand the regression models are developed for the customers thathave a profit less than $500 and greater than $0. Three alternativemodels are developed:
1. an LSE regression model built by taking the dependent variableas it is,
2. an LSE regression model built by taking the logarithm of thedependent variable,
3. an ANN regression model built by standardizing all of thevariables.
Eighty percent of the cases are selected as the training set andthe R2 of the predicted model is found to be 0.472, which meansthat 47.2% of the variance in the dependent variable can be pre-dicted from the independent variables. The R2 of the test set is0.441, which is close to 0.472. Therefore, we can say that the devel-oped model fits for the whole of the data. In addition, the logarithmof the dependent variable is taken and a rival model is also studied,but the R2 of the training set is found to be 0.110 and, hence, it iseliminated.
The R2 values of the ANN regression model are 0.46 for the trainset and 0.425 for the test set. The MATLAB Neural Network toolboxis used for the ANN based regression model. The training functionis selected as ‘‘Train GDM’’ while the Mean Squared Error (MSE) isutilized as the performance function (Hassoun, 1995). Since log sig-moid function is chosen as activity function, the data should benormalized between 0 and 1. This has been done by dividing allof the variables by the greatest value of that variable (the predictedresults are again unstandardized after taking the values from themodel). One hidden layer and one output layer formed thenetwork. The network is trained with different numbers of hiddenneurons until a minimum MSE (8098.01-unstandardized value) isreached. During the training process, the software calculates the
Table 3Percentiles and descriptives of 2009 customer profit values.
Percentiles
5 10 25 50 75
Customer profit 2009 0.000 0.000 0.980 52.775 232.978
Please cite this article in press as: Ekinci, Y., et al. Analysis of customer lifetimmodel. European Journal of Operational Research (2014), http://dx.doi.org/10.10
MSE for different structures by taking the average of squarederrors, where errors are the differences between fitted and actualoutput (dependent variable) values. The structure that suppliedthe minimum MSE includes four hidden neurons.
As the R2 value of the ANN model (0.46 for the train set and0.425 for the test set) is lower than that of the first model (0.472for the train set and 0.441 for the test set), the ANN model is alsoeliminated. The variance in the dependent variable is explainedbetter in the selected model which has a higher R2. Furthermore,ANN has its black-box nature which makes it difficult to interpretthe relation between the independent variables and dependentvariables. ANNs cannot always explain why they arrived at a par-ticular solution and they cannot always guarantee a completelycertain solution, they cannot guarantee to arrive at the same solu-tion again with the same input data. Therefore, the first regressionformula is used to predict the profits of customers whose profitsare higher than $500 in order to see if the model can be generalizedfor all customers. The correlation for the predicted and actualprofits is found to be 0.674, which means that the formula can alsobe used for them. VIF scores and Condition Indices were also calcu-lated in order to check the multicollinearity of the variables. Thehighest VIF score was 1.3 which means there is almost no multicol-linearity. Additionally the highest Condition Index was found as5.44 which is under the critical value. Therefore it can be statedthat there is no evidence for multicollinearity problem in the mod-el. The details of the model structure are provided in Table 4. Ascan be seen from Table 4 28 variables are significant at 5% signifi-cance level, and one variable is significant at 10% significance level.The F value of the model is 28.614 and it is significant at 1% signif-icance level.
Among the independent variables that are positively associatedwith the dependent variable, the monetary value 1 (the total valueof the average period balances of deferred-payment credits) andthe profit values 2 (profits gained from fund transactions) and 7(profit value of cash loans) have the highest impacts, respectively,as can be seen from the standardized coefficients.
On the other hand, among the independent variables that arenegatively associated with the independent variable, monetaryvalues 2, 5 and 8 have the highest impacts. This result shows thatmonetary values (the total values of the services/products used bythe customer) and profit values (the profits obtained by the bank asa result of the usage of these services/products by the customer)are of crucial importance to prediction.
Another result derived from the model is that, as a response tothe criticism made by Jain and Singh (2002), the product usagevariables are included. For instance, as the total value of some spe-cific services/products for the year 2008 increases, the value of thecustomer in 2009 increases. On the other hand, when some ofthem (intuitively loans, debts) increase, the value of the customerdecreases. Another significant contribution is the inclusion ofmonetary risk variables, which have been ignored by previousresearchers, and their models (monetary risks were found to besignificant by seven of the experts). However, it is interesting tonote that one of the monetary risk variables is a positively affectingvariable. This may be because of the extra interest charged to thecustomer when amounts due are not paid on time.
The analysis also indicates that some of the variables in thesame category have positive coefficients and others have negative
Descriptive statistics
90 95 Mean Variance Skewness Kurtosis
572.861 932.753 341.300 34413131 86.498 8080.669
e value and marketing expenditure decisions through a Markovian-based16/j.ejor.2014.01.014

Table 4Summary of the regression model.
Coefficients Unstandardized coefficients Standardized coefficients T Sig.
B Std. error Beta
(Constant) 50.376 6.885 7.317 0.000Total assets 0.002 0.000 0.167 8.930 0.000
Profit valuesProfit value 1 0.089 0.009 0.147 10.045 0.000Profit value 2 13.261 5.389 0.237 2.461 0.014Profit value 3 �16.431 4.147 �0.080 �3.962 0.000Profit value 4 2.286 0.354 0.177 6.462 0.000Profit value 5 2.987 0.944 0.029 3.163 0.002Profit value 6 �2.772 1.382 �0.018 �2.005 0.045Profit value 7 4.795 0.260 0.294 18.449 0.000
Activity level of customerActivity level 1 of customer �52.725 6.184 �0.151 �8.525 0.000Activity level 2 of customer �13.990 6.393 �0.037 �2.188 0.029Activity level 3 of customer 7.153 1.362 0.090 5.253 0.000
Product related variablesProduct related variable 1 69.470 4.325 0.196 16.063 0.000Product related variable 2 201.533 16.406 0.125 12.284 0.000Product related variable 3 �31.722 4.541 �0.094 �6.986 0.000Product related variable 4 11.464 2.211 0.126 5.184 0.000Product related variable 5 �4.835 1.385 �0.034 �3.491 0.000Product related variable 6 �3.063 1.403 �0.035 �2.183 0.029Product related variable 7 40.769 19.603 0.040 2.080 0.038
Monetary valuesMonetary value 1 0.019 0.002 0.386 11.109 0.000Monetary value 2 �0.012 0.001 �0.310 �8.815 0.000Monetary value 3 0.028 0.005 0.064 5.382 0.000Monetary value 4 �0.030 0.005 �0.064 �5.736 0.000Monetary value 5 �0.107 0.015 �0.154 �7.132 0.000Monetary value 6 0.018 0.002 0.146 9.281 0.000Monetary value 7 �0.001 0.000 �0.056 �4.356 0.000Monetary value 8 �0.029 0.014 �0.193 �1.997 0.046
Monetary risksMonetary risk 1 91.254 17.538 0.060 5.203 0.000Monetary risk 2 �34.885 19.979 �0.018 �1.746 0.081Monetary risk 3 �76.610 27.611 �0.028 �2.775 0.006
Table 5Classification of the actual and predicted 20–80% groups for 1-year CLV.
Actual Total
Bottom 80% Top 20%
PredictedBottom 80%
Number of customers 7361 639 8000Hit ratio 0.92 0.08 0.80
Top 20%Number of customers 639 1361 2000Hit ratio 0.32 0.68 0.20
TotalNumber of customers 8000 2000 10,000
Y. Ekinci et al. / European Journal of Operational Research xxx (2014) xxx–xxx 7
coefficients. For instance, some product related variables havepositive impacts while others have negative impacts on customervalue. This might imply that some of the products owned by thecustomer cause customer values to decrease, such as the numberof products where the bank mediates the payments. This is under-standable because the bank does not gain any profit from thepayments that it mediates. Product/service ownerships were sup-ported for inclusion in the model by nine of the 11 experts, whichis a high proportion, and the necessity for their inclusion is provedby the model.
As can be seen from the model, profits obtained from transac-tions influence positively or negatively the next year’s customervalues. The same comment also applies to monetary values.
5.4. Step 4. Measurement of the performance of the model
The performance of the model is measured via the hit ratio,based on correctly predicting the segment of the customer. Thehit ratio is equal to the number of customers that is predicted bythe model to be in the segment divided by the number of custom-ers that are actually in the segment.
The regression model developed based on the 2008 predictorsis used to forecast the 2009 values of the customers and thepredictive accuracy is measured by the hit ratio criterion (Don-kers et al., 2007; Malthouse & Blattberg, 2005). The ratio of thetop 2000 customers predicted by the model versus the actualtop 2000 customers is calculated and can be seen in Table 5. Thisis similar to the classification table in the study by Malthouse and
Please cite this article in press as: Ekinci, Y., et al. Analysis of customer lifetimmodel. European Journal of Operational Research (2014), http://dx.doi.org/10.10
Blattberg (2005). The table shows that of the top 20% of the mostprofitable customers in 2009, 32% would not be identified by thismodel. Similarly, 8% of the least profitable (bottom 80%) custom-ers are misclassified. In order to compare the results of this study,the 20–55 and 80–15 rules derived as a conclusion of the study ofMalthouse and Blattberg (2005) can be used. They evaluated afirm’s ability to estimate the future value of customers using fourdata sets from different industries. As a result of their estima-tions, they found that; of the actual top 20%, approximately 55%will be misclassified (the 20–55 rule) and of the actual bottom80%, 15% will be misclassified (the 80–15 rule). Compared toMalthouse and Blattberg’s study (2005), our results are highlycompetitive.
e value and marketing expenditure decisions through a Markovian-based16/j.ejor.2014.01.014

Table 8Transition probabilities matrix (no segment-special promotion).
State 1 State 2 State 3 State 4
State 1 0.677 0.237 0.050 0.037State 2 0.169 0.547 0.200 0.083State 3 0.035 0.265 0.485 0.215State 4 0.016 0.046 0.423 0.516
8 Y. Ekinci et al. / European Journal of Operational Research xxx (2014) xxx–xxx
5.5. Step 5. Determination of the states of the customers for next yearvia a segmentation technique
In step 4, the performance of the study is measured by the hitratios for the top 20% and bottom 80% profitability levels ofcustomers, based on the study by Malthouse and Blattberg(2005). Because of the proposed segmentation approach for theprevious step, namely that the customer pyramid divides thebottom 80% into three more segments, being 30%, 30% and 20%,the performance measures are also calculated for this differencein approach (Table 6).
As can be seen from Table 6, the worst hit ratio is 54.86% for thethird segment, which is a competitive result when compared to the20–55 and 80–15 rules of Malthouse and Blattberg (2005). This54.86% hit ratio means that the proposed model in step 3 correctlyclassified approximately 55 out of every 100 customers that aregoing to be in state 3 next year. This model forecasts the most prof-itable and the least profitable customers more accurately. In fact,these two groups are the ones who have more stable behaviors.Probably, they stayed in the same segment in 2008 and 2009consecutive years. However, the remaining two groups, betweenthese two extremes, might be influenced by different factors. Theyseem to be ‘‘potentially unstable’’ in terms of profitability and theirprofitabilities are harder to forecast.
The values of the states are determined by taking the average ofthe profit values gained from the customers in the same state.Table 7 shows the values of the states.
As can be seen from Table 7, the average value of the first stateis very high and keeping the customers in that segment has highimportance.
5.6. Step 6. Calculation of transition probabilities for segment specificpromotion and no segment specific promotion periods
An experiment was designed to observe the effects of promo-tions on customers. Two representative samples, each containing5000 customers, were derived from the customer database, andsegment-special promotions were directed to one sample while nosegment- specific promotions were directed to the other sample.The study covered a period of one year, but the segment-special pro-motion was applied for only six months. As a result, it was possibleto evaluate the situation both before and after the experiment.
Transition probabilities between states for segment-specificpromotion/no segment-specific promotion periods are calculated.Table 8 shows the transition probabilities between states underthe no segment-special promotion condition. This transition matrixwill also be used for the status quo case. For example, the cell‘‘state 1-state 1’’ denotes the percentage of customers staying in
Table 6The performance measures for the customer pyramid.
Segment State no Hit ratio
Top 20% 1 0.6805Next 30% 2 0.5690Latter 30% 3 0.5486Bottom 20% 4 0.6365
Table 7Values of states.
State Values of the states ($)
1 1203.622 150.763 28.304 1.31
Please cite this article in press as: Ekinci, Y., et al. Analysis of customer lifetimmodel. European Journal of Operational Research (2014), http://dx.doi.org/10.10
the same segment (state 1) next year. In other words, 67.7% ofthe most profitable customers of the first year stayed in the samesegment in the next year under the status quo condition, and23.7% of them transitioned to the latter 30% segment in the nextyear.
The transition probabilities between states under segment-spe-cial promotions are calculated according to the same formula. Thetransition probability matrix is given below (Table 9).
A comparison of Tables 8 and 9 does not give us a quick guide tothe success of the promotions. For instance, the probability of stay-ing at the first state has increased from 0.677 to 0.720 but theprobability of moving to the fourth state has also increased. Inaddition, the probability of staying at the fourth state has de-creased from 0.516 to 0.410, but the probability of moving to thefirst state has also decreased. These results show that the promo-tions directed to the third state are unsuccessful since the reten-tion probability and the transition probabilities to upper stateshave decreased, whereas the transition probability to the fourthstate has increased.
5.7. Step 7. Determination of discount factor, problem formulation andsolution for maximum CLV
a. In order to see the robustness of the results, the model issolved using three different discount factors (namely 0.90,0.95 and 0.99), as suggested by the experts during our in-depth interviews. Furthermore, these discount factors weresuggested in a similar study of Ching et al. (2004).
b. Using Markov decision processes, the optimal marketingdecisions are calculated with the discount factors of 0.90,0.95 and 0.99 for infinite horizons. Here we have four statesand two marketing actions (j = do segment-specific promo-tion/no segment-specific promotion). The mean customervalues of states (ck) and the transition probabilities for thecustomer to move from state i to state k under the jthmarketing action in each period (pðjÞik ) were calculated inthe previous steps. Lastly, the discount factors (a) areassumed as 0.90, 0.95 and 0.99. Accordingly, the inputs areprepared for the model and the linear programming problemis solved by using an Excel spreadsheet.
Table 10 shows the maximum expected CLVs of each statetogether with the optimal action decisions.
The expected values for an infinite horizon in Table 10 decreasewhen the discount factor decreases but the optimal action deci-sions do not change generally. Therefore, the solution can be saidto be robust for different discount factors, but the resulting values
Table 9Transition probabilities matrix (segment-special promotion).
State 1 State 2 State 3 State 4
State 1 0.720 0.179 0.059 0.043State 2 0.156 0.610 0.144 0.090State 3 0.027 0.260 0.439 0.274State 4 0.006 0.017 0.568 0.410
e value and marketing expenditure decisions through a Markovian-based16/j.ejor.2014.01.014

Table 10Results under different discount factors.
State Discount factor = 0.99 Discount factor = 0.95 Discount factor = 0.90
Do segment-specificpromotion (2)/nosegment-specificpromotion (1)
ExpectedCLV ($)
Do segment-specificpromotion (2)/nosegment-specificpromotion (1)
ExpectedCLV ($)
Do segment-specificpromotion (2)/nosegment-specificpromotion (1)
ExpectedCLV ($)
1 2 33314.940 2 8389.175 2 5185.7472 2 30724.320 1 5973.144 1 2953.2453 1 29836.910 1 5189.452 1 2271.0814 1 29431.730 1 4843.055 1 1981.621
Total value 123307.900 24394.826 12391.694
Table 11Results under different discount factors and the status quo.
State Discountfactor = 0.99
Discountfactor = 0.95
Discountfactor = 0.90
Expected CLV ($) Expected CLV ($) Expected CLV ($)
1 32149.400 8159.788 5080.3182 29654.200 5817.032 2897.0823 28795.220 5051.121 2225.9094 28396.830 4707.608 1936.953
Total value 118995.650 23735.549 12140.262
Y. Ekinci et al. / European Journal of Operational Research xxx (2014) xxx–xxx 9
change. However, for state 2, when the discount factor decreasesfrom 0.99, the optimal action decision changes from do segment-specific promotion to no segment-specific promotion. Additionally,for states 1, 3 and 4, the optimal decision does not change for dif-ferent discount factors.
The values of the states decrease from state 1 to 4. Moving fromthis information and the optimal marketing action decisions, wecan comment further about the behaviors of the customers at eachstate. States 3 and 4 have the customers with the lowest customervalue, and it seems that applying segment-specific promotion doesnot affect their transition to more valuable states, since the optimalmarketing action is selected as no segment-specific promotion. Fur-thermore, the company may decrease its profit by directing seg-ment-specific promotions to those customers since they arecostly. State 1, for which the optimal action is do segment-specificpromotion, includes profitable customers and they seem to staythere if segment-specific promotion is offered to them. Similarly,when the discount factor is 0.99, the same comment is valid forstate 2, but when the discount factor decreases, it is profitablenot to offer segment-specific promotion to these customers.
Table 11 shows the expected CLVs in each state under differentdiscount factors with the status quo case. To demostrate the find-ings, some values in Tables 10 and 11 can be compared. The optimalmarketing action for state 1 was found as do segment-specific promo-tion and, on this basis, the expected value was $33314.940 for the0.99 discount factor. However, in the status quo, this value is$32149.400, which shows that the former basis is $1165.540 greaterthan the latter one. Similar findings are present for other states.
The results show that, when the problem is solved for aninfinite horizon using stochastic dynamic programming, the totalvalue gained from the states under the optimal marketing decisionis greater than the value gained under the status quo, but thedifference is reduced for small discount factors. The total valuesin Table 10 for 0.99, 0.95 and 0.90 discount factors are, respec-tively, $123307.900, $24394.826, and $12391.694. However theequivalent values are $118995.650, $23735.549 and $12140.262for the status quo. This difference shows us the importance ofkeeping previous data for customers, mining the data and usingoptimization techniques to decide on future marketing plans.
Please cite this article in press as: Ekinci, Y., et al. Analysis of customer lifetimmodel. European Journal of Operational Research (2014), http://dx.doi.org/10.10
5.8. Step 8. Specification of the optimal promotion plan
The resulting optimal promotion plan is proposed as offeringsegment-specific promotion to the customers of states 1 and 2and not offering it to those of states 3 and 4 if the discount factoris 0.99. For discount factors 0.95 and 0.90, the optimal decision forstate 2 is changed to no segment-specific promotion. A significantpoint that should be considered here is the nature of the promotionplan offered to the states. These results may have occurred becauseof the irrelevant nature of the actions taken and the customercharacteristics. If the customer characteristics and behavior areanalyzed and appropriate marketing plans are prepared, customersmay respond to them and move to more profitable states.
6. Conclusions and further suggestions
Due to the growing importance of customer relationship man-agement, CLV analysis has been one of the significant concerns ofmanagers. By using the CLV paradigm, the companies can makeconsistent decisions about which customers have to be retainedover time. They can also determine the allocation of the marketingand promotion budget for each market segment and plan the mostappropriate marketing strategies. Taking into account this primaryimportance of CLV and hence, the related gaps in the literatureconcerning CLV modeling; the major purpose of this research isto develop an applicable and industry-specific model that proposesa guide for potential/future marketing decisions based onpredicted potential customer values. This study tries to forecastpotential customer value instead of current one in order to makefuture plans since current customer value may not be useful formaking decisions for future. Due to the fact that the banks offera wide range of products and the previous literature has been lim-ited to industries that offer only one type of product, the bankingindustry is selected as a special case study for the application ofthe proposed methodology. Since the literature survey shows thatthe previous studies have concentrated on optimal marketingstrategies for the companies offering only one type of product orservice, those studies used recency–frequency–monetary valuesin order to define the states. In fact; while data on credit-cardtransactions includes all of the recency–frequency–monetaryvalues, the frequency values do not exist for some investmentproducts such as forward accounts. On the other hand, the banksoffer a wide range of products and a customer may use many prod-ucts or services, such as investment products, and routine servicessuch as electronic fund transfers, cash withdrawal, credit cards,and loans in the case of banking services. Therefore, due to thisfact, in this study, this narrow framework is extended to multi-product or service offerings and the recency–frequency–monetarysegmentation approach is not adopted.
With the aim of developing an industry-specific model, anexploratory research was carried out through in-depth interviews
e value and marketing expenditure decisions through a Markovian-based16/j.ejor.2014.01.014

10 Y. Ekinci et al. / European Journal of Operational Research xxx (2014) xxx–xxx
with industry experts at the preliminary stage of the study. The po-tential customer value forecast model proposed in this study showthat two different groups; namely service-specific revenue/costindicators and product/service ownership related indicators aresignificant factors in measuring customer value in bankingindustry. These were also viewed as significant by the interviewedexperts. In addition; although the importance of the product own-ership and usage related indicators was emphasized by Ho et al.(2006) and Haenlein et al. (2007), these indicators have been gen-erally neglected in the models developed by researchers. However,our proposed model points out that these factors significantlyleverage the value obtained from the customers. Another signifi-cant contribution is the inclusion of monetary risk variables as theyare also ignored in the literature. Due to the fact that product- re-lated variables and monetary risks are among the industry-specificfactors, the model presented in this paper gives possible responsesto criticisms about the previous models made by Jain and Singh(2002) and Haenlein et al. (2007) by indicating that CLV has tobe measured by considering industry and product-specific indica-tors. It is obvious that, in order to increase the potential value oftheir customers, organizations in the banking industry, have togive priority to facilitate the use of certain services as well as topersuade their customers to use those services more frequently.
Based on the study by Malthouse and Blattberg (2005), the per-formance of forecasting is measured by the hit ratios for the top20% and bottom 80% profitability levels of customers. It is foundthat the performance is highly competitive when compared tothe 20–55 and 80–15 rules of Malthouse and Blattberg (2005).
An important result derived from the empirical findings of theoptimization model is that the valuable segments respondpositively to the segment-specific promotions by moving to morevaluable states. Additionally, the results show that the total valuegained from the states under optimal marketing decisions is higherthan that of the status quo when the problem is solved for an infi-nite horizon using stochastic dynamic programming. As expected,the difference is reduced for smaller discount factors. The otherimportant finding of the model is about the nature of the promo-tion plans offered to the customers for the states for which nosegment-specific promotion decision is found to be the optimal.The basic problem for these states may be the lack of success ofthe current promotion plans. This result shows us the importanceof keeping previous data for customers, mining the data and usingoptimization techniques to decide on future marketing plans.Additionally, this study shows that customer value-based segmen-tation is effective for optimal promotion determination if thecompany concerned offers more than one type of product.
A further research topic could be solving the problem for a finiteas well as an infinite horizon and leaving the decision of which ofthe results (finite–infinite horizon) should be implemented in reallife applications to the managers of companies. The inclusion ofdemographic variables and the scope of segment-specific promo-tions would also increase the value of the study. In fact, the resultsof our proposed framework may be different with differentdemographic characteristics and promotions. Therefore, theimplementation of the model with different demographic clustersand different promotions would provide a more valuable guide tomanagers for developing strategies.
Acknowledgements
This paper is a part of the PhD thesis of Yeliz Ekinci which washeld at Istanbul Technical University (ITU) and she was awarded byThe Scientific and Technological Research Council of Turkey 2211scholarship. This research was also supported by Republic of Tur-key, Ministry of Industry and Trade (Project No: 00432.STZ.2009-2) and ITU, Institute of Science and Technology (Project No:
Please cite this article in press as: Ekinci, Y., et al. Analysis of customer lifetimmodel. European Journal of Operational Research (2014), http://dx.doi.org/10.10
34228). The interpretation and conclusions revealed in this studydo not represent the official perspectives of the institutes statedabove. The authors would like to express their deep gratitude tothe anonymous referees for their invaluable comments and tothe anonymous financial services company that supplied the data.
References
Aeron, H., Bhaskar, T., Sundararajan, R., Kumar, A., & Moorthy, J. (2008). A metric forcustomer lifetime value of credit card customers. Journal of Database Marketingand Customer Strategy Management, 15, 153–168.
Atkeson, C. G., Moore, A. W., & Schaal, S. (1997). Locally weighted learning forcontrol. Artificial Intelligence Review, 11, 75–113.
Belsey, D. A., Kuh, E., & Welsch, R. E. (1980). Regression diagnostics. New York: JohnWiley & Sons.
Benoit, D. F., & Van den Poel, D. (2009). Benefits of quantile regression for theanalysis of customer lifetime value in a contractual setting: An application infinancial services. Expert Systems with Applications, 36, 10475–10484.
Berger, P. D., & Bechwati, N. N. (2001). The allocation of promotion budget tomaximize customer equity. Omega, 29(1), 49–61.
Blattberg, R. C., & Deighton, J. (1996). Manage marketing by the customer equitytest. Harvard Business Review (July–August), 136–144.
Borle, S., Singh, S. S., & Jain, D. C. (2008). Customer lifetime value measurement.Management Science, 54(1), 100–112.
Borrero, J. S., & Akhavan-Tabatabaei, R. (2013). Time and inventory dependentoptimal maintenance policies for single machine workstations: An MDPapproach. European Journal of Operational Research, 228(3), 545–555.
Boutilier, C., Dearden, R., & Goldszmidt, M. (2000). Stochastic dynamicprogramming with factored representations. Artificial Intelligence, 121(1–2),49–107.
Chan, S. L., Ip, W. H., & Cho, V. (2010). A model for predicting customer value fromperspectives of product attractiveness and marketing strategy. Expert Systemswith Applications, 37, 1207–1215.
Cheng, C.-H., & Chen, Y. S. (2009). Classifying the segmentation of customer valuevia RFM model and RS theory. Expert Systems with Applications, 36, 4176–4184.
Chin Liu, B. S., Petruzzi, N. C., & Sudharshan, D. (2007). A service effort allocationmodel for assessing customer lifetime value in service marketing. Journal ofServices Marketing, 21(1), 24–35.
Ching, W.-K., Ng, M. K., Wong, K.-K., & Altman, E. (2004). Customer lifetime value:stochastic optimization approach. Journal of the Operational Research Society, 55,860–868.
Donkers, B., Verhoef, P. C., & de Jong, M. G. (2007). Modeling CLV: A test ofcompeting models in the insurance industry. Quantitative Marketing andEconomics, 5, 163–190.
Draper, N. R., & Smith, H. (1998). Applied regression analysis. New York: John Wiley &Sons.
Duman, E., Ekinci, Y., & Tanrıverdi, A. (2012). Comparing alternative classifiers fordatabase marketing: The case of imbalanced datasets. Expert Systems withApplications, 39, 48–53.
Durango-Cohen, E. J. (2013). Modeling contribution behavior in fundraising:Segmentation analysis for a public broadcasting station. European Journal ofOperational Research, 227(3), 538–551.
Gelbrich, K., & Nakhaeizadeh, R. (2000). Value miner: A data mining environmentfor the calculation of the customer lifetime value with application to theautomotive industry. In ECML 2000, LNAI 1810 (pp. 154–161).
Gelly, S., Mary, J., & Teytaud, O. (2006). Learning for stochastic dynamicprogramming. In 11th European symposium on artificial neural networks (ESANN).
Gupta, S., Hanssens, D., Hardie, B., Kahn, W., Kumar, V., Lin, N., et al. (2006).Modeling customer lifetime value. Journal of Service Research, 9(2), 139–150.
Gurau, C., & Ranchhod, A. (2002). How to calculate the value of a customer –Measuring customer satisfaction: A platform for calculating, predicting andincreasing customer profitability. Journal of Targeting, Measurement and Analysisfor Marketing, 10(3), 203–220.
Haenlein, M., Kaplan, A., & Beeser, A. (2007). A model to determine customerlifetime value in a retail banking context. European Management Journal, 25(3),221–234.
Hartfeil, G. (1996). Bank One measures profitability of customers, not just products.Journal of Retail Banking Service, 18(2), 2–15.
Hassoun, M. H. (1995). Fundamentals of artificial neural networks. MIT Press.Helgesen, Q. (2006). Are loyal customers profitable? Customer satisfaction,
customer (action) loyalty and customer profitability at the individual level.Journal of Marketing Management, 22, 245–266.
Ho, T. H., Park, Y. H., & Zhou, Y. P. (2006). Incorporating satisfaction into customervalue analysis: Optimal investment in lifetime. Marketing Science, 25(3),260–273.
Hwang, H., Jung, T., & Suh, E. (2004). An LTV model and customer segmentationbased on customer value: A case study on the wireless telecommunicationindustry. Expert Systems with Applications, 26, 181–188.
Jain, D., & Singh, S. S. (2002). Customer lifetime value research in marketing: Areview and future directions. Journal of Interactive Marketing, 16(2), 34–45.
Jonker, J. J., Piersma, N., & Poel, D. V. (2004). Joint optimization of customersegmentation and marketing policy to maximize long-term profitability. ExpertSystems with Applications, 27, 159–168.
e value and marketing expenditure decisions through a Markovian-based16/j.ejor.2014.01.014

Y. Ekinci et al. / European Journal of Operational Research xxx (2014) xxx–xxx 11
Kall, P., & Wallace, S. W. (1994). Stochastic programming. Chichester: John Wiley &Sons.
Kim, S. Y., Jung, T. S., Suh, E. H., & Hwang, H. S. (2006). Customer segmentation andstrategy development based on customer lifetime value: A case study. ExpertSystems with Applications, 31, 101–107.
Kumar, V., Ramani, G., & Bohling, T. (2004). Customer lifetime value approaches andbest practice applications. Journal of Interactive Marketing, 18, 3–21.
Labbi, A., & Berrospi, C. (2007). Optimizing marketing planning and budgeting usingMarkov decision processes: An airline case study. IBM Journal of Research andDevelopment, 51(3/4), 421–431.
Malthouse, E. C., & Blattberg, R. C. (2005). Can we predict customer lifetime value?Journal of Interactive Marketing, 19(1), 2–16.
Montgomery, D. C., Peck, E. A., & Vining, G. G. (2007). Introduction to linear regressionanalysis (4th ed.). Wiley-Interscience.
Morrison, D. G., Chen, R. D. H., Karpis, S. L., & Britney, K. E. A. (1982). Modelling retailcustomer behaviour at Merrill Lynch. Marketing Science, 1(2), 123–141.
Mulhern, F. J. (1999). Customer profitability analysis: Measurement, concentration,and research directions. Journal of Interactive Marketing, 13(1), 25–40.
Pfeifer, P. E., & Carraway, R. L. (2000). Modeling customer relationships as Markovchains. Journal of Interactive Marketing, 14(2), 43–56.
Piersma, N., & Jonker, J.-J. (2004). Determining the optimal direct mailing frequency.European Journal of Operational Research, 158, 173–182.
Puterman, M. L. (2005). Markov decision processes: Discrete stochastic dynamicprogramming. In Wiley series in probability and statistics. Wiley-Interscience, TheUniversity of California.
Ross, S. (2000). Introduction to Probability Models (7th ed.). New York, NY: AcademicPress.
Please cite this article in press as: Ekinci, Y., et al. Analysis of customer lifetimmodel. European Journal of Operational Research (2014), http://dx.doi.org/10.10
Rust, R. T., Lemon, K. N., & Zeithaml, V. A. (2004). Return on marketing: Usingcustomer equity to focus marketing strategy. Journal of Marketing, 68(1),109–127.
Ryals, L. J., & Knox, S. (2005). Measuring risk-adjusted customer lifetime value andits impact on relationship marketing strategies and shareholder value. EuropeanJournal of Marketing, 39(5/6), 456–471.
Shih, Y., & Liu, D. R. (2003). A method for customer lifetime value ranking –Combining the analytic hierarchy process and clustering analysis. Journal ofDatabase Marketing and Customer Strategy Management, 11(2), 159–173.
Shih, Y., & Liu, D. R. (2008). Product recommendation approaches: Collaborativefiltering via customer lifetime value and customer demands. Expert Systems withApplications, 35, 350–360.
Storbacka, K. (1997). Segmentation based on customer profitability – Retrospectiveanalysis of retail bank customer bases. Journal of Marketing Management, 13,479–492.
TBA (Turkish Banks Association) Report (2009).Venkatesan, R., Kumar, V., & Bohling, T. (2007). Optimal relationship management
using Bayesian decision theory: An application for customer selection. Journal ofMarketing Research, XLIV, 579–594.
Winston, W. L. (1994). Operations research: Applications and algorithms (3rd ed.).Belmont, CA: Duxbury Press.
Zeithaml, V. A., Rust, R. T., & Lemon, K. N. (2001). The customer pyramid: Creatingand serving profitable customers. California Management Review, 43(4),118–142.
e value and marketing expenditure decisions through a Markovian-based16/j.ejor.2014.01.014