an examination of the population dynamics of syngnathid fishes within tampa bay, florida, usa
TRANSCRIPT

Current Zoology 56 (1): 118−133, 2010
Received Oct. 30, 2009; accepted Dec. 08, 2009
∗ Corresponding author. E-mail: [email protected] © 2010 Current Zoology
An examination of the population dynamics of syngnathid fishes within Tampa Bay, Florida, USA
Heather D. MASONJONES1*, Emily ROSE1,2, Lori Benson McRAE1, Danielle L. DIXSON1,3 1 Biology Department, University of Tampa, Tampa, FL 33606, USA 2 Biology Department, Texas A & M University, College Station, TX 77843, USA 3 School of Marine and Tropical Biology, James Cook University, Townsville QLD 4811, AU
Abstract Seagrass ecosystems worldwide have been declining, leading to a decrease in associated fish populations, especially those with low mobility such as syngnathids (pipefish and seahorses). This two-year pilot study investigated seasonal patterns in density, growth, site fidelity, and population dynamics of Tampa Bay (FL) syngnathid fishes at a site adjacent to two marinas un-der construction. Using a modified mark-recapture technique, fish were collected periodically from three closely located sites that varied in seagrass species (Thalassia spp., Syringodium spp., and mixed-grass sites) and their distance from open water, but had consistent physical/chemical environmental characteristics. Fish were marked, photographed for body size and gender measure-ments, and released the same day at the capture site. Of the 5695 individuals surveyed, 49 individuals were recaptured, indicating a large, flexible population. Population density peaks were observed in July of both years, with low densities in late winter and late summer. Spatially, syngnathid densities were highest closest to the mouth of the bay and lowest near the shoreline. Seven species of syngnathid fishes were observed, and species-specific patterns of seagrass use emerged during the study. However, only two species, Syngnathus scovelli and Hippocampus zosterae, were observed at high frequencies. For these two species, body size decreased across the study period, but while S. scovelli’s population density decreased, H. zosterae’s increased. Across six of the seven species, population size declined over the course of this preliminary study; however, seasonal shifts were impossible to distinguish from potential anthropogenic effects of construction [Current Zoology 56 (1): 118–133 2010].
Key words Syngnathids, Habitat-use, Seahorse, Pipefish, Population density, Mark-recapture
Seagrass ecosystems worldwide are under threat from various anthropogenic stressors, including eutro-phication leading to phytoplankton and macroalgal blooms, increased sedimentation leading to light limita-tion, rising temperatures, dredging, coastal construction, and boat propeller scarring (Short et al., 1995; Thrush and Dayton, 2002; Campbell et al., 2003; Davenport and Davenport, 2006; Orth et al., 2006; Fyfe and Davis, 2007). Decline of this vital habitat is devastating to the local marine environment, with increases in nutrients due to both the loss of seagrasses as a nutrient filter as well as the breakdown of seagrass into organic compo-nents (Wang et al., 1999). In addition, seagrasses stabi-lize sediments, and their absence leads to increased tur-bidity in the water column and altered water flow (Fonseca and Fisher, 1986). Parallel with the weakening of these extensive ecosystem functions is the loss of habitat, as seagrasses play a critical role in providing food resources for herbivorous species, nursery areas for
juvenile fish and invertebrates, and structurally complex habitats for a diverse array of fauna (Sogard et al., 1987; Jenkins and Wheatley, 1998; Boström et al., 2006; Car-ruthers et al., 2007).
Before seagrasses are lost from the system, succes-sional changes have been observed as one grass type is replaced with another, either in isolated locations or in large areas of habitat previously occupied by another seagrass species (Williams, 1990; Fourqurean et al., 1995; Robbins and Bell, 2000). This has been attributed to differences in the competitive abilities and physio-logical tolerances to disturbance, nutrients, and in-creased sedimentation of the seagrass species involved. These types of interactions between seagrasses have even led to changes in the morphological structure of the seagrass itself; in Halodule wrightii, for example, reduced branching has been observed under the canopy cover of Thalassia testudinum, leading to a less com-plex growth form (Tomasko, 1992). Both drift macroal-
H. D. MASONJONES et al.: An examination of the population dynamics 119
gae and epiphytic algae have the potential to alter sea-grass habitat complexity. In small amounts, growth of these algae can increase habitat complexity; however, moderate to large amounts of drift or epiphytic algae can lead to seagrass loss over time (Cebrián et al., 2001; Hauxwell et al., 2001; Havens et al., 2001; Balata et al., 2008). As a result, broad-scale seagrass surveys would not record an overall loss of seagrass area, but given the structural differences between seagrass species, these shifts have the potential to have dramatic effects on habitat complexity. In addition, many animal and fish species are commonly associated with specific types and/or densities of seagrass for foraging or reproductive habitat (Irlandi et al., 1995; Jenkins and Wheatley, 1998; Matheson et al., 1999; Boström et al., 2006; Horinouchi, 2007; Malavasi et al., 2007); thus, shifts in seagrass species during successional events can influence the faunal diversity in a seagrass ecosystem. Even grass beds with the same species but different timelines of establishment (natural vs. well-established recolonized) have different fish species complexes (Brown-Peterson et al., 1993).
Seagrass-dependent organisms that rely on particular seagrass species or the entire seagrass ecosystem are expected to be most affected by seagrass loss or succes-sional events. Syngnathid fishes (pipefish and sea-horses), are such a group, because numerous species that have been described are indeed associated with seagrass landscapes (Matlock, 1992; Vincent et al., 1995; Lourie et al., 2004; Kuiter, 2003; Foster and Vincent, 2004; Monteiro et al., 2006). More important, one pipe-fish species Solegnathus hardwickii and the entire genus Hippocampus have been listed in CITES Appendix II, with at least one species identified as endangered, nine others as vulnerable, and the rest of the 33 species as data-deficient (H. capensis, IUCN 2008). In addition to their limited mobility and association with threatened seagrass ecosystems, it has been suggested that other aspects of their biology may play a role in their eco-logical vulnerability. For example, patchy spatial distri-butions, low population density, and monogamous mat-ing systems (seahorses and some pipefish) make them particularly susceptible to habitat change or loss (Jones and Avise, 2001; Foster and Vincent, 2004; Lourie et al., 2004). With their complex reproductive behaviors, even an increase in turbidity could affect the ability of indi-viduals to locate each other and receive visual cues as-sociated with courtship and mating (Gronell, 1984; Vincent, 1994; Masonjones and Lewis, 1996). World-wide, many syngnathid populations are declining due to
fishing pressure, habitat destruction, and other unknown causes (Baum et al., 2003; Martin-Smith and Vincent, 2005).
Few field studies on the distribution of syngnathid fishes have investigated microhabitat preferences, but in those that have, some species have demonstrated a con-sistent association with a limited array of seagrass spe-cies and/or preference for specific locations within the seagrass landscape. In studies of the diverse assemblage of Australian syngnathids, the most common species found, pipefish Stigmatopora argus and S. nigra, were both more often associated with the seaward edges of seagrass beds (Smith et al., 2008), and S. nigra was predominantly found in Posidonia coriacea seagrass (Kendrick and Hyndes, 2003). In preference tests in the laboratory, male Nerophis ophidian preferred long over short seagrass blades, and both N. ophidian and Syng-nathus typhle showed preferences for specific micro-habitat locations within an artificial grass bed, findings that correlated with observations from the field (Malavasi et al., 2007). However, although clearly asso-ciated with seagrass ecosystems (Diaz-Ruiz et al., 2000), the gulf pipefish Syngnathus scovelli was found to in-crease in abundance in areas scarred with boat propel-lers, indicating that, although seagrass may be important, moderate fragmentation of the landscape does not in-hibit retention or recruitment in this species (Bell et al., 2002). Seahorses have also been shown to exhibit habi-tat preferences (Hippocampus reidi, Dias and Rosa, 2003; H. breviceps, Moreau and Vincent, 2004). How-ever, two seahorse species found in Portugal (H. hippo-campus and H. guttulatus) are the only species for which seagrass preference has been investigated in de-tail (Curtis and Vincent, 2005).
In this pilot study, our aim was to determine if, in a continuous seagrass landscape composed of a complex of seagrass species distributed in monospecific stands, mixed-species stands, and with varying amounts of drift macroalgae, we could detect differences in the species diversity and abundance of syngnathid fishes between these types of seagrass areas over time. Seahorses, due to their lower mobility and high site fidelity found in previous field studies (H. whitei, Vincent and Sadler, 1995), are expected to exhibit consistent population densities across season. Furthermore, a study of two other species suggested a preference for specific hold-fasts (Curtis and Vincent, 2005); thus, we hypothesize stronger preferences for seagrass type than found in pipefish. Based on work with Australian pipefish and a pilot study investigating the potential for migration in

120 Current Zoology Vol. 56 No. 1
Syngnathus fuscus (Lazzari and Able, 1990; Kendrick and Hyndes, 2003), we predict that pipefish will be found in all habitats independent of seagrass species and macroalgal cover, but with higher population densities closer to open water. We also predict that pipefish den-sities will fluctuate across seasons as they move to deeper locations during the colder months.
1 Materials and Methods 1.1 Study region
The research site was located in the southeast end of Old Tampa Bay, which is positioned on the western up-per lobe of Tampa Bay (N27º52.34’, W82º32.19’; Fig. 1). This site was selected because of its robust syngnathid populations relative to other locations in Tampa Bay (Masonjones, unpublished data). The tidal regime in the area is mixed semi-diurnal, and to access the site for sampling and to standardize measurements, all sampling events took place during either primary or secondary low tide events. The area selected is a shallow seagrass sys-tem, sections of which are exposed at extreme low tides. The immediate western edge of the study site is bounded by a sandbar, which is exposed during the majority of primary low tides. As a result of the sandbar, access to the site is restricted to wading during sampling. The sandbar serves as a partial barrier to water flow and therefore animal movement, at least during low tide events.
Within the region, three seagrass-covered sites were chosen that varied in seagrass type, macroalgal cover, and distance from open water (Table 1; for measurement information, see section 1.3). Site M1, dominated by Syringodium filiforme (manatee grass), was the deepest of the three sites and had the most macroalgal cover (both drift and epiphytic). In addition, M1 was a moder-ate distance from the sandbar at the western edge of the site, and thus had more access to open water than M2 and less than M3. Site M2 was the shallowest and most
inland of the three sites. It was dominated by Thalassia testudinum (turtle grass) and had moderate macroalgal cover (although seasonally high in the late fall and early winter) and small bare sand patches (0.5 – 2 m in di-ameter) interspersed with the seagrass patches. Site M3 had a moderate depth but was the site with the most contact with open water. It was dominated by T. testu-dinum but had some S. filiforme and Halodule wrightii (shoal grass). In both M1 and M3, Ruppia maratima was occasionally observed during sampling. Each site was roughly circular (shape determined by both capture and return GPS coordinates) with a 100-m diameter, and the centers of the sites were located roughly 170 – 200 m from each other.
Fig. 1 Research site located at the south end of Tampa Bay (inset 1), on the southeast side of the Gandy Bridge (inset 2) Animal collection and return locations are indicated in symbols; trian-gles denote site M1, circles M2, pentagons/hexagons M3. Dotted symbols denote samples in 2006, and open symbols 2007. The two contiguous marina construction sites are A) Westshore Yacht Club (WCI Communities) and B) Tampa Harbour Yacht Club (Tampa Ma-rina Investments LLC). SAP indicates NOAA buoy used to obtain temperature data. Aerials provided by USGS through Microsoft Terraserver.
Table 1 Mean (± 1 SE) environmental data collected intermittently near the sites between 2005 and 2007
Environmental factors 2005 n 2006 n 2007 n F-value 2,14** P-value
Depth (cm) 86.9 (5.45) 7 78.4 (7.21) 5 97.5 (6.81) 5 0.584 0.057
Salinity (ppt) 24.1 (0.34) 7 27.4 (0.50) 5 25.8 (1.34) 5 3.301 0.067
Turbidity (ntu) 2.05 (0.44) 7 2.14 (0.32) 5 2.78 (0.48) 5 0.888 0.433
Water temp. (C°)* 27.1 (1.99) 7 24.5 (2.47) 5 31.3 (0.79) 5 2.758 0.098
Blade height (cm) 35.0 (2.35) 7 27.6 (2.23) 5 38.0 (2.18) 5 2.563 0.113
Blade density (per 0.1 m2)* 185 (42.4) 7 53.2 (5.12) 5 177 (24.8) 5 3.723 0.051
Faunal species diversity (H’) 0.62 (0.04) 7 0.68 (0.07) 5 0.53 (0.07) 5 0.944 0.412 * Data double-log transformed before use in MANOVA.** Univariate statistical results obtained after calculating the MANOVA. Differences between years was investigated with a MANOVA, which showed a significant effect of year (Wilkes λ14,16 = 0.051, F14,16 = 3.913, P = 0.005).

H. D. MASONJONES et al.: An examination of the population dynamics 121
1.2 History of site and land use Tampa Bay has had a long history of water quality
issues that have devastated seagrass communities throughout the estuary, but the area has been steadily making progress in decreasing nutrient sources and aid-ing in seagrass recovery (Wang et al., 1999; Tomasko et al., 2005). In the research site being investigated in this study, until roughly 1950, the seagrass was continuous up to the Gandy Bridge, at the top edge of inset 2 (Fig-ure 1; Pirello, personal communication). In the 1950s, dredging occurred at the north edge of the site to create the Tyson Street peninsula, the location of one of the construction projects that occurred during the study (B, inset 2). During the late 1960s, the Westinghouse sub-marine engine facility was constructed (A, inset 2), which led to the dredging of an 11-ft channel stretching from A to B and then out into Old Tampa Bay, and the creation of two spoil islands seen just west of “A” in Fig. 1. This channel was the main method of export of sub-marine engines out of the site from the early 1970s until the early 1990s. To the east of the research site, an apartment complex with limited water access was con-structed in the 1980s. To the south, a channel was dredged to a boat-launching facility some time in the mid-1930s, and is still periodically dredged to maintain channel depth (shown at the south edge of inset 2). At locations A and B, demolition of existing structures and construction of new buildings and marine facilities oc-curred for the two marina complexes from February 2004 to October 2007. 1.3 Measurement of environmental variables and distinguishing between sites
Environmental variables were tracked in two con-texts during the course of the study. First, environmental data were monitored to identify potential environmental changes over time. Just outside the area of the three research sites, environmental samples were obtained through an existing research protocol using a 100-m transect with five replicate samples collected along its length. At each site, ecological variables such as water turbidity (Oakton T-100 Turbidimeter, measured in nephritic turbidity units, ntu), temperature (ºC), salinity (Extech refractometer, Model RF20, ppt), seagrass spe-cies, seagrass blade density (total number of blades in a 0.1-m2 quadrat), seagrass blade heights (cm), and epi-faunal and fish diversity (collected with pushnet and analyzed as Shannon-Weiner diversity, H’) were deter-mined for each sample (Table 1). We used seagrass blade density rather than the density of short shoots to
measure seagrass cover because, for seahorses espe-cially, blades are used as attachment sites and thus rep-resent habitat better than do short shoots. Because of the subtropical climate observed in central Florida, tradi-tional seasons were not used for analysis. Instead, the distinction of the “wet season”, typically May 1 through October 31 in Florida, and “dry season”, from Novem-ber 1 through April 31, was used.
To distinguish between years a MANOVA was con-ducted, with year used as the explanatory variable, and salinity, temperature, depth, turbidity, total faunal diver-sity, seagrass blade density, and seagrass blade height used as response variables. Both temperature and blade density were double-log transformed to fit the assump-tions of parametric statistical tests. MANOVA results indicated that although a significant shift across years was detected (Wilkes λ14,16 = 0.051, F14,16 = 3.913, P = 0.005; Table 1), pairwise comparisons did not indicate that any of the years were significantly different from one another (Hotelling’s T2, all P > 0.05), and univari-ate tests did not indicate which environmental vari-ables contributed to the overall differences detected among years (ANOVA, all P > 0.05). As a result, no detectable shifts in the environment occurred during the study period.
Second, environmental variables were collected dur-ing the wet season at each site (Table 2), to distinguish the sites from each other. Salinity, temperature, turbidity, and dissolved oxygen were determined using a YSI Multiprobe (MPS 556). Depth (in cm) was measured at the location of each environmental sample. Seagrass variables were also measured, including the height of a random sample of blades (in cm) and the density of blades in five replicate 0.1-m2 quadrats. Also, a N,N,-dimethyl formamide chlorophyll extraction was taken of five randomly sampled blades at each replicate location to measure seagrass health, following the methods of Dunton and Tomasko (1994) and using the equations for chlorophyll content from Porra et al. (1989). During each fish collection, seagrass type was scored every 20 m, and these tallies were used to de-scribe the dominant seagrass species at the site. Macro-algal cover was approximated based on an estimate of the blotted, uncompacted volume of algae that was in the net after each fish collection, as 0 (less than 1 l), low (1–5 l), moderate (5–10 l) or high (> 10 l). These scores were then used to provide the macroalgal cover descrip-tion seen in Table 2.
To determine the most important environmental components distinguishing sites from one another, two

122 Current Zoology Vol. 56 No. 1
Table 2 General research site characteristics; environmental samples presented for late summer samples only
Environmental characteristics M1 M2 M3 F-value2,12** P-value
Distance from open water (m) 137.5 236.6 94.9 -- --
Location N27º52.33’ W82º32.14’
N27º52.39’ W82º32.19’
N27º52.32’ W82º32.26’ -- --
Salinity (ppt) * 28.6 (0.36) 28.5 (0.35) 28.6 (0.38) 0.029 0.971
Mean water temp. (C°) by site 27.6 (1.4) 27.7 (1.3) 27.7 (1.3) 0.001 0.999
Mean turbidity (ntu) * 6.92 (1.4) 5.85 (1.2) 6.26 (0.8) 0.299 0.747
Mean dissolved oxygen (mg O2/L) * 5.68 (1.9) 6.1 (2.1) 7.68 (2.1) 0.741 0.497
Mean depth (cm) 87.6 (3.5) 74.2 (9.8) 82.0 (5.8) 0.951 0.414
Overall faunal diversity (H’) 0.663 (0.05) 0.51 (0.03) 0.67 (0.02) 5.36 0.022
Mean seagrass blade count (per 0.1 m2) 218.7 (12.5) 145.1 (19.3) 223.2 (16.4) 7.22 0.009
Mean blade height (cm) * 66.5 (1.74) 29.8 (0.33) 54.3 (4.0) 32.5 < 0.0001
Total chlorophyll a/b content (mg/l) * 23.4 (3.6) 26.1 (4.0) 15.7 (0.7) 2.67 0.110
Dominant seagrass species Syringodium Thalassia, sand patches Thalassia, Halodule Syringodium -- --
Macroalgal level High Moderate/seasonal Low -- -- * Values were transformed for normality and equal variances before use in MANOVA (log-log; power1.5; log-log; power2.2; log transformed, respec-tively). **Univariate statistical results obtained after calculating the MANOVA. Mean (± 1 SE) provided. Two MANOVAs were conducted; one including only physical/chemical variables (listed above the line) to determine if they alone could distinguish between sites, and one including biological variables (below the line).
MANOVAs were conducted. Variables were trans-formed to fit parametric test assumptions (transforma-tions listed in Table 2). The first MANOVA was to de-termine if sites were similar with respect to physical and chemical characteristics (abiotic factors), with site as the explanatory variable and salinity, temperature, depth, turbidity, dissolved oxygen, and depth the response variables. Sites were indistinguishable from one another based on physical/chemical characteristics (Wilkes λ10,16
= 0.310, F10,16 = 1.275, P = 0.321), with no individual environmental characteristics significantly different across sites (Univariate ANOVA, all P > 0.05; Table 2).
To determine if the seagrass or biological variables differed among sites, a separate MANOVA was con-ducted for site by total faunal diversity, seagrass blade density, seagrass blade height, and total chlorophyll content. Based on these biological variables, significant differences were detected among sites (Wilkes λ8,18 = 0.023, F8,18 = 12.624, P < 0.0001), with pairwise com-parisons indicating that sites M1 and M2, and M2 and M3 were significantly different from one another, and sites M1 and M3 approached significance (M1:M2, Hotelling’s T2 = 221.7, P = 0.001; M2:M3, Hotelling’s T2 = 122.4, P = 0.003; M1:M3, Hotelling’s T2 = 29.3, P = 0.06). Faunal diversity, seagrass blade density, and seagrass blade height all significantly contributed to the distinction among sites (Table 2). M1 seagrass had longer blades than M3, while M2 seagrass blades had the shortest length. This corresponds with the predomi-
nant seagrass species observed in M1 (S. filiforme) and the slightly higher average depth in the site. Blade den-sity also varied with grass type, with M2 having fewer blades and dominated by Thalassia seagrass, and M3 having the highest blade count, reflecting the mixture of Thalassia with Syringodium and Halodule, which both have much higher blade densities than Thalassia alone, and which led to M3 most likely having the most spa-tially complex habitat. 1.4 Fish collection and return to sites
Organisms were collected at three sites (M1, M2, M3) using 1.3 m-wide pushnets with 6 mm pore size over a linear distance target of 100 m, as described by Strawn (1958). The net was modified to include cable ties wrapped around the bottom edge to form soft teeth with which to “comb” the seagrass and encourage seahorses to leave their holdfasts and swim up into the net. Sam-pling distances were carefully measured to obtain an accurate density estimate, and samples were collected in random directions within each site in short (20 – 30 m) segments to avoid stressing the animals from being in the net too long. Mean distance surveyed at each site was 114.0 m (standard error, 39.6), and total distance covered was approximately 10,833 m. During collection, GPS points for the start and end of each sampling drag were collected to map collection history at each site. The mean area surveyed at each site on each sampling day was 148.24 m (standard error, 51.4), and mean area of sites did not differ. Organisms were released the same

H. D. MASONJONES et al.: An examination of the population dynamics 123
day to their original collection sites, which were tracked and mapped for each site and day using ArcGIS 9.2 (Fig. 1). Collections occurred between December 2005 and December 2007, with an average sampling interval of 22.7 days (standard error, 2.73; range, 5 – 56 days). Upon subsequent sampling days, the starting point within the site was randomized to avoid pseudoreplication. 1.5 Marking protocol
To determine independence of samples across the study, fish were anesthetized with clove oil and then marked intradermally using visible implant fluorescent elastomer (VIFE; Northwest Marine Technology, Inc.) on the ventral surface at the base of the tail, following the protocol of Woods and Martin-Smith (2004) for the larger seahorse species Hippocampus abdominalis. During marking, fish were examined to determine if they had previous marks, which would indicate a recap-ture event. In this study, marking was used specifically to determine if we had previously collected individuals and not as a technique for population estimation.
VIFE marking has been used successfully on many species of small organisms (juvenile kingfish Menti-cirrhus saxatilis, Miller et al., 2002; larval salamanders Eurycea bislineata, Campbell and Grant, 2008; rainbow darters Etheostoma caeruleum, Weston and Johnson, 2008). In addition, a laboratory-based pilot study was run during the summer of 2004 on H. zosterae seahorses, selected because they are smaller and more difficult to mark due to their more ossified surface than the pipefish species commonly seen in Tampa Bay. In the pilot, 24 individuals (12 males and 12 females) were selected for a range of body sizes from a seagrass sampling event near Ft. DeSoto, Florida. All 24 animals were anesthe-tized with clove oil (GNC incorporated), and 6 males and 6 females were then selected at random for VIFE marking. All 24 animals were housed in a common 30-gal tank for 12 weeks post-marking. We observed 100% survivorship and complete mark retention (Ma-sonjones and Curtis, unpublished data). 1.6 Fish data collection
Once marked, fish were photographed using a high-resolution digital camera with a measurement scale included in the frame. Seahorses and female pipefish were photographed laterally and male pipefish ventrally to identify reproductive stage and increase reliability of gender determination from photos. Photos were later analyzed to determine the sex, species, and standard length of syngnathids using the program ImageJ 1.40g (NIH). Due to their unique body shape, seahorse stan-dard length was measured as the linear distance from
the snout to the middle of the operculum, and then down the axis of the body to the end of the tail, following the measurement protocol from Lourie (2003). 1.7 Statistical analysis
Data were analyzed to identify patterns across site, year, and species using queries written in Microsoft Ac-cess (2003), with more advanced statistical analysis conducted in JMP 5.1.2 and Systat 12.0. All study val-ues are provided as means plus one standard error, dis-played in parentheses after the mean value.
Fish counts were obtained across sampling days and were analyzed with a chi-squared goodness-of-fit test. Because density data with small numbers of organisms observed were right-skewed, a 0.33 power transforma-tion was applied. In addition, data sets with high num-bers of zero densities were excluded from ANOVA sta-tistical analysis (S. louisianae and S. floridae density data) and analyzed using one-way Wilcoxon or Kruskal-Wallis tests (χ2 approximation). When standard length data violated the assumptions of heteroscedastic-ity (Bartlett’s test) and/or normality (Shapiro-Wilk’s test), data were transformed by calculating the lengths to the 1.2 power. In some cases of body length calcula-tions, transformation did not completely normalize the data sets; as a result, an alpha of 0.01 was applied to those parametric statistical analyses following the pro-cedure of Underwood (1997). Multiple comparisons were conducted for ANOVA comparisons using Tukey’s HSD values.
Because recapture samples were small in number and inconsistent in frequency over time, population esti-mates are unlikely to be accurate (Krebs, 1999). In addi-tion, the population is only intermittently geographically closed at low tide. Other research in our laboratory in-dicates that, although H. zosterae are relatively sessile and might be candidates for closed population estima-tion techniques such as the Schnabel method (Krebs, 1999), in S. scovelli pipefish, up to 20% of recaptures have changed location (Masonjones and Rose, unpub-lished data). These factors, combined with recapture numbers too small for open population estimates, mean that we did not use recaptures to estimate population size of fish in the study. Marking instead was used to verify that fish captured during each sampling event had not been sampled in a previous event, thus verifying sample independence.
2 Results 2.1 Syngnathid density shifts across site and season
Seven syngnathid species were observed in the study

124 Current Zoology Vol. 56 No. 1
region across the two-year sampling period (Table 3). Anarchopterus criniger (fringed pipefish), H. erectus (lined seahorse), and S. springeri (bull pipefish) were all seen at frequencies well below 1% during the study. However, four species (H. zosterae, S. scovelli, S. lou-isianae, S. floridae) were observed at frequencies of 1.3% – 82% across sites and species. By far, the most common species during all sampling events across all sites was the gulf pipefish S. scovelli, seen at frequen-cies roughly five times higher than the next most com-mon species, the dwarf seahorse H. zosterae.
No observed pattern in distribution relative to site location was found in rare species (> 1%). Anarchop-terus criniger was most common in M1, H. erectus was most common in M2, and S. springeri was only ob-served in M3. Site M2 had a 26.8% lower observed count of H. zosterae than was expected given the fish counts at the other two sites (χ2 = 20.24, df = 2, P < 0.001). A similar pattern was observed with S. scovelli, S. louisianae, and S. floridae with M2, a site dominated by Thalassia, sand patches, and moderate algae (Table 2) that exhibited the smallest number of fish. M1 had the next highest fish count, and M3 had the highest fish counts and was clearly preferred by far over the other two sites (S. scovelli: χ2 = 193.17, df = 2, P < 0.001; S. louisianae: χ2 = 47.52, df = 2, P < 0.001; S. floridae: χ2
= 42.02, df = 2, P < 0.001). Total density of all syngnathid fishes over the course
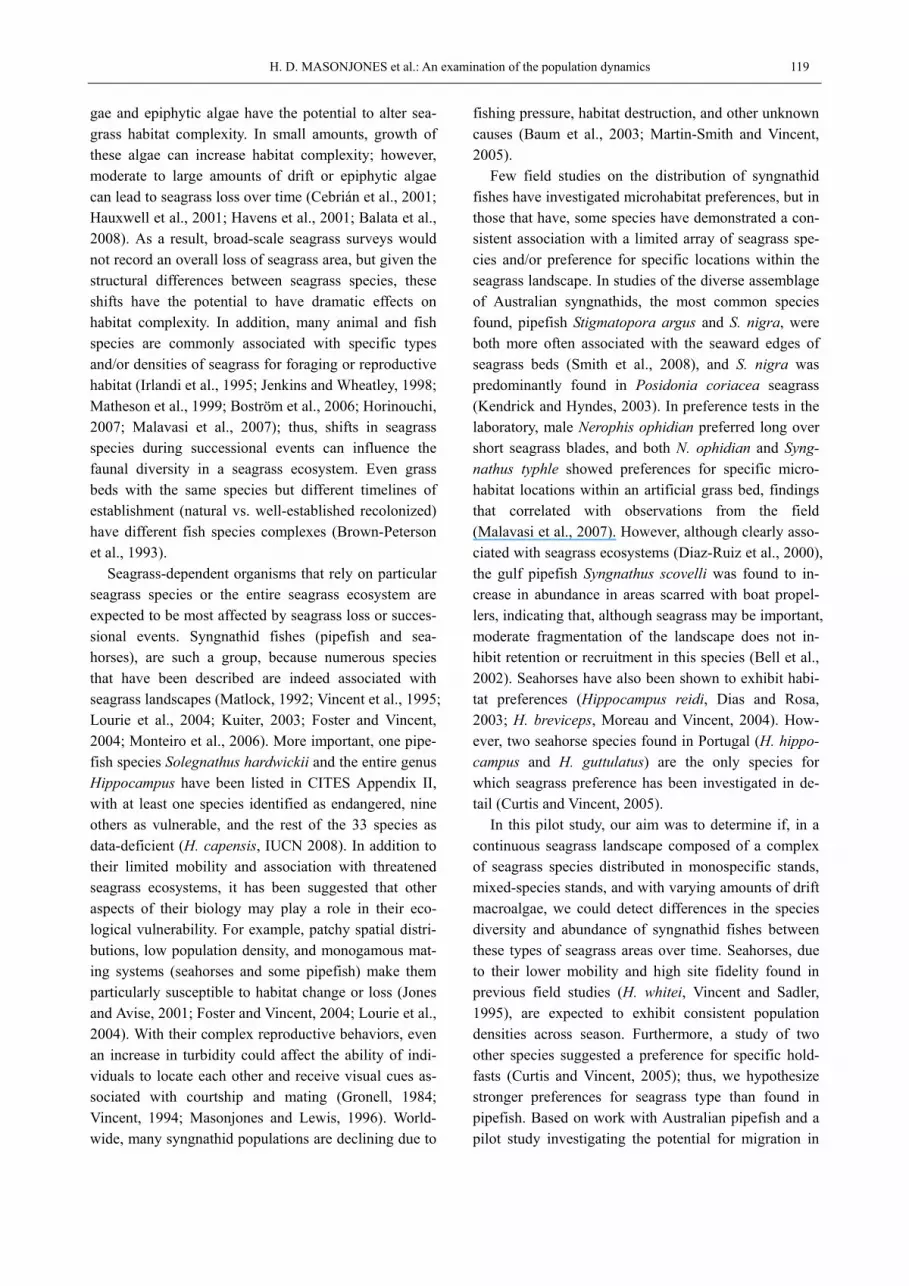
of the study was investigated by examining independent effects of site, season, and year. Differences in density for both season and year were significant (Table 4), in-dicating that, overall, the wet season and 2006 both had the highest population densities observed in the study (Tukey HSD, both P < 0.05). However, this does not consider the timeline of the study and does not give a measure, other than year, that the overall population has changed. As a result, a concatenated variable of season and year was created to quantify shifts in population density (Fig. 2). It appears that the population is large in the wet season of 2006 and then declines through the other two seasons. Analyzed for season-year combined, significant relationships were detected (One-Way ANOVA, F3,95 = 12.74, P < 0.0001). Most recently, the population density at the end of 2007 was significantly lower than all other groups, and the population density in the 2007 wet season was much lower than in the 2006 wet season (Tukey HSD, both P < 0.05).
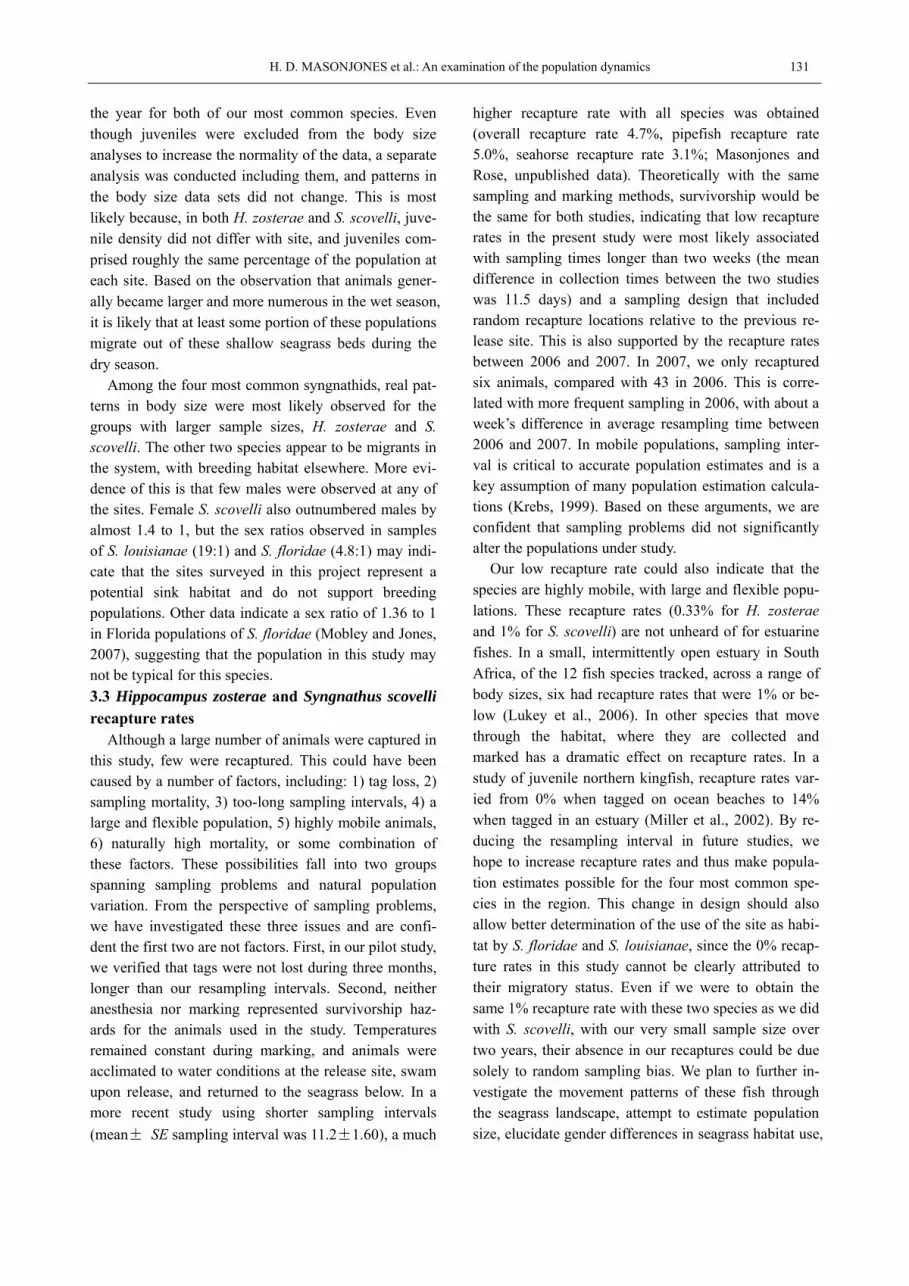
H. zosterae showed even densities across sites when separated across seasons (Fig. 3), with overall mean density of 0.08 (0.009) animals/m2, and a range of 0.02 animals/m2 (M2, 2006 dry season) to 0.18 animals/m2 (M3, 2007 wet season). This may seem contradictory considering that M2 had the lowest fish count observed across the four most common species above. However, the pattern is clearly driven by the three times higher densities of seahorses in both M1 and M3 in the 2006
Table 3 Syngnathid species observed between December 2005 and December 2007, providing both counts and frequencies of occurrence of species by research site (M1, M2, M3) listed in order of abundance
Species M1 f M2 f M3 f Total count Total-f
Syngnathus scovelli 1310 75.42% 1240 81.69% 1930 79.10% 4480 78.66%
Hippocampus zosterae 318 18.31% 247 16.27% 357 14.63% 922 16.19%
Syngnathus louisianae 76 4.38% 18 1.19% 90 3.69% 184 3.23%
male 3 0 3
female 65 15 73
Syngnathus floridae 22 1.27% 9 0.59% 57 2.33% 88 1.54%
male 0 2 11
female 19 6 39
Anarchopterus criniger 10 0.58% 1 0.07% 3 0.12% 14 0.25%
male 3 0 2
female 7 1 1
Hippocampus erectus 1 0.06% 3 0.20% 1 0.04% 5 0.09%
Syngnathus springeri 0 0.00% 0 0.00% 2 0.08% 2 0.03%
Total observed 1737 30.50% 1518 26.65% 2440 42.84% 5695
For species of moderate abundance, gender of collected individuals is noted. See Table 6 for gender abundance data for most abundant species.

H. D. MASONJONES et al.: An examination of the population dynamics 125
Table 4 ANOVA (H. zosterae, S. scovelli) results and Wilcoxon/Kruskal Wallis results (χ2 approximation; S. louisianae, S. floridae) for shifts in fish density (per m2) with site (M1, M2, M3), season (wet/dry), and year (2006 – 2007)
Total density H. zosterae S. scovelli S. louisianae S. floridae
Sample size 96 95 95 95 95
Source of variation df F11,84 P F11,83 P F11,83 P χ2 P χ2 P
Main effects
Site 2 2.44 0.093 0.37 0.692 2.67 0.075 6.23 0.044 13.49 0.001
Wet/dry season 1 4.32 0.041 5.78 0.018 1.85 0.177 6.51 0.011 11.53 0.0007
Year 1 8.47 0.005 6.75 0.011 9.25 0.003 2.44 0.119 0.91 0.340
Two-way interactions
Site*season 2 1.69 0.191 0.78 0.462 6.44 0.002 -- -- -- --
Site*year 2 1.35 0.265 0.76 0.473 0.96 0.387 -- -- -- --
Season*year 1 17.90 < .0001 6.06 0.016 34.57 < .0001 -- -- -- --
Three-way interaction
Site*season*year 2 0.31 0.737 3.79 0.027 0.141 0.869 -- -- -- --
Missing data indicates samples sizes too small for meaningful results.
Fig. 2 Total syngnathid fish density (number of fish/m2) over time (late December 2005 – December 2007) separated by site (M1, M2, M3) and season (bar across top of figure) Dry season 2006 (December 2005 – April 2006), Wet season 2006 (May 1 – November 1, 2006), Dry season 2007 (November 1, 2006 – April 2007), Wet season 2007 (May 1 – November 1, 2007). wet season. Statistically, no effect of site was observed for density, but both season and year had moderately significant effects. Higher densities were found both in the wet season and in 2007 (Table 4; both P < 0.02), and a significant interaction was found among them, with the 2006 dry season having a significantly lower
density then the other three seasons (Tukey HSD, P < 0.05). Juvenile density was investigated to determine if some sites harbored more offspring than others, but sta-tistically there was no difference across sites [M1: 0.0076 (0.0048), M2: 0.0046 (0.0048), M3: 0.0108 (0.0049); χ2 = 2.33, df = 2, P = 0.31].

126 Current Zoology Vol. 56 No. 1
Densities of S. scovelli, on the other hand, were quite variable, with values over three times higher than densi-ties seen in any other season or site (1.04 animals/m2 in M3, 2006 wet season; Fig. 3), dropping to a low of 0.14 animals/m2 observed in M1 during the 2007 wet season, with an overall mean density of 0.34 (0.019) animals/m2. Although neither site nor season were significant on their own, year had a highly significant effect on density, with values falling between 2006 and 2007 (Table 4). In addition, there were significant interactions, with site M3 during the wet season having significantly higher densities than all other sites under wet or dry conditions (Tukey HSD, P < 0.05). Also, density significantly in-creased in dry seasons between 2006 and 2007, but de-creased across years in the wet seasons (Tukey HSD,
both P < 0.05). Similar to H. zosterae, S. scovelli juve-nile density across sites did not differ (M1: 0.046 (0.0066), M2: 0.029 (0.0068), M3: 0.038 (0.0067); χ2 = 3.12, df = 2, P = 0.21).
Data could not be transformed satisfactorily for S. louisianae and S. floridae, so non-parametric tests were used. Site played a significant role in describing density differences (Table 4), with both species of pipefish rarely observed in site M2 (Fig. 3). In addition, season was an important factor explaining variation in both species’ density, with much higher values during the 2006 wet season than in all other seasons (Fig. 3). However, year did not significantly differ in either spe-cies. What is most interesting about the distribution of densities across time and site in both species is that
Fig. 3 Syngnathid density (number of fish/m2) separated forthe four most common species in the study (H. zosterae, S.scovelli, S. louisianae, S. floridae) and organized by site (A:M1, B: M2, C: M3) Changes across time are indicated as follows: Dry season 2006 (De-cember 2005 – April 2006), Wet season 2006 (May 1 – November 1,2006), Dry season 2007 (November 1, 2006 – April 2007), Wet sea-son 2007 (May 1 – November 1 2007).

H. D. MASONJONES et al.: An examination of the population dynamics 127
males were rarely observed. Male S. louisianae were observed only a few times during the study, and not at all in site M2 or during the 2007 wet season (Table 3). Male S. floridae comprised a larger percentage of the population than did male S. louisianae, but male S. floridae were not observed in site M1 and were also not seen during the 2007 dry season. 2.2 Body sizes and variation across species, gen-der, site, and season
Body size varied substantially across factors investi-gated for both H. zosterae and S. scovelli, but not for S. louisianae or S. floridae (Fig. 4). For H. zosterae, sea-son played a highly significant role in describing varia-tion in body size, with body size higher during wet sea-sons than dry seasons (Table 5). Body size did not vary by site, year, or gender. However, there was a significant interaction between site and season: Dwarf seahorses from the M1 site during the dry season were signifi-cantly smaller than all other groups (Tukey HSD, P < 0.05). M1 dwarf seahorses collected in all of 2006 were
6% smaller overall then all other combinations of site and year, with sites in 2007 far more homogeneous in size overall than sites in 2006 (Tukey HSD, P < 0.05). Finally, although there was no size difference across year between dry seasons, there was a significant in-crease in body size among fish collected in the 2007 wet season (Tukey HSD, P < 0.05).
For S. scovelli, site, season, and gender all contrib-uted to describing variation in body size among pipefish (Table 5, all P < 0.001, α = 0.01). Animals were sig-nificantly larger in the site closest to open water with the least macroalgal cover and a mixed seagrass species assemblage (M3). Animals were also larger in the wet season but significantly smaller overall in 2007 than in 2006 (Fig. 4). In addition, there was a significant inter-action effect between site and season in S. scovelli, with small and extremely homogeneous body sizes in the dry season but larger and more variable body sizes in the wet season (Tukey HSD, all P < 0.05). Sexual dimor-phism was also observed in this species.
Fig. 4 Mean (± 1 SE) syngnathid body sizes (measured as standard length, mm) for the four most common species in this study (H. zosterae, S. scovelli, S. floridae, S. louisianae) organized by site (M1, M2, M3) within species Counts of number of fish included within each mean are included above each bar. Changes in body size across both year and season are indicated as follows: A. Dry season 2006 (late December 2005 – April 2006), B. Wet season 2006 (May 1 – November 1, 2006), C. Dry season 2007 (No-vember 1, 2006 – April 2007), D. Wet season 2007 (May 1 – November 1, 2007).

128 Current Zoology Vol. 56 No. 1
Table 5 ANOVA results for shifts in body sizes of syngnathid fishes with site (M1, M2, M3), season (wet/dry), year (2006-2007), and gender (M, F; where enough data available for gender analysis)
H. zosterae** S. scovelli* S. louisianae S. floridae
Sample size (n**) 842 4252 160 77
Source of variation df F15,826 P F15,3962 P F7,152 P F8,66 P
Main effects
Site 2 2.71 0.067 27.40 < 0.0001 0.45 0.636 0.15 0.861
Wet/dry season 1 75.82 < 0.0001 175.52 < 0.0001 0.28 0.596 0.59 0.446
Year 1 4.91 0.027 2.39 0.122 0.036 0.850 3.97 0.051
Gender 1 4.93 0.027 126.06 < 0.0001 1.04 0.309 0.99 0.322
Two-way interactions
Site*season 2 6.34 0.002 12.18 < 0.0001 1.02 0.364 0.51 0.560
Site*year 2 7.55 0.001 4.28 0.014 -- -- 1.22 0.303
Season*year 1 11.27 0.001 0.16 0.685 2.78 0.098 3.87 0.053
Site*gender 2 1.10 0.332 5.55 0.004 -- -- -- --
Season*gender 1 0.09 0.766 4.36 0.037 -- -- -- --
Three-way interactions
Site*season*gender 2 0.34 0.712 2.45 0.086 -- -- -- -- * Because of minor violations of assumptions, according to Underwood (1997), α = 0.01. ** Juveniles omitted from size analysis because they contributed to the violation of parametric assumptions and were unevenly distributed across sampling days. Missing data indicates samples sizes too small for meaningful results.
Table 6 Recaptured animals organized by species, gender and research site. No juveniles were recaptured, but their numbers are included in the totals
Species M1 M1 recaps M2 M2 recaps M3 M3 recaps Total count Recap. totals Recap. freq.
H. zosterae 318 0 247 3 357 0 922 3 0.325%
male 110 0 103 0 128 0 341 0 0
female 184 0 126 3 192 0 502 3 0.598%
S. scovelli 1310 12 1240 7 1930 27 4480 46 1.027%
male 456 6 373 2 850 9 1679 17 1.012%
female 651 6 740 5 919 18 2300 29 1.261%
Total count 1628 12 1487 17 2287 27 5402 49 0.907%
Recap. freq. 0.737% 1.143% 1.180%
2.3 Hippocampus zosterae and Syngnathus scovelli recapture rates
All animals that were collected were tagged, but only dwarf seahorses and gulf pipefish were recaptured. Re-capture rates for both H. zosterae and S. scovelli were extremely low, at 0.33% and 1.0% respectively, making population estimates unreliable (Table 6). However, we used marking as a technique to verify whether or not we had observed individuals during a prior collection event and not to estimate populations, and our sampling tech-niques reflected the goal of obtaining samples that were independent from one another over time.
Recapture rates reflected the overall density of ani-mals in sites the first year, with extremely high popula-tions in the M3 site during the 2006 wet season, when most of the recaptures occurred. In fact, only six ani-
mals were recovered in 2007, and two of those recap-tures were two of the only three remarked seahorses in the study. No male seahorses were recaptured, and among pipefish, females were more frequently recap-tured, corresponding with their higher catch rate overall.
3 Discussion 3.1 Syngnathid density shifts across site and season
In investigating the patterns of syngnathid distribu-tion by site, H. zosterae appear to be generalists in the seagrass landscape. This result is contrary to our expec-tations, based on their limited mobility and previous research showing that some seahorse species display particular habitat preferences. We observed low popula-tion densities overall, with a consistent distribution across seagrass sites and seasons. There were, however,

H. D. MASONJONES et al.: An examination of the population dynamics 129
significant density increases during the wet season and from 2006 to 2007. The density increase during the wet season cannot be explained by increases in the number of juveniles, as juvenile densities were consistent across site and across years. During collection, some seahorses were observed clinging to drift macroalgae in sampling nets, and this could serve as a method of dispersal for H. zosterae similar to that seen in the predominant distri-bution of Syngnathus fuscus in drift algae in a Cape Cod estuary (Able et al., 2002). In other studies of seahorse habitat distribution, seahorses were also found at mean densities at or below 0.06 seahorses/m2, but locally high densities were observed around preferred habitat (1 seahorse/m2 in H. whitei, Vincent et al., 2004; 0.70/m2, H. breviceps, Moreau and Vincent, 2004; 0.51/m2, H. guttulatus, Curtis and Vincent, 2005). However, these studies were all focused on larger species of seahorse that could be visually located in a complex landscape, allowing assessment of local high densities. In the pre-sent study, lower densities are a function of a general survey approach. In previous seahorse studies con-ducted with visual surveys, seahorses were found asso-ciated with structures that could be used as holdfasts, although substantial variation existed in those structures, including macroalgae, bryozoans, tunicates, polychaetes, and seagrass. Across species investigated, few prefer-ences were observed, and no preferences for specific seagrass species as holdfasts were noted.
All previous studies observed seahorse residents re-maining in a small area for a given period of time, indi-cating small home range size. However, H. breviceps, the species closest in size to the dwarf seahorse ob-served in this study, had a high turnover rate in these high-occupancy sites, with adults observed on average only 20 days (range 1 – 37 day residency time) out of the 37-day study (Moreau and Vincent, 2004). This in-dicates that at least some fraction of the adult population is mobile, and it differs from other studies of seahorses that have indicated high site fidelity and low mobility (H. whitei, Vincent et al., 2004; H. subelongatus, Kvarnemo et al., 2000). Our data suggest that H. zoste-rae may be seagrass generalists, found across a gradient of seagrass species, macroalgal abundance, and distance to open water. Low recapture rates may indicate that this species is more mobile and more similar to H. breviceps than to other seahorse species.
For S. scovelli, the most common species in this study, site M3 during the 2006 wet season exhibited three times higher densities than any other combination of sites, seasons, and year. Site M3 was composed of
mixed Thalassia, Syringodium, and Halodule seagrasses, but with the lowest observed levels of macroalgae, likely due to the close proximity to open water and as-sociated wave action, leading to more flushing. Con-trary to what was observed for the dwarf seahorse, the overall trend for S. scovelli was of decreasing densities from 2006 to 2007. As we hypothesized, S. scovelli were observed along a gradient relative to the open ocean, with higher densities in M3, followed by M1 and then M2, which was the site farthest away from open water. This pattern was also observed for both Stigma-topora nigra and S. argus populations in southeast Aus-tralia, where syngnathids were more common on the seaward edge of grass beds than the shoreward edge (Smith et al., 2008), and which may reflect a general preference for access to open water in pipefish species.
This association of S. scovelli with site M3 could be explained in many ways. First, it is possible that the seaward edge allows better access to open water for foraging, although in other studies, pipefish have rarely been associated with open sand sites, and 20 – 30 me-ters of sand separates M3 from open-water seagrass beds (Kendrick and Hyndes, 2003; Smith et al., 2008). Gulf pipefish and dwarf seahorses feed on harpacticoid copepods and amphipods, and due to changes in the velocity of the water as it moves over the seagrass, these organisms may be more abundant along the edges of seagrass beds (Huh and Kitting, 1985; Fonseca and Fisher, 1986; Tipton and Bell, 1988; Smith et al., 2008). Because M3 is at the outer edge of this seagrass system, these food sources are likely to be more abundant, thus potentially explaining the higher abundance of pipefish and their larger size in this site as well.
Another reason S. scovelli may be abundant at this site is the combination of the diversity of seagrass blades and their length. Gulf pipefish, like other pipefish, rely on crypsis to avoid predation, and their body shape aids in the process of hiding among the seagrass blades. In M3, the mixture of broad-bladed Thalassia spp. with the thinner-bladed Syringodium, both with long blades, could potentially provide the best cover for the broad-bodied females and thinner-bodied males. In other species, seagrass preference followed these types of body dimension patterns. The larger Syngnathus ty-phle and Nerophis ophidian preferred long over short blades in the laboratory and were more often associated with broader-bladed Cymnodocea nodosa; the smaller S. abaster preferred Zostera marina (Malavasi et al., 2007). In another study, both Stigmatopora nigris and S. argus preferred the strap-like Posidonia spp., which matches

130 Current Zoology Vol. 56 No. 1
their body morphology more closely than the branching Amphibolis griffithii (Kendrick and Hyndes, 2003). Al-though only correlations, the distribution of pipefish body shapes with seagrass morphology is an interesting pattern observed across studies and might explain some of the variation in this study.
Although there were no differences in density be-tween years in S. louisianae and S. floridae, these spe-cies had significantly higher densities during the wet season overall. Site was significant, as they were rarely observed in M2, which had a mix of Thalassia spp., sand, and algae and had significantly lower blade height and blade densities. We expected that pipefish in general would be found in all seagrass locations due to their greater mobility; however, these two species were ob-served at extremely low levels at the most inland site and not at all there in some seasons. This can potentially be explained by the size difference in these two species from the smaller S. scovelli. With a longer body size, the two larger species may prefer a deeper habitat, which allows for longer grass to create more protection from predators and closer access to open water to facilitate possible migrations (Lazzari and Able, 1990; Power and Attrill, 2003; Malavasi et al., 2007). Further evidence of migration for the two larger species is the lack of males in the populations. Previous research shows that, within pipefish populations of Syngnathus fuscus, males are the limiting factor and do not tend to migrate and risk pre-dation (Roelke and Sogard, 1993). In our study, this could explain the high number of females relative to males; females may migrate to search for mates in a new habitat or use the current habitat as foraging space independent of males.
During the course of the two-year research study, we observed a substantial decrease in overall syngnathid population size. It is possible but unlikely that our sam-pling techniques had a deleterious effect on the popula-tion, as our pilot study indicated 100% laboratory sur-vivorship after marking, and another more recent study showed significantly higher recapture rates of all syng-nathids and much more consistent numbers of syng-nathid fish across seasons (see section 3.3 below; Ma-sonjones and Rose, unpublished). This study did not follow the proper BACI study design for detecting the effects of anthropomorphic stressors on ecological sys-tems, with a clear before and after and an appropriate control (Underwood, 1994); however, there is still the potential to glean insight from the changes we observed during the study. Another limitation in this context is the study period, as two years is a short time to conduct a
population study for the purpose of distinguishing natu-ral fluctuations from anthropogenic effects on the popu-lation (Estacio et al., 1999). These issues notwithstand-ing, a measured decrease in syngnathid population size occurred in the same time frame as the demolition and construction phases of two marina projects adjacent to the research site. Dramatic construction projects in aquatic systems, like building a dam, can have immedi-ate and obvious impacts on resident fish communities (Habit et al., 2007), but slower changes such as the gradual loss of seagrass and succession to less optimal species can also cause dramatic shifts in resident fish distribution and community composition (Thayer et al., 1999). Although we did not observe a shift in species composition during the study, population density de-creased from one year to the next. This could indicate a disturbance in the natural population cycle of wet and dry seasons at the site, indicating the potential for shifts to have occurred in the environment that we are not yet able to detect. Only continued post-construction population monitoring in the site will help resolve these questions. 3.2 Body sizes and variation across species, gen-der, site, and season
We observed an increase in body size for dwarf sea-horses overall and for gulf pipefish in M3 during the wet season. Increasing body size through increased growth in wet seasons could certainly be an explanation, because increased rains and longer days increase pho-tosynthetic rates and therefore food availability. How-ever, this may indicate also that larger individuals mi-grate into the site from deeper-water seagrasses not in-cluded in the study area. Residents are smaller and theoretically poorer swimmers, and larger individuals may shift habitats seasonally to broaden their range of resources. Predation could also play a role; because of the protected nature of the site, there may be fewer re-sources and predators, and the larger individuals might seasonally risk leaving in order to gain more food in another habitat.
Evidence from some species of pipefish indicates that seasonal migrations occur based on size frequency data (S. fuscus, Lazzari and Able, 1990; S. rostellatus, Power and Attrill, 2003; Nerophis ophidian, Monteiro et al., 2006), but in other species studied, the evidence is equivocal (Stigmatopora nigra, Kendrick and Hyndes, 2003). In our studies, the increase in density during the wet season did not appear to simply be a factor of in-creases in juveniles, because very few were observed in the study, and their numbers were consistent throughout
H. D. MASONJONES et al.: An examination of the population dynamics 131
the year for both of our most common species. Even though juveniles were excluded from the body size analyses to increase the normality of the data, a separate analysis was conducted including them, and patterns in the body size data sets did not change. This is most likely because, in both H. zosterae and S. scovelli, juve-nile density did not differ with site, and juveniles com-prised roughly the same percentage of the population at each site. Based on the observation that animals gener-ally became larger and more numerous in the wet season, it is likely that at least some portion of these populations migrate out of these shallow seagrass beds during the dry season.
Among the four most common syngnathids, real pat-terns in body size were most likely observed for the groups with larger sample sizes, H. zosterae and S. scovelli. The other two species appear to be migrants in the system, with breeding habitat elsewhere. More evi-dence of this is that few males were observed at any of the sites. Female S. scovelli also outnumbered males by almost 1.4 to 1, but the sex ratios observed in samples of S. louisianae (19:1) and S. floridae (4.8:1) may indi-cate that the sites surveyed in this project represent a potential sink habitat and do not support breeding populations. Other data indicate a sex ratio of 1.36 to 1 in Florida populations of S. floridae (Mobley and Jones, 2007), suggesting that the population in this study may not be typical for this species. 3.3 Hippocampus zosterae and Syngnathus scovelli recapture rates
Although a large number of animals were captured in this study, few were recaptured. This could have been caused by a number of factors, including: 1) tag loss, 2) sampling mortality, 3) too-long sampling intervals, 4) a large and flexible population, 5) highly mobile animals, 6) naturally high mortality, or some combination of these factors. These possibilities fall into two groups spanning sampling problems and natural population variation. From the perspective of sampling problems, we have investigated these three issues and are confi-dent the first two are not factors. First, in our pilot study, we verified that tags were not lost during three months, longer than our resampling intervals. Second, neither anesthesia nor marking represented survivorship haz-ards for the animals used in the study. Temperatures remained constant during marking, and animals were acclimated to water conditions at the release site, swam upon release, and returned to the seagrass below. In a more recent study using shorter sampling intervals (mean± SE sampling interval was 11.2±1.60), a much
higher recapture rate with all species was obtained (overall recapture rate 4.7%, pipefish recapture rate 5.0%, seahorse recapture rate 3.1%; Masonjones and Rose, unpublished data). Theoretically with the same sampling and marking methods, survivorship would be the same for both studies, indicating that low recapture rates in the present study were most likely associated with sampling times longer than two weeks (the mean difference in collection times between the two studies was 11.5 days) and a sampling design that included random recapture locations relative to the previous re-lease site. This is also supported by the recapture rates between 2006 and 2007. In 2007, we only recaptured six animals, compared with 43 in 2006. This is corre-lated with more frequent sampling in 2006, with about a week’s difference in average resampling time between 2006 and 2007. In mobile populations, sampling inter-val is critical to accurate population estimates and is a key assumption of many population estimation calcula-tions (Krebs, 1999). Based on these arguments, we are confident that sampling problems did not significantly alter the populations under study.
Our low recapture rate could also indicate that the species are highly mobile, with large and flexible popu-lations. These recapture rates (0.33% for H. zosterae and 1% for S. scovelli) are not unheard of for estuarine fishes. In a small, intermittently open estuary in South Africa, of the 12 fish species tracked, across a range of body sizes, six had recapture rates that were 1% or be-low (Lukey et al., 2006). In other species that move through the habitat, where they are collected and marked has a dramatic effect on recapture rates. In a study of juvenile northern kingfish, recapture rates var-ied from 0% when tagged on ocean beaches to 14% when tagged in an estuary (Miller et al., 2002). By re-ducing the resampling interval in future studies, we hope to increase recapture rates and thus make popula-tion estimates possible for the four most common spe-cies in the region. This change in design should also allow better determination of the use of the site as habi-tat by S. floridae and S. louisianae, since the 0% recap-ture rates in this study cannot be clearly attributed to their migratory status. Even if we were to obtain the same 1% recapture rate with these two species as we did with S. scovelli, with our very small sample size over two years, their absence in our recaptures could be due solely to random sampling bias. We plan to further in-vestigate the movement patterns of these fish through the seagrass landscape, attempt to estimate population size, elucidate gender differences in seagrass habitat use,

132 Current Zoology Vol. 56 No. 1
and further resolve the conservation status of these CITES Appendix II listed species.
Acknowledgements Field work for this project was con-ducted under State of Florida Special Activities License Number 05SR-902. We would like to thank the many UT stu-dents who volunteered hundreds of hours in total on the field crew for the project. In addition, Sawyer, Kellerin, and Grae-lyn Masonjones provided a great deal of field and data proc-essing assistance. Thanks to Dr. Michael Masonjones for pro-viding Access database and statistical assistance. Dr. Mark McRae provided valuable statistical assistance on revisions of the manuscript. Funding was provided in part by the Tampa Bay Estuary Program, Delo Research Professor Grant (Uni-versity of Tampa), the Dana Award Program (University of Tampa), and the Biology Department (University of Tampa).
References Able KW, Fahay MP, Heck KL, Roman CT, Lazzari MA et al., 2002.
Seasonal distribution and abundance of fishes and decapod crusta-ceans in a Cape Cod estuary. North. Nat. 9 (3): 285–302.
Baum JK, Meeuwig JJ, Vincent ACJ, 2003. Bycatch of lined seahorses Hippocampus erectus in a Gulf of Mexico shrimp trawl fishery. Fish. Bull. 101: 721–731.
Bell SS, Hall MO, Soffian S, Madley K, 2002. Assessing the impact of boat propeller scars on fish and shrimp utilizing seagrass beds. Ecol. Appl. 12: 206–217.
Boström C, Jackson EL, Simenstad CA, 2006. Seagrass landscapes and their effects on associated faunal: A review. Est. Coast. Shelf Sci. 68: 383–403.
Brown-Peterson NJ, Peterson MS, Rydene DA, Eames RW, 1993. Fish assemblages in natural versus well-established recolonized sea-grass meadows. Estuaries 16 (2): 177–189.
Campbell S, Miller C, Steven A, Stephens A, 2003. Photosynthetic responses of two temperate seagrasses across a water quality gra-dient using chlorophyll fluorescence. J. Exp. Mar. Biol. 291(1): 57–78.
Campbell Grant EH, 2008. Visual implant elastomer mark retention through metamorphosis in amphibian. J. Wild. Mgmt. 72(5): 1247–1252.
Carruthers TJB, Dennison WC, Kendrick GA, Waycott M, Walker DI et al., 2007. Seagrasses of south-west Australia: A conceptual syn-thesis of the world’s most diverse and extensive seagrass meadows. J. Exp. Mar. Bio. Ecol. 350(1): 21–45.
Cebrián J, Furlong C, Hauxwell J, Valiela I, 2001. Macroalgal cano-pies contribute to eelgrass Zostera marina decline in temperate estuarine ecosystems. Ecology 82(4): 1007–1022.
Curtis JMR, Vincent ACJ, 2005 Distribution of sympatric seahorse species along a gradient of habitat complexity in a sea-grass-dominated community. Mar. Eco. Prog. Ser. 291: 81–91.
Davenport J, Davenport JL, 2006. The impact of tourism and personal leisure transport on coastal environments: A review. Est. Coast. Shelf Sci. 67: 280–292.
Dias TL, Rosa IL, 2003. Habitat preferences of a seahorse species Hippocampus reidi (Teleostei: Syngnathidae). Aq. J. of Ichth. Aq. Biol. 65(3): 326.
Diaz-Ruiz S, Aguirre-Leon A, Perez-Solis O, 2000. Distribution and abundance of Syngnathus louisianae and Syngnathus scovelli
(Syngnathidae) in Tamiahua Lagoon, Gulf of Mexico. Ciencias Marinas 26(1): 125–143.
Dunton KH, Tomasko DA, 1994. In situ photosynthesis in the seagrass Halodule wrightii in a hypersaline subtropical lagoon. Mar. Ecol. Prog. Ser. 107: 281–293.
Estacio FJ, Garcia-Adiego EM, Carballo JL, Sanchez-Moyano JE, Izquierdo JJ et al., 1999. Interpreting temporal disturbances in an estuarine benthic community under combined anthropogenic and climatic effects. J. Coast. Res. 15(1): 155–167.
Fonseca MS, Fisher JS, 1986. A comparison of canopy friction and sediment movement between four species of seagrass with refer-ence to their ecology and restoration. Mar. Ecol. Prog. Ser. 29: 155–122.
Foster SJ, Vincent ACJ, 2004. Life history and ecology of seahorses: Implications for conservation and management. J. Fish. Biol. 65: 1–61.
Fourqurean JW, Powell GVN, Kenworthy WJ, Zieman JC, 1995. The effects of long-term manipulation of nutrient supply on the compe-tition between the seagrasses Thalassia testudinum and Halodule wrightii in Florida Bay. OIKOS 72: 349–358.
Fyfe SK, Davis AR, 2007. Spatial scale and the detection of impacts on the seagrass Posidonia australis following pier construction in an embayment in southeastern Australia. Est. Coast. Shelf Sci. 74: 297–305.
Gronell AM, 1984. Courtship, spawning and social organization of the pipefish Corythoichthys intestinalis (Pices: Syngnathidae) with notes on two congeneric species. Z. Tierpsychol. 65: 1–24.
Habit E, Belk MC, Parra O, 2007. Response of the riverine fish com-munity to the construction and operation of a diversion hydro-power plant in central Chile. Aquatic Conserv. Mar. Fresh. Eco. 17: 37–49
Hauxwell J, Cebrián J, Furlong C, Valiela I, 2001. Macroalgal cano-pies contribute to eelgrass Zostera marina decline in temperate estuarine ecosystems. Ecology 82(4): 1007–1002.
Havens KE, Hauxwell J, Tyler AC, Thomas S, McGlathery KJ et al., 2001. Complex interactions between autotrophs in shallow marine and freshwater ecosystems: Implications for community responses to nutrient stress. Env. Poll. 113: 95–107.
Horinouchi M, 2007. Review of the effects of within-patch scale structural complexity on seagrass fishes. J. Exp. Mar. Biol. Ecol. 350 (1): 111–129.
Huh SH, Kitting KL, 1985. Trophic relationships among concentrated populations of small fishes in seagrass meadows. J. Exp. Mar. Biol. Ecol. 92: 29–43.
IUCN 2008. 2008 IUCN Red List of Threatened Species. <www.iucnredlist.org>. Accessed on 23 January 2009.
Irlandi EA, Ambrose WG, Orlando BA, 1995. Landscape ecology and the marine environment: How spatial configuration of seagrass habitat influences growth and survival of the bay scallop. OIKOS 72(3): 307–313.
Jenkins GP, Wheatley MJ, 1998. The influence of habitat structure on nearshore fish assemblages in a southern Australian embayment. J. Exp. Mar. Ecol. 221(1998): 147–172.
Jones AG, Avise JC, 2001. Mating systems and sexual selection in male-pregnant pipefishes and seahorses: Insights from microsatel-lite-based studies of maternity. J. Hered. 92: 150–158.
Kendrick AJ, Hyndes GA, 2003. Patterns in the abundance and size-distribution of syngnathid fishes among habitats in a sea-grass-dominated landscape. Est. Coast. Shelf Sci. 57: 631–640.
Krebs CJ, 1999. Ecological Methodology. 2nd edition. Menlo Park,

H. D. MASONJONES et al.: An examination of the population dynamics 133
USA: Addison-Wesley. Kuiter RH, 2003. Seahorses, pipefishes and their relatives. Chorley-
wood, UK: TMC Publishing. Kvarnemo C, Moore GI, Jones AG, Nelson WS, Avise JC, 2000. Mo-
nogamous pair bonds and mate switching in the Western Australian seahorse Hippocampus subelongatus. J. Evol. Biol. 13: 882–888.
Lazzari MA, Able KW, 1990. Northern pipefish Syngnathus fuscus occurrences over the Mid-Atlantic Bight continental shelf: Evi-dence of seasonal migration. Env. Biol. Fish. 27: 177–185.
Lourie SA, 2003. Measuring seahorses. Project Seahorse Technical Report No.4, Version 1.0. Project Seahorse, Fisheries Centre, Uni-versity of British Columbia.
Lourie SA, Foster SJ, Cooper EWT, Vincent ACJ, 2004. A guide to the identification of seahorses. Project Seahorse and TRAFFIC North America. Washington D.C.: University of British Columbia and World Wildlife Fund.
Lukey JR, Booth AJ, Froneman PW, 2006. Fish population size and movement patterns in a small intermittently open South African estuary. Est. Coast. Shelf Sci. 67: 10–20.
Malavasi S, Franco A, Riccato F, Valerio C, Torricelli P, Franzoi P, 2007. Habitat selection and spatial segregation in three pipefish species. Est. Coast. Shelf Sci. 75:143–150.
Martin-Smith KM, Vincent ACJ, 2005. Seahorse declines in the Der-went estuary, Tasmania, in the absence of fishing pressure. Biol. Cons. 123: 533–545.
Masonjones HD, Lewis SM, 1996. Courtship behavior in the dwarf seahorse Hippocampus zosterae. Copeia 1996(3): 634–640.
Matheson Jr RE, Sogard SM, Bjorgo KA, 1999. Changes in sea-grass-associated fish and crustacean communities on Florida Bay mud banks: The effects of recent ecosystem changes? Estuaries 22(28): 534–551.
Matlock GC, 1992. Life history aspects of seahorses Hippocampus in Texas. Tex. Jour. Sci. 44(2): 213–222.
Miller MJ, Rowe PM, Able KW, 2002. Occurrence and growth rates of young-of-year northern kingfish Menticirrhus saxatilis on ocean and estuarine beaches in southern New Jersey. Copeia 2002 (3): 815–823.
Mobley KB, Jones AG, 2007. Geographical variation in the mating system of the dusky pipefish Syngnathus floridae. Mol. Ecol. 16: 2596–2606.
Monteiro NM, Berglund A, Vieira MN, Almada VC, 2006. Reproduc-tive migrations of the sex role reversed pipefish Nerophis lum-briciformis. J. Fish. Biol. 69: 66–74.
Moreau MA, Vincent ACJ, 2004. Social structure and space use in a wild population of the Australian short-headed seahorse Hippo-campus breviceps Peters, 1869. Mar. Fresh. Res. 55: 231–239.
Orth RJ, Carruthers TJB, Dennison WC, Duarte CM, Fourqurean JW et al., 2006. A global crisis for seagrass ecosystems. BioScience. 56(12): 987–996.
Porra RJ, Thompson WA, Kriedmann PE, 1989. Determination of accurate extinction coefficients and simultaneous equations for as-saying chlorophylls a and b extracted with four different solvents: Verification of the concentration of chlorophyll standards by atomic absorbtion spectroscopy. Biochim. Biophys. Acta. 975(3): 384–394.
Power M, Attrill MJ, 2003. Long-term trends in the estuarine abun-dance of Nilsson’s pipefish. Est. Coast. Shelf Sci. 57: 325–333.
Ralph PJ, Durako MJ, Enriquez S, Collier CJ, Doblin MA, 2007. Impact of light limitation on seagrasses. J. Exp. Mar. Biol. Ecol. 350(1): 176–193.
Robbins BD, Bell SS, 2000. Dynamics of a subtidal seagrass land-scape: Seasonal and annual change in relation to water depth. Ecology 81(5): 1193–1205.
Roelke DL, Sogard SM, 1993. Gender-based differences in habitat selection and activity level in the northern pipefish Syngnathus fuscus. Copeia 1993(2): 528–532.
Short FT, Burdick DM, Kaldy III JE, 1995. Mesocosm experiments quantify the effects of eutrophication on eelgrass Zostera marina. Limnol. Ocean. 40: 740–749.
Smith TM, Hindell JS, Jenkins GP, Connolly RM, 2008. Edge effects on fish associated with seagrass and sand patches. Mar. Ecol. Prog. Ser. 359: 203–213.
Sogard SM, Powell GVM, Holmquist JG, 1987. Epibenthic fish com-munities on Florida Bay banks: Relations with physical parameters and seagrass cover. Mar. Ecol. Prog. Ser. 40: 25–39.
Strawn K, 1958. Life history of the pigmy seahorse Hippocampus zosterae Jordan and Gilbert, at Cedar Key, Florida. Copeia 1958: 16–22.
Thayer GW, Powell AB, Hoss DE, 1999. Composition of larval, juve-nile, and small adult fishes relative to changes in environmental conditions in Florida bay. Estuaries 22(2b): 518–533.
Thrush SF, Dayton PK, 2002. Disturbance to marine benthic habitats by trawling and dredging: Implications for marine biodiversity. Ann. Rev. Ecol. Syst. 33: 449–73.
Tipton K, Bell SS, 1988. Foraging patterns of two syngnathid fishes: Importance of harpacticoid copepods. Mar. Ecol. Prog. Ser. 47: 31–43.
Tomasko DA, 1992. Variation in growth form of shoal grass Halodule wrightii due to spectral composition of light below a canopy of turtle grass Thalassia testudinum. Estuaries 15: 214–217.
Tomasko DA, Corbett CA, Greening HS, Raulerson GE, 2005. Spatial and temporal variation in seagrass coverage in southwest Florida: Assessing the relative effects of anthropogenic nutrient load reduc-tions and rainfall in four contiguous estuaries. Mar. Poll. Bull. 50(8): 797–805.
Underwood AJ, 1994. On beyond BACI: Sampling designs that might reliably detect environmental disturbances. Ecol. Appl. 4(1): 4–15.
Underwood AJ, 1997. Experiments in ecology: Their logical design and interpretation using analysis of variance. Cambridge, UK: Cambridge University Press.
Vincent ACJ, 1994. Seahorses exhibit conventional sex roles in mating competition, despite male pregnancy. Behaviour 128: 135–151.
Vincent ACJ, Sadler LM, 1995. Faithful pair bonds in wild seahorses Hippocampus whitei. Anim. Behav. 50: 1557–1569.
Vincent ACJ, Berglund A, Ahnesjo I, 1995. Reproductive ecology of five pipefish species in one eelgrass meadow. Env. Biol. Fish. 44: 347–361.
Vincent ACJ, Marsden AD, Evans KL, Sadler LS, 2004. Temporal and spatial opportunities for polygamy in a monogamous seahorse Hippocampus whitei. Behaviour 141: 141–156.
Wang PF, Martin J, Morrison G, 1999. Water quality and eutrophica-tion in Tampa Bay, Florida. Est. Coast. Shelf Sci. 49: 1–20.
Weston MR, Johnson RL, 2008. Visible implant elastomer as a tool for marking etheostomine darters (Actinopterygii: Percidae). S.E. Nat. 7(1): 159–164.
Williams SL, 1990. Experimental studies of Caribbean seagrass bed development. Ecol. Mon. 60(4): 449–469.
Woods CMC, Martin-Smith KM, 2004. Visible implant fluorescent elastomer tagging of the big-bellied seahorse Hippocampus ab-dominalis. Fish. Res. 66: 363–371.