an empirical study into the satisfaction level of travelers to
TRANSCRIPT

An empirical study into the satisfaction level
of travelers to Bangladesh
Abu Zafar Md Shaleh & Syed Reza
2020 Laurea
CORE Metadata, citation and similar papers at core.ac.uk
Provided by Theseus

1-1
Laurea University of Applied Sciences
An empirical study on the satisfaction level among the travelers of
Bangladesh
Abu Zafar Md Shaleh & Syed Reza
Bachelor`s in Service Business Manage
ment
Thesis
26.05.2020

1-2
Laurea University of Applied Sciences Abstract
Degree program in Service Business Management
Bachelor’s Thesis
Abu Zafar Md Shaleh, Syed Reza
An empirical study on the satisfaction level among the travelers of Bangladesh
Year 2020 Number of pages 49
The aim of this study was to diagnose the service quality and price perception of Biman Bangladesh
Airlines passengers and to analyze the effects of price and service quality on customer satisfaction.
The study is based on the AIRQUAL model which shows the dimensions and how these dimensions
are related to customer satisfaction. Price theory is also used to examine the influence or price on
satisfaction, and satisfaction theory shows the relationship between satisfaction and customer loy-
alty.
Survey data was collected from 60 passengers who travelled on Biman Airlines in Bangladesh in the
preceding year. The purpose of collecting data was to test seven hypothesized relationships among
airline tangibles, terminal tangibles, personnel, empathy, image, price, customer satisfaction and
customer loyalty. To test the conceptual model, a structural equation model (SEM) has been used
and evaluated by R studio 3.5.3 with lavaan package.
The findings of the study show that price and AIRQUAL dimensions have a positive and direct rela-
tionship with customer satisfaction. It is also found that customer satisfaction is important to ex-
plain behavioural intentions such as customer loyalty. Satisfied customers tend to be with the air-
lines and dissatisfied customer change the airlines.
The results indicate that Biman Bangladesh airline needs to put their emphasis on maintaining high
levels in the dimensions measured in AIRQUAL and price so that they can make the customer satis-
fied, and as a result ensure customer loyalty. Biman needs to invest more in its personnel so that
they can provide a better service. It would also be advisable to buy more modern aircraft so that
they can operate to more destinations.
Keywords: Service quality, Customer satisfaction, Customer loyalty, Biman Bangladesh airline, SEM.

3
Contents
1 Introduction ............................................................................................ 4
1.1 Purpose of the thesis ........................................................................ 4
1.2 Construction of the thesis .................................................................. 5
1.3 Framework of the thesis .................................................................... 5
2 Literature review ...................................................................................... 5
2.1 Customer satisfaction ....................................................................... 6
2.2 Service quality ................................................................................ 7
2.3 Price ..........................................................................................10
2.4 Customer loyalty ............................................................................10
3 Methodology...........................................................................................12
3.1 Research Design .............................................................................12
3.2 Questionnaire development ...............................................................13
3.3 Data Collection and sample collection ...................................................13
3.4 Measure .......................................................................................14
3.4.1 Airline tangibles .....................................................................14
3.4.2 Terminal tangibles ..................................................................15
3.4.3 Personnel .............................................................................15
3.4.4 Empathy ..............................................................................15
3.4.5 Image ..................................................................................16
3.4.6 Price ...................................................................................16
3.4.7 Customer satisfaction ...............................................................16
3.5 Reliability and validity .....................................................................17
3.6 Data analysis .................................................................................18
4 Analysis ................................................................................................18
5 Discussion ..............................................................................................29
6 Conclusion and implications ........................................................................31
References ..................................................................................................34
Figures ......................................................................................................43
Tables .......................................................................................................43
Appendix : Questionnaire .................................................................................44

4
4
1 Introduction
Nowadays the business environment becomes more competitive especially in the airline in-
dustry due to the technological advancement as a result customer expectations and demands
are also changing which is the biggest challenge for airlines to meet up those expectations
(Ali et al., 2015). Airlines need to tackle this situation by measuring, maintaining and provid-
ing higher customer satisfaction with better service quality and need to achieve the desired
expectations of customers (Park et al.,2005). Authors have been chosen to study about to
measure customer satisfaction because Bangladesh is a densely populated country where
there are more travelers and no one has studied their satisfaction. In addition, studying Ser-
vice Business Management, Will also help us to understand the service quality impact on the
customer. This study will not only helpful for the travelers of Bangladesh but also for the
Biman Bangladesh authority.
1.1 Purpose of the thesis
The main aim of the study is to conduct a customer research where it going to identify which
factors are affecting travelers to towards customer satisfaction. The study will find out that
either customer is loyal or not to the airline. This study believes that there is a positive rela-
tionship between price and service quality model with customer satisfaction. For this reason,
we have proposed a conceptual model which will solve the stated problem form Biman Bang-
ladesh.
The study is going to investigate the research question: ‘What are the factors affecting the
customer satisfaction level evidence from travellers of Bangladesh?’
The study is important because this study will contribute to the literature of the aviation
industry and specifically in Bangladesh aviation that how price and service quality (AIRQUAL)
are influencing customer satisfaction and what could be possible consequence such as cus-
tomer loyalty. Study output can give information which will help airline authority to make
their service better. This study is not only necessary but also fruitful and relevant as it scruti-
nizes service quality in Bangladesh which has not studied more before and identify other pos-
sible determinants of service quality which has an impact on customer satisfaction and im-
pacts of customer satisfaction. Besides these, researches will get new ideas to do further
study.

5
5
1.2 Construction of the thesis
The study requires quantitative method which will help to gather information about the trav-
eler’s preferences and will provide insight information that which factors need to be upgrad-
ed to make travelers satisfied. Due to the Corona virus it is not possible to conduct random
quantitative study, so we have to choose convenient sampling method for collecting data.
Questionnaire will be made based on the literature. After collecting the data, we will do our
analysis where we will use different statistical analysis to test the hypotheses.
1.3 Framework of the thesis
To make this paper easy for the readers, this study is divided among six chapters. It starts
with an introduction where it shows the main purpose of the study, research question and the
how this study is going to conduct. After introduction thesis moves to the theoretical perspec-
tive where it demonstrates the key theories and propose hypothesizes. After covering all the
necessary theories, the study introduces the methodology where it depicts which methods
have been used to conduct the study and which analysis have been used. Moving to the next is
the analysis where the study shows the survey results. Then thesis moves to the discussion of
the analysis. The last part of the thesis is to conclude the study and show the practical and
theoretical implementation, contribution and limitation of the study. Framework of the study
is given below:
Figure 1: Structure of the thesis.
2 Literature review
In the literature review we will primarily focus on service quality because the thesis is output
is based on service quality. As the main target of the research is to find out what is wrong
in facility services and how to improve those in the airline industry. Then we will depict the

6
6
customer satisfaction theories. Customer satisfaction theory will help us to find all the exist-
ing problems in airbuses as well as in terminals and also help us to find a way to solve those
problems. Also, show how customer satisfaction theory is related to service quality theories.
We will make hypothesises based on literature.
2.1 Customer satisfaction
Customer satisfaction could be a measurement that determines what quantity satisfied or
surpass customer expectations. Cardozo (1965) considers that satisfaction is the result of
expectation, while the expectation is partly derived from previous experience. Oliver (1980)
holds the idea that satisfaction is a temporary and emotional reaction of consumers to mat-
ters. Customer satisfaction is defined as a measurement that determines how happy custom-
ers are with a firm’s product, service and capabilities. Customer satisfaction is also one of the
hot topics in marketing for all time because it plays a vital role in achieving organizational
goal and it is not only measured performance but also quantify the quality of organization
(Munusamy and Chelliah, 2011).
Satisfaction is a kind of cognitive appraisal process in the comparison between the actual
product performance and the previous expectation by customers (Westbrook, 1981). Churchill
& Superenant (1982) consider that satisfaction of customers is a result of the purchase and
use, which is produced by the comparison of the remuneration of expected results and the
investment cost by buyers. Consumers will use emotional statements to express the positive
or negative emotion on the usage of products, thereby affecting their satisfaction (Cadotte,
Woodruff & Jenkins, 1987). Customer satisfaction is determined by the gap between the ser-
vices that customers get and the expected services (Parasurman, Zeithaml & Berry, 1985). If
a firm’s product or services meet customer’s expectation customer gets satisfied on the other
hand, if it’s below customer expectation customer will be dissatisfied. Nowadays it is very
much important to know customer satisfaction level almost in every kind of business. This
measurement process help business to grow further and improve their delivered product or
service quality. Hill and Alexander (2006) mentioned that nowadays, firms of all types and
sizes have started to give more emphasize on customer satisfaction because they have real-
ized that to get new customer is costly than to keep existing customers.
Most of the time, Customer has their sets of expectation for the product or service and these
expectations become the standard before purchasing. Once the product or service is used,
the outcomes or perceptions are compared to pre-purchase expectations. Consumer generat-
ed content contains a variety of media forms and types (Gretzel, 2006). Customer satisfaction
of airline passengers can be measured by employees of airline, technical and physical re-
sources, aircraft, food and other passengers (Gronroos, 1984). Archana and Subha (2012)
added the list of the drivers of customer satisfaction in airline industry, where customer satis-

7
7
faction is carried by out by multidimensional service quality such as pre-flight services, in-
flight services, baggage handling, in-flight digital services, and post-flight services.
If a customer gets satisfied repurchasing can occur and they also recommend others. The
repurchasing intention is that consumers willingly buy the service online, physical channel and
they also recommend others about the service (Kim et al., 2016).
Customer satisfaction can be measured by several factors of service quality: employees of the
airline, technical and physical resources, aircraft, food and other passengers, pre-flight ser-
vices, in-flight services, baggage handling, in-flight digital services and post-flight services.
Airlines enjoy more satisfied customers and consequently, more passengers when they deliver
more quality services than airlines with dissatisfied customers (Gronroos, 1984; Archana
& Subha, 2012; Khan & Khan, 2013).
2.2 Service quality
In the recent past, service quality has gotten attention in the field of marketing and business
development for doing research (Farooq et al., 2018). Zeithaml et al. (2009) defined service
quality as the judgement of consumer´s regarding the superiority of a product or service in a
holistic view. Parasuraman et al. (1988) defined service quality is a function which determine
the gaps between the customer’s service expectations and perceptions of the delivered ser-
vice. From the definitions we can see that expected service and perceived service are the
two factors which can influence service quality. Parasuraman et al. (1985) also mentioned
that when customers meet the expected service as perceived then they become satisfied and
when service exceed expected service then customer become delighted.
Airlines need to improve their service quality continuously to fulfill the customer’s needs and
desires to make customer happy. Service quality could be a competitive advantage by creat-
ing and maintaining service quality. By improving service quality, an airline could be benefi-
cial in such a ways: creating and developing a relationship with customer, repurchase activi-
ties will increase, customer become loyal and they will spread positive word-of-mouth to
others and they will become an advocate of the airline which is a free marketing for airline
(Park et al., 2005). Hussain et al. (2015) reveled the cost incurred for maintaining and up-
grading service quality that should be considered as an investment rather than an expense to
an organization.
Suhartanto and Noor (2012) depict that the Nordic approach and the American approach are
the two approaches to measure service quality. According to Nordic approach, there are two
types of quality consists: technical and functional quality in service quality and in the Ameri-
can approach service quality consists of five components: reliability, responsiveness, empa-
thy, assurance and tangibles components these are familiar with SERVQUAL dimensions (Su-

8
8
hartanto and Noor, 2012). Technical quality is an interaction between buyer and seller where
the customer gets technical the outcome from the service delivery (Lau, Akbar, and Fie,
2005). Functional quality is the interaction between employees and customers where there is
an influence of other customers and customer himself participate in the process (Grönroos,
1984). Both approaches are not superior but SURVQUAL approach is widely accepted and has
been questioned by many scholars (Cronin and Taylor, 1992; Culiberg and Rojsek, 2010). Park
et al. (2005) also argued along with Culiberg and Rojsek (2010) that it is not possible to meas-
ure all the dimensions of the service industry especially the airline industry with these five
components (reliability, responsiveness, empathy, assurance, and tangibles).This approach
makes the comparison between perceived service quality and excepted service quality (Cro-
nin and Taylor, 1992; Buttle, 1996). Park et al. (2005) opposed that this approach cannot
measure some of the airline activities: online ticketing, check-in, luggage allowance, board-
ing service and on-board facilities.
AIRQUAL model has developed by Bari et al. (2001) to overcome those problem mentioned by
Park et al. (2005) and other researchers. AIRQUAL model has five factors which we will see
below. AIRQUAL model has been presented by EKIZ et al. (2006) on perceptions of service
quality in North Cyprus National Airline, Nadiri et al. (2008) also validated AIRQUAL scale by
using it to assess the impact of airline service quality on customer loyalty of North Cyprus
Airlines, later on, followed by Ali et al. (2015) used it for assessing service quality in Pakistan
International Airlines.
Five dimensions of AIRQUAL is described as follows:
Airline tangible is the first dimension of AIRQUAL model, and it is acknowledged by the condi-
tion of airplane which includes quality of interior and exterior equipment, meal service, seats
and cleanliness (Ali et al., 2015). It is mainly emphasizing on the tangible elements which are
associated with the service quality of an airline. It can be said that when the services of air-
line tangibles are better than it is expected to have a higher satisfaction (Farooq et al.,
2018).Saha and Theingi (2009) examined the relationship between customer satisfaction and
service quality, and they found a very strong relationship among them. From here we can
generate hypothesis as:
H1:Airline tangibles have direct influence on customer satisfaction.
Terminal tangibles are the services that can be found at a terminal (Ekiz et al.,
2006). According to Farooq et al. (2018), terminal tangibles have the ability to build an image
for the airline. As terminal tangible and customer satisfaction is not dependent on each oth-
er, but they have relationship due to the using same airport can be used by other airlines and
their passengers will get the same facilities. From here, we can make assumption that cus-
tomer satisfaction would be higher when quality of terminal tangibles would be better. So,
we can propose a hypothesis:

9
9
H2: Terminal tangibles have direct influence on customer satisfaction.
Personnel services are the services which is provided by the airline’s staff and cabin crews
(Ekiz et al., 2006). Personnel play a vital role in service quality as they are the one who have
contact with the passengers (Babbar & Koufteros, 2008). Here is a difference to other
AIRQUAL dimension that personnel are directly involve with the passengers and personnel’s
behavior influence the level of satisfaction and perception of the service (ibid.).Personnel
service work as a trigger of customer’s perception of service quality where perception level is
depends on skills, nature and attribute of the employees (ibid.). Personnel factors work as
how the employees are treating/ giving services to the customers (Farooq et al., 2018). Per-
sonnel is an important factor and it has a significant impact on customer satisfaction (Ali et
al., 2015). We can propose a hypothesis as follows:
H3: Personnel have direct influence on customer satisfaction.
Farooq et al. (2018), empathy can be treated as a vital factor in the model of service quality
and it plays an important role not only in airline industry but also in any other industries. In
the airline industry empathy could be defined as spontaneous hassle-free service which in-
cludes luggage handling, well-mannered ticketing service and compensation (Ekiz et al.,
2006). To provide better quality service, company need to understand the customers’ needs
and concern for their well-being (Babbar & Koufteros, 2008).
There is a secret that the benefit of emotional intelligence and empathy in airline business
and it has direct effect in customer satisfaction (Farooq et al., 2018). From here we can pro-
pose a hypothesis is:
H4: There is a positive relationship between empathy and customer satisfaction.
Last but not the least dimension of AIRQUAL is image. Image is the perception of airline over-
all, value for money; promotional offers and reputation (Ekiz et al., 2006). While passenger
evaluating the service quality of airline at that time image play a vital role. According to
Grönroos (1984) positive image has the ability to increase level of service quality by reducing
the negative experience that passenger face. Airlines care about their image, goodwill be-
cause they have found that image have direct relationship with customer satisfaction. From
here we can propose a hypothesis:
H5: Image have direct influence on customer satisfaction.

10
10
2.3 Price
As we know that price is one of the components of the marketing mix and price is also a criti-
cal topic for the airline. Price is defined as what customers actually pay in exchange for the
benefits accruing from a product or service (Lovelock & Wirtz, 2007). According to Zeithaml
(1988) price has both monetary and non-monetary characteristics. Monetary characteristic is
what customer pay to get the product or service and non-monetary could be how a customer
perceives the value of the price.
In the past, price used to be same for the same route when there was not any regulation of
price in the airline industry. Now the situation has been changed many airline companies have
started to make pricing strategy (Siriwardena and Silva, 2017). According to Boin et. al.
(2017) beside core ticket price, the airline has a good strategy to generate revenue apart
from checked baggage, onboard food, premium seat selection, and extra legroom. The airline
also earns from seasonal pricing, when there is a demand for a particular season then the
airline can charge a high price, this is another way to generate revenue (Siriwardena and Sil-
va, 2017). The airline industry also uses market segmentation; vacationers, business travellers
and group operators to maximize their profit like other industries (De Pew and Stripling,
2003). Price is associated with the service and passengers are also sensitive regarding service.
If there is a little or no difference between the services offered in the airline industry, a cus-
tomer may just choose the cheapest airline (Lovelock & Wirtz, 2007). Lower price than com-
petitors can attract more customers and may stimulate demand in the off-peak period.
Price is also associated with customer satisfaction, after buying service customer measure the
satisfaction by comparing to other services. When a customer receives good service according
to the price then customer tends to build a relationship to the airline so that customer be-
comes ready to buy the service at buyer’s asking price. When a customer does not receive a
good service from the airline then the customer is not coming to fly with the same airline,
perhaps customer will change airline (Low et al., 2013). Form here we can propose another
hypothesis:
H6: Price have direct influence on customer satisfaction.
2.4 Customer loyalty
A few years ago, companies used to focus on brand loyalty on tangible goods which had been
changed over the year. (Tucker, 1964; Day, 1969). Loyalty term can be defined as when
customer purchase necessary staff from a particular company or brand again, it is kind of
behavioural choice to buy from there (Cunningham., 1956). Some famous brand has their
unique product or service quality and preferred price or market influence customers and it
has strong conviction to keep the promises of the customer to buy again and to prefer the

11
11
product or service over other product or service (Oliver, 1999). Oliver (1999) opposed to the
customer loyalty definition and mentioned that definition of customer loyalty would be ap-
propriate when awareness, adoption and behavioral intention. Zeithaml et al. (1996) also
argued that price sensitivity and price-increase tolerance is a big factor which is missing in
previous research. Satisfaction could be a vital and positive term to attain customer loyalty.
Satisfaction could be a vital and positive term to attain customer loyalty. When the customer
is satisfied with the product/service then customers have the tendency to stay with the prod-
uct or service as a result this relationship continuous and satisfied customer becomes the
loyal customers (Heitmann et al., 2007).
Customer satisfaction demonstrated that customer satisfaction has a direct relationship with
customer loyalty. This relationship influences by some factors of the customer which are a
wide range of product or services, age of the customers and income of the customers (Hom-
burg & Gierin, 2000). Many scholars (Zeithaml, 2000; Blomer et al., 1998; Reichheld, 1996;
Reichheld & Sasser, 1990) have identified that customer buy the product or services from a
certain company or brand when customers have a good feeling about the product or services
from here we can say that loyal customer is profitable to the company.
There is a theory of Hirschman's (1970) named exit-voice theory which has been developed to
identity the relationship between customer satisfaction and customer loyalty. The basic theo-
ry is that each customer has two options when customer is not satisfied with the product or
service then customer exits the product or service that means customer is not going to use it
any more or customer raise voice it means customer makes a complain regarding product or
services. On the other hand, when customer is satisfied with the product then customer con-
sume the product or service again and become a loyal customer (Bloemer and Odekerken-
Schroder, 2002). It can be hypothesized that customer satisfaction has a positive correlation
with customer loyalty.
H7: Customer satisfaction have direct influence on customer loyalty.

12
12
Based on our research question and hypotheses we can propose a research model:
Figure 2: Conceptual research model.
Our conceptual research model is divided into three parts, in the first stage we have all of the
independent variable such as airline tangibles, terminal tangibles, personnel, empathy, image
and price. Next come to the second part where we have mediating variable which is custom-
er satisfaction. In the last part we have customer loyalty. We are trying to see the effect of
all the independent variable on customer satisfaction and want to see the either customer
satisfaction can have an output namely customer loyalty.
3 Methodology
This chapter is going to demonstrate the how this study is going to use methodological ap-
proach. This chapter will also depict the research method in details and what type of statisti-
cal elements are going to use for analyzing data.
3.1 Research Design
Research design as “organizing research activity, including the collection of data, in ways
that are most likely to achieve the research aims” (Easterby-Smith et al.,2012).Descriptive
Airline tangibles
Personnel
Empathy
Image
Customer
Satisfaction
Customer loyalty
Price
Terminal tangibles

13
13
research design is applicable in this study, because the study seeks to describe meaningful
observations of market phenomena (Malhotra and Birks, 2006). One research question and
seven hypotheses are going to examine by this study. Descriptive research design is the pro-
cedure to collect data through questionnaire and it is generally used for collecting quantita-
tive data from a large sample (Malhotra and Birks, 2006).
We have conducted a survey in Dhaka, Bangladesh. The sample has been measured and reveal
the relationship between the independent and intervening variables and will depict the out-
come of the intervening variable The survey also includes six control variables: Age, gender,
education, travel for, travel with, and nationality.
3.2 Questionnaire development
The questionnaire is the main instrument of data collection.
We have developed a questionnaire with the aid of literature and based on the described
hypothesis. We have followed the suggestion of Zikmund (2000) that the identity of the re-
spondent will be anonymous. Respondent’s opinion about the statement that how strongly
they agree or disagree has been measured by using Likert scale. The questionnaire has been
developed by focusing on customer travel experience from the very beginning of the journey
such as from the airport. The questionnaire is divided into basic three parts where the first
part summarized the intention of the research and researcher information and affiliation of
researchers. Then all the 56 question was structured in 11 categories about the experience of
travel conducted on service quality including experience in airport and in the aircraft.
In this study, we have used the Likert scale to make it easy for respondents to answer in a
short time, every question is designed according to the respondent’s nearest expectation,
experiences, and importance about service quality. Respondents are asked to circle the most
appropriate experience. The Likert scale is used to get the respondent’s opinion about state-
ment that how strongly they agree or disagree. Satisfaction level is structured as, a lot lower
than expected =1, Lower than expected=2, Expected=3, Better than expected=4, A lot better
than expected= 5.
3.3 Data Collection and sample collection
The main reason for this research is to collect information about the satisfaction level of pas-
sengers of Biman Bangladesh Airlines and to analyze the relationship among service quality,
price and customer satisfaction. Probability and non-probability sampling are the two kinds of
sampling design (Malhotra, 2008; Sekaran, 2003). Probability sampling make sure that popula-
tion are taken from the known place and non-probability sampling ensure that the population
have no clue of being selected as a participants of the study (Sekaran, 2003).

14
14
We can distinguish this collection process between probability sampling and non-probability
sampling, where probability sampling has a stronger credibility in general (Easterby-Smith et
al., 2012). However, in this study, it would have been impossible to know who has travelled
by Biman Bangladesh Airline in past one year. We had no other choice without choosing a non-
probability convenient sample. For collecting data, we have used non-probability: convenient
sampling to test the hypotheses.
We have constructed a questionnaire with a tool called Google forms. This tool was conven-
ient to use, and we were able to follow respondent’s participation as they were completed.
We ensured respondents that survey was anonymous, and the result should not be used other
than this study.
We have contacted a renowned travel agent in the beginning and asked them to help us.
Travel agent had found approximately 100 travelers who had travelled by Biman Bangladesh
Airline from their database. We have collected approximately 38 respondents from that travel
agent within 7 days then data collection had stopped totally. Then, we have sent question-
naires to our friend and relatives by e-mail and through other social media and requested
them to fill up if they have had travel experience in Biman Bangladesh Airlines within the past
one year. We also have requested them to share and invite their friends and acquaintances to
participate. This result refers to a snowball sampling effect; where you start with one who
meets the criteria for inclusion and this person name others who also are qualified (Easterby-
Smith et al., 2012).The survey was distributed to the internet, to get a larger sample and to
get a faster respondents rate (Jacobsen, 2011). We got 60 respondents in total whereas 38
from the travel agent and 22from friends and acquaintances.
3.4 Measure
The measure of AIRQUAL is taken from several authors (Ekiz et al., 2006; Nadiri et al., 2008;
Ali et al., 2015 and Simsek and Deirbag, 2017). We have used Likert scale to measure collect-
ed data from respondent’s satisfaction level. In this survey gender, education, travel for, and
travel with, can be treated as a control variable.
There are in total of 56 questions in the questionnaire in 11category which is based on
AIRQUAL. All categories are described below:
3.4.1 Airline tangibles
Airline tangibles include airbuses interior design, inside facilities such as air-conditioning,
comfortable seats, cleanness of seats and toilets, delivered catering services etc. Airline tan-
gibles is a measure of overall facilities or product served to customers. To measure, airline
tangibles we asked five questions which are based on Ekiz et al. (2006):

15
15
‘Aircrafts are clean’
‘Aircrafts are modern looking’
‘Aircraft’s toilets are clean’
‘Aircraft’s seats are clean’
‘Quality of air-conditioning in the aircraft is good enough’
3.4.2 Terminal tangibles
Terminal tangibles cover all the facilities available in the terminal. We have considered the
above-mentioned facts as our measurement question in terminal tangible. To measure termi-
nal tangibles concept is taken from Nadiri et al. (2008) we have structured six important
questions:
‘Airport toilets are clean’
‘Number of shops in airport is enough for my need’
‘Air-conditioning in airport is effective’
‘Sign system in airport is noticeable’
‘Availability of trolleys in airport is enough’
‘I feel comfort of waiting in hall of the airport’
3.4.3 Personnel
Personnel services are measured by the quality of delivered services of airline staff and cabin
crews. Personnel services including airline staff and cabin crew’s skill and professionalism
regarding their duty and customer services. Here we measure personnel with four important
items based on Ali et al. (2015):
‘Airline employees’ general attitude is good’
‘Flight attendants are well-dressed’
‘Personnel show personnel care equally to everyone’
‘Personnel are aware of their duties’
3.4.4 Empathy
Empathy is considered as the airline company’s ability to communicate with their customer
with individualized attention. Five items have been borrowed from S ̧ims ̧ek, and Demirbag ̆
(2017):

16
16
‘Airline maintains punctuality of departures and arrivals’
‘Number of flights is enough to satisfy passengers demand’
‘Compensation schemes in case of loss or hazard is effective’
‘Services regarding entertainment is enough’
‘Quality of online services is secure’
3.4.5 Image
Image can be defined as the overall reputation of the airline. Company image can affect cus-
tomer perception in many ways. Here we have taken four items from Ekiz et al. (2006) and
respondents gave answers to those:
‘Airline offers low-price ticket regularly’
‘Ticket pricing is consistent with given service’
‘Airline company has a good reputation’
‘Promotion offerings are very much attracting to me’
3.4.6 Price
Price is the monetary value of the product or service that exchanged between customers and
service provider. Price can be measured with four items which are borrowed and altered from
Riandarini et al. (2015) and Saha and Theingi (2009), Johnson et al. (2001) :
‘Price of air ticket is reasonable’
‘Discounted price is useful to me’
‘I feel there is fairness of price according to service delivery’
‘My expectations are fulfilled according to the price’
3.4.7 Customer satisfaction
Customer satisfaction is a consumer’s fulfillment response. Customer satisfaction is measured
with four items which are borrowed from Leong et al. (2015) and Ekiz et al. (2006) and asked
respondents five statements:
‘I am satisfied with my decision to use this airline’
‘My choice to fly with this airline was a good one’
‘I chose the right airline for traveling’
‘I have enjoyed travelling with this airline’

17
17
‘My satisfaction with the airline has increased’
3.5 Reliability and validity
Reliability and validity are crucial aspects in research practice and everyone who is engaged
in survey work must be familiar with these criteria. These terms are not always readily distin-
guished; some degree of overlap seems almost inevitable and they are, in any case, intercon-
nected (Chisnall, 1997). Reliability refers the consistency of a measure. Systemic sources of
error do not have an adverse impact on reliability because they affect the measurement in a
consistent way and do not lead to inconsistency (Malhotra, 2010). Reliability is the degree to
which measures are free from random error and, therefore, provide consistent data (Mc Dan-
iel and Gates, 2004). Error-free measurement is always acceptable as a correct measure.
Test-retest, the use of equivalent forms, and internal consistency are three widely used paths
of access reliability.
The validity of a scale may be defined as the extent to which differences in observed scale
scores reflect true differences among the characteristics being measured, rather than sys-
tematic or random error. Thus, a measuring device is valid only if differences in scores reflect
true differences in the characteristics being measured rather than systematic or random error
(Malhotra, 2010). Validity addresses the issue of whether what the researcher was trying to
measure was actually measured. To measure the credibility of research, we need to examine
the validity and reliability of latent variables so that the study can get error free influence
results (Wong, 2013). Validity is the extent to which any measuring instrument measures what
it is supposed to be measured in quantitative research (Thatcher, 2010). Validity consists:
internal validity and external validity (Easterby-Smith et al., 2015). Internal validity means
that the research can be replicated (Willis, 2007). In our study, we generated hypotheses and
explain the relationship with theory. As we have conducted the survey fully online, but we
had done the pre-test with selected respondents. We also depict the logic behind our re-
search model and also provide justify the hypothesis.
In our study we also cover the external validity by collecting data from the convenience sam-
ple and respondents belong to Biman Bangladesh Airline travelers. As the survey conducted
online, all the respondent participation was without any interruption and unbiased.
A confirmatory factor analysis (CFA) is used to access the measurement model and to examine
the reliability and construct validity (Ali et al., 2015). Ahmad et al. (2016) mentioned that
‘Construct validity is achieved when the fitness Indexes achieve the level of acceptance’.
Where fitness indexes are chi-square (χ2) /degree of freedom (d.f), Comparative Fit Index
(CFI), Tucker-Lewis Index (TLI) and, root mean square of approximation (RMSEA). Discriminant
validity will be accepted when the square root of the AVE values of each latent variable is
higher than the correlation between the latent variables (Fornell and Larcker, 1981). Accord-

18
18
ing to Hair et al. (2010) the factor loadings are supposed to be the value of 0.50 when factor
loadings are equal to 0.7 then it could be considered as a good indicator. AVE is acceptable
when it is 0.5. There is an exceptional rule that if a variable’s AVE is less than 0.4, we can
accept it if that variable’s composite reliability is higher than 0.6 (Fornell and Larcker, 1981).
According to Ahmad et al. (2016) the aim of the construct reliability is to measure reliability
and internal consistency of the measured variables representing a latent construct. Construct
reliability will be achieved when composite reliability (CR) would be higher than 0.6.
3.6 Data analysis
We have collected data through google form. All the collected data were analyzed using
SmartPLS version 3 for pre-testing and used R studio 3.5.3 with lavaan package for the final
analysis. The reason to use this software, because it considers the causal relationship among
latent constructs and takes account measurements errors in the structural model (Hair et al.,
2017). In our study validity and reliability test have been performed and analyzed by the
method of using hypothesis.
4 Analysis
This chapter will demonstrate the analysis of the survey where the study will show some
charts for presenting demographic information of the participants. This study requires con-
firmatory factor analysis (CFA), which has been used to measure and to validate the unidi-
mensional, reliability, construct validity and discriminant validity. CFA is also used for meas-
uring the dimension of AIRQUAL (airline tangibles, terminal tangibles, personnel, empathy
and image) customer satisfaction and customer loyalty. Structural equation modelling (SEM)
has been used to test the hypothesises. Data has been analysed by R studio 3.5.3 with Lavaan
package.
Background information.

19
19
Figure 3: Gender
The figure illustrates that majority of the participants were male. In this study 60 participants
participant where 34 was male and female participant is 36.7% which means the number of
female participants was 22. There are 4 persons who do not want to reveal their gender and
their percentage is 6.7%.
Now the study will move towards the education of the respondents.
Figure 4:Education
The pie chart depicts that majority of the respondents are master’s degree holder and their
percentage are 41.7%. 30% respondents have bachelor degree which counts 18 respondents
whereas 12 respondents have professional education. Last but not least we have received
responses from the doctoral degree holders and their percentage is 8.3%.
Next information is the age of the respondents.

20
20
Figure 5:Age
The pie chart is telling us about the age of the respondents. Majority of the participant's age
is between 26 to 35 which is 43.3%. The second-largest group of age is 36-45 which is fol-
lowed by 25%. Mid age people between 46-59 is the third largest group with15% and the youth
people (18-25) is the fourth major participants where their percentage is 13.3. Only 3.3% per
cent of people belong to older age (60+).
Now the purpose of the using airline is going to revel.
Figure 6: travel purpose
30% of participants are travelling for a vacation to different destinations, this is the majority
group. 26.7% participants use airline for visiting friends and family. Participants use airline for
the business purpose which is 20%, they travel to a various destination for doing business. For
the education purpose 18.3% participants use Biman airlines. 3% of participants travel for
medication.
Now the chart will tell with whom participants are travelling.

21
21
Figure 7: Travel with
For the chart, it can be said that 45%people love to travel alone which is the 27 respondents
among 60. There is 20% respondents who are travelling with their family and 20% of respond-
ents are travelling with their friends. Rest of the 6.7%respondents travel with their colleague.
Now study will revel the nationality of the respondents.
Figure 8: Nationality
The survey is able to collect a diverse nationality. It is obvious that the majority would
be Bangladeshi as this study is conducted in Dhaka, Bangladesh where the percentage is 63.3.
10% participant is Indian who is our neighbour. Nepalese also use this airline for the travelling
purpose where their percentage is 6.7. Among 60 respondents there are 5% of respondents
who are American and European. Survey has found that there is 2 Chinese and 2 Palestinian
where their percentage is 3.3. Only 1 participant is found in the survey who are from Pakistan
and Italy. These people have been using Biman airline for the business, tourism and educa-
tion purposes.
We have asked respondents about their expectations before travelling with Biman and try to
know what their perception about the aspects of Biman. From figure 8 we can say that major-
ity of the respondents have an average expectation of the aircraft which means not so good

22
22
not so bad, the same perception about the airport services and hassle-free service. Respond-
ents have a good perception of the airline services which means they believe they will get the
service properly. Respondents have kind of negative expectations of the image of the airline
and the price of the airline.
Figure 9: Expectations of aspects
At the end of the questionnaire, we asked them whether their expectation was matched after
travelling or not. Figure 9 tells us that respondent expectation after travelling, the expecta-
tion of the aircraft is changed and they are delighted with the aircraft. Their expectation
matched about the airport and hassle-free services that they found both services are average.
Respondents expectations do not matched with the airline employee helpfulness, which
means they have got less service what they have thought. After travelling with Biman, they
have changed their perception about the Image which means Biman has average image. Ac-
cording to the price, they have not got the service so that they have a negative perception
about price.
Figure 10: Aspects match expectations.
We can see that either their expectation matched or not after having experience of
Biman. Before travelling, majority of the respondents have an average image about aircraft
but after having experience it has been changed and respondents have a good perception noW
about the aircraft now. Airport service’s expectation remains the same that is average service
is given to passengers. Respondents assume that they will get more service from the airline
employee but they have received less than expected so they think that it is also an average
service. Respondents perception has not been changed for hassle-free service and for price.
23
23
Respondents have a negative perception of the image of Biman, but after getting the service
they think now that Biman has moderate image.
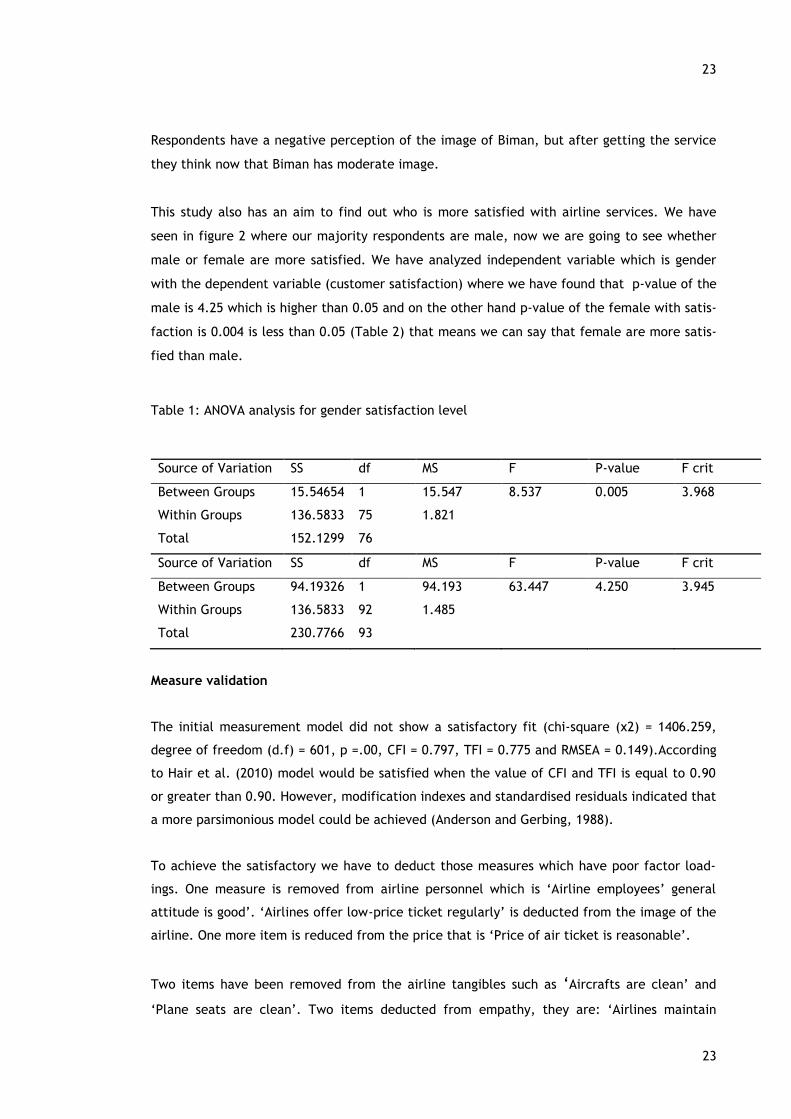
This study also has an aim to find out who is more satisfied with airline services. We have
seen in figure 2 where our majority respondents are male, now we are going to see whether
male or female are more satisfied. We have analyzed independent variable which is gender
with the dependent variable (customer satisfaction) where we have found that p-value of the
male is 4.25 which is higher than 0.05 and on the other hand p-value of the female with satis-
faction is 0.004 is less than 0.05 (Table 2) that means we can say that female are more satis-
fied than male.
Table 1: ANOVA analysis for gender satisfaction level
Source of Variation SS df MS F P-value F crit
Between Groups 15.54654 1 15.547 8.537 0.005 3.968
Within Groups 136.5833 75 1.821
Total 152.1299 76
Source of Variation SS df MS F P-value F crit
Between Groups 94.19326 1 94.193 63.447 4.250 3.945
Within Groups 136.5833 92 1.485
Total 230.7766 93
Measure validation
The initial measurement model did not show a satisfactory fit (chi-square (χ2) = 1406.259,
degree of freedom (d.f) = 601, p =.00, CFI = 0.797, TFI = 0.775 and RMSEA = 0.149).According
to Hair et al. (2010) model would be satisfied when the value of CFI and TFI is equal to 0.90
or greater than 0.90. However, modification indexes and standardised residuals indicated that
a more parsimonious model could be achieved (Anderson and Gerbing, 1988).
To achieve the satisfactory we have to deduct those measures which have poor factor load-
ings. One measure is removed from airline personnel which is ‘Airline employees’ general
attitude is good’. ‘Airlines offer low-price ticket regularly’ is deducted from the image of the
airline. One more item is reduced from the price that is ‘Price of air ticket is reasonable’.
Two items have been removed from the airline tangibles such as ‘Aircrafts are clean’ and
‘Plane seats are clean’. Two items deducted from empathy, they are: ‘Airlines maintain

24
24
punctuality of departures and arrivals’ and ‘Quality of online services is secure’. There are
two items which have been removed from customer satisfaction, they are: ‘I am satisfied
with my decision to use this airline’ and ‘I enjoyed travelling with this airline’. Two more
items also deleted from customer loyalty, those are: ‘I am intended to continue being a client
of the airline for a long time to come’ and ‘Switch to a competitor if you have experienced a
problem with this airline service’.
Three items have been deducted from terminal tangibles, they are: ‘Airport toilets are
clean’, ‘Sign system in airport is noticeable’ and ‘I feel comfort of waiting in hall of the air-
port’.
After removing the above-mentioned measures from the factor analysis, I conducted a new
and accepted value which is given in Table 2. Beside factor analysis, we will see also compo-
site reliability and average variance extracted (AVE).
Table 2: Standardized factor loadings of constructs and indicators.
Constructs and indicators Factor loading CR/AVE
Airline tangibles: 0.95/0.86
Aircrafts are modern looking. 0.93
Plane toilets are clean. 0.93
Quality of air-conditioning in the planes is good
enough. 0.92
Terminal tangibles: 091/0.77
Number of shops in airport is enough for my
need. 0.96
Air-conditioning in airport is effective. 0.93
Availability of trolleys in airport is enough. 0.73
Personnel: 0.95/0.85
Flight attendants are well-dressed. 0.86

25
25
Personnel show personnel care equally to eve-
ryone. 0.95
Personnel are Aware of their duties. 0.96
Empathy: 0.92/0.79
Number of flights is enough to satisfy passen-
gers’ demands. 0.91
Compensation schemes in case of loss or hazard
is effective. 0.86
Services regarding entertainment is enough. 0.90
Image: 0.89/0.74
Ticket price is consistent with given service. 0.84
Airline company has a good reputation. 0.85
Promotion offerings are very much attracting to
me. 0.89
Price: 0.95/0.86
Discounted price is useful to me. 0.92
I feel there is fairness of price according to
service delivery. 0.90
My expectations are fulfilled according to price. 0.96
Customer satisfaction: 0.94/0.84
My choice to fly with this airline was a nice one. 0.91
I chose the right airline. 0.94
My satisfaction with the airline has increased. 0.91
Customer loyalty: 0.95/0.86
To me, the airline clearly can provide the best 0.92

26
26
services.
Consider this airline your first choice to buy
services. 0.95
Continue to do business with this airline if its
prices increase somewhat. 0.92
Notes: χ2 = 364.454 (df. = 224, p = .00), CFI = 0.935, TLI= 0.92, RMSEA = 0.103
From Table 2 we can understand that this model is improved and satisfy the fit measures. The
fit of the re-specified model improved to chi-square (χ2) = 364.454 (degree of freedom (df) =
224, p = .00), CFI = 0.935, TLI = 0.92, root mean square of approximation (RMSEA) = 0.103.
CFI and TLI are above the recommended level of 0.90 (Bollen, 1989). RMSEA is 0.103 which
indicates that the model is mediocre fit, according to MacCallum et al. (1996) RMSEA is be-
tween 0.08 to 0.10 is mediocre fit and below 0.08 is a good fit.
We have also calculated the reliability of two measures. Table 2 depicts that composite relia-
bilities are 0.89 or above which is satisfy the recommendation level (0.60) suggested by Ah-
mad et al. (2016) and AVE lies between 0.74 to 0.86, we can accept AVE, because AVE values
are above 0.60 (Fornell and Larcker, 1981).All of the items factor loadings lies between 0.73
to 0.96.
Construct validity can be achieved when the fit of the model is above the recommendation
values where χ2/d.f is 1.62 which is less than 5, CFI is 0.935 and TLI is 0.92 both are above
0.90 and RMSEA is 0.103. It can be said that construct validity is achieved in all aspects.
Convergent validity can be achieved when the value of AVE would be higher than or equals to
0.5 (Ahmad et al. 2016). From our analysis, we can see that all of the value of AVE is higher
than 0.50 which means it satisfies the convergent validity criteria.
According to Ahmad et al. (2016) when measurement model would be free from each other
and there would not be redundant then discriminant validity can be achieved. Fornell and
Larcker (1981) explained that the square root of the AVE value of each latent variable sup-
posed to be higher than the correlation between the latent variables. Bold value in table 3
represents the square root of AVE and other values are considered as the correlation value.
Discriminant validity can be achieved when the bold value would be higher than the other
values in rows and columns (Safiih and Azreen, 2016). We can see that empathy- image and
image-price are facing a problem where their value is slightly more than the bold value.
Table 3: Discriminant validity.

27
27
1 2 3 4 5 6 7 8
1.Airline tangibles 0.95
2.Terminal tangibles 0.77 0.91
3.Personnel 0.85 0.88 0.95
4.Empathy 0.85 0.87 0.93 0.93
5.Image 0.86 0.88 0.91 0.93 0.91
6. Price 0.80 0.86 0.87 0.89 0.93 0.95
7. Customer satisfaction 0.90 0.82 0.89 0.90 0.90 0.89 0.95
8. Customer loyalty 0.90 0.80 0.85 0.89 0.89 0.86 0.94 0.96
Construct reliability can be achieved when the composite reliability (CR) is higher than 0.6
and it need to be achieved in every measurement (Ahmad et al. 2016). CR measures the in-
ternal consistency of the model when CR is higher than 0.6 then the reliability is also higher.
from table 2 we have found that CR values are lies between 0.89 to 0.95 which means it satis-
fies the construct validity. Our model satisfies the construct reliability, construct validity,
convergent validity and discriminant validity (partially).
Structural equation model.
Structural equation model (SEM) is used to test the hypotheses and also to measure the pa-
rameters. We have used a structural model of service quality, price, customer satisfaction
and customer loyalty. Beside testing hypothesis, SEM is also used for evaluating whether di-
mensions of AIRQUAL and price have a significant influence on customer satisfaction and the
consequence.
The goodness-of-fit tests for the structural models are satisfactory (χ2 = 426.262, d.f. = 245,
p. = 0.00, CFI = 0.917, TLI = 0.907, RMSEA = 0.111). The outcomes illustrate that the model is
acceptable which is determined by the goodness of the fit measures. We can see that CFI is
0.917 which higher than 0.90 and TFI is 0.907 which is greater than 0.90, RMSEA is higher than
0.08 which means it is acceptable, but the model is mediocre.
Table 4: Standardised structural parameter estimates.
Concepts Customer satisfaction Customer loyalty
Airline tangibles 0.948 (0.00*)

28
28
Terminal tangibles 0.871(0.00*)
Personnel 0.932 (0.00*)
Empathy 0.965 (0.00*)
Image 0.979 (0.00*)
Price 0.938 (0.00*)
Customer satisfaction 0.990 (0.00*)
Goodness-of-fit
χ2 (df) 426.262 (245)
p-value 0.00
CFI 0.917
TLI 0.907
RMSEA 0.115
Note: *p<0.00
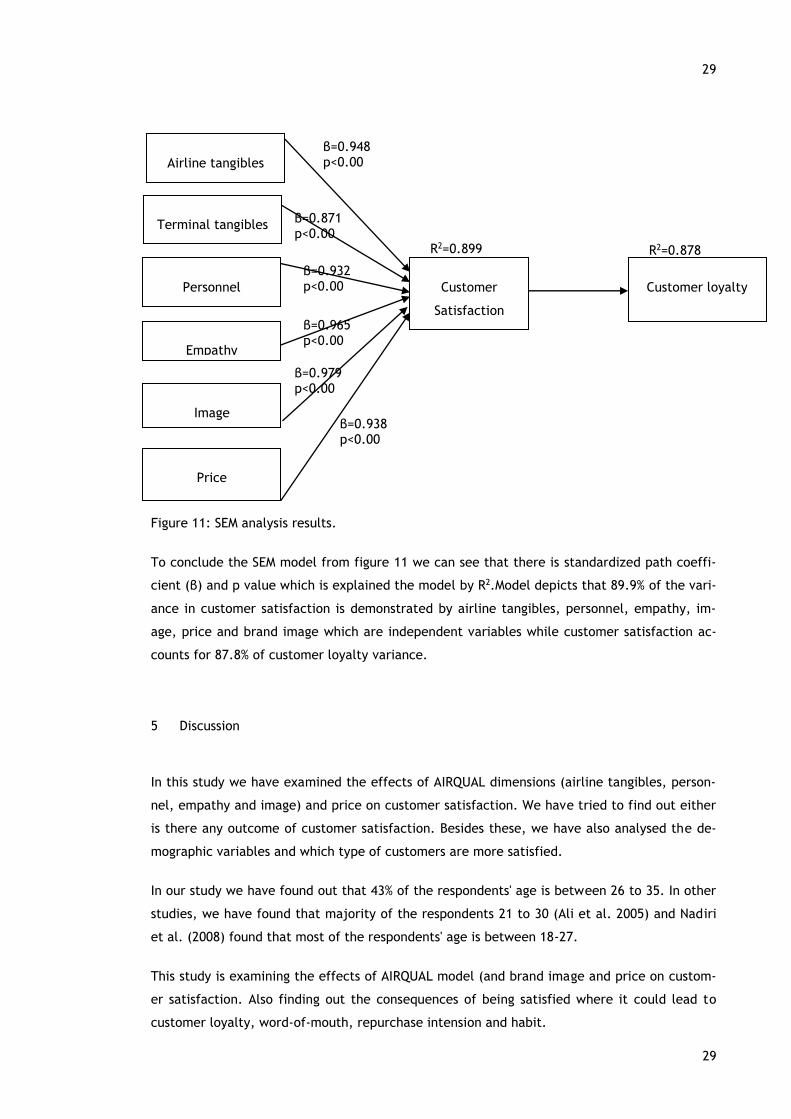
Hypothesis 1 states that airline tangibles have direct influence on customer satisfaction and
the hypothesis is approved by data (β=0.948, p≤0.000). Hypothesis 2 is terminal tangibles
have direct influence on customer satisfaction. The hypothesis is accepted by the data
(β=0.871, p≤0.000). Hypothesis 3 depicts personnel have direct influence on customer satis-
faction. This hypothesis is approved by the data (β=0.932, p≤0.000). Hypothesis 4 demon-
strates empathy have direct influence on customer satisfaction and this hypothesis is also
supported by the data (β=0.965, p≤0.000). Hypothesis 5 demonstrates image have direct in-
fluence on customer satisfaction. The hypothesis is supported by the data (β=0.979,
p=≤0.000). Hypothesis 6 shows that price have direct influence on customer satisfaction. The
hypothesis is supported by the data (β=0.938, p≤0.000). Hypothesis 7 predicts that customer
satisfaction have direct influence on customer loyalty. The hypothesis is supported by the
data (β=0.990, p≤0.000).
29
29
Figure 11: SEM analysis results.
To conclude the SEM model from figure 11 we can see that there is standardized path coeffi-
cient (β) and p value which is explained the model by R2.Model depicts that 89.9% of the vari-
ance in customer satisfaction is demonstrated by airline tangibles, personnel, empathy, im-
age, price and brand image which are independent variables while customer satisfaction ac-
counts for 87.8% of customer loyalty variance.
5 Discussion
In this study we have examined the effects of AIRQUAL dimensions (airline tangibles, person-
nel, empathy and image) and price on customer satisfaction. We have tried to find out either
is there any outcome of customer satisfaction. Besides these, we have also analysed the de-
mographic variables and which type of customers are more satisfied.
In our study we have found out that 43% of the respondents' age is between 26 to 35. In other
studies, we have found that majority of the respondents 21 to 30 (Ali et al. 2005) and Nadiri
et al. (2008) found that most of the respondents' age is between 18-27.
This study is examining the effects of AIRQUAL model (and brand image and price on custom-
er satisfaction. Also finding out the consequences of being satisfied where it could lead to
customer loyalty, word-of-mouth, repurchase intension and habit.
β=0.932 p<0.00
β=0.979 p<0.00
β=0.965 p<0.00
β=0.871 p<0.00
β=0.938 p<0.00
β=0.948 p<0.00
Airline tangibles
Personnel
Empathy
Image
Customer
Satisfaction
Customer loyalty
Price
Terminal tangibles
R2=0.899
R2=0.878
30
30
63.3% of respondents are Bangladeshi, the study has been conducted in Dhaka, Bangladesh so
that the majority is the locals. Ekiz et al. (2006) mentioned in their study that 72.2% of re-
spondents are Turkish as the study was conducted in North Cyprus. From here we can see that
local people are participating in the survey.
We have also analysed which customer group by gender is satisfied with the airline services.
Our analysis shows that female is satisfied more than the male participants.
Our study supports that the dimensions of AIRQUAL have a significant impact on customer
satisfaction. The customer becomes satisfied when they see the aircraft is new and modern,
seats and toilets are clean. Airlines authority needs to maintain a clean, modern aircraft
which will increase the comfort level of the customer. Airlines need to maintain their air-
craft, if necessary then they need to repair or fix the problem. Saha and Theingi (2009) sup-
port our analysis and they have pointed out that airline tangibles are responsible for customer
satisfaction and also to increase the reputation of the company.
Terminal tangibles have a strong relationship with customer satisfaction. The airport is an
important factor for customer satisfaction because before going to the aircraft customers go
through the all the formalities and they need to wait, check luggage, and use the toilet in the
airport. There are so many aspects that airport authority needs to take care properly to main-
tain a satisfied customer level. Nadiri et al. (2008) supports this relationship and mentioned
that passenger’s satisfaction is increased by the quality of the terminal tangibility and it has a
strong influence on passenger’s satisfaction.
In the study, personnel are found to have a significant direct impact on customer satisfaction.
Personnel is the one who has direct contact with the passengers so that passengers have an
expectation that personnel would be well dressed up, well-mannered and can provide ade-
quate information. Şimşek and Demirbağ (2017) mentioned that passengers would like to see
the good-looking and kind personnel and the quality of the personnel appearance also in-
crease customer satisfaction. Leong et al. (2015) added more on this relationship that airline
companies invest money in education for their personnel so that they can provide better ser-
vice to the passengers.
We have found that empathy has a direct impact on customer satisfaction. Passengers will be
more satisfied when there will be enough flights to more destinations, flights will not be de-
layed or cancelled and if there is a flight delay, cancel then airlines need to pay compensa-
tion. Ali et al. (2015), Naridi et al. (2008) and Ekiz et al. (2006) support this relationship.
Naridi et al. (2008) mentioned that personal empathy has a positive influence on the service
quality of Cyprus National Airline.

31
31
The study observes that image has significant relationship with customer satisfaction. Airlines
need to promote promotional and to keep consistency in the price. Ekiz et al. (2006) men-
tioned to increase customer satisfaction, airline companies need to achieve the consistency
of price and sometimes need to provide low price ticket.
Price is considered an important factor for customer satisfaction and it has strong relationship
with customer satisfaction. Our result is also supported by Riandarini et al. (2015) where they
have found that price has a strong connection with the customer satisfaction. Airlines need to
provide affordable price so that they can get new customer and keep the customer.
Our study mentions that customer satisfaction has direct influence on customer loyalty. This
relationship is supported by Naridi et al. (2008), Saha and Theingi (2009) and Nadiri et al.
(2008) mentioned that it is good for the company to have a loyal customer so that that they
can bring more profit. Airline companies need to measure their loyal customer by having a
small survey or taking feedback from the passengers while they are travelling which will help
them to retain existing customer and to make them loyal.
6 Conclusion and implications
The aim of the study is to investigate how price and dimensions of AIRQUAL are influencing
customer satisfaction and the study also focus on the outcome of customer satisfaction which
is customer loyalty. According to Ekiz et al. (2006), in the developing countries service quality
is one of the most important sectors. Nowadays the airline industry becomes challenging due
to the change in customer demands and companies are trying to meet the demands of the
customers. However, technology is helping airline industry a lot so that they can provide
modern facilities to the customer to make satisfied. The key to success for the airline compa-
nies is to provide high-quality service and maintain the quality to make the customer satisfied
otherwise dissatisfaction can bring failure in the airline business (Ekiz et al., 2006).
This study provides the answer to the research question, which is airline tangibles, terminal
tangibles, empathy, personnel, image and price have a strong influence on customer satisfac-
tion and as a result, the output of customer satisfaction is customer loyalty. All of the hy-
potheses support the study. Our study findings satisfy the findings of the prior studies (Ekiz et
al., 2006; Nadiri et al., 2008; Ali et al., 2015 and Simsek and Deirbag, 2017) that service qual-
ity acts as a significant factor of the customer satisfaction and both quality and satisfaction
enhance the behaviour intention which is loyalty.

32
32
The study also indicates the gender group who are satisfied more. This could be the target
group for Biman. As female are more satisfied to male then Biman can need to take care to
keep them satisfied and also need to take initiative to enhance their loyalty. When they are
travelling with family or with friends they can motivate, spread positive things of Biman so
that other people will be influenced to use Biman. Biman Bangladesh airlines know that it is
easy to retain an existing customer rather than getting a new customer. When customers are
loyal then they have less tendency to go to other airlines and those loyal customers will bring
more customer and they will make a repurchase.
Implications
There are some important implications for the authority of the Biman Bangladesh Airlines
which is taken from the finding of the study. To enhance the safety of the passengers' author-
ity, need to give importance to the physical equipment such as aircraft’s exterior and interior
and cleanliness of the aircraft. Authority also needs to ensure the maintenance of the aircraft
so that flight can be scheduled properly. The airline can invest more on the employees so
that they get more training and can provide service with empathy. Biman also needs to invest
more in digital and physical marketing so that they can get more customer and can be ahead
of the competition. The airline also needs to focus on retaining more customer, Biman can
conduct a small survey, telephone interview or face-to-face interview to find out the area of
improvement. As there are many aircraft is joining the airlines so they need to extant their
route. Biman can try to get a route to central Europe, America, Australia and Canada because
so many Bangladeshi lives abroad so it would be easy to get more customer. Biman and air-
port authority can also work in the beautification, modernization, safety and cleanliness of
the airport so that passengers can feel comfortable.
There is also the contribution of the study where previous studies (Ali et al., 2015; Farooq et
al., 2018; Nadiri et., 2008 and Şimşek and Demirbağ 2017) only focus on the AIRQUAL model,
but in our study, we have used price variable along with the AIRQUAL model. Our study also
points out the consequence of customer satisfaction, when the passenger is satisfied then
they have a tendency to become loyal. This is the only study which has been conducted on
customer satisfaction of Biman in Bangladesh, there is not any other study so this study can
contribute to the literature of the aviation industry in Bangladesh. This study also contributes
to the statistical analysis technique, where we have used R studio to analyse SEM whereas
most of the studies measured SEM by SPSS, LISERAL and SmartPls.
Limitations and further research
There are few limitations have been found in the study. Firstly, the sample size is small, and
it could be better if the sample size would be larger. Secondly, the study may not be general-
ized with other geographical regions because the study is conducted in a developing nation.

33
33
Thirdly, this study does not consider other factors such as safety, technology, other factors
which can influence satisfaction. These gaps can be used in future studies where future re-
search could consider other factors which influence satisfaction and will bring out more con-
sequences other than customer loyalty. Another study could be done to compare Biman and
with other airlines to see which airline customers are satisfied. The airport is an important
factor for customer satisfaction for all airlines so there could be a study based on the airport
services so that authority can know which area they need to improve.
34
34
References
Printed
Ali, F., Dey, B.L. and Filieri, R. 2015. An Assessment of Service Quality and Resulting Custom-
er Satisfaction in Pakistan International Airlines: Findings from Foreigners and Overseas Paki-
stani Customers, International Journal of Quality and Reliability Management.
Babbar, S. & Koufteros, X. 2008. The human element in airline service quality: contact per-
sonnel and the customer. International Journal of Operations & Production Management,
28(9), 804–830.
Bari, S., Bavik, A., Ekiz, H. E., Hussain, K. and Toner, S. 2001.AIRQUAL: A Multiple-Item Scale
for Measuring Service Quality, Customer Satisfaction, and Repurchase Intention, HOS-414
Graduation Project (Thesis), Gazimagusa: Eastern Mediterranean University, School of Tour-
ism and Hospitality Management.
Bollen, K.A. 1989. Structural Equations with Latent Variables, John Wiley & Sons, New York.
Chisnall, P. M. 1997. Marketing research. London: McGraw- hill.
Culiberg, B. and Rojs ̌ek, I. 2010. Identifying Service Quality Dimensions as Antecedents to
Customer Satisfaction in Retail Banking. Economic and Business Review, 12(3), 151-166.
Cunningham, R. M. 1956. Brand Loyalty: What, Where, How Much? Harvard Busi-
ness Review, 34, 116-128.
Day, G. 1969. A two-dimensional concept of brand loyalty. Journal of Advertising Research, 9
(3), 29-35.
Easterby-Smith, M., Thorpe, R. and Jackson, P. R. 2015. Management and Business Research.
5th
edition. London: Sage edge
Easterby-Smith M., Thorpe, R., & Jackson, P. 2012. Management Research. London: Sage Pub-
lications.
Ekiz, H. E., Hussain, K., & Bavik, A. 2006. Perceptions of service quality in North Cyprus na-
tional airline. Tourism and Hospitality Industry 2006- New Trends in Tourism and Hospitality
Management, Proceedings of 18th Biennial International Conference. 03-05, pp. 778-790.
Croatia: Faculty of Tourism and Hospitality Management.
35
35
Ekiz, H.E., Hussain, K. and Bavik, A. 2006. Perceptions of Service Quality in North Cyprus Na-
tional Airline, Tourism and Hospitality Industry 2006 – New Trends in Tourism and Hospitality
Management, Proceedings of 18th Biennial International Conference, Croatia: Faculty of Tour-
ism and Hospitality Management, Opatija.
Fornell, C., and Larcker, D. F. 1981. Evaluating Structural Equation Models with Unobservable
Variables and Measurement Error, Journal of Marketing Research.
Gronroos, C. 1984. A Service Quality Model and Its Marketing Implication, European Journal of
Marketing.
Hair, J. F., Black, W. C., Babin, B. J., and Anderson, R. E. 2010. Multivariate Data Analysis.
7th
edition. Englewood Cliffs: Prentice Hall.
Hair, J.F., Hult, G.T.M., Ringle, C., Sarstedt, M. 2017. A Primer on Partial Least Squares
Structural Equation Modeling (PLS-SEM), 2nd
edition. Sage Publications Limited Inc,Thousand
Oaks, Calif.
Gretzel, U. Consumer generated content–trends and implications for branding. E Rev. Tour.
Res. 2006, 4, 9–11.
Grönroos C.2001. Service Management and Marketing: a customer relationship management
approach. Second edition. Chichester: John Wiley & Sons Ltd.
Hill, N., and Alexander, J. 2006.The Handbook of Customer Satisfaction and Loyalty Meas-
urement, 3rd
edition. Gower, Aldershot, England; Burlington, VT
Jacobsen, D. I. 2011. Hvordan Gjennomføre Undersøkelser?: Innføring i Samfunnsvitenskapelig
Metode. Kristiansand: Høyskoleforlaget AS.
Johnson, M. D., Gustafsson, A., Andreassen, T. W., Lervik, L., and Cha, J. 2001. The Evolution
and Future Of National Customer Satisfaction Index Models, Journal of economic Psychology.
Lau, P. M., Akbar, A. K., and Fie, D. Y. 2005. Service Quality: A Study of The Luxury Hotels in
Malaysia. Journal of American Academy of Business, 7-46.
Lovelock, C., & Wirtz, J. 2007. Services marketing - people, technology, strategy .6th edition.
Upper Saddle River: Pearson Prentice Hall.
McDaniel C. & Gates R. 2004. Marketing research essentials. New Jersey: John Wiley and sons,
Inc.

36
36
Malhotra k. Naresh 2010 Marketing research. New Jersey: Prentice hall, Pearson education
Inc.
Malhotra, N. K., and Birks, D. F. 2006. Marketing Research: An Applied Approach. 3rd
edition.
United Kingdom: Pearson Education M.U.A.
Malhotra k. Naresh 2010 Marketing research. New Jersey: Prentice hall, Pearson education
Inc.
Malhotra, N. K. 2008. Marketing Research: An Applied Orientation, 5th edition. Pearson Educa-
tion India.
Munusamy, J., Chelliah, S. 2011. An Investigation of Impact of Service Strategy On Customers'
Satisfaction In The Budget Airline Industry In Malaysia: A Case Study Of Air Asia, Contempo-
rary Marketing Review, Vol.1, No.1, 1-13.
Oliver, R. L. 1980. A cognitive model of the antecedents and consequences of satisfaction
decisions. Journal of Marketing Research , 17 (4), 460-469.
Parasuraman, A., Berry, L.L. and Zeithaml, V.A. 1988. SERVQUAL: A Multiple Item Scale for
Measuring Consumer Perceptions of Service Quality. Journal of Retailing, 4(1), 12-37.
Park, J.W., Robertson, R., and Wu, C.L. 2005. Investigating the Effects of Airline Service
Quality on Airline Image and Passengers' Future Behavioral Intentions: Finding From Australian
International Air Passengers. The Journal of Tourism Studies, 16(1), 1-11.
Parasuraman, A., Zeithaml, V. A., & Berry, L. L. 1990. Moving Forward in Service Quality Re-
search: Measuring Different Customer Expectation Levels, Comparing Alternative Scales, and
Examining the Performance-Behavioral Intentions Link. MSI Report, 94-114.
Reichheld, F. F., & Sasser, W. E. 1990. Quality comes to services. Harvard Busi-
ness Review, 68 (5), 105-111.
Hirschman, A. O. 1970. Exit, Voice, And Loyalty: Responses to Decline in Firms, Organizations,
And States. Massachusetts: Harvard University Press.
Reichheld, F. F. 1996. Learning from customer defection. Harvard Business Review, 74 (2),
56-67.
Reichheld, F. F., Markey, R. G., & Hopton, C. 2000. The loyalty effect- the relationship be-
tween loyalty and profits. European Business Journal, 12 (3), 134-139.
37
37
Sekaran, U. 2003. Research Methods for Business: A Skill-Building Approach. 4th Edition, John
Wiley & Sons, New York.
Soderlund, M., & Vilgon, M. 1999. Customer satisfaction and links to customer profitability:
An empirical examination of the association between attitudes and behavior. SSE/EFI Working
Paper Series in Business Administration, 1-21.
Thatcher, R. 2010. Validity and Reliability of Quantitative Electroencephalography, 38 Journal
of Neurotherapy, Vol.14.
Tucker, W. T. 1964. The Development of brand loyalty. Journal of Marketing Research, 1, 32-
35.
Westbrook, R.A. 1981. Source of Consumer Satisfaction with Retail Outlets. Journal of Retail-
ing, 3, 68.
Willis, J. 2007. Foundations of Qualitative Research: Interpretive and Critical Approaches.
SAGE Publications.
Wong, K. K. K. 2013. Partial Least Squares Structural Equation Modeling (PLSSEM) Techniques
Using SmartPLS, Marketing Bulletin, Vol.24, No. 1, 1-32.
Zeithaml, V. A., & Bitner, M. J. 1996. Services marketing: Integrating customer focus across
the firm Boston: McGraw-Hill/Irwin: Boston: McGraw-Hill/Irwin.
Zeithaml, V. A., Bitner, M. J., and Gremler, D. D. 2009. Services Marketing: Integrating Cus-
tomer Focus Across the Firm, 5th
edition. New York: McGraw-Hill/Irwin.
Zeithaml V.A., Bitner M.J., Gremler D.D. 2009. Service Marketing: Integrating Customer Focus
Across the Firm. Fifth edition. New York: McGraw-Hill Companies, Inc.
Zikmund, W.G. 2000. Business Research Methods. 6th
Edition. The Dryden Press, Fort Worth.
Electronic
Ahmad, S., Zulkurnain, N., and Khairushalimi, F. 2016. Assessing the Validity and Reliability of
a Measurement Model in Structural Equation Modeling (SEM)’, British Journal of Mathematics
& Computer Science. Assessed April 03, 20202. DOI:10.9734/bjmcs/2016/25183.
Ali, F., Dey, B.L. and Filieri, R. 2015. An Assessment of Service Quality and Resulting Custom-
er Satisfaction in Pakistan International Airlines: Findings from Foreigners and Overseas Paki-

38
38
stani Customers. International Journal of Quality and Reliability Management, 32(5), 486 –
502. Assessed March 24,2020. DOI: 10.1108/ijqrm-07-2013-0110
Anderson, E. W., & Mittal, V. 2000. Strengthening the satisfaction-profit chain. Journal of
Service Research, 3 (2), 107-120. Assessed March 28, 2020. DOI: 10.1177/109467050032001
Anderson, E. W., Fornell, C., & Lehmann, D. R. 1994. Customer satisfaction, market share,
and profitability: Findings from Sweden. Journal of Marketing, 58 (3), 53-66. Assessed April 1,
2020. DOI: 10.2307/1252310.
Archana, R., and Subha, M.V. 2012. A Study on Service Quality and Passenger Satisfaction On
Indian Airlines, Indian journal of multidisciplinary research, Vol.2, 50–63. Assessed April 1,
2020. http://www.prosperfinancialmanagement.com/assets/client_files/PDFs/jd.pdf
Bloemer, J., Ruyter, K., & Peeters, P. 1998. Investigating drivers of bank loyalty: The com-
plex relationship between image, service quality and satisfaction. International Journal of
Bank Marketing, 16 (7), 276-286. Assessed March 27,2020. DOI: 10.1108/02652329810245984.
Bloemer, J. M., & Kasper, H. D. 1995. The complex relationship between consumer satisfac-
tion and brand loyalty. Journal of Economic Psychology, 16, 311-329.Assessed March 30,2020.
DOI: 10.1016/0167-4870(95)00007-b.
Bloemer, J.M.M., and Odekerken-Schroder, G. 2002.Store Satisfaction and Store Loyalty Ex-
plained by Customer- And Store-Related Factors. Journal of Consumer Satisfaction, Dissatis-
faction and Complaining Behavior,15, 68-80. Assessed April 02,
2020.https://jcsdcb.com/index.php/JCSDCB/article/view/95.
Buttle, F. 1996. SERVQUAL: review, critique, research agenda, European Journal of Market-
ing, 30, 8–32. Assessed April 02, 2020. DOI: 10.1108/03090569610105762
Cadotte, E.R. 1987. Expectations and Norms in Models of Consumer Satisfaction. Journal of
Marketing Research, 24, 305-314. Assessed April 03, 2020.
http://dx.doi.org/10.2307/3151641
Cardozo, R.N. 1965. An Experimental Study of Customer Effort, Expectation, and Satisfaction.
Journal of Marketing Research, 3, 244-249. Assessed April 05,
2020.dx.doi.org/10.2307/3150182 .
Cronin, J.J., and Taylor, S.A. 1992. Measuring Service Quality: A Re-Examination and Exten-
sion. Journal of Marketing,5(3), 55-68. Assessed April 02, 2020. DOI: 10.2307/1252296
39
39
Churchill Jr., G.A. and Superenant, C. 1982. An Investigation into the Determinants of Con-
sumer Satisfaction. Journal of Marketing Research, 3, 491-504. Assessed April 13, 2020.
dx.doi.org/10.2307/3151722
De Pew, T., and Stripling, B. 2003. Leveraging the airlines, Using pricing and yield manage-
ment in field service optimization. Assessed March
28,2020. https://www.eds.com/services/innovation/downloads/leveraging_airlines.pdf
Dick, A. S., & Basu, K. 1994. Customer Loyalty: Toward an Integrated Conceptual Framework.
Journal of the Academy of Marketing Science, 22 (2), 99-113. Assessed April 02, 2020. DOI:
10.1177/0092070394222001.
Durvasula, S., Lysonski, S., Mehta, S. C., & Tang, B. P. 2004. Forging relationships with ser-
vices: The antecedents that have an impact on behavioral outcomes in the life insur-
ance industry. Journal of Financial Services Marketing, 8 (4), 314-326. Assessed April 02,
2020. DOI: 10.1057/palgrave.fsm.4770129.
Edvardsson, B., Johnson, M. D., Gustafsson, A., & Strandvik, T. 2000. The effects of satisfac-
tion and loyalty on profits and growth: Products versus services. Total Quali-
ty Management, 11 (7), 917-927. Assessed April 03, 2020. DOI: 10.1080/09544120050135461.
Farooq, M.S., Salam, M., Fayolle, A., Jaafar, N. & Ayupp, K. 2018. Impact of service quality
on customer satisfaction in Malaysia airlines: A PLS-SEM approach. Journal of Air Transport
Management. 67, 169– 180. Assessed April 03, 2020. DOI: 10.1016/j.jairtraman.2017.12.008.
Forgas, S., Moliner, M.A., Sa ́nchez, J. & Palau, R. 2010. Antecedents of airline passenger loy-
alty: Low-cost versus traditional airlines. Journal of Air Transport Management. 16(4), 229–
233. Accessed March 28, 2020. Assessed April 11, 2020. DOI:
10.1016/j.jairtraman.2010.01.001
Fornell, C. 1992. A national customer satisfaction barometer: The Swedish experience. Jour-
nal of Marketing, 56 (1), 6-21. Assessed April 03, 2020. DOI: 10.2307/1252129
Grigoroudis E. & Siskos Y. 2010. Customer Satisfaction Evaluation: Methods for Measuring and
Implementing Service Quality. First edition. New York: Springer Science + Business Media,
LLC. Assessed April 03, 2020. DOI: 10.1007/978-1-4419-1640-2.
Gronroos, C. 1984. A Service Quality Model and Its Marketing Implication, European Journal of
Marketing, 18(4), 36–44. Assessed April 01, 2020. DOI: 10.1108/eum0000000004784.

40
40
Hallowell, R. 1996. The relationships of customer satisfaction, customer loyalty, and profita-
bility: an empirical study. International Journal of Service Industry, 7 (4), 27-42. Assessed
April 02, 2020. DOI: 10.1108/09564239610129931.
Heitmann, M., Lehmann, D. R., & Herrmann, A. 2007. Choice goal attainment and decision
and consumption satisfaction. Journal of Marketing Research, 44 (2), 234-250.Assessed March
28, 2020. DOI: 10.1509/jmkr.44.2.234
Homburg, C., & Gierin, A. 2000. Personal characteristics as moderators of the relationship
between customer satisfaction and loyalty - An empirical analysis. Psychology & Marketing, 18
(1), 43-66. Assessed March 27, 2020. DOI: 10.1002/1520-6793(200101)18:1<43::aid-
mar3>3.0.co;2-i
Hussain, R., Nasser, A. A., and Hussain, Y. K. 2015. Service Quality and Customer Satisfaction
of A UAE-Based Airline: An Empirical Investigation. Journal of Air Transport Management, 42,
167-175.Assessed
April8,2020.https://www.sciencedirect.com/science/article/abs/pii/S0969699714001355.
Kim, S., Kim, I., and Hyun, S. S. 2016. First-Class in-Flight Services and Advertising Effective-
ness: Antecedents of Customer-Centric Innovativeness and Customer loyalty in the United
States (US) Airline Industry, Journal of Travel and Tourism Marketing,Vol.33, No. 1, 118-140.
Assessed April 02, 2020. DOI: 10.1080/10548408.2015.1038420 .
Khan, U., and Khan, N. 2013. Customer Satisfaction in Airline Industry, International Proceed-
ings of Economics Development and Research, 76(12), 63–67. Assessed March 26, 2020. DOI:
10.7763/IPEDR. 2014.
Leong, L., Hew, T., Lee, V., and Ooi, K. 2015. An SEM–Artificial-Neural-Network Analysis of
The Relationships Between SERVPERF, Customer Satisfaction and Loyalty Among Low-Cost and
Full-Service Airline, Expert Systems with Applications. Assessed April 12, 2020. DOI:
10.1016/j.eswa.2015.04.043
Low, W., Lee, J., and Cheng, S. 2013. The Link Between Customer Satisfaction and Price Sen-
sitivity: An Investigation of Retailing Industry In Taiwan. Journal of Retailing and Consumer
Services, 20(1), 1-10. Assessed March 28,2020. DOI: 10.1016/j.jretconser.2012.06.011.
Maccallum, R. C., Browne, M. W., & Sugawara, H. M. 1996. Power analysis and determination
of sample size for covariance structure modeling. Psychological Methods, 1(2), 130-149. As-
sessed May 02,2020.doi:10.1037/1082-989x.1.2.130.
41
41
Nadiri, H., Hussain, K., Ekiz, E. H. Erdogan S. 2008. An investigation on the factors influenc-
ing passengers‟ loyalty in the North Cyprus national airline. The TQM Journal. Vol. 20 (3), 265-
280. Assessed April 03, 2020. DOI: 10.1108/17542730810867272.
Oliver, R.L. (1980) A Cognitive Model of the Antecedents and Consequences of Satisfaction Decisions. Journal Marketing Research, 4, 460-469. Assessed April 03, 2020.dx.doi.org/10.2307/3150499
Oliver, R. I. 1999. Whence consumer loyalty? Journal of Marketing, 63, 33- 44. Accessed March
26,2020. Assessed March 27, 2020. DOI: 10.2307/1252099.
Parasuraman, A., Zeithaml, V. A., and Berry, L. L. 1985. A Conceptual Model of Service Quali-
ty and Its Implications for Future Research. Journal of Marketing,49(4). Assessed March
30,2020. DOI: 10.2307/1251430.
Park, J.W., Robertson, R., and Wu, C.L. 2004. The Effect of Airline Service Quality Behaviour-
al Intentions: A Korean Case Study. Journal of Air Transport Management, 10, 435-
439. Assessed March 27,2020. DOI: 10.1016/j.jairtraman.2004.06.001.
Riandarini, R. H., Sumarwan, U., Yuliati, L. N., and K. 2015. Comparison of Power Influence
Factors Shaping Loyalty Indonesian Domestic Airlines’, European Journal of Business and Man-
agement, Vol.7, No 11, 120-132. Assessed April 05, 2020.
https://www.iiste.org/Journals/index.php/EJBM/article/viewFile/21814/22359.
Saha, G. C., & Theingi. 2009. Service Quality, Satisfaction,
and Behavioural Intentions. Managing Service Quality: An International Journal, 19(3), 350-
372. Assessed March 24,2020. DOI: 10.1108/09604520910955348
S ̧ims ̧ek, K., and Demirbag ̆, O. 2017. Modeling Service Quality, Customer Satisfaction and Be-
havioral Intentions in Airline Industry: A SEM Approach, The Journal of International Scientific
Researches, 2(6), 11-29.Accessed April 12,2020. doi:10.23834/isrjournal.341694
Suhartanto, D. and Noor, A. A. 2012. Customer Satisfaction in The Airline Industry: The Role
of Service Quality and Price, Asia Tourism Forum Conference, 1-9. Assessed March 30,2020,
https://www.researchgate.net/publication/283725801
Tse, D. K., & Wilton, P. C. 1988. Models of consumer satisfaction formation: An extension.
Journal of Marketing Research, 25(2). Assessed March 28,2020. DOI: 10.2307/3172652
Zeithaml, V. A. 2000. Service Quality, Profitability, and the Economic Worth of Customers:
What we Know and What We Need to Learn. Journal of the Academy of Marketing Science, 28
(1), 67-85. Assessed April 02, 2020. DOI: 10.1177/0092070300281007

42
42
Zeithaml, V. A., Barry, L. L., & Parasuraman, A. 1996. The Behavioral Consequences of Ser-
vice Quality. Journal of Marketing, 60 (2), 31-46. Assessed April 05,2020. DOI:
10.2307/1251929

43
43
Figures
Figure 1: Structure of the thesis. ........................................................................ 5
Figure 2: Conceptual research model. ................................................................. 12
Figure 3: Gender .......................................................................................... 19
Figure 4:Education ....................................................................................... 19
Figure 5:Age ............................................................................................... 20
Figure 6: travel purpose ................................................................................. 20
Figure 7: Travel with ..................................................................................... 21
Figure 8: Nationality ..................................................................................... 21
Figure 9: Expectations of aspects ..................................................................... 22
Figure 10: Aspects match expectations. .............................................................. 22
Figure 11: SEM analysis results. ........................................................................ 29
Tables
Table 1: ANOVA analysis for gender satisfaction level .............................................. 23
Table 2: Standardized factor loadings of constructs and indicators............................... 24
Table 3: Discriminant validity. ......................................................................... 26
Table 4: Standardised structural parameter estimates. ............................................ 27
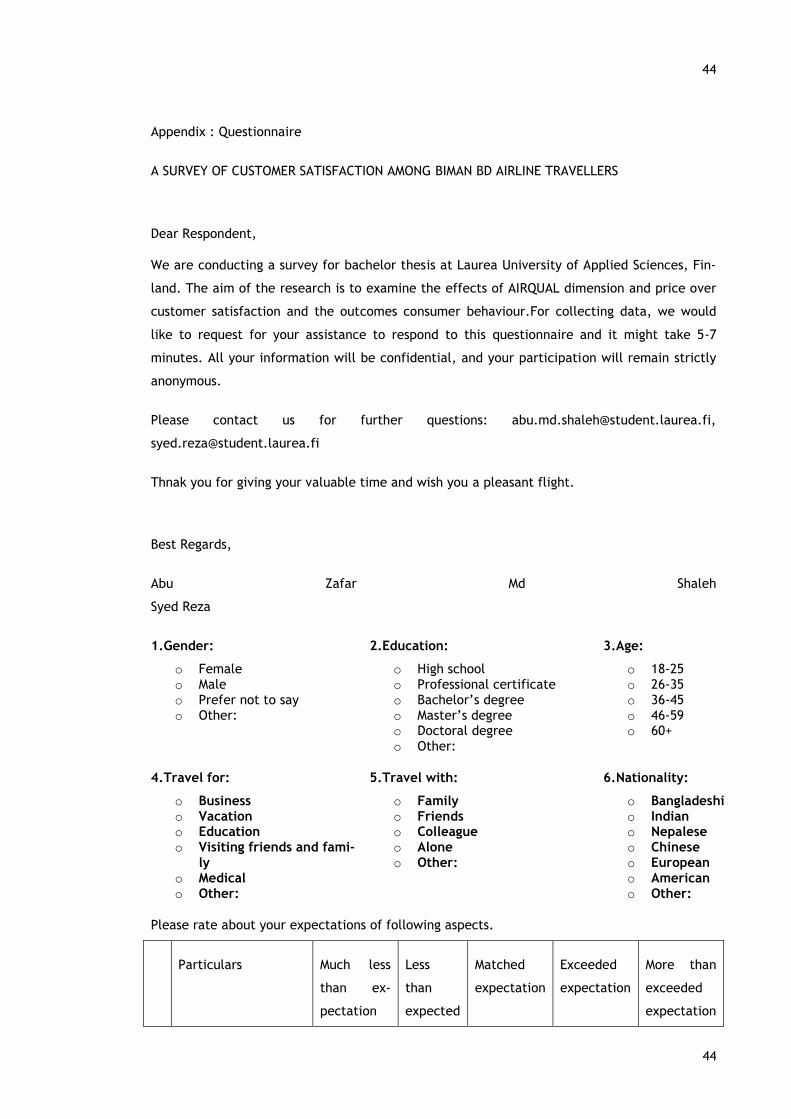
44
44
Appendix : Questionnaire
A SURVEY OF CUSTOMER SATISFACTION AMONG BIMAN BD AIRLINE TRAVELLERS
Dear Respondent,
We are conducting a survey for bachelor thesis at Laurea University of Applied Sciences, Fin-
land. The aim of the research is to examine the effects of AIRQUAL dimension and price over
customer satisfaction and the outcomes consumer behaviour.For collecting data, we would
like to request for your assistance to respond to this questionnaire and it might take 5-7
minutes. All your information will be confidential, and your participation will remain strictly
anonymous.
Please contact us for further questions: [email protected],
Thnak you for giving your valuable time and wish you a pleasant flight.
Best Regards,
Abu Zafar Md Shaleh
Syed Reza
1.Gender:
o Female o Male o Prefer not to say o Other:
2.Education:
o High school o Professional certificate o Bachelor’s degree o Master’s degree o Doctoral degree o Other:
3.Age:
o 18-25 o 26-35 o 36-45 o 46-59 o 60+
4.Travel for:
o Business o Vacation o Education o Visiting friends and fami-
ly o Medical o Other:
5.Travel with:
o Family o Friends o Colleague o Alone o Other:
6.Nationality:
o Bangladeshi o Indian o Nepalese o Chinese o European o American o Other:
Please rate about your expectations of following aspects.
Particulars Much less
than ex-
pectation
Less
than
expected
Matched
expectation
Exceeded
expectation
More than
exceeded
expectation

45
45
1 Aircraft
2 Airport service
3 Airline employee
helpfulness
4 Spontaneous hassle-
free service
5 Image of Biman
6 Price
To what extent do you agree with the following statements?
Statements: A lot lower than ex-pected
Lower than ex-pected
ex-pected
Agree better than ex-pected
A lot better than ex-pected
My Satisfaction with Airline tangibles.
1 Aircrafts are clean.
2 Aircrafts are modern looking.
3 Plane toilets are clean.
4 Plane seats are clean.
5 Quality of air-conditioning in the planes
is good enough.
My Satisfaction with terminal tangibles.
6 Airport toilets are clean.
7 Number of shops in airport is enough
for my need.
8 Air-conditioning in airport is effective.
9 Sign system in airport is noticeable.

46
46
10 Availability of trolleys in airport is
enough.
11 I feel comfort of waiting in hall of the
airport.
My Satisfaction with airline personnel.
12 Airline employees’ general attitude is
good.
13 Flight attendants are well-dressed.
14 Personnel show personnel care equally
to everyone.
15 Personnel are Aware of their duties.
My Satisfaction with the empathy of airline
16 Airlines maintain punctuality of depar-
tures and arrivals.
17 Number of flights is enough to satisfy
passengers’ demands.
18 Compensation schemes in case of loss
or hazard is effective.
19 Services regarding entertainment is
enough.
20 Quality of online services is secure.
My Satisfaction with the image of airline
21 Airlines offer low-price ticket regularly.
22 Ticket price is consistent with given
service.
23 Airline company has a good reputation.
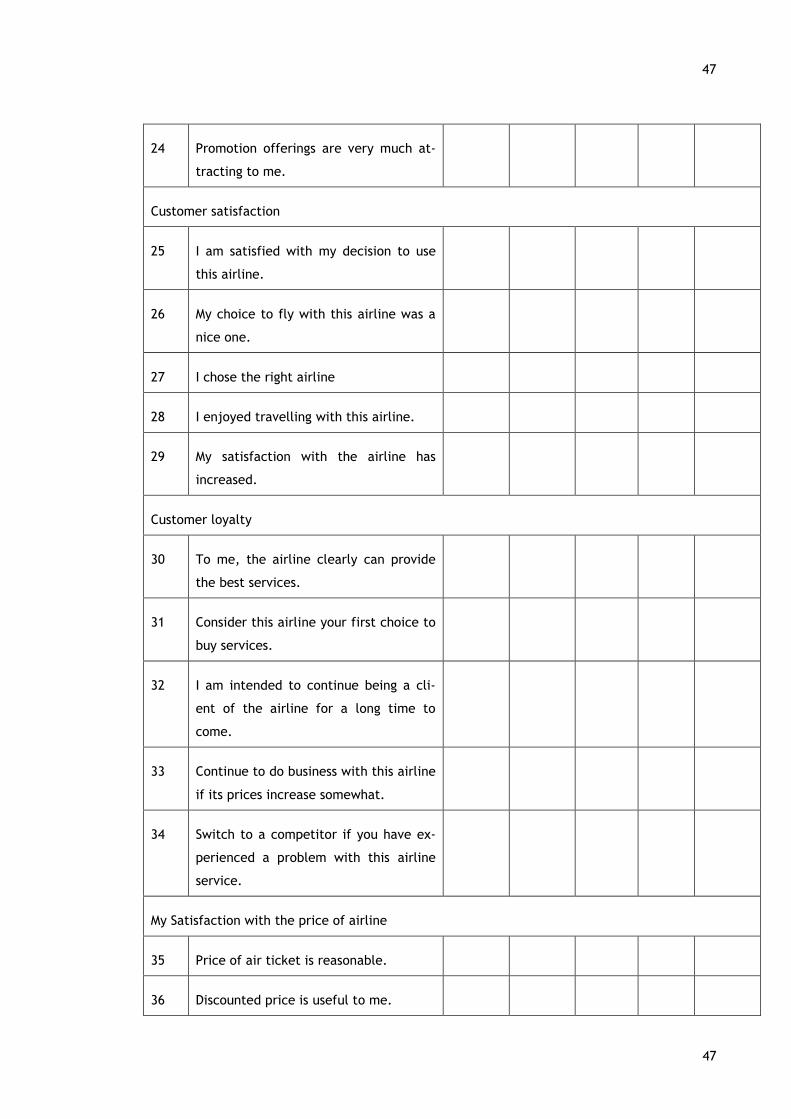
47
47
24 Promotion offerings are very much at-
tracting to me.
Customer satisfaction
25 I am satisfied with my decision to use
this airline.
26 My choice to fly with this airline was a
nice one.
27 I chose the right airline
28 I enjoyed travelling with this airline.
29 My satisfaction with the airline has
increased.
Customer loyalty
30 To me, the airline clearly can provide
the best services.
31 Consider this airline your first choice to
buy services.
32 I am intended to continue being a cli-
ent of the airline for a long time to
come.
33 Continue to do business with this airline
if its prices increase somewhat.
34 Switch to a competitor if you have ex-
perienced a problem with this airline
service.
My Satisfaction with the price of airline
35 Price of air ticket is reasonable.
36 Discounted price is useful to me.

48
48
37 I feel there is fairness of price accord-
ing to service delivery.
38 My expectations are fulfilled according
to price.
Please rate how well following aspects match your expectations.
Particulars Much less
than ex-
pectation
Less than
expected
Matched
expectation
Exceeded
expectation
More than
exceeded
expectation
1 Aircraft
2 Airport service
3 Airline employee
helpfulness
4 Spontaneous has-
sle-free service
5 Image of Biman
6 Price