an empirical codon model for protein sequence evolution
TRANSCRIPT
An empirical codon model for proteinsequence evolution
CAROLIN KOSIOL♯*, IAN HOLMES3 and NICK
GOLDMAN♯
♯EMBL-European Bioinformatics Institute, Hinxton, U.K.
3Department of Bioengineering, University of California, Berkeley, USA.
*Current address and corresponding author:
Carolin Kosiol
Department of Biological Statistics and Computational Biology
169 Biotechnology Building
Cornell University
Ithaca
NY 14853
USA
tel: +1-607-255 7430
fax: +1-607-255 4698
e-mail: [email protected]
Manuscript type: Research article
Key words: protein evolution, codon models, Markov models, maximum
likelihood, phylogenetic inference.
Running head: An empirical codon model
[This version: 16iii2007]
This is an Open Access article distributed under the terms of the Creative Commons Attribution Non-Commercial License (http://creativecommons.org/licenses/by-nc/2.0/uk/) which permits unrestricted non-commercial use, distribution, and reproduction in any medium, provided the original work is properly cited.
© 2007 The Authors
MBE Advance Access published March 30, 2007 by guest on D
ecember 17, 2015
http://mbe.oxfordjournals.org/
Dow
nloaded from
ABSTRACT
In the past, two kinds of Markov models have been considered to
describe protein sequence evolution. Codon-level models have been
mechanistic, with a small number of parameters designed to take into
account features such as transition-transversion bias, codon frequency
bias and synonymous-nonsynonymous amino acid substitution bias.
Amino acid models have been empirical, attempting to summarize the
replacement patterns observed in large quantities of data and not
explicitly considering the distinct factors that shape protein evolution.
We have estimated the first empirical codon model. Previous codon
models assume that protein evolution proceeds only by successive
single nucleotide substitutions, but our results indicate that model
accuracy is significantly improved by incorporating instantaneous
doublet and triplet changes. We also find that the affiliations between
codons, the amino acid each encodes and the physico-chemical
properties of the amino acids are main factors driving the process of
codon evolution. Neither multiple nucleotide changes nor the strong
influence of the genetic code nor amino acids’ physico-chemical
properties form a part of standard mechanistic models and their views
of how codon evolution proceeds. We have implemented the empirical
codon model for likelihood-based phylogenetic analysis, and an
assessment of its ability to describe protein evolution shows it
consistently outperforms comparable mechanistic codon models. We
point out the biological interpretation of our empirical codon model
and possible consequences for studies of selection.
1
by guest on Decem
ber 17, 2015http://m
be.oxfordjournals.org/D
ownloaded from

1 INTRODUCTION
Protein sequence evolution has been investigated on two data levels: amino acids
and triplets of cDNA interpreted as codons. Amino acid sequences are popular
because they evolve more slowly than DNA and are easier to align, they are less
prone to ‘saturation’ effects that some phylogenetic inference methods handle
poorly and because amino acid residue frequency biases are often less marked
than DNA nucleotide frequency biases. However, DNA sequences contain more
information and studying protein evolution by modeling the evolutionary process
on coding DNA is appealing because it allows us to take the genetic code into
account.
There are 20 amino acids, but 64 possible codons. Three amino acids —
arginine, leucine and serine — are each encoded by six different codons, while
another five can each be produced by four codons which only differ in the third
position. A further 9 amino acids are specified by a pair of codons which differ
by a transition substitution at the third position, while isoleucine is produced by
three different codons and methionine and tryptophan by only a single codon.
Codon-level models are able to make distinctions between codons which encode
the same amino acid and those that do not. They also allow the study of
whether there is a tendency for mutations maintaining the encoded amino acid
(synonymous changes) to be accepted by selection less, equally, or more
frequently than those that alter the amino acid (nonsynonymous changes). Thus,
by introducing parameters describing the ratio of nonsynonymous to synonymous
changes, it is possible to measure the effect of natural selection on the sequence.
Phylogenetic analyses using codon models have therefore become very
popular, permitting in silico study of selective forces acting upon a protein that
can be highly informative about its biological function and evolutionary history
(Yang and Bielawski, 2000). The interactions of proteins through their
regulatory and metabolic networks are also reflected in the selection acting upon
them: for example, it has been demonstrated that the more interactions a protein
has with other molecules, the slower it evolves; and that proteins operating in
2
by guest on Decem
ber 17, 2015http://m
be.oxfordjournals.org/D
ownloaded from
complexes (e.g., involved in translation or DNA repair) are, on average, more
constrained than those with simple house-keeping functions (Aris-Brosou, 2005).
Existing models that describe protein evolution at the amino acid and codon
levels use Markov processes (Lio and Goldman, 1998), and can be distinguished
into two types. Empirical models do not explicitly consider biological factors
that shape protein evolution, but simply attempt to summarize the substitution
patterns observed in large quantities of data. Typically used for amino acid level
modeling, they describe substitution patterns by parameters representing the
relative rates of replacements between amino acids; these parameters are an
aggregated measure of all kinds of physico-chemical properties of the amino
acids and of their interaction with their local environment. Often empirical
models have many such parameters, and these are typically estimated once from
a large data set and subsequently re-used with the assumption that they are
applicable to a wide range of sequence data sets.
On the other hand, mechanistic models explicitly take into account features
of the process of protein evolution such as selective pressures and the frequency
of character states in the data (e.g., relative occurrence of different codons),
allowing the testing of hypotheses related to these factors for each data set of
interest. Typically, only a relatively small number of parameters is used; their
values are not assumed to be widely-applicable ‘constants’, but are estimated
afresh for each data set.
At the amino acid level, there is a long tradition of empirical amino acid
models. Dayhoff and colleagues (Dayhoff and Eck, 1968; Dayhoff et al., 1972,
1978) estimated the first amino acid models, resulting in the widely-used PAM
matrices (see also Kosiol and Goldman, 2005). Jones and colleagues (Jones
et al., 1992) employed much the same methods but based the estimation of the
JTT model on a larger sequence database; Whelan and Goldman (2001) used a
maximum likelihood (ML) estimation technique to generate the WAG model.
The PAM, JTT and WAG models give increasingly good descriptions of the
‘average’ patterns and processes of evolution of large collections of sequences.
3
by guest on Decem
ber 17, 2015http://m
be.oxfordjournals.org/D
ownloaded from

Such average models can fail to describe proteins with particular functions and
structures, however, and in various cases improved empirical amino acid models
have been derived by estimating them from data sets representing particular
functional and structural properties of the proteins (e.g., transmembrane
proteins (Jones et al., 1994), different protein secondary structure contexts
(Goldman et al., 1998), mitochondrially-encoded proteins (Adachi and
Hasegawa, 1996), chloroplast-derived proteins (Adachi et al., 2000) and
retroviral polymerase proteins (Dimmic et al., 2002)).
Purely mechanistic amino acid models are rare; they came much later than
empirical amino acid models and were introduced to try to explain observed
amino acid substitution patterns. Koshi and colleagues (Koshi et al., 1997)
developed a mechanistic amino acid model which incorporates the ‘fitness’ of
each of the amino acids, defined as a function of physico-chemical properties of
that amino acid. Their model, based on Boltzmann statistics and Metropolis
kinetics (Metropolis et al., 1953), uses far fewer than the theoretical maximum of
380 adjustable parameters for a Markov process amino acid model, such that it
is possible to optimize the model for each specific data set of protein sequences
studied. Yang and colleagues reduced the mechanistic codon model M0 (see
below) to a mechanistic amino acid model, enforcing the Markov property and
reversibility (Yang et al., 1998). This ‘collapsed-codon’ amino acid model
performed significantly better when it also incorporated mechanistic parameters
describing physico-chemical properties.
Empirical amino acid models have also been combined with additional
mechanistic parameters highly successfully. The ‘+F’ method of Cao and
colleagues (Cao et al., 1994) allows the incorporation of the amino acid
frequencies from a specific data set under study in place of those of the database
from which the substitution matrix was estimated, and is now very widely used
in phylogenetics. The inclusion of a Γ-distribution (Yang, 1994b) containing a
single biologically interpretable shape parameter that can accommodate varying
degrees of heterogeneity of evolutionary rate amongst the sites of a protein has
4
by guest on Decem
ber 17, 2015http://m
be.oxfordjournals.org/D
ownloaded from

also been proven to improve the description of sequence evolution for many
proteins (Goldman and Whelan, 2002).
Codon models, on the other hand, are traditionally mechanistic,
characterizing a Markov process using only a small number of parameters
representing biologically relevant factors such as bias towards transition
mutations, variability in codon frequencies and, importantly, the tendency of
mutations maintaining the encoded amino acid (synonymous changes) to be
accepted by selection with a different probability from those changes that change
the amino acid (nonsynonymous changes). A single parameter ω, the
synonymous-nonsynonymous amino acid substitution rate ratio, is widely used
to detect selection in proteins (Goldman and Yang, 1994; Nielsen and Yang,
1998; Yang et al., 2000; Yang and Bielawski, 2000). Advanced codon models do
not assume a single fixed ω, but permit consideration of different ω values over
sites (Yang et al., 2000; Wong et al., 2004; Massingham and Goldman, 2005),
lineages (Yang and Nielsen, 1998), or both sites and lineages (Yang and Nielsen,
2002). These models are popular for detecting proteins, and individual sites in
proteins, undergoing positive selection (Nielsen and Yang, 1998; Yang et al.,
2000; Wong et al., 2004; Massingham and Goldman, 2005).
All the codon models in common use make the assumption that every
mutation alters just one nucleotide. Evolutionary change between codons
varying in two or three nucleotides are therefore necessarily interpreted as having
arisen via a succession of single nucleotide changes. In contrast, Whelan and
Goldman (2004) introduced a model including the same evolutionary factors as
the standard mechanistic codon models, but in addition allowing for
instantaneous single, double and triple nucleotide changes. Their results
suggested that protein sequence evolution was better described by models that
include significant proportions of double and triple changes. If this is correct,
there could be important consequences for the application of codon models to
detect selection — we address the question of instantaneous multiple nucleotide
substitutions in detail in this paper.
5
by guest on Decem
ber 17, 2015http://m
be.oxfordjournals.org/D
ownloaded from

The success of purely empirical models and combined mechanistic and
empirical models on the amino acid level, for example in database searches,
alignment and phylogenetic studies, suggests that empirical codon models could
potentially be very useful for both understanding protein evolution and in
phylogenetic applications. There has, however, been very little work in this area.
Empirical codon models are harder to estimate — they have a high number of
parameters since they work on a 64 letter alphabet (61 if stop codons are
discarded) — and application of methods analogous to those used to derive
empirical amino acid models requires large amounts of protein-coding DNA
sequence data not previously available in a convenient form. We know of only
one example, by Schneider and colleagues (Schneider et al., 2005), in which a
log-odds matrix is derived from codon sequences separated by a small
evolutionary distance (time) and applied in an alignment program. However,
although Schneider and colleagues’ codon matrix is a step in the direction of an
empirical model of codon sequence evolution, they only describe probabilities
and log-odds values for codon substitutions for a particular set of evolutionary
distances.
In this paper, we estimate an empirical codon model from a large database
of protein-coding DNA sequences. We then incorporate it in ML phylogenetic
inference software to see if it gives a good description of protein evolution and
may be generally useful for the phylogenetic analysis of particular proteins. We
have implemented the empirical codon model in combination with various
mechanistic parameters, and our assessment of its utility for ML phylogenetics
shows that it performs better than comparable existing models.
6
by guest on Decem
ber 17, 2015http://m
be.oxfordjournals.org/D
ownloaded from

2 METHODS AND MATERIALS
2.1 Standard Markov models for codon sequence
evolution
Markov models of codon substitution were first proposed by Goldman and Yang
(1994) and Muse and Gaut (1994). We introduce these models by reference to
the simple mechanistic model called M0 by Yang and colleagues (Yang et al.,
2000) (see also Goldman and Yang, 1994). This model specifies the relative
instantaneous substitution rate from codon i to codon j as:
qij =
0 if i or j is a stop codon or i → j requires > 1 nucleotide substitution,
πj if i → j is a synonymous transversion,
πjκ if i → j is a synonymous transition,
πjωM if i → j is a nonsynonymous transversion,
πjκωM if i → j is a nonsynonymous transition,
(1)
for all i 6= j, where parameter ωM represents the nonsynonymous-synonymous
rate ratio (the subscript M denoting the mechanistic M0 model), κ the
transition-transversion rate ratio, and πj the equilibrium frequency of codon j.
Different assumptions can be made concerning πj (Goldman and Yang, 1994;
Muse and Gaut, 1994; Yang, 1997). Here, we mostly consider the πj as 61
parameters, independent apart from the constraint that their sum is 1 (i.e., the
F61 parameterization, (Yang, 1997)). In common with all Markov models of
sequence evolution, absolute rates are found by normalizing the relative rates to
a mean rate of 1 at equilibrium, i.e. by enforcing∑
i
∑
j 6=i πiqij = 1, and
completing the instantaneous rate matrix Q = (qij) by defining qii = −∑
j 6=i qij
to give a form in which the transition probability matrix is calculated as
P (t) = eQt (Lio and Goldman, 1998). Evolutionary times t are measured in
expected numbers of nucleotide substitutions per codon.
Codon-level Markov models are typically used for ML phylogenetic inference.
The model defines the likelihood for hypotheses consisting of values for all model
7
by guest on Decem
ber 17, 2015http://m
be.oxfordjournals.org/D
ownloaded from
parameters, a phylogenetic tree and its branch lengths (see, e.g., Felsenstein,
1981; Goldman and Yang, 1994; Lio and Goldman, 1998; Felsenstein, 2004), and
this likelihood is then maximized over all hypotheses (parameter values) of
interest. Codon models are increasingly used for estimating phylogenetic
relationships, i.e. the likelihood is maximized over tree shapes (Ren et al., 2005);
otherwise, a good tree topology found by other means may be taken as known.
Models describing evolution at the codon level allow the estimation of
measures of the selective forces acting on proteins. The ML estimate of the
parameter describing the ratio of rates between nonsynonymous and synonymous
substitutions, ωM , is widely used as a direct measure of these forces. When there
are few selective pressures acting, sequences are said to be evolving neutrally and
the relative rates of fixation of synonymous and nonsynonymous mutations are
roughly equal (ωM is approximately 1). When a sequence has an important
function its sequence is highly conserved through evolution and ωM takes a value
substantially less than 1. Conversely, when sequences are under pressure to
adapt quickly to their environment, nonsynonymous changes are strongly
selected for and ωM will take a value greater then 1.
The most advanced codon models do not assume a single fixed ωM for all
sites, but permit consideration of a distribution of values over sites. Yang and
colleagues (Yang et al., 2000) proposed and investigated a series of such models,
designated M0 to M13 (the ‘M-series’). M7 is widely-used, and describes
among-site variation in ωM with a β-distribution, allowing for purifying selection
and neutral evolution only (0 ≤ ωM ≤ 1). Other models allow also for positive
selection at some sites; for example, M8 contains the β-distribution of M7 and a
single additional category of sites with ωM permitted to be greater than 1. In
this paper, implementations of our empirical codon model do not attain this
level of complexity and we will concentrate on comparisons with M0 and M7 as
defined in Yang et al. (2000).
8
by guest on Decem
ber 17, 2015http://m
be.oxfordjournals.org/D
ownloaded from

2.2 Estimation of empirical models
Following Whelan and Goldman (2001), we use a ML approach to infer an
empirical model from a data set of many multiple sequence alignments. We
retain the mathematical and computational convenience that empirical models
are often assumed to be reversible (Tavare, 1986; Yang, 1994a; Felsenstein,
2004). Under this assumption, instantaneous rates qij can be parameterized as:
qij = πjsij for all i 6= j, (2)
where the sij, often denoted exchangeabilities (Whelan and Goldman, 2001), are
symmetric (sij = sji) and πj describes the equilibrium frequencies. For amino
acid models, the instantaneous rate matrix can therefore be described by 208
independent terms, namely 189 exchangeabilities sij and 19 frequency
parameters πj. In general, the number of independent parameters for a
reversible substitution model with N character states can be calculated as[
N2 − N
2− 1
]
+ [N − 1] =N(N + 1)
2− 2, (3)
where the first term in square brackets represents the exchangeabilities and the
second represents the state frequencies. Thus, to estimate a reversible empirical
codon model (N = 61), 1889 independent parameters have to be determined.
Whelan and Goldman (2001) developed an approximate likelihood method
that is based on the observation that the inference of parameters describing the
evolutionary process remains stable across near-optimal tree topologies. This
means that, so long as tree topologies and their branch lengths are close enough
to optimal when estimating a new model, any minor inaccuracies will not
influence the parameter estimates to any great extent (see also Sullivan et al.,
1996; Abdo et al., 2005; Sullivan et al., 2005). Relying on this approximation,
empirical model estimation proceeds by taking a large data set of many sequence
alignments, each with an associated phylogenetic tree, and computing the
likelihood of all these data as a function of the parameters sij and πj . This
likelihood is then maximized over the sij and πj , taking the trees (topologies and
branch lengths) as fixed.
9
by guest on Decem
ber 17, 2015http://m
be.oxfordjournals.org/D
ownloaded from

In theory, it would be possible instead to fix only the relative branch lengths
on a per-alignment basis, to re-estimate all branch lengths, or even to
re-estimate all tree topologies and branch lengths during the estimation of the
codon model. However, in practice this slows down the estimation considerably
and experience from the estimation of WAG (Whelan and Goldman, 2001) shows
it had little effect. Likewise, it would be possible estimate a different set of the
codon frequencies for every protein family. This would require another 60
parameters per protein family used. Again, we expect from the results of
Whelan and Goldman (2001) that this would not improve the fit of the empirical
model significantly.
The ML estimates, after normalization so the inferred Markov process has
mean rate 1 at equilibrium, are denoted s∗ij and π∗j . We will refer to this model
as ECM, standing for Empirical Codon Model. Notice that in the context of
codon models, we need make no assumption that only single nucleotide changes
occur. If required, this can be enforced by requiring s∗ij = 0 whenever codons i
and j differ at more than one position.
Even using Whelan and Goldman’s approximation, an ML estimation of an
empirical codon model has previously seemed infeasible because of the
computational burden of estimating 1889 parameters and the lack of a suitable
data set. The introduction of an expectation-maximization algorithm to ML
training of substitution rate matrices by Holmes and Rubin (2002) has greatly
speeded up the computations, now making it feasible to estimate an empirical
codon model from a database of multiple alignments and phylogenetic trees.
Holmes and colleagues provide an implementation of this algorithm within a
C++ program called DART (Klosterman et al., 2006). Robustness tests have
confirmed the suitability of DART for the estimation of an empirical codon
model (Klosterman et al., 2006).
10
by guest on Decem
ber 17, 2015http://m
be.oxfordjournals.org/D
ownloaded from

2.3 The Pandit database
The large number of sequence alignments and phylogenies needed to estimate an
empirical codon model reliably were taken from the Pandit database of aligned
protein domains (Whelan et al., 2003, 2006). Each family in Pandit includes an
alignment of amino acid sequences and the corresponding alignment of the DNA
sequences encoding the protein, and each alignment has an estimated
phylogenetic tree associated with it (for full details, see Whelan et al., 2006).
For the estimation of an empirical codon model only the DNA alignments
and their inferred trees were utilized. Because the Pandit alignments vary in the
quality of their reconstruction of homology, both within and between alignments,
the profile hidden Markov model described by Whelan and colleagues (Whelan
et al., 2006) was used to classify the columns in each alignment as being
‘reliable’ or otherwise. All matrices were estimated using only reliable alignment
columns. Further data cleaning (e.g., discarding additional codons neighboring
gap regions; removing very short alignment fragments) did not noticeably change
the substitution patterns of the empirical codon models estimated. After
removing all families that could not be confidently classified as using the
universal genetic code or that included any sequences with internal stop codons,
we were left with 7332 protein families from Pandit. These were used to estimate
the empirical codon model.
Pandit contains only trees based on DNA or amino acid data, not on codon
data. We assumed that the DNA tree topologies were near optimal for
codon-level analysis and that the branch lengths differ by just one scaling factor
common to all alignments. This scaling factor is expected to be around 3,
because there are three nucleotides in a codon and the branch lengths in the
DNA trees are measured in expected number of substitutions per nucleotide site.
However, the exact value of the scaling factor is irrelevant since the resulting
instantaneous rate matrix is anyway normalized to mean rate 1.
For a more detailed analysis of the performance of the estimated empirical
codon model in phylogenetic analysis, a subset of 200 protein-coding DNA
11
by guest on Decem
ber 17, 2015http://m
be.oxfordjournals.org/D
ownloaded from
alignments and tree topologies was selected (see Supplementary Material
http://www.ebi.ac.uk/goldman/ECM/ for details).
2.4 Statistical comparison of competing models
We use likelihood ratio tests (LRTs) and the Akaike information criterion (AIC)
to make statistical comparisons between competing codon models of protein
evolution. Simply preferring the model with the highest likelihood may lead to
the selection of one that is unnecessarily complex. For example, a more general
model will always have a higher likelihood than a more restricted model nested
within it. Statistical methods are required to balance model complexity against
useful improvements in likelihood.
The LRT offers a very powerful way of comparing models (Silvey, 1970),
widely-used in phylogenetics (Goldman, 1993; Felsenstein, 2004). It requires the
formation of two competing hypotheses, H0 and H1, represented by models with
different parameter constraints. The ML values (L) for the competing
hypotheses are compared using the LRT statistic
2∆ = 2 ln
(
L1
L0
)
= 2(
ln(L1) − ln(L0))
. (4)
This statistic has very useful properties for significance testing (Silvey, 1970). In
straightforward cases, when H0 can be formed by placing restrictions on the
parameters in H1, the hypotheses are said to be nested and for significance
testing 2∆ can be compared (e.g.) to the 95% point of a χ2n distribution
(Felsenstein, 2004), where n is the number of free parameters by which H0 and
H1 differ (see Goldman, 1993; Whelan and Goldman, 1999; Goldman and
Whelan, 2000, for more complex cases).
The AIC is an alternative method that reaches a compromise between
goodness of fit and the complexity of models. It is particularly valuable when
comparing multiple models and models that are not nested (Felsenstein, 2004).
The AIC for a hypothesis (in our application, a model) is computed by taking −2
times the maximum log-likelihood of the hypothesis, and penalizing it by adding
12
by guest on Decem
ber 17, 2015http://m
be.oxfordjournals.org/D
ownloaded from

twice the number of free parameters. So, for hypothesis i with pi free parameters,
AICi = −2lnLi + 2pi. (5)
Values of AICi are compared among hypotheses i, with the model that has the
lowest value of AIC preferred.
2.5 Application of the empirical codon model
ECM could simply be used in the same way that the original Dayhoff, JTT or
WAG models (see above) can be used for amino acid sequences. However, for
amino acid sequence evolution past experience shows that the performance of
empirical models can be significantly improved by combining them with
mechanistic parameters. Existing mechanistic codon models are based on
parameters describing codon frequencies πi, transition-transversion bias κ and
nonsynonmous-synonymous bias ω. Additionally, we have seen in another study
on whole proteome data sets that codon substitution patterns vary strongly for
sequences with different ω values (Kosiol and Goldman, ms. in preparation). All
this suggests that it will be beneficial to consider re-introducing mechanistic
parameters πi, κ and ω.
Analogous to the definition of the mechanistic codon model M0 (eq. 1), we
define the instantaneous rate matrix of the empirical codon model with
mechanistic parameters as:
qij =
0 if i or j is a stop codon
s∗ijπjκ(i, j) if i → j is a synonymous change
s∗ijπjκ(i, j)ω if i → j is a nonsynonymous change
(6)
where s∗ij are the empirical codon model exchangeabilities estimated from the
Pandit database, πj is the frequency of codon j estimated from each particular
data set analyzed, κ(i, j) is a term representing transition-transversion bias
between codons i and j (see below) and ω represents
nonsynonymous-synonymous bias. The instantaneous rate matrix Q = (qij) is
13
by guest on Decem
ber 17, 2015http://m
be.oxfordjournals.org/D
ownloaded from

again completed by defining qii = −∑
j 6=i qij and normalizing to mean rate 1.
Note the use of the +F method (Cao et al., 1994) of replacing the database-wide
codon frequency estimates π∗j by a set of estimates πj derived from each
particular alignment studied (F61 model (Yang, 1997)). We will denote the
combined empirical and mechanistic model as ECM+F+ω+nκ, where different
values of n will allow us to distinguish between model variants incorporating
transition-transversion bias κ in different ways. There is no theoretical reason
why the exchangeabilities s∗ij should remain fixed while we re-estimate the πj for
each family. However, in an alignment of one protein family we often do not
observe enough substitutions to infer the sij for each of the changes between
codons i and j. In contrast, the re-estimation of πj is widely and successfully
used in practice for nucleotide, amino acid and codon models (see, e.g.,
Felsenstein, 1981; Cao et al., 1994; Goldman and Yang, 1994; Goldman and
Whelan, 2002). Note also that there is no requirement inherent in equation (6)
that i and j differ at exactly one nucleotide position, as is required in the
definition of the standard model M0 (eq. 1), and that evolutionary time is now
measured in substitution events per codon.
In an empirical codon model the parameter ω can no longer be simply
interpreted as a rate ratio. An empirical codon model already reflects the
‘average’ nonsynonymous-synonymous bias present in the proteins composing
the database it was estimated from. Estimates obtained from mechanistic codon
models, ωM , and estimates from empirical codon models, ω, therefore cannot be
compared directly: ωM represents the absolute nonsynonymous-synonymous rate
ratio, while ω measures the relative strength of selection with respect of an
average level implicit in the Pandit database. To make a valid comparison, we
need to disentangle estimated values of ω from the expected value under neutral
evolution.
To do this, we take an approach that was pursued in the early mechanistic
codon model of Goldman and Yang (1994). There, the ratio of the instantaneous
rates per codon of nonsynonymous and synonymous nucleotide substitutions is
14
by guest on Decem
ber 17, 2015http://m
be.oxfordjournals.org/D
ownloaded from
calculated as ρa/ρs, where the nonsynonymous substitution rate is given by
ρa =∑
i
∑
j 6=iaaj 6=aai
πiqij (7)
(aai indicates the amino acid encoded by codon i) and the synonymous rate per
codon can be calculated as ρs = 1 − ρa, since the overall rate is normalized to 1.
We also take the values ρneutrala = 0.79 and ρneutral
s = 0.21, derived by Nei and
Gojobori (1986) as typical values for neutrally evolving proteins. Thus the
‘corrected’ nonsynonymous-synonymous rate ratio ωE is given by
ωE =ρaρ
neutrals
ρsρneutrala
(8)
and can be directly compared with estimates ωM from mechanistic models. Note
that ωE depends on ω through ρs and ρa, themselves functions of the qij (eq. 7)
which depend on ω (eq. 6).
Similarly, our expression κ(i, j) in equation (6) represents a measure of the
relative strength of the transition-transversion bias with respect to the average
level implicit in the Pandit database. Whereas the transition-tranversion bias is
traditionally modeled by a single parameter, permitting double and triple
nucleotide changes in the empirical codon model leads to new scenarios in
addition to the single transitions or single transversions inherent in single
nucleotide changes. The 9 possible ways to combine transitions (ts) and
transversions (tv) in multiple nucleotide changes within one codon are as follows:
1 nucleotide change: (1ts, 0tv), (0ts, 1tv); (9)
2 nucleotide changes: (2ts, 0tv), (1ts, 1tv), (0ts, 2tv); (10)
3 nucleotide changes: (3ts, 0tv), (2ts, 1tv), (1ts, 2tv), (0ts, 3tv). (11)
As a consequence, transition-transversion bias may now be modeled as a
function κ(i, j) that depends on the numbers of transitions (nts) and
transversions (ntv) of the change from codon i to codon j.
Here we describe the six formulations for κ(i, j) that are most interesting or
successful out of a larger set of relationships devised and studied without
15
by guest on Decem
ber 17, 2015http://m
be.oxfordjournals.org/D
ownloaded from

preassumptions about what might best fit real sequence data (see
Supplementary Material at http://www.ebi.ac.uk/goldman/ECM/).
• ECM+F+ω: The factor κ is set to 1 for all changes:
κ(i, j) = 1.
This model assumes that transition-transversion bias is fully accounted for
by the Pandit exchangeabilities s∗ij , and does not vary significantly from
one protein to another.
• ECM+F+ω+1κ(ts) and ECM+F+ω+1κ(tv):
– ECM+F+ω+1κ(ts) is similar to existing mechanistic codon models,
and considers that the biasing effect introduced by multiple
transitions may be multiplicative:
κ(i, j) = κnts .
In standard mechanistic codon models nts is necessarily 0 or 1 and we
expect κ > 1. In our model these constraints disappear, since multiple
nucleotide changes are permitted (nts = 0, 1, 2 or 3) and κ is a
measure relative to the value implicit in the s∗ij.
– ECM+F+ω+1κ(tv) is similar to ECM+F+ω+1κ(ts) except that it
focuses on transversions. This is unusual, but perhaps more natural in
the same way that the standard ω parameter is generally considered a
‘rate reducing’ effect:
κ(i, j) = κntv .
• ECM+F+ω+2κ: In this model, transitions and transversions are
modeled with individual parameters (κ1 for transitions, κ2 for
transversions) and the effect is seen as multiplicative in terms of the
relative rates:
κ(i, j) = κnts
1 κntv
2 .
16
by guest on Decem
ber 17, 2015http://m
be.oxfordjournals.org/D
ownloaded from

• ECM+F+ω+9κ: In this model, each of the 9 possible cases (listed in
eqs. 9–11 above) is modeled by an individual rate-modifying parameter
(κ1–κ9). Note that because of the overall rate normalization, this model is
equivalent to one with just 8 independent κ parameters.
Note that ECM+F+ω is nested in all the other models. The (ts) and (tv)
variants of ECM+F+ω+1κ are each nested in ECM+F+ω+2κ, and all three of
these models are nested in ECM+F+ω+9κ.
The empirical codon models introduced in this section were incorporated
into the program codeml from release 3.14b of PAML, a software package for ML
phylogenetic analysis of DNA and protein sequences written and maintained by
Ziheng Yang (Yang, 1997). For each data set analyzed, free parameters of the
models (πj , ω and appropriate κ parameters as described above) were estimated
by ML, as were branch lengths of trees. Tree topologies from the Pandit
database were assumed correct.
3 RESULTS AND DISCUSSION
3.1 Empirical codon model estimated from Pandit
We estimated instantaneous rate matrices from the entire collection of 7332
protein families taken from Pandit as described above. Figure 1 illustrates
ECMs in the form of ‘bubble plots’. The areas of the bubbles represent the rates
of instantaneous change (q∗ij = π∗j s
∗ij), with the grey bubble in the upper left
corner showing the area representing an instantaneous rate of 0.5. The rate
matrices are not symmetric because the codons have different frequencies. The
codons are listed to the left and top, and amino acid translations are given on
the bottom and right (see also Klosterman et al., 2006).
Figure 1(a) shows the instantaneous rate matrix permitting all single, double
and triple nucleotide changes, inferred as in section 2.2 above. For this matrix,
denoted ‘unrest’ to indicate unrestricted optimization of all exchangeability
17
by guest on Decem
ber 17, 2015http://m
be.oxfordjournals.org/D
ownloaded from
parameters, 1889 parameters were estimated. The maximum likelihood obtained
was lnLunrest = −9.157731 × 10⁷.
DART also enabled us to restrict the estimated rate matrix to single
nucleotide changes only (i.e., enforcing s∗ij = 0 unless codons i and j differ by
exactly one nucleotide). Figure 1(b) shows the bubble plot of the optimal
instantaneous rate matrix restricted (‘rest’) in this way. For this matrix 322
parameters were estimated, and the maximum likelihood obtained was
ln Lrest = −9.343274 × 10⁷. The matrices illustrated in figure 1 are available in
the Supplementary Material (http://www.ebi.ac.uk/goldman/ECM/).
There has been some debate about the existence and level of multiple
nucleotide changes (Averof et al., 2000; Smith et al., 2003; Bazykin et al., 2004;
Whelan and Goldman, 2004). Possible biological mechanisms for changes in two
neighboring nucleotides, for example dipyrimidine lesions induced by ultraviolet
light and template-directed mutations during DNA repair and replication, have
been pointed out (Averof et al., 2000). However, their effect on evolutionary
substitution patterns is likely to be small. Comparing figures 1(a) and (b) by
eye, the existence of multiple nucleotide changes (blue and green bubbles) in the
unrestricted model is quite striking. The fact that instantaneous rate matrices
are normalized to mean rate 1 allows us to calculate the proportions of single,
double and triple changes (ρS, ρD, ρT , respectively) in a straightforward manner.
Defining S, D and T to be the sets of codon pairs (i, j) differing by a single
nucleotide change, a double change and a triple change, respectively, then we
observe:
ρS =∑
(i,j)∈S
π∗i q
∗ij = 0.753, ρD =
∑
(i,j)∈D
π∗i q
∗ij = 0.212, ρT =
∑
(i,j)∈T
π∗i q
∗ij = 0.035.
In other words, we observe 75.3% single, 21.2% double and 3.5% triple changes.
We performed a LRT between the restricted and unrestricted ECMs to see if
the addition of double and triple changes was statistically significant.
Comparing the statistic 2∆ = 2(ln Lunrest − ln Lrest) = 3.71 × 10⁶ (eq. 4) with a
χ21567 distribution, we see this is highly significant; the P-value is too small to be
calculated reliably. This means that the codon substitution patterns in the
18
by guest on Decem
ber 17, 2015http://m
be.oxfordjournals.org/D
ownloaded from

Pandit data set are overwhelmingly better explained by a model that allows for
multiple nucleotide changes to occur instantaneously, rather than only via
successive single changes.
We also estimated rate matrices restricted to single and double, or single and
triple, changes only. The maximum likelihood calculated for an instantaneous
rate matrix restricted to single and double changes is ln L = −9.167463 × 10⁷
(75.3% single and 24.7% double changes), and that for a matrix restricted to
single and triple changes is ln L = −9.195009 × 10⁷ (88.3% single and 11.7%
triple changes). Appropriate LRTs indicate that the introduction of either
double or triple changes to the restricted model permitting single changes only is
a significant improvement, as is the subsequent addition of triple or double, as
appropriate changes. In brief, our statistical tests confirm that both double and
triple changes are making a significant contribution to the fit of the ECM to the
evolution of the proteins represented in the Pandit data sets.
A further illustration of the importance of double and triple nucleotide
changes is given in figure 2. Here, we present histograms of the magnitudes of
the instantaneous rates q∗ij from the ECM, for all double and triple nucleotide
changes i → j. These are compared to corresponding histograms from a
simulation study in which data conforming to M0, i.e. with no double or triple
changes, were analyzed using the same methods (see Supplementary Material for
further details). Whereas DART was able to recover M0 well (note that very few
non-zero rates were estimated for double changes, and virtually none for triple
changes), the majority of the double and triple nucleotide changes estimated
from the Pandit data sets are well above these estimation errors. This confirms
that our methodology and the DART software can accurately recover zero rates
when these do exist; therefore we can trust the small but non-zero rates observed
for multiple nucleotide changes in real data (e.g. in fig. 1(a)) to be genuine, and
not an artifact.
19
by guest on Decem
ber 17, 2015http://m
be.oxfordjournals.org/D
ownloaded from
3.2 Physico-chemical interpretation of empirical codon
model
Apart from the observation of the existence of multiple nucleotide changes, it is
quite difficult to extract biologically relevant information from all 61× 61 matrix
elements at once. The Almost Invariant Sets (AIS) algorithm (Kosiol et al.,
2004) is a method to summarize the information of Markov substitution models
by analyzing their instantaneous rate matrices. It is a grouping method that
identifies disjoint sets with high rates of change between elements of each set but
small rates of change between elements of different sets. This gives a
quantitative method of identifying subsets of the states of models within which
interchanges occur readily, but between which interchanges are relatively
uncommon. Table 1 shows the results of applying AIS to the unrestricted ECM
derived in section 3.1, and, for comparative purposes, to the mechanistic codon
model M0 and the WAG amino acid model.
For the ECM, a natural grouping to consider is the division into 20 subsets.
This perfectly separates the 61 codons according to the amino acids they encode,
i.e. in perfect agreement with the genetic code (table 1, empirical codon model,
20 subsets). This recovery of the genetic code is in itself a remarkable result, and
shows that amino acid identity is highly relevant to codon substitution patterns.
A division into seven subsets is also interesting, as it is easily compared to
results from studies on amino acid models (Kosiol et al., 2004). This leads to a
result very similar to the corresponding grouping of the (empirical) WAG amino
acid replacement matrix (table 1, empirical codon model, 7 subsets cf. WAG, 7
subsets). This similarity is particularly striking as the two models were
estimated from very different data sets (see Whelan and Goldman (2001) and
Whelan et al. (2006)) and with one data set interpreted at the amino acid level
and the other at the codon level. The grouping derived from the empirical codon
model has the following, biochemically reasonable, interpretation. The codons
encoding hydrophilic and basic amino acids (T, S, A, E, D, N, Q, K, R, H) are
grouped together, as are the codons encoding the aromatics (Y, F). Four amino
20
by guest on Decem
ber 17, 2015http://m
be.oxfordjournals.org/D
ownloaded from

Empirical AA
Empirical Codon Model (ECM) Mechanistic Codon Model (M0) Model (WAG)
20 subsets 7 subsets 20 subsets 7 subsets 7 subsets
{W} {W} {W} {W} {W}
{YY} {YY}
{FF} {YY FF} {FF(TTY) LL(CTY)} {FF LLLLLL} {Y F}
{LLLLLL} {LL(CTR) LL(TTR)}
{M} {LLLLLL M {M} {M III VVVV {L M I}
{III} II VVVV} {III} EE DD QQ KK}
{VVVV} {VVVV}
{CC} {CC} {CC} {V C}
{TTTT} {TTTT} {CC TTTT
{SSSSSS} {SSSS(TCN)} SS(AGY)
{AAAA} {TTTT {SS(AGY) RR(AGR)} AAAA NN {T
{EE} SSSSSS {AAAA} RR(AGR) S
{DD} AAAA EE DD {EE(GAY) DD(GAR)} GGGG} A E D
{NN} NN QQ KK {NN} N Q K
{QQ} RRRRRR {QQ} R
{KK} HH} {KK} H}
{RRRRRR} {RRRR(CGN)} {RRRR(CGN)}
{HH} {HH} {HH YY}
{GGGG} {GGGG} {GGGG} {G}
{PPPP} {PPPP} {PPPP} {PPPP SSSS(TCN)} {P}
Table 1: Application of the AIS algorithm to the ECM, M0 and the WAG aminoacid model. For clarity the codons are generally represented by the amino acidthey encode. Where informative, codons are also given, with R = purine, Y =pyrimidine, N = any base.
acids (W, C, G, P) each have a group consisting of only their codons; these
singletons appear to be the most conserved amino acids. All codons of the
aliphatics (L, M, I, V) form one group. In the grouping derived from the WAG
model, the only difference is that valine (V) is removed from the aliphatic group
and placed instead with cysteine (C).
We have investigated whether the alignment algorithms underlying the
Pandit data sets could have added bias towards these results. Pandit alignments
are performed on the proteins’ amino acid sequences, and we wondered whether
amino acid sequence alignments could be biased towards aligning
non-homologous residues because of chance amino acid identity or
physico-chemical similarity. If so, we would expect this effect to be strongest in
hard to align regions. Our results using stricter criteria for removing uncertain
alignment regions (see above) show no significant differences, however.
21
by guest on Decem
ber 17, 2015http://m
be.oxfordjournals.org/D
ownloaded from
Additionally, in a study of proteomic data sets we have compared results from
sequences aligned on the amino acid level and on the DNA level and again no
significant differences were observed (Kosiol and Goldman, ms. in preparation).
Although instantaneous rate matrices estimated from DNA alignments might
suffer from different artifacts, they should not suffer from the same alignment
artifacts as matrices estimated from amino acid alignments. Thus the
observation that both matrices show strong influence of the genetic code and
physico-chemical properties indicates that these observed substitution patterns
are not artifacts of the alignment program used.
Applying the AIS algorithm to an instantaneous rate matrix defined by the
M0 model (see Supplementary Material) reveals quite different groups (table 1,
M0). In particular, transition-transversion differences seem to play an overly
important role, with too little importance placed on the identity or
physico-chemical properties of encoded amino acids. In the grouping into 20
subsets, for example, codons encoding phenylalanine (F) share a group with
some of the leucine (L) codons. Likewise, the codons of serine (S) and arginine
(R) are each split over two groups. For the grouping of M0 into 7 subsets the
groups contain codons coding for mixtures of amino acids with very different
physico-chemical properties (e.g., {M, I, V, E, D, Q, K}) and the codons
encoding serine and arginine remain separated. In particular, we note that the
serine codons AGY are grouped with threonine (T; ACN) and alanine (A;
GCN), but the TCN serine codons (only differing by one nucleotide from
threonine and alanine) are not. Instead, these are placed with proline (P; CCN)
which is also only separated by one nucleotide substitution, but is
physicochemically quite different. Since the AIS grouping is purely based on
replacement rates and not amino acid properties, the discrepancies observed
between groupings and physicochemical properties can be interpreted as a failure
of M0 to reflect evolutionary pressures. In contrast to ECM, the M0 results are
difficult to interpret in a biologically meaningful manner. Note that these
patterns are not fully dictated by inferred evolutionary dynamics, but are to a
22
by guest on Decem
ber 17, 2015http://m
be.oxfordjournals.org/D
ownloaded from
large degree influenced by the parametric form enforced in this model (eq. 1).
In contrast, the ‘rediscovery’ of the genetic code and the detection of
biologically meaningful groupings based on amino acids’ physico-chemical
properties, both found from purely evolutionary patterns in the ECM, indicate
that these are highly significant in determining the dynamics of evolutionary
change in protein sequences. These factors are at best poorly incorporated in
existing mechanistic codon models. Although physico-chemical properties were
introduced in early codon models by Goldman and Yang (1994), based on the
Grantham matrix (Grantham, 1974), they were subsequently omitted from
further developments of these models (e.g., Nielsen and Yang, 1998; Yang et al.,
2000). Massingham (2002) used large quantities of data to estimate empirical
exchangeability parameters, finding that different amino acid pairs have different
tendencies to replace one-another over evolutionary time and that using these
parameters in an evolutionary model gave significant improvements for many
data sets.
Recently, Higgs and colleagues (Higgs et al., 2007) developed a mechanistic
codon model which incorporates distances reflecting amino acid properties and
allows for multiple nucleotide changes. They found that variants that do not
include double and triple substitutions perform worse. Our empirical codon
matrix gives further evidence that a much finer distinction than simply
considering whether evolving codons are synonymous or nonsynonymous is
important to accurate modeling of protein evolution. A major application of
codon models is the detection of selection and it is likely that these findings will
also have consequences for selection studies.
3.3 ML performance analysis
We next consider whether our implementation of the empirical codon model, in
combination with mechanistic parameters as described in section 2.5, performs
well in phylogenetic analysis of individual protein-coding DNA alignments.
A small preliminary study showed that amongst our κ(i, j)-model variants
the likelihood score of the ECM+F+ω+9κ was always best, but the
23
by guest on Decem
ber 17, 2015http://m
be.oxfordjournals.org/D
ownloaded from
improvement it gave in likelihood values over any of the less parameter-rich
κ-models was never significant. This clearly indicates that ECM+F+ω+9κ is
over-parameterized and, consequently, the ML analyses we present focus on 0κ-,
1κ- and 2κ-models. We compare these to each other, and to the mechanistic
models M0, M7 (Yang et al., 2000) and SDT (Whelan and Goldman (2004); see
also section 3.3.3 below).
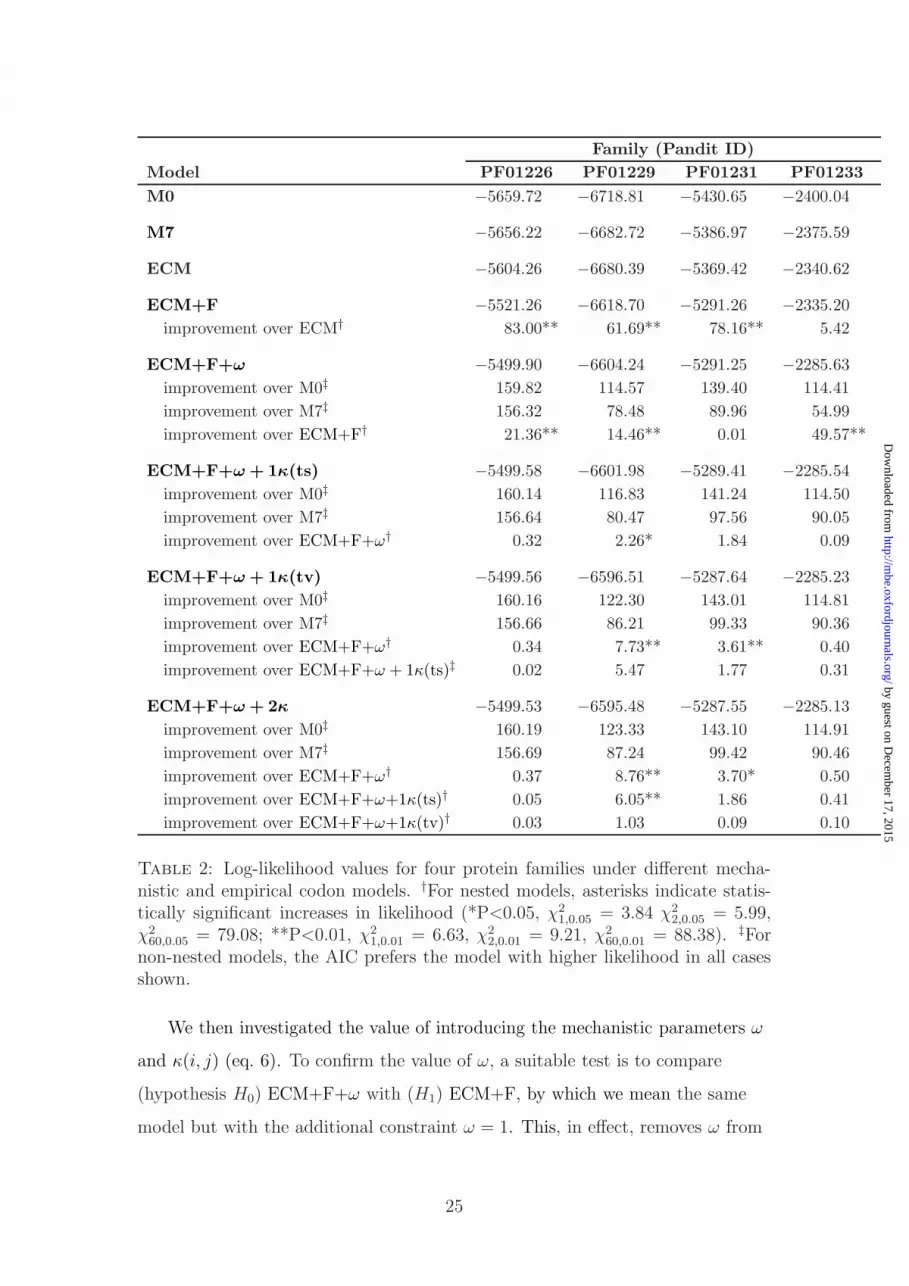
We calculated the maximum likelihoods for 200 protein family cDNA
alignments under different variants of ECM and also under M0, M7 and SDT.
Table 2 shows the results for four representative families, and table 3
summarizes the results of the full test set of 200 families. A brief note on the use
of LRT and AIC in this context is in order: the exchangeability parameters s∗ij
are interpreted as fixed although they have in fact been estimated from 7332
protein families, one of which is the protein family under investigation. One way
to avoid this problem would be to re-estimate another 200 ECMs, each time
removing the test family from the database of 7332 protein families. However,
this would be impractically time-consuming and it is highly unlikely that any
one of the protein families could influence the overall estimation of the ECM
enough to create a detectable bias.
3.3.1 Comparison of empirical codon model variants
First, we assess the performance of the unmodified ECM and of ECM+F for 200
protein families. For ECM+F the 61 codon frequencies can be described by 60
additional free parameters because of the constraint∑
j πj = 1. Using the LRT
described in section 2.4 we test for significance using a χ260 distribution. Table 2
illustrates this LRT for four test data sets, and shows the improvement of
ECM+F over ECM to be significant in three cases at the 0.01 significance level.
In table 3 we confirm that for the majority of the test cases (111 out of the 200)
a per-data set estimation of πi improves the fit of the empirical codon model
significantly (P<0.05). Since the +F modelling of frequencies is often good, and
following its almost universal acceptance in DNA, amino acid and codon models
we adopt its use throughout the rest of this paper.
24
by guest on Decem
ber 17, 2015http://m
be.oxfordjournals.org/D
ownloaded from
Family (Pandit ID)
Model PF01226 PF01229 PF01231 PF01233
M0 −5659.72 −6718.81 −5430.65 −2400.04
M7 −5656.22 −6682.72 −5386.97 −2375.59
ECM −5604.26 −6680.39 −5369.42 −2340.62
ECM+F −5521.26 −6618.70 −5291.26 −2335.20
improvement over ECM† 83.00** 61.69** 78.16** 5.42
ECM+F+ω −5499.90 −6604.24 −5291.25 −2285.63
improvement over M0‡ 159.82 114.57 139.40 114.41
improvement over M7‡ 156.32 78.48 89.96 54.99
improvement over ECM+F† 21.36** 14.46** 0.01 49.57**
ECM+F+ω + 1κ(ts) −5499.58 −6601.98 −5289.41 −2285.54
improvement over M0‡ 160.14 116.83 141.24 114.50
improvement over M7‡ 156.64 80.47 97.56 90.05
improvement over ECM+F+ω† 0.32 2.26* 1.84 0.09
ECM+F+ω + 1κ(tv) −5499.56 −6596.51 −5287.64 −2285.23
improvement over M0‡ 160.16 122.30 143.01 114.81
improvement over M7‡ 156.66 86.21 99.33 90.36
improvement over ECM+F+ω† 0.34 7.73** 3.61** 0.40
improvement over ECM+F+ω + 1κ(ts)‡ 0.02 5.47 1.77 0.31
ECM+F+ω + 2κ −5499.53 −6595.48 −5287.55 −2285.13
improvement over M0‡ 160.19 123.33 143.10 114.91
improvement over M7‡ 156.69 87.24 99.42 90.46
improvement over ECM+F+ω† 0.37 8.76** 3.70* 0.50
improvement over ECM+F+ω+1κ(ts)† 0.05 6.05** 1.86 0.41
improvement over ECM+F+ω+1κ(tv)† 0.03 1.03 0.09 0.10
Table 2: Log-likelihood values for four protein families under different mecha-nistic and empirical codon models. †For nested models, asterisks indicate statis-tically significant increases in likelihood (*P<0.05, χ2
1,0.05 = 3.84 χ22,0.05 = 5.99,
χ260,0.05 = 79.08; **P<0.01, χ2
1,0.01 = 6.63, χ22,0.01 = 9.21, χ2
60,0.01 = 88.38). ‡Fornon-nested models, the AIC prefers the model with higher likelihood in all casesshown.
We then investigated the value of introducing the mechanistic parameters ω
and κ(i, j) (eq. 6). To confirm the value of ω, a suitable test is to compare
(hypothesis H0) ECM+F+ω with (H1) ECM+F, by which we mean the same
model but with the additional constraint ω = 1. This, in effect, removes ω from
25
by guest on Decem
ber 17, 2015http://m
be.oxfordjournals.org/D
ownloaded from

ECM
+F +F+ω +F+ω+1κ(ts) +F+ω+1κ(tv) +F+ω+2κ
M0200 200 200 200 200
(n/a) (n/a) (n/a) (n/a) (n/a)
M7197 200 200 200 200
(n/a) (n/a) (n/a) (n/a) (n/a)
ECM70 123 125 131 132
(111) (152) (156) (158) (159)
ECM+F184 191 195 196
(181) (186) (194) (188)
ECM+F+ω
84 140 134
(62) (109) (117)
ECM+F+ω + 1κ(ts)200 143
(n/a) (121)
ECM+F+ω + 1κ(tv)89
(73)
Table 3: Comparison of codon models over 200 protein-coding DNA data sets.The table gives the number of protein families for which the model indicated bythe column labels (hypothesis H1 in LRTs) is significantly better than the modelgiven by the row labels (H0 in LRTs). The upper number given for each modelcomparison corresponds to AIC results; for nested models, results of LRTs arebelow, in parentheses (otherwise the LRT was not applicable).
eq. 6 and assumes that the effects of natural selection are adequately described
for all proteins by the exchangeabilities s∗ij estimated from the 7738 Pandit data
sets. Table 2 illustrates this LRT for four test data sets, and shows the
introduction of ω to be significant (P<0.01) in three cases. Furthermore, we
found in 181 out of 200 test cases (see table 3) a significant improvement,
confirming that per-data set estimation of ω is highly valuable in the empirical
codon model. All applications of the empirical codon model discussed from now
on include the parameter ω.
The relative success of the different transition-transversion bias models was
also assessed by likelihood-based tests. Here, results are less clear. Table 2
26
by guest on Decem
ber 17, 2015http://m
be.oxfordjournals.org/D
ownloaded from

illustrates cases where ECM+F+ω seems to have adequately captured the
transition-transversion bias (PF01226, PF01233), where ECM+F+ω+1κ(tv) is
clearly preferred (data set PF01231) and where all +1κ- and +2κ-variants
appear to perform well (PF01229). The results from all 200 test data sets
confirm this pattern (table 3). There is no clear-cut leader amongst our
κ-models, although it is interesting to note that of the +1κ-models, the (tv)
variant is always preferred to the (ts) variant that is more similar to the
formulation used in existing mechanistic codon models.
These results suggest that much of the transition-transversion bias effect is
common to many proteins studied and is quite well-modeled by the bias already
implicitly captured by the parameters s∗ij. The small observed residual effect (i.e.
some variation in preferred κ-model over data sets) suggests that maybe some
slight extra transition-transversion effect was detected, which is varying between
data sets and is possibly not very well modeled by our κ-models. We
investigated whether the small effect measured by the κ-models could be
capturing some other variation, as transition-transversion bias varies both at the
level of organisms and genes (e.g., mitochondrially encoded proteins are known
to have elevated levels of bias (Brown et al., 1982)). For families that had
unusually improved likelihoods under some κ-models, we checked the Pfam
annotation (Bateman et al., 2004) for any unusual features, but could identify no
relationships between the organisms or genes and likelihood performance.
3.3.2 Comparison of empirical codon model with M0 and M7
Having confirmed the empirical codon model with mechanistic parameters ω and
κ(i, j) introduced (eq. 6) worthy of further consideration, our main aim is to see
how the empirical codon model fares in comparison with comparable existing
mechanistic codon models. Table 2 illustrates that the log-likelihoods of M0 and
M7 were lower than under any of the ECM+F+ω+nκ variants of the empirical
codon model, significantly so according to the AIC test. This result was
confirmed across every one of the 200 test data sets (table 3).
These results indicate that the empirical codon model gives a very much
27
by guest on Decem
ber 17, 2015http://m
be.oxfordjournals.org/D
ownloaded from
more accurate description of the observed patterns of protein-coding DNA
sequence evolution than do the models M0 and M7. Figure 3 illustrates a
comparison of instantaneous rates, adjusted for codon frequencies, from M0 and
ECM. While M0 gives only five values (0, for multiple nucleotide substitutions,
and four other values arising from its mechanistic transition-transversion bias
and nonsynonymous-synonymous bias parameters), ECM takes many different
values, over a wider range, reflecting much finer distinctions being made
(including differences in nonsynonymous changes orginating from amino acid
properties).
The improvement of ECM+F over M7 in 197 out of 200 cases is particularly
impressive, since that M7 permits variation of nonsynonymous-synonymous bias
amongst sites, whereas ECM+F does not even have a family-specific parameter
ω. Given the existing success of M7 and variants of it for phylogenetic inference
and, particularly, analysis of natural selection, our results argue very strongly in
favour of the use of the empirical codon model and its future development.
3.3.3 Comparison of empirical codon model with SDT
We also compared the empirical codon model to the mechanistic SDT model
(Whelan and Goldman, 2004). The SDT model describes protein-coding
sequence evolution at the codon level, allowing for single, double and triple
substitutions both within codons and spanning codon boundaries. The SDT
model’s parameters, estimated on a per-data set basis, describe the proportions
of single, double and triple changes, transition-transversion bias on the
nucleotide level, nonsynoymous-synonymous substitution biases and codon
frequencies (for full details, see Whelan and Goldman, 2004).
To make a fair comparison with SDT, we need to change the method used to
parameterize codon frequencies within the empirical codon model. The SDT
model, in common with the model of Muse and Gaut (1994), assumes that the
instantaneous rates of change are proportional to the frequency of the
replacement nucleotide(s), and not the replacement codon. This
parameterization for codon frequencies, referred to as F1x4MG (Yang, 1997),
28
by guest on Decem
ber 17, 2015http://m
be.oxfordjournals.org/D
ownloaded from

was implemented in our empirical codon model for comparisons with SDT. It is
already available in M0 in the codeml program (Yang, 1997).
Comparison with the SDT model was restricted to a total of 15 families,
corresponding to those analyzed by Whelan and Goldman (Whelan and
Goldman, 2004) and whose DNA sequences remain available in the current
version of Pandit (see Supplementary Material for full details). Results for four
typical protein families are shown in table 4. Of all 15 protein families studied,
PF01056 is the only one for which SDT is preferred to the empirical codon
models according to the AIC. For all other protein families the empirical codon
models perform better, as illustrated for PF01226, PF01229 and PF01231 in
table 4.
Family (Pandit ID)
Model PF01056 PF01226 PF01229 PF01231
M0 −5483.54 −5853.10 −6865.90 −5567.11
SDT −5360.42 −5771.16 −6818.44 −5508.95
improvement over M0† 123.12 81.94 47.46 58.16
ECM+F+ω −5397.32 −5697.21 −6770.95 −5451.76
improvement over SDT† −36.90 73.95 47.49 57.19
ECM+F+ω+1κ(ts) −5392.67 −5697.19 −6765.33 −5449.78
improvement over SDT† −32.25 73.97 53.11 59.17
ECM+F+ω+1κ(tv) −5373.78 −5696.95 −6753.29 −5445.28
improvement over SDT† −13.36 74.21 65.15 63.67
ECM+F+ω+2κ −5367.29 −5696.79 −6750.14 −5543.90
improvement over SDT† −6.87 74.37 68.30 65.05
Table 4: Log-likelihood values for protein families from Pandit under differentmechanistic and empirical codon models, using the F1x4MG parameterization ofcodon frequencies. †For non-nested models, the AIC prefers the model with higherlikelihood in all cases shown.
In all 15 comparisons the SDT model is always better than M0 (illustrated
in table 4), suggesting that SDT, with its inclusions of single, double and triple
nucleotide substitutions, was a good attempt at modeling a real effect (see also
Whelan and Goldman, 2004). However, the general superiority of all variants of
29
by guest on Decem
ber 17, 2015http://m
be.oxfordjournals.org/D
ownloaded from
the empirical codon in this study suggests these have successfully captured more
information on typical patterns of codon substitutions.
LRT comparisons between F61 (table 2) and F1x4MG (table 4) variants of
the empirical codon model for protein families PF01226, PF01229 and PF01231
show that the F61 variants perform significantly better. The overall picture
amongst the κ-models remains inconclusive (table 4; see also Conclusions,
below).
3.4 Comparison of estimates ofnonsynonymous-synonymous bias
For the ECM estimated from Pandit, we find ωE = 0.192 (eqn. 8). For
applications of ECM to other data sets this value will vary, obviously greatly
affected by estimates of ω and also depending (less strongly) on family-specific
estimates of πj and any κ-parameters. We have calculated ωE values from
ECM+F+ω+2κ for all alignments in our test set of 200 proteins, and we
compare them with corresponding estimates of ωM from M0 in figure 4. The ωM
and ωE values are largely similar as the inset plot of figure 4 shows.
However, there is some interesting variation and in particular we note that
the cases with strongest purifying selection (e.g. ωM < 0.1) are often assessed as
less extreme under the empirical model (ωE > ωM). Conversely, proteins
experiencing weaker purifying selection are generally assessed as having more
constraints under ECM (ωE < ωM). Under strong purifying selection most
observed changes will be synonymous. In ECM, however, there is not only a
probability that synonymous change occurs via single synonymous substitutions,
but also a non-zero probability via nonsynonymous double and triple nucleotide
changes, thus decreasing the inferred strength of purifying selection. For genes
under weaker purifying selection, more nonsynonymous changes are observed;
ECM allows for a non-zero probability that these nonsynonymous changes
happened via multiple nucleotide substitutions to synonymous intermediates,
resulting in the estimation of lower ωE values. The change-over value for these
competing effects lies at approximately ωE = ωM = 0.15 for our test data set of
30
by guest on Decem
ber 17, 2015http://m
be.oxfordjournals.org/D
ownloaded from

200 protein families. In the future it will require further investigation into what
the two parameters ωE and ωM are measuring, and which is most useful.
4 CONCLUSIONS
We have estimated an empirical codon model, called ECM, from alignments in
the Pandit database, using a ML method embodied in the DART software.
Analyzing the substitution patterns represented by ECM allows us to draw
conclusions about the biological pressures and processes acting during codon
sequence evolution. Existing codon models generally only allow for single
nucleotide changes. However, our results indicate that modeling can be
significantly improved by allowing for single, double and triple nucleotide
changes. Groupings of the 61 sense codons into subsets with high probability of
change amongst codons of each group but small probability of change between
groups shows that the affiliation between a triplet of DNA and the amino acid it
encodes is a main factor driving the process of codon evolution. Relationships
between different amino acids based on their physico-chemical properties also
have a strong influence.
The observations of multiple nucleotide change and the strong influence of
physico-chemical properties are not reflected in existing mechanistic models such
as the widely-used ‘M-series’ of standard codon models (Yang et al., 2000). The
importance of the genetic code may also be underestimated in existing models.
In M0 (eq. 1) and M7, for example, it is only incorporated through the
placement of the parameter ωM and is entirely confounded with the strength of
selection. In future it may be important to give further consideration to how we
should weight the evidence for natural selection given by multiple-nucleotide
replacements, nonsynonymous replacements between biochemically similar
amino acids and nonsynonymous replacements between biochemically different
amino acids. Our analysis of estimates of parameters representing the strength
of purifying selection derived from existing models and from our empirical codon
model suggests a complex relationship that requires further investigation before
31
by guest on Decem
ber 17, 2015http://m
be.oxfordjournals.org/D
ownloaded from

we fully understand what effects our new model may have on methods for
detecting positively selected proteins and proteins sites.
The existence of simultaneous multiple nucleotide changes is controversial:
Averof and colleagues (Averof et al., 2000) find evidence for simultaneous
multiple changes in residues coding for serines, and results from the use of the
SDT model (Whelan and Goldman, 2004) imply that multiple nucleotides
changes occur. However, Bazykin and collaborators (Bazykin et al., 2004) argue
for successive single compensatory changes instead.
Some of our findings suggest that on the mutation level only single nucleotide
changes occur. In particular, the relatively common occurrence of double
changes in the first and third positions of a codon (e.g., CGT (R) ↔ AGA (R);
GTG (V) ↔ ATC (I); TTG (L) ↔ CTA (L); TTA (L) ↔ CTT (L) — see Figure
1) suggests a process of compensatory change: we do not know of any biological
mechanism affecting non-contiguous nucleotides, and the relatively lower
frequency of triple nucleotide substitutions means that an explanation by triple
mutations that by chance have matching second positions is highly unlikely.
A highly significant component of our findings is, however, that codon-level
sequence evolution is better modeled when we include simultaneous multiple
nucleotide substitutions. How, then, can we reconcile these two aspects of our
findings? Arguing on the population level, realistic rates of mutation per
generation (e.g. Neuhauser, 2003) mean that the probability of multiple
independent mutations in one individual is far too low to explain the proportions
of double and triple changes observed in our ECM. Likewise, recombination
events (Nordborg, 2003) are not a plausible explanation for the observed effect:
the probability of an individual having a mutation at one site, another individual
a mutation at a neighbouring site, and those two mating and the cross-over
placing the two mutations onto one genome is too low, particularly since the
cross-overs would require a break exactly between the two neighbouring sites.
Positive selection favoring the compensation for a deleterious mutation by a
mutation at another, epistatically interacting, site in the genome, seems to be
32
by guest on Decem
ber 17, 2015http://m
be.oxfordjournals.org/D
ownloaded from

the most likely mechanism to explain the multiple changes observed. Such a
process will be dependent on often unknown population genetic factors such as
population size, allowing for various scenarios. Multiple nucleotide changes could
be the result of neutral mutations spreading in a population by genetic drift
(Neuhauser, 2003) and then an advantageous mutation occurring which is
positively selected for. In large populations mildly deleterious mutations can also
be sustained in a subpopulation (Excoffier, 2003); if a compensatory mutation
then occurs it will be positively selected, and may spread through the whole
population and be fixed. On the other hand small populations are more
susceptible to even deleterious mutations becoming fixed in the population
(Neuhauser, 2003). These mutations may then be followed by compensatory
mutations that become fixed too: this mechanism could give a plausible
mechanism for serine switches (AGY (S) ↔ TGY (C) or ACY (T) ↔ TCY (S)),
where the substitution to the intermediate amino acid is believed to be very
deleterious in general (Averof et al., 2000).
In summary, ECM suggests the existence of double and triple nucleotide
changes, but the study of the patterns suggests that only single changes occur
instantaneously. The explanation of this apparent discrepancy is that the
multiple changes are in fact successive single changes occurring on a much faster
timescale. This is expected from our explanation, as positive selection will act to
fix compensatory mutations at a much higher rate than neutral or mildly
deleterious mutations. The phylogenetic application of ECM is successful
because phylogenetic data represent evolution over long timescales and cannot
discriminate the short timescales over which compensatory changes occur.
Similar arguments have been used to explain pairs of changes in sequences
encoding functional RNA structures. Here, mutations that change a single base
in a stem region of an RNA molecule are rare because there is strong selection to
maintain complementary base pairing. Replacement of paired bases by different
complementary pairs does, however, occur regularly in stem regions. This
process has also been successfully modeled as an instantaneous change of
33
by guest on Decem
ber 17, 2015http://m
be.oxfordjournals.org/D
ownloaded from

multiple nucleotides (Higgs, 1998; Savill et al., 2001). However, this topic
requires further study, for example by combining comparative analysis with
large-scale polymorphism data (e.g., HapMap (The International HapMap
Consortium, 2003) and the Trace Archive (Trace Archive, 2006)).
We also tested ECM for utility in phylogenetic analyses. Past experience
suggested that it would be beneficial to consider combining some mechanistic
parameters with the pure ECM, and our choice of parameters was oriented
towards those used in existing mechanistic codon models used for the detection
of selection: codon frequencies, transition-transversion bias and
nonsynonymous-synonymous bias were used and combined models successfully
implemented in PAML. Various parameterizations of the transition-transversion
κ(i, j) (eq. 6) were investigated, inspired by new scenarios which arise because
instantaneous single, double and triple nucleotide changes are permitted in the
empirical codon model. Compared to the simplest model, the more complex
transition-transversion bias models can further improve likelihoods significantly
in many, but clearly not all, cases. We recommend consideration of four κ-models
(ECM+F+ω, ECM+F+ω+1κ(ts), ECM+F+ω+1κ(tv), ECM+F+ω+2κ) with
choice among them determined using LRTs on a per-data set basis.
Overwhelmingly, the empirical models outperform the mechanistic models
M0 and M7 and these results argue very strongly in favour of re-considering
codon models which do not treat all nonsynonymous changes equally
(Massingham, 2002). However, the original Goldman and Yang model which
incoporated amino acid properties based on the Grantham matrix is known to
perform worse than M0 (Yang et al., 1998). We therefore focuss further
comparisions to mechanistic models allowing for multiple nucleotide changes and
we show that empircal codon model outperforms the SDT model in most cases.
This proves that our empirical codon model is suitable for use in phylogenetic
analysis. Since codon models are becoming an option in phylogenetic
reconstruction, despite their computational burden (Ren et al., 2005), we hope
that our empirical codon models will be used for this purpose.
34
by guest on Decem
ber 17, 2015http://m
be.oxfordjournals.org/D
ownloaded from

The mechanistic models M0 and M7 form the basis of current methods for
detecting the footprints of positive selection acting on protein evolution (Yang
et al., 2000). Great advances in the power to detect selection have been achieved
by adapting M0-type models to allow for heterogeneity of
nonsynonymous-synonymous biases amongst protein sites: for example, M7 uses
a β-distribution of ω values and M8 adds the possibility of codons evolving with
ω > 1. It is remarkable that our empirical codon model, which assumes a
homogeneous pattern of evolutionary change at all sites, consistently outperforms
M7 in our test set of 200 alignments. We have indicated how our per-data set
estimates of the parameter ω can be used to compute a measure that is, in
effect, the protein-wide average synonymous-nonsynonymous bias. This gives
values comparable to those obtained using the mechanistic M0 model. In the
future, we plan to adapt our empirical codon model to incorporate site-specific
synonymous-nonsynonymous biases, and investigate to the consequences for
studies aimed at determining the existence and location of selective effects.
ACKNOWLEDGMENTS
We thank Simon Whelan for many helpful discussions of codon models and
access to SDT model results, Ziheng Yang and Tim Massingham for assistance
with modifications to PAML code, and Robert Bradley for further developing
our bubble plot code and help with figure 1. C.K. was supported in part by a
Wellcome Trust Prize Studentship and was a member of Wolfson College,
University of Cambridge. N.G. was supported in part by a Wellcome Trust
Senior Fellowship in Basic Biomedical Research.
35
by guest on Decem
ber 17, 2015http://m
be.oxfordjournals.org/D
ownloaded from
Bibliography
Abdo, Z., Minin, V., Joyce, P., and Sullivan, J. 2005. Accounting for
uncertainty in the tree topology has little effect on the decision-theoretic
approach to model selection in phylogeny estimation. Mol Biol Evol,
22:691–703.
Adachi, J. and Hasegawa, M. 1996. Model of amino acid substitution in
proteins encoded by mitochondrial DNA. J Mol Evol, 42:459–468.
Adachi, J., Waddell, P., Martin, W., and Hasegawa, M. 2000. Plastid genome
phylogeny and a model of amino acid substitution for proteins encoded by
chloroplast DNA. J Mol Evol, 50:348–358.
Aris-Brosou, S. 2005. Determinants of adaptive evolution at the molecular
level: the extended complexity hypothesis. Mol Biol Evol, 22:200–209.
Averof, M., Rokas, A., Wolfe, K., and Sharp, P. 2000. Evidence for a high
frequency of simultaneous double-nucleotide substitutions. Science,
287:1283–1286.
Bateman, A., Coin, L., Durbin, R., Finn, R., Hollich, V., Griffiths-Jones, S.,
Khanna, A., Marshall, M., Moxon, S., Sonnhammer, E., Studholme, D., Yeats,
C., and Eddy, S. 2004. The Pfam protein families database. Nucleic Acids Res,
32:D138–D141.
Bazykin, G., Kondrashov, F., Ogurtsov, A., Sunyaev, S., and Kondrashov, A.
2004. Positive selection at sites of multiple amino acid replacements since
rat-mouse divergence. Nature, 429:558–562.
Brown, W., Prager, E., Wang, A., and Wilson, A. 1982. Mitochondrial dna
sequences of primates: tempo and mode of evolution. J Mol Evol, 18:225–239.
Cao, Y., Adachi, J., Janke, A., Paabo, S., and Hasegawa, M. 1994.
Phylogenetic relationships among eutherian orders estimated from inferred
36
by guest on Decem
ber 17, 2015http://m
be.oxfordjournals.org/D
ownloaded from
sequences of mitochondrial proteins: instability of a tree based on a single gene.
J Mol Evol, 39:519–527.
Dayhoff, M. and Eck, R. 1968. A model of evolutionary change in proteins. In:
Dayhoff, M. and Eck, R. (Editors), Atlas of protein sequence and structure
1967–68, pages 33–41. National Biomedical Research Foundation, Washington,
D.C.
Dayhoff, M., Eck, R., and Park, C. 1972. A model of evolutionary change in
proteins. In: Dayhoff, M. (Editor), Atlas of protein sequence and structure,
volume 5, pages 89–99. Biomedical Research Foundation, Washington, D.C.
Dayhoff, M., Schwarz, R., and Orcutt, B. 1978. A model of evolutionary change
in proteins. In: Dayhoff, M. (Editor), Atlas of protein sequence and structure,
volume 5, suppl. 3, pages 345–352. National Biomedical Research Foundation,
Washington, D.C.
Dimmic, M., Rest, J., Mindell, D., and Goldstein, R. 2002. rtREV: an amino
acid substitution matrix for inference of retrovirus and reverse transcriptase
phylogeny. J Mol Evol, 55:65–73.
Excoffier, L. 2003. Analysis of population subdivision. In: Balding, D., Bishop,
M., and Cannings, C. (Editors), Handbook of statistical genetics, 2nd edition,
volume 2, pages 713–745. Wiley, Chichester.
Felsenstein, J. 1981. Evolutionary trees from DNA sequences: a maximum
likelihood approach. J Mol Evol, 17:368–76.
Felsenstein, J. 2004. Inferring phylogenies. Sinauer Associates, Sunderland,
Massachusetts.
Goldman, N. 1993. Statistical tests of models of DNA substitution. J Mol Evol,
36:182–198.
37
by guest on Decem
ber 17, 2015http://m
be.oxfordjournals.org/D
ownloaded from

Goldman, N., Thorne, J., and Jones, D. 1998. Assessing the impact of
secondary structure and solvent accessibility on protein evolution. Genetics,
149:445–458.
Goldman, N. and Whelan, S. 2000. Statistical tests of gamma-distributed rate
heterogeneity in models of sequence evolution in phylogenetics. Mol Biol Evol,
17:975–978.
Goldman, N. and Whelan, S. 2002. A novel use of equilibrium frequencies in
models of sequence evolution. Mol Biol Evol, 19:1821–1831.
Goldman, N. and Yang, Z. 1994. A codon-based model of nucleotide
substitution for protein-coding DNA sequences. Mol Biol Evol, 11:725–736.
Grantham, R. 1974. Amino acid difference formula to help explain protein
evolution. Science, 185:862–864.
Higgs, P. 1998. Compensatory neutral mutations and the evolution of RNA.
Genetica, 102–103:91–101.
Higgs, P., Hao, W., and Golding, B. 2007. Identification of conflicting selective
effects on highly expressed genes. Evolutionary Bioinformatics (In press).
Holmes, I. and Rubin, G. 2002. An expectation maximization algorithm for
training hidden substitution models. J Mol Biol, 317:753–764.
Jones, D., Taylor, W., and Thornton, J. 1992. The rapid generation of mutation
data matrices from protein sequences. Comput Appl Biosci, 8:275–282.
Jones, D., Taylor, W., and Thornton, J. 1994. A mutation data matrix for
transmembrane proteins. FEBS Lett, 339:269–275.
Klosterman, P., Uzilov, A., Bendana, Y., Bradley, R., Chao, S., Kosiol, C.,
Goldman, N., and Holmes, I. 2006. Xrate: a fast prototyping, training and
annotation tool for phylo-grammars. BMC Bioinformatics, 7:428.
38
by guest on Decem
ber 17, 2015http://m
be.oxfordjournals.org/D
ownloaded from
Koshi, J., Mindell, D., and Goldstein, R. 1997. Beyond mutation matrices:
physical-chemistry based evolutionary models. Genome Informatics, 8:80–89.
Kosiol, C. and Goldman, N. 2005. Different versions of the Dayhoff rate matrix.
Mol Biol Evol, 22:193–199.
Kosiol, C., Goldman, N., and Buttimore, N. 2004. A new criterion and method
for amino acid classification. J Theor Biol, 228:97–106.
Lio, P. and Goldman, N. 1998. Models of molecular evolution and phylogeny.
Genome Res, 8:1233–1244.
Massingham, T. 2002. Detecting postitive selection in proteins: models of
evolution and statistical tests. PhD thesis, Dept. of Zoology, University of
Cambridge.
Massingham, T. and Goldman, N. 2005. Detecting amino acid sites under
positive selection and purifying selection. Genetics, 169:1753–1762.
Metropolis, N., Rosenbluth, A., Rosenbluth, M., Teller, A., and Teller, E. 1953.
Equation of state calculation for fast computing machines. J Chem Phys,
21:1087–1092.
Muse, S. and Gaut, B. 1994. A likelihood approach for comparing synonymous
and nonsynonymous nucleotide substitution rates, with application to the
chloroplast genome. Mol Biol Evol, 11:715–724.
Nei, M. and Gojobori, T. 1986. Simple methods for estimating the numbers of
synonymous and nonsynonymous nucleotide substitutions. Mol Biol Evol,
3:418–426.
Neuhauser, C. 2003. Mathematical models in population genetics. In: Balding,
D., Bishop, M., and Cannings, C. (Editors), Handbook of statistical genetics,
2nd edition, volume 2, pages 577–599. Wiley, Chichester.
39
by guest on Decem
ber 17, 2015http://m
be.oxfordjournals.org/D
ownloaded from

Nielsen, R. and Yang, Z. 1998. Likelihood models for detecting positively
selected amino acid sites and applications to the HIV-1 envelope gene.
Genetics, 148:929–936.
Nordborg, M. 2003. Coalescent theory. In: Balding, D., Bishop, M., and
Cannings, C. (Editors), Handbook of statistical genetics, 2nd edition, volume 2,
pages 602–631. Wiley, Chichester.
Ren, F., Tanaka, H., and Yang, Z. 2005. An empirical examination of the
utility of codon substitution models in phylogenetic reconstruction. Syst Biol,
54:808–818.
Savill, N., Hoyle, D., and Higgs, P. 2001. RNA sequence evolution with
secondary structure constraints: comparison of substitution rate models using
maximum-likelihood methods. Genetics, 157:399–411.
Schneider, A., Cannarozzi, G., and Gonnet, G. 2005. Empirical codon
substitution matrix. BMC Bioinformatics, 6:134.
Silvey, S. 1970. Statistical inference. Chapman and Hall, London.
Smith, N., Webster, M., and Ellegren, H. 2003. A low rate of simultaneous
double-nucleotide mutations in primates. Mol Biol Evol, 20:47–53.
Sullivan, J., Abdo, Z., Joyce, P., and Swofford, D. 2005. Evaluating the
performance of a successive-approximations approach to parameter optimization
in maximum-likelihood phylogeny estimation. Mol Biol Evol, 22:1386–1392.
Sullivan, J., Holsinger, K., and Simon, C. 1996. The effect of topology on
estimates of among-site rate variation. J Mol Evol, 42:308–312.
Tavare, S. 1986. Some probabilistic and statistical problems in the analysis of
dna sequences. In: Miura, R. (Editor), Lectures on mathematics in the life
sciences., pages 57–86. American Mathematical Society, Providence, RI.
40
by guest on Decem
ber 17, 2015http://m
be.oxfordjournals.org/D
ownloaded from
The International HapMap Consortium 2003. The international HapMap
project. Nature, 426:789–796.
Trace Archive 2006. http://www.ncbi.nih.gov/Traces (v4.1, accessed 10 Nov
2006).
Urbina, D., Tang, B., and Higgs, P. 2006. The response of amino acid
frequencies to directional mutational pressure in mitochondrial genome
sequences is related to the physical properties of the amino acids and to the
structure of the genetic code. J. Mol. Evol., 62:340–361.
Whelan, S., de Bakker, P., and Goldman, N. 2003. Pandit: a database of
protein and associated nucleotide domains with inferred trees. Bioinformatics,
19:1556–1563.
Whelan, S., de Bakker, P., Quevillon, E., Rodriguez, N., and Goldman, N.
2006. PANDIT: an evolution-centric database of protein and associated
nucleotide domains with inferred trees. Nucleic Acids Res, 34:D327–331.
Whelan, S. and Goldman, N. 1999. Distributions of statistics used for the
comparison of models of sequence evolution in phylogenetics. Mol Biol Evol,
16:1292–1299.
Whelan, S. and Goldman, N. 2001. A general empirical model of protein
evolution derived from multiple protein families using a maximum-likelihood
approach. Mol Biol Evol, 18:691–699.
Whelan, S. and Goldman, N. 2004. Estimating the frequency of events that
cause multiple-nucleotide changes. Genetics, 167:2027–2043.
Wong, W., Yang, Z., Goldman, N., and Nielsen, R. 2004. Accuracy and power
of statistical methods for detecting adaptive evolution in protein coding
sequences and for identifying positively selected sites. Genetics, 168:1041–1051.
Yang, Z. 1994a. Estimating the pattern of nucleotide substitution. J Mol Evol,
39:105–111.
41
by guest on Decem
ber 17, 2015http://m
be.oxfordjournals.org/D
ownloaded from

Yang, Z. 1994b. Maximum likelihood phylogenetic estimation from DNA
sequences with variable rates over sites: approximate methods. J Mol Evol,
39:306–314.
Yang, Z. 1997. PAML: a program package for phylogenetic analysis by
maximum likelihood. Comput Appl Biosci, 13:555–556.
Yang, Z. and Bielawski, J. 2000. Statistical methods for detecting molecular
adaptation. Trends Ecol Evol, 15:496–503.
Yang, Z. and Nielsen, R. 1998. Synonymous and nonsynonymous rate variation
in nuclear genes of mammals. J Mol Evol, 46:409–418.
Yang, Z. and Nielsen, R. 2002. Codon-substitution models for detecting
molecular adaptation at individual sites along specific lineages. Mol Biol Evol,
19:908–917.
Yang, Z., Nielsen, R., Goldman, N., and Pedersen, A.-M. 2000.
Codon-substitution models for heterogeneous selection pressure at amino acid
sites. Genetics, 155:431–449.
Yang, Z., Nielsen, R., and Hasegawa, M. 1998. Models of amino acid
substitution and applications to mitochondrial protein evolution. Mol Biol
Evol, 15:1600–1611.
42
by guest on Decem
ber 17, 2015http://m
be.oxfordjournals.org/D
ownloaded from

FIGURES
FIG. 1: Bubble plots of ECMs for the Pandit data set.
FIG. 2: Histogram comparing instantaneous rates estimated from the Pandit
data and from simulated M0 data.
FIG. 3: Instantaneous rates, adjusted for codon frequencies, from
ECM+F+ω+1κ(tv) and M0 estimated for protein family PF01231.
FIG. 4: Nonsynonymous-synonymous rate ratios for 200 protein families,
estimated using ECM+F+ω+2κ (ωE) and the mechanistic model M0 (ωM).
43
by guest on Decem
ber 17, 2015http://m
be.oxfordjournals.org/D
ownloaded from
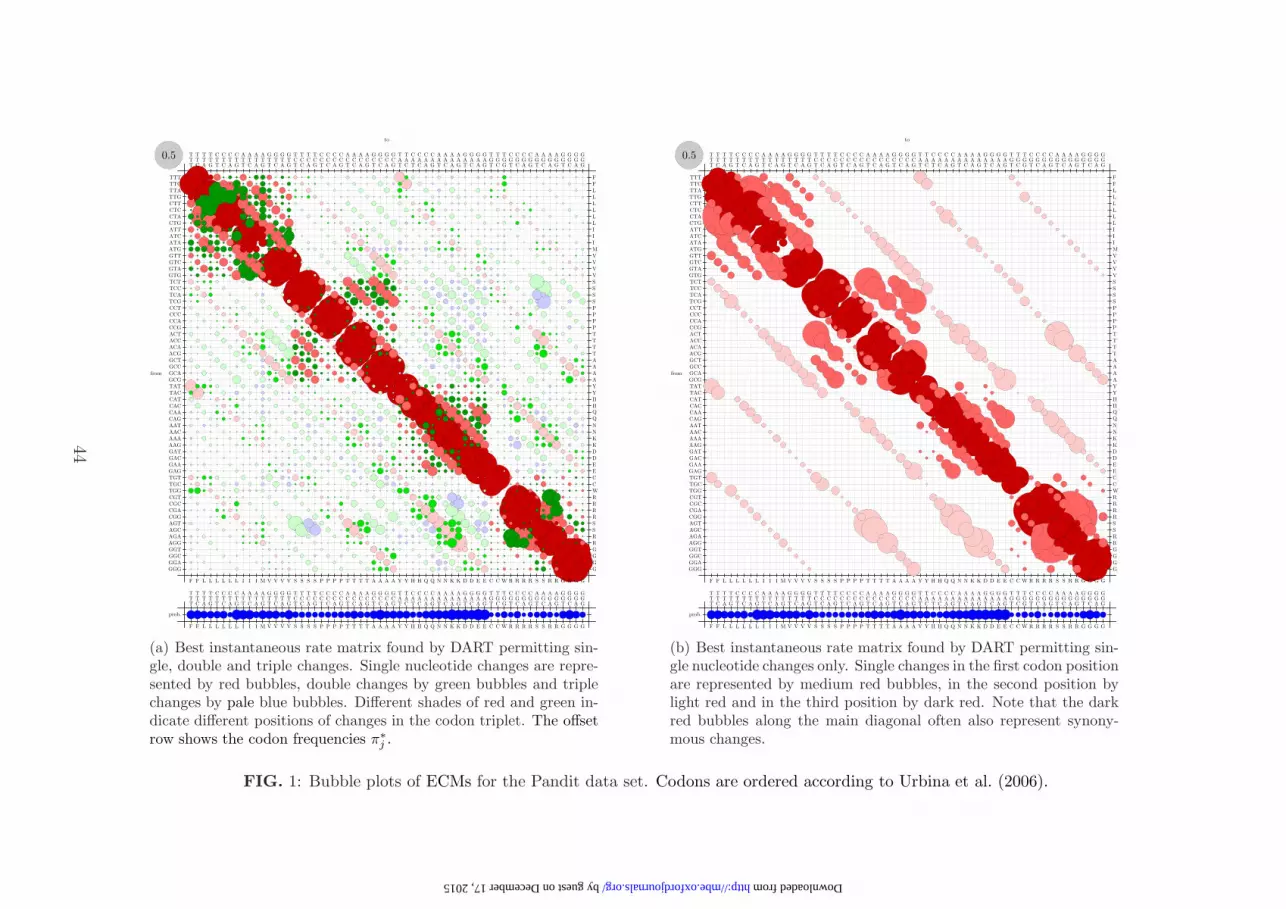
0.5
from
to
AAA KAAC N
AAG K
AAT N
ACA TACC T
ACG T
ACT T
AGA RAGC S
AGG R
AGT S
ATA IATC I
ATG M
ATT I
CAA QCAC H
CAG Q
CAT H
CCA PCCC P
CCG P
CCT P
CGA RCGC R
CGG R
CGT R
CTA LCTC L
CTG L
CTT L
GAA EGAC D
GAG E
GAT D
GCA AGCC A
GCG A
GCT A
GGA GGGC G
GGG G
GGT G
GTA VGTC V
GTG V
GTT V
TAC YTAT Y
TCA STCC S
TCG S
TCT S
TGC CTGG W
TGT C
TTA LTTC F
TTG L
TTT F
AAA
K
AAC
N
AAG
K
AAT
N
ACA
T
ACC
T
ACG
T
ACT
T
AGA
R
AGC
S
AGG
R
AGT
S
ATA
I
ATC
I
ATG
M
ATT
I
CAA
Q
CAC
H
CAG
Q
CAT
H
CCA
P
CCC
P
CCG
P
CCT
P
CGA
R
CGC
R
CGG
R
CGT
R
CTA
L
CTC
L
CTG
L
CTT
L
GAA
E
GAC
D
GAG
E
GAT
D
GCA
A
GCC
A
GCG
A
GCT
A
GGA
G
GGC
G
GGG
G
GGT
G
GTA
V
GTC
V
GTG
V
GTT
V
TAC
Y
TAT
Y
TCA
S
TCC
S
TCG
S
TCT
S
TGC
C
TGG
W
TGT
C
TTA
L
TTC
F
TTG
L
TTT
F
prob.
AAA
K
AAC
N
AAG
K
AAT
N
ACA
T
ACC
T
ACG
T
ACT
T
AGA
R
AGC
S
AGG
R
AGT
S
ATA
I
ATC
I
ATG
M
ATT
I
CAA
Q
CAC
H
CAG
Q
CAT
H
CCA
P
CCC
P
CCG
P
CCT
P
CGA
R
CGC
R
CGG
R
CGT
R
CTA
L
CTC
L
CTG
L
CTT
L
GAA
E
GAC
D
GAG
E
GAT
D
GCA
A
GCC
A
GCG
A
GCT
A
GGA
G
GGC
G
GGG
G
GGT
G
GTA
V
GTC
V
GTG
V
GTT
V
TAC
Y
TAT
Y
TCA
S
TCC
S
TCG
S
TCT
S
TGC
C
TGG
W
TGT
C
TTA
L
TTC
F
TTG
L
TTT
F
(a) Best instantaneous rate matrix found by DART permitting sin-gle, double and triple changes. Single nucleotide changes are repre-sented by red bubbles, double changes by green bubbles and triplechanges by pale blue bubbles. Different shades of red and green in-dicate different positions of changes in the codon triplet. The offsetrow shows the codon frequencies π∗
j .
0.5
from
to
AAA KAAC N
AAG K
AAT N
ACA TACC T
ACG T
ACT T
AGA RAGC S
AGG R
AGT S
ATA IATC I
ATG M
ATT I
CAA QCAC H
CAG Q
CAT H
CCA PCCC P
CCG P
CCT P
CGA RCGC R
CGG R
CGT R
CTA LCTC L
CTG L
CTT L
GAA EGAC D
GAG E
GAT D
GCA AGCC A
GCG A
GCT A
GGA GGGC G
GGG G
GGT G
GTA VGTC V
GTG V
GTT V
TAC YTAT Y
TCA STCC S
TCG S
TCT S
TGC CTGG W
TGT C
TTA LTTC F
TTG L
TTT F
AAA
K
AAC
N
AAG
K
AAT
N
ACA
T
ACC
T
ACG
T
ACT
T
AGA
R
AGC
S
AGG
R
AGT
S
ATA
I
ATC
I
ATG
M
ATT
I
CAA
Q
CAC
H
CAG
Q
CAT
H
CCA
P
CCC
P
CCG
P
CCT
P
CGA
R
CGC
R
CGG
R
CGT
R
CTA
L
CTC
L
CTG
L
CTT
L
GAA
E
GAC
D
GAG
E
GAT
D
GCA
A
GCC
A
GCG
A
GCT
A
GGA
G
GGC
G
GGG
G
GGT
G
GTA
V
GTC
V
GTG
V
GTT
V
TAC
Y
TAT
Y
TCA
S
TCC
S
TCG
S
TCT
S
TGC
C
TGG
W
TGT
C
TTA
L
TTC
F
TTG
L
TTT
F
prob.
AAA
K
AAC
N
AAG
K
AAT
N
ACA
T
ACC
T
ACG
T
ACT
T
AGA
R
AGC
S
AGG
R
AGT
S
ATA
I
ATC
I
ATG
M
ATT
I
CAA
Q
CAC
H
CAG
Q
CAT
H
CCA
P
CCC
P
CCG
P
CCT
P
CGA
R
CGC
R
CGG
R
CGT
R
CTA
L
CTC
L
CTG
L
CTT
L
GAA
E
GAC
D
GAG
E
GAT
D
GCA
A
GCC
A
GCG
A
GCT
A
GGA
G
GGC
G
GGG
G
GGT
G
GTA
V
GTC
V
GTG
V
GTT
V
TAC
Y
TAT
Y
TCA
S
TCC
S
TCG
S
TCT
S
TGC
C
TGG
W
TGT
C
TTA
L
TTC
F
TTG
L
TTT
F
(b) Best instantaneous rate matrix found by DART permitting sin-gle nucleotide changes only. Single changes in the first codon positionare represented by medium red bubbles, in the second position bylight red and in the third position by dark red. Note that the darkred bubbles along the main diagonal often also represent synony-mous changes.
FIG. 1: Bubble plots of ECMs for the Pandit data set. Codons are ordered according to Urbina et al. (2006).
44
by guest on December 17, 2015 http://mbe.oxfordjournals.org/ Downloaded from

1
4
16
64
256
1024
4096
0 0.005 0.01 0.015 0.02 0.025
Num
ber
q*_ij
FIG. 2: Histogram comparing instantaneous rates estimated from the Pandit dataand from simulated M0 data. Note the logarithmic scale on the y-axis. For the ECMestimated from the Pandit database the dark grey bars show the distribution of values ofinstantaneous rates of double nucleotide changes and light grey bars represent the ratesof triple changes. For the model estimated from M0 simulated data, upwards stripes(�) indicate double changes and downwards stripes (�) triple changes, respectively.
45
by guest on Decem
ber 17, 2015http://m
be.oxfordjournals.org/D
ownloaded from

0
5
10
15
20
25
30
0 5 10 15 20 25 30 35 40 45 50 55 60 65 70
M0
EMC+F+ω+1κ(tv)
×× ×
××
×
×
×
×× ×
× ×
××
××
×
× ×
× ×
××
×
××
× ×
×
× ×
×× ××
××
×
××
× ×
×
× ×
×
×
××
×
×
×
× ×
× ×
××
×
× × ××
×
× ×
× ×××× ×
××
××
×
× ×
××
××
×
×
×
× ×
×
×
×
×
×
×
× ××
×
××
×
× × ××
×
× ×
×××××
×× ××
×
× ×× ×
×
××
×
×
×
×× ×
×
××
××
×
× × ××
×
× ×
××
××
×
× × ××
×
× ×
× ×××××
××
×
× ×××
×
× ×
×
+++
+++
+
+
+
++
+
+++++++++++++++
+
+++++++++++++++
+
+++++++++++++++
++
+
+
+++
+
+
+
++
+
+++++++++++++++
+
+++++++++++++++
+
++++++++++++++
++
++
+
++++++++++++++++++++
+
+++++++++++++++
+
+++++++++++++
++
+++
+
++++
+
+++++++++++++++
+
+++++++++++++++
+
++++++++++++
+
+++
+
+
+
++++++
+
+++++++++++++++
+
+++++++++++++
+
++++++++++++
+
+++
+
+
+
++++++
+
+++++++++++++++
+
+++++++++++++
+
++++++++++++
+
++++++++++++
+
+++++++++++++++
+
+++++++++++++
+
++++++++++++
+
++++
+
+++++++
+
+++++++++++++++
+
+++++++++++++
+
++++++++
+
+++
+
+++
+
++++++++++
+
+++++++++++++++
+
+++++++++++++++
+
++++++++
+
+++
+
+++
+
++++++++++
+
+++++++++++++++
+
+++++++++++++++
+
++++++
+
+++
+
+++
+
+
+
++++++++++++
+
+++++++++++++++
+
+++++++++++++++
+
++++
+
+++
+
+++
++
+++++++++++++
+
+++++++++++++++
+
+++++++++++++++
+
+++++
+
+++
+
++
++
+++++++++++++++
+
+++++++++++++++
+
+++++++++++++++
++
++++++++++
+
+++
+
+++
+
+++
+
+++++++++++++++
+
++++++++++++++++
+
++++++++++
+
+++
+
+++
+
+++
+
+++++++++++++++
+
+++++++++++++++++++++++++++
+
+++
+
+++
+
+++
+
+++++++++++++++
+
+++++++++++++++++++++++++++
+
+++
+
+++
+
+++
+
+++++++++++++++
+
++++++++++++++++
+
++++++++
+
+++
+
+++
+
+++++++
+
+++++++++++++++
+
++++++++++++++++
+
++++++++
+
+++
+
+++
+
+++++++
+
+++++++++++++++
+
++++++++++++++++
+
++++++++
+
+++
+
+++
+
+++++++
+
+++++++++++++++
+
++++++++++++++++
+
++++++++
+
+++
+
+++
+
+++++++
+
+++++++++++++++
+
++++++++++++++++
+
++++
+
+++
+
+++
+++
+++++++++++
+
+++++++++++++++
+
++++++++++++++++
+
++++
+
+++
+
++
++
+
+
+++++++++++
+
+++++++++++++++
+
+++++++++++++++++++++
+
+++
+
+
++
++
+
+++++++++++
+
+++++++++++++++
+
+++++++++++++++++++++
+
+++
+++
+++
+
+++++++++++
+
+++++++++++++++
+
++++++++++++++
+
++
+
+++
+
+++
+
+++++++++++++++
+
+++++++++++++
+
++++++++++++++
+
++
+
+++
+
+++
+
+++++++++++++++
+
+++++++++++++
+
+++++++++++++++++
+
+++
+
+++
+
+++++++++++ ++++++++++++++++++
+
+++++++++++++
+
+++
+
+++
+
+++
+
+++++++ ++++ ++++++++++ ++++++++
++
++++++++++++
+
+++++++++++++++
++
+++
+
+++
+
+++
+
++++++++++++++++
+
++++++++++++
+
++++++++++++++
+
+
+
+++
+
+++
+
+++
+
+ +++++++++++++++
+
++++++++++++
+
+++++++++++++
+
++
+
+++
+
+++
+
+ ++
+
++++++++++++++++
+
++++++++++++
+
++++++++++++
+++
+++
+
+++
+
+++
+
+++
+
++++++++++++++++
+
++++++++++++
+
+++++++++++
+
+++
+
+++
+
+++ ++++
+
++++++++++++++++
+
++++++++++++
+
+++++++++++
+
+++
+
+++
+
+++ ++++
+
++++++++++++++++
+
++++++++++++
+
+++++++++++
+
+++
+
+++
+
+++ ++++
+
++++++++++++++++
+
++++++++++++
+
+++++++ ++++
+
+++
+
+++
+
+++ ++++
+
++++++++++++++++
+
++++++++++++
+
+++++++
+
+++
+
+++
+++
+++++++++++
+
++++++++++++++++
+
++++++++++++
+
+++++++
+
+++
+
++
++
+
+
+++++++++++
+
+++++++++++++++++++++++++++++
+
+++ ++++
+
+++
+
+
++
++
+
+++++++++++
+
+++++++++++++++++++++++++++++
+
+++ ++++
+
+++
+++
+++
+
+++++++++++
+
++++++++++
+
++++++++++++++
+
+++
+
+++
+
+++
+
+++
++
++++ ++++++++
+
++++++++++
+
++++++++++++++
+
+++
+
+++
+
+++
+
++
++
+++++++++ ++++
+
+++++++++++++++++++++++++++++
+
+++
+
+++
+
+
++
++++++++++++++
+
+++++++++++++
+
+++++++++++++++
+
+++
+
+++
+++
+++++++++++++++
++
++++++++++++
+
+++++++++++++++
+
+++ ++++++++++++
+
+++
+
+++
+
++++
+
++++++++++++
+
+++++++++++++++
+
+++ ++++++++++++
+
+++
+
+++
+
++++
+
++++++++++++
+
+++++++++++++ ++
+
+++ ++++++++++++
+
+++
+
+++
+
++++
+
++++++++++++
+
+++++++++++++ ++
+
+++ ++++++++++++
+
+++
+
+++
+
++++
+
++++++++++++
+
+++++++++++++++
+
+++++++++++
+
+++
+
+++
+
++++++++
+
++++++++++++
+
+++++++++++++++
+
+++++++++++
+
+++
+
+++
+
++++++++
+
++++++++++++
+
+++++++++++++++
+
+++++++++++
+
+++
+
+++
+
++++++++
+
++++++++++++
+
+++++++ ++++++++
+
+++++++++++
+
+++
+
+++
+
++++++++
+
++++++++++++
+
+++++++++++++++
+
+++++++
+
+++
+
+++
+++
++++++++++++
+
++++++++++++
+
+++++++++++++++
+
+++ ++++
+
+++
+
++
+ +
+
+
+++++++++++++++++++++++++
+
+++++++++++++++
+
+++++++
+
+++
+
+
++
++
+
+++++++++++++++++++++++++
+
+++++++++++++++
+
+++++++
+
+++
+++
+++
+
++++++++++
+
++++++++++++++
+
+++++++++++++++
+
+++
+
+++
+
+++
+
++++++++++++++
+
++++++++++++++
+
+++++++++++++++
+
+++
+
+++
+
+++
+
+++++++++++++++++++++++++++++
+
+++++++++++++++
+
+++
+
+++
+
+++
+
+++++++++++++
+
+++++++++++++++
+
+++++++++++++++
+
+++
+
+++
+
+++
+
FIG. 3: Instantaneous rates, adjusted for codon frequencies, from ECM+F+ω+1κ(tv)and M0 estimated for protein family PF01231. These are calculated as qij/πj fromequations 1 (M0) and 6 (ECM+F+ω+1κ(tv)). Rates of nonsynonymous changes arerepresented by +, rates of synonymous changes by ×.
46
by guest on Decem
ber 17, 2015http://m
be.oxfordjournals.org/D
ownloaded from

0.1
0.05
0
0.10.05
ωE
ωM
+
+
+
+
+
+
+
+
++
+
+
+
+
+
+
+ +
++
+
+
+
+
+
+ +
+
+ +
+
++
+
+
+
+
+
++
++
+ +
+
+
+
+
+
+
++
+
+
+
+
+
+
+
+
+
++
+
+
++
+
+
+
+
+
+
+
+
+
+
+
+
++
+
+
+ +
++
++
+
+
++
+
+
+
+ +
+
++
+
+
+
+
+
+
+
+
+
+
+
+
+
+++
+
++
+
+
+
+
+
+
+
+
+
+
++
+
+
+
+
+
1
0.5
0
10.5
+ +++++++++++++++++++++ ++++
+++
++
++++++ ++++++++++
+
+++++++++++
+
+
+
+++ ++ ++++++
++++++
+++++++
++++
+
+
++++ +
+++++++++++
++++++
+++
+
++
++
++
+ +
+
+ ++++ +
+
++
+++
+
+
+++
+++++
+++++ ++++
++++
++
++++++ +++++++++
++++++
+
++
++
++++++
+++
+
++
+
++
++ +
++
FIG. 4: Nonsynonymous-synonymous rate ratios for 200 protein families, estimatedusing ECM+F+ω+2κ (ωE) and the mechanistic model M0 (ωM ). The dotted lineindicates ωE = ωM . Note that the inset plot shows all nonsynonymous-synonymousrate ratios estimated while the larger plot is an expanded version of the region 0 ≤ωE, ωM ≤ 0.1.
47
by guest on Decem
ber 17, 2015http://m
be.oxfordjournals.org/D
ownloaded from