an embedded subnetwork of highly active neurons in the neocortex
TRANSCRIPT
Neuron
Report
An Embedded Subnetwork of HighlyActive Neurons in the NeocortexLina Yassin,1,4 Brett L. Benedetti,1 Jean-SebastienJouhanneau,2,3 JingA.Wen,1JamesF.A.Poulet,2,3 andAlisonL.Barth1,*1Department of Biological Sciences and Center for the Neural Basis of Cognition, Carnegie Mellon University, 4400 Fifth Avenue, Pittsburgh,
PA 15213, USA2Department of Neuroscience, Max Delbruck Center for Molecular Medicine, Robert Rossle Strasse 10, D-13092 Berlin-Buch, Germany3NeuroCure, Neuroscience Research Center of the Charite Universitatmedizin, 10115 Berlin, Germany4Present address: Division of Neurobiology, Department Biology II, Ludwig-Maximilians-Universitat Munich, D-82152 Martinsried-Planegg,
Germany
*Correspondence: [email protected] 10.1016/j.neuron.2010.11.029
SUMMARY
Unbiasedmethods to assess the firing activity of indi-vidual neurons in the neocortex have revealed thata large proportion of cells fire at extremely low rates(<0.1 Hz), both in their spontaneous and evokedactivity. Thus, firing in neocortical networks appearsto be dominated by a small population of highly activeneurons. Here, we use a fosGFP transgenic mouse toexamine the properties of cellswith a recent history ofelevated activity. FosGFP-expressing layer 2/3 pyra-midal cells fired at higher rates compared to fosGFP�
neurons, both in vivo and in vitro. Elevated activitycould be attributed to increased excitatory and de-creased inhibitory drive to fosGFP+ neurons. Paired-cell recordings indicated that fosGFP+ neurons hada greater likelihood of being connected to each other.These findings indicate that highly active, intercon-nected neuronal ensembles are present in theneocortex and suggest these cells may play a role inthe encoding of sensory information.
INTRODUCTION
Neocortical neurons are differentially recruited by network
activation. Individual neurons show more than ten-fold variation
in stimulus-driven and spontaneous firing output with most cells
exhibiting extremely low or no firing activity (Margrie et al., 2002;
Brecht et al., 2003; Petersen et al., 2003; de Kock et al., 2007;
Hromadka et al., 2008; but see Vijayan et al., 2010). The reasons
underlying the disparity in neocortical firing rates are unclear. It
may be that over minutes to hours, mean firing rates across
different neocortical neurons become similar, or the disparity in
firing rates might be a stable feature of neurons within the
network. In this case, the underlying explanation for a more
active neural subset might be higher intrinsic excitability or
stronger synaptic connectivity. Regardless, the existence of
a highly active subset of neurons has important implications for
the processing and encoding of sensory or motor information.
Detailed analysis of the cellular and network properties of this
Ne
more active neuronal subset has been hampered by an inability
to reliably identify and record from these cells.
It has long been noted that a subset of neocortical neurons
express the immediate-early gene (IEG) c-fos under basal condi-
tions, a property that has been ascribed to the recent, experi-
ence-dependent activation of these cells. Indeed, fos expression
is induced by elevated neuronal firing (Sagar et al., 1988), where
expression levels peak 30–60 min after stimulation and decline
to baseline 2–4 hr later. Thus, fos has beenwidely used as an indi-
catorofneuronalactivity (reviewedbyGall et al., 1998).To facilitate
the identification and analysis of neurons exhibiting expression of
this activity-dependent transcription factor under basal, unstimu-
lated conditions,weemployeda transgenicmouse that expresses
GFP under the control of the c-fos promoter (Barth et al., 2004).
Because fosGFP requires several hours following its induction to
become fluorescent, it serves as a marker for neurons that have
undergone a prior period of elevated activity in vivo. Thus, analysis
of fosGFP-expressing neurons may help elucidate the principles
by which active neural subsets are established and maintained.
Targeted recordings in vivo reveal that expression of the IEG
c-fos in fosGFP transgenic mice is associated with elevated
spontaneous firing activity compared to neighboring, fosGFP�
neurons in layer 2/3 of primary sensory cortex. In vitro analysis
confirmed this and demonstrated that higher firing rates could
not be attributed to elevated intrinsic excitability but rather to
increased excitatory and reduced inhibitory drive, specifically in
the context of network activity. In addition, we find that fosGFP+
neurons are highly interconnected within the layer 2/3 network.
Thus, IEG expression marks a highly active and intercon-
nected subnetwork of neurons that is stable over time periods
of at least many hours. These findings suggest that the preferen-
tial activation of specific neuronal ensembles in vivo is not
stochastically generated at any instant in time but is determined
by synaptic interconnectivity of a specific cell subset and that an
identifiable subset of highly active cells is likely to play an impor-
tant role in the representation of information in the neocortex.
RESULTS
FosGFP+ Cells Show High Spontaneous Firing ActivityIn VivoTo determine whether fosGFP expression was correlated with
elevated spontaneous firing activity in vivo, targeted juxtacellular
uron 68, 1043–1050, December 22, 2010 ª2010 Elsevier Inc. 1043
I
E
D
G 1
2/3
4
5
6
H
0.0
0.2
0.4
0.6
0.81.41.5
Firin
g ra
te (H
z)
fosGFP- fosGFP+
0.0
0.1
0.2
0.3
0.4
Firin
g ra
te (H
z)
fosGFP- fosGFP+
20 mV20 s 1s
J
*
0
5
10
15
20
25
30
Nor
mal
ized
firin
g ra
te
---------------------------------------
F
fosGFP
1
2/3
4
5
6
A B
fos-IR
C
0.4 mV13 s40 ms
*
0
5
10
15
Nor
mal
ized
firin
g ra
te*
*
---------------------------------------
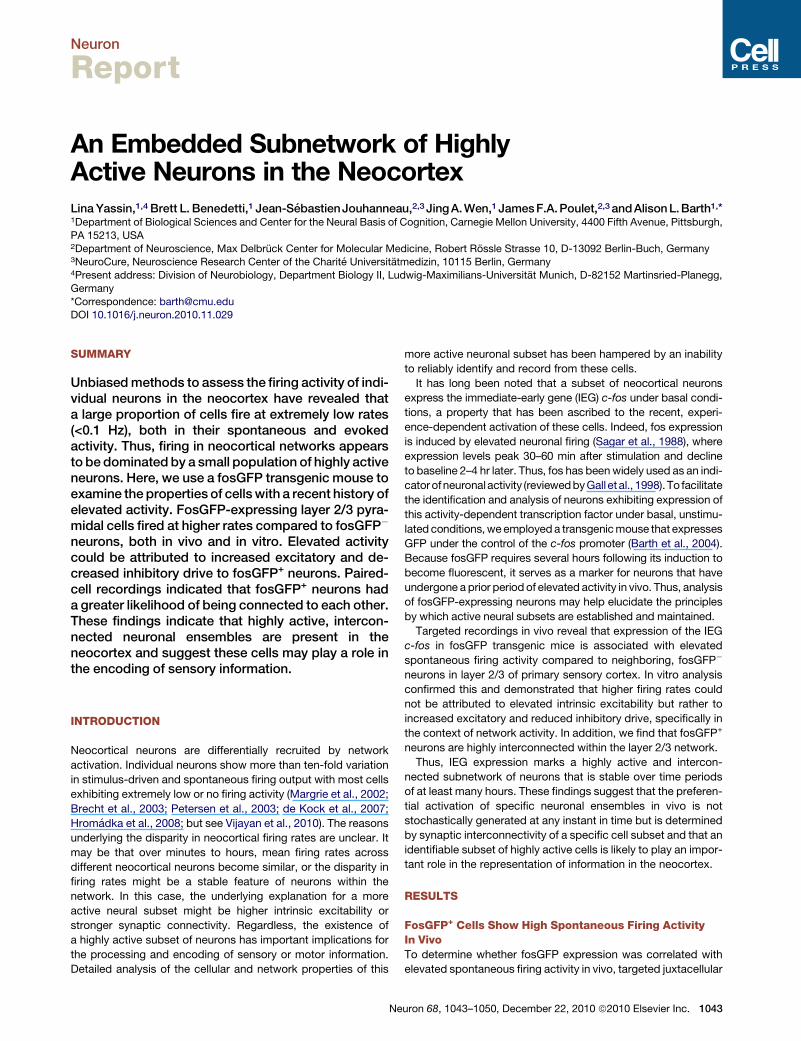
Figure 1. Fos-Expressing Pyramidal Neurons in Layer 2/3 Exhibit
Higher Spontaneous Firing Rates In Vivo
(A) Fos-IR from wild-type animals.
(B) Intrinsic fluorescence from fosGFP transgenic animals. Scale = 100 mm.
(C) (Top) In vivo fosGFP expression in layer 2/3 barrel cortex. (Middle) Dual
electrode recording setup in vivo, where cell bodies are visualized by
‘‘shadows’’ created by the red fluorescent dye Alexa 568. (Bottom) Overlay
of images. Asterisks indicate electrode positions. Scale = 20 mm.
(D) Example trace from a simultaneously recorded juxtacellular fosGFP�
(black) and fosGFP+ (green) pair. Top traces were filtered and offset for clarity;
inset below shows a detail from (d) above.
Neuron
Subnetwork of IEG-Expressing Neurons in Neocortex
1044 Neuron 68, 1043–1050, December 22, 2010 ª2010 Elsevier Inc
recordings were carried out in fosGFP+ and fosGFP� cell pairs
within layer 2/3 of primary somatosensory (barrel) cortex of anes-
thetized animals. Under basal, unstimulated conditions, the
percentage of both fos-immunoreactive neurons in wild-type
(Figure 1A) and fosGFP+ neurons in transgenic animals (Fig-
ure 1B) was similar across different neocortical areas, (�15%
of layer 2/3 cells; see Figure S1 available online).
Two-photon imaging of GFP expression combined with local
illumination of cell bodies using a red fluorescent dye (shadow
patching; Kitamura et al., 2008) enabled identification of fosGFP+
and fosGFP� neurons (Figure 1C). A great deal is known about
neurons in this layer with respect to local network properties
(Feldmeyer et al., 2006; Wang et al., 2006; Kapfer et al., 2007;
Adesnik and Scanziani, 2010), their activity during perception
and ability to drive behavior (Kerr et al., 2007; Houweling and
Brecht, 2008; Huber et al., 2008; Poulet and Petersen, 2008;
Gentet et al., 2010) and their capacity for experience-dependent
plasticity (Glazewski and Fox, 1996; Allen et al., 2003; Celikel
et al., 2004; Clem et al., 2008); as such they offer a strong entry
point for analyses of neocortical networks.
Targeted neurons were 185 ± 46 mm from the pial surface (n =
12 pairs), andwere located 38.6 ± 19 mmapart (n = 7 pairs; not all
pairsmeasured). As in previous studies, firing rates across simul-
taneously recorded cell pairs varied substantially (range 0.017–
1.43 Hz). However, expression of the immediate-early gene
fosGFP was a strong predictor of a cell having a higher overall
firing rate compared to neighboring, unlabeled cells (Figures
1D and 1E; firing rate for simultaneously recorded fosGFP� cells
0.099 ± 0.2 Hz versus fosGFP+ cells 0.25 ± 0.4 Hz, n = 12, p =
0.03). On average, fosGFP+ cells fired at �2.5-fold higher rates
compared to fosGFP� cells (Figure 1F).
Thus, fosGFP expression is predictive of neurons with
elevated firing activity in vivo. Because of the well-characterized
delay between induction of fos expression and intrinsic GFP fluo-
rescence, these data suggest that highly active neuronal subsets
may be stable for hours in vivo.
FosGFP+ Neurons Fire More Ex VivoTo carry out a detailed mechanistic analysis of the cellular and
synaptic basis of this increased firing within fosGFP+ neurons,
we examined whether fosGFP expression was correlated with
elevated spontaneous firing activity for layer 2/3 pyramidal
neurons in acute brain slices, using paired-cell recordings.
Spontaneous network activity at levels comparable to what
was observed in vivo was facilitated by bathing slices in a low-
divalent ACSF solution (Sanchez-Vives and McCormick, 2000;
Maffei et al., 2004; Shruti et al., 2008). Targeted cells were in
(E) Scatter plot showing firing rates for each recorded pair, mean firing rates
are also plotted.
(F) Firing rates of fosGFP� cells normalized to paired fosGFP+ firing rate as
mean (bar) and scatter (points). Dotted line represents ratio of one.
(G) (Left) Recording setup for dual whole-cell recordings in layer 2/3 pyramidal
neurons in acute slices. Scale = 200 mm. (Right-Top) FosGFP expression
in vitro. (Middle) Alexa 568 filled fosGFP� and fosGFP+ neurons after
recording. (Bottom) Overlay of images. Scale = 50 mm.
(H) Example trace from fosGFP� (black) and fosGFP+ (green) pair.
Conventions in (I) and (J) as in (E) and (F).
.
A B
--------------------------- 0.0 0.1 0.2 0.3 0.4 0.50
2
4
6
8
10
Num
ber o
f eve
nts
Epoch onset for fosGFP- cells (s)
F
C D
E
10 s1 s
20 mV
Epo
ch fr
eque
ncy
(Hz)
Spi
kes/
Epo
ch0
2
4
6
8
10
12
134 149 1818 0.00
0.01
0.02
0.03
0.04
0.05
**
fosGFP0
2
4
6
8
10
8983 9 9 0.00
0.01
0.02
0.03
0.04
0.05
Spi
kes/
Epo
ch
Epo
ch fr
eque
ncy
(Hz)**
arcGFP
0.1 s
20 mV
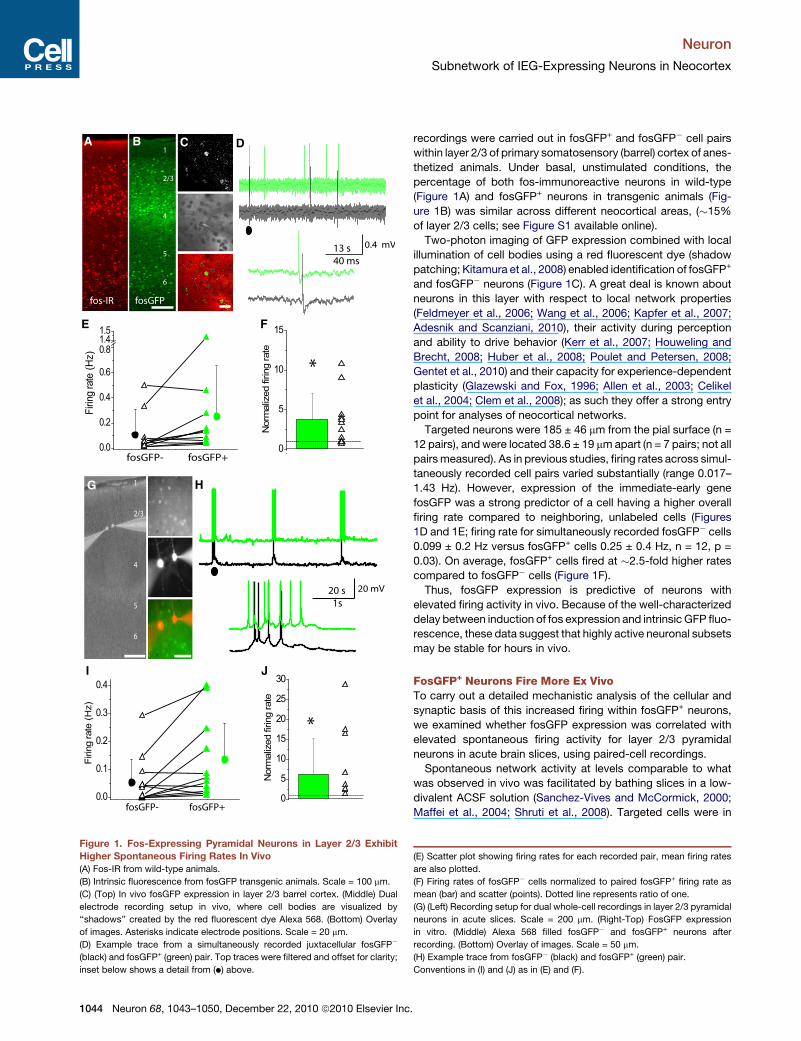
Figure 2. IEG-ExpressingNeurons Fire at Higher Frequencies during
Network Activity
(A and B) Spontaneous firing activity from a pair of simultaneously-recorded
fosGFP� and fosGFP+ neurons (A) and arcGFP� and arcGFP+ neurons (B).
Traces have been offset for clarity. Inset below (d) shows higher temporal reso-
lution of firing.
(C) The number of spikes per epoch was significantly different for fosGFP�
(black) and fosGFP+ (green) cells (n = number of epochs for each group).
The frequency of depolarizing epochs for simultaneously recorded fosGFP+
and fosGFP� cells is similar (p = 0.14).
(D) Same as in (C) but for arcGFP� (black) and arcGFP+ (green) cells.
(E) Example traces showing depolarizing epochs begin earlier for fosGFP+
cells (dotted line) compared to simultaneously-recorded fosGFP� cells.
(F) Histogram of the timing of epoch onset for a representative subset of
fosGFP� cells relative to fosGFP+ cells. Epoch onset times for fosGFP� cells
are shifted later (0 = time of epoch onset for fosGFP+ cells; green arrow).
Neuron
Subnetwork of IEG-Expressing Neurons in Neocortex
midlayer 2/3 (232 ± 41 mm depth from pia, n = 26 cells; 45.5 ±
17 mm apart; n = 13 cell pairs).
Because fosGFP expression is not induced by slice prepara-
tion (Barth et al., 2004), the stimulus responsible for induction
of fosGFP expression was likely to have occurred at least several
hours prior to tissue preparation. Ex vivo, fosGFP+ cells main-
tained significantly higher rates of overall firing activity compared
to neighboring fosGFP� cells (Figures 1G and 1H; firing rate for
simultaneously recorded fosGFP� cells 0.050 ± 0.08 Hz versus
fosGFP+ cells, 0.12 ± 0.14 Hz, n = 13, p = 0.01) . Elevated firing
rates in fosGFP+ cells could be observed for many hours (3+)
after slice preparation and did not decline over the recording
session.
In wild-type animals, mean firing rates of individually recorded
neurons were similar to those of fosGFP� neurons (Figure S1;
0.103 ± 0.023 Hz, n = 30, p = 0.9). However, a subset of wild-
type neurons exhibited high firing rates comparable to those
observed in fosGFP+ cells, suggesting that this subset is present
in wild-type animals but can be uniquely visualized in fosGFP
transgenic mice.
FosGFP+ Neurons Fire Earlier and More Often duringNetwork ActivityIn both our experiments and others’ (Steriade et al., 1993;
Sanchez-Vives and McCormick, 2000; MacLean et al., 2005),
spontaneous firing in neocortical neurons ex vivo tends to occur
during epochs of depolarization, similar to what has been termed
Upstates in vivo. Although the precise trigger for these events is
unknown, epochs are observed in both neurons that fire
frequently and those that do not fire at all, where they appear
as prolonged subthreshold events (Figure 2). Are fosGFP+
neurons differentially recruited during these epochs of network
activity?
FosGFP+ cells fired more spikes during a depolarizing epoch
compared to fosGFP� cells, although epoch duration was iden-
tical (fosGFP� 2.7 ± 0.17 s, n = 134 epochs over 18 cells, versus
fosGFP+ 2.7 ± 0.14 s, n = 149 epochs over 18 cells, p = 0.8).
FosGFP+ cells showed significantly more spikes per epoch
(s/e) than simultaneously recorded, neighboring fosGFP� cells
(Figure 2C; fosGFP� 3.61 ± 0.47 s/e; fosGFP+ 9.8 ± 1.1 s/e,
p < 0.01).
Epoch frequency (including subthreshold depolarizations) was
not significantly increased in fosGFP+ cells (Figure 2C; fosGFP�
cells 0.035 ± 0.007 Hz; fosGFP+ cells 0.034 ± 0.007 Hz, p = 0.26),
indicating that network activity can engage both cell
populations.
Identification of High-Firing Neurons using Expressionof an Alternate IEGTo verify that the elevated spontaneous firing activity observed in
fosGFP+ neurons was not due to expression of the fosGFP trans-
gene, a second strain of transgenic mice expressing GFP under
the control of the arc/arg3.1 promoter was analyzed (GENSAT
BAC transgenic resource, Rockefeller University; Gong et al.,
2003). Similar to fosGFP+ neurons, arcGFP+ neurons tended to
fire more than arcGFP� neurons within a cell pair (Figure 2B
and data not shown; mean overall firing rate, arcGFP� 0.23 ±
0.21 Hz versus arcGFP+ 0.32 ± 0.14 Hz; n = 9 pairs, p = 0.07).
Ne
Like fosGFP+/� cell pairs, the frequency of depolarizing epochs
was identical, and arcGFP+ neurons showed significantly more
spikes/epoch than arcGFP� cells (Figure 2D; arcGFP� 6.4 ±
0.7 s/e, n = 83 epochs over 9 cells versus arcGFP+ 8.1 ± 0.6 s/e,
n = 89 epochs over 9 cells, p = 0.003). On average, arcGFP+ cells
fired 2.5-fold more than arcGFP� cells, a significant difference
(p = 0.04). Although values from arcGFP+ neurons were more
variable compared to fosGFP+ neurons, it is remarkable that
the basic observations made in both transgenic mice are so
similar. Thus, it is unlikely that the increased firing activity char-
acterized in fosGFP+ neurons is due to expression of the fosGFP
transgene.
uron 68, 1043–1050, December 22, 2010 ª2010 Elsevier Inc. 1045
A E
5 pA10 ms
10 pA1 s
5 pA50 ms
20 pA1 s
C
F
G
D
B
H
2
3
4
5
6
1.0
1.5
2.0
2.5
3.0
Pai
red
sEP
SC
freq
uenc
y (H
z)
0
1
2
3
4
IPSC
freq
uenc
y (H
z)
0
4
8
12
16
EP
SC
am
plitu
de (p
A)
spontaneous +TTX0.0
0.5
1.0
1.5
2.0
7EP
SC
freq
uenc
y (H
z)
13
*
0
10
20
30
IPS
C a
mpl
itude
(pA
) *
spontaneous +TTX
spontaneous +TTX
spontaneous +TTX
Pai
red
sIP
SC
freq
uenc
y (H
z)* **
13
1313
1313
13137
77 77
77
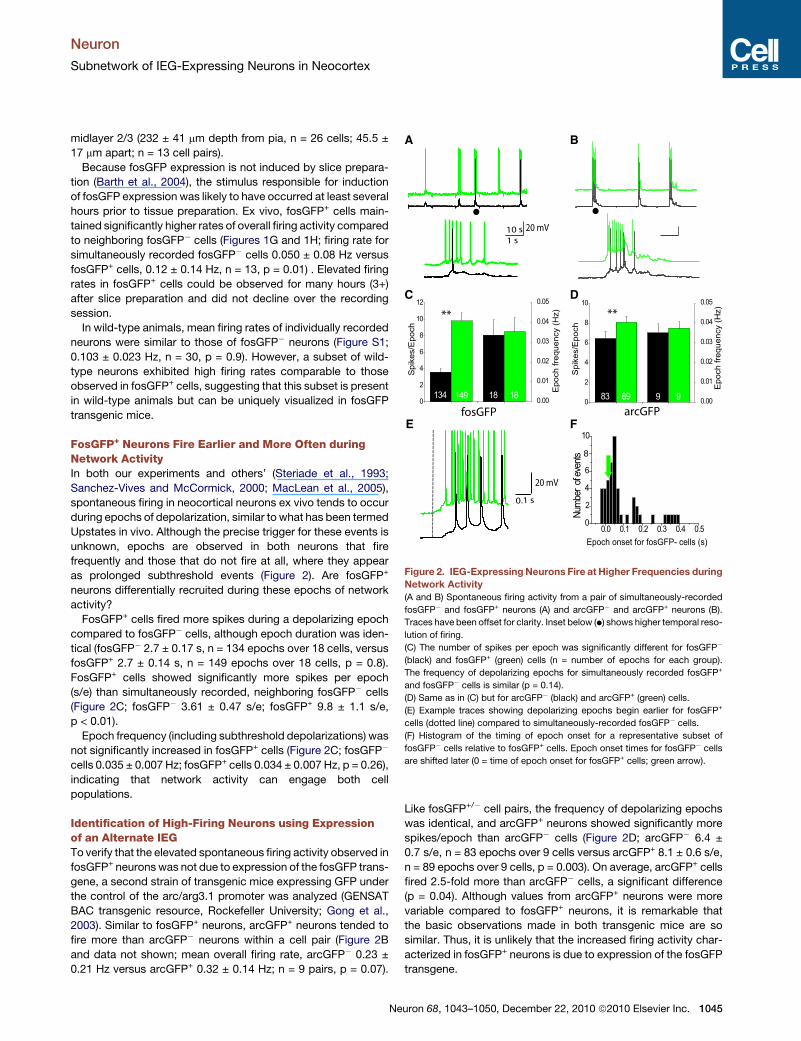
Figure 3. FosGFP+ Neurons Receive Increased Excitatory and
Decreased Inhibitory Synaptic Drive during Network Activity
(A) Sample traces of sEPSCs for fosGFP� (black) and fosGFP+ (green) individ-
ually recorded neurons. Inset shows mean sEPSC from representative
fosGFP� and fosGFP+ cells.
(B) Mean sEPSC (spontaneous) and mEPSC (+TTX) amplitude in fosGFP�
(black) and fosGFP+ (green) neurons. Number of cells indicated in bar.
(C) As in (B) but for sEPSC and mEPSC frequency.
(D) Scatter plot for sEPSC frequency from simultaneously-recorded fosGFP�
and fosGFP+ neurons. Group mean ±SEM are plotted as solid circles. n = 7
pairs.
(E) As in (A) but for sIPSCs in fosGFP� and fosGFP+ individually recorded
neurons. Inset shows mean sIPSC from representative fosGFP� and fosGFP+
cells.
(F) As in (B) but for sIPSC and mIPSC amplitude.
(G) As in (C) but for sIPSC and mIPSC frequency.
(H) As in (D), but for sIPSC frequency from simultaneously recorded fosGFP�
and fosGFP+ neurons. n = 7 pairs.
Neuron
Subnetwork of IEG-Expressing Neurons in Neocortex
Network Activity Rapidly Engages FosGFP+ NeuronsSimultaneous recordings of fosGFP+ and fosGFP� cells enabled
a direct comparison of cell engagement during an epoch of
network activity. We found that fosGFP+ neurons were recruited
into a depolarizing epoch significantly earlier than fosGFP�
neurons (Figures 2E and 2F; mean onset timing for fosGFP�
was 67.3 ± 27 ms after onset in fosGFP+ cells; n = 48 epochs
over 9 cell pairs; p < 0.001). Thus, although spontaneous network
activity engages both cell types, fosGFP+ cells are activated
earlier and are more likely to fire during a depolarizing epoch.
FosGFP+ Neurons Show Reduced Intrinsic ExcitabilityWhy do fosGFP-expressing neurons display elevated sponta-
neous firing activity? One explanation is that these neurons
show greater intrinsic excitability (i.e., depolarized resting
membrane potential, action potential [AP] threshold, or input
resistance). However, comparison between fosGFP+ and
fosGFP� cells showed that these properties were identical
between groups (Table S1).
To evaluate intrinsic excitability, input-output curves were
constructed, using constant current injection to elicit firing (Fig-
ure S2). FosGFP+ cells requiredmore current to generate a single
spike (mean rheobase current fosGFP� 37.12 ± 1.6 pA versus
fosGFP+ 45.6 ± 2.99 pA, n = 16 for both; p = 0.02) and exhibited
fewer spikes at all levels of current injection compared to
fosGFP� cells (Figure S2). AP threshold for fosGFP+ and
fosGFP� cells was similar, despite the finding that fosGFP+ cells
required more current to spike. This suggests that other voltage-
dependent, spike-delaying conductances are differentially regu-
lated in fosGFP+ neurons. However, increased spontaneous
activity in fosGFP+ neurons is unlikely to result from cell-intrinsic
electrophysiological properties.
FosGFP+ Cells Receive Increased Excitatoryand Reduced Inhibitory DriveUnder our recording conditions, spontaneous activity in layer 2/3
neurons requires synaptic input since it is abolished in the pres-
ence of GABA- and glutamate receptor antagonists (Shruti et al.,
2008). To examine whether fosGFP+ neurons receive differential
synaptic drive, the frequency and amplitude of postsynaptic
currents (PSCs) during spontaneous network activity was
analyzed.
Although the amplitude of spontaneous excitatory PSCs
(sEPSCs) was similar between fosGFP+ and fosGFP� neurons,
fosGFP+ neurons showed a significantly greater sEPSC
frequency (Figures 3A–3C; sEPSC frequency fosGFP� 1.3 ±
0.2 Hz versus fosGFP+ 1.7 ± 0.2 Hz; n = 13 cells for both; p =
0.001), a finding further confirmed by paired-cell recordings
(Figure 3D).
FosGFP+ neurons showed a significantly reduced amplitude
of spontaneous inhibitory PSCs (sIPSCs; Figures 3E and 3F;
fosGFP� 24 ± 3 pA versus fosGFP+ 19 ± 2 pA; p = 0.02), although
frequency was not significantly different (Figure 3G; frequency
fosGFP� 3.1 ± 0.5 Hz versus fosGFP+ 2.6 ± 0.5 Hz; p = 0.3).
Paired-cell recordings show a significant reduction in sIPSC
frequency for fosGFP+ cells (Figure 3H). These data indicate
that fosGFP+ neurons receive both more excitation and less inhi-
bition during spontaneous network firing.
1046 Neuron 68, 1043–1050, December 22, 2010 ª2010 Elsevier Inc
To determine whether this difference in excitatory and inhibi-
tory input would be maintained in the absence of spiking, minia-
ture EPSCs and IPSCs (mEPSCs and mIPSCs) were assessed in
.
0
3
6
9
12
0/220/271/52 6/58
% c
onne
cted
cel
ls
0/55
A B C
ED
WTWT
5 mV50 mV
0.2 s
?
0.0
0.5
1.0
1.5
Nor
mal
ized
EPS
P fre
quen
cy **
WTWT
----------------------------------------------
0.2 s
5 mV
* * *
* * *
* *
* *
*
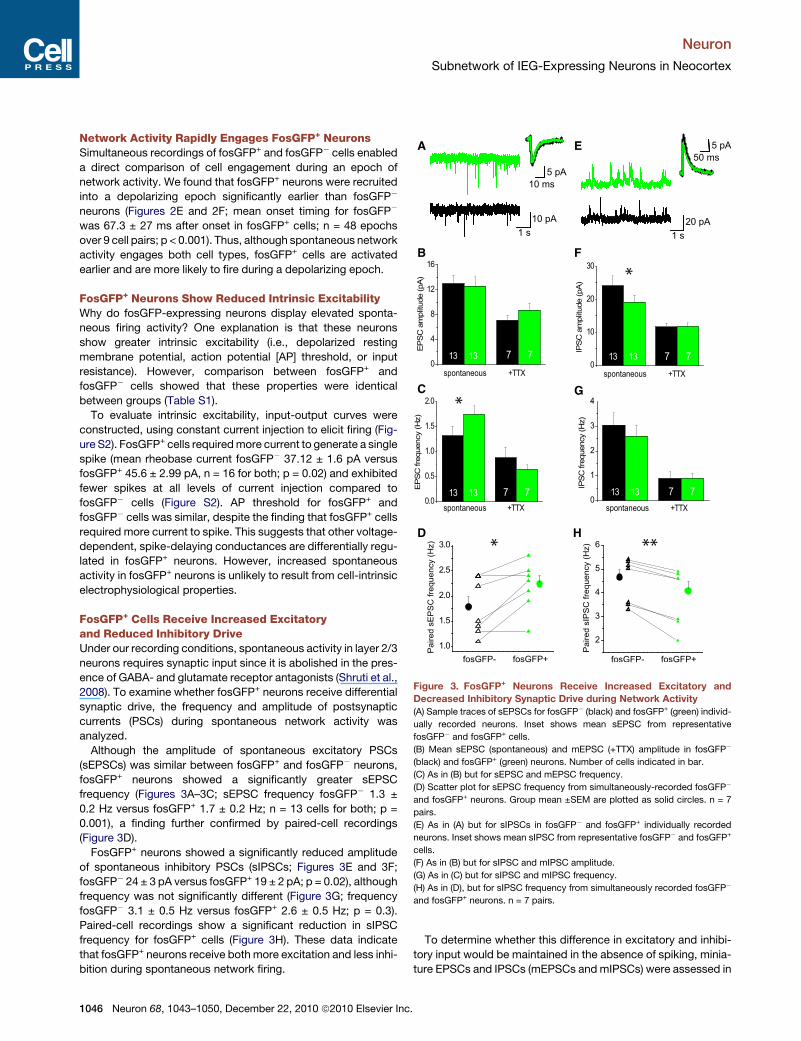
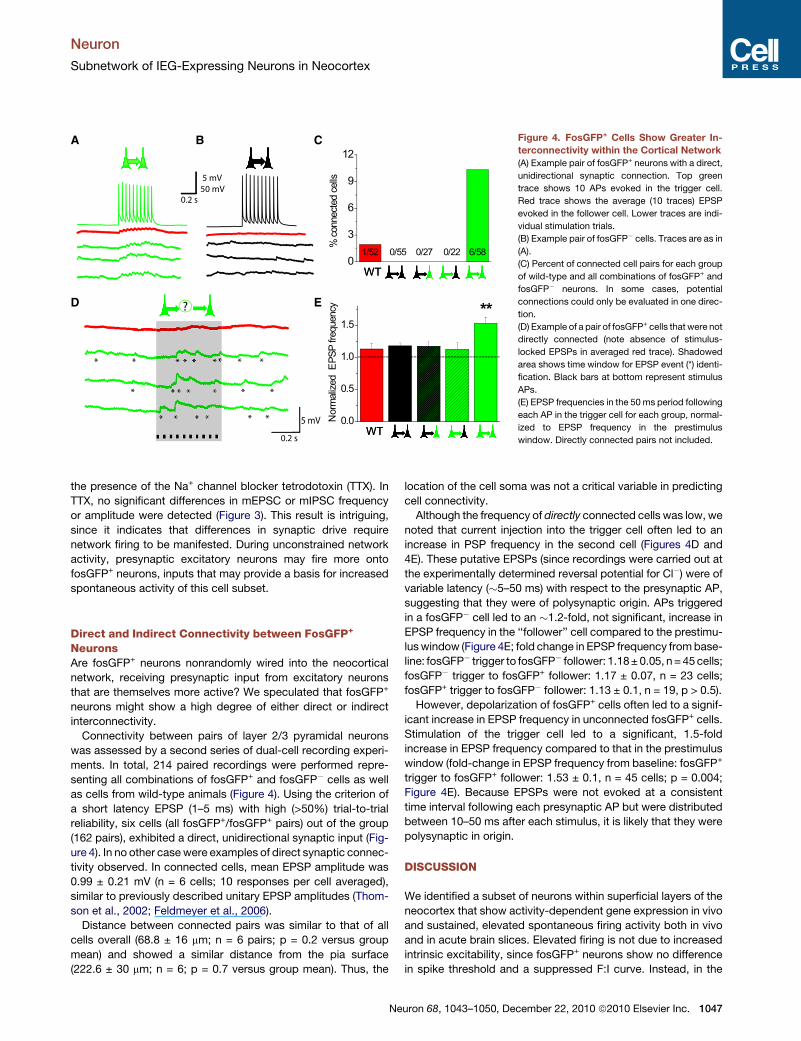
Figure 4. FosGFP+ Cells Show Greater In-
terconnectivity within the Cortical Network
(A) Example pair of fosGFP+ neurons with a direct,
unidirectional synaptic connection. Top green
trace shows 10 APs evoked in the trigger cell.
Red trace shows the average (10 traces) EPSP
evoked in the follower cell. Lower traces are indi-
vidual stimulation trials.
(B) Example pair of fosGFP� cells. Traces are as in
(A).
(C) Percent of connected cell pairs for each group
of wild-type and all combinations of fosGFP+ and
fosGFP� neurons. In some cases, potential
connections could only be evaluated in one direc-
tion.
(D) Example of a pair of fosGFP+ cells that were not
directly connected (note absence of stimulus-
locked EPSPs in averaged red trace). Shadowed
area shows time window for EPSP event (*) identi-
fication. Black bars at bottom represent stimulus
APs.
(E) EPSP frequencies in the 50 ms period following
each AP in the trigger cell for each group, normal-
ized to EPSP frequency in the prestimulus
window. Directly connected pairs not included.
Neuron
Subnetwork of IEG-Expressing Neurons in Neocortex
the presence of the Na+ channel blocker tetrodotoxin (TTX). In
TTX, no significant differences in mEPSC or mIPSC frequency
or amplitude were detected (Figure 3). This result is intriguing,
since it indicates that differences in synaptic drive require
network firing to be manifested. During unconstrained network
activity, presynaptic excitatory neurons may fire more onto
fosGFP+ neurons, inputs that may provide a basis for increased
spontaneous activity of this cell subset.
Direct and Indirect Connectivity between FosGFP+
NeuronsAre fosGFP+ neurons nonrandomly wired into the neocortical
network, receiving presynaptic input from excitatory neurons
that are themselves more active? We speculated that fosGFP+
neurons might show a high degree of either direct or indirect
interconnectivity.
Connectivity between pairs of layer 2/3 pyramidal neurons
was assessed by a second series of dual-cell recording experi-
ments. In total, 214 paired recordings were performed repre-
senting all combinations of fosGFP+ and fosGFP� cells as well
as cells from wild-type animals (Figure 4). Using the criterion of
a short latency EPSP (1–5 ms) with high (>50%) trial-to-trial
reliability, six cells (all fosGFP+/fosGFP+ pairs) out of the group
(162 pairs), exhibited a direct, unidirectional synaptic input (Fig-
ure 4). In no other casewere examples of direct synaptic connec-
tivity observed. In connected cells, mean EPSP amplitude was
0.99 ± 0.21 mV (n = 6 cells; 10 responses per cell averaged),
similar to previously described unitary EPSP amplitudes (Thom-
son et al., 2002; Feldmeyer et al., 2006).
Distance between connected pairs was similar to that of all
cells overall (68.8 ± 16 mm; n = 6 pairs; p = 0.2 versus group
mean) and showed a similar distance from the pia surface
(222.6 ± 30 mm; n = 6; p = 0.7 versus group mean). Thus, the
Ne
location of the cell soma was not a critical variable in predicting
cell connectivity.
Although the frequency of directly connected cells was low, we
noted that current injection into the trigger cell often led to an
increase in PSP frequency in the second cell (Figures 4D and
4E). These putative EPSPs (since recordings were carried out at
the experimentally determined reversal potential for Cl�) were of
variable latency (�5–50 ms) with respect to the presynaptic AP,
suggesting that they were of polysynaptic origin. APs triggered
in a fosGFP� cell led to an �1.2-fold, not significant, increase in
EPSP frequency in the ‘‘follower’’ cell compared to the prestimu-
luswindow (Figure 4E; fold change in EPSP frequency frombase-
line: fosGFP� trigger to fosGFP� follower: 1.18±0.05, n=45cells;
fosGFP� trigger to fosGFP+ follower: 1.17 ± 0.07, n = 23 cells;
fosGFP+ trigger to fosGFP� follower: 1.13 ± 0.1, n = 19, p > 0.5).
However, depolarization of fosGFP+ cells often led to a signif-
icant increase in EPSP frequency in unconnected fosGFP+ cells.
Stimulation of the trigger cell led to a significant, 1.5-fold
increase in EPSP frequency compared to that in the prestimulus
window (fold-change in EPSP frequency from baseline: fosGFP+
trigger to fosGFP+ follower: 1.53 ± 0.1, n = 45 cells; p = 0.004;
Figure 4E). Because EPSPs were not evoked at a consistent
time interval following each presynaptic AP but were distributed
between 10–50 ms after each stimulus, it is likely that they were
polysynaptic in origin.
DISCUSSION
We identified a subset of neurons within superficial layers of the
neocortex that show activity-dependent gene expression in vivo
and sustained, elevated spontaneous firing activity both in vivo
and in acute brain slices. Elevated firing is not due to increased
intrinsic excitability, since fosGFP+ neurons show no difference
in spike threshold and a suppressed F:I curve. Instead, in the
uron 68, 1043–1050, December 22, 2010 ª2010 Elsevier Inc. 1047
Neuron
Subnetwork of IEG-Expressing Neurons in Neocortex
context of network activity, fosGFP+ neurons receive greater
excitation and less inhibition compared to neighboring, fosGFP�
cells. Dual-cell recordings reveal that fosGFP+ neurons are more
effective at driving recurrent activity in the neocortical network
than fosGFP� neurons, suggesting that fos-expressing cells
show a higher frequency of both direct and indirect connections
to each other than to fosGFP� cells. Compared to neighboring
cells, these neurons are preferentially activated during epochs
of network depolarization. Based upon the delay between induc-
tion of IEG expression, GFP fluorescence, and targeted record-
ings, fosGFP+ neurons appear to be maintained as a coactive
ensemble over the course of many hours.
Activity as a Parameter to Define Cell FunctionDespite the fact that layer 2/3 pyramidal neurons have been
considered to be a relatively homogeneous cell population, it
is well established that in vivo firing rates among these cells
can vary more than ten-fold. Similarly, it has long been noted
that a subset of neurons in the neocortex exhibit expression
of the activity-dependent gene c-fos even under basal condi-
tions. Here we show that a history of immediate-early gene
expression is an indicator of elevated spontaneous firing activity
in a subpopulation of layer 2/3 pyramidal neurons. Whether
elevated activity is a cause or an effect of activated IEG expres-
sion, these data indicate that some neurons disproportionately
contribute to the propagation of neocortical activity. It has
recently been proposed that a single extra spike within
a neocortical neuron might be capable of driving dozens of
spikes in its synaptically connected partners (London et al.,
2010), and indeed, under some conditions stimulation of a single
neurons can alter global network activity (Li et al., 2009) and
perception (Houweling and Brecht, 2008). Based upon this
finding, we propose that fosGFP+ neurons may drive or propa-
gate network activity and information transfer across brain
areas.
What Drives Firing and IEG Expression in the ActiveSubnetwork?Is sensory input required to drive fosGFP expression and indi-
rectly, the increased spontaneous firing activity of these cells?
Our preliminary analysis suggests this is not the case. Bilateral
removal of all large facial vibrissae for 24 hr did not eliminate or
even noticeably reduce fosGFP expression in layer 2/3. In
addition, paired-cell recordings showed that fosGFP+ cells
maintained elevated firing activity in sensory-deprived tissue
(data not shown). Although it is possible that whisker removal
is not sufficient to get rid of all afferent activity, these data
suggest that sensory input is not required for fosGFP expression
or elevated spontaneous firing. The question of whether these
cell assemblies are generated from internal neocortical
dynamics or are constructed by information from the periphery
(Kenet et al., 2003; MacLean et al., 2005; Golshani et al., 2009)
is of great interest.
Nonrandom Distribution of Activity across NeocorticalNetworksIt has been suggested that the population of neurons exhibiting
both high and low levels of activity are unstable and drift over
1048 Neuron 68, 1043–1050, December 22, 2010 ª2010 Elsevier Inc
timescales ranging from seconds to minutes (Ikegaya et al.,
2004; Kerr et al., 2007; Mokeichev et al., 2007). Our data indicate
that the firing output of a cell is muchmore conserved than previ-
ously estimated. Due to the time course of fosGFP expression,
which requires at least 2–3 hr to become fluorescently visible,
we conclude that a subpopulation of neurons exhibits specific
network connectivity, driving elevated activity that can be main-
tained for at least 4–7 hr.
Homeostasis of neuronal firing rates is a powerful concept that
has guided current thinking about how neurons respond to
perturbations in firing output (Turrigiano and Nelson, 2000).
The reduction in intrinsic excitability in fosGFP+ cells may be
a homeostatic adjustment to limit participation of these neurons
in positive feedback loops that might otherwise lead to epileptic-
like activity. This may be an intermediate step in hobbling highly
active cells, in order to make way for a new population of cells to
step in and take their place; alternatively, the suppressed input-
output function may represent a new set-point for a stable
subset of highly-active neurons.
Subnetwork of Highly Active NeuronsIt has been controversial whether there is structure that repeats
itself during episodes of spontaneous activity. The search for
recurrent motifs of activity has been evaluated at the levels of
patterns of EPSCs received by a single cell or in the temporal
pattern of spikes in neurons across epochs of activity (Ikegaya
et al., 2004, 2008; Luczak et al., 2007; Mokeichev et al., 2007).
Previous analyses may have inadvertently focused on the
specific temporal dynamics of these motifs, when in fact the
precise sequence of neuronal activation is less conserved than
the particular cells that are recruited over time. In other words,
the singers may be more conserved than the song.
Although the absolute number of neurons that exhibited
a direct synaptic connection was low, it is notable that in all
cases synaptically connected pairs were fosGFP+ neurons
receiving input from other fosGFP+ neurons. Consistent with
this, other studies have shown that coactive neurons are more
likely to share strong synaptic connections (Yoshimura et al.,
2005).
Implications for Information TransmissionNeurons transform synaptic input into spikes, and it is well
accepted that the information encoded by a cell is determined
almost exclusively by its firing output. Neurons that fire more
are thus likely to convey more information within a neural circuit.
In addition, neurons that fire earlier during a stimulus are thought
to convey more information than neurons firing later (Johansson
and Birznieks, 2004; VanRullen et al., 2005). Although it has been
disputed whether rate codes or timing codes are more impor-
tant, fosGFP+ cells show both a higher rate of firing and earlier
recruitment during network activation and as such their spikes
may carry more information than other neurons.
These data do not resolve the questions of whether neural
activity leads to the development of a synaptically connected
cell assembly (i.e., neural activity is the independent variable)
or whether this population of fos-expressing neurons is develop-
mentally specified (and neural activity might be the dependent
variable linking this subpopulation). However, the dynamic
.
Neuron
Subnetwork of IEG-Expressing Neurons in Neocortex
network properties of these cells indicate that a subpopulation of
highly active neuronsmay dominate the way information is trans-
mitted across the neocortex. Because these cells may constitute
the neural substrate of ‘‘sparse coding’’ in the cerebral cortex
(Wolfe et al., 2010), it will be of great interest to evaluate the
role of these highly active neurons in the representation of
sensory input during normal experience as well as during condi-
tions that evoke plasticity.
EXPERIMENTAL PROCEDURES
In Vivo Recording
Surgical Procedures
Mice P13–23 were urethane-anesthetized (1.2 g/kg), and a small (1–2 mm)
cranial window was created over the barrel cortex. All in vivo experimental
procedures were in accordance with national regulation and institutional
guidelines and follow previously described methods (Crochet and Petersen,
2006; Glazewski et al., 2007).
Electrophysiology and Imaging
Juxtacellular, loose patch recordings were performed with glass microelec-
trodes. Internal solution contained 50 mm Alexa 594 for shadow patching
(Kitamura et al., 2008). For imaging, the laser was tuned to 930 nm for GFP
visualization or 820 nm for Alexa 594 emission during electrode positioning.
Analysis
To verify that electrodes could detect APs from a target, cells were only
included in the analysis if they fired at least once during the recording period.
Firing rates were calculated over �300+ s.
In Vitro Recording
Brain Slice Preparation
Coronal or thalamocortical brain slices (350 mm thick) from mice P12–P15
(wild-type C57Bl6, fosGFP heterozygotes, or arcGFP heterozygotes) were
prepared. Slices were recovered in regular ACSF at 35�C for 30 min and main-
tained at room temperature in low-divalent ACSF (0.5 mM MgSO4, 1 mM
CaCl2, 3.5 mM KCl).
Whole-Cell Recording of Evoked and Spontaneous Activity
Spiny, pyramidal layer 2/3 neurons in primary somatosensory cortex were tar-
geted for recording based upon fosGFP+/� expression. Internal pipette solu-
tion contained a K-gluconate internal solution (Supplemental Experimental
Procedures). Because the whole-cell recording configuration unambiguously
indicated that a single neuron was targeted for recording, pairs in which one
cell did not exhibit any firing (0 Hz) were included in analysis of whole-cell
recordings.
Evoked Firing
APs were elicited by injection of minimal current (using 20, 60, 80 pA steps),
and trials that yielded a single AP were used for analysis. AP threshold,
peak, and half-width (threshold to peak) were determined using custom-
written Igor Pro macros.
Spontaneous Firing
Spontaneous firing activity was collected where Vrest was maintained
at �50 mV to normalize differences in resting potential between cells, a tech-
nique that did not appreciably alter firing rates (data not shown). Onset and
offset of synchronized network activity were determined using membrane
potential mean and standard deviation over 500 ms, with a 10 ms sliding
window (Gerkin et al., 2010).
Connectivity Analysis
Cells were maintained at their normal resting potential, which was approxi-
mately �60 mV, the experimentally determined reversal potential for Cl�.One cell was assigned as the trigger cell and a series of 10 pulses (500 pA,
5 ms duration) at 20 Hz were delivered across 20 separate trials. Bidirectional
connectivity was assessed sequentially for each pair. Spontaneous EPSP
frequency was calculated in the 500 ms time window preceding the stimulus,
and evoked EPSP frequency was calculated across the 10-pulse series
including 50 ms after the last pulse (500 ms total).
Ne
m- and sPSC Analysis
Cells were held at�60 mV for EPSC isolation (the Cl� reversal potential.) Cells
were held at +10 mV to isolate IPSCs.
Statistical Analysis
All values are mean ± SEM unless otherwise indicated. Where data were nor-
mally distributed, t tests were used. For nonnormal distributions, a two-tailed
Mann-Whitney test for individual comparisons was used.
SUPPLEMENTAL INFORMATION
Supplemental Information includes two figures, one table, and Supplemental
Experimental Procedures and can be found with this article online at doi:10.
1016/j.neuron.2010.11.029.
ACKNOWLEDGMENTS
This work was supported by the NIH DA0171-88 (A.L.B.), the Alexander von
Humboldt Foundation (A.L.B.), NeuroCure (A.L.B. and J.F.A.P.), the Deutsch
Forschung Gemeinshaft (Exc 257; J.F.A.P.), the Swiss-German Research
Unit ‘‘Barrel Cortex Function’’ (SNF-DFG FOR 1341; J.F.A.P.) and the Max-
Delbruck Center-Berlin (J.F.A.P.). Thanks to Kazuo Kitamura for help with
fosGFP imaging in vivo and Rick Gerkin for custom Igor Pro macros. Thanks
also to Jesse Sheehan, Jill Guy, and Joanne Steinmiller for animal care, and
Michael Brecht and members of the Barth, Urban, and Crowley laboratories
for helpful discussions. A.L.B. is the author of a patent covering the fosGFP
transgenic mice.
Accepted: October 11, 2010
Published: December 21, 2010
REFERENCES
Adesnik, H., and Scanziani, M. (2010). Lateral competition for cortical space by
layer-specific horizontal circuits. Nature 464, 1155–1160.
Allen, C.B., Celikel, T., and Feldman, D.E. (2003). Long-term depression
induced by sensory deprivation during cortical map plasticity in vivo. Nat.
Neurosci. 6, 291–299.
Barth, A.L., Gerkin, R.C., and Dean, K.L. (2004). Alteration of neuronal firing
properties after in vivo experience in a FosGFP transgenic mouse.
J. Neurosci. 24, 6466–6475.
Brecht, M., Roth, A., and Sakmann, B. (2003). Dynamic receptive fields of
reconstructed pyramidal cells in layers 3 and 2 of rat somatosensory barrel
cortex. J. Physiol. 553, 243–265.
Celikel, T., Szostak, V.A., and Feldman, D.E. (2004). Modulation of spike timing
by sensory deprivation during induction of cortical map plasticity. Nat.
Neurosci. 7, 534–541.
Clem, R.L., Celikel, T., and Barth, A.L. (2008). Ongoing in vivo experience trig-
gers synaptic metaplasticity in the neocortex. Science 319, 101–104.
Crochet, S., and Petersen, C.C. (2006). Correlating whisker behavior with
membrane potential in barrel cortex of awakemice. Nat. Neurosci. 9, 608–610.
de Kock, C.P., Bruno, R.M., Spors, H., and Sakmann, B. (2007). Layer- and
cell-type-specific suprathreshold stimulus representation in rat primary
somatosensory cortex. J. Physiol. 581, 139–154.
Feldmeyer, D., Lubke, J., and Sakmann, B. (2006). Efficacy and connectivity of
intracolumnar pairs of layer 2/3 pyramidal cells in the barrel cortex of juvenile
rats. J. Physiol. 575, 583–602.
Gall, C.M., Hess, U.S., and Lynch, G. (1998). Mapping brain networks engaged
by, and changed by, learning. Neurobiol. Learn. Mem. 70, 14–36.
Gentet, L.J., Avermann, M., Matyas, F., Staiger, J.F., and Petersen, C.C.
(2010). Membrane potential dynamics of GABAergic neurons in the barrel
cortex of behaving mice. Neuron 65, 422–435.
Gerkin, R.C., Clem, R.L., Shruti, S., Kass, R.E., and Barth, A.L. (2010). Cortical
up state activity is enhanced after seizures: A quantitative analysis. J. Clin.
Neurophysiol 27, 425–432.
uron 68, 1043–1050, December 22, 2010 ª2010 Elsevier Inc. 1049
Neuron
Subnetwork of IEG-Expressing Neurons in Neocortex
Glazewski, S., and Fox, K. (1996). Time course of experience-dependent
synaptic potentiation and depression in barrel cortex of adolescent rats.
J. Neurophysiol. 75, 1714–1729.
Glazewski, S., Benedetti, B.L., and Barth, A.L. (2007). Ipsilateral whiskers
suppress experience-dependent plasticity in the barrel cortex. J. Neurosci.
27, 3910–3920.
Golshani, P., Goncalves, J.T., Khoshkhoo, S., Mostany, R., Smirnakis, S., and
Portera-Cailliau, C. (2009). Internally mediated developmental desynchroniza-
tion of neocortical network activity. J. Neurosci. 29, 10890–10899.
Gong, S., Zheng, C., Doughty,M.L., Losos, K., Didkovsky, N., Schambra, U.B.,
Nowak, N.J., Joyner, A., Leblanc, G., Hatten, M.E., and Heintz, N. (2003).
A gene expression atlas of the central nervous system based on bacterial arti-
ficial chromosomes. Nature 425, 917–925.
Houweling, A.R., and Brecht, M. (2008). Behavioural report of single neuron
stimulation in somatosensory cortex. Nature 451, 65–68.
Hromadka, T., Deweese, M.R., and Zador, A.M. (2008). Sparse representation
of sounds in the unanesthetized auditory cortex. PLoS Biol. 6, e16.
Huber, D., Petreanu, L., Ghitani, N., Ranade, S., Hromadka, T., Mainen, Z., and
Svoboda, K. (2008). Sparse optical microstimulation in barrel cortex drives
learned behaviour in freely moving mice. Nature 451, 61–64.
Ikegaya, Y., Aaron, G., Cossart, R., Aronov, D., Lampl, I., Ferster, D., and
Yuste, R. (2004). Synfire chains and cortical songs: temporal modules of
cortical activity. Science 304, 559–564.
Ikegaya, Y., Matsumoto, W., Chiou, H.Y., Yuste, R., and Aaron, G. (2008).
Statistical significance of precisely repeated intracellular synaptic patterns.
PLoS ONE 3, e3983. 10.1371/journal.pone.0003983.
Johansson, R.S., and Birznieks, I. (2004). First spikes in ensembles of human
tactile afferents code complex spatial fingertip events. Nat. Neurosci. 7,
170–177.
Kapfer, C., Glickfeld, L.L., Atallah, B.V., and Scanziani, M. (2007). Supralinear
increase of recurrent inhibition during sparse activity in the somatosensory
cortex. Nat. Neurosci. 10, 743–753.
Kenet, T., Bibitchkov, D., Tsodyks, M., Grinvald, A., and Arieli, A. (2003).
Spontaneously emerging cortical representations of visual attributes. Nature
425, 954–956.
Kerr, J.N., de Kock, C.P., Greenberg, D.S., Bruno, R.M., Sakmann, B., and
Helmchen, F. (2007). Spatial organization of neuronal population responses
in layer 2/3 of rat barrel cortex. J. Neurosci. 27, 13316–13328.
Kitamura, K., Judkewitz, B., Kano, M., Denk, W., and Hausser, M. (2008).
Targeted patch-clamp recordings and single-cell electroporation of unlabeled
neurons in vivo. Nat. Methods 5, 61–67.
Li, C.Y., Poo,M.M., and Dan, Y. (2009). Burst spiking of a single cortical neuron
modifies global brain state. Science 324, 643–646.
London, M., Roth, A., Beeren, L., Hausser, M., and Latham, P.E. (2010).
Sensitivity to perturbations in vivo implies high noise and suggests rate coding
in cortex. Nature 466, 123–127.
Luczak, A., Bartho, P., Marguet, S.L., Buzsaki, G., and Harris, K.D. (2007).
Sequential structure of neocortical spontaneous activity in vivo. Proc. Natl.
Acad. Sci. USA 104, 347–352.
1050 Neuron 68, 1043–1050, December 22, 2010 ª2010 Elsevier Inc
MacLean, J.N., Watson, B.O., Aaron, G.B., and Yuste, R. (2005). Internal
dynamics determine the cortical response to thalamic stimulation. Neuron
48, 811–823.
Maffei, A., Nelson, S.B., and Turrigiano, G.G. (2004). Selective reconfiguration
of layer 4 visual cortical circuitry by visual deprivation. Nat. Neurosci. 7, 1353–
1359.
Margrie, T.W., Brecht, M., and Sakmann, B. (2002). In vivo, low-resistance,
whole-cell recordings from neurons in the anaesthetized and awake mamma-
lian brain. Pflugers Arch. 444, 491–498.
Mokeichev, A., Okun, M., Barak, O., Katz, Y., Ben-Shahar, O., and Lampl, I.
(2007). Stochastic emergence of repeating cortical motifs in spontaneous
membrane potential fluctuations in vivo. Neuron 53, 413–425.
Petersen, C.C., Hahn, T.T., Mehta, M., Grinvald, A., and Sakmann, B. (2003).
Interaction of sensory responses with spontaneous depolarization in layer
2/3 barrel cortex. Proc. Natl. Acad. Sci. USA 100, 13638–13643.
Poulet, J.F.A., and Petersen, C.C. (2008). Internal brain state regulates
membrane potential synchrony in barrel cortex of behaving mice. Nature
454, 881–885.
Sagar, S.M., Sharp, F.R., and Curran, T. (1988). Expression of c-fos protein in
brain: Metabolic mapping at the cellular level. Science 240, 1328–1331.
Sanchez-Vives, M.V., and McCormick, D.A. (2000). Cellular and network
mechanisms of rhythmic recurrent activity in neocortex. Nat. Neurosci. 3,
1027–1034.
Shruti, S., Clem, R.L., and Barth, A.L. (2008). A seizure-induced gain-of-func-
tion in BK channels is associated with elevated firing activity in neocortical
pyramidal neurons. Neurobiol. Dis. 30, 323–330.
Steriade, M., Nunez, A., and Amzica, F. (1993). A novel slow (< 1 Hz) oscillation
of neocortical neurons in vivo: depolarizing and hyperpolarizing components.
J. Neurosci. 13, 3252–3265.
Thomson, A.M., West, D.C., Wang, Y., and Bannister, A.P. (2002). Synaptic
connections and small circuits involving excitatory and inhibitory neurons in
layers 2-5 of adult rat and cat neocortex: Triple intracellular recordings and
biocytin labelling in vitro. Cereb. Cortex 12, 936–953.
Turrigiano, G.G., and Nelson, S.B. (2000). Hebb and homeostasis in neuronal
plasticity. Curr. Opin. Neurobiol. 10, 358–364.
VanRullen, R., Guyonneau, R., and Thorpe, S.J. (2005). Spike times make
sense. Trends Neurosci. 28, 1–4.
Vijayan, S., Hale, G.J., Moore, C.I., Brown, E.N., and Wilson, M.A. (2010).
Activity in the barrel cortex during active behavior and sleep.
J. Neurophysiol. 103, 2074–2084.
Wang, K.H., Majewska, A., Schummers, J., Farley, B., Hu, C., Sur, M., and
Tonegawa, S. (2006). In vivo two-photon imaging reveals a role of arc in
enhancing orientation specificity in visual cortex. Cell 126, 389–402.
Wolfe, J., Houweling, A.R., and Brecht, M. (2010). Sparse and powerful cortical
spikes. Curr. Opin. Neurobiol. 20, 306–312.
Yoshimura, Y., Dantzker, J.L., and Callaway, E.M. (2005). Excitatory cortical
neurons form fine-scale functional networks. Nature 433, 868–873.
.