an assessment of poultry feeds and feeding - citeseerx
TRANSCRIPT

i
BINDURA UNIVERSITY OF SCIENCE EDUCATION
FACULTY OF AGRICULTURE AND ENVIRONMENTAL SCIENCE
DEPARTMENT OF ANIMAL SCIENCE
AN ASSESSMENT OF POULTRY FEEDS AND FEEDING REGIMES, THEIR EFFECTS ON GROWTH PERFORMANCE
OF BROILERS IN URBAN AND PERI URBAN AREAS OF HARARE.
TOPODZI JONATHAN
B1130171
A THESIS SUBMITTED IN PARTIAL FULFILMENT FOR THE
REQUIREMENTS OF THE BACHELOR OF AGRICULTURAL SCIENCE
HONOURS DEGREE IN ANIMAL SCIENCE
BINDURA UNIVERSITY OF SCIENCE EDUCATION.
2014
ii
AN ASSESSMENT OF POULTRY FEEDS AND FEEDING REGIMES, THEIR EFFECTS ON GROWTH PERFOMANCE OF BROILERS IN URBAN AND PERI URBAN AREAS OF HARARE.
BY TOPODZI JONATHAN (B 1130171)
A thesis submitted to the
Department of Animal Science
Faculty of Agriculture and Environmental Science
Bindura University of Science Education
In fulfillment for the degree
BACHELOR OF AGRICULTURAL SCIENCE HONOURS IN ANIMAL SCIENCE
Approved by the department of Agriculture:
Mr. Washaya J. S (Main Supervisor) …………………………………………………….
Mr. Chikwanda A. T (Joint Supervisor)…………………………………………………..
iii
ABSTRACT A study was done on the feed types and feeding systems used by urban small holder poultry farmers in Harare. Adoption of commercial feeds was also assessed. A structured questionnaire was used to collect data including the demographic data of the farmers, chicken production related data, feeding systems related, feed production sources data and the flock healthy related data.
During interviews, feed samples were also collected and were tested for CP and CF using both dry and wet chemistry methods. Effects of variations on CP and CF for feeds from different production sources on weight at day 42 were assessed using linear regression model using Statistical Package for Social Sciences (SPSS) version 16.0. There was a significant difference on the weights obtained at day 42 between farmers using home-made and commercial diets (p<0.05) on Cobb 500, Hubbard and Ross chicks. Results from tests done showed that commercial feeds had higher CP values and lower CF values compared to home-made irrespective of the analysis method used. It was concluded that ingredients used in home-made diets should be analysed, their inclusion levels should be monitored, formulas they use should be revised, mixing procedures should be improved and essential amino acids, minerals and vitamins should be incorporated into home-made diets for them to perform as commercial feeds.
On effects of feeding regimes, there was significant difference on weight obtained by farmers using different feeding phases (p<0.05) for all the 3 breeds. The mean weight of birds on 2 and 3 phase feeding were significantly different from those on 4 phases (p<0.05). It was concluded that choice between 2 and 3 phase maybe based on cost, meat quality as their mean weight difference was not significant. The farmers were advised to start using 4 phase as it improves weight at day 42.
The adoption of commercial feeds was also assessed where farmers using home-made diets were the non-adopters. The binary logistic model was used to rank the independent factors or the predictor factors on predicting the adoption of commercial feeds. Sex, age and education were ranked as predictors of adoption using the odds ratios [Exp (B) > 0] and their B coefficient values showed that they were significant in predicting adoption (B>0). Marital status and density were also amongst the predictors in adoption of commercial feeds using odds ratios [Exp (B) > 0] but their B coefficient values showed that they were insignificant predictors (B<0). Religion have no relationship in predicting the adoption of commercial diets [Exp (B) = 0] and the B coefficient showed that it’s an insignificant predictor (B<0). It was therefore concluded that to improve the adoption of commercial feeds, males and those who have attained form 4 should be targeted as they have contributed more to odds ratios in predicting the adoption of commercial diets. In addition, though marital status, religion and density were not significant predictors, more emphasis can be done on married people, Christians and those living in high density suburbs as they were the most dominant groups doing urban poultry production.

iv
DEDICATION
To
Topodzi family

v
ACKNOWLEDGEMENTS
I would like to express my deep and sincere gratitude to my main supervisor Mr. S.J. Washaya
and my joint supervisor Mr. A.T. Chikwanda for their encouragements, constructive positive
criticisms and guidance. Their advice, patience, assignments and assistance in coming up with
this thesis is worth to be appraised.
In the Animal Science department, I would like to express my sincere thanks to my lecturers,
Mr M. Dhliwayo, Mr C. Mangwiro and Mr K. Kunaka for their suggestions and improvements.
Amongst my classmates and friends, I would like to thank Mr Akbar Mutasa and Mr Tinashe
Chipondeni for their ideas and contributions in coming up with this research document.
My warmest regards goes to Mr. T.S Topodzi, Ms P.B. Machingauta and Ms J. Topodzi for
assisting me in conducting the surveys in different locations within Harare. I would also like
to thank Mr. S. Musamba, the former sales manager and the nutritionist of National Foods as
one of my key informants as far as recent information on feeds is concern. Their contributions,
efforts and patience in collecting the data needed for this research deserves to be respected.
The relationships, friendships, efforts and time consumed by farmers, feed manufacturing sales
persons during the interviews and sampling deserve to be mentioned. In addition, would also
like to thank National Foods Aspindale laboratory and its supervisor Ms. F. Mandipa as well
as all the analysts, for allowing me to do my chemical analyses on the samples collected. Their
contribution in terms of data collection is of much importance as far as progress of this research
was concern.
Above all, I thank the Almighty Lord for His intervention, for His wisdom and guidance as
well as remaining my pillar of strength in all my academic endeavours.
LIST OF FIGURES
vi
Figure 2.1 Basic needs of a broiler………………………………………….………….10
LIST OF TABLES
Table 2.1 A vaccination programme followed in Zimbabwe………….………………..13
Table 2.2 Standards requirement of nutrients in 2 phases…………………………..…..15
Table 2.3 Protein and energy targets of broilers following 3 phases……………………16
Table 2.4 The 4 phase and average amount of feed expected to be consumed………….17
Table 2.5 Nutrition composition in the four phases……………………………………..17
Table 2.6 The Provimi five phase feeding system………………………………………18
Table 3.1 Stock feeds depots…………………………………………………………….25
Table 4.1 Average nutritive values of samples collected………………………………..31
Table 4.2 Average CDM weights attained at day 42 using different feed sources...……33
Table 4.3 Mean live weight at day 42 using different feeding phases…………………...36
Table 4.4 Ranked predictors from the binary logistic regression……………….…..38
LIST OF APPENDICES APPENDIX 1: Questionnaire on poultry producers in Harare …………………………….47 APPENDIX 2: Table showing effects of feed source and CP, CF on weight at day 42……51 APPENDIX 3: Table showing effects of feed sources and analysis method on the CP and CF content of the feed…………………………………………………………………………...52 APPENDIX 4: Table showing effects of phases on weight at day 42……………………….52 APPENDIX 5: Table showing the significances of mean differences between phases……..52 APPENDIX 6: Table showing the predictor variables of adoption………………………….53
LIST OF ACRONYMS AOAC = Association of Official Analytical Chemists
CDM = Cold Dry Mass
vii
CSO = Central Statistic Office
CP = crude protein
CF = crude fibre
FAO = Food and Agricultural Organization
GDP = Gross Domestic Product
NRC = National Research Council
SMA = Stockfeed Manufacturer Association
USA = United States of America
GALT = gut associated lymphoid tissue
GMO = genetically modified organisms
RUIF = Resource Centres on Urban Agriculture and Food security
NIR = Near Infrared Reflectance
NRC = National Research Council
SPSS = Statistical Package for Social Sciences
SMA = Stockfeeds Manufacturer Association
ITK = Indigenous Technical Knowledge
ZPA = Zimbabwe Poultry Association
Table of Contents
ABSTRACT ............................................................................................................................................... iii
DEDICATION ........................................................................................................................................... iv
ACKNOWLEDGEMENTS ........................................................................................................................... v
viii
LIST OF FIGURES ...................................................................................................................................... v
LIST OF TABLES ....................................................................................................................................... vi
LIST OF APPENDICES .............................................................................................................................. vi
LIST OF ACRONYMS ................................................................................................................................ vi
CHAPTER ONE ....................................................................................................................................... 10
1.0 INTRODUCTION ............................................................................................................................... 10
1.1 Background to the Study ............................................................................................................. 10
1.2 Problem statement ..................................................................................................................... 12
1.3 Justification of study ................................................................................................................... 12
1.4 Main objective ............................................................................................................................ 13
1.4.1 Specific objectives ................................................................................................................ 13
1.5 Hypotheses ................................................................................................................................. 13
CHAPTER TWO ...................................................................................................................................... 14
2.0 REVIEW OF LITERATURE .................................................................................................................. 14
2.1 Introduction to Broiler Production ............................................................................................. 14
2.2 Keys Aspects to Successful Broiler Production. .......................................................................... 17
2.2.1 Advantages of broiler production over other livestock species. ......................................... 17
2.2.2 Characteristics of a good broiler site. .................................................................................. 18
2.2.3 Preparation of placement of chicks ..................................................................................... 18
2.2.4 Health management ............................................................................................................ 20
2.3 Feeding Schemes and Regimes in Broiler Production ................................................................ 22
2.3.1 Two phase programme ........................................................................................................ 24
2.3.2 Three phase programme ...................................................................................................... 24
2.3.3 Four phase programme........................................................................................................ 25
2.3.4 Five phase programme ........................................................................................................ 26
2.4 Broiler Diets and Products .......................................................................................................... 27
2.4.1 Pre-Starter Products ............................................................................................................ 27
2.4.2 Broiler Starter Feeds ............................................................................................................ 28
2.4.3 Broiler Grower Feeds ........................................................................................................... 29
2.4.4 Broiler Finisher Feeds ........................................................................................................... 29
2.5 Feed Resources Used By Small Holder Farmers.......................................................................... 30
2.5.1 Soybean seeds ...................................................................................................................... 30
2.5.2 Sunflower seeds ................................................................................................................... 31
2.5.3 Wheat bran .......................................................................................................................... 32
ix
2.5.4 Maize meal and maize germ ................................................................................................ 32
2.5.5 Sorghum seeds ..................................................................................................................... 33
CHAPTER 3 ............................................................................................................................................ 33
3.0 MATERIALS AND METHODOLOGY .................................................................................................. 33
3.1 Study Area ................................................................................................................................... 33
3.2 Experimental design .................................................................................................................... 34
3.3 Sampling procedure .................................................................................................................... 34
3.4 Measurements ............................................................................................................................ 35
3.5 Data collection ............................................................................................................................ 35
3.5.1 Chemical analysis ................................................................................................................. 35
3.5.2 Questionnaire survey on feeding regimes ........................................................................... 38
3.5.3 Questionnaire survey on adoption of commercial diets ..................................................... 38
CHAPTER 4 ............................................................................................................................................ 39
RESULTS AND DISCUSSION.................................................................................................................... 39
CHAPTER 5 ............................................................................................................................................ 49
5.0 CONCLUSION AND RECOMMENDATIONS ....................................................................................... 49
5.1 Conclusion ................................................................................................................................... 49
5.2 Recommendations ...................................................................................................................... 50
CHAPTER 6 ............................................................................................................................................ 51
6.0 REFERENCES AND APPENDICES ....................................................................................................... 51
6.1 References .................................................................................................................................. 51
6.2 Appendices .................................................................................................................................. 55
10
CHAPTER ONE
1.0 INTRODUCTION
1.1 Background to the Study
Livestock production makes significant contribution to the national Gross Domestic Product in
Zimbabwe, amounting to US$357 million in 2012 (Central Statistics Office, 2012). It is also a
source of employment, manure, household income, protein and many view it as a part time
activity (Zimbabwe Poultry Association, 2012). Small stock also contribute to food security,
improve human health through a more varied diet, alleviate poverty, contribute to the
empowerment of women, children, the sick, disabled as well as other marginalized groups
and it gives value to local feedstuffs that are normally not suitable for direct consumption by
people (Mack et al., 2009 and Drakakis et al., 1995). Small animals have high rates of
productivity and offer opportunities for regular cash inflow throughout the year. They ensure
optimum use of the means of land, labour and capital. They can make excellent use of
farm and industrial by-products (Jensen and Askov, 2009).
There is a growing need for feeding the growing urban population resulting from rural to urban
migration in Zimbabwe (RUIF foundation, 2007). The requirement for animal protein has
increased and has seen many urban people venturing into poultry production. The relevance of
chicken has also increased owing to escalating beef prices that has seen many opting for
chicken (Zimbabwe Poultry Association, 2012). Moreover, the business can easily be
intensified and hence occupying little space reducing the complications for it to be done in
urban areas. Naturally Zimbabweans are pro-agricultural and hence their desire for keeping
poultry seems to be a mandate (Mlambo, 2000). An increase in the unemployment rate in urban
areas makes poultry industry an important enterprise as it improves the lives of unemployed
people. RUIF foundation (2007) added that the implementation of urban agriculture (UA) in
Bulawayo is envisaged to alleviate poverty and provide food security for the Bulawayo urban
community.
Small scale poultry production in urban areas of Zimbabwe has undergone major changes over
the past decade adopting numerous scientific technologies in nutrition and health, vis-à-vis
biotechnology. In nutrition, the use of additives such as enzymes, inoculants, antibiotics,
11
minerals and vitamins that are designed to improve digestion, live weight gain, liveability and
reproductive performance have been adopted (Creswell, 2005). Others have started to
formulate their own diets (Musamba, personal communication). Feeds in Zimbabwe are
divided into two sources namely conventional (2, 3 and 4-phases) and home-made diets by
utilising cereals and oil seed meals. The effects of adding additives like growth and intake
stimulants continue to be debated in terms of human health (FAO, 2012). In poultry production,
improved nutrition and health were identified as major pillars explaining the rise in productivity
growth on studies on constraints affecting poultry competitiveness (Sukume, 2011).
Nutrition has remained a cost of economic importance to small scale farmers as it now
swallowing up to 80% of the total broiler costs (Mpofu, 2004). In Zimbabwe, most farmer have
been concentrating on conventional feeds that includes prestarter, starter, grower and finisher
diets though some of the farmers have started formulating their own feeds. Ready-to-feed
commercial diets are becoming increasingly expensive due to the effects of recurrent droughts
which reduce maize production (Dhliwayo, 2011). This decrease in maize production leads to
an increase in the price due to a sharp rise in demand, as maize is also a staple crop to many
families (Dhliwayo, 2011).According to Sonaiya (2011) small scale poultry producers have
used simple ingredients such as wheat bran, maize germ meal, soya meal, sunflower meal,
crushed maize and limestone flour in their feed formulations. Luis et al. (2004) added that other
small holder use raw soya beans, sunflower seeds, sorghum seeds and maize grain in
supplementing their broilers though he argued that they will not supplement enough nutrients
for broiler requirements.
The two and three phase feeding systems have been widely used in Zimbabwe and were proved
efficient by achieving 1.6kg and 1.8kg cold dry mass (CDM) at 6 weeks (Poultry site, 2011).
However, other large poultry farmers have already started using the four phase programme
where chicks are given prestarter crumbles from day one until day ten before proceeding to
starter crumbles. Irvines’ Zimbabwe as one of the big companies using the four phase, it have
achieved 1.65kg in 28 days arguing that this regime produces birds with tender meat and
accepted by many customers especially the food outlets and hotels (Irvine’s, 2011). The
performance of broilers has been associated with lower grower rates for small holder farmers
as proposed by breeders. Despite the fact that poultry production is increasing, there is an
apparent increase in the level of feeds being re-processed after reaching their expiry dates in
depots (Feed Matters, 2013). This is puzzling, given that day old chick producers claim that
12
there is an increase in the number of clients who are now into chicken production (Zimbabwe
Poultry Association of Zimbabwe, 2012), yet there is no corresponding statistics in stock feed
consumption from Feed Mills. There is need to assess where the majority of the chicken farmers
(65 %), who are small scale urban chicken producers obtain their feed or what they are using
to feed their chickens and categorising the phase they prefer.
The use of different poultry feeds and poultry regimes have raised debates in relation to their
effects on growth rates and mortality rates in broilers (Pond et al., 2005). In dealing with these
issues, wise decisions on choosing a feeding regime to use and farmers ability to follow
instructions for that regime were emphasised in the Ross manual (2007). Feed Matters (2011)
added that three phase system produces better growth rates as compared to two phases since it
produces enough proteins and energy for each level of growth.
1.2 Problem statement
Lower growth rate in broilers have been experienced by most smallholder farmers in Harare
(Musamba, personal communication). This is increasingly becoming more difficult to maintain
total feed consumption below 3.5kgs /35 days in order to reach an average of 1.8kg live weights
as proposed by most feed mills. Hence has increased the feed costs well above the expected
averages of 70-80% of total costs (Mpofu, 2004). As a way of improvising, other small holder
farmers have opted to use home-made rations (Musamba, personal communication). This has
also lead to the use of a wide array of conventional feeds with variations in nutritive values
from renowned suppliers and reprocessing of certain diets is now being experienced. In
addition, the use of non-conventional feeds with unknown nutritive values is increasing in
broiler smallholder farmers. Non-conventional feeds need to be documented and have their
nutritive values tested using standard procedures .Due to lack of adequate market; feed mills
have produced excessively large volumes of feed that is beyond the farmers’ consumption.
1.3 Justification of study
Low growth rates of broilers kept by urban smallholder broiler farmers are a serious cause for
concern. The broilers are taking too long to attain the required market weights. The urban
broiler farmers end up giving more feed to the broilers than what is normally consumed to
complete the cycle. As a result, feeding costs shoot up well above 70-80% averages. Some
farmers have therefore, have resorted to formulation of own feed to substitute commercial
feeds. Homemade feeds usually lack consistence in the available nutrients (Sonaiya, 2008).
13
Some farmers may not be knowledgeable on the nutritive values of the ingredients they use
and they are danger of compromised performance.
The question remains, why not attaining target weight set by breeders? This has raised the need
for collecting and analyzing raw materials as well as final feeds formulated by farmers. In a
bid to help quantify the causes of reduced weight gain, there is need to collect samples of
different feeds from different sources and use scientific procedures to observe their imperative
nutritive capacity. Nevertheless, there is need to verify whether possible variations on crude
protein and crude fibre of different marketed broiler feeds are causing variations on slaughter
weight at day 42. Reprocessing of feed is superficial in an economy with a booming broiler
industry. Hence, there is need to categorize the preferred feeding phase by the majority of urban
smallholder broiler producers and elucidate the reasons that might cause re-processing of
certain diets. Considerable dynamics of feeding phases can result in different nutritive values
and costs. Hence, weights at day 42 are varying. The outcome of this research might help
explain causes of reduced weight gain in broilers based on scientific analysis of feed types,
feeding materials and production sources. At the same time, the results can mitigate the reasons
behind increased reprocessing by feed producers as a way to increase efficiency.
1.4 Main objective
The main objective of the study is to assess the nutritive values of homemade feed stuffs and
compare them to commercial rations as well as determining their effects on broiler
performance.
1.4.1 Specific objectives
-To evaluate the nutritive composition (CP and CF) of different feed sources and their effects
on the 42 day weight of broilers.
-To assess the effects of using different feeding regimes on the weight of broilers at day 42
for Harare poultry producers.
-To assess the rationale behind farmer preferences and adoption of feed resources between
home-made and commercial diets.
1.5 Hypotheses
Null Hypothesis 1
There is no difference on the nutritive composition of different feed sources and their effects
on 42 day weight in broilers.

14
Null Hypothesis 2
There is no difference on weight at day 42 from broilers fed using different feeding regimes.
Null Hypothesis 3
There are reasons behind the adoption of either home-made or commercial diets
CHAPTER TWO
2.0 REVIEW OF LITERATURE
2.1 Introduction to Broiler Production
Chicken production in Zimbabwe comprises of keeping broilers, layers or indigenous chickens
(Mapiye et al., 2008). Broilers (Gallus gallus domesticus) are specially bred birds with the
15
ability to grow fast, they take more feed voluntarily, are quick at feathering, have a good
conformation, they are well covered with muscles and also convert feed very effectively
(Ugwu, 1990). Encyclopaedia Britannica (2007) added that in urban areas broilers are kept as
pets and are acting as a great tool for teaching youngsters responsibility by allowing them to
be actively involved in the process. Broilers in Zimbabwe are also kept as a source of protein,
income and as a part time activity by other people (ZPA, 2012).
In terms of poultry development, production rates in Zimbabwe have shown tremendous
recovery and growth from an all-time low in January 2009 with the adoption of multiple foreign
currencies (Central Statistics Office, 2012). The day old chick production in the first quarter of
2009 was 160 000/week and continued to show linear recovery to date (CSO, 2012). It was
added that day old chick production in 2010 averaged 721600/week, exceeding the previous
peak achieved in 2000 of 720 200/week. Day old chick production in the first nine months of
2011 exceeded production attained in 2010. The recovery and expansion has been spurred by
resuscitation and expansion of established breeders as well as entry of new breeders with a total
hatch capacity of 1 432 800 chicks/week.
In Zimbabwe three day old chick breeds are used namely Cobb 500 which are obtained from
Irvine’s, Hubbard flex at Hubbard breeders and Ross chicks which are obtained as Chinyika
chicks, Fivet chicks, Supa chicks, Charles Stewart’s Ross amongst others. The most common
stock feeds manufacturers includes Natfoods, Novatek, Profeeds, Windmill, Agrifoods, Capital
foods, R T feeds, Hyperfeeds, Feedmix, Bascom feeds and Fivet (Feed Matters, 2011). Despite
the presence of these feed manufacturers and day old chick suppliers in Zimbabwe, the market
demands for chicken are reaching up to 12 000 tonnes per month and hence local farmers are
failing to beat the demand. According to Zimbabwe Poultry Association (2012), the country is
allowing an import quota of up to 500mt per month from countries like South Africa, Brazil
and USA amongst others.
Poultry production presents an efficient alternative to meet animal protein needs of the nation
because of its rapid growth and short generation cycle (Luis et al., 2004). It has played a vital
role to meet the gap in animal protein supply at cost effective prices in Zimbabwe during the
last 3 decades. At present, the industry is facing feed crisis because of high cost of production
attributed to scarcity of cereal grains, high costs of importing non GMO soya from India and
Zambia as well as minerals, vitamins and amino acids from Germany (National Foods Article,
2013). The fact that feeding cost constitutes 70-80% of the total cost (Mpofu, 2004) and are
16
even increasing in broiler farming due to an increase in feeds is eroding the returns in broiler
production (Hubbard, 2013). Protein and energy are the major nutrients for poultry feed
formulation as their sources take up to 30% and 60% respectively in diet formulation formulas
(Creswell, 2005). When fed adlibitum from day old to finishing, broiler birds attain just above
2 kg live weight to reach 1.8kg CDM at about 6 weeks (Creswell, 2005). However, other
researchers recommended dietary restriction. They argue that restriction has the welfare
benefits of enhancing physical health (such as walking ability), increases growth rates by
compensatory growth, enables utilisation of excess fat and avoids their deposition, mitigates
metabolic disease and prolong lifespan as well as reducing cases of heart failure and ascites
[Richards et al. (2010), Darre, (2011) and Luis et al. (2004)].
The introduction of broilers in Zimbabwe is not well documented but is believed to have started
by a few large scales farmers well before independence (Kusina et al., 2001). Scoones et al.
(2012) argued that though broilers were kept at a very small scale in urban areas, the scale have
been increasing since independence and is still growing seeing 50% of day old chicks from
hatcheries being taken by small scale producers. Rose et al. (2007) also argue that broilers are
omnivorous animals that can be grown under intensive conditions and hence it’s possible to
keep them in urban areas. Feighner and Dashkevicz (2010) agreed that urban farmers are
concentrating more on typical broilers that have white feathers, yellowish skin than any other
breeds.
Lack of employment in the main cities of Zimbabwe have increased back-yard poultry
production in the lower middle-class hence acting as an instrument of social justice and poverty
alleviation (Mack et al., 2009). This has raised a need to evaluate the success of the urban
poultry and critically examine the poultry feeding materials and regimes to avoid unnecessary
losses by analysing the nutritive values of these feeds as well as strengthening decisions.
According to Lilburn (2007), raw materials like sunflower meal have been decorticated to
improve digestion and soya bean have been roasted to eliminate anti-nutritional factors. Mpofu
(2004) added that oil extraction of soya bean and cotton seed also generated heat that removes
the effects of anti-nutritional factors. Other small holder farmers are relying on home-made
rations though they don’t know the nutritive values of these feeds. Hence need for analysing
the feeds, identifying methods to improve digestibility and correct feeding programs remain in
isolation seeking attention at both small scale and commercial levels.
17
Feeds are usually analysed for CP and CF as well as calcium as they are growth determinants
and their levels regulate voluntary feed intake. In Zimbabwe feed analysis is done mainly using
two methods namely the dry and wet chemistry (Feed Matters, 2011). Use of machines like the
near infrared reflectance (NIR) which are accurate, rapid and produce correct estimates in 6
seconds is becoming a common dry chemistry method all over the world. The Kjeldhal method
is one of the traditional methods used for analysing for CP and the alternate acid and alkali
treatments have been used for analysing for CF (AOAC, 1990).
According to Stockfeed Manufacturer Association (2013), a successful nutrition plan can
assist in reducing losses in broiler production by increasing weight gain and reducing days to
maturity, increasing batches reared per annum thereby maximising returns on every dollar
invested. Researches on the feeding programs used in broiler production has been on-going for
decades, most of them have been concentrating on 2-phase program since the 3 and 4-phase
were not common in Zimbabwe (Poultry site, 2011). It was added that the growth rates of
broilers under 3 and 4 phase systems have been done only under experimental conditions and
their effects under farm conditions have not yet been extensively assessed. The development
of innovative ideas for improving poultry feeding requires a complete understanding of the
system and its key players (Hooshmand, 2006). In Zimbabwe, there is limited reliable
information on feeding systems, poultry genetics, lighting programs, nutritive values of feeds
and feeding materials used in poultry production and hence there is need to concentrate on
these aspects (Kusina et al., 2001).
2.2 Keys Aspects to Successful Broiler Production.
2.2.1 Advantages of broiler production over other livestock species.
The initial investment and capitalisation of broiler production is lower than other animal
enterprises like layer, beef, dairy farming and a short rearing period of about 5-8 weeks
(Creswell, 2007). Jensen and Askov (2009) added that more batches can be reared over a short
period of time, requires a small piece of land and broilers have high feed conversion efficiency
making it possible to be done in urban areas. ZPA (2012) and on the Poultry Site (2011), it was
agreed that the demand for poultry meat is high and hence easy to market as compared to sheep,
goat and pig meat which are more associated with religious taboos. Broiler farming can be a
main source of family income and gainful employment to farmers throughout the year since it
is not highly affected by seasons as the environments they require are a little bit easy to
manipulate for (Dolberg and Petersen, 2005). According to Rose et al. (2007), poultry manure
18
has high fertilizer value and can be used for increasing yield of all crops and hence it’s an
enterprise that can be mixed with crop production.
2.2.2 Characteristics of a good broiler site.
Site selection of a fowl run is an important factor and availability of sufficient land to enable
future extending of the enterprise need to be considered (Chikwanda and Chikwanda,
unpublished). Preferably higher land are used to avoid water logging which is associated with
fungal diseases is a appropriate though good drainage systems have catered for this problem in
urban areas. A permanent, clean water supply is needed since water need to be changed at least
three times a day due to the fact that broilers do not consume slippery water and are easily
affected by dehydration especially in hot weather (Bennert et al., 2009 and Lilburn, 2007).
Moreover, water is needed for washing houses at the end of every production cycle. In urban
areas tanks, sinks, tubs, swimming pools amongst others have been used as water reservoirs
due to massive water cuts. Good road connectivity, electricity for heating and lighting are very
important factors in broiler production (Sukume et al., 2012 and Jensen et al., 2000). Though
susceptible to more power cuts, electricity for lighting and heating have not been a major
problem in most urban areas of Zimbabwe. Irvines’ Zimbabwe (2011) recommends that when
constructing fowl run in Zimbabwe, the east and west directions must be covered with solid
walls to avoid pathogens carried by wind drafts as well as direct sunlight and hence the other
two remaining sides are covered with wire mash for aeration. However, in urban areas garages
and internal rooms have been used as brooding houses in urban areas (Mbiba, 1995). After the
brooding period, broilers are transferred to other houses that might be constructed with wood
or solid bricks. Hence there is a clear need to investigate the performance of broilers under
such improvised structures and feeding schemes to see how they differ with the standards.
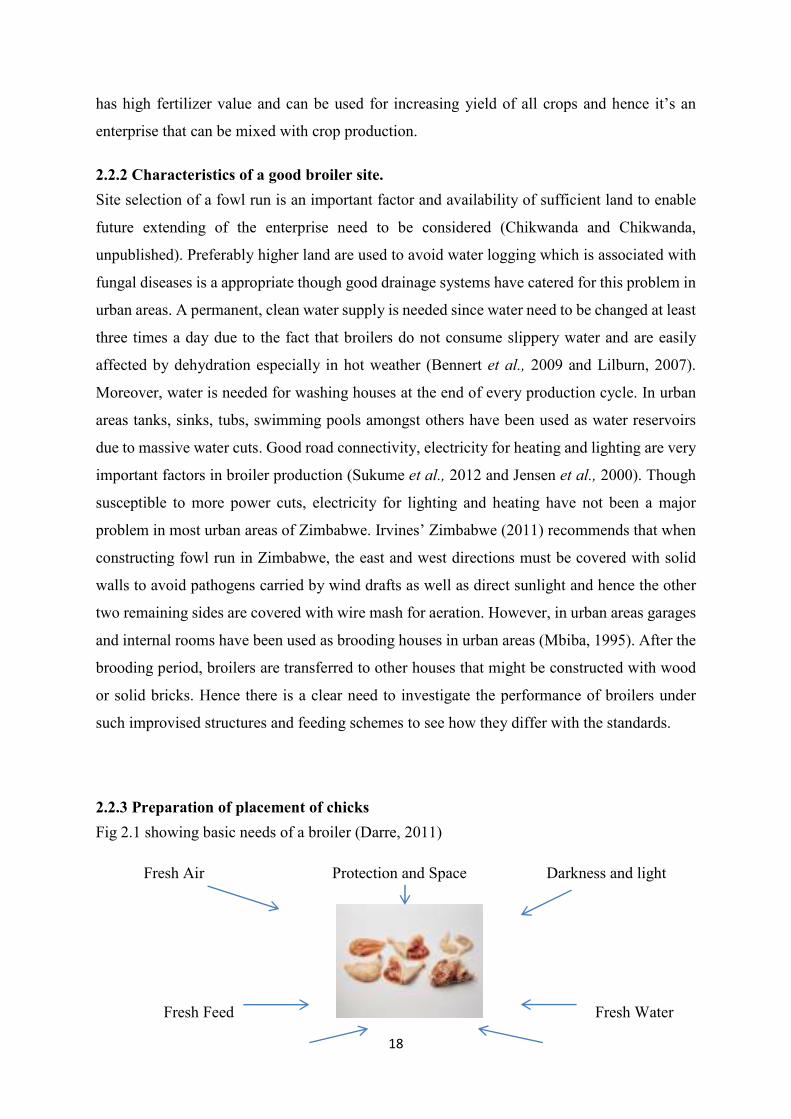
2.2.3 Preparation of placement of chicks
Fig 2.1 showing basic needs of a broiler (Darre, 2011)
Fresh Air Protection and Space Darkness and light
Fresh Feed Fresh Water
19
Space Controlled Temperatures
Activities that are done before chick arrival include thorough cleaning, spraying sanitizers and
fumigating the brooder houses (Mercia, 2010). This is done to remove dirty from previous
batches and excess gases like ammonia (Bennet et al., 2009). Cleanliness has been taken
seriously in low density suburbs compared to high density suburbs (Drakakis et al., 1995).
After thorough cleaning, disinfection with virakill is necessary to kill pathogens and hence
avoiding transfer of diseases from one batch to another (Paxton et al., 2010). Infrared lamps
are used for supplementing heat and electric bulbs are used for lighting to enable feeding at
night and bedding of soft, dry wood shavings should be 5cm thick in summer, 10cm in winter
(Broiler Management Guide, 2008). Fine shavings or sawdust is not recommended for litter as
the chicks may pick up the small particles and die due to gizzard impaction (Sukume and
Maleni, 2012). Zimbabwe Poultry Association (2012) added that the brooder house corners
should be circular to avoid crowding and huddling of chicks in corners which is one of the
factors which contribute to chick mortality. Placing of water troughs and feeding troughs 2m
apart in the brooder house is done 24 hours before chick arrival and egg trays have been widely
used to supplement chick feeding troughs since they expose the feed well (Cobb Breeder
Management Guide, 2005).
Preparations and activities that are done on the day of chick arrival include mixing of water
and vitamin stress pack at a rate of 100g/200litres for drinking 2-3 hours before feeding chicks
with broiler starter mash or crumbles (Cresswell, 2005). Moreover, adding some sort of
sweetener substance like sugar to the water (4% solution) for the first few hours of life is
important. The sugar helps to replenish the depleted energy in the chicks during transportation
and may stimulate the chicks to consume feed (Noy and Sklan, 2011). The sweet water can
also loosen up the impacted intestine and prepare the gut linings for the incoming feed. Eliana
and Balcazar (2010) argued that delayed access to feed impairs not only intestinal development
or chick weight shrinkage but also development of gut-associated lymphoid tissue (GALT) like
the bursa of fabricius, caecal tonsils and meckel's diverticulum. Mercia (2010) added that
farmers physical count and check for deformities, weakness and sickness to separate these
chicks from the healthy ones. On automated systems, weighing is done and the average weight
is recorded. Few chicks will be trained how to drink by dipping their beaks into the drinking
troughs and how to feed by winnowing a little bit of some feed in the air and then the rest will
copy from other (Ross Manual, 2007).
20
The broiler manager should strive to achieve the required flock performance in terms of live
weight, feed conversion, uniformity and final meat yield. In the first two weeks of life
developing appetite and immune function in a broiler flock is critical (Broiler management
guide, 2009). This requires particular attention and therefore, chick handling, brooding and
early growth management are all of great importance (Luis et al., 2004 and Bennett et al.,
2009). A broiler chick should be able to gain four times its post-hatch body weight by seven
days of age (Hubbard, 2013 and Madriga et al., 1994). The fact that broiler production is a
sequential process, ultimate performance is dependent on the successful completion of each
step and meeting specified targets (Noy and Sklan, 2011). They added that each stage must be
assessed critically and improvements made wherever required. This maximises performance in
developing the skeleton and cardiovascular system thereby optimising carcase quality. Feed
analysis and digestibility trials are essential to address questions related to the nutritive value
and digestibility of raw materials, final products, inclusion rates as well as degree of processing
that might be necessary (Sonaiya, 2011).
The ideal temperature for the brooding area for broiler chicks should be 32°C (90°F) with the
heat source being placed at least 18 inches above the floor and temperature readings taken at
chick height (Hooshmand, 2006). Chikwanda and Chikwanda (unpublished) added that pre-
warming the brooder to achieve this ideal temperature is essential. A National Foods article
(2013) added that a thermometer is hanged in the house, at a point furthest away from the heat
source at chick height. Both Ross Manual (2007) and Profeeds feeding manual (2013)
emphasised that reducing the temperatures by 3°C (5°F) every week is recommended until the
ideal temperature of 21°C (70°F) is reached. Cobb broiler management guide (2008) added
that the chick behaviour is the best temperature indicator amongst all and if they are huddled
(they are too cold), if they are panting or are crowding near the brooder guard (they are more
than likely too hot). The flock needs to be evenly spread over the area to show correct
temperatures.
2.2.4 Health management
In poultry health the primary emphasis is given more on prevention and control than curative
measures, hence a suggestive disease prevention and control programme which start with
disease free stock should be implemented (Dolberg and Petersen, 2005). Vaccinating chicks
against Ranikhet (New castle) and Marek’s disease at hatchery, keeping feed free from
aflatoxins is of paramount importance (Mercia, 2010). The use of chick mash or prestarter
crumbles with coccidiostat to prevent coccidiosis is recommended (Noy and Sklan, 2011). In
21
Zimbabwe, usually visitors or outsiders are not allowed inside the poultry premises in big
companies like Irvine’s and Hubbard breeders unless they wear disinfected boots and clean
protective clothing to avoid the transmission of disease causing organisms.
The Storey’s guide to raising chickens (2010) pointed out that floors must be covered with
clean, dry litter or wood shavings at least 3 inches deep in order to keep them warm in cold
environments, for comfort reasons and absorbing excess moisture. The litter need to be
properly managed because it can pollute the pen with ammonia which damages the chickens’
eyes and respiratory systems (Sukume 2011). He argued that heavier birds are affected more
as they spend longer times resting causing painful burns on their legs (called hock burns) and
foot ulcerations. Moreover, Creswell (2007) and Rose et al. (2007) agreed that all-in-all out
system of rearing broilers is recommended as it ensures minimum disease problems or cross
infections between different batches. In addition to suitable management, other factors that
reduces moisture level in the brooder houses include avoiding excessive levels of crude protein
in diets, avoiding high salt/sodium levels as this will increase bird water intake and causes wet
litter, avoiding using poorly digestible or high fibre feed ingredients in the diets, providing
good quality feed fats/oils in the diet. All these factors help in maintaining good litter quality
(FAO, 2012).
According Mack et al. (2009) the feed, housing, rodents, water, wild birds, other poultry,
livestock and pets, people, litter, insects, hatchery management, equipment and vehicles
remains elements of disease exposure. In dealing with issues of health, bio-security remains
the key aspect and is composed of three major components which are Isolation, Traffic Control
and Sanitation (Ross manual, 2007). Bio-security measures include fencing, keeping visitors
to a minimum, keeping wild birds out of poultry houses, practicing sound rodent and pest
control programs, inspecting flocks daily and recognizing disease symptoms as well as good
ventilation and relatively dry litter (Poultry site, 2011). More so, keeping areas around houses
off grass and feeding bins clean, proper disposal of dead birds, using disinfected and sanitised
poultry house and equipment need attention (National Research Council, 1994). Bio security
is one of the areas that are ignored by urban small holder farmers as some of its components
are not applicable in case of farmers that raise birds in residential areas.
The general management like checking birds daily for signs of disease as well as getting a
reliable diagnosis and treatment are necessary (Broiler management guide, 2009). Culling very
sick or injured birds, using proper disposal methods (burning or burying deep), establishing a
22
regular de-worming program, replacing wet litter and proper disposal of manure such as
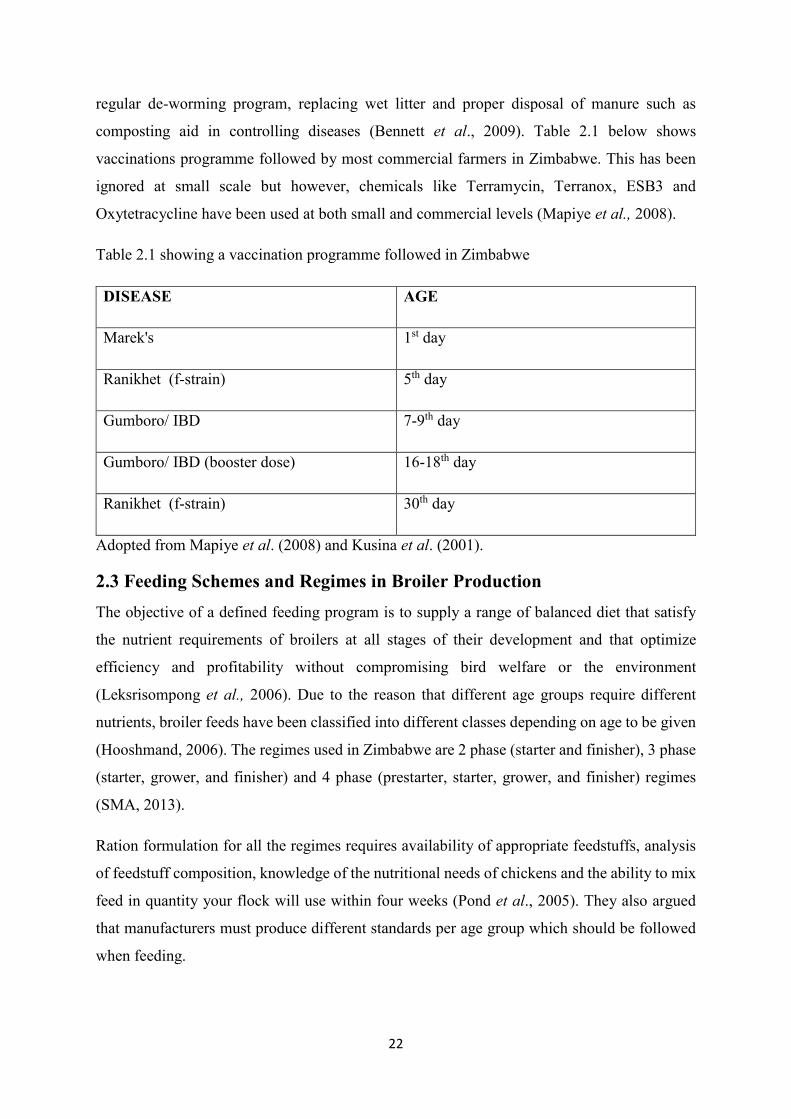
composting aid in controlling diseases (Bennett et al., 2009). Table 2.1 below shows
vaccinations programme followed by most commercial farmers in Zimbabwe. This has been
ignored at small scale but however, chemicals like Terramycin, Terranox, ESB3 and
Oxytetracycline have been used at both small and commercial levels (Mapiye et al., 2008).
Table 2.1 showing a vaccination programme followed in Zimbabwe
DISEASE AGE
Marek's 1st day
Ranikhet (f-strain) 5th day
Gumboro/ IBD 7-9th day
Gumboro/ IBD (booster dose) 16-18th day
Ranikhet (f-strain) 30th day
Adopted from Mapiye et al. (2008) and Kusina et al. (2001).
2.3 Feeding Schemes and Regimes in Broiler Production
The objective of a defined feeding program is to supply a range of balanced diet that satisfy
the nutrient requirements of broilers at all stages of their development and that optimize
efficiency and profitability without compromising bird welfare or the environment
(Leksrisompong et al., 2006). Due to the reason that different age groups require different
nutrients, broiler feeds have been classified into different classes depending on age to be given
(Hooshmand, 2006). The regimes used in Zimbabwe are 2 phase (starter and finisher), 3 phase
(starter, grower, and finisher) and 4 phase (prestarter, starter, grower, and finisher) regimes
(SMA, 2013).
Ration formulation for all the regimes requires availability of appropriate feedstuffs, analysis
of feedstuff composition, knowledge of the nutritional needs of chickens and the ability to mix
feed in quantity your flock will use within four weeks (Pond et al., 2005). They also argued
that manufacturers must produce different standards per age group which should be followed
when feeding.
23
When farmers adhere to proper feeding techniques, chicks usually increase their weight four
to five times in the first six weeks of life and this tremendous growth demands proper nutrition
(Lilburn, 2007). To ensure proper skeletal and muscular development as well as healthy gains,
a fully balanced diet must be fed to chicks and levels of calcium to phosphorus, CP, CF and
fats should be considered. Eliana and Balcazar (2010) agreed that starter and prestarter products
must be used in early broiler life time. Lack of nutritionally balanced ration causes poor
feathering, slow growth, increased fatness and leg problems (Noy and Sklan, 2011 and
Madrigal et al., 1994). In another text, Luis et al. (2004) argued that use of poorly digested
ingredients in feeds significantly lowers the growth rates and this cannot be corrected by
providing grits or sand to chicks. Jensen and Dolberg (2009) added that conditions such as
easy access to feed, clean water, vaccine, vaccinations services contributes positively to poultry
business.
In small holder farmers, the use of 3-phase feeding programme have been associated with
challenges as lack of funds to purchase the feed, unable to follow the lighting programmes,
overfeeding the birds leading to ascites, heart problems and sudden death (Zimbabwe Poultry
Association, 2012). These have caused a resistance in terms of adopting the 3 and 4 phases
hence a greater percentage are still using the 2 phase. However, most commercial farmers are
criticising the 2-phase saying that it requires more than 7 weeks to achieve a weight of 2,5kg
live weight which can be attained within 7 weeks when using the 3-phase programme or even
less when using 4-phase.
In the analyses supported by UNICEF, Feighner and Dashkevicz (2010) have however
strongly questioned the effects of biotechnology and enhancers as well levels of synthetic
amino acids included in the prestarter given in the 4-phase on agricultural productivity growth,
poultry welfare and household food security. The issues on proper space, odour, noise, pests,
diseases and housing have controversially raised complications to broiler production in urban
areas (Mack et al., 2009 and Ranichauri, 1999). However, understanding the national and
regionally-disaggregated movements in animal production in terms of how raw materials are
being manipulated for easy digestion, how chickens are housed to reduce noise as well as
odour, how to control pests and diseases, proper ways of disposing waste and how other
supplements added to feeds over time is a critical component step in clarifying such discussions
(Mapiye et al., 2008).
24
2.3.1 Two phase programme
The two phase programme is commonly used in Zimbabwe (ZPA, 2012), where the first 3
weeks of life, a broiler consumes an average of 1,5kg of broiler starter diet which can be in
form of crumbles or mashes. From day 21 the broilers are given broiler finisher diet up to
slaughtering and consume an average of 2,5kgs (National foods article, 2013). In the 2 phases,
the starter diets have a higher protein and lower energy level comparing with the finisher diet
shown by table 2.2 below. Hubbard (2013) pointed out that a smaller chick does not have a
fully developed GIT and hence requires a nutritive diet in terms of proteins and hence must be
formulated from easily digestible and palatable raw materials. It is the most common phase
followed by farmers in Zimbabwe even those who make their feeds. It was the first regime that
was developed by nutritionists in trying to provide required nutrients at each stage of life (NRC,
1994). However, it was criticised and lead to the development of another diet to be given the
starter and finisher diets in-between to adequately satisfy each stage. The standards below are
the same with those targeted by Zimbabwean stockfeed companies (SMA, 2013).
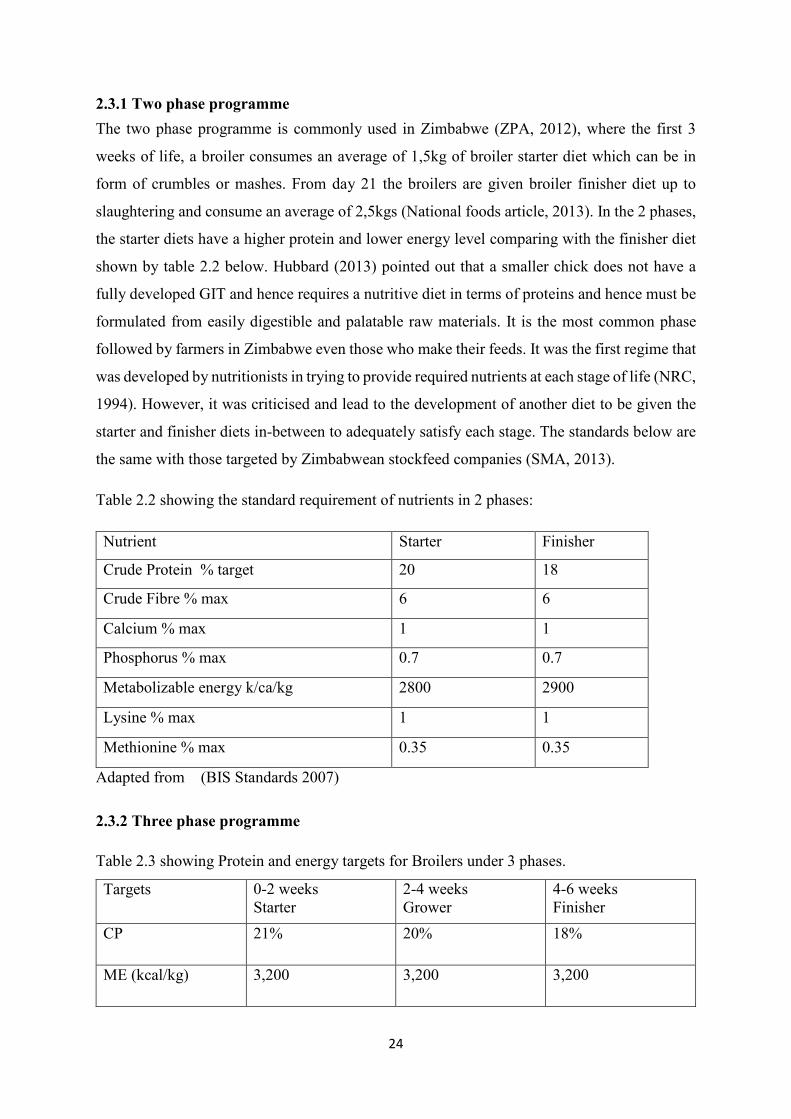
Table 2.2 showing the standard requirement of nutrients in 2 phases:
Nutrient Starter Finisher
Crude Protein % target 20 18
Crude Fibre % max 6 6
Calcium % max 1 1
Phosphorus % max 0.7 0.7
Metabolizable energy k/ca/kg 2800 2900
Lysine % max 1 1
Methionine % max 0.35 0.35
Adapted from (BIS Standards 2007)
2.3.2 Three phase programme
Table 2.3 showing Protein and energy targets for Broilers under 3 phases.
Targets 0-2 weeks Starter
2-4 weeks Grower
4-6 weeks Finisher
CP 21% 20% 18%
ME (kcal/kg) 3,200 3,200 3,200
25
Extracted from Cobb Broiler Management Guide (2008)
Leksrisompong et al. (2006) recommends that broiler farmers targeting 1.8 kg CDM at 6 weeks
of age must use the 3-phase feeding system where commercially prepared broiler starter,
grower, and finisher are used. According to Hubbard (2010), these targets can be reached at 5
and half weeks when using controlled houses. A coccidiostat is usually added in the starter
and grower diets though cleanliness remains the most important factor in eliminating
coccidiosis. Lilburn (2007) added that following feed supplier or veterinarian's
recommendation for coccidiostat in the finisher is advised. Moreover, following a lighting
programme is recommended to avoid overfeeding the birds and heart problems to the chicks
(Profeeds feeding manual, 2013). In this phase, a broiler chicken will consume an average of
0.9 kg of starter, 1.5 kg of grower and 1.4 kg of finisher for 6 weeks or alternatively can
consume 3.5kg for 5 weeks (National foods article, 2013).
2.3.3 Four phase programme
This programme involves the beginning of the feeding with the prestarter crumbles that are
more digestible and nutritive than the starter crumbles (Noy and Sklan, 2001). In Zimbabwe,
broiler producers like Irvine’s and its contract farmers uses this feeding programme. Four phase
feeding system have produced better weights that 2 and 3 producing about 1.65kg in 28 days
(Irvines, 2011). Broilers are bred for fast growth have a high incidence of leg deformities
because the large breast muscles cause distortions of the developing legs and pelvis and the
birds cannot support their increased body weight (Eliana and Balcazar, 2010). It was observed
that these cases increases when using 4 phases as it enables broilers to fully express their
genetic potential (Saki et al., 2010). Therefore, they may become lame or suffer from broken
legs. The added weight also puts a strain on their hearts, lungs and exposing birds at risk from
ascites (Hooshmand, 2006).
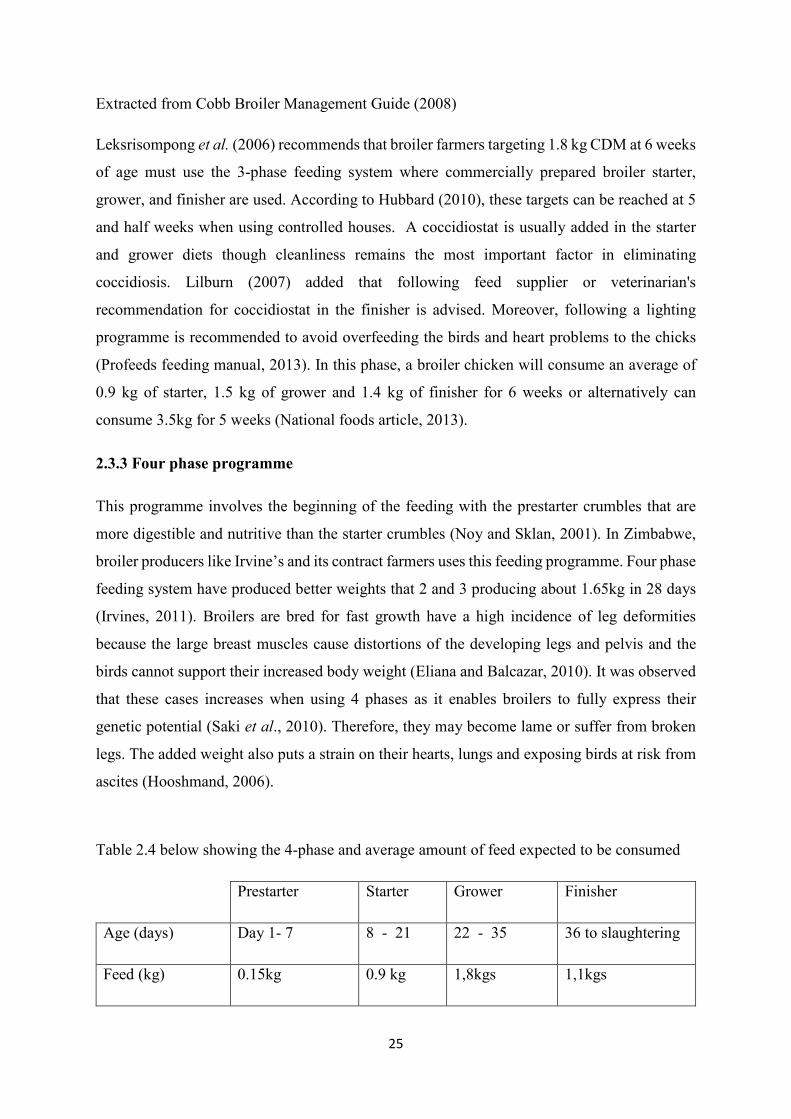
Table 2.4 below showing the 4-phase and average amount of feed expected to be consumed
Prestarter Starter Grower Finisher
Age (days) Day 1- 7 8 - 21 22 - 35 36 to slaughtering
Feed (kg) 0.15kg 0.9 kg 1,8kgs 1,1kgs
26
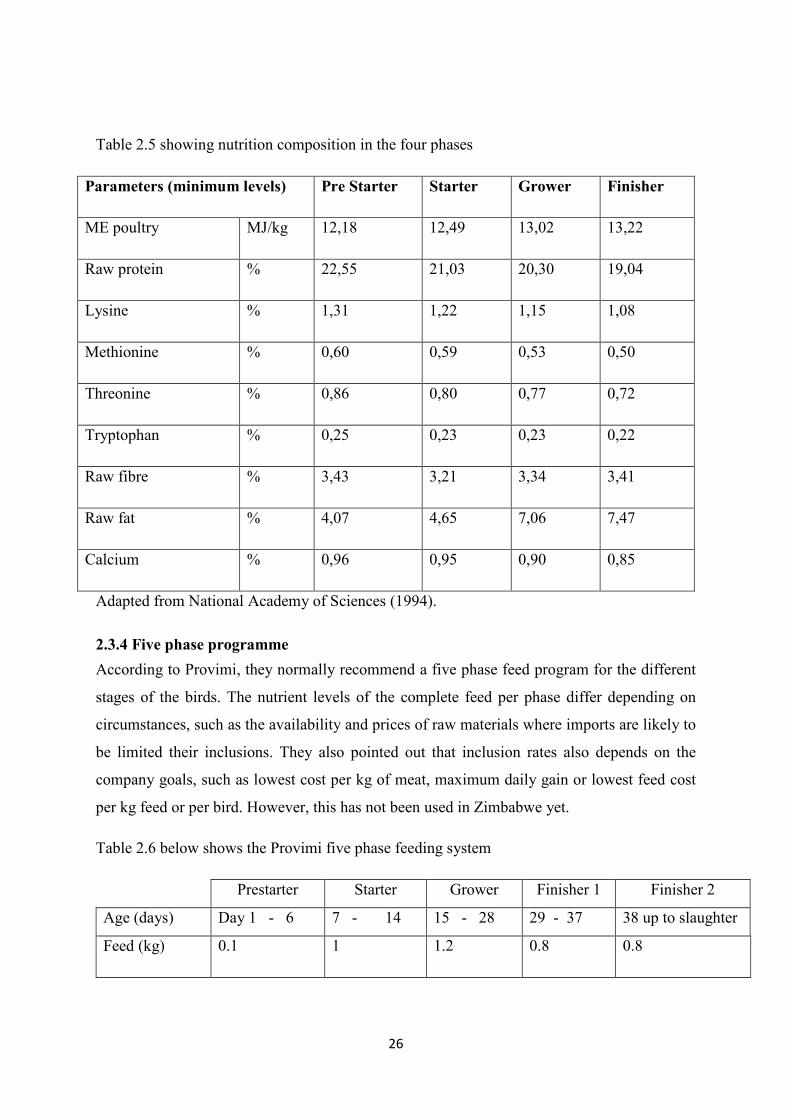
Table 2.5 showing nutrition composition in the four phases
Parameters (minimum levels) Pre Starter Starter Grower Finisher
ME poultry MJ/kg 12,18 12,49 13,02 13,22
Raw protein % 22,55 21,03 20,30 19,04
Lysine % 1,31 1,22 1,15 1,08
Methionine % 0,60 0,59 0,53 0,50
Threonine % 0,86 0,80 0,77 0,72
Tryptophan % 0,25 0,23 0,23 0,22
Raw fibre % 3,43 3,21 3,34 3,41
Raw fat % 4,07 4,65 7,06 7,47
Calcium % 0,96 0,95 0,90 0,85
Adapted from National Academy of Sciences (1994).
2.3.4 Five phase programme
According to Provimi, they normally recommend a five phase feed program for the different
stages of the birds. The nutrient levels of the complete feed per phase differ depending on
circumstances, such as the availability and prices of raw materials where imports are likely to
be limited their inclusions. They also pointed out that inclusion rates also depends on the
company goals, such as lowest cost per kg of meat, maximum daily gain or lowest feed cost
per kg feed or per bird. However, this has not been used in Zimbabwe yet.
Table 2.6 below shows the Provimi five phase feeding system
Prestarter Starter Grower Finisher 1 Finisher 2
Age (days) Day 1 - 6 7 - 14 15 - 28 29 - 37 38 up to slaughter
Feed (kg) 0.1 1 1.2 0.8 0.8
27
2.4 Broiler Diets and Products
Poultry complete feed is composed of 60-65% energy giving materials, 30-35% of protein
source and 2-8% minerals source in its formulation (Poultry site, 2011). The sources of energy
that have been used include maize up to 60%, maize germ up to 10%, sorghum (Milo) up to
45%, wheat up to 25% and with enzyme up to 45%, wheat by-products (bran, shorts,
screenings) up to 15%, rice by-products (bran, polishing) up to 15%, barley up to 15% and with
enzyme up to 35%, molasses up to 5% for diets given after 2 weeks and water. For protein
sources soybean meal up to 30%, soybeans up to 15% (heated to remove anti-nutrients),
sunflower meal up to 10%, fish meal up to 10% blood meal and feather meal up to 2% (BIS
standards, 2007 and Sonaiya, 2011).
Water which is considered as the principal nutrient should be pure, whole some, free from
physical impurities, toxic substances and bacterial contamination. The recommended water to
feed ratio is 2.2: 1 respectively (Creswell, 2007). Though poultry need sufficient nutrients, too
much of other nutrients have caused metabolic disorders such as ascites, sudden death
syndrome (SDS) and leg problems (Broiler management guide, 2009). In general, people have
associated such conditions with rapid growth, thus various feeding programs have been
recommended in an attempt to reduce the incidence of these problems (Jensen and Askov,
2000).
2.4.1 Pre-Starter Products
The fact that, the anatomy and physiology of young chicks differs significantly from that of
older broilers raises the issue of producing prestarter products (Cobb broiler management
guide, 2008). This marks the period when chicks are being transformed from embryonic
absorption of yolk to utilisation of feed which is accompanied by dramatic changes in the
digestive tract (Eliana and Balcazar, 2010). Hence need palatable feeding materials. Noy and
Sklan (2011) added that in the first few days after hatching, the length and weight of the
proventriculus, gizzard, liver, pancreas, and intestine (duodenum, jejunum and ileum) increase
in size almost four times quicker than the body as a whole and hence requires feed with high
digestibility.
A strong positive correlation exists between first week live weight and finishing weight at the
end of production cycle that intensify the importance of a good start for ultimate better
performance in commercial broilers (Irvine’s Zimbabwe, 2011). Adequate protein availability
28
in the pre-starter phase (min-22.5%) seems to be essential to increase muscle development in
later phases (Ross manual, 2007)
The use of special pre-starter products, some of which contain more digestible raw materials,
have been shown to be effective in promoting early development of broilers and improving
subsequent processing performance (Creswell, 2005). Such products are often of superior
physical quality and provide a feed intake response. The Ross manual (2007) pointed out that
the pre-starter products increases feed costs in 4 phases though they are only used for the first
few days of life when feed intake is still relatively low. Therefore, they have only a small
impact on overall cost of production. Generally, there is a positive response in margin achieved
as a result of improved overall broiler performance and increased revenue (Aviagen, 2007).
Some features of Pre-Starter products are listed below:
• Use of highly processed and digestible ingredients which are more palatable.
• Use of pre- and pro-biotics.
• High nutrient levels, especially amino acids, vitamin E and zinc.
• Addition of immunity stimulants; essential oils or nucleotides.
• Inclusion of intake stimulants; feed form, high sodium and flavours.
2.4.2 Broiler Starter Feeds
The starter should contain a coccidiostat to stop intestinal damage caused by one of the
common types of chicken parasites. The objective of the brooding period which is the first 14
days of age is to establish good appetite and achieve maximum early growth (Cresswell, 2007).
The target is to achieve a seven-day body weight of 170 g or above (Hubbard, 2013). Most
companies in Zimbabwe target a range of 19-23% crude protein to allow the bird to achieve
maximum early growth (SMA, 2013). The starter represents a small proportion of the total
feed cost and decisions on starter formulation should be based on performance and profitability
rather than cost. Total fat levels should be kept low (<5%) and saturated fats should be avoided,
especially in combination with wheat as they reduces feed intake (Luis et al., 2004).
Early nutrition plays a vital role in early life and productivity of broilers (Creswell, 2007). Noy
and Sklan (2011) argued that maximum growth occurs in the first week of broiler’s life (takes
approximately 20% of total). A strong positive correlation exists between first week live weight
29
and finishing weight at the end of production cycle that intensify the importance of a good start
for ultimate better performance in commercial broilers.
2.4.3 Broiler Grower Feeds
Broiler grower feed will normally be fed for 14 to 16 days (Ross manual, 2007). The transition
from starter feed to grower feed will involve a change of texture from crumbs to pellets though
manufacturing companies also produce grower crumbles (Profeeds feeding manual, 2013).
There is a continuing need for a good quality grower feed to maximise performance and 20%
of crude protein is targeted (Stockfeed Manufacturer Association, 2013). If any growth
restriction is required, it should be applied during this period to avoid over feeding the birds
that lead to heart problems and ascites. Use of management techniques, like meal feeding or
lighting to restrict feed intake, is preferred (Champion Feed Services, 2009). However, growth
restriction by diet composition is not recommended.
According to the Aviagen Ross Poultry Breeders (2009), unrestricted feeding is related to
growth rate that increases body fat deposition, mortality and incidence of metabolic diseases
and skeletal disorders. These situations most commonly occur with broilers that consume feed
adlibitum. Thus feed restriction has been proposed to reduce these problems (Balcazar and
Eliana, 2010).
2.4.4 Broiler Finisher Feeds
Broiler finisher feeds account for the major cost of feeding and economic principles should be
applied to the design of these feeds. Changes in body composition can be rapid during this
period and excessive fat deposition and loss of breast meat yield need to be carefully considered
(Aviagen, 2007). The broiler finisher feed targets a lower protein level of about 19% due to the
fact that a smaller increase in weight will be expected compared to the fat that will be required
for marbling (Creswell, 2005).
The decision whether to use one or two broiler finisher feeds will depend on desired slaughter
weight, the length of the production period and the design of the feeding programme (Ross
Poultry Breeders, 2009). Withdrawal periods for drugs may dictate the use of a special
withdrawal finisher feed. This feed should be adjusted for the age of the birds but the practice
of extreme nutrient withdrawal during this period is not recommended.
30
2.5 Feed Resources Used By Small Holder Farmers
A complete feed is a prepared ration that contains all of the nutrients like the protein, calcium,
potassium, phosphorus, salt, fibre and other minerals as well as the vitamins for the
physiological growth and development in poultry (Poultry Site, 2011). These feeds in
Zimbabwe are usually produced commercially by feed manufacturers like Agrifoods, National
foods, Profeeds and Capital foods amongst others. On average a broiler is expected to consume
a protein level of about 20 to 24% in its early life (day 1 up to day 14) and a grower with protein
ranging from 18% to 20% at day 14 to day 21 and or a finisher with protein ranging from 17%
to 19% and higher in energy at day 21until ready for market (Zimbabwe Poultry Association,
2012). However, materials used by small holder farmers as poultry feed are usually not tested
for nutritive composition. Concentrates can also be prescribed by feed mills which require
mixing with cereals like sorghum or maize to produce the starter and finisher diets. Hence
mixing ratios are provided by the manufacturer.
Apart from these commercial feeds, small holder farmers are using other feed resources such
as the soybean seeds, sunflower seeds, wheat bran, crushed maize, maize germ and red
sorghum seeds in poultry feeding (Mapiye et al., 2008). Gadzirayi et al. (2012) categorized
them as cereals for energy and oilseeds for proteins. These feed resources are either fed directly
to poultry or they can be used as raw materials for feed formulations.
2.5.1 Soybean seeds
In Zimbabwe, 50 000 smallholder farmers are currently growing soya beans which are mainly
used for oil and stock feed production (Zimstats, 2008). In stock feed manufacturing, soybeans
are used as ingredients for protein in three forms, the mature dry roasted seeds (Soy nuts), full
fat soya extruded under pressure with the presence of heat and soya meal obtained after
mechanical extraction of oil (Heuser, 2013). Small holder farmers, however use raw soybean
seeds to feed their poultry. FAO (2011) added that their inclusion need to be limited to
maximum inclusion levels of about 30% citing that they have an imbalance of nutrients
especially amino acids like methionine, the presence of anti-nutritional factors as the trypsin
inhibitor, urease, phytoestrogens and lectins hence can reduce the feed general palatability.
Creswell (2005) added that small birds are more susceptible to anti-nutritional factors and
hence use of raw soya beans in formulating their diets must be avoided. As mentioned on the
Poultry site (2011), Mogridge et al. (1996) observed that use of raw soya increases the size of
the pancreas and the duodenum decreasing the feed intake and growth by a significant
31
percentage. Though raw soya beans are associated with anti-nutritional factors, Knabe and
Tanksley (2006) argued that it is rich in calcium and magnesium that will be sufficient to home
raised meat chicken. They also raised an alarm to the world on the amount of poly unsaturated
fatty acids found in soya beans arguing that it reduces the general feed intake of broilers and
hence their inclusion levels should be less than 30% in any formulae. The Poultry site (2011)
added that Summers et al. (1966) have discovered that the chickens fed with 20% untreated
beans grew by 24% less and had a conversion of 11% worse than the control chickens fed with
soybean meal and fat. He added that raw beans reduced the consumption of the feed (88 vs.
101 g/day), laying capacity (53.8 vs. 79.0%) and egg size (58.1 vs. 61.7 g).
It is argued that mechanical and heat treatments can also be used to process the seed to reduce
the effects of these anti-nutritional factors. In addition to the fact that processing is required,
World Poultry (2009) argued that the duration exposed to heating also influences the goodness
of the final product and define its nutritional value to a large extent. More recently,
commercially available enzymes have been developed to improve the digestion of non-starch
polysaccharides in soybeans for pigs and poultry. According to the Poultry Site (2011), Saxena
et al. (1963) argued that soybeans can be roasted using the traditional fire until they turn dark
brown or auto cleaved using an oven between 100-130°c for about 25 to 30 minutes at a small
scale to deal with anti-nutritional factors. Boiling raw soybeans for 30 minutes was reported to
result in satisfactory performance in broilers and laying hens, even at up to 35 percent of the
diet (Chen et al., 2011). Gadzirayi et al. (2012) argued that soybean can be replaced by mature
Moringa oleifera leaf meal and concluded that up to 25% inclusion of this supplement can
attain similar weight gain as conventional feeds.
2.5.2 Sunflower seeds
Sunflower (Helianthus annuus) is a fast-growing cash crop grown primarily for its oil as well
as a protein supplement in poultry and ruminants (Pond et al., 2005). At a small scale Doli et
al. (2006) noted that the mature seeds can be supplemented without any processing though he
argued that they will be having too much fat and oil. In dealing with this Lilliboe (2005) added
that mechanical pressing or solvent extraction can be used to extract excess oil. Mack (2009)
added that mechanical pressing leaves up to 13% oil in the meal which is still too high for
poultry as it reduces feed intake and he urged that the solvent extraction should be used which
leaves oil as low as 1%.
32
Sonaiya (2008) observed that most small holder farmers ignore dehulling as they view it as
wasting though he argued that this improves the nutritive value as well as the palatability of
sunflower meal in poultry diets. He also observed that sunflower meal is richer in the sulphur-
amino acids than soya bean meal although its lysine and threonine are much lower causing
some restrictions in formulation of non-ruminant feed rations. Luis et al. (2004) added that the
process of dehulling or decortication results in a sunflower meal with protein levels above 30%
and fibre levels of 21% and below. There are known phytotoxins present in the sunflower plants
though there is no strong evidence that they are also found in its mature seeds (Doli et al.,
2006). The maximum amount of sunflower meal that can be included in diets for broiler chicks
appears to be 15 percent in all mash diets and 30 percent in pelleted diets (BIS standards, 2007).
Sunflower meal has been successfully been used at levels of up to 20% in broiler and layer
diets, but complete substitution of Soyabean meal resulted in lower productivity and feed
conversion (Stockfeed Manufacturer Association, 2013).
2.5.3 Wheat bran
Wheat bran consists of the outer layers (cuticle, pericarp and seed coat) combined with small
amounts of starchy endosperm of the wheat kernel that has a fairly high protein and fibre
content as well as mineral and vitamins; hence it has a laxative effect when fed at excessive
levels to poultry (Sonaiya, 2011). Wheat bran is believed to contain pentosans which are
thought to have anti-nutritive activities in poultry and result in depressed nutrient utilization
and poor growth. Luis et al. (2004) argued that though it has a higher fibre content, wheat bran
has a high phytate activity which increases the availability of phosphorus in poultry. He also
argued that it contains a very heat-stable lipase which causes hydrolytic rancidity and is more
active when the bran is finely ground. Rose et al. (2007) argued that wheat bran is necessary
as it is insoluble and hence passes through the gastrointestinal system aiding digestion, adding
bulk to stools and preventing constipation. However, too much wheat bran in a formulation
results in pellets with poor water stability due to the water absorption characteristics of fibre.
The wheat bran produced in Zimbabwe has an average well above 15% crude protein and an
average of around 5% fat (Feed Matters, 2013).
2.5.4 Maize meal and maize germ
Maize (Zea mays) also known as corn and is one of the cereal crop that is used for feed
formulations in poultry. Maize grains contain the highest energy content of all the major cereals
and approximately two-thirds of the grain is starch, which is readily digested by monogastric
33
animals (Sonaiya, 2008). Its inclusion rate is even up to 60% of the feed ration formulas that
are used in Zimbabwe (Feed Matters, 2013). Besides providing energy, maize meal helps in
reducing constipation of feed in poultry especially when using mashes.
One of the important by product of dry maize milling is maize germ meal which is comprised
of mainly the external testas. It contains a crude protein level from about 10-25% and oil level
which ranges from about 5-10%, fibre of 4.5-10% and a starch content around 23% (Feed
Matters, 2013). The amount of the oil and the fibre reduces its inclusion in poultry feed rations
since it is not allowed to exceed 10%.
2.5.5 Sorghum seeds
Sorghum (Sorghum bicoloris) seed in general contains an average of 70% starch, so is a good
energy source. Sonaiya (2008) argued that it have a lower energy level than maize as its starch
consists of 70 to 80% amylopectin, a branched-chain polymer of glucose which has a very low
digestibility and 20 to 30% amylose, a straight-chain polymer which is the one digestible.
Thakur et al. (2008) added that it contains anti-nutritional factors such as tannins and the
presence of tannins is claimed to contribute to the poor digestibility of sorghum starch. In
Zimbabwe sorghum is rarely used due to the fact that its grown at a very small rate and its costs
in terms of importing is higher compared to using our local maize (Poultry site, 2011). In diet
formulations, Dhliwayo (2011) concluded that substituting maize with sorghum by up to 40%
would not adversely affect broiler performance and hence there is need to substitute maize for
sorghum if available.
CHAPTER 3
3.0 MATERIALS AND METHODOLOGY
3.1 Study Area
The research was done in Harare province which lies in the agro-ecological Region II b
receiving an average of 600 mm to 1000 mm of rainfall per annum. The mean temperature
ranges from 19-28°c. Region ΙΙ is suitable for intensive farming systems for both crops and
livestock. Most residents in Harare are now backyard broiler producers and there is a variety
of feed manufacturing companies with depots distributed all over the province. Due to these
34
poultry production activities, chicken houses and pens have been constructed within the
residential areas.
3.2 Experimental design
Data collection was done via formal interviews conducted through structured questionnaires.
For the broiler smallholder farmers to interview, names and the details of the broiler farmers
in Harare were obtained from different feed manufacturing companies. Frequent buyers of
stock feeds and day old chicks were nominated and a total of 120 farmers were obtained. A
third of these farmers were randomly selected by hat picks coming up with a sample population
size of 40 farmers who were interviewed. The structured questionnaires designed in English
language were pretested at one of the stock feed producing companies. The questionnaires were
then distributed in person to the targeted respondents who were poultry farmers in urban and
peri-urban areas in Harare.
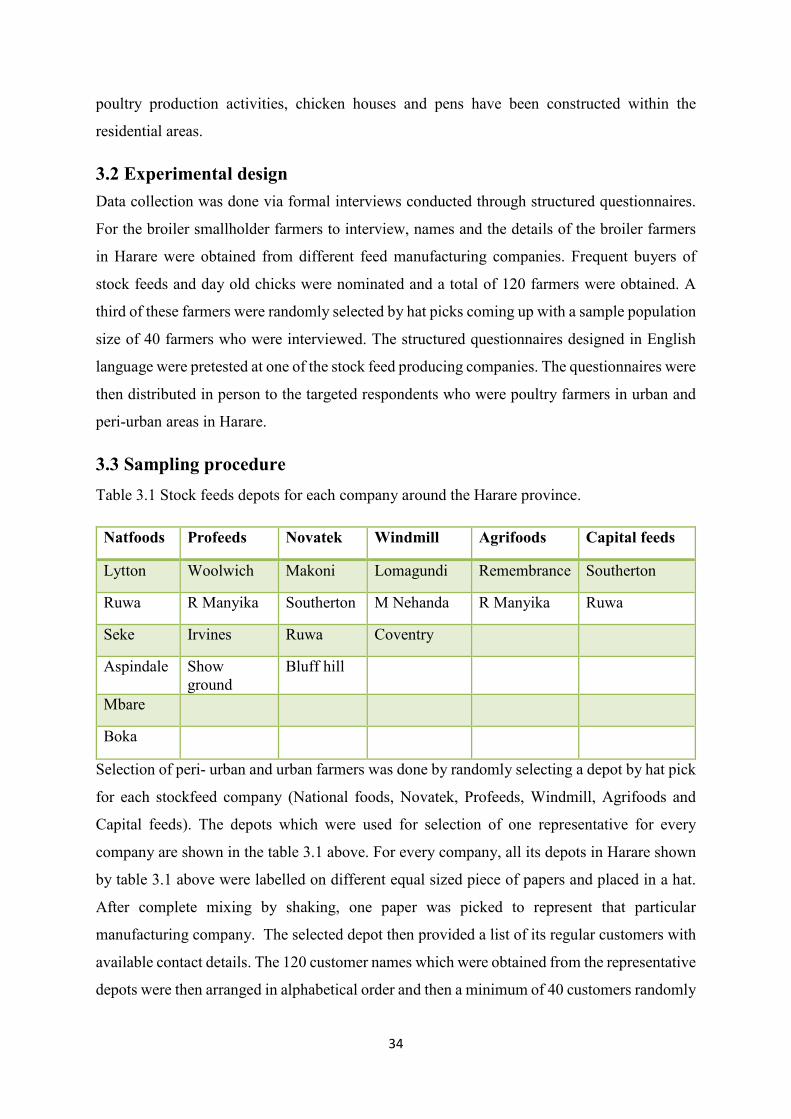
3.3 Sampling procedure
Table 3.1 Stock feeds depots for each company around the Harare province.
Natfoods Profeeds Novatek Windmill Agrifoods Capital feeds
Lytton Woolwich Makoni Lomagundi Remembrance Southerton
Ruwa R Manyika Southerton M Nehanda R Manyika Ruwa
Seke Irvines Ruwa Coventry
Aspindale Show ground
Bluff hill
Mbare
Boka
Selection of peri- urban and urban farmers was done by randomly selecting a depot by hat pick
for each stockfeed company (National foods, Novatek, Profeeds, Windmill, Agrifoods and
Capital feeds). The depots which were used for selection of one representative for every
company are shown in the table 3.1 above. For every company, all its depots in Harare shown
by table 3.1 above were labelled on different equal sized piece of papers and placed in a hat.
After complete mixing by shaking, one paper was picked to represent that particular
manufacturing company. The selected depot then provided a list of its regular customers with
available contact details. The 120 customer names which were obtained from the representative
depots were then arranged in alphabetical order and then a minimum of 40 customers randomly
35
chosen by hat picks. The customers which were provided by the feed mill depots included the
feed customers and day old chick customers.
3.4 Measurements
The data that was generated from the questionnaire included demographic data of the farmer,
chicken production related data, feeding systems related data and the flock healthy related data
shown by appendices 1. The broiler live weight obtained at day 42 by every farmer interviewed
were weighed and recorded. Moreover, details on the types of feeds used (whether conventional
or non-conventional), the cost of feeds used, the feed production sources (Home-made,
Novatek, National foods, Pro-feeds, Agri-foods, Windmill and Capital foods) were obtained.
The feeding regimes followed and the adoption of commercial feeds was also assessed. On the
conventional and non-conventional feed samples collected, the crude protein content were
measured using the near infrared reflectance machine (NIR) and the Kjedahl method. The crude
fibre content of the diets was analyzed by the NIR as well as the alternating heating and cooling
with both an acid and alkali.
3.5 Data collection
A questionnaire was used to collect the data from the representative sample of 40 small holder
farmers. Personal interviews were conducted answering different questions; samples were
collected to fulfil requirements for other objectives as described below:
3.5.1 Chemical analysis
Samples on types of feed offered to chicks (home-made or conventional) were collected from
farmers during interviews. A 200g feed sample was collected from every farmer. A total of 32
samples were collected and amongst them 11 were broilers starter samples, 8 were grower
samples and 13 were finisher samples. The pelleted samples were thoroughly mixed by
grinding them using the grinding machine before thorough shaking. After complete mixing,
the dry chemistry (NIR) was used for both CP and CF (Blake, 2011). On wet chemistry
Kjeldhal method was used for CP and alternate acid and alkali treatment for CF (AOAC, 1990).
Methods of Analysing For CP and CF Content
Dry chemistry
The DA 7200 Near Infrared Reflectance machine was used for scanning the samples for both
CP and CF. The process was divided into three steps. Firstly a sample was poured into two
36
open aluminium dishes; strike off excess sample using a ruler to be levelled before placing the
dish under the light beam. A product in line with the type of feed to be analyzed was then
selected from the list displayed on the screen. The products displayed on the screen were within
the calibrated database of the machine. After selecting the product, pressing enter was done to
scan the first dish before placing the second dish for completing the analysis of that sample.
Wet chemistry- Kjeldhal method for CP.
This method was divided into three steps, which were digestion, neutralisation and titration.
On digestion, 1g of the grounded and homogenously mixed samples was firstly weighed using
an electronic balance into 500-800ml Kjeldhal flasks. They were then mixed with 10g of a
catalyst that was made up of a mixture of sodium sulphate, copper sulphate and selenium
powder, heated in the presence of 30ml sulphuric acid for an hour using heating mantles
protruding into the fume cupboard. After a complete hour of heating with constant turning, the
flasks were cooled in a running sink for 15 minutes. After losing all the heat, the digest was
then transferred to 250ml volumetric flasks and top up to the maximum level with tap water.
Afterwards, 25ml of the cooled samples were then pipetted into Hoskins flasks together with
25ml of 50% sodium hydroxide for neutralisation. The samples were then steam distilled into
a conical flask containing 15ml of a mixture of boric acid and the mixed indicator. Shortly after
the volume in the conical flask passed the 50ml mark, the flasks were removed from the
Hoskins distillation apparatus and titrated with standardized 0.01N sulphuric acid. The colour
changed from green to purple. The titre or the amount of sulphuric acid used to change the
digest colour from green to purple (Nitrogen value) was used in calculating the percentage
crude protein using formulae below:
% Protein = Blank-Titre x 6.25 x 1.401 ÷ sample weight
Wet chemistry-alternate treatment with acid and alkali for CF
The method was divided into 2 digestions and 2 filtrations. Firstly, excess fats were removed
by defating the samples with three washings using 25ml portions of hexane. For first digestion,
3g of defatted samples were measured using the analytical balance and transferred it into 1-
litre long neck conical flasks. 200ml of boiling sulphuric acid (1.25%) were added into the
flasks and attach the cold finger condenser. The contents were boiled and continued refluxing
was done gently for 30minutes from the onset of boiling using the condenser. The flasks were
rotated at 5 minutes intervals to prevent samples from adhering to the sides of the flask. At the
37
end of the acid digestion, the contents were filtered from the flask with suction onto a filter
paper (No 541 or 1505) fitted to a Buchner funnel. The sample left in the flask was removed by
rinsing it down with portions of hot water. Washing the filtrate was done using 50-100ml of
boiling water. Repeated washing was done until the samples were no longer acidic. The
samples were washed back into the digestion flask with 200ml of hot Sodium Hydroxide
(1.25%). The contents were boiled again for 30minutes and the flasks were kept rotating by
shaking at 5 minutes intervals.
The samples were filtered with suction through a Whatman filter paper (No 541), fitted to
Buchner funnel and boiling water was used for rinsing. The samples were washed with boiling
water until the samples were no longer basic and the residues were transferred into porcelain
crucibles using a spatula. The samples were dried in an oven at 130oC for 2hours and were
cooled to room temperature in a desiccator. The weights of the crucible + residue were
recorded. The samples were ignited in a muffle furnace at 550o C to 600oC for 3hours before
cooling them in a desiccator to room temperature and weighing them after cooling.
CALCULATIONS
(a) % Crude Fibre on as fed basis = Loss of weight on ignition X100 Weight of sample before drying and oil extraction (b) % Crude Fibre on DM Basis = % Crude Fibre on as fed basis X 100 % Dry Matter of as fed basis sample
After obtaining values, the data was captured in the Microsoft excel aligning with the source
of the feed and the method of analysis. The analysis of variations in CP and CF were done
using a linear regression model which was as follows:
Yij = µ + Fi + Aj + eij
Where:
Yij = response variable being crude protein and crude fibre values
µ = generalized mean
Fi = effect of feed source (i = 1, 2, 3, 4, 5, 6, 7)
Aj = effect of analysis method used ( j = 1, 2)
eij = experimental error
38
The effects of feeds from different feed sources and their nutritive values (CP and CF) on
weight at day 42 were analyzed by the following general linear regression model where breed
was used as a blocking factor:
Yijk = µ + Bi + Tj + eij
Where:
Yij = response variable being weight at day 42
µ = generalized mean
Bi = effect of blocking (i = 1, 2, 3)
Tj = effect of treatment (j = 1, 2)
eij = experimental error
3.5.2 Questionnaire survey on feeding regimes
The feeding regimes followed by the farmers were also identified and were categorized into 2,
3 and 4-phase feeding systems. For every farmer, 42 day live weight obtained by the regime
used were also captured and recorded. The information was captured in the Statistical Package
for Social Sciences (SPSS) version 16.0. The analyses of variance between different feeding
regimes on weight at day 42 were captured in the general linear model with breed as a blocking
factor on the following equation:
Yijk = µ + Bi + Pj + eijk
Where:
Yij = response variable being weight gain at day 42
µ = generalized mean
Bi = effect of blocking (i = 1, 2, 3)
Pi = effect of feeding regime used (j = 1, 2, 3)
eij = experimental error
3.5.3 Questionnaire survey on adoption of commercial diets
The farmer preference on feed source and adoption of commercial feeds were also identified.
The commercial feeds were categorized into six groups namely the Pro-feeds diets, National
39
foods diets, Agri-foods diets, Capital foods diets, Novatek and Windmill diets. Amongst the
farmers interviewed, all farmers using commercial feeds were categorized as adopters and
those using home-made feeds were categorized as non-adopters. For those categorized as
adopters, their preferences on cost and adoption of the commercial diets were assessed by
binary logistic regression equation:
Yijk = β0 + β1X1i + β2X2i + β3X3i + β4X4i + β5X5i + β6X6i + eijk
Where: Yijk = farmer preference and adoption of commercial diets Β0 = constant
X1i = is the odds ratio of choosing commercial over home-made feeds using site of residence (i = high, low)
X2i = is the odds ratio of choosing commercial over home-made feeds using sex (i = male, female)
X3i = is the odds ratio of choosing commercial over home-made feeds using marital status (i = married, single, widowed, divorced)
X4i = is the odds ratio of choosing commercial over home-made feeds using age (i = < 20 yrs, 21-30yrs, 31-40yrs, 41-50yrs, >50yrs)
X5i = is the odds ratio of choosing commercial over home-made feeds using highest level of education (i = no formal education, grade 7, form 4, form 6, diploma, degree)
X6i = is the odds ratio of choosing commercial over home-made feeds using religion (i = Christianity, Muslim, traditional)
Exp (B) = (p/1-p) odds ratio= probability of occurrence ÷ probability of not occurring
eijk = error term
CHAPTER 4
RESULTS AND DISCUSSION
There was no significant difference on the values of CP and CF obtained irrespective of the
method of analysis used (p>0.05). There were slight differences on the results obtained from
wet and dry chemistry methods for same samples from the same production sources. Castro
(2006) argued that the near infrared reflectance (NIR) is a modernized machine that accurately
estimates the nutritive value of a sample as long as it is correctly calibrated with true nutritive
values of the raw materials to be used. Foss (2013) added that the NIR is accurate in
determining the CP and CF levels as their structures are made up of carbon backbones. Donald
and Emil (2007) agreed that NIR is most suitable machine which uses infrared waves to
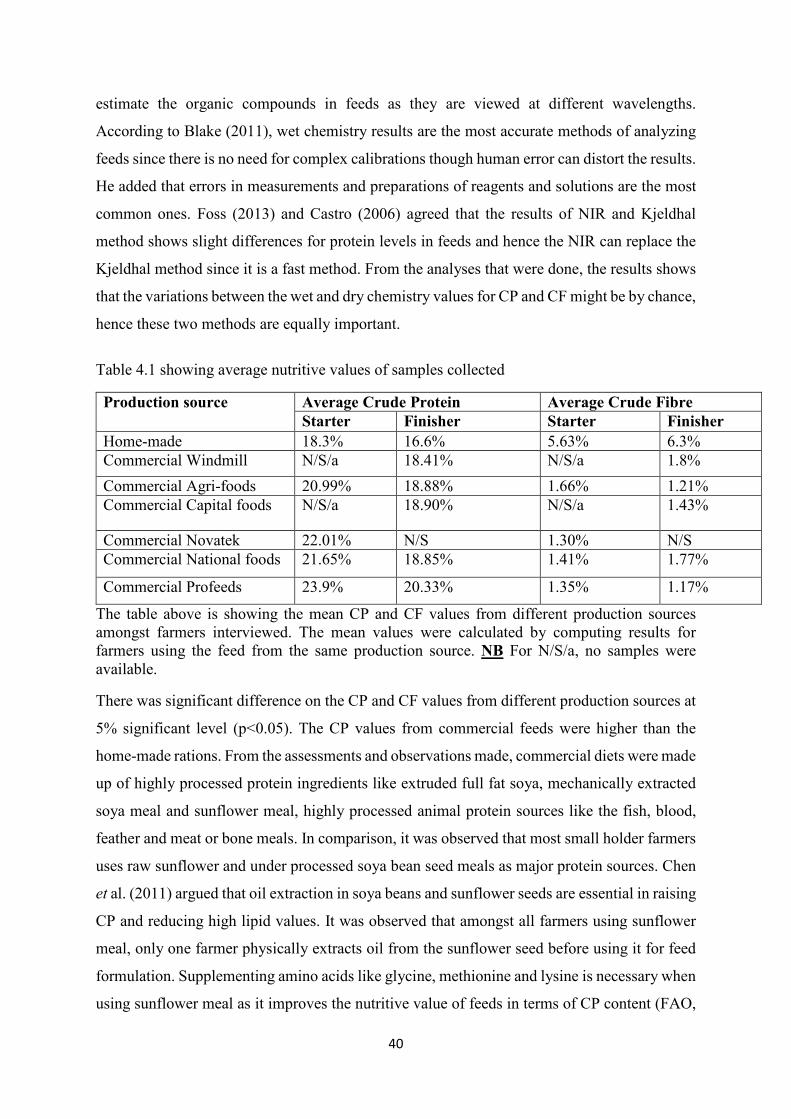
40
estimate the organic compounds in feeds as they are viewed at different wavelengths.
According to Blake (2011), wet chemistry results are the most accurate methods of analyzing
feeds since there is no need for complex calibrations though human error can distort the results.
He added that errors in measurements and preparations of reagents and solutions are the most
common ones. Foss (2013) and Castro (2006) agreed that the results of NIR and Kjeldhal
method shows slight differences for protein levels in feeds and hence the NIR can replace the
Kjeldhal method since it is a fast method. From the analyses that were done, the results shows
that the variations between the wet and dry chemistry values for CP and CF might be by chance,
hence these two methods are equally important.
Table 4.1 showing average nutritive values of samples collected
Production source Average Crude Protein Average Crude Fibre Starter Finisher Starter Finisher
Home-made 18.3% 16.6% 5.63% 6.3%
Commercial Windmill N/S/a 18.41% N/S/a 1.8%
Commercial Agri-foods 20.99% 18.88% 1.66% 1.21%
Commercial Capital foods N/S/a 18.90% N/S/a 1.43%
Commercial Novatek 22.01% N/S 1.30% N/S
Commercial National foods 21.65% 18.85% 1.41% 1.77%
Commercial Profeeds 23.9% 20.33% 1.35% 1.17%
The table above is showing the mean CP and CF values from different production sources amongst farmers interviewed. The mean values were calculated by computing results for farmers using the feed from the same production source. NB For N/S/a, no samples were available.
There was significant difference on the CP and CF values from different production sources at
5% significant level (p<0.05). The CP values from commercial feeds were higher than the
home-made rations. From the assessments and observations made, commercial diets were made
up of highly processed protein ingredients like extruded full fat soya, mechanically extracted
soya meal and sunflower meal, highly processed animal protein sources like the fish, blood,
feather and meat or bone meals. In comparison, it was observed that most small holder farmers
uses raw sunflower and under processed soya bean seed meals as major protein sources. Chen
et al. (2011) argued that oil extraction in soya beans and sunflower seeds are essential in raising
CP and reducing high lipid values. It was observed that amongst all farmers using sunflower
meal, only one farmer physically extracts oil from the sunflower seed before using it for feed
formulation. Supplementing amino acids like glycine, methionine and lysine is necessary when
using sunflower meal as it improves the nutritive value of feeds in terms of CP content (FAO,
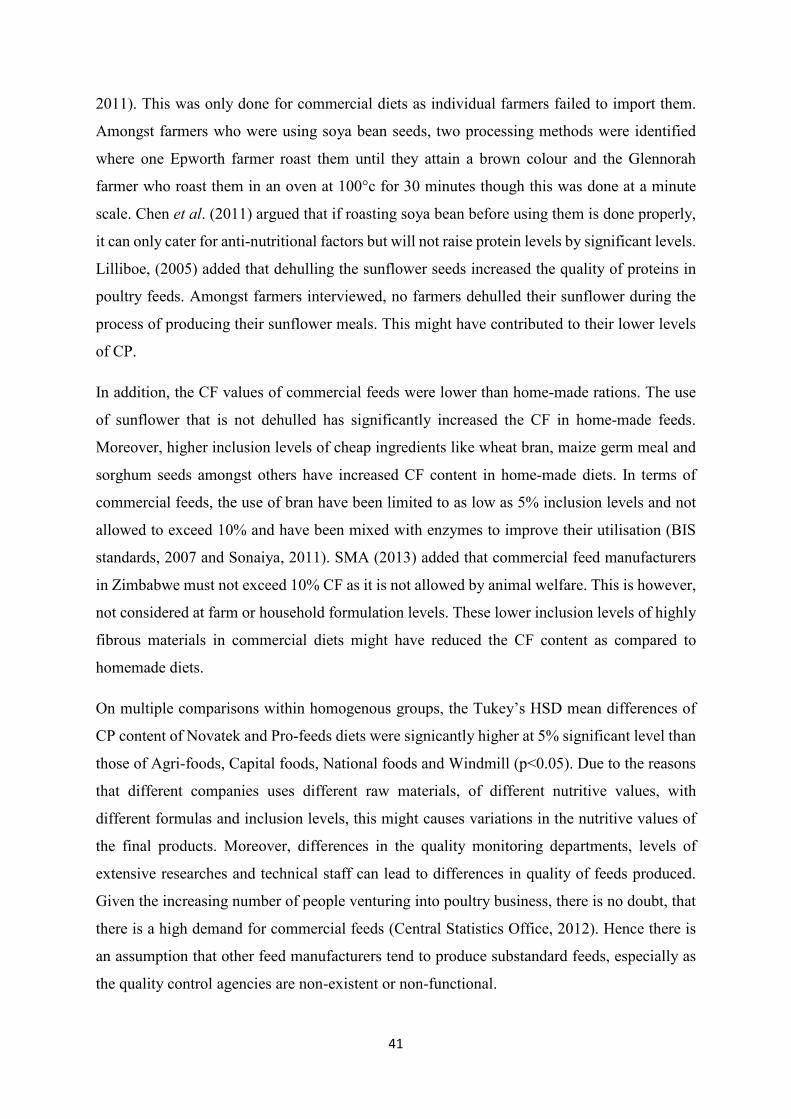
41
2011). This was only done for commercial diets as individual farmers failed to import them.
Amongst farmers who were using soya bean seeds, two processing methods were identified
where one Epworth farmer roast them until they attain a brown colour and the Glennorah
farmer who roast them in an oven at 100°c for 30 minutes though this was done at a minute
scale. Chen et al. (2011) argued that if roasting soya bean before using them is done properly,
it can only cater for anti-nutritional factors but will not raise protein levels by significant levels.
Lilliboe, (2005) added that dehulling the sunflower seeds increased the quality of proteins in
poultry feeds. Amongst farmers interviewed, no farmers dehulled their sunflower during the
process of producing their sunflower meals. This might have contributed to their lower levels
of CP.
In addition, the CF values of commercial feeds were lower than home-made rations. The use
of sunflower that is not dehulled has significantly increased the CF in home-made feeds.
Moreover, higher inclusion levels of cheap ingredients like wheat bran, maize germ meal and
sorghum seeds amongst others have increased CF content in home-made diets. In terms of
commercial feeds, the use of bran have been limited to as low as 5% inclusion levels and not
allowed to exceed 10% and have been mixed with enzymes to improve their utilisation (BIS
standards, 2007 and Sonaiya, 2011). SMA (2013) added that commercial feed manufacturers
in Zimbabwe must not exceed 10% CF as it is not allowed by animal welfare. This is however,
not considered at farm or household formulation levels. These lower inclusion levels of highly
fibrous materials in commercial diets might have reduced the CF content as compared to
homemade diets.
On multiple comparisons within homogenous groups, the Tukey’s HSD mean differences of
CP content of Novatek and Pro-feeds diets were signicantly higher at 5% significant level than
those of Agri-foods, Capital foods, National foods and Windmill (p<0.05). Due to the reasons
that different companies uses different raw materials, of different nutritive values, with
different formulas and inclusion levels, this might causes variations in the nutritive values of
the final products. Moreover, differences in the quality monitoring departments, levels of
extensive researches and technical staff can lead to differences in quality of feeds produced.
Given the increasing number of people venturing into poultry business, there is no doubt, that
there is a high demand for commercial feeds (Central Statistics Office, 2012). Hence there is
an assumption that other feed manufacturers tend to produce substandard feeds, especially as
the quality control agencies are non-existent or non-functional.
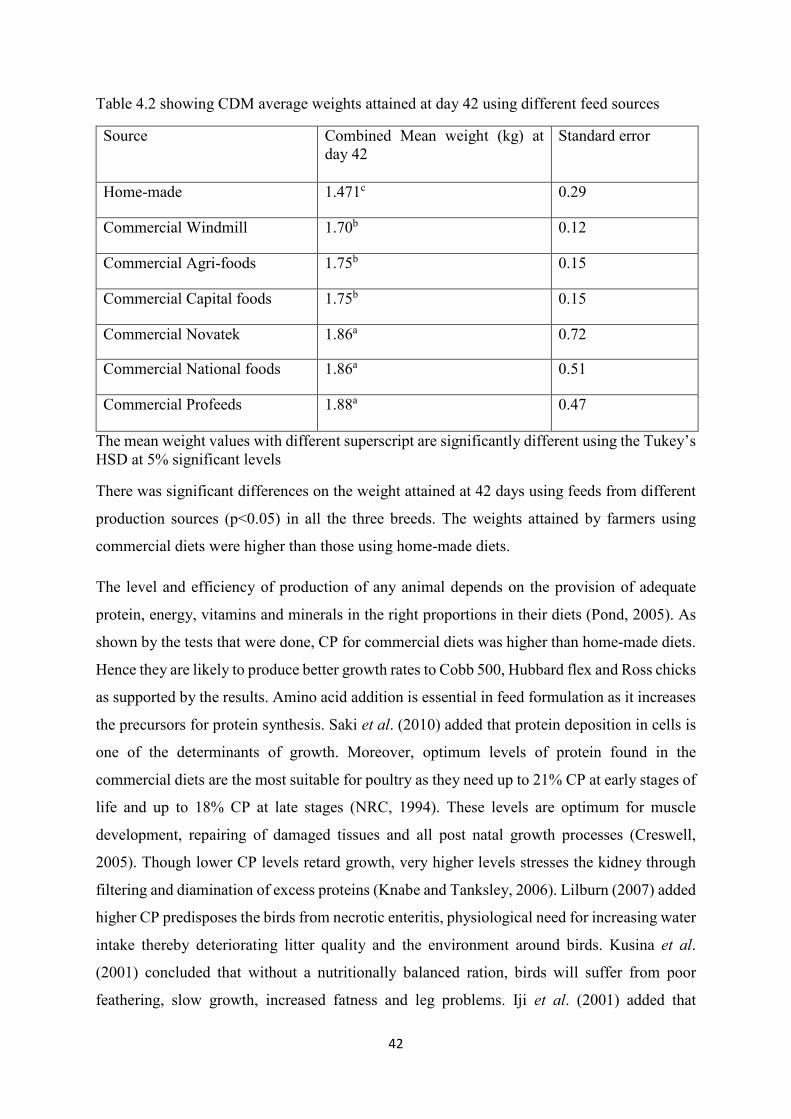
42
Table 4.2 showing CDM average weights attained at day 42 using different feed sources
Source Combined Mean weight (kg) at day 42
Standard error
Home-made 1.471c 0.29
Commercial Windmill 1.70b 0.12
Commercial Agri-foods 1.75b 0.15
Commercial Capital foods 1.75b 0.15
Commercial Novatek 1.86a 0.72
Commercial National foods 1.86a 0.51
Commercial Profeeds 1.88a 0.47
The mean weight values with different superscript are significantly different using the Tukey’s HSD at 5% significant levels
There was significant differences on the weight attained at 42 days using feeds from different
production sources (p<0.05) in all the three breeds. The weights attained by farmers using
commercial diets were higher than those using home-made diets.
The level and efficiency of production of any animal depends on the provision of adequate
protein, energy, vitamins and minerals in the right proportions in their diets (Pond, 2005). As
shown by the tests that were done, CP for commercial diets was higher than home-made diets.
Hence they are likely to produce better growth rates to Cobb 500, Hubbard flex and Ross chicks
as supported by the results. Amino acid addition is essential in feed formulation as it increases
the precursors for protein synthesis. Saki et al. (2010) added that protein deposition in cells is
one of the determinants of growth. Moreover, optimum levels of protein found in the
commercial diets are the most suitable for poultry as they need up to 21% CP at early stages of
life and up to 18% CP at late stages (NRC, 1994). These levels are optimum for muscle
development, repairing of damaged tissues and all post natal growth processes (Creswell,
2005). Though lower CP levels retard growth, very higher levels stresses the kidney through
filtering and diamination of excess proteins (Knabe and Tanksley, 2006). Lilburn (2007) added
higher CP predisposes the birds from necrotic enteritis, physiological need for increasing water
intake thereby deteriorating litter quality and the environment around birds. Kusina et al.
(2001) concluded that without a nutritionally balanced ration, birds will suffer from poor
feathering, slow growth, increased fatness and leg problems. Iji et al. (2001) added that
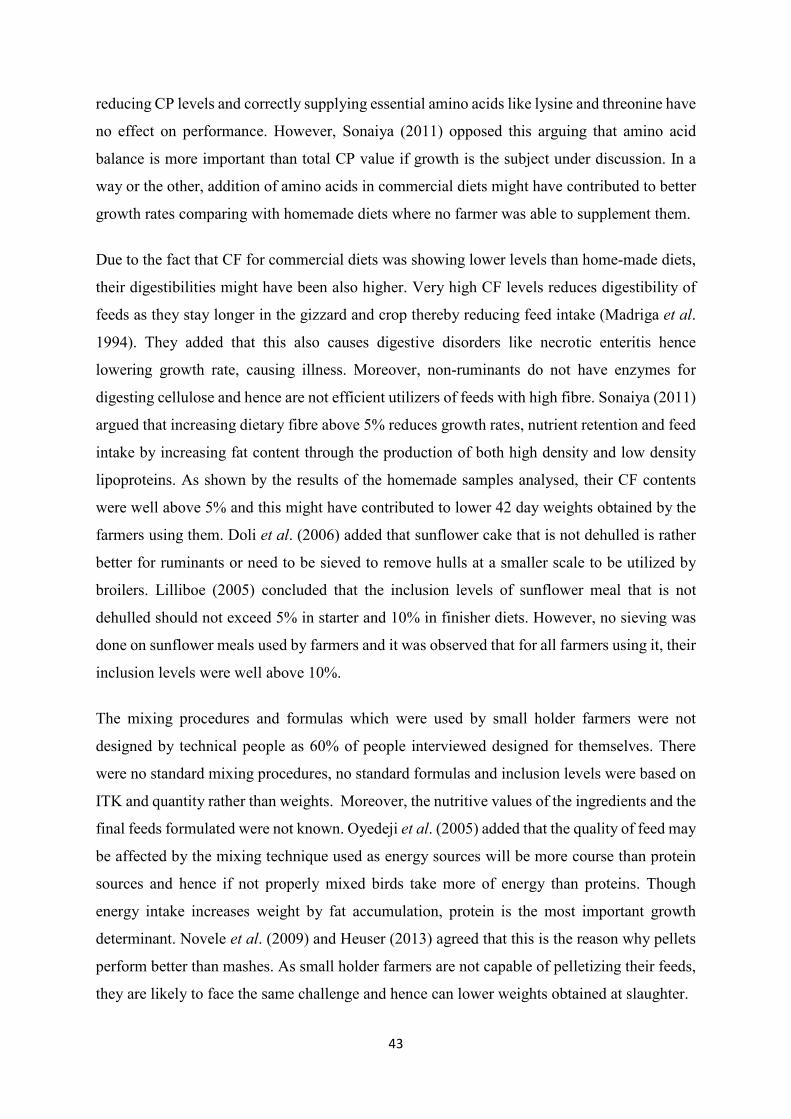
43
reducing CP levels and correctly supplying essential amino acids like lysine and threonine have
no effect on performance. However, Sonaiya (2011) opposed this arguing that amino acid
balance is more important than total CP value if growth is the subject under discussion. In a
way or the other, addition of amino acids in commercial diets might have contributed to better
growth rates comparing with homemade diets where no farmer was able to supplement them.
Due to the fact that CF for commercial diets was showing lower levels than home-made diets,
their digestibilities might have been also higher. Very high CF levels reduces digestibility of
feeds as they stay longer in the gizzard and crop thereby reducing feed intake (Madriga et al.
1994). They added that this also causes digestive disorders like necrotic enteritis hence
lowering growth rate, causing illness. Moreover, non-ruminants do not have enzymes for
digesting cellulose and hence are not efficient utilizers of feeds with high fibre. Sonaiya (2011)
argued that increasing dietary fibre above 5% reduces growth rates, nutrient retention and feed
intake by increasing fat content through the production of both high density and low density
lipoproteins. As shown by the results of the homemade samples analysed, their CF contents
were well above 5% and this might have contributed to lower 42 day weights obtained by the
farmers using them. Doli et al. (2006) added that sunflower cake that is not dehulled is rather
better for ruminants or need to be sieved to remove hulls at a smaller scale to be utilized by
broilers. Lilliboe (2005) concluded that the inclusion levels of sunflower meal that is not
dehulled should not exceed 5% in starter and 10% in finisher diets. However, no sieving was
done on sunflower meals used by farmers and it was observed that for all farmers using it, their
inclusion levels were well above 10%.
The mixing procedures and formulas which were used by small holder farmers were not
designed by technical people as 60% of people interviewed designed for themselves. There
were no standard mixing procedures, no standard formulas and inclusion levels were based on
ITK and quantity rather than weights. Moreover, the nutritive values of the ingredients and the
final feeds formulated were not known. Oyedeji et al. (2005) added that the quality of feed may
be affected by the mixing technique used as energy sources will be more course than protein
sources and hence if not properly mixed birds take more of energy than proteins. Though
energy intake increases weight by fat accumulation, protein is the most important growth
determinant. Novele et al. (2009) and Heuser (2013) agreed that this is the reason why pellets
perform better than mashes. As small holder farmers are not capable of pelletizing their feeds,
they are likely to face the same challenge and hence can lower weights obtained at slaughter.
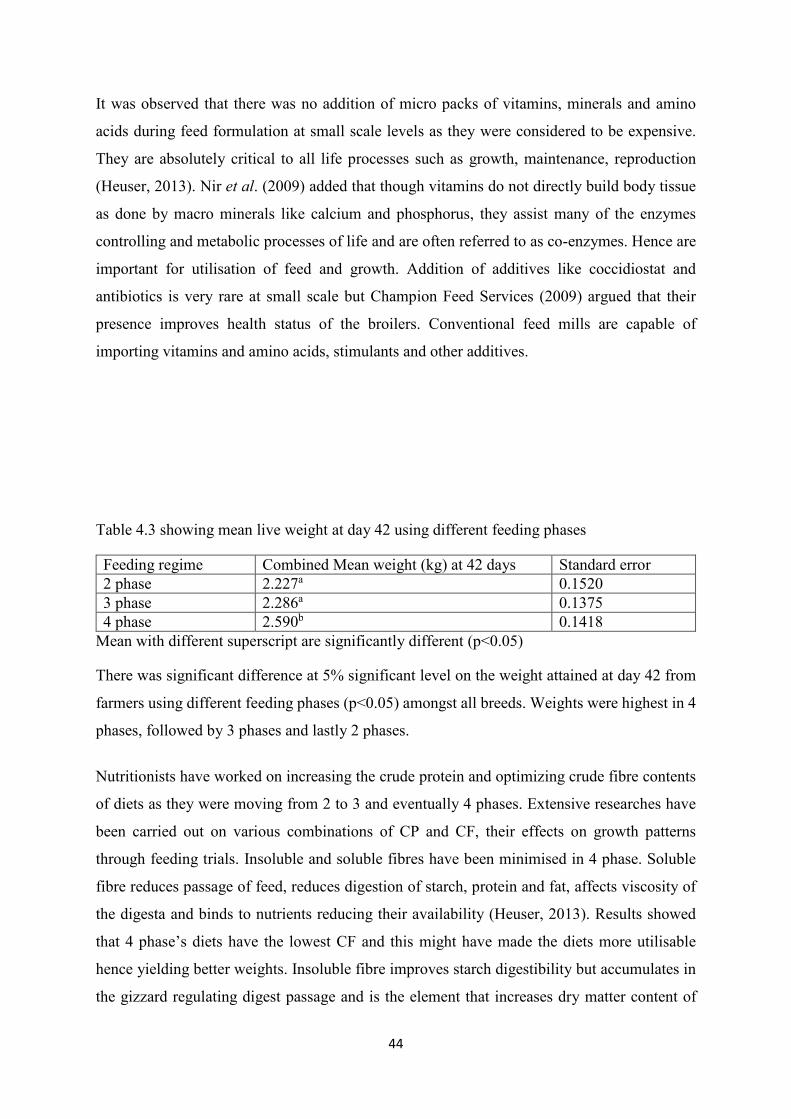
44
It was observed that there was no addition of micro packs of vitamins, minerals and amino
acids during feed formulation at small scale levels as they were considered to be expensive.
They are absolutely critical to all life processes such as growth, maintenance, reproduction
(Heuser, 2013). Nir et al. (2009) added that though vitamins do not directly build body tissue
as done by macro minerals like calcium and phosphorus, they assist many of the enzymes
controlling and metabolic processes of life and are often referred to as co-enzymes. Hence are
important for utilisation of feed and growth. Addition of additives like coccidiostat and
antibiotics is very rare at small scale but Champion Feed Services (2009) argued that their
presence improves health status of the broilers. Conventional feed mills are capable of
importing vitamins and amino acids, stimulants and other additives.
Table 4.3 showing mean live weight at day 42 using different feeding phases
Feeding regime Combined Mean weight (kg) at 42 days Standard error
2 phase 2.227a 0.1520
3 phase 2.286a 0.1375
4 phase 2.590b 0.1418
Mean with different superscript are significantly different (p<0.05)
There was significant difference at 5% significant level on the weight attained at day 42 from
farmers using different feeding phases (p<0.05) amongst all breeds. Weights were highest in 4
phases, followed by 3 phases and lastly 2 phases.
Nutritionists have worked on increasing the crude protein and optimizing crude fibre contents
of diets as they were moving from 2 to 3 and eventually 4 phases. Extensive researches have
been carried out on various combinations of CP and CF, their effects on growth patterns
through feeding trials. Insoluble and soluble fibres have been minimised in 4 phase. Soluble
fibre reduces passage of feed, reduces digestion of starch, protein and fat, affects viscosity of
the digesta and binds to nutrients reducing their availability (Heuser, 2013). Results showed
that 4 phase’s diets have the lowest CF and this might have made the diets more utilisable
hence yielding better weights. Insoluble fibre improves starch digestibility but accumulates in
the gizzard regulating digest passage and is the element that increases dry matter content of
45
faeces (Eliana and Balcazar, 2010). Luis et al. (2004) concluded that high levels of CF diets is
not beneficiary but is required in small quantities for avoiding digestive problems in poultry.
Moreover, there is a gradual decrease in CP levels in the later phases like the 4 phase where
birds start by consuming a diet with 23%, followed by 21%, 20% and eventually 19%. This
gradual decrease is associated with lower stress and has no much impact on the reducing feed
consumed as a result of differences in composition. It has also been observed that highly
processed and nutritive value ingredients as well as growth stimulants and probiotics have been
widely used in the later phases. For example, 33% sunflower is not used on 3 and 4 phase diets
but sometimes 40% sunflower can be included in smaller quantities. This is because of its high
fibre and imbalance in amino acids. Instead fish meal, meat and bone meal, soya meal and
blood meal are commonly used for later phases. Moreover, the differences in weight might
have been attributed by the fact that later phase have more CP as proved by the results obtained.
This is partly because their targets in terms of CP are different, where taking for example on
finisher diets 2 phase target 17%, 3 phase 18% and 4 phase 19% (National foods, 2013).
Moreover, amino acids have been balanced by adding enough essential amino acids like lysine
and threonine.
Using the Tukey’s HSD, there was no significant mean difference at 5% significant level on
the weight attained at day 42 from farmers using 2 and 3 phase (p>0.05) but there the was
significant difference on mean weight difference to those using those using 4 phase feeding
regimes (p<0.005).
From the results obtained by the tests done, the CP levels were slightly increasing and CF was
slightly decreasing from 2, 3 and 4-phase feeding systems though they were a little bit closer
on 2 and 3 phase diets. The target percentages of CP are almost similar for 3 and 2 phases and
they target the same amount of CF. According to National foods article (2013), 2 phase starter
diets targets 20% CP and 3 phase targets 21% CP and both aim below 5% CF. It can be
observed that these targets are almost the same though nutritionists are working on increasing
amino acid balances in three phase system. World Poultry Net (2009) added that birds using
three phase feeding programme should grower better than those using two phase from the
period they consume grower diets, which is in the 3rd and 4th week. This is so because the birds
following 2 phases will be already consuming finisher diets that are less nutritive than grower
diets of 3 phases. Owing to the increased efficiency of protein deposition by three phase
grower, it may results in more gain per gram protein deposited than lipid deposited by the 2
46
phase finisher. Hence, higher rates of protein deposition during the 3rd and 4th weeks would
have a significant impact on the overall growth rates (Novele et al., 2009). This makes 3 phases
better than 2 phases. This was proved wrong by the results of the survey which showed that
there is no significant difference on mean weight difference at 42 days on broilers under 2 and
3 phase systems. However, little differences on weights obtained were noticed. Lee and Lesson
(2001) agreed that weights attained at day 42 when using 2 and 3 phase programmes are slightly
different and this was supported by results obtained. Hubbard (2013) agreed to that and
concluded that fat deposition is higher in 2 phases and hence will add to weight.
As shown by the results in table 4.3, 4-phase is highly nutritious than both 2 and 3 phase diets.
Lilburn, (2007) argued that pre-starter diets increase the rate at of development of the
proventriculus, gizzard, liver, pancreas, intestine and skeletal development. All these lead to
better weights at day 42. Leksrisompong et al. (2006) added that the amount of CP of the diet
is not the correct determinant of the nutritive value of a feed but is determined by the amino
acid balances. The use of the ideal amino acids like the lysine, iso-leucine, glycine , tryptophan,
valine, methionine, threonine, cystine and threonine as done in formulating 4 phase diets have
made them special and expensive diets (Ross Poultry Breeders, 2009). Balanced protein level
with balanced amino acids in 4 phase helps in maximizing muscle development, full feathering
to meet the requirements for optimum performance of meat-type birds (Creswell, 2007). Saki
et al. (2010) concluded that 4-phase is the best feed to use for Cobb broilers and it is the phase
that have been adopted by Irvine’s in Zimbabwe and they are achieving 1.65kg/28days (Irvine,
2011).
Farmers favouring 2 phase over 3 have mentioned that it is easy and cheap method to use, no
complex lighting programs to follow. Those using 3 phase argued that its rationed specific
accordingly for different ages, involves a gradual decrease in CP levels hence less stress,
relatively fast growth rates and provides uniform growth rates. For those using 4-phases 80%
of the farmers interviewed were contract farmers for Irvine’s Zimbabwe hence were given the
feed. Despite that, they also mentioned that it is specific for different age groups hence lead to
fast growth rate and the prestarter that gives a quick start and produces a good skeletal
development.
Table 4.4 showing ranked predictors for adoption from the binary logistic regression
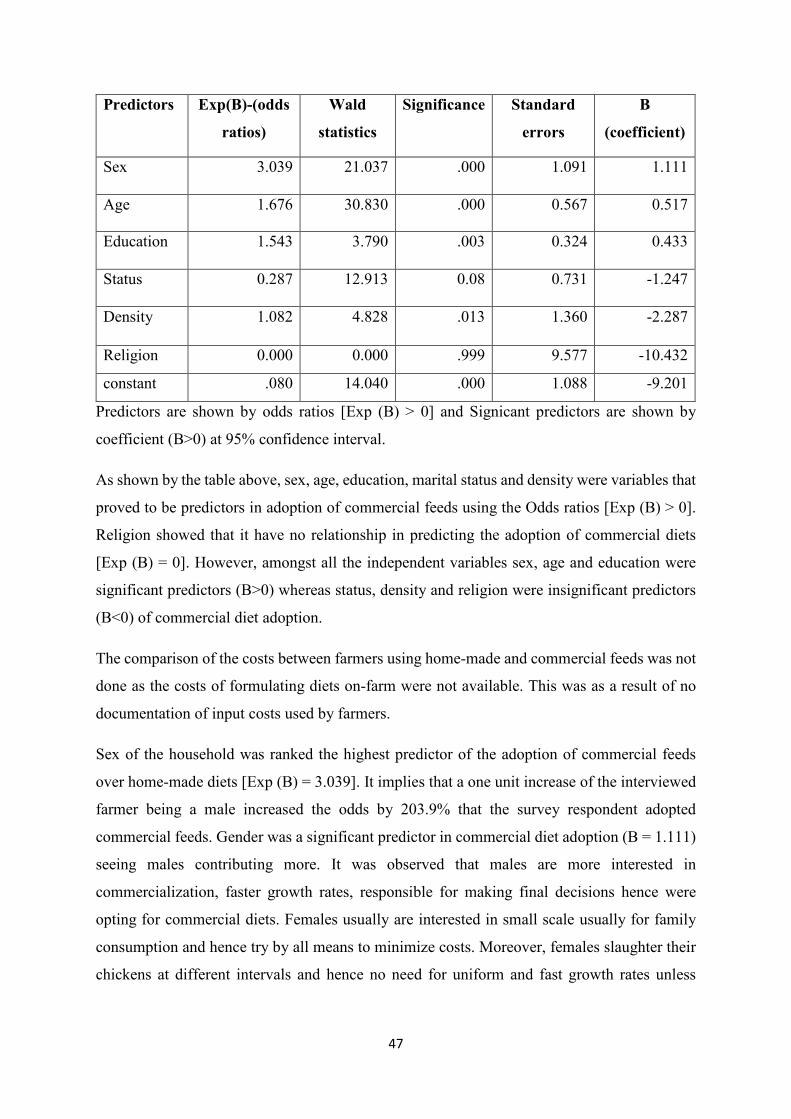
47
Predictors Exp(B)-(odds
ratios)
Wald
statistics
Significance Standard
errors
B
(coefficient)
Sex 3.039 21.037 .000 1.091 1.111
Age 1.676 30.830 .000 0.567 0.517
Education 1.543 3.790 .003 0.324 0.433
Status 0.287 12.913 0.08 0.731 -1.247
Density 1.082 4.828 .013 1.360 -2.287
Religion 0.000 0.000 .999 9.577 -10.432
constant .080 14.040 .000 1.088 -9.201
Predictors are shown by odds ratios [Exp (B) > 0] and Signicant predictors are shown by
coefficient (B>0) at 95% confidence interval.
As shown by the table above, sex, age, education, marital status and density were variables that
proved to be predictors in adoption of commercial feeds using the Odds ratios [Exp (B) > 0].
Religion showed that it have no relationship in predicting the adoption of commercial diets
[Exp (B) = 0]. However, amongst all the independent variables sex, age and education were
significant predictors (B>0) whereas status, density and religion were insignificant predictors
(B<0) of commercial diet adoption.
The comparison of the costs between farmers using home-made and commercial feeds was not
done as the costs of formulating diets on-farm were not available. This was as a result of no
documentation of input costs used by farmers.
Sex of the household was ranked the highest predictor of the adoption of commercial feeds
over home-made diets [Exp (B) = 3.039]. It implies that a one unit increase of the interviewed
farmer being a male increased the odds by 203.9% that the survey respondent adopted
commercial feeds. Gender was a significant predictor in commercial diet adoption (B = 1.111)
seeing males contributing more. It was observed that males are more interested in
commercialization, faster growth rates, responsible for making final decisions hence were
opting for commercial diets. Females usually are interested in small scale usually for family
consumption and hence try by all means to minimize costs. Moreover, females slaughter their
chickens at different intervals and hence no need for uniform and fast growth rates unless
48
otherwise they will be keeping them for income generating. Therefore, efforts to improve the
adoption of commercial feeds should be target male farmers.
The odds ratios ranked age to be the one of the better predictor of adoption of commercial feeds
[Exp (B) = 1.676]. Using the same rule, a one unit increase in age increased the odds that
farmers would adopt commercial feeds by 67.6%. Age was a significant predictor in
commercial diet adoption (B = 0.517) and the age group of 31-40 contributing more. Middle
aged people are amongst the working class and are associated with more responsibilities. Due
to unemployment, low salaries in the Zimbabwean cities, the working class is forced into small
businesses like poultry production for earning a living. This group is still active, energetic and
usually prefers commercial diets because they value quick returns. Hence, to improve the
adoption of commercial feeds, one should focus on the age group 31-40.
The highest level of education attained was also amongst better predictors of commercial diet
adoption in poultry [Exp (B) = 1.543). The farmers that attained form 4 occupied 45% of the
farmers interviewed and have contributed 54.3% for every unit to the change in odds ratios.
Level of education is a significant predictor in commercial feed adoption (B = 0.433). The level
of education affects the perceptions of farmers and reasoning capacities. Progressive farmers
adopt new innovations faster than laggards as they believe in increasing yields. Prokopy et al.
(2008) argued that despite level of education, experience can also affect adoption. In improving
adoption of commercial feeds, people who have attained form 4 as their highest education level
should be targeted.
According to the results obtained marital status was also ranked as a poor predictor of the
adoption of commercial diets [Exp (B) = 0.287]. This means that for a single increase of an
interviewed farmer being married, it increased the odds of adopting commercial diets by
28.7%. Its coefficient is showing that marital status is not a significant predictor (B = -1.247)
in adoption of commercial feeds. Hence married, single, widowed and divorced people are
likely to adopt commercial feeds. Though marital status have no much impact on adoption,
married people contributed more as they occupied 70% of the interviewed farmers and hence
can be targeted when improving adoption of commercial feeds. This is partly because as people
marry responsibilities in terms of cash for rentals, school fees for children, food for the family
will increase compared to single people.
The location of the farmers interviewed was also amongst the poor predictors of commercial
feed adoption [Exp (B) = 1.082]. This was meaning that a single chance that the interviewed
49
farmer was from high densities, it increased the odds of adopting commercial feeds by 8.2%.
Hence the people living either in high or low densities can adopt commercial feeds and hence
location was not a significant predictor (B = -2.287). Basing on the numbers of interviewed
farmers, it can be concluded that concentrating on high densities where more people are into
broiler production can be another better way to improve adoption of commercial feeds.
The religion of the farmer was not related in predicting the adoption of commercial diets [Exp
(B) = 0.000]. This means that all farmers from different religions can adopt commercial feeds
and has no effect on predicting adoption of commercial diets (B = -10.432). Since statistics
shows that more Christians are into broiler production, concentrating on them can however aid
in improving adoption of commercial feeds.
CHAPTER 5
5.0 CONCLUSION AND RECOMMENDATIONS
5.1 Conclusion
In this study, there was significant difference on weights at day 42 from farmers using home-
made and commercial feeds. Commercial diets have higher CP, lower CF and contributed to
better weights than home-made feed. Hence it can be concluded that farmers making their own
feeds should concentrate on increasing CP and reducing CF as they are not within the expected
ranges of good broiler welfare. Ingredients used in home-made diets should be analyzed, their
inclusion levels should be monitored, formulas should be revised, mixing procedures should
be improved and essential amino acids, minerals and vitamins should be incorporated into
home-made diets.
It was also seen that there was no significant difference on the weight at day 42 between farmers
using 2 and 3-phase feeding system and hence choice between the two different feeding phases
should be based on the cost and meat quality expected. It was therefore, concluded that both
farmers using 2 and 3-phase systems can safely switch and start using 4 phase as it can improve
growth rates by a significant margin. In improving adoption of commercial feeds, feed mills
can target males, the 31-40 age group, christians, married people, farmers living in high
densities and community members that hold form 4 as their highest education qualification as
they have proved to be better predictors in adoption of commercial feeds.

50
5.2 Recommendations
To farmers using their own feeds: need to consider: -
• Send raw materials for nutritive values analysis for coming with feasible inclusion
levels as per broiler welfare.
• Use soya bean meal rather than sunflower meal or should screen it through 1mm sieve
to reduce fibre.
• Eliminate excess fat from sunflower seeds by physical pressing the seeds.
• Concentrate on increasing their CP and reducing CF in their formulas.
• Send samples of their final product to have an idea of its nutritive value in terms of CP,
CF, calcium, fat and other minerals.
• Keep records in order to evaluate whether they are making profits.
• Mix ingredients in small quantities and incorporate vitamin and mineral macro-packs
in their formulations.
For farmers using commercial feeds: need to consider: -
• Use 4 phase feeding system preferably to 2 and 3 phase systems.
General recommendations from observations: - should
• Improve ventilation to avoid ammonia build up which is causing odours.
• Insulate chicken houses properly and follow proper lighting programmes to reduce
much noise through continued crowing, quacking, clucking and gobbling.
• Turn dry bedding and change wet bedding regularly.
• Proper disposing of bedding in composts or using in vegetable production
For feed manufacturing companies: - should
• Advertise 4 phase feeding programme
• Concentrate more on 2-phase because it is the most commonly used phase
51
• Target males, 31-41 aged, married, form 4 holders in improving adoption of diets
For further studies
• Other researches should concentrate on the effects of fat content, different housing,
different lighting programmes and breeds on weight at day 42 for small holder
producers
CHAPTER 6
6.0 REFERENCES AND APPENDICES
6.1 References
Association of Official Analytical Chemists (AOAC), (1990) Official methods of analysis. Association of Official Analytical Chemists, Washington, DC.
Aviagen, (2007) Economic Approach to Broiler Production. Atlantic Poultry Research Institute.
Aviagen Ross Poultry Breeders (2009) Ross 308 Broiler Management Guide and Nutrition Supplement, Alabama, USA.
Balcazar E. and Eliana P. (2010) Effect of Breeder Nutrition and Feeding Program during Rearing and Production on Broiler Leg Health. Poultry Science Raleigh, North Carolina.
Bennett C.D., Classen H.L. and Riddell C. (2009) Live performance and health of broiler chickens fed diets diluted with whole or crumbled wheat. Canadian Journal of Animal Science.
Blake. J. (2011) Handbook of Food Analysis: Physical Characterization of Nutrients Analysed. 2nd edition. USA.
Castro P. (2006) Use of near infrared reflectance spectroscopy NIRs for feed and forage analysis. FAO Corporate Document Repository.
Central Statistics Office (2012) Agricultural and livestock survey in communal lands-Central Statistics Office report. Zimbabwe Government, Harare, Zimbabwe.
Creswell D. (2007) Feeding the broiler. Asian Poultry Magazine, Asia.
Creswell, D. (2005) The nutritional requirements of today's broiler. Asian Poultry Magazine, Asia.
Chen L., Madl R.L., Vadlani P.V. and Wang W. (2011) Value Added Products from Soybean: Removal of Anti-Nutritional Factors via Bio-processing. Department of Food Science, South China University of Technology, Guangzhou, China.
Chikwanda A.T and Chikwanda D. (2012) Monogastric animal production module for B.U.S.E VODL programme. (Unpublished).
52
Darre M.J. (2011) Extension Poultry Specialist, Department of Animal Science, University of
Connecticut. [email protected].
Drakakis S.D., Bowyer B.T. and Tevera D. (1995) Urban poverty and urban agriculture. An overview of linkages in Harare, Habitat environment, 19 183-93.
Dolberg F. and Petersen P. H. (2005) Poultry as a Tool in Poverty Eradication and Promotion of Gender Equality, Denmark.
Doli M.G., Usturoi M.G., Radu-Rusu, Usturoi A.l. and Luminiţa Doli (2006) Researches concerning the usage of whole sunflower seeds in poultry feeding, University of Agricultural Sciences and Veterinary Medicine, Romania.
Donald A.B. and Emil W.C (2007) Handbook of Near-Infrared Analysis, 2nd edition, Applications of NIR Spectroscopy to Agricultural products. CRC Press, Amazon.
Dhliwayo M. (2011) Towards sustainable broiler production – does use of sorghum (sorghum bicolour) as an adjunct substitute of maize affects broiler performance? Department of Animal and Wildlife Management, Bindura University of Science Education, Zimbabwe.
FAO (2011) Feed ingredients survey- Feeding poultry, pigs and fish in developing countries, Poultry, Fisheries and Aquaculture department, Rome, Italy.
Feighner S.D., Dashkevicz M.P. (2010) Sub-therapeutic levels of antibiotics in poultry feeds and their effects on weight gain, feed efficiency, and bacterial cholyltaurine hydrolase activity, National Centre for Biotechnology Information, USA.
Gadzirayi C.T., Masamha B., Mupangwa J.F. and Washaya S. (2012) Performance of Broiler Chickens Fed on Mature Moringa oleifera Leaf Meal as a Protein Supplement to Soyabean
Meal, Department of Agriculture, Bindura University of Science Education, P. Bag 1020, Bindura, Zimbabwe.
Hanyani-Mlambo, B.T. (2000). Demand for livestock feed and benefits for the poor: A Zimbabwean case study. Project Report March 2000. Natural Resources Institute, Chatham, Kent, UK.
Heuser G. F. (2013) Feeding Poultry – The classic guide to poultry nutrition and diet formulation. Norton Creek Press.
Hooshmand M. (2006) Effect of early feeding programs on broiler performance. Introductory Journal to Poultry Science. Department of Animal Science, Yasouj University, Yasouj, Iran.
Jensen H. and Askov (2009) Paradigm and Visions: Network for Poultry Production in Developing Countries. University of Copenhagen.
Leksrisompong N., Plumstead P.W., Romero H.S., and Brake J.T. (2006) Effect of feeding program during rearing and onset of lay on reproductive performance of broiler breeder
females. Journal of environmental quality, Poultry Science.
Lee K.H. and Lesson S. (2001) Performance of broilers fed limited quantities of feed or nutrients during seven to fourteen days of age. Poultry Science 80: 446-454.
Lilburn, M. S. (2007) Ingredient quality and its impact on digestion and absorption in poultry Journal for Applied Poultry Researches.
53
Kusina J. F., Kusina N. T. and Mhlanga F. (2001) A survey on Village chicken losses: Causes and solutions as perceived by farmers, SADC workshop on Newcastle disease control in village chickens, Australian Centre for International Agricultural Research.
Lilliboe D. (2005) Sunflower meal applications-for livestock and poultry feeds. The Sunflower. Carlifornia, USA.
Luis E.S., Sullivan T.W. and Welson L.A. (2004) Nutrient composition and feeding value of wheat, sunflower, sorghum grains, corn and their by-products in broiler diets. Poultry Science.
Mack S., Hoffmann D. and Otte J. (2009) Animal Production and Health Division, Food and Agriculture, The contribution of poultry to rural and urban development Organization of the United Nations, Rome, Italy.
Madriga S.A., Watkins S.E. and Waldroup P.W. (1994) Feeding programs designed to modify early growth rates in male broilers grown to 56 days of age. Faculty of Agricultural Sciences, Lautech, Ogbomoso, Ibadan Nigeria.
Mapiye C., Mwale M., Mupangwa J. F., Chimonyo M., R. Foti R. and Mutenje M.J.,(2008) A Research Review of Village Chicken Production Constraints and Opportunities in Zimbabwe, Department of Livestock and Pasture Science, Faculty of Science and Agriculture University of Fort Hare, South Africa.
Mbiba B (1995) Urban agriculture in Zimbabwe. Implications for urban poverty and management, Ashgate Publishing, Avebury.
Masunda B. and Mutetwa L. R. (2006) Commercial Poultry Production Training Manual Department of Animal Science University Of Zimbabwe.
Mercia L.S. (2010) The storey’s guide to raising chickens, Storey Books, Pownal, Vermont. http://www.amazon.com.
Mpofu, I. (2004). Applied animal feed science and technology. 1st edition, Upfront Publishing Limited, Leicestershire, United Kingdom.
Muchadeyi F.C., Wollny C.B.A., Eding H., Weigend S., Makuza M. and Simianer H. (2007)Variation in village chicken production systems among agro-ecological zones of Zimbabwe, Tropical Animal Health and Production, 39, 453-461
Musamba S. The Nutritionist and former Sales Manager. National Foods Limited, 13 Foundry Road, Aspindale, Harare.
McCracken K.J. and Allen C.W. (1994) Effect of live weight and diet form on organ growth and development in male Ross broiler chicks. Department of Agriculture and Environment Science, Queens University, Belfast Ireland.
Knabe D.A. and Tanksley T.D. (2006) Apparent digestibility of amino acids, gross energy and starch in corn, wheat, barley and wheat bran for growing poultry and pigs. Journal of Animal Science.
National Research Council (NRC) (1994) Nutrient Requirements of Poultry 8th edition. National Academy of Sciences, Washington.
54
Nir, I., Nitsan Z., Dunnington E.A. and Siegel P.B., (2009). Aspects of food intake in young domestic fowl: Metabolic and genetic considerations. World Poultry Science Journal, 52: 251-266.
NIRsTM (2013) Feed and Forage Analyzer www.foss.dk accessed on 11/09/14
Novele, D.J., Norris D. and C.A. Mbaji C.A. (2009) Effect of different feed restriction regimes during the starter stage on productivity and carcass characteristics of male and female Ross
308 broiler chickens, Introductory Journal of Poultry Science. P35-39.
Noy Y. and Sklan D. (2011) Nutrient use in chicks during the first week post hatch, Journal of Poultry Science. P 233-54.
Oyedeji, J.O. and Atteh J.O. (2005) Response of broilers to feeding manipulations. International Journal of Poultry Science 35: 677-685.
Pond W.G., Church D.C., Pond K.R. and Schoknecht P.A. (2005) Basic animal nutrition and feeding 5th edition. John Wiley and Sons, USA.
Prokopy, L. S., Floress, K., Klotthor-Weinkauf, & Baumgart-Getz. (2008). Determinants of agricultural best management practice adoption: Evidence from the literature. Journal of Soil and Water Conservation, Fort Hare, Private Bag X1314, Alice 5700, South Africa.
Rose S.P., Elden M.F., Foote W.R. and Gordin P. (2007) Sequential feeding of whole wheat and it’s by-products to growing broiler chicks. British Poultry Science 36:97-111.
Saki A.A. , M. Momeni, M.M. Tabatabaei, A. Ahmadi, M.M.H. Rahmati, H.R. Hemati Matin and A. Janjan (2010) Effect of Feeding Programs on Broilers Cobb and Arbour Acres plus Performance Department of Animal Science, Faculty of Agriculture, Bu-Ali Sina University, Hameden, Iran.
Scoones I., Marongwe N., Mavedzenge B., Murimbarimba F., Mahenehene J. And Sukume C. (2012) Livelihoods after Land Reform in Zimbabwe: Understanding Processes of Rural Differentiation. Journal of Agrarian Change, Blackwell Publishing Limited.
Stockfeed Manufacturer Association (2013) Feed matters regional symposium, Harare, Zimbabwe.
Sonaiya E.B., (2011) Evaluation of non-conventional feed ingredients as supplements for scavenging chicken. Department of Animal Science, Obafemi Awolowo University, Ile-Ife, Nigeria.
Sonaiya E.B. (2008) Feed resources for smallholder poultry in Nigeria, Department of Animal Science, Obafemi Awolowo University, Nigeria.
Sukume C. and Maleni D. (2012) Constraints Affecting Poultry Competitiveness. Agricultural Competitiveness Programme, USAID, Zimbabwe’s Livestock Sector. Harare, Zimbabwe.
Thakur R.S., Gupta P.C., and Lodhi G.P. (2008) Feeding value of different varieties of sorghum in broiler ration. Indian Journal of Poultry Science 19:103–107.
Ugwu D.S., (1990) The Economics of Small Ruminant Production by Small Holder Farmers, University of Nigeria.
55
Wilson, M.H., (2005) Production focus in balancing genetics, welfare and economics in broiler production, Journal of applied physiology, Publication of Cobb-Vantress.
Zimbabwe Poultry Association (2012) Zimbabweans giving up steak for chicken, Associated Newspapers of Zimbabwe (Pvt) Ltd.
Champion Feed Services (2009) Poultry Feeding Guide www.championfeeds.com/ accessed on 28/11/13
Encyclopaedia Britannica (2007) www.britannica.com accessed on 11/02/14
Irvines (2011) http://www.wattagnet.com/Poultry.aspx accessed on 08/10/14
The Latest News (2011) www.thepoultrysite.com accessed on 6/4/14
Profeeds feeding manual (2013) www.progroup.co.zw/profeeds/product/ accessed on 21/08/14
National foods article (2013) www.natfoods.co.zw accessed on 08/12/13
World Poultry.Net (2009) www.worldpoultry.net accessed on 10/07/14
Hubbard Flex Performance (2013) www.hubbardbreeders.com accessed on 3/08/14
6.2 Appendices
APPENDIX 1: Questionnaire on poultry producers in Harare Questionnaire number: Enumerator’s name …………… Residential Suburb: Village ………… Feed depot : Sample number ……………….. Respondent number: Date :
May you please tick or complete the spaces provided:-
1.0 Demographic information
1.1 Sex of head of household: Male Female 1.2 Marital status: Married Single Widowed Divorced 1.3 What is the age of head of household? <20yrs 21-30yrs 31-40yrs 41-50yrs >50 yrs 1.4 Sex of respondent: Male Female 1.5 Highest educational status of the respondent: No formal education Grade 7 Form 4 “A” Level Diploma Degree 1.6 Race of respondent?
Black African White Coloured Indian Other (Specify)........................... 1.7 What is your principal occupation? ...................................................................................... 1.8 What is your religion? Christianity Muslim traditional Other (Specify)…………...
2.0 Chicken production 2.1 Is the respondent into poultry production? Yes No 2.2 How long has the respondent been into poultry production?
< 1 year 1- 2 years +2 to 4 years More than four years 2.3 What type of poultry is kept by the respondent
Broiler Layers Turkeys Guinea fowls Ducks Other (specify)…. 2.4 Rank the preferred type of poultry from 1 (most liked) to 5 (least preferred)

56
Type of chicken Rank of preference Broiler
Layers
Turkey
Guniea fowls
Ducks
Other (specify)
2.5 Does the respondent keep broilers? Yes No 2.6 Is the respondent the owner of the broiler project? Yes No 2.7 Which broiler chicken do you keep? Hubbard Ross Cobb 500 Other …………..
2.8 Rank the type of broiler you want to keep from 1 (most liked) to 5 (least preferred)?
Broiler type Rank of choice Cobb 500
Hubbard
Ross
Other (specify)
2.9 Tick and rank the reason for the above ranking of choice of your broiler
Reason Tick (√) Rank of reason Can grow on poor quality feeds
Easy to manage
Eats less food
Fast growth rate
Low mortality
Resistant to diseases
2.10 Which breeding system do you use? All in-all out (one group at a time) Multiple age (more groups at the same time)
3.0 FEEDING SYSTEMS 3.1 Who supplies you with chicken feed? Tick suppliers and rank them 1 (one that supplies you the most) to 5 (one that you rarely buy from) state reason for ranking
Feed supplier Tick supplier
Rank Reason for ranking
National Foods
Capital Foods
Profeeds
Windmill
Others (specify)……………..
3.2 If you buy commercial feed, who is your favourite supplier? Novatek Agrifoods National foods Profeeds Capital foods Windmill Others (specify)………………. 3.2 Which feed do you buy for the following types of chickens? (a) Broilers …………………………………………………. 3.3 Do you make your own chicken feeds? Yes No 3.4 If the answer to 3.3 above is YES, tick the possible reason of making your own feed and rank the reasons in the table below rank 1 (reason that mostly drive you) 5 (least drives you to

57
mix your own feeds)
Reason Tick (√) Rank Because I grow own ingredients
I buy own ingredients
I get donations of ingredients
I grew up in a family that mixed own feeds
I had formal training on feed formulation
Other (Specify)
3.5 Did you ever receive formal training on feed formulation? Yes No 3.6 If you received training on feed formulation, who trained you?........................................... 3.7 List the ingredients that you use to formulate your own chicken feed…………………….. 3.8 If the ingredients written in 3.7 are not available what do you use to substitute them? (a) …………………………substitute with …………. 3.9. Is there any treatment that you do to the feed ingredients before using them?
Ingredient Treatment done to ingredient
Reason for the treatment before mixing
(a)………………..
3.10 Is there a written mixing procedure that you follow when mixing own feed? Yes No 3.11 Who designed the mixing procedure for you? …………………………………………… 3.12 Have you ever heard about micro ingredients? Yes No 3.13 What do you think micro ingredients are? ……………………………………….. 3.14 What do you think is the reason for using micro ingredients? ………………. 3.15 State examples of micro ingredients. 3.16. Kindly give the enumerator a small sample (e.g. 200g) of feed that you prepared for a recent batch of chicken and put label on:
(a) Date prepared …………………………………….. (b) Type of chicken fed …………………………………….. (c) How it was mixed ……………………………………………………………….. (d) Duration of feed e.g. from …….days old to ……………days old
3.17 For the batch that ate the home mixed feed state the following: (a) Mortality % at six weeks…………………………………………. (b) Weight at six weeks ……………………………………………… (c) Number of birds at six weeks …………………………………. (c) Duration of time taken to sale the chickens …………………… 3.1.8 Are you happy with the performance of your chickens on the feed that you produce Yes No 3.19 If you are not happy what are the challenges that you can complain about?.................
4.0 Flock Health 4.1 Do you vaccinate your chickens? Yes No 4.2 If the answer is yes, which vaccines do you use and at what age?
Vaccine used Date vaccinated

58
4.3 When chickens fall sick, sate the action taken and rank the action. Rank 1 (action mostly done) 5 (action least taken)
Action Tick (√) Rank Buy medication and treat
Call a veterinary doctor for advice
Eat the chicken
Ignore
Kill the chicken and sell
Look for traditional medicine
Other (specify)
4.4 If you use any traditional medicines, which ones do you use and for which problems?
Traditional medicine Problem used to treat
4.5 Did you experience any feed related problems/diseases? Yes No 4.6 What is the name of that disease/condition……………………………………………. 4.7 Can you name any other diseases that you have experienced……………………………. 4.8 What do you think was the cause of the diseases? ………………………………………… 4.9 Do you add any antibiotic in feeds or water that you give your birds? Yes No . 4.10 What is the name of the antibiotics that you use? ………………………………………. 4.11 Do you follow a defined vaccination programme? Yes No 4.12 Can you describe how you vaccinate your birds………………………………………… 4.13 Where do you dispose your bedding……………………………………………………. 4.14 Where do you store your feeds? ……………………………………………………….. 4.15 What do you do with the residual feed when giving fresh feed? ………………………. 4.16 Do your chickens show any of the following signs and symptoms? Rank the occurrence of the problems.
Problem Tick (√) if they experience problem
Rank occurrence of problem
Leg problems
Chicken skin turning green
Water in the abdomen
Pale combs
Stunted growth
Loss of feathers
Cannibalism
4.1.7 When such problems occur how do you address the problem? Write problem and solution…………………………………………………………………………………………
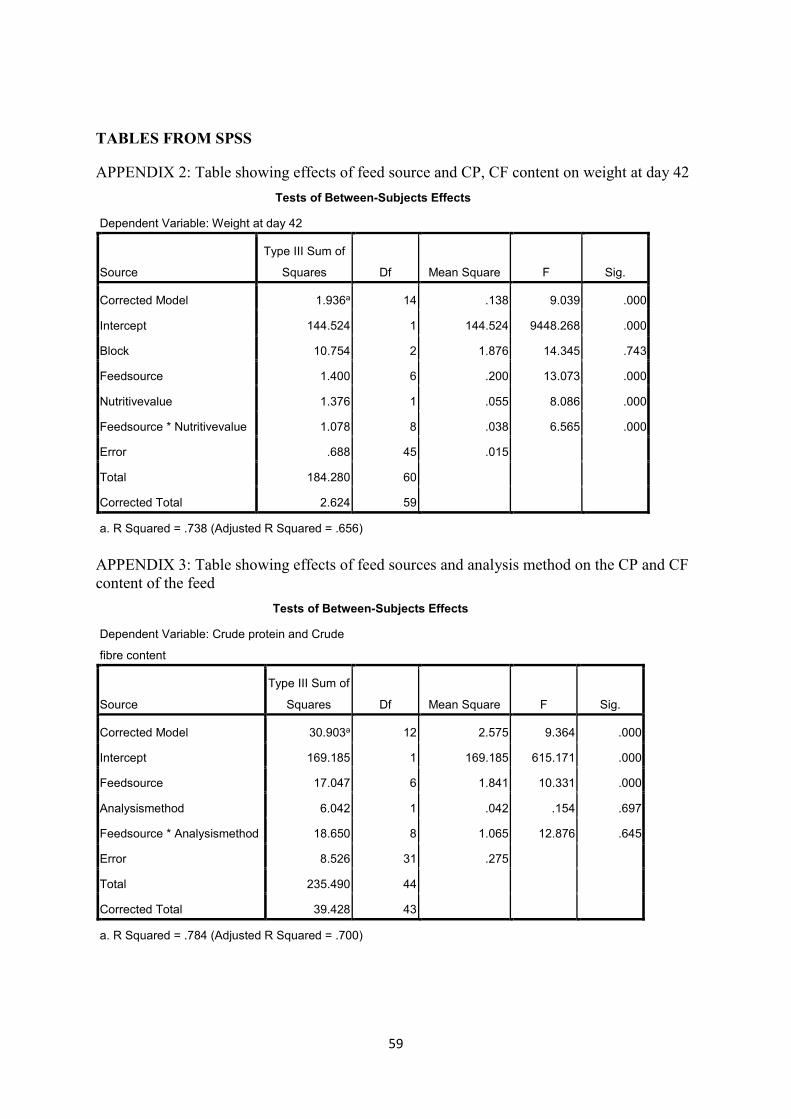
59
TABLES FROM SPSS
APPENDIX 2: Table showing effects of feed source and CP, CF content on weight at day 42
Tests of Between-Subjects Effects
Dependent Variable: Weight at day 42
Source
Type III Sum of
Squares Df Mean Square F Sig.
Corrected Model 1.936a 14 .138 9.039 .000
Intercept 144.524 1 144.524 9448.268 .000
Block 10.754 2 1.876 14.345 .743
Feedsource 1.400 6 .200 13.073 .000
Nutritivevalue 1.376 1 .055 8.086 .000
Feedsource * Nutritivevalue 1.078 8 .038 6.565 .000
Error .688 45 .015
Total 184.280 60
Corrected Total 2.624 59
a. R Squared = .738 (Adjusted R Squared = .656)
APPENDIX 3: Table showing effects of feed sources and analysis method on the CP and CF content of the feed
Tests of Between-Subjects Effects
Dependent Variable: Crude protein and Crude
fibre content
Source
Type III Sum of
Squares Df Mean Square F Sig.
Corrected Model 30.903a 12 2.575 9.364 .000
Intercept 169.185 1 169.185 615.171 .000
Feedsource 17.047 6 1.841 10.331 .000
Analysismethod 6.042 1 .042 .154 .697
Feedsource * Analysismethod 18.650 8 1.065 12.876 .645
Error 8.526 31 .275
Total 235.490 44
Corrected Total 39.428 43
a. R Squared = .784 (Adjusted R Squared = .700)
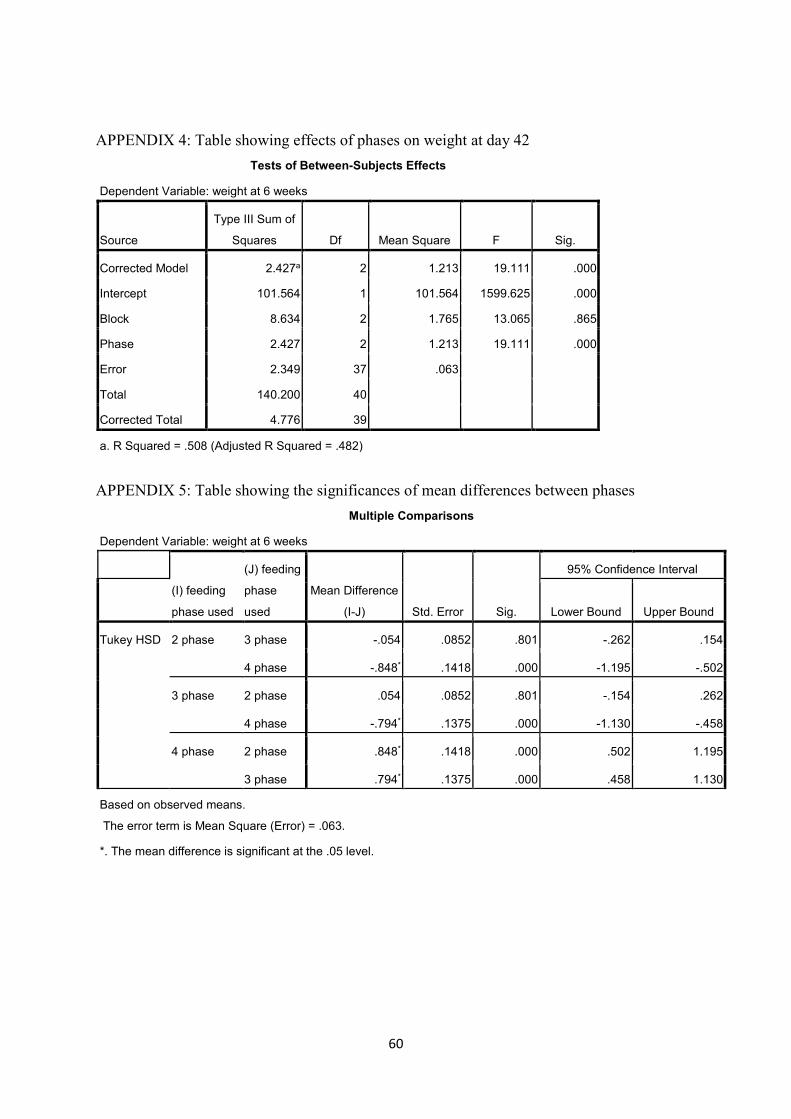
60
APPENDIX 4: Table showing effects of phases on weight at day 42
Tests of Between-Subjects Effects
Dependent Variable: weight at 6 weeks
Source
Type III Sum of
Squares Df Mean Square F Sig.
Corrected Model 2.427a 2 1.213 19.111 .000
Intercept 101.564 1 101.564 1599.625 .000
Block 8.634 2 1.765 13.065 .865
Phase 2.427 2 1.213 19.111 .000
Error 2.349 37 .063
Total 140.200 40
Corrected Total 4.776 39
a. R Squared = .508 (Adjusted R Squared = .482)
APPENDIX 5: Table showing the significances of mean differences between phases
Multiple Comparisons
Dependent Variable: weight at 6 weeks
(I) feeding
phase used
(J) feeding
phase
used
Mean Difference
(I-J) Std. Error Sig.
95% Confidence Interval
Lower Bound Upper Bound
Tukey HSD 2 phase 3 phase -.054 .0852 .801 -.262 .154
4 phase -.848* .1418 .000 -1.195 -.502
3 phase 2 phase .054 .0852 .801 -.154 .262
4 phase -.794* .1375 .000 -1.130 -.458
4 phase 2 phase .848* .1418 .000 .502 1.195
3 phase .794* .1375 .000 .458 1.130
Based on observed means.
The error term is Mean Square (Error) = .063.
*. The mean difference is significant at the .05 level.
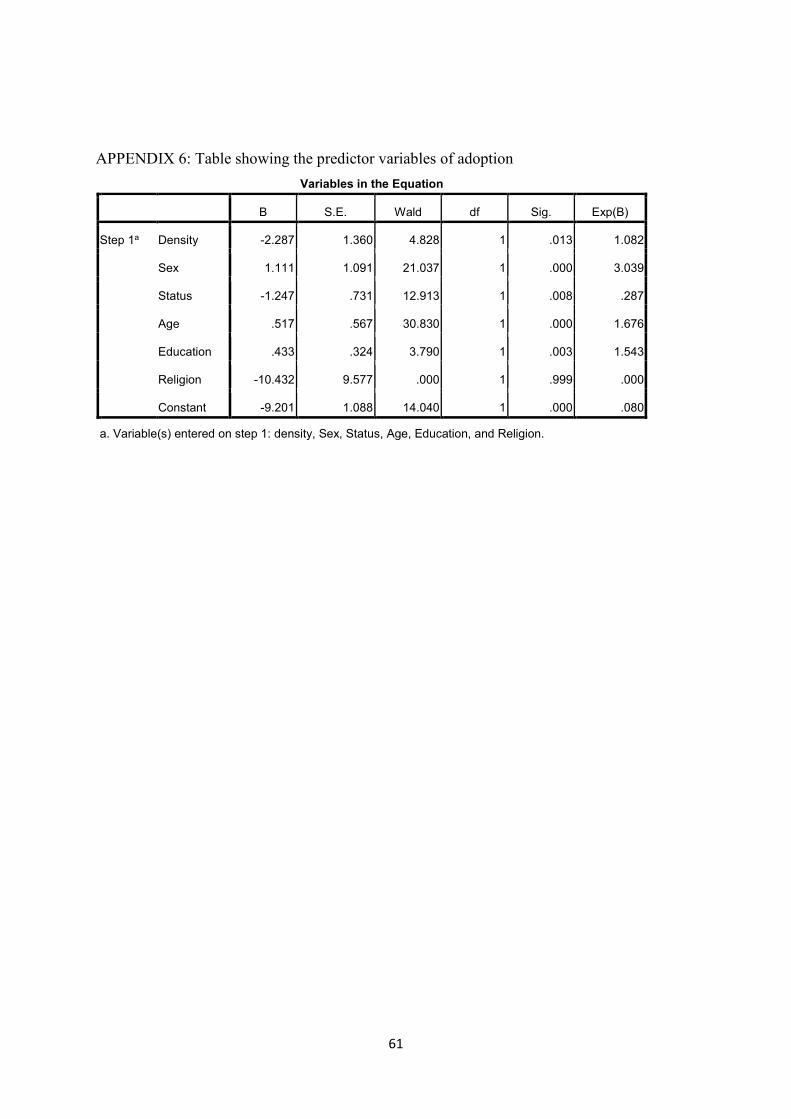
61
APPENDIX 6: Table showing the predictor variables of adoption
Variables in the Equation
B S.E. Wald df Sig. Exp(B)
Step 1a Density -2.287 1.360 4.828 1 .013 1.082
Sex 1.111 1.091 21.037 1 .000 3.039
Status -1.247 .731 12.913 1 .008 .287
Age .517 .567 30.830 1 .000 1.676
Education .433 .324 3.790 1 .003 1.543
Religion -10.432 9.577 .000 1 .999 .000
Constant -9.201 1.088 14.040 1 .000 .080
a. Variable(s) entered on step 1: density, Sex, Status, Age, Education, and Religion.