an algorithm for finding gene signatures supervised by survival time data
TRANSCRIPT
An algorithm for finding gene signatures supervised bysurvival time data
Stefano M. Pagnotta1 and Michele Ceccarelli1,2
1Department of ScienceUniversity of Sannio, 82100, Benevento, Italy,
2Bioinformatics CORE, BIOGEM s.c.a.r.l., Contrada Camporeale, Ariano Irpino, [email protected], [email protected]
Abstract. Signature learning from gene expression consists into selecting a subset ofmolecular markers which best correlate with prognosis. It can be cast as a feature selec-tion problem. Here we use as optimality criterion the separation between survival curvesof clusters induced by the selected features. We address some important problems inthis fields such as developing an unbiased search procedure and significance analysisof a set of generated signatures. We apply the proposed procedure to the selection ofgene signatures for Non Small Lung Cancer prognosis by using a real data-set.
1 Introduction
Gene expression profiling allows to characterize, analyze and classify tissues as function ofthe amount of trascript present in the cell for each of tens of thousand of genes. Many com-plex diseases such as cancer, can be studied by observing the variability profile of expressionfor thousands of genes by using microarray technologies [1, 9]. Clustering of global gene ex-pression patterns has been used to identify, at a molecular level, distinct subtypes of cancer,distinguished by extensive differences in gene expression, in diseases that were consideredhomogeneous based on classical diagnostic methods [13, 15, 18]. The molecular subtypes canbe then associated with different clinical outcomes.
One of important open question in this area is related to the methods to extract suitablefeatures from global gene expression that best correlate with clinical behavior to create prog-nostic signatures [7]. For example in breast cancer, a poor prognosis gene expression signaturein the primary tumor can accurately predict the risk of subsequent metastases, independentof other well known clinico-pathologic risk factors [8]. Most of these approaches are basedon expert knowledge to select, from thousands of genes, molecular markers which can beassociated to prognosis [7]. Just recently some new methods grounded on the data miningand machine learning theory have appeared [3]. “Signature learning” is a rather new researchtopic in Bioinformatics, however it can be modeled as a standard problem of feature selection[11]: given a set of expression levels of N genes (of order of tens of thousands) in M differentconditions or samples (of order of hundres) and a target classification C (prognostic classes),the problem consists in selecting a subspace of n features from the N dimensional observationthat “optimally” characterizes C. Given the optimality criterion, a search algorithm must bedevised to find the best subspace from the 2N possibilities. This poses two important ques-tions: (i) how to select the optimality criterion; (ii) since exhaustive search is not viable, how
2
to devise a suitable heuristic search. For the first question we adopt, as in [3], the survivaltime measured by using the log-rank test [16] between the separation in group induced bythe selected features. For the second problem we propose a novel procedure which integratesseveral signatures generated by a simple greedy algorithm.
The paper is organized as follows, the next section reports a description of the signaturelearning algorithms, whereas in the section of Results we report an evaluation of the methodon a real dataset
2 An unbiased procedure for signature learning and discriminativegene ranking
Here we present a novel algorithm for signature learning from gene expression data, we extendthe method proposed in [3].
2.1 The mSD algorithmn
Boutros et al. [3] introduced a promising algorithm, called modified Steepest Descent (mSD),to discover prognostic gene signatures related to the non-small-cell lung cancer (NSCLC).The data necessary for the algorithm are an N ×M matrix of expression levels of a set of Ngenes measured on M samples; and, for each sample, the survival time ti, i = 1, 2, . . . ,M todeath (eventually right censored if the corresponding person exits from the clinical study).
The expression levels are used to cluster the samples into two groups. The times aregenerally used to estimate the survival function S(t) that measures the fraction of peoplewhich survive after the time t. Actually two survival curves S1(t) and S2(t) are considered,one for each of the two groups provided by the clustering. When S1(t) > S2(t), for all t > 0,then the samples used to estimate S1(t) define the good prognosis group, while those usedfor S2(t) define the poor prognosis group. At present the survival curves are not estimatedbut their difference is inferentially measured through the p-value of the log-rank test [16]concerning the null hypothesis of no difference is in the population survival curves for thegood and poor prognosis group. The p-value is used as a measure of similarity between thepopulation survival curves so that they are as different as the p-value is close to 0. The basicidea of the signature finding algorithm was to find the sequence of genes having the properties(1) to separate the samples in two groups according to an unsupervised strategy, then (2) theestimated population survival curves related to the good and poor prognosis groups have to bemaximally different. To this aim, the first step is to select a single gene having the properties(1) and (2); then the set of genes is scanned again to find the best pair of genes still havingthe properties (1) and (2) where one element of the pair is that found in the previous step.The scanning is iterated until a sequence of L > 0 genes is found so that no sequence of L+ 1elements can reach a separation of the survival curves better than the sequence of K genes.
2.2 A heuristic search for the signature
The algorithms described above has been applied to find a new signature for NSLC. Howeveris has some drawbacks: (i) it is a greedy procedure and the genes of the signature are selectedone at time in a sequential order, but the results are strongly influenced by the order in
3
which gene are added to the signature, in particular, starting from a different gene can leadto a completely different signature; this means that there are many local minima and thedeterministic behavior of mSD can be easily trapped in a local minimum, for this reasonour algorithm tries to generate several signature from different genes chosen on the basisof a statistical test; (ii) as reported in the Results section, the genes of the signature canbe used for diagnostic purposes if they have a different behavior, with a given statisticalsignificance, in the two populations (poor or good prognosis), we observed that not all genesin the signature generated by the mSD algorithm have this property, therefore we develop apruning strategy (iii) finally the mSD can suffer by the selection bias, we developed a featureselection procedure using an external cross validation scheme.
Our algorithm consists of four separate steps: (1) find candidate seed genes; (2) generatea signature for each seed gene; (3) prune the signatures by statistical inference; (4) integratesignatures by gene ranking.
Finding the seed genes The first step of our algorithm is aimed at selecting a set of geneswhich can be a reliable starting point to expand the signature. We use as starting seed ofthe signature a set of genes according to two main conditions: (i) a bimodal distribution ofthe expression levels, (ii) ability to separate the dataset in two groups on the basis of thesurvival analysis test. In particular, for each gene i consider the sequence gi = {xi,j}j=1,...,M ,where xi,j is the expression level of gene i in the sample j. The sequence gi is clustered intwo subsets S1 and S2 by using a k-median algorithm (k = 2). The bimodality hypothesisis checked by using the Bayesian Information Criterion (BIC) [20]. In particular, the wholesequence gi is checked against a normal distribution:
BIC1 = −2M∑
j=1
log φ(xi,j ;µ, σ2
)+ 2 logM
and a mixture of two gaussians (with means and variances computed from S1 and S2),
BIC2 = −2n∑
i=1
log fmix(xi,j ;µ1, σ
21 , µ2, σ
22 , τ)
+ 5 logM
where: fmix(x;µ1, σ
21 , µ2, σ
22 , τ)
= τ φ(x, µ1, σ
21
)+ (1− τ)φ
(x, µ2, σ
22
).
The set of seed genes is selected by considering those genes with BIC2 < BIC1 and thep-value of the log-rank test between S1(t) and S2(t) less than a specified threshold α (in allthe experiments reported below we use α = 0.05).
Generation of gene signatures We assume that a set of h� m candidate starting genesj1, j2, . . . , jh has been found from the previous step. For each of these genes we generate ag signature having one of these gene as the starting point to expand the signature. Given apartial sequence of l genes having a log-rank test pl-value, it seems from the mSD algorithmthat the searching of the signature is performed by selecting the l+1 gene such that pl+1 < pl.This means that always some samples migrate from the poor prognosis group to the goodone and viceversa. The constrain pl+1 < pl excludes all the genes that leave unchanged

4
the composition of the groups. Here we consider a weaker constraint pl+1 ≤ pl instead ofthe original one in order to include in the signature those genes that support the samegroup separation. The final signature could result longer than that obtained with the originalconstrain, but we can further prune the set generated set of genes as reported below.
The main steps to find a signature from a candidate gene follows. Let j be one of the seedgenes, selected with the previous step, from which to build the signature.
1. find two groups by using the non missing data in the jth gene and set α to the p-value ofthe log-rank test; let S = {j} be signature.
2. For each gene j′ not in S, cluster in two groups the dataset by using the features S ∪{j′}and evaluate the corresponding p-value
3. set pmin as minimum of the p-values in step (2)4. if pmin > α stop the searching and exit; the signature is in S.5. consider those genes Stmp for which the corresponding p-value is pmin
6. if the groups obtained by clustering the genes S ∪ Stmp are consistent and have tolerablybalanced dimensions, then set S to S ∪ Stmp, α to pmin and continue from step (2);otherwise set pmin as minimum of the p-values in step (2) except those corresponding tothe genes in Stmp and continue from step (4)
The classification method adopted for finding the clusters is the Partitioning AroundMedoids (PAM) from Kaufman and Rousseeuw [12] which falls in the class of K-medians.Other approaches more specific of biological data are also possible [5].
This method can handle missing data and is generally robust to outlying data, althoughsome problem can be meet when a value is so far away from the bulk to be identified itself asa cluster.
Statistical analysis of the signature and pruning For each gene of a signature, wemeasure its importance with respect to the other genes and we test if the gene is differentiallyexpressed; when this last event occurs we can provide also information on how weak or strongis the differential regulation. This information is particularly useful for further biologicalanalysis to be performed in vivo.
Let S be a signature whose elements are the genes g1, g2, . . . , gL, where L is the lengthof the signature; let p(S) be the p-value provided by the log-rank test for the signature Sand p(S(l)) be the p-value of the signature S(l) obtained from S leaving out the lth gene,l = 1, 2, . . . , L. The measure of importance of the lth gene with respect to the signature is
i(gl | S) = Logp(S(l))p(S)
, l = 1, 2, . . . , L.
The ratio p(S(l))/p(S) measures the separation between the good and poor prognosis groupswith when gl is left out from the signature S with respect to the separation measured from thecomplete signature. As smaller is the separation between the groups as higher is the intensityof the index. It can happen that p(S(l)) < p(S). This is the case when the omission of thegene improves the p-value.
Once that a given signature has been generated, in order to effectively use it in prognosticcase, one should give the indication of the expected behavior of a given gene, i.e. it should
5
be differentially regulated in the various prognostic groups. Thefore, in addition to the aboveindicator, we further apply two statistical controls to the signature in order to check if itsmembers, the genes, are differentially regulated. The first is the test about the differentialexpression of the gene with respect to good and poor prognosis groups. This test if performedthrough the standard permutation test methodology [21] concerning the Welch’s test statis-tic which is equivalent to the t-test when the variances of the two population are unequal.The rejection of equal level of gene-expression hypothesis means that the gene can be founddifferentially expressed in subsequent empirical experiment.
The second statistical control we propose is closed to the first but provide a differentinformation. Two bootstrap confidence intervals at 95% level are computed for the expressionsof the gene in the two groups. We calculate these only when the previous test rejects thehypothesis of equal means. The confidence intervals can be overlapping or not. When theyoverlaps we conclude that the expression-gene difference is weak, otherwise if the intervalshave no intersection we consider the expression-gene as strong.
Each signature can be pruned with some rule concerning the gene-importance ans/or bytaking into account the results of the equal means hypothesis testing. Our proposed strategyis to prune the signatures by using the results of the test in view of a later use of the genesfor prognosis evaluation.
Gene ranking and integrated signature An overall signature can be extracted from ∪kSk
where Sk, k = 1, 2, . . . ,K, is a signature each of one stemmed from a seed gene. The selectionof the genes can be done with respect to some indicators. The first one is nl that counts howmany signature Sk contain the gene gl. A second indicator is the mean importance i(gl) ofthe gene gl, defined as
i(gl) =1nl
∑{S:gl∈S}
i(gl | S),
and its weighted versionI(gl) =
nl
Ki(gl)
we call weighted importance.These indicators allow to rank the genes in ∪kSk and select a subset providing a meta-
signature. This is an improvement of the greedy procedure of [3] where the sequential natureof the process tends to generate suboptimal solutions due to local minima of the optimalitycriterion. Furthermore the gene ranking has the advantage to be easily interpreted by lifescientists.
As an example, our procedure generates 16 signatures as reported in table 2. Our finalsignature is obtained by selecting all the genes of table whose indicators nl, i(gl) and I(gl)are above their corresponding averages and whose expression values are significantly differentin the diagnostic group according to the permutation test described above.
3 Results
The data consider for the evaluation of the proposed algorithm is the Non Small Lung CancerDataset reported in [14]. The study contains the normalized expression values of 158 genes
6
observed in 148 patients treated by patients treated by lobectomy or pneumonectomy. Theset of potential prognostic genes were chosen on the basis of a set of microarray experimentsreported by the authors and using further biological knowledge about genes associated withpoor prognosis in gene with KRAS mutations. The expression of the 158 candidate gene wasmeasured by using with RT-qPCR [14].
In this section first we analyze the signature obtained with the mSD algorithm, then werun our proposed algorithm on the gene expression data.
3.1 Analysis of the signature of Boutros et al.
The original algorithm mSD found a signature of 6 genes (STX1A, HIF1A, CCT3, HLA-DBP1, MAFK and RNF5) with a p-value of 2.14 · 10−8. When the same set of genes isprocessed by PAM, the corresponding separation of the survival curves has 5.5 · 10−4 asp-value.
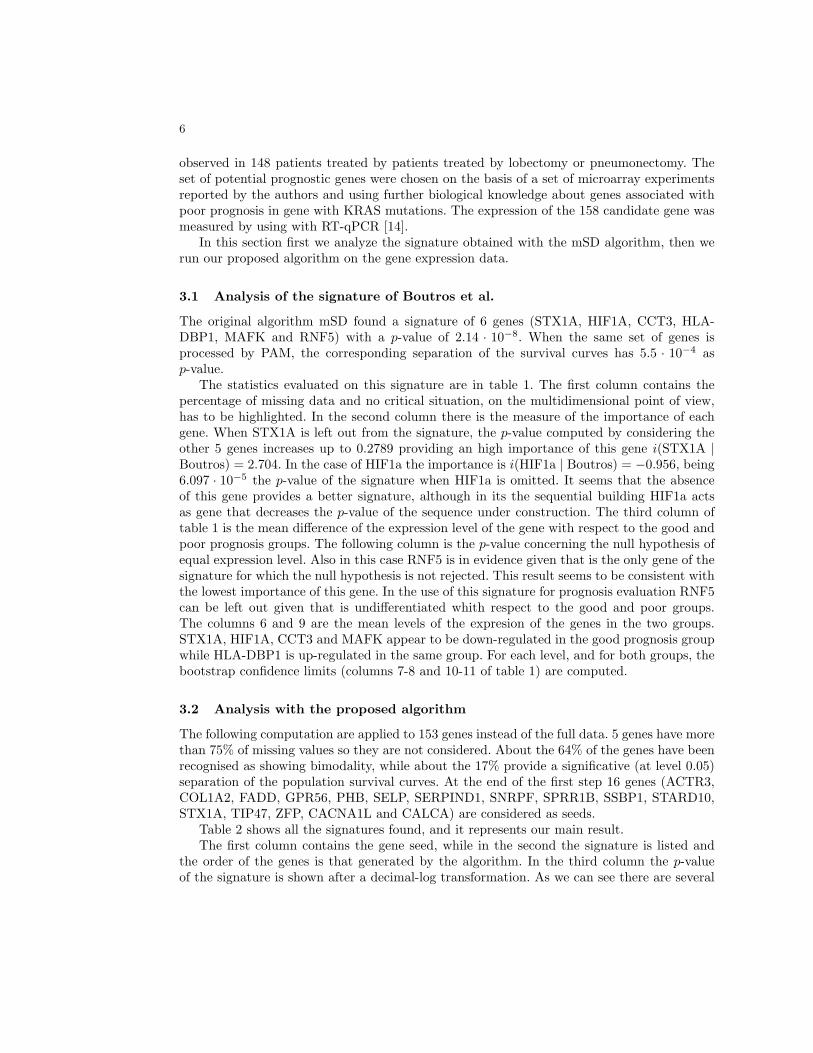
The statistics evaluated on this signature are in table 1. The first column contains thepercentage of missing data and no critical situation, on the multidimensional point of view,has to be highlighted. In the second column there is the measure of the importance of eachgene. When STX1A is left out from the signature, the p-value computed by considering theother 5 genes increases up to 0.2789 providing an high importance of this gene i(STX1A |Boutros) = 2.704. In the case of HIF1a the importance is i(HIF1a | Boutros) = −0.956, being6.097 · 10−5 the p-value of the signature when HIF1a is omitted. It seems that the absenceof this gene provides a better signature, although in its the sequential building HIF1a actsas gene that decreases the p-value of the sequence under construction. The third column oftable 1 is the mean difference of the expression level of the gene with respect to the good andpoor prognosis groups. The following column is the p-value concerning the null hypothesis ofequal expression level. Also in this case RNF5 is in evidence given that is the only gene of thesignature for which the null hypothesis is not rejected. This result seems to be consistent withthe lowest importance of this gene. In the use of this signature for prognosis evaluation RNF5can be left out given that is undifferentiated whith respect to the good and poor groups.The columns 6 and 9 are the mean levels of the expresion of the genes in the two groups.STX1A, HIF1A, CCT3 and MAFK appear to be down-regulated in the good prognosis groupwhile HLA-DBP1 is up-regulated in the same group. For each level, and for both groups, thebootstrap confidence limits (columns 7-8 and 10-11 of table 1) are computed.
3.2 Analysis with the proposed algorithm
The following computation are applied to 153 genes instead of the full data. 5 genes have morethan 75% of missing values so they are not considered. About the 64% of the genes have beenrecognised as showing bimodality, while about the 17% provide a significative (at level 0.05)separation of the population survival curves. At the end of the first step 16 genes (ACTR3,COL1A2, FADD, GPR56, PHB, SELP, SERPIND1, SNRPF, SPRR1B, SSBP1, STARD10,STX1A, TIP47, ZFP, CACNA1L and CALCA) are considered as seeds.
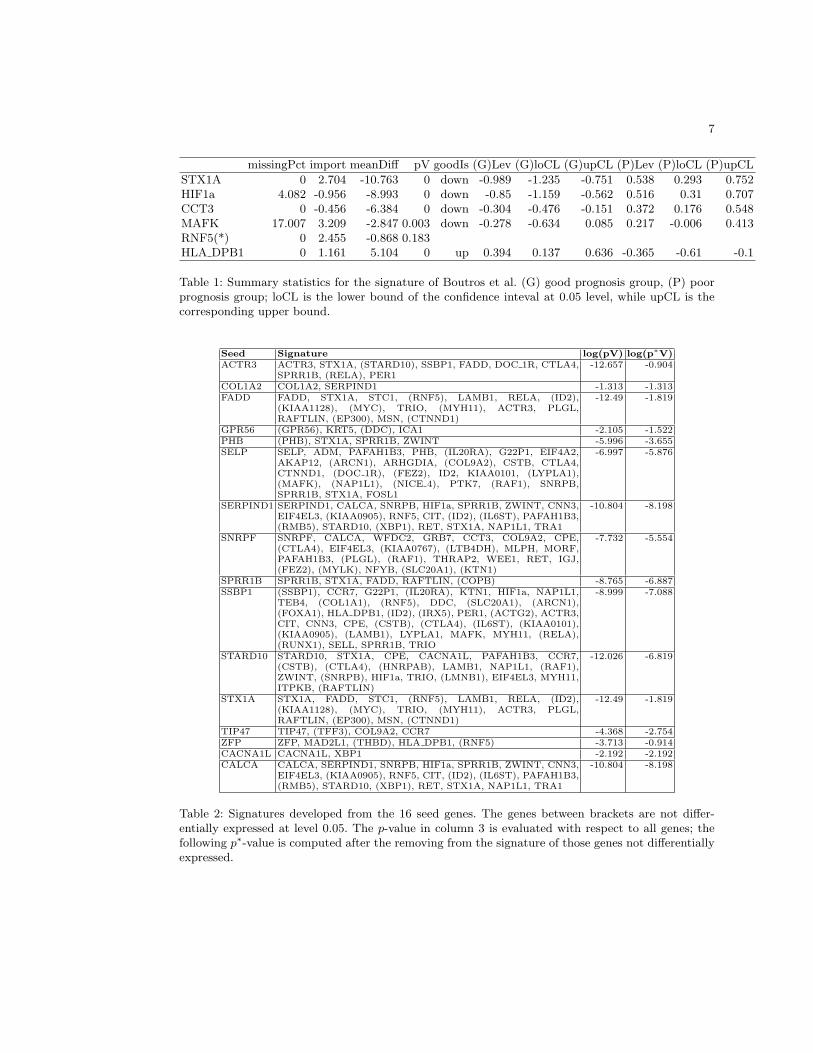
Table 2 shows all the signatures found, and it represents our main result.The first column contains the gene seed, while in the second the signature is listed and
the order of the genes is that generated by the algorithm. In the third column the p-valueof the signature is shown after a decimal-log transformation. As we can see there are several
7
missingPct import meanDiff pV goodIs (G)Lev (G)loCL (G)upCL (P)Lev (P)loCL (P)upCL
STX1A 0 2.704 -10.763 0 down -0.989 -1.235 -0.751 0.538 0.293 0.752HIF1a 4.082 -0.956 -8.993 0 down -0.85 -1.159 -0.562 0.516 0.31 0.707CCT3 0 -0.456 -6.384 0 down -0.304 -0.476 -0.151 0.372 0.176 0.548MAFK 17.007 3.209 -2.847 0.003 down -0.278 -0.634 0.085 0.217 -0.006 0.413RNF5(*) 0 2.455 -0.868 0.183HLA DPB1 0 1.161 5.104 0 up 0.394 0.137 0.636 -0.365 -0.61 -0.1
Table 1: Summary statistics for the signature of Boutros et al. (G) good prognosis group, (P) poorprognosis group; loCL is the lower bound of the confidence inteval at 0.05 level, while upCL is thecorresponding upper bound.
Seed Signature log(pV) log(p∗V)ACTR3 ACTR3, STX1A, (STARD10), SSBP1, FADD, DOC 1R, CTLA4,
SPRR1B, (RELA), PER1-12.657 -0.904
COL1A2 COL1A2, SERPIND1 -1.313 -1.313FADD FADD, STX1A, STC1, (RNF5), LAMB1, RELA, (ID2),
(KIAA1128), (MYC), TRIO, (MYH11), ACTR3, PLGL,RAFTLIN, (EP300), MSN, (CTNND1)
-12.49 -1.819
GPR56 (GPR56), KRT5, (DDC), ICA1 -2.105 -1.522PHB (PHB), STX1A, SPRR1B, ZWINT -5.996 -3.655SELP SELP, ADM, PAFAH1B3, PHB, (IL20RA), G22P1, EIF4A2,
AKAP12, (ARCN1), ARHGDIA, (COL9A2), CSTB, CTLA4,CTNND1, (DOC 1R), (FEZ2), ID2, KIAA0101, (LYPLA1),(MAFK), (NAP1L1), (NICE 4), PTK7, (RAF1), SNRPB,SPRR1B, STX1A, FOSL1
-6.997 -5.876
SERPIND1 SERPIND1, CALCA, SNRPB, HIF1a, SPRR1B, ZWINT, CNN3,EIF4EL3, (KIAA0905), RNF5, CIT, (ID2), (IL6ST), PAFAH1B3,(RMB5), STARD10, (XBP1), RET, STX1A, NAP1L1, TRA1
-10.804 -8.198
SNRPF SNRPF, CALCA, WFDC2, GRB7, CCT3, COL9A2, CPE,(CTLA4), EIF4EL3, (KIAA0767), (LTB4DH), MLPH, MORF,PAFAH1B3, (PLGL), (RAF1), THRAP2, WEE1, RET, IGJ,(FEZ2), (MYLK), NFYB, (SLC20A1), (KTN1)
-7.732 -5.554
SPRR1B SPRR1B, STX1A, FADD, RAFTLIN, (COPB) -8.765 -6.887SSBP1 (SSBP1), CCR7, G22P1, (IL20RA), KTN1, HIF1a, NAP1L1,
TEB4, (COL1A1), (RNF5), DDC, (SLC20A1), (ARCN1),(FOXA1), HLA DPB1, (ID2), (IRX5), PER1, (ACTG2), ACTR3,CIT, CNN3, CPE, (CSTB), (CTLA4), (IL6ST), (KIAA0101),(KIAA0905), (LAMB1), LYPLA1, MAFK, MYH11, (RELA),(RUNX1), SELL, SPRR1B, TRIO
-8.999 -7.088
STARD10 STARD10, STX1A, CPE, CACNA1L, PAFAH1B3, CCR7,(CSTB), (CTLA4), (HNRPAB), LAMB1, NAP1L1, (RAF1),ZWINT, (SNRPB), HIF1a, TRIO, (LMNB1), EIF4EL3, MYH11,ITPKB, (RAFTLIN)
-12.026 -6.819
STX1A STX1A, FADD, STC1, (RNF5), LAMB1, RELA, (ID2),(KIAA1128), (MYC), TRIO, (MYH11), ACTR3, PLGL,RAFTLIN, (EP300), MSN, (CTNND1)
-12.49 -1.819
TIP47 TIP47, (TFF3), COL9A2, CCR7 -4.368 -2.754ZFP ZFP, MAD2L1, (THBD), HLA DPB1, (RNF5) -3.713 -0.914CACNA1L CACNA1L, XBP1 -2.192 -2.192CALCA CALCA, SERPIND1, SNRPB, HIF1a, SPRR1B, ZWINT, CNN3,
EIF4EL3, (KIAA0905), RNF5, CIT, (ID2), (IL6ST), PAFAH1B3,(RMB5), STARD10, (XBP1), RET, STX1A, NAP1L1, TRA1
-10.804 -8.198
Table 2: Signatures developed from the 16 seed genes. The genes between brackets are not differ-entially expressed at level 0.05. The p-value in column 3 is evaluated with respect to all genes; thefollowing p∗-value is computed after the removing from the signature of those genes not differentiallyexpressed.
8
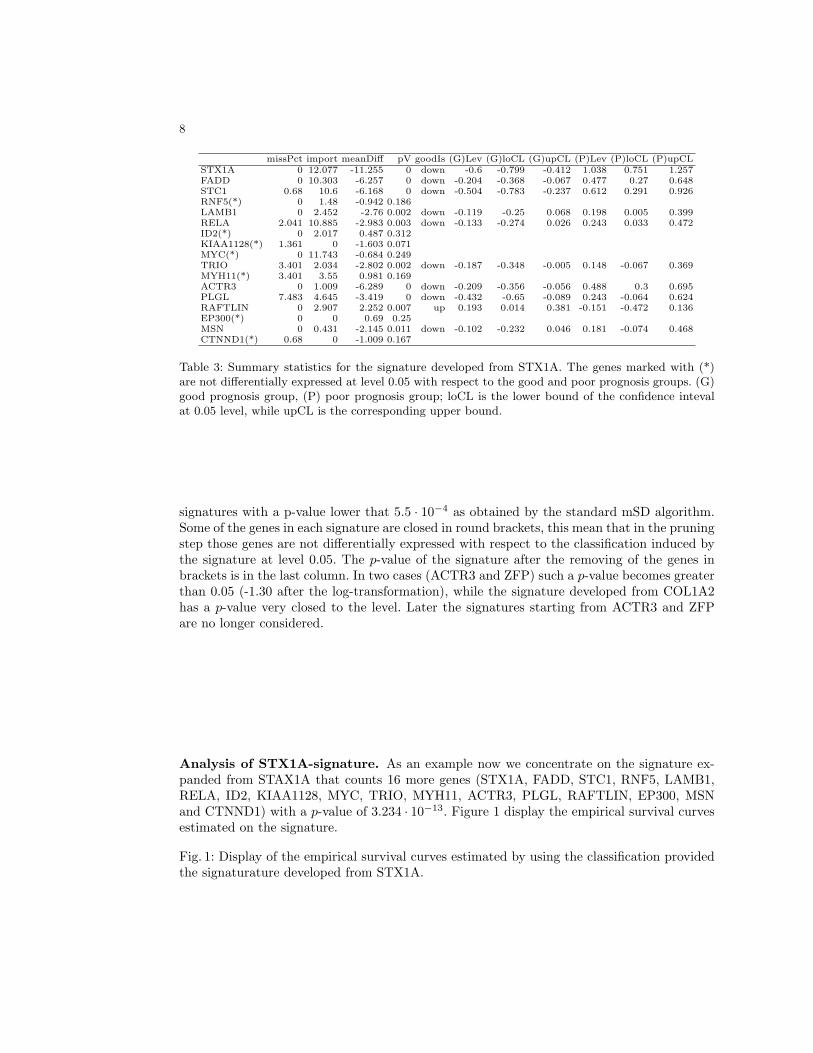
missPct import meanDiff pV goodIs (G)Lev (G)loCL (G)upCL (P)Lev (P)loCL (P)upCLSTX1A 0 12.077 -11.255 0 down -0.6 -0.799 -0.412 1.038 0.751 1.257FADD 0 10.303 -6.257 0 down -0.204 -0.368 -0.067 0.477 0.27 0.648STC1 0.68 10.6 -6.168 0 down -0.504 -0.783 -0.237 0.612 0.291 0.926RNF5(*) 0 1.48 -0.942 0.186LAMB1 0 2.452 -2.76 0.002 down -0.119 -0.25 0.068 0.198 0.005 0.399RELA 2.041 10.885 -2.983 0.003 down -0.133 -0.274 0.026 0.243 0.033 0.472ID2(*) 0 2.017 0.487 0.312KIAA1128(*) 1.361 0 -1.603 0.071MYC(*) 0 11.743 -0.684 0.249TRIO 3.401 2.034 -2.802 0.002 down -0.187 -0.348 -0.005 0.148 -0.067 0.369MYH11(*) 3.401 3.55 0.981 0.169ACTR3 0 1.009 -6.289 0 down -0.209 -0.356 -0.056 0.488 0.3 0.695PLGL 7.483 4.645 -3.419 0 down -0.432 -0.65 -0.089 0.243 -0.064 0.624RAFTLIN 0 2.907 2.252 0.007 up 0.193 0.014 0.381 -0.151 -0.472 0.136EP300(*) 0 0 0.69 0.25MSN 0 0.431 -2.145 0.011 down -0.102 -0.232 0.046 0.181 -0.074 0.468CTNND1(*) 0.68 0 -1.009 0.167
Table 3: Summary statistics for the signature developed from STX1A. The genes marked with (*)are not differentially expressed at level 0.05 with respect to the good and poor prognosis groups. (G)good prognosis group, (P) poor prognosis group; loCL is the lower bound of the confidence intevalat 0.05 level, while upCL is the corresponding upper bound.
signatures with a p-value lower that 5.5 · 10−4 as obtained by the standard mSD algorithm.Some of the genes in each signature are closed in round brackets, this mean that in the pruningstep those genes are not differentially expressed with respect to the classification induced bythe signature at level 0.05. The p-value of the signature after the removing of the genes inbrackets is in the last column. In two cases (ACTR3 and ZFP) such a p-value becomes greaterthan 0.05 (-1.30 after the log-transformation), while the signature developed from COL1A2has a p-value very closed to the level. Later the signatures starting from ACTR3 and ZFPare no longer considered.
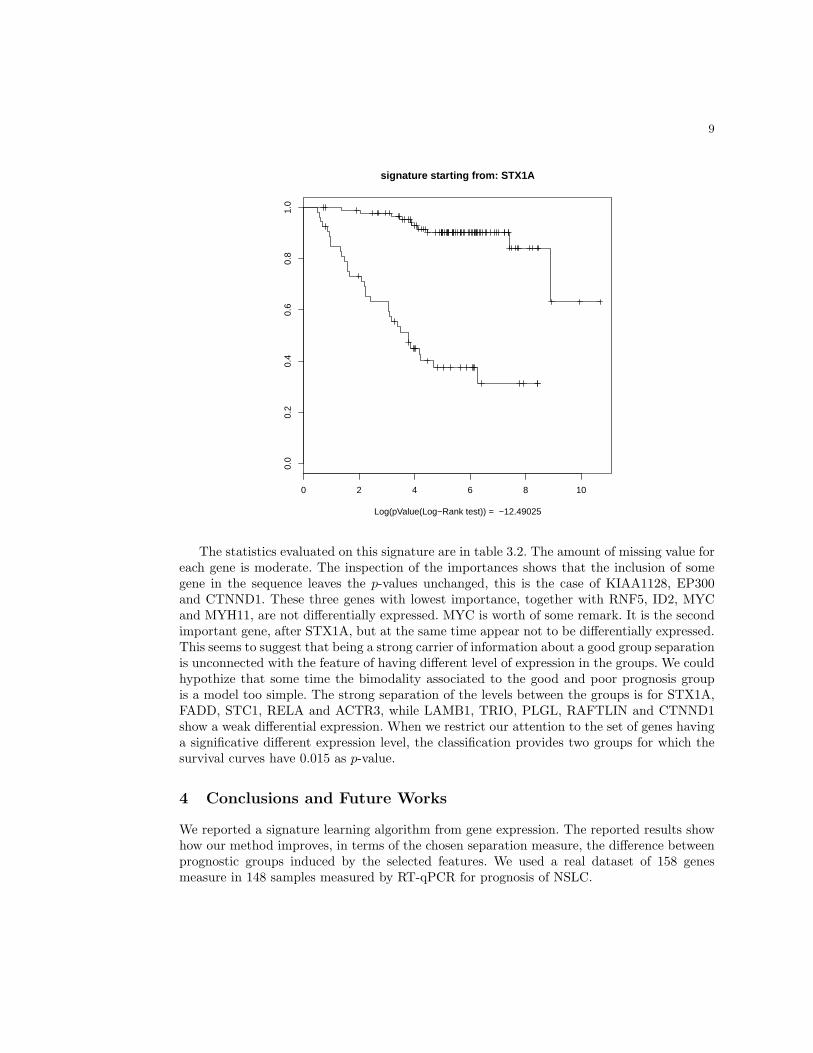
Analysis of STX1A-signature. As an example now we concentrate on the signature ex-panded from STAX1A that counts 16 more genes (STX1A, FADD, STC1, RNF5, LAMB1,RELA, ID2, KIAA1128, MYC, TRIO, MYH11, ACTR3, PLGL, RAFTLIN, EP300, MSNand CTNND1) with a p-value of 3.234 · 10−13. Figure 1 display the empirical survival curvesestimated on the signature.
Fig. 1: Display of the empirical survival curves estimated by using the classification providedthe signaturature developed from STX1A.
9
0 2 4 6 8 10
0.0
0.2
0.4
0.6
0.8
1.0
signature starting from: STX1A
Log(pValue(Log−Rank test)) = −12.49025
The statistics evaluated on this signature are in table 3.2. The amount of missing value foreach gene is moderate. The inspection of the importances shows that the inclusion of somegene in the sequence leaves the p-values unchanged, this is the case of KIAA1128, EP300and CTNND1. These three genes with lowest importance, together with RNF5, ID2, MYCand MYH11, are not differentially expressed. MYC is worth of some remark. It is the secondimportant gene, after STX1A, but at the same time appear not to be differentially expressed.This seems to suggest that being a strong carrier of information about a good group separationis unconnected with the feature of having different level of expression in the groups. We couldhypothize that some time the bimodality associated to the good and poor prognosis groupis a model too simple. The strong separation of the levels between the groups is for STX1A,FADD, STC1, RELA and ACTR3, while LAMB1, TRIO, PLGL, RAFTLIN and CTNND1show a weak differential expression. When we restrict our attention to the set of genes havinga significative different expression level, the classification provides two groups for which thesurvival curves have 0.015 as p-value.
4 Conclusions and Future Works
We reported a signature learning algorithm from gene expression. The reported results showhow our method improves, in terms of the chosen separation measure, the difference betweenprognostic groups induced by the selected features. We used a real dataset of 158 genesmeasure in 148 samples measured by RT-qPCR for prognosis of NSLC.

10
References
1. Alizadeh, A.A. et al.: Distinct types of diffuse large B-cell lymphoma identified by gene expressionprofiling. Nature, 403 (6769), pp. 503–511, 2000.
2. Ambroise C, McLachlan G. J.: Selection bias in gene extraction on the basis of microarray gene-expression data. Proceedings of the National Academy of Sciences of the United States of America,99(10), 6562-6566 (2002).
3. Boutros, P.C., Lau S.K., Pintilie M., Liu N., Sheperd F.A., Der D.S., Tao M., Penn, L.Z., JuriscaI.: Prognostic gene signatures for non-small-cell lung cancer Arch. Rat. Mech. Anal. 78, 315–333(1982)
4. Cai Y.D., Huang T., Feng K.-Y., Hu L. , Xie L.: A unified 35-gene signature for both subtypeclassification and survival prediction in diffuse large B-cell lymphomas. PloS one 5 (9) p. e12726.(2010)
5. Ceccarelli M., Maratea A.: Improving fuzzy clustering of biological data by metric learning withside information. International Journal of Approximate Reasoning, 47(1), 45-57, 2008.
6. Chang H., Nuyten D., et al.: Robustness, scalability, and integration of a wound-response geneexpression signature in predicting breast cancer survival. PNAS, 102(10), 3738-3743, 2005.
7. Chen H.-Y. et al.: A Five-Gene Signature and Clinical Outcome in NonSmall-Cell Lung Cancer.The New England Journal of medicine, 356(1), pp. 11, 2007.
8. Van De Vijver M.J. et al.: A gene-expression signature as a predictor of survival in breast cancer.New England Journal of Medicine, 347 (25), pp. 1999–2009, 2002.
9. Golub, T.R. et al.: Molecular classification of cancer: class discovery and class prediction by geneexpression monitoring. Science 286 (5439), pp. 531, 1999
10. Guyon I., Weston J., Barnhill S. and Vapnik V.: Gene selection for cancer classification usingsupport vector machines. Machine Learning, 46, 389-422, 2002.
11. Jain A.K., Zongker D.: Feature Selection: Evaluation, Application, and Small Sample Perfor-mance. IEEE Trans. Pattern Analysis and Machine Intelligence 19(2) pp. 153-158, 1997.
12. Kaufman L., Rousseeuw P.J.: Finding Groups in Data. Wiley (1990)13. Lapointe et al.: Gene expression profiling identifies clinically relevant subtypes of prostate cancer.
Proceedings of the National Academy of Sciences of the United States of America, 101(3), pp. 801,2004.
14. Lau S. et al.: Three-gene prognostic classifier for early-stage non–small-cell lung cancer. Journalof Clinical Oncology, 25(25), pp. 5562-5566, 2007.
15. Lisboa P., Velido A., Tagliaferri R., Ceccarelli M., Martin-Guerrero J. , Biganzoli E.: Data Miningin Cancer Research. IEEE Computational Intelligence Magazine, 5(1), 14-18, 2010.
16. N. Mantel: Evaluation of survival data and two new rank order statistics arising in its consider-ation. Cancer Chemother Rep. 50(3), pp. 163-70, 1966.
17. Peng H, Long F, Ding C: Feature selection based on mutual information: criteria of max-dependency, max-relevance, and min-redundancy. IEEE Trans Pattern Anal Mach Intell 27:12261238 (2005).
18. Sørlie T et al.: Gene expression patterns of breast carcinomas distinguish tumor subclasses withclinical implications. Proceedings of the National Academy of Sciences of the United States ofAmerica, 98 (19), pp. 10869, 2001.
19. Rousseeuw P.J., van Driessen K.: A Fast Algorithm for the Minimum Covariance DeterminantEstimator. Technometrics 41, 212–223 (1999)
20. Schwarz, G.: Estimating the dimension of a model. Ann. Stat. 6, 461–464 (1978).21. W.J. Welch: Construction of Permutation Tests. Journal of the American Statistical Associa-
tion,85(411), pp. 693-698, 1990.22. X. Zhang, X. L. Qian, X.-Q. Xu, H.-C. Leung, and L. Harris, J. Iglehart, A. Miron. J. Liu,
W. Wong: Recursive SVM feature selection and sample classification for mass-spectrometry andmicroarray data. BMC Bioinformatics, 7, pp, 197 2006.