amazon: there is hope! if we all do ‘the right thing’… deforestation, protected areas and...
TRANSCRIPT
WWF Living Amazon Initiative
Amazon: There is Hope! If we all do ‘the right thing’…
Deforestation, Protected Areas and Indigenous
Territories:
Past, evolution and…
Which future?
WWF LAI Internal Report
by Cláudio C. Maretti, Leader
Living Amazon Initiative WWF Network
Member of the World Commission on Protected Areas of IUCN
Preliminary citation:
Maretti, C.C. 2014. Amazon: There is Hope! If we all do ‘the right thing’…; Deforestation, Protected Areas and Indigenous Territories: Past, evolution and… Which future?. Brasília, WWF Living Amazon Initiative; internal report. 43 p + appendix etc. (total 49 p.)
Main sources and references to the data associated:
On deforestation:
Terra-i. 2014. Raw data on Amazon countries deforestation: www.terra-i.org. (Last updated data downloaded in 2014 Jan. 20.) Centro Internacional de Agricultura Tropical (Ciat), The Nature Conservancy (TNC), the School of Business and Engineering (HEIG-VD) and King’s College London (KCL). (Not published.)
(See also Reymondin, 2012. Used, adapted and reinterpreted by C.C. Maretti, 2014.)
On protected areas:
Riveros S., J. C.; 2013a (Jan.) Raw organised data collected from several sources in organised spreadsheet (following themes, etc.) and graphs on Amazon protected areas and indigenous territory. (Not published.)
(Prepared to be used for Riveros, 2013 and Riveros et alii, 2014. Main original sources: Bolivia – SERNANP, FAN Bolivia, Ministerio de Medio Ambiente y Agua; Brazil – Ministério do Meio Ambiente; Colombia –Sistema de Parques Nacionales Naturales; Ecuador –Ecociencia, TNC; French Guiana – Guiana Shield Initiative, DIREN Guyane, WWF; Guyana – Guiana Shield Initiative, WWF; Peru – SERNANP; Suriname –Guiana Shield Initiative, WWF; and Venezuela –ECOSIG. Used, adapted and reinterpreted by C.C. Maretti, 2014. WWF preliminary internal draft.)
Data on indigenous territories:
RAISG. 2010. Raw organised data collected from several sources in organised spreadsheet on Amazon indigenous territories (for RAISG, 2012, and others). Red Amazónica de Información Socioambiental Georreferenciada . (Not published.)
(Organised probably for RAIS, 2012. Obtained by Riveros 2013a for Riveros 2013 and Riveros et alii, 2014. Used, adapted and reinterpreted by C.C. Maretti, 2014. Only for our internal use. Not for diffusion.)
Amazon limits and ecoregions:
WWF. 2007-08 (ANI/LAI). Amazon strategy planning internal work – (to the WWF 2009). (Not published.)
WWF (Amazon Offices, others). 2009 (May). Amazon Network Initiative Strategic Plan – Amazonia Viva / Living Amazon. WWF. 148 p. + annexes. (Version 2.0.)
Complementary sources and others in ‘Bibliography and sources’
See summary on the WWF Living Amazon Initiative at the end.
1
Amazon: There is Hope! If we all do ‘the right thing’…
Deforestation, Protected Areas and Indigenous Territories: Past, evolution
and… Which future?
Cláudio C. Marettii
Amazon, Amazoniasii
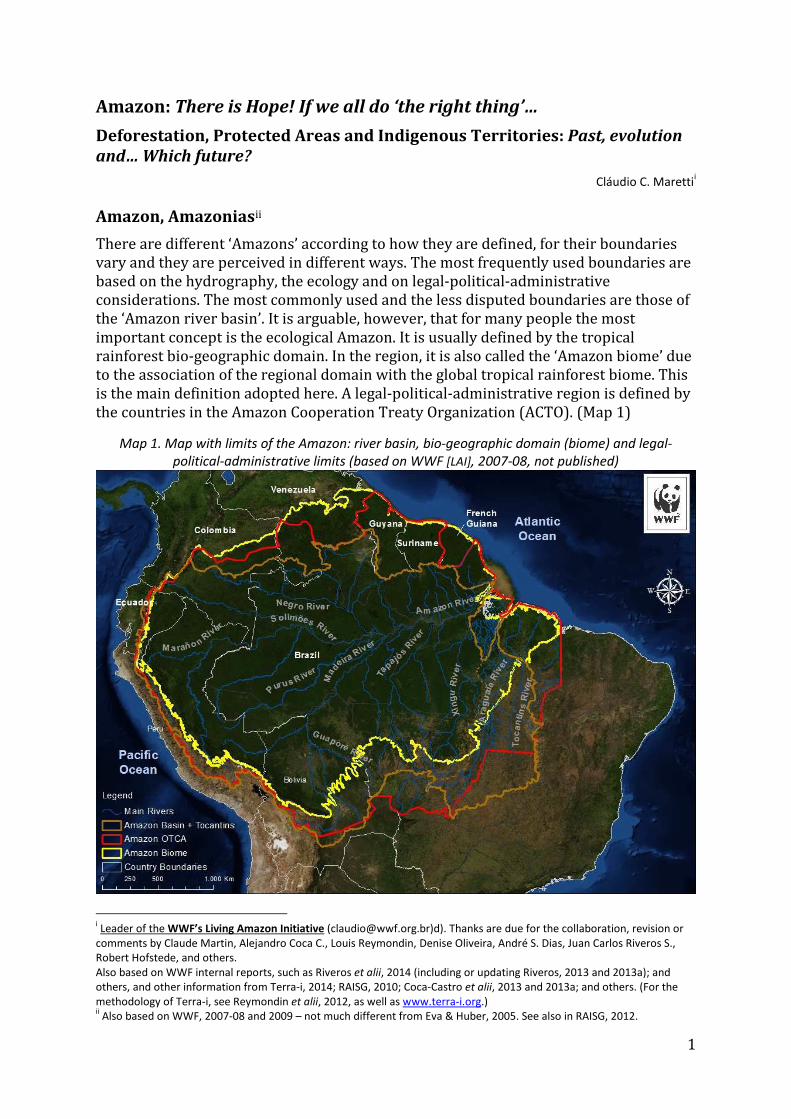
There are different ‘Amazons’ according to how they are defined, for their boundaries
vary and they are perceived in different ways. The most frequently used boundaries are
based on the hydrography, the ecology and on legal-political-administrative
considerations. The most commonly used and the less disputed boundaries are those of
the ‘Amazon river basin’. It is arguable, however, that for many people the most
important concept is the ecological Amazon. It is usually defined by the tropical
rainforest bio-geographic domain. In the region, it is also called the ‘Amazon biome’ due
to the association of the regional domain with the global tropical rainforest biome. This
is the main definition adopted here. A legal-political-administrative region is defined by
the countries in the Amazon Cooperation Treaty Organization (ACTO). (Map 1)
Map 1. Map with limits of the Amazon: river basin, bio-geographic domain (biome) and legal-political-administrative limits (based on WWF [LAI], 2007-08, not published)
i Leader of the WWF’s Living Amazon Initiative ([email protected])d). Thanks are due for the collaboration, revision or comments by Claude Martin, Alejandro Coca C., Louis Reymondin, Denise Oliveira, André S. Dias, Juan Carlos Riveros S., Robert Hofstede, and others. Also based on WWF internal reports, such as Riveros et alii, 2014 (including or updating Riveros, 2013 and 2013a); and others, and other information from Terra-i, 2014; RAISG, 2010; Coca-Castro et alii, 2013 and 2013a; and others. (For the methodology of Terra-i, see Reymondin et alii, 2012, as well as www.terra-i.org.) ii Also based on WWF, 2007-08 and 2009 – not much different from Eva & Huber, 2005. See also in RAISG, 2012.
WWF Living Amazon Initiative Internal Report
2
Many other Amazons could be defined using economic, cultural and social criteria. They
differ in their content (mystic, economic, cultural, natural resources, or others) and
limits (possibly different from the ones presented here), as well as purposes, interests
and associated rights (indigenous peoples, local communities, national governments,
land tenure/dominion, concessions, etc.). Nevertheless, the Amazon is one of the
world’s best known regions, with a significant core of common understanding.
However, there are also differences on many aspects and a series of interests and rights
are under dispute, and we all take sides, explicitly or not. Therefore, we should all be
better informed to enable us to decide in a conscious way. This paper hopes to help
towards providing better information for better decision making.
Natural features, ecosystem processes and servicesi
One of the most important remaining natural regions in the world, the Amazon is
number one in biodiversity. On this front, everything is superlative. More species of
primates can be found in the Amazon than anywhere else on Earth. It contains the
world’s richest diversity of birds, butterflies and other taxa. It has well over a thousand
species of birds and amphibians and several hundred species of both mammals and
reptiles. With some estimates as high as 9,000, this is the region with the largest
number of freshwater fish species. To date, at least some 40,000 plant species have been
found there. For the largest groups of living beings, such as the invertebrates, however,
it is almost impossible to list, so large the number could be and so little we know about
them; not to mention microorganisms. In short, the region probably includes 10% of the
world’s known biodiversity.
Furthermore some numbers rapidly become outdated due the huge extent of many of
the unique habitats, the inaccessibility of much of the vast Amazon region and the
endless discoveries. Between 1999 and 2013, scientists discovered, classified and
presented at least 1,661 new species of plants and vertebrates in the Amazon. The new
species include 40 mammals, 34 birds, 274 amphibians, 77 reptiles, 341 fish, and 895
species of plants. It also houses endemic and endangered flora and fauna. It is the
world’s last refuge for threatened species such as harpy eagles and pink river dolphins.
There are also jaguars, giant otters, scarlet macaws, southern two-toed sloths, pygmy
marmosets, saddleback and emperor tamarins, Goeldi’s monkeys and howler monkeys.
The Amazon is the world’s largest river basin. It holds about 12-20% of the world’s
global freshwater. The Amazon is also very important for its carbon stock. It is
estimated that the region contains almost 10% of the global reserve of carbon stored in
land ecosystems. There the greatest amount of living matter per unit area of the world
can be found. The role of the Amazon in climate stability and functioning is even more
important than the amount of carbon it stores. The Amazon biome drives the
atmospheric circulation in the tropics by absorbing energy and recycling about half of
the rain which falls on it. That highly energetic biosphere-atmosphere ‘pump’ is a very
important condition for the rain that falls in other parts of the continent, particularly in
guiding moisture to its central-southern zone.
i Also based on Jenkins et alii, 2013; Jenkins, 2012; RedParques et alii, 2010; Reid et alii, 2005; Ruesch & Gibbs, 2008; Scharlemann et alii [no date]; WWF, 2007-08, 2010 and 2013; and others.
Amazon: There is Hope! If we all do ‘the right thing’… Deforestation, Protected Areas and Indigenous Territories: Past, evolution and… Which future?
3
Amazon is locally and globally important in all the ecosystem services categories
(supporting, provisioning, regulating, and cultural) and for all components of human
well-being (security, basic material for good life, health, good social relations and
freedom of choice and action). Biodiversity resources have been the basis of local,
national, regional and world economies and are used for food, building houses, making
tools and utensils for manufacturing (textiles, handicrafts, pharmaceuticals,
biotechnology, wood, dye, perfumes, resins, gums, oils, etc.) and also in socio-cultural
ceremonies and rituals. The Amazonian ecosystems, including biological and physical
processes, also directly and indirectly provide other goods and services essential to
humanity, among which the regulation of hydrological cycles, climate regulation
(moderation of floods, droughts, extreme temperatures, wind forces), carbon
sequestration, oxygen production, soil conservation, erosion control and the control of
pests and diseases.
Human occupation, historical glimpsesi
Humans have lived in the Amazon region for at least 11,000 years. After the arrival of
the Europeans, peoples from Africa were brought in and peoples from Asia also arrived
in the region. Their settlements and exploration of natural resources provoked strong
impacts on the indigenous peoples – mainly through slavery, genocide and forced
settling close to villages. There were historically important immigration movements
related to the extraction of rubber, mostly related to the two big wars of the 20th
century, or to the industrialization of the US and Europe, particularly the automobile
industry. Nevertheless, roughly up until the 2nd World War the occupation of the
Amazon was mostly sparse, with very low density and with relatively small impacts on
nature.
From the mid-20th century up to now, first in Brazil and later in the other countries, the
Amazon has seen an intensification of human occupation and use of natural resources,
including land, minerals, and sources of energy. Equally important have been the
geopolitical interests, related to the domination of the territory, with issues such as of
‘national security’ (borders, etc.) and ‘national integration’, including establishment of
roads, settlements and military presence. Besides their direct effect, the roads open the
way for more settlement and more intense use of resources. Also, exploration and
exploitation of minerals, oil and gas and hydropower indirectly attract more people and
promote settlement and use of natural resources.
Currently, the region is inhabited by various human groups. Land use ranges from
industrial zones to historical cities, as well as local communities (rubber tappers,
riverine settlers, etc.), African-descendant communities and indigenous peoples (385,
with 60 of them living in voluntary isolation). Around 33 million people live in the
Amazon region today. Farmers and ranchers represent a very important but diverse
universe, with a composition ranging from the descendants of the old settlers to
newcomers, from small land holders, including those who came in under the aegis of
i Also based on May et alii, 2011 (on processes related to deforestation); Maretti et alii, 2005 (synthesis on rubber exploitation, ‘extractivists movement’ and extractive reserves); RAISG, 2012; RedParques et alii, 2010; WWF, 2009; and others.
WWF Living Amazon Initiative Internal Report
4
agrarian reform, to big land owners and supposed ranchers with a significant amount of
land illegally or irregularly acquired.
In the absence of good planning, good economic guidance and the presence of the State-
related powers to regulate human activities, an important share of that occupation is
irregular and the main consequences of that include violence against the traditional
dwellers or even against more recently established small settlers, as well as other social
disturbances (prostitution, diseases, slave-like labour conditions, etc.), over-
exploitation of some resources and degradation of the ecosystems, including
deforestation. Over the years variations have occurred, including some reduction in the
degradation impetus between the 1980’s and the 2000’s, due to the resistance of
Amazonian peoples and the national and international demand for human rights and
nature conservation, but they have been unable either to completely stop or to reverse
the intense process. Unfortunately, from the end of 1990’s, the tendency has been the
opposite, and basically the same processes from before have been taken up again, but
now on a much larger scale that includes stronger connections to global markets, both
as a consequence and, at the same time, one of the causes of the emerging economic
growth of several South American countries.
Nowadays the search for land, energy sources and minerals as well as the continuation
of opening accesses has become more intensive than ever. Important representatives of
the current phase are the relatively recent ‘invasion’ of soya plantations in the southern
Brazilian Amazon (mostly Mato Grosso), the access to the oil and gas deposits in the
Amazonian part of the Andean countries, more technical and capital intensive cattle
ranching in several parts (including the state of Pará), and the reactivation of
hydroelectric projects (that were on hold from 20+ years ago due to the earlier
resistance to building dams in the Xingu river basin), besides the continuation of road
building and renewal, and the ups and downs of mining.
Deforestation
Underlying causes, drivers, threats and processesi
In the early stages of European presence the Amazon represented the possibility of
riches, real or not – such as the “El Dorado” legend. However, the region remained
almost ‘forgotten’ from the main interventions for centuries, with the exception of one
or other resource exploited here or there (minerals, rubber, etc.), until the relatively
recent attention, from mid-20th century on. However, the myths of abundance of land
and ‘endless resources’ and the supposed or imposed right to access and exploit them
for whoever arrived ‘first’ have been subjacent to all the various long processes. On the
one hand, the control over the land and other natural resources enabled the formation
of new economic and political elites or the strengthening of the pre-existing ones, in
each phase throughout the history of the region. On the other hand, following the
historical quest for dominion, ‘grabbing’ and ‘developing’ (clearing, deforesting, etc.) the
land and resources have been a source of economic and social ascension, real or hoped
i Also based on Velarde, 2010; Che Piu & Menton, 2013; May et alii, 2011; Pacheco et alii, 2011a; Pautrat et alii, 2009; and others. There is no clear consensus in the literature, but the use of the terms drivers, underlying causes, and threats, is relatively common although not always with the same definition or relating to the same elements. See also notes below for more geographically referred references.
Amazon: There is Hope! If we all do ‘the right thing’… Deforestation, Protected Areas and Indigenous Territories: Past, evolution and… Which future?
5
for. While greed can certainly be seen in all that, on the other hand, the relative poverty
of an important portion of the related societies, and the struggle to overcome it, has also
been a key element throughout the region’s history.
Therefore, there are some interlinked elements functioning as enabling conditions and
drivers for the deforestation processes, including: the culture, attitudes related to
occupation and domination processes, or ‘what nature has to offer’ and the ‘right to
grab’ and take control over land and resources; production dependency on the open
fields model for agriculture and ranching (imported centuries ago from other climatic,
bio-geographical and cultural zones of the world, but still prevalent in the Amazon
processes); the Colonial governments and then the ‘National’ States territorial conquest
and consolidation; the need to make a show in land ‘grabbing’ processes (including the
most visible possible signs of occupation and domain), in some cases associated to de
facto subsidies; minerals and oil and gas exploitation, hydropower production and
similar interests in resources; transportation/access improvement; land distribution;
social ascension interests; lack of governmental presence; etc.
Deforestation is generated by highly entangled and complex processes. Usually several
different factors and drivers (direct and underlying ones) combine to generate the
‘results’ seen – and there are multiple consequences, including negative ones. Among
the deforestation-associated processes are: new ‘developments’ (roads, dam
constructions, mining, settlements, etc.) attracting people; government-driven
settlement; easier access to forest resources; land ‘grabbing’, speculation or acquisition;
food production; land-related wealth concentration; new mining or oil and gas
exploitation; expansion of land use by small land holders; illegal crops; etc. The
processes above can quite often be linked to each other and are also interlinked to the
enabling conditions and the direct or indirect drivers. Deforestation can represent: a
real need (direct farming, for instance) or an economic one (for root capital, for
example); an ‘occupation’ or ‘production’ demonstration (for financial flow, for
instance), even if it is fake (as in land ‘grabbing’ processes); settlement promoted
directly (commercial ventures, for instance) or indirectly (through access
improvement), or deliberately (for inhabiting borders related to territorial control, for
instance) or unintentionally (migration attracted by jobs expectation around
hydropower dam building or mines, for instance); or other interests.
Deforestation processes
Although the deforestation processes are usually different according to the places and
times, and usually interconnected as well as linked to several causes and drivers, some
examples of more or less generic processes can be described as follows:
• New developments (attraction points, areas or fronts), such as road or dam
constructions, mining or drilling new areas, new settlements, etc. (for instance,
Tucuruí, Carajás, Camisea, Jirau, Putumayo…), attract people, either in the hope of
the jobs offered, or in an attempt to take advantage of activities parallel to the main
venture. Associated new demands for housing and farming (or ranching) either
directly open new areas (legally or not), or become a pressure fuelling land
speculation or land grabbing.
WWF Living Amazon Initiative Internal Report
6
• Governments interested in land settlement (Rondônia and Mato Grosso, for
instance), for different reasons which are often combined (occupation of the borders
to assure national territory control; food production; alternative for poor landless
people; etc.) approve new legislation or directly open the land for concessions, for
selling cheaply or for giving it to interested parties. Infrastructure (such as
transportation and others) may be provided by the governments involved or
requested as a counterpart by those who receive the land.
• Better access, such as a new road (legal or irregular, usually but not necessarily
unpaved at first) (Porto Velho–Rio Branco, BR-364, Rondônia and Acre, Cuiabá–
Santarém, BR-163, Pará and Mato Grosso, for instance), is opened (for several
possible reasons, including politics, new development works, increase in
inhabitants, etc.).
o If opened into a forest area, it will shorten the distances to access high value
timber, frequently with a view to exportation. Usually, irregular loggers go
deeper into the jungle, with the access facilitated by the new road. The small and
irregular dirt roads opened to give access to the high value timber can then be
used to extract lower value timber, usually for local or national markets.
o Once the timber is extracted, the next and the most valuable element is the land –
which, possibly, in the Amazon, would have no legal or well accepted land tenure
documents. Then signs of occupation and dominion might start to appear, such
as fences and signboards, and somebody could be allocated there to ‘take care’ of
the land on behalf of the supposed (possibly false) owner (as in the Brazilian
Amazon, for instance.)
o Depending on whether there were local communities or not beforehand, they
might have been expelled from the land, through cheap payments, gun shots or
fires, either during the timber exploitation (robbery), or most probably during
the initial land grabbing stages (Pará state and others.)
o The easiest, cheapest and most effective way to demonstrate occupation is
through the pretence of cattle ranching – the area is deforested and few,
scattered cows are put in the fields. (Pará, for instance.)
o From this stage on, there could be or not advances in the land ‘ownership’
(dominion), depending on various context conditions (existence or not of other
land designations, corrupt authorities for ‘whitewashing’, economic interests to
continue into higher level investments, etc.). If it does progress, probably two
tracks could be followed, most probably in combination: stabilisation of the
occupation through more intensified ranching and more technical and capital
intensive agriculture (or ranching); and whitewashing paper, titles, documents,
which could include just a request for the land or go as far as bribing judges to
decide that the ‘tenure’ is ‘legal’.
• Land acquired, obtained through different means, becomes productive and the
owners (legal or otherwise) deforest (legally or not) parts of the lands adjacent to
the already converted parts to increase production. (Rondônia, for instance.)
• The increase in production or value of crops generates increase in the demand or in
the prices of land, which in turn promotes land speculation, and land grabbing
elsewhere to feed the latter. (Mato Grosso and others.)
• The discovery of new high value mineral deposits (particularly gold, but also
diamonds or other high value stones or metals) or the increase in the market price
Amazon: There is Hope! If we all do ‘the right thing’… Deforestation, Protected Areas and Indigenous Territories: Past, evolution and… Which future?
7
or ‘improvement’ in the buying price of those minerals promotes interest of
newcomers or previous local dwellers. (Most likely no other activity can compete
economically). These would arrive or shift activities, deforest, open, excavate (for
instance, current or old river banks) and/or pollute areas (with mercury, for
example). Usually the social impacts are significant and even more important and
affect the local communities through their direct or indirect engagement or with
their suffering the consequences (Madre de Dios and the Guianas, for example).
• The expansion of land use by of small land holders or even local communities, either
for their livelihoods or for increased participation in local or larger markets, also
usually leads to more deforestation.
o Even if not usually very significant at the beginning, particularly in the case of the
more traditional local communities, in some cases it might progressively become
cumulatively important. One possibility for this to happen is the lack of trust in
the governmental, banking or markets conditions related to forest and
freshwater products. Another could be the ‘attraction’ by the (usually bad)
example of ‘neighbouring’ ranchers (Xapuri, for instance). Investing their small
amounts of resources in animals, including for their savings, can also be a reason.
In any case, there are demands for ‘opening’ new or additional areas.
o For the small farmers, new comers, usually associated to government driven
settlement processes, that expansion trend can be more important, particularly
in the cases where, either they do not adapt their farming or ranching
management to the local (new) conditions and then need to progressively open
new areas in an attempt to cope and produce, or they sell or relate to a larger
‘producer’ (who could also be a land speculator) and expand directly or
indirectly representing the latter. (Transamazônica highway, for instance.)
o Landless farmers or jobless people get into the jungle for survival. Small crops,
including manioc, and when possible some animals, could be the start. The
evolution could be linked to absorption or expulsion by the other occupation
processes.
• Areas are opened for illegal crops (in some Andean-Amazon countries, for example).
Local small farmers are either forced or persuaded to join (it is rarely that any other
crop will pay better). Directly or through pressure the tendency will be to convert
forests into small plantations. After a short period of usually one or a few years, the
illegal crops pressure will go somewhere else. The use or abandon of the previously
used area will depend on the conditions left ‘behind’, including the ones related to
safety and markets.
• Peace processes (Colombia, for example) demand land for settlement of former
military or guerrilleros, or settlement is proposed for political reasons (agrarian
reform, for instance).
New settlements become direct causes of deforestation. Furthermore most processes
indirectly promote more occupation and deforestation and degradation. Usually there is
a core deforestation or ecosystem conversion area, more directly linked to the
intervention, but also a larger indirectly promoted conversion area, besides another
area of ecosystem degradation. Depending on the perspectives of becoming regular
(through ‘whitewashing’ or not) –besides the linkages to the relief of the land
(possibilities of mechanization), access (transportation infrastructure) and soil quality–,
the land tends to value more after the deforestation.
WWF Living Amazon Initiative Internal Report
8
Sub-regions
On a more general level, there are currently three different trends in Amazon
deforestation: (i) deforestation curbing in Brazil, since around 2004 –with two trends,
contradictory in geography and processes–, but still a very large area deforested per
year; (ii) important increase in deforestation in the last decades in the Andean-Amazon
countries, possibly becoming ‘champions’; and (iii) still small in absolute terms but
increasingly relatively important deforestation in the Guianas. All countries show
contradictory policy and economic trends, pushing for economic and social activities
which promote deforestation pressures as well as proposing regulations to resist or
avoid degradation processes.
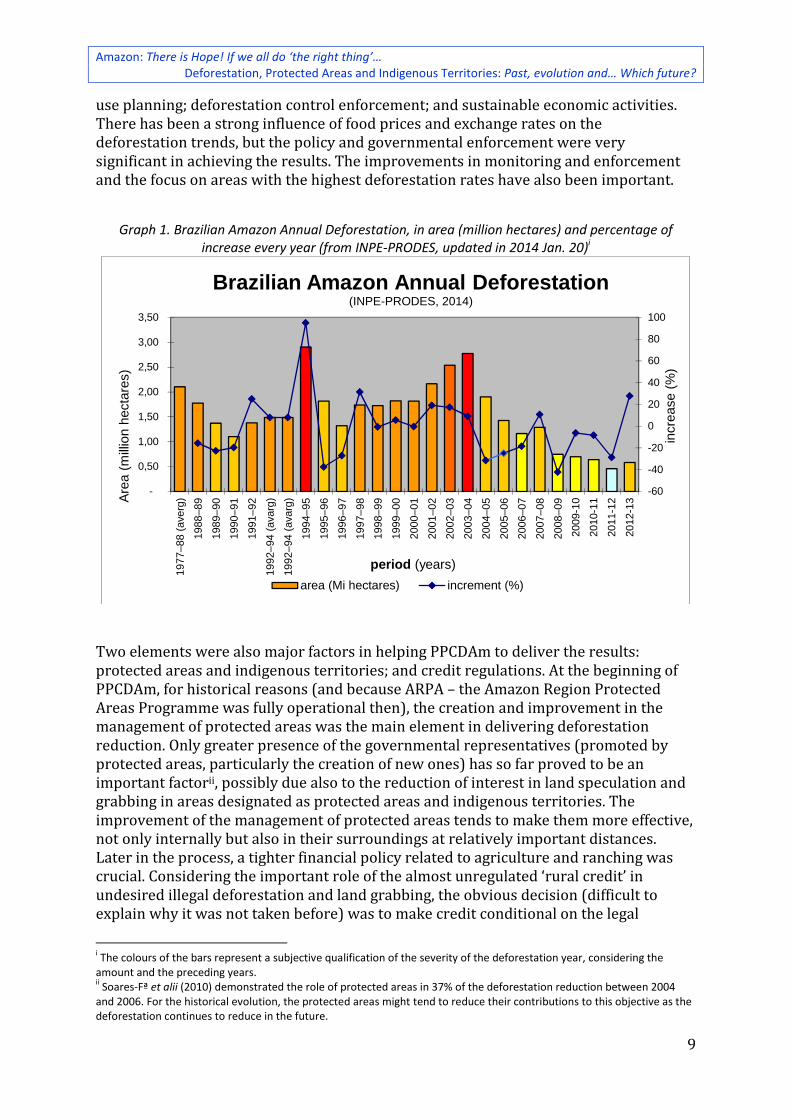
Brazil has had important deforestation at least since it started to be monitored by INPE
– with an average of almost 2 million hectares per year from 1977 to 2004, with
important ups and downs between 1.1 and 2.9 million ha. In cumulative terms, from
1978 to 2013, the states with the greatest deforestation have been Pará, Mato Grosso,
Maranhão and Rondônia. In recent times, probably due to its relatively higher earlier
deforestation rate, Maranhão has diminished its gross annual deforestation. Usually
after the years of larger amounts of deforestation (such as 1995 and 2002-04) outcries
were heard and/or actions were taken. Particularly since the development and launch
of the Action Plan for the Prevention and Control of Deforestation in the Legal Amazon
(“PPCDAm”) in 2004, important reduction in deforestation has been achieved in
Brazilian Amazon, and sustained so far. (Graph 1.) Meanwhile, the total area deforested
still keeps growing, and reached some 76 million hectares in 2013, which already
represents some 20% of the original forests. Nevertheless, the total decrease of annual
deforestation from 2004 to 2013 is of 79%. It probably represented a significant sign of
the Brazilian commitment expressed at the UNFCCC CoP 15 in Copenhagen to reduce
80% of the Amazon deforestation by 2020, which was expressed later as a voluntary
national commitment. (All data consider the ‘Legal Amazon’, going beyond the
ecological Amazon and different from the Amazon basin.)i
There have been a series of direct and indirect evaluations of the Brazilian deforestation
curbing and the PPCDAm, most of them offering much valid analysis and contribution
but with partial or biased approaches and conclusions. A thorough interpretation of this
historical process might yet take several years of debates to be completed. PPCDAm has
functioned most of the time as a guiding framework, important to foster engagement,
cooperation across organisations and governmental levels and development of specific
programmes. The political will from higher level and the integrated approach from
different sectors have been very important. The first Action Plan had three fronts: land
i INPE-PRODES measures deforestation from August to July in the ‘Legal Amazon’ (“Amazônia Legal”), which is the area designated by the Brazilian federal government in 1953, including parts of the Cerrado. Although the attention to the Cerrado has increased in the last decade, there has not been a similar level of care as in the Amazon, and this bio-geographic domain has been the one relatively more under threat in Brazil in recent times. Brazilian related information is also based on INPE-PRODES, 2014; IBGE, 2013; Coca-Castro et alii, 2013; and others, some presenting direct and indirect evaluations of the Brazilian deforestation curb or the PPCDAm (“Plano de Ação para a Prevenção e o Controle do Desmatamento na Amazônia Legal”), as IPEA, CEPAL & GIZ, 2011; May et alii, 2011; and others, including some with more attention to the economic factors, such as Assunção et alii, 2012; and others, some with attention more on the roles of protected areas and indigenous territories, as Brasil et alii, 2010-2012; Soares-Fº. et alii, 2009 and 2010; WWF-Brasil et alii, 2009; Jenkins & Joppa, 2009; Ricketts et alii, 2010; and others; among other factors (infra-structure, etc.) and sources.
Amazon: There is Hope! If we all do ‘the right thing’… Deforestation, Protected Areas and Indigenous Territories: Past, evolution and… Which future?
9
use planning; deforestation control enforcement; and sustainable economic activities.
There has been a strong influence of food prices and exchange rates on the
deforestation trends, but the policy and governmental enforcement were very
significant in achieving the results. The improvements in monitoring and enforcement
and the focus on areas with the highest deforestation rates have also been important.
Graph 1. Brazilian Amazon Annual Deforestation, in area (million hectares) and percentage of increase every year (from INPE-PRODES, updated in 2014 Jan. 20)i
Two elements were also major factors in helping PPCDAm to deliver the results:
protected areas and indigenous territories; and credit regulations. At the beginning of
PPCDAm, for historical reasons (and because ARPA – the Amazon Region Protected
Areas Programme was fully operational then), the creation and improvement in the
management of protected areas was the main element in delivering deforestation
reduction. Only greater presence of the governmental representatives (promoted by
protected areas, particularly the creation of new ones) has so far proved to be an
important factorii, possibly due also to the reduction of interest in land speculation and
grabbing in areas designated as protected areas and indigenous territories. The
improvement of the management of protected areas tends to make them more effective,
not only internally but also in their surroundings at relatively important distances.
Later in the process, a tighter financial policy related to agriculture and ranching was
crucial. Considering the important role of the almost unregulated ‘rural credit’ in
undesired illegal deforestation and land grabbing, the obvious decision (difficult to
explain why it was not taken before) was to make credit conditional on the legal
i The colours of the bars represent a subjective qualification of the severity of the deforestation year, considering the amount and the preceding years. ii Soares-Fª et alii (2010) demonstrated the role of protected areas in 37% of the deforestation reduction between 2004
and 2006. For the historical evolution, the protected areas might tend to reduce their contributions to this objective as the deforestation continues to reduce in the future.
-60
-40
-20
0
20
40
60
80
100
-
0,50
1,00
1,50
2,00
2,50
3,00
3,50
1977
–88
(ave
rg)
1988
–89
1989
–90
1990
–91
1991
–92
1992
–94
(ava
rg)
1992
–94
(ava
rg)
1994
–95
1995
–96
1996
–97
1997
–98
1998
–99
1999
–00
2000
–01
2001
–02
2002
–03
2003
–04
2004
–05
2005
–06
2006
–07
2007
–08
2008
–09
2009
-10
2010
-11
2011
-12
2012
-13
incr
ease
(%
)
Are
a (m
illio
n he
ctar
es)
period (years)
Brazilian Amazon Annual Deforestation (INPE-PRODES, 2014)
area (Mi hectares) increment (%)
WWF Living Amazon Initiative Internal Report
10
conditions of the farms and ranches in terms of environmental compliance and legal
ownership and it has been hugely important.
Far from being a completed task, the context evolution contains serious gaps and
contradictions. The third pillar (promotion of sustainable economic activities) is the one
that has been performing least satisfactorily and is probably the one most needed for
the long term sustainability of the deforestation curbing (hopefully tending to zero).
This is true for the activities directly linked to the PPCDAm and for the ones without any
clear relation to it. Due to the focused control, but also to the fact that the contradictions
continue in the form of governmental infrastructure and economic activities in the
Amazon, the deforestation is no longer strong only in the ‘deforestation crescent’, but
has started to go deeper into the Amazon and to become more disperse. Due to the
relative efficiency of deforestation control, the large deforested areas have tended to
become reduced, but there has been a rise in the proportion of smaller areas, probably
resulting both from the reduction in the size of the areas deforested by larger
producers, possibly trying to escape from the satellite-related control, and from the
maintenance (or increase) of deforestation by the small landholders, which are
politically and operationally much more difficult to control (poorer, out of the reach of
the monitoring tools, etc.)
Beyond Brazil, the challenge for the other Amazon countries starts with the absence of
regular, timely, official and well accepted deforestation monitoring. Some countries
have several data sources, which can be different from each other, or not be officially
adopted. Others do not produce regular and timely information, without which it is
difficult to properly inform public opinion and achieve the consequent building or
improvement of policy support. Only a few sources can offer easily accessible
monitoring data about the whole Amazon ‘biome’.
In the Andean-Amazon countries –Bolivia, Peru, Ecuador, Colombia and Venezuela–,
although they were relatively late in entering in the heavy exploitation and occupation
of the Amazon (compared to Brazil), they got strongly into that in the last 20 to 30
years. From a more traditional tendency of opening small areas for agriculture, usually
through slash-and-burn, unsustainable extraction of timber and some firewood, besides
localised more intense actions, most of the Andean-Amazon countries have been seeing
Amazon deforestation in these last decades being driven by factors related to energy,
infrastructure and mining, and particularly the economic importance of oil and gas.i
Some countries have a ‘pre-Amazon’ ecological area, usually drier (from open forests to
savannahs), which sometimes supports agriculture and ranching activities , either
beforehand or as the leakage from the Amazon protection, such as the Cerrado (Brazil,
Bolivia), “Orinoquía” (Colombia, Venezuela) and “Bosque Chiquitano” (Bolivia). Others
do not, and connect more directly their Amazon to the Andes. For several different
causes, interests, drivers and processes, there is a general economic and demographic
movement from the Andes mountains to the Amazon lowlands, and that related
i Andean-Amazon countries reported information also based on Armenteras et alii, 2013; Cabrera et alii, 2011; Che Piu & Menton, 2013; Coca-Castro et alii, 2013; Coca et alii [no date; 2013]; Coca-Castro, 2014; Colombia et alii, [no date; 2013]; Dourojeanni et alii, 2009; Nepstad et alii, 2013; Pacheco et alii, 2011a & b; Pautrat et alii, 2009; Peru, 2011; Velarde et alii, 2010; and others.
Amazon: There is Hope! If we all do ‘the right thing’… Deforestation, Protected Areas and Indigenous Territories: Past, evolution and… Which future?
11
migration, in some cases, generates a ‘negative spiral’ when poor migrants are not
adapted to the ‘new’ conditions.
Probably in Bolivia the downwards movement is combined with the socio-economic
dynamics throughout the lowlands (including Brazilian influences) with the large
plantations (including soya) progressively approaching and entering the Amazon and
the strengthening the cattle ranching into an industrial scale intensifying inside the
Amazon, which seems to have been increasing rapidly in the last decade. Both cases are
increasing the Amazon deforestation risks, together with big fires. Some land-use
change is also promoting habitat loss, such as exotic grass plantations, drying or more
intensive use of wetlands, etc. In 2012, Beni, in Bolivia, showed a high deforestation
tendency. Bolivian Madre Tierra policy and law, the proposed Joint Mitigation and
Adaptation Mechanism and the reform on the forestry laws compose a framework that
could help to reduce deforestation.
Besides small and local farming, cumulatively important for deforestation, Peru has
been suffering more from mining, prior to and in addition to the others. It has also
already been more directly impacted by proposals of medium to large hydropower
projects, although all still in very early stages of development. Nevertheless,
hydropower is probably going to touch all of the Amazon countries, either for exporting
to the Brazilian market, or due to other internal or external reasons. As with the other
countries, Peru has already started to see pressure from oil palm plantations provoking
some specific areas of large-scale deforestation. In 2012, Loreto, followed by Ucayali,
were the sub-national deforestation champions outside of Brazil. The case of Madre de
Dios went from a proposed sustainable model into a serious crisis due to the artisanal
and illegal gold mining. Peru has a commitment to no deforestation in all assigned forest
lands –some 54 million hectares– and to reduce emissions from land-use change
tending to zero by 2021.
Colombia and Ecuador have more endogenous processes, with deforestation linked to
the internal frontier, particularly with smaller scale cattle ranching and local farming –
always complementing the elements presented above. The Colombian Caquetá is
becoming a strong deforestation hotspot. In Ecuador the settlements related to the oil
exploitation areas seem important. Arguably those deforestation trends tend to
increase, due to the relative high population density in Ecuador and the probable
Colombian need to settle former military and guerrilleros, as well as much larger
contingents of poor campesinos, with the possible peace agreement. Although not a
primary deforestation driver, illegal drugs should be considered, especially in view of
their quick and pushing dynamics, and they have become progressively more important
in Peru. Reducing deforestation in Ecuador is a national priority under the National Plan
for Good Living, and community and private forest owners receive financial incentives
to keep their forests standing. Colombia has been restating its ambitious goal to reach
zero net deforestation in the Amazon by 2020. In Venezuela, again, the agriculture,
infrastructure and logging seem to be the main deforestation drivers. In 2012, Bolívar
and Amazonas states, in Venezuela, showed high deforestation tendencies.
The three ‘Guianas’ –Guyana, Suriname and French Guiana– historically have their
relative small population concentrated on the coast, with settlements by the Europeans
and other immigrants (such as from India and Indonesia). In contrast, after slave
WWF Living Amazon Initiative Internal Report
12
struggles and revolts, African descendent communities established themselves more in
the hinterland, mostly mid-way between the coast and the watershed limits (the latter
on the borders with Brazil). Significant populations of indigenous peoples remain in the
forests, including those close to the southern borders of the Guianas. Those countries
(one of them, a European overseas territory) have traditionally been under socio-
economic dynamics related to the Caribbean and Europe.i
They represent the last group of Amazon countries to start more significant disturbance
of the Amazon. Nevertheless, in the last decades, the ‘small scale and artisanal’ gold
mining has been a source of important disturbance to the Amazon, including
deforestation, mercury pollution, etc., besides social impacts and other issues (bad
working conditions, illegal migration and transport of supplies and gold, health
contamination, violence, prostitution, etc. – some of them including interactions with
Brazil). This has been the main deforestation driver in this sub-region. Although in all
three Guianas deforestation is relatively low (in French Guiana it seems lower), in all
three it has been rising more steeply in the last years. Due to the increasingly higher
gold prices in the last decade mining has regained importance across the Amazon. More
recently than the other countries, there have been plans for infrastructure, including
roads and dams. In Suriname they are already producing more impacts, together with
small agriculture and plantations. Guyana has a Low Carbon Development Strategy with
very low deforestation accepted in it, but this includes a hydropower dam and related
accesses to the Guyanese Amazon inland.
Regional Amazon analyses
A regional, internationally integrated approach and the improvement in the policies and
the results in deforestation curbing are necessary due to the fact that the Amazon has
some regionally interlinked physical and ecological processes and because the
consequences of ecosystem conversion and degradation in some places affect others,
including through hydrological, ecological and climatic interactions across the borders.
However, there is almost no consistent regional analysis on Pan-Amazon deforestation,
with few exceptions. Most of the analyses have different methodologies. Besides, the
different analyses consider distinct Amazon limits.
Killeen collected information from different sources and made extrapolations, based on
judgements about best source for each country and each period. In Brazil the numbers
have been showing a tendency to reduction but his interpretation and data show a
tendency to increase for the ‘non-Brazilian’ Amazon. According to those data and
interpretations, in terms of percentage, in 2011, the only countries with significantly
less deforestation than Brazil were Venezuela and Guyana, with Suriname and French
Guiana presenting similar levels to Brazil, and most Andean-Amazon countries showing
proportionally more deforestation – Bolivia, Ecuador, Colombia, and Peru, in order
from higher to lower levels. Killeen concluded that, also in terms of the absolute area
deforested, the aggregate deforestation of non-Brazilian countries is already higher
than the Brazilian Amazon one, particularly with the contribution from Andean-Amazon
as the highest in recent years. Nevertheless, the history of Brazilian deforestation still
i There is relatively less readily available literature on the Guianas. Related information also based on Coca-Castro et alii, 2013; Coca et alii [no date; 2013]; FAO, 2010b; Guyana [no date; 2013]; Reymondin, 2014; The REDD Desk, [no date; 2013]; WWF Guianas, 2012; and others.
Amazon: There is Hope! If we all do ‘the right thing’… Deforestation, Protected Areas and Indigenous Territories: Past, evolution and… Which future?
13
places this country well above all the others put together in historical accumulated
terms, even in percentage of each Amazon area, with almost three times more in terms
of absolute total area deforested. (This and some other analyses consider the “Bosque
Chiquitano” as part of the Amazon, which is not the case for others, including WWF
Living Amazon Initiative. It also considered the Brazilian Legal Amazon.)i
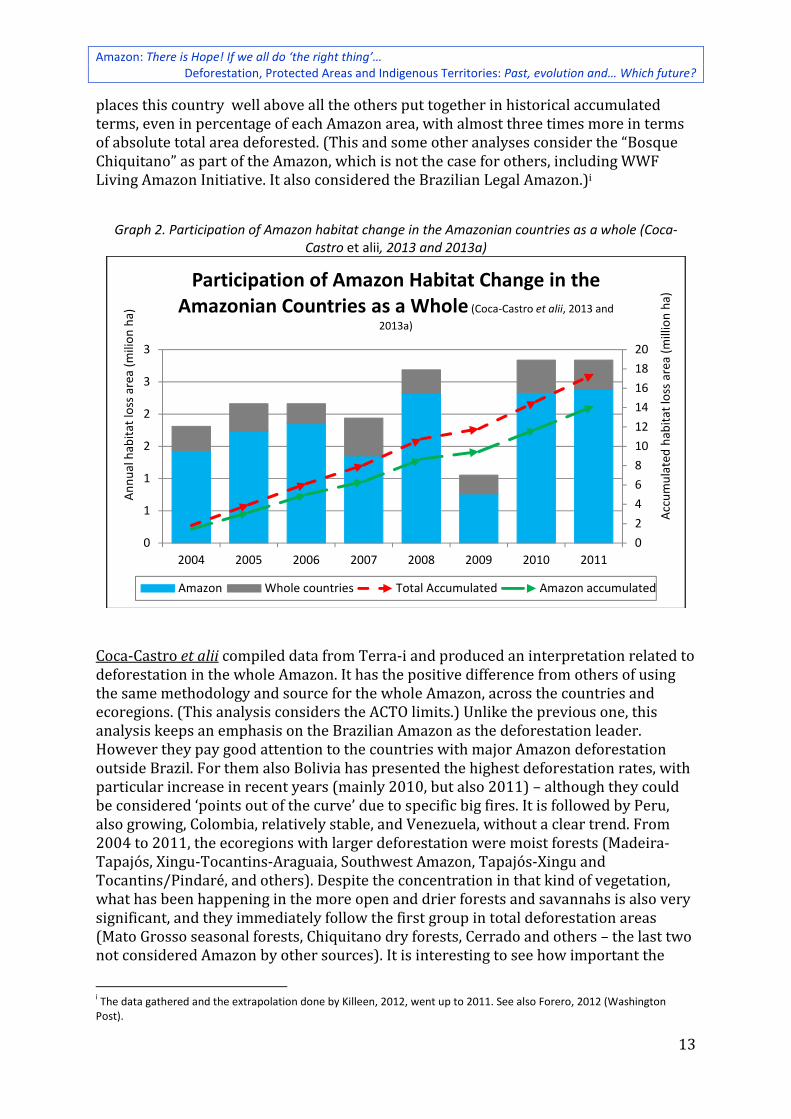
Graph 2. Participation of Amazon habitat change in the Amazonian countries as a whole (Coca-Castro et alii, 2013 and 2013a)
Coca-Castro et alii compiled data from Terra-i and produced an interpretation related to
deforestation in the whole Amazon. It has the positive difference from others of using
the same methodology and source for the whole Amazon, across the countries and
ecoregions. (This analysis considers the ACTO limits.) Unlike the previous one, this
analysis keeps an emphasis on the Brazilian Amazon as the deforestation leader.
However they pay good attention to the countries with major Amazon deforestation
outside Brazil. For them also Bolivia has presented the highest deforestation rates, with
particular increase in recent years (mainly 2010, but also 2011) – although they could
be considered ‘points out of the curve’ due to specific big fires. It is followed by Peru,
also growing, Colombia, relatively stable, and Venezuela, without a clear trend. From
2004 to 2011, the ecoregions with larger deforestation were moist forests (Madeira-
Tapajós, Xingu-Tocantins-Araguaia, Southwest Amazon, Tapajós-Xingu and
Tocantins/Pindaré, and others). Despite the concentration in that kind of vegetation,
what has been happening in the more open and drier forests and savannahs is also very
significant, and they immediately follow the first group in total deforestation areas
(Mato Grosso seasonal forests, Chiquitano dry forests, Cerrado and others – the last two
not considered Amazon by other sources). It is interesting to see how important the
i The data gathered and the extrapolation done by Killeen, 2012, went up to 2011. See also Forero, 2012 (Washington Post).
0
2
4
6
8
10
12
14
16
18
20
0
1
1
2
2
3
3
2004 2005 2006 2007 2008 2009 2010 2011
Acc
um
ula
ted
hab
itat
loss
are
a (m
illio
n h
a)
An
nu
al h
abit
at lo
ss a
rea
(mili
on
ha)
Participation of Amazon Habitat Change in the Amazonian Countries as a Whole (Coca-Castro et alii, 2013 and
2013a)
Amazon Whole countries Total Accumulated Amazon accumulated
WWF Living Amazon Initiative Internal Report
14
Amazon’s share of national deforestation is for the countries and the fact that,
deforestation in Ecuador and Colombia, as well as more irregularly in Venezuela, has
important components outside the Amazon. (Graph 2).i
New analysis
Acknowledging the importance of using a single methodology and source across the
whole Amazon for a consistent approach, but considering also the interest of the
ecological focus, a new analysis was needed, which is presented here. It organised the
most up to date data (from Terra-i, 2014) and adopts the definition and criteria of the
bio-geographic Amazon. (Therefore, numbers and graphs do not completely coincide
with what was presented above.)ii
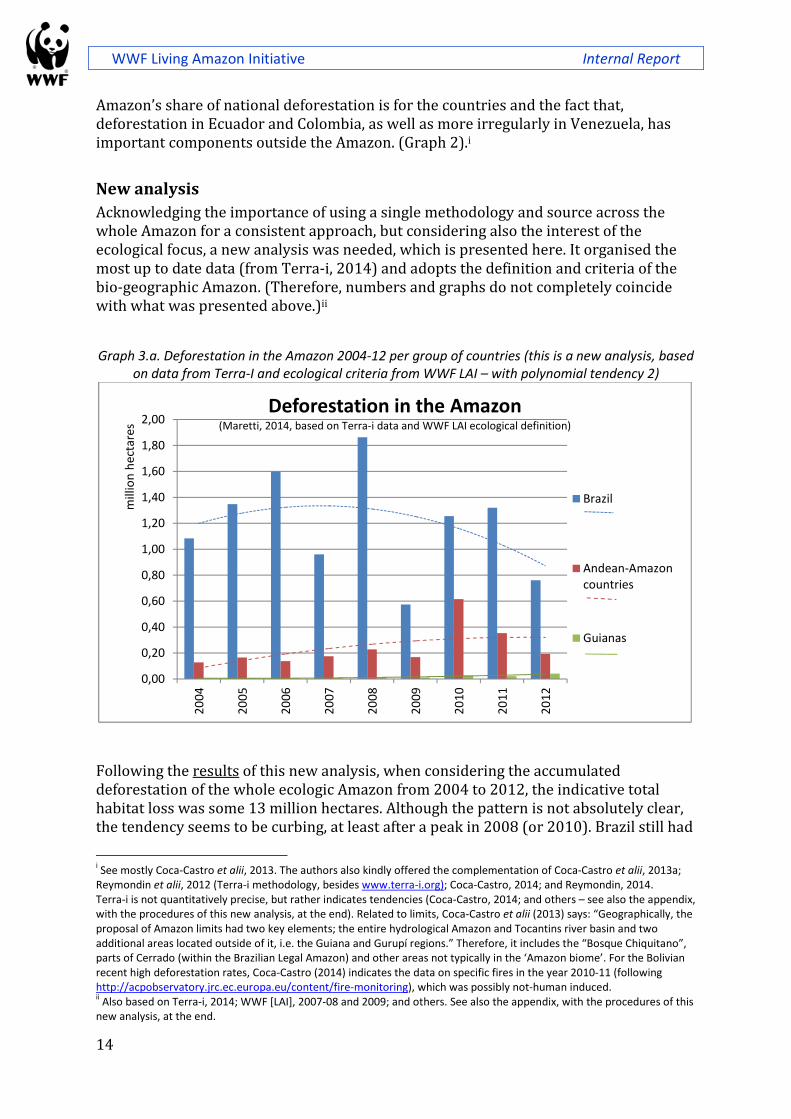
Graph 3.a. Deforestation in the Amazon 2004-12 per group of countries (this is a new analysis, based on data from Terra-I and ecological criteria from WWF LAI – with polynomial tendency 2)
Following the results of this new analysis, when considering the accumulated
deforestation of the whole ecologic Amazon from 2004 to 2012, the indicative total
habitat loss was some 13 million hectares. Although the pattern is not absolutely clear,
the tendency seems to be curbing, at least after a peak in 2008 (or 2010). Brazil still had
i See mostly Coca-Castro et alii, 2013. The authors also kindly offered the complementation of Coca-Castro et alii, 2013a; Reymondin et alii, 2012 (Terra-i methodology, besides www.terra-i.org); Coca-Castro, 2014; and Reymondin, 2014. Terra-i is not quantitatively precise, but rather indicates tendencies (Coca-Castro, 2014; and others – see also the appendix, with the procedures of this new analysis, at the end). Related to limits, Coca-Castro et alii (2013) says: “Geographically, the proposal of Amazon limits had two key elements; the entire hydrological Amazon and Tocantins river basin and two additional areas located outside of it, i.e. the Guiana and Gurupí regions.” Therefore, it includes the “Bosque Chiquitano”, parts of Cerrado (within the Brazilian Legal Amazon) and other areas not typically in the ‘Amazon biome’. For the Bolivian recent high deforestation rates, Coca-Castro (2014) indicates the data on specific fires in the year 2010-11 (following http://acpobservatory.jrc.ec.europa.eu/content/fire-monitoring), which was possibly not-human induced. ii Also based on Terra-i, 2014; WWF [LAI], 2007-08 and 2009; and others. See also the appendix, with the procedures of this
new analysis, at the end.
0,00
0,20
0,40
0,60
0,80
1,00
1,20
1,40
1,60
1,80
2,00
20
04
20
05
20
06
20
07
20
08
20
09
20
10
20
11
20
12
mill
ion
hec
tare
s
Deforestation in the Amazon(Maretti, 2014, based on Terra-i data and WWF LAI ecological definition)
Brazil
Andean-Amazoncountries
Guianas
Amazon: There is Hope! If we all do ‘the right thing’… Deforestation, Protected Areas and Indigenous Territories: Past, evolution and… Which future?
15
much more absolute deforestation amounts then all other countries together –
considering the whole 9-year period, it answered for around 82.4% of the total
deforestation, the Andean-Amazon countries around 16.6% and the Guianas a bit more
than 1%. However, in relative terms, and considering the last years tendency, this
‘leadership’ could not be the reality for much longer – if Brazil remains in its positive
curbing track and if the Andean-Amazon countries do not correct their negative
increasing tendency (Graphs 3.a and .b).i
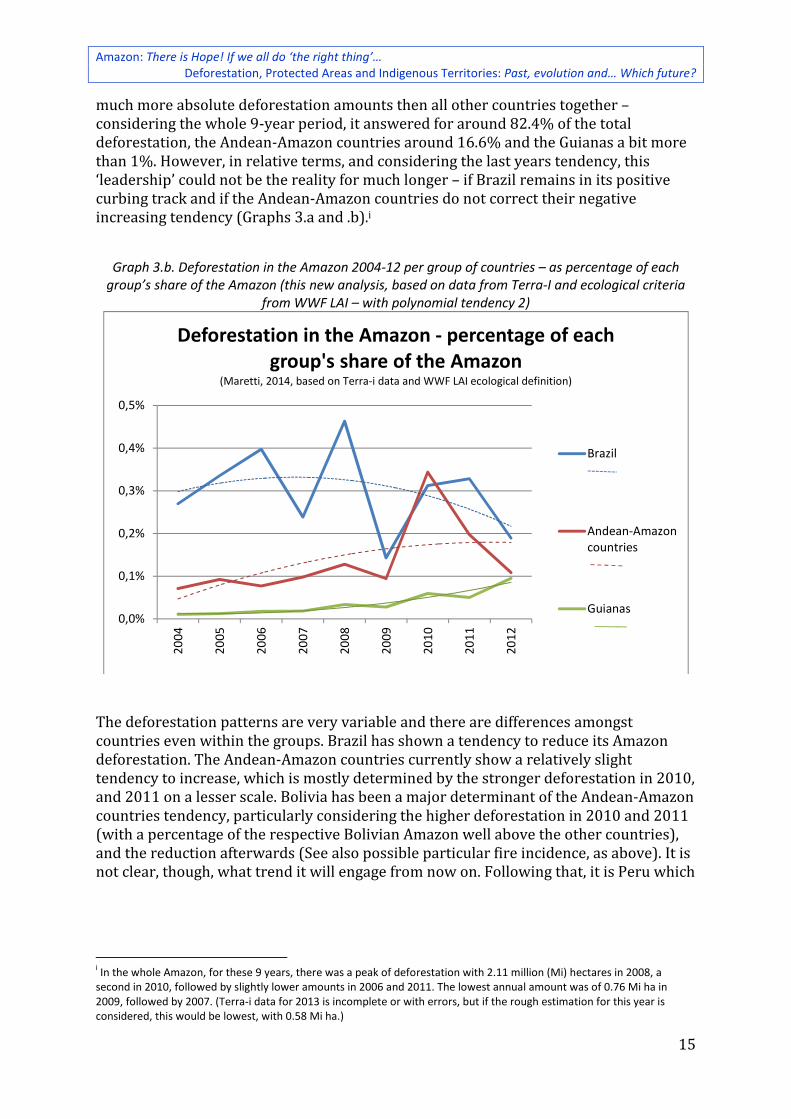
Graph 3.b. Deforestation in the Amazon 2004-12 per group of countries – as percentage of each group’s share of the Amazon (this new analysis, based on data from Terra-I and ecological criteria
from WWF LAI – with polynomial tendency 2)
The deforestation patterns are very variable and there are differences amongst
countries even within the groups. Brazil has shown a tendency to reduce its Amazon
deforestation. The Andean-Amazon countries currently show a relatively slight
tendency to increase, which is mostly determined by the stronger deforestation in 2010,
and 2011 on a lesser scale. Bolivia has been a major determinant of the Andean-Amazon
countries tendency, particularly considering the higher deforestation in 2010 and 2011
(with a percentage of the respective Bolivian Amazon well above the other countries),
and the reduction afterwards (See also possible particular fire incidence, as above). It is
not clear, though, what trend it will engage from now on. Following that, it is Peru which
i In the whole Amazon, for these 9 years, there was a peak of deforestation with 2.11 million (Mi) hectares in 2008, a second in 2010, followed by slightly lower amounts in 2006 and 2011. The lowest annual amount was of 0.76 Mi ha in 2009, followed by 2007. (Terra-i data for 2013 is incomplete or with errors, but if the rough estimation for this year is considered, this would be lowest, with 0.58 Mi ha.)
0,0%
0,1%
0,2%
0,3%
0,4%
0,5%
20
04
20
05
20
06
20
07
20
08
20
09
20
10
20
11
20
12
Deforestation in the Amazon - percentage of each group's share of the Amazon
(Maretti, 2014, based on Terra-i data and WWF LAI ecological definition)
Brazil
Andean-Amazoncountries
Guianas
WWF Living Amazon Initiative Internal Report
16
has shown greater increase in deforestation in the last years, and has been presenting a
particularly systematic increase.i
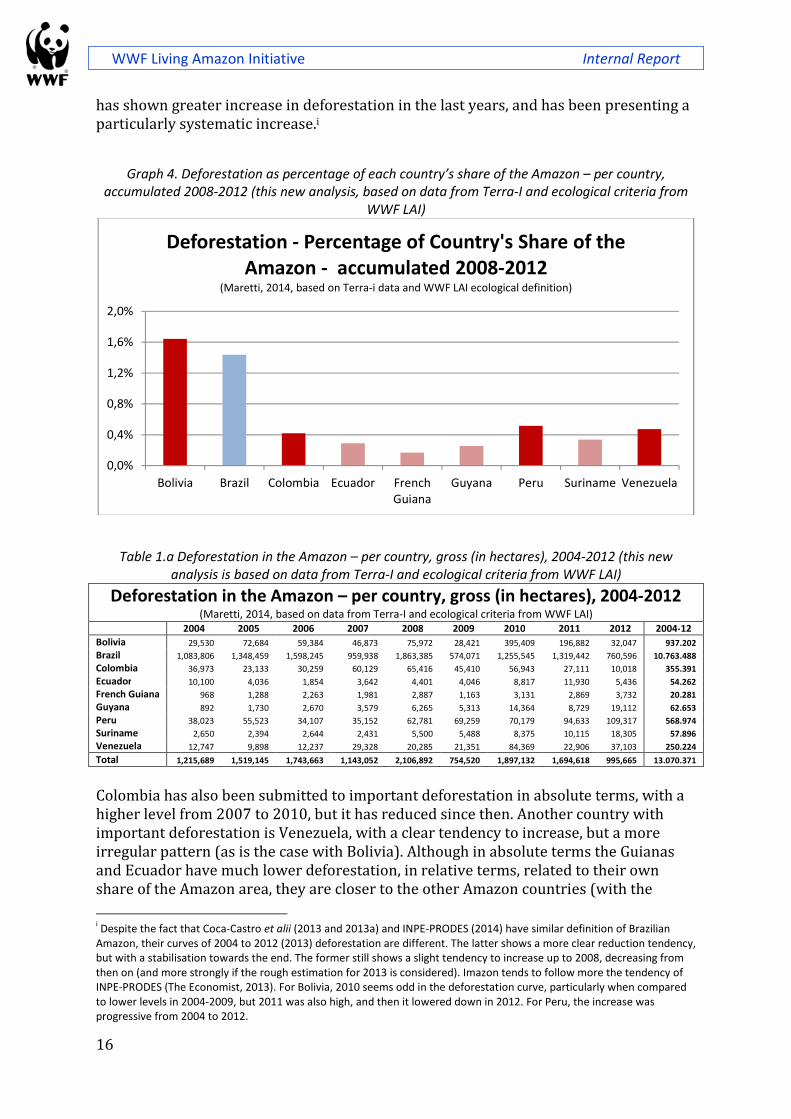
Graph 4. Deforestation as percentage of each country’s share of the Amazon – per country, accumulated 2008-2012 (this new analysis, based on data from Terra-I and ecological criteria from
WWF LAI)
Table 1.a Deforestation in the Amazon – per country, gross (in hectares), 2004-2012 (this new analysis is based on data from Terra-I and ecological criteria from WWF LAI)
Deforestation in the Amazon – per country, gross (in hectares), 2004-2012 (Maretti, 2014, based on data from Terra-I and ecological criteria from WWF LAI)
2004 2005 2006 2007 2008 2009 2010 2011 2012 2004-12
Bolivia 29,530 72,684 59,384 46,873 75,972 28,421 395,409 196,882 32,047 937.202
Brazil 1,083,806 1,348,459 1,598,245 959,938 1,863,385 574,071 1,255,545 1,319,442 760,596 10.763.488
Colombia 36,973 23,133 30,259 60,129 65,416 45,410 56,943 27,111 10,018 355.391
Ecuador 10,100 4,036 1,854 3,642 4,401 4,046 8,817 11,930 5,436 54.262
French Guiana 968 1,288 2,263 1,981 2,887 1,163 3,131 2,869 3,732 20.281
Guyana 892 1,730 2,670 3,579 6,265 5,313 14,364 8,729 19,112 62.653
Peru 38,023 55,523 34,107 35,152 62,781 69,259 70,179 94,633 109,317 568.974
Suriname 2,650 2,394 2,644 2,431 5,500 5,488 8,375 10,115 18,305 57.896
Venezuela 12,747 9,898 12,237 29,328 20,285 21,351 84,369 22,906 37,103 250.224
Total 1,215,689 1,519,145 1,743,663 1,143,052 2,106,892 754,520 1,897,132 1,694,618 995,665 13.070.371
Colombia has also been submitted to important deforestation in absolute terms, with a
higher level from 2007 to 2010, but it has reduced since then. Another country with
important deforestation is Venezuela, with a clear tendency to increase, but a more
irregular pattern (as is the case with Bolivia). Although in absolute terms the Guianas
and Ecuador have much lower deforestation, in relative terms, related to their own
share of the Amazon area, they are closer to the other Amazon countries (with the
i Despite the fact that Coca-Castro et alii (2013 and 2013a) and INPE-PRODES (2014) have similar definition of Brazilian Amazon, their curves of 2004 to 2012 (2013) deforestation are different. The latter shows a more clear reduction tendency, but with a stabilisation towards the end. The former still shows a slight tendency to increase up to 2008, decreasing from then on (and more strongly if the rough estimation for 2013 is considered). Imazon tends to follow more the tendency of INPE-PRODES (The Economist, 2013). For Bolivia, 2010 seems odd in the deforestation curve, particularly when compared to lower levels in 2004-2009, but 2011 was also high, and then it lowered down in 2012. For Peru, the increase was progressive from 2004 to 2012.
0,0%
0,4%
0,8%
1,2%
1,6%
2,0%
Bolivia Brazil Colombia Ecuador FrenchGuiana
Guyana Peru Suriname Venezuela
Deforestation - Percentage of Country's Share of the Amazon - accumulated 2008-2012
(Maretti, 2014, based on Terra-i data and WWF LAI ecological definition)
Amazon: There is Hope! If we all do ‘the right thing’… Deforestation, Protected Areas and Indigenous Territories: Past, evolution and… Which future?
17
exception of Brazil and Bolivia) in the accumulated amount for 2004-09. All four last
mentioned countries show a clear tendency to increase, stronger in the case of Ecuador,
Guyana and Suriname. When the last five years are considered (2008-12 accumulated)
the recent dominance of Bolivia is clearer, but also the relative importance of the other
countries. (Graph 4 and tables 1.a and 1.b.)i
Table 1.b Deforestation in the Amazon – per country, percentage (related to each one’s Amazon areas), 2004-2012 (this new analysis is based on data from Terra-I and ecological criteria from WWF
LAI)
Deforestation in the Amazon – per country, percentage of each country’s share of the Amazon, 2004-2012
(Maretti, 2014, based on data from Terra-I and ecological criteria from WWF LAI)
2004 2005 2006 2007 2008 2009 2010 2011 2012 2004-12
Bolivia 0.07% 0.16% 0.13% 0.11% 0.17% 0.06% 0.89% 0.44% 0.07% 2.11% Brazil 0.27% 0.34% 0.40% 0.24% 0.46% 0.14% 0.31% 0.33% 0.19% 2.68% Colombia 0.08% 0.05% 0.06% 0.12% 0.13% 0.09% 0.12% 0.06% 0.02% 0.73% Ecuador 0.08% 0.03% 0.02% 0.03% 0.04% 0.03% 0.07% 0.10% 0.05% 0.45% French Guiana 0.01% 0.02% 0.03% 0.02% 0.04% 0.01% 0.04% 0.04% 0.05% 0.25% Guyana 0.00% 0.01% 0.01% 0.02% 0.03% 0.03% 0.07% 0.04% 0.09% 0.30% Peru 0.05% 0.07% 0.04% 0.04% 0.08% 0.09% 0.09% 0.12% 0.14% 0.72% Suriname 0.02% 0.02% 0.02% 0.02% 0.04% 0.04% 0.06% 0.07% 0.13% 0.41% Venezuela 0.03% 0.03% 0.03% 0.07% 0.05% 0.05% 0.21% 0.06% 0.09% 0.64%
Amazon 0.18% 0.23% 0.26% 0.17% 0.32% 0.11% 0.28% 0.25% 0.15% 1.95%
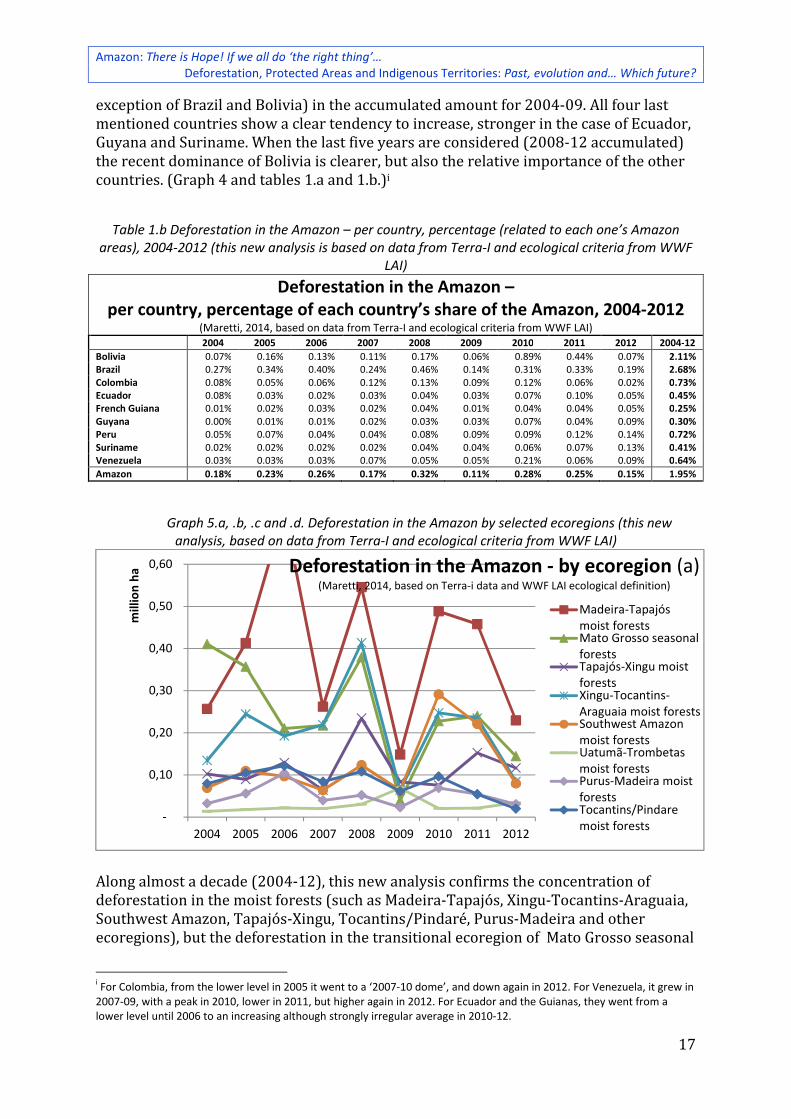
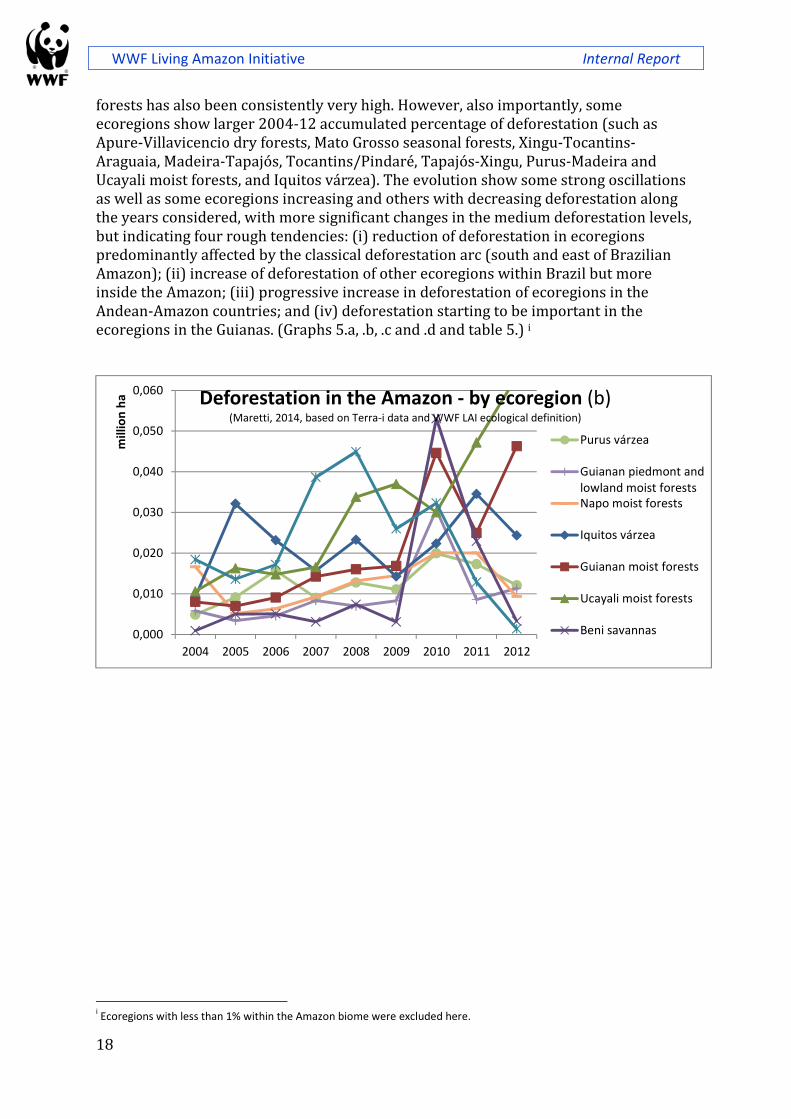
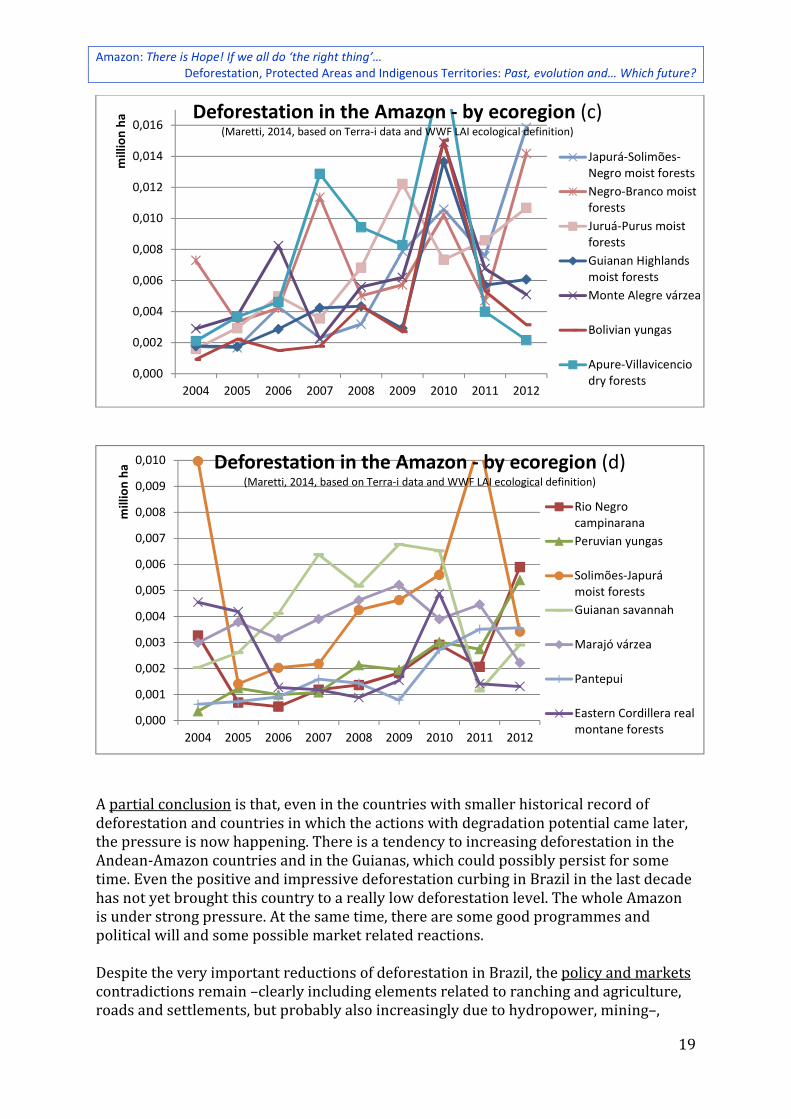
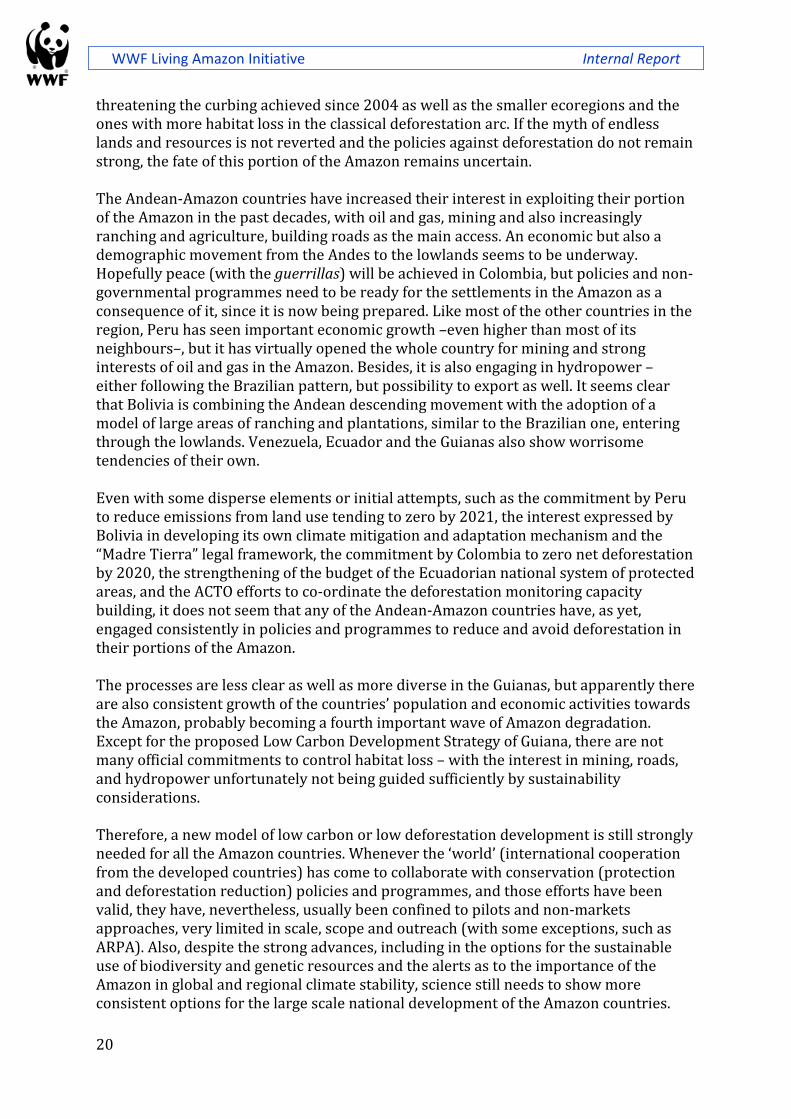
Graph 5.a, .b, .c and .d. Deforestation in the Amazon by selected ecoregions (this new analysis, based on data from Terra-I and ecological criteria from WWF LAI)
Along almost a decade (2004-12), this new analysis confirms the concentration of
deforestation in the moist forests (such as Madeira-Tapajós, Xingu-Tocantins-Araguaia,
Southwest Amazon, Tapajós-Xingu, Tocantins/Pindaré, Purus-Madeira and other
ecoregions), but the deforestation in the transitional ecoregion of Mato Grosso seasonal
i For Colombia, from the lower level in 2005 it went to a ‘2007-10 dome’, and down again in 2012. For Venezuela, it grew in 2007-09, with a peak in 2010, lower in 2011, but higher again in 2012. For Ecuador and the Guianas, they went from a lower level until 2006 to an increasing although strongly irregular average in 2010-12.
-
0,10
0,20
0,30
0,40
0,50
0,60
2004 2005 2006 2007 2008 2009 2010 2011 2012
mill
ion
ha Deforestation in the Amazon - by ecoregion (a)
(Maretti, 2014, based on Terra-i data and WWF LAI ecological definition)
Madeira-Tapajósmoist forestsMato Grosso seasonalforestsTapajós-Xingu moistforestsXingu-Tocantins-Araguaia moist forestsSouthwest Amazonmoist forestsUatumã-Trombetasmoist forestsPurus-Madeira moistforestsTocantins/Pindaremoist forests
WWF Living Amazon Initiative Internal Report
18
forests has also been consistently very high. However, also importantly, some
ecoregions show larger 2004-12 accumulated percentage of deforestation (such as
Apure-Villavicencio dry forests, Mato Grosso seasonal forests, Xingu-Tocantins-
Araguaia, Madeira-Tapajós, Tocantins/Pindaré, Tapajós-Xingu, Purus-Madeira and
Ucayali moist forests, and Iquitos várzea). The evolution show some strong oscillations
as well as some ecoregions increasing and others with decreasing deforestation along
the years considered, with more significant changes in the medium deforestation levels,
but indicating four rough tendencies: (i) reduction of deforestation in ecoregions
predominantly affected by the classical deforestation arc (south and east of Brazilian
Amazon); (ii) increase of deforestation of other ecoregions within Brazil but more
inside the Amazon; (iii) progressive increase in deforestation of ecoregions in the
Andean-Amazon countries; and (iv) deforestation starting to be important in the
ecoregions in the Guianas. (Graphs 5.a, .b, .c and .d and table 5.) i
i Ecoregions with less than 1% within the Amazon biome were excluded here.
0,000
0,010
0,020
0,030
0,040
0,050
0,060
2004 2005 2006 2007 2008 2009 2010 2011 2012
mill
ion
ha Deforestation in the Amazon - by ecoregion (b)
(Maretti, 2014, based on Terra-i data and WWF LAI ecological definition)
Purus várzea
Guianan piedmont andlowland moist forestsNapo moist forests
Iquitos várzea
Guianan moist forests
Ucayali moist forests
Beni savannas
Amazon: There is Hope! If we all do ‘the right thing’… Deforestation, Protected Areas and Indigenous Territories: Past, evolution and… Which future?
19
A partial conclusion is that, even in the countries with smaller historical record of
deforestation and countries in which the actions with degradation potential came later,
the pressure is now happening. There is a tendency to increasing deforestation in the
Andean-Amazon countries and in the Guianas, which could possibly persist for some
time. Even the positive and impressive deforestation curbing in Brazil in the last decade
has not yet brought this country to a really low deforestation level. The whole Amazon
is under strong pressure. At the same time, there are some good programmes and
political will and some possible market related reactions.
Despite the very important reductions of deforestation in Brazil, the policy and markets
contradictions remain –clearly including elements related to ranching and agriculture,
roads and settlements, but probably also increasingly due to hydropower, mining–,
0,000
0,002
0,004
0,006
0,008
0,010
0,012
0,014
0,016
2004 2005 2006 2007 2008 2009 2010 2011 2012
mill
ion
ha Deforestation in the Amazon - by ecoregion (c)
(Maretti, 2014, based on Terra-i data and WWF LAI ecological definition)
Japurá-Solimões-Negro moist forests
Negro-Branco moistforests
Juruá-Purus moistforests
Guianan Highlandsmoist forests
Monte Alegre várzea
Bolivian yungas
Apure-Villavicenciodry forests
0,000
0,001
0,002
0,003
0,004
0,005
0,006
0,007
0,008
0,009
0,010
2004 2005 2006 2007 2008 2009 2010 2011 2012
mill
ion
ha Deforestation in the Amazon - by ecoregion (d)
(Maretti, 2014, based on Terra-i data and WWF LAI ecological definition)
Rio Negrocampinarana
Peruvian yungas
Solimões-Japurámoist forests
Guianan savannah
Marajó várzea
Pantepui
Eastern Cordillera realmontane forests
WWF Living Amazon Initiative Internal Report
20
threatening the curbing achieved since 2004 as well as the smaller ecoregions and the
ones with more habitat loss in the classical deforestation arc. If the myth of endless
lands and resources is not reverted and the policies against deforestation do not remain
strong, the fate of this portion of the Amazon remains uncertain.
The Andean-Amazon countries have increased their interest in exploiting their portion
of the Amazon in the past decades, with oil and gas, mining and also increasingly
ranching and agriculture, building roads as the main access. An economic but also a
demographic movement from the Andes to the lowlands seems to be underway.
Hopefully peace (with the guerrillas) will be achieved in Colombia, but policies and non-
governmental programmes need to be ready for the settlements in the Amazon as a
consequence of it, since it is now being prepared. Like most of the other countries in the
region, Peru has seen important economic growth –even higher than most of its
neighbours–, but it has virtually opened the whole country for mining and strong
interests of oil and gas in the Amazon. Besides, it is also engaging in hydropower –
either following the Brazilian pattern, but possibility to export as well. It seems clear
that Bolivia is combining the Andean descending movement with the adoption of a
model of large areas of ranching and plantations, similar to the Brazilian one, entering
through the lowlands. Venezuela, Ecuador and the Guianas also show worrisome
tendencies of their own.
Even with some disperse elements or initial attempts, such as the commitment by Peru
to reduce emissions from land use tending to zero by 2021, the interest expressed by
Bolivia in developing its own climate mitigation and adaptation mechanism and the
“Madre Tierra” legal framework, the commitment by Colombia to zero net deforestation
by 2020, the strengthening of the budget of the Ecuadorian national system of protected
areas, and the ACTO efforts to co-ordinate the deforestation monitoring capacity
building, it does not seem that any of the Andean-Amazon countries have, as yet,
engaged consistently in policies and programmes to reduce and avoid deforestation in
their portions of the Amazon.
The processes are less clear as well as more diverse in the Guianas, but apparently there
are also consistent growth of the countries’ population and economic activities towards
the Amazon, probably becoming a fourth important wave of Amazon degradation.
Except for the proposed Low Carbon Development Strategy of Guiana, there are not
many official commitments to control habitat loss – with the interest in mining, roads,
and hydropower unfortunately not being guided sufficiently by sustainability
considerations.
Therefore, a new model of low carbon or low deforestation development is still strongly
needed for all the Amazon countries. Whenever the ‘world’ (international cooperation
from the developed countries) has come to collaborate with conservation (protection
and deforestation reduction) policies and programmes, and those efforts have been
valid, they have, nevertheless, usually been confined to pilots and non-markets
approaches, very limited in scale, scope and outreach (with some exceptions, such as
ARPA). Also, despite the strong advances, including in the options for the sustainable
use of biodiversity and genetic resources and the alerts as to the importance of the
Amazon in global and regional climate stability, science still needs to show more
consistent options for the large scale national development of the Amazon countries.
Amazon: There is Hope! If we all do ‘the right thing’… Deforestation, Protected Areas and Indigenous Territories: Past, evolution and… Which future?
21
More than anything, though, the Amazon and non-Amazon governments, as well as
private and finance sectors and societies in general, need now to engage in sustainable
development models, taking advantage of the Amazon’s ecological wealth (and not
moving against it).
Protected Areas and Indigenous Territories – including new analyses
The Amazon is arguably amongst the best conserved of the most important natural
areas on Earth – probably together with Antarctica, some ocean areas and few others.
This is not a ‘small thing’ also considering that the Amazon is among the larger natural
regions in the world. This important achievement is probably a result of a combination
of reasons – including the difficulties in ‘conquering’ the region through centuries based
on the tools available then, what could be called an unintentional result of the ‘western’
development model proposed. Another relevant factor so far has been the intentional
efforts to protect the Amazon, due the significant national and global level awareness
about its importance. The protected areas are the best known mechanism to conserve
ecosystems – including for people’s benefits, when correctly done. Conservation has
also been done through defending indigenous peoples and promoting sustainable
development of local communities, among other means.
The indigenous peoples have been in the region for millennia and in several cases are
currently under social and cultural protection from government policies. The Amazon
countries, however, have different legal frameworks and policies for the indigenous
peoples’ territories. They have been recognising part of the areas the indigenous
peoples still live on as ‘Indians reserves’ or indigenous peoples’ territories. In most
cases the indigenous peoples are managing the areas that they still hold with strong
conservation results, either managing them as a whole nature reserve (usually based on
the holistic approach in their integration with nature), or particularly protecting parts
of their lands. Nevertheless, most of their territories are not yet considered as nature
conservation mechanisms. In several cases other local communities –including
communities of descendants of former slaves, extractive communities, fishermen, small
farmers, forest dwellers and other communities– also manage the areas they hold
considering nature conservation. Although the creation and management of protected
areas have not always considered the rights and interests of local communities and
indigenous peoples, several governments have been progressively considering
protection together with local communities’ interests. A particular case is the ‘extractive
reserves’ in Brazil, a protected area category that was created to respond to the local
communities demands, and that has influenced the definition of an international
category of protected areas management (the VI).i
i This and following paragraphs and notes are also based on data of internal WWF LAI reports to assess the state of the Amazon: also Riveros et alii, 2014 (based on Riveros, 2013 and 2013a, with most of the data); complemented by RedParques et alii, 2010; WCMC/UNEP with IUCN (WCPA), 2014; as well as others. Complementing, for the protected areas paradigms see also Phillips, 2003; and others. For the relation of protected areas with indigenous territories and community conserved areas and the importance of them, see also: Beltrán, et alii, 2000; Borrini, 2002; Maretti, 2005; Maretti et alii, 2003 and 2005; Oviedo, 2003; and others. And, for protected areas management categories, see also Dudley [et alii], 2008; and Bishop et alii, 2004, besides the previous documents, such as the results of the World Congress on National Parks and Other Protected Areas, Caracas 1992, and the IUCN Assembly, Buenos Aires 1994, the previous categories classification guidelines, etc.
WWF Living Amazon Initiative Internal Report
22
Protected areas
In terms of the protected areas officially considered by governments for nature
conservation following the ‘national parks’ paradigm, the first protected area in the
‘Amazon biome’ was possibly created in the then British colony which is now Guyana.
Following the general pattern of protected areas, South America included, until the
1940s and to 60s they were established mostly with limited objectives, particularly to
protect a specific feature, like mountains, falls or caves.
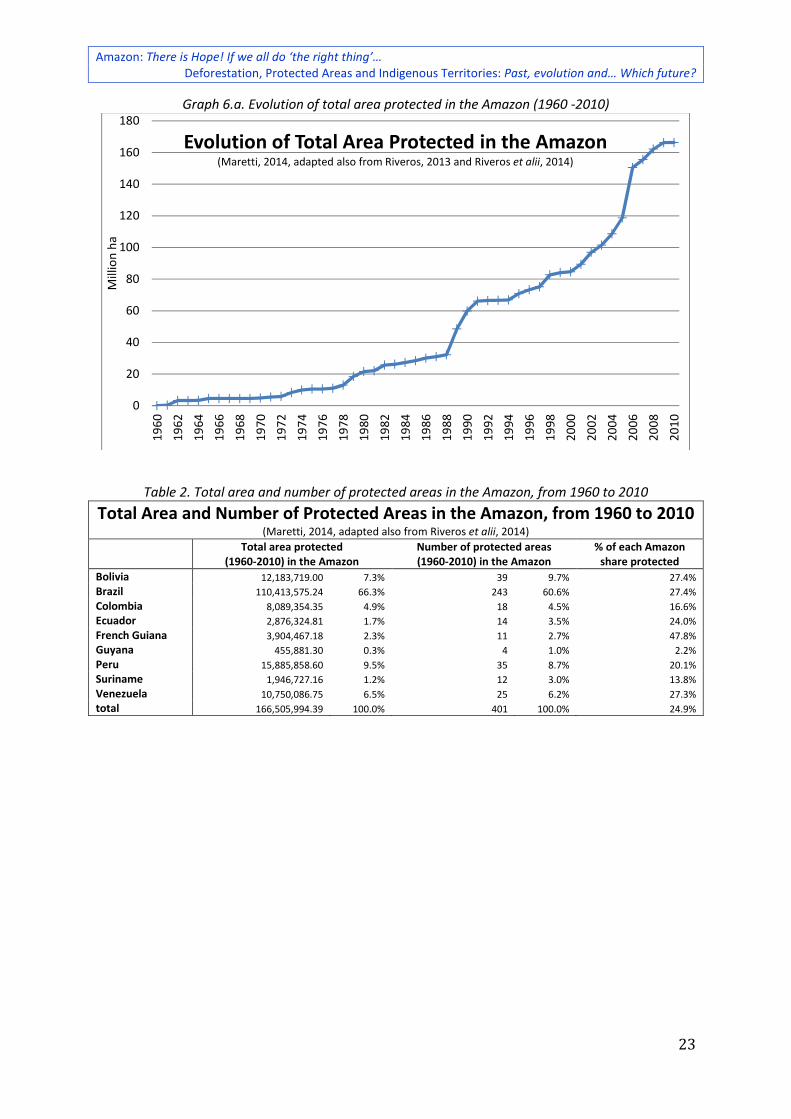
Protected areas evolution: Numerically, after 1960, it shows some clear phases, with (i)
a relative slow increase until 1988 – with some exceptions, particularly strong in 1965,
1973-74 and 1978-79. Then, there was (ii) a bigger jump in 1988-1990, and back to
(iii.a) a relatively gentler slope until 2000 –this with relatively slight exceptions in 1991
and 1998–, and then (iii.b) increasing the growth a bit until 2005. There was (iv) a new
jump in 2006 and (v.a) a gentle increase until 2009 and (v.b) apparently it almost
stopped after that. Among the important events and processes influencing Amazon
conservation, in the 1970’s there was a significant public opinion movement in favour of
conservation and sustainable development. Back then, the first large (500 000+
hectares) protected areas were declared in the Amazon, a tendency that continued
afterwards. This number has some significance in terms of an area that is considered
large enough to protect ecosystem processes and viable species in the Amazon
adequately – some say this should be the minimum size for consistent biodiversity
preservation in the Amazon (protected areas in the Amazon ‘biome’ is presented
through the total surface of protected areas created and the percentage protected of
each country’s Amazon in graphs 6.a and .b., the total numbers are in table 2., and
graphs 7 and 8 present the large protected areas).i
i Among the large national parks created in the 1970’s there were Manu, Yasuní, Jaú and Pico da Neblina (all category II). Up to 2010, there were 102 protected areas with more them 500 thousand (K) hectares, 7 (or 8) of them with more than 3 Mi ha – the latter, larger are 6 in in Brazil and 1 in Venezuela, as well as 1 in French Guiana. The “Parc amazonien de Guyane” has been considered here with the two built-in categories included (~2.0 Mi ha of core zone (cat. II) and ~1.4 Mi ha of “zone de libre adhesion”, which is questioned as to whether it is a protected area) Also France, 2013. Also based on Riveros et alii, 2014; and others. Most graphs and tables ‘based on’ Riveros et alii, 2014, use data from Riveros, 2013a. Most tables and graphs ‘adapted from’ Riveros et alii, 2014, use data with some adjustments.
Amazon: There is Hope! If we all do ‘the right thing’… Deforestation, Protected Areas and Indigenous Territories: Past, evolution and… Which future?
23
Graph 6.a. Evolution of total area protected in the Amazon (1960 -2010)
Table 2. Total area and number of protected areas in the Amazon, from 1960 to 2010
Total Area and Number of Protected Areas in the Amazon, from 1960 to 2010 (Maretti, 2014, adapted also from Riveros et alii, 2014)
Total area protected
(1960-2010) in the Amazon Number of protected areas (1960-2010) in the Amazon
% of each Amazon share protected
Bolivia 12,183,719.00 7.3% 39 9.7% 27.4%
Brazil 110,413,575.24 66.3% 243 60.6% 27.4%
Colombia 8,089,354.35 4.9% 18 4.5% 16.6%
Ecuador 2,876,324.81 1.7% 14 3.5% 24.0%
French Guiana 3,904,467.18 2.3% 11 2.7% 47.8%
Guyana 455,881.30 0.3% 4 1.0% 2.2%
Peru 15,885,858.60 9.5% 35 8.7% 20.1%
Suriname 1,946,727.16 1.2% 12 3.0% 13.8%
Venezuela 10,750,086.75 6.5% 25 6.2% 27.3%
total 166,505,994.39 100.0% 401 100.0% 24.9%
0
20
40
60
80
100
120
140
160
180
19
60
19
62
19
64
19
66
19
68
19
70
19
72
19
74
19
76
19
78
19
80
19
82
19
84
19
86
19
88
19
90
19
92
19
94
19
96
19
98
20
00
20
02
20
04
20
06
20
08
20
10
Mill
ion
ha
Evolution of Total Area Protected in the Amazon(Maretti, 2014, adapted also from Riveros, 2013 and Riveros et alii, 2014)
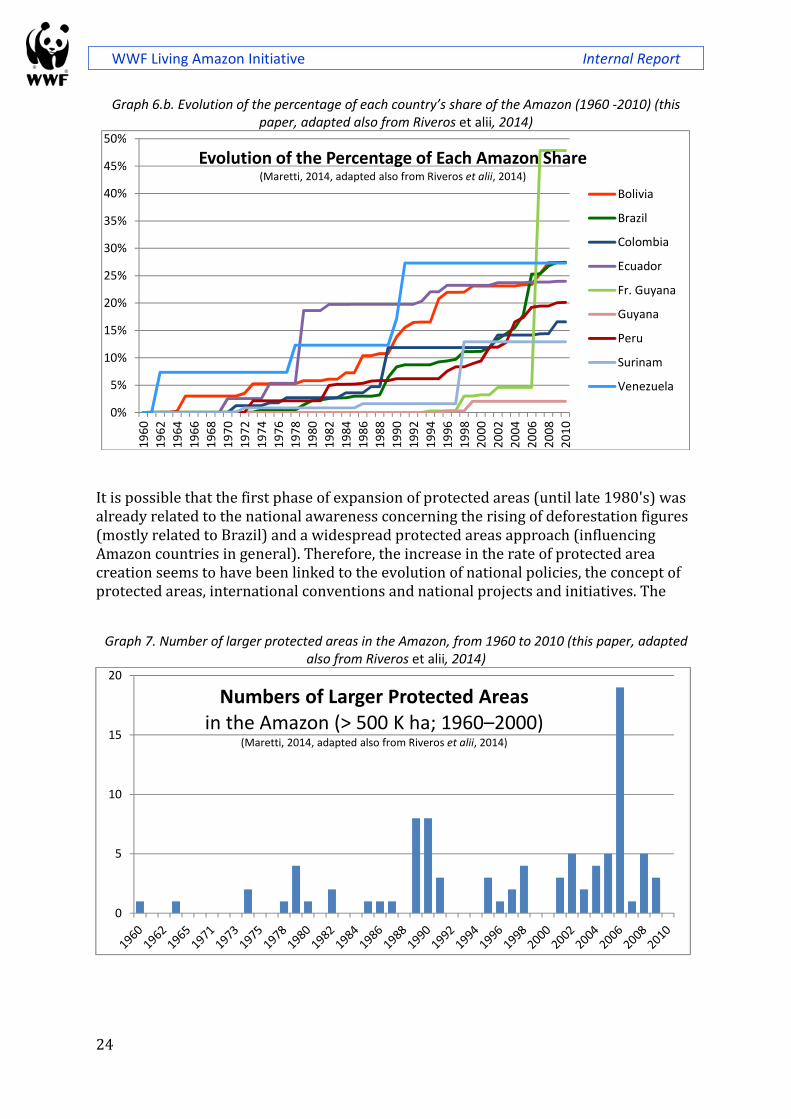
WWF Living Amazon Initiative Internal Report
24
Graph 6.b. Evolution of the percentage of each country’s share of the Amazon (1960 -2010) (this paper, adapted also from Riveros et alii, 2014)
It is possible that the first phase of expansion of protected areas (until late 1980's) was
already related to the national awareness concerning the rising of deforestation figures
(mostly related to Brazil) and a widespread protected areas approach (influencing
Amazon countries in general). Therefore, the increase in the rate of protected area
creation seems to have been linked to the evolution of national policies, the concept of
protected areas, international conventions and national projects and initiatives. The
Graph 7. Number of larger protected areas in the Amazon, from 1960 to 2010 (this paper, adapted also from Riveros et alii, 2014)
0%
5%
10%
15%
20%
25%
30%
35%
40%
45%
50%1
96
0
19
62
19
64
19
66
19
68
19
70
19
72
19
74
19
76
19
78
19
80
19
82
19
84
19
86
19
88
19
90
19
92
19
94
19
96
19
98
20
00
20
02
20
04
20
06
20
08
20
10
Evolution of the Percentage of Each Amazon Share(Maretti, 2014, adapted also from Riveros et alii, 2014)
Bolivia
Brazil
Colombia
Ecuador
Fr. Guyana
Guyana
Peru
Surinam
Venezuela
0
5
10
15
20
Numbers of Larger Protected Areasin the Amazon (> 500 K ha; 1960–2000)
(Maretti, 2014, adapted also from Riveros et alii, 2014)
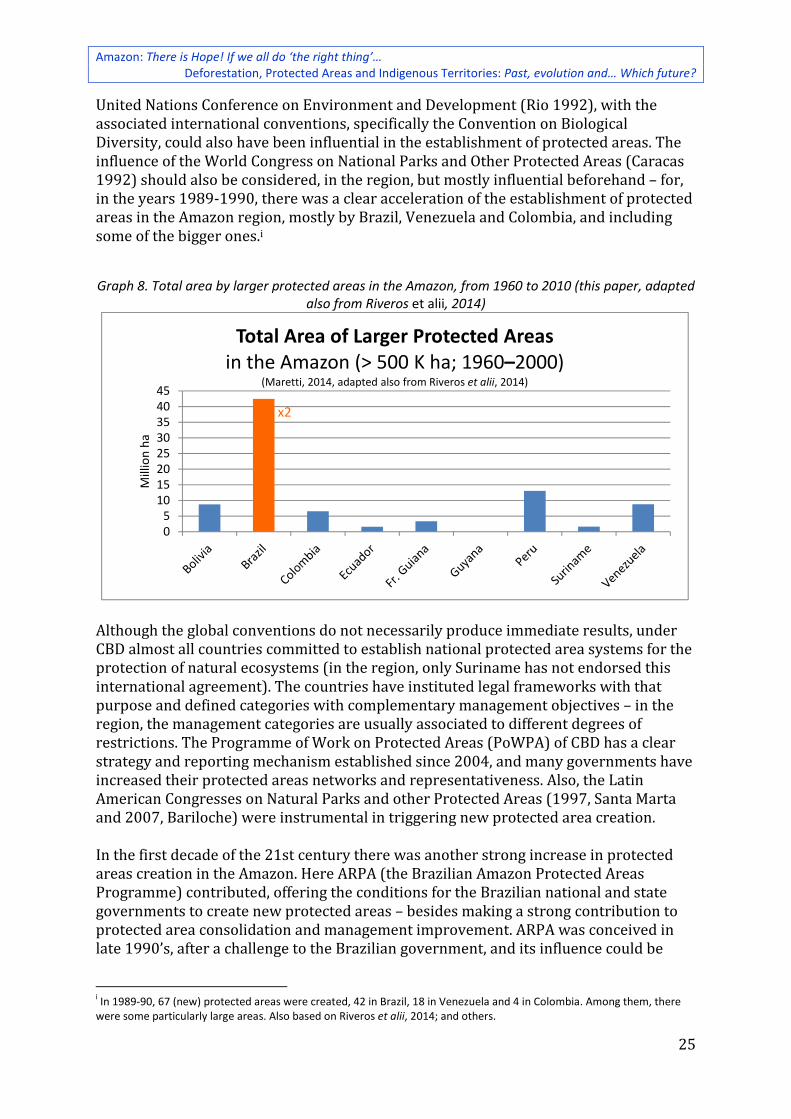
Amazon: There is Hope! If we all do ‘the right thing’… Deforestation, Protected Areas and Indigenous Territories: Past, evolution and… Which future?
25
United Nations Conference on Environment and Development (Rio 1992), with the
associated international conventions, specifically the Convention on Biological
Diversity, could also have been influential in the establishment of protected areas. The
influence of the World Congress on National Parks and Other Protected Areas (Caracas
1992) should also be considered, in the region, but mostly influential beforehand – for,
in the years 1989-1990, there was a clear acceleration of the establishment of protected
areas in the Amazon region, mostly by Brazil, Venezuela and Colombia, and including
some of the bigger ones.i
Graph 8. Total area by larger protected areas in the Amazon, from 1960 to 2010 (this paper, adapted also from Riveros et alii, 2014)
Although the global conventions do not necessarily produce immediate results, under
CBD almost all countries committed to establish national protected area systems for the
protection of natural ecosystems (in the region, only Suriname has not endorsed this
international agreement). The countries have instituted legal frameworks with that
purpose and defined categories with complementary management objectives – in the
region, the management categories are usually associated to different degrees of
restrictions. The Programme of Work on Protected Areas (PoWPA) of CBD has a clear
strategy and reporting mechanism established since 2004, and many governments have
increased their protected areas networks and representativeness. Also, the Latin
American Congresses on Natural Parks and other Protected Areas (1997, Santa Marta
and 2007, Bariloche) were instrumental in triggering new protected area creation.
In the first decade of the 21st century there was another strong increase in protected
areas creation in the Amazon. Here ARPA (the Brazilian Amazon Protected Areas
Programme) contributed, offering the conditions for the Brazilian national and state
governments to create new protected areas – besides making a strong contribution to
protected area consolidation and management improvement. ARPA was conceived in
late 1990’s, after a challenge to the Brazilian government, and its influence could be
i In 1989-90, 67 (new) protected areas were created, 42 in Brazil, 18 in Venezuela and 4 in Colombia. Among them, there were some particularly large areas. Also based on Riveros et alii, 2014; and others.
05
1015202530354045
Mill
ion
ha
Total Area of Larger Protected Areasin the Amazon (> 500 K ha; 1960–2000)
(Maretti, 2014, adapted also from Riveros et alii, 2014)
x2
WWF Living Amazon Initiative Internal Report
26
considered strong since the beginning of the years 2000 – particularly from 2002-03
onwards. This programme was already ambitious in the planning phase, and improved
itself along the way, filling gaps, adapting to new contexts, etc., as well as positively
influencing the national system of protected areas.i
In terms of further integration in the landscapes, in the 1990’s there was strong
attention paid to conservation planning and policy vision for large areas, including
through the ‘conservation corridors’. In terms of protected areas systems’ best practice
improvements in the years 2000, the mosaics must be mentioned. They are groups of
protected areas and other land use definitions brought together to optimise their
management, as well as upscale or upgrade the conservation objectives and
achievements. In some cases they can be part of the legal framework and be defined in
advance, before the respective protected areas are created, but in most cases of Amazon
countries they are still a post facto informal grouping (to inform policy related action,
for management, patrolling, etc.). Although sometimes difficult to define (both
temporally, because the related protected areas are not necessarily created all together,
and spatially, due to the several possible connections in different fronts), some mosaics
are particularly significant for the Amazon (high level of conservation ambition, large
scale, number of protected areas and indigenous territories, remoteness, relative low
level management conditions, etc.). Very briefly, a few examples are presented here.
• Around 2004, Peru accomplished a significant mosaic, in the “Alto Purus”, also in
attention to indigenous peoples’ protection, including some peoples living in
voluntary isolation. What is now called the Purus-Manu conservation corridor
has some 10 Mi ha, in Peru alone, including previously existing protected areas.
• The Brazilian Amazonas State’s Apuí State Mosaic was created in 2005 already
integrated with an area of 2.4 Mi ha. With the creation of the Juruena and
“Campos Amazônicos” National Parks in 2006, and complementing a series of
other protected areas, they integrated into the larger Southern Amazon Mosaic,
with 7+ Mi ha.
• Brazil advanced significantly to achieve the very important “Terra do Meio”
mosaic, in Pará, in 2005-06, with around 11+ Mi ha including other protected
areas (A larger group of protected areas composed the efforts to avoid damage
from the renewing of the BR-163 highway). More importantly, the Terra do Meio
mosaic links to indigenous territories, complementing the conservation of a
larger area of some 25 Mi ha, a big share of the Xingu river basin.
i WWF (through the then International Director General, Claude Martin) had challenged the Brazilian President (then, Fernando Henrique Cardoso) to protect 10% of the Amazon. He accepted and asked the Ministry of Environment to prepare a plan to achieve that, with support from WWF, World Bank and other partners. This came also as a good result of the World Bank and WWF Forest Alliance. The 10% target was based on a recommendation of the Protected Areas Congress, Caracas 1992. The negotiations evolved and, to include not only strict presentation areas (categories I and II), but also sustainable use reserves (category VI) with local communities co-management, the target was increased to 50 million hectares (12% of the Brazilian Amazon), mostly new protected areas. Later, considering the important share of targets was already achieved in its phase 1 (mostly under President ‘Lula’ da Silva), from the planning to its phase 2 on, ARPA target was increased to 60 million hectares. In 2001, 17 protected areas were created, 15 of them in Brazil (some of them already linked to ARPA since its creation) and the other 2 in Peru. In 2002, 20 protected areas were created, 14 of them in Brazil –including the symbolic “Montanhas do Tumucumaque” National Park–, 2 in Colombia, 2 in Bolivia, 1 in French Guiana and 1 in Ecuador. In those two years 12,245,698.28 ha came under protection. Also based on years of personal experience; Brasil et alii (2010 and 2012); Brasil (2010); Soares-Fº et alii (2009); Riveros et alii, 2014; WWF-Brasil et alii (2009); and others.
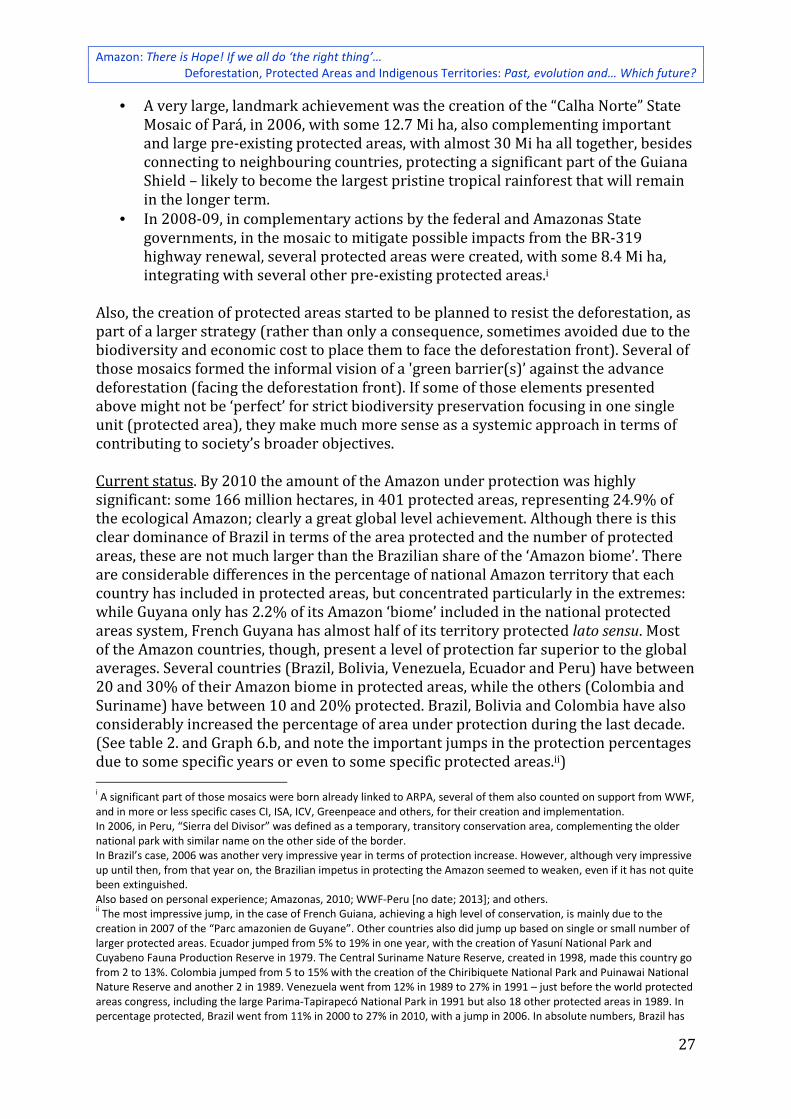
Amazon: There is Hope! If we all do ‘the right thing’… Deforestation, Protected Areas and Indigenous Territories: Past, evolution and… Which future?
27
• A very large, landmark achievement was the creation of the “Calha Norte” State
Mosaic of Pará, in 2006, with some 12.7 Mi ha, also complementing important
and large pre-existing protected areas, with almost 30 Mi ha all together, besides
connecting to neighbouring countries, protecting a significant part of the Guiana
Shield – likely to become the largest pristine tropical rainforest that will remain
in the longer term.
• In 2008-09, in complementary actions by the federal and Amazonas State
governments, in the mosaic to mitigate possible impacts from the BR-319
highway renewal, several protected areas were created, with some 8.4 Mi ha,
integrating with several other pre-existing protected areas.i
Also, the creation of protected areas started to be planned to resist the deforestation, as
part of a larger strategy (rather than only a consequence, sometimes avoided due to the
biodiversity and economic cost to place them to face the deforestation front). Several of
those mosaics formed the informal vision of a 'green barrier(s)’ against the advance
deforestation (facing the deforestation front). If some of those elements presented
above might not be ‘perfect’ for strict biodiversity preservation focusing in one single
unit (protected area), they make much more sense as a systemic approach in terms of
contributing to society’s broader objectives.
Current status. By 2010 the amount of the Amazon under protection was highly
significant: some 166 million hectares, in 401 protected areas, representing 24.9% of
the ecological Amazon; clearly a great global level achievement. Although there is this
clear dominance of Brazil in terms of the area protected and the number of protected
areas, these are not much larger than the Brazilian share of the ‘Amazon biome’. There
are considerable differences in the percentage of national Amazon territory that each
country has included in protected areas, but concentrated particularly in the extremes:
while Guyana only has 2.2% of its Amazon ‘biome’ included in the national protected
areas system, French Guyana has almost half of its territory protected lato sensu. Most
of the Amazon countries, though, present a level of protection far superior to the global
averages. Several countries (Brazil, Bolivia, Venezuela, Ecuador and Peru) have between
20 and 30% of their Amazon biome in protected areas, while the others (Colombia and
Suriname) have between 10 and 20% protected. Brazil, Bolivia and Colombia have also
considerably increased the percentage of area under protection during the last decade.
(See table 2. and Graph 6.b, and note the important jumps in the protection percentages
due to some specific years or even to some specific protected areas.ii)
i A significant part of those mosaics were born already linked to ARPA, several of them also counted on support from WWF, and in more or less specific cases CI, ISA, ICV, Greenpeace and others, for their creation and implementation. In 2006, in Peru, “Sierra del Divisor” was defined as a temporary, transitory conservation area, complementing the older national park with similar name on the other side of the border. In Brazil’s case, 2006 was another very impressive year in terms of protection increase. However, although very impressive up until then, from that year on, the Brazilian impetus in protecting the Amazon seemed to weaken, even if it has not quite been extinguished. Also based on personal experience; Amazonas, 2010; WWF-Peru [no date; 2013]; and others. ii The most impressive jump, in the case of French Guiana, achieving a high level of conservation, is mainly due to the
creation in 2007 of the “Parc amazonien de Guyane”. Other countries also did jump up based on single or small number of larger protected areas. Ecuador jumped from 5% to 19% in one year, with the creation of Yasuní National Park and Cuyabeno Fauna Production Reserve in 1979. The Central Suriname Nature Reserve, created in 1998, made this country go from 2 to 13%. Colombia jumped from 5 to 15% with the creation of the Chiribiquete National Park and Puinawai National Nature Reserve and another 2 in 1989. Venezuela went from 12% in 1989 to 27% in 1991 – just before the world protected areas congress, including the large Parima-Tapirapecó National Park in 1991 but also 18 other protected areas in 1989. In percentage protected, Brazil went from 11% in 2000 to 27% in 2010, with a jump in 2006. In absolute numbers, Brazil has
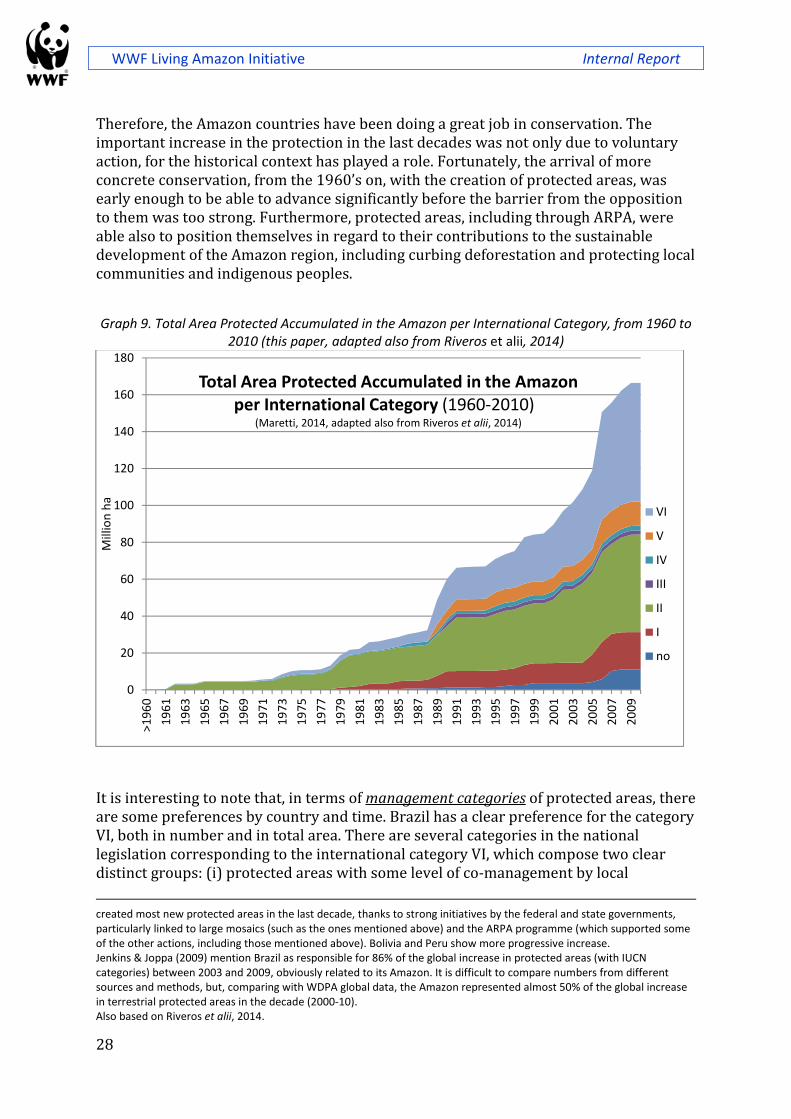
WWF Living Amazon Initiative Internal Report
28
Therefore, the Amazon countries have been doing a great job in conservation. The
important increase in the protection in the last decades was not only due to voluntary
action, for the historical context has played a role. Fortunately, the arrival of more
concrete conservation, from the 1960’s on, with the creation of protected areas, was
early enough to be able to advance significantly before the barrier from the opposition
to them was too strong. Furthermore, protected areas, including through ARPA, were
able also to position themselves in regard to their contributions to the sustainable
development of the Amazon region, including curbing deforestation and protecting local
communities and indigenous peoples.
Graph 9. Total Area Protected Accumulated in the Amazon per International Category, from 1960 to 2010 (this paper, adapted also from Riveros et alii, 2014)
It is interesting to note that, in terms of management categories of protected areas, there
are some preferences by country and time. Brazil has a clear preference for the category
VI, both in number and in total area. There are several categories in the national
legislation corresponding to the international category VI, which compose two clear
distinct groups: (i) protected areas with some level of co-management by local
created most new protected areas in the last decade, thanks to strong initiatives by the federal and state governments, particularly linked to large mosaics (such as the ones mentioned above) and the ARPA programme (which supported some of the other actions, including those mentioned above). Bolivia and Peru show more progressive increase. Jenkins & Joppa (2009) mention Brazil as responsible for 86% of the global increase in protected areas (with IUCN categories) between 2003 and 2009, obviously related to its Amazon. It is difficult to compare numbers from different sources and methods, but, comparing with WDPA global data, the Amazon represented almost 50% of the global increase in terrestrial protected areas in the decade (2000-10). Also based on Riveros et alii, 2014.
0
20
40
60
80
100
120
140
160
180
>1
96
0
19
61
19
63
19
65
19
67
19
69
19
71
19
73
19
75
19
77
19
79
19
81
19
83
19
85
19
87
19
89
19
91
19
93
19
95
19
97
19
99
20
01
20
03
20
05
20
07
20
09
Mill
ion
ha
Total Area Protected Accumulated in the Amazon per International Category (1960-2010)
(Maretti, 2014, adapted also from Riveros et alii, 2014)
VI
V
IV
III
II
I
no
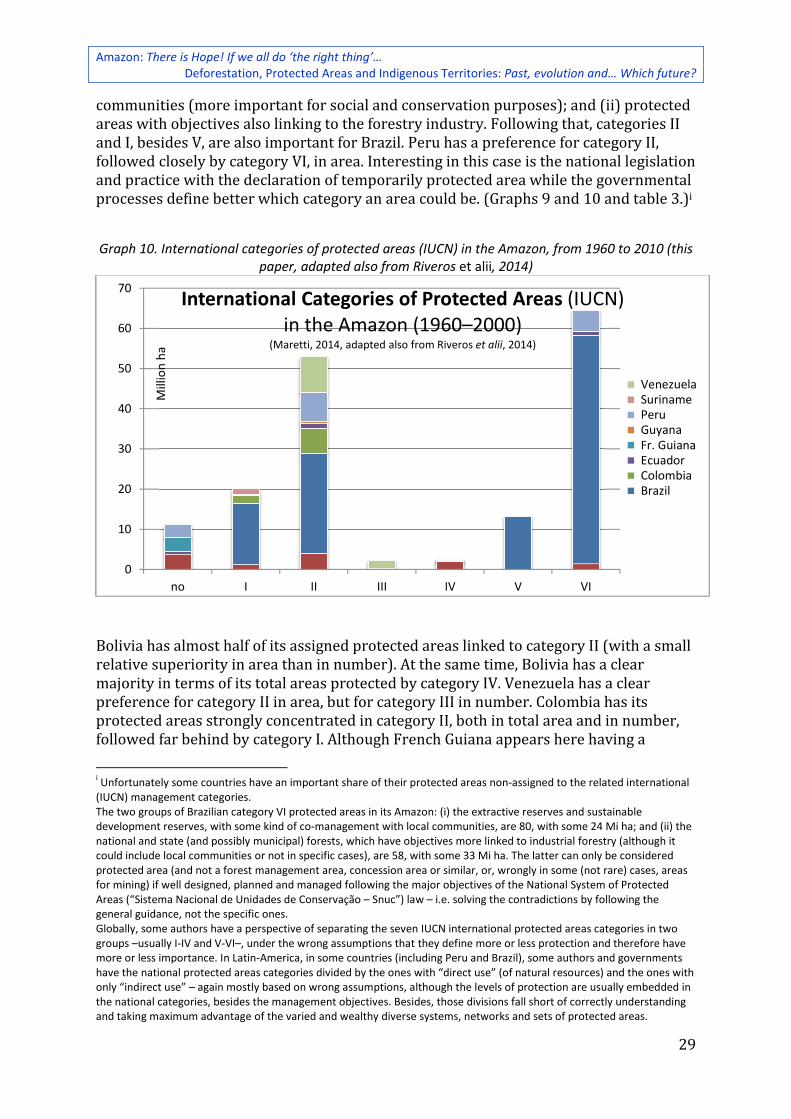
Amazon: There is Hope! If we all do ‘the right thing’… Deforestation, Protected Areas and Indigenous Territories: Past, evolution and… Which future?
29
communities (more important for social and conservation purposes); and (ii) protected
areas with objectives also linking to the forestry industry. Following that, categories II
and I, besides V, are also important for Brazil. Peru has a preference for category II,
followed closely by category VI, in area. Interesting in this case is the national legislation
and practice with the declaration of temporarily protected area while the governmental
processes define better which category an area could be. (Graphs 9 and 10 and table 3.)i
Graph 10. International categories of protected areas (IUCN) in the Amazon, from 1960 to 2010 (this paper, adapted also from Riveros et alii, 2014)
Bolivia has almost half of its assigned protected areas linked to category II (with a small
relative superiority in area than in number). At the same time, Bolivia has a clear
majority in terms of its total areas protected by category IV. Venezuela has a clear
preference for category II in area, but for category III in number. Colombia has its
protected areas strongly concentrated in category II, both in total area and in number,
followed far behind by category I. Although French Guiana appears here having a
i Unfortunately some countries have an important share of their protected areas non-assigned to the related international (IUCN) management categories. The two groups of Brazilian category VI protected areas in its Amazon: (i) the extractive reserves and sustainable development reserves, with some kind of co-management with local communities, are 80, with some 24 Mi ha; and (ii) the national and state (and possibly municipal) forests, which have objectives more linked to industrial forestry (although it could include local communities or not in specific cases), are 58, with some 33 Mi ha. The latter can only be considered protected area (and not a forest management area, concession area or similar, or, wrongly in some (not rare) cases, areas for mining) if well designed, planned and managed following the major objectives of the National System of Protected Areas (“Sistema Nacional de Unidades de Conservação – Snuc”) law – i.e. solving the contradictions by following the general guidance, not the specific ones. Globally, some authors have a perspective of separating the seven IUCN international protected areas categories in two groups –usually I-IV and V-VI–, under the wrong assumptions that they define more or less protection and therefore have more or less importance. In Latin-America, in some countries (including Peru and Brazil), some authors and governments have the national protected areas categories divided by the ones with “direct use” (of natural resources) and the ones with only “indirect use” – again mostly based on wrong assumptions, although the levels of protection are usually embedded in the national categories, besides the management objectives. Besides, those divisions fall short of correctly understanding and taking maximum advantage of the varied and wealthy diverse systems, networks and sets of protected areas.
0
10
20
30
40
50
60
70
no I II III IV V VI
Mill
ion
ha
International Categories of Protected Areas (IUCN) in the Amazon (1960–2000)
(Maretti, 2014, adapted also from Riveros et alii, 2014)
Venezuela Suriname Peru Guyana Fr. Guiana Ecuador Colombia Brazil
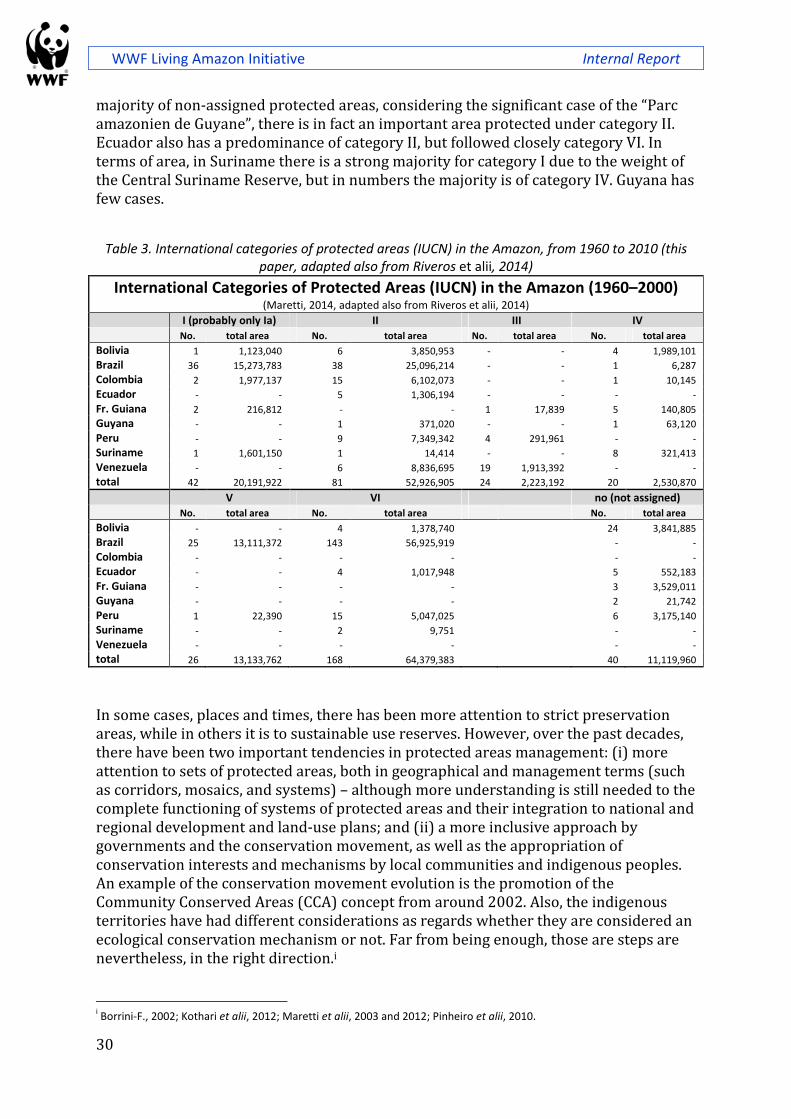
WWF Living Amazon Initiative Internal Report
30
majority of non-assigned protected areas, considering the significant case of the “Parc
amazonien de Guyane”, there is in fact an important area protected under category II.
Ecuador also has a predominance of category II, but followed closely category VI. In
terms of area, in Suriname there is a strong majority for category I due to the weight of
the Central Suriname Reserve, but in numbers the majority is of category IV. Guyana has
few cases.
Table 3. International categories of protected areas (IUCN) in the Amazon, from 1960 to 2010 (this paper, adapted also from Riveros et alii, 2014)
International Categories of Protected Areas (IUCN) in the Amazon (1960–2000)
(Maretti, 2014, adapted also from Riveros et alii, 2014) I (probably only Ia) II III IV
No. total area No. total area No. total area No. total area
Bolivia 1 1,123,040 6 3,850,953 - - 4 1,989,101
Brazil 36 15,273,783 38 25,096,214 - - 1 6,287
Colombia 2 1,977,137 15 6,102,073 - - 1 10,145
Ecuador - - 5 1,306,194 - - - -
Fr. Guiana 2 216,812 - - 1 17,839 5 140,805
Guyana - - 1 371,020 - - 1 63,120
Peru - - 9 7,349,342 4 291,961 - -
Suriname 1 1,601,150 1 14,414 - - 8 321,413
Venezuela - - 6 8,836,695 19 1,913,392 - -
total 42 20,191,922 81 52,926,905 24 2,223,192 20 2,530,870
V VI no (not assigned) No. total area No. total area No. total area
Bolivia - - 4 1,378,740 24 3,841,885
Brazil 25 13,111,372 143 56,925,919 - -
Colombia - - - - - -
Ecuador - - 4 1,017,948 5 552,183
Fr. Guiana - - - - 3 3,529,011
Guyana - - - - 2 21,742
Peru 1 22,390 15 5,047,025 6 3,175,140
Suriname - - 2 9,751 - -
Venezuela - - - - - -
total 26 13,133,762 168 64,379,383 40 11,119,960
In some cases, places and times, there has been more attention to strict preservation
areas, while in others it is to sustainable use reserves. However, over the past decades,
there have been two important tendencies in protected areas management: (i) more
attention to sets of protected areas, both in geographical and management terms (such
as corridors, mosaics, and systems) – although more understanding is still needed to the
complete functioning of systems of protected areas and their integration to national and
regional development and land-use plans; and (ii) a more inclusive approach by
governments and the conservation movement, as well as the appropriation of
conservation interests and mechanisms by local communities and indigenous peoples.
An example of the conservation movement evolution is the promotion of the
Community Conserved Areas (CCA) concept from around 2002. Also, the indigenous
territories have had different considerations as regards whether they are considered an
ecological conservation mechanism or not. Far from being enough, those are steps are
nevertheless, in the right direction.i
i Borrini-F., 2002; Kothari et alii, 2012; Maretti et alii, 2003 and 2012; Pinheiro et alii, 2010.
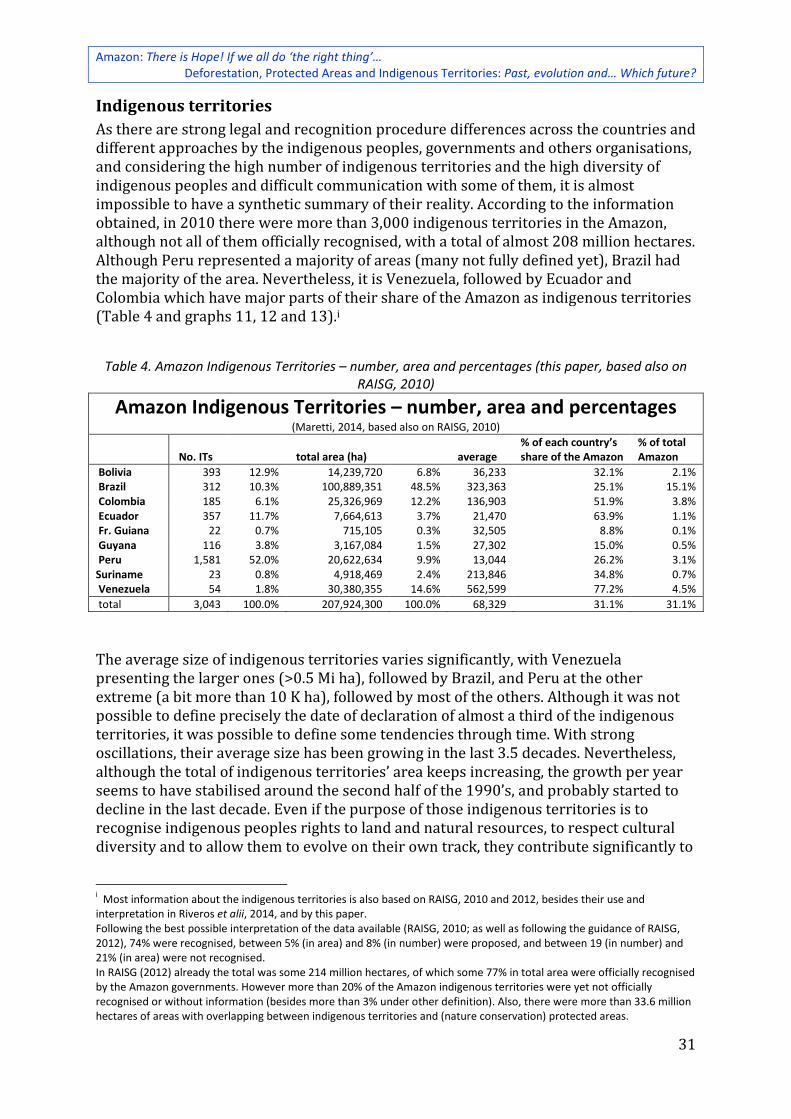
Amazon: There is Hope! If we all do ‘the right thing’… Deforestation, Protected Areas and Indigenous Territories: Past, evolution and… Which future?
31
Indigenous territories
As there are strong legal and recognition procedure differences across the countries and
different approaches by the indigenous peoples, governments and others organisations,
and considering the high number of indigenous territories and the high diversity of
indigenous peoples and difficult communication with some of them, it is almost
impossible to have a synthetic summary of their reality. According to the information
obtained, in 2010 there were more than 3,000 indigenous territories in the Amazon,
although not all of them officially recognised, with a total of almost 208 million hectares.
Although Peru represented a majority of areas (many not fully defined yet), Brazil had
the majority of the area. Nevertheless, it is Venezuela, followed by Ecuador and
Colombia which have major parts of their share of the Amazon as indigenous territories
(Table 4 and graphs 11, 12 and 13).i
Table 4. Amazon Indigenous Territories – number, area and percentages (this paper, based also on RAISG, 2010)
Amazon Indigenous Territories – number, area and percentages
(Maretti, 2014, based also on RAISG, 2010)
No. ITs total area (ha) average % of each country’s share of the Amazon
% of total Amazon
Bolivia 393 12.9% 14,239,720 6.8% 36,233 32.1% 2.1% Brazil 312 10.3% 100,889,351 48.5% 323,363 25.1% 15.1% Colombia 185 6.1% 25,326,969 12.2% 136,903 51.9% 3.8% Ecuador 357 11.7% 7,664,613 3.7% 21,470 63.9% 1.1% Fr. Guiana 22 0.7% 715,105 0.3% 32,505 8.8% 0.1% Guyana 116 3.8% 3,167,084 1.5% 27,302 15.0% 0.5% Peru 1,581 52.0% 20,622,634 9.9% 13,044 26.2% 3.1% Suriname 23 0.8% 4,918,469 2.4% 213,846 34.8% 0.7% Venezuela 54 1.8% 30,380,355 14.6% 562,599 77.2% 4.5%
total 3,043 100.0% 207,924,300 100.0% 68,329 31.1% 31.1%
The average size of indigenous territories varies significantly, with Venezuela
presenting the larger ones (>0.5 Mi ha), followed by Brazil, and Peru at the other
extreme (a bit more than 10 K ha), followed by most of the others. Although it was not
possible to define precisely the date of declaration of almost a third of the indigenous
territories, it was possible to define some tendencies through time. With strong
oscillations, their average size has been growing in the last 3.5 decades. Nevertheless,
although the total of indigenous territories’ area keeps increasing, the growth per year
seems to have stabilised around the second half of the 1990’s, and probably started to
decline in the last decade. Even if the purpose of those indigenous territories is to
recognise indigenous peoples rights to land and natural resources, to respect cultural
diversity and to allow them to evolve on their own track, they contribute significantly to
i Most information about the indigenous territories is also based on RAISG, 2010 and 2012, besides their use and interpretation in Riveros et alii, 2014, and by this paper. Following the best possible interpretation of the data available (RAISG, 2010; as well as following the guidance of RAISG, 2012), 74% were recognised, between 5% (in area) and 8% (in number) were proposed, and between 19 (in number) and 21% (in area) were not recognised. In RAISG (2012) already the total was some 214 million hectares, of which some 77% in total area were officially recognised by the Amazon governments. However more than 20% of the Amazon indigenous territories were yet not officially recognised or without information (besides more than 3% under other definition). Also, there were more than 33.6 million hectares of areas with overlapping between indigenous territories and (nature conservation) protected areas.
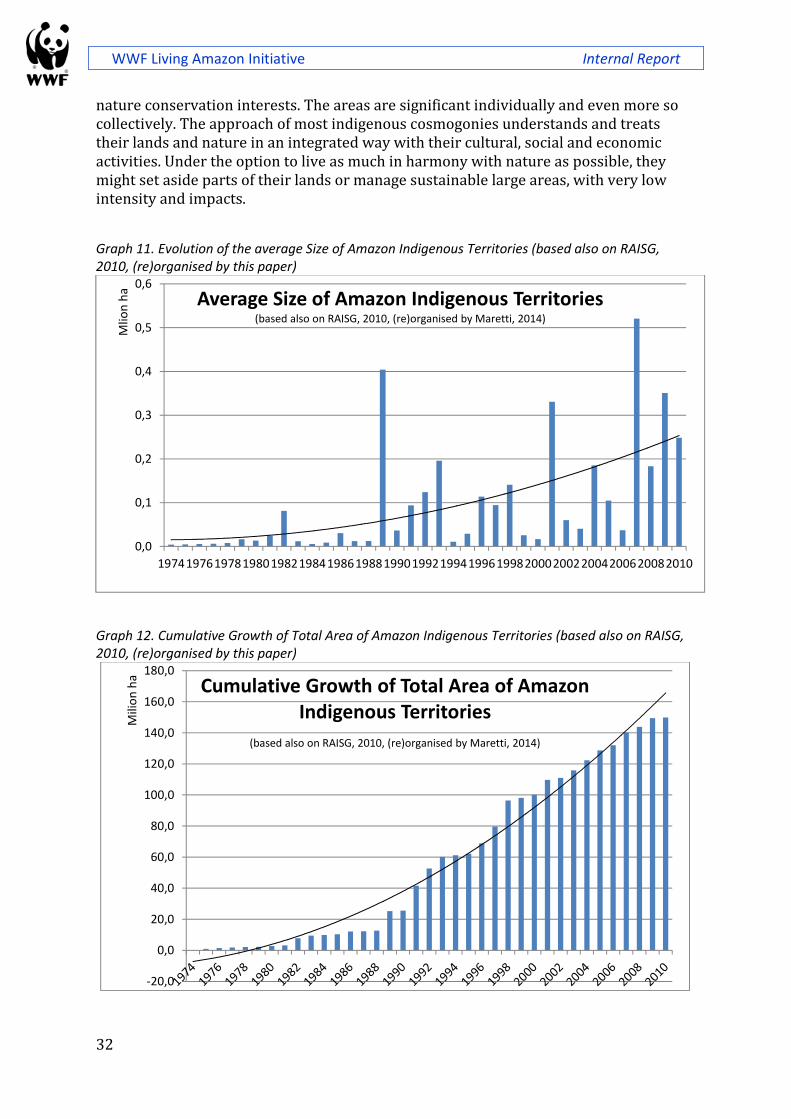
WWF Living Amazon Initiative Internal Report
32
nature conservation interests. The areas are significant individually and even more so
collectively. The approach of most indigenous cosmogonies understands and treats
their lands and nature in an integrated way with their cultural, social and economic
activities. Under the option to live as much in harmony with nature as possible, they
might set aside parts of their lands or manage sustainable large areas, with very low
intensity and impacts.
Graph 11. Evolution of the average Size of Amazon Indigenous Territories (based also on RAISG, 2010, (re)organised by this paper)
Graph 12. Cumulative Growth of Total Area of Amazon Indigenous Territories (based also on RAISG, 2010, (re)organised by this paper)
0,0
0,1
0,2
0,3
0,4
0,5
0,6
1974197619781980198219841986198819901992199419961998200020022004200620082010
Mlio
n h
a
Average Size of Amazon Indigenous Territories(based also on RAISG, 2010, (re)organised by Maretti, 2014)
-20,0
0,0
20,0
40,0
60,0
80,0
100,0
120,0
140,0
160,0
180,0
Mili
on
ha
Cumulative Growth of Total Area of Amazon Indigenous Territories
(based also on RAISG, 2010, (re)organised by Maretti, 2014)
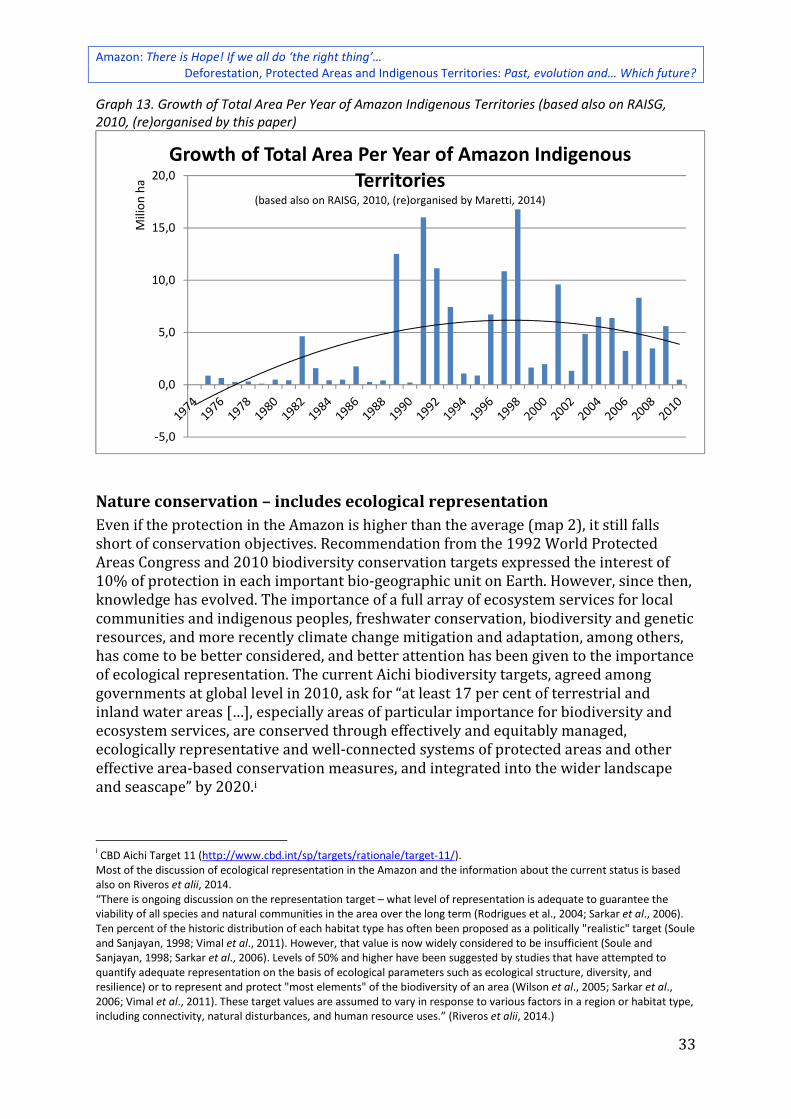
Amazon: There is Hope! If we all do ‘the right thing’… Deforestation, Protected Areas and Indigenous Territories: Past, evolution and… Which future?
33
Graph 13. Growth of Total Area Per Year of Amazon Indigenous Territories (based also on RAISG, 2010, (re)organised by this paper)
Nature conservation – includes ecological representation
Even if the protection in the Amazon is higher than the average (map 2), it still falls
short of conservation objectives. Recommendation from the 1992 World Protected
Areas Congress and 2010 biodiversity conservation targets expressed the interest of
10% of protection in each important bio-geographic unit on Earth. However, since then,
knowledge has evolved. The importance of a full array of ecosystem services for local
communities and indigenous peoples, freshwater conservation, biodiversity and genetic
resources, and more recently climate change mitigation and adaptation, among others,
has come to be better considered, and better attention has been given to the importance
of ecological representation. The current Aichi biodiversity targets, agreed among
governments at global level in 2010, ask for “at least 17 per cent of terrestrial and
inland water areas […], especially areas of particular importance for biodiversity and
ecosystem services, are conserved through effectively and equitably managed,
ecologically representative and well-connected systems of protected areas and other
effective area-based conservation measures, and integrated into the wider landscape
and seascape” by 2020.i
i CBD Aichi Target 11 (http://www.cbd.int/sp/targets/rationale/target-11/). Most of the discussion of ecological representation in the Amazon and the information about the current status is based also on Riveros et alii, 2014. “There is ongoing discussion on the representation target – what level of representation is adequate to guarantee the viability of all species and natural communities in the area over the long term (Rodrigues et al., 2004; Sarkar et al., 2006). Ten percent of the historic distribution of each habitat type has often been proposed as a politically "realistic" target (Soule and Sanjayan, 1998; Vimal et al., 2011). However, that value is now widely considered to be insufficient (Soule and Sanjayan, 1998; Sarkar et al., 2006). Levels of 50% and higher have been suggested by studies that have attempted to quantify adequate representation on the basis of ecological parameters such as ecological structure, diversity, and resilience) or to represent and protect "most elements" of the biodiversity of an area (Wilson et al., 2005; Sarkar et al., 2006; Vimal et al., 2011). These target values are assumed to vary in response to various factors in a region or habitat type, including connectivity, natural disturbances, and human resource uses.” (Riveros et alii, 2014.)
-5,0
0,0
5,0
10,0
15,0
20,0
Mili
on
ha
Growth of Total Area Per Year of Amazon Indigenous Territories
(based also on RAISG, 2010, (re)organised by Maretti, 2014)
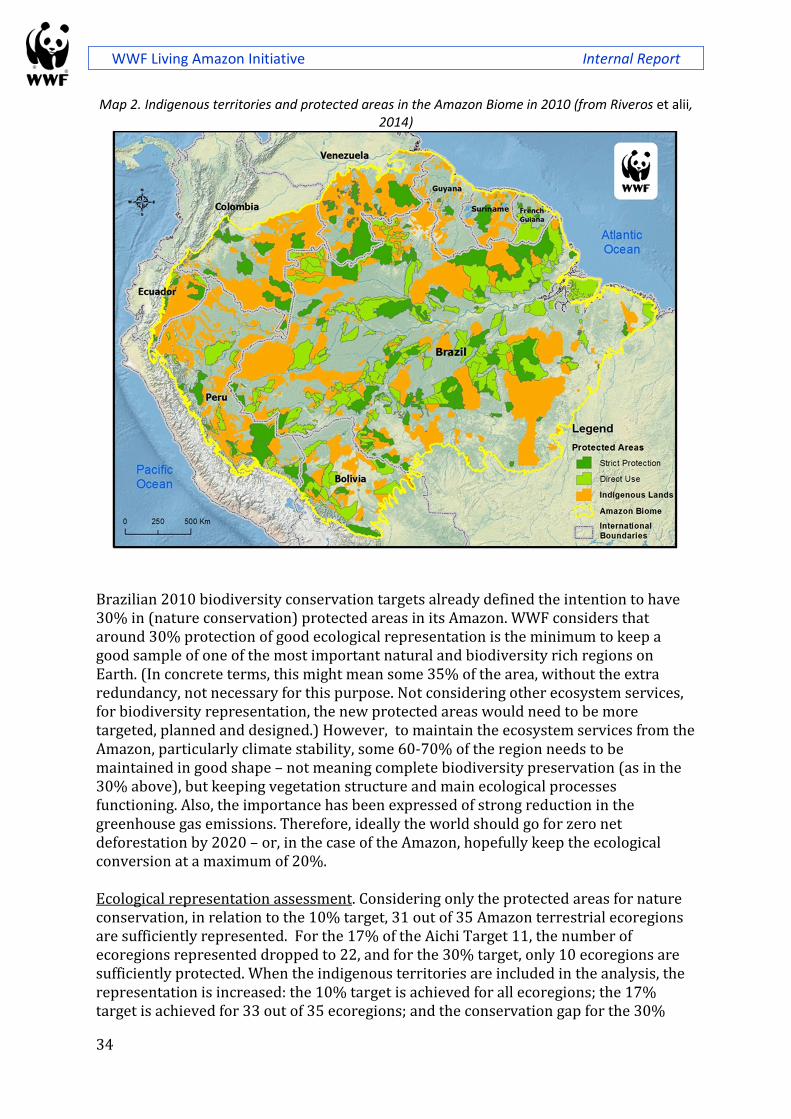
WWF Living Amazon Initiative Internal Report
34
Map 2. Indigenous territories and protected areas in the Amazon Biome in 2010 (from Riveros et alii, 2014)
Brazilian 2010 biodiversity conservation targets already defined the intention to have
30% in (nature conservation) protected areas in its Amazon. WWF considers that
around 30% protection of good ecological representation is the minimum to keep a
good sample of one of the most important natural and biodiversity rich regions on
Earth. (In concrete terms, this might mean some 35% of the area, without the extra
redundancy, not necessary for this purpose. Not considering other ecosystem services,
for biodiversity representation, the new protected areas would need to be more
targeted, planned and designed.) However, to maintain the ecosystem services from the
Amazon, particularly climate stability, some 60-70% of the region needs to be
maintained in good shape – not meaning complete biodiversity preservation (as in the
30% above), but keeping vegetation structure and main ecological processes
functioning. Also, the importance has been expressed of strong reduction in the
greenhouse gas emissions. Therefore, ideally the world should go for zero net
deforestation by 2020 – or, in the case of the Amazon, hopefully keep the ecological
conversion at a maximum of 20%.
Ecological representation assessment. Considering only the protected areas for nature
conservation, in relation to the 10% target, 31 out of 35 Amazon terrestrial ecoregions
are sufficiently represented. For the 17% of the Aichi Target 11, the number of
ecoregions represented dropped to 22, and for the 30% target, only 10 ecoregions are
sufficiently protected. When the indigenous territories are included in the analysis, the
representation is increased: the 10% target is achieved for all ecoregions; the 17%
target is achieved for 33 out of 35 ecoregions; and the conservation gap for the 30%
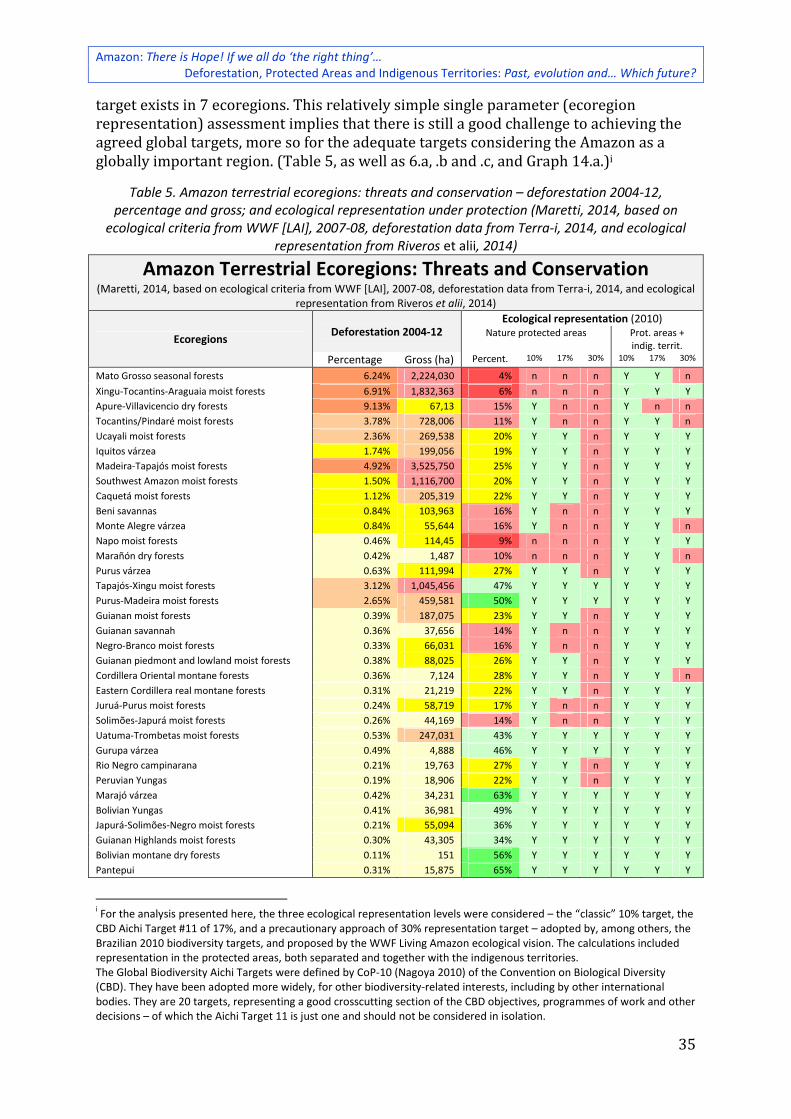
Amazon: There is Hope! If we all do ‘the right thing’… Deforestation, Protected Areas and Indigenous Territories: Past, evolution and… Which future?
35
target exists in 7 ecoregions. This relatively simple single parameter (ecoregion
representation) assessment implies that there is still a good challenge to achieving the
agreed global targets, more so for the adequate targets considering the Amazon as a
globally important region. (Table 5, as well as 6.a, .b and .c, and Graph 14.a.)i
Table 5. Amazon terrestrial ecoregions: threats and conservation – deforestation 2004-12, percentage and gross; and ecological representation under protection (Maretti, 2014, based on
ecological criteria from WWF [LAI], 2007-08, deforestation data from Terra-i, 2014, and ecological representation from Riveros et alii, 2014)
Amazon Terrestrial Ecoregions: Threats and Conservation (Maretti, 2014, based on ecological criteria from WWF [LAI], 2007-08, deforestation data from Terra-i, 2014, and ecological
representation from Riveros et alii, 2014)
Ecoregions Deforestation 2004-12
Ecological representation (2010) Nature protected areas Prot. areas +
indig. territ.
Percentage Gross (ha) Percent. 10% 17% 30% 10% 17% 30%
Mato Grosso seasonal forests 6.24% 2,224,030 4% n n n Y Y n
Xingu-Tocantins-Araguaia moist forests 6.91% 1,832,363 6% n n n Y Y Y
Apure-Villavicencio dry forests 9.13% 67,13 15% Y n n Y n n
Tocantins/Pindaré moist forests 3.78% 728,006 11% Y n n Y Y n
Ucayali moist forests 2.36% 269,538 20% Y Y n Y Y Y
Iquitos várzea 1.74% 199,056 19% Y Y n Y Y Y
Madeira-Tapajós moist forests 4.92% 3,525,750 25% Y Y n Y Y Y
Southwest Amazon moist forests 1.50% 1,116,700 20% Y Y n Y Y Y
Caquetá moist forests 1.12% 205,319 22% Y Y n Y Y Y
Beni savannas 0.84% 103,963 16% Y n n Y Y Y
Monte Alegre várzea 0.84% 55,644 16% Y n n Y Y n
Napo moist forests 0.46% 114,45 9% n n n Y Y Y
Marañón dry forests 0.42% 1,487 10% n n n Y Y n
Purus várzea 0.63% 111,994 27% Y Y n Y Y Y
Tapajós-Xingu moist forests 3.12% 1,045,456 47% Y Y Y Y Y Y
Purus-Madeira moist forests 2.65% 459,581 50% Y Y Y Y Y Y
Guianan moist forests 0.39% 187,075 23% Y Y n Y Y Y
Guianan savannah 0.36% 37,656 14% Y n n Y Y Y
Negro-Branco moist forests 0.33% 66,031 16% Y n n Y Y Y
Guianan piedmont and lowland moist forests 0.38% 88,025 26% Y Y n Y Y Y
Cordillera Oriental montane forests 0.36% 7,124 28% Y Y n Y Y n
Eastern Cordillera real montane forests 0.31% 21,219 22% Y Y n Y Y Y
Juruá-Purus moist forests 0.24% 58,719 17% Y n n Y Y Y
Solimões-Japurá moist forests 0.26% 44,169 14% Y n n Y Y Y
Uatuma-Trombetas moist forests 0.53% 247,031 43% Y Y Y Y Y Y
Gurupa várzea 0.49% 4,888 46% Y Y Y Y Y Y
Rio Negro campinarana 0.21% 19,763 27% Y Y n Y Y Y
Peruvian Yungas 0.19% 18,906 22% Y Y n Y Y Y
Marajó várzea 0.42% 34,231 63% Y Y Y Y Y Y
Bolivian Yungas 0.41% 36,981 49% Y Y Y Y Y Y
Japurá-Solimões-Negro moist forests 0.21% 55,094 36% Y Y Y Y Y Y
Guianan Highlands moist forests 0.30% 43,305 34% Y Y Y Y Y Y
Bolivian montane dry forests 0.11% 151 56% Y Y Y Y Y Y
Pantepui 0.31% 15,875 65% Y Y Y Y Y Y
i For the analysis presented here, the three ecological representation levels were considered – the “classic” 10% target, the CBD Aichi Target #11 of 17%, and a precautionary approach of 30% representation target – adopted by, among others, the Brazilian 2010 biodiversity targets, and proposed by the WWF Living Amazon ecological vision. The calculations included representation in the protected areas, both separated and together with the indigenous territories. The Global Biodiversity Aichi Targets were defined by CoP-10 (Nagoya 2010) of the Convention on Biological Diversity (CBD). They have been adopted more widely, for other biodiversity-related interests, including by other international bodies. They are 20 targets, representing a good crosscutting section of the CBD objectives, programmes of work and other decisions – of which the Aichi Target 11 is just one and should not be considered in isolation.
WWF Living Amazon Initiative Internal Report
36
Although the total area under protection has been increasing, there is a challenge ahead
in directing the creation of new areas to include specifically under-represented
ecoregions. Some ecoregions present good conservation level (such as Uatumã-
Trombetas, Tapajós-Xingu, Purus-Madeira, Japurá-Solimões-Negro and Guianan
Highlands moist forests, Pantepui, Marajó and Gurupá várzeas, Bolivian montane dry
forests and Bolivian Yungas), while at the other extreme, others still have very low
conservation levels (such as Mato Grosso seasonal forests, Marañón and Apure-
Villavicencio dry forests, Xingu-Tocantins-Araguaia and Napo moist forests). Creating
new protected areas might be feasible for certain ecoregions but more difficult for
others, depending for instance on the capacity (technical, legal, financial…), or because
the political space can be more limited in sub-regions under greater stress.
Nevertheless, the very important representation assessment based on ecoregions is
good enough for some levels of analysis and scales, but it presents important limitations
and caveats. First, the conservation of an ecologically representative sample of Amazon
biodiversity cannot stop at this bio-geographical level. There is enough diversity within
ecoregions for the representation to be considered in smaller units – for instance,
considering at the national level, units using vegetation types and geomorphology or
soils as criteria. Ultimately, at more detailed and local levels, the representation should
include all elements of biodiversity (ecosystems, species and genes). Aichi Target 11
has additional criteria for the conservation spaces and efforts to be considered effective
(including integration in the landscape, connectivity, effective management and equity),
which calls for more comprehensive, well integrated and well managed networks or
systems of areas.
Furthermore, although positively considering the inclusion of the indigenous territories
in the ecological representation assessment, it should be kept clear that, unless defined
by the very communities, the territories can be used for a series of different purposes
other than biodiversity conservation. The solutions would come with rights, respect and
integration. Given that indigenous territories are covering a significant portion of the
Amazon landscape, and the multiple coincidences between the conservation of
biodiversity agenda and the governance over natural resources requested by
indigenous peoples' groups, the need to reinforce these links and develop innovative
alliances for the benefit of the Amazon ecosystems and its original inhabitants is
evident.
Another threat to the protected areas and all the benefits they can provide is
impermanence – by definition protected areas are defined, declared or created to be
permanent. Obviously, some flexibility is necessary to adapt to the new contexts, as well
as correct mistakes. In the Amazon, this can still be done with minimal negative impacts,
compared to other regions of the world. If the protected areas are seen as part of a
system, and at the service of the interests of local and indigenous communities and the
sustainable development of regions and countries, then they have meanings and goals.
Any downsizing or alteration of legal status should go through technical analysis and
political negotiations at least at the same level necessary for its creation, and, if decided
on, how to compensate the roles they have towards those meanings and goals must be
taken into consideration – for instance, through analysis and compensation of
biodiversity conservation and ecosystem services provision. Unfortunately this is not
Amazon: There is Hope! If we all do ‘the right thing’… Deforestation, Protected Areas and Indigenous Territories: Past, evolution and… Which future?
37
what has been happening in the Amazon in recent years. The Amazon is suffering from
increasing pressure from several fronts, and amongst the most important defence
mechanisms, the protected areas, are also under threat, without any compensation
efforts at all. Political and physical threats are also escalating against the indigenous
territories.i
Deforestation, Protected Areas and Indigenous Territories
On the one hand, conservation strategies should look both to the defence line of the
protected areas and other conservation spaces and efforts and to their threats. In this
case, threat is ‘measured’ by deforestation. Although they lie beyond the scope of this
paper which is focusing on forests, in a more accurate assessment of the threats and
conservation of the Amazon, the freshwater ecosystems should not be left out – their
ecological representation and fragmentation should be analysed. In their best condition,
some ecoregions have good level of protection and up to now are relatively out of the
main pressures (such as Pantepui, Bolivian montane dry forests, Guiana Highlands and
Japurá-Solimões-Negro moist forests, among others), while, at the other extreme, some
ecoregions do not have enough conservation yet and are already under much greater
stress (such as Mato Grosso seasonal forests, Apure-Villavicencio dry forests, Iquitos
várzea and Xingu-Tocantins-Araguaia, Tocantins/Pindaré, Ucayali, Madeira-Tapajós,
Southwest Amazon and Caquetá moist forests). (See table 5.)
On the other hand, besides biodiversity conservation, other important contributions of
the protected areas and indigenous peoples do exist, including contributions of social
and economic interest. Due to the pervasive impact from climate change, a benefit of
particular interest is the one related to the reduction of deforestation, associated
positively both to the agendas of mitigation and adaptation to climate changes. As
mentioned above, the indigenous lands are not defined for nature conservation, even
less specifically for curbing deforestation. Nevertheless, it has been demonstrated that
they have a positive effect in resisting deforestation. Similar to most protected areas
(particularly of some categories in some countries), the land titling or land-use
definition may be effective in pushing away the land grabbing interests and
consequently an important share of deforestation pressures. Moreover, the presence of
the indigenous peoples, as well as of governmental authorities, is important to inhibit
illegal and outsider deforestation-related actions. Some indigenous groups have specific
strategies of be more apparent in the limits of their lands so as to dissuade those kinds
of actions. Attacks to indigenous territories, might lead to fines, punishments and
possibly legal trials. Also, the social image associated to indigenous peoples or their
territories considers negative actions against them. ii
The case of nature conservation protected areas is not much different, except for the
fact that some of them are uninhabited and in some cases with lower collective culture-
related respect (particularly when created in violent ways against the opposition of
i Also Dudley, 2008; Mascia et alii, 2011 and 2014; and Martins et alii, 2012. See also http://www.padddtracker.org. ii Also Vergara, & Scholz, 2011; and Nepstad et alii, 2007.
“Large-scale degradation of Amazon forests could speed the global climatic disruption, influencing the rainfall in far-flung places around the planet. The predictions for the period from now to 2030 described in (1) would release 15-26 billion tonnes of carbon to the atmosphere equivalent to 1.5 to 2.6 years of current worldwide carbon emissions” (Nepstad et alii, 2007).
WWF Living Amazon Initiative Internal Report
38
local communities). Although there is always criticism about the effectiveness of
protected areas, studies have shown that the deforestation is significantly lower inside
protected areas and indigenous territories, than outside of them – something between 2
to 30 times more effective.i Despite the fact that different studies have presented more
or less slight differences between categories of management and governance types,
possibly there are other factors that play a not completely elucidated role (such as a
more consistent analysis of the level of management capacity), particularly related to
the degree and type of pressure the sample is under. Adequate strategies would include
protected areas of several categories and management types, indigenous territories,
control of land grabbing, agriculture and ranching compliance with regulations, etc.ii
Concluding remarks – which Amazon in 2050?
Which is the Amazon the peoples of this region and the world want to see in 2050? This
is one of the regions on Earth with largest potential to become a concrete and consistent
sustainable development model. Decision makers from the whole word (from the
municipal leaders of rural areas in Suriname, to traders in China and Japan, from
indigenous peoples in the Bolivian Amazon, to energy consumers in São Paulo, from
those responsible for protected areas of the Venezuelan Amazon, to the private and
public banks in Europe and US, etc.) have a responsibility to avoid the damage that the
Amazon’s destruction brings to the whole world and to the Amazon region and its
peoples.
In that sense, we need to:
• Recognise the rights of the Amazon indigenous peoples, including their right to land
and natural resources (particularly for the ones that do not have legally recognised
territories yet), but also for the right to give or withhold their prior informed
consent related to activities that affect them or their lands and the associated
natural resources;
• Recognise the rights of other local communities, particularly the more traditional
ones and the ones who live in close relationship with and dependence on the
ecosystems, and that includes supporting their economic activities, such as
‘extractivism’ and fisheries, and promoting their economic integration into the
global economy, while still maintaining their way of life;
• Promote the recognition of community conserved areas (ICCA) in all countries and
sub-national political entities of the Amazon;
• Keep up the good pace of the creation of new protected areas –reaching 30% of true
ecological representation– and improving the management quality and effectiveness
of the existing ones, and manage them as systems, sub-systems and ecological
networks;
i Also Nepstad et alii, 2006; Soares-Fº. et alii, 2009 and 2010; Ricketts et alii, 2010; and Note et alii, 2013. ii Also Soares-Fº. et alii, 2010.
As the pressure evolves, potentially in the future becoming less related to frontier like activities (such as land speculation and land grabbing, low productivity cattle ranching, illegal logging, etc.) and more to high capital intensive ones (high technology agriculture, hydropower, oil and gas, mining, etc.), it is less likely that the protected areas will keep their important role in resisting deforestation and degradation. On the contrary, a more negotiable approach may be needed, including protected areas as mitigation and compensation/offsetting tools, even partially funded by some of the business involved.
Amazon: There is Hope! If we all do ‘the right thing’… Deforestation, Protected Areas and Indigenous Territories: Past, evolution and… Which future?
39
• Integrate protected areas into the economy and policy more, including improving
the services they provide to societies and economies, but also considering further,
stronger, larger and much better mechanisms to assure financial sustainability of the
protected areas systems. Also, avoid downsizing and altering the legal status of
protected areas and indigenous territories, particularly without proper, scientifically
sound and socially accepted mechanisms of compensation (biodiversity
conservation, ecosystem services provision, cultural and social interests, etc.);
• Adopt national policies and programmes to control and avoid deforestation
(integrating and up scaling good actions in all countries and looking for integrated
approaches, improving on the example of Brazil), aiming at (a) zero net
deforestation by 2020 and (b) to limit ecosystem conversion in the whole Amazon to
20%;
• Support science for environmental monitoring. Particularly, in this case, consistent
(within themselves), independent and complementary monitoring of ecosystem
conversion (including deforestation, freshwater fragmentation, etc.) is needed, with
consistent methods and sources across the whole Amazon;
• Establish better regulation and voluntary standards for public and private economic
and financial activities, including biodiversity and GHG offset procedures,
considering the full array of ecosystem services provided by the ecosystems possibly
affected;
• Develop adequate science and technology knowledge in order to replace the model
of open areas agriculture, interrupting rivers for hydropower production, non-forest
friendly roads, etc., by a sustainable development model adequate for the Amazon
conditions;
• Promote clarity in land tenure and access to natural resources conditions and,
through an adequate typology classification, implement specific actions for each case
(combination or separation of rights related to the land and to the natural resources;
public lands, collective communal lands, private ownership and possible
combinations; etc.);
• Integrate policies and programmes and private relationships amongst the nine
Amazon countries;
• Govern the region by democratic and participatory means; and
• Establish attention and care for the Amazon as a special globally important region
(similar to that devoted to the Antarctic) on the part of governments, companies and
societies, respecting national sovereignty and the rights of the local communities
and indigenous peoples.
In synthesis, taking care of the Amazon is a matter of global importance. The global
changes are affecting and will increase the impact on this region. The impacts of its
degradation will apply to all. For the Amazon countries, local communities and
indigenous peoples and the whole world, caring for the Amazon is also taking care of
themselves, yourselves, and ourselves.
WWF Living Amazon Initiative Internal Report
40
Bibliography and sources
Abell, R., M. Thieme, C. Revenga, M. Bryer, M. Kottelat, N. Bogutskaya, B. Coad, N. Mandrak, S. Contreras-Balderas, W. Bussing, M. L. J. Stiassny, P. Skelton, G. R. Allen, P. Unmack, A. Naseka, R. Ng, N. Sindorf, J. Robertson, E. Armijo, J. Higgins, T. J. Heibel, E. Wikramanayake, D. Olson, H. L. Lopez, R. E. d. Reis, J. G. Lundberg, M. H. Sabaj Perez, and P. Petry. 2008. Freshwater Ecoregions of the World: A new map of bio-geographic units for freshwater biodiversity conservation. BioScience, 58: 403-414.
Amazonas. 2010. Plano de Gestão do Mosaico de Unidades de Conservação do Apuí; vol. I & II. Apuí, Governo do Amazonas, Secretaria de Estado do Meio Ambiente e Desenvolvimento Sustentável, Centro Estadual de Unidades de Conservação and WWF-Brasil. 245 p.
Armenteras, D.; Cabrera, E.; Rodríguez, N. & Retana, J. 2013. National and regional determinants of tropical deforestation in Colombia. Reg Environ Change. (DOI 10.1007/s10113-013-0433-7, published on line 2013 Mar. 06). 13 p.
Assunção, J; Gandour, Clarissa C. e & Rocha, R. 2012 (Feb). Deforestation Slowdown in the Legal Amazon: Prices or Policies? Rio de Janeiro, PUC-Rio. 37 p. (CPI Working Paper. Climate Policy Initiative, PUC-Rio. February 06th, 2012.)
Beltrán, J. (ed.) et alii. 2000. Indigenous and traditional peoples and protected areas: principles, guidelines and case studies. Gland and Cambridge, IUCN & WWF International. xi + 133 p.
Bishop, K.; Dudley, N.; Phillips, A. & Stolton, S. (eds.) 2004. Speaking a Common Language – the uses and performance of the IUCN System of Management Categories for Protected Areas. Cardiff University, IUCN and UNEP/WCMC. 192 p.
Borrini-F., G. 2002. Indigenous and local communities and protected areas: rethinking the relationship. Gland and Newbury, IUCN Protected Areas Programme, Parks, Local Communities and Protected Areas, vol. 12, nº 2, 2002, pp. 5–15.
Brasil (MMA), WWF-Brasil et alii. 2010 and 2012 (update). Arpa: Programa Áreas Protegidas da Amazônia; um novo caminho para a conservação da Amazônia. Brasília, MMA, ICMBio, Acre, Amapá, Amazonas, Mato Grosso, Rondônia, Pará, Tocantins, Funbio, BNDES – Fundo Amazônia, GEF (Banco Mundial), Cooperação Alemã (KfW e GIZ) , WWF (WWF-Brasil). 5 encartes (total 10+34+69+39+49 p.)
Brasil (MMA). 2010. Programa Áreas Protegidas da Amazônia, Fase II; documento de programa do Governo Brasileiro. Brasília, MMA-SBFDAP-Arpa. 79 p.
Brasil (MMA). 2011. Portaria nº 332, de 25 de agosto de 2011 (que reconhece o Mosaico da Amazônia Meridional). Brasília, Ministério do Meio Ambiente. 2 p.
Brasil. [2014]. Cadastro Nacional de Unidades de Conservação. Brasília, Ministério do Meio Ambiente, http://www.mma.gov.br/areas-protegidas/cadastro-nacional-de-ucs. (A web platform on Brazilian protected areas – integrated to the WWF PAs Observatory CNUC, WWF-Brasil [2014]. Last consultation in 2014 Apr. 05.)
Butler, R.A. 2013. Deforestation rates for Amazon countries outside Brazil. Mongabay.com; June 26, 2013 (http://news.mongabay.com/2013/0626-amazon-deforestation.html). (Following Faleiros, G. & Valois, H. 2013; O Eco InfoAmazonia, which was based on Coca [no date].)
Cabrera, E.; Vargas, D.M.; Galindo, G.; García, M.C.; Ordoñez, M.F.; Vergara, L.K.; Pacheco, A.M.; Rubiano, J.C. & Giraldo, P. 2011. Memoria técnica de la cuantificación de la deforestación histórica nacional – escalas gruesa y fina. Bogotá, Instituto de Hidrología, Meteorología, y Estudios Ambientales (Ideam). 106 p.
Che Piu, H. & Menton, M. 2013. Contexto de REDD+ en Perú: Motores, actores e instituciones. CIFOR, Bogor. X + 75 p. (Documentos Ocasionales 90.)
CI & Nestlé. [no date]. Deforestation Guides for Commodity Sourcing. http://www.conservation.org/how/science/Pages/deforestation-guides-for-commodity-sourcing.aspx. (Or Nestlé & CI. 2013. Insight: mapping our way to zero deforestation. http://www.nestle.com/media/newsandfeatures/insight-duncan-pollard.) Nestlé and Conservation International. Web sites and separated 20 maps and factsheets per country, including Bolivia, Brazil, Colombia, Ecuador, Peru and Venezuela.
Clinton N. Jenkins, C.N. & Joppa, L. 2009. Expansion of the global terrestrial protected area system. Biological Conservation, vol. 142, Issue 10, October 2009, pp. 2166–2174.
Coca, A.; Reymondin, L.; Tello, J.J. & Paz, P. [no date]. La deforestación en la región del Amazonas en 8 países según datos del sistema Terra-i. 4 p. (For Faleiros, G. & Valois, H. 2013; O Eco InfoAmazonia; and followed by Butler, R.A. 2013; Mongabay.com.)
Coca-Castro, A. 2014 (Jan.-Feb) Informal (email communications, based on Terra-i data, his publications and bibliography). Coca-Castro, A. et alii. 2013a. Raw organised data from Terra-i and organised spreadsheet (following themes, etc.) and
graphics on Amazon deforestation (for Coca-Castro et alii, 2013); not published. Centro Internacional de Agricultura Tropical (Ciat) and Terra-i.
Coca-Castro, A.; Reymondin, L.; Bellfield, H. & Hyman, G. 2013. Land Use Status and Trends in Amazonia. Global Canopy Programme (GCP), Centro Internacional de Agricultura Tropical (Ciat), Climate and Development Knowledge Network (CDKN) and Fundación Futuro Latinoamericano (FFLA). 72 p.
Colombia, Germany, Norway and the United Kingdom. [2013]. Joint statement of Colombia, Germany, Norway and the United Kingdom on reducing emissions from deforestation in the Colombian Amazon. [Warsaw.] 2 p.
Convention on Biological Diversity. 2013. Quick guides to the Aichi Biodiversity Targets (version 2). Montral, CBD. 42 p. Dourojeanni, M.; Barandiarán, A. & Dourojeanni, D. 2009. Amazonía peruana en 2021; Explotación de recursos naturales e
infraestructuras: ¿Qué está pasando? ¿Qué es lo que significan para el futuro?. ProNaturaleza (Fundación Peruana para la Conservación de la Naturaleza), with SPDA (Sociedad Peruana de Derecho Ambiental), DAR (Derecho,
Amazon: There is Hope! If we all do ‘the right thing’… Deforestation, Protected Areas and Indigenous Territories: Past, evolution and… Which future?
41
Ambiente y Recursos Naturales) and ICAA (Iniciativa para la Conservación en la Amazonía Andina), Lima. 144 p + annex (total 160).
Dudley, N. (ed.) 2008. Guidelines for Applying Protected Area Management Categories. Gland, IUCN. x + 86 p. Eva, H.D. & Huber, O. (editors). 2005. A proposal for defining the geographical boundaries of the Amazonia. European
Commission, Directorate General, Joint Research Center and ACTO. x + 41 p. Faleiros, G. & Valois, H. 2013. Incremento de 24% en la deforestación de la Amazonía. O Eco InfoAmazonia; June 21st, 2013
(http://oeco.org.br/mapas/27291-incremento-de-24-en-la-deforestacion-de-la-amazonia) (Based on Coca et alii [no date]; and followed by Butler, 2013.)
FAO. 2010a. Global forest resources assessment 2010; main report. Food and Agriculture Organization of the United Nations (FAO), Rome. xxxi + 198 p, annexes (total 378 p.) (FAO Forestry Paper 163.)
FAO. 2010b. Global forest resources assessment 2010; Country Report Suriname. Food and Agriculture Organization of the United Nations (FAO), Rome. 56 p. (FRA2010/199.)
Fitzgerald, K.A.; De Dijn, B.P.E. & Mitro, S. 2002. Brownsberg Nature Park: Ecological Research & Monitoring Program 2001-2006. Paramaribo, Suriname, Foundation for Nature Conservation in Suriname (STINASU). v + 38 p. + appendix (total 96 p.)
Forero, J. 2012. Amazon forest threat is greater outside Brazil. Washington, Washington Post. August 30, 2012. (http://www.washingtonpost.com/world/amazon-forest-threat-is-greater-outside-brazil/2012/08/30/2d47c4b0-ee08-11e1-b624-99dee49d8d67_story.html) (See Killen, 2012.)
France. 2013. Charte do Parc Amazonien de Guyane; document approve par décret nº 2013-968 du 28 octobre 2013, paru au JORF º 0253 du 30 octobre 2013. Paris and Cayenne, Ministère de l’Écologie, du Développment durable et de l’Énergie; Parc Amazonien de Guyane (parc national). 212 p.
Guyana. [no date]. Guyana’s 3rd National Report on Deforestation. Ministry of Natural Resources and the Environment, web site http://www.nre.gov.gy/Guyanas%203rd%20National%20Report%20on%20Deforestation.%20November%2001%202013.html [reference to October 16th, 2013; downloaded March 17, 2014].
IBGE. 2012. Indicadores de Desenvolvimento Sustentável; Brasil 2012. Rio de Janeiro, Instituto Brasileiro de Geografia e Estatística. 350 p. (Estudos e Pesquisas, Informação Geográfica, número 9.)
IBGE. 2013. Sustainable Development Indexes 2013 (Indicadores de Desenvolvimento Sustentável), in http://www.sidra.ibge.gov.br/bda/pesquisas/ids/default.asp#1 and sub-pages (data accessed and downloaded on Jan. 22, 2014).
INPE-PRODES. 2014. Brazilian ‘Legal Amazon’ deforestation data, from http://www.obt.inpe.br/prodes/index.php and sub-pages (updated data downloaded on Jan. 20, 2014).
Ipea, Cepal & GIZ. 2011 (Dec.) Avaliação do Plano de Ação para Prevenção e Controle do Desmatamento na Amazônia Legal (PPCDAm), 2007–2010. Brasília, Instituto de Pesquisa Econômica Aplicada (Ipea), Comissão Econômica para a América Latina e Caribe (Cepal) and Deutsche Gesellschaft für Internationale Zusammenarbeit (GIZ) GmbH. 103 p.
IUCN & UNEP-WCMC. 2011. The World Database on Protected Areas (WDPA): January 2011. Cambridge, UK: UNEP-WCMC.
Jenkins, C.N. & Joppa, L. 2009. Expansion of the global terrestrial protected area system. Biological Conservation, vol. 142, No. 10, Oct. 2009, pp. 2166–2174. (http://www.sciencedirect.com/science/article/pii/S0006320709001980)
Jenkins, C.N. 2012. Stunning new biodiversity maps show where to prioritize conservation. SavingSpecies. Web pag (blog). (http://savingspecies.org/2012/stunning-new-biodiversity-maps-show-where-to-prioritize-conservation/).
Jenkins, C.N.; Pimm, S.L. & Joppa, L.N. 2013. Global patterns of terrestrial vertebrate diversity and conservation. Proceedings of the National Academy of Sciences (PNAS). 9 p. (www.pnas.org/cgi/doi/10.1073/pnas.1302251110, PNAS Early Edition)
Killen, T. 2012. (Non-published matrix.) (A base for article in the Washington Post: Forero, 2012.) Kothari, A.; Corrigan, C.; Jonas, H.; Neumann, A. & Shrumm, H. (eds). 2012. Recognising and Supporting Territories and
Areas Conserved By Indigenous Peoples and Local Communities: Global Overview and National Case Studies. Secretariat of the Convention on Biological Diversity, ICCA Consortium, Kalpavriksh, and Natural Justice, Montreal, Canada. Technical Series no. 64, 160 pp.
Maretti, C.C. 2005. Conservação e valores; relações entre áreas protegidas e indígenas: possíveis conflitos e soluções. In: Ricardo, Fani (org.). 2004. Terras indígenas & unidades de conservação da natureza: o desafio das sobreposições. São Paulo, Instituto Socioambiental, pp. 85–101.
Maretti, C.C. et alii. 2003. Brazil; lessons learned in the establishment and management of protected areas by indigenous and local communities. São Paulo and Gland, ed. Author for IUCN (WCPA, CEESP-CMWG and TILCEPA. 72 p. (V World Parks Congress, Durban 2003: http://cmsdata.iucn.org/downloads/cca_cmaretti.pdf.)
Maretti, C.C., in collaboration with Wadt, L.H.O.; Gomes-Silva, D.A.P.; Maldonado, W.T.P. de V.; Sanches, R.A.; Coutinho, F. & Brito, S. da S. 2005. From pre-assumptions to a ‘just world conserving nature:’ the role of category VI in protecting landscapes. In: Brown, J.; Mitchell, N. & Beresford, M.(eds.). The protected landscape approach: linking nature, culture and community. Gland and Cambridge, IUCN (with The Countryside Agency (UK), IUCN TILCEPA, QLF Atlantic Center for the Environment, Conservation Study Institute (US National Parks Service), and International Centre for Protected Landscapes), pp. 47–64. (IUCN World Commission on Protected Areas.)
Maretti, C.C.; Catapan, M.I.S.; Abreu, M.J,P. de; Oliveira, J.E.D. de. 2012. Áreas protegidas: definições, tipos e conjuntos. Reflexões conceituais e diretrizes para gestão. In WWF-Brasil & IPÊ. Gestão de Unidades de Conservação:
WWF Living Amazon Initiative Internal Report
42
compartilhando uma experiência de capacitação. Brasília, WWF-Brasil and Instituto de Pesquisas Ecológicas (organisation M. O. Cases; idealisation C.C. Maretti and C. Pádua.), pp. 331-367. (http://www.wwf.org.br/informacoes/bliblioteca/?32545/Gesto-de-unidades-de-conservao-compartilhando-uma-experincia-de-capacitao.)
Martins, H.; Vedoveto, M.; Araújo, E.; Barreto, P.; Baima, S.; Souza Jr., C. & Veríssimo, A. 2012. Áreas protegidas críticas na Amazônia legal. Belém, Imazon. 52 p.
Mascia, M.B. & Pailler, S. 2011. Protected area downgrading, downsizing, and degazettement (PADDD) and its conservation implications. Conservation Letters, 4, pp. 9–20.
Mascia, M.B.; Pailler, S.; Krithivasan, R.; Roshchanka, V.; Burns, D.; Mlotha, M.J.; Murray, D.R. & Peng, N. 2014. Protected area downgrading, downsizing, and degazettement (PADDD) in Africa, Asia, and Latin America and the Caribbean, 1900–2010. Biological Conservation, 169 (2014), pp. 355–361.
May, P.H.; Millikan, B. and Gebara, M.F. 2011. The context of REDD+ in Brazil: Drivers, agents and institutions. 71 p. CIFOR, Bogor, Indonesia. (Occasional paper 55. 2nd edition.)
Nepstad, D. C. et alii. 2007. The Amazon’s Vicious Cycles: Drought and Fire in the Greenhouse; Ecological and Climatic Tipping Points of the World’s Largest Tropical Rainforest, and Practical Preventive Measures. WWF, 23 p. (A report to the World Wide Fund for Nature – WWF.)
Nepstad, D.; Bezerra, T.; Tepper, D.; McCann, K.; Stickler, C.; McGrath, D.G.; Barrera, M. X.; Lowery, S.; Armijo, E.; Higgins, M.L.; Monschke, J.; Gomez, R.; Velez, S.; Tejada, M.; Tejada, M.; Killeen, T.; Schwalbe, K. & Ruedas, A. 2013. Addressing Agricultural Drivers of Deforestation in Colombia: Increasing Land-Based Production While Reducing Deforestation, Forest Degradation, Greenhouse Gas Emissions and Rural Poverty. Earth Innovation Institute. xvi + 102 p.
Nepstad, D.; Schwartzman, S.; Bamberger, B.; Santilli, M.; Ray, D.; Schlesinger, P.; Lefebvre, P.; Alencar, A.; Prinz, E.; Fiske, G. & Rolla, A. 2006. Inhibition of Amazon deforestation and fire by parks and indigenous lands. Conservation Biology, 20: 65–73.
Nolte, C.; Agrawala, A.; Silvius, K.M. & Soares-Fº., B. 2013. Governance regime and location influence avoided deforestation success of protected areas in the Brazilian Amazon. PNAS 2013 110 (13) 4956-4961. (PNAS Early Edition, published ahead of print March 11, 2013, doi:10.1073/pnas.1214786110.)
Olson, D.M. & E. Dinerstein. 1998. The Global 200: A representation approach to conserving the earth’s most biologically valuable ecoregions. Conservation Biology, 12: 502–515.
Olson, D.M. et alii. 2000. The Global 200: A Representation Approach to Conserving the Earth’s Distinctive Ecoregions. Conservation Science Program, WWF-US, Washington DC, USA.
Olson, D.M.; Dinerstein, E.; Wikramanayake, D.; Burgess, N.D.; Powell, G.V.; Underwood, E.C.; D’Amico, J.A., Itoua, Il; Strand, H.E.; Morrison, J.C.; Loucks, C.J.; Allnutt, T.F.; Ricketts, T.H.; Kura, Y. Lamoreux, J.H.; Wettengel, W.W.; Hedao, P. & Kassem, K.R. 2001. Terrestrial Ecoregions of the World: A New Map of Life on Earth. BioScience, vol. 51 No. 11: 933-938 (November 2001).
Oviedo, G. 2003. [Spanish speaking South America]; lessons learned in the establishment and management of protected areas by indigenous and local communities. Gland, IUCN (CEESP-CMWG and TILCEPA). 52 p. (World Parks Congress, Durban 2003.)
Pacheco, C.; Aguado, I.; & Mollicone, D. 2011a. Dinámica de la deforestación en Venezuela: análisis de los cambios a partir de mapas históricos. Interciencia, vol. 36, nº 8, pp. 578-586. (http://www.interciencia.org/v36_08/578.pdf).
Pacheco, C.; Aguado, I.; & Mollicone, D. 2011b. Las causas de la deforestación en Venezuela: un estudio retrospectivo. BioLlania, 10, 281-292.
Pautrat, L.; Che Piu, H.; Samaniego, C. & Torres, P. 2009. Sistematización y mapeo de actores en los procesos de deforestación en los ejes IIRSA norte y sur del Perú. Derecho, Ambiente y Recursos Naturales (DAR) y WWF-Perú, Lima.
Peru. 2011. FCPF R-PP Peru. World Bank, Washington. 145 p. ((Forest Carbon partnership Facility (FCPF); Readiness Preparation Proposal (R-PP); https://www.forestcarbonpartnership.org/sites/forestcarbonpartnership.org/files/Documents/PDF/Mar2011/Peru%20R-PP-%20Final%20English%20Translation-March7%20version-March16,%202011.pdf).
Phillips, A. 2003. Turning ideas on their head; the new paradigm for protected areas. In: Jaireth, Hanna & Smyth, Dermot (eds.) Innovative governance: indigenous peoples, local communities and protected areas. Ane Books, New Delhi, pp.: 1–27.
Pinheiro, M.R.; Delelis, C.; Costa, C.; Lino, C.F.; Dias, H.; Ferreira, I.V.; Lamas, I.R.; Lederman, M.R.; Fernandes, R.V. & Cardoso, T. M. 2010. Recomendações para reconhecimento e implementação de mosaicos de áreas protegidas. Brasília, GIZ, WWF-Brasil, Valor Natural, Conservação Internacional do Brasil, Fundação SOS Mata Atlântica, Associação Mico-Leão Dourado, Conselho Nacional da Reserva da Biosfera da Mata Atlântica, Cooperação Franco-Brasileira para as Áreas Protegidas. 75 p. + anexos.
RAISG. 2010. Raw organised data collected from several sources in organised spreadsheet on Amazon indigenous territories (for RAISG, 2012, and others). Red Amazónica de Información Socioambiental Georreferenciada . Not published.
RAISG. 2012. Amazonia under Pressure. Red Amazónica de Información Socioambiental Georreferenciada . 68 pages. (www.raisg.socioambiental.org.)
RapidEye. [no date]. RapidEye Imagery for REDDr MRV Activities: Guyana. 4 p. (Customer reference – Guyana Forestry Commission.)
Amazon: There is Hope! If we all do ‘the right thing’… Deforestation, Protected Areas and Indigenous Territories: Past, evolution and… Which future?
43
RedParques, WWF [LAI] et alii. 2010. Progress in the Development of the Program of Work on Protected Areas; Region: Amazon Biome. (Report and 10-year action plan.) Bolivia National Protected Area Service, Ministry of the Environment of Brazil, Colombia National Natural Parks System, Ministry of the Environment of Ecuador, Développement et Aménagement durables of French Guiana, Environmental Protection Agency of Guyana, National Service of Protected Areas of Peru (SERNANP), Forest Service of Suriname, National Park Institute (InParques) of Venezuela, with Secretariat of the CBD, IUCN and WWF. 134 p. + attachments (148 p. in total).
Reid, W.V.; Mooney, H.A; Cropper, A.; Capistrano, D.; Carpenter, S.R.; Chopra, K. et alii. 2005. Ecosystems and Human Well-being: Synthesis. Island Press, Washington. Millennium Ecosystem Assessment. 102 p. + appendixes.
Reymondin, L. 2014 (Jan.-Feb) Informal (email communications, based on Terra-i data, his publications and bibliography). Reymondin, L.; Jarvis, A.; Perez-Uribe, A.; Touval, J.; Argote, K.; Coca, A.; Rebetez, J.; Guevara, E. & Mulligan, M. 2012. A
methodology for near real-time monitoring of habitat change at continental scales using MODIS-NDVI and TRMM. Centro Internacional de Agricultura Tropical (Ciat), The Nature Conservancy (TNC), the School of Business and Engineering (HEIG-VD) and King’s College London (KCL). 33 p. (http://terra-i.org/dms/docs/reports/Terra-i-Method/Terra-i%20Method.pdf)
Ricketts, T.H; Soares-Fº., B.; Fonseca, G.A.B. da; Nepstad, D.; Pfaff, A.; Petsonk, A.; Anderson, A.; Boucher, D.; Cattaneo, A.; Conte, M.; Creighton, K.; Linden, L.; Maretti, C.; Moutinho, P.; Ullman, R.; Victurine, R.; . 2010. Indigenous Lands, Protected Areas, and Slowing Climate Change. PLoS Biol 8(3): e1000331. doi:10.1371/journal.pbio.1000331.
Riveros S., J. C.; 2013a (Jan.) Raw organised data collected from several sources in organised spreadsheet (following themes, etc.) and graphics on Amazon protected areas and indigenous territory (for Riveros, 2013, and Riveros et alii, 2014); not published. [Internal WWF preliminary draft.]
Riveros S., J. C.; 2014 (Jan.) Informal (email communications, further interpreting and explaining the basis of WWF, 2007-08).
Riveros S., J. C.; Hofstede, R.; Granizo, T.; Maretti, C. C. & Oliveira, D. 2014. Protected Areas and Indigenous Territories of the Amazon – Five Decades of Change (1960 -2012); A WWF Living Amazon Initiative report (related to the state of the Amazon). ~48 p. (Internal WWF preliminary draft, updating and complementing Riveros S., J. C.; 2013. 22 p.)
Ruesch, A. & Gibbs, H. K. 2008. New IPCC Tier-1 Global Biomass Carbon Map For the Year 2000. Oak Ridge National Laboratory, Oak Ridge. (Available from the Carbon Dioxide Information Analysis Center http://cdiac.ornl.gov.)
Scharlemann, J.P.W.; Hiederer, R.; Kapos, V. & Ravilious, C. Updated global carbon map. UNEP-WCMC and BfN (German Federal Agency for Nature Conservation). (http://www.unep-wcmc.org/medialibrary/2010/10/05/ebab7f39/Updated%20Global%20Carbon%20Map%20Poster.pdf.)
Soares-Fº., B. S.; Nepstad, D.C.; Curran, L.M.; Cerqueira, G. C.; Garcia, R. A.; Azevedo, C.; Voll, E.; McDonald, A. & Lefebvre, P. 2006. Modeling conservation in the Amazon basin. Nature, 440 (23) 520-523.
Soares-Fº., B.; Dietzsch, L; Moutinho, P.; Falieri, A.; Rodrigues, H.; Pinto, E.; Maretti, C. C.; Scaramuzza, C. A. de M.; Anderson, A.; Suassuna, K.; Lanna, M. & Vasconcelos de Araújo, F. 2009. Reducing Carbon Emissions from Deforestation: the Role of ARPA’s Protected ARPA’s Protected Areas in the Brazilian Amazon. Brasília, WWF-Brasil, with UFMG, IPAM, WHRC 11 p.
Soares-Fº., B.; Moutinho, P.; Nepstad, D.; Bowman, M.; Rodrigues, H.; Anderson, A.; Garcia, R.; Dietzsch, L.; Merry, F.; Hissa, L.; Silvestrini, R.; & Maretti, C. C. 2010. Role of Brazilian Amazon Protected Areas in Climate Change Mitigation. Proceedings of the National Academy of Sciences, 107(24):10821-10826.
Terra-i. 2014. Raw data on Amazon countries deforestation: www.terra-i.org. (Last updated data downloaded on Jan. 20, 2014) Centro Internacional de Agricultura Tropical (Ciat), The Nature Conservancy (TNC), the School of Business and Engineering (HEIG-VD) and King’s College London (KCL). (See Reymondin, 2012.)
The Economist. 2013. Brazil’s conversion; Trees of knowledge; How Brazil is using education, technology and politics to save its rainforest. http://www.economist.com/news/special-report/21585096-how-brazil-using-education-technology-and-politics-save-its-rainforest-trees. Sep 14th 2013 [From the print edition]. (Special report: Biodiversity.)
The REDD Desk. [no date]. Web site with factsheets per country (including Bolivia, Colombia, Ecuador, Guyana and Peru – 2013 last updates), http://theredddesk.org. Global Canopy Programme’s Internet platform ((The REDD Desk; a collaborative resource for REDD readiness; based on evolution of The Little REDD Book.)
Velarde, S.J.; Ugarte-Guerra, J.; Tito, M.R.; Capella, J.L.; Sandoval, M.; Hyman, G.; Castro, A.; Marín, J.A. & Barona, E. 2010. Reducing Emissions from All Land Uses in Peru. Final National Report. World Agroforestry Centre. Nairobi, Kenya. 142 p. (ASB Partnership for the Tropical Forest Margins)
Vergara, W. & Scholz, S.M. (eds.). 2011. Assessment of the Risk of Amazon Dieback. World Bank. xiv + 95 p. (World Bank study.)
WCMC/UNEP with IUCN (WCPA). 2014. World Database on Protected Areas (WDPA); Amazon Countries' protected areas. World Conservation Monitoring Centre, associated to the United Nations Environmental Programme, in collaboration with the International Union for Conservation of Nature (and its World Commission on Protected Areas), and other partners. Home page at http://www.wdpa.org/; Research and data from http://protectedplanet.net/. (Data downloaded on 2014 January 04, 2014, by Cláudio C. Maretti, to the use of WWF Living Amazon Initiative.)
WWF (Amazon Offices, others). 2009 (May). Amazon Network Initiative Strategic Plan – Amazonia Viva / Living Amazon. WWF. 148 p. + annexes. (Version 2.0.)
WWF (ANI/LAI). 2010. WWF’s Living Amazon Initiative; A comprehensive approach to conserving the largest rainforest and river system on Earth. WWF, Brasília, Washington, Lima and other places. 65 p.
WWF Living Amazon Initiative Internal Report
44
(http://wwf.panda.org/what_we_do/where_we_work/amazon/?196095/LIVING-AMAZON-INITIATIVE-STRATEGY-SUMMMARY.)
WWF (UK, LAI). 2010. Amazon Alive: a decade of discovery 1999-2009. WWF. 57 p. (http://wwf.panda.org/?196057/Amazing-Discoveries-in-the-Amazon-New-Species-Found-Every-Three-Days-Over-Last-Decade.)
WWF (UK, LAI). 2013. New species update; internal report. (Not published.) (http://wwf.panda.org/what_we_do/where_we_work/amazon/species/amazon_species_report_2010_2013/ and http://wwf.panda.org/what_we_do/where_we_work/amazon/news/?211676/purring-monkey-among-441-new-species-discovered-in-the-amazon-rainforest.)
WWF. 2007-08 (ANI/LAI). Amazon strategy planning internal work – (to the WWF 2009). (Not published.) WWF-Brasil, IPAM, Linden Trust for Conservation et alii. 2009. Climate change, reducing emissions from deforestation, and
protected areas. Brasilia, October 8th, 2009. Worshop declaration. 7 p. (APs-Redd seminary 2009 Oct. 08, final statement, Maretti, C.C. org./rep.)
WWF-Brasil. [2014]. Observatório de unidades de conservação. Brasília, WWF-Brasil, http://observatorio.wwf.org.br/. (A web platform on Brazilian protected areas – integrated to the CNUC of Brasil [2014]. Last consultation in Apr. 05, 2014)
WWF-Guianas. 2012. Living Guianas Report 2012. WWF Guianas, Paramaribo, and Copernicus Institute, Utrecht. 81 p. WWF-Peru. [no date] Corredor Purús-Manu; la mayor extensión de la Amazonía peruana conservada. Lima, WWF-Peru,
with ICCA (US-Aid) and others. Infographic. (http://peru.panda.org/informate/publicaciones/?212151/corredorpurusmanu; 2013 Nov. 06)
WWF-US. [no date; 2014] Amazon ecoregions WidlFinder. (http://worldwildlife.org/science/wildfinder/ – checked or downloaded on Feb. 02, 2014.)
Amazon: There is Hope! If we all do ‘the right thing’… Deforestation, Protected Areas and Indigenous Territories: Past, evolution and… Which future?
45
Appendix
Procedure of this new analysis of deforestation
Introduction
Most deforestation data and analyses available before the new analysis presented here did not consider the Amazon as an ecological unit (as defined by Living Amazon Initiative - LAI, in WWF, 2007-08 and 2009), or were not based on comprehensive data (rather focusing on one or some specific countries, sub-national administrative entities or ecoregions), or compared data from different sources or based on different methodologies. INPE-PRODES (http://www.obt.inpe.br/prodes/index.php) has a very good process and offers good measuring data (among the world’s bests and with a long systematic history), but it applies only to Brazil and uses a legal, political-administrative definition of the Amazon (not an ecological, or a hydrological one). Among non-governmental efforts, Imazon (http://www.imazon.org.br/) has done significant work, also in Brazil, and its deforestation monitoring data is very important as a possible check on the official data. Some other Amazon countries are evolving in developing their monitoring systems, but in most cases there are not yet consistently defined, applied and accepted methods and sources, the reason being that most of them are new (although some have been making good retrospective efforts) or are not well recognised internationally yet. Two pan-amazon efforts before this new analysis have been considered here. Killeen (2012), however, used different sources and like Coca-Castro et alii (2013 and 2013a), did not use the Amazon’s ecological limits – actually basing themselves on INPE-PRODES (including parts of the Cerrado in Brazil) and considering “Bosque Chiquitano” in Bolivia as part of the Amazon. RAISG (2012 and www.raisg.socioambiental.org checked on Jan. 28, 2014) is also a very important attempt and should be better considered as it evolves, but currently it also considers the political-legal limits (instead of ecological ones) and has not enough consistency across the whole Amazon yet.
New analysis procedure
This new analysis was inspired by Coca-Castro et alii (2013 and 2013a) based on data downloaded from Terra-i (2014 Jan. 20) and used the Amazon definition criteria of the Living Amazon Initiative (WWF, 2007-08 and 2009). The preparation of information for this new analysis considered the following elements and steps: - After analysing several criteria, Living Amazon Initiative (WWF, 2007-08 and 2009) defined the ecological
Amazon considering mostly the bio-geographic limits, particularly expressed by the ecoregions (highlighting their forest and moisture elements), and complementarily the physiographic limits, through the river basins. Within its bio-geographic domain, the ‘Amazon biome’ does include a series of vegetation physiognomies (such as floodplains, swamps, and flooded, bamboo, palm and mixed forests, among others, besides the moist broadleaf forests) and patches of other biomes (such as savannahs and grasslands).
- Coca-Castro et alii (2013 and 2013a) data on ecoregions (from 2004 to 2011, considering their Amazon definition) were compared with the WWF (2007-08 and 2009) Amazon definition and respective ecoregions data.
- Based on WWF (op. cit.), the presence and percentage of ecoregion groups/types were considered within the ecologically defined Amazon (including Amazon forests; savannahs and transitions; and non-typically Amazon ones partially or totally included in the Amazon as defined). Ecoregions with less than 1% within the Amazon biome were excluded.
- Raw data on deforestation from Terra-I (www.terra-i.org; Terra-i, 2014), on countries and ecoregions, from 2004 to 2013, were downloaded (on Jan. 20, 2014). Note: The natural habitat conversion data from Terra-i seems unsuitable for measuring deforestation, but probably indicates tendencies well (Coca-Castro, 2014; and others), and was the only easily available source for the whole ‘Amazon biome’ to be used in this new analysis. In Terra-i (2014) data was available from 2004 to 2013. Nevertheless, 2013 seemed incomplete (or with errors), confirmed by Coca-Castro (2014). Therefore, this new analysis considered the years up to 2012. (however, the 2013 data could give some further although very rough
tendency indications, multiplying by 2 and bearing in mind that the deforestation does not take place at the same rate throughout the year.)
- Data per country were organised disaggregated into ecoregions within countries. Following the WWF definition, the percentage of occurrence in the Amazon was applied to each of them. (Therefore, the resulting information is valid only considering the ecoregions as units, not for spatial variations within them.) The information was then re-aggregated by country and by ecoregion. WWF criteria on ecoregion
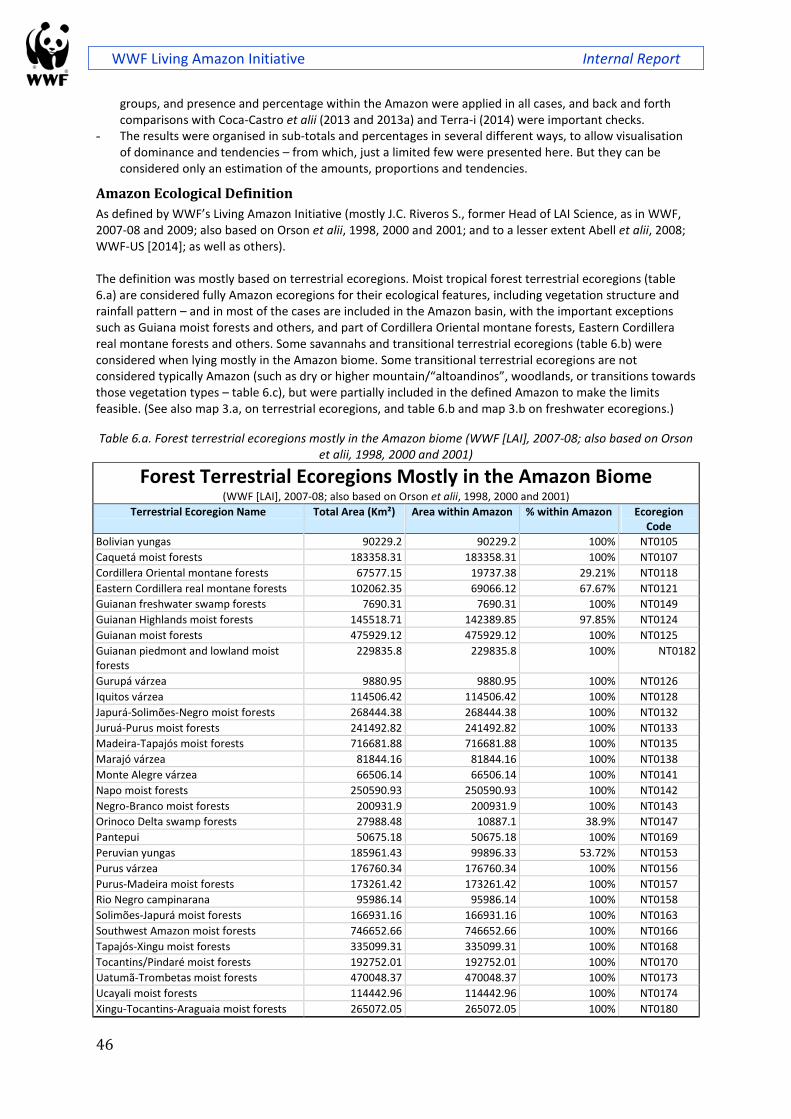
WWF Living Amazon Initiative Internal Report
46
groups, and presence and percentage within the Amazon were applied in all cases, and back and forth comparisons with Coca-Castro et alii (2013 and 2013a) and Terra-i (2014) were important checks.
- The results were organised in sub-totals and percentages in several different ways, to allow visualisation of dominance and tendencies – from which, just a limited few were presented here. But they can be considered only an estimation of the amounts, proportions and tendencies.
Amazon Ecological Definition
As defined by WWF’s Living Amazon Initiative (mostly J.C. Riveros S., former Head of LAI Science, as in WWF, 2007-08 and 2009; also based on Orson et alii, 1998, 2000 and 2001; and to a lesser extent Abell et alii, 2008; WWF-US [2014]; as well as others). The definition was mostly based on terrestrial ecoregions. Moist tropical forest terrestrial ecoregions (table 6.a) are considered fully Amazon ecoregions for their ecological features, including vegetation structure and rainfall pattern – and in most of the cases are included in the Amazon basin, with the important exceptions such as Guiana moist forests and others, and part of Cordillera Oriental montane forests, Eastern Cordillera real montane forests and others. Some savannahs and transitional terrestrial ecoregions (table 6.b) were considered when lying mostly in the Amazon biome. Some transitional terrestrial ecoregions are not considered typically Amazon (such as dry or higher mountain/“altoandinos”, woodlands, or transitions towards those vegetation types – table 6.c), but were partially included in the defined Amazon to make the limits feasible. (See also map 3.a, on terrestrial ecoregions, and table 6.b and map 3.b on freshwater ecoregions.)
Table 6.a. Forest terrestrial ecoregions mostly in the Amazon biome (WWF [LAI], 2007-08; also based on Orson et alii, 1998, 2000 and 2001)
Forest Terrestrial Ecoregions Mostly in the Amazon Biome (WWF [LAI], 2007-08; also based on Orson et alii, 1998, 2000 and 2001)
Terrestrial Ecoregion Name Total Area (Km²) Area within Amazon % within Amazon Ecoregion Code
Bolivian yungas 90229.2 90229.2 100% NT0105
Caquetá moist forests 183358.31 183358.31 100% NT0107
Cordillera Oriental montane forests 67577.15 19737.38 29.21% NT0118
Eastern Cordillera real montane forests 102062.35 69066.12 67.67% NT0121
Guianan freshwater swamp forests 7690.31 7690.31 100% NT0149
Guianan Highlands moist forests 145518.71 142389.85 97.85% NT0124
Guianan moist forests 475929.12 475929.12 100% NT0125
Guianan piedmont and lowland moist forests
229835.8 229835.8 100% NT0182
Gurupá várzea 9880.95 9880.95 100% NT0126
Iquitos várzea 114506.42 114506.42 100% NT0128
Japurá-Solimões-Negro moist forests 268444.38 268444.38 100% NT0132
Juruá-Purus moist forests 241492.82 241492.82 100% NT0133
Madeira-Tapajós moist forests 716681.88 716681.88 100% NT0135
Marajó várzea 81844.16 81844.16 100% NT0138
Monte Alegre várzea 66506.14 66506.14 100% NT0141
Napo moist forests 250590.93 250590.93 100% NT0142
Negro-Branco moist forests 200931.9 200931.9 100% NT0143
Orinoco Delta swamp forests 27988.48 10887.1 38.9% NT0147
Pantepui 50675.18 50675.18 100% NT0169
Peruvian yungas 185961.43 99896.33 53.72% NT0153
Purus várzea 176760.34 176760.34 100% NT0156
Purus-Madeira moist forests 173261.42 173261.42 100% NT0157
Rio Negro campinarana 95986.14 95986.14 100% NT0158
Solimões-Japurá moist forests 166931.16 166931.16 100% NT0163
Southwest Amazon moist forests 746652.66 746652.66 100% NT0166
Tapajós-Xingu moist forests 335099.31 335099.31 100% NT0168
Tocantins/Pindaré moist forests 192752.01 192752.01 100% NT0170
Uatumã-Trombetas moist forests 470048.37 470048.37 100% NT0173
Ucayali moist forests 114442.96 114442.96 100% NT0174
Xingu-Tocantins-Araguaia moist forests 265072.05 265072.05 100% NT0180
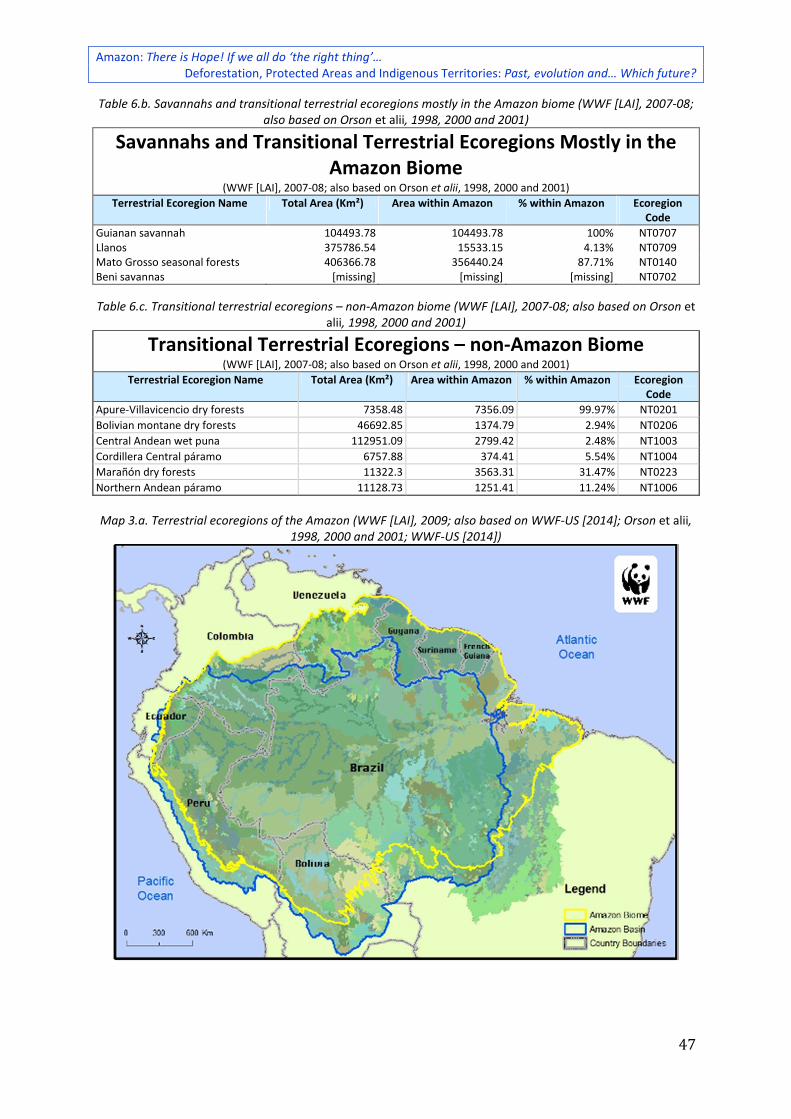
Amazon: There is Hope! If we all do ‘the right thing’… Deforestation, Protected Areas and Indigenous Territories: Past, evolution and… Which future?
47
Table 6.b. Savannahs and transitional terrestrial ecoregions mostly in the Amazon biome (WWF [LAI], 2007-08; also based on Orson et alii, 1998, 2000 and 2001)
Savannahs and Transitional Terrestrial Ecoregions Mostly in the Amazon Biome
(WWF [LAI], 2007-08; also based on Orson et alii, 1998, 2000 and 2001) Terrestrial Ecoregion Name Total Area (Km²) Area within Amazon % within Amazon Ecoregion
Code
Guianan savannah 104493.78 104493.78 100% NT0707 Llanos 375786.54 15533.15 4.13% NT0709 Mato Grosso seasonal forests 406366.78 356440.24 87.71% NT0140 Beni savannas [missing] [missing] [missing] NT0702
Table 6.c. Transitional terrestrial ecoregions – non-Amazon biome (WWF [LAI], 2007-08; also based on Orson et alii, 1998, 2000 and 2001)
Transitional Terrestrial Ecoregions – non-Amazon Biome (WWF [LAI], 2007-08; also based on Orson et alii, 1998, 2000 and 2001)
Terrestrial Ecoregion Name Total Area (Km²) Area within Amazon % within Amazon Ecoregion Code
Apure-Villavicencio dry forests 7358.48 7356.09 99.97% NT0201
Bolivian montane dry forests 46692.85 1374.79 2.94% NT0206
Central Andean wet puna 112951.09 2799.42 2.48% NT1003
Cordillera Central páramo 6757.88 374.41 5.54% NT1004
Marañón dry forests 11322.3 3563.31 31.47% NT0223
Northern Andean páramo 11128.73 1251.41 11.24% NT1006
Map 3.a. Terrestrial ecoregions of the Amazon (WWF [LAI], 2009; also based on WWF-US [2014]; Orson et alii,
1998, 2000 and 2001; WWF-US [2014])
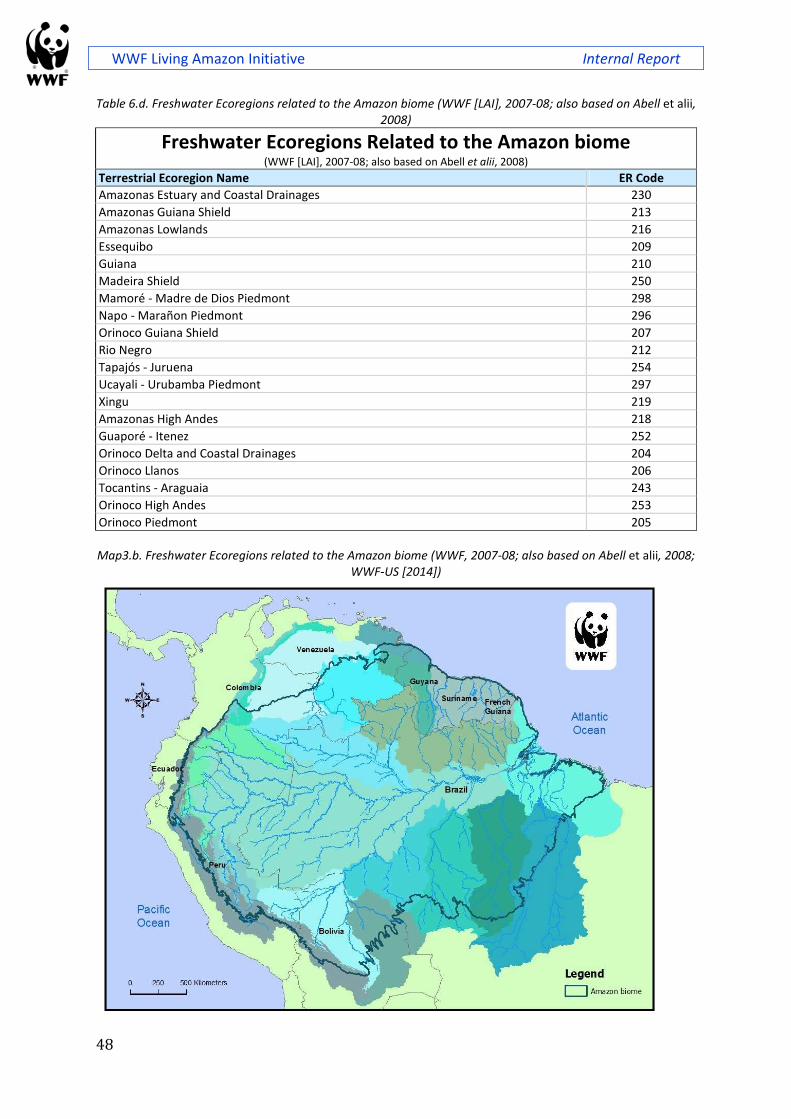
WWF Living Amazon Initiative Internal Report
48
Table 6.d. Freshwater Ecoregions related to the Amazon biome (WWF [LAI], 2007-08; also based on Abell et alii, 2008)
Freshwater Ecoregions Related to the Amazon biome (WWF [LAI], 2007-08; also based on Abell et alii, 2008)
Terrestrial Ecoregion Name ER Code
Amazonas Estuary and Coastal Drainages 230
Amazonas Guiana Shield 213
Amazonas Lowlands 216
Essequibo 209
Guiana 210
Madeira Shield 250
Mamoré - Madre de Dios Piedmont 298
Napo - Marañon Piedmont 296
Orinoco Guiana Shield 207
Rio Negro 212
Tapajós - Juruena 254
Ucayali - Urubamba Piedmont 297
Xingu 219
Amazonas High Andes 218
Guaporé - Itenez 252
Orinoco Delta and Coastal Drainages 204
Orinoco Llanos 206
Tocantins - Araguaia 243
Orinoco High Andes 253
Orinoco Piedmont 205
Map3.b. Freshwater Ecoregions related to the Amazon biome (WWF, 2007-08; also based on Abell et alii, 2008;
WWF-US [2014])
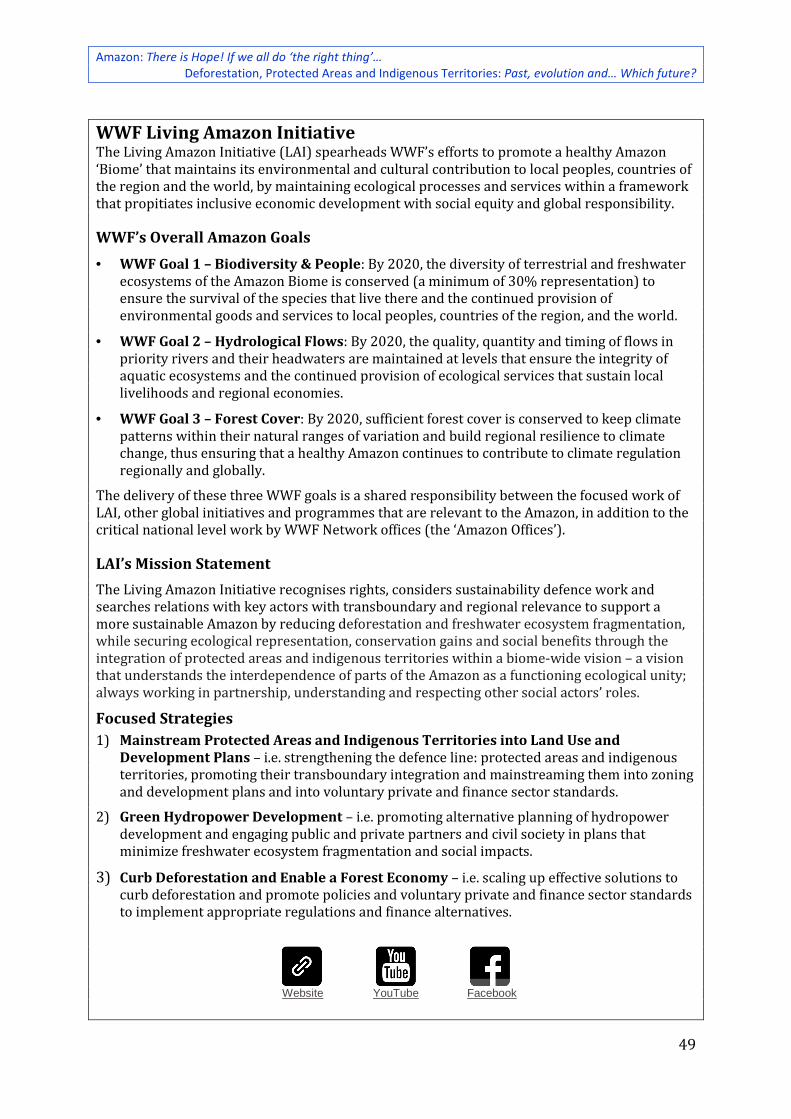
Amazon: There is Hope! If we all do ‘the right thing’… Deforestation, Protected Areas and Indigenous Territories: Past, evolution and… Which future?
49
WWF Living Amazon Initiative The Living Amazon Initiative (LAI) spearheads WWF’s efforts to promote a healthy Amazon
‘Biome’ that maintains its environmental and cultural contribution to local peoples, countries of
the region and the world, by maintaining ecological processes and services within a framework
that propitiates inclusive economic development with social equity and global responsibility.
WWF’s Overall Amazon Goals
• WWF Goal 1 – Biodiversity & People: By 2020, the diversity of terrestrial and freshwater
ecosystems of the Amazon Biome is conserved (a minimum of 30% representation) to
ensure the survival of the species that live there and the continued provision of
environmental goods and services to local peoples, countries of the region, and the world.
• WWF Goal 2 – Hydrological Flows: By 2020, the quality, quantity and timing of flows in
priority rivers and their headwaters are maintained at levels that ensure the integrity of
aquatic ecosystems and the continued provision of ecological services that sustain local
livelihoods and regional economies.
• WWF Goal 3 – Forest Cover: By 2020, sufficient forest cover is conserved to keep climate
patterns within their natural ranges of variation and build regional resilience to climate
change, thus ensuring that a healthy Amazon continues to contribute to climate regulation
regionally and globally.
The delivery of these three WWF goals is a shared responsibility between the focused work of
LAI, other global initiatives and programmes that are relevant to the Amazon, in addition to the
critical national level work by WWF Network offices (the ‘Amazon Offices’).
LAI’s Mission Statement
The Living Amazon Initiative recognises rights, considers sustainability defence work and
searches relations with key actors with transboundary and regional relevance to support a
more sustainable Amazon by reducing deforestation and freshwater ecosystem fragmentation,
while securing ecological representation, conservation gains and social benefits through the
integration of protected areas and indigenous territories within a biome-wide vision – a vision
that understands the interdependence of parts of the Amazon as a functioning ecological unity;
always working in partnership, understanding and respecting other social actors’ roles.
Focused Strategies
1) Mainstream Protected Areas and Indigenous Territories into Land Use and
Development Plans – i.e. strengthening the defence line: protected areas and indigenous
territories, promoting their transboundary integration and mainstreaming them into zoning
and development plans and into voluntary private and finance sector standards.
2) Green Hydropower Development – i.e. promoting alternative planning of hydropower
development and engaging public and private partners and civil society in plans that
minimize freshwater ecosystem fragmentation and social impacts.
3) Curb Deforestation and Enable a Forest Economy – i.e. scaling up effective solutions to
curb deforestation and promote policies and voluntary private and finance sector standards
to implement appropriate regulations and finance alternatives.
Website YouTube Facebook