alternative revenue generation in vermont public schools: raising funds outside the tax base to...
TRANSCRIPT

Alternative Revenue Generation in Vermont Public Schools:
Raising funds outside the tax base to support public education
Thomas Downes Department of Economics
Tufts University e-mail: [email protected]
Jason Steinman
Division of Monetary Affairs Board of Governors of the Federal Reserve System
e-mail: [email protected]
March 2007
Abstract: Nationwide, public school districts are increasingly seeking revenue from non-tax sources, through a variety of direct fund-raising strategies and through affiliated fund-raising organizations (local education foundations, parent teacher associations, parent teacher organizations and booster clubs). The growing importance of private funds in public schools raises a number of questions. This paper uses the intriguing case of Vermont to shed light on two of them: How sensitive is school district fund-raising to policy changes that create incentives for the generation of private revenue? Why do some school districts and supporting organizations raise private funds more effectively than others? We find compelling evidence that the extent to which districts substitute nontraditional revenues for property tax revenues depends on the local tax price. We also document links between variation in the use of nontraditional revenues and variation in factors that are likely to be correlated with the median voter’s tax price. Finally, we find that the success of local education foundations depends both on the environment in which they operate, particularly the wealth of the community, and on the scope of their solicitation activities. Thanks to Eric Brunner, Bill Mathis, Bill Hoyt, Gib Metcalf, Steve Cohen, Lori Taylor, participants at the annual meetings of the National Tax Association and the American Education Finance Association for their helpful suggestions. All remaining errors are attributable to the authors.

1
Introduction
Concerns of educational equity have motivated a series of education finance reforms at
the state level, often dramatically altering the funding streams available to schools. In the past 30
years, states including California, Vermont and Michigan have passed legislation linking
education reform and tax relief, weakening the autonomous capacity of municipalities to raise
revenue through property taxes to support education. School district adaptation to altered policy
incentives and the general fiscal strain of state financial crises, escalating special education costs
and No Child Left Behind compliance, juxtaposed against rising enrollments and rising
expectations for academic success and accountability, demands capitalizing on new opportunities
for revenue creation. Fiscal shortfalls present a noxious alternative, imperiling art and music
instruction, non-fee athletic participation and extracurricular programs, obstructing purchases of
new technology, depressing teacher and administrator salaries and placing upward pressure on
class sizes.
Nationwide, public school districts are increasingly seeking revenue from non-tax
sources, through a variety of direct fundraising strategies and through affiliated fundraising
organizations (local education foundations (LEFs), parent teacher associations (PTAs), parent
teacher organizations (PTOs) and booster clubs). The growing importance of private funds in
public schools raises a number of questions. This paper uses the intriguing case of Vermont to
shed light on two of them: How sensitive is school district fundraising to policy changes that
create incentives for the generation of private revenue? Why do some school districts and
supporting organizations raise private funds more effectively than others?
The existing literature on the questions of interest is relatively sparse. The only study
explicitly linking policy incentives to increased private revenue generation in public schools is

2
Brunner and Sonstelie’s (1996) analysis of the California case. The only academic investigation
of fundraising performed directly by schools and districts appears to be Zimmer, Krop and
Brewer’s (2003) investigation of 6 Southern California districts. The literature on supporting
fundraising organizations – local education foundations, parent teacher
associations/organizations and booster clubs is somewhat broader. Generally, however, these
studies leverage only a single source of information: quantitative IRS data, quantitative school
district data, or survey data. In addition, none of these studies have shed light on the relative
efficacy of specific fundraising strategies.
A dramatic policy change and stable demographic conditions in Vermont provide an
excellent opportunity to study the sensitivity of public school alternative revenue generation to
policy incentives and determinants of its success. The Equal Educational Opportunity Act (Act
60) of 1997 dramatically changed the school finance landscape in Vermont. Act 60, incremental
implementation of which began in fiscal year 1999 with full implementation in fiscal year 2001,
created tax prices of more than $1 for education in 125 of Vermont’s 253 towns and tax prices of
$2 or more in 37 towns. (Schmidt and Scott, 2004). For Stratton, the most extreme case,
taxpayers were required to contribute more than $30 in local taxes for every $1 increase in local
education spending above the foundation amount (Schmidt and Scott, 2004). Since Act 60 did
not regulate the generation of non-tax revenue, (every dollar of non-tax revenue generated
directly increased local education spending by $1), towns with a tax price of more than one
dollar faced an incentive to generate all local revenue for education above foundation outside of
the tax system.
Community members in many towns with high tax prices (gold towns) formed LEFs,
501(c)3 non profit organizations with the express purpose of raising resources for the public

3
schools. These LEFs served as the primary conduit for generation of sharing pool exempt non-
tax revenue in the gold towns. Foundations in towns with as few as 1000 residents raised more
than one million dollars in annual revenue, with some towns disdaining to use property taxes to
fund education beyond the base level of spending that was financed through state aid. Incentives
for private fundraising were strong enough that some towns used strong arm tactics, such as
publishing names of non-contributors or boycotting non-contributing businesses.
Nevertheless, local education foundations were not successfully established in all
Vermont towns where there was a financial incentive for their operation. Among foundations
successfully launched, some raised per pupil more revenue than others. Some easily cleared
fundraising goals, while others struggled, and still others failed.
This paper seeks to explain the response of the Vermont gold towns to Act 60 and the
varying success of their private fundraising efforts. In particular, the empirical analysis
investigates the rapidity and extent of the gold towns’ responses, and the role demographics,
district characteristics, selection of fundraising strategy, and foundation governance and
operation played in the fundraising disparities between districts.
The study encompasses fiscal years 1996 through 2004, covering the pre-Act 60 period
(1996-1998) in which a traditional foundation formula allocated state aid, the incremental
implementation of Act 60 (1999-2000) and the full implementation of Act 60 (2001-2004).
Detailed quantitative IRS data on affiliated fundraising organizations, school district financial
and administrative data, Census data, survey data and personal interviews provide a rich basis of
information.
The first section reviews the existing literature. The next section describes the data
sources analyzed. The third section describes the methods used for analysis. Results appear in the

4
fourth section. We find compelling evidence that the extent to which districts substitute
nontraditional revenues for property tax revenues depends on the local tax price. We also
document links between variation in the use of nontraditional revenues and variation in factors
that are likely to be correlated with the median voter’s tax price. Finally, we find that the success
of local education foundations depends both on the environment in which they operate,
particularly the wealth of the community, and on the scope of their solicitation activities. The
fifth section concludes.
Context
In 1997 the Supreme Court of the State of Vermont invalidated the existing system of
education financing in the state, concluding that the system deprived “children of an equal
educational opportunity in violation of the Vermont Constitution” (Brigham v. State (96-502);
166 Vt. 246). While the court decision focused on inequities in spending, the support in the state
for the suit grew out of widespread dissatisfaction with inequalities in educational spending and
disparities in property tax burdens resulting from the existing foundation system of education
financing and the existing system of property taxation.
The discontent with the system of education finance which resulted in the suit also
influenced the dynamics of the 1996 legislative elections. The state senate that was elected in
1996 was committed to property tax reform (Mathis, 2001). The result was a state legislature
that was ready to move on legislation that would comply with the Brigham decision and reduce
the property tax burdens of poor individuals.
Given the political dynamic in Vermont, the speed with which Act 60, the legislation
designed to comply with Brigham and to provide property tax relief, was passed surprised no
one. Signed into law on June 26, 1997, Act 60 created a system of school financing that
5
combined elements of foundation and power equalization plans. A statewide property tax was
established, with revenues from the tax being used to finance a portion of foundation aid.1 If in a
locality property tax revenues generated by levying the statewide rate exceed the amount needed
to finance the foundation level of spending, the excess property tax revenues are recaptured by
the state.
Under Act 60, localities were allowed to choose spending levels in excess of the
foundation level. To weaken the link between property wealth and spending in excess of the
foundation level, the act established a power equalization scheme that insured that localities with
the same nominal tax rates would have the same levels of education spending. As other district
power equalization reforms, Act 60 sought to equalize tax bases and per pupil tax yields for
education across the state. Act 60 importantly diverged from traditional district power
equalization in the financing of the system. In most district power equalization systems, aid
drawn from state funds supplements the tax yields of the low property wealth towns. Act 60
deviated from this norm, creating a sharing pool that directly tapped local property tax revenues
from property-rich towns to supply the aid to property-poor towns. Because the sharing pool’s
redistribution mechanism utilized property tax revenues from gold towns to finance the power
equalizing aid to property-poor towns, the marginal tax price of education increased in some
towns, and the tax rate required for a given level of additional education spending fell in others.
Schmidt and Scott (2004) document the dramatic impact of the reforms on the tax prices for
education faced by Vermont towns.
While the Brigham decision forced state policy makers to implement finance reforms, the
reality was that Act 60 was as much about property tax relief as it was about school finance
reform. For taxpayers in many communities, the finance reforms by themselves would have
1In the 2000-2001 school year, the nominal property tax rate was 1.1 percent, and the foundation level was $5200.

6
dramatically reduced tax burdens by allowing localities to maintain or even increase education
spending with substantially lower tax rates. At the same time, taxpayers in high-wealth
communities, which have been labeled “gold towns,” necessarily faced increases in their
property tax payments.2 To lessen the burden on low-income residents of the “gold towns,” the
drafters of Act 60 included in the legislation a provision that granted tax adjustments to certain
homestead owners. These tax adjustments were explicitly linked to the taxpayer’s income; the
original legislation specified that all owners with incomes at or below $75,000 were eligible for
adjustments.
All residents of “gold towns” had access to a second avenue for limiting their tax
liability, private contributions. Act 60 did not regulate the generation of non-tax revenue; every
dollar of non-tax revenue generated directly increased local education spending by $1. As a
result, towns with a tax price of more than one dollar faced an incentive to generate all local
revenue for education above foundation outside of the tax system. Yet not all towns with tax
prices in excess of $1 made equal use of this option. Understanding why this was so is the main
goal of this paper.
Not surprisingly, Act 60 generated significant unhappiness and strong criticism from the
property rich towns3 and was repealed by the Vermont legislature in 2004 by the passage of Act
68. Act 68 eliminated the sharing pool and reduced the marginal tax rates for education to below
$1 in the gold towns. Implemented in fiscal year 2005, Act 68 entirely removed Act 60’s
incentives for financing public education through non-tax revenue.
2In the 1994-95 school year, 69 of the 248 towns in Vermont for which data were available had effective education property tax rates below $1.10 per $100 in assessed value. While the percentage of towns with effective education rates below $1.10 had undoubtedly declined by the 1997-98 school year, the last year before the phasing in of Act 60 began, the reality was still that Act 60 forced a sizeable fraction of the towns in Vermont to increase property tax rates. 3 A lawsuit filed by the towns of Wilmington and Whitingham challenging the legality of Act 60, and the town of Killington’s threat of secession from the state provide the most extreme examples of the disapproval of the property-rich towns.

7
The short period in which Act 60 was fully operative provides us with a stark natural
experiment that allows us to quantify the extent to which generation of nontraditional revenues
responds to the incentives created by the financing system. In addition, the Vermont context
gives us a unique opportunity to document the degree to which nontraditional revenues limit the
extent to which finance reform has produced equalization.
Literature Review
Exploring the extent to which residents of school districts in Vermont responded to the
incentives implicit in Act 60 will be at the core of the empirical work that follows. As a result.,
this paper builds most directly off of the work of Brunner and Sonstelie (1996). In 1978,
California’s Proposition 13 limited local property taxes to 1% of assessed value, severely
inhibiting the ability of municipalities to raise revenue to supplement state foundation aid.
Brunner and Sonstelie chart the explosive growth of local education foundations in California,
from 22 in 1978, to more than 500 by the mid-90s. By 1992, LEFs, PTAs, PTOs, booster clubs
and urban foundations contributed more than $100 million in total to support public education.
Brunner and Sonstelie demonstrate that districts whose revenue generating capacity was most
severely constrained by Proposition 13 generated much more average private revenue per pupil
than less constrained districts.
In a follow-up paper, Brunner and Sonstelie (2003) describe the fallout from Proposition
13 as a government failure to provide a level of service (education) for which taxpayers were
willing to pay, equating private support of public schools to a type of voluntary fiscal federalism.
Collective action filled the taxation void, generating new fundraising organizations and strategies
to privately supplement public schooling.
8
Devoid of the legally binding authority to compel cooperation, collective action is
perpetually haunted by the specter of free riding. In the case of local education foundations, as
in other efforts to provide privately public goods, a variety of strategies and circumstances
ameliorate and intensify the free rider problem. As a result, in addition to exploring the link
between the incentives implicit in Act 60 and the extent to which nontraditional revenues were
part of a school district’s total revenues, we will also draw on the growing literature that has
examined the determinants of private fundraising success. It is to that literature that we now
turn.
Brunner and Sonstelie posit that social interaction, through the creation of a group
identity among families, enhances individual generosity4. The depressing effect of face to face
encounters on free riding may explain the greater success of foundations in Vermont towns with
a defined town center as compared to Vermont towns with no defined center (Fischel, 2003).
Fundraising organizations set annual fundraising goals, institutionalizing the collective
philanthropic decision-making process (Brunner and Sonstelie, 1996). To promote a sense of
sustainability and collective responsibility, many Vermont LEFs set a minimum monetary goal
and a minimum contribution rate for the initiation of a fund.
Social norms condemning free riding on the contributions of others encourage successful
collective generosity (Fehr and Gachter, 2000), while individual differences in demand for
school quality, income level and attitudes toward free riding discourage equal contributions.
Brunner and Sonstelie (2003) hypothesize that individuals contribute up to where the price of
cooperation equals the cost of free-riding. In Vermont, foundations attempted to enhance
contributions by raising the cost of free-riding. The Manchester School Fund publicized names
4 The authors explicitly reject Sugden’s (1985) theory that social interactions reduce generosity through fear of one individual’s contributions encouraging others to free ride.

9
of non contributors, and some residents refused to patronize businesses which were not
scholastic benefactors (Fischel, 2003).
The surrounding socioeconomic and community context also influence the fundraising
dynamic, as the success of various strategies and the generosity of different types of donors vary
by community type. In Zimmer, Krop and Brewer (2003), parental support was strongest in the
communities on the highest end of the socioeconomic scale. Wealthier schools relied more on
parents for in-kind as well as monetary contributions, while poorer schools, which did not have
strong parent associations, received more in-kind donations from local businesses and
community organizations. Poorer districts reached out to more donors than wealthier districts,
and enjoyed greater access to corporations, philanthropic foundations and community-based
organizations than wealthier schools.
In Zimmer, Krop and Brewer (2003), wealthier schools, despite relying on relatively
fewer donors, employed more mechanisms to attract their support. Wealthier schools and
districts strongly focused on securing monetary donations, while poorer schools and districts
focused relatively more on in-kind contributions.
The inconstancy of fundraising across community types raises equity concerns. If
wealthier schools and districts can more successfully attract private resources than poorer
schools and districts, private fundraising threatens to undo state resource equalizing mechanisms.
Thus far, private fundraising has been sufficiently small in relative terms so as to not severely
alter the distributions of resources, but relative advantages in fundraising in wealthy
communities pose long-term concerns if a scholastic reliance on private funds continues to
increase. In Zimmer, Krop and Brewer (2003), wealthier districts attracted more monetary

10
support than poorer districts5, and, as district wealth increased, so did the number of programs,
services and materials purchased with private monetary donations. However, middle and lower
income schools attracted at least as much in-kind support as the wealthier schools and, even for
the wealthiest schools, private monetary contributions accounted for less than 5% of the school
budget.
Of the various public school fundraising strategies, one of the most intriguing, most
studied, and perhaps the most relevant to the Vermont context is the creation of local education
foundations. Nationwide, most local education foundations came in existence after 1989 (Merz
and Frankel, 1995). Most were formed with specific goals in mind and a majority in
Massachusetts (Medina, 1988), California6, Illinois, Oregon, and Washington were formed
because of declining public school revenue. In Vermont, the passage of Act 60 in 1997 provided
the impetus for the state’s LEF boom.
Research on LEF formation has established that, while the district administration most
often initiated LEFs, broad community support tended to be crucial for their survival (Merz and
Frankel, 1995). Foundations tended to develop faster in cohesive communities, as compared to
large districts or multiple districts (McCormick, Bauer, and Ferguson, 2001).
Few foundations pay employees (Merz and Frankel, 1995), but those with paid
fundraisers and/or paid staff raise significantly more revenue7 (Merz and Frankel, 1995, Muro,
1995) more quickly (Muro, 1995) than LEFs entirely reliant on volunteers. Most staff positions
5 This was partly attributed to increased revenue generation through LEFs. 6 Brunner and Sonstelie (1996) found that school fundraising organizations in districts whose revenue generating capacity was most negatively impacted by reform generated the most revenue per pupil. However, the high correlation between statutory impact and district wealth muddies this conclusion. 7 Merz and Frankel acknowledge that LEFs which employ paid fundraisers and staff tend to be larger and older. At least some of their increased revenue generating potential, then, is likely explained by reach and experience as opposed to hired staff.

11
were found to be part-time and very low paying. In addition to staff support,8 a paid executive
director facilitates fundraising (McCormick, Bauer, and Ferguson, 2001, Muro, 1995), because
of the director’s broad responsibilities - brokering relations, implementing programs, raising
organizational visibility - and the dramatic increase in volunteer time necessary to compensate
for the absence of a paid director (Muro, 1995).
Foundations which directly solicited contributions raised on average more than one and a
half times as much as those which did not (Merz and Frankel, 1995). Most foundations used mail
or phone solicitations and asked for annual contributions. Direct mail solicitation is costly, but
builds a donor list (McCormick, Bauer, and Ferguson, 2001).
Elementary and K-12 foundations raised more than high school foundations (averages of
$41,267 and $37,817 as compared to an average of $12,950) (Merz and Frankel, 1995).9
Brunner and Sonstelie (1996) discovered that California education fundraising organizations
associated with elementary schools raised more revenue per pupil than organizations associated
with other grade levels. Brunner and Sonstelie (2003) found that parental philanthropic
collaboration deteriorated, albeit slowly, as schools increased in size.
LEFs have generally enjoyed greater success in wealthier communities, but in neither
California nor Michigan have LEFs have not have raised sufficient revenue to affect significantly
state efforts to equalize the distribution of revenue. Merz and Frankel (1995) discovered
foundations to be more successful, but not more prevalent, in high-income communities, and
noted that successful LEFs have been formed in communities of all income levels. Addonizio
(1998) found Michigan foundations to be more prevalent in districts with higher average
8 In the first two years, generally 6 hours a week of secretarial support is sufficient for foundations, which, in many cases, can be provided by the school district (McCormick, Bauer, and Ferguson, 2001). 9 Personal interviews attributed this to lesser parent involvement in the education of high school children, a shorter time frame (4 years) for developing a relationship with parents and parental focus on saving for college.

12
incomes, smaller fractions minority, larger enrollments, higher spending, and higher levels of
scholastic achievement. In progressively wealthier districts in California, there were more non-
profits reporting more than $25,000 in revenues, and a better chance that an LEF would be found
in the district (Brunner and Sonstelie, 1996). These progressively wealthier districts also raised
increasing amounts of revenue per pupil. In Zimmer, Krop, and Brewer, (2003) LEFs were found
at districts of all income levels, but were particularly active in the two wealthiest districts.
McCormick, Bauer, and Ferguson (2001) argued that a large corporate base, a large base of
individual wealth, and a high percentage of professionals facilitate a foundation’s success.
Surprisingly, the existence of many retired people or many families without children in
foundation districts did not affect fundraising success (Merz and Frankel, 1995). Case study
analysis of foundation success in Vermont has tended to confirm this observation, with
nonresidential property owners the least likely to free ride and owners of vacation homes in ski
resorts contributing reliably (Fischel, 2003). In Killington, where most of the condominiums are
managed by full time employees, the managers collectively convinced the owners’ associations
to bill members for LEF contributions. Because of the tax prebates awarded to families with less
than $75,000 in adjusted gross income, successfully organizing a foundation was more difficult
for property-rich towns with many low-income families (Fischel, 2003).
Addonizio (1998) concluded that LEFs did not “measurably negate” Michigan’s
education equalization efforts. Analyzing private contribution levels by district type and linking
contribution levels to school inputs and resource levels in California, Brunner and Imazeki
(2003) concluded that more than 99% of elementary school students attended schools where
private contributions “have almost no effect on inputs.” A few schools, small in number and
generally small in size, raised large amounts of private funds (more than $500 per pupil) which

13
were used to purchase more computers and teacher aides and reduce class-sizes and teacher-
pupil ratios, but these were isolated instances and appeared to offset lower levels of government
revenue that the higher income districts receive. Merz and Frankel also found LEF funds to be
decidedly supplemental, with foundations raising an average of 0.3% of the district budget.
Data
The data analyzed in this research are comprised of financial data on Vermont non-profit
organizations acquired through the purchase of data sets from the Urban Institute’s National
Center for Charitable Statistics (NCCS), school district data available through the Common Core
of Data maintained by the National Center for Education Statistics, town level school
expenditure and administrative data obtained from the Vermont School Report, publications of
the Vermont Tax Department, and the Vermont Department of Education, and migration and age
demographic data from the Census.
The NCCS data contain detailed financial information gleaned from the form 990 that all
501(c)3 non-profit organizations generating more than $25,000 in annual revenue must file with
the Internal Revenue Service. Included among these organizations are the local education
foundations, parent teacher organizations and booster clubs which this paper substantially
investigates. Nineteen NCCS data sets of three different types were acquired. Core data sets for
Vermont public charities for the years 1995-2002 contain data on from 73 (1995) to 124 (2002)
variables from the Form 990 including classification and identifying information, revenue,
expenses and net income, balance sheet and net assets information, and organizational activities.
Core data sets for Vermont private foundations for the years 1995-2002 contain data on from 60
(1995) to 154 (2002) variables from the Form 990 including classification and identifying
information, revenue, expenses and net income, balance sheet and net assets information, and

14
foundation activities. Digitized data sets include 178 variables from the functional expenses
portion of the 990 form, 121 variables from the balance sheet portion of the 990 form and 52
variables from the other information portion of the 990 form for public charities for the years
1998-2001.
The subset of nonprofits wholly or substantially supporting local public schools was
drawn in an iterative manner. Searches were performed on Guidestar, an online national database
of nonprofits. For public charities, searches were performed for Vermont nonprofits for the
following key words in field “non-profit name”: “school and foundation,” “education and
foundation,” “education and fund,” “school and fund,” “educational and foundation,” “friends
of,” “parent and teacher,” “parents and teacher,” and “PTO.” Keyword searches for “school” and
“public education” were also performed.
The general National Taxonomy of Exempt Entities major group codes for education (B)
and Philanthropy, Voluntarism and Grantmaking Foundations as well as the NTEE core codes of
each organization in the subset were searched in the Core 2002, Core 2000, Core 1998 and Core
1996 data sets. Since the core data sets contain the most recent return year for each organization
that filed in the last three calendar years and cover one of the last three fiscal years (the core
2001 data sets cover fiscal years 1999 through 2002, for example), this search encompassed all
organizations filing within the time period.
For the private foundations, a search was performed for all Vermont private operating
and non-operating foundations in the category of education and as well as for public, society
benefit. Name and keyword searches for “school” and “education” were also performed. The
NTEE major group codes for education (B) and Philanthropy, Voluntarism, and Grantmaking

15
Foundations (T), as well as the Z99 NTEE Core code (unknown) were searched in the Core
2002, Core 2000, Core 1998 and Core 1996 data sets.
The profiles of the organizations were in most cases sufficient to determine the primary
purpose of the organization, but when profiles did not contain sufficient information, PDF
versions of the 990 forms were examined10 and Google searches were used to find out more
about the organizations. Those organizations with a primary purpose of providing support to
local public schools were included in the local education foundation subset. These organizations
were then compared against a spreadsheet of private contributions reported from each town in
Vermont compiled by the Vermont Department of Education. In cases where towns reported
receiving significant (greater than $10,000) private donations and the public contribution figures
from education foundations located in the town did not closely match, or no local education
foundations with the same zip code as the town were represented in the local education
foundation subset, city and county searches were then performed on Guidestar to identify any
organizations missed by the initial search.
The Common Core data provide information on school district revenues and expenses,
including data on tax revenue and non-tax income sources such as user fees, capital gains,
tuition, and miscellaneous alternative revenue as well as enrollment figures, per pupil expenses
and test score information. The Vermont Education Report, Vermont Tax Department
publications, and Vermont Department of Education data provide measures of school district
characteristics, including property wealth, income, school inputs, and salaries.
There are several important limitations to the data. The affiliated organizations data
exclude organizations raising less than $25,000 in annual revenue. Some organizations raising
more than $25,000 in annual revenue are also excluded from the analysis either due to a lack of
10 For the private foundations, the “direct charitable activities” section was particularly useful in this regard.

16
enrollment information for the school district (Craftsbury School Corporation) or due to their
absence in the underlying data (the North Hero Education Fund). Additionally, the Freeman
Foundation provided more than $14 million in grants to these organizations between 1999 and
2001 to facilitate start-up and to match taxpayer donations. These contributions represent a
potentially significant confounding factor. As Freeman grants were awarded to virtually every
major local education foundation, with most receiving matching grants, their effect is mostly one
of magnitude, not distribution. In the empirical models below, we use time dummies to account
for the impact of Freeman Foundation grants and other effects that tended to be common across
foundations.
The membership figures from the Common Core of Data do not include students that are
tuitioned out of a district to attend public school in a neighboring district. These data provide an
accurate picture of the number of students educated in a district in a given year, but may not
accurately indicate the number of pupils for whose schooling a district is required to pay. For
that reason, average daily membership figures from the Vermont Department of Education were
used to calculate all per pupil revenue and expenditure amounts.
In the limited literature that has examined the determinants of nontraditional revenue,
schools or districts have always been the unit of analysis. When contributions have been the
component of nontraditional revenues analyzed, the $25,000 minimum required for reporting has
created a censoring problem. Our data allow us to avoid that problem in two ways. First, when
school districts are the unit of analysis, we use as our dependent variables the various measures
of nontraditional revenue available from the Common Core of Data. Since most districts
generate some of these revenues, particularly in times of fiscal stress, censoring is not a problem.
17
In addition, we are able to look more completely at the nature of district responses to fiscal
stress.
What the Common Core data do not allow us to do is separately analyze districts and
schools. Therefore, we cannot, as Brunner and Sonstelie could, determine if there were
differences between districts and schools in the impact of certain determinants of contributions.
This inability is less problematic in the Vermont context than it was in the California context
considered by Brunner and Sonstelie, since the norm in Vermont is that districts include a single
school.
While our data on nonprofits supporting public schools are similar to the data analyzed
by Brunner and Sonstelie (1997, 2003) and Brunner and Imazeki (2005), we have chosen to
analyze these data by treating the nonprofits themselves as the unit of analysis, rather than
creating district- and school-level measures of voluntary contributions. This decision was driven
partly by our concern that the $25,000 reporting threshold could create substantial selection
problems. But the main motivation for treating the nonprofits as the unit of analysis was our
desire to understand better the factors that contribute to foundation success. Thus, while we
mirror the work of Brunner and Sonstelie (2003) and examine the link between the attributes of
the district(s) served by a foundation and its contributions, we also take advantage of the richness
of our data to consider other attributes of foundations that could contribute to their success.
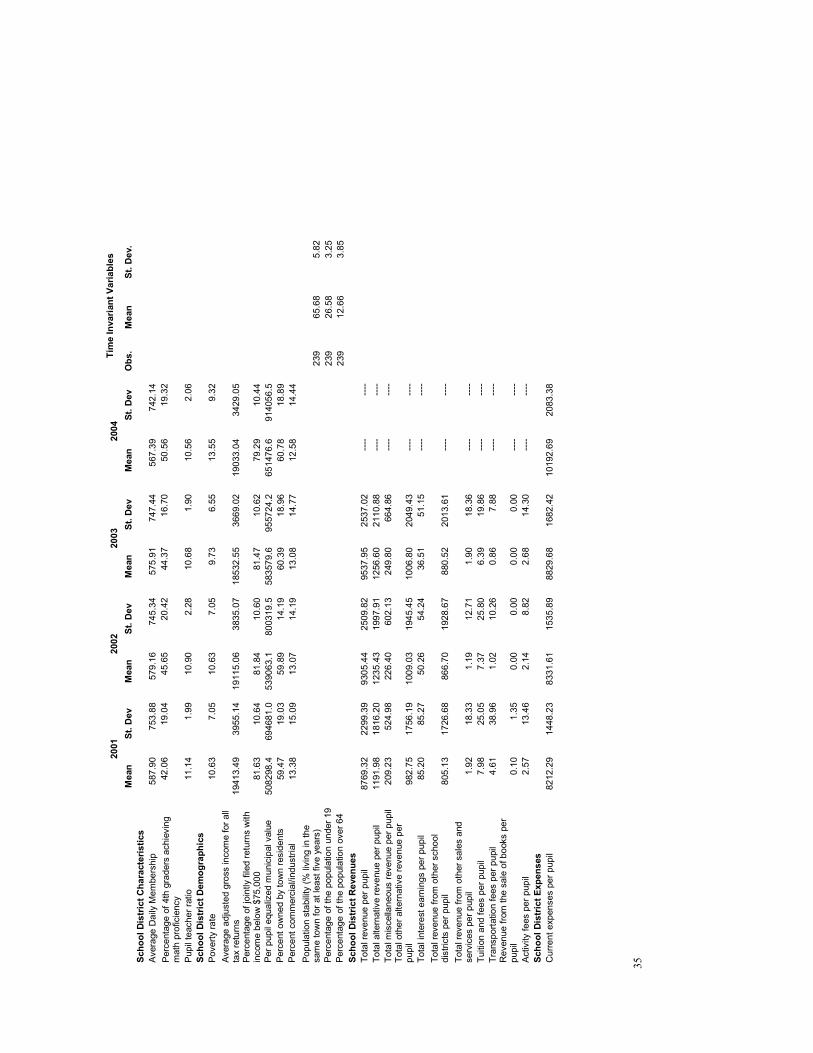
Table 1 includes summary measures for the school district data. Student enrollment in
Vermont declined for each post-Act 60 year. School achievement, as measured by fourth grade
test scores, was on the rise, and the pupil-teacher ratio was consistently declining. Total school
district revenue consistently increased, and per pupil expenditures did the same after the passage
of Act 60. Most relevant to this study, alternative revenue, composed of interest earnings,

18
revenue from other school districts, revenue from other sales and services, tuition and fees,
transportation fees, revenue from book sales, activity fees, federal math, science and professional
development grants, and miscellaneous revenues, increased constantly, registering dramatic
increases in 2000 and 2001. The mean per pupil level of alternative revenue increased almost
25% between fiscal years 1999 and 2001.
The bulk of this increase is derived from two sources: miscellaneous revenues and
revenues from other school districts. Miscellaneous revenues, a catch-all alternative revenue
category including contributions from the local education foundations, increased the most
dramatically. After an unexplained decline to about $60 per pupil in fiscal year 1999,
miscellaneous revenues more than doubled, in real terms, by fiscal year 2001. Revenues from
other school districts, comprised most significantly of tuition monies received to educate
students from other towns, jumped from $795.73 per pupil in fiscal year 2000 to $865.19 in
fiscal year 2001 and $957.83 by fiscal year 2003.
The numbers in Table 1 provide an incomplete picture of the import of nontraditional
revenues for some districts. Examining the evolution of the distribution of miscellaneous
revenues as a share of total revenues provides a much clear indication of how important for some
districts contributions became in the post-Act 60 period. In the period we consider, the median
of miscellaneous revenues as a fraction of total revenues reached its maximum of 0.00934 in
fiscal year 1997. In the fiscal years from 1999 to 2003, this median moved up and down, never
exceeding 0.00425. The evolution of the upper percentiles of this fraction was very different.
For example, the 95th percentile of miscellaneous revenues as a fraction of total revenues drifted
upward to 0.03547 in fiscal 1998, and then declined to 0.02492 in fiscal year 1999. In every
fiscal year after 1999, the 95th percentile increased, rising to 0.07833 in 2000, 0.1637 in 2001,

19
0.2067 in 2002, and 0.2194 in 2003. For a subset of districts, miscellaneous revenues had gone
from being inconsequential to comprising over a fifth of revenues.
The effect of this growth in nontraditional revenues on inequality is difficult to quantify,
since we can never know what would have happened to revenues if districts with dramatic
growth of nontraditional revenues had been forced to participate in the sharing pool. If,
however, we assume that miscellaneous revenues remained at their pre-Act 60 levels and that
districts opting out of the sharing pool post-Act 60 would have done so even if they did not have
access to contributions and other nontraditional revenues, we can provide an upper bound on the
extent to which access to nontraditional revenues limited inequality reductions after Act 60.
To execute this thought exercise, we set per pupil miscellaneous revenues in each fiscal
year from 1999 to 2003 equal to the real value of the average of per pupil miscellaneous
revenues in fiscal years 1996, 1997, and 1998. We then computed pupil-weighted inequality
measures using actual revenues and this alternative revenue measure. For Vermont districts
serving elementary students, the Gini coefficient for actual revenues was 0.1026 in 1998. For
these districts for the fiscal years from 1999 to 2003, the actual values of the Gini coefficients
were 0.1007, 0.0869, 0.0986, 0.1008, and 0.0965. For these districts for fiscal years 1999 to
2003, the Gini coefficients for the alternative revenue measure were 0.1003, 0.0887, 0.0935,
0.0958, and 0.0903. The implication is that, while nontraditional revenues had little impact on
inequality in the transition years of 1999 and 2000, the effects of these revenues had potentially
become large by fiscal year 2003. And while the actual Gini likely would not have fallen to
0.0903 in 2003 if access to nontraditional revenues had been constrained, the difference between
the actual Gini of 0.0965 and this alternative Gini of 0.0903 may give a rough indication of the
extent to which redistribution of economic resources was undone by access to nontraditional

20
revenues, since the economic burden of financing the local schools on property owners in gold
towns would have been larger if those towns had not been able to opt out of the sharing pool.
Further trends present themselves in the affiliated fundraising organizations data,
summarized in Table 2. The number of affiliated organization dramatically increases from 10 in
fiscal year 1998 to 29 in fiscal year 1999, the first year of Act 60’s implementation. By the full
implementation of Act 60, the number of organizations had increased to 40. Beginning in 1998,
the organizations generated much greater per pupil contribution levels and much more total
revenue. Mean real per pupil contributions increased from $57.78 in 1997 to $343.67 in 1998 to
$996.20 in 1999. After 1999, contributions declined and flattened out at between $889 and $982
per pupil11. Beginning in 1998, contributions accounted for virtually all revenues received by the
organizations.
Solicitation expenses and compensation do not significantly detract from overall
affiliated organizations revenue, with solicitation expenses never exceeding 1.5% of mean total
revenue and total compensation never exceeding 2% of mean total revenue. No organization
reported any rental expenses and the $100 in lobbying expenses by the Edmunds Elementary
School Parent Teacher Organization was the only reported political expenditure. This largely
corroborates Merz and Frankel (1995), who also found that, for local education foundations,
there was very little leakage of revenue targeted for schools.
Beginning in 1998, solicitation expenses and their component parts followed no time
trend. The presence of paid staff hovered between 26% and 40% between 1998 and 2003, with
the exception of 1999 where this percentage fell to 13.8%. The concurrence of a decline in paid
11 The decline of contributions in 2002 is attributable, at least in part, to the cessation of Freeman Foundation grants. Data from the Vermont Department of Education indicate that these foundation contributions virtually disappeared after the passage of Act 68. Donated dollars reported by the schools dropped from more than $11million in fiscal year 2004 to less than $80,000 in fiscal year 2005.

21
staff and the initial filings of a majority of the Act 60 local education foundations likely indicates
a lag between organization start-up and hiring staff. Other compensation increased dramatically
from 1999 to 2003, rising in real dollars per pupil every year, with particularly large increases
between 2000 and 2001 and between 2002 and 2003.
Empirical Models
In developing our empirical models of alternative revenue generation, we have built on
two literatures that have modeled the determination of school district expenditures and revenues.
In part, we draw on such papers as Hoxby (2001) and Schmidt and Scott (2004), which use the
basic model of local demand for public services developed by Borcherding and Deacon (1972)
and Bergstrom and Goodman (1973). Papers in this tradition emphasize the importance of the
local tax price, local taxable resources, and local demographics in modeling the determination of
local expenditures. While in the empirical analysis that follows we consider sub-components of
total revenue, the balanced budget requirement facing all districts in Vermont insures that the
determinants of total expenditures will tend to be the determinants of total revenues and of the
subcomponents of revenue.
At the same time, the extent to which districts utilize the various subcomponents of
revenue depends on the extent to which districts have access to the nondiscretionary components
of revenue and on the relative attractiveness of the discretionary components of revenue. Both
before and after Act 60, commonly noted determinants of donations, such as the size of the
district (Brunner and Sonstelie, 2003) and the presence of a large commercial base (McCormick,
Bauer, and Ferguson, 2001), should be strongly related to the extent to which districts utilize
nontraditional revenues.

22
We expect, however, that the nature of the relationship between nontraditional revenues
and other determinants of these revenues will change after Act 60 becomes operative. Prior to
Act 60, one dollar in local resources cost local residents a dollar in local resources, as did a dollar
in local property taxes. After Act 60, the marginal cost in property tax revenues of an additional
dollar of spending depended on the property wealth of the locality. As Schmidt and Scott (2004)
note, tax prices in fiscal year 2004 ranged widely, with 21 towns with tax prices below $0.60 and
9 towns with tax prices in excess of $5. Donations continued to cost localities one dollar in local
resources for each dollar of additional spending. Thus, for high wealth communities an
additional dollar of spending could require fewer local resources if financed out of donations
rather than out of property taxes.
A simple illustrative model helps clarify how Act 60 changed the relationship between
nontraditional revenues and the factors that determine the extent to which districts utilize these
revenues.12
This change in the relative attractiveness of nontraditional revenues post-Act 60 means
our basic empirical strategy is simple. In the pre-Act 60 era, the attractiveness of donations
relative to property taxes would depend on their relative cost to the median voter. As Downes
and Pogue (1994) observe, the cost to the median voter of an increase in property taxes is
proportional to the ratio of the median voter’s property wealth and the total property wealth in
the community. We do not have a measure of the median voter’s property wealth. We would
expect, however, that once we have accounted for community size, the median voter’s property
wealth would be positively correlated with both total property wealth and the fraction of property
wealth owned by town residents. As a result, we do not have a clear prediction of the
relationship between total property wealth and the use of nontraditional revenues in the pre-Act
12 Many thanks to Eric Brunner for this illustrative model.
Deleted: eextent

23
60 period. Prior to Act 60, we do expect relatively more use of nontraditional revenues in
communities with higher shares of property owned by town residents, since the median voter’s
tax price will tend to be higher in such communities.
After Act 60, nontraditional revenues become substantially more attractive to
communities with higher levels of total property wealth, since a community’s tax price and its
total wealth are positively correlated. Thus, we expect a positive relationship between property
wealth and nontraditional revenues in the post-Act 60 period.
In the post-Act 60 period, modeling the determination of contributions and, thus,
nontraditional revenues is complicated by the fact that the extent to which the median voter,
versus the town as a whole, preferred donations to property taxes depended critically on whether
the median voter was eligible for the tax adjustments provided to taxpayers with incomes below
$75,000. For that reason, we control for the fraction of joint filers in each community with
incomes below $75,000. We would not expect this fraction to be related to nontraditional
revenue generation prior to Act 60, since the differential treatment post-dated Act 60. After Act
60, in communities with higher fractions of voters eligible for the prebate, generating widespread
support for replacing property taxes with nontraditional revenues should have been harder, since
the income sensitivity provisions of Act 60 limited the tax liability of taxpayers with incomes
below $75,000. As a result, such taxpayers might have favored increased use of the property tax
since, on the margin, the burden of property tax increases tended to be shifted to high income
residents, nonresidents, and owners of commercial and industrial properties.
Most of the results presented below were generated using fixed effects regressions
performed on our two longitudinal data sets. By using both data sets, we could examine both the
sensitivity of school districts to policy changes creating incentives for the generation of non-tax

24
revenue and the efficacy of the response of the non-profit organizations raising non-tax revenue
for the schools. The fixed effects models allowed us to control for temporally stable, unobserved
factors that might have influenced use of nontraditional revenues or foundation success.
For the regressions in which a measure of nontraditional revenue was the dependent
variable, the most inclusive specification took the form:
Yit = αi + τt + Xitβ + Wi,t-1γ + Act60tDitζ + Act60tZiη + εit .13
In these regressions the dependent variable Yit was the log of one of the measures of real non-tax
per pupil revenue raised by school district i in year t. The vector Xit included contemporaneous
school district characteristics including income, poverty and enrollment levels, while the vector
Wi,t-1 included school district characteristics, such as per pupil expenditures, 4th grade test scores
and pupil teacher ratios, lagged one year. Act60 was a dummy variable indicating the presence of
Act 60’s alternative revenue generation incentives. It was equal to one for the fiscal years 2000-
2003 and equal to zero otherwise.14 The vector Dit included several time-varying factors which,
in light of the discussion above, could have a different relationship with nontraditional revenues
in the post-Act 60 period. Among these variables were per pupil equalized municipal property
wealth, the fraction of joint filers with incomes less than $75,000, the fraction of property wealth
judged by assessors to be residential, and the fraction of property wealth judged to be
commercial or industrial. The vector Zi included demographic variables, such as the stability of
the local population, that are observed only at the time of the 2000 Census and that may have
influenced the ease with which communities raised contributions. The district-specific fixed
13 In this specification, the impact of Act 60 on the level of each nontraditional revenue source was absorbed into the year dummies. 14 The choice of 2000 as the starting year was driven by the incomplete implementation of the sharing pool in fiscal year 1999. We experimented with both 1999 and 2001 as the starting year. Results generated using these alternative definitions of the Act 60 dummy variable are qualitatively the same as those presented below and are available from the authors upon request.

25
effect is denoted by αi, while the τt denote year effects for all years except 1995, 1996 and 2003,
which were dropped to avoid perfect multicollinearity. All financial variables as well as school
district enrollment are measured in logs.
The affiliated organizations regressions took a similar form
Yit = αi + τt + Xitβ + Wi,t-1γ + Vitς + Ditζ + εit .
The dependent variable Yit was the real per pupil contributions received by the organization and
most of the remaining variables were defined as above. In addition, we included in this
specification Vit, a vector of foundation attributes. The existence of a significant number of zero
values for the independent variables necessitated a level-level model. Further, because most
affiliated organization activity post-dated Act 60, we could not estimate variants of this model
that included interactions with the Act 60 dummy.
All district variables for foundations which covered multiple districts were enrollment-
weighted sums.
Results
As is apparent from Tables 3, 4, and 5, all school district regression results indicated that
towns did respond to the policy incentives of Act 60 to increasingly finance K-12 education
through nontraditional revenue. While the coefficient on per pupil equalized municipal property
wealth is insignificant in most of the specifications, the coefficient on the interaction of this
variable with the Act60 dummy is positive and significant in all models. Thus, as expected, in
high wealth communities, after Act 60 the extent to which nontraditional revenues were used
increased significantly. For example, the results in the third column of Table 3 indicate that,
when the dependent variable is the log of the most inclusive measure of alternative revenue
available in the Common Core of data, a 1% increase in a school district’s per pupil real

26
equalized property wealth increased the district’s Act 60 response by about 0.24%. This
elasticity fluctuates between .24 and .37 for the specifications in Table 3.
Income levels of a school districts residents and variation in these income levels do not
appear to have a consistently significant impact on the alternative revenue response. While in a
few specifications, the coefficient on the poverty rate is significant and negative, this expected
effect is not evident in all specifications. And in no specification is the coefficient on average
adjusted gross income significant. Since the results in Table 4 indicate that prior to Act 60 there
was a negative relationship between property wealth and the amount of miscellaneous revenue in
a district, we find no evidence that school districts with higher incomes and higher wealth more
successfully generated alternative revenue in the pre-Act 60 period.
What we do find, however, is evidence of a link between alternative revenue generation
and those factors that correlate with the attractiveness to the median voter of replacing property
tax revenues with contributions and other alternative revenues. As was noted above, residents
earning less than $75,000 in annual income were essentially exempt from the incentives of the
sharing pool. While high income residents of gold towns enjoyed tax savings in excess of fair
share contributions15 if a town were to generate above-foundation education revenue using non-
property tax sources of revenue, low income residents did not. Anecdotal evidence that gold
towns with higher proportions of low-income residents had more difficulty generating non-tax
revenue in response to Act 60 is supported by these data. As expected, an interaction term
between the percent of school district residents earning less than $75,000 in annual income as
measured by joint/ head of household returns and the Act 60 dummy was significant at the 10
percent level in all specifications.
15 Fair share contributions were the contributions requested by local education foundations of Vermont taxpayers based on property values.

27
The negative coefficient on the interaction between the Act 60 dummy and the share of
property owned by town residents also provides evidence that, in communities in which larger
percentages of taxpayers were eligible for tax breaks, raising contributions was more difficult.
Due to a real estate boom, the proportion of out of state residents of many gold towns increased
during the period. The exclusion of out-of-state residents from the low-income prebate implies
that all else equal, out-of-state residents enjoyed greater economic benefit from successful school
district alternative revenue generation than in-state residents.
In contrast to what some in the literature have argued, we find no consistent evidence that
generating alternative revenue was easier in communities with a larger corporate presence. Our
estimates also indicate that Act 60 had no impact on the link between alternative revenue and the
share of property the assessor estimated to be commercial or industrial.
The coefficient on enrollment is consistently negative and highly significant. Increases in
district enrollment implied increasing difficulty or decreasing willingness to generate alterative
revenue. In the second regression, a 1% decline in membership implies a 1.7% increase in
alternative revenue generation. This result concurs with the hypothesis, first posited by Brunner
and Sonstelie (2003), that smaller community size mitigates the free rider problem inherent in
alternative revenue generation efforts.
In Table 3 we observe a positive, significant coefficient on the interaction between the
Act 60 dummy variable and the fraction of a district’s population over the age of 64 indicates
that the presence of many senior citizens enhanced a town’s Act 60 response. A potential
explanation involves the surplus of volunteer hours implied by a large elderly population. The
Vermont foundations relied heavily on volunteers, and anecdotal evidence indicated that many
older, retired residents were particularly active on foundation boards. But given the absence of a

28
significant coefficient on similar interaction terms in Tables 4 and 5, what seems more likely is
that communities with larger shares elderly were able to tap into non-contribution sources of
revenue.
The absence of a significant coefficient on the interaction between the Act 60 dummy and
the proxy for population stability indicates that these results provide little support for a
hypothesis that with towns more stable populations would be more cohesive, contain more
school alumni and therefore be able to generate alternative revenue more effectively.
Since alternative revenue includes all nontraditional revenue, we also estimated
specifications using as our dependent variable the log of miscellaneous revenues. As can be seen
in Table 1, miscellaneous revenue increased dramatically after Act 60. This jump in
miscellaneous revenue is largely due to school district receipt of contributions by local education
foundations.
As is apparent from Table 4, in the all of the specifications of the model with
miscellaneous revenue as the dependent variable, the coefficient on the interaction between
property wealth and the Act 60 dummy is highly significant. In the richest specification, the
coefficient on the interaction implies a .9% increase in miscellaneous revenue raised for every
1% increase in per pupil equalized property wealth during the Act 60 period. The coefficient on
enrollment is negative, significant and quantitatively large, implying a positive relationship
between smaller enrollments and increased generation of miscellaneous revenue. A 1% decrease
in enrollment implies a nearly 2.8% increase in the generation of miscellaneous revenue,
corroborating Fischel (2003) that smaller community size reduces free-riding. The interaction
between the Act 60 dummy and the percent of joint/head of household returns reporting less than
$75,000 continues to provide evidence that towns with a higher percentage of residents with less

29
than $75,000 in annual income had greater difficulty generating miscellaneous revenue during
Act 60. We do not continue to see any evidence that miscellaneous revenues grew more in
districts with older populations. Thus, as was noted above, we do not have a clear indication that
the presence of relatively more senior citizens facilitated fundraising.
Because of the lag in availability of Common Core data, we also constructed a measure if
non-tax, non-tuition revenue using administrative data from Vermont. By using this measure as
our dependent variable, we were able to add to our analysis fiscal year 2004. The results with
this dependent variable,16 which are presented in Table 5, closely parallel those generated when
the dependent variable was constructed from miscellaneous revenue. Incentives continue to
matter, as does the size of the school district.
The regressions using contributions to affiliated organizations regressions, which are
presented in Table 6, tell, in many important dimensions, the same story as do the regressions in
which nontraditional revenue measures are the dependent variable. For example, we find that
contributions were higher in communities with more property wealth, and we see no link
between contributions and average income in a community. We do see some evidence that
affiliated organizations are less successful in communities with higher levels of poverty, since
the coefficient on the poverty rate is negative and significant in specifications 2 and 3.
Two differences between these results and those for the measures of nontraditional
revenues are also worth noting. First, we see no evidence that organizations in larger school
districts were less successful at generating contributions. Second, we find that more
contributions were generated in communities in which larger fractions of students had in the past
shown evidence of math proficiency. This result would certainly be consistent with
16 Because the data on state and federal aid were drawn from the Common Core, these variables were omitted from the specifications given in Table 5. Adding these variables to the specification and dropping fiscal year 2004 resulted in no qualitative changes in the results.

30
organizations using past schooling success as a selling point for contributions. We found,
however, when we included test score measures in specifications with a nontraditional revenue
measure as the dependent variable, no similar evidence of success breeding success.
In specification 2, real solicitation expenses were consistently positive and significant,
with a consistently quantitatively large coefficient. A one dollar increase in solicitation expenses
implied at least a $10.70 increase in contributions. That a greater foundation fundraising effort
would generate a greater level of contributions, particularly at a sufficiently low level of
fundraising expenses to mitigate concerns of contributions funding solicitation rather than the
organization’s charitable purpose is a logical result. The magnitude of the impact of additional
solicitation expenses is impressive.
We find no evidence that compensation of officers and executive directors increases
contributions. We do, however, find some support for the argument that paid staff matters; the
relationship between compensation to the support staff and contributions is consistently positive
and significant.
As can be seen from Table 7, specifications run solely on local education foundations
(about three quarters of the affiliated organizations subset) yielded similar results.
Conclusion
Act 60 provided powerful incentives to generate revenue outside of the tax base to fund
public education, and Vermont taxpayers responded, forming local education foundations to
circumvent unusually high tax prices for education. A strong, consistent relationship between the
non-tax revenue raised and the incentives facing the taxpayers to raise it clearly demarcates the
impact of a sharp change in education finance policy on taxation and supplementary financial
activity.

31
The data also reveal certain district characteristics dampen or magnify the alternative
revenue generation response. In particular, higher property values (a stronger Act 60 incentive),
lower district memberships, and a smaller percentage of residents eligible for property tax
reductions, and a larger percentage of property owned by town residents facilitated raising
alternative revenue during Act 60. These results indicate that the incentives implicit in Act 60
influenced the extent to which supplemental funding was provided by contributions. These
estimates also confirm Brunner and Sonstelie’s main conclusion; size matters because size helps
determine the sense of community in a school district.
For the Vermont affiliated organizations, solicitation expenses enhanced real
contributions received. The Act 60 incentive, measured by property wealth, and the poverty rate
also appeared to significantly impact contributions. The data did not reveal other school district
characteristics and other foundation activities to significantly impact revenue generating efforts.
More detailed data on the composition and operation of the foundations, as well as other
analytical models, may yield further conclusions in this regard.
The policy incentive of Act 60 was unequivocally unique, but the issues of alternative
revenue generation in public schools and education finance reform are broadly relevant. Several
of the lessons learned from Vermont should be applicable to school districts and local education
foundations in other states facing similar demands for non tax funds to support K-12 education.
A crucial direction of future study is to determine the applicability of these lessons.

32
References
Addonizio, M.F. (1998). New revenues for public schools: Alternatives to broad based taxes. In W. J. Fowler, (Ed.), Selected Papers in School Finance, 1997–99. Washington, D.C.: National Center for Education Statistics 1999-334, 89–110.
Addonizio, M. F. (2000). Private funds for public schools. The Clearing House, (74)2.
Addonizio, M. F. (1998). Private funding of public schools: local education foundations. Nonprofit Sector Research Fund Working Paper Series.
Bergstrom, T. C. and Goodman, R. P. (1973). Private Demands for Public Goods. American
Economic Review, 63(3), 280-96.
Borcherding, T. E. and Deacon, R. T. (1972). The Demand for the Services of Non-Federal Governments. American Economic Review, 62(5), 891-901
Brunner, E. J., & Imazeki. J. (2003). Private Contributions and Public School Resources. Center
for Public Economics Discussion Paper 07-03. San Diego, CA: San Diego State University.
Brunner, E., & Sonstelie, J. (2003). School finance reform and voluntary fiscal federalism. Journal of Public Economics, 87(9-10), 2157-2185.
Brunner, E., & Sonstelie, J. (1997). Coping with serrano: Voluntary contributions to California's local public schools. In National Tax Association-Tax Institute of America (Ed.), 1996
proceedings of the eighty-ninth annual conference on taxation held under the auspices of the
national tax association at Boston, Massachusetts, November 10-12, 1996 and minutes of
the annual meeting Held sunday, November 10, 1996 (pp. 372-381). Columbus: Author.
Downes, T. (2004). School finance reform and school quality: Lessons from Vermont. In William C. Fowler, (Ed.), Developments in School Finance: 2003. Washington, D.C.: National Center for Education Statistics.
Downes, Thomas A. and Pogue, Thomas F. (1994). "Accounting for Fiscal Capacity and Need in the Design of School Aid Formulas." In Anderson, John E., ed., Fiscal Equalization for
State and Local Government Finance. New York: Praeger Publishers.
Fischel, W. (2003). Notes on the voluntary payment of taxes: How Vermont towns avoid the Act 60’s penalties for local school spending. Unpublished manuscript.
Fehr, E., & Gachter, S. (2000). Cooperation and punishment in public goods experiments. American Economic Review, 90(4), 980-994.
Hoxby, C. M. (2001). All school finance equalizations are not created equal. Quarterly Journal
of Economics, 116(4), 1189-1231.

33
Huntsinger, J. (1989). Fund raising letters : A comprehensive study guide to raising money by
direct response marketing (3rd ed.). Richmond, Va: Emerson Publishers.
Lampkin, L. & Stern, D. (2003). Who helps public schools: A portrait of local education funds, 1991-2001. Distributed by the Public Education Network and the Urban Institute.
Mathis, W. J. (2001). “Vermont.” In Catherine C. Sielke , John Dayton, C. Thomas Holmes, and Anne L. Jefferson, editors, Public School Finance Programs of the U.S. and Canada:
1998-99. Washington, DC: National Center for Education Statistics.
McCormick, D. H., Bauer, D. G., & Ferguson, D. E. (2001). Creating foundations for American
schools. Gaithersburg, Md: Aspen Publishers.
Medina, N. J., Education Policy Research, Massachusetts, Dept. of Education, & Community Education Office. (1988). Private support for public schools : A description of local
education funds in Massachusetts. Quincy, Mass.: Office of Community Education, Massachusetts Dept. of Education.
Merz, C., & Frankel, S. S. (1995). Private funds for public schools : A study of school
foundations. Tacoma, Wash: distributed by the School of Education, Univ. of Puget Sound.
Muro, J. J. (1995). Creating and funding educational foundations : A guide for local school
districts. Boston: Allyn and Bacon.
Raphael, J. & Anderson, A. (2002). PEN Leading Ways: Preliminary research on LEF leadership for the Public Education Network. Distributed by the Public Education Network and the Urban Institute.
Schmidt, S.J. and Scott, K. (2004). Reforming reforms: Incentive effects in education finance in Vermont. Renssselaer Working Papers in Economics, Number 0425.
Sugden, R. (1985). Consistent conjectures and voluntary contributions to public goods: Why the conventional theory does not work. Journal of Public Economics, 27(1), 117-124.
Zimmer, R.W., Krop, C. & Brewer, D. J. (2003) Private resources in public schools: Evidence from a pilot study. Journal of Education Finance 28(Spring), 485-522.

34
Table 1: School District Summary Statistics
1996
1997
1998
1999
2000
Mean
Standard
Deviation
Mean
Standard
Deviation
Mean
Standard
Deviation
Mean
Standard
Deviation
Mean
Standard
Deviation
School District Characteristics
Average Daily Membership
591.217
758.26
591.36
756.47
594.09
758.92
589.34
759.47
588.97
760.39
17.97
16.54
----
----
32.66
19.24
37.94
17.88
38.14
18.85
Percentage of 4th graders achieving
math proficiency
Pupil teacher ratio
21.49
61.27
12.98
2.13
12.75
2.32
12.30
2.29
12.15
2.25
School District Demographics
Poverty rate
12.28
7.74
12.46
7.89
11.55
7.41
10.71
7.52
11.81
7.70
16377.64
3221.10
16599.11
3293.60
17316.98
3513.02
18337.46
3695.69
18993.97
3747.93
Average adjusted gross income for all
tax returns
Percentage of jointly filed returns with
income below $75,000
----
----
89.30
7.50
87.04
8.40
85.34
9.20
83.58
9.58
Per pupil equalized m
unicipal value
551877.5
896217.2
494406.2
676312.9
480944.6
611934.9
484676.4
600454.8
496968.4
661983.0
Percent owned by town residents
57.22
19.45
57.91
19.78
58.15
19.56
58.67
19.41
58.95
19.20
Percent commercial/industrial
14.25
17.07
14.13
17.07
14.09
17.00
13.42
15.86
13.40
15.68
School District Revenues
Total revenue per pupil
7496.59
2114.42
7520.72
2061.63
7735.20
2214.63
8230.90
2386.36
8383.15
2150.16
Total alternative revenue per pupil
923.99
1597.56
905.39
1531.47
930.33
1591.96
954.32
1614.04
1076.45
1679.17
Total miscellaneous revenue per pupil
88.94
223.37
107.46
158.55
98.09
134.19
63.99
168.12
182.15
542.19
Total other alternative revenue per
pupil
835.04
1549.72
797.92
1489.93
832.24
1539.96
890.33
1568.63
894.30
1603.31
Total interest earnings per pupil
74.98
75.27
67.85
64.46
66.45
61.41
68.22
68.23
71.91
77.85
Total revenue from other school
districts per pupil
654.52
1469.49
645.24
1460.13
684.49
1513.93
732.69
1550.12
741.37
1583.67
Total revenue from other sales and
services per pupil
0.36
4.18
1.28
9.20
0.40
5.17
0.87
7.56
0.02
0.29
Tuition and fees per pupil
33.51
243.33
12.89
93.52
12.55
93.75
15.01
95.89
7.34
28.18
Transportation fees per pupil
3.35
29.87
3.49
31.77
2.00
18.46
1.45
18.70
0.59
5.37
Revenue from the sale of books per
pupil
0.76
12.26
0.00
0.00
0.00
0.00
0.00
0.00
0.08
1.25
Activity fees per pupil
4.16
17.81
3.74
15.88
3.17
16.07
3.06
13.31
1.72
7.33
School District Expenditures
Current expenditures per pupil
6626.30
1614.59
6622.75
1130.02
6753.76
1207.02
7217.65
1403.97
8142.53
1425.03
35
2001
2002
2003
2004
Tim
e Invariant Variables
Mean
St. Dev
Mean
St. Dev
Mean
St. Dev
Mean
St. Dev
Obs.
Mean
St. Dev.
School District Characteristics
Average Daily Membership
587.90
753.88
579.16
745.34
575.91
747.44
567.39
742.14
42.06
19.04
45.65
20.42
44.37
16.70
50.56
19.32
Percentage of 4th graders achieving
math proficiency
Pupil teacher ratio
11.14
1.99
10.90
2.28
10.68
1.90
10.56
2.06
School District Demographics
Poverty rate
10.63
7.05
10.63
7.05
9.73
6.55
13.55
9.32
Average adjusted gross income for all
tax returns
19413.49
3955.14
19115.06
3835.07
18532.55
3669.02
19033.04
3429.05
Percentage of jointly filed returns with
income below $75,000
81.63
10.64
81.84
10.60
81.47
10.62
79.29
10.44
Per pupil equalized m
unicipal value
508298.4
694681.0
539063.1
800319.5
583579.6
955724.2
651476.6
914056.5
Percent owned by town residents
59.47
19.03
59.89
14.19
60.39
18.96
60.78
18.89
Percent commercial/industrial
13.38
15.09
13.07
14.19
13.08
14.77
12.58
14.44
Population stability (% living in the
same town for at least five years)
239
65.68
5.82
Percentage of the population under 19
239
26.58
3.25
Percentage of the population over 64
239
12.66
3.85
School District Revenues
Total revenue per pupil
8769.32
2299.39
9305.44
2509.82
9537.95
2537.02
----
----
Total alternative revenue per pupil
1191.98
1816.20
1235.43
1997.91
1256.60
2110.88
----
----
Total m
iscellaneous revenue per pupil
209.23
524.98
226.40
602.13
249.80
664.86
----
----
Total other alternative revenue per
pupil
982.75
1756.19
1009.03
1945.45
1006.80
2049.43
----
----
Total interest earnings per pupil
85.20
85.27
50.26
54.24
36.51
51.15
----
----
Total revenue from other school
districts per pupil
805.13
1726.68
866.70
1928.67
880.52
2013.61
----
----
Total revenue from other sales and
services per pupil
1.92
18.33
1.19
12.71
1.90
18.36
----
----
Tuition and fees per pupil
7.98
25.05
7.37
25.80
6.39
19.86
----
----
Transportation fees per pupil
4.61
38.96
1.02
10.26
0.86
7.88
----
----
Revenue from the sale of books per
pupil
0.10
1.35
0.00
0.00
0.00
0.00
----
----
Activity fees per pupil
2.57
13.46
2.14
8.82
2.68
14.30
----
----
School District Expenses
Current expenses per pupil
8212.29
1448.23
8331.61
1535.89
8829.68
1682.42
10192.69
2083.38

36
Table 2: Foundation Summary Statistics
1996
1997
1998
1999
N
Mean
Standard
Deviation
N
Mean
Standard
Deviation
N
Mean
Standard
Deviation
N
Mean
Standard
Deviation
School District Characteristics
Average daily m
embership
6
1248.72
1483.14
5
1442.94
1514.93
10
1121.44
1326.29
29
832.34
1018.02
4th grade m
ath proficiency (%
) 6
27.05
7.71
0
---
---
10
40.02
16.45
28
45.53
15.45
Pupil teacher ratio
6
13.46
1.45
5
12.55
1.94
10
112.14
2.06
28
11.88
1.54
School District Demographics
Poverty rate
5
15.20
12.44
5
10.34
10.95
9
9.88
9.68
28
6.31
6.09
Average adjusted gross income for all
tax returns
5
19092.53
4660.27
5
18440.13
4556.05
9
20776.70
3835.13
28
23197.37
4453.16
Percentage of jointly filed returns with
income below $75,000
0
---
---
5
75.03
22.32
7
72.92
18.08
23
70.99
14.93
Per pupil equalized m
unicipal value
6
635185.1
584289.1
5
334073.7
122647.0
10
1288003
1338947
29
1063814
884291
Percent owned by town residents
6
64.45
16.64
5
72.11
5.22
10
49.36
23.76
29
48.33
23.64
Percent commercial/industrial
6
10.72
8.81
5
10.87
8,57
10
10.96
9.26
29
12.17
9.06
School District Expenditures
Expenditures per pupil
6
6888.38
444.14
5
6991.14
752.75
9
7413.83
773.45
28
7983.63
1133.55
Organization Revenues
Contributions per pupil
6
108.32
230.62
5
57.80
107.48
10
343.67
442.44
29
996.20
1529.80
Total revenue per pupil
6
188.00
228.46
5
109.24
107.44
10
403.02
467.66
29
1042.62
1540.09
Program revenue per pupil
3
0
0
2
3.87
5.47
8
0.70
1.98
27
0.77
3.80
Special events income per pupil
3
80.77
139.90
2
0
0
8
32.26
85.07
27
19.57
57.21
Investm
ent income per pupil
4
86.25
154.77
4
87.48
148.89
10
35.47
92.97
29
29.11
67.91
Organization Expenses
Solicitation expenses per pupil
3
0
0
2
0
0
7
17.03
45.02
27
13.93
29.13
Total phone expenses per pupil
0
0
6
0
0
22
1.01
2.48
Fundraising phone expenses per pupil
0
0
6
0
0
22
0
0
Total postage expenses per pupil
0
0
6
0
0
22
3.71
6.32
Fundraising postage expenses per
pupil
0
0
6
0
0
22
2.63
5.86
Total printing expenses per pupil
0
0
6
0.01
0.04
22
4.12
11.83
Fundraising printing expenses per pupil
0
0
6
0.01
0.04
22
2.68
6.45
Presence of paid staff
6
0.83
0.41
1
1
0
10
0.40
0.52
29
0.14
0.35
Compensation to officers and directors
6
6.00
14.71
4
7.26
16.24
10
4.69
13.47
29
1.58
8.51
Other compensation
1
0
0
1
0
.0
7
0
0
27
1.64
8.51

37
2000
2001
2002
2003
N
Mean
Standard
Deviation
N
Mean
Standard
Deviation
N
Mean
Standard
Deviation
N
Mean
Standard
Deviation
School District Characteristics
Average daily m
embership
38
986.65
1480.29
42
1138.35
1493.41
44
1042.09
1401.14
42
1042.90
1428.70
4th grade m
ath proficiency (%
) 36
42.20
17.38
39
42.55
15.35
40
52.01
17.78
34
49.65
14.64
Pupil teacher ratio
36
11.79
1.67
40
11.05
1.89
42
10.67
2.12
40
10.02
2.35
School District Demographics
Poverty rate
36
6.96
5.45
40
6.95
6.27
42
6.75
5.60
40
6.61
5.34
Average adjusted gross income for all
tax returns
36
23726.38
4356.17
40
23881.11
4430.85
42
23056.72
4062.68
40
22261.69
3703.35
Percentage of jointly filed returns with
income below $75,000
36
72.41
12.61
40
70.87
12.93
42
71.93
11.95
40
71.74
11.57
Per pupil equalized m
unicipal value
38
1024669
891592.9
42
1002117
925150.4
44
1051777
926149.6
42
1208198
1074131
Percent owned by town residents
38
49.16
22.35
42
51.68
20.78
44
51.67
20.40
42
50.63
19.70
Percent commercial/industrial
38
13.16
9.47
42
14,33
9.36
44
13.30
8.52
42
13.67
9.01
School District Expenditures
Expenditures per pupil
36
8735.60
1317.35
40
8977.96
1348.35
42
9165.94
1375.36
40
9691.82
1435.90
Organization Revenues
Contributions per pupil
38
982.17
1258.63
42
959.17
1236.60
44
889.14
1301.23
38
907.57
1321.94
Total revenue per pupil
38
1029.58
1292.75
42
1016.63
1264.31
44
983.22
1327.10
42
932.86
1316.30
Program revenue per pupil
37
1.27
4.62
40
5.13
20.68
42
64.09
367.12
37
85.73
465.55
Special events income per pupil
37
11.78
38.98
40
8.58
28.56
42
11.59
32.53
37
9.99
40.08
Investm
ent income per pupil
38
38.31
58.29
41
38.22
57.40
43
23.06
32.43
38
18.24
32.43
Organization Expenses
Solicitation expenses per pupil
37
6.84
15.88
40
9.75
27.29
41
10.35
23.56
35
12.12
28.76
Total phone expenses per pupil
31
0.87
2.13
35
0.37
1.05
0
0
Fundraising phone expenses per pupil
31
0.10
0.53
35
0.13
0.54
0
0
Total postage expenses per pupil
31
4.28
6.26
35
4.31
7.36
0
0
Fundraising postage expenses per
pupil
31
2.62
5.17
35
2.07
4.59
0
0
Total printing expenses per pupil
31
2.21
5.91
35
2.99
7.05
0
0
Fundraising printing expenses per
pupil
31
0.69
1.70
35
1.23
3.23
0
0
Presence of paid staff
38
0.26
0.45
42
0.26
0.45
44
0.30
0.46
42
0.36
0.48
Compensation to officers and directors
38
6.15
22.18
42
3.31
16.63
44
3.84
15.88
34
5.01
14.69
Other compensation
37
3.04
10.81
40
11.18
30.76
42
13.39
45.80
33
26.81
112.23

38
Table 3: Alternative Revenue Regressions1
Dependent variable: Natural log of alternative revenues per pupil
(Heteroskedastic robust standard errors in parentheses)
Variable Specification 1 Specification 2 Specification 3
Log of average daily membership
-1.3836 (0.2319)
-1.6983 (0.2835)
-1.5914 (0.2918)
Log of average adjusted gross income per exemption
-0.1199 (0.4402)
0.0109 (0.5386)
0.1257 (0.5425)
Poverty rate -0.0126 (0.0063)
-0.0099 (0.0070)
-0.0085 (0.0072)
Log of equalized municipal property value
-0.0850 (0.1011)
-0.1633 (0.1916)
-0.0622 (0.1981)
Share of property owned by town residents
-0.0004 (0.0049)
0.0011 (0.0070)
0.0029 (0.0069)
Share of property commercial/industrial
0.0016 (0.0034)
0.0033 (0.0046)
0.0048 (0.0046)
Log of categorical aid from the state
-0.0249 (0.0216)
-0.0074 (0.0299)
-0.0063 (0.0302)
Log of federal aid 0.1042 (0.0251)
0.0774 (0.0248)
0.0791 (0.0250)
Percent of households filing joint tax returns with income below $75,000
0.0140 (0.0102)
0.0121 (0.0106)
Interactions with Act 60 dummy variable
Log of equalized municipal property value
0.3748 (0.0712)
0.2865 (0.1019)
0.2360 (0.1102)
Share of property owned by town residents
-0.0060 (0.0023)
-0.0111 (0.0033)
-0.0112 (0.0034)
Share of property commercial/industrial
-0.0019 (0.0026)
-0.0030 (0.0029)
-0.0045 (0.0029)
Percent of households filing joint tax returns with income below $75,000
-0.0122 (0.0047)
-0.0139 (0.0052)
Population over 64 (%) 2.0440 (0.8520)
Population under 19 (%) -0.0655 (1.1336)
Population stability (% living in the same town for at least five years)
-0.3078 (0.4257)
Constant 16.3831 (5.0150)
15.5866 (6.9893)
13.4607 (7.1175)
Number of observations 1606 1361 1344
Within R2 0.1796 0.2063 0.2131
Note: 1) All regressions include district-specific fixed effects and year dummies.

39
Table 4: Miscellaneous Revenue Regressions1
Dependent variable: Natural log of miscellaneous revenues per pupil
(Heteroskedastic robust standard errors in parentheses)
Variable Specification 1 Specification 2 Specification 3
Log of average daily membership
-1.5736 (0.5446)
-2.7546 (0.6988)
-2.7625 (0.7255)
Log of average adjusted gross income per exemption
-0.0910 (0.9860)
-0.1573 (1.3187)
-0.1151 (1.3194)
Poverty rate -0.0096 (0.0089)
-0.0048 (0.0174)
-0.0042 (0.0176)
Log of equalized municipal property value
-0.4238 (0.2471)
-1.3075 (0.3911)
-1.3233 (0.3987)
Share of property owned by town residents
-0.0010 (0.0089)
0.0039 (0.0122)
0.0050 (0.0125)
Share of property commercial/industrial
-0.0137 (0.0084)
-0.0052 (0.0112)
-0.0042 (0.0113)
Log of categorical aid from the state
0.0494 (0.0682)
-0.1038 (0.0831)
-0.0945 (0.0845)
Log of federal aid 0.1730 (0.0549)
0.1826 (0.0626)
0.1790 (0.0633)
Percent of households filing joint tax returns with income below $75,000
-0.0027 (0.0267)
-0.0039 (0.0273)
Interactions with Act 60 dummy variable
Log of equalized municipal property value
1.0743 (0.1595)
0.9562 (0.2477)
0.8966 (0.2690)
Share of property owned by town residents
-0.0124 (0.0053)
-0.0228 (0.0084)
-0.0239 (0.0087)
Share of property commercial/industrial
0.0016 (0.0064)
-0.0059 (0.0078)
-0.0067 (0.0081)
Percent of households filing joint tax returns with income below $75,000
-0.0209 (0.0120)
-0.0224 (0.0127)
Population over 64 (%) 0.4478 (2.0615)
Population under 19 (%) -0.9543 (2.5483)
Population stability (% living in the same town for at least five years)
0.2350 (1.1860)
Constant 19.0752 (11.4457)
38.7453 (17.0783)
38.5273 (17.0918)
Number of observations 1473 1239 1223
Within R2 0.2006 0.2177 0.2192
Note: 1) All regressions include district-specific fixed effects and year dummies.

40
Table 5: Other Local Revenue Regressions1
Dependent variable: Natural log of other local revenue per pupil
(Heteroskedastic robust standard errors in parentheses)
Variable Specification 1 Specification 2 Specification 3
Log of average daily membership
-0.6725 (0.3074)
-1.2196 (0.3921)
-1.2837 (0.4468)
Log of average adjusted gross income per exemption
-0.1073 (0.4493)
-0.4208 (0.6125)
-0.1580 (0.6091)
Poverty rate 0.0108 (0.0081)
0.0164 (0.0087)
-0.0107 (0.0118)
Log of equalized municipal property value
-0.0992 (0.1634)
-0.4208 (0.6125)
-0.1116 (0.2951)
Share of property owned by town residents
0.0071 (0.0072)
0.0137 (0.0100)
0.0169 (0.0088)
Share of property commercial/industrial
0.0062 (0.0071)
0.0128 (0.0099)
0.0135 (0.0066)
Percent of households filing joint tax returns with income below $75,000
-0.0081 (0.0146)
-0.0052 (0.0146)
Interactions with Act 60 dummy variable
Log of equalized municipal property value
0.6278 (0.0916)
0.5072 (0.1461)
0.3949 (0.1647)
Share of property owned by town residents
-0.0102 (0.0029)
-0.0190 (0.0048)
-0.0186 (0.0052)
Share of property commercial/industrial
0.0063 (0.0036)
0.0008 (0.0043)
0.0016 (0.0045)
Percent of households filing joint tax returns with income below $75,000
-0.0134 (0.0061)
-0.0177 (0.0068)
Population over 64 (%) 1.1618 (1.1964)
Population under 19 (%) -1.2875 (1.4686)
Population stability (% living in the same town for at least five years)
0.0346 (0.6980)
Constant 10.4398 (5.5148)
21.2256 (8.5776)
14.7893 (8.8206)
Number of observations 2051 1774 1516
Within R2 0.1824 0.2039 0.2175
Note: 1) All regressions include district-specific fixed effects and year dummies.

41
Table 6: Affiliated Organizations Regressions
Dependent variable: Contributions per pupil
(Heteroskedastic robust standard errors in parentheses)
Variable Specification 1 Specification 2 Specification 3
Average daily membership
-1.0167 (0.7355)
-0.7396 (0.7239)
-0.8419 (1.4765)
Average adjusted gross income per exemption
-0.0458 (0.1363)
-0.0853 (0.1531)
-0.0865 (0.1925)
Poverty rate -111.6216 (80.1857)
-235.1361 (114.2373)
-354.6349 (136.4965)
Categorical aid from the state per pupil
-0.0374 (0.5235)
0.1436 (0.5613)
-0.3539 (0.6958)
Federal aid per pupil -0.0910 (0.6367)
0.0347 (0.8373)
0.2896 (1.0922)
Equalized municipal property value per pupil (in $1000s)
1.2589 (0.4528)
1.2154 (0.4586)
1.1065 (0.6032)
Share of property owned by town residents
-6.0343 (13.7916)
-18.7284 (18.2796)
-2.8645 (24.1247)
Share of property commercial/industrial
8.2726 (22.7361)
0.3031 (29.0184)
-12.7658 (28.8545)
Percent of households filing joint tax returns with income below $75,000
-8.4721 (9.9285)
-14.6203 (15.8247)
-5.4020 (17.4664)
Solicitation expenses per pupil
10.7050 (6.1210)
5.8577 (6.1210)
Compensation of officers and directors per pupil
7.3488 (9.1812)
-3.5363 (10.5323)
Compensation of other staff per pupil
3.8108 (0.8426)
4.3301 (0.8729)
Percent of 4th graders at or above the standard – Math Concepts (lagged to previous test results)
9.4982 (5.3469)
Constant 3409.868 (3004.539)
6566.820 (3749.588)
6523.426 (5464.547)
Number of observations 189 171 131
Within R2 0.1036 0.2182 0.2474
Note: 1) All regressions include district-specific fixed effects and year dummies.

42
Table 7: Local Education Foundation (LEF) Regressions Dependent variable: Contributions per pupil
(Heteroskedastic robust standard errors in parentheses)
Variable Specification 1 Specification 2 Specification 3
Average daily membership
-1.1008 (0.7750)
-0.9007 (0.8249)
-1.0395 (1.8176)
Average adjusted gross income per exemption
-0.0530 (0.1495)
-0.1219 (0.1710)
-0.1174 (0.2216)
Poverty rate -125.6305 (86.6602)
-278.8759 (130.4026)
-416.9790 (149.6573)
Categorical aid from the state per pupil
-0.0631 (0.5819)
0.1436 (0.6681)
-0.3309 (0.8206)
Federal aid per pupil 0.2072 (0.8059)
0.3752 (0.9853)
0.7823 (1.2990)
Equalized municipal property value per pupil (in $1000s)
1.3800 (0.4864)
1.3897 (0.5120)
1.2260 (0.6339)
Share of property owned by town residents
-53.1291 (100.2541)
-94.9774 (125.9114)
-11.9409 (157.2920)
Share of property commercial/industrial
24.6632 (74.9880)
-55.6965 (96.9991)
-28.5930 (113.1429)
Percent of households filing joint tax returns with income below $75,000
-6.7705 (10.6471)
-12.4733 (15.3890)
-4.1779 (17.8305)
Solicitation expenses per pupil
10.7555 (6.1025)
5.3974 (6.1367)
Compensation of officers and directors per pupil
8.8648 (10.8430)
-4.1738 (13.5206)
Compensation of other staff per pupil
4.0897 (0.9192)
5.1576 (0.8260)
Percent of 4th graders at or above the standard – Math Concepts (lagged to previous test results)
10.3282 (5.9989)
Constant 6385.753 (7242.807)
11759.06 (8870.154)
8377.719 (12438.39)
Number of observations 142 126 99
Within R2 0.1112 0.2386 0.2877
Note: 1) All regressions include district-specific fixed effects and year dummies.