air toxics in ambient air of delhi
TRANSCRIPT
ARTICLE IN PRESS
1352-2310/$ - se
doi:10.1016/j.at
�CorrespondE-mail addr
Atmospheric Environment 39 (2005) 59–71
www.elsevier.com/locate/atmosenv
Air toxics in ambient air of Delhi
Anjali Srivastavaa,�, A.E. Josepha, S. Patila, A. Morea, R.C. Dixitb, M. Prakashb
aMumbai Zonal Laboratory, National Environmental Engineering Research Institute (NEERI), 89/B, Dr. A.B. Road,
Worli, Mumbai-18, IndiabDelhi Zonal Laboratory, NEERI, Chandarwal Waterworks. No. II, Lala Shamnath Marg, Delhi-54, India
Received 28 May 2004; accepted 14 September 2004
Abstract
Volatile organic compounds (VOCs) are major group of air pollutants which play critical role in atmospheric
chemistry. It contributes to toxic oxidants which are harmful to ecosystem human health and atmosphere. Data on
levels of VOCs in developing countries is lacking. In India information at target VOCs as defined in USEPA
compendium method TO-14 is almost totally lacking. The present work deals with estimation of target VOCs at 15
locations in five categories namely residential, industrial, commercial, traffic intersections and petrol refueling stations
in Delhi, the capital of India. The monitoring was carried out during peak hours in morning and evening each month
for a year in 2001. Ambient air was adsorbed on adsorbent tubes, thermally desorbed and analyzed on GC–MS. The
results show that levels of VOCs are high and stress the need for regular monitoring programme of VOCs in urban
environment.
r 2004 Elsevier Ltd. All rights reserved.
Keywords: Air toxics; VOCs; Delhi; Ambient air
1. Introduction
Urban air pollution is rapidly becoming an environ-
mental problem of public concern from the last few
decades. Industrial growth, increased transportation,
fossil fuel burning and high rate of urbanization in
developing countries have resulted in increase of
pollutants concentrations as well as the category of
pollutants. Volatile organic compounds (VOCs) are a
major group of pollutants, which have now become a
cause of concern worldwide. VOCs are harmful to
ecosystem, human health and atmosphere (Edgerton et
al., 1989; Atkinson, 2000; Derwent, 1995; Kuran and
Sojak, 1996; Dewulf and Van Langenhove, 1997). Many
VOCs like benzene and tetrachloroethylene have been
e front matter r 2004 Elsevier Ltd. All rights reserve
mosenv.2004.09.053
ing author.
ess: [email protected] (A. Srivastava).
proved to be a potent carcinogen (USEPA, 1990;
Wallace, 1986; Tancrede et al., 1987). Some VOCs are
highly toxic and mutagenic (Duce et al., 1983; Sweet and
Vermette, 1992; Kostianen 1995; Mukund et al., 1996).
Large numbers of VOCs undergo complex photochemi-
cal reactions giving rise to highly toxic secondary
pollutants, such as tropospheric ozone (Aikin et al.,
1982) and PAN (Crutzen, 1979), which are injurious to
human health and vegetation. In the United States,
VOCs are regulated under the criteria pollutant program
because they are precursors of ozone. USEPA has
identified 189 hazardous air pollutants (HAPs) out of
which 97 are VOCs (US Clean Air Act, Amendment,
1990; Ruddy and Carroll, 1993). Sources of VOC
emission are both anthropogenic and natural. It is thus
essential to control anthropogenic emissions of VOCs.
Knowledge of ambient levels of VOCs is necessary to
evolve a proper strategy to control tropospheric ozone
d.
ARTICLE IN PRESSA. Srivastava et al. / Atmospheric Environment 39 (2005) 59–7160
build up and maintain healthy air quality. Information
on VOC levels for Indian cities is lacking. Levels of
benzene, toluene, xylene and ethylbenzene at few
locations in some cities of India are available (Srivastava
et al., 2000; Chattopadhyay et al., 1997; MohanRao et
al., 1996). However, total VOCs and concentrations of
target VOCs specified in the USEPA Compendium
Method TO-17 are almost totally lacking. An attempt
has been made to determine the ambient levels of target
VOCs in the urban atmosphere of Delhi, the capital of
India, during the year 2001.
2. Study area
Delhi, the capital and one of the largest cities in India,
lies at an altitude of between 700 and 1000 ft. It covers
an area of approximately 1500 km2 situated on the
banks of Yamuna River. Delhi is bordered on the east
by the state of Uttar Pradesh and on the north, west and
south by Haryana, with a population of 13.79 million.
Delhi has become a nucleus of trade, commerce and
industry in the northern region of India. Government
office complexes are a major source of employment and
the city is also home to important radical, agricultural
and educational institutions. Steady increase in indus-
trial units has been witnessed despite the introduction of
planning restrictions on large industries.
Delhi sprawls an area of 1500 km2. Its east–west
length is approximately 51.9 km and the northwest
width approximately 48.48 km. The spread of Delhi is
somewhat circular. The transportation network in Delhi
is predominately road based. Delhi has the largest road
length of 1284 km/100 km2 of area in India. The road
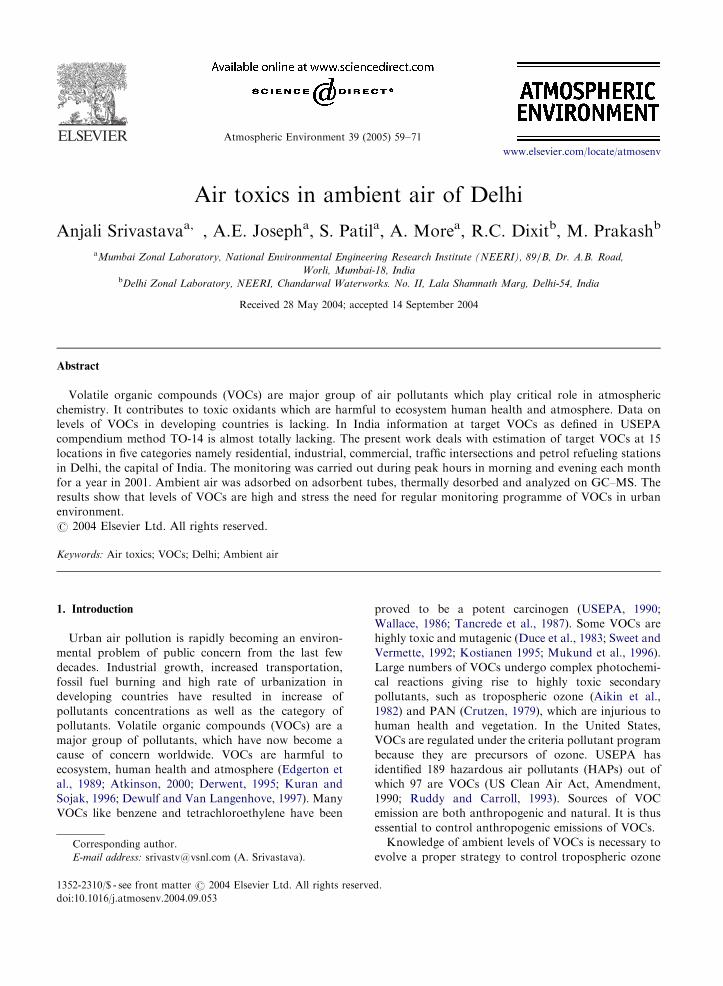
network in the city is 22487 km long. Fig. 1 gives the
composition of registered vehicles in Delhi in 2002.
Engineering, clothing and commercial activities pre-
dominate, although electrical goods are gaining impor-
tance. Most industries are located in the west, south and
southwest of the city. Northwesterly winds often drag
pollution from western industrial areas across the city. It
has been recommended that all future industrial devel-
opments are limited to the southeast to avoid such
Fig. 1. Composition of registered vehicle during 2002.
problems and the Okhla industrial estate has recently
been built in this area. Increasing industrial productivity
combined with rapid urbanization means that there is a
greater demand for energy in Delhi that can be supplied;
therefore, the industry cannot generate at full capacity.
Delhi has two major thermal power plants, which
are not sufficient to cater to the total power need of
the city. Generator sets are thus used in commercial,
residential and industrial areas as backup power. All
these activities have led to increased fuel demand and
accrued into deteriorating air quality. Cooking, gen-
erator sets, various internal combustion engines, burn-
ing of organic wastes landfill, sewage treatment plants,
slums and open defecation are some of the sources of
VOCs in Delhi.
Delhi has a tropical steppe climate. The general
prevalence of continental air leads to relatively dry
condition with extremely hot summers. Monthly mean
temperature ranges from 14.3 1C in January (minimum
3 1C) to 34.5 1C in June (maximum 47 1C). The annual
mean temperature is 25.3 1C. The main seasonal climatic
influence is that of monsoon, typically from June to
October. The mean annual rainfall total is 71.5mm.
Maximum rainfall occurs in July (211mm). The heavy
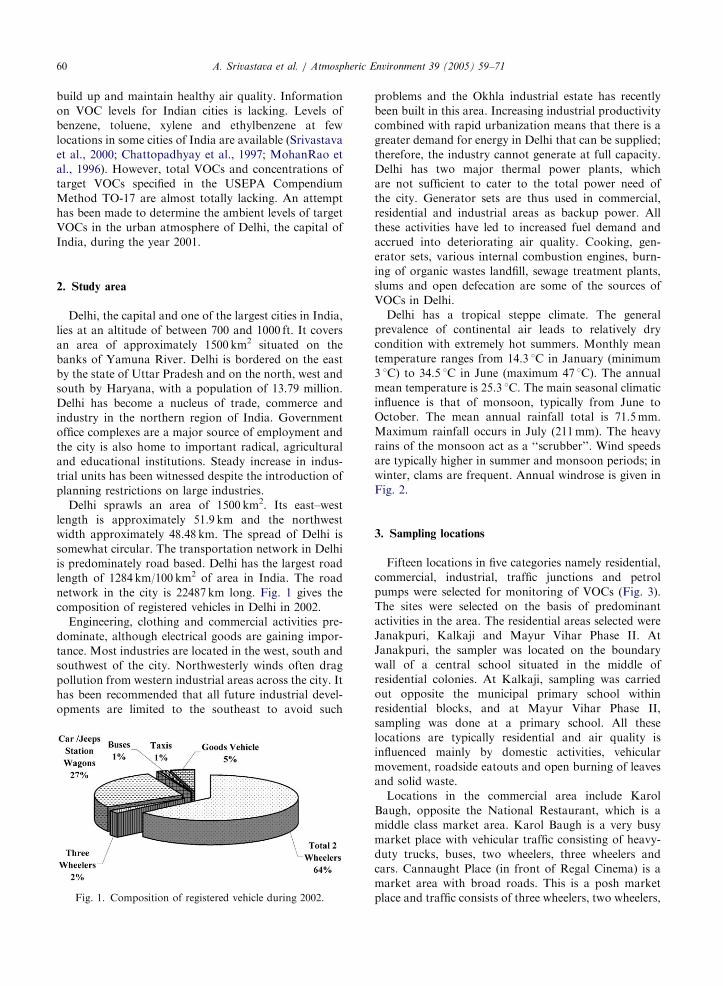
rains of the monsoon act as a ‘‘scrubber’’. Wind speeds
are typically higher in summer and monsoon periods; in
winter, clams are frequent. Annual windrose is given in
Fig. 2.
3. Sampling locations
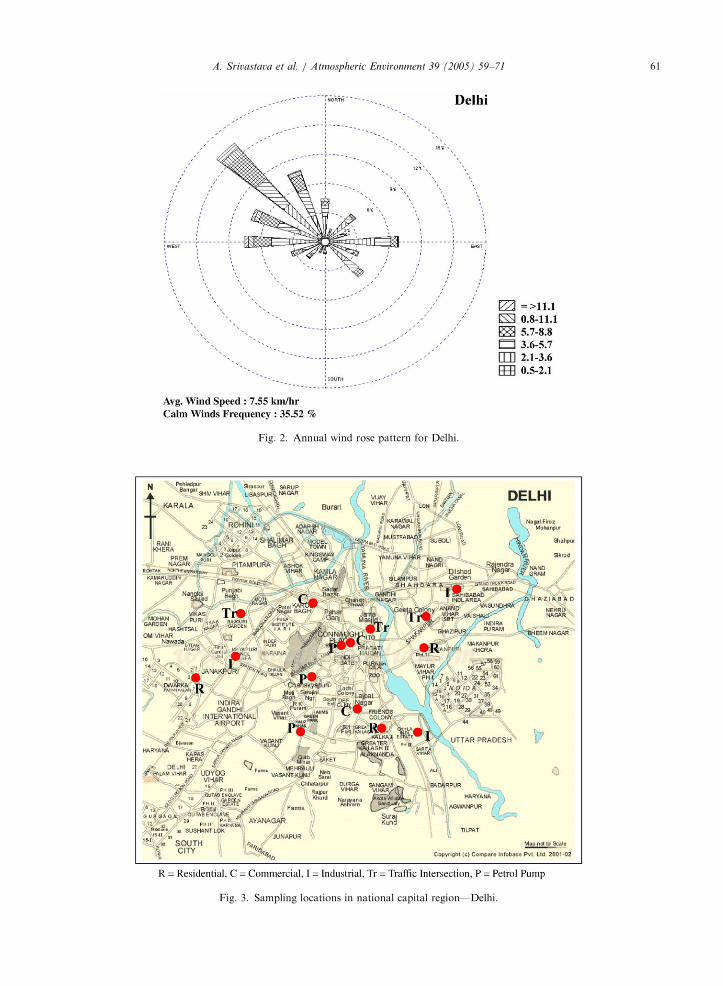
Fifteen locations in five categories namely residential,
commercial, industrial, traffic junctions and petrol
pumps were selected for monitoring of VOCs (Fig. 3).
The sites were selected on the basis of predominant
activities in the area. The residential areas selected were
Janakpuri, Kalkaji and Mayur Vihar Phase II. At
Janakpuri, the sampler was located on the boundary
wall of a central school situated in the middle of
residential colonies. At Kalkaji, sampling was carried
out opposite the municipal primary school within
residential blocks, and at Mayur Vihar Phase II,
sampling was done at a primary school. All these
locations are typically residential and air quality is
influenced mainly by domestic activities, vehicular
movement, roadside eatouts and open burning of leaves
and solid waste.
Locations in the commercial area include Karol
Baugh, opposite the National Restaurant, which is a
middle class market area. Karol Baugh is a very busy
market place with vehicular traffic consisting of heavy-
duty trucks, buses, two wheelers, three wheelers and
cars. Cannaught Place (in front of Regal Cinema) is a
market area with broad roads. This is a posh market
place and traffic consists of three wheelers, two wheelers,
ARTICLE IN PRESS
Fig. 2. Annual wind rose pattern for Delhi.
Fig. 3. Sampling locations in national capital region—Delhi.
A. Srivastava et al. / Atmospheric Environment 39 (2005) 59–71 61
ARTICLE IN PRESSA. Srivastava et al. / Atmospheric Environment 39 (2005) 59–7162
buses and cars. Cinema halls, restaurants, roadside
eatouts and markets are in plenty. Lajpat Nagar is a
crowded market place in South Delhi. Air quality is
mainly influenced by generator sets, vehicular move-
ment, roadside eatouts and markets.
In the industrial category the three notified industrial
areas namely Jhilmil, Okhla Phase I and Mayapuri were
chosen in the study. All the three sites are purely
industrial with no mixing of residential or commercial
areas. The location of monitoring carried out in Jhilmil
industrial area was opposite to Para Sheild Cables
manufacturing industry. The area is surrounded by
other cable and tyre manufacturing industries. Monitor-
ing in Okhla Phase I was carried out at the open terrace
of Enviro Tech Pvt Ltd. This industry is also surrounded
by other industries. In Mayapuri, the sampling was
conducted in an industry behind Car Service Centre near
the Delhi Transport Corporation bus stand and metal
forging company.
Locations at traffic intersections include ITO, Raja
Garden (Raja Garden Flyover Crossing at Police help
post), Shakarpur Crossing (Shakarpur Crossing oppo-
site police post). All these traffic intersections are very
busy intersections. Monitoring was carried out at the
kerbsides near traffic intersections. During peak hours
traffic jams are frequent in these locations. The average
vehicular speed is atmost 20–25 kmh�1 at these loca-
tions.
The refueling stations selected for the study were
petrol pumps at Cannaught Place at Janapath next to
Imperial Hotel, IIT Crossing and Race course. Sampling
was carried out in the center of petrol pump where
vehicles halt for refueling.
4. Sampling and analytical
4.1. Methodology
Levels of VOCs in ambient air have been determined
by adsorbing ambient air at a uniform flow rate on
specially fabricated activated-charcoal cartridge fol-
lowed by thermal desorption and detection on Varian
GC–MS in accordance with TO-17 compendium of
methods for the determination of toxic organic com-
pounds (USEPA, 1999).
A battery-operated personal air sampler (model
Staplex PST 3000 A) was used to sample air at the rate
of 20mlmin�1 through adsorption cartridge containing
activated charcoal. Uniform flow rate was maintained
using a rotameter. The monitoring schedule followed 4
hourly samples during peaks hours, i.e. 08.00–12.00 and
17.00–21.00 h every month during the period August,
2001–July 2002. Sorbent carbon cartridges were fabri-
cated from stainless-steel pipes (SS-316) having a length
of 15 cm with internal diameter of 4mm and external
diameter of 6mm with caps on both sides. Analytical
grade activated carbon was heated at 200 1C for 12 h and
cooled in vacuum desiccators. Approximately 800mg of
preheated cooled activated charcoal was filled in the
cartridge with glass wool plugs on either side of the
sorption cartridge. Desorption from sorbent cartridge
was carried out by heating at 200 1C for 20min. Two
tubes were connected in series. When the concentration
in the second tube was more than 5% of total
concentration it was assumed that break through
occurred.
As soon as the pump was turned off the cartridges
were removed and capped tightly and sealed in plastic
bags. The tubes were stored in refrigeration. Blank
cartridges were also stored in identical condition.
Varian GC–MS (Model Saturn 3) with injection mode
of sample introduction with DB 624 capillary column of
30m length, 0.32mm interval diameter and 1.8 micro-
film was used. Helium gas with flow rate of 1mlmin�1
was used as carrier gas with split ratio 1:25, GC oven
was programmed for 35 1C hold for 2min and ramped
to 210 1C with rate of 10 1C. Ion trap temperature was
maintained at 125 1C while acquisition mass range was
from 35 to 260 amu in E1 model 100 ml of desorbed
sample was injected into the GC.
Quantification of VOCs was carried out using VOC
Mix 15 of Dr. Erhenstrofer as standard with an accuracy
of 715%.
5. Results and discussions
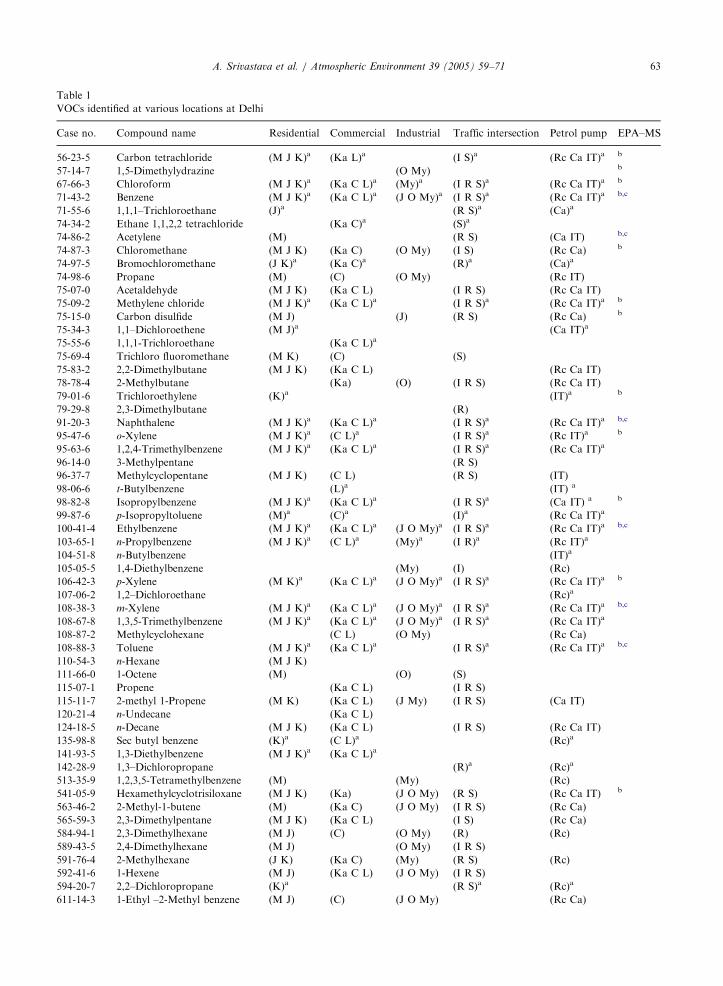
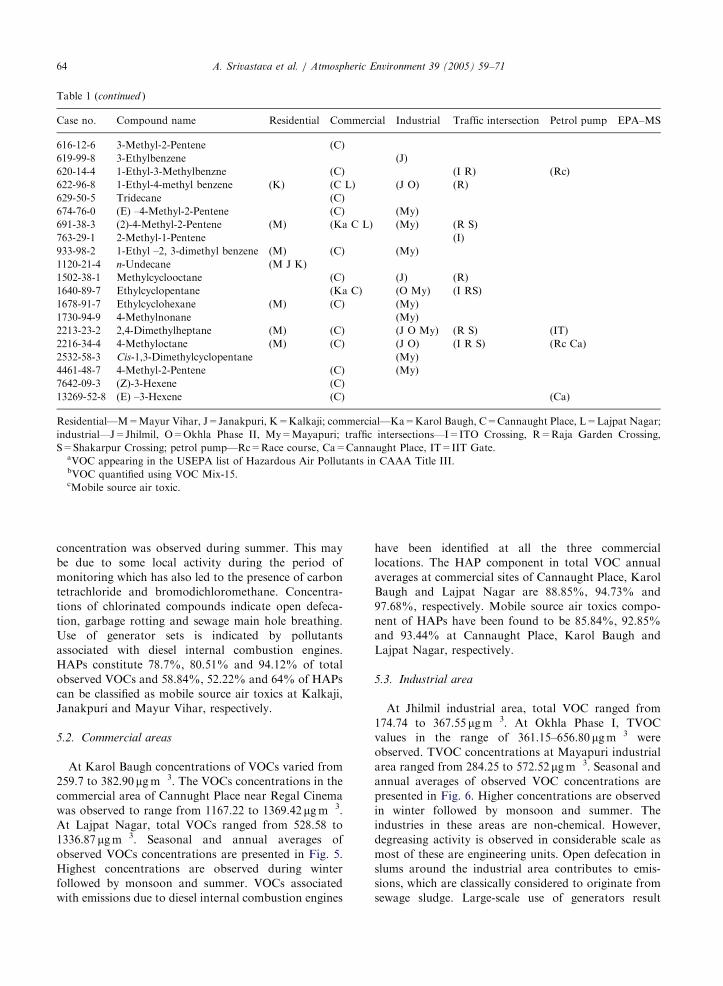
Table 1 presents the list of VOCs identified in different
categories of locations in Delhi. As many as 52 VOCs
have been identified in residential areas. Eleven VOCs
amongst these are included in the list of HAPs of CAAA
Title III of USEPA and seven of them are identified as
mobile source air toxics. In commercial areas, 59 VOCs
have been identified out of which 12 are HAPs and eight
mobile air toxic. In industrial areas 61 VOCs have been
identified including 13 HAPs and five mobile air toxics.
At traffic intersections 54 VOCs have been identified,
which include 15 HAPs and seven mobile source air
toxics. At the petrol pumps 50 VOCs were identified out
of which 12 are HAPs and four are mobile source air
toxics.
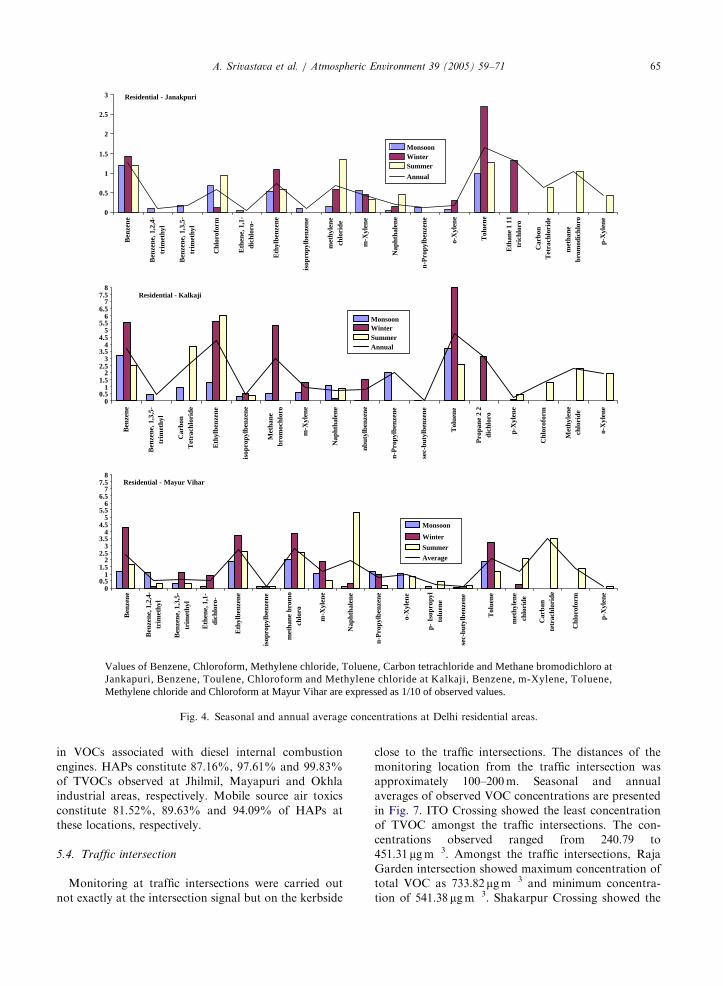
5.1. Residential areas
At Janakpuri, concentrations of total VOCs ranged
from 23.74 to 52.16mgm�3. The concentration of total
VOCs at Kalkaji ranges from 92.46 to 162.68 mgm�3. At
Mayur Vihar concentrations ranged from 1.13 to
30.45mgm�3. Seasonal and annual averages are
presented in Fig. 4. Higher concentrations are
observed during winter; however, at Janakpuri, higher
ARTICLE IN PRESS
Table 1
VOCs identified at various locations at Delhi
Case no. Compound name Residential Commercial Industrial Traffic intersection Petrol pump EPA–MS
56-23-5 Carbon tetrachloride (M J K)a (Ka L)a (I S)a (Rc Ca IT)a b
57-14-7 1,5-Dimethylydrazine (O My) b
67-66-3 Chloroform (M J K)a (Ka C L)a (My)a (I R S)a (Rc Ca IT)a b
71-43-2 Benzene (M J K)a (Ka C L)a (J O My)a (I R S)a (Rc Ca IT)a b,c
71-55-6 1,1,1–Trichloroethane (J)a (R S)a (Ca)a
74-34-2 Ethane 1,1,2,2 tetrachloride (Ka C)a (S)a
74-86-2 Acetylene (M) (R S) (Ca IT) b,c
74-87-3 Chloromethane (M J K) (Ka C) (O My) (I S) (Rc Ca) b
74-97-5 Bromochloromethane (J K)a (Ka C)a (R)a (Ca)a
74-98-6 Propane (M) (C) (O My) (Rc IT)
75-07-0 Acetaldehyde (M J K) (Ka C L) (I R S) (Rc Ca IT)
75-09-2 Methylene chloride (M J K)a (Ka C L)a (I R S)a (Rc Ca IT)a b
75-15-0 Carbon disulfide (M J) (J) (R S) (Rc Ca) b
75-34-3 1,1–Dichloroethene (M J)a (Ca IT)a
75-55-6 1,1,1-Trichloroethane (Ka C L)a
75-69-4 Trichloro fluoromethane (M K) (C) (S)
75-83-2 2,2-Dimethylbutane (M J K) (Ka C L) (Rc Ca IT)
78-78-4 2-Methylbutane (Ka) (O) (I R S) (Rc Ca IT)
79-01-6 Trichloroethylene (K)a (IT)a b
79-29-8 2,3-Dimethylbutane (R)
91-20-3 Naphthalene (M J K)a (Ka C L)a (I R S)a (Rc Ca IT)a b,c
95-47-6 o-Xylene (M J K)a (C L)a (I R S)a (Rc IT)a b
95-63-6 1,2,4-Trimethylbenzene (M J K)a (Ka C L)a (I R S)a (Rc Ca IT)a
96-14-0 3-Methylpentane (R S)
96-37-7 Methylcyclopentane (M J K) (C L) (R S) (IT)
98-06-6 t-Butylbenzene (L)a (IT) a
98-82-8 Isopropylbenzene (M J K)a (Ka C L)a (I R S)a (Ca IT) a b
99-87-6 p-Isopropyltoluene (M)a (C)a (I)a (Rc Ca IT)a
100-41-4 Ethylbenzene (M J K)a (Ka C L)a (J O My)a (I R S)a (Rc Ca IT)a b,c
103-65-1 n-Propylbenzene (M J K)a (C L)a (My)a (I R)a (Rc IT)a
104-51-8 n-Butylbenzene (IT)a
105-05-5 1,4-Diethylbenzene (My) (I) (Rc)
106-42-3 p-Xylene (M K)a (Ka C L)a (J O My)a (I R S)a (Rc Ca IT)a b
107-06-2 1,2–Dichloroethane (Rc)a
108-38-3 m-Xylene (M J K)a (Ka C L)a (J O My)a (I R S)a (Rc Ca IT)a b,c
108-67-8 1,3,5-Trimethylbenzene (M J K)a (Ka C L)a (J O My)a (I R S)a (Rc Ca IT)a
108-87-2 Methylcyclohexane (C L) (O My) (Rc Ca)
108-88-3 Toluene (M J K)a (Ka C L)a (I R S)a (Rc Ca IT)a b,c
110-54-3 n-Hexane (M J K)
111-66-0 1-Octene (M) (O) (S)
115-07-1 Propene (Ka C L) (I R S)
115-11-7 2-methyl 1-Propene (M K) (Ka C L) (J My) (I R S) (Ca IT)
120-21-4 n-Undecane (Ka C L)
124-18-5 n-Decane (M J K) (Ka C L) (I R S) (Rc Ca IT)
135-98-8 Sec butyl benzene (K)a (C L)a (Rc)a
141-93-5 1,3-Diethylbenzene (M J K)a (Ka C L)a
142-28-9 1,3–Dichloropropane (R)a (Rc)a
513-35-9 1,2,3,5-Tetramethylbenzene (M) (My) (Rc)
541-05-9 Hexamethylcyclotrisiloxane (M J K) (Ka) (J O My) (R S) (Rc Ca IT) b
563-46-2 2-Methyl-1-butene (M) (Ka C) (J O My) (I R S) (Rc Ca)
565-59-3 2,3-Dimethylpentane (M J K) (Ka C L) (I S) (Rc Ca)
584-94-1 2,3-Dimethylhexane (M J) (C) (O My) (R) (Rc)
589-43-5 2,4-Dimethylhexane (M J) (O My) (I R S)
591-76-4 2-Methylhexane (J K) (Ka C) (My) (R S) (Rc)
592-41-6 1-Hexene (M J) (Ka C L) (J O My) (I R S)
594-20-7 2,2–Dichloropropane (K)a (R S)a (Rc)a
611-14-3 1-Ethyl –2-Methyl benzene (M J) (C) (J O My) (Rc Ca)
A. Srivastava et al. / Atmospheric Environment 39 (2005) 59–71 63
ARTICLE IN PRESS
Table 1 (continued )
Case no. Compound name Residential Commercial Industrial Traffic intersection Petrol pump EPA–MS
616-12-6 3-Methyl-2-Pentene (C)
619-99-8 3-Ethylbenzene (J)
620-14-4 1-Ethyl-3-Methylbenzne (C) (I R) (Rc)
622-96-8 1-Ethyl-4-methyl benzene (K) (C L) (J O) (R)
629-50-5 Tridecane (C)
674-76-0 (E) –4-Methyl-2-Pentene (C) (My)
691-38-3 (2)-4-Methyl-2-Pentene (M) (Ka C L) (My) (R S)
763-29-1 2-Methyl-1-Pentene (I)
933-98-2 1-Ethyl –2, 3-dimethyl benzene (M) (C) (My)
1120-21-4 n-Undecane (M J K)
1502-38-1 Methylcyclooctane (C) (J) (R)
1640-89-7 Ethylcyclopentane (Ka C) (O My) (I RS)
1678-91-7 Ethylcyclohexane (M) (C) (My)
1730-94-9 4-Methylnonane (My)
2213-23-2 2,4-Dimethylheptane (M) (C) (J O My) (R S) (IT)
2216-34-4 4-Methyloctane (M) (C) (J O) (I R S) (Rc Ca)
2532-58-3 Cis-1,3-Dimethylcyclopentane (My)
4461-48-7 4-Methyl-2-Pentene (C) (My)
7642-09-3 (Z)-3-Hexene (C)
13269-52-8 (E) –3-Hexene (C) (Ca)
Residential—M=Mayur Vihar, J=Janakpuri, K=Kalkaji; commercial—Ka=Karol Baugh, C=Cannaught Place, L=Lajpat Nagar;
industrial—J=Jhilmil, O=Okhla Phase II, My=Mayapuri; traffic intersections—I=ITO Crossing, R=Raja Garden Crossing,
S=Shakarpur Crossing; petrol pump—Rc=Race course, Ca=Cannaught Place, IT=IIT Gate.aVOC appearing in the USEPA list of Hazardous Air Pollutants in CAAA Title III.bVOC quantified using VOC Mix-15.cMobile source air toxic.
A. Srivastava et al. / Atmospheric Environment 39 (2005) 59–7164
concentration was observed during summer. This may
be due to some local activity during the period of
monitoring which has also led to the presence of carbon
tetrachloride and bromodichloromethane. Concentra-
tions of chlorinated compounds indicate open defeca-
tion, garbage rotting and sewage main hole breathing.
Use of generator sets is indicated by pollutants
associated with diesel internal combustion engines.
HAPs constitute 78.7%, 80.51% and 94.12% of total
observed VOCs and 58.84%, 52.22% and 64% of HAPs
can be classified as mobile source air toxics at Kalkaji,
Janakpuri and Mayur Vihar, respectively.
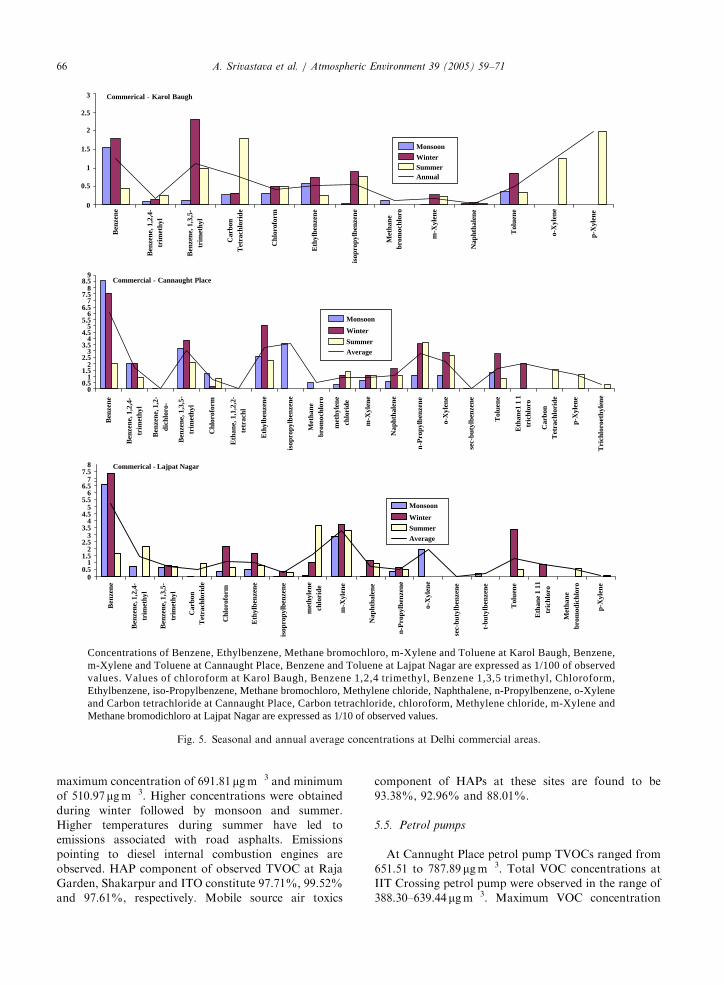
5.2. Commercial areas
At Karol Baugh concentrations of VOCs varied from
259.7 to 382.90mgm�3. The VOCs concentrations in the
commercial area of Cannught Place near Regal Cinema
was observed to range from 1167.22 to 1369.42 mgm�3.
At Lajpat Nagar, total VOCs ranged from 528.58 to
1336.87 mgm�3. Seasonal and annual averages of
observed VOCs concentrations are presented in Fig. 5.
Highest concentrations are observed during winter
followed by monsoon and summer. VOCs associated
with emissions due to diesel internal combustion engines
have been identified at all the three commercial
locations. The HAP component in total VOC annual
averages at commercial sites of Cannaught Place, Karol
Baugh and Lajpat Nagar are 88.85%, 94.73% and
97.68%, respectively. Mobile source air toxics compo-
nent of HAPs have been found to be 85.84%, 92.85%
and 93.44% at Cannaught Place, Karol Baugh and
Lajpat Nagar, respectively.
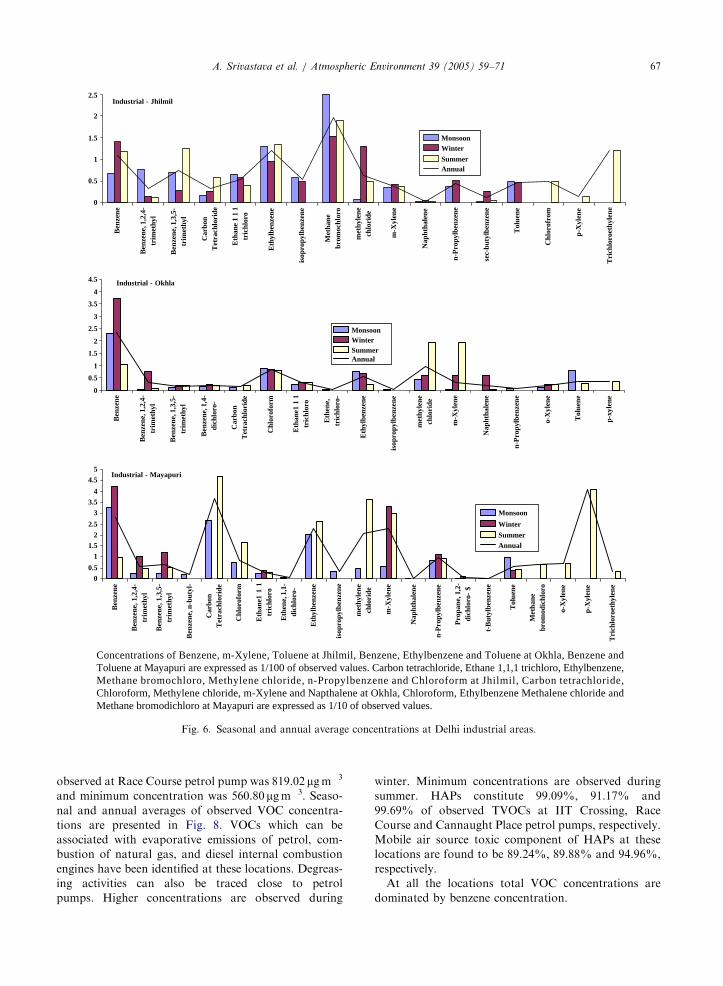
5.3. Industrial area
At Jhilmil industrial area, total VOC ranged from
174.74 to 367.55 mgm�3. At Okhla Phase I, TVOC
values in the range of 361.15–656.80 mgm�3 were
observed. TVOC concentrations at Mayapuri industrial
area ranged from 284.25 to 572.52mgm�3. Seasonal and
annual averages of observed VOC concentrations are
presented in Fig. 6. Higher concentrations are observed
in winter followed by monsoon and summer. The
industries in these areas are non-chemical. However,
degreasing activity is observed in considerable scale as
most of these are engineering units. Open defecation in
slums around the industrial area contributes to emis-
sions, which are classically considered to originate from
sewage sludge. Large-scale use of generators result
ARTICLE IN PRESS
Residential - Janakpuri
0
0.5
1
1.5
2
2.5
3
Ben
zene
Ben
zene
, 1,2
,4-
trim
ethy
l
Ben
zene
, 1,3
,5-
trim
ethy
l
Chl
orof
orm
Eth
ene,
1,1
-di
chlo
ro-
Eth
ylbe
nzen
e
isop
ropy
lben
zene
met
hyle
nech
lori
de
m-X
ylen
e
Nap
htha
lene
n-P
ropy
lben
zene
o-X
ylen
e
Tol
uene
Eth
ane
1 11
tric
hlor
o
Car
bon
Tet
rach
lori
de
met
hane
brom
odic
hlor
o
p-X
ylen
e
MonsoonWinterSummer
Annual
Residential - Kalkaji
00.5
11.5
22.5
33.5
44.5
55.5
66.5
77.5
8
Ben
zene
Ben
zene
, 1,3
,5-
trim
ethy
l
Car
bon
Tet
rach
lori
de
Eth
ylbe
nzen
e
isop
ropy
lben
zene
Met
hane
brom
ochl
oro
m-X
ylen
e
Nap
htha
lene
nbut
ylbe
nzen
e
n-P
ropy
lben
zene
sec-
buty
lben
zene
Tol
uene
Pro
pane
2 2
dich
loro
p-X
ylen
e
Chl
orof
orm
Met
hyle
nech
lori
de
o-X
ylen
e
MonsoonWinterSummerAnnual
Residential - Mayur Vihar
00.5
11.5
22.5
33.5
44.5
55.5
66.5
77.5
8
Ben
zene
Ben
zene
, 1,2
,4-
trim
ethy
l
Ben
zene
, 1,3
,5-
trim
ethy
l
Eth
ene,
1,1
-di
chlo
ro-
Eth
ylbe
nzen
e
isop
ropy
lben
zene
met
hane
bro
mo
chlo
ro
m-X
ylen
e
Nap
htha
lene
n-P
ropy
lben
zene
o-X
ylen
e
p- I
sopr
opyl
tolu
ene
sec-
buty
lben
zene
Tol
uene
met
hyle
nech
lori
de
Car
ban
tetr
achl
orid
e
Chl
orof
orm
p-X
ylen
e
Monsoon
Winter
Summer
Average
Values of Benzene, Chloroform, Methylene chloride, Toluene, Carbon tetrachloride and Methane bromodichloro at Jankapuri, Benzene, Toulene, Chloroform and Methylene chloride at Kalkaji, Benzene, m-Xylene, Toluene, Methylene chloride and Chloroform at Mayur Vihar are expressed as 1/10 of observed values.
Fig. 4. Seasonal and annual average concentrations at Delhi residential areas.
A. Srivastava et al. / Atmospheric Environment 39 (2005) 59–71 65
in VOCs associated with diesel internal combustion
engines. HAPs constitute 87.16%, 97.61% and 99.83%
of TVOCs observed at Jhilmil, Mayapuri and Okhla
industrial areas, respectively. Mobile source air toxics
constitute 81.52%, 89.63% and 94.09% of HAPs at
these locations, respectively.
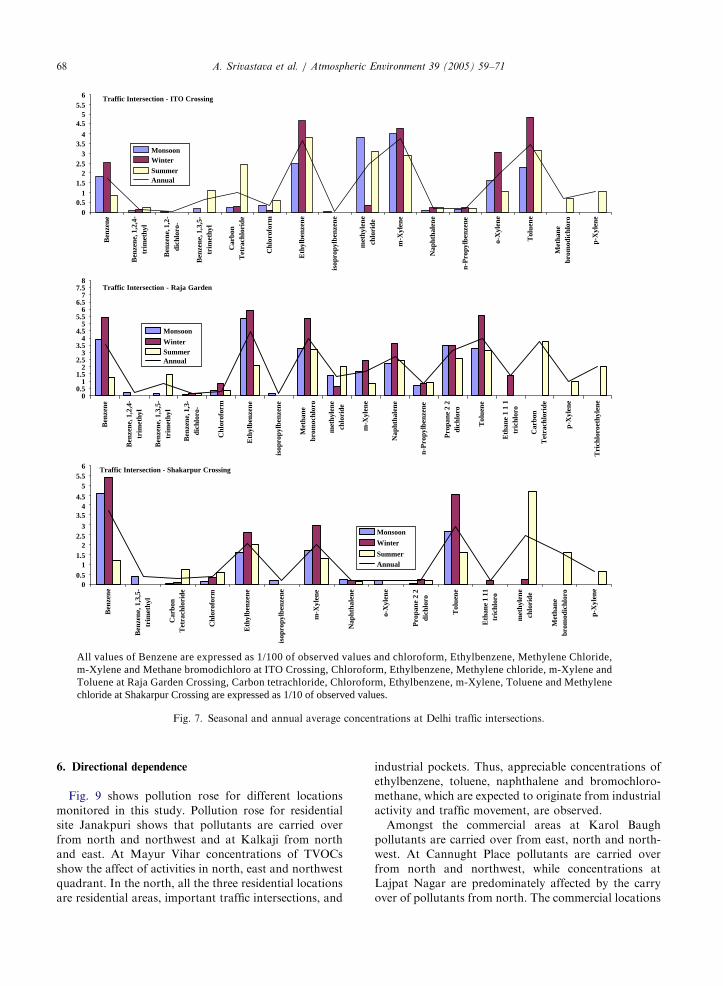
5.4. Traffic intersection
Monitoring at traffic intersections were carried out
not exactly at the intersection signal but on the kerbside
close to the traffic intersections. The distances of the
monitoring location from the traffic intersection was
approximately 100–200m. Seasonal and annual
averages of observed VOC concentrations are presented
in Fig. 7. ITO Crossing showed the least concentration
of TVOC amongst the traffic intersections. The con-
centrations observed ranged from 240.79 to
451.31mgm�3. Amongst the traffic intersections, Raja
Garden intersection showed maximum concentration of
total VOC as 733.82mgm�3 and minimum concentra-
tion of 541.38mgm�3. Shakarpur Crossing showed the
ARTICLE IN PRESS
Commerical - Karol Baugh
0
0.5
1
1.5
2
2.5
3
Ben
zene
Ben
zene
, 1,2
,4-
trim
ethy
l
Ben
zene
, 1,3
,5-
trim
ethy
l
Car
bon
Tet
rach
lori
de
Chl
orof
orm
Eth
ylbe
nzen
e
isop
ropy
lben
zene
Met
hane
brom
ochl
oro
m-X
ylen
e
Nap
htha
lene
Tol
uene
o-X
ylen
e
p-X
ylen
e
Monsoon
WinterSummerAnnual
Commercial - Cannaught Place
00.5
11.5
22.5
33.5
44.5
55.5
66.5
77.5
88.5
9
Ben
zene
Ben
zene
, 1,2
,4-
trim
ethy
l
Ben
zene
, 1,2
-di
chlo
ro-
Ben
zene
, 1,3
,5-
trim
ethy
l
Chl
orof
orm
Eth
ane,
1,1
,2,2
-te
trac
hl
Eth
ylbe
nzen
e
isop
ropy
lben
zene
Met
hane
brom
ochl
oro
met
hyle
nech
lori
de
m-X
ylen
e
Nap
htha
lene
n-P
ropy
lben
zene
o-X
ylen
e
sec-
buty
lben
zene
Tol
uene
Eth
ane1
1 1
tric
hlor
o
Car
bon
Tet
rach
lori
de
p-X
ylen
e
Tri
chlo
roet
hyle
ne
Monsoon
Winter
SummerAverage
Commerical - Lajpat Nagar
00.5
11.5
22.5
33.5
44.5
55.5
66.5
77.5
8
Ben
zene
Ben
zene
, 1,2
,4-
trim
ethy
l
Ben
zene
, 1,3
,5-
trim
ethy
l
Car
bon
Tet
rach
lori
de
Chl
orof
orm
Eth
ylbe
nzen
e
isop
ropy
lben
zene
met
hyle
nech
lori
de
m-X
ylen
e
Nap
htha
lene
n-P
ropy
lben
zene
o-X
ylen
e
sec-
buty
lben
zene
t-bu
tylb
enze
ne
Tol
uene
Eth
ane
1 11
tric
hlor
o
Met
hane
brom
odic
hlor
o
p-X
ylen
e
Monsoon
Winter
SummerAverage
Concentrations of Benzene, Ethylbenzene, Methane bromochloro, m-Xylene and Toluene at Karol Baugh, Benzene, m-Xylene and Toluene at Cannaught Place, Benzene and Toluene at Lajpat Nagar are expressed as 1/100 of observed values. Values of chloroform at Karol Baugh, Benzene 1,2,4 trimethyl, Benzene 1,3,5 trimethyl, Chloroform, Ethylbenzene, iso-Propylbenzene, Methane bromochloro, Methylene chloride, Naphthalene, n-Propylbenzene, o-Xylene and Carbon tetrachloride at Cannaught Place, Carbon tetrachloride, chloroform, Methylene chloride, m-Xylene and Methane bromodichloro at Lajpat Nagar are expressed as 1/10 of observed values.
Fig. 5. Seasonal and annual average concentrations at Delhi commercial areas.
A. Srivastava et al. / Atmospheric Environment 39 (2005) 59–7166
maximum concentration of 691.81mgm�3 and minimum
of 510.97mgm�3. Higher concentrations were obtained
during winter followed by monsoon and summer.
Higher temperatures during summer have led to
emissions associated with road asphalts. Emissions
pointing to diesel internal combustion engines are
observed. HAP component of observed TVOC at Raja
Garden, Shakarpur and ITO constitute 97.71%, 99.52%
and 97.61%, respectively. Mobile source air toxics
component of HAPs at these sites are found to be
93.38%, 92.96% and 88.01%.
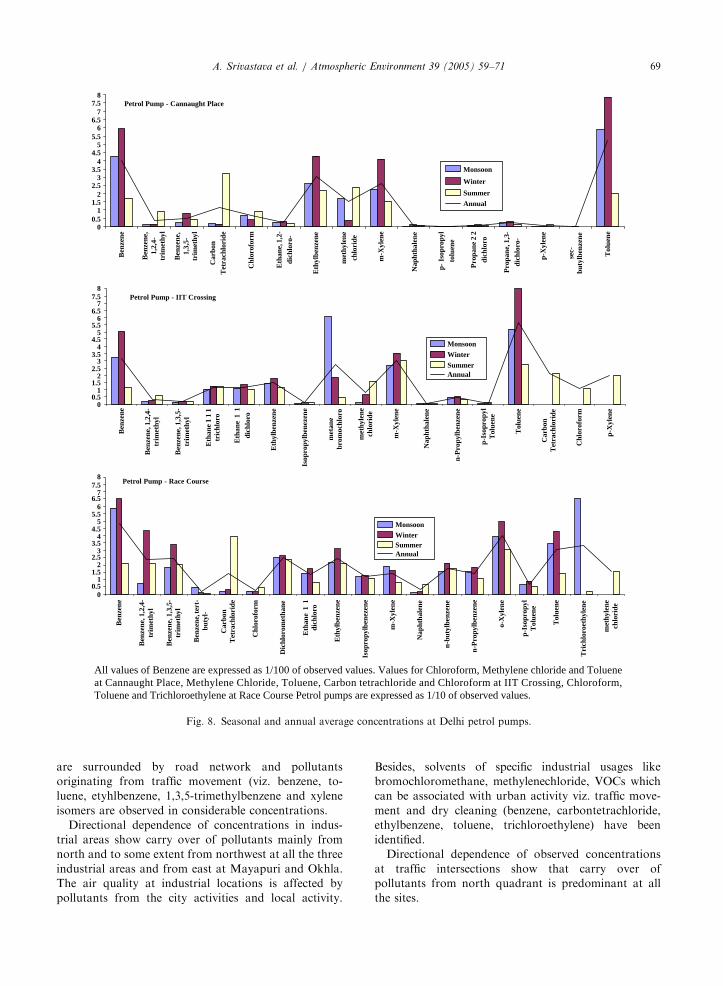
5.5. Petrol pumps
At Cannught Place petrol pump TVOCs ranged from
651.51 to 787.89mgm�3. Total VOC concentrations at
IIT Crossing petrol pump were observed in the range of
388.30–639.44mgm�3. Maximum VOC concentration
ARTICLE IN PRESS
Industrial - Jhilmil
0
0.5
1
1.5
2
2.5
Ben
zene
Ben
zene
, 1,2
,4-
trim
ethy
l
Ben
zene
, 1,3
,5-
trim
ethy
l
Car
bon
Tet
rach
lori
de
Eth
ane
1 1
1tr
ichl
oro
Eth
ylbe
nzen
e
isop
ropy
lben
zene
Met
hane
brom
ochl
oro
met
hyle
nech
lori
de
m-X
ylen
e
Nap
htha
lene
n-P
ropy
lben
zene
sec-
buty
lben
zene
Tol
uene
Chl
orof
rom
p-X
ylen
e
Tri
chlo
roet
hyle
ne
MonsoonWinter
SummerAnnual
Industrial - Okhla
0
0.5
1
1.5
2
2.5
3
3.5
4
4.5
Ben
zene
Ben
zene
, 1,2
,4-
trim
ethy
l
Ben
zene
, 1,3
,5-
trim
ethy
l
Ben
zene
, 1,4
-di
chlo
ro-
Car
bon
Tet
rach
lori
de
Chl
orof
orm
Eth
ane1
1 1
tric
hlor
o
Eth
ene,
tric
hlor
o-
Eth
ylbe
nzen
e
isop
ropy
lben
zene
met
hyle
nech
lori
de
m-X
ylen
e
Nap
htha
lene
n-P
ropy
lben
zene
o-X
ylen
e
Tol
uene
p-xy
lene
MonsoonWinterSummerAnnual
Industrial - Mayapuri
0
0.5
1
1.5
2
2.5
3
3.5
4
4.5
5
Ben
zene
Ben
zene
, 1,2
,4-
trim
ethy
l
Ben
zene
, 1,3
,5-
trim
ethy
l
Ben
zene
, n-b
utyl
-
Car
bon
Tet
rach
lori
de
Chl
orof
orm
Eth
ane1
1 1
tric
hlor
o
Eth
ene,
1,1
-di
chlo
ro-
Eth
ylbe
nzen
e
isop
ropy
lben
zene
met
hyle
nech
lori
de
m-X
ylen
e
Nap
htha
lene
n-P
ropy
lben
zene
Pro
pane
, 1,2
-di
chlo
ro-
$
t-B
utyl
benz
ene
Tol
uene
Met
hane
brom
odic
hlor
o
o-X
ylen
e
p-X
ylen
e
Tri
chlo
roet
hyle
ne
Monsoon
Winter
SummerAnnual
Concentrations of Benzene, m-Xylene, Toluene at Jhilmil, Benzene, Ethylbenzene and Toluene at Okhla, Benzene and Toluene at Mayapuri are expressed as 1/100 of observed values. Carbon tetrachloride, Ethane 1,1,1 trichloro, Ethylbenzene, Methane bromochloro, Methylene chloride, n-Propylbenzene and Chloroform at Jhilmil, Carbon tetrachloride, Chloroform, Methylene chloride, m-Xylene and Napthalene at Okhla, Chloroform, Ethylbenzene Methalene chloride and Methane bromodichloro at Mayapuri are expressed as 1/10 of observed values.
Fig. 6. Seasonal and annual average concentrations at Delhi industrial areas.
A. Srivastava et al. / Atmospheric Environment 39 (2005) 59–71 67
observed at Race Course petrol pump was 819.02 mgm�3
and minimum concentration was 560.80mgm�3. Seaso-
nal and annual averages of observed VOC concentra-
tions are presented in Fig. 8. VOCs which can be
associated with evaporative emissions of petrol, com-
bustion of natural gas, and diesel internal combustion
engines have been identified at these locations. Degreas-
ing activities can also be traced close to petrol
pumps. Higher concentrations are observed during
winter. Minimum concentrations are observed during
summer. HAPs constitute 99.09%, 91.17% and
99.69% of observed TVOCs at IIT Crossing, Race
Course and Cannaught Place petrol pumps, respectively.
Mobile air source toxic component of HAPs at these
locations are found to be 89.24%, 89.88% and 94.96%,
respectively.
At all the locations total VOC concentrations are
dominated by benzene concentration.
ARTICLE IN PRESS
Traffic Intersection - ITO Crossing
00.5
11.5
22.5
33.5
4
4.55
5.56
Ben
zene
Ben
zene
, 1,2
,4-
trim
ethy
l
Ben
zene
, 1,2
-di
chlo
ro-
Ben
zene
, 1,3
,5-
trim
ethy
l
Car
bon
Tet
rach
lori
de
Chl
orof
orm
Eth
ylbe
nzen
e
isop
ropy
lben
zene
met
hyle
nech
lori
de
m-X
ylen
e
Nap
htha
lene
n-P
ropy
lben
zene
o-X
ylen
e
Tol
uene
Met
hane
brom
odic
hlor
o
p-X
ylen
e
MonsoonWinterSummerAnnual
Traffic Intersection - Raja Garden
00.5
11.5
22.5
33.5
44.5
55.5
66.5
77.5
8
Ben
zene
Ben
zene
, 1,2
,4-
trim
ethy
l
Ben
zene
, 1,3
,5-
trim
ethy
l
Ben
zene
, 1,3
-di
chlo
ro-
Chl
orof
orm
Eth
ylbe
nzen
e
isop
ropy
lben
zene
Met
hane
brom
ochl
oro
met
hyle
nech
lori
de
m-X
ylen
e
Nap
htha
lene
n-P
ropy
lben
zene
Pro
pane
2 2
dich
loro
Tol
uene
Eth
ane
1 1
1tr
ichl
oro
Car
bon
Tet
rach
lori
de
p-X
ylen
e
Tri
chlo
roet
hyle
ne
Monsoon
WinterSummerAnnual
Traffic Intersection - Shakarpur Crossing
00.5
11.5
22.5
3
3.54
4.5
55.5
6
Ben
zene
Ben
zene
, 1,3
,5-
trim
ethy
l
Car
bon
Tet
rach
lori
de
Chl
orof
orm
Eth
ylbe
nzen
e
isop
ropy
lben
zene
m-X
ylen
e
Nap
htha
lene
o-X
ylen
e
Pro
pane
2 2
dich
loro
Tol
uene
Eth
ane
1 11
tric
hlor
o
met
hyle
nech
lori
de
Met
hane
brom
odic
hlor
o
p-X
ylen
e
Monsoon
Winter
SummerAnnual
All values of Benzene are expressed as 1/100 of observed values and chloroform, Ethylbenzene, Methylene Chloride, m-Xylene and Methane bromodichloro at ITO Crossing, Chloroform, Ethylbenzene, Methylene chloride, m-Xylene and Toluene at Raja Garden Crossing, Carbon tetrachloride, Chloroform, Ethylbenzene, m-Xylene, Toluene and Methylene chloride at Shakarpur Crossing are expressed as 1/10 of observed values.
Fig. 7. Seasonal and annual average concentrations at Delhi traffic intersections.
A. Srivastava et al. / Atmospheric Environment 39 (2005) 59–7168
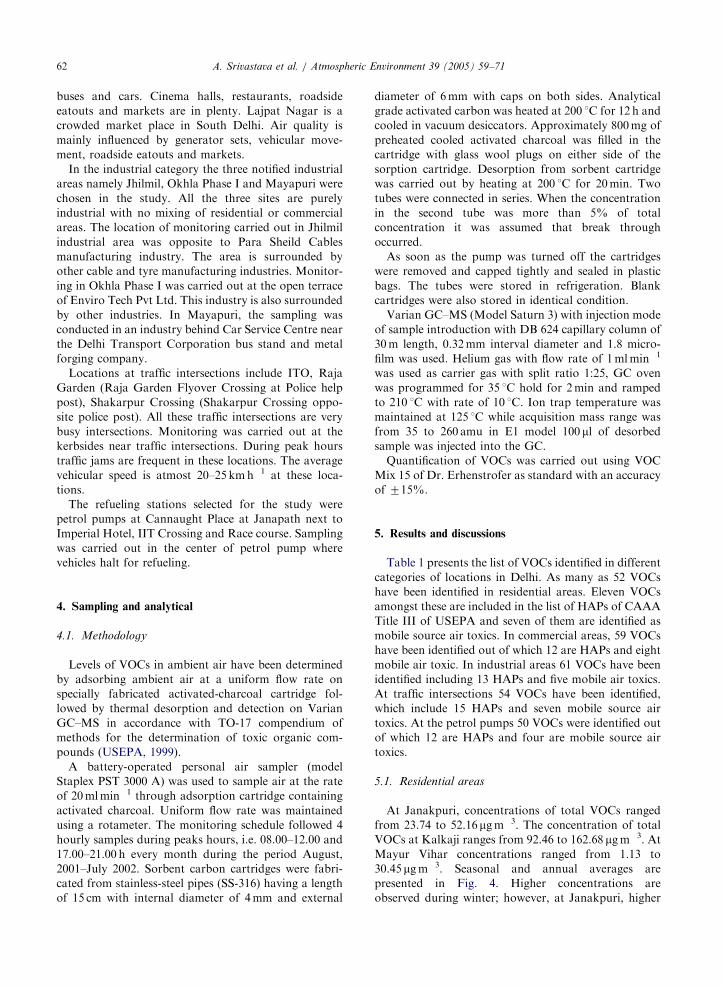
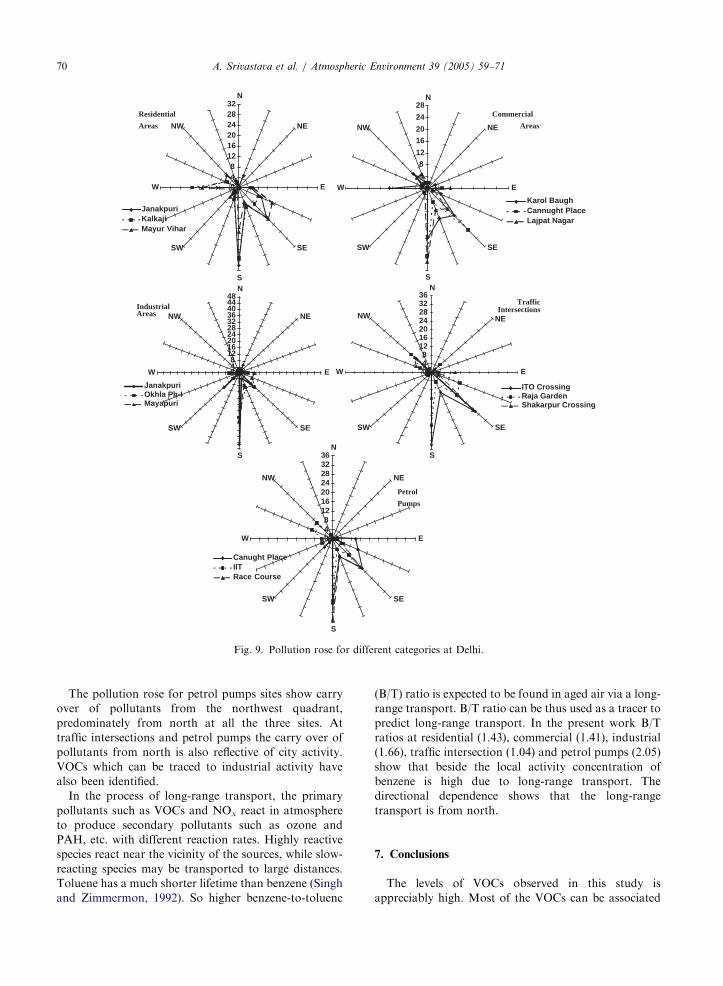
6. Directional dependence
Fig. 9 shows pollution rose for different locations
monitored in this study. Pollution rose for residential
site Janakpuri shows that pollutants are carried over
from north and northwest and at Kalkaji from north
and east. At Mayur Vihar concentrations of TVOCs
show the affect of activities in north, east and northwest
quadrant. In the north, all the three residential locations
are residential areas, important traffic intersections, and
industrial pockets. Thus, appreciable concentrations of
ethylbenzene, toluene, naphthalene and bromochloro-
methane, which are expected to originate from industrial
activity and traffic movement, are observed.
Amongst the commercial areas at Karol Baugh
pollutants are carried over from east, north and north-
west. At Cannught Place pollutants are carried over
from north and northwest, while concentrations at
Lajpat Nagar are predominately affected by the carry
over of pollutants from north. The commercial locations
ARTICLE IN PRESS
Petrol Pump - Cannaught Place
00.5
11.5
22.5
33.5
44.5
55.5
66.5
77.5
8
Ben
zene
Ben
zene
,1,
2,4-
trim
ethy
l
Ben
zene
,1,
3,5-
trim
ethy
l
Car
bon
Tet
rach
lori
de
Chl
orof
orm
Eth
ane,
1,2
-di
chlo
ro-
Eth
ylbe
nzen
e
met
hyle
ne
chlo
ride
m-X
ylen
e
Nap
htha
lene
p- I
sopr
opyl
tolu
ene
Pro
pane
2 2
dich
loro
Pro
pane
, 1,3
-
dich
loro
-
p-X
ylen
e
sec-
buty
lben
zene
Tol
uene
Monsoon
Winter
Summer
Annual
Petrol Pump - IIT Crossing
00.5
11.5
22.5
33.5
44.5
55.5
66.5
77.5
8
Ben
zene
Ben
zene
, 1,2
,4-
trim
ethy
l
Ben
zene
, 1,3
,5-
trim
ethy
l
Eth
ane
1 1
1tr
ichl
oro
Eth
ane
1 1
dich
loro
Eth
ylbe
nzen
e
Isop
ropy
lben
ezen
e
met
ane
brom
ochl
oro
met
hyle
nech
lori
de
m-X
ylen
e
Nap
htha
lene
n-P
ropy
lben
zene
p-Is
opro
pyl
Tol
uene
Tol
uene
Car
bon
Tet
rach
lori
de
Chl
orof
orm
p-X
ylen
e
Monsoon
Winter
SummerAnnual
Petrol Pump - Race Course
00.5
11.5
22.5
33.5
44.5
55.5
66.5
77.5
8
Ben
zene
Ben
zene
, 1,2
,4-
trim
ethy
l
Ben
zene
, 1,3
,5-
trim
ethy
l
Ben
zene
, ter
t-bu
tyl-
Car
bon
Tet
rach
lori
de
Chl
orof
orm
Dic
hlor
omet
hane
Eth
ane
1 1
dich
loro
Eth
ylbe
nzen
e
Isop
ropy
lben
ezen
e
m-X
ylen
e
Nap
htha
lene
n-bu
tylb
enze
ne
n-P
ropy
lben
zene
o-X
ylen
e
p-Is
opro
pyl
Tol
uene
Tol
uene
Tri
chlo
roet
hyle
ne
met
hyle
nech
lori
de
MonsoonWinterSummerAnnual
All values of Benzene are expressed as 1/100 of observed values. Values for Chloroform, Methylene chloride and Toluene at Cannaught Place, Methylene Chloride, Toluene, Carbon tetrachloride and Chloroform at IIT Crossing, Chloroform, Toluene and Trichloroethylene at Race Course Petrol pumps are expressed as 1/10 of observed values.
Fig. 8. Seasonal and annual average concentrations at Delhi petrol pumps.
A. Srivastava et al. / Atmospheric Environment 39 (2005) 59–71 69
are surrounded by road network and pollutants
originating from traffic movement (viz. benzene, to-
luene, etyhlbenzene, 1,3,5-trimethylbenzene and xylene
isomers are observed in considerable concentrations.
Directional dependence of concentrations in indus-
trial areas show carry over of pollutants mainly from
north and to some extent from northwest at all the three
industrial areas and from east at Mayapuri and Okhla.
The air quality at industrial locations is affected by
pollutants from the city activities and local activity.
Besides, solvents of specific industrial usages like
bromochloromethane, methylenechloride, VOCs which
can be associated with urban activity viz. traffic move-
ment and dry cleaning (benzene, carbontetrachloride,
ethylbenzene, toluene, trichloroethylene) have been
identified.
Directional dependence of observed concentrations
at traffic intersections show that carry over of
pollutants from north quadrant is predominant at all
the sites.
ARTICLE IN PRESS
04
8
12
1620
24
28N
NE
E
SE
S
SW
W
NW
Karol BaughCannught PlaceLajpat Nagar
048
12162024283236
N
NE
E
SE
S
SW
W
NW
ITO CrossingRaja GardenShakarpur Crossing
048
121620242832
N
NE
E
SE
S
SW
W
NW
JanakpuriKalkajiMayur Vihar
048
12162024283236404448
N
NE
E
SE
S
SW
W
NW
JanakpuriOkhla Ph-IMayapuri
048
12162024283236
N
NE
E
SE
S
SW
W
NW
Canught PlaceIITRace Course
Residential
Areas
Commercial
Areas
Industrial Areas
Petrol
Pumps
TrafficIntersections
Fig. 9. Pollution rose for different categories at Delhi.
A. Srivastava et al. / Atmospheric Environment 39 (2005) 59–7170
The pollution rose for petrol pumps sites show carry
over of pollutants from the northwest quadrant,
predominately from north at all the three sites. At
traffic intersections and petrol pumps the carry over of
pollutants from north is also reflective of city activity.
VOCs which can be traced to industrial activity have
also been identified.
In the process of long-range transport, the primary
pollutants such as VOCs and NOx react in atmosphere
to produce secondary pollutants such as ozone and
PAH, etc. with different reaction rates. Highly reactive
species react near the vicinity of the sources, while slow-
reacting species may be transported to large distances.
Toluene has a much shorter lifetime than benzene (Singh
and Zimmermon, 1992). So higher benzene-to-toluene
(B/T) ratio is expected to be found in aged air via a long-
range transport. B/T ratio can be thus used as a tracer to
predict long-range transport. In the present work B/T
ratios at residential (1.43), commercial (1.41), industrial
(1.66), traffic intersection (1.04) and petrol pumps (2.05)
show that beside the local activity concentration of
benzene is high due to long-range transport. The
directional dependence shows that the long-range
transport is from north.
7. Conclusions
The levels of VOCs observed in this study is
appreciably high. Most of the VOCs can be associated
ARTICLE IN PRESSA. Srivastava et al. / Atmospheric Environment 39 (2005) 59–71 71
with mobile sources and diesel internal combustion
engines. This is the first study reporting target VOCs
concentrations in the urban area of Delhi. However, as
per the auto fuel policy of Govt. of India, buses, taxis
and autorickshaws have switched over to CNG as fuel
and benzene content in petrol has been reduced to 1%
(Auto Fuel Policy, Govt. of India, 2001). There is a need
to monitor VOCs again in changed scenario to assess the
effect of actions taken. This work is in progress.
Acknowledgement
The authors are thankful to Dr. Sukumar Devotta,
Director, NEERI, for his encouragement, and the
Central Pollution Control Board for funding this study.
References
Aikin, A.C., Herman, J.R., Maier, F.J., McQuillan, C.J., 1982.
Journal of Geophysical Research 87 (C4), 3105–3118.
Atkinson, R., 2000. Atmospheric Environment 34, 2063–2101.
Chattopadhyay, G., Samanta, G., Chatterjee, S., Chakroborti,
P., 1997. Environmental Technology 18, 211–218.
Crutzen, P., 1979. Annual Review of Earth and Planetary
Sciences 7, 443–472.
Derwent, R.G., 1995. Issues in Environmental Science and
Technology 4, 1–15.
Dewulf, J., Van Langenhove, H., 1997. Atomspheric Environ-
ment 31, 3291–3307.
Duce, R.A., Mohnen, V.A., Zimmerman, P.R., Grosjean, D.,
Cautreels, W.J., Chatfield, R., Jaenicke, R., Ogren, J.A.,
Pellizzari, E.D., Wallace, G.T., 1983. Reviews of Geophy-
sical Space Physics 21, 921–952.
Edgerton, S.A., Holdren, M.W., Smith, D.L., 1989. JAPCA 39,
729–732.
Kostianen, R., 1995. Atmospheric Environment 29 (6),
696–702.
Kuran, P., Sojak, L., 1996. Journal of Chromatography A 733,
119–141.
MohanRao, A.M., Pandit, G.C., Sain, P., Sharma, S.,
Krishnamoorthy, T.M., Nambi, K.S.V., 1996. Atmospheric
Environment 31 (7), 1077–1085.
Mukund, R., Kelly, T.J., Spicer, C.W., 1996. Atmospheric
Environment 30 (20), 3457–3470.
Report on the Expert Committee on Auto Fuel Policy, 2001.
Chapter 14, Government of India, 2001.
Ruddy, E.N., Carroll, L.A., 1993. Chemical Engineering
Progress 89, 28.
Singh, H.B., Zimmermon, P.B., 1992. Gaseous pollutants
characterization and cycling. In: Nriaga, O. (Ed.), Services
on Advances in Environment Science and Technology, vol.
24. Wiley, New York, p. 177.
Srivastava, P.K., Pandit, G.C., Sharma, S., Mohan, A.M.,
2000. The Science of Total Environment 255,
161–168.
Sweet, C.W., Vermette, S.J., 1992. Environmental Science and
Technology 26, 165.
Tancrede, M.R., Zeise, W.L., Crouch, E.A.C., 1987. Atmo-
spheric Environment 21, 2187–2193.
USEPA, 1990. Cancer Risk from Outdoor Exposure to Air
Toxics, PA-450/1-90-004a. Research Triangle Park, NC,
Office of Air Quality Planning and Standards.
USEPA, 1999. Compendium Method TO-17, EPA/625/R-96/
010b.
Wallace, L.A., 1986. Proceedings of Environmental Risk
Management. APCA, Pittsburgh, PA, pp. 14–24.