aid for civil society organisations - oecd
TRANSCRIPT
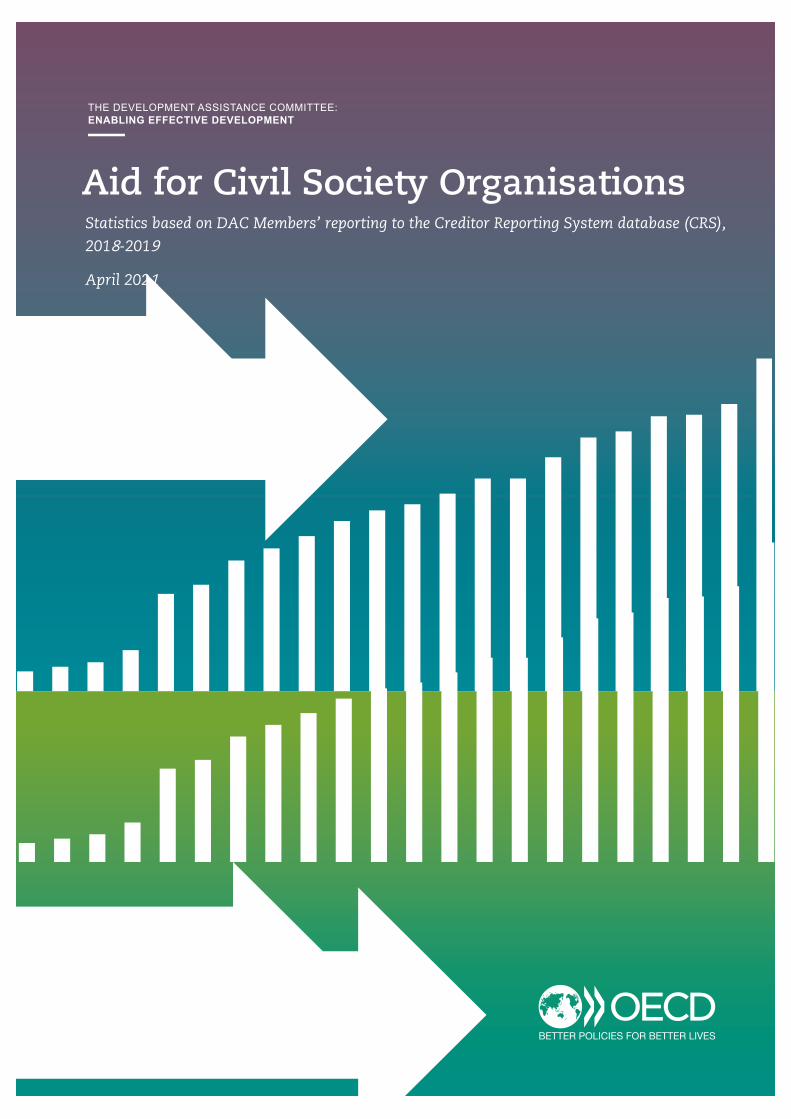
Aid for Civil Society OrganisationsStatistics based on DAC Members’ reporting to the Creditor Reporting System database (CRS), ���� ����
!PRIL 20��
NGOs/CSOs
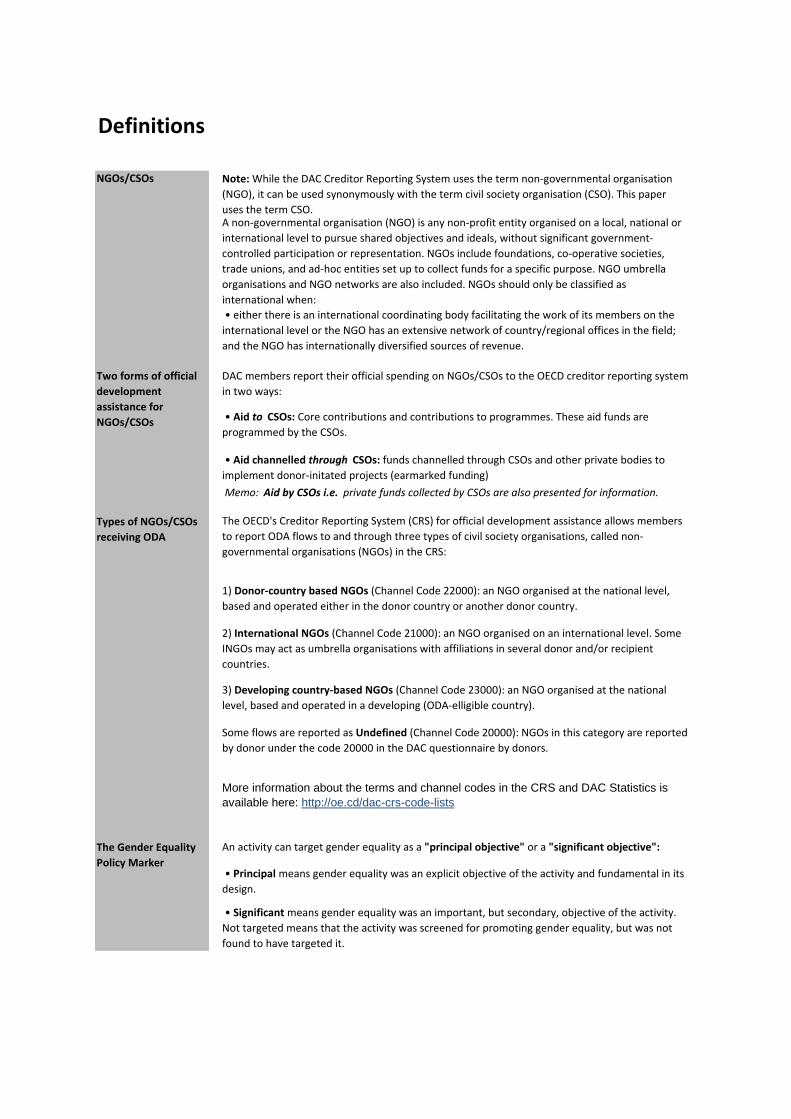
The Gender Equality Policy Marker
An activity can target gender equality as a "principal objective" or a "significant objective":
• Principal means gender equality was an explicit objective of the activity and fundamental in its
design.
• Significant means gender equality was an important, but secondary, objective of the activity.
Not targeted means that the activity was screened for promoting gender equality, but was not
found to have targeted it.
3) Developing country-based NGOs (Channel Code 23000): an NGO organised at the national
level, based and operated in a developing (ODA-elligible country).
Some flows are reported as Undefined (Channel Code 20000): NGOs in this category are reported
by donor under the code 20000 in the DAC questionnaire by donors.
More information about the terms and channel codes in the CRS and DAC Statistics is available here: http://oe.cd/dac-crs-code-lists
Definitions
2) International NGOs (Channel Code 21000): an NGO organised on an international level. Some
INGOs may act as umbrella organisations with affiliations in several donor and/or recipient
countries.
Two forms of official development assistance for NGOs/CSOs
DAC members report their official spending on NGOs/CSOs to the OECD creditor reporting system
in two ways:
• Aid to CSOs: Core contributions and contributions to programmes. These aid funds are
programmed by the CSOs.
• either there is an international coordinating body facilitating the work of its members on the international level or the NGO has an extensive network of country/regional offices in the field;
and the NGO has internationally diversified sources of revenue.
1) Donor-country based NGOs (Channel Code 22000): an NGO organised at the national level,
based and operated either in the donor country or another donor country.
• Aid channelled through CSOs: funds channelled through CSOs and other private bodies to
implement donor-initated projects (earmarked funding)
The OECD's Creditor Reporting System (CRS) for official development assistance allows members
to report ODA flows to and through three types of civil society organisations, called non-
governmental organisations (NGOs) in the CRS:
Memo: Aid by CSOs i.e. private funds collected by CSOs are also presented for information.
Note: While the DAC Creditor Reporting System uses the term non-governmental organisation
(NGO), it can be used synonymously with the term civil society organisation (CSO). This paper
uses the term CSO.A non-governmental organisation (NGO) is any non-profit entity organised on a local, national or
international level to pursue shared objectives and ideals, without significant government-
controlled participation or representation. NGOs include foundations, co-operative societies,
trade unions, and ad-hoc entities set up to collect funds for a specific purpose. NGO umbrella
organisations and NGO networks are also included. NGOs should only be classified as
international when:
Types of NGOs/CSOs receiving ODA
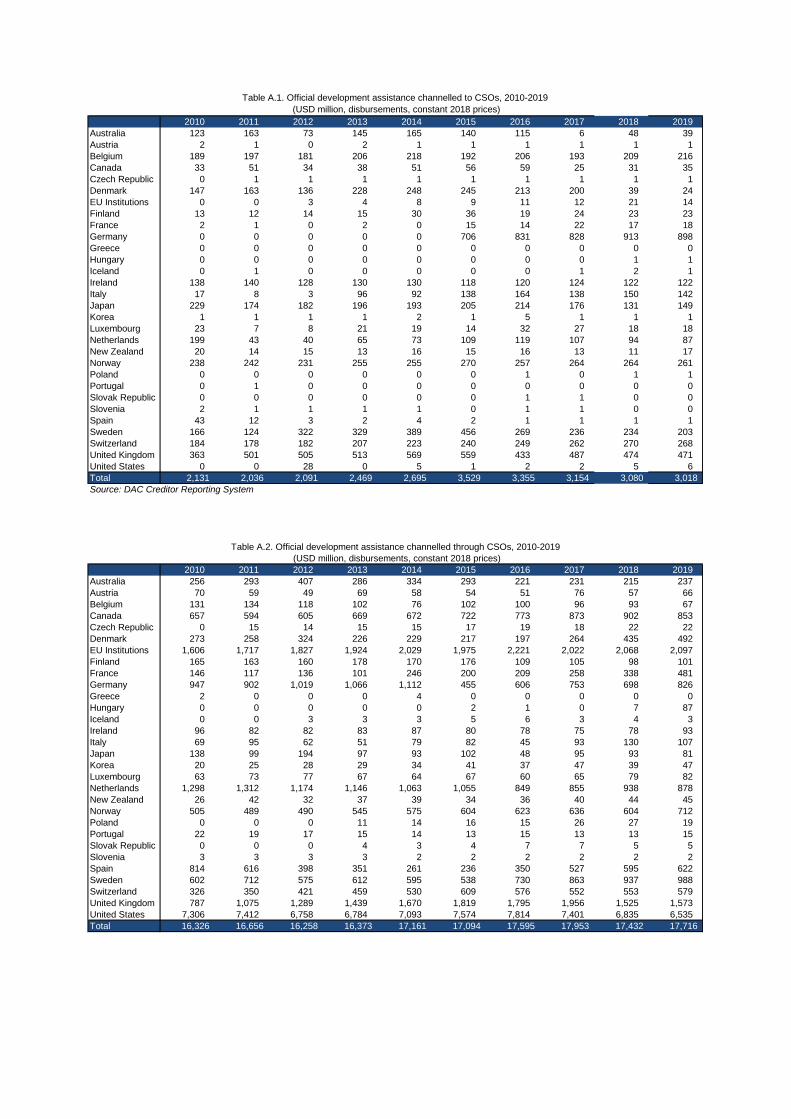
2010 2011 2012 2013 2014 2015 2016 2017 2018 2019Australia 123 163 73 145 165 140 115 6 48 39Austria 2 1 0 2 1 1 1 1 1 1Belgium 189 197 181 206 218 192 206 193 209 216Canada 33 51 34 38 51 56 59 25 31 35Czech Republic 0 1 1 1 1 1 1 1 1 1Denmark 147 163 136 228 248 245 213 200 39 24EU Institutions 0 0 3 4 8 9 11 12 21 14Finland 13 12 14 15 30 36 19 24 23 23France 2 1 0 2 0 15 14 22 17 18Germany 0 0 0 0 0 706 831 828 913 898Greece 0 0 0 0 0 0 0 0 0 0Hungary 0 0 0 0 0 0 0 0 1 1Iceland 0 1 0 0 0 0 0 1 2 1Ireland 138 140 128 130 130 118 120 124 122 122Italy 17 8 3 96 92 138 164 138 150 142Japan 229 174 182 196 193 205 214 176 131 149Korea 1 1 1 1 2 1 5 1 1 1Luxembourg 23 7 8 21 19 14 32 27 18 18Netherlands 199 43 40 65 73 109 119 107 94 87New Zealand 20 14 15 13 16 15 16 13 11 17Norway 238 242 231 255 255 270 257 264 264 261Poland 0 0 0 0 0 0 1 0 1 1Portugal 0 1 0 0 0 0 0 0 0 0Slovak Republic 0 0 0 0 0 0 1 1 0 0Slovenia 2 1 1 1 1 0 1 1 0 0Spain 43 12 3 2 4 2 1 1 1 1Sweden 166 124 322 329 389 456 269 236 234 203Switzerland 184 178 182 207 223 240 249 262 270 268United Kingdom 363 501 505 513 569 559 433 487 474 471United States 0 0 28 0 5 1 2 2 5 6Total 2,131 2,036 2,091 2,469 2,695 3,529 3,355 3,154 3,080 3,018
2010 2011 2012 2013 2014 2015 2016 2017 2018 2019Australia 256 293 407 286 334 293 221 231 215 237Austria 70 59 49 69 58 54 51 76 57 66Belgium 131 134 118 102 76 102 100 96 93 67Canada 657 594 605 669 672 722 773 873 902 853Czech Republic 0 15 14 15 15 17 19 18 22 22Denmark 273 258 324 226 229 217 197 264 435 492EU Institutions 1,606 1,717 1,827 1,924 2,029 1,975 2,221 2,022 2,068 2,097Finland 165 163 160 178 170 176 109 105 98 101France 146 117 136 101 246 200 209 258 338 481Germany 947 902 1,019 1,066 1,112 455 606 753 698 826Greece 2 0 0 0 4 0 0 0 0 0Hungary 0 0 0 0 0 2 1 0 7 87Iceland 0 0 3 3 3 5 6 3 4 3Ireland 96 82 82 83 87 80 78 75 78 93Italy 69 95 62 51 79 82 45 93 130 107Japan 138 99 194 97 93 102 48 95 93 81Korea 20 25 28 29 34 41 37 47 39 47Luxembourg 63 73 77 67 64 67 60 65 79 82Netherlands 1,298 1,312 1,174 1,146 1,063 1,055 849 855 938 878New Zealand 26 42 32 37 39 34 36 40 44 45Norway 505 489 490 545 575 604 623 636 604 712Poland 0 0 0 11 14 16 15 26 27 19Portugal 22 19 17 15 14 13 15 13 13 15Slovak Republic 0 0 0 4 3 4 7 7 5 5Slovenia 3 3 3 3 2 2 2 2 2 2Spain 814 616 398 351 261 236 350 527 595 622Sweden 602 712 575 612 595 538 730 863 937 988Switzerland 326 350 421 459 530 609 576 552 553 579United Kingdom 787 1,075 1,289 1,439 1,670 1,819 1,795 1,956 1,525 1,573United States 7,306 7,412 6,758 6,784 7,093 7,574 7,814 7,401 6,835 6,535Total 16,326 16,656 16,258 16,373 17,161 17,094 17,595 17,953 17,432 17,716
(USD million, disbursements, constant 2018 prices)
(USD million, disbursements, constant 2018 prices)
Table A.1. Official development assistance channelled to CSOs, 2010-2019
Table A.2. Official development assistance channelled through CSOs, 2010-2019
Source: DAC Creditor Reporting System
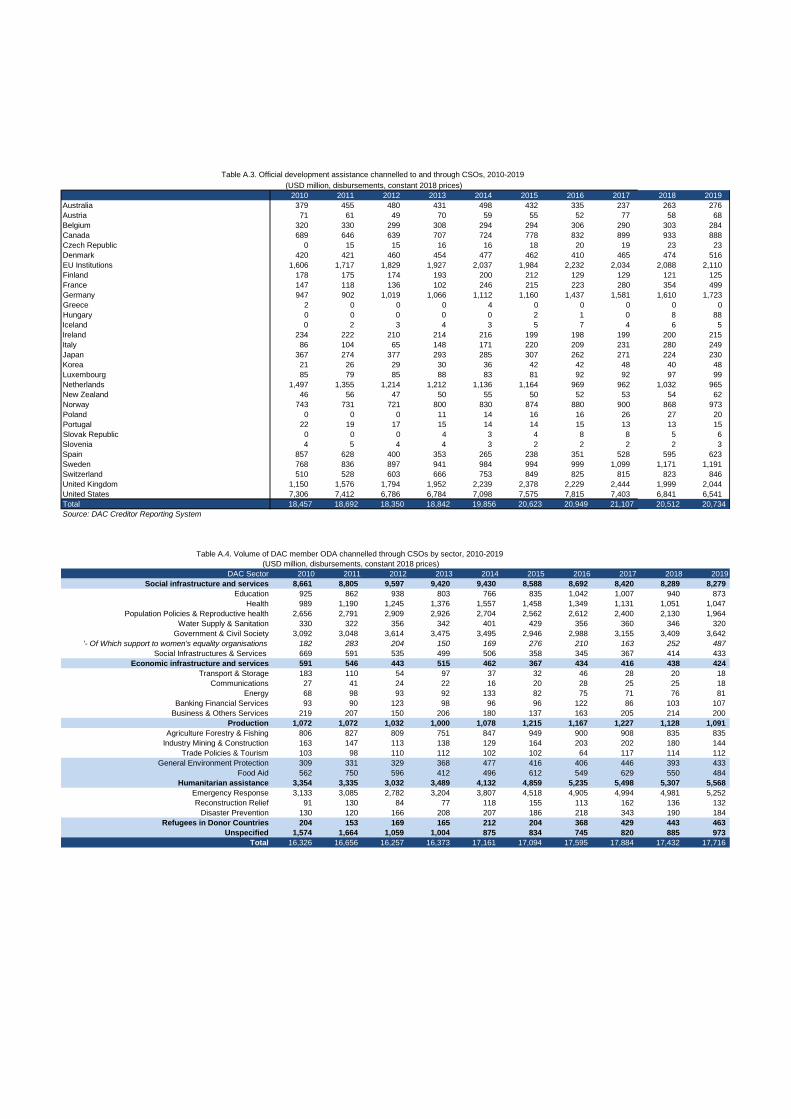
2010 2011 2012 2013 2014 2015 2016 2017 2018 2019Australia 379 455 480 431 498 432 335 237 263 276Austria 71 61 49 70 59 55 52 77 58 68Belgium 320 330 299 308 294 294 306 290 303 284Canada 689 646 639 707 724 778 832 899 933 888Czech Republic 0 15 15 16 16 18 20 19 23 23Denmark 420 421 460 454 477 462 410 465 474 516EU Institutions 1,606 1,717 1,829 1,927 2,037 1,984 2,232 2,034 2,088 2,110Finland 178 175 174 193 200 212 129 129 121 125France 147 118 136 102 246 215 223 280 354 499Germany 947 902 1,019 1,066 1,112 1,160 1,437 1,581 1,610 1,723Greece 2 0 0 0 4 0 0 0 0 0Hungary 0 0 0 0 0 2 1 0 8 88Iceland 0 2 3 4 3 5 7 4 6 5Ireland 234 222 210 214 216 199 198 199 200 215Italy 86 104 65 148 171 220 209 231 280 249Japan 367 274 377 293 285 307 262 271 224 230Korea 21 26 29 30 36 42 42 48 40 48Luxembourg 85 79 85 88 83 81 92 92 97 99Netherlands 1,497 1,355 1,214 1,212 1,136 1,164 969 962 1,032 965New Zealand 46 56 47 50 55 50 52 53 54 62Norway 743 731 721 800 830 874 880 900 868 973Poland 0 0 0 11 14 16 16 26 27 20Portugal 22 19 17 15 14 14 15 13 13 15Slovak Republic 0 0 0 4 3 4 8 8 5 6Slovenia 4 5 4 4 3 2 2 2 2 3Spain 857 628 400 353 265 238 351 528 595 623Sweden 768 836 897 941 984 994 999 1,099 1,171 1,191Switzerland 510 528 603 666 753 849 825 815 823 846United Kingdom 1,150 1,576 1,794 1,952 2,239 2,378 2,229 2,444 1,999 2,044United States 7,306 7,412 6,786 6,784 7,098 7,575 7,815 7,403 6,841 6,541Total 18,457 18,692 18,350 18,842 19,856 20,623 20,949 21,107 20,512 20,734
DAC Sector 2010 2011 2012 2013 2014 2015 2016 2017 2018 2019Social infrastructure and services 8,661 8,805 9,597 9,420 9,430 8,588 8,692 8,420 8,289 8,279
Education 925 862 938 803 766 835 1,042 1,007 940 873 Health 989 1,190 1,245 1,376 1,557 1,458 1,349 1,131 1,051 1,047
Population Policies & Reproductive health 2,656 2,791 2,909 2,926 2,704 2,562 2,612 2,400 2,130 1,964 Water Supply & Sanitation 330 322 356 342 401 429 356 360 346 320
Government & Civil Society 3,092 3,048 3,614 3,475 3,495 2,946 2,988 3,155 3,409 3,642 '- Of Which support to women's equality organisations 182 283 204 150 169 276 210 163 252 487
Social Infrastructures & Services 669 591 535 499 506 358 345 367 414 433 Economic infrastructure and services 591 546 443 515 462 367 434 416 438 424
Transport & Storage 183 110 54 97 37 32 46 28 20 18 Communications 27 41 24 22 16 20 28 25 25 18
Energy 68 98 93 92 133 82 75 71 76 81 Banking Financial Services 93 90 123 98 96 96 122 86 103 107
Business & Others Services 219 207 150 206 180 137 163 205 214 200 Production 1,072 1,072 1,032 1,000 1,078 1,215 1,167 1,227 1,128 1,091
Agriculture Forestry & Fishing 806 827 809 751 847 949 900 908 835 835 Industry Mining & Construction 163 147 113 138 129 164 203 202 180 144
Trade Policies & Tourism 103 98 110 112 102 102 64 117 114 112 General Environment Protection 309 331 329 368 477 416 406 446 393 433
Food Aid 562 750 596 412 496 612 549 629 550 484 Humanitarian assistance 3,354 3,335 3,032 3,489 4,132 4,859 5,235 5,498 5,307 5,568
Emergency Response 3,133 3,085 2,782 3,204 3,807 4,518 4,905 4,994 4,981 5,252 Reconstruction Relief 91 130 84 77 118 155 113 162 136 132
Disaster Prevention 130 120 166 208 207 186 218 343 190 184 Refugees in Donor Countries 204 153 169 165 212 204 368 429 443 463
Unspecified 1,574 1,664 1,059 1,004 875 834 745 820 885 973 Total 16,326 16,656 16,257 16,373 17,161 17,094 17,595 17,884 17,432 17,716
(USD million, disbursements, constant 2018 prices)
Source: DAC Creditor Reporting System
Table A.3. Official development assistance channelled to and through CSOs, 2010-2019
Table A.4. Volume of DAC member ODA channelled through CSOs by sector, 2010-2019
(USD million, disbursements, constant 2018 prices)
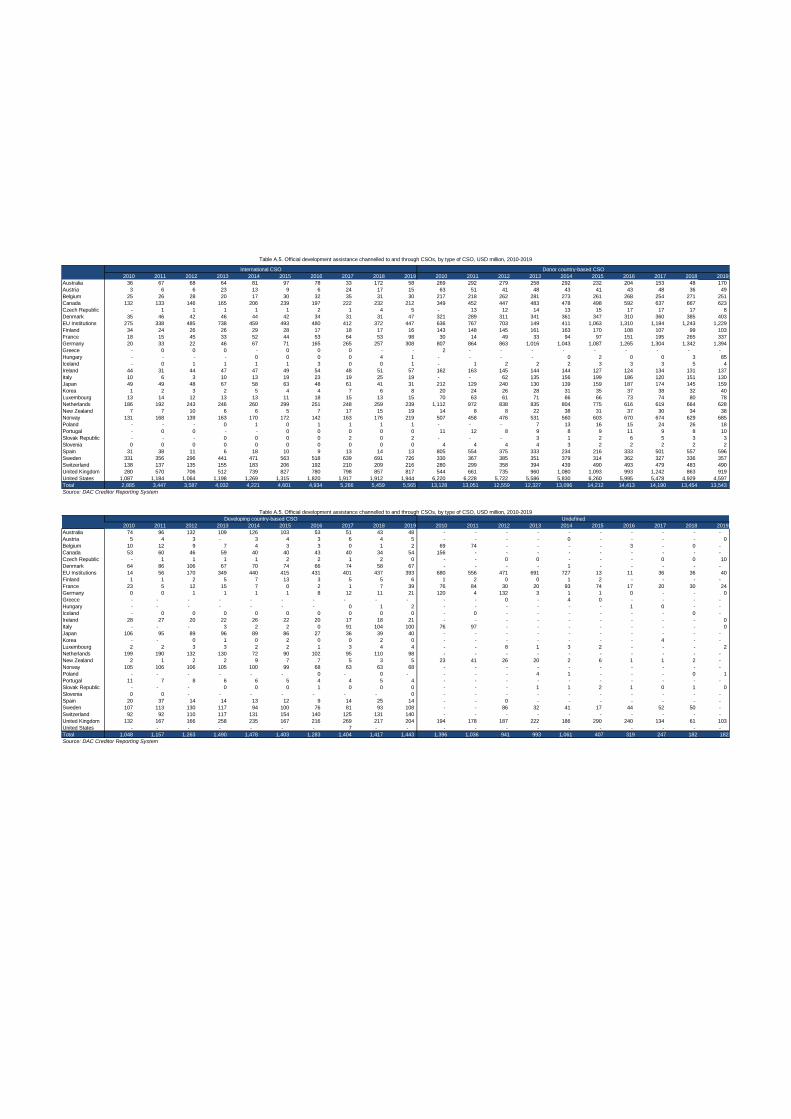
2010 2011 2012 2013 2014 2015 2016 2017 2018 2019 2010 2011 2012 2013 2014 2015 2016 2017 2018 2019Australia 36 67 68 64 81 97 78 33 172 58 269 292 279 258 292 232 204 153 48 170 Austria 3 6 6 23 13 9 6 24 17 15 63 51 41 48 43 41 43 48 36 49 Belgium 25 26 28 20 17 30 32 35 31 30 217 218 262 281 273 261 268 254 271 251 Canada 132 133 146 165 206 239 197 222 232 212 349 452 447 483 478 498 592 637 667 623 Czech Republic - 1 1 1 1 1 2 1 4 5 - 13 12 14 13 15 17 17 17 8 Denmark 35 46 42 46 44 42 34 31 31 47 321 289 311 341 361 347 310 360 385 403 EU Institutions 275 338 485 738 459 493 480 412 372 447 636 767 703 149 411 1,063 1,310 1,184 1,243 1,229 Finland 34 24 26 26 29 28 17 18 17 16 143 148 145 161 163 170 108 107 99 103 France 18 15 45 33 52 44 53 64 53 98 30 14 49 33 94 97 151 195 265 337 Germany 20 33 22 46 67 71 165 265 257 308 807 864 863 1,016 1,043 1,087 1,265 1,304 1,342 1,394 Greece - 0 0 0 - 0 0 0 - - 2 - - - - - - - - - Hungary - - - - 0 0 0 0 4 1 - - - - 0 2 0 0 3 85 Iceland - 0 1 1 1 1 3 0 0 1 - 1 2 2 2 3 3 3 5 4 Ireland 44 31 44 47 47 49 54 48 51 57 162 163 145 144 144 127 124 134 131 137 Italy 10 6 3 10 13 19 23 19 25 19 - - 62 135 156 199 186 120 151 130 Japan 49 49 48 67 58 63 48 61 41 31 212 129 240 130 139 159 187 174 145 159 Korea 1 2 3 2 5 4 4 7 6 8 20 24 26 28 31 35 37 38 32 40 Luxembourg 13 14 12 13 13 11 18 15 13 15 70 63 61 71 66 66 73 74 80 78 Netherlands 186 192 243 246 260 299 251 248 259 239 1,112 972 838 835 804 775 616 619 664 628 New Zealand 7 7 10 6 6 5 7 17 15 19 14 8 8 22 38 31 37 30 34 38 Norway 131 168 139 163 170 172 142 163 176 219 507 458 476 531 560 603 670 674 629 685 Poland - - - 0 1 0 1 1 1 1 - - - 7 13 16 15 24 26 18 Portugal - 0 0 - - 0 0 0 0 0 11 12 8 9 8 9 11 9 8 10 Slovak Republic - - - 0 0 0 0 2 0 2 - - - 3 1 2 6 5 3 3 Slovenia 0 0 0 0 0 0 0 0 0 0 4 4 4 4 3 2 2 2 2 2 Spain 31 38 11 6 18 10 9 13 14 13 805 554 375 333 234 216 333 501 557 596 Sweden 331 356 296 441 471 563 518 639 691 726 330 367 385 351 379 314 362 327 336 357 Switzerland 138 137 135 155 183 206 192 210 209 216 280 299 358 394 439 490 493 479 483 490 United Kingdom 280 570 706 512 739 827 780 798 857 817 544 661 735 960 1,080 1,093 993 1,242 863 919 United States 1,087 1,184 1,064 1,198 1,269 1,315 1,820 1,917 1,912 1,944 6,220 6,228 5,722 5,586 5,830 6,260 5,995 5,478 4,929 4,597 Total 2,885 3,447 3,587 4,032 4,221 4,601 4,934 5,266 5,459 5,565 13,128 13,051 12,559 12,327 13,096 14,212 14,413 14,190 13,454 13,543
2010 2011 2012 2013 2014 2015 2016 2017 2018 2019 2010 2011 2012 2013 2014 2015 2016 2017 2018 2019Australia 74 96 132 109 126 103 53 51 43 48 - - - - - - - - - - Austria 5 4 3 - 3 4 3 6 4 5 - - - - 0 - - - - 0 Belgium 10 12 9 7 4 3 3 0 1 2 69 74 - - - - 3 - 0 - Canada 53 60 46 59 40 40 43 40 34 54 156 - - - - - - - - - Czech Republic - 1 1 1 1 2 2 1 2 0 - - 0 0 - - - 0 0 10 Denmark 64 86 106 67 70 74 66 74 58 67 - - - - 1 - - - - - EU Institutions 14 56 170 349 440 415 431 401 437 393 680 556 471 691 727 13 11 36 36 40 Finland 1 1 2 5 7 13 3 5 5 6 1 2 0 0 1 2 - - - - France 23 5 12 15 7 0 2 1 7 39 76 84 30 20 93 74 17 20 30 24 Germany 0 0 1 1 1 1 8 12 11 21 120 4 132 3 1 1 0 - - 0 Greece - - - - - - - - - - - - 0 - 4 0 - - - - Hungary - - - - - - - 0 1 2 - - - - - - 1 0 - - Iceland - 0 0 0 0 0 0 0 0 0 - 0 - - - - - - 0 - Ireland 28 27 20 22 26 22 20 17 18 21 - - - - - - - - - 0 Italy - - - 3 2 2 0 91 104 100 76 97 - - - - - - - 0 Japan 106 95 89 96 89 86 27 36 39 40 - - - - - - - - - - Korea - - 0 1 0 2 0 0 2 0 - - - - - - - 4 - - Luxembourg 2 2 3 3 2 2 1 3 4 4 - - 8 1 3 2 - - - 2 Netherlands 199 190 132 130 72 90 102 95 110 98 - - - - - - - - - - New Zealand 2 1 2 2 9 7 7 5 3 5 23 41 26 20 2 6 1 1 2 - Norway 105 106 106 105 100 99 68 63 63 68 - - - - - - - - - - Poland - - - - - - 0 - 0 - - - - 4 1 - - - 0 1 Portugal 11 7 8 6 6 5 4 4 5 4 - - - - - - - - - - Slovak Republic - - - 0 0 0 1 0 0 0 - - - 1 1 2 1 0 1 0 Slovenia 0 0 - - - - - - - 0 - - - - - - - - - - Spain 20 37 14 14 13 12 9 14 25 14 - - 0 - - - - - - - Sweden 107 113 130 117 94 100 76 81 93 108 - - 86 32 41 17 44 52 50 - Switzerland 92 92 110 117 131 154 140 125 131 140 - - - - - - - - - - United Kingdom 132 167 166 258 235 167 216 269 217 204 194 178 187 222 186 290 240 134 61 103 United States - - - - - - - 7 - - - - - - - - - - - - Total 1,048 1,157 1,263 1,490 1,478 1,403 1,283 1,404 1,417 1,443 1,396 1,036 941 993 1,061 407 319 247 182 182
Undefined
Source: DAC Creditor Reporting System
Source: DAC Creditor Reporting System
Table A.5. Official development assistance channelled to and through CSOs, by type of CSO, USD million, 2010-2019
Table A.5. Official development assistance channelled to and through CSOs, by type of CSO, USD million, 2010-2019
International CSO Donor country-based CSO
Developing country-based CSO
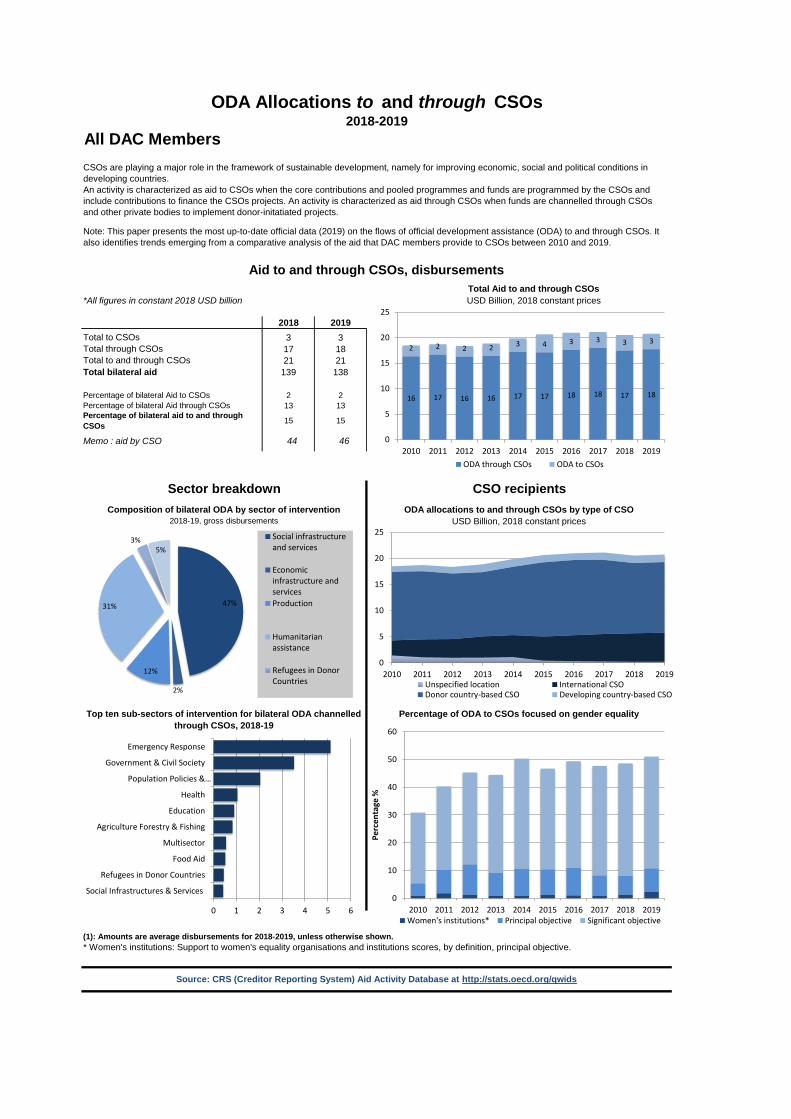
All DAC Members
*All figures in constant 2018 USD billion
2018 20193 317 1821 21
139 138
2 213 13
44 46
Total through CSOs
ODA Allocations to and through CSOs2018-2019
CSOs are playing a major role in the framework of sustainable development, namely for improving economic, social and political conditions in developing countries. An activity is characterized as aid to CSOs when the core contributions and pooled programmes and funds are programmed by the CSOs and include contributions to finance the CSOs projects. An activity is characterized as aid through CSOs when funds are channelled through CSOs and other private bodies to implement donor-initatiated projects.
Note: This paper presents the most up-to-date official data (2019) on the flows of official development assistance (ODA) to and through CSOs. It also identifies trends emerging from a comparative analysis of the aid that DAC members provide to CSOs between 2010 and 2019.
Aid to and through CSOs, disbursementsTotal Aid to and through CSOsUSD Billion, 2018 constant prices
Total to CSOs
Total to and through CSOsTotal bilateral aid
Percentage of bilateral Aid to CSOsPercentage of bilateral Aid through CSOsPercentage of bilateral aid to and through CSOs
Memo : aid by CSO
Sector breakdown CSO recipients
15
(1): Amounts are average disbursements for 2018-2019, unless otherwise shown.* Women's institutions: Support to women's equality organisations and institutions scores, by definition, principal objective.
Source: CRS (Creditor Reporting System) Aid Activity Database at http://stats.oecd.org/qwids
Composition of bilateral ODA by sector of intervention ODA allocations to and through CSOs by type of CSO2018-19, gross disbursements USD Billion, 2018 constant prices
Top ten sub-sectors of intervention for bilateral ODA channelled through CSOs, 2018-19
Percentage of ODA to CSOs focused on gender equality
15
0
10
20
30
40
50
60
2010 2011 2012 2013 2014 2015 2016 2017 2018 2019
Perc
enta
ge %
Women's institutions* Principal objective Significant objective
16 17 16 16 17 17 18 18 17 18
2 2 2 2 3 4 3 3 3 3
0
5
10
15
20
25
2010 2011 2012 2013 2014 2015 2016 2017 2018 2019ODA through CSOs ODA to CSOs
0
5
10
15
20
25
2010 2011 2012 2013 2014 2015 2016 2017 2018 2019Unspecified location International CSODonor country-based CSO Developing country-based CSO
47%
2%
12%
31%
3%5%
Social infrastructureand services
Economicinfrastructure andservicesProduction
Humanitarianassistance
Refugees in DonorCountries
0 1 2 3 4 5 6
Social Infrastructures & Services
Refugees in Donor Countries
Food Aid
Multisector
Agriculture Forestry & Fishing
Education
Health
Population Policies &…
Government & Civil Society
Emergency Response
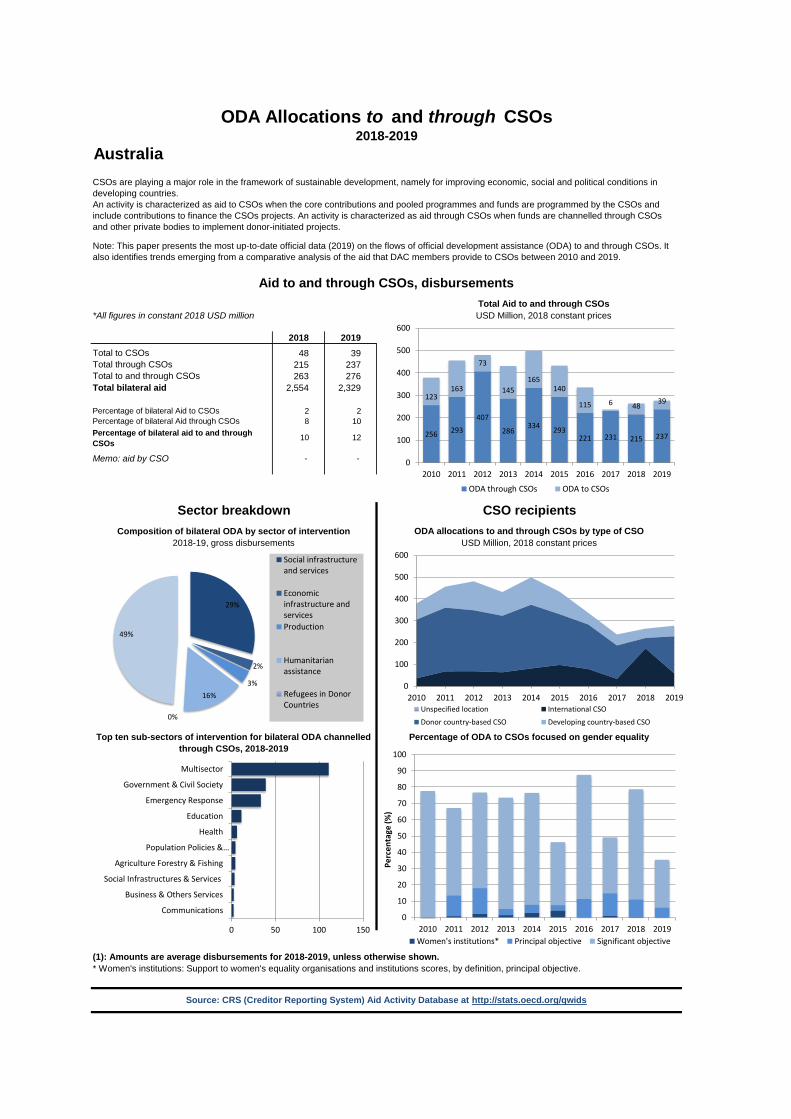
Australia
*All figures in constant 2018 USD million
2018 201948 39
215 237263 276
2,554 2,329
2 28 10
10 12
- -
ODA Allocations to and through CSOs2018-2019
CSOs are playing a major role in the framework of sustainable development, namely for improving economic, social and political conditions in developing countries. An activity is characterized as aid to CSOs when the core contributions and pooled programmes and funds are programmed by the CSOs and include contributions to finance the CSOs projects. An activity is characterized as aid through CSOs when funds are channelled through CSOs and other private bodies to implement donor-initiated projects.
Note: This paper presents the most up-to-date official data (2019) on the flows of official development assistance (ODA) to and through CSOs. It also identifies trends emerging from a comparative analysis of the aid that DAC members provide to CSOs between 2010 and 2019.
Memo: aid by CSO
Aid to and through CSOs, disbursementsTotal Aid to and through CSOsUSD Million, 2018 constant prices
Total to CSOsTotal through CSOsTotal to and through CSOsTotal bilateral aid
Percentage of bilateral Aid to CSOsPercentage of bilateral Aid through CSOsPercentage of bilateral aid to and through CSOs
Sector breakdown CSO recipientsComposition of bilateral ODA by sector of intervention ODA allocations to and through CSOs by type of CSO
(1): Amounts are average disbursements for 2018-2019, unless otherwise shown.* Women's institutions: Support to women's equality organisations and institutions scores, by definition, principal objective.
Source: CRS (Creditor Reporting System) Aid Activity Database at http://stats.oecd.org/qwids
2018-19, gross disbursements USD Million, 2018 constant prices
Top ten sub-sectors of intervention for bilateral ODA channelled through CSOs, 2018-2019
Percentage of ODA to CSOs focused on gender equality
0
10
20
30
40
50
60
70
80
90
100
2010 2011 2012 2013 2014 2015 2016 2017 2018 2019
Perc
enta
ge (%
)
Women's institutions* Principal objective Significant objective
256 293407
286334 293
221 231 215 237
123163
73
145165
140
115 6 48 39
0
100
200
300
400
500
600
2010 2011 2012 2013 2014 2015 2016 2017 2018 2019
ODA through CSOs ODA to CSOs
0
100
200
300
400
500
600
2010 2011 2012 2013 2014 2015 2016 2017 2018 2019Unspecified location International CSO
Donor country-based CSO Developing country-based CSO
29%
2%
3%16%
0%
49%
Social infrastructureand services
Economicinfrastructure andservicesProduction
Humanitarianassistance
Refugees in DonorCountries
0 50 100 150
Communications
Business & Others Services
Social Infrastructures & Services
Agriculture Forestry & Fishing
Population Policies &…
Health
Education
Emergency Response
Government & Civil Society
Multisector
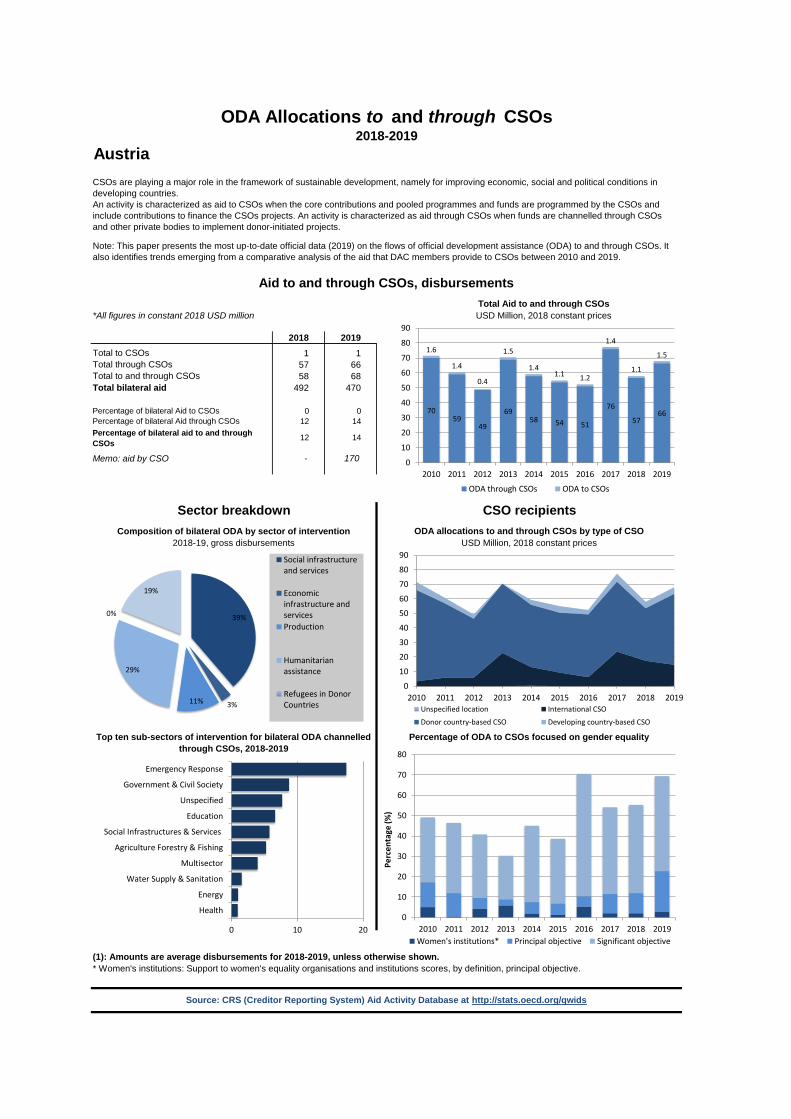
Austria
*All figures in constant 2018 USD million
2018 20191 1
57 6658 68
492 470
0 012 14
12 14
- 170
ODA Allocations to and through CSOs2018-2019
CSOs are playing a major role in the framework of sustainable development, namely for improving economic, social and political conditions in developing countries. An activity is characterized as aid to CSOs when the core contributions and pooled programmes and funds are programmed by the CSOs and include contributions to finance the CSOs projects. An activity is characterized as aid through CSOs when funds are channelled through CSOs and other private bodies to implement donor-initiated projects.
Note: This paper presents the most up-to-date official data (2019) on the flows of official development assistance (ODA) to and through CSOs. It also identifies trends emerging from a comparative analysis of the aid that DAC members provide to CSOs between 2010 and 2019.
Memo: aid by CSO
Aid to and through CSOs, disbursementsTotal Aid to and through CSOsUSD Million, 2018 constant prices
Total to CSOsTotal through CSOsTotal to and through CSOsTotal bilateral aid
Percentage of bilateral Aid to CSOsPercentage of bilateral Aid through CSOsPercentage of bilateral aid to and through CSOs
Sector breakdown CSO recipientsComposition of bilateral ODA by sector of intervention ODA allocations to and through CSOs by type of CSO
(1): Amounts are average disbursements for 2018-2019, unless otherwise shown.* Women's institutions: Support to women's equality organisations and institutions scores, by definition, principal objective.
Source: CRS (Creditor Reporting System) Aid Activity Database at http://stats.oecd.org/qwids
2018-19, gross disbursements USD Million, 2018 constant prices
Top ten sub-sectors of intervention for bilateral ODA channelled through CSOs, 2018-2019
Percentage of ODA to CSOs focused on gender equality
0
10
20
30
40
50
60
70
80
2010 2011 2012 2013 2014 2015 2016 2017 2018 2019
Perc
enta
ge (%
)
Women's institutions* Principal objective Significant objective
7059
49
6958 54 51
76
5766
1.6
1.4
0.4
1.5
1.41.1 1.2
1.4
1.1
1.5
0
10
20
30
40
50
60
70
80
90
2010 2011 2012 2013 2014 2015 2016 2017 2018 2019
ODA through CSOs ODA to CSOs
0
10
20
30
40
50
60
70
80
90
2010 2011 2012 2013 2014 2015 2016 2017 2018 2019Unspecified location International CSO
Donor country-based CSO Developing country-based CSO
39%
3%11%
29%
0%
19%
Social infrastructureand services
Economicinfrastructure andservicesProduction
Humanitarianassistance
Refugees in DonorCountries
0 10 20
Health
Energy
Water Supply & Sanitation
Multisector
Agriculture Forestry & Fishing
Social Infrastructures & Services
Education
Unspecified
Government & Civil Society
Emergency Response
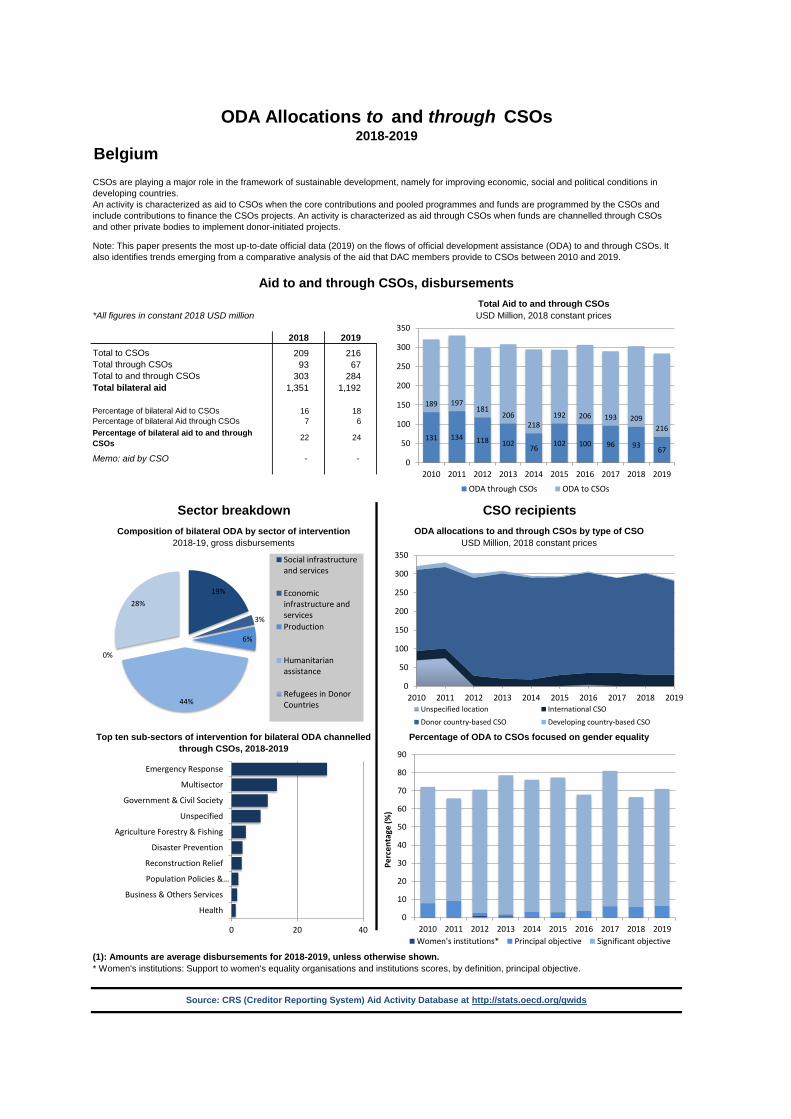
Belgium
*All figures in constant 2018 USD million
2018 2019209 216
93 67303 284
1,351 1,192
16 187 6
22 24
- -
ODA Allocations to and through CSOs2018-2019
CSOs are playing a major role in the framework of sustainable development, namely for improving economic, social and political conditions in developing countries. An activity is characterized as aid to CSOs when the core contributions and pooled programmes and funds are programmed by the CSOs and include contributions to finance the CSOs projects. An activity is characterized as aid through CSOs when funds are channelled through CSOs and other private bodies to implement donor-initiated projects.
Note: This paper presents the most up-to-date official data (2019) on the flows of official development assistance (ODA) to and through CSOs. It also identifies trends emerging from a comparative analysis of the aid that DAC members provide to CSOs between 2010 and 2019.
Memo: aid by CSO
Aid to and through CSOs, disbursementsTotal Aid to and through CSOsUSD Million, 2018 constant prices
Total to CSOsTotal through CSOsTotal to and through CSOsTotal bilateral aid
Percentage of bilateral Aid to CSOsPercentage of bilateral Aid through CSOsPercentage of bilateral aid to and through CSOs
Sector breakdown CSO recipientsComposition of bilateral ODA by sector of intervention ODA allocations to and through CSOs by type of CSO
(1): Amounts are average disbursements for 2018-2019, unless otherwise shown.* Women's institutions: Support to women's equality organisations and institutions scores, by definition, principal objective.
Source: CRS (Creditor Reporting System) Aid Activity Database at http://stats.oecd.org/qwids
2018-19, gross disbursements USD Million, 2018 constant prices
Top ten sub-sectors of intervention for bilateral ODA channelled through CSOs, 2018-2019
Percentage of ODA to CSOs focused on gender equality
0
10
20
30
40
50
60
70
80
90
2010 2011 2012 2013 2014 2015 2016 2017 2018 2019
Perc
enta
ge (%
)
Women's institutions* Principal objective Significant objective
131 134 118 102 76 102 100 96 93 67
189 197181
206218
192 206 193 209216
0
50
100
150
200
250
300
350
2010 2011 2012 2013 2014 2015 2016 2017 2018 2019
ODA through CSOs ODA to CSOs
0
50
100
150
200
250
300
350
2010 2011 2012 2013 2014 2015 2016 2017 2018 2019Unspecified location International CSO
Donor country-based CSO Developing country-based CSO
19%
3%
6%
44%
0%
28%
Social infrastructureand services
Economicinfrastructure andservicesProduction
Humanitarianassistance
Refugees in DonorCountries
0 20 40
Health
Business & Others Services
Population Policies &…
Reconstruction Relief
Disaster Prevention
Agriculture Forestry & Fishing
Unspecified
Government & Civil Society
Multisector
Emergency Response
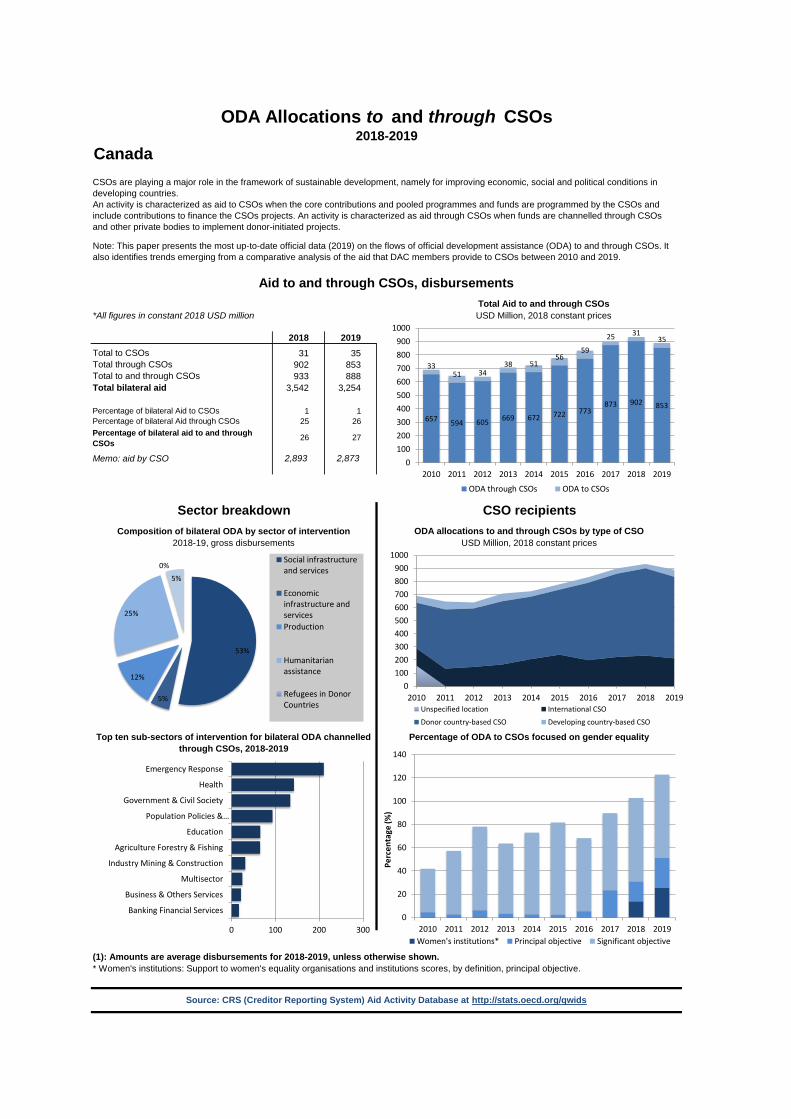
Canada
*All figures in constant 2018 USD million
2018 201931 35
902 853933 888
3,542 3,254
1 125 26
26 27
2,893 2,873
ODA Allocations to and through CSOs2018-2019
CSOs are playing a major role in the framework of sustainable development, namely for improving economic, social and political conditions in developing countries. An activity is characterized as aid to CSOs when the core contributions and pooled programmes and funds are programmed by the CSOs and include contributions to finance the CSOs projects. An activity is characterized as aid through CSOs when funds are channelled through CSOs and other private bodies to implement donor-initiated projects.
Note: This paper presents the most up-to-date official data (2019) on the flows of official development assistance (ODA) to and through CSOs. It also identifies trends emerging from a comparative analysis of the aid that DAC members provide to CSOs between 2010 and 2019.
Memo: aid by CSO
Aid to and through CSOs, disbursementsTotal Aid to and through CSOsUSD Million, 2018 constant prices
Total to CSOsTotal through CSOsTotal to and through CSOsTotal bilateral aid
Percentage of bilateral Aid to CSOsPercentage of bilateral Aid through CSOsPercentage of bilateral aid to and through CSOs
Sector breakdown CSO recipientsComposition of bilateral ODA by sector of intervention ODA allocations to and through CSOs by type of CSO
(1): Amounts are average disbursements for 2018-2019, unless otherwise shown.* Women's institutions: Support to women's equality organisations and institutions scores, by definition, principal objective.
Source: CRS (Creditor Reporting System) Aid Activity Database at http://stats.oecd.org/qwids
2018-19, gross disbursements USD Million, 2018 constant prices
Top ten sub-sectors of intervention for bilateral ODA channelled through CSOs, 2018-2019
Percentage of ODA to CSOs focused on gender equality
0
20
40
60
80
100
120
140
2010 2011 2012 2013 2014 2015 2016 2017 2018 2019
Perc
enta
ge (%
)
Women's institutions* Principal objective Significant objective
657 594 605 669 672 722 773873 902 853
3351 34
38 5156
59
25 3135
0100200300400500600700800900
1000
2010 2011 2012 2013 2014 2015 2016 2017 2018 2019
ODA through CSOs ODA to CSOs
0100200300400500600700800900
1000
2010 2011 2012 2013 2014 2015 2016 2017 2018 2019Unspecified location International CSO
Donor country-based CSO Developing country-based CSO
53%
5%
12%
25%
0%5%
Social infrastructureand services
Economicinfrastructure andservicesProduction
Humanitarianassistance
Refugees in DonorCountries
0 100 200 300
Banking Financial Services
Business & Others Services
Multisector
Industry Mining & Construction
Agriculture Forestry & Fishing
Education
Population Policies &…
Government & Civil Society
Health
Emergency Response
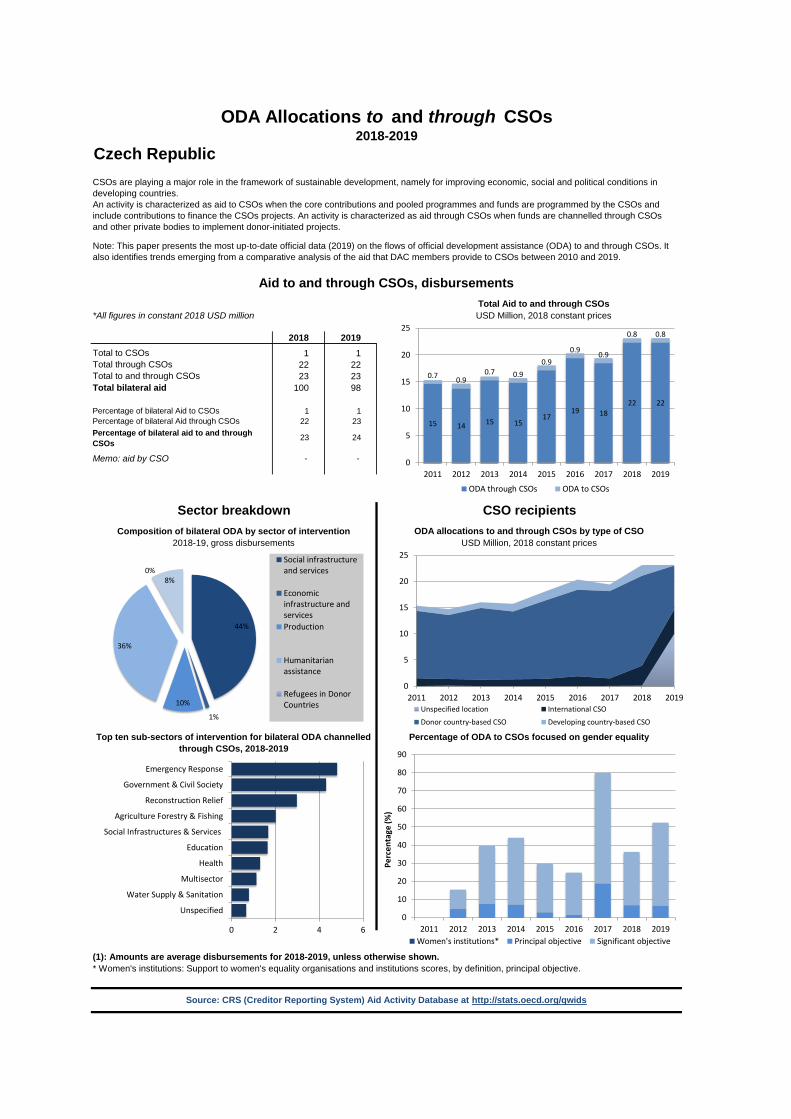
Czech Republic
*All figures in constant 2018 USD million
2018 20191 1
22 2223 23
100 98
1 122 23
23 24
- -
ODA Allocations to and through CSOs2018-2019
CSOs are playing a major role in the framework of sustainable development, namely for improving economic, social and political conditions in developing countries. An activity is characterized as aid to CSOs when the core contributions and pooled programmes and funds are programmed by the CSOs and include contributions to finance the CSOs projects. An activity is characterized as aid through CSOs when funds are channelled through CSOs and other private bodies to implement donor-initiated projects.
Note: This paper presents the most up-to-date official data (2019) on the flows of official development assistance (ODA) to and through CSOs. It also identifies trends emerging from a comparative analysis of the aid that DAC members provide to CSOs between 2010 and 2019.
Memo: aid by CSO
Aid to and through CSOs, disbursementsTotal Aid to and through CSOsUSD Million, 2018 constant prices
Total to CSOsTotal through CSOsTotal to and through CSOsTotal bilateral aid
Percentage of bilateral Aid to CSOsPercentage of bilateral Aid through CSOsPercentage of bilateral aid to and through CSOs
Sector breakdown CSO recipientsComposition of bilateral ODA by sector of intervention ODA allocations to and through CSOs by type of CSO
(1): Amounts are average disbursements for 2018-2019, unless otherwise shown.* Women's institutions: Support to women's equality organisations and institutions scores, by definition, principal objective.
Source: CRS (Creditor Reporting System) Aid Activity Database at http://stats.oecd.org/qwids
2018-19, gross disbursements USD Million, 2018 constant prices
Top ten sub-sectors of intervention for bilateral ODA channelled through CSOs, 2018-2019
Percentage of ODA to CSOs focused on gender equality
0
10
20
30
40
50
60
70
80
90
2011 2012 2013 2014 2015 2016 2017 2018 2019
Perc
enta
ge (%
)
Women's institutions* Principal objective Significant objective
15 14 15 1517
19 1822 22
0.7 0.90.7 0.9
0.90.9 0.9
0.8 0.8
0
5
10
15
20
25
2011 2012 2013 2014 2015 2016 2017 2018 2019
ODA through CSOs ODA to CSOs
0
5
10
15
20
25
2011 2012 2013 2014 2015 2016 2017 2018 2019Unspecified location International CSO
Donor country-based CSO Developing country-based CSO
44%
1%
10%
36%
0%8%
Social infrastructureand services
Economicinfrastructure andservicesProduction
Humanitarianassistance
Refugees in DonorCountries
0 2 4 6
Unspecified
Water Supply & Sanitation
Multisector
Health
Education
Social Infrastructures & Services
Agriculture Forestry & Fishing
Reconstruction Relief
Government & Civil Society
Emergency Response
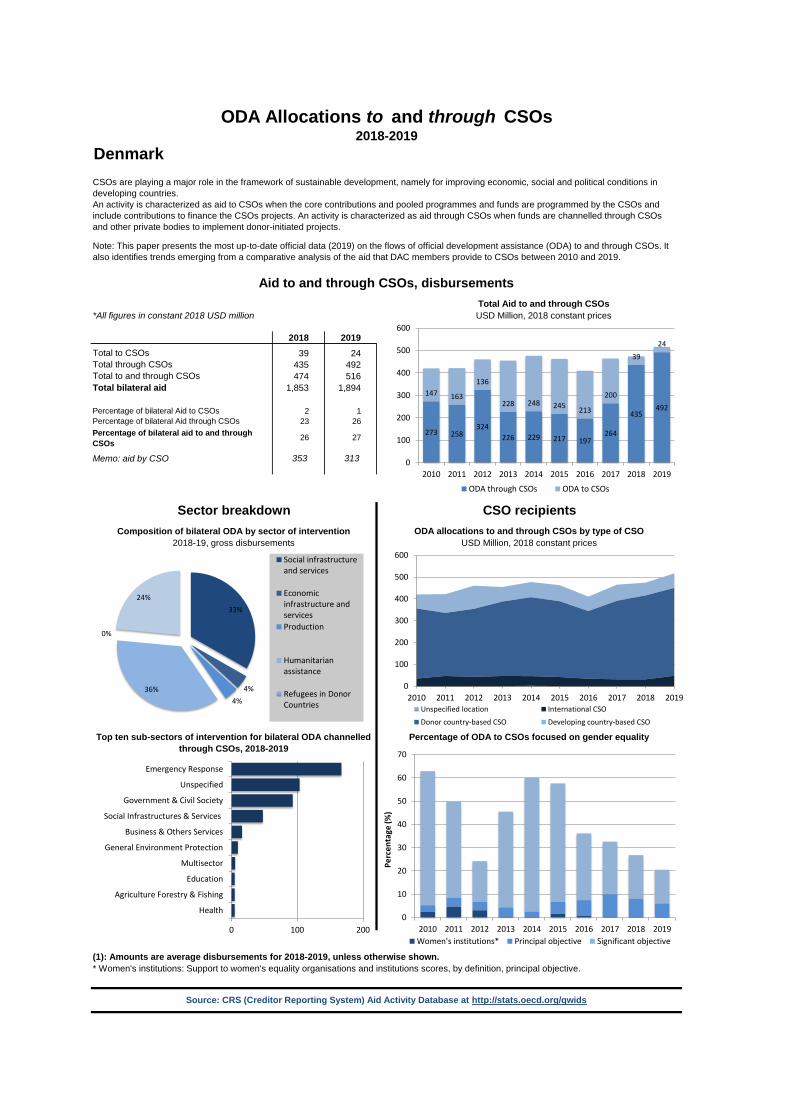
Denmark
*All figures in constant 2018 USD million
2018 201939 24
435 492474 516
1,853 1,894
2 123 26
26 27
353 313
ODA Allocations to and through CSOs2018-2019
CSOs are playing a major role in the framework of sustainable development, namely for improving economic, social and political conditions in developing countries. An activity is characterized as aid to CSOs when the core contributions and pooled programmes and funds are programmed by the CSOs and include contributions to finance the CSOs projects. An activity is characterized as aid through CSOs when funds are channelled through CSOs and other private bodies to implement donor-initiated projects.
Note: This paper presents the most up-to-date official data (2019) on the flows of official development assistance (ODA) to and through CSOs. It also identifies trends emerging from a comparative analysis of the aid that DAC members provide to CSOs between 2010 and 2019.
Memo: aid by CSO
Aid to and through CSOs, disbursementsTotal Aid to and through CSOsUSD Million, 2018 constant prices
Total to CSOsTotal through CSOsTotal to and through CSOsTotal bilateral aid
Percentage of bilateral Aid to CSOsPercentage of bilateral Aid through CSOsPercentage of bilateral aid to and through CSOs
Sector breakdown CSO recipientsComposition of bilateral ODA by sector of intervention ODA allocations to and through CSOs by type of CSO
(1): Amounts are average disbursements for 2018-2019, unless otherwise shown.* Women's institutions: Support to women's equality organisations and institutions scores, by definition, principal objective.
Source: CRS (Creditor Reporting System) Aid Activity Database at http://stats.oecd.org/qwids
2018-19, gross disbursements USD Million, 2018 constant prices
Top ten sub-sectors of intervention for bilateral ODA channelled through CSOs, 2018-2019
Percentage of ODA to CSOs focused on gender equality
0
10
20
30
40
50
60
70
2010 2011 2012 2013 2014 2015 2016 2017 2018 2019
Perc
enta
ge (%
)
Women's institutions* Principal objective Significant objective
273 258324
226 229 217 197264
435492
147 163
136
228 248 245 213
200
3924
0
100
200
300
400
500
600
2010 2011 2012 2013 2014 2015 2016 2017 2018 2019
ODA through CSOs ODA to CSOs
0
100
200
300
400
500
600
2010 2011 2012 2013 2014 2015 2016 2017 2018 2019Unspecified location International CSO
Donor country-based CSO Developing country-based CSO
33%
4%4%
36%
0%
24%
Social infrastructureand services
Economicinfrastructure andservicesProduction
Humanitarianassistance
Refugees in DonorCountries
0 100 200
Health
Agriculture Forestry & Fishing
Education
Multisector
General Environment Protection
Business & Others Services
Social Infrastructures & Services
Government & Civil Society
Unspecified
Emergency Response
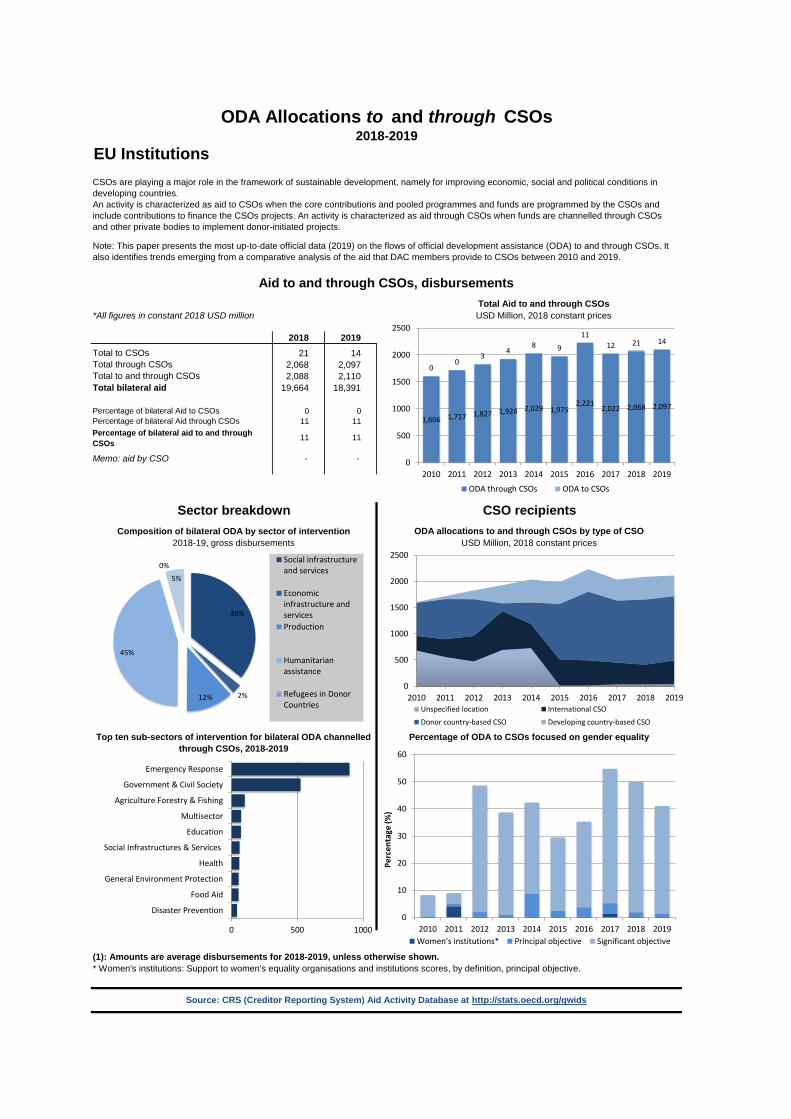
EU Institutions
*All figures in constant 2018 USD million
2018 201921 14
2,068 2,0972,088 2,110
19,664 18,391
0 011 11
11 11
- -
ODA Allocations to and through CSOs2018-2019
CSOs are playing a major role in the framework of sustainable development, namely for improving economic, social and political conditions in developing countries. An activity is characterized as aid to CSOs when the core contributions and pooled programmes and funds are programmed by the CSOs and include contributions to finance the CSOs projects. An activity is characterized as aid through CSOs when funds are channelled through CSOs and other private bodies to implement donor-initiated projects.
Note: This paper presents the most up-to-date official data (2019) on the flows of official development assistance (ODA) to and through CSOs. It also identifies trends emerging from a comparative analysis of the aid that DAC members provide to CSOs between 2010 and 2019.
Memo: aid by CSO
Aid to and through CSOs, disbursementsTotal Aid to and through CSOsUSD Million, 2018 constant prices
Total to CSOsTotal through CSOsTotal to and through CSOsTotal bilateral aid
Percentage of bilateral Aid to CSOsPercentage of bilateral Aid through CSOsPercentage of bilateral aid to and through CSOs
Sector breakdown CSO recipientsComposition of bilateral ODA by sector of intervention ODA allocations to and through CSOs by type of CSO
(1): Amounts are average disbursements for 2018-2019, unless otherwise shown.* Women's institutions: Support to women's equality organisations and institutions scores, by definition, principal objective.
Source: CRS (Creditor Reporting System) Aid Activity Database at http://stats.oecd.org/qwids
2018-19, gross disbursements USD Million, 2018 constant prices
Top ten sub-sectors of intervention for bilateral ODA channelled through CSOs, 2018-2019
Percentage of ODA to CSOs focused on gender equality
0
10
20
30
40
50
60
2010 2011 2012 2013 2014 2015 2016 2017 2018 2019
Perc
enta
ge (%
)
Women's institutions* Principal objective Significant objective
1,606 1,717 1,827 1,924 2,029 1,9752,221
2,022 2,068 2,097
00
34
8 9
1112 21 14
0
500
1000
1500
2000
2500
2010 2011 2012 2013 2014 2015 2016 2017 2018 2019
ODA through CSOs ODA to CSOs
0
500
1000
1500
2000
2500
2010 2011 2012 2013 2014 2015 2016 2017 2018 2019Unspecified location International CSO
Donor country-based CSO Developing country-based CSO
36%
2%12%
45%
0%5%
Social infrastructureand services
Economicinfrastructure andservicesProduction
Humanitarianassistance
Refugees in DonorCountries
0 500 1000
Disaster Prevention
Food Aid
General Environment Protection
Health
Social Infrastructures & Services
Education
Multisector
Agriculture Forestry & Fishing
Government & Civil Society
Emergency Response
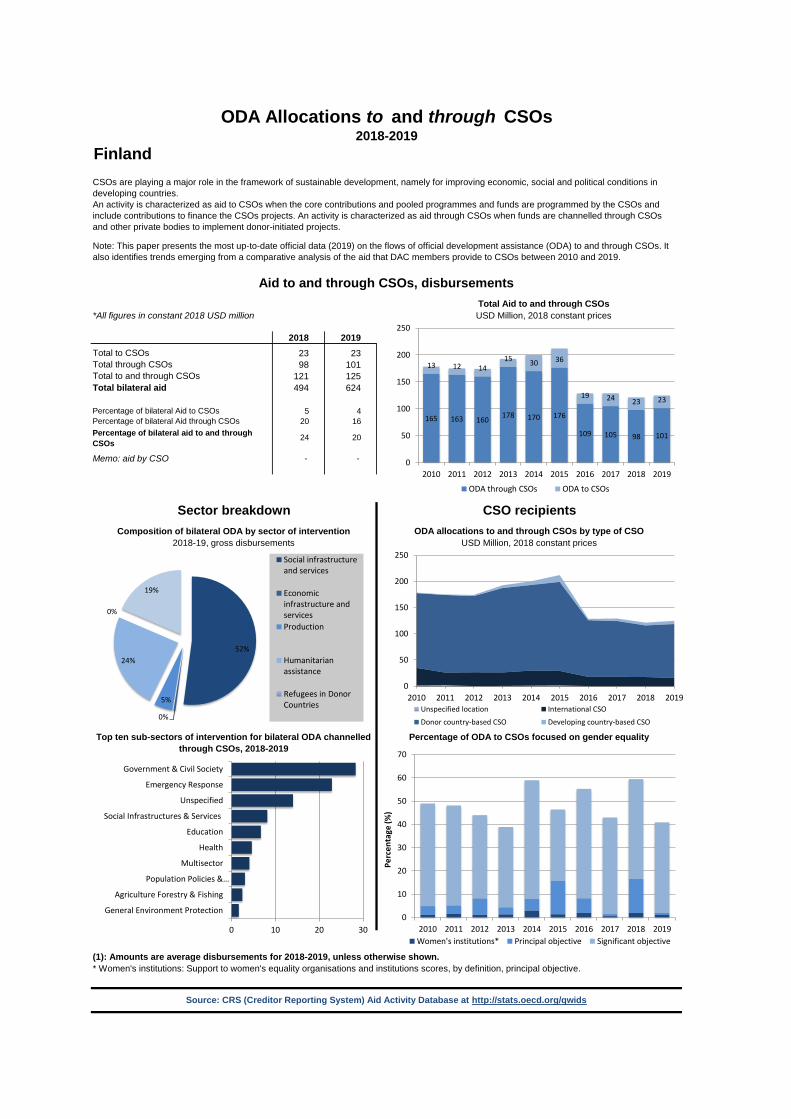
Finland
*All figures in constant 2018 USD million
2018 201923 2398 101
121 125494 624
5 420 16
24 20
- -
ODA Allocations to and through CSOs2018-2019
CSOs are playing a major role in the framework of sustainable development, namely for improving economic, social and political conditions in developing countries. An activity is characterized as aid to CSOs when the core contributions and pooled programmes and funds are programmed by the CSOs and include contributions to finance the CSOs projects. An activity is characterized as aid through CSOs when funds are channelled through CSOs and other private bodies to implement donor-initiated projects.
Note: This paper presents the most up-to-date official data (2019) on the flows of official development assistance (ODA) to and through CSOs. It also identifies trends emerging from a comparative analysis of the aid that DAC members provide to CSOs between 2010 and 2019.
Memo: aid by CSO
Aid to and through CSOs, disbursementsTotal Aid to and through CSOsUSD Million, 2018 constant prices
Total to CSOsTotal through CSOsTotal to and through CSOsTotal bilateral aid
Percentage of bilateral Aid to CSOsPercentage of bilateral Aid through CSOsPercentage of bilateral aid to and through CSOs
Sector breakdown CSO recipientsComposition of bilateral ODA by sector of intervention ODA allocations to and through CSOs by type of CSO
(1): Amounts are average disbursements for 2018-2019, unless otherwise shown.* Women's institutions: Support to women's equality organisations and institutions scores, by definition, principal objective.
Source: CRS (Creditor Reporting System) Aid Activity Database at http://stats.oecd.org/qwids
2018-19, gross disbursements USD Million, 2018 constant prices
Top ten sub-sectors of intervention for bilateral ODA channelled through CSOs, 2018-2019
Percentage of ODA to CSOs focused on gender equality
0
10
20
30
40
50
60
70
2010 2011 2012 2013 2014 2015 2016 2017 2018 2019
Perc
enta
ge (%
)
Women's institutions* Principal objective Significant objective
165 163 160 178 170 176
109 105 98 101
13 12 1415 30 36
19 24 23 23
0
50
100
150
200
250
2010 2011 2012 2013 2014 2015 2016 2017 2018 2019
ODA through CSOs ODA to CSOs
0
50
100
150
200
250
2010 2011 2012 2013 2014 2015 2016 2017 2018 2019Unspecified location International CSO
Donor country-based CSO Developing country-based CSO
52%
0%
5%
24%
0%
19%
Social infrastructureand services
Economicinfrastructure andservicesProduction
Humanitarianassistance
Refugees in DonorCountries
0 10 20 30
General Environment Protection
Agriculture Forestry & Fishing
Population Policies &…
Multisector
Health
Education
Social Infrastructures & Services
Unspecified
Emergency Response
Government & Civil Society
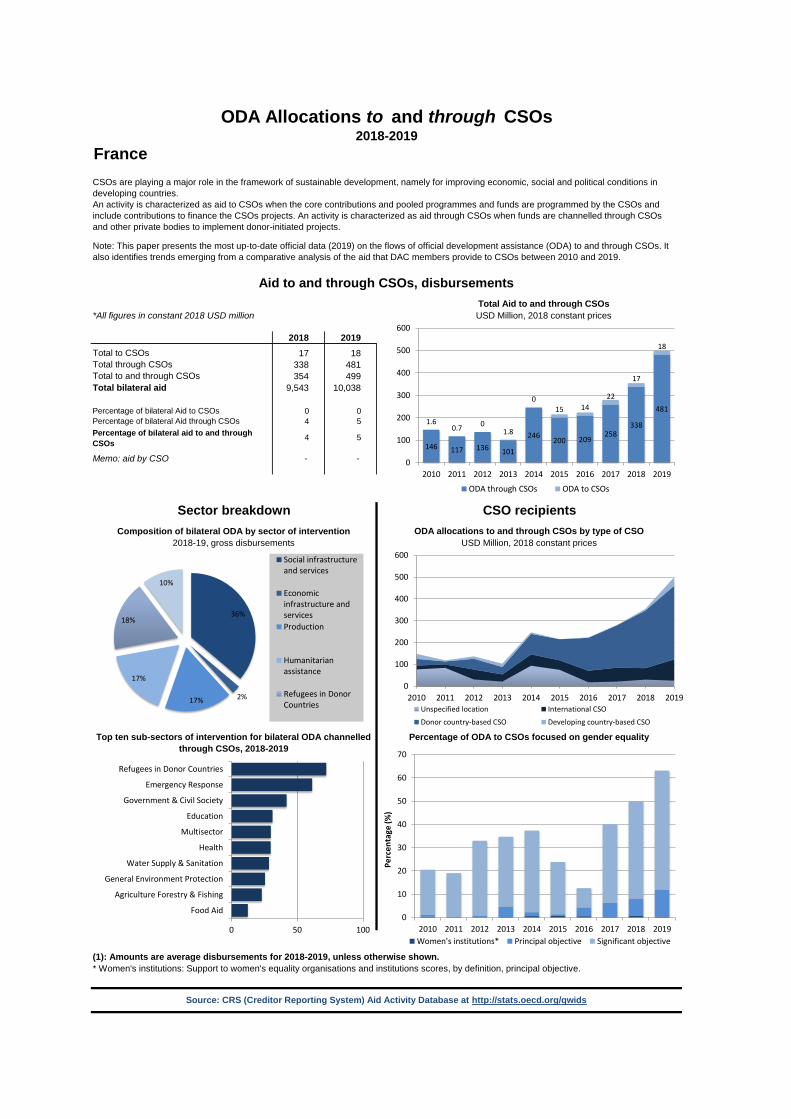
France
*All figures in constant 2018 USD million
2018 201917 18
338 481354 499
9,543 10,038
0 04 5
4 5
- -
ODA Allocations to and through CSOs2018-2019
CSOs are playing a major role in the framework of sustainable development, namely for improving economic, social and political conditions in developing countries. An activity is characterized as aid to CSOs when the core contributions and pooled programmes and funds are programmed by the CSOs and include contributions to finance the CSOs projects. An activity is characterized as aid through CSOs when funds are channelled through CSOs and other private bodies to implement donor-initiated projects.
Note: This paper presents the most up-to-date official data (2019) on the flows of official development assistance (ODA) to and through CSOs. It also identifies trends emerging from a comparative analysis of the aid that DAC members provide to CSOs between 2010 and 2019.
Memo: aid by CSO
Aid to and through CSOs, disbursementsTotal Aid to and through CSOsUSD Million, 2018 constant prices
Total to CSOsTotal through CSOsTotal to and through CSOsTotal bilateral aid
Percentage of bilateral Aid to CSOsPercentage of bilateral Aid through CSOsPercentage of bilateral aid to and through CSOs
Sector breakdown CSO recipientsComposition of bilateral ODA by sector of intervention ODA allocations to and through CSOs by type of CSO
(1): Amounts are average disbursements for 2018-2019, unless otherwise shown.* Women's institutions: Support to women's equality organisations and institutions scores, by definition, principal objective.
Source: CRS (Creditor Reporting System) Aid Activity Database at http://stats.oecd.org/qwids
2018-19, gross disbursements USD Million, 2018 constant prices
Top ten sub-sectors of intervention for bilateral ODA channelled through CSOs, 2018-2019
Percentage of ODA to CSOs focused on gender equality
0
10
20
30
40
50
60
70
2010 2011 2012 2013 2014 2015 2016 2017 2018 2019
Perc
enta
ge (%
)
Women's institutions* Principal objective Significant objective
146 117 136 101
246200 209
258338
4811.6
0.7 01.8
015 14
22
17
18
0
100
200
300
400
500
600
2010 2011 2012 2013 2014 2015 2016 2017 2018 2019
ODA through CSOs ODA to CSOs
0
100
200
300
400
500
600
2010 2011 2012 2013 2014 2015 2016 2017 2018 2019Unspecified location International CSO
Donor country-based CSO Developing country-based CSO
36%
2%17%
17%
18%
10%
Social infrastructureand services
Economicinfrastructure andservicesProduction
Humanitarianassistance
Refugees in DonorCountries
0 50 100
Food Aid
Agriculture Forestry & Fishing
General Environment Protection
Water Supply & Sanitation
Health
Multisector
Education
Government & Civil Society
Emergency Response
Refugees in Donor Countries
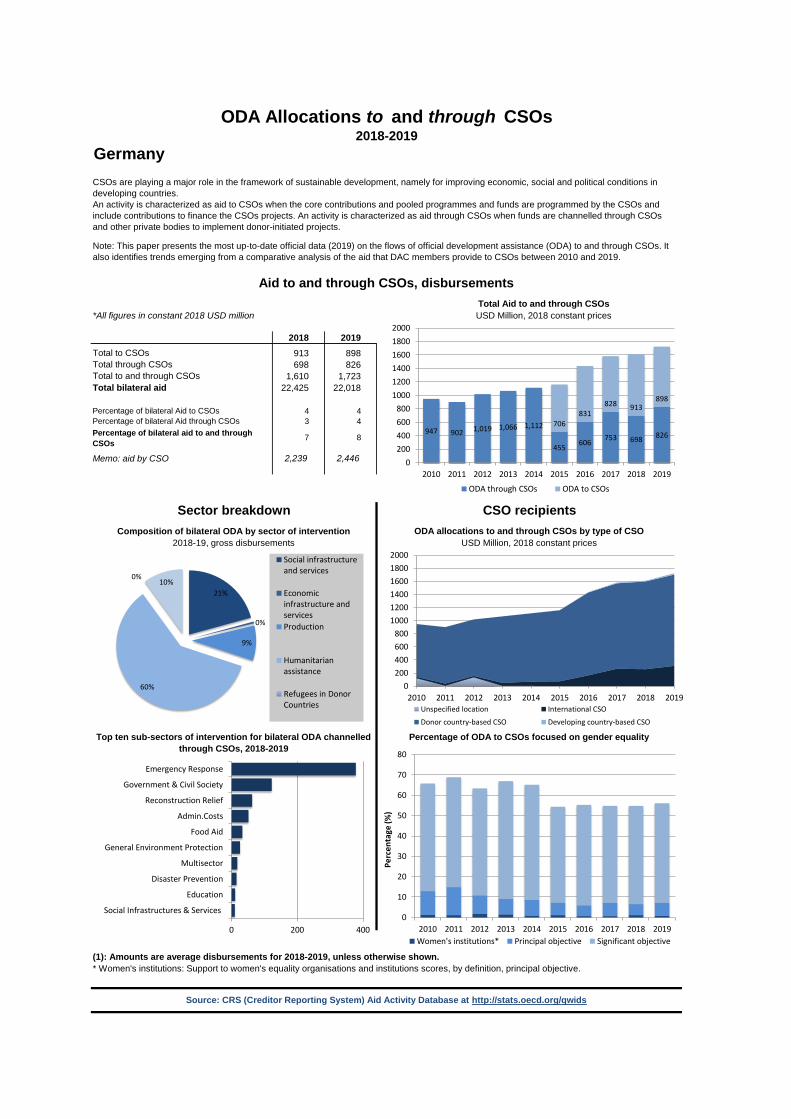
Germany
*All figures in constant 2018 USD million
2018 2019913 898698 826
1,610 1,72322,425 22,018
4 43 4
7 8
2,239 2,446
ODA Allocations to and through CSOs2018-2019
CSOs are playing a major role in the framework of sustainable development, namely for improving economic, social and political conditions in developing countries. An activity is characterized as aid to CSOs when the core contributions and pooled programmes and funds are programmed by the CSOs and include contributions to finance the CSOs projects. An activity is characterized as aid through CSOs when funds are channelled through CSOs and other private bodies to implement donor-initiated projects.
Note: This paper presents the most up-to-date official data (2019) on the flows of official development assistance (ODA) to and through CSOs. It also identifies trends emerging from a comparative analysis of the aid that DAC members provide to CSOs between 2010 and 2019.
Memo: aid by CSO
Aid to and through CSOs, disbursementsTotal Aid to and through CSOsUSD Million, 2018 constant prices
Total to CSOsTotal through CSOsTotal to and through CSOsTotal bilateral aid
Percentage of bilateral Aid to CSOsPercentage of bilateral Aid through CSOsPercentage of bilateral aid to and through CSOs
Sector breakdown CSO recipientsComposition of bilateral ODA by sector of intervention ODA allocations to and through CSOs by type of CSO
(1): Amounts are average disbursements for 2018-2019, unless otherwise shown.* Women's institutions: Support to women's equality organisations and institutions scores, by definition, principal objective.
Source: CRS (Creditor Reporting System) Aid Activity Database at http://stats.oecd.org/qwids
2018-19, gross disbursements USD Million, 2018 constant prices
Top ten sub-sectors of intervention for bilateral ODA channelled through CSOs, 2018-2019
Percentage of ODA to CSOs focused on gender equality
0
10
20
30
40
50
60
70
80
2010 2011 2012 2013 2014 2015 2016 2017 2018 2019
Perc
enta
ge (%
)
Women's institutions* Principal objective Significant objective
947 902 1,019 1,066 1,112
455 606 753 698 826706
831828 913
898
0200400600800
100012001400160018002000
2010 2011 2012 2013 2014 2015 2016 2017 2018 2019
ODA through CSOs ODA to CSOs
0200400600800
100012001400160018002000
2010 2011 2012 2013 2014 2015 2016 2017 2018 2019Unspecified location International CSO
Donor country-based CSO Developing country-based CSO
21%
0%
9%
60%
0%10%
Social infrastructureand services
Economicinfrastructure andservicesProduction
Humanitarianassistance
Refugees in DonorCountries
0 200 400
Social Infrastructures & Services
Education
Disaster Prevention
Multisector
General Environment Protection
Food Aid
Admin.Costs
Reconstruction Relief
Government & Civil Society
Emergency Response
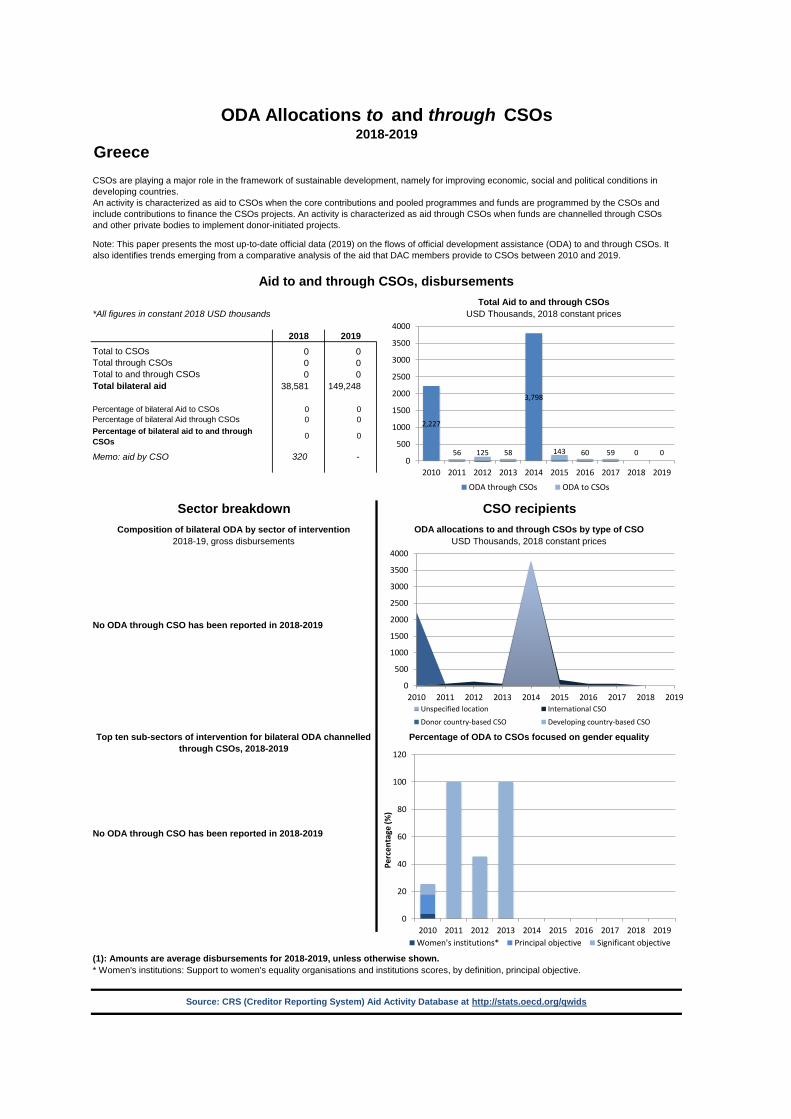
Greece
*All figures in constant 2018 USD thousands
2018 20190 00 00 0
38,581 149,248
0 00 0
0 0
320 -
No ODA through CSO has been reported in 2018-2019
No ODA through CSO has been reported in 2018-2019
ODA Allocations to and through CSOs2018-2019
CSOs are playing a major role in the framework of sustainable development, namely for improving economic, social and political conditions in developing countries. An activity is characterized as aid to CSOs when the core contributions and pooled programmes and funds are programmed by the CSOs and include contributions to finance the CSOs projects. An activity is characterized as aid through CSOs when funds are channelled through CSOs and other private bodies to implement donor-initiated projects.
Note: This paper presents the most up-to-date official data (2019) on the flows of official development assistance (ODA) to and through CSOs. It also identifies trends emerging from a comparative analysis of the aid that DAC members provide to CSOs between 2010 and 2019.
Memo: aid by CSO
Aid to and through CSOs, disbursementsTotal Aid to and through CSOs
USD Thousands, 2018 constant prices
Total to CSOsTotal through CSOsTotal to and through CSOsTotal bilateral aid
Percentage of bilateral Aid to CSOsPercentage of bilateral Aid through CSOsPercentage of bilateral aid to and through CSOs
Sector breakdown CSO recipientsComposition of bilateral ODA by sector of intervention ODA allocations to and through CSOs by type of CSO
(1): Amounts are average disbursements for 2018-2019, unless otherwise shown.* Women's institutions: Support to women's equality organisations and institutions scores, by definition, principal objective.
Source: CRS (Creditor Reporting System) Aid Activity Database at http://stats.oecd.org/qwids
2018-19, gross disbursements USD Thousands, 2018 constant prices
Top ten sub-sectors of intervention for bilateral ODA channelled through CSOs, 2018-2019
Percentage of ODA to CSOs focused on gender equality
0
20
40
60
80
100
120
2010 2011 2012 2013 2014 2015 2016 2017 2018 2019
Perc
enta
ge (%
)
Women's institutions* Principal objective Significant objective
2,227
3,798
56 125 58 143 60 59 0 00
500
1000
1500
2000
2500
3000
3500
4000
2010 2011 2012 2013 2014 2015 2016 2017 2018 2019
ODA through CSOs ODA to CSOs
0
500
1000
1500
2000
2500
3000
3500
4000
2010 2011 2012 2013 2014 2015 2016 2017 2018 2019Unspecified location International CSO
Donor country-based CSO Developing country-based CSO
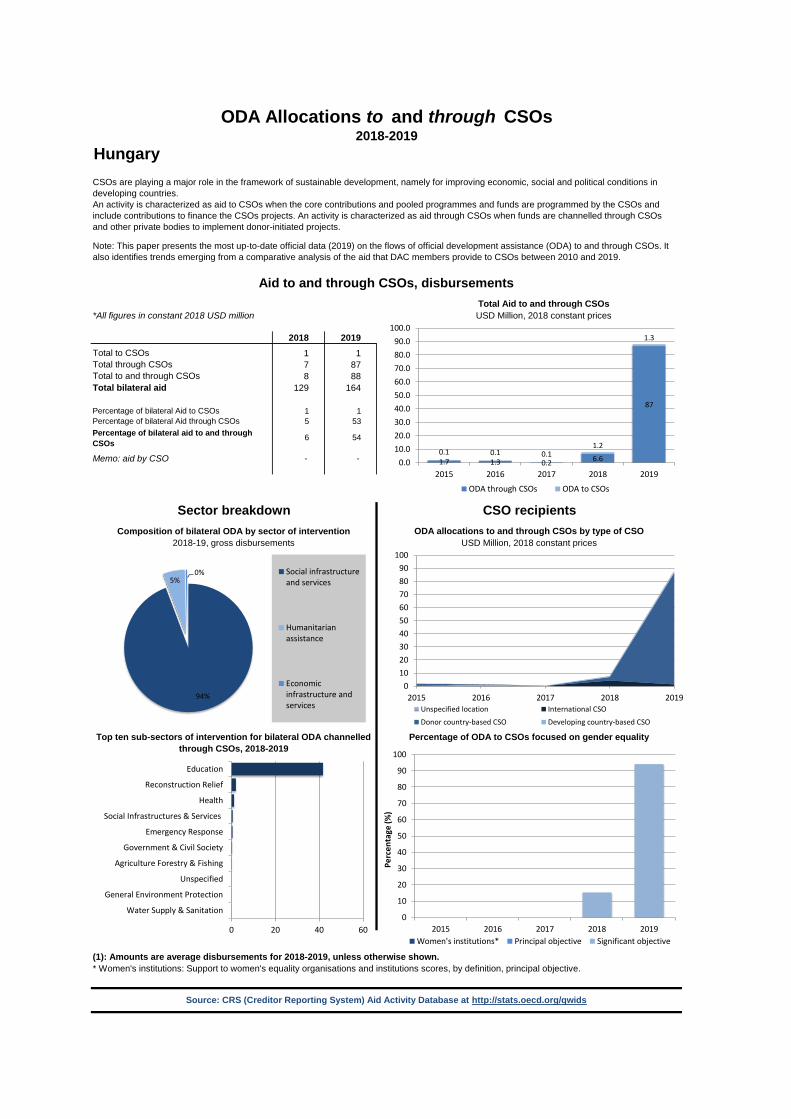
Hungary
*All figures in constant 2018 USD million
2018 20191 17 878 88
129 164
1 15 53
6 54
- -
ODA Allocations to and through CSOs2018-2019
CSOs are playing a major role in the framework of sustainable development, namely for improving economic, social and political conditions in developing countries. An activity is characterized as aid to CSOs when the core contributions and pooled programmes and funds are programmed by the CSOs and include contributions to finance the CSOs projects. An activity is characterized as aid through CSOs when funds are channelled through CSOs and other private bodies to implement donor-initiated projects.
Note: This paper presents the most up-to-date official data (2019) on the flows of official development assistance (ODA) to and through CSOs. It also identifies trends emerging from a comparative analysis of the aid that DAC members provide to CSOs between 2010 and 2019.
Memo: aid by CSO
Aid to and through CSOs, disbursementsTotal Aid to and through CSOsUSD Million, 2018 constant prices
Total to CSOsTotal through CSOsTotal to and through CSOsTotal bilateral aid
Percentage of bilateral Aid to CSOsPercentage of bilateral Aid through CSOsPercentage of bilateral aid to and through CSOs
Sector breakdown CSO recipientsComposition of bilateral ODA by sector of intervention ODA allocations to and through CSOs by type of CSO
(1): Amounts are average disbursements for 2018-2019, unless otherwise shown.* Women's institutions: Support to women's equality organisations and institutions scores, by definition, principal objective.
Source: CRS (Creditor Reporting System) Aid Activity Database at http://stats.oecd.org/qwids
2018-19, gross disbursements USD Million, 2018 constant prices
Top ten sub-sectors of intervention for bilateral ODA channelled through CSOs, 2018-2019
Percentage of ODA to CSOs focused on gender equality
0
10
20
30
40
50
60
70
80
90
100
2015 2016 2017 2018 2019
Perc
enta
ge (%
)
Women's institutions* Principal objective Significant objective
1.7 1.3 0.2 6.6
87
0.1 0.1 0.11.2
1.3
0.010.020.030.040.050.060.070.080.090.0
100.0
2015 2016 2017 2018 2019
ODA through CSOs ODA to CSOs
0102030405060708090
100
2015 2016 2017 2018 2019Unspecified location International CSO
Donor country-based CSO Developing country-based CSO
94%
5%0% Social infrastructure
and services
Humanitarianassistance
Economicinfrastructure andservices
0 20 40 60
Water Supply & Sanitation
General Environment Protection
Unspecified
Agriculture Forestry & Fishing
Government & Civil Society
Emergency Response
Social Infrastructures & Services
Health
Reconstruction Relief
Education
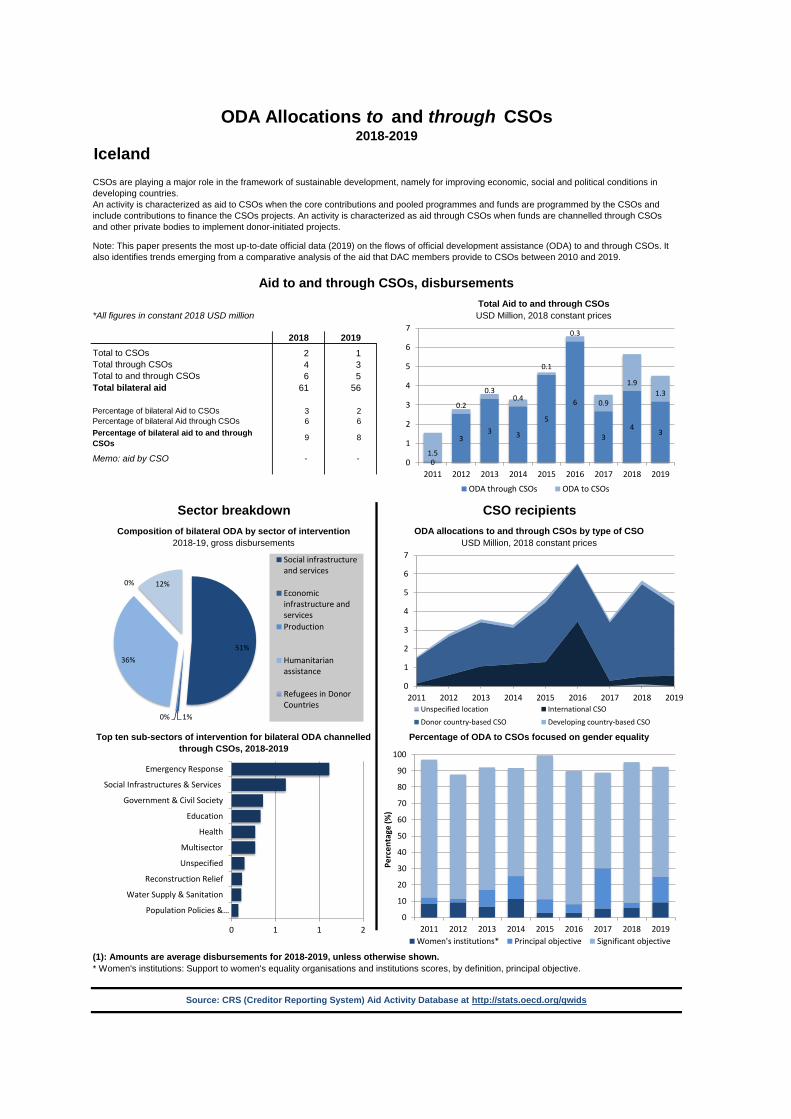
Iceland
*All figures in constant 2018 USD million
2018 20192 14 36 5
61 56
3 26 6
9 8
- -
ODA Allocations to and through CSOs2018-2019
CSOs are playing a major role in the framework of sustainable development, namely for improving economic, social and political conditions in developing countries. An activity is characterized as aid to CSOs when the core contributions and pooled programmes and funds are programmed by the CSOs and include contributions to finance the CSOs projects. An activity is characterized as aid through CSOs when funds are channelled through CSOs and other private bodies to implement donor-initiated projects.
Note: This paper presents the most up-to-date official data (2019) on the flows of official development assistance (ODA) to and through CSOs. It also identifies trends emerging from a comparative analysis of the aid that DAC members provide to CSOs between 2010 and 2019.
Memo: aid by CSO
Aid to and through CSOs, disbursementsTotal Aid to and through CSOsUSD Million, 2018 constant prices
Total to CSOsTotal through CSOsTotal to and through CSOsTotal bilateral aid
Percentage of bilateral Aid to CSOsPercentage of bilateral Aid through CSOsPercentage of bilateral aid to and through CSOs
Sector breakdown CSO recipientsComposition of bilateral ODA by sector of intervention ODA allocations to and through CSOs by type of CSO
(1): Amounts are average disbursements for 2018-2019, unless otherwise shown.* Women's institutions: Support to women's equality organisations and institutions scores, by definition, principal objective.
Source: CRS (Creditor Reporting System) Aid Activity Database at http://stats.oecd.org/qwids
2018-19, gross disbursements USD Million, 2018 constant prices
Top ten sub-sectors of intervention for bilateral ODA channelled through CSOs, 2018-2019
Percentage of ODA to CSOs focused on gender equality
0
10
20
30
40
50
60
70
80
90
100
2011 2012 2013 2014 2015 2016 2017 2018 2019
Perc
enta
ge (%
)
Women's institutions* Principal objective Significant objective
0
33 3
5
6
34
3
1.5
0.2
0.30.4
0.1
0.3
0.9
1.91.3
0
1
2
3
4
5
6
7
2011 2012 2013 2014 2015 2016 2017 2018 2019
ODA through CSOs ODA to CSOs
0
1
2
3
4
5
6
7
2011 2012 2013 2014 2015 2016 2017 2018 2019Unspecified location International CSO
Donor country-based CSO Developing country-based CSO
51%
1%0%
36%
0% 12%
Social infrastructureand services
Economicinfrastructure andservicesProduction
Humanitarianassistance
Refugees in DonorCountries
0 1 1 2
Population Policies &…
Water Supply & Sanitation
Reconstruction Relief
Unspecified
Multisector
Health
Education
Government & Civil Society
Social Infrastructures & Services
Emergency Response
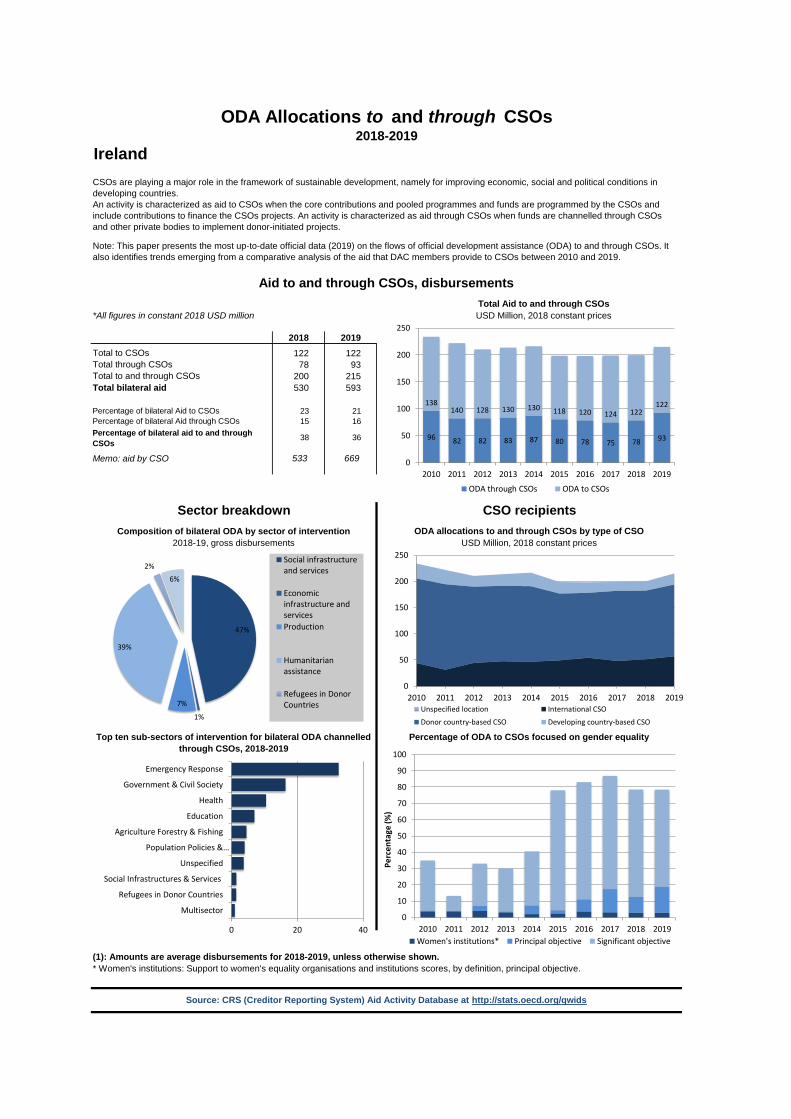
Ireland
*All figures in constant 2018 USD million
2018 2019122 122
78 93200 215530 593
23 2115 16
38 36
533 669
ODA Allocations to and through CSOs2018-2019
CSOs are playing a major role in the framework of sustainable development, namely for improving economic, social and political conditions in developing countries. An activity is characterized as aid to CSOs when the core contributions and pooled programmes and funds are programmed by the CSOs and include contributions to finance the CSOs projects. An activity is characterized as aid through CSOs when funds are channelled through CSOs and other private bodies to implement donor-initiated projects.
Note: This paper presents the most up-to-date official data (2019) on the flows of official development assistance (ODA) to and through CSOs. It also identifies trends emerging from a comparative analysis of the aid that DAC members provide to CSOs between 2010 and 2019.
Memo: aid by CSO
Aid to and through CSOs, disbursementsTotal Aid to and through CSOsUSD Million, 2018 constant prices
Total to CSOsTotal through CSOsTotal to and through CSOsTotal bilateral aid
Percentage of bilateral Aid to CSOsPercentage of bilateral Aid through CSOsPercentage of bilateral aid to and through CSOs
Sector breakdown CSO recipientsComposition of bilateral ODA by sector of intervention ODA allocations to and through CSOs by type of CSO
(1): Amounts are average disbursements for 2018-2019, unless otherwise shown.* Women's institutions: Support to women's equality organisations and institutions scores, by definition, principal objective.
Source: CRS (Creditor Reporting System) Aid Activity Database at http://stats.oecd.org/qwids
2018-19, gross disbursements USD Million, 2018 constant prices
Top ten sub-sectors of intervention for bilateral ODA channelled through CSOs, 2018-2019
Percentage of ODA to CSOs focused on gender equality
0
10
20
30
40
50
60
70
80
90
100
2010 2011 2012 2013 2014 2015 2016 2017 2018 2019
Perc
enta
ge (%
)
Women's institutions* Principal objective Significant objective
96 82 82 83 87 80 78 75 78 93
138140 128 130 130 118 120 124 122
122
0
50
100
150
200
250
2010 2011 2012 2013 2014 2015 2016 2017 2018 2019
ODA through CSOs ODA to CSOs
0
50
100
150
200
250
2010 2011 2012 2013 2014 2015 2016 2017 2018 2019Unspecified location International CSO
Donor country-based CSO Developing country-based CSO
47%
1%
7%
39%
2%6%
Social infrastructureand services
Economicinfrastructure andservicesProduction
Humanitarianassistance
Refugees in DonorCountries
0 20 40
Multisector
Refugees in Donor Countries
Social Infrastructures & Services
Unspecified
Population Policies &…
Agriculture Forestry & Fishing
Education
Health
Government & Civil Society
Emergency Response
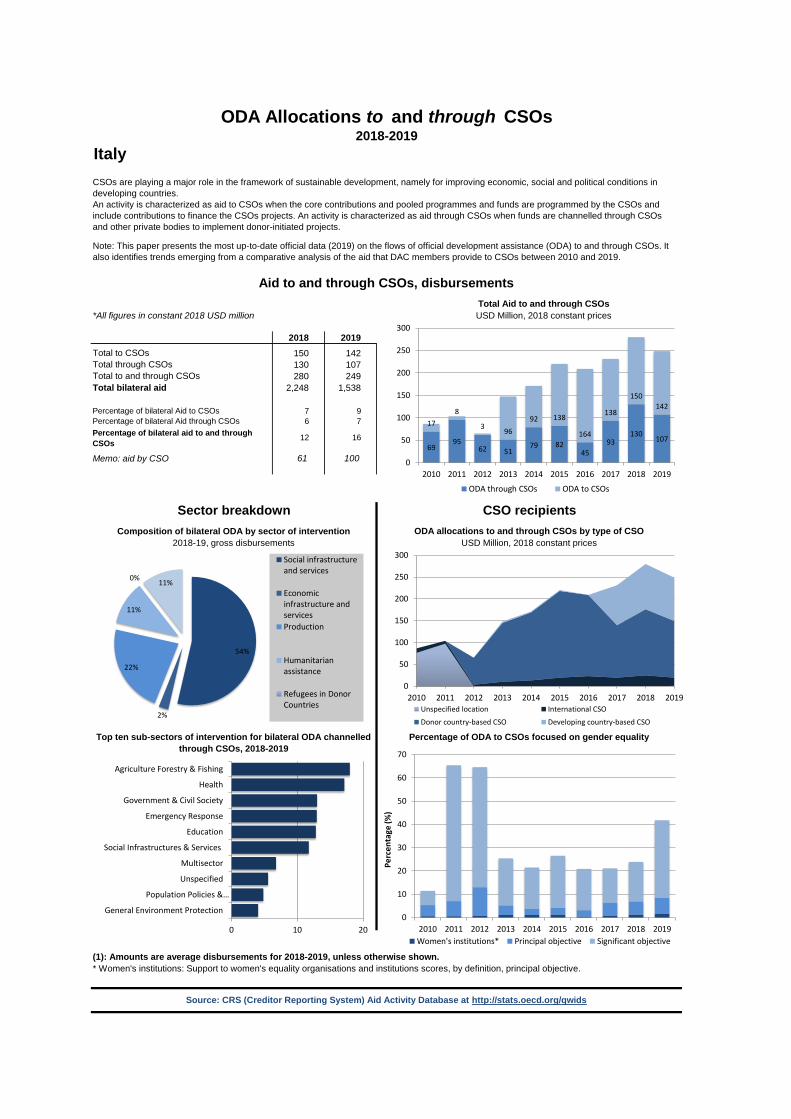
Italy
*All figures in constant 2018 USD million
2018 2019150 142130 107280 249
2,248 1,538
7 96 7
12 16
61 100
ODA Allocations to and through CSOs2018-2019
CSOs are playing a major role in the framework of sustainable development, namely for improving economic, social and political conditions in developing countries. An activity is characterized as aid to CSOs when the core contributions and pooled programmes and funds are programmed by the CSOs and include contributions to finance the CSOs projects. An activity is characterized as aid through CSOs when funds are channelled through CSOs and other private bodies to implement donor-initiated projects.
Note: This paper presents the most up-to-date official data (2019) on the flows of official development assistance (ODA) to and through CSOs. It also identifies trends emerging from a comparative analysis of the aid that DAC members provide to CSOs between 2010 and 2019.
Memo: aid by CSO
Aid to and through CSOs, disbursementsTotal Aid to and through CSOsUSD Million, 2018 constant prices
Total to CSOsTotal through CSOsTotal to and through CSOsTotal bilateral aid
Percentage of bilateral Aid to CSOsPercentage of bilateral Aid through CSOsPercentage of bilateral aid to and through CSOs
Sector breakdown CSO recipientsComposition of bilateral ODA by sector of intervention ODA allocations to and through CSOs by type of CSO
(1): Amounts are average disbursements for 2018-2019, unless otherwise shown.* Women's institutions: Support to women's equality organisations and institutions scores, by definition, principal objective.
Source: CRS (Creditor Reporting System) Aid Activity Database at http://stats.oecd.org/qwids
2018-19, gross disbursements USD Million, 2018 constant prices
Top ten sub-sectors of intervention for bilateral ODA channelled through CSOs, 2018-2019
Percentage of ODA to CSOs focused on gender equality
0
10
20
30
40
50
60
70
2010 2011 2012 2013 2014 2015 2016 2017 2018 2019
Perc
enta
ge (%
)
Women's institutions* Principal objective Significant objective
6995
62 5179 82
4593
130107
178
3 9692 138
164
138
150142
0
50
100
150
200
250
300
2010 2011 2012 2013 2014 2015 2016 2017 2018 2019
ODA through CSOs ODA to CSOs
0
50
100
150
200
250
300
2010 2011 2012 2013 2014 2015 2016 2017 2018 2019Unspecified location International CSO
Donor country-based CSO Developing country-based CSO
54%
2%
22%
11%
0% 11%
Social infrastructureand services
Economicinfrastructure andservicesProduction
Humanitarianassistance
Refugees in DonorCountries
0 10 20
General Environment Protection
Population Policies &…
Unspecified
Multisector
Social Infrastructures & Services
Education
Emergency Response
Government & Civil Society
Health
Agriculture Forestry & Fishing
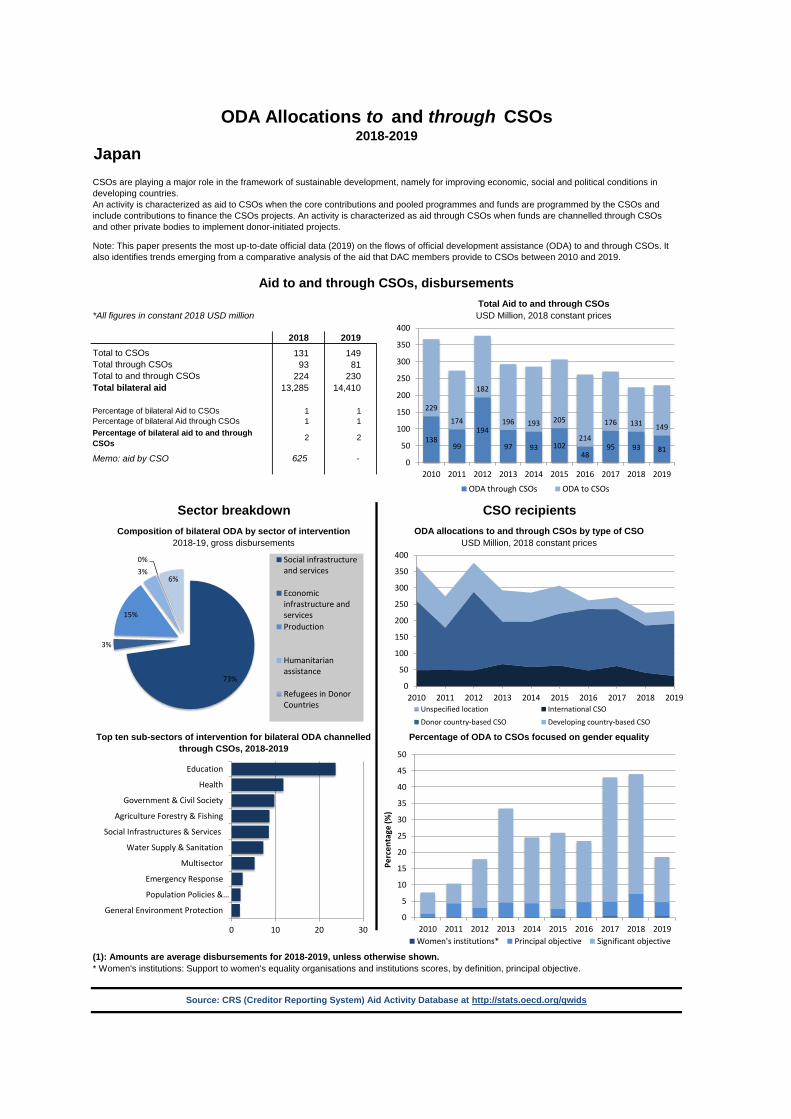
Japan
*All figures in constant 2018 USD million
2018 2019131 149
93 81224 230
13,285 14,410
1 11 1
2 2
625 -
ODA Allocations to and through CSOs2018-2019
CSOs are playing a major role in the framework of sustainable development, namely for improving economic, social and political conditions in developing countries. An activity is characterized as aid to CSOs when the core contributions and pooled programmes and funds are programmed by the CSOs and include contributions to finance the CSOs projects. An activity is characterized as aid through CSOs when funds are channelled through CSOs and other private bodies to implement donor-initiated projects.
Note: This paper presents the most up-to-date official data (2019) on the flows of official development assistance (ODA) to and through CSOs. It also identifies trends emerging from a comparative analysis of the aid that DAC members provide to CSOs between 2010 and 2019.
Memo: aid by CSO
Aid to and through CSOs, disbursementsTotal Aid to and through CSOsUSD Million, 2018 constant prices
Total to CSOsTotal through CSOsTotal to and through CSOsTotal bilateral aid
Percentage of bilateral Aid to CSOsPercentage of bilateral Aid through CSOsPercentage of bilateral aid to and through CSOs
Sector breakdown CSO recipientsComposition of bilateral ODA by sector of intervention ODA allocations to and through CSOs by type of CSO
(1): Amounts are average disbursements for 2018-2019, unless otherwise shown.* Women's institutions: Support to women's equality organisations and institutions scores, by definition, principal objective.
Source: CRS (Creditor Reporting System) Aid Activity Database at http://stats.oecd.org/qwids
2018-19, gross disbursements USD Million, 2018 constant prices
Top ten sub-sectors of intervention for bilateral ODA channelled through CSOs, 2018-2019
Percentage of ODA to CSOs focused on gender equality
0
5
10
15
20
25
30
35
40
45
50
2010 2011 2012 2013 2014 2015 2016 2017 2018 2019
Perc
enta
ge (%
)
Women's institutions* Principal objective Significant objective
13899
194
97 93 10248
95 93 81
229
174
182
196 193 205
214
176 131 149
0
50
100
150
200
250
300
350
400
2010 2011 2012 2013 2014 2015 2016 2017 2018 2019
ODA through CSOs ODA to CSOs
0
50
100
150
200
250
300
350
400
2010 2011 2012 2013 2014 2015 2016 2017 2018 2019Unspecified location International CSO
Donor country-based CSO Developing country-based CSO
73%
3%
15%
3%0%
6%
Social infrastructureand services
Economicinfrastructure andservicesProduction
Humanitarianassistance
Refugees in DonorCountries
0 10 20 30
General Environment Protection
Population Policies &…
Emergency Response
Multisector
Water Supply & Sanitation
Social Infrastructures & Services
Agriculture Forestry & Fishing
Government & Civil Society
Health
Education
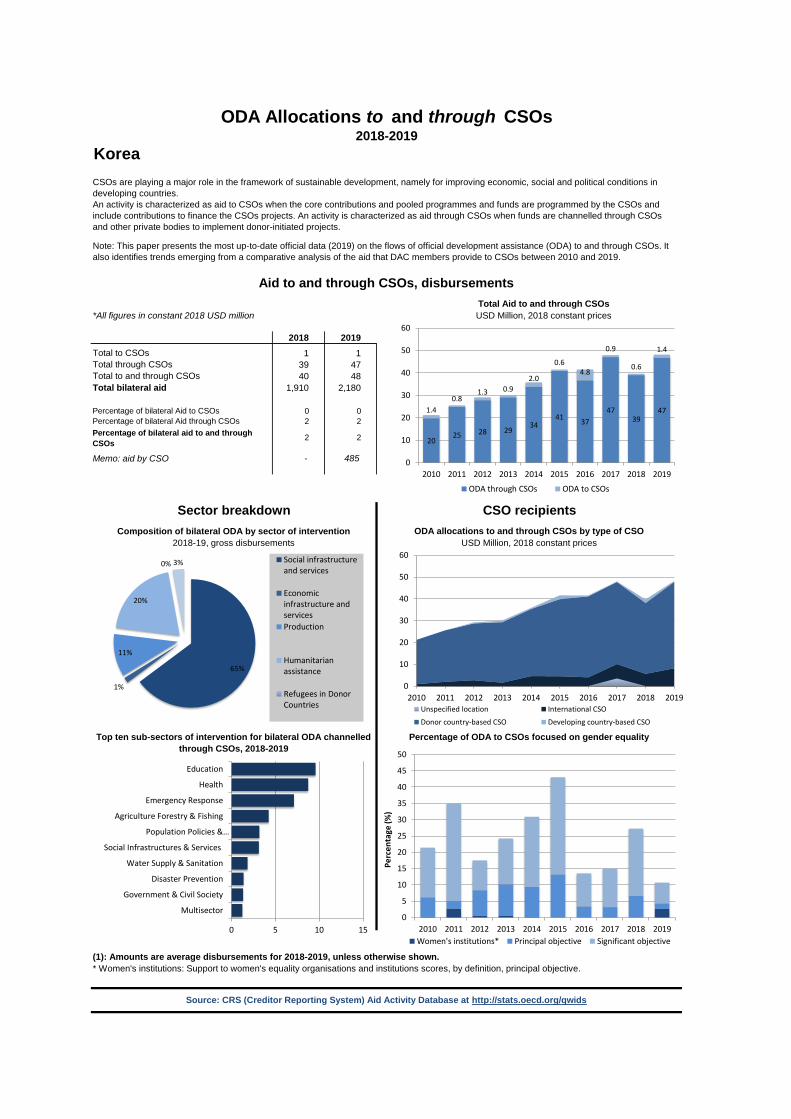
Korea
*All figures in constant 2018 USD million
2018 20191 1
39 4740 48
1,910 2,180
0 02 2
2 2
- 485
ODA Allocations to and through CSOs2018-2019
CSOs are playing a major role in the framework of sustainable development, namely for improving economic, social and political conditions in developing countries. An activity is characterized as aid to CSOs when the core contributions and pooled programmes and funds are programmed by the CSOs and include contributions to finance the CSOs projects. An activity is characterized as aid through CSOs when funds are channelled through CSOs and other private bodies to implement donor-initiated projects.
Note: This paper presents the most up-to-date official data (2019) on the flows of official development assistance (ODA) to and through CSOs. It also identifies trends emerging from a comparative analysis of the aid that DAC members provide to CSOs between 2010 and 2019.
Memo: aid by CSO
Aid to and through CSOs, disbursementsTotal Aid to and through CSOsUSD Million, 2018 constant prices
Total to CSOsTotal through CSOsTotal to and through CSOsTotal bilateral aid
Percentage of bilateral Aid to CSOsPercentage of bilateral Aid through CSOsPercentage of bilateral aid to and through CSOs
Sector breakdown CSO recipientsComposition of bilateral ODA by sector of intervention ODA allocations to and through CSOs by type of CSO
(1): Amounts are average disbursements for 2018-2019, unless otherwise shown.* Women's institutions: Support to women's equality organisations and institutions scores, by definition, principal objective.
Source: CRS (Creditor Reporting System) Aid Activity Database at http://stats.oecd.org/qwids
2018-19, gross disbursements USD Million, 2018 constant prices
Top ten sub-sectors of intervention for bilateral ODA channelled through CSOs, 2018-2019
Percentage of ODA to CSOs focused on gender equality
0
5
10
15
20
25
30
35
40
45
50
2010 2011 2012 2013 2014 2015 2016 2017 2018 2019
Perc
enta
ge (%
)
Women's institutions* Principal objective Significant objective
2025 28 29
3441 37
4739
471.40.8
1.3 0.92.0
0.64.8
0.9
0.6
1.4
0
10
20
30
40
50
60
2010 2011 2012 2013 2014 2015 2016 2017 2018 2019
ODA through CSOs ODA to CSOs
0
10
20
30
40
50
60
2010 2011 2012 2013 2014 2015 2016 2017 2018 2019Unspecified location International CSO
Donor country-based CSO Developing country-based CSO
65%
1%
11%
20%
0% 3% Social infrastructureand services
Economicinfrastructure andservicesProduction
Humanitarianassistance
Refugees in DonorCountries
0 5 10 15
Multisector
Government & Civil Society
Disaster Prevention
Water Supply & Sanitation
Social Infrastructures & Services
Population Policies &…
Agriculture Forestry & Fishing
Emergency Response
Health
Education
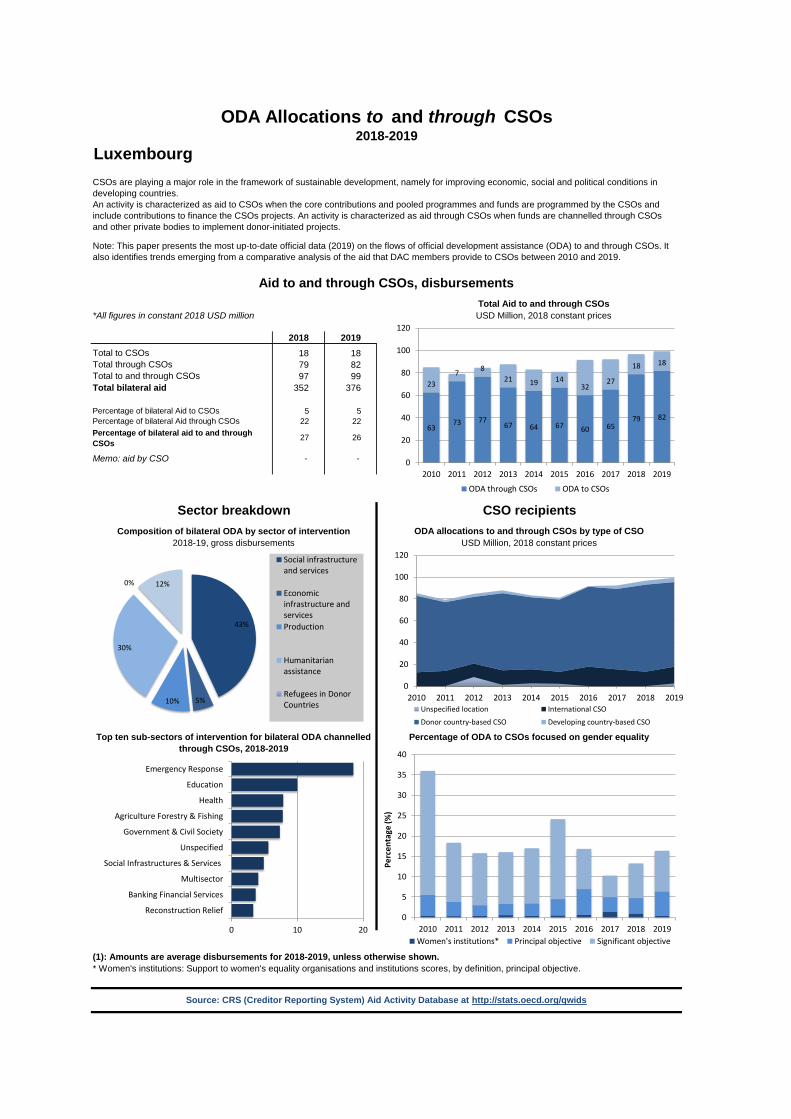
Luxembourg
*All figures in constant 2018 USD million
2018 201918 1879 8297 99
352 376
5 522 22
27 26
- -
ODA Allocations to and through CSOs2018-2019
CSOs are playing a major role in the framework of sustainable development, namely for improving economic, social and political conditions in developing countries. An activity is characterized as aid to CSOs when the core contributions and pooled programmes and funds are programmed by the CSOs and include contributions to finance the CSOs projects. An activity is characterized as aid through CSOs when funds are channelled through CSOs and other private bodies to implement donor-initiated projects.
Note: This paper presents the most up-to-date official data (2019) on the flows of official development assistance (ODA) to and through CSOs. It also identifies trends emerging from a comparative analysis of the aid that DAC members provide to CSOs between 2010 and 2019.
Memo: aid by CSO
Aid to and through CSOs, disbursementsTotal Aid to and through CSOsUSD Million, 2018 constant prices
Total to CSOsTotal through CSOsTotal to and through CSOsTotal bilateral aid
Percentage of bilateral Aid to CSOsPercentage of bilateral Aid through CSOsPercentage of bilateral aid to and through CSOs
Sector breakdown CSO recipientsComposition of bilateral ODA by sector of intervention ODA allocations to and through CSOs by type of CSO
(1): Amounts are average disbursements for 2018-2019, unless otherwise shown.* Women's institutions: Support to women's equality organisations and institutions scores, by definition, principal objective.
Source: CRS (Creditor Reporting System) Aid Activity Database at http://stats.oecd.org/qwids
2018-19, gross disbursements USD Million, 2018 constant prices
Top ten sub-sectors of intervention for bilateral ODA channelled through CSOs, 2018-2019
Percentage of ODA to CSOs focused on gender equality
0
5
10
15
20
25
30
35
40
2010 2011 2012 2013 2014 2015 2016 2017 2018 2019
Perc
enta
ge (%
)
Women's institutions* Principal objective Significant objective
6373 77
67 64 67 60 6579 82
237 8
21 19 1432
27
18 18
0
20
40
60
80
100
120
2010 2011 2012 2013 2014 2015 2016 2017 2018 2019
ODA through CSOs ODA to CSOs
0
20
40
60
80
100
120
2010 2011 2012 2013 2014 2015 2016 2017 2018 2019Unspecified location International CSO
Donor country-based CSO Developing country-based CSO
43%
5%10%
30%
0% 12%
Social infrastructureand services
Economicinfrastructure andservicesProduction
Humanitarianassistance
Refugees in DonorCountries
0 10 20
Reconstruction Relief
Banking Financial Services
Multisector
Social Infrastructures & Services
Unspecified
Government & Civil Society
Agriculture Forestry & Fishing
Health
Education
Emergency Response
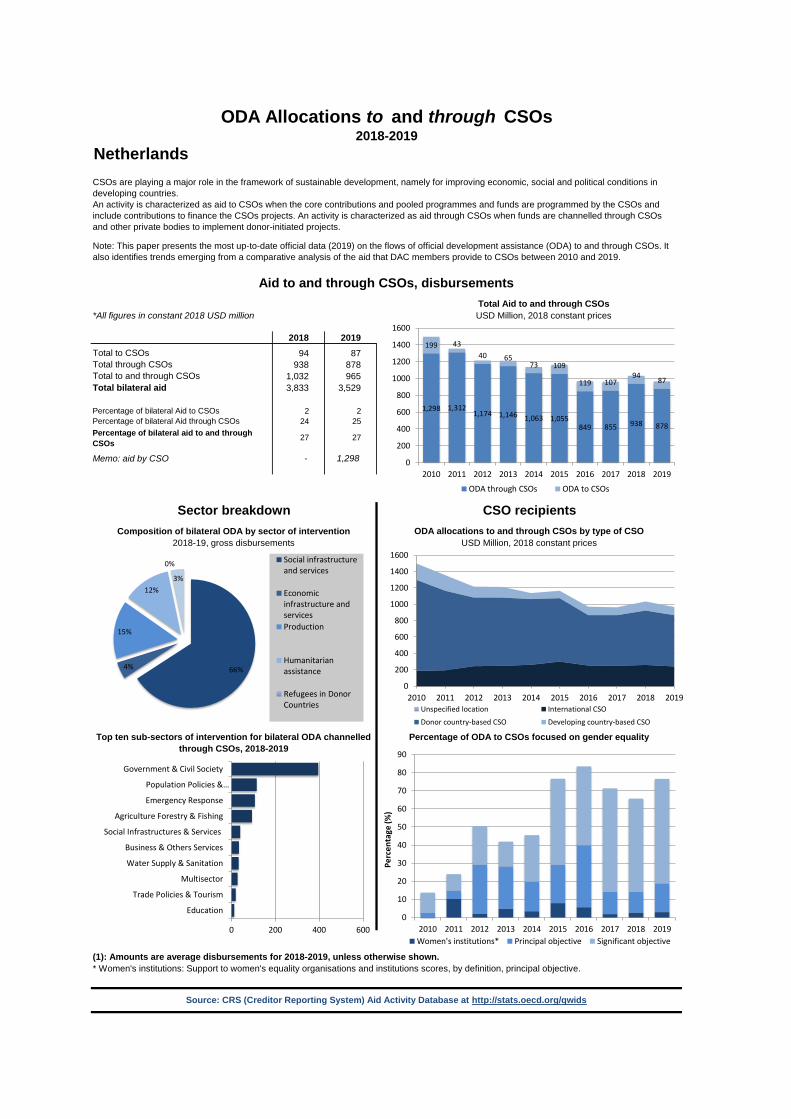
Netherlands
*All figures in constant 2018 USD million
2018 201994 87
938 8781,032 9653,833 3,529
2 224 25
27 27
- 1,298
ODA Allocations to and through CSOs2018-2019
CSOs are playing a major role in the framework of sustainable development, namely for improving economic, social and political conditions in developing countries. An activity is characterized as aid to CSOs when the core contributions and pooled programmes and funds are programmed by the CSOs and include contributions to finance the CSOs projects. An activity is characterized as aid through CSOs when funds are channelled through CSOs and other private bodies to implement donor-initiated projects.
Note: This paper presents the most up-to-date official data (2019) on the flows of official development assistance (ODA) to and through CSOs. It also identifies trends emerging from a comparative analysis of the aid that DAC members provide to CSOs between 2010 and 2019.
Memo: aid by CSO
Aid to and through CSOs, disbursementsTotal Aid to and through CSOsUSD Million, 2018 constant prices
Total to CSOsTotal through CSOsTotal to and through CSOsTotal bilateral aid
Percentage of bilateral Aid to CSOsPercentage of bilateral Aid through CSOsPercentage of bilateral aid to and through CSOs
Sector breakdown CSO recipientsComposition of bilateral ODA by sector of intervention ODA allocations to and through CSOs by type of CSO
(1): Amounts are average disbursements for 2018-2019, unless otherwise shown.* Women's institutions: Support to women's equality organisations and institutions scores, by definition, principal objective.
Source: CRS (Creditor Reporting System) Aid Activity Database at http://stats.oecd.org/qwids
2018-19, gross disbursements USD Million, 2018 constant prices
Top ten sub-sectors of intervention for bilateral ODA channelled through CSOs, 2018-2019
Percentage of ODA to CSOs focused on gender equality
0
10
20
30
40
50
60
70
80
90
2010 2011 2012 2013 2014 2015 2016 2017 2018 2019
Perc
enta
ge (%
)
Women's institutions* Principal objective Significant objective
1,298 1,3121,174 1,146 1,063 1,055
849 855 938 878
199 4340 65
73 109
119 10794 87
0
200
400
600
800
1000
1200
1400
1600
2010 2011 2012 2013 2014 2015 2016 2017 2018 2019
ODA through CSOs ODA to CSOs
0
200
400
600
800
1000
1200
1400
1600
2010 2011 2012 2013 2014 2015 2016 2017 2018 2019Unspecified location International CSO
Donor country-based CSO Developing country-based CSO
66%4%
15%
12%
0%
3%
Social infrastructureand services
Economicinfrastructure andservicesProduction
Humanitarianassistance
Refugees in DonorCountries
0 200 400 600
Education
Trade Policies & Tourism
Multisector
Water Supply & Sanitation
Business & Others Services
Social Infrastructures & Services
Agriculture Forestry & Fishing
Emergency Response
Population Policies &…
Government & Civil Society
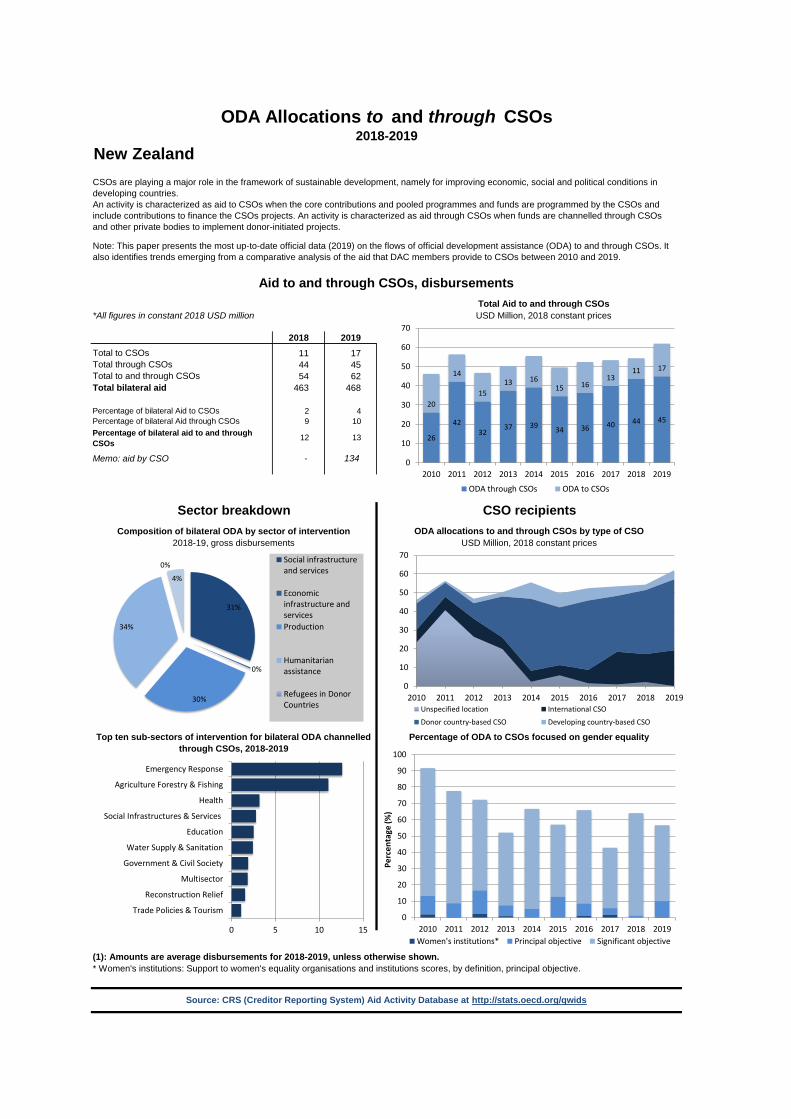
New Zealand
*All figures in constant 2018 USD million
2018 201911 1744 4554 62
463 468
2 49 10
12 13
- 134
ODA Allocations to and through CSOs2018-2019
CSOs are playing a major role in the framework of sustainable development, namely for improving economic, social and political conditions in developing countries. An activity is characterized as aid to CSOs when the core contributions and pooled programmes and funds are programmed by the CSOs and include contributions to finance the CSOs projects. An activity is characterized as aid through CSOs when funds are channelled through CSOs and other private bodies to implement donor-initiated projects.
Note: This paper presents the most up-to-date official data (2019) on the flows of official development assistance (ODA) to and through CSOs. It also identifies trends emerging from a comparative analysis of the aid that DAC members provide to CSOs between 2010 and 2019.
Memo: aid by CSO
Aid to and through CSOs, disbursementsTotal Aid to and through CSOsUSD Million, 2018 constant prices
Total to CSOsTotal through CSOsTotal to and through CSOsTotal bilateral aid
Percentage of bilateral Aid to CSOsPercentage of bilateral Aid through CSOsPercentage of bilateral aid to and through CSOs
Sector breakdown CSO recipientsComposition of bilateral ODA by sector of intervention ODA allocations to and through CSOs by type of CSO
(1): Amounts are average disbursements for 2018-2019, unless otherwise shown.* Women's institutions: Support to women's equality organisations and institutions scores, by definition, principal objective.
Source: CRS (Creditor Reporting System) Aid Activity Database at http://stats.oecd.org/qwids
2018-19, gross disbursements USD Million, 2018 constant prices
Top ten sub-sectors of intervention for bilateral ODA channelled through CSOs, 2018-2019
Percentage of ODA to CSOs focused on gender equality
0
10
20
30
40
50
60
70
80
90
100
2010 2011 2012 2013 2014 2015 2016 2017 2018 2019
Perc
enta
ge (%
)
Women's institutions* Principal objective Significant objective
26
4232
37 39 34 36 40 44 45
20
14
1513 16
15 1613
11 17
0
10
20
30
40
50
60
70
2010 2011 2012 2013 2014 2015 2016 2017 2018 2019
ODA through CSOs ODA to CSOs
0
10
20
30
40
50
60
70
2010 2011 2012 2013 2014 2015 2016 2017 2018 2019Unspecified location International CSO
Donor country-based CSO Developing country-based CSO
31%
0%
30%
34%
0%
4%
Social infrastructureand services
Economicinfrastructure andservicesProduction
Humanitarianassistance
Refugees in DonorCountries
0 5 10 15
Trade Policies & Tourism
Reconstruction Relief
Multisector
Government & Civil Society
Water Supply & Sanitation
Education
Social Infrastructures & Services
Health
Agriculture Forestry & Fishing
Emergency Response
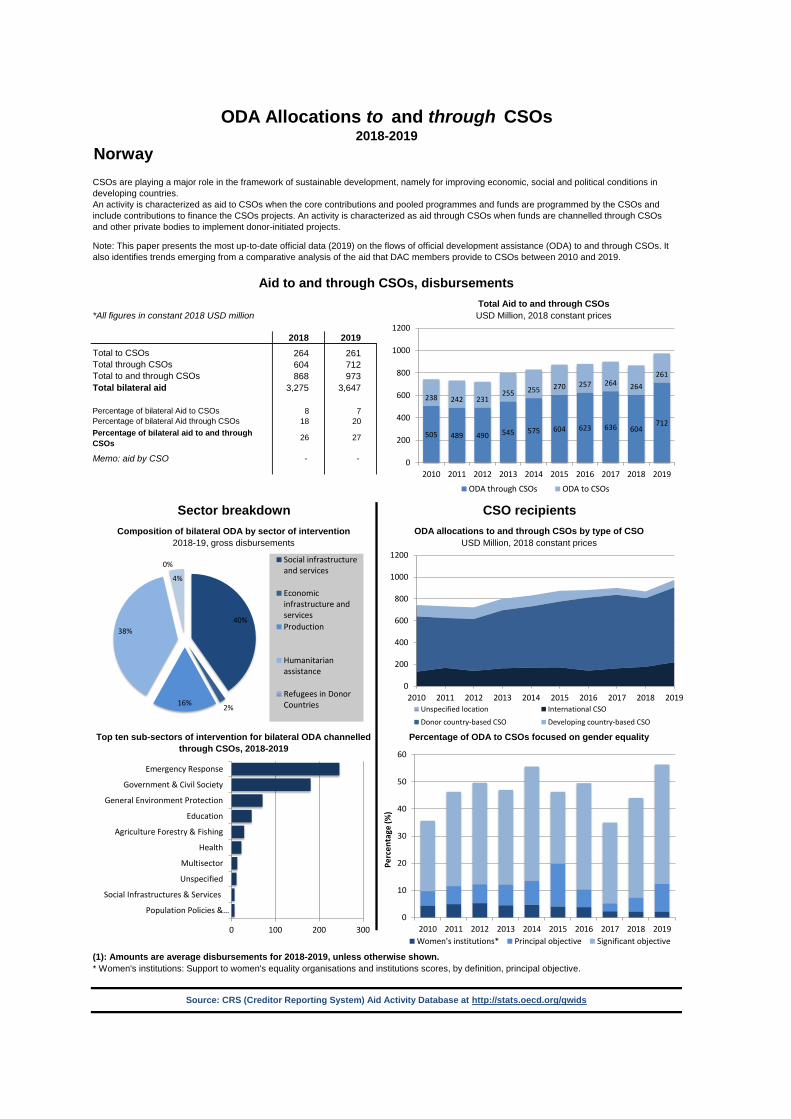
Norway
*All figures in constant 2018 USD million
2018 2019264 261604 712868 973
3,275 3,647
8 718 20
26 27
- -
ODA Allocations to and through CSOs2018-2019
CSOs are playing a major role in the framework of sustainable development, namely for improving economic, social and political conditions in developing countries. An activity is characterized as aid to CSOs when the core contributions and pooled programmes and funds are programmed by the CSOs and include contributions to finance the CSOs projects. An activity is characterized as aid through CSOs when funds are channelled through CSOs and other private bodies to implement donor-initiated projects.
Note: This paper presents the most up-to-date official data (2019) on the flows of official development assistance (ODA) to and through CSOs. It also identifies trends emerging from a comparative analysis of the aid that DAC members provide to CSOs between 2010 and 2019.
Memo: aid by CSO
Aid to and through CSOs, disbursementsTotal Aid to and through CSOsUSD Million, 2018 constant prices
Total to CSOsTotal through CSOsTotal to and through CSOsTotal bilateral aid
Percentage of bilateral Aid to CSOsPercentage of bilateral Aid through CSOsPercentage of bilateral aid to and through CSOs
Sector breakdown CSO recipientsComposition of bilateral ODA by sector of intervention ODA allocations to and through CSOs by type of CSO
(1): Amounts are average disbursements for 2018-2019, unless otherwise shown.* Women's institutions: Support to women's equality organisations and institutions scores, by definition, principal objective.
Source: CRS (Creditor Reporting System) Aid Activity Database at http://stats.oecd.org/qwids
2018-19, gross disbursements USD Million, 2018 constant prices
Top ten sub-sectors of intervention for bilateral ODA channelled through CSOs, 2018-2019
Percentage of ODA to CSOs focused on gender equality
0
10
20
30
40
50
60
2010 2011 2012 2013 2014 2015 2016 2017 2018 2019
Perc
enta
ge (%
)
Women's institutions* Principal objective Significant objective
505 489 490 545 575 604 623 636 604712
238 242 231255 255 270 257 264 264
261
0
200
400
600
800
1000
1200
2010 2011 2012 2013 2014 2015 2016 2017 2018 2019
ODA through CSOs ODA to CSOs
0
200
400
600
800
1000
1200
2010 2011 2012 2013 2014 2015 2016 2017 2018 2019Unspecified location International CSO
Donor country-based CSO Developing country-based CSO
40%
2%16%
38%
0%
4%
Social infrastructureand services
Economicinfrastructure andservicesProduction
Humanitarianassistance
Refugees in DonorCountries
0 100 200 300
Population Policies &…
Social Infrastructures & Services
Unspecified
Multisector
Health
Agriculture Forestry & Fishing
Education
General Environment Protection
Government & Civil Society
Emergency Response
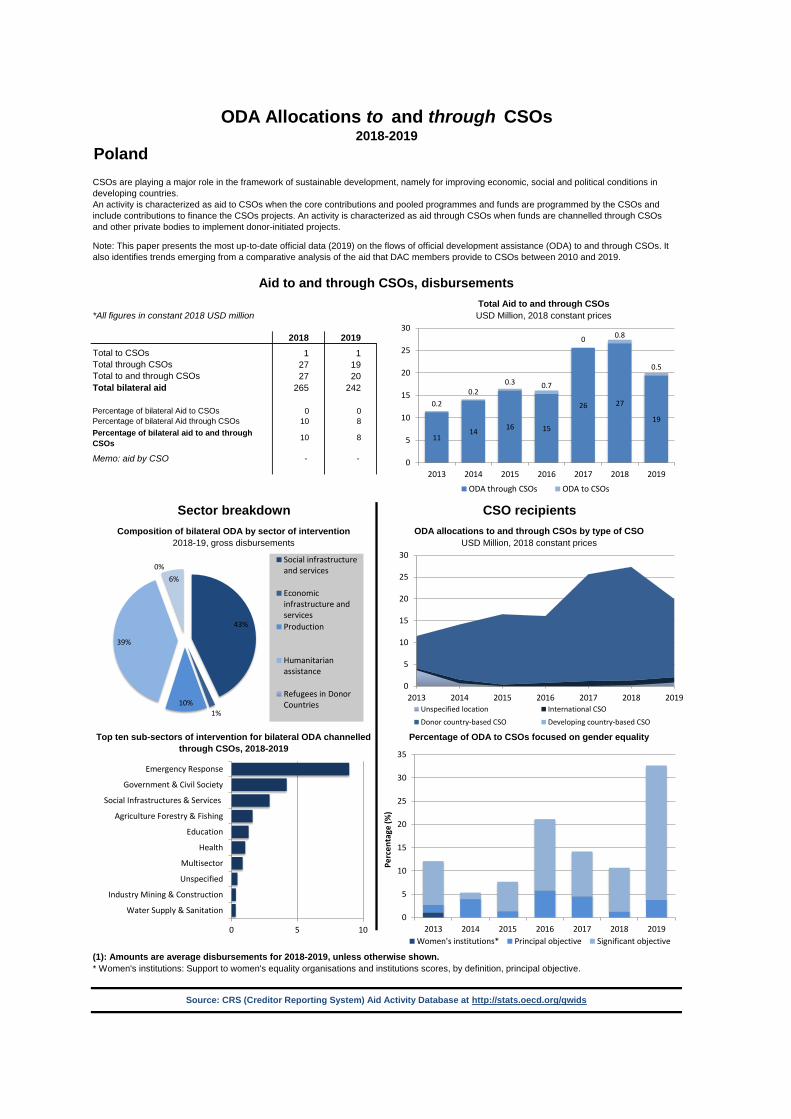
Poland
*All figures in constant 2018 USD million
2018 20191 1
27 1927 20
265 242
0 010 8
10 8
- -
ODA Allocations to and through CSOs2018-2019
CSOs are playing a major role in the framework of sustainable development, namely for improving economic, social and political conditions in developing countries. An activity is characterized as aid to CSOs when the core contributions and pooled programmes and funds are programmed by the CSOs and include contributions to finance the CSOs projects. An activity is characterized as aid through CSOs when funds are channelled through CSOs and other private bodies to implement donor-initiated projects.
Note: This paper presents the most up-to-date official data (2019) on the flows of official development assistance (ODA) to and through CSOs. It also identifies trends emerging from a comparative analysis of the aid that DAC members provide to CSOs between 2010 and 2019.
Memo: aid by CSO
Aid to and through CSOs, disbursementsTotal Aid to and through CSOsUSD Million, 2018 constant prices
Total to CSOsTotal through CSOsTotal to and through CSOsTotal bilateral aid
Percentage of bilateral Aid to CSOsPercentage of bilateral Aid through CSOsPercentage of bilateral aid to and through CSOs
Sector breakdown CSO recipientsComposition of bilateral ODA by sector of intervention ODA allocations to and through CSOs by type of CSO
(1): Amounts are average disbursements for 2018-2019, unless otherwise shown.* Women's institutions: Support to women's equality organisations and institutions scores, by definition, principal objective.
Source: CRS (Creditor Reporting System) Aid Activity Database at http://stats.oecd.org/qwids
2018-19, gross disbursements USD Million, 2018 constant prices
Top ten sub-sectors of intervention for bilateral ODA channelled through CSOs, 2018-2019
Percentage of ODA to CSOs focused on gender equality
0
5
10
15
20
25
30
35
2013 2014 2015 2016 2017 2018 2019
Perc
enta
ge (%
)
Women's institutions* Principal objective Significant objective
1114 16 15
26 27
19
0.20.2
0.3 0.7
0 0.8
0.5
0
5
10
15
20
25
30
2013 2014 2015 2016 2017 2018 2019
ODA through CSOs ODA to CSOs
0
5
10
15
20
25
30
2013 2014 2015 2016 2017 2018 2019Unspecified location International CSO
Donor country-based CSO Developing country-based CSO
43%
1%10%
39%
0%6%
Social infrastructureand services
Economicinfrastructure andservicesProduction
Humanitarianassistance
Refugees in DonorCountries
0 5 10
Water Supply & Sanitation
Industry Mining & Construction
Unspecified
Multisector
Health
Education
Agriculture Forestry & Fishing
Social Infrastructures & Services
Government & Civil Society
Emergency Response
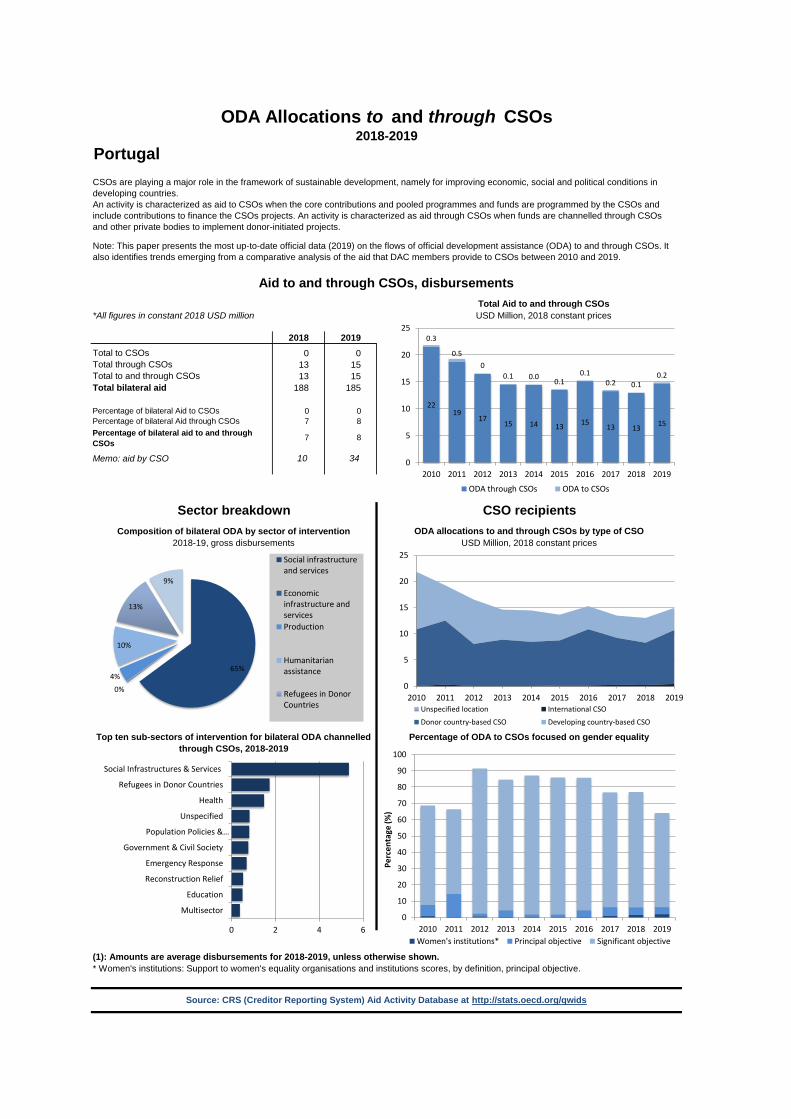
Portugal
*All figures in constant 2018 USD million
2018 20190 0
13 1513 15
188 185
0 07 8
7 8
10 34
ODA Allocations to and through CSOs2018-2019
CSOs are playing a major role in the framework of sustainable development, namely for improving economic, social and political conditions in developing countries. An activity is characterized as aid to CSOs when the core contributions and pooled programmes and funds are programmed by the CSOs and include contributions to finance the CSOs projects. An activity is characterized as aid through CSOs when funds are channelled through CSOs and other private bodies to implement donor-initiated projects.
Note: This paper presents the most up-to-date official data (2019) on the flows of official development assistance (ODA) to and through CSOs. It also identifies trends emerging from a comparative analysis of the aid that DAC members provide to CSOs between 2010 and 2019.
Memo: aid by CSO
Aid to and through CSOs, disbursementsTotal Aid to and through CSOsUSD Million, 2018 constant prices
Total to CSOsTotal through CSOsTotal to and through CSOsTotal bilateral aid
Percentage of bilateral Aid to CSOsPercentage of bilateral Aid through CSOsPercentage of bilateral aid to and through CSOs
Sector breakdown CSO recipientsComposition of bilateral ODA by sector of intervention ODA allocations to and through CSOs by type of CSO
(1): Amounts are average disbursements for 2018-2019, unless otherwise shown.* Women's institutions: Support to women's equality organisations and institutions scores, by definition, principal objective.
Source: CRS (Creditor Reporting System) Aid Activity Database at http://stats.oecd.org/qwids
2018-19, gross disbursements USD Million, 2018 constant prices
Top ten sub-sectors of intervention for bilateral ODA channelled through CSOs, 2018-2019
Percentage of ODA to CSOs focused on gender equality
0
10
20
30
40
50
60
70
80
90
100
2010 2011 2012 2013 2014 2015 2016 2017 2018 2019
Perc
enta
ge (%
)
Women's institutions* Principal objective Significant objective
2219
1715 14 13 15 13 13 15
0.3
0.50
0.1 0.0 0.10.1
0.2 0.10.2
0
5
10
15
20
25
2010 2011 2012 2013 2014 2015 2016 2017 2018 2019
ODA through CSOs ODA to CSOs
0
5
10
15
20
25
2010 2011 2012 2013 2014 2015 2016 2017 2018 2019Unspecified location International CSO
Donor country-based CSO Developing country-based CSO
65%
0%4%
10%
13%
9%
Social infrastructureand services
Economicinfrastructure andservicesProduction
Humanitarianassistance
Refugees in DonorCountries
0 2 4 6
Multisector
Education
Reconstruction Relief
Emergency Response
Government & Civil Society
Population Policies &…
Unspecified
Health
Refugees in Donor Countries
Social Infrastructures & Services

Slovak Republic
*All figures in constant 2018 USD million
2018 20190 05 55 6
32 22
0 115 25
15 26
- -
ODA Allocations to and through CSOs2018-2019
CSOs are playing a major role in the framework of sustainable development, namely for improving economic, social and political conditions in developing countries. An activity is characterized as aid to CSOs when the core contributions and pooled programmes and funds are programmed by the CSOs and include contributions to finance the CSOs projects. An activity is characterized as aid through CSOs when funds are channelled through CSOs and other private bodies to implement donor-initiated projects.
Note: This paper presents the most up-to-date official data (2019) on the flows of official development assistance (ODA) to and through CSOs. It also identifies trends emerging from a comparative analysis of the aid that DAC members provide to CSOs between 2010 and 2019.
Memo: aid by CSO
Aid to and through CSOs, disbursementsTotal Aid to and through CSOsUSD Million, 2018 constant prices
Total to CSOsTotal through CSOsTotal to and through CSOsTotal bilateral aid
Percentage of bilateral Aid to CSOsPercentage of bilateral Aid through CSOsPercentage of bilateral aid to and through CSOs
Sector breakdown CSO recipientsComposition of bilateral ODA by sector of intervention ODA allocations to and through CSOs by type of CSO
(1): Amounts are average disbursements for 2018-2019, unless otherwise shown.* Women's institutions: Support to women's equality organisations and institutions scores, by definition, principal objective.
Source: CRS (Creditor Reporting System) Aid Activity Database at http://stats.oecd.org/qwids
2018-19, gross disbursements USD Million, 2018 constant prices
Top ten sub-sectors of intervention for bilateral ODA channelled through CSOs, 2018-2019
Percentage of ODA to CSOs focused on gender equality
0
10
20
30
40
50
60
70
80
2013 2014 2015 2016 2017 2018 2019
Perc
enta
ge (%
)
Women's institutions* Principal objective Significant objective
4
34
7 7
5 5
0
0.1
0
0.8 1.1
0.20.2
0
1
2
3
4
5
6
7
8
9
2013 2014 2015 2016 2017 2018 2019
ODA through CSOs ODA to CSOs
0
1
2
3
4
5
6
7
8
9
2013 2014 2015 2016 2017 2018 2019Unspecified location International CSO
Donor country-based CSO Developing country-based CSO
62%
1%
13%
12%
7%4%
Social infrastructureand services
Economicinfrastructure andservicesProduction
Humanitarianassistance
Refugees in DonorCountries
0 1 1 2
Reconstruction Relief
Water Supply & Sanitation
Unspecified
Refugees in Donor Countries
Social Infrastructures & Services
Emergency Response
Health
Agriculture Forestry & Fishing
Government & Civil Society
Education
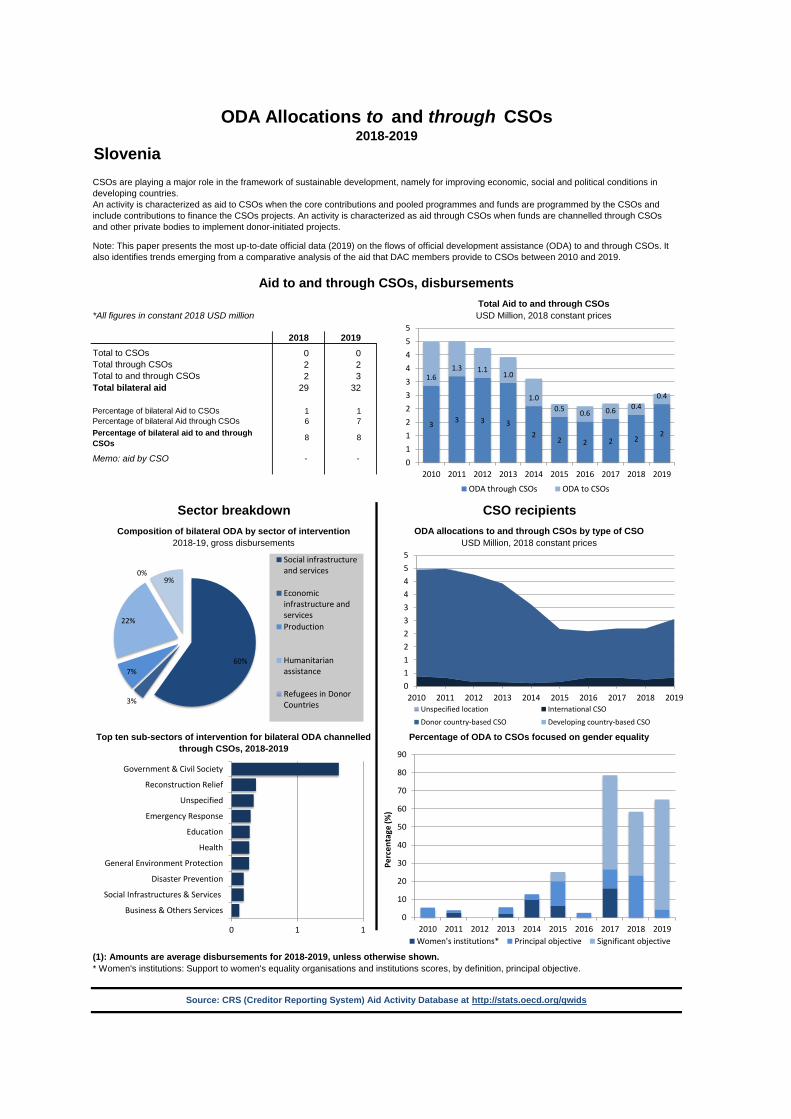
Slovenia
*All figures in constant 2018 USD million
2018 20190 02 22 3
29 32
1 16 7
8 8
- -
ODA Allocations to and through CSOs2018-2019
CSOs are playing a major role in the framework of sustainable development, namely for improving economic, social and political conditions in developing countries. An activity is characterized as aid to CSOs when the core contributions and pooled programmes and funds are programmed by the CSOs and include contributions to finance the CSOs projects. An activity is characterized as aid through CSOs when funds are channelled through CSOs and other private bodies to implement donor-initiated projects.
Note: This paper presents the most up-to-date official data (2019) on the flows of official development assistance (ODA) to and through CSOs. It also identifies trends emerging from a comparative analysis of the aid that DAC members provide to CSOs between 2010 and 2019.
Memo: aid by CSO
Aid to and through CSOs, disbursementsTotal Aid to and through CSOsUSD Million, 2018 constant prices
Total to CSOsTotal through CSOsTotal to and through CSOsTotal bilateral aid
Percentage of bilateral Aid to CSOsPercentage of bilateral Aid through CSOsPercentage of bilateral aid to and through CSOs
Sector breakdown CSO recipientsComposition of bilateral ODA by sector of intervention ODA allocations to and through CSOs by type of CSO
(1): Amounts are average disbursements for 2018-2019, unless otherwise shown.* Women's institutions: Support to women's equality organisations and institutions scores, by definition, principal objective.
Source: CRS (Creditor Reporting System) Aid Activity Database at http://stats.oecd.org/qwids
2018-19, gross disbursements USD Million, 2018 constant prices
Top ten sub-sectors of intervention for bilateral ODA channelled through CSOs, 2018-2019
Percentage of ODA to CSOs focused on gender equality
0
10
20
30
40
50
60
70
80
90
2010 2011 2012 2013 2014 2015 2016 2017 2018 2019
Perc
enta
ge (%
)
Women's institutions* Principal objective Significant objective
3 3 3 32
2 2 2 22
1.61.3 1.1 1.0
1.00.5 0.6 0.6 0.4
0.4
01122334455
2010 2011 2012 2013 2014 2015 2016 2017 2018 2019
ODA through CSOs ODA to CSOs
01122334455
2010 2011 2012 2013 2014 2015 2016 2017 2018 2019Unspecified location International CSO
Donor country-based CSO Developing country-based CSO
60%
3%
7%
22%
0%9%
Social infrastructureand services
Economicinfrastructure andservicesProduction
Humanitarianassistance
Refugees in DonorCountries
0 1 1
Business & Others Services
Social Infrastructures & Services
Disaster Prevention
General Environment Protection
Health
Education
Emergency Response
Unspecified
Reconstruction Relief
Government & Civil Society
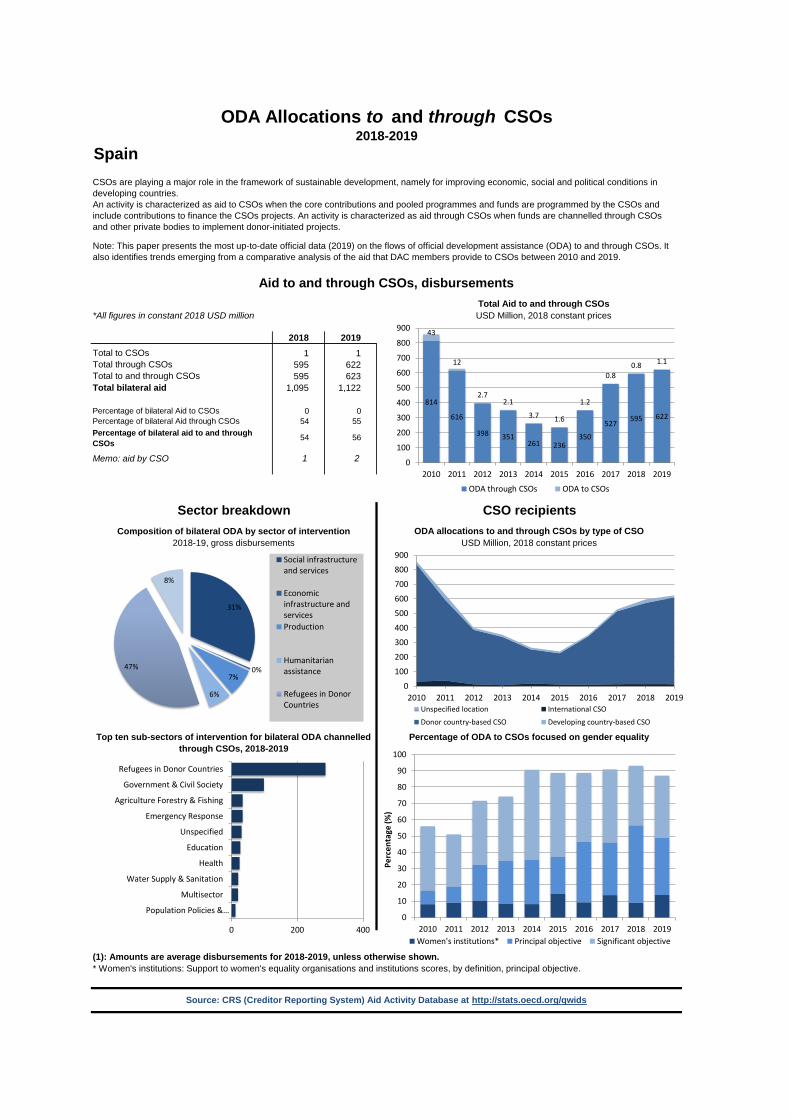
Spain
*All figures in constant 2018 USD million
2018 20191 1
595 622595 623
1,095 1,122
0 054 55
54 56
1 2
ODA Allocations to and through CSOs2018-2019
CSOs are playing a major role in the framework of sustainable development, namely for improving economic, social and political conditions in developing countries. An activity is characterized as aid to CSOs when the core contributions and pooled programmes and funds are programmed by the CSOs and include contributions to finance the CSOs projects. An activity is characterized as aid through CSOs when funds are channelled through CSOs and other private bodies to implement donor-initiated projects.
Note: This paper presents the most up-to-date official data (2019) on the flows of official development assistance (ODA) to and through CSOs. It also identifies trends emerging from a comparative analysis of the aid that DAC members provide to CSOs between 2010 and 2019.
Memo: aid by CSO
Aid to and through CSOs, disbursementsTotal Aid to and through CSOsUSD Million, 2018 constant prices
Total to CSOsTotal through CSOsTotal to and through CSOsTotal bilateral aid
Percentage of bilateral Aid to CSOsPercentage of bilateral Aid through CSOsPercentage of bilateral aid to and through CSOs
Sector breakdown CSO recipientsComposition of bilateral ODA by sector of intervention ODA allocations to and through CSOs by type of CSO
(1): Amounts are average disbursements for 2018-2019, unless otherwise shown.* Women's institutions: Support to women's equality organisations and institutions scores, by definition, principal objective.
Source: CRS (Creditor Reporting System) Aid Activity Database at http://stats.oecd.org/qwids
2018-19, gross disbursements USD Million, 2018 constant prices
Top ten sub-sectors of intervention for bilateral ODA channelled through CSOs, 2018-2019
Percentage of ODA to CSOs focused on gender equality
0
10
20
30
40
50
60
70
80
90
100
2010 2011 2012 2013 2014 2015 2016 2017 2018 2019
Perc
enta
ge (%
)
Women's institutions* Principal objective Significant objective
814
616
398 351261 236
350
527 595 622
43
12
2.72.1
3.7 1.6
1.2
0.80.8 1.1
0
100
200
300
400
500
600
700
800
900
2010 2011 2012 2013 2014 2015 2016 2017 2018 2019
ODA through CSOs ODA to CSOs
0
100
200
300
400
500
600
700
800
900
2010 2011 2012 2013 2014 2015 2016 2017 2018 2019Unspecified location International CSO
Donor country-based CSO Developing country-based CSO
31%
0%7%
6%
47%
8%
Social infrastructureand services
Economicinfrastructure andservicesProduction
Humanitarianassistance
Refugees in DonorCountries
0 200 400
Population Policies &…
Multisector
Water Supply & Sanitation
Health
Education
Unspecified
Emergency Response
Agriculture Forestry & Fishing
Government & Civil Society
Refugees in Donor Countries
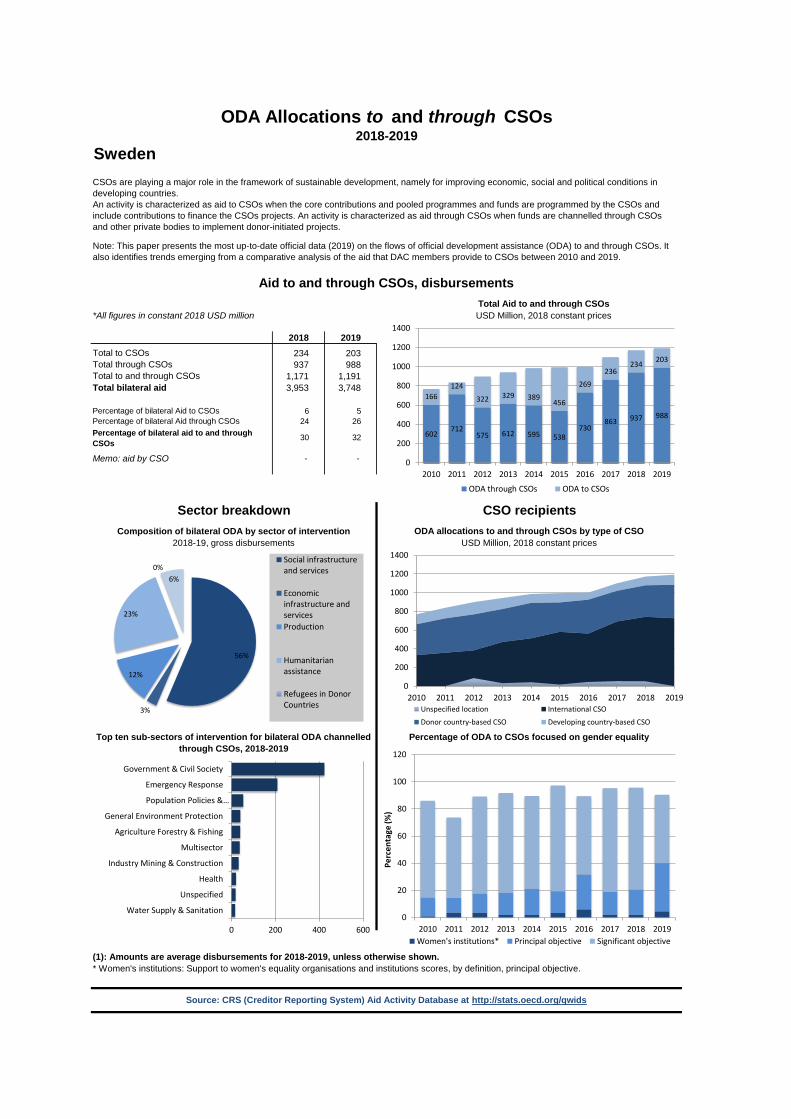
Sweden
*All figures in constant 2018 USD million
2018 2019234 203937 988
1,171 1,1913,953 3,748
6 524 26
30 32
- -
ODA Allocations to and through CSOs2018-2019
CSOs are playing a major role in the framework of sustainable development, namely for improving economic, social and political conditions in developing countries. An activity is characterized as aid to CSOs when the core contributions and pooled programmes and funds are programmed by the CSOs and include contributions to finance the CSOs projects. An activity is characterized as aid through CSOs when funds are channelled through CSOs and other private bodies to implement donor-initiated projects.
Note: This paper presents the most up-to-date official data (2019) on the flows of official development assistance (ODA) to and through CSOs. It also identifies trends emerging from a comparative analysis of the aid that DAC members provide to CSOs between 2010 and 2019.
Memo: aid by CSO
Aid to and through CSOs, disbursementsTotal Aid to and through CSOsUSD Million, 2018 constant prices
Total to CSOsTotal through CSOsTotal to and through CSOsTotal bilateral aid
Percentage of bilateral Aid to CSOsPercentage of bilateral Aid through CSOsPercentage of bilateral aid to and through CSOs
Sector breakdown CSO recipientsComposition of bilateral ODA by sector of intervention ODA allocations to and through CSOs by type of CSO
(1): Amounts are average disbursements for 2018-2019, unless otherwise shown.* Women's institutions: Support to women's equality organisations and institutions scores, by definition, principal objective.
Source: CRS (Creditor Reporting System) Aid Activity Database at http://stats.oecd.org/qwids
2018-19, gross disbursements USD Million, 2018 constant prices
Top ten sub-sectors of intervention for bilateral ODA channelled through CSOs, 2018-2019
Percentage of ODA to CSOs focused on gender equality
0
20
40
60
80
100
120
2010 2011 2012 2013 2014 2015 2016 2017 2018 2019
Perc
enta
ge (%
)
Women's institutions* Principal objective Significant objective
602712
575 612 595 538730
863 937 988
166124
322 329 389456
269236
234 203
0
200
400
600
800
1000
1200
1400
2010 2011 2012 2013 2014 2015 2016 2017 2018 2019
ODA through CSOs ODA to CSOs
0
200
400
600
800
1000
1200
1400
2010 2011 2012 2013 2014 2015 2016 2017 2018 2019Unspecified location International CSO
Donor country-based CSO Developing country-based CSO
56%
3%
12%
23%
0%6%
Social infrastructureand services
Economicinfrastructure andservicesProduction
Humanitarianassistance
Refugees in DonorCountries
0 200 400 600
Water Supply & Sanitation
Unspecified
Health
Industry Mining & Construction
Multisector
Agriculture Forestry & Fishing
General Environment Protection
Population Policies &…
Emergency Response
Government & Civil Society
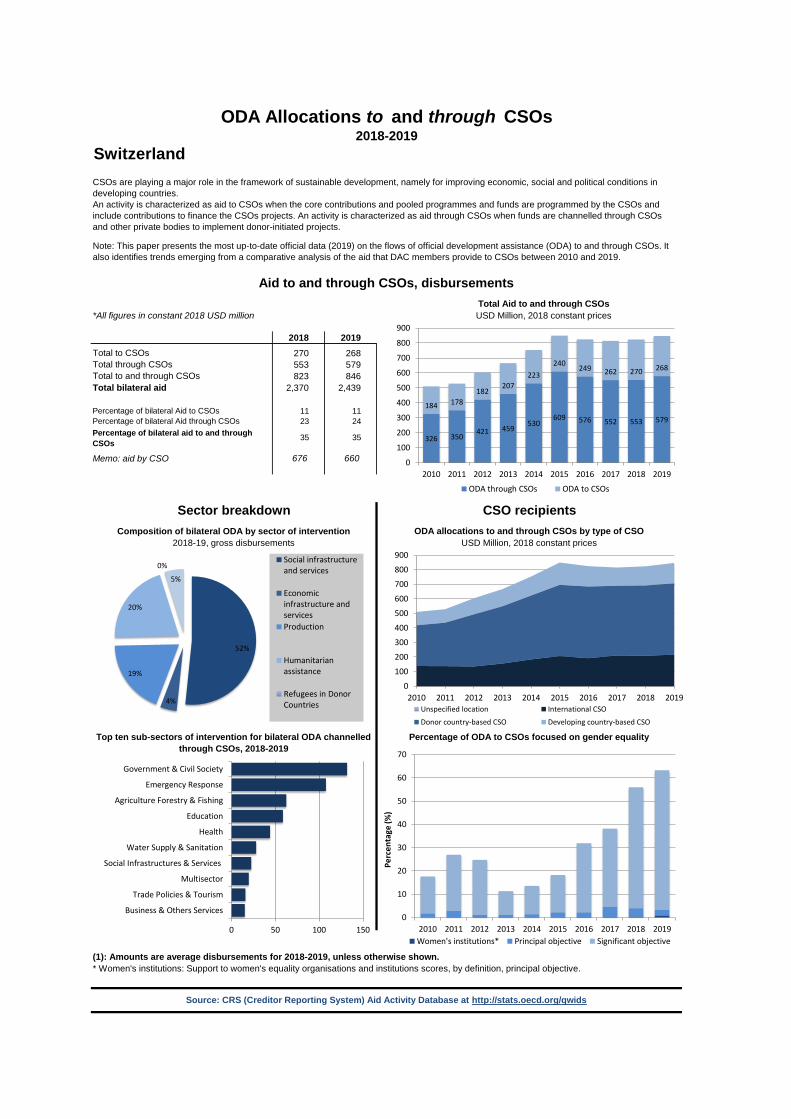
Switzerland
*All figures in constant 2018 USD million
2018 2019270 268553 579823 846
2,370 2,439
11 1123 24
35 35
676 660
ODA Allocations to and through CSOs2018-2019
CSOs are playing a major role in the framework of sustainable development, namely for improving economic, social and political conditions in developing countries. An activity is characterized as aid to CSOs when the core contributions and pooled programmes and funds are programmed by the CSOs and include contributions to finance the CSOs projects. An activity is characterized as aid through CSOs when funds are channelled through CSOs and other private bodies to implement donor-initiated projects.
Note: This paper presents the most up-to-date official data (2019) on the flows of official development assistance (ODA) to and through CSOs. It also identifies trends emerging from a comparative analysis of the aid that DAC members provide to CSOs between 2010 and 2019.
Memo: aid by CSO
Aid to and through CSOs, disbursementsTotal Aid to and through CSOsUSD Million, 2018 constant prices
Total to CSOsTotal through CSOsTotal to and through CSOsTotal bilateral aid
Percentage of bilateral Aid to CSOsPercentage of bilateral Aid through CSOsPercentage of bilateral aid to and through CSOs
Sector breakdown CSO recipientsComposition of bilateral ODA by sector of intervention ODA allocations to and through CSOs by type of CSO
(1): Amounts are average disbursements for 2018-2019, unless otherwise shown.* Women's institutions: Support to women's equality organisations and institutions scores, by definition, principal objective.
Source: CRS (Creditor Reporting System) Aid Activity Database at http://stats.oecd.org/qwids
2018-19, gross disbursements USD Million, 2018 constant prices
Top ten sub-sectors of intervention for bilateral ODA channelled through CSOs, 2018-2019
Percentage of ODA to CSOs focused on gender equality
0
10
20
30
40
50
60
70
2010 2011 2012 2013 2014 2015 2016 2017 2018 2019
Perc
enta
ge (%
)
Women's institutions* Principal objective Significant objective
326 350421 459
530609 576 552 553 579
184 178182
207223
240 249 262 270 268
0
100
200
300
400
500
600
700
800
900
2010 2011 2012 2013 2014 2015 2016 2017 2018 2019
ODA through CSOs ODA to CSOs
0
100
200
300
400
500
600
700
800
900
2010 2011 2012 2013 2014 2015 2016 2017 2018 2019Unspecified location International CSO
Donor country-based CSO Developing country-based CSO
52%
4%
19%
20%
0%
5%
Social infrastructureand services
Economicinfrastructure andservicesProduction
Humanitarianassistance
Refugees in DonorCountries
0 50 100 150
Business & Others Services
Trade Policies & Tourism
Multisector
Social Infrastructures & Services
Water Supply & Sanitation
Health
Education
Agriculture Forestry & Fishing
Emergency Response
Government & Civil Society
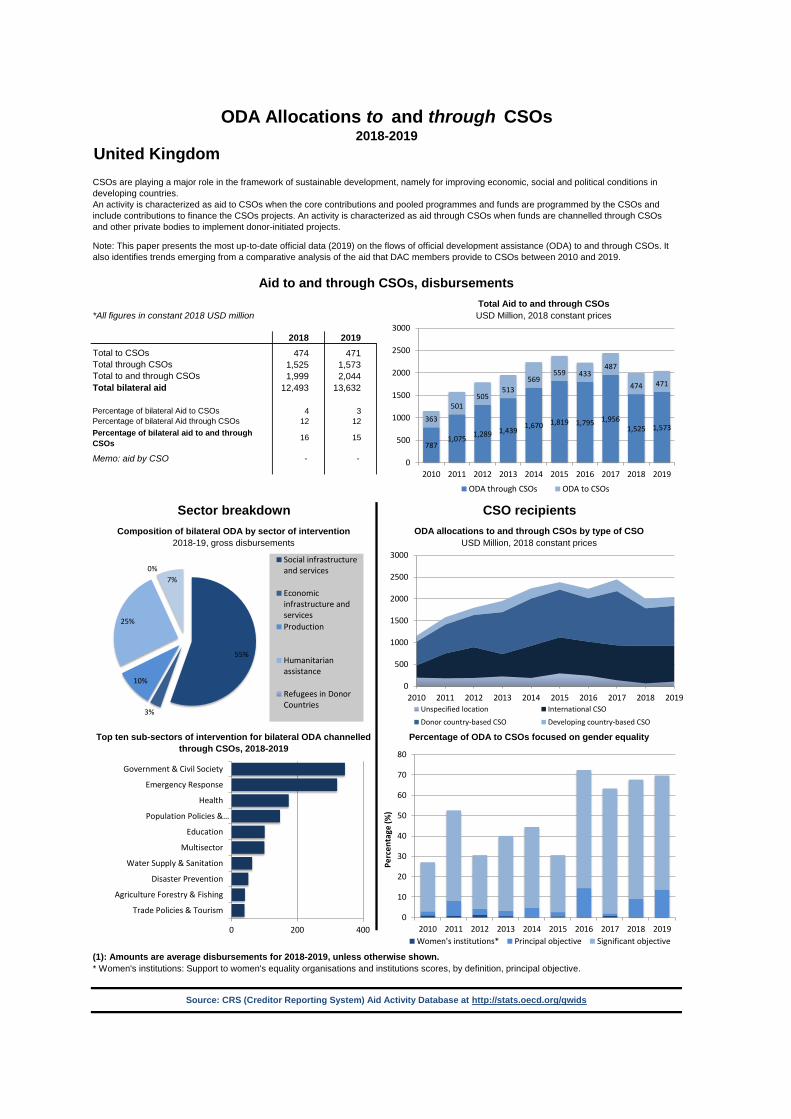
United Kingdom
*All figures in constant 2018 USD million
2018 2019474 471
1,525 1,5731,999 2,044
12,493 13,632
4 312 12
16 15
- -
ODA Allocations to and through CSOs2018-2019
CSOs are playing a major role in the framework of sustainable development, namely for improving economic, social and political conditions in developing countries. An activity is characterized as aid to CSOs when the core contributions and pooled programmes and funds are programmed by the CSOs and include contributions to finance the CSOs projects. An activity is characterized as aid through CSOs when funds are channelled through CSOs and other private bodies to implement donor-initiated projects.
Note: This paper presents the most up-to-date official data (2019) on the flows of official development assistance (ODA) to and through CSOs. It also identifies trends emerging from a comparative analysis of the aid that DAC members provide to CSOs between 2010 and 2019.
Memo: aid by CSO
Aid to and through CSOs, disbursementsTotal Aid to and through CSOsUSD Million, 2018 constant prices
Total to CSOsTotal through CSOsTotal to and through CSOsTotal bilateral aid
Percentage of bilateral Aid to CSOsPercentage of bilateral Aid through CSOsPercentage of bilateral aid to and through CSOs
Sector breakdown CSO recipientsComposition of bilateral ODA by sector of intervention ODA allocations to and through CSOs by type of CSO
(1): Amounts are average disbursements for 2018-2019, unless otherwise shown.* Women's institutions: Support to women's equality organisations and institutions scores, by definition, principal objective.
Source: CRS (Creditor Reporting System) Aid Activity Database at http://stats.oecd.org/qwids
2018-19, gross disbursements USD Million, 2018 constant prices
Top ten sub-sectors of intervention for bilateral ODA channelled through CSOs, 2018-2019
Percentage of ODA to CSOs focused on gender equality
0
10
20
30
40
50
60
70
80
2010 2011 2012 2013 2014 2015 2016 2017 2018 2019
Perc
enta
ge (%
)
Women's institutions* Principal objective Significant objective
7871,075 1,289 1,439
1,670 1,819 1,795 1,9561,525 1,573
363
501505
513569
559 433487
474 471
0
500
1000
1500
2000
2500
3000
2010 2011 2012 2013 2014 2015 2016 2017 2018 2019
ODA through CSOs ODA to CSOs
0
500
1000
1500
2000
2500
3000
2010 2011 2012 2013 2014 2015 2016 2017 2018 2019Unspecified location International CSO
Donor country-based CSO Developing country-based CSO
55%
3%
10%
25%
0%7%
Social infrastructureand services
Economicinfrastructure andservicesProduction
Humanitarianassistance
Refugees in DonorCountries
0 200 400
Trade Policies & Tourism
Agriculture Forestry & Fishing
Disaster Prevention
Water Supply & Sanitation
Multisector
Education
Population Policies &…
Health
Emergency Response
Government & Civil Society
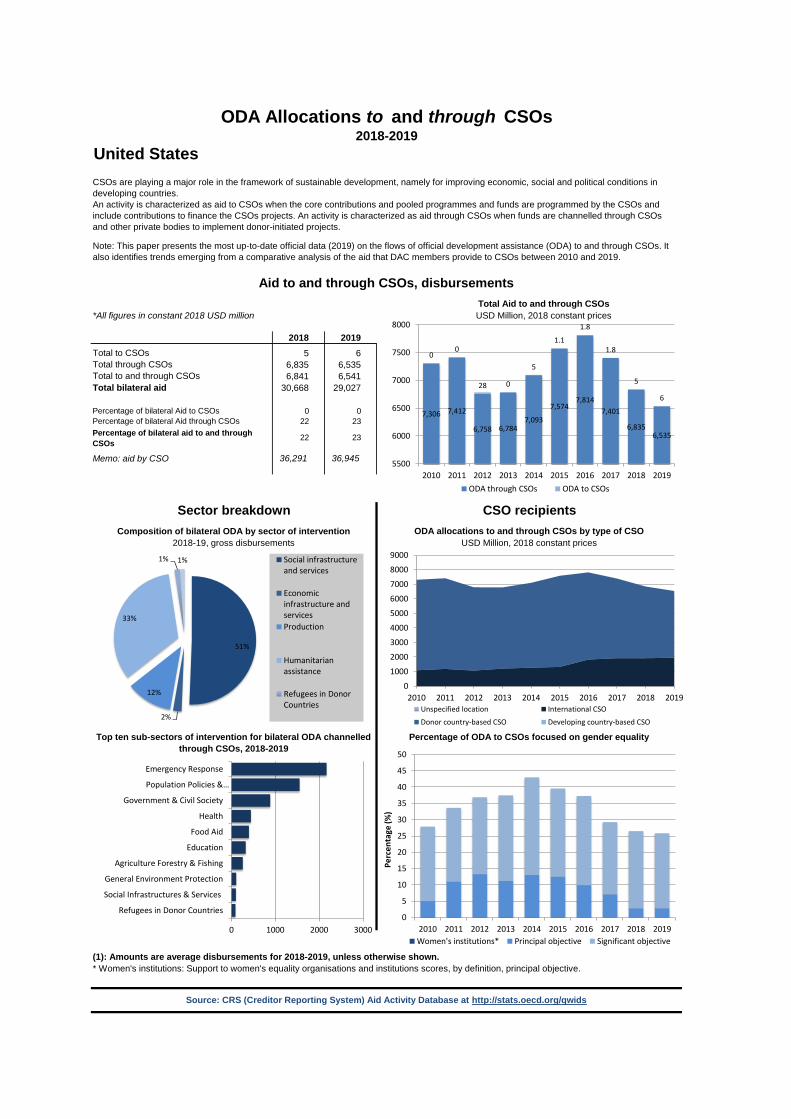
United States
*All figures in constant 2018 USD million
2018 20195 6
6,835 6,5356,841 6,541
30,668 29,027
0 022 23
22 23
36,291 36,945
ODA Allocations to and through CSOs2018-2019
CSOs are playing a major role in the framework of sustainable development, namely for improving economic, social and political conditions in developing countries. An activity is characterized as aid to CSOs when the core contributions and pooled programmes and funds are programmed by the CSOs and include contributions to finance the CSOs projects. An activity is characterized as aid through CSOs when funds are channelled through CSOs and other private bodies to implement donor-initiated projects.
Note: This paper presents the most up-to-date official data (2019) on the flows of official development assistance (ODA) to and through CSOs. It also identifies trends emerging from a comparative analysis of the aid that DAC members provide to CSOs between 2010 and 2019.
Memo: aid by CSO
Aid to and through CSOs, disbursementsTotal Aid to and through CSOsUSD Million, 2018 constant prices
Total to CSOsTotal through CSOsTotal to and through CSOsTotal bilateral aid
Percentage of bilateral Aid to CSOsPercentage of bilateral Aid through CSOsPercentage of bilateral aid to and through CSOs
Sector breakdown CSO recipientsComposition of bilateral ODA by sector of intervention ODA allocations to and through CSOs by type of CSO
(1): Amounts are average disbursements for 2018-2019, unless otherwise shown.* Women's institutions: Support to women's equality organisations and institutions scores, by definition, principal objective.
Source: CRS (Creditor Reporting System) Aid Activity Database at http://stats.oecd.org/qwids
2018-19, gross disbursements USD Million, 2018 constant prices
Top ten sub-sectors of intervention for bilateral ODA channelled through CSOs, 2018-2019
Percentage of ODA to CSOs focused on gender equality
0
5
10
15
20
25
30
35
40
45
50
2010 2011 2012 2013 2014 2015 2016 2017 2018 2019
Perc
enta
ge (%
)
Women's institutions* Principal objective Significant objective
7,306 7,412
6,758 6,7847,093
7,5747,814
7,401
6,8356,535
00
28 0
5
1.1
1.8
1.8
5
6
5500
6000
6500
7000
7500
8000
2010 2011 2012 2013 2014 2015 2016 2017 2018 2019ODA through CSOs ODA to CSOs
0
1000
2000
3000
4000
5000
6000
7000
8000
9000
2010 2011 2012 2013 2014 2015 2016 2017 2018 2019Unspecified location International CSO
Donor country-based CSO Developing country-based CSO
51%
2%
12%
33%
1% 1% Social infrastructureand services
Economicinfrastructure andservicesProduction
Humanitarianassistance
Refugees in DonorCountries
0 1000 2000 3000
Refugees in Donor Countries
Social Infrastructures & Services
General Environment Protection
Agriculture Forestry & Fishing
Education
Food Aid
Health
Government & Civil Society
Population Policies &…
Emergency Response