agrarian perspectives xxii
TRANSCRIPT
CZECH UNIVERSITY OF LIFE SCIENCES PRAGUE
FACULTY OF ECONOMICS AND MANAGEMENT
AGRARIAN PERSPECTIVES XXII.
DEVELOPMENT TRENDS IN AGRIBUSINESS
PROCEEDINGS of the 22th International Scientific Conference
September 17 – 18, 2013 Prague, Czech Republic
2
Czech University of Life Sciences Prague Faculty of Economics and Management © 2013
Programme Committee Professor Peter Bielik (Slovak University of Agriculture in Nitra) Professor Ivana Boháčková (CULS, Praha) Dr. Stephen Clark (Nova Scotia Agricultural College) Assoc. Professor Lukáš Čechura (CULS, Praha) Dr. Helena Čermáková (CULS, Praha) Professor Vladimír Gozora (School of Economics and Management in Public Administration Bratislava) Assoc. Professor Zdeněk Havlíček (CULS, Praha) Professor Jan Hron (CULS, Praha) Dr. Eamon Lenihan (University College Cork) Assoc. Professor Zdeněk Linhart (CULS, Praha) Assoc. Professor Michal Lošťák (CULS Praha) ProfessorVěra Majerová (CULS, Praha) Professor Thomas Payne (University of Missouri, Columbia) Dr. Martin Pelikán (CULS, Praha) Dr. Derek Shepherd (University of Plymouth) Professor Miroslav Svatoš (CULS, Praha) Professor Pavel Tomšík (Mendel University in Brno) Dr. Lukáš Zagata(CULS, Praha)
Editors: Assoc. Professor Luboš Smutka (CULS, Praha) Dr. Lukáš Zagata(CULS, Praha)
Technical cooperation: Jiří Jiral (CULS, Praha)
ISBN 978-80-213-2419-0
3
Foreword ............................................................................................................................... 9
Economics of Resources, Competitiveness and Changes in CAP .................... 11
Energy consumption in agriculture: an input-output analysis ...................................... 13
Zuzana Bednaříková
Gravity model of barley export in selected Central European countries ..................... 20
Petra Bubáková
Model farms and economic viability of farming ............................................................. 35
Ivan Foltýn, Ida Zedníčková, Jaroslav Humpál
Wage differences and labor productivity in the Czech agriculture
and the CAP changes ......................................................................................................... 42
Marta Gryčová
Efficiency of biodynamic farms ........................................................................................ 55
Marie Pechrova
Comparison of two approaches to prediction of prices .................................................. 70
Jiri Pokorny, Pavel Fronek, and Miluse Abrahamova
Analysis of the Impact of Subsidies on Economic Performance of Agricultural Enterprises in the Czech Republic .................................................................................... 78
Helena Řezbová, Ondřej Škubna
Theoretical potential of biogas production from agricultural biogas plants ................ 86
Josef Slaboch, Pavlína Hálová, Jiří Mach
4
Fiscal and Parafiscal Burden of Polish Farms vs. Farm Net Income and Cash Flow .............................................................................. 104
Michał Soliwoda
New EU members: agriculture and investment ............................................................ 116
Luboš Smutka, Michal Steininger
ICT .................................................................................................................................... 123
The Career Perceptions of Future Graduates ............................................................... 125
Ondřej Gojda
Monitoring IP addresses of attackers to the information system ................................ 136
Cestmir Halbich
Web application for Collection and visualization of positional data - Wild boars and deer monitoring in Czech Republic ......................................................................... 141
Jan Masner, Michal Stočes
Logo design for websites .................................................................................................. 148
Martina Šmejkalová
BORM-II and UML as accessibility process in knowledge and business modeling... 155
Vojtěch Merunka, Sandra Milena Choles Arvilla1, Martin Plas, Jakub Tůma
International Business and Marketing .................................................................. 165
Health services approach to the communication audit ................................................. 167
Tereza Balcarova
5
Buying at the Weekly Market or at the Farm Shop? Consumer Preferences of Local Food Products Directly Sold by Farmers in Germany .................................. 180
Miroslava Bavorová, Ilkay Unay Gailhard and Mira Lehberger
Consumer Perception and Use of Products with Health Claims in Western Balkan Countries ......................................................................................... 199
Jelena Filipović, Žaklina Stojanović
Revealed comparative advantage of Russian agricultural exports ............................ 212
Natalia Ishchukova, Luboš Smutka
Methodology of Supply Chain Value – Oilseed Rape (OSR) Case .............................. 219
Zdenek Linhart
Valuation of intangible assets in mergers and acquisitions: Event study approach ...................................................................................................... 236
Alexey Shvetsov, Konstantin Rychkov
Performance Implications of Business Models .............................................................. 253
Ivana Ticha
Regional and Social Development ........................................................................... 259
The process of rural restructuring as a factor of heterogeneity of the rural areas in the Czech Republic ........................................................................ 261
Jiří Hrabák, Andrea Čapkovičová
Social Entrepreneurschip in the context of Czech regional policy ............................. 274
Eva Kučerová
6
Innovative Practices as a Factor of Transformation of the Rural Everyday Life ...... 282
Morekhanova M.
Best practice in rural development: Case study on municipalities awarded in competition the Village of the Year ................................................................................ 290
Marie Pechrová, Kateřina Boukalová
The Definition of Rural Areas in the Czech Republic with Regard to the Policy Objectives .......................................................................................................................... 303
Marie Pechrová
How to measure capital of rural areas ........................................................................... 315
Vít Skála
Rural Areas in the Czech Republic: How Do They Differ from Urban Areas? ......... 322
Marie Pechrová, Ondřej Šimpach
Landscape memory as rural heritage – the changes of Czech cultural landscape in the mental reflection of its inhabitants ....................................................................... 335
Hana Vavrouchová
Social Responsibility of a Company ........................................................................ 341
Social responsibility of forest enterprises in the Czech Republic ................................ 343
Helena Čermáková
CSR and Availability of Food for Celiacs in Retail Trade CR .................................... 349
Aleš Hes, Marta Regnerová
7
Promotion of Fair Trade .................................................................................................. 361
Olga Regnerová, Miroslava Navrátilová, Pavel Štáfek
Social Responsibility in the Purchase of Consumer Goods in the Czech Republic ...................................................................................................... 369
Daniela Šálková, Štefan Toth
GLOBALG.A.P. as a possible tool of corporate social responsibility in agricultural production ............................................................................................... 381
Petra Šánová
Effect of crop selection on the economy of crop production and quality of the environment ........................................................................................................... 389
Václav Voltr, Martin Hruška
Financial reporting of environmental and social aspects in business practice ........... 403
Jitka Zborková, Jana Hinke

8

9
Dear ladies and gentlemen,
our conference “Agrarian perspectives XXII: Development trends in agribusiness” is an important international event designed to bring together key stakeholders involved in agricultural and food systems, business and marketing, and regional and rural development research for discussion on the most important issues related to current national, European and World economy, and society development. The importance of cooperation both at national and international level is an important factor in the field of research activities devoted to current World economy and society development. The modern research activities rely upon the communication and sharing of research results, plans, resources and lessons learned by all local and international stakeholders.
Agricultural, foodstuff and rural development originate from combining innovatively a wide range of different and often, refigured resources, which consequently flow into a set of new activities, interactions, transactions and networks. Cooperation among individual scientists, experts, institutions etc. is one of the most important drivers in the current scientific field. Modern research is especially based on the mutual sharing of knowledge, information and experiences. It is not possible to make any research in isolation. We cannot undertake modern research separately – in this case it is mutual cooperation which is an engine of successful scientific activities.
In this case it is really necessary to emphasize that our conference has attracted many local and foreign scientists from many countries e.g. China, Germany, Poland, Romania, Russia, Serbia and USA etc. All the participants will be awarded the possibility to express their attitudes towards the scientific issues related to the Economics of resources, competitiveness and Changes in CAP, International business and marketing, Social responsibility of a company, Regional and social development and International communication and technologies – all topics are devoted to specific issues of agricultural and rural areas development.
It is our hope that this conference will be a useful step in meeting the challenges faced by agricultural and rural communities. On behalf of the organization committee I would like to thank all those, who were involved in the hectic preparation, and probably also a few sleepless nights, hoping that everything will work out well. At this point I would like to acknowledge my faculty colleagues who took part in the organization. I would also like to thank to members of the international programme committee, and also the members of the Faculty of Economics and Management, which hosts this event.
I also hope that the presented ideas, results and findings will promote constructive debate and search for new solutions, sharing the experience and will encourage further cooperation in and sustainability of rural areas development.
Let me end with wishing you a fruitful conference.
Professor Jan Hron
Head of the Programme Committee

10
11
Economics of Resources,
Competitiveness and Changes in CAP

12
13
Energy consumption in agriculture: an input-output analysis
Zuzana Bednaříková Department of Rural Development, Institute of Agricultural Economics and Information,
Mánesova 75, 120 56 Praha 2 [email protected]
Annotation: This paper analyses and evaluates linkages between agriculture and energy sectors in the Czech Republic. To evaluate the interconnectedness between agriculture and energy sectors, the input-output analysis was used. The input-output model was constructed for four sectors of the Czech economy: Agriculture; Manufacture of coke, refined petroleum products; Production, collection and distribution of electricity, gas and heat; and Collection, purification and distribution of water. The analysis gave the following results. If an agricultural output increases by 1 million CZK, the sector Agriculture has to purchase energy in the amount of 0.074 million CZK from monitored sectors. The final demand multiplier which shows the indirect effect of energy consumption in backward linked sectors caused by changes in inputs of directly affected sectors, is relatively high for agriculture because this sector is strongly interrelated with the energy-intensive fertilizer sector. However, the highest multiplier is for the sector of production, collection and distribution of electricity, gas and heat. This is because this sector is strongly interrelated with raw materials production whose production and transport are highly energy demand.
Key words: energy input-output, agriculture, supply and use table
JEL classification: R15
1 Introduction The agricultural sector, as well as other sectors, has become dependent increasingly on energy resources such as electricity, natural gas, fuels and coke. Energy consumption in agriculture increases very fast mainly due to progressive mechanization of agricultural production and growing interest in commercial fertilises. The objective of the paper is to analyse and evaluate linkages between agriculture and energy sectors in the Czech Republic. Only two generally accepted methods to evaluate energy consumption in agriculture exist: the first is economic analysis of energy and energy accounting and the second is energy input-output analysis (e.g. Casler and Wilbur, 1984; Hsu, 1989; Karkacier and Gokalp, 2005; Neuwahl et al, 2008; Silalertruksa et al, 2012). Application of the input analysis enables to project requirements of output that have to be met by agriculture and their projection to output changes in the energy sectors of the given economy). Application of the input-output analysis provides e.g. policy-makers with important information on the energy requirements for the development or growth of each economic sector, in this case agricultural sector. To evaluate the interconnectedness between agriculture and energy sector, the input-output analysis was used. The input-output model was constructed for four sectors of the Czech economy. The model covers the following sectors: (1) Agriculture; (2) Manufacture of coke, refined petroleum products, (3) Production, collection and distribution of electricity, gas and heat, (4) Collection, purification and distribution of water.
2 Materials and Methods Input-output models are often used by economists to examine the economics interrelations between the agricultural sector and other sectors of the given economy, such as energy sector or manufacturing.
14
The basis of the input-output analysis (Leontief, 1966) is an input-output table. Input-output table shows, how is the output of each sector distributed between other sectors of the economy. Simultaneously, it shows inputs of each sector to other sectors (Miernyk, 1965).
Data for the analysis comes from supply and use table for the year 2011 provided by the Czech Statistical Office. These tables show the flows of goods and services between production sectors of the given economy.
When creating the input-output model and when interpreting the results, all of the constraints typical for the input-output analysis were taken into account. In particular, it means the existence of a static linear production function, its transience, the fixed input structure, the impossibility of substitution and using impacts from economies of scale (Miller and Blair, 2009).
An input-output model consists of the three basic tables: technical coefficients matrix, the transaction table and table of economic interrelationships between sectors in the economy.
Technical coefficient is usually obtained by dividing required intermediate consumption and total production of the column´s sector. Technical coefficients for the whole economy can be calculated as follows:
aij =j
ij
XX (1)
where i, j = 1, 2, 3, ….n, Xij is an intermediate consumption, i.e. flows of goods and production from row´s sector i to column´s sector j. Xj is the value of production of the column´s sector j. The flows between sectors measured by constant prices are indicate in transaction table as Xij, where i is a part of production (input) produced by row´s sector i and purchased by column´s sector j in order to produce its output, Xj. The cross-sectoral flows for n sectors are displayed as the sum of all inputs to the sector j:
∑n
iijX (2)
where i,j = 1, 2, …, n.
Final demand Yi, where i = 1, 2,…, n, absorbs output of the sectors i till n. Total output of a sector is indicated as Xj. Interdependence of each sector on all other sector can be written as:
X11 + X12 + X13 + … + X1n + Y1 = X1
X21 + X22 + X23 + … + X2n + Y2 = X2
X31 + X32 + X33 + … + X3n + Y3 = X3
…………………………….
Xn1 + Xn2 + Xn3 + … + Xnn + Yn = Xn
(3)
As the input-output model assumes that cross-sectoral flows Xij are both linear and ratio functions of the level of the output Xj, so aij are ratio coefficients that show the number of units of product i (produced by row´s sector i) needed to produce one unit of column´s sector j. Therefore,
15
Xij = aij Xj (4) where i, j = 1, 2, 3, ….n
Using equation (4) in the system of equations (3) we obtain:
a11X1 + a12X2 + a13X3 + … + a14Xn + Y1 = X1
a21X1 + a22X2 + a23X3 + … + a2nXn + Y2 = X2
a31X1 + a32X2 + a33X3 + … + a3nXn + Y3 = X3
…………………………….
an1X1 + an2X2 + an3X3 + … + annXn + Yn = Xn
(5)
The system of equations (5) can be written in the matrix form as:
AX + Y = X (6)
Therefore,
A =
nnnnn
n
n
n
aaaa
aaaaaaaaaaaa
.....
.....................
.....
.....
.....
321
3333231
2232221
1131211
X =
nX
XXX
...3
2
1
Y =
nY
YYY
...3
2
1
Matrix A is called the matrix of technical coefficients as consists of the fixed technical coefficients of the input-output model. X represents column´s vector of the output of each sector and Y is column´s vector of final demand for individual sector´s output. Equation (6) can be written as
Y = X – AX = (I-A)X (7)
where I is n x n Identity matrix, (I-A) is Leontief matrix. Multiplying equation (7) by inverse matrix to (I-A), we receive
X = (I-A)-1Y (8)
Equation (8) shows, knowing matrix of technical coefficients A and column´s vector of final demand Y, that we can indicate the value of the sector´s output X (Miernyk, 1965).
3 Results and Discussion Table 1 shows the transaction table of the Czech economy which has been divided into four sectors: (1) Agriculture; (2) Manufacture of coke, refined petroleum products; (3) Production, collection and distribution of electricity, gas and heat; (4) Collection, purification and distribution of water.
Transaction table provides information on economy structure during given period, usually one year. It describes flows of production of individual sectors and the origin of its inputs. It also
16
presents information on relative importance of relations in the economy and between the economy and other economies.
The primary purpose of a transaction table is to determinate impacts of exogenous demand shocks. Once the interrelationships in the economy are quantified, it is possible to find out impacts of final demand changes on the region (Armstrong and Taylor, 2000).
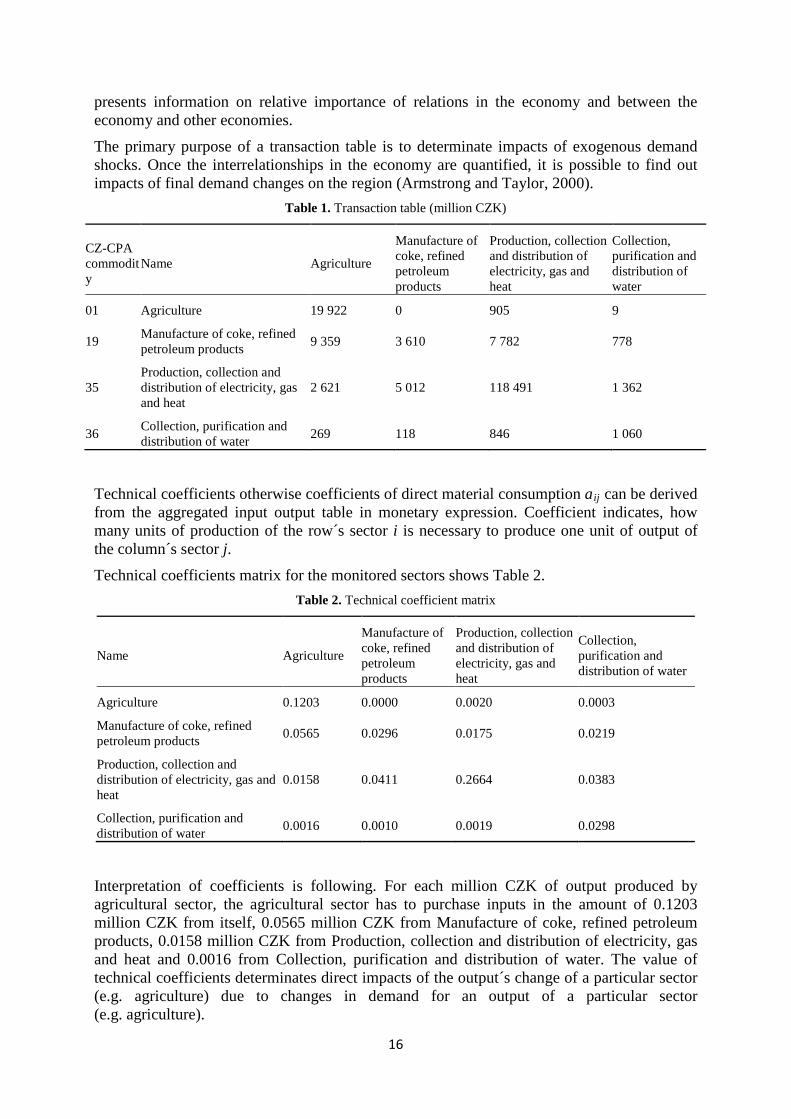
Table 1. Transaction table (million CZK)
CZ-CPA commodity
Name Agriculture
Manufacture of coke, refined petroleum products
Production, collection and distribution of electricity, gas and heat
Collection, purification and distribution of water
01 Agriculture 19 922 0 905 9
19 Manufacture of coke, refined petroleum products 9 359 3 610 7 782 778
35 Production, collection and distribution of electricity, gas and heat
2 621 5 012 118 491 1 362
36 Collection, purification and distribution of water 269 118 846 1 060
Technical coefficients otherwise coefficients of direct material consumption aij can be derived from the aggregated input output table in monetary expression. Coefficient indicates, how many units of production of the row´s sector i is necessary to produce one unit of output of the column´s sector j. Technical coefficients matrix for the monitored sectors shows Table 2.
Table 2. Technical coefficient matrix
Name Agriculture
Manufacture of coke, refined petroleum products
Production, collection and distribution of electricity, gas and heat
Collection, purification and distribution of water
Agriculture 0.1203 0.0000 0.0020 0.0003
Manufacture of coke, refined petroleum products 0.0565 0.0296 0.0175 0.0219
Production, collection and distribution of electricity, gas and heat
0.0158 0.0411 0.2664 0.0383
Collection, purification and distribution of water 0.0016 0.0010 0.0019 0.0298
Interpretation of coefficients is following. For each million CZK of output produced by agricultural sector, the agricultural sector has to purchase inputs in the amount of 0.1203 million CZK from itself, 0.0565 million CZK from Manufacture of coke, refined petroleum products, 0.0158 million CZK from Production, collection and distribution of electricity, gas and heat and 0.0016 from Collection, purification and distribution of water. The value of technical coefficients determinates direct impacts of the output´s change of a particular sector (e.g. agriculture) due to changes in demand for an output of a particular sector (e.g. agriculture).
17
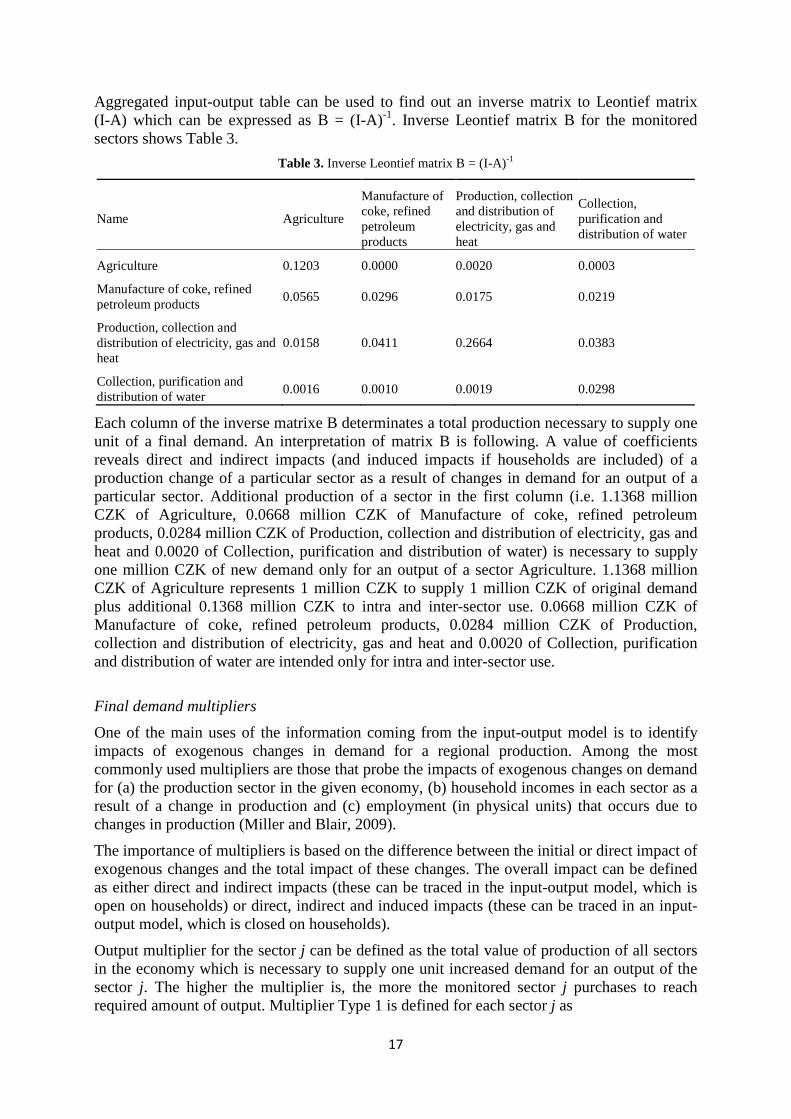
Aggregated input-output table can be used to find out an inverse matrix to Leontief matrix (I-A) which can be expressed as B = (I-A)-1. Inverse Leontief matrix B for the monitored sectors shows Table 3.
Table 3. Inverse Leontief matrix B = (I-A)-1
Name Agriculture
Manufacture of coke, refined petroleum products
Production, collection and distribution of electricity, gas and heat
Collection, purification and distribution of water
Agriculture 0.1203 0.0000 0.0020 0.0003
Manufacture of coke, refined petroleum products 0.0565 0.0296 0.0175 0.0219
Production, collection and distribution of electricity, gas and heat
0.0158 0.0411 0.2664 0.0383
Collection, purification and distribution of water 0.0016 0.0010 0.0019 0.0298
Each column of the inverse matrixe B determinates a total production necessary to supply one unit of a final demand. An interpretation of matrix B is following. A value of coefficients reveals direct and indirect impacts (and induced impacts if households are included) of a production change of a particular sector as a result of changes in demand for an output of a particular sector. Additional production of a sector in the first column (i.e. 1.1368 million CZK of Agriculture, 0.0668 million CZK of Manufacture of coke, refined petroleum products, 0.0284 million CZK of Production, collection and distribution of electricity, gas and heat and 0.0020 of Collection, purification and distribution of water) is necessary to supply one million CZK of new demand only for an output of a sector Agriculture. 1.1368 million CZK of Agriculture represents 1 million CZK to supply 1 million CZK of original demand plus additional 0.1368 million CZK to intra and inter-sector use. 0.0668 million CZK of Manufacture of coke, refined petroleum products, 0.0284 million CZK of Production, collection and distribution of electricity, gas and heat and 0.0020 of Collection, purification and distribution of water are intended only for intra and inter-sector use.
Final demand multipliers One of the main uses of the information coming from the input-output model is to identify impacts of exogenous changes in demand for a regional production. Among the most commonly used multipliers are those that probe the impacts of exogenous changes on demand for (a) the production sector in the given economy, (b) household incomes in each sector as a result of a change in production and (c) employment (in physical units) that occurs due to changes in production (Miller and Blair, 2009).
The importance of multipliers is based on the difference between the initial or direct impact of exogenous changes and the total impact of these changes. The overall impact can be defined as either direct and indirect impacts (these can be traced in the input-output model, which is open on households) or direct, indirect and induced impacts (these can be traced in an input-output model, which is closed on households).
Output multiplier for the sector j can be defined as the total value of production of all sectors in the economy which is necessary to supply one unit increased demand for an output of the sector j. The higher the multiplier is, the more the monitored sector j purchases to reach required amount of output. Multiplier Type 1 is defined for each sector j as
18
Chyba! Záložka není definována. MOj = ∑=
n
iijb
1 (9)
where bij is a coefficient of a total supplies consumption which determinates direct and indirect inter-sectors impacts on demand for an output of a sector i as a result of demand changes (as well as input requirements changes) of a sector j (Fiala and Dlouhý, 2006).
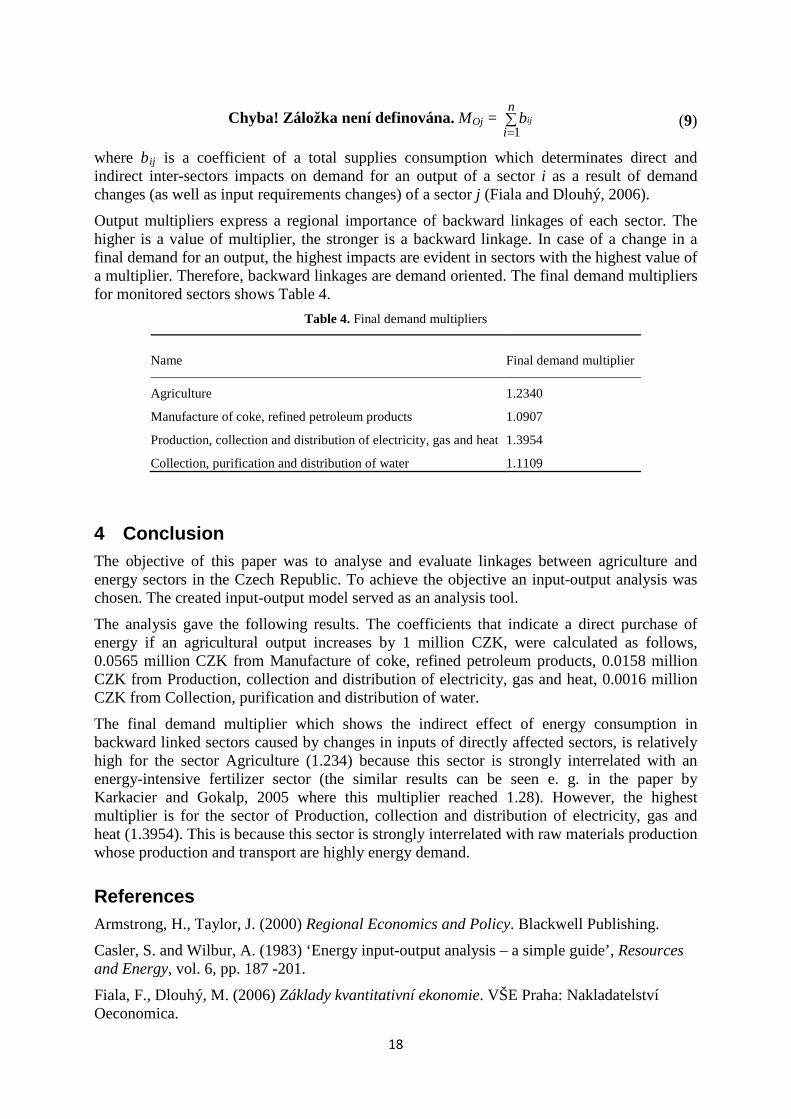
Output multipliers express a regional importance of backward linkages of each sector. The higher is a value of multiplier, the stronger is a backward linkage. In case of a change in a final demand for an output, the highest impacts are evident in sectors with the highest value of a multiplier. Therefore, backward linkages are demand oriented. The final demand multipliers for monitored sectors shows Table 4.
Table 4. Final demand multipliers
Name Final demand multiplier
Agriculture 1.2340
Manufacture of coke, refined petroleum products 1.0907
Production, collection and distribution of electricity, gas and heat 1.3954
Collection, purification and distribution of water 1.1109
4 Conclusion The objective of this paper was to analyse and evaluate linkages between agriculture and energy sectors in the Czech Republic. To achieve the objective an input-output analysis was chosen. The created input-output model served as an analysis tool.
The analysis gave the following results. The coefficients that indicate a direct purchase of energy if an agricultural output increases by 1 million CZK, were calculated as follows, 0.0565 million CZK from Manufacture of coke, refined petroleum products, 0.0158 million CZK from Production, collection and distribution of electricity, gas and heat, 0.0016 million CZK from Collection, purification and distribution of water.
The final demand multiplier which shows the indirect effect of energy consumption in backward linked sectors caused by changes in inputs of directly affected sectors, is relatively high for the sector Agriculture (1.234) because this sector is strongly interrelated with an energy-intensive fertilizer sector (the similar results can be seen e. g. in the paper by Karkacier and Gokalp, 2005 where this multiplier reached 1.28). However, the highest multiplier is for the sector of Production, collection and distribution of electricity, gas and heat (1.3954). This is because this sector is strongly interrelated with raw materials production whose production and transport are highly energy demand.
References Armstrong, H., Taylor, J. (2000) Regional Economics and Policy. Blackwell Publishing.
Casler, S. and Wilbur, A. (1983) ‘Energy input-output analysis – a simple guide’, Resources and Energy, vol. 6, pp. 187 -201.
Fiala, F., Dlouhý, M. (2006) Základy kvantitativní ekonomie. VŠE Praha: Nakladatelství Oeconomica.
19
Hsu, G. J. Y (1989) Energy multipliers for economic analysis – an input-output approach, Energy Economics, Taipei: Chung-Hua Institution for Economic Research.
Karkacier O. and Goktolga, Z. G. (2005) ‘Input-output analysis of energy use in agriculture’, Energy Conversion and Management, vol. 46, pp. 1513-1521.
Miernyk, W. H.(1965) The elements of input-output analysis. New York: Random House.
Miller, R. E., Blair, P. D. (2009) Input-output analysis: Foundations and Expectations (Second Edition). New York: Cambridge University Press.
Leontief, W. (1966) Input-output economics. New York: Oxford University Press.
Neuwahl, F., Löschel, A., Mongelli I. and Delgado, L. (2008) ‘Employment impacts of EU biofuels policy: Combining bottom-up technology information and sectoral market simulations in an input-output framework’, Ecological Economics, vol. 68, pp. 447-460.
Silalertruksa, T., Gheewala, S. H., Hünecke, K. and Fritsche U. R. (2012) ‘Biofuels and employment effects: Implications for socio-economic development in Thailand’, Biomass and Bioenergy, vol. 46, pp. 409-418.
20
Gravity model of barley export in selected Central European countries
Gravitační model vývozu ječmene vybraných
středoevropských zemí
Petra Bubáková Department of Economics, FEM, Czech University of Life Sciences Prague,
Kamycka 129, 165 21 Prague 6 – Suchdol [email protected]
Annotation: Part of agribusiness are the issues in the production and processing of agricultural commodities but also in their distribution . Econometric models of international trade can be applied for determination of significant variables affecting foreign trade. This information can be used to make decisions about distribution. In this article, major variable affecting the export of barley from Central European countries are analyzed. Also, their quantification is provided using the gravity model. Goal of this article is to describe the main variables influencing the export of barley and answer given research questions . For the analysis , which covers the period 1995-2012 were selected the following countries : the Czech Republic , Slovakia , Poland , Hungary , Germany and Austria . Gravity model of barley export was estimated using panel data in two fixed effects specifications . The estimation method used was Least Squared Dummy Variable (LSDV) method . The gravity model estimates that the market size of the importing country affects exports to a greater extent than the size of the domestic economy. The second most important group of variables were the size of the export crop areas and yields of barley . Furthermore, transport costs as well as cultural and historical ties are statistically significant. The estimates that were found to have negative effect are the financial and economic crisis and barley price shock in 2008 and 2009. The models shows that there is no reduction of exports to non-EU countries for members of the EU . In contrast, the possibility to export to the EU countries was significantly reduced for countries that were member of CEFTA . Membership in the EU for the Czech Republic, Slovakia , Poland and Hungary led to an increase of exports to Germany and Austria. The paper was prepared within the research project IGA 20121050 " Spatial integration of regional markets for agricultural commodities."
Key Words: Export of barley, gravity model, Central European countries, LSDV estimation, fixed effects.
JEL classification: C23, C51, F10
1 Úvod V rámci agrobusinessu je podstatná otázka distribuce zemědělských komodit. S distribucí se neoddělitelně váže možnost vývozu produkce do zahraničí. Z teorie mezinárodní směny plyne, že zahraniční obchod je vždy prospěšný a vede ke zvýšení životní úrovně všech zúčastněných zemí. Dané ekonomiky mohou ve výsledku spotřebovávat více než by byly schopny samy vyrobit a zároveň se specializovat na výrobu výrobků, u kterých mají komparativní výhodu. Determinace efektů faktorů, které jsou významné pro mezinárodní obchod se zemědělskými komoditami, umožňuje porozumět zákonitostem a vztahům zkoumaného trhu. Tato informace může být následně využita pro zvýšení profitu či zefektivnění procesů a to jak pro soukromou, tak řídící sféru.
V rámci analýzy zahraničního obchodu se zemědělskými komoditami lze využít ekonometrický model gravitační rovnice, který byl představen v 60. letech 20. století autory
21
Tinbergenem (1962) a Pöyhönenem (1963). V prvopočátcích bylo gravitačním modelům vytýkáno nedostatečné teoretické zázemí, jelikož modely byly založeny zejména na empirických pozorováních mezinárodního obchodu. Přesto byly využívány díky značné empirické robustnosti a vypovídacím schopnostem. Teoretická opora vznikla až později okolo 70. a 80. let a na její tvorbě se podíleli autoři Anderson (1979), Bergstrand (1985, 1989), Helpman a Krugman (1985) či později Deardorff (1998). V tradičním konceptu gravitačního modelu je obchod mezi dvěma partnery vysvětlován velikosti zemí neboli jejich ekonomickou silou, dále pak jejich geografickou blízkostí a faktory omezující či podporující obchod (Egger, 2002; Cheng, Wall, 2005). Modely se využívají především pro hodnocení dopadů obchodních politik a pro analýzu účinků dohod volného obchodu mezi zeměmi (Kepaptsoglou, Karlaftis, Tsamboulas, 2010). Mimo jiné jsou aplikovány pro hodnocení měnové unie, účinků obchodních politik, mezinárodní migrace, určení stupně regionální integrace a další (viz Egger, Pfaffermayr, 2003; Cheng, Wall; 2005, Cheng, Tsai; 2008).
Gravitační model v oblasti zemědělství byl aplikován např. autory Ševelou (2002), Sarkerou a Jayasinghem (2007) či Grantem a Lambertem (2008).
Ševela (2002) se zaměřuje ve svém článku na vývoz potravin a živých zvířat v České republice. K analýze využil panelová data s ročním pozorováním od roku 1999 do roku 2001. Do modelu zahrnul několik proměnných, ale jako významné byly prokázány pouze proměnné hrubého národního důchodu a hrubého národního důchodu na obyvatele s pozitivním působením a geografická vzdálenost se záporným směrem působení. Efekt členství uskupení EU a EFTA nebyl prokázán jako statisticky významný.
Sarkera a Jayasingheho (2007) se ve své studii zaměřili na dopady regionálních dohod na obchod se zemědělsko-potravinářskými výrobky. Zkoumanými produkty byly: červené maso, zelenina, ovoce, cukr a olejniny. Závislá proměnná představovala celkový bilaterální obchod pro těchto pět komodit (vývoz + dovoz). Autoři využili disagregovaná data pro 15 zemí EU a dalších 42 nečlenských zemí od roku 1985 do roku 2000. Vytvořili pět Pooled Cross-Sectional modelů v intervalu po třech letech odhadovaných zobecněnou metodou nejmenších čtverců. Z odhadnutých modelů vyplývá, že integrace EU sloužila k oživení obchodu výrazněji u svých členů než u nečlenských zemí zbytku světa. U čtyř komodit (červené maso, ovoce, cukr, olejniny) výsledky naznačují, že vznikl vnitřní blok, který se následně rozrostl v rámci EU-15 a došlo k upřednostňování obchodu mezi těmito zeměmi. U zeleniny byl prokázán nárůst dovozu v zemích EU vůči nečlenským zemím. Hlavním závěrem článku je, že rozšiřování EU může způsobit redukci stupně relativní otevřenosti trhu se zemědělko-potravinářskými komoditami vůči zbytku světa.
Grant a Lambert (2008) odhadli sedm gravitačních modelů pro panelová data v období od roku 1982 do roku 2002 a to jak pro zemědělskou komoditní skupinu, tak nezemědělskou. Prokázali, že efekt regionálních obchodních dohod je vyšší v zemědělském sektoru než v nezemědělském. Důvodem existence této situace je, že před podepsáním smluv byly celní sazby na zemědělské komodity mnohem vyšší než u nezemědělských produktů. Tím pádem úspěšná integrace má větší dopad na obchod se zemědělsko-potravinářskými komoditami. Toto potvrzují i jiní autoři ve dřívějších publikacích. Ingco (1995) prokázal, že protekce zemědělství v roce 1992 byla patnáctkrát vyšší než u výrobního a zpracovatelského průmyslu. Gibson a kol. (2001) uvedli, že clo na zemědělské produkty bylo v roce 2001 dvanáctkrát vyšší vzhledem k nezemědělskému protekcionismu.
22
Mezi aplikace mimo zemědělský sektor lze jmenovat mnohé. Mezi publikace 21. století lze jmenovat např. Gopinath a Echeverria (2004), kteří zkoumali vztah mezi přímými zahraničními investicemi (PZI) a dvoustranným obchodem a poukazují na fakt, že země s vyšší vzdáleností se zaměřuje namísto vzájemného obchodu se zbožím na PZI. Autoři Martínez-Zarzoso a Suárez-Burguet (2005) zkoumali vztah obchodních toků a dopravních nákladů a upozorňují, že dopravní náklady mají v současné době nejvýznamnější dopad na obchod, jelikož jiné bariéry jako jsou cla, kvóty atd. byly zredukovány v poslední dekádě. Cheng a Tsai (2008) analyzovali dopady rozšíření a posílení regionálních bloků. Zjistili např., že Evropské hospodářské společenství mělo pozitivní dopad na členské státy, ale ve výsledku objem obchodu poklesl vůči nečlenským státům či že země patřící do uskupení EFTA obchodují mezi sebou méně než před členstvím a pozitivní efekt lze nalézt jen v případě, kdy je členem pouze jedna země z obchodní dvojice.
Daný článek se zaměřuje na vývoz ječmene vybraných středoevropských zemí, jmenovitě České republiky, Slovenska, Polska, Německa, Rakouska a Maďarska. Cílem článku je charakterizovat hlavní proměnné ovlivňující vývoz ječmene vybraných zemí prostřednictvím aplikace gravitačního modelu a vymezit jejich dopad na vývoz. V rámci analýzy budou zodpovězeny následující otázky:
Jaký je efekt členství v Evropské unii na vývoz vybrané komodity?
Jsou proměnné zastupující produkci ječmene podstatné v rámci modelování zahraničního vývozu?
Jsou vzdálenost, geografické a kulturní vazby významné pro vývoz vybrané komodity u středoevropských zemí?
2 Obecná specifikace gravitačního modelu Pokud vyjdeme z obecné specifikace gravitační rovnice od autorů Andersona (1979), Bergstranda (1985) či později Martíneza-Zarzosa, Suáreze-Burgueta (2005), lze model zapsat v následující podobě:
ijijijjijiij uADYHYHYYM 6543210
βββββββ= (1)
kde vysvětlovaná proměnná Mij představuje objem exportu ze země i do země j či celkový obchodní tok daný součtem exportu a importu. Tyto proměnné využili např. Egger (2002), Ševela (2002), Nitsch (2007). V některých publikacích jako jsou např. Nilsson, (2000) či Martínez-Zarzoso a Suárez-Burguet (2005) se setkáváme s objemem importu ze země i do země j. Proměnné Yi a Yj reprezentují velikost zemí resp. jejich ekonomickou sílu a jsou nejčastěji aproximovány hrubým domácím produktem (např. v publikacích Sohn, 2005; Cheng, Tsai, 2008; Stack, Pentecost, 2011) či hrubým národním důchodem (např. Ševela, 2002). Proměnné YHi a YHj zastupují proměnné HDP na obyvatele či HND na obyvatele jednotlivých zemí a reprezentují úroveň příjmů neboli kupní sílu obyvatel vývozní a dovozní země. Tyto proměnné využil např. Nilsson (2000), Ševela (2002), Gopinath a Echeverria (2004) či Martínez-Zarzoso a Suárez-Burguet (2005). Namísto proměnných HDP na obyvatele lze využít proměnnou populaci, která reprezentuje fyzickou velikost ekonomiky. Tuto proměnnou lze nalézt v publikacích od autorů Cheng a Wall (2005), Carrére (2006), Tzouvelekas (2007) či Aiello, Cardamone a Agostino (2010). Zatímco u proměnných HDP,
23
resp. HND celkového či na obyvatele je předpokládáno kladné působení těchto proměnných na mezinárodní obchod, u proměnné populace nelze předem určit ekonomicky odvoditelný směr působení. Hamilton a Winters (1992) předpokládají záporné znaménko, jelikož s růstem populace vývozní země bude klesat její vývoz a u dovozní země bude s růstem populace růst její soběstačnost, a tak se bude snižovat množství statků, které země dováží. Oproti tomu Oguledo a MacPhee (1994) očekávají kladné znaménko odhadnutého parametru, protože velký domácí trh podporuje dělbu práce a tak vytváří možnost široké škály výrobků, což může zvyšovat bilaterální obchod. Někteří autoři jako je např. Nilsson (2000) předpokládají obě možnosti působení. Proměnná Dij reprezentuje geografickou vzdálenost mezi objekty i a j. Tato proměnná se využívá pro aproximování dopravních nákladů, které omezují obchod. Tato proměnná byla navrhnuta již samotným Tinbergenem (1962). Proměnnou využívá ve své práci i Anderson (1979), který byl mezi prvními autory poskytující teoretický základ gravitačních modelů. Stejně tak tuto proměnnou nalezneme v aktuálních publikacích, viz Wang, Wei, Liu (2010), Aiello, Cardamone, Agostino (2010) či Stack, Pentecost (2011). Směr působení dané proměnné na obchod je negativní. V neposlední řadě proměnná Aij reprezentuje všechny další faktory, které napomáhají či brání obchodu. Může se jednat o překážky obchodu, jako jsou cla, rozdílné ceny, politická rizika či naopak faktory podporující obchod jako je společný jazyk, společná hranice, preferenční dohody, členství v obchodních blocích či regionálních uskupení a další (viz publikace Cheng, Tsai, 2008; Aiello, Cardamone, Agostino, 2010; Stack, Pentecost, 2011 a další). Proměnná uij reprezentuje stochastickou proměnnou modelu s tradičními Gauss-Markovovy předpoklady.
Pro odhad modelu se využívají průřezová či panelová data. Model se odhaduje v logaritmické transformaci pomocí různých metod. Nejčastěji se jedná o běžnou metodu nejmenších čtverců (OLS = Ordinary Least Squares method), zobečněnou metodu nejmenších čtverců (GLS = Generalized Least Squares method) či metodu maximální věrohodnosti (MLE = maximum Likelihood Estimator) pro průřezová data. Pro data panelová se s největší frekvencí využívají odhadové metody minimalizace čtverců dummy proměnné (LSDV = least squres dummy variable method), modely fixních efektů (FE = Fixed Effects model) či modely náhodných efektů (RE = Random Effects model).
Pro účel článku je gravitační model vývozu ječmene odhadován ve dvou specifikacích. V první specifikaci jsou aplikovány fixní efekty pro páry zemí, viz vztah (2):
ijtijtijijt XY εβαα +′++= 0 (2)
kde Yijt je vzájemný obchod mezi zemí i a j v čase t, Xijt zastupuje všechny vysvětlující proměnné v modelu a εijt je náhodná složka daného modelu s předpoklady bílého šumu. Parametr αij představuje specifický efekt mezi párem zemí, tzv. country-pair effect. Tuto specifikaci fixního efektu použili např. Cheng, Wall (2005), Cheng, Tsai (2008) či Fidrmuc (2009). Každý pár země má odhadovánu vlastní konstantu, která reprezentuje jedinečný vztah mezi obchodujícími zeměmi. V rámci analýzy je předpokládáno, že nezáleží na směru obchodu. Příkladem může být proměnná vzdálenost, která se řadí mezi fixní efekt jedinečný mezi párem zemí, který je stejný ať se jedná o vývoz ze země A do země B či vývoz ze země B do země A. V případě 6 zemí by se jednalo o 15 individuálních konstant. Výhodou této specifikace je, že odčerpá veškerou heterogenitu zemí vyplývající jak z pozorovatelných tak nepozorovatelných proměnných. Její nevýhodou je, že nelze číselně vyjádřit efekty fixních
24
proměnných mezi zeměmi jako je např. vzdálenost, společný jazyk, společná hranice atd. Jelikož ale tyto proměnné jsou důležité pro zodpovězení výzkumných otázek, z tohoto důvodu je využita další specifikace fixních efektů v modelu. V druhé specifikaci je pro odčerpání heterogenity využito dummy proměnných specifikovaných zvlášť pro vývozní a dovozní zemi. Tím je umožněn odhad dopadu fixních proměnných na mezinárodní obchod. Daný vztah je uveden v rovnici (3).
ijtijtjiijt XY εβααα +′+++= 0 (3)
kde αi je efekt vývozní země a αj je efekt dovozní země. Obdobnou specifikaci využil např. Mátyás (1997) či Stack (2009). Tito autoři navíc využili ve vztahu (3) efekt času. Tento efekt v tomto článku není využit, jelikož databáze dat poskytuje nevyrovnaný panel, a tak časové řady vývozu pro jednotlivé země nejsou spojité (viz následující kapitola).
3 Metodika a data Pro analýzu, která pokrývá období let 1995 až 2012 byly vybrány zakládající země uskupení CEFTA, tj. Česká republika, Slovensko, Polsko, Maďarsko, a země EU Německo a Rakousko jakožto hlavní obchodní partneři České republiky z původní EU15. Analýza hlavních faktorů vývozu a jejich kvantifikace je založena na odhadu gravitačního modelu mezinárodního obchodu (viz kapitola obecná specifikace gravitačního modelu).
Vzájemný obchod mezi zeměmi je reprezentován množstvím vývozu ječmene v kilogramech za rok ze země i do země j v čase t. Data byla získána z databáze UN Comtrade. V rámci sledovaného období 18ti let pro šest jmenovaných zemí by se v případě existence vývozu v každém roce mělo vyskytovat 540 pozorování, avšak databáze poskytuje celkem 396 hodnot. S chybějícími 144 hodnotami je pracováno jako s neznámými chybějícími hodnotami, jelikož je nepravděpodobné, že by v tolika případech byl vývoz roven nule a tak je nutné pracovat s nevyrovnaným (unbalanced) panelem. Z tohoto důvodu není využit v modelu efekt času. Mezi vysvětlující proměnné vycházející z teorie gravitačních modelů byly zařazeny následující. Reálné HDP vývozní a dovozní země v milionech EUR, resp. milionech ECU do 31.12.1998. Nominální HDP byl získán z databáze Eurostatu a převeden na reálné hodnoty na základě deflátoru od Mezinárodního měnového fondu IMF (International Monetary Found). Dále pro vyjádření velikosti ekonomiky byla využita proměnná populace v tisících osobách. Data byla získána z Eurostatu. Dopravní náklady jsou aproximovány geografickou vzdáleností mezi zeměmi vyjádřenou v km. Silniční vzdálenost byla zjištěna v aplikaci Worldatlas. Kulturní a historické vazby mezi zeměmi jsou modelovány na základě dummy proměnných vyjadřujících společnou hranici a společný či podobný jazyk. Dummy proměnná společný jazyk byla rovna jedné v případě páru zemí Česká republika-Slovensko a páru zemí Německo-Rakousko. Jako další potenciálně významné faktory ovlivňující mezinárodní obchod s ječmenem byly do modelu zařazeny proměnné odrážející výslednou produkci v daném období t ve vztahu ke klimatickým podmínkám. Jedná se o plochu osevu v 1000 ha a výnosy ve 100 kg/ha pro vývozní zemi v daném roce. Data byla získána z Eurostatu. V neposlední řadě je modelován efekt regionálních uskupení, konkrétně pro daná data efekt členství v Evropské unii. Pro tento účel bylo využito širší specifikace od Chenga a Tsaiho (2008). Dummy proměnná EU2 reprezentuje efekt členství obou zemí v Evropské unii v čase t. Odhadnutý parametr této proměnné představuje vnitřní efekt regionální ekonomické
25
integrace. Předpokládá se kladné působení dané proměnné, jelikož eliminuje bariéry obchodu. Další dvě nula-jedničkové proměnné představují situaci, kdy je pouze vývozní země (EUX), či pouze dovozní země (EUM) členem daného uskupení v čase t. Koeficienty těchto proměnných následně vyjadřují vnější efekt regionální ekonomické integrace. Oproti předchozímu případu je tento efekt předem nejednoznačný. Nutno poznamenat, že jelikož ve sledovaném období nečlenství zemí EU znamená členství v organizaci CEFTA, je ve výsledku odhadován rozdíl ve vývozu mezi těmito členstvími. Jelikož v období let 2008 a 2009 došlo k finanční a ekonomické krizi, byla do modelu zařazena také dummy proměnná pro odchycení tohoto efektu v případě jeho významnosti. Začínající rok 2008 byl vybrán z toho důvodu, že v tomto období americká hypoteční krize přerostla ve světovou finanční krizi. V následujícím roce se pak začala projevovat v jednotlivých zemích i krize ekonomická.
Celková deklarace proměnných: EXPijt ....... Vývoz ječmene tvrdého ze země i do země j v čase t v kilogramech za rok. GDPit ....... HDP vývozní země i v čase t v milionech EUR (od 1.1.1999) a v milionech ECU
(do 31.12.1998). GDPjt ....... HDP dovozní země j v čase t v milionech EUR (od 1.1.1999) a v milionech ECU
(do 31.12.1998). POPit ....... Populace vývozní země i v čase t v tisících obyvatel. POPjt ....... Populace dovozní země j v čase t v tisících obyvatel. DISij ....... Silniční vzdálenost mezi zemí i a j v km. COMBij .... Dummy proměnná rovna jedné v případě společné hranice mezi zemí i a j. COMLij .... Dummy proměnná rovna jedné v případě společného či podobného jazyka mezi
zeměmi i a j. AREAit ..... Plocha osevu vývozní země i v čase t v 1000 ha. YIELDit ..... Výnosy vývozní země i v čase t v 100 kg/ha. EU2t ......... Dummy proměnná rovna jedné v případě členství obou zemí v Evropské unii
v čase t. EUXt ........ Dummy proměnná rovna jedné v případě členství vývozní země v Evropské unii
v čase t. EUMt ....... Dummy proměnná rovna jedné v případě členství dovozní země v Evropské unii
v čase t. SOK2 ...... Dummy proměnná rovna jedné v případě roku 2008 a 2009, finanční
a ekonomická krize. εijt ........... Stochastická proměnná modelu s vlastnostmi i.i.d. (0, σ2)
Poznamenejme, že index i označuje zemi vývozní, index j zemi dovozní a index t označuje čas. Odhadované modely mají následující podobu. Ve vztahu ke specifikaci (2) se jedná o model:
ijttttit
itjtitjtitijijt
SOKEUMEUXEUYIELD
AREAPOPPOPGDPGDPEXP
εβββββ
βββββαα
++++++
++++++=
22ln
lnlnlnlnlnln
109876
543210 (4)
26
Ve vztahu ke specifikaci (3) se jedná o model:
ijtttt
ititijijij
jtitjtitjiijt
SOKEUMEUXEU
YIELDAREACOMLCOMBDIS
POPPOPGDPGDPEXP
εγγγγ
γγγγγ
γγγγααα
+++++
+++++
++++++=
22
lnlnln
lnlnlnlnln
13121110
98765
43210
(5)
Před odhadem modelu byla zjišťována multikolinearita mezi proměnnými pomocí korelační matice. Sestavený model byl odhadnut metodou LSDV (Least Squared Dummy Variable method). Zároveň byl aplikován odhad robustní, aby testové hodnoty nebyly zkreslené případnou zbývající heteroskedasticitou či autokorelací. K výpočtům byl využit software STATA, ver. 11.
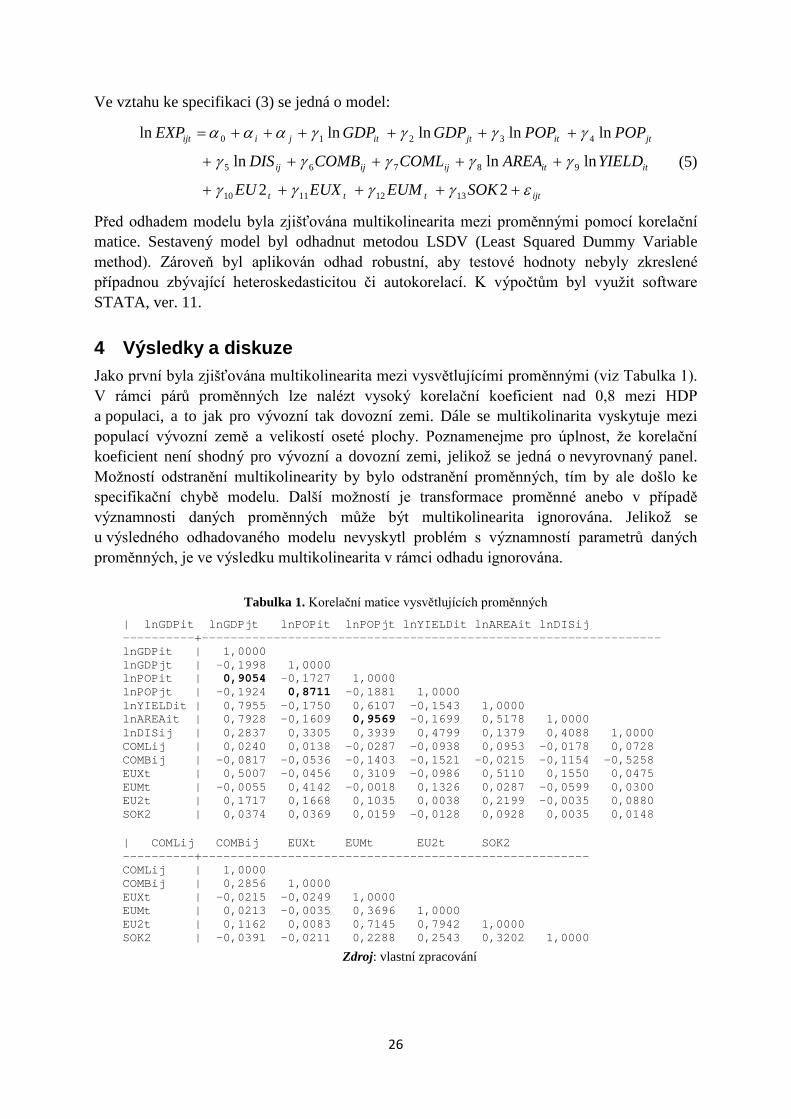
4 Výsledky a diskuze Jako první byla zjišťována multikolinearita mezi vysvětlujícími proměnnými (viz Tabulka 1). V rámci párů proměnných lze nalézt vysoký korelační koeficient nad 0,8 mezi HDP a populaci, a to jak pro vývozní tak dovozní zemi. Dále se multikolinarita vyskytuje mezi populací vývozní země a velikostí oseté plochy. Poznamenejme pro úplnost, že korelační koeficient není shodný pro vývozní a dovozní zemi, jelikož se jedná o nevyrovnaný panel. Možností odstranění multikolinearity by bylo odstranění proměnných, tím by ale došlo ke specifikační chybě modelu. Další možností je transformace proměnné anebo v případě významnosti daných proměnných může být multikolinearita ignorována. Jelikož se u výsledného odhadovaného modelu nevyskytl problém s významností parametrů daných proměnných, je ve výsledku multikolinearita v rámci odhadu ignorována.
Tabulka 1. Korelační matice vysvětlujících proměnných | lnGDPit lnGDPjt lnPOPit lnPOPjt lnYIELDit lnAREAit lnDISij ----------+---------------------------------------------------------------- lnGDPit | 1,0000 lnGDPjt | -0,1998 1,0000 lnPOPit | 0,9054 -0,1727 1,0000 lnPOPjt | -0,1924 0,8711 -0,1881 1,0000 lnYIELDit | 0,7955 -0,1750 0,6107 -0,1543 1,0000 lnAREAit | 0,7928 -0,1609 0,9569 -0,1699 0,5178 1,0000 lnDISij | 0,2837 0,3305 0,3939 0,4799 0,1379 0,4088 1,0000 COMLij | 0,0240 0,0138 -0,0287 -0,0938 0,0953 -0,0178 0,0728 COMBij | -0,0817 -0,0536 -0,1403 -0,1521 -0,0215 -0,1154 -0,5258 EUXt | 0,5007 -0,0456 0,3109 -0,0986 0,5110 0,1550 0,0475 EUMt | -0,0055 0,4142 -0,0018 0,1326 0,0287 -0,0599 0,0300 EU2t | 0,1717 0,1668 0,1035 0,0038 0,2199 -0,0035 0,0880 SOK2 | 0,0374 0,0369 0,0159 -0,0128 0,0928 0,0035 0,0148 | COMLij COMBij EUXt EUMt EU2t SOK2 ----------+------------------------------------------------------ COMLij | 1,0000 COMBij | 0,2856 1,0000 EUXt | -0,0215 -0,0249 1,0000 EUMt | 0,0213 -0,0035 0,3696 1,0000 EU2t | 0,1162 0,0083 0,7145 0,7942 1,0000 SOK2 | -0,0391 -0,0211 0,2288 0,2543 0,3202 1,0000
Zdroj: vlastní zpracování
27
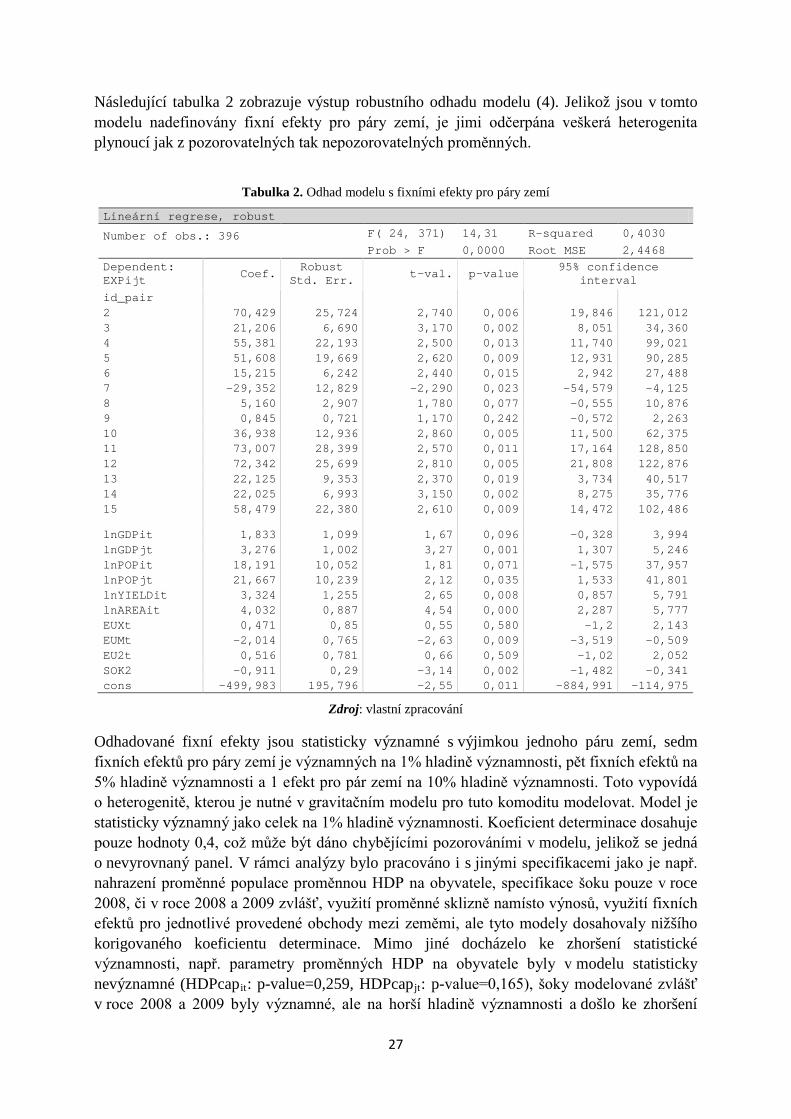
Následující tabulka 2 zobrazuje výstup robustního odhadu modelu (4). Jelikož jsou v tomto modelu nadefinovány fixní efekty pro páry zemí, je jimi odčerpána veškerá heterogenita plynoucí jak z pozorovatelných tak nepozorovatelných proměnných.
Tabulka 2. Odhad modelu s fixními efekty pro páry zemí
Lineární regrese, robust
Number of obs.: 396 F( 24, 371) 14,31 R-squared 0,4030
Prob > F 0,0000 Root MSE 2,4468 Dependent: EXPijt Coef.
Robust Std. Err. t-val. p-value
95% confidence interval
id_pair 2 70,429 25,724 2,740 0,006 19,846 121,012 3 21,206 6,690 3,170 0,002 8,051 34,360 4 55,381 22,193 2,500 0,013 11,740 99,021 5 51,608 19,669 2,620 0,009 12,931 90,285 6 15,215 6,242 2,440 0,015 2,942 27,488 7 -29,352 12,829 -2,290 0,023 -54,579 -4,125 8 5,160 2,907 1,780 0,077 -0,555 10,876 9 0,845 0,721 1,170 0,242 -0,572 2,263 10 36,938 12,936 2,860 0,005 11,500 62,375 11 73,007 28,399 2,570 0,011 17,164 128,850 12 72,342 25,699 2,810 0,005 21,808 122,876 13 22,125 9,353 2,370 0,019 3,734 40,517 14 22,025 6,993 3,150 0,002 8,275 35,776 15 58,479 22,380 2,610 0,009 14,472 102,486
lnGDPit 1,833 1,099 1,67 0,096 -0,328 3,994 lnGDPjt 3,276 1,002 3,27 0,001 1,307 5,246 lnPOPit 18,191 10,052 1,81 0,071 -1,575 37,957 lnPOPjt 21,667 10,239 2,12 0,035 1,533 41,801 lnYIELDit 3,324 1,255 2,65 0,008 0,857 5,791 lnAREAit 4,032 0,887 4,54 0,000 2,287 5,777 EUXt 0,471 0,85 0,55 0,580 -1,2 2,143 EUMt -2,014 0,765 -2,63 0,009 -3,519 -0,509 EU2t 0,516 0,781 0,66 0,509 -1,02 2,052 SOK2 -0,911 0,29 -3,14 0,002 -1,482 -0,341 cons -499,983 195,796 -2,55 0,011 -884,991 -114,975
Zdroj: vlastní zpracování
Odhadované fixní efekty jsou statisticky významné s výjimkou jednoho páru zemí, sedm fixních efektů pro páry zemí je významných na 1% hladině významnosti, pět fixních efektů na 5% hladině významnosti a 1 efekt pro pár zemí na 10% hladině významnosti. Toto vypovídá o heterogenitě, kterou je nutné v gravitačním modelu pro tuto komoditu modelovat. Model je statisticky významný jako celek na 1% hladině významnosti. Koeficient determinace dosahuje pouze hodnoty 0,4, což může být dáno chybějícími pozorováními v modelu, jelikož se jedná o nevyrovnaný panel. V rámci analýzy bylo pracováno i s jinými specifikacemi jako je např. nahrazení proměnné populace proměnnou HDP na obyvatele, specifikace šoku pouze v roce 2008, či v roce 2008 a 2009 zvlášť, využití proměnné sklizně namísto výnosů, využití fixních efektů pro jednotlivé provedené obchody mezi zeměmi, ale tyto modely dosahovaly nižšího korigovaného koeficientu determinace. Mimo jiné docházelo ke zhoršení statistické významnosti, např. parametry proměnných HDP na obyvatele byly v modelu statisticky nevýznamné (HDPcapit: p-value=0,259, HDPcapjt: p-value=0,165), šoky modelované zvlášť v roce 2008 a 2009 byly významné, ale na horší hladině významnosti a došlo ke zhoršení
28
korigovaného koeficientu determinace, šok odhadovaný pouze v roce 2008 byl významný, ale pouze na 10% hladině významnosti. V některých případech docházelo k zamítnutí modelu v rámci ekonomické verifikace. Z hlediska ekonomické verifikace výsledný směr působení proměnných odpovídá předpokladům gravitačního modelu. V následujících odstavcích je pozornost věnována intenzitě působení jednotlivých proměnných a statistické významnosti odhadovaných parametrů. Z odhadů vyplývá následující.
Při zvýšení HDP či počtu obyvatel dochází k pozitivnímu efektu na vývoz, který se navýší. Změna je elastická. Dále je patrné, že velikost populace má větší dopad na vývoz ječmene než samotná ekonomická síla státu reprezentovaná proměnou HDP. Toto je logické, jelikož se jedná o jednu ze základních komodit pro potravinářské účely a její vývoz je závislý především na množství obyvatel na dovozním poptávajícím trhu a stejně tak na spotřebě dané suroviny na trhu domácím, která souvisí s množstvím populace ve vývozní zemi. Odhady dále nasvědčují tomu, že proměnné HDP a populace dovozní země mají větší efekt na export v porovnání s HDP a populací vývozní země, jelikož odhadované parametry dovozní země dosahují vyšších hodnot (vyšší intenzity) s vyšší statistickou významností. Zatímco parametry jmenovaných proměnných pro vývozní zemi jsou významné na 10% hladině významnosti, u dovozní země zamítáme nulovou hypotézu o nevýznamnosti na 5% hladině významnosti. Z tohoto vyplývá, že velikost a síla trhu dovozní země je důležitější proměnnou ovlivňující vývoz než velikost a síla domácí ekonomiky. Export ječmene je dále závislý na velkosti osevních ploch a výnosech ječmene. Při navýšení osevních ploch či výnosů o 1 % dochází k navýšení vývozu o 4 %, resp. 3 %. Obě proměnné jsou vysoce statisticky významné. Ekonomická a finanční krize v letech 2008 a 2009 se projevuje také statisticky významně s hladinou α = 0,01, její ekonomický dopad je značně velký. Vývoz ječmene středoevropských zemí pokles v tomto období o 91 %. Intenzita je značně velká, ovšem pokud se zamyslíme nad daným obdobím, v roce 2008 a 2009 došlo nejen k finanční a ekonomické krizi ale také ke značným změnám v cenách ječmene u všech analyzovaných států. Po postupném nárůstu cen začínajícího v roce 2007 došlo v roce 2008 k dosažení maxima cen obilovin. Pokud spočteme relativní rozdíl mezi nejvyšší cenou zemědělských výrobců ječmene krmného v roce 2008 a průměrem stabilizovaného období v letech 1996 až 2006, v České republice cena v tomto období vzrostla o 76 %, v Rakousku o 96 %, v Německu dokonce o 117 %, v Polsku o 74 % a v Maďarsku o 132 %. Nejmenší změnu pak nalezneme u cen ječmene na Slovensku, ale stále se jedná o znatelnou změnu o 32 %. Nárůst cen v roce 2008 byl pak následován poklesem cen v roce následujícím. Cenový šok v tomto období měl dozajista efekt také na vývoz dané komodity. Při nárůstu ceny dochází ke substitučnímu a negativnímu důchodovému efektu a tedy snížení poptávky na trzích. V závěru cenový šok vede k poklesu poptávky na dovozním trhu a omezení vývozu jednotlivých zemí. Ve výsledku poté změna odhadovaná proměnnou SOK2 reprezentuje kumulovanou změnu finanční a ekonomické krize a cenového šoku. Poté výsledná hodnota 91 % již získává reálný i ekonomický smysl. Konkrétní efekt jednotlivých situací bohužel nemůže být zde vyčíslen.
Pokud se zaměříme na dopad integračních bloků, parametr dummy proměnné členství vývozní země v EU má kladné působení, ale je statisticky nevýznamný. V tomto případě členství vývozní země v EU nesnižovalo export do nečlenských zemí, jelikož výsledný parametr je kladný. V daném vzorku se pak jedná o situaci, kdy členství Německa a Rakouska v EU nemělo negativní dopad na jejich vývoz do ostatních nečlenských zemí, které v té době byly členem CEFTA. Parametr dummy proměnné pro členství obou zemí v EU je kladný, což
29
odpovídá stanoveným předpokladům, avšak je opět statisticky nevýznamný. Velikost parametru informuje, že členské země EU obchodují mezi sebou o 51,6 % v porovnání nečlenským párem zemí. Chyba daného parametru je ale vysoká, a tak v rámci zobecnění musí být efekt považován ve výsledku za nulový, tj. nedochází ke statisticky významnému zvýšení obchodu pouze z důvodu, že obě země jsou členy EU. Oproti tomu ale byl odhadnut významný dopad členství na export v případě, kdy dovozní země byla členem EU a vývozní nikoli. Parametr je významný na 1% hladině významnosti. V případě, že vývozní země nebyla členem EU ale dovozní země ano, byla možnost vývozu snížena o 201 %. Pro nečlenské země je tedy snížena možnost dostat svoje zboží, konkrétně ječmen, do členské země EU, tzn. členské země Evropské unie jsou méně otevřené vůči nečlenským zemím.
Autoři Cheng a Tsai (2008) analyzující celkový export dochází k obdobným výsledkům, tj. že objem obchodu členských zemí je nižší vůči nečlenským zemím. Oproti jejich studii ale nebylo u ječmene prokázáno statisticky významné zvýšení obchodu mezi členskými státy jako takovými v porovnání s průměrným párem nečlenských zemí, jelikož daný parametr je nevýznamný. Ovšem odhadovaná intenzita je velmi podobná. Model z roku 2008 odhaduje navýšení exportu mezi členskými zeměmi o 59,2 % oproti nečlenskému pár zemí. Model v tomto článku vykazuje navýšení vývozu o 51,6 %. Ševela (2002) nenalezl významný efekt členství EU, avšak autor nevyužil pro jeho odchycení rozšířené nastavení nula-jedničkových proměnných, jako tomu bylo provedeno v tomto článku. Toto může být důvodem zamítnutí efektu členství EU pro Českou republiku v Ševelově článku. Obecně lze stanovit na základě odhadnutého efektu, že přechod ze členství CEFTA do členství EU mělo pozitivní efekt na vývoz ječmene pro země ČR, Slovensko, Polsko a Maďarsko.
V rámci celkového porovnání relativní velikosti vlivu kvantitativních proměnných má na vývoz ječmene sestupně největší dopad populace dovozní země následována populací vývozní země, s druhou největší intenzitou působí na vývoz velikost oseté plochy a výnosy. Do třetí skupiny můžeme zařadit HDP dovozní a vývozní země. Z hlediska umělých proměnných má největší dopad finanční a ekonomická krize následována vlivem EU pro členství dovozní země.
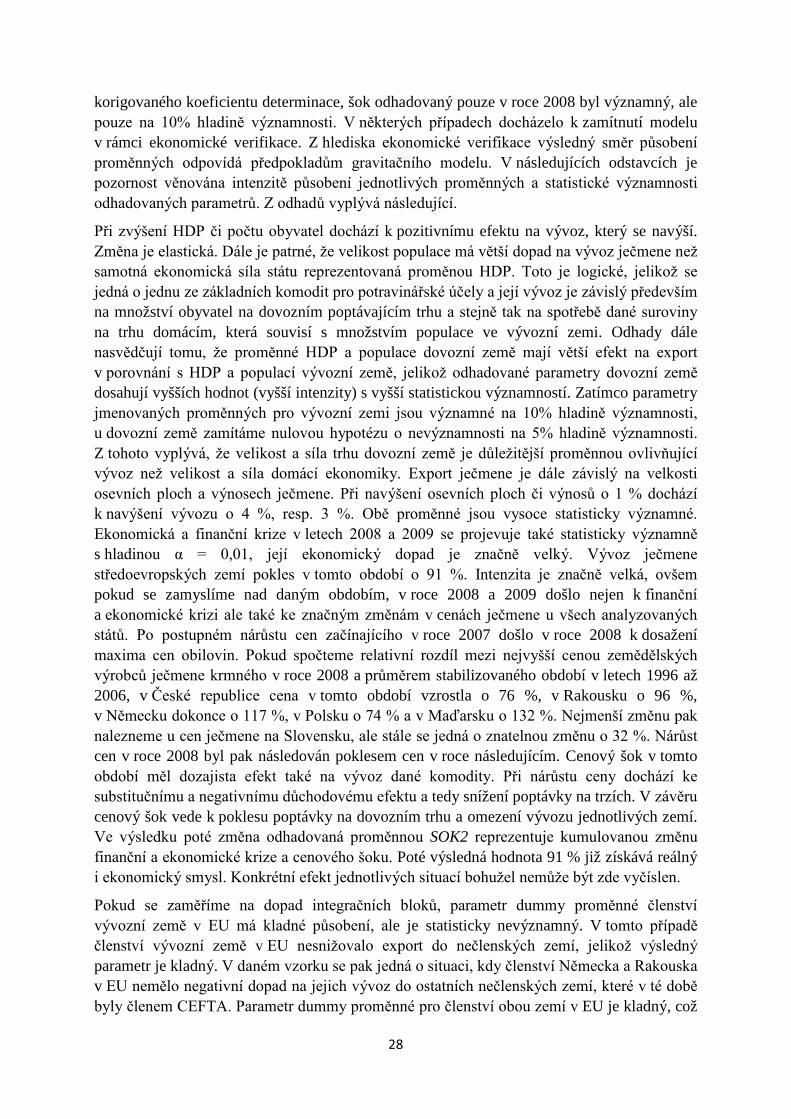
Aby mohl být odhadnut i dopad fixních proměnných jako je např. vzdálenost mezi zeměmi, byl odhadnut model (5). Robustní výstupy tohoto modelu s fixními efekty zvlášť pro vývozní a dovozní zemi je zobrazen v následující tabulce 3.
30
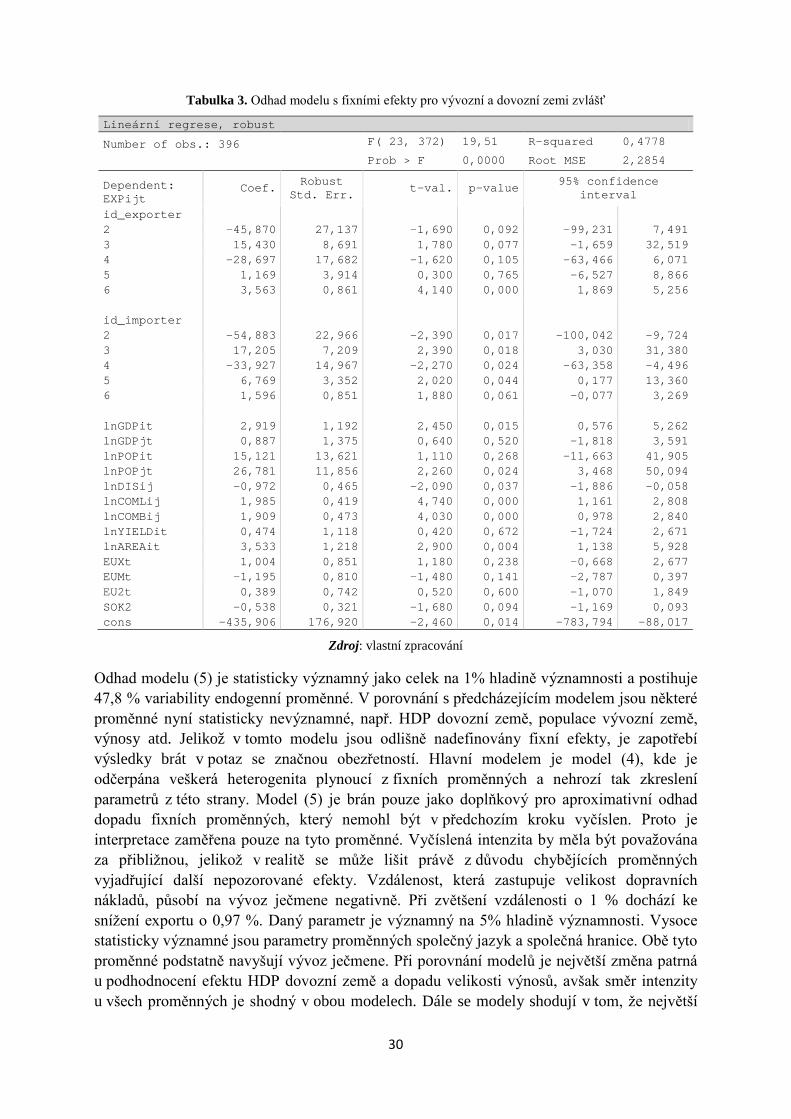
Tabulka 3. Odhad modelu s fixními efekty pro vývozní a dovozní zemi zvlášť
Lineární regrese, robust
Number of obs.: 396 F( 23, 372) 19,51 R-squared 0,4778
Prob > F 0,0000 Root MSE 2,2854
Dependent: EXPijt
Coef. Robust Std. Err.
t-val. p-value 95% confidence interval
id_exporter 2 -45,870 27,137 -1,690 0,092 -99,231 7,491 3 15,430 8,691 1,780 0,077 -1,659 32,519 4 -28,697 17,682 -1,620 0,105 -63,466 6,071 5 1,169 3,914 0,300 0,765 -6,527 8,866 6 3,563 0,861 4,140 0,000 1,869 5,256 id_importer 2 -54,883 22,966 -2,390 0,017 -100,042 -9,724 3 17,205 7,209 2,390 0,018 3,030 31,380 4 -33,927 14,967 -2,270 0,024 -63,358 -4,496 5 6,769 3,352 2,020 0,044 0,177 13,360 6 1,596 0,851 1,880 0,061 -0,077 3,269 lnGDPit 2,919 1,192 2,450 0,015 0,576 5,262 lnGDPjt 0,887 1,375 0,640 0,520 -1,818 3,591 lnPOPit 15,121 13,621 1,110 0,268 -11,663 41,905 lnPOPjt 26,781 11,856 2,260 0,024 3,468 50,094 lnDISij -0,972 0,465 -2,090 0,037 -1,886 -0,058 lnCOMLij 1,985 0,419 4,740 0,000 1,161 2,808 lnCOMBij 1,909 0,473 4,030 0,000 0,978 2,840 lnYIELDit 0,474 1,118 0,420 0,672 -1,724 2,671 lnAREAit 3,533 1,218 2,900 0,004 1,138 5,928 EUXt 1,004 0,851 1,180 0,238 -0,668 2,677 EUMt -1,195 0,810 -1,480 0,141 -2,787 0,397 EU2t 0,389 0,742 0,520 0,600 -1,070 1,849 SOK2 -0,538 0,321 -1,680 0,094 -1,169 0,093 cons -435,906 176,920 -2,460 0,014 -783,794 -88,017
Zdroj: vlastní zpracování
Odhad modelu (5) je statisticky významný jako celek na 1% hladině významnosti a postihuje 47,8 % variability endogenní proměnné. V porovnání s předcházejícím modelem jsou některé proměnné nyní statisticky nevýznamné, např. HDP dovozní země, populace vývozní země, výnosy atd. Jelikož v tomto modelu jsou odlišně nadefinovány fixní efekty, je zapotřebí výsledky brát v potaz se značnou obezřetností. Hlavní modelem je model (4), kde je odčerpána veškerá heterogenita plynoucí z fixních proměnných a nehrozí tak zkreslení parametrů z této strany. Model (5) je brán pouze jako doplňkový pro aproximativní odhad dopadu fixních proměnných, který nemohl být v předchozím kroku vyčíslen. Proto je interpretace zaměřena pouze na tyto proměnné. Vyčíslená intenzita by měla být považována za přibližnou, jelikož v realitě se může lišit právě z důvodu chybějících proměnných vyjadřující další nepozorované efekty. Vzdálenost, která zastupuje velikost dopravních nákladů, působí na vývoz ječmene negativně. Při zvětšení vzdálenosti o 1 % dochází ke snížení exportu o 0,97 %. Daný parametr je významný na 5% hladině významnosti. Vysoce statisticky významné jsou parametry proměnných společný jazyk a společná hranice. Obě tyto proměnné podstatně navyšují vývoz ječmene. Při porovnání modelů je největší změna patrná u podhodnocení efektu HDP dovozní země a dopadu velikosti výnosů, avšak směr intenzity u všech proměnných je shodný v obou modelech. Dále se modely shodují v tom, že největší
31
efekt na vývoz má populace daných zemí a druhý nejvýznamnější dopad na export má velikost oseté plochy.
5 Závěr V rámci článku byl analyzován vývoz ječmene mezi vybranými středoevropskými zeměmi v období 1995-2012. Odhady gravitačních modelů byly použity pro zodpovězení výzkumných otázek. V souvislosti s první výzkumnou otázkou „Jaký je efekt členství v Evropské unii na vývoz vybrané komodity?“ bylo zjištěno, že členské země EU jsou méně otevřené vůči nečlenským zemím. Pokud země není členem EU (poznamenejme, že v daném vzorku se jedná o situaci, kdy je země členem organizace CEFTA), poté možnost vyvážet do země EU je snížena podstatně snížena. Změna byla prokázána statisticky významná na 1% hladině významnosti. Mimo jiné výsledky nasvědčují, že nedochází ke snížení vývozu do nečlenských zemí EU v případě členství vývozní země v EU. S ohledem na daný vzorek lze situaci shrnout tak, že členství v EU vedlo v důsledku pro Českou republiku, Slovensko, Polsko a Maďarsko ke zvýšení vývozu do Německa a Rakouska, tedy k pozitivnímu efektu způsobeného vstupem do EU. V rámci druhé otázky „Jsou proměnné zastupující produkci ječmene podstatné v rámci modelování zahraničního vývozu?“ výsledky poukazují na významný efekt těchto proměnných a tedy jejich nepostradatelnost při modelování vývozu ječmene. Dané proměnné působí na vývoz větší mírou než vlastní ekonomická síla země reprezentovaná HDP jednotlivých zemí. Otázku, zda produkce ovlivňuje významně export i u dalších rostlinných komodit a její efekt převyšuje ostatní ekonomické proměnné, lze ověřit při aplikaci gravitačních modelů na další zemědělské komodity v budoucnosti. V souladu s poslední výzkumnou otázkou bylo zjištěno, že i přes to, že byl analyzován středoevropský trh, jenž zabírá malou plochu v porovnání s celosvětovým trhem a země jsou si obecně vzájemně podobné, proměnné jako jsou vzdálenost, geografické a kulturní vazby významně ovlivňují vývoz ječmene, kdy při růstu vzdálenosti dochází k jeho snížení a při společném jazyku a hranic k jeho navýšení. Mimo stanovené výzkumné otázky bylo dále zjištěno, že velikost trhu dovozní země je důležitější proměnnou ovlivňující vývoz ječmene než velikost vývozní ekonomiky. Množství obyvatel země působí pozitivně na vývoz a větší měrou než samotná ekonomická síla země. Pokud ekonomika prochází recesí či krizí či dojde k velkému navýšení cen, export ječmene je znatelně snížen.
Acknowledgements Článek byl zpracován v rámci výzkumného projektu IGA 20121050 “Prostorová integrace regionálních trhů se zemědělskými komoditami”.
Použitá literatura Aiello, F.; Cardamone, P.; Agostino, M. R. (2010). Evaluating the Impact of Nonreciprocal Trade Preferences Using Gravity Models. Applied Economics. Vol. 42, Issue 28-30, pp. 3745-60.
Anderson, J. E. (1979). A Theoretical Foundation for the Gravity Equation, American Economic Review. Vol. 69, Issue 1, pp. 106–116.
32
Bergstrand, J. H. (1985). The Gravity Equation in International Trade: Some Microeconomic Foundations and Empirical Evidence. Review of Economics and Statistics. Vol. 67, Issue 3, pp. 474–481.
Bergstrand, J. H. (1989). The Generalized Gravity Equation, Monopolistic Competition and the Factor-Proportions Theory in International Trade. Review of Economics and Statistics. Vol. 71, Issue 1, pp. 143–153.
Carrére, C. (2006). Revisiting the Effects of Regional Trade Agreements on Trade Flows with Proper Specification of the Gravity Model. European Economic Review. Vol. 50, Issue 2, pp. 223-47.
Deardorff, A. (1998). Determinants of Bilateral Trade: Does GravityWork in a Neoclassical World? In Jeffrey A. Frankel, ed. The Regionalization of the World Economy. Chicago: University of Chicago Press, pp. 7–32.
Egger, P. (2002). An Econometric View on the Estimation of Gravity Models and the Calculation of Trade Potentials. World Economy. Vol. 25, Issue 2, pp. 297-312.
Egger, P.; Pfaffermayr, M. (2003). The proper panel econometric specification of the gravity equation: A three-way model with bilateral interaction effects. Empirical Economics. Vol. 28, Issue 3, p. 571-80.
Fidrmuc, J. (2009). Gravity Models in Integrated Panels. Empirical Economics. Vol. 37, Issue 2, pp. 435-446.
Gibson, P. a kol. (2001). Profiles of Tariffs in Global Agricultural Markets. Washington DC: U.S. Department of Agriculture, Agricultural Economic Report 796.
Gopinath, M.; Echeverria, R. (2004). Does Economic Development Impact the Foreign Direct Investment-Trade Relationship? A Gravity-Model Approach. American Journal of Agricultural Economics. Vol. 86, Issue 3, pp. 782-87.
Grant, J. S.; Lambert, D. M. (2008). Do regional trade agreements increase members’ agricultural trade? American Journal of Agricultural Economics. Vol. 90, Issue 3, p. 765-82.
Hamilton, C. B.; Winters, A. L. (1992). Opening up International Trade with Eastern Europe. Economic Policy. Vol. 7, Issue 1, p. 78-116.
Helpman, E.; Krugman, P. (1985). Market Structure and Foreign Trade: Increasing Returns, Imperfect Competition and the International Economy. Cambridge, Mass.: MIT Press.
Cheng, I.-H.; Tsai, Y.-Y. (2008). Estimating the staged effects of regional economic integration on trade volumes. Applied Economics. Vol. 40 Issue 3, p. 383-393.
Cheng, I.-H.; Wall, H. J. (2005). Controlling for Heterogeneity in Gravity Models of Trade and Integration. Federal Reserve Bank of St. Louis Review. Vol. 87, Issue 1, pp. 49-63.
Ingco, M. D. (1995). Agricultural Liberalization in the Uruguay Round: One Step Forward, One Step Back? World Bank Policy Research Working Paper No. 1500, Washington DC.
Kepaptsoglou K., Karlaftis M. G., Tsamboulas D. (2010). The Gravity Model Specification for Modeling International Trade Flows and Free Trade Agreement Effects: A 10-Year Review of Empirical Studies. Open Economics Journal. Vol. 3, p. 1-13.
33
Martínez-Zarzoso, I.; Suárez-Burgeut, C. (2005). Transport Costs and Trade: Empirical Evidence for Latin American Imports from the European Union. Journal of International Trade & Economic Development. Vol. 14, Issue 3, p. 353-371.
Mátyás, L. (1997). Proper Econometric Specification of the Gravity Model. World Economy. Vol. 20, Issue 3, pp. 363-68.
Nilsson, L. (2000). Trade Integration and the EU Economic Membership Criteria. European Journal of Political Economy. Vol. 16, Issue 4, pp. 807–27.
Nitsch, V. (2007). State Visits and International Trade. World Economy. Vol. 30, Issue 12, pp. 1797-1816.
Oguledo, V. I.; MacPhee, C. R. (1994). Gravity models: A reformulation and an application to discriminatory trade arrangements. Applied Economics. Vol. 26, Issue 2, p. 107–120.
Pöyhönen, P. (1963). Tentative Model for the Volume of Trade between Countries. Weltwirtschaftliches Archiv. vol. 90, issue 1, pp. 93-100.
Sarker, R.; Jayasinghe, S. (2007). Regional Trade Agreements and Trade in Agri-food Products: Evidence for the European Union from Gravity Modeling Using Disaggregated Data. Agricultural Economics. Vol. 37, Issue 1, pp. 93-104.
Sohn, C-H. (2005). Does the gravity model explain South Korea’s trade flows? Japanese Economic Review. Vol. 56, Issue 4, pp. 417-430.
Stack, M. M. (2009). Regional Integration and Trade: Controlling for Varying Degrees of Heterogeneity in the Gravity Model. World Economy. Vol. 32, Issue 5, pp. 772-89.
Stack, M. M.; Pentecost, E. J. (2011). Regional Integration and Trade: A Panel Cointegration Approach to Estimating the Gravity Model. Journal of International Trade and Economic Development. Vol. 20, Issue 1, pp. 53-65.
Ševela, M. (2002). Gravity-type model for Czech agricultural export. Agricultural Economics. vol. 48, issue 10, pp. 463-466.
Tinbergen, J. (1962). Shaping the World Economy: Suggestion for an International Economic Policy. New York: Twentieth Century Fund. 352 p.
Tzouvelekas, V. (2007). Accounting for Pairwise Heterogeneity in Bilateral Trade Flows: A Stochastic Varying Coefficient Gravity Model. Applied Economics Letters. Vol. 14, Issue 10-12, pp. 927-30.
Wang, Ch.; Wei, Y.; Liu, X. (2010). Determinants of Bilateral Trade Flows in OECD Countries: Evidence from Gravity Panel Data Models. World Economy. Vol. 33, Issue 7, pp. 894-915.
Anotace: Součástí agrobusinessu je řešení otázek v oblasti výroby a zpracovaní zemědělských komodit avšak také v oboru distribuce. Ekonometrické modely mezinárodní směny mohou být uplatněny pro determinaci významných proměnných ovlivňujících zahraniční obchod a tato informace může být využita při rozhodování o distribuci. Článek se zabývá analýzou hlavních proměnných ovlivňujících vývoz ječmene středoevropských zemí a jejich kvantifikací prostřednictvím aplikace gravitačního modelu. Cílem článku je charakterizovat hlavní proměnné působící na vývoz ječmene a zodpovědět stanovené výzkumné otázky. Pro analýzu, která pokrývá období let 1995-2012 byly vybrány země: Česká republika, Slovensko, Polsko, Maďarsko, Německo a Rakousko. Gravitační model vývozu ječmene byl odhadován na základě panelových
34
dat ve dvou specifikacích fixních efektů. Pro odhad byla využita metoda LSDV – Least Squared Dummy Variable method. Z odhadů gravitačních modelů vyplývá, že velikost trhu dovozní země ovlivňuje vývoz ve větší míře než velikost domácí ekonomiky. Druhou nejvýznamnější skupinou proměnných působících na export je velikost osevních ploch a výnosy ječmene. Krom jmenovaných jsou statisticky významné dopravní náklady stejně jako kulturní a historické vazby. V rámci odhadů byl nalezen negativní efekt finanční a ekonomické krize a cenového šoku ječmene v letech 2008 a 2009. Na základě modelu nebylo prokázáno snížení vývozu do nečlenských zemí EU v případě členství vývozní země v EU. Oproti tomu možnost vyvážet do zemí EU byla významně snížena pro země, které byly členem organizace CEFTA. Členství v EU v důsledku pro Českou republiku, Slovensko, Polsko a Maďarsko vedlo ke zvýšení vývozu do Německa a Rakouska. Článek byl zpracován v rámci výzkumného projektu IGA 20121050 “Prostorová integrace regionálních trhů se zemědělskými komoditami”.
Klíčová slova: Vývoz ječmene, gravitační model, středoevropské země, odhad LSDV, fixní efekty.
JEL klasifikace: C23, C51, F10
35
Model farms and economic viability of farming
Typové farmy a ekonomická životaschopnost zemědělského podnikání
Ivan Foltýn, Ida Zedníčková, Jaroslav Humpál ÚZEI Praha, Mánesova 75, 120 56 Praha 2
Annotation: The aim of this paper was to compare the economy of model farms in the period 2009-2012 with forecasts for the years 2013 to 2014 . Model farms represent possibility of farming in different production areas of the Czech Republic (corn and beet , potato growing and potato and oat ) with the support of the EU CAP both commodity- oriented (SAPS , Top- Up ), and LFA . Model farms are standardized for an area of 100 hectares. Calculation of model farms economy is carried out using Model Farm 4 , which calculates optimum economy of farms. The model is based on the production of economic data from model RENT 4 , which calculates the profitability of agricultural commodities with and without subsidies during the period 1998-2017 . RENT Model 4 is based on a sample survey of costs of selected farms that is annually conducted by ÚZEI . For plant and animal commodities calculation, producer prices were used for the CR (source: CSO). In order distinguish differences in the production area, producer prices were modified in accordance with the results of the sample survey. Information on future EU agricultural policy is based on the latest available information.
Farming in different production areas of the Czech Republic in the case of "economically normal" conditions is profitable, when proper production focus and agricultural supports are used. This corresponds to the years 2011-2014 . In the case of an economic crisis that can be characterized by a significant decrease in market prices, there may be a loss for some model farms - see 2009 and 2010.
Key Words: mathematical models, model farms, agrarian policy, total profit
JEL classification: Q18, D04, D22
1 Úvod Cílem příspěvku je ukázat typové farmy jako vhodný nástroj pro posuzování správnosti a efektivnosti uplatňování agrární politiky na české zemědělství. Jedná se zejména o predikce dopadů agrární politiky na období 2014-2020 podle nových pravidel (nové plánovací období EU) a porovnání se stavem do roku 2012.
Typové farmy reprezentují typické varianty výrobního zaměření v různých výrobních oblastech ČR (kukuřičná a řepařská, bramborářská, bramborářsko-ovesná a horská) s využitím vybraných podpor v rámci SZP (SAPS, Top-Up a LFA). Podpory AEO se neuvažují vzhledem k tomu, že mají pouze kompenzovat ekonomickou újmu za realizaci agro-environmentálních opatření. Typové farmy jsou standardizovány na výměru 100 ha z. p.
Výpočet ekonomiky typových farem se provádí pomocí optimalizačního modelu FARMA-4, (Foltýn a Zedníčková 2012), který simuluje ekonomické (optimální) chování zemědělského podniku. Model vychází z výrobně ekonomických údajů modelu RENT-4 (Foltýn a Zedníčková 2010), který počítá rentabilitu (bez podpor a s podporami) pro 37 zemědělských komodit v jednotlivých výrobních oblastech s využitím výběrového šetření nákladů v časové řadě 1998-2017.
36
Modelové výpočty vycházejí ze stavu diskuze o návrzích nařízení o přímých platbách pro období 2014-2020.
2 Materiál a metody
Charakteristika typových farem Typová farma je hypotetická konstrukce zemědělského podniku, která reprezentuje určitou skupinu zemědělských podniků lokalizovaných do stejných nebo podobných výrobních podmínek s podobným výrobním zaměřením a s podobnými dosahovanými ekonomickými výsledky, u nichž se předpokládají i podobné ekonomické reakce na vnější stimuly (CZV, vývoj inflace, nákladů a úrovně podpor) v budoucnosti. Typové farmy mají přesně definovanou výrobní strukturu (proti skutečným podnikům zjednodušenou) zaměřenou na vybrané komodity, které pro posouzení dopadů AP mají rozhodující význam.
Ekonomika typových farem Pro výpočet ekonomiky typových farem se používá optimalizační model FARMA-4, který využívá následující vstupní parametry:
- struktura výroby – plochy rostlinných komodit (tržních i krmných), průměrné stavy jednotlivých kategorií skotu s mléčnou produkcí a skotu bez tržní produkce mléka – na základě zadání
- hektarové výnosy a celkové náklady na hektar zemědělské půdy pro jednotlivé rostlinné komodity (tržní i krmné) – zdroj model RENT-4
- užitkovost jednotlivých kategorií zvířat, zejména průměrná roční dojivost, průměrné denní přírůstky (pro telata, jalovice a výkrm) a náklady na krmný den (bez nákladů na vlastní krmiva) – zdroj model RENT-4
- CZV tržních komodit – zdroj ČSÚ, příp. realizační ceny (RC) – zdroj výběrové šetření nákladů
- agrární politika – podpory typu SAPS, Top-Up a LFA, které jsou přiřazené jednotlivým komoditám podle pravidel SZP EU daného roku.
- model FARMA-4 obsahuje uzavřené obraty stáda pro oba typy skotu (mléčný i masný), odvozené na základě vstupních parametrů (natalita, hmotnost při narození, denní přírůstky, finální hmotnost výkrmu, procento zabřezávání jalovic atd.), které vedou ke stanovení průměrných stavů jednotlivých kategorií zvířat. Na průměrné stavy jsou napojeny normativní potřeby krmiv (jadrná krmiva, seno, siláž, senáž), které vstupují do bilancí krmiv pro zajištění celkových potřeb ŽV (prostřednictvím živin NEL, NEV), (AgroKonzulta 2012). Tím je v modelu zajištěna rovnováha mezi produkcí krmiv (krmné plodiny) a jejich potřebou.
Konstrukce typových farem Typové farmy se standardní výměrou 100 ha z. p. (tab. 1) byly zkonstruovány pro tři výrobní oblasti ČR (KR – kukuřičná a řepařská, BR – bramborářská a BH – bramborářsko-ovesná).
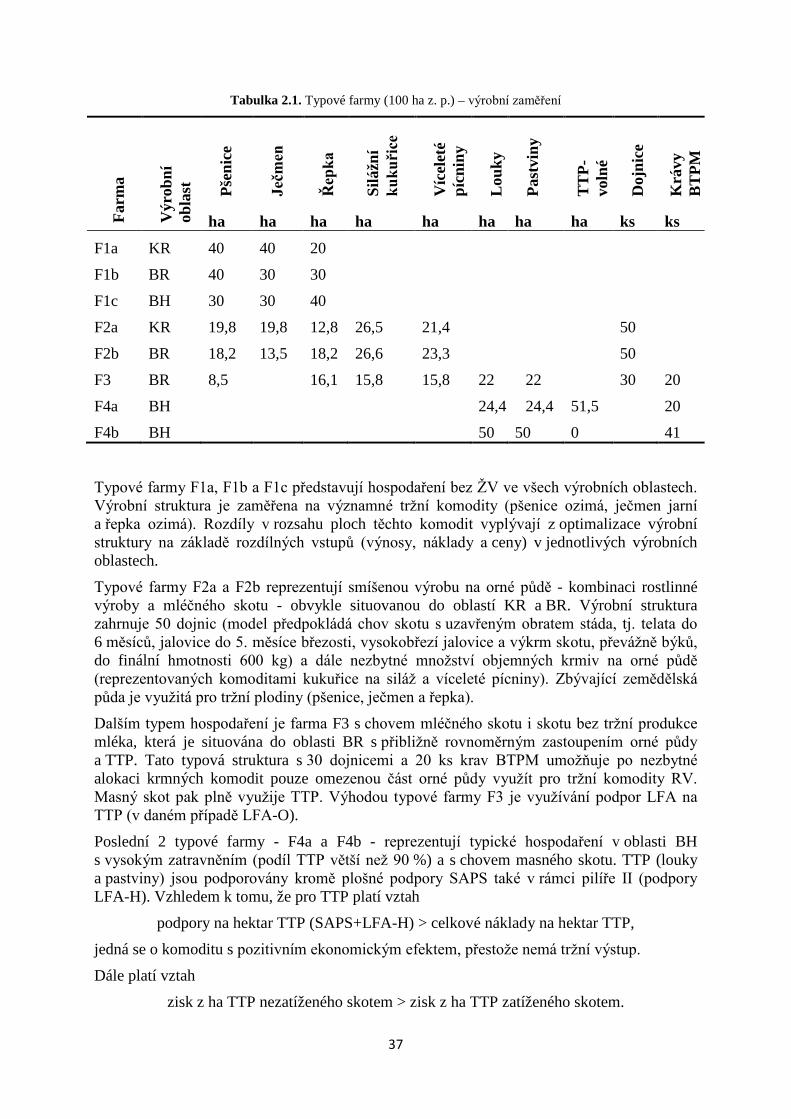
37
Tabulka 2.1. Typové farmy (100 ha z. p.) – výrobní zaměření Fa
rma
Výr
obní
ob
last
Pšen
ice
Ječm
en
Řep
ka
Silá
žní
kuku
řice
Víc
elet
é pí
cnin
y
Lou
ky
Past
viny
TT
P-vo
lné
Doj
nice
Krá
vy
BT
PM
ha ha ha ha ha ha ha ha ks ks
F1a KR 40 40 20
F1b BR 40 30 30
F1c BH 30 30 40
F2a KR 19,8 19,8 12,8 26,5 21,4 50
F2b BR 18,2 13,5 18,2 26,6 23,3 50
F3 BR 8,5 16,1 15,8 15,8 22 22 30 20
F4a BH 24,4 24,4 51,5 20
F4b BH 50 50 0 41
Typové farmy F1a, F1b a F1c představují hospodaření bez ŽV ve všech výrobních oblastech. Výrobní struktura je zaměřena na významné tržní komodity (pšenice ozimá, ječmen jarní a řepka ozimá). Rozdíly v rozsahu ploch těchto komodit vyplývají z optimalizace výrobní struktury na základě rozdílných vstupů (výnosy, náklady a ceny) v jednotlivých výrobních oblastech.
Typové farmy F2a a F2b reprezentují smíšenou výrobu na orné půdě - kombinaci rostlinné výroby a mléčného skotu - obvykle situovanou do oblastí KR a BR. Výrobní struktura zahrnuje 50 dojnic (model předpokládá chov skotu s uzavřeným obratem stáda, tj. telata do 6 měsíců, jalovice do 5. měsíce březosti, vysokobřezí jalovice a výkrm skotu, převážně býků, do finální hmotnosti 600 kg) a dále nezbytné množství objemných krmiv na orné půdě (reprezentovaných komoditami kukuřice na siláž a víceleté pícniny). Zbývající zemědělská půda je využitá pro tržní plodiny (pšenice, ječmen a řepka).
Dalším typem hospodaření je farma F3 s chovem mléčného skotu i skotu bez tržní produkce mléka, která je situována do oblasti BR s přibližně rovnoměrným zastoupením orné půdy a TTP. Tato typová struktura s 30 dojnicemi a 20 ks krav BTPM umožňuje po nezbytné alokaci krmných komodit pouze omezenou část orné půdy využít pro tržní komodity RV. Masný skot pak plně využije TTP. Výhodou typové farmy F3 je využívání podpor LFA na TTP (v daném případě LFA-O).
Poslední 2 typové farmy - F4a a F4b - reprezentují typické hospodaření v oblasti BH s vysokým zatravněním (podíl TTP větší než 90 %) a s chovem masného skotu. TTP (louky a pastviny) jsou podporovány kromě plošné podpory SAPS také v rámci pilíře II (podpory LFA-H). Vzhledem k tomu, že pro TTP platí vztah
podpory na hektar TTP (SAPS+LFA-H) > celkové náklady na hektar TTP,
jedná se o komoditu s pozitivním ekonomickým efektem, přestože nemá tržní výstup.
Dále platí vztah
zisk z ha TTP nezatíženého skotem > zisk z ha TTP zatíženého skotem.
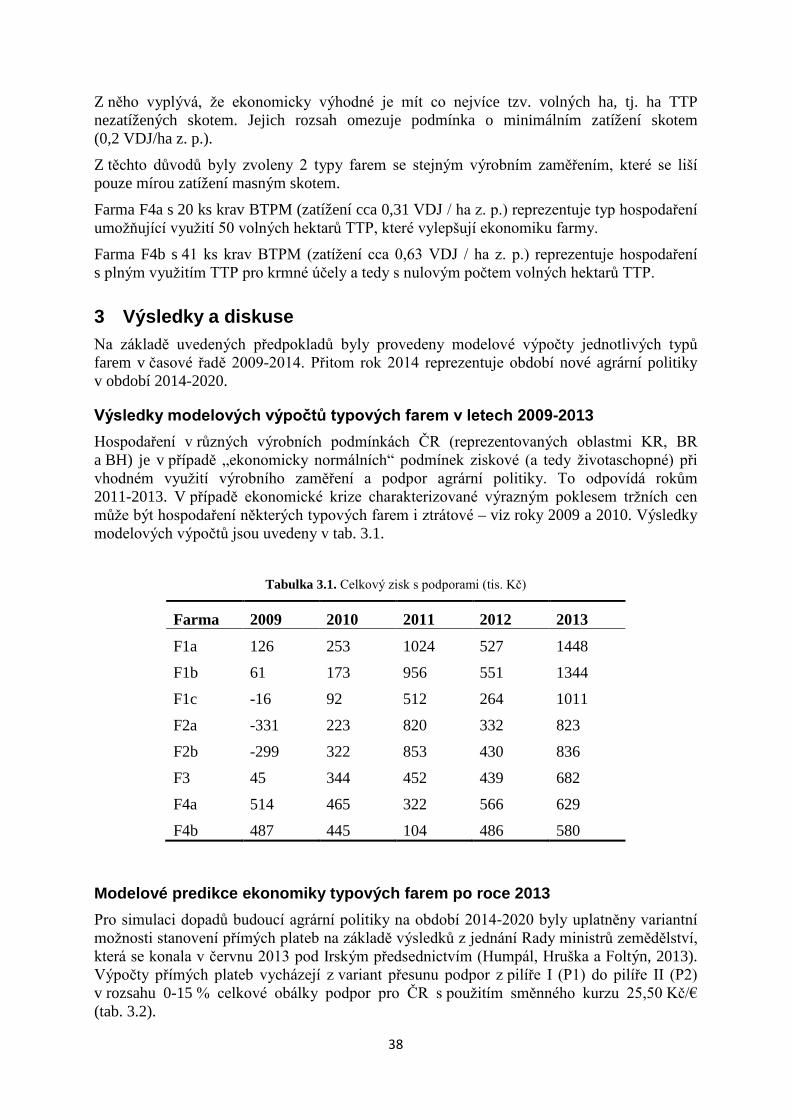
38
Z něho vyplývá, že ekonomicky výhodné je mít co nejvíce tzv. volných ha, tj. ha TTP nezatížených skotem. Jejich rozsah omezuje podmínka o minimálním zatížení skotem (0,2 VDJ/ha z. p.).
Z těchto důvodů byly zvoleny 2 typy farem se stejným výrobním zaměřením, které se liší pouze mírou zatížení masným skotem.
Farma F4a s 20 ks krav BTPM (zatížení cca 0,31 VDJ / ha z. p.) reprezentuje typ hospodaření umožňující využití 50 volných hektarů TTP, které vylepšují ekonomiku farmy.
Farma F4b s 41 ks krav BTPM (zatížení cca 0,63 VDJ / ha z. p.) reprezentuje hospodaření s plným využitím TTP pro krmné účely a tedy s nulovým počtem volných hektarů TTP.
3 Výsledky a diskuse Na základě uvedených předpokladů byly provedeny modelové výpočty jednotlivých typů farem v časové řadě 2009-2014. Přitom rok 2014 reprezentuje období nové agrární politiky v období 2014-2020.
Výsledky modelových výpočtů typových farem v letech 2009-2013 Hospodaření v různých výrobních podmínkách ČR (reprezentovaných oblastmi KR, BR a BH) je v případě „ekonomicky normálních“ podmínek ziskové (a tedy životaschopné) při vhodném využití výrobního zaměření a podpor agrární politiky. To odpovídá rokům 2011-2013. V případě ekonomické krize charakterizované výrazným poklesem tržních cen může být hospodaření některých typových farem i ztrátové – viz roky 2009 a 2010. Výsledky modelových výpočtů jsou uvedeny v tab. 3.1.
Tabulka 3.1. Celkový zisk s podporami (tis. Kč)
Farma 2009 2010 2011 2012 2013
F1a 126 253 1024 527 1448
F1b 61 173 956 551 1344
F1c -16 92 512 264 1011
F2a -331 223 820 332 823
F2b -299 322 853 430 836
F3 45 344 452 439 682
F4a 514 465 322 566 629
F4b 487 445 104 486 580
Modelové predikce ekonomiky typových farem po roce 2013 Pro simulaci dopadů budoucí agrární politiky na období 2014-2020 byly uplatněny variantní možnosti stanovení přímých plateb na základě výsledků z jednání Rady ministrů zemědělství, která se konala v červnu 2013 pod Irským předsednictvím (Humpál, Hruška a Foltýn, 2013). Výpočty přímých plateb vycházejí z variant přesunu podpor z pilíře I (P1) do pilíře II (P2) v rozsahu 0-15 % celkové obálky podpor pro ČR s použitím směnného kurzu 25,50 Kč/€ (tab. 3.2).
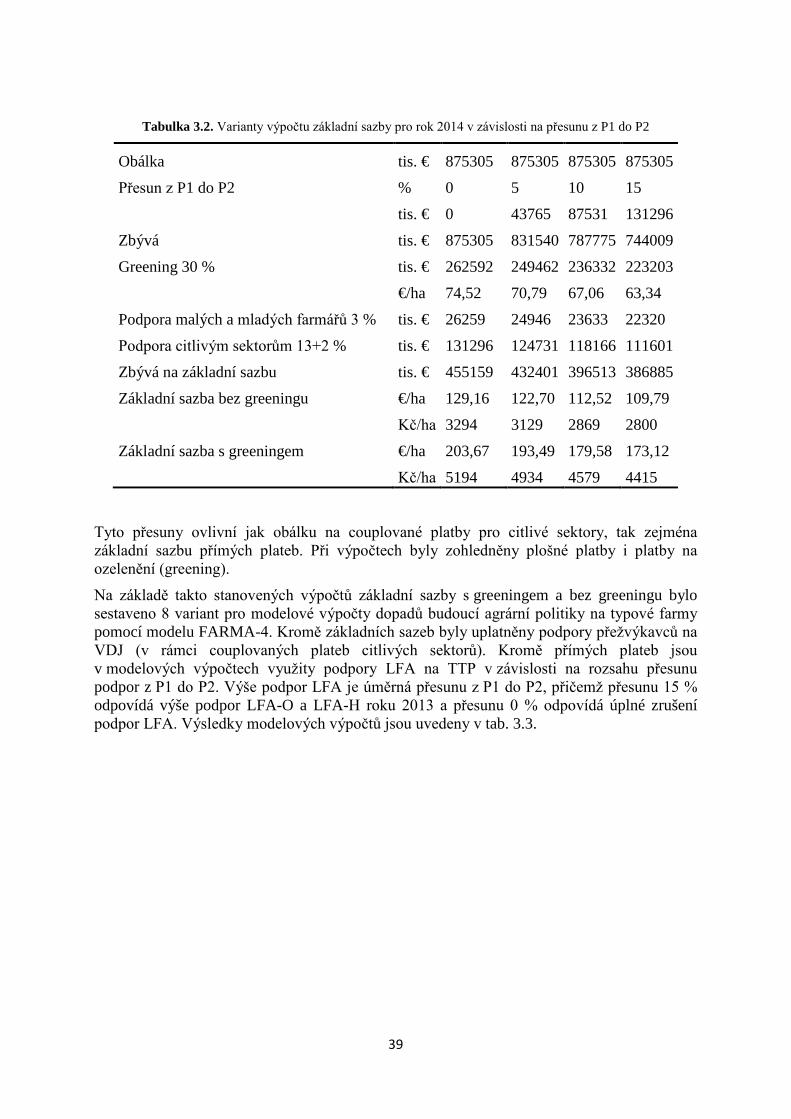
39
Tabulka 3.2. Varianty výpočtu základní sazby pro rok 2014 v závislosti na přesunu z P1 do P2
Obálka tis. € 875305 875305 875305 875305
Přesun z P1 do P2 % 0 5 10 15
tis. € 0 43765 87531 131296
Zbývá tis. € 875305 831540 787775 744009
Greening 30 % tis. € 262592 249462 236332 223203
€/ha 74,52 70,79 67,06 63,34
Podpora malých a mladých farmářů 3 % tis. € 26259 24946 23633 22320
Podpora citlivým sektorům 13+2 % tis. € 131296 124731 118166 111601
Zbývá na základní sazbu tis. € 455159 432401 396513 386885
Základní sazba bez greeningu €/ha 129,16 122,70 112,52 109,79
Kč/ha 3294 3129 2869 2800
Základní sazba s greeningem €/ha 203,67 193,49 179,58 173,12
Kč/ha 5194 4934 4579 4415
Tyto přesuny ovlivní jak obálku na couplované platby pro citlivé sektory, tak zejména základní sazbu přímých plateb. Při výpočtech byly zohledněny plošné platby i platby na ozelenění (greening).
Na základě takto stanovených výpočtů základní sazby s greeningem a bez greeningu bylo sestaveno 8 variant pro modelové výpočty dopadů budoucí agrární politiky na typové farmy pomocí modelu FARMA-4. Kromě základních sazeb byly uplatněny podpory přežvýkavců na VDJ (v rámci couplovaných plateb citlivých sektorů). Kromě přímých plateb jsou v modelových výpočtech využity podpory LFA na TTP v závislosti na rozsahu přesunu podpor z P1 do P2. Výše podpor LFA je úměrná přesunu z P1 do P2, přičemž přesunu 15 % odpovídá výše podpor LFA-O a LFA-H roku 2013 a přesunu 0 % odpovídá úplné zrušení podpor LFA. Výsledky modelových výpočtů jsou uvedeny v tab. 3.3.
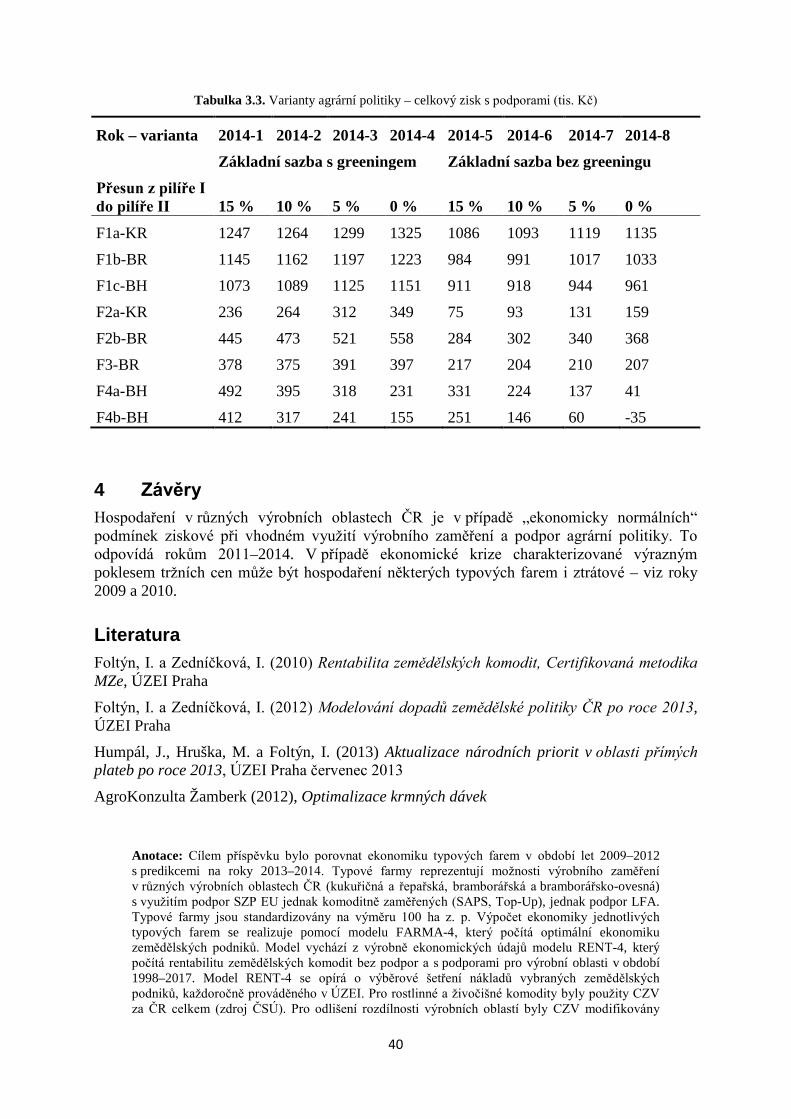
40
Tabulka 3.3. Varianty agrární politiky – celkový zisk s podporami (tis. Kč)
Rok – varianta 2014-1 2014-2 2014-3 2014-4 2014-5 2014-6 2014-7 2014-8 Základní sazba s greeningem Základní sazba bez greeningu Přesun z pilíře I do pilíře II 15 % 10 % 5 % 0 % 15 % 10 % 5 % 0 %
F1a-KR 1247 1264 1299 1325 1086 1093 1119 1135
F1b-BR 1145 1162 1197 1223 984 991 1017 1033
F1c-BH 1073 1089 1125 1151 911 918 944 961
F2a-KR 236 264 312 349 75 93 131 159
F2b-BR 445 473 521 558 284 302 340 368
F3-BR 378 375 391 397 217 204 210 207
F4a-BH 492 395 318 231 331 224 137 41
F4b-BH 412 317 241 155 251 146 60 -35
4 Závěry Hospodaření v různých výrobních oblastech ČR je v případě „ekonomicky normálních“ podmínek ziskové při vhodném využití výrobního zaměření a podpor agrární politiky. To odpovídá rokům 2011–2014. V případě ekonomické krize charakterizované výrazným poklesem tržních cen může být hospodaření některých typových farem i ztrátové – viz roky 2009 a 2010.
Literatura Foltýn, I. a Zedníčková, I. (2010) Rentabilita zemědělských komodit, Certifikovaná metodika MZe, ÚZEI Praha
Foltýn, I. a Zedníčková, I. (2012) Modelování dopadů zemědělské politiky ČR po roce 2013, ÚZEI Praha
Humpál, J., Hruška, M. a Foltýn, I. (2013) Aktualizace národních priorit v oblasti přímých plateb po roce 2013, ÚZEI Praha červenec 2013
AgroKonzulta Žamberk (2012), Optimalizace krmných dávek
Anotace: Cílem příspěvku bylo porovnat ekonomiku typových farem v období let 2009–2012 s predikcemi na roky 2013–2014. Typové farmy reprezentují možnosti výrobního zaměření v různých výrobních oblastech ČR (kukuřičná a řepařská, bramborářská a bramborářsko-ovesná) s využitím podpor SZP EU jednak komoditně zaměřených (SAPS, Top-Up), jednak podpor LFA. Typové farmy jsou standardizovány na výměru 100 ha z. p. Výpočet ekonomiky jednotlivých typových farem se realizuje pomocí modelu FARMA-4, který počítá optimální ekonomiku zemědělských podniků. Model vychází z výrobně ekonomických údajů modelu RENT-4, který počítá rentabilitu zemědělských komodit bez podpor a s podporami pro výrobní oblasti v období 1998–2017. Model RENT-4 se opírá o výběrové šetření nákladů vybraných zemědělských podniků, každoročně prováděného v ÚZEI. Pro rostlinné a živočišné komodity byly použity CZV za ČR celkem (zdroj ČSÚ). Pro odlišení rozdílnosti výrobních oblastí byly CZV modifikovány

41
v souladu s výsledky výběrového šetření. Údaje o budoucí agrární politice EU vycházejí z posledních dostupných informací.
Hospodaření v různých výrobních oblastech ČR je v případě „ekonomicky normálních“ podmínek ziskové při vhodném využití výrobního zaměření a podpor agrární politiky. To odpovídá rokům 2011–2014. V případě ekonomické krize charakterizované výrazným poklesem tržních cen může být hospodaření některých typových farem i ztrátové – viz roky 2009 a 2010.
Klíčová slova: matematické modely, typové farmy, agrární politika, celkový zisk
JEL classification: Q18, D04, D22
42
Wage differences and labor productivity in the Czech agriculture and the CAP changes
Marta Gryčová Department ofEconomics, FEM, Czech University ofLifeSciences Prague,
Kamycka 129, 165 21 Prague 6 – Suchdol [email protected]
Annotation:The comparatively high wage disparity is the never-ending problem in the Czech agriculture. The share of the gross nominal average wage in agriculture of its national economy counterpart is about only about 78% in 2011, which is not so much lower than the percentage in the year 2000 and the years when the Czech Republic started to draw the support from the pre-accession EU programs.The objective of the research is to depict the effect of changes in the Common Agricultural Policy (CAP) on the wage differentials in agriculture and on the labor productivity in the Czech Republic in the period with a starting point of pre-accession help of the EU funds until 2012. So the research question of this paper is whether and to what extent the CAP changes do have any effect on wage differentials in agriculture in terms of the differences between the gross nominal average wage in agriculture and the one in the national economy and on the labor productivity differences in terms of average product per employee. Simple linear regression models (LRM) to map the relationship between the chosen variables are applied on the datasets from the databases Czech Statistical Office (CSO) and Eurostat and is estimated by the ordinary least square (OLS) method, using the variable of wage differences, in terms of the differences between the gross nominal average wage in agriculture and the one in the national economy, and the variable of labor productivity in agriculture as endogenous, and changes in the CAP and national support as exogenous. The expected results of this paper are very small positive effects of the changes in the CAP and also of the changes of national support on the level labor productivity and very small negative or even negligible effects on wage differences in agriculture. However, the results seem ambiguous showing rather opposite impact on the wage differentials.
Key words:wage differences, agricultural sector, common agricultural policy, labor productivity.
JEL classification: J43, J31, H24, Q18
1 Introduction The Czech Republic firstly received the support from the EU into the agriculture (the program PHARE was focused on developing the institutional framework) by the pre-accession help program SAPARD, resp. the Multiannual financial agreement for guiding the program SAPARD – Special Accession Programme for Agriculture and Rural Development for the period of 2000-2006 approved by the European Commission on 26th October 2000.1One of the principle aims of CAP is to provide farmers with a reasonable standard of living.2However, after those more over than decade of the EU agricultural support and CAP reforms and health checks, the comparatively high wage disparity is still the never-ending problem in the Czech agriculture. The share of the gross nominal average wage in agriculture of its national economy counterpart is about only about 77.7% in 2011, which is not so much lower than the percentage in the year the Czech Republic started to draw the agricultural support from the pre-accession EU program SAPARD.Using data of nominal wages in agricultural sector CZ-NACE A, nominal wages in the total economy in mil. CZK and an amount of hours worked in the sector (in thousand hours) from national accountsthe measure of average wage difference per thousand hours as a share of average wage per thousand hours 1For more detail see WWW: http://eagri.cz/public/web/en/mze/subsidies/sapard/[16/07/2013]
2For more detail about the aims of CAP EU see WWW:http://ec.europa.eu/agriculture/cap-overview/2012_en.pdf.[21/07/2013].
43
in the total economy is even worse, i.e. 74.9 in 2011 and 73,7% in 2012 compared to the value of 85,9% in 1995.
This paper combines three concepts: the classical theoryof labor productivity, the concept of wage differentials, resp. the hypothesis of equalitybetween marginal wage and marginal labor productivity, and agricultural policy impact analysis in a very simpleway.
The phenomenon of the wage differentials across sectors of economy was firstly analyzed by Slichter (1950) and by Krueger andSummers (1987 and 1988). For more detail and further development see Blinder (1973), Dickens and Katz (1987), Oaxaca and Ransom (1994), Zanchi (1998), Blackburn (2007), Ricaurte (2009), Du Caju et al. (2010), Van Biesebroeck (2011), and for the productivity differentials across sectors see Bureau and Butault (1997), and for the relationship between the wage growth and labor productivity growth see the summarizing study Meager a Speckesser(2011) or Pessoa and Reenen (2012).
There are many publicationsfocusing on the impact of subsidies under CommonAgricultural Policy on the income, e.g. Keeney (2000), Schmidet al. (2006),Witzke and Noleppa(2006),Benni and Finger (2011).Trnková and Malá (2012) approved that subsidies, especially direct payments, contribute to equal distribution, but the impact is very small. Butault and Lerouvillois (1999) found out that over half of the income disparities can be explained by labour productivity differences among countries and regions. Also the inequality in the EU varied little in the two years after the reform in 1992.However, it decreased in major crops and beef, at least within each country.CAP transfers tend to reduce incomeinequality also according to Hansen and Teuber (2011). Hansen and Herrmann (2012) also mentioned that CAP transfers unaffected income convergence for society asa whole, in agricultural sectorCAP transfers lead to a convergence of receipts per farm, but toa divergence of farm receipts per hectarein Germany over the period 1991–2009.
The main milestones of changes of CAP in the period of 2000 and 2012 were the Agenda 2000 (further reducing the agricultural support and intervention prices compensated by direct payments and also focusing on environmental issues, see Dai, 2004), 2003 reform and 2008Health Check and 2011 reform (see Cantore, Kennan and Page, 2011).Gomez yPaloma et al. (2013) reviews major recent studies on projections of agriculture and rural areas at world and EU levels and assesses the methodologies usedto analyze impacts of agricultural and ruralpolicies on the farming sector and rural areas.
The objective of this paperis to depict the impact of changes in the EU CAP and also in the Czech national agricultural support on wage differentials and labor productivity differentials in agriculture using dummy variables as well as the differences of values for the policy variables in the period with a starting point of pre-accession help of the EU funds until 2012. The linear regression model of mentioned variables will be estimated by OLS method.
Simple linear regression models (LRM) to map the relationship between the chosen variables are applied on the datasets from the databases Czech Statistical Office (CSO) and Eurostat and is estimated by the ordinary least square (OLS) method, using the variable of wage differences, in terms of the differences between the gross nominal average wage in agriculture and the one in the national economy, and the variable of labor productivity in agriculture as endogenous, and changes in the CAP and national support as exogenous.
2 Materials and Methods The research question of this paper is whether and to what extent the CAP changes, resp. changes in the level and the character of the financial support to agriculture from the EU funds and separately the Czech national support, do have any and what kind of effect on wage

44
differentials in agriculture in terms of the differences between the gross nominal average wage in agriculture and the one in the national economy and on the labor productivity in terms of average product per employee. In the next sections the data and the model used are described.
Data Time series of the gross nominal values of wages, gross value added and employment in levels and in thousands hours in agricultural sector, CZ NACE A, and in the total national economy was extracted from the Czech statistical office database of the annual national accounts. The calculation of the average values per employee and per thousand hours and then the difference among the values for agricultural sector and for the national economywas proceeded.
Chyba! Záložka není definována.𝑊𝑎 = 𝑊𝐴𝐿ℎ𝑜𝑢𝑟𝑠𝐴
𝑊𝑎 = 𝑊𝐴𝐿𝑒𝑚𝑝𝑙𝑜𝑦𝑒𝑒𝑠𝐴
(1)
𝑊𝑛𝑒 =𝑊𝑁𝐸
𝐿ℎ𝑜𝑢𝑟𝑠𝑁𝐸 𝑊𝑛𝑒 =
𝑊𝑁𝐸
𝐿𝑒𝑚𝑝𝑙𝑜𝑦𝑒𝑒𝑠𝑁𝐸 (2)
Chyba! Záložka není definována.𝑊𝑑𝑖𝑓𝑓 = 𝑊𝑛𝑒 −𝑊𝑎 (3)
Chyba! Záložka není definována.𝐺𝐴𝑉𝑎 = 𝐺𝐴𝑉𝐴𝐿ℎ𝑜𝑢𝑟𝑠𝐴
𝐺𝐴𝑉𝑎 = 𝐺𝐴𝑉𝐴𝐿𝑒𝑚𝑝𝑙𝑜𝑦𝑒𝑒𝑠𝐴
(4)
Chyba! Záložka není definována.𝐺𝐴𝑉𝑛𝑒 = 𝐺𝐴𝑉𝑁𝐸𝐿ℎ𝑜𝑢𝑟𝑠𝑁𝐸
𝐺𝐴𝑉𝑛𝑒 = 𝐺𝐴𝑉𝑁𝐸𝐿𝑒𝑚𝑝𝑙𝑜𝑦𝑒𝑒𝑠𝑁𝐸
(5)
Chyba! Záložka není definována.𝐺𝐴𝑉𝑑𝑖𝑓𝑓 = 𝐺𝐴𝑉𝑛𝑒 − 𝐺𝐴𝑉𝑎 (6)
The real values were calculated by dividing by the Consumer Price Index. The correlation coefficient between the two time series of average wage differences and average gross value added differences was of course higher in nominal terms than in real terms, i.e. 0.745 related to 0.406.
Fig 1.Average gross value added differential and average wage differential per employee, and average gross
value added-wage differentials (on the right) in mil. CZK, 1996-2012, nominal (blue) and real (red), data CSO, own elaboration.
Figure 1 demonstrates that the slope of the average wage – gross value added differentials are higher in nominal terms than in real terms. This means that in real terms the average wage
y = 0,9969x + 0,1121 R² = 0,1648
y = 2,5775x + 0,0341 R² = 0,5553
0,06
0,11
0,16
0,21
0,26
0,015 0,035 0,055
Gro
ss v
alue
add
ed d
iffer
ence
per
em
ploy
ee in
m
il. C
ZK
Wage difference per employee in mil. CZK
y = 0,0026x + 0,0883 R² = 0,1457
y = 0,0057x + 0,0583 R² = 0,2676
0,05
0,1
0,15
0,2
0,25
1996
1997
1998
1999
2000
2001
2002
2003
2004
2005
2006
2007
2008
2009
2010
2011
2012
GAV/Wdiffreal
GAV/Wdiffnominal
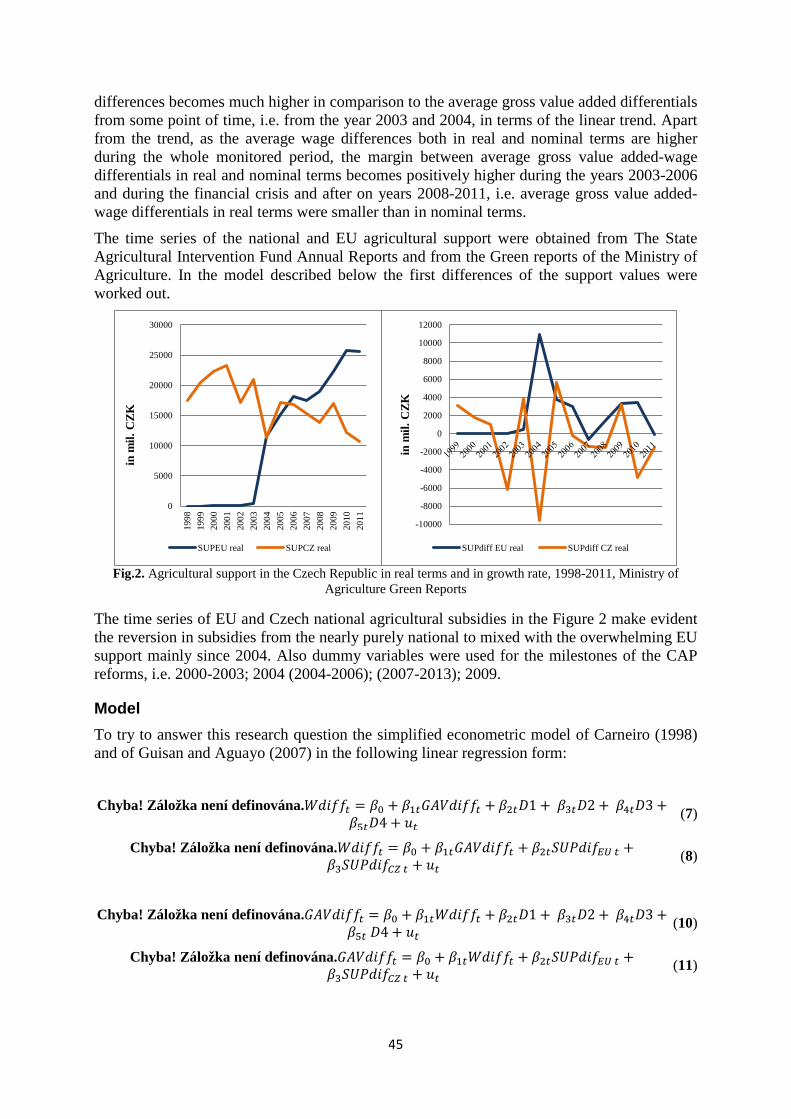
45
differences becomes much higher in comparison to the average gross value added differentials from some point of time, i.e. from the year 2003 and 2004, in terms of the linear trend. Apart from the trend, as the average wage differences both in real and nominal terms are higher during the whole monitored period, the margin between average gross value added-wage differentials in real and nominal terms becomes positively higher during the years 2003-2006 and during the financial crisis and after on years 2008-2011, i.e. average gross value added-wage differentials in real terms were smaller than in nominal terms.
The time series of the national and EU agricultural support were obtained from The State Agricultural Intervention Fund Annual Reports and from the Green reports of the Ministry of Agriculture. In the model described below the first differences of the support values were worked out.
Fig.2. Agricultural support in the Czech Republic in real terms and in growth rate, 1998-2011, Ministry of
Agriculture Green Reports
The time series of EU and Czech national agricultural subsidies in the Figure 2 make evident the reversion in subsidies from the nearly purely national to mixed with the overwhelming EU support mainly since 2004. Also dummy variables were used for the milestones of the CAP reforms, i.e. 2000-2003; 2004 (2004-2006); (2007-2013); 2009.
Model To try to answer this research question the simplified econometric model of Carneiro (1998) and of Guisan and Aguayo (2007) in the following linear regression form:
Chyba! Záložka není definována.𝑊𝑑𝑖𝑓𝑓𝑡 = 𝛽0 + 𝛽1𝑡𝐺𝐴𝑉𝑑𝑖𝑓𝑓𝑡 + 𝛽2𝑡𝐷1 + 𝛽3𝑡𝐷2 + 𝛽4𝑡𝐷3 +
𝛽5𝑡𝐷4 + 𝑢𝑡 (7)
Chyba! Záložka není definována.𝑊𝑑𝑖𝑓𝑓𝑡 = 𝛽0 + 𝛽1𝑡𝐺𝐴𝑉𝑑𝑖𝑓𝑓𝑡 + 𝛽2𝑡𝑆𝑈𝑃𝑑𝑖𝑓𝐸𝑈 𝑡 + 𝛽3𝑆𝑈𝑃𝑑𝑖𝑓𝐶𝑍 𝑡 + 𝑢𝑡
(8)
Chyba! Záložka není definována.𝐺𝐴𝑉𝑑𝑖𝑓𝑓𝑡 = 𝛽0 + 𝛽1𝑡𝑊𝑑𝑖𝑓𝑓𝑡 + 𝛽2𝑡𝐷1 + 𝛽3𝑡𝐷2 + 𝛽4𝑡𝐷3 + 𝛽5𝑡 𝐷4 + 𝑢𝑡
(10)
Chyba! Záložka není definována.𝐺𝐴𝑉𝑑𝑖𝑓𝑓𝑡 = 𝛽0 + 𝛽1𝑡𝑊𝑑𝑖𝑓𝑓𝑡 + 𝛽2𝑡𝑆𝑈𝑃𝑑𝑖𝑓𝐸𝑈 𝑡 + 𝛽3𝑆𝑈𝑃𝑑𝑖𝑓𝐶𝑍 𝑡 + 𝑢𝑡
(11)
0
5000
10000
15000
20000
25000
30000
1998
1999
2000
2001
2002
2003
2004
2005
2006
2007
2008
2009
2010
2011
in m
il. C
ZK
SUPEU real SUPCZ real
-10000
-8000
-6000
-4000
-2000
0
2000
4000
6000
8000
10000
12000
in m
il. C
ZK
SUPdiff EU real SUPdiff CZ real
46
GAVdiff is the average gross value added difference between the total national economy value and the value for the agricultural sector in mil. CZK in real terms (in prices of 2005), Wdiff indicates similarly the difference in average wages between the total national economy value and the value for the agricultural sector in mil. CZK in real terms (in prices of 2005), D1, D2, D3 and D4 are dummy variables for the milestones in the CAP reforms during the monitored period, SUPdif EU and CZ are the variables for the agricultural support from the EU funds and from the national origin respectively in mil. CZK in prices of 2005 and u is the error term. These models were estimated using the ordinary least square method (see e.g. Gujarati, 2003).
The main hypotheses about the probable results of these regressions are summarized below.
Hypothesis 1: The program SAPARD as D1 has a negative effect on average wage differences/average gross value added differences in real terms in mil. CZKthat means e.g. a larger increase in average wages in agricultural sector than in average wages in the total national economy.
Hypothesis 2: The entrance into the EU (and the years of the rest of that financial perspective 2000-2006; that means years 2004-2006) as D2 has a negative effect on average wage differences/average gross value added differences in real terms in mil. CZK.
Hypothesis 3: The financial perspective 2007-2013 as D3 has a negative effect on average wage differences/average gross value added differences in real terms in mil. CZK.
Hypothesis 4: The 2008 reform (partly effective from the year 2009) as D4 has a smaller positive effect on average wage differences/average gross value added differences in real terms in mil. CZK.
Hypothesis 5: The EU agricultural support in mil. CZK has a negative effect on average wage differences/average gross value added differences in real terms in mil. CZK.
Hypothesis 6: The Czech national agricultural support in mil. CZK has a negative effect on average wage differences/average gross value added differences in real terms in mil. CZK.
3 Results and Discussion The expected results of this paper were very small positive effects of the changes in the CAP and national support on the labor productivity and on wage differences in agriculture.
Firstly, the simple linear regression of the average wage differences in real terms to the differences in EU agricultural support has an increasing slope (see Fig. 3) that means that a positive change in the EU agricultural support might causes an increase in the average wage
differences, resp. an increase in the wage disparity. However, the slope is negativefor the case of the effect of the Czech national agricultural support.
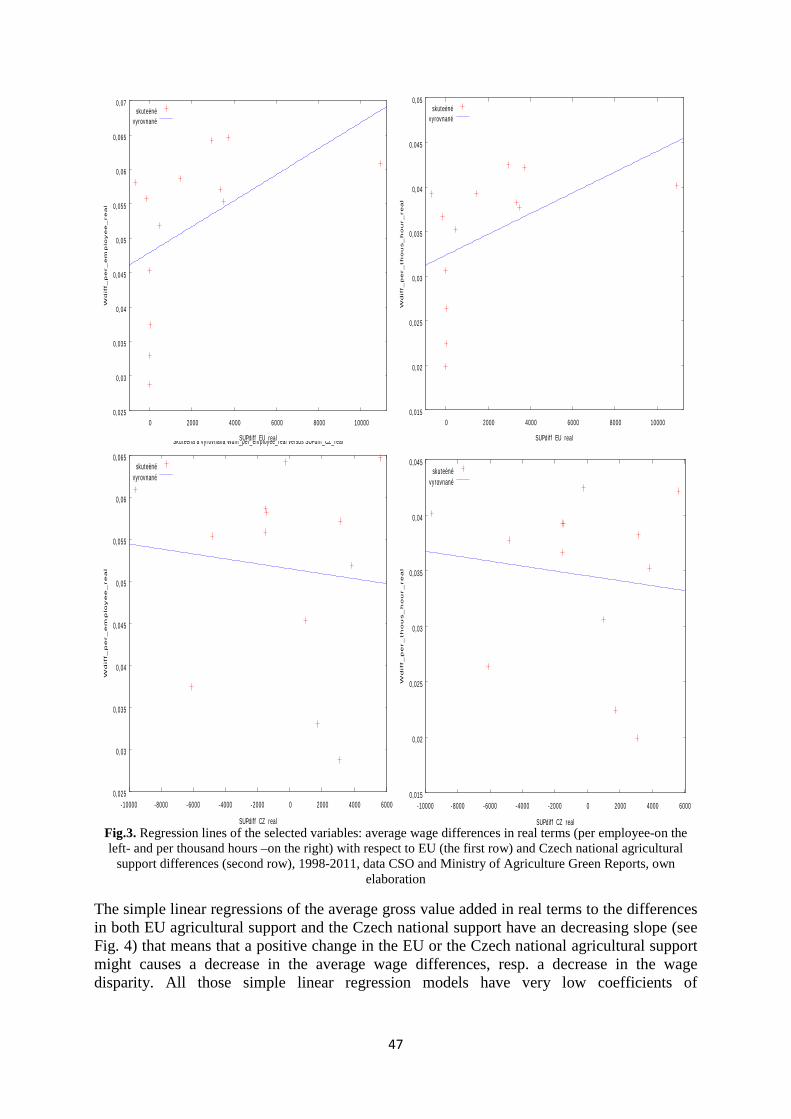
47
Fig.3. Regression lines of the selected variables: average wage differences in real terms (per employee-on the left- and per thousand hours –on the right) with respect to EU (the first row) and Czech national agricultural
support differences (second row), 1998-2011, data CSO and Ministry of Agriculture Green Reports, own elaboration
The simple linear regressions of the average gross value added in real terms to the differences in both EU agricultural support and the Czech national support have an decreasing slope (see Fig. 4) that means that a positive change in the EU or the Czech national agricultural support might causes a decrease in the average wage differences, resp. a decrease in the wage disparity. All those simple linear regression models have very low coefficients of
0,025
0,03
0,035
0,04
0,045
0,05
0,055
0,06
0,065
0,07
0 2000 4000 6000 8000 10000
Wdiff_
per_em
plo
yee_real
SUPdiff EU real
skuteènévyrovnané
0,015
0,02
0,025
0,03
0,035
0,04
0,045
0,05
0 2000 4000 6000 8000 10000
Wdiff_
per_th
ous_hour_real
SUPdiff EU real
skuteènévyrovnané
0,025
0,03
0,035
0,04
0,045
0,05
0,055
0,06
0,065
-10000 -8000 -6000 -4000 -2000 0 2000 4000 6000
Wdiff_
per_em
plo
yee_real
SUPdiff_CZ_real
Skuteèná a vyrovnaná Wdiff_per_employee_real versus SUPdiff_CZ_real
skuteènévyrovnané
0,015
0,02
0,025
0,03
0,035
0,04
0,045
-10000 -8000 -6000 -4000 -2000 0 2000 4000 6000
Wdiff_
per_thous_hour_real
SUPdiff CZ real
skuteènévyrovnané
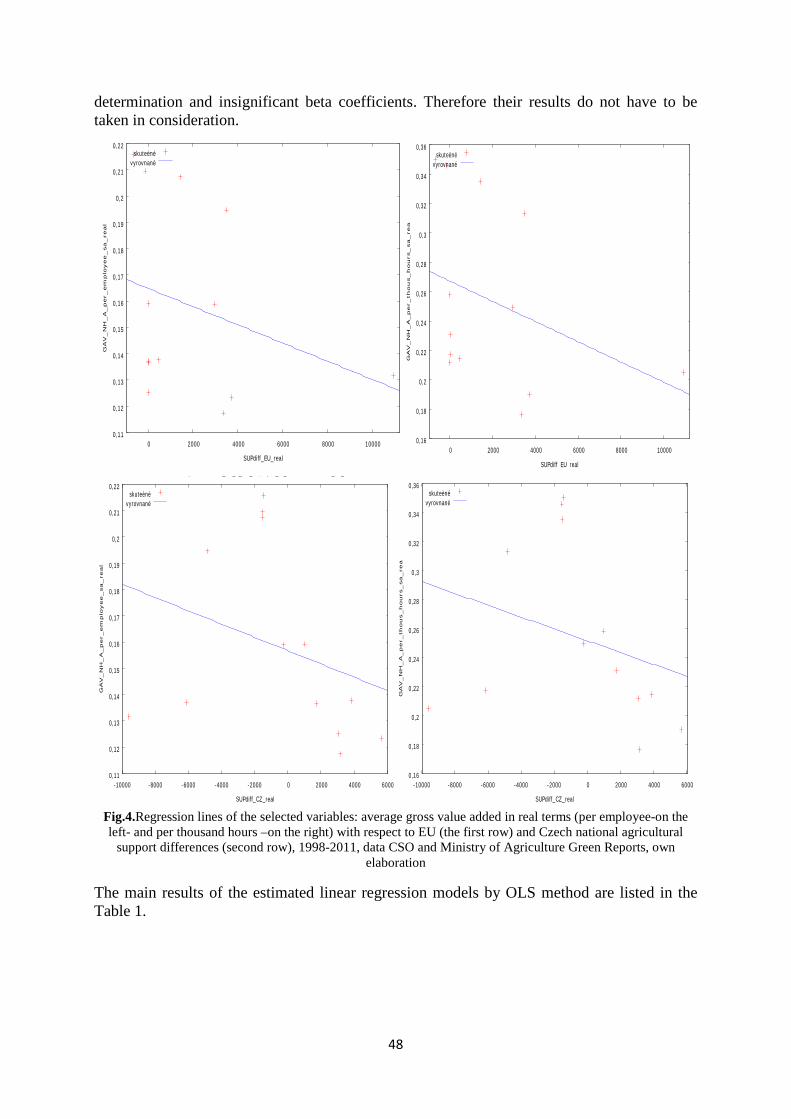
48
determination and insignificant beta coefficients. Therefore their results do not have to be taken in consideration.
Fig.4.Regression lines of the selected variables: average gross value added in real terms (per employee-on the left- and per thousand hours –on the right) with respect to EU (the first row) and Czech national agricultural
support differences (second row), 1998-2011, data CSO and Ministry of Agriculture Green Reports, own elaboration
The main results of the estimated linear regression models by OLS method are listed in the Table 1.
0,11
0,12
0,13
0,14
0,15
0,16
0,17
0,18
0,19
0,2
0,21
0,22
0 2000 4000 6000 8000 10000
GAV_N
H_A_per_
em
plo
yee_sa_re
al
SUPdiff_EU_real
skuteènévyrovnané
0,16
0,18
0,2
0,22
0,24
0,26
0,28
0,3
0,32
0,34
0,36
0 2000 4000 6000 8000 10000
GAV_N
H_A_per_th
ous_hours_sa_rea
SUPdiff_EU_real
skuteènévyrovnané
0,11
0,12
0,13
0,14
0,15
0,16
0,17
0,18
0,19
0,2
0,21
0,22
-10000 -8000 -6000 -4000 -2000 0 2000 4000 6000
GAV_N
H_A_per_
em
plo
yee_sa_re
al
SUPdiff_CZ_real
y _ _ _p _ p y _ _ _ _
skuteènévyrovnané
0,16
0,18
0,2
0,22
0,24
0,26
0,28
0,3
0,32
0,34
0,36
-10000 -8000 -6000 -4000 -2000 0 2000 4000 6000
GAV_N
H_A_per_
thous_hours
_sa_re
a
SUPdiff_CZ_real
skuteènévyrovnané
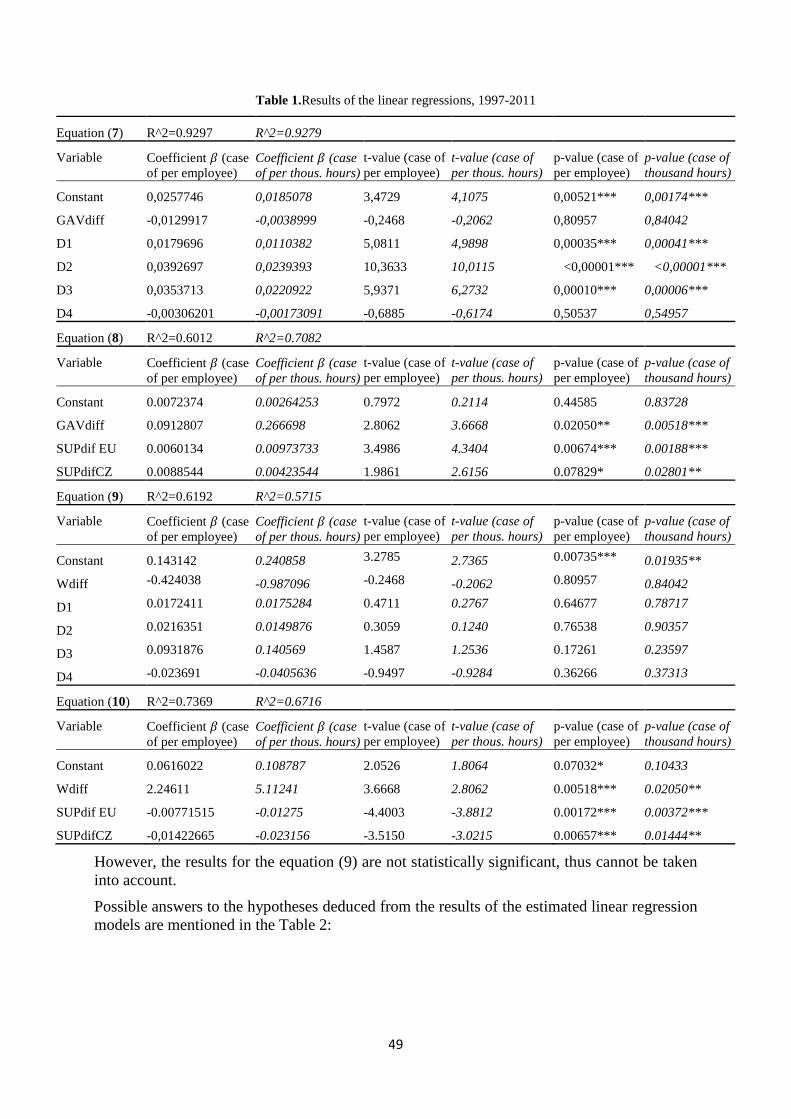
49
Table 1.Results of the linear regressions, 1997-2011
Equation (7) R^2=0.9297 R^2=0.9279
Variable Coefficient 𝛽 (case of per employee)
Coefficient 𝛽 (case of per thous. hours)
t-value (case of per employee)
t-value (case of per thous. hours)
p-value (case of per employee)
p-value (case of thousand hours)
Constant 0,0257746 0,0185078 3,4729 4,1075 0,00521*** 0,00174***
GAVdiff -0,0129917 -0,0038999 -0,2468 -0,2062 0,80957 0,84042
D1 0,0179696 0,0110382 5,0811 4,9898 0,00035*** 0,00041***
D2 0,0392697 0,0239393 10,3633 10,0115 <0,00001*** <0,00001***
D3 0,0353713 0,0220922 5,9371 6,2732 0,00010*** 0,00006***
D4 -0,00306201 -0,00173091 -0,6885 -0,6174 0,50537 0,54957
Equation (8) R^2=0.6012 R^2=0.7082
Variable Coefficient 𝛽 (case of per employee)
Coefficient 𝛽 (case of per thous. hours)
t-value (case of per employee)
t-value (case of per thous. hours)
p-value (case of per employee)
p-value (case of thousand hours)
Constant 0.0072374 0.00264253 0.7972 0.2114 0.44585 0.83728
GAVdiff 0.0912807 0.266698 2.8062 3.6668 0.02050** 0.00518***
SUPdif EU 0.0060134 0.00973733 3.4986 4.3404 0.00674*** 0.00188***
SUPdifCZ 0.0088544 0.00423544 1.9861 2.6156 0.07829* 0.02801**
Equation (9) R^2=0.6192 R^2=0.5715
Variable Coefficient 𝛽 (case of per employee)
Coefficient 𝛽 (case of per thous. hours)
t-value (case of per employee)
t-value (case of per thous. hours)
p-value (case of per employee)
p-value (case of thousand hours)
Constant 0.143142 0.240858 3.2785 2.7365 0.00735*** 0.01935**
Wdiff -0.424038 -0.987096 -0.2468 -0.2062 0.80957 0.84042
D1 0.0172411 0.0175284 0.4711 0.2767 0.64677 0.78717
D2 0.0216351 0.0149876 0.3059 0.1240 0.76538 0.90357
D3 0.0931876 0.140569 1.4587 1.2536 0.17261 0.23597
D4 -0.023691 -0.0405636 -0.9497 -0.9284 0.36266 0.37313
Equation (10) R^2=0.7369 R^2=0.6716
Variable Coefficient 𝛽 (case of per employee)
Coefficient 𝛽 (case of per thous. hours)
t-value (case of per employee)
t-value (case of per thous. hours)
p-value (case of per employee)
p-value (case of thousand hours)
Constant 0.0616022 0.108787 2.0526 1.8064 0.07032* 0.10433
Wdiff 2.24611 5.11241 3.6668 2.8062 0.00518*** 0.02050**
SUPdif EU -0.00771515 -0.01275 -4.4003 -3.8812 0.00172*** 0.00372***
SUPdifCZ -0,01422665 -0.023156 -3.5150 -3.0215 0.00657*** 0.01444**
However, the results for the equation (9) are not statistically significant, thus cannot be taken into account.
Possible answers to the hypotheses deduced from the results of the estimated linear regression models are mentioned in the Table 2:
50
Table 2.Answers to the paper hypotheses from chapter 2.2
Hypothesis Empirical result
1. negative effect of D1 on Wdiff and GAVdiff positive on Wdiff
2. negative effect of D2 on Wdiff and GAVdiff positive on Wdiff
3. negative effect of D3 on Wdiff and GAVdiff positive on Wdiff
4. negative effect of D4 on Wdiff and GAVdiff negative on Wdiff
5. negative effect of SUP EUdif on Wdiff and GAVdiff positive on Wdiff and negative on GAVdiff
6. negative effect of SUP CZdif on Wdiff and GAVdiff positive on Wdiff and negative on GAVdiff
Discussion of results.The sign of the results might not be wrong according to the economic theory because if an increase in wages in the national economy and wages in the agricultural sectorper employee/per thousand hoursby the same percentage the difference still increase (even though the wages in the agricultural sector increase), because even the same percentage of the bigger number of wages in the national economyper employee/per thousand hours is larger in absolute terms than a percentage of smaller number of wages in the agricultural sector per employee/per thousand hoursand thus the difference increases. Even if the growth rate of wages in the national economy is lower than the growth rate of wages in agricultural sector, the difference still might increase a little. The only possible situation when the difference decrease is in the case of the lower absolute value of the increase in wages in the national economyper employee/per thousand hours than the wages in the agricultural sectorper employee/per thousand hours, or the non-changing wages in the national economyper employee/per thousand hours with increasingwages in the agricultural sectorper employee/per thousand hours or in the case of decreasing wages in the national economy per employee/per thousand hours with constant or increasingwagesin the agricultural sector per employee/per thousand hours.
When observingthe raw data in Figure 5 the wages in the national economy per employee/per thousand hours increase not always by larger absolute amount and even in some years decrease in the real terms mainly in the crisis years.So the positive effect of the EU and Czech national agricultural support on average wage differences was only for the dummy variable D4, but the coefficient of D4 is not statistical significant.
Fig.5. Average wage differentials and GAV differentials (counting differently: firstly differences in time
separately and then the difference between the national economy and the agricultural sector), data CSO, own calculation
-0,01
-0,005
2E-17
0,005
0,01
0,015
1996
1997
1998
1999
2000
2001
2002
2003
2004
2005
2006
2007
2008
2009
2010
2011
2012in
mil.
CZK
WDIF real in mil CZK per employee
WDIF real in mil CZK per thous hours
-0,17
-0,12
-0,07
-0,02
0,03
0,08
0,13
1997
1998
1999
2000
2001
2002
2003
2004
2005
2006
2007
2008
2009
2010
2011
2012
in m
il. C
ZK
GAVDIF real in mil CZK per employee
GAVDIF real in mil CZK per thous hours
51
According to the results of the linear regression model (no. 8 and 10) the effect of EU and the Czech national agricultural support in absolute values on average wage differentials is positive contrary to the hypothesis 5 and 6 and on the average value added differentials negative in accordance with the hypothesis 5 and 6.
Apart from the discussion of the sign of the results the level of the results does not indicate the expected negligibility of results. The occurrence of the dummy variable D1 (the SAPARD program)is connected with the increase in average annual wage differentials during the whole period by 0.018 mil. CZK in per employee terms (that is about 33% of the wage difference value in 2012)and by 0.011 mil.CZK (that is about 29% of the wage difference value in 2012) in per thousand hours terms.The dummy variable D2 (the entrance into the EU until the year 2006) causes the increase in average annual wage differentials during the whole period by 0.039 mil. CZK in per employee terms(about 72% of the wage difference value in 2012) and by 0.024 mil. CZK in per thousand hours terms(about 63% of the wage difference value in 2012).The dummy variable D3 (the financial perspective 2007-2013) is connected with the increase in average annual wage differentials during the whole period by 0.035 mil. CZK in per employee terms (about 64 % of the wage difference value in 2012)and by 0.022 mil. CZK in per thousand hours terms(about 58 % of the wage difference value in 2012).
The interpretation of results from the regression models 8 and 10 also indicate the significance of results. An increase in the difference of EU agricultural support by 1 mil. CZK is connected with an increase in the average annual wage difference by 0.006 mil. CZK in per employee terms (that is about 11 % of the wage difference value in 2012)and by 0.0097 mil.CZK in per thousand hours terms(that is about 25 % of the wage difference value in 2012)and with a decrease in the average annual gross value added difference by 0.0077 mil.CZK in per employee terms(about 3.28 % of the GAV difference value in 2012)and by 0.0127 mil. CZK in per thousand hours terms(about 3.34 % of the GAV difference value in 2012).Similarly an increase in the difference of theCzechnational agricultural support by 1 mil. CZK is connected with an increase in the average annual wage difference by 0.0088 mil. CZK in per employee terms (about 16 % of the wage difference value in 2012)and by 0.0042 mil. CZK in per thousand hours terms (about 11 % of the wage difference value in 2012)and with a decrease in the average annual gross value added difference by 0.014 mil. CZK in per employee terms (about 5.97 % of the GAV difference value in 2012) and by 0.023 mil. CZK in per thousand hours terms(about 6.06 % of the GAV difference value in 2012).
The amount of the change in the average annual wage differentials as the effect of the agricultural support seems very small, but the average change in the average annual wage differentials during the monitored period is 0.0022 mil. CZK per year (in per employee terms) and 0.00147mil. CZK per year (in per thousand hours terms) and the average change in the average annual gross value added differentials during the monitored period is 0.0006 mil. CZK per year (in per employee terms) and 0.0009 mil.CZK per year (in per thousand hours terms). Therefore those values of the beta coefficients are not so small. Also the impact of the Czech national agricultural support on GAV differences and on wage differences only in per employee terms is higher than the EU support. The EU support has larger impact only in case of wage differences in per thousand hours terms. However, the models in this paper are very simplified and the results could be distorted by the omitted important variables.
From the same reasons those results are hard to compare to the results of other authors on the field of agricultural policy analysis. Therefore only the sign of the effect of policy changes and the changes in the amount of the support could be evaluated comparing the other authors’ results. Our results are in accordance with the result of Butault and Lerouvillois (1999)that income disparities can be explained mainlyby the labor productivity differences than by the changes in the CAP policy.However, the result of positive impact of the agricultural subsidies
52
on wage differentials (in the sense that an increase in wages in agricultural sector is lower than in the national economy therefore the wage differential increases) is contrary to the results of Keeney (2000), Schmidet al. (2006),Witzke and Noleppa(2006), Benni and Finger (2011) andTrnková and Malá (2012).
4 Conclusion The paper tries to contribute to the field of agricultural policy impact analysis and to answer the question of whether and to what extent the CAP changes and the Czech national support do have any and what kind of effect on wage differentials in agriculture and on the labor productivity differences. The impact of the dummy variables representing the milestones of the CAP changes for the Czech Republic is mostly positive on average wage differentials contrary to the paper hypothesis except for the 2008 reform. The impact of the dummy variables is negative on average gross value added (per employee or per thousand hours) representing the labor productivity.The effect of the EU and the Czech national agricultural support in absolute values on average wage differentials is positive contrary to the hypothesis 5 and 6 and on the average value added differentials negative in accordance with the hypothesis 5 and 6. The impact of the Czech national agricultural support on GAV differences and on wage differences only in per employee terms is higher than the EU support. The EU support has a larger impact only in the case of wage differences in per thousand hours terms. The collateral result is that average wage differentials are mostly explained by labor productivity differences.
The econometric models in this paper are very simplified and the results distorted by the omitted important variables and factors.More thorough and much more complicated model of agricultural labor market modified for agricultural policy analysis including all important variables need to be estimated.
References Benni, E. N., and Finger, R. (2011) ‘The effect of agricultural policy reforms on income inequality in Swiss agriculture’, Contributed paper at the EAAE 2011 Congress “Change and Uncertainty”, Zurich, [online], Available at WWW: http:// ageconsearch.umn.edu/bitstream/114346/2/ El%20Bennin_Nadja_548.pdf [10/07/2013].
Blackburn, McKinley L. (2007) ‘Estimating wage differentials without logarithms’, Labour Economics, Elsevier, vol. 14(1), pages 73-98, January.
Blinder, A. S. (1973) ‘Wage Discrimination: Reduced Form and Structural Estimates’, Journal of Human Resources, University of Wisconsin Press, vol. 8(4), pages 436-455.
Bureau, J.-C.etButault, J.-P. (1997) ’Analysespatiale et temporelle de la productivité des agricultures européennes entre 1973 et 1994’,Insee, Synthèses, n° 10, pp. 17-23.
Butault, J.-P.andLerouvillois, P. (1999) ‘La réforme de la PAC et l'inégalité des revenusagricolesdansl'Unioneuropéenne : les premiers effets’,Economie et statistique, N°329-330, pp. 73-86.
Cantore, N., Kennan, J. and Page, S. (2011) ‘CAP reform and development – Introduction, reform options and suggestions for further research,’ Overseas Development Institute
Carneiro, F. G. (1998)’Productivity effects in Brazilian wage determination’,World Development,vol. 26(1), pp. 139-153.
53
Dai, M. (2004)’La politiqueagricole commune : les enjeux de la réforme et le défi de l’élargissement de l’UE’,Bulletin de l'Observatoire des politiqueséconomiques en Europe,Observatoire des PolitiquesÉconomiques en Europe (OPEE), vol. 10(4), 07.
Dickens, W. T., and Katz, L. F. (1987) ‘Inter-Industry Wage Differences and Industry Charachteristics’, Unemployment and the Structure of Labor Markets, edited by K. Lang and J. Leonard, pp. 48-89. New York: Basil Blackwell.
Du Caju, P et al. (2010) ‘Inter-Industry Wage Differentials In EU Countries: What Do Cross-Country Time Varying Data Add to the Picture?’,Journal of the European Economic Association, MIT Press, vol. 8(2-3), pages 478-486, 04-05.
Ezcurra, R.,Iraizoz, B.,Pascual, P., and Rapún, M. (2011) ‘Agricultural productivity in the European regions: Trends and explanatory factors’,European Urban and Regional Studies, vol. 18 (2), pp. 113-135.
Gomez y Paloma, S. et al. (2013) ’The future of agriculture. Prospective scenarios and modelling approaches for policy analysis’,Land Use Policy,vol.31 (2013),pp. 102– 113.
Guisan, M. C., and Aguayo, E. (2007) ‘Wages, Productivity And Human Capital In The European Union: Econometric Models And Comparison With The Usa 1985-2005’, Applied Econometrics and International Development, Euro-American Association of Economic Development, vol. 7(1).
Gujarati, D. (2003) Basic Econometrics, 4th edition (GJ), McGraw Hill international editions: Economic series, p. 1002, ISBN 0072335424.
Hansen, H., and Herrmann, R. (2012) ‘The two dimensions of policy impacts on economic cohesion: Concept and illustration for the CAP’, Food Policy, vol. 37 (2012), pp. 483–491.
Hansen, H., and Teuber, R. (2011) ‘Assessing the impacts of EU’s common agricultural policy on regional convergence: Sub-national evidence from Germany’, Applied Economics, vol. 43 (26), pp. 3755–3765.
Keeney, M. (2000) ‘The distributional impact of direct payments on Irish farm incomes’, Journal of Agricultural Economics, vol. 51, no. 2, pp. 252–265.
Krueger, A. B. and Summers, L. H. (1987) ‘Reflections on the Inter-Industry Wage Structure’, NBER Working Paper No. 1968.
Krueger, A., andSummers, L. (1988): ‘Efficiency Wages and theInter-Industry Wage Structure’,Econometrica,vol. 56, pp. 259–294.
Meager, N. and Speckesser, S. (2011) ‘Wages, productivity and employment: A review of theory and international data’, European Employment Observatory, Thematic expert ad-hoc paper, Institute for Employment Studies, [online],Available at WWW: http://www.eu-employment-observatory.net/resources/reports/WagesProductivityandEmployment.pdf [30/06/2013]
Ministry of Agriculture (1997-2011) Zelené zprávy (Green reports 1997-2011), [online], Available at WWW: http://eagri.cz/public/web/mze/ministerstvo-zemedelstvi/vyrocni-a-hodnotici-zpravy/zpravy-o-stavu-zemedelstvi/ [20/07/2013]
Oaxaca, R. L., and Ransom, M. R. (1994) ‘On discrimination and the decomposition of wage differentials’, Journal of Econometrics, Elsevier, vol. 61(1), pages 5-21, March.
Pessoa, J. P., and Van Reenen, J. (2012) ‘Decoupling of Wage Growth and Productivity Growth?Myth and Reality’, Resolution Foundation. Ref No:B26915, [online], Available at WWW:
54
http://www.resolutionfoundation.org/media/media/downloads/Decoupling_of_wages_and_productivity.pdf [30/06/2013] Ricaurte, M. (2009) ‘Interindustry Wage Differences: An Empirical Review’, Working Papers Central Bank of Chile 525, Central Bank of Chile.
Slichter. S. (1950) ‘Notes on the Structure of Wages’,Review ofEconomics and Statistics,vol. 32, pp. 80-91.
Schmid, E. et al. (2006)‘Impacts of CAP Instruments on theDistribution of Farm Incomes – Results for Austria’,Diskussionspapier,InstitutfürnachhaltigeWirtschaftsentwicklung, DP-13-200613,[online],Available at WWW:http://franz.sinabell.wifo.ac.at/papers/DP-13-2006.pdf [15/07/2013].
Severini, S., and Tantari, A. (2012) ‘How direct payments and their reform have affected farm income inequality in Italy?’, Contributed paper at 1st AIEAA Conference “Towards a Sustainable Bio-economy: Economic Issues and Policy Challenges”, [online], Available at WWW: http://ageconsearch.umn.edu/ bitstream/124099/2/Severini Tantari_How%20 direct%20payments%20and%20their%20 reform%20have%20affected%20farm%20 income%20inequality%20in%20Italy.pdf [cit. 2012- 20-08].
Trnková, G., and Malá, Z. (2012) ‘Analysis of distribution impact of subsidies within the Common Agricultural Policy on field production businesses in the Czech Republic’, Actauniv. agric. etsilvic. Mendel. Brun.,vol. LX., No. 7, pp. 415–424.
Van Biesebroeck, J. (2011) ‘Wages Equal Productivity.Fact or Fiction? Evidence from Sub Saharan Africa,’ World Development, Vol. 39, No. 8, pp. 1333–1346.
VonWitzke, H. and Noleppa, S. (2006) ‘Distributive Effects of Direct Payments in GermanAgriculture under the New Common Agricultural Policyof the European Union’, The German Marshall Fund of the United States, Washington, D.C., [online],Available at WWW:http://www.gmfus.org/publications/index.cfm[12/07/2013].
Zanchi, L. (1998) ‘Interindustry wage differentials in dummy variable models’, Economics Letters, vol. 60 (1998), pp. 297–301.
55
Efficiency of biodynamic farms
Marie Pechrova Department of Economics, FEM, Czech University of Life Sciences Prague,
Kamycka 129, 165 21 Prague 6 [email protected]
Annotation: The aim of this article is to introduce theoretical approach to the analysis of the technical efficiency of the biodynamic farms. The biodynamic agriculture is broad topic usually viewed by scholars from the philosophical or biological point of view. The surveys from the economic point of view remind limited. While the organic farming gains the importance in agricultural research with its support from the Common Agricultural Policy of the European Union, biodynamic stays aside. Both approaches towards the evaluation of the efficiency – parametric or non-parametric – were utilized in the paper. The analysis was done for 4 biodynamic farms in the Czech Republic. Production of the farms was explained by five inputs: material, capital, labor, land and subsidies. Firstly, Farrell´s technical efficiency was calculated. Parametric approach was represented by Stochastic frontier analysis (SFA) and non-parametric by Data envelopment analysis (DEA). The SFA predicted in majority cases lower efficiency level of the input usage by the farms than DEA. While the average efficiency of biodynamic farms varied from 48.67 % to 74.79 % in case of SFA, DEA estimated the efficiency in the interval of 46.85 % to 84.01 %. On the basis of comparison of the analyses results, the appropriate method for further was suggested considering the pros and cons of each method.
This article is a starting point for a research financed from internal grant No. 11110/1312/3160 - “Analýza vybraných ukazatelů biodynamického zemědělství – komparace ve světovém měřítku” of the IGA of the FEM, CULS.
Key words: biodynamic agriculture, technical efficiency, data envelopment analysis, stochastic frontier analysis
JEL classification: JEL classification code(s)
1 Introduction The history of biodynamic agriculture dates to the beginning of the 20th century. The origin of biodynamic agriculture is linked to Rudolf Steiner’s lectures which he held in 1924 and published in a book “Spiritual Foundations for the Renewal of Agriculture”. His approach towards farming was based on spiritual science he developed called anthroposophy. (Phillips and Rodriguez, 2006) Steiner thought that chemicals caused problems in terms of weakening the vitality of crops. “Plants which formerly gathered their own nutrients and minerals from the earth now had become dependent on the dead chemical fertilizers for their minerals and as people ate these weak plants they also lost their will.” (Steiner 1993) Therefore Steiner recommended eight preparations – two spray preparations applied to soils and crops and six manure preparations.
Various researches started after Steiner’s lectures. They covered the topics of the production processes of the biodynamic products and the influence of the biodynamic farming on the quality of soil, on the health of plants or on the weed population. However, the scope of research from the economic point of view remind mild. While organic farming received considerable attention, biodynamic stays aside. Only few researches have been done on the efficiency of the production and financial performance of biodynamic farms. “Like organic agriculture, biodynamic agriculture has a certification process, but it has not received as much research attention from agricultural economists.” (Phillips and Rodriguez, 2006) The reason might be that, as Phillips (2006) states, it is “an agricultural system with beliefs in quality
56
over quantity and moral growth above traditional market value.” Nevertheless this should not prevent the research in economic area.
The aim of the article is to introduce the current approaches towards analysis of the technical efficiency of the farms, compare them and choose the best possible one which could be applied on biodynamic farms. Firstly, the history of the biodynamic farming and its basis are introduced. Than we describe various methods used for efficiency analysis. Results of different researches of efficiency of farms are introduced next. On the basis of their comparison, the appropriate method for further research is chosen.
Efficiency of farms Efficient production is defined as “the maximum quantity of output attainable by given input” (Pitt and Lee, 1981). Efficient input use is desirable as it goes hand in hand with reducing of the waste and resource. Technical efficiency, allocative efficiency, and scale efficiency, as well as more advanced concepts like dynamic efficiency and structural efficiency can be assessed. “Efficiency refers to the relationship between all outputs and inputs in a production process. The performance of a farm can be evaluated based on different efficiency measures, namely technical, allocative and economic efficiency.” (Speelmant et al., 2008).
Farrell (1957) defined the technical efficiency as the ability of a farm to produce the maximum feasible output from a given set of inputs or (from other point of view) to use minimum feasible inputs to produce a given level of output. On the basis of chosen definition the approach can be defined as output-oriented or the input-oriented. Technical efficiency can be measured also in terms of both types of spaces. It is possible to decompose it in two components: scale efficiency (related to the most efficient scale of operation in the sense of maximizing average productivity) and pure technical efficiency (obtained when separating the scale effect from the technical efficiency). Regarding the scale efficiency, decreasing, increasing, constant, non-increasing or non-decreasing returns to scale (RTS) can be distinguished. When the prices of inputs are known we can assess cost efficiency and decompose it into technical and allocative efficiency. The later one gives information about the costs to the farm when it picks up more expensive set of inputs than the optimal (i.e. less expensive but still sufficient).
There are generally two approaches to the evaluation of the efficiency: parametric and non-parametric. Some researchers use both methods (see e.g. Mathijs and Swinnen, 2001), as each of them has its advantages or disadvantages. While the parametric approach is characterized by a priori defined finite set of parameters, which are consequently estimated from data, nonparametric models are less restricted.
Another possibility is to distinguish between stochastic or deterministic models. Stochastic models take into account that individual observation could be affected by random noise and “tries to identify the underlying mean structure stripped from the impact of the random elements.” (Bogetoft and Otto, 2011, p. 17). Deterministic models do not reflect the variation in the data. The literature has reported many methods for studying the utilization efficiency of farmland, this includes the Stochastic Frontier Production Model, the Cobb-Douglas Production Function (see e.g. Phillips and Rodriguez, 2006), the Data Envelopment Analysis (DEA) approach and the DEA-Tobit Two Step Method, etc.
Čechura (2009) stated in his book that stochastic frontier production function approach is the mostly used parametric technique of the efficiency measurement. The same role in non-parametric estimation plays DEA. Bogetoft and Otto (2011) give an overview of the taxonomy of methods (see in Table 1).
57
Table 1. Taxonomy of the approaches used in efficiency analysis
Deterministic Stochastic
Parametric Corrected Ordinary Least Squares (COLS)
Stochastic Frontier Analysis (SFA)
Non-parametric Data Envelopment Analysis (DEA)
Stochastic Data Envelopment Analysis (SDEA)
Source: Bogetoft and Otto (2011)
Among the pros of the non-parametric approach belongs that there is no need for prior statement of the production function and no need to taking any assumptions about the inefficiency distribution. (Čechura, 2009). However, as Pitt and Lee (1981) pointed out, it “does not allow for random shocks in the production process which are outside the firm’s control. As a consequence, a few extreme measured observations determine the frontier and exaggerate the maximum possible output given input.” Contrary to that, SFA contains the statistical noise and enables hypothesis testing by usual statistical tests.
Parametric Estimation of Efficiency Parametric approach requires a priory assumption about the structure of the production possibility set and the data generation process. The first one gives the information about the transformation process of the inputs to outputs. The later one explains why actual values differ from production function. There are two possibilities. It could be due to inefficiency of the particular farm, or also because of the noise in the data. Deterministic frontier considers the distance from production function to be caused only by the inefficiency of the farm. The earlier applied approach was to estimate production function by Ordinary Least Squares (OLS) method and let some firms be below or above the regression line. Production function estimated by OLS could be either in additive (1a) or multiplicative (1b) form.
( ) vfy += βx; (1a)
( ) vefy ⋅= βx; (1b)
),0(~ 2σNviid
k = 1, ..., K
where x is a n dimensional input vector and y is the m-1 dimensional output, β is a vector of unknown parameters and v∈R is normally distributed noise term.
Later variant of the OLS, the Corrected ordinary least squares (COLS), is still used in the literature. The essence of this approach is that after the estimation of the parameters by OLS, the intercept parameter β0 is adjusted upward by adding the maximum error term. This enables to efficient firms to lie on the regression line leaving the inefficient firms below. The additive form (2a) and multiplicative form (2b) of a model estimated by COLS are presented below.
( ) ufy −= βx; (2a) uefy −⋅= );( βx (2b)
Huiid~ k = 1, ..., K
where H is certain probability distribution in R+.
58
Stochastic frontier analysis (SFA) allows for both the inefficiency of the farm as same as the noise in the data. It enables the decomposition of the error term ε in two parts: the efficiency term u and stochastic error term v ( uv −=ε ). Firms laying at the frontier are considered to be 100 % efficient. As the model is highly non-linear, the estimation method is Maximal likelihood (ML). It is an iterative optimization algorithm based on the maximization of the likelihood function (3) or log likelihood function (4).
( ) ( )βyβ ;ϕ=L (3)
( ) ( )( )ββ Lln= (4)
where y donates output, ( )βϕ ;y is the density function for the probability distribution of y with given input x and β is a vector of parameters. In large samples the estimates are nearly unbiased, consistent and efficient. The additive form of a model (5a) and multiplicative model (5b) are displayed below.
( ) uvfy −+= βx; (5a)
( ) uv eefy −⋅⋅= βx; (5b)
),0(~ 2vNv σ ( )2,0~ uNu σ+ k = 1, ..., K
where N+ represents a half-normal distribution. However, other types of distribution can be used – e.g. truncated normal, exponential or gamma. If u = 0 the firm is 100 % efficient, when u < 0, there is some degree of inefficiency. The distribution of composite error term ε is convolution of a normal distribution and half-normal one. While the total error term ε can be directly calculated after the parameters estimation, the u and v has to be calculated on the basis of their variance (6).
222uv σσσ += and 2
2
v
u
σσ
λ = (6)
where 2vσ is variance of error term v and 2
uσ variance of inefficiency u and λ is a parameter. All these parameters are included in the likelihood function.
Mostly used type of production functions are Cobb-Douglas or translogarithmic (translog) functions. Both of them are usually expressed in logarithmic form and therefore the coefficients give the information about the percentage change of output caused by 1 % in input. In other words, each estimated parameter of the Cobb-Douglas production function is interpreted as the production elasticity for the used input. Sum of the parameters represents the scale elasticity. In the context of organic farming, Cobb-Douglas was used for example by Mathijs and Swinnen (2011) to estimate the production function frontier for the organic wheat crop producers. Singh and Grover (2011) who assessed the economic viability of organic wheat cultivation in India used also Cobb-Douglas function.
First SFA models were based on cross-sectional data, but because panel data (data for farms during few years) have certain advantages, currently majority of researchers are using and further developing the models with panel data. Here can be mentioned for example Greene (2005), Kumbhakar et al. (2012) who are evolving Stochastic Frontier Analysis method with panel data sets. The types of SFA models differ according to the assumptions. Some researchers consider the inefficiency of the firms to be persistent in time – they use time invariant models, while others suppose the firms improvement and suggest time variant models. Also the intercept in a model can be common for all firms or specific for each.
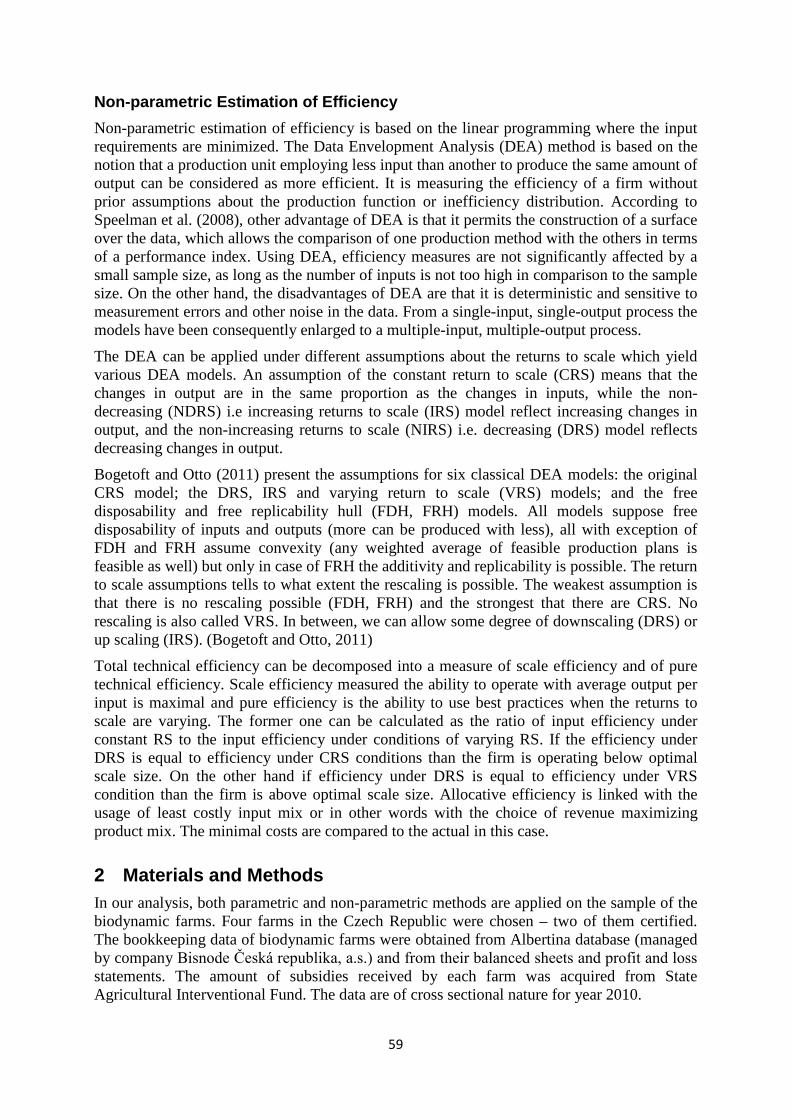
59
Non-parametric Estimation of Efficiency Non-parametric estimation of efficiency is based on the linear programming where the input requirements are minimized. The Data Envelopment Analysis (DEA) method is based on the notion that a production unit employing less input than another to produce the same amount of output can be considered as more efficient. It is measuring the efficiency of a firm without prior assumptions about the production function or inefficiency distribution. According to Speelman et al. (2008), other advantage of DEA is that it permits the construction of a surface over the data, which allows the comparison of one production method with the others in terms of a performance index. Using DEA, efficiency measures are not significantly affected by a small sample size, as long as the number of inputs is not too high in comparison to the sample size. On the other hand, the disadvantages of DEA are that it is deterministic and sensitive to measurement errors and other noise in the data. From a single-input, single-output process the models have been consequently enlarged to a multiple-input, multiple-output process.
The DEA can be applied under different assumptions about the returns to scale which yield various DEA models. An assumption of the constant return to scale (CRS) means that the changes in output are in the same proportion as the changes in inputs, while the non-decreasing (NDRS) i.e increasing returns to scale (IRS) model reflect increasing changes in output, and the non-increasing returns to scale (NIRS) i.e. decreasing (DRS) model reflects decreasing changes in output.
Bogetoft and Otto (2011) present the assumptions for six classical DEA models: the original CRS model; the DRS, IRS and varying return to scale (VRS) models; and the free disposability and free replicability hull (FDH, FRH) models. All models suppose free disposability of inputs and outputs (more can be produced with less), all with exception of FDH and FRH assume convexity (any weighted average of feasible production plans is feasible as well) but only in case of FRH the additivity and replicability is possible. The return to scale assumptions tells to what extent the rescaling is possible. The weakest assumption is that there is no rescaling possible (FDH, FRH) and the strongest that there are CRS. No rescaling is also called VRS. In between, we can allow some degree of downscaling (DRS) or up scaling (IRS). (Bogetoft and Otto, 2011)
Total technical efficiency can be decomposed into a measure of scale efficiency and of pure technical efficiency. Scale efficiency measured the ability to operate with average output per input is maximal and pure efficiency is the ability to use best practices when the returns to scale are varying. The former one can be calculated as the ratio of input efficiency under constant RS to the input efficiency under conditions of varying RS. If the efficiency under DRS is equal to efficiency under CRS conditions than the firm is operating below optimal scale size. On the other hand if efficiency under DRS is equal to efficiency under VRS condition than the firm is above optimal scale size. Allocative efficiency is linked with the usage of least costly input mix or in other words with the choice of revenue maximizing product mix. The minimal costs are compared to the actual in this case.
2 Materials and Methods In our analysis, both parametric and non-parametric methods are applied on the sample of the biodynamic farms. Four farms in the Czech Republic were chosen – two of them certified. The bookkeeping data of biodynamic farms were obtained from Albertina database (managed by company Bisnode Česká republika, a.s.) and from their balanced sheets and profit and loss statements. The amount of subsidies received by each farm was acquired from State Agricultural Interventional Fund. The data are of cross sectional nature for year 2010.
60
Production is represented by the sales of own products and services and change of the stock of own activity in particular year (in thousands of CZK. Material included the amount of consumed material and energy by farm and capital consisted of long-term assets of the farm. Labour was calculated as the division of wages of particular agricultural holding by average wages in agriculture in particular region of the Czech Republic. For one company with no employees was assumed that there is at least one owner and the labour input was set to 1. The acreage of farmland was the fourth input and the subsidies the fifth. Summary statistics for the biodynamic farms are displayed in Table 2.
Table 2. Summary statistics for biodynamic farms
Production Material Capital Labour Land Subsidies thous. CZK thous. CZK thous. CZK Nr. of workers ha thous. CZK
Average 8368.75 5662.00 27160.75 31.75 381.54 9988.92 Std. dev. 8408.55 5059.18 36816.27 49.25 330.94 13201.01 Min 1312.00 1359.00 1891.00 1.00 71.97 1697.53 Max 22111.00 14229.00 90660.00 117.00 918.70 32832.25
Source: own elaboration
It can be seen that the standard deviation of all variables is higher than the average. It is due to the presence of one large biodynamic farm with high production and high input usage – especially material and capital. Also the highest amount of subsidies was obtained by the largest firm. Number of workers varied from 1 to 117 and the land from 71.97 to 918.70 ha.
Firstly, Farrell’s input and output efficiency was calculated. Then technical efficiency was introduced and calculated for combinations of two inputs. It was not possible to calculate cost efficiency as the prices of the production factors were unknown. Hence, allocative efficiency was not assessed either. Consequently, two approaches – parametric and non-parametric were applied on the sample. Parametric approach was covered by SFA and non-parametric by DEA method. The estimated SF function was in a form of Cobb-Douglas and the inefficiency and efficiency was calculated using approaches introduced by Jondrow et al. (1982) or Battese and Coeli (1988). For the calculation of efficiency with DEA approach different assumptions of RTS were taken in account. This enabled to assess also the scale efficiency of the companies. Finally, the efficiency of the farms calculated with different methods was compared.
The calculations were done either in spreadsheet Microsoft Excel version 2007 or in software R, version 2.15.3 (2013-03-01) with help of library Benchmarking and Stata version 11.2.
3 Results and Discussion According to the Demeter International statistics, there are only three certified biodynamic farms in the Czech Republic. On the other hand, average area of the farm is the largest. It is 445 ha, which is the most from all certified biodynamic farms all over the world. Second largest farms can be found in Poland and then in Hungary. The smallest are situated in Sri Lanka (1.64 ha). In Europe, the smallest biodynamic farms are registered in Ireland (7.67 ha).
Farrell efficiency of biodynamic farms Efficiency refers to the amount of used inputs in order to produce certain amount of output. The basic idea of efficiency calculation is to compare observed output of a certain activity with the maximum output which could be achieved using the same inputs. In other words the farms producing the same amount of output are ranked according the minimal production
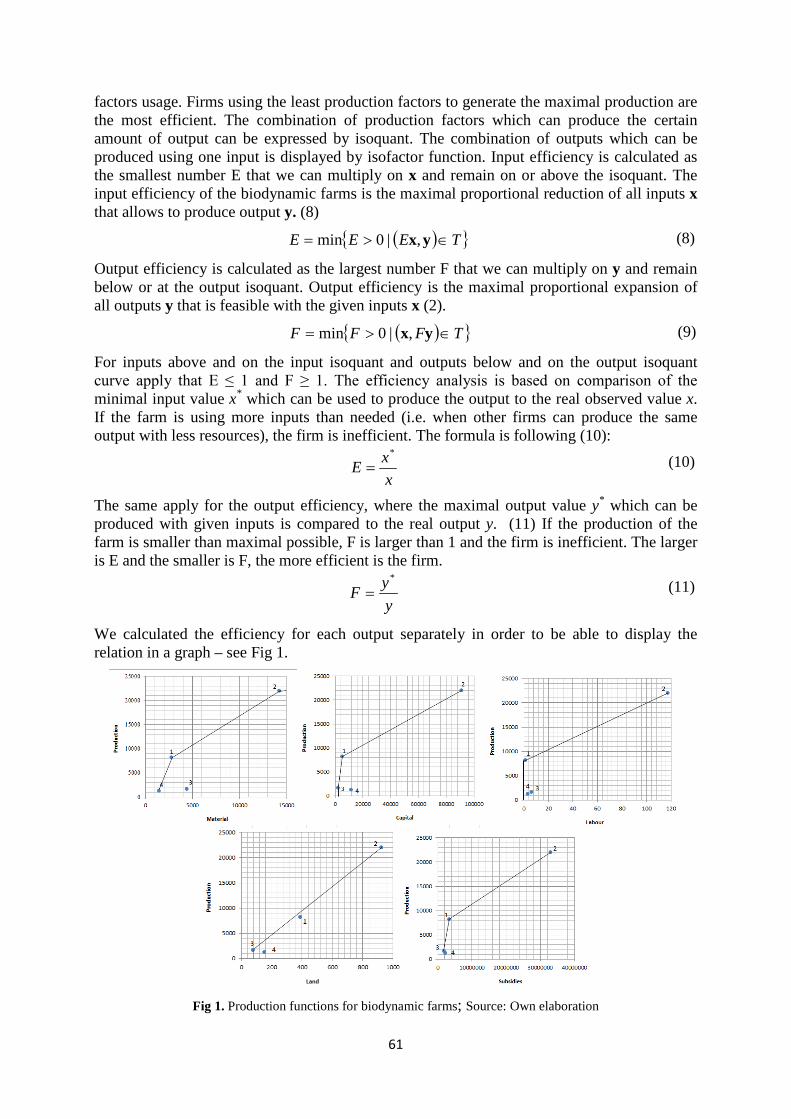
61
factors usage. Firms using the least production factors to generate the maximal production are the most efficient. The combination of production factors which can produce the certain amount of output can be expressed by isoquant. The combination of outputs which can be produced using one input is displayed by isofactor function. Input efficiency is calculated as the smallest number E that we can multiply on x and remain on or above the isoquant. The input efficiency of the biodynamic farms is the maximal proportional reduction of all inputs x that allows to produce output y. (8)
{ ( ) }TEEE ∈>= yx,|0min (8)
Output efficiency is calculated as the largest number F that we can multiply on y and remain below or at the output isoquant. Output efficiency is the maximal proportional expansion of all outputs y that is feasible with the given inputs x (2).
{ ( ) }TFFF ∈>= yx,|0min (9)
For inputs above and on the input isoquant and outputs below and on the output isoquant curve apply that E ≤ 1 and F ≥ 1. The efficiency analysis is based on comparison of the minimal input value x* which can be used to produce the output to the real observed value x. If the farm is using more inputs than needed (i.e. when other firms can produce the same output with less resources), the firm is inefficient. The formula is following (10):
xxE
*
= (10)
The same apply for the output efficiency, where the maximal output value y* which can be produced with given inputs is compared to the real output y. (11) If the production of the farm is smaller than maximal possible, F is larger than 1 and the firm is inefficient. The larger is E and the smaller is F, the more efficient is the firm.
yyF
*
= (11)
We calculated the efficiency for each output separately in order to be able to display the relation in a graph – see Fig 1.
Fig 1. Production functions for biodynamic farms; Source: Own elaboration
62
Farm number 2 always lies at the frontier of the function. This implies that this farm is efficient in using of all inputs. Regarding the material, only farm 3 can reduce this input by 55.55 % to produce the same amount of production. Or to put it differently, it can increase the output by 498.70 % without using more material. In the second case, the farm 4 can save 56.64 % of capital to produce the same output. Or it can expand its production by 612.83 % with current amount of capital. In case of labour, two companies can expand their production with current resource, firm 3 by 26.44 % and firm 4 by 66.22 %.
Regarding the outputs, there can be produced 417.88 % more by firm 3 and 552.94 % more by firm 4 using the same amount of available resources. If we consider the land input, firm 1 can reduce it by 10.41 % and still produce the same amount of production. It also can mildly expand its production by 11.37 % without changing the amount of used land. Analogical situation is for firm 4. It could reduce the land by 51.97 % to produce the same or expand the production by 174.22 % with current land. Finally, the firm 4 can save 21.24 % of subsidies and still produce the same output. The production could have been 69.16 % higher with current subsidies.
Technical, costs and allocative efficiency Without knowing prices Farrell efficiency can be measured by the relation of the actual point on the isoquant obtained by the projection of the observed x onto the isoquant - x~ . Than the technical efficiency is calculated as the ratio of the projected x~ (possibly multiplied by price w) and the real value of x (or wx). Knowing the prices of the production factors, it is also possible to calculate cost efficiency and to decompose it into technical and allocative. The cost-efficiency is the ratio of the minimal costs wx* to the actual costs wx, where x* stays for the intersection of the isoquant and isocost. It is the optimal costs combination where the isocost line is tanget of the isoquant. When we compare the prices and quantity (i.e. costs) of x~ to x* it tells how much it cost to the company to choose the current input mix in comparison to the optimal one. Allocative efficiency is derived as the ration of the current costs to the “optimal” costs. The relation between all types of efficiencies is displayed below (12).
xwwx
wxxwAETE
wxwxCE ~.
~.
**
=== (12)
where CE stays for cost, TE for technical and AE for allocative efficiency, x is the empirical observation of the production factors usage for particular firm, x* marks the point where isoquant intersect the isocost and x~ is the point on the isoquant obtained via proportional scaling for the observed x along the line from real observation x to the zero point.
The isoquants for pairs of production factors were drawn. Due to the limited sample, this could not be done for each combination of inputs. Therefore we considered only combinations of following production factors: material and capital, material and land, material and subsidies, capital and labor, material and labor, and labor and subsidies.
Most of the times, firm 2 is the only one not laying at the frontier and therefore being inefficient. Considering the relation of material and capital for firm 2, it can reduce these inputs by 11.45 % to be as efficient as other firms. The same situation is with relation material and land; they could be reduced by 14.38 %. Firm 2 can reduce material and subsidies even by 70.22 % to be as efficient as other firms. Regarding the capital and labour relation, firm 2 is not efficient as it can reduce both inputs by 3.27 % to produce the same amount. Firm 4 should reduce input use even by 38.22 % to be as efficient as other farms. In case of the relation of labour and subsidies, the isoquant is again made by firms 1, 3 and 4. Therefore we can assess only the efficiency of the firm 2. This farm can save 5.15 % of both inputs to produce the same output. We may conclude that firm 2 is not efficient in input usage.
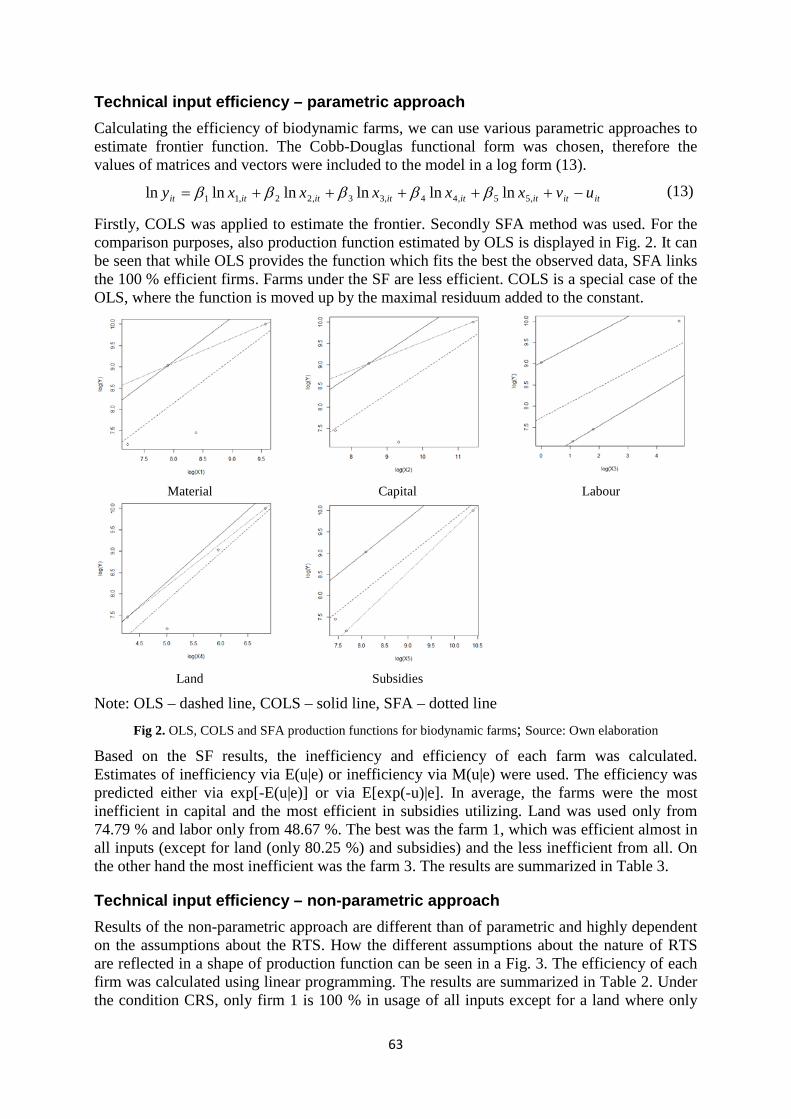
63
Technical input efficiency – parametric approach Calculating the efficiency of biodynamic farms, we can use various parametric approaches to estimate frontier function. The Cobb-Douglas functional form was chosen, therefore the values of matrices and vectors were included to the model in a log form (13).
itititititititit uvxxxxxy −+++++= ,55,44,33,22,11 lnlnlnlnlnln βββββ (13)
Firstly, COLS was applied to estimate the frontier. Secondly SFA method was used. For the comparison purposes, also production function estimated by OLS is displayed in Fig. 2. It can be seen that while OLS provides the function which fits the best the observed data, SFA links the 100 % efficient firms. Farms under the SF are less efficient. COLS is a special case of the OLS, where the function is moved up by the maximal residuum added to the constant.
Material Capital Labour
Land Subsidies
Note: OLS – dashed line, COLS – solid line, SFA – dotted line
Fig 2. OLS, COLS and SFA production functions for biodynamic farms; Source: Own elaboration
Based on the SF results, the inefficiency and efficiency of each farm was calculated. Estimates of inefficiency via E(u|e) or inefficiency via M(u|e) were used. The efficiency was predicted either via exp[-E(u|e)] or via E[exp(-u)|e]. In average, the farms were the most inefficient in capital and the most efficient in subsidies utilizing. Land was used only from 74.79 % and labor only from 48.67 %. The best was the farm 1, which was efficient almost in all inputs (except for land (only 80.25 %) and subsidies) and the less inefficient from all. On the other hand the most inefficient was the farm 3. The results are summarized in Table 3.
Technical input efficiency – non-parametric approach Results of the non-parametric approach are different than of parametric and highly dependent on the assumptions about the RTS. How the different assumptions about the nature of RTS are reflected in a shape of production function can be seen in a Fig. 3. The efficiency of each firm was calculated using linear programming. The results are summarized in Table 2. Under the condition CRS, only firm 1 is 100 % in usage of all inputs except for a land where only
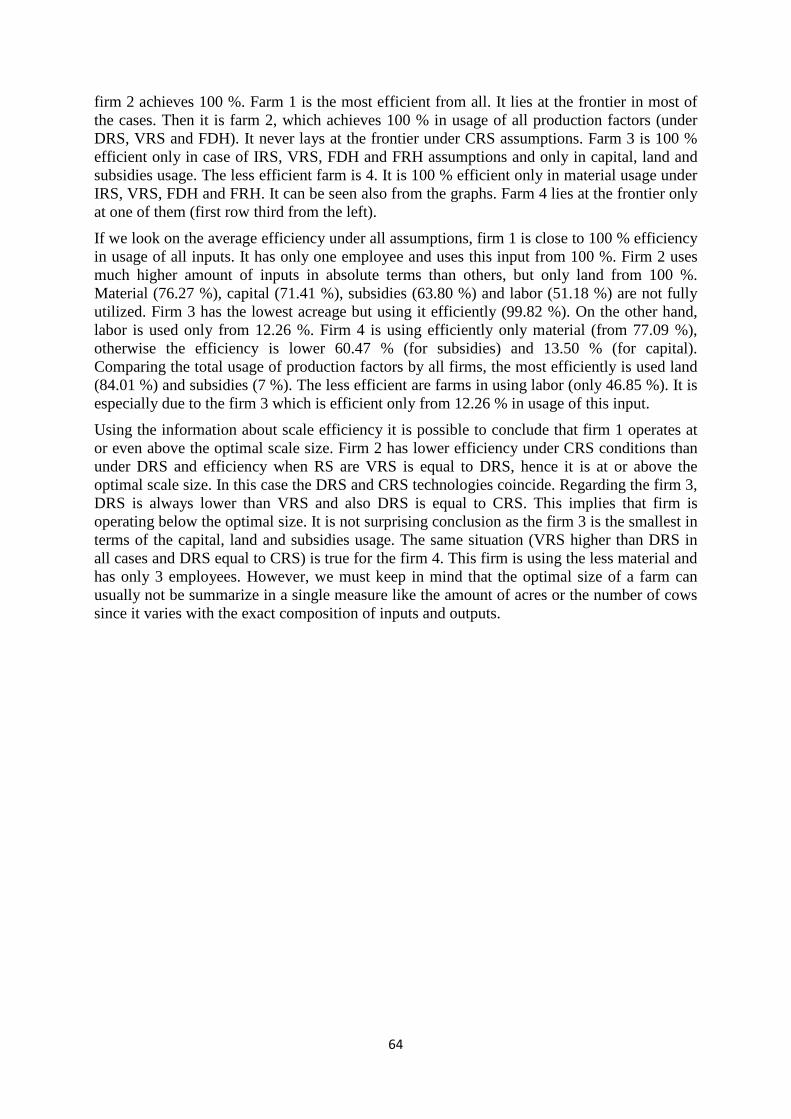
64
firm 2 achieves 100 %. Farm 1 is the most efficient from all. It lies at the frontier in most of the cases. Then it is farm 2, which achieves 100 % in usage of all production factors (under DRS, VRS and FDH). It never lays at the frontier under CRS assumptions. Farm 3 is 100 % efficient only in case of IRS, VRS, FDH and FRH assumptions and only in capital, land and subsidies usage. The less efficient farm is 4. It is 100 % efficient only in material usage under IRS, VRS, FDH and FRH. It can be seen also from the graphs. Farm 4 lies at the frontier only at one of them (first row third from the left).
If we look on the average efficiency under all assumptions, firm 1 is close to 100 % efficiency in usage of all inputs. It has only one employee and uses this input from 100 %. Firm 2 uses much higher amount of inputs in absolute terms than others, but only land from 100 %. Material (76.27 %), capital (71.41 %), subsidies (63.80 %) and labor (51.18 %) are not fully utilized. Firm 3 has the lowest acreage but using it efficiently (99.82 %). On the other hand, labor is used only from 12.26 %. Firm 4 is using efficiently only material (from 77.09 %), otherwise the efficiency is lower 60.47 % (for subsidies) and 13.50 % (for capital). Comparing the total usage of production factors by all firms, the most efficiently is used land (84.01 %) and subsidies (7 %). The less efficient are farms in using labor (only 46.85 %). It is especially due to the firm 3 which is efficient only from 12.26 % in usage of this input.
Using the information about scale efficiency it is possible to conclude that firm 1 operates at or even above the optimal scale size. Firm 2 has lower efficiency under CRS conditions than under DRS and efficiency when RS are VRS is equal to DRS, hence it is at or above the optimal scale size. In this case the DRS and CRS technologies coincide. Regarding the firm 3, DRS is always lower than VRS and also DRS is equal to CRS. This implies that firm is operating below the optimal size. It is not surprising conclusion as the firm 3 is the smallest in terms of the capital, land and subsidies usage. The same situation (VRS higher than DRS in all cases and DRS equal to CRS) is true for the firm 4. This firm is using the less material and has only 3 employees. However, we must keep in mind that the optimal size of a farm can usually not be summarize in a single measure like the amount of acres or the number of cows since it varies with the exact composition of inputs and outputs.
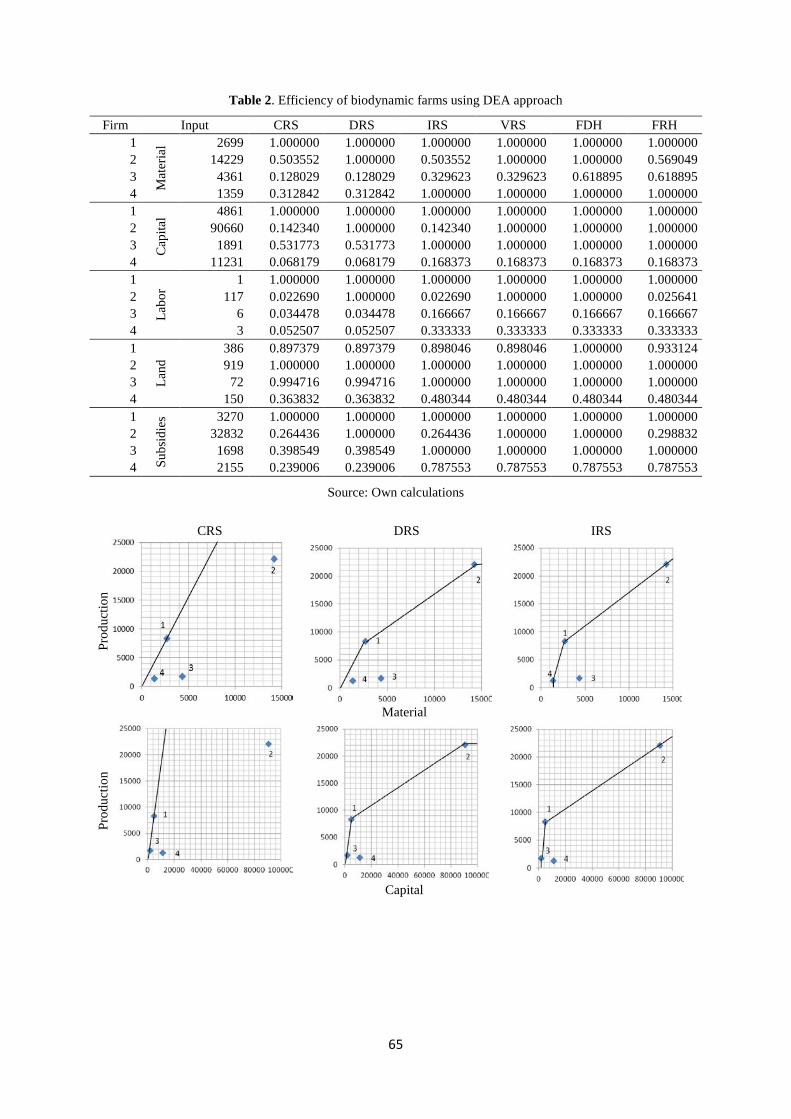
65
Table 2. Efficiency of biodynamic farms using DEA approach
Firm Input CRS DRS IRS VRS FDH FRH 1
Mat
eria
l 2699 1.000000 1.000000 1.000000 1.000000 1.000000 1.000000 2 14229 0.503552 1.000000 0.503552 1.000000 1.000000 0.569049 3 4361 0.128029 0.128029 0.329623 0.329623 0.618895 0.618895 4 1359 0.312842 0.312842 1.000000 1.000000 1.000000 1.000000 1
Cap
ital 4861 1.000000 1.000000 1.000000 1.000000 1.000000 1.000000
2 90660 0.142340 1.000000 0.142340 1.000000 1.000000 1.000000 3 1891 0.531773 0.531773 1.000000 1.000000 1.000000 1.000000 4 11231 0.068179 0.068179 0.168373 0.168373 0.168373 0.168373 1
Labo
r
1 1.000000 1.000000 1.000000 1.000000 1.000000 1.000000 2 117 0.022690 1.000000 0.022690 1.000000 1.000000 0.025641 3 6 0.034478 0.034478 0.166667 0.166667 0.166667 0.166667 4 3 0.052507 0.052507 0.333333 0.333333 0.333333 0.333333 1
Land
386 0.897379 0.897379 0.898046 0.898046 1.000000 0.933124 2 919 1.000000 1.000000 1.000000 1.000000 1.000000 1.000000 3 72 0.994716 0.994716 1.000000 1.000000 1.000000 1.000000 4 150 0.363832 0.363832 0.480344 0.480344 0.480344 0.480344 1
Subs
idie
s 3270 1.000000 1.000000 1.000000 1.000000 1.000000 1.000000 2 32832 0.264436 1.000000 0.264436 1.000000 1.000000 0.298832 3 1698 0.398549 0.398549 1.000000 1.000000 1.000000 1.000000 4 2155 0.239006 0.239006 0.787553 0.787553 0.787553 0.787553
Source: Own calculations
CRS DRS IRS
Prod
uctio
n
Material
Prod
uctio
n
Capital
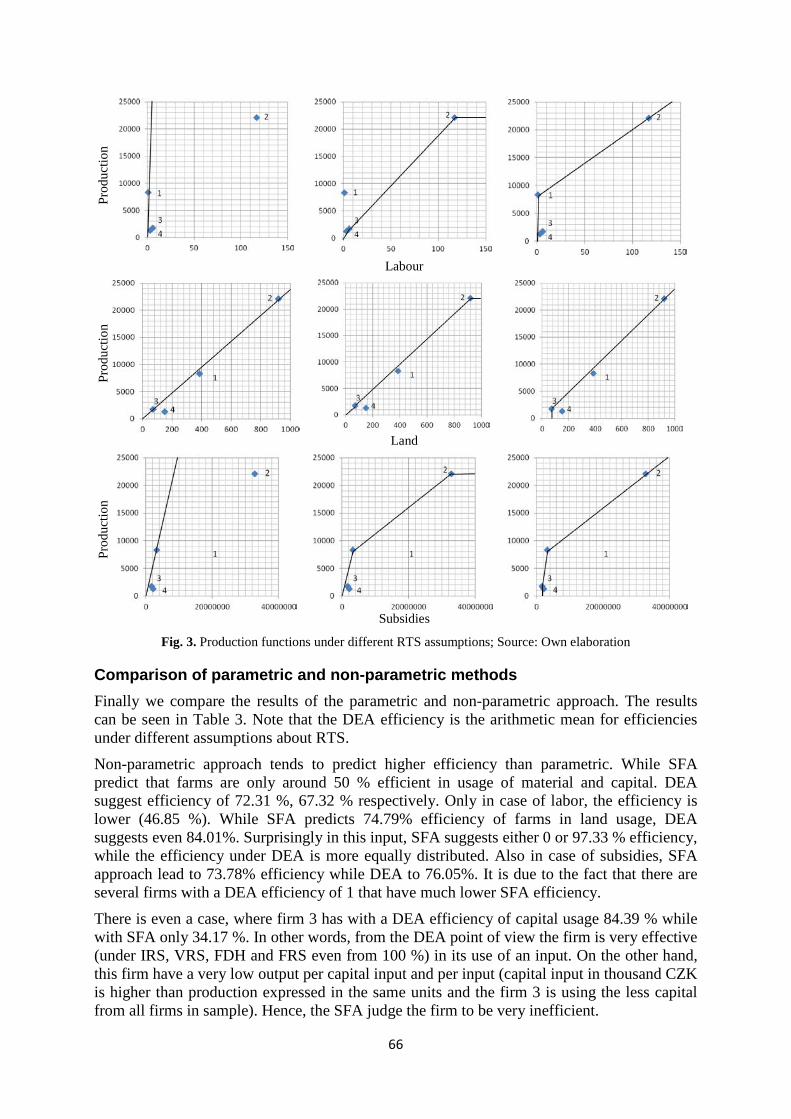
66
Prod
uctio
n
Labour
Prod
uctio
n
Land
Prod
uctio
n
Subsidies
Fig. 3. Production functions under different RTS assumptions; Source: Own elaboration
Comparison of parametric and non-parametric methods Finally we compare the results of the parametric and non-parametric approach. The results can be seen in Table 3. Note that the DEA efficiency is the arithmetic mean for efficiencies under different assumptions about RTS.
Non-parametric approach tends to predict higher efficiency than parametric. While SFA predict that farms are only around 50 % efficient in usage of material and capital. DEA suggest efficiency of 72.31 %, 67.32 % respectively. Only in case of labor, the efficiency is lower (46.85 %). While SFA predicts 74.79% efficiency of farms in land usage, DEA suggests even 84.01%. Surprisingly in this input, SFA suggests either 0 or 97.33 % efficiency, while the efficiency under DEA is more equally distributed. Also in case of subsidies, SFA approach lead to 73.78% efficiency while DEA to 76.05%. It is due to the fact that there are several firms with a DEA efficiency of 1 that have much lower SFA efficiency.
There is even a case, where firm 3 has with a DEA efficiency of capital usage 84.39 % while with SFA only 34.17 %. In other words, from the DEA point of view the firm is very effective (under IRS, VRS, FDH and FRS even from 100 %) in its use of an input. On the other hand, this firm have a very low output per capital input and per input (capital input in thousand CZK is higher than production expressed in the same units and the firm 3 is using the less capital from all firms in sample). Hence, the SFA judge the firm to be very inefficient.
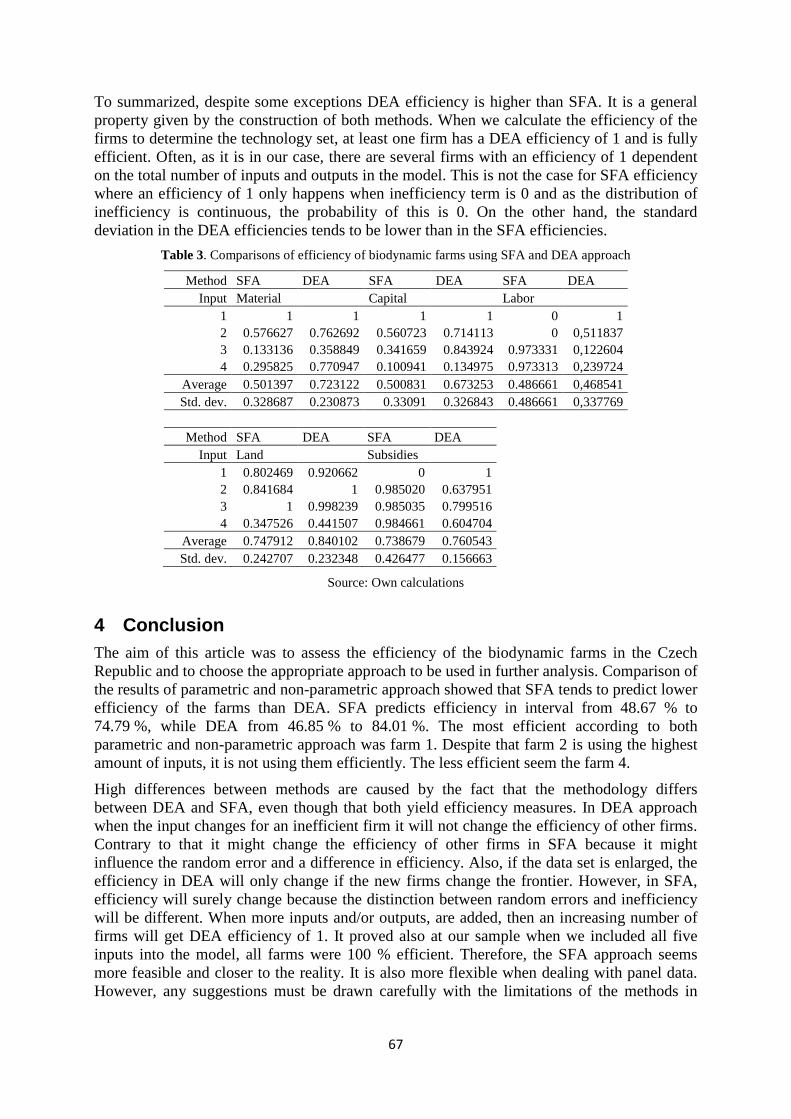
67
To summarized, despite some exceptions DEA efficiency is higher than SFA. It is a general property given by the construction of both methods. When we calculate the efficiency of the firms to determine the technology set, at least one firm has a DEA efficiency of 1 and is fully efficient. Often, as it is in our case, there are several firms with an efficiency of 1 dependent on the total number of inputs and outputs in the model. This is not the case for SFA efficiency where an efficiency of 1 only happens when inefficiency term is 0 and as the distribution of inefficiency is continuous, the probability of this is 0. On the other hand, the standard deviation in the DEA efficiencies tends to be lower than in the SFA efficiencies.
Table 3. Comparisons of efficiency of biodynamic farms using SFA and DEA approach
Method SFA DEA SFA DEA SFA DEA Input Material Capital Labor
1 1 1 1 1 0 1 2 0.576627 0.762692 0.560723 0.714113 0 0,511837 3 0.133136 0.358849 0.341659 0.843924 0.973331 0,122604 4 0.295825 0.770947 0.100941 0.134975 0.973313 0,239724
Average 0.501397 0.723122 0.500831 0.673253 0.486661 0,468541 Std. dev. 0.328687 0.230873 0.33091 0.326843 0.486661 0,337769
Method SFA DEA SFA DEA
Input Land Subsidies 1 0.802469 0.920662 0 1 2 0.841684 1 0.985020 0.637951 3 1 0.998239 0.985035 0.799516 4 0.347526 0.441507 0.984661 0.604704
Average 0.747912 0.840102 0.738679 0.760543 Std. dev. 0.242707 0.232348 0.426477 0.156663
Source: Own calculations
4 Conclusion The aim of this article was to assess the efficiency of the biodynamic farms in the Czech Republic and to choose the appropriate approach to be used in further analysis. Comparison of the results of parametric and non-parametric approach showed that SFA tends to predict lower efficiency of the farms than DEA. SFA predicts efficiency in interval from 48.67 % to 74.79 %, while DEA from 46.85 % to 84.01 %. The most efficient according to both parametric and non-parametric approach was farm 1. Despite that farm 2 is using the highest amount of inputs, it is not using them efficiently. The less efficient seem the farm 4.
High differences between methods are caused by the fact that the methodology differs between DEA and SFA, even though that both yield efficiency measures. In DEA approach when the input changes for an inefficient firm it will not change the efficiency of other firms. Contrary to that it might change the efficiency of other firms in SFA because it might influence the random error and a difference in efficiency. Also, if the data set is enlarged, the efficiency in DEA will only change if the new firms change the frontier. However, in SFA, efficiency will surely change because the distinction between random errors and inefficiency will be different. When more inputs and/or outputs, are added, then an increasing number of firms will get DEA efficiency of 1. It proved also at our sample when we included all five inputs into the model, all farms were 100 % efficient. Therefore, the SFA approach seems more feasible and closer to the reality. It is also more flexible when dealing with panel data. However, any suggestions must be drawn carefully with the limitations of the methods in
68
mind. As we have just presented, the results of the efficiency analysis do not depend solely on the data but mostly on the method used.
Our calculations are based on limited sample. Therefore, the challenge for future research is to further enlarge the survey. As there are no other biodynamic farms in the Czech Republic, the data will have to be obtained from foreign countries. This will also enable the comparison of the farms’ technical efficiency among different states.
Acknowledgements The research is financed from grant No. 11110/1312/3160 - “Analýza vybraných ukazatelů biodynamického zemědělství – komparace ve světovém měřítku” of the IGA, FEM, CULS.
References Battese, G. and T. Coelli (1988) ‘Prediction of Firm-Level Technical Efficiencies with a Generalised Frontier Production Function and Panel Data’, Journal of Econometrics, vol. 38, pp. 387-399.
Bogetoft, P., Otto, L. (2011) Benchmarking with DEA, SFA, and R. New York: Springer. ISBN 978-1-4419-7960-5.
Čechura, L. (2009) Zdroje a limity růstu agrárního sektoru: analýza efektivnosti a produktivity českého agrárního sektoru – aplikace SFA (Stochastic Frontier Analysis). Prague: Wolters Kluwer ČR. ISBN 978-80-7357-493-2.
Farrell, M. J. (1957) ‘The Measurement of Productive Efficiency’, Journal of the Royal Statistical Society, vol. 120, no. 3, pp. 253-290.
Greene, W. (2005) ‘Reconsidering heterogeneity in panel data estimators of the stochastic frontier model’, Journal of Econometrics, vol. 126, pp. 269–303.
Jondrow, J., Lovell, C. A. K, Materov, I. S., Schmidt, P. (1982) ‘On the Estimation of Technical Inefficiency in the Stochastic Frontier Production Function Model’, Journal of Econometrics, vol. 19, pp. 233–238.
Kumbhakar, S. C., Lien, G., Hardaker J. B. (2012) ‘Technical efficiency in competing panel data models: a study of Norwegian grain farming’, Journal of Productivity Analysis, vol. 19 September 2012, pp. 1-17.
Mathijs, E., swinnen, J. (2001) ‘Production organization and efficiency during transition: an empirical analysis of east-German agriculture’, The Review of economics and Statistics, vol. 83, pp. 100-107.
Phillips, J. C., Rodriguez, L. P. (2006) ‘Beyond Organic: An Overview of Biodynamic Agriculture with Case Examples’, Selected paper prepared for presentation at the American Agricultural Economics Association Annual Meeting, Long Beach, California, July 23 – 26.
Pitt, M. M., Lee, L-F. (1981) ‘The Measurement and Sources of Technical Inefficiency in the Indonesian weaving Industry’, Journal of Development Economics, vol. 9, pp. 43-64.
Singh, I. P., Grover, D. K. (2011) ‘Economic Viability of Organic farming: An Empirical Experience of Wheat Cultivation in Punjab’, Agricultural economics Research Review, vol. 24, pp. 275-281.

69
Speelman, S., D’Haese, M., Buysse, J., D’Haese, L. (2008) ‘A measure for the efficiency of water use and its determinants, a case study of small-scale irrigation schemes in North-Wet Province, South Africa’, Agricultural economics, vol. 98, pp. 31-39.
Steiner, R. (1993) Spiritual Foundation for the Renewal of Agriculture: A Course of Lectures, Kimberton, PA: Biodynamic Farming and Gardening Association.
70
Comparison of two approaches to prediction of prices
Jiri Pokorny, Pavel Fronek, and Miluse Abrahamova Institute of Agricultural Economics and Information,
Manesova 1453/75, 120 56, Prague 2 – Vinohrady [email protected] [email protected]
Annotation:
This article evaluates and compares two approaches to prediction of monthly prices of agricultural commodities in the Czech Republic. The first approach is an auto-regressive analysis, and the second one is a regression analysis of transmission of prices in a production vertical. Predictions were made from year 2004 until present each month up to three months ahead. Several statistical tests and descriptive statistics are applied on results of the two approaches. Results show that the auto-regressive method provides much more accurate predictions than those provided by the analysis of price transmission, which are even worse than a naïve prediction (the price will stay the same in the next month), but on the other hand make use of some relations between agricultural commodities. The first method, which predicts better than the naïve method, is tested for efficiency, and it is found that it is not efficient, which means that it is not optimal. Moreover, in the case of prediction three months ahead it is biased. For the second method, it was found that the best predictor from those that are considered are producers’ prices of feed mixture. For producers’ prices of feed mixture and other explained variables, a weighted average of farming prices of wheat and maize is a better predictor than farming prices of wheat.
Key words: predictions, evaluation, prices, transmission, commodities, agriculture
JEL classification: C52, Q11
1 Introduction The article compares two approaches to the prediction (forecast) of prices of agricultural commodities. These approaches are used at the Institute of Agricultural Economics and Information (IAEI) and this work is meant to evaluate them in terms of accuracy.
The first method is a classical analysis of time series and the second method is an analysis of transmission of prices in a production vertical (production chain). The methods are quite standard and well known. What is new is the application of these methods on particular commodities in the Czech agricultural sector. The prediction of prices is useful for various decision makers and policy makers as long as it is accurate. The second method is moreover helpful for identifying relations between prices of different commodities – for example to what extent a fall in farming prices (FP) will influence industry producers and end consumers.
There are two main texts as a source of this study, both written in Czech and as a part of research on the IAEI: The first (Muzik and Fronek 1994) explains the first method, and the second one (Abrahamova et al., 2012) corresponds to the second method.
Model predictions similar to those made in the first text are not known to be done for the Czech agricultural sector. A comparable exercise has been done by Zhemin et al. (2010) for Chinese eggs market.
On the other side, analysis of price transmission has been already done for example by Gallova & Cirova (2005) – for wheat and barley, Sobrova (2009) – for pork, Pankova (2009) – for feed wheat, and Pezlarova (2002).
71
We are primarily interested in statistical evaluation methods, for which a good reference is Sanders and Manfredo (2002).
2 Materials and Methods
The first approach The first method is a classical analysis of time series of prices of agricultural commodities where a prediction of price of a commodity is made from past prices of the same commodity using the least squares regression method. It takes into account the trend and because of seasonality in agricultural production also cyclical fluctuations. The predictions are usually made from monthly data for the three following months. The parameters of computation can vary while the choice is made in collaboration with experts who make fundamental analysis of different commodities. The experts’ view and their fundamental analysis is the most important, so the parameters of the technical analysis are chosen according to what is preferred by them.
To be more exact, the method consists of computation of a trend, which can be linear, quadratic, logarithmic, etc. Then there is a correction of the trend curve by cyclical indices, smoothing with three-month moving averages, and some other corrections. If it is the case that the prediction of a variable is made depending on some independent variable, then it is done in two phases: First, the independent variable is predicted, and then the dependent variable is predicted using also the predicted values of the first variable.
It must be emphasized that the choice of parameters is made extra for every prediction, to have the results consistent with an expert’s point of view. Therefore we evaluate not a single model, but rather a dynamic approach where human factor is important.
The second approach The second method is an analysis of transmission of prices, which means that the evolution of price of some commodity is explained by the evolution of price of some other commodity, typically lying above in the distribution vertical of production. In opposition to the first method, here the parameters (that is the coefficients of a regression analysis) are fixed for a certain period of time.
Since the explained variables and datasets are the same in both cases, it makes sense to compare these two methods. For example, the experts’ view is a part of prediction process only in the first method, so the comparison gives some information on how the experts are successful in combination with a technical analysis, compared to an analysis which is only technical.
The proceedings of the analysis are the following: It is again an application of the least squares method, as in the first case, and also the time series are the same – monthly data of prices of agricultural commodities. Additionally, the correlation coefficients were computed here. Unlike the previous, the dependent variable is not explained auto-regressively by its past values, but by contemporary or past values of other commodities in the same vertical of production (for example feed mixtures for pigs depending on ingredients for feed mixtures for pigs). There can be more than one explanatory variable and one explanatory variable can be represented with more than one lag, but most often there is only one explanatory variable in a contemporaneous relation to the explained one. Relating two variables contemporaneously is
72
actually not a prediction in the right sense, but in practice it can be used for predicting when the future value of one variable is known and not known for the other one.
Materials The main purpose of this paper is to evaluate the methods described above. The data for this are results of the two studies made at IAEI that were mentioned in 1), which themselves obtain the data mainly from The Czech Statistical Office, Ministry of Agriculture of the Czech Republic, and The State Agricultural Intervention Fund.
For the first method, the dependent (explained) variable are FP of eggs, which was chosen for the comparison because it is also analyzed with second method. Independent variables are lagged values of the price of that commodity three months back.
For the second method, dependent variables are: producers’ prices (PP) of feed mixture, FP of chicken, PP of chicken, consumer prices (CP) of chicken, PP of feed mixture, FP of eggs, and CP of eggs. This is the maximal amount of variables that can be compared based on the two main studies mentioned in 1).
Independent variables are: weighted average of FP of wheat and maize, FP of wheat, PP of feed mixture, and lagged variables of each of these.
Evaluation methods Here we describe the methods that were used for evaluation of the accuracy of predictions. See also Table 1 in section 3.1), where they are listed in the column “Similarity test”. The name of the column is due to the statistical methods used to evaluate the accuracy are comparing the predicted time series with the true time series.
The first test is quite intuitive. It is simply the average of the ratios of predicted and true values. If we subtract one, we have a mean percentage error.
Then there is a paired two-sample t-test, which takes the difference between the predicted and the true value for each period. Tables in 3.1) show the p-value. If it is lower than 0,05, we reject the hypothesis that the two series have the same mean.
The Runs test is also summarizing the two series as a whole in one number, which says how much the predicted values are biased on one side more than on the other. In tables with results we only have “1” if the bias is on the two sides the same, and “0” if it is not.
The correlation and the root mean squared error are standard measures. For the RMSE, it must be taken into account that the data are not standardized, so a comparison is possible only between the explanatory variables, not between the explained ones.
Finally we use the Theil’s U statistic, which compares our prediction with an alternative one, which would be done by putting the value of the current period as the prediction for the next one.
It makes sense to compare the two methods even though the purpose of the second method is not only prediction, as was said in 1). Moreover, we can also compare the independent variables of the second method in terms of how they predict the dependent variables.
For the first method, since it shows up to be substantially better for predicting than the second one, we additionally apply a test for the optimality of a forecast to see whether it makes good
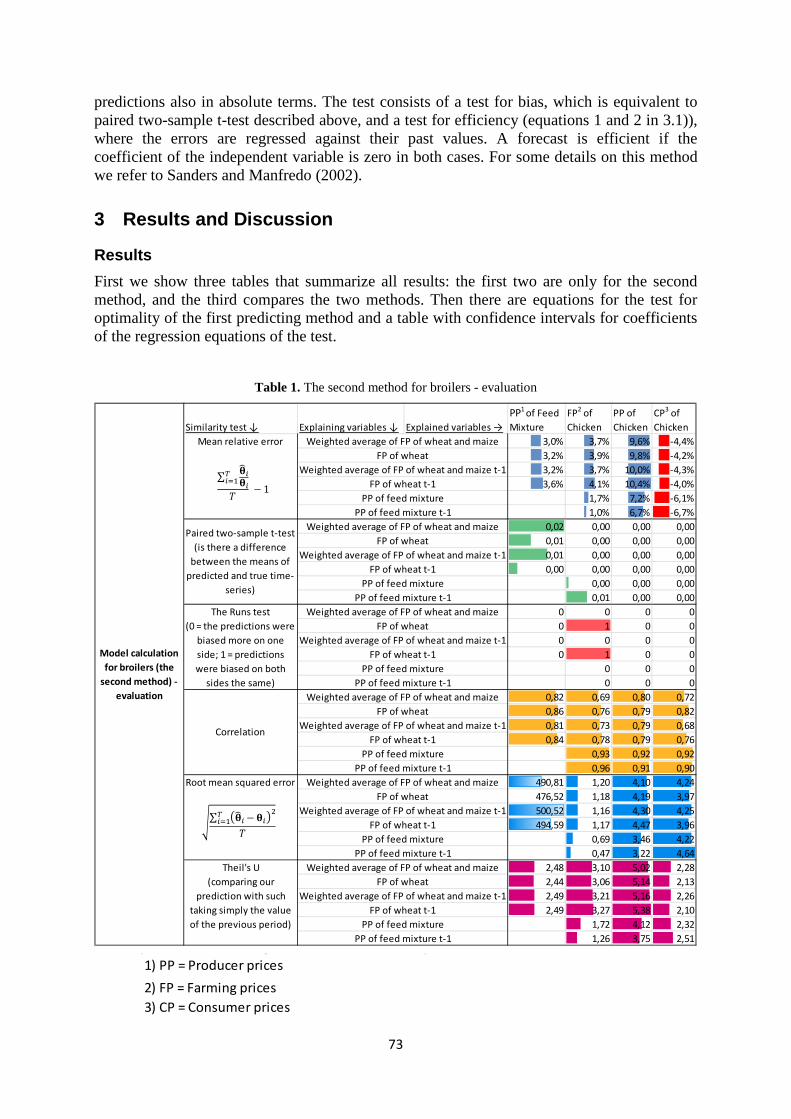
73
predictions also in absolute terms. The test consists of a test for bias, which is equivalent to paired two-sample t-test described above, and a test for efficiency (equations 1 and 2 in 3.1)), where the errors are regressed against their past values. A forecast is efficient if the coefficient of the independent variable is zero in both cases. For some details on this method we refer to Sanders and Manfredo (2002).
3 Results and Discussion
Results First we show three tables that summarize all results: the first two are only for the second method, and the third compares the two methods. Then there are equations for the test for optimality of the first predicting method and a table with confidence intervals for coefficients of the regression equations of the test.
Table 1. The second method for broilers - evaluation
Similarity test ↓ Explaining variables ↓ Explained variables →PP1 of Feed Mixture
FP2 of Chicken
PP of Chicken
CP3 of Chicken
3,0% 3,7% 9,6% -4,4%3,2% 3,9% 9,8% -4,2%3,2% 3,7% 10,0% -4,3%3,6% 4,1% 10,4% -4,0%
1,7% 7,2% -6,1%1,0% 6,7% -6,7%
0,02 0,00 0,00 0,000,01 0,00 0,00 0,000,01 0,00 0,00 0,000,00 0,00 0,00 0,00
0,00 0,00 0,000,01 0,00 0,00
0 0 0 00 1 0 00 0 0 00 1 0 0
0 0 00 0 0
0,82 0,69 0,80 0,720,86 0,76 0,79 0,820,81 0,73 0,79 0,680,84 0,78 0,79 0,76
0,93 0,92 0,920,96 0,91 0,90
490,81 1,20 4,10 4,24476,52 1,18 4,19 3,97500,52 1,16 4,30 4,25494,59 1,17 4,47 3,96
0,69 3,46 4,220,47 3,22 4,64
2,48 3,10 5,02 2,282,44 3,06 5,14 2,132,49 3,21 5,16 2,262,49 3,27 5,38 2,10
1,72 4,12 2,321,26 3,75 2,51
Model calculation for broilers (the
second method) - evaluation
Mean relative error Weighted average of FP of wheat and maizeFP of wheat
Weighted average of FP of wheat and maize t-1FP of wheat t-1
PP of feed mixturePP of feed mixture t-1
Paired two-sample t-test (is there a difference
between the means of predicted and true time-
series)
Weighted average of FP of wheat and maizeFP of wheat
Weighted average of FP of wheat and maize t-1FP of wheat t-1
PP of feed mixturePP of feed mixture t-1
The Runs test (0 = the predictions were
biased more on one side; 1 = predictions were biased on both
sides the same)
Weighted average of FP of wheat and maizeFP of wheat
Weighted average of FP of wheat and maize t-1FP of wheat t-1
PP of feed mixturePP of feed mixture t-1
Correlation
Weighted average of FP of wheat and maizeFP of wheat
Weighted average of FP of wheat and maize t-1FP of wheat t-1
PP of feed mixturePP of feed mixture t-1
Root mean squared error Weighted average of FP of wheat and maizeFP of wheat
Weighted average of FP of wheat and maize t-1FP of wheat t-1
PP of feed mixturePP of feed mixture t-1
Theil's U (comparing our
prediction with such taking simply the value of the previous period)
Weighted average of FP of wheat and maizeFP of wheat
Weighted average of FP of wheat and maize t-1FP of wheat t-1
PP of feed mixturePP of feed mixture t-1
∑ 𝛉�𝑖 − 𝛉𝑖2𝑇
𝑖=1𝑇
∑ 𝛉�𝑖𝛉𝑖
𝑇𝑖=1
𝑇 − 1
3) CP = Consumer prices
1) PP = Producer prices2) FP = Farming prices
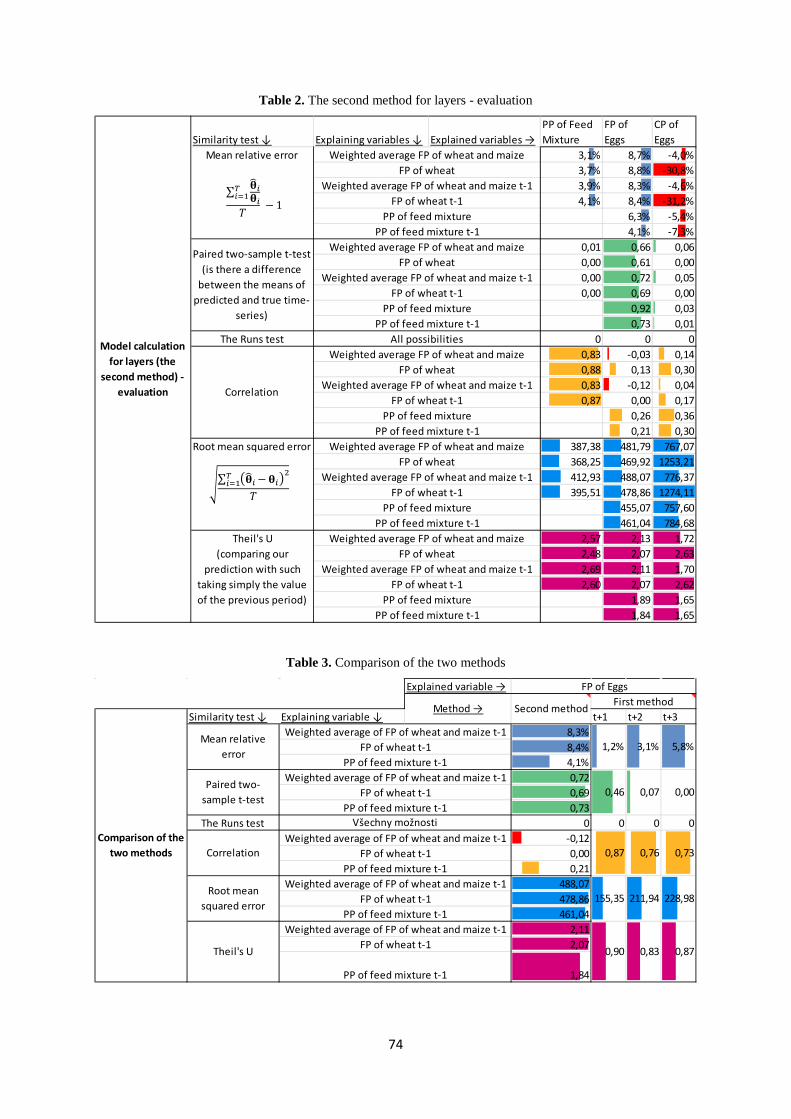
74
Table 2. The second method for layers - evaluation
Table 3. Comparison of the two methods
Similarity test ↓ Explaining variables ↓ Explained variables →PP of Feed Mixture
FP of Eggs
CP of Eggs
3,1% 8,7% -4,0%3,7% 8,8% -30,8%3,9% 8,3% -4,6%4,1% 8,4% -31,2%
6,3% -5,4%4,1% -7,3%
0,01 0,66 0,060,00 0,61 0,000,00 0,72 0,050,00 0,69 0,00
0,92 0,030,73 0,01
The Runs test 0 0 00,83 -0,03 0,140,88 0,13 0,300,83 -0,12 0,040,87 0,00 0,17
0,26 0,360,21 0,30
387,38 481,79 767,07368,25 469,92 1253,21412,93 488,07 776,37395,51 478,86 1274,11
455,07 757,60461,04 784,68
2,57 2,13 1,722,48 2,07 2,632,69 2,11 1,702,60 2,07 2,62
1,89 1,651,84 1,65
Model calculation for layers (the
second method) - evaluation
Mean relative error Weighted average FP of wheat and maizeFP of wheat
Weighted average FP of wheat and maize t-1FP of wheat t-1
PP of feed mixturePP of feed mixture t-1
Paired two-sample t-test (is there a difference
between the means of predicted and true time-
series)
Weighted average FP of wheat and maizeFP of wheat
Weighted average FP of wheat and maize t-1FP of wheat t-1
PP of feed mixturePP of feed mixture t-1
All possibilities
Correlation
Weighted average FP of wheat and maizeFP of wheat
Weighted average FP of wheat and maize t-1FP of wheat t-1
PP of feed mixturePP of feed mixture t-1
Root mean squared error Weighted average FP of wheat and maizeFP of wheat
Weighted average FP of wheat and maize t-1FP of wheat t-1
PP of feed mixturePP of feed mixture t-1
Theil's U (comparing our
prediction with such taking simply the value of the previous period)
Weighted average FP of wheat and maizeFP of wheat
Weighted average FP of wheat and maize t-1FP of wheat t-1
PP of feed mixturePP of feed mixture t-1
∑ 𝛉�𝑖𝛉𝑖
𝑇𝑖=1
𝑇 − 1
∑ 𝛉�𝑖 − 𝛉𝑖2𝑇
𝑖=1𝑇
Explained variable →
Similarity test ↓ Explaining variable ↓ t+1 t+2 t+38,3%8,4%4,1%0,720,690,73
The Runs test 0 0 0 0-0,120,000,21
488,07478,86461,04
2,112,07
1,84
Root mean squared error
Weighted average of FP of wheat and maize t-1155,35 211,94 228,98FP of wheat t-1
PP of feed mixture t-1
Theil's U
Weighted average of FP of wheat and maize t-1
0,90 0,83 0,87FP of wheat t-1
PP of feed mixture t-1
0,07 0,00FP of wheat t-1PP of feed mixture t-1
Všechny možnosti
CorrelationWeighted average of FP of wheat and maize t-1
0,87 0,76 0,73FP of wheat t-1PP of feed mixture t-1
FP of Eggs
Method → Second method First method
Comparison of the two methods
Mean relative error
Weighted average of FP of wheat and maize t-11,2% 3,1% 5,8%FP of wheat t-1
PP of feed mixture t-1
Paired two-sample t-test
Weighted average of FP of wheat and maize t-10,46
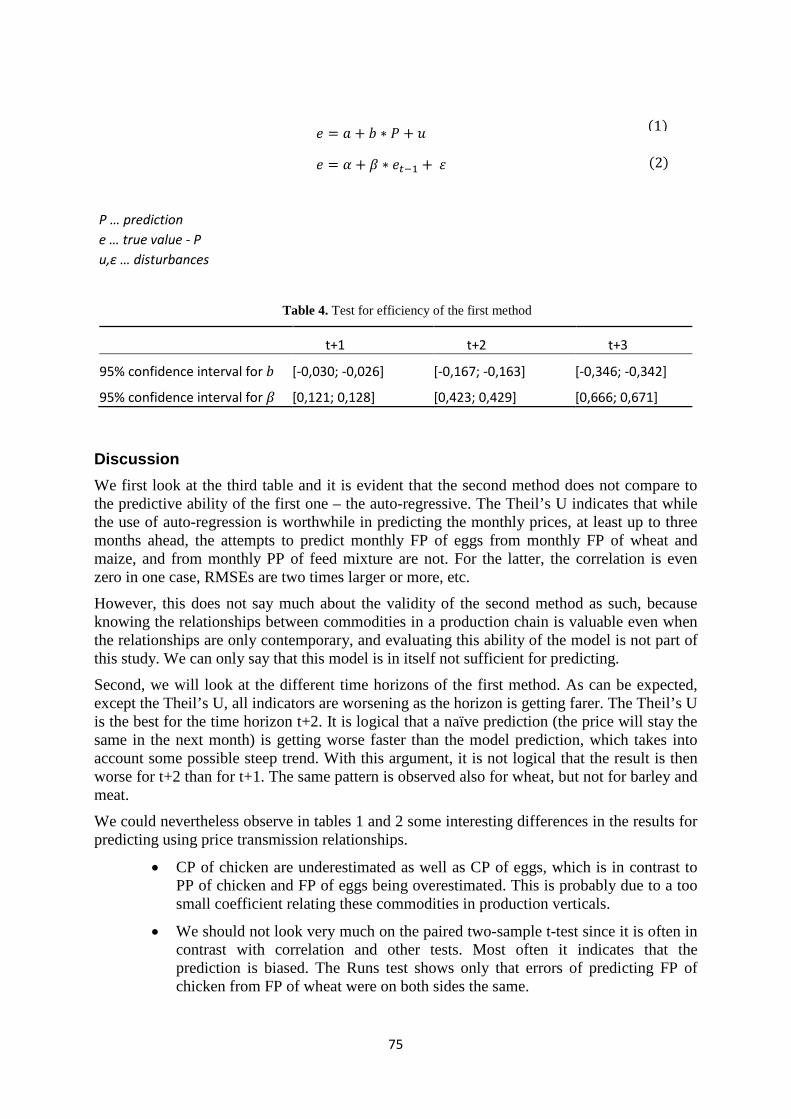
75
P … prediction e … true value - P u,ε … disturbances
Table 4. Test for efficiency of the first method
t+1 t+2 t+3
95% confidence interval for 𝑏 [-0,030; -0,026] [-0,167; -0,163] [-0,346; -0,342]
95% confidence interval for 𝛽 [0,121; 0,128] [0,423; 0,429] [0,666; 0,671]
Discussion We first look at the third table and it is evident that the second method does not compare to the predictive ability of the first one – the auto-regressive. The Theil’s U indicates that while the use of auto-regression is worthwhile in predicting the monthly prices, at least up to three months ahead, the attempts to predict monthly FP of eggs from monthly FP of wheat and maize, and from monthly PP of feed mixture are not. For the latter, the correlation is even zero in one case, RMSEs are two times larger or more, etc.
However, this does not say much about the validity of the second method as such, because knowing the relationships between commodities in a production chain is valuable even when the relationships are only contemporary, and evaluating this ability of the model is not part of this study. We can only say that this model is in itself not sufficient for predicting.
Second, we will look at the different time horizons of the first method. As can be expected, except the Theil’s U, all indicators are worsening as the horizon is getting farer. The Theil’s U is the best for the time horizon t+2. It is logical that a naïve prediction (the price will stay the same in the next month) is getting worse faster than the model prediction, which takes into account some possible steep trend. With this argument, it is not logical that the result is then worse for t+2 than for t+1. The same pattern is observed also for wheat, but not for barley and meat.
We could nevertheless observe in tables 1 and 2 some interesting differences in the results for predicting using price transmission relationships.
• CP of chicken are underestimated as well as CP of eggs, which is in contrast to PP of chicken and FP of eggs being overestimated. This is probably due to a too small coefficient relating these commodities in production verticals.
• We should not look very much on the paired two-sample t-test since it is often in contrast with correlation and other tests. Most often it indicates that the prediction is biased. The Runs test shows only that errors of predicting FP of chicken from FP of wheat were on both sides the same.
𝑒 = 𝑎 + 𝑏 ∗ 𝑃 + 𝑢
𝑒 = 𝛼 + 𝛽 ∗ 𝑒𝑡−1 + 𝜀
(1)
(2)
76
• According to the correlation coefficient, PP of feed mixture are the best predictor, with the exception of CP of chicken, where FP of wheat might be preferred.
• Correlation coefficients show that a weighted average of FP of wheat and maize is a better predictor for PP of feed mixture and other explained variables than FP of wheat.
• Confidence intervals in table 4 show clearly that the prediction is not efficient, meaning that it can be improved by changing the estimator used for the prediction, or by a correction of the prediction up or down. We already know from table 3 that future values are overestimated, and the results of the efficiency test are quite in line with it. We can use the estimated coefficients to correct our prediction by adding e of equation 1 or 2, depending for example on what would be in accord with the computed mean relative errors. Average amounts that should be added are given in the following table.
Table 5. Suggested corrections of predictions of the first method
t+1 t+2 t+3 According to equation 1 -12,19791209 -40,74644444 -89,30853933 According to equation 2 -10,52815643 -4,760508198 30,32908668
4 Conclusion The study found that the second approach, whose purpose is however not only predicting, does not make good predictions. Not only compared to the first one, but also absolutely, since the results signify a naïve prediction (the price will stay the same in the next month) being more accurate. An advantage of the first approach is that it is consulted with experts and updated every month, while coefficients in the model of the second approach are unchanged for a long period. Its predictions are more accurate than the naïve prediction, but inefficient and in the case of predicting three months ahead also biased. Farming prices and producers’ prices are overestimated by both methods, while consumer prices are underestimated by the second method. The errors are usually more than 3%. Producers’ prices of feed mixture are the best predictor, with the exception of explaining CP of chicken, where FP of wheat might be preferred. A weighted average of farming prices of wheat is a better predictor for producers’ prices of feed mixture and other explained variables than farming prices of wheat. The conclusion is that for predictive purposes we should use the auto-regressive analysis, and if we want to have some more insight into why prices of agricultural commodities evolve this or that way, we can use the model of price transmission, preferably on those commodities where predictions are relatively more accurate. Tests that were made in this study suggest that producers’ prices of feed mixture should be preferred as an independent (explanatory) variable.
References Abrahamová, M., Froněk, P., Teichmanová, J., and Špička, J. (2012) ‘Analýza cenové transmise výrobkové vertikály vepřového masa, drůbežího masa a vajec’, Ústav zemědělské ekonomiky a informací.
77
Gallová, L. and Círová, V. (2005) ‘Cenový přenos ve výrobkové vertikále’, ISBN 80-213-1372-2, Sborník prací z mezinárodní vědecké conference APXIV – “Znalostní ekonomika”: 116-120. Mužík, V. and Froněk, P. (1994) ‘Modelové zpracování predikce cen zemědělských a navazujících výrobků’, Výzkumný ústav zemědělské ekonomiky. Pánková, L. (2009) ‘Analýza cenové transmise krmné pšenice a potenciál jejího užití na domácím trhu’, Disertation Thesis, Czech University of Life Sciences Prague. Pezlarová, V. (2002) ‘Analysis of the relation between the price of fodder mixture ingredients and the price of chicken meat’, Agricultural Economics, 48, 2002 (11): 495-501. Sanders, Dwight R. and Manfredo, Mark R. (2002) ‘USDA Production Forecasts for Pork, Beef, and Broilers: An Evaluation’, Journal of Agricultural and Resource Economics 27(1): 114-127. Šobrová, L. (2009) ‘Ekonometrická analýza cenových přenosů na zemědělsko-potravinářském trhu ve vertikále vepřového masa v České republice’, Disertation Thesis, Czech University of Life Sciences Prague. Zhemin, L., Ganqiong, L., and Yuting, W. (2010) ‘Construction of Short-Term Forecast Model of Eggs Market Price’, Agriculture and Agricultural Science Procedia I (2010), 396-401.
78
Analysis of the Impact of Subsidies on Economic Performance of Agricultural Enterprises in the Czech
Republic
Analýza vlivu dotací na ekonomické výsledky zemědělských podniků v České republice
Helena Řezbová, Ondřej Škubna
Department of Economics, Czech University of Life Sciences Prague, Kamycka 129, 165 21 Prague 6 – Suchdol [email protected], [email protected]
Annotation:
The aim of this paper is to define recommendations for appropriate indicators, based on FADN database and indicating the effect of operating subsidies (direct payments) on the economic results of agricultural subjects. It followed a linear relationship within the selected group of indicators. The selected dependent variables were chosen indicators: net value added in CZK per 1 hectare, net value added in CZK per annual work unit and the amount of depreciation in CZK per hectare . The linear dependence is observed in nine size groups of agricultural enterprises, selected by small family farmers and legal persons and agricultural land. Basic source was obtained through web-based information system for the data network FADN CZ (IS FADN CZ, www.fadn.cz ) module BASIC and RESEARCH. The results confirm the linear dependence of the above parameters on the volume of operating subsidies in CZK / ha for all groups of enterprises.
Key words: FADN, Farm accountancy data network, agricultural enterprises, subsidies, farm net value added, depreciation
JEL classification: Q12, Q14
1 Úvod Analýza vlivu provozních dotací a jejich struktury na ekonomické výsledky zemědělských podniků je velmi diskutovaným tématem, a to jak na úrovni vědeckých studií, tak i na úrovni zájmových organizací: Agrární komory, Zemědělského svazu České republiky, Svazu marginálních oblastí a dalších. Problematika je řešena nejen na úrovni ČR, ale i na úrovni všech členských států Evropské unie. Základní databází, která poskytuje data pro komparaci jednotlivých států je zemědělská účetní datová síť (FADN, Farm Accountancy Data Network). Na základě dat z této datové sítě byla na úrovni EU zpracována nejnovější studie z roku 2012, zachycující nejen strukturu farem (podniků), ale i analyzující důležitost přímých plateb ve vyjádření jejich procentického podílu na celkových příjmech (total revenues) a jejich podílu na čisté přidané hodnotě podniku (EU farm economics – based on FADN data, 2012). Dalšími studiemi, které využívají databáze FADN jsou například studie ÚZEI Praha (2009), či studie konkrétních autorů (Hanibal a kol., 2012; Picková a Špička, 2008; Lekešová a Havrilíková, 2005; Špička 2010). Autoři Štolbová a Hlavsa (2008) vymezují na základě databáze FADN vliv LFA plateb na ekonomiku zemědělských podniků. Autor Špička (2013) ve svém odborném příspěvku analyzuje na základě databáze FADN ekonomické disparity v evropském zemědělství, problematikou databáze FADN a výsledků zemědělských podniků v Polsku včetně řízení jejich pracovního kapitálu se zabývá autor Ryś-Jurek (2008, 2011).
79
Výše uvedený výčet autorů a studií prokazuje význam zemědělské účetní datové sítě. Autoři příspěvku provedli v rámci širšího šetření analýzu ukazatelů, které jsou nejčastěji užívány ve vztahu k prokazování účinku vlivu provozních dotací (respektive přímých plateb) na ekonomické výsledky podniků z databáze FADN. Kromě dvou výše zmíněných ukazatelů, tj. podílu přímých plateb na celkových příjmech podniku a podílu přímých plateb na čisté přidané hodnotě podniku (EU farm economics – based on FADN data, 2012), nebyly v českých ani zahraničních publikacích, vycházejících z databáze FADN zjištěny žádné další vazby (korelace), které by zachycovaly tento vztah.
Cílem příspěvku je vymezit doporučení pro aplikaci vhodných ukazatelů, vycházejících z databáze FADN a indikujících vliv provozních dotací (přímých plateb) na ekonomické výsledky zemědělských subjektů. Bude sledována lineární závislost v rámci vybrané skupiny ukazatelů.
2 Materiál a metody Základní zdrojová databáze byla získána na základě Internetového informačního systému pro datovou síť FADN CZ (IS FADN CZ, www.fadn.cz). Informační systém IS FADN CZ je založen na přímém přístupu k databázi FADN CZ prostřednictvím internetu s možností interaktivního zadávání požadavků na výběry a agregace dat z různých hledisek. Byly využity dva moduly – modul BASIC (přístup pro odbornou veřejnost) a modul RESEARCH (autorizovaný přístup). Byly zkoumány výsledky zemědělských podnikatelských subjektů za roky 2001-2011. Podnikatelské subjekty byly rozděleny do 9-ti velikostních skupin, dle právní formy a výměry zemědělské půdy. Počet podniků v každé skupině byl 50-220 subjektů. V rámci fyzických osob bylo v databázi FADN vymezeno pět velikostních skupin dle výměry zemědělské půdy, jedná se o výměru do 5 hektarů, 5-50 hektarů, 50-100 hektarů, 100-300 hektarů a nad 300 hektarů zemědělské půdy. V rámci právnických osob byly v databázi FADN vymezeny čtyři velikostní skupiny dle výměry zemědělské půdy, jedná se o výměru do 50 hektarů, 50-1000 hektarů, 1000-2000 hektarů a nad 2000 hektarů zemědělské půdy.
Velikost provozních dotací na jeden hektar (v Kč) bude porovnávána s následujícími ukazateli:
(i) čistá přidaná hodnota na 1 hektar (ČPH/ha), jednotky Kč/ha
(ii) čistá přidaná hodnota na 1 roční pracovní jednotku (ČPH/AWU), jednotky Kč/PS
(iii) čistá přidaná hodnota na 1 roční pracovní jednotku (ČPH/AWU), následující 1 rok po vyplacení provozní dotace (čas t+1), jednotky Kč/PS
(iv) odpisy na 1 hektar, následující jeden rok po vyplacení provozní dotace (čas t+1), jednotky Kč/ha
Na základě regresní analýzy (lineární závislost) bude stanovena hodnota regresního koeficientu a koeficientu determinance a bude provedena diskuse k jednotlivým závisle proměnným. Regresní koeficienty a koeficienty determinance budou stanoveny jak pro celý soubor podniků celkem (bez členění na kategorie), tak pro jednotlivé velikostní skupiny podniků fyzických a právnických osob, za roky 2001-2011.
Autoři článku jsou si vědomi, že dalšími ukazateli, u kterých by se mohla projevit jejich lineární závislost na velikosti provozních dotací (přímých plateb) jsou ukazatelé zadluženosti (samofinancování), ukazatelé rentability a ukazatel likvidity II. stupně (včetně časového zpoždění t+1). Analýza lineární závislosti těchto ukazatelů na velikosti provozních dotací na 1 hektar je předmětem následných studií.
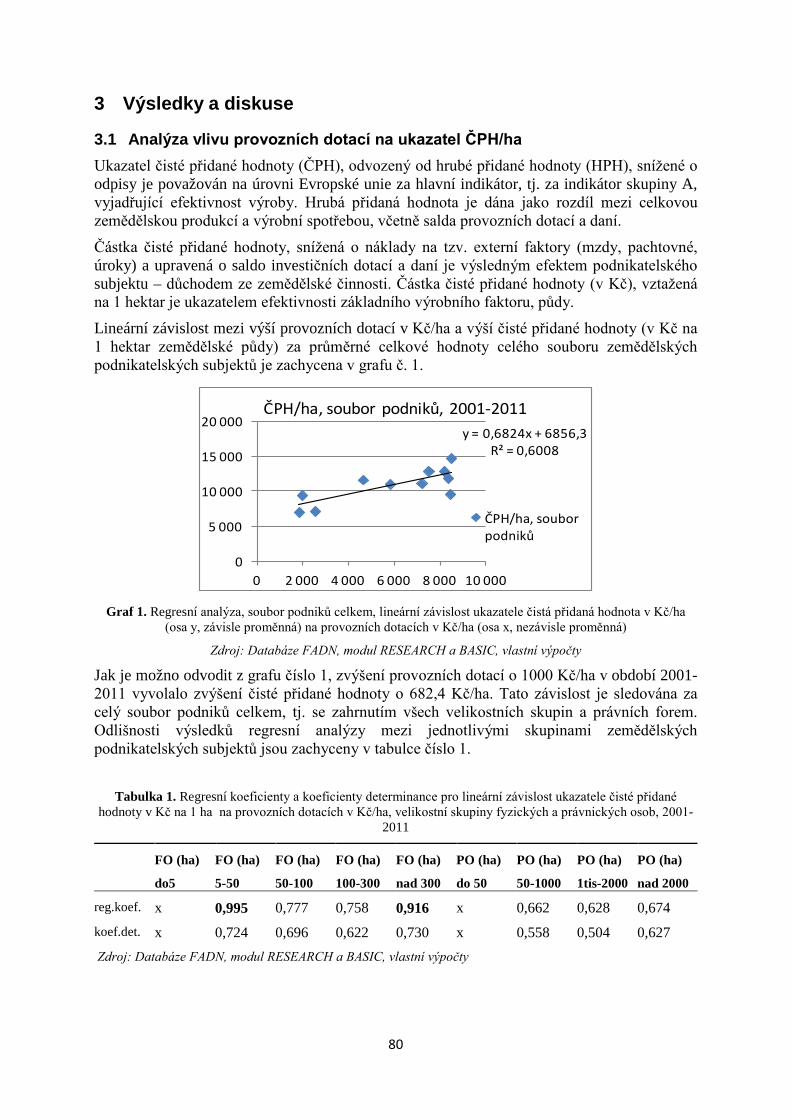
80
3 Výsledky a diskuse
3.1 Analýza vlivu provozních dotací na ukazatel ČPH/ha Ukazatel čisté přidané hodnoty (ČPH), odvozený od hrubé přidané hodnoty (HPH), snížené o odpisy je považován na úrovni Evropské unie za hlavní indikátor, tj. za indikátor skupiny A, vyjadřující efektivnost výroby. Hrubá přidaná hodnota je dána jako rozdíl mezi celkovou zemědělskou produkcí a výrobní spotřebou, včetně salda provozních dotací a daní.
Částka čisté přidané hodnoty, snížená o náklady na tzv. externí faktory (mzdy, pachtovné, úroky) a upravená o saldo investičních dotací a daní je výsledným efektem podnikatelského subjektu – důchodem ze zemědělské činnosti. Částka čisté přidané hodnoty (v Kč), vztažená na 1 hektar je ukazatelem efektivnosti základního výrobního faktoru, půdy.
Lineární závislost mezi výší provozních dotací v Kč/ha a výší čisté přidané hodnoty (v Kč na 1 hektar zemědělské půdy) za průměrné celkové hodnoty celého souboru zemědělských podnikatelských subjektů je zachycena v grafu č. 1.
y = 0,6824x + 6856,3R² = 0,6008
0
5 000
10 000
15 000
20 000
0 2 000 4 000 6 000 8 000 10 000
ČPH/ha, soubor podniků, 2001-2011
ČPH/ha, soubor podniků
Graf 1. Regresní analýza, soubor podniků celkem, lineární závislost ukazatele čistá přidaná hodnota v Kč/ha
(osa y, závisle proměnná) na provozních dotacích v Kč/ha (osa x, nezávisle proměnná)
Zdroj: Databáze FADN, modul RESEARCH a BASIC, vlastní výpočty
Jak je možno odvodit z grafu číslo 1, zvýšení provozních dotací o 1000 Kč/ha v období 2001-2011 vyvolalo zvýšení čisté přidané hodnoty o 682,4 Kč/ha. Tato závislost je sledována za celý soubor podniků celkem, tj. se zahrnutím všech velikostních skupin a právních forem. Odlišnosti výsledků regresní analýzy mezi jednotlivými skupinami zemědělských podnikatelských subjektů jsou zachyceny v tabulce číslo 1.
Tabulka 1. Regresní koeficienty a koeficienty determinance pro lineární závislost ukazatele čisté přidané hodnoty v Kč na 1 ha na provozních dotacích v Kč/ha, velikostní skupiny fyzických a právnických osob, 2001-
2011
FO (ha)
do5
FO (ha)
5-50
FO (ha)
50-100
FO (ha)
100-300
FO (ha)
nad 300
PO (ha)
do 50
PO (ha)
50-1000
PO (ha)
1tis-2000
PO (ha)
nad 2000
reg.koef. x 0,995 0,777 0,758 0,916 x 0,662 0,628 0,674 koef.det. x 0,724 0,696 0,622 0,730 x 0,558 0,504 0,627 Zdroj: Databáze FADN, modul RESEARCH a BASIC, vlastní výpočty
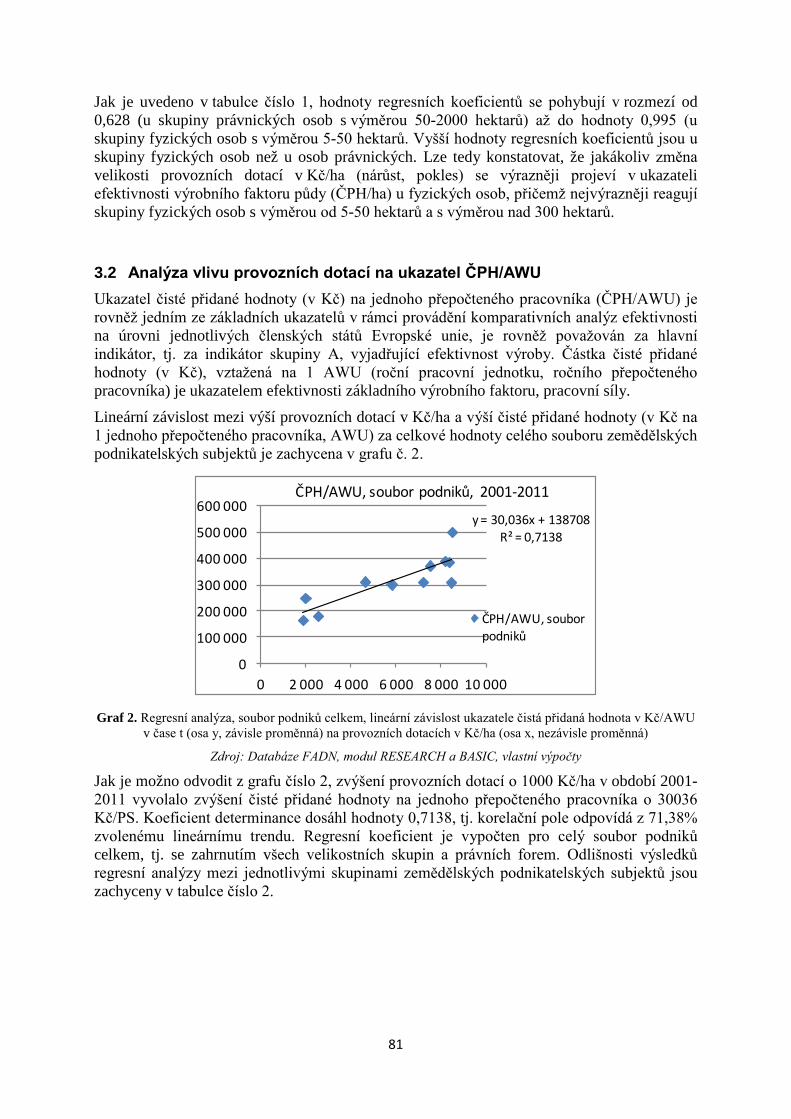
81
Jak je uvedeno v tabulce číslo 1, hodnoty regresních koeficientů se pohybují v rozmezí od 0,628 (u skupiny právnických osob s výměrou 50-2000 hektarů) až do hodnoty 0,995 (u skupiny fyzických osob s výměrou 5-50 hektarů. Vyšší hodnoty regresních koeficientů jsou u skupiny fyzických osob než u osob právnických. Lze tedy konstatovat, že jakákoliv změna velikosti provozních dotací v Kč/ha (nárůst, pokles) se výrazněji projeví v ukazateli efektivnosti výrobního faktoru půdy (ČPH/ha) u fyzických osob, přičemž nejvýrazněji reagují skupiny fyzických osob s výměrou od 5-50 hektarů a s výměrou nad 300 hektarů.
3.2 Analýza vlivu provozních dotací na ukazatel ČPH/AWU Ukazatel čisté přidané hodnoty (v Kč) na jednoho přepočteného pracovníka (ČPH/AWU) je rovněž jedním ze základních ukazatelů v rámci provádění komparativních analýz efektivnosti na úrovni jednotlivých členských států Evropské unie, je rovněž považován za hlavní indikátor, tj. za indikátor skupiny A, vyjadřující efektivnost výroby. Částka čisté přidané hodnoty (v Kč), vztažená na 1 AWU (roční pracovní jednotku, ročního přepočteného pracovníka) je ukazatelem efektivnosti základního výrobního faktoru, pracovní síly.
Lineární závislost mezi výší provozních dotací v Kč/ha a výší čisté přidané hodnoty (v Kč na 1 jednoho přepočteného pracovníka, AWU) za celkové hodnoty celého souboru zemědělských podnikatelských subjektů je zachycena v grafu č. 2.
y = 30,036x + 138708R² = 0,7138
0
100 000
200 000
300 000
400 000
500 000
600 000
0 2 000 4 000 6 000 8 000 10 000
ČPH/AWU, soubor podniků, 2001-2011
ČPH/AWU, soubor podniků
Graf 2. Regresní analýza, soubor podniků celkem, lineární závislost ukazatele čistá přidaná hodnota v Kč/AWU
v čase t (osa y, závisle proměnná) na provozních dotacích v Kč/ha (osa x, nezávisle proměnná)
Zdroj: Databáze FADN, modul RESEARCH a BASIC, vlastní výpočty
Jak je možno odvodit z grafu číslo 2, zvýšení provozních dotací o 1000 Kč/ha v období 2001-2011 vyvolalo zvýšení čisté přidané hodnoty na jednoho přepočteného pracovníka o 30036 Kč/PS. Koeficient determinance dosáhl hodnoty 0,7138, tj. korelační pole odpovídá z 71,38% zvolenému lineárnímu trendu. Regresní koeficient je vypočten pro celý soubor podniků celkem, tj. se zahrnutím všech velikostních skupin a právních forem. Odlišnosti výsledků regresní analýzy mezi jednotlivými skupinami zemědělských podnikatelských subjektů jsou zachyceny v tabulce číslo 2.
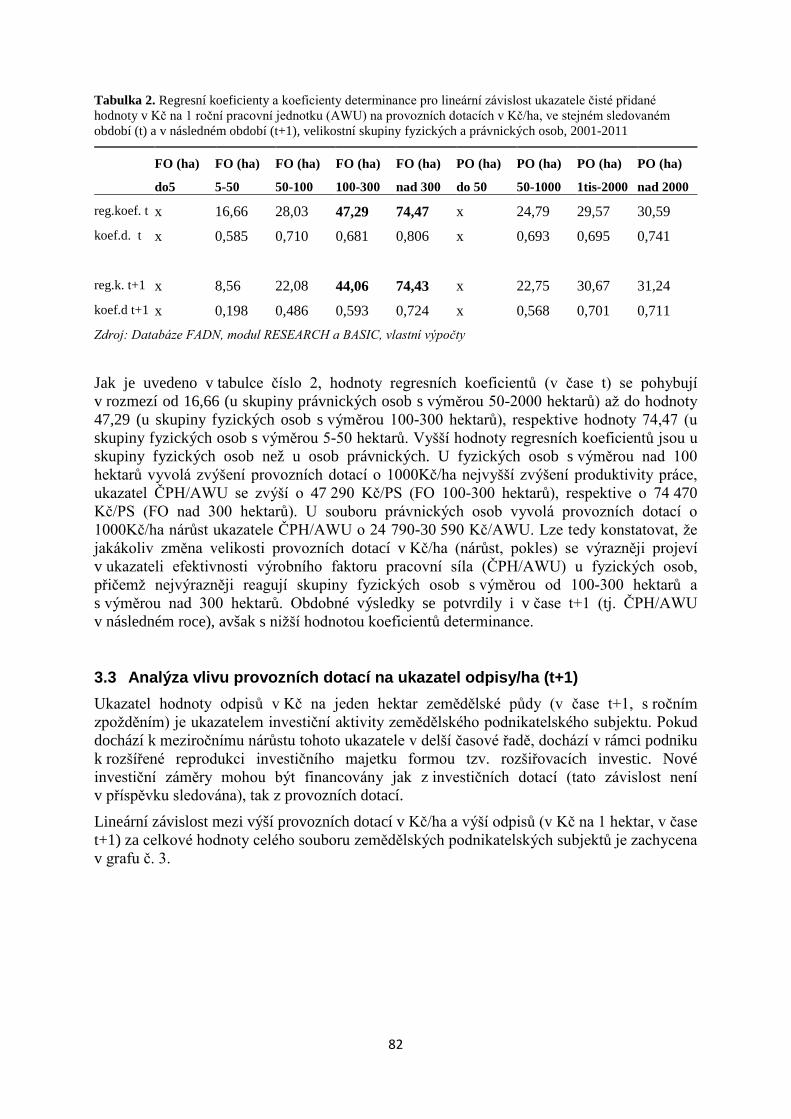
82
Tabulka 2. Regresní koeficienty a koeficienty determinance pro lineární závislost ukazatele čisté přidané hodnoty v Kč na 1 roční pracovní jednotku (AWU) na provozních dotacích v Kč/ha, ve stejném sledovaném období (t) a v následném období (t+1), velikostní skupiny fyzických a právnických osob, 2001-2011
FO (ha)
do5
FO (ha)
5-50
FO (ha)
50-100
FO (ha)
100-300
FO (ha)
nad 300
PO (ha)
do 50
PO (ha)
50-1000
PO (ha)
1tis-2000
PO (ha)
nad 2000
reg.koef. t x 16,66 28,03 47,29 74,47 x 24,79 29,57 30,59 koef.d. t x 0,585 0,710 0,681 0,806 x 0,693 0,695 0,741 reg.k. t+1 x 8,56 22,08 44,06 74,43 x 22,75 30,67 31,24 koef.d t+1 x 0,198 0,486 0,593 0,724 x 0,568 0,701 0,711 Zdroj: Databáze FADN, modul RESEARCH a BASIC, vlastní výpočty
Jak je uvedeno v tabulce číslo 2, hodnoty regresních koeficientů (v čase t) se pohybují v rozmezí od 16,66 (u skupiny právnických osob s výměrou 50-2000 hektarů) až do hodnoty 47,29 (u skupiny fyzických osob s výměrou 100-300 hektarů), respektive hodnoty 74,47 (u skupiny fyzických osob s výměrou 5-50 hektarů. Vyšší hodnoty regresních koeficientů jsou u skupiny fyzických osob než u osob právnických. U fyzických osob s výměrou nad 100 hektarů vyvolá zvýšení provozních dotací o 1000Kč/ha nejvyšší zvýšení produktivity práce, ukazatel ČPH/AWU se zvýší o 47 290 Kč/PS (FO 100-300 hektarů), respektive o 74 470 Kč/PS (FO nad 300 hektarů). U souboru právnických osob vyvolá provozních dotací o 1000Kč/ha nárůst ukazatele ČPH/AWU o 24 790-30 590 Kč/AWU. Lze tedy konstatovat, že jakákoliv změna velikosti provozních dotací v Kč/ha (nárůst, pokles) se výrazněji projeví v ukazateli efektivnosti výrobního faktoru pracovní síla (ČPH/AWU) u fyzických osob, přičemž nejvýrazněji reagují skupiny fyzických osob s výměrou od 100-300 hektarů a s výměrou nad 300 hektarů. Obdobné výsledky se potvrdily i v čase t+1 (tj. ČPH/AWU v následném roce), avšak s nižší hodnotou koeficientů determinance.
3.3 Analýza vlivu provozních dotací na ukazatel odpisy/ha (t+1) Ukazatel hodnoty odpisů v Kč na jeden hektar zemědělské půdy (v čase t+1, s ročním zpožděním) je ukazatelem investiční aktivity zemědělského podnikatelského subjektu. Pokud dochází k meziročnímu nárůstu tohoto ukazatele v delší časové řadě, dochází v rámci podniku k rozšířené reprodukci investičního majetku formou tzv. rozšiřovacích investic. Nové investiční záměry mohou být financovány jak z investičních dotací (tato závislost není v příspěvku sledována), tak z provozních dotací.
Lineární závislost mezi výší provozních dotací v Kč/ha a výší odpisů (v Kč na 1 hektar, v čase t+1) za celkové hodnoty celého souboru zemědělských podnikatelských subjektů je zachycena v grafu č. 3.
83
y = 0,1661x + 2242,8R² = 0,9288
0
1 000
2 000
3 000
4 000
5 000
0 2 000 4 000 6 000 8 000 10 000
Odpisy t+1, soubor podniků, 2001-2011
Odpisy t+1
Graf 3. Regresní analýza, soubor podniků celkem, lineární závislost ukazatele odpisy v Kč/ha v čase t+1 (osa y,
závisle proměnná) na provozních dotacích v Kč/ha (osa x, nezávisle proměnná)
Zdroj:Databáze FADN, modul RESEARCH a BASIC, vlastní výpočty
Jak je možno odvodit z grafu číslo 3, zvýšení provozních dotací o 1000 Kč/ha v období 2001-2011 vyvolalo zvýšení hodnoty odpisů na 1 hektar v následném roce o 166,1 Kč. Koeficient determinance dosáhl vysoké hodnoty 0,9288, tj. korelační pole odpovídá z 92,88% zvolenému lineárnímu trendu. Regresní koeficient je vypočten pro celý soubor podniků celkem, tj. se zahrnutím všech velikostních skupin a právních forem. Odlišnosti výsledků regresní analýzy mezi jednotlivými skupinami zemědělských podnikatelských subjektů jsou zachyceny v tabulce číslo 3.
Tabulka 3. Regresní koeficienty a koeficienty determinance pro lineární závislost ukazatele odpisy v Kč na 1 hektar v čase t+1 na provozních dotacích v Kč/ha, velikostní skupiny fyzických a právnických osob, 2001-2011
FO (ha)
do5
FO (ha)
5-50
FO (ha)
50-100
FO (ha)
100-300
FO (ha)
nad 300
PO (ha)
do 50
PO (ha)
50-1000
PO (ha)
1tis-2000
PO (ha)
nad 2000
reg.k. t+1 x 0,619 0,196 0,211 0,106 x 0,137 0,134 0,165 koef.d t+1 x 0,809 0,912 0,915 0,637 x 0,846 0,816 0,883 Zdroj: Databáze FADN, modul RESEARCH a BASIC, vlastní výpočty
Jak je uvedeno v tabulce číslo 3, hodnoty regresních koeficientů (v čase t+1) se pohybují v rámci fyzických osob v rozmezí od 0,106 (u skupiny fyzických osob s vysokou výměrou nad 300 hektarů) až do hodnoty 0,619 (u skupiny fyzických osob s nízkou výměrou 5-50 hektarů). U fyzických osob dochází k výraznému rozdílu mezi velikostními skupinami: mnohem výrazněji se zvyšuje investiční aktivita v následném roce u fyzických osob s malou výměrou (5-50 ha), kde zvýšení provozních dotací o 1000Kč/ha vyvolá nárůst hodnoty odpisů/ha v následném roce o 619 Kč/ha !, zatímco u fyzických osob s nejvyšší výměrou (nad 300 ha) vyvolá zvýšení provozních dotací o 1000Kč/ha nárůst hodnoty odpisů/ha v následném roce pouze o 106 Kč/ha, což je téměř šestinásobně nižší hodnota. Tento jev je možno vysvětlit omezenými možnostmi přístupu fyzických osob s malou výměrou k investičním úvěrům (problematika ručení) a k investičním dotacím (administrativní náročnost získání investiční dotace). V souboru právnických osob jsou hodnoty vyrovnané, zvýšení provozních dotací o
84
1000Kč/ha vyvolá nárůst hodnoty odpisů/ha v následném roce o 137-165 Kč na jeden hektar zemědělské půdy.
4 Závěr Rozšířená verze databáze FADN, moduly RESEARCH a BADIC umožňují více variant třídění podniků, včetně souběžného členění na fyzické a právnické osoby dle jejich výměry zemědělské půdy v hektarech. V rámci modulů však není možno analyzovat nejmenší velikostní skupiny – u fyzických osob se jedná o skupinu do 5 ha, u právnických osob o skupinu do 50 ha zemědělské půdy. Ve výše uvedených skupinách jsou zahrnuty zřejmě i zemědělské podnikatelské subjekty bez půdy a tímto dochází ke značnému zkreslení databáze.
Ukazatel ČPH/ha (čistá přidaná hodnota v Kč na 1 hektar) vhodně indikuje přímý vliv provozních dotací v průběhu let 2001-2011 v databázi FADN, koeficient determinance v rámci lineární závislosti se pohybuje v rozmezí 0,504 – 0,730.
Ukazatel ČPH/AWU (čistá přidaná hodnota v Kč na 1 přepočteného pracovníka) rovněž vhodně indikuje přímý vliv provozních dotací v průběhu let 2001-2011, koeficient determinance se při lineární závislosti pohybuje v rozmezí 0,585 – 0,747, přičemž zvýšení provozních dotací o 1000 Kč/ha přináší zvýšení ČPH/AWU v rozmezí 17-74 000 Kč.
Ukazatel ČPH/AWU pro t+1 vykazuje nižší hodnotu koeficientů determinance.
Ukazatel Odpisy/ha (v Kč na 1 hektar, pro t+1) vhodně indikuje přímý vliv provozních dotací na investiční činnost podniku, v průběhu let 2001-2011 se koeficient determinance pohybuje v rozmezí 0,637 – 0,915, přičemž zvýšení provozních dotací o 1000 Kč/ha přináší zvýšení hodnoty odpisů v Kč/ha v následujícím roce v rozmezí o 106-211 Kč, pouze u skupiny fyzických osob s malou výměrou 5-50 ha se jedná o 619 Kč/ha
Článek byl zpracován v rámci VZ MSM 6046070906 „Ekonomika zdrojů českého zemědělství a jejich efektivní využívání v rámci multifunkčních zemědělskopotravinářských systémů“.
Reference Hanibal, J. a kolektiv (2012) Výběrové šetření hospodářských výsledků zemědělských podniků v síti FADN CZ za rok 2011 (Samostatná příloha ke Zprávě o stavu zemědělství ČR za rok 2011). Praha: ÚZEI, 131 s.. ISBN 978-80-86671-96-3.
Hanibal, J. a kolektiv (2004) Uplatnění „Zemědělské účetní datové sítě“ (FADN) v České republice (Výzkumná studie č.78). Praha: VÚZE, 71 s. + přílohy. ISBN 80-86671-23-2.
Lekešová, M., Harvilíková, M.(2005) Information System FADN Czech Republic. In: Pacioli 13, pp.146-153. The Hague: Agricultural Economics Research Institute (LEI), 2005. ISBN 90-8615-031-4.
Picková, A. – Špička, J. (2008) Hospodaření zemědělských podniků v produkčně znevýhodněných oblastech Beskyd a Bílých Karpat. Praha: Ústav zemědělské ekonomiky a informací. 56 s. ISBN 978-80-86671-54-3.
Ryś-Jurek R., (2008). The output of the average individual farm in Poland and in the European Union countries. An attempt of defining similarity of structures in 2005. J. Agribus. Rural Dev. 2(8),119-133;
85
Ryś-Jurek R., (2011). Working capital management in farms in the year 2007 (based on FADN data) . J. Agribus. Rural Dev. 3(21),95-104;
Špička, J. (2010) Ekonomické výsledky sektoru a jednotlivých kategorií podniků. In BAŠEK, V. a kol. České zemědělství šest let po vstupu do Evropské unie. Praha: Ústav zemědělské ekonomiky a informací, 77 s. ISBN 978-80-86671-81-9.
Špička, J. (2013) The Economic Disparity in European Agriculture in the Context of Recent EU Enlargements. Journal of Economics and Sustainable Development, 2013, roč. 4, č. 15, s. 125-133. ISSN 2222-1700 (Print), 2222-2855 (Online).
Štolbová M., Hlavsa T.(2008): The impact of the LFA payments on the FADN farms in the
Czech Republic. Agricultural Economics – Zemedelska ekonomika, 54, (10): 489–497. ISSN 0139-570X.
EU farm economics 2012: based on FADN data. Brussels: European Union, 2013, 56 s. (online), (10.7.2013), Dostupné z: http://ec.europa.eu/agriculture/rica/pdf/EU_farm_economics_2012.pdf
Výsledky zemědělských podniků zemí EU na bázi Standardního výstupu FADN za období 2004-2007. Praha: ÚZEI, 2009, 271 s.. ISBN 978-80-86671-71-0.
Anotace:
Cílem příspěvku je vymezit doporučení pro aplikaci vhodných ukazatelů, vycházejících z databáze FADN a indikujících vliv provozních dotací (přímých plateb) na ekonomické výsledky zemědělských subjektů. Je sledována lineární závislost v rámci vybrané skupiny ukazatelů. Vybranými závisle proměnnými byly zvoleny ukazatele: čistá přidaná hodnota v Kč na 1 hektar, čistá přidaná hodnota v Kč na jednoho přepočteného pracovníka a výše odpisů v Kč na jeden hektar. Lineární závislost je sledována u devíti velikostních skupin zemědělských podnikatelských subjektů, v členění na fyzické a právnické osoby a výměru zemědělské půdy. Základní zdrojová databáze byla získána na základě Internetového informačního systému pro datovou síť FADN CZ (IS FADN CZ, www.fadn.cz), modul BASIC a RESEARCH. Výsledky potvrzují lineární závislost výše uvedených ukazatelů na velikosti provozních dotací v Kč/ha u všech skupin podnikatelských subjektů i za výsledky souboru celkem.
Klíčová slova: FADN, zemědělská účetní datová síť, zemědělský podnik, dotace, čistá přidaná hodnota, odpisy
JEL kód: Q12, Q14
86
Theoretical potential of biogas production from agricultural biogas plants
Teoretický potenciál produkce bioplynu ze zemědělských
bioplynových stanic
Josef Slaboch, Pavlína Hálová, Jiří Mach Department of Economics, Czech University of Life Sciences Prague,
Kamycka 129, 165 21 Prague 6 - Suchdol [email protected], [email protected], [email protected]
Annotation: One of the ways to achieve a smaller dependence on imported fossil fuels is the production of biogas from animal waste and biomass. The aim of this paper is to determine the theoretical potential of biogas production from agricultural biogas plants in the Czech Republic and its regions .
To meet this goal, a comparison of edge production capacity that is based on the full utilization of animal waste and the possibility of using "excess land" for selected commodities in crop production ( wheat , barley , maize , canola, sunflower , potatoes ) with sustaining of 105% self-sufficiency for period 2002 to 2015 is used . Theoretical potential for biogas production is further converted to the possibility of producing electricity and heat for individual regions. The potential for biogas production from animal wastes and crop production in the Czech Republic ( 2012) is on the level of 2,252.62 million m3 . Among regions, highest potential is identified for Central Bohemia , South Moravia , Vysocina and South Bohemia. The least theoretical possibility of biogas production while maintaining 105% self-sufficiency and maximum utilization of animal waste have regions of Karlovy Vary and Liberec .
Key words: biogas, degree of self-sufficiency, potential, energy
1 Úvod V oblasti energetiky je v posledních letech zřejmý trend odklonu od fosilních paliv a snaha o jejich nahrazení energií z obnovitelných zdrojů. Nová směrnice Evropského parlamentu a rady 2009/28/ES o podpoře a využívání energie z obnovitelných zdrojů energie a o změně a doplnění směrnic 2001/77/ES a 2003/30/ES ustanovuje jako celkový závazný cíl do roku 2020 podíl obnovitelných zdrojů energie na celkové spotřebě ve výši 20% a podíl biopaliv v dopravě ve výši 10%. Česká republika jako člen Evropské unie se zavázala do roku 2020 pokrýt alternativními zdroji 13 % své spotřeby energie. Mnohdy se tak děje na úkor ústupu zemědělské půdy (stavění solárních polí či v současnosti pěstování alternativních plodin jako je řepka, šťovík, kukuřice apod., na úkor potravinových a krmných komodit). K dosažení těchto cílů je potřeba hledat zdroje, které jsou snadno dostupné a stabilní. Právě energie biomasy splňuje tyto základní podmínky. Generování energie z obnovitelných zdrojů se stává stále důležitějším tématem ve světě, jednak z důvodů možnosti vyčerpání fosilních paliv, ale také z důvodu ochrany životního prostředí. (TATLIDIL, 2012) Česká republika je charakteristická intenzivním zemědělstvím, které se potýká s nadprodukcí a problematickým odbytem u některých komodit rostlinné produkce. Výroba energie v zemědělských bioplynových stanicích nabízí určitou stabilizaci pro zemědělský sektor. (BAČÍK, 2009) Dotace výroby bioplynu s vysokými a pevnými výkupními cenami jsou hlavním důvodem pro rozvíjení tohoto oboru a stávají se tak oporou pro zemědělce. I přesto jsou zde významné rizikové aspekty jako například kolísavé ceny vstupů v zemědělství. (KELLNER, 2012) Právě z těchto důvodů v posledních letech výrazně stoupá zájem o technologii bioplynu (rostoucí
87
počet projektovaných i budovaných bioplynových stanic). Tato technologie je ekologicky výhodná nejen pro zpracování biomasy, ale také pro zpracování odpadu živočišné produkce. (KOUĎA, 2008) K výrobě bioplynu lze využívat jednak energetické plodiny (převážně silážní kukuřici), ale také organické odpady a exkrementy hospodářských zvířat. (OSLAJ, 2010) Někteří autoři se však domnívají, že energie z biomasy je vhodná volba pro životní prostředí, protože je šetrnější z hlediska produkce skleníkových plynů. Na druhou stranu negativním důsledkem je používání zemědělské půdy k jiným účelům než k produkci potravin. (KIMMING, 2011) Výhodou v ČR je relativně velká velikost zemědělských podniků, které jsou schopny mít ekonomicky životaschopné bioplynové stanice, na rozdíl od jiných států EU (Polsko, Chorvatsko), kde jsou zemědělské podniky relativně malé. (PUKSEC, 2011) Vzniklý bioplyn je možné dodávat přímo do sítě nebo jej přeměnit pomocí kogenerací na elektrickou a tepelnou energii. Cílem tohoto článku je určit teoretický potenciál produkce elektrické a tepelné energie v jednotlivých krajích ze zemědělských bioplynových stanic. K tomu účelu je využito porovnání jednotlivých krajů s ohledem na 105 % soběstačnost u vybraných komodit rostlinné produkce a živočišných odpadů.
2 Materiál a metody Jednotlivé prognózy vývoje produkce a spotřeby vybraných zemědělských komodit jsou odhadnuty pomocí lineárních i nelineárních trendových funkcí a autoregresních modelů generovaných programem Gretl na období 2013-2015 s cílem predikovat teoretický potenciál výroby bioplynu z živočisných odpadů a rostlinné produkce. Data jsou čerpána z českého statistického úřadu (stavy hospodářských zvířat podle jednotlivých krajů), z výhledových a situačních zpráv MZe (obiloviny, olejniny, okopaniny) za období 2002-2012. Výpočet teoretického potenciálu vychází z odhadu produkce bioplynu (elektrické a tepelné energie) z živočišných odpadů. Zpracováním údajů ze statistik o počtu zvířat v jednotlivých krajích byl vypočítán teoretický potenciál bioplynových stanic. Přepočet byl proveden na základě hodnot uvedených v publikaci “Využití obnovitelných zdrojů energie v zemědělství” viz následující tabulka 1. U rostlinné produkce jsou vybrány plodiny s největším zastoupením na orné půdě ze skupin obilovin, olejnin a okopanin a dále kukuřice na siláž, kde je stanoven předpoklad využití 15 % ploch na energetické účely pro zemědělské bioplynové stanice. U ostatních komodit je předpoklad stanoven na určení 105 % míry soběstačnosti (rozdíl, resp. index mezi celkovou výrobou a celkovou spotřebou dané komodity) s cílem využít nadbytečnou plochu pro kukuřici na siláž a její následné využití v bioplynových stanicích jako vstupní substrát. Nadbytečná plocha u jednotlivých komodit je rozpočítána podle podílu oseté plochy v jednotlivých krajích. U prognóz na období 2013-2015 je produkce počítána jako součin prognózované oseté plochy a průměrného výnosu za sledované období (2002-2012). Pro jednotlivé kraje je na základě “nadbytečné plochy” vypočítán teoretický potenciál výroby bioplynu z kukuřice na siláž a potenciální výroba elektřiny a tepla. Zemědělská bioplynová stanice spadající do kategorie AF1 používá jako vstupní suroviny cíleně pěstované plodiny, které jsou primárně určeny k energetickému použití, neprošly technologickou úpravou a tvoří více než polovinu hmotnostního podílu v sušině vstupní suroviny (Metodický pokyn MŽP 12/2008 rozdělení bioplynových stanic). Přepočet množství bioplynu na elektrickou a tepelnou energii proběhl na základě hodnot uvedených dle Motlíka a Mikolaje. Mikolaj uvádí koeficient přepočtu 1,7-2,2 kWhel z 1 m3 bioplynu a Motlík uvádí 1,98 kWhel z 1 m3 bioplynu – s tímto číslem bylo v článku počítáno. U převodu na tepelnou energie uvádí Mikolaj hodnotu 2,2-4 kWht a Motlík hodnotu 3 kWht, která byla k přepočtu použita.
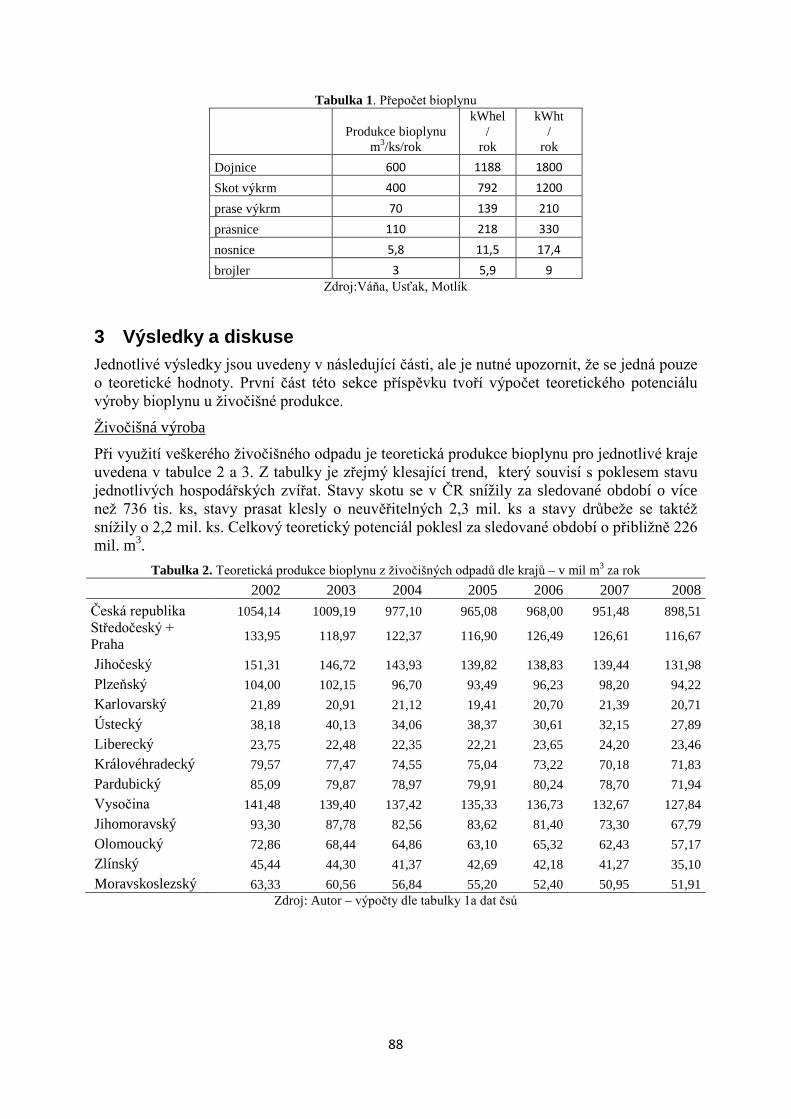
88
Tabulka 1. Přepočet bioplynu
Produkce bioplynu
m3/ks/rok
kWhel /
rok
kWht /
rok Dojnice 600 1188 1800 Skot výkrm 400 792 1200
prase výkrm 70 139 210 prasnice 110 218 330 nosnice 5,8 11,5 17,4 brojler 3 5,9 9
Zdroj:Váňa, Usťak, Motlík
3 Výsledky a diskuse Jednotlivé výsledky jsou uvedeny v následující části, ale je nutné upozornit, že se jedná pouze o teoretické hodnoty. První část této sekce příspěvku tvoří výpočet teoretického potenciálu výroby bioplynu u živočišné produkce.
Živočišná výroba
Při využití veškerého živočišného odpadu je teoretická produkce bioplynu pro jednotlivé kraje uvedena v tabulce 2 a 3. Z tabulky je zřejmý klesající trend, který souvisí s poklesem stavu jednotlivých hospodářských zvířat. Stavy skotu se v ČR snížily za sledované období o více než 736 tis. ks, stavy prasat klesly o neuvěřitelných 2,3 mil. ks a stavy drůbeže se taktéž snížily o 2,2 mil. ks. Celkový teoretický potenciál poklesl za sledované období o přibližně 226 mil. m3.
Tabulka 2. Teoretická produkce bioplynu z živočišných odpadů dle krajů – v mil m3 za rok 2002 2003 2004 2005 2006 2007 2008 Česká republika 1054,14 1009,19 977,10 965,08 968,00 951,48 898,51 Středočeský + Praha 133,95 118,97 122,37 116,90 126,49 126,61 116,67
Jihočeský 151,31 146,72 143,93 139,82 138,83 139,44 131,98 Plzeňský 104,00 102,15 96,70 93,49 96,23 98,20 94,22 Karlovarský 21,89 20,91 21,12 19,41 20,70 21,39 20,71 Ústecký 38,18 40,13 34,06 38,37 30,61 32,15 27,89 Liberecký 23,75 22,48 22,35 22,21 23,65 24,20 23,46 Královéhradecký 79,57 77,47 74,55 75,04 73,22 70,18 71,83 Pardubický 85,09 79,87 78,97 79,91 80,24 78,70 71,94 Vysočina 141,48 139,40 137,42 135,33 136,73 132,67 127,84 Jihomoravský 93,30 87,78 82,56 83,62 81,40 73,30 67,79 Olomoucký 72,86 68,44 64,86 63,10 65,32 62,43 57,17 Zlínský 45,44 44,30 41,37 42,69 42,18 41,27 35,10 Moravskoslezský 63,33 60,56 56,84 55,20 52,40 50,95 51,91
Zdroj: Autor – výpočty dle tabulky 1a dat čsú
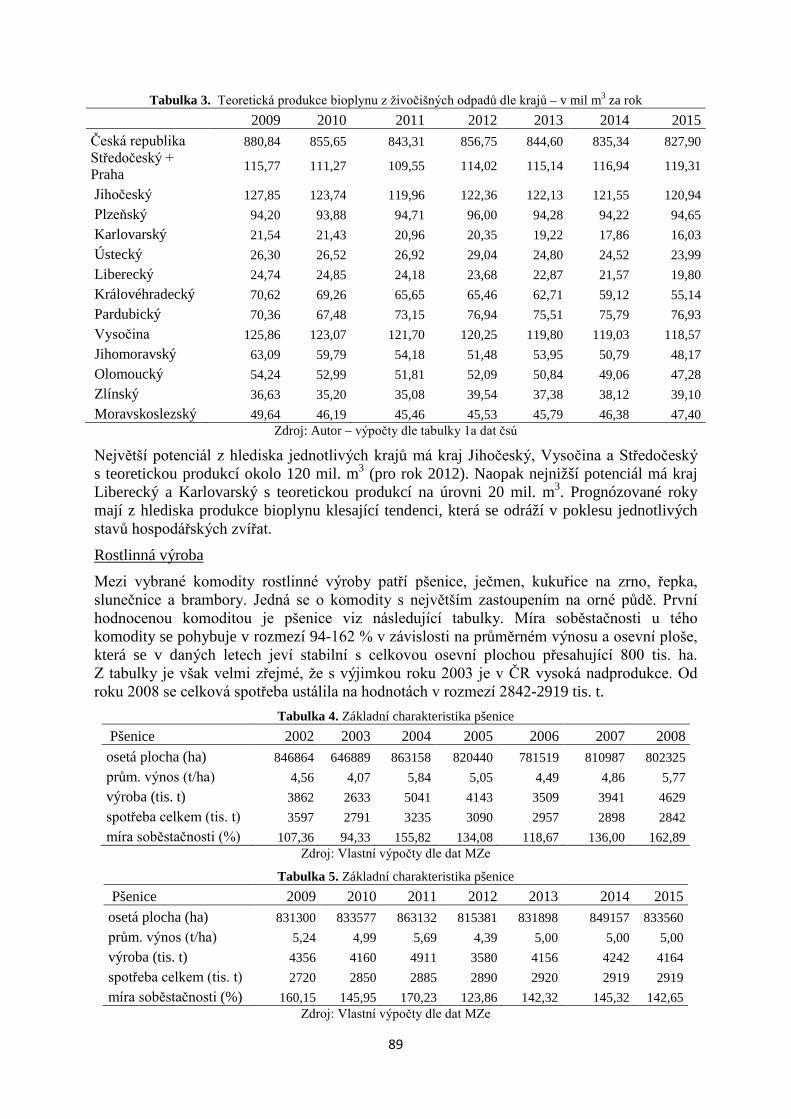
89
Tabulka 3. Teoretická produkce bioplynu z živočišných odpadů dle krajů – v mil m3 za rok 2009 2010 2011 2012 2013 2014 2015 Česká republika 880,84 855,65 843,31 856,75 844,60 835,34 827,90 Středočeský + Praha 115,77 111,27 109,55 114,02 115,14 116,94 119,31
Jihočeský 127,85 123,74 119,96 122,36 122,13 121,55 120,94 Plzeňský 94,20 93,88 94,71 96,00 94,28 94,22 94,65 Karlovarský 21,54 21,43 20,96 20,35 19,22 17,86 16,03 Ústecký 26,30 26,52 26,92 29,04 24,80 24,52 23,99 Liberecký 24,74 24,85 24,18 23,68 22,87 21,57 19,80 Královéhradecký 70,62 69,26 65,65 65,46 62,71 59,12 55,14 Pardubický 70,36 67,48 73,15 76,94 75,51 75,79 76,93 Vysočina 125,86 123,07 121,70 120,25 119,80 119,03 118,57 Jihomoravský 63,09 59,79 54,18 51,48 53,95 50,79 48,17 Olomoucký 54,24 52,99 51,81 52,09 50,84 49,06 47,28 Zlínský 36,63 35,20 35,08 39,54 37,38 38,12 39,10 Moravskoslezský 49,64 46,19 45,46 45,53 45,79 46,38 47,40
Zdroj: Autor – výpočty dle tabulky 1a dat čsú
Největší potenciál z hlediska jednotlivých krajů má kraj Jihočeský, Vysočina a Středočeský s teoretickou produkcí okolo 120 mil. m3 (pro rok 2012). Naopak nejnižší potenciál má kraj Liberecký a Karlovarský s teoretickou produkcí na úrovni 20 mil. m3. Prognózované roky mají z hlediska produkce bioplynu klesající tendenci, která se odráží v poklesu jednotlivých stavů hospodářských zvířat.
Rostlinná výroba
Mezi vybrané komodity rostlinné výroby patří pšenice, ječmen, kukuřice na zrno, řepka, slunečnice a brambory. Jedná se o komodity s největším zastoupením na orné půdě. První hodnocenou komoditou je pšenice viz následující tabulky. Míra soběstačnosti u tého komodity se pohybuje v rozmezí 94-162 % v závislosti na průměrném výnosu a osevní ploše, která se v daných letech jeví stabilní s celkovou osevní plochou přesahující 800 tis. ha. Z tabulky je však velmi zřejmé, že s výjimkou roku 2003 je v ČR vysoká nadprodukce. Od roku 2008 se celková spotřeba ustálila na hodnotách v rozmezí 2842-2919 tis. t.
Tabulka 4. Základní charakteristika pšenice Pšenice 2002 2003 2004 2005 2006 2007 2008 osetá plocha (ha) 846864 646889 863158 820440 781519 810987 802325 prům. výnos (t/ha) 4,56 4,07 5,84 5,05 4,49 4,86 5,77 výroba (tis. t) 3862 2633 5041 4143 3509 3941 4629 spotřeba celkem (tis. t) 3597 2791 3235 3090 2957 2898 2842 míra soběstačnosti (%) 107,36 94,33 155,82 134,08 118,67 136,00 162,89
Zdroj: Vlastní výpočty dle dat MZe
Tabulka 5. Základní charakteristika pšenice Pšenice 2009 2010 2011 2012 2013 2014 2015 osetá plocha (ha) 831300 833577 863132 815381 831898 849157 833560 prům. výnos (t/ha) 5,24 4,99 5,69 4,39 5,00 5,00 5,00 výroba (tis. t) 4356 4160 4911 3580 4156 4242 4164 spotřeba celkem (tis. t) 2720 2850 2885 2890 2920 2919 2919 míra soběstačnosti (%) 160,15 145,95 170,23 123,86 142,32 145,32 142,65
Zdroj: Vlastní výpočty dle dat MZe
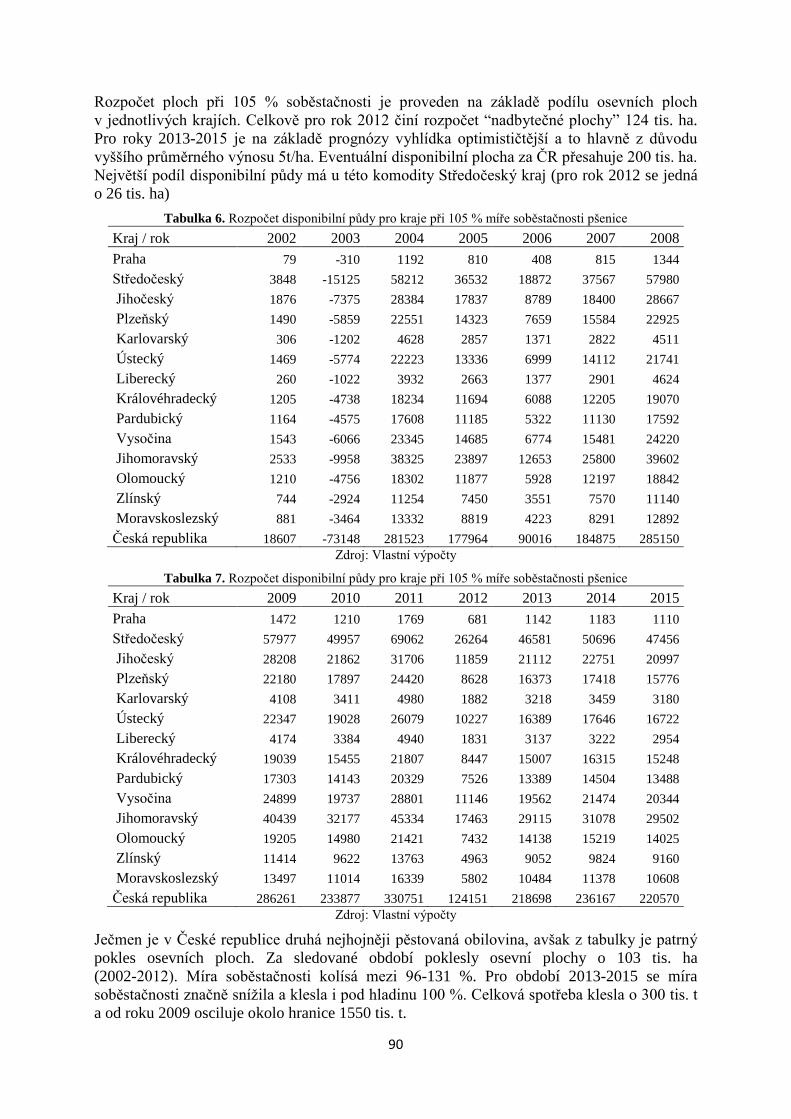
90
Rozpočet ploch při 105 % soběstačnosti je proveden na základě podílu osevních ploch v jednotlivých krajích. Celkově pro rok 2012 činí rozpočet “nadbytečné plochy” 124 tis. ha. Pro roky 2013-2015 je na základě prognózy vyhlídka optimističtější a to hlavně z důvodu vyššího průměrného výnosu 5t/ha. Eventuální disponibilní plocha za ČR přesahuje 200 tis. ha. Největší podíl disponibilní půdy má u této komodity Středočeský kraj (pro rok 2012 se jedná o 26 tis. ha)
Tabulka 6. Rozpočet disponibilní půdy pro kraje při 105 % míře soběstačnosti pšenice Kraj / rok 2002 2003 2004 2005 2006 2007 2008 Praha 79 -310 1192 810 408 815 1344 Středočeský 3848 -15125 58212 36532 18872 37567 57980 Jihočeský 1876 -7375 28384 17837 8789 18400 28667 Plzeňský 1490 -5859 22551 14323 7659 15584 22925 Karlovarský 306 -1202 4628 2857 1371 2822 4511 Ústecký 1469 -5774 22223 13336 6999 14112 21741 Liberecký 260 -1022 3932 2663 1377 2901 4624 Královéhradecký 1205 -4738 18234 11694 6088 12205 19070 Pardubický 1164 -4575 17608 11185 5322 11130 17592 Vysočina 1543 -6066 23345 14685 6774 15481 24220 Jihomoravský 2533 -9958 38325 23897 12653 25800 39602 Olomoucký 1210 -4756 18302 11877 5928 12197 18842 Zlínský 744 -2924 11254 7450 3551 7570 11140 Moravskoslezský 881 -3464 13332 8819 4223 8291 12892 Česká republika 18607 -73148 281523 177964 90016 184875 285150
Zdroj: Vlastní výpočty
Tabulka 7. Rozpočet disponibilní půdy pro kraje při 105 % míře soběstačnosti pšenice Kraj / rok 2009 2010 2011 2012 2013 2014 2015 Praha 1472 1210 1769 681 1142 1183 1110 Středočeský 57977 49957 69062 26264 46581 50696 47456 Jihočeský 28208 21862 31706 11859 21112 22751 20997 Plzeňský 22180 17897 24420 8628 16373 17418 15776 Karlovarský 4108 3411 4980 1882 3218 3459 3180 Ústecký 22347 19028 26079 10227 16389 17646 16722 Liberecký 4174 3384 4940 1831 3137 3222 2954 Královéhradecký 19039 15455 21807 8447 15007 16315 15248 Pardubický 17303 14143 20329 7526 13389 14504 13488 Vysočina 24899 19737 28801 11146 19562 21474 20344 Jihomoravský 40439 32177 45334 17463 29115 31078 29502 Olomoucký 19205 14980 21421 7432 14138 15219 14025 Zlínský 11414 9622 13763 4963 9052 9824 9160 Moravskoslezský 13497 11014 16339 5802 10484 11378 10608 Česká republika 286261 233877 330751 124151 218698 236167 220570
Zdroj: Vlastní výpočty
Ječmen je v České republice druhá nejhojněji pěstovaná obilovina, avšak z tabulky je patrný pokles osevních ploch. Za sledované období poklesly osevní plochy o 103 tis. ha (2002-2012). Míra soběstačnosti kolísá mezi 96-131 %. Pro období 2013-2015 se míra soběstačnosti značně snížila a klesla i pod hladinu 100 %. Celková spotřeba klesla o 300 tis. t a od roku 2009 osciluje okolo hranice 1550 tis. t.
91
Tabulka 8. Základní charakteristika ječmene Ječmen 2002 2003 2004 2005 2006 2007 2008 osetá plocha (ha) 485993 547615 468996 521527 528145 498692 482395 prům. výnos (t/ha) 3,67 3,76 4,97 4,21 3,59 3,80 4,65 výroba (tis. t) 1784 2059 2331 2196 1896 1895 2243 spotřeba celkem (tis. t) 1845 1791 1795 1905 1735 1709 1704 míra soběstačnosti (%) 96,67 114,97 129,86 115,26 109,28 110,89 131,64
Zdroj: Vlastní výpočty dle dat MZe
Tabulka 9. Základní charakteristika ječmene Ječmen 2009 2010 2011 2012 2013 2014 2015 osetá plocha (ha) 454820 388925 374781 382330 382560 373455 365883 prům. výnos (t/ha) 4,40 4,07 4,87 4,34 4,21 4,21 4,21 výroba (tis. t) 2001 1583 1825 1659 1611 1573 1541 spotřeba celkem (tis. t) 1558 1515 1620 1545 1558 1569 1576 míra soběstačnosti (%) 128,45 104,48 112,67 107,40 103,42 100,25 97,78
Zdroj: Vlastní výpočty dle dat MZe
Rozpočet ploch při 105 % soběstačnosti za sledované období klesá (v závislosti na průměrném výnosu na 1 ha), a pro roky 2013-2015 se dostal do záporných čísel. Pro zachování a udržení soběstačnosti je nutné zvýšit osevní plochy. Nejvyšší podíl na pěstování ječmene má Středočeský, Jihomoravský kraj a Vysočina. Nejmenší podíl na celkové produkci vyjma Prahy má kraj Karlovarský a Liberecký.
Tabulka 10. Rozpočet disponibilní půdy pro kraje při 105 % míře soběstačnosti ječmene Kraj / rok 2002 2003 2004 2005 2006 2007 2008 Praha -149 169 320 130 93 133 495 Středočeský -7927 8988 16997 9131 3880 5223 18907 Jihočeský -4208 4771 9022 4620 2089 2601 9618 Plzeňský -3471 3935 7442 3811 1651 2136 8018 Karlovarský -627 711 1345 712 323 387 1318 Ústecký -2549 2890 5465 3109 1316 1737 6556 Liberecký -595 675 1276 720 330 421 1547 Královéhradecký -1944 2204 4168 2261 1028 1290 4718 Pardubický -2465 2795 5286 2828 1251 1594 5842 Vysočina -5478 6211 11746 5750 2817 3178 11861 Jihomoravský -5247 5949 11250 5701 2507 3361 11785 Olomoucký -3599 4080 7716 3857 1738 2322 8861 Zlínský -1439 1631 3085 1527 649 825 3057 Moravskoslezský -2170 2460 4653 2252 1020 1261 5037 Česká republika -41868 47469 89770 46409 20694 26469 97620
Zdroj: Vlastní výpočty
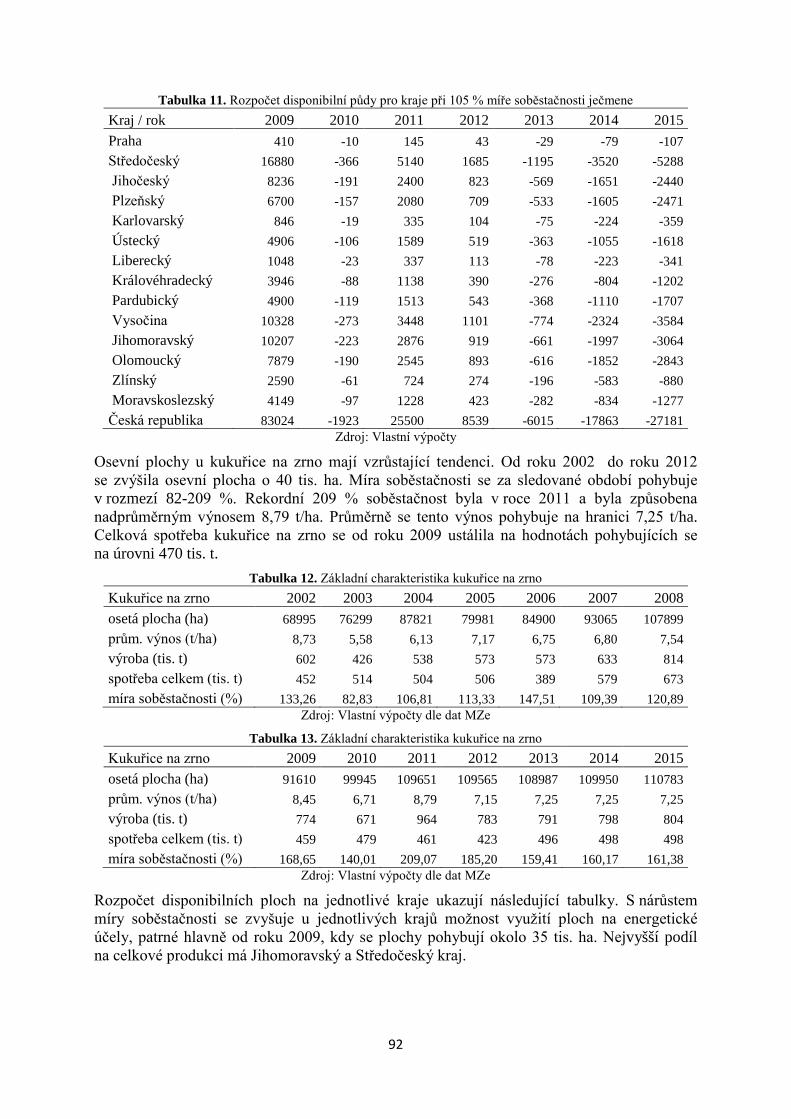
92
Tabulka 11. Rozpočet disponibilní půdy pro kraje při 105 % míře soběstačnosti ječmene Kraj / rok 2009 2010 2011 2012 2013 2014 2015 Praha 410 -10 145 43 -29 -79 -107 Středočeský 16880 -366 5140 1685 -1195 -3520 -5288 Jihočeský 8236 -191 2400 823 -569 -1651 -2440 Plzeňský 6700 -157 2080 709 -533 -1605 -2471 Karlovarský 846 -19 335 104 -75 -224 -359 Ústecký 4906 -106 1589 519 -363 -1055 -1618 Liberecký 1048 -23 337 113 -78 -223 -341 Královéhradecký 3946 -88 1138 390 -276 -804 -1202 Pardubický 4900 -119 1513 543 -368 -1110 -1707 Vysočina 10328 -273 3448 1101 -774 -2324 -3584 Jihomoravský 10207 -223 2876 919 -661 -1997 -3064 Olomoucký 7879 -190 2545 893 -616 -1852 -2843 Zlínský 2590 -61 724 274 -196 -583 -880 Moravskoslezský 4149 -97 1228 423 -282 -834 -1277 Česká republika 83024 -1923 25500 8539 -6015 -17863 -27181
Zdroj: Vlastní výpočty
Osevní plochy u kukuřice na zrno mají vzrůstající tendenci. Od roku 2002 do roku 2012 se zvýšila osevní plocha o 40 tis. ha. Míra soběstačnosti se za sledované období pohybuje v rozmezí 82-209 %. Rekordní 209 % soběstačnost byla v roce 2011 a byla způsobena nadprůměrným výnosem 8,79 t/ha. Průměrně se tento výnos pohybuje na hranici 7,25 t/ha. Celková spotřeba kukuřice na zrno se od roku 2009 ustálila na hodnotách pohybujících se na úrovni 470 tis. t.
Tabulka 12. Základní charakteristika kukuřice na zrno Kukuřice na zrno 2002 2003 2004 2005 2006 2007 2008 osetá plocha (ha) 68995 76299 87821 79981 84900 93065 107899 prům. výnos (t/ha) 8,73 5,58 6,13 7,17 6,75 6,80 7,54 výroba (tis. t) 602 426 538 573 573 633 814 spotřeba celkem (tis. t) 452 514 504 506 389 579 673 míra soběstačnosti (%) 133,26 82,83 106,81 113,33 147,51 109,39 120,89
Zdroj: Vlastní výpočty dle dat MZe
Tabulka 13. Základní charakteristika kukuřice na zrno Kukuřice na zrno 2009 2010 2011 2012 2013 2014 2015 osetá plocha (ha) 91610 99945 109651 109565 108987 109950 110783 prům. výnos (t/ha) 8,45 6,71 8,79 7,15 7,25 7,25 7,25 výroba (tis. t) 774 671 964 783 791 798 804 spotřeba celkem (tis. t) 459 479 461 423 496 498 498 míra soběstačnosti (%) 168,65 140,01 209,07 185,20 159,41 160,17 161,38
Zdroj: Vlastní výpočty dle dat MZe
Rozpočet disponibilních ploch na jednotlivé kraje ukazují následující tabulky. S nárůstem míry soběstačnosti se zvyšuje u jednotlivých krajů možnost využití ploch na energetické účely, patrné hlavně od roku 2009, kdy se plochy pohybují okolo 35 tis. ha. Nejvyšší podíl na celkové produkci má Jihomoravský a Středočeský kraj.
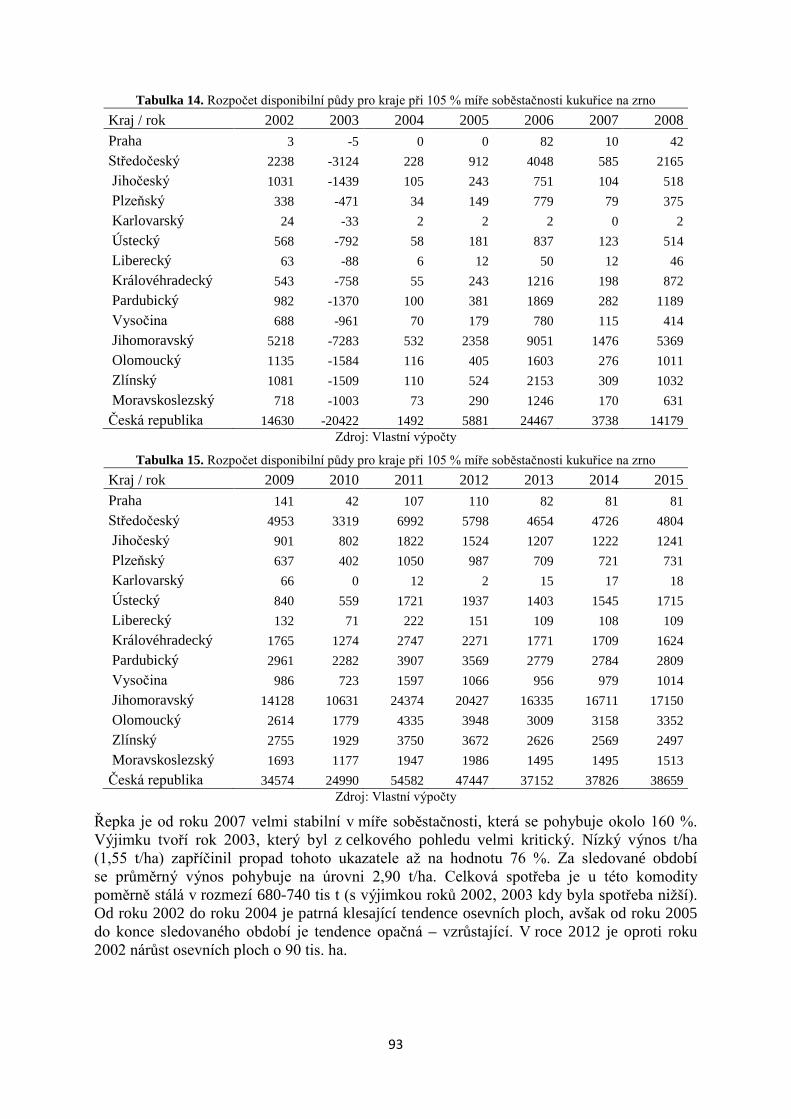
93
Tabulka 14. Rozpočet disponibilní půdy pro kraje při 105 % míře soběstačnosti kukuřice na zrno Kraj / rok 2002 2003 2004 2005 2006 2007 2008 Praha 3 -5 0 0 82 10 42 Středočeský 2238 -3124 228 912 4048 585 2165 Jihočeský 1031 -1439 105 243 751 104 518 Plzeňský 338 -471 34 149 779 79 375 Karlovarský 24 -33 2 2 2 0 2 Ústecký 568 -792 58 181 837 123 514 Liberecký 63 -88 6 12 50 12 46 Královéhradecký 543 -758 55 243 1216 198 872 Pardubický 982 -1370 100 381 1869 282 1189 Vysočina 688 -961 70 179 780 115 414 Jihomoravský 5218 -7283 532 2358 9051 1476 5369 Olomoucký 1135 -1584 116 405 1603 276 1011 Zlínský 1081 -1509 110 524 2153 309 1032 Moravskoslezský 718 -1003 73 290 1246 170 631 Česká republika 14630 -20422 1492 5881 24467 3738 14179
Zdroj: Vlastní výpočty
Tabulka 15. Rozpočet disponibilní půdy pro kraje při 105 % míře soběstačnosti kukuřice na zrno Kraj / rok 2009 2010 2011 2012 2013 2014 2015 Praha 141 42 107 110 82 81 81 Středočeský 4953 3319 6992 5798 4654 4726 4804 Jihočeský 901 802 1822 1524 1207 1222 1241 Plzeňský 637 402 1050 987 709 721 731 Karlovarský 66 0 12 2 15 17 18 Ústecký 840 559 1721 1937 1403 1545 1715 Liberecký 132 71 222 151 109 108 109 Královéhradecký 1765 1274 2747 2271 1771 1709 1624 Pardubický 2961 2282 3907 3569 2779 2784 2809 Vysočina 986 723 1597 1066 956 979 1014 Jihomoravský 14128 10631 24374 20427 16335 16711 17150 Olomoucký 2614 1779 4335 3948 3009 3158 3352 Zlínský 2755 1929 3750 3672 2626 2569 2497 Moravskoslezský 1693 1177 1947 1986 1495 1495 1513 Česká republika 34574 24990 54582 47447 37152 37826 38659
Zdroj: Vlastní výpočty
Řepka je od roku 2007 velmi stabilní v míře soběstačnosti, která se pohybuje okolo 160 %. Výjimku tvoří rok 2003, který byl z celkového pohledu velmi kritický. Nízký výnos t/ha (1,55 t/ha) zapříčinil propad tohoto ukazatele až na hodnotu 76 %. Za sledované období se průměrný výnos pohybuje na úrovni 2,90 t/ha. Celková spotřeba je u této komodity poměrně stálá v rozmezí 680-740 tis t (s výjimkou roků 2002, 2003 kdy byla spotřeba nižší). Od roku 2002 do roku 2004 je patrná klesající tendence osevních ploch, avšak od roku 2005 do konce sledovaného období je tendence opačná – vzrůstající. V roce 2012 je oproti roku 2002 nárůst osevních ploch o 90 tis. ha.

94
Tabulka 16. Základní charakteristika řepky Řepka 2002 2003 2004 2005 2006 2007 2008 osetá plocha (ha) 310625 249035 259460 267160 292246 337570 356924 prům. výnos (t/ha) 2,27 1,55 3,60 2,88 3,01 3,06 2,94 výroba (tis. t) 705 386 934 769 880 1033 1049 spotřeba celkem (tis. t) 502 507 688 746 718 700 650 míra soběstačnosti (%) 140,46 76,14 135,76 103,14 122,52 147,57 161,44
Zdroj: Vlastní výpočty dle dat MZe
Tabulka 17. Základní charakteristika řepky Řepka 2009 2010 2011 2012 2013 2014 2015 osetá plocha (ha) 354826 368824 373386 401319 403227 407047 412520 prům. výnos (t/ha) 3,20 3,17 2,98 3,24 2,90 2,90 2,90 výroba (tis. t) 1135 1169 1113 1300 1169 1180 1196 spotřeba celkem (tis. t) 700 730 715 740 732 726 723 míra soběstačnosti (%) 162,21 160,16 155,62 175,71 159,75 162,59 165,46
Zdroj: Vlastní výpočty dle dat MZe
Nejvyšší podíl na celkové produkci řepky má Středočeský kraj, dále pak kraj Jihočeský, Vysočina, Plzeňský a Jihomoravský. Z tabulek je zřejmé, že od roku 2008 se počet „nadbytečné plochy“ při zachování 105 % míry soběstačnoti ustálil přibližně na úrovni 130 tis. ha. Nejmenší podíl na produkci řepky má kraj Karlovarský a Liberecký (s výjimkou Prahy).
Tabulka 18. Rozpočet disponibilní půdy pro kraje při 105 % míře soběstačnosti řepky Kraj / rok 2002 2003 2004 2005 2006 2007 2008 Praha 368 -443 276 -25 275 582 748 Středočeský 15480 -18637 11605 -963 8841 20661 26773 Jihočeský 10435 -12563 7823 -653 5076 11698 14689 Plzeňský 7437 -8954 5576 -539 4645 10112 12755 Karlovarský 1706 -2054 1279 -84 753 1787 2073 Ústecký 1172 -1411 879 -150 1688 4805 6526 Liberecký 1573 -1893 1179 -91 827 2015 2223 Královéhradecký 6121 -7369 4589 -359 3057 6583 8039 Pardubický 6901 -8309 5174 -397 3234 7361 9505 Vysočina 9849 -11857 7384 -562 4683 10546 13200 Jihomoravský 5080 -6116 3808 -268 2462 6876 9833 Olomoucký 5068 -6102 3800 -286 2500 5716 7395 Zlínský 2278 -2742 1708 -156 1158 3133 4178 Moravskoslezský 4955 -5966 3715 -285 2583 5500 6844 Česká republika 78422 -94416 58793 -4819 41781 97374 124781
Zdroj: Vlastní výpočty
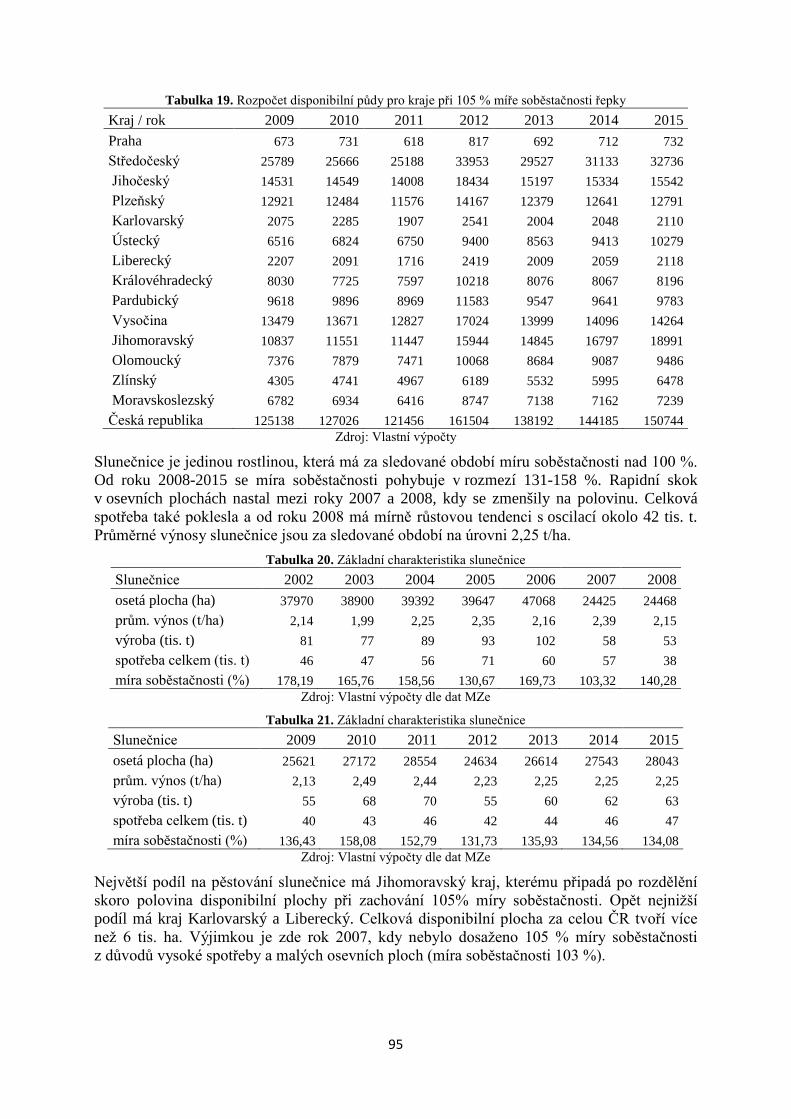
95
Tabulka 19. Rozpočet disponibilní půdy pro kraje při 105 % míře soběstačnosti řepky Kraj / rok 2009 2010 2011 2012 2013 2014 2015 Praha 673 731 618 817 692 712 732 Středočeský 25789 25666 25188 33953 29527 31133 32736 Jihočeský 14531 14549 14008 18434 15197 15334 15542 Plzeňský 12921 12484 11576 14167 12379 12641 12791 Karlovarský 2075 2285 1907 2541 2004 2048 2110 Ústecký 6516 6824 6750 9400 8563 9413 10279 Liberecký 2207 2091 1716 2419 2009 2059 2118 Královéhradecký 8030 7725 7597 10218 8076 8067 8196 Pardubický 9618 9896 8969 11583 9547 9641 9783 Vysočina 13479 13671 12827 17024 13999 14096 14264 Jihomoravský 10837 11551 11447 15944 14845 16797 18991 Olomoucký 7376 7879 7471 10068 8684 9087 9486 Zlínský 4305 4741 4967 6189 5532 5995 6478 Moravskoslezský 6782 6934 6416 8747 7138 7162 7239 Česká republika 125138 127026 121456 161504 138192 144185 150744
Zdroj: Vlastní výpočty
Slunečnice je jedinou rostlinou, která má za sledované období míru soběstačnosti nad 100 %. Od roku 2008-2015 se míra soběstačnosti pohybuje v rozmezí 131-158 %. Rapidní skok v osevních plochách nastal mezi roky 2007 a 2008, kdy se zmenšily na polovinu. Celková spotřeba také poklesla a od roku 2008 má mírně růstovou tendenci s oscilací okolo 42 tis. t. Průměrné výnosy slunečnice jsou za sledované období na úrovni 2,25 t/ha.
Tabulka 20. Základní charakteristika slunečnice Slunečnice 2002 2003 2004 2005 2006 2007 2008 osetá plocha (ha) 37970 38900 39392 39647 47068 24425 24468 prům. výnos (t/ha) 2,14 1,99 2,25 2,35 2,16 2,39 2,15 výroba (tis. t) 81 77 89 93 102 58 53 spotřeba celkem (tis. t) 46 47 56 71 60 57 38 míra soběstačnosti (%) 178,19 165,76 158,56 130,67 169,73 103,32 140,28
Zdroj: Vlastní výpočty dle dat MZe
Tabulka 21. Základní charakteristika slunečnice Slunečnice 2009 2010 2011 2012 2013 2014 2015 osetá plocha (ha) 25621 27172 28554 24634 26614 27543 28043 prům. výnos (t/ha) 2,13 2,49 2,44 2,23 2,25 2,25 2,25 výroba (tis. t) 55 68 70 55 60 62 63 spotřeba celkem (tis. t) 40 43 46 42 44 46 47 míra soběstačnosti (%) 136,43 158,08 152,79 131,73 135,93 134,56 134,08
Zdroj: Vlastní výpočty dle dat MZe
Největší podíl na pěstování slunečnice má Jihomoravský kraj, kterému připadá po rozdělění skoro polovina disponibilní plochy při zachování 105% míry soběstačnosti. Opět nejnižší podíl má kraj Karlovarský a Liberecký. Celková disponibilní plocha za celou ČR tvoří více než 6 tis. ha. Výjimkou je zde rok 2007, kdy nebylo dosaženo 105 % míry soběstačnosti z důvodů vysoké spotřeby a malých osevních ploch (míra soběstačnosti 103 %).
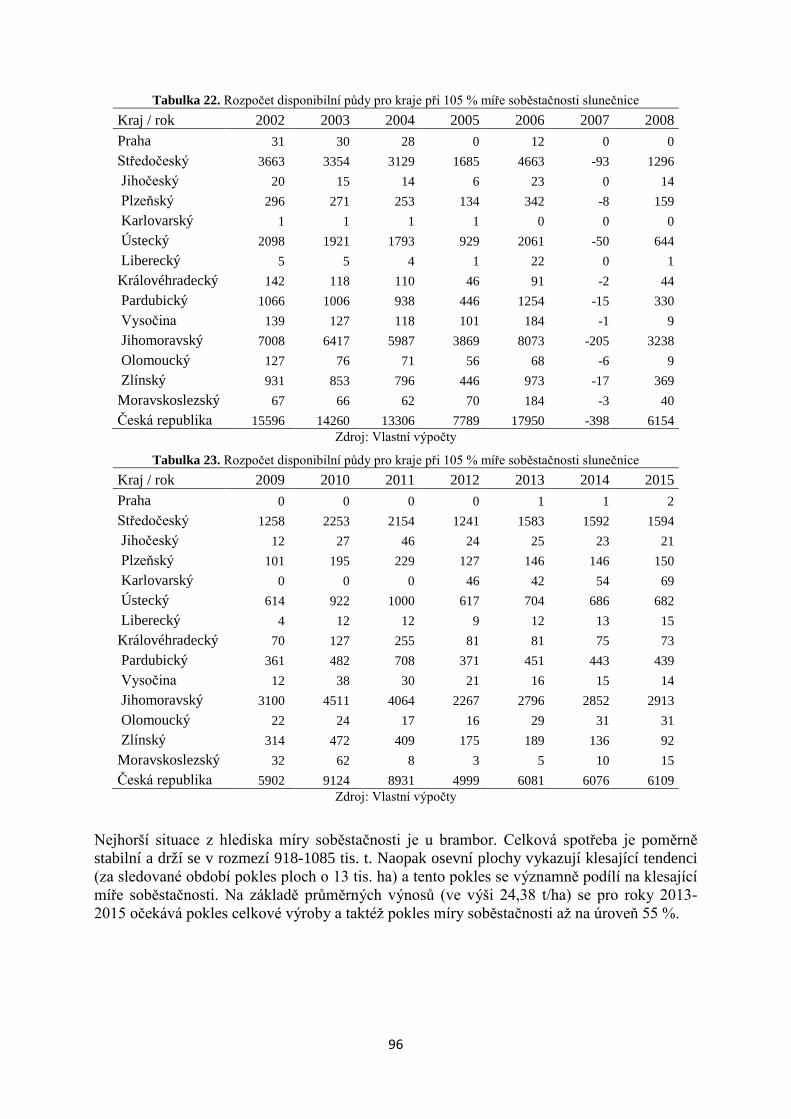
96
Tabulka 22. Rozpočet disponibilní půdy pro kraje při 105 % míře soběstačnosti slunečnice Kraj / rok 2002 2003 2004 2005 2006 2007 2008 Praha 31 30 28 0 12 0 0 Středočeský 3663 3354 3129 1685 4663 -93 1296 Jihočeský 20 15 14 6 23 0 14 Plzeňský 296 271 253 134 342 -8 159 Karlovarský 1 1 1 1 0 0 0 Ústecký 2098 1921 1793 929 2061 -50 644 Liberecký 5 5 4 1 22 0 1 Královéhradecký 142 118 110 46 91 -2 44 Pardubický 1066 1006 938 446 1254 -15 330 Vysočina 139 127 118 101 184 -1 9 Jihomoravský 7008 6417 5987 3869 8073 -205 3238 Olomoucký 127 76 71 56 68 -6 9 Zlínský 931 853 796 446 973 -17 369 Moravskoslezský 67 66 62 70 184 -3 40 Česká republika 15596 14260 13306 7789 17950 -398 6154
Zdroj: Vlastní výpočty
Tabulka 23. Rozpočet disponibilní půdy pro kraje při 105 % míře soběstačnosti slunečnice Kraj / rok 2009 2010 2011 2012 2013 2014 2015 Praha 0 0 0 0 1 1 2 Středočeský 1258 2253 2154 1241 1583 1592 1594 Jihočeský 12 27 46 24 25 23 21 Plzeňský 101 195 229 127 146 146 150 Karlovarský 0 0 0 46 42 54 69 Ústecký 614 922 1000 617 704 686 682 Liberecký 4 12 12 9 12 13 15 Královéhradecký 70 127 255 81 81 75 73 Pardubický 361 482 708 371 451 443 439 Vysočina 12 38 30 21 16 15 14 Jihomoravský 3100 4511 4064 2267 2796 2852 2913 Olomoucký 22 24 17 16 29 31 31 Zlínský 314 472 409 175 189 136 92 Moravskoslezský 32 62 8 3 5 10 15 Česká republika 5902 9124 8931 4999 6081 6076 6109
Zdroj: Vlastní výpočty
Nejhorší situace z hlediska míry soběstačnosti je u brambor. Celková spotřeba je poměrně stabilní a drží se v rozmezí 918-1085 tis. t. Naopak osevní plochy vykazují klesající tendenci (za sledované období pokles ploch o 13 tis. ha) a tento pokles se významně podílí na klesající míře soběstačnosti. Na základě průměrných výnosů (ve výši 24,38 t/ha) se pro roky 2013-2015 očekává pokles celkové výroby a taktéž pokles míry soběstačnosti až na úroveň 55 %.
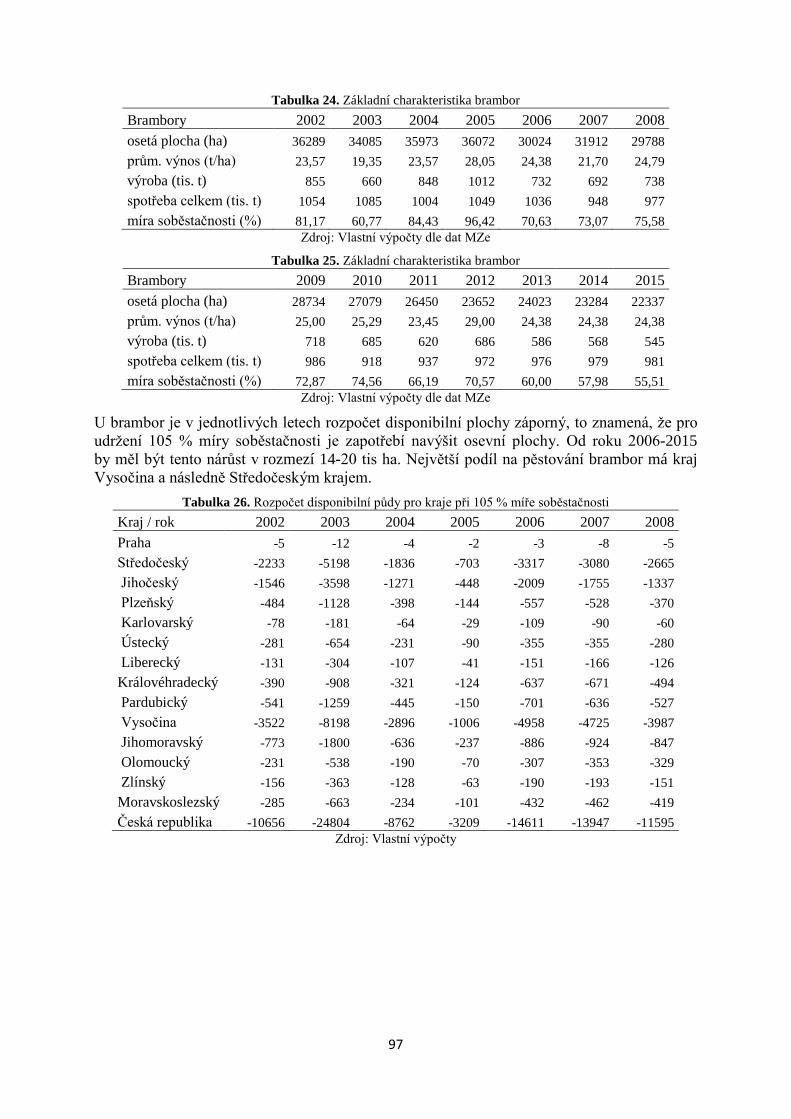
97
Tabulka 24. Základní charakteristika brambor Brambory 2002 2003 2004 2005 2006 2007 2008 osetá plocha (ha) 36289 34085 35973 36072 30024 31912 29788 prům. výnos (t/ha) 23,57 19,35 23,57 28,05 24,38 21,70 24,79 výroba (tis. t) 855 660 848 1012 732 692 738 spotřeba celkem (tis. t) 1054 1085 1004 1049 1036 948 977 míra soběstačnosti (%) 81,17 60,77 84,43 96,42 70,63 73,07 75,58
Zdroj: Vlastní výpočty dle dat MZe
Tabulka 25. Základní charakteristika brambor Brambory 2009 2010 2011 2012 2013 2014 2015 osetá plocha (ha) 28734 27079 26450 23652 24023 23284 22337 prům. výnos (t/ha) 25,00 25,29 23,45 29,00 24,38 24,38 24,38 výroba (tis. t) 718 685 620 686 586 568 545 spotřeba celkem (tis. t) 986 918 937 972 976 979 981 míra soběstačnosti (%) 72,87 74,56 66,19 70,57 60,00 57,98 55,51
Zdroj: Vlastní výpočty dle dat MZe
U brambor je v jednotlivých letech rozpočet disponibilní plochy záporný, to znamená, že pro udržení 105 % míry soběstačnosti je zapotřebí navýšit osevní plochy. Od roku 2006-2015 by měl být tento nárůst v rozmezí 14-20 tis ha. Největší podíl na pěstování brambor má kraj Vysočina a následně Středočeským krajem.
Tabulka 26. Rozpočet disponibilní půdy pro kraje při 105 % míře soběstačnosti Kraj / rok 2002 2003 2004 2005 2006 2007 2008 Praha -5 -12 -4 -2 -3 -8 -5 Středočeský -2233 -5198 -1836 -703 -3317 -3080 -2665 Jihočeský -1546 -3598 -1271 -448 -2009 -1755 -1337 Plzeňský -484 -1128 -398 -144 -557 -528 -370 Karlovarský -78 -181 -64 -29 -109 -90 -60 Ústecký -281 -654 -231 -90 -355 -355 -280 Liberecký -131 -304 -107 -41 -151 -166 -126 Královéhradecký -390 -908 -321 -124 -637 -671 -494 Pardubický -541 -1259 -445 -150 -701 -636 -527 Vysočina -3522 -8198 -2896 -1006 -4958 -4725 -3987 Jihomoravský -773 -1800 -636 -237 -886 -924 -847 Olomoucký -231 -538 -190 -70 -307 -353 -329 Zlínský -156 -363 -128 -63 -190 -193 -151 Moravskoslezský -285 -663 -234 -101 -432 -462 -419 Česká republika -10656 -24804 -8762 -3209 -14611 -13947 -11595
Zdroj: Vlastní výpočty
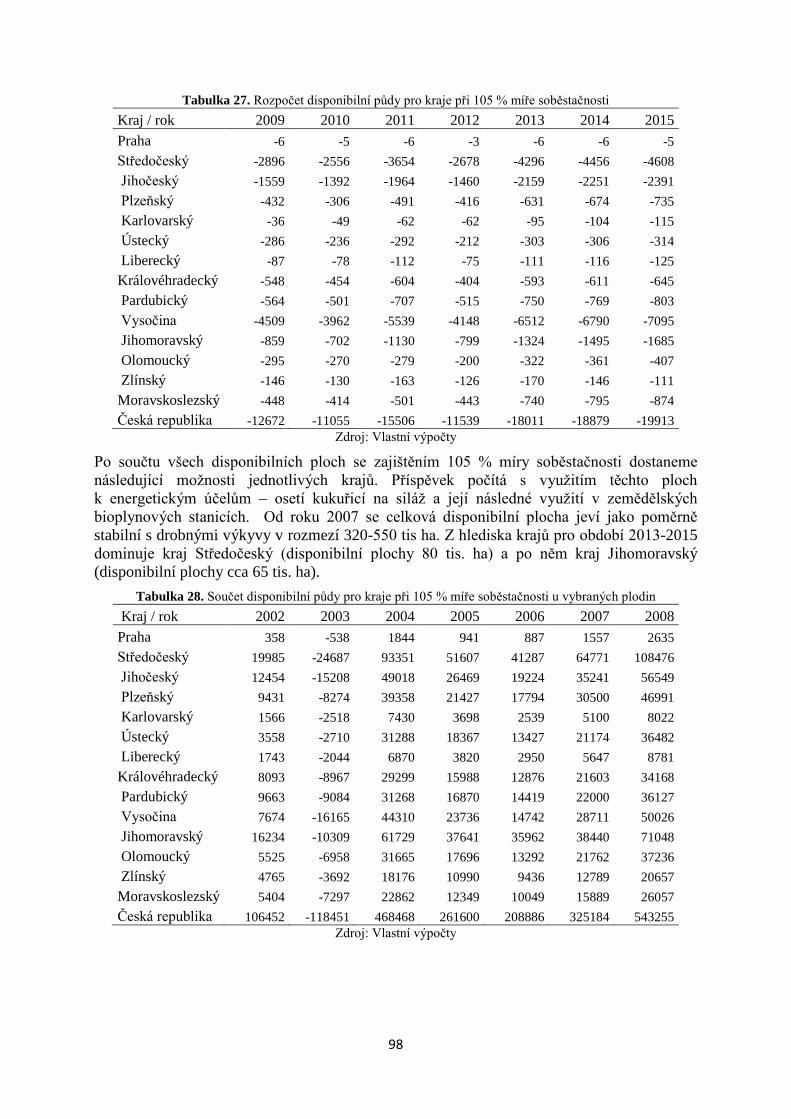
98
Tabulka 27. Rozpočet disponibilní půdy pro kraje při 105 % míře soběstačnosti Kraj / rok 2009 2010 2011 2012 2013 2014 2015 Praha -6 -5 -6 -3 -6 -6 -5 Středočeský -2896 -2556 -3654 -2678 -4296 -4456 -4608 Jihočeský -1559 -1392 -1964 -1460 -2159 -2251 -2391 Plzeňský -432 -306 -491 -416 -631 -674 -735 Karlovarský -36 -49 -62 -62 -95 -104 -115 Ústecký -286 -236 -292 -212 -303 -306 -314 Liberecký -87 -78 -112 -75 -111 -116 -125 Královéhradecký -548 -454 -604 -404 -593 -611 -645 Pardubický -564 -501 -707 -515 -750 -769 -803 Vysočina -4509 -3962 -5539 -4148 -6512 -6790 -7095 Jihomoravský -859 -702 -1130 -799 -1324 -1495 -1685 Olomoucký -295 -270 -279 -200 -322 -361 -407 Zlínský -146 -130 -163 -126 -170 -146 -111 Moravskoslezský -448 -414 -501 -443 -740 -795 -874 Česká republika -12672 -11055 -15506 -11539 -18011 -18879 -19913
Zdroj: Vlastní výpočty
Po součtu všech disponibilních ploch se zajištěním 105 % míry soběstačnosti dostaneme následující možnosti jednotlivých krajů. Příspěvek počítá s využitím těchto ploch k energetickým účelům – osetí kukuřicí na siláž a její následné využití v zemědělských bioplynových stanicích. Od roku 2007 se celková disponibilní plocha jeví jako poměrně stabilní s drobnými výkyvy v rozmezí 320-550 tis ha. Z hlediska krajů pro období 2013-2015 dominuje kraj Středočeský (disponibilní plochy 80 tis. ha) a po něm kraj Jihomoravský (disponibilní plochy cca 65 tis. ha).
Tabulka 28. Součet disponibilní půdy pro kraje při 105 % míře soběstačnosti u vybraných plodin Kraj / rok 2002 2003 2004 2005 2006 2007 2008 Praha 358 -538 1844 941 887 1557 2635 Středočeský 19985 -24687 93351 51607 41287 64771 108476 Jihočeský 12454 -15208 49018 26469 19224 35241 56549 Plzeňský 9431 -8274 39358 21427 17794 30500 46991 Karlovarský 1566 -2518 7430 3698 2539 5100 8022 Ústecký 3558 -2710 31288 18367 13427 21174 36482 Liberecký 1743 -2044 6870 3820 2950 5647 8781 Královéhradecký 8093 -8967 29299 15988 12876 21603 34168 Pardubický 9663 -9084 31268 16870 14419 22000 36127 Vysočina 7674 -16165 44310 23736 14742 28711 50026 Jihomoravský 16234 -10309 61729 37641 35962 38440 71048 Olomoucký 5525 -6958 31665 17696 13292 21762 37236 Zlínský 4765 -3692 18176 10990 9436 12789 20657 Moravskoslezský 5404 -7297 22862 12349 10049 15889 26057 Česká republika 106452 -118451 468468 261600 208886 325184 543255
Zdroj: Vlastní výpočty
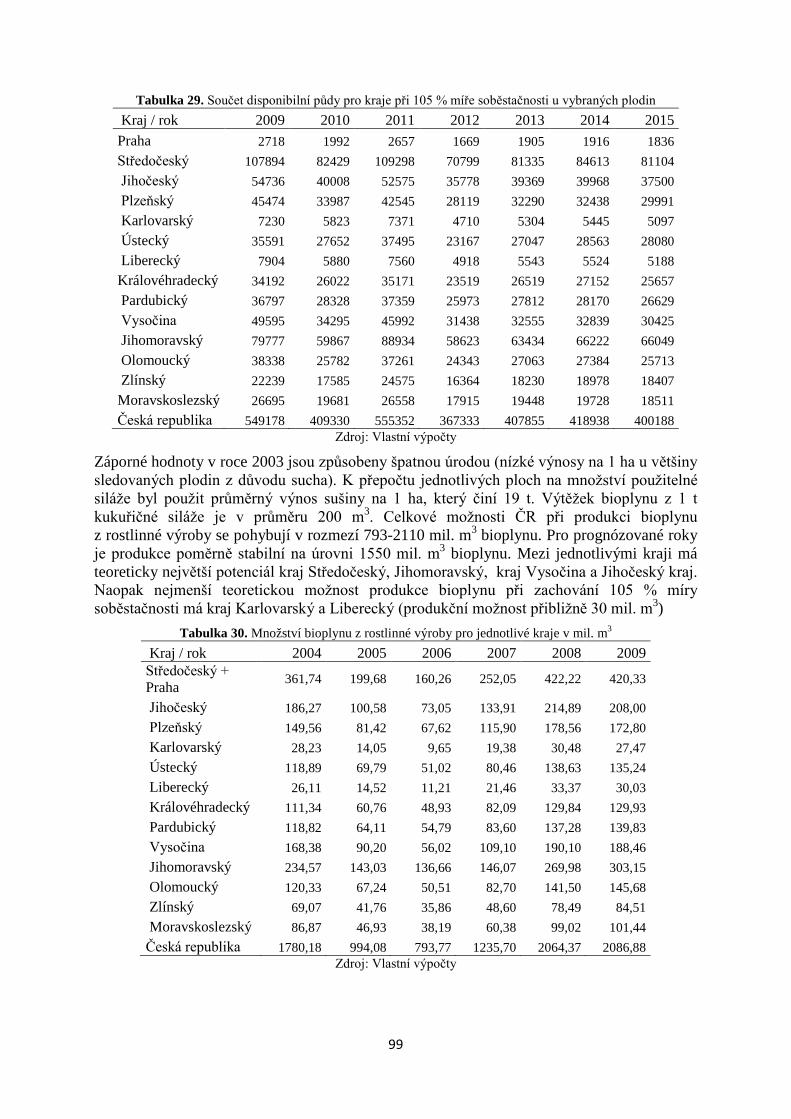
99
Tabulka 29. Součet disponibilní půdy pro kraje při 105 % míře soběstačnosti u vybraných plodin Kraj / rok 2009 2010 2011 2012 2013 2014 2015 Praha 2718 1992 2657 1669 1905 1916 1836 Středočeský 107894 82429 109298 70799 81335 84613 81104 Jihočeský 54736 40008 52575 35778 39369 39968 37500 Plzeňský 45474 33987 42545 28119 32290 32438 29991 Karlovarský 7230 5823 7371 4710 5304 5445 5097 Ústecký 35591 27652 37495 23167 27047 28563 28080 Liberecký 7904 5880 7560 4918 5543 5524 5188 Královéhradecký 34192 26022 35171 23519 26519 27152 25657 Pardubický 36797 28328 37359 25973 27812 28170 26629 Vysočina 49595 34295 45992 31438 32555 32839 30425 Jihomoravský 79777 59867 88934 58623 63434 66222 66049 Olomoucký 38338 25782 37261 24343 27063 27384 25713 Zlínský 22239 17585 24575 16364 18230 18978 18407 Moravskoslezský 26695 19681 26558 17915 19448 19728 18511 Česká republika 549178 409330 555352 367333 407855 418938 400188
Zdroj: Vlastní výpočty
Záporné hodnoty v roce 2003 jsou způsobeny špatnou úrodou (nízké výnosy na 1 ha u většiny sledovaných plodin z důvodu sucha). K přepočtu jednotlivých ploch na množství použitelné siláže byl použit průměrný výnos sušiny na 1 ha, který činí 19 t. Výtěžek bioplynu z 1 t kukuřičné siláže je v průměru 200 m3. Celkové možnosti ČR při produkci bioplynu z rostlinné výroby se pohybují v rozmezí 793-2110 mil. m3 bioplynu. Pro prognózované roky je produkce poměrně stabilní na úrovni 1550 mil. m3 bioplynu. Mezi jednotlivými kraji má teoreticky největší potenciál kraj Středočeský, Jihomoravský, kraj Vysočina a Jihočeský kraj. Naopak nejmenší teoretickou možnost produkce bioplynu při zachování 105 % míry soběstačnosti má kraj Karlovarský a Liberecký (produkční možnost přibližně 30 mil. m3)
Tabulka 30. Množství bioplynu z rostlinné výroby pro jednotlivé kraje v mil. m3 Kraj / rok 2004 2005 2006 2007 2008 2009 Středočeský + Praha 361,74 199,68 160,26 252,05 422,22 420,33
Jihočeský 186,27 100,58 73,05 133,91 214,89 208,00 Plzeňský 149,56 81,42 67,62 115,90 178,56 172,80 Karlovarský 28,23 14,05 9,65 19,38 30,48 27,47 Ústecký 118,89 69,79 51,02 80,46 138,63 135,24 Liberecký 26,11 14,52 11,21 21,46 33,37 30,03 Královéhradecký 111,34 60,76 48,93 82,09 129,84 129,93 Pardubický 118,82 64,11 54,79 83,60 137,28 139,83 Vysočina 168,38 90,20 56,02 109,10 190,10 188,46 Jihomoravský 234,57 143,03 136,66 146,07 269,98 303,15 Olomoucký 120,33 67,24 50,51 82,70 141,50 145,68 Zlínský 69,07 41,76 35,86 48,60 78,49 84,51 Moravskoslezský 86,87 46,93 38,19 60,38 99,02 101,44 Česká republika 1780,18 994,08 793,77 1235,70 2064,37 2086,88
Zdroj: Vlastní výpočty
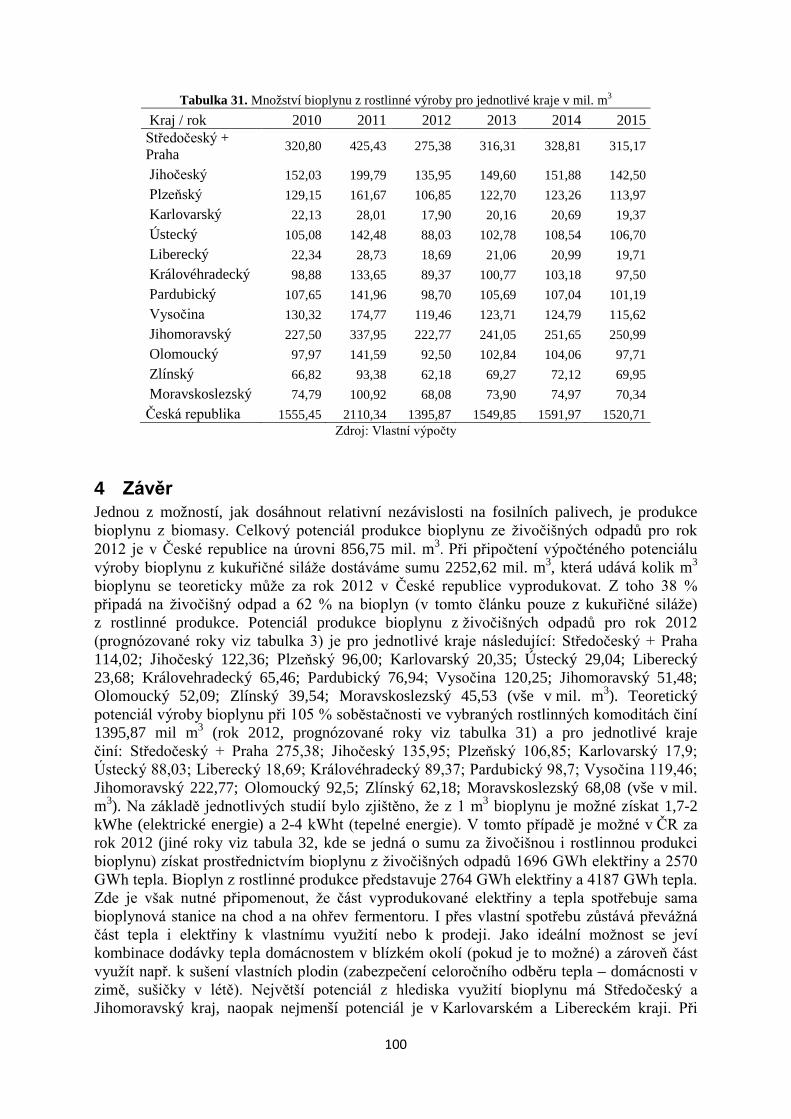
100
Tabulka 31. Množství bioplynu z rostlinné výroby pro jednotlivé kraje v mil. m3 Kraj / rok 2010 2011 2012 2013 2014 2015 Středočeský + Praha 320,80 425,43 275,38 316,31 328,81 315,17
Jihočeský 152,03 199,79 135,95 149,60 151,88 142,50 Plzeňský 129,15 161,67 106,85 122,70 123,26 113,97 Karlovarský 22,13 28,01 17,90 20,16 20,69 19,37 Ústecký 105,08 142,48 88,03 102,78 108,54 106,70 Liberecký 22,34 28,73 18,69 21,06 20,99 19,71 Královéhradecký 98,88 133,65 89,37 100,77 103,18 97,50 Pardubický 107,65 141,96 98,70 105,69 107,04 101,19 Vysočina 130,32 174,77 119,46 123,71 124,79 115,62 Jihomoravský 227,50 337,95 222,77 241,05 251,65 250,99 Olomoucký 97,97 141,59 92,50 102,84 104,06 97,71 Zlínský 66,82 93,38 62,18 69,27 72,12 69,95 Moravskoslezský 74,79 100,92 68,08 73,90 74,97 70,34 Česká republika 1555,45 2110,34 1395,87 1549,85 1591,97 1520,71
Zdroj: Vlastní výpočty
4 Závěr Jednou z možností, jak dosáhnout relativní nezávislosti na fosilních palivech, je produkce bioplynu z biomasy. Celkový potenciál produkce bioplynu ze živočišných odpadů pro rok 2012 je v České republice na úrovni 856,75 mil. m3. Při připočtení výpočténého potenciálu výroby bioplynu z kukuřičné siláže dostáváme sumu 2252,62 mil. m3, která udává kolik m3 bioplynu se teoreticky může za rok 2012 v České republice vyprodukovat. Z toho 38 % připadá na živočišný odpad a 62 % na bioplyn (v tomto článku pouze z kukuřičné siláže) z rostlinné produkce. Potenciál produkce bioplynu z živočišných odpadů pro rok 2012 (prognózované roky viz tabulka 3) je pro jednotlivé kraje následující: Středočeský + Praha 114,02; Jihočeský 122,36; Plzeňský 96,00; Karlovarský 20,35; Ústecký 29,04; Liberecký 23,68; Královehradecký 65,46; Pardubický 76,94; Vysočina 120,25; Jihomoravský 51,48; Olomoucký 52,09; Zlínský 39,54; Moravskoslezský 45,53 (vše v mil. m3). Teoretický potenciál výroby bioplynu při 105 % soběstačnosti ve vybraných rostlinných komoditách činí 1395,87 mil m3 (rok 2012, prognózované roky viz tabulka 31) a pro jednotlivé kraje činí: Středočeský + Praha 275,38; Jihočeský 135,95; Plzeňský 106,85; Karlovarský 17,9; Ústecký 88,03; Liberecký 18,69; Královéhradecký 89,37; Pardubický 98,7; Vysočina 119,46; Jihomoravský 222,77; Olomoucký 92,5; Zlínský 62,18; Moravskoslezský 68,08 (vše v mil. m3). Na základě jednotlivých studií bylo zjištěno, že z 1 m3 bioplynu je možné získat 1,7-2 kWhe (elektrické energie) a 2-4 kWht (tepelné energie). V tomto případě je možné v ČR za rok 2012 (jiné roky viz tabula 32, kde se jedná o sumu za živočišnou i rostlinnou produkci bioplynu) získat prostřednictvím bioplynu z živočišných odpadů 1696 GWh elektřiny a 2570 GWh tepla. Bioplyn z rostlinné produkce představuje 2764 GWh elektřiny a 4187 GWh tepla. Zde je však nutné připomenout, že část vyprodukované elektřiny a tepla spotřebuje sama bioplynová stanice na chod a na ohřev fermentoru. I přes vlastní spotřebu zůstává převážná část tepla i elektřiny k vlastnímu využití nebo k prodeji. Jako ideální možnost se jeví kombinace dodávky tepla domácnostem v blízkém okolí (pokud je to možné) a zároveň část využít např. k sušení vlastních plodin (zabezpečení celoročního odběru tepla – domácnosti v zimě, sušičky v létě). Největší potenciál z hlediska využití bioplynu má Středočeský a Jihomoravský kraj, naopak nejmenší potenciál je v Karlovarském a Libereckém kraji. Při
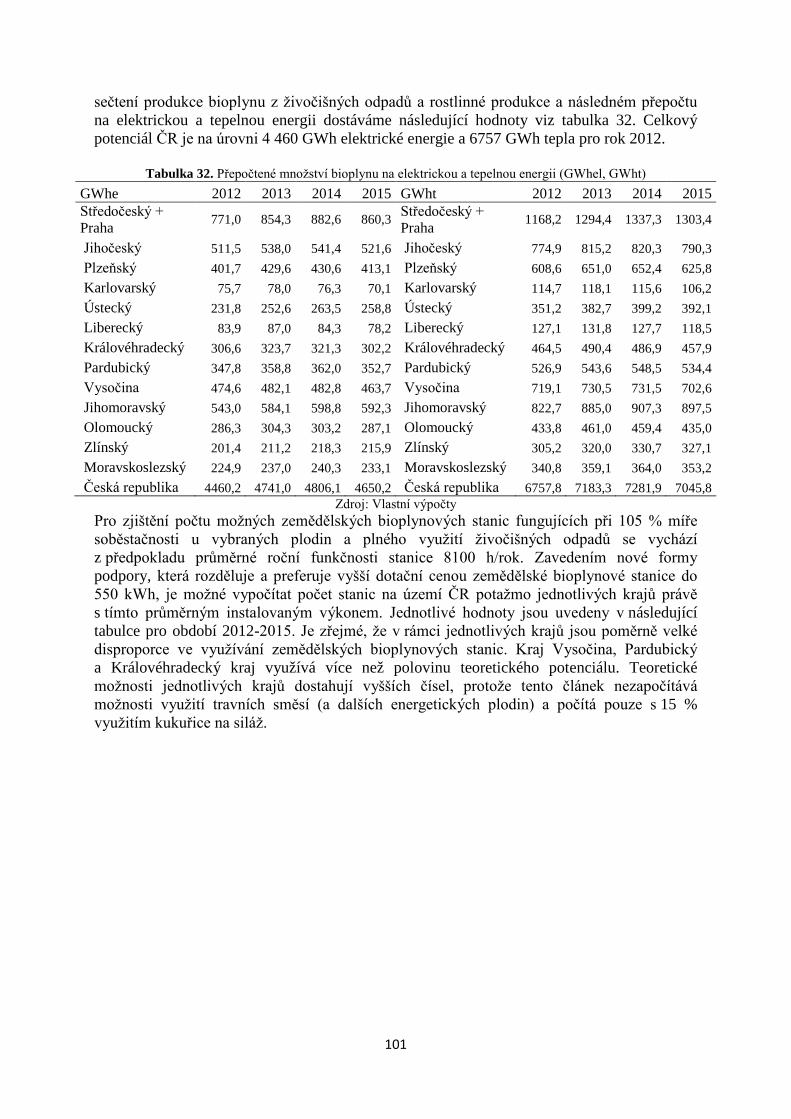
101
sečtení produkce bioplynu z živočišných odpadů a rostlinné produkce a následném přepočtu na elektrickou a tepelnou energii dostáváme následující hodnoty viz tabulka 32. Celkový potenciál ČR je na úrovni 4 460 GWh elektrické energie a 6757 GWh tepla pro rok 2012.
Tabulka 32. Přepočtené množství bioplynu na elektrickou a tepelnou energii (GWhel, GWht) GWhe 2012 2013 2014 2015 GWht 2012 2013 2014 2015 Středočeský + Praha 771,0 854,3 882,6 860,3 Středočeský +
Praha 1168,2 1294,4 1337,3 1303,4
Jihočeský 511,5 538,0 541,4 521,6 Jihočeský 774,9 815,2 820,3 790,3 Plzeňský 401,7 429,6 430,6 413,1 Plzeňský 608,6 651,0 652,4 625,8 Karlovarský 75,7 78,0 76,3 70,1 Karlovarský 114,7 118,1 115,6 106,2 Ústecký 231,8 252,6 263,5 258,8 Ústecký 351,2 382,7 399,2 392,1 Liberecký 83,9 87,0 84,3 78,2 Liberecký 127,1 131,8 127,7 118,5 Královéhradecký 306,6 323,7 321,3 302,2 Královéhradecký 464,5 490,4 486,9 457,9 Pardubický 347,8 358,8 362,0 352,7 Pardubický 526,9 543,6 548,5 534,4 Vysočina 474,6 482,1 482,8 463,7 Vysočina 719,1 730,5 731,5 702,6 Jihomoravský 543,0 584,1 598,8 592,3 Jihomoravský 822,7 885,0 907,3 897,5 Olomoucký 286,3 304,3 303,2 287,1 Olomoucký 433,8 461,0 459,4 435,0 Zlínský 201,4 211,2 218,3 215,9 Zlínský 305,2 320,0 330,7 327,1 Moravskoslezský 224,9 237,0 240,3 233,1 Moravskoslezský 340,8 359,1 364,0 353,2 Česká republika 4460,2 4741,0 4806,1 4650,2 Česká republika 6757,8 7183,3 7281,9 7045,8
Zdroj: Vlastní výpočty Pro zjištění počtu možných zemědělských bioplynových stanic fungujících při 105 % míře soběstačnosti u vybraných plodin a plného využití živočišných odpadů se vychází z předpokladu průměrné roční funkčnosti stanice 8100 h/rok. Zavedením nové formy podpory, která rozděluje a preferuje vyšší dotační cenou zemědělské bioplynové stanice do 550 kWh, je možné vypočítat počet stanic na území ČR potažmo jednotlivých krajů právě s tímto průměrným instalovaným výkonem. Jednotlivé hodnoty jsou uvedeny v následující tabulce pro období 2012-2015. Je zřejmé, že v rámci jednotlivých krajů jsou poměrně velké disproporce ve využívání zemědělských bioplynových stanic. Kraj Vysočina, Pardubický a Královéhradecký kraj využívá více než polovinu teoretického potenciálu. Teoretické možnosti jednotlivých krajů dostahují vyšších čísel, protože tento článek nezapočítává možnosti využití travních směsí (a dalších energetických plodin) a počítá pouze s 15 % využitím kukuřice na siláž.
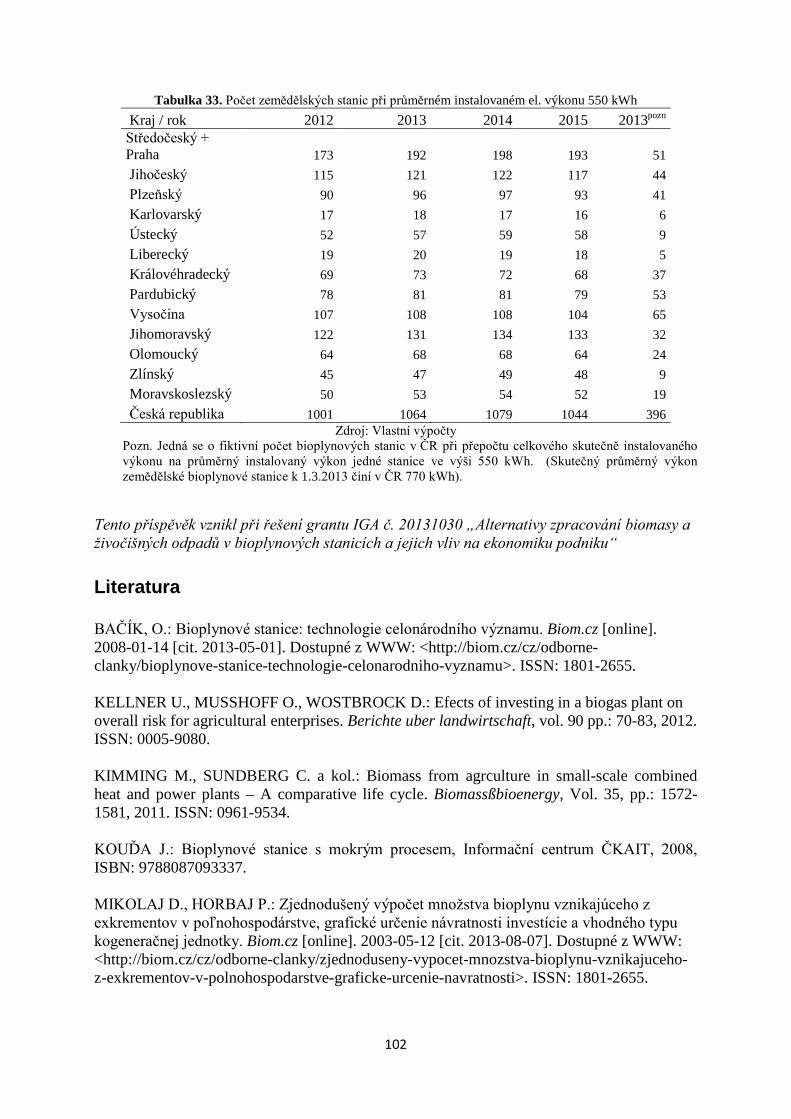
102
Tabulka 33. Počet zemědělských stanic při průměrném instalovaném el. výkonu 550 kWh Kraj / rok 2012 2013 2014 2015 2013pozn Středočeský + Praha 173 192 198 193 51 Jihočeský 115 121 122 117 44 Plzeňský 90 96 97 93 41 Karlovarský 17 18 17 16 6 Ústecký 52 57 59 58 9 Liberecký 19 20 19 18 5 Královéhradecký 69 73 72 68 37 Pardubický 78 81 81 79 53 Vysočina 107 108 108 104 65 Jihomoravský 122 131 134 133 32 Olomoucký 64 68 68 64 24 Zlínský 45 47 49 48 9 Moravskoslezský 50 53 54 52 19 Česká republika 1001 1064 1079 1044 396
Zdroj: Vlastní výpočty Pozn. Jedná se o fiktivní počet bioplynových stanic v ČR při přepočtu celkového skutečně instalovaného výkonu na průměrný instalovaný výkon jedné stanice ve výši 550 kWh. (Skutečný průměrný výkon zemědělské bioplynové stanice k 1.3.2013 činí v ČR 770 kWh).
Tento příspěvěk vznikl při řešení grantu IGA č. 20131030 „Alternativy zpracování biomasy a živočišných odpadů v bioplynových stanicích a jejich vliv na ekonomiku podniku“
Literatura BAČÍK, O.: Bioplynové stanice: technologie celonárodního významu. Biom.cz [online]. 2008-01-14 [cit. 2013-05-01]. Dostupné z WWW: <http://biom.cz/cz/odborne-clanky/bioplynove-stanice-technologie-celonarodniho-vyznamu>. ISSN: 1801-2655. KELLNER U., MUSSHOFF O., WOSTBROCK D.: Efects of investing in a biogas plant on overall risk for agricultural enterprises. Berichte uber landwirtschaft, vol. 90 pp.: 70-83, 2012. ISSN: 0005-9080. KIMMING M., SUNDBERG C. a kol.: Biomass from agrculture in small-scale combined heat and power plants – A comparative life cycle. Biomassßbioenergy, Vol. 35, pp.: 1572-1581, 2011. ISSN: 0961-9534. KOUĎA J.: Bioplynové stanice s mokrým procesem, Informační centrum ČKAIT, 2008, ISBN: 9788087093337. MIKOLAJ D., HORBAJ P.: Zjednodušený výpočet množstva bioplynu vznikajúceho z exkrementov v poľnohospodárstve, grafické určenie návratnosti investície a vhodného typu kogeneračnej jednotky. Biom.cz [online]. 2003-05-12 [cit. 2013-08-07]. Dostupné z WWW: <http://biom.cz/cz/odborne-clanky/zjednoduseny-vypocet-mnozstva-bioplynu-vznikajuceho-z-exkrementov-v-polnohospodarstve-graficke-urcenie-navratnosti>. ISSN: 1801-2655.
103
MOTLÍK J. a kol.: Čisté teplo: Příležitost leží ladem, Potenciál výroby tepla z obnovitelných zdrojů energie, Hnutí Duha a Calla, 2008. ISBN: 978-80-86834-22-1. OSLAJ M., MURSEC B.,VINDIS P.: Biogas production from maize hybrids, Biomass and bioenergy 34 (2010). PUKSEC T., DUIC N.: Geographic distribution and economic potential of biogas from Croatian farming sector. 14th IC – modelling and optimisation for energy saving and pollution reduction. 2011. ISBN: 978-88-95608-16-7. TATLIDIL F., BAYRAMOGLU Z., AKTURK D.: Biogas production potential in agriculture. Journal of environmental protection and ecology. Vol. 13, pp.: 247-252, 2012. ISSN: 1311-5065. VÁŇA J.,USŤAK S.: Využití odpadů ze zemědělského provozu a biomasy energetických rostlin k výrobě bioplynu In: využití obnovitelných zdrojů energie v zemědělství - zemědělské bioplynové stanice. Vodní zdroje Ekonomonitor spol. s.r.o. Chrudim. ISBN 978-80-86832-49-2
Anotace: Jednou z možností, jak docílit menší závisloti na dovozu fosilních paliv, je produkce bioplynu z živočišných odpadů a biomasy. Cílem tohoto příspěvku je určení teoretického potenciálu produkce bioplynu ze zemědělských bioplynových stanic v ČR a jednotlivých krajích. K naplnění tohoto cíle je využito krajového srovnání produkčních možností na základě plného využití živočišných odpadů a možností využití “nadbytečné plochy” u vybraných komodit rostlinné produkce (pšenice, ječmen, kukuřice na zrno, řepka, slunečnice, brambory) se zachováním 105 % míry soběstačnosti za období 2002-2015. Teoretický potenciál produkce bioplynu je dále přepočítán na možnost výroby elektrické energie a tepla za jednotlivé kraje i za ČR. Celkový potenciál produkce bioplynu ze živočišných odpadů a rostlinné produkce je v České republice (rok 2012) na úrovni 2252,62 mil. m3. Mezi jednotlivými kraji má teoreticky největší potenciál kraj Středočeský, Jihomoravský, Vysočina a Jihočeský. Naopak nejmenší teoretickou možnost produkce bioplynu při zachování 105 % míry soběstačnosti a maximálního využití živočišných odpadů má kraj Karlovarský a Liberecký.
Klíčová slova: bioplyn, míra soběstačnosti, potenciál, energie
104
Fiscal and Parafiscal Burden of Polish Farms vs. Farm Net Income and Cash Flow
Michał Soliwoda Institute of Agricultural and Food Economics – National Research Institute, Department of
Agricultural Finance, Świętokrzyska 20, 00-002 Warsaw, Poland [email protected]
Annotation: The paper presents the significance of the system of fiscal and parafiscal burden from the perspective of an ability of agricultural holdings in Poland to generate positive farm net income and cash flows. The following hypothesis was verified: the level and the type of current fiscal and parafiscal burden are not a significant impediment to generate positive farm net income and cash flows. In order to achieve the main objective of the paper three tasks were carried out: (i) presenting the system of fiscal (including so called “agricultural” tax and income tax from the special agricultural sectors) and parafiscal (mainly, social security contribution for the Agricultural Social Insurance Fund – KRUS) in Polish agriculture; (ii) analysis of the level of fiscal and parafiscal burden, given the type of farms; (iii) analysis of dependencies between the level of fiscal and parafiscal levies, farm net income, as well as cash flow. The statistical data, (collected by PL-FADN System) was treated as the main source of the secondary data. The research period covered the years 2007-2011. The research objects for statistical analysis included agricultural holdings representing the mixed production from 2010 and 2011. The following methods were used: literature overview, analysis of financial reporting, statistical analysis as well. Farm representing the type „fieldcrops“ were strongly burdened with fiscal levies, whereas the level of parafiscal levies in households specialising in animal production was the highest.
Key words: agricultural taxation, fiscal and parafiscal burden, agicultural policy, farm income.
JEL classification: G33, H24.
1 Introduction Fiscal (inter alia, income and business taxes) and parafiscal (among others, social security contributions) affect all types of businesses, including farms and ranches (Kay, Edward and Duffy, 2012). The system of agricultural taxation depends on the priorities of public policy of each country. Moreover, James and Nobes (1992) emphasize four requirements relevent to a functional tax system: efficiency, incentives, equity and macroeconomic considerations. These criteria stem from old four canons of taxation, dating back to Adam Smith, namely equity, certainty, convenience and efficiency. According to Andersen et al (2002), rates of taxes and their structure may be changed or manipulated to intervene within the economic policy. The policymakers will have their own priority of what they want to achieve with the current tax structure. Agriculture is regarded as commonly rated the hardest to tax of all hard-to-tax sectors. This is universally the case, due to the small scale and the spatial spread of activity, and the need for state-contingent levies, given the intrinsic vulnerability of agriculture to exogenous shocks (Bird, 1983). Tax concessions to farmers often represent an alternative to programmes incurring direct government outlay yet, because no budgetary spending takes place, the level of public scrutiny is often low. Furthermore, ignoring tax concessions may lead to an understatement of the real extent of government involvement in the agricultural sector (OECD, 2006). Dennis and İşcan (2011) investigated into dependencies between directed/ indirect agricultural taxation, subsidizing of the agricultural sector and overal economic growth (including convergency of GDP growth rate). According to Kulawik (2012), there were two opposite approaches to the impact of fiscal policy on the agricultural sector. The first group of researchers (Lewis, Matsuyama, Timmer) stated that taxes in the agricultural sector were the main source of national savings at early stages of

105
economic growth and development. Hovewer, the adversaries (Betes, Mwabu, Rastø, Torbeck, Torvik) assumed that discrimination of agriculture in economic policy was harmful to the poorest. The most significant remarks based on research of Dennis and İşcan (2011) are following: (i) deformation in agribusiness revailed and remained in a stable way, (ii) there was a strong negative correlation between the agricultural taxation and productivity (measured by TFP indice), (iii) the level of fiscal burden influcenced farm income, which may lead to a decrease in total productivity (TFP). Modelling and prediction of financial distress or bankruptcy seems to be a very popular topic of research in the area of corporate finance. Nonetheless, agricultural economists (Rayner, 1999; Kisielińska 2008; Hung-Hao, 2013; Turvey, 2013) discussed the foregoing problems. According to Gruszczyński (2012), firm survival models have become more and more popular in the literature representing the approach of ‘industrial organisation’. The significance of cash flow approach from the perspective of financial performance of farm households was discussed by Barnard and Nordquist (2012). Furthermore, Mishra and El-Osta (2009) noted that wealth accumulation plays many roles in enhancing the economic well-being of agricultural families. Some forms of wealth can be converted directly into cash, and thus can be used to meet immediate consumption needs. The main aim of this paper was to present the significance of the system of fiscal and parafiscal burden from the perspective of an ability of agricultural holdings in Poland to generate positive farm net income and cash flow. The following hypothesis was verified: the level and the type of current fiscal and parafiscal burden is not a significant impediment to generate positive farm net income and cash flows. In order to achieve the main aim of the paper three tasks were carried out: (i) presenting the system of fiscal and parafiscal (mainly social security contribution for the Agricultural Social Insurance Fund – KRUS) burden in the Polish agriculture; (ii) analysis of the share of fiscal and parafiscal burden in the farm net income, given the type of farms; (iii) analysis of dependencies between the level of fiscal and parafiscal levies, farm net income, as well as cash flow.
2 Materials and Methods The sources of data for the purpose of achieving the first objective included the legal acts and the economic literature In this case, the economic analysis of law and the documentary method were used. The emipirical data concerning the second objective was collected within Farm Accoutancy Data Network (FADN), operated by Institute of Agricultural and Food Economics – National Research Institute. The research period covered years 2007-2011 (for the purpose of analysis of the level of fiscal and parafiscal burden, given the type of farms). The detailed description of the number of sample was described in table A.1 (in Appendix). However, the data set was limited only to farm households representing the type T8 (mixed production) because these units are the most widespread in Poland. These households (1112 objects) reported the financial data in both 2010 and 2011.
The statistical analysis was based on quartile regression. The sum of fiscal and parafiscal levies in 2010 (FPL2010) was the independent variable for all models. There are four dependent variables:
FNI2010 – farm net income [PLN] in 2010;
FNI2011 – farm net income [PLN] in 2011;
CF12010 – cash flow (1) [PLN] in 2010;
CF12010 – cash flow (1) [PLN] in 2011.
106
Farm Net Income is treated as the remunaration of fixed factors of production of the farm (work, land and capital) and remuneration to the entrepreneurs risks (loss/profit) in the accounting years, whereas cash flow (1) is defined as the holding’s capacity for saving and self-financing (namely, receipts minus expenditure for the accounting year, not taking into account operations on capital and on debts and loans. Fiscal and parafical levies include expedintures for the agricultural tax, the income tax from special sector, as well as social security contributions to KRUS). Consequently, four models of quantile regression were constructed and analysed. The concept of quantile regression was proposed by Koenker and Basett (1978). Quantile regression tries to estimate either the conditional median or other quantiles of the response variable, whereas the method of least squares results in estimates that approximate the conditional mean of the response variable given certain values of the predictor variables. Moreover, quantile regression estimates are more robust against outliers in the response measurements. Koenker and Hallock (2001) stated that quantile regression generalizes the concept of a univariate quantile to a conditional quantile given one or more covariates. The classic regression method depicts an incomplete view on dependencies between variables, particularly in case of heteroscedascity. The estimation of the regression based on quartiles is semiparametric. It was emphasised that if we know the form of cummulative disitribution τ-quantile may be calculated in the following way (Widłak and Nehrebecka, 2011):
𝜉𝜏 = 𝑭𝒚−𝟏(𝝉) (1)
where: ξτ — τ-quantile τ∈[1,0] (for example, τ = 0,5 is median); F — distribution of y. The conditional quantile may be expressed as:
𝜉𝜏(𝐱) = 𝑭𝒚|𝒙−𝟏 (𝝉)
(2) To obtain an estimate of the conditional median function, we should use the linear programming method. Namely, the goal function for the median is presented below:
min𝛽∈𝑅𝐾
�|𝑦𝑖 − 𝜉0.5(xi,𝛽)|𝑁
𝑖=1
(3) where: N – the number of observations; yi – the value of the dependant variable; β – the vector of parameters for the expected value. GRETL (version 1.9.12) was exploited for the purpose of computations. All outliers3 were eliminated before the process of modelling.
3 Outliers are observations that fall below Q1 - 1.5(IQR) or above Q3 + 1.5(IQR), where: Q1,Q3 – 1./3. quartiles, IQR – interquartile range.
107
3 Results and Discussion
The system of fiscal and parafiscal levies in Polish agriculture Pawłowska-Tyszko (2012) stated that nowadays Polish agricultural sector seems to belong to significantly privilaged branches of economies. Given the present-day system of taxation, farm income falls outside of PIT4 taxation system. It means that Polish citizens are aware of the fact that the agricultural sector is an exemption from the rule of tax equity. The peculiarity of agricultural production results stems from biological/natural bases, particularly climatic and soil factors that are out of control of human beings. Furthermore, this peculiarity leads to the fact that contemporary agricultural taxation does not play the basic fiscal role. Ipso facto, present taxes (and parataxes or parafiscal levies as well) do not result in any direct fiscal effects (i.e., lower or higher budgetary revenues), though they are treated as the aid for development of farms (Dziemianowicz, 2008). Polish tax system is based on several types of levies, including so called agricultural tax, forestry tax, personal income tax (strictly from special section of agriculture), value added tax (VAT), transport tax, other levies (connected with inheritance, donation, fiscal charges, etc.). Hence, we can divide overall taxes and levies on the agricultural sector into three categories: income taxes, wealth taxes (capital levies) and indirect taxes. Nowadays economists and policymakers strongly deliberate on the implementation of changes in agricultural taxation. The axis of considerations is the following problem: substitution of the archaic agricultural tax with the income tax. This results from the marginal role of the agricultural tax in financial of rural communities5. A key feature of the agricultural tax is a relatively simplicity. In substance the agricultural tax replaces the income tax for farms. The agricultural holding covers a total area of more than 1 physical hectare6 that might be owned by a natural person, a legal entity or an organizational unit without a legal personality. A land with an area of less than 1 ha is levied by higher rate of agricultural tax. Moreover, agricultural activities in Poland cover plant and animal production, including seed production, breeding and reproduction; production of vegetables, ornamental plants, fungi, horticulture, insemination, industrial livestock production as well. Due to the fact that farmers engaged in on-farm agricultural production are not required to keep accounting records which that constitute the basis for the size of the tax (exception: special sectors of agricultural production). Consequently, the burden of the agricultural tax is determined by means of the lump-slum method, using a rate depending on the area of conversion hectares. The rate of the agricultural tax refers to the price of rye. It should be noted that the price of this price does not reflect the current financial situation of the farms. This is mainly due to the fact that the share of this cereal in areas under crop is gradually decreasing. The agricultural tax has a very extensive system of tax deductions and exemptions. In addition, taxpayers can snatch the opportunity of many types of deductions that are subject to specific mechanism of accumulation. In conclusion, the agricultural levy resembles wealth taxes.As a result, farm incomes are taxed differently than incomes from typical non-agricultural activities.
4 Personal Income Tax (PIT). 5 The most significant role is played by the real estate tax. 6 Or „conversion hectar” that is a synthetic unit describing the ability of the farm to generate the farm income. The number of “conversion hectars” might be determined on the ground of the area and the class of utilised arable areas stemming from the filling system of buildings and lands, as well as the type of tax district. See: Ustawa z dnia 15 listopada 1984 r. o podatku rolnym (Dz.U. 1984 nr 52 poz. 268).
108
According to the principle of fair taxation, income from agricultural activities should be taxed on the basis of documented income. The introduction of tax accounting to farms would be beneficial from the perspective of improving the economic and financial situation of the agricultural sector. In addition, fiscal policy ought to take into account the different forms of taxation, including a lump-sum method, based on recorded revenues. The income tax for special sections of agricultural production includes the plant production in greenhouses and plastic tunnels, fungi and mycelium production, plants in vitro, farmed breeding and rearing of poultry for slaughter, poultry poultry hatcheries (avicultures), breeding and rearing of fur and laboratory animals, raising earthworms and entomophages, cocoonery, beekeeping, animal breading and rearing outside farm as well. The tax base of taxpayers engaged in special sectors is the business's income. Taxpayers characterized by the legal personality (i.e., limited liability companies, joint stock companies or cooperatives) calculate the income tax on the basis of books. On the other hand, taxpayers in the form of individuals set the amount of income tax on the basis of: (1) an estimated income (by means of standards); (2) a simplified accounting for tax purposes (tax register of revenues and expenses) and (3) complete accounting records. Kowalski (1998) stated that in the countries which operate a separate social security system for farmers, the organisations established for this purpose not only deal with providing benefits to the agricultural holding users and their families, but they also perform the function of agricultural policy instrument, regarding farmers’ income and agrarian policy instruments. Moreover, many EU countries operate social insurance systems for farmers, and Poland is no exception. In Poland the administration of insured persons and recipients has been entrusted to the Agricultural Social Insurance Fund, referred to as the Agricultural Social Insurance Fund, Kasa Rolniczych Ubezpieczeń Społecznych, KRUS)7. The insurance system of farmers is similar to those in EU contries, belonging to the European Network of Agricultural Social Protection Systems (ENASP) where insurance are co-financed from public funds. The sum of co-financing amounted to 3.9 billion EUR in 2008, whereas the share of state subsidy to the system accounted for 92%. It is worth noting that around 38% of population resides in rural areas, whereas the agricultural population constitutes around 22% (Pawłowska-Tyszko, 2013).
The share of fiscal and parafiscal burden in the farm net income Table 1 shows the share of taxes (only the agricultural tax and the income tax from the special sectors, excluding VAT as the very marginal levy for farm household). The average share of fiscal burden for overall types of agricultural holdings accounted for 2.5%.Taking a closer look at the fiscal levies, farm representing the type 1 (field crops) were most significantly burdened with the levies. It is worth noting that the share of taxes in the farm income reached 3.8% in the analyzed period. This situation is not surprising if we take into account the fact that the tax base in the agricultural depends on the area of agricultural land. The crop production is closely bound up with the agricultural land as the production factor. Furthermore, the holdings represting the mixed type (T8) paid the taxes that constituted 3.0% of their farm incomes. It is worth noting that the aforementioned farms operate on the majority of the utilised arable area in Poland. The agricultural holding that represent the animal production (particularly, specialised in cow rearing/breading and pig production, namely T5+T6 and T7) were characterised by relatively lower level of the fiscal burden (in relation to farm net income). The farm households specialised in milking were a good case 7 The basic act of legislation for social insurance of farmers is Ustawa z dnia 14 grudnia 1982 roku o ubezpieczeniu społecznym rolników indywidualnych i członków i ich rodzin (Dz. U. Nr 40, poz. 268).
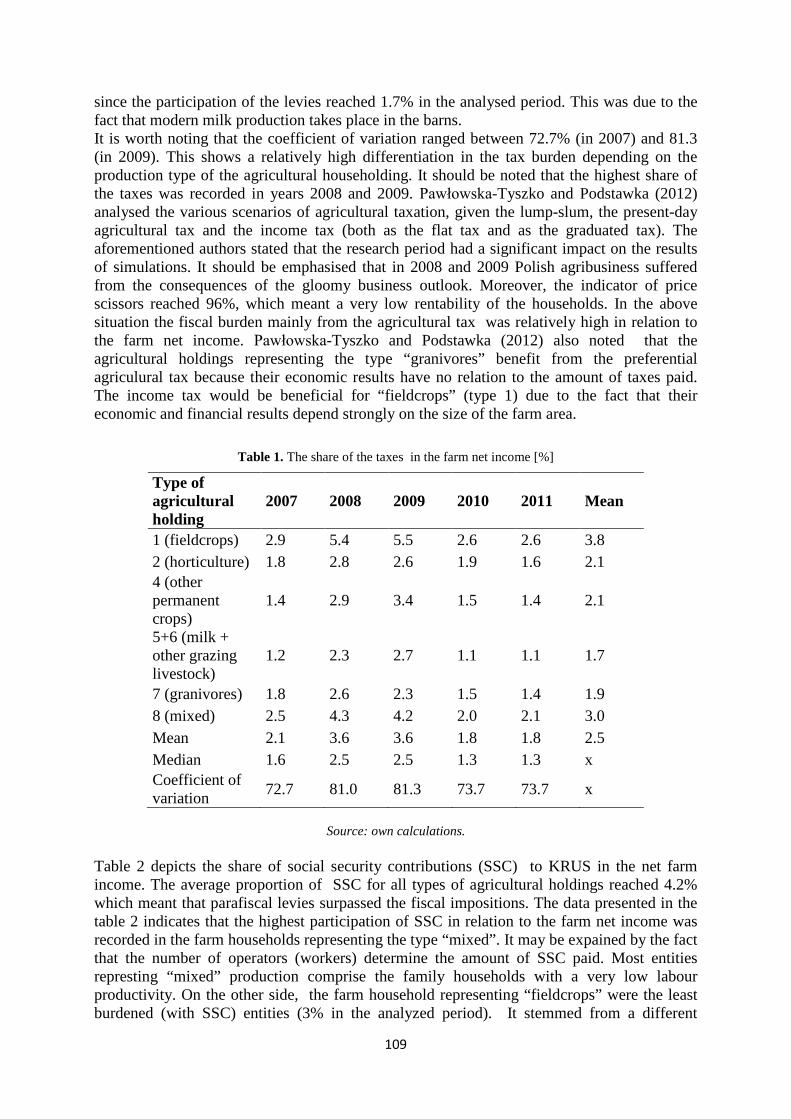
109
since the participation of the levies reached 1.7% in the analysed period. This was due to the fact that modern milk production takes place in the barns. It is worth noting that the coefficient of variation ranged between 72.7% (in 2007) and 81.3 (in 2009). This shows a relatively high differentiation in the tax burden depending on the production type of the agricultural householding. It should be noted that the highest share of the taxes was recorded in years 2008 and 2009. Pawłowska-Tyszko and Podstawka (2012) analysed the various scenarios of agricultural taxation, given the lump-slum, the present-day agricultural tax and the income tax (both as the flat tax and as the graduated tax). The aforementioned authors stated that the research period had a significant impact on the results of simulations. It should be emphasised that in 2008 and 2009 Polish agribusiness suffered from the consequences of the gloomy business outlook. Moreover, the indicator of price scissors reached 96%, which meant a very low rentability of the households. In the above situation the fiscal burden mainly from the agricultural tax was relatively high in relation to the farm net income. Pawłowska-Tyszko and Podstawka (2012) also noted that the agricultural holdings representing the type “granivores” benefit from the preferential agriculural tax because their economic results have no relation to the amount of taxes paid. The income tax would be beneficial for “fieldcrops” (type 1) due to the fact that their economic and financial results depend strongly on the size of the farm area.
Table 1. The share of the taxes in the farm net income [%]
Type of agricultural holding
2007 2008 2009 2010 2011 Mean
1 (fieldcrops) 2.9 5.4 5.5 2.6 2.6 3.8 2 (horticulture) 1.8 2.8 2.6 1.9 1.6 2.1 4 (other permanent crops)
1.4 2.9 3.4 1.5 1.4 2.1
5+6 (milk + other grazing livestock)
1.2 2.3 2.7 1.1 1.1 1.7
7 (granivores) 1.8 2.6 2.3 1.5 1.4 1.9 8 (mixed) 2.5 4.3 4.2 2.0 2.1 3.0 Mean 2.1 3.6 3.6 1.8 1.8 2.5 Median 1.6 2.5 2.5 1.3 1.3 x Coefficient of variation 72.7 81.0 81.3 73.7 73.7 x
Source: own calculations.
Table 2 depicts the share of social security contributions (SSC) to KRUS in the net farm income. The average proportion of SSC for all types of agricultural holdings reached 4.2% which meant that parafiscal levies surpassed the fiscal impositions. The data presented in the table 2 indicates that the highest participation of SSC in relation to the farm net income was recorded in the farm households representing the type “mixed”. It may be expained by the fact that the number of operators (workers) determine the amount of SSC paid. Most entities represting “mixed” production comprise the family households with a very low labour productivity. On the other side, the farm household representing “fieldcrops” were the least burdened (with SSC) entities (3% in the analyzed period). It stemmed from a different
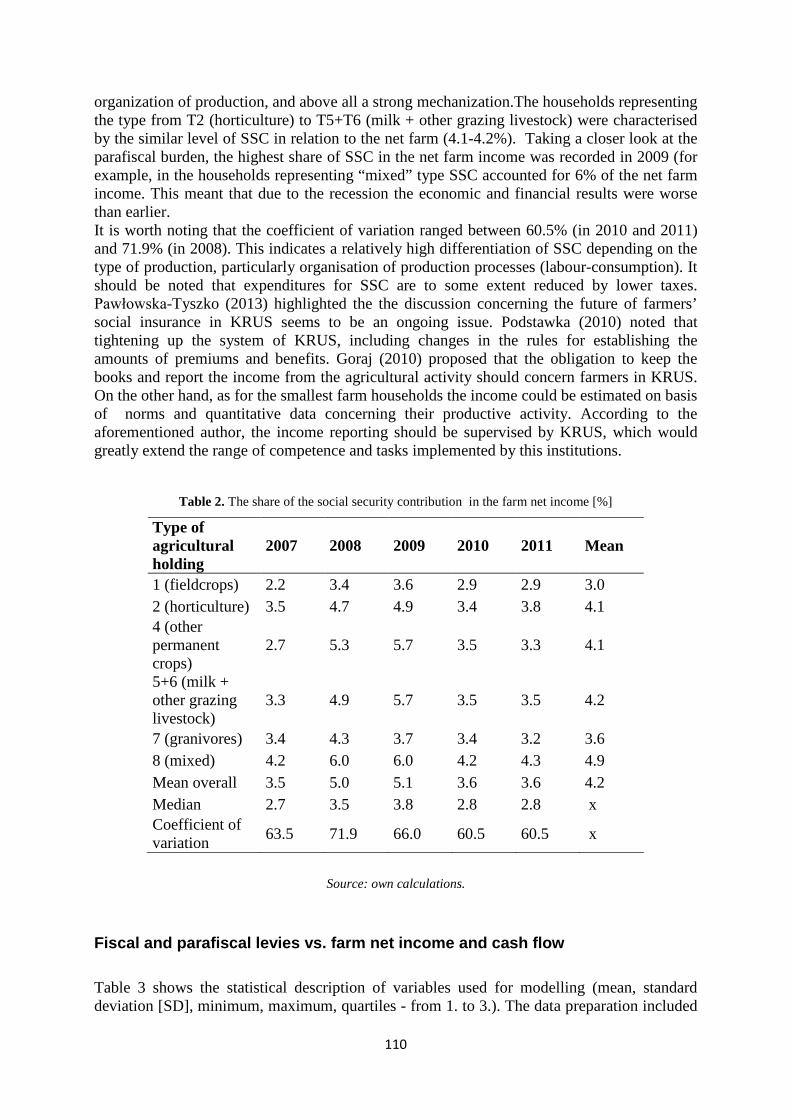
110
organization of production, and above all a strong mechanization.The households representing the type from T2 (horticulture) to T5+T6 (milk + other grazing livestock) were characterised by the similar level of SSC in relation to the net farm (4.1-4.2%). Taking a closer look at the parafiscal burden, the highest share of SSC in the net farm income was recorded in 2009 (for example, in the households representing “mixed” type SSC accounted for 6% of the net farm income. This meant that due to the recession the economic and financial results were worse than earlier. It is worth noting that the coefficient of variation ranged between 60.5% (in 2010 and 2011) and 71.9% (in 2008). This indicates a relatively high differentiation of SSC depending on the type of production, particularly organisation of production processes (labour-consumption). It should be noted that expenditures for SSC are to some extent reduced by lower taxes. Pawłowska-Tyszko (2013) highlighted the the discussion concerning the future of farmers’ social insurance in KRUS seems to be an ongoing issue. Podstawka (2010) noted that tightening up the system of KRUS, including changes in the rules for establishing the amounts of premiums and benefits. Goraj (2010) proposed that the obligation to keep the books and report the income from the agricultural activity should concern farmers in KRUS. On the other hand, as for the smallest farm households the income could be estimated on basis of norms and quantitative data concerning their productive activity. According to the aforementioned author, the income reporting should be supervised by KRUS, which would greatly extend the range of competence and tasks implemented by this institutions.
Table 2. The share of the social security contribution in the farm net income [%]
Type of agricultural holding
2007 2008 2009 2010 2011 Mean
1 (fieldcrops) 2.2 3.4 3.6 2.9 2.9 3.0 2 (horticulture) 3.5 4.7 4.9 3.4 3.8 4.1 4 (other permanent crops)
2.7 5.3 5.7 3.5 3.3 4.1
5+6 (milk + other grazing livestock)
3.3 4.9 5.7 3.5 3.5 4.2
7 (granivores) 3.4 4.3 3.7 3.4 3.2 3.6 8 (mixed) 4.2 6.0 6.0 4.2 4.3 4.9 Mean overall 3.5 5.0 5.1 3.6 3.6 4.2 Median 2.7 3.5 3.8 2.8 2.8 x Coefficient of variation 63.5 71.9 66.0 60.5 60.5 x
Source: own calculations.
Fiscal and parafiscal levies vs. farm net income and cash flow Table 3 shows the statistical description of variables used for modelling (mean, standard deviation [SD], minimum, maximum, quartiles - from 1. to 3.). The data preparation included
111
looking up research objects with errors and trimming the outliers. It should be noted the research sample that was selected deliberately included only objects with positive farm net income and cash flow (1).
Table 3. The statistical description of variables
Variables Mean SD Min. Max. Q0,25 Q0,50 (median) Q0,75
FPL2010 809 627 0 2877 340 649 1137 FNI2010 45365 32160 2018 156816 20924 35494 63324 FNI2011 52347 38777 1488 184650 22552 40181 72737 CF12010 51745 34836 1437 171099 24154 43315 70177 CF12011 57430 39473 489 205107 27043 46754 79800
Source: own calculations.
Table 4 presents statistics for 50. percentile (median), namely coefficents, standard errors (SE), t-Student statistics and p-value for both the constant and the explanatory variable (FPL2010). In all cases the dependant variables were significant at a 1% level.
Table 4. Results of estimation for 50. percentile
Variables Coefficient SE t-Student p-value FNI2010 as dependant variable
Constant 17498,9 1371,9 12,8 7,18e-035*** FPL2010 25,3 1,8 13,9 1,84e-040***
CF12010 as dependant variable Constant 21401,7 1544,0 13,9 2,05e-040*** FPL2010 28,1 1,9 15,0 1,34e-046***
FNI2011 as dependant variable Constant 19378,9 1780,80 11,1 3,74e-0,27*** FPL2010 27,3 2,3 12,1 1,39e-031***
CF12011 as dependant variable Constant 23313,2 1754,54 13,3 1,70e-0,37*** FPL2010 29,8 2,3 13,2 4,88e-0,37***
Note: *** significant at a 1% level.
Source: own calculations.
Figures 1-4 depict so called sequences of estimates for quantile regression. For each for 4 dependant variables we plot the 9 distinct quantile regression estimates for τ ranging from 0.10 to 0.90 as the solid curve with crosses. Moreover, each of the plots has a horizontal quantile, or τ-scale, whereas the vertical scale indicates the covariate effect. The dashed line in each figure shows estimate of the conditional mean effect based on the method of least squares (LS). The shaded green area depicts a 95% pointwise confidence band for the quantile regression estimates.
112
Fig. 1. Sequence of estimates for quantile regression - FNI2010 as dependent variable
It should be noted that quantile regression educed a non-linear dependency between the fiscal and parafiscal levies (in 2010) and cash flow 1 (also in 2010). Moreover, the relationship between the base explanatory variable and net farm income (in 2011) seems to be more complex than described by means of the LS method. This may lie in the peculiarity of farms with larger areas (particularly, representing “fieldcrops”), including economies of scale. The taxes (mainly, the agricultural tax) do not inhibit an ability to generate income and cash flow. However, the disparity between the impact of the fiscal and parafiscal levies in different years is substantial, particularly above 80. percentile. The fiscal and parafiscal levies as the explanatory variable for the farm net income in 2011 (fig. 3) enters the model as a quadratic effect.
Fig. 2. Sequence of estimates for quantile regression – CF12010 as dependent variable
Fig. 3. Sequence of estimates for quantile regression - FNI2011 as dependent variable
Quantile estimator with a 95% confidence level
Quantile estimator with a 95% confidence level
Quantile estimator with a 95% confidence level
113
As for the dependency between fiscal/parafiscal levies (in 2010) and cash flow (1) (in 2011), depicted in fig. 4, the association between 6. and 8. decile seems to be more intricate. However, large households that were strongly burdened with levies of every description can efficiently manage cash flow (Kay, Edward and Duffy, 2012).
Fig. 4. Sequence of estimates for quantile regression – CF12011 as dependent variable
4 Conclusion Nowadays the agricultural taxation plays a very marginal role in the fiscal policy. In substance the agricultural tax, the main component of levies for the farm households, replaces the income tax for these entities. On the other hand, social security contributions to KRUS may be treated a form of special privilege, addressed to the agricultural sector. This raises the question on subsidizing of such an inefficient system.
The analyzes showed that levies paid were sensititve to business outlook. Moreover, the archaic construction of agricultural tax depends on the price of rye. The farm households running labour-absorbing processes were burdened with the highest parafiscal impositions, mainly contributions to KRUS. Hovewer, this imposes the need for simplified reporting of the agricultural income.
Dependencies between the sum of taxes and parafiscal levies (mainly the agricultural tax and SSC to KRUS) may be non-linear. This forces researchers to investigate into the following problems: willingness-to-pay (WTP) and sensivity of farm income to various shocks. On the other hand, the psychological factors determing farmers’ decisions (from approach of behavioural economics) on taxes and parataxes should be also discussed.
The implementation of changes in agricultural taxation and social insurances is strongly deliberated (Pawłowska-Tyszko and Soliwoda, 2013). The proposed legislation should not limit potential of large family farms with promising financial results. On the other hand, new law regulations have to tighten up the present-day system of social insurance for farmers. This requires social consensus because a large number of small farms seems to be in fact the significant political player.
Quantile estimator with a 95% confidence level
114
References Andersen, G., Asheim, L.I., Mittenzwei, K. and Veggeland, F. (2002) Taxation of Agriculture in selected countries. Study of The United States, Canada, Australia, Germany, United Kingdom, Ireland, France, Switzerland and Italy with relevance to the WTO. NILF-report 2002–8. Oslo: Norwegian Agricultural Economic Research Institute (NILF).
Barnard, F.L. and Nordquist, D.W., (2012) ‘Using sector financial statements and ARMS data to prepare statements of owner equity and cash flows for the agricultural sector’, Agricultural Finance Review, vol. 72, iss. 2, pp. 273-285.
Bird, R.M. (1983) ‘Income Tax Reform in Developing Countries: The Administrative Dimension’, Bulletin for International Fiscal Documentation , vol.37, no. 1; pp. 3-4.
Dennis, B.N. and İşcan T.B. (2011) ‘Agricultural Distortions, Structural Changes and Economic Growth: A Cross-Country Analysis, American Journal of Agricultural Economics, vol. 93, no. 3, April 2011, pp. 885-905.
Dziemanowicz, R.I. (2008) ‘System podatkowy jako czynnik wpływający na konkurencyjność gospodarstw rolnych’, Roczniki Naukowe Stowarzyszenia Ekonomistów Rolnictwa i Agrobiznesu, vol. X, no. 3, pp. 139.
Goraj, L. (2010) ‘Możliwa rola KRUS we wspomaganiu i implementacji działań reformujących system ubezpieczenia rolników’, Ubezpieczenia w rolnictwie. Materiały i studia, KRUS, No. 36/2010, pp. 27-35.
Gruszczyński, M. (2012), Empiryczne finanse przedsiębiorstw. Mikroekonometria finansowa. Warszawa: Difin.
Hung-Hao, Ch., (2013) ‘Impact of the Economic Crisis on Income Inequality Among Farm Households‘, China Agricultural Economic Review, vol. 5, iss. 3 (pre-print), pp. 1-29.
Kay, R.D., Edwards, W.M. and Duffy, P.A. (2012) Farm management, New York: McGraw-Hill.
Kisielińska, J.(2008) Modele klasyfikacyjne prognozowania sytuacji finansowej gospodarsw rolniczych’, Warszawa: Wydawnictwo SGGW.
Koenker, R. and Bassett, G. (1978) ‘Regression Quantiles’, Econometrica, vol. 46, no. 1 (January), pp. 33–50.
Koenker, R. and Hallock, K.F. (2001) ‘Quantile Regression’, Journal of Economic Perspectives, vol. 15, no. 4 (fall), pp. 143-156.
Kowalski, A. (1998) Społeczne uwarunkowania rozwoju wsi i rolnictwa, Warszawa: Instytut Ekonomiki Rolnictwa i Gospodarki Żywnościowej – Państwowy Instytut Badawczy.
Kulawik, J. (2012) Subsydiować czy opodatkować – aspekt teoretyczny, [in:], Zmiany systemu podatkowego w rolnictwie, Pawłowska-Tyszko, J. (ed.), Warszawa: Instytut Ekonomiki Rolnictwa i Gospodarki Żywnościowej – Państwowy Instytut Badawczy.
Mishra, A. and El-Osta, H.S, (2009) ‘Estimating wealth of self-employed farm households’, Agricultural Finance Review, vol. 69, iss. 2, pp.248 – 262.
OECD (2006), ‘Taxation and Social Security in Agriculture’, Policy Brief, no. July, pp. 1-8.
Pawłowska-Tyszko, J. (ed.) (2012) Zmiany systemu podatkowego w rolnictwie, Warszawa: Instytut Ekonomiki Rolnictwa i Gospodarki Żywnościowej – Państwowy Instytut Badawczy.
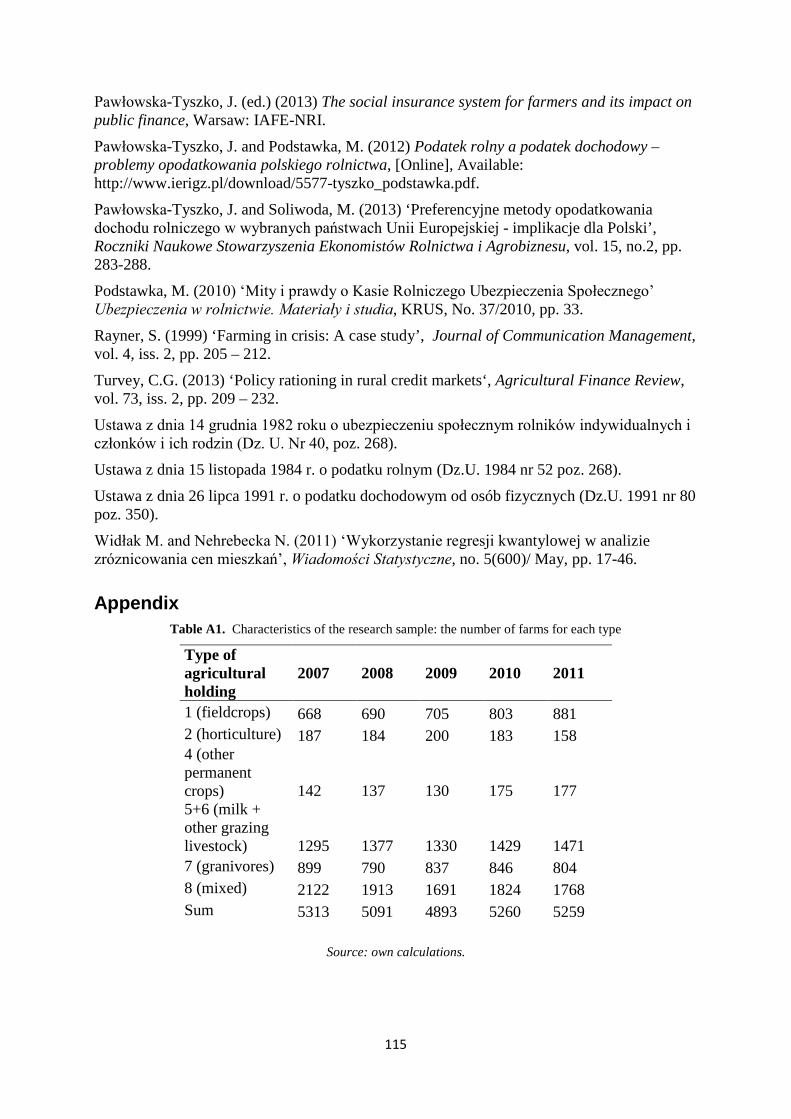
115
Pawłowska-Tyszko, J. (ed.) (2013) The social insurance system for farmers and its impact on public finance, Warsaw: IAFE-NRI.
Pawłowska-Tyszko, J. and Podstawka, M. (2012) Podatek rolny a podatek dochodowy – problemy opodatkowania polskiego rolnictwa, [Online], Available: http://www.ierigz.pl/download/5577-tyszko_podstawka.pdf.
Pawłowska-Tyszko, J. and Soliwoda, M. (2013) ‘Preferencyjne metody opodatkowania dochodu rolniczego w wybranych państwach Unii Europejskiej - implikacje dla Polski’, Roczniki Naukowe Stowarzyszenia Ekonomistów Rolnictwa i Agrobiznesu, vol. 15, no.2, pp. 283-288.
Podstawka, M. (2010) ‘Mity i prawdy o Kasie Rolniczego Ubezpieczenia Społecznego’ Ubezpieczenia w rolnictwie. Materiały i studia, KRUS, No. 37/2010, pp. 33.
Rayner, S. (1999) ‘Farming in crisis: A case study’, Journal of Communication Management, vol. 4, iss. 2, pp. 205 – 212.
Turvey, C.G. (2013) ‘Policy rationing in rural credit markets‘, Agricultural Finance Review, vol. 73, iss. 2, pp. 209 – 232.
Ustawa z dnia 14 grudnia 1982 roku o ubezpieczeniu społecznym rolników indywidualnych i członków i ich rodzin (Dz. U. Nr 40, poz. 268).
Ustawa z dnia 15 listopada 1984 r. o podatku rolnym (Dz.U. 1984 nr 52 poz. 268).
Ustawa z dnia 26 lipca 1991 r. o podatku dochodowym od osób fizycznych (Dz.U. 1991 nr 80 poz. 350).
Widłak M. and Nehrebecka N. (2011) ‘Wykorzystanie regresji kwantylowej w analizie zróznicowania cen mieszkań’, Wiadomości Statystyczne, no. 5(600)/ May, pp. 17-46.
Appendix Table A1. Characteristics of the research sample: the number of farms for each type
Type of agricultural holding
2007 2008 2009 2010 2011
1 (fieldcrops) 668 690 705 803 881 2 (horticulture) 187 184 200 183 158 4 (other permanent crops) 142 137 130 175 177 5+6 (milk + other grazing livestock) 1295 1377 1330 1429 1471 7 (granivores) 899 790 837 846 804 8 (mixed) 2122 1913 1691 1824 1768 Sum 5313 5091 4893 5260 5259
Source: own calculations.
116
New EU members: agriculture and investment
Nové členské státy EU: Zemědělství a investice
Luboš Smutka, Michal Steininger Department of Economics, FEM, Czech University of Life Sciences Prague,
Kamycka 129, 165 21 Prague 6 – Suchdol [email protected]
Annotation: Main goal of this paper is to analyze the development of the agrarian sector in the new EU member countries with an emphasis on investment flowing into agriculture. The aim is to analyze the relationship between agricultural sector and its performance on the one hand, and the amount and structure of investment ( gross capital stock) coming into agriculture on the other hand. The authors analyze the period before the global economic crisis. The results from the analysis show that the agricultural sector in the last two decades has changed dramatically its structure and its position in the national economy for the new EU Member States. In the period before the global economic crisis, in each of the analyzed country the size of its agricultural sector shrank, and also performance of this sector was decreased. Despite the significant reduction of the agricultural sector in many of the analyzed countries, it can be argued that each country has managed to streamline the agricultural sector, particularly in terms of its performance. The agricultural sector analyzed countries became more efficient and increased its competitiveness. The size and performance of the agricultural sector of these countries is closely associated with investments flowing into the sector . Structure and production performance of the agricultural sector is closely linked with the available investments (gross value of capital stock). With regard to the main objective of this paper, it can be argues that the most sensitive segments of the agricultural sector in the context of investments are livestock production and land (investment into land). With regard to the sensitivity of the efficiency of agricultural production in relation to changes in the value of investments it can be argued that the most sensitive are animal production and non-food agricultural production .
Key Words: Investment, agriculture, production, trade, value, volume, new EU member states
JEL classification: Q10, Q14, Q17
1 Úvod Agrární sektor a trh s potravinami jsou bezesporu klíčové sektory v každém hospodářství po celém světě (Svatoš, 2009). Dobře fungující zemědělství a výroba potravin jsou silně závislé na investicích a na úrovni kapitálových zásob (Svatoš, 2011). Pokud země nemá dostatečnou úroveň investic přicházejících do zemědělství, lze očekávat, že její zemědělství bude stagnovat (Mezera, Špička, 2013). Na druhou stranu silné investice plynoucí do zemědělství podporují zemědělskou produkci jak z hlediska produktivity, tak z hlediska efektivity (Žídková, Řezbová, Rosochatecká, 2011). Agrární sektor je ovlivněn v mnoha zemích postojem jednotlivých vlád k zemědělství. Zemědělství, jeho výkon a velikost představují pro mnoho vlád důležitou část jejich politických aktivit a strategických rozhodnutí. Zemědělství je nejen důležitou součástí ekonomiky, ale je také součástí strategického odvětví tím, že potravinami uspokojuje jednu z nejdůležitějších potřeb lidské populace (Horská, 2011). Neexistuje žádná země, která by neřešila problémy při zabezpečování dostatku potravin, proto součástí vnitřní bezpečnostní politiky státu je i bezpečnost potravin (Bielik, 2010). Na základě těchto skutečností je třeba zdůraznit, že zemědělství představuje specifický sektor světového hospodářství a jeho vývoj je ovlivněn nejen ekonomickými silami (nabídkou a poptávkou), ale je také ovlivněn politickou mocí (liberalizace, protekcionismus atd.). (Jeníček, 2009). Zemědělský trh jednotlivých zemí je jak z globálního, tak regionálního hlediska silně
117
ovlivňován prováděnou agrární politikou, která ovlivňuje rozvoj tohoto trhu (Svatoš, 2008). Výsledkem politických zásahů do zemědělství je, že zemědělský trh představuje jeden z nejméně liberalizovaných trhů v rámci světového trhu (Horská, Hambálková, 2008). Významným činitelem v rámci celosvětového zemědělského trhu je Evropské unie. Společná zemědělská politika EU, doprovázená společnou obchodní politikou, významně ovlivňuje nejen vnitřní zemědělský trh Unie, ale i globální rozvoj agrárního trhu. Každý nový členský stát EU je povinen přijmout společnou zemědělskou a obchodní politiku – přičemž obě politiky mají přímý vliv na výkon zemědělského sektoru jednotlivých zemí (Drabík, Bártová, 2008). Pro některé z nich může být dopad těchto politik pozitivní, pro jiné může být dopad těchto politik na výkonnost jejich zemědělského odvětví naopak záporný. Vstup do EU pro jednotlivé země způsobuje významné změny v jejich ekonomice, včetně zemědělství (Lukas, Pöschl et al., 2004). V souvislosti s přistoupením k EU se trhy jednotlivých členských zemí stávají součástí jednotného trhu EU a jejich předpisy týkající se agrárního sektoru musejí být v souladu s legislativou EU (Pokrivčák, Drábik, 2008). Vliv vstupu do EU na výkon a velikost sektoru zemědělství jednotlivých zemí je významný (Bartošová, Bartová, Fidrmuc, 2008). Hlavním cílem tohoto článku je analyzovat vývoj agrárního sektoru v jednotlivých nových členských zemích EU s důrazem na investice zaměřené na zemědělství. Cílem je analyzovat vztah mezi výkonností zemědělského sektoru a úrovní investic přicházejících do zemědělství. Investice do zemědělství spolu s vládními výdaji na zemědělství představují velmi důležitý prvek ovlivňující pozici a výkonnost zemědělství v ekonomikách jednotlivých zemí. Investice do zemědělství mají přímý vliv na vývoj objemu rostlinné a živočišné výroby. Investice mají také významný dopad na velikost odvětví zemědělství, jeho produktivitu a konkurenceschopnost. Existují velké rozdíly mezi jednotlivými novými členy EU, zejména ve vztahu k jejich ekonomické síle, velikosti trhu, k úloze zemědělství v národním hospodářství a politice a ve vztahu k výrobním podmínkám. Provedená analýza poskytuje základní přehled o vývoji investic a o velikosti a výkonnosti odvětví zemědělství v období před vypuknutím globální hospodářské krize (1993 - 2007).
2 Cíl a metodika Článek analyzuje vývoj hodnoty a strukturu kapitálové zásoby v zemědělství v deseti nových členských státech EU (NČS) (Bulharsko, Česká republika, Estonsko, Maďarsko, Lotyšsko, Litva, Polsko, Rumunsko, Slovensko a Slovinsko). Hlavním cílem je určit vztah mezi vývojem hodnoty kapitálové zásoby agrárního sektoru a výkonem tohoto sektoru v každé z těchto analyzovaných zemí. Analýza poskytuje základní přehled o rozvoji zemědělství v jednotlivých zemích. V tomto případě se autoři zaměřili zejména na výstup zemědělského odvětví (vývoj hodnoty zemědělské produkce), produktivitu (vývoj hodnoty zemědělské produkce na pracovníka) a vývoj ukazatele velikosti (vývoj výměry zemědělské a orné půdy, počet lidí pracujících v zemědělství). Článek rovněž analyzuje hodnotu hrubé kapitálové zásoby v oblasti rozvoje zemědělství a v tomto případě jde zejména o strukturu hrubé kapitálové zásoby – tzn. hodnota hrubé kapitálové zásoby ve vztahu k následujícím oblastem: vývoj výměry, hospodářská zvířata (hmotný majetek, zásoby), stroje a zařízení, pěstované plodiny a struktura hospodářských zvířat. Článek analyzuje základní vztahy mezi hodnotou kapitálové zásoby a vybranými proměnnými, které se týkají výkonu odvětví zemědělství. Je analyzována korelace mezi celkovou hodnotou kapitálové zásoby a následujícími proměnnými: HDP, ekonomicky aktivní obyvatelstvo v zemědělství celkem, zemědělská půda, orná půda, zemědělská výroba, produkce obilovin, produkce plodin, produkce potravin, živočišná výroba, zemědělská nepotravinářská výroba. Korelační analýza se také zaměřuje na vztahy mezi celkovou hodnotou kapitálové zásoby a jednotlivými oblastmi distribuce kapitálové zásoby (vývoj výměry, hospodářská zvířata (hmotný majetek, zásoby), stroje a
118
zařízení, pěstované plodiny a struktura hospodářských zvířat). Kromě korelační analýzy se článek zabývá rovněž analýzou citlivosti (elasticitou) jednotlivých proměnných ve vztahu ke změnám hodnoty celkové hrubé kapitálové zásoby v zemědělství. Cílem této analýzy je zjistit úroveň citlivosti jednotlivých proměnných na změny hodnoty hrubé kapitálové zásoby a zemědělských investic. Nástroje použité k dosažení těchto cílů jsou: bazické indexy, řetězové indexy, geometrický průměr, výpočet elasticity, regrese a korelace. Pro výpočet elasticity bylo nutné provést regresi, která poskytuje základní informace o vzájemných vztazích mezi jednotlivými exogenními proměnnými (hodnota hrubé kapitálové zásoby) a jednotlivými endogenními proměnnými. Nejvhodnější formou regrese pro analýzu je logaritmická regrese. Tento typ regrese poskytuje informace o elasticitě přímo (Jednotlivé regrese byly testovány kvůli získání informací o významu analyzovaných vztahů. Jednotlivé regrese a jejich charakteristiky nejsou z důvodu své rozsáhlosti součástí tohoto článku.). Hlavními zdroji dat jsou databáze poskytované OSN FAOSTAT a Světovou bankou. Analyzované časové období je v letech 1993 až 2007. To znamená, že článek se vztahuje na období před vznikem světové hospodářské krize (Junková, Matušková, 2011). Údaje pro následující roky nejsou v současné době k dispozici. Data použitá v této analýze jsou uváděna ve stálých cenách.
3 Výsledky a diskuse
Zemědělský sektor v nových členských státech EU (NČS) v letech 1993 až 2007 Během posledních dvaceti let zemědělský sektor výrazně změnil svou pozici v národním hospodářství u každého z nových členských států EU (NČS). Podíl zemědělství na HDP celé skupiny zemí poklesl z více než 7 % na cca 4 %. Nejvýznamnější snížení podílu agrárního sektoru na HDP bylo zaznamenáno v České republice, Polsku, Bulharsku, Slovinsku a Rumunsku (pokles podílu o 40 – 50 %). Ačkoliv všechny analyzované země zaznamenaly výrazný pokles podílu zemědělství v jejich národním hospodářství (výjimku tvoří pouze Maďarsko), hodnota výkonu odvětví zemědělství v analyzovaných zemích byla snížena jen o 13 %. Výrazný pokles výkonu odvětví zemědělství byl zaznamenán zejména v Bulharsku, na Slovensku, v České republice a Lotyšsku. Na druhou stranu, jediné země, které byly schopny stabilizovat hodnoty zemědělské produkce, byly Polsko, Maďarsko a Slovinsko.
Při analyzování vývoje výkonnosti sektoru zemědělství jednotlivých zemí je třeba zdůraznit, že i přes pokles významu odvětví zemědělství v rámci národního hospodářství všech analyzovaných zemí, jeho efektivnost se v porovnání s celkovou produkcí výrazně zvýšila, a to zejména ve vztahu k počtu pracovníků činných v agrárním sektoru. Všechny analyzované země zaznamenaly v analyzovaném časovém období výrazný nárůst vygenerované hodnoty produkce na jednoho pracovníka. Nejpůsobivější růst hodnoty zemědělské produkce byl zaznamenán ve Slovinsku, Rumunsku, Litvě, Bulharsku, Maďarsku a Polsku.
Tento vývoj lze vysvětlit tak, že zatímco u analyzovaných zemí byl ve sledovaném období zaznamenán pokles hodnoty zemědělské produkce o cca 13 %, počet zaměstnanců v analyzovaných zemích se snížil z 9,4 mil. na méně než 5,6 mil. - tj. o 40 %. Důvodem pro růst produktivity agrárního sektoru ve vztahu k počtu zaměstnanců je růst investic, zejména do strojního zařízení. V letech 1993 - 2007 se samotná hodnota investic do strojů a zemědělské techniky ve všech NČS zvýšila o téměř 20 %, zatímco hodnota investic (hrubá kapitálová zásoba) do půdy (pokles o 14 %), hospodářských zvířat (pokles o více než 30 %) a produkce plodin (pokles o více než 12 %) se výrazně snížila. Počet kusů strojního zařízení se ve všech analyzovaných zemích v období let 1993 - 2005 zvýšil z 2,5 milionu na více než 7 milionů kusů.
119
Vývoj zemědělského sektoru v analyzovaných zemích byl významně ovlivněn zmenšením rozlohy zemědělské a zejména orné půdy. Nejvýznamnější zmenšení rozlohy bylo patrné zejména v Estonsku, Bulharsku, Lotyšsku, Polsku, na Slovensku a ve Slovinsku. Ohledně rozlohy orné půdy byl nejvýznamnější pokles zaznamenán v případě Estonska, Lotyšska, Litvy a Polska.
Vztah mezi investicemi (hrubou kapitálovou zásobou) a vývojem výkonnosti agrárního sektoru v NČS
Během posledních dvou desetiletí bylo odvětví zemědělství v jednotlivých NČS ovlivněno mnoha faktory. Investice a dostupná hrubá kapitálová zásoba jsou velmi důležité faktory, které ovlivňují velikost a výkon zemědělského odvětví v jednotlivých analyzovaných zemích.
Hodnota hrubé kapitálové zásoby, jako jedna z hnacích sil ovlivňujících vývoj agrárního sektoru, se v analyzované skupině zemí mírně snížila za sledované časové období, asi o 5 % (z cca 181 miliard USD v roce 1993 na cca 174 miliard USD v roce 2007). Navzdory tomu, že sledovaná skupina zemí nezaznamenala významné snížení dostupné hrubé kapitálové zásoby, objevily se mezi jednotlivými zeměmi obrovské rozdíly ve vývoji hrubé hodnoty zásoby kapitálu. Významný nárůst hodnoty byl zaznamenán v případě Slovinska, Polska a Litvy. Na druhé straně bylo zjištěno významné snížení hodnoty v případě Bulharska, Estonska a Slovenska. Česká republika, Maďarsko, Lotyšsko a Rumunsko vykazují pouze mírný pokles. Opět je třeba zdůraznit, že i přes snížení dostupné hrubé kapitálové zásoby v případě většiny sledovaných zemí není situace tak kritická. Přepočteme-li dostupné hodnoty hrubé kapitálové zásoby na jednoho pracovníka činného v agrárním sektoru v jednotlivých analyzovaných zemích, zjistíme, že situace je ještě lepší v případě všech NČS s výjimkou Slovenska. Hodnota dostupné hrubé kapitálové zásoby se výrazně zvýšila především ve Slovinsku, Litvě, Rumunsku, Lotyšsku, Polsku a Bulharsku.
Je potřeba zdůraznit, že se měnila nejen hodnota hrubé kapitálové zásoby v jednotlivých analyzovaných zemích za sledované časové období, ale také se v jednotlivých zemích výrazně změnila struktura rozdělení této hodnoty v souvislosti se zemědělskými podniky.
V rámci analýzy skupiny sledovaných zemí bylo zjištěno, že k hlavním změnám došlo především u distribuce sledované dostupné hrubé kapitálové zásoby vztažené k živočišné výrobě (cca mínus 30 %), vývoji výměry (cca mínus 13 %) a pěstovaným plodinám (cca mínus11 %). Mezi jednotlivými zeměmi existují obrovské rozdíly ve změnách struktury hrubé kapitálové zásoby.
Hodnota investice a dostupné hrubé kapitálové zásoby úzce souvisí s vývojem a výkonností odvětví zemědělství jednotlivých zemí.
Navzdory existenci obrovských rozdílů mezi jednotlivými analyzovanými zeměmi lze nalézt také některé podobnosti. Obecně lze říci, že existují významné korelace mezi dostupnou hrubou kapitálovou zásobou a hrubým národním produktem, počtem pracovníků, kteří působí v oblasti zemědělství, disponibilní zemědělskou půdou a úrovní živočišné výroby. Zemědělská výroba, a také jednotlivé oblasti zemědělství akumulující hrubou kapitálovou zásobu, vykazují různé úrovně citlivosti ve vztahu ke změnám celkové hodnoty hrubé kapitálové zásoby v jednotlivých zemích. Ve vztahu k zemědělské produkci zaznamenala většina analyzovaných zemí vysokou úroveň senzitivity mezi investicemi (hrubou kapitálovou zásobou) a zejména hodnotou živočišné produkce a hodnotou nepotravinářské zemědělské produkce. Ve vztahu k distribuci dostupné hrubé kapitálové zásoby mezi jednotlivé oblasti odvětví zemědělství lze říci, že nejvyšší úroveň citlivosti existuje zejména mezi vývojem hodnoty celkové disponibilní hrubé zásoby kapitálu a vývojem hodnoty hrubé kapitálové zásoby ve vztahu k půdě a živočišné výrobě.
120
4 Závěr V průběhu posledních dvou desetiletí zemědělský sektor významně změnil svou strukturu a postavení v rámci národního hospodářství jednotlivých nových členských států EU. V období před vznikem globální ekonomické krize jednotlivé analyzované země zmenšovaly velikost svého agrárního sektoru a také redukovaly hodnotu výkonu tohoto sektoru. Navzdory výraznému zmenšení zemědělského sektoru v mnoha analyzovaných zemích lze říci následující. Agrární odvětví sledovaných zemí se stalo efektivnější a zvýšila se jeho konkurenceschopnost. Velikost a struktura zemědělského sektoru a také jeho produkční výkon úzce souvisejí s dostupnými investicemi (s hodnotou hrubé kapitálové zásoby). Vezmeme-li v úvahu hlavní cíl tohoto článku (hlavním cílem je určit vztah mezi vývojem hodnoty kapitálové zásoby a výkonem agrárního sektoru v jednotlivých analyzovaných zemích), můžeme říci, že nejcitlivějšími segmenty odvětví zemědělství reagujícími na investice jsou živočišná výroba a půda (investice do půdy). Pokud jde o citlivost výkonnosti zemědělské produkce ve vztahu ke změnám hodnoty investic, lze říci, že nejcitlivější jsou živočišná výroba a nepotravinářská zemědělská výroba. Investice jsou velmi důležitou složkou ovlivňující vývoj agrárního sektoru jednotlivých zemí. Problém posledních dvou desetiletí je v tom, že hodnota investic do zemědělství ve většině analyzovaných zemí stagnuje. Jediné země, kterým se podařilo zvýšit hodnotu hrubé kapitálové zásoby, byly Polsko, Litva a Slovinsko. Ostatní země zaznamenaly snížení hodnoty hrubé zásoby kapitálu - v případě některých z nich bylo snížení opravdu významné, např. Bulharsko nebo Slovensko. Agrární sektor jednotlivých analyzovaných zemí se ve sledovaném období vyznačoval schopností zvýšit svou efektivnost. Vzhledem k výraznému snížení počtu ekonomicky aktivních pracovníků v zemědělství, které bylo doprovázeno mnohem nižším snížením hodnoty produkce, došlo v jednotlivých zemích ke zefektivnění, a to jak ve vztahu k hodnotě agrárního výstupu na osobu, tak ve vztahu k hodnotě hrubé kapitálové zásoby na osobu. Do budoucna lze očekávat, že investice budou hrát velmi důležitou roli v procesu restrukturalizace agrárního sektoru jednotlivých analyzovaných zemí. Některé země, které mají potenciál být konkurenceschopné jak na evropském, tak i na světovém agrárním trhu, budou podporovat tok investic plynoucích do zemědělství (např. Polsko). Na druhou stranu lze očekávat, že některé jiné země, jejichž potenciál zemědělské produkce je omezen, budou přicházet o investiční toky plynoucí do zemědělství a postavení jejich agrárního sektoru na domácím, evropském, i světovém agrárním trhu se tak bude spíše jen zhoršovat (např. Slovensko).
Poděkování Tento článek je součástí výzkumu zpracovávaného v rámci výzkumného záměru 6046070906, financovaného Ministerstvem školství mládeže a tělovýchovy České republiky.
Reference Bartošová, D., Bartová, L., Fidrmuc, J., (2008): "EU Enlargement Implications on the New Member States Agri-food Trade," 2008 International Congress, August 26-29, 2008, Ghent, Belgium 44122, European Association of Agricultural Economists, dostupné: http://ideas.repec.org/p/ags/eaae08/44122.html
Bielik, P. et al. (2010): Economics, social policy and citizenship in the EU Evidence of V4 countries and perspectives for Ukraine, SPU, Nitra, ISBN 978-80-552-0448-2.
Drabík, D., Bártová, L., (2008): An Assessment of the Impact of the EU Enlargement on Agri-food Trade of New EU Member States, SPU Nitra, ISBN 978-80-552-0139-9.
121
Horská, E. et al. (2011): European studies on intercultural dimension of international business, SPU, Nitra, ISBN 978-80-552-0530-4.
Horská, E., Hambálková, M. (2008): Internationalization of agrarian companies, SPU Nitra, ISBN 978-80-552-0136-8.
Jeníček, V. (2009): The role of foreign trade and its effects, Agric. Econ. – Czech, 55, ISSN 0139-570X.
Junková, S., Matušková, E. (2011): The influence of crisis on the sector structure of economy focusing on agriculture, Agris on-line Papers in Economics and Informatics, 2, III, ISSN 1804-1930.
Lukas, Z., Poschl, J., et al., (2004): Possibilities and barriers of agrarian sector development in central and eastern European countries within EU-25, Ministry of agriculture, Praha 2004, ISBN 80-7084-343-8.
Mezera, J., Špička, J. (2013): Economic Effects of Investment Support of Adding Value to Food Products, Agris on-line Papers in Economics and Informatics, 1, V, ISSN 1804-1930.
Pokrivčák J., Drábik D. (2008): Agricultural Trade in Central and Eastern Europe. 1st ed. SPU, Nitra; ISBN 978-80-552-0139-9.
Svatoš, M. (2008): Selected trends forming European agriculture, Agric. Econ.-Czech, 54, ISSN 0139-570X.
Svatoš, M. et al. (2011): Globalization processes in agriculture and the role of EU within global market. Praha, PowerPrint. ISBN 978-8087415-26-9.
Svatoš, M. et al. (2009): Foreign trade – theory and practice. Praha, Grada. ISBN 978-80-247-2708-0.
Žídková, D., Řezbová, H., Rosochatecká, E. (2011): Analysis of Development of Investments in the Agricultural Sector of the Czech Republic, Agris on-line Papers in Economics and Informatics, 1, III, ISSN 1804-1930.
Anotace: Hlavním cílem článku je analyzovat vývoj agrárního sektoru v jednotlivých nových členských zemích EU s důrazem na investice plynoucí do zemědělství. Cílem je analyzovat vztah mezi zemědělským sektorem a jeho výkonností na jedné straně, a výší a strukturou investic (hrubé kapitálové zásoby) přicházejících do zemědělství na straně druhé. Autoři článku analyzují dobu před vypuknutím globální hospodářské krize. Výsledky vycházející z analýz jsou následující: Agrární sektor v posledních dvou desetiletích změnil výrazně svou strukturu a své postavení v rámci národního hospodářství v jednotlivých nových členských státech EU. V období před vypuknutím globální hospodářské krize jednotlivé analyzované země zmenšovaly velikost svého agrárního sektoru, a také snižovaly hodnotu výkonu tohoto sektoru. Navzdory výrazné redukci zemědělského sektoru v mnoha analyzovaných zemích lze říci, že jednotlivým zemím se podařilo zefektivnit odvětví zemědělství, a to především co do výkonu. Agrární sektor analyzovaných zemí se stal efektivnější a zvýšila se jeho konkurenceschopnost. Velikost a výkonnost zemědělského sektoru sledovaných zemí úzce souvisejí s investicemi plynoucími do tohoto sektoru. Struktura a produkční výkonnost zemědělského sektoru úzce souvisejí s dostupnými investicemi (s hodnotou hrubé kapitálové zásoby). S ohledem na hlavní cíl článku lze říci, že nejcitlivějšími segmenty odvětví zemědělství v souvislosti s investicemi jsou živočišná výroba a půda (investice do půdy). Pokud jde o citlivost výkonnosti zemědělské produkce ve vztahu ke změnám hodnoty investic, lze říci, že nejcitlivější jsou živočišná výroba a nepotravinářská zemědělská výroba.
Klíčová slova: Investice, zemědělství, výroba, obchod, hodnota, objem, nové členské země EU.
JEL classification: Q10, Q14, Q17

122

123
ICT

124
125
The Career Perceptions of Future Graduates
Ondřej Gojda Department of Information Engineering, FEM, Czech University of Life Sciences Prague,
Kamycka 129, 165 21 Prague 6 – Suchdol [email protected]
Tomáš Martínek
Department of Information Engineering, FEM, Czech University of Life Sciences Prague, Kamycka 129, 165 21 Prague 6 – Suchdol
Petr Hanzlík Department of Information Engineering, FEM, Czech University of Life Sciences Prague,
Kamycka 129, 165 21 Prague 6 – Suchdol [email protected]
Annotation: Every year thousands of the fresh university graduates enter the labour market. Such a huge amount of prosperous employees is a sufficient stimulus for the majority of employers to study the factors that make the company attractive in the eyes of the students, in order to gain attention of the most talented of them, convince them to join the organisation, and keep them engaged and satisfied within. To address this problem, an online survey aiming at the students of Czech agricultural universities, focusing on their future career perceptions was launched in the second quarter of 2013. The questions asked were loosely based on the research study conducted in 2012 by the US Achievers company. The original research was designed primarily to help employers to improve their corporate presentation on the labour market by considering the expectations about the future employment, and the main motivations for joining an organisation among the current generation of graduates (Achievers, Inc., 2012). The aim of this paper is to provide a comprehensive overview of the current situation, and the comparison between the results of the initial study and the data gathered from the questionnaire targeting the students of the CULS.
Key words: Recruiting strategies, personnel, career perceptions, rewarding, Labour market
JEL classification: E24, J64, A23
1 Introduction Vast amounts of students enter the Labour market every year after the graduation. Each generation of such prosperous employees has their specific set of new attitudes and expectations toward employers, which in fact describe the desired properties of an organization. Every company interested in attracting the most talented job candidates, should thus constantly adjust their motivation strategies, and corporate presentation in overall to be recognized as an appealing workplace.
In order to be able to efficiently react to the anticipations and perceptions of future employees, an organization must be aware of them, and succeed to recognize uprising trends in such a data. To address various aspects of this issue, many recruiters and independent research organizations conduct regular surveys to assess the situation on the Labour market. Recent research describes several notable changes in the career perceptions of future graduates and their way of first interaction with the labour market. Among the most notable are an uprise of looking for a job using an internet social network (Langlois, 2012; Reppler,
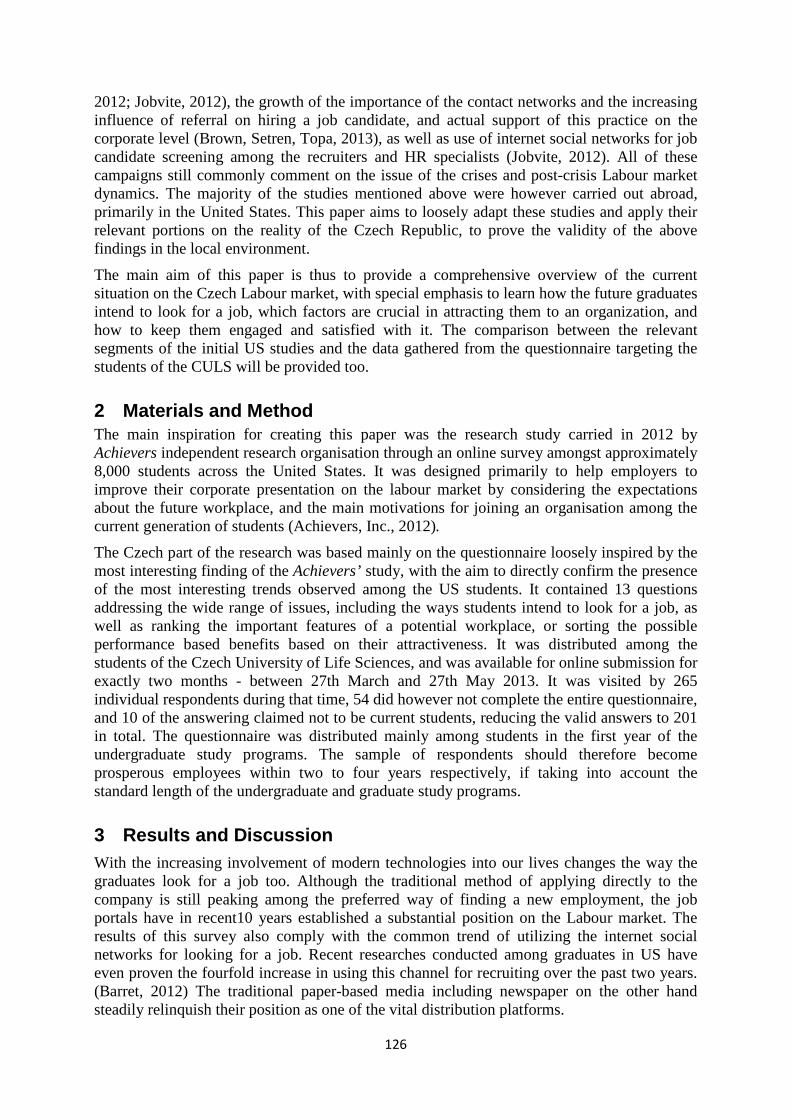
126
2012; Jobvite, 2012), the growth of the importance of the contact networks and the increasing influence of referral on hiring a job candidate, and actual support of this practice on the corporate level (Brown, Setren, Topa, 2013), as well as use of internet social networks for job candidate screening among the recruiters and HR specialists (Jobvite, 2012). All of these campaigns still commonly comment on the issue of the crises and post-crisis Labour market dynamics. The majority of the studies mentioned above were however carried out abroad, primarily in the United States. This paper aims to loosely adapt these studies and apply their relevant portions on the reality of the Czech Republic, to prove the validity of the above findings in the local environment.
The main aim of this paper is thus to provide a comprehensive overview of the current situation on the Czech Labour market, with special emphasis to learn how the future graduates intend to look for a job, which factors are crucial in attracting them to an organization, and how to keep them engaged and satisfied with it. The comparison between the relevant segments of the initial US studies and the data gathered from the questionnaire targeting the students of the CULS will be provided too.
2 Materials and Method The main inspiration for creating this paper was the research study carried in 2012 by Achievers independent research organisation through an online survey amongst approximately 8,000 students across the United States. It was designed primarily to help employers to improve their corporate presentation on the labour market by considering the expectations about the future workplace, and the main motivations for joining an organisation among the current generation of students (Achievers, Inc., 2012). The Czech part of the research was based mainly on the questionnaire loosely inspired by the most interesting finding of the Achievers’ study, with the aim to directly confirm the presence of the most interesting trends observed among the US students. It contained 13 questions addressing the wide range of issues, including the ways students intend to look for a job, as well as ranking the important features of a potential workplace, or sorting the possible performance based benefits based on their attractiveness. It was distributed among the students of the Czech University of Life Sciences, and was available for online submission for exactly two months - between 27th March and 27th May 2013. It was visited by 265 individual respondents during that time, 54 did however not complete the entire questionnaire, and 10 of the answering claimed not to be current students, reducing the valid answers to 201 in total. The questionnaire was distributed mainly among students in the first year of the undergraduate study programs. The sample of respondents should therefore become prosperous employees within two to four years respectively, if taking into account the standard length of the undergraduate and graduate study programs.
3 Results and Discussion With the increasing involvement of modern technologies into our lives changes the way the graduates look for a job too. Although the traditional method of applying directly to the company is still peaking among the preferred way of finding a new employment, the job portals have in recent10 years established a substantial position on the Labour market. The results of this survey also comply with the common trend of utilizing the internet social networks for looking for a job. Recent researches conducted among graduates in US have even proven the fourfold increase in using this channel for recruiting over the past two years. (Barret, 2012) The traditional paper-based media including newspaper on the other hand steadily relinquish their position as one of the vital distribution platforms.
127
The detailed results of which ways are favoured among current students in seeking for a work are presented in the following figure. This question allowed multiple answers to be marked as correct without further assessing their priority.
Fig. 1. Where do the students expect to find a job after graduating
The vast majority of the surveyed students admits expecting to find a job with the help of friends. Though it may seem as over-relying on established contact networks, recent studies have proven the job candidate being recommended by a current employee is twice as likely to get hired (Brown, Setren, and Topa, 2012). According to the findings of their research many companies even actively support these referral programs by rewarding the employees who actually recommend a new candidate for a position, and intend to hire up to the half of new workers this way.
The common means of seeking a job change, and naturally so do the various factors, which the potential job applicants find attractive and can thus influence their determination to engage with an organization. By following the perceptions of prosperous employees, recruiters can attract the most desirable employees by cleverly adjusting the company
128
propagation and HR strategy of advertising a vacant position. Following diagram presents the factors the respondents marked as crucial when looking for a job.
Fig. 2. Factors deemed to be the most important when selecting a job
The results brought no significant surprise - the most commonly mentioned factor was salary, relatively closely followed by the possibility of career advancement. Besides these two, US students and fresh graduates, also signified the importance of “Interesting and challenging work”, which peaked with the overall 51 % of respondent seeing it as a vital factor (Barret, 2012). It however reached only bare 15% among their Czech counterparts. Unsurprisingly, the US respondent also found a much higher interest in the mentorship (31% of respondents seeing this factor as very important), company image and reputation (23%), and company culture (22%) (Barret, 2012). These differences can however be easily accounted for the cultural differences and to the different attitudes towards engaging with a company, which are closely related. Discussion on this topic is continues by the following graph, which elaborates on the methodology of importance evaluation.
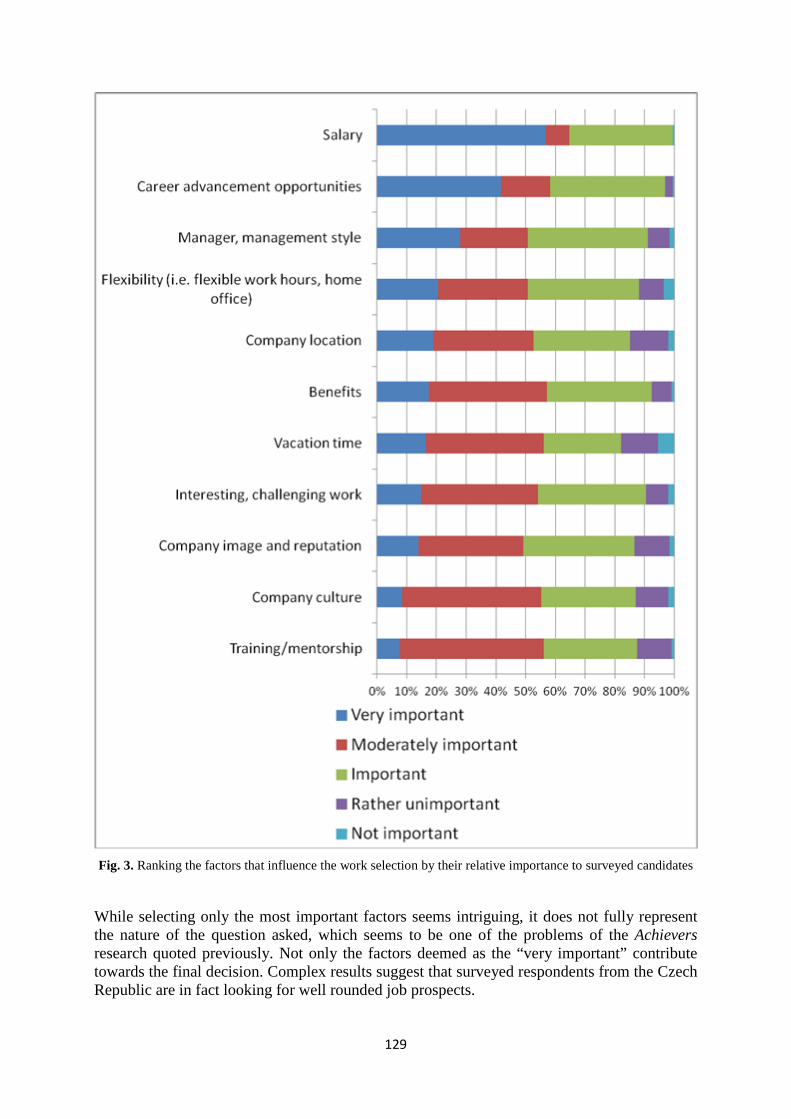
129
Fig. 3. Ranking the factors that influence the work selection by their relative importance to surveyed candidates
While selecting only the most important factors seems intriguing, it does not fully represent the nature of the question asked, which seems to be one of the problems of the Achievers research quoted previously. Not only the factors deemed as the “very important” contribute towards the final decision. Complex results suggest that surveyed respondents from the Czech Republic are in fact looking for well rounded job prospects.
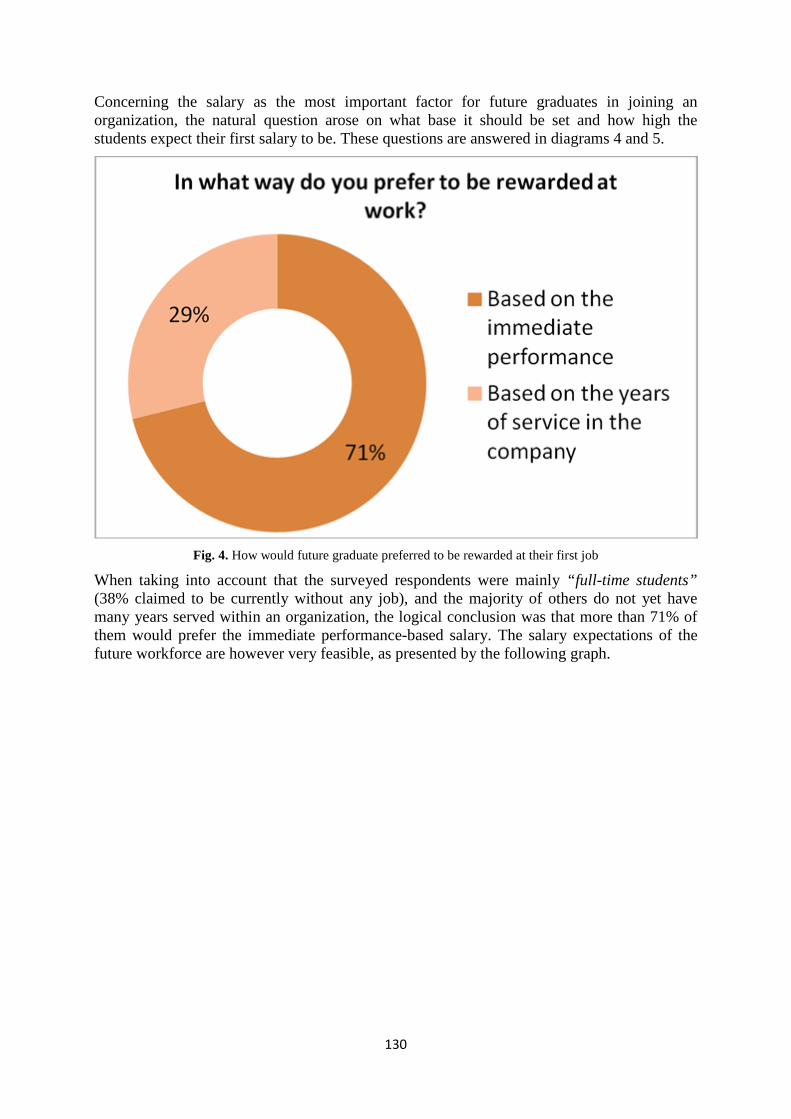
130
Concerning the salary as the most important factor for future graduates in joining an organization, the natural question arose on what base it should be set and how high the students expect their first salary to be. These questions are answered in diagrams 4 and 5.
Fig. 4. How would future graduate preferred to be rewarded at their first job
When taking into account that the surveyed respondents were mainly “full-time students” (38% claimed to be currently without any job), and the majority of others do not yet have many years served within an organization, the logical conclusion was that more than 71% of them would prefer the immediate performance-based salary. The salary expectations of the future workforce are however very feasible, as presented by the following graph.
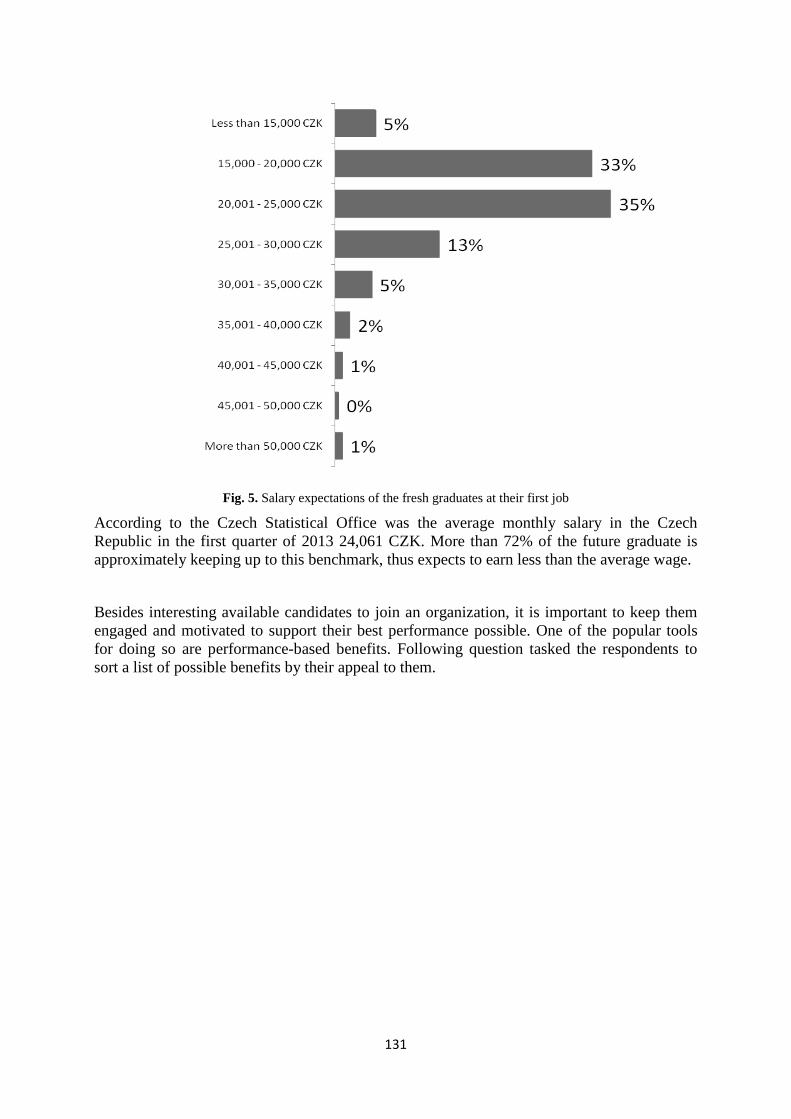
131
Fig. 5. Salary expectations of the fresh graduates at their first job
According to the Czech Statistical Office was the average monthly salary in the Czech Republic in the first quarter of 2013 24,061 CZK. More than 72% of the future graduate is approximately keeping up to this benchmark, thus expects to earn less than the average wage.
Besides interesting available candidates to join an organization, it is important to keep them engaged and motivated to support their best performance possible. One of the popular tools for doing so are performance-based benefits. Following question tasked the respondents to sort a list of possible benefits by their appeal to them.
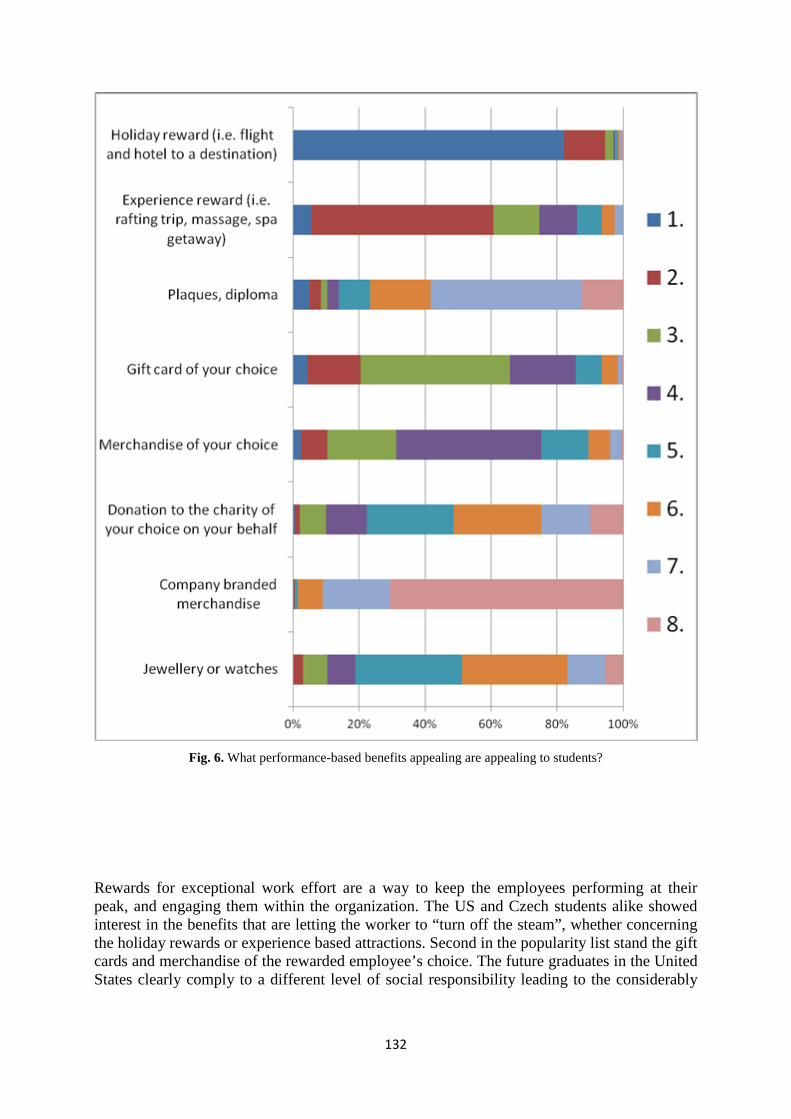
132
Fig. 6. What performance-based benefits appealing are appealing to students?
Rewards for exceptional work effort are a way to keep the employees performing at their peak, and engaging them within the organization. The US and Czech students alike showed interest in the benefits that are letting the worker to “turn off the steam”, whether concerning the holiday rewards or experience based attractions. Second in the popularity list stand the gift cards and merchandise of the rewarded employee’s choice. The future graduates in the United States clearly comply to a different level of social responsibility leading to the considerably
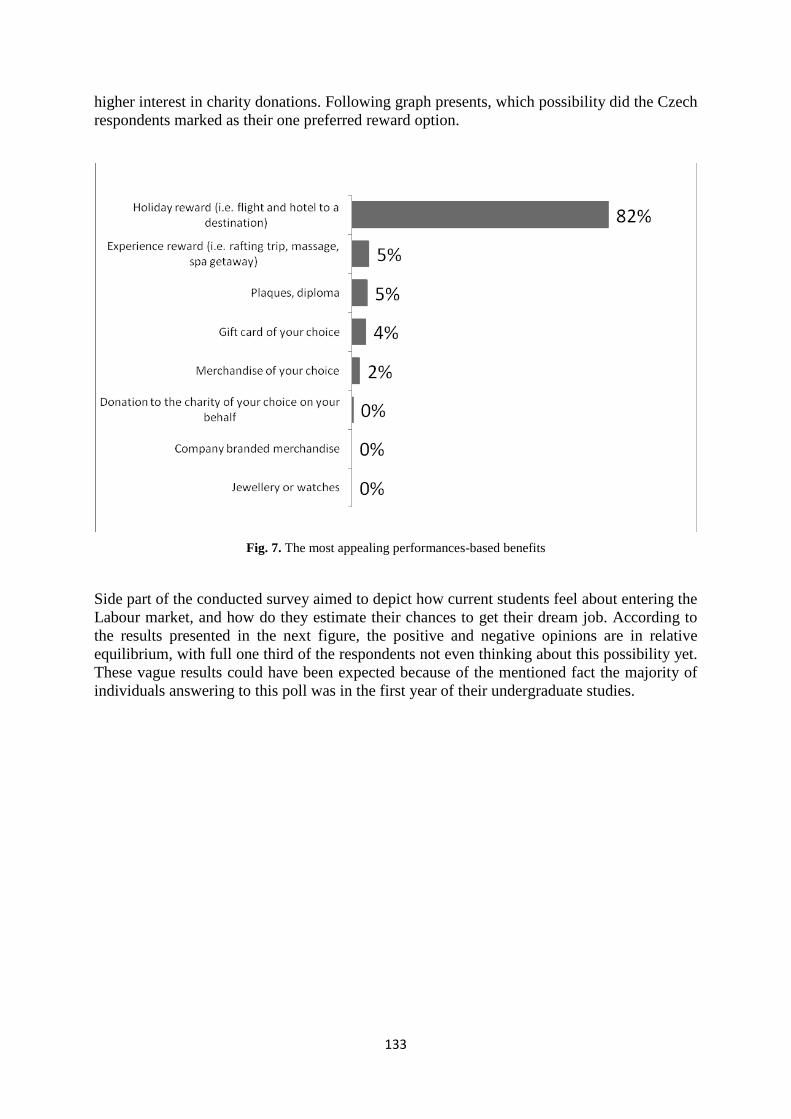
133
higher interest in charity donations. Following graph presents, which possibility did the Czech respondents marked as their one preferred reward option.
Fig. 7. The most appealing performances-based benefits
Side part of the conducted survey aimed to depict how current students feel about entering the Labour market, and how do they estimate their chances to get their dream job. According to the results presented in the next figure, the positive and negative opinions are in relative equilibrium, with full one third of the respondents not even thinking about this possibility yet. These vague results could have been expected because of the mentioned fact the majority of individuals answering to this poll was in the first year of their undergraduate studies.

134
Fig. 8. How do the students feel about job prospect upon the graduation
The figure 9 responds to the question primarily designed to point out the current trend in university study program selection. Two thirds of the participating listeners of the Czech University of Life sciences have confirmed it is not important for them to work in the domain of their study programs. This demonstrates that students often enter the fields they are not of primary interest to them, solely for reaching an academic title. Diplomas than often serve only as a prove of graduates potential rather then a proof of vast knowledge in the studied field.
Fig. 9. Is it important for you to work in the field of your study program?
135
Conclusion This paper provides valuable insight about what employers can expect from their future workforce and enables them so to apply proactive steps in their strategies of recruiting, engaging, and retaining employees. Both the Czech and US students’ alike plan to extensively rely on social networks in finding a job, both from the perspective of using them as a platform for actual searching, as well as using the contacts to their advantage in actually getting hired. The current generation still considers the salary as a crucial factor in looking for a job; however, the results of the survey suggest the spreading orientation on well rounded work position, with possible career advancement. The Czech respondents have traditionally shown lower interest in engaging with the company, since corporate culture, goodwill, and social responsibility influence are on a significantly lower level than in the case of their US counterparts. The graduating classes however do not only aim for interesting and challenging job, they want to be rewarded according to their current performance, and recognized for their accomplishments in a stimulating way. This gradual shift in the relationship between employers and employees may cause certain uncertainty, especially at the recruiter’s side. By understanding the perceptions and needs of the future workforce, businesses can however greatly benefit by being able to attract the most desirable candidates for vacant positions.
Reference BARRET, A.: Achievers and Experience Inc. Reveal Class of 2012 Study Results to
Understand the Needs of the Future Workforce. [Online]. Archivers. [Accessed 2012-04-03]. Available from WWW: <http://www.achievers.com/about-us/press-release/achievers-and-experience-inc-reveal-class-2012-study-results>
BROWN, M; SETREN, E; TOPA, G.: Do Informal Referrals Lead to Better Matches? Evidence from a Firm's Employee Referral System. [Online]. Federal Reserve Bank of New York Staff Reports, 568, Revised June 2013. [Accessed 2013-05-06]. Available from WWW: < http://www.newyorkfed.org/research/staff_reports/sr568.pdf>
JOBVITE: Social Job Seeker Survey. [Online]. [Accessed 2011-12-12]. Available from WWW: `<http://web.jobvite.com/rs/jobvite/images/Jobvite-Social-Job-Seeker-Survey-2011.pdf>
LANGLOIS, M.: Social Media and Job Searching Among Young Canadian Workers: A Summary of Government Initatives. [Online]. Parliament of Canada. [Accessed 2012-07-26]. Available from WWW: <http://www.parl.gc.ca/Content/LOP/ResearchPublications/2012-44-e.pdf>
REPPLER: How Recruiters Use Social Networks to Screen Candidate. [Online]. Mashable. [Accessed 2011-10-23]. Available from WWW: <http://mashable.com/2011/10/23/how-recruiters-use-social-networks-to-screen-candidates-infographic/>
CZECH STATISTICAL OFFICE.: Average wage – 1st quarter 2013 (CZ).[Online]. [Accessed 2013-07-08]. Available from WWW: <https://www.czso.cz/csu/csu.nsf/informace/cpmz060513.doc>
136
Monitoring IP addresses of attackers to the information system
Cestmir Halbich Department of Information Technologies, FEM, Czech University of Life Sciences Prague,
Kamycka 129, 165 21 Prague 6 – Suchdol [email protected]
Abstract. First, it is characterized the current situation in the field of Information Systems (IS). In addition to authorized users there is a considerable number of illegal invaders who try to exploit known bugs of IS to penetrate foreign IS. It is discussed model based on systems theory, which describes some of the protection mechanisms hampering the attacker’s penetration into IS. Information system and data stored on it are so protected. Some results of the model are visualized for clarity. In an introduction of the paper is characterized ability to detect attacks on IP addresses and next an equipment used to monitor attacks. The next section describes specific monitoring system for direct monitoring IP addresses of attackers. Monitoring is carried out attacks in two modes. The first mode is characterized by the protection of information systems operated on a specific computer with a firewall. The second mode is characterized that the computer is complemented by so called honeypot software. This software attracts attackers to attack by using of weak passwords. In the next section shows some results of monitoring attacks on the information system. To evaluate the direct measurement was ingested statistical software. Results of statistical processing are disclosed and explained next. In conclusion contains some models describing the behavior of an information system during an attack in comparison with the behavior without attacking. Typically, the attacker does not have detailed information about the contested IS. The main subject of investigation by the present model is not the case when is attacked with detailed information about the contested IS. Situation with more detailed information about the contested IS occurs rarely. In further studies will be searched differential or difference equations which can best describe the model.
Keywords: model of security measures in information system, fictional information system, protection by traps, monitoring IP addresses of attackers
1 Introduction
The current period is characterized by the widespread use of computers in almost all areas of human activity. In addition to authorized users there is a considerable number of illegal invaders who try to exploit known bugs of IS to penetrate foreign IS. Their goal is to either get money (eg, stealing credit card numbers, the attack on bank accounts of users, etc.), or cause direct damage, damage to industrial facilities using computers (see Falliere, N., O Murchu, L. and Chien, E. (2011)) or by DDOS attack make impossible the services provided by IS, see Anonymous attacks against Web sites.
2 Model and current situation in information systems security
For the purposes of our model based on the mechanism described by (Halbich 2012) we can divide attackers into two kinds. Firstly, on the internet there are mass attackers, whose aim is to get as many "scalps" as intrusions into information systems. A bonus for them can be any financial benefit from the successful penetration. On the other hand, there are less numerous invaders, aimed specifically your IS and penetration made almost at any cost, because it is their clear intent and goal. (eg damage to competitors, high financial profit, etc.). Against this second group of patterned precautions almost certainly fail, but slow attack down so that it is possible to prepare specific countermeasures. Against the first group is discussed model

137
almost foolproof. The attackers from the first group are not sufficiently motivated and experienced to be able to successfully complete an attack if there presents difficulties and attacked IS is protected by more than average. After some time losses caused by unsuccessful attempts to break into our IS will then decide to attack elsewhere. Therefore discussed the protection of our IS help protect other IS around the world, because after the attack phase automated attackers from the first group attacking manually selected only one IS. In time attack on our IS course they cannot attack elsewhere. The model adopts the common idiom ”A chain is no stronger than its weakest link” as a management paradigm Goldratt’s theory of constraints (TOC) (in Goldratt 1997). See Fig. 1.
Fig. 1. Physical model of security chain Source: Author's archive
The attacker will always try to attack the weakest link in the chain. In the first phase, the attacker is attacking with a minimum of information about the contested IS, the information obtains in the other phases. On the other hand, almost never attack with detailed information about the contested IS. Generally, it can be said that the attacker in our model attacking fictional system that considers a production system of the company. In the first phase, the attackers use automated software tools to obtain basic information about the contested IS. They get an idea of what security holes that IS can contain. In the next stage, they have the same or a different tool to use to attack the so-called exploits. Set of exploits is ready-made of hackers community. Man uses his knowledge and strengths, but also weaknesses. Eg. traps record errors and typos in attacker’s activities on the command line. When the attacker does not know the detail information about the contested IS attacks by trial and error, want to obtain additional information about the contested IS. The Fig. 2. shows the situation in the surroundings of protected production IS.
Fig. 2. Wireframe model of IS with tunnel across wells and peaks Source: Author's archive
It is almost impossible to transport the ball by trial and error at the highest peak so that it stayed there (the analogy of a successful penetration into IS). On the other hand, the ball will almost certainly end up in one of the wells, hidden traps in fictional IS. Height of the peak is proportional to the strength of the protection of the IS (in the form of password strength). Peaks in the vicinity of holes represent protection of fictional IS protected with deliberately weaker passwords than it was used to protect the production system. In the hole which represented fictional system attacker spends about 10 minutes or more of his valuable time by trial and error before he discover that the IS is fictional. All his trial and error process does not
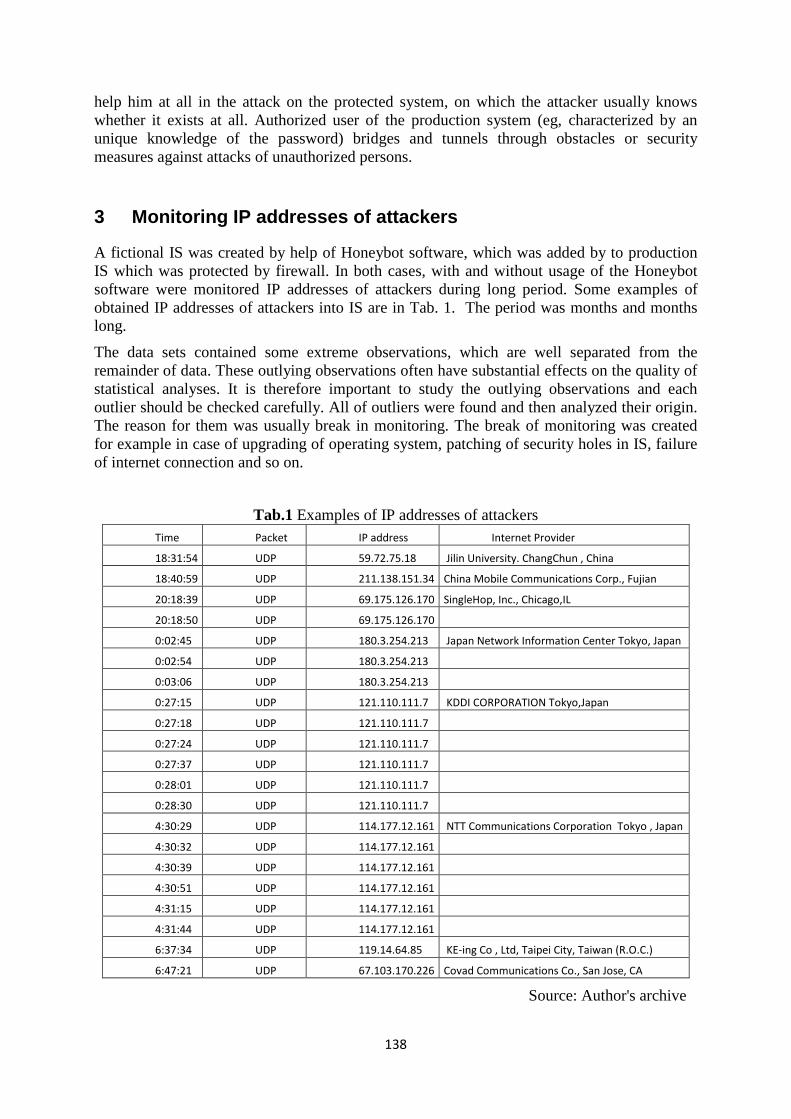
138
help him at all in the attack on the protected system, on which the attacker usually knows whether it exists at all. Authorized user of the production system (eg, characterized by an unique knowledge of the password) bridges and tunnels through obstacles or security measures against attacks of unauthorized persons.
3 Monitoring IP addresses of attackers
A fictional IS was created by help of Honeybot software, which was added by to production IS which was protected by firewall. In both cases, with and without usage of the Honeybot software were monitored IP addresses of attackers during long period. Some examples of obtained IP addresses of attackers into IS are in Tab. 1. The period was months and months long.
The data sets contained some extreme observations, which are well separated from the remainder of data. These outlying observations often have substantial effects on the quality of statistical analyses. It is therefore important to study the outlying observations and each outlier should be checked carefully. All of outliers were found and then analyzed their origin. The reason for them was usually break in monitoring. The break of monitoring was created for example in case of upgrading of operating system, patching of security holes in IS, failure of internet connection and so on.
Tab.1 Examples of IP addresses of attackers Time Packet IP address Internet Provider
18:31:54 UDP 59.72.75.18 Jilin University. ChangChun , China
18:40:59 UDP 211.138.151.34 China Mobile Communications Corp., Fujian
20:18:39 UDP 69.175.126.170 SingleHop, Inc., Chicago,IL
20:18:50 UDP 69.175.126.170
0:02:45 UDP 180.3.254.213 Japan Network Information Center Tokyo, Japan
0:02:54 UDP 180.3.254.213
0:03:06 UDP 180.3.254.213
0:27:15 UDP 121.110.111.7 KDDI CORPORATION Tokyo,Japan
0:27:18 UDP 121.110.111.7
0:27:24 UDP 121.110.111.7
0:27:37 UDP 121.110.111.7
0:28:01 UDP 121.110.111.7
0:28:30 UDP 121.110.111.7
4:30:29 UDP 114.177.12.161 NTT Communications Corporation Tokyo , Japan
4:30:32 UDP 114.177.12.161
4:30:39 UDP 114.177.12.161
4:30:51 UDP 114.177.12.161
4:31:15 UDP 114.177.12.161
4:31:44 UDP 114.177.12.161
6:37:34 UDP 119.14.64.85 KE-ing Co , Ltd, Taipei City, Taiwan (R.O.C.)
6:47:21 UDP 67.103.170.226 Covad Communications Co., San Jose, CA
Source: Author's archive
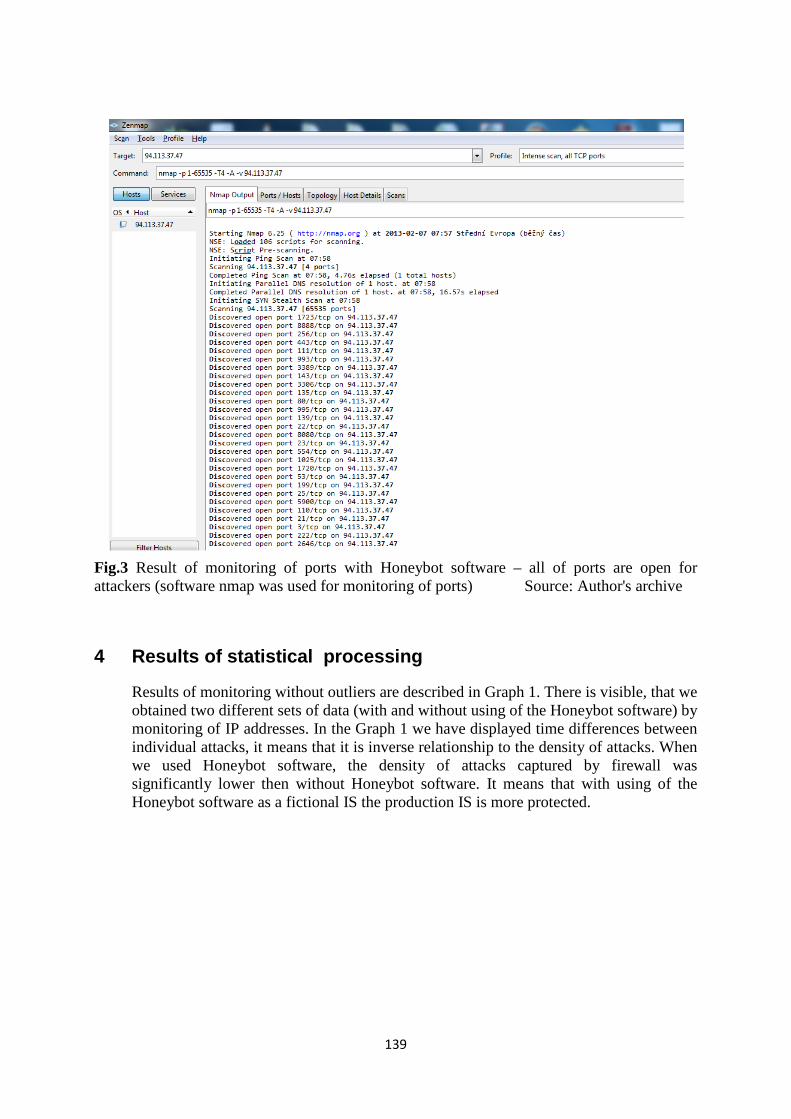
139
Fig.3 Result of monitoring of ports with Honeybot software – all of ports are open for attackers (software nmap was used for monitoring of ports) Source: Author's archive
4 Results of statistical processing
Results of monitoring without outliers are described in Graph 1. There is visible, that we obtained two different sets of data (with and without using of the Honeybot software) by monitoring of IP addresses. In the Graph 1 we have displayed time differences between individual attacks, it means that it is inverse relationship to the density of attacks. When we used Honeybot software, the density of attacks captured by firewall was significantly lower then without Honeybot software. It means that with using of the Honeybot software as a fictional IS the production IS is more protected.
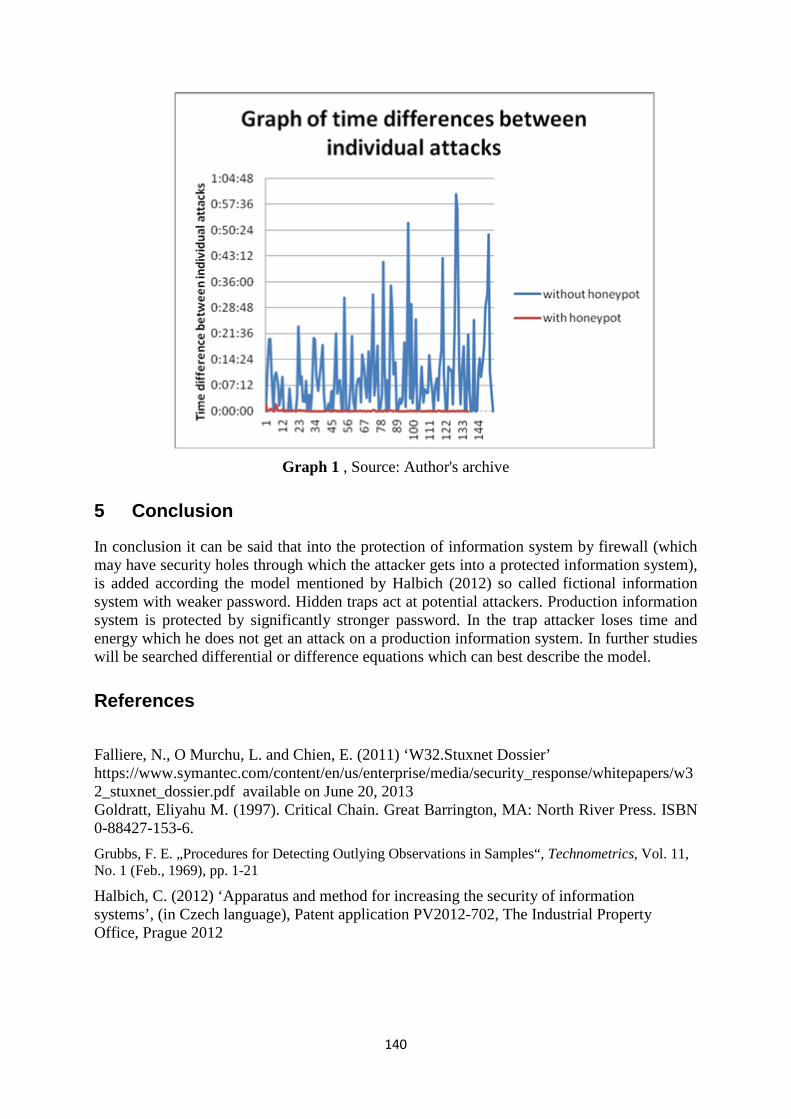
140
Graph 1 , Source: Author's archive
5 Conclusion
In conclusion it can be said that into the protection of information system by firewall (which may have security holes through which the attacker gets into a protected information system), is added according the model mentioned by Halbich (2012) so called fictional information system with weaker password. Hidden traps act at potential attackers. Production information system is protected by significantly stronger password. In the trap attacker loses time and energy which he does not get an attack on a production information system. In further studies will be searched differential or difference equations which can best describe the model.
References
Falliere, N., O Murchu, L. and Chien, E. (2011) ‘W32.Stuxnet Dossier’ https://www.symantec.com/content/en/us/enterprise/media/security_response/whitepapers/w32_stuxnet_dossier.pdf available on June 20, 2013 Goldratt, Eliyahu M. (1997). Critical Chain. Great Barrington, MA: North River Press. ISBN 0-88427-153-6. Grubbs, F. E. „Procedures for Detecting Outlying Observations in Samples“, Technometrics, Vol. 11, No. 1 (Feb., 1969), pp. 1-21 Halbich, C. (2012) ‘Apparatus and method for increasing the security of information systems’, (in Czech language), Patent application PV2012-702, The Industrial Property Office, Prague 2012
141
Web application for Collection and visualization of positional data - Wild boars and deer monitoring in Czech
Republic Jan Masner, Michal Stočes
Department of Information Technology, FEM, Czech University of Life Sciences Prague, Kamycka 129, 165 21 Prague 6 – Suchdol [email protected], [email protected]
Annotation: These papers deal with issues of making a general web application for collection and visualization of positional data. Principles and knowledge obtained have been used in evaluation of animal´s spatial activity in Šumava National Park, Doupovské Mountains and in Ore Mountains. The data for analysis are placed in database, obtained via GPS and GSM systems in cooperation with the Military Forests and Estates of the Czech Republic, the Šumava National Park and the Faculty of Forestry and Wood Sciences at the Czech University of Life Sciences in Prague. The application for processing, analyzing and visualization of the data was developed by the Department of Information Technologies Faculty of Economics and Management at the Czech University of Life Sciences in Prague. It is also being administered, managed and run by this department.
Key words: web application, wild animals, position data, Czech republic,GPS, GSM
JEL classification: C88
1 Introduction The positional data is mainly gained via radio based GNSS (Global Navigation Satellite System). Nowadays, there are two available functional systems; GPS (Global Positioning System) created and managed by the U.S. Department of Defence and GLONASS (Globalnaya navigatsionnaya sputnikovaya sistema) operated by the Russian Aerospace Defence Forces. It is possible to gain the data through many mobile devices equipped with chips able to process satellite data (animal colars, smart phones ...). (Lechner and Baumann, 2000) When the data is measured, it is saved into the memory of the device and then batched to be processed. It is possible to gain the data from the devices via wire or wireless technologies (GSM, UHF, VHF or satellite communication ). Owing to development of up-to-date ICT technologies it is technically relatively easy and not too expensive to obtain positional data and to transfer it online to be processed. There is a possibility to utilize the positional data in many industries, from security technologies, through logistic systems to agriculture and environmental protection. Certainly, this data is utilized also for research purposes.
2 Materials and Methods There is a variety of ways for the positional data to be collected, transferred and processed. Online collection, batch data transmission according to the chosen technology and time period followed by the validation of the data which is been archived including the possibility of further processing and display (e.g. map outputs) appears to be the optimum. On the basis of analysis of needs, principles and knowledge for online collection, validation, archiving and displaying of the positional data were obtained. (Stillwell and Clarke, 2004) Gained knowledge and principles have been used for example in game’s spatial activity evaluation in the Doupovske Mountains and the Sumava National Park in the Czech Republic. The database for analyses and processing have been formed by large data set obtained by
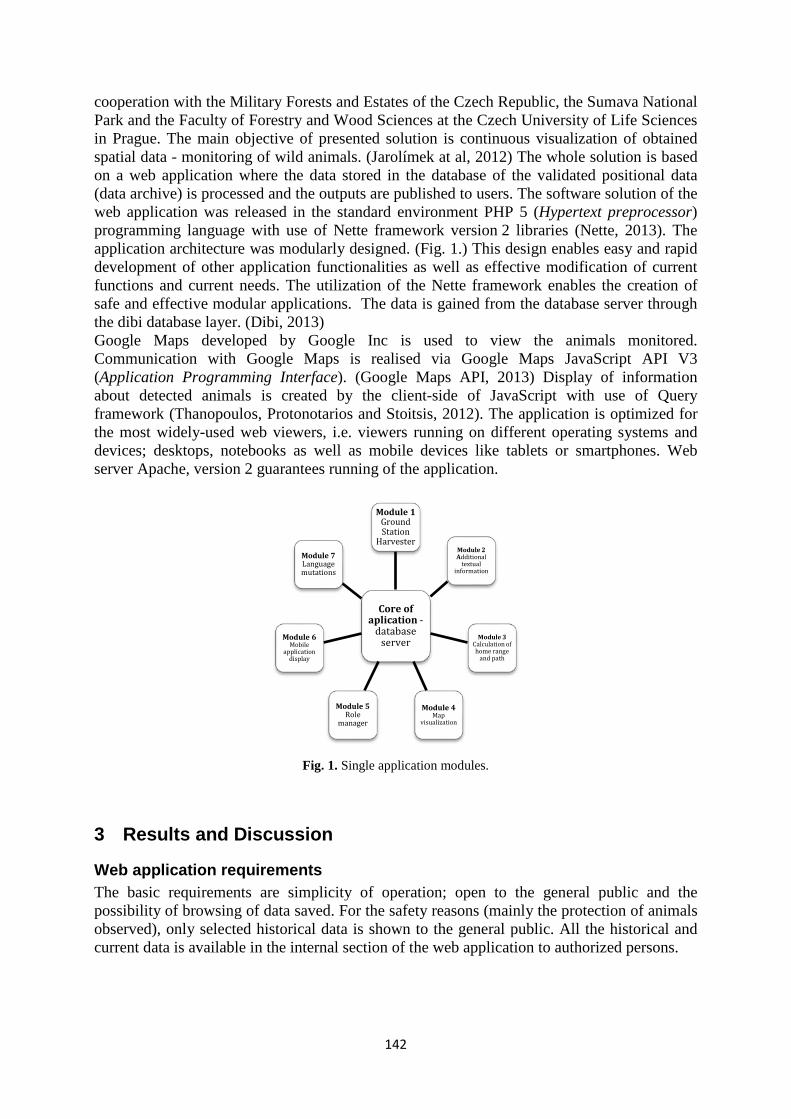
142
cooperation with the Military Forests and Estates of the Czech Republic, the Sumava National Park and the Faculty of Forestry and Wood Sciences at the Czech University of Life Sciences in Prague. The main objective of presented solution is continuous visualization of obtained spatial data - monitoring of wild animals. (Jarolímek at al, 2012) The whole solution is based on a web application where the data stored in the database of the validated positional data (data archive) is processed and the outputs are published to users. The software solution of the web application was released in the standard environment PHP 5 (Hypertext preprocessor) programming language with use of Nette framework version 2 libraries (Nette, 2013). The application architecture was modularly designed. (Fig. 1.) This design enables easy and rapid development of other application functionalities as well as effective modification of current functions and current needs. The utilization of the Nette framework enables the creation of safe and effective modular applications. The data is gained from the database server through the dibi database layer. (Dibi, 2013) Google Maps developed by Google Inc is used to view the animals monitored. Communication with Google Maps is realised via Google Maps JavaScript API V3 (Application Programming Interface). (Google Maps API, 2013) Display of information about detected animals is created by the client-side of JavaScript with use of Query framework (Thanopoulos, Protonotarios and Stoitsis, 2012). The application is optimized for the most widely-used web viewers, i.e. viewers running on different operating systems and devices; desktops, notebooks as well as mobile devices like tablets or smartphones. Web server Apache, version 2 guarantees running of the application.
Fig. 1. Single application modules.
3 Results and Discussion
Web application requirements The basic requirements are simplicity of operation; open to the general public and the possibility of browsing of data saved. For the safety reasons (mainly the protection of animals observed), only selected historical data is shown to the general public. All the historical and current data is available in the internal section of the web application to authorized persons.
Core of aplication -
database server
Module 1 Ground Station
Harvester Module 2 Additional
textual information
Module 3 Calculation of home range
and path
Module 4 Map
visualization
Module 5 Role
manager
Module 6 Mobile
application display
Module 7 Language mutations
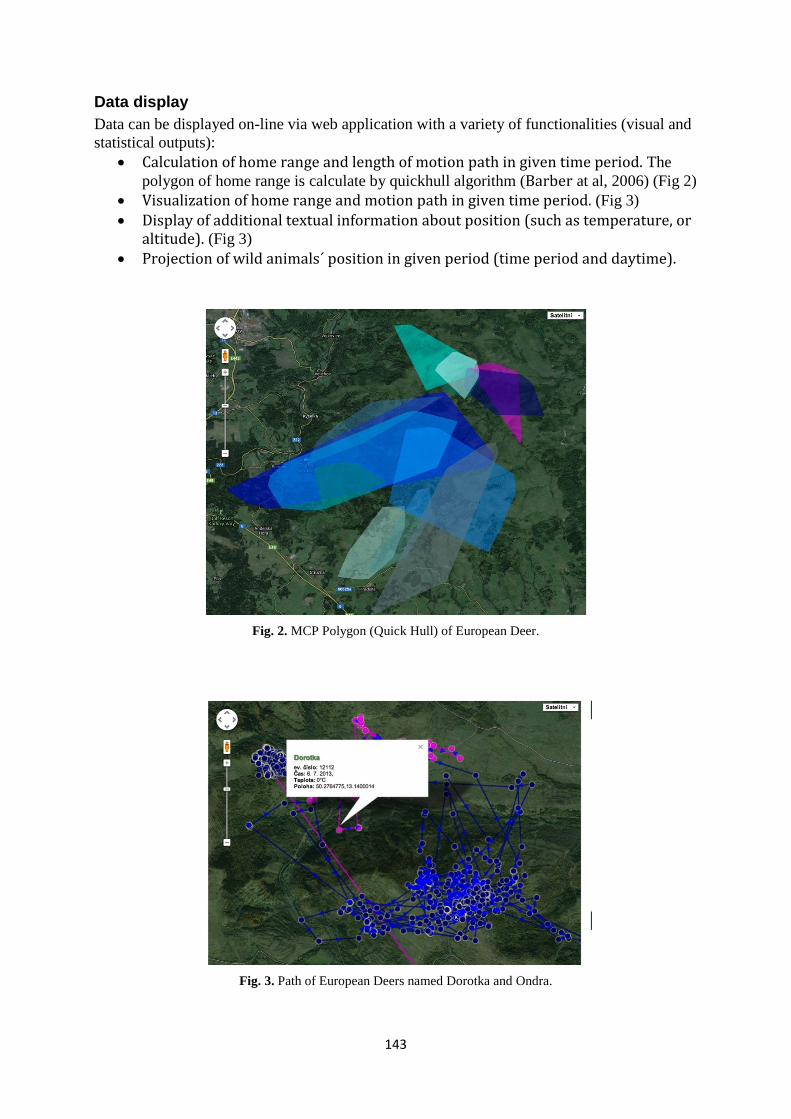
143
Data display Data can be displayed on-line via web application with a variety of functionalities (visual and statistical outputs):
• Calculation of home range and length of motion path in given time period. The polygon of home range is calculate by quickhull algorithm (Barber at al, 2006) (Fig 2)
• Visualization of home range and motion path in given time period. (Fig 3) • Display of additional textual information about position (such as temperature, or
altitude). (Fig 3) • Projection of wild animals´ position in given period (time period and daytime).
Fig. 2. MCP Polygon (Quick Hull) of European Deer.
Fig. 3. Path of European Deers named Dorotka and Ondra.

144
System function requirements • Friendly data entry for users • Data selection and filtering (Fig. 4) • Online availability of application • A public part for the data entering and browsing; and an internal (administrative)
part for data validation, dial adjustment and utilization of advanced functions of data analysis
• Possibility to use historical data • Possibility to use application on different types of devices (PCs, notebooks,
smartphones, tablets) and operating systems • Possibility to create new language versions of application
Fig. 4. Data selection and filtering.
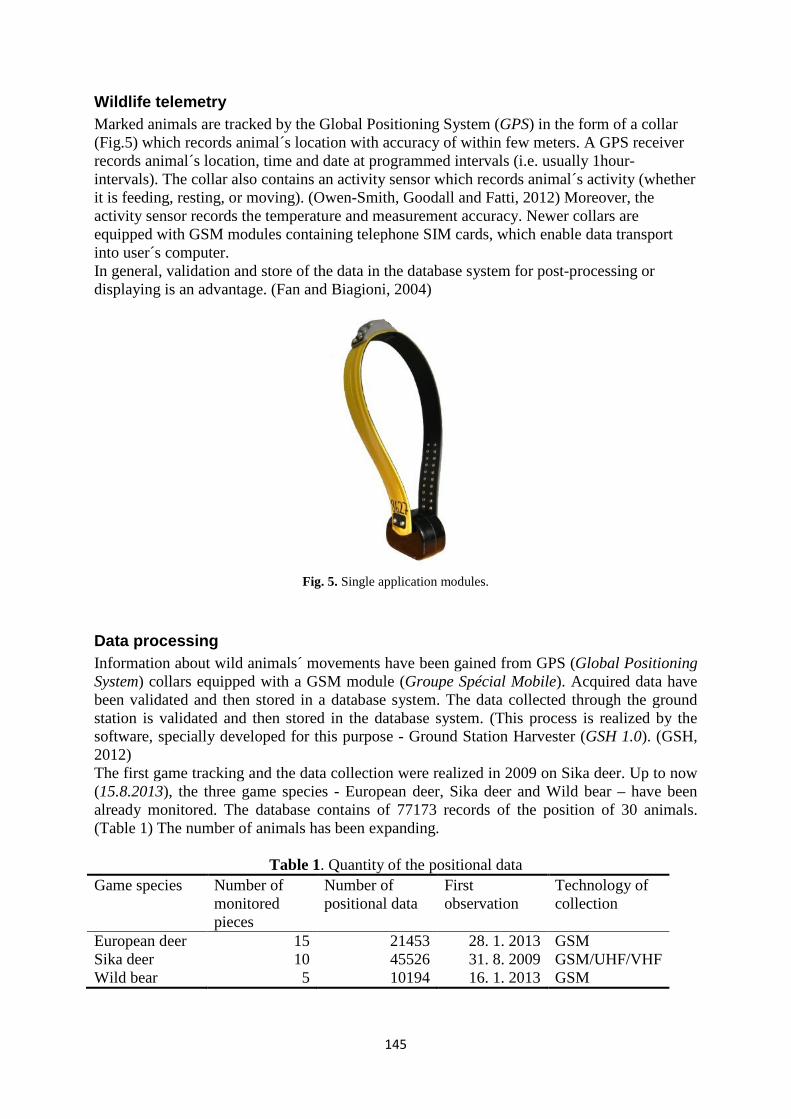
145
Wildlife telemetry Marked animals are tracked by the Global Positioning System (GPS) in the form of a collar (Fig.5) which records animal´s location with accuracy of within few meters. A GPS receiver records animal´s location, time and date at programmed intervals (i.e. usually 1hour-intervals). The collar also contains an activity sensor which records animal´s activity (whether it is feeding, resting, or moving). (Owen-Smith, Goodall and Fatti, 2012) Moreover, the activity sensor records the temperature and measurement accuracy. Newer collars are equipped with GSM modules containing telephone SIM cards, which enable data transport into user´s computer. In general, validation and store of the data in the database system for post-processing or displaying is an advantage. (Fan and Biagioni, 2004)
Fig. 5. Single application modules.
Data processing Information about wild animals´ movements have been gained from GPS (Global Positioning System) collars equipped with a GSM module (Groupe Spécial Mobile). Acquired data have been validated and then stored in a database system. The data collected through the ground station is validated and then stored in the database system. (This process is realized by the software, specially developed for this purpose - Ground Station Harvester (GSH 1.0). (GSH, 2012) The first game tracking and the data collection were realized in 2009 on Sika deer. Up to now (15.8.2013), the three game species - European deer, Sika deer and Wild bear – have been already monitored. The database contains of 77173 records of the position of 30 animals. (Table 1) The number of animals has been expanding.
Table 1. Quantity of the positional data Game species Number of
monitored pieces
Number of positional data
First observation
Technology of collection
European deer 15 21453 28. 1. 2013 GSM Sika deer 10 45526 31. 8. 2009 GSM/UHF/VHF Wild bear 5 10194 16. 1. 2013 GSM
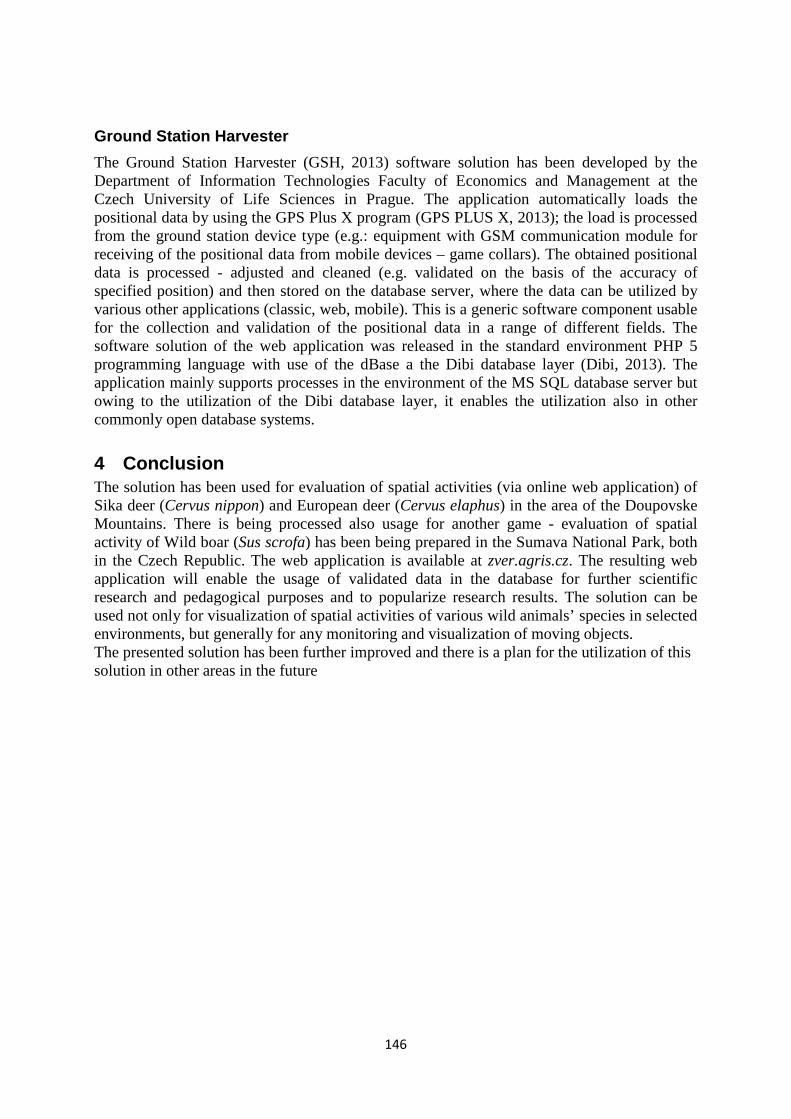
146
Ground Station Harvester The Ground Station Harvester (GSH, 2013) software solution has been developed by the Department of Information Technologies Faculty of Economics and Management at the Czech University of Life Sciences in Prague. The application automatically loads the positional data by using the GPS Plus X program (GPS PLUS X, 2013); the load is processed from the ground station device type (e.g.: equipment with GSM communication module for receiving of the positional data from mobile devices – game collars). The obtained positional data is processed - adjusted and cleaned (e.g. validated on the basis of the accuracy of specified position) and then stored on the database server, where the data can be utilized by various other applications (classic, web, mobile). This is a generic software component usable for the collection and validation of the positional data in a range of different fields. The software solution of the web application was released in the standard environment PHP 5 programming language with use of the dBase a the Dibi database layer (Dibi, 2013). The application mainly supports processes in the environment of the MS SQL database server but owing to the utilization of the Dibi database layer, it enables the utilization also in other commonly open database systems.
4 Conclusion The solution has been used for evaluation of spatial activities (via online web application) of Sika deer (Cervus nippon) and European deer (Cervus elaphus) in the area of the Doupovske Mountains. There is being processed also usage for another game - evaluation of spatial activity of Wild boar (Sus scrofa) has been being prepared in the Sumava National Park, both in the Czech Republic. The web application is available at zver.agris.cz. The resulting web application will enable the usage of validated data in the database for further scientific research and pedagogical purposes and to popularize research results. The solution can be used not only for visualization of spatial activities of various wild animals’ species in selected environments, but generally for any monitoring and visualization of moving objects. The presented solution has been further improved and there is a plan for the utilization of this solution in other areas in the future
147
Acknowledgements
Pieces of knowledge introduced in this paper resulted from solution of an institutional research intention. Internal grant agency of the Faculty of Economics and Management, Czech University of Life Sciences in Prague, grant no. 20121043, “Sběr a interpretace pozičních dat“.
University internal grant agency of the Czech University of Life Sciences in Prague, grant no. 20134312, “Analysis and visualization of GPS telemetry outputs of cloven-hoofed animals in Doupov Mountains and the Bohemian Switzerland National Park“
The knowledge and data presented in the paper were obtained as a result of the Research Program titled “Economy of the Czech Agriculture Resources and Their Efficient Use within the Framework of the Multifunctional Agri-food Systems” of the Czech Ministry of Education, Youth and Sports number VZ MSM 6046070906
References Barber, C.B., Dobkin, D.P. and Huhdanpaa, H. (1996) ‘The Quickhull Algorithm for Convex Hulls’, ACM Transactions on Mathematical Software, vol. 22, no. 4, pp. 469-483.
Dibi - Database Abstraction Library for PHP 5 (2013) [on-line], available: http://dibiphp.com/en/.
Fan, F. and Biagioni, E. S. (2004)‘An approach to data visualization and interpretation for sensor networks’, Paper presented at the Proceedings of the Hawaii International Conference on System Sciences, 37 999-1008
Google Maps API (2013), [on-line], available: https://developers.google.com/maps/
GPS PLUS X (2013), [on-line], available: http://www.vectronic-aerospace.com/wildlife.php?p=wildlife_downloads.
GSH - Ground Station Harvester 1.0. (2012), [on-line], available: http://www.agris.cz/kit/gsh/ in czech.
Jarolímek, J., Masner, J., Ulman, M, Ulman and M., Dvořák, S. (2012) ‘Cloven-hoofed animals spatial activity evaluation methods in Doupov Mountains in the Czech Republic’, AGRIS on-line Papers in Economics and Informatics. 4(3), pp. 41 - 48. ISSN:1804-1930.
Lechner, W. and Baumann, S. (2000) ‘Global navigation satellite systems’. Computers and Electronics in Agriculture, 25(1-2), pp. 67-85
Nette Framework (2013) [on-line], available: http://nette.org/en/ .
Owen-Smith, N., Goodall, V., and Fatti, P. (2012) ‘Applying mixture models to derive activity states of large herbivores from movement rates obtained using GPS telemetry’, Wildlife Research, 39(5), pp. 452-462.
Stillwell, J. and Clarke, G. (2004).‘Applied GIS and Spatial Analysis’, Wiley, Chichester, 420 pages, ISBN: 978-0-470-84409-0
Thanopoulos, C, Protonotarios, V and Stoitsis ,G (2012) ‘Online Web portal of competence-based training opportunities for Organic Agriculture’ AGRIS on-line Papers in Economics and Informatics, 4(1), pp. 49 - 63. ISSN: 1804-1930.
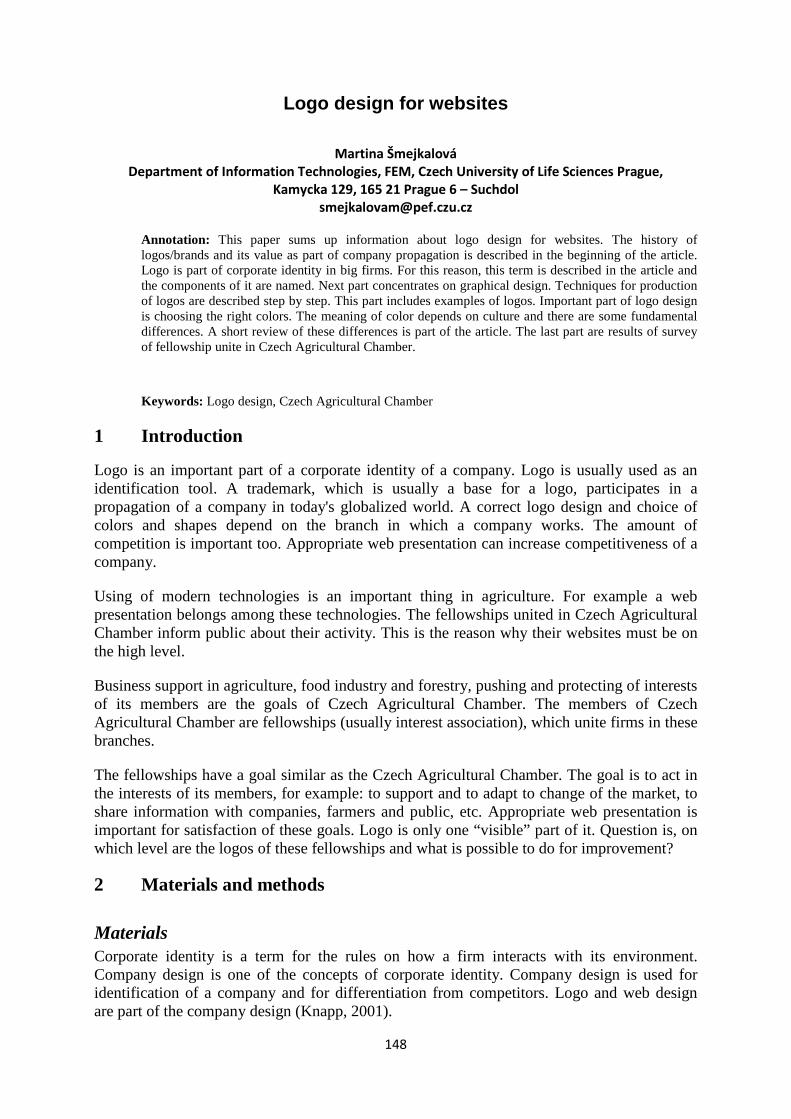
148
Logo design for websites
Martina Šmejkalová Department of Information Technologies, FEM, Czech University of Life Sciences Prague,
Kamycka 129, 165 21 Prague 6 – Suchdol [email protected]
Annotation: This paper sums up information about logo design for websites. The history of logos/brands and its value as part of company propagation is described in the beginning of the article. Logo is part of corporate identity in big firms. For this reason, this term is described in the article and the components of it are named. Next part concentrates on graphical design. Techniques for production of logos are described step by step. This part includes examples of logos. Important part of logo design is choosing the right colors. The meaning of color depends on culture and there are some fundamental differences. A short review of these differences is part of the article. The last part are results of survey of fellowship unite in Czech Agricultural Chamber.
Keywords: Logo design, Czech Agricultural Chamber
1 Introduction
Logo is an important part of a corporate identity of a company. Logo is usually used as an identification tool. A trademark, which is usually a base for a logo, participates in a propagation of a company in today's globalized world. A correct logo design and choice of colors and shapes depend on the branch in which a company works. The amount of competition is important too. Appropriate web presentation can increase competitiveness of a company.
Using of modern technologies is an important thing in agriculture. For example a web presentation belongs among these technologies. The fellowships united in Czech Agricultural Chamber inform public about their activity. This is the reason why their websites must be on the high level.
Business support in agriculture, food industry and forestry, pushing and protecting of interests of its members are the goals of Czech Agricultural Chamber. The members of Czech Agricultural Chamber are fellowships (usually interest association), which unite firms in these branches.
The fellowships have a goal similar as the Czech Agricultural Chamber. The goal is to act in the interests of its members, for example: to support and to adapt to change of the market, to share information with companies, farmers and public, etc. Appropriate web presentation is important for satisfaction of these goals. Logo is only one “visible” part of it. Question is, on which level are the logos of these fellowships and what is possible to do for improvement?
2 Materials and methods
Materials Corporate identity is a term for the rules on how a firm interacts with its environment. Company design is one of the concepts of corporate identity. Company design is used for identification of a company and for differentiation from competitors. Logo and web design are part of the company design (Knapp, 2001).
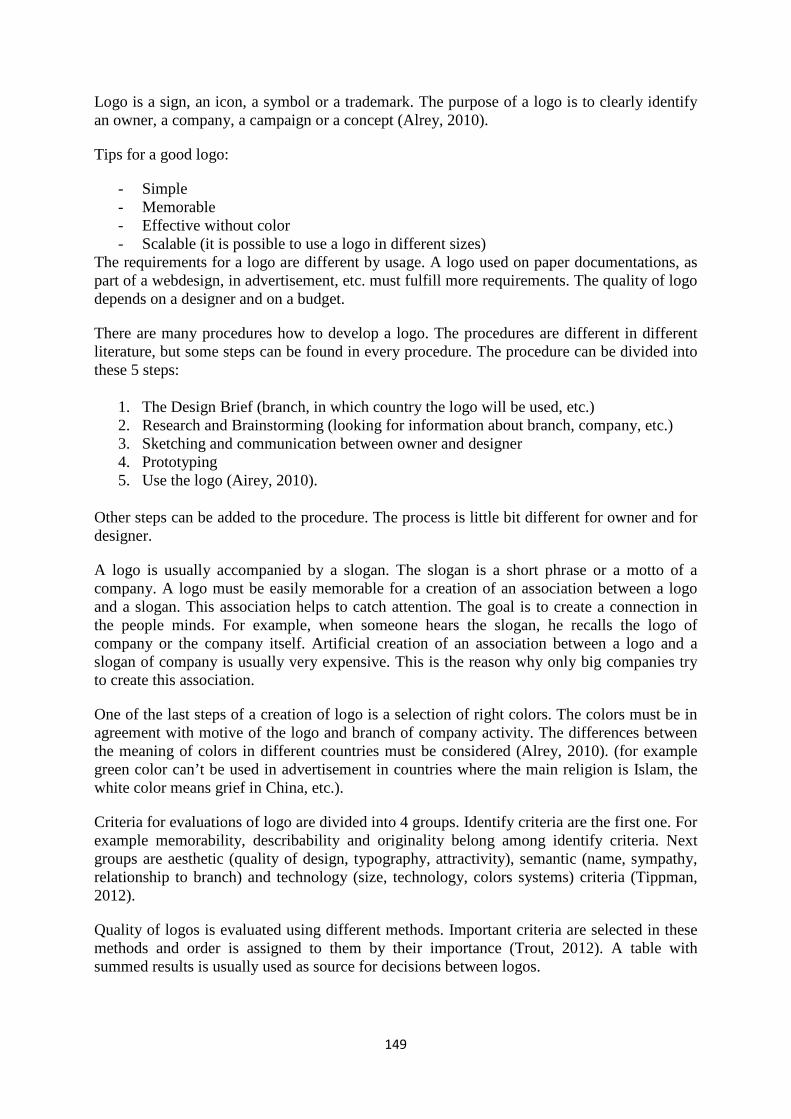
149
Logo is a sign, an icon, a symbol or a trademark. The purpose of a logo is to clearly identify an owner, a company, a campaign or a concept (Alrey, 2010).
Tips for a good logo:
- Simple - Memorable - Effective without color - Scalable (it is possible to use a logo in different sizes)
The requirements for a logo are different by usage. A logo used on paper documentations, as part of a webdesign, in advertisement, etc. must fulfill more requirements. The quality of logo depends on a designer and on a budget.
There are many procedures how to develop a logo. The procedures are different in different literature, but some steps can be found in every procedure. The procedure can be divided into these 5 steps:
1. The Design Brief (branch, in which country the logo will be used, etc.) 2. Research and Brainstorming (looking for information about branch, company, etc.) 3. Sketching and communication between owner and designer 4. Prototyping 5. Use the logo (Airey, 2010).
Other steps can be added to the procedure. The process is little bit different for owner and for designer.
A logo is usually accompanied by a slogan. The slogan is a short phrase or a motto of a company. A logo must be easily memorable for a creation of an association between a logo and a slogan. This association helps to catch attention. The goal is to create a connection in the people minds. For example, when someone hears the slogan, he recalls the logo of company or the company itself. Artificial creation of an association between a logo and a slogan of company is usually very expensive. This is the reason why only big companies try to create this association.
One of the last steps of a creation of logo is a selection of right colors. The colors must be in agreement with motive of the logo and branch of company activity. The differences between the meaning of colors in different countries must be considered (Alrey, 2010). (for example green color can’t be used in advertisement in countries where the main religion is Islam, the white color means grief in China, etc.).
Criteria for evaluations of logo are divided into 4 groups. Identify criteria are the first one. For example memorability, describability and originality belong among identify criteria. Next groups are aesthetic (quality of design, typography, attractivity), semantic (name, sympathy, relationship to branch) and technology (size, technology, colors systems) criteria (Tippman, 2012).
Quality of logos is evaluated using different methods. Important criteria are selected in these methods and order is assigned to them by their importance (Trout, 2012). A table with summed results is usually used as source for decisions between logos.

150
Methods The evaluated subjects were fellowships of Czech Agricultural chamber. 18 subjects were selected. 7 from these fellowships unite agricultural firms of animal farming and 11 fellowships unite firms of crop farming. All of these fellowships have their own websites.
4 fellowships were eliminated, because 3 haven’t their own web presentation and one website was under reconstruction. Table 1 summarizes the included fellowships.
Table 1: Fellowships and their logos included in survey
Nr. Logo Name Nr. Logo Name 1
Českomoravská drůbežářská
unie, o.s.
10
Českomoravská šlechtitelská a semenářská
asociace 2
Český svaz včelařů, o.s.
11
Lnářský svaz ČR
3
Mlécoop, odbytové družstvo
12
Ovocnářská unie ČR
4
Rybářské sdružení České
republiky
13
Svaz pěstitelů a zpracovatelů
olejnin
5
Svaz chovatelů českého
strakatého skotu
14
Svaz pěstitelů cukrovy Čech
6
Svaz chovatelů holštýnského skotu ČR, o.s.
15
Svaz pěstitelů chmele ČR
7
Svaz chovatelů prasat v
Čechách a na Moravě
16
Svaz vinařů ČR
8
Asociace zahradnicých společenstev
17
Ústřední bramborářský
svaz ČR

151
9
Českomoravské sdružení organizací
zemědělského nákupu
18
Zelinářská unie Čech a Moravy,
o.s.
Logos were evaluated by 4 different criteria. Points from 1 to 5 were used for evaluation. Maximum score was 20 points. Only criteria important for identification were chosen.
Criterion:
- Scalable - Work in one color - Describable - Webdesign (works with web design)
The criteria were evaluated this way:
Scalable – size was changed to 48 pixels and then the readability of a text was evaluated in logo.
Work in one color – the Colorize function was used for changing the count of colors. And then readability of text, recognizability of shapes and usability of logo were evaluated.
Describable – subject was concentrating on logo for 2 seconds during the experiment and then he tried to redraw the logo on paper. Number of elements of logo included and its recognizabibility and memorability were evaluated.
Web design – how the web design fits with the logo, used colors, fonts and shapes was evaluated.
Every logo was evaluated in all 4 criteria. The results were summed in one table.
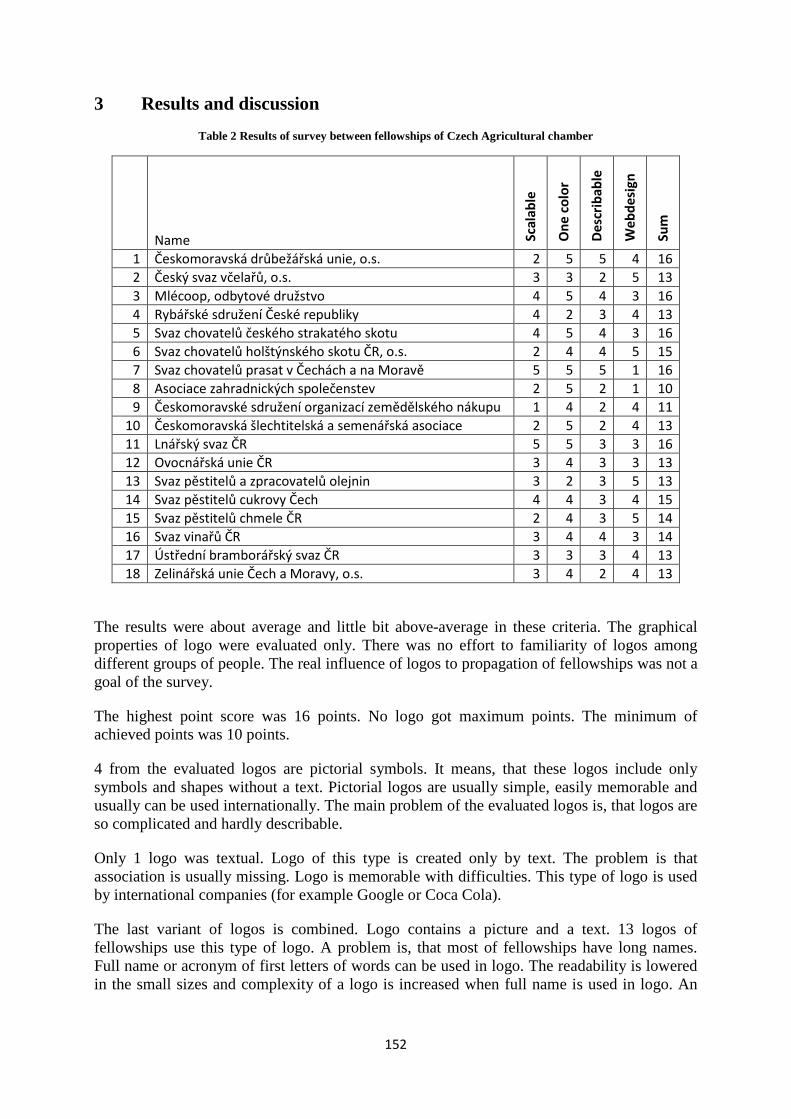
152
3 Results and discussion Table 2 Results of survey between fellowships of Czech Agricultural chamber
Name Scal
able
One
col
or
Desc
ribab
le
Web
desi
gn
Sum
1 Českomoravská drůbežářská unie, o.s. 2 5 5 4 16 2 Český svaz včelařů, o.s. 3 3 2 5 13 3 Mlécoop, odbytové družstvo 4 5 4 3 16 4 Rybářské sdružení České republiky 4 2 3 4 13 5 Svaz chovatelů českého strakatého skotu 4 5 4 3 16 6 Svaz chovatelů holštýnského skotu ČR, o.s. 2 4 4 5 15 7 Svaz chovatelů prasat v Čechách a na Moravě 5 5 5 1 16 8 Asociace zahradnických společenstev 2 5 2 1 10 9 Českomoravské sdružení organizací zemědělského nákupu 1 4 2 4 11
10 Českomoravská šlechtitelská a semenářská asociace 2 5 2 4 13 11 Lnářský svaz ČR 5 5 3 3 16 12 Ovocnářská unie ČR 3 4 3 3 13 13 Svaz pěstitelů a zpracovatelů olejnin 3 2 3 5 13 14 Svaz pěstitelů cukrovy Čech 4 4 3 4 15 15 Svaz pěstitelů chmele ČR 2 4 3 5 14 16 Svaz vinařů ČR 3 4 4 3 14 17 Ústřední bramborářský svaz ČR 3 3 3 4 13 18 Zelinářská unie Čech a Moravy, o.s. 3 4 2 4 13
The results were about average and little bit above-average in these criteria. The graphical properties of logo were evaluated only. There was no effort to familiarity of logos among different groups of people. The real influence of logos to propagation of fellowships was not a goal of the survey.
The highest point score was 16 points. No logo got maximum points. The minimum of achieved points was 10 points.
4 from the evaluated logos are pictorial symbols. It means, that these logos include only symbols and shapes without a text. Pictorial logos are usually simple, easily memorable and usually can be used internationally. The main problem of the evaluated logos is, that logos are so complicated and hardly describable.
Only 1 logo was textual. Logo of this type is created only by text. The problem is that association is usually missing. Logo is memorable with difficulties. This type of logo is used by international companies (for example Google or Coca Cola).
The last variant of logos is combined. Logo contains a picture and a text. 13 logos of fellowships use this type of logo. A problem is, that most of fellowships have long names. Full name or acronym of first letters of words can be used in logo. The readability is lowered in the small sizes and complexity of a logo is increased when full name is used in logo. An
153
acronym has a disadvantage too. Fellowships are not known so much. So many people don’t understand used acronyms.
The logos of these fellowships had the highest point score: Českomoravská drůbežářská unie, o.s., Lnářský svaz ČR and Svaz chovatelů prasat v Čechách a na Moravě.
Picture 1: Logo of Českomoravská Drůbežářská unie
The logo on picture number 1 includes symbol of an egg and a text. An association between a egg and a poultry is easily understandable. The connection is supported by the used colors. Same colors are used on an egg symbol and a word “drůbežářská” means poultry. Worse quality of a logo is at smaller pictures and logo is too wide. This logo is easy describable. Design of web presentation is on a high level.
Picture 2: Logo of Svaz chovatelů prasat
Logo of Svaz chovatelů prasat (on picture 2) fellowship gets high point score too. The logo includes silhouette of a pig and an acronym of the name of fellowship. The acronym is interpretable with a little difficulty. On the other hand, silhouette of a pig represents the object of activity really well. Webdesign was the worst criterion for this logo.
Picture 3: Logo of Lnářský svaz ČR
Logo of Lnářský svaz fellowship is on a good level. The logo includes letter L and a picture of a flower of flax. Logo is stylized in blue colors. The logo is simple, but the problem is for people with minimum knowledge from botany.
The logos of these fellowships had the lowest point score: Asociace zahradnických společenstev and Českomoravské sdružení organizací zemědělského nákupu.
154
Picture 4: Logo of Asociace Zahradnických společenstev
Logo Asociace Zahradnických společenstev was evaluated as worst from all logos. The logo is hardly describable and low quality in small sizes. An acronym of the first letters from the name of fellowship is highlighted in the logo, but this element is completely lost in the complexity of the logo. Webdesign of the web presentation doesn’t match with logo.
Picture 5: Logo of Českomoravské sdruření organizací zemědělského nákupu
Logo on picture number 5 is the most complicated from the evaluated logos. The logo is hardly describable and hardly recognizable in the small sizes.
Main problem of these logos is complexity.
4 Conclusions
The logos of fellowships are average and above-average in some criteria. The logos are different from each other. The main problem of some of these logos is low recognizability of used shapes in smaller sizes.
The logos are part of the design identity of fellowships. The problem is, that most of fellowships united in Czech Agricultural Chamber are not known enough. Logos include complete names of fellowships or acronyms of their names. This fact decreased the values of logos in some graphical criteria.
References
TROUT, Jack (2012). How To Evaluate Logos. s. 3. Dostupné z: http://www.forbes.com/2007/05/30/trout-marketing-logos-oped-cx_jt_0531trout.html 301/1992 Sb. Zákon o Hospodářské komoře České republiky a Agrární komoře České republiky. 1995. vyd. TIPPMAN, Jan. Předhled dílčích kritérií hodnocení loga. (2012) [online]. [cit. 2013-08-06]. Dostupné z: http://unie-grafickeho-designu.cz/prehled-dilcich-kriterii-hodnoceni-loga/#.UgEfz6yrKUn KNAPP, Pat Matson. Designing corporate identity. USA: Rockport Publishers, Inc., 2001. ISBN 1-56496-797-2. AIREY, David. Logo Design Love: a guide to creation iconic brand identitites. USA, 2010. ISBN 978-0-321-66076-3.

155
BORM-II and UML as accessibility process in knowledge and business modelling
Vojtěch Merunka, Sandra Milena Choles Arvilla, Martin Plas, Jakub Tůma 1Department of Information Engineering, FEM, Czech University of Life Sciences Prague,
Kamycka 129, 165 21 Prague 6 – Suchdol merunka, choles_arvilla, plasm, [email protected]
Annotation: This paper presents two system and knowledge modelling techniques that may be used as a tool to coordinate the communication between researchers and users from the agriculture problem domain.
The paper is focused on the usage of a general approach UML (Unified Modelling Language) and an innovative approach BORM-II (Business Object Relation Modelling, second generation) as communication standards within research projects.
The first part of this paper describes the framework, laying out the main aspects of both notations, metamodel and theoretical background as well as their advantages and disadvantages.
The paper analyses practical examples from agriculture, rural and organization modelling domains. These innovation processes in both approaches are applied on the same business process description and evaluates the impact on researchers and users of research.
The main part is focused on the transformation model to model based on BORM-II. The transformation is in line with UML and SBVR (Semantics of Business Vocabulary and Rules) standards from OMG (Object Management Group). My predecessor worked on model transformation and published Šplíchal problem of transformation BORM to UML. This work follows Petr Šplíchal‘s work and goes further. This transformation will be composed into a modelling tool and will be based on approach HOT (High Order Trasformation).
The objective of this research is to achieve documentation output like SBVR, and bridge the gap between business people (users) and designers (researchers) of information systems (IS).
The paper concludes that the gap between IS designers (software engineers) and domain experts can be bridged by automated transformation of previously mentioned models. The main goal is to achieve a documentation output similar to SBVR, and ICT Accessibility for business people.
Key words: Business Process and Knowledge Modelling, ICT Accessibility, Unified Modelling Language, Business Object Relation Modelling, Model Transformation, Tool, Semantics of Business Vocabulary and Rules
JEL classification: M15
1 Introduction This paper presents two system and knowledge modelling techniques that may be used as a tool to coordinate the communication between researchers and users from the agriculture problem domain.
The paper is focused on the use of a general approach UML (Unified Modelling Language) UML (2007) and an innovative approach BORM-II (Business Object Relation Modelling, second generation) as communication standards within research projects.
• BORM Business Object Relationship Modelling (Knott et al, 2006), (Polák et al, 2006) is an object-
156
oriented software engineering methodology, which has proven to be very effective in the development of business information and knowledge systems. Its effectiveness is achieved by unified and simple method for presenting all aspects of the relevant model. The BORM methodology makes extensive use of business process modelling [5]. BORM was designed as a method covering all phases of the software development. BORM focuses mainly on the first phases of the project also known as business analysis. BORM uses only limited, easily comprehensible group of concepts for every lifecycle phase. This makes it easier to understand even for the first-time users with almost no knowledge of business analysis.
Another fact that makes the BORM methodology more expressive is that it doesn´t need the division to static and dynamic views of the model and therefore does not bring a need of creation of different diagrams with a different view points. BORM introduces the following types of diagrams:
• Business architecture diagram
• Object relationship diagram
• Class diagram
BORM represents every concept with the same symbols in the data structure, the communication or other diagrams. For visual presentation of the information BORM uses simple diagrams that contain only a necessary number of concepts and symbols. These concepts and symbols cover most of the needs for the initial description of the model and its processes. The following symbols belong to the symbols used in the initial description:
• Participant – an object representing the stakeholder involved in one of the modelled processes, which is recognised during the analysis.
• State – sequential changes of the participants in time are described by these states.
• Association – data-orientated relation between the participants.
• Activity – represents an atomic step of the behaviour of the object recognised during the analysis.
• Communication – represents the data flow and dependencies between the activities. Data may flow bidirectionally during the communication.
• Transition – connects the state-activity-state and represents changes of the states through activities.
• Condition – expresses constraint that holds for the communication or activity, (Polák et al, 2006).
• UML The Unified Modelling Language (UML) is a standardised notation for specifying object-oriented software systems (Booch et al, 1999), (OMG, 1999), (Rumbaugh et al, 1999). A UML model is a set of diagrams describing and documenting the structure, behaviour and usage of a software system. UML is used to model all kinds of software systems, including concurrent and embedded systems. There are commercial modelling tools available on the market to help the designer in creating the UML models and these tools can also generate program code from some diagrams of the model. UML is an expressive and rich language,

157
their models must still be verified, since a model may contain unexpected behaviours from the designer.
2 Materials and Methods
a. Goal The goal of this contribution is to present an approach for flexible modelling of business processes both at the management and operations level. The approach consists of combining a suitable modelling method and developing an original software tool to support it, as well as to perform automated model transformations.
The goal presented another view-point of this research is achieving documentation output like SBVR, OMG (2008), and bridge the gap between business people (users) and designers (researchers) of information systems (IS), Cabot et al (2009).
b. Methodology 1. First we set requirements for a suitable management-level business process model and operation-level business process model (BPM).
2. We describe how the selected modelling method and the OpenCASE support these requirements.
3. We present a case study to illustrate the results.
Requirements for Management-Level and Operation-Level BPM For our purpose, let's define the management level is focused on the process orchestration, specifically:
1. terminology,
2. the logic of processes,
3. the relations of processes (transition, decomposition, …,
4. communications between participants,
5. optimisation of the overall process.
For the management level, the language of the model needs to support the mentioned aspects. This is why usually a combination of graphical and textual language is used.
The management level BPM specifies terms and their relations that are consequently manipulated in different ways:
• They need to be verified for correctness.
• They need to be communicated.
• They are used for reasoning.
• Various reports and statistics need to be calculated.
• They are often changed (they evolve).

158
This is why the management-level BPM needs to be sort of a knowledge base, not just a set of diagrams (graphical objects).
By the operationel level here, we mean concrete process participants (staff, systems) performing the specified processes. For this level, we specify the following requirements on the operation model:
• The language of the model is close to the language of the participant.
• The model is accurate.
• The model contains just necessary details to perform the operations.
• The model is up to date and consistent with the management-level model. As systems participants provide quite a different category (being software and thus computer science and software engineering methods apply here), we will consider just human participants (staff) here. Staff at the operation level are not supposed to be interested in the “big picture” they just need accurate instructions for performing their tasks, i.e. the management needs to answer their questions:
What are the steps I should follow to successfully complete a task?
How should I make decisions and select correct approach?
What are the inputs that I will get? From whom, how and when?
What are the outputs that I should produce? To whom shall I handle them, how and when?
For operation levels, usually textual operation manuals are used, as operation-level staff is not supposed to prefer abstract notations.
3 Results and Discussion The case study demonstrates the transformation from the management-level business process model into the operation-level business process model. As we specified in requirements, the operation-level model should be textual and tailored for each participant. This is where we utilize the OpenCASE the knowledge base and API and generate HTML page for each participant. HTML documentation output is like SBVR, OMG (2008). This is achieved by selecting the Project - Generate Report menu item in OpenCASE. Generation is based on publication Šplíchal (2011) and this transformation is composed of a modelling tool and based on approach HOT (High Order Trasformation) published by Brambilla (2008).
The case study deals with the process of smell identification method (MPI) used in criminalistic. Just a part of the process is presented here due to space limitations. The case study is focused on collecting smell samples and their analysis. The process covers collection of smell samples. The case study was written with cooperation of the Faculty of Agrobiology, Food and Natural Resources, namely we would like to thank Ing. Petr Vlasak from Canine Behavior Research Center. Here we will use just a simplified version to demonstrate the concepts presented in the paper.
The MPI process is carried out by cooperation between four participants: Regional institution – Distribution, Territorial criminal technician, Regional institution – Analysis and Inspector. The whole case study is shown in figure 1.
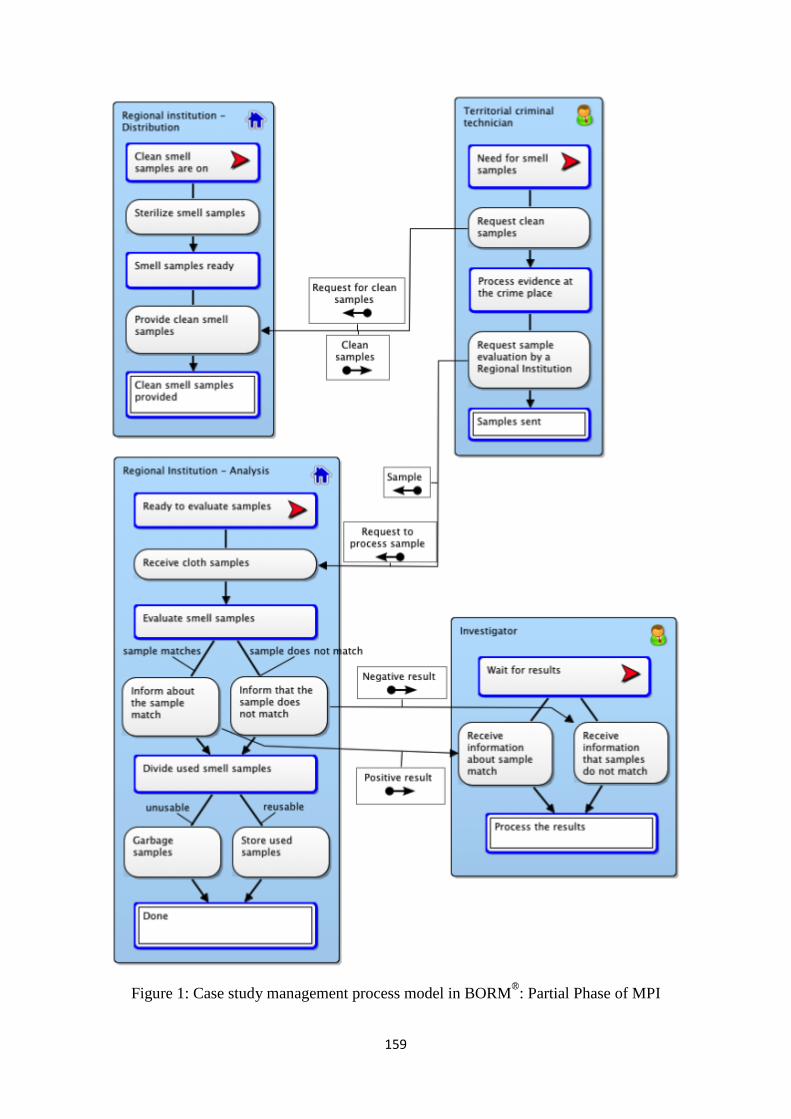
159
Figure 1: Case study management process model in BORM®: Partial Phase of MPI
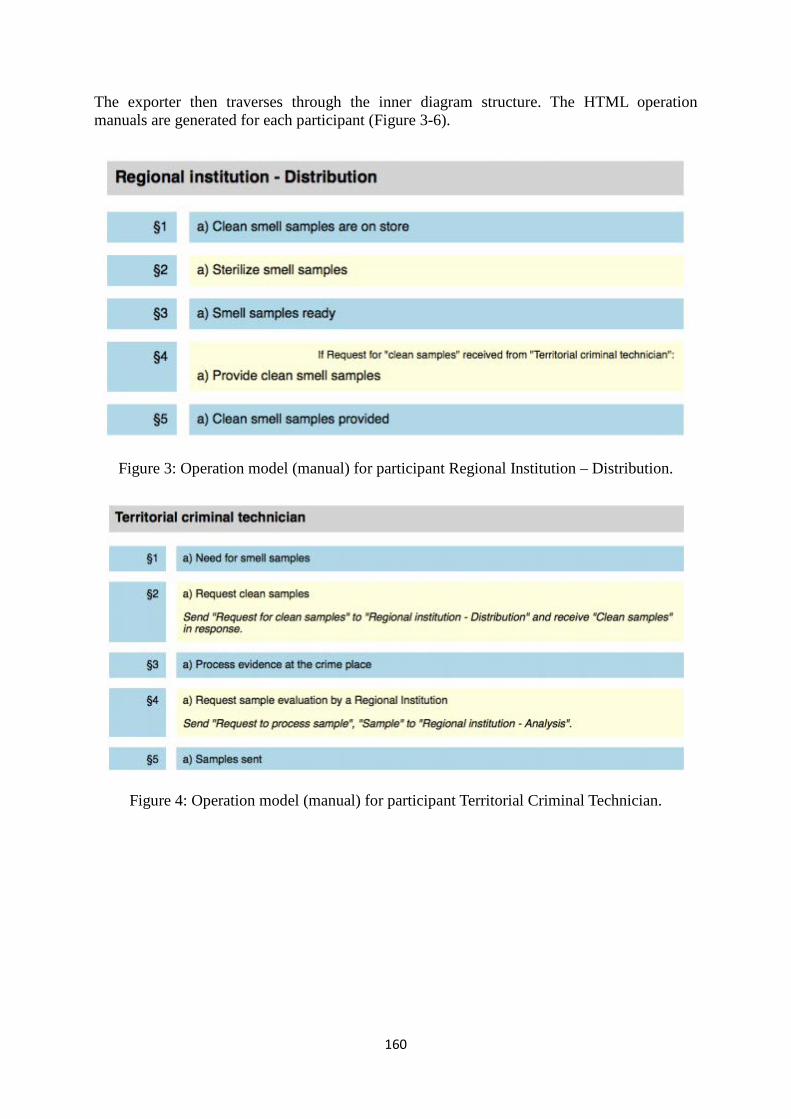
160
The exporter then traverses through the inner diagram structure. The HTML operation manuals are generated for each participant (Figure 3-6).
Figure 3: Operation model (manual) for participant Regional Institution – Distribution.
Figure 4: Operation model (manual) for participant Territorial Criminal Technician.
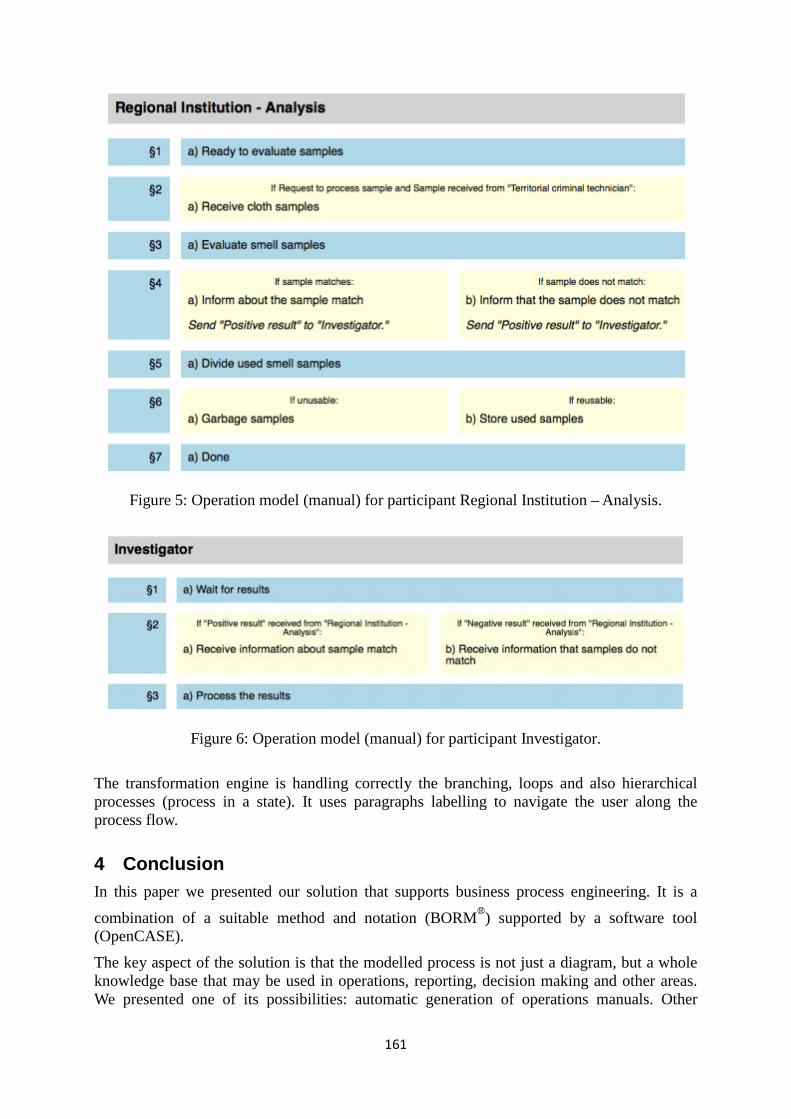
161
Figure 5: Operation model (manual) for participant Regional Institution – Analysis.
Figure 6: Operation model (manual) for participant Investigator.
The transformation engine is handling correctly the branching, loops and also hierarchical processes (process in a state). It uses paragraphs labelling to navigate the user along the process flow.
4 Conclusion In this paper we presented our solution that supports business process engineering. It is a
combination of a suitable method and notation (BORM®) supported by a software tool (OpenCASE).
The key aspect of the solution is that the modelled process is not just a diagram, but a whole knowledge base that may be used in operations, reporting, decision making and other areas. We presented one of its possibilities: automatic generation of operations manuals. Other
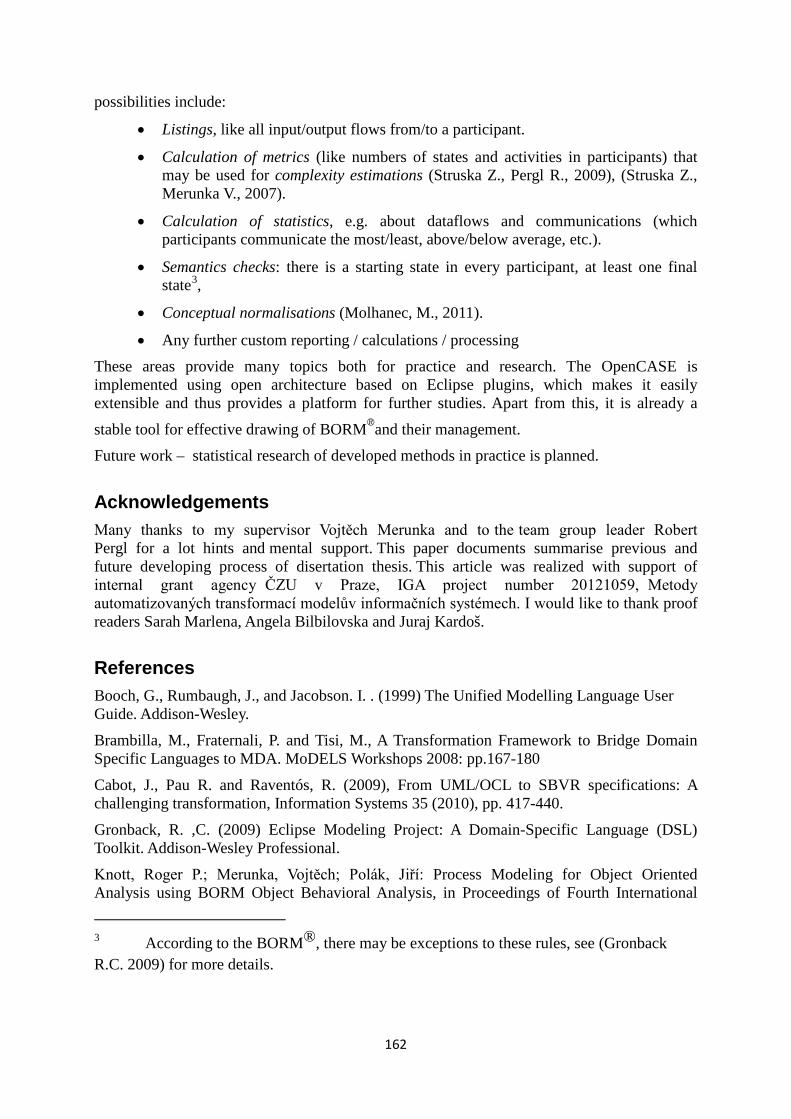
162
possibilities include:
• Listings, like all input/output flows from/to a participant.
• Calculation of metrics (like numbers of states and activities in participants) that may be used for complexity estimations (Struska Z., Pergl R., 2009), (Struska Z., Merunka V., 2007).
• Calculation of statistics, e.g. about dataflows and communications (which participants communicate the most/least, above/below average, etc.).
• Semantics checks: there is a starting state in every participant, at least one final state3,
• Conceptual normalisations (Molhanec, M., 2011).
• Any further custom reporting / calculations / processing These areas provide many topics both for practice and research. The OpenCASE is implemented using open architecture based on Eclipse plugins, which makes it easily extensible and thus provides a platform for further studies. Apart from this, it is already a
stable tool for effective drawing of BORM®and their management. Future work – statistical research of developed methods in practice is planned.
Acknowledgements Many thanks to my supervisor Vojtěch Merunka and to the team group leader Robert Pergl for a lot hints and mental support. This paper documents summarise previous and future developing process of disertation thesis. This article was realized with support of internal grant agency ČZU v Praze, IGA project number 20121059, Metody automatizovaných transformací modelův informačních systémech. I would like to thank proof readers Sarah Marlena, Angela Bilbilovska and Juraj Kardoš.
References Booch, G., Rumbaugh, J., and Jacobson. I. . (1999) The Unified Modelling Language User Guide. Addison-Wesley.
Brambilla, M., Fraternali, P. and Tisi, M., A Transformation Framework to Bridge Domain Specific Languages to MDA. MoDELS Workshops 2008: pp.167-180
Cabot, J., Pau R. and Raventós, R. (2009), From UML/OCL to SBVR specifications: A challenging transformation, Information Systems 35 (2010), pp. 417-440.
Gronback, R. ,C. (2009) Eclipse Modeling Project: A Domain-Specific Language (DSL) Toolkit. Addison-Wesley Professional.
Knott, Roger P.; Merunka, Vojtěch; Polák, Jiří: Process Modeling for Object Oriented Analysis using BORM Object Behavioral Analysis, in Proceedings of Fourth International 3 According to the BORM®, there may be exceptions to these rules, see (Gronback R.C. 2009) for more details.
163
Conference on Requirements Engineering, IEEE&ACM, Chicago 2000.
Knott, R., Merunka, V., Polák, J. (2006) Chapter 15: The BORM Method: A Third Generation Object-Oriented Methodology. In: Liu, L., Roussev B. (eds) Management of the Object-Oriented Development Process. pp. 337-360. IGI Publishing, [s.l.], ISBN 9781591406044.
Molhanec, M. (2011) Some Reasoning Behind Conceptual Normalisation. In: Information Systems Development Information Systems Development, Springer Science+Business Media, Berlin, pp. 517-525.
OMG Unified Language Specification (draft). Version 1.3 alpha R5, March 1999, available at http://www.rational.com/uml/resources/documentation/media/OMG-UML-1_3-Alpha5-PDF.zip.
OMG: Semantics of Business Vocabulary and Rules (SBVR) Specification, v 1.0 (formal/08-01-02), 2008.
OMG: UML 2.1.1 Superstructure Specification, OMG Adopted Specification (formal/07-02-03), 2007.
Polák, J., Merunka, V., Carda, A. (2003) Umění systémového návrhu: objektové orientovaná tvorba informačních systémů pomocí původní metody BORM. Grada, Prague, ISBN 80-247-0424-2.
Rumbaugh, J., Jacobson, I., and Booch, G. . (1999) The Unified Modelling Language Reference Manual. Addison-Wesley.
Splichal, Petr, Robert Pergl, and Marek Pícka. (2011) "BORM Model Transformation."
Šplíchal, P. (2011) “Model Transformation”, Agrarian perspectives proceeding of the 20th International Scientific Conference, Prague, pp. 423 – 430.
Struska Z., Merunka V. (2007) BORM points New concept proposal of complexity estimation method. In: ICEIS 2007: PROCEEDINGS OF THE NINTH INTERNATIONAL CONFERENCE ON ENTERPRISE INFORMATION SYSTEMS: INFORMATION SYSTEMS ANALYSIS AND SPECIFICATION, 9th International Conference on Enterprise Information Systems (ICEIS 2007), Funchal, PORTUGAL, JUN 12-16, 2007, pp. 580-586
Struska Z., Pergl R. (2009). BORM-points: Introduction and Results of Practical Testing. In: ENTERPRISE INFORMATION SYSTEMS, Lecture Notes in Business Information Processing, vol. 24, pp. 590-599

164

165
International Business and
Marketing

166
167
Health services approach to the communication audit
Tereza Balcarova Department of Management, FEM, Czech University of Life Sciences Prague,
Kamycka 129, 165 21 Prague 6 – Suchdol [email protected]
Annotation: This paper deals with the use of a communication audit as a tool for evaluating the effectiveness of public relations health services. The research was conducted within healthcare institutions operating in the Czech Republic. Areas of research questions were focused on health services ‘approach for implementation of the communication audit: Is the communication audit tied to the level of public relations effectiveness evaluation? Is the approach influenced by public relations staff specialization? Is the approach affected by the type of health services according to the typology defined by the Institute of Health Information and Statistics of the Czech Republic? Can we consider the health services communication audit usable? For Health services who stated that they implement the communication audit, further research was focused on reporting audit results, link budget with results of the audit, the auditor's relationship with the rated entity, and criteria for an effective audit. Related hypotheses were tested statistically and the approaches to the implementation of the communication audit were clustered using Ward cluster analysis. Research has identified three levels of approach of health services to the audit implementation. These were the variables used for determining the levels: audit outputs of health services, relation to the public relations budget, the person conducting the audit and the typical characteristics of audit realization. Small commitment is evident by the public relations executives, by which the lack of interest has been identified and to some extent ignorance of standards for implementation of the communication audit.
Key words: Public relations, Health Services, Effectiveness, Evaluation, Communication Audit
JEL classification: I11, M30
1 Introduction Providing health care in the Czech Republic is exposed to constant change, which often leads to an increased need for communication with significant stakeholders. The provision of health services should be treated as any other service. Health services operate in an open market, using public relations tools to achieve direct contact with customers - patients (Wroski, Okraszewski and Bocian, 2008). The customer is in this case the patient, health insurers and self-paying (Madar et al, 2004). Previous studies have shown that health services were mostly aimed at the evaluation of relationships with physicians and entities that support healthcare services as the only major stakeholder groups (Gbadeyan, 2010; Burdette, 2007). Today, however, we must take into account the perception of environmental changes and various challenges. Perception of environmental changes influences the strategic response (efficiency oriented or market-focused) of healthcare organization, which is related to appropriate measures of performance (Filipović et al., 2010; Kumar et al., 2002)
Using an ongoing evaluation of the effectiveness of processes within public relations can contribute to building and maintaining better relationships with stakeholders. One of these methods is a communications audit, which provides a standardized comprehensive report on the current state of communication within an organization (Francis and Woodcock, 2004), but is also seen as a diagnostic and intervention tool for the avoidance of doubt and to increase the effectiveness of communication inside and outside the organization (Belasen, 2008). In conjunction with an emphasis on providing quality health care, Czech Health services are increasingly seeking to guarantee the safety and quality of health care provided to patients. The Joint Commission International (JCI) is a worldwide organization with more than a
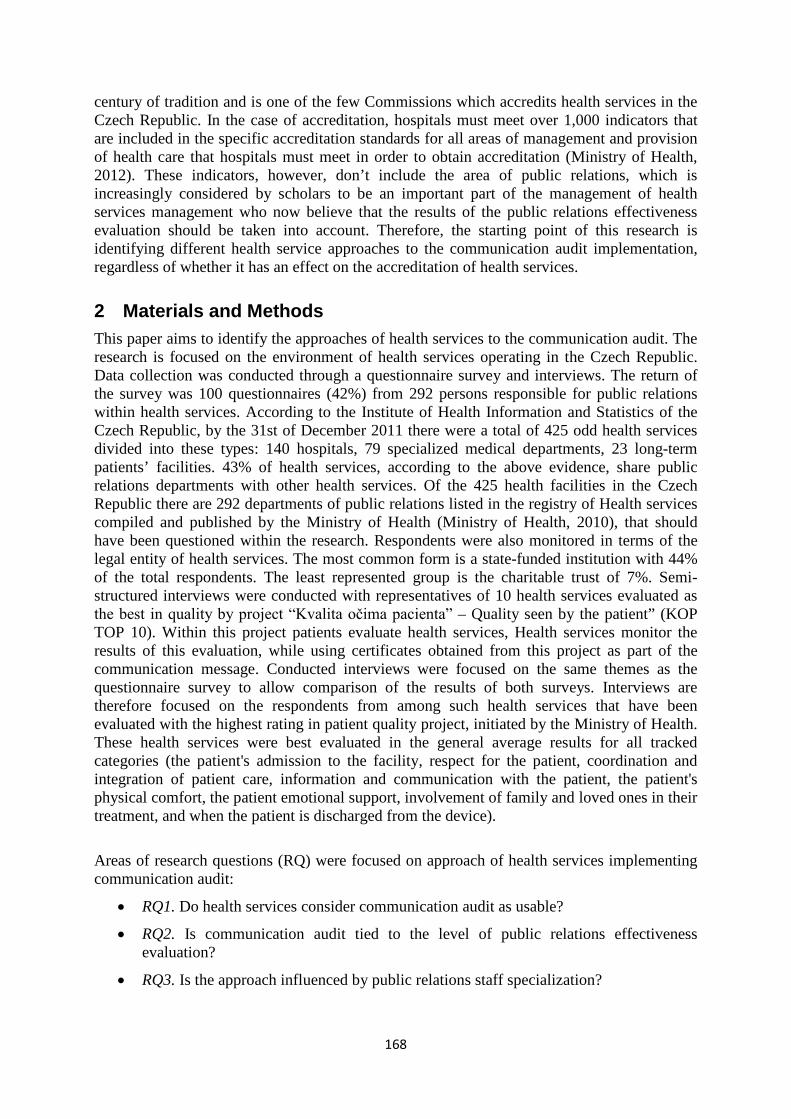
168
century of tradition and is one of the few Commissions which accredits health services in the Czech Republic. In the case of accreditation, hospitals must meet over 1,000 indicators that are included in the specific accreditation standards for all areas of management and provision of health care that hospitals must meet in order to obtain accreditation (Ministry of Health, 2012). These indicators, however, don’t include the area of public relations, which is increasingly considered by scholars to be an important part of the management of health services management who now believe that the results of the public relations effectiveness evaluation should be taken into account. Therefore, the starting point of this research is identifying different health service approaches to the communication audit implementation, regardless of whether it has an effect on the accreditation of health services.
2 Materials and Methods This paper aims to identify the approaches of health services to the communication audit. The research is focused on the environment of health services operating in the Czech Republic. Data collection was conducted through a questionnaire survey and interviews. The return of the survey was 100 questionnaires (42%) from 292 persons responsible for public relations within health services. According to the Institute of Health Information and Statistics of the Czech Republic, by the 31st of December 2011 there were a total of 425 odd health services divided into these types: 140 hospitals, 79 specialized medical departments, 23 long-term patients’ facilities. 43% of health services, according to the above evidence, share public relations departments with other health services. Of the 425 health facilities in the Czech Republic there are 292 departments of public relations listed in the registry of Health services compiled and published by the Ministry of Health (Ministry of Health, 2010), that should have been questioned within the research. Respondents were also monitored in terms of the legal entity of health services. The most common form is a state-funded institution with 44% of the total respondents. The least represented group is the charitable trust of 7%. Semi- structured interviews were conducted with representatives of 10 health services evaluated as the best in quality by project “Kvalita očima pacienta” – Quality seen by the patient” (KOP TOP 10). Within this project patients evaluate health services, Health services monitor the results of this evaluation, while using certificates obtained from this project as part of the communication message. Conducted interviews were focused on the same themes as the questionnaire survey to allow comparison of the results of both surveys. Interviews are therefore focused on the respondents from among such health services that have been evaluated with the highest rating in patient quality project, initiated by the Ministry of Health. These health services were best evaluated in the general average results for all tracked categories (the patient's admission to the facility, respect for the patient, coordination and integration of patient care, information and communication with the patient, the patient's physical comfort, the patient emotional support, involvement of family and loved ones in their treatment, and when the patient is discharged from the device).
Areas of research questions (RQ) were focused on approach of health services implementing communication audit:
• RQ1. Do health services consider communication audit as usable?
• RQ2. Is communication audit tied to the level of public relations effectiveness evaluation?
• RQ3. Is the approach influenced by public relations staff specialization?
169
• RQ4. Is the approach affected by the type of health services according to the typology defined by the Institute of Health Information and Statistics of the Czech Republic?
For those health services, which stated that they have already implemented the communication audit, further research is focused on reporting the audit results, link of the budget to the audit results, the auditor's relationship with the rated entity, criteria for an effective audit. Related hypotheses were tested statistically and the approaches to the implementation of the communication audit were clustered. For hypotheses testing, the 5% level of significance was used. For the two qualitative variables, Pearson's chi-square test was used. To identify the structure of approaches to health services communication auditing, agglomerative clustering was used, when once connected clusters cannot be split (Řezanková, 2011). Within methods that are distinguished by the closest clusters selection criteria, Ward's method was chosen. This method is based on the loss of information that results from clustering. The criterion for clustering is the total sum of squared deviations of each object from the centroid of a cluster to which it belongs (Lepš, Šmilauer, 2003).
3 Results The results of the survey are based on the questionnaire evaluation, frequency and statistical hypothesis testing in this chapter below.
Results of the frequencies and testing of related hypotheses RQ1. Consider health services usable for audit? Audit of public relations performs 15% of health services, 85% do and did not perform the communication audit. 20% of respondents said that the reason why they do not implement the communication audit is due to ignorance of audit standards and methods. 18% of respondents do not consider the audit necessary. On the contrary, none of the respondents stated that the reason is following the competition. According to the respondents' answers, only 26% of health services managers have ever even considered establishing a communication audit, while 74% of respondents have not even considered the implementation of a communication audit. The only time the management of a health service considered for the implementation of a communication audit, would be in a crisis situation (21%), or if the publication to the public, patients, employees or shareholders and partners have low (16% of respondents).
Most respondents stated that they would consider the implementation of an audit in a public relations crisis. When the publication is presented to the public, patients, employees or shareholders and partners have low ratings (annual reports, internal magazines, magazines for the public, press releases, etc.), a new plan of public relations campaigns and the creation of new public relations division or existing plans were reorganized or divisions given a new mandate from the institution (Chart 1).
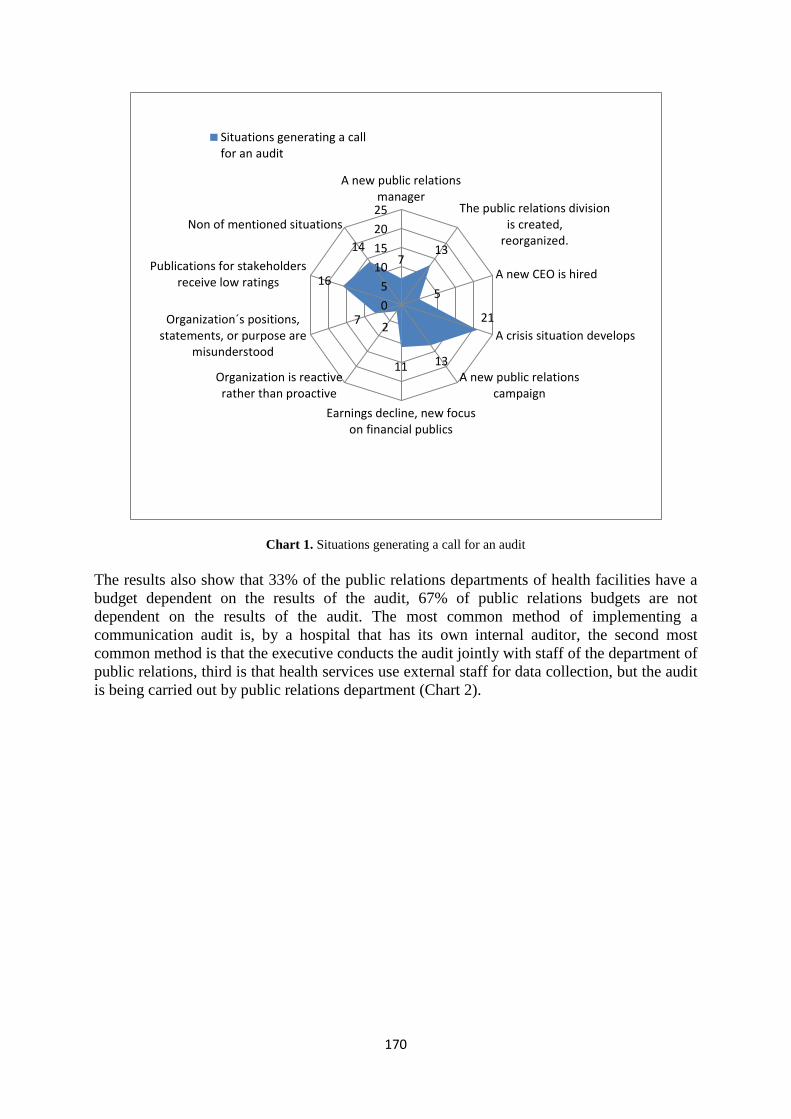
170
Chart 1. Situations generating a call for an audit The results also show that 33% of the public relations departments of health facilities have a budget dependent on the results of the audit, 67% of public relations budgets are not dependent on the results of the audit. The most common method of implementing a communication audit is, by a hospital that has its own internal auditor, the second most common method is that the executive conducts the audit jointly with staff of the department of public relations, third is that health services use external staff for data collection, but the audit is being carried out by public relations department (Chart 2).
7 13
5
21
13 11
2 7
16
14
05
10152025
A new public relationsmanager
The public relations divisionis created,
reorganized.
A new CEO is hired
A crisis situation develops
A new public relationscampaign
Earnings decline, new focuson financial publics
Organization is reactiverather than proactive
Organization´s positions,statements, or purpose are
misunderstood
Publications for stakeholdersreceive low ratings
Non of mentioned situations
Situations generating a callfor an audit
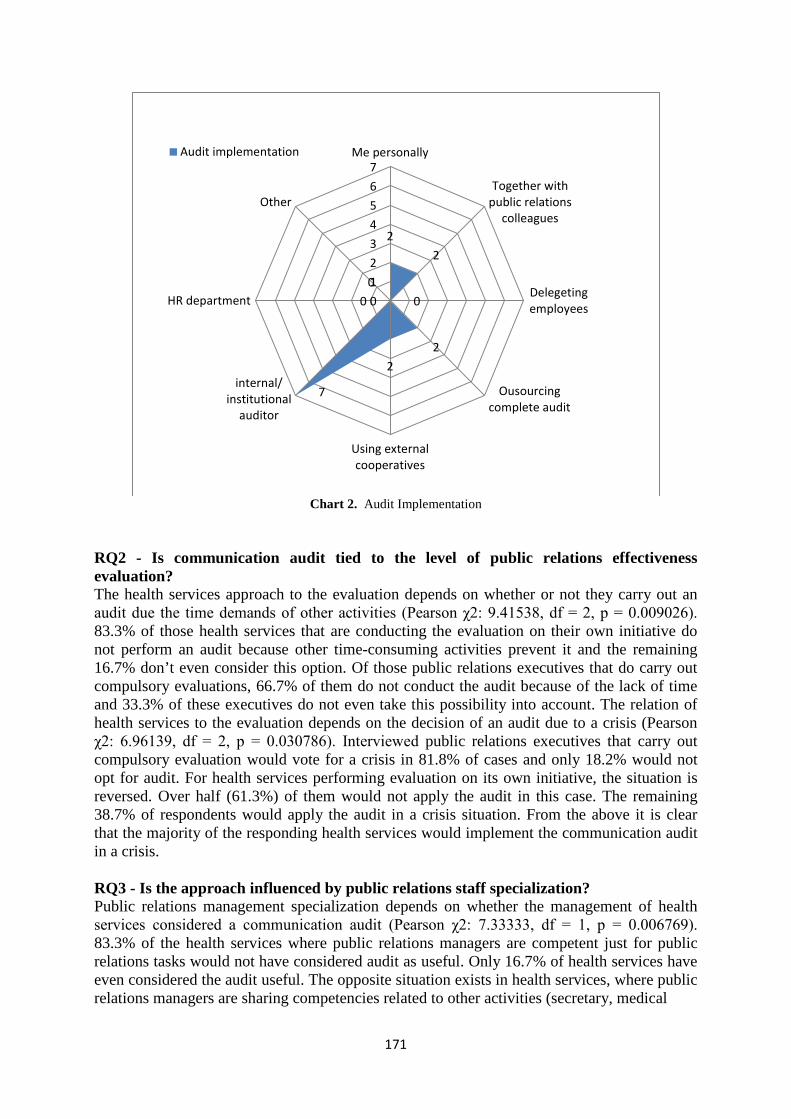
171
Chart 2. Audit Implementation
RQ2 - Is communication audit tied to the level of public relations effectiveness evaluation? The health services approach to the evaluation depends on whether or not they carry out an audit due the time demands of other activities (Pearson χ2: 9.41538, df = 2, p = 0.009026). 83.3% of those health services that are conducting the evaluation on their own initiative do not perform an audit because other time-consuming activities prevent it and the remaining 16.7% don’t even consider this option. Of those public relations executives that do carry out compulsory evaluations, 66.7% of them do not conduct the audit because of the lack of time and 33.3% of these executives do not even take this possibility into account. The relation of health services to the evaluation depends on the decision of an audit due to a crisis (Pearson χ2: 6.96139, df = 2, p = 0.030786). Interviewed public relations executives that carry out compulsory evaluation would vote for a crisis in 81.8% of cases and only 18.2% would not opt for audit. For health services performing evaluation on its own initiative, the situation is reversed. Over half (61.3%) of them would not apply the audit in this case. The remaining 38.7% of respondents would apply the audit in a crisis situation. From the above it is clear that the majority of the responding health services would implement the communication audit in a crisis. RQ3 - Is the approach influenced by public relations staff specialization? Public relations management specialization depends on whether the management of health services considered a communication audit (Pearson χ2: 7.33333, df = 1, p = 0.006769). 83.3% of the health services where public relations managers are competent just for public relations tasks would not have considered audit as useful. Only 16.7% of health services have even considered the audit useful. The opposite situation exists in health services, where public relations managers are sharing competencies related to other activities (secretary, medical
2 2
0
2 2
7
0 0 01234567
Me personally
Together withpublic relations
colleagues
Delegetingemployees
Ousourcingcomplete audit
Using externalcooperatives
internal/institutional
auditor
HR department
Other
Audit implementation
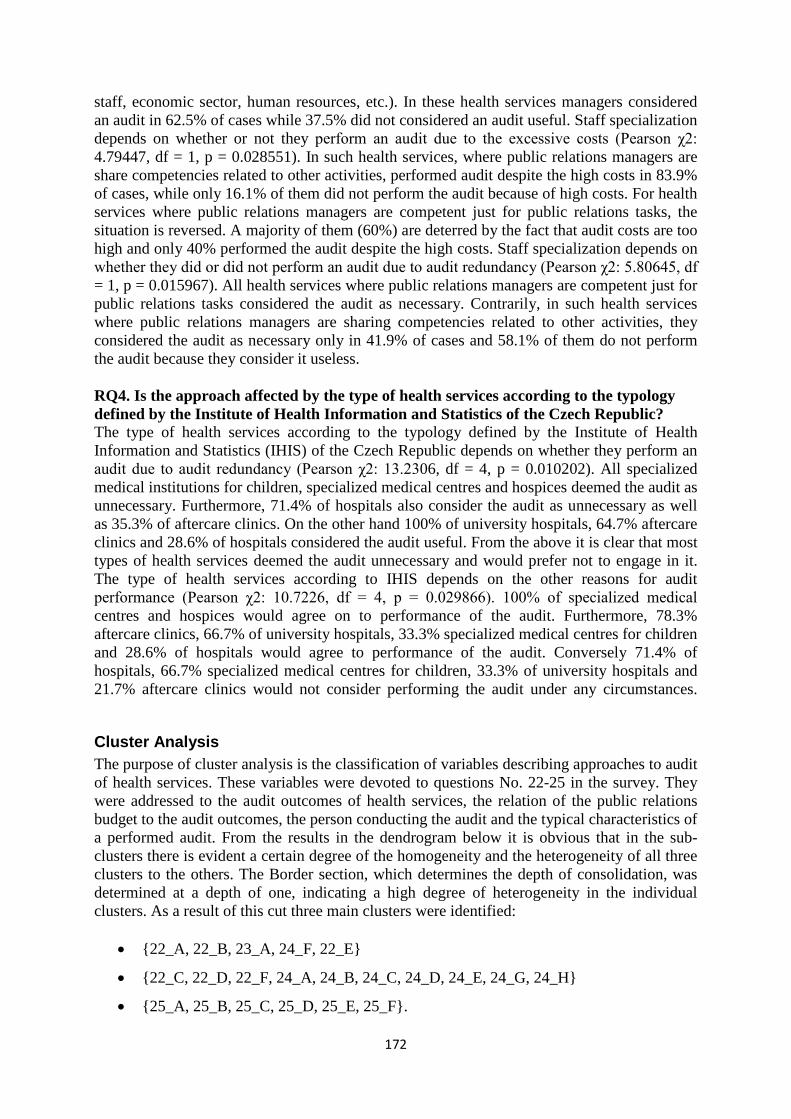
172
staff, economic sector, human resources, etc.). In these health services managers considered an audit in 62.5% of cases while 37.5% did not considered an audit useful. Staff specialization depends on whether or not they perform an audit due to the excessive costs (Pearson χ2: 4.79447, df = 1, p = 0.028551). In such health services, where public relations managers are share competencies related to other activities, performed audit despite the high costs in 83.9% of cases, while only 16.1% of them did not perform the audit because of high costs. For health services where public relations managers are competent just for public relations tasks, the situation is reversed. A majority of them (60%) are deterred by the fact that audit costs are too high and only 40% performed the audit despite the high costs. Staff specialization depends on whether they did or did not perform an audit due to audit redundancy (Pearson χ2: 5.80645, df = 1, p = 0.015967). All health services where public relations managers are competent just for public relations tasks considered the audit as necessary. Contrarily, in such health services where public relations managers are sharing competencies related to other activities, they considered the audit as necessary only in 41.9% of cases and 58.1% of them do not perform the audit because they consider it useless. RQ4. Is the approach affected by the type of health services according to the typology defined by the Institute of Health Information and Statistics of the Czech Republic? The type of health services according to the typology defined by the Institute of Health Information and Statistics (IHIS) of the Czech Republic depends on whether they perform an audit due to audit redundancy (Pearson χ2: 13.2306, df = 4, p = 0.010202). All specialized medical institutions for children, specialized medical centres and hospices deemed the audit as unnecessary. Furthermore, 71.4% of hospitals also consider the audit as unnecessary as well as 35.3% of aftercare clinics. On the other hand 100% of university hospitals, 64.7% aftercare clinics and 28.6% of hospitals considered the audit useful. From the above it is clear that most types of health services deemed the audit unnecessary and would prefer not to engage in it. The type of health services according to IHIS depends on the other reasons for audit performance (Pearson χ2: 10.7226, df = 4, p = 0.029866). 100% of specialized medical centres and hospices would agree on to performance of the audit. Furthermore, 78.3% aftercare clinics, 66.7% of university hospitals, 33.3% specialized medical centres for children and 28.6% of hospitals would agree to performance of the audit. Conversely 71.4% of hospitals, 66.7% specialized medical centres for children, 33.3% of university hospitals and 21.7% aftercare clinics would not consider performing the audit under any circumstances.
Cluster Analysis The purpose of cluster analysis is the classification of variables describing approaches to audit of health services. These variables were devoted to questions No. 22-25 in the survey. They were addressed to the audit outcomes of health services, the relation of the public relations budget to the audit outcomes, the person conducting the audit and the typical characteristics of a performed audit. From the results in the dendrogram below it is obvious that in the sub- clusters there is evident a certain degree of the homogeneity and the heterogeneity of all three clusters to the others. The Border section, which determines the depth of consolidation, was determined at a depth of one, indicating a high degree of heterogeneity in the individual clusters. As a result of this cut three main clusters were identified:
• {22_A, 22_B, 23_A, 24_F, 22_E}
• {22_C, 22_D, 22_F, 24_A, 24_B, 24_C, 24_D, 24_E, 24_G, 24_H}
• {25_A, 25_B, 25_C, 25_D, 25_E, 25_F}.
173
The Figure 1 – Cluster analysis, which covers the variables describing approaches to the audit of health services shows, that it is clear that the first and second cluster are together in interaction with the third cluster, where there is also seen a large distance between the first two clusters and third cluster described.
Fig. 1. Cluster Analysis
The first cluster is characterized by the pursuit of an objective approach to the implementation of the communication audit with the application of audit outsourcing, i.e., the external auditor usage (22_F), who processes the entire audit. The audit is attached to the amount of emphasis given to the impact of the audit results in the budget for public relations (23_A). The indicators monitored by the audit are typical macro indicators, focusing on the resulting impact on the attitudes of stakeholders (22_A), monitoring the long-term effect of building relationships with stakeholders (22_E) and the resulting knowledge and understanding of the published messages (22_B). The second cluster is a specific by using internal staff to perform the audit. Whether they are executives or managers of public relations (24_A), their subordinates or colleagues (24_B, 24_C), or whether they are using the internal auditor (24_E), or the human resources department (24_G). Another option they are using is the usage of an external person to obtain data, which then process themselves (24_D). In this cluster are also variables relating to the characteristics of monitored audit. For the second cluster are specific the indicators at the micro level. These indicators include: The content of the message that was distributed to the stakeholders in the connection with the publication of press releases (22_C), a summary of the results of sub-campaigns (22_D), the volume of cost spent on public relations represented by the time spent on the public relations activities (22_F). A third cluster is formed variables 25_A - 25_F concerning characteristics of effective audit. These characteristics were defined by Downs (1988) in relation to the person conducting the audit that has the expertise competency (25_A), experience (25_B) and can generate possible solutions (25_C). Audit is then characterized by a unique design that is most
174
suitable for the specific health service (25_D), and also whether there is implementation of the proposed changes resulting from the audit (25_E) and that the audit is carried out on time and on a regular basis (25_F). The above cluster analysis produces three basic types of health services audit approaches. They can be divided according to the principles of auditing; the second cluster is characterized by approach from inside the hospital. Audit is always conducted by a person who is an employee of the health services, thereby reducing the degree of objectivity of the results. At the same time, its focus more towards micro-level evaluation of public relations, which means that the criteria are aimed at the validation of the tactics and their partial results (monitoring of embedded costs, measurements made of the potential audience, tracking the number of cuttings, the use of advertising techniques equivalence readership tracking used by the media). This is a publication of press releases from the content and quantitative monitoring of the expended funds on sub-campaign and the results of these campaigns. The second group can be considered as a higher degree of an audit due to objectivity, where the person processing the communication audit is an external professional auditor and is able to focus on the macro level evaluation, from an institutional point of view, when is aimed at getting feedback about stakeholders attitudes, resulting knowledge and long exposure to interest groups. Audit results are important for this group to determine the budget for public relations. The third group is characterized by the implementation of the principles of effective audit characterized by Downs (1988). These principles are certain standards that should be typical for the audit. Emphasis is placed on the auditor's expertise, his experience, his ability to present a comprehensive approach proposed solutions. There is also an emphasis on the uniqueness of the structure of audit with regard to specific health service. There is also an active use of audit results, not only as a communication to internal and external stakeholders (management, shareholders, employees, ministry, public, etc.), but also their application in practice, but it is necessary to carry out audit in a time and on regular basis.
4 Discussion The conducted research shows low interest of health services in implementing the communication audit on the voluntary basis. Although authors (Henderson, 2005; Belasen, 2008; Downs, 1988) referred that the audit is often used as an alternative effectiveness measurement tool, which is characterized by generally applicable standards for evaluating the external an internal communication, respondents expressed the lack of knowledge of the instrument. They do not consider the usability of the audit in everyday practice within the systematic management of public relations. Respondents see audit primarily as a tool used by health services top managers for the control of a public relations department or public relations executives, or by the external stakeholders, such as the Accreditation Committee that requires its completion as part of their standards. By the further research the relation between public relations and strategic management within health services can be identified. Research suggests that health services top managers are involved in the decision-making within public relations and public relations is also considered from the perspective of strategic management as a significant. So the question is, to what extent and how health services top managers use public relations evaluation or audit results. Summary of health services that have been best evaluated in the above-mentioned project KOP TOP 10 and other health services in the Czech Republic comparison can be seen from Table 1.
175
Table 1. Audit approaches comparison
Criteria KOP TOP 10 Other health services
Implementation None. 15 % implement audit.
Reasons for decline The lack of methods knowledge; Audit is useless; Top managers are not interested in the results.
Other time-consuming activities; High cost; Audit is useless; Top managers are not interested in the results.
Decision for Audit Only in case of an obligation (e.g. for accreditation).
76 % never considered the communication audit.
Reasons for implementation
A new public relations manager; A new public relations division; Reorganization; A new CEO is hired; A crisis situation develops; Earning decline; A new public relations campaign; Organization is reactive rather than proactive.
A crisis situation develops; Publications for stakeholders receive low ratings.
Within health services generally a client/patient represents vital group of stakeholders. The number of patients is significant for health services incomes received from health insurance institutions. Thus the number of clients/patients is crucial for the health services existence. While taking into account the fact that currently the focus is not primary aimed at health care physicians (first diagnosis and treatment recommendations) as the person deciding the health services´ task and subsequent care. Active patient (assuming it is not a critical situation in life threatening) determines evaluation criteria and subsequently selects a particular health services on his own. Research has shown that most of health services including KOP TOP 10 do not implement a communication audit. Small commitment is evident mostly by those public relations managers, by which the lack of interest and to some extent ignorance of standards for implementation of the communication audit has been identified. These factors are most often stated by respondents as a reason for refusing the implementation of the communication audit. Nevertheless it is also the attitude of top managers of health services that the results are not required. They would actively implement the audit only in case of compulsory requirements, or in case of other quality verification of health services, or for the accreditation. Within the research of health services approaches to the communication audit, the cluster analysis was conducted. The cluster analysis reduced the variables to create a typology of the specific features within characteristics of an audit conducted by health services in Czech Republic. These characteristics of health services auditing can be divided into three grades according to the level of the audit process (Figure 2):
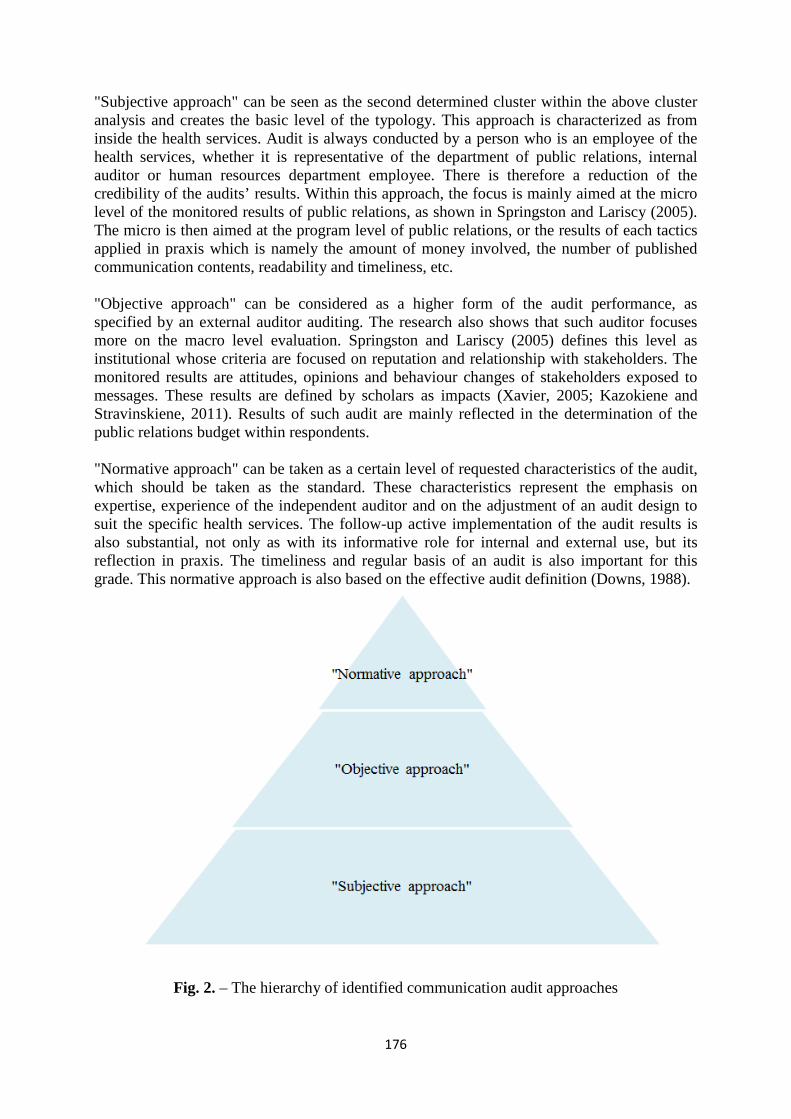
176
"Subjective approach" can be seen as the second determined cluster within the above cluster analysis and creates the basic level of the typology. This approach is characterized as from inside the health services. Audit is always conducted by a person who is an employee of the health services, whether it is representative of the department of public relations, internal auditor or human resources department employee. There is therefore a reduction of the credibility of the audits’ results. Within this approach, the focus is mainly aimed at the micro level of the monitored results of public relations, as shown in Springston and Lariscy (2005). The micro is then aimed at the program level of public relations, or the results of each tactics applied in praxis which is namely the amount of money involved, the number of published communication contents, readability and timeliness, etc. "Objective approach" can be considered as a higher form of the audit performance, as specified by an external auditor auditing. The research also shows that such auditor focuses more on the macro level evaluation. Springston and Lariscy (2005) defines this level as institutional whose criteria are focused on reputation and relationship with stakeholders. The monitored results are attitudes, opinions and behaviour changes of stakeholders exposed to messages. These results are defined by scholars as impacts (Xavier, 2005; Kazokiene and Stravinskiene, 2011). Results of such audit are mainly reflected in the determination of the public relations budget within respondents. "Normative approach" can be taken as a certain level of requested characteristics of the audit, which should be taken as the standard. These characteristics represent the emphasis on expertise, experience of the independent auditor and on the adjustment of an audit design to suit the specific health services. The follow-up active implementation of the audit results is also substantial, not only as with its informative role for internal and external use, but its reflection in praxis. The timeliness and regular basis of an audit is also important for this grade. This normative approach is also based on the effective audit definition (Downs, 1988).
Fig. 2. – The hierarchy of identified communication audit approaches
177
5 Conclusion The research confirmed that health services do not consider the communication audit within public relations as usable (RQ1). Top managers in 76% of health services have never considered using the communication audit. Of the listed cases (Chart 1) when the audit should be used, defined by Downs (1988) and Henderson (2005), health services would conduct the audit only in a situation of crisis or low rating of health services publications. In contrary, KOP TOP 10 listed all possible situations as stimuli for the application of audit, just the possibility of low publication ratings, or poor understanding of the positions, statements or purpose were not considered to be grounds for an audit. In the opinion of respondents, it is possible to deal with these situations within the usual everyday evaluation activities. These respondents also indicated that they do not implement the audit. The top managers of these health services would implement the audit only in case of an obligation (e.g. for accreditation). None of KOP TOP 10 health services implement the audit, the reason is ignorance of methods, the fact that they consider the audit as unnecessary and that top managers has no interest in its implementation. The surveyed health services audited public relations in 15% of all survey respondents (RQ1). Those health services that are conducting the evaluation on their own initiative do not perform an audit because of other time-consuming activities. Those health services that do carry out compulsory public relations evaluations would implement the audit only in crisis. This confirms the dependency of the approach to the public relations evaluation and the audit implementation (RQ2). Those health services where public relations executives are competent only for public relations tasks and do not share the competencies to other activities with other areas of competence, the main reason for refusing the audit implementation are often high costs. Those who share competencies to other activities do not considered the audit as useful, and it is the most common reason for the refusal (RQ3). RQ4 is the last research area within submitted paper. In terms of the type of health services according to the typology defined by the Institute of Health Information and Statistics (IHIS) of the Czech Republic, the research indicated that the type affected the approach to the communication audit. All specialized medical institutions for children, specialized medical centers and hospices deemed the audit as unnecessary and do not implement the audit. In general, the most common reason for audit refusal was the lack of audit methods knowledge, redundancy of an audit by the public relations executives and lack of interest by the top managers of health services. Research has identified three levels of health services approaches to the audit implementation. Small commitment is evident by those public relations executives that have considered the lack of interest and to some extent ignorance of standards for implementation of the communication audit as main reasons for audit refusal. Health services do not consider communication audit as usable in everyday practice within a systematic management of public relations. Respondents see audit primarily as a tool used by health services top managers for the control of a public relations department or public relations executives, or by the external stakeholders, such as the Accreditation Committee that requires its completion as part of their standards. The strategic mission of the health services is to provide quality health care and achieving the satisfaction of a customer - patient. The quality of health care is assessed with respect to requirements of patients. Getting feedback of stakeholders is thus one of the major challenges in achieving patient satisfaction. In the public relations praxis is then necessary to adapt management processes, so that the health services is able to respond to the requirements and expectations of stakeholders,

178
including adequate response to current active approach of patients in obtaining information. Current patient is able to evaluate such information and use it for assessing the quality of health care in the health care services. For public relations management processes is vital to include the impact of environment, stakeholders assumptions and the current state of health services communication, together with an evaluation of the corresponding symmetrical principle of communication that is aimed at getting feedback rather than evaluating the effort and cost of public relations activities. The prerequisite for such organizational unit responsible for implementing public relations strategies is according the mission of health services and thus public relations to achieve a sufficient degree of specialization, formalization.
References Belasen A. T. (2008) The Theory and Practice of Corporate Communication. London: Sage.
Burdette, R. A. (2007) Marketing quality to consumers – Does it work for the Marketer? Louisiana: Louisiana State University and Agricultural Mechanical College, pp. 1-40. Downs, C. (1988). Communication audits. Glenview, Il: Scott, Foresman and Company. Francis, D., Woodcock, M. (2004) Audits for organizational effectiveness: eight ready-to-use audits for organizations. Gower: Aldershot. Filipović V, Cicvarić, S., Štavljanin, V. et al. (2010) Influence of healthcare institution managers’ proactive approach to communication activities on patient satisfaction. Vojnosanit Pregl, vol. 67, no. 4, pp. 267–271. Gbadeyan, R. A. (2010) Health Care Marketing and Public Relations in Not for Profit Hospitals in Nigeria. International Journal of Business and Management, vol. 5, no. 7, pp. 117-125. Henderson, J. K. (2005) Evaluating Public Relations Effectiveness in a Health Care Setting: The identification of Communication Assets and Liabilities via a Communication Audit, Journal of Health and Human Services Administration, vol. 28, no. 1, pp. 282-322. Kazokiene, L., Stravinskiene, J. (2011) Criteria for the Evaluation of Public Relations Effectiveness. Inzinerine Ekonomika-Engineering Economics,vol. 22, no. 1, pp. 91-105. Kumar K, Subramanian R, Strandholm K. et al. (2002) Market and efficiency based strategic responses to environmental changes in the health care industry. Health Care Management Review, vol. 27, no. 3, pp. 21–31. Leps, J., Smilauer, P., (2003) Multivariate analysis of ecological data using CANOCO, Cambridge University Press, Cambridge. Madar, J., Němcová, K. a Zeman, M. (2004) Řízení kvality ve zdravotnickém zařízení. Praha: Grada Publishing. Ministerstvo zdravotnictví: Akreditace zdravotnických zařízení (2010) [online] [cited: 10.6.2013] Available: <http://www.mzcr.cz/Kvalita/obsah/akreditace-zdravotnickych-zarizeni_1829_13.html>.

179
Řezánková, H. (2011) Analýza dat z dotazníkových šetření. 3. doplněné vydání. Praha: Professional Publishing. Springston, J. K., Lariscy, R. A. (2005) Public relations effectiveness in public health institutions, Journal of Health and Human Services Administration, vol. 28, no. 1, pp. 218-245. Wroski, K., Okraszewski, J. and Bocian R. (2008) Public relations as a tool of communication between health care organizations and patients. Wspolczesna onkologia - Contemporary Oncology, vol. 12, no. 1, pp 30-34. Xavier, R., Johnston, K., Patel, A., Watson, T. & Simmons, P. (2005) Using evaluation techniques and performances claims to demonstrate public relations impal: An Australian perspective. Public Relations Review, vol. 31, no. 3, pp. 417-424.
180
Buying at the Weekly Market or at the Farm Shop? Consumer Preferences of Local Food Products Directly
Sold by Farmers in Germany Miroslava Bavorová, Ilkay Unay Gailhard and Mira Lehberger
Institute of Agricultural and Nutritional Sciences, Martin-Luther University Halle-Wittenberg, Karl-Freiherr-von-Fritsch-Str. 4, 06120 Halle (Saale), Germany,
[email protected], [email protected]
Leibniz Institute of Agricultural Development in Central and Eastern Europe (IAMO), Theodor-Lieser-Str.2, 06120 Halle (Saale), Germany,
Abstract: The key objective of this article is to understand the influence of private and public attributes of food products and their sources on the frequency of buying food at the weekly markets and at the farm shops. The considered private attributes include product attributes, process attributes and source attributes, as well as consumers’ confidence in product and process quality. The considered public attributes are the two source attributes of supporting local farmers and transportation distance. By carrying out standardized face-to-face interviews with pedestrians in 2011 and 2012, a total of n=550 consumers were interviewed. The target regions of the study were the former Eastern German federal states. Study employs an ordered logit regression model and investigated weekly markets and farm shops as two direct marketing channels. Results show that in addition to socio-demographic characteristics, public and private attributes of food products significantly influence the likelihood of buying from direct marketing channels. If consumers perceive that food sold directly by farmers is fresh or they think that their purchase supports local producers, consumers are more likely to buy from weekly markets. Consumers who find it important to know where food is produced and those who do not find it difficult to reach farm shops are more likely to buy at these direct marketing outlets. Moreover, the study finds that frequent farm shop buyers do not perceive direct marketing products as being too expensive. The study results imply that considering consumer behavior separately for the different direct food marketing channels, rather than considering all direct buyers at once as done in some studies, would be fruitful.
Key words: Local food, direct marketing channels, farm shops, weekly market, private attributes, public attributes
JEL classification: M39
1 Introduction Direct marketing (direct selling) can be defined in multiple ways. Our study is concerned with direct marketing in a narrow sense, where producers sell their ready-to-eat products directly to consumers through farm shops, farmers’ markets or roadside stands (Wirthgen and Maurer, 2000). No single definitions for farm shops or farmers’ markets exist. The following description of farm shops and farmers’ markets is used by the UK government (UK Government, 2013): Farm shops aim to sell fresh produce and/or local foods that are normally grown, picked, reared or produced on the own farm or on land close to where the shop is located. The two key characteristics for a farmers’ market are, that it connects the food consumer directly with the food producer and it provides local, fresh, quality produce. All the products on sale should have been grown, reared, caught, brewed, pickled, baked, smoked or processed by the stallholder. These definitions use the term local as it is understood in this paper. Thus, for simplicity’s sake, even though there are a number of descriptions of what “local” means (Giovannucci, Barham and Pirog, 2010), we understand products sold directly
181
by farmers’ to be local products. Besides farmers’ markets, further types of markets exist and take place at different locations at certain frequencies. At these markets a variety of products are sold. In Central Germany, where the examined survey took place, many markets involve both stallholders selling food products they produced themselves (mostly local products) and stallholders selling food products purchased from intermediate traders. Therefore, we speak about weekly markets, though for the purposes of this paper they do not necessarily take place weekly.
Direct marketing is an example of a short food supply chain and is discussed to serve multiple goals. The benefits of short food supply chains can be divided into economic, environmental and social benefits (Rocchi, Cavicchi and Baldeschi, 2012). Considering the economic benefits to farmers, direct selling can be an income alternative for them, while at the same time it can be a way to increase profits (e.g. Zenner, Wirthgen and Altmann, 2004). The principle idea behind this reasoning is that by omitting steps within the conventional food supply chain and establishing direct contact between producers and consumers, both traceability and profitability increase for the actors involved. Establishing a close relationship with consumers has become particularly important over the past decade, because an increasing amount of food scandals have left consumers insecure about the quality of conventional food products. Direct selling allows consumers to buy food with clear and reliable origins. Thus, it is not surprising that empirical evidence indicates that a significant amount of consumers express a willingness to pay price premiums for locally produced products (e.g. Batte et al, 2007; Brown, 2003; Gil, Garcia and Sanchez, 2000). An additional economic benefit for the farmer is that the publicity for direct food selling outlets is usually generated by word-of-mouth, resulting in lower advertising costs. The environmental impacts of direct selling are twofold: On the one hand, direct selling reduces sellers’ food miles of transport, storage and distribution compared to conventional retailers. A further positive environmental impact is derived from direct sellers mostly selling seasonal fresh products, which typically requires less energy consumption for preserving food. On the other hand, negative environmental impacts can result from an increase of consumers’ food miles, i.e. the distance consumers need to travel in order to reach the direct sellers’ outlet. Consumers often need more food miles to reach the direct seller’s outlet than to reach conventional outlets (Duram and Oberholtzer, 2010). The opportunity for consumers to learn about regional food traditions and cultures can be considered as a social benefit. Further social benefits are identified in the embededdness concept by Feagan and Morris (2009). These authors distinguish between social embeddedness values (social interaction, knowledge of vendor, etc.), spatial embeddedness values (food freshness, supporting the local, etc.) and natural embededdness values (organic production, “food mails” concerns, etc.). The authors examined the concept of embeddedness based on a case study of a farmers’ market in Canada. Results from the case study show that social and spatial embeddedness values were the core motivation for consumers to buy at the considered farmers’ market.
In Germany, as in other countries, it used to be common for farmers to sell their products directly to the consumer. However, after the Second World War the direct marketing approach to buying and selling food products almost disappeared. In order to increase revenues, the reestablishment of direct marketing started in the 1980s (Sommer, 1995). Although no official statistics are available regarding the current number of German farmers involved in direct marketing, it is estimated that approximately 30 000 to 40 000 farms sold their production directly to the consumer in 2013 (BMELV, 2013). This number corresponds to approximately 6 – 8 % of German farms. The number of direct-selling farmers is higher in the former West German federal states compared to the former East Germany federal states, mainly due to differences in farms structures: Significantly more family farms exist in the
182
former West German federal states compared to the former East German federal states. In Bavaria, for example, the number of direct-selling farmers is estimated to be around 3 500 (STMELF Bayern, 2013), leading to around 3 580 consumers per farm. Compared to Bavaria, the number of direct-selling farmers in the former East German federal state of Saxony was around 500 in 2013 (approx. 8 300 consumers per farm) (Direktvermarktung in Sachsen e.V., 2013).
A growing market for local products is attracting increased scientific interest in consumers’ perception of and attitude towards direct marketing. This is reflected by an increasing number of published studies (e.g. Bond, Thilmany and Bond, 2006; Cranfield, Henson and Blandon , 2012; Rocchi, Cavicchi and Baldeschi, 2012; Thilmany, Bond and Bond, 2008; Wirthgen, 2005; Zenner, Wirthgen and Altmann, 2004; Zepeda and Li, 2006). Most studies on consumer preferences for directly-sold food by farmers concentrate on consumers on farmers’ markets. To the best of the authors’ knowledge, there is no study comparing consumers’ preferences between farmers’ markets and farm shops. To contribute to this understanding, we employ an ordered logit regression model on data collected in Germany. The main objective of this article is to investigate the link between the frequency of buying food directly from farmers and consumers’ stated perception of private and public attributes of food products. Furthermore, the attitudes of consumers who shop at weekly markets and farm shops are compared.
Not only scientists but various actors, e.g. agriculture marketing agencies and farmers, may profit from these results, as they help them to build consumers’ adapted informational measures to support the consumption of local food.
The rest of the article is structured as follows. After describing the study’s theoretical framework, the survey and the sample are detailed. Afterwards, the methodology and results are presented. The paper closes with a discussion and conclusions.
2 Theoretical Framework: Direct Marketing Attitudes The theoretical framework of the presented survey builds upon the concept of Thilmany, Bond and Bond (2008), who model direct marketing consumers’ product and source choices of food produce. Enhancing the model of Lancasted (1966) by incorporating the concept of public goods (Zaichkowsky, 1985), Thilmany, Bond and Bond (2008) recognize that consumer objectives may be more complex than expected from modeling simple self-interested behavior. These authors assume that the marginal utility of consuming each good may differ with choice of outlet source. Thence, private attributes of source characteristics such as convenience, travel costs, etc. may influence consumers’ decisions. Non-private, quasi-public characteristics such as locally-sourced products or promoting environmentally friendly products are included in the decision model. Including quasi-public characteristics is motivated by the argument that individuals use their money to make a public statement of activism, and pursue “sustainable” consumption (Seyfang, 2006; Vermeir and Verbeke, 2006).
In the following, those products and outlet attributes are identified from the existing literature, which have been found to determine consumers’ buying frequency of directly marketed food products. Similar to the concept of Thilmany, Bond and Bond (2008), the attributes are divided into private and public attributes.
183
Private Attributes Product quality Consumers’ evaluations of the quality and price of a product are considered to be the two pivotal determinants of their purchase decisions (Zeithaml, 1988). The concept of quality may be operationlized in many different ways. However, there is a shared understanding that one can distinguish between an objective and subjective dimension of quality. Objective quality refers to the physical characteristics of the product. Subjective quality is the evaluation of the quality of a product, i.e. perceived quality (Grunert, 2005). In this study, we investigate how quality is perceived by consumers, and how these perceptions influence consumers’ decision-making. Using a question on quality itself as a manifest variable has been considered imprecise, as it allows too much room for interpretation (Zeithaml, 1988). To test for the subjective dimension of quality, we decided to ask for the perceived taste and freshness of local products. Taste and freshness are chosen because consumers commonly positively associate these two attributes with local food products (e.g. Chamber et al., 2007; Selfa and Qazi, 2005, La Trobe, 2001). In this study, we test the following hypotheses:
H1: “Consumers who find they receive very fresh food when buying directly from farmers will likely more frequently buy directly from farmers than those who do not find the food fresher.” H2: “Consumers that find that the food purchased directly from farmers tastes better will likely more frequently buy directly from farmers than those who do not find that the food tastes better.”
Product price Similar to the differentiation between the subjective and objective dimensions of quality, scholars have emphasized the difference between objective and perceived prices. Consumers tend to have little knowledge or recollection on exact (i.e. objective) prices, but rather encode prices in a way that gives them meaning. Thus, products are often remembered as cheap or expensive, likely leading to a gap between objective and perceived prices (Zeithaml, 1988). Empirical evidence suggests that prices of local food products are perceived to be high (e.g. Roininen, Arvola and Lähteenmaki, 2006). Findings from a focus group discussion carried out by Chambers et al. (2007) suggest that the perceived prices, rather than objective prices, influence the decision to not buy local food products. In order to test for perceived expensiveness of local products, we asked study participants to evaluate the perceived expensiveness of local foods.
H3: “Consumers who find that the food purchased directly from farmers is too expensive likely less frequently buy directly from farmers than those who do not find the food expensive.”
Consumer confidence in product quality In contrast to taste or price, some product attributes cannot be measured or evaluated by the consumer even after consumption, e.g. the usage of pesticides in the food production process. Due to such “credence attributes”, information asymmetries exist between producers and consumers. Eliminating these information asymmetries is often cost intensive or even impossible. High information costs can be overcome through trust. Beck (1992) shows that distrust is related to uncertainty, risk and fear; the level of uncertainty, risk and fear is low in relationships based on trust. Siegrist, Earle and Gutscher (2003) emphasizes that trust has to be treated differently than confidence. Trust is based on social relationships between individuals or between an individual and an institution, whereas one can have confidence in anything e.g. process quality. In our study, we test the following hypothesis:
184
H4: “Consumers with higher confidence in products coming directly from farmers compared to other sources likely more frequently buy directly from farmers than those who do not have higher confidence in this source.”
Process attributes Numerous studies have focused on consumers’ stated preferences concerning the process attributes of food products. Here, it has been established that consumers’ motivation to buy certain food products partly depends on process attributes such as being organic, pesticide free or locally grown (e.g. Bond, Thilmany and Bond, 2006). Thus, the attribute of being locally grown serves as a motivator to buy food products. Further empirical evidence confirms that a key benefit of local food perceived by consumers is that they know “where the food came from’’ (Roininen, Arvola and Lähteenmaki, 2006). Literature suggests that consumers associate local food production with greater transparency (Jones, Comfort and Hillier, 2004). This assumption is supported by the results of a study in Germany, where the results of a rank-ordered logit analysis show consumers’ regional, nutritional, and environmental consciousness, as well as a low price sensitivity and mistrust in conventional food from elsewhere (Wirthgen, 2005).
Consequently, to test the revealed consumer preferences towards directly marketed food by farmers, we test the following hypotheses:
H5: “Consumers that find it important to know where food was produced likely more frequently buy directly from farmers than those who do not find it important.” H6: “Consumers that find it important to know how food was produced likely more frequently buy from farmers then those who do not find it important.”
Consumer confidence in process quality The confidence in process attributes is tested with the statement “I trust that animal products that I purchase directly from farmers tend to be breaded under higher standards of animal welfare than animal products that I purchase from other outlets” in this survey.
H7: “Consumers with higher confidence in the animal welfare processing compliance of products bought directly from farmers compared to other sources likely more frequently buy directly from farmers than those who do not have higher confidence in this source.”
Convenience of location Consumers who are interested in buying locally-produced food face the difficulty that farmers markets or direct marketing outlets have very restricted opening hours and are often not as easy to reach. It is thus not surprising that a number of studies have confirmed that convenience of location is of high importance of choice of outlet (e.g. Bond, Thilmany and Bond, 2006). To test the role of perceived convenience of outlet source and buying products directly from farmers, the following hypothesis was verified:
H8: “Consumers that find it convenient to buy directly from farmers likely more frequently buy directly from farmers that those who do not find it convenient.”
Public Attributes Support local farmers The public attributes of a food source not only impact the decision maker (the consumer) but also other members of the community. Consumers that take public attributes into consideration do not act purely rationally in the economic sense and do not only consider their own profit. Instead, consumer decisions to buy food from local farmers is driven e.g. by the

185
willingness to support them, and thus the region, as confirmed by a number of studies (e.g. Bond, Thilmany and Bond, 2006; Eastwood et al., 1999; Zepeda and Leviten-Reid, 2004). We test the influence of the “support local farmers” variable on buying frequency with the following hypothesis: H9: “Consumers that prefer to support local farmers likely more frequently buy directly from farmers than those who do not want to support local farmers.”
Transportation distance Consumers often associate transportation distance with fuel consumption, and those who are environmentally concerned may be more inclined to buy locally (e.g. Zepeda and Li, 2006; Seyfang, 2006). However, Sirieix, Grolleau and Schaer (2008) found in face-to-face interviews in France that most consumers are not concerned with “food miles” and their subsequent environmental impact. These authors argue that environmental quality resulting from reduced food miles has non-excludable public properties, and is therefore vulnerable to free riding behavior. In our study, we thus test the following hypothesis:
H10: “Consumers that consider food transportation distance important likely more frequently buy directly from farmers than those who do not find it important.” All nine hypotheses are separately tested for weekly markets and farm shops in this study. An overview of the hypotheses is given in Chyba! Nenalezen zdroj odkazů..
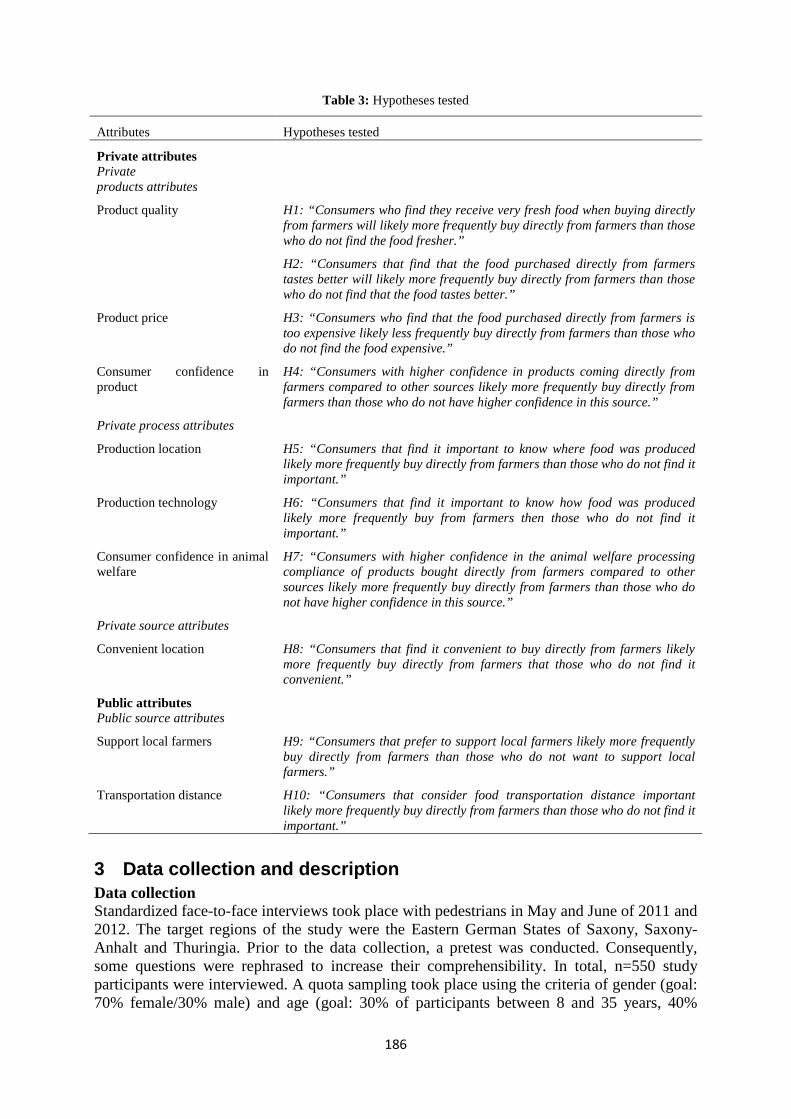
186
Table 3: Hypotheses tested
Attributes Hypotheses tested
Private attributes Private products attributes
Product quality H1: “Consumers who find they receive very fresh food when buying directly from farmers will likely more frequently buy directly from farmers than those who do not find the food fresher.”
H2: “Consumers that find that the food purchased directly from farmers tastes better will likely more frequently buy directly from farmers than those who do not find that the food tastes better.”
Product price H3: “Consumers who find that the food purchased directly from farmers is too expensive likely less frequently buy directly from farmers than those who do not find the food expensive.”
Consumer confidence in product
H4: “Consumers with higher confidence in products coming directly from farmers compared to other sources likely more frequently buy directly from farmers than those who do not have higher confidence in this source.”
Private process attributes
Production location H5: “Consumers that find it important to know where food was produced likely more frequently buy directly from farmers than those who do not find it important.”
Production technology H6: “Consumers that find it important to know how food was produced likely more frequently buy from farmers then those who do not find it important.”
Consumer confidence in animal welfare
H7: “Consumers with higher confidence in the animal welfare processing compliance of products bought directly from farmers compared to other sources likely more frequently buy directly from farmers than those who do not have higher confidence in this source.”
Private source attributes
Convenient location H8: “Consumers that find it convenient to buy directly from farmers likely more frequently buy directly from farmers that those who do not find it convenient.”
Public attributes Public source attributes
Support local farmers H9: “Consumers that prefer to support local farmers likely more frequently buy directly from farmers than those who do not want to support local farmers.”
Transportation distance H10: “Consumers that consider food transportation distance important likely more frequently buy directly from farmers than those who do not find it important.”
3 Data collection and description Data collection Standardized face-to-face interviews took place with pedestrians in May and June of 2011 and 2012. The target regions of the study were the Eastern German States of Saxony, Saxony-Anhalt and Thuringia. Prior to the data collection, a pretest was conducted. Consequently, some questions were rephrased to increase their comprehensibility. In total, n=550 study participants were interviewed. A quota sampling took place using the criteria of gender (goal: 70% female/30% male) and age (goal: 30% of participants between 8 and 35 years, 40%
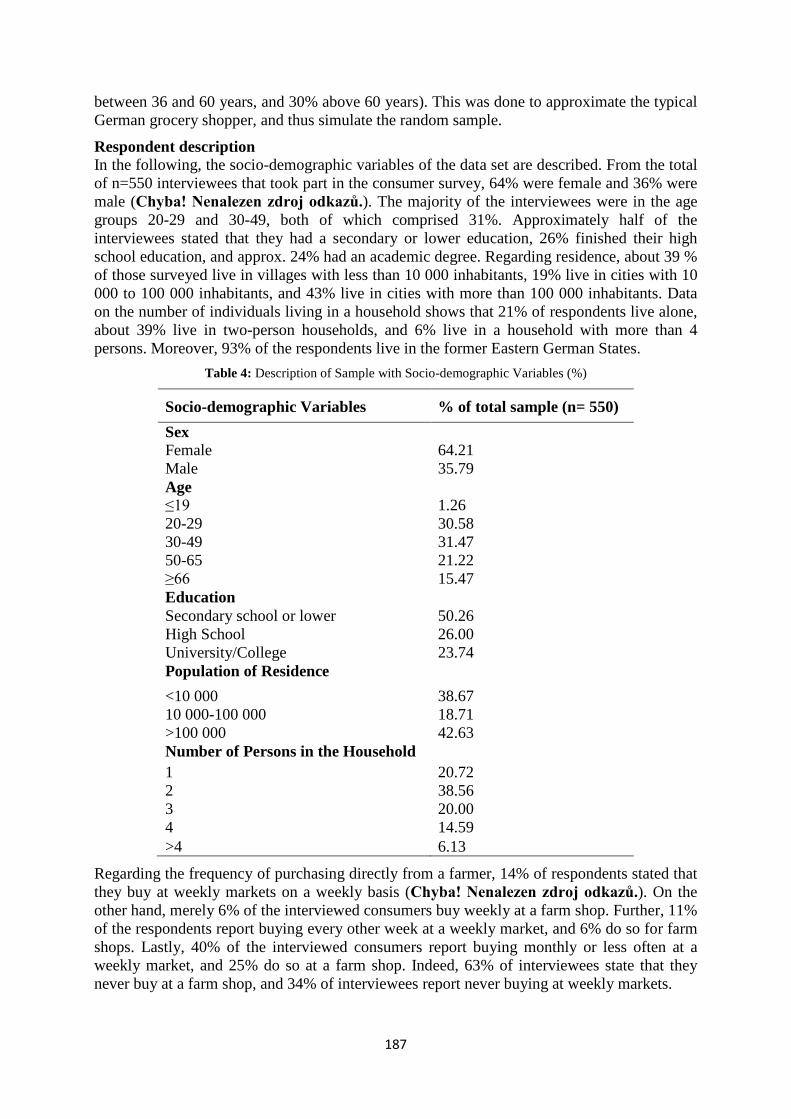
187
between 36 and 60 years, and 30% above 60 years). This was done to approximate the typical German grocery shopper, and thus simulate the random sample.
Respondent description In the following, the socio-demographic variables of the data set are described. From the total of n=550 interviewees that took part in the consumer survey, 64% were female and 36% were male (Chyba! Nenalezen zdroj odkazů.). The majority of the interviewees were in the age groups 20-29 and 30-49, both of which comprised 31%. Approximately half of the interviewees stated that they had a secondary or lower education, 26% finished their high school education, and approx. 24% had an academic degree. Regarding residence, about 39 % of those surveyed live in villages with less than 10 000 inhabitants, 19% live in cities with 10 000 to 100 000 inhabitants, and 43% live in cities with more than 100 000 inhabitants. Data on the number of individuals living in a household shows that 21% of respondents live alone, about 39% live in two-person households, and 6% live in a household with more than 4 persons. Moreover, 93% of the respondents live in the former Eastern German States.
Table 4: Description of Sample with Socio-demographic Variables (%)
Socio-demographic Variables % of total sample (n= 550) Sex Female 64.21 Male 35.79 Age ≤19 1.26 20-29 30.58 30-49 31.47 50-65 21.22 ≥66 15.47 Education Secondary school or lower 50.26 High School 26.00 University/College 23.74 Population of Residence <10 000 38.67 10 000-100 000 18.71 >100 000 42.63 Number of Persons in the Household 1 20.72 2 38.56 3 20.00 4 14.59 >4 6.13
Regarding the frequency of purchasing directly from a farmer, 14% of respondents stated that they buy at weekly markets on a weekly basis (Chyba! Nenalezen zdroj odkazů.). On the other hand, merely 6% of the interviewed consumers buy weekly at a farm shop. Further, 11% of the respondents report buying every other week at a weekly market, and 6% do so for farm shops. Lastly, 40% of the interviewed consumers report buying monthly or less often at a weekly market, and 25% do so at a farm shop. Indeed, 63% of interviewees state that they never buy at a farm shop, and 34% of interviewees report never buying at weekly markets.
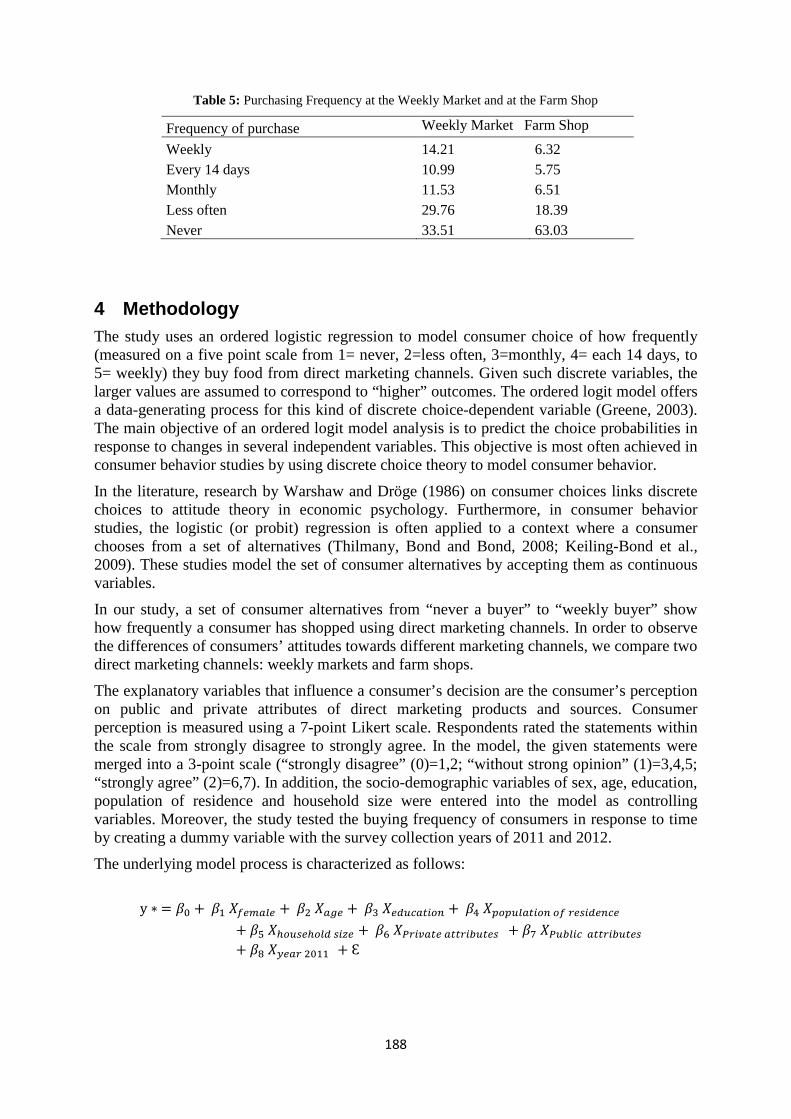
188
Table 5: Purchasing Frequency at the Weekly Market and at the Farm Shop
4 Methodology The study uses an ordered logistic regression to model consumer choice of how frequently (measured on a five point scale from 1= never, 2=less often, 3=monthly, 4= each 14 days, to 5= weekly) they buy food from direct marketing channels. Given such discrete variables, the larger values are assumed to correspond to “higher” outcomes. The ordered logit model offers a data-generating process for this kind of discrete choice-dependent variable (Greene, 2003). The main objective of an ordered logit model analysis is to predict the choice probabilities in response to changes in several independent variables. This objective is most often achieved in consumer behavior studies by using discrete choice theory to model consumer behavior.
In the literature, research by Warshaw and Dröge (1986) on consumer choices links discrete choices to attitude theory in economic psychology. Furthermore, in consumer behavior studies, the logistic (or probit) regression is often applied to a context where a consumer chooses from a set of alternatives (Thilmany, Bond and Bond, 2008; Keiling-Bond et al., 2009). These studies model the set of consumer alternatives by accepting them as continuous variables.
In our study, a set of consumer alternatives from “never a buyer” to “weekly buyer” show how frequently a consumer has shopped using direct marketing channels. In order to observe the differences of consumers’ attitudes towards different marketing channels, we compare two direct marketing channels: weekly markets and farm shops.
The explanatory variables that influence a consumer’s decision are the consumer’s perception on public and private attributes of direct marketing products and sources. Consumer perception is measured using a 7-point Likert scale. Respondents rated the statements within the scale from strongly disagree to strongly agree. In the model, the given statements were merged into a 3-point scale (“strongly disagree” (0)=1,2; “without strong opinion” (1)=3,4,5; “strongly agree” (2)=6,7). In addition, the socio-demographic variables of sex, age, education, population of residence and household size were entered into the model as controlling variables. Moreover, the study tested the buying frequency of consumers in response to time by creating a dummy variable with the survey collection years of 2011 and 2012.
The underlying model process is characterized as follows:
y ∗ = 𝛽0 + 𝛽1 𝑋𝑓𝑒𝑚𝑎𝑙𝑒 + 𝛽2 𝑋𝑎𝑔𝑒 + 𝛽3 𝑋𝑒𝑑𝑢𝑐𝑎𝑡𝑖𝑜𝑛 + 𝛽4 𝑋𝑝𝑜𝑝𝑢𝑙𝑎𝑡𝑖𝑜𝑛 𝑜𝑓 𝑟𝑒𝑠𝑖𝑑𝑒𝑛𝑐𝑒
+ 𝛽5 𝑋ℎ𝑜𝑢𝑠𝑒ℎ𝑜𝑙𝑑 𝑠𝑖𝑧𝑒 + 𝛽6 𝑋𝑃𝑟𝑖𝑣𝑎𝑡𝑒 𝑎𝑡𝑡𝑟𝑖𝑏𝑢𝑡𝑒𝑠 + 𝛽7 𝑋𝑃𝑢𝑏𝑙𝑖𝑐 𝑎𝑡𝑡𝑟𝑖𝑏𝑢𝑡𝑒𝑠 + 𝛽8 𝑋𝑦𝑒𝑎𝑟 2011 + Ɛ
Frequency of purchase Weekly Market Farm Shop
Weekly 14.21 6.32 Every 14 days 10.99 5.75 Monthly 11.53 6.51 Less often 29.76 18.39 Never 33.51 63.03
189
where y* is the unobserved dependent variable. In the mapping process of the dependent variable that provides the frequency of buying from two direct marketing channels, the study followed the set of consumer alternatives as:
y𝑖 = 0 if y*≤ 0, never a buyer
= 1 if 0 < y* ≤ µ1, buy less often
= 2 if µ1 < y* ≤ µ2, buy monthly
= 3 if µ2 < y* ≤ µ3, = buy each 14 days
= 4 if µ3 ≤ y*, weekly buyer.
X is the vector of explanatory variables, and β (beta) is the vector of regression coefficients that the study has aimed to estimate. The beta coefficients are the ordered log-odds (logit) regression coefficients that allow interpretation of the ordered logit model. Standard interpretations of beta coefficients are: a one-unit increase in the explanatory variables; the response variable level is expected to change by its respective regression coefficient in the ordered log-odds scale; and the other variables should remain constant in the model (Bruin, 2006). The study used the statistical software package STATA to conduct the descriptive statistical analysis and to run the ordered logit model.
5 Results 5. 1. Evaluation of Private and Public Attributes by Consumers To assess consumers’ preferences of private and public attributes of food products and sources, respondents were asked to evaluate how far they agree with nine statements. More concretely, respondents were to indicate their answer on a bipolar seven-point Likert scale, ranging from “strongly disagree” to “strongly agree”. Table 4 provides a detailed overview of the results.
Private Attributes In terms of evaluating the private attributes, direct marketing products are mostly evaluated positively by study participants. The majority of interviewees agree that food directly from the farmer is fresh (approx. 80%) and tastes better than food from other outlets (approx. 69%). We also find that over 60% of interviewees are interested in how and where their food is produced. The data shows that it is not the (subjective) price (35% of the respondents agree that products purchased directly from farmers are too expensive) but rather the difficulty to reach an outlet selling these direct market products is the main drawback of such products. More than half of the interviewees agree it is “very inconvenient” to buy directly from a farmer.
Answers to the question of whether consumers’ confidence in foods produced directly from farmers is higher than in products from other outlets show that merely 20% of consumers’ do not have high confidence in direct market products. Furthermore, 64% of consumers agree that they trust that animal products they purchase directly from farmers come from an animal husbandry. This is more species-appropriate than the animal-husbandry from which products from the retail market are sourced.
Public Attributes The majority of interviewees indicate that they are concerned with the ideas of wanting to support local farmers and to have short transportation distances to their food source. On the one hand, over 50% agree or strongly agree that they want to support local farmers with their
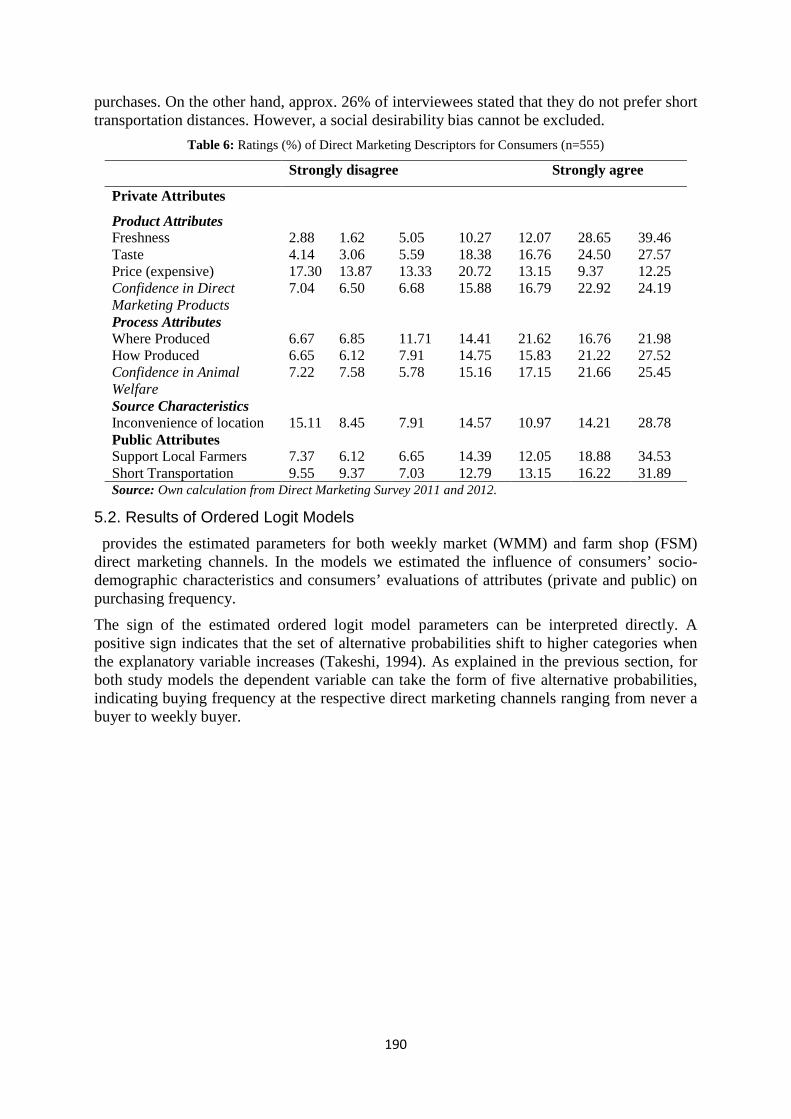
190
purchases. On the other hand, approx. 26% of interviewees stated that they do not prefer short transportation distances. However, a social desirability bias cannot be excluded.
Table 6: Ratings (%) of Direct Marketing Descriptors for Consumers (n=555)
Strongly disagree Strongly agree
Private Attributes
Product Attributes Freshness 2.88 1.62 5.05 10.27 12.07 28.65 39.46 Taste 4.14 3.06 5.59 18.38 16.76 24.50 27.57 Price (expensive) 17.30 13.87 13.33 20.72 13.15 9.37 12.25 Confidence in Direct Marketing Products
7.04 6.50 6.68 15.88 16.79 22.92 24.19
Process Attributes Where Produced 6.67 6.85 11.71 14.41 21.62 16.76 21.98 How Produced 6.65 6.12 7.91 14.75 15.83 21.22 27.52 Confidence in Animal Welfare
7.22 7.58 5.78 15.16 17.15 21.66 25.45
Source Characteristics Inconvenience of location 15.11 8.45 7.91 14.57 10.97 14.21 28.78 Public Attributes Support Local Farmers 7.37 6.12 6.65 14.39 12.05 18.88 34.53 Short Transportation 9.55 9.37 7.03 12.79 13.15 16.22 31.89 Source: Own calculation from Direct Marketing Survey 2011 and 2012.
5.2. Results of Ordered Logit Models provides the estimated parameters for both weekly market (WMM) and farm shop (FSM) direct marketing channels. In the models we estimated the influence of consumers’ socio-demographic characteristics and consumers’ evaluations of attributes (private and public) on purchasing frequency.
The sign of the estimated ordered logit model parameters can be interpreted directly. A positive sign indicates that the set of alternative probabilities shift to higher categories when the explanatory variable increases (Takeshi, 1994). As explained in the previous section, for both study models the dependent variable can take the form of five alternative probabilities, indicating buying frequency at the respective direct marketing channels ranging from never a buyer to weekly buyer.
191
Table 7: Results of Ordered Logit Models, Frequency of Buying as Dependent Variables
Weekly Market Model (WMM) Farm Shop Model (FSM) Explanatory Variables Coef. Std. Error Coef. Std. Error Sex Female .619** .174 -.006 .204 Age Groups 30-65 .703** .209 .547 .258 ≥ 66 .898** .291 .336** .356 Education High School .246 .228 .175 .280 University/ College .141 .205 .020 .245 Population of Residence 10 000-100 000 .757** .231 -.047 .252 > 100 000 .528** .205 -1.167** .248 Household Size -.005 .075 .170* .089 Product Attributes Freshness .125* .070 -.0824 .0897 Taste .015 .163 .271 .213 Price -.169 .126 -.307** .157 Confidence in Product Attributes
Confidence in Direct Marketing Products
-.108 .153 .103 .198
Process Attributes Where Produced .112 .162 .396* .218 How Produced -.011 .165 -.343* .206 Confidence in Process Attributes
Confidence in Animal Welfare .155 .160 -.041 .204 Source Attributes Convenient Location .113 .118 .914** .143 Public Attribute Support Local Farmers .298* .155 .254 .204 Short Transportation .135 .148 .099 .186 Year 2011 -.174 .178 .033 .207 Number of observations 537 520 Prob > chi2 0.000 0.000 Pseudo R2 0.0613 0.150
Source: Own calculation from Direct Marketing Survey 2011 and 2012; Significance levels: * = p < .10, ** = p < .05.
Both models were tested for multicollinearity by calculating the Variance Inflation Score (VIF) applying an ordinary least squares (OLS) regression model. Results show the mean VIF value of 1.58 for the weekly market model, and 1.59 for the farm shop model. A commonly accepted upper critic limit is 10 (Chatterjee and Hadi, 2006). Thus, we conclude that there are no problems related to multicollinearity between the used explanatory variables in both models. In addition, the results of the OLS logistic regression models were compared with the results of the OLS regression analyses. Both methods of analysis indicate identical positive and significant relationships between the dependent and explanatory variables.
Influence of socio-demographic characteristics and year Looking at the Weekly Market Model (WMM), we find that women are more likely to be frequent buyers at a weekly market than men (Coef. = .619, p < .05). The positive signs of the estimates for the categorical age group variables reveal that frequent buyers from weekly
192
markets increase with consumers’ increasing age (Coef. = .703, p < .05 for the age group 30-65; Coef. = .898, p < .05 for the age group ≥ 66). Additionally, consumers who are living in moderately and highly-populated areas are more likely to frequently purchase goods at weekly markets than those living in the base category of population density (Coef. = .757, p < .05 for population 10 000 – 100 000; Coef. = .528, p < .05 for a population of more than 100 000). Finally, 2011 is found not to contain significant determinants for explaining consumer frequency of buying behavior compared to year 2012.
In the Farm Shop Model (FSM) we find that gender is not a significant determinant for the frequency of buying at a farm shop. Regarding the categorical age variable, consumers in older age groups (≥ 66) are found to be significantly more likely to be frequent buyers from farm shops than the base (≤ 29) and middle (30-65) age categories (Coef. = .336, p < .05). Furthermore, consumers who live in a city with more than 100.000 inhabitants are less likely to frequently buy at a farm shop than those who live in less populated locations (Coef. = -1.167, p < .05). A possible explanation for this is that due to the distance between farm shops and cites, consumers living in highly populated areas need to increase food miles to access farm shops relative to consumers living in less populated areas. We also find that higher household size is a significant positive determinant for the frequency of buying at a farm shop (Coef. = .170, p < .1). Similar to the Weekly Market Model, 2011 is not a significant determinant for explaining consumers’ buying behavior relative to 2012. This implies that consumers’ frequency of buying from two studied direct marketing channel models does not change depending on the survey year.
Overall, findings related to socio-demographic characteristics reveal that the influence of gender, age, population of location and household size on the consumers’ buying behavior differs slightly by marketing channel.
Private attributes hypotheses Hypothesis 1 (H1) predicts that if a consumer receive very fresh food when buying directly from farmers, then the consumer will likely buy more frequently from farmers. While this hypothesis has confirmed in the WMM (Coef. = 125, p< .1), for the FSM, there is no significant influence of perceived freshness and buying frequency at the farm shop.
Hypothesis 2 (H2) assumed that if a consumer find that the food purchased directly from farmers tastes better than other marketing channels, then the consumer will likely buy more frequently from farmers. Findings show that consumers’ positive perception of taste of food that was purchased directly from a farmer does not explain the probability of buying frequency for both WMM and FSM models. Thus, H2 is rejected for the two study models.
Hypothesis 3 (H3) tested the influence of perceived price of food in direct marketing channels on the buying behavior of consumers. For the FSM, the negative sign for the variable of the consumer’s perceptions on the food price reveal that if a consumer find that the food purchased directly from farmers is too expensive then the consumer will less likely buy more frequently (Coef. = -.307, p < .05). For the WMM, food price perception by consumers does not explain buying frequency. Thus, H3 was corroborated for the FSM and denied for the WMM.
Hypothesis 4 (H4) assumes that if consumer who have a greater confidence in products directly purchased from a farmer will more likely buy from direct marketing outlets. This hypothesis is not supported by our results. Confidence in direct marketing products does not have a significant influence on buying frequency at weekly markets, nor on buying frequency at farm shops.
193
Hypotheses 5 (H5) and 6 (H6) predict that if consumer find it important to know where and how the food is produced will more likely buy from direct marketing channels. These hypotheses are partly supported by our findings. With respect to WMM, contradictory to our hypothesis, knowing where and how the food is produced was found not to be a significant determinant for explaining consumers’ buying behavior at weekly markets. A fairly different picture is found with respect to FSM. At a significance level of p < .1, placing higher importance on where food is produced is, as expected, a significantly influential factor regarding the consumers’ frequency of buying from farm shops. However, the negative sign of estimates for the importance of information on how the food is produced implies that frequency of buying from farm shops decreased with the increasing attention of consumers on how the food is produced. Thus, while H5 is only confirmed for the FSM, H6 is rejected for both WMM and FSM.
Hypothesis 7 (H7) predicts that if a consumer have a strong confidence in the animal welfare processing compliance of products (better species-appropriate animal husbandry) purchased from a farmer, then the consumer will more likely buy from a direct marketing channel. However, H7 is not supported for either study model, since the significant level is higher than p > .1.
Hypothesis 8 (H8) assume that if consumers find that buying from a farmer is convenient, then they will be more likely to buy directly from a farmer. While H8 is not supported for the WMM, it is confirmed by FSM. With respect to FSM, the positive significant sign (Coef. = .914, p< .05) of estimates for convenient location implies that an increase in consumer perception of convenient location leads to an increase in the likelihood that a consumer would frequently travel to farm shops. A possible explanation is that consumers living in convenient locations are more likely to be frequent buyers from farm shops. This could be supported by the negative sign of estimates for a higher category of population density for the FSM; consumers who live in a city with more than 100.000 inhabitants are less likely to frequently buy at a farm shop.
Public attributes hypotheses Hypothesis 9 (H9) assumed that if a consumer prefer to support local farmers by purchasing food from a direct marketing channel, then consumer will more likely frequently purchase from that source. H9 is confirmed only for the WMM (Coef. = .298, p < .1). Support for local farmers is found to be a positive significant determinant for explaining buying behavior only for the WMM.
Finally, Hypothesis 10 (H10) predicts that if a consumer considers food transportation distance is important, then consumer will more likely frequently purchase through direct marketing channels. Placing importance on food transportation distance is found not to be a significant determinant for explaining consumers’ frequency of buying behavior from both studied direct marketing channels.
Because both study models have been evaluated by the same explanatory variables, the differences between both ordered logit estimations are attributable to the different nature of consumer behaviors for the direct marketing channels. Table 6 summarizes the results of the nine hypotheses tested for weekly markets and farm shops.
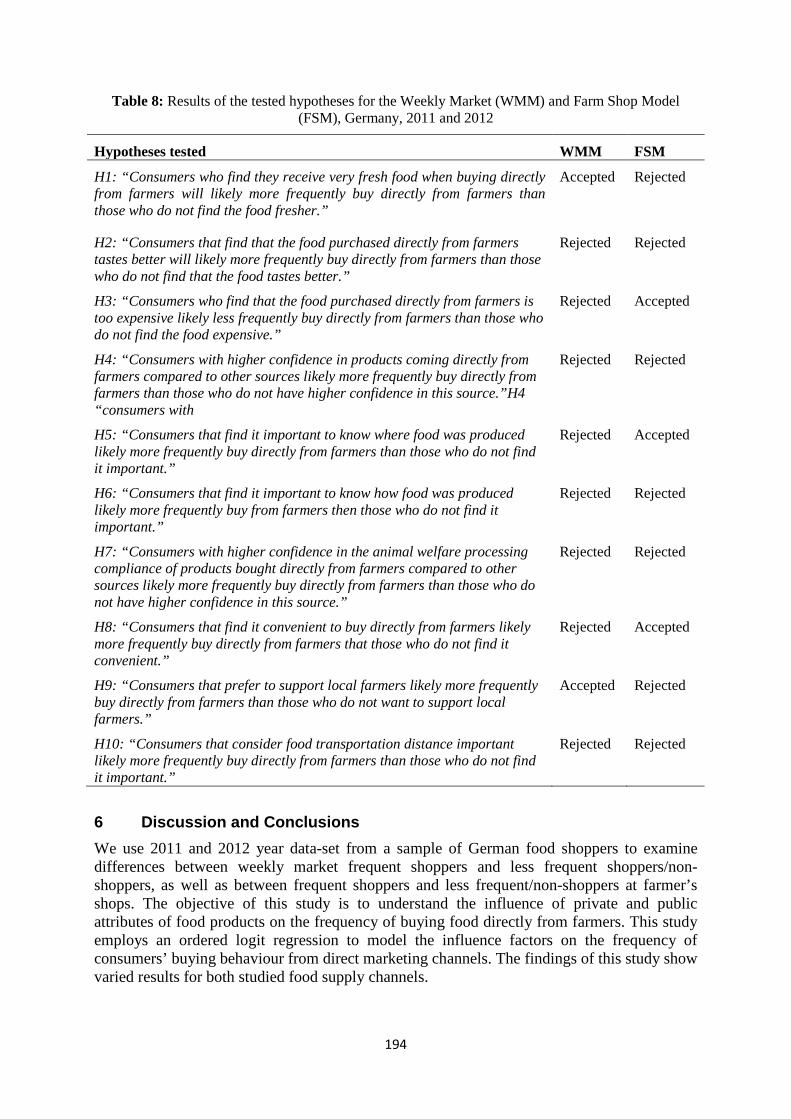
194
Table 8: Results of the tested hypotheses for the Weekly Market (WMM) and Farm Shop Model (FSM), Germany, 2011 and 2012
Hypotheses tested WMM FSM
H1: “Consumers who find they receive very fresh food when buying directly from farmers will likely more frequently buy directly from farmers than those who do not find the food fresher.”
Accepted Rejected
H2: “Consumers that find that the food purchased directly from farmers tastes better will likely more frequently buy directly from farmers than those who do not find that the food tastes better.”
Rejected Rejected
H3: “Consumers who find that the food purchased directly from farmers is too expensive likely less frequently buy directly from farmers than those who do not find the food expensive.”
Rejected Accepted
H4: “Consumers with higher confidence in products coming directly from farmers compared to other sources likely more frequently buy directly from farmers than those who do not have higher confidence in this source.”H4 “consumers with
Rejected Rejected
H5: “Consumers that find it important to know where food was produced likely more frequently buy directly from farmers than those who do not find it important.”
Rejected Accepted
H6: “Consumers that find it important to know how food was produced likely more frequently buy from farmers then those who do not find it important.”
Rejected Rejected
H7: “Consumers with higher confidence in the animal welfare processing compliance of products bought directly from farmers compared to other sources likely more frequently buy directly from farmers than those who do not have higher confidence in this source.”
Rejected Rejected
H8: “Consumers that find it convenient to buy directly from farmers likely more frequently buy directly from farmers that those who do not find it convenient.”
Rejected Accepted
H9: “Consumers that prefer to support local farmers likely more frequently buy directly from farmers than those who do not want to support local farmers.”
Accepted Rejected
H10: “Consumers that consider food transportation distance important likely more frequently buy directly from farmers than those who do not find it important.”
Rejected Rejected
6 Discussion and Conclusions We use 2011 and 2012 year data-set from a sample of German food shoppers to examine differences between weekly market frequent shoppers and less frequent shoppers/non-shoppers, as well as between frequent shoppers and less frequent/non-shoppers at farmer’s shops. The objective of this study is to understand the influence of private and public attributes of food products on the frequency of buying food directly from farmers. This study employs an ordered logit regression to model the influence factors on the frequency of consumers’ buying behaviour from direct marketing channels. The findings of this study show varied results for both studied food supply channels.
195
Regarding stated preferences, the majority of interviewees agree that food they get directly from a farmer is quite fresh and tastes better than other products. In general, interviewees are interested in where and how their food is produced. On the one hand, the majority of respondents have higher confidence in both the product and the process quality of the food purchased directly from farmers, they want to support local farmers, and they prefer products with short transportation distances. On the other hand, more than 50% of the interviewees find it very inconvenient to buy directly from a farmer. The question arises whether these findings are reflected in the buying frequency of directly marketed food products.
Considering weekly markets, consumers who are female, in an age group >30 years and living in cities larger than 10 000 inhabitants are more likely to frequently purchase direct marketing products than others. The latter might be explained by the lack of weekly markets in villages and less inhabited places, and thus it is inconvenient to reach them. As expected, the analysis shows that consumers who are very satisfied with the freshness of their food are more likely to buy more frequently at the weekly market. This stands in contrast to findings by Zepeda (2009), who finds that freshness of food products does not significantly influence the buying decision of consumers at US farmers markets. Regarding the influence of source attributes on consumers’ decisions, our data confirms results from studies in the US (Bond, Thilmany and Bond, 2006; Eastwood et al, 1999; Zepeda and Leviten-Reid, 2004): Consumers who consider it important to support local producers buy more frequently at a weekly market.
The results for farm shops buyers show a different picture: Consumers who are ≥ 66 years old, living in a place smaller than 100 000 inhabitants and in larger households are more likely to buy frequently at farm shops than others. Moreover, consumers who do not think that the price of directly marketed products is too high and those who are interested in knowing where food is produced are more likely to buy at farm shops. Consumers who find it convenient to buy directly at farm shops buy more often than the others. This may explain our findings which show that inhabitants of less populated areas more likely buy frequently at farm shops: The majority of farm shops in Germany are located in less populated areas. Consequently, it is more convenient for people living in these areas to reach farm shops. Some people who live in less populated areas and commute to the cities for work shop in the farm shop as they drive by. Surprisingly, consumers who are interested in how food is produced buy at the farm shop less frequently than others. This may be explained by the fact that people from less inhabited areas live closer to farmers and know more about agriculture than people in the large cities. Because of this knowledge, they may feel less uncertain about food production in general. Interestingly, people who want to support local farmers do not buy more frequently at farm shops.
Transportation distance does not have a significant influence on buying frequency for either considered source. This can be interpreted as evidence supporting the hypothesis of Sirieix, Grolleau and Schaer (2008), who argue that the improved environmental quality resulting from reduced food miles does not have an excludable public property. Thus, these authors assume that reduced food miles do not have a significant influence on consumers’ buying behavior.
Our study shows that weekly market buyers and farm shop buyers are in many aspects different regarding both their socio-demographic characteristics and their attitudes. For selling at the weekly market, the generally known fact that farmers should focus on advertising the freshness of their food is confirmed. Furthermore, they should make it clear that the food they sell is produced by themselves or other farmers from the region. Farmers selling their products in farm shops should focus more on consumers from the region, as the perceived convenience of getting to a direct marketing outlet is a key determining factor for the frequency of buying at a farm shop.
196
Regarding further research, our results imply that considering consumer behavior for single direct marketing channels separately, rather than considering all direct buyers at once as done in some studies, would provide fruitful results.
References
Batte, M.T., Hooker, N.H., Haab, T.C. and Beaverson, J. (2007) ‘Putting their money where their mouths are: Consumer willingness to pay for multi-ingredient, processed organic food products’, Food Policy, vol. 32, pp. 145–159.
Beck, U. (1992) Risk society: Towards a new modernity. Sage. BMELV (2013): Einkaufen direkt auf dem Bauernhof, [Online], Available:
http://www.bmelv.de/SharedDocs/Standardartikel/Landwirtschaft/Laendliche-Raeume/RausAufsLand/EinkaufenBauernhof.html;jsessionid=8B0AE163B34FE597228E2527077D9644.2_cid376 [6 Aug 2013]
Bond, J.K., Thilmany, D. and Bond, C.A. (2006) ‘Direct Marketing of Fresh Produce: Understanding Consumer Purchasing Decisions’, Choices, vol. 21, no. 4, pp. 229-236.
Brown, C. (2003) ‘Consumers' preferences for locally produced food: A study in southeast Missouri’, American Journal of Alternative Agriculture, vol. 18, no. 4, pp. 213-224.
Bruin, J. (2006) Newtest: command to compute new test, UCLA: Statistical Consulting Group. Chambers, S., Lobb, A., Butler, L., Harvey, K. and Traill, W.B. (2007) ‘Local, national and
imported foods: A qualitative study’, Appetite, vol. 49, pp. 208-213. Cranfield, J., Henson S. and Blandon J. (2012) ‘The Effect of Attitudinal and
Sociodemographic Factors on the Likelihood of Buying Locally Produced Food’, Agribusiness, vol. 28, no 2, pp. 205-221.
Chatterjee, S and Hadi, A.S. (2006) Regression Analysis by Example, 4rd edition. John Wiley & Sons, Inc.
Direktvermarktung in Sachsen e.V. (2013), [Online], Available: http://www.direktvermarktung-sachsen.de/homeframe.htm [6 Aug 2013]
Duram, L. and Oberholtzer, L. (2010) ‘A Geographic Approach to Place and Natural Resource Use in Local Food Systems’, Renewable Agriculture and Food Systems, vol. 25, pp. 99-108.
Eastwood, D., Brooker, J. and Gray, M. (1999) ‘Location and Other Market Attributes Affecting
Farmers’ Market Patronage: The Case of Tennessee’, Journal of Food Distribution Research, vol. 30, no. 1, pp. 63–72.
Feagan, R.B. and Morris, D. (2009) ‘Consumer quest for embeddedness: a case study of the Brantford Farmers’ Market’, International Journal of Consumer Studies, vol. 33, pp. 235-243.
Gil, J.M., Gracia, A. and Sanchez, M. (2000) ‘Market segmentation and willingness to pay for organic products in Spain’, International Food and Agribusiness Management Review, vol. 3, pp. 207–226.
Giovannucci, D., Barham, E. and Pirog, R. (2010) ‘Defining and Marketing “local” Foods: Geographical Indications for US Products’, The Journal of World Intellectual Property, vol. 13, pp. 94-120.
197
Greene, W.H. (2003) Econometric Analysis, Prentice Hall. Grunert, K.G. (2005) ’Food quality and safety: consumer perception and demand’, European
Review of Agricultural Economics, vol. 32, no. 3, pp. 369–391. Jones, P., Comfort, D. and Hillier, D. (2004) ‘A case study of local food and its routes to
market in the UK’, British Food Journal, vol. 106, no. 4, pp. 328–335. Keeling Bond, Thilmany J.D. and Bond, C. (2009) ‘Where Do Consumers Shop for Fresh
Produce andWhy?’ Journal of Agriculture and Applied Economics, vol. 41, no. 1. La Trobe, H. (2001) ‘Farmers’ markets: Consuming local rural produce’, International
Journal of Consumer Studies, vol. 25, no. 3, pp. 181–192. Lancaster, K. J. ‘A new approach to consumer theory’, The journal of political economy, vol.
74, no. 2, pp. 132-157 Rocchi, B., Cavicchi, A. and Baldeschi, M. (2012) ‘Consumers‘ attitude towards farmers‘
markets in Tuscany’, Sviluppo locale, vol. 37-38, pp. 5-23. Roininen, K., Arvola, A. and Lähteenmaki, L. (2006) ‘Exploring consumers perceptions of
local food with two different qualitative techniques: Laddering and word association’, Food Quality and Preference, vol. 17, pp. 20–30.
Selfa, T. and Qazi, J. (2005) ‘Place, taste, or face-to-face? Understanding producer–consumer networks in ‘‘local’’ food systems in Washington State’, Agriculture and Human Values, vol. 22, pp. 451–464.
Seyfang, G. (2006) ‘Ecological citizenship and sustainable consumption: examining local organic food networks’, Journal of Rural Studies, vol. 22, pp. 383-395.
Siegrist, M., Earle, T.C. and Gutscher, H. (2003) ‘Test of a trust and confidence model in the applied context of electromagnetic field (EMF) risks’, Risk analysis, vol. 23, no. 4, pp. 705-716.
Sirieix, L., Grolleau, G. and Schaer, B. (2008)’Do consumers care about food miles? An empirical analysis in France’, International Journal of Consumer Studies, vol. 32, no. 5, pp. 508-515.
Sommer, R. (1995) Das Konsumentenverhalten von Direktverkäufern landwirtschaftlicher Produkte in NRW, Dissertation, Universität Bonn: Institut für Agrarpolitik, Marktforschung und Wirtschaftssoziologie.
STMELF Bayern (2013) Regionale Vermarktung, [Online], Available: http://www.stmelf.bayern.de/landwirtschaft/erwerbskombination/003696/ [14 Aug 2013] Takeshi, A. (1994) Introduction to Statistics and Econometrics, Harvard University Press. Thilmany, D., Bond, C.A. and Bond, J.K. (2008) ‘Going local: exploring consumer behaviour
and motivations for direct food purchases’, American Journal of Agricultural Economics, vol. 90, pp. 1303-1309.
UK Government (2013) Farm shops and farmers’ market, [Online], Available: https://www.gov.uk/farm-shops-and-farmers-markets [2 Aug 2013]
Vermeir, I., and Verbeke,W. (2006) ‘Sustainable food consumption: exploring the consumer “attitude–behavioral intention” gap." Journal of Agricultural and Environmental Ethics,vol. 19, no. 2: 169-194.
Warshaw, P.R. and Dröge, C. (1986) ‘Economic Utility Versus the Attitudinal Perspective of Consumer Choice’, Journal of Economic Psychology, vol.7, no. 3, p. 37.
198
Wirthgen, A. (2005) ‘Consumer, Retailer, and Producer Assessments of Product Differentiation According to Regional Origin and Process Quality’, Agribusiness, vol. 21, no. 2, pp. 191-211.
Wirthgen, B. and Maurer, O. (2000) Direktvermarktung: Verarbeitung, Absatz, Rentabilität, Recht, Stuttgart (2nd Edition): Ulmer.
Zaichkowsky, J. L. (1985) ‘Measuring the involvement construct‘, Journal of consumer research, pp. 341-352.
Zeithaml, V.A. (1988) ‘Perceptions of Price, Quality, and Value: A Means-End Model and Synthesis of evidence’, Journal of Marketing, vol. 52, no. 3, pp. 2-22.
Zenner, S., Wirthgen, B. and Altmann, M. (2004) ‘Analyse des Verbraucherverhaltens bei Direktvermarktung- dargestellt für die Befragungsregion Niedersachen‘, Berichte über Landwirtschaft, vol. 82, no. 1, pp. 81-100.
Zepeda, L. (2009) ‘Which little piggy goes to market? Characteristics of US farmers' market shoppers’, International Journal of Consumer Studies vol. 33, no. 3, pp. 250-257.
Zepeda, L. and Li, J. (2006) ‘Who buys local food?’, Journal of Food Distribution Research, vol. 37, pp. 1-11.
Zepeda, L. and Leviten-Reid, C. (2004) ‘Consumers’ views on local food’, Journal of Food Distribution Research, vol. 35, no. 3, pp. 1-5.
199
Consumer Perception and Use of Products with Health Claims in Western Balkan Countries
Jelena Filipović, Žaklina Stojanović 1Faculty of Economics, University of Belgrade, Kamenička 6, 11000 Belgrade, Serbia
Abstract: Functional food market in Eastern Europe has gained in its importance recently and it is expected that this trend will continue in the future. This study aimed to investigate determinants (socio-demographic characteristics and attitudes) of acceptance of functional food in Western Balkans and to analyze to what extent these factors affected individuals’ consumption of food with health claims. The findings indicate that individuals’ age, education, standard of household, level of knowledge and skepticism on products with health claims and perception of some product attributes affect the frequency of functional food consumption. Profiles of typical consumers are distinguished through cluster analysis and discussed according to their socio-demographic features and attitudes. Functional food consumers in the Western Balkans differ from their global counterparts relative to their age, gender, presence of children in household and appraisal of healthiness of functional food. It is recommended that companies should provide consumers with more information on functional food and attempt to diminish the relevance of price through other product attributes. Since this paper presents the first cross-national assessment of factors that influence functional food consumption in the Western Balkans it will be a valuable benchmark for future studies in the field.
Key words: functional food, Western Balkans, cluster analysis, health claims, consumption.
JEL classification: M16, M31, Q13
1 Introduction In the last decades market and academic research have reported a raising awareness and interest of consumers in health matters and functional foods in general (Urala and Lahteenmdki, 2004; Ares and Gambaro, 2007). Several factors could be acknowledged as influencing agents for this trend: recognition of the role of the food in the preservation of health (Krystallis et al, 2008), increase in life expectancy and increasing cost of healthcare (Menrad, 2003). Even though the lack of an official definition of the functional food complicate and limit to some extent monitoring of functional food markets, there are clear evidence that this market has been in the rise in the previous period and it is expected that this trend will continue in the future also. This market was estimated to be $47.6 billion, whereas the United States were the largest market segment, followed by Europe and Japan (Sloan, 2002). It is projected that the market of functional food will exceed $130 billion by the year of 2015 (Functional Foods and Drinks: A Global Strategic Business Report). The same report argued that developing regions would be the prime growth engines, especially highlighting East Europe, Asia-Pacific, Latin America and Middle East. This is in line with Sibbel’s (2007) assertion that functional foods are commercially relevant in many countries globally.
In spite of this, it could be noted that there is a vast number of studies that tackled functional food market in developed countries (U.S. and EU mainly), while consumer behavior on this matter remained understudied in emerging markets (van Trijp and van der Lans, 2007; Verbeke et al., 2009; Dmitrovic et al., 2009). Several scholars (Frewer et al., 2003; Milosevic et al., 2009) called for attention in reference to this observation, emphasizing that consumer behavior related to functional food varied considerably cross-culturally, with regard to the diversity of specific socio-cultural environments. According to these authors European market is heterogeneous in terms of acceptance of functional food, appraisal of its characteristics and appreciation of different kinds of functional food and nutritive claims. Therefore, it can be
200
concluded that it is necessary to conduct more research on this matter in developing countries and, thus help better understanding of functional food consumption patterns and market potentials in those regions.
One of the widely accepted definitions (Diplock et al., 1999) describes functional food as a food that “affects beneficially one or more target functions of the body, beyond adequate nutritional effects, in a way that is relevant to either an improved state of health and well-being and/or reduction of risk of disease”. In the more simple manner, it could be alleged that functional foods are those which can promote health and diminish the risk of illness (Christidis et al., 2011). Hence, European Union legislation (Regulation (EC) No 1924/2006 of the European Parliament and of the Council of 20 December 2006 on nutrition and health claims made on foods) approves two types to be designated on the foodstuffs: nutrition claims and health claims (HC), whereas the latter are used to mark functional foods.
Elements that affect food choice are generally considered to be: the consumers, the food and the environmental and economic issues. Concerning the consumers, usually two groups of attributes are taken into account – their socio-demographic characteristics and their attitudes and motivations to use functional foods. In the sphere of the food, beside its sensory characteristics, the type of the health claim made on the package and the kind of the foods that is carrier are acknowledged also to be important in food selection and acceptance.
It can be argued that of numerous socio-demographic characteristics that have been examined in broad range of studies undertaken on the subject of functional food consumption, just few of them proved to be significant. Nevertheless, research consistently point out that socio-demographic features have certain power to explain differences in acceptability and intention to use functional food (Verbeke, 2005; Ares and Gambaro, 2007).
There is general consensus with respect to the gender of functional food’s buyers – females demonstrate stronger purchase interest towards this kind of food (Childs, 1997; Poulsen, 1999). This outcome is quite salient, provided that females are persons who are responsible for food purchasing in the households. Moreover, functional food users in Europe are often more educated and of higher economic status (Hilliam, 1996; Anttolainen et al., 2001). However, in the domain of consumers’ age there cannot be find such unanimity of opinions and findings. According to Poulsen (1999) and Urala (2005), elderly (older than 55 years) show more intention to buy functional food, which is adverse to the findings of Childs (1997). Another important socio-demographic attribute pertains to the presence of children in household (Xu and Wu, 2008; Verbeke et al., 2009). This finding may be explained in the way that families with children potentially have higher risk aversion, while also seek for fortification in their foods.
In the recent years, lifestyle factors appear to gain in the relevance for unfolding consumers’ food selections. It is deemed that if person lives a healthy lifestyle, that will reflect to her/his food consumption (Villegas et al., 2008), while functional food can provide consumers with a modern way of leading a healthier life without changing their eating habits (Chen, 2011). Studies (Urala, 2005; Krystallis et al., 2008) consistently allege that one of the crucial motives for consumers to use functional food is the preservation of good health status and that one’s health condition and the type of a product’s health claim are highly correlated (van Kleef et al, 2005) with his/her acceptance of a certain functional food product. With regard to the HC, even though they are perceived to be useful (William, 2005), consumers are usually skeptical towards their trustworthiness (Verbeke et al., 2009). It should be noted, that knowledge of food and food ingredients contribute positively to the functional food consumption (Christidis et al., 2011) and that more informed (i.e. knowledgeable) consumers understand better (Grunert et al., 2011) benefits that they could gain from the balanced diet. Indeed, as Sun

201
(2008) concluded, individuals’ perception of their health status, their health concerns and nutritional knowledge would affect the formation of their healthy eating attitudes, and consequently, their habits related to functional food usage.
Furthermore, psychological factors determine to the very high extent what foods individual eats. Of these factors, the most prominent ones related to making food choice are: food preferences, food likes and dislikes and response to sensory attributes (Asp, 1999), which correspond to the attitudes. Attitudes can be defined “as a psychological tendency that is expressed by evaluating a particular entity with some degree of favour or disfavour” (Urala and Ldhteenmdki, 2004). In other terms, “attitude is the sum of experiences and information about a product (cognition), which evokes positive or negative feelings towards it (affection) and drives the tendency to behave in a certain way (motivation to buy and eat it)” (Behrens et al., 2007).
With respect to the functional food consumers’ attitudes are mostly focused on the healthiness, taste, convenience of use (Gray et al., 2003; Urala and Ldhteenmdki, 2007) and price. It is generally considered and established that belief in the health benefits of functional foods determined positively acceptance of this kind of food (Verbeke, 2005). Nonetheless, the way in which HC are being presented have very low impact on perceived overall healthiness and consumer appeal (van Trijp and van der Lans, 2007), which is in line with consumers’ expressed skepticism towards HC. In addition, consumers are not willing to compromise taste for eventual health benefits (Gray et al., 2003; Ares et al., 2008), implying that sensory attributes are the essential in determining ultimate food choice. Correspondingly, certain findings (Asp, 1999) suggest that liked foods are those that are familiar and considered pleasant, while disliked foods are rejected either because they are perceived to be unpleasant or they have never been tasted. Concerning the perception of the price of the functional food, rather equivocal findings are encountered in the subject literature (Krystallis et al., 2008; Verbeke et al., 2009). One rational explanation could be the one proposed by Verbeke et al. (2009), citing that consumers may express the price argument in order to rationalize their reserves against functional foods, even though underlying reasons for this rejection is rather related to non-economic considerations.
Stemming from the subject literature and observed research gaps, this study aimed to explore determinants of acceptance of functional food in the Western Balkans and to analyze to what extent these factors affected individuals’ consumption of food with HC.
2 Materials and Methods
Participants and Sampling The sample included 3085 respondents, coming from six Western Balkan countries (WBCs), namely: Bosnia-Herzegovina, Croatia, Former Yugoslav Republic of Macedonia, Montenegro, Serbia and Slovenia. The questionnaire was administered to approximately 500 respondents in each country, while stratified three-stage random sampling method was adopted, in order to ensure nationally representative samples.
Primary sampling units were polling station territories, each encompassed about 200 households defined by street names, in all countries except in Slovenia where enumeration areas were used as approximate primary sampling units. In the second stage specific households were chosen; and in the third phase sampling units were actual respondents. In order to optimize the sample plan and reduce sampling error, the stratification for each country was done by region and type of settlement. The survey was undertaken in September
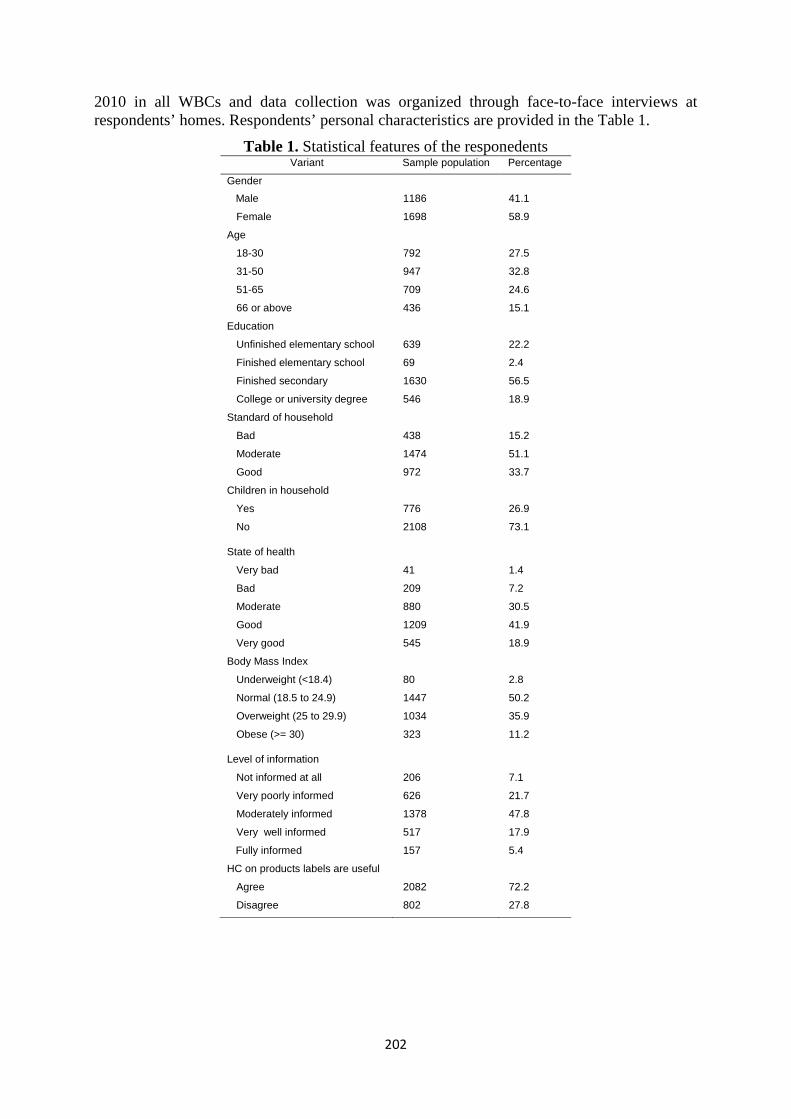
202
2010 in all WBCs and data collection was organized through face-to-face interviews at respondents’ homes. Respondents’ personal characteristics are provided in the Table 1.
Table 1. Statistical features of the responedents
Variant Sample population Percentage
Gender
Male 1186 41.1
Female 1698 58.9
Age
18-30 792 27.5
31-50 947 32.8
51-65 709 24.6
66 or above 436 15.1
Education
Unfinished elementary school 639 22.2
Finished elementary school 69 2.4
Finished secondary 1630 56.5
College or university degree 546 18.9
Standard of household
Bad 438 15.2
Moderate 1474 51.1
Good 972 33.7
Children in household
Yes 776 26.9
No 2108 73.1
State of health
Very bad 41 1.4
Bad 209 7.2
Moderate 880 30.5
Good 1209 41.9
Very good 545 18.9
Body Mass Index
Underweight (<18.4) 80 2.8
Normal (18.5 to 24.9) 1447 50.2
Overweight (25 to 29.9) 1034 35.9
Obese (>= 30) 323 11.2
Level of information
Not informed at all 206 7.1
Very poorly informed 626 21.7
Moderately informed 1378 47.8
Very well informed 517 17.9
Fully informed 157 5.4
HC on products labels are useful
Agree 2082 72.2
Disagree 802 27.8
203
Instrument The questionnaire was developed in order to investigate broad range of research questions, regarding motives on food choice and consumption, attitudes, knowledge and social norms related to four product categories (fruit, traditional food, organic food and products with HC). In the last section of the survey, participant’s socio-demographic data were gathered. The questionnaire was developed in English, translated in Serbian and then back-translated to English. Based on Serbian questionnaire, five separate versions were developed for the other studied countries. The comprehensibility of the questionnaire was investigated by pilot study that comprised 60 respondents, 10 from each country.
Given the research subject of this paper, only relevant part of the questionnaire, which concerns products with HC, will be described. In the introductory part of the survey it was explained to the respondents what it was meant by the term “products with HC” and some examples were given. We considered this to be important since some previous studies (van Trijp and van der Lans, 2007; Christidis et al., 2011) identified that consumers in various European countries often do not know the term of “functional food” or related concepts (e.g. health claims). The formulation in the questionnaire was as following: “Health claims that we see on product packages are claims that link a nutrient to a normal functioning of the body or a specific disease. An example of a health claim – High in calcium, Calcium helps build strong bones. Adequate calcium throughout life, as part of well-balanced diet, may reduce risk of the osteoporosis”. Some pictures with products with HC (e.g., probiotic yoghurts, milk enriched with vitamins and minerals, etc.) were provided also, ascertaining respondent’s better apprehension of this kind of the food.
Self-reported assessment was applied in responses to questions about: a) frequency of consumption, b) respondent’s level of information on food with HC, c) whether participant perceives HC made on product labels to be useful, d) his/her state of health, e) standard of his/her household. For evaluation of frequency of consumption 10-points scale was used, including subsequent items: more than 2 times a day, twice a day, once a day, once in 2-3 days, once a week, 2-3 times a month, once a month, several times a year, once a year or less, never. Attitudes were measured by 7-point semantic differential scales, ranging from -3 to 3, including 0, which represented neutral score. Answer modalities for the other questions can be observed in the Table 1.
Data Analysis Several statistical techniques were employed for investigating data: regression, cluster analysis, ANOVA and chi-square. Multiple linear regression was run aiming to establish whether certain respondent’s features affect his/her frequency of purchasing of products with HC. These results are accompanied with descriptive statistics, which should help better understanding of obtained data in regression analysis.
In the second phase of the examination, hierarchical cluster analysis was performed. Respondents were segmented into the clusters based on their attitudes towards food with HC (i.e., their expressed level of evaluation of the following food attributes – bad/good; unpleasant/pleasant; unhealthy/healthy; inconvenient for consumption/convenient for consumption; tasteless/tasty; cheap/expensive). Ward’s aggregation method and Euclidian distances were applied.
Clusters profiling through identifying distinctive characteristics of each of the clusters was obtained by chi-square test and ANOVA. In the case of categorical variables (e.g., gender, presence of the children in the household, etc.) chi-square test at the significance level of 5% was performed, while in the case of metric variables (e.g., frequency of consumption of
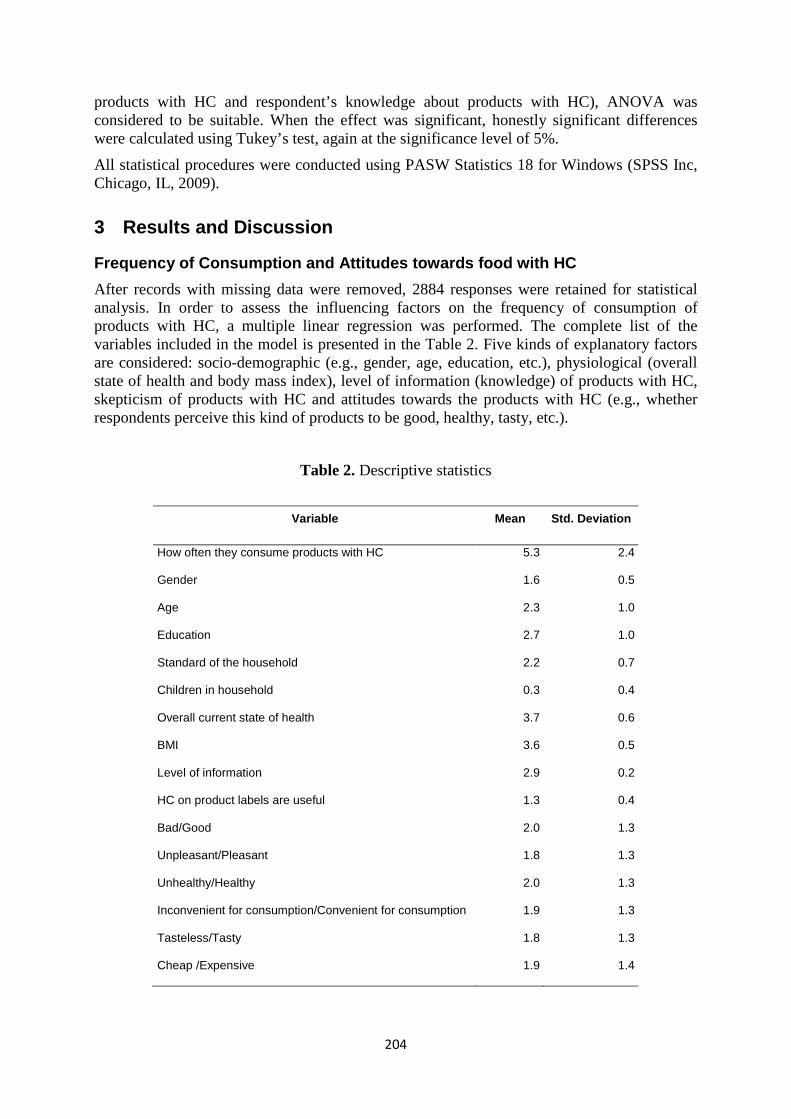
204
products with HC and respondent’s knowledge about products with HC), ANOVA was considered to be suitable. When the effect was significant, honestly significant differences were calculated using Tukey’s test, again at the significance level of 5%.
All statistical procedures were conducted using PASW Statistics 18 for Windows (SPSS Inc, Chicago, IL, 2009).
3 Results and Discussion
Frequency of Consumption and Attitudes towards food with HC After records with missing data were removed, 2884 responses were retained for statistical analysis. In order to assess the influencing factors on the frequency of consumption of products with HC, a multiple linear regression was performed. The complete list of the variables included in the model is presented in the Table 2. Five kinds of explanatory factors are considered: socio-demographic (e.g., gender, age, education, etc.), physiological (overall state of health and body mass index), level of information (knowledge) of products with HC, skepticism of products with HC and attitudes towards the products with HC (e.g., whether respondents perceive this kind of products to be good, healthy, tasty, etc.).
Table 2. Descriptive statistics
Variable Mean Std. Deviation
How often they consume products with HC 5.3 2.4
Gender 1.6 0.5
Age 2.3 1.0
Education 2.7 1.0
Standard of the household 2.2 0.7
Children in household 0.3 0.4
Overall current state of health 3.7 0.6
BMI 3.6 0.5
Level of information 2.9 0.2
HC on product labels are useful 1.3 0.4
Bad/Good 2.0 1.3
Unpleasant/Pleasant 1.8 1.3
Unhealthy/Healthy 2.0 1.3
Inconvenient for consumption/Convenient for consumption 1.9 1.3
Tasteless/Tasty 1.8 1.3
Cheap /Expensive 1.9 1.4
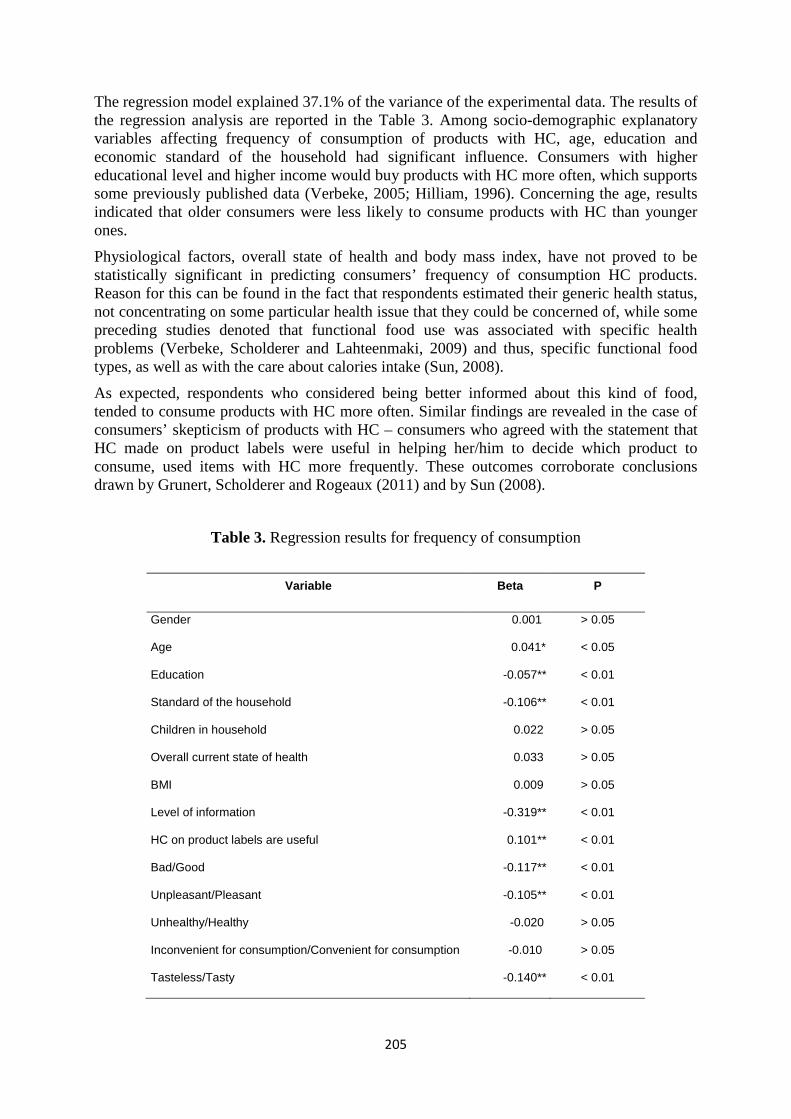
205
The regression model explained 37.1% of the variance of the experimental data. The results of the regression analysis are reported in the Table 3. Among socio-demographic explanatory variables affecting frequency of consumption of products with HC, age, education and economic standard of the household had significant influence. Consumers with higher educational level and higher income would buy products with HC more often, which supports some previously published data (Verbeke, 2005; Hilliam, 1996). Concerning the age, results indicated that older consumers were less likely to consume products with HC than younger ones.
Physiological factors, overall state of health and body mass index, have not proved to be statistically significant in predicting consumers’ frequency of consumption HC products. Reason for this can be found in the fact that respondents estimated their generic health status, not concentrating on some particular health issue that they could be concerned of, while some preceding studies denoted that functional food use was associated with specific health problems (Verbeke, Scholderer and Lahteenmaki, 2009) and thus, specific functional food types, as well as with the care about calories intake (Sun, 2008).
As expected, respondents who considered being better informed about this kind of food, tended to consume products with HC more often. Similar findings are revealed in the case of consumers’ skepticism of products with HC – consumers who agreed with the statement that HC made on product labels were useful in helping her/him to decide which product to consume, used items with HC more frequently. These outcomes corroborate conclusions drawn by Grunert, Scholderer and Rogeaux (2011) and by Sun (2008).
Table 3. Regression results for frequency of consumption
Variable Beta P
Gender 0.001 > 0.05
Age 0.041* < 0.05
Education -0.057** < 0.01
Standard of the household -0.106** < 0.01
Children in household 0.022 > 0.05
Overall current state of health 0.033 > 0.05
BMI 0.009 > 0.05
Level of information -0.319** < 0.01
HC on product labels are useful 0.101** < 0.01
Bad/Good -0.117** < 0.01
Unpleasant/Pleasant -0.105** < 0.01
Unhealthy/Healthy -0.020 > 0.05
Inconvenient for consumption/Convenient for consumption -0.010 > 0.05
Tasteless/Tasty -0.140** < 0.01
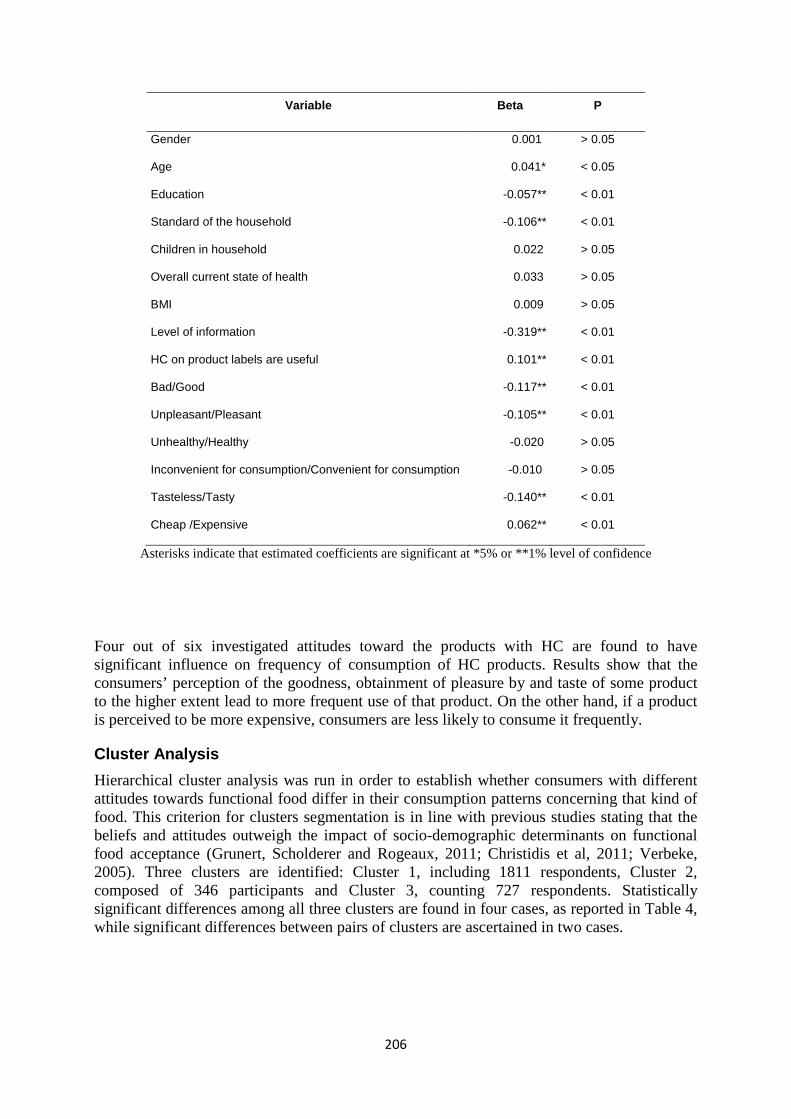
206
Variable Beta P
Gender 0.001 > 0.05
Age 0.041* < 0.05
Education -0.057** < 0.01
Standard of the household -0.106** < 0.01
Children in household 0.022 > 0.05
Overall current state of health 0.033 > 0.05
BMI 0.009 > 0.05
Level of information -0.319** < 0.01
HC on product labels are useful 0.101** < 0.01
Bad/Good -0.117** < 0.01
Unpleasant/Pleasant -0.105** < 0.01
Unhealthy/Healthy -0.020 > 0.05
Inconvenient for consumption/Convenient for consumption -0.010 > 0.05
Tasteless/Tasty -0.140** < 0.01
Cheap /Expensive 0.062** < 0.01
Asterisks indicate that estimated coefficients are significant at *5% or **1% level of confidence
Four out of six investigated attitudes toward the products with HC are found to have significant influence on frequency of consumption of HC products. Results show that the consumers’ perception of the goodness, obtainment of pleasure by and taste of some product to the higher extent lead to more frequent use of that product. On the other hand, if a product is perceived to be more expensive, consumers are less likely to consume it frequently.
Cluster Analysis Hierarchical cluster analysis was run in order to establish whether consumers with different attitudes towards functional food differ in their consumption patterns concerning that kind of food. This criterion for clusters segmentation is in line with previous studies stating that the beliefs and attitudes outweigh the impact of socio-demographic determinants on functional food acceptance (Grunert, Scholderer and Rogeaux, 2011; Christidis et al, 2011; Verbeke, 2005). Three clusters are identified: Cluster 1, including 1811 respondents, Cluster 2, composed of 346 participants and Cluster 3, counting 727 respondents. Statistically significant differences among all three clusters are found in four cases, as reported in Table 4, while significant differences between pairs of clusters are ascertained in two cases.
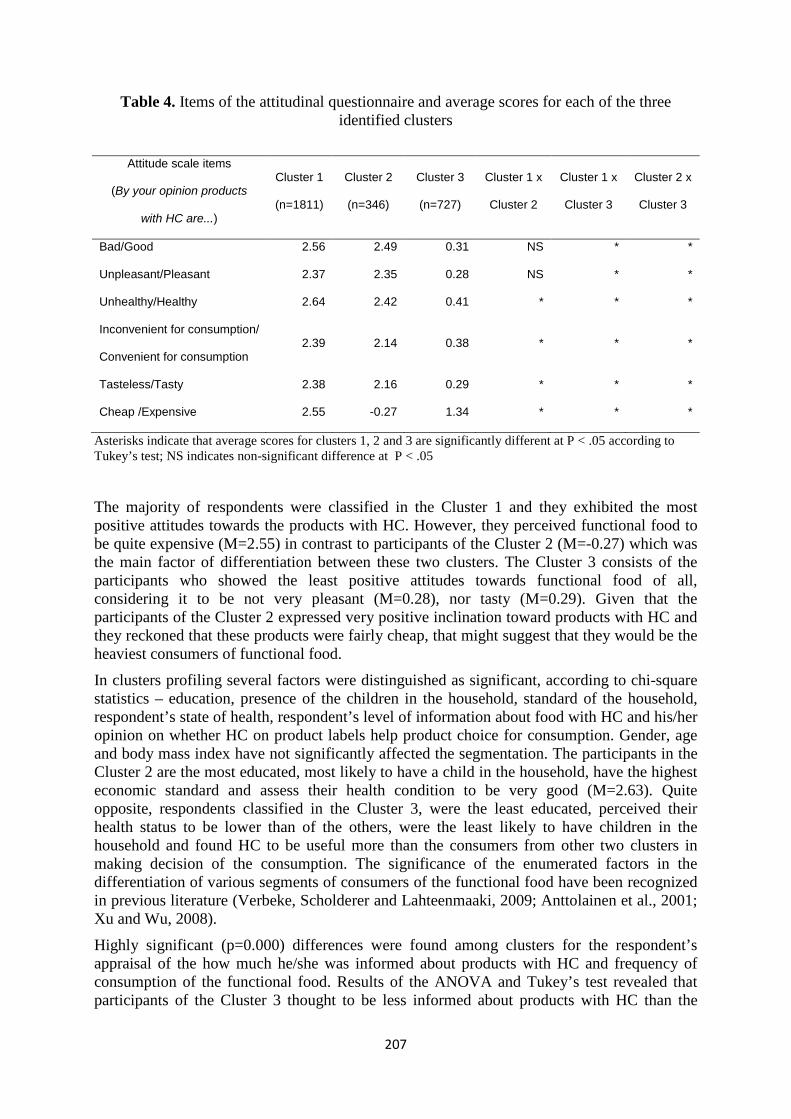
207
Table 4. Items of the attitudinal questionnaire and average scores for each of the three identified clusters
Attitude scale items
(By your opinion products
with HC are...)
Cluster 1
(n=1811)
Cluster 2
(n=346)
Cluster 3
(n=727)
Cluster 1 x
Cluster 2
Cluster 1 x
Cluster 3
Cluster 2 x
Cluster 3
Bad/Good 2.56 2.49 0.31 NS * *
Unpleasant/Pleasant 2.37 2.35 0.28 NS * *
Unhealthy/Healthy 2.64 2.42 0.41 * * *
Inconvenient for consumption/
Convenient for consumption 2.39 2.14 0.38 * * *
Tasteless/Tasty 2.38 2.16 0.29 * * *
Cheap /Expensive 2.55 -0.27 1.34 * * *
Asterisks indicate that average scores for clusters 1, 2 and 3 are significantly different at P < .05 according to Tukey’s test; NS indicates non-significant difference at P < .05
The majority of respondents were classified in the Cluster 1 and they exhibited the most positive attitudes towards the products with HC. However, they perceived functional food to be quite expensive (M=2.55) in contrast to participants of the Cluster 2 (M=-0.27) which was the main factor of differentiation between these two clusters. The Cluster 3 consists of the participants who showed the least positive attitudes towards functional food of all, considering it to be not very pleasant (M=0.28), nor tasty (M=0.29). Given that the participants of the Cluster 2 expressed very positive inclination toward products with HC and they reckoned that these products were fairly cheap, that might suggest that they would be the heaviest consumers of functional food.
In clusters profiling several factors were distinguished as significant, according to chi-square statistics – education, presence of the children in the household, standard of the household, respondent’s state of health, respondent’s level of information about food with HC and his/her opinion on whether HC on product labels help product choice for consumption. Gender, age and body mass index have not significantly affected the segmentation. The participants in the Cluster 2 are the most educated, most likely to have a child in the household, have the highest economic standard and assess their health condition to be very good (M=2.63). Quite opposite, respondents classified in the Cluster 3, were the least educated, perceived their health status to be lower than of the others, were the least likely to have children in the household and found HC to be useful more than the consumers from other two clusters in making decision of the consumption. The significance of the enumerated factors in the differentiation of various segments of consumers of the functional food have been recognized in previous literature (Verbeke, Scholderer and Lahteenmaaki, 2009; Anttolainen et al., 2001; Xu and Wu, 2008).
Highly significant (p=0.000) differences were found among clusters for the respondent’s appraisal of the how much he/she was informed about products with HC and frequency of consumption of the functional food. Results of the ANOVA and Tukey’s test revealed that participants of the Cluster 3 thought to be less informed about products with HC than the
208
participants of the other two clusters, which is confirmed by descriptive statistics also (M1=3.05, M2=3.14, M3=2.53; means are given respectively for Cluster 1, Cluster 2 and Cluster 3). Moreover, all three clusters significantly varied with regard to the frequency of consumption of products with HC. In this case, inspection of the clusters’ means could also be useful, in terms that it exhibits that respondents from the Cluster 2 buy functional food very often (M=4.25, twice a week on the average), participants from the Cluster 1 consume products with HC slightly less often (M=4.81, once a week), while respondents from the Cluster 3 do that very rarely (M=6.98, once a month). These findings suggest that consumers’ attitudes towards food characteristics have an impact on the frequency of consumption of functional foods, which is underpinned by prior subject research (Grunert, Scholderer and Rogeaux, 2011; Gray, Armstrong and Farley, 2003).
4 Conclusion This paper presents the first cross-national assessment of factors that influence functional food consumption in the WBCs. Provided that estimates indicate raising significance of Eastern European market of foods with HC, gaining an insight and better knowledge of local consumers on this matter is of the crucial importance. This study revealed manifold differences between Western Balkan consumers of functional foods and their global counterparts.
Several variables established as highly relevant in previous subject research failed to demonstrate their significance in determining differences in level of consumption of products with HC in our case. Above all, these variables pertain to gender, presence of children in household and perceived state of health. The majority of previous studies ascertained that these three factors highly affect individuals’ consumption of products with HC, however our regression model did not confirm the same. With regard to the age, somewhat opposite to the findings in Western European countries (Poulsen, 1999; Urala), it was revealed that younger consumers are more prone to consume functional foods more frequently than older consumers. It might be explained in the way that younger people are more receptive to the new concepts, including food, and think more about their appearance, while functional food is considered from the point of view of low-calorie value (Sun, 2008), than elderly. In addition, perceived individual health status, healthiness of food and convenience of consumption have not appeared to influence frequency of consumption, which is opposite to findings of some prior research (Villegas, Carbonell and Costell, 2008; Urala and Lahteenmaaki, 2007; Chen, 2011). It may be concluded that taste and price represent prevailing elements in determining how often food with HC would be used, which has already been confirmed to be true for foods in general.
Cluster analysis indicated that companies should put more efforts in informing consumers about functional food and HC. Provided that respondents of the Cluster 3 demonstrated the least positive attitudes toward functional food, but on the other hand they expressed to be poorly informed about products with HC, marketers could consider providing more information on this matter to them in order to influence their more positive attitudes in the future. It is interesting to notice that Cluster 2 consisted of the least number of participants (12%), while it reflected the archetypal Western European consumer of functional food – well educated, with higher than average income and with children in household. These individuals should be more investigated in terms of lifestyle in order to achieve their effective marketing targeting, since they represent main force and the most lucrative segment of Western Balkans functional foods market. The same conclusion apply to the participants of the Cluster 1, given that they constitute the largest Cluster (62.7%) and correspond more by their consumption
209
behavior and attitudes to the respondents of the Cluster 2 than to the participants of the Cluster 3. Moreover, with regard to the fact that they are very sensitive to the price and perceive functional food to be expensive, companies should try to communicate better to which extent prices of products with HC differ comparing to prices of conventional products, and what kind of benefits they provide their consumers with for these premium prices.
Acknowledgements The research leading to these results has received funding from the European Union's Seventh Framework Programme (FP7 2007-2013) under grant agreement 212 579, co-ordinated by Dr. Dominique Barjolle. The financing of this work by European Commission is gratefully acknowledged.
References Anttolainen, M., Luoto, R., Uutela, A., Boice, J.D. Jr, Blot, W.J., McLaughlin, J.K. and Puska, P. (2001). 'Characteristics of users and nonusers of plant stanol ester margarine in Finland: An approach to study functional foods'. Journal of the American Dietetic Association, Vol. 101, No. 11, pp. 1365–1368.
Ares, G. and Gambaro, A. (2007). 'Influence of gender, age and motives underlying food choice on perceived healthiness and willingness to try functional foods', Appetite, Vol. 49, No. 1, pp. 148–158.
Ares, G., Giménez, A. and Gámbaro, A. (2008). 'Does information about the source of functional ingredients influence consumer perception of functional milk desserts?', Journal of the Science of Food and Agriculture, Vol. 88, No. 12, pp. 2061-2068.
Asp, E.H. (1999). 'Factors affecting food decisions made by individual consumers', Food Policy, Vol. 24, No. 2-3, pp. 287–294.
Behrens, J.H., Heinemann, R.J.B. and Lanfer-Marquez, U.M. (2007). 'Parboiled rice, A study about attitude, consumer liking and consumption in Sao Paulo, Brazil', Journal of the Science of Food and Agriculture, Vol. 87, No. 6, pp. 992-999. Chen, M.F. (2011). 'The joint moderating effect of health consciousness and healthy lifestyle on consumers’ willingness to use functional foods in Taiwan', Appetite, Vol. 57, No. 1, pp. 253-262.
Chen, M.F. (2011). 'The mediating role of subjective health complaints on willingness to use selected functional foods', Food Quality and Preference, Vol. 22, No. 1, pp. 110-118.
Childs, N.M. (1997). 'Functional foods and the food industry, consumer, economic and product development issues', Journal of Nutraceuticals, Functional and Medical Foods, Vol. 1, pp. 25–43.
Christidis, N., Tsoulfa, G., Varagunam, M. and Babatzimopoulou, M. (2011). 'A cross sectional study of consumer awareness of functional foods in Thessaloniki, Greece', Nutrition & Food Science, Vol. 41, No. 3, pp. 165–174.
Diplock, A.T., Aggett, P.J., Ashwell, M, Bornet, F., Fern, E.B. and Roberfroid, M.B., eds. (1999). 'Scientific Concepts of Functional Foods in Europe: Consensus Document', British Journal of Nutrition, Vol. 81, pp. S1–S27
Dmitrovic, T., Vida, I. and Reardon, J. (2009). 'Purchase behavior in favor of domestic products in the West Balkans', International Business Review, Vol. 18, No. 5, pp. 523–535.
210
Frewer, L., J. Scholderer and N. Lambert (2003). 'Consumer acceptance of functional foods: issue for the future', British Food Journal, Vol. 105, No. 10, pp. 714–731.
Functional Foods and Drinks, A Global Strategic Business Report, http://www.prweb.com/releases/functional_foods/functional_drinks/prweb4688424.htm, [Accessed, 16 September 2012]
Gray. J., Armstrong, G. and Farley, H. (2003). 'Opportunities and constraints in the functional food market', Nutrition & Food Science, Vol. 33, No. 5, pp. 213–218.
Grunert, K.G., Scholderer, J. and Rogeaux, M. (2011). 'Determinants of consumer understanding of health claims', Appetite, Vol. 56, No. 2, pp. 269–277.
Hilliam, M. (1996). 'Functional foods: The Western consumer viewpoint', Nutrition Research, Vol. 54, No. 11, pp. S189–S194.
Krystallis, A., Maglaras, G. and Mamalis, S. (2008). 'Motivations and cognitive structures of consumers in their purchasing of functional foods', Food Quality and Preference, Vol. 19, No. 6, pp. 525-538.
Menrad, K. (2003). 'Market and marketing of functional food in Europe', Journal of Food Engineering, Vol. 56, No. 2-3, pp. 181–188.
Milosevic, J., Zezelj, I. and Gorton, M. (2012). 'Understanding the motives for food choice in Western Balkan Countries', Appetite, Vol. 58, No. 1, pp. 205-214.
Poulsen, J.B. (1999). 'Danish consumers’ attitudes towards functional foods', Working Paper [62], Aarhus School of Business, MAPP, Aarhus.
Regulation (EC) No 1924/2006 of the European Parliament and of the Council of 20 December 2006 on nutrition and health claims made on foods, http://eur-lex.europa.eu/LexUriServ/LexUriServ.do?uri=OJ:L:2007:012:0003:0018:EN:PDF, [Accessed: 15 September 2012]
Sibbel, A. (2007). 'The sustainability of functional foods', Social Science and Medicine, Vol. 64, No. 3, pp. 554–561.
Sloan, E. (2002). 'The top 10 functional food trends: The next generation', Food Technology, Vol. 56, pp. 32–57.
Sun, Y.H.C. (2008). 'Health concern, food choice motives, and attitudes toward healthy eating:The mediating role of food choice motives', Appetite, Vol. 51, No. 1, pp. 42–49.
Urala, N., Functional foods in Finland, Consumers’ views, attitudes and willingness to use. http://www.vtt.fi/inf/pdf/publications/2005/P581.pdf, [Accessed, 8 May 2012]
Urala, N. and Lähteenmäki, L. (2004). 'Attitudes behind consumers' willingness to use functional foods', Food Quality and Preference, Vol. 15, No. 7-8, pp. 793–803.
Urala, N. and Lahteenmaki, L. (2007). 'Consumers’ changing attitudes towards functional foods', Food Quality and Preference, Vol. 18, No. 1, pp. 1–12.
van Kleef, E., van Trijp, H.C.M. and Luning, P. (2005). 'Functional foods, health claim-food product compatibility and the impact of health claim framing on consumer evaluation', Appetite, Vol. 44, No. 3, pp. 299–308.
van Trijp, H.C.M. and van der Lans, I.A. (2007). 'Consumer perceptions of nutrition and health claims', Appetite, Vol. 48, No. 3, pp. 305–324.
211
Verbeke, W. (2005). 'Consumer acceptance of functional foods: sociodemographic, cognitive and attitudinal determinants', Food Quality and Preference, Vol. 16, No. 1, pp. 45–57.
Verbeke, W., Scholderer, J. and Lahteenmaki, L. (2009). 'Consumer appeal of nutrition and health claims in three existing product concepts', Appetite, Vol. 52, No. 3, pp. 684–692.
Villegas, B., Carbonell, I. and Costell, E. (2008). 'Effects of product information and consumer attitudes on responses to milk and soybean vanilla beverages', Journal of the Science of Food and Agriculture, Vol. 88, No. 14, pp. 2426-2434.
William, P. (2005). 'Consumer understanding and use of health claims for foods', Nutrition Research, Vol. 63, No. 7, pp. 256-64.
Xu, L. and Wu, L. (2008). 'Food safety and consumer willingness to pay for certified traceable food in China', Journal of the Science of Food and Agriculture, Vol. 90, No. 8, pp. 1368-1373.
Zezelj, I., Milosevic-Djordjevic, J., Stojanovic, Z. and Ognjanov, G. (2012). 'The motivational and informational basis of attitudes toward foods with health claims', Appetite, Vol. 59, No. 3, pp. 960-967.
212
Revealed comparative advantage of Russian agricultural exports
Natalia Ishchukova, Luboš Smutka Department of Economics, FEM, Czech University of Life Sciences Prague,
Kamycka 129, 165 21 Prague 6 – Suchdol [email protected]
Annotation: This paper studies the issue of revealed comparative advantage in the case of the Russian foreign trade in agricultural products and foodstuffs. The objective of this study is to analyze specialization and the competitive performance of the Russian agricultural sector and to determine whether or not patterns of comparative advantage for Russia have undergone significant changes over the period 1998–2010. For this purposes we applied complex of methods: classical Balassa’s index, Vollrath’s index and Lafay index. Moreover we used an analytical tool named “products mapping”. Balassa’s index identified a group of products, which has relatively stable comparative advantage during the whole period. Among those products we can count cereals, their by-products and products of their processing, as well as oilseeds, vegetable oils and chocolate. Vollrath’s index showed that the number of products that have revealed competitive advantage was growing during the period and increased from 2% to 8% of all items. Analysis by Lafay’s index showed that Russia has comparative advantages in relation to CIS countries and Asian countries due to its geographical location and good trade relations. Analysis by groups of products (according to the degree of processing) revealed a shift of comparative advantage from by-products in 1998–2001 to primary products in 2002–2010. During the second part of the study, we distinguished a group of products that includes 5% of the exported goods, but accounts for about 50% of the value of total agricultural exports. Items in this group have a comparative advantage and positive trade balance. This is the basis of the competitiveness of Russian agricultural exports. This group has been steadily growing. There was also identified the group where 80% of items account for only about 30% of total exports, but 95-99% of the total imports. These items have comparative disadvantage and negative trade balance. There was a reduction in the value of this group. The above trends can be considered as a strengthening of the comparative advantages of Russian agricultural export.
Key words: “revealed” comparative advantage, agricultural products, foodstuffs, foreign trade, Russia
JEL classification: JEL classification codes: F11, F14
1 Introduction Throughout its history, Russia was a major agrarian country. The economic transformations that have started in Russia in the early 1990s spurred major changes in the structure and volume of the country’s agricultural production and trade. Currently, Russia is seeking not only to achieve a high level of self-sufficiency in basic agricultural products, but also claims to be a major exporter of agricultural products and foodstuffs. In the last decade, exports of agricultural products has been growing at fast pace.
However, in Russia, as in any other country, the different branches of agriculture have different efficiency. Therefore for the effective development of Russian exports it is necessary to focus on the areas of agriculture that are competitive and have comparative or absolute advantages in the world market.
In the theories of international trade, comparative advantage is an important concept for explaining trade patterns.
213
The concept of comparative advantages was first developed by the classical economist David Ricardo (1817) building on Adam Smith’s (1776) principle of absolute advantages.
The idea of exploring the comparative advantage from observed trade patterns belongs to Hungarian economist Béla Balassa (1965). He proposed that it may not be necessary to include all constituents effecting country’s comparative advantage. Instead, he suggests that comparative advantage is “revealed” by observed trade patterns, and in line with the theory, one needs pre-trade relative prices which are not observable. This method considerably simplifies the calculations but does not determine the underlying sources of comparative advantage.
The methodology proposed by Balassa is often used in empirical studies of specialization and comparative advantage of many countries, including Russia. However, there are a very limited number of studies concentrating directly on the issue of international trade in agricultural products and foodstuffs in Russian Federation. In this paper we present one such study.
2 Materials and Methods The idea of this paper is to examine the structure of Russian foreign trade in agricultural products from the point of view of its specialization and the competitive performance.
The objective of this study is to analyze specialization and the competitive performance of the Russian agricultural sector and to determine whether or not patterns of comparative advantage for Russia have undergone significant changes over the period 1998–2010.
The paper contains a detailed analysis of Russian foreign trade through the three basic indices Balassa index, Vollrath index and Lafay index of “revealed” comparative advantage. Moreover we used an analytical tool named “products mapping” to assess leading exported products from two different points of view, i.e. domestic trade-balance and international competitiveness. (Widodo, 2009)
The classification of agricultural commodities used in the paper is the FAOSTAT Commodity List (FCL) that is originally based on the Standard International Trade Classification of the United Nations. All value figures are calculated at current prices in USD.
The Balassa index tries to identify whether a country has a “revealed” comparative advantage rather than to determine the underlying sources of comparative advantage. The index is calculated as follows.
Chyba! Záložka není definována. )//()/()//()/( ntitnjijntnjitij XXXXXXXXRCA == (1)
where x represents exports, i is a country, j is a commodity and n is a set of countries, t is a set of commodities .
RCA is based on export performance and observed trade patterns. It measures a country’s exports of a commodity relative to its total exports. If RCA>1, then a comparative advantage is revealed.
Evaluating the shortcomings of Balassa’s index, Vollrath (1991) suggests that the revealed competitiveness (RC) index is preferable since supply and demand balances are embodied in the index. The revealed competitiveness is calculated as the difference between relative export advantage (RXA), which is the equivalent to the original Balassa index (RCA), and its counterpart, relative import advantage (RMA).
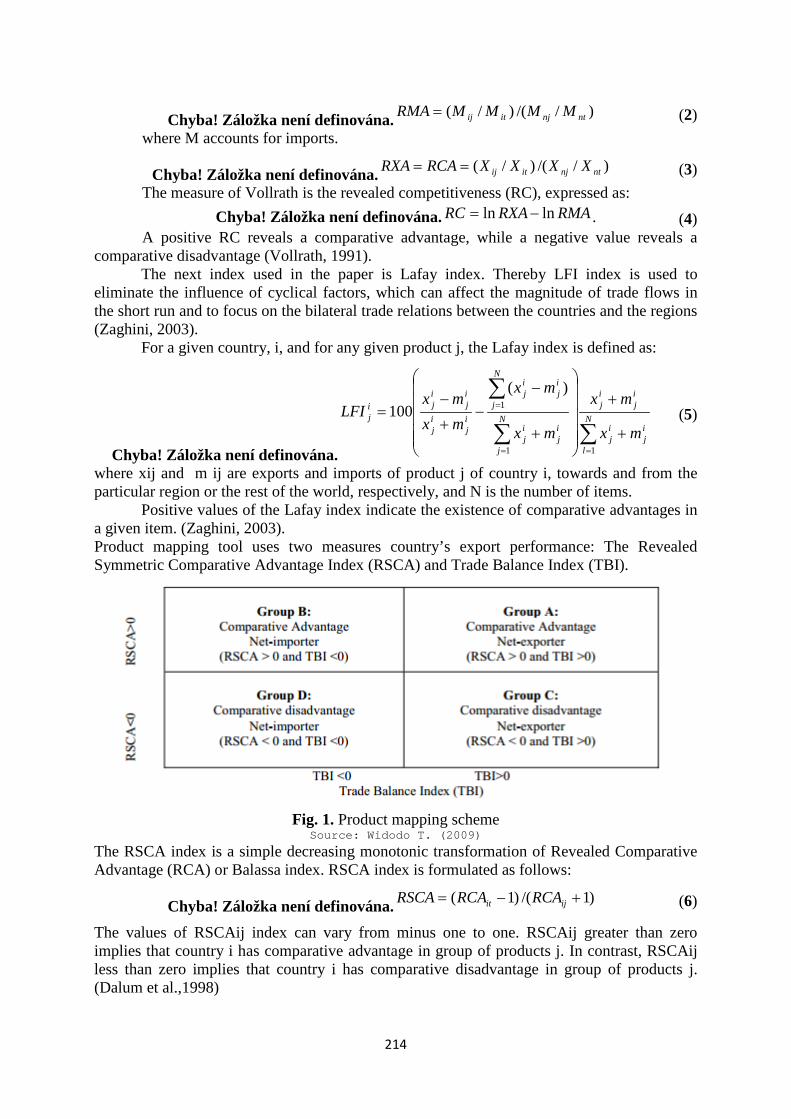
214
Chyba! Záložka není definována. )//()/( ntnjitij MMMMRMA = (2) where M accounts for imports.
Chyba! Záložka není definována. )//()/( ntnjitij XXXXRCARXA == (3) The measure of Vollrath is the revealed competitiveness (RC), expressed as:
Chyba! Záložka není definována. RMARXARC lnln −= . (4) A positive RC reveals a comparative advantage, while a negative value reveals a
comparative disadvantage (Vollrath, 1991). The next index used in the paper is Lafay index. Thereby LFI index is used to
eliminate the influence of cyclical factors, which can affect the magnitude of trade flows in the short run and to focus on the bilateral trade relations between the countries and the regions (Zaghini, 2003).
For a given country, i, and for any given product j, the Lafay index is defined as:
Chyba! Záložka není definována.∑∑
∑
==
=
+
+
+
−−
+
−= N
l
ij
ij
ij
ij
N
j
ij
ij
N
j
ij
ij
ij
ij
ij
iji
j
mx
mx
mx
mx
mxmx
LFI
11
1)(
100
(5)
where xij and m ij are exports and imports of product j of country i, towards and from the particular region or the rest of the world, respectively, and N is the number of items.
Positive values of the Lafay index indicate the existence of comparative advantages in a given item. (Zaghini, 2003). Product mapping tool uses two measures country’s export performance: The Revealed Symmetric Comparative Advantage Index (RSCA) and Trade Balance Index (TBI).
Fig. 1. Product mapping scheme
Source: Widodo T. (2009)
The RSCA index is a simple decreasing monotonic transformation of Revealed Comparative Advantage (RCA) or Balassa index. RSCA index is formulated as follows:
Chyba! Záložka není definována. )1/()1( +−= ijit RCARCARSCA (6)
The values of RSCAij index can vary from minus one to one. RSCAij greater than zero implies that country i has comparative advantage in group of products j. In contrast, RSCAij less than zero implies that country i has comparative disadvantage in group of products j. (Dalum et al.,1998)
215
Trade Balance Index (TBI) is employed to analyze whether a country has specialization in export (as net-exporter) or in import (as net-importer) for a specific group of products. TBI is simply formulated as follows:
Chyba! Záložka není definována. )/()( ijijijijij mxmxTBI +−= (7)
where TBIij denotes trade balance index of country i for product j; xij and mij represent exports and imports of group of products j by country i, respectively. (Lafay, 1992)
Values of the index range from -1 to +1. Extremely, the TBI equals -1 if a country only imports, in contrast, the TBI equals +1 if a country only exports. A country is referred to as “net-importer” in a specific group of product if the value of TBI is negative, and as “net-exporter” if the value of TBI is positive. (Widodo, 2009)
3 Results and Discussion
Russian foreign trade in agricultural products Food and agricultural products amount about only 2% of Russian agricultural export.
The share of agricultural products in Russian import is more significant and amounts to 14%. However in 2000s, there is the significant growth of foreign trade turnover due to the expansion of both imports and exports.
In the early 2000s Russia became one of the major suppliers of wheat in the world market. Since then, Russia holds its position in this market. According to the Food and Agriculture Organization, in 2010, the value of wheat exported by Russian Federation was $2.069 billion that is 35.4% of total exports of the country and a fifth position in the world export of wheat (Gaidar, 2011). Besides, traditional items of Russia’s food export are fish, sea products, alcoholic beverages, etc.
Briefly describing the territorial structure of Russian foreign trade in agricultural products, following can be said. At the end of the 90's most of the country’s agri-food exports went to EU countries. However, in the last years the largest importers of Russian agricultural products and foodstuffs are Asian and CIS countries (25.3% and 36.6% of total agri-food exports respectively).
In terms of imports, EU countries are the largest suppliers of agricultural and food products to Russia throughout the whole period. Imports from EU amount more than a third of total imports. Then it is followed by countries of North and South Americas (predominantly USA and Brazil).
Analysis of the revealed comparative advantages of Russian agricultural exports
How it comes up from the analysis by Balassa’s index (RCA), calculated on the basis of trade flows between Russia and the whole world, in a modern Russia’s agricultural export, the comparative advantage belongs mostly to crops (Wheat, Barley), their by-products (Bran of Wheat) and products of their processing, such as Barley Pearled, Pot Barley, Barley Flour and Grits, Cereal Preparations, etc.
Analyzing the same set of products using Vollrath’s index, we observe approximately the same patterns. However, using this index, one interesting trend was found. For the analyzed period, the number of products that have revealed competitive advantage has grown steadily and increased from 13 to 46 items. This trend can be seen as increasing total competitiveness of the Russian agricultural exports.
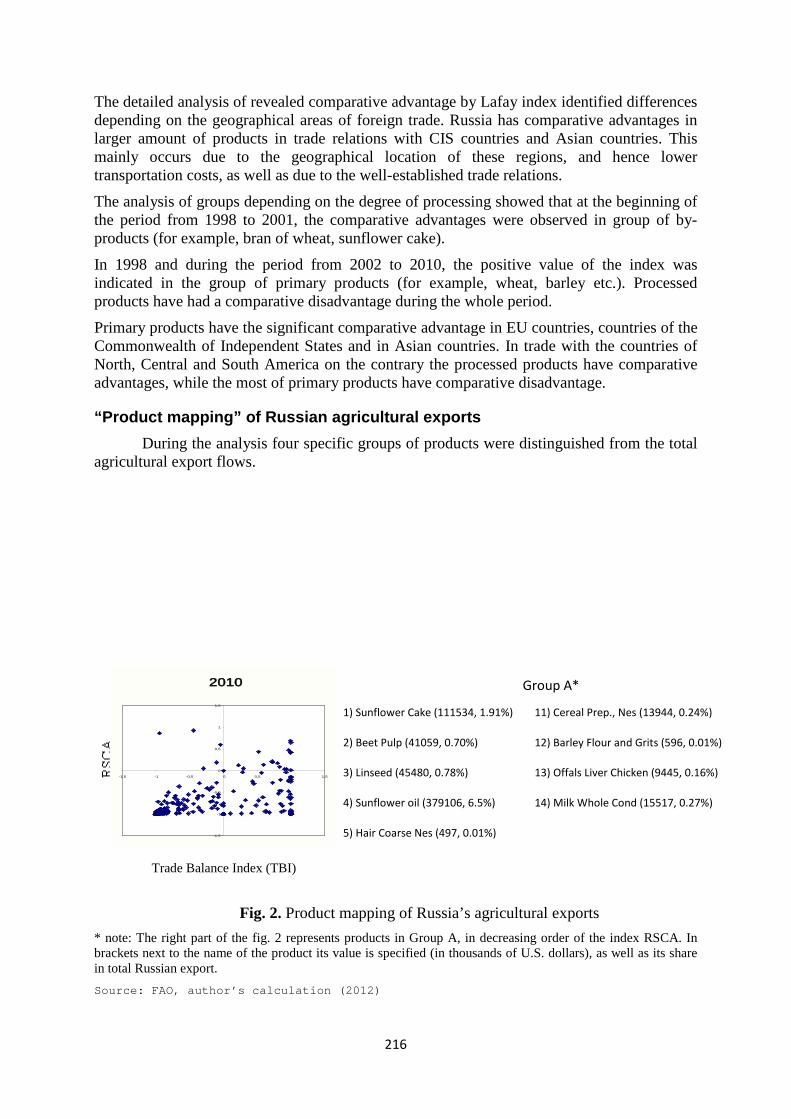
216
The detailed analysis of revealed comparative advantage by Lafay index identified differences depending on the geographical areas of foreign trade. Russia has comparative advantages in larger amount of products in trade relations with CIS countries and Asian countries. This mainly occurs due to the geographical location of these regions, and hence lower transportation costs, as well as due to the well-established trade relations.
The analysis of groups depending on the degree of processing showed that at the beginning of the period from 1998 to 2001, the comparative advantages were observed in group of by-products (for example, bran of wheat, sunflower cake).
In 1998 and during the period from 2002 to 2010, the positive value of the index was indicated in the group of primary products (for example, wheat, barley etc.). Processed products have had a comparative disadvantage during the whole period.
Primary products have the significant comparative advantage in EU countries, countries of the Commonwealth of Independent States and in Asian countries. In trade with the countries of North, Central and South America on the contrary the processed products have comparative advantages, while the most of primary products have comparative disadvantage.
“Product mapping” of Russian agricultural exports During the analysis four specific groups of products were distinguished from the total
agricultural export flows.
Fig. 2. Product mapping of Russia’s agricultural exports
* note: The right part of the fig. 2 represents products in Group A, in decreasing order of the index RSCA. In brackets next to the name of the product its value is specified (in thousands of U.S. dollars), as well as its share in total Russian export. Source: FAO, author’s calculation (2012)
1) Sunflower Cake (111534, 1.91%)
2) Beet Pulp (41059, 0.70%)
3) Linseed (45480, 0.78%)
4) Sunflower oil (379106, 6.5%)
5) Hair Coarse Nes (497, 0.01%)
11) Cereal Prep., Nes (13944, 0.24%)
12) Barley Flour and Grits (596, 0.01%)
13) Offals Liver Chicken (9445, 0.16%)
14) Milk Whole Cond (15517, 0.27%)
Trade Balance Index (TBI)
Group A* 2010
-1,5
-1
-0,5
0
0,5
1
1,5
-1,5 -1 -0,5 0 0,5 1 1,5
217
According to the results of “products mapping”, the largest number of the agricultural products exported by Russian Federation is part of the group D. They have no revealed comparative advantage and keep negative trade balance. Production of these commodities is ineffective due to economic, historical, natural or geographical factors within the Russian Federation. Such goods are, for example, tropical fruits (bananas, apricots, coconut, etc.), meat, and most of the meat products, tea, coffee etc.
But considering the value of products in each group instead of the number of products, we got completely different results. In 1998, the Group A comprised 43.8% of the total value of agricultural exports, in 2002-2003 increased to almost 60%, in 2007 reached its maximum of 65.7% and in 2010 it was 50.6%.
Despite some fluctuations, the overall trend can be assessed as a steady growth of the share of the group A in the total value of Russian agricultural exports. Wheat has the greatest weight in the group A. At the same time, there is a reduction in the share of groups D and C in the total exports value. These trends can be considered as a strengthening of the comparative advantages of Russian exports on the whole.
It should be noticed that Group C products are also important. They do not have comparative advantages, but have a positive trade balance. The comparative disadvantage is observed in relation to the whole world, while in bilateral trade with individual regions or countries comparative advantages exist.
4 Conclusion During the analysis by the Balassa’s index, there was identified a group of products, having relatively stable comparative advantage during the whole period. This group includes cereals (wheat, barley), their by-products (bran of wheat) and products of its processing (barley pearled, pot barley, cereal preparations etc), oil crops, vegetable oils and chocolate.
Vollrath’s index showed that the number of products having revealed competitive advantage grew steadily during the period. For the analyzed period, the number of such products has grown steadily and increased from 13 to 46 items. This trend can be seen as increasing total competitiveness of the Russian agricultural exports.
Analysis by groups and by region showed significant comparative advantages in relation to CIS countries and Asian countries.
Analysis by groups according to the degree of processing revealed a shift of comparative advantage from by-products (e.g. bran of wheat, sunflower cake etc.) in 1998-2001 to primary products in 2002-2010 (wheat, barley, whole cow milk, sunflower seed etc.).
Primary products have the significant comparative advantage in relation to EU countries, countries of the CIS and in Asian countries. In trade with the countries of Americas on the contrary the processed products have greater comparative advantages. But even there, this advantage is weak (values of LFI are close to zero). So, there were no significant movements towards growth of comparative advantage of processed products over the period
During the study, from the total export flows we distinguished a group of products (Group A) that includes 5% of the exported goods, but accounts for about 50% of the value of total agricultural exports. Items in this group have a comparative advantage and positive trade balance. The greatest weight in the group A has wheat.
There was also identified the group D where 80% of items account for only about 30% of total exports, but 95-99% of the total imports. These items have comparative disadvantage
218
and negative trade balance. But there was a reduction in the value of group D, while the group A has been steadily growing. These trends can be considered as a strengthening of the comparative advantages of Russian agricultural export.
References Ahrend R. (2004) Russian industrial restructuring: Trends in productivity, competitiveness and comparative advantage, Routledge Journals, vol. 18, no 3, pp. 277–295, ISSN 1463-1377.
Balassa, B. (1977) Revealed’ Comparative Advantage Revisited, The The Manchester School of Economics and Social Studies, vol. 45, no. 4, pp. 327-44., ISSN: 0025-2034
Balassa, B. (1965) Trade liberalization and “revealed” comparative advantage, The Manchester School of Economics and Social Studies, vol. 33, no. 2, pp. 99–123, ISSN 10490078.
Ferto, I. and Hubbard L. J. (2003) Revealed Comparative Advantage and Competitiveness in Hungarian Agri-Food Sectors, The World Economy, vol. 26, no.2, pp. 247–259. ISSN 0378-5920.
Gaidar, Y., Sinelnikov-Mourylev, S., Glavatskaya, N. (2011) Russian Economy in 2010. Trends and Outlooks, Moscow: Gaidar Institute Publishers, No 32, 544 p. ISBN 978-5-93255-316-9.
ICTSD (2012) Possible Effects of Russia's WTO Accession on Agricultural Trade and Production, ICTSD Programme on Agricultural Trade and Sustainable Development, No 40, 66 p. ISSN 1817 356X.
Lafay, G. (1992) The measurement of revealed comparative advantages. In: DAGENAIS, M. G. and MUET, P. A. (eds.), London: International Trade Modeling, Chapman & Hill, pp. 209–234. Liefert W. (2009) Russia’s Growing Agricultural Imports: Causes and Outlook, Economic Research Service, United States Department of Agriculture, WRS-09-04
Liefert, W., Liefert, O. and Serova, E. (2009) Russia's Transition to Major Player in World Agricultural Markets, Choices Magazine, vol. 24, no 2, pp. 47–51. ISSN 0886-5558.
Ricardo, D. (2005) On the Principles of Political Economy and Taxation, Barnes & Noble Publishing. 350 p. ISBN 0-86597-965-0. Simsek, N., Seymen, D,.Utkulu, U. (2010) Turkey’s competitiveness in the EU market: a comparison of different trade measures, Working paper. Dokuz Eylul Univeristy, 44 p., ISSN 1302 – 3284.
Vollrath, T. L. (1991) A Theoretical Evaluation of Alternative Trade Intensity Measures of Revealed Comparative Advantage, Weltwirtschaftliches Archiv-Review Of World Economics, vol. 127, no. 2, pp. 265–280. ISSN 0043-2636.
Zaghini, A. (2003) Trade advantages and specialization dynamics in acceding countries. Working paper № 249. Frankfurt am Main, Germany: European central bank, 4–15. ISBN 1725-2806.
Widodo, T. (2009) Comparative Advantage: Theory, Empirical Measures And Case Studies, Review of Economic and Business Studies, Alexandru Ioan Cuza University, Faculty of Economics and Business Administration, No. 4: pp. 57–82.
219
Methodology of Supply Chain Value – Oilseed Rape (OSR) Case
Zdenek Linhart 1Department of Management, FEM, Czech University of Life Sciences Prague,
Kamycka 129, 165 21 Prague 6 – Suchdol [email protected]
Annotation: Farmers with researchers have developed high oleic and low linoleic (HOLL) OSR supply chain in Switzerland for market of frying oils that is increasing. Opposed to that biofuels, which were developed by processing industry and lobby for saving of greenhouse gases (GHG) and renewable energy are decreasing its market share. We argue that both can be explained by perception of market participants. Supply chain is composed of many competing groups of companies without own management. Still, OSR's co-products for edible oils, bio-fuel, glycerol, feed proteins and chemical composition of proteins in oil bodies have new markets while sugar beet, flax, pig meat, hops and other supply chains have collapsed at Czech territory. Research question is “What and who develops durable co-product?" The answer is that least specific properties, which competing participants of supply chain and consumers cannot reject or misuse. Objective of this article is to find aspects of co-product necessary durability repaying investments. In OSR case a health in HOLL is more understandable then lifestyle of GHG renewable energies of biofuels. It was shown that it is easier to change habits of food frying then use propaganda of climate warming.
Key words: Supply chain, sustainability, oilseed rape, value.
JEL classification: Q56
1 Introduction Environmental aspects of bio-fuels, expansion of traditional uses of HOLL and new dietary health benefits of PUFA have opened not only new markets but also new research agendas. Research merging or moving either citizen or consumer perception of product features is based on role playing. Roles can develop priorities as mass customization, product family, and mass production with respect to scaling, attribute, and configuration (Zahed and Jiju, 2006).
Product to co-product (Adamek, Herrlich and Strecker, 2004) in mathematics behaves similarly dual as innovation investment to product in supply chain. Therefore, duality of innovation of HOLL at Swiss market must have long durability as it is co-product. Stakeholders investing to competing soy, palm or algae co-products would appreciate also evidence durability to guarantee repayment of investments but, these commodities do not have similar features for development of co-products as OSR. What are these features?
OSR had image of low cost and low involvement commodity market. But, such product features as health keeping minimal daily intake of its 10% PUFA content, resistance to high frying temperatures, especially if 10% PUFA is decreased to 2% PUFA in Holl varieties, high quality renewable biofuels and GHG savings may change low involvement towards commodity to high involvement towards innovation. Mass investment was done to standardise quality of each OSR co-product according to market segment demand. The fact
220
that OSR processing capacity is approximately three times higher in EU then production shows interest and trust of investors.
The main obstacles of recent development are firstly, that OSR area is reaching maximum and secondly, that recent bio-diesel production may decrease due to politically suspended EU objective for renewable energies from 10% to 5% of total fuels. These obstacles are compensated by five positive effects of OSR. Firstly, excess of World demand for soy is causing lack of feed proteins, which OSR skins can deliver in lower quality but, high quantity feed protein and glycerol, which remain as by-products of bio-diesel production. Turnover of these by-products are decreasing price and increasing competitiveness of OSR oil as the main product. Secondly, certification of GHG traceability is giving the evidence of savings CO2 emissions. Thirdly, crop rotation with OSR enriches biodiversity of agricultural countryside. Agricultural biodiversity of OSR crop rotation is significantly better then monoculture of maize grown for bio-gas. Fourthly, edible OSR oil improves health due to delivery of cheap poly unsaturated fatty acids (PUFA). Therefore, edible oils get part of market share of olive oil for cold kitchen as it happened in Czech Republic and Germany already. Fifthly, innovated HOLL oils have opened new markets in Switzerland causing decrease of market share of palm and soybean oils for frying. All these benefits may compensate consequences of politically suspended limit for biofuels and increase market share of OSR and increase price as OSR is limited source.
HOLL have previously adapted industry, which is standardising processes recently. How it comes that HOLL and PUFA were not supported by politicians and have growing market share opposed to biofuels? The answer is that political decisions can be attacked but low price of sustainable product not. Politicians are distorting competition by subsidies for favoured objectives, which finally prove to be wrong and must be cancelled. Enculturation of consumers who have learned to distinguish and have both cold kitchen and frying oils is opposed to degenerative phenomena8 (Washburn, 2008) of policy, especially if it fights for outstanding values by renewable energy directive 2009/28/EC (RED) by biofuels against mineral oil industry. These personal postures to outstanding values are occurring often. This problem of perception is tackled by parallel information processing on main and peripheral front in elimination likelihood model (Petty and Caccioppo, 1986) or by tacit and implicit knowledge with reciprocal nepotism (Jaskiewicz, at al, 2013). Further, we will open cognitive and attitudinal approaches and results in literature.
Arguments for cognition Cognition is opposed to attitudes. This subchapter of cognition starts with view of outputs through strategy perspectives continues by elaboration of analytical tools and finishes with acceptance models. Therefore, strategies (Scheme 1) depend on its understanding elaboration and implementation.
8 Enculturation then, can be seen as the activity of association as augmented by intrinsically idiosyncratic phenomena. The degenerative phenomena that allow language and signs to be shared between people are, within each individual, constantly changing via idiosyncratic neuronal firing patterns and via the incorporation of new experience and altered memory. (Washburn, 2008)
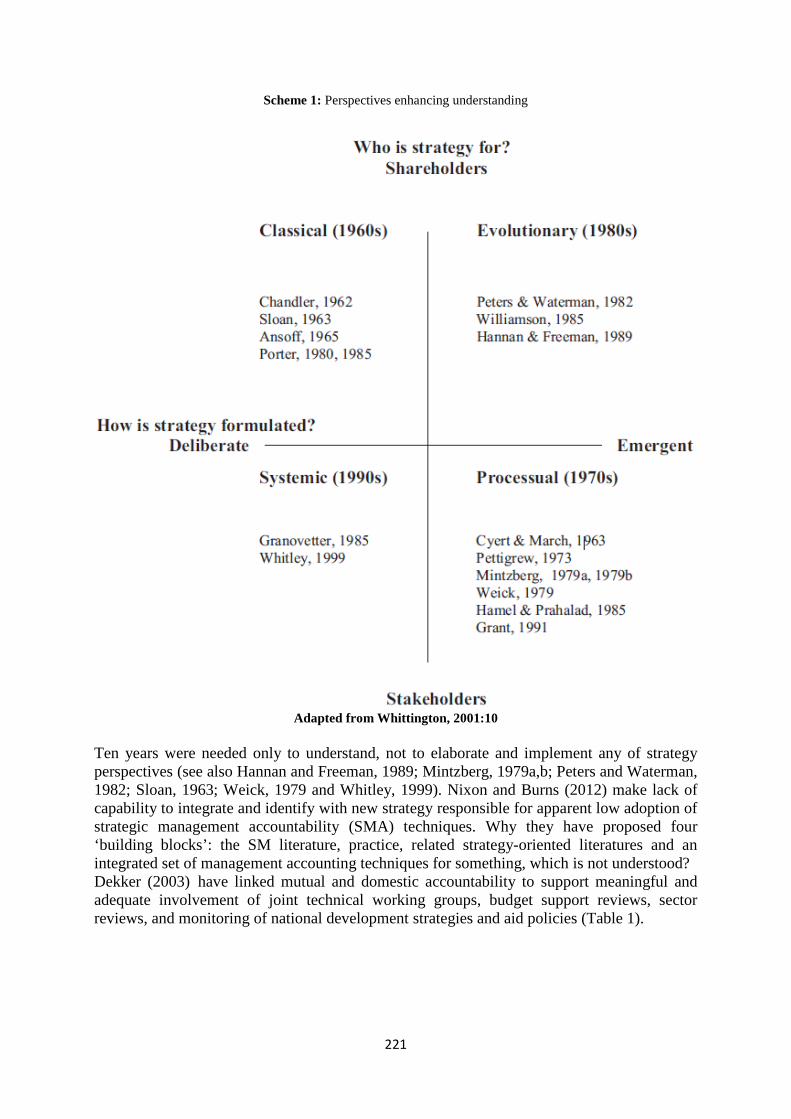
221
Scheme 1: Perspectives enhancing understanding
Adapted from Whittington, 2001:10
Ten years were needed only to understand, not to elaborate and implement any of strategy perspectives (see also Hannan and Freeman, 1989; Mintzberg, 1979a,b; Peters and Waterman, 1982; Sloan, 1963; Weick, 1979 and Whitley, 1999). Nixon and Burns (2012) make lack of capability to integrate and identify with new strategy responsible for apparent low adoption of strategic management accountability (SMA) techniques. Why they have proposed four ‘building blocks’: the SM literature, practice, related strategy-oriented literatures and an integrated set of management accounting techniques for something, which is not understood? Dekker (2003) have linked mutual and domestic accountability to support meaningful and adequate involvement of joint technical working groups, budget support reviews, sector reviews, and monitoring of national development strategies and aid policies (Table 1).
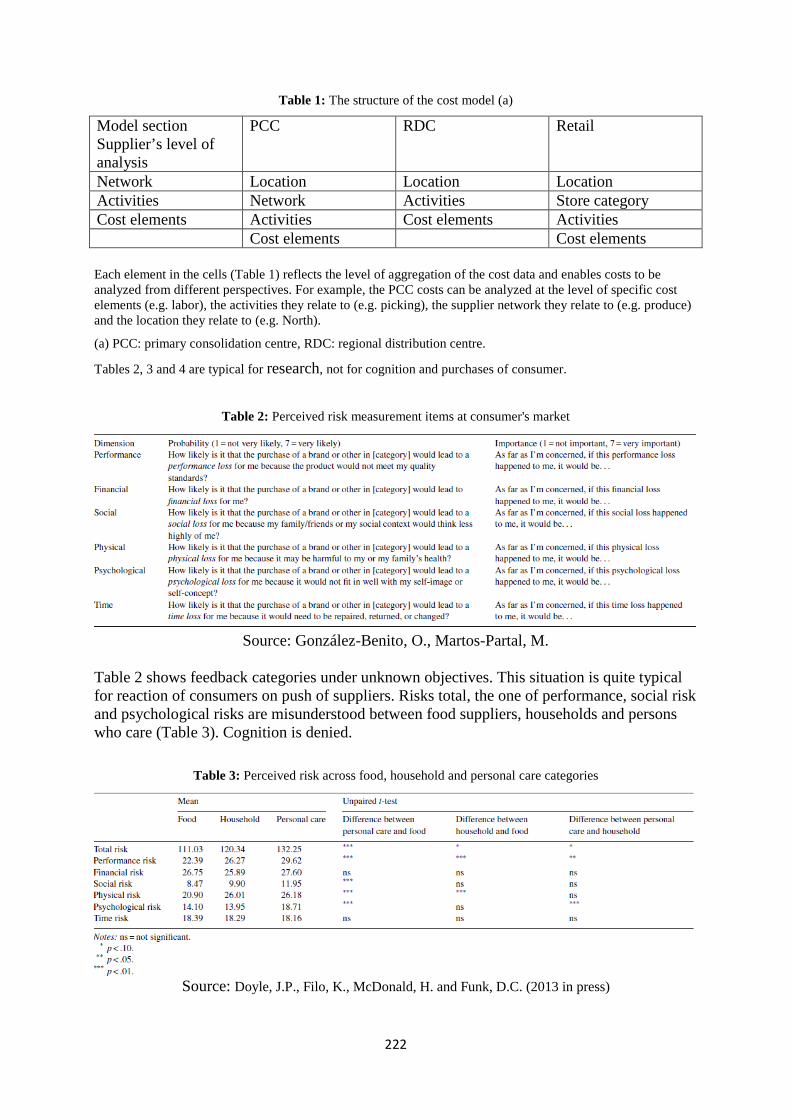
222
Table 1: The structure of the cost model (a)
Model section Supplier’s level of analysis
PCC RDC Retail
Network Location Location Location Activities Network Activities Store category Cost elements Activities Cost elements Activities Cost elements Cost elements Each element in the cells (Table 1) reflects the level of aggregation of the cost data and enables costs to be analyzed from different perspectives. For example, the PCC costs can be analyzed at the level of specific cost elements (e.g. labor), the activities they relate to (e.g. picking), the supplier network they relate to (e.g. produce) and the location they relate to (e.g. North).
(a) PCC: primary consolidation centre, RDC: regional distribution centre.
Tables 2, 3 and 4 are typical for research, not for cognition and purchases of consumer.
Table 2: Perceived risk measurement items at consumer's market
Source: González-Benito, O., Martos-Partal, M.
Table 2 shows feedback categories under unknown objectives. This situation is quite typical for reaction of consumers on push of suppliers. Risks total, the one of performance, social risk and psychological risks are misunderstood between food suppliers, households and persons who care (Table 3). Cognition is denied.
Table 3: Perceived risk across food, household and personal care categories
Source: Doyle, J.P., Filo, K., McDonald, H. and Funk, D.C. (2013 in press)
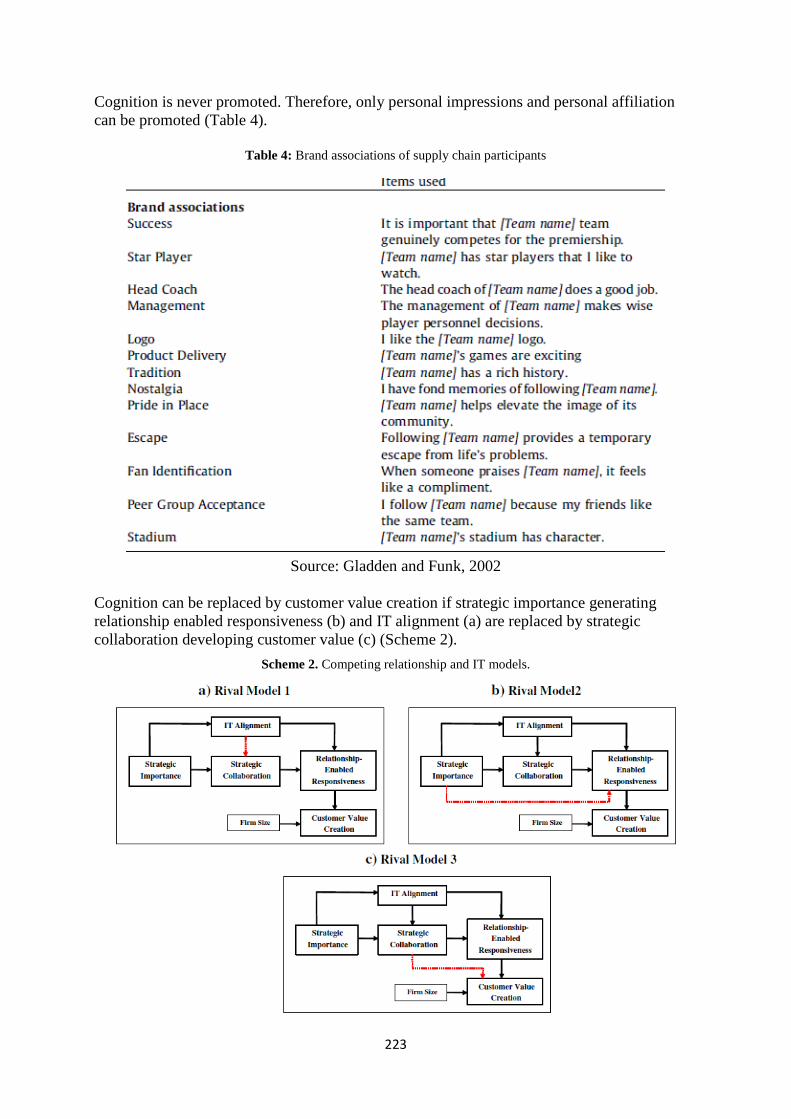
223
Cognition is never promoted. Therefore, only personal impressions and personal affiliation can be promoted (Table 4).
Table 4: Brand associations of supply chain participants
Source: Gladden and Funk, 2002
Cognition can be replaced by customer value creation if strategic importance generating relationship enabled responsiveness (b) and IT alignment (a) are replaced by strategic collaboration developing customer value (c) (Scheme 2).
Scheme 2. Competing relationship and IT models.
224
Dashed line indicates a path removed from our proposed conceptual model. Dotted line indicates a path added to our proposed conceptual model. In H1 Kim, Cavusgil, and Cavusgil (2013) have maintained that relationship-enabled responsiveness facilitates customer value creation and according to the results, it is supported (H1: b = .436, p b .01) And, these attitudes are moving back from attitudes toward displayed impulse or ad through attitudes towards brands to general attitudes towards institution of advertising as such.
Attitudinal drivers of enculturation Consumers’ attitudes toward an ad (Aad) have offered a critical theoretical construct since 1981, with the publication of two influential articles (Mitchell & Olson, 1981; Shimp, 1981). Following these seminal articles, various studies were dedicated to demonstrating the effects of Aad on brand attitudes and purchase intentions (e.g., Gardner, 1985; MacKenzie, Lutz, & Belch 1986; McKenzie, & Lutz, 1989). Other studies show that Aad notably depends on attitudes toward advertising in general (Lutz, MacKenzie, & Belch, 1983; Muehling, 1987; MacKenzie & Lutz, 1989; Mehta, 2000). Yet attitudes toward advertising in general (AG) and their influence on advertising effectiveness have rarely been studied in cross-national studies (Mehta, 2000). Dianoux, Linhart, and Ognajov (2012) who found that attitudes toward advertising in general (measured by: advertising in general is bad/good, Unfavorable/favorable, negative/positive with a seven-point semantic differential pairs) differ significantly across the two European countries with French people who tend to like advertising in general (M = 4.30), and Czech people who tend to dislike advertising in general (M = 3.81). Attitudes towards advertising are dependent on culture. Therefore, methodology of attitudes towards advertising offers standard comparable values also for attitudes towards outstanding values of innovations in the supply chain and also towards weekly repeated announcements that crisis is over.
The objective of this article is to find methodology for either understanding or enculturation to co-products of supply chain. Methodology of enculturation is responsible for adaptation of innovation driver and degenerative phenomena for its standardisation. Both are translating outstanding values to all supply chain participants who support or deny each of them. As language and signs to be shared between people are, within each individual, constantly changing or ‘degenerating’ via idiosyncratic neuronal firing patterns and via the incorporation of new experience and altered memory (Washburn, 2008) the relationships among mass customization, product family, and mass production was applied with respect to scaling, attribute, and configuration (Zahed and Jiju, 2006). Detailed and configured attributes of OSR were generalised to be associated and augmented by intrinsically idiosyncratic phenomena during enculturation (Washburn, 2008) of each supply chain participant. Scaling must locate and categorise factors of innovations similarly to scheme 3, which is valid only for detail of OSR factors.
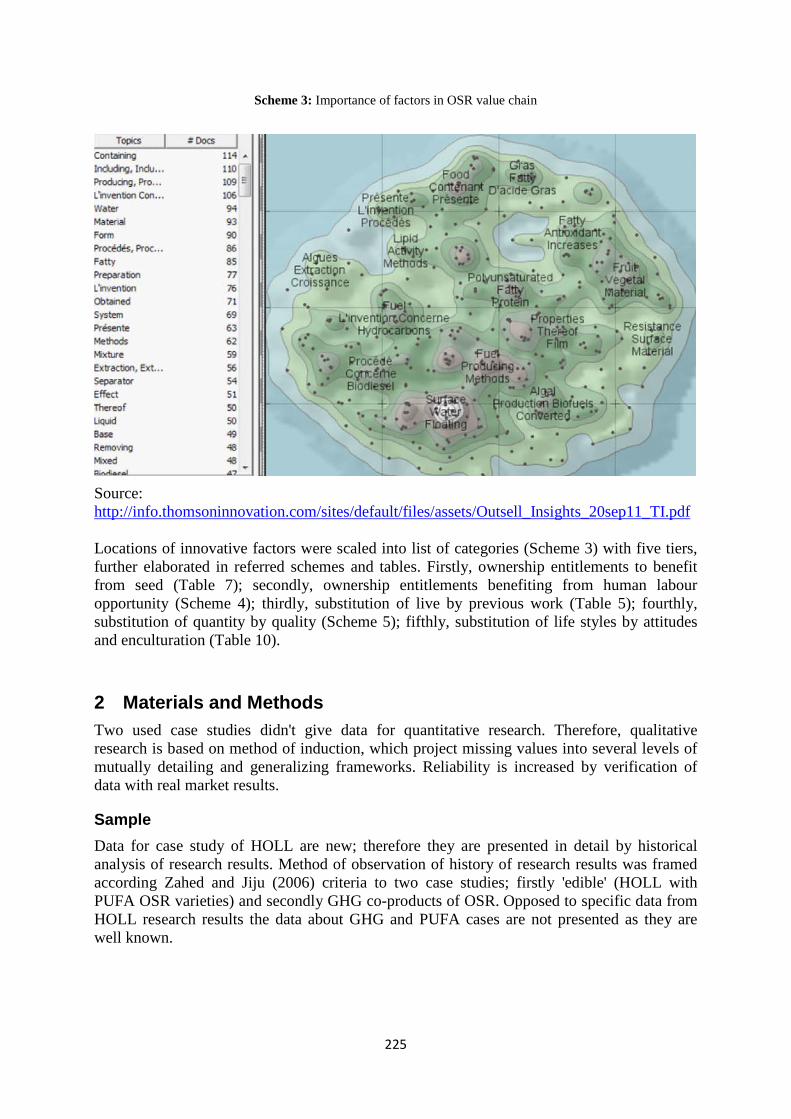
225
Scheme 3: Importance of factors in OSR value chain
Source: http://info.thomsoninnovation.com/sites/default/files/assets/Outsell_Insights_20sep11_TI.pdf Locations of innovative factors were scaled into list of categories (Scheme 3) with five tiers, further elaborated in referred schemes and tables. Firstly, ownership entitlements to benefit from seed (Table 7); secondly, ownership entitlements benefiting from human labour opportunity (Scheme 4); thirdly, substitution of live by previous work (Table 5); fourthly, substitution of quantity by quality (Scheme 5); fifthly, substitution of life styles by attitudes and enculturation (Table 10).
2 Materials and Methods Two used case studies didn't give data for quantitative research. Therefore, qualitative research is based on method of induction, which project missing values into several levels of mutually detailing and generalizing frameworks. Reliability is increased by verification of data with real market results.
Sample Data for case study of HOLL are new; therefore they are presented in detail by historical analysis of research results. Method of observation of history of research results was framed according Zahed and Jiju (2006) criteria to two case studies; firstly 'edible' (HOLL with PUFA OSR varieties) and secondly GHG co-products of OSR. Opposed to specific data from HOLL research results the data about GHG and PUFA cases are not presented as they are well known.
226
Treatment of data Observations of criteria 'mass customization' is associated with health effects for consumers, effect of criteria 'product family' with impact on decreasing price of the main product, effect of criteria 'mass production' with volume of investments and criteria of 'scaling' with innovation categories.
Outliers from each criteria and class of innovation scales are compared with one proposed alternative by author in last column of tables 8, 9, and 10. Tables 8 and 9 are elaborating supplier's view and table 10 demand view.
3 Results and Discussion Firstly presented new interesting data about HOLL are showing how organizational measures have adopted new research findings to increase market share of OSR co-products. Three level comparisons of source variables for further development of OSR co-products are presented next to the HOLL to show priorities for further promotion or development of co-products.
Competitive advantages and competing products of OSR
It was found that 10% poly unsaturated fatty acids (PUFA) in OSR oil clean venae if daily minimum intake is exceeded. High oleic and low linoleic (HOLL) varieties (Baux, Colbach and Pellet, 2011) fulfil all technical criteria for frying. Decrease of GHG and energy savings of bio-fuels (Schroder et al., 2012) were promoted to politicians who have set 10% target of biofuels, which was recently decreased to 5%. Yield stability of broad assortment of varieties and hybrids is base of promotional message to farmers. Biodiversity of crop rotation with OSR are efficient arguments for rural politicians if compared with maize grown for biogas.
Production and technologies have left Europe to East Asia. OSR is still grown and processed in Europe. But competitors growing oil palm or soybeans are always questioning sustainability of OSR. Palm gives four times higher yield than OSR and soy protein and nitrogen fertilizer decreases price of soybean oil. Therefore, OSR sustainability depends on newly added and sold co-product or byproduct decreases price of main product improving its sustainability.
Habitual obstacles at markets for OSR co-products Consumers have learned to have both oil from 00 varieties of OSR for cold kitchen and HOLL varieties for frying. OSR HOLL varieties have increased OSR area by 30% by changing habits of consumers in kitchen.
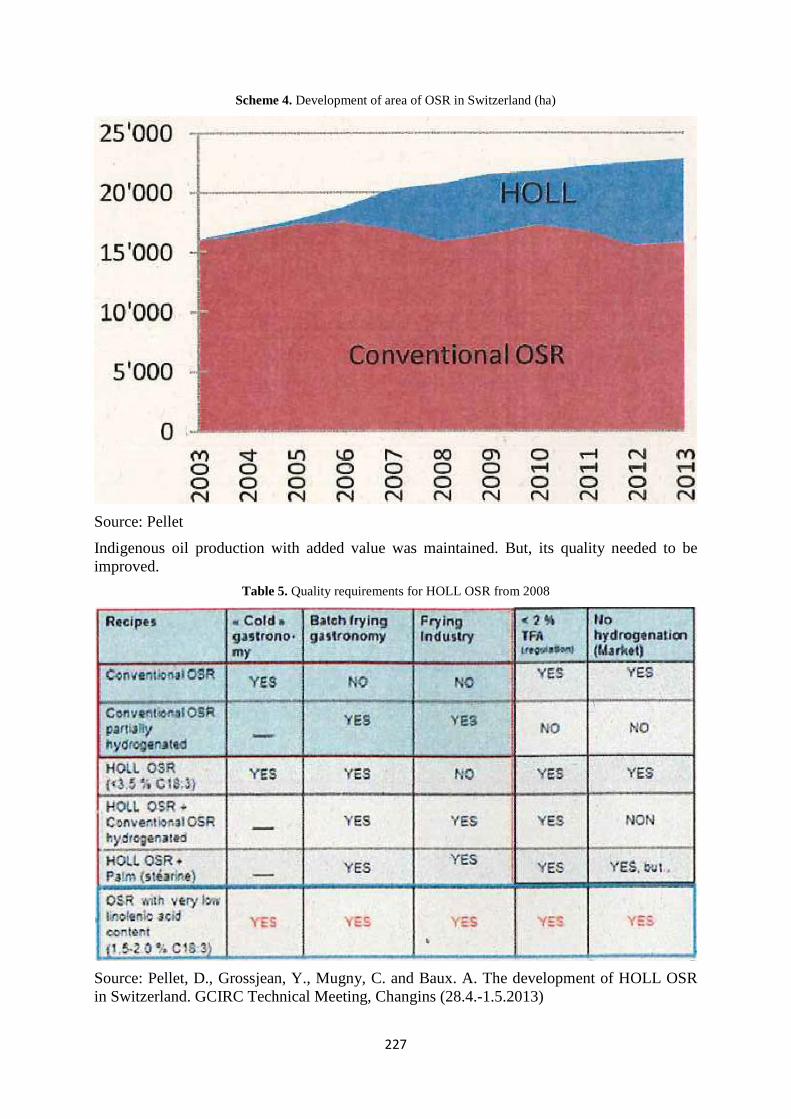
227
Scheme 4. Development of area of OSR in Switzerland (ha)
Source: Pellet
Indigenous oil production with added value was maintained. But, its quality needed to be improved.
Table 5. Quality requirements for HOLL OSR from 2008
Source: Pellet, D., Grossjean, Y., Mugny, C. and Baux. A. The development of HOLL OSR in Switzerland. GCIRC Technical Meeting, Changins (28.4.-1.5.2013)
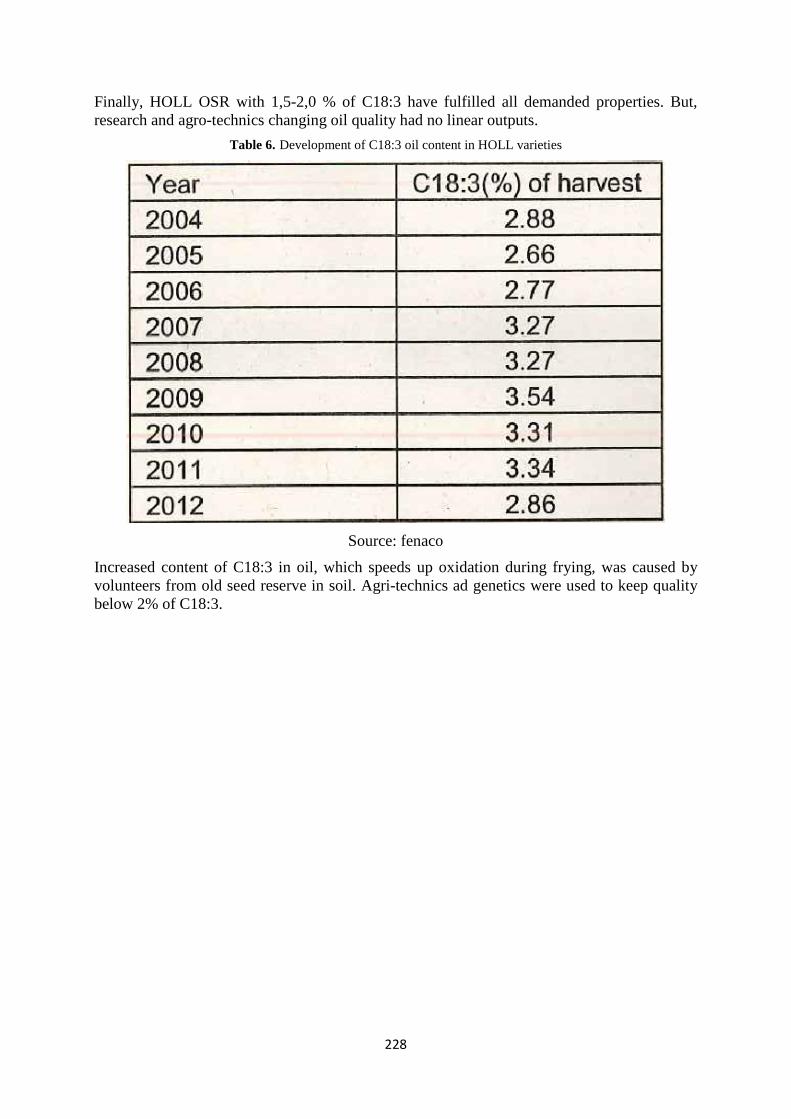
228
Finally, HOLL OSR with 1,5-2,0 % of C18:3 have fulfilled all demanded properties. But, research and agro-technics changing oil quality had no linear outputs.
Table 6. Development of C18:3 oil content in HOLL varieties
Source: fenaco
Increased content of C18:3 in oil, which speeds up oxidation during frying, was caused by volunteers from old seed reserve in soil. Agri-technics ad genetics were used to keep quality below 2% of C18:3.
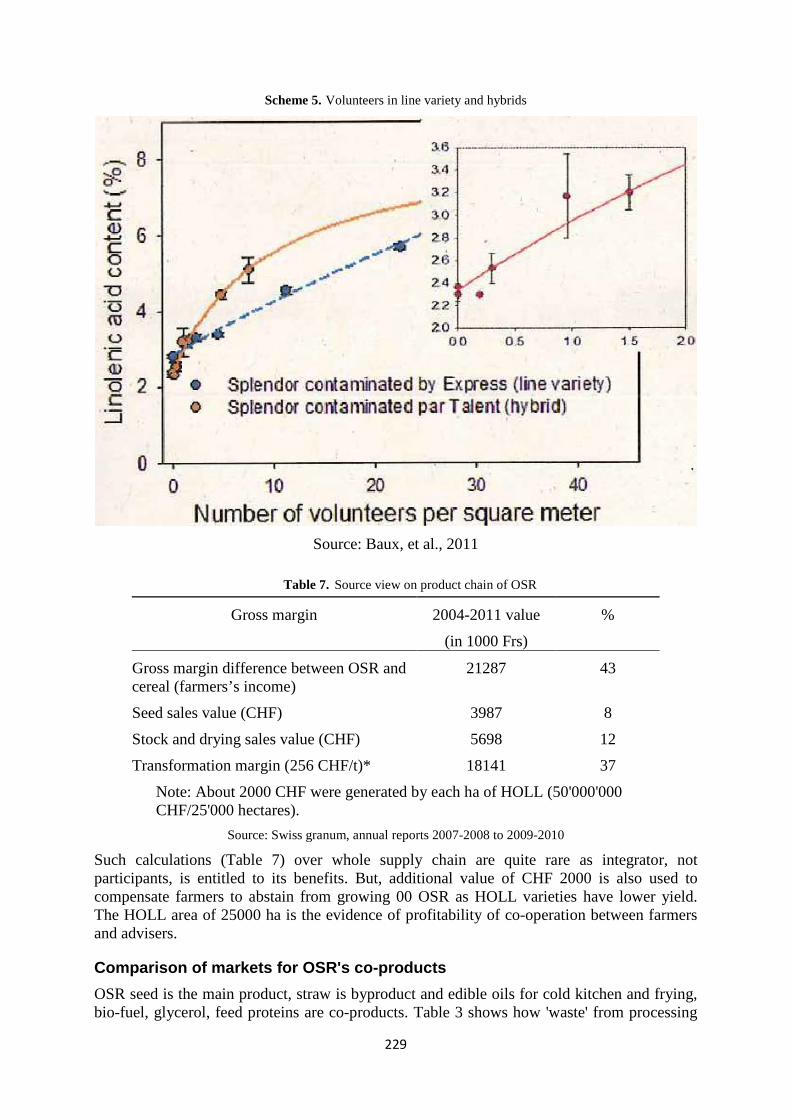
229
Scheme 5. Volunteers in line variety and hybrids
Source: Baux, et al., 2011
Table 7. Source view on product chain of OSR Gross margin 2004-2011 value
(in 1000 Frs)
%
Gross margin difference between OSR and cereal (farmers’s income)
21287 43
Seed sales value (CHF) 3987 8
Stock and drying sales value (CHF) 5698 12
Transformation margin (256 CHF/t)* 18141 37
Note: About 2000 CHF were generated by each ha of HOLL (50'000'000 CHF/25'000 hectares).
Source: Swiss granum, annual reports 2007-2008 to 2009-2010
Such calculations (Table 7) over whole supply chain are quite rare as integrator, not participants, is entitled to its benefits. But, additional value of CHF 2000 is also used to compensate farmers to abstain from growing 00 OSR as HOLL varieties have lower yield. The HOLL area of 25000 ha is the evidence of profitability of co-operation between farmers and advisers.
Comparison of markets for OSR's co-products OSR seed is the main product, straw is byproduct and edible oils for cold kitchen and frying, bio-fuel, glycerol, feed proteins are co-products. Table 3 shows how 'waste' from processing
230
of recent co-products creates opportunities for development of new co-products. Centralisation, scaling, attribute and configuration from Zahed and Jiju (2006) in rows makes insight deeper but doesn't prove reliability but presents list and volumes of available source variables for new co-products.
Table 8. Source view on product chain of OSR
Heading type GHG HOLL_PUFA Sources for new co-products
Centralisation Biofuel Edible oil Feed protein, glycerol
Scaling 70% 10% 20% saved imports
Attribute Industry invest PUFA Up to 5% for monogasters
Configuration Market maintains New markets9 Genetics needed
Note ILUC make food for growing population possible
Source: Own processing
Oil for cold kitchen with 10 % of PUFA is produced almost equally by all 00 OSR varieties. HOLL varieties for frying must not be grown in area of PUFA OSR. But both 00 and HOLL varieties produce edible oil for consumer's market. All OSR varieties can be processed into biofuels if needed due to political reason or overproduction. The political reason is changing. Renewable energy was the priority in the beginning and GHG later. Therefore, GHG for industrial markets is presented in one column and compared with co-products for edible purposes with specifics of PUFA from 00 varieties and HOLL.
Complementarily life styles After comparison of consumer's and industrial markets the co-products for edible purposes (PUFA with HOLL) are compared (Table 3) to derive future diet proposal, which may serve as proposal for future co-products on consumer's markets. Yield stability, proteins in oil bodies of OSR, certification of GHG traceability, biodiversity, for both wild and agricultural countryside, are keywords quality maintenance and development of outstanding values of OSR. Therefore, purpose function of OSR may differ but, minimal coincidence of all these functions for individual, household and in media need to be assessed.
Table 9. Demand views of supply chain of OSR Heading type Fresh diet (PUFA) Diet reserves
(HOLL) Future diet proposal
Decentralisation Vegetable Edible oil Neolithic garden
Scaling 5-30% 20% 10%
Attribute Proximity MDI10 Oil bodies11
Configuration Family cares New recipes Internet needed
Note Internet in ‘yurts’ cares for help and creativity of families
Source: Own processing
9 HOLL for frying or eruca for cosmetic purposes are examples of markets, which may expand. 10 MDI is minimum daily intake 11 Proteins steering oil bodies may co-regulate also body of the one who eats them
231
Cold and frying kitchen habits are projected to three life styles firstly, to neolithic household style, secondly, to global and thirdly, to state governance style. The three styles are testing bottom-up and top-down complementarity of foods, income to buy it or skills and space to produce it. Global market has the highest mass customization, product family, and mass production with respect to scaling, attribute, and configuration. State cares for GHG and energy. Groups of jobless or homeless people, if not drug addicted, care for polarising extremes and bridges between them (Washburn, 2008). Data for all styles and extremes will be collected in OSR agenda.
Message responsiveness in media The impact of mass customization, product family and mass production (in rows) on complementarity of life styles (in columns) is used to derive World demand in Table 5.
Table 10. Demand derived from and life style constructions
Heading type GHG lobby HOLL_PUFA promotion
Proposal of markers of perspectives for individuals
Customisation AG Aad Social and market exclusion
Product families Instrument HS Enculturation
Mass production Institution SS and degenerative principal12
Security Habits, symbols, culture
Cad, Cb Collective attitudes
Note. Offers of global market and state are followed until individual doesn’t fell off
Source: Own processing
Dual mediation model explains how cognition towards ad (Cad) or brand (Cb) wins or loses over attitudes towards ad (Aad) or brand (Ab). More precisely how hard-sell (HS) ads use existing instrumental attitudes to use understanding to product chain. Soft-sell (SS) ads use existing institutional attitudes to use understanding to supply chain.
Effect of advertised supply chain offers is measurable if found values are compared with parallel options the population has.
3.6 Discussion of viewpoints of value in OSR chain The source view of product chain (Table 1) has changed to demand view of supply chain due to categorization of co-product features and conversion of perceptions. It was shown how to replace view of sourcing supplies according to features of demand for co-product. Cognitive
12 "Enculturation is activity of association as augmented by intrinsically idiosyncratic phenomena. The degenerative phenomena that allow language and signs to be shared between people are, within each individual, constantly changing via idiosyncratic neuronal firing patterns and via the incorporation of new experience and altered memory” (Washburn, 2008)
232
methods were rejected in France. Producers prefer to sell both OSR and sunflower edible oils there. Standardization of low involvement of behavior of consumers has happened as neither PUFA nor HOLL quality of OSR is promoted there. Therefore, consumers couldn’t apply enculturation improving their health by PUFA and HOLL frying oils and degenerative principle leaving less beneficial substitutes in shop shelves. Similar situation can be expected in territories where other vegetable oils like olive, hemp, soybean and palm are produced. Impact of OSR edible oil with PUFA on health was promoted in Czech and German supermarkets where it has the first position in turnover between edible oils. HOLL case shows that only Switzerland producers were courageous enough to decide to teach consumers to distinguish and have two oils for frying and cold salads in their kitchen. Low price, local production and pride for nature may be decisive arguments for many consumers. Czech consumers have no problem to buy on etiquette clearly marked genetically modified edible soy oil in supermarkets and simultaneously buy OSR oil what indicates enculturation to both low price and health. We may guess that many countries have less developed rules for obligatory information on etiquettes and edible oil mixtures with uncertain content and health benefits have big market share there.
Health benefits of edible oils are set by minimal daily intake of omega 3 PUFA, which is often not satisfied causing cholesterol content in veins of population with high incidence of heart attacks. High content of omega 3 PUFA can be found in fish meat, flax or hemp oil. Zhang, Nakai, and Masunaga, (2009) have shown that methylmercury often does not lead consumers to replace fish meat by other sources of EPA DHA. This abbreviation is used for an essential fatty acid which stands for docosahexaenoic acid and eicosapentaenoic acid. This essential fatty acid is also an Omega 3 fat. But, OSR is the cheapest source of omega 3 PUFA if taking into account the rest of diet. The higher number and volume of produced OSR products, the lower price. These logical arguments were not applied in promotion and wouldn't be understood, probably. Enculturation differs from adaptation because consumer, not advertiser, is changing his or her instrumental attitudes. The evidence is shown by presence of both salad and frying OSR oils in kitchen with ability to teach all household members how to use them properly. Therefore, this instrumental attitude should work also in masculine (Hofstede, 2005) population of Czechs and Germans. German market has absorbed certified cold pressed OSR oils with high price already. Potential of both HOLL and cold pressed certified oils at Czech market is still not used.
Enculturation towards co-products was newly found in OSR's value chain. Attitudes towards co-products are derived from OSR's commodity brand. OSR's generally known properties as PUFA, HOLL, GHG, glycerol and feed proteins of biofuels transfer image of commodity brand to each co-product. Evidence of commodity brand image are 30% market share of HOLL at Swiss fields, first place for OSR oil for cold kitchen due to PUFA at Czech and German market and savings of GHG and renewable energies in EU policies. Feed proteins still have potential to develop new co-product of OSR, which will satisfy uncovered demand of industry for glycerol. Exceeding capacities of suppliers for this co-product exist already.
Method of yield stability for fine tuning of competing checks, registered and candidate competing innovations was not used here but its framework will be used during implementation of proposal. Generally, yield stability is calculated from gradient of the regression line in a correlation to the yields with the yield potential of the location equal to one. But here no database of long term observations was available. Therefore, the outstanding values of yield stability for each homogeneous group of impulse factors were in proposal inspired by enculturation drivers only. We expect that such outliers will make 'least specific' co-product feature from demand point of view to supplier better understandable.
233
4 Conclusion The objective of this article to find methodology was searched in conversion of consumer's into industrial behavior. It was tested whether cognition or attitudes of consumers increase involvement to specific features of edible oils for frying and cold kitchen and GHG, renewable energy and price stabilization effect of biofuels. Logic of enculturation and degenerative principle was chosen for high involvement situations, which all specific features of OSR can create. Historical analysis of case studies has elaborated logic of enculturation and degenerative principle to general, institutional or instrumental attitudes. Adaptation and standardization logic was not used as it is applied for low involvement situations of brand intentions or attitude towards advertising. Cognition based promotion should be banned opposed to deep research insight during the development as it was shown in tables 2, 3 and 4 and scheme 2.
Enculturation and degeneration starts from the very risky role of first runner due to “herd” behavior of population, which defends old standards and attacks suppliers of new outstanding values of innovations. We may extend initial research question to 'Why HOLL innovation was done in Switzerland and 00 innovation of OSR worldwide and not in EU?' Simply, innovators should keep innovations secret until “Do it right the first time” (DRIFT) doesn’t guarantee survival in attack of defenders of former standards. And, EU subsidies for projects provoke implementation of immature solution. EU shouldn't distort competition by subsidising of innovations and learn from DRIFT marketing programs for foreign market entry.
Research methodology has applied enculturation and degenerative principal frameworks in tables 7, 8, 9 and 10. The framework of mass customization, product family, and mass production with respect to scaling, attribute, and configuration (Zahed and Jiju, 2006) is deepening analysis and its form in tables 8, 9 and 10 stressing also aspects of attitudes is challenging for followers to confirm its validity or form. These results are suitable for DRIFT approval in implementation discussions, which connect scientists with practitioners. Yield stability method for each new variety of OSR standardizes co-product to product.
Both parts of research question “What and who develops durable co-product?" were answered. Instruction ‘take this and leave that’ of enculturation and degenerative style of promotional message of OSR co-products have answered question 'what' together with decrease of social and market exclusion by low price and collective approaches in whole supply chain and households (Table 10). Researchers with farmers and nature rather than politicians with lobbyists have answered the question 'who' will not suffer by exclusion, acculturates and takes the collective approach.
OSR value chain developers of HOLL in Switzerland, PUFA in Czech Republic and Germany and GHG in EU policies have acculturated to role of first runner, while fulfilling all the above claims of table 10. We hope that durability of enculturation and degeneration will be used during decision making about development of co-products of any supply chain.
References Baux, A., Colbach, N., Pellet, D. (2011) Crop management for optimal low-linolenic rapeseed oil production—Field experiments and modelling, European Journal of Agronomy, Volume 35, Issue 3, Pages 144-153, ISSN 1161-0301 Dianoux Christian, Linhart Zdenek, Ognjanov Galjina (2012), A cross-european perspective on attitudes toward advertising in general and attitude toward an ad, 41th Annual Conference of European Marketing Academy, 22-25 may, Lisbonne.
234
Dekker H.C. (2003) Value chain analysis in interfirm relationships: a field study. Management Accounting Research 14 1–23 Gardner, M.P. (1985), “Does Attitude Toward the Ad Affect Brand Attitude Under a Brand Evaluation Set?”, Journal of Marketing Research, Vol. 22 No. 2, pp.192-198.
Hofstede, G., & Hofstede, G.J. (2005). Cultures and organizations: software of the mind (Revised and expanded 2nd ed.). New York: McGraw-Hill. Jaskiewicz, P., Uhlenbruck, K., Balkin, D.B. and Reay, T. (2013) Is Nepotism Good or Bad? Types of Nepotism and Implications for Knowledge Management. Family Business Review 26(2) 121–139 Kim D., Cavusgil S., T and Cavusgil E. (2013) Does IT alignment between supply chain partners enhance customer value creation? Industrial Marketing Management (article in press) MacKenzie, S.B., Lutz, R.J. & Belch, G.E. (1986), “The Role of Attitude Toward the Ad as a Mediator of Advertising Effectiveness: A Test of Competing Explanations”, Journal of Marketing Research, Vol. 23 No. 2, pp. 130-143. MacKenzie, S.B., Lutz, R.J. (1989) “Am Empirical Examination of the Structural Antecedents of Attitude Toward the Ad in an Advertising Pretesting Context.” Journal of Marketing, Vol. 53, No. 2, pp. 48 - 65. Mehta, A. (2000), “Advertising Attitudes and Advertising Effectiveness”, Journal of Advertising Research, Vol. 40 No. 3, pp. 67-72. Mitchell, A.A., Olson, J.C. (1981), “Are Product Attribute Beliefs the Only Mediator of Advertising Effects on Brand Attitude?” Journal of Marketing Research, Vol. 18 No. 3, pp. 318-332. Muehling, D.D. (1987), “An Investigation Of Factors Underlying Attitude-Toward-Advertising-In-General”, Journal of Advertising, Vol. 16 No. 1, pp. 32-40. Nixon. B and Burns J. (2012) The paradox of strategic management accounting. Management Accounting Research 23 229– 244 Pellet, D. (2011) Impact économique et financier du projet CTI 7101.1 (2004-2008): Production de colza à faible teneur en acide gras alpha-linolénique . Rapport à la CTI. Agroscope Changins Wädenswil Pellet, D., Grossjean, Y., Mugny, C. and Baux. A. The development of HOLL OSR in Switzerland. GCIRC Technical Meeting, Changins (28.4.-1.5.2013) Petty, R. E., & Cacioppo, J. T. (1986). Communication and Persuasion: Central and Peripheral Routes to Attitude Change. New York: Springer-Verlag. Schroder, O., Munack, A., Schaak, J., Pabst, C., Schmidt, L., Bunger, J., Krahl, J. Emissions from diesel engines using fatty acid methyl esters from different vegetable oils as
235
blends and pure fuel. Journal of Physics Conference Series, 25th International Congress on Condition Monitoring and Diagnostic Engineering (COMADEM) JUN 18-20, 2012 Huddersfield Washburn, D (2008) Enculturation and the Degenerative Principle. CONTEMPORARY issues, (2008) Vol. 1, No. 1 Zahed S. and Jiju A. N. (2006). Modeling of modularity and scaling for integration of customer in design of engineer-to-order products. Integr. Comput.-Aided Eng. 13, 2 (April 2006), 133-148. Zhang, Y., Nakai, S. and Masunaga, S. (2009). Simulated impact of a change in fish consumption on intake of n-3 polyunsaturated fatty acids. Journal of Food Composition and Analysis, Volume 22, Issues 7–8, Pages 657-662
Sources Adamek, J., Herrlich, H. and Strecker, G.E. (2004) Abstract and Concrete Categories: The Joy of Cats. http://katmat.math.uni-bremen.de/acc/acc.pdf from 10 August 2013.
Doyle, J.P., Filo, K., McDonald, H. and Funk, D.C. (2013 in press) Exploring sport brand double jeopardy: The link between team market share and attitudinal loyalty. Sport Management Review xxx (2012) xxx–xxx
Outsell: Advancing the business of information (2011) Product review: Thomson Innovation. http://info.thomsoninnovation.com/sites/default/files/assets/Outsell_Insights_20sep11_TI.pdf
González-Benito, O., Martos-Partal, M. Role of Retailer Positioning and Product Category on the Relationship Between Store Brand Consumption and Store Loyalty. Journal of Retailing 88 (2, 2012) 236–249 Renewable energy directive 2009/28/EC Swiss granum, annual reports 2007-2008 to 2009-2010
236
Valuation of intangible assets in mergers and acquisitions: Event study approach
Alexey Shvetsov & Konstantin Rychkov Department of Management, FEM, Czech University of Life Sciences Prague,
Kamycka 129, 165 21 Prague 6 – Suchdol [email protected]
Research Analyst, Software, IDC CEMA s.r.o. Prague, Male Namesti 13, 11000 Prague 1
Annotation: This article studies the impact of merger or acquisition on intangible assets of acquiring company in intangibles-intensive industry and observes the opportunity of simplifying the appraisal of such assets by using market indicators coupled with operational performance data. The short-term analysis reveals that excess stock volatility in the announcement-to-merger period and insider trading-induced volatility in two days before announcement skew the regression analysis prediction power and that probable CAR corridor in this period widens twofold if compared to the analogous period after the close date of the M&A deal. Nevertheless, it is evident that cumulating average abnormal returns and comparing them with 𝐼𝐴/𝐶𝑎𝑝. ratio in the long-term we can with a higher probability and less effort predict future value of intangible assets in mergers.
Key words: M&A, intangible assets, valuation, event study, CAR.
1 Introduction
Mergers and Intangibles’ Value Since the last acquisition activity peak in couple years preceding 2008’s events, mergers and acquisitions (hereinafter referred to as M&A) activity worldwide across all segments was rather scarce. In 2007 they accounted for more than $4.2 trillion, but 2010 M&A volume did not rise over $2.5 trillion point. Recovery has started quite recently, as industry analysts observe, and all players are cautious at this moment. Nevertheless, M&As are commonly perceived as a value-adding activity by market, as evidenced by Asquith, Bruner and Mullins (1983), Malatesta (1982), Cummins and Xie (2008), and etc.
Information technology (IT) sector’s M&As got on ascending curve very soon after the break down, according to market analysts opinion. First steps were done cautiously by multiple minor acquisitions in the sphere through 2009-2011. As supported by Leger and Quach (2009) software industry matured and therefore M&A activity is unprecedented, if we look at recent years. On a semiannual basis sector records between 700 and 800 deals worldwide!
Financial literature has always been paying a lot of attention to mergers and acquisitions, and this continues to be true. Studies targeted at analysis of value creation for shareholders in M&As proportionally prevail, although some authors prefer to examine efficiency of business combinations instead (Cloodt, Hagedoorn and Van Kranenburg, 2006; Cummins and Xie, 2008). For many researchers creation of value as a corporate performance indicator stands in the first place (Agrawaj, Jaffe and Mandelker, 1992; Asquith, Bruner and Mullins, 1983; Dutta and Jog 2009; Lubatkin, 1987; Rheaume and Bhabra, 2008). Usual indicator of the M&A impact on corporate performance for almost all studies, from financial point of view, are stock price fluctuations in distinction from the benchmark (e.g. Brown and Warner, 1980
237
and 1985; Harris and Titman, 1991; Mushidzhi and Ward, 2004). Not being mutually exclusive, this indicator in minority of researches may be replaced by various accounting and economic terms, such as: corporate turnover (Gagnon et al, 1982), operating cash flows (Ghosh, 2001), intrinsic value (Ma, Whidbee and Zhang, 2011), synergetic results (Cloodt, Hagedoorn and Van Kranenburg, 2006; Larsson and Finkelstein, 1999).
The diversity of views on M&As describe the value creation and drivers allocation issues in mergers as highly complex and multi-dimensional field of research and methods elaboration. Having previous findings at hand, in this work we intend to dig dipper into the abnormal returns estimations for a very specific and recently highly valued group of corporate assets – intangibles.
Sullivan Jr. and Sullivan (2000: 328) in their survey point out that there is a dramatic increase in the number of companies whose value lies largely in their intangible assets; with relatively little or no value associated with their tangible assets. And according to Ciprian et al (2012: 682), today, 75-85% of assets are intangible, while in 1978, intangible assets constituted 5% of assets.
Current state of the question in literature suggests that value creation by IA impact on corporate performance is significant across all industries at a different degree, but looking at this group of assets in context of their appraisal many researchers came to conclusion, that use of traditional accounting data is biased as such (Choi, Kwon and Lobo 2000; Ciprian et al, 2012; Eckstein, 2004). However, in their research Olivera, Rodrigues and Craig (2010: 250), when testing the value relevance of recognized intangible assets, found that net earnings, reported goodwill and other intangible assets are highly significantly associated with the stock price. These findings support the opinion that perception of company on the stock market, when compared to its book value, serves as significant indicator of IA value of organization (Niculita, Popa and Caloian, 2012: 308).
Following this observations we see software market M&As as the most suitable source of data for the study, not only from the market maturity and information availability point, but also as highly intangibles-intensive industry, where companies intangibles comprise for substantial (if not exhaustive) portion of the company value, and that have sufficient evidence and research performed in regards of value creation and IA participation in it.
Methodology and Hypothesis Most studies of M&A results, preceding changes, and effects are performed in a form of event studies (e.g. Andre, Kooli and L’Her, 2004; Franks, 1991; Shelton, 2000). An event study is a method of measuring market performance that is based on the theory of efficient and rational financial markets, first used to estimate the effects of mergers on the stock prices of acquirer and target around the date of announcement by Fama et al, 1969. A major concern in event studies is to assess the extent to which security returns were different from those which would have been appropriate, given the model determining equilibrium expected returns (Brown and Warner, 1980: 205).
There are three controversial aspects of event studies revealed in literature which bare the major biases of methodology. First is the choice of benchmark. Depending on research goal and statistics authors pick different rules for benchmarking for illustration of abnormal behavior of examined parameters. We cannot say that there is an ultimate benchmark in the market, but we need to keep this issue in mind while interpreting obtained results
Second biased aspect of event study methodology derives from the choice between regressive market modeling and non-regression market-adjusted models. Cable and Holland (1999: 84)
238
concluded that non-regression models of normal returns are not sustained: by test MAR model was wholly rejected, and index model was rejected in 40-96% of cases. This study confirms our intent to use regression-based market model being the best practice.
The last biased aspect is lying within the gap between stock market and corporate operational performance; and the necessity to choose or mitigate the implications of two. Dube and Glascock’s (2006) observe that there is a need to augment stock returns with operating performance for studies, since markets may not incorporate underlying operating data efficiently into the stock price over the long term. In this light, we intend to combine both event study approach and operating data analysis in our work.
In this article we analyze the influence of M&A on the stock-price of the acquiring vendor, target firm, and resulting company in merger of intangibles intensive organizations. As evident from our mergers market review, software vendors at large suffice our initial requirements for this study. Nevertheless, with this research at hand we plan to further analyze the matter in more secluded and specific markets – such as biotechnology.
In our research we follow the structured analysis, which consist of four steps. We, first, examine effect of M&A deals using event study method. Second, we test actual operating performance in pre- and post- merger accounting data and open market data. Third, we test relationship between operating performance and abnormal returns after the announced M&A in long-term test, to see if market could predict this behavior and measure it prior to occasion. Forth, we inspect historically the added value dedicated to intangible assets and analyze the proportional input of two clusters of assets – intangible and tangible – into CAR estimations.
While our research covers a volatile period for the stock of any company and highly depends on market information representativeness, we have to test if insider trading in M&A – aspect covered in works by Jabbour, Jalivand and Switzer (2000), Park and Lee (2010), Tavakoli, McMillan and McKnight (2012), – is distinguishable and has significant impact on value creation.
H1. Corporate stock indicates pre-disclosure of the M&A deal information to secluded group of investors prior to the publication of the press release.
As a pre-test of IA and CAR correlation we need to define if chosen sector shows statistical evidence for such research to be conducted. Building on preceding researches results we hypothesize that, in relatively homogenous environment, for comparable variables in M&A conditions we will be able to find a mean coefficient to link CAR and intangibles value.
H2. CAR for intangibles intensive organizations in M&A lay in a scalable and measurable corridor similar to all companies (with ±5% deviation).
It is possible by means of regression analysis within event study framework to build such model which will allow us to improve IA value measurement of intangibles intensive company in such specific occasion as M&A process? This is the key question of our research, which we assume to have a positive answer on, so that our further research would be built on relatively simple improved IA valuation method.
H3. Inclusion of CAR impact on corporate intangible assets value in appraisal gradually improves the explainability of IA value in M&A.
As a result we receive correlation analyses for industry-adjusted abnormal returns for intangible assets intensive companies, which broadly describe the intangibles behavior in M&A, indicating positive relation between the abnormal intangible assets return and the change in (GW+IA)/Capitalization ratio for the sample studies. Actual result here is
239
development of a coefficient for predicting the abnormal return to software vendor in M&A in monthly and annual timeframe.
The reminder of this paper is organized as follows. Section 2 describes our sample data and chosen process of data analysis. Empirical results are discussed in section 3, followed by conclusion on results and findings in section 4.
2 Materials and methods
Sample The choice of event study methodology for this research implies that we further will build a regression-based market model, which is data-intensive. For our research we already have chosen a segment, and initial sample consists of public software IT companies, which were parties to M&A process during the period of 2006-2012. Full sample includes 90 acquiring software vendors and 222 targets – 312 companies total. Economic uncertainty would have had a significant impact in 2007-2009, therefore we had to immediately exclude number of deals conducted in years before 2010. This decision benefits our research not only from the position of disruptive statistics exclusion, but as well by timeframe being limited to the M&A post-recovery period in rather mature software market (as described in the first chapter). To achieve homogeneity and representativeness of sample we applied following criteria/restrictions:
1. acquisitors are companies listed on NYSE;
2. targets are public and either are traded under American depositary receipt (ADR) conditions or are listed on NYSE;
3. the acquiring firm controls less than 50% of the shares of the target firm before the announcement;
4. acquired company is not a subsidiary of another company and 100% is transferred to acquisitor during the transaction;
5. accounting data is available for both parties of M&A process;
6. main source of revenue for both acquisitor and the target is software and software-related services sales, including cloud computing, maintenance, technical support, and software-as-a-service (SaaS) categories. This is one of the most important criteria in the scope of current research;
7. the transaction size is higher than $50 M to filter insignificant deals;
8. difference corridor between bid and ask price for both companies stocks on a short-term basis in general does not exceed 20% and 25% for the period before the announcement date and acquisition close date, respectively;
9. in the observed long-term period acquisitors do not have any other significant M&A transactions, so that their effects will not overlap observed event.
For the short-term study we collected market data in two event windows: (-10;10) trading days around announcement date and around the date, when M&A deal was closed. In case of data overlap (less than 20 trading days between announcement and closure) we took the number of trading days less than 20 after announcement and before finalization of the deal, so that announcement date was not included in ‘closure sample’, and vice versa.
240
Long-term event window was determined on a calendar basis, including not less than one year of stock data information before and after the acquisition. Intent here was to obtain a comparable set of data, consistent with corporate reporting. Second set of long-term data comprised of quarterly operational performance indicators, obtained from quarterly and annual filings to SEC (Security and Exchange Commission, US) and Bloomberg L.P. – financial software, data and media company.
This combination of statistical data constitutes the input for our further analysis.
Event Study, Regression Models and CAR Our intent to review the abnormal return on security assumes that there is some ‘normal’ return. This ‘normal’ return is a benchmark we define to perform our analysis. Thus, it is necessary to specify the model we use for ‘normal’ returns estimation before we will be able to measure abnormal returns. Prior researches’ results suggest that the best choice here is to use market (and risk) adjusted returns model.
According to Brown and Warner (1980: 208) market and risk adjusted returns model presumes that some version of Capital Asset Pricing Model generates expected returns. Two-parameter model, then, may be described as follows:
Chyba! Záložka není definována.𝐸�𝑅�𝑖𝑡� = 𝐸�𝑅�𝑧𝑡�+ 𝛽𝑖�𝐸�𝑅�𝑚𝑡� − 𝐸�𝑅�𝑧𝑡�� = 𝐾𝑖𝑡 (1)
where
𝑅�𝑖𝑡 – return on asset i in day t; 𝑅�𝑧𝑡 – return on minimum variance asset portfolio z in day t; 𝑅�𝑚𝑡 – return for the market in day t;
𝐾𝑖𝑡 = 𝐸�𝑅�𝑖𝑡� – expected return given by particular model;
𝛽𝑖 – the sensitivity of the expected excess asset returns to the expected excess market returns.
Generalizing and modifying equation (1) by Cable and Holland (1999: 82) enveloping model we receive the following model:
Chyba! Záložka není definována.𝑅�𝑖𝑡 = 𝑅�𝑧𝑡 + (𝛾𝑖 − 𝛽𝑖)𝑅�𝑧𝑡 + 𝛽𝑖𝑅�𝑚𝑡 (2)
where 𝛾𝑖 – coefficient of distinction, showing the sensitivity of the expected excess market returns to the expected risk-free returns;
𝑅�𝑖𝑡 = 𝐸�𝑅�𝑖𝑡�;
𝑅�𝑧𝑡 = 𝐸�𝑅�𝑧𝑡� – expected risk-free return on day t;
𝑅�𝑚𝑡 = 𝐸�𝑅�𝑚𝑡� – expected market return in day t.
Equation (2) explains regression model, which we utilize for benchmarking and CAR estimations. Inbound data will be a lot similar, except for individual vendor stock prices. With vendor daily stock price being a dependant variable we need independent variables, which will combine into regression equation. The best data to tangle software vendor stock price with is an industry market index MSECTOR8. This technology sector index includes 32 sub-indexes. Filtering out software-related sub-indexes we build a custom set of software market indicators, which will serve as independent variables for purposes of benchmarking in our analysis.
241
We suspect that function of dependant variable will be a linear combination of multiple independent variables. That results in a multiple linear regression function being an illustration of proposed model.
Regression models should be built so that we can compare not only impact of announced M&A, but also see the difference between effects from announcing the transaction and actual merger. For this purpose we compose two analyses. One researches retrospective data from the sample before announcement date; and one is based on the same data plus stock prices fluctuations till the day of closing the M&A transaction. Second dataset applies post-announcement effects and therefore will bring us to a less predictable model than the first one, but may give us a valuable insight in short-term stock behavior.
Due to the amount of work and data, regression models are best to be developed with IBM SPSS package, which was a party to merger itself not that long ago, when IBM acquired relational database management software vendor SPSS. Overall modeling exercise will result in 26 regression models.
Having ‘normal’ return estimated we estimate abnormal returns and assess their relation to actual post-M&A performance. Daily abnormal returns (𝐴𝑅𝑖𝑡) are best illustrated by equation:
Chyba! Záložka není definována.𝐴𝑅𝑖𝑡 = 𝑅𝑖𝑡 − 𝑅�𝑖𝑡 (3)
In order to examine the cumulative effect of each event, the cumulative abnormal returns (𝐶𝐴𝑅) are produced as association of all AR in event period T:
Chyba! Záložka není definována.𝐶𝐴𝑅𝑖𝑇 = ∑ 𝐴𝑅𝑖𝑡𝑇2𝑡=𝑇1 (4)
where 𝑇1 and 𝑇2 are starting and ending days of event period T respectively.
Finally, to test if each individual period’s abnormal return 𝐴𝑅𝑖𝑡 is significant in the event period, the test statistic – 𝜑, – is obtained by dividing 𝐴𝑅𝑖𝑡 by the estimated standard deviation. This statistic test is sometimes as well called a standardized abnormal returns (𝑆𝐴𝑅) test.
Chyba! Záložka není definována.𝜑𝑖𝑡 = 𝐴𝑅𝑖𝑡𝑆(𝐴𝑅𝑖)� (5)
where 𝑆(𝐴𝑅𝑖) is the standard deviation of abnormal returns of security during the estimation period before the event day 𝑇0 and is estimated by:
Chyba! Záložka není definována.𝑆(𝐴𝑅𝑖) = � 1𝑇0−𝑇1−1
� 𝐴𝑅𝑖𝑡2𝑇0𝑡=𝑇1+1
(6)
To find if our estimates have statistically significant results we need to modify test statistic (5) for 𝐶𝐴𝑅, receiving 𝑆𝐶𝐴𝑅 test (𝜑(𝑐𝑎𝑟)):
Chyba! Záložka není definována.𝜑(𝑐𝑎𝑟)𝑖𝑇 = 𝐶𝐴𝑅𝑖𝑇𝑆(𝐶𝐴𝑅𝑖)� (7)
Standard deviation of cumulative abnormal returns in estimation period – 𝑆(𝐶𝐴𝑅𝑖), – calculations fully comply with equation (6), with the only distinction that we assess 𝐶𝐴𝑅𝑖 instead of 𝐴𝑅𝑖.
The 𝑆𝐴𝑅 and 𝑆𝐶𝐴𝑅 is in essence a calculation where each abnormal security return or abnormal returns aggregation is normalized by its estimation period standard deviation. As such, it is a t-statistic, with [-1.96, 1.96] as the null hypothesis test interval (in large samples). If we get outside the boundaries of null hypothesis – our results are statistically significant.
Thus, with final estimations ready we can perform correlation analysis and examine generalities for built models. From this section we will as well obtain significant amount of
242
information for operational performance study, which is based on quarterly CAR and (GW+IA)/Capitalization ratio interaction and relation analysis.
Operational Performance and CAR analysis In the search for an acquisition target, which may well take place in conditions of considerable secrecy, a potential acquirer will most likely have to depend on publicly available information on target companies such as annual reports and earnings announcements.
Leger and Quach (2009) in their research indicate that, in the long run, financial factors tend to influence the combination’s performance in terms of ROA (return on assets), ROE (return on equity) and profit margin. Nevertheless, analysis suggests that characteristics of the software product portfolio play a significant role in the performance of merged software firms. More specifically, software compatibility appears to be an antecedent to the new entity’s long-term performance as measured by increased sales one and two years after the announcement of the merger.
With a strong support in literature we presume corporate operation performance to introduce valuable parameter to intangible assets value assessment in context of mergers and acquisitions, as discussed in methodology of this study. From this perspective the calendar quarter statistics on corporate change in goodwill, IA, and capitalization was included into our review to see and examine the link between CAR and intellectual assets, as factors of corporate development in M&A.
If our analysis will not prove H2 then for further estimates we will need to replace 𝐶𝐴𝑅𝑖𝑇 with cumulative average abnormal returns in period T (𝐶𝐴𝐴𝑅𝑇), estimated for N observations in day t from (3) and (4) as follows:
Chyba! Záložka není definována.𝐴𝐴𝑅𝑡 = 1𝑁𝑡
× ∑ 𝐴𝑅𝑖𝑡𝑁𝑡𝑖=1 (8)
Chyba! Záložka není definována.𝐶𝐴𝐴𝑅𝑇 = ∑ 𝐴𝐴𝑅𝑖𝑡𝑇2𝑡=𝑇1 (9)
Significance tests for average abnormal returns (𝐴𝐴𝑅𝑡) in each period are performed by comparing them to estimated standard deviation, similar to equations (5-7). To include distinction between two scenarios in further estimations we insert a parametrical variable 𝑦. When 𝑦 = 1, 𝑓(𝑦) = 𝐶𝐴𝑅𝚤𝑇�������� = 𝐶𝐴𝑅𝑇; alternatively with 𝑦 = 0, 𝑓(𝑦) = 𝐶𝐴𝐴𝑅𝑇.
We examine impact of intangible assets performance in 𝐶𝐴𝑅 (𝐶𝐴𝐴𝑅) on a day to day basis, reviewing IA in relation to market capitalization (Cap) ratio development, so that with 𝑗 = (1,𝑁𝑇) in timeframe T and sequential day number (𝑛𝑡) regression is described by:
Chyba! Záložka není definována.𝑓(𝑦)𝑡 = 𝛽0 + 𝛽𝑗1𝑛𝑡 + 𝛽𝑗2 �𝐼𝐴𝐶𝑎𝑝
�𝑗,𝑡
+ 𝜀𝑗𝑇 (10)
where
𝛽0 is constant parameter of the model;
𝜀𝑗𝑇 – statistical error.
Input of IA here is restricted to its portion in market value of the company in the eyes of investor, described by 𝐶𝑎𝑝.This restriction becomes obvious, if we look at it in the light of reporting practices. Intellectual assets’ balance value in most cases looks underestimated, if compared to real value derived from IA input into performance (usually used in appraisal). Dube and Glascock (2006) advocate that reported value of intangibles suffice the purposes of
243
returns analysis. Thus, assuming that relative input of reported IA value has identical pattern with their real value input, we apply the described restriction to regression model variables.
By performing these two analyses, we aim at obtaining such 𝛽𝑗, that with proper inputs and 𝐶𝐴𝑅 (𝐶𝐴𝐴𝑅) models, appraisers will be able to use coefficient simplifying estimations of future value for Intellectual Assets for purposes of M&A by income approach methods of valuation.
3 Results and Discussion Following the flow of suggested methodology, we started estimations with benchmarking. Comparison of market indexes to real performance of stock in 365 days before the event was our best choice to improve the forecasting power of regression models. This was dictated by the limited data sample in the first place. But post-event model testing has shown that excess volatility in announcement-to-close period cuts off most of the chosen market indexes (see Table 1).
Table 1. Models description for regression, based on 365 days before the closure of M&A deal. Coeff. M1-A M1-T M2-A M2-T M3-A M3-T M4-A M4-T M5-A M5-T M6-A M7-T M8-A M8-T
R 81.10% 89.30% 91.00% 82.70% 90.00% 82.80% 92.00% 84.80% 57.20% 94.10% 96.30% 90.50% 83.90% 90.30%
R Square 65.76% 79.74% 82.80% 68.38% 81.03% 68.56% 84.70% 71.88% 32.77% 88.46% 92.82% 81.90% 70.45% 81.60%
Adj. R Sq. 65.07% 79.33% 82.45% 67.74% 80.49% 67.92% 84.05% 71.08% 31.38% 88.18% 92.70% 81.46% 69.97% 81.38%
Variable Std. Error
MS810 0.002 0.001 0.002 0.001 0.002 - - - 0.036 0.021 - - - 0.006
MS820 0.001 0.001 0.002 - 0.001 0.001 0.002 0.005 - 0.018 - 0.002 - 0.005
MS821 0.002 0.001 0.003 0.001 0.002 0.001 0.003 - 0.045 - 0.004 - 0.003 0.007
MS822 0.002 - 0.001 0.001 0.001 - - - - 0.015 0.002 0.003 0.003 -
MS823 0.002 - 0.002 0.000 0.001 - - - - 0.023 0.001 - - 0.004
MS824 0.001 0.000 - 0.000 0.001 0.001 - 0.002 0.015 - - - 0.001 0.002
MS826 0.001 0.001 - 0.001 0.001 0.001 0.002 - 0.026 - 0.003 0.005 - 0.004
MS852 0.001 0.001 - - 0.001 - - - 0.016 0.018 0.002 0.001 0.001 -
t-Statistics
MS810 - 5.3 8.6 5.8 3.5 4.8 - - - 3.4 3.1 - - - 5.9
MS820 - 3.3 - 7.4 - 6.9 - - 6.3 - 21.6 - 27.1 14.2 - - 6.3 - - 6.8 - - 6.5
MS821 10.6 - 8.4 - 4.4 4.7 5.4 30.7 5.3 - - 6.4 - 8.2 - 7.2 5.0
MS822 6.0 - 3.0 2.2 5.2 - - - - 19.1 9.8 - 7.2 6.4 -
MS823 - 3.2 - 15.5 4.5 - 2.1 - - - - - 5.8 - 4.2 - - - 7.9
MS824 - 15.0 - 10.4 - - 22.7 - 18.2 - 15.4 - 14.4 - 5.8 - - - - 2.4 - 12.5
MS826 6.3 6.2 - - 3.2 8.9 8.5 8.8 - 4.8 - - 3.1 - 6.3 - 12.0
MS852 - 3.3 12.3 - - 4.2 - - - 10.7 - 8.8 5.1 24.2 3.4 -
If compared to models, built on pre-announcement data (see Table 2), coefficients of determination: 𝑅, 𝑅2 and 𝑅�2 – show that volatility in announcement-to-merger period is damaging the analysis.
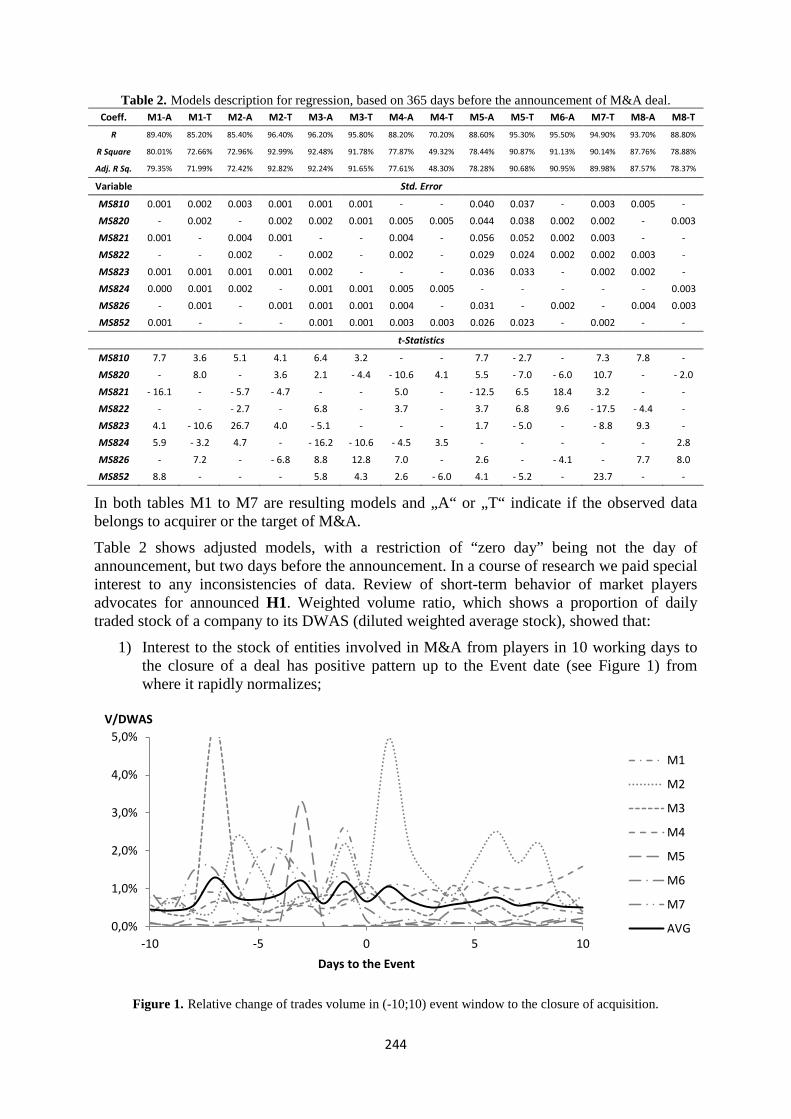
244
Table 2. Models description for regression, based on 365 days before the announcement of M&A deal. Coeff. M1-A M1-T M2-A M2-T M3-A M3-T M4-A M4-T M5-A M5-T M6-A M7-T M8-A M8-T
R 89.40% 85.20% 85.40% 96.40% 96.20% 95.80% 88.20% 70.20% 88.60% 95.30% 95.50% 94.90% 93.70% 88.80%
R Square 80.01% 72.66% 72.96% 92.99% 92.48% 91.78% 77.87% 49.32% 78.44% 90.87% 91.13% 90.14% 87.76% 78.88%
Adj. R Sq. 79.35% 71.99% 72.42% 92.82% 92.24% 91.65% 77.61% 48.30% 78.28% 90.68% 90.95% 89.98% 87.57% 78.37%
Variable Std. Error
MS810 0.001 0.002 0.003 0.001 0.001 0.001 - - 0.040 0.037 - 0.003 0.005 -
MS820 - 0.002 - 0.002 0.002 0.001 0.005 0.005 0.044 0.038 0.002 0.002 - 0.003
MS821 0.001 - 0.004 0.001 - - 0.004 - 0.056 0.052 0.002 0.003 - -
MS822 - - 0.002 - 0.002 - 0.002 - 0.029 0.024 0.002 0.002 0.003 -
MS823 0.001 0.001 0.001 0.001 0.002 - - - 0.036 0.033 - 0.002 0.002 -
MS824 0.000 0.001 0.002 - 0.001 0.001 0.005 0.005 - - - - - 0.003
MS826 - 0.001 - 0.001 0.001 0.001 0.004 - 0.031 - 0.002 - 0.004 0.003
MS852 0.001 - - - 0.001 0.001 0.003 0.003 0.026 0.023 - 0.002 - -
t-Statistics
MS810 7.7 3.6 5.1 4.1 6.4 3.2 - - 7.7 - 2.7 - 7.3 7.8 -
MS820 - 8.0 - 3.6 2.1 - 4.4 - 10.6 4.1 5.5 - 7.0 - 6.0 10.7 - - 2.0
MS821 - 16.1 - - 5.7 - 4.7 - - 5.0 - - 12.5 6.5 18.4 3.2 - -
MS822 - - - 2.7 - 6.8 - 3.7 - 3.7 6.8 9.6 - 17.5 - 4.4 -
MS823 4.1 - 10.6 26.7 4.0 - 5.1 - - - 1.7 - 5.0 - - 8.8 9.3 -
MS824 5.9 - 3.2 4.7 - - 16.2 - 10.6 - 4.5 3.5 - - - - - 2.8
MS826 - 7.2 - - 6.8 8.8 12.8 7.0 - 2.6 - - 4.1 - 7.7 8.0
MS852 8.8 - - - 5.8 4.3 2.6 - 6.0 4.1 - 5.2 - 23.7 - -
In both tables M1 to M7 are resulting models and „A“ or „T“ indicate if the observed data belongs to acquirer or the target of M&A.
Table 2 shows adjusted models, with a restriction of “zero day” being not the day of announcement, but two days before the announcement. In a course of research we paid special interest to any inconsistencies of data. Review of short-term behavior of market players advocates for announced H1. Weighted volume ratio, which shows a proportion of daily traded stock of a company to its DWAS (diluted weighted average stock), showed that:
1) Interest to the stock of entities involved in M&A from players in 10 working days to the closure of a deal has positive pattern up to the Event date (see Figure 1) from where it rapidly normalizes;
Figure 1. Relative change of trades volume in (-10;10) event window to the closure of acquisition.
0,0%
1,0%
2,0%
3,0%
4,0%
5,0%
-10 -5 0 5 10
V/DWAS
Days to the Event
M1
M2
M3
M4
M5
M6
M7
AVG
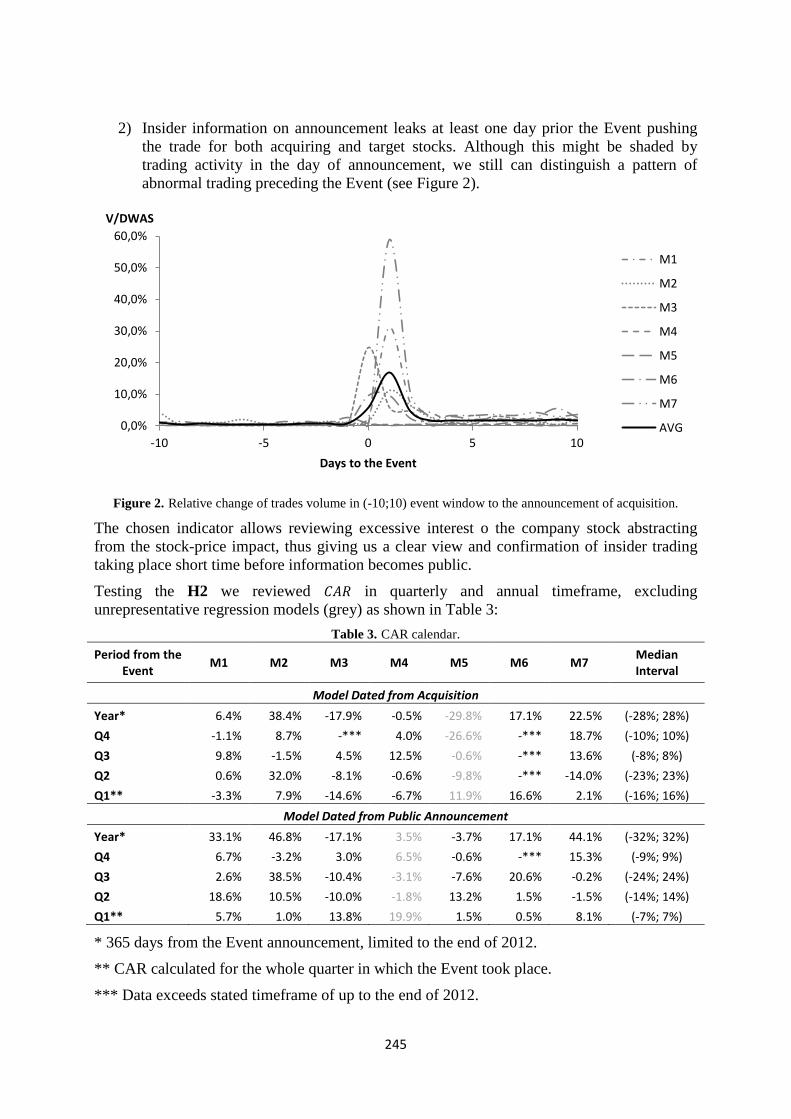
245
2) Insider information on announcement leaks at least one day prior the Event pushing the trade for both acquiring and target stocks. Although this might be shaded by trading activity in the day of announcement, we still can distinguish a pattern of abnormal trading preceding the Event (see Figure 2).
Figure 2. Relative change of trades volume in (-10;10) event window to the announcement of acquisition.
The chosen indicator allows reviewing excessive interest o the company stock abstracting from the stock-price impact, thus giving us a clear view and confirmation of insider trading taking place short time before information becomes public.
Testing the H2 we reviewed 𝐶𝐴𝑅 in quarterly and annual timeframe, excluding unrepresentative regression models (grey) as shown in Table 3:
Table 3. CAR calendar. Period from the
Event M1 M2 M3 M4 M5 M6 M7 Median Interval
Model Dated from Acquisition Year* 6.4% 38.4% -17.9% -0.5% -29.8% 17.1% 22.5% (-28%; 28%) Q4 -1.1% 8.7% -*** 4.0% -26.6% -*** 18.7% (-10%; 10%) Q3 9.8% -1.5% 4.5% 12.5% -0.6% -*** 13.6% (-8%; 8%) Q2 0.6% 32.0% -8.1% -0.6% -9.8% -*** -14.0% (-23%; 23%) Q1** -3.3% 7.9% -14.6% -6.7% 11.9% 16.6% 2.1% (-16%; 16%)
Model Dated from Public Announcement Year* 33.1% 46.8% -17.1% 3.5% -3.7% 17.1% 44.1% (-32%; 32%) Q4 6.7% -3.2% 3.0% 6.5% -0.6% -*** 15.3% (-9%; 9%) Q3 2.6% 38.5% -10.4% -3.1% -7.6% 20.6% -0.2% (-24%; 24%) Q2 18.6% 10.5% -10.0% -1.8% 13.2% 1.5% -1.5% (-14%; 14%) Q1** 5.7% 1.0% 13.8% 19.9% 1.5% 0.5% 8.1% (-7%; 7%)
* 365 days from the Event announcement, limited to the end of 2012.
** CAR calculated for the whole quarter in which the Event took place.
*** Data exceeds stated timeframe of up to the end of 2012.
0,0%
10,0%
20,0%
30,0%
40,0%
50,0%
60,0%
-10 -5 0 5 10
V/DWAS
Days to the Event
M1
M2
M3
M4
M5
M6
M7
AVG
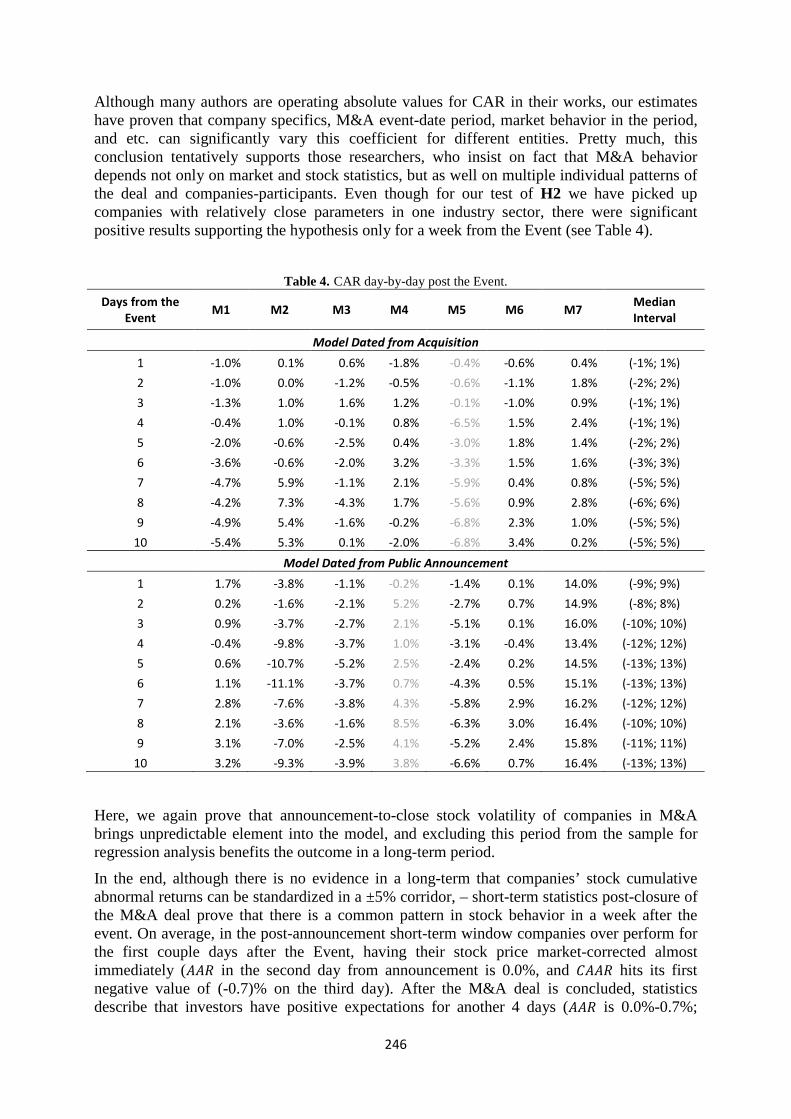
246
Although many authors are operating absolute values for CAR in their works, our estimates have proven that company specifics, M&A event-date period, market behavior in the period, and etc. can significantly vary this coefficient for different entities. Pretty much, this conclusion tentatively supports those researchers, who insist on fact that M&A behavior depends not only on market and stock statistics, but as well on multiple individual patterns of the deal and companies-participants. Even though for our test of H2 we have picked up companies with relatively close parameters in one industry sector, there were significant positive results supporting the hypothesis only for a week from the Event (see Table 4).
Table 4. CAR day-by-day post the Event.
Days from the Event M1 M2 M3 M4 M5 M6 M7 Median
Interval
Model Dated from Acquisition 1 -1.0% 0.1% 0.6% -1.8% -0.4% -0.6% 0.4% (-1%; 1%) 2 -1.0% 0.0% -1.2% -0.5% -0.6% -1.1% 1.8% (-2%; 2%) 3 -1.3% 1.0% 1.6% 1.2% -0.1% -1.0% 0.9% (-1%; 1%) 4 -0.4% 1.0% -0.1% 0.8% -6.5% 1.5% 2.4% (-1%; 1%) 5 -2.0% -0.6% -2.5% 0.4% -3.0% 1.8% 1.4% (-2%; 2%) 6 -3.6% -0.6% -2.0% 3.2% -3.3% 1.5% 1.6% (-3%; 3%) 7 -4.7% 5.9% -1.1% 2.1% -5.9% 0.4% 0.8% (-5%; 5%) 8 -4.2% 7.3% -4.3% 1.7% -5.6% 0.9% 2.8% (-6%; 6%) 9 -4.9% 5.4% -1.6% -0.2% -6.8% 2.3% 1.0% (-5%; 5%)
10 -5.4% 5.3% 0.1% -2.0% -6.8% 3.4% 0.2% (-5%; 5%) Model Dated from Public Announcement
1 1.7% -3.8% -1.1% -0.2% -1.4% 0.1% 14.0% (-9%; 9%) 2 0.2% -1.6% -2.1% 5.2% -2.7% 0.7% 14.9% (-8%; 8%) 3 0.9% -3.7% -2.7% 2.1% -5.1% 0.1% 16.0% (-10%; 10%) 4 -0.4% -9.8% -3.7% 1.0% -3.1% -0.4% 13.4% (-12%; 12%) 5 0.6% -10.7% -5.2% 2.5% -2.4% 0.2% 14.5% (-13%; 13%) 6 1.1% -11.1% -3.7% 0.7% -4.3% 0.5% 15.1% (-13%; 13%) 7 2.8% -7.6% -3.8% 4.3% -5.8% 2.9% 16.2% (-12%; 12%) 8 2.1% -3.6% -1.6% 8.5% -6.3% 3.0% 16.4% (-10%; 10%) 9 3.1% -7.0% -2.5% 4.1% -5.2% 2.4% 15.8% (-11%; 11%)
10 3.2% -9.3% -3.9% 3.8% -6.6% 0.7% 16.4% (-13%; 13%)
Here, we again prove that announcement-to-close stock volatility of companies in M&A brings unpredictable element into the model, and excluding this period from the sample for regression analysis benefits the outcome in a long-term period.
In the end, although there is no evidence in a long-term that companies’ stock cumulative abnormal returns can be standardized in a ±5% corridor, – short-term statistics post-closure of the M&A deal prove that there is a common pattern in stock behavior in a week after the event. On average, in the post-announcement short-term window companies over perform for the first couple days after the Event, having their stock price market-corrected almost immediately (𝐴𝐴𝑅 in the second day from announcement is 0.0%, and 𝐶𝐴𝐴𝑅 hits its first negative value of (-0.7)% on the third day). After the M&A deal is concluded, statistics describe that investors have positive expectations for another 4 days (𝐴𝐴𝑅 is 0.0%-0.7%;
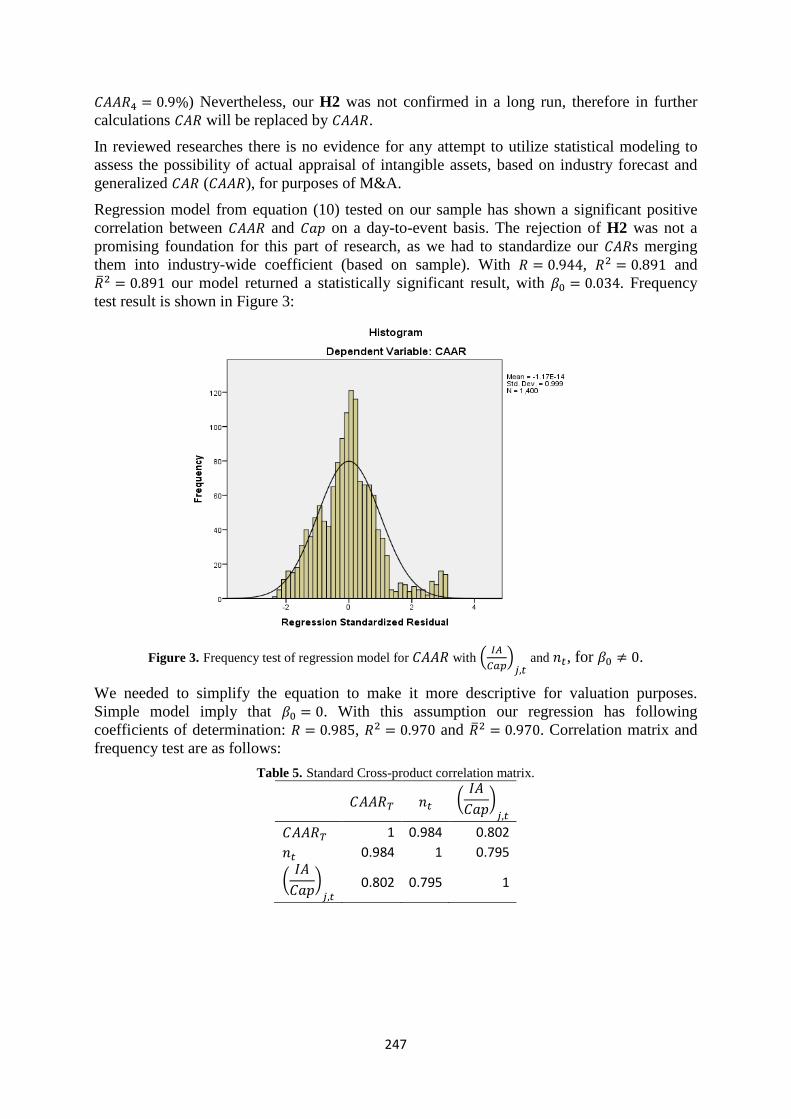
247
𝐶𝐴𝐴𝑅4 = 0.9%) Nevertheless, our H2 was not confirmed in a long run, therefore in further calculations 𝐶𝐴𝑅 will be replaced by 𝐶𝐴𝐴𝑅.
In reviewed researches there is no evidence for any attempt to utilize statistical modeling to assess the possibility of actual appraisal of intangible assets, based on industry forecast and generalized 𝐶𝐴𝑅 (𝐶𝐴𝐴𝑅), for purposes of M&A.
Regression model from equation (10) tested on our sample has shown a significant positive correlation between 𝐶𝐴𝐴𝑅 and 𝐶𝑎𝑝 on a day-to-event basis. The rejection of H2 was not a promising foundation for this part of research, as we had to standardize our 𝐶𝐴𝑅s merging them into industry-wide coefficient (based on sample). With 𝑅 = 0.944, 𝑅2 = 0.891 and 𝑅�2 = 0.891 our model returned a statistically significant result, with 𝛽0 = 0.034. Frequency test result is shown in Figure 3:
Figure 3. Frequency test of regression model for 𝐶𝐴𝐴𝑅 with � 𝐼𝐴𝐶𝑎𝑝
�𝑗,𝑡
and 𝑛𝑡, for 𝛽0 ≠ 0.
We needed to simplify the equation to make it more descriptive for valuation purposes. Simple model imply that 𝛽0 = 0. With this assumption our regression has following coefficients of determination: 𝑅 = 0.985, 𝑅2 = 0.970 and 𝑅�2 = 0.970. Correlation matrix and frequency test are as follows:
Table 5. Standard Cross-product correlation matrix.
𝐶𝐴𝐴𝑅𝑇 𝑛𝑡 �𝐼𝐴𝐶𝑎𝑝
�𝑗,𝑡
𝐶𝐴𝐴𝑅𝑇 1 0.984 0.802 𝑛𝑡 0.984 1 0.795
�𝐼𝐴𝐶𝑎𝑝
�𝑗,𝑡
0.802 0.795 1
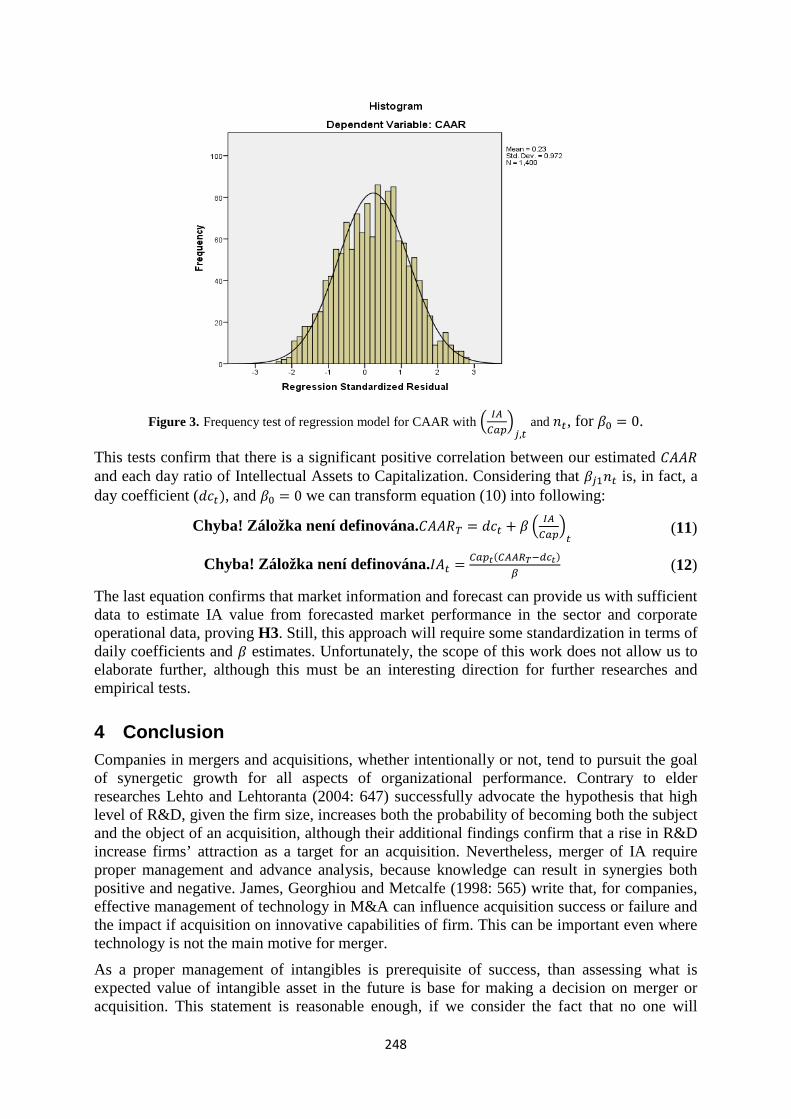
248
Figure 3. Frequency test of regression model for CAAR with � 𝐼𝐴𝐶𝑎𝑝
�𝑗,𝑡
and 𝑛𝑡, for 𝛽0 = 0.
This tests confirm that there is a significant positive correlation between our estimated 𝐶𝐴𝐴𝑅 and each day ratio of Intellectual Assets to Capitalization. Considering that 𝛽𝑗1𝑛𝑡 is, in fact, a day coefficient (𝑑𝑐𝑡), and 𝛽0 = 0 we can transform equation (10) into following:
Chyba! Záložka není definována.𝐶𝐴𝐴𝑅𝑇 = 𝑑𝑐𝑡 + 𝛽 � 𝐼𝐴𝐶𝑎𝑝
�𝑡 (11)
Chyba! Záložka není definována.𝐼𝐴𝑡 = 𝐶𝑎𝑝𝑡(𝐶𝐴𝐴𝑅𝑇−𝑑𝑐𝑡)𝛽
(12)
The last equation confirms that market information and forecast can provide us with sufficient data to estimate IA value from forecasted market performance in the sector and corporate operational data, proving H3. Still, this approach will require some standardization in terms of daily coefficients and 𝛽 estimates. Unfortunately, the scope of this work does not allow us to elaborate further, although this must be an interesting direction for further researches and empirical tests.
4 Conclusion Companies in mergers and acquisitions, whether intentionally or not, tend to pursuit the goal of synergetic growth for all aspects of organizational performance. Contrary to elder researches Lehto and Lehtoranta (2004: 647) successfully advocate the hypothesis that high level of R&D, given the firm size, increases both the probability of becoming both the subject and the object of an acquisition, although their additional findings confirm that a rise in R&D increase firms’ attraction as a target for an acquisition. Nevertheless, merger of IA require proper management and advance analysis, because knowledge can result in synergies both positive and negative. James, Georghiou and Metcalfe (1998: 565) write that, for companies, effective management of technology in M&A can influence acquisition success or failure and the impact if acquisition on innovative capabilities of firm. This can be important even where technology is not the main motive for merger.
As a proper management of intangibles is prerequisite of success, than assessing what is expected value of intangible asset in the future is base for making a decision on merger or acquisition. This statement is reasonable enough, if we consider the fact that no one will
249
invest into acquisition of any intangibles, in case the homothetic profit can be derived at the same period of time by other less or equally risky means. With the value of intangibles being so important within the M&A framework and accounting tools being able to provide only relative assessment of intangible assets value, appraisal for the decision-making purposes in acquisitions must be addressed with precision. And significant level of precision may be reached by using both market indicators and corporate reported data, as proven in our research.
The complexity of using the market as a base for value determination yet must be considered. While the expected CAR for intangibles intensive organizations in M&A was hypothesized to be measured in a scalable and definable corridor similar to all companies (with ±5% deviation), real market data shows that the further we look into the future – the broader this corridor may become. In post-acquisition short-term period CAR lays in (-5%; 5%) median interval for no longer than one trading week, being distracted by stock volatility prior and after this short period. However, our results rather disprove than approve common anticipation of positive short-term performance of M&A participants, showing that excess returns may vary considerably and bring negative as well as positive stock value flows. In the first quarter after announcement we observe CAR in (-7%; 7%) interval from median, but by the end of the year after the Event this corridor widens to (-32%; 32%).
This significant deviation between corporations’ excess earnings in a long-term event window underlines the multi-dimensionality of value behavior in intangibles intensive M&As. Within our study we mitigated the major portion of factors impacting the final model using a benchmark built on the optimal market sector data and excluding any unrepresentative data, such as highly volatile stock performance in announcement-to-merger window. Moreover, for best statistical description of the long-term behavior further researches are suggested to exclude statistics for two days before the announcement from the sample, in order to avoid inclusion of data biased by insider trading, which was proved to take place and affect regression analysis results.
Disregarding the lack of CAR homogeneity, sequential CAAR is proven to be sufficient in measuring intellectual assets value in its connection to corporate market capitalization. Resulting evaluation technique suggests that there is a definite possibility to build such model which will allow us to improve IA value measurement of intangibles intensive company in such specific occasion as M&A process by means of regression analysis within event study framework. Equation (12) proves that IA value, with a proper market forecast, can be optimally measured by changes in capitalization and CAAR.
This framework still requires further analysis and empirical study to prove applicability of our theoretical conclusions to less intangibles intensive industries. As recent development of society heads towards intensification of research and development in natural resource-preserving technologies, we see a great potential in observing biotechnologies sector (as part of this tendency) in aspect of merging research capabilities and cumulating synergetic value.
References Agrawal, A., Jaffe, J. F., & Mandelker, G. N. (1992) 'The Post-Merger Performance of Acquiring Firms: A Re-examination of an Anomaly’ The Journal of Finance, vol. 47, no. 4, pp. 1605-1621.
Ahammad, M. F., & Glaister, K. W. (2013) ‘The pre-acquisition evaluation of target firms and cross border acquisition performance’. International Business Review, pp. 894-904.
250
Andre, P., Kooli, M., & L'Her, J. (2004) ‘The Long-Run Performance of Mergers and Acquisitions: Evidence from the Canadian Stock Market’, Financial Management, pp. 27-43.
Asquith, P. (1983) ‘Merger bids, uncertainty, and stockholder returns’, Journal of Financial Economics, vol. 11, pp .51-83.
Asquith, P., Bruner, R. F., & Mullins Jr, D. W. (1983) ‘The gains to bidding firms from merger’, Journal of Financial Economics, vol. 11, no. 1-4, pp. 121-139.
Bayona, C., Corredor, P., & Santamaría, R. (2006) ‘Technological alliances and the market valuation of new economy firms’, Technovation, vol. 26, no.3, pp.369-383.
Boehme, R. D., & Sorescu, S. M. (2002) 'The long-run performance following dividend initiations and resumptions: Underreaction or product of change', Journal of Finance, 57.
Brown, S. J., & Warner, J. B. (1980) ‘Measuring security price perfomance’, Journal of Financial Economics, vol. 8, pp.205-258.
Cable, J., & Holland, K. (1998) ‘Regression vs non-regression models of normal returns: Implications for event studies’, Aberystwyth: University of Wales Press.
Chen, S., Chou, R. K., & Lee, Y. (2011) ‘Bidders’ strategic timing of acquisition announcements and the effects of payment method on target returns and competing bids’, Journal of Banking & Finance, vol. 35, no. 9, pp. 2231-2244.
Choi, W. W., Kwon, S. S., & Lobo, G. J. (2000) ‘Market Valuation of Intangible Assets’ Journal of Business Research, vol. 49, no. 35-45.
Ciprian, G. G., Valentin, R., Aurelia Madalina, G. I., & Madalina Lucia, V. V. (2012) ‘From visible to hidden intangible assets’, Procedia - Social and Behavioral Sciences, vol. 62, pp. 682-688.
Cloodt, M., Hagedoorn, J., & Van Kranenburg, H. (2006) ‘Mergers and acquisitions: Their effect on the innovative performance of companies in high-tech industries’, Research Policy, vol. 35, no.5, pp.642-654.
Cohen, J. A. (2005) Intangible assets: Valuation and economic benefit. Hoboken, NJ: Wiley
Cummins, J., & Xie, X. (2008) ‘Mergers and acquisitions in the US property-liability insurance industry: Productivity and efficiency effects’, Journal of Banking & Finance, vol. 32 no 1, pp. 30-55.
Dobija, D., Klimczak, K., Roztocki, N., & Weistroffer, H. (2012) ‘Information technology investment announcements and market value in transition economies: Evidence from Warsaw Stock Exchange’, Journal of Strategic Information System, vol. 21, pp. 308-319.
Dodd, P., & Ruback, R. (1977) ‘Tender offers and stockholders returns’, Journal of Financial Economics, vol. 5, pp. 351-373.
Dube, S., & Glascock, J. (2006) ‘Effects of the method of payment and the mode of acquisition on performance and risk metrics’, International Journal of Managerial Finance, vol. 2, no.3, pp. 176-195.
Dubin, J. (2007) ‘Valuing intangible assets with a nested logit market share model’, Journal of Econometrics, vol. 139, no. 2, pp. 285-302.
Dutta, S., & Jog, V. (2009) ‘The long-term performance of acquiring firms: A re-examination of an anomaly’, Journal of Banking & Finance, vol. 33 no. 8, pp.1400-1412.
251
Eckstein, C. (2004) ‘The measurement and recognition of intangible assets: Then and now’, Accounting Forum, vol. 28, no. 2, pp.139-158.
Franks, J. (1991) ‘The postmerger share-price performance of acquiring firms’, Journal of Financial Economics, vol. 29, no. 1, pp. 81-96.
Gagnon, J., Brehain, P., Broquet, C., & Guerra, F. (1982) ‘Stock market behaviour of merging firmsThe Belgian experience’, European Economic Review, vol.17, no. 2, pp. 187-211.
Ghosh, A. (2001) ‘Does operating performance really improve following corporate acquisitions?’, Journal of Corporate Finance, vol. 7, pp. 151-178.
Goodwin, J., & Ahmed, K. (2006) ‘Longitudinal value relevance of earnings and intangible assets: Evidence from Australian firms’, Journal of International Accounting, Auditing and Taxation, vol. 15, no.1, pp. 72-91.
Huang, Y., & Walking, R. A. (1987) ‘Target abnormal returns associated with acquisition announcements’, Journal of Financial Economics, vol. 19, pp. 329-349.
Jabbour, A. R., Jalilvand, A., & Switzer, J. A. (2000) ‘Pre-bid price run-ups and insider trading activity Evidence from Canadian acquisitions’, International Review of Financial Analysis, vol. 9, no.1, pp. 21-43.
James, A. D., Georghinou, L., & Metcalfe, S., J. (1998) ‘Integrating technology into merger and acquisition decision making’, Technovation, vol. 18, no. 8, pp. 563-591.
Jr, P. H., Sullivan, & Sr, P. H., Sullivan. (2000) ‘Valuing intangibles companies – An intellectual capital approach’. Journal of Intellectual Capital, vol. 1, no.4, pp. 328-340.
Lehto, E., & Lehtoranta, M. (2004) ‘Becoming an acquirer and becoming acquired’, Technological Forecasting and Social Change, vol.71, no 6, pp.635-650.
Léger, P., & Quach, L. (2009) ‘Post-merger performance in the software industry: The impact of characteristics of the software product portfolio’, Technovation, vol. 29, no. 10, pp. 704-713.
Lubatkin, M. (1987) ‘Merger strategies and stockholder value’, Strategic Management Journal, vol. 8, no. 1, pp. 39-53.
Lukas, E., Reuer, J. J., & Welling, A. (2012) ‘Earnouts in mergers and acquisitions: A game-theoretic option pricing approach’, European Journal of Operational Research, vol. 223, pp. 256-263.
Ma, Q., Whidbee, D. A., & Zhang, A. W. (2011) ‘Value, valuation, and the long-run performance of merged firms’, Journal of Corporate Finance, vol. 17, no 1, pp. 1-17.
Mac Kinlay, C. A. (1997) 'Event studies in economics and finance', Journal of Economic Literature, vol. 35, no.1, pp.13-39.
Malatesta, P. H. (1983) ‘The wealth effect of merger activity and the objective functions of merging firms’, Journal of Financial Economics, vol. 11, pp. 155-181.
Mushidzhi, T., & Ward, M. (2004) ‘Abnormal returns for cash vs share funded ascuisition’, Investment Analysts Journal, vol. 60, pp.17-31.
Niculita, A., Popa, A., & Caloian, F. (2012) ‘The Intangible Assets A New Dimension in The Company's Success’, Procedia Economics and Finance, vol. 3, pp. 304-308.
252
Oliveira, L., Rodrigues, L. L., & Craig, R. (2010) ‘Intangible assets and value relevance: Evidence from the portuguese stock exchange’, The British Accounting Review, vol. 42, no. 4, pp. 241-252.
Park, Y. S., & Lee, J. (2010) ‘Detecting insider trading: The theory and validation in Korea Exchange’, Journal of Banking & Finance, vol. 34, no. 9, pp. 2110-2120.
Pratt, S. P. (2007) Valuing a business: The analysis and appraisal of closely-held companies vol. 5. Homewood, IL: Dow Jones-Irwin
Rhéaume, L., & Bhabra, H. S. (2008) ‘Value creation in information-based industries through convergence: A study of U.S. mergers and acquisitions between 1993 and 2005’, Information & Management, vol. 45, no. 5, pp. 304-311.
Tavakoli, M., McMillan, D., & McKnight, P. J. (2012) ‘Insider trading and stock prices’ International Review of Financial Analysis of Economics and Finance, vol. 22, pp. 254-266.
Vandenhonert, R., & Stewart, T. (1992) ‘A game-theoretic model for mergers and acquisitions’, European Journal of Operational Research, vol. 59, no. 2, pp. 275-287.
Yu, J., & Xu, B. (2011) ‘The game analyses to price the target enterprise of merger and acquisition based on the perspective of real options under stochastic surroundings’, Economic Modelling, vol. 28, pp. 1587-1594.
253
Performance Implications of Business Models
Ivana Ticha Department of management, FEM, Czech University of Life Sciences Prague,
Kamycka 129, 165 21 Prague 6 – Suchdol [email protected]
Annotation: This paper aims at reviewing the concept of business model in relation to the explanation of differences of firm performance levels and thus contributing to the preparation of empirical research aiming at identification of factors affecting business performance. The paper builds on ongoing debate in the field of strategic management reviewing two fundamental perspectives explaining firm performance heterogeneity (positioning approach and resource-based view) and combines them with recently emerged concept of business models, which are especially by business practitioners used as the explanation of above-average returns.
Key words: business model, competitive advantage, performance, resource-based view, positioning approach.
JEL classification: M10
1 Introduction One of the fundamental issues in strategic management deals with the source of competitive advantage of a business. Over the years two distinctive approaches explaining the source of competitive advantage have been developed: one based on the structure-conduct-performance paradigm called industry or positioning approach (see Porter, 1980) and the other is based on resources possessed by a firm and called resource based perspective (see e.g. Wernerfelt, 1984). The industry approach is rooted in industrial organization economics and explains differences among firms performances by industry level factors such as market share, barriers to entry, bargaining power of suppliers and buyers, etc. (for details see Porter, 1980 and Rumelt et al., 1991). Industry attractiveness is the driving force of profit generation and firms are thus encouraged to search for most profitable position within the industry in order to generate above-average returns. However, growing dissatisfaction with limitations embedded in economics of industrial organisation particularly in static equilibrium model turned attention to older theories of profit and competition represented by e.g. David Ricardo or Joseph Schumpeter. Resource-based theory in business strategy traces to the long-neglected work of Penrose (1959). Consciously avoiding the term "factor of production" because of its ambiguity, she viewed the firm as a "collection of productive resources" and pointed out that "it is never resources themselves that are the 'inputs' to the production process, but only the services that the resources can render" (pp. 24-25; italics in original). Viewing resources as bundles of possible services that an entity can provide, she argues that it "is the heterogeneity ... of the productive services available or potentially available from its resources that gives each firm its unique character" (pp. 75, 77). Therefore, contrasted with the neoclassical notion of an optimum size of firm, "the expansion of firms is largely based on opportunities to use their existing productive resources more efficiently than they are being used" (p. 88). Resource-based view thus offers a different explanation if performance heterogeneity: firms can produce above-average returns if they posses resources taht are valuable, rare, non-substitutable an non-imitable. Barney (1986, 1991, 1992, 1995) explicates resource-based concepts and their interrelationships in greater detail than had hitherto been done. First, he defines firm resources to "include all assets, capabilities, organizational processes, firm attributes, information, knowledge, etc., controlled by a firm that enable the firm to conceive
254
of and implement strategies that improve its efficiency and effectiveness" (1991, p. 101). He points out that if all firms in an industry have homogeneous, perfectly mobile resources, then all firms will implement the same strategies equally well and no firm can have a competitive advantage. Therefore, only resources that are heterogeneous, imperfectly mobile, and asymmetrically distributed among rivals, that is, are rare, can generate competitive advantage and superior financial performance. Second, Barney (1991) points out that heterogeneity and immobility alone do not guarantee a sustained competitive advantage. Sustainability occurs only when rivals find it difficult to both imitate the competitive advantage-producing resource and develop or acquire strategic substitutes for it. Imperfect imitability results from (1) unique historical circumstances (e.g., buying a piece of property that later provides a locational advantage), (2) causally ambiguous resources, and (3) socially complex resources. Third, Barney (1992) describes socially complex resources as those "that enable an organization to conceive, choose, and implement strategies because of the values, beliefs, symbols, and interpersonal relationships possessed by individuals or groups in a firm" (p. 45). Examples include organizational culture, trust, reputation among customers, and managerial teamwork. As to physical technology, it is customarily imitable. However, the ability to exploit physical technology often involves socially complex phenomena, for example, social relations and/or a culture, that is imperfectly imitable. Hence the exploitation of physical technology can often sustain a competitive advantage.
Yet another explanation of differences in firms performance levels have emerged in trade literature and among practitioners. Not only the industry or the firm specific capabilities are sources of the firm success - innovative business models are offered as an explanation of outstanding performance levels (see e.g. Kaplan et al.,2004)
The concept of business models has emerged in mid-1990s driven by the advent of Internet (see for instance Amit and Zott, 2001), rapid growth in emerging markets and interest in “bottom-of-the-pyramid” issues (Prahalad and Hart, 2002; Seelos and Mair, 2007), as well as expanding industries and organizations dependent on post-industrial technologies (Perkman and Spicer, 2010). Developing and adapting their firm’s business model has become a major task for many executives in their efforts to cope successfully with technological progress, competitive changes, or governmental and regulatory alterations. (Johnson et al, 2008).
Business models can play a central role in explaining firm performance. Afuah and Tucci (2001) propose the business model as a unifying construct for explaining competitive advantage and firm performance and define it as “the method by which a firm builds and uses its resources to offer its customer better value and to make money in doing so” (2001:3) Afuah (2004) focuses on firm’s profitability and introduces a strategic framework in which the business model is conceptualized by means of a set of components that corresponds to the determinants of firm profitability. The framework includes the following components: resources (including competences and capabilities), industry factors, activities, and position. By envisioning the business model through the lens of the factors affecting the firm´s profitability, he implicitly establishes a casual relationship between the business model and firm performance.
This paper aims at reviewing the concept of business model in relation to the explanation of differences of firm performance levels and thus contributing to the preparation of empirical research aiming at identification of factors affecting business performance.
255
2 Materials and Methods The paper contributes to the research project financed by CIGA CUAP “Performance Implications of Business Models Adopted by the Czech Agribusiness SME´s” and by reviewing the concept of business models aims at contributing to the process of development of operational definition of business model as the basis for designing empirical research.
3 Results and Discussion There is no commonly accepted definition of business model in the literature. Instead, the literature reveals a wide range of definitions that vary in their emphases and scope. Nevertheless, most authors agree that a business model articulates a firm’s value proposition, its sources of revenue, the resources used to extract rents, and the governance mechanism that links firm’s stakeholders (Zott and Amit 2010). The business model represents the firm’s distinctive logic for value creation and appropriation (Chesbrough and Rosenbloom 2002; Gambardella and McGahan 2010; Osterwalder and Pigneur 2009; Teece 2010; Zott and Amit 2010). For instance, a business model may outline how the firm creates value for customers via activities related to product development and flexible pricing. A business model may also outline how value is appropriated through, for instance, improved inventory management and changes to governance structures that reduce opportunity costs, increase customers’ switching costs, or lower the leverage that various stakeholders exercise on the firm. Articulating the means by which a firm creates and appropriates value allows for a clearer delineation of the sources of its competitive advantage, which, in turn, facilitates updating and strengthening the business model. Zott and Amit (2010) have acknowledged the importance of conceptualizing business models as integrated systems and have characterized them using prototypical design themes which detail these systems’ dominant value drivers. They suggest a ‘NICE’ framework – novelty, lock-in, complementarities, and efficiency – and argue that these themes represent how interdependencies among the elements of a business model are orchestrated. Novelty involves introducing new elements related to activities, actors, and/or linkages. Lock-in refers to business models that emphasize retention of activities and actors. Complementarities involve the bundling of activities and/or linking of specific actors such that the system is bigger than the sum of its parts. Efficiency builds interdependencies for lean operations, minimal costs, and/or low coordination costs. In their view, the essence of the association between business model design and firm performance can be analyzed by looking at two distinct effects: the total value creation potential of the business model design and the firm´s ability to appropriate that value. In their empirical work, Zott and Amit see the business model as the independent variable, and link it to firm performance, moderated by environment. In another empirical study on firm performance, the business model has been employed as a contingent variable. Palzelt, Knyphausen-Aufsess, and Nikol (2008) introduce the business model as a variable moderating the effect of top management team composition and organizational performance. They analyze a set of biotechnology ventures in the German industry and focus on two types of business models which biotechnology firms might adopt: platform and therapeutics business models. They show that founder-based, firm-specific experience of management team members can have either positive or negative effect on the firm´s performance, depending on the business model adopted. Similarly, Zott and Amit (2008) acknowledge the possible contingent effect of the business model in mediating between product market strategy and firm performance. They root their study in contingency theory and ask: how do the firm´s business model and product market strategy interact to impact the firm performance? They see the business model as a structural construct that captures the firm´s architecture of transactions with external parties, namely customers,
256
partners, and vendors. In Their work they develop a formal model and test it empirically, finding that: 1) business models that emphasize novelty and are occupied with either differentiation or cost leadership can have a positive impact on the firm´s performance, and 2) novelty-centered business models together with early entry into a market have a positive impact on performance. Other studies on the performance implications of business models design come from business practitioners and consultants. Linder and Cantrell (2001), from the Accenture Institute for Strategic Change, have published a report that comments on the results of interviews with 70 companies’ executives and analysts, as well as extensive secondary research on the role of the business model in firms´ success. According to their research, successful companies choose an effective business model and execute it superbly, or they relentlessly alter their business model as competition threatens. Consultants at IBM Global Business Services, interviewing 765 corporate and public sector leader world-wide, found that firms that were financial outperformers put twice as much emphasis on business model innovation as underperformers. Going a step further, Giesen and colleagues (Giesen, Berman, Bell and Blitz, 2007), also from IBM, looked at the relationship between business model innovation, namely industry models (innovations in industry supply chain), revenue models (innovations in how companies generate value), and enterprise models (innovations in the role of an enterprise plays in new or existing value chains). They report two key findings: 1) each type of business model innovation can generate success, and 2) innovation in enterprise models that focuses on external collaboration and partnerships is particularly effective in older companies as compared to younger ones. Yet another approach to define business models is the typological one (Lai, R., Weill, P. and Malone, T. 2006). This typology uses two criteria: one criterion is the type of assets involved––i.e., what products or services have been created for appropriation (four types of assets are considered: physical, financial, intangible, and human), the other is the type of rights being sold––i.e., how value is appropriated (the rights include: ownership, the right to use an asset, the right to make temporary use of the assets, the right to be matched with potential buyers or sellers). These two criteria lead to sixteen business models. However, neither this typological definition explains how the business model impacts the performance level.
4 Conclusion The ongoing debate in the field of strategic management on the source of performance differences among firms has been for a long period of time dominated by two approaches attributing the firm success predominantly to the industry factors (positioning approach) or to the firm specific assets (resource-based view). Recently, business practitioners have contributed to the debate by introducing the concept of business models, especially innovative business models and consider them the drivers of business success. However, little academic contribution to develop the concept has been found, reasons being the difficulty to carry on rigorous studies based on empirical data. Data available are classified according to industries and make it difficult to attribute them to even simply defined business models.
Acknowledgements This paper is part of research project financed by CIGA CUAP “Performance Implications of Business Models Adopted by the Czech Agribusiness SME´s”
257
References Afuah A., Tucci C.L.(2001) Internet Business Models and Strategies, Irwin/McGraw-Hill
Afuah, A.( 2004) Business Models. A Strategic Management Approach, McGraw-Hill, New York, NY.
Amit, R., Zott, C.(2001): Value Creation in E-Business, Strategic Management Journal, vol 22, pp.493-520
Barney, Jay (1991): Firm Resources and Sustainable Competitive Advantage, Journal of Management 17(1), 99-120
Barney, Jay (1992): Integrating Organizational Behavior and Strategy Formulation Research: A Resource-based Analysis, pp. 39-61 in P. Shrivastava, A.S. Hugg, and J.E. Dutton eds. Advances in strategic Management, Greenwich, CN: JAI Press
Barney, Jay (1995): Looking Inside for Competitive Advantage, Academy of Management Executive 9, 49-61
Chesbrough, H., Rosenbloom, R. S. (2002), The Role of the Business Model in Capturing Value from Innovation: Evidence from Xerox Corporation’s Technology Spin-Off Companies, Industrial and Corporate Change, 2002, 11 (3), 529–55.
Gambardella, A., McGahan, A. M.: Business-Model Innovation: General Purpose Technologies and their Implications for Industry Architecture, Long Range Planning, 2010, 43 (2/3), 267–71.
Giesen, E., Berman,S.J., Bell,R., Blitz,A.( 2007): Three ways to successfully innovate your business model", Strategy & Leadership, Vol. 35 Iss: 6, pp.27 – 33
Harvard Business School Press: Boston, MA IBM Global CEO Study, The Enterprise of the Future, New York, 2008
Johnson, M. W., Christensen, C. C., Kagermann, H. (2008) Reinventing your business model, Harvard Business Review 86(12), pp. 63-68
Kaplan RS, Norton DP. (2004). Strategy Maps: Converting Intangible Assets in to Tangible Outcomes.
Lai, R., Weill, P. and Malone, T. (2006) Do Business Model Matter? Research paper funded by
Linder, J., Cantrell, S.( 2001) Changing Business Models: Surveying the Landscape, Accenture Institute for Strategic Change,
Malone, T. W., Weill, P., Lai, R., D'Urso, V.T., Herman, G., Apel, T.G., Woerner, S. (2006) Do Some Business Models Perform Better than Others? A Study of the 1000 Largest US Firms, MIT Sloan School Working Paper 4615-06. MIT SeeIt Project: Cambridge, MA
Osterwalder, A., Pigneur, Y.( 2009): Business Model Generation, Self Published, (ISBN 978-2-8399-0580-0)
Patzelt, H., zu Knyphausen-Aufseß, D., Nikol, P.( 2008): Top Management Teams, Business Models, and Performance of Biotechnology Ventures: An Upper Echelon Perspective, British Journal of Management vol. 19, issue 3, p. 205-221
Penrose, Edith, T. (1959): The Theory of the Growth of the Firm, London, Basil Blackwell and Mott
258
Perkmann, M., Spicer, A.( 2010): What are Business models? Developing a Theory of Performative Representations. Research in the Sociology of Organizations, Technology and Organization: Essays in Honour of Joan Woodward, Michael Lounsbury, p. 265-275
Porter ME. 1980. Competitive Strategy: Techniques for Analyzing Industries and Competitors. Free Press: New York
Prahalad, C. K., Hart, S. L.( 2002) The Fortune at the Bottom of the Pyramid. Strategy + Business, , vol. 26, pp. 2-14.
Seelos, C., Mair, J.( 2007) Profitable business models and market creation in the context of deep poverty: A strategic view, Academy of Management Perspectives, vol. 21, pp. 49-63.
Teece, D.: Business Models, Business Strategy and Innovation, Long Range Planning, 2010, 43 (2/3), 172-94
Wernerfelt, Birger (1984): A Resource-Based View of the Firm, Strategic Management Journal, 5, 171-80
Zott, C., Amit, R. ( 2010): Business Model Design: An Activity System Perspective,” Long Range Planning, 43 (2/3), 216–2.
Zott, C., Amit, R.: Business Model Design: An Activity System Perspective,” Long Range Planning, 2010, 43 (2/3), 216–2.

259
Regional and Social Development

260
261
The process of rural restructuring as a factor of heterogeneity of the rural areas in the Czech Republic
Proces venkovské restrukturalizace jako faktor popisující
heterogenitu venkova v podmínkách České republiky
Jiří Hrabák, Andrea Čapkovičová Ústav zemědělské ekonomiky a informací, Mánesova 75, 120 56 Praha 2
[email protected], [email protected]
Annotation:
This paper deals with the process of rural restructuring, which brings social and economic changes in the countryside. Specifically, there are changes in sectoral employment, demographic changes and changes in the social structure of the population. Rural restructuring is understood as a process that affects different levels of individual sites, thus leading to an increase in the heterogeneity of rural areas. The aim of this paper is to describe the existing heterogeneity in the Czech countryside. In our research, we find whether there is a dependence of selected socio-economic indicators on the size groups of municipalities and the character of settlements in typological regions. As an indicator of the character of settlements OECD typology is used. This typology divides regions according to population density into significantly rural regions, predominantly rural regions and predominantly urban regions . The methodology of this paper is based on the evaluation of municipalities in relation to the OECD typology and size groups of municipalities. For each category of typology selected socio -economic characteristics (migration balance, sectoral employment ,education structure and the unemployment rate) are observed. Furthermore, the differentiation of these indicators by size of municipality and district is analyzed. On the basis of indicators, it can be demonstrated that the smallest municipalities in rural areas have worse socioeconomic characteristics. The analysis also shows considerable diversification of selected indicators, depending on the geographical location of the region , which plays an important role in the process of rural restructuring.
Key words: Rural development, rural restructuring, rural heterogeneity, Czech Republic
1 Úvod Na venkově probíhají sociální a ekonomické změny, které jsou často konceptualizovány jako proces venkovské restrukturalizace (Woods, 2005). Konkrétně dochází ke změnám v sektorové zaměstnanosti, sociodemografickým změnám a změnám v sociální struktuře obyvatelstva. Venkovské lokality jsou ve srovnání s městskými protějšky v daleko větší míře ovlivňovány geografickou polohou, která podmiňuje proces ekonomické a sociální restrukturalizace (Cloke, Marsden a Mooney, 2006). Obecně platí, že sídla v zázemí větších měst jsou odolnější vůči působení probíhajícího procesu globalizace. Ke zvětšování působení těchto změn dochází mimo vlivu geografické polohy a také v důsledku odlišného charakteru osídlení a velikosti obce. Lze konstatovat, že venkovská restrukturalizace ovlivňuje jednotlivé lokality rozdílnou mírou, což přispívá ke zvyšování heterogenity venkova. Cílem tohoto příspěvku je popsat existující heterogenitu českého venkova. Naším výzkumem zjišťujeme, zda existuje závislost vybraných socioekonomických ukazatelů na velikostních skupinách obcí a na charakteru osídlení v typologických regionech.
Nejprve je v článku diskutován proces venkovské restrukturalizace. Dále je představena metodika článku a jsou znázorněny používané ukazatele. Zmíněno je také vymezování typologických regionů podle metodiky OECD. V analytické části článku jsou představeny
262
hlavní výsledky, které jsou diskutovány s poznatky uvedenými v odborné literatuře. V závěru je provedeno shrnutí hlavních výsledků.
2 Diskuse literatury Venkovský prostor ČR prodělal řadu změn, které souvisely především s transformací z centrálně plánované ekonomiky na ekonomiku tržní. Restrukturalizace venkova byla tedy chápána především v souvislostech s transformačními změnami (Hudečková, 1995). Na venkově docházelo k privatizaci (především státních statků), k restituci zemědělské půdy původním majitelům a k transformaci jednotných zemědělských družstev často spojené s oddělením tzv. „přidružených výrob“ do samostatných řemeslných firem (stavebnictví, opravny, zpracování dřeva atd.) (Bičík a Jančák, 2005). Po období těchto dramatických změn, které proběhly v 90. letech minulého století, nastalo období přípravy na vstup do Evropské unie (Doucha, 2004) a posléze došlo k přizpůsobení se pravidlům Společné zemědělské politiky (SZP), čímž se ČR plně začlenila do společného Evropského hospodářského prostoru. V poslední době lze na českém venkově vypozorovat obdobné procesy popisované v zahraniční literatuře jako důsledek venkovské restrukturalizace probíhající od konce sedmdesátých let (např. Woods, 2005; Marini a Mooney, 2006). Jedná se konkrétně o proces globalizace a technologického rozvoje (Sotte 2005, OECD, 2006), který zasahuje také venkovské prostory, dále došlo ke zvýšení mobility obyvatelstva a sociálním změnám například v podobě zvyšovaní vzdělanosti na venkově (Woods, 2005). Teorie venkovské restrukturalizace se pokouší popsat změny na venkově prostřednictvím důrazu na jednotlivé procesy, které na venkově působí souběžně. Koncept venkovské restrukturalizace může být chápán jako analytický přístup zdůrazňující potřebu holistického pohledu na probíhající změny na venkově (Hoggart a Paniagua, 2001).
V tomto příspěvku chápeme venkovskou restrukturalizaci jako proces, který rozdílnou mírou ovlivňuje jednotlivé lokality a tím dochází ke zvyšování heterogenity venkova. Koncept venkovské restrukturalizace představili v ČR Hruška a Konečný (2011), kteří tvrdí, že přínos tohoto konceptu je především v důrazu na diferencované možnosti venkovských lokalit pro rozvoj. Na základě působení procesu venkovské restrukturalizace lze předpokládat zvyšování rozdílů mezi jednotlivými venkovskými regiony v závislosti na geografické poloze. Regiony s příznivou geografickou polohou (s dobrou dostupností velkých měst) budou na tuto restrukturalizaci reagovat více flexibilně. To lze ilustrovat na příkladu snižování zaměstnanosti v zemědělství v těchto regionech, která však neznamenala zvýšenou nezaměstnanost, ale změnu zaměstnanosti v ostatních sektorech. Naopak regiony v periferní poloze s nepříznivými socioekonomickými charakteristikami jsou venkovskou restrukturalizací ohroženy. Tyto regiony jsou často charakteristické specializovanou ekonomikou a jsou tedy málo rezistentní vůči změnám. V těchto regionech může mít proces venkovské restrukturalizace negativní dopad (zvýšená nezaměstnanost, negativní migrační saldo).
Z hlediska plánování rozvoje venkova je důležité brát ohled na různorodost sídelních jednotek, které reprezentují různorodost potřeb jednotlivých typů venkova. Úroveň zachycení heterogenity venkova je různá v závislosti na způsobu vymezení jednotlivých typů venkova. Při vymezování typů venkova pro potřeby plánování politiky je snahou vymezit co nejhomogennější celky. Tento přístup (one-size-fits-all) snižuje administrativní náročnost, o to víc však přispívá ke zvětšování nerovnoměrností rozvoje venkova. Byla vytvořena řada typologii venkova, které doplňují mezinárodně aplikované standardy vymezení. Nejpoužívanější je metodika vymezování venkova vytvořená OECD, která je založena na hodnocení hustoty obyvatelstva (OECD, 2010). Alternativní vymezení českého venkova
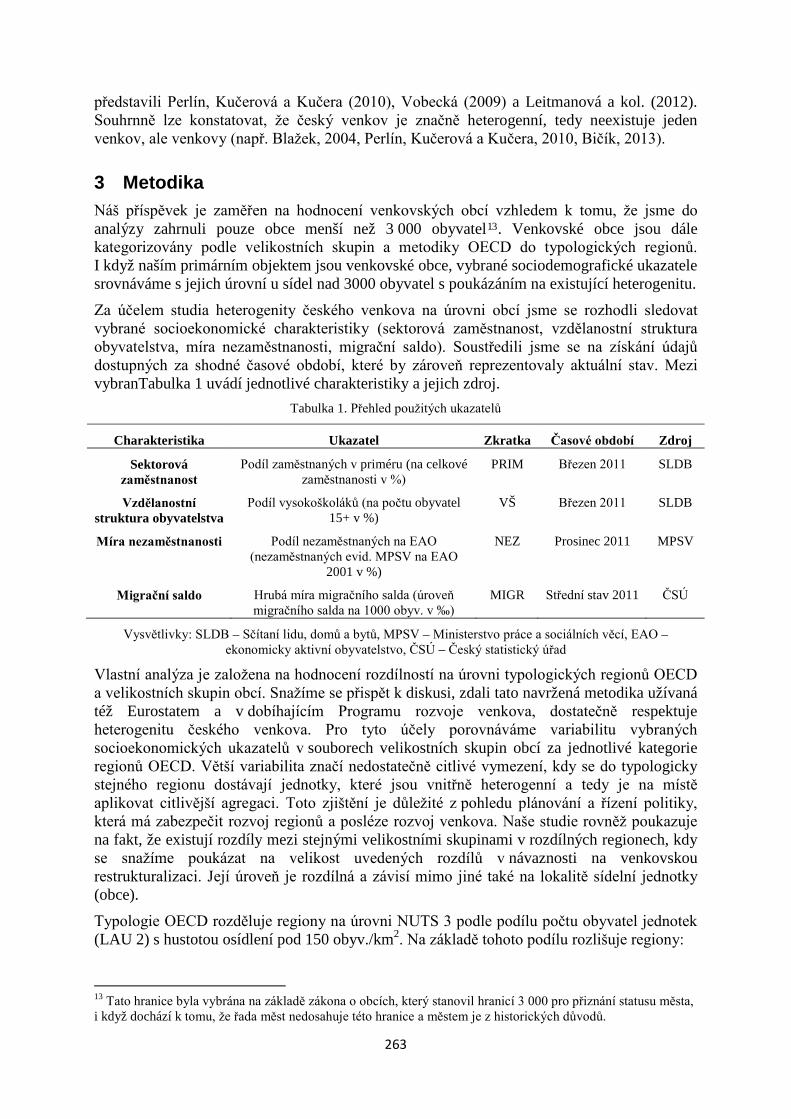
263
představili Perlín, Kučerová a Kučera (2010), Vobecká (2009) a Leitmanová a kol. (2012). Souhrnně lze konstatovat, že český venkov je značně heterogenní, tedy neexistuje jeden venkov, ale venkovy (např. Blažek, 2004, Perlín, Kučerová a Kučera, 2010, Bičík, 2013).
3 Metodika Náš příspěvek je zaměřen na hodnocení venkovských obcí vzhledem k tomu, že jsme do analýzy zahrnuli pouze obce menší než 3 000 obyvatel13. Venkovské obce jsou dále kategorizovány podle velikostních skupin a metodiky OECD do typologických regionů. I když naším primárním objektem jsou venkovské obce, vybrané sociodemografické ukazatele srovnáváme s jejich úrovní u sídel nad 3000 obyvatel s poukázáním na existující heterogenitu.
Za účelem studia heterogenity českého venkova na úrovni obcí jsme se rozhodli sledovat vybrané socioekonomické charakteristiky (sektorová zaměstnanost, vzdělanostní struktura obyvatelstva, míra nezaměstnanosti, migrační saldo). Soustředili jsme se na získání údajů dostupných za shodné časové období, které by zároveň reprezentovaly aktuální stav. Mezi vybranTabulka 1 uvádí jednotlivé charakteristiky a jejich zdroj.
Tabulka 1. Přehled použitých ukazatelů
Charakteristika Ukazatel Zkratka Časové období Zdroj
Sektorová zaměstnanost
Podíl zaměstnaných v priméru (na celkové zaměstnanosti v %)
PRIM Březen 2011 SLDB
Vzdělanostní struktura obyvatelstva
Podíl vysokoškoláků (na počtu obyvatel 15+ v %)
VŠ Březen 2011 SLDB
Míra nezaměstnanosti Podíl nezaměstnaných na EAO (nezaměstnaných evid. MPSV na EAO
2001 v %)
NEZ Prosinec 2011 MPSV
Migrační saldo Hrubá míra migračního salda (úroveň migračního salda na 1000 obyv. v ‰)
MIGR Střední stav 2011 ČSÚ
Vysvětlivky: SLDB – Sčítaní lidu, domů a bytů, MPSV – Ministerstvo práce a sociálních věcí, EAO – ekonomicky aktivní obyvatelstvo, ČSÚ – Český statistický úřad
Vlastní analýza je založena na hodnocení rozdílností na úrovni typologických regionů OECD a velikostních skupin obcí. Snažíme se přispět k diskusi, zdali tato navržená metodika užívaná též Eurostatem a v dobíhajícím Programu rozvoje venkova, dostatečně respektuje heterogenitu českého venkova. Pro tyto účely porovnáváme variabilitu vybraných socioekonomických ukazatelů v souborech velikostních skupin obcí za jednotlivé kategorie regionů OECD. Větší variabilita značí nedostatečně citlivé vymezení, kdy se do typologicky stejného regionu dostávají jednotky, které jsou vnitřně heterogenní a tedy je na místě aplikovat citlivější agregaci. Toto zjištění je důležité z pohledu plánování a řízení politiky, která má zabezpečit rozvoj regionů a posléze rozvoj venkova. Naše studie rovněž poukazuje na fakt, že existují rozdíly mezi stejnými velikostními skupinami v rozdílných regionech, kdy se snažíme poukázat na velikost uvedených rozdílů v návaznosti na venkovskou restrukturalizaci. Její úroveň je rozdílná a závisí mimo jiné také na lokalitě sídelní jednotky (obce).
Typologie OECD rozděluje regiony na úrovni NUTS 3 podle podílu počtu obyvatel jednotek (LAU 2) s hustotou osídlení pod 150 obyv./km2. Na základě tohoto podílu rozlišuje regiony:
13 Tato hranice byla vybrána na základě zákona o obcích, který stanovil hranicí 3 000 pro přiznání statusu města, i když dochází k tomu, že řada měst nedosahuje této hranice a městem je z historických důvodů.
264
• převážně venkovské (predominantly rural – PR) – podíl obyvatelstva žijící v jednotkách LAU 2 s hustotou osídlení pod 150 obyv./km2 větší než 50 %
• přechodné (intermediate – IN) – podíl obyvatelstva žijící v jednotkách LAU 2 s hustotou osídlení pod 150 obyv./km2 mezi 15 – 50 %
• převážně městské (predominantly urban – PU) – podíl obyvatelstva žijící v jednotkách LAU 2 s hustotou osídlení pod 150 obyv./km2 menší než 15 %
V našem příspěvku pracujeme s metodikou OECD na úrovni okresů (NUTS 4), co umožňuje ještě podrobněji zachytit heterogenitu regionů a vyčlenit městské regiony krajských a průmyslových měst. Tyto regiony jsou na úrovni NUTS 3 definovány jako přechodné, což zkresluje interpretaci výsledků. Z naší studie je rovněž vyčleněno hlavní město Praha, vzhledem k tomu, že Praha tvoří samostatný kraj a není okresem.
Z hlediska statistického zpracování jsme využívali základní výpočty popisné statistiky (průměr, směrodatná odchylka). Pro hodnocení míry heterogenity jsme použili metody hodnocení variability souboru. Konkrétně se jednalo o variační koeficient, který udává poměr mezi směrodatnou odchylkou a průměrem. Tento ukazatel se vyjadřuje v procentech. Velkou výhodou je bezrozměrnost tohoto ukazatele.
µσ 100*
=V
kde
V variační koeficient
σ směrodatná odchylka
µ průměr
Variační koeficient jako ukazatel vhodný pro měření regionálních rozdílů používá například Michálek (2012), který zdůrazňuje jeho schopnost popsat variabilitu proměnné a porovnání proměnných s rozdílnými hodnotami.
K popisné statistice jsme přidali prostorovou dimenzi prostřednictvím hodnocení na úrovni okresů České republiky. Takto získané výsledky byly dále hodnoceny prostřednictvím kartografické analýzy (tvorba kartogramu a kartodiagramu) a vizualizovány do map za použití softwaru ArcGIS.
Z metodického hlediska se jeví jako problematické hodnocení typologických skupin obcí s rozdílným počtem jednotek. Přehled počtu obcí velikostních skupin v jednotlivých kategoricích udává tabulka 2. Kategorie převážně městských regionů zahrnuje pouze 134 obcí do 3 000 obyvatel, což je oproti ostatním kategoriím výrazně méně (převážně venkovské regiony 1 931 obcí, přechodné regiony 3 747 obcí). Vzhledem k tomu, že obce do 3 000 obyvatel ležící v převážně městských regionech mají odlišné charakteristiky a často vystihují suburbanizační proces. Poskytují tedy cenné informace, a proto jsme je zahrnuli do analýzy.
Tabulka 2 Počet obcí podle velikostních skupin a typoloigie OECD
do 199 200-499 500-999 1000-2999 3000+
PR Počet 717 644 349 221 95
IN Počet 804 1 318 947 678 301
PU Počet 9 35 40 50 40
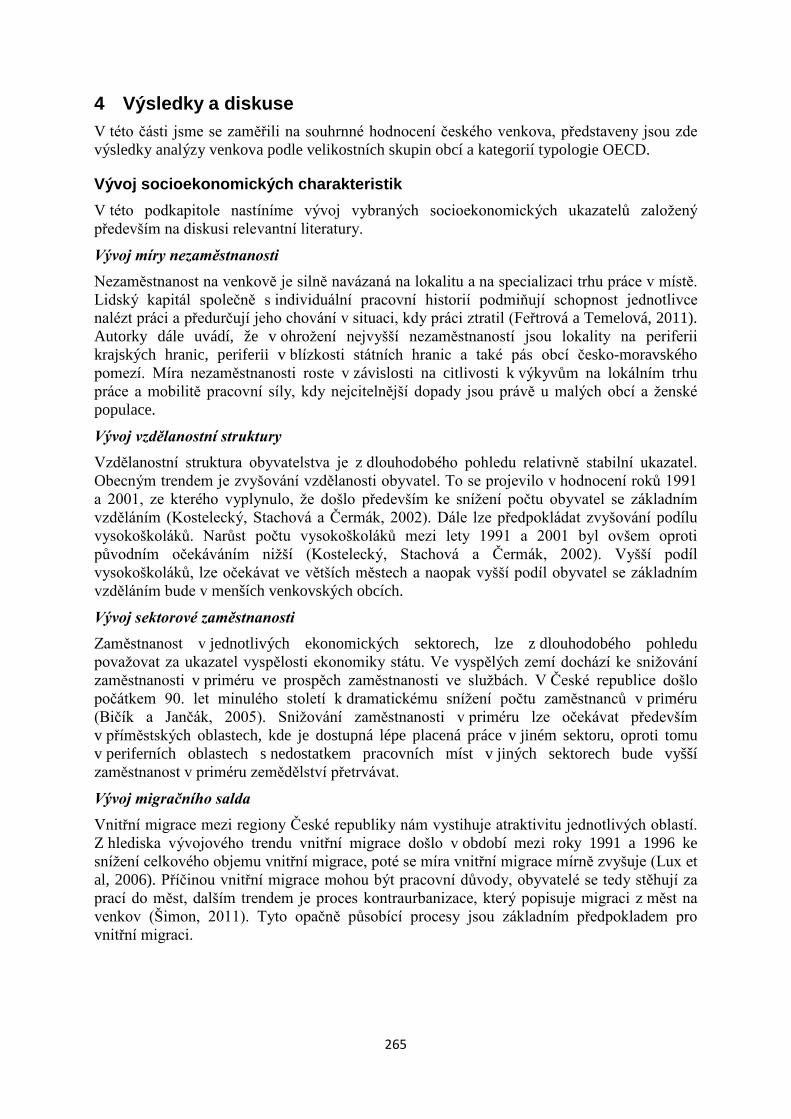
265
4 Výsledky a diskuse V této části jsme se zaměřili na souhrnné hodnocení českého venkova, představeny jsou zde výsledky analýzy venkova podle velikostních skupin obcí a kategorií typologie OECD.
Vývoj socioekonomických charakteristik V této podkapitole nastíníme vývoj vybraných socioekonomických ukazatelů založený především na diskusi relevantní literatury.
Vývoj míry nezaměstnanosti Nezaměstnanost na venkově je silně navázaná na lokalitu a na specializaci trhu práce v místě. Lidský kapitál společně s individuální pracovní historií podmiňují schopnost jednotlivce nalézt práci a předurčují jeho chování v situaci, kdy práci ztratil (Feřtrová a Temelová, 2011). Autorky dále uvádí, že v ohrožení nejvyšší nezaměstnaností jsou lokality na periferii krajských hranic, periferii v blízkosti státních hranic a také pás obcí česko-moravského pomezí. Míra nezaměstnanosti roste v závislosti na citlivosti k výkyvům na lokálním trhu práce a mobilitě pracovní síly, kdy nejcitelnější dopady jsou právě u malých obcí a ženské populace.
Vývoj vzdělanostní struktury Vzdělanostní struktura obyvatelstva je z dlouhodobého pohledu relativně stabilní ukazatel. Obecným trendem je zvyšování vzdělanosti obyvatel. To se projevilo v hodnocení roků 1991 a 2001, ze kterého vyplynulo, že došlo především ke snížení počtu obyvatel se základním vzděláním (Kostelecký, Stachová a Čermák, 2002). Dále lze předpokládat zvyšování podílu vysokoškoláků. Narůst počtu vysokoškoláků mezi lety 1991 a 2001 byl ovšem oproti původním očekáváním nižší (Kostelecký, Stachová a Čermák, 2002). Vyšší podíl vysokoškoláků, lze očekávat ve větších městech a naopak vyšší podíl obyvatel se základním vzděláním bude v menších venkovských obcích.
Vývoj sektorové zaměstnanosti Zaměstnanost v jednotlivých ekonomických sektorech, lze z dlouhodobého pohledu považovat za ukazatel vyspělosti ekonomiky státu. Ve vyspělých zemí dochází ke snižování zaměstnanosti v priméru ve prospěch zaměstnanosti ve službách. V České republice došlo počátkem 90. let minulého století k dramatickému snížení počtu zaměstnanců v priméru (Bičík a Jančák, 2005). Snižování zaměstnanosti v priméru lze očekávat především v příměstských oblastech, kde je dostupná lépe placená práce v jiném sektoru, oproti tomu v periferních oblastech s nedostatkem pracovních míst v jiných sektorech bude vyšší zaměstnanost v priméru zemědělství přetrvávat.
Vývoj migračního salda Vnitřní migrace mezi regiony České republiky nám vystihuje atraktivitu jednotlivých oblastí. Z hlediska vývojového trendu vnitřní migrace došlo v období mezi roky 1991 a 1996 ke snížení celkového objemu vnitřní migrace, poté se míra vnitřní migrace mírně zvyšuje (Lux et al, 2006). Příčinou vnitřní migrace mohou být pracovní důvody, obyvatelé se tedy stěhují za prací do měst, dalším trendem je proces kontraurbanizace, který popisuje migraci z měst na venkov (Šimon, 2011). Tyto opačně působící procesy jsou základním předpokladem pro vnitřní migraci.
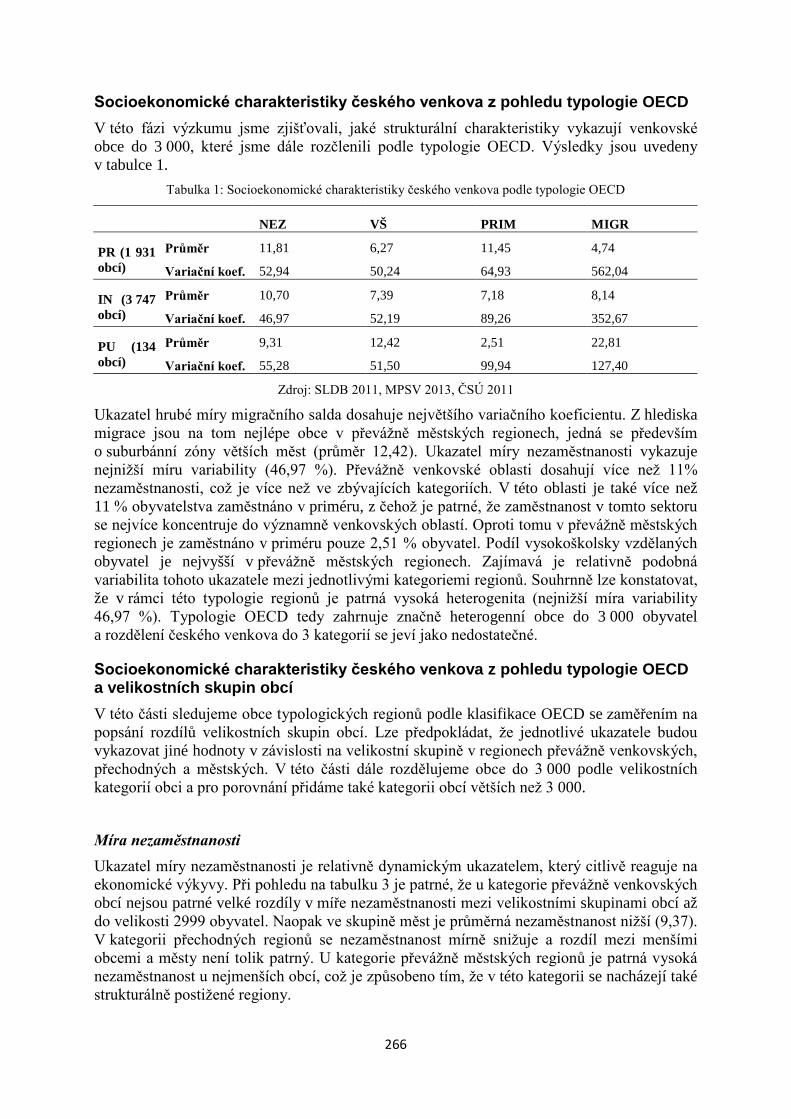
266
Socioekonomické charakteristiky českého venkova z pohledu typologie OECD V této fázi výzkumu jsme zjišťovali, jaké strukturální charakteristiky vykazují venkovské obce do 3 000, které jsme dále rozčlenili podle typologie OECD. Výsledky jsou uvedeny v tabulce 1.
Tabulka 1: Socioekonomické charakteristiky českého venkova podle typologie OECD
NEZ VŠ PRIM MIGR
PR (1 931 obcí)
Průměr 11,81 6,27 11,45 4,74
Variační koef. 52,94 50,24 64,93 562,04
IN (3 747 obcí)
Průměr 10,70 7,39 7,18 8,14
Variační koef. 46,97 52,19 89,26 352,67
PU (134 obcí)
Průměr 9,31 12,42 2,51 22,81
Variační koef. 55,28 51,50 99,94 127,40
Zdroj: SLDB 2011, MPSV 2013, ČSÚ 2011
Ukazatel hrubé míry migračního salda dosahuje největšího variačního koeficientu. Z hlediska migrace jsou na tom nejlépe obce v převážně městských regionech, jedná se především o suburbánní zóny větších měst (průměr 12,42). Ukazatel míry nezaměstnanosti vykazuje nejnižší míru variability (46,97 %). Převážně venkovské oblasti dosahují více než 11% nezaměstnanosti, což je více než ve zbývajících kategoriích. V této oblasti je také více než 11 % obyvatelstva zaměstnáno v priméru, z čehož je patrné, že zaměstnanost v tomto sektoru se nejvíce koncentruje do významně venkovských oblastí. Oproti tomu v převážně městských regionech je zaměstnáno v priméru pouze 2,51 % obyvatel. Podíl vysokoškolsky vzdělaných obyvatel je nejvyšší v převážně městských regionech. Zajímavá je relativně podobná variabilita tohoto ukazatele mezi jednotlivými kategoriemi regionů. Souhrnně lze konstatovat, že v rámci této typologie regionů je patrná vysoká heterogenita (nejnižší míra variability 46,97 %). Typologie OECD tedy zahrnuje značně heterogenní obce do 3 000 obyvatel a rozdělení českého venkova do 3 kategorií se jeví jako nedostatečné.
Socioekonomické charakteristiky českého venkova z pohledu typologie OECD a velikostních skupin obcí V této části sledujeme obce typologických regionů podle klasifikace OECD se zaměřením na popsání rozdílů velikostních skupin obcí. Lze předpokládat, že jednotlivé ukazatele budou vykazovat jiné hodnoty v závislosti na velikostní skupině v regionech převážně venkovských, přechodných a městských. V této části dále rozdělujeme obce do 3 000 podle velikostních kategorií obci a pro porovnání přidáme také kategorii obcí větších než 3 000.
Míra nezaměstnanosti Ukazatel míry nezaměstnanosti je relativně dynamickým ukazatelem, který citlivě reaguje na ekonomické výkyvy. Při pohledu na tabulku 3 je patrné, že u kategorie převážně venkovských obcí nejsou patrné velké rozdíly v míře nezaměstnanosti mezi velikostními skupinami obcí až do velikosti 2999 obyvatel. Naopak ve skupině měst je průměrná nezaměstnanost nižší (9,37). V kategorii přechodných regionů se nezaměstnanost mírně snižuje a rozdíl mezi menšími obcemi a městy není tolik patrný. U kategorie převážně městských regionů je patrná vysoká nezaměstnanost u nejmenších obcí, což je způsobeno tím, že v této kategorii se nacházejí také strukturálně postižené regiony.
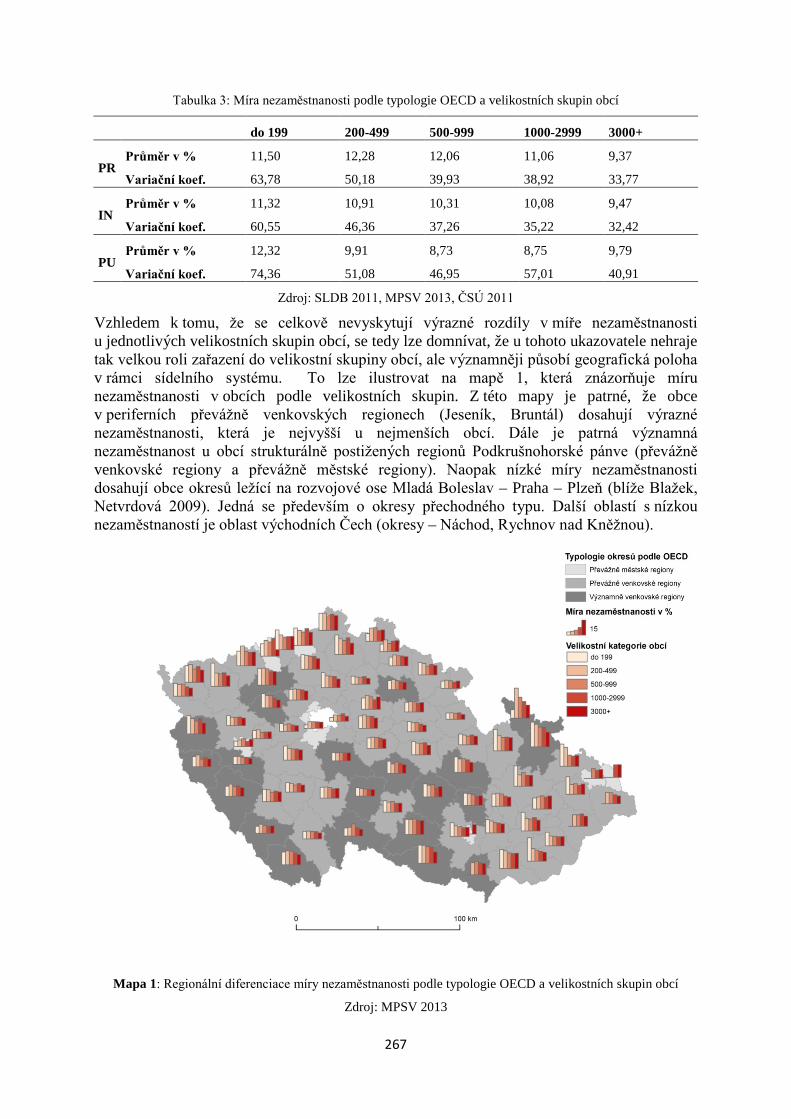
267
Tabulka 3: Míra nezaměstnanosti podle typologie OECD a velikostních skupin obcí
do 199 200-499 500-999 1000-2999 3000+
PR Průměr v % 11,50 12,28 12,06 11,06 9,37
Variační koef. 63,78 50,18 39,93 38,92 33,77
IN Průměr v % 11,32 10,91 10,31 10,08 9,47
Variační koef. 60,55 46,36 37,26 35,22 32,42
PU Průměr v % 12,32 9,91 8,73 8,75 9,79
Variační koef. 74,36 51,08 46,95 57,01 40,91
Zdroj: SLDB 2011, MPSV 2013, ČSÚ 2011
Vzhledem k tomu, že se celkově nevyskytují výrazné rozdíly v míře nezaměstnanosti u jednotlivých velikostních skupin obcí, se tedy lze domnívat, že u tohoto ukazovatele nehraje tak velkou roli zařazení do velikostní skupiny obcí, ale významněji působí geografická poloha v rámci sídelního systému. To lze ilustrovat na mapě 1, která znázorňuje míru nezaměstnanosti v obcích podle velikostních skupin. Z této mapy je patrné, že obce v periferních převážně venkovských regionech (Jeseník, Bruntál) dosahují výrazné nezaměstnanosti, která je nejvyšší u nejmenších obcí. Dále je patrná významná nezaměstnanost u obcí strukturálně postižených regionů Podkrušnohorské pánve (převážně venkovské regiony a převážně městské regiony). Naopak nízké míry nezaměstnanosti dosahují obce okresů ležící na rozvojové ose Mladá Boleslav – Praha – Plzeň (blíže Blažek, Netvrdová 2009). Jedná se především o okresy přechodného typu. Další oblastí s nízkou nezaměstnaností je oblast východních Čech (okresy – Náchod, Rychnov nad Kněžnou).
Mapa 1: Regionální diferenciace míry nezaměstnanosti podle typologie OECD a velikostních skupin obcí
Zdroj: MPSV 2013
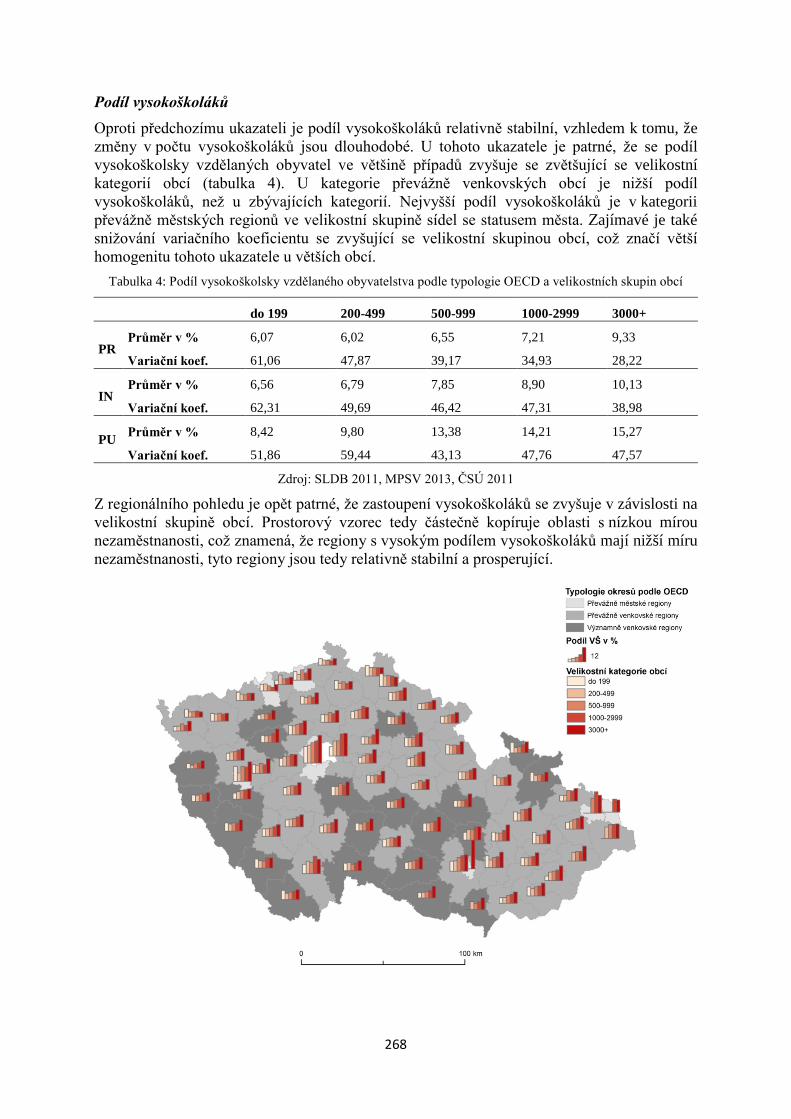
268
Podíl vysokoškoláků Oproti předchozímu ukazateli je podíl vysokoškoláků relativně stabilní, vzhledem k tomu, že změny v počtu vysokoškoláků jsou dlouhodobé. U tohoto ukazatele je patrné, že se podíl vysokoškolsky vzdělaných obyvatel ve většině případů zvyšuje se zvětšující se velikostní kategorií obcí (tabulka 4). U kategorie převážně venkovských obcí je nižší podíl vysokoškoláků, než u zbývajících kategorií. Nejvyšší podíl vysokoškoláků je v kategorii převážně městských regionů ve velikostní skupině sídel se statusem města. Zajímavé je také snižování variačního koeficientu se zvyšující se velikostní skupinou obcí, což značí větší homogenitu tohoto ukazatele u větších obcí.
Tabulka 4: Podíl vysokoškolsky vzdělaného obyvatelstva podle typologie OECD a velikostních skupin obcí
do 199 200-499 500-999 1000-2999 3000+
PR Průměr v % 6,07 6,02 6,55 7,21 9,33
Variační koef. 61,06 47,87 39,17 34,93 28,22
IN Průměr v % 6,56 6,79 7,85 8,90 10,13
Variační koef. 62,31 49,69 46,42 47,31 38,98
PU Průměr v % 8,42 9,80 13,38 14,21 15,27
Variační koef. 51,86 59,44 43,13 47,76 47,57
Zdroj: SLDB 2011, MPSV 2013, ČSÚ 2011
Z regionálního pohledu je opět patrné, že zastoupení vysokoškoláků se zvyšuje v závislosti na velikostní skupině obcí. Prostorový vzorec tedy částečně kopíruje oblasti s nízkou mírou nezaměstnanosti, což znamená, že regiony s vysokým podílem vysokoškoláků mají nižší míru nezaměstnanosti, tyto regiony jsou tedy relativně stabilní a prosperující.
269
Mapa 2: Regionální diferenciace podílu vysokoškolsky vzdělaného obyvatelstva podle typologie OECD a velikostních skupin obcí
Zdroj: SLDB 2011
Zaměstnanost v priméru Vysoká zaměstnanost v priméru je charakteristická pro venkovské oblasti, což potvrzuje tabulka 5. Z této tabulky je patrné, že nejvyšší podíl zaměstnanosti v priméru mají nejmenší obce v převážně venkovských oblastech (14,32 %). S nárůstem počtu obyvatel se snižuje podíl zaměstnanosti, ale zároveň zůstává výrazně vyšší než u ostatních typologických kategorií. Naopak u kategorie převážně městského obyvatelstva je podle předpokladů podíl nízký. Za zmínku stojí také relativně vysoký variační koeficient u všech kategorií. U kategorie převážně venkovských regionů je tento koeficient nižší a relativně stabilní mezi jednotlivými velikostními skupinami obcí, naopak přechodné regiony dosahují vyšší variability v rámci jednotlivých velikostních skupin obcí.
Tabulka 5: Zaměstnanost v priméru podle typologie OECD a velikostních skupin obcí
do 199 200-499 500-999 1000-2999 3000+
PR Průměr v % 14,32 11,11 8,99 7,04 3,39
Variační koef. 63,23 55,75 52,73 53,81 59,67
IN
Průměr v % 11,16 7,61 5,39 4,13 1,98
Variační koef. 83,16 72,01 75,63 78,77 67,49
PU Průměr v % 4,65 3,56 2,27 1,58 0,80
Variační koef. 93,62 95,62 74,02 67,19 54,29
Zdroj: SLDB 2011, MPSV 2013, ČSÚ 2011
Při pohledu na mapu 3 lze toho rozrůznění zaměstnanosti v priméru dále analyzovat. Převážně venkovské regiony dosahují až na výjimky (např. Benešov) vysoké míry zaměstnanosti v priméru. Ovšem kategorie přechodných regionů je značně různorodá, vyskytují se zde regiony s vysokým podílem zaměstnanosti v priméru (především regiony Šumavy a Českomoravské vysočiny) a také regiony s nízkým podílem (např. hraniční regiony se Slovenskem). Převážně městské regiony pochopitelně dosahují nízkých hodnot zaměstnanosti v priméru, nízkých hodnot dosahují také přechodné regiony v zázemí velkých měst (Praha – východ, Brno – město).
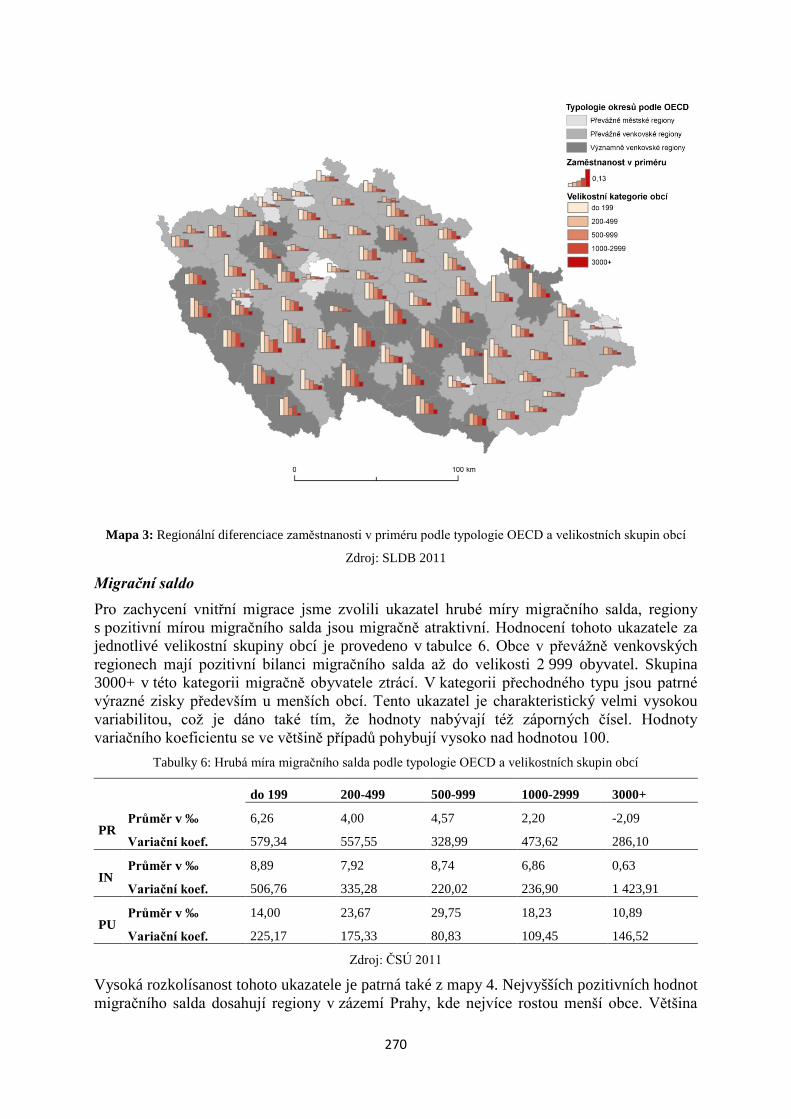
270
Mapa 3: Regionální diferenciace zaměstnanosti v priméru podle typologie OECD a velikostních skupin obcí
Zdroj: SLDB 2011
Migrační saldo Pro zachycení vnitřní migrace jsme zvolili ukazatel hrubé míry migračního salda, regiony s pozitivní mírou migračního salda jsou migračně atraktivní. Hodnocení tohoto ukazatele za jednotlivé velikostní skupiny obcí je provedeno v tabulce 6. Obce v převážně venkovských regionech mají pozitivní bilanci migračního salda až do velikosti 2 999 obyvatel. Skupina 3000+ v této kategorii migračně obyvatele ztrácí. V kategorii přechodného typu jsou patrné výrazné zisky především u menších obcí. Tento ukazatel je charakteristický velmi vysokou variabilitou, což je dáno také tím, že hodnoty nabývají též záporných čísel. Hodnoty variačního koeficientu se ve většině případů pohybují vysoko nad hodnotou 100.
Tabulky 6: Hrubá míra migračního salda podle typologie OECD a velikostních skupin obcí
do 199 200-499 500-999 1000-2999 3000+
PR Průměr v ‰ 6,26 4,00 4,57 2,20 -2,09
Variační koef. 579,34 557,55 328,99 473,62 286,10
IN Průměr v ‰ 8,89 7,92 8,74 6,86 0,63
Variační koef. 506,76 335,28 220,02 236,90 1 423,91
PU Průměr v ‰ 14,00 23,67 29,75 18,23 10,89
Variační koef. 225,17 175,33 80,83 109,45 146,52
Zdroj: ČSÚ 2011
Vysoká rozkolísanost tohoto ukazatele je patrná také z mapy 4. Nejvyšších pozitivních hodnot migračního salda dosahují regiony v zázemí Prahy, kde nejvíce rostou menší obce. Většina
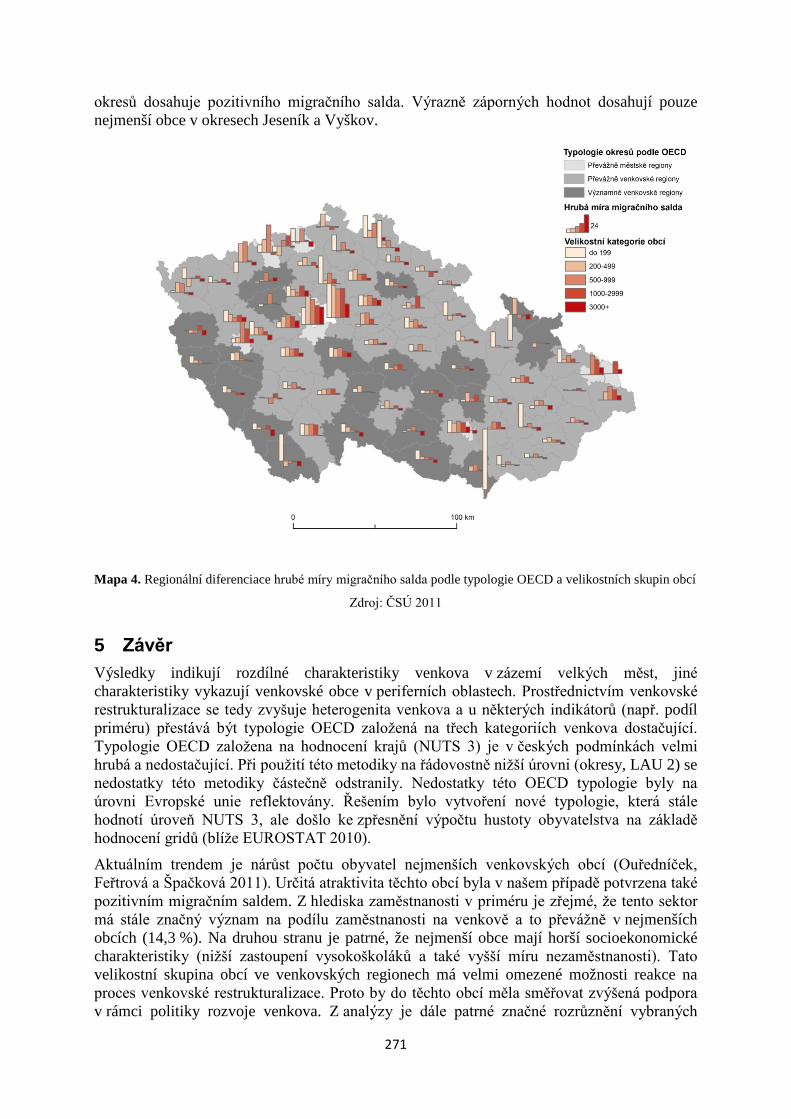
271
okresů dosahuje pozitivního migračního salda. Výrazně záporných hodnot dosahují pouze nejmenší obce v okresech Jeseník a Vyškov.
Mapa 4. Regionální diferenciace hrubé míry migračního salda podle typologie OECD a velikostních skupin obcí
Zdroj: ČSÚ 2011
5 Závěr Výsledky indikují rozdílné charakteristiky venkova v zázemí velkých měst, jiné charakteristiky vykazují venkovské obce v periferních oblastech. Prostřednictvím venkovské restrukturalizace se tedy zvyšuje heterogenita venkova a u některých indikátorů (např. podíl priméru) přestává být typologie OECD založená na třech kategoriích venkova dostačující. Typologie OECD založena na hodnocení krajů (NUTS 3) je v českých podmínkách velmi hrubá a nedostačující. Při použití této metodiky na řádovostně nižší úrovni (okresy, LAU 2) se nedostatky této metodiky částečně odstranily. Nedostatky této OECD typologie byly na úrovni Evropské unie reflektovány. Řešením bylo vytvoření nové typologie, která stále hodnotí úroveň NUTS 3, ale došlo ke zpřesnění výpočtu hustoty obyvatelstva na základě hodnocení gridů (blíže EUROSTAT 2010).
Aktuálním trendem je nárůst počtu obyvatel nejmenších venkovských obcí (Ouředníček, Feřtrová a Špačková 2011). Určitá atraktivita těchto obcí byla v našem případě potvrzena také pozitivním migračním saldem. Z hlediska zaměstnanosti v priméru je zřejmé, že tento sektor má stále značný význam na podílu zaměstnanosti na venkově a to převážně v nejmenších obcích (14,3 %). Na druhou stranu je patrné, že nejmenší obce mají horší socioekonomické charakteristiky (nižší zastoupení vysokoškoláků a také vyšší míru nezaměstnanosti). Tato velikostní skupina obcí ve venkovských regionech má velmi omezené možnosti reakce na proces venkovské restrukturalizace. Proto by do těchto obcí měla směřovat zvýšená podpora v rámci politiky rozvoje venkova. Z analýzy je dále patrné značné rozrůznění vybraných
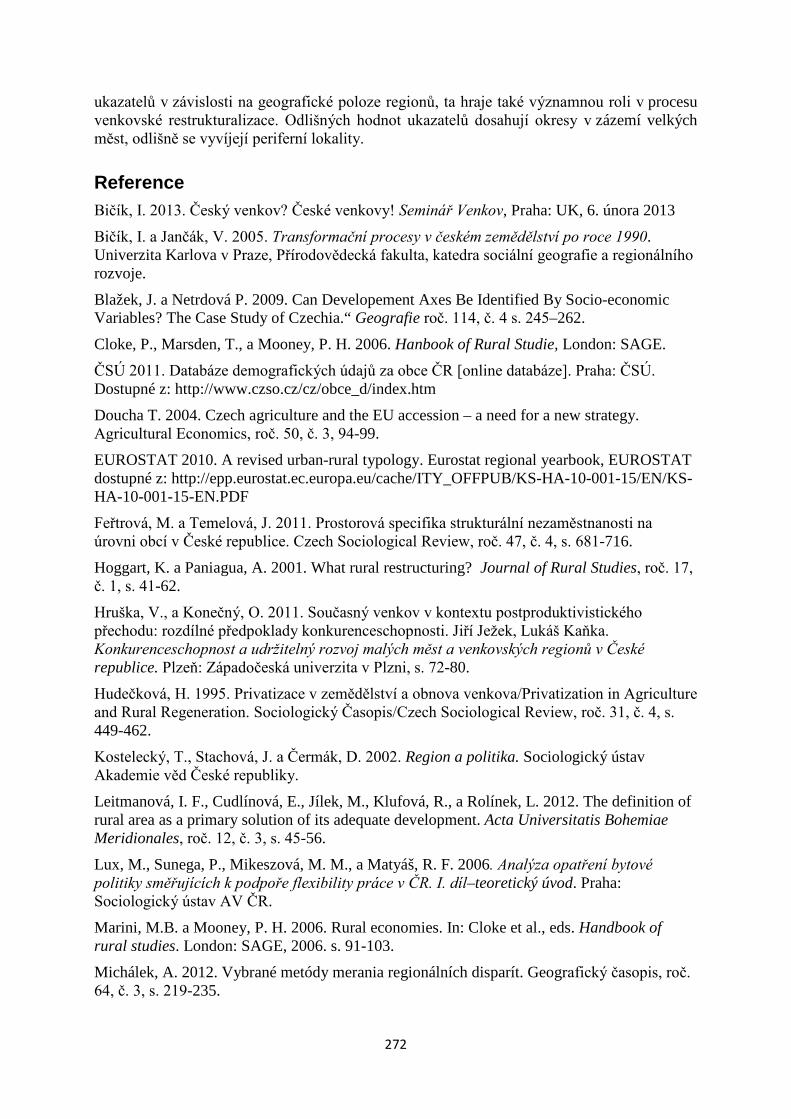
272
ukazatelů v závislosti na geografické poloze regionů, ta hraje také významnou roli v procesu venkovské restrukturalizace. Odlišných hodnot ukazatelů dosahují okresy v zázemí velkých měst, odlišně se vyvíjejí periferní lokality.
Reference Bičík, I. 2013. Český venkov? České venkovy! Seminář Venkov, Praha: UK, 6. února 2013
Bičík, I. a Jančák, V. 2005. Transformační procesy v českém zemědělství po roce 1990. Univerzita Karlova v Praze, Přírodovědecká fakulta, katedra sociální geografie a regionálního rozvoje.
Blažek, J. a Netrdová P. 2009. Can Developement Axes Be Identified By Socio-economic Variables? The Case Study of Czechia.“ Geografie roč. 114, č. 4 s. 245–262.
Cloke, P., Marsden, T., a Mooney, P. H. 2006. Hanbook of Rural Studie, London: SAGE.
ČSÚ 2011. Databáze demografických údajů za obce ČR [online databáze]. Praha: ČSÚ. Dostupné z: http://www.czso.cz/cz/obce_d/index.htm
Doucha T. 2004. Czech agriculture and the EU accession – a need for a new strategy. Agricultural Economics, roč. 50, č. 3, 94-99.
EUROSTAT 2010. A revised urban-rural typology. Eurostat regional yearbook, EUROSTAT dostupné z: http://epp.eurostat.ec.europa.eu/cache/ITY_OFFPUB/KS-HA-10-001-15/EN/KS-HA-10-001-15-EN.PDF
Feřtrová, M. a Temelová, J. 2011. Prostorová specifika strukturální nezaměstnanosti na úrovni obcí v České republice. Czech Sociological Review, roč. 47, č. 4, s. 681-716.
Hoggart, K. a Paniagua, A. 2001. What rural restructuring? Journal of Rural Studies, roč. 17, č. 1, s. 41-62.
Hruška, V., a Konečný, O. 2011. Současný venkov v kontextu postproduktivistického přechodu: rozdílné předpoklady konkurenceschopnosti. Jiří Ježek, Lukáš Kaňka. Konkurenceschopnost a udržitelný rozvoj malých měst a venkovských regionů v České republice. Plzeň: Západočeská univerzita v Plzni, s. 72-80.
Hudečková, H. 1995. Privatizace v zemědělství a obnova venkova/Privatization in Agriculture and Rural Regeneration. Sociologický Časopis/Czech Sociological Review, roč. 31, č. 4, s. 449-462.
Kostelecký, T., Stachová, J. a Čermák, D. 2002. Region a politika. Sociologický ústav Akademie věd České republiky.
Leitmanová, I. F., Cudlínová, E., Jílek, M., Klufová, R., a Rolínek, L. 2012. The definition of rural area as a primary solution of its adequate development. Acta Universitatis Bohemiae Meridionales, roč. 12, č. 3, s. 45-56.
Lux, M., Sunega, P., Mikeszová, M. M., a Matyáš, R. F. 2006. Analýza opatření bytové politiky směřujících k podpoře flexibility práce v ČR. I. díl–teoretický úvod. Praha: Sociologický ústav AV ČR.
Marini, M.B. a Mooney, P. H. 2006. Rural economies. In: Cloke et al., eds. Handbook of rural studies. London: SAGE, 2006. s. 91-103.
Michálek, A. 2012. Vybrané metódy merania regionálních disparít. Geografický časopis, roč. 64, č. 3, s. 219-235.
273
MPSV 2013. Statistiky nezaměstnanosti z územního hlediska. Ministerstvo práce a sociálních věcí, dostupné z: http://portal.mpsv.cz/sz/stat/nz/uzem
OECD 2006. The New Rural Paradigm. Policies and Governance, Paris: OECD Publishing.
OECD 2010. OECD REGIONAL TYPOLOGY, Directorate for Public Governance and Territorial Development, dostupné z: http://www.oecd.org/gov/regional-policy/42392595.pdf
Ouředníček, M., Feřtrová, M., a Špačková, P. 2011. Změny sociálního prostředí a kvality života v depopulačních regionech České republiky. Czech Sociological Review, roč. 47, č. 4. s. 777-804.
Perlín, R., Kučerová, S., a Kučera, Z. 2010. Typologie venkovského prostoru Česka. Geografie, roč. 115, č. 2, 61-187.
SLDB 2011. Sčítání lidu, domů a bytů. Českého statistického úřadu, dostupné z: http://www.scitani.cz/
Sotte, F. 2005. European Rural Development Policy and Territorial Diversity in Europe. Prezentovaný příspěvek, Symposion international. Lyon, France, 9.-11. březen 2005.
Šimon, M. 2011. Kontraurbanizace: chaotický koncept. Geografie, roč. 116, č. 3, 231-255.
Vobecká, J. 2009. Dojížďkový přístup k vymezení městského, příměstského a venkovského obyvatelstva v České republice. Demografie, roč 50, č. 1, s. 14-23.
Woods, M. 2005. Rural Geography. London:SAGE.
Anotace:
Příspěvek řeší proces venkovské restrukturalizace, která s sebou přínáší sociální a ekonomické změny na venkově. Konkrétně dochází ke změnám v sektorové zaměstnanosti, sociodemografickým změnám a změnám v sociální struktuře obyvatelstva. Venkovskou restrukturalizaci chápeme jako proces, který rozdílnou mírou ovlivňuje jednotlivé lokality a tím dochází ke zvyšování heterogenity venkova. Cílem tohoto příspěvku je popsat existující heterogenitu českého venkova. Naším výzkumem zjišťujeme, zda existuje závislost vybraných socioekonomických ukazatelů na velikostních skupinách obcí a na charakteru osídlení v typologických regionech. Jako ukazatel charakteru osídlení používáme typologii OECD. Tato typologie rozděluje regiony podle hustoty zalidnění na významně venkovské regiony, převážně venkovské regiony a převážně městské regiony. Metodika příspěvku je založena na hodnocení obcí ve vztahu k typologii OECD a velikostním skupinám obcí. U jednotlivých kategorií typologie jsme sledovali vybrané socio-ekonomické charakteristiky (migrační saldo, sektorová zaměstnanost, vzdělanostní struktura a míru nezaměstnanosti) a dále jsme analyzovali rozrůznění těchto ukazatelů u velikostních skupin obcí a okresů. Na základě sledovaných ukazatelů je patrné, že nejmenší obce ve venkovských regionech dosahují horších socioekonomických charakteristik. Z analýzy je také patrné značné rozrůznění vybraných ukazatelů v závislosti na geografické poloze regionů, která hraje také významnou roli v procesu venkovské restrukturalizace.
Key words: Rozvoj venkova, venkovská restrukturalizace, heterogenita venkova, Česká republika
274
Social Entrepreneurschip in the context of Czech regional policy
Sociální podnikání v kontextu české regionální politiky
Eva Kučerová Katedra humanitních věd, Česká zemědělská univerzita,
Kamýcká 129, 165 21 Praha 6 – Suchdol [email protected]
Annotation:
The paper deals with social economy concept and its implementation in the regional development at the Czech Republic. The starting point is experience which lead to the Welfare State re-conceptualization in the way of state in the position of crucial political actor. The emphasize is put more on the role of state to institualize rules for various cooperative subjects in social care, neither taken the responsibility for the social policy realization. The social economy concept is represented by the social entrepreneurship, which are not in the Czech legislative system implemented. The paper represents the structure of economy subjects with potentials to the activities typical for social entrepreneurships. Author brings arguments for weak support of social economy concept in the regional policy at the Czech Republic based on the analyze of strategical documents 2007-2013. The conclusion gives hypotheses on the non respect of social entrepreneurship which is situated on the crossway of two public policies – regional policy and social policy.
Key Words:
Social economy, social entrepreneurship, social policy, regional policy, Welfare State
JEL classification: R 58
1 Úvod Článek předpokládá efektivní propojování veřejných politik, resp. sociální a regionální politiky. Současné pojetí sociálního státu nepředstavuje pečující stát. Stát zůstává v pozici vrcholné politické instituce, avšak není orientován na monopolní řešení sociálních problémů, bez participace jiných aktérů. Kritika konceptu Welfare State realizovaného v druhé polovině 20. století vyjadřuje pochybnosti o efektivním fungování státní sociální politiky. Drucker již v 70. letech upozorňuje na nutnost redefinice postoje státu k vládnutí směrem ke koncepčnímu a strategickému přístupu (Drucker, 2004). Obecně lze říci, že mezi sociálně potřebné ohrožené sociální exkluzí v současné evropské společnosti patří nezaměstnaní lidé (zejména dlouhodobě nezsaměstnaní a v předdůchodovém věku), tělesně a duševně hendikepovaní, absolventi škol, rodiče se závislými dětmi. Dlouhodobě fungující “tradiční” přístup sociální politiky charakteristický závislostí na nástrojích sociálního státu (zejména pasivního typu, redistribuujících sociální dávky hmotného charakteru) je kritizovaný, nabízí se alternace aktivní sociální politikou s potlačením/vyloučením státu jako subjektu sociální politiky (vyjma vytváření rámce sociální politiky, případně koordinace). Takovým předpokladům odpovídá koncept sociální ekonomiky aplikací sociálního podnikání (Dohnalová, 2011).
275
2 Materiály a metody Cílem článku je zhodnotit současnou českou regionální politiku z hlediska možností a předpokladů pro přípravu a realizaci rozvojových projektů, které vycházejí z principů sociální ekonomiky, konkrétně sociálního podnikání jako vhodného zdroje pro redukci sociálních problémů v jednotlivých, zejména venkovských lokalitách. Autorka přitom respektuje tři základní přístupy k regionálnímu rozvoji – liberální, keynesiánský a institucionální (Wokoun – Mates 2006; Blažek – Uhlíř 2011). Autorka volí techniku studia strategických rozvojových dokumentů o regionální politice ČR, které vytvářejí rámec pro dotyčné rozvojové projekty. Obsah těchto dokumentů konfrontuje se zahraničními zkušenostmi. Analýza dokumentů se zaměřila do tří úrovní: od nejvíce obecného dokumentu regionální politiky ČR (Národní strategický referenční rámec 2007-2013, dále NSRR), dále dokumentů „střední úrovně“ (tématické a regionální operační programy) až k Programu obnovy venkova jakožto dokumentu vázaného ke konkrétním lokalitám ve venkovském prostoru.
3 Výsledky a diskuse 3.1 Předpoklady pro sociální podnikání V České republice patří mezi sociálně ohrožené skupiny zvláště Romové, nezaměstnaní a samostatně žijící senioři (Mareš 2006). Nejzávažnější formou sociální exkluze je v současné společnosti marginalizace na trhu práce (nezaměstnaností, anebo vyloučením z “dobré práce” na tzv. sekundární trh práce) (Mareš 2000). V jednotlivých regionech/krajích v České republice je podíl nezaměstnaných v populaci ekonomicky aktivních v rozpětí 3,9% (v Praze) až k 10% (v Ústeckém kraji). Průměrně jde v České republice o necelých 7% ekonomicky aktivní populace. Aktéři jednotlivých veřejných politik (sociální a regionální nevyjímaje), bez ohledu na sektor, v němž jsou činní – trh, stát a neziskový sektor (Potůček 1997), mohou přispívat ke zmírňování sociálního vyloučení členů ohrožených sociálních skupin. Stát jako aktér sociální politiky prosazuje a snaží se realizovat aktivní politiku zaměstnanosti, avšak podle empirických výzkumů český stát své potence (ve srovnání s uplatňováním konkrétních nástrojů sociální politiky v západní Evropě například programem veřejných prací, pobídkou k podnikání) nevyužívá (Sirovátka – Šimíková 2013). V případě uvažovaného příspěvku tzv. třetím sektorem lze spíše než o neziskových společnostech, resp. veřejně prospěšných organizacích (Public Benefit Organization), produkujících veřejné a smíšené statky, např. ekologické, vzdělávací, charitativní, uvažovat spíše o vzájemně prospěšných organizacích (Mutual Benefit Organization) podporujících občany a skupiny občanů spojené společným zájmem (Rektořík, 2001). Jen málokdy je v oblasti politiky zaměstnanosti aktivním subjektem sám sektor trhu. Spíše dochází k součinnosti tržních subjektů se státem (resp. jeho podnětem, podporou), anebo propojení prvků trhu a třetího sektoru (v rámci sociálního podnikání jako praktické realizace konceptu sociální ekonomiky). Typickým příkladem je řešení problému marginalizace hendikepovaných osob, v tomto případě se zdravotním postižením, na trhu práce. Stát orientuje politiku zaměstnanosti jednak k samotným zdravotně postiženým (poskytováním rekvalifikace, pracovní rehabilitace, tedy přípravou jedince pro zvládnutí konkrétní práce, anebo tzv. přípravou k práci, tedy přípravou pro konkrétní pracovní místo), a jednak k zaměstnavatelům zdravotně postižených osob prostřednictvím instituce podporovaného chráněného pracovního místa. Uplatňuje se také sociální podnikání zejména tím, že v sociálních podnicích jsou nabízena pracovní místa těm,
276
kteří mají významně menší šance na získání pracovního místa, tedy i osobám se zdravotním hendikepem14. O konceptu sociální ekonomiky uvažují oborníci již více než třicet let a jde o koncept, který se ve své aplikaci váže na společenství, nikoliv jen individua ve společnosti. Principy fungování jednotlivých kolektivních členů (zejména družstev, nadací a občanských sdružení vzájemné pomoci) odpovídají respektu k tržnímu prostředí a současně ke vzájemné podpoře členů. Jedinečnost aktéra jako subjektu sociální ekonomiky je charakteristická tím, že respektuje právo pozitivního přebytku (zisku subjektu v tržním prostředí), který se nestává ani ziskem děleným mezi členy subjektu, ani pouhou podporou oslabeného člena společenství, ale prvkem vyjadřujícím vzájemnou solidaritu (Dohnalová 2006). V sociální ekonomice je zdůrazňována mnohost, pokud možno silně spolupracujících aktérů (Hunčová 2010), a proto se někdy rozkládá do tří komponent neboli subsektorů – podnikatelského (social enterprise), lokálního (community sector) a občanského (voluntary sector) – působících v rámci malých a středních lokalit. Mezi sociální podniky se řadí zejména družstva, spolky, nadace a občanská sdružení (Mutual Societies) s podmínkou, že vykonávají ekonomické činnosti. Jejich aktivity vykazují silnou sociální citlivost a orientaci na lokality a mezi hlavní oblasti činnosti zpravidla patří:
• pracovní integrace (podpora a zajištění vzdělání, integrace nezaměstnaných) • osobní služby (péče o děti, seniory, znevýhodněné jedince) • místní rozvoj (ve znevýhodněných oblastech, odlehlých venkovských oblastech,
problematických městských čtvrtích). Sociální podniky, respektive aktéři, prosazující a realizující principy sociální ekonomiky v praxi, se sdružují za účelem vzájemné spolupráce při provozování ekonomických aktivit, které jsou sociálně prospěšné. Z hlediska lokálního je pro sociální podniky charakteristická známost v lokalitě působnosti (proto také dochází k snazšímu navázání výhodných vztahů s organizacemi místní veřejné správy a dalšími aktéry regionálního rozvoje). Ačkoliv statistická data registrující potenciální subjekty sociální ekonomiky (družstva, obecně prospěšné společnosti, sdružení a církevní organizace) jsou obecně na vzestupu (zejména sdružení se od roku 2006 do současnosti zvýšila asi o pětinu)15, stále přetrvávají překážky kladené rozvoji sociálního podnikání, zejména legislativní neukotvenost, závislost neziskových organizací v sociální oblasti na státu odporující prosazujícímu se liberalistickému přístupu, nedůvěra společnosti spojenou s negativní zkušeností z minulosti (Borzaga – Defourny 2004). Oblast zemědělství doznala významné redukce počtu zaměstnanců, je ale jistou potencí pro zaměstnávání ve venkovských lokalitách včetně zaměstnávání osob ohrožených sociální exkluzí, je předpokladem pro sociální podnikání. V tomto smyslu se mluví o tzv. social farming, kde sociálními podniky jsou sociální družstva, zpravidla farmy poskytující sociální služby s tím, že mají základ v existenci potřeb sociálně slabých v lokalitě a schopnosti citlivě je integrovat do svých aktivit a naplnit jejich přirozené 14 Dle Statistické ročenky trhu práce v České republice 2012 je v České republice více než 60 tisíc nezaměstnaných osob se zdravotním postižením, tj. cca 11% všech nezaměstnaných. Zároveň je v České republice k dispozici více než 30 tisíc chráněných pracovních mist a každým rokem jich několik set přibývá.
15 Zdrojem jsou data ČSÚ: registrované ekonomické subjekty:
http://vdb.czso.cz/vdbvo/tabdetail.jsp?potvrd=Zobrazit+tabulku&go_zobraz=1&cislotab=ORG9020UC&childsel0=1&vo=null&voa=tabulka&str=tabdetail.jsp ze dne 29.12.2012.
277
potřeby v „ne-umělém“, ale reálném a přirozeném venkovském prostředí. Mezi základní předpoklady (vzniku) sociálních farem patří reakce na potřeby, které nejsou ve veřejné politice nabízeny z důvodu nedostatků ekonomického, politického a organizačního charakteru – schopnost vytvořit sociální konsensus pro zajištění sociální potřebnosti a podnícení zájmu o sociálně politicky orientované organizace, aby vložily prostředky na řešení sociálních problémů v lokalitách (Fazzi 2011). Jmenovaná autorka na základě empirické studie v Itálii rozlišuje tři základní typy sociálních farem:
1. Terapeutická a rehabilitační venkovská družstva, v jejichž aktivitě se spojují farmy s neziskovými organizacemi (zpravidla zaměřenými na sociálně a mentálně postižené jedince). Tito jedinci pro farmu pracují v rámci rozličných workshopů, terapeutických rehabilitačních komunit atp.
2. Venkovská pracovně integrační družstva, která v rámci platné legislativy zajišťují pracovní integraci sociálně potřebných a hendikepovaných.
3. Venkovská družstva pro rozvoj lokalit založená na principu reciprocity, kdy se jednotliví aktéři (farmy a hendikepovaní jedinci či jejich organizovaná sdružení) pokoušejí nalézt shodu mezi tím, co mohou nabídnout, a co je přínosné a zároveň sociálně citlivé pro obě dvě strany.
3.2 Možnosti sociálního podnikání v české regionální politice 3.2.1 Obecná úroveň
V dokumentu NSRR jsou jednoznačně zdůrazněné slabiny regionálního rozvoje území pod úrovní NUTS 3, zejména těch, v nichž jsou mikroregionální disparity nejvýraznější. Akcentuje se propojení ekonomické a sociální sféry a zaměření do komunity s využitím jejího vnitřního potenciálu, připojuje se i propojení ekonomické, sociální a územní soudržnosti citlivě k nerovnostem mezi jednotlivými sociálními skupinami v regionech. To rozhodně konvenuje s pravidly sociální ekonomiky. Předpokládá se také udržitelnost ekonomických a sociálních struktur v jednotlivých typech území prostřednictvím komplexního a strategického přístupu rozvíjejícího místní potenciál a optimalizuje se intervence v území (NSRR, s. 33). Řešení nerovností na trhu práce v souvislosti s neadaptabilitou jedinců předpokládá horizontální provázání intervencí realizovaných prostřednictvím jednotlivých programů, v nichž dojde k propojení sociální intervence (zabezpečení aktivní sociální politikou) a podnikání (aktivitou s pravidly konkurenceschopnosti v tržním prostředí). Konceptoři se dokonce zaměřují na programy rozvoje podnikání v kontextu synergického rozvoje lidských zdrojů a posilování místní ekonomiky (NSRR, s. 39), avšak jediným sociálním aspektem podporovaným v rámci podnikání jsou aktivity vedoucí ke zlepšení podmínek zaměstnanců-rodičů se snahou harmonizovat profesní a rodinný život. Přestože sociální skupiny ohrožené sociální exkluzí v důsledku neadaptability na trhu práce identifikuje přesně, v oblasti zaměstnanosti a prosazování aktivní politiky zaměstnanosti se dokument omezuje na „jednoduchá“ neinovativní řešení nezaměstnanosti rekvalifikací a územní mobilitou zaměstnanců.
3.2.2 Střední úroveň Z přehledu vypracovaného na základě podrobného studia příslušných programových dokumentů, zejména tématických a regionálních operačních programů, je patrné (viz tabulka č. 1), že v některých regionálních i tématických operačních programech se objevuje pravidlo/a charakteristické/á pro sociální podnikání, avšak v žádném ze studovaných dokumentů nejsou zohledněna pravidla a možnosti tohoto fenoménu natolik, aby bylo možné připravit projekt založený výhradně na konceptu sociálního podnikání.
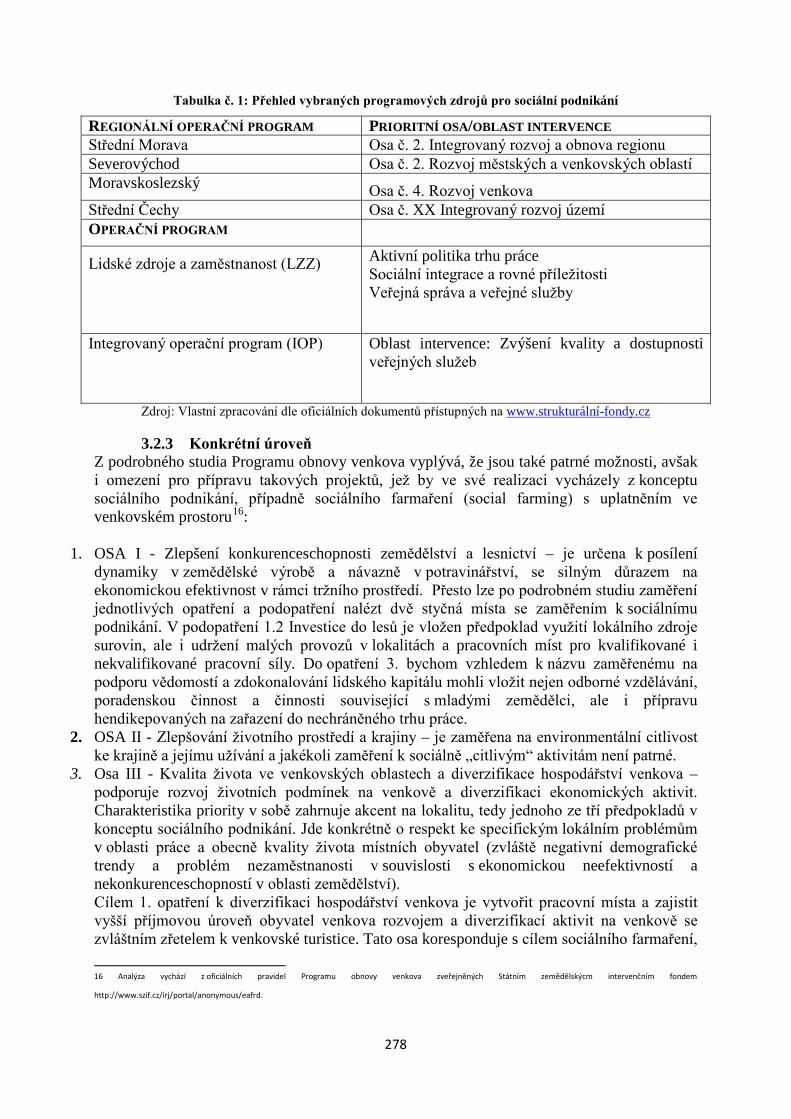
278
Tabulka č. 1: Přehled vybraných programových zdrojů pro sociální podnikání
REGIONÁLNÍ OPERAČNÍ PROGRAM PRIORITNÍ OSA/OBLAST INTERVENCE Střední Morava Osa č. 2. Integrovaný rozvoj a obnova regionu Severovýchod Osa č. 2. Rozvoj městských a venkovských oblastí Moravskoslezský Osa č. 4. Rozvoj venkova Střední Čechy Osa č. XX Integrovaný rozvoj území OPERAČNÍ PROGRAM
Lidské zdroje a zaměstnanost (LZZ) Aktivní politika trhu práce Sociální integrace a rovné příležitosti Veřejná správa a veřejné služby
Integrovaný operační program (IOP)
Oblast intervence: Zvýšení kvality a dostupnosti veřejných služeb
Zdroj: Vlastní zpracování dle oficiálních dokumentů přístupných na www.strukturální-fondy.cz
3.2.3 Konkrétní úroveň Z podrobného studia Programu obnovy venkova vyplývá, že jsou také patrné možnosti, avšak i omezení pro přípravu takových projektů, jež by ve své realizaci vycházely z konceptu sociálního podnikání, případně sociálního farmaření (social farming) s uplatněním ve venkovském prostoru16:
1. OSA I - Zlepšení konkurenceschopnosti zemědělství a lesnictví – je určena k posílení dynamiky v zemědělské výrobě a návazně v potravinářství, se silným důrazem na ekonomickou efektivnost v rámci tržního prostředí. Přesto lze po podrobném studiu zaměření jednotlivých opatření a podopatření nalézt dvě styčná místa se zaměřením k sociálnímu podnikání. V podopatření 1.2 Investice do lesů je vložen předpoklad využití lokálního zdroje surovin, ale i udržení malých provozů v lokalitách a pracovních míst pro kvalifikované i nekvalifikované pracovní síly. Do opatření 3. bychom vzhledem k názvu zaměřenému na podporu vědomostí a zdokonalování lidského kapitálu mohli vložit nejen odborné vzdělávání, poradenskou činnost a činnosti související s mladými zemědělci, ale i přípravu hendikepovaných na zařazení do nechráněného trhu práce.
2. OSA II - Zlepšování životního prostředí a krajiny – je zaměřena na environmentální citlivost ke krajině a jejímu užívání a jakékoli zaměření k sociálně „citlivým“ aktivitám není patrné.
3. Osa III - Kvalita života ve venkovských oblastech a diverzifikace hospodářství venkova – podporuje rozvoj životních podmínek na venkově a diverzifikaci ekonomických aktivit. Charakteristika priority v sobě zahrnuje akcent na lokalitu, tedy jednoho ze tří předpokladů v konceptu sociálního podnikání. Jde konkrétně o respekt ke specifickým lokálním problémům v oblasti práce a obecně kvality života místních obyvatel (zvláště negativní demografické trendy a problém nezaměstnanosti v souvislosti s ekonomickou neefektivností a nekonkurenceschopností v oblasti zemědělství). Cílem 1. opatření k diverzifikaci hospodářství venkova je vytvořit pracovní místa a zajistit vyšší příjmovou úroveň obyvatel venkova rozvojem a diverzifikací aktivit na venkově se zvláštním zřetelem k venkovské turistice. Tato osa koresponduje s cílem sociálního farmaření, 16 Analýza vychází z oficiálních pravidel Programu obnovy venkova zveřejněných Státním zemědělskýcm intervenčním fondem
http://www.szif.cz/irj/portal/anonymous/eafrd.
279
a to diverzifikací aktivit farem a respektem k problémům na venkově, ale objektově je zaměřena na „normální“ populaci a předmětně na zabránění odlivu venkovské populace. Nezaměřuje kvalitu života sociálně slabých či hendikepovaných jedinců ve venkovské společnosti. Sociální farmaření, ani sociální podnikání obecně by nemělo být zaměřeno pouze na vytvoření pracovního místa za účelem vyššího příjmu jedinců či podniku, ale spíše na sociální inkluzi vyloučených jedinců. Jednotlivá podopatření rozpracovávají podporu projektů aktivit diverzifikujících v oblasti energetické, konkrétně k výrobě a případně k zajištění energetické soběstačnosti venkovských lokalit (potažmo přispění ke kvalitě života místních obyvatel) a projektů zakládání a rozvoje takových podniků, které budou diverzifikovat do venkovských nezemědělských aktivit spojených s tradicí a vědomostmi.
4. Osa IV. LEADER, opatření IV.1.2. Realizace místní rozvojové strategie cílí k místním rozvojovým strategiím (tedy Strategickému plánu Leader) a místní partnerské spolupráci. Principy Leaderu vedou k pozitivním efektům tím, že dochází jednak k propojení jednotlivých aktérů ve venkovském prostoru a jednak prostřednictvím místních akčních skupin (MAS) dostávají široké vrstvy obyvatelstva šanci zapojit se do problematiky jednotlivých oblastí, a to především formou převzetí rozhodovacích pravomocí týkajících se příslušných území. S ohledem na mnohost a variabilitu aktérů, kteří se mohou zapojit do projektů a disponují širokým rámcem pro naplňování inovativních aktivit, není třeba pochybovat o využitelnosti pro přípravu projektů vycházejících z principů sociálního podnikání a realizujících myšlenku sociálního farmaření.
4 Závěr V koncepci regionálního rozvoje České republiky je patrná kombinace liberálního a keynesiánského přístupu. Jde tedy o různorodé míry vlivu zásahů státu do regionálního rozvoje (odhlédneme-li od centralistického financování rozvojových aktivit, které jsou smyslem evropské regionální politiky). Dle autorčina soudu je institucionální přístup vnořen do strategického dokumentu méně. Podporované aktivity předpokládají inovativnost a vzdělávání se, jsou však jednostranně orientované ke konkurenceschopnosti na trhu práce a „ziskovému“ podnikání respektujícímu normativní pravidla trhu. V dokumentu není zřetelné síťové chápání ekonomiky, kdy region (dle Granovetter 1985) vnímáme jako průsečík prostorových vztahů, sítí a kontaktů. Toto posouzení nelze chápat pouze jako negativní kritiku, neboť je zřejmé (ačkoliv explicitně nevyslovené), že analyzovaný dokument je zasazen do konceptu nového vládnutí, tedy kolektivní schopnosti ovlivňovat budoucnost k lepšímu (Dror 2002). Jako pozitivní se jeví respekt k přechodu od paradigmatu národního státu k víceúrovňovému vládnutí, kdy stát deleguje pravomoci a více se stává koordinátorem věcí veřejných (Dančák–Hloušek 2007, Potůček 2007). Negativně vyznívá nerespektování toho, že uplatňování takového konceptu (governance) je alternativním koordinačním mechanismem mezi monocentrickým státním aparátem a multicentrickým tržním prostředím (Bernard in Vobecká–Čermák 2011). Participující aktéři pak sledují jak společné, tak individuální zájmy, tedy participace nemusí vždy nutně zahrnovat spolupráci s dalšími aktéry ve smyslu racionálního, recipročního jednání. Z programových dokumentů to pak jsou pravidla Programu obnovy venkova, která lze považovat za respektující více pravidla sociálního podnikání, byť ne všechna zároveň. Tedy takřka vždy je porušeno některé z kritérií naplňující koncept sociálního podnikání. Lze usuzovat, že konceptoři české regionální politiky nevycházeli v programových dokumentech z konceptu sociálního podnikání (včetně sociálního farmaření) a nepředpokládali předkládání takových projektů, které by koncepci využívaly a aplikovaly.
280
Z provedené analýzy je možné usuzovat, že vytvořený institucionální rámec české regionální politiky je stále příliš sevřený v tom smyslu, že nedovoluje kombinovat spolupráci rozličných aktérů a jejich participaci v rámci různorodých oblastí aktivit tak, aby byl propojen (a nezůstal oddělen) racionální přístup typický pro podniky v tržním prostředí a solidární a sociálně citlivý přístup typický pro neziskové organizace, jak to vyžaduje předpoklad sociálního podnikání. Přesto je ve strategických a programových dokumentech české regionální politiky patrné, že vychází z vícerozměrnosti ekonomických, sociálních a prostorových předpokladů rozvoje a již respektuje inovativní přístup k řešení problémů v regionálně disparitních lokalitách.
Literatura BERNARD, Josef. Tradiční a nové modely participace a partnerství v místní veřejné správě: šance a rizika, s. 36-46 In: ČERMÁK, Daniel et al. Spolupráce, partnerství a participace v místní veřejné správě: význam, praxe, příslib. Vyd. 1. Praha: Sociologické nakladatelství (SLON), 2011. 181 s. Studie; sv. 74. ISBN 978-80-7419-067-4. BLAŽEK, Jiří a UHLÍŘ, David. Teorie regionálního rozvoje: nástin, kritika, implikace. Vyd. 2., přeprac. a rozš. Praha: Karolinum, 2011. 342 s. ISBN 978-80-246-1974-3. BORZAGA, Carlo, ed. a DEFOURNY, Jacques., ed. The emergence of social enterprise. London: Routledge, 2004. xi, 383 s. Routledge studies in the management of voluntary and non-profit organizations; 4. ISBN 0-415-33921-9. DANČÁK, Břetislav, ed. a HLOUŠEK, Vít, ed. Víceúrovňové vládnutí v Evropě: zkušenosti, problémy a výzvy. 1. vyd. Brno: Masarykova univerzita, Mezinárodní politologický ústav, 2007. 245 s. Výzkum; sv. č. 2. ISBN 978-80-210-4458-6. DOHNALOVÁ, Marie a kol. Sociální ekonomika. Vyd. 1. Praha: Wolters Kluwer Česká republika, 2011. 175 s. ISBN 978-80-7357-573-1. DOHNALOVÁ, Marie. Sociální ekonomika v evropském kontextu. V Brně: Nadace Universitas, 2006. 314 s. Scientia. ISBN 80-7204-428-1. DROR,Yehezkel. The Capacity to Govern: A Report to the Rome Club. London, Frank Cass 2002. ISBN 0-7146-5228-8 DRUCKER, Peter Ferdinand. Fungující společnost: vybrané eseje o společenství, společnosti a politickém systému. Vyd. 1. Praha: Management Press, 2004. 242 s. Knihovna světového managementu. ISBN 80-7261-098-8. FAZZI, Luca. Social Coooperatives and Social Farming in Italy. Sociologia ruralis, 51(2), (2011), 119-136. GRANOVETTER, Mark. Economic Action and Social Structure: The Problem of Embeddedness. The American Journal of Sociology, Vol. 91, No. 3 (Nov., 1985), pp. 481-510. HUNČOVÁ, Magdalena. Ekonomický rozměr občanské společnosti. 2., přeprac. vyd. Praha: Wolters Kluwer Česká republika, 2010. 239 s. ISBN 978-80-7357-545-8.
281
Mareš, Petr. Faktory sociálního vyloučení. Výzkumný ústav práce a sociálních věcí. 2006. 41 s. ISBN 80-87007-15-8. MAREŠ, PETR. Chdoba, marginalizace, sociální vyloučení. Suociologický časopis, 2000, Vol. 36 (No. 3: 285-297) Národní strategický referenční rámec 2007-2013 http://strukturalni-fondy.cz/getmedia/66d8e801-18b1-42ea-b682-5969a961cdf6/Narodni-strategicky-referencni-ramec-cervenec-20_66d8e801-18b1-42ea-b682-5969a961cdf6.pdf ze dne 27.12.2012. POTŮČEK, Martin. Nejen trh: role trhu, státu a občanského sektoru v proměnách české společnosti. Vyd. 1. Praha: Sociologické nakladatelství, 1997. 188 s. Studie; sv. 13. ISBN 80-85850-26-5. REKTOŘÍK, Jaroslav a kol. Organizace neziskového sektoru: základy ekonomiky, teorie a řízení. Vyd. 1. Praha: Ekopress, 2001. 177 s. ISBN 80-86119-41-6. SIROVÁTKA, Tomáš, Šimíková, Ivana. Politika zaměstnanosti a další opatření na trhu práce v dlouhodobé perspektivěa v průběhu krize. Praha: Výzkumný ústav práce a sociálních věcí, v.v.i. 2013. 95 s. ISBN 978-80-7416-114-8. WOKOUN, René, ed., MATES, Pavel, ed. a COGAN, Rudolf. Management regionální politiky a reforma veřejné správy. Praha: Linde, 2006. 351 s. ISBN 80-7201-608-3. Veřejná databáze Českého statistického úřadu: http://vdb.czso.cz/vdbvo/tabdetail.jsp?potvrd=Zobrazit+tabulku&go_zobraz=1&cislotab=ORG9020UC&childsel0=1&vo=null&voa=tabulka&str=tabdetail.jsp ze dne 29.12.2012. http://www.revesnetwork.net/social-economy-in-europe-today.html ze dne 20.11.2012
Anotace:
Článek se zabývá uplatňováním konceptu sociální ekonomiky v regionálním rozvoji v České republice. Vychází ze zkušeností, které dovedly k rekonceptualizaci Welfare State ve směru, aby stát méně poskytoval sociální péči, a tím více posiloval roli vrcholného aktéra při institucionalizaci rozličných spolupracujících subjektů v sociální ochraně občanů. Zde mají prostor sociální podniky (subjekty reprezentující sociální ekonomiku), které v české legislativě zatím nemají místo. Článek představuje strukturu ekonomických subjektů, které mají potenci k aktivitám, jež jsou pro sociální podniky charakteristické. Dále dokazuje, na základě analýzy strategických dokumentů pro období 2007-2013, že také v regionální politice České republiky není přístup sociální ekonomiky zřetelný. V závěru pak usuzuje, že sociální podnikání jako možný průsečík realizace sociální a regionální politiky inovativním způsobem česká regionální politika zatím nerespektuje.
Klíčová slova:
sociální ekonomika, sociální podnikání, sociální politika, regionální politika, Welfare State
282
Innovative Practices as a Factor of Transformation of the Rural Everyday Life
Morekhanova M.
Federal State Budget Institution of Science Institute of Agrarian Problems of the Russian Academy of Sciences (IAgP RAS) Moskovskaya 94, Saratov, 410012, Russia
Annotation: The paper addresses the social consequences of dissemination of innovative practices in the contemporary rural society. The focus is made on the impact of dissemination of information and computer technologies on the processes of social differentiation, including the processes of elimination of the “digital inequality” among individual social strata of the rural population. The paper is based on the results of the sociological surveys of the processes of proliferation of and familiarization with innovation practices in local rural communities conducted by the Institute of Agrarian Problems of the Russian Academy of Sciences in one of the Russian regions (Saratov’s oblast) in 2010-2011 with personal involvement of the author. The analysis of the obtained empirical information enabled to identify the features of dissemination of individual innovative practices, high-tech goods and services in local rural communities; to form the basic social groups differentiated by the intensity of use of innovative practices in the fields of production, consumption and leisure; make a comparative analysis of the quantitative and qualitative characteristics of these groups, their lifestyle and employment strategies; to describe the different models of innovative behavior of the rural population. The author pays particular attention to drawing a portrait of the rural Internet user. It is found out that Internet users are the most active social group of rural population demonstrating a high level of professional education and innovative culture. They know how to derive social and economic benefits from new technologies and knowledge. The deepening “digital inequality” among local rural communities cannot be overcome only through providing technical and economic access to new technologies. All population groups and strata should have equal opportunities of acquiring the new proficiencies and skills they need to familiarize themselves with innovative technologies.
Key words: Rural society, Innovative practices, Social differentiation
JEL classification: R58
1 Introduction
It is impossible today to imagine our everyday life without innovative technologies that increasingly change the way of life and determine its quality. The desire to purchase high-tech goods is not a mere reflection of the level of well-being, but also a manifestation of the willingness to master something new, acquire new knowledge and skills.
Despite the still remaining difference in technological and economic availability of contemporary opportunities and technologies between the city and the countryside, innovative goods and practices are being increasingly used by rural residents changing their everyday life. The list of durable goods, used by households, has expanded considerably over the past fifteen years. Personal computers, mobile phones, microwave ovens, air conditioners, DVD-players, stereos, satellite TV antennas are now familiar trappings of life for many rural families. Through the introduction of new technologies the consumer properties of traditional household appliances – refrigerators, TVs, washing machines – are being constantly improved. An example of a new technology that in a short time passed through all stages of
283
development and familiarization – from recognition to prevalence – is the mobile cellular communication. In 2000, only 2% of the Russians used mobile phones. Today, the use of cellular communication has become a common practice, both in the city and in the countryside. The gap between the city and the countryside in respect of the use of mobile phones is steadily decreasing. While in 2004 (information of the Federal State Statistics Service of the Russian Federation) there were only 24 mobile phones per 100 rural households compared to 67 in the city, by 2012 the figures have changed to 215 and 232, respectively. Being increasingly used are the Internet and satellite TV. The use of these technologies is one of the basic ways to eliminate the digital inequality of the rural population, which is still a problem. In 2011, only 40.9% of rural households had access to the Internet, including 33.4% - by using their home computers. That same year 100 rural households possessed 46 personal computers compared to 1 in 2000. 70.0% of them were stationary and 30.0% - portable (laptops).
Innovative practices are usually viewed as some typical actions of people that are not quite common yet, but are already quite noticeable, and on the other hand, they mean acting in some different way, which a decade ago was not practiced at all or practiced to a limited extent (Radayev V.V., 2003). The sources of innovative practices are technical, technological and social innovations. An important thing in considering these or that practices as innovative is the extent to which they are used in a given society, even if they are already common for other societies.
The issues of proliferation of conventional and innovative practices and stratification of the Russian society according to the inclusion in the new social reality were addressed in a number of projects of Russian sociologists. The results of these projects are presented by V.V. Radayev (Radayev V.V., 2003), S.V. Goryunova (Goryunova S.V., 2008) and sociologists of the “Public Opinion” foundation (Oberemko О., 2008). However, taking into account the specific features of the way of life of the rural society was beyond the objectives and tasks of these projects. For the purposes of our study we had to adapt this method paying due respect for the peculiarities of the living standard and quality of life of the rural population. First of all, this regarded the range of innovative practices. Many of the practices viewed by colleagues are not widely applied by the rural society not because of its inertia, but for quite objective reasons (living standard of the rural population, the state of the social and information infrastructure). At the same time, when estimating the innovative potential of rural residents we need to take into account the peculiarities of the rural way of life: for instance, the fact that the main area of innovative activity for a large part of the rural population today is their private farmsteads. Thus, the countryside uses its own innovative practices that are often obscure for urban residents.
2 Materials and Methods This study is based on the results of the sociological survey conducted in 2010-2011 in three administrative districts of one of the typical agrarian regions of Russia – Saratov Oblast. The spontaneous sample represents the able-bodied and working-age rural population of the country and includes 743 respondents.
Separate sets of questions were about the use of innovative practices, the culture of getting familiar with high-tech goods and services, the information demands and the readiness to take part in continuing education.
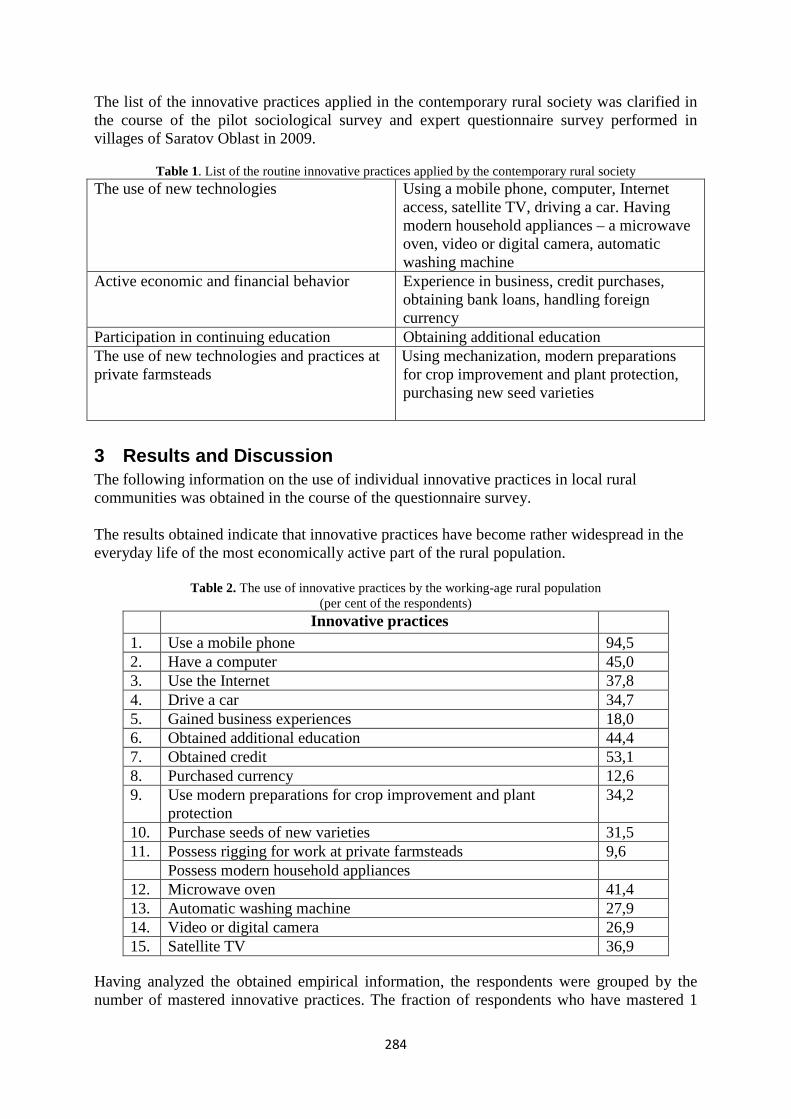
284
The list of the innovative practices applied in the contemporary rural society was clarified in the course of the pilot sociological survey and expert questionnaire survey performed in villages of Saratov Oblast in 2009.
Table 1. List of the routine innovative practices applied by the contemporary rural society The use of new technologies Using a mobile phone, computer, Internet
access, satellite TV, driving a car. Having modern household appliances – a microwave oven, video or digital camera, automatic washing machine
Active economic and financial behavior Experience in business, credit purchases, obtaining bank loans, handling foreign currency
Participation in continuing education Obtaining additional education The use of new technologies and practices at private farmsteads
Using mechanization, modern preparations for crop improvement and plant protection, purchasing new seed varieties
3 Results and Discussion The following information on the use of individual innovative practices in local rural communities was obtained in the course of the questionnaire survey. The results obtained indicate that innovative practices have become rather widespread in the everyday life of the most economically active part of the rural population.
Table 2. The use of innovative practices by the working-age rural population
(per cent of the respondents) Innovative practices
1. Use a mobile phone 94,5 2. Have a computer 45,0 3. Use the Internet 37,8 4. Drive a car 34,7 5. Gained business experiences 18,0 6. Obtained additional education 44,4 7. Obtained credit 53,1 8. Purchased currency 12,6 9. Use modern preparations for crop improvement and plant
protection 34,2
10. Purchase seeds of new varieties 31,5 11. Possess rigging for work at private farmsteads 9,6 Possess modern household appliances 12. Microwave oven 41,4 13. Automatic washing machine 27,9 14. Video or digital camera 26,9 15. Satellite TV 36,9
Having analyzed the obtained empirical information, the respondents were grouped by the number of mastered innovative practices. The fraction of respondents who have mastered 1
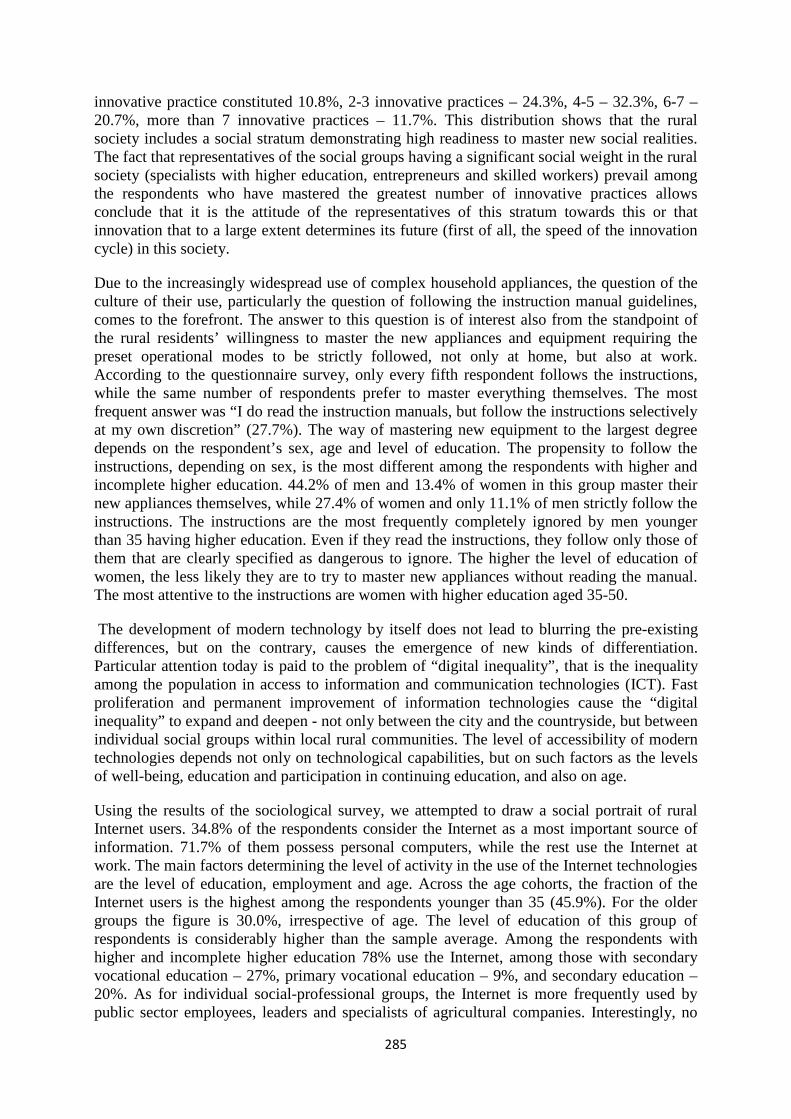
285
innovative practice constituted 10.8%, 2-3 innovative practices – 24.3%, 4-5 – 32.3%, 6-7 – 20.7%, more than 7 innovative practices – 11.7%. This distribution shows that the rural society includes a social stratum demonstrating high readiness to master new social realities. The fact that representatives of the social groups having a significant social weight in the rural society (specialists with higher education, entrepreneurs and skilled workers) prevail among the respondents who have mastered the greatest number of innovative practices allows conclude that it is the attitude of the representatives of this stratum towards this or that innovation that to a large extent determines its future (first of all, the speed of the innovation cycle) in this society.
Due to the increasingly widespread use of complex household appliances, the question of the culture of their use, particularly the question of following the instruction manual guidelines, comes to the forefront. The answer to this question is of interest also from the standpoint of the rural residents’ willingness to master the new appliances and equipment requiring the preset operational modes to be strictly followed, not only at home, but also at work. According to the questionnaire survey, only every fifth respondent follows the instructions, while the same number of respondents prefer to master everything themselves. The most frequent answer was “I do read the instruction manuals, but follow the instructions selectively at my own discretion” (27.7%). The way of mastering new equipment to the largest degree depends on the respondent’s sex, age and level of education. The propensity to follow the instructions, depending on sex, is the most different among the respondents with higher and incomplete higher education. 44.2% of men and 13.4% of women in this group master their new appliances themselves, while 27.4% of women and only 11.1% of men strictly follow the instructions. The instructions are the most frequently completely ignored by men younger than 35 having higher education. Even if they read the instructions, they follow only those of them that are clearly specified as dangerous to ignore. The higher the level of education of women, the less likely they are to try to master new appliances without reading the manual. The most attentive to the instructions are women with higher education aged 35-50.
The development of modern technology by itself does not lead to blurring the pre-existing differences, but on the contrary, causes the emergence of new kinds of differentiation. Particular attention today is paid to the problem of “digital inequality”, that is the inequality among the population in access to information and communication technologies (ICT). Fast proliferation and permanent improvement of information technologies cause the “digital inequality” to expand and deepen - not only between the city and the countryside, but between individual social groups within local rural communities. The level of accessibility of modern technologies depends not only on technological capabilities, but on such factors as the levels of well-being, education and participation in continuing education, and also on age.
Using the results of the sociological survey, we attempted to draw a social portrait of rural Internet users. 34.8% of the respondents consider the Internet as a most important source of information. 71.7% of them possess personal computers, while the rest use the Internet at work. The main factors determining the level of activity in the use of the Internet technologies are the level of education, employment and age. Across the age cohorts, the fraction of the Internet users is the highest among the respondents younger than 35 (45.9%). For the older groups the figure is 30.0%, irrespective of age. The level of education of this group of respondents is considerably higher than the sample average. Among the respondents with higher and incomplete higher education 78% use the Internet, among those with secondary vocational education – 27%, primary vocational education – 9%, and secondary education – 20%. As for individual social-professional groups, the Internet is more frequently used by public sector employees, leaders and specialists of agricultural companies. Interestingly, no
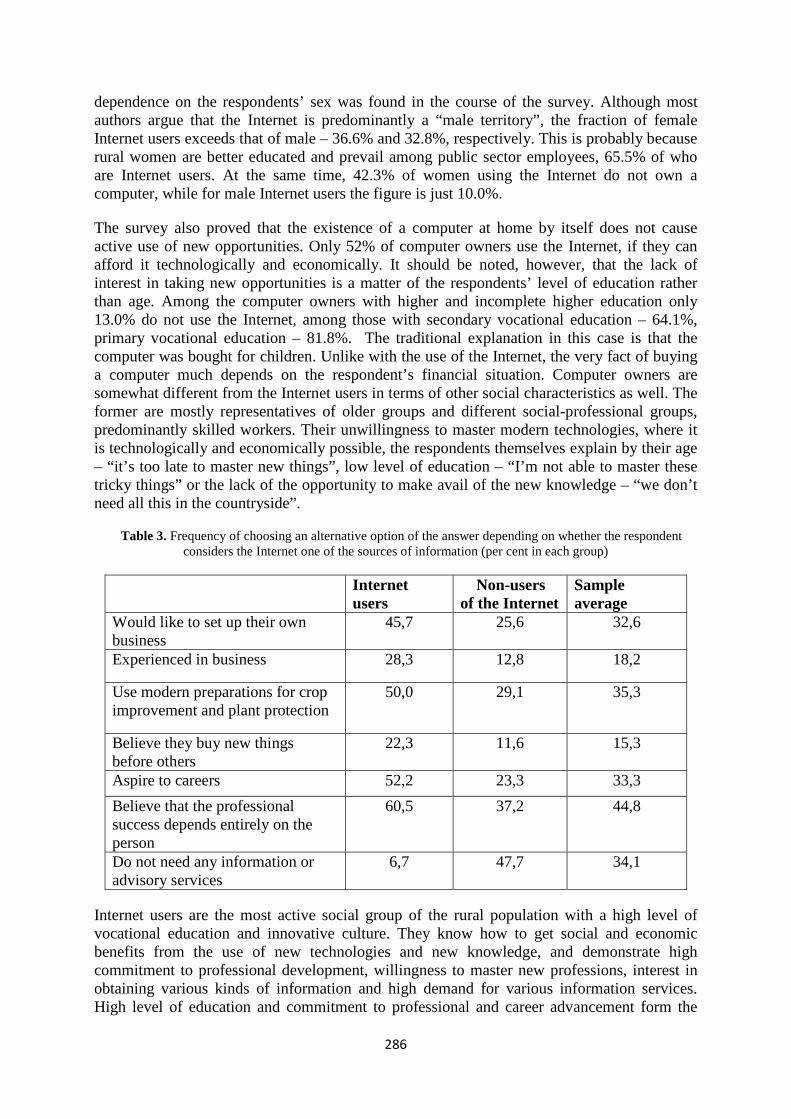
286
dependence on the respondents’ sex was found in the course of the survey. Although most authors argue that the Internet is predominantly a “male territory”, the fraction of female Internet users exceeds that of male – 36.6% and 32.8%, respectively. This is probably because rural women are better educated and prevail among public sector employees, 65.5% of who are Internet users. At the same time, 42.3% of women using the Internet do not own a computer, while for male Internet users the figure is just 10.0%.
The survey also proved that the existence of a computer at home by itself does not cause active use of new opportunities. Only 52% of computer owners use the Internet, if they can afford it technologically and economically. It should be noted, however, that the lack of interest in taking new opportunities is a matter of the respondents’ level of education rather than age. Among the computer owners with higher and incomplete higher education only 13.0% do not use the Internet, among those with secondary vocational education – 64.1%, primary vocational education – 81.8%. The traditional explanation in this case is that the computer was bought for children. Unlike with the use of the Internet, the very fact of buying a computer much depends on the respondent’s financial situation. Computer owners are somewhat different from the Internet users in terms of other social characteristics as well. The former are mostly representatives of older groups and different social-professional groups, predominantly skilled workers. Their unwillingness to master modern technologies, where it is technologically and economically possible, the respondents themselves explain by their age – “it’s too late to master new things”, low level of education – “I’m not able to master these tricky things” or the lack of the opportunity to make avail of the new knowledge – “we don’t need all this in the countryside”.
Table 3. Frequency of choosing an alternative option of the answer depending on whether the respondent considers the Internet one of the sources of information (per cent in each group)
Internet users
Non-users of the Internet
Sample average
Would like to set up their own business
45,7 25,6 32,6
Experienced in business 28,3 12,8 18,2
Use modern preparations for crop improvement and plant protection
50,0 29,1 35,3
Believe they buy new things before others
22,3 11,6 15,3
Aspire to careers 52,2 23,3 33,3 Believe that the professional success depends entirely on the person
60,5 37,2 44,8
Do not need any information or advisory services
6,7 47,7 34,1
Internet users are the most active social group of the rural population with a high level of vocational education and innovative culture. They know how to get social and economic benefits from the use of new technologies and new knowledge, and demonstrate high commitment to professional development, willingness to master new professions, interest in obtaining various kinds of information and high demand for various information services. High level of education and commitment to professional and career advancement form the
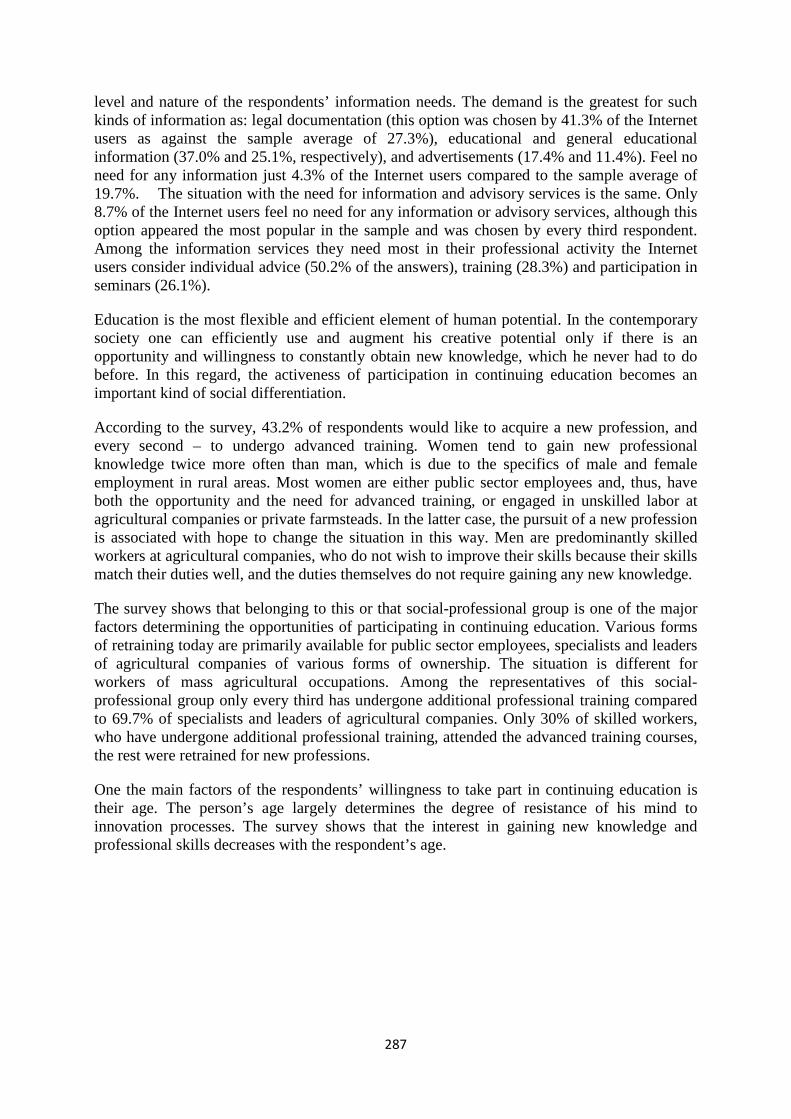
287
level and nature of the respondents’ information needs. The demand is the greatest for such kinds of information as: legal documentation (this option was chosen by 41.3% of the Internet users as against the sample average of 27.3%), educational and general educational information (37.0% and 25.1%, respectively), and advertisements (17.4% and 11.4%). Feel no need for any information just 4.3% of the Internet users compared to the sample average of 19.7%. The situation with the need for information and advisory services is the same. Only 8.7% of the Internet users feel no need for any information or advisory services, although this option appeared the most popular in the sample and was chosen by every third respondent. Among the information services they need most in their professional activity the Internet users consider individual advice (50.2% of the answers), training (28.3%) and participation in seminars (26.1%).
Education is the most flexible and efficient element of human potential. In the contemporary society one can efficiently use and augment his creative potential only if there is an opportunity and willingness to constantly obtain new knowledge, which he never had to do before. In this regard, the activeness of participation in continuing education becomes an important kind of social differentiation.
According to the survey, 43.2% of respondents would like to acquire a new profession, and every second – to undergo advanced training. Women tend to gain new professional knowledge twice more often than man, which is due to the specifics of male and female employment in rural areas. Most women are either public sector employees and, thus, have both the opportunity and the need for advanced training, or engaged in unskilled labor at agricultural companies or private farmsteads. In the latter case, the pursuit of a new profession is associated with hope to change the situation in this way. Men are predominantly skilled workers at agricultural companies, who do not wish to improve their skills because their skills match their duties well, and the duties themselves do not require gaining any new knowledge.
The survey shows that belonging to this or that social-professional group is one of the major factors determining the opportunities of participating in continuing education. Various forms of retraining today are primarily available for public sector employees, specialists and leaders of agricultural companies of various forms of ownership. The situation is different for workers of mass agricultural occupations. Among the representatives of this social-professional group only every third has undergone additional professional training compared to 69.7% of specialists and leaders of agricultural companies. Only 30% of skilled workers, who have undergone additional professional training, attended the advanced training courses, the rest were retrained for new professions.
One the main factors of the respondents’ willingness to take part in continuing education is their age. The person’s age largely determines the degree of resistance of his mind to innovation processes. The survey shows that the interest in gaining new knowledge and professional skills decreases with the respondent’s age.
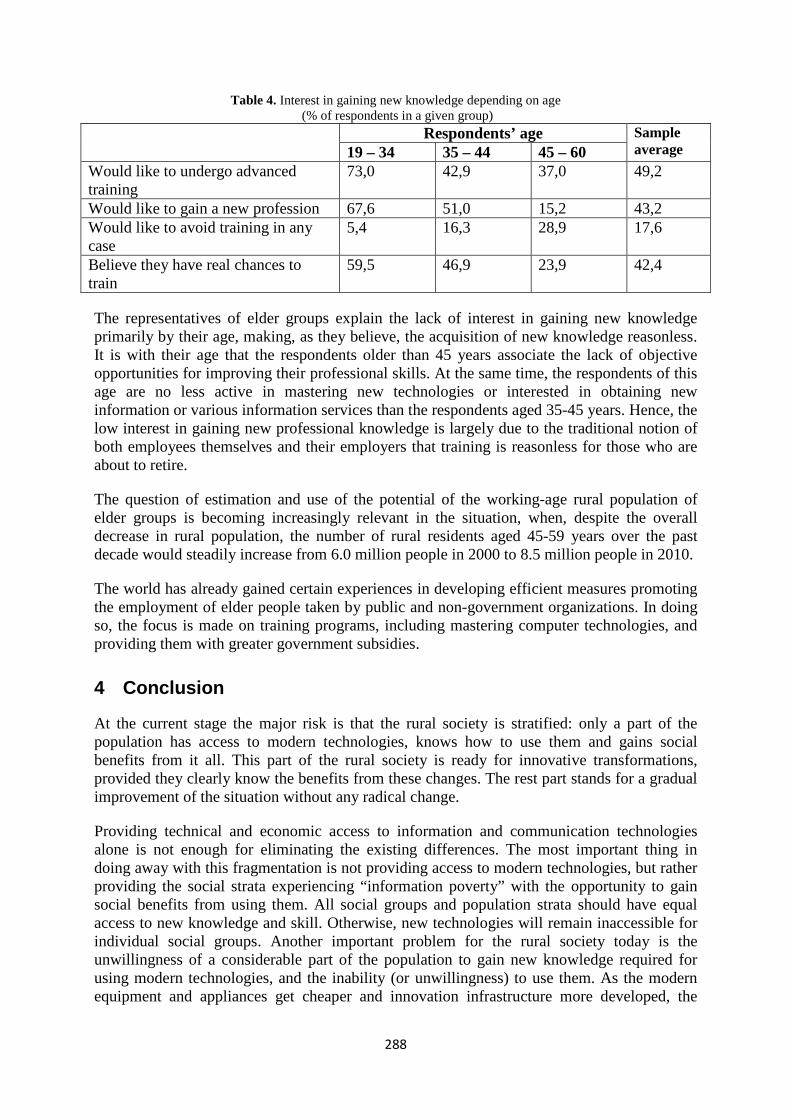
288
Table 4. Interest in gaining new knowledge depending on age (% of respondents in a given group)
Respondents’ age Sample average 19 – 34 35 – 44 45 – 60
Would like to undergo advanced training
73,0 42,9 37,0 49,2
Would like to gain a new profession 67,6 51,0 15,2 43,2 Would like to avoid training in any case
5,4 16,3 28,9 17,6
Believe they have real chances to train
59,5 46,9 23,9 42,4
The representatives of elder groups explain the lack of interest in gaining new knowledge primarily by their age, making, as they believe, the acquisition of new knowledge reasonless. It is with their age that the respondents older than 45 years associate the lack of objective opportunities for improving their professional skills. At the same time, the respondents of this age are no less active in mastering new technologies or interested in obtaining new information or various information services than the respondents aged 35-45 years. Hence, the low interest in gaining new professional knowledge is largely due to the traditional notion of both employees themselves and their employers that training is reasonless for those who are about to retire.
The question of estimation and use of the potential of the working-age rural population of elder groups is becoming increasingly relevant in the situation, when, despite the overall decrease in rural population, the number of rural residents aged 45-59 years over the past decade would steadily increase from 6.0 million people in 2000 to 8.5 million people in 2010.
The world has already gained certain experiences in developing efficient measures promoting the employment of elder people taken by public and non-government organizations. In doing so, the focus is made on training programs, including mastering computer technologies, and providing them with greater government subsidies.
4 Conclusion
At the current stage the major risk is that the rural society is stratified: only a part of the population has access to modern technologies, knows how to use them and gains social benefits from it all. This part of the rural society is ready for innovative transformations, provided they clearly know the benefits from these changes. The rest part stands for a gradual improvement of the situation without any radical change.
Providing technical and economic access to information and communication technologies alone is not enough for eliminating the existing differences. The most important thing in doing away with this fragmentation is not providing access to modern technologies, but rather providing the social strata experiencing “information poverty” with the opportunity to gain social benefits from using them. All social groups and population strata should have equal access to new knowledge and skill. Otherwise, new technologies will remain inaccessible for individual social groups. Another important problem for the rural society today is the unwillingness of a considerable part of the population to gain new knowledge required for using modern technologies, and the inability (or unwillingness) to use them. As the modern equipment and appliances get cheaper and innovation infrastructure more developed, the

289
question of implementing programs for improving the innovative culture of the population becomes increasingly relevant.
With the development of infrastructure and reduction of the prices of household appliances and information services, the differentiation of population by the use of information and communication technologies will increasingly depend on the willingness of the different social groups to acquire and use the knowledge required for mastering new technologies and gaining social benefits from it. A sine qua non in reducing the “digital inequality” is the development of ICT-skills training systems for different social groups with taking into account the degree of their willingness to gain new knowledge, and greater awareness of the population of the advantages of the “information” way of life and the opportunities it offers. any
References
1. Oberemko О. (2008) Whom We Call “21st Century People”?, Social Reality. – no. 3, pp. 42–65.
2. Radayev V.V. (2003) Common and Innovative Practices in the Activities of the Russian Middle Class, The World of Russia, no. 4, pp. 89–119. 3. Goryunova S.V.(2008) Innovative and Conventional in the Consciousness and Behavior of the Urban Middle Class // Traditions and Innovations in Contemporary Russia - Moscow, ROSSPEN, pp. 211-238.
290
Best practice in rural development: Case study on municipalities awarded in competition the Village of the
Year
Marie Pechrová, Kateřina Boukalová Department of Economics, FEM, Czech University of Life Sciences Prague,
Kamycka 129, 165 21 Prague 6 – Suchdol [email protected],
Department of Humanities, FEM, Czech University of Life Sciences Prague, Kamycka 129, 165 21 Prague 6 – Suchdol
Annotation: The aim of this contribution is to formulate suggestions for rural villages how to approach to their development. As the example of the good practice were surveyed municipalities awarded by Golden ribbon in the competition The Village of the Year. The objective of this competition is to enhance the interest of local people in the fate of “their” municipality, because exactly the cohesion of the inhabitants with the village and active participation on the development activities are considered to be key aspects which contribute to the successful and sustainable development. These principles have foundation in endogenous model of the development, which is nowadays the leading approach towards the regional or local development. Theoretical background builds on social capital concept, because especially this intangible capital supports the cooperation which additionally enables easier achievement of the set of collective objectives.
Research is based on the content analysis of the documents published by the organizers or participants of the competition. Various brochures, information and propagation materials contain the information about the best practices in rural development, which can be shared by rural villages. The authors search for common features, which are characteristic for the winning villages, and indicate social capital presence. We suppose that social capital is better observable in awarded municipalities, and plays significant role in the villages’ development. Findings from the documents are compared to the theoretical social capital concepts. On the basis of the synthesis of the gained results, we recommend to municipalities to hold collective actions which enhance the cooperation and social capital, hence the quality of life in a village.
Key words: The Village of the Year, rural development, social capital, best practice
JEL classification: JEL classification code(s)
1 Introduction In the Czech context, the issue of the joining the inhabitants to the rural development started to appear in 90’s of the 20th century. The evidence is the competition the Village of the Year in the framework of Program for Rural Renewal. The effort of this competition is to encourage the rural inhabitants to actively participate on the development of their homes, publish diversity and variety of realized programs for village renewal and inform the public about the importance of the rural areas (Ministry for Regional Development – MRD, 2013).
The evaluation criteria are aimed at the areas of the awards. There are five so called ribbons given in the regional round of the competition. White ribbon gains the village for the activities with young people. Blue ribbon is for social life, diversity and activities of local associations. Green ribbon is concern with greenery, threes, and plants in the villages and with the maintenance of the public spaces, natural elements and intravillan greenery. With Orange ribbon is awarded the village, which cooperates with an agricultural subject or with other voluntary association of agricultural character such as hunters, beekeepers or fishers. Finally
291
the highest award is Gold ribbon for the overall development of the village, the character of the life and its atmosphere and bloom. They are evaluated in the following areas: policy documents, social life, activities of citizens, business, care for the building and the image of the village, amenities, utilities and energy saving, maintenance of the public spaces, natural elements and greenery in the village, landscape management, upcoming projects and information technology community. The evaluation committee assess the village on the basis of its presentation (part of this presentation are also interviews with representatives of the community), sightseeing and tour around the village, the content material documented as part of the application for the competition.
The competition is organized at two levels – regional and state. White and Blue ribbons are awarded only at the regional level, while Green, Orange and Gold ribbons have also national level and top three municipalities are awarded. All registered municipalities are firstly evaluated in the regional round. To the national round proceeds always one municipality for each region, which was awarded by the Green, Orange or Gold Ribbon in the regional round. The national round is taken separately for each ribbon. There are three evaluation committees consisting of the experts for a given area of the award.
The roots of the competition are related to the after Velvet revolution (1989) times and to the Program for Village Renewal. This subsidy program was aimed at the renewal and restoration of the villages in the Czech Republic after the communism era. The program was founded in May 1991 in order to mitigate the depopulation of the rural areas, to help to find again lost identity, renew and develop rich social life, find new job opportunities and increase the level of public facilities and technical infrastructure and to develop ecological and esthetical value of the rural areas (Perlín et al., 1994). The competition itself is taking place from 1995 when the first year was proclaimed by the Association for the Countryside of the Czech Republic (ACR) under the name of Competition for the best village renewal program. Firstly, it was not connected with any financial reward.
Since 1996, one of the Award announcers is Ministry for Regional Development (MRD) and the Association of Towns and Municipalities (ATM). The Ministry of Agriculture (MoA) joined the competition in 2007 with Orange ribbon award. There are other co-announcers (Office of the president, Ministry of Culture, of Environment (MoE), Association of librarians and information employees, Society for gardening and landscape creation and Folklore association as there are also others awards such as for library, Fulín’s price, architecture etc.
Competition is proclaimed annually in March at the Day of small villages in Prague. The final results are announced in September at folklore festival “By Song and Dance” in Luhačovice. Winning villages can obtain relatively high financial grants for they projects – up to 1,000,000 CZK in national round. However, this amount was cut by half from year 2013 on.
Only municipality (city and township) of rural character, which has more than 6,200 people and has a strategic document dealing with community development, village renewal program or program of development of its territory, can take part in the competition. We consider the winners of the competition to be the good examples of how to develop the local area. The awarded villages have certain features such as social life, participation of the people, and trust among inhabitants, which contribute to the overall growth of the area.
Social capital in rural development Social capital is important feature of the endogenous approach towards rural development. To the classical theories of the social capital we can count Putnam’s view, which points on the importance of the common interests, mutual communication, trust and the ability to achieve particular form of the organization and institutionalization of appropriate forms of cooperation

292
(Bernard et al. 2011). Social capital is according to Putnam (1993) “formed, maintained and developed trough (formal as well as informal) social interactions within social networks, groups, communities or whole societies. These interactions mean transfer and sharing of resources, information or knowledge between individuals in these social networks or groups. This then facilitate mutual coordination of social activities and thus increase the effectiveness of social organization” (Putnam 1993). Localities, regions, nations and communities are more likely to achieve higher levels of development and to mitigate negative external influences if they have higher level of embedded social capital” (Matoušek and Sýkora, 2008).
Coleman (1990) sees social capital as individual resource in a form of mutual obligations and in part as a set of aspects of social structure, “which enable people to achieve their goals in easier way” (Lošťák, 2005). In contrast to other forms of capital, social capital consists in social relations; it is not part of individuals (human capital) or things (physical capital). It is not decreasing by its usage, but conversely its amount increases. Falk and Kilpatrick (2000) define “social capital as the product of social interactions with the potential to contribute to the social, civic or economic well-being of a community”. Bourdieu (1986 in Šafr and Sedláčková, 2006) brings to the scientific discourse different view on the social capital. He defines it as a part of the resources available and owned only by particular groups in a society. One is using own social capital in order to achieve higher position in social field and therefore he or she must compete with others in a group and with other groups (Bourdieu, 1980; 1984; 1991 in Lee et al., 2005). This is in line with the opinion of Rifkin (2001) who stated that social capital promotes access to resources.
Social capital creation in rural areas is specific. “Social environment of the rural areas retained some original cultural features, such as institutionalized and organized meetings of villagers, their symbolic communication and normative subculture” (Tomšík, 2009). Important is mutual cooperation, trust and willingness to combine individual and collective interests. The specific of the structure of social relations of rural society is that in regional projects are involved local actors, which are at varying levels of economic and social life (Tomšík, 2009).
An important precondition for the village development is the creation of the social capital and local capacities. As Wiesinger (2007) proclaims “Social capital is a precious asset. A “connected society” that is rich of social capital may promote rural development more easily.” The concept of social capital in the context of rural development was also discussed by Árnason et al. (2004). They proclaimed that social capital may affect the performance, competitiveness and social cohesion of a community. Networks can be understood as articulating the flows of information and resources that produce rural development and society more generally. “The existence of the social capital decrease transaction costs and increase efficiency of the facilitation and interaction system between actors in a society. However, “the structure of social capital has to adapt to new challenges and developments. New collective organizations will have to emerge in response to new needs” (Wiesinger, 2007). Therefore it is crucial for the local actors to know potential and limits of their social capital in order to be able to continuously adapt to the changing environment.
The term “social capital” is not fully established in a discourse and can be defined in different ways. In this contribution we look on the social capital as on the aspect, which positively influences citizens’ participation, mutual trust of the rural inhabitants, and their cohesion with locality referring to the collective social capital. The aim of this paper is to assess the winning villages in the competition the Village of the Year (Gold Ribbon) and to find the common features and identify the examples of best practice, which contribute to the development of these villages. We formulate the conclusions on the basis of the document analysis.
293
2 Materials and Methods The quantitative part of the analysis utilizing the date from Czech Statistical Office, qualitative part is based on the documents review. The used literature included brochures with winning villages published by some regions and by MRD, books and guidelines related to the Program of the Village Renewal and various articles in state and regional press where the readers were informed about the results of the competition. Also information from official web pages of the competition and MRD, MoA, MoE and ACR’s newsletter were utilized.
We looked on the villages which won at the national level and obtained the title the Village of the Year in particular year. There were 18 of them so far. Firstly they were characterized from quantitative point of view. Then the qualitative analysis followed. Then the particular examples of best practice present in winning villages are summarized. We considered here various activities and actions of local communities. We also consider as best practice proved procedures in the rural development practice, which helped the municipalities to achieve their goal – in our case the victory in the competition The Village of the Year.
The features referring to the presence of social capital, which we looked for, are mentioned below. They are based on the literature review. The common feature of the observed characteristics was emphasis on inner endogenous potential of the localities.
1) Connection outside the community
2) Neighborly community
First two features are related to the structure of the social networks of the winning villages. Indicator “Connection outside the community” refers to the more distant contacts maintained by the villages and therefore to the weak ties concept introduced by Granovetter (1983). He concluded in his study that for the dissemination of information and making resources in social network available are much more important weak ties than strong ones. This point of view is close to the Putnam's “bringing” social capital. It represents the weak ties of more distant contacts, “which are needed additional resources for development” (Teilmann, 2012).
On the other hand, the second indicator “Neighborly community” refers to the strong ties. We can link this approach with Putnam's “bonding” social capital, which is present in homogenous groups, among people with similar characteristics where they know each other very well. Without the presence of “bonding” social capital would not be possible the rise of local partnership, the perception of strong local identity and the interest of people to participate in the rural / community development (Putnam, 2000).
3) Presence of collective actions
Well-functioning joint effort (joint implementation of collective actions) community interested in achieving a common goal suggests significant presence of social capital that retrospectively helps to the cooperation and facilitates it. Community, which has a sufficient amount of social capital, can cooperate better (Putnam, 1993). As evidenced also by Bernard (2010), the interactions between people in the area help to improve the quality of life, mainly due to the ability to find common existing problem and solve it.
4) Interpersonal relations
In the framework of this indicator we focused mainly on the phenomena pointing on the wiliness of people to help each other and on mutual trust. Social trust is based on “belief or expectation that the others (here understood as other inhabitants of the village) will not try to consciously and intentionally harm us” (Šafr and Sedláčková, 2006). It is precisely the trust, which, according to Putnam (1993), represents the most important component of the social
294
capital. High level of social trust leads (despite of occasional conflicts) to the cooperation and strengthen mutual relations of the village inhabitants.
5) Caring for own locality
The presence of the indicator implies that there are shared values, which reinforce the interest and caring of inhabitants about their locality. These values consequently strengthen the acting in favor of all community instead of only own interest (Coleman, 1988 in Šafr and Sedláčková, 2006) and lead to the positive development of the village.
6) Local identity
Observation of the indicator was the perception of the village through the eyes of the local people. “Strong sense of share identity is an aspect of social capital that a community can mobilize for developmental benefits” (Lee et al., 2005). When people can clearly localize their home, we can talk about so-called “embeddedness” or “identification with the locality”. This consequently strengthens social networks.
Based on the identified social capital factors and observed best practices the recommendation to other villages how to proceed to enhance their development are formulated.
3 Results and Discussion
Characteristics of the winning villages – quantitative view Before we proceed to the analysis of the presence of social capital and examples of best practice identification, we should have a clear idea about the characteristics of the winning villages. The location of the municipality can influence the mentality of people because of the historical development. Eight winning villages were from Bohemia while ten from the Moravia, five of them from South Moravian region. This may suggest that there are particular features of the villages, which help them to win. There might be higher social capital created, higher local identity and will to participate on the social life of the village more often. Also strong participation is from Zlínský region, where three municipalities were winners during 18 years history of The Village of the Year competition.
On the other hand, there has never been a winner from Karlovarský or Liberecký region. The cultural life and traditions in this area are not as alive as in Moravia. What is more, both regions are traditionally industrial and suffered by structural changes as same as by transfer of the former inhabitants – mainly Germans. As Perlín (2013) reminds many villages disappeared and had to be re-settled, there was significant migration of the newcommers, which did not settled fully in the area. The territory also suffered with complete loss of social ties based on the long-term knowledge (especially trust). These phenomena were observed especially in northwest and north regions of the Czech Republic. The impacts of the transfer are significant till these days. Moravian Silesian’s municipality also never won the title the Village of the Year.
From the Czech part of the Republic, the best was Jihočeský region with 3 prices famous for its tradition, which are highly evaluated in the assessment criteria of the competition as stated in the rules of the competition. Ústecký, Pardubický, Plzeňský, Vysočina, Královéhradecký, Olomoucký and Středočeský regions won the price only once.
According to Perlín (2013), in regions Vysočina, Central Bohemia South and at the borders of Central Bohemia and South Czechia, the municipalities consist of higher amount of settlements. Contrary to that, at South Moravia, the villages are not usually divided to local parts and therefore are bigger (around 1,000 inhabitants). The typical structure of Bohemian
295
and Moravian villages is apparent also on our sample. While Bohemian villages consist of 5.38 parts in average, Moravian only from 1.80. However, most of the villages have only 1 part. The extreme is Kovářov in South Bohemia with 17 parts or Nečtiny in Plzeňský region with 12. Then follows Vilémov in Vysočina region with 9. Lower division of the villages supports the observation of local traditions. This is in line with our findings.
We were interested whether also the size of the municipality is important feature for the village success and hence for social capital creation. We supposed that in bigger villages there is more human capacity to act together but on the other hand, in smaller ones inhabitants have stronger relations among each other. Winning municipalities had from 294 to 1819 inhabitants. In average, the village had 932, while the villages from Bohemia were smaller (716) than from Moravia (1,106 inhabitants in average). This is according to general pattern of the Czech villages. However, we must take in account that there is a threshold for villages to apply for the competition. Only villages with rural character with less than 6,200 inhabitants can enter the competition. Naturally the villages are smaller than the average village in the Czech Republic (1,682 inhabitants).
The distance from the administrative center is also important. It is a possible source of the jobs for people from wide area around and also a center of services which are not accessible in the villages themselves. We supposed that villages, which are closer to the centers, have higher potential for development and higher probability to win the competition the Village of the Year. Regarding the distance from the centers in average the villages are 15.69 km far (i.e. 18.44 min.) from the municipality with extended powers. Bohemian villages are closer to the centers (11.93 km, 14.5 min.) than Moravian (18.71 km, 21.6 min.). When we consider, that majority of winning villages are from Moravia, it seems that the distance does not play significant role.
One would expect that exemplary villages will have positive migration balance. This is not true only for two villages. Nevertheless, in average the municipalities were migration profitable, while those in Bohemia two times more. This was also proved by the mayor of Tučín in Olomoucký region, who said in an interview that despite that the people feel good in the village, it is about their decision if they stay or not.
On the other hand, the problem of depopulation might not be that urgent as the winning villages have favorable age structure of inhabitants. Share of people from 0 to 14 is 15.52 %, the share of people older than 65 years is 16.34 %. The share of young people is also slightly higher (15.24 %) and the share of old people slightly lower (16.56 %) than CR average. The average age of inhabitants is the same for Bohemia and Moravia - almost 40 years - which correspond to the Czech average. We can therefore assume that the villages have certain attractively for young people and that the social ties are working and the quality of live high which in consequence might cause even that people stay in the village.
Charakteristics of the winning villages – qualitative view After quantitative description, a qualitative analysis followed. The documents published by organizers of the competition or by winning villages of the state round of the competition the Village of the Year were analyzed. The aim was to search for and find common features, which characterize intangible development factors referring to the social capital concept. We evaluated which of these features is present the most significantly in the winning villages. Selection of observed indicators described in details in methodology section.
Fig. 1 shows the distribution of particular observed indicators related to the in per cent. Despite that we present the indicators separately, it is worthy to note that they are jointly related to each other and the separation is only for the analysis purposes. They can describe
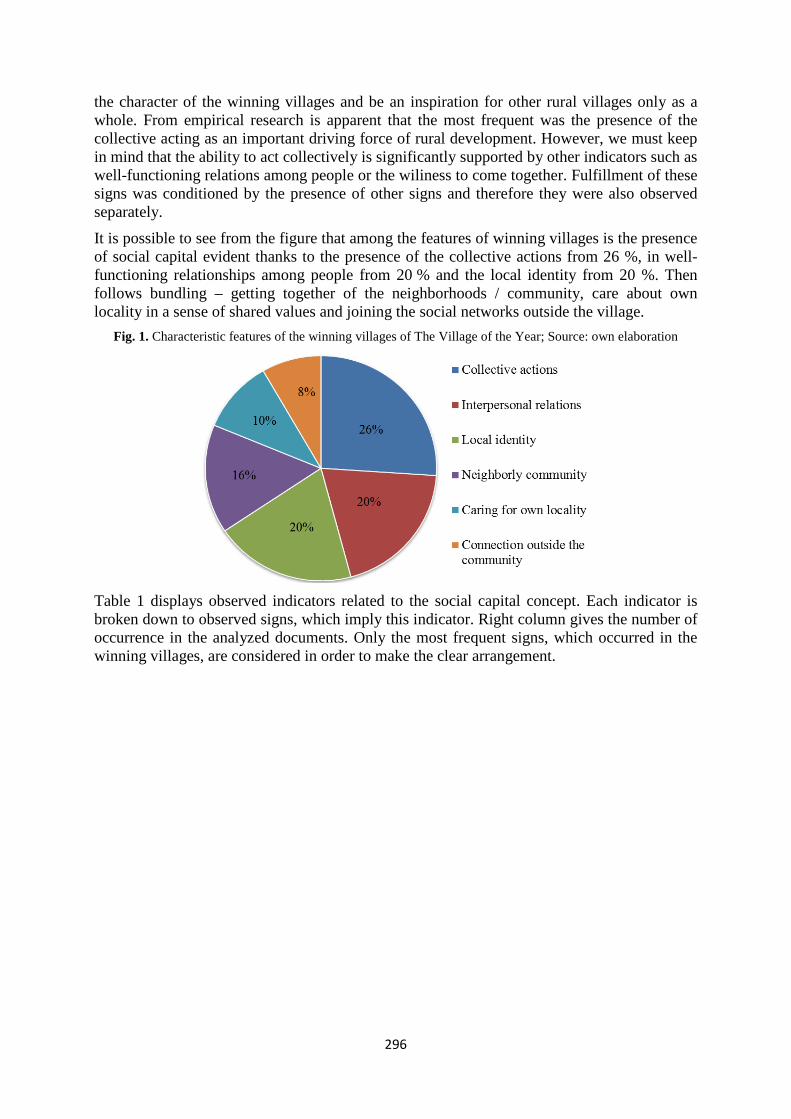
296
the character of the winning villages and be an inspiration for other rural villages only as a whole. From empirical research is apparent that the most frequent was the presence of the collective acting as an important driving force of rural development. However, we must keep in mind that the ability to act collectively is significantly supported by other indicators such as well-functioning relations among people or the wiliness to come together. Fulfillment of these signs was conditioned by the presence of other signs and therefore they were also observed separately.
It is possible to see from the figure that among the features of winning villages is the presence of social capital evident thanks to the presence of the collective actions from 26 %, in well-functioning relationships among people from 20 % and the local identity from 20 %. Then follows bundling – getting together of the neighborhoods / community, care about own locality in a sense of shared values and joining the social networks outside the village.
Fig. 1. Characteristic features of the winning villages of The Village of the Year; Source: own elaboration
Table 1 displays observed indicators related to the social capital concept. Each indicator is broken down to observed signs, which imply this indicator. Right column gives the number of occurrence in the analyzed documents. Only the most frequent signs, which occurred in the winning villages, are considered in order to make the clear arrangement.
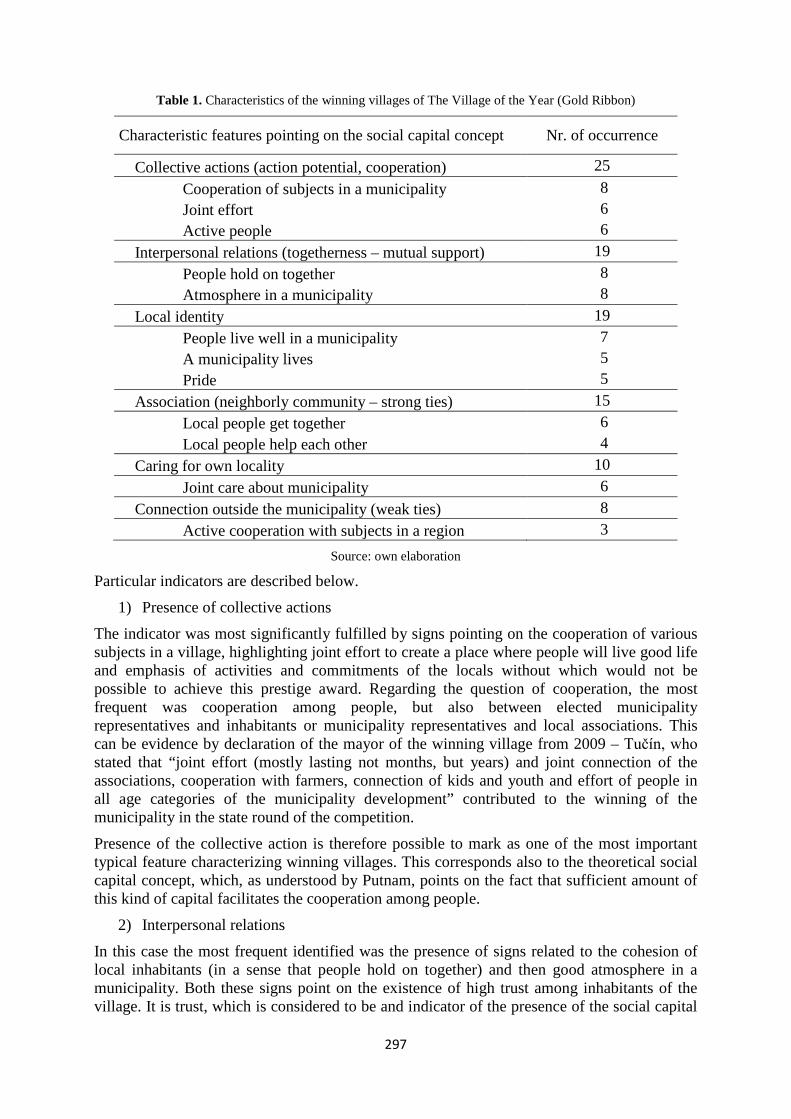
297
Table 1. Characteristics of the winning villages of The Village of the Year (Gold Ribbon)
Characteristic features pointing on the social capital concept Nr. of occurrence
Collective actions (action potential, cooperation) 25 Cooperation of subjects in a municipality 8 Joint effort 6 Active people 6
Interpersonal relations (togetherness – mutual support) 19 People hold on together 8 Atmosphere in a municipality 8
Local identity 19 People live well in a municipality 7 A municipality lives 5 Pride 5
Association (neighborly community – strong ties) 15 Local people get together 6 Local people help each other 4
Caring for own locality 10 Joint care about municipality 6
Connection outside the municipality (weak ties) 8 Active cooperation with subjects in a region 3
Source: own elaboration
Particular indicators are described below.
1) Presence of collective actions
The indicator was most significantly fulfilled by signs pointing on the cooperation of various subjects in a village, highlighting joint effort to create a place where people will live good life and emphasis of activities and commitments of the locals without which would not be possible to achieve this prestige award. Regarding the question of cooperation, the most frequent was cooperation among people, but also between elected municipality representatives and inhabitants or municipality representatives and local associations. This can be evidence by declaration of the mayor of the winning village from 2009 – Tučín, who stated that “joint effort (mostly lasting not months, but years) and joint connection of the associations, cooperation with farmers, connection of kids and youth and effort of people in all age categories of the municipality development” contributed to the winning of the municipality in the state round of the competition.
Presence of the collective action is therefore possible to mark as one of the most important typical feature characterizing winning villages. This corresponds also to the theoretical social capital concept, which, as understood by Putnam, points on the fact that sufficient amount of this kind of capital facilitates the cooperation among people.
2) Interpersonal relations
In this case the most frequent identified was the presence of signs related to the cohesion of local inhabitants (in a sense that people hold on together) and then good atmosphere in a municipality. Both these signs point on the existence of high trust among inhabitants of the village. It is trust, which is considered to be and indicator of the presence of the social capital
298
and is being used to measure it. We do not directly measure the social capital in our contribution; therefore we utilized the trust only to see the presence of the social capital in winning villages. We can document it for example by the proclamation of mayor of the Village of the Year 2012 – Řepice, who mentiones the importance of the trust presence through the well-functioning interpersonal relations: “it [winning the award] would not be possible without the coherence and cohesion of locals”. He believes that it is this factor which contributed the most to gain the award.
Another mayor of the winning village – Tučín is talking about that “there's a good community of people and when needed, they can get together”. Note that the second part of the statement refers to the indicator “Neighborly community”. Here one can find links to the most frequently occurring indicator “Collective action”. To summarize, if there are functioning interpersonal relationships in the village, it is easier to implement collective action together.
3) Local identity
Local identity was observed in terms of to how the inhabitants perceive their locality. Hence, it is a strong emotional relationship to the village. It should also be noted that this and the above mentioned indicator are very close to each other. It is therefore no coincidence that these two were observed with the same frequency. This indicator was fulfilled most of the times by the notes about that people live well in a village, that there is still something going on and that the people are proud on what was done in a village, what activities are held there etc. The inhabitants of The Village of the Year 2006 – Liptál admitted that they are “so happy to live and reside just here”. Mayor of The Village of the Year 2002 noted that he “sees more and more local people to be proud on the fact that they live just in Nečtiny. While previously the feeling of in-settled population without the roots to the locality prevailed, nowadays the fate of the village is not indifferent to them anymore.” It is possible to find here a clear reference to the strengthening of social capital over time in the community. Another mayor proclaimed that even he perceives the municipality as his “own large family” and therefore he wants people to live well in it.
4) Neighborly community
The indicator related to the existing strong ties in the winning villages in a sense that people in particular area can meet and help each other on the lower than municipality level. This point of view is included in the “Collective actions” indicator. Bundling is therefore related to the issue of social networks, which are inseparably connected to the social capital. The most frequently was the indicator fulfilled by signs related to bundling of local inhabitants and that the people are able to help each other when needed. How is evident by the declaration of the mayor of The Village of the Year 2005 – Bořetice about the social events in the village: “Than until the late night you hear singing, ...people are talking about all sorts of things, and mainly, no one wants to sleep.” Another mayor of The Village of the Year 2002 – Nečtiny shows that “in reality, everything is just about the people who live in that locality ... You can have millions at the treasury, but if you do not have the support of the people, everything you do will be a dead investment.” This corresponds to the theoretical concept of social capital, which is the wealth of relationships between people. If they are wealth relations between local people it will help to also fulfill other here observed indicators.
5) Caring for own locality
We observed here the presence of shared values among local people by the indirect indicator “Caring for own locality”. We assumed that in the framework of fulfillment of other indicators the people can meet for example “only” due to the social events. Based on this fact it would not be possible to reveal whether there are common shared values in a community.
299
On the other hand, if people are meeting in order to fulfill some commonly shared duty, it is possible to perceive particular form of harmony with the community and strengthening of shared values (e.g. if the inhabitants meet to jointly adjust the village square, it is more likely that nobody of them will dare to damage anything in this area anymore). It is about creation of something common, not only tangible, but also in terms of the strengthening of the community and creation of its shared values.
The indicator was fulfilled especially by the sign of joint care about the municipality, when the people were able to for example together restore old buildings or on voluntary basis to adjust public areas and greenery in a village.
6) Connection outside the community
This indicator was included into the empirical part in order to observe social networks of the winning villages not only from the point of view of strong ties existing inside the municipalities, but also from the view of weak ties, which are necessary during development activities. These ties, which are close to the Putnam’s concept of bringing social capital, are necessary for the community because they enable the access to the resources and information outside the community.
Despite that, the signs of this indicator appeared in observed documents the less frequently, mostly in a sense of cooperation with other actors in a region. Development of outer networks was strongly evident mainly after receiving the award Village of Year. The village came to the attention of the wider public and thus opened the space for communication with new actors, both from the side of the representatives of municipalities, who wanted to get inspiration, and from the media, investment partners and tourists.
Best practice in winning villages This chapter states particular activities which were done by the municipalities and which can be considered as good practice examples of the winning villages. These should serve as examples for other rural villages, their elected representatives, subjects and local inhabitants. From our analysis is evident that the municipalities developed all areas of the life in a village. Almost in all texts related to the winning villages the restoration and maintaining of the traditions (folklore) and rich cultural and social live in a form of carnivals, amateur theater, cutting the maypole, harvest festivals, sports tournaments and meetings of seniors. People in awarded villages were able to compose from many little details compact complex of active and well-functioning village.
In these practical examples it is possible to find links to the theoretical endogenous model of rural development, which stresses the usage of local resources and ability of local people and implementation of this development would not be possible without the presence of sufficient amount of social capital. Another significant feature of the most of the winning villages is active associations, which “always thinks about something new and the life in the village goes on” as stated by the mayor of The Village of the Year 2009 – Tučín. According to the mayor of The Village of the Year – 2010 “won the spirit of the village and cohesion of local people”. According to him it is important to give to the village development something more, because “everybody has fireman, everybody has football players, everybody cares about traditions. But it is very important to put “hearth” in these activities, to fully take care.” It is necessary that local inhabitants are fully associated and that they have an interest in development of the locality. Without this is impossible to achieve good living standards in a village.
Another important part of the municipality development is infrastructure. Awarded villages managed to restore the school, which brings the life to the locality (the condition is well-
300
function of the school), and the church, build water treatment plant or sewage, new roads or pavements. On some of these actions participated even the inhabitants of the municipality – either by their work in a free time, or even by financial contribution, which is the case of the Village of the Year 2008 – Lidečko, where the people were able to raise funds for repair local church among themselves. The Village of the Year can contribute in this sense as the victory is related to (relatively high) financial subsidy.
Another highly appreciated development area is the attitude towards the questions of the environmental protection. Positively awarded is ecologically friendly approach towards natural elements and countryside (e.g. planting of original types of fruit trees and planting the greenery on public spaces), building of the bio-corridors, planting and maintains of threes or non-disturbance allocation of the water treatment plant in the countryside.
The last but not least area is elaboration (but also fulfillment of this document) of long-term vision (conception strategy) of the village development and area plan.
4 Conclusion Our aim was to analyze the winning villages of the competition The Village of the Year and to search for the common features, which point on the presence of the social capital and to identify the best practice in order to be the inspiration for other villages in rural areas. The quantitative point of view did not reveal any significant patter which would suggest that particular type of village have higher chance to win the price. Only the fact that the most winning villages were from Moravia, particularly South Moravian region suggests that some local specifics present here make the victory more probable. We assumed that this is thanks to the traditions which are more alive in this part of the Czech Republic. This was proved by the qualitative part of the analysis.
From six observed indicators of the occurrence of social capital, the most frequent was “Collective actions” related to the cooperation of subjects in a municipality, joint effort of the locals and active people. This corresponds to Putnam’s theoretical concept of the social capital, which states that sufficient amount of the social capital facilitates the cooperation among people. Various activities, events, traditional or newly established festivals, meetings etc. are also among identified best practice. Most of the documents (published articles with interviews with mayors and brochures) highlighted those activities. Therefore we can recommend to the rural villages to try to bring people together as the interactions between people help to raise the social capital which consequently improve the quality of life.
The challenge for the future research is to observe the contribution of the social capital we identified in our analysis to combat the problems by which usually the rural villages suffers such as depopulation, population ageing, lack of jobs etc. This would require deep questioning the mayors of the villages personally and can bring interesting insight in to the rural development issue.
Acknowledgements The paper is supported by the internal grants of the Internal Grant Agency of the Faculty of Economics and Management of the Czech University of Life Sciences in Prague: “Potenciál spolupráce očima místních akčních skupin: synergie nebo obava”, No. 20131041: 11190/1312/3156 and “Využití finančních prostředků fondů EU pro rozvoj venkova”, No. 20121054:11110/1312/3112.
301
References Árnason A., Lee J., Shucksmith M. (2004) ‘Understanding networks and social capital in European rural development. Improving Living Conditions and Quality of Life in Rural Europe’, Proceeding of the EU Conference, Westport, Ireland, pp. 1-15.
Bartůňková, T., Hromádka, M., Sedláček, P. (2010) ‘Vesnicí roku 2010 jsou Ratměřice na Benešovsku’. Český rozhlas. Available from: < http://www.rozhlas.cz/zpravy/politika/_zprava/782456>.
Bernard, J. (2010) Endogenní rozvojové potenciály malých venkovských obcí a místní samospráva, Prague: Sociologický ústav AV ČR.
Bernard, J. et al. (2011) Samospráva venkovských obcí a místní rozvoj, Prague: Sociologické nakladatelství (SLON).
Bourdieu, P. (1986) in Šafr, J. and Sedláčková, M. (2006) Sociální kapitál. Koncepty, teorie a metody měření. Praha: Sociologický ústav Akademie věd ČR.
Bourdieu, P. (1980; 1984; 1990) in Lee, J., Árnason, A., Nightingale, A., Shucksmith, M. (2005) ‘Networking: Social Capital and Identities in European Rural Development’. Sociologia Ruralis, vol. 45, no. 4, pp. 269-283.
Burešová, J. (2006) ‘Bořetice - Vesnice roku 2005 postupuje do soutěže o titul Evropská vesnice’. Stavebnictví a interiér. Available from: < http://www.stavebnictvi3000.cz/clanky/boretice-vesnice-roku-2005/>.
Coleman, J. S. (1990) Foundations of social theory. Cambridge: Harward University Press.
Coleman, J. S. (1988) in Šafr, J. and Sedláčková, M. (2006) Sociální kapitál. Koncepty, teorie a metody měření. Praha: Sociologický ústav Akademie věd ČR.
Falk, I. and Kilpatrick, S. (2000) ‘What is social capital? A study of interaction in a rural community’, Sociologia Ruralis, vol. 40, no. 1, pp. 87-110.
Fišerová, E. (2013) ‘Tučín: Vesnice roku 2009’. Ministerstvo vnitra ČR. Available from: <http://www.mvcr.cz/clanek/tucin-vesnice-roku-2009.aspx>.
Granovetter, M (1983) The Strength of Weak Ties: A Network Theory Revisited. Sociological Theory, vol. 1, pp. 201-233.
Hosmanová, I. (2002) ‘Nečtiny se staly vesnicí roku’. MF DNES. Available from: <http://zpravy.idnes.cz/nectiny-se-staly-vesnici-roku-dkk-/domaci.aspx?c=A020924_212636 _domaci_jan>.
Lee, J., Árnason, A., Nightingale, A., Shucksmith, M. (2005) ‘Networking: Social Capital and Identities in European Rural Development’. Sociologia Ruralis, vol. 45, no. 4, pp. 269-283.
Liptálský zpravodaj (2006) ‘Liptál – Vesnice roku 2006’. Available from: < http://www.liptal.cz/soubory/dokument_2011-04-10_1302411963.pdf>.
Lošťák, M. (2005) ‘New possibilities of identifying social capital for its use in sustainable rural development’, Agricultural Economics, vol.51, no. 2, pp. 57-63.
Matoušek, R. and Sýkora, L. (2008) ‘Social Capital and Area: Territoriality of Social Networks and Groups’, Proceeding of International Conference „Venkov je náš svět-Countryside-our world, Česká zemědělská univerzita, Prague, pp. 412-420.
302
Ministry for Regional Development – MRD (2013). The Village of the Year. Available from <www.vesniceroku.cz>.
Perlín, R. et al. (1994) Obnova venkova: Program obnovy vesnice. MoA: Prague. 100 p.
Perlín, R. (2013) Rozvojové problémy venkova. Přednášky. Praha: Univerzita Karlova. 18.2.-15.4. 2013.
Putnam, R. D. (1993) Making Democracy Work: Civic Tradition in Modern Italy. Princeton: Princeton University Press.
Putnam, R. D. (2000) Bowling Alone. The Collapse and Revival of American Community. New York: Simon & Schuster Paperbacks.
Rifkin, J. (2001) The Age of Access. The new Culture of Hypercapitalism where all of Life is a paid-for Experience. New York: Tarcher.
Strakonická televize (2012) ‘Obyvatelé Řepice oslavovali vítězství v soutěži Vesnice roku’. Available from: < http://www.tv.strakonice.eu/drupal/obyvatel%C3%A9-%C5%99epice-oslavovali-v%C3%ADt%C4%9Bzstv%C3%AD-v-sout%C4%9B%C5%BEi-vesnice-roku>.
Šafr, J. and Sedláčková, M. (2006) Sociální kapitál. Koncepty, teorie a metody měření. Praha: Sociologický ústav Akademie věd ČR.
Teilmann, K. (2012) ‘Measuring social capital accumulation in rural development’, Journal of Rural Studies, vol. 28, pp. 458-465.
Tomšík, K. (2009) Vývoj a perspektivy evropského venkova. I. vyd. Praha: Wolters Kluwer ČR.
Vojáček M. (2013) ‘Lidé v Tučíně drží pospolu,říká starosta Jiří Řezníček’. Hranický deník.cz. Available from: <http://hranicky.denik.cz/zpravy_region/lide-v-tucine-drzi-pospolu-rika-starosta-jiri-reznicek-20130717-aqjm.html>.
Wiesinger, G. (2007) ‘The importance of social capital in rural development, networking and decision-making in rural areas’, Paysages alpins en perspective, vol. 95, no.4, pp. 43-56.
303
The Definition of Rural Areas in the Czech Republic with Regard to the Policy Objectives
Marie Pechrová Czech University of Life Sciences in Prague,
Kamycka 129, 165 21 Prague 6 – Suchdol, Czech Republic [email protected]
Annotation: The aim of this article is to determine the rural areas in a way that the definition can be utilized for policy making purposes. The basic requirements on criteria used are simplicity, relevance and stability in time. On the international level the comparability among countries is also important. Exact definition of rurality represents an unsolved problem not only in the Czech Republic (CR). Scholars usually use one or more criteria to describe significant features of rurality. This article focuses on the definition of rural areas in the CR for EU’s subsidies policy as a new need to redefine the rurality emerged with next programming period 2014–2020. The main aim is to set the eligible areas for support and to compare number of inhabitants, number of villages and acreage among a range of definitions. Various determination of rurality has the impact on received subsidies per capita in rural areas. Therefore, it is necessary to clearly state the main goal of the grant policy. If it is to support as many inhabitants as possible, than all regions with exception of Prague should be considered. Also wide amount of population is covered if the eligible areas include stabilized and peripheral regions defined according to the methodology of Ministry for Rural Development. However, the fewest villages are able to gain the support in this case. As the most of municipalities in the CR are smaller than 3,000 inhabitants, this enables to support 94 % of them and cover around 30 % of population on almost 80 % of area. In terms of the area, the population density criterion (less than 150 inhabitants per km2) makes possible to support 80 % of the area of the CR.
Key words: rural areas definition, rurality, Rural Development Programme
JEL classification: O18, R51
1 Introduction Many papers, articles or policy documents have addressed the definition of rural and rurality. As rural areas can be seen from various perspectives, they cannot be described by single definition. „Firstly, we have to decide whether we are looking for the borders of the rural space or rural communes, secondly, it regards the criteria according to which we will define the countryside, and, last but not least, quantification of these criteria (if possible at all).” (Maříková, 2007) Maříková (2007) identified three types of definitions in her paper: (1) subjective where – the criteria are only subjective, based on impressions and feelings of people; (2) objective qualitative – the criteria are more or less precisely specified, but they are difficult to quantify (measure) – e.g. architectonical features, structure of inhabitation, historical development, social criteria etc.; (3) objective quantitative – the criteria for defining countryside are precisely defined, they are measurable and their following and measuring is easy.
The definition must be in line with the purpose. There are various reasons why to distinguish rural and non-rural areas. The determinations can serve for collecting of the statistical data, administrative purposes, social or economic analyses and the most importantly for intentions of policy making. Raupeliené and Jazepčikas (2009) determined about 60 alternative definitions of the rural areas and divided them into six categories according of the purpose of their usage: (1) policy measures / analytic tool, (2) spatial / performance indicator, (3)
304
conceptual / empirical study, (4) broad / narrow coverage, macro- or micro- / input-output / cost-benefit analysis / multi-criteria analyses, (4) disaggregate / aggregative approach. This article follows the ongoing debates about the definition of rural from the point of view of policy purposes.
The lack of universal definition of rurality can result in different approaches to the rural development and lead to fragmentation which would prevent the synergy effect of to the ill-conceived plans. The importance of precise determination of the rural areas especially for policy-making purposes is highlighted by Binek et al (2007) who observed the synergies in rural areas of the Czech Republic (CR). He stresses particularly the fact that rural areas are heterogeneous, hence a typology which “enables to move from diversified set of elements to the small number of relatively homogenous categories” (Binek et al, 2007) is needed. This will enable the rural development policies to focus on particular problems of these areas. Bogdanov et al (2008) is of the same opinion. „Effective rural development policies must be based on an accurate classification of the essential characteristics of the various regional types. Such a framework allows the identification of both needs and opportunities in the rural areas.” (Bogdanov et al, 2008) “A precise definition of rural areas and rural population is clearly a precondition for any further policy action as well as policy definition, targeting, and evaluation.” (Vobecká, 2009)
“Drawing a line between urban and rural areas seems quite simple in everyday life, but suggesting a conceptual definition which is both precise and statistically meaningful, becomes much more difficult.” (Gennaro, Fantini, 2002) There are definitions based on the spatial characteristics such as driving time to the nearest city, landscape and land cover or settlement structure of the municipality or according to the prevailing economic activities, demographic structures, social features etc. “Some of these criteria are specific ones which could be applied to the Czech Republic only, or even to a certain region, another are, on the opposite, international ones.” (Maříková, 2007)
Each definition has its pros and cons. The ones based on one dimension criterion such as the number of inhabitants or population density has advantage in their simplicity. The information value is higher when we choose criteria which are stable in time. However, these fail to provide deeper view on the problematic. On the other hand too complex determinations based on many different criteria which are often changing overtime have only limited usage in real life. They might serve only for scientific purposes. This article is concerned with policy-making usage of rural areas definition. Particularly it is examined what would be the consequences of various determinations of the rural areas for the subsidy policy.
Official determinations of the rural areas The most well-known determination according to the percentage of population living in rural local units was elaborated by OECD. The criterion of density of population is based on the assumption that for urban areas is typical a higher concentration of inhabitants. Firstly, local units (LU) (municipalities in case of the CR) are classified as rural if their population density is below 150 inhabitants per km2. Then they are aggregated into regions classified:
(1) Predominantly Urban (PU), if the share of population living in rural LU is below 15 %;
(2) Intermediate (IN), if the share of population living in rural LU is 15 % to 50 %;
(3) Predominantly Rural (PR), if the share of population living in rural LU is over 50 %.
Finally, there are corrections applied if a region classified as predominantly rural contains an urban centre of more than 200,000 inhabitants representing at least 25 % of the regional population, than it becomes intermediate. If intermediate region contains an urban centre with
305
more than 500,000 inhabitants representing at least 25 % of the regional population it is reclassified as predominantly urban. (OECD, 2010) Despite that this methodology enables to compare the regions all over the world, it has several drawbacks in terms of too high threshold and too wide and diverse area of the aggregated regions. For example in the Czech Republic, all regions (except for the capital city of Prague which is considered to be predominantly urban region and Vysocina region defined as predominantly rural) are classified as intermediate. There are only 7 regions on the NUTS 2 level, which are highly diverse and therefore the OECD regional typology gives only little information about the real “rurality”.
For this reason, EU has developed new typology based on the one km2 grid cells which will replace formerly used definition of the OECD. Firstly, the population living in rural areas is defined as the population living outside the urban areas. These are determined as territories where the density of population is above 300 inhabitants per km2 applied to grid cell and a minimum size threshold (5,000 inhabitants) applied to grouped grid cells above the density threshold. This approach has the benefit that it creates a more balanced distribution of population. In a number of countries the shifts between intermediate and predominantly rural are quite significant, as for example in the Czech Republic. (Eurostat, 2010)
Eurostat based the typology on the density of population only and distinguishes areas highly populated (population density over 500 inhabitants per km2 and above 50,000 inhabitants), middle inhabited (density over 100 inhabitants per km2 and over 50,000 inhabitants) and sparsely populated (others).
The statistical limit commonly used not only in the CR for the definition of rural municipalities is 2,000 inhabitants. Municipalities with a population of less than this threshold are considered to be rural. “This limit was set as a definition already by J. Korčák in 1929 his study on the depopulation of Bohemia in the period 1850–1930. Officially, this criterion for delimitation of rural population was recommended by the International Statistical Office in 1938.” (Maříková, 2007). “In the Czech countries, we can regard as rural all communes with less than 2,000 inhabitants and a part of communes with 2,000–5,000 inhabitants.” (Votrubec, 1980) However, there are also typical villages that have more residents and are not classified among the rural by this criterion, although they are still not a city (Rural Development Programme (RDP), 2013). Hence, the definition is not always reliable.
The concrete determination was absent in previous strategic documents of rural policy. As Vobecká (2009) stated after the analysis of Horizontal Rural Development Programme (HRDP) and Operational Programme Agriculture, “these documents avoid any clear definition of “rural” and instead refer to existing or “commonly used” definitions.” (Vobecká, 2009). Rural Development Programme of the Czech Republic (RDP) for 2007–2013 distinguishes suburban, intermediate and remote rural areas. The first category includes rural municipalities near city agglomerations with more than 50,000 inhabitants. Remote rural areas are defined not only by unfavourable economic, demographic and settlement characteristics, but also by social problems. Intermediate areas are represented by the rest of territory. However, the distribution of finances focused on villages with less than 2,000 inhabitants with special attention to those with less than 500.
Strategy of regional development for 2014–2020 introduced in the first half or 2013 by Ministry for Regional Development (MRD) categorizes the area into three types according to the development features on: (1) development areas, (2) stabilized areas and (3) peripheral areas. These are further divided on the basis of the number of inhabitants, population density and urbanization degree on urbanized areas and countryside. The limit is 100 inhabitants per km2. First group includes metropolitan areas, settlement agglomerations and regional centres. A statistical limit for distinguishing of rural municipalities is currently 3,000 while in the
306
previous document it was only 2,000. State is supporting economically problematic regions and other regions such as former military areas and socially disadvantaged areas. (MRD, 2012) This typology is further utilized in the analysis.
The official typologies have several drawbacks. Firstly, they are based on limited number of criteria. As Raupeliené and Jazepčikas (2009) argue, despite that “the main purpose of rural areas typologies is to ensure the policies objectives for rural areas which are multidimensional ... the typologies are built on one or two criteria.” Secondly, the areas of focus are stated at the beginning of the period for which is the policy formulated. In case of the EU, the programming period is seven years. Static definition does not make possible to fully reflect possible changes in rural areas which could have occurred during the period. „Therefore, it is important that new alternatives which are enabling to reflect the reality more suitably and overcome current, less optimal solutions are submitted, especially in the scientific area.” (Binek et al, 2009).
Alternative determinations of the rural areas An answer for the criticism is the alternative determination based on more criteria or more relevant indicators. Various scholars elaborated numbers of definitions using different methods to determine and further describe rural areas. In the European context, the classification of rural areas concern for example Blunden et al (1998). They elaborated typology using neural network applications to be used for rural development programme. From a point of view of sociologists, the determination of rural was usually based on the description of the features of the areas that differ from the urban. Never the less, as Friedland (2002) argues „Whereas much of the definitional approach sought to find differences in sociodemographic, attitudinal, and cultural variables, an important finding was that rural and urban were less polarities or elements of a dichotomy than stations along a continuum.” Halfacree (1993) presents a large overview of the definitions of rural which he summarized into two main approaches – either in descriptive or social-cultural terms. If we define ‘rural areas’ according to their socio-spatial characteristics, which are observable and measurable, we obtain descriptive definitions. “Descriptive methods only describe the rural; they do not define it themselves. Attention must thus be given to what it is that they are trying to articulate, a point to which we shall return after considering the socio-cultural way of defining the rural.” Halfacree (1993) He argues for a social representation theory.
Vobecká (2009) in her research considered the driving time to the urban centres providing more than certain number of job opportunities as the main indicator of rurality. Binek et al. (2007) determined rural areas according to the number of inhabitants and transport accessibility. Perlín (1998) used 16 social-economical indicators such as number of inhabitants, net migration, the number of inhabited houses newly build between 1995 and 2009, share of inhabitants older than 65 years, share of natives, unemployment rate, or election turnover. Leitmanová et al (2012) categorized as rural these municipalities which are not located in suburban areas determined in prior buffer analysis. The rest of the municipalities were reduced by those which had more than 2,000 inhabitants and the population density was higher than 150 inhabitants per km2. These criteria were supplemented by the net migration and change in “rurality” status between years 1995 and 2009.
As Binek et al (2009) summarizes, “In any case, it is necessary to take in account that none solution will be completely acceptable for all involved actors – due to the diversity of interests, missions and competences. However, this should not be irremovable barrier for knowledge and for development of the countryside and rural areas themselves.” (Binek et al, 2009).
307
Rural development policy The decline of a former main economic activity in rural areas – agriculture – in terms of its share on the GDP and employment justifies the need for support of countryside. „Over the past decades, major changes have taken place in Europe’s rural areas. These changes include contrasting developments like depopulation and land abandonment in some regions, and urbanisation and agricultural intensification in others.” (Westhoek et al, 2006) Specially targeted policy emerged. It “is implemented via set of optional tools which provide with flexibility of policy in adapting to specific needs of a rural area.” (Raupeliené and Jazepčikas, 2009). It is functioning within the Common Agricultural Policy (CAP). Particularly, under the second pillar which is financed from the European Agricultural Fund for Rural Development (EAFRD). In the programming period 2007–2013 there are 858 mil. EUR prepared to be devoted to support the objectives of the CAP. The EU’s policy is translated on a national level by National Strategic Plan for Rural Development. Subsidies are distributed according to Rural Development Programme (RDP). It is divided into the four axes with objectives of “improving the competitiveness of the agricultural and forestry sector (Axis 1), improving the environment and the countryside (Axis 2), and improving the quality of life in rural areas and encouraging diversification of the rural economy (Axis 3)” (Margarian, 2013). The fourth axis includes top-down LEADER approach to the rural development.
Currently a new programming document is being drafted. Policy-makers, therefore, stand in front of an important question, how to define the rural areas. It is necessary to analyse how wide areas will be eligible for support and how many people and municipalities can possibly benefit from subsidies. This paper provides various possibilities of rural areas definitions. Firstly, recent studies of rural area classification are reviewed. EU’s subsidies policy is introduced next. Analysis is based on the simulations of various determinations of the rural areas. Final part contains the conclusions.
2 Materials and Methods The analysis includes quantitative types of possible determination of rural areas. There were chosen with regard to their possible utilization in rural development policy. Therefore, only simple indicators such as the number of inhabitants, number of municipalities, population density and typology elaborated by MRD were utilized. The research is based on secondary data obtained from Czech Statistical Office (CZSO). The data for municipalities for year 2011 were used. The division of the municipalities according to their membership to development, stabilized and peripheral areas is based on the MRD data.
At the beginning was described the structure of municipalities in the CR in terms of the number of inhabitants and acreage in particular size categories. Then we performed simulations of possible rural definitions and calculated the impact on the acreage of supported areas, number of population living in eligible areas and the number of municipalities lying in those territories. Firstly, the definition according to the number of inhabitants, secondly according to OECD determination, next the criterion of population density was used and finally as a basis was utilized MRD definition. The data were displayed in graphs and compared. Synthesis shows the consequences of rural definitions for rural development policy.
3 Results There are 6,251 municipalities with 10.51 mil. inhabitants on the area of 7.89 mil. ha in the CR. Rural municipalities represent 89.82 % of all the municipalities and administer the
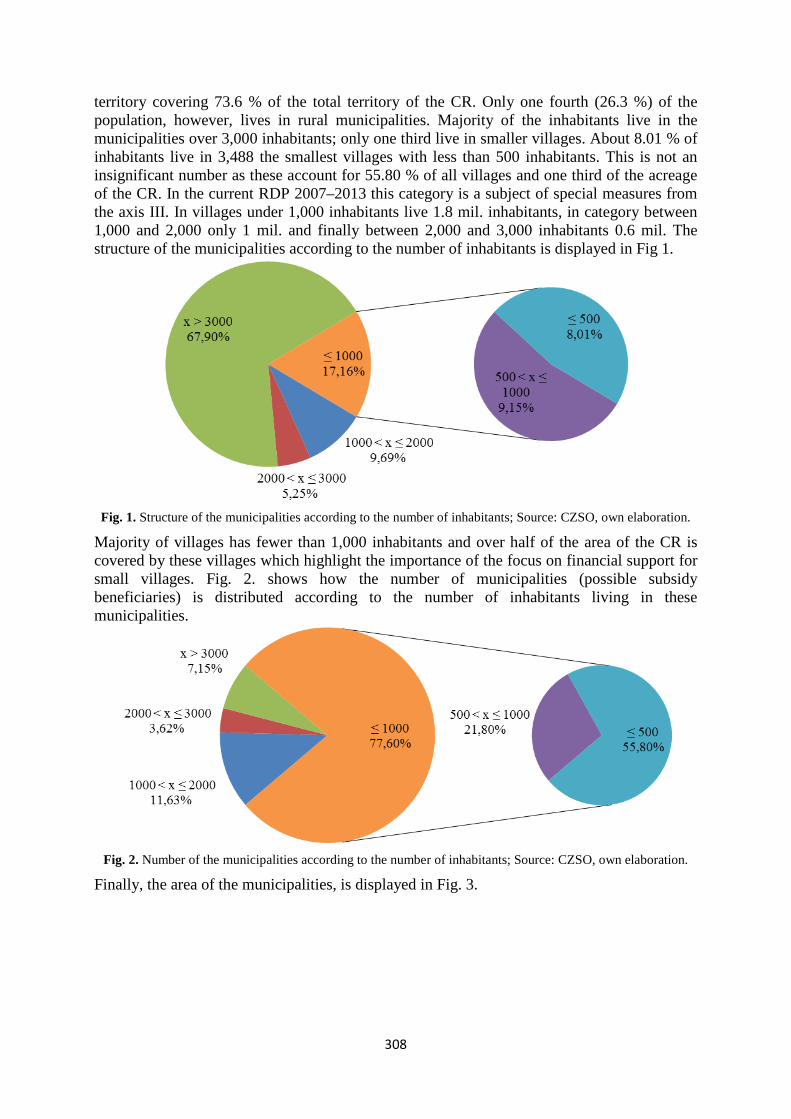
308
territory covering 73.6 % of the total territory of the CR. Only one fourth (26.3 %) of the population, however, lives in rural municipalities. Majority of the inhabitants live in the municipalities over 3,000 inhabitants; only one third live in smaller villages. About 8.01 % of inhabitants live in 3,488 the smallest villages with less than 500 inhabitants. This is not an insignificant number as these account for 55.80 % of all villages and one third of the acreage of the CR. In the current RDP 2007–2013 this category is a subject of special measures from the axis III. In villages under 1,000 inhabitants live 1.8 mil. inhabitants, in category between 1,000 and 2,000 only 1 mil. and finally between 2,000 and 3,000 inhabitants 0.6 mil. The structure of the municipalities according to the number of inhabitants is displayed in Fig 1.
Fig. 1. Structure of the municipalities according to the number of inhabitants; Source: CZSO, own elaboration.
Majority of villages has fewer than 1,000 inhabitants and over half of the area of the CR is covered by these villages which highlight the importance of the focus on financial support for small villages. Fig. 2. shows how the number of municipalities (possible subsidy beneficiaries) is distributed according to the number of inhabitants living in these municipalities.
Fig. 2. Number of the municipalities according to the number of inhabitants; Source: CZSO, own elaboration.
Finally, the area of the municipalities, is displayed in Fig. 3.
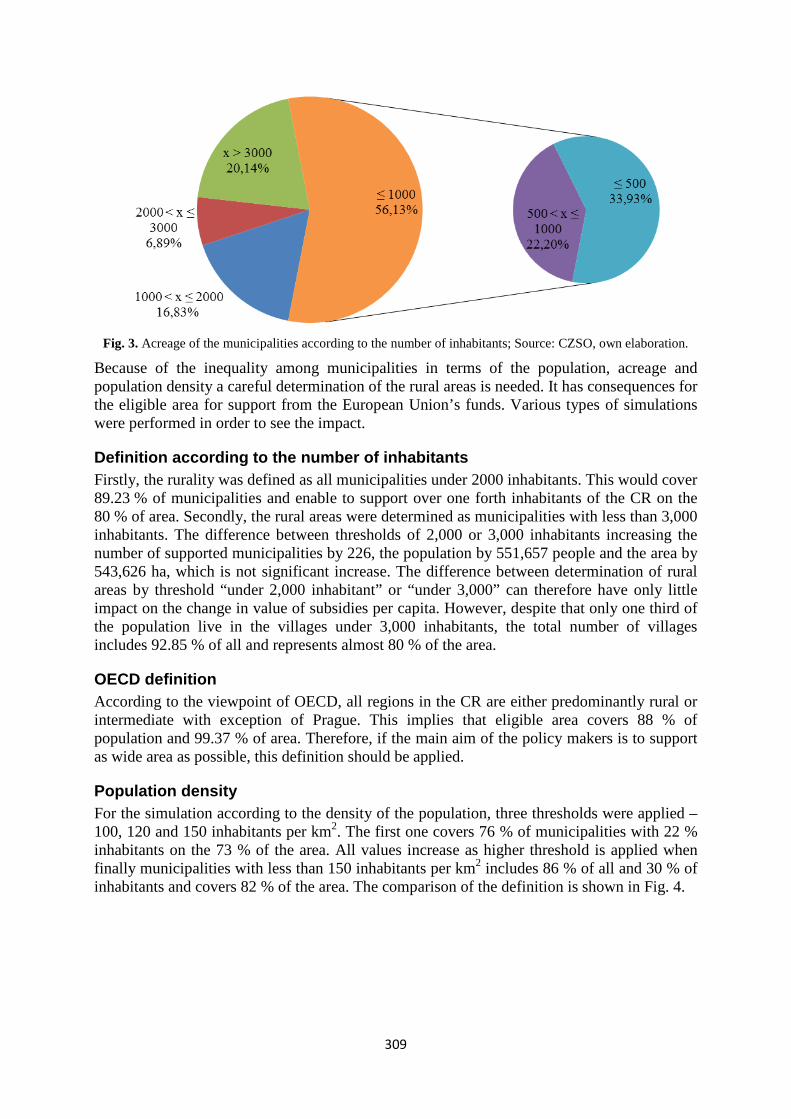
309
Fig. 3. Acreage of the municipalities according to the number of inhabitants; Source: CZSO, own elaboration.
Because of the inequality among municipalities in terms of the population, acreage and population density a careful determination of the rural areas is needed. It has consequences for the eligible area for support from the European Union’s funds. Various types of simulations were performed in order to see the impact.
Definition according to the number of inhabitants Firstly, the rurality was defined as all municipalities under 2000 inhabitants. This would cover 89.23 % of municipalities and enable to support over one forth inhabitants of the CR on the 80 % of area. Secondly, the rural areas were determined as municipalities with less than 3,000 inhabitants. The difference between thresholds of 2,000 or 3,000 inhabitants increasing the number of supported municipalities by 226, the population by 551,657 people and the area by 543,626 ha, which is not significant increase. The difference between determination of rural areas by threshold “under 2,000 inhabitant” or “under 3,000” can therefore have only little impact on the change in value of subsidies per capita. However, despite that only one third of the population live in the villages under 3,000 inhabitants, the total number of villages includes 92.85 % of all and represents almost 80 % of the area.
OECD definition According to the viewpoint of OECD, all regions in the CR are either predominantly rural or intermediate with exception of Prague. This implies that eligible area covers 88 % of population and 99.37 % of area. Therefore, if the main aim of the policy makers is to support as wide area as possible, this definition should be applied.
Population density For the simulation according to the density of the population, three thresholds were applied – 100, 120 and 150 inhabitants per km2. The first one covers 76 % of municipalities with 22 % inhabitants on the 73 % of the area. All values increase as higher threshold is applied when finally municipalities with less than 150 inhabitants per km2 includes 86 % of all and 30 % of inhabitants and covers 82 % of the area. The comparison of the definition is shown in Fig. 4.
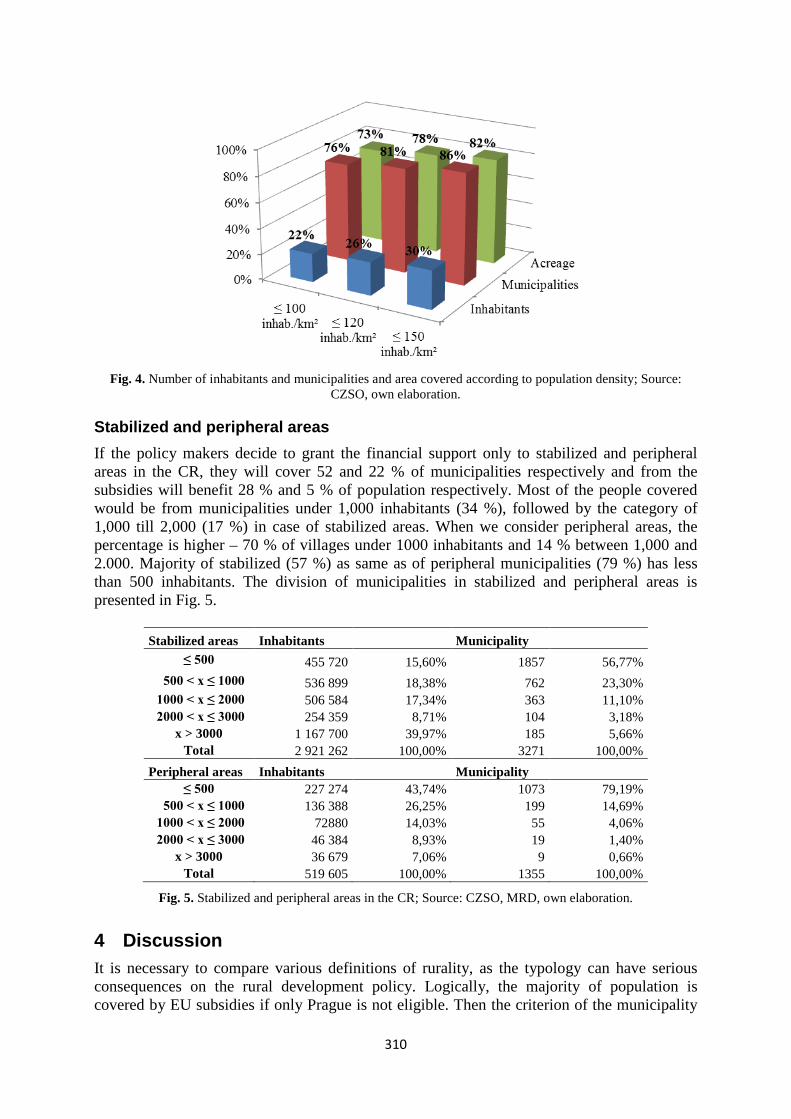
310
Fig. 4. Number of inhabitants and municipalities and area covered according to population density; Source:
CZSO, own elaboration.
Stabilized and peripheral areas If the policy makers decide to grant the financial support only to stabilized and peripheral areas in the CR, they will cover 52 and 22 % of municipalities respectively and from the subsidies will benefit 28 % and 5 % of population respectively. Most of the people covered would be from municipalities under 1,000 inhabitants (34 %), followed by the category of 1,000 till 2,000 (17 %) in case of stabilized areas. When we consider peripheral areas, the percentage is higher – 70 % of villages under 1000 inhabitants and 14 % between 1,000 and 2.000. Majority of stabilized (57 %) as same as of peripheral municipalities (79 %) has less than 500 inhabitants. The division of municipalities in stabilized and peripheral areas is presented in Fig. 5.
Stabilized areas Inhabitants Municipality ≤ 500 455 720 15,60% 1857 56,77%
500 < x ≤ 1000 536 899 18,38% 762 23,30% 1000 < x ≤ 2000 506 584 17,34% 363 11,10% 2000 < x ≤ 3000 254 359 8,71% 104 3,18%
x > 3000 1 167 700 39,97% 185 5,66% Total 2 921 262 100,00% 3271 100,00%
Peripheral areas Inhabitants Municipality ≤ 500 227 274 43,74% 1073 79,19%
500 < x ≤ 1000 136 388 26,25% 199 14,69% 1000 < x ≤ 2000 72880 14,03% 55 4,06% 2000 < x ≤ 3000 46 384 8,93% 19 1,40%
x > 3000 36 679 7,06% 9 0,66% Total 519 605 100,00% 1355 100,00%
Fig. 5. Stabilized and peripheral areas in the CR; Source: CZSO, MRD, own elaboration.
4 Discussion It is necessary to compare various definitions of rurality, as the typology can have serious consequences on the rural development policy. Logically, the majority of population is covered by EU subsidies if only Prague is not eligible. Then the criterion of the municipality
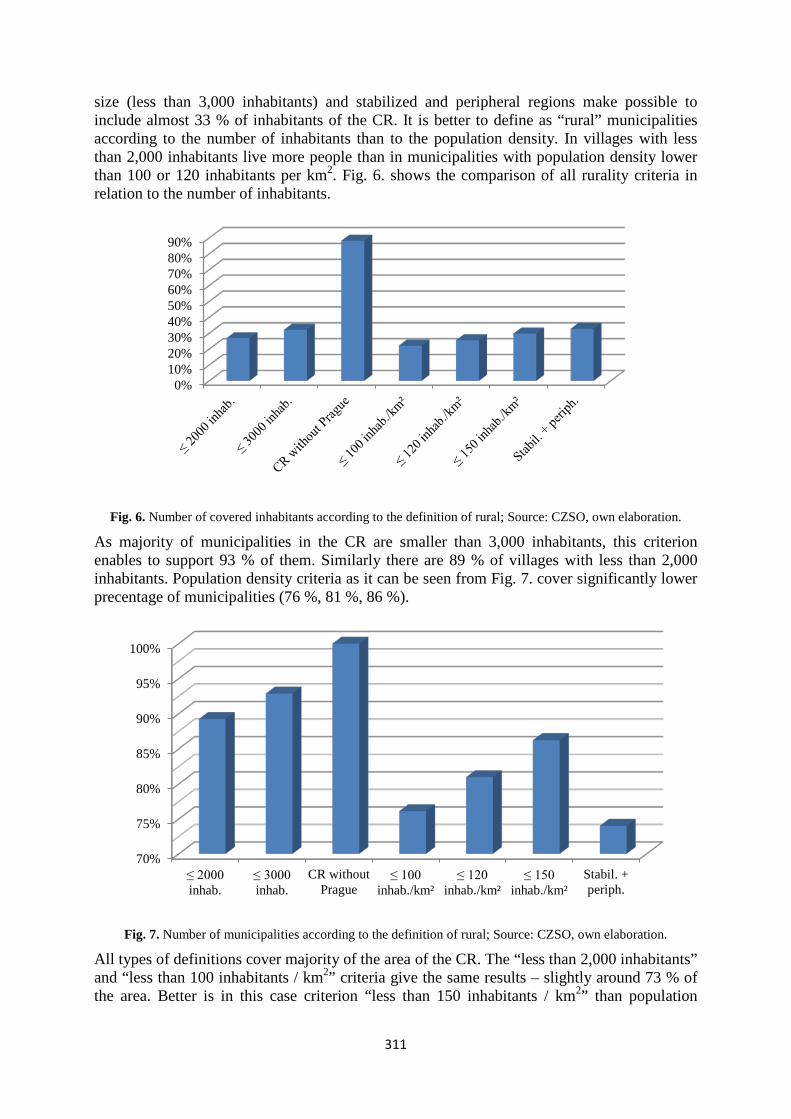
311
size (less than 3,000 inhabitants) and stabilized and peripheral regions make possible to include almost 33 % of inhabitants of the CR. It is better to define as “rural” municipalities according to the number of inhabitants than to the population density. In villages with less than 2,000 inhabitants live more people than in municipalities with population density lower than 100 or 120 inhabitants per km2. Fig. 6. shows the comparison of all rurality criteria in relation to the number of inhabitants.
Fig. 6. Number of covered inhabitants according to the definition of rural; Source: CZSO, own elaboration.
As majority of municipalities in the CR are smaller than 3,000 inhabitants, this criterion enables to support 93 % of them. Similarly there are 89 % of villages with less than 2,000 inhabitants. Population density criteria as it can be seen from Fig. 7. cover significantly lower precentage of municipalities (76 %, 81 %, 86 %).
Fig. 7. Number of municipalities according to the definition of rural; Source: CZSO, own elaboration.
All types of definitions cover majority of the area of the CR. The “less than 2,000 inhabitants” and “less than 100 inhabitants / km2” criteria give the same results – slightly around 73 % of the area. Better is in this case criterion “less than 150 inhabitants / km2” than population
0%10%20%30%40%50%60%70%80%90%
70%
75%
80%
85%
90%
95%
100%
≤ 2000 inhab.
≤ 3000 inhab.
CR withoutPrague
≤ 100 inhab./km²
≤ 120 inhab./km²
≤ 150 inhab./km²
Stabil. +periph.
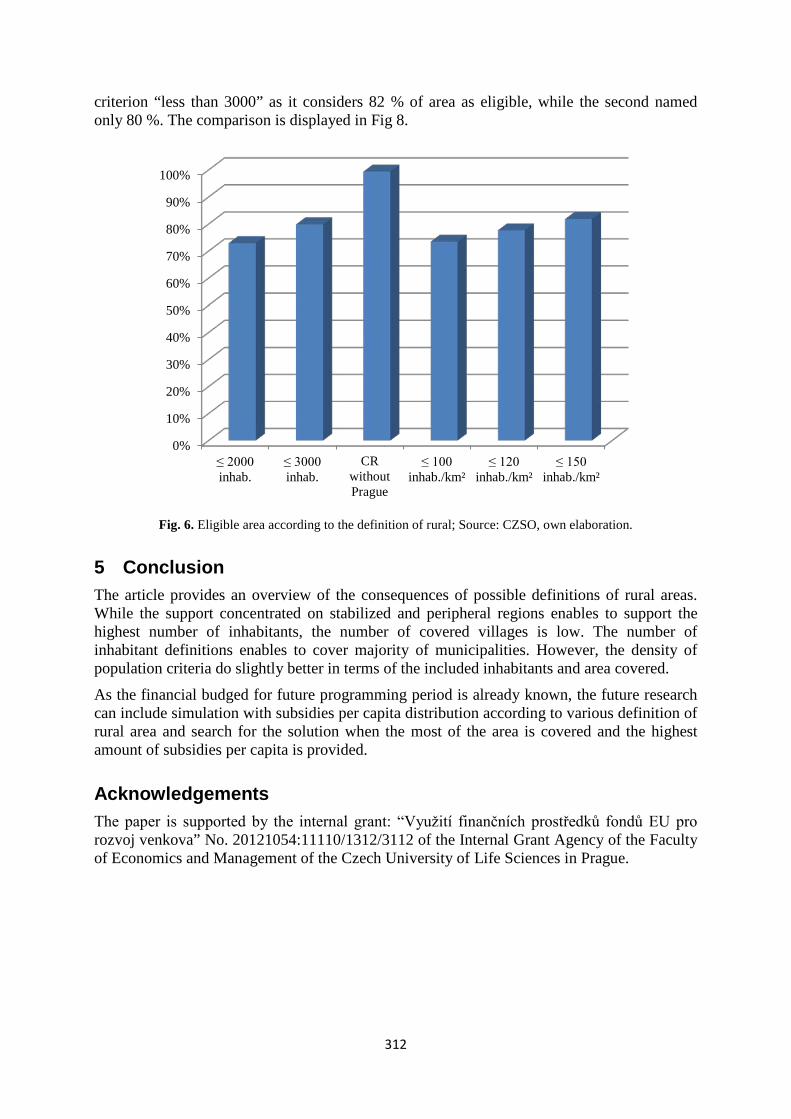
312
criterion “less than 3000” as it considers 82 % of area as eligible, while the second named only 80 %. The comparison is displayed in Fig 8.
Fig. 6. Eligible area according to the definition of rural; Source: CZSO, own elaboration.
5 Conclusion The article provides an overview of the consequences of possible definitions of rural areas. While the support concentrated on stabilized and peripheral regions enables to support the highest number of inhabitants, the number of covered villages is low. The number of inhabitant definitions enables to cover majority of municipalities. However, the density of population criteria do slightly better in terms of the included inhabitants and area covered.
As the financial budged for future programming period is already known, the future research can include simulation with subsidies per capita distribution according to various definition of rural area and search for the solution when the most of the area is covered and the highest amount of subsidies per capita is provided.
Acknowledgements The paper is supported by the internal grant: “Využití finančních prostředků fondů EU pro rozvoj venkova” No. 20121054:11110/1312/3112 of the Internal Grant Agency of the Faculty of Economics and Management of the Czech University of Life Sciences in Prague.
0%
10%
20%
30%
40%
50%
60%
70%
80%
90%
100%
≤ 2000 inhab.
≤ 3000 inhab.
CRwithoutPrague
≤ 100 inhab./km²
≤ 120 inhab./km²
≤ 150 inhab./km²
313
References
Binek, J. et al (2007) Venkovský prostor a jeho oživení, Brno: Georgetown. p. 140. ISBN 80-251-19-5
Binek, J. et al (2009) Synergie ve venkovském prostoru. Aktéři a nástroje rozvoje venkova, Brno: GaREP, spol. s r.o., p. 96. ISBN 978-80-904308-0-8.
Bogdanov, N., Meredith, D., Efstratoglou, S. (2008) ‘A typology of Rural Areas in Serbia’ Scientific Papers. pp. 7–29.
Blunden, J. R., Pryce, W. T. R. and Dryer, P. (1998) ‘The classification of rural areas in the European context: an exploration of a typology using neural network applications’, Regional Studies, vol. 32, pp. 149-160.
Eurostat (2010) Eurostat regional yearbook 2010: Urban-Rural typology, Luxembourg: Publications Office of the European Union, 2010. ISBN 978-92-79-14565-0, ISSN 1830-9674. Available from <http://epp.eurostat.ec.europa.eu/cache/ITY_OFFPUB/KS-HA-10-001/EN/KS-HA-10-001-EN.PDF>.
Friedland, W. H. (2002) ‘Agriculture and Rurality: Beginning the “Final Separation”?’ Rural Sociology, vol. 67, no. 3, pp. 350–371.
Gennaro and Fantini (2002) ‘The Concept of Rurality and the Rural-urban Relationship as Perceived by Young People’, IFSA - Workshop3: Rural/Urban relations. pp. 253–263, Available from <http://ifsa.boku.ac.at/cms/index.php?id=74>.
Halfacree, K. H. (1993) ‘Locality and Social Representation: Space, Discourse and Alternative Definitions of the Rural’, Journal of Rural Studies, vol. 9, no. 1, pp. 23-37.
Jánsky, J. (2012) Metodické postupy k hodnocení disparit v obcích mikroregionů. Metodické postupy k hodnocení disparit v obcích mikroregionů. [CD-ROM]. In Proccedings from international conference Region v rozvoji společnosti 2012. pp. 105-119. ISBN 978-80-7375-652-9.
Leitmanová, I. F. et al, (2012) Venkov jako místo pro žití, Praha: Wolters Kluwer. p. 100. ISBN 978-80-7357-911 -1.
Margarian, A. (2013) ‘A Constructive Critique of the Endogenous Development Approach in the European Support of Rural Areas’, Growth and Change, vol. 44, no. 1, pp. 1–29.
Maříková, P. (2007) ‘Countryside in the Czech Republic – determination,criteria, borders’, Agricultural Economics, vol. 53, no. 6, pp. 247–255.
Ministry of Rural Development (MRD) (2012) Strategy of Regional Development of CR for period 2014–2020. Available from <http://www.mmr.cz/getmedia/5acbe736-6893-4ff6-b548-c3d5b57dbc83/SRR-(2012-12-11).pdf>.
314
Ministry of Agriculture (2013) Rural Development Programme of the Czech Republic. Available from < http://eagri.cz/public/web/mze/dotace/program-rozvoje-venkova-na-obdobi-2007/programove-dokumenty/>
Perlín R., (1998) ‘Venkov, typologie venkovského prostoru’, Praha: MVCR. Available from www.mvcr.cz/odbor/reforma/perlin.pdf.
Raupeliené, A. and Jazepčikas, D. (2009) ‘Typologies of Rural Areas in EU-27 for Spatial Analysis: Rural Labour Market Approach’, Integrated and Sustainable Rural Development. Rural Development, vol. 2009, pp. 127-134.
Vobecká, J. (2009) ‘Czech Rural Development Policies for Human Resources after 2004: A Story of Muddled Definitions Preventing Strategic Visions?’ Central European Journal of Public Policy, vol. 2009, no. 1, pp. 44-65.
Votrubec C. (1980) Lidská sídla, jejich typy a rozmístění ve světě. Praha: Academia.
Westhoek, H. J., van den Berg, M., Bakkes, J. A. (2006) ‘Scenario Development to Explore the Future of Europe’s Rural Areas’, Agriculture, Ecosystems and Environment, vol. 114, no. 29, pp. 7-20.
315
How to measure capital of rural areas
Jak měřit sociální kapitál venkovských obcí
Vít Skála Fakulta sociálních věd, Univerzita Karlova v Praze,
Smetanovo nábř. 6, Praha 1, 110 01 [email protected]
Annotation: The Czech Republic is characterized by a large number of separate municipalities with size up to thousand inhabitants. Municipalities with more than 3000 inhabitants in the Czech Republic create about 93 % of all municipalities and home to a total of 3.3 million inhabitants , i.e about one third of the population of the country. This size category is in this research considered to be part of rural space. Some of these municipalities are growing, some are not. This development is affected not only its geographic location, but also many other factors. Many authors seek how these communities can be diversified (different typologies of rural areas are created) and how the differences between rural communities can be reduced (addressing disparities). In recent years, it appears that one of the major factors that cause differences between municipalities is social capital. The question remains, however, how to measure social capital at the level of individual municipalities.
This paper presents a methodology how to measure the social capital of municipalities that was developed within two years of research supported by the GAUK. Using the research design of case studies that closely monitor and evaluate hundred characteristics in 18 villages in three different regions of the Czech Republic, 10 indicators were found, from which an index of potential development potential of communities was developed. Half of this index consists of indicators related to social capital (individual and collective). The paper presents these indicators, the way they were determined and the possibility of subsequent use of the partial index of social municipal capital.
Key Words: countryside, social capital, regional development, case studies, development potential
JEL classification: R58
1 Úvod V tomto příspěvku představím výsledky svého dvouletého výzkumu zaměřeného na měření sociálního kapitálu v malých obcích. Tímto tématem se v posledních letech zabývá řada výzkumných týmů nejen v České republice. Za využití teorie sociálního kapitálu jsou rozvíjeny různé metodické koncepty, které mají snahu sociální kapitál v obcích zachytit. Viz např. Majerová, Kostelecký, Sýkora (2011).
V literatuře jsou popsány různé charakteristiky, dle kterých je možné sociální kapitál sledovat (např. volební účast, zapojení obyvatel do činností místních občanských iniciativ, důvěra v komunitě, hustota a diverzita sociálních sítí atd.), existují i metodiky na měření sociálního kapitálu v rozvojových komunitách, např. metodika Světové banky (World Bank, 2010). Přesto prakticky použitelná metodika, která by byla za přiměřených nákladů uplatnitelná v celoplošném měřítku na stovkách různých subjektů (malých obcí) dosud popsána nebyla.
V realizovaném výzkumu byly za využití 18 případových studií hledány konkrétní charakteristiky, které přesvědčivě vypovídají o výši sociálního kapitálu v konkrétní obci a jejichž zjišťování není technicky a finančně příliš náročné. Výzkum pracoval s hypotézou, že sociální kapitál je faktorem, který pozitivně přispívá k rozvoji obcí. Z celkem 100 sledovaných
316
charakteristik, u kterých existoval předpoklad, že nějakým způsobem souvisí s rozvojovým potenciálem obcí, bylo v závěru vybráno devět charakteristik, ze kterých bylo vytvořeno pět indikátorů na měření sociálního kapitálu v malých obcích.
Představenou metodiku je nutné podrobit dalšímu testování na větších vzorcích dat a po prokázání její praktické využitelnosti, případně po určitých dílčích úpravách, ji bude možné využít při hledání vhodných cest na řešení disparit venkovských obcí.
2 Použitá metodika Jako základní výzkumný design byly využity případové studie. Případové studie jsou vhodný nástroj pro porozumění konkrétním složitějším případům (Stake, 2003). Dle klasifikace Yin (Denzin a Lincoln 2003) se jedná o vysvětlující případové studie popisného typu, dle Stake (2003) o kolektivní případovou studii, která bude sledovat jev na více případech.
Případové studie byly dle metodiky Stake (2003) strukturovány do šesti částí: popis podstaty případu, historické pozadí, reálné prostředí, specifický kontext, další obdobné případy, specifické charakteristiky případu. Prvních pět částí bylo zpracováno na základě veřejně dostupných dat, šestá část pak obsahuje specifické informace získané během osobního polostrukturovaného rozhovoru s představiteli obce. Celkem bylo tímto způsobem sledováno 100 různých charakteristik u každé zkoumané obce. Samostatnou sledovanou charakteristikou byla sociální síť starostů obcí. Pro její zmapování byl použit generátor jmen, generátor pozic a formulář na zjišťování vazeb na politické představitele. Podrobněji o této metodice např. Lin (2001).
Data obsažená v případových studiích (700 stran textů, tabulek a grafů) byla následně vyhodnocena částečně pomocí shlukové analýzy (za využití programu NVivo 10), částečně kvalitativními srovnávacími metodami (za využití programu MS Excel).
Zjištěné poznatky byly následně představeny na ohniskové skupině (29. 5. 2013), které se zúčastnilo 12 odborníků na problematiku regionálního rozvoje: starostové obcí, akademičtí pracovníci, místní aktéři.
Výběr zkoumaných jednotek Aby byla zajištěna určitá škála vzorků, rozhodl jsem se vybrat obce ze tří různých krajů. Pro minimalizaci neopakovatelných vlivů regionálních kultur a historických tradic, které by mohly zkreslit zjištěné výsledky, jsem z výběru záměrně odstranil typické moravské kraje: Jihomoravský kraj, Zlínský kraj, Moravskoslezský kraj a Ostravský kraj. Dále jsem vyloučil Severočeský a Ústecký kraj jako kraje se specifickou historií a socio-ekonomickou skladbou, která není pro zbytek naší republiky typická. Z ostatních krajů jsem pak zvolil Kraj Vysočina jako jediný převážně venkovský region v ČR dle metodiky OECD, dále Jihočeský kraj jako typický český region a Královéhradecký kraj jako relativně stabilní region ovšem s prvky příhraniční periferie. Jedná se o kraje, ve kterých lze nalézt venkov charakterizovaný jako tzv. vnitřní periferie. Tj. oblast, ve které jsou obce závislé z velké míry jen na svém vnitřním potenciálu s minimálními vlivy z okolí (Musil, Müller, 2008, Perlín, Kučerová, Kučera, 2010), což je vhodné pro můj předmět zkoumání. Nejedná se o reprezentativní výběr a není takto možné zachytit všechny možné variety, se kterými je možné se na území ČR setkat, to ovšem v designu případových studií není ani účelem.
V každém ze sledovaných krajů jsem vybral vždy šest obcí, přičemž tři z těchto obcí splňovaly charakteristiky obcí rozvíjejících se a tři odpovídaly obcím stagnujícím až v útlumu. Tzn., že šlo o porovnání protikladů.
317
Na základě zkušeností jiných autorů (Putnam, 2001, Musil, 2008, Binek a kol., 2009, Perlín, Kučerová, Kučera, 2010) byly za obce rozvíjející považovány ty, které splňovaly následující kritéria:
a) Trend, byť mírného, zvyšování počtu obyvatel během posledních 10 let.
b) Obec se v posledních 3 letech umístila alespoň jednou v celonárodní soutěži Vesnice roku v kategorii Zlatá stuha, Modrá stuha, Bílá stuha nebo Zelená stuha.
c) Při dvojích posledních volbách do místního zastupitelstva byly postaveny více než dvě kandidátní listiny.
d) Účast v dvojích posledních volbách do místního zastupitelstva dosahuje vyšší než celorepublikový průměr.
Aby byla obec zařazena mezi stagnující, musela splňovat inverzní kritéria:
a) Trend snižování počtu obyvatel během posledních 10 let.
b) Za poslední 3 roky se obec ani jednou nezúčastnila celonárodní soutěže Vesnice roku.
c) Při dvojích posledních volbách do místního zastupitelstva byla postavena pouze jedna kandidátní listina.
d) Účast v dvojích posledních volbách do místního zastupitelstva dosahuje nižší než celorepublikový průměr.
Způsob sběru dat Případové studie byly zpracovány ve dvou fázích. V první fázi (květen – srpen 2012) byla shromážděna data z veřejně dostupných zdrojů o jednotlivých vybraných obcí. Jednalo se o data ČSÚ17, databázi CEDR18, portál Města a obce19, webové stránky NS MAS20, jednotlivých MAS a mikroregionů i samotných obcí, databáze IDOS21 a mapy společnosti Google22. Ve druhé fází (září – listopad 2012, březen – květen 2013) byly tyto informace doplněny o poznatky z osobní prohlídky vybraných obcí a polostrukturovaných rozhovorů vedených s vedoucími představiteli obce, obvykle se starostou a místostarostou.
Při těchto osobních schůzkách byly též starostou obce vyplňovány tabulky generátoru jmen, generátoru pozic a tabulky mapující vazby starostů na místní, regionální a celonárodní politiky.
3 Výsledky Po kvalitativní analýze shromážděných dat a na základě závěrů ohniskové skupiny jsem vydefinoval pět indikátorů, které považuji za vhodné pro měření sociálního kapitálu na úrovni obcí. Z těchto pěti indikátorů se tři týkají kolektivního sociálního kapitálu (volební účast, aktivita obyvatel, upravenost obce) a dva individuálního sociálního kapitálu starostů obcí (aktivita starosty, sociální síť starosty), jejichž role je při rozvoji obce klíčová.
Jelikož má na hodnotu některých indikátorů výrazný vliv velikost obce (byť se stále pohybujeme v kategorii obcí do 3 000 obyvatel), zavedl jsem u některých indikátorů
17 Český statistický úřad 18 Centrální evidence dotací z rozpočtu 19 www.mestaobce.cz 20 Národní síť Místních akčních skupin 21 Informační dopravní systém (www.idos.cz) 22 http://maps.google.com
318
koeficienty, zohledňující velikost obce. Z důvodu omezeného prostoru v tomto článku a toho, že pro samotné představení metodiky na měření sociálního kapitálu nejsou tyto koeficienty podstatné, nebudu zde konkrétní hodnoty těchto koeficientů představovat.
Volební účast. Tento indikátor charakterizuje občanskou angažovanost obyvatel a měla by být větší v těch obcích, kde je vyšší hladina sociálního kapitálu, což se ve vzorku zkoumaných obcí projevilo. Výše volební účasti v každé obci ČR je možné poměrně snadno zjistit z dat Českého statistického úřadu23.
Aktivita obyvatel. Tento indikátor v sobě zahrnuje počet uskutečněných kulturních, sportovních a společenských akcí v obci za rok, podíl obyvatel obce, kteří se zúčastní alespoň jedné akce ročně a počet OOS24 působících v obci. O akcích konaných na území obce je zpravidla informace na WWW stránkách obce. Počet, respektive podíl, obyvatel obce, kteří se akcí účastní, je nutné zjišťovat formou osobního dotazování v obci. Dotazovat je vhodné starostu obce. Přesnějších odpovědí je možné dosáhnout dotazováním též organizátorů jednotlivých akcí. Často se jedná o místní Sbor dobrovolných hasičů, místní tělovýchovnou organizaci (obvykle TJ nebo Sokol) nebo myslivecké sdružení. Počet OOS působících v obci je možné zjistit z WWW stránek obce, u menších obcí je možné provést kontrolu i prostřednictvím databáze ARES25.
Aktivita starosty. Jedná se o indikátor složený ze čtyř samostatných ukazatelů: četnost komunikace starosty (odchozí telefonáty, odchozí e-maily), účast starosty na konkrétních strategických jednáních (počet dní mimo obec), investice starosty do jeho vlastního rozvoje (počet absolvovaných vzdělávacích aktivit). Tyto informace je možné zjistit pouze osobním dotazováním starosty obce a jedná se o ukazatel, který je nejvíce zatížen subjektivním faktorem respondenta.
Sociální síť starosty. Tento indikátor je přímo zaměřen na sledování individuálního sociálního kapitálu starosty. Na základě rozsáhlého množství sebraných dat jsem po porovnání zjištěných hodnot a zkušeností ze sběru dat do indikátoru zahrnul dva ukazatele a to počet známých osob, na které se starosta může v případě potřeby obrátit – velikost sociální sítě – a počet pozic, ve kterých tyto osoby působí – diverzita sítě. Platí, že čím má jedinec sociální síť větší a diverzifikovanější, tím vyšším sociálním kapitálem disponuje. Opět je nutné dotazovat se přímo starosty obce.
Upravenost obce. Poslední z definovaných indikátorů se týká vzhledu obce. Jedná se o porovnání souhrnu předem zvolených charakteristik: stav a charakter budovy obecního úřadu, autobusové zastávky, fasád soukromých domů, centrální části obce, dětského hřiště, upravenost komunikací a veřejných prostranství. Toto posouzení je možné provést buď osobní pochůzkou po obci, nebo je možné využít i vzdáleného přístupu za využití informačních technologií. V rámci realizovaného výzkumu bylo úspěšně testování využití systému Google Street View společnosti Google, který umožňuje virtuální prohlídku i těch nejmenších obcí v ČR. Jedná se o údaj, který klade vysoké nároky na proškolení těch, kteří budou vzhled obce hodnotit. Jinak existuje velké riziko zatížení výsledné hodnoty subjektivním hlediskem hodnotitele.
V rámci realizovaného výzkumu byla vytvořena metodika, která sběr výše uvedených dat maximálně usnadňuje. Byť při zpracování případových studií byly využívány formuláře, které obsahovaly desítky stránek, na základě vyhodnocení sebraných dat a zkušeností z terénního
23 Veřejně dostupná databáze: www.volby.cz 24 Organizace občanského sektoru 25 http://wwwinfo.mfcr.cz/ares/ares_es.html.cz
319
šetření byl vytvořen velmi jednoduchý formulář na dvě strany A4, jehož prostřednictvím je možné sebrat všechny potřebné informace, které nelze získat z veřejně dostupných zdrojů.
Aby bylo možné jednotlivé obce na základě těchto hodnot porovnávat, byl vytvořen index sociálního kapitálu obce. Do tohoto indexu vstupuje aritmetický průměr výsledných hodnot výše uvedených indikátorů, které byly předem matematicky upraveny, aby bylo možné aritmetický průměr z nesourodých primárních dat provést. U každého indikátoru byla stanovena minimální a maximální hodnota, přičemž minimální hodnotě byla přiřazena 0, maximální hodnotě 100, ostatní hodnoty byly přepočteny na tuto škálu při zachování původních poměrů mezi zjištěnými hodnotami. Tím bylo zajištěno, že výsledná hodnota indexu nabývá hodnot 0 až 100, přičemž čím vyšší hodnota, tím vyšší sociální kapitál obce.
Podrobnější informace o realizovaném výzkumu včetně konkrétních zjištění v 18 zkoumaných obcích je uvedeno v Skála (2013).
4 Diskuse Realizovaný výzkum se snažil najít vypovídající indikátory, jejichž hodnoty budou relativně snadno zjistitelné. Je otázka, zda využívání WWW stránek obce jako jednoho z informačních zdrojů není již příliš velkým metodickým zjednodušením. Při spoléhání na tento informační zdroj existuje velké riziko, že na WWW stránkách některé obce nebudou informace v tak úplné podobně jako na WWW stránkách jiných obcí, čímž pak může dojít ke zkreslení při vzájemném porovnání obcí. Pro zajištění vyšší validity dat je tak nutné informace získané z WWW stránek obce ověřit i z jiných zdrojů, např. dotazováním představitelů občanských iniciativ působících v obci.
Někteří též mohou namítat, že není metodicky vhodné využít pro zjišťování dat (ukazatel upravenost obce) on-line služeb poskytovaných soukromým subjektem. Při realizovaném výzkumu, kdy bylo této služby využito a následně byla obec hlavním řešitelem osobně navštívena, se však služba ukázala jako velmi užitečný nástroj, jehož prostřednictvím je možné získat poměrně přesně vypovídající obraz o konkrétní obci.
Výše představené indikátory jsou součástí širšího indexu rozvojového potenciálu obcí, který byl v rámci realizovaného výzkumu též vytvořen. Ten obsahuje i další charakteristiky, které vedle sociálního kapitálu mají významný vliv na rozvoj jednotlivých obcí. Dle výše tohoto indexu rozvojového potenciálu je pak možné porovnávat rozvojové potenciály jednotlivých obcí a dle vnitřní skladby indexu odhalovat, ve které oblasti má konkrétní obec své silné a slabé stránky. Dle těchto poznatků je pak možné diverzifikovat intervenční podpory do jednotlivých obcí a tím efektivněji cílit omezené zdroje veřejných prostředků.
5 Závěr V tomto článku jsem představil pět indikátorů na měření sociálního kapitálu obcí, včetně metodiky, jak byly tyto indikátory nalezeny a jak je možné tyto indikátory v další praxi používat. Jedná se o následující indikátory: volební účast, aktivita obyvatel, aktivita starosty, sociální síť starosty, upravenost obce. Z těchto indikátorů byl vytvořen index sociálního kapitálu obce. Jelikož každý z uvedených indikátorů pokrývá jinou oblast sociálního kapitálu, zahrnuje jak aktivitu místních obyvatel, tak aktivitu starosty a při zjišťování hodnot je používáno různých metod a zdrojů dat, je tak dosaženo i při relativně malém počtu indikátorů poměrně robustního indexu. Ten umožňuje porovnávání jednotlivých obcí na základě sociálního kapitálu. Po zapojení i dalších ukazatelů je možné obce porovnávat dle jejich rozvojových potenciálů. Tohoto přístupu je možné využít při mnoha různých šetřeních, pro které je potřebné pracovat se sociálním kapitálem. Může se jednat o zjišťování rozvojového
320
potenciálu obcí, o zjišťování, do jakých oblastí „měkkých“ aktivit směrovat v konkrétní obci dotace, pro vyhodnocování dopadu určitých intervenčních aktivit, při srovnávání různých metodických přístupů na měření sociálního kapitálu apod.
Realizovaný výzkum pracoval s hypotézou, že sociální kapitál je faktorem, který pozitivně přispívá k rozvoji obcí. Po vyhodnocení zjištěných výsledků bylo znění hypotézy upraveno: „Sociální kapitál je jedním z faktorů, které zvyšují rozvojový potenciál malých obcí.“, což poznatky ze zpracovaných případových studií potvrdily.
Dedikace Tento výzkum byl realizován za částečné finanční podpory Grantové agentury Univerzity Karlovy v Praze.
Použitá literatura Binek, J., a kol. (2009) Synergie ve venkovském prostoru – Aktéři a nástroje rozvoje venkova. Brno: GaREP Publishing.
Denzin, K. N., Lincoln, S. Y. (2003) Strategie of qualitative Inquiry. London: SAGE Publications.
Lin, N. (2001). Social capital : theory and research / Nan Lin, Karen Cook, Ronald S. Burt, editors. New York: Aldine de Gruyter.
Majerová, V., Kostelecký, T., Sýkora., L. (2011). Sociální kapitál a rozvoj regionu. Příklad Kraje Vysočina. Praha: Grada.
Musil, J. (2008) Sociální a kulturní soudržnost v diferencované společnosti. CESES FSV UK, Praha.
Musil, J., Müller, J. (2008) Vnitřní periferie v České republice jako mechanismus sociální exkluze. Sociologický časopis. Vol. 44, č. 2, s. 321 - 348.
Perlín, R., Kučerová, S., Kučera, Z. (2010) Typologie venkovského prostoru Česka. Geografie. Vol. 110, č. 2, s. 161–187.
Putnam, R. D. (2001). Bowling Alone: The Collapse and Revival of American Community. Simon & Schuster. New York.
Skála, V. (2013) Klasifikace venkovských obcí dle rozvojového potenciálu. Praha: Univerzita Karlova v Praze, Fakulta sociálních věd, Institut sociologických studií, katedra Veřejné a sociální politiky, 2013. s. 296. Vedoucí disertační práce: prof. PhDr. Martin Potůček, CSc.
Stake, R. E. (2003) Case Studies. In Strategie of qualitative Inquiry. Ed. Denzin, K. N., Lincoln, S. Y. London: SAGE Publications.
World Bank. (2010) Understanding and Measuring Social Capital. [on-line]. [cit. 2010-20-05]. Dostupné z: <http://go.worldbank.org/LHI4AYZEF0>
Anotace: Česká republika je charakteristická velkým počtem samostatných obcí o velikosti do tisíce obyvatel. Obcí, které mají nejvíce 3 000 obyvatel, je v ČR cca 93 % ze všech obcí a žije v nich celkem 3,3 mil. obyvatel, tj. cca třetina všech obyvatel naší země. Tato velikostní kategorie obcí je v rámci realizovaného výzkumu považována za venkovské obce. Některé z těchto obcí se rozvíjejí, některé nikoliv. Zda se obec rozvíjí či nikoliv ovlivňuje nejen její geografické umístění, ale i řada dalších faktorů. Mnozí autoři hledají, jakým způsobem tyto obce diverzifikovat (vytvářejí se různé typologie venkovských prostorů) a jakými opatřeními rozdíly mezi

321
venkovskými obcemi snižovat (řešení disparit). V posledních letech se ukazuje, že jeden z významných faktorů, který způsobuje rozdíly mezi jednotlivými obcemi, je sociální kapitál. Otázkou však zůstává, jak tento sociální kapitál na úrovni jednotlivých obcí měřit.
V tomto příspěvku bude představena metodika na měření sociálního kapitálu obcí vyvinutá v rámci dvouletého výzkumu podpořeného z GAUK. Za využití výzkumného designu případových studií, které podrobně sledují a vyhodnocují sto charakteristik u 18 obcí ve třech různých krajích ČR, bylo nalezeno 10 ukazatelů, ze kterých byl vytvořen index rozvojového potenciálu obcí. Polovinu tohoto indexu tvoří ukazatele vztahující se k sociálnímu kapitálu (individuálnímu i kolektivnímu). V příspěvku budou představeny tyto ukazatele, způsob, jakým byly nalezeny a možnosti následného využití dílčího indexu sociálního kapitálu obce.
Klíčová slova: venkov, sociální kapitál, regionální rozvoj, případové studie, rozvojový potenciál
JEL klasifikace: R58
322
Rural Areas in the Czech Republic: How Do They Differ from Urban Areas?
Marie Pechrová, Ondřej Šimpach Department of Economics, FEM, Czech University of Life Sciences Prague,
Kamycka 129, 165 21 Prague 6 – Suchdol [email protected]
Department of Demography, FIS, University of Economics in Prague,
W. Churchill sq. 4, 130 67 Prague 3 – Zizkov [email protected]
Annotation: There has been wide discussion among researchers, policy-makers and various rural stakeholders about the special position of rural areas. It is argued that rural areas are subject of various problems and deserve special attention and financial support. The aim of this article is to assess how the rural areas differ from the urban areas in certain features important for rural development. The basis for analysis is the current definition of rural areas according to the European Union on NUTS 3 level (analogy of “kraj” in the Czech Republic). The dataset from 2003 until 2011 includes 16 indicators from the area of population, economics, labour market, constructions, health and social security. The differences among values of particular indicator in predominantly rural (PR), intermediate (IN) and predominantly urban (PU) areas are tested using analysis of variance (ANOVA) method. When there are significant dissimilarities found, the particular means which differ from each other are tested using Tuckey’s test. According to our findings, we came to the conclusion that there are not statistically significant differences among PR, IN and PU shires in mortality, average living floor area per completed dwelling, healthcare indicators and average old-age person. On the other hand, there are statistically significant differences in other demographic features, economic characteristics and in labour market indicators. Therefore, the different situation of the PR areas might be a good argument justifying special attention and potential financial support.
Key words: rural areas, rural development, ANOVA, Tukey’s test, NUTS 3
JEL classification: C23, R11
1 Introduction The rural areas must be defined especially for policy making purposes. There have been long debates among scholars and also at the policy making areas, whether the rural areas deserve special attitude and particularly financial support from the state or other institutions. Rural areas are considered to be different and being a subject of specific problems in various fields ranging from slower economic development, unfavorable demographic characteristics, higher rate of unemployment to difficult living conditions and remoteness. However, these expectations might not be true in all cases. We argue that rural areas are not always in poor situation in all indicators important for development. The article is structured as follows: firstly, the literature review of the main problems in rural areas in general and especially in relation to the CR in post-communism period is presented. Then the special approach towards rural areas is justified. The methodology and utilized statistical properties are described in the next chapter. The results are described on the basis of performed analysis of variance for the values of particular development indicators for the PR, IN and PU regions. Finally the conclusions are summarized.
323
Scholars devoted much time exploring the differences between “rural” and “urban” in the area of economic performance, demographic indicators, society characteristics, standards of living etc. However, according to Friedland (2002) “Whereas much of the definitional approach sought to find differences in socio-demographic, attitudinal, and cultural variables, an important finding was that rural and urban were less polarities or elements of a dichotomy than stations along a continuum.” „Researchers soon realized that there was no simple dichotomy between ‘rural’ and ‘urban’ areas. Instead, they recognized a variety of communities conforming to various levels of urbanism and ruralism” (Halfacree, 1993). As Maříková (2007) declare “the borders between towns and countryside have disappeared gradually during the historical development and at present they are overlapping.”
Rural areas are subjects of specific problems. The situation was critical after the transitional period after the revolution in 1989 in the Czech Republic (CR). Tisenkopfs (1999) identified the problems of Latvia’s countryside in relation to the post-socialistic situation. He pointed out declined agricultural production, a scattered structure of enterprises, increased unemployment and poverty, poor infrastructure, great distances to cities, lack of business skills, low population density levels, the aging of the rural population and the weakness of non-governmental organizations. The situation in the CR was analogical. According to the research of Tvrdoň (2011, p. 255) the transition period in the Czech Republic „brought the reduction of agricultural operations due to lack of competitiveness in comparison with original EU countries, loss of traditional employment opportunities, or worsening conditions for commuting.”
The situation in rural areas was influenced especially by changes in agriculture. „Over the past decades, major changes have taken place in Europe’s rural areas. These changes include contrasting developments like depopulation and land abandonment in some regions, and urbanisation and agricultural intensification in others.” (Westhoek et al., 2006, p. 7) In the CR strong collectivization during the socialist era had an impact on the current structure of the agricultural sector (Binek, Svobodová, 2009) as same as inadequate infrastructure, underdeveloped tertiary sector, low pay for workers employed in agriculture and lower availability of basic health and social services (Majerová 2003).
„Given the major political breakthrough represented by 1989 and membership in the EU in 2004, rural society in the Czech Republic has responded in variety of ways to the new requirements made by the marketplace and by EU directives in economic matters. Deep social and cultural changes, partly legitimated by national or EU projects and policies, have modified how Czech rural areas are used ... and how society views these areas.” (Chevalier, 2008)
In the strategic policy making documents of the Czech Republic are highlighted especially “population ageing, unfavorable age structure and low fertility levels, flight of the young, educated inhabitants and competent entrepreneurs, and low potential of economic diversification are seen as the main threats.“ (Vobecká, 2009) According to the Rural Development Programme (RDP, Ministry of Agriculture, 2013), the major problem faced by rural areas is the stabilization of the rural population as it is aging more rapidly than the rest of the country because of the emigration of young people to urban centres to obtain jobs and better social infrastructure. Agriculture – with its relatively low share in the total employment (11 % in rural areas and 3.8 % overall) – has a limited capacity to reverse this trend. (Tvrdoň, 2011)
There are different approaches to solving the problems of rural areas, some of them acknowledging the role of the external financial support from the government. One extreme idea proclaims the state the main actor which has to solve the problems, because they are out
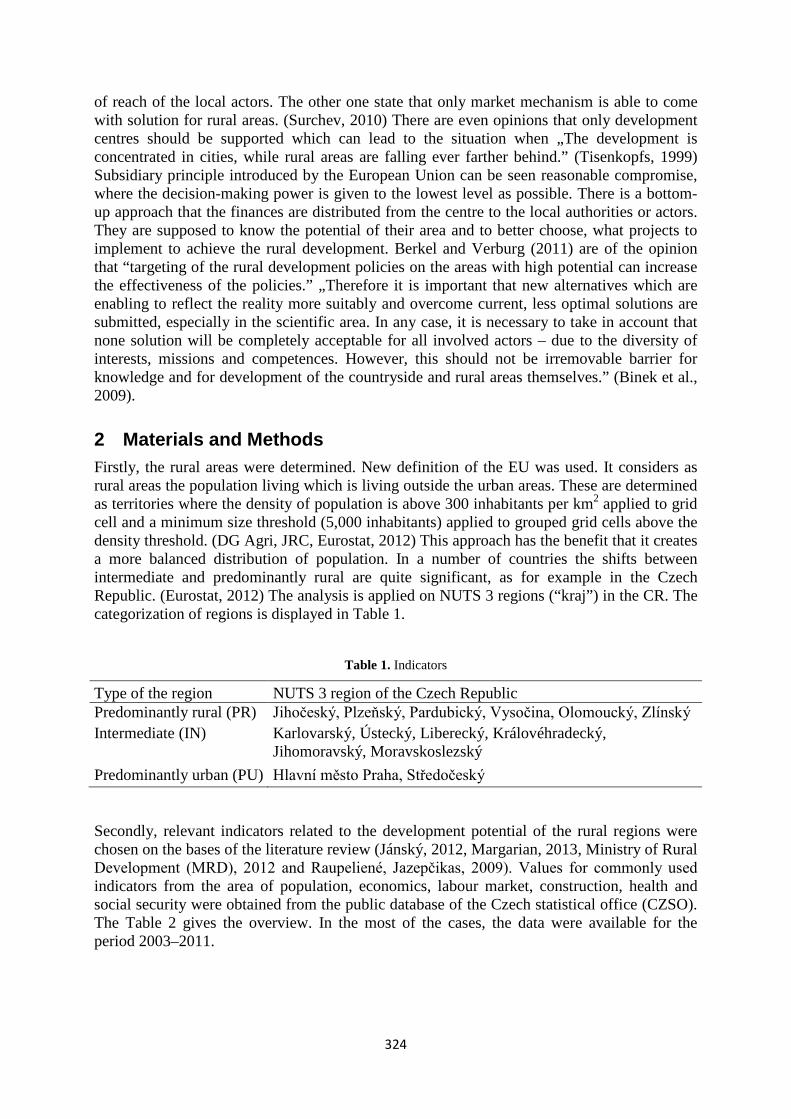
324
of reach of the local actors. The other one state that only market mechanism is able to come with solution for rural areas. (Surchev, 2010) There are even opinions that only development centres should be supported which can lead to the situation when „The development is concentrated in cities, while rural areas are falling ever farther behind.” (Tisenkopfs, 1999) Subsidiary principle introduced by the European Union can be seen reasonable compromise, where the decision-making power is given to the lowest level as possible. There is a bottom-up approach that the finances are distributed from the centre to the local authorities or actors. They are supposed to know the potential of their area and to better choose, what projects to implement to achieve the rural development. Berkel and Verburg (2011) are of the opinion that “targeting of the rural development policies on the areas with high potential can increase the effectiveness of the policies.” „Therefore it is important that new alternatives which are enabling to reflect the reality more suitably and overcome current, less optimal solutions are submitted, especially in the scientific area. In any case, it is necessary to take in account that none solution will be completely acceptable for all involved actors – due to the diversity of interests, missions and competences. However, this should not be irremovable barrier for knowledge and for development of the countryside and rural areas themselves.” (Binek et al., 2009).
2 Materials and Methods Firstly, the rural areas were determined. New definition of the EU was used. It considers as rural areas the population living which is living outside the urban areas. These are determined as territories where the density of population is above 300 inhabitants per km2 applied to grid cell and a minimum size threshold (5,000 inhabitants) applied to grouped grid cells above the density threshold. (DG Agri, JRC, Eurostat, 2012) This approach has the benefit that it creates a more balanced distribution of population. In a number of countries the shifts between intermediate and predominantly rural are quite significant, as for example in the Czech Republic. (Eurostat, 2012) The analysis is applied on NUTS 3 regions (“kraj”) in the CR. The categorization of regions is displayed in Table 1.
Table 1. Indicators
Type of the region NUTS 3 region of the Czech Republic Predominantly rural (PR) Jihočeský, Plzeňský, Pardubický, Vysočina, Olomoucký, Zlínský Intermediate (IN) Karlovarský, Ústecký, Liberecký, Královéhradecký,
Jihomoravský, Moravskoslezský Predominantly urban (PU) Hlavní město Praha, Středočeský
Secondly, relevant indicators related to the development potential of the rural regions were chosen on the bases of the literature review (Jánský, 2012, Margarian, 2013, Ministry of Rural Development (MRD), 2012 and Raupeliené, Jazepčikas, 2009). Values for commonly used indicators from the area of population, economics, labour market, construction, health and social security were obtained from the public database of the Czech statistical office (CZSO). The Table 2 gives the overview. In the most of the cases, the data were available for the period 2003–2011.
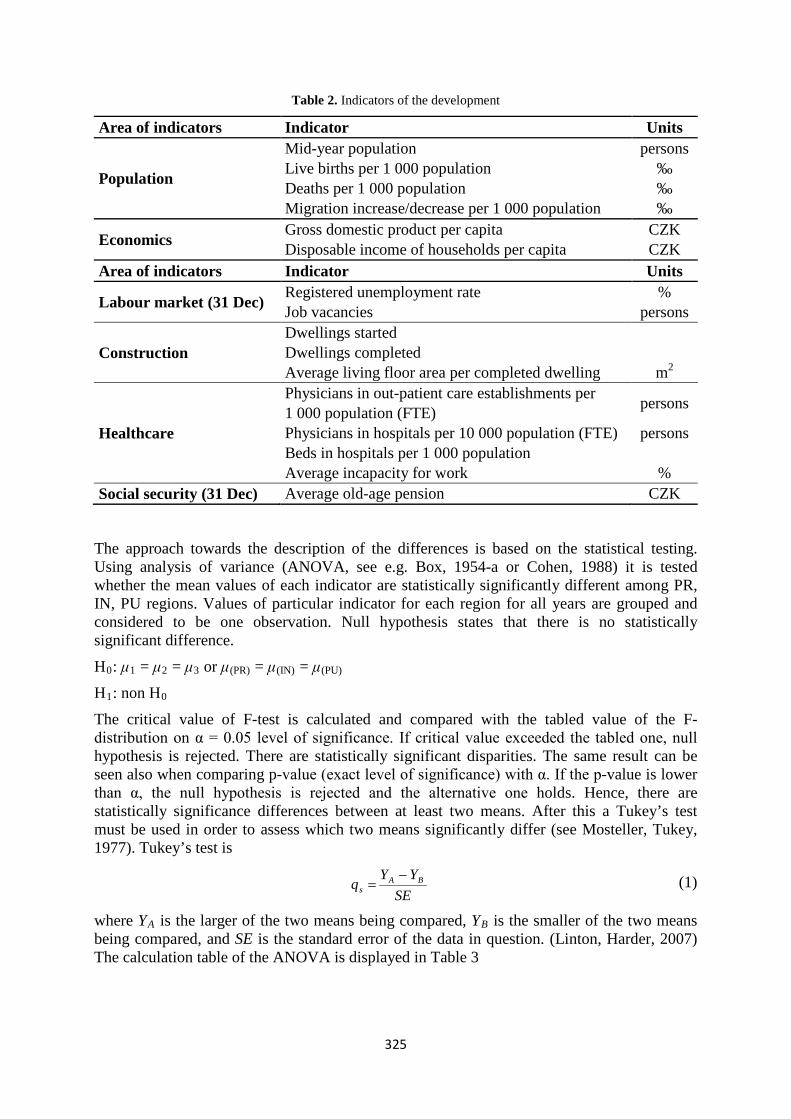
325
Table 2. Indicators of the development
Area of indicators Indicator Units
Population
Mid-year population persons Live births per 1 000 population ‰ Deaths per 1 000 population ‰ Migration increase/decrease per 1 000 population ‰
Economics Gross domestic product per capita CZK Disposable income of households per capita CZK
Area of indicators Indicator Units
Labour market (31 Dec) Registered unemployment rate % Job vacancies persons
Construction Dwellings started Dwellings completed Average living floor area per completed dwelling m2
Healthcare
Physicians in out-patient care establishments per persons 1 000 population (FTE) Physicians in hospitals per 10 000 population (FTE) persons Beds in hospitals per 1 000 population Average incapacity for work %
Social security (31 Dec) Average old-age pension CZK
The approach towards the description of the differences is based on the statistical testing. Using analysis of variance (ANOVA, see e.g. Box, 1954-a or Cohen, 1988) it is tested whether the mean values of each indicator are statistically significantly different among PR, IN, PU regions. Values of particular indicator for each region for all years are grouped and considered to be one observation. Null hypothesis states that there is no statistically significant difference.
H0: μ1 = μ2 = μ3 or μ(PR) = μ(IN) = μ(PU)
H1: non H0
The critical value of F-test is calculated and compared with the tabled value of the F-distribution on α = 0.05 level of significance. If critical value exceeded the tabled one, null hypothesis is rejected. There are statistically significant disparities. The same result can be seen also when comparing p-value (exact level of significance) with α. If the p-value is lower than α, the null hypothesis is rejected and the alternative one holds. Hence, there are statistically significance differences between at least two means. After this a Tukey’s test must be used in order to assess which two means significantly differ (see Mosteller, Tukey, 1977). Tukey’s test is
SEYY
q BAs
−= (1)
where YA is the larger of the two means being compared, YB is the smaller of the two means being compared, and SE is the standard error of the data in question. (Linton, Harder, 2007) The calculation table of the ANOVA is displayed in Table 3
326
Table 3. Computational scheme of ANOVA
Source Sum of Squares Df Mean Square F-ratio
Between group ( ) ik
i iby nyyS2
1, ∑ =−= k-1
1,2
, −=
kS
s byby
2
,
2,
wy
by
ss
F = Within group ( )2
1 1, ∑ ∑= =−=
k
i
n
j iijwyi yyS n-k
knS
s wywy −
= ,2,
Total (Corr.) ( )2
1 1∑ ∑= =−=
k
i
n
j ijyi yyS n-1
where k is the total number of factors (PR, IN, PU) and n is the total number of observations. The calculations are done in Statgraphics Centurion XVI and IBM SPSS Statistics.
3 Results and Discussion Firstly, the regions of the Czech Republic were divided according to their affiliation to PR, IN or PU. The values of each indicator for all available years were assigned to particular group. The differences among the regions were consequently tested by one-way ANOVA.
Despite that rural areas are considered to have worst demographic characteristics, lower economic performance and worst state of infrastructure, the analysis showed that it is not true in all cases. The results showed that there are not statistically significant differences between means of the PR, IN and PU regions in case of deaths per 1 000 population, average living floor area per completed dwelling, physicians in out-patient care establishments per 1 000 population, beds in hospitals per 1 000 population and average age-old pension. It means that all types of regions are similar in these areas and even PU does not do worst. As one indicator is from population group, one from construction area, one from social security and two from healthcare group, there is not clear pattern. It can be only stated that PU regions probably do not perform worst in the area of healthcare than PR or IN regions.
In case of the number of physicians and beds in hospitals, there are few significant outliers present. Nevertheless, they do not have impact on the results of the ANOVA due to the low variance of the values. In spite of that the results still show no statistical difference among the mean values. This can be clearly seen on Fig. 1 on Box and Whiskers plot (see e.g. McGill et al., 1978) or on the calculated p-values presented in Table 4 which are higher that stated level of significance α = 0.05.
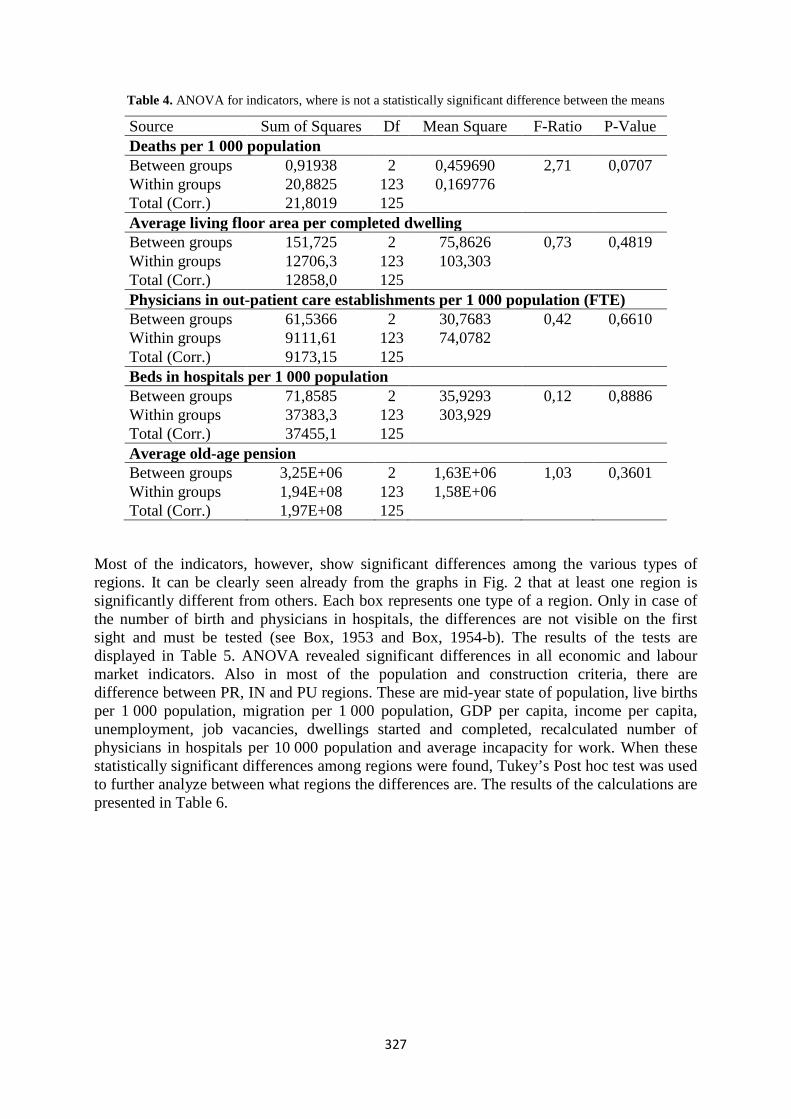
327
Table 4. ANOVA for indicators, where is not a statistically significant difference between the means
Source Sum of Squares Df Mean Square F-Ratio P-Value Deaths per 1 000 population Between groups 0,91938 2 0,459690 2,71 0,0707 Within groups 20,8825 123 0,169776
Total (Corr.) 21,8019 125 Average living floor area per completed dwelling
Between groups 151,725 2 75,8626 0,73 0,4819 Within groups 12706,3 123 103,303
Total (Corr.) 12858,0 125 Physicians in out-patient care establishments per 1 000 population (FTE)
Between groups 61,5366 2 30,7683 0,42 0,6610 Within groups 9111,61 123 74,0782
Total (Corr.) 9173,15 125 Beds in hospitals per 1 000 population
Between groups 71,8585 2 35,9293 0,12 0,8886 Within groups 37383,3 123 303,929
Total (Corr.) 37455,1 125 Average old-age pension
Between groups 3,25E+06 2 1,63E+06 1,03 0,3601 Within groups 1,94E+08 123 1,58E+06
Total (Corr.) 1,97E+08 125
Most of the indicators, however, show significant differences among the various types of regions. It can be clearly seen already from the graphs in Fig. 2 that at least one region is significantly different from others. Each box represents one type of a region. Only in case of the number of birth and physicians in hospitals, the differences are not visible on the first sight and must be tested (see Box, 1953 and Box, 1954-b). The results of the tests are displayed in Table 5. ANOVA revealed significant differences in all economic and labour market indicators. Also in most of the population and construction criteria, there are difference between PR, IN and PU regions. These are mid-year state of population, live births per 1 000 population, migration per 1 000 population, GDP per capita, income per capita, unemployment, job vacancies, dwellings started and completed, recalculated number of physicians in hospitals per 10 000 population and average incapacity for work. When these statistically significant differences among regions were found, Tukey’s Post hoc test was used to further analyze between what regions the differences are. The results of the calculations are presented in Table 6.
328
Fig. 1. Box and Whisker plots for indicators, where is not a statistically significant difference between the means
Contrary to expectation the test further revealed that in case of variable mid-year population and unemployment, there are not statistically significant differences between two pairs of regions on the level of significance α = 0.05. On the other hand the differences are present in live births per 1 000 population between PU and IN regions and between IN and PR. Surprisingly the PU and PR do not differ. In case of the migration increase/decrease per 1 000 population, GDP per capita, disposable income of households per capita, jobs vacancies and dwelling started or completed, only difference were between IN and PR. Again, PU and PR were similar as same as PU and IN. There were statistically significant differences in the number of physicians in hospitals per 10 000 population between IN and PR regions on the α = 0.05. If the level of significance was lower α = 0.01 there would be also differences between PU and IN region. In any case could be found difference between PU and PR region. In average incapability for work, again, only IN and PR regions differ.
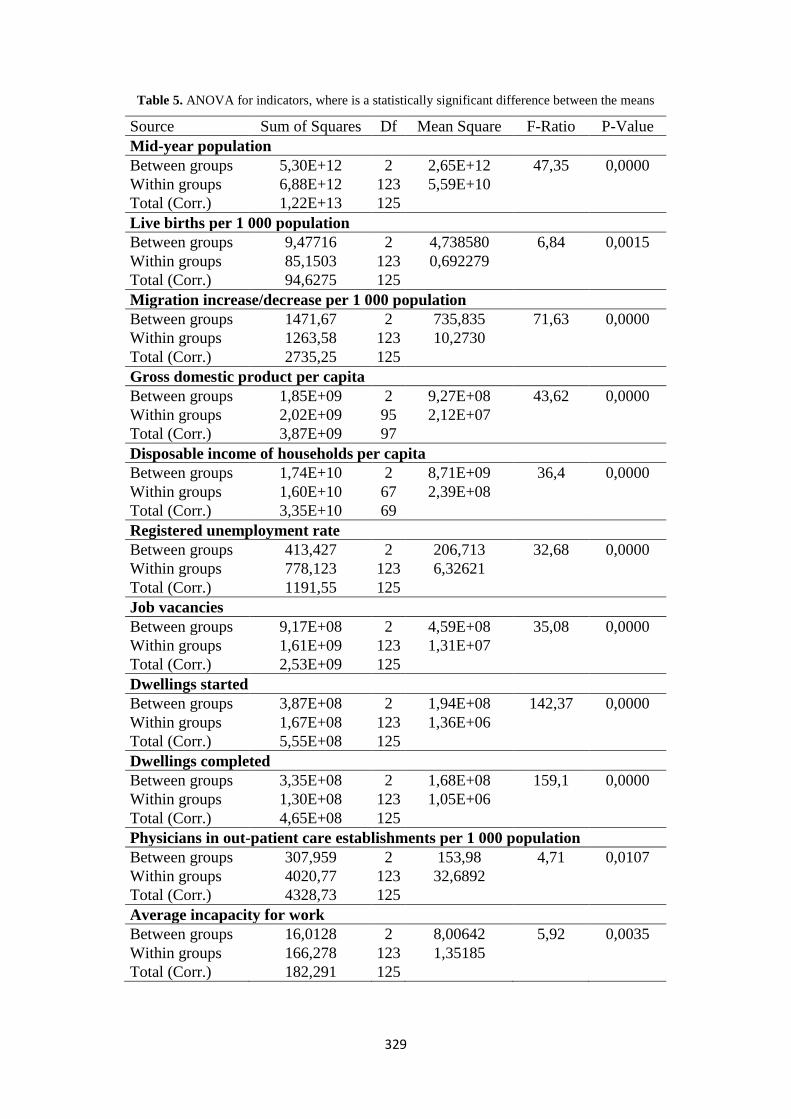
329
Table 5. ANOVA for indicators, where is a statistically significant difference between the means
Source Sum of Squares Df Mean Square F-Ratio P-Value Mid-year population Between groups 5,30E+12 2 2,65E+12 47,35 0,0000 Within groups 6,88E+12 123 5,59E+10
Total (Corr.) 1,22E+13 125 Live births per 1 000 population
Between groups 9,47716 2 4,738580 6,84 0,0015 Within groups 85,1503 123 0,692279
Total (Corr.) 94,6275 125 Migration increase/decrease per 1 000 population
Between groups 1471,67 2 735,835 71,63 0,0000 Within groups 1263,58 123 10,2730
Total (Corr.) 2735,25 125 Gross domestic product per capita
Between groups 1,85E+09 2 9,27E+08 43,62 0,0000 Within groups 2,02E+09 95 2,12E+07
Total (Corr.) 3,87E+09 97 Disposable income of households per capita
Between groups 1,74E+10 2 8,71E+09 36,4 0,0000 Within groups 1,60E+10 67 2,39E+08
Total (Corr.) 3,35E+10 69 Registered unemployment rate
Between groups 413,427 2 206,713 32,68 0,0000 Within groups 778,123 123 6,32621
Total (Corr.) 1191,55 125 Job vacancies
Between groups 9,17E+08 2 4,59E+08 35,08 0,0000 Within groups 1,61E+09 123 1,31E+07
Total (Corr.) 2,53E+09 125 Dwellings started
Between groups 3,87E+08 2 1,94E+08 142,37 0,0000 Within groups 1,67E+08 123 1,36E+06
Total (Corr.) 5,55E+08 125 Dwellings completed
Between groups 3,35E+08 2 1,68E+08 159,1 0,0000 Within groups 1,30E+08 123 1,05E+06
Total (Corr.) 4,65E+08 125 Physicians in out-patient care establishments per 1 000 population
Between groups 307,959 2 153,98 4,71 0,0107 Within groups 4020,77 123 32,6892
Total (Corr.) 4328,73 125 Average incapacity for work
Between groups 16,0128 2 8,00642 5,92 0,0035 Within groups 166,278 123 1,35185
Total (Corr.) 182,291 125
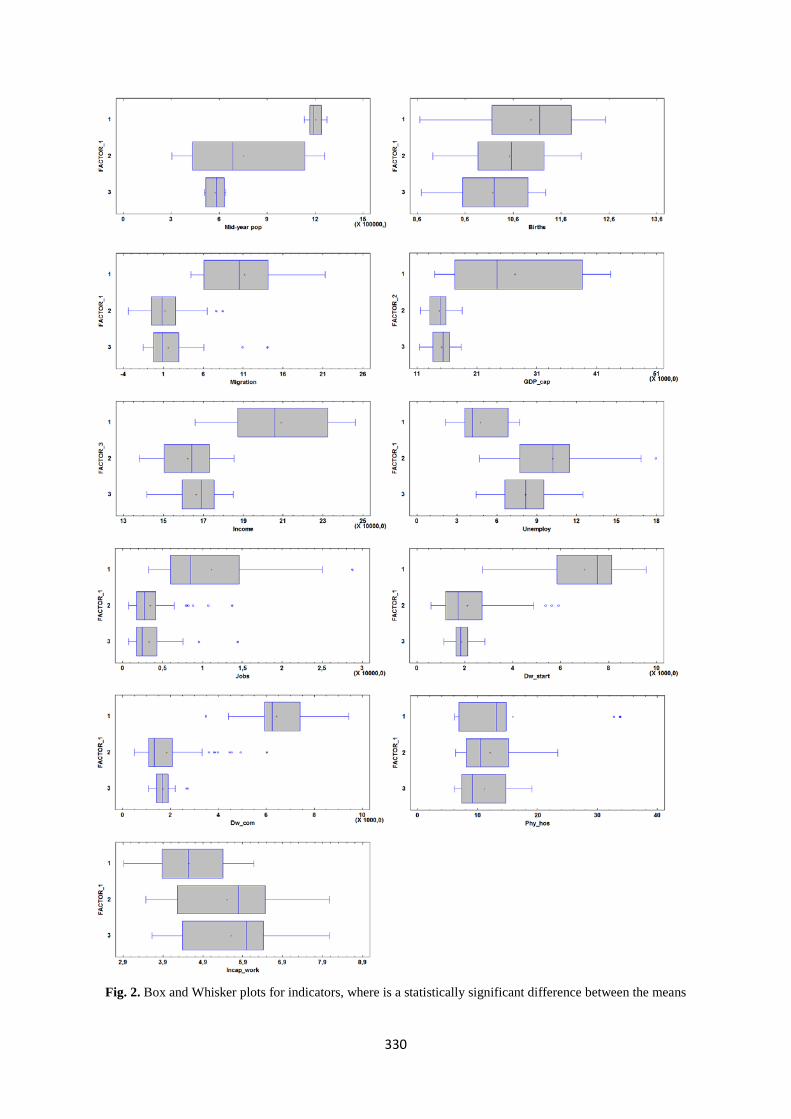
330
Fig. 2. Box and Whisker plots for indicators, where is a statistically significant difference between the means
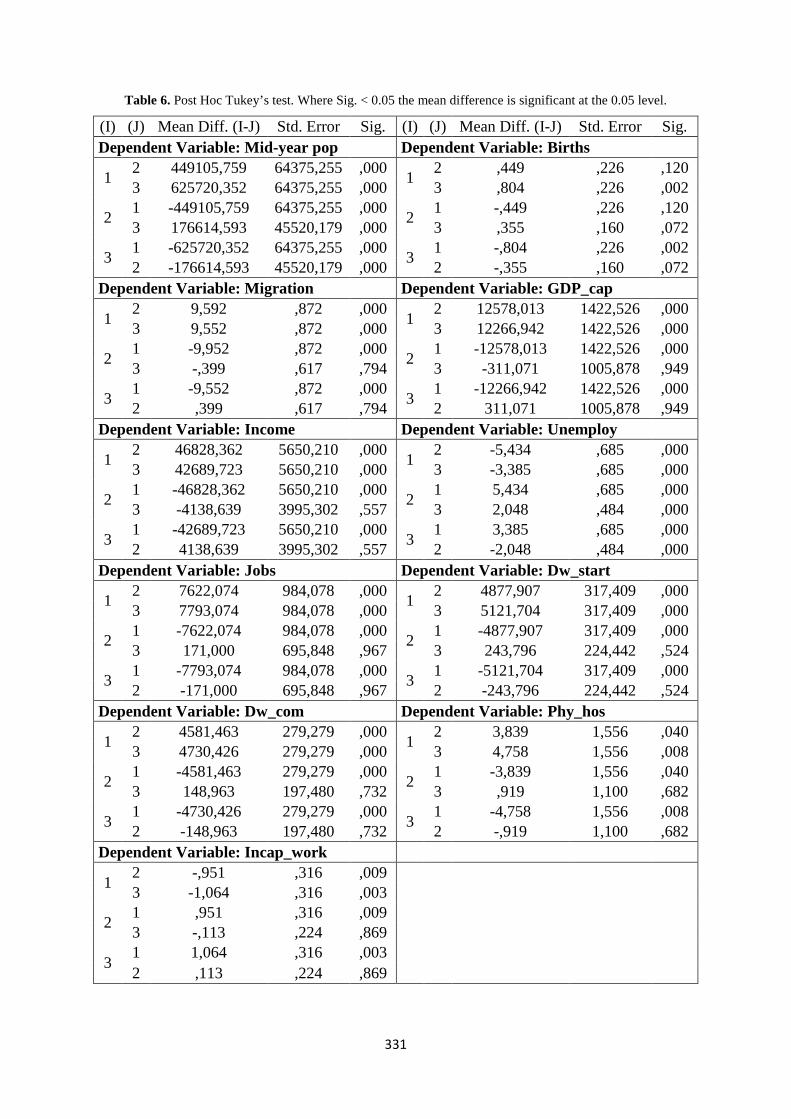
331
Table 6. Post Hoc Tukey’s test. Where Sig. < 0.05 the mean difference is significant at the 0.05 level.
(I) (J) Mean Diff. (I-J) Std. Error Sig. (I) (J) Mean Diff. (I-J) Std. Error Sig. Dependent Variable: Mid-year pop Dependent Variable: Births
1 2 449105,759 64375,255 ,000 1 2 ,449 ,226 ,120 3 625720,352 64375,255 ,000 3 ,804 ,226 ,002
2 1 -449105,759 64375,255 ,000 2 1 -,449 ,226 ,120 3 176614,593 45520,179 ,000 3 ,355 ,160 ,072
3 1 -625720,352 64375,255 ,000 3 1 -,804 ,226 ,002 2 -176614,593 45520,179 ,000 2 -,355 ,160 ,072
Dependent Variable: Migration Dependent Variable: GDP_cap
1 2 9,592 ,872 ,000 1 2 12578,013 1422,526 ,000 3 9,552 ,872 ,000 3 12266,942 1422,526 ,000
2 1 -9,952 ,872 ,000 2 1 -12578,013 1422,526 ,000 3 -,399 ,617 ,794 3 -311,071 1005,878 ,949
3 1 -9,552 ,872 ,000 3 1 -12266,942 1422,526 ,000 2 ,399 ,617 ,794 2 311,071 1005,878 ,949
Dependent Variable: Income Dependent Variable: Unemploy
1 2 46828,362 5650,210 ,000 1 2 -5,434 ,685 ,000 3 42689,723 5650,210 ,000 3 -3,385 ,685 ,000
2 1 -46828,362 5650,210 ,000 2 1 5,434 ,685 ,000 3 -4138,639 3995,302 ,557 3 2,048 ,484 ,000
3 1 -42689,723 5650,210 ,000 3 1 3,385 ,685 ,000 2 4138,639 3995,302 ,557 2 -2,048 ,484 ,000
Dependent Variable: Jobs Dependent Variable: Dw_start
1 2 7622,074 984,078 ,000 1 2 4877,907 317,409 ,000 3 7793,074 984,078 ,000 3 5121,704 317,409 ,000
2 1 -7622,074 984,078 ,000 2 1 -4877,907 317,409 ,000 3 171,000 695,848 ,967 3 243,796 224,442 ,524
3 1 -7793,074 984,078 ,000 3 1 -5121,704 317,409 ,000 2 -171,000 695,848 ,967 2 -243,796 224,442 ,524
Dependent Variable: Dw_com Dependent Variable: Phy_hos
1 2 4581,463 279,279 ,000 1 2 3,839 1,556 ,040 3 4730,426 279,279 ,000 3 4,758 1,556 ,008
2 1 -4581,463 279,279 ,000 2 1 -3,839 1,556 ,040 3 148,963 197,480 ,732 3 ,919 1,100 ,682
3 1 -4730,426 279,279 ,000 3 1 -4,758 1,556 ,008 2 -148,963 197,480 ,732 2 -,919 1,100 ,682
Dependent Variable: Incap_work
1 2 -,951 ,316 ,009 3 -1,064 ,316 ,003
2 1 ,951 ,316 ,009 3 -,113 ,224 ,869
3 1 1,064 ,316 ,003 2 ,113 ,224 ,869
332
4 Conclusion The objective of this article was to assess how the rural areas differ from the urban areas in certain features important for rural development. Indicators from the area of demography, economics, labour market, construction, healthcare and social security were taken. The differences among values of particular indicator in predominantly rural (PR), intermediate (IN) and predominantly urban (PU) areas were tested using ANOVA method. In case of deaths per 1 000 population, average living floor area per completed dwelling, physicians in out-patient care establishments per 1 000 population, beds in hospitals per 1 000 population and average old-age pension, there were no statistically significant differences found. On the other hand, based on the results of Tuckey’s test, the most dissimilarities were found between IN and PR regions. They differ in migration increase/decrease per 1 000 population, GDP per capita, disposable income of households per capita, jobs vacancies and dwelling started or completed. This clearly shows that PU and PR regions are not always that dissimilar as stated. Our findings speak for the urban-rural continuum theory rather than for the rural definition based on the distinction between rural and urban. Many researches consider PR areas unfavorable, but our results show that it is not always the case. In average they do not differ in the majority of indicators used to measure the development state of the region. PR regions are disadvantaged only in both economic indicators.
There are several possibilities for future research. In the first place it would be advantageous to obtain a longer time series of the indicators. The analysis, which was introduced in this paper, then could be performed separately, i.e. after certain time periods. Another possibility is to use that longer time series and make the predictions using one of the methodological approaches for modeling time series (see e.g. Box and Jenkins, 1968, or Box, Jenkins and MacGregor, 1974 or Ray, 1982). With the predicted values then would be also performed ANOVA and with the time delay could be compared how the estimated values differ from the actual, that will emerge from the empirical data.
Acknowledgements The paper is supported by the internal grant: “Využití finančních prostředků fondů EU pro rozvoj venkova” No. 20121054:11110/1312/3112 of the Internal Grant Agency of the Faculty of Economics and Management of the Czech University of Life Sciences in Prague.
References Berkel, D. B., Verburg, P. H. (2011) Sensitising rural policy: Assessing spatial variation in rural development options for Europe. Land Use Policy. Vol. 28, pp. 447–459.
Binek, J. et al. (2009). Synergie ve venkovském prostoru. Aktéři a nástroje rozvoje venkova. Brno: GaREP, spol. s r.o., p. 96. ISBN 978-80-904308-0-8.
Binek J., Svobodová H. (2009). Rural Development and Regional Development: Common Agricultural Policy and Regional Policy on one field. Czech Regional Studies, Vol. 3, Issue 1, pp. 12-18.
Box, G.E.P. (1953). Non-Normality and Tests on Variances. Biometrika (Biometrika Trust) 40 (3/4): 318–335.
333
Box, G.E.P. (1954-a). Some Theorems on Quadratic Forms Applied in the Study of Analysis of Variance Problems, II. Effects of Inequality of Variance and of Correlation Between Errors in the Two-Way Classification. The Annals of Mathematical Statistics 25 (3): 484.
Box, G.E.P. (1954-b). Some Theorems on Quadratic Forms Applied in the Study of Analysis of Variance Problems, I. Effect of Inequality of Variance in the One-Way Classification. The Annals of Mathematical Statistics 25 (2): 290.
Box, G.E.P. and Jenkins G.M. (1968). Some Recent Advances in Forecasting and Control, Part I. Journal of the Royal Statistical Society. Series C (Applied Statistics). Vol. 17, No. 2, 1968, p. 91-109.
Box, G.E.P., Jenkins G.M. and MacGregor J.F. (1974). Some Recent Advances in Forecasting and Control, Part II. Journal of the Royal Statistical Society. Series C (Applied Statistics). Vol. 23, No. 2, 1974, p. 158-179.
Cohen, J. (1988). Statistical power analysis for the behavior sciences (2nd ed.). Routledge ISBN 978-0-8058-0283-2.
Eurostat (2012). Urban-rural typology. Last modified on 15 May 2013, at 15:56. Available from <http://epp.eurostat.ec.europa.eu/statistics_explained/index.php/Urban-rural_typology>
Friedland, W. H. (2002). Agriculture and Rurality: Beginning the “Final Separation”?, Rural Sociology, vol. 67, no. 3, pp. 350–371.
Halfacree, K. H. (1993). Locality and Social Representation: Space, Discourse and Alternative Definitions of the Rural, Journal of Rural Studies, vol. 9, no. 1, pp. 23-37.
Chevalier, P. (2008). Diversification and transformation of the economic base in Czech rural areas. Revue d'études comparatives Est-Ouest, Vol. 39, Issue 4, (December 2008), p. 143-+.
Jánský, J. (2012). Metodické postupy k hodnocení disparit v obcích mikroregionů. In: Sborník příspěvků z mezinárodní vědecké konference Region v rozvoji společnosti 2012 [CD-ROM]. s. 105-119. ISBN 978-80-7375-652-9.
Linton, L.R., Harder, L.D. (2007). Biology 315 – Quantitative Biology Lecture Notes. University of Calgary, Calgary, AB
Majerová V. (2003). Český venkov 2003: situace před vstupem do EU (Czech Rural Areas 2003: Situation before accession into the EU). Česká zemědělská univerzita, Praha.
Margarian, A. (2013). A Constructive Critique of the Endogenous Development Approach in the European Support of Rural Areas, Growth and Change, vol. 44, no. 1, pp. 1–29.
Maříková, P. (2007). Countryside in the Czech Republic – determination,criteria, borders, Agricultural Economics, vol. 53, no. 6, pp. 247–255.
McGill, R., Tukey, John, W., Larsen, Wayne, A. (1978). Variations of Box Plots. The American Statistician 32 (1): 12–16.
Ministry of Rural Development (MRD) (2012). Strategy of Regional Development of CR for period 2014–2020. Available from <http://www.mmr.cz/getmedia/5acbe736-6893-4ff6-b548-c3d5b57dbc83/SRR-(2012-12-11).pdf>.
Ministry of Agriculture (2013). Rural Development Programme of the Czech Republic.
Mosteller, F., Tukey, John, W. (1977). Data analysis and regression. A second course in statistics. Addison-Wesley Series in Behavioral Science: Quantitative Methods, Reading, Mass.: Addison-Wesley, 1977.
334
Raupeliené, A. and Jazepčikas, D. (2009). Typologies of Rural Areas in EU-27 for Spatial Analysis: Rural Labour Market Approach. Integrated and Sustainable Rural Development. Rural Development, vol. 2009, pp. 127-134.
Ray W.D. (1982). ARIMA Forecasting Models in Inventory Control. The Journal of the Operational Research Society, vol. 33, No. 6, Jun., 1982, p. 567-574.
Surchev, P. (2010). Rural Areas – Problems and Opportunities for Development. Trakia Journal of Science, vol. 8, no. 3, pp. 234-239. Tisenkopfs, T (1999). Rurality as a created field: Towards an integrated rural development in Latvia? Sociologia Ruralis, vol. 39, no. 3, pp. 411-430.
Tvrdoň, M. (2011). EU Rural Development Policy: the Case of the Czech Republic. Rural Development In Global Changes, vol. 5, no. 1, pp. 254-260.
Vobecká, J. (2009). Czech Rural Development Policies for Human Resources after 2004: A Story of Muddled Definitions Preventing Strategic Visions?. Central European Journal of Public Policy, vol. 2009, no. 1, pp. 44- 65.
Westhoek, H.J., van den Berg, M., Bakkes, J.A. (2006). Scenario Development to Explore the Future of Europe’s Rural Areas, Agriculture, Ecosystems and Environment, vol. 114, no. 29, pp. 7-20.

335
Landscape memory as rural heritage – the changes of Czech cultural landscape in the mental reflection of its
inhabitants
Hana Vavrouchová Department of Applied and Landscape Ecology, Faculty of Agronomy, Mendel University in Brno,
Zemědělská 1, 613 00 Brno [email protected]
Annotation: This contribution is focused on the presentation of the upcoming project. The specific objective of this project is to record vanishing testimony – the cultural landscape image in the first half of the last century (and the subsequent structural changes) and to preserve it for future generations. Methodologically, the project is based on the identification, analysis and documentation of changes in the Czech cultural landscape recorded in the mental image of their population (questioning the population 65+ years). One of the outputs is a ‘Modern chronicle of the village’ – an electronic record of landscape dynamics in a particular time and space (the combination of graphics and audio tracks). A number of Czech and foreign authors are aimed to the research on the cultural landscape dynamics. But social and mental dimensions of these changes are applied very rarely. For the local identity formation and the rural population stabilization is often determining these mental ties to the landscape. Local identity within cultural landscape often plays a role in regional development. The sub-objectives of the project are: a) to identify, analyze and document the changes of Czech cultural landscape generally
and in the mental reflection of its inhabitants, b) to document the disappearing cultural heritage recorded in the individual memory –
social memory, c) to create a database of qualitative information in relation to the cultural landscape and
its dynamics (enrichment the current state of knowledge about mental dimension), d) to describe the transformation of the cultural landscape values perception over the
time, e) to describe the role of landscape changes (dynamics) in local identity formation and
to determine the driving forces of this process, f) to confront the different age categories (primarily pupils and students on one side
with pensioners in the other) and to contribute to healthy social and cultural atmosphere in the village.
Key words: landscape dynamics, local identity, cultural landscape memory, inhabitants, historical (social) memory
JEL classification: Y20, R14, Z19
1 Introduction In the Czech Republic, protected cultural values have very diverse character and particular importance – especially in the historical evolution context of Central Europe. The immovable monuments can be found in both urban monuments, as well as typically rural (often associated with rustic architecture), religious, feudal and technical, archaeological, historical and modern. Movable monuments are varied particularly with regard to the period of its formation. Nature of cultural monuments is also diverse in frame of the range and territorial units – except the individual movable and immovable objects, there are also significant protection of architectural and urban complexes, and finally landscape composition and landscape context at all. The cultural values protection has to be based on the concept of

336
sustainable development. The main instrument of its achievement is quality and expert care. In the Czech Republic, there is law 20/1987 Coll., about State monument protection. This protection, however, usually refers to the material values, mental values are underestimated.
This contribution is focused on the upcoming project presentation. The specific objective of this project is to record vanishing testimony – the cultural landscape image in the first half of the last century (and the subsequent structural changes) and to preserve it for future generations.
The benefit of this project is to minimize the loss of tangible and particularly intangible cultural heritage connected with vanishing landscape form (old landscape structure covered within a new form of postmodern pattern). Further, the outputs will be exercisable on practical level of planning within landscape (urban planning, landscape planning, landscaping, etc.). The European Landscape Convention requirements will be fulfilled.
2 Objectives of the project
a) to identify, analyze and document the changes of Czech cultural landscape generally and in the mental reflection of its inhabitants,
b) to document the disappearing cultural heritage recorded in the individual memory (to create a “modern chronicle of the village”) – social memory,
c) to create a database of qualitative information in relation to the cultural landscape and its dynamics (enrichment the current state of knowledge about mental dimension),
d) to describe the transformation of the cultural landscape values perception over the time,
e) to describe the role of landscape changes (dynamics) in local identity formation and to determine the driving forces of this process,
f) in relation to the European Landscape Convention to incorporate issues of cultural landscape and its dynamics to the educational process with emphasis on the regional aspect (within secondary education),
g) in relation to the European Landscape Convention to deepen knowledge and understanding of the cultural landscape and its dynamics (within the tertiary education and lifelong learning),
h) to gain data on the theoretical-methodological basis to improve planning practice (especially for the purpose of landscape plan, for defining target landscape characteristics etc.),
i) to confront the different age categories (primarily pupils and students on one side with pensioners in the other) and to contribute to healthy social and cultural relationships in the village,
j) to draw recommendations for the strategic development of municipalities and regions (by generalization of findings).

337
3 Materials and Methods
a) the analytical and synthetic part:
• to make typology of Czech cultural landscapes in relation to the research subject (physical-geographic, demographic, ethnographic, historical and cultural characteristics of region/locality),
• the selection of model areas (usually defined by one or more administrative districts of municipalities),
• to establish cooperation in communities (the mayors, local clubs, schools, etc.),
• the field survey of the model areas,
• analytical and synthetic evaluation of model areas (analysis of primary, secondary and tertiary structure of the landscape in a historical context, determination of developmental characteristics and trends in the area, determination of values and limits, evaluating the potential area in relation to the subject of the research),
• the hypotheses construction and creation of the interviews structure.
b) the application part (case studies)
• management the semi-standardized interviews with mayors and former mayors (written documentation, video and audio),
• conducting individual semi-standardized interviews with residents older than 65 years (written documentation, video and audio),
• organizing debates and discussions (ideally for students of local and regional primary and secondary schools with citizens aged over 65 years),
c) evaluation of qualitative data and their comparison with the outputs of previous analytical and synthetic parts,
d) implementation of the outcomes and their presentation and popularization, formulation of the conclusions,
e) creation of educational programs (including methodological support/manuals and presentations).
4 Discussion – general background The cultural landscape is a dynamic medium. Structural changes in the landscape (landscape dynamics) can be fairly well quantitatively and qualitatively analyze and evaluate. The
338
knowledge are often transposed into decision-making processes and planning tools – e.g. Skaloš (2012), Skaloš et al. (2011), Salašová et al. (2010), Brierley (2010), Lipský (2001). However, the social and mental dimensions of these changes are rarely implemented into the research of the cultural landscape dynamics. Taking just these mental ties to the land is often decisive for the formation of local identity and stabilizing the rural population. Local identity bound to the cultural landscape often plays a role in regional development. Yet, the local identity is considered as key factor by Zanon and Geneletti (2011). The role of cultural heritage in shaping with local is also confirmed by Roig Ventura and Arrieta Urtizberea (2010). According to Corsale and Iorio (2010), this relationship can be used to develop (often marginal) rural areas – particularly within tourism development and the regional planning practice. This thesis is also confirmed by the Levant (2010) within his study of cultural identity. Moore and Whelan (2007) – in their book – deal the complex relationships between identity, memory, heritage and cultural landscapes within case studies (Anglo-Saxon countries). But the collective (also historical or social) memory in the context of the cultural landscape, its dynamics and role in the identity formation is missing in research (on national, as well as international level). At least, the issue is partly discussed – e.g. Barthel et al. (2010), Gimmi and Burg (2007) and Jones et al. (2010). In the Czech Republic, we can poit out Doc. Matousek (2005).
5 Conclusion Landscape structure is constantly evolving. In many cases, the landscape becomes uniform. Young generation so usually loses awareness of its original view. For young people also often lack awareness of the landscape structures changes at all. The planned project would be to eliminate this gap. The project outputs are (except the usual presentation forms – conferences papers, contributions in scientific journals) a monograph, special exhibition and discussions with pupils and students on one side and with citizens over 65 years on other side. A very significant result will be local "modern chronicle of the village" – digital and printed file for each of the model areas. Chronicles will consist of videos, maps and text records.
Concerning the project risks – the project activities are largely based on the cooperation of residents. Residents´ willingness to share their experiences, memories, reasoning, and the feelings induced by interaction with the environment (positive or negative) is essential. On the other hand, the topic is quite motivational and it is based on the sharing and exchange of experiences and memories with younger generations as a basic need of man.
The nature of research beforehand eliminates specific personality (psychological characteristics of individuals, personal barriers, migration and mortality of the population, etc.) – this is of course a certain distortion of reality, so absolute generalization of the results of the project can´t be assumed. It should be noted, however, the project is based rather on identifying and arranging individual dimension of human perception and view of reality.
References
Barthel, S., Folke, C. and Colding, J. (2010) ‘Social-ecological memory in urban gardens – retaining the capacity for management of ecosystem services‘, Global Environmental Change vol. 20, no. 2, pp. 255-265
Brierley, G. J. (2010) ‘Landscape memory: the imprint of the past on contemporary landscape forms and processes‘, Area, vol. 42, no. 1, pp. 76-85
339
Corsale, A. and IORIO, M. (2010) ‘I musei di identità: un ´opportunità per lo sviluppo locale e turistico delle aree marginali‘. PASOS: Revista de Turismo y Patrimonio Cultural, vol. 8, no. 4, pp. 555-568.
Gimmi, U. and Burgi, M. (2007) ‘Using oral history and forest management plans to reconstruct traditional non-timber forest uses in the Swiss Rhone valley (Valais) since the late nineteenth century‘, Environment and History, vol. 13, no. 2, pp. 211-246
Jones. L. U., Petty, A., Schulz, M., Sharpless, R. and Walker, M. (2010) ‘Agricultural history roundtable complicating the story: oral history and the study of the rural south‘, Agricultural History, vol. 84, no. 3, pp. 281-326
Levanto, G. (2010) ‘A case study on how local identity could become part of the touristic supply‘, in: Tourism and visual culture: Theories and concepts, Antonioni, S., Gemini, L. and Mazzoli, L. pp. 107-123, ISBN 978-1-84593-609-9
Lipský, Z. (2001) ‘Present land use changes in the Czech cultural landscape: driving forces and environmental consequences‘, Moravian Geographical Reports, vol. 9, no. 2, pp. 2-14.
Matoušek, V. (2005) ‘Několik poznámek k archeologickým metodám studia novověké krajiny‘, Historická geografie, pp. 410-420
Moore, N. M. and Whelan, Y. (2007) Heritage, memory and the politics of identity: new perspectives on the cultural landscape (Heritage, Culture and Identity), Ashgate Publishing Copany, pp. 153, ISBN 0754640086.
Roige Ventura, X. and– Arrieta Urtizberea, I. (2010) ‘Construction of identities in the museums of Catalonia and Basque country: local, national and global‘, PASOS: Revista de Turismo y Patrimonio Cultural, vol. 8, no. 4, pp. 539-553, ISBN 1695-7121.
Salašová, A., Kulišťáková, L. and Kučera, P. (2010) ‘Indikátory kvality krajinného prostředí‘, Acta Horticulturae et Regiotecturae, sv. 13, č. mimořádné, pp. 8-14, ISSN 1335-2563.
Skaloš, J. and Kašparová, I. (2012) ‘Landscape memory and landscape change in relation to mining‘, Ecological Engineering, vol 43., pp. 60-69.
Skaloš, J., Kašparová, I. and Trpáková, I. (2011) Historický land use zájmového území Sokolovsko – rok 1842 (Historical land use in territory Sokolovsko – year 1842. DO-Ochrana krajinných území, Specializovaná mapa s odborným obsahem, 8.15, HLU- Funkční změny krajin
Zanon, B. and Geneletti, D. (2011) ‘Integrating ecological, scenic and local identity values in the management plan of an Alpine Natural Park‘, Journal of Environmental Planning and Management, vol. 54, no. 6, Routledge, Taylor & Francis, Abingdon, UK, s. 833-850, ISSN 0964-0568.
Evropská úmluva o krajině (13/2005 Mezinárodní sbírka smluv)

340

341
Social Responsibility of a Company

342
343
Social responsibility of forest enterprises in the Czech Republic
Společenská zodpovědnost lesních podniků v České
republice
Helena Čermáková Katedra obchodu a financí, PEF ,Česká zemědělská univerzita v Praze,
Kamýcká 129, 165 21 Praha 6 – Suchdol [email protected]
Annotation: Corporate Social Responsibility is a concept that has been known for several decades , especially in the field of management. However, its importance began to increase in recent years as a result of globalization and the economic crisis , which highlighted the need for corporate social responsibility. Sustainable development in all aspects of human activity at the moment seems to be the only perspective.
The paper describes the general nature of corporate social responsibility and at the same time a debate is provided on approach to this issue in context of forest enterprises in the Czech Republic. The aim of this paper is to carry out a discussion on the principles of CSR application according to the theory. The basic pillars of CSR are economic, legal , ethical and voluntary (philanthropic) pillars . Selected forest enterprises that have different types of ownership of forest resources will be chosen for investigations in relation to the application of CSR principles, and to what extent they are applied. Based on the results, recommendation for enterprises to fulfill their social responsibility will be proposed.
Key words: Corporate Social Responsibility (CSR), corporate social responsibility, CSR pillars, stakeholders, forestry, forest companies.
JEL classification: M 14
1 Úvod Corporate Social Responsibility (CSR) tj. společenská zodpovědnost firem z obecného pohledu představuje koncept trvale udržitelného rozvoje. Uvedený přístup je založen na čtyřech pilířích. Jedná se o pilíř ekonomický, etický, enviromentální a filantropický. Přístup firem k uvedeným oblastem je globální. Nejedná se o přístup aplikovaný izolovaně v prostředí firmy, ba naopak podstata této filosofie je založena na zodpovědnosti firmy vůči vnějšímu okolí. V této souvislosti je uváděn pojem stakeholders. Zástupci stakeholders jsou zákazníci firmy, dodavatelé, zaměstnanci a ostatní subjekty, které vstupují do interakcí s danou firmou.
Cílem předkládaného článku je provést diskusi na téma společenské zodpovědnosti se zaměřením na lesní podniky v České republice. V příspěvku budou posuzovány jednotlivé pilíře CSR ve vztahu k lesnímu hospodářství a vyslovení doporučení, která by umožnila ve větším rozsahu zahrnout principy společenské zodpovědnosti do podnikových strategií lesních podniků.
2 Materiál a metody Společenská zodpovědnost firem (CSR) Caroll (2008) definuje CSR jako závazek firem přijímat taková rozhodnutí a realizovat takové postupy, které jsou žádoucí z hlediska hodnot a cílů naší společnosti.
344
Blažek et al. (2005) uvádí, že společenská zodpovědnost podniku není koncepce zcela nová. Začala se rozvíjet už od poloviny minulého století především v USA. Nejprve byla rozpracována na poli manangementu a později byla rozpracována i marketingem, který ovšem nevyšel z poznatků nashromážděných v managementu, ale šel svou vlastní cestou. V 90. letech se touto problematikou začíná zabývat Evropská unie, která v ní spatřuje nástroj na dosažení trvale udržitelného a přijatelného růstu a která se snaží přesvědčit malé a středné podniky o výhodnosti přijetí této koncepce.
Jak uvádí Kuldová (2010, 2012) v praxi to znamená, že podniky, které přijaly zásady CSR za své, si dobrovolně stanovují vysoké etické standardy, snaží se minimalizovat negativní dopady na životní prostředí, pečují o své zaměstnance, udržují s nimi dobré vztahy a přispívají na podporu regionu, v němž podnikají. To firmám přináší možnost odlišit se od konkurence, stát se pro své zaměstnance atraktivním zaměstnavatelem a pro ostatní žádaným partnerem.
V průvodci poradců CSR Evropské unie (Knopf, Mayer-Scholl, 2013) je uvedeno, CSR je pouze normální každodenní práce, nic zvláštního, nic těžkého, nic finančné náročného a nic trendy. Dnešní společnost a stakeholders jen požadují od společností více transparentnosti a více informací. Podniky tak musí začít dělat něco, co možná předtím nedělaly. Například začnou používat nové nástroje a ukazatele. Je to každodenní práce pro zítřejší svět.
Caroll (1979) shrnul svou studii CSR do čtyř typů společenské zodpovědnosti v podnikání: ekonomická, právní, etická a filantropická. Ačkoliv tato klasifikace byla v následujících letech kritizována, je tato typologie stále používána (Enderle, 2010).
Murphy a Schlegelmilch (2013) podotýkají, že společenská odpovědnost firem (CSR) je termín, který byl představen před před mnoha lety, ale na vážnosti získal až v 21. století. Stejně tak jako firmy tak vědci z mnoha oborů jsou nyní zastánci této praxe. Nicméně, kritici z médií, průmyslu a akademické obce jsou skeptičtí poukazem na skutečnost, že CSR je nedokonalý koncept, který stále postrádá všeobecně přijímanou definici, a začali psát o společenské nezodpovědnosti (CSI).
Lesnictví v České republice Česká republika patří k zemím s vysokou lesnatostí. Lesy zaujímají podle stavu k roku 2011 rozlohu 2 659 837 hektarů, což představuje 33,7 % rozlohy České republiky. V kontextu Evropy je lesnatost České republiky vyšší, a to o více než 5 %. Z uvedeným faktům vyplývá, že lesnictví představuje nejem významné odvětví v rámci zemědělství, ale současně také z pohledu národního hospodářství a celospolečenského zájmu.
Hospodaření v lesích má jednoznačně přímý vliv na kvalitu životního prostředí, a proto se zde nabízí aplikace CSR ve vztahu k enviromentálnímu pilíři. Lesnictví je společensky důležité odvětví, u kterého je aplikace CRS indikována.
Pro zpracování příspěvku byl na základě studia odborné literatury vybrán následující tabulkový přehled, který obsahuje strukturované všeobecné principy CSR.
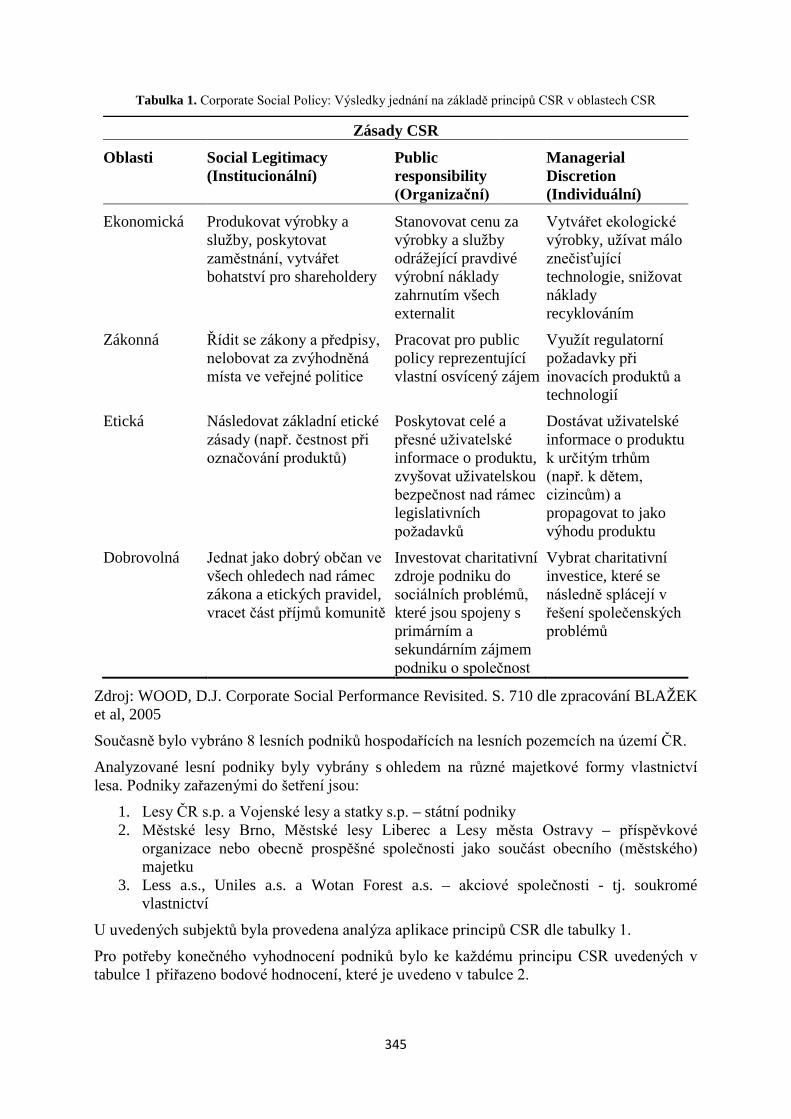
345
Tabulka 1. Corporate Social Policy: Výsledky jednání na základě principů CSR v oblastech CSR
Zásady CSR
Oblasti Social Legitimacy (Institucionální)
Public responsibility (Organizační)
Managerial Discretion (Individuální)
Ekonomická Produkovat výrobky a služby, poskytovat zaměstnání, vytvářet bohatství pro shareholdery
Stanovovat cenu za výrobky a služby odrážející pravdivé výrobní náklady zahrnutím všech externalit
Vytvářet ekologické výrobky, užívat málo znečisťující technologie, snižovat náklady recyklováním
Zákonná Řídit se zákony a předpisy, nelobovat za zvýhodněná místa ve veřejné politice
Pracovat pro public policy reprezentující vlastní osvícený zájem
Využít regulatorní požadavky při inovacích produktů a technologií
Etická Následovat základní etické zásady (např. čestnost při označování produktů)
Poskytovat celé a přesné uživatelské informace o produktu, zvyšovat uživatelskou bezpečnost nad rámec legislativních požadavků
Dostávat uživatelské informace o produktu k určitým trhům (např. k dětem, cizincům) a propagovat to jako výhodu produktu
Dobrovolná Jednat jako dobrý občan ve všech ohledech nad rámec zákona a etických pravidel, vracet část příjmů komunitě
Investovat charitativní zdroje podniku do sociálních problémů, které jsou spojeny s primárním a sekundárním zájmem podniku o společnost
Vybrat charitativní investice, které se následně splácejí v řešení společenských problémů
Zdroj: WOOD, D.J. Corporate Social Performance Revisited. S. 710 dle zpracování BLAŽEK et al, 2005
Současně bylo vybráno 8 lesních podniků hospodařících na lesních pozemcích na území ČR.
Analyzované lesní podniky byly vybrány s ohledem na různé majetkové formy vlastnictví lesa. Podniky zařazenými do šetření jsou:
1. Lesy ČR s.p. a Vojenské lesy a statky s.p. – státní podniky 2. Městské lesy Brno, Městské lesy Liberec a Lesy města Ostravy – příspěvkové
organizace nebo obecně prospěšné společnosti jako součást obecního (městského) majetku
3. Less a.s., Uniles a.s. a Wotan Forest a.s. – akciové společnosti - tj. soukromé vlastnictví
U uvedených subjektů byla provedena analýza aplikace principů CSR dle tabulky 1.
Pro potřeby konečného vyhodnocení podniků bylo ke každému principu CSR uvedených v tabulce 1 přiřazeno bodové hodnocení, které je uvedeno v tabulce 2.
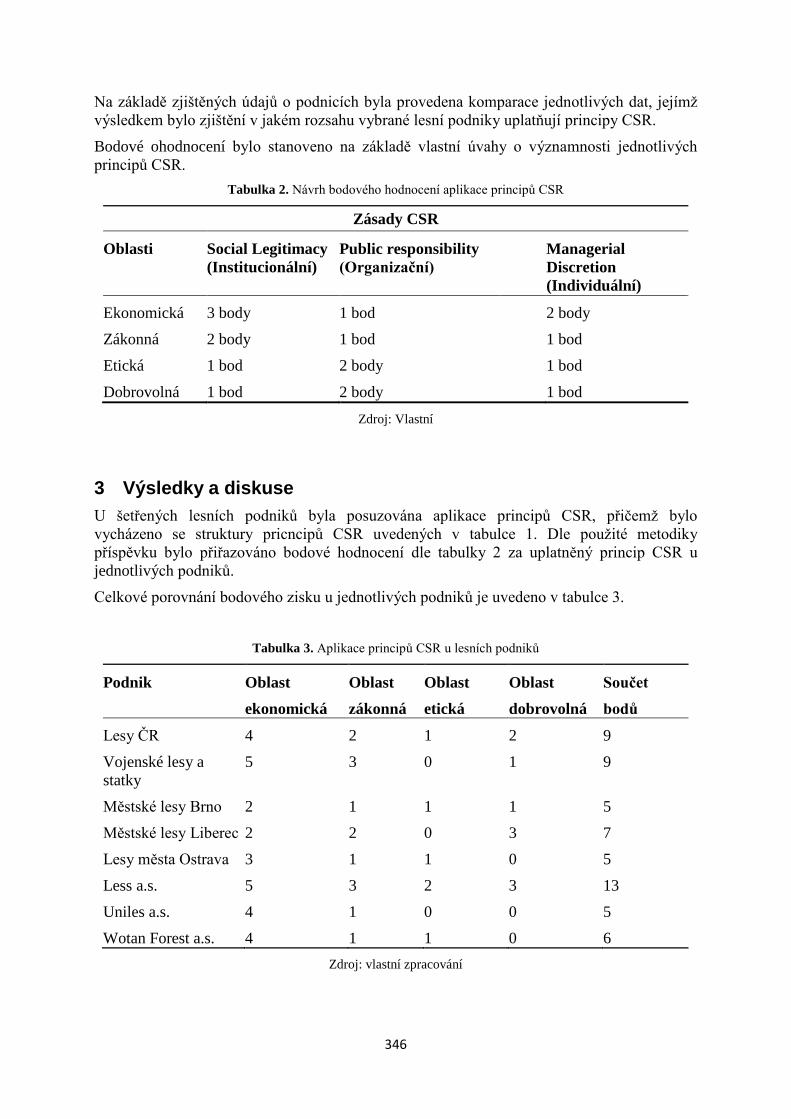
346
Na základě zjištěných údajů o podnicích byla provedena komparace jednotlivých dat, jejímž výsledkem bylo zjištění v jakém rozsahu vybrané lesní podniky uplatňují principy CSR.
Bodové ohodnocení bylo stanoveno na základě vlastní úvahy o významnosti jednotlivých principů CSR.
Tabulka 2. Návrh bodového hodnocení aplikace principů CSR
Zásady CSR
Oblasti Social Legitimacy (Institucionální)
Public responsibility (Organizační)
Managerial Discretion (Individuální)
Ekonomická 3 body 1 bod 2 body
Zákonná 2 body 1 bod 1 bod
Etická 1 bod 2 body 1 bod
Dobrovolná 1 bod 2 body 1 bod Zdroj: Vlastní
3 Výsledky a diskuse U šetřených lesních podniků byla posuzována aplikace principů CSR, přičemž bylo vycházeno se struktury pricncipů CSR uvedených v tabulce 1. Dle použité metodiky příspěvku bylo přiřazováno bodové hodnocení dle tabulky 2 za uplatněný princip CSR u jednotlivých podniků.
Celkové porovnání bodového zisku u jednotlivých podniků je uvedeno v tabulce 3.
Tabulka 3. Aplikace principů CSR u lesních podniků
Podnik Oblast ekonomická
Oblast zákonná
Oblast etická
Oblast dobrovolná
Součet bodů
Lesy ČR 4 2 1 2 9
Vojenské lesy a statky
5 3 0 1 9
Městské lesy Brno 2 1 1 1 5
Městské lesy Liberec 2 2 0 3 7
Lesy města Ostrava 3 1 1 0 5
Less a.s. 5 3 2 3 13
Uniles a.s. 4 1 0 0 5
Wotan Forest a.s. 4 1 1 0 6 Zdroj: vlastní zpracování
347
Vyhodnocení zjištěných výsledků Nejvyššího bodového zisku dosáhl podnik Less a.s., který dosáhl bodového hodnocení ve všech čtyřech sledovaných oblastech. Ve své sebeprezentaci se společnost představuje především jako moderní a dynamická firma, jejímž cílem je orientace na projekty a technologie, které umožňují využívání obnovitelných zdrojů. Mimořádnost firmy Less a.s. mezi hodnocenými podniky spočívá v šířce a komplexnosti intuitivního dodržování principů CSR.
Posuzovaný státní podnik Lesy České republiky v oblasti ekonomického pilíře splňuje požadavek dle zvolené struktury principů CSR uvedených v tabulce 1. Podnik Lesy ČR produkuje výrobky v podobě vytěženého dříví a zároveň poskytuje služby v oblasti lesnictví. Je nezanedbatelným zaměstnanvatelem ve všech reginech ČR, jelikož obhospodařuje 50 % z celkové rozlohy lesních pozemků ČR. Šetřený podnik v rámci ekonomického pilíře nespecifikuje a neinformuje o cenách svých výrobků a služeb. Neuvádí informace, které by se týkaly konkrétních technologií, které by byly šetrné k přírodě. V oblasti etické a dobrovolné se podnik Lesy ČR zaměřuje na podporu projektů spojených s lesní činností a ochranou přírody. Pro podporu projektů je zřízena Grantová agentura Lesů ČR.
Se stejným bodovým ziskem byl ohodnocen podnik Vojenské lesy a statky. Poskytování ekonomických informací je dano majetkovou podstatou jak Lesů ČR, tak i Vojenských lesů a statků, protože v obou případech se jedná o státní podniky, které mají povinnost ze zákona zveřejňovat své ekonomické výsledky (např. Výroční zprávy). Vojenské lesy a statky ve své činnosti zcela opomíjejí oblast dobrovolnictví, a tak podniku chybí sociální rozměr.
Městské lesy Liberec v rámci tzv. městských lesů získaly větší počet bodů oproti svým partnerům z důvodu rozšíření své působnosti i do oblasti sociální.
S nejnižším počtem bodů se umístily dva podniky hospodařící na lesních pozemcích ve vlastnictví města a dva soukromé lesní podniky. Ze šetření vyplývá zaměření podniků pouze na lesní výrobu tj. na ekonomický prospěch nebo plnění práva hospodaření, podniky se neprezentují jako významně společensky zodpovědné.
4 Závěr Cílem příspěvku bylo prodiskutovat obecnou otázku společenské zodpovědnosti firem s užším zaměřením na lesní podniky v ČR. Z předloženého příspěvku vyplývá, že žádný z podniků, který byl zahrnut v šetření oficiálně nedeklaruje zahrnutí principů CSR do své firemní politiky.
Současně však bylo základě provené analýzy zjištěno, že všechny šetřené podniky více či méně principy CSR aplikují, aniž by se však jednalo o vědomé prosazování myšlenek CSR.
Nejúspěšnějším podnikem vyhodnoceným na základě zvolených parametrů byl subjekt Less a.s., který aplikoval 75% z celkového počtu posuzovaných principů CSR. Následovaly dva největší lesní podniky v ČR, které hospodaří s majetkem státu a které naplňovaly sledované principy přibližně z 50 %. Zbývajících pět zkoumaných subjektů zaznamenalo shodu v jedné třetině porovnávaných principů. Oblast shody se týkala především ekonomických faktorů.
Doporučení pro lesní podniky spočívá v přijetí konceptu trvale udržitelného rozvoje, který je vizí uskutečňovanou prostřednictvím společenské zodpovědnosti. V rámci činnosti lesních podniků by na prvním místě měla být ochrana obnovitelných přírodních zdrojů a péče o krajinu s upozaděním ekonomických aspektů.
348
Další doporučení se týká etické a dobrovolné oblasti, tyto oblasti jsou lesními podniky opomíjeny, a přesto se jedná o oblasti, které významnou měrou ovlivňují vnímání podniku celou společností.
Pokud se podnik rozhodne uskutečňovat principy CSR jako součást své firemní politiky, pak by vedení společnosti mělo dbát na jejich komplexní aplikaci, protože jenom uzavřený systém je plně funkční.
Použitá literatura Blažek, L. et al (2005) Společenská zodpovědnost podniků [Online]. Available at: http://is.muni.cz/do/1456/soubory/oddeleni/centrum/papers/wp2005-09.pdf [Přístup získán 13. srpna 2013]
Caroll, A.B. (1979) A three – dimensional conceptual model of corporate performance, Academy of Management Review, 4 (4) , s. 497-505
Enderle, G. (2010) Clarifying the terms of business ethics and CSR, Business Ethics Quarterly, 20 (4) , s. 730-732
Kuldová, L. (2010) Společenská odpovědnost firem – etické podnikání a sociální odpovědnost v praxi, Kanina: O.P.S.
Kuldová, L. (2012) Nový pohled na společenskou zodpovědnost firem, Plzeň: NAVA
Wood, D.J. (1991) Corporate Social Performance Revisited, Academy of Management Review 16 (4)
Knopf, J. and Mayer-Scholl, B. Tips and Tricks for Advisors [Online]. Available at: http://ec.europa.eu/enterprise/policies/sustaible-business/corporate-social-responsibility/sme/index-en.html [Přístup získán 12. srpna 2013]
Murphy, PE, Schlegelmilch, BB (2013) Corporate social responsibility and corporate social irresponsibility: Introduction to a special topic section, Journal of business research, 65 (10)
Anotace: Společenská zodpovědnost firem je pojem, který je známý již několik desetiletí, a to především v oblasti managementu. Avšak na své důležitosti začal získávat až v posledních letech jako důsledek globalizace a hospodářské krize, které poukázaly na nutnost společenské zodpovědnosti firem za své chování. Trvale udržitelný rozvoj ve všech směrech lidské činnosti se v tuto chvíli jeví jako jediný perspektivní. V příspěvku je uvedena obecná podstata společenské zodpovědnosti firem a zároveň je zahájena diskuse na téma přístupu k této problematice s pohledu lesních podniků v České republice. Cílem příspěvku je provést diskusi na téma uplatňování principů dle teorie CSR. Základními pilíři CSR je pilíř ekonomický, zákonný, etický a dobrovolný (filantropický). U zvolených lesních podniků, které mají různé druhy vlastnictví lesního majetku, bude provedeno šetření ve vztahu k uplatňování principů CSR a případně v jakém rozsahu. Na základě zjištěných výsledků budou navržena doporučení podnikům, jak naplnit svou společenskou zodpověnost.
Key words: Corporate Social Responsibility (CSR), společenská zodpovědnost firem, pilíře CRS, stakeholders, lesnictví, lesní podniky.
JEL classification: M 14
349
CSR and Availability of Food for Celiacs in Retail Trade CR
CSR a dostupnost potravin pro celiaky v maloobchodu ČR
Aleš HES, Marta REGNEROVÁ Department of Trade and Finance , FEM, Czech University of Life Sciences Prague,
Kamýcká 129, 165 21 Prague 6 – Suchdol, Czech Republic [email protected], [email protected]
Annotation Corporate Social Responsibility (CSR) refers to the responsible way of making business. As an integral part of the corporate strategy CSR complies with the business plan and key competences of the company. It forms a part of everyday business activities of the company, and is an integral part of a corporate culture. Apart from arousing positive social changes it involves philanthropy, sponsoring, infrastructure development and environmental protection. As defined by McElhanney K. A. (2011) CSR in general means making business to create a better world. In the Czech Republic the CSR is usually compared to business ethics. It relates to the sustainable development, company conduct and also to stakeholders, i.e. all entities within and outside the company with the interests in the company (owners, investors, employees, customers, vendors, etc.). Trouble-free performance of the company or institution is closely linked with regulatory compliance (which is obligatory and enforceable), from the long-term view also with the application of ethical principles, most frequently in the form of ethical code of conduct or corporate culture standards (that are important but not enforceable). Socially responsible company has to adopt an ethical approach to all parties incl. customers – end consumers with specific demands, such as a group of consumers that suffer from celiac disease or diabetes mellitus. As a part of Trade Science and IGA PEF ČZU in Prague there has been being realized a research (2012-2013) focused on the availability of food for the specific group of consumers with gluten intolerance – with celiac disease, gluten allergy or Duhring herpetiformis dermatitis. For these consumers the gluten free diet is the precondition to reduce or prevent the manifestation of the disease. In order to be able to adhere to the gluten free diet the patients have to buy appropriate food the availability, width and depths of range, merchandising (presentation) and prices of which were mapped and monitored during the first phase of the research in selected operating units of the retail trade within the Czech Republic Three types of self-service operational units were chosen (convenience store - superette, supermarket and hypermarket), one operational unit with service (variety store or specialized store) and one internet shop selling gluten-free food. During the second phase of the research an inquiry via questionnaires was performed focused on preferences of consumers purchasing gluten-free food. The results of the research and consumer gluten-free food buying preferences incl. responsible (or irresponsible) approach of the selected operational units are presented and analyzed in the following paper. The findings referred to in the paper are from IGA FEM CULS project No. 20121027 (11210/1312/3106) "The Research of the Retail Trade Offer of Food Suitable for Customers with Gluten Intolerance".
Key words: company, corporate social responsibility, research, retail, offer, consumer – celiac
JEL classification: M14, M21, M31
1 Úvod Zákazníci-koneční spotřebitelé přecitlivělí na výskyt lepku v potravinách při nákupu potravin do svého stravovacího režimu (diety) přicházejí na trh se specifickými požadavky. Celiakie, alergie na lepek nebo Duhringova dermatitida jako chronické onemocnění sliznice tenkého střeva vyžadují při stravování takové potraviny, které lepek neobsahují nebo jen v malé koncentraci. To představuje pro člověka s tímto onemocněním, které je doposud nevyléčitelné a dokonce geneticky přenosné na další generace, celoživotní gastronomický problém.
350
Spotřebitelé s tímto onemocněním jsou nuceni si vytvořit svůj alternativní jídelníček z potravin, které nežádoucí složky neobsahují nebo jen v nepatrném množství. Je důležité si uvědomit, že korektním a poctivým dodržováním předepsané diety se zpravidla omezí negativní dopady na lidský organizmus. Pro uváděnou zákaznickou skupinu je zvlášť důležité, aby bezlepkové potraviny byly v maloobchodních provozních jednotkách dostupné jak v šířce i v hloubce sortimentu, v cenovém rozpětí, tak i v prostorové vzdálenosti. Tyto podmínky jsou závislé na řadě faktorů v oblastech prvovýroby, zpracování, distribuce, dopravy, skladování i obchodu-prodeje (včetně obsluhy). Firmy, které se na jednotlivých článcích tohoto logistického řetězce podílejí, specifickým způsobem vůči této zákaznické skupině spotřebitelů projevují společenskou odpovědnost ze své podnikatelské činnosti a tím také nesou určitý podíl na jejich kvalitě života (Regnerová a Hes, 2012).
Odborná platforma Byznys pro společnost zabývající se společenskou odpovědností a udržitelného podnikání v ČR sdružuje firmy, které ve své činnosti uplatňují principy společenské odpovědnosti (CSR=Corporate Social Responsibiliti) a trvalé udržitelnosti podnikání. V roce 2012 byla udělována národní cena této platformy v soutěži „TOP Odpovědná firma 2012“ v několika kategoriích. Některé kategorie jako např. Regionální obchodník roku, Odpovědný hotel a restaurace 2012, Firma vstřícná seniorům, Odpovědný produkt a marketing 2012 a Odpovědný leader 2012 pronikly i do podnikání v systému vnitřního obchodu a obsah jejich ocenění směřoval nejen k zákazníkům obecně, ale i ke konečným spotřebitelům vybraných zákaznických skupin jako jsou handicapovaní zákazníci či senioři a ke kvalitě jejich života (CSR fórum, 2012).
2 Materiál a metodika Celiakie, alergie na lepek a Duhringova dermatitida jsou nemoci způsobené nesnášenlivostí lepku. U celiakie a alergie na lepek je bezlepková dieta jediný způsob, jak zabránit projevům nemoci. Dodržováním bezlepkové diety zpravidla v relativně krátké době vymizí vnější projevy onemocnění. U Duhringovy dermatitidy je bezlepková dieta základní terapií (Kohout a Pavlíčková, 2010). Pokud nestačí, bývá doplněna medikamenty. Reakce na zavedení bezlepkové diety může být pomalejší než u celiakie (Společnost pro bezlepkovou dietu, 2013). Počet občanů s nesnášenlivostí lepku činí v ČR asi jen o 0,5-1% obyvatelstva, číselně jde asi o 50 až 120 tisíc lidí. Z tohoto počtu pouze 10-15% je léčeno, ostatní nejsou dosud diagnostikováni. Příčiny onemocnění mohou být rozličné, jde například o souvislosti celiakie a rachitidy (křivice) u dětí, jak uvádí Saeed, A. (2013). Nemoc se může vyskytnout v dětském věku, ale i v dospělosti, spouštěcích faktorů může být více, například infekční onemocnění, náhlá změna v životě, stres, porod, operace atd. (Kohout a Pavlíčková, 2010).
Lidí s tímto onemocněním stále přibývá, vyléčit zcela nelze a největším problémem je včasná a především správná diagnostika tohoto onemocnění (ČT24 Studio 6, 12.03.2013). Pro specifickou zákaznickou skupinu spotřebitelů s nesnášenlivostí lepku nejdůležitější determinantou k udržení kvality jejich života je dodržování správné životosprávy- bezlepkové diety, ke které jsou nutné bezlepkové potraviny. Pro celiaky je nutné vyloučit žitnou, ječnou, pšeničnou i ovesnou mouku a všechny potraviny, které lepek obsahují (omáčky, pivo, polévky, těstoviny ad.). Je proto důležité, aby bezlepkové potraviny na našem trhu byly pro spotřebitele s nesnášenlivostí lepku dostupné, byly dobře značeny a složení na
351
nich čitelné, protože i malé množství lepku může způsobit spotřebitelům velké potíže. Zde se otevírá otázka k prověření společenské odpovědnosti (CSR) zainteresovaných podniků v logistickém řetězci, zda-li jsou k těmto specifickým zákaznickým skupinám spotřebitelů profesionální v konzistentní nabídce (ve výrobě, v šířce a v hloubce sortimentu, cenové úrovni, dostupnosti v maloobchodní síti).
Při zpracovávání tohoto příspěvku bylo využito výsledků průzkumu z projektu, který byl zaměřen na průzkum nabídky potravin vhodných pro zákazníky s nesnášenlivostí lepku v maloobchodě 2012-2013. (A survey of suitable food supply for customers with gluten intolerance in retail.) Hlavním cílem projektu bylo objektivně zjistit proporcionalitu spotřebitelské nabídky deglutenizovaných potravin ve vybraných maloobchodních provozovnách pro specifickou skupinu spotřebitelů s onemocněním způsobené nesnášenlivostí lepku a zkonstruovat vývojový trend nabídky v naturální formě, který bude kodifikován s vybranými faktory spotřebitelského rozhodování zkoumané specifické skupiny spotřebitelů.
Projekt byl rozdělen do dvou realizačních fází:
Průzkum nabídky bezlepkových potravin (období 2012-1.pol. 2013) ve vybraných typech maloobchodních provozoven formou terénního výzkumu ve vazbě na sledování faktorů:
šíře a hloubka sortimentu,
merchandising,
značky a výrobce,
cenové hladiny zkoumaných potravin,
prostorová dostupnost v maloobchodní síti.
Průzkum potřeb-spotřebitelských preferencí u spotřebitelů, kteří tyto potraviny skutečně potřebují ve vazbě na jejich rozhodování při nákupu a kupní sílu (dotazníkové šetření s názvem Spotřebitelské preference při nákupu potravin pro spotřebitele s nesnášenlivostí lepku realizovaného v období 1. poloviny roku 2013).
Respondenti-celiaci byli vybíráni náhodným výběrem prostřednictvím dotazu, zda-li jsou ochotni odpovědět na zkoumané otázky v dotazníkovém šetření. Charakteristika souboru respondentů uvádí tabulka č. 3.
Bylo uskutečněno196 písemných zápisů ze šetření prodeje bezlepkových potravin ve vybraných typech provozních jednotek maloobchodu a zpracováno 137 dotazníků.
Hlavním cílem tohoto příspěvku je na základě výše provedeného průzkumu (ad. 1) v letech 2012/2013 prověření existence synergického efektu mezi nabídkou bezlepkových potravin ve vybraných maloobchodních provozovnách ve sledovaných faktorech a nákupním rozhodováním specifické skupiny spotřebitelů ve vazbě na objektivizaci společenské
352
odpovědnosti obchodníků ke spotřebitelským preferencím nákupního chování těchto spotřebitelů.
Byl sestaven následující metodický postup:
Studium dostupné literatury a odborných článků týkajících se dané problematiky (nabídky bezlepkových potravin a nákupní chování spotřebitelů při jejich nákupu).
Zpracování literárního přehledu formou deskripce a citace odborného textu.
Vyhodnocení výsledků primárního výzkumu a dotazníkového šetření v terénu (ad. 1 a 2).
Konstrukce návrhu (doporučení) mechanismu prodeje bezlepkových potravin ve vybraných typech provozních jednotek maloobchodu z hlediska jejich společenské odpovědnosti ve sledovaných faktorech v synergii ke spotřebitelským preferencím specifické skupiny spotřebitelů pomocí logické dedukce a syntézy dílčích výsledků z průzkumů.
3 Výsledky a diskuse Změny v systému vnitřního obchodu na přelomu 20. a 21. století determinované vnějšími vývojovými trendy vnesly do systému provozních jednotek maloobchodu řadu inovací, které měly převážně kladnou odezvu u spotřebitelů. Došlo k rozšíření nákupních možností a zejména k prohloubení šíře a hloubky sortimentu zboží, začaly se lépe a účinně projevovat marketingové nástroje ve všech maloobchodních formách. Inovační procesy zasáhly i do nákupního chování spotřebitelů (Hes a kol., 2008). Přesto některé maloobchodní jednotky získaly vyšší oblibu u spotřebitelů při nákupu potravin a staly se tak dominantními v prodeji potravin (diskontní prodejny, hypermarkety, supermarkety, internetový obchod).
Pro průzkum byly proto v metodickém postupu zvoleny tři typy samoobslužných provozních jednotek: hypermarket, supermarket a superettum (menší samoobsluha do 400 m2 prodejní plochy) diskontně orientované, jedna prodejna s obsluhou (smíšené zboží nebo specializovaná prodejna) a jeden internetový obchod, ve kterých byla uskutečněna terénní šetření. V každém typu provozní jednotky byly sledovány ze sortimentu zboží vhodného pro skupinu spotřebitelů s bezlepkovou dietou šest vybraných výrobků: chléb, čerstvé pečivo-sladké nebo slané, sušenky, mouka, instantní výrobky a uzeniny.
U každé položky byly sledovány faktory: šířka a hloubka sortimentu, prezentace-merchandising, značka výrobku (výrobce) a cenová hladina včetně přepočtu ceny/na kg hmotnosti nebo 1 litr objemu ve vybraných provozních jednotkách. Na základě zjištěných výsledků bylo možno charakterizovat současnou situaci v daných provozních jednotkách při prodeji vybraných produktů pro zákaznickou skupinu s bezlepkovou dietou. Šetření byla uskutečněna v 63 náhodně vybraných městských a venkovských sídlech regionů ČR. Na toto šetření navázalo dotazníkové šetření „Spotřebitelské preference při nákupu potravin pro spotřebitele s bezlepkovou dietou“. Charakteristiky sledovaných oblastí jsou následující.
Šířka a hloubka sortimentu Šířka a hloubka sortimentu bezlepkových potravin se odvíjí podle typu provozní jednotky.
353
HYPERMARKET A SUPERMARKET: u hypermarketu a supermarketu ve většině případech není uspokojivá, od jednotlivých druhů bezlepkových výrobků je zastoupeno málo značek od různých výrobců. Jednotlivé druhy zboží není tak možné vybrat z různých cenových hladin přijatelných dle finančních možností zákazníků. V porovnání s nabízeným „běžným“ sortimentem je tento sortiment zboží malý a spíše se jedná o okrajový sortiment, který tvoří malé procento obratu provozoven, přestože ceny u bezlepkových výrobků jsou 2 – 8 x vyšší než běžné výrobky. Šířka a hloubka nabízeného sortimentu se odvíjí i od provozovatele prodejny, obchodní řetězce firem Albert, Tesco, Globus a Kaufland mají v podstatě rovnocenné zastoupení sortimentu.
SUPERRETA: menší samoobslužné provozovny tohoto typu mají omezenou šířku i hloubku sortimentu, především z pohledu omezené prostorové kapacity prodejen, dále pak z důvodu cenové náročnosti prodávaného zboží s ohledem na celkový obrat prodejny a náročnosti nákupu od dodavatelů. Tyto firmy nemají takové možnosti v rámci obchodních marží jako jejich konkurenti (hypermarket, supermarket) a není výjimkou, že u některých provozoven tento sortiment zboží se omezuje na jeden druh, například na mouku či instantní směsi nebo zcela chybí.
PRODEJNA S OBSLUHOU (SMÍŠENÉ ZBOŽÍ NEBO SPECIALIZOVANÁ): jde-li o specializovanou prodejnu s bezlepkovými produkty, pak sortiment je široký i hluboký a obsluha je ochotná poradit a pomoci i s výběrem. Pokud jde o prodejnu se smíšeným zbožím, pak tento sortiment je velmi omezený nebo nulový.
INTERNETOVÝ OBCHOD: sortiment se zaměřením na bezlepkové potraviny je velmi široký i hluboký včetně příznivé cenové hladiny u některých druhů (chléb, mouka), u jiných, zejména nově zaváděných druhů, jsou i zde ceny vysoké. Problémy jsou s dodáním a poplatek za doručení vyrovnává většinou ceny těchto produktů s cenami v kamenných obchodech.
Prezentace a merchandising HYPERMARKET A SUPERMARKET: sortiment bezlepkových potravin je ve většině případů přehledně prezentován v regálech, utříděn dle jednotlivých druhů zboží. Ač tyto produkty umístěné na jednom vyhrazeném místě – regálu, bohužel však v některých případech je bylo obtížné v rozsáhlém prodejním prostoru dohledat díky špatnému nebo nulovému zřetelnému označení prostoru – chybí nástěnné nebo stropní displeje jasně směrující zákazníka k těmto produktům (Hrubá a Regnerová, 2003).
V řadě případů byly bezlepkové potraviny zahrnuty do regálu se zdravou výživou nebo bylo prodejní místo spojeno s prodejem například bio výrobků; i když se jedná v podstatě také o specifický druh potravin, není možno tyto produkty spojovat s výrobky zahrnutými pod značku bio nebo produkty zdravé výživy, jedná se o zcela odlišné produkty s jiným určením i preferencí. Bezlepkové potraviny jsou více specifické než produkty zdravé výživy nebo bio produkty, protože ty jsou zpravidla určeny spotřebitelům s jinými zdravotními obtížemi, dietetickými omezeními či pouze související s preferencí zdravého životního stylu. Proto by bezlepkové produkty vždy měly mít svoje zvláštní místo – regál (koutek) a vždy by měly být zřetelně a jasně označeny.
354
V řetězci Kaufland, který sice disponuje širokým sortimentem zboží, jsou bezlepkové potraviny zahrnuty mezi ostatní produkty vybrané skupiny zboží. V tomto případě spotřebitel musí projít značnou část rozsáhlé prodejní plochy ve dvou podlaží a hledat jednotlivé dia-produkty i bezlepkové potraviny. Jde více o marketingový tah, aby nakupující prošli celou nabídkou zboží a koupili i jiné druhy.
SUPERRETA: v těchto provozních jednotkách maloobchodu se bohužel situace odvíjí od již výše popsané šířky a hloubky sortimentu. Vzhledem k menší prodejní ploše a především horší nebo nulové „zásobenosti“ bezlepkovými potravinami, zcela chybí vyhrazená část prodejní plochy pro tyto specifické druhy. Produkty jsou umístěny mezi ostatními běžnými výrobky např. chléb; pro zákazníka, který je v prodejně poprvé, je obtížné se zorientovat a pohodlně si vybrat na jednom místě bezlepkové potraviny, jako je tomu v převážném počtu u hypermarketů či supermarketů. Šířka a hloubka v některých případech byla nulová.
PRODEJNA S OBSLUHOU (SMÍŠENÉ ZBOŽÍ NEBO SPECIALIZOVANÁ: v tomto typu provozních jednotek prezentace a merchandising závisí na prodejní strategii a je úzce spjata s obsluhou, jeho ochotou a znalostí dané problematiky bezlepkových potravin.
INTERNETOVÝ OBCHOD: nejpříznivější prezentace pro spotřebitele a nejpohodlnější výběr bezlepkových potravin je na internetu. Nevýhodou však je, že výrobky jsou prezentovány pomocí obrázků, ze kterých často nelze ani vyčíst potřebné údaje.
Zastoupené značky a výrobci Značka produktu je důležitým nástrojem komunikace s cílovou zákaznickou skupinou na trhu. Cílem marketingové strategie je vytvořit situaci, aby spotřebitel vnímal značku jako něco specifického, co dokáže optimálně identifikovat produkt a jeho kvalitu. Spotřebitelé, kteří mají větší přehled o určitém produktu, se při nákupu cíleně zaměřují na určitou značku, protože přibližuje kvalitu produktu a spotřebitelé vědí, že v každém čase a na různém místě nákupu dostanou stejnou kvalitu (Nadányiová, 2012).
Značek od sledovaných skupin bezlepkových potravin bylo několik, stejně jak od českých tak i zahraničních výrobců (např. z Itálie, Německa). Nejčastěji zastoupené produkty-značky a výrobci bezlepkových produktů v šetřených typech provozních jednotek maloobchodu jsou uvedeny v tabulce č. 1.
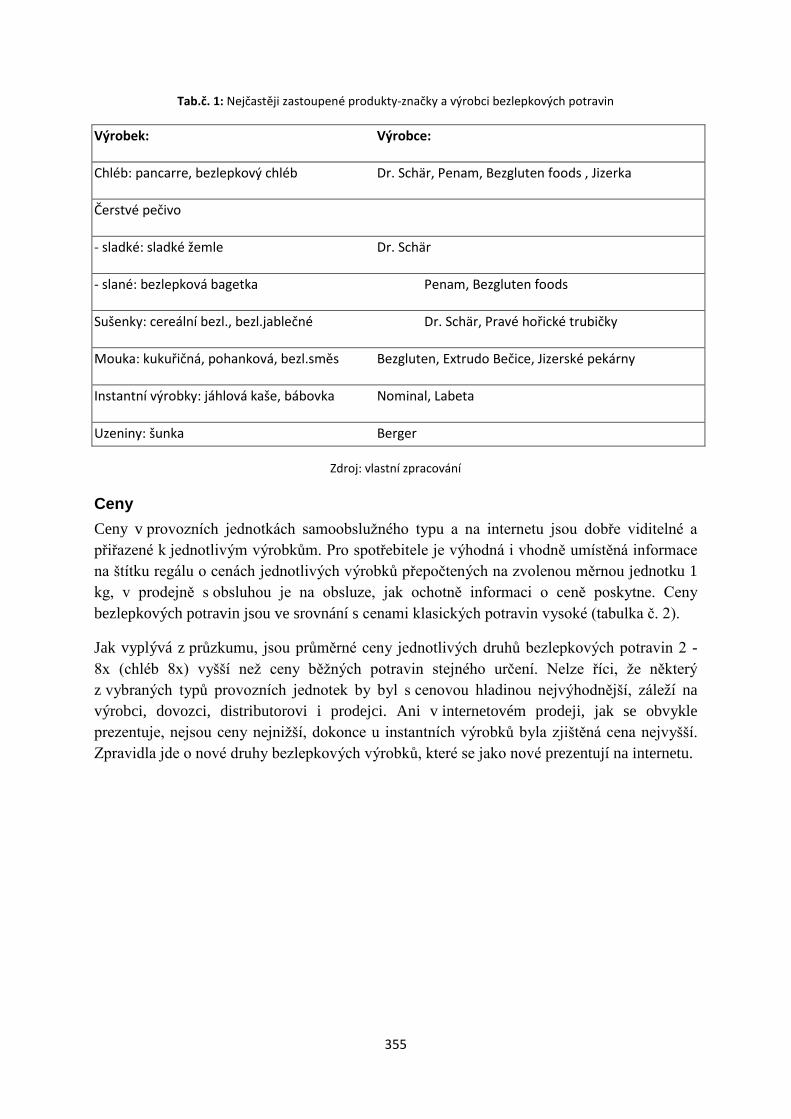
355
Tab.č. 1: Nejčastěji zastoupené produkty-značky a výrobci bezlepkových potravin
Výrobek: Výrobce:
Chléb: pancarre, bezlepkový chléb Dr. Schär, Penam, Bezgluten foods , Jizerka
Čerstvé pečivo
- sladké: sladké žemle Dr. Schär
- slané: bezlepková bagetka Penam, Bezgluten foods
Sušenky: cereální bezl., bezl.jablečné Dr. Schär, Pravé hořické trubičky
Mouka: kukuřičná, pohanková, bezl.směs Bezgluten, Extrudo Bečice, Jizerské pekárny
Instantní výrobky: jáhlová kaše, bábovka Nominal, Labeta
Uzeniny: šunka Berger
Zdroj: vlastní zpracování
Ceny Ceny v provozních jednotkách samoobslužného typu a na internetu jsou dobře viditelné a přiřazené k jednotlivým výrobkům. Pro spotřebitele je výhodná i vhodně umístěná informace na štítku regálu o cenách jednotlivých výrobků přepočtených na zvolenou měrnou jednotku 1 kg, v prodejně s obsluhou je na obsluze, jak ochotně informaci o ceně poskytne. Ceny bezlepkových potravin jsou ve srovnání s cenami klasických potravin vysoké (tabulka č. 2).
Jak vyplývá z průzkumu, jsou průměrné ceny jednotlivých druhů bezlepkových potravin 2 - 8x (chléb 8x) vyšší než ceny běžných potravin stejného určení. Nelze říci, že některý z vybraných typů provozních jednotek by byl s cenovou hladinou nejvýhodnější, záleží na výrobci, dovozci, distributorovi i prodejci. Ani v internetovém prodeji, jak se obvykle prezentuje, nejsou ceny nejnižší, dokonce u instantních výrobků byla zjištěná cena nejvyšší. Zpravidla jde o nové druhy bezlepkových výrobků, které se jako nové prezentují na internetu.
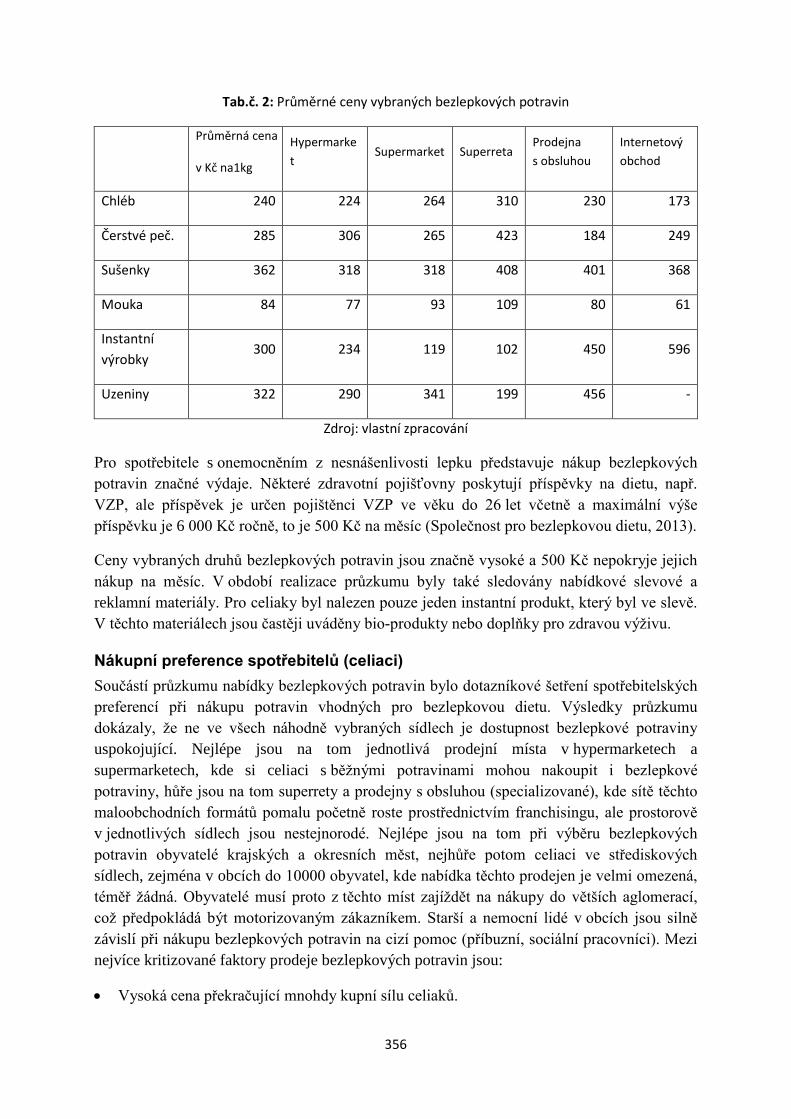
356
Tab.č. 2: Průměrné ceny vybraných bezlepkových potravin
Průměrná cena
v Kč na1kg
Hypermarket
Supermarket Superreta Prodejna s obsluhou
Internetový obchod
Chléb 240 224 264 310 230 173
Čerstvé peč. 285 306 265 423 184 249
Sušenky 362 318 318 408 401 368
Mouka 84 77 93 109 80 61
Instantní výrobky
300 234 119 102 450 596
Uzeniny 322 290 341 199 456 -
Zdroj: vlastní zpracování
Pro spotřebitele s onemocněním z nesnášenlivosti lepku představuje nákup bezlepkových potravin značné výdaje. Některé zdravotní pojišťovny poskytují příspěvky na dietu, např. VZP, ale příspěvek je určen pojištěnci VZP ve věku do 26 let včetně a maximální výše příspěvku je 6 000 Kč ročně, to je 500 Kč na měsíc (Společnost pro bezlepkovou dietu, 2013).
Ceny vybraných druhů bezlepkových potravin jsou značně vysoké a 500 Kč nepokryje jejich nákup na měsíc. V období realizace průzkumu byly také sledovány nabídkové slevové a reklamní materiály. Pro celiaky byl nalezen pouze jeden instantní produkt, který byl ve slevě. V těchto materiálech jsou častěji uváděny bio-produkty nebo doplňky pro zdravou výživu.
Nákupní preference spotřebitelů (celiaci) Součástí průzkumu nabídky bezlepkových potravin bylo dotazníkové šetření spotřebitelských preferencí při nákupu potravin vhodných pro bezlepkovou dietu. Výsledky průzkumu dokázaly, že ne ve všech náhodně vybraných sídlech je dostupnost bezlepkové potraviny uspokojující. Nejlépe jsou na tom jednotlivá prodejní místa v hypermarketech a supermarketech, kde si celiaci s běžnými potravinami mohou nakoupit i bezlepkové potraviny, hůře jsou na tom superrety a prodejny s obsluhou (specializované), kde sítě těchto maloobchodních formátů pomalu početně roste prostřednictvím franchisingu, ale prostorově v jednotlivých sídlech jsou nestejnorodé. Nejlépe jsou na tom při výběru bezlepkových potravin obyvatelé krajských a okresních měst, nejhůře potom celiaci ve střediskových sídlech, zejména v obcích do 10000 obyvatel, kde nabídka těchto prodejen je velmi omezená, téměř žádná. Obyvatelé musí proto z těchto míst zajíždět na nákupy do větších aglomerací, což předpokládá být motorizovaným zákazníkem. Starší a nemocní lidé v obcích jsou silně závislí při nákupu bezlepkových potravin na cizí pomoc (příbuzní, sociální pracovníci). Mezi nejvíce kritizované faktory prodeje bezlepkových potravin jsou:
• Vysoká cena překračující mnohdy kupní sílu celiaků.
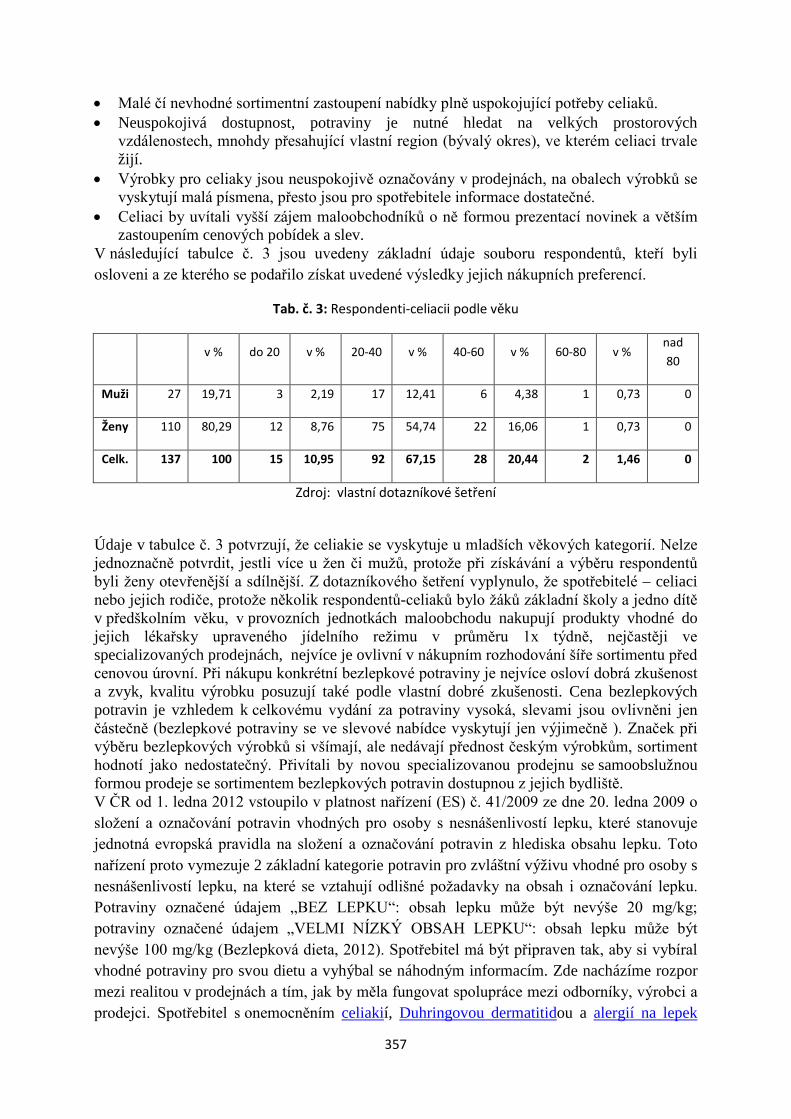
357
• Malé čí nevhodné sortimentní zastoupení nabídky plně uspokojující potřeby celiaků. • Neuspokojivá dostupnost, potraviny je nutné hledat na velkých prostorových
vzdálenostech, mnohdy přesahující vlastní region (bývalý okres), ve kterém celiaci trvale žijí.
• Výrobky pro celiaky jsou neuspokojivě označovány v prodejnách, na obalech výrobků se vyskytují malá písmena, přesto jsou pro spotřebitele informace dostatečné.
• Celiaci by uvítali vyšší zájem maloobchodníků o ně formou prezentací novinek a větším zastoupením cenových pobídek a slev.
V následující tabulce č. 3 jsou uvedeny základní údaje souboru respondentů, kteří byli osloveni a ze kterého se podařilo získat uvedené výsledky jejich nákupních preferencí.
Tab. č. 3: Respondenti-celiacii podle věku
v % do 20 v % 20-40 v % 40-60 v % 60-80 v % nad 80
Muži 27 19,71 3 2,19 17 12,41 6 4,38 1 0,73 0
Ženy 110 80,29 12 8,76 75 54,74 22 16,06 1 0,73 0
Celk. 137 100 15 10,95 92 67,15 28 20,44 2 1,46 0
Zdroj: vlastní dotazníkové šetření
Údaje v tabulce č. 3 potvrzují, že celiakie se vyskytuje u mladších věkových kategorií. Nelze jednoznačně potvrdit, jestli více u žen či mužů, protože při získávání a výběru respondentů byli ženy otevřenější a sdílnější. Z dotazníkového šetření vyplynulo, že spotřebitelé – celiaci nebo jejich rodiče, protože několik respondentů-celiaků bylo žáků základní školy a jedno dítě v předškolním věku, v provozních jednotkách maloobchodu nakupují produkty vhodné do jejich lékařsky upraveného jídelního režimu v průměru 1x týdně, nejčastěji ve specializovaných prodejnách, nejvíce je ovlivní v nákupním rozhodování šíře sortimentu před cenovou úrovní. Při nákupu konkrétní bezlepkové potraviny je nejvíce osloví dobrá zkušenost a zvyk, kvalitu výrobku posuzují také podle vlastní dobré zkušenosti. Cena bezlepkových potravin je vzhledem k celkovému vydání za potraviny vysoká, slevami jsou ovlivněni jen částečně (bezlepkové potraviny se ve slevové nabídce vyskytují jen výjimečně ). Značek při výběru bezlepkových výrobků si všímají, ale nedávají přednost českým výrobkům, sortiment hodnotí jako nedostatečný. Přivítali by novou specializovanou prodejnu se samoobslužnou formou prodeje se sortimentem bezlepkových potravin dostupnou z jejich bydliště. V ČR od 1. ledna 2012 vstoupilo v platnost nařízení (ES) č. 41/2009 ze dne 20. ledna 2009 o složení a označování potravin vhodných pro osoby s nesnášenlivostí lepku, které stanovuje jednotná evropská pravidla na složení a označování potravin z hlediska obsahu lepku. Toto nařízení proto vymezuje 2 základní kategorie potravin pro zvláštní výživu vhodné pro osoby s nesnášenlivostí lepku, na které se vztahují odlišné požadavky na obsah i označování lepku. Potraviny označené údajem „BEZ LEPKU“: obsah lepku může být nevýše 20 mg/kg; potraviny označené údajem „VELMI NÍZKÝ OBSAH LEPKU“: obsah lepku může být nevýše 100 mg/kg (Bezlepková dieta, 2012). Spotřebitel má být připraven tak, aby si vybíral vhodné potraviny pro svou dietu a vyhýbal se náhodným informacím. Zde nacházíme rozpor mezi realitou v prodejnách a tím, jak by měla fungovat spolupráce mezi odborníky, výrobci a prodejci. Spotřebitel s onemocněním celiakií, Duhringovou dermatitidou a alergií na lepek
358
více či méně informovaný lékařem se při nakupování pro uspokojení svých potřeb rozhoduje (Koudelka, 1997) pod vlivem různých, často neodborných, informací. A protože osvěta v masmediích pro asi 50-100 tisíc spotřebitelů s onemocněním nesnášenlivostí k lepku je minimální, může uváděný rozpor pro mnohé z těchto spotřebitelů znamenat nevratné riziko pro jeho zdraví i život (Smejkal a Rais, 2006).
4 Závěr Na základě zjištěných výsledků lze říci, že bezlepkové potraviny pro prodejce nejsou neznámým pojmem a patří již, až na výjimky, ve většině případů do jejich nabízeného sortimentu zboží, i když nepředstavují významnou část podílu na prodávaném zboží. Ze zjištěných výsledků je možné potvrdit určitou synergii mezi typem provozní jednotky a jednotlivými sledovanými faktory, tj. obecně řečeno, čím menší provozní jednotka je (mimo specializované), tím je objem nabízeného sortimentu bezlepkových produktů menší. Všechny ostatní sledované faktory pouze kopírují obecně daná specifika, která jsou platná pro daný typ provozních jednotek, jak v nabízeném sortimentu, prezentaci, merchandisingu i cenách. U prodeje bezlepkových potravin se zjistila malá společenská odpovědnost všech firem vůči této specifické skupině zákazníků. Všechny zainteresované subjekty se obávají z ekonomických neúspěchů při prodeji těchto potravin. Neumějí odhadnout, kolik bude vůbec zákazníků a kolik bezlepkových potravin dokážou prodat. Ekonomická stránka obchodu převažuje nad celospolečenským posláním obchodu - uspokojit i spotřebitele, vyžadující bezlepkové potraviny. To je však nutné prodiskutovat v otevřeném fóru za účasti všech dotčených subjektů. I výsledky průzkumu a dotazníkového šetření dokazují nezbytnost spolupráce všech zainteresovaných subjektů: Sdružení celiaků, specialistů-lékařů, odborníků v prvovýrobě, při zpracování bezlepkových potravin, ve všech fázích distribuce i prodeje a samozřejmě i spotřebitelů.
Chování subjektů (maloobchodních provozoven) vůči konečnému spotřebiteli by mělo být prioritou, protože konečný spotřebitel výrobky a služby firem spotřebovává a tím vytváří předpoklady pro další reprodukční proces firmy (Regnerová a Hes, 2011). Marketing, ale i společenská odpovědnost, ve svém výsledku představují podnikatelskou „filozofii“, která nejen pro podnikatelskou sféru znamená, že musí vycházet z předpokladu a poznatku, že uspokojení přání, zájmů a potřeb konečného zákazníka je ekonomickou a sociální podmínkou existence tohoto subjektu – nejen obchodní firmy, ale i všech ostatních subjektů, které vstupují do logistického řetězce, na jehož konci je právě konečný spotřebitel. Toto je důležité zejména v současném období přetrvávání sociálních, ekonomických a environmentálních problémů světa (Musová, 2012), kdy společenská odpovědnost podnikatelských i institucionálních subjektů by se měla projevit ve všech jejich činnostech, tedy i v odpovědném chování vůči zákazníkovi s potřebou bezlepkových potravin.
359
Použitá literatura a informační zdroje Hes a kol. (2008): Chování spotřebitele při nákupu potravin. Praha: Alfa nakladatelství. 156 s. ISBN 978-80-903962-0-3.
Kohout, P., Pavlíčková, J. (2010): Otázky kolem celiakie. Praha: Forsapi. 128 s. ISBN 978-80-87250-09-9.
Koudelka, J. (1997): Spotřební chování a marketing. Vydání 1. Praha: Grada.
McElhanney, K., A. (2011): Just Good Business. The Strategic Guide to Aligning Corporate Responsibility and Brand. Bratislava: Eastone Books. ISBN 978-80-8109-193-3. Musová, Z. (2012): Enviromentálny marketing v súčasnom globálnom ekonomickom prostredí. Recenzovaný zborník z mezinárodnej vedeckej konferencie: Globalizácia a jej sociálno-ekonomické dôsledky ´12 vydaný ako mimoriadne číslo elektronického časopisu. Žilina: ŽU v Žilině, s. 561-568. ISSN 1336-5878.
Nadányiová, M. (2012): Faktory ovplyvňujúce správanie spotrebiteľa na globálnom trhu. Recenzovaný zborník z mezinárodnej vedeckej konferencie: Globalizácia a jej sociálno-ekonomické dôsledky ´12 vydaný ako mimoriadne číslo elektronického časopisu. Žilina: ŽU v Žilině, s. 569-572. ISSN 1336-5878.
Regnerová, M., Hes, A. (2011): Společenská odpovědnost firmy a spotřebitel. In: Trendy v podnikání-Business Trends, ročn. I, č.1., s. 49-56. ISSN 1805-0603.
Regnerová, M., Hes, A. (2012): Corporate Social Responsibility – firmy, instituce, zákazník, Zborník z mezinárodnej vedeckej konferencie Nové trendy v marketingu (společenská zodpovědnost), Trnava, s. 209-225, ISBN 978-80-8105-438-9. Saeed, A. (2013): Celiac disease presenting as rickets in Saudi children. Ann Saudi Med. 2013 Jan; 33(1): 49-51. doi: 10.5144/0256-4947.2013.49. SCOPUS.
Smejkal, V., Rais, K. (2006): Řízení rizik ve firmách a jiných organizacích. Vydání 2. aktualizované a rozšířené. Praha: Grada Publishing. ISBN 80-247-1667-4.
TOP Odpovědná firma 2012. CSR fórum, 2012, ročn. VI., č. 9, s. 10-20, ISSN 0862-9315. Bezlepková dieta (2012): [cit. 2013-05-15]. Dostupné na:
http://www.bezlepkovadieta.cz/potraviny-domaci-legislativa_1/2032-3/oznacovani-potravin-z-hlediska-obsahu-lepku-plati-od-1-1-2012
Společnost pro bezlepkovou dietu. [cit. 2013-06-22]. Dostupné na: http://celiak.cz/
Anotace Corporate Social Responsibility (CSR) – jde o projekt odpovědného podnikání. Jako součást firemní strategie je v souladu s hlavním podnikatelským záměrem a klíčovými kompetencemi firmy. Stává se součástí každodenních obchodních aktivit a firemní kultury, týká se firemní filantropie, sponzoringu, rozvoje infrastruktury, péče o životní prostředí, přináší pozitivní společenské změny při podnikání. Z obecného pohledu lze přistoupit na vymezení autorky McElhanney (2011) jako využití podnikání pro vytvoření lepšího světa. V ČR se pojem
360
společenská odpovědnost podnikání svým obsahem srovnává nejčastěji s pojmem etika v podnikání. Souvisí s udržitelným rozvojem, s chováním firmy, ale i se stakeholdery, což jsou vůči společnosti všechny zainteresované osoby uvnitř podniku i v jejím okolí (vlastníci, investoři, zaměstnanci, zákazníci, dodavatelé, atd.) Bezproblémový chod firmy či instituce je vázán na dodržování právních norem (dodržovat je – je nutné a vymahatelné), ale z dlouhodobého hlediska také na uplatňování etických principů uspořádaných nejčastěji do podoby norem etického kodexu nebo firemní kultury (dodržovat je – je sice důležité, ale nevymahatelné). Být společensky odpovědnou firmou znamená eticky se chovat vůči svému okolí, do kterého také patří zákazníci-koneční spotřebitelé se specifickými požadavky týkající se kvality jejich života. Takovým příkladem je skupina spotřebitelů s nesnášenlivostí lepku nebo s onemocněním diabetes mellitus, popř. dodržování správné životosprávy. Součástí výuky Obchodní nauky a IGA PEF ČZU v Praze byl a je realizován průzkum (2012-2013) týkající se nabídky potravin pro specifickou skupinu spotřebitelů s nesnášenlivostí lepku - s onemocněním celiakií, alergií na lepek nebo Duhringovou dermatitidou. Bezlepková dieta je pro tyto spotřebitele základním předpokladem, jak zmírnit nebo zabránit projevům nemoci. Dodržování bezlepkové diety představuje nákup vhodných potraviny. Jejich dostupnost, šíře a hloubka sortimentu, merchandising (prezentace) a ceny byly v první fázi v realizovaném průzkumu mapovány a sledovány ve vybraných provozních jednotkách maloobchodu v ČR. Byly vybrány tři samoobslužné provozní jednotky diskontně orientované – superretum, supermarket a hypermarket, jedna provozní jednotka s obsluhou (smíšené zboží nebo specializovaná) a jeden internetový obchod s potravinami pro celiaky. V druhé fázi průzkumu bylo provedeno dotazníkové šetření spotřebitelských preferencí při nákupu bezlepkových potravin. Výsledky průzkumu a spotřebitelské preference při nákupu bezlepkových potravin včetně odpovědného (či neodpovědného) přístupu vybraných maloobchodních firem jsou uvedeny a analyzovány v následujícím článku (příspěvku). Poznatky uváděné v příspěvku vyplynuly z řešení projektu v rámci IGA PEF ČZU v Praze 20121027(11210/1312/3106) „Průzkum nabídky potravin vhodných pro zákazníky s nesnášenlivostí lepku v maloobchodě“.
Klíčová slova: firma, odpovědnost (CSR), průzkum, maloobchod, nabídka, spotřebitel-celiak
361
Promotion of Fair Trade
Propagace Fair Trade
Olga Regnerová, Miroslava Navrátilová, Pavel Štáfek Katedra obchodu a financí, PEF, Česká zemědělská univerzita v Praze,
Kamýcká 129, 165 21 Praha 6 – Suchdol [email protected], [email protected], [email protected]
Annotation: Fair Trade is a trading partnership, based on dialogue, transparency and respect, seeking greater equality, thereby contributing to sustainable development. The basic objectives of Fair Trade are defined since 2002, when it first appeared in the report of the International Labour Organisation (ILO) . Currently, fair trade is regulated by several international organizations that influence their business processes, create standards and help to promote it in individual countries. Substantial role in the Fair Trade have rules under which production and trade are conducted. One of the main rules is equitable distribution of retail price that allows producers to cover the cost of production itself , while it provides sufficient funds for their own livelihood . One of the tools used is to set minimum prices below which an agreement between the producer and the customer cannot drop. By a request, customers are provided with the option to get a favorable loan and allow their suppliers to develop their business. In many cases , this includes also advance payments granted a few months before the harvest . Fair Trade shops in the Czech Republic are not since their emergence accurately monitored, but the Association of Fair Trade provides estimates of number of these stores. Since 2007, the Fair Trade shops are accurately recorded. Development of retail trade turnover with fair trade products in the Czech Republic has an upward trend. Based on this, it can be concluded that the total volume of products traded within the Fair Trade also increases. In comparison to other European countries, the overall turnover of fair trade products remains, however, still relatively low. Total number of fair trade outlets does not change but the structure of these outlets is changing. In the Czech Republic, Fair Trade shops focus mainly on food items . These products are also known through Fairtrades ® certification marks. However, there are products that are not labeled with Fairtrades ® trademark, but are traded on the principle of Fair Trade shops. This applies in particular to craft products. Among most traded products with the certification marks belong in the Czech Republic mainly coffee, chocolate, tea, nuts and oilseeds, etc. On a global scale, the most traded are nuts and oil seeds, dried fruits, herbs and spices, followed by flowers, bananas and sugar cane. Since in the Czech Republic only 5 % of the total products traded are traded on the principle of Fair Trade there is a need to increase awareness and interest of retailers and consumers. This publicity and media campaign should be of interest to the government of the Czech Republic, as i tis in the case in other European countries. It is in the interest of the Czech Republic that a sale of quality products which respect fundamental human rights and improved working conditions of workers directly involved in the production of food, is supported.
Key Words: Fair Trade, retail chain, promotion, products, business concept
JEL klasifikace: Q01
1 Úvod Fenomén Fair Trade je v současnosti často zmiňován v souvislosti s rostoucím důrazem, který je kladen na trvale udržitelný rozvoj celé planety. V době sílící globalizace a internacionalizace světového hospodářství jistě nelze opominout skutečnost, že nadále přetrvávají a mnohdy se prohlubují rozdíly v životních podmínkách populace vyspělých ekonomik a rozvojových zemí.
362
Pojem trvale udržitelný rozvoj je definován v tzv. Zprávě komise Bruntlandové, známé pod oficiálním názvem Naše společná budoucnost z roku 1987 jako rozvoj, který zajišťuje kvalitu života současné generace a zároveň pro budoucí generace zachovává možnost volby uspokojit své vlastní potřeby (Brutlandbericht, 2013). Princip udržitelného rozvoje klade do popředí vzájemné vazby, které existují mezi životním stylem, kvalitou životního prostředí a spravedlivým rozdělování zdrojů. Tento termín je tradičně používán v otázkách ekologie, teprve v nedávné době získal tento pojem také sociální rozměr, kdy pro harmonický vývoj lidské společnosti je nezbytným předpokladem rovná příležitost participace každého jedince. Sociální udržitelnost tedy znamená rovnováhu společenských sil s trvale udržitelným rozvojem. Hospodářský pokrok není udržitelný bez sociálního rozvoje, zatímco sociální rozvoj bez ekonomického pokroku není uskutečnitelný (World Economic Forum – Issues, 2013).
Koncept Fair Trade je založen na principu sociální a ekonomické solidarity mezi chudší a bohatší částí světa, kdy jednotlivci – zákazníkovi je poskytována možnost, aby svým individuálním výběrem nákupu alespoň částečně ovlivnil rozložení sil v oblasti světového obchodu. Velký díl společenské odpovědnosti (Corporation Social Responsibility - CSR) spočívá také na firmách, jedná se tedy o problematiku vysoce aktuální. Společenskou odpovědnost firem lze vymezit jako dobrovolnou integraci sociálních a ekologických ohledů v součinnosti se zainteresovanými stranami do podnikatelských činností firmy, která nebude sledovat pouze své úzké ekonomické cíle, ale bude se soustřeďovat také na širší společenskou prospěšnost (Dytrt a kol., 2006). CSR je tedy dobrovolný přínos firmy k udržitelnému rozvoji, který je založen na implementaci sociálních a ekologických hledisek do jejích obchodních aktivit. (Barth, Wolff, 2009). Důležitým prvkem sociální odpovědnosti firem je princip dobrovolnosti. V praxi to tedy znamená, že CSR zahrnuje koncept, kdy firma dobrovolně spoluodpovídá za blaho a udržitelný rozvoj moderní společnosti a zároveň očekává zachování konkurenceschopnosti a ziskovosti (Kuldová, 2012).
Způsob obchodování ve stylu Fair Trade je tak jedním z možných způsobů zmírnění světového problému chudoby, protože získané finanční prostředky putují přímo k výrobcům či pěstitelům a mohou tak být přehledným a transparentním způsobem využity pro zlepšení jejich mnohdy jinak neřešitelné životní situace.
Názory na existenci Fair Trade a jeho aplikaci v praxi se různí, přesto však lze vyjádřit názor, že myšlenka osobní participace jedince na řešení problémů druhých je jistě pozitivní a její sociální rozměr je významný.
Cílem příspěvku je na základě studia literárních pramenů a analýzy některých statických ukazatelů diskutovat problematiku obchodního konceptu Fair Trade a jeho vazby na sociální odpovědnost v České republice z pohledu jeho propagace.
2 Materiál a metody Metodika tohoto příspěvku spočívá především v teoretické kompilaci zahraničních a tuzemských odborných zdrojů. Problematika je diskutována s ohledem na zjištěné statistické informace, které byly shromážděny a analyzovány v čase. Na základě zjištěných informací byla následně provedena interpretace a zpracována predikce vývoje Fair Trade v ČR.
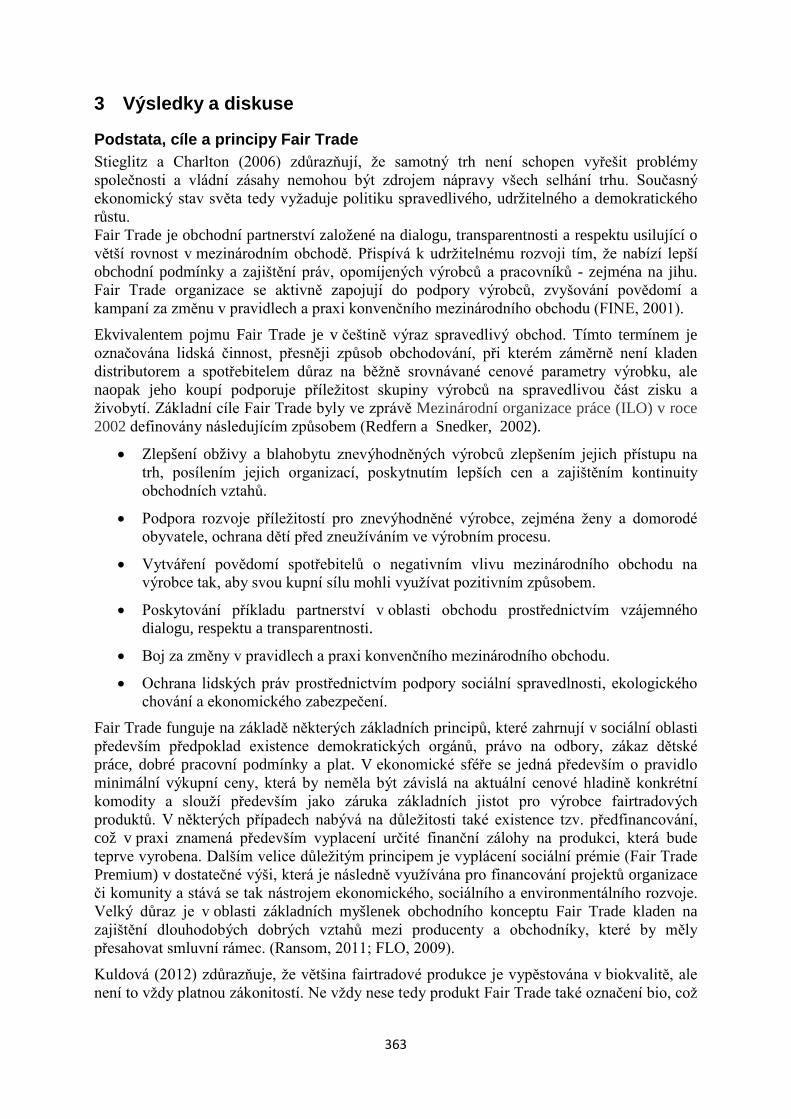
363
3 Výsledky a diskuse
Podstata, cíle a principy Fair Trade Stieglitz a Charlton (2006) zdůrazňují, že samotný trh není schopen vyřešit problémy společnosti a vládní zásahy nemohou být zdrojem nápravy všech selhání trhu. Současný ekonomický stav světa tedy vyžaduje politiku spravedlivého, udržitelného a demokratického růstu. Fair Trade je obchodní partnerství založené na dialogu, transparentnosti a respektu usilující o větší rovnost v mezinárodním obchodě. Přispívá k udržitelnému rozvoji tím, že nabízí lepší obchodní podmínky a zajištění práv, opomíjených výrobců a pracovníků - zejména na jihu. Fair Trade organizace se aktivně zapojují do podpory výrobců, zvyšování povědomí a kampaní za změnu v pravidlech a praxi konvenčního mezinárodního obchodu (FINE, 2001).
Ekvivalentem pojmu Fair Trade je v češtině výraz spravedlivý obchod. Tímto termínem je označována lidská činnost, přesněji způsob obchodování, při kterém záměrně není kladen distributorem a spotřebitelem důraz na běžně srovnávané cenové parametry výrobku, ale naopak jeho koupí podporuje příležitost skupiny výrobců na spravedlivou část zisku a živobytí. Základní cíle Fair Trade byly ve zprávě Mezinárodní organizace práce (ILO) v roce 2002 definovány následujícím způsobem (Redfern a Snedker, 2002).
• Zlepšení obživy a blahobytu znevýhodněných výrobců zlepšením jejich přístupu na trh, posílením jejich organizací, poskytnutím lepších cen a zajištěním kontinuity obchodních vztahů.
• Podpora rozvoje příležitostí pro znevýhodněné výrobce, zejména ženy a domorodé obyvatele, ochrana dětí před zneužíváním ve výrobním procesu.
• Vytváření povědomí spotřebitelů o negativním vlivu mezinárodního obchodu na výrobce tak, aby svou kupní sílu mohli využívat pozitivním způsobem.
• Poskytování příkladu partnerství v oblasti obchodu prostřednictvím vzájemného dialogu, respektu a transparentnosti.
• Boj za změny v pravidlech a praxi konvenčního mezinárodního obchodu.
• Ochrana lidských práv prostřednictvím podpory sociální spravedlnosti, ekologického chování a ekonomického zabezpečení.
Fair Trade funguje na základě některých základních principů, které zahrnují v sociální oblasti především předpoklad existence demokratických orgánů, právo na odbory, zákaz dětské práce, dobré pracovní podmínky a plat. V ekonomické sféře se jedná především o pravidlo minimální výkupní ceny, která by neměla být závislá na aktuální cenové hladině konkrétní komodity a slouží především jako záruka základních jistot pro výrobce fairtradových produktů. V některých případech nabývá na důležitosti také existence tzv. předfinancování, což v praxi znamená především vyplacení určité finanční zálohy na produkci, která bude teprve vyrobena. Dalším velice důležitým principem je vyplácení sociální prémie (Fair Trade Premium) v dostatečné výši, která je následně využívána pro financování projektů organizace či komunity a stává se tak nástrojem ekonomického, sociálního a environmentálního rozvoje. Velký důraz je v oblasti základních myšlenek obchodního konceptu Fair Trade kladen na zajištění dlouhodobých dobrých vztahů mezi producenty a obchodníky, které by měly přesahovat smluvní rámec. (Ransom, 2011; FLO, 2009).
Kuldová (2012) zdůrazňuje, že většina fairtradové produkce je vypěstována v biokvalitě, ale není to vždy platnou zákonitostí. Ne vždy nese tedy produkt Fair Trade také označení bio, což
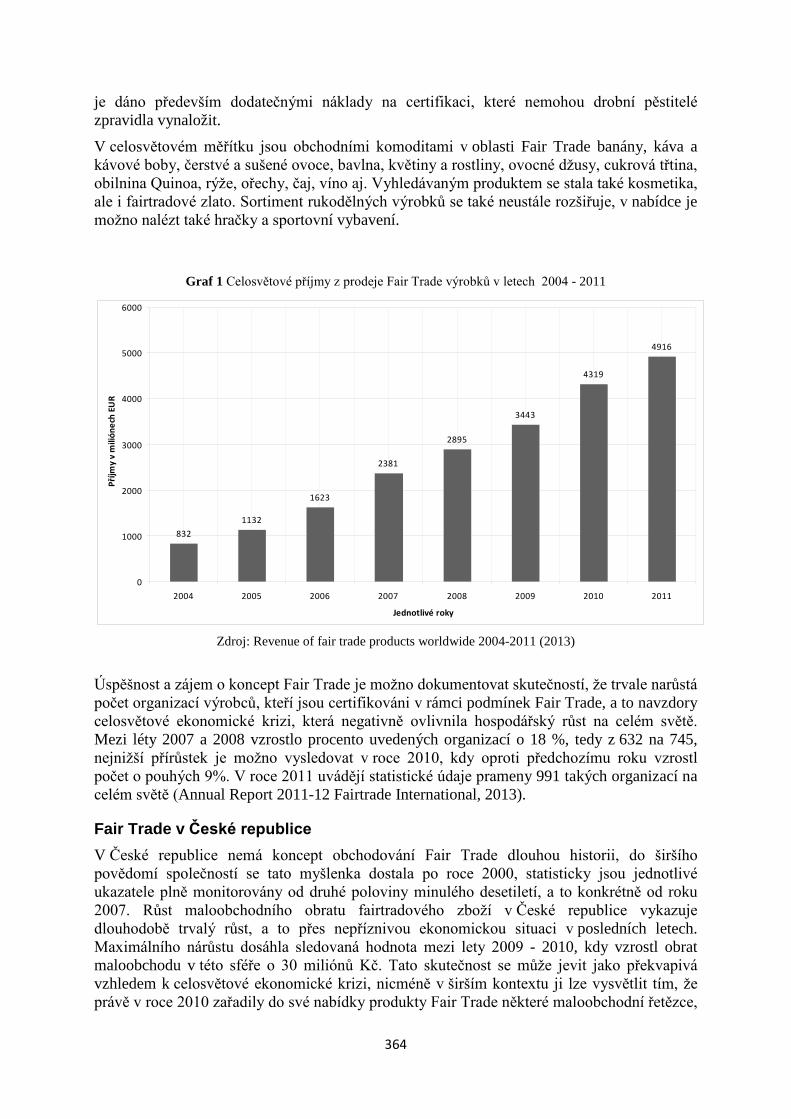
364
je dáno především dodatečnými náklady na certifikaci, které nemohou drobní pěstitelé zpravidla vynaložit.
V celosvětovém měřítku jsou obchodními komoditami v oblasti Fair Trade banány, káva a kávové boby, čerstvé a sušené ovoce, bavlna, květiny a rostliny, ovocné džusy, cukrová třtina, obilnina Quinoa, rýže, ořechy, čaj, víno aj. Vyhledávaným produktem se stala také kosmetika, ale i fairtradové zlato. Sortiment rukodělných výrobků se také neustále rozšiřuje, v nabídce je možno nalézt také hračky a sportovní vybavení.
Graf 1 Celosvětové příjmy z prodeje Fair Trade výrobků v letech 2004 - 2011
Zdroj: Revenue of fair trade products worldwide 2004-2011 (2013)
Úspěšnost a zájem o koncept Fair Trade je možno dokumentovat skutečností, že trvale narůstá počet organizací výrobců, kteří jsou certifikováni v rámci podmínek Fair Trade, a to navzdory celosvětové ekonomické krizi, která negativně ovlivnila hospodářský růst na celém světě. Mezi léty 2007 a 2008 vzrostlo procento uvedených organizací o 18 %, tedy z 632 na 745, nejnižší přírůstek je možno vysledovat v roce 2010, kdy oproti předchozímu roku vzrostl počet o pouhých 9%. V roce 2011 uvádějí statistické údaje prameny 991 takých organizací na celém světě (Annual Report 2011-12 Fairtrade International, 2013).
Fair Trade v České republice V České republice nemá koncept obchodování Fair Trade dlouhou historii, do širšího povědomí společností se tato myšlenka dostala po roce 2000, statisticky jsou jednotlivé ukazatele plně monitorovány od druhé poloviny minulého desetiletí, a to konkrétně od roku 2007. Růst maloobchodního obratu fairtradového zboží v České republice vykazuje dlouhodobě trvalý růst, a to přes nepříznivou ekonomickou situaci v posledních letech. Maximálního nárůstu dosáhla sledovaná hodnota mezi lety 2009 - 2010, kdy vzrostl obrat maloobchodu v této sféře o 30 miliónů Kč. Tato skutečnost se může jevit jako překvapivá vzhledem k celosvětové ekonomické krizi, nicméně v širším kontextu ji lze vysvětlit tím, že právě v roce 2010 zařadily do své nabídky produkty Fair Trade některé maloobchodní řetězce,
8321132
1623
2381
2895
3443
4319
4916
0
1000
2000
3000
4000
5000
6000
2004 2005 2006 2007 2008 2009 2010 2011
Jednotlivé roky
Příjm
y v
mili
ónec
h EU
R
365
a tím došlo k nárůstu objemu prodaného zboží. Uvedené skutečnosti jsou přehledně znázorněny v následujícím grafu.
Graf 2 Maloobchodní obrat produktů Fair Trade v České republice v období let 2005-2011 v milionech Kč
Zdroj: vlastní zpracování dle výročních zpráv 2009, 2010, 2011-2012 a Tiskové zprávy 2013
Z pohledu sortimentu lze konstatovat, že nejprodávanějším produktem je jednoznačně káva, jejíž procentní podíl na celkové struktuře prodávaného zboží Fair Trade se neustále zvyšuje, nejvyšší meziroční nárůst je možno vysledovat v letech 2010 – 2011, a to o 23 %. Dalšími druhy prodávaného fairtradového zboží v České republice jsou kakao, čokoláda a cukrovinky a zpracované potraviny, mírný procentní podíl tvoří také třtinový cukr a sladidla, nápoje, obilniny, rýže, semena a ořechy. Pokles prodeje je patrný u čaje, kdy v roce došlo ke snížení jeho procentního podílu o 8 %. V roce 2012 se nově na českém trhu objevila nově kosmetika nesoucí označení Fairtrade®. 85% z celkového objemu realizovaného prodeje bylo označeno ochrannou známkou (Tisková zpráva Fairtrade Česká republika 2013). Řemeslné a rukodělné výrobky zpravidla toto označení nenesou. Celková nabídka Fair Trade zboží je převážně trvanlivého charakteru a lze říci, že některé produkty obvyklé v sortimentu Fair Trade v jiných západoevropských zemích, se v české republice prodávají pouze v minimálním množstvím, jedná se především o řezané květiny a banány. K velice zajímavým změnám došlo v posledních několika letech ve struktuře prodejních míst fairtradového zboží, dlouhodobě klesá význam menších specializovaných prodejen, stabilní se jeví nabídka maloobchodních jednotek jako jsou prodejny biopotravin a zdravé výživy. Procentní podíl internetového prodeje na celkovém objemu prodaného zboží se v letech 2010 a 2011 snížil oproti roku 2009 téměř na polovinu (v roce 2009 tvořil 12%, v roce 2011 6%). Tuto situaci je možno přičíst skutečnosti, že v tomto období se staly fairtradové výrobky dostupnějšími na trhu a mnoho konzumentů si je tak zakoupilo přímo v maloobchodní síti. Nejvýznamnějších změn doznal obchod s produkty Fair Trade v:
• maloobchodních řetězcích a
• gastronomických zařízeních.
Maloobchodní řetězce v roce 2009 zaujímaly 28% podíl na celkovém složení prodejních míst sledovaného zboží, v roce 2010 se podílely již necelou polovinou (47%), což v důsledku
310
27
4150
80
92
113
0
20
40
60
80
100
120
2005 2006 2007 2008 2009 2010 2011 2012
Jednotlivé roky
Mal
oobc
hodn
í obr
at v
mili
ónec
h Kč
366
vedlo k rekordnímu růstu maloobchodního obratu v celé historii Fair Trade v České republice, jak je naznačeno výše. V roce 2011 pak následoval prudký pokles a řetězce tvořily opět pouze čtvrtinu všech prodejních míst. Tento jev lze dle názoru autorů vysvětlit mimo jiné tím, že maloobchodní řetězce vstoupily na trh zboží Fair Trade s očekáváním ekonomického profitu, který nedošel naplnění. Cílová skupina zákazníků tohoto typu maloobchodu zřejmě preferuje především cenu zboží a není ochotna investovat do svých nákupů větší objem finančních prostředků než je nezbytně nutné. Další možnou příčinou neúspěchu prodeje fairtradového zboží v maloobchodních řetězcích může být nedostatečný či nevhodný způsob propagace těchto produktů (Výroční zpráva Asociace pro Fair Trade, 2009; Výroční zpráva Asociace pro Fair Trade, 2010; Výroční zpráva Fair Trade 2011 - 2012; Tisková zpráva Fairtrade Česká republika, 2013)
Gastronomická zařízení se v roce 2009 podílela na celkovém počtu prodejních míst pouhými 8% a v roce 2010 15%. Největšího významu bylo dosaženo v roce 2011, kdy se gastronomická zařízení tvořila necelou polovinu prodejních míst (45%), v roce 2012 se již gastronomie podílela 53 %. Tento vývoj lze odůvodnit především, že v tomto roce zařadily fairtradovou kávu do nabídky svých provozoven některé nadnárodní firmy podnikající na území České republiky a byly následovány menšími provozovateli restauračních zařízení (Tisková zpráva Fairtrade Česká republika 2013).
V České republice je myšlenka Fair Trade propagována v mnoha oblastech, jako příklady je možné uvést konkrétní realizované projekty. V roce 2013 se na celostátní úrovni již potřetí uskutečnila akce Férová snídaně ve vašem městě v rámci Světového dne pro fair trade, kdy se na 87 místech v České republice sešli příznivci této myšlenky aby, společně posnídali fairtradové potraviny a lokální produkty (Fairtradová snídaně, 2013). V roce 2011 byla v České republice zahájena kampaň Fairtradová města, v současnosti jsou držiteli tohoto titulu Český Krumlov, Litoměřice, Volyně a Vsetín, dalších osm měst se zařadilo mezi žadatele. V současnosti mohou získat označení „fairtrade“ také školy či církve. Ve školství je nositelem přívlastku „fairtradová škola“ již pět škol, z toho jedna vysokoškolská instituce - Ekonomická fakulta Jihočeské univerzity v Českých Budějovicích. Dalších pět škol usiluje o získání tohoto statutu (Fairtradová města, 2013). Se vzrůstajícím zájmem o problematiku obchodního konceptu Fair Trade se také uskutečňuje celá řada programů na podporu vzdělávání pracovníků zabývajících se touto problematikou a pedagogů základních a středních škol.
Propagace produktů Fair Trade je však v České republice realizována spíše formou osvětových informačních kampaní, které jsou uskutečňovány převážně neziskovými a zájmovými organizacemi. V obchodní sféře je zviditelnění toto sortimentu zboží spojeno především s jeho komercionalizací na trhu a se stoupajícím zájmem o zdravý životní styl a kvalitu potravin.
4. Závěr
Obchodní koncept Fair Trade je relativně nový fenomén, jehož význam v posledních letech narůstá. Principy solidarity a společenské odpovědnosti se v současnosti dotýkají každého jedince i firmy. Objem fairtradových výrobků vykazuje trvale rostoucí tendenci, dynamicky se mění jejich struktura i způsob, jakým je realizován jejich prodej. Působení tržních sil v oblasti produkce Fair Trade zesiluje, jeho další podoba nabízí tedy mnoho otazníků, správnost jeho principů však nelze popřít.
367
Použité zdroje Annual Report 2011-12 Fairtrade International. In: Fair Trade International [online]. [cit. 2013-08-18]. Dostupné z: http://www.slideshare.net/fairtrade/fairtrade-international-annual-report-201112-for-producers-with-producers
Barth, Regine ., Wolff, Franziska. 2009. Corporate social responsibility in Europe: rhetoric and realities. Cheltenham: Edward Elgar.
Brundtland-Bericht, 1987. BNE-Portal: Startseite [online]. [cit. 2013-02-12]. Dostupné z: http://www.bne-portal.de/coremedia/generator/unesco/de/02__UN-Dekade_20BNE/01__Was_20ist_20BNE/Brundtland-Bericht.html
Dytrt, Zdeněk. a kol. Etika v podnikatelském prostředí. 1. vyd. Praha: Grada Publishing a. s., 2006, 196 s. ISBN 80-247-1589-9.
FINE. Definition of Fair Trade In: FAIR TRADE DEFINITION AND PRINCIPLES As agreed by FINE in December 2001. [online]. Brussels: Fair Trade Advocacy Office, 2001 [cit. 2013-02-12]. Dostupné z: http://www.fair-trade-hub.com/support-files/fair-trade-definition.pdf Férová snídaně - 10. 5. 2014 [online]. [cit. 2013-08-18]. Dostupné z: www.ferovasnidane.cz Fairtradová města - Úvodní stránka [online]. [cit. 2013-08-18]. Dostupné z: www.fairtradovamesta.cz Kuldová, Lucie. Nový pohled na společenskou odpovědnost firem: Strategická CSR. 1. vyd. Plzeň: NAVA, nakladatelská a vydavatelská agentura, 2012, 173 s. ISBN 978-80-7211-408-5.
Ransom, David. Fair trade. 1. vyd. Brno: Doplněk, 2011, 137 s. Společensko-ekologická edice, sv. 16. ISBN 978-807-2392-582. Revenue of fair trade products worldwide 2004-2011: Statistic. In: Statista - The Statistics Portal for Market Data, Market Research and Survey Results [online]. 2013. vyd. [cit. 2013-08-18]. Dostupné z: http://www.statista.com/statistics/171401/revenues-of-fairtrade-products-worldwide-since-2004/ Stieglitz, Joseph E. a Andrew Charleton. Fair Trade: Agenda für einen gerechten Welthandel. 1. Aufl. Hamburg: Murmann Verlag, 2006. ISBN 39-380-1763-5. Redfern, Andy and Paul Snedker. 2002. "Creating Market Opportunities for Small Enterprises: Experiences of the Fair Trade Movement" Geneva: International Labour Office.
Tisková zpráva: Prodej fairtradových výrobků meziročně vzrostl o 23 %. In: Fairtrade Česká republika [online]. 9.5.2013. [cit. 2013-08-18]. Dostupné z: http://www.fairtrade-asociace.cz/media/tz_09_5_2013.845e.pdf Výroční zpráva 2009: ASOCIACE PRO FAIR TRADE. In: Fairtrade Česká republika [online]. [cit. 2013-08-18]. Dostupné z: http://www.fairtrade-asociace.cz/media/2009_vz.ac7f.pdf Výroční zpráva 2010: ASOCIACE PRO FAIR TRADE. In: Fairtrade Česká republika [online]. [cit. 2013-08-18]. Dostupné z: http://www.fairtrade-asociace.cz/media/2010_vz.2835.pdf Výroční zpráva Fair Trade Česká republika 2011 - 2012. In: Fairtrade Česká republika [online]. [cit. 2013-08-18]. Dostupné z: http://www.fairtrade-asociace.cz/media/vyrocka_2011_web.1f2f.pdf World Economic Forum - Issues. In: The World Economic Forum [online]. [cit. 2013-08-18]. Dostupné z: http://www.weforum.org/issues#social-development
368
Zvyšující se tendence ve spotřebě fairtradových výrobků v roce 2011. In: Fairtrade Česká republika [online]. [cit. 2013-08-18]. Dostupné z: http://www.fairtrade-asociace.cz/#!pro-media/obrazky-a-grafy
Anotace: Fair Trade je obchodní partnerství založené na dialogu, transparentnosti a respektu usilující o větší rovnost, čímž přispívá k udržitelnému rozvoji. Ekvivalentním pojmem výrazu Fair Trade je v češtině spravedlivý obchod. Tímto termínem je označována lidská činnost, přesněji způsob obchodování, při kterém se koupí podporuje příležitost skupiny výrobců na spravedlivou část zisku. Základní cíle Fair Trade jsou definovány od roku 2002, kdy se poprvé objevily ve zprávě Mezinárodní organizace práce (ILO). V současnosti se Fair Trade obchody zabývá několik mezinárodních organizací, které tyto obchody regulují, vytvářejí standardy, napomáhají jejich propagaci v jednotlivých zemích apod. Podstatnou roli ve Fair Trade mají pravidla za kterých výroba a obchod samotný probíhají. Jedním z hlavních pravidel je spravedlivé rozdělení maloobchodní ceny produktu, která umožní producentovi pokrýt náklady na samotnou výrobu a zároveň mu poskytuje dostatečné finanční prostředky na vlastní živobytí. Jedním z používaných nástrojů je stanovení minimální výkupní ceny, pod jejíž hranici nesmí dohoda mezi producentem a odběratelem klesnout. Na požádání pak poskytují odběratelé možnost čerpat výhodný úvěr a umožňují svým dodavatelům rozvíjet své podnikání. V mnoha případech se jedná například i o zálohu poskytnutou několik měsíců před sklizní. Fair Trade obchody nejsou v České republice od svých počátků přesně monitorovány, avšak Asociace pro Fair Trade poskytuje alespoň odhady těchto obchodů. Od roku 2007 jsou Fair Trade obchody přesně zaznamenávány. Vývoj maloobchodního obratu s fairtradovými produkty má v České republice rostoucí tendenci. Na základě toho lze usoudit, že i celkový objem produktů obchodovaných v rámci Fair Trade se zvyšuje. Ve srovnání s ostatními evropskými zeměmi je však celkový obrat fairtradových produktů stale na nízké úrovni. Z vývoje počtu prodejních míst produktů Fair Trade vyplývá, že se počet prodejních míst v České republice příliš nemění, avšak mění se struktura těchto prodejních míst. V České republice Fair Trade obchody zaměřují především na potravinářské zboží. Tyto produkty jsou také označovány certifikační známkou Fairtrades®. Existují však i produkty, které nejsou označovány známkou Fairtrades®, avšak jsou obchodovány na principu Fair Trade obchodů. To se týká především řemeslných výrobků. Mezi produkty s certifikační známkou řadíme v České republice především kávu, čokoládu, čaj, ořechy a olejnatá semena apod., které jsou na českém trhu nejvíce obchodované. V celosvětovém měřítku jsou však formou Fair Trade nejvíce obchodované ořechy a olejnatá semena, sušené ovoce, byliny a koření a dále následují květiny, banány a cukrová třtina. Jelikož v České republice je obchodováno pouze cca.5 % produktů na principu Fair Trade z celkového objemu obchodovaných produktů potravinářského zboží, je třeba zvýšit povědomí a zájem obchodníků a spotřebitelů. O tuto propagaci a mediální kampaň by se měla zajímat také vláda České republiky, tak jak tomu je v jiných evropských zemích, jelikož v zájmu České republiky je, aby v tomto státě byly podporovány prodeje kvalitních výrobků, při jejichž produkci jsou dodržována základní lidská práva a jsou zlepšovány pracovní podmínky pracovníků přímo se podílejících na produkci zejména potravin.
Klíčová slova: Fair Trade, maloobchodní řetězec, propagace, produkty, obchodní koncept
JEL klasifikace: Q01
369
Social Responsibility in the Purchase of Consumer Goods in the Czech Republic
Daniela Šálková, Štefan Toth Department of Trade and Accounting, FEM, Czech University of Life Sciences Prague,
Kamycka 129, 165 21 Prague 6 – Suchdol [email protected]
Annotation:
This article deals with the issue of ethical shopping. This concept can be understood as so called negative or positive approach to purchasing The essence of a negative attitude to final purchasing decision is a moral boycott of unethical products. Consumers who want to implement a positive socially responsible shopping, do actively seek ethical products in the manufacture of which the abuse of employees, cruelty to animals or environmental destruction were avoided. There is a number of issues that affect the ours. Among the most important are global warming, environmental pollution, loss of animal and plant species. This is of course reflected in the global economic environment. The tendency of these influences is high and during the time even more intensive. On one side there is the corporate social responsibility in terms of ethical production. It's also the noninfringement of basic principles of sustainable development, on the other hand, it is important not to neglect social responsibility of the consumers themselves. The interest in ethical consumerism and ethical shopping, the effort to help in ethical, human and environmental terms would be, in our opinion, higher in the case of providing consumers with sufficient information about the products, individual brands, principles of their functioning but also about the issues of trade and environmental protection, animal abuse, violations of rights, etc. The proposals are defined by implementing more effective promotion and advertising in the mass media. Retail stores should include the information about these ethical products in their promotional materials, such as flyers, where more or less only action items and exceptionally even some bioproducts are offered.
Key words: Business, Consumer, Ethical shopping, Sustainable Development Rainforest, UTZ, Fair Trade
JEL classification: F
1 Introduction In the conditions of the current environment a number of global problems can be identified. Among the most important are global warming, environmental pollution, loss of animal and plant species. All this is reflected in the global economic environment with increasing urgency. There is the corporate social responsibility in terms of ethical production and non-infringement of the fundamental principles of sustainable development on one hand, on the other hand it is important not to neglect social responsibility of the consumers themselves. Although socially responsible shopping is not an entirely new phenomenon, in the last two decades the ethical consumer behaviour gets increasingly to the fore. As indicated by Harrison at al. (2005) it has gained in popularity since the 1990s with more emphasis being put on the power of consumer actions to create social, economic and environmental change. In any case, however, it is a very broad field with many activities Papaoikonomou at al. (2012) „there is a growing multi-disciplinary interest in ethical consumer behaviour with relevant contributions from social psychology, consumer behaviour, sociology, marketing, anthropology and human geography.
370
It is possible to find a wide variety of definitions of ethical shopping (there are different definitions of ethical behaviour, ethical retailing and ethical consumption). Long a Murray (2013) definují etickou spotřebu jako “the act of purchasing products that have additional attributes (e.g., social, environmental, political, health, etc.) in addition to their immediate use-value, to signify commitment to their values and/or to support changes to unjust market practices“. Cooper-Martin and Holbrook (1993) define ethical consumer behaviour as „decision-making, purchases and other consumption experiences that are affected by the consumer’s ethical concerns“. The fact that final buying decision is an individual choice of every consumer aiming to promote sustainable development is also evidenced by Low and Davenport (2007) „ethical consumption is the action of buying one product over another with an ethical ideal in mind (e.g. environmental sustainability, workers rights, animal welfare, etc.)”.
The British organization Ethical Consumer distinguishes between four types of ethical buying:
- Positive buying - Negative purchasing - Company based purchasing - Fully screened approach
Consumers who want to implement a positive socially responsible shopping, do actively seek ethical products in the manufacture of which the abuse of employees, cruelty to animals or environmental destruction were avoided.
The essence of a negative attitude to final purchasing decision is a moral boycott of unethical products. Negative shopping can be understood as a moral boycott of products during the production of which human rights and freedoms were violated, the pollution or other environmental damage occurred or animals were tortured or otherwise harmed.
Company based purchasing means targeting a business as a whole and avoiding - boycott all the products made by one company, in case of its unethical proceeding. In the past, consumers have boycotted the products of many well-known companies (such as Nestle, Coca-cola, etc).
Fully screened approach means looking both at companies and at products and evaluating which product is the most ethical overall.
There is an increasing group of consumers who are aware of the impact of contemporary lifestyle and consumption. They are the so-called "ethically conscious consumers". This group of responsible shoppers is well aware of the impact of their consumer behaviour on the surrounding world. They decide on the basis of environmental, ethical, human and other motives. The principles of ethical shopping is thus to help to improve or sustain the environment, to prevent violations of human rights and freedoms and to care of animals in the wild. Despite the fact that a great potential of ethical market products is predicted, and the values of the increase in the market share of these products as well as the realized researches do confirm this customer interest, there is a phenomenon known as „30:3 syndrome“ (30% of population claims to be motivated to buy ethically featured products, but ethically featured products typically account for 3% of the marketshare) Cowe and Williams (2000). This phenomenon is also referred to by Bray at al. (2011) „Although consumers are increasingly engaged with ethical factors when forming opinions about products and making purchase decisions, recent studies have highlighted significant differences between consumers’ intentions to consume ethically, and their actual purchase behaviour“. In this context, also the so called ‘Ethical Purchasing Gap’ is mentioned.
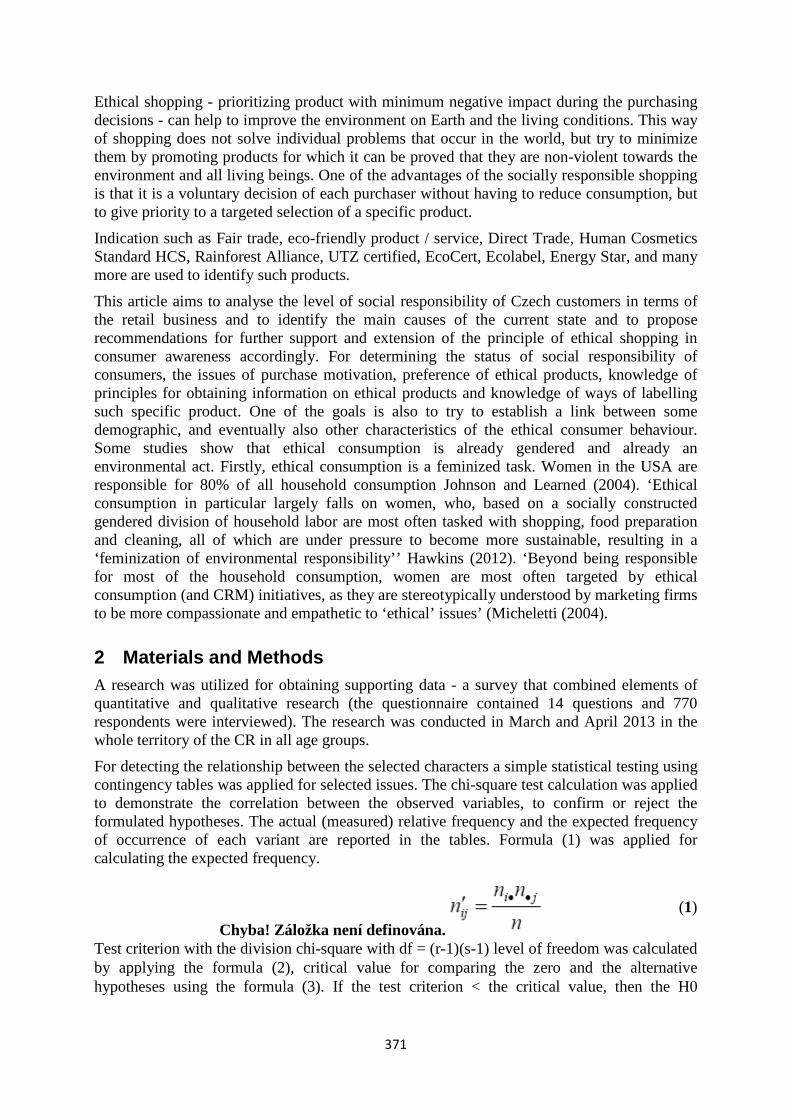
371
Ethical shopping - prioritizing product with minimum negative impact during the purchasing decisions - can help to improve the environment on Earth and the living conditions. This way of shopping does not solve individual problems that occur in the world, but try to minimize them by promoting products for which it can be proved that they are non-violent towards the environment and all living beings. One of the advantages of the socially responsible shopping is that it is a voluntary decision of each purchaser without having to reduce consumption, but to give priority to a targeted selection of a specific product.
Indication such as Fair trade, eco-friendly product / service, Direct Trade, Human Cosmetics Standard HCS, Rainforest Alliance, UTZ certified, EcoCert, Ecolabel, Energy Star, and many more are used to identify such products.
This article aims to analyse the level of social responsibility of Czech customers in terms of the retail business and to identify the main causes of the current state and to propose recommendations for further support and extension of the principle of ethical shopping in consumer awareness accordingly. For determining the status of social responsibility of consumers, the issues of purchase motivation, preference of ethical products, knowledge of principles for obtaining information on ethical products and knowledge of ways of labelling such specific product. One of the goals is also to try to establish a link between some demographic, and eventually also other characteristics of the ethical consumer behaviour. Some studies show that ethical consumption is already gendered and already an environmental act. Firstly, ethical consumption is a feminized task. Women in the USA are responsible for 80% of all household consumption Johnson and Learned (2004). ‘Ethical consumption in particular largely falls on women, who, based on a socially constructed gendered division of household labor are most often tasked with shopping, food preparation and cleaning, all of which are under pressure to become more sustainable, resulting in a ‘feminization of environmental responsibility’’ Hawkins (2012). ‘Beyond being responsible for most of the household consumption, women are most often targeted by ethical consumption (and CRM) initiatives, as they are stereotypically understood by marketing firms to be more compassionate and empathetic to ‘ethical’ issues’ (Micheletti (2004).
2 Materials and Methods A research was utilized for obtaining supporting data - a survey that combined elements of quantitative and qualitative research (the questionnaire contained 14 questions and 770 respondents were interviewed). The research was conducted in March and April 2013 in the whole territory of the CR in all age groups.
For detecting the relationship between the selected characters a simple statistical testing using contingency tables was applied for selected issues. The chi-square test calculation was applied to demonstrate the correlation between the observed variables, to confirm or reject the formulated hypotheses. The actual (measured) relative frequency and the expected frequency of occurrence of each variant are reported in the tables. Formula (1) was applied for calculating the expected frequency.
Chyba! Záložka není definována. (1)
Test criterion with the division chi-square with df = (r-1)(s-1) level of freedom was calculated by applying the formula (2), critical value for comparing the zero and the alternative hypotheses using the formula (3). If the test criterion < the critical value, then the H0
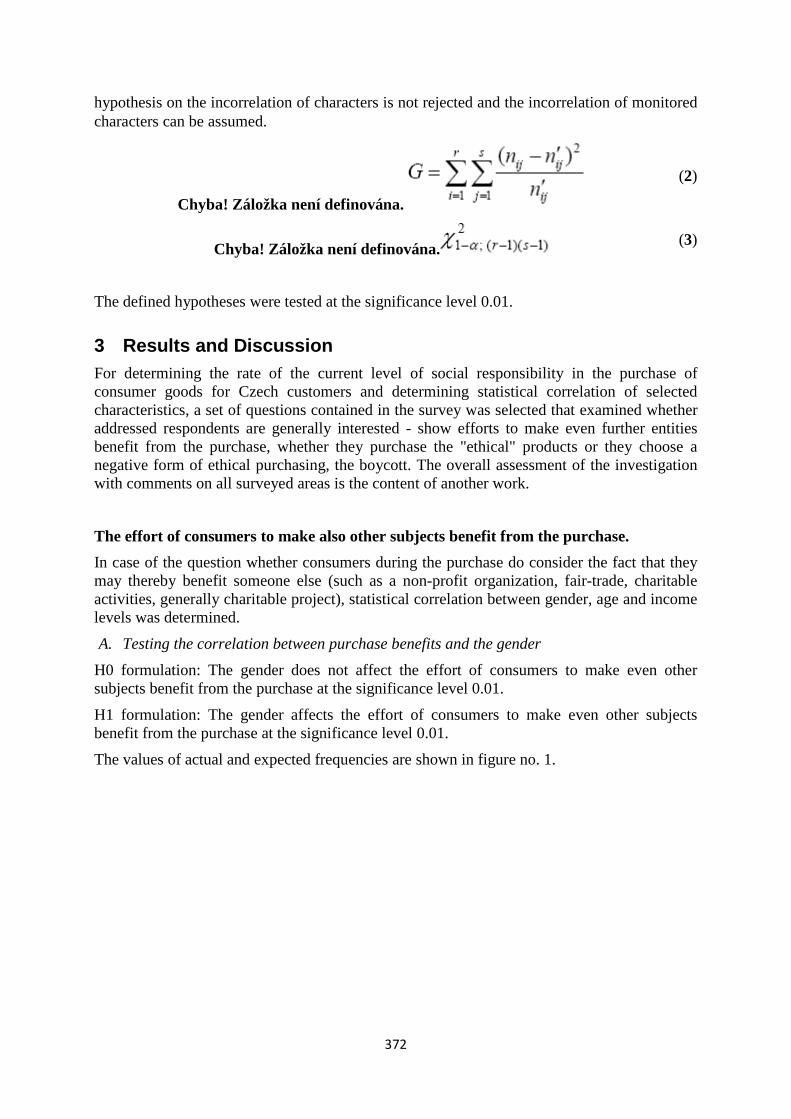
372
hypothesis on the incorrelation of characters is not rejected and the incorrelation of monitored characters can be assumed.
Chyba! Záložka není definována.
(2)
Chyba! Záložka není definována. (3)
The defined hypotheses were tested at the significance level 0.01.
3 Results and Discussion For determining the rate of the current level of social responsibility in the purchase of consumer goods for Czech customers and determining statistical correlation of selected characteristics, a set of questions contained in the survey was selected that examined whether addressed respondents are generally interested - show efforts to make even further entities benefit from the purchase, whether they purchase the "ethical" products or they choose a negative form of ethical purchasing, the boycott. The overall assessment of the investigation with comments on all surveyed areas is the content of another work.
The effort of consumers to make also other subjects benefit from the purchase. In case of the question whether consumers during the purchase do consider the fact that they may thereby benefit someone else (such as a non-profit organization, fair-trade, charitable activities, generally charitable project), statistical correlation between gender, age and income levels was determined.
A. Testing the correlation between purchase benefits and the gender H0 formulation: The gender does not affect the effort of consumers to make even other subjects benefit from the purchase at the significance level 0.01.
H1 formulation: The gender affects the effort of consumers to make even other subjects benefit from the purchase at the significance level 0.01.
The values of actual and expected frequencies are shown in figure no. 1.
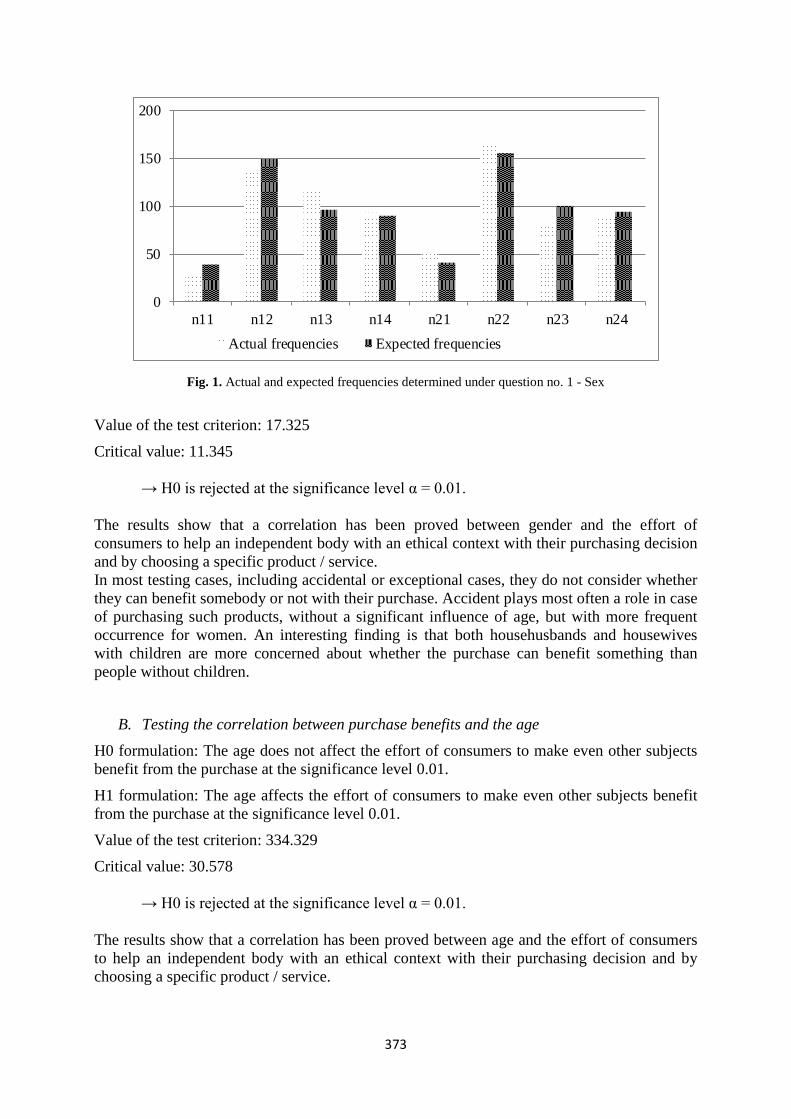
373
0
50
100
150
200
n11 n12 n13 n14 n21 n22 n23 n24Actual frequencies Expected frequencies
Fig. 1. Actual and expected frequencies determined under question no. 1 - Sex
Value of the test criterion: 17.325
Critical value: 11.345 → H0 is rejected at the significance level α = 0.01. The results show that a correlation has been proved between gender and the effort of consumers to help an independent body with an ethical context with their purchasing decision and by choosing a specific product / service. In most testing cases, including accidental or exceptional cases, they do not consider whether they can benefit somebody or not with their purchase. Accident plays most often a role in case of purchasing such products, without a significant influence of age, but with more frequent occurrence for women. An interesting finding is that both househusbands and housewives with children are more concerned about whether the purchase can benefit something than people without children.
B. Testing the correlation between purchase benefits and the age
H0 formulation: The age does not affect the effort of consumers to make even other subjects benefit from the purchase at the significance level 0.01.
H1 formulation: The age affects the effort of consumers to make even other subjects benefit from the purchase at the significance level 0.01.
Value of the test criterion: 334.329
Critical value: 30.578 → H0 is rejected at the significance level α = 0.01. The results show that a correlation has been proved between age and the effort of consumers to help an independent body with an ethical context with their purchasing decision and by choosing a specific product / service.
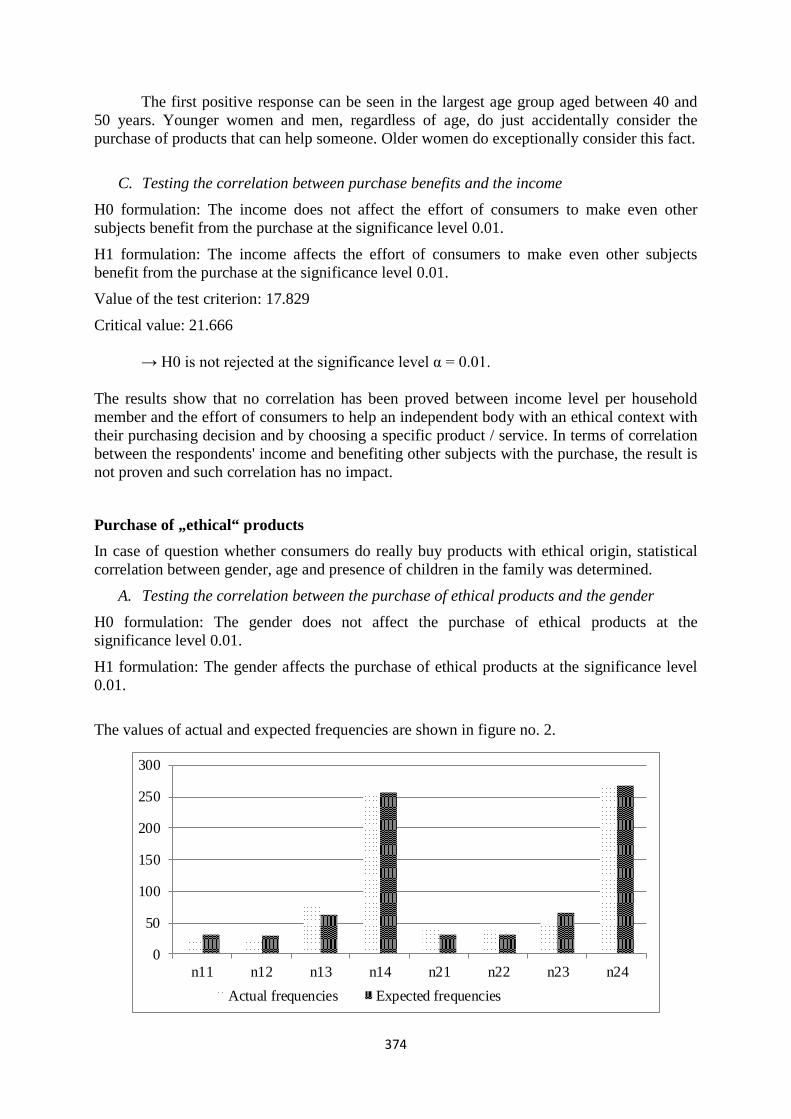
374
The first positive response can be seen in the largest age group aged between 40 and 50 years. Younger women and men, regardless of age, do just accidentally consider the purchase of products that can help someone. Older women do exceptionally consider this fact.
C. Testing the correlation between purchase benefits and the income H0 formulation: The income does not affect the effort of consumers to make even other subjects benefit from the purchase at the significance level 0.01.
H1 formulation: The income affects the effort of consumers to make even other subjects benefit from the purchase at the significance level 0.01.
Value of the test criterion: 17.829
Critical value: 21.666 → H0 is not rejected at the significance level α = 0.01. The results show that no correlation has been proved between income level per household member and the effort of consumers to help an independent body with an ethical context with their purchasing decision and by choosing a specific product / service. In terms of correlation between the respondents' income and benefiting other subjects with the purchase, the result is not proven and such correlation has no impact.
Purchase of „ethical“ products In case of question whether consumers do really buy products with ethical origin, statistical correlation between gender, age and presence of children in the family was determined.
A. Testing the correlation between the purchase of ethical products and the gender H0 formulation: The gender does not affect the purchase of ethical products at the significance level 0.01.
H1 formulation: The gender affects the purchase of ethical products at the significance level 0.01.
The values of actual and expected frequencies are shown in figure no. 2.
0
50
100
150
200
250
300
n11 n12 n13 n14 n21 n22 n23 n24Actual frequencies Expected frequencies
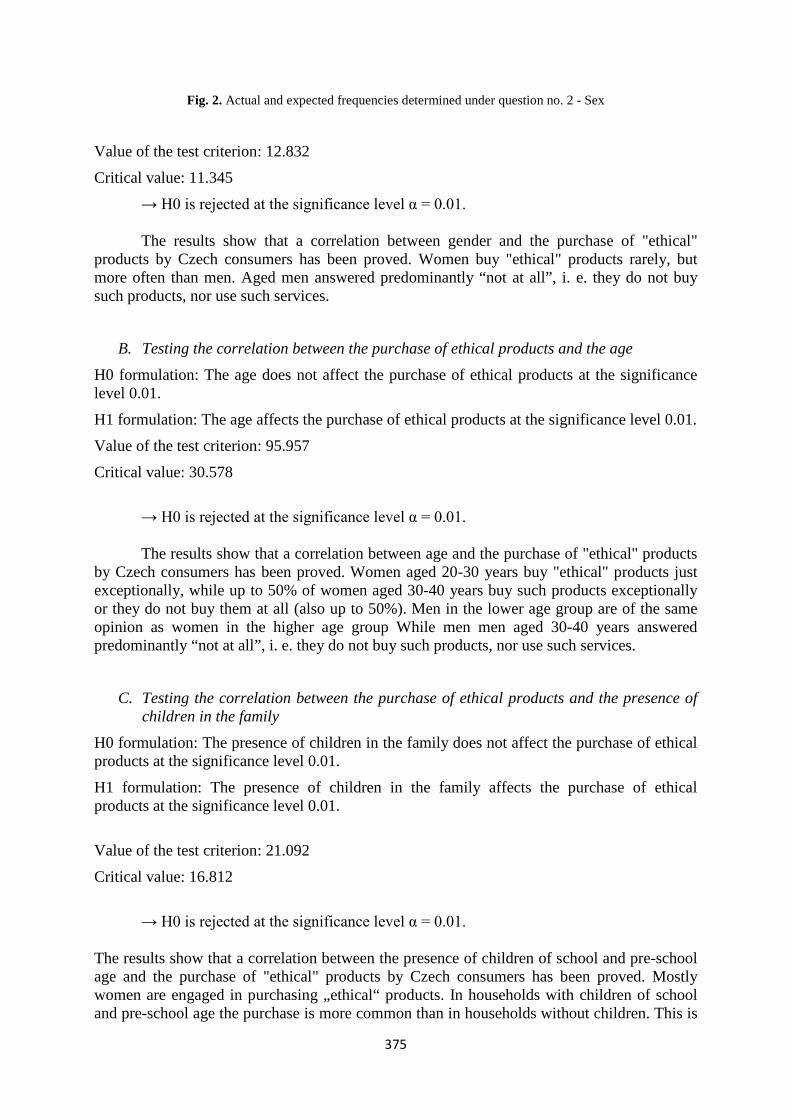
375
Fig. 2. Actual and expected frequencies determined under question no. 2 - Sex
Value of the test criterion: 12.832
Critical value: 11.345
→ H0 is rejected at the significance level α = 0.01.
The results show that a correlation between gender and the purchase of "ethical" products by Czech consumers has been proved. Women buy "ethical" products rarely, but more often than men. Aged men answered predominantly “not at all”, i. e. they do not buy such products, nor use such services.
B. Testing the correlation between the purchase of ethical products and the age
H0 formulation: The age does not affect the purchase of ethical products at the significance level 0.01.
H1 formulation: The age affects the purchase of ethical products at the significance level 0.01.
Value of the test criterion: 95.957
Critical value: 30.578
→ H0 is rejected at the significance level α = 0.01.
The results show that a correlation between age and the purchase of "ethical" products by Czech consumers has been proved. Women aged 20-30 years buy "ethical" products just exceptionally, while up to 50% of women aged 30-40 years buy such products exceptionally or they do not buy them at all (also up to 50%). Men in the lower age group are of the same opinion as women in the higher age group While men men aged 30-40 years answered predominantly “not at all”, i. e. they do not buy such products, nor use such services.
C. Testing the correlation between the purchase of ethical products and the presence of
children in the family H0 formulation: The presence of children in the family does not affect the purchase of ethical products at the significance level 0.01.
H1 formulation: The presence of children in the family affects the purchase of ethical products at the significance level 0.01.
Value of the test criterion: 21.092
Critical value: 16.812
→ H0 is rejected at the significance level α = 0.01. The results show that a correlation between the presence of children of school and pre-school age and the purchase of "ethical" products by Czech consumers has been proved. Mostly women are engaged in purchasing „ethical“ products. In households with children of school and pre-school age the purchase is more common than in households without children. This is

376
due to the fact that the intensity of purchases of food products is higher for women than for men. Women also usually associate such products with higher quality.
Interest in the origin of goods In case of question whether consumers consider the origin when buying a product, a statistical correlation between gender, age and income was determined.
A. Testing the correlation between the interest of product origin and the gender H0 formulation: The gender does not affect the consumer interest in the origin of purchased goods at a significance level 0.01.
H1 formulation: The gender affects the consumer interest in the origin of purchased goods at a significance level 0.01.
The values of actual and expected frequencies are shown in figure no. 3.
0
50
100
150
200
n11 n12 n13 n21 n22 n23Actual frequencies Expected frequencies
Fig. 3. Actual and expected frequencies determined under question no. 6 - Sex
Value of the test criterion: 8.532
Critical value: 9.21
→ H0 is not rejected at the significance level α = 0.01.
The results show that no correlation was proved between gender and the interest of Czech consumers in information on the origin of goods purchased. The origin of goods is only important for young women. While for women aged 30-40 years and for the whole group of men it is less significant, as they are only "sometimes" interested in the origin of goods. Both genders do similarly approach the awareness of origin.
B. Testing the correlation between the interest of product origin and the age H0 formulation: The age does not affect the consumer interest in the origin of purchased goods at a significance level 0.01.
377
H1 formulation: The age affects the consumer interest in the origin of purchased goods at a significance level 0.01.
Value of the test criterion: 41.025
Critical value: 23.209
→ H0 is rejected at the significance level α = 0.01.
The results show that a correlation was proved between gender and the interest of Czech consumers in information on the origin of goods purchased. The origin of goods is important for food and non-food products. Food for women aged 20-30 years, non-food products for women aged 30-40 years, non-food products for men aged 20-30 years and food for men aged 30-40 years.
C. Testing the correlation between the interest of product origin and the income H0 formulation: The income does not affect the consumer interest in the origin of purchased goods at a significance level 0.01.
H1 formulation: The income affects the consumer interest in the origin of purchased goods at a significance level 0.01.
Value of the test criterion: 36.423
Critical value: 16.812
→ H0 is rejected at the significance level α = 0.01. The results show that a correlation was proved between the level of income and the interest of Czech consumers in information on the origin of goods purchased. In case of a lower income level there is also a higher awareness of the products. In a situation where the respondents have higher incomes, their interest in information about the origin of products decreases.
Boycott of unethical products In case of question whether consumers, when buying consumer goods, do purposefully boycott unethical products, statistical correlation between gender and presence of children in the family was determined.
A. Testing the correlation between the boycott of unethical products and gender H0 formulation: The gender does not affect the boycott of unethical products at the significance level 0.01.
H1 formulation: The gender affects the boycott of unethical products at the significance level 0.01.
The values of actual and expected frequencies are shown in figure no. 4.
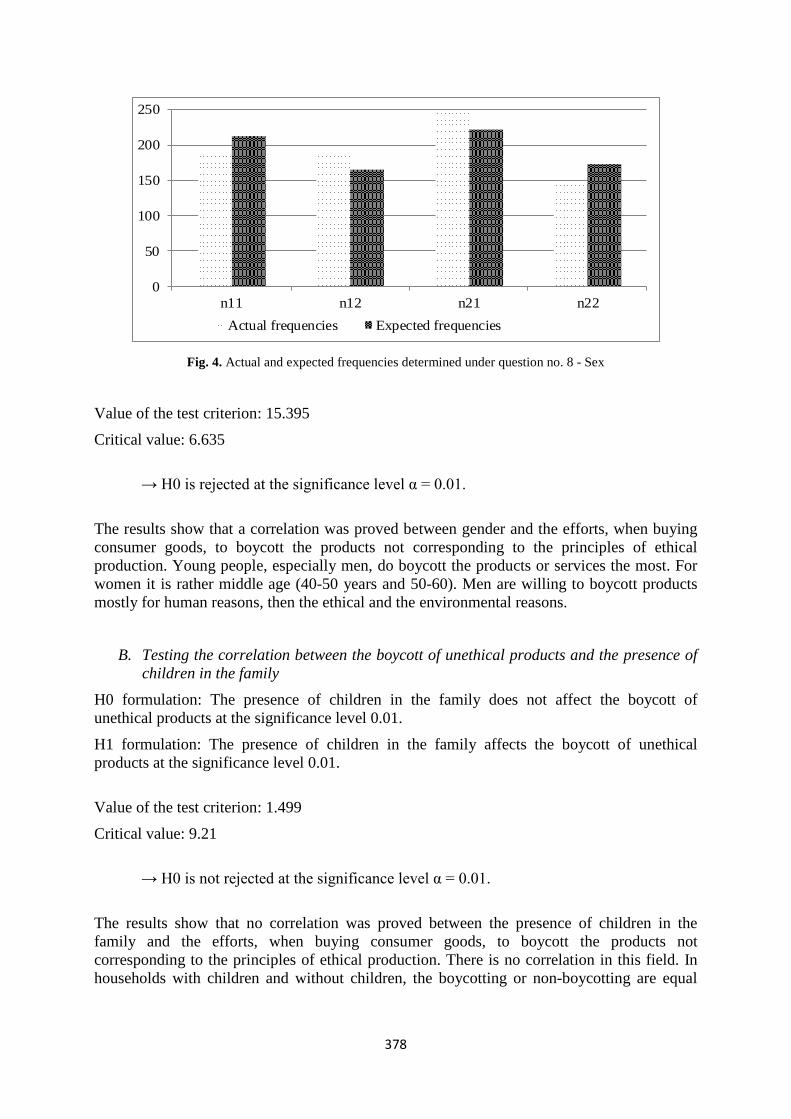
378
0
50
100
150
200
250
n11 n12 n21 n22Actual frequencies Expected frequencies
Fig. 4. Actual and expected frequencies determined under question no. 8 - Sex
Value of the test criterion: 15.395
Critical value: 6.635
→ H0 is rejected at the significance level α = 0.01.
The results show that a correlation was proved between gender and the efforts, when buying consumer goods, to boycott the products not corresponding to the principles of ethical production. Young people, especially men, do boycott the products or services the most. For women it is rather middle age (40-50 years and 50-60). Men are willing to boycott products mostly for human reasons, then the ethical and the environmental reasons.
B. Testing the correlation between the boycott of unethical products and the presence of
children in the family H0 formulation: The presence of children in the family does not affect the boycott of unethical products at the significance level 0.01.
H1 formulation: The presence of children in the family affects the boycott of unethical products at the significance level 0.01.
Value of the test criterion: 1.499
Critical value: 9.21
→ H0 is not rejected at the significance level α = 0.01.
The results show that no correlation was proved between the presence of children in the family and the efforts, when buying consumer goods, to boycott the products not corresponding to the principles of ethical production. There is no correlation in this field. In households with children and without children, the boycotting or non-boycotting are equal
379
and there is no correlation. The absence or the presence of children does not affect the approach of respondents to boycott brands of ethical shopping.
4 Conclusion It was found that awareness about the ethical shopping is negligible. When comparing gender, women have clearly a greater overview and awareness and also exceptional purchase of ethical products was recorded. The younger generation has more information than the older one. It may be due to the fact that women buy food products, cosmetics, baby products and also efficient appliances of Class A more than men. This implies that women have a greater overview of ethical products. This theme is still at the beginning in the Czech Republic and we can only hope that in the future more awareness will develop, but so far the issue remains in ignorance for Czech consumers. Although just a small part of the respondents buys purposefully ethical products, it is positive that the greater part of the respondents is willing to boycott unethical products violating human rights or destroying the environment. Lack of information can therefore be considered a larger problem than a complete lack of interest in the issue, which deals with ethical products. The interest in ethical consumerism and ethical shopping, the effort to help in ethical, human and environmental terms would be, in our opinion, higher in the case of providing consumers with sufficient information about the products, individual brands, principles of their functioning but also about the issues of trade and environmental protection, animal abuse, violations of rights, etc. On the Czech market, such goods is not as desired and have not such a tradition as in England and the Netherlands. There is a lot of academic texts on the ethical products, but most of them can be found on foreign websites that are not in Czech language. This results in great ignorance of these principles for the Czech public. Suggestions are oriented to more promotion and advertising in the mass media, such as television advertising and various spots. Other recommendations are aimed at raising the awareness of pupils and students. Retail stores should include the information about these ethical products in their promotional materials, such as flyers, where more or less only action items and exceptionally even some bioproducts are offered. In conclusion, we would therefore recommend the extension of advertising and website localization in the Czech language.
References Bray, J., Johns, N. and Kilburn, D. (2011), ‘An Exploratory Study into the Factors Impeding Ethical Consumption’, Journal of Business Ethics, vol. 98, Issue 4, pp 597-608
Cooper-Martin, E. and M. B. Holbrook (1993), ‘Ethical Consumption Experiences and Ethical Space’, Advances in Consumer Research 20(1), pp 113–118.
Cowe, R. and Williams, S. (2000), Who are the ethical consumers?, London: The Cooperative Bank.
Harrison, R. Newholm, T. and Shaw D. (2005), Introduction, The Ethical Consumer, Sage, London (2005), pp. 1–10
Hawkins, R. (2012) Shopping to save lives: Gender and environment theories meet ethical consumption, Geoforum, vol. 43, Issue 4, pp. 750–759
Johnson, L., Learned, A. (2004), Don’t Think Pink: What Really Makes Women Buy – and How to Increase Your Share of This Crucial Market. American Management Association, New York.
380
Long, M. and Murray, D. (2013) ‘Ethical Consumption, Values Convergence/Divergence and Community Development’, Journal of Agricultural and Environmental Ethics, vol. 26, Issue 2, pp 351-375.
Low, W. and Davenport, E. (2007) ‘To boldly go…exploring ethical spaces to re-politicise ethical consumption and fair trade’, Journal of Consumers Behaviour, vol.6, pp. 336–348
Micheletti, M. (2004). Why more women? Issues of gender and political consumerism, Politics, Products and Markets. Transaction Publishers, New Brunswick, USA.
Papaoikonomou, E., Valverde, M. and Ryan. G. (2012) ‘Articulating the Meanings of Collective Experiences of Ethical Consumption’, Journal of Business Ethics, vol. 110, Issue 1, pp 15-32.
Ethical Consumer A BEGINNER’S GUIDE, http://www.ethicalconsumer.org/linkclick.aspx?fileticket=9SvJhnu632s%3d&tabid=155, last accessed: 15/06/2013
381
GLOBALG.A.P. as a possible tool of corporate social responsibility in agricultural production
GLOBALG.A.P. jako možný nástroj společenské odpovědnosti firem v zemědělské prvovýrobě
Petra Šánová
1Katedra obchodu a financí, PEF, Česká zemědělská univerzita v Praze, Kamýcká 129, 165 21 Praha 6 – Suchdol
Annotation: Corporation Social Responsibility (CSR) is often perceived as a " missing link " in the solution of disjunction between economic growth within the market economy and its negative effects. It is the voluntary integration of social and environmental considerations into everyday business operations and interactions with stakeholders. CSR thus aims to facilitate the transition towards socially and environmentally sustainable future. Certification of this approach is not common in the Czech Republic. Agriculture is yet an area where the social responsibility has an important place. In addition to the certification requirements of ISO 14000 , organic farming in the Czech Republic is also used by private certification standard GLOBALG.AP The paper discusses the possibilities of using standard GLOBALG.AP as a potential tool of corporate social responsibility for the sector of agricultural production . Its implementation and certification represents producer‘s interest in creating safe and quality food, providing safety and employee development and in reflecting increasingly important concern for the environment and its sustainability. This standard is intended to serve as a tool for objective assessment of systemic application of good agricultural practices and through fulfillment of given checkpoints to guarantee production of safe food, while ensuring accountability farms to consumers, environment, animals and farm workers. This standard is applicable to various conditions and areas of agricultural production.
Key Words: agriculture, GLOBALG.AP, CSR, corporate social responsibility, environment, sustainability, health and safety
JEL klasifikace: Q01
1 Úvod S pokračujícím trendem globalizace stale vice a více firem zvyšuje své konkurenční možnosti snižováním nákladů, vývojem produktů a přístupem k přírodním a lidským zdrojům v mezinárodním kontextu (Boyd et al., 2004). Běžnou odpovědí na tento tlak je v prvé řadě zavádění kodexů, které mají vést k tomu, že obchodně partnerské vztahy budou sociálně odpovědné (Pedersen and Andersen, 2006).
Sociální odpovědnost firem, označována také zkratkou CSR (Corporation Social Responsibility) je často vnímána jako "chybějící spojovací článek" v řešení disjunkce mezi hospodářským růstem v rámci tržní ekonomiky a jeho negativními důsledky. Existuje řada definic "CSR". Obecně lze říci, že jde o dobrovolné integrování sociálních a ekologických hledisek do každodenních firemních operací a interakcí se zainteresovanými stranami. Princip zahrnutí ekonomických, sociálních a environmentálních hledisek do strategie firmy se nazývá také trojí zodpovědnost. CSR se tak zaměřuje na usnadnění přechodu směrem k sociálně a ekologicky udržitelné budoucnosti.
382
V kodexu podnikatelského chování společnosti by měly být zahrnuty zásady pro ekonomickou oblast, jako je odmítnutí korupce, transparentnost, dobré vztahy se zákazníky, akcionáři, obchodními partner, ochrana duševního vlastnictví. Za sociální oblast společensky odpovědné firmy jsou to zásady filantropie, komunikace se zainteresovanými stranami, striktní dodržování lidských práv, dodržování pracovních standardů. V rámci enviromentální oblasti jde např. o zavedení šetrné produkce (včetně např. certifikace podle ISO 14000), zavedení ekologické politiky na všech úrovních (např. využívání recyklovaného papíru v administrativě) či ochrana využívaných přírodních zdrojů.
Průzkum provedený časopisem The Economist (2005) ukázal, že vice jak 85% ze 136 vedoucích pracovníků a 65 investorů vidí CSR jako “hlavní” nebo “důležitý faktor pro učinění investičního rozhodnutí.
Udržitelný rozvoj v zemědělství je často spojován s multifunkčním pojetí a životního prostředí a ochrany přírody. Svatoš et al. (1999) uvádí, že udržitelný rozvoj předpokládá progresivní hospodářské a sociální změny. Princip trvale udržitelného rozvoje zahrnuje zájem o sociální spravedlnosti mezi generacemi a je jen logické, že tento zájem je třeba podporovat i uvnitř každého jednotlivce, tedy i současné generace. Je zřejmé, že ve světě s oblastí chudoby, nespravedlnosti, existuje značné riziko ekologických, ekonomických, politických, vojenských a jiných krizí, a že neexistují žádné základní předpoklady pro udržitelný rozvoj.
Udržitelné zemědělství používá pouze obnovitelné zdroje a neničí integritu ekosystému, protože je součástí tohoto ekosystému (Nátr, 1999). Udržitelné zemědělství udržuje úrodnost půdy, neplýtvá s vodními zdroji a napomáhá udržovat druhovou rozmanitost (Lehman et al., 1993).
Zemědělství má velký vliv na kvalitu životního prostředí především v důsledku používání hnojiv, pesticidů a vody pro zavlažování či praní produkce. Další, ekologická rizika pak vznikají v souvislosti s uskladněním kejdy či močůvky. Například v České republice připadlo v roce 2007 sedm ekologických havárií z celkem 181 nehod s dopadem na kvalitu vody právě na zemědělství.
Všechny členské státy EU jsou povinny sledovat a vyhodnocovat environmentální, zemědělské a sociálně-ekonomické dopady svých agroenvironmentálních programů (čl. 16 Nařízení ES č. 746/96) a Společný rámec monitorování a hodnocení26 (CMEF) požadující metody hodnocení, které jsou srovnatelné (ES, 2006). Členské státy často používají rutině získávané administrativní údaje k monitorování míry účinnosti různých opatření AES27. Nicméně, často tento přístup neposkytuje spolehlivé hodnocení dopadů politických nástrojů na životní prostředí, protože účast na AES nezaručuje skutečnou ochranu životního prostředí nebo jeho zlepšení, pokud jde o např. dosažení určitých environmentálních standardů (Kapos et al., 2009, Knickel a Schramek, 1998 a Primdahl et al., 2003).
Odpovědný přístup podnikatelů z pohledu životního prostředí je proto dnes dán i právními předpisy, a to především Zákonem 167/2008 Sb., o předcházení ekologické újmě a o její nápravě v platném znění. Také provozování ekologické zemědělství podle zákona 242/2000 Sb., o ekologickém zemědělství v platném znění je pak jednou z možností odpovědného přístupu z pohledu environmentu. Tyto přístupy však nenaplňují plně princip trojí zodpovědnosti. Chybí zde často aspekt ekonomický a sociální. Dalším problémem CSR v české zemědělské prvovýrobě může být velmi častá absence certifikovaného přístupu, který by nezávislým posouzením chování podniku a jeho procesů dokladoval přístup sociální odpovědnosti farmy veřejnosti a orgánům státní správy.
26 Common Monitoring and Evaluation Framework 27 Agri Environment Schemes
383
Cílem příspěveku je na základě teoretických východisek a zkušeností autora diskutovat možnosti uplatnění certifikovatelného soukromého mezinárodního standardu GLOBALG.A.P. jako nástroje sociální odpovědnosti firem (CSR) pro sektor zemědělské prvovýroby v České republice.
2 Materiál a metody Metodika práce vychází v prvé řadě z teoretické kompilační báze z českých i zahraničních zdrojů, znalosti požadavků standardu GLOBALG.A.P. a reálné situace v řadě zemědělských podniků v ČR v průřezu od r. 2007 do r. 2013. Autorka příspěvku zároveň působí jako inspektor a auditor standardu GLOBALG.A.P. pro variantu 1 a 2 v rostlinné a živočišné výrobě a také jako technický expert Českého institutu pro akreditaci pro tento standard.
Na základě zkušeností s vývojem situace u podniků s certifikovaným systémem je pak diskutována možnost uplatnění tohoto standardu a jeho požadavků v rámci CSR. K argumentaci jsou využívány příklady vývoje podniků v oblasti environmentální, sociální a ekonomické před a po zavedení standardu až do současnosti.
3 Výsledky a diskuse
Standard GLOBALG.A.P. Jedním z nejzajímavějších aspektů nedávných proměn globálních zemědělsko-potravinářských systémů je vznik auditorské kultury jako důležitá nová forma potravinové správy. V reakci na tyto změny se řada vědců pokusila pochopit dynamiku, rozsah a důsledky těchto auditů a jejich aplikaci v zemědělsko-potravinářských systémů (např. Busch a Bain, 2004, Campbell, 2005; Hatanaka et al, 2005;. Henson a Reardon, 2005; Jahn et al, 2005). Závěr těchto šetření je, že potravinové standardy, normy, audity a protokoly patří mezi nejvlivnější a teoreticky zajímavé nové dynamiky v rámci současných zemědělsko-potravinářských systémů, a to zejména v regionech jako je Evropa a Japonsko.
Nové auditní disciplíny mají současně rozvíjet udržitelnost spolu s vysokou přidanou hodnotou potravin. Příkladem může být kontrolované ekologické zemědělství a související klíčové vlastnosti tohoto typu zemědělství: implikace hodnoty spojené s udržitelností, využívání nezávislé certifikace třetí stranou, silné vazby jak na dlouhodobé sociální hnutí, tak na nové strategie prodeje a rychlý růst vysokohodnotného trhu (Campbell a Le Heron, 2007).
Vedle certifikovaného ekologického zemědělství se zde paralelně objevily standardy a audity nazývané jako integrované systémy, určené většinou pro maloobchodníky, kteří podporují značení/tvrzení "udržitelná" a "bezpečná" produkce, aniž by se výslovně jednalo o produkty organické. Nejpozoruhodnější z nich je audit aliance EurepGAP (nyní GLOBALG.A.P), který se rychle rozšířil mezi evropské maloobchodníky (Campbell, 2005).
GLOBALG.A.P. (dříve EurepGAP) je příkladem celosvětově uznávaného schématu pro zajištění kvality a bezpečnosti produktů určené přímo pro zemědělskou prvovýrobu. Jde o jednoduchý integrovaný standard založený na aplikaci normativních modulů podle skupin produktů od rostlinné výroby, s rozdělením na skupinu produktů ovoce a zelenina a skupinu polní plodiny, po živočišnou výrobu (masný skot a ovce, mléčný skot, prasata a drůbež), přičemž bere v úvahu i rozmnožovací materiál (osivo a setbu) a krmný průmysl.
Zásadou GLOBALG.A.P.u je “globální partnerství pro bezpečné a udržitelné zemědělství”, tzn. reagovat na zájem spotřebitele o bezpečnost potravin, ochranu životního prostředí, zdraví,
384
bezpečnost a dobré podmínky pracovníků a dobré zacházení se zvířaty. Standard je vhodný jak pro malé rodinné farmy, tak pro velké podniky právnických osob, družstva atd. Může se integrovat s dalšími systémy řízení bezpečnosti a kvality a tvoří tak základ, na němž je možné dále stavět. V České republice je implementace normy také významným krokem pro splnění podmínek hospodaření v souladu s principy cross – compliance (GLOBALG.A.P., 2013).
Jde o dobrovolnou normu pro zemědělskou praxi, jejíž zavedení představuje producentův zájem o vytváření bezpečných a kvalitních potravin, spolu se zajištěním bezpečnosti práce a rozvoje zaměstnanců a v neposlední řadě i stále významnější zájem o životní prostředí a jeho udržitelnost. V praxi to znamená minimalizaci agrochemických vstupů, dodržení welfare hospodářských zvířat, sledovatelnost vzniku, komunikace se spotřebiteli a aplikaci tzv. nejlepší zemědělské, ale i hygienické praxe. Auditní princip spočívá v porovnání existujících lokálních přístupů s požadavky normy (kontrolními body).
Schéma GLOBALG.A.P se jako systém opírá svou stavbu o zajišťování správné výrobní praxe. Nabízí 16 standardů (modulů) pro tři základní oblasti: rostlinná výroba, živočišná výroba a akvakultura V desetinném třídění uvádí kontrolní body, které byly stanoveny jako více (major) či méně (minor) rizikové (závažné), popř. jako doporučení. Je třeba dodat, že splnění podmínek národní legislativy je vždy bráno jako klíčová povinnost (major must), která musí být splněna vždy, přestože by standard uváděl danou povinnost pouze jako doporučení. Výchozí postulování základních modulů rostlinné i živočišné výroby vychází z obecně známých a prověřených rizik v jednotlivých systémech pěstování rostlinných produktů a chovech hospodářských zvířat. Princip standardu dále vychází z analýzy rizik, kterou provozovatel musí podle své výrobní technologie sám provést a určit kritické body. Analýza rizik se vytváří jak z pohledu zajištění bezpečnosti produktu, tak zajištění bezpečnosti a welfare pracovníků a zvířat a v neposlední řadě i vůči dopadům zemědělské praxe na životní prostředí. Pro úspěšnou certifikaci pak musí producent dosáhnout splnění 100% klíčových povinností (major must) a minimálně 95% poviností (minor must).
Přínosy certifikace tohoto systému jsou obdobné jako u jiných systémů řízení jakosti a lze je shrnout do následujících bodů:
• prokázání závazku k plnění zákonných požadavků a požadavků předpisů.
• garance stálosti výrobního procesu a tím i stabilní a vysokou kvalitu poskytovaných produktů zákazníkům.
• prokázání vhodnosti, účinnosti a efektivnosti vybudovaného systému třetí nezávislou stranou.
• zkvalitnění systému řízení, zdokonalení organizační struktury organizace.
• zlepšení pořádku a zvýšení efektivnosti v celé organizaci.
• optimalizace nákladů – redukce provozních nákladů, snížení nákladů na neshodné výrobky, úspory surovin, energie a dalších zdrojů.
• zvýšení důvěry veřejnosti a státních kontrolních orgánů. V současnosti je certifikováno více než 400 typů výrobků a přes 130 tisíc certifikovaných výrobců ve více než 110 zemích světa. Nejen díky tomu standard může zvyšovat konkurenceschopnost zemědělských prvovýrobců na evropských trzích, rozvíjet správnou zemědělskou a ekologickou praxi a posilovat prvky systémového řízení zemědělského podniku (GLOBALG.A.P., 2013).
385
GLOBALG.A.P a CSR v zemědělské praxi V České republice je standard GLOBALG.A.P. (dříve EUREPGAP) zaváděn od roku 2006 zejména v oblasti pěstování ovoce a zeleniny. Na tyto produkty byl soustředěn tlak většiny obchodních řetězců, které standard vyžadují jako jednu z dodavatelsko-obchodních podmínek.
Proto i následující diskuse, vycházející především se znalostí uplatňování tohoto standardu v dosavadní praxi, je zaměřena především na oblast modulu GLOBALG.A.P. „Ovoce a zelenina“, kam patří i brambory, bylinky, sušené plody a houby. Tento modul zahrnuje splnění kontrolních bodů uvedených v checklistech pro tři subsystémy – Všeobecné požadavky na farmy (All Farms – AF), Rostlinná produkce (Crop Base - CB) a Ovoce a zelenina (Fruit and Vegetables - FV).
Ačkoli je systém prioritně zaměřen na správnou zemědělskou praxi a na zajištění bezpečné produkce na základě principu HACCP28, pilíře sociální odpovědnosti lze nalézt ve všech těchto subsystémech průřezově.
Oblast životního prostředí je řešena především v subsystému AF a CB. Po producentovi je zde vyžadována analýza rizik hodnotící, nakolik jeho podnikatelské aktivity ovlivňují negativně environment. Jde především o ohrožení půdy (kontaminací, erozí) a vody (z pohledu udržitelnosti, znečištění apod.), a dále ovlivnění fauny a flóry. Podnikatel by měl mít plán na zlepšování životního prostředí. V několika bodech je řešena problematika odpadních vod a odpadů jako takových, vč. nebezpečného odpadu. Další významné položky tvoří hodnocení skladování a manipulace s hnojivy a pesticidy. Je třeba poznamenat, že ačkoli všechny skladové prostory na pesticidy jsou schváleny SRS29, i zde se podle standardu najde ve většině případů řada nedostatků, která souvisí především s absencí havarijní soupravy, špatného stavu záchytných jam či skladování přípravků kapalných nad sypkými či přímo na zemi bez podložení paletou apod. Vzhledem k tomu, že splnění požadavků národního právního rámce je nadřazeno požadavkům standardu a považuje se za klíčovou povinnost, vede tato skutečnost zemědělské podnikatele k tomu, že lépe implementují a aplikují právní předpisy této oblasti. To jim může přinést hypotetickou úsporu peněz, které by museli vynaložit na pokuty a sankce v případě kontroly např. Českou inspekcí životního prostředí. Ze zkušeností při hodnocení podniků před a po zavedení standardu vyplývá, že ve všech hodnocených podnicích by před zavedením standardu tyto pokuty a sankce byly uloženy.
Oblast sociální se dotýká všech pracovníků, tj. stálých i sezónních. Standard je mezinárodní a proto požadavky v základním uvedení se v našich podmínkách mohou někdy jevit jako triviální. Nicméně vzhledem k již několikrát zmiňovanému faktu o národních předpisech, při bližším sledování před samotným zavedením standardu je často zjištěno, že legislativní požadavky jsou splňovány částečně nebo vágně a to ne zcela z viny producentů. Požadavek na zpracování komplexu dokumentace a zavedení BOZP30 bývá zadáván externím firmám, které nezohlední specifičnost bezpečnostních rizik v zemědělství, ať se již týká tento problém speciálních strojů, jako jsou např. kombajny, či běžně používaných nástrojů (nože, žebříky, zvedací plošinky aj.). Po producentovi se požaduje, aby ve firmě byla alespoň jedna osoba s výcvikem první pomoci, která bude přítomna při prováděných pracích. Toto je důležité zejména při sklizni. Požadavky standardu důsledně vedou producenta k péči o bezpečnost a welfare pracovníků. Někdy jde o kontrolní bod, který sleduje spíše zajištění hygieny produktu, ale v konečném efektu má velký význam pro zkvalitnění prostředí zaměstnanců. Takovým příkladem může být požadavek na toalety s vodou na umytí rukou pro pracovníky v blízkosti 500 metrů (nebo možnost dojezdu pro motorizované pracovníky – traktoristy) 28 Hazard Analysis of Critical Control Points (Analýza rizik kritických kontrolních bodů) 29 Státní rostlinolékařská správa 30 Bezpečnost a ochrana zdraví při práci
386
uváděný při sklizni. Jako příkladem může být sklizeň jahod či zeleniny, kdy pracovnice velmi pozitivně hodnotili zavedení mobilních WC na poli.
Do zorného pole se pak při auditech dostávají také prostory technické, především dílny a nejrůznější sklady různých materiálů. Zde dochází k častému pochybení jak z pohledu zákonných předpisů BOZP, tak z hlediska předpisů týkajících se životního prostředí. Ruku v ruce s těmito body je pak z pohledu CSR oblast ekonomická, která je spjata s environmentální a sociální oblastí. Producent musí vést záznamy o spotřebě vody, odůvodnit volbu zavlažovacího či pracího zařízení, které musí být zvoleno tak, aby nedocházelo ke zbytečné spotřebě vody, záznamy a sledování spotřeby pohonných hmot a maziv, hnojiv a pesticidů (což souvisí také s jejich uskladněním), likvidace a uskladnění veškerých odpadů. Při auditu je možné nahlížet i do faktur či dodacích listů. Cílem je zajištění transparentnosti a dosledovatelnosti produktu.
Zemědělské podniky monitorované v letech 2007-2013 mají zavedený a certifikovaný standard GLOBALG.A.P. a liší se velikostí i manažerským a administrativním zázemím. Po zavedení standardu prošly obdobným vývojem, který se promítá v kontinuálním poklesu zjištěných neshod vůči požadavkům standardu. Neshody se většinou netýkali správné zemědělské praxe v oblasti hnojení, ochrany rostlin či zavlažování. Také tam, kde byl zaveden certifikovaný systém HACCP pro skladování a manipulaci s produkcí nebyly zaznamenány významnější prohřešky. Řada podniků se však musela při zavádění a v prvních letech udržování standardu zaměřit právě na oblasti BOZP či oblast úklidu farmy a jejího okolí většinou z důvodů starých zátěží uložených chemických látek, pneumatik, starých a nepoužívaných strojů apod. Novinkou byl pro řadu zemědělců například požadavek zajištění toalet s tekoucí vodou pro pracovníky sklizně, vyřešení otázky školení všech pracovníků v první pomoci či umístění pomocných piktogramů k podpoře hygieny pracovníků v terénu. Podnikové postupy byly v řadě případů zefektivněny a byl eliminován syndrom tzv. podnikové slepoty.
Rezervy v plnění požadavků v souvislosti s environmentální oblastí CSR se ještě nyní občas objevují v oblastech, které souvisí zejména se subsystémem AF. Zde je pozornost zaměřena k procesům a postupům, které ovlivňují životní prostředí, biodiverzitu a udržování neproduktivních míst. Záměrem je, aby si producent více uvědomil, že je součástí přírodního prostředí. Správná zemědělská praxe zde má vést k zemědělství, které bude trvale udržitelné a povede i k naplnění mimoprodukční funkce tohoto sektoru. Často není v podnicích dostatečný tlak na zaměstnance, aby bránili možnosti vzniku eroze a zhutňování půdy.
Z pohledu autora jako inspektora a auditora standardu nastal za sledované období největší a nejpozitivnější posun v dodržování požadavků na ochranu vod a půdy, zejména hlediska kontaminace ropnými produkty a dále v oblasti zajištění BOZP. Tím se celá řada podniků s certifikací GLOBALG.A.P. jednoznačně liší od podniků bez certifikátu a rozhodně tak demonstruje účinnost standardu v rámci CSR. Zavedení standardu a jeho udržování si často vynutilo určité kroky směřující k rekonstrukcím, obnově technického zařízení a zázemí a k důkladnějšímu proškolení pracovníků v oblasti environmentu i BOZP i k důslednějšímu vedení podřízených. Většina manažerů zemědělských podniků, zejména těch menších, hodnotí změny v podniku pozitivně v tom, že mají větší přehled v pravomocích a odpovědnostech vedoucích pracovníků a podřízených, prvotní investice přinesly snížení některých provozních nákladů a posunuly organizaci na „vyšší úroveň“. Oblast vedení lidí a s tím související delegování zejména odpovědností na konkrétní pracovníky hodnotí vedení zhruba poloviny podniků jako efektivnější.
387
4 Závěr Standard GLOBALG.A.P. (původní název EUREPG.A.P.) je soukromý dobrovolný standard pro zemědělskou praxi, jejíž zavedení představuje producentův zájem o vytváření bezpečných a kvalitních potravin, spolu se zajištěním bezpečnosti práce a rozvoje zaměstnanců a v neposlední řadě i stále významnější zájem o životní prostředí a jeho udržitelnost. Tato norma má sloužit jako nástroj pro objektivní systémové posouzení používané správné zemědělské praxe a naplněním kontrolních bodů garantovat produkci zdravotně nezávadných potravin spolu se zajištěním odpovědnosti farmy ke spotřebitelům, životnímu prostředí, zvířatům na farmě i pracovníkům. Standard je použitelný pro různé podmínky a oblasti zemědělské produkce. Princip efektivní aplikace spočívá v nutnosti provázanosti existujících lokálních právních přístupů s normou. Proto bylo cílem příspěvku poukázat na schéma GLOBALG.A.P. jako na vhodný nástroj pro prezentaci a realizaci společenské odpovědnosti firem v zemědělství v České republice.
Nezávislým sledováním skupiny zemědělců v oblasti rostlinné výroby, především producentů ovoce a zeleniny byly sledovány hlavní změny v oblastech CSR. Zavedením standardu a jeho přísným dodržováním došlo často u producentů dle jejich sdělení k poklesu energetických nákladů (zejména spotřeba pohonných hmot, méně pak elektřina, voda). Dle požadavků standardu i národního právního rámce dochází u certifikovaných subjektů k poklesu reálné či potencionální kontaminace životního prostředí škodlivými látkami. Důsledkem plnění standardu je také růst biodiversity a její podpora v jednotlivých ekosystémech a mikroregionech, zvyšování biologické aktivity půdy, dlouhodobé úrodnosti půdy.
Z pohledu sociálního aspektu největších změn doznává v podnicích s certifikovaným systémem zajištění BOZP, a to i nad rámec českých právních norem. Naplňováním požadavků standardu pak producenti vychází vstříc základním požadavkům a myšlenkám ochrany životního prostředí, trvale udržitelného zemědělství, trvale udržitelného rozvoje společnosti, odpovědnosti ke svým pracovníkům i ekonomickým aspektům svého podnikání. Certifikace standardu GLOBALG.A.P. tak může být plnohodnotným nástrojem realizace a prezentace sociální odpovědnosti farmy.
Použité zdroje Boyd, D. E., Speckman, R. E., Werhane, P. (2004).Corporate social responsibility and global supply chain management: a normative perspective, Working paper. (No. 04-05), University of Virginia.
Busch, L., Bain, C. (2004). New! improved? The transformation of the global agrifood systém Rural Sociology, 69 (3) (2004), pp. 321–346.
Campbell, H. (2005). The rise and rise of EurepGAP: the European (re)invention of colonial food relations? International Journal of Sociology of Agriculture and Food, 13 (2) (2005), pp. 6–19.
Campbell, H., Le Heron, R. (2007). Supermarkets, producers and audit technologies: the constitutive micro-politics of food, legitimacy and governance. G. Lawrence, D. Burch (Eds.), Supermarkets and Agri-Food Supply Chains: Transformations in the Production and Consumption of Foods, Edward Elgar, London (2007), pp. 131–153.
Hatanaka, M., Bain, C., Busch, L. Third-party certification in the global agrifood systém. Food Policy, 30 (2005), pp. 354–369
388
Henson, S, Reardon, T. (2005). Private agri-food standards: implications for food policy and the agri-food systém. Food Policy, 30 (2005), pp. 241–253.
Jahn, G., Schramm, M., Spiller, A. (2005). The reliability of certification: quality labels as a consumer policy tool. Journal of Consumer Policy, 28 (2005), pp. 53–73
Kapos, V., Balmford, A., Aveling, R., Bubb, P., Carey, P., Entwistle, A., Hopkins, J., Mulliken, T., Safford, R., Stattersfield, A., Walpole, M., Manica, A. (2009). Outcomes, notimplementation, predict conservation success. Oryx 43, 336–342.
Knickel, K., Schramek, J. (1998). Managing high nature conservation value farmland: policies, processes and practices. In: Pienkowski, M. W., Jones, D.G.L. (Eds.), Changes in Farming Systéms and Nature Conservation: How Successful are AgriEnvironmental Schemes in Germany? European Forum on Nature Conservation and Pastoralism (EFNCP), Argyll, UK, pp. 80–88.
Lehman, H. et al. (1993). Clarifying the definition of sustainable agriculture. J. agric. environm. Ethics 6, pp 127-143.
Nátr, L. (1999) Rozvoj trvale neudržitelný, Karolinum, Charles University, Prague.
Pedersen, E. R., Andersen, M. (2006). Safe guarding corporate social responsibility (CSR) in globa lsupply chains: how codes of conductare managed in buyer-supplier relationships. Journal of Public Affairs 6 (3/4), 228–240.
Primdahl, J., Peco, B., Schramek, J., Andersen, E., Onate, J.J. (2003). Environmental effects of agri-environment schemes in Western Europe. Journal of Environmental Management 67, 129–138.
Svatoš, M. et al. (1999). Economics of Czech and Slovak agriculture integration with the EU, Czech Agricultural University at Prague, Prague.
The Economist (2005). The Good Company (survey) 374, 8410.
GLOBALG.A.P. (2013). Official information about organization and standard. [on-line]. FoodPlus GmbH. Cologne [cit. 2013-08-08]. In: http://www.globalgap.org/uk_en/what-we-do/.
Anotace: Sociální odpovědnost firem, označována také zkratkou CSR (Corporation Social Responsibility) je často vnímána jako "chybějící spojovací článek" v řešení disjunkce mezi hospodářským růstem v rámci tržní ekonomiky a jeho negativními důsledky. Jde o dobrovolné integrování sociálních a ekologických hledisek do každodenních firemních operací a interakcí se zainteresovanými stranami. CSR se tak zaměřuje na usnadnění přechodu směrem k sociálně a ekologicky udržitelné budoucnosti. Certifikace tohoto přístupu není v České republice častá. Zemědělství je přitom oblastí, kde má společenská odpovědnost své významné místo. Kromě certifikace na požadavky normy ISO řady 14000, ekologického zemědělství je v České republice využíváno i certifikace soukromého standardu GLOBALG.A.P. Příspěvek diskutuje možnosti využití standardu GLOBALG.A.P. jako možného nástroje sociální odpovědnosti firem pro sektor zemědělské prvovýroby. Jeho zavedení a certifikace představuje producentův zájem o vytváření bezpečných a kvalitních potravin, spolu se zajištěním bezpečnosti práce a rozvoje zaměstnanců a v neposlední řadě i stále významnější zájem o životní prostředí a jeho udržitelnost. Tato norma má sloužit jako nástroj pro objektivní systémové posouzení používané správné zemědělské praxe a naplněním kontrolních bodů garantovat produkci zdravotně nezávadných potravin spolu se zajištěním odpovědnosti farmy ke spotřebitelům, životnímu prostředí, zvířatům na farmě i pracovníkům. Standard je použitelný pro různé podmínky a oblasti zemědělské produkce.
Klíčová slova: zemědělství, GLOBALG.A.P., CSR, společenská odpovědnost, environment, trvalá udržitelnost, BOZP
JEL klasifikace: Q01
389
Effect of crop selection on the economy of crop production and quality of the environment
Efekt výběru plodin na ekonomiku produkce plodin
a souvislosti s kvalitou životního prostředí
Václav Voltr, Martin Hruška Oddělení modelování dopadů zemědělské ekonomiky, Ústav zemědělské ekonomiky a informací,
Mánesova 75, Praha 2, 120 56 [email protected]
Annotation: This paper describes approaches to evaluation of production according to production focus. For this purpose, appropriate assembly plants in given soil and climatic conditions, especially from an agronomic point of view and from the point of view of environmental protection are used. The achievable profit in terms of specific production focus differs by up to CZK 1,500 per hectare . The work includes analysis of agricultural land revenues in terms of the focus on the production of cereals, oilseeds and livestock. It analyzes value of returns on agricultural land using BPEJ. Main basis is certified methodology of calculation of the gross annual rent effect, for specific values of inputs of nutrients, plant protection products and technology costs . The model adjusts returns and costs of agricultural crops according to the current price and cost developments. The paper also evaluates the loss of gross annual rent effect due to incorrect sequencing of crops,\ especially on the basis of reduced revenues. Observed decline in gross annual rent effect due to improper crop rotation sequence may be up to 1900 CZK per hectare. With respect to the protection of the environment functions for nitrogen doses 50, 90, 100, 110 % are evaluated for given soil and climatic conditions. The impact of 50 % dose reduction of nitrogen is in the case of winter wheat on average 600 CZK per hectare. Own choice of production structure affects economic results especially in warmer climatic regions and while intensive production is used.
Key words: crop production, yield, costs, nitrate, production function, winter wheat
JEL classification: Q01, Q16, Q24, Q51, Q56
Úvod Produkční funkci půdy je možné hodnotit na základě akceptování společných rysů, dané požadavky na stabilní systém bez zásadních změn v krátkém období, možnosti kvantifikace hodnotových vztahů a dostatečnou přesností pro potřebu výše uvedených cílů. Přes poměrně bohatý výčet metod pro hodnocení půdy zůstává nedořešeným problémem soulad vlastního zaměření hodnocení půdy podle ekonomických výstupů a podle dalších fyzikálních a produkčních ukazatelů, přičemž uváděné systémy mají svá pozitiva i negativa. Hlavní přístup závisí na majoritní potřebě systému, zda má být použit k hodnocení příjmu, výroby nebo environmentálních souvislostí.
Modelování zemědělské produkce obecně vychází z prací Headyho (1961), který stále ještě představuje syntetický pohled a východisko aplikační a badatelské činnosti v této vědní oblasti.
Komplexní vztah ekonomických a environmentálních souvislostí pro regionální podmínky zemí EU řešil projekt SEAMLESS (Van Ittersum a kol. 2010), který kvantifikoval vztah produkčních a ekonomických faktorů výroby na základě počítačové simulace výroby v souladu s ekologickými limity a požadavky. Výsledkem projektu je systém hodnocení dopadů zemědělské politiky na základě propojení dostupných evropských databází popisu půdních,
390
klimatických a ekonomických podmínek. Vlastní kvantifikace vychází přitom z hodnocení výroby na úrovni pole, farmy a regionu na základě požadavku pro hodnocení zemědělské politiky podle modelových scénářů. Základní vztah produkčních podmínek se opírá o řadu teoretických modelů umožňujících detailně popsat jednotlivé komponenty tvorby výnosu plodin a externalit při výrobě. Jedná se o koncepční řešení umožňující provázání ekologických, ekonomických a sociálních aspektů zemědělské výroby s odpovídajícími propočty.
Základní přístup ke stanovení produktivity půdy v podmínkách ČR je odvozen od analytického odvození efektivity technologií a environmentálních omezení daných strukturou výroby. Volba plodin v rostlinné výrobě tak výrazně ovlivňuje výslednou ekonomiku podniku. Pro vyhodnocení vzájemných vazeb mezi skladbou plodin a jejím vlivem na ekonomiku výroby a životní prostředí byly zpracovány oceňovací typové struktury (Voltr a kol. 2011), umožňující hodnocení dopadů alternativních zastoupení plodin, agronomicky vyhovujících v daných půdně-klimatických podmínkách. Plodiny v oceňovacích typových strukturách (OTS) jsou navrženy alternativně. Respektování environmentálních zásad je dané ve vztahu k výběru plodin na erozně ohrožené půdě, vláhovým poměrům a respektováním půdoochranných technologií výroby plodin. Principy ochrany životního prostředí tak spočívají jak v samotné volbě plodin, tak v dodržování zásad trvalé udržitelnosti stavu půdy a navazujících vodních zdrojů s navazující ekonomikou výroby, která uvedené technologie zahrnuje.
Pro vyhodnocení půdně-klimatických podmínek je použitý systém BPEJ, který popsal Klečka (1989).
Materiál a metody Pro zemědělství je v oblasti produkčních funkcí důležitý popis vztahu mezi zemědělskou rentou (R) a ovlivňujícími faktory, kterými jsou jednotkový výnos (Y), výrobní náklady na jednotku komodity (c), tržní jednotkovou cenou komodity (p), dopravní sazbou (F) a vzdáleností od trhu (m), který, formuloval Johann Heinrich von Thünen (1930) ve tvaru:
( ) mFYcpYR **−−⋅= (1) Tento obecný tvar produkční funkce byl naplňován řadou odborných prací. Modelování produkce popsal obecně Heady (1961) a dále řada dalších autorů, např. Ittersum et al (2008), speciální přístupy jsou voleny ke střídaní plodin (Mullen J. D., Wetzstein M. E., Bergstrom J. C. 2013), de Wit, C.T. , van Keulen H. (1987) a další.
V zemědělském pohledu byla v tomto ohledu důležitá práce Dabberta (1994) která vyhodnocuje vazby mezi jednotlivými skupinami a faktory při definici produkčních funkcí na základě souhrnné matice výrobních faktorů. Výnos lze potom obecně popsat funkcí (2):
);;;;;;( KTPLPZSWfY tttttt = (2) Kde Y: výnos, t: období sledování (rok), W: klimatické proměnné, S: typ, druh a stav půdy, Z: výživa rostlin, P: úroveň chemické ochrany rostlin, L: technologie výroby TP: technický pokrok, K: konfigurace pozemku
Vzhledem ke specifickým podmínkám klasifikace půdně-klimatických podmínek v ČR byla pro další postup zvolena cesta funkčního doložení vazby výnosů a nákladů podle fyzikálních charakteristik popisu výrobních faktorů. Pro popis produkčních vlastností půdy byla zpracována komplexní statistická metoda na základě víceúrovňové regresní analýzy (Voltr a
391
kol. 2011), která pokrývá všechny hlavní směry tvorby výnosu. V průběhu let 2002–2010 byly na 500 homogenních pozemcích sledovány detailní základní informace o půdě, klimatických, ekonomických a technologických podmínkách pěstování plodin. Účelem bylo zjistit vzájemné chování výnosů a faktorů tvorby výnosu. Na základě zjištěných výsledků byly sestaveny produkční funkce plodin, podle kterých byly navrženy standardizované hodnoty výnosu, živin a intenzity chemické ochrany.
Za hlavní skupiny faktorů z věcně logického pohledu lze označit klima, typ půdy, charakteristiku HPJ, technologický postup, zásoba P, K, Mg v půdě, dále pak konfigurace a zrnitostní, sorpční a humusová charakteristika půdy. Zvláštní postavení mezi těmito faktory má dusík, který je považován za jeden z největších faktorů působící na výnos, proto tvoří samostatnou kategorii.
Stanovení hrubého ročního rentního efektu Hrubý roční rentní efekt v Kč na ha z.p. je stanoven z rovnice (4)
TTPTTPOPOPBPEJ kHRREkHRREHRRE ** += (4)
Kde: HRREBPEJ: hrubý roční rentní efekt jednotlivých BPEJ, HRREOP: hrubý roční rentní efekt plodin na orné půdě, kOP: koeficient normativního podílu OP na ZP, HRRETTP: hrubý roční rentní efekt trvalých travních porostů, KTTP : koeficient normativního podílu TTP na ZP.
HRREOP je stanoven z rovnice:
∑=
=n
iiOP REHRRE
1 (5) Kde REi : rentní efekt jednotlivých oceňovacích plodin na orné půdě, stanovený ze vztahu (6), i: plodiny v oceňovací typové struktuře
OTSii iKNPPCPPREi *)( −= (6) Kde CPPi: cena parametrizované produkce podle vztahu (7) (Kč/t), NPPi: normativní náklad na parametrizovanou produkci (Kč/ha), KiOTS: bezrozměrné číslo vyplývající z procentického zastoupení jednotlivých plodin v dané oceňovací typové struktuře (%).
NPP je stanoven podle detailního popisu pracovních operací na TF ČZU.
HRRETTP je stanoven stejným způsobem, jako HRRE jednotlivých oceňovacích plodin na orné půdě s využitím normativních parametrů stanovených pro louky a pastviny.
KRiii CVPPCPP *= (7) kde:
VPPi : výnos jednotlivých hlavních zemědělských plodin pro jednotlivé BPEJ, stanovený na základě využití návrhu produkčních funkcí (t/ha)
CKR : normativní ceny jednotlivých hlavních plodin diferencované podle bonitační klimatické regionalizace (Kč/t),
hsseP kkkVVPP ***= (8) Kde: Vp: produkční parametry naturálních výnosů jednotlivých hlavních zemědělských plodin pro jednotlivé hlavní půdně klimatické jednotky (t/ha), ke: koeficient pro expozici, ks: koeficient pro svažitost, khs : koeficient pro hloubku a skeletovitost zemědělské půdy.
392
Metoda odvození celkových nákladů parametrizované produkce NPP: Náklady parametrizované produkce (NPP) představují sumu nákladů, které je třeba vynaložit k realizaci produkce plodin poměrně zastoupených ve zvolené oceňovací typové struktuře (OTS), v daných půdně klimatických podmínkách (BPEJ), při dodržení udržitelného ekologického standardu hospodaření při zahrnutí i operací.
∑=
++=n
iiii NFjNMjNPTNPP
1
)( (9)
jNPTi = jednotkové náklady na práci strojů po provedení všech operací v rámci pěstebních technologií k plodinám.
Výpočet jednotkových nákladů pracovních operací k plodině jNPTi:
∑=
++=n
iiiii jNZPjSjEnOpjNPTi
1
)(* (10)
Náklady na provádění pěstebních technologií k plodinám zahrnutých do navržených oceňovacích typových struktur OTS se provádí na základě normativů dodaných ČZU:
nOpi = počet opakování i-té technologické operace v roce, jEi = normativní náklady spotřeby PHM u i-té technologické operace.
K dispozici je pro každou technologickou operaci sada normativů spotřeby pohonných hmot, které vyhovují různým půdním a terénním podmínkám hospodaření. Jednotkové náklady na spotřebované palivo jE jsou diferencovány na základě atributů svažitosti, výrobní oblasti a půdního typu na pozemku (l/ha)
jSi = jednotkové náklady soupravy používané při provádění i-té technologické operace
Výpočet jednotkových nákladů soupravy pro jednotlivé technologické operace k pěstebním technologiím každé plodiny jsou stanovené samostatně i pro těžké půdy. Výpočet akceptuje zvýšené náklady na mechanizaci v souvislosti s potřebou vybavení podniku na provedení prací v úzkém časovém rozpětí daném zpracovatelností půd. (Kč/ha)
Výpočet jednotkových nákladů soupravy jSi: jNosjNgsjNspsjNusjNasjSi ++++= (11)
Kde: jNas: amortizace stroje, jNus: zúročení stroje, jNsps: poplatky a pojištění stroje, jNgs : garážování stroje, jNos: údržbu a opravy stroje
Podklady k produkčním funkcím a vlivu předplodin Závislost na dávkách minerálního dusíku vychází z charakteristiky produkčních funkcí, ke kterým byly použity odběrové normativy výživy plodin (Klír J., Kunzová E., Čermák P. 2009) s vyhodnocením v práci Voltra (2011) – Tabulka 1.

393
Tabulka 1 Koeficienty produkčních funkcí závislosti výnosu na dávce dusíku
Konstanta Koeficient pro celkovou dávku dusíku (kg/ha)
Koeficient pro kvadrát celkové dávky dusíku
Pšenice ozimá 3,669 ,021 -3,52722E-05 Pšenice jarní 2,596 ,025 -5,85269E-05 Žito oz 3,303 ,015 -4,70739E-05 Ječmen oz 3,410 ,019 -3,18091E-05 Ječmen jarní 4,291 ,004 1,15111E-05 Oves 3,356 ,005 -5,39835E-06 Tritikále 2,835 ,027 -7,28541E-05 Řepka 2,713 ,004 -4,16336E-06 Mák ,760 ,002 -8,44505E-06 Brambory 11,682 ,249 -0,00079526 Cukrovka 34,146 ,121 -0,000297515 Kukuřice na siláž
34,979 ,023 -3,78968E-05
Kukuřice na zrno
3,866 ,078 -0,000156931
Vojtěška 35,992 ,006 -0,000261099 Jetel 25,962 ,077 -0,000171869
Vliv předplodiny je možno vyhodnotit na základě zjištěných dat projektu QH72257, vyjádřený v tabulce 2.
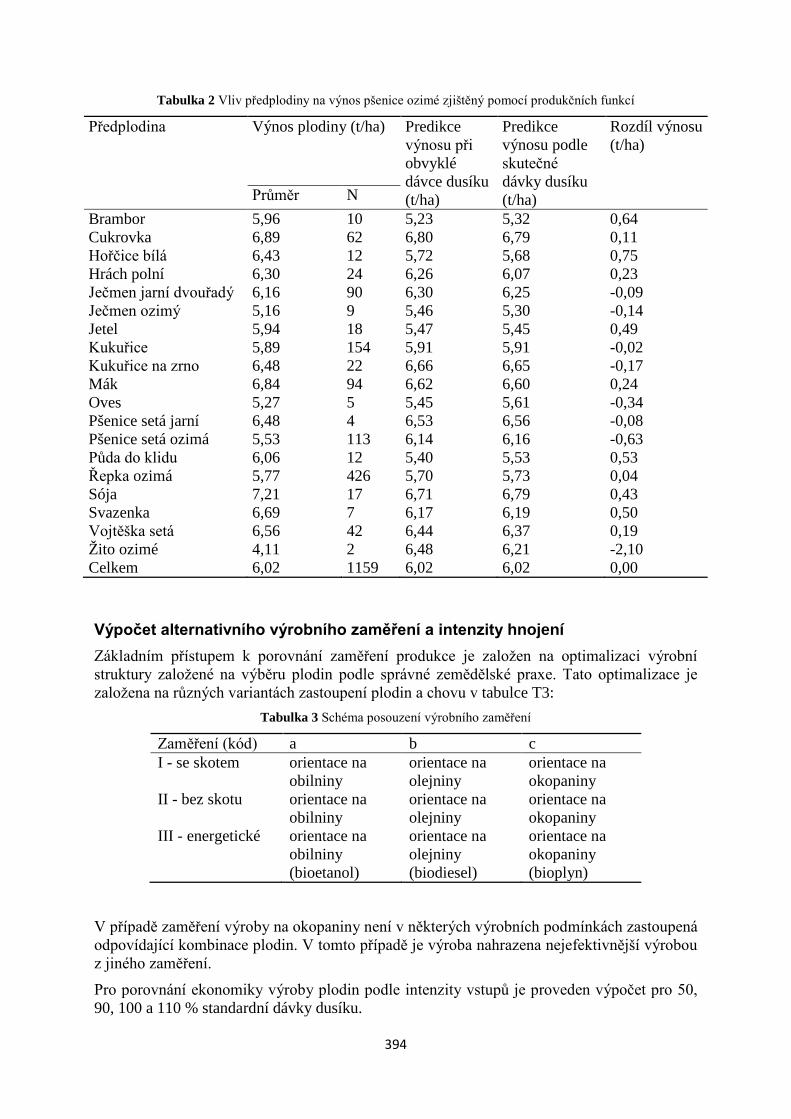
394
Tabulka 2 Vliv předplodiny na výnos pšenice ozimé zjištěný pomocí produkčních funkcí
Předplodina
Výnos plodiny (t/ha) Predikce výnosu při obvyklé dávce dusíku (t/ha)
Predikce výnosu podle skutečné dávky dusíku (t/ha)
Rozdíl výnosu (t/ha)
Průměr N Brambor 5,96 10 5,23 5,32 0,64 Cukrovka 6,89 62 6,80 6,79 0,11 Hořčice bílá 6,43 12 5,72 5,68 0,75 Hrách polní 6,30 24 6,26 6,07 0,23 Ječmen jarní dvouřadý 6,16 90 6,30 6,25 -0,09 Ječmen ozimý 5,16 9 5,46 5,30 -0,14 Jetel 5,94 18 5,47 5,45 0,49 Kukuřice 5,89 154 5,91 5,91 -0,02 Kukuřice na zrno 6,48 22 6,66 6,65 -0,17 Mák 6,84 94 6,62 6,60 0,24 Oves 5,27 5 5,45 5,61 -0,34 Pšenice setá jarní 6,48 4 6,53 6,56 -0,08 Pšenice setá ozimá 5,53 113 6,14 6,16 -0,63 Půda do klidu 6,06 12 5,40 5,53 0,53 Řepka ozimá 5,77 426 5,70 5,73 0,04 Sója 7,21 17 6,71 6,79 0,43 Svazenka 6,69 7 6,17 6,19 0,50 Vojtěška setá 6,56 42 6,44 6,37 0,19 Žito ozimé 4,11 2 6,48 6,21 -2,10 Celkem 6,02 1159 6,02 6,02 0,00
Výpočet alternativního výrobního zaměření a intenzity hnojení Základním přístupem k porovnání zaměření produkce je založen na optimalizaci výrobní struktury založené na výběru plodin podle správné zemědělské praxe. Tato optimalizace je založena na různých variantách zastoupení plodin a chovu v tabulce T3:
Tabulka 3 Schéma posouzení výrobního zaměření
Zaměření (kód) a b c I - se skotem orientace na
obilniny orientace na olejniny
orientace na okopaniny
II - bez skotu orientace na obilniny
orientace na olejniny
orientace na okopaniny
III - energetické orientace na obilniny (bioetanol)
orientace na olejniny (biodiesel)
orientace na okopaniny (bioplyn)
V případě zaměření výroby na okopaniny není v některých výrobních podmínkách zastoupená odpovídající kombinace plodin. V tomto případě je výroba nahrazena nejefektivnější výrobou z jiného zaměření.
Pro porovnání ekonomiky výroby plodin podle intenzity vstupů je proveden výpočet pro 50, 90, 100 a 110 % standardní dávky dusíku.
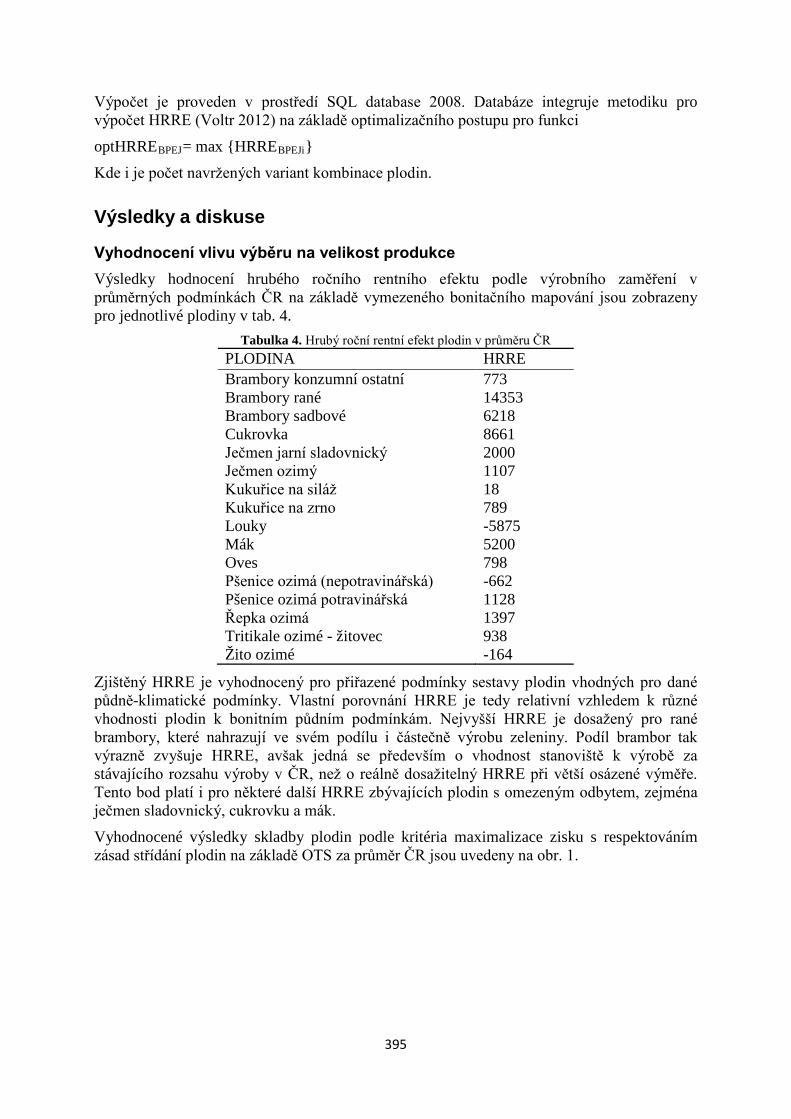
395
Výpočet je proveden v prostředí SQL database 2008. Databáze integruje metodiku pro výpočet HRRE (Voltr 2012) na základě optimalizačního postupu pro funkci
optHRREBPEJ= max {HRREBPEJi}
Kde i je počet navržených variant kombinace plodin.
Výsledky a diskuse
Vyhodnocení vlivu výběru na velikost produkce Výsledky hodnocení hrubého ročního rentního efektu podle výrobního zaměření v průměrných podmínkách ČR na základě vymezeného bonitačního mapování jsou zobrazeny pro jednotlivé plodiny v tab. 4.
Tabulka 4. Hrubý roční rentní efekt plodin v průměru ČR PLODINA HRRE Brambory konzumní ostatní 773 Brambory rané 14353 Brambory sadbové 6218 Cukrovka 8661 Ječmen jarní sladovnický 2000 Ječmen ozimý 1107 Kukuřice na siláž 18 Kukuřice na zrno 789 Louky -5875 Mák 5200 Oves 798 Pšenice ozimá (nepotravinářská) -662 Pšenice ozimá potravinářská 1128 Řepka ozimá 1397 Tritikale ozimé - žitovec 938 Žito ozimé -164
Zjištěný HRRE je vyhodnocený pro přiřazené podmínky sestavy plodin vhodných pro dané půdně-klimatické podmínky. Vlastní porovnání HRRE je tedy relativní vzhledem k různé vhodnosti plodin k bonitním půdním podmínkám. Nejvyšší HRRE je dosažený pro rané brambory, které nahrazují ve svém podílu i částečně výrobu zeleniny. Podíl brambor tak výrazně zvyšuje HRRE, avšak jedná se především o vhodnost stanoviště k výrobě za stávajícího rozsahu výroby v ČR, než o reálně dosažitelný HRRE při větší osázené výměře. Tento bod platí i pro některé další HRRE zbývajících plodin s omezeným odbytem, zejména ječmen sladovnický, cukrovku a mák.
Vyhodnocené výsledky skladby plodin podle kritéria maximalizace zisku s respektováním zásad střídání plodin na základě OTS za průměr ČR jsou uvedeny na obr. 1.
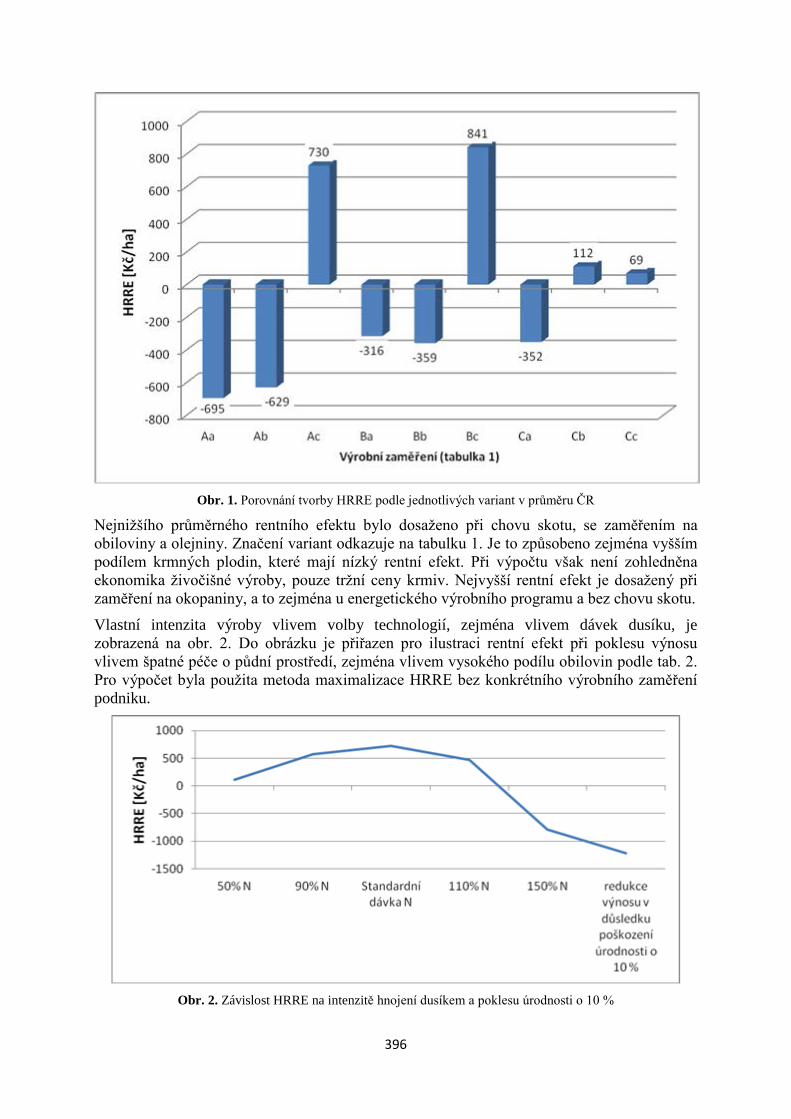
396
Obr. 1. Porovnání tvorby HRRE podle jednotlivých variant v průměru ČR
Nejnižšího průměrného rentního efektu bylo dosaženo při chovu skotu, se zaměřením na obiloviny a olejniny. Značení variant odkazuje na tabulku 1. Je to způsobeno zejména vyšším podílem krmných plodin, které mají nízký rentní efekt. Při výpočtu však není zohledněna ekonomika živočišné výroby, pouze tržní ceny krmiv. Nejvyšší rentní efekt je dosažený při zaměření na okopaniny, a to zejména u energetického výrobního programu a bez chovu skotu.
Vlastní intenzita výroby vlivem volby technologií, zejména vlivem dávek dusíku, je zobrazená na obr. 2. Do obrázku je přiřazen pro ilustraci rentní efekt při poklesu výnosu vlivem špatné péče o půdní prostředí, zejména vlivem vysokého podílu obilovin podle tab. 2. Pro výpočet byla použita metoda maximalizace HRRE bez konkrétního výrobního zaměření podniku.
Obr. 2. Závislost HRRE na intenzitě hnojení dusíkem a poklesu úrodnosti o 10 %
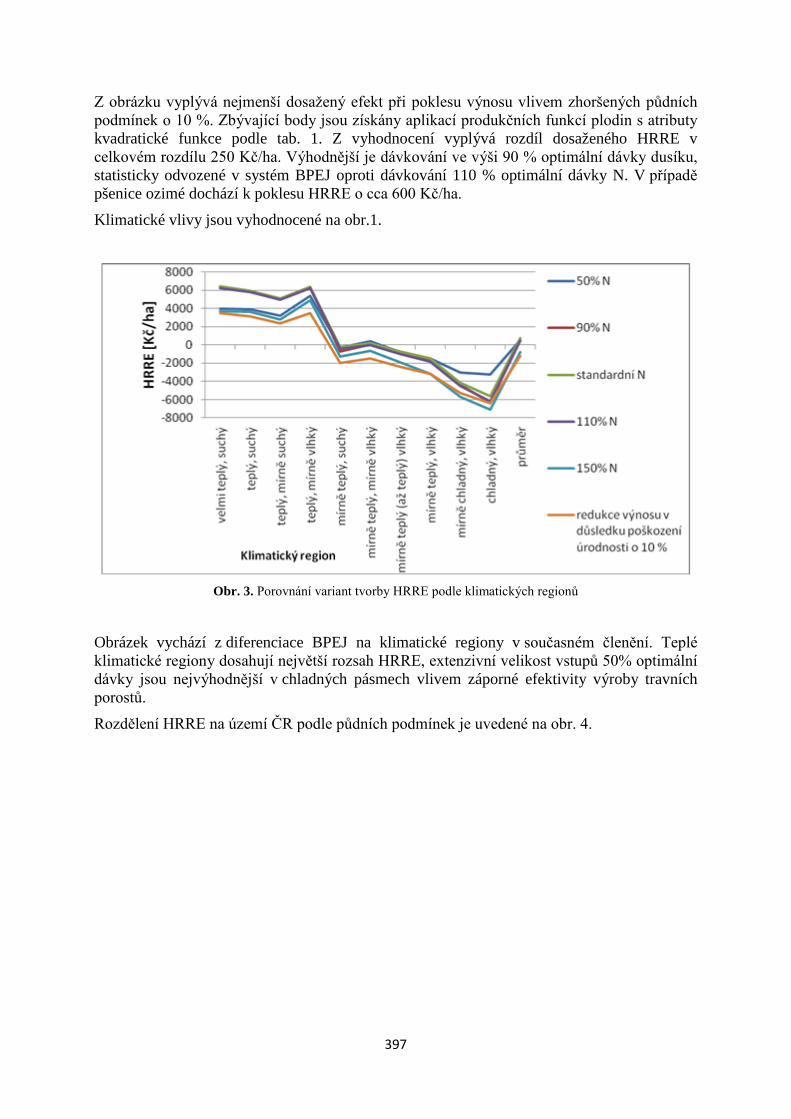
397
Z obrázku vyplývá nejmenší dosažený efekt při poklesu výnosu vlivem zhoršených půdních podmínek o 10 %. Zbývající body jsou získány aplikací produkčních funkcí plodin s atributy kvadratické funkce podle tab. 1. Z vyhodnocení vyplývá rozdíl dosaženého HRRE v celkovém rozdílu 250 Kč/ha. Výhodnější je dávkování ve výši 90 % optimální dávky dusíku, statisticky odvozené v systém BPEJ oproti dávkování 110 % optimální dávky N. V případě pšenice ozimé dochází k poklesu HRRE o cca 600 Kč/ha.
Klimatické vlivy jsou vyhodnocené na obr.1.
Obr. 3. Porovnání variant tvorby HRRE podle klimatických regionů
Obrázek vychází z diferenciace BPEJ na klimatické regiony v současném členění. Teplé klimatické regiony dosahují největší rozsah HRRE, extenzivní velikost vstupů 50% optimální dávky jsou nejvýhodnější v chladných pásmech vlivem záporné efektivity výroby travních porostů.
Rozdělení HRRE na území ČR podle půdních podmínek je uvedené na obr. 4.
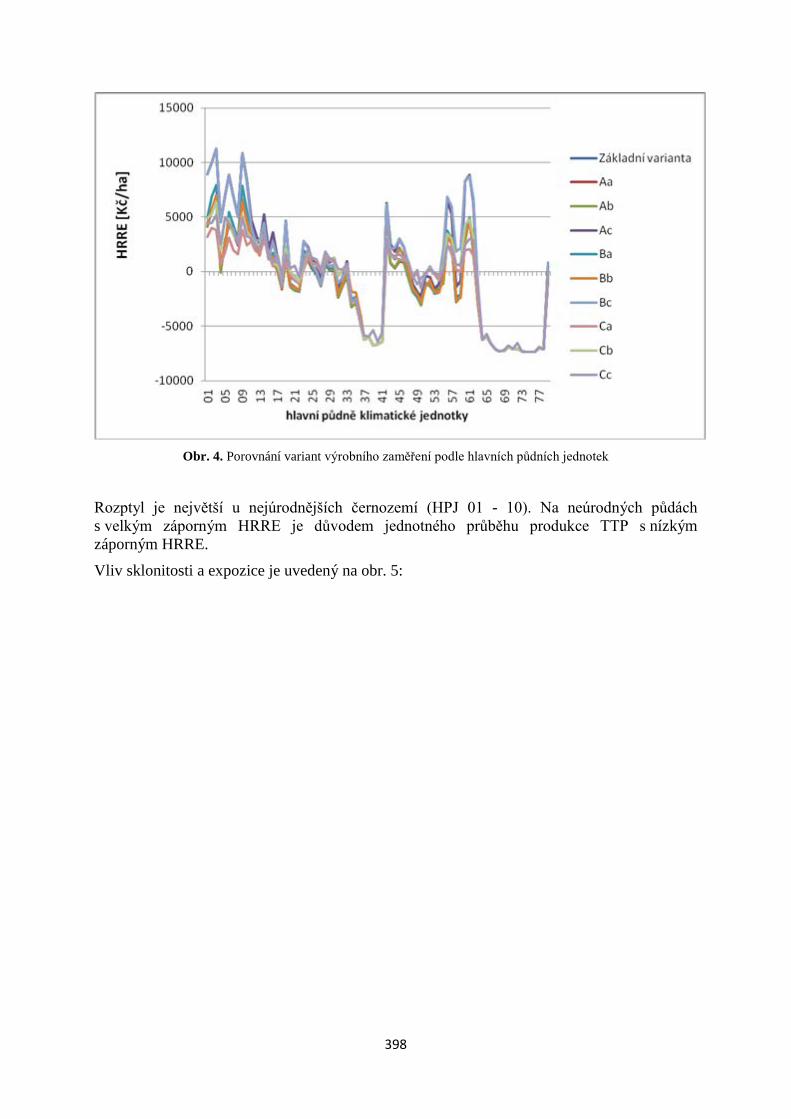
398
Obr. 4. Porovnání variant výrobního zaměření podle hlavních půdních jednotek
Rozptyl je největší u nejúrodnějších černozemí (HPJ 01 - 10). Na neúrodných půdách s velkým záporným HRRE je důvodem jednotného průběhu produkce TTP s nízkým záporným HRRE.
Vliv sklonitosti a expozice je uvedený na obr. 5:
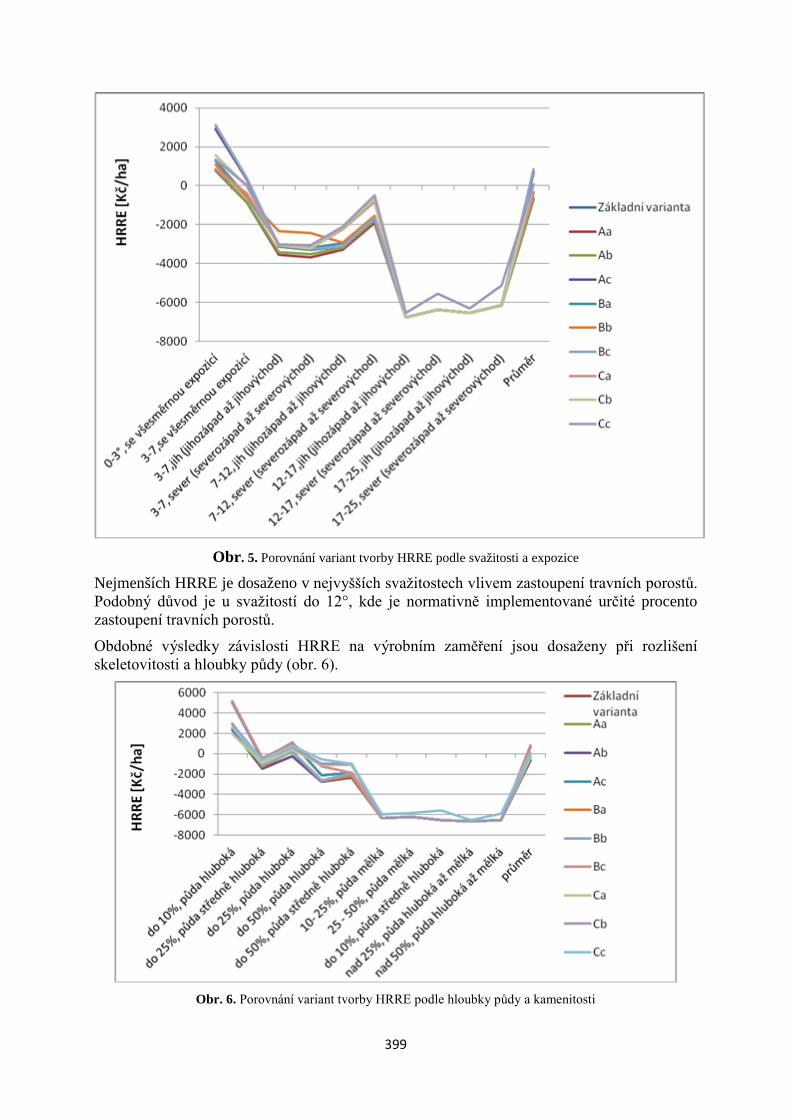
399
Obr. 5. Porovnání variant tvorby HRRE podle svažitosti a expozice
Nejmenších HRRE je dosaženo v nejvyšších svažitostech vlivem zastoupení travních porostů. Podobný důvod je u svažitostí do 12°, kde je normativně implementované určité procento zastoupení travních porostů.
Obdobné výsledky závislosti HRRE na výrobním zaměření jsou dosaženy při rozlišení skeletovitosti a hloubky půdy (obr. 6).
Obr. 6. Porovnání variant tvorby HRRE podle hloubky půdy a kamenitosti
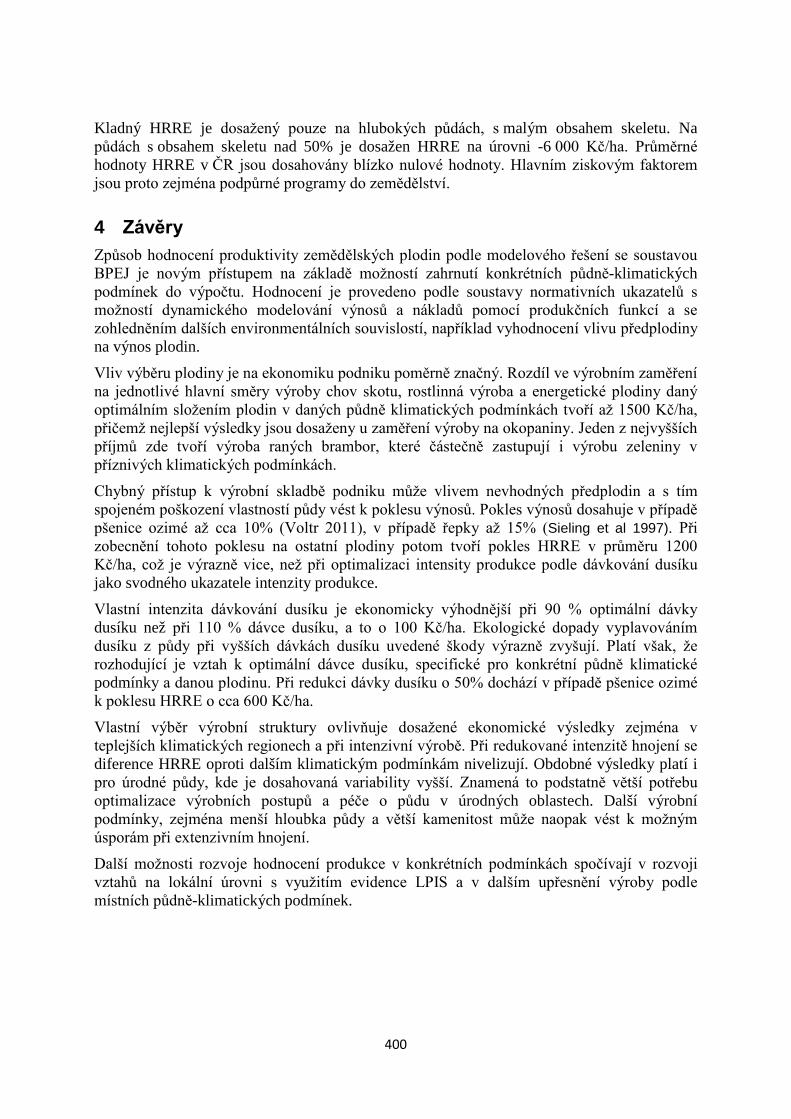
400
Kladný HRRE je dosažený pouze na hlubokých půdách, s malým obsahem skeletu. Na půdách s obsahem skeletu nad 50% je dosažen HRRE na úrovni -6 000 Kč/ha. Průměrné hodnoty HRRE v ČR jsou dosahovány blízko nulové hodnoty. Hlavním ziskovým faktorem jsou proto zejména podpůrné programy do zemědělství.
4 Závěry Způsob hodnocení produktivity zemědělských plodin podle modelového řešení se soustavou BPEJ je novým přístupem na základě možností zahrnutí konkrétních půdně-klimatických podmínek do výpočtu. Hodnocení je provedeno podle soustavy normativních ukazatelů s možností dynamického modelování výnosů a nákladů pomocí produkčních funkcí a se zohledněním dalších environmentálních souvislostí, například vyhodnocení vlivu předplodiny na výnos plodin.
Vliv výběru plodiny je na ekonomiku podniku poměrně značný. Rozdíl ve výrobním zaměření na jednotlivé hlavní směry výroby chov skotu, rostlinná výroba a energetické plodiny daný optimálním složením plodin v daných půdně klimatických podmínkách tvoří až 1500 Kč/ha, přičemž nejlepší výsledky jsou dosaženy u zaměření výroby na okopaniny. Jeden z nejvyšších příjmů zde tvoří výroba raných brambor, které částečně zastupují i výrobu zeleniny v příznivých klimatických podmínkách.
Chybný přístup k výrobní skladbě podniku může vlivem nevhodných předplodin a s tím spojeném poškození vlastností půdy vést k poklesu výnosů. Pokles výnosů dosahuje v případě pšenice ozimé až cca 10% (Voltr 2011), v případě řepky až 15% (Sieling et al 1997). Při zobecnění tohoto poklesu na ostatní plodiny potom tvoří pokles HRRE v průměru 1200 Kč/ha, což je výrazně vice, než při optimalizaci intensity produkce podle dávkování dusíku jako svodného ukazatele intenzity produkce.
Vlastní intenzita dávkování dusíku je ekonomicky výhodnější při 90 % optimální dávky dusíku než při 110 % dávce dusíku, a to o 100 Kč/ha. Ekologické dopady vyplavováním dusíku z půdy při vyšších dávkách dusíku uvedené škody výrazně zvyšují. Platí však, že rozhodující je vztah k optimální dávce dusíku, specifické pro konkrétní půdně klimatické podmínky a danou plodinu. Při redukci dávky dusíku o 50% dochází v případě pšenice ozimé k poklesu HRRE o cca 600 Kč/ha.
Vlastní výběr výrobní struktury ovlivňuje dosažené ekonomické výsledky zejména v teplejších klimatických regionech a při intenzivní výrobě. Při redukované intenzitě hnojení se diference HRRE oproti dalším klimatickým podmínkám nivelizují. Obdobné výsledky platí i pro úrodné půdy, kde je dosahovaná variability vyšší. Znamená to podstatně větší potřebu optimalizace výrobních postupů a péče o půdu v úrodných oblastech. Další výrobní podmínky, zejména menší hloubka půdy a větší kamenitost může naopak vést k možným úsporám při extenzivním hnojení.
Další možnosti rozvoje hodnocení produkce v konkrétních podmínkách spočívají v rozvoji vztahů na lokální úrovni s využitím evidence LPIS a v dalším upřesnění výroby podle místních půdně-klimatických podmínek.
401
Poděkování
Autoři děkují za podporu financování projektu NAZV – QH 72257 Hodnocení zemědělského půdního fondu se zohledněním ochrany životního prostředí.
Literatura Dabbert S. (1994),: Ekonomik der Fruchtbarkeit (Economic Fertility). Stuttgart: Ulmer; 201 p.
Sieling, K., Christen, O. Nemati, B., Hanus H. (1997): Effects of previous cropping on seed yield and yield components of oil-seed rape (Brassica napus L.) European Journal of Agronomy, Volume 6, Issues 3–4, May Pages 215-223
Mullen J. D., Wetzstein M. E., Bergstrom J. C. (2013): The impacts of crop yield and price volatility on producers’ cropping patterns: A dynamic optimal crop rotation model. Agricultural systems 116., March, p. 52 – 59
de Wit, C.T. , van Keulen H. (1987),: Modelling production of field crops and its requirements. Geoderma, Volume 40, Issues 3–4, P. 253-265
Gandorfer M. − Pannell D. − Meyer-Aurich A. (2011): Analyzing the effects of risk and uncertainty on optimal tillage and nitrogen fertilizer intensity for field crops in Germany. Agricultural Systems, Volume 104, Issue 8, p. 615–622.
Van Ittersum, M.K., Ewert, F., Heckelei, T., Wery, J., Alkan Olsson, J., Andersen, E., Bezlepkina, I., Brouwer, F., Donatelli, M., Flichman, G., Olsson, L., Rizzoli, A., Van der Wal, T., Wien, J.E., Wolf, J. (2008): Integrated assessment of agricultural systems – A component-based framework for the European Union (SEAMLESS). Agricultural Systems 96, s. 150-165.
Thünen, J., H. Von (1930): der isolierte staat in beziehung auf landwirtschaft und nationalökonomie. 3 volumes : Fischer, Jena, Germany.
Klečka, M. et al. (1989): bonitace čs. Zemědělských půd a směry jejich využití (valuation of czech soils and trends of their use). 3. Part, Praha – Bratislava 195 s.
Klír, J., Kunzová, E., Čermák p. (2009): Bilancování rostlinných živin. Výzkumný ústav rostlinné výroby, v.v.i., Praha, Metodika schválena ministerstvem zemědělství ČR č.j. 49012/2007-17220.
Voltr, V. et al. (2011): Hodnocení půdy v podmínkách ochrany životního prostředí. (Evaluation of land in terms the context of environmental protection). Prague: ÚZEI, 480 p.
Voltr, V., Hruška, M., Šařec, P., Leština J., Froněk P.: Metodika ocenění půdy pro bonitované půdně-ekologické jednotky (certifikovaná metodika). ÚZEI 2012, 19 s , 21 příloh
Abstrakt: V článku je popsaný způsob hodnocení produkce podle výrobního zaměření. K tomuto účelu jsou použity vhodné sestavy plodin v daných půdně-klimatických podmínkách zejména z agronomického hlediska a z hlediska ochrany životního prostředí. Dosažitelný zisk z hlediska konkrétních zaměření se liší až o 1500 Kč/ha. Práce obsahuje analýzu příjmů ze zemědělské půdy, pokud jde o zaměření výroby na obiloviny, olejniny a chov dobytka. Je analyzována hodnot výnosů na zemědělské půdě prostřednictvím systému BPEJ. Základním podkladem je certifikovaná metodika výpočtu hrubého ročního rentního efektu, pro konkrétní hodnoty vstupů živin, přípravků na ochranu rostlin a náklady na technologie. V modelu jsou očištěné výnosy a náklady zemědělských plodin podle aktuálního vývoje cen a nákladů. V práci jsou rovněž vyhodnoceny ztráty hrubého ročního rentního efektu způsobené chybným sledem plodin, zejména

402
na základě snížených výnosů. Dosažený pokles hrubého ročního rentního efektu z důvodu nevhodného sledu plodin je až 1900 Kč/ha. Souvislosti s ochranou životního prostředí jsou vyhodnoceny na základě produkční funkce plodin pro dávky dusíku 50, 90, 100, 110 % standardní dávky dusíku v daných půdně klimatických podmínkách. Dopad redukce dávky dusíku o 50 % na velikost hrubého ročního rentního efektu je v případě pšenice ozimé v průměru 600 Kč/ha. Vlastní výběr výrobní struktury ovlivňuje dosažené ekonomické výsledky zejména v teplejších klimatických regionech a při intenzivní výrobě.
Key words: crop production, yield, costs, nitrate, production function, winter wheat
JEL classification: Q01, Q16, Q24, Q51, Q56
403
Financial reporting of environmental and social aspects in business practice
Účetní výkaznictví environmentálních a sociálních aspektů
v podnikové praxi
Jitka Zborková, Jana Hinke Katedra financí a účetnictví, Ekonomická fakulta, Západočeská univerzita v Plzni,
Husova 11, 306 14 Plzeň [email protected], [email protected]
Annotation: If an enterprise provides a sustainable development as its strategic goal must address the question of how to measure corporate sustainability, how to it really achieved, but also how to it effectively manage. It is necessary to collect, record, analyze and disseminate relevant information about the environmental and social performance and their impact on the economic performance of the enterprise. It is important that these needs were adapted by an accounting system, which should render the economic consequences of environmental and social aspects of the business. The theoretical framework of this paper is based on a comparison of theses various authors in the accounting for sustainable business development. The paper will mainly present the results of research on financial reporting of environmental and social aspects of the business environment in the Czech Republic. Based on research consists of a questionnaire survey carried out on a sample of 100 enterprises of different sizes Pilsen, Karlovy Vary and South Region. A questionnaire survey were investigated methods reporting environmental and social aspects of business and ways of monitoring environmental benefits and costs in the accounting system of enterprises Czech Republic. The respondents' answers were statistically analyzed and are presented both verbally and graphically. The results of the survey provide interesting findings in the category of small and medium enterprises, and large enterprises.
Key words: Reporting, enterprise, development, sustainability, questionnaire, accounting
JEL classification: M 41
1 Úvod Motto:
„We do not inherit the Earth from our ancestors, we borrow it from our children.“ Antoine de Saint Exupéry
Příspěvek se zabývá problematikou udržitelného rozvoje na podnikové úrovni. Koncept udržitelného rozvoje byl nejprve diskutován a postupně implementován na makroekonomické úrovni jako reakce na akcelerující problémy se spotřebou neobnovitelných zdrojů, narůstajícím znečištěním životního prostředí a globálními problémy světa, které jsou na lokální úrovni neřešitelné.
V současné době je koncept udržitelného rozvoje považován za fenomén 21. století, neboť současné spotřební a výrobní vzorce jsou přinejmenším z dlouhodobého hlediska považovány za neudržitelné. V dnešní době podniky často implementují dobrovolné environmentální nástroje, vytváří a hlásí se k etickým kodexům v environmentální i sociální oblasti, které svou činností ovlivňují, přijímají tzv. principy společensky odpovědné firmy. Z tohoto pohledu se příspěvek koncentruje nejen na problematiku podnikání v souladu s principy udržitelného rozvoje, ale analyzuje tuto oblast také ve vztahu k těmto dobrovolně zaváděným aktivitám.
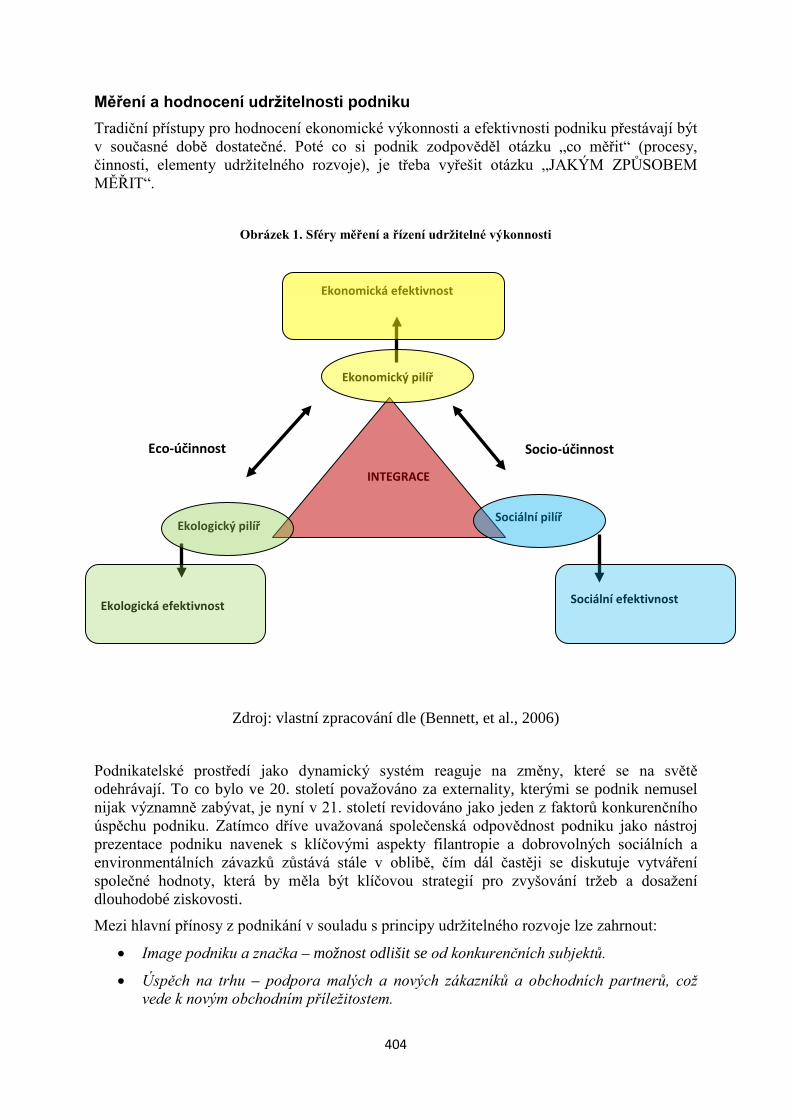
404
Měření a hodnocení udržitelnosti podniku Tradiční přístupy pro hodnocení ekonomické výkonnosti a efektivnosti podniku přestávají být v současné době dostatečné. Poté co si podnik zodpověděl otázku „co měřit“ (procesy, činnosti, elementy udržitelného rozvoje), je třeba vyřešit otázku „JAKÝM ZPŮSOBEM MĚŘIT“.
Obrázek 1. Sféry měření a řízení udržitelné výkonnosti
Zdroj: vlastní zpracování dle (Bennett, et al., 2006)
Podnikatelské prostředí jako dynamický systém reaguje na změny, které se na světě odehrávají. To co bylo ve 20. století považováno za externality, kterými se podnik nemusel nijak významně zabývat, je nyní v 21. století revidováno jako jeden z faktorů konkurenčního úspěchu podniku. Zatímco dříve uvažovaná společenská odpovědnost podniku jako nástroj prezentace podniku navenek s klíčovými aspekty filantropie a dobrovolných sociálních a environmentálních závazků zůstává stále v oblibě, čím dál častěji se diskutuje vytváření společné hodnoty, která by měla být klíčovou strategií pro zvyšování tržeb a dosažení dlouhodobé ziskovosti.
Mezi hlavní přínosy z podnikání v souladu s principy udržitelného rozvoje lze zahrnout:
• Image podniku a značka – možnost odlišit se od konkurenčních subjektů.
• Úspěch na trhu – podpora malých a nových zákazníků a obchodních partnerů, což vede k novým obchodním příležitostem.
Ekonomická efektivnost
Ekologická efektivnost Sociální efektivnost
Ekonomický pilíř
Ekologický pilíř Sociální pilíř
INTEGRACE
Eco-účinnost
Socio-účinnost
405
• Úspora nákladů – ochrana životního prostředí, zdraví zaměstnanců, bezpečnostní management, to vše vede v konečném důsledku k úspoře nákladů.
Zavedení komplexního systému pro měření, hodnocení a řízení podnikání v souladu s principy udržitelného rozvoje zahrnuje dva základní předpoklady. Prvním je závazek ze strany vedení podniku, ovšem ne ve smyslu udržitelnosti jako další aktivity, které se podnik účastní. Musí se jednat o nový způsob podnikání, který ovlivní všechny klíčové procesy a činnosti. Druhým předpokladem je zahrnutí environmentálních a sociálních cílů jako faktorů tvorby přidané hodnoty, tudíž jako klíčových ukazatelů finanční výkonnosti.
Jako příklad komplexních systémů pro měření, řízení a hodnocení podnikání v souladu s principy udržitelného rozvoje je dále prezentován systém EVAS (EXPANDED VALUE ADDED STATEMEN): jedná se o model, který propojuje jednotlivé pilíře udržitelného rozvoje. Dává do souvislosti ekonomickou výkonnost, environmentální profil a sociální výkonnost podniku.
Obecně je přidaná hodnota představována rozdílem mezi tržní hodnotou podnikových produktů a náklady na tyto produkty, které byly nakoupeny od třetích subjektů a zaměřuje se na finanční informace. V tomto případě jsou brány v úvahu i environmentální a sociální dopady podnikových činností, které tento tradiční výkaz doplňují a rozšiřují.
Pro sestavení výkazu EVAS je třeba vzít v úvahu přímé a nepřímé výstupy a dopady podnikových činností. Nepřímé výstupy a dopady jsou dále členěny, zda mají účinky na zákazníky či ostatní stakeholdery. Při konstrukci výkazu je nejprve třeba určit přidanou hodnotu, která uvažuje i environmentální a sociální dopady podnikových činností, a poté je třeba rozdělit přidanou hodnotu jednotlivým stakeholderům.
Výhody tohoto výkazu lze shrnout následovně.
• Prezentace dopadů podnikových činností na stakeholdery.
• Role podniku při tvorbě ekonomické, environmentální a sociální hodnoty.
• Propojení jednotlivých dimenzí udržitelného rozvoje. Nevýhody tohoto výkazu zahrnují především:
• Stanovení položek, které budou součástí tohoto výkazu a zvolit metodu jejich ocenění.
• Identifikace a kvantifikace hodnoty klíčových environmentálních a sociálních indikátorů.
• Určení hodnot odečítaných od podnikových vstupů (negativní dopady) (Hyršlová, 2009).
Přidaná hodnota = Obchodní marže + Výkony – Výkonová spotřeba
Přidaná hodnota = Osobní náklady + Úroky + Odpisy + Dividendy + Daň z příjmu + Nerozdělený zisk
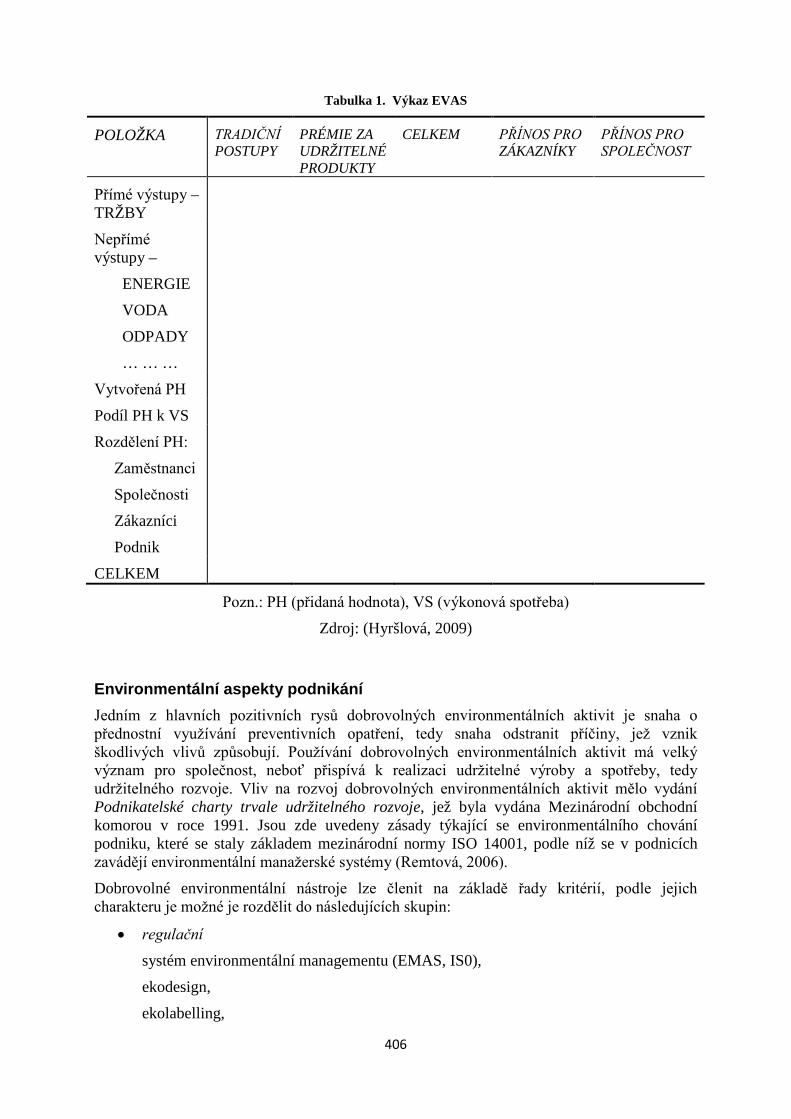
406
Tabulka 1. Výkaz EVAS
POLOŽKA TRADIČNÍ POSTUPY
PRÉMIE ZA UDRŽITELNÉ PRODUKTY
CELKEM PŘÍNOS PRO ZÁKAZNÍKY
PŘÍNOS PRO SPOLEČNOST
Přímé výstupy – TRŽBY
Nepřímé výstupy –
ENERGIE
VODA
ODPADY
… … …
Vytvořená PH
Podíl PH k VS
Rozdělení PH:
Zaměstnanci
Společnosti
Zákazníci
Podnik
CELKEM
Pozn.: PH (přidaná hodnota), VS (výkonová spotřeba)
Zdroj: (Hyršlová, 2009)
Environmentální aspekty podnikání Jedním z hlavních pozitivních rysů dobrovolných environmentálních aktivit je snaha o přednostní využívání preventivních opatření, tedy snaha odstranit příčiny, jež vznik škodlivých vlivů způsobují. Používání dobrovolných environmentálních aktivit má velký význam pro společnost, neboť přispívá k realizaci udržitelné výroby a spotřeby, tedy udržitelného rozvoje. Vliv na rozvoj dobrovolných environmentálních aktivit mělo vydání Podnikatelské charty trvale udržitelného rozvoje, jež byla vydána Mezinárodní obchodní komorou v roce 1991. Jsou zde uvedeny zásady týkající se environmentálního chování podniku, které se staly základem mezinárodní normy ISO 14001, podle níž se v podnicích zavádějí environmentální manažerské systémy (Remtová, 2006).
Dobrovolné environmentální nástroje lze členit na základě řady kritérií, podle jejich charakteru je možné je rozdělit do následujících skupin:
• regulační systém environmentální managementu (EMAS, IS0),
ekodesign,
ekolabelling,
407
dobrovolné dohody,
jednostranné závazky, …
• informační hodnocení životního cyklu produktu,
čistší produkce,
environmentální účetnictví,
environmentální benchmarking, …
• vzdělávací školení,
informační semináře, … (Remtová, 2006)
Účelem aplikace regulačních nástrojů je snížení negativních vlivů podniku na životní prostředí, tedy snížení celkového negativního dopadu podniku na životní prostředí. Oproti tomu informační nástroje jsou podnikem využívány k získání nebo k poskytnutí informací o vlastních vlivech na životní prostředí. Smyslem vzdělávacích nástrojů je vychovat subjekty chápající problematiku životního prostředí a probudit v nich vědomí odpovědnosti za stávající podobu a stav životního prostředí. Hlavním cílem je dosažení změny v chování subjektů k životnímu prostředí. Z hlediska podniku patří mezi tyto nástroje především školení zaměřená na ochranu životního prostředí.
Sociální aspekty v podnikové praxi Za sociálně odpovědné podniky můžeme považovat podniky, které dobrovolně berou v úvahu environmentální a sociální aspekty a začleňují je do svých strategií a aktivit, jakými jsou například:
• péče o zdraví, bezpečnost a celkový prospěch zaměstnanců, zákazníků a obchodních partnerů;
• motivování zaměstnanců odborným vzděláváním a možnostmi rozvoje;
• zaměstnávání zdravotně postižených pracovníků;
• pozornost věnovaná přírodním zdrojů, které podniky při své činnosti využívají;
• kritéria uplatňovaná při investičním rozhodování a výběru dodavatelského řetězce. Vedle velkých společností se na sociálně odpovědných činnostech podílejí i malé podniky, přičemž si obvykle ne zcela uvědomují hodnotu a potenciál svých postupů a činností (EC, 2011). Neustále narůstající tlak v globálním prostředí podniku vede k dobrovolnému přijímání závazků a snaze respektovat a naplňovat očekávání stakeholderů, a to nejen za účelem tvorby společné hodnoty, ale i s předpokladem vyšší konkurenceschopnosti podniku. Té může být dosaženo přímo, například prostřednictví růstu tržeb od spokojených zákazníků, či nepřímo, například na základě pozitivního vlivu na image a reputaci podniku.
Jedním ze zásadních problémů při měření, hodnocení a řízení podnikové společenské výkonnosti je neporozumění pojmu „společenský“ a také nekonzistentní používání pojmů výkon, výstup, výsledek, dopad a efekt. Následující tabulka uvádí přehled nejčastěji používaných definic v souvislosti se sociální stránkou podnikání.
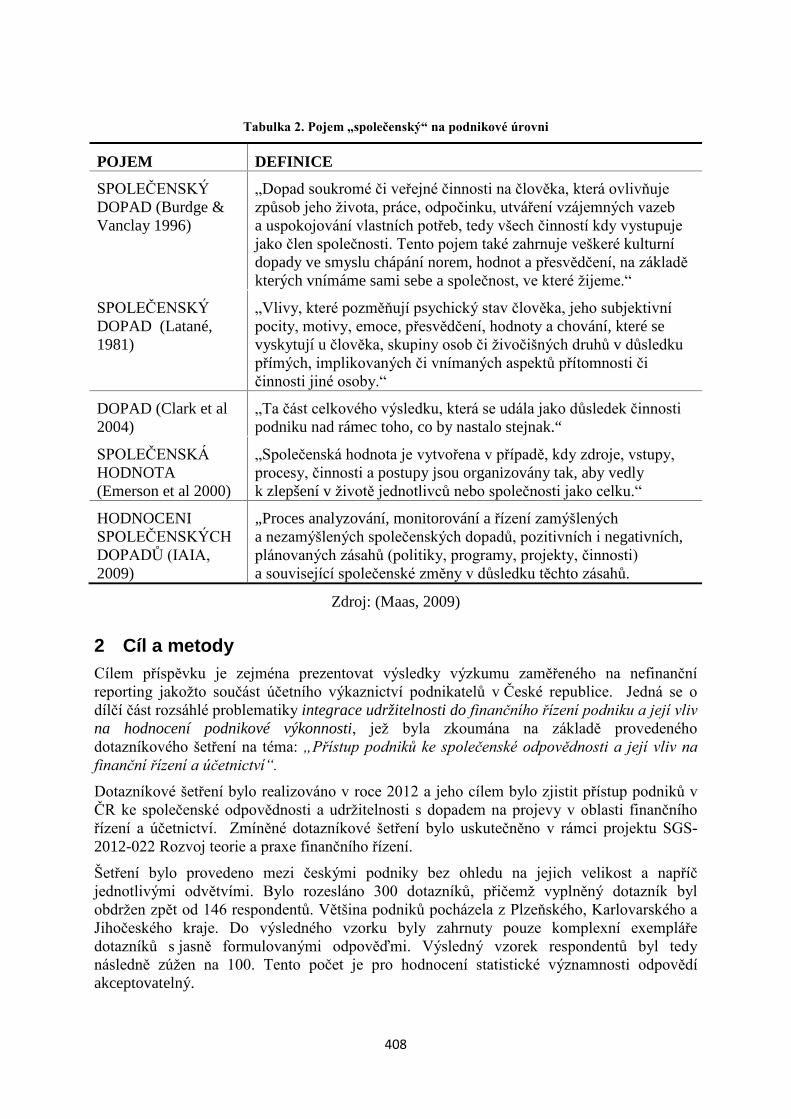
408
Tabulka 2. Pojem „společenský“ na podnikové úrovni
POJEM DEFINICE
SPOLEČENSKÝ DOPAD (Burdge & Vanclay 1996)
„Dopad soukromé či veřejné činnosti na člověka, která ovlivňuje způsob jeho života, práce, odpočinku, utváření vzájemných vazeb a uspokojování vlastních potřeb, tedy všech činností kdy vystupuje jako člen společnosti. Tento pojem také zahrnuje veškeré kulturní dopady ve smyslu chápání norem, hodnot a přesvědčení, na základě kterých vnímáme sami sebe a společnost, ve které žijeme.“
SPOLEČENSKÝ DOPAD (Latané, 1981)
„Vlivy, které pozměňují psychický stav člověka, jeho subjektivní pocity, motivy, emoce, přesvědčení, hodnoty a chování, které se vyskytují u člověka, skupiny osob či živočišných druhů v důsledku přímých, implikovaných či vnímaných aspektů přítomnosti či činnosti jiné osoby.“
DOPAD (Clark et al 2004)
„Ta část celkového výsledku, která se udála jako důsledek činnosti podniku nad rámec toho, co by nastalo stejnak.“
SPOLEČENSKÁ HODNOTA (Emerson et al 2000)
„Společenská hodnota je vytvořena v případě, kdy zdroje, vstupy, procesy, činnosti a postupy jsou organizovány tak, aby vedly k zlepšení v životě jednotlivců nebo společnosti jako celku.“
HODNOCENI SPOLEČENSKÝCH DOPADŮ (IAIA, 2009)
„Proces analyzování, monitorování a řízení zamýšlených a nezamýšlených společenských dopadů, pozitivních i negativních, plánovaných zásahů (politiky, programy, projekty, činnosti) a související společenské změny v důsledku těchto zásahů.
Zdroj: (Maas, 2009)
2 Cíl a metody Cílem příspěvku je zejména prezentovat výsledky výzkumu zaměřeného na nefinanční reporting jakožto součást účetního výkaznictví podnikatelů v České republice. Jedná se o dílčí část rozsáhlé problematiky integrace udržitelnosti do finančního řízení podniku a její vliv na hodnocení podnikové výkonnosti, jež byla zkoumána na základě provedeného dotazníkového šetření na téma: „Přístup podniků ke společenské odpovědnosti a její vliv na finanční řízení a účetnictví“. Dotazníkové šetření bylo realizováno v roce 2012 a jeho cílem bylo zjistit přístup podniků v ČR ke společenské odpovědnosti a udržitelnosti s dopadem na projevy v oblasti finančního řízení a účetnictví. Zmíněné dotazníkové šetření bylo uskutečněno v rámci projektu SGS-2012-022 Rozvoj teorie a praxe finančního řízení.
Šetření bylo provedeno mezi českými podniky bez ohledu na jejich velikost a napříč jednotlivými odvětvími. Bylo rozesláno 300 dotazníků, přičemž vyplněný dotazník byl obdržen zpět od 146 respondentů. Většina podniků pocházela z Plzeňského, Karlovarského a Jihočeského kraje. Do výsledného vzorku byly zahrnuty pouze komplexní exempláře dotazníků s jasně formulovanými odpověďmi. Výsledný vzorek respondentů byl tedy následně zúžen na 100. Tento počet je pro hodnocení statistické významnosti odpovědí akceptovatelný.
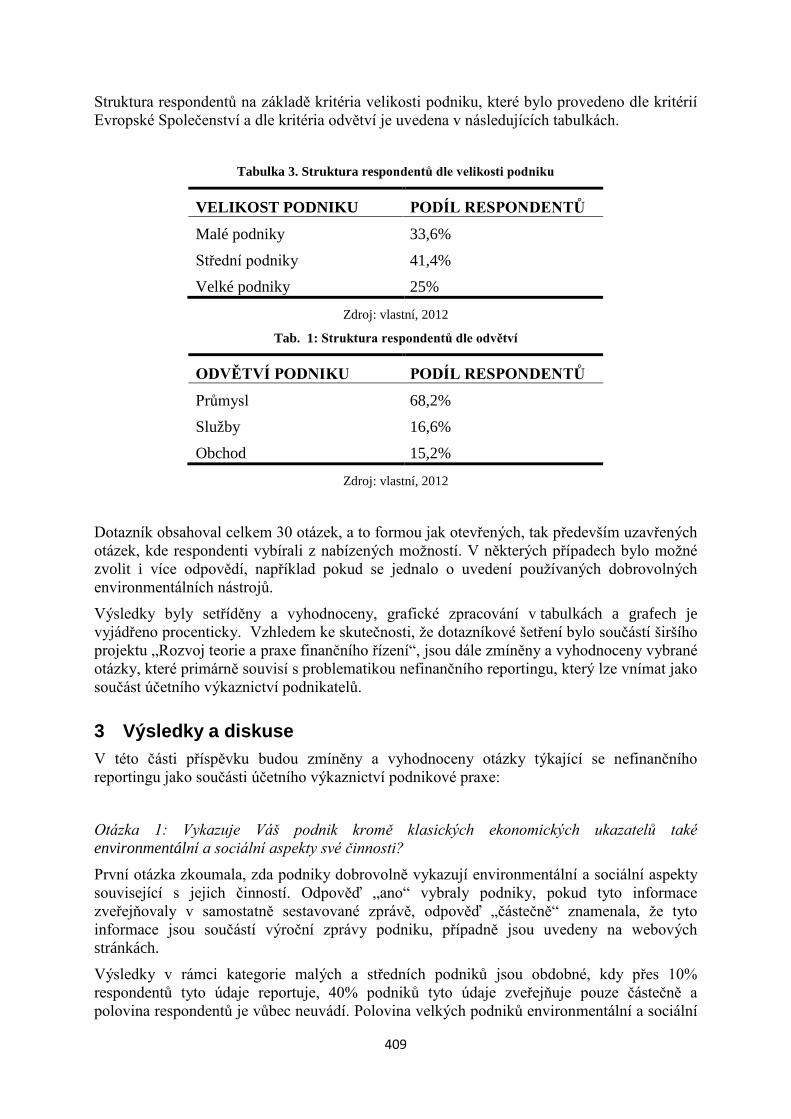
409
Struktura respondentů na základě kritéria velikosti podniku, které bylo provedeno dle kritérií Evropské Společenství a dle kritéria odvětví je uvedena v následujících tabulkách.
Tabulka 3. Struktura respondentů dle velikosti podniku
VELIKOST PODNIKU PODÍL RESPONDENTŮ
Malé podniky 33,6%
Střední podniky 41,4%
Velké podniky 25%
Zdroj: vlastní, 2012
Tab. 1: Struktura respondentů dle odvětví
ODVĚTVÍ PODNIKU PODÍL RESPONDENTŮ
Průmysl 68,2%
Služby 16,6%
Obchod 15,2%
Zdroj: vlastní, 2012
Dotazník obsahoval celkem 30 otázek, a to formou jak otevřených, tak především uzavřených otázek, kde respondenti vybírali z nabízených možností. V některých případech bylo možné zvolit i více odpovědí, například pokud se jednalo o uvedení používaných dobrovolných environmentálních nástrojů.
Výsledky byly setříděny a vyhodnoceny, grafické zpracování v tabulkách a grafech je vyjádřeno procenticky. Vzhledem ke skutečnosti, že dotazníkové šetření bylo součástí širšího projektu „Rozvoj teorie a praxe finančního řízení“, jsou dále zmíněny a vyhodnoceny vybrané otázky, které primárně souvisí s problematikou nefinančního reportingu, který lze vnímat jako součást účetního výkaznictví podnikatelů.
3 Výsledky a diskuse V této části příspěvku budou zmíněny a vyhodnoceny otázky týkající se nefinančního reportingu jako součásti účetního výkaznictví podnikové praxe:
Otázka 1: Vykazuje Váš podnik kromě klasických ekonomických ukazatelů také environmentální a sociální aspekty své činnosti? První otázka zkoumala, zda podniky dobrovolně vykazují environmentální a sociální aspekty související s jejich činností. Odpověď „ano“ vybraly podniky, pokud tyto informace zveřejňovaly v samostatně sestavované zprávě, odpověď „částečně“ znamenala, že tyto informace jsou součástí výroční zprávy podniku, případně jsou uvedeny na webových stránkách.
Výsledky v rámci kategorie malých a středních podniků jsou obdobné, kdy přes 10% respondentů tyto údaje reportuje, 40% podniků tyto údaje zveřejňuje pouze částečně a polovina respondentů je vůbec neuvádí. Polovina velkých podniků environmentální a sociální
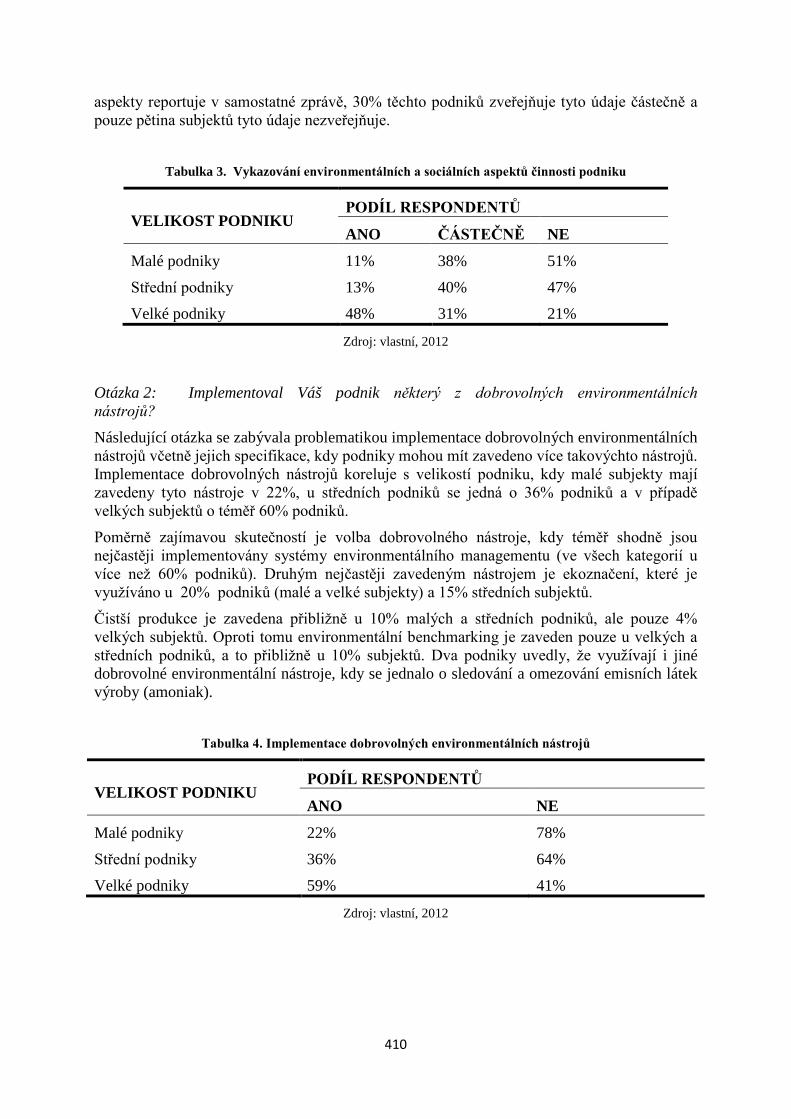
410
aspekty reportuje v samostatné zprávě, 30% těchto podniků zveřejňuje tyto údaje částečně a pouze pětina subjektů tyto údaje nezveřejňuje.
Tabulka 3. Vykazování environmentálních a sociálních aspektů činnosti podniku
VELIKOST PODNIKU PODÍL RESPONDENTŮ
ANO ČÁSTEČNĚ NE
Malé podniky 11% 38% 51%
Střední podniky 13% 40% 47%
Velké podniky 48% 31% 21%
Zdroj: vlastní, 2012
Otázka 2: Implementoval Váš podnik některý z dobrovolných environmentálních nástrojů? Následující otázka se zabývala problematikou implementace dobrovolných environmentálních nástrojů včetně jejich specifikace, kdy podniky mohou mít zavedeno více takovýchto nástrojů. Implementace dobrovolných nástrojů koreluje s velikostí podniku, kdy malé subjekty mají zavedeny tyto nástroje v 22%, u středních podniků se jedná o 36% podniků a v případě velkých subjektů o téměř 60% podniků.
Poměrně zajímavou skutečností je volba dobrovolného nástroje, kdy téměř shodně jsou nejčastěji implementovány systémy environmentálního managementu (ve všech kategorií u více než 60% podniků). Druhým nejčastěji zavedeným nástrojem je ekoznačení, které je využíváno u 20% podniků (malé a velké subjekty) a 15% středních subjektů.
Čistší produkce je zavedena přibližně u 10% malých a středních podniků, ale pouze 4% velkých subjektů. Oproti tomu environmentální benchmarking je zaveden pouze u velkých a středních podniků, a to přibližně u 10% subjektů. Dva podniky uvedly, že využívají i jiné dobrovolné environmentální nástroje, kdy se jednalo o sledování a omezování emisních látek výroby (amoniak).
Tabulka 4. Implementace dobrovolných environmentálních nástrojů
VELIKOST PODNIKU PODÍL RESPONDENTŮ
ANO NE
Malé podniky 22% 78%
Střední podniky 36% 64%
Velké podniky 59% 41%
Zdroj: vlastní, 2012
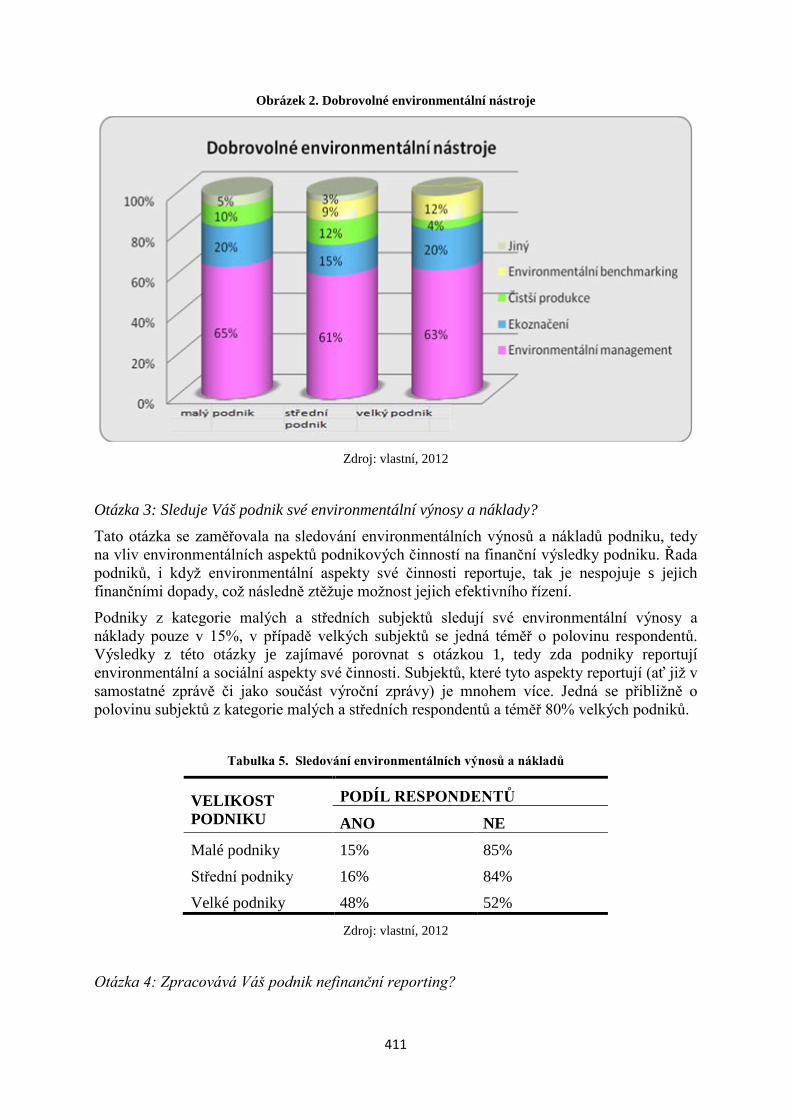
411
Obrázek 2. Dobrovolné environmentální nástroje
Zdroj: vlastní, 2012
Otázka 3: Sleduje Váš podnik své environmentální výnosy a náklady? Tato otázka se zaměřovala na sledování environmentálních výnosů a nákladů podniku, tedy na vliv environmentálních aspektů podnikových činností na finanční výsledky podniku. Řada podniků, i když environmentální aspekty své činnosti reportuje, tak je nespojuje s jejich finančními dopady, což následně ztěžuje možnost jejich efektivního řízení.
Podniky z kategorie malých a středních subjektů sledují své environmentální výnosy a náklady pouze v 15%, v případě velkých subjektů se jedná téměř o polovinu respondentů. Výsledky z této otázky je zajímavé porovnat s otázkou 1, tedy zda podniky reportují environmentální a sociální aspekty své činnosti. Subjektů, které tyto aspekty reportují (ať již v samostatné zprávě či jako součást výroční zprávy) je mnohem více. Jedná se přibližně o polovinu subjektů z kategorie malých a středních respondentů a téměř 80% velkých podniků.
Tabulka 5. Sledování environmentálních výnosů a nákladů
VELIKOST PODNIKU
PODÍL RESPONDENTŮ
ANO NE
Malé podniky 15% 85%
Střední podniky 16% 84%
Velké podniky 48% 52%
Zdroj: vlastní, 2012
Otázka 4: Zpracovává Váš podnik nefinanční reporting?
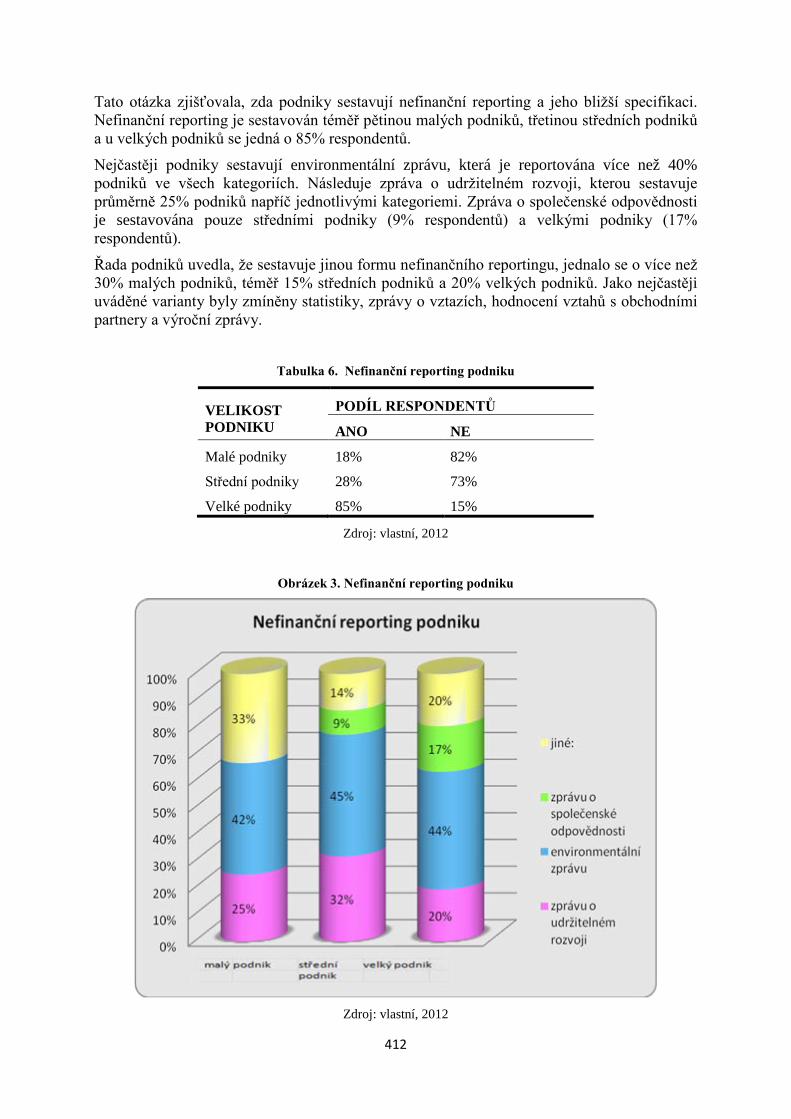
412
Tato otázka zjišťovala, zda podniky sestavují nefinanční reporting a jeho bližší specifikaci. Nefinanční reporting je sestavován téměř pětinou malých podniků, třetinou středních podniků a u velkých podniků se jedná o 85% respondentů.
Nejčastěji podniky sestavují environmentální zprávu, která je reportována více než 40% podniků ve všech kategoriích. Následuje zpráva o udržitelném rozvoji, kterou sestavuje průměrně 25% podniků napříč jednotlivými kategoriemi. Zpráva o společenské odpovědnosti je sestavována pouze středními podniky (9% respondentů) a velkými podniky (17% respondentů).
Řada podniků uvedla, že sestavuje jinou formu nefinančního reportingu, jednalo se o více než 30% malých podniků, téměř 15% středních podniků a 20% velkých podniků. Jako nejčastěji uváděné varianty byly zmíněny statistiky, zprávy o vztazích, hodnocení vztahů s obchodními partnery a výroční zprávy.
Tabulka 6. Nefinanční reporting podniku
VELIKOST PODNIKU
PODÍL RESPONDENTŮ
ANO NE
Malé podniky 18% 82%
Střední podniky 28% 73%
Velké podniky 85% 15%
Zdroj: vlastní, 2012
Obrázek 3. Nefinanční reporting podniku
Zdroj: vlastní, 2012
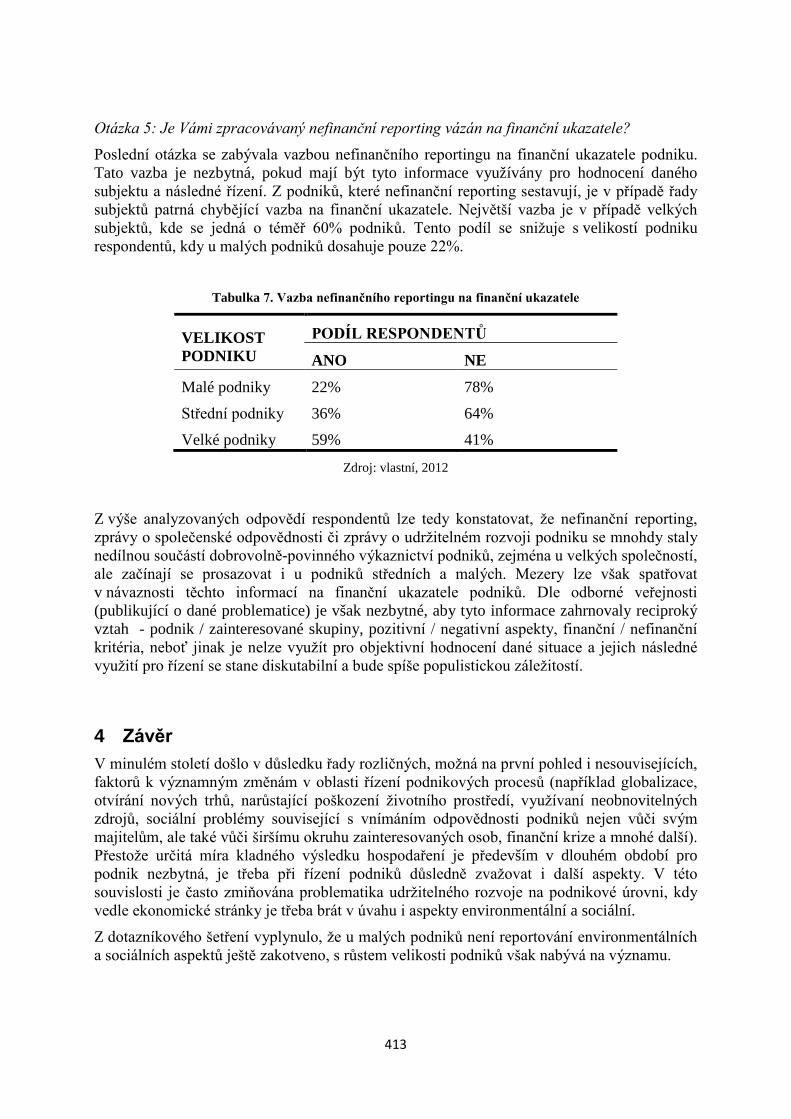
413
Otázka 5: Je Vámi zpracovávaný nefinanční reporting vázán na finanční ukazatele? Poslední otázka se zabývala vazbou nefinančního reportingu na finanční ukazatele podniku. Tato vazba je nezbytná, pokud mají být tyto informace využívány pro hodnocení daného subjektu a následné řízení. Z podniků, které nefinanční reporting sestavují, je v případě řady subjektů patrná chybějící vazba na finanční ukazatele. Největší vazba je v případě velkých subjektů, kde se jedná o téměř 60% podniků. Tento podíl se snižuje s velikostí podniku respondentů, kdy u malých podniků dosahuje pouze 22%.
Tabulka 7. Vazba nefinančního reportingu na finanční ukazatele
VELIKOST PODNIKU
PODÍL RESPONDENTŮ
ANO NE
Malé podniky 22% 78%
Střední podniky 36% 64%
Velké podniky 59% 41%
Zdroj: vlastní, 2012
Z výše analyzovaných odpovědí respondentů lze tedy konstatovat, že nefinanční reporting, zprávy o společenské odpovědnosti či zprávy o udržitelném rozvoji podniku se mnohdy staly nedílnou součástí dobrovolně-povinného výkaznictví podniků, zejména u velkých společností, ale začínají se prosazovat i u podniků středních a malých. Mezery lze však spatřovat v návaznosti těchto informací na finanční ukazatele podniků. Dle odborné veřejnosti (publikující o dané problematice) je však nezbytné, aby tyto informace zahrnovaly reciproký vztah - podnik / zainteresované skupiny, pozitivní / negativní aspekty, finanční / nefinanční kritéria, neboť jinak je nelze využít pro objektivní hodnocení dané situace a jejich následné využití pro řízení se stane diskutabilní a bude spíše populistickou záležitostí.
4 Závěr V minulém století došlo v důsledku řady rozličných, možná na první pohled i nesouvisejících, faktorů k významným změnám v oblasti řízení podnikových procesů (například globalizace, otvírání nových trhů, narůstající poškození životního prostředí, využívaní neobnovitelných zdrojů, sociální problémy související s vnímáním odpovědnosti podniků nejen vůči svým majitelům, ale také vůči širšímu okruhu zainteresovaných osob, finanční krize a mnohé další). Přestože určitá míra kladného výsledku hospodaření je především v dlouhém období pro podnik nezbytná, je třeba při řízení podniků důsledně zvažovat i další aspekty. V této souvislosti je často zmiňována problematika udržitelného rozvoje na podnikové úrovni, kdy vedle ekonomické stránky je třeba brát v úvahu i aspekty environmentální a sociální.
Z dotazníkového šetření vyplynulo, že u malých podniků není reportování environmentálních a sociálních aspektů ještě zakotveno, s růstem velikosti podniků však nabývá na významu.
414
Nejčastěji implementovaným environmentálním nástrojem je v případě výše definovaných respondentů ČR environmentální management, na druhém místě stojí ekoznačení. Dalšími nástroji jsou: čistší produkce a environmentální benchmarking.
Nefinanční reporting jako součást účetního výkaznictví je sestavován téměř pětinou malých podniků, třetinou středních podniků a 85% velkých podniků, bývá prezentován formou environmentální zprávy, zprávy o udržitelném rozvoji či zprávy o společenské odpovědnosti.
Mezery lze však spatřit ve vazbě nefinančního reportingu na finanční ukazatele. Z podniků, které nefinanční reporting sestavují, je v případě řady subjektů patrná chybějící vazba na finanční ukazatele. Je však nezbytné, aby se finanční a nefinanční informace doplňovaly a přispívaly tak k objektivnímu hodnocení pozice a výkonnosti podniku.
Použitá literatura Bennett, M., Burritt, R. & Schaltegger, S., 2006. Sustainability Accounting and Reporting - An Introduction. Dordrecht: Springer.
EC, E. C., 2011. Udržitelný rozvoj - Vaše Evropa - podniky. [Online] Available at: http://ec. europa.eu/youreurope/business/doing-business-responsibly/taking-sustainability-further/index cs.htm [Přístup získán 4. února 2012].
Hyršlová J., 2009. Účetnictví udržitelného rozvoje. [Online]. Available at: http://www.enviweb.cz/download/ea/ucetnictvi_udrzitelneho_rozvoje.pdf [Přístup získán 24. listopadu 2010].
Maas, K., 2009. Corporate Social Performance: From Output Measurement to Impact Measurement. Maas: ERIM.
Remtová, K., 2006. Dobrovolné environmentální aktivity - orientační příručka pro podniky. Planeta, 6, pp. 1-30.
Zborková, Jitka. Model účetnictví udržitelného rozvoje na bázi integrace ekonomických, environmentálních a sociálních aspektů podnikové výkonnosti. Plzeň, 2013. Disertační práce. Západočeská univerzita v Plzni. Fakulta ekonomická. Odborný školitel Lilia Dvořáková.